Credible conservation offsets draft-DBrinkman-24may09
190
1 Credible Conservation Offsets for Natural Areas in British Columbia: Technical Report, May 2009 Dirk Brinkman and Richard J. Hebda Edited Briony Penn Land Trust Alliance of British Columbia
Transcript of Credible conservation offsets draft-DBrinkman-24may09

1
Credible Conservation Offsets for Natural Areas in British Columbia: Technical Report, May 2009
Dirk Brinkman and Richard J. Hebda
Edited Briony Penn
Land Trust Alliance of British Columbia

2
Editorial Assistance: Sheila Harrington, Cameron St. John
Acknowledgements:
Gary Bull, UBC, Pierre Iachetti, NCC and Shawn Burke, Carbon Credit Corporation, who are also at the forefront of pilots in British Columbia, were consulted. To understand the Garcia Project, Dirk Brinkman talked to Evan Smith RPF, California who lead the development of the project. Others consulted included Jan Kirkby, Canadian Wildlife Service; Andrew Lush, Trees for Trust; Robert Seaton, Brinkman Forest Restoration; Fred Felleman, Dalhousie University, Cameron St. Johns, Brinkman Forest Restoration and Frederik Vroom, BARCA Panama.
Published by The Land Trust Alliance of British Columbia
This research and report was graciously funded by:
REF MEC Vancouver Foundation VanCity
Support for this project does not necessarily imply Vancity’s endorsement of the findings or contents of this report.
The report may be published, quoted or distributed to any other party provided that Land Trust Alliance of British Columbia is given acknowledgement. No responsibility can be accepted for losses to any person claiming to have acted or avoided action as a result of reliance on the report.

3
Preface It is with gratitude to the Land Trust Alliance of British Columbia, which represents the thirty land trusts in this province, that the authors accepted the commission to explore practical conservation offsets. BC's new Emission Offset Regulation and parallel initiatives in other parts of the Western Climate Initiative illuminate a new path to carbon credits. However, because BC still has to develop guidelines and Forest Protocols for these regulations, there is still some uncertainty on how to pioneer the pilot projects. This document is designed to help devise a context within which land managers in BC can develop credible conservation offsets of natural areas to the highest standards. The next step is to support the hard work of pioneering the first pilot projects, and ease BC’s high development costs faced by first movers in other jurisdictions, such as the Van Eyck and Garcia Forest Projects in California.
The authors’ advice in this report is supplied in good faith and reflects the limited knowledge and experience to be gained practically in an emerging field as well as uncertainties at the date of the writing and pre-publication (2009). Dirk Brinkman’s contribution to this paper is based on wide-ranging provincial and international experience in reforestation, offset and climate change projects such as: BC’s first land use change offset market; Canada’s first zero net forest loss offset market (Ontario Hydro); the first methodology for Afforestation/Reforestation put before the UNFCCC’s CDM; the World Bank’s leading Bio-carbon project, Pico Bonito, Honduras; Clinton Climate Initiative report on Overcoming Barriers to Financing Avoided Deforestation and Afforestation/Reforestation; four UNFCCC climate negotiations and the World Summit on Sustainable Development; being the Champion for Ecosystem-Based Forest Management Theme of Canada’s National Forest Strategy.
Richard Hebda's contribution derives from years of writing about climate change impacts on ecosystems in British Columbia, academic research in the dynamics of ecosystem change in the past, preparing models of climate change impacts, curating a major climate change exhibit and as coauthor of a recent report on climate change and conservation.
While the analyses used in this report are based on ecosystem value principles, logic and available knowledge, the biophysics, technical, economic and options analysis are indicative only. As emphasized throughout the report, appropriate specific project design and mensuration data have to be validated and modeled for each project before making any commercial decisions. Professional carbon market consultants are poised to provide these services for conservation offsets in British Columbia and LTABC is exploring the future relationships with consulting firms who are abreast of ever-changing international standards and market fluctuations. Carbon and non-timber value markets are even more volatile than timber markets, and any future market predictions made in this report are for the purpose of stimulating analytical thinking and should not be relied on for making market decisions.
It is our hope that ecosystem service market mechanisms will help integrate the values of conservation into every business decision. It will be another small step towards shifting human development to sustainability. The authors ask everyone, who shares

4
the LTABC’s vision, to accept the flaws in this effort to do their vision justice, and to also support the integration of all ecosystem values into their daily lives. We hope that all people interested in the efforts of land trusts and conservation organizations and land use issues in general share the contents of this report with their members and audiences. Dirk Brinkman and Richard Hebda

5
PREFACE .................................................................................................................................................... 3
INTRODUCTION ....................................................................................................................................... 9
CHAPTER 1: ROLE OF ECOSYSTEMS IN CONTAINING CLIMATE CHANGE........................ 14
INTERNATIONAL CONTEXT .................................................................................................................................................... 14 CHANGING ROLE OF CARBON SINKS AND CLIMATE ACTION FOCUS ......................................................................... 17 BC’S EMISSION OFFSET REGULATION .............................................................................................................................. 18 SCOPE OF LAND USE CHANGE TO PREVENT CATASTROPHIC WARMING ................................................................... 19 CONSERVATION’S GREEN ECONOMIC REVIVAL .............................................................................................................. 20 MIMICKING INDUSTRIAL GROWTH IN CONSTRAINING CARBON ................................................................................. 21 BEYOND CONTAINING CARBON LIES THE STEWARDSHIP OF LIVING SYSTEMS ...................................................... 22 BRITISH COLUMBIA AS A GLOBAL PRESSURE POINT ..................................................................................................... 23
CHAPTER 2: AGREEMENTS AND MARKETS FOR CONTAINING CLIMATE CHANGE ....... 25
INTERNATIONAL AND REGIONAL BENCHMARKS ........................................................................................................... 25 2009 REDD NEGOTIATIONS ................................................................................................................................................ 29 CARBON STANDARDS AND REGULATORY ENVIRONMENTS ....................................................................................... 31
BC offset opportunities and guarantees .............................................................................................. 33 Kyoto definition of a forest for carbon accounting purposes .............................................................. 36 Canada elects not to include managed forests on its Kyoto Account .................................................. 37 Canada’s managed forest sinks and sources 1990-2005 .................................................................... 38 Government of Canada proposed Protocols and Guidelines for Offsets ............................................ 41 The Emissions Trading System ........................................................................................................... 42
CHAPTER 3: PRINCIPLES AND DEFINITIONS OF CARBON ACCOUNTING .......................... 43
PROJECTS .................................................................................................................................................................................... 43 BASELINE ................................................................................................................................................................................... 43 ADDITIONALITY ....................................................................................................................................................................... 43 LEAKAGE .................................................................................................................................................................................... 43 PERMANENCE ............................................................................................................................................................................ 44 PROJECT PERIOD ....................................................................................................................................................................... 45 PROJECT BOUNDARY ............................................................................................................................................................... 45 METHODOLOGY ........................................................................................................................................................................ 45 VALIDATION .............................................................................................................................................................................. 45 VERIFICATION ........................................................................................................................................................................... 45 CONSERVATISM ........................................................................................................................................................................ 45 PROJECT DESIGN DOCUMENT .............................................................................................................................................. 46 GLOBAL STANDARDS ............................................................................................................................................................. 46 COMPETING STANDARDS....................................................................................................................................................... 46 THREE STRATEGIES TO INCREASE FOREST CARBON ...................................................................................................... 47 CARBON POOLS ......................................................................................................................................................................... 50
Living biomass .................................................................................................................................... 50 Dead Biomass ..................................................................................................................................... 50 Soil pools............................................................................................................................................. 51 Soil Methodology ................................................................................................................................ 51
LARGE SCALE VERSUS SMALL SCALE PROJECTS ............................................................................................................ 52 DEFAULT VALUES .................................................................................................................................................................... 52

6
RIGOUR IN SETTING STANDARDS ....................................................................................................................................... 54
CHAPTER 4: ECOSYSTEM SERVICES: CLASSIFICATION, VALUATION, AND A FRAMEWORK FOR THEIR QUANTIFICATION FOR OFFSET PROJECTS .............................. 55
IMPORTANCE AND CLASSIFICATION OF ECOSYSTEM SERVICES ................................................................................ 57 CLASSIFICATION OF ECOSYSTEM SERVICES .................................................................................................................... 58 TABLE 1: LIST OF ECOSYSTEM SERVICES ADAPTED AND MODIFIED FROM MEA AND WRI FOR USE IN CONSERVATION PROJECTS ................................................................................................................................... 61 QUANTITATIVE PROJECT ECOSYSTEM SERVICE VALUATION ...................................................................................... 64
ES Valuation Step 1: Identify the services ........................................................................................... 65 ES Valuation Step 2: Characterize the services with respect to their benefits and supply .................. 66 ES Valuation Step 3: Estimate amount of services and future trends (trajectories) ............................ 67 ES Valuation Step 4: Estimate the reliability of the services ............................................................... 71 ES Valuation Step 5: Identify how to value the services...................................................................... 72 ES Valuation Step 6: Estimate the value of the services...................................................................... 73 ES Valuation Step 7: Evaluate and account for the risks to and trade-offs between services ............. 76 ES Valuation Step 8: Define the project structure .............................................................................. 76 ES Valuation Step 9: Estimate the cost of providing the services ....................................................... 77 ES Valuation Step 10: Calculating the returns from providing services and commodities ................. 78
IMPORTANCE OF VALUATION AND COMPARISON ........................................................................................................... 78 AN EXPERIMENTAL FRAMEWORK FOR EVALUATING CARBON AND ECOSYSTEM SERVICE VALUES OF PROJECTS .................................................................................................................................................................................... 81
CHAPTER 5: FRAMEWORK FOR CARBON VALUATION FOR A PROJECT ............................ 82
Carbon Valuation Step 1: Definition of project structure ................................................................... 82 Carbon Valuation Step 2: Initial definitions of boundaries ................................................................ 82 Carbon Valuation Step 3: Stratification of the project area .............................................................. 83 Carbon Valuation Step 4: Demonstration of additionality .................................................................. 84 Carbon Valuation Step 5: Analysis of agents, drivers and underlying causes of change on the land. ..84 Carbon Valuation Step 6: Final stratification of the land ................................................................... 85 Carbon Valuation Step 7: Determination of current amount of carbon in the accounted pools in each stratum ................................................................................................................................................ 85 Carbon Valuation Step 8: Estimation of initial Carbon Stocks and baseline Carbon Stock changes. 85 Carbon Valuation Step 9: Estimation of expected Carbon Stock changes and non-CO2 emissions resulting from leakage ........................................................................................................................ 86 Carbon Valuation Step 10: Estimation of projected Carbon Stock changes under the Project Scenario .............................................................................................................................................. 86 Carbon Valuation Step 11: Calculation of expected net anthropogenic GHG emission reductions .. 87 Carbon Valuation Step 12: Financial analysis and analysis of risks .................................................. 87
SORTING FOR VALUE IN A CONSERVATION TRUST’S LAND INVENTORY .................................................................. 87 Value Sort Step 1: Sort projects into groups by start date .................................................................. 87 Value Sort Step 2: Stratify properties .................................................................................................. 88 Value Sort Step 3: Aggregate projects ................................................................................................ 88 Value Sort Step 4: Rough model types ................................................................................................ 88 Value Sort Step 5: Visit site to do field work ....................................................................................... 88 Value Sort Step 6: Develop a plan ...................................................................................................... 88
CHAPTER 6: STRATEGIC REVIEW OF POTENTIAL MARKET VALUE AND OPTIONS ....... 89
RISK MANAGEMENT ............................................................................................................................................................... 89

7
EARLY ACTION ......................................................................................................................................................................... 90 OPTIMIZING VALUE................................................................................................................................................................. 90 INDEMNIFYING REGULATORY RISK .................................................................................................................................... 92 VINTAGE ..................................................................................................................................................................................... 92 DESIGNING FUTURE PROJECTS ............................................................................................................................................. 93
CHAPTER 7: CASE STUDIES ................................................................................................................ 96
LOMPICO HEADWATERS FOREST, LOS ALTOS CALIFORNIA ...................................................................................... 98 TREES IN TRUST, NEW BRUNSWICK .................................................................................................................................. 99 CREEKSIDE RAINFOREST – SALTSPRING ISLAND, BC ............................................................................... 100 COMMUNITY FORESTS: VEDDER MOUNTAIN FOREST, CHILLIWACK, CASCADE LOWER CANYON COMMUNITY FOREST, HOPE, SUNSHINE COAST COMMUNITY FOREST .................................................................. 101 THE COMMUNITY ECOSYSTEM RESTORATION PROJECT ............................................................................................. 103 PACK FOREST, UNIVERSITY OF WASHINGTON ............................................................................................................ 105 DARKWOODS – NATURE CONSERVANCY OF CANADA.............................................................................................. 106 VAN EYCK FOREST, CALIFORNIA .................................................................................................................................... 107 GARCIA RIVER CONSERVATION PROJECT ..................................................................................................................... 108 CROWN LAND INITIATIVES IN BC WITH CARBON/BIODIVERSITY OBJECTIVES.................................................. 110
Crown Land Post Harvest Reforestation Projects ............................................................................ 110 The Coast Conservation Initiative ..................................................................................................... 112 The Columbia Basin Trust ................................................................................................................ 113 The Pacific Climate Trust ................................................................................................................. 114
CHAPTER 8: RECOMMENDATIONS ................................................................................................ 116
A1. CONTRIBUTE TO GLOBAL VISION OF ECOSYSTEM SINKS WITH HIGH QUALITY STANDARDS .................. 116 A2. INFLUENCE PROVINCIAL STANDARDS.................................................................................................................... 117 B. RESEARCH & COLLABORATION .................................................................................................................................. 117 C. DEVELOP PILOT PROJECTS ........................................................................................................................................... 118 D. CONSERVATION PROJECTS AND THE OFFSET MARKETS ..................................................................................... 119 E. FINAL RECCOMENDATION SHARE INFORMATION AND COLLABORATE ........................................................... 121
APPENDICES .......................................................................................................................................... 122
APPENDIX 1: BIBLIOGRAPHY ............................................................................................................................................ 122 APPENDIX 2: ABBREVIATIONS AND ACRONYMS ......................................................................................................... 132 APPENDIX 3: GLOSSARY ..................................................................................................................................................... 134 APPENDIX 4: BC EMISSION OFFSET REGULATION ..................................................................................................... 152 APPENDIX 5: COMPARING CCAR AND VCS STANDARDS ....................................................................................... 164 APPENDIX 6: A NORTH AMERICAN STANDARD FOREST METHODOLOGY .......................................................... 172 APPENDIX 7: A PROVISIONAL FRAMEWORK FOR EVALUATING PROJECT CARBON AND ECOSYSTEM
SERVICE VALUES .................................................................................................................................................................. 175 Components of the valuation ............................................................................................................. 177 Establishing Current value ............................................................................................................... 178 Carbon emission value and accumulated emissions ......................................................................... 180 Simple Carbon Emission (CE) Equations ......................................................................................... 181 Leakage ............................................................................................................................................. 182 Ecosystem Services Valuation Equation ........................................................................................... 183 An Example Ecosystem Services Index ............................................................................................. 184
Accounting for risk ............................................................................................................................ 185

8
Combining ACE and AES ................................................................................................................. 185 APPENDIX 8: BEGINNER’S INTRODUCTION TO OFFSETTING ................................................................................... 189

9
Introduction In 2008, The Land Trust Alliance of British Columbia published a report entitled Mitigating and Adapting to Climate Change through the Conservation of Nature in British Columbia.1 The key recommendation of that report was to explore the “major opportunities to use the remarkable value of conserved lands” including living carbon and ecosystem services through the growing offset markets. This report seeks to bring the relevant elements together to prepare for this next step. Conservation projects, including ecological restoration and management, provide options for generating revenue and support for conservancies, land trusts, First Nations, and other owners and managers of protected and conserved lands.
Since the publication of the Hebda/Wilson report, international and regional developments in the living carbon markets have expanded exponentially. In response to the evidence of growing catastrophic risks resulting from climate change, offset trading in Green House Gases (GHG) has dominated the emerging science and practice of climate action. GHG trading is expected to become the largest single commodity traded in the world’s largest ecoregion—the atmosphere—a global commons. The rising importance of reducing emissions from deforestation and land use degradation (REDD) and reforestation offsets as part of an integrated climate change strategy, has led to the proliferation of methodologies and regulatory mechanisms for living carbon credits.
The Province of BC has been a regional leader in responding to the climate change challenge, through its Climate Action Plan that targets a 20% reduction in 2004 GHG emission levels by 2020, to be implemented by the recently passed Emission Offset Regulations. The BC government's carbon tax and the creation of the Pacific Carbon Trust, with its call for forestry offsets, are examples of an emerging market for forest emission reduction and for ecosystem sink creation. US President Obama's recent commitment to cap and trade and the government appointees for implementing this system are encouraging. Land trusts and other land managers can now consider how ecosystem GHG reduction benefits can be traded to conserve, restore or enhance natural systems. In anticipation of these markets, various discussion papers have been recently released on carbon offsets for BC’s diverse and rich ecosystems.2 This report complements these papers and attempts to provide recommendations for the direction BC should take in developing this market.
1 (Wilson & Hebda, 2008) 2 Three discussion papers within British Columbia have come out on carbon offsets, forests and biodiversity in 2008/09 all of which are recommended reading. Off setters. January 30 2009. A Discussion Paper on the Feasibility of Funding Riparian Restoration with Revenue Sourced from Carbon Credits, Fraser Basin Council; M. Greig G. Bull. 2009. Carbon Management in British Columbia’s Forests: Opportunities and Challenges. Forrex Series 24; and T.A. Black et al, November 2008. Carbon Sequestration in British Columbia’s Forests and Management Options. Pacific Institute for Climate Solutions. A fourth paper is in draft form and due to be released by the Forest/Climate/Biodiversity Working Group of various ENGOs in BC,. J. Pojar’s The Credible Case for Nature Conservation in BC: Biodiversity, Carbon and Climate Change. Also Simon Dyer et al 2008. Catching Up: Conservation and Biodiversity Offsets in Alberta’s Boreal Forest. Canadian Boreal Initiative. provides useful insight into Alberta’s opportunities.

10
In addition to carbon storage and sequestration, ecosystems provide an enormous range of services or values vital to the well-being of humans.3 4 Such values have motivated the conservation and protection of ecosystems by many land trusts and other land agencies as well as governments. Any climate change initiative involving ecosystem conservation has greater value because of the added benefits of conservation and even enhancement of vital ecosystem services. From the perspective of climate change alone, these services provide an important adaptation component of confronting climate change5. British Columbia has exceptional potential to develop a market for the integration of ecosystem services with carbon services and the development of a valuation program. The province has the greatest biological diversity at ecological and taxonomic scales in the country and much of it remains in a relatively sound state.6 This makes the region an excellent place to invest in many ecosystem services, particularly those related to biodiversity and climate change adaptation. The region has a stable social infrastructure and governance for supporting perpetual covenants assuring permanence.
3 (Assessment, 2005)
4 (Ranganathan J. R.-H., 2008)
5 (Eliash, 2008) Also note (Wilson & Hebda, 2008) (Pojar, 2009) 6 (Austin, Buffett, Nicolson, Scudder, & Stevens, 2008)
The Offsets Market
'Offsets' is used in this report to describe the link between the effort to reduce industrial (and personal) emissions and the equally important conservation and restoration of ecosystem sinks. The emerging offset market for reducing emissions by purchasing sinks is very small compared to the trading market to cap emissions, but this market provides important precedents for the bigger challenge of securing the stability of existing global sinks and restoring the earth’s degraded soils and ecosystems (Millennium Ecosystem Assessment, 2005) to meet the climate challenge (Eliasch Review 2008).
The offset market is recognizing a continuum from avoided deforestation of natural forests (or full conservation) to different degrees of carbon management, such as afforestation /reforestation/restoration and soil rehabilitation. It prepares the critical road ahead for expanding global terrestrial sinks to an extent that the climatic disruptions of greater than 2C warming and its consequent geopolitical chaos may be avoided, or at least mitigated.
The US has had an offset market for twenty years in wetlands with ecologist entrepreneurs partnered with investors. Farms, that may have been struggling to stay drained, were bought and restored to wetlands over four or five years and then traded through the wetland program of two-restored- hectares-for-one-disturbed-hectare—creating the wetland offset market.

11
The process of measuring and valuing carbon in ecosystems and valuing ecosystem services, and then integrating the valuations into the business of offset trading, is complex and evolving rapidly. It requires technical expertise in many fields: physical and biological sciences, economic and social systems, policies and legislation. Furthermore, this technical expertise has to be applied on a range of geographic scales. The specific tools and frameworks for measuring carbon, CO2 emissions and ecosystem components and services are evolving rapidly and are yet to be standardized.
The chapters that follow are necessarily technical and are intended to guide the professionals involved with land trusts and other land agencies in the evaluation, choice and development of appropriate approaches and methods pertinent to offset projects. For opinion leaders and policy makers, it summarizes the rapidly changing institutional framework, mechanisms and markets for originating and selling conservation offsets in BC. For the lay readers, a carbon primer is also provided with the principles of valuing carbon and ecosystem services. Pioneering case studies are profiled to show the range of emerging opportunities and challenges for developing carbon/conservation offsets in both the voluntary and compliance offset markets. As the first pilot projects for conserving living carbon are tested and have their methods refined, assigning value to nature will become more comprehensible and more widely integrated into all conservation projects. Land trusts and other managers of conservation lands are encouraged to get acquainted with the language and methods of this process, since significant and exciting opportunities are available. Finally, some of the international impetus for forest offsets has come from the forestry sector seeking to fund reforestation, restoration and improved forest practices. This has led to an outcry by ENGOs and the public against forestry offsets who fear that large emitters will simply buy their way out of immediate emission reductions, by paying for distant future forest carbon sinks. The experience in California, however, suggests that the sustained critical tension between the environmental community and public, on the one side, and the forest industry, on the other, has required vintage matching, raising the bar on the debate and creating some huge opportunities. The protocols and methods developed for forestry offset projects in California are now directly transferable to conservation projects. Lompico Forest Project generated the first carbon credits for full conservation of a redwood forest to be traded on the compliance market, just last year. The April 2009 call for forest offsets from the Pacific Carbon Trust indicates that British Columbia is taking a similar route to California. BC, like California also has forest ecosystems unique in the world, and some of the most well-informed and passionate environmentalists to defend them. British Columbia is a world leader in measuring and understanding biological diversity, ecosystem characteristics and its forest management practices are the best in the world, according to Ben Cashore, Professor at Yale University.7 So an opportunity exists to enable conservation organizations to build on
7 (Cashore & Auld, 2003)

12
the regulatory framework within which forestry companies’ practice. The Forest Practices Act provides a sound foundation for the unprecedented level of sophisticated accounting required to trade ecosystem GHGs and their atmospheric interactions which are both subtle and complicated. But this approach is appropriate because the statistical disciplines for data collection and sampling developed within forest research transfer soundly into the measurements related to actions on climate change. The technical report includes considerable discussion of some of these debates over the last decade, the global context, and the scientific data that is accumulating about full-cost accounting for carbon and the role of forests and ecosystems in a comprehensive climate action plan. It is important that some of these fundamental relationships between terrestrial ecosystems and the atmosphere, reducing emissions and increasing sinks, and the critical timing for action, all be well understood.
Throughout, the report makes recommendations to members of the Land Trust Alliance of British Columbia.
In this report,
• Chapter one sets the context for the global role that conservation and restoration of BC’s
natural ecosystems can play in reducing emissions.
• Chapter two provides the critical context for BC offset programs climate change action within the international challenge to contain climate, because offset activity today occurs in the international realm.
• Chapter three provides the principles of carbon accounting.
• Chapter four examines the classification and valuation of ecosystem services.
• Chapter five provides the current framework for valuing carbon and managing risk.
• Chapter six provides a strategic review of potential markets.
• Chapter seven reviews case studies and some pilot projects using ecosystem service and carbon offsets in BC and the Western Climate Initiative states of California and Washington.
• Chapter eight integrates and summarizes the recommendations that appear throughout the report related to the material being discussed.
The Executive Summary is published separately and available online as well on www.ltabc.ca. Appendix 1 is the bibliography including a recommended reading list. Appendix 2 are the abbreviations and acronyms. Appendix 3 is a glossary of terms as differently defined in each standard. Appendix 4 includes the BC Emission Offsets Regulation (2009). Appendix 5 compares two dominant North American standards: VCS and CCAR.

13
Appendix 6 describes a 2009 initiative to develop North American forestry carbon standards. Appendix 7 outlines a provisional framework for evaluating project carbon and ecosystem service values. Appendix 8 is a beginner’s introduction to offsetting.

14
Chapter 1: Role of Ecosystems in Containing Climate Change
Photo: Dirk Brinkman
“What the world needs is ‘Less emissions, more sinks’” Indonesia’s President Susilo Bambang Yudhoyono opening the political session of the 2007 UNFCCC’s MOP3/COP13 in Bali. International context The global urgency of action provides a critical mission context for directing BC land trust initiatives and aligning its various constituents to the key priorities for its climate and ecosystem service initiatives. This section attempts to develop some foundation elements for LTABC’s mission and land managers interested in conservation of biodiversity. Two unprecedented global science teams have defined the scope and scale of the challenge of two of the converging calamities facing the sustainability generation: the International Panel of Climate Change scientists (IPCC) who have advised the UN Framework Convention on Climate Change (UNFCCC) 1992-2009, and 1360 scientists, agronomists, ecologists and foresters who undertook the UN’s Millennium Ecosystem Assessment (MEA) between 2000 and 2005. Susan Solomon, the former head of the US National Oceanic and Atmospheric Administration (NOAA) recently said “continued, unabated CO2 emissions to the atmosphere would have climatic consequences that would persist for a thousand years.8”
8 Susan Solomon, ozone hole luminary and Nobel Prize winning chair of the IPCC and former chair of NOAA, with her colleagues, published a paper entitled “Irreversible climate change because of carbon dioxide emissions” in the Proceedings of the National Academy of Sciences of USA. In it she talked about the long tail of carbon that will take thousands of years before it will be removed from the atmosphere. This long residual time is because the oceans are already saturated, and as you reduce atmospheric carbon the oceans will release some of their stored carbon to re- equilibrate, just as they will absorb more as the atmospheric fraction of carbon containing molecules increases. The only solution is a global terrestrial bio-sequestration initiative such as this paper discusses.

15
The IPCC’s 2007 report, authored by the largest and most credible scientific body the world has ever known, confirmed there is over 90% certainty that human Green House Gas (GHG) emissions are driving global climatic disruptions. The ‘geopolitical chaos’9 expected to arise from these disruptions of climate, agriculture, settlements and ecosystems, has the potential to be far worse than the consequences of the current financial meltdown.10 “Without action we risk losing,” according to James Hansen, scientist with National Aeronautics and Space Administration (NASA), “a planet similar to that on which civilization developed and to which life on Earth is adapted11.”
This urgency has driven the huge up-swell of material on reducing emissions from forest loss and degradation in the last 18 months as policy and science catch up. The interest in reducing deforestation has provided a major impetus to the role of land trusts. However, also new is the need for a global sinks program, which changes the discussion about the nature of forest carbon and ecosystem services. It is this new dynamic that is important to understand, so that land trusts and other land managers can play a leading role in a global sinks initiative. This critical shift is recognizing the dynamic interdependence of industrial emissions and ecosystem sinks. This is well illustrated by the trends in their annual dynamics as shown in Figure 1 of the terrestrial/atmospheric carbon cycle.
9 This apropos term ‘geopolitical chaos’ was used in the Pentagon’s 2008 confidential assessment “The National Security Implications of Climate Change through 2030” authored by Thomas Fingar who was nicknamed 'Yoda' by Pentagon colleagues for his long record of accurate predictions. The countries, states and counties identified to be at risk in this assessment remain confidential. Presented to the US Congress in July 2008.
10 "If we do not reduce our emissions from their present path by at least half globally, by 2050, we will bring upon ourselves a human and economic catastrophe that will make today’s crisis look small." UK PM Gordon Brown, Feb. 1, 2009
11 (Hansen & et al, 2008)

16
Figure 1: The terrestrial/ocean atmospheric carbon cycle is illustrated below in the period 2000-2005 and this is compared to the period 1990-1999 in the chart below.
Sources Sinks
Average
annual
atmospheric
Emissions Emissions
Terrestrial
Average
annual
%age
Period
fraction
GtC/yr
from Fossil from
Fuel deforestation
ecosystem Oceans
GtC/yr GtC/yr
surface
absorption
1990-1999 3.2 +- 0.2 6.4 +- 0.4 1.6 +- 0.9 2.6 2.2 +- 0.4 50%
2000-2005 4.1 +- 0.1 7.3 +- 0.3 1.6 +- 0.9 2.6 2.2 +- 0.5 46% The characterization of the annual cycle of the atmospheric/surface dynamic in the illustration
and the chart above is shown in gigatonnes of carbon, whereas often emissions and sinks are
characterized in gigatonnes of CO2 or CO2e (carbon dioxide equivalent calculating for all
greenhouse gases). The conversion from C to CO2 uses the ratio of 12:44.
Image by Dirk Brinkman, adapted from the 2007 IPCC Report, the Science.

17
Changing role of carbon sinks and climate action focus During the period between 1990 and 2000, each year on average 50% of industrial and deforestation emissions were re-absorbed into terrestrial and ocean sinks, almost all through photosynthesis. However, during the 2001 to 2005 period the portion that the world’s ecosystems absorbed was only 46% of annual industrial emissions. The main reason for this proportional decline is the increasing annual fossil fuel emissions and the decreasing forest cover and degradation of ecosystem health. This resulted in the annual fraction of GHGs staying in atmosphere increasing from 3.2 GtC/yr to 4.1GtC/yr, an increase of 28%. This trend is measured from the weighted mid-point 1990-1999 to the mid-point of 2000-2005, only a period of only 7.5 years. Such acceleration in global warming GHGs is very alarming.12 Especially because it is not only the annual increase in emissions that causes this trend of forest loss from deforestation reducing forest cover furthermore reducing annual absorption. A bigger interrupter of this annual absorption is that the seasonal growth with interrupted rainy periods in the tropics and drier springs in temperate zones result in years with extreme drought and fire. Both 1998 and 2003 were such extreme fire and drought years in many parts of the globe. Flying in a helicopter for 12 hours over a sev million hectare burn on Kalimantan in 2006 showed very little growth recovery.13 The 2003 firestorm in BC was replicated in California, Australia, the European Union (with 22,000 deaths in France during the heat waves) and Siberia—where 23 million hectares burned. In extreme drought years such as 2003, land use changes from fire, and reduced seasonal growth may have had as great a climate impact as the emissions from fossil fuels. Beyond the trends of deforestation and degradation of terrestrial and ocean ecosystems, both the ocean and the remaining ecosystems have saturation maximums that limit the annual role these ecosystems can play in moderating climate change. To avoid the IPCC's Fourth Assessment Report (IPCC FAR) critical warming threshold of 2°C, the global climate change debate focused on reducing industrial (and personal) emissions. On December 8th of 2008, in Poznan, Poland, during the UNFCCC’s COP14/MOP4 climate talks, members agreed to include a protocol for forest protection measures known as Reduced Emissions from Deforestation and (Forest) Degradation (REDD), adding to the UNFCCC’s protocols for Afforestation/Reforestation/Restoration (ARR).
12 (IPCC, 2007) 13 Dirk Brinkman, personal observation, 2006

18
It is possible for REDD initiatives to reduce deforestation emissions by 75% through altering historic patterns according to the Eliasch Review, published November, 2008.14 Whether such a global land use change program matched with an emission reduction agenda could prevent 2oC warming was modeled and debated for the climate negotiations by James Hansen of NASA in 2008. The emergence of a global sinks program is now without doubt and is estimated to create trillions in new economic activity over the next two decades15. BC’s Emission Offset Regulation In a wonderful serendipity, suggesting that emerging changes have reached a tipping point, and also on the week of December 8th, 2008 harmonizing with the UNFCCC's REDD modality for conservation carbon, the Government of BC through an Order in Council (#905) passed BC’s "Emission Offset Regulation" under the Greenhouse Gas Reduction Targets Act, 2007.16 So as the international negotiations added tools for ecosystem sink conservation to the existing tools of Afforestation/ Reforestation/ Restoration (ARR), the BC Legislature effectively enabled the use of these mechanisms within British Columbia.
This is very significant for Canada since, because the federal momentum of having ratified the Kyoto Protocol in 2004 was lost in 2005, any possibility of using the emerging international tools to restore or conserve forests have been stalled in this country. BC’s Climate Action Plan (CAP), which is a part of the Western Climate Initiative (WCI) involving four provinces and seven states, recognizes both the trading value of emission reductions from avoiding forest degradation, and ecosystem sinks created through forest enhancement and restoration programs, but before December 8th, offered no regulatory direction for project developers, proponents or land managers in BC. While at this time there are still no guidelines or validated project methodologies within BC, the California Air Resources Board (CARB) which is also a part of the WCI, adopted the nation’s first standards for forest-generated emission reductions and has completed the validation of several forest conservation/restoration projects which offer ready prototypes for similar projects in British Columbia (Van Eyck, Lompico and Garcia Forest Projects, see Chapter 7).
14 (Eliash, 2008)
15 (Institute, 2008)
16 (Bill 44: The Greenhouse Gas Reduction Targets Act, Section 12, 2007)

19
Furthermore, with the establishment of a basic framework for carbon as an ecosystem service value, the methodological process for trading other ecosystem values has a greater opportunity to emerge. This is because the bioethics of carbon offset protocols provide important precedents for other ecosystem values—precedents in the fundamental process that must be followed to result in a robust offset trading system. This paper attempts to address some of the issues that arise on the route to this new market economy of ecosystem service trading, especially issues facing land trusts and other land managers in BC. Credible, accountable, affordable and trackable methods that meet standards so that projects can be assessed for a variety of markets, are comparable for ranking and so that their progress can be evaluated are required for a robust market to emerge in BC.
Scope of land use change to prevent catastrophic warming Because all indications are that we will exceed a 2oC increase if we rely on the inadequate global actions to reduce emissions, shifting more land use sources to sinks and improving land use sink capacity is becoming an increasing part of climate action.
The full potential of a global land scale restoration program for addressing climate would effectively restore the capacity of carbon sinks to what they were 8000 years ago, when the emergence of this rich state of civilization began. This does not mean that we will revert all of the areas now dedicated to agriculture today back to forests. However, carbon trading will create incentives to modify agricultural practices as soil degradation is a net source of GHGs, and these new practices can return the soil to being a net GHG sink. This land stewardship initiative is needed to avoid having the steamroller of industrial development destroy terrestrial ecosystems, including soils, the basis of human well-being. Land trusts have a critical role in teaching businesses and individuals about how to become ecosystem stewards. Through narrating more positive climate scenarios, land trusts can encourage the emergence of a land-nurturing market.
To achieve the necessary reductions in emissions from land use changes and the most effective system of maintaining biological diversity, an integrated approach needs to be adopted. Franklin et al. describe it as the management of this values matrix.17 Franklin points to the urgent necessity of all land managers from foresters to farmers becoming engaged in this task of carbon and biodiversity conservation as part of an integrated strategy of mitigation and adaptation. Pojar in his recent draft paper,18 outlines an integrated strategy for BC that highlights the need for a multi-sector approach.
17 (Franklin & Lindenmayer, 2009) 18 (Pojar, 2009)

20
Conservation’s green economic revival It is the conservation community that led the vision for the first challenge to overcome the global trends in ecosystem degradation in the last century. As we entered the new millennium, the conservation community’s imperative has to be embedded in all economic transactions. Fortunately, conserving and restoring ecosystems and constraining carbon dioxide gas emissions can also create sustainable new economic growth. Pricing carbon sequestration can lead the green economic revolution that may develop from pricing and creating markets for all of the ecosystem services. Ecosystem service markets could provide the sustainable pull to lift the world economy out of its downward spiral and will certainly do far more than pouring bailout capital into the old industrial economic giants19. The industrial revolution of the past century had huge impacts on the atmosphere, the oceans, soils and ecosystems. The information revolution had a huge impact on the financial system the consequences of which we are all witnessing and experiencing now. Mass production concepts from the industrial era were programmed into computer transacted derivative, futures and bond trading that leveraged real dollars into astronomical debt, insurance and security exposure. Now this whole recently created financial constellation, which once promised high rates of return on each layered transaction, is all unwinding like a million kites suddenly without wind that are falling back to the ground in a tangled web. As long as this recession remains a time of peace, this great financial unwinding may be a blessing for natural systems. Eliminating the stellar internal rates of return promised by the world economic boom permits the slow growth of natural systems (agricultural, forestry and ecosystem services) to compete on a level playing field for human and capital resources. It is in the new ecosystem services economy that a government financial and regulatory stimulus can create sustainable new jobs20. It is the natural economy that will harness the extensive land resources of the poorest of the poor, who in Canada are the aboriginal people, and help them escape hardship with cultural integrity. Of the two great global threats, ecosystem degradation and climate change, the threat of climate change is now the greatest. The need to contain climate change with ecosystem, soil and forest conservation and restoration may also solve the ecosystem degradation challenge.
19 ‘And no one puts new wine into old wineskins; otherwise, the new wine will burst the skins and will be spilled, and the skins will be destroyed. But new wine must be put into fresh wineskins. And no one after drinking old wine desires new wine, but says, “The old is good.”’ Gospel of Luke 5:37-39, New Revised Standard Version: 1989. Most of us instinctively recognize that this ancient knowledge embed in New Testament Christian teachings can help guide those trying to refill the draining global economy. The new economy that must emerge to revive global trade will not come from filling the old automobile and oil and gas industry giants with bail outs. Pouring in billions before a new emission standard, and a new regulatory cap and trade system has been formed will result in a huge lost opportunity. 20 (Organization, 2009)

21
" The forest sector could benefit from the pursuit of a “green path” to development – through building up of natural resource capital (e.g., through afforestation and reforestation and increased investments in sustainable forest management), generation of rural employment and active promotion of wood in green building practices and renewable energy. Certainly, this change of path will require fundamental institutional changes, but the crisis may bring about greater willingness to accept and implement long-overdue reforms."21
Mimicking industrial growth in constraining carbon The road to a zero-carbon economy has been marked by the IPCC interim goal: which is to reduce total human produced GHGs to a global target of 20 gigatonnes by 2050. Reducing emissions can be seen, not as reducing the carbon intensity of the GDP22, but according to the McKinsey Global Institute, ‘as increasing the carbon productivity of the economy’.23 To also allow the remaining one third of the world to reach the UN Millennium Development Goals, the GDP per tonne of CO2e (carbon dioxide equivalent which is used to reference all GHGs) has to increase by ten times. This seems impossible until you reflect on the fact that the United State industrial revolution achieved a ten times increase in labor productivity between 1830 and 1955.24 The second third of humanity in SE Asia emerging from hunger, disease and hardship are showing that a ten times increase in labor productivity is now possible in one or two generations. Today’s rate of dissemination of technological, structural and governance advantages, like today’s business transactions, have accelerated change by hundreds of times. Combine that ready freeway to change with the desperation of the current economic downward spiral and we do not need to doubt the outcome, providing we can collectively sustain our common determination and clarity of purpose. It is for that clarity of purpose that the authors thank the BC Land Trust Alliance, and its member conservation trusts.
Carbon sequestration by healthy ecosystems not only increases carbon productivity as a positive sink offset for some of the old industrial emitters, but it also provides a mechanism eventually to remove the cumulative atmospheric carbon dioxide of the previous industrial era and in that role, to become not just a highly-valued ecosystem service, but one essential to the survival of civilization.
21 Food and Agriculture Organization of the UN. 2009. State of the World’s Forests. 22 (Kaya & Yokobori, 1993) This work sees carbon productivity as the inverse of carbon intensity and considers it along with labor and capital as input factors.
23 McKinsey Global Institute. 2008. The Carbon Productivity Challenge.
24 (Maddison, 2007)

22
Beyond containing carbon lies the stewardship of living systems
“We have arrived at a moment of decision. Our home – Earth – is in grave danger. What is at risk of being destroyed is not the planet itself, of course, but the conditions that have made it hospitable for human beings” …The elements that I believe are key to a successful agreement in Copenhagen include:
• Strong targets and timetables from industrialized countries and differentiated
but binding commitments from developing countries that put the entire world under a system with one commitment: to reduce emissions of carbon dioxide and other global warming pollutants that cause the climate crisis;
• The inclusion of deforestation, which alone accounts for twenty percent of the emissions that cause global warming;
• The addition of sinks including those from soils, principally from farmlands
and grazing lands with appropriate methodologies and accounting. Farmers and ranchers in the U.S. and around the world need to know that they can be part of the solution;”25
The role of conservation organizations in the climate action context is to lead beyond the concept of carbon offsets. Within the context of the conservation movement, ecosystem restoration and land stewardship of natural systems can be seen for what they really are—life affirming activities which nurture us, not just compensate for emissions. The function of conservation communities is to inspire ‘emission offset projects’ with the recognition that they embody the fundamental vitality of life within all of its ecosystem services.
A central purpose of land conservation projects in climate action may lead to a point where natural capital becomes the foundation of the new green economy, replacing the US dollar as the benchmark for international currency values. Today’s sustainability generation does not have much choice—we must integrate ecosystem values into the economics of our daily lives. There is a rapidly growing opportunity for land trusts to work with other land managing agencies like municipalities, First Nations, forestry companies and government because they have common cause.
Recommendation: Conservation trusts should immediately explore the potential and benefits for collaboration and partnerships with First Nations, Municipalities, forest companies, governments and other organizations to provide voluntary and compliance offsets.
25 Selections from Statement to the Senate Foreign Relations Committee as prepared by the Hon. Al Gore
Wednesday, January 28, 2009

23
‘Living Carbon Standard’ beyond a ‘Gold Standard’
British Columbia has an excellent opportunity to use its ecological cachet (‘the greatest biodiversity in Canada’) and its global cachet (‘the best place in the world to live’) to brand ‘Living Carbon’ as beyond the gold standard for the new millennium. Those who develop conservation credits have sometimes sought to have them acknowledged as the ‘gold standard’ to differentiate them from less ecologically aligned carbon sinks. While the ‘Gold Standard’ may be useful for the energy sector to characterize premium quality carbon credits, the ‘Living Carbon Standard’ could distinguish itself by the conservation community as the new gold of the 21st century. Gold was the world currency standard in previous millennia, but Al Gore in his documentary,
when he quipped about the difficulty, “Hmm, gold, or the planet?” touches on the shift in societal attitudes of what holds value.
Land stewards who have intact ecosystems provide benchmarks against which we can monitor the combined indirect human factors such as climate change and direct human management factors in the rest of the stressed-out ecosystem. Those same lands and ecosystems also benchmark the supply of key ecosystem services which contribute to the wellbeing, function
and health of communities and by comparison remind us of what is being lost in more disturbed landscapes. Of course, they also provide the opportunity to demonstrate adaptive management as the impacts of climate change occur.26
Recommendation: Consider branding “Living Carbon”, as the conservation trust’s climate action product. This term more closely embodies the multiple benefits characteristic of perpetual covenants of living ecosystems.
British Columbia as a global pressure point The global context for conservation to play a role in GHG and offset trading is very compelling, especially in the province with the greatest ecological diversity.27
British Columbia lands and ecosystems in particular are sensitive to climate change,28 but at the same time, because of the extensive forests and wetland cover, have considerable potential for removing and storing carbon and providing a wide range of adaptation values. The UNEP-World Conservation Monitoring Centre clearly link carbon storage and conservation of biodiversity in many parts of the world especially in the tropics.29 In Canada, BC has the highest biodiversity and BC's coastal forest ecosystems have the highest 26 (Wilson & Hebda, 2008)
27 (Austin, Buffett, Nicolson, Scudder, & Stevens, 2008).http://www.biodiversitybc.org/EN/main/20.html 28 A variety of recent reports on impacts to biodiversity have come out recently including Austin et al., 2008. Pojar, 2009 and Lemmen, D.S., Warren, F.J., Lacroix, J. and Bush, E. 2008. From Impacts to Adaptation: Canada in a Changing Climate. 2007. Government of Canada, Ottawa. 448 pp.
29 (UNEP World Conservation Monitoring Centre, 2008)

24
carbon storage per hectare30 emphasizing the juxtaposition of these two key values. The BC-Alberta region is also one of the world's species at risk hotspots.31 Particularly notable are the large relatively intact tracts of major biomes supporting natural large predator-prey systems.32
British Columbia, with the last intact coastal temperate rainforest in the world, and its vast internationally renowned mountain and boreal forests and its world class cluster of professional expertise in forest dynamics has the potential to be the global leader in forest ecosystem climate initiatives. Thanks to the legislation passed in 2007 and 2008 in British Columbia, and more particularly the Emission Offset Regulation passed on December 8th, 2008, both restoration and conservation initiatives have now been made possible in BC.
Recommendation: Conservation organizations and agencies should align behind a common understanding of and vision for a global ecosystem sink through conservation and restoration initiatives to minimize climate change.
30 (Wilson & Hebda, 2008) 31 (Global Hotspot Assesment, 2006) 32 A full scientific discussion of this important overlap of biodiversity and carbon storage in British Columbia is found in the draft technical report by Pojar, 2009.

25
Chapter 2: Agreements and Markets for Containing Climate Change
A short history of climate change initiatives and agreements is outlined below. The historical pattern and rate of change suggests the degree and pace of future trends. The most significant development to watch will be the US commitment to lead the United Nations Framework Convention on Climate Change (UNFCCC) negotiation process in Copenhagen in December 2009. Local initiatives (within the US and UNFCCC negotiation teams) leading up to Copenhagen may have an effect on the Western Climate Initiative, the BC regulations and presumably also on Government of Canada initiatives. Because the final accounting for carbon occurs within each nation—called Parties in the UNFCCC negotiations—and because of the dominance of global corporations in the world’s economy, international protocols will ultimately predominate.
International and Regional Benchmarks The following account highlights developments relevant to ecosystems and climate.
In 1979, the First World Climate Conference to consider climate change due to human emissions of GHGs (primarily CO2 at that time) was held in Geneva.
In 1988, the Intergovernmental Panel of Climate Change (IPCC) was formed by the World Meteorological Organization (WMO) and the United Nations Environment Program (UNEP) as a UN intergovernmental scientific body. The IPCC shared the 2007 Nobel Peace prize with Al Gore.
In 1990, Forests Absorbing Carbon Emissions (FACE)33 in the Netherlands, whose slogan is ‘More forests, less CO2’, was funded by large thermal electric facilities. FACE developed many basic concepts still in use today.
In 1992, the Earth Summit at Rio de Janeiro established the United Nations Framework Convention on Climate Change (UNFCCC), signed by 160 nations, which held
a. Emissions of greenhouse gases such as carbon dioxide (CO2) affect the climate. b. Climate change is a global issue, irrespective of the emissions’ source location. c. Emissions climate effects develop in the atmosphere with a time lag of only 20 years.
In 1996, the Good Practice Guidance for Land Use, Land Use Change and Forestry (GUG LULUCF) was tabled by the IPCC scientists. The methodology, principles and bioethics of this fundamental analysis remains the science basis for conservation offsets today.
In 1997, at the Third Conference of Parties (COP) to the UNFCCC, 186 countries signed the Kyoto Protocol, in which industrialized countries agreed to reduce their greenhouse gas emissions to an average of 5.5% below their 1990 national emission levels. To enable these countries to realize their commitments a comprehensive scheme of baseline measurement programs and credit trading mechanisms were
33 www.stichtingface.nl

26
developed. These systems were based on internationally recognized emission certificates being issued for each tonne emitted.
This scheme enabled large emitters in industrial countries to trade reduction obligations in an international trading platform that was parallel to the trading provisions in the successful Montreal Protocol to eliminate the production of Ozone Depleting substances agreed to in 1989.
The Kyoto Protocol also provided for project-based Kyoto mechanisms, which allow for emission credits arising from individual climate protection projects to offset reduction obligations. This adaptive mechanism was designed to:
i. assist emerging economies and developing countries to prepare for their own reduction commitments
ii. develop wider internationally transparent mechanisms for developing a suite of new climate actions and
iii. reduce the initial cost of climate actions in industrial countries.
The offset projects in emerging economies were governed by the Joint Implementation (JI) initiative and the offset projects in developing countries were governed by the Clean Development Mechanism (CDM).
Figure 2: Division of the world into the Kyoto categories
Source: UNFCC and Brinkman Earth Systems
Developed economies, mostly Annex 1
Economies in transition, mostly Annex 1
G77 and LDCs, mostly non-Annex 1
The Kyoto Protocol divided the world into three types of countries: industrial or developed countries (brown), economies in transition (olive) and developing countries (green). The developed economies accepted negotiated hard emission reduction targets benchmarked against 1990. Emerging economies were governed by Joint Initiatives, in which they can partner with industrial countries, and the developing countries participated in climate action through the Clean Development Mechanism. Some developing countries like Korea and emerging economies like Poland will accept hard targets in the post Kyoto Copenhagen Protocol now being negotiated.

27
In 2002, at the World Summit for Sustainable Development,34 the World Bank launched its Biocarbon Fund for “pilot” reforestation projects. (In 2008, one of the leading projects of the Biocarbon Fund was Pico Bonito,35 in Honduras, which Brinkman Forest Restoration co- developed and managed.)
In 2003, the IPCC published the Good Practice Guidance for Land Use, Land Use Change and Forestry (GPG LULUCF).
The 2004 Joint Initiative (JI) for emerging economies and Clean Development Mechanism (CDM) for developing countries permitted projects in transitional and developing countries to be traded into the allowance trading systems of industrial countries. The basic protocol for emission offset trading developed through the IPCC and UNFCCC forms an excellent basis for all other ecosystem value trading and monetizing. The IPCC guidelines developed in 1996 for the Kyoto Protocols and the subsequent papers adding dimension to the issues, remain the largest body of science and analysis associated with project-based ecosystem benefit trading.36
In 2006, the Good Practice Guidance for LULUCF was improved/extended by a body of updated analysis called IPCC Guidelines for National Greenhouse Gas Inventories, Volume 4 Agriculture, Forestry and Other Land Use (AFULO).
Despite these developments, the USA focused solely on an international energy security path, and ignored its climate change international protocols, resulting in its smaller partners in the North American Free Trade zone also ignoring the Kyoto Protocol. In that regulatory vacuum, a number of regional, simpler or specialized standards emerged in North America.
In 2002, the Chicago Climate Exchange (CCE) was set up in its commodity exchange to capture what was expected to be the largest commodity traded in the world.
In 2004, the Western Climate Initiative (WCI) was set up in Oregon, and with characteristic celebrity, was soon joined by California.
In 2005, the Regional Greenhouse Gas Initiative (REGGI) was set up to trade emissions among eastern US states.
In 2006, International Standards Organization (ISO) tabled ISO 14064, parts 1, 2 and 3. These are comprehensive documentation standards which provide for robust auditing of GHG accounting. ISO has proven immensely useful in chemical, pollutant and mechanical standards.
In 2006, Alberta Climate Protocol began to permit the funding of agriculture and forestry offsets.
34 Brinkman’s first climate related international negotiations as a delegate for Canada. 35 Pico Bonito is an ARR and REDD buffer zone project led by Ecologic in partnership with a local ENGO in Honduras, which has been managed by Brinkman Forest Restoration. 36 On Oct 8, 2004, Brinkman submitted the first reforestation methodology to the CDM, N09001.

28
In 2007, Canada’s Ministry of Environment reported that managed forests would not be included, and that the Agriculture Tilth Quantification protocol would be the only offset project type permitted under Canada’s Kyoto Protocol obligations.
In 2007, the Voluntary Carbon Market formed, with the additional proviso that it would rest on the same guidelines as the UNFCCC agreements—proposing more streamlined bureaucracy and the goal of having the world shift to the simpler VC standards beyond 2013.
In 2007, BC joined the Western Climate Initiative (WCI) and later that year it set its Greenhouse Gas Targets.
In 2008 December, BC passed the Emission Offset Regulations. The guidelines for these regulations were scheduled to be released in April 2009, and a forestry protocol may emerge in the fall of 2009.
In 2009 April, the Pacific Climate Trust issued its first request for information (RFI) for proposed forest offsets from within BC. These forest offsets can be three types of silviculture-based offset projects:
Afforestation: Increasing the size and number of B.C. forests by planting land that has not been forested since Dec. 31, 1989. Superior Seed: Planting seedlings grown from superior seeds to promote faster growth, increased carbon content, and resistance to insects and disease. Fertilization: Adding nutrients to increase tree growth on sites deficient in one or more soil nutrients.
Projects related to the RFI can be located on private land, land held by local governments and First Nations, and Crown land that is managed under long-term area- based tenures. There will also be a consultation period to review draft protocols for eligible projects. A protocol is a detailed set of instructions on how to carry out specific offset activities. Protocols must meet the criteria for offset projects under the Emissions Offsets Regulation. The RFQ phase will commence in summer/fall 2009 and involve a formal request for proposals. The results of the RFQ will be announced before the end of the year.
The Pacific Climate Trust's call for incremental silviculture projects, and not for conservation or restoration projects, may be a signal that the government expects to rely on traditional forest practices, forest legislation and governance in its new regulations. (See Recommendation 5 in the last chapter.)
In 2009, because the US is finally ready, it appears possible that the North American trajectory of developments and the international trajectory of UNFCCC negotiations may finally converge. In 2009 December, the Copenhagen UNFCCC meeting is scheduled to be the point of agreement for post 2013 accounting and beyond. It is almost certain that REDD and ARR will be a part of the climate management options. However, there are a lot of other ecosystem opportunities to achieve sustainability that are emerging within the US, the

29
EU and other member countries, which are supported by the UNFCCC negotiated guidelines.
2009 REDD Negotiations The new type of conservation offset will be the REDD mechanism. A part of the 2007 UNFCCC COP 13/MOP3 2007 Bali Action Plan included a process for finalizing the REDD rules for the 2009 UNFCCC COP15/MOP5 in Copenhagen. The halfway point for these negotiations was the UNFCCC COP14/MOP4 in Poznan in 2008, where there were few decisions. However, negotiators did decide on
d. more emphasis on enabling conservation
e. an expert meeting to focus on resolving the methodological issues including
o the role and contribution of conservation,
o sustainable management of forests,
o changes in forest cover and associated carbon stocks and greenhouse gas emissions and
o the enhancement of forest carbon stocks
o support the readiness of developing countries to use REDD
o full and effective participation of indigenous people and local communities in any REDD process
o acceptance of the Revised 1996 IPCC Guidelines, and the Good Practice Guidance for LULUCF for REDD projects and
o a technical paper on the cost of implementing methodologies and monitoring systems prepared by the Secretariat
o parties and accredited observers invited to submit their views on issues relating to indigenous people and local communities for the development and application of methodologies; an Ad Hoc Working Group on Long-term Cooperative Action under the Convention (AWG-LCA) AWG-LCA guidance used to facilitate further progress on methodological issues.

30
Figure 3: The overlays of different regional standards creates considerable regulatory dissonance through which a conservation land manager is expected to find the most appropriate route to market for their projects. It is not surprising that within this regulatory dissonance ENGOs, NGOs, private enterprise and other entities initiate voluntary carbon credit standards that only apply to their projects.
Source: Brinkman & Associates Reforestation Ltd--
In 2009, the new President of the US, Barack Obama, and the now Democrat-dominated Congress and House of Representatives, promised to enact new legislation which will lead the world in curbing climate change. Obviously, what the US chooses to do will influence outcomes in Copenhagen. More importantly for Canada, because the US is our major trading partner, its decisions may stimulate Canadian climate initiatives, because aligning with our major trading partner has long been a Canadian survival mechanism. Those affected by the US/Canada Lumber Agreement will understand immediately the potentially profound impacts of the US enacting carbon footprint tariffs on imported goods.
In summary, agreements and their interrelationships in any of the four jurisdictions have to be watched closely as each can affect the opportunity for carbon conservation projects within the other and of course affect BC conservation carbon credit opportunities.

31
Carbon Standards and Regulatory Environment in 2009 Listed below are the standards or regulatory environments that are relevant to Canada and the USA (unless noted US only). They are arranged according to applicable jurisdictions.
British Columbia legislation
BC GHGT - Green House Gas Target Legislation November 29, 2007 http://www.leg.bc.ca/38th3rd/3rd_read/gov44-3.htm
BCEOR - BC Offset Emissions Regulation December 8, 2008. http://www.env.gov.bc.ca/epd/codes/ggrta/pdf/offsets-reg.pdf
Forest carbon accounting methodologies/standards/protocols
CCAR – California Climate Action Registry, Revised Forest Project Protocol (Draft), December 2008—new draft being released imminently. https://www.climateactionreserve.org/wp-content/uploads/2009/03/Forest-Project-Protocol/Version-3.0-Public-Comments/Forest%20Protocol%20Comments%20-%20NAFO%20et%20al..pdf. (US only)
VCS -- Voluntary Carbon Standard Guidance for Agriculture, Forestry and Other Land Use Projects -- 19 November 2007 https://verra.org/wp-content/uploads/2018/03/Guidance-for-AFOLU-Projects.pdf
CDM-A/R Clean Development Mechanism of the UNFCCC-A/R http://cdm.unfccc.int/methodologies/ARmethodologies/index.html
AOS – Alberta Offset System with protocols for agriculture and forestry http://www.carbonoffsetsolutions.ca/offsetprotocols/finalAB.html
CCBA –Climate, Community & Biodiversity Project Design Standards Second Edition. CCBA, Arlington, VA. December, 2008. www.climate-standards.org. http://www.climate- standards.org/standards/pdf/ccb_standards_second_edition_december_2008.pdf
GA – The Georgia Carbon Sequestration Registry Project Protocol, Version 1.0, July 2007. www.gacarbon.org. http://www.gacarbon.org/downloads/GFC%20Carbon%20Registry%20Protocol%20v1.0.pdf) (US only)

32
CCX – Chicago Climate Exchange Rulebook, Chapter 9: CCX Exchange Offsets and Exchange Early Action Credits. https://www.theice.com/publicdocs/ccx/CCX_Rulebook.pdf. RGGI – Regional Greenhouse Gas Initiative Recommendations for forest management standards under consideration http://www.rggi.org/ (US eastern states only)
HFF – Recommendations contained in a publication from Duke University, Harnessing Farms and Forests in the Low-Carbon Economy.
https://agris.fao.org/agris-search/search.do?recordID=US201300121386

33
BC offset opportunities and guarantees Thanks to BC’s Emission Offset Regulation, passed 2008, it is now technically possible to initiate conservation offsets (see p. 20). This is broad legislation for both alternative energy and sink based offset projects. There appear to be only very small differences between the forestry protocol for CCAR and BC Emission Offset Regulation (BCEOR). Perhaps the most significant difference is the different starting dates—January 1, 2000, for CCAR and November 29, 2007 for BCEOR. Offset opportunities in BC are best undertaken within the legislation and regulations that apply in BC.37
When developing projects in accordance with regulations for smaller jurisdictions like states and provinces, (or in accordance with voluntary guidelines which may later have to be subsumed into international agreements), there is a risk that the project does not comply with a significant requirement of a national or international framework, later disqualifying the credits38.
This risk type joins a family of political risk which includes situations where alienated land might be expropriated by the Crown for some public purpose such as building a highway or dam or be nationalized so the carbon benefits rest on the government's account. One of the political risks is the right of governments to change the rules. The conservation organization selling a carbon credit offset to a buyer that has to advise them at a later date that a regulation was changed, there may have been indications that something was overlooked, and the credit does not qualify, would in normal circumstances have to replace the credit with another offset at its own cost. That can be avoided in BC.
In recognition that climate action is based on emerging science, BC's EO regulation emphasizes the right of the government to add requirements to the regulations.39However, within BC, to protect registered projects, the Emissions Offset Regulation's Clause 6 rules that new guidelines do not apply 'to a project for which a
37 (BC Government Carbon Neutral Public Sector, n.d.). (BC Government Proposed Offset Regulations for Public Sector Organizations, n.d.) (Pacific Carbon Trust, n.d.) 38 The lesson from “Early Action”: After signing the Kyoto Accord the federal government, as did every other government developing climate regulations, encouraged what was called 'early action' on climate. Corporations, anticipating the benefit of offsets reducing their emission reduction costs, undertook a number of green initiatives both within and outside of Canada to 'learn by doing'—another key phrase from the early days of determining rules of practice for Kyoto carbon credits. This approach was a practical strategy for industries facing emerging regulations and provided them with a depth of field from which they could advise both governments and the UNFCCC. However, they also undertook these initiatives to create some offsets for their emissions. It is an object lesson that between 1997 and 2004 it was estimated that of $164 million in expenditures by Canadian corporations on potential offset projects, not one credit was tradable. This was because none of the projects reflected the rigour of accounting required to address all of the science, ecosystem dynamics, full accounting and bioethical issues that have emerged and been recognized to exist within the climate issue.
39 Emission Offsets Regulation; Clause 7, Protocols and Guidelines, 'The director may establish or designate a protocol for any aspect of the carrying out of a project in a class of projects, including without limitation...the director may issue a guideline...and a person...must comply with the applicable guideline.'

34
project plan was validated before the protocol or guideline comes into effect.' It will be critical therefore for conservation projects to be implemented, validated and registered very rapidly to eliminate this aspect of political risk.
How the provincial government’s indemnity would support the loss of credits in the case the provincial registry transitions into a national, continental or international registry whose rules might disqualify a project, has yet to be more clearly defined. Compensation by government for costs that arise from the effect of policy change on personal, corporate or trust business has rarely been available, so the assurance of Clause 6, while it can doubtless be relied on within British Columbia's regulatory framework, must still be clarified further before it can be relied on unequivocally.
Reflecting on the international protocol, which Canada ratified, but whose commitments have been ignored, illustrates the regulatory risk facing proponents. In fact, many offset projects were undertaken both within Canada and in developing countries on the assumption of the Kyoto Protocol guidelines and standards would apply. All of this investment, sometimes championed as ‘early action,’ did not qualify. Some estimates put the expenditures for early action in Canada at over $150 million. The BC Emission Offset Regulation uses the ISO 14064-3 (Clause 4, Validation of Project Plan) as the standard to govern project development. This is not a complex standard and will encourage project proponents and developers. ISO 14064-1 is the basis for quantifying the greenhouse gas inventory, ISO 14064-2 for developing their project for verification, and ISO 14064-3 for validation. These three ISO standards are inter-related40 and can be purchased from the ISO Standards store either digitally or in paper (Figure 4). Figure 4: Interrelationships of standards from ISO 14064-1 Document
Source: ‘Building a better MD&A: Climate Change Disclosures’. Chartered Accountants of Canada.
39 Emission Offsets Regulation; Clause 7, Protocols and Guidelines, 'The director may establish or designate a protocol for any aspect of the carrying out of a project in a class of projects, including without limitation...the director may issue a guideline...and a person...must comply with the applicable guideline.' 40 Either a PDF or Paper copy of each of the ISO 14064-1,2 &3 standards, the 14065 standard for verifiers and, if

35
Use of the ISO standard is no guarantee of the veracity of the data, rather the rigour of the analysis or the validity of the methodology being used to quantify the GHG removals or offsets depends on the proponent and is not dictated by the ISO standard.
As this project takes place within Canada, reporting must also be done in accordance with Canadian accounting and reporting standards. The Canadian Institute of Chartered Accountants41 have set out guidelines for climate change reporting which all emission offsets must also follow. These guidelines were first written to ensure financial reporting and disclosures did not ignore the realities of global warming and potential impacts of current or emerging legislation. They are also understood to apply by BC's Climate Centre and are not onerous.
These guiding principles are well illustrated in the below diagram in "Climate Change Disclosures".
a) Relationship between transactions costs, project scale and viability (db)
b) Simplification, project types, replication and aggregators (db)
c) Atmosphere and mechanism for the program
d) Early action and emerging standards (db)
e) Private or NGO, provincial, national and international standards.
f) Principles & recommendations – what’s the business basis
g) Conservation, restoration, reforestation,
h) Show all costs to illustrate what works
i) Private or NGO, provincial, national and international standards.
j) Principles & recommendations – what’s the business basis
k) Conservation, restoration, reforestation,
l) Show all costs to illustrate what works
-the project involves payment for other ecosystem services, the 14062 and 14063 standards for environmental reporting, can all be purchased at the ISO catalogue website http://www.iso.org/iso/catalogue_detail?csnumber=34676 . The cost of the ISO 14064-1, 2, and 3 documents can be purchased for about 346 CHF (Swiss Francs).
41 (Climate Change Disclosures, Building a Better MD&A, Canadian Institute of Chartered Accountants, 2006) (Discussion Brief MD&A Disclosure About the Financial Impact of Climate Change and Other Environmental Issues, 2005) (Management's Discussion & Analysis: Guidance on Preparation and Disclosure, 2004)

36
m) Private or NGO, provincial, national and international standards.
n) Principles & recommendations – what’s the business basis
o) Conservation, restoration, reforestation,
p) Show all costs to illustrate what works Kyoto definition of a forest for carbon accounting purposes The definition of forest differs from country to country. Countries that ratified the Kyoto Protocol also committed to define what would constitute a forest within their borders, and what would not. This definition underpinned two purposes in being accountable for: forest land use. The first purpose meets the requirement to define the record of the carbon stock in the standing forests and affords each country some choice in defining which portion of their forests they wished to include in the countries GHG account.
The second purpose was to define each project areas land use condition, so that the journey of business-as-usual from forest to degraded forest, or to no forest, could be clearly defined starting from the current condition, and also so that the route back again to sustainability had clearly defined signposts for good accounting practices.
The IPCC who developed the 2003 Guidelines for Land Use, Land Use Change and Forestry practices determined to offer developing and developed countries alike the option to elect to define a forest as having a forest canopy cover with between 10% and 30% closure, above 4-5 metres, as measured in a minimum area between 1/10th to one hectare42.
This range of options was designed to permit countries like Namibia, with open park-like biomes to consider them forests with only 10% canopy closure, if they felt that would help them include projects more typically found in the country. At that time only reforestation projects were permitted within the UNFCCC CDM for which qualified project areas had to have been without forest on December 31st, 1989, and be without forest at the time of the project. To qualify for reforestation projects, countries soon recognized that the lower the threshold was set defining forests above 10% - 30% canopy closure, the less area qualified for reforestation credits. However, to qualify a maximum REDD projects, some countries are now reconsidering their choice.
In its 1990-2004 GHG Inventory report submitted in April 200643 Canada chose to define a forest as all areas of 1 ha or more where tree formations can reach 25% crown cover and 5 m in height in situ.
42 Brinkman has advised countries on which definition to choose and also on why to change a definition that they had chosen because of disadvantages the definition creates. It may be interesting for the reader to consider Canada’s options. On its open park-like grassland dominated by scattered yellow pine (Ponderosa pine) the canopy closure may be below 30%, yet the forest is mature and the forest ecosystem quite healthy. In fact, increasing forest density, as unfortunately is common, creates accumulations of fuel and so much fire and pest risk as to foster intense fires that would threaten the soils on which the forest depends. As a consequence, climate ecologists have moved on from these general definitions to recognize seral states and adaptive ecosystem states as part of appropriate definitions. 43 (National Inventory Report- Greenhouse Gas Sources and Sinks in Canada. 1990-2004, Section 7.3, 2006) The Canadian Government's Submission to the UN Framework Convention on Climate Change April 2006 Section 7.3:

37
Canada elects not to include managed forests on its Kyoto Account Canada is a signatory who eventually ratified the Kyoto Protocol. Consequently, despite having a federal government that seemed to do everything possible within the bounds of its international obligations to postpone action or frustrate its international partners, the country eventually met its reporting obligations. In the spring of 2006, Canada submitted a report on its Kyoto Obligations and decisions, which included a couple of sentences related to forests. Once declared, Canada elected not to include its 240+ million hectares of managed forests on its national GHG account. The other, discussed above, declared that over 25% of a half hectare or more with canopy closure comprised of over 5-meter trees constitute a forest.
That Canada does have a Kyoto Account on which it is reporting is, of course, news to many. While perhaps the lack of inclusion of all of the 495 million hectares of forests in Canada was not surprising, it was surprising that the 250 million hectares, which are under management, were deemed by the federal government not to be a conservation, restoration or improved management opportunity for its foresters, silviculturists, land managers, First Nations or provincial and territorial forest departments.
Many Canadians committed to improving land use practices have been frustrated that forest are off the national account and so this potential tool was denied. Opportunities were lost to attain higher public values on Crown lands than the marginal profits directly benefiting a small number of international entrepreneurs. The global forest community, who have admired many aspects of Canada’s capacity to manage its natural forest areas, were also shocked at Canada’s decision and one of the authors fielded many questions at the UNFCCC climate negotiations from people who wondered why Canada made the decision to opt out using its forests to help it meet its obligations. Why would Canada postpone until after 2012 the opportunity for improved forest management to capture some carbon benefits?
The ostensible reason Canada chose to not put its managed forests on account is an object lesson in considering the risk of forest permanence. Emerging scientific data at the time was generating the question as to whether Canada’s forests, viewed as an entire unit, were a source or sink, due to the high carbon releases of increased fire and pest disturbance in the mountain pine beetle44 forests. As in-depth analyses are made of different carbon pools in different forest ecosystem types 45 (in which a greater understanding is reached of the importance of all ecosystem services for adaptation as well as mitigation) the urgency increases to factor in our forests and intact ecosystems as a major tool in a climate action plan.
44 (Kurz, Stinson, Rampley, Dymond, & Neilson, 2008)
45 (Franklin, Hogberg, Ekblad, & Agren, 2003)

38
Canada’s managed forest sinks and sources 1990-2005 Canada’s Fourth National Report on Climate Change to the Kyoto Protocol for 2004 indicates in that year Canada’s forests emitted an estimated 81 MT (mega tonnes) of greenhouse gases (GHG). It notes that if Canada included its managed forests (250 million of Canada’s 450 million ha of forests) it “would…increase the total Canadian GHG emissions by 11%”.
This determination was based on the historical data illustrated in the graph below. After these data were collected, the Canadian Forest Service’s Carbon Budget modelling team developed over 100 national stochastic projections to 2012 and found that over 90% of these probable models emitted more GHGs from wildfire and pest disturbances than growth, resulting in the future managed forests likely becoming a net source. It is on the basis of these findings that Canada elected to not include its forests on its national GHG account.
Figure 5
Despite the fact that pest populations are disturbing many times the area that Canada harvests annually, as is well illustrated above in ‘Managed forest sinks and sources 1990-2005’46, every year from 1990 to 2005 (except in 1995, 1998 and 2004), Canada’s forests have been net sinks.
46 (Kurtz, 2007)

39
The projections to 2012 form a graphic warning to originators of projects how important it is to manage for risks. It should be pointed out that the CFS carbon modelling team’s projection assumed that there would be no incentive to manage to avoid emissions or increase sinks within Canada’s managed forests-- which was, of course, the decision of the current government. The federal forest carbon modelling team have not developed a projection of whether Canada’s forests would still be a source if forest land managers had the tools of forest-related standards, protocols and trading markets to create GHG benefits within Canada’s forests. If Canada’s forest professionals were given forest management climate incentives, they are sure to develop innovative practices which would be hard to quantify now.
Europe was the first to grant carbon benefits for bioenergy. As a consequence, the leading-edge pellet manufacturing equipment is manufactured in the EU. Granting carbon rights to those with private land and public land rights such as forest tenures across Canada may also create forest management innovation.
Recommendation: Conservation organizations become educated in the international, continental, national and regional developments in the language, concepts and principles of climate change offsets; as well as becoming involved in developing sound climate policy, standards and programs that integrate among all these levels of government.
Figure 6
Fig. xxx. Image from Kurtz’s Jan. 2008 article in Proceeding of the National Academy of Science of USA. Annual net

40
GHG balance (ecosystem flux) for Canada's managed forests. The model results are based on disturbance and management statistics for 2000–2005 and projections for 2006–2022. A small range in the estimates for 2003–2005 resulted from the need to fill some gaps in the available disturbance data with Monte Carlo projections. Monte Carlo simulations were used to project ecosystem GHG balance for future years, in which the area disturbed by fire and insects is not yet known, resulting in the wide range of projected estimates. The 50th percentile estimate for each year is indicated with a cyan triangle, and colors indicate the areas representing the range of estimates between the 10th and 90th percentiles. Negative GHG balance represents a net flux from the forest to the atmosphere (net GHG source).

41
Government of Canada proposed Protocols & Guidelines for Offsets The federal government has announced a number of times that a cap-and-trade program will be set up for trading in Montreal in 2008 which may include options for offsets. The federal government issued a draft "Guide for protocol developers" on August 9, 2008 for public comment. It was posted at http://climateforests.blogspot.com/2008/09/status-of-regulated- forest-offsets-in.html. The revised version has not yet been posted. This guideline relied, as does the BC Emission Offset Regulation, on the ISO 14065 standards.
Recommendation: Conservation organizations and agencies should align behind a common request to the Government of Canada for a clear climate plan and strategic direction that includes nature conservation as a key element of a climate action plan.
Offsets: A Human sin or Nature’s salvation
Sinks were linked to emissions because those who create emissions are seeking to reduce costs, and those who create sinks are seeking to finance natural restoration projects. Calling the linking-mechanism of using a sink to counterbalance an emission an “Offset”, leads to some confusion. First this is because the problem of accumulating emissions is seen by some Christians as a climate ‘sin’. leading to the predictable and perhaps unfortunate perception that the emitter is buying an ‘indulgence’ in nature to permit their “sin” of emission into the atmosphere. Second, an ‘Offset’ is a visual double negative to some people who visualize an ‘Offset’ as going up like an ‘emission’, while they visualize a ‘sink’ as going ‘down’. Third ‘Offsets’ seem to some as a bit of a negative concept in the life affirming business of conserving and restoring ecosystems. However, these confusions are dwarfed by real-world sinks and emissions. Natural terrestrial and ocean sinks have mitigated over half of the accumulation of annual anthropomorphic GHG emissions in the atmosphere. In fact, it is now too late to respond to climate by reducing emissions alone. So, there is simply urgency to grow the role of terrestrial sinks. So, nations within which the offsetting concept has to be exchanged, who have been as derelict in protecting their ecosystem sinks as in reducing emissions have to get on with a simple task of offsetting both the sinks and emissions sins of the past. That started in BC as the government proposed to buy Great Bear Rainforest sinks to offset its emissions.

42
The Emissions Trading System The Emission Trading System (ETS) in the European Union of twenty-five nations is by far the largest carbon market in the world. In 2008, the first year of the Kyoto Protocol 2008-2012 (which the EU nations have all ratified) nearly 5 billion tonnes of CO2 equivalent (5 gigatonnes or Gt) were traded in the ETS—83% more than in 2007. Trading commenced in 2005 with most trading being for the period 2008 to 2013. The collective demand of the large emitters in the EU have kept the prices for a tonne of CO2 equivalent (CO2e) well above most other trading systems. Some analysts believe that the demand of the large emitters in the US, when they enter a market, will also create high prices. There are also negotiations to link the ETS and the US markets, just as New Zealand linked its new Kyoto compliance market to ETS trading. Most trading system lobbyists in the US seek to engineer a system that will trade at lower prices, especially in the face of fears that adding the US demand to the global carbon market will drive prices up. The ETS traded 90 billion in 2008 and is the largest trading system in the world. However, until Canada is compliant with its Kyoto commitments, or in some other way reestablishes itself as a credible climate partner with other industrial nations, projects developed in Canada will not be able to trade within the ETS.
Recommendation: Conservation organizations and agencies should work towards initiatives that have the highest credibility in meeting objectives to limit the impacts of climate change that are accepted globally. The broader the applicability of a standard, usually the higher the value of the initiatives. International markets usually have the highest standards. The stronger international markets become, the wider the ecosystem scope for conservation initiatives.
Carbon Prices in the EU's Emission Trading System
In the period January 2007 to January 2009 prices of emission allowance units (EAUs) per tonne of CO2 equivalent fluctuated in some correlation with the price of a barrel of oil. In the early years of the EU market, when the global economic boom drove growing energy demand, the price fluctuated with the difference between the price of natural gas and the price of coal. This was because the main buyer in the EU—coal-fired emission plants—whose emission caps were ratcheting down to meet their nation's emission targets, had two options while there was growing energy demand: one was to substitute natural gas for coal and the other was to buy EAUs. In winters when the price of natural gas was high, coal-fired plants would elect to buy EAUs and continue to burn coal. However, as demand for EAUs rose, EAU prices soon converged with the natural gas substitution cost. The price of EAUs was also vulnerable to Russia's manipulation of natural gas supplies to the EU. The ENGO community found the market behavior of coal-fired emission plants, preferring EAUs when natural gas prices were high, vexing and lobbied against the development of linking mechanisms that included CDM offsets.

43
Chapter 3: Principles and Definitions of Carbon Accounting Forest Absorbing Carbon Emissions (FACE) developed the first recognized and formally traded carbon sequestration projects in forests. Their standards were later refined by the IPCC for the UNFCC in their Land Use, Land Use Change, Forestry guidelines. As a consequence of these early actions, developments in accounting of forest ecosystems have defined the concepts and criteria for other terrestrial carbon sink accounting in other ecosystems such as soil, grasslands and wetlands.
Projects Projects are qualified areas strictly defined by predetermined boundaries where both the business as usual and projected project activities that lead to defined future conditions are expected to take place. The most rigorously defined standards of ecological carbon accounting were developed for project initiatives. Although many of those guidelines also apply to the national forest on each party’s carbon account, the data and analysis is inevitably less precise on a national scale like Canada. Forest projects are typically areas greater than 1000 ha whose existing and potential revenue will be adequate to fund the high costs of project development and registry. The few pilots that have been done in North America were highly dependent on revenue from the sale of carbon credits, and the price of the carbon credit is often in direct relationship to the quality of accounting and the rigour of the standards—although that is not always true. The following definitions are stated in terms of projects because conservation trusts will be doing projects on defined areas. However, the same basic concepts do generally apply at all levels and scales of carbon accounting, including at the national level. The following principles have been derived from the experiences of carbon accounting in existing projects, some of which are profiled under Case Studies.
Baseline In order to understand the carbon benefits of the proponent’s proposed changes to land management and other practices, it is first necessary to define and describe the emissions and uptakes of carbon that would occur in the absence of the project. The baseline condition is the detailed accounting of amounts and trajectories in the carbon pools and emissions, which will occur without the undertaking of the project.
Additionality The effectiveness of an offset program in mitigating climate change depends on one simple but key outcome: the offset project results in less GHG gases in the atmosphere than otherwise would be the case. This may seem like a simple goal but achieving it is usually complex. Additionality, in its simplest terms means that the project must prevent emissions or remove GHG amounts greater than would be the case if the project were not undertaken. In the CCAR 2008 protocol, this means that reductions must be greater than would have occurred under business-as-usual conditions. This additionality is determined into the future by comparison to a "quantitative baseline estimate" of carbon stocks on the project lands. The creditable offset amount is the net increase in carbon stocks (the result of avoided or reduced emission) as a result of the project. Leakage Offset projects may have secondary on-site and off-site effects resulting in CO2 (and other GHG) emissions from obviously causally related activities. Some of these occur outside of the project boundary and are not easy to account for, (e.g., displaced resource removal activity (timber removal from a non-project site)).

44
For a forestry offset project such secondary leakage effects may include harvesting of-offsite forests as a replacement for the non-harvested timber and increased transport of products. For example, if a community forest proponent proposes project offsets in a specific part of their forest which they decided to conserve, but then increases logging elsewhere on its lands, the logging related emissions must be deducted from the project’s carbon account.
The California protocol includes specific methods and guidance for calculating leakage risk for a reforestation project. It gives an example of reforestation on harvested forest land that leads to clearing of land for the same harvest production elsewhere. Emissions from any land cleared to provide the services that were offset from the conservation of the project area must be recognized and deducted from the project account. In the case of a preservation project for example that forces the shifting of grazing activity with its the associated emissions has to put that ‘leakage’ on the project account.
Leakage activities are normally estimated from socio-economic effects within a large geographic area, like a country, or occasionally a province or state.47 The value of using defined areas rather than the whole world is that the shifting of resource harvesting and emissions to off-project sites can be reasonably detected and accounted.
In the case of a small, constrained conservation area, most of the emissions of concern would be those related to the management activities associated with the site and those related to limited associated product resource sales and distribution directly related to the project. It may be that once more land use change negative leakage calculations are reviewed, audited and validated, some simpler default values will become the standard.
Permanence Technically permanence means that GHG reductions remain permanent and that there are no reversals, whereby the credited reductions no longer remain in the carbon sink. The California draft protocol defines the interval for permanence to be 100 years. A reversal is defined essentially as a decrease in the difference between project and baseline carbon stocks from one year to the next. In the draft California protocol, some of the carbon credits of a project are placed in a buffer pool to anticipate reversals, providing a self-contributed reversal insurance for the project (according to a risk rating for the project). Credits from the buffer pools must eventually be replaced according to a defined set of rules. Risks to permanence include financial, management, social and natural (risks are explained in detail in CCAR 2008: Appendix C). For conservation projects, financial and management risks concern the stability of the organization in control of the project and on-site actions that would lead to biomass reductions (illegal timber harvest for example). Social risks concern broad changes in society such as the government altering climate change policy.
47 (Eliash, 2008)

45
Conservation lands are most likely subject to natural risks of carbon and other value losses. In general, these can be discounted for, based on some understanding of the likelihood of a natural event occurring. For British Columbia's mountain pine beetle forests, there are regional calculations available for emissions associated with a mountain pine beetle outbreak, for example, which could be used for estimating a discount for this sort of risk. Similarly, there are values available for other sorts of pests with respect to yield losses from standing forests. Aside from including a discount for risk, the CCAR 2008 draft protocol focuses on two approaches to deal with natural disturbance reversals: mitigating the disturbance (fireproofing or fuel reduction for example); and rapid restoration (specifically reforestation) of a disturbed site as part of the recovery plan.
Project period The project period is the length of time over which the project will monitor carbon and other values and receive credits for the benefits of the project.
Project boundary For ecosystem projects, the project boundary defines the area within which the project activity will take place, and carbon benefits will accrue. To avoid the problem of proponents including and excluding areas based on actual GHG credits, most methodologies require that project boundaries be defined before the project commences.
Methodology Each ecosystem climate project must adhere to a specific standard for developing the baseline conditions and monitoring changes to them. This methodology may be designed specifically for the project, or it may be an existing one designed for some other project. The methodology must be consistent with the requirements of the regulatory or voluntary carbon regime under which the credits are to be validated and verified.
Validation Under most regulatory and voluntary carbon regimes, some form of audit by an independent auditor is required to validate that the project has used the chosen methodology properly to develop a baseline for the project, and to put into place a plan for monitoring the results of the project.
Verification Once a project is underway, an independent verification of the monitoring results is required before carbon credits can be issued under most voluntary and regulated systems.
Conservatism Accounting the carbon benefits of a project is potentially subject to error. For instance,

46
the baseline is an estimate of what would have happened in the future without the project, and as with most projections, typically involves considerable uncertainty about what future conditions will be. To reduce the chance that a project will be credited for carbon benefits which are not real, a principle of conservatism is usually required in carbon accounting, so that estimates of benefits will be more likely to err on the low side than the high side.
Project Design Document The Project Design Document (PDD) in most standards is the central record of the property, the specific baseline condition and the methodology by which it was determined, the management plan that will create additionality and the indicators that will be measured and validated.
Global Standards Though there remain some differences between how standards are treated, the vigorous debate around the world is in fact arriving at an increasing number of elements with common definitions so that there is a gradual methodological convergence across all of the regulatory systems. The overall driver for this convergence is that the atmosphere is a global commons and accounting for atmospheric benefits ultimately will have to be recognized on national accounts within a global strategy (e.g., 2007 IPCC recommendation the world meet a Global target in 2050 of 50% of 1990 emissions). National credibility rests in national peer reviews, which must be registered in an international multilateral jurisdiction to retain credibility. To date there is only one such internationally recognized jurisdiction, and that is the United Nations Framework Convention on Climate Change (UNFCCC) and its historically unparalleled body of peer reviewed science, through the scientists of the IPCC (Intergovernmental Panel on Climate Change).
Competing Standards Because nations have, what the UNFCCC has agreed to call, common but differentiated interests, different climate action models are constantly being proposed. Some speculate that just as the US dollar replaced the gold as the standard of currency value in 1972, the strength of the emerging US carbon market will dominate change in some aspects of the UNFCCC standards. However, at the time of writing of this report, the visible features of the emerging US climate regulations strongly reflect the developing new UNFCCC standards. These UN standards are also reflected in the subset North American trading regimes like the Western Climate Initiative (WCI), the Regional Greenhouse Gas Initiative (RGGI, the eastern states equivalent) and the Voluntary Carbon Standards (VCS).

47
UN vs other standards
The UNFCCC Clean Development Mechanism (CDM) forest carbon measurement and analysis tools for developing methodologies are available to use on the UNFCCC CDM web site.48 However, due to the highly divergent interests between nations, the UN bureaucracy has been long on protocol and short on efficacy, resulting in complex registry, approval and validation processes. This complexity has resulted in the emergence of parallel standards like the Voluntary Carbon Standard (VCS), CarbonFix and others. These standards developed by the voluntary sector have the goal of reducing transaction costs, while maintaining scientific credibility. It is the UN’s role to establish a critical bioethical scientific framework and then encourage market momentum to cause practical considerations to predominate in the delivery to these standards. The sheer volume of the North American market has the potential to develop an acceptable second tier and less bureaucratic standard. But until the VCS and regional standards include all of the critical elements of the UNFCCC standards, it is best to match up to UNFCCC standards to avoid potential project disqualification. Use of global standards is important in offset transactions, because buyers are often global corporations, or part of global organizations (e.g., BC Hydro is not only a member of the World Council of Sustainable Business, but currently they chair the environmental committee) and are committed to international accounting protocols, like the UNFCCC to manage their multilateral accounting obligations.
Three strategies to increase forest carbon Currently there are three main strategies for increasing forest carbon stocks:
1. Reduced Emissions from Deforestation and Degradation REDD— (also avoided conversion or avoided deforestation AD) this strategy involves preventing actions that would occur without a need to manage for climate change. This offset strategy includes preservation of ecosystems, thus avoiding emissions from disturbance. Normally to qualify under government programs (e.g., California, BC), the avoided conversion has to be clearly demonstrated to have been likely to occur in the near future. Such projects aim to maintain the carbon sink value (considerable in the case of BC coastal forests) and have the potential to add to it if the ecosystem is sequestering carbon (through photosynthesis).
2. Improved Forest Management49 IFM—a verifiable forest management program that has GHG benefits. The improved management approach involves altering management practices such that the GHG emissions of degradation are decreased, and the sequestration of carbon is increased. The California forest protocol focuses on the application of natural forest management practices to promote and maintain native forests. California has defined Sustainable Forest Management practices
48 Clean Development Mechanism (CDM) protocols for afforestation, reforestation, restoration (ARR) methodologies and tools for developing methodologies for forest carbon accounting can be found at http://cdm.unfccc.int/methodologies/ARmethodologies/approved_ar.html
49 The US Waxman Bill accepted the term Improved Forest Management after some earlier drafts included other concepts, and also accepts reforestation though it calls REDD, preservation.

48
which provide auditable permanence for an improved practice. Certification standards also have the potential to define some improved practices. Improved management for optimum carbon carrying capacity requires highly specific management plans.
3. Afforestation, Reforestation or Restoration (ARR)— returning land to forest lands from a degraded state:
Restoration—Is the direct human induced activity to reduce emissions of greenhouse gas by restoring degraded ecosystems thus limiting carbon stock degradation; Afforestation— Is the direct human-induced conversion of non-forested land to forested land that has not been forested for at least 50 years through planting, seeding and/or human induced promotion of natural seed sources; Reforestation—Same as afforestation except that it has not been forested for at least 20 years.50
Accounting for carbon credits within each of these types of land use change must meet the same criteria as other initiatives to demonstrate reduction of atmospheric GHGs. The REDD approach would seem the most likely to be consistent with conservation initiatives. However, many conservation projects often also involve restoration and improved forest management.
4. Other ecosystem modifying interventions
A report on Australian temperate forests51 lists some additional strategies to maintain and restore carbon sinks, each of which may, with the right project design, reduce emissions or increase a projects carbon reservoir. These include:
1. Assisting ecosystems to reach climax through accelerated succession 2. Converting one ecosystem to another: e.g., re-flooding former marsh land to restart organic
matter accumulation 3. Connecting ecosystems through restoring corridors to build biodiversity 4. Modifying the chemistry of aquatic systems, e.g., liming lakes to neutralize toxic metals 5. Restoring extirpated ecosystem to recreate habitat for species at risk 6. Removing invasive species, amending soil, modifying hydrology.
50 (Land Use, Land Use Change, and Forestry, 2009) Definitions from the Ad Hoc Working Group on Further Commitments for Annex 1 Parties under the Kyoto Protocol. Seventh Session.
51 (Mackey, Berry, & Lindenmeyer, Green Carbon: The Role of Natural Forests in Carbon Storage, Part 1, A Green Carbon Account of Australia's Eucalypt Forest and Policy Implications, 47 pp, 2008)

49
Figure 7: Carbon initiative on a BC forest harvest area.
Figure 452 illustrates the scenarios of conserving an area with an annual allowable cut (AAC) of 10 units per year—perhaps an AAC of 10,000 cubic meters per year which in the interior of the province would be about 10,000 trees per year and be equivalent to about 10,000 tonnes of CO2e per year. In this graph the annual harvest is documented for the past seven years and becomes the baseline going forward at the bottom of the grey additional carbon area, marked “Annual emission offsets”. After seven years, as is characteristic for some ecosystems within BC’s Forest & Range Practices Act requirements, the natural and planted regeneration would begin to out-grow the annual rate of carbon loss from the harvest. This baseline business-as- usual pattern is altered by replacing a portion of the AAC through a perpetual conservation covenant on that portion of the AAC commencing at year “0” creating a higher forest ecosystem CO2e reservoir level going forward in time, shown along the top of the graph.
52 This graph is from an analysis by Brinkman Forest Ltd to illustrate the potential additional carbon credits for introducing some partial conservation measures within an area-based license in the interior of BC, such as a Community Forest License where the carbon right has also been granted.

50
The difference between the baseline and the new project carbon is the additional carbon created by the conservation project. These potential ‘annual emission offsets’ could be validated and credited for purchase by a large (or small) final emitter to make their atmospheric footprint carbon neutral53. A portion of the additional carbon is set aside as a permanence or performance risk buffer to reflect the potential for the project implementation to be imperfect as it is managing ecosystem dynamics.
Carbon pools There are three primary carbon pools within the CCAR 2008 protocols: living biomass, dead biomass, soil carbon. Up to six carbon pools are recognized in other standards—above ground living biomass, below ground living biomass, soil, dead wood, litter, and timber products and others use foliage, stem, litter roots and soil carbon. The choice of and accounting for pools depends on the type of project undertaken, and the requirements of the standards being used. Translating forest inventory into carbon stocks must also take into account terrestrial- atmospheric processes and is more complex. It is a useful exercise to become familiar and keep abreast of the tools available from the different registries as methods improve.
Living biomass Living biomass is the foliage, composed of needles and leaves, tops or branches, the stem and the roots of the living species on the site. In California, the methods of measuring the carbon values of each ecosystem use established forest mensuration tools in carbon accounting developed for California over the past century. In Canada, the equivalent standards were most recently summarized by Tony Trofymo of the Canadian Forest Service in ‘Canada’s National Forest Inventory Standards’ for ground plots and for photo plots.54
Dead Biomass Dead biomass is a much more common characteristic of BC forests due to the regulatory and forest practice awareness of the importance of structural materials to ecosystem dynamics and for wildlife habitat. There are negligible amounts of dead biomass on many European forests and forests in areas with high population densities such as in SE Asia.
53 The carbon footprint is another upside-down concept in the climate language of double negatives -- at least it is counterintuitive to conceptualize carbon as a footprint in the sky or in the atmosphere. 54 (NFIS, n.d.)
51
Soil pools Soils are the hidden value in Canada’s forests and in many ecosystems are as much at risk as the trees. In avoided disturbances, there may be considerable value in soil protection. The boreal has vast areas of peat which can catch fire and burn through several winters, resulting in the kind of emission spikes that occurred when Indonesia’s peat forests burned in 1998. In that year Indonesia was estimated to have emitted more GHGs than all industrial sources together. If this is the consequence of poor management, and not attributable to indirect causes like climate change, for an industrial country like Canada, peer pressure would require that these kinds of emissions be put on the country’s account in international negotiations.
The European Commission has recently adopted the Thematic Strategy for Soil Protection (COM (2006) 231 final55), with the objective to ensure that Europe’s soils remain healthy and capable of supporting human activities and ecosystems. Climate change is identified as a common element in many soil threats and an assessment of the actual contribution of the protection of soil to climate change mitigation and a literature review of the effects of climate change on soil productivity and the possible depletion of soil organic matter as result of climate change has been undertaken56. The methods for measuring soil carbon and dynamics in soil carbon stocks are complex and in their early stages of development. Nevertheless, rigorous soil accounting standards are vital because of the huge amount of carbon tied up in soil sinks in many forest ecosystems.
Soil Methodology ‘Growing soil’ is a newly defined land use-change climate initiative and is included in the Waxman Climate Change bill now before the US congress. Soil growing can include conservation opportunities like taking ranchland with poor soil management and converting it back to traditional long-grass prairie, which rebuilds the soil. Improved agriculture practices can also grow soil that may have been a source of GHG. Soil loss can usually be measured in GHG accounting as reduced soil carbon and often involves the venting of NO2 and CO4, strongly active GHGs. Enhancing the soil's biotic activity through discontinuing soil health inhibiting practices such as pesticides and fertilizers, can increase net profit per hectare through reducing costs. Studies show that healthier soils grow healthier food and reduce public health care costs, so there is considerable incentive to shift agricultural practices.
55 The European Parliament’s Economic and Social committee and the Committee of the Regions Thematic Strategy for Soil Protection can be found at https://www.msp-platform.eu/sites/default/files/celex_52014dc0086_en_txt.pdf
56 The EU’s review of the relationship between soil and climate change from which the Thematic Strategy for Soil Protection was developed can be found at https://ec.europa.eu/environment/soil/index_en.htm.

52
Conservation trusts will find that exploring collaborative land use change partnerships with the agriculture industry will become a new climate action pathway to a more sustainable future. For example, combining the conservation of wetlands, long grass prairie or riparian forest habitat with improved farming practices can create joint carbon management projects with shared planning, oversight, audit, and registry costs. One critical missing ingredient for securing climate credits from growing soils has been a robust soil methodology which takes into consideration all of the soil’s GHG dynamics. Such a methodology has been developed by The Earth Partners57 which is presently going through peer review.
Large scale versus small scale projects Geographical scale is an important issue in offset projects. Land management agencies typically are involved with relatively small plots of land, some of which have the potential for changing or adapting management regimes. Yet climate change information is often reported on very large geographic scales.58 Forest estate level information, such as over-all rate of emission or sequestration for the boreal forest of Canada, suggests many forests have become a source of GHG's. By extension, this is sometimes taken to imply that protecting forest for carbon benefits is a poor choice, or that it is better to use the forest for biofuel before it all burns or decomposes. This kind of macro-scale reporting belies the substantive benefits that can be achieved in emission reductions at the regional level.59 For example, fuel reduction initiatives in a region can reduce the risk of catastrophic fires.
Default values In some standards the proponent has two options to calculate many of these pools to evaluate and monitor the carbon value of an ecosystem. One is to use intensive specific measurements for the ecosystem and the other is to apply accepted (default) values for carbon stores and fluxes for the ecosystem that have been accepted within the regulatory framework within which the project is being developed.
In BC these default values will be nested in the ecosystem site types used by Ministry of Forests and Range which have been defined to one of the finest scales of resolution in any jurisdiction through the Bio geoclimatic Ecosystem Classification system (BEC). Where values can be
57 (Afpelbaum, Brinkman, & Seaton, 2009). One of the authors is a founding partner of The Earth Partners. 58 (Kurz, et al., 2008) 59 (Wilson & Hebda, 2008), (Pojar, 2009)

53
determined for a representative unit. For the more common ecosystem types, those values will quickly develop default options to reduce mensuration costs for smaller areas in question.
However, in practice, many specific properties will have undergone a level of disturbance so that these values need to be modified for the degree and nature of disturbance and the stage of succession of the ecosystem. Project specific measurements will be required and will generally provide greater credit values due to increased certainty. At this time there are few such accepted default measurements60.
As larger properties or aggregated sets of properties will most likely be assembled to justify the costs of developing the cost of measurement, analysis, planning and credit modeling, a number of ecosystems and even complex ecosystem compositions such as combined wetlands and forests are likely to have to be quantified61. Consequently, the proponent`s option for using default values is not expected to be substantively available for some time in BC.
After a few years of consistent techniques applied across a provincial offset program enough measured carbon in each site type might be available to infer values for various plots of land. It may appear as if few large-scale research programs could accelerate the emergence of these data sets, but the research would likely best be done within the discipline of actual projects meeting international protocols and guidelines for optimum market value.
Recommendation: LTABC in collaboration with climate sector professionals, an academic or other business science partners, develop the expertise to evaluate its capacity to offer conservation offset projects including Carbon and Ecosystem Services in B.C.
Recommendation: LTABC in collaboration with climate sector professionals, academic or other business/science partners, secure funding for research to develop a coordinated and collaborative project to evaluate and test key methodologies for
a) evaluating ecosystem services and carbon benefits across all projects being developed within BC’s land trusts.
60 (Trofymow, Blackwell, & Blackwell, 1998) (Trofymow & MacKinnon, 1998)
61 Note here that wetlands (except for some swamps) have low sequestration values but extremely high storage values. For example, the low scrubby vegetation of Burns Bog in the Fraser Lowland of BC sequesters relatively small amounts of carbon annually compared to an upland forest. However, Burns Bog stores 1-2 x 10⁶ metric tonnes of carbon. Hebda et al. (2000).

54
b) supporting an evaluation of the best and most reliable integrated carbon/ecosystem service offset strategies/projects to simplify decision making for investors.
c) quantifying carbon and ecosystem service values in representative properties.
d) exploring opportunities and challenges of different geographic scales of projects— from comprehensive projects on large areas with complex carbon activities to the simplified smaller, high-quality REDD projects (such as protecting remnant old-growth forest areas).
Rigour in Setting Standards Many investors are looking for projects with sustainability benefits stapled into the project designs. There is considerable latitude to invent a new arena of sustainability. Because carbon may become the largest commodity being traded globally, investigative journalists will be shining the bright light of the rigorous scientific standards being developed at the international level, including onto small local projects. It is important to undertake these projects to the highest standards, because if under the intense light of critical scrutiny, the claimed benefits all dissolve, the damage to the reputation of an organization could be considerable.
Recommendation: LTABC in partnership with individual land trusts, raise funding to undertake a test program to quantify carbon benefits for select past and new projects using the highest standards and market offset criteria. Recommendation: Provide the research, pilot studies and promote the credibility and permanence of legally conserved private and public land projects as reliable, high quality offset originators.

55
Chapter 4: Ecosystem Services: Classification, Valuation, and a Framework for their Quantification for Offset Projects
The previous sections have discussed the underlying concepts and principles for establishing the value of carbon benefits. Carbon storage and sequestration are only two ecosystem services provided by a conservation project. Other ecosystem services (ES) (also referred to as services in this report) are likely to ensue from a project. These services can provide value at a local, regional or global scale. They can, in some cases, be monetized (have monetary value established) to support the development of a project or acquisition and management of a property.
In this chapter, we first examine the importance and classification of ES particularly in the context of major international initiatives and schemes. As with carbon valuation, the evolving international framework is key to the development of widely accepted offset projects—for both compliance and regulatory markets. We then provide a step-by-step practical framework by which land trusts and other land-managing agencies can establish the value of their project, monitor it into the future and report on its values. We emphasize that the framework requires that the project purpose and goals must be well understood at the outset for its application. The project model that will emerge from answering all of the questions outlined in the framework allows the investor or purchaser to compare what they are investing in against other options and their objectives, and subsequently allows them to track whether or not that investment is paying off.
In the end, both carbon valuation and ES valuation have to be integrated into one analytic model that enables many scenarios and management options to be explored. We include a summary of a flexible experimental tool that is described in detail in Appendix 9 for project initiators and proponents to use in the valuation of their initiatives.
The lay reader may get lost in some of the complexity of discussion in this chapter. Although the fundamentals are all well understood, it will be clear from this chapter that the process of ES valuation, at this stage in its evolution, currently requires experienced professionals. This is also true of the several other modeling systems, which attempt to guide and pre-structure the analysis of all of the factors.62 In practice an ES valuation should be as quantitative as possible, based on empirical data. It is wise to be very cautious of simplified quantitative analyses or pre- structured formulas and comparisons, especially across various ecosystem types and services.
62 (Ranganathan , et al., 2008)

56
Figure 8: Ecosystem values accrue for three basic management strategies63.
63 Image from Brinkman Forest Restoration.

57
Importance and Classification of Ecosystem Services Building on the Millennium Ecosystem Assessment (MEA),64 the World Resources Institute (WRI) released a consideration of ES and their valuation and is an excellent starting point.65 It describes and summarizes effectively what ecosystem services are and how they are evaluated or could be evaluated. It includes summaries of several valuation examples. At the outset, it has to be made clear that there is no standard method for establishing values especially monetary values for all services. It could be argued that for some of these services, such as biodiversity, it is not appropriate to have a monetary value in any case. Yet these services have real value, and this value needs to be assessed, integrated into a project, and tracked into the future against a standard.66 Like the carbon value, a credible accounting is highly desirable and can be seen as a good business practice.
All ecosystem value management projects share a common simple structure. They all map value (V) over a future time (Tf.). The future value of a project is increased through three common strategies: one avoids the loss of the value under a business as usual scenario though protection which results in the maintenance of the values already present at the beginning (Time zero =T0)) and; two management action which improves the amount of the ecosystem value (or services) to a future time (Tf) of: three, both avoiding losses and increasing the value or service through a complex of management practices appropriately tailored to each part of a complex mosaic of ecotypes, seral stages and states of degradation or recovery. The third stratagem is known as Improved Forest Management in carbon trading. Almost every project which we manage involves IFM in which, for every baseline ecosystem value Vb the project Value Vp = Va + Vl where Va is the Additional value from management and Vl is the avoided value that would have been lost without protection.
We note that the WRI summary is concerned with services of importance to humans and specifically development. These services are viewed as separate from conservation values. However, the authors point out that ecosystem conservation "values" such as "existence" values have benefits to humans, (under the WRI category of Cultural Services) within the stricter definition of ecosystem services for human development. In our approach, we do not make this distinction between services for nature and services for people. First, many of the traditional and potential supporters participating in land trusts do not see this as a clear distinction. Their interests tend to be concerned with values for nature, as an implicit service ultimately for the web of life including
64 (Millenium Ecosystem Assessment, 2005) 65 (Ranganathan J. R.-H., 2008) 66 (Millenium Ecosystem Assessment, 2005), (Ranganathan , et al., 2008)

58
humans. Second, in practice it is difficult to assign the proportion of a service or benefit for each of the two types. For example, what proportion of biodiversity value belongs to nature and what proportion accrues to humans? Our assumption is that many if not most of the services benefit both nature and people.
Classification of Ecosystem Services BC Hydro advises that it has developed a classification and valuation system for offsetting their footprint which has not yet been released. This model has the potential to set a precedent for other developments and regulations for creating a market for ecosystem service.
Recommendation: LTABC should watch closely for BC Hydro’s unpublished standards and consider adopting them, as BC Hydro may become one of the first buyers of conservation offsets based on a systematic valuation of each service benefit.
Recommendation: LTABC undertake a closer analysis of the examples of a potential partnership with BC Hydro to align the goals of natural area conservation by land trusts and land managers and BC Hydro’s new goal of zero cumulative environmental impact.
The MEA67 presents a widely accepted classification scheme of ES as it pertains to human well- being and development. The assessment recognizes four broad categories: Provisioning, Regulating, Cultural and Supporting. The first three groups broadly reflect: 1. those services which provide us with materials including food; 2. those services which do things for us, such as clean the water, and 3. those services which are elements of human culture, such as natural beauty or spiritual value in belief systems. Category 4, supporting services, are explicitly excluded because they…." are not used directly by people."68 To this human-centered group of services, Ranganathan69 have added and enumerated supporting services. This group constitutes basic ecological processes, which underlie all other services, and include water and nutrient cycling, soil formation and photosynthesis and primary production. These supporting services are often a major focus in land conservation initiatives in particular as a foundation for conservation values, such as protection of ecosystems.
Following the lead of the MEA, Ranganathan et al explicitly exclude biodiversity values though they acknowledge that these are a foundation to many of the accepted ecosystem services. They suggest that the non-service component of this to be
67 (Millenium Ecosystem Assessment, 2005) Table 1, Multiscale Assessments.
68 Ibid, Table 7
69 Ibid, Table 2.1

59
considered under the set of cultural ethical and existence values. They also include what some people may view as services under the heading of "development goals": adaptation to climate change, energy security, environmental conservation, food production, freshwater provision, health, natural hazard protection, poverty reduction.70
These goals can be seen as the reasons that the services listed in Table 1 are important.
The issue or recognition of what is and what is not an ES must be clear at the outset of any project. As set out in the ES approach in the pages that follow, services need to be enumerated, assessed as relevant or not and accordingly evaluated. The key step of enumeration requires a starting list, and that list needs to be as wide-ranging as possible for the applications intended. In the context of land trusts, and out of the context of strictly human needs, the scope of ES is greater that the MEA and WRI lists. In particular nature conservation benefits without reference to human needs or demands have stature and value. From this perspective, each of the supporting services merit individual recognition and evaluation as appropriate. Many of these are central in the process of carbon sequestration and maintaining carbon sinks. More importantly, there is a wide recognition that biodiversity or conservation services have intrinsic value or benefit regardless of human development needs. These are not just of theoretical value but resonate in society. For example, Ecuador has recently passed legislation recognizing and protecting these intrinsic values.71 When one considers adaptation values of ecosystems and processes, in the context of climate change, these values can simply be seen from the perspective of whether or not they help human communities and society and general to weather the impacts of climate change (the WRI approach). Or they can be viewed from the perspective of whether or not they provide adaptation capacity for a species, ecosystem, or process to the impacts of climate change.
70 (Ranganathan , et al., 2008) Table 1.1, p 4
71 (Mychaleiko, 2008)

60
The example of climate change adaptation services is particularly complex. At first it may be easiest simply to account for value according to each of the ES elements such as water quantity, quality, flood avoidance, biodiversity values that need to be sustained as we face the uncertainties of climate change. However, adaptation could also be considered a separate service or value, essentially an insurance value. The development of a monetary value for this insurance may be difficult to calculate at this time. Possibly it could be considered as a proportion of the total value of ES, in the way other insurance policies are. Alternatively, it can be evaluated using the same approach as for other services, that is a relative ranking on a scale from maximum value to no or minimum value. A strong argument
that the climate change adaptation value is a distinct ES can be made as follows. Had there been no climate change threat there would be no need for this specific service. Now that we recognize that climate change not only might but will occur (just as a house fire will occur somewhere) and that it will impact ecosystems and their services, there is now a need for the adaptation benefits. If adaptation is considered a separate benefit or value, it has to be included as a separate service.
Debris washing into the Chilliwack River from flooding. http://www.fishingwithrod.com/crac/ In the context of the need to assess the full value and potential of a land trust project, adaptation services and conservation benefits should be evaluated separately, much as we argue in this report that carbon services should be. In the context of the likely sources of
Combining climate action and ecosystem restoration
Conservation carbon initiatives combine practical action preventing climate change and restoring climatic balance with the maintenance and restoration of vital ecological values and services. When projects take into account, both adaptation risks or provide for adaptive management of these risks, they provide the double benefit of mitigation and adaptation. Vulnerable ecosystems have the risk of becoming negative climate feedback systems. The fifteen years of warm winters in western North America resulted in a catastrophic infestation of mountain pine beetles and an unprecedented mortality across tens of millions of hectares of pine. This in turn released gigatonnes of CO2 and millions of tonnes of CH4, NO2 and other GHGs which will lead to further warming and increase the risk of mortality in other ecosystems. Given this provincial catastrophe, BC must lead in integrating carbon and ecosystem values. It cannot default to considering such phenomena as simply natural events and allow further consequences without analyzing the long-term trajectory and impacts and taking adaptive action.

61
support for climate change and land trust conservation projects, these services should not simply be viewed as part of "cultural" benefits.
Ecosystem services may be simply accounted under the following primary categories:
a. Products, like timber, and non-timber forest products
b. Offsets like GHGs
c. Water separated perhaps into quality and quantity,
d. Biodiversity which includes habitat
Table 1 lists ecosystem services that merit consideration in an assessment and valuation exercise, taking the broad view of ecosystem services. The assessment will have to explicitly include or exclude the services according to the objectives of the project. This approach is central in defining the "assets" of project and looking to the future of the assets because it explicitly explains assumptions, such as the inclusion of conservation values and cultural values for example. The approach provides clarity and fosters credibility and accountability.
In the final analysis the project proponents and designers in consultation with stakeholders need to make the decisions about ecosystem service components, but those decisions must be clearly explained. Table 1: List of Ecosystem Services adapted and modified from MEA and WRI for use in conservation projects. Ecosystem Service or Benefit Category
Description References to methods and approaches
Selected examples of valuation
Provisioning Services Goods or products from ecosystems
Special forest products collection-- markets are volatile
Nelson et al. 2009 (commodity value)
Food: natural ecosystems
Wild foods including Capture (wild) fisheries
Seasonal collections are more than subsistence value for First Nations, they define the culture.
First Nations local culture in every part of BC.
Food: "cultivated ecosystems"
Crops Wild Blue Berries Quebec grants berry picking ‘tenure rights’
Livestock Woodlands buffalo, elk Northern Alberta
Aquaculture Stream restoration tied to a right to harvest a portion of the increased salmon runs.
Williamette Forest Products, Oregon on Williametter River in 1990’s

62
Fibre Wood Standard timber valuations are as complex as carbon crediting
Woodlot owners seem to think that the US Scribner Scale is designed to benefit the mill and shortchange the land owner.
Fuel Biomass= Bioenergy The MOF&R is offering biomass tenures of over 1 million Cu M/year
No one has accepted a MF&R biomass license and begun to harvest-- yet.
Water Ground water Ranganthan et al. 2008 (Table 3.3)
BC Drinking Water Legislation
Surface water Surface water, often the source of drinking water, purer flowing from intact forest stands.
NY’s acquisition of the Appalachians to avoid the construction of $1 billion in water treatment plants
Genetic resources Breeding. Biotechnology
The Pacific Carbon Trust invited plus tree projects for their carbon benefit.
These were selected from natural forests.
BC’s Future Forest Ecosystem adjusted seedzone guidelines raised the elevation to which seedlots could be planted to reflect climate change
Biochemicals, natural medicines, Pharmaceuticals
e.g., Taxol collection from yew, taxus baccata resulted in a short-term collection--until substituted by cheaper sources in the developing countries.
Yew hedge plantations have been planted and are being harvested, with payment based on taxol extraction value.
Regulating Services e.g., restoring wetlands Flood prevention through absorption of peak rainfall incidents
Avoids the construction of levys e.g., New Orleans
Air quality Chemicals, emissions and removals
Nitrous oxides, particulate matter and metals absorption
Trees Canada has kept the best record of the value of trees to city air
Climate Carbon sequestration and sinks for climate change
See Chapter3 See Chapter 3Nelson et al. 2009Mackey et al. 2008
Adaptation to climate changes
Management to improve forest health/ecosystem
Future Forest Ecosystem Adaptation Plans

63
stress resilience
Local climates Shade and temperature moderation
City Parks
Water Hydrology, timing of runoff, flooding, recharge
Mountain Pine beetle shifts in rainfall. Water table and cycles research
Consequences and management options still being explored
Erosion prevention Vegetation cover Wattling, bio- engineering, vegetation cover stability analysis
Nelson et al. 2009 e.g., UBC cliffs below BC Anthropological Museum
Water purification and waste treatment
Water quality Reduced infrastructure costs through restoration
Nelson et al. 2009
Disease regulation Human pathogens
Pest control Crops and livestock
Pollination Domestic and natural crops
Wild and natural crops Beekeeper contracts with blueberry growers
Natural hazard regulation
Hurricanes, tsunamis, fires
Mangrove forests retention in Sri lanka
Restoration work tsunami preparation
Cultural services Non-Material benefits Cultivated trees Totem trees
Ethical values Religion and spiritual Singing Forest Hamil Crk
Aesthetic
Existence values Knowing it's there Golden Spruce It was cut to delink it from corporate identity
Intergenerational value For future generations
Cultural traditions and identity
Recreation and Tourism
Off-Sets Conservation
Carbon
Supporting Services
Nutrient Cycling
Soil formation
Primary Production

64
Photosynthesis
Water cycling
Values for Nature/Conservation
Biodiversity Composition: combinations of species, keystone, charismatic species
Spirit bear and the Great Coastal Rainforest
Nelson et al. 2009
Structure F&RPA requirement to leave standing dead
Morrison et al. nd
Rare species Species at risk legislation US EPA is the best example, not Canada
Ecosystems e.g., Dry coastal Fd Morrison et al. nd
Ecological processes, such as food webs
Interconnected species conservation
Delta mud flats nutrient rich slime for migrant sandpipers
Resilience
Intrinsic right to exist Species at risk Habitat conservation Spotted Owl
Reference systems for research
Due to the extent of human disturbance
Conservation of key representative ecosystems
Biodiversity conservation payment
Quantitative project ecosystem service valuation Ranganathan et al. outlines a general approach to assessing ecosystem services for "…assessing risks and opportunities related to ecosystem services."72 This approach modified to valuing services for specific projects might look as follows:
1. Identify all the ecosystem services provided by a particular project by
comparing the ecosystems involved to the list in Table 1 at the project site.
2. Determine/ prioritize the ecosystem services that are central to the goals of the project to set priorities for valuing them.
72 (Ranganathan , et al., 2008):30, Figure 3.1

65
3. Analyze (measure) the condition, establish trends and describe likely trajectories of the relevant ecosystem services. This requires choosing an appropriate method for valuation, establishing the base line condition, determining trends and forecasting trajectories into future. Typical land trust projects need to look 100 years into the future.73
4. Establish value, relatively or in monetary terms (dollar value) of the ecosystem services (summary valuation) in question, for use in cost-benefit analyses.
5. Compare alternate scenarios both for the site and to other sites and projects.
This approach provides a simple map of the activities and their order, but it belies the complexity of the practical requirements for doing a valuation. The following 10-step comprehensive framework provides a credible transparent process of an ES valuation and the project’s potential value. The first seven steps apply to the valuation of the ES that are available at site and contribute to a project. The last three steps pertain to the estimation of the project value (Pv), by taking into account of costs associated with the development and running of the project. We emphasize again that there is still no standard approach for doing an ES valuation, but conventions are evolving rapidly especially at the international level. The Province of British Columbia's Biodiversity Adaptation Initiative (CCATT website) has this idea at its core.
ES Valuation Step 1: Identify the services On any given parcel of land, a wide number of services exist within a sustainable management context. For example, a piece of land may:
• Sequester atmospheric carbon • Filter, store and deliver clean water • Provide biodiversity benefits through habitat for specific species and refugia for genetic
strains • Provide recreational areas • Provide connectivity between habitat areas • Provide aesthetic benefits to residents in the area • Provide wood for timber, fuel, or other uses • Provide sustainable populations where wild-crafted foods, medicines and materials can be
gathered • Provide opportunities for hunting or fishing.
73 see (CCAR, 2008)

66
The ES offered by a wetland may differ from those offered by an upland forest. In this step, project originators/proponents need to realistically agree on what the significant ES values of a project are and will be. It is a selection exercise where specific services need to be established as priorities, such that progress toward the chosen objectives can be measured and tracked. For example, are the primary goals of the project to contribute to and combine carbon storage, biodiversity, water storage or do they focus more on an economic activity (jobs) and so on? Thus, the first step in evaluating a property should be to list all of the possible services provided by a property, without regard to how they are valued or who might want them.
ES Valuation Step 2: Characterize the services with respect to their benefits and supply
Using the list of services prepared in Step 1, for each identified service answer the following questions:
a) What does the service do? Services may do several things:
• Provide specific benefits to users simply by being in existence, e.g., an old
growth forest parcel may provide habitat, recreational use, aesthetics and other benefits simply by being there.
• Provide specific benefits to users when extracted, taken, or used off of the property, e.g., a property may provide specific objects or items, which have value in a human context outside of the property. The property may be a “producer” of a commodity.
• Reduce costs which would otherwise be borne by users, e.g., a wetland may produce a service such as clean water, which is beneficial to the user because it reduces costs which they would otherwise bear such as installing a water treatment plant.
Understanding what the service does will help to understand how the service benefits users, and how it may be valued, and who might be interested in buying it.
b) Who uses or benefits from this service? Determining who uses or benefits from a service will be critical to understanding how that service may be valued, and ultimately monetized. In general, the beneficiaries may fall into the following types:
• Global. The service benefits the entire global community equally. GHG sequestration is an example of this type of service.
• Regional. The service benefits the region in which the property lies. For example, provision of habitat connectivity may be a regional service.
• Specific users. The service benefits a specific group of people, e.g., downstream water users, local hikers, etc.

67
In general, the expectation will be that these specific users or organizations representing them are the most likely to pay for the services.
c) When and how does the property produce the service? Services are not necessarily produced continuously and evenly. For example, a property with a young seral stand might produce wood from a thinning as part of a management plan designed to accelerate the development of old-growth characteristics, and then never produce wood again, while on the other hand the same property might serve as a filter and storage area for water for 6 to 8 months of every year and sequester carbon continuously.
d) Is there an existing market for the service?
For some services, such as carbon sequestration, there may be a relatively well defined and developing market. For other services, such as habitat for endangered species, there may be an indirect market through government programs designed to sustain and enhance that habitat. Yet other services, such as clean water, may be viewed as an externality with no value, or local governments might fund acquisition of watershed lands to internally offset costly water treatment facilities, as happened in New York State.74
e) What might reduce or enhance the amount of the service provided? What natural changes or management activities might enhance the delivery of the services? What changes or risks might lead to a reduction in the delivery of the service?
ES Valuation Step 3: Estimate amount of services and future trends (trajectories)
Once the characteristics of an ES have been established, its present and future amount and condition will need to be determined. Step 3 is the technical component of a project. It is intended to contribute to specific measures of the value of a project and its potential for the future. Broadly speaking this step has three stages:
1. Survey and chose a technical method (see below) suitable for the ES.
2. Measure or otherwise determine the current state or condition, known as the baseline condition. 3. Establish trends and acquire models to create forecasts (trajectories) of the ES for the project.
74 (New York City's Wastewater Treatmemt System, n.d.)

68
Each ES will have its own set of appropriate measuring tools. Often these involve some measurement of the service such as the volume or flow of water, but they can also be measured in a relative sense compared to an ideal or best value and worst or no value. Ranganathan et al.75 list five broad methods available for measuring or establishing the current condition and trends (which can be used to develop forecasts): remote sensing, geographic information systems, inventories, ecological models, and participatory approaches with expert opinion. Making direct measurements of specific components is implied in their description but should probably be recognized as a separate practical strategy. For example, timber volume can be directly measured from on-the-ground survey or estimated from models for stands similar in structure and composition to the one of interest.
The method or combination of methods chosen depends on the nature of the feature or service measured. Large scale phenomena such as global carbon stocks and biodiversity in natural ecosystems76 or the size of the Arctic ice area77 use remote sensing, often in combination with models and on the ground observations. The Australian study of forests and carbon storage combined remote sensing, models and direct measurement.78 It should be noted that with advancing technology, remote sensing is becoming more and more useful at the local scale, especially in combination with directly observed data in the field.
On the other hand, the size and condition of a rare species population is best established through direct observations according to established standards.79
We cannot in this report summarize and evaluate all the possible ways of obtaining the measurements of the conditions of the wide range of ecosystem services involved in a conservation project. Chapter 5 of this report on the business of carbon valuation demonstrates the complexities and challenges involved for only one of the services. For some services, e.g., aesthetic and biodiversity values, widely accepted methods have yet to be established. However, for many services, there are already developed standards in specific jurisdictions, e.g., BC has water quality standards that have
75 (Ranganathan , et al., 2008):34, Table 3.2
76 (UNEP, 2008)
77 (Dow & Dowling, 2006)
78 (Mackey, Berry, & Lindenmeyer, Part 1: A Green Carbon Account of Australia's Eucalypt Forest and Policy Implications)
79 Reference to BC CDC or COSEWIC Status reports as examples

69
specific requirements for water flow on rivers and streams. In the 1990s, BC developed a standard set of protocols for observing many natural phenomena such as wildlife trees.80 The Millennium Ecosystem Assessment used a set of approaches now widely being accepted.
Project proponents will have to consult recognized or certified experts to provide the best advice for monitoring methods, forecasting tools and estimates for baseline evaluation. In all cases, reference must be made to jurisdictional requirements and standards, but needs also to consider the acceptability of these requirements to the potential project participants. For example, a program of voluntary offsets for nature may have much higher biodiversity standards than a regional or provincial jurisdiction.
Project proponents need to understand that forecasts of the values are a critical element of any valuation. Forecasts, which are developed by trajectories (curves) showing potential future condition of an ES, are an indication of the yield of present-day investment. These can be determined either by extending present day trends into the future or use of suitable models. The interval for the forecast can vary from a decade to hundreds of years. Considering the nature and timing of climate change, a major driver of ecosystem services, forecasting 100 years into the future is highly desirable. The long-time frame is necessary too because many of the processes and attributes of ecosystems have lengthy response times (species migration for example). Hebda et al.81 demonstrated that for raised bogs (and by implication many wetlands) key ecological processes operate on a century scale, The same is true for the development of old growth attributes in a coastal forest.82 The CCAR 2008 protocols explicitly propose a 100- year time frame for its Forest Project Protocol agreements.
Table 2 provides a starting point for those looking for guidance in the selection of ES methods or approaches for a project. It shows a basic set of services (except for carbon) with suggestions on how to evaluate them. The Forest Project Protocol includes a comprehensive range of approaches and methods suitable to conservation values and is a good starting point.
80 (Manning, 2000)
81 (Hebda, Gustavson, Golinski, & Calder, 2000)
82 (Brown, 2008)

70
The amount of a service provided can be measured in several different ways to determine the value of a single service on a given property:
a) The absolute amount available
b) The amount still conservatively available after a risk value analysis
c) The amount the market can absorb from that property, which might quite different than what is available
While the habitat value for a single species might be a very specific amount, a risk analysis and the interests of the trading market may result in an adjustment in the ultimate value of the service provided by the property as an offset. In many cases these adjustments will be simple. For instance, the market may be huge, and there may be no difference between the absolute amount available and the amount available on a cautious sustainable basis. However, in other cases, determining which of these factors limits the amount that can be sold or offered as an offset may be very complex, requiring sophisticated knowledge of both markets and ecosystem processes.
As indicated earlier, it is important not only to determine how much of the service can currently be provided and sold, but how much will be able to be provided and sold into the future over the term of the project.
Several different methods may be used to determine the amount of the commodity available for offer as an offset. In all cases, the goal is to identify the amount of valuable service which can be provided to the market.
a) Production over time, either continuous or intermittent
This approach will generally be the simplest. Depending on how and when the service is valuable (continuously, intermittently, when produced), the current flow (rate of supply) of the ES can be estimated based on a wide variety of records, such as:
• Records of stream and ground water flow • Records of recreational use • Inventories of harvestable timber derived from restoration plans
Projecting future flows may be more complex, and may need to take into account
• Changes in ecosystem function due to seral stage change • Changes in human population in the area • Changes in ecosystem inputs, such as rainfall
Projections of future conditions should generally be conservative, i.e., err on the side of underestimating the production of the service to avoid basing projects on unrealizable production estimates.

71
b) Enhancement over baseline Estimating the enhancement over a baseline is generally more complex, since it relies on projections into the future of conditions both with and without the project. All carbon crediting regimes are examples of this type. The detailed step-by-step description of the process of estimating the amount of carbon credits available based on differences between a baseline business-as-usual conditions and one involving increased sequestration, contained in Chapter 5 of this report, is an example of this type.
c) Relative amount In some cases, the absolute amount may not be what makes a service valuable, but the relative amount. For instance, habitat for an endangered species may be considerably more valuable if the property contains 10% of the provincial total of habitat for that species than if it contains 0.1%. Research will need to be done on the regional, provincial, national or worldwide supply of this service, to determine how significant the service provided by the property is. Consideration will also have to be given to changes in that relative amount over time. Is there expected to be more or less of this habitat in the future? Will the property itself contain more or less of this habitat in the future?
d) Not quantifiable Some services may simply not be quantifiable. In these cases, if there is a potential for payment for these services, it must presumably be based on some non-quantifiable valuation of the service by the individual or group willing to pay for it. For instance, someone may be willing to pay to preserve a value that only they perceive, such as an aesthetic value.
ES Valuation Step 4: Estimate the reliability of the services The value of an ES depends not only on whether it capable of being provided, but whether or not it can be provided reliably and furthermore whether it can be measured or valued reliably. Reliability of services is typically the result of two factors:
a. The inherent characteristics of an offset project property and its ecological
functions. For instance, reliability of habitat for an endangered species may depend on a wide variety of factors, including seral stage, landform, location, etc.
b. The reliability of the work undertaken to identify and establish the value of the service. The quality of the service provided can depend on a wide variety of technical issues which effect the degree to which a client can depend on the current and future provision of the service, and the value of that service. For instance, if carbon credits are validated and verified using a rigorous standard, they will be seen in the marketplace as having higher value than carbon credits that only meet minimal standards.

72
Reliability of service is closely related to issues of risk. If the client perceives a high degree of risk that they may not receive the service as promised, they will perceive the service as delivering a low offset amount. The questions to be asked are:
• How reliably can the service be delivered? • What are the risks that the service might not be as promised? For instance, with
carbon credits, what is the risk that a carbon credit might prove not to be permanent?
• How is the proposed system for measuring and delivering the service perceived in the marketplace?
Reliability of an ES can also be related to factors that are linked to how the service is delivered, e.g., customers may perceive clean water as having higher value if it comes from a pristine old growth forest than a secondary forest, even if it has the same measurable chemical qualities. A service will often include not only the value purveyed, but also the story that goes with it. Projects which have positive ecological and social stories, typically are perceived as somehow better or more valuable.
Estimation of the reliability of services should include an assessment of what could be done to improve the reliability and its perception. Like assessing the future condition of an ES, there needs to be an assessment of reliability in the future (trajectory) and what could be done to limit risks to reliability.
ES Valuation Step 5: Identify how to value the services Getting to the value of any natural service is a challenge, yet it is absolutely necessary for a credible and accountable offset project. An analysis of the costs and benefits of fuel removal to avoid forest fire losses in Washington State demonstrates the complexity of a monetary valuation of ES.83 Though timber values and regeneration and rehabilitation costs could be estimated, benefits such as habitat and water quality and quantity could not.84
The valuation becomes more complex when multiple factors are assessed, especially those with intrinsic values such a biodiversity or intergenerational values. However, the analysis is approached, the method of assessing the value must be explicit so that it can be accounted for and monitored.
Services may be valued based on very different principles, depending on the nature of the service and who is valuing it. As well, some part of the production of a service may have value,
83 (Mason, Lippke, Zobrist, & Bloxton Jr., 2006)
84 (Mason, Lippke, Zobrist, & Bloxton Jr., 2006) Figure 3. Incidentally this paper also includes and applies a simple equation for estimating costs and benefits over time. This is a critical component of any valuation.

73
whereas another part may not. In general, for a given service, how that service is valued will probably fall into one of the following categories:
a) Services which have value at all times. Some services may have value simply by existing, e.g., the monetary value of habitat is difficult to calculate but habitat clearly provides benefits by its mere existence.
b) Services which have value only at certain times. Services may also have seasonal or intermittent value. For instance, if the service is water storage and regulation, the service is delivered only during peak winter rains when flows may exceed safe or useable quantities. Water storage service may have little or no value for flood protection when the rainy season is over. On the other hand, once rains stop the gradual release of water from the property into surface streams, aquifer recharge may have significant value too.
c) Services which have value only when they are enhanced or above a certain amount. Some services may have offset value only to the degree that they can be enhanced above the baseline amount or quality of service provided. For instance, under most regulatory schemes, carbon has value only when actions are taken to reduce emissions or enhance storage above what would have occurred in a business-as- usual case. Other services may have value only when a property provides them in unusual quantity or quality, as compared with surrounding properties.
d) Services for which values cannot be determined. There are also ES for which it may not be possible to determine what makes them valuable. For instance, the spiritual value of a certain location may be very strong for some people and non-existent for others. Establishing a value for such a service is difficult and often involves a relative valuation by those who recognize the spirituality of site. Such spiritual services can galvanize popular and monetary support for a project, at which point it is very clear that they have real value.
ES Valuation Step 6: Estimate the value of the services As with the amount of the services, the value of the services must be not only estimated for the present time but projected into the future. Value may depend on the reliability, amount, and location of the services, as determined above. In order to determine the value, the first step will be to review the work undertaken in preceding steps. Value may be determined in several ways, depending on the nature of the service, and on who benefits from or wants the service:

74
a) Known willingness to pay In some cases, while there may be no market per se for the service, there may be an individual or organization with a known willingness to pay for the service, e.g., a watershed manager may have an outstanding program of paying for sediment reduction within the watershed. In such cases value can usually be determined in discussion with the known buyer. Discussions should cover not only current price, but also future directions in the purchaser's intentions and needs, by which future demand and price can be forecast.
b) Existing market Where there currently exists a market for the service, current value will usually be relatively straight forward to determine, based on quoted market prices. In some cases, the market may exist in another jurisdiction, and be developing locally, and some premium or discount may apply based on the differences in supply and demand between the markets. Projecting future value will typically be done based on some combination of analysis of the trajectory the amount of the service, the market for it, and on projection of future supplies and demands, and drivers of supply and demand.
c) Costs to the customer if the service is not provided Across much of our economy, costs of providing specific benefits to people are reduced by relying on free services from the environment. For instance, a water district may not have to build a water treatment plant because a forest is providing the water treatment function. Although in many cases these benefits are unrecognized, when faced with the alternative of losing these services, customers may be willing to help pay to ensure that loss does not happen. In this case the upper bound of the value of the service will typically be the cost of providing the service through alternate means. The actual value achievable will typically be less than this upper bound, both because a lower price gives the customer incentive to maintain the service, and because there may be some reliability issues with the service. These factors mean that the customer cannot depend 100% on receiving the service and may have to invest in a back-up plan.
d) Perceived future market and supply shortage In some cases no market or value may currently be assignable to the service. However, it may be clear that people do require the service, and that a market or payment method may develop for the service in the future. In that case the future value of the ES may be estimated based on the expected supply and demand of the service. Typically, the risk that no market develops will also have to be factored into the forecast price.

75
e) Existing market
Where there currently exists a market for the service, current value will usually be relatively straight forward to determine, based on quoted market prices. In some cases, the market may exist in another jurisdiction, and be developing locally, and some premium or discount may apply based on the differences in supply and demand between the markets. Projecting future value will typically be done based on some combination of analysis of the trajectory the amount of the service, the market for it, and on projection of future supplies and demands, and drivers of supply and demand.
f) Costs to the customer if the service is not provided Across much of our economy, costs of providing specific benefits to people are reduced by relying on free services from the environment. For instance, a water district may not have to build a water treatment plant because a forest is providing the water treatment function. Although in many cases these benefits are unrecognized, when faced with the alternative of losing these services, customers may be willing to help pay to ensure that loss does not happen. In this case the upper bound of the value of the service will typically be the cost of providing the service through alternate means. The actual value achievable will typically be less than this upper bound, both because a lower price gives the customer incentive to maintain the service, and because there may be some reliability issues with the service. These factors mean that the customer cannot depend 100% on receiving the service and may have to invest in a back-up plan.
g) Perceived future market and supply shortage In some cases no market or value may currently be assignable to the service. However, it may be clear that people do require the service, and that a market or payment method may develop for the service in the future. In that case the future value of the ES may be estimated based on the expected supply and demand of the service. Typically, the risk that no market develops will also have to be factored into the forecast price.
h) No quantitative value assignable Although it may be clear that a service has qualitative value, not all such services will have a value that can be established in monetary terms, or for which payment can be expected. For instance, the value of spiritual and aesthetic services may not be quantifiable, and a value may not be able to be assigned to them. However, recognizing and emphasizing these services may also have value in so much as people may be willing to make donations of time or money to maintain. Such willingness sometimes results in the contribution of large sums of money for the perceived importance of yet hard to value ES.

76
ES Valuation Step 7: Evaluate and account for the risks to and trade- offs between services The inter-relationships between services vary, both from ecosystem to ecosystem, and market to market and may be unique to particular sites. Consequently, the next step is to determine the dynamic functions that occur within an ecosystem, and to determine:
• Whether provision of one service may negatively impact the delivery of another service, and if so how much and for how long?
• Which services are independent of each other? • Which services complement each other and may enhance other services? • Which services are mutually exclusive and cannot coexist in the same project
(materials removal and maintaining original biodiversity?
As well, it is important to assess the risks of losses of the services due to human or natural disturbance, or due to natural changes in the ecosystem. Examples of risk include:
• The yield of non-timber forest products such as berries may decline as open early seral vegetation is converted to second growth forest and shade increases.
• Wildfire burns a project site and releases carbon from the sink to the atmosphere and interrupts sequestration.
• A river changes course and destroys a specific habitat.
An understanding of these risks and trade-offs should be built into the management model, and into the model of the monetary returns from the ES. It is also very important to be aware of political risk. Identify the regulatory requirements that must be met to monetize the service. Analyze anticipated regulatory change, especially if key project services depend on new regulations, policies, or protocols. The California Forest Project Protocol outlines such social risks in detail.85 ES Valuation Step 8: Define the project structure The preceding steps lead to a valuation of the ecosystem services and their offset values. They, however, do not lead to a calculation of the value of a project, because there are a variety of costs involved in developing and running the project. The first of these costs are related to the structure of project and its social, policy and regulatory context. The nature of these costs can be identified by answering the following questions related to the circumstances of the project.
• What are the planned and predicted changes in the ecology and use of
the land over time?
85 (CCAR, 2008)

77
• How will the project create its services?
• How will the project land be secured? What legal or social structure will be used to give protection to the land area?
• Who needs to be part of the project team to make the project successful?
• Who will be the key actors driving the management or land use change? How will they be rewarded or compensated for their actions?
• How will the corporate, NGO, community, etc. bodies responsible for elements be structured into the project to provide long-term continuity of action?
• How does the project fit into local, regional, national and international programs and priorities? Are there incentives, support, taxes, etc., which apply to the project?
ES Valuation Step 9: Estimate the cost of providing the services In addition to structural costs there are operational costs both at the outset and as the project is running. These are accounted for by quantifying the costs for: each intervention or site treatment; payment to local stakeholders or those driving the intended change; requirements for management, protection, data collection, analysis; management planning, quantification of services; validating, verifying, accrediting and marketing. Some of these costs can be estimated for the project as a whole, while other costs will be for valuing each ecosystem service. They then need to be modeled for the duration of the project to obtain an over–all project cost.
Acquisition of land or management responsibility for climate change and ecosystem values comes with long-term responsibilities. First the investors or purchasers of the credits will need to know whether or not the values they acquired remain in the project or property. Second, by their nature these conservation and carbon values are often anticipated to increase with time, e.g., a purchase of forest land for its carbon sink value also brings with it increased sequestration value. Many factors could lead to changes in the growth of value but also to the loss of portions of the original carbon sink and ES investment. Furthermore, ES of any credible and accountable project must be tracked in a consistent and standard manner for the duration of the project. This requirement is clearly for perpetuity. This characteristic of "permanency" is one of the advantages of land trust projects. A credible monitoring program furthermore allows for adaptive management, that is, interventions or changes in management that could either increase the value accruing from the project over time or avert losses.
Typically, land trust projects protect the land, monitor for obvious disasters but otherwise leave the land alone. Interventions are usually in reaction to some pressing issues., e.g., removal of invasive species or planting of native species, stream or wetland restoration are involved.

78
Rarely is there a long-term standardized monitoring program with requirements for accounting of values. More recently, there is a recognition of the benefits of long-term accounting and monitoring, with an improved understanding of the carbon carrying potential of a site.86
For the types of projects of concern in this report, the tenure holders will have to monitor and actively manage ecosystems to ensure that they maintain their adaptation characteristics and are as adapted or resilient as possible to changing climates and maintain the benefits for which they were established. There will clearly be a responsibility to be active managers not just observers. And the costs of these activities must be included in the project budget; minimally monitoring, assessing the data, accounting and reporting and intervention. For many projects, the combination of some degree of degradation/disturbance and indirect human caused ecosystem stresses of climatic disruption may well require proactive interventions in ecosystem processes, namely active stewardship rather than simple protection. The costs of such stewardship and reporting may be difficult to estimate at this point in our understanding of what will be required. Nevertheless, climate change will have impacts on conservation projects, and we will have to respond.87
ES Valuation Step 10: Calculating the returns from providing services and commodities Typically, a financial project model reflecting the potential returns and their associated costs will have been created prior to this final step. At this stage the project financial model should be fine-tuned in order to consider refining the project, structuring the steps and stages of the implementation plan and developing the financial structures to make it possible to finance the project.
With a model, which is sensitive to all of the above inter-relationships, the analysis can quantify risks, the cost of management for avoiding risk, and identify the optimum financial and management plan. Such a model is typically tied closely to a GIS map that stratifies an area by ecosystem or intended use types, and the map helps provide the rationale for management planning.
Importance of valuation and comparison Valuation takes place for a purpose and that purpose is to make comparisons, not only among projects but also among options for a project. Valuation also helps to answer the question: If we did not do the project what would it "cost" us or what benefits would we lose.
86 (Mackey, Berry, & Lindenmeyer, 2008)
87 (Lemmen, Warren, Lacroix, & Bush, 2008)

79
For the conservation movement this is often a central issue, because projects often involve alternate use scenarios. Those scenarios usually involve the loss or significant degradation of ecosystem services and benefits, usually for economic benefit. The WRI report88 demonstrates how to apply valuations to the process of decision-making in the context of options. Decision-making is essentially the process of comparisons.
The second function of valuation, using a standard and credible protocol, is to compare the original baseline condition to future conditions. Tracking or monitoring a project using the same methods for the baseline is required for accounting purposes and is necessary for adaptive management. The monitoring data either demonstrate that a project is on course or that management changes are necessary to maintain and even increase ecosystem benefits.
The power of cumulative benefits (the principle of compound interest in the natural world), forecasting and monitoring (valuation at future times) are absolutely central in demonstrating the value of conservation projects. Usually once a project is implemented, its accruing benefits are rarely assessed, nor are they specifically anticipated in a measurable way. How often do we see calculations of what the accumulated benefit of a project have been? Yet at the outset the decision to choose and implement a project was based on an alternate future such as degradation or conversion of an ecosystem.
A key measure of a project is its accumulated benefits compared to not undertaking it. Like choices concerning carbon and CO2 emission for a forested plot,89 the difference in the outcome of the choices change with time. The real measure is the accumulated difference in the future, the net total benefit of having followed one road versus another.
At the beginning of a project, these differences can be anticipated by establishing a baseline and forecasting trajectories for ES into the future. The anticipated difference between choices over time is the potential value (Pv) for the project, more precisely the cumulative benefits potential for ES. Future measurements allow the determination of the Realized Ecosystem Service benefits which can be tracked with a valuation mechanism and is a measure that grows with time when compared to the original choice. It is a particularly key measure when facing a time of uncertainty and likely increase in value of ecosystem services. The concept of accumulated values or benefits is used in the method or protocol proposed for valuing projects in Appendix 10. The types of comparisons useful to conservation projects are summarized in Table 2 below.
88 (Ranganathan , et al., 2008) 89 (Wilson & Hebda, 2008) Figure 3

80
Table 2: Valuation comparisons applicable to conservation projects.
Baseline Condition at future time (tn)
Alternate Choice for site
Expected out come
Different project
Baseline Condition without the project
Ex ante projection required
Condition at future time (tn)
Monitoring at any time in the
future.
Required for
accounting and credibility
Options Compare to a Demonstrates conversion of cumulative the site to benefits or losses another
condition
Expected out come
Real benefits or losses compared
Tracking trajectory of
Real benefits or losses
to those change against compared to expected projected values those expected
Different project
Permits setting of priorities or
Demonstrates with time the
N/A Demonstrates with time the
choices of value of project value of project projects at the and similar and similar outset projects; projects;
Case example for
Case example for
similar choices in similar choices in the future the future
Management: Adaptive changes or intervention in the project in response to impacts, new knowledge or inadequate accumulating benefits
Tracks effectiveness of management interventions relative to starting point
Demonstrates whether or not adaptive management is working. Permits assessment of adaptive strategies for use in other sites
N/A Established whether adaptive management returns project to forecast trajectory
N/A

81
An Experimental Framework for Evaluating Carbon and Ecosystem Service Values of Projects The preceding description reveals that evaluating ecosystem services is clearly a complex and evolving area of activity. In practice there is as yet no standard approach or method available to do so. Nevertheless, there is an immediate need to begin to be able to evaluate the ecosystem services of a project and estimate their offset value if only for the voluntary market. Furthermore, the supporters of such projects must have some confidence that there will indeed be a yield on their investment and will need reports on the progress of the project. Project managers (land trusts or others) will need to know whether or not their projects are progressing with respect to their offset value as per plan in order to make management adjustments.
There are many challenges in aggregating ES values into a total project value because many ES cannot be valued on a monetary basis. They can, however, be valued on a relative scale in terms of providing the maximum amount of the service in comparison to a minimum amount.90 We include in Appendix 10 a flexible experimental tool for valuing and aggregating ecosystem services in a standard and internally consistent manner. The tool uses the concept of index units that can be added to create a project value and modeled into the future to estimate the yield. This index valuation tool or approach is particularly useful in comparing and explaining choices for a parcel of land and evaluating management scenarios. The tool also facilitates tracking the progress of project in a consistent manner and thus monitoring for the need of changes in management. We encourage the use and testing of the tool as land trusts and land managers contemplate offset projects that involve a wide range of different ecosystem services.
This chapter reveals the complexity of ecosystem structures and dynamics, which, when combined with the uncertainty of which market standards optimize at this time the value for conservation trusts, underlines the importance of involving climate and ecosystem professionals in the development of projects.
Recommendation: Secure dedicated ecosystem professionals that have the capacity to compare offset values for project if they were traded in different regulatory jurisdictions and markets.
90 (Mackey, Berry, & Lindenmeyer, 2008)..

82
Chapter 5: Framework for Carbon Valuation for a Project Quantifying carbon may be nearly as complex as quantifying multiple services since carbon is only the equivalent value for the dynamic interactions of all Green House Gases in a number of pools. The sample framework for quantifying carbon employs all of the underlying concepts which define the Baseline and the Project Design Document (PDD), such as additionality, leakage, permanence, project period and boundary, methodology, validation and verification, conservatism and of course the three main action paths to carbon credits—mainly avoided conversion or REDD, Improved or enhanced forest management and reforestation or restoration. The application of these concepts ultimately is always specific to each project, and requires a unique careful dynamic analysis, which is embodied in the baseline and PDD, just as there must be specific analysis for integrating the other ecosystem values.
Carbon Valuation Step 1: Definition of project structure Identify the basic structural elements of the project:
• What are the predicted basic methods of reducing emissions or increasing
carbon sequestration?
• How will the project put these methods into practice?
• How will the land on which the project works be secured? What legal or social structure will be used to give protection to the land area?
• Who needs to be part of the project team to make the project successful?
• Who will the stakeholders be in the project? How will they be rewarded or compensated for their actions?
• How will the corporate, NGO, community, etc. bodies responsible for elements of the project be structured to provide long term continuity of action?
• How does the project fit into local, regional, national and international programs and priorities? Are there incentives, support, taxes, etc., which apply to the project.
Carbon Valuation Step 2: Initial definitions of boundaries
• Determine the area within which the project will take place (the “Project Area”.)
• Determine the region surrounding the Project Area which may influence the outcome of the project, and which may provide examples of the situation outside of the Project Area (Reference Region). This area should include land on which the causes, drivers and rates of land use and land use change are expected to be similar to those found within the Project Area, in the event that the project does not go ahead.

83
• Determine the temporal boundaries: When did or will the project activities start? What will the historical period be within which patterns of land use change will be analyzed? What crediting period will be used?
• Determine which carbon pools will be accounted. Six basic carbon pools are recognized in different standards—above ground living biomass, below ground living biomass, soil, dead wood, litter, and timber products. The choice of accounting will depend on the type of project undertaken, and the requirements of the methods used. In general, any pool which may tend to be reduced—therefore causing emissions—as a result of the project must be included in the accounting.
Note that all of these project characteristics may change as work moves forward on the steps described below. However, the initial spatial boundaries should be inclusive of all the areas that might be in the Project Area or Reference Region. Dropping areas later is substantially easier than adding new land areas, since for each parcel added, you will have to demonstrate that all of the work undertaken up to that point also applies to the new area. Unlike the current Clean Development Mechanism protocol, there is no reason to be concerned about adding lands to a project later, but these additions should occur after the initial project PDD, and Baseline study are complete. Additions should be of substantial size to justify the added analyses required.
Carbon Valuation Step 3: Stratification of the project area
Stratification—the division of a study area into subunits based on differences in the characteristics of the land—is a critical step in the process of describing and evaluating the project area. Once divided into relatively uniform units, considerations of what treatments may be undertaken (and what would happen if the treatments were not undertaken) can be made. Criteria, which determine this initial stratification, may include:
• Differences in the existing ecosystem or successional stage, and/or differences
in the expected climax ecosystem.
• Differences in soil or climatic characteristics for specific uses of the land
• Differences in access for land conversion agents/users
• Differences in risk factors based on site conditions or surrounding land uses, e.g., drier sites, or sites near to agricultural land where fire is used may be at higher risk of burning.
• Differences in human population dynamics
• Differences in site history
The land classification step should be undertaken both on the basis of current conditions, and on past and anticipated future conditions. Typically, this work will be undertaken using the following steps:
• Identification of likely land units (ecological or otherwise), based on local

84
knowledge, past research, etc. This step may often include the use of discussions with local residents who know the land well, and should include the gathering of specific knowledge of the history and expectations of the future use of specific parcels.
• Analysis of the land, based on the initial identified strata. This step could be undertaken using remote sensing analysis (air photos) but may be carried out using existing cartographic or other information. It is also possible in some areas that this step will be undertaken based solely on the overlaying of local knowledge and memory on existing maps or based simply on a systematic walk-through of the area. During this step there is likely to be feedback which will result in the modification of the definitions of the units and their boundaries, additions of new units, amalgamation of several units into larger ones.
• Based on the stratification of the land, develop an understanding of the processes and history of each stratum. What is happening in each stratum and why? What can be done in each stratum to enhance carbon and other values?
At the end of this step, you should have a pretty good idea of what types and rates of change have occurred in the past, and why. This information will be further elucidated in step 5, to allow extrapolation into the future for the purpose of determining the baseline.
Carbon Valuation Step 4: Demonstration of additionality Demonstrate that the project would not be undertaken without the incentives.
Carbon Valuation Step 5: Analysis of agents, drivers and underlying causes of change on the land. During this step the goal is to determine why change is occurring, who is doing it, and what triggers specific events of change. Typically, this analysis will be undertaken at least partly on a unit-by-unit basis, since there may be significant differences between parcels. For instance, one stratified unit may be likely to be deforested by logging, followed by regrowth, whereas another one may be primarily deforested in order to allow development into medium density housing.
Information for this step will be gathered from a wide variety of sources. Information will be cross referenced with the known patterns of change determined in Step 3, to assess impact and applicability of identified agents, drivers and causes.
During this step, it is also necessary to project what future changes in agents, drivers and causes are expected to occur. For instance, changes in access may be predictable, based on known road building plans. For each projection, the reason for the projection, the range of potential variation in the predicted outcome, and the factors which could cause the outcome to be different than that projected should be documented. Where possible these analyses should be quantitative. However, in many cases only qualitative assessments will be possible. In either case the work should allow some sensitivity analyses to be undertaken in Step 8.

85
Carbon Valuation Step 6: Final stratification of the land Based on everything determined in the steps above, it should now be possible to complete a final stratification of the land, based both on current conditions and on forecast future conditions.
An integral part of this step is an initial mapping of the projected future impacts of agents, drivers and causes undertaken where applicable. For instance, projected timing and extent of access changes can be shown on map layers. The overlay of the stratification and the geographic delineation of the impacts of agents, drivers and causes will be key to developing Step 9.
Carbon Valuation Step 7: Determination of current amount of carbon in the accounted pools in each stratum During this step a combination of existing information and fieldwork should be undertaken to determine the amount of carbon in each carbon pool in each identified landscape unit. The sources for these data should be statistically and methodologically defensible. Where field work is undertaken, it must be demonstrable that the methods used result in data which are representative, systematic and unbiased.
Carbon Valuation Step 8: Estimation of initial Carbon Stocks and baseline Carbon Stock changes. During this step the baseline carbon stock changes projected over time are determined. This work is undertaken using all of the work undertaken in the steps above. The outputs should be:
• A calculation of all the carbon stocks in the accounted carbon pools within each stratum (land unit), and within the project area as a whole.
• An estimation of the drivers that result in a change within the strata, and the rates at which this change happens. Determination of rates of change may be based on the analysis of historic change in the region, known plans of identified agents, etc.
• A projection of the future expected drivers and their impacts on specific areas. Identify what economic, geographic, social and ecological changes are likely to impact the area, e.g., a property may not currently be threatened with development, but expanding development may make it highly desirable for this use at some time in the future.
• A projection of anticipated future carbon stocks, on a unit and pool (substratum) basis, within the Project Area. Typically, these projections will be undertaken for a series of 5-year intervals extending over the crediting period. Typically, this should also be undertaken at least roughly for the Reference Region (the area around the project), to allow future checking
of the baseline against actual changes.
• Sensitivity analysis or assessment of the impacts on the projected carbon stocks of possible changes in the projected agents, drivers and causes of deforestation and degradation.

86
At the end of Step 8, the work required to complete the Baseline Study is complete. Steps 9 through 12 will typically be undertaken to allow business analysis of the proposed project and may also be required to a lesser or greater degree of accuracy for the PDD.
Carbon Valuation Step 9: Estimation of expected Carbon Stock changes and non-CO2 emissions resulting from leakage. A number of different types of leakage (emissions caused by the implementation of the project) exist. The main types which are usually accounted for include:
• Emissions from power equipment used for the project. Just driving a truck to look at the property causes an emission!
• “Displacement leakage” – emissions caused when activities which would have occurred on the property (for instance logging) happen elsewhere instead, e.g., the ex-landowner buys another piece of property to log using the money he or she got for the land the project is on. Displacement leakage must be “direct” – people must have specifically moved activities from the area to another area.
Methodologies exist for these types of leakage. With the exception of fuel use, the methodologies are all essentially unproven; this is an area where significant development still needs to occur. Other types of leakage, besides those mentioned here, are even more controversial, particularly what is called “market leakage.” An example of market leakage would be someone logging somewhere else because the cessation of logging on the project property has resulted in a shortage of timber supply on the market, and increased prices, making logging more attractive elsewhere. Currently leakage types such as market leakage are not assessed.
For Step 9, a determination of which types of leakage will be accounted needs to be completed, and estimates made of how much leakage may occur.
Carbon Valuation Step 10: Estimation of projected Carbon Stock changes under the Project Scenario Typically, carbon stocks will not be static under the project scenario. A number of drivers should be assessed for their potential impacts on carbon stocks, including:
• Imperfect project implementation. Achieving 100% protection from fire, illegal logging, or other causes of deforestation and forest degradation is typically not possible.
• Natural disturbance. Protected ecosystems may be subject to natural disturbance. In some cases, protection may increase the risk of specific types of natural disturbance.
• Successional processes and ecosystem dynamics. Natural processes may result in continued changes to carbon stocks.
The impact of these and other identified carbon stock change drivers under the project scenario should be modeled. The modeling aims to predict the future carbon stocks under the project scenario for the same 5-year intervals as the baseline.

87
Carbon Valuation Step 11: Calculation of expected net anthropogenic GHG emission reductions Subtraction of the baseline carbon stocks from the project carbon stocks.
Carbon Valuation Step 12: Financial analysis and analysis of risks Typically, a financial model of the project will have been created prior to the commencement of step 3, at the latest. However, at this stage the financial model of the project should be fine-tuned to reflect the projections of the project and baseline carbon pools. This analysis should examine and attempt where possible to quantify the risks, as well as the potential up-sides, under both on the baseline and project scenarios.
Sorting for value in a conservation trust’s land inventory The preceding framework can guide a typical project level analysis. However, once a broad set of projects have been analyzed, it will be important to review comparative considerations to strategically guide the use of limited resources or fluctuating market demand.
Land trusts and other land managers may have a wide range ecosystem types within their high conservation value properties in British Columbia. These can be held through fee simple ownership; joint fee simple ownership with others; associations with lands that have passed through their ownership into public bodies, or association with a property through a covenant—factors which can influence value.
At the outset it might seem that it would not be possible to apply the rigorous and complex analyses that have been described especially to the variety of current and potential land trust projects/acquisitions. A rapid assessment of potential carbon values within a conservation trust inventory could follow the six-steps outlined below to provide a first estimate of comparative value and allow the development of a strategic planning session to follow the more detailed steps outlined in the chapters on carbon and ecosystem services. Value Sort Step 1: Sort projects into groups by start date 1. Sort projects into categories according to the time conservation covenants were registered.
a. Kyoto Qualified: Pre- December 31, 1999
b. Voluntary Carbon Market: January 1, 1990, to December 31, 1999
c. CARR or BC Emission Offset Regulation: January 1, 2000, to November 28, 2007
d. BC Emission Offset Regulation: November 28, 2007- present

88
Value Sort Step 2: Stratify properties Using standard forestry mensuration and ecosystem practices, stratify each property into ecosystem and subset ecosystem types as well as map the ecosystems seral state or condition, and then aggregate these types on a spread sheet of biologically comparable ecosystems and states comprising relatively homogenous characteristics.
Value Sort Step 3: Aggregate projects Further aggregate these sets into their carbon credit types according to year of establishment, review these sets taking into consideration the market, regulatory and methodological options for optimizing value.
Value Sort Step 4: Rough model types Rough model the carbon credit types using key factors:
a. carbon pools at commencement, b. normal carbon pool dynamics, c. threats to the carbon pools under the baseline conditions, and d. risks to the carbon pools under the managed conditions.
Value Sort Step 5: Visit site to do field work This kind of comparative analysis is impossible if it conducted only at a desk level. From hard experience, it is essential to visit representative project sites to confirm their fit with the emerging value sets and prospective regulatory regimes. Every vegetation biomass inventory and ecological assessment, however rich in paper data, requires confirmation through field observation and interpretation to confirm historic dynamics and current conditions and trajectories.
Value Sort Step 6: Develop a plan Develop a plan for filling data gaps, model the transaction costs against a rough quantitative model exploring the highest market value options for which each project type might qualify.
These six steps will help BC land trusts understand the nature of their typical projects with respect to carbon offsets and identify how many of them might qualify and under what criteria. The analysis might also prove useful in helping land trusts and other similar organizations and agencies to structure their projects to be eligible for offset support.

89
Chapter 6: Strategic Review of Potential Market Value and Options Once a rapid assessment has been done of an inventory of projects, ( select similar properties can be aggregated into e project) there are likely enough data for a Strategic Planning Session based on initial assessments of potential routes to market, value options and further work required.
In this review, new conservation management options, collaborations and market communications may emerge and be worth exploration. Overarching issues can have a significant impact on the quantity of credits that may become available. These include:
• whether the trust is the fee simple owner, in whole or in part, • if a previous transfer to a public entity remains in the project's best interest, • the level of control of the management of the property, • the quality of existing covenants and covenants possible, • current and potential arrangements with other public or private parties with an interest
in the properties, • nature of the risk management and insurance program available to protect the carbon
credits from mismanagement or force major losses.
Some assumptions to explore in the strategy session may include:
1. It may be easier to demonstrate eligibility, management control and perpetual protection, plus permanence through reduced risk if the project title is in the trust's name.
2. Sales of carbon may be managed into higher price points in the market if they are aggregated or pooled and held for times when demand is high.
Risk Management Using provincial guarantees is a useful strategy to insure for regulatory risk, but it does little to manage real risks. Distribution of risk to partners with variable risk tolerance may solve some structuring problems and as well there may be two sorts of carbon buyers—those for whom no carbon risk is acceptable, and those for whom carbon credits risk is acceptable,
1. Risk is almost always better self-insured through a buffer set-aside than through
buying insurance, especially in current financial markets.
2. Actuarial analysis may show that the percentage area set-aside for risk self-insurance will decrease as the project pool gets larger, more diversified, ecologically, geographically and perhaps also across management regimes.

90
3. Risk self-insurance may reduce project value considerably in the early years, however, as the set-asides demonstrate they are superfluous some of the insurance hectares can find other routes to financing.
These recommendations address the characteristic conservation trust inventory of properties and derives from a review of one of the trusts potential carbon assets.
Early Action BC has set its baseline date as November 28, 2007, the date that BC’s GHG Target Legislation was passed. This date automatically divides the conservation lands into two sets: those projects whose covenants were registered before November 2007 and those projects not yet registered on that date.
Unlike California’s recent decision to grandfather any projects developed after the year 2000, it appears to be the decision of BC’s Climate Central that the projects which were registered before BC’s baseline date will not qualify within BC Emission Offset Regulation. Therefore, any credits that may arise from applying the methodological protocols to calculate the GHG reduction benefit of the project can only be traded on a voluntary market, or perhaps under the Kyoto Protocol.
Optimizing Value Carbon credit value is reflected in the credibility of the credit that primarily rests on the rigour of the methodological analysis and integrity of the credit values, as well of course on the capacity of the registering body to indemnify the credit’s security.
Land trusts will make good proponents. They pioneered perpetual protection covenants and brought immense stability to the questions of permanence. Their conservation history has demonstrated that there is little or no risk of political interference with the legal stability of a credible conservation trust’s protected ecosystem sink. They may have more to prove taking on a reforestation or restoration program, but credibility there can be acquired through their implementer. Because of the convergence of conservation credits with the historic goals of land trusts, they are a natural choice for project proponents or originators and their existing support networks, members, and donors will make then good direct marketers of their own carbon credits.
Recommendation: Support consensus building among land trusts, land managers and all levels of government to assure they will capture the highest potential conservation credits within the province’s regulatory frameworks for the best long-term future.
Recommendation: Reach out to foundations and government bodies for support to develop indicators and criteria for markets that recognize ecosystem conservation and ecological restoration. Build on the experimental tools of the technical report by using them to develop provisional cumulative net ecosystem productivity calculations.

91
Once there are registered projects under BC Emission Offset Regulation these will be best traded within BC through BC’s Pacific Carbon Trust. No broker should be required if the project has been properly developed.
Recommendation: Land trusts should make no forward arrangements with brokers until a trust actually has inventory to trade that has been segregated into regulatory types. When land trusts are ready to sell, there will be plenty of brokers competing for the right to handle the credits. However, there remains the question through which registry and associated standards a land trust should develop and market their credits. Some trusts have looked at whether they should develop their own standards and off-set registry, or through an aggregation of projects of the various land trusts managed through the Land Trust Alliance of BC, to develop a regional marketing initiative. This makes sense for pre-November 2007 projects, which if they qualify under the Kyoto Protocol baseline and PDD guidelines, are creating internationally creditable values—even though they cannot trade within the Emission Trading System in the EU because of Canada’s current governments’ intransigence within the UN, they will comprise a valid Canadian market for serious offset buyers.
Recommendation: Encourage land trusts to analyze their diverse property holdings and categorize their inventory in the context of the array of options discussed in this report. This will include sorting for projects best suited for different markets, which could be based on eligibility or other regulatory attributes, ecosystem types, management treatment types, sizes, sets that may only quality for early action, direct marketing in the voluntary market, sizes which are too small to carry their transaction costs, sizes which might best consider default values, etc. Initially it might be useful to start each conservation portfolio of project types by sorting into divisions set out within BC’s Emission Offset Regulation for projects which:
a) Were started before November 27th, 2007, and do not qualify as climate action projects withing BC’s Emission Offset Regulation but which may be used for a local trust voluntary conservation carbon offset through direct sales to existing or new donors.
b) Were started after November 27th, 2007 and completed before the present so
may qualify within BC’s Emission Offset Regulation but will have to demonstrate a credible dependency on carbon values to qualify as additional.
c) Were committed to after November 27th, 2007 but have not been fully funded or completed and may be able to use the argument that they are financially dependent on climate trading funding.

92
d) Are being contemplated and may become feasible, especially if these projects can trade in some additional carbon or ecosystem service values, which is one test that qualifies them as additional.
Indemnifying regulatory risk Because of real security issues, no land trust should undertake to develop its own regulatory mechanism, nor register its own credit regime. A number have, but there are several risks involved and in British Columbia reinventing that wheel is unnecessary.
First of all, BC indemnifies any validated credit, and despite the perceived deep pockets of some conservation organizations, a government guarantee removes a major risk from the trust. Because of the immense complexity associated with calculating GHG benefits, there is a risk that a trust overlooked some bioethical standards (or a critical pool or calculates leakage without consideration for best practices) relative to a more rigorous standard being overlaid by the Government of Canada for example. A buyer who has offset emissions with credits registered and guaranteed by a conservation trust, after Canada participates in more rigorous international criteria and principles, might reasonably seek to have those credits replaced by the trust, or have their money repaid, perhaps at current carbon values. This has more reputational cost than real costs, as agreements can legally protect from this risk. But these agreements cannot protect from the charge that substantive and credible GHG accounting was not done.
The complexity of determining standards, participating in the public debate of which standards are appropriate, and which solve the many political, ethical and scientific problems associated, especially with forestry standards, makes the question of developing independent standards moot. BC has its own regulations and is developing protocols and standards. The only question facing trusts for projects after November 2007 is: are BC’s standards high enough for the land trusts, or should they set a higher standard?
Vintage Some projects seek to sell credits up to one hundred years in the future as offsets against emissions today. This problem is referred to as the vintage of the credits. This term encapsulates two problems, the GHG cost of the project pushing benefits into the future and the critical action horizon for preventing catastrophic warming.
The first problem arises from projects that commence with some soil and vegetation disturbance. These projects have the additional problem that it may take a few decades for the new growth to offset the emissions of site prep. These projects are like windmills, whose vintage problem is to produce renewable credits for a number of years before they overcome the emission costs of their construction.

93
The second problem with matching a vintage sink 100 years in the future with an emission today, is that it is increasingly clear that the critical time for action is now in the next forty years. This leads to the concept of weighted values, and net present value discounts to reflect vintage matching. This may be countered by the argument that avoided emissions now may be more effective than potential emission reductions in the future but that both are absolutely necessary. The counter argument is further made that we, the problem species on this planet, will not be in the clear in two hundred years and that long a sequestration may be required to reduce the carbon accumulated from two hundred years of fossil fuel development.
Designing future projects The methodological questions and steps outlined in the sample ecosystem service and carbon framework are simplified in the following Figures 9-11. Reflecting on the key steps for designing future projects in these charts may give the reader some conceptual orientation and help navigate the decision-making process.
Figure 9: Decision making tool for which carbon activity to take with potential property.
Yes
Former right of way
No
Settlements There is a risk of converting to other land use type if project is not executed?
Marginal land Yes
Cropland
ARR and Management
No Forestland Grassland Wetland
Potential property

94
Figure 10: Decision making tool for improved forest management as a carbon activity.
Possible to obtain Carbon credits through Nature
conservation
No Yes IFM: Restoration
• Description: • Increase carbon stock in depleted project
area by implementing management which is focused in restoring “natural” productivity
• Requirements: • Historical data which indicates reduced
productivity due to overharvesting. • Management which restores “natural”
productivity • Example
• Areas overharvested and show reduced productivity compared with comparable other areas.
No
Is the system degraded?
Are you planning to actively manage the area (restoration, protection)?
Improved Forest Management
IFM: Protection
• Description: • Protecting the area from carbon emitting
events. The emitting of GHG can be avoided. Management is focused on reducing the risk of carbon emitting events compared with baseline scenario
• Requirements: • Current risk of emitting events (historical data • Accepted projected Risk reduction due to
proposed management • Example
• Fire protection leading to decrease of Fire occurrences. Result: increase of carbon stock in project area.
Restoration
Protection
Not eligible project

95
Figure 11: Decision making tool for REDD activity on property.
Recommendation: LTABC in partnership with individual land trusts, raise funding to undertake a test program to quantity carbon benefits for select past and new projects using the highest standards and market carbon offset criteria.
Does the conversion take place if project is not
implemented?
Yes
Possible to obtain Carbon credits through REDD
No
REDD
• Description: • Preventing a conversion with
REDD project by gaining control of area at risk. Baseline is projected carbon stock if conversion would have been implemented.
• Requirements: • Proof of proposed risk of
conversion or methodology determining risk of conversion
• Rate of conversion in project area region
• Example • Project area close to growing
population. Risk of conversion of current situation in Housing, industry or golf course.
Reduced Emission from Deforestation and
Degradation (REDD)
Not eligible project
RED
D

96
Chapter 7: Case Studies At this time no conservation project in BC has yet sold credits in an established voluntary or compliance market because nature conservation has only recently been recognized as a legitimate carbon offset mechanism (as in the California draft protocol for example, CCAR 2008). However, BC has a long history of working towards offsetting various environmental impacts through activities like reforestation through the Forest and Range Practices Act and BC Hydro Regional Compensation programs like the Columbia Basin Trust.
Some of the case studies noted below already play the function of being pilot projects. These have been undertaken in the province and member states of the Western Climate Initiative by conservation land trusts, land management agencies, academic institutions and corporations to value carbon and/or ecosystem services and indicate some aspects of the potential voluntary and compliance markets. These pilot projects have used various frameworks and methods and point to specific challenges. Comparative project pricing reveals considerable variability in value. These case studies profile some of the challenges of developing project models.
For each of the following case studies, the following aspects are discussed:
Project: Name as registered with a registry
Buyer: If there is a buyer there is a buyer noted, but this can also be the proponent or party most likely to benefit from the project who purchased the project because it met their goals.
Originator/Broker: The proponent that puts forward or “originates” the project for valuation and verification can be the owner of the land or an agent acting on behalf of the owner. Brokers can be originators as well or contracted independently to find markets for credits. Note: Nothing noted about brokers should be constituted as a recommendation from the authors. It is clear that there is going to be stiff competition to broker carbon, and at this early stage, with such a high level of uncertainty, proponents can feel that on the one hand, they have a lot to lose through ignorance, but they are also vulnerable to giving brokers advantages in exchange for insuring some of this perceived risk. In response to the emerging demand most bank, major accounting and financial firms are setting up a carbon trading desk and team. This rapid proliferation of brokers suggests that the market will soon be quite competitive and has discouraged some savvy proponents from being the first to close deals.
Values: Most projects have some specific values embed in their goals; however, some projects may seek to capture all of the ecosystem’s benefits, including its additional products, services qualities and processes. This can include, timber, carbon, water quality and quantity, biodiversity, erosion control, non-timber products, traditional cultural and medicinal values and recreation.
Carbon valuation method: Refers to the standard governing the methodology by which the carbon value is established. Some proponents (including the author) use several valuation methods in order to segregate out the highest potential values for each site type, modality or value.
Standards: These are the standards set for compliance with a governing regulation and can be voluntary standards which generally are designed to meet the UNFCCC requirements, and try to anticipate the Copenhagen post 2012 rules.
Carbon activity: This is the land use means by which carbon is being stored, what are known as

97
the carbon modalities: REDD, IFM, ARR. For other ecosystem services, the offset type is far more varied.
Cost to operationalize: This is the cost of bringing the offset value to market and on small projects, at this stage, may exceed the value of the credits.
Money raised: Not all credits are sold, or traded, and not all can be monetized.
Permanence: Primarily refers to the nature and duration of legal and anticipated natural tenure of the ecosystem reservoir. In BC it is generally addressed through conservation covenants that are binding and flow with title over 100 years, a standard requirement of permanence for most compliance markets. Physical risks to a carbon reservoir like fire, pests or disease has given rise to a concern about the permanence of a biological carbon sink.
Additionality: How the project defines the baseline and qualifies its actions as being beneficial for GHG reduction. Understanding detail is critical in the analysis of this attribute.
Summary: Describes the project and gives some historical context.
Issues: Challenges or questions raised about the project.
Several Case Projects in 2009 Follow.

98
Lompico Headwaters Forest, Los Altos California Seller: Sempervirens Fund https://sempervirens.org/protect/redwood-forests/lompico-headwaters/
Buyer: Pacific Gas and Utility under Climate Smart Program
Broker: Sempervirens Fund
Values: Wildlife, biodiversity and carbon storage. Avoided emissions through conservation.
Carbon valuation method: California Forest Protocols
Carbon activity: REDD
Standards: CCAR, registered September 2007
Type of offset: Voluntary. Under the ClimateSmart Program PG&E cannot use the credits it purchases from Sempervirens Fund to meet any mandatory emissions cap. These credits are “over and above” any current or future emissions requirement. The carbon offsets it is purchasing are simply one more way of reducing PG&E’s footprint.
Cost to operationalize: Privately funded as a pilot project. Information not available.
Cost effective: 14,000 carbon credits will be sold from the Lompico Forest Carbon Project to PG&E as part of PG&E’s ClimateSmart Program. The credits are generated over a period of 14 years: 2007-2021. Over 28,000 mtCO2e in emissions reductions credits are anticipated to be generated over the next 100 years.
Permanence: Conservation easement
Additionality: This land was to be logged under existing regulatory framework.
Summary: Founded in 1900, Sempervirens Fund is California’s oldest land conservation organization. The Lompico Forest Carbon Project will result in the first carbon credit sale under CA’s Forest Protocols that does not involve logging. Most projects submitted for CCAR approval to date involve sustainable logging where carbon credits are generated in return for a reduced timber harvest. Lompico, in contrast, is a 100% preservation project, and sets an important precedent for the development of future emissions reduction projects based on forest protection. This is the first project Sempervirens Fund has seen that establishes an economic value for redwood forestland other than timber harvest or development potential. The valuation and origination of the project was done through private donations with the intention of selling carbon credits to the local utility, Pacific Gas and Electric. The 202-acre forest was second growth around 80 to 100 years old and was given permanence by the placing of a conservation easement for strictly preservation with no logging.

99
Trees in Trust, New Brunswick Seller: land trusts
Buyer: members of the public
Broker: Trees in Trust nonprofit (www.treesintrust.com)
Values: Ecosystem services, cultural values and carbon storage
Carbon valuation method: No valuation method used, assumption of carbon storage values
Carbon activity: Potentially REDD
Standards: none
Market: voluntary
Cost to operationalize: Very inexpensive to run, online registration
Money raised: Little investment as there is no valuation or registration process, low returns
Permanence: Forest ecosystem land acquired and covenanted
Additionality: Avoided deforestation, degradation and land conversion
Issues: Falls in line with other voluntary ecosystem acquisition by donors on the basis of trust. Very inexpensive to implement but also foregone opportunity.
Summary: Trees in Trust, in conjunction with the Nature Trust in New Brunswick and other land agencies, is an online program that sells affordable shares in small parcels (1/6th hectare) of mature woodland as ways for individuals to help protect (biodiversity and intergenerational services) nature and combat climate change. Buyer’s ‘purchase’ an existing protected parcel of woodland of a partnering land trust or agency and the proceeds go to purchase more woodland in the region. Trees in Trust are not part of any formal voluntary offset market and according to Andrew Lush (Director), “that is part of the attraction. There is a certain amount of cynicism towards government systems for carbon offsetting.” There is no valuation method. Lush, using the literature and online tools available on mature woodland sequestration, roughly estimates how much carbon a unit of conserved woodland prevents from getting into the atmosphere over time. For example, they suggest that buying 3-4 acres of woodland offsets the average individual’s car travel for a year. He points out, “it is not particularly scientific, people are making a reasonable decision that their financial contributions help store carbon.” Currently the lowest charitable donation allowed buys 1/6th of an acre in New Brunswick. The transactions are done completely online and don’t require any staff time handling payments, producing maps or printing certificates. Trees in Trust was launched in November 2007 and has raised approximately $10,000 a year for trusts, with most of the sales at Christmas time. There is no reporting or monitoring on the condition of the lands and these projects are unlikely to meet regulatory guidelines, should they want to enter into the more formal markets.

100
Creekside Rainforest – Saltspring Island, BC Seller: The Land Conservancy of BC & The Salt Spring Island Conservancy
Buyer: members of the public
Broker: none
Values: Ecosystem services, cultural values and carbon storage
Carbon valuation method: Private Woodland Planner, on-line tool
Carbon activity: potentially REDD
Standards: None
Type of offset: voluntary
Cost to operationalize: Very inexpensive, done by volunteers
Money raised: None on any formal markets. Voluntary donors simply donate money on the basis that they recognize the carbon storage capacity as an important selling feature.
Permanence: Conservation covenant
Additionality: This land was to be logged and subdivided under existing planning regulations.
Issues: The small size of this property raises the issue of risk, such as a fire, which might impact the carbon sink. There is no standard monitoring to see if carbon value and other ES values remain, other than the baseline inventory required through the conservation covenant, but which did not include carbon storage. This property might meet regulatory guidelines, but expenses of accounting, verification and monitoring would be too large for the area involved.
Summary: This is a typical acquisition of a land trust except that the carbon potential was added as a bonus “selling feature.” by the land trusts involved to raise money for the acquisition of Creekside Rainforest on Saltspring Island. The carbon budget was calculated using the Private Woodland Planner Model available online which uses basic forest attributes. Other values used as selling points included culturally important features, biodiversity ecosystem services. There was no participation in a more formal voluntary carbon offset market. Over one million dollars were raised, and it is impossible to determine what proportion of these donations were motivated by a desire to offset carbon emissions. There is no formal carbon sink and sequestration monitoring and report plan. Importantly though, these ‘back of envelope’ calculations are important for reserving future options of proper carbon registration as they demonstrate additionality.

101
Community Forests: Vedder Mountain Forest, Chilliwack, Cascade Lower Canyon Community Forest, Hope, Sunshine Coast Community Forest Seller: Community forests lease holders/Government of BC
Buyer: Not sold, experimental projects
Broker: yet to be determined
Values: Ecosystem services, including timber sales and management (as legislated requirements for community forest lands), cultural values and carbon storage
Carbon valuation method: Canadian Budget Model CBM-CFS2
Carbon Activity: REDD, IFM and ARR
Standards: None yet
Type of offset: Not determined
Cost to operationalize: Done by students for clients
Money raised: Carbon credits not sold
Permanence: Management plan might require being monitored under covenant
Additionality: Comparison of regular ‘business as usual’ logging plans
Issues: As an example, the Sunshine Community Forest initiative91 is a complex project that would likely involve all three modalities to offset emissions: REDD, IFM and ARR. The cost of valuation and originating one of these projects without amalgamating them might exceed the value of the carbon credits.
Summary: A series of small-scale projects have been undertaken by Gary Bull, Department of Forestry and students at the University of British Columbia in conjunction with several stakeholders including First Nations. These projects are, according to Bull, voluntary and ‘learn- by-doing’ initiatives” and their details are in many cases proprietary. The projects typically looked at community forests, near urban areas, that are experiencing issues of competing interests and values, e.g., high biodiversity values, cultural and recreation. The goal of the analyses was to evaluate management options for a wide range of values. Carbon storage is seen as both a value and a means of potential revenue to manage the lands for values other than timber.
Three case studies are available publicly: Vedder Mountain in Chilliwack, Cascade Lower Canyon Community Forest near Hope and Sunshine Coast Community Forest.
Vedder Mountain in Chilliwack is a Crown Forest of 3350 ha with species at risk and multiple users from greater Vancouver. Lower Canyon Community Forest is 8290 hectares with a spotted
91 (Morrison, et al.)

102
owl habitat while the Sunshine Coast Community Forest consists of five areas totaling 11,807 hectares.
In each case, a variety of forest management scenarios are developed, ranging from a business- as-usual scenario to low intensity harvesting with large, conserved areas. Each ecosystem service of the study area is analyzed for different future scenarios. Services included in the analyses include timber products, non-timber products, soil, water quality, wildlife, biodiversity, recreational use, social/economic well-being and carbon. Students used the Carbon Budget Model of the Canadian Forest Sector (CBM-CFS2) to determine above and below ground carbon accounting over a period of time. In some cases, they used existing forest inventory data, making it a desk exercise. In some instances, they collected field data to determine the type and age of forest. The CBM model provides the carbon numbers in the form of metric tons of biomass (tC) which are easily converted to Kyoto Protocol Carbon Dioxide Equivalents (CO2E)—the units that are used to sell carbon credits in carbon markets.92
Technically, the community forests could apply as forest carbon offset projects and sell their carbon credits potentially even under a regulatory framework as long as their sink and sequestration values, requirements for additionality, permanence and leakage could be verified. The projects cover relatively complex and large areas for which the costs of project initiation, valuation, monitoring etc. might be affordable, especially if data already exist for similar ecosystems and conditions. Legislated requirements (such as sustained timber harvest), whether under a voluntary or regulated market, may limit options for adaptive management related to maintaining carbon sink values and sequestration rates (potential for forced reversals?). The Sunshine Coast Community Forest is one example of a multi-criterion (ecosystem service) analysis that involves valuation by relative ranking for scenario comparison. The analysis also demonstrates how biodiversity values can be highly simplified and presented by an ecosystem proxy, in this case how much Old Growth remains according to the scenario chosen. Whether or not this is adequate to become a full project remains to be seen.
92 (Greig & Bull, 2009)

103
The Community Ecosystem Restoration Project Seller: ERA Ecosystem Restoration Associates Inc. (Land is owned by District of Maple Ridge, but ERA holds carbon rights to improvements on the forest for 100 years)
Buyer: Shell Canada, Zerofootprint, Air Canada customers, Catalyst Paper, Pemberton Music Film Festival, Run for 1 Planet, others.
Broker: Zerofootprint, self-brokered
Values: 100-year carbon credits are being sold to offset emissions today. Pending CCB Standards Validation. Other ecosystem services, e.g., invasive species removal etc.
Carbon valuation method: CO2fix carbon modeling, with project standardized to ISO 14064-2
Carbon activity: ARR
Standards: ISO 14064 — 2 certified
Type of offset: voluntary market
Cost to operationalize: unknown
Money raised: According to Zerofootprint, who purchased the credits, Air Canada were charging over $15/tonne. Their website claims that the planting of over 25,000 indigenous trees on an area of 83 hectares developed over 200,000 tonnes of credits.
Permanence: Restoration plantings are all on either a) riparian zones protected by Municipal, Provincial and Federal statutes or in regional parks. This project’s permanence is backed up by agreements with Maple Ridge to protect the project areas and its implementation. By planting native species in appropriate sites, survival and permanence of plantings are encouraged. ERA also holds back a 25% buffer of unsold credits to protect against disease/fire/underperformance. The spatially distributed nature of the plantings also minimizes risk of catastrophic failure.
Additionality: Baseline is the senescence of Red Alder Forest to invasion by Himalayan Blackberry and prevents re-growth of conifer forest. Due to the fragmented nature of habitats, and low conifer seed stock, natural re-establishment of a conifer forest is extremely unlikely. There are no municipal/provincial/federal statutes, nor precedent, that require the restoration of this landscape, and P\project costs would be prohibitive in absence of carbon financing.
Issues: There has been some controversy about the project with some observers claiming it commenced by cutting well established alders which would create an emission that would have to be deducted from the claimed credits. All alder clearing and land preparation carbon fluxes are included in the carbon modeling and calculation. Because the cleared trees will die and decompose in the baseline case as well as the project case, the net carbon benefit remains unchanged. The other criticism was that 220,000 tonnes on 83 hectares may occur at best in 250 to 300 years. At 350 Stems per hectare, this would equal out to 7.57 tonnes of CO2e per tree (including soil stocks, underground biomass and woody litter) over 100 years. In response ERA, the company which planted the trees, advised that it planted considerably more trees than

104
23,000—reasonable for 83 hectares. Another criticism was that the project proposed to use credits from 100 years from now to offset today’s emissions.
Summary: Air Canada has partnered with Zerofootprint, a carbon offset company, to provide a voluntary offset market for air travelers. Zerofootprint have selected three projects, one of which is a 83 hectare forest restoration project in Maple Ridge developed and planted by ERA, also an offset provider. The project is aimed at ecological restoration of degraded logged forestland in urban areas with a range of native species followed by some ongoing management to free-to- grow status. This involved the planting of indigenous Douglas Firs, Sitka Spruces, Western Red Cedars, Western Hemlocks and Cottonwoods since 2006. By late 2008, ERA has had over 600,000 tonnes of CO2e verified ex-ante, by von Schilling Forest Management Ltd.

105
Pack Forest, University of Washington Seller: Potentially University of Washington
Buyer: Auction
Broker: U of Washington Ecosystem Services Auction, some credits may be sold in May, 2009
Values: Ecosystem services, cultural and carbon storage
Carbon valuation method: ECOSEL model
Carbon activity: varied options
Standards: None yet
Type of offset: voluntary
Cost to operationalize: relatively inexpensive, computer model
Money raised: Experimental. Not sold yet.
Permanence: Conservation covenant/easement which has considerable solid jurisprudence in the State of Washington.
Additionality: This land was to be logged more intensively under existing regulatory mechanisms. The project was to both reduce timber harvest and reforest.
Issues: The initial auction was a trial and did not involve cash transactions. While the results suggested that funding would be forthcoming, a full live auction still has to be held.
Summary: Pack Forest is a 4,300-acre forest that belongs to the University of Washington and is described as a self-sustaining forest with revenues coming from timber production. The University administration is keen to explore non-timber revenue alternatives that would help avoid the risk of conversion to real estate. Different management scenarios were analyzed using ECOSEL software to generate valuations for increasing degrees of carbon protection and ecosystem services. Bidders will be invited to bid on the different scenarios and thereby determine a market value for carbon and ecosystem services without the costly step of valuation and brokers. Initial trials with this system provide some interesting conclusions. For example, 65% of the bids were for the scenario that favoured carbon sink protection and sequestration with delivery of a high level of ecosystem services. The auction mechanism demonstrates that what may appear to be difficult to value, ecological services, in the broadest sense have real monetary value.

106
Darkwoods – Nature Conservancy of Canada Seller: The Nature Conservancy of BC (NCC)
Buyer: Exploring various markets possible
Originator/Broker: Carbon Credit Corporation
Values: Wildlife habitat, biodiversity, other ecosystem services, cultural,
Carbon activity: REDD, IFM and ARR.
Carbon valuation method: First stage – timber values, second stage – methods suitable for compliance markets.
Standards: CCAR, Chicago Carbon Exchange
Type of offset: Voluntary or compliance
Cost to operationalize: Still in development. Very expensive, expert involvement.
Money raised: Not determined yet
Permanence: Conservation covenant would be required to be registered.
Additionality: This land was to be logged and subdivided under existing planning regulations.
Issues: Benefits from large size which provides options to manage risk and reversals. Largely an ES project with carbon values added to strengthen the case. Demonstrates the synergy of biodiversity and CE offsets.
Summary: Darkwoods is a 55,000-hectare tract of land in the Southern Selkirk Mountains, between Nelson and Creston, BC. It was purchased by the Nature Conservancy of Canada after being put up for auction. There were no regulatory restrictions on the logging or conversion of this land to other uses. It is significant ecologically especially as a large unfragmented mountain ecosystem with crucial winter habitat for mountain caribou in the south Selkirk Mountains. Part of the rationale for protection as well as a potential revenue stream for acquisition is the carbon sink value and future sequestration. The carbon valuation was carried out by Dr. Bill Freedman of Dalhousie University and director of NCC using the carbon sink value based on standing volume of the timber from timber inventory. The analysis did not include a subsurface soil carbon estimate that also would remain in the sink.
The initial calculation formed an important strategic step in later carbon valuation by experts with the Carbon Credit Corporation. Pierre Iachetti of the NCC stresses the importance of documenting the initial valuation of carbon and the motivation to purchase the land for carbon sequestration as a critical first step in the process of getting carbon credits in the compliance market. The issue of permanence was relatively easy to demonstrate through purchase and conservation covenants, but the additionality issue was secured through documentation of the other bidders in the auction and the potential carbon loss through deforestation and conversion. A proportion of the carbon credit are anticipated to be held back as part of the insurance against loss through fire, insects etc. (see CCAR 2008 approach).

107
Van Eyck Forest, California Seller: Fred M. van Eck Forest Foundation
Buyer: Pacific Gas and Electric
Originator/Broker: Pacific Forest Trust
Values: Ecosystem services and carbon storage
Carbon activity: REDD, IFM and ARR
Carbon valuation method: California Forest Protocols
Standards: CCAR
Type of offset: compliance/regulatory market
Cost to operationalize: Very expensive, expert involvement
Money raised: No information
Permanence: Working forest conservation easement
Additionality: This land was to be logged more intensively under existing regulatory mechanisms, offset results from change in management
Issues:
Summary: In 1993, Laurie Wayburn and Constance Best founded the Pacific Forest Trust to promote carbon sequestration in the forests of California. In 2007, the Pacific Forest Trust provided the first project under the newly minted Forest Protocols, which established the means and standards for admission into the compliance markets. The Van Eyck Forest, a 2,200-acre redwood forest had high biodiversity values, was an important wildlife habitat and had old growth characteristics. The long-term management plan and conservation easement, under which the project was officially registered, is projected to permanently reduce half a million tons of CO2 emissions over a 100-year period. In a highly visible event in 2007, Governor Schwarzenegger offset his carbon emissions for travel by purchasing credits from the Pacific Forest Trust. It is the first emissions reduction forest project registered under the accounting standards adopted by the California Air Resources Board (CARB). CARB was set up to assist California’s carbon reduction targets. According to Wayburn, “We like to give them [landowners] six-figure checks on an ongoing basis as additional carbon continues to be stored. Demand from buyers continues to grow and money is increasingly available in these new carbon markets.” Permanence is guaranteed through covenants and additionality is met by comparing business as usual logging activities (baseline) to the lower intensity harvest management plan, which maintains the carbon sink and increases sequestration.

108
Garcia River Conservation Project Seller: The Conservation Foundation
Buyer: TCF’s traditional supporters under Climate Smart Program
Originator/Broker: The Conservation Foundation
Values: Ecosystem services and carbon storage
Carbon valuation method: CCAR Forest Protocol.
Standards: CARR standards.
Carbon activity: REDD, IFM and ARR—future credits are not being sold to offset current emissions.
Cost to operationalize: This was the first project of its kind and took approximately four years of intensive ‘learning by doing’ to validate. Costs are broken down below to provide a detailed analysis.
Cost effective: The project has sold about 140,000 tonnes of 2007 credits but has only started its marketing.
Permanence: Perpetual Conservation Easement (PCE) designed to be registered on a private property in California.
Additionality: This land was to be logged more intensively under the previously registered management plan. Now most of it is being conserved and some of it is being harvested under the criteria and practices of California’s registered Sustainable Forest Management plan.
Issues: This was a pilot project for the Conservation Foundation and as such cost an immense amount of dedicated key management time. However, now that they have developed an internal methodological approach, the investment can be put towards other projects.
Summary: This ‘summary’ is longer than the others as the Garcia River Project is the most important pilot project for improved forest management within the Western Climate Initiative because it involves all three forest carbon modalities: REDD, IFM and ARR. It was developed over the past five years and has gone through all phases to validation. The documents related to this project can be found on the CARB website at https://thereserve1.apx.com/mymodule/ProjectDoc/EditProjectDoc.asp?id1=102. These documents provide a helpful template of each of the steps for registering a forest project within CCAR and are likely to be similar in BC.
The Garcia River Forest (GRF) project was defined by The Conservation Foundation (TCF) within the California Climate Action Registry (CCAR) as a conservation forest management project to create additional carbon stocks in the forested area through modifications of harvest and regeneration practices, relative to baseline practices, as defined in the CCAR Forest Project Protocol. The GRF meets the CCAR project eligibility requirements set by using native species, and by being secured by a perpetual conservation easement.
TCF elected to contract with SGS/SCS (Scientific Certification Systems registered verifiers) to perform a verification audit of their Garcia River Forest conservation-based forest management

109
project for the year 2007. Carbon Credits for Year 2007: 126,169 tCO2e emission reductions Plus CCAR adjustment added 17,174 tCO2e emission reductions= Total issued for year 2007 = 143,343 tonnes CO2e.
Permanent Inventory Plots: a stratified inventory was conducted by an expert consultant Terra Verde Inc. involving relatively intense randomized representative sampling representing 22,583 acres.
The baseline and project activity were modeled to a 100-year horizon to quantify GHG emission reductions associated with the project. The existing carbon stocks were projected using the Forest Projection System (FPS) growth model and the modeling data included harvesting scenarios defined by the project description and baseline assumptions to be consistent with the California Forest Practice Rules.
Steps in the CCAR validation process:
Step 1: initial review: Project Summary Worksheet (a standardized CCAR form) uploaded documents into Climate Action Reserve Database which confirmed initial conformance with the data requirements of the CCAR Forest Project Protocol. From this review an Audit Plan was created to focus on the critical elements presenting potential risk for errors in the reported data. These data risk elements included inventory data collection and handling, assumptions underlying the project and baseline characterizations, application of the growth model, and compliance with the California Forest Practice Rules.
Step 2: A site visit by CCAR was used to review project records, review the correlation of CCAR document submittals with the site and project characteristics, discuss methodologies used to calculate carbon pools and growth models, visit random portions of the ownership in order to acquire a familiarity with the property issues, assess the appropriateness of the vegetative stratification, and conduct a field review of the sampling methodology which was undertaken through check cruises of a random sample of the project developer’s inventory plots.
Step 3: Based on the newly submitted data in response to requests generated during the initial site visit, CCAR conducted a second visit and received a briefing on these changes by the project developer.
Step 4: This was the final step in the verification process and involved a final review of the submitted data, analysis of raw data collected during the check cruise, completion of the certification activities log, and drafting of the certification opinion and final report.
These four steps sound logical and simple. In reality, the Garcia River project, because it was TCF's pilot project, took years to develop and provided critical learning for both CCAR and TCF as well as SSG. The business case modeling involved far more exploratory strategic option exploration steps. However, in subsequent projects, all three parties expect this process to be as simple as it is described here.

110
Crown Land Initiatives in BC with Carbon/biodiversity Objectives Three initiatives in British Columbia whereby government agencies are creating internal offset markets under their own regulatory frameworks are described. It is clear that these precedents will influence BC’s future role in global climate standards and markets. The regulatory requirement to reforest applies on both BC’s crown forests and large private forest land, which combined constitute a huge land area. The current requirement to reforest harvest areas and other ecosystem obligations in the Forest & Range Practices Act form the business as usual baseline, but their terms of reference could also have major influences on the evolution of offset markets, valuation costs through economy of scale, markets, buyer’s confidence, standards etc.
Crown Land Post Harvest Reforestation Projects Owner/Originator: Province of BC
Buyer: the harvester buys the right to harvest by offsetting harvest disturbance with reforestation. It should be emphasized that this is not a carbon compliance purchase, but it is nevertheless an offset purchase.
Broker: no broker, direct reforestation services are purchased by the forest sector tenure holder from BC’s silviculture industry
Values: Restored mixed species, ecosystem appropriate, free growing forest stand
Carbon valuation method: there is no carbon valuation, but there are statistically sound audits as defined by the Forest Practices Board, with a set of randomly selected licensees being required to cooperate with full audits every year, and occasional province wide audits to confirm the Forest & Range Practices Act regulations are fully met.
Carbon activity: Reforestation of harvested areas have no carbon benefits outside of creating carbon neutrality for the harvest area.
Standards: Forest & Range Practices Act, Association of BC Professional Foresters, various governmental silviculture guides and standards and research and practice precedents from within BC and across Canada.
Market: The Forest & Range Practices Act legislation created a stable reforestation industry serving a $200 million dollar restoration offset market.
Cost to operationalize: Cost per hectare to reach free growing ranges from $1500 to $6000 and averages about $2000. Approximately 35% of the area regenerates naturally but still involves monitoring and careful surveying costs and occasional fill planting. Before the economic downturn 180,000 hectares were being harvested each year.
Cost effective: Annual Forest sector revenues are over $14 billion, so spending approximately $200 million for reforestation and approximately $200 million for other ecosystem services for the right to harvest may reasonably be considered a good public investment.
Permanence: These areas are in the commercial forest and will be harvested at the end of the next rotation and therefore are not permanent in that sense. Reforestation of harvest areas has historically been called ‘basic silviculture’ in BC. This is regarded as forming the baseline on which Improved Silviculture Activities that might qualify for carbon could be considered.
Additionality: ‘Basic silviculture’ obligations are not considered additional and by virtue of having commenced before 1989, this is considered business as usual and forms the baseline.

111
Issues: In general, the stewardship accountability for commercial forest tenures of assuring post-harvest stands arrive at a free growing state enroute to the maturity reflected by the harvest stand has been a fundamentally successful regulation. However, 22 years since the establishment of the regulation it is time to review the interim accountability goal of free to grow and consider moving the goal posts of accountability to full rotation concept intended within sustainable development concept of timber supply. Of course, provincial reforestation stocking standards have been under pressure from the forest sector to regionalize issues which reflect differences in conditions in order to reduce per hectare costs. After 22 years it is time to determine whether or not these shifts have compromised the public and provinces regional forest value goals. This has become difficult because, despite the land use planning tables of the nineties, there is no current robust long-term vision for the forests of British Columbia that is commensurate with the depth of understanding of its ecosystem role. These goals are missing at a regional level because First Nation rights and title which have been made clearer by court decisions were not accommodated during the planning processes, and because there is dramatic change in BC’s forests, particularly because of climate change. These goals are missing at a provincial level because of threatened species and evolving public understanding of the multiple ecosystem services, values and benefits discussed in this report. These goals are missing nationally because there is no provincial federal vision for Canada’s forests especially because of the of the critical importance of the global role of forests in responding to climate change.
In April 2009, the province shifted its stocking standards to anticipate the effects of climate change but the work of the newly minted Future Forest Ecosystem Initiative which is still evolving. FFEI’s exploratory science and adaptation planning against regionalized scenario analysis of climate change’s effects creates a perpetual management challenge that does not end until, in some parts of the interior, ecosystem phase shifts from forest to grassland are complete.
Summary: In 1987 BC passed the world’s first user pay reforestation regulation, which was based on ecosystem restoration principles. Essentially, the right to harvest suddenly included a regulation requiring the harvester to, at his own cost, restore a climax mix of appropriate tree species on each site ecotype within the forest ecosystem disturbance area of harvesting -- no matter whether the disturbance was a clear cut or a selection harvest.
In 2004, 15 years after the regulation was imposed, the Forest Practices Board reviewed the province and found 97.5% of the stands had reached or were on track to reach free to grow before the deadline set for each ecosystem type. This level of success revealed that a provincial offset program working to ecosystem appropriate standards can meet the goals set for it.
More carbon accounting analysis is required to examine more explicitly the baseline values of the lifecycle in various ecosystems in order to support the initiation of projects on Crown forestland within the Pacific Carbon Trust.

112
The Coast Conservation Initiative Seller: Parties to the Mid Coast Accord, which include local and aboriginal communities, aboriginal rights and title which are yet to be settled within the region, forest companies, government of BC and conservation organizations.
Buyer: credits still have to be measured, validated and registered
Broker: Sustainability Trust BOD, advisors and executive are the brokers for the economic activity that protects the coast from a resumption of harvesting
Values: this regional conservation initiative will protect a wide range of values that had the risk of being degraded through historic harvesting practices. Improved Forest Management and REDD will both create value. But the amounts of these ecosystems’ values are yet to be determined. For carbon the initial value may be picked up within the Pacific Climate Trust.
Carbon valuation method: one key test for the success of REDD is whether the local economic and employment benefits can support the communities with the conservation region.
Standards: standards for the economic activity with a triple bottom line is that it does not impact the US Lumber Tariff against unfair subsidies to Canadian forest sector businesses
Market: Temperate rainforest conservation foundations
Cost to operationalize: unknown -- too new, but includes six years of negotiations, and the identification, registry and measurement of the carbon benefits will still have to be developed
Cost effective: unknown -- too new
Permanence: if registered on any title lands, through the perpetual conservation covenant embedded within legislation and government policy, but it is vulnerable to subsequent governments reconsidering the decision if there is pressure from the coastal communities that there is inadequate economic activity generated from the Sustainability Trust
Additionality: Turning Point compiled a binder documenting all of the discussions related to carbon credits which had taken place throughout the six years of negotiations. This establishes that the initial investment of $120 million was made with the full intention to supplement the funding of the alternative economic activities that support this REDD initiative from carbon credits in order to adequately protect the regional conservation goals.
Issues: This trust fund promises to create a parallel economy within the region to replace the approximately 6 million cubic meters of annual harvest and its associated economic spin offs which were extirpated by the conservation decision. Whether or not the businesses that come forward and may receive capital of funds for feasibility will be viable remains to be seen. No project of this scale has been undertaken within either a developed or developing country, and the methodological issues, the questions of the impact of such a large quantity of credits on the fledgling market and the robustness of the new BC Emission offset Regulation being tested in its early stages with a project of this scale all give rise to a high level of uncertainty that this project is viable. Eligibility questions arise immediately, as the project may be deemed to be the product of government policy, although there is ample evidence it is a result of ENGO and regional proponents’ years of lobbying.
Summary: Announced on March 31, 2009, the last day of negotiations, this is the largest REDD project in BC. In order to qualify the REDD activity, it is necessary for the Coast Conservation Trust to establish offsetting economic activity for the people on the coast who worked in the forest harvesting and milling sector but are now displaced by the conservation initiative. The purpose of the $120 million Sustainability Trust is to offset the economic impact of a major

113
ecosystem conservation area mandated by the Province in BC’s mid coast region. In that sense this initiative is the reverse of the one before it, the Columbia Basin Trust (see below), where the footprint of the dams was established before some offsets were sought. The Columbia Basin Trust Seller: Columbia Basin Trust (CBT) Board of Directors
Buyer: BC Hydro
Broker: CBT executive
Values: Ecosystem services and cultural values for residents of the Columbia basin (drainage) in Canada
Type of valuation method: comparative analysis based on public consultation and advisory input
Standards: none
Market: Voluntary
Cost to operationalize: Relatively expensive as it is highly political and involves a lot of studies and soft analysis
Cost effective: tenders are sometimes direct, and sometimes competitive
Permanence: Some conservation land acquired and covenanted, restoration work also on BC Hydro land is covenanted for conservation
Additionality: Projects must be incremental to any that would otherwise occur.
Issues: The impact of the Columbia Treaty system of dams in the east Kootenay and upper Columbia far exceeds any offset value that might ever arise from this program. The program would have been better off to set some goals, and then propose projects that best reached those goals with the limited funds available.
Summary: Like many jurisdictions in the developed world, BC set up several offset funds in the nineties. One such trust fund, the Columbia Basin Trust (CBT), was set up by BC Hydro in 1996. BC Hydro allocated $2 million a year in expenditures to 2010 and revenue from an endowment fund of $45 million to fund ecosystem restoration projects in the Columbia drainage whose extensive US/BC Columbia Treaty network of dams had created considerable ecological havoc. Within the CBT trust there have been a number of small conservation initiatives, the latest of these being CBT’s support of the Valhalla Mile93. Over the life of its program the CBT has assisted in the acquisition of a number of conservation offsets to mitigate its environmental footprint.
This initiative, however, is not results based. There is no metric demonstrating even a percentage offset benefit. Instead, the CBT provides a limited amount of cash allocating the income earned from the CBT’s investment program to whatever the current appointed CBT Board of Directors feels best meets its mission which includes both formal advisors, the government of BC and its stakeholders—all residents in the basin.
93 http://www.cbt.org/newsroom/?view&vars=1&content=News%20Release&WebDynID=988

114
The Pacific Climate Trust Seller: (Proponents have not yet responded to this recent request for expressions of interest.)
Buyer: Pacific Climate Trust (PCT)
Broker: PCT executive
Values: 700,000 and 1,000,000 tonnes of carbon-dioxide equivalent offsets each year, largely to meet the public sector commitment to become carbon neutral.
Type of valuation method: BC Emission Offset Regulation (soon to be released for public comment a draft BC forest offset protocol
Standards: WCI, BCEOR, ISO
Market: Province of BC Market for Government carbon neutrality by 2015
Cost to operationalize: remains to be seen
Cost effective: invitation to solicit proposals through an expression of interest typically results in relatively cost-effective carbon offsets
Permanence: this will depend on the strength and practicability of BC’s still to be released protocol
Additionality: Projects must be incremental to any that would otherwise occur.
Issues: Additionality
Offsets associated with three types of forest activities will be considered by the Pacific Carbon Trust for the purposes of their RFI:
(1) Afforestation - The direct human-induced conversion of land that has not been forested since December 31st, 1989, to forested land through planting, seeding and/or the human-induced promotion of natural seed sources. (2) Using select seed (forest management) – Reforesting with seedlings grown from seed (and vegetative propagules) selected to produce trees with desirable traits such as faster growth, better wood quality (wood density/carbon content) and insect and disease resistance, beyond what is anticipated under the baseline scenario. (3) Fertilizing (forest management) - The addition of nutrients to increase tree growth on sites deficient in one or more soil nutrients, beyond what is anticipated under the baseline scenario. It is somewhat surprising that these are the first additionality invitations from the Pacific Carbon Trust. BC has a sophisticated body of analytic and research data for developing silviculture- based projects but these project invitations suggest that it is still in its infancy when accounting for the potential benefits of IFM.
1. Reforestation: The invitation to do ARR (Afforestation/Reforestation/Restoration) on land that has been without forests since 1989 is completely in compliance with IPCC guidelines for meeting the additionality test, but the fact that the trust is only purchasing 10 years of the offsets, that is while the new seedlings are still relatively small, makes this a difficult project type from which to get very much carbon.

115
2. Select seed: On Crown land under the Forest & Range Practices Act it is required to use
select seed if it is available, so that makes it difficult to understand how an additionality test can be met.
3. Fertilization: fertilization trials in BC do provide benefits in the first ten years, however,
the permanence of these benefits may be brought into question. There are nutrient deficit areas where the limiting factor to growth is positively identified. In that case, there may be a supportable analysis that shows that shifting growth up to the next limiting factor, whatever that is (e.g., moisture), creates a sustainable benefit. If that is not identified, the offset may require legal agreements that the fertilization will be repeated every ten years as many long-term trials show that growth can trend back to that of unfertilized stands as some other limiting factors to growth on the forest site prevail. It is likely that good accounting of the energy required to manufacture, transport and distribute the fertilizers will be deducted from the carbon absorbed from the atmosphere as would be required of any methodology.
Summary: Despite these concerns, this request for Expressions of Interest is a good sign and will result in BC’s first market-based forest offset projects, helping develop the pathway to conservation offsets of natural systems in BC.
Recommendation: Prepare a formal response to the Minister of Forests and Range concerning the allowable offsets for the Pacific Carbon Trust, inviting a broader vision than the existing proposed ‘silviculture-based one’ and giving consideration to enabling REDD projects and mixed modality (REDD, IFM and ARR) projects.
Recommendation: The Darkwoods Forest Project of the Nature Conservancy of Canada is one of the first large conservation carbon projects in BC. It is recommended that NCC share the results of its valuation work on the Darkwoods Forest Project and its caron offset assessment with LTABC members to help inform similar projects for conservation land trusts and other protected areas in BC.
Recommendation: LTABC undertake a closer analysis of the examples of a potential partnership with BC Hydro to align the goals of natural area conservation by land trusts and land managers and BC Hydro’s new goal of zero cumulative environmental impact.

116
Chapter 8: Recommendations
The overall purpose of this report was to explore the opportunities and ways for land trusts to be involved in the rapidly growing market for offsetting carbon dioxide emissions and losses of ecosystem services. With the emergence of British Columbia’s new Emission Offset. Regulation for carbon offsets there is a huge opportunity to get involved in emerging ecosystem service offset markets for new and existing natural area conservation projects. With the infrastructure nearly in place to support the first forest carbon projects for REDD in BC, there is now a credible case for providing a future funding mechanism for the work of conserving and restoring natural areas by land trusts, conservancies and other land management agencies including municipalities, First Nations, parks and other land planning agencies. Land trusts are especially well-placed to consider participating in offset initiatives because they have long been leaders in conservation of land and its many values. Clearly the financial support available through offset investment can provide a major new source of revenue for the projects carried out by land trusts.
There are five broad areas for strategic action:
• participating in the global vision that nature conservation and restoration are a
vital way to confront climate change • influencing provincial standards
• encouraging and collaborating in research and projects
• preparing for pilot projects
• inventorying projects with respect to voluntary and compliance markets
• sharing information and collaborating widely among land trusts, with land agencies with similar interests, and across jurisdictions.
A1. Contribute to global vision of ecosystem sinks with high quality standards BC has the ability to contribute to a global vision of how nature conservation and ecological restoration can be a major force in climate change action plans and an emerging green economy. With the level of professional expertise and the significant natural legacy of the province, BC also has the opportunity to set global standards of excellence and initiate programs towards achieving those ends. Land trusts, conservancies and other land management agencies including municipalities, First Nations, parks and other land planning agencies will benefit from these developments and will also find considerable opportunity for mutually beneficial collaboration. Capitalizing on the wealth of BC’s incredible natural areas to

117
transform its economy requires that we all work together and share the learning of this rapidly emerging sector in world markets.
1) Recommendation: Conservation organizations and agencies become educated in the
international, continental, national and regional developments in the language, concepts and principles of climate change offsets; as well as becoming involved in developing sound climate policy, standards and programs that integrate among all these levels of governance.
2) Recommendation: Conservation organizations and agencies should work towards initiatives that have the highest credibility in meeting objectives to limit the impacts of climate change that are accepted globally. The broader the applicability of a standard usually the higher the value of the initiatives. The stronger international markets become the wider the ecosystem scope for conservation initiatives.
3) Recommendation: Conservation organizations and agencies should align behind a common request to the Government of Canada for a clear climate plan and strategic direction that includes nature conservation as a key element of a climate action plan.
4) Recommendation: Conservation organizations and agencies should align behind a common understanding of and vision for a global ecosystem sink through conservation and restoration initiatives to minimize climate change.
A2. Influence Provincial Standards Given the wide range of values yielded through applying different standards, it is obvious that the details of BC’s regulations and standards will have considerable influence on the potential value of carbon offsets and the emergence of other ecosystem value markets. Consequently, the following recommendations are included.
5) Recommendation: Prepare a formal response to the Minister of Forests and Range
concerning the allowable offsets for the Pacific Carbon Trust, inviting a broader vision than the existing proposed ‘Silviculture-based one’ and giving consideration to enabling REDD projects and mixed modality (REDD, IFM & ARR) projects.
6) Recommendation: Watch closely for BC Hydro’s new unpublished standards and consider adopting them, as BC Hydro may become one of the first buyers of conservation offsets based on a systematic valuation of each service benefit.
B. Research & Collaboration Land trusts and other conservation organizations have a long history of permanently protecting land for ecosystem services. BC requires demonstration prototypes to lead the sector. At this time to qualify projects for compliance market standards requires significant investment in expertise to obtain data, develop models and establish credible business offset projects. There are many opportunities for collaboration, funding and research that are noted in the report.
7) Recommendation: LTABC in collaboration with other agencies, academic institutions
and interested parties, including those outside of BC, develop the expertise to evaluate its capacity to offer conservation offset projects including Carbon and

118
Ecosystem Services in BC.
8) Recommendation: LTABC secure funding and take the lead in bringing together prospective partners to analyze project types, aggregate properties and benefits from sharing transaction, research and valuation costs.
9) Recommendation: LTABC, in partnership with individual land trusts, raise funding to undertake a test program to quantify carbon benefits for select past and new projects using the highest standards and market carbon offset criteria.
10) Recommendation: LTABC undertake a closer analysis of the examples of a potential partnership with BC Hydro to align the goals of natural area conservation by land trusts and land managers and BC Hydro’s new goal of zero cumulative environmental impact.
11) Recommendation: The Darkwoods Forest Project of The Nature Conservancy of Canada is one of the first large conservation carbon projects in British Columbia. It is recommended that NCC share the results of its valuation work on the Darkwoods Forest Project and its carbon offset assessment with LTABC members to help inform similar projects for conservation land trusts and other protected areas in BC.
12) Recommendation: LTABC share the learning and distribute the findings and
recommendations of this report as widely as possible. Also engage in discussions of the evolving offset market and protocols to become familiar with the concepts and language.
13) Recommendation: LTABC in collaboration with climate sector professionals, an academic or other business/science partners, secure funding for research to develop a coordinated and collaborative project to evaluate and test key methodologies for:
i) evaluating ecosystems services and carbon benefits, across all the projects being developed within BC's conservation trusts
ii) supporting an evaluation of the best and most reliable integrated carbon/ecosystem service offset strategies/projects to simplify decision making for investors.
iii) quantifying carbon and ecosystem service values in representative properties.
iv) exploring opportunities and challenges of different geographic scales of projects— from comprehensive projects on large areas with complex carbon activities to the simplified smaller, high-quality REDD projects (such as protecting remnant old-growth forest areas).
C. Develop Pilot Projects The experience of other jurisdictions, such as California, is that the most effective way of developing standards and methodologies which are operational, feasible and meet

119
the highest expectations of the conservation community, is to learn by doing. Implementing projects using different standards or protocols reveals considerable variation in the volume and tradable portion of the offset credits. The next set of recommendations address the need to ensure optimum value yield from the implementation of pilot projects.
14) Recommendation: Secure dedicated professionals that have the capacity to compare offset values for projects if they were traded in different regulatory jurisdictions and markets.
15) Recommendation: Support consensus building among land trusts, land managers and all levels of government to assure they will capture the highest potential conservation credits within the province’s regulatory frameworks for the best long-term future.
16) Recommendation: Carry out a comprehensive compilation of literature which contains verifiable data for each ecosystem type which develop ranges of carbon offset values derived from a) research reports, b) models, c) direct measurement in the field and d) default standards for key areas in BC and collate these with further field measurements to confirm the ranges this produces.
17) Recommendation: Reach out to foundations and government bodies for support to develop criteria and indicators for markets that recognize ecosystem conservation and ecological restoration. Build on the experimental tools of the technical report by using them to develop provisional cumulative net ecosystem productivity calculations.
18) Recommendation: Identify the buyers and develop precedents for negotiating market transactions with these parties.
D. Conservation Projects and the Offset Markets The integration of business mechanisms with the conservation of ecological services provides an opportunity to raise support for conservation initiatives as never before. The number of opportunities will grow rapidly especially for carbon offsets as the impacts of climate change intensify. Projects with the option of qualifying for the voluntary market or the compliance market will have pros and cons requiring a fairly sophisticated analysis to determine the route to the highest monetary support and the lowest project risk. Currently, the analysis and project development for the voluntary market is much less onerous than for the compliance market; however, compliance market standards result in offsets with higher potential purchase prices and will likely appear more attractive to investors because of the government indemnity of risk. Currently the market is complex and underdeveloped so that brokers can be very helpful in understanding these emerging market elements. However, a contract engagement may both be premature and perhaps overlook the internal market each conservation trust has built for marketing its own projects to its traditional philanthropic community.
19) Recommendation: Encourage conservation trusts to analyze their diverse property
holdings and categorize their inventory in the context of the array of options

120
discussed in the longer technical report. These will include sorting for projects best suited for different markets, which could be based on eligibility or other regulatory attributes, ecosystem types, management treatment types, sizes, sets that may only qualify for early action, direct marketing in the voluntary market, sizes which are too small to carry their transaction costs, sizes which might best consider default values, etc. Initially it may be useful to start each conservation portfolio of project types by sorting into divisions set out within BC’s Emission Offset Regulation for projects which:
a. were started before November 27th, 2007 and do not qualify as climate action projects within BC’s Emission Offset Regulation, but which may be used for a local trust voluntary conservation carbon offset through direct sales to existing or new donors;
b. were started after November 27th, 2007 and completed before the present so may qualify within BC’s Emission Offset Regulation but will have to demonstrate a credible dependency on carbon values to qualify as additional;
c. were committed to after November 27th, 2007 but have not been fully funded or completed and may be able to use the argument that they are financially dependent on climate trading funding;
d. are being contemplated and may become feasible, especially if these projects can trade in some additional carbon or ecosystem service values, which is one test that qualifies them as additional.
These latter two sets of projects may have the capability of being designed to attract the highest volume and value of credits and will help select for future conservation opportunities which have the highest offset value within the current BC compliance market. The set of projects within each of BC Emission Offset Regulation are also wisely divided further, particularly while a number of credible standards may still apply, such as the Voluntary Carbon Standard and again according to how each fit the different standards.
20) Recommendation: Land trusts should make no formal arrangements with brokers
until land trust directors and other land managers actually have developed an inventory to trade that has been segregated into its regulatory types. When land trust credits are ready to sell, there will be plenty of brokers competing for the right to handle the credits.
21) Recommendation: Provide the research, pilot studies and promote the credibility
and permanence of legally conserved private and public land projects as reliable, high quality offset originators.
22) Recommendation: Consider branding “Living Carbon”, as a climate action product. This term more closely embodies the multiple benefits characteristics of perpetual covenants of living ecosystems.

121
23) Final Recommendation: Share Information and Collaborate Capitalizing on the wealth of BC’s incredible natural areas to transform its economy requires that land trusts work together to secure the broadest possible benefits. REDD has been supported in the Waxman Bill before congress in the US and in CCAR in California and it is certain to become a part of BC’s Emission Offset Regulation. More than any other modality it offers an opportunity for doing projects of scale like the mid coast accord. Almost all climate offset projects lend themselves to a mosaic of treatments on various areas on each of which different offset strategies can be undertaken. There are considerable economies of scale from assembling large projects to motivating trusts, conservancies and other land management agencies to look for creative collaboration with municipalities, First Nations, federal and provincial regulatory agencies like parks and private landowners.

122
Appendices
Appendix 1: Bibliography Achard, F., H. D. Eva, H. J. Stibig, P. Mayaux, J. Gallego, T. Richards, and J. P. Malingreau. (2002).
Determination of deforestation rates of the world’s humid tropical forests. Science. 297: 999-1002 Achard et al. (2004). Presentation at UNFCCC Workshop in Rome on Reducing emissions from
deforestation. Afpelbaum, S., Brinkman, D., & Seaton, R. (2009). Soils Role in Evolving Healthy Earth. Silviculture
Magazine. Angelsen, A. and D. Kaimowitz (1999). Rethinking the causes of deforestation: lessons from economic
models. The World Bank Research Observer. 14: (No.1) Assessment, M. E. (2005). Ecosystems and Well-being Vol 5. Washington D.C.: Island Press. Austin, M., Buffett, D., Nicolson, D., Scudder, G., & Stevens, V. (2008). Taking Nature's Pulse: The Status
of Biodviersity in British Colombia. Victoria, B.C.: Biodiversity B.C. BC Government Carbon Neutral Public Sector. (n.d.). Retrieved from
https://www2.gov.bc.ca/gov/content/environment/climate-change/public-sector/carbon-neutral BC Government Proposed Offset Regulations for Public Sector Organizations. (n.d.). Retrieved from
http://www.env.gov.bc.ca/epd/codes/ggrta/offsets_reg.htm (2007). Bill 44: The Greenhouse Gas Reduction Targets Act, Section 12. B.C.
https://www.leg.bc.ca/pages/bclass-legacy.aspx#/content/legacy/web/38th3rd/1st_read/gov44-1.htm Bollier, D. (2002). Silent Theft: The Private Plunder of our Common Wealth. Routledge. Brown, S. (1997). Estimating Biomass and Biomass Change of Tropical Forests: A primer. FAO Forestry
Paper 134. UN FAO, Rome. Brown, S. & Dushku A. (2003). Spatial modeling for LULUCF carbon projects: the GEOMOD modeling
approach. 2003 International Conference on Tropical Forests and Climate Change: Carbon Sequestration and the Clean Development Mechanism. Manila, October 21. 13 p.
Brown, S., Achard, F., de Fries, R., Grassi, G., Harris, N., Herold M., Molicone D., Pandey. D., Pearson,
T., & Shoch, D. (2007). Reducing Greenhouse Gas Emissions from Deforestation and Degradation in Developing Countries: A Sourcebook of Methods and Procedures for Monitoring, Measuring and Reporting.
Brown, S., Hall, M., Andrasko, K., Ruiz, F., Marzoli, W., Guerrero, G., Masera, O., Dushku, A., DeJong, B.,
& Cornell, J. (2007). Baselines for land-use change in the tropics: application to avoided deforestation projects. Mitigation and Adaptation Strategies for Climate Change. 12:1001-1026
Brown, R. (2008). The Implications of Climate Change for the Conservation, Restoration and Management

123
of National Forest Lands. Defenders of Wildlife, National Forest Restoration Collaborative. https://www.ecosystemmarketplace.com/wp-content/uploads/archive/documents/Doc_428.pdf
California Climate Registry. (2008). Draft Forest Project Protocol Revised. 68 pp.
https://www.climateactionreserve.org/wp-content/uploads/2009/03/Forest-Project-Protocol/Version-3.0-Public-Comments/Forest%20Protocol%20Comments%20-%20NAFO%20et%20al..pdf
Canada Forest Service Science Policy Notes.(2007). Is Canada’s Forest a Carbon Sink or Source?
https://cfs.nrcan.gc.ca/pubwarehouse/pdfs/27501.pdf Cashore, B., & Auld, G. (2003). British Colombia's Environmental Forest Policy in Perspective. Journal of
Forestry, 101(8): 42-47. Castillo-Santiago, M. Hellier, A., Tipper, R., de Jong, B. (2007). Carbon emissions from land-use change:
a regional analysis of causal factors in Chiapas, México. Mitigation Adaptation Strategies Global Change, 12 (6):
Chomitz, K. M., Buys, P., De Luca, C., Thomas, T.S., & Wertz-Kanounnikoff, S. (2006). At loggerheads?
Agricultural Expansion, Poverty Reduction, and Environment in the Tropical Forests. World Bank Policy Research Report. 308 pp.
Cox, P. M., Betts, R.A., Jones, C.D., Spall, S.A., & Totterdell, I.J. (2000). Acceleration of global warming
due to carbon-cycle feedbacks in a coupled climate model. Nature. 408:184-187 Centre, U. W. (2008). (2006). Climate Change Disclosures, Building a Better MD&A. Canadian Institute of Chartered
Accountants. DeFries R. S., Houghton, R.A., Hansen, M.C., Field, C.B., Skole, D., & Townshend, J. (2002).
Carbon emissions from tropical deforestation and regrowth based on satellite. De Jong, B., Hellier, A., Castillo-Santiago, M., & Tipper, R. (2005). Application of the ‘Climafor’ approach
to estimate baseline carbon emissions of a forest conservation project in the La Selva Lacandona, Chiapas, Mexico. Mitigation and Adaptation Strategies for Global Change, 10:265-278
De Jong, B., Esquivel Bazán, E. (2007). Application of the “Climafor” baseline to determine leakage: The
case of Scolel Té. De Mendonça, M. J. C. , del Vera Diaz, M.C., Nepsad, D.C., Seroa da Motta, R., Alentar, A., Gomes, J.C.,
& Ortiz, R.A. (2004). The economic cost of the use of fire in Amazon. Ecological Economics. 49:89-105.
DiFiore, A., Higuchi, N., Killeen, T.J., Laurance, S.G., Lewis, W.F., Montoya, L.M.M., Monteagudo, A.,
Neill, D.A., Vargas, P.N., Patina, S., Pitman, N.C.A., Quesada, C.A., Silva, J.N.M., Lezama, A.T., Martinez, R.V., Terborgh, J., Vinceti, B., & Lloyd J. (2004). The above-ground wood productivity and net primary productivity of 100 Neotropical forest plots. Global Change Biology. 10:563-591.
(2005). Discussion Brief MD&A Disclosure About the Financial Impact of Climate Change and Other

124
Environmental Issues. Canadian Institute of Chartered Accountants. Dow, K., & Dowling, T. (2006). The Atlas of Climate Change: Mapping the World's Greatest Challenge,
112 pp. London: Earthscan. Eliash, J. E. (2008). Climate Change: Financing Global Forests. The Eliasch Review.
https://www.taylorfrancis.com/books/mono/10.4324/9781849770828/climate-change-financing-global-forests-johan-eliasch
Faustmann, M. (1859). “Berechnung des Werthes, welchen Waldboden, sowie noch nicht haubare
Holzbestände für die Waldwirthschaft besitzen” Figueroa, B., Kanninen, M., Louman, B., Pedroni, L., & Gómez, M. (2004). Contenido de carbono en los
productos y residuos forestales generados por el aprovechamiento y el aserrío en la reserva de Biosfera Maya . Recursos Naturales y Ambiente, 2004: 102-110.
Franklin, J.,& Lindenmayer, D. (2009). Importance of Matrix Habitats in Maintaining Biological Diversity
106: 349-350. National Academy of Science. Franklin, O., Hogberg, A., Ekblad, G., & Agren, I. (2003). Pine Forest Floor Carbon Accumulation in
Response to N and PK Additions: Bomb 14C Modelling and Respiration Studies. 6(7): 644-658. Freese, F. (1962). Elementary Forest Sampling. USDA Handbook 232. GPO Washington, DC. 91 Gillespie, A. J. R, Brown, S., & Lugo, A.E. (1992). Tropical forest biomass estimation from truncated stand tables. Forest Ecology and Management. 48:69-88. Glass, L. (2010). Mackey-glass equation. Scholarpedia, : Scholarpedia, . (2006). Global Hotspot Assesment. Greig, M., & Bull, G. (2009). Carbon management in British Columbia's forests: opportunities and
challenges. Kamloops, Canada. Forest Research Extension Partnership. https://www.cabdirect.org/cabdirect/abstract/20093088721.
Hansen, J., Sato, M., Kharecha, P., Beerling, D., Berner, R., Masson-Delmotte, V., Pagani, M., Raymo,
M., Royer, D.L., James, C.Z. (2008). Target Atmospheric Co2: Where Should Humanity Aim? NASA/Goddard Institute for Space Studies. https://arxiv.org/ftp/arxiv/papers/0804/0804.1126.pdf.
Hebda, R., Gustavson, K., Golinski, K., & Calder, A. (2000). Burns Bog Ecosystem Review: Sythesis
Reprot for Burns Bog 271 pp plus Appendices. Victoria, B.C.: Environmental Assessment Office. Houghton, R.A. (2005). Aboveground forest biomass and the global carbon balance. Global Change
Biology. 11(6): 945-958. Houghton R. A. (2006). Presentation at the UNFCCC Rome workshop on reducing emissions from
deforestation. Institute, M. G. (2008). The Carbon Productivity Challenge: Curbing Climate Change and Sustaining
Economic Growth. https://www.mckinsey.com/mgi/overview.

125
Intergovernmental Panel on Climate Change. (1996). IPCC Guidelines for National Greenhouse Gas Inventories.
Intergovernmental Panel on Climate Change. (2003). Good Practice Guidance for Land Use, Land Use-
Change, and Forestry. Intergovernmental Panel on Climate Change. (2006). Guidelines for National Greenhouse Gas
Inventories, Volume 4, Agriculture, Forestry and Other Land Uses. Intergovernmental Panel on Climate Change. (2007). Climate Change. The Physical Science Basis.
https://ui.adsabs.harvard.edu/abs/2007AGUFM.U43D..01S/abstract. International Livestock Research Institute (Nairobi, Kenya) and Wageningen University (the Netherlands),
80 pp. http://www.paesaggiruralisardegna.it/wordpress/wp-content/uploads/2016/01/Lesschen_2005_Statistical-methods-for-analysing-the-spatial-dimension.pdf
Kaya, Y., & Yokobori, K. (1993). Environment, Energy & Economy: Strategies for Sustainability pp. 387.
Tokyo, Japan: United University Press. Kurtz, W. (2007). Is Canada's Forest a Sink or Source? CFS Policy Notes. Kurz, W., Dymond, C., Stinson, G., Rampley, G., Neilson, E., Carroll, A., Safranvik, L. (2008). Mountain
Pine Beetle and Forest Carbon Feedback to Climate Change. 452: 987-990. Kurz, W., Stinson, G., Gregory, J., Rampley, G., Caren, C., Dymond, C., & Neilson, E. (2008). Risk of
Natural Disturbances Makes Future Contribution of Canada's Forests to the Global Carbon Cycle Highly Uncertain 105(5): 1551-1555. Proc. of the National Academy of Science. https://www.pnas.org/content/105/5/1551.
(2009). Land Use, Land Use Change, and Forestry. UNFCCC, LULUCF. Lemmen, D., Warren, F., Lacroix, J., & Bush, E. (2008). From Impacts to Adaptation: Canada in a
Changing Climate. Ottawa: Government of Canada. On 448 p. (n.d.) Lesschen, J. P., Verburg, P. H., & Staal, S.J. (2005). Statistical methods for analyzing the spatial dimension of changes in land use and farming systems. LUCC Report Series No. 7. LLSCHAFT, München. Loetsch, F. & Haller, K. (1964). Forest Inventory. Volume 1. BLV-VERLAGS GESE Mackey, B., Berry, S., & Lindenmeyer, D. (2008). Green Carbon: The Role of Natural Forests in Carbon
Storage, Part 1, A Green Carbon Account of Australia's Eucalypt Forest and Policy Implications, 47 pp. Canberra: Australian National University.
Mackey, B., Berry, S., & Lindenmeyer, D. (n.d.). Part 1: A Green Carbon Account of Australia's Eucalypt
Forest and Policy Implications. In Green Carbon: The Role of Natural Forests in Carbon Storage. (p. 47 pp). Canberra: Australian National University.
Maddison, A. (2007). Contours of the World Economy, 1000-2030 AD. Oxford University Press.

126
(2004). Management's Discussion & Analysis: Guidance on Preparation and Disclosure. Canadian Institute of Chartered Accountants.
Malhi Y., Naker, T., Phillips, O.L., Almeida, S., Alvarez, E., Arroyo, L., Chave,J., Czimezik, C.I. (2008).
Methodology for Estimating Reductions of GHG Emissions from Mosaic Deforestation. BioCarbon Fund. https://unfccc.int/sites/default/files/redd_20090425_biocarbon_fund.pdf.
Manning, e. a. (2000). Mason, C., Lippke, B., Zobrist, K., & Bloxton Jr., T. (2006). Investments in Fuel Removals to Avoid Forest
Fires Result in Substantial Benefit. Journal of Forestry, 104: 27-31. Millenium Ecosystem Assessment. (2005). (2009). MOFR Future Forest Ecosystem Initiative: Climate Change Adaptation Research Projects
Database, March. FFESC Research Needs Gap Analysis. This is a useful biography of climate change effects in British Columbia and can be found in the Future Forest Ecosystem website at; https://www.for.gov.bc.ca/hfd/library/FFEI/
Morrison, et al. (n.d.). Mychaleiko, C. (2008). Ecuador's Constitution Gives Rights to Nature. Retrieved from Countercurrent.org:
http://www.countercurrents.org/mychalejko250908.htm (2006). National Inventory Report- Greenhouse Gas Sources and Sinks in Canada. 1990-2004, Section
7.3. https://publications.gc.ca/site/eng/9.506002/publication.html. Nelson, E., et al. (2009). Modeling multiple ecosystem services, biodiversity conservation, commodity
production, and tradeoffs at landscape scales. Frontiers in Ecology and Environment. 7:4-11 New York City's Wastewater Treatmemt System. (n.d.). Retrieved from NYC Department of Environmental
Protection: https://www1.nyc.gov/site/dep/water/wastewater-treatment-system.page NFIS. (n.d.). Retrieved from https://nfi.nfis.org/documentation/ground_plot/Gp_guidelines_v4 Olander L. P., Murry, B. C., Gibbs, H., & Steininger, M. (2006). Establishing credible national baselines for
efforts to reduce emissions from degradation and deforestation. Coalition for Rainforest Nations. Organization, F. a. (2009). State of the World's Forest. Rome. http://www.fao.org/3/i0350e/i0350e00.htm. Nobre C. A., Sellers, P. & Shukla, J. (1991). Regional climate change and Amazonian deforestation
model. Journal of Climatology. 4:957-988 Pacific Carbon Trust. (n.d.). Retrieved from https://www2.gov.bc.ca/assets/gov/environment/climate-
change/offsets/offsets-portfolio/2010-offset-portfolio.pdf Page S. E., Siegert, F., Rieley, J. O., Boehm Hans-Dieter, V., Jaya, A., & Lenin, S. (2002). The amount of
carbon released from peat and forest fires in Indonesia during 1997. Nature, 420: 61-65. Pearson T., Walker S., Brown, S., (2006). Sourcebook for Land Use, Land Use Change and Forestry
Projects. BioCarbon Fund (World Bank) and Winrock International, Washington D.C., pp. 64

127
Pedroni, L. & Streck, C. (2007). The Nested Approach: A flexible mechanism to reduce emissions from
deforestation. Annex to the submission by Paraguay on behalf of Mexico, Honduras, Panama and Peru to the UNFCCC (August 2007).
Pojar, J. (2009). The Credible Case for Nature Conservation in BC: Biodiversity Carbon and Climate
Change Draft Discussion Paper. B.C. Pontius, R. G., Jr. (2000). Quantification error versus location error in comparison of categorical maps.
Photogrammetric Engineering and Remote Sensing, 66:1011-1016 Pontius, R. G., Cornell, J. D., Hall, C. A. S. (2001). Modeling the spatial pattern of land-use change within
GEOMOD2: application and validation in Costa Rica. Agriculture, Ecosystems and Environment: 85, 191-203
Pontius, R. G. Jr. (2002). Statistical methods to partition effects of quantity and location during comparison
of categorical maps at multiple resolutions. Photogrammetric Engineering and Remote Sensing, 68 (1):1041-1049
Pontius, R. G. Jr. & Chen, H. (2006). GEOMOD Modelling. Clark University Ranganathan , J., Ruadsepp-Hearne, C., Lucas, N., Irwin, F., Zurek, M., Bennett, K., West, P. (2008).
Ecosystem Services: A Guide for Decision Makers 75 pp. World Resources Institute. Ranganathan, J. R.-H. (2008). Ecosystem Services: A Guide for Decision Makers, 75 pp. World
Resources Institute.
Santilli M., Moutinho, P., Schwartzman, S., Nepstad, D., Curran L., & Norbe, C. (2005). Tropical deforestation and the Kyoto Protocol [editorial essay]. Journal of Climatic Change. 71:267-276.
Sathaye, J. A. & Andrasko, K. (2007). Land use change and forestry climate project regional baselines: a
review. Mitigation and Adaptation Strategies for Global Change, 12:971-1000. Schlamandinger, B., Carlens, H., Bird, N., Emmer, I., Garcia-Quijano, J.F., Jara, L.F., Muys, B., Robledo,
C., Stilma, A., & Tennigkeit, T. (2006). Guiding principles for including avoidance of emission from deforestation, forest degradation and devegetation (DDD) in the international response to climate change. Submission by the ENCOFOR project team https://unfccc.int/resource/docs/2006/smsn/ngo/010.pdf. See also Submission to the UNFCCC/SBSTA/2006/L.25
Shellenberger, M. & Nordhaus, T. (2007). Break Through: From the Death of Environmentalism to the
Politics of Possibility. Houghton Mifflin Siegert F., Ruecker, G., Hinrichs, A., & Hoffmann, A. (2001). Increased damage from fires in logged
forests during droughts caused by El Niño. Nature. 414: 437-440. Sierra, C.A. et al. (2007). Total carbon stocks in a tropical forest landscape of the Porce region, Colombia.
Forest Ecology and Management. 243: 299-309. Silva-Dias M. A. F., Rutledge, S., Kabat, P., Silva-Dias, P.L., Nobre, C., Fisch, G., Dolman, A.J.,

128
Zipser, E., Garstang, M., Manzi, A.O., Fuentes, J.D., Rocha, H.R., Marengo, J., Plana-Fattori, A., Sa,
L.D.A., Alvala, R.C.S., Andreae, M.O., Artaxo, P., Gielow, R., & Gatti, L. (2002). Clouds and rain processes in a biosphere atmosphere interaction context in the Amazon Region. J. Geophys. Res.-Atmos. 107:8072-8092.
Soares-Filho, B. S., Nepstad, D. C., Curran, L. M., Cerqueira, G. C., Garcia, R. A., Ramos, C. A., Voll, E.,
McDonald, A., Lefevre, P. & Schlesinger, P., (2006). Modeling conservation in the Amazon basin. Nature. 440: 520-523.
Reyes et al. (1992). Wood densities of tropical tree species. USDA. Timmermann A., Oberhuber, J., Bacher, A., Esch, M., Latif, M., & Roeckner, E. (1999). Increased El Niño
frequency in a climate model forced by future greenhouse warming. Geophys. Res. Lett. 24:3057-3060.
Trenberth K. E. & Hoar, T.J. (1997). El Niño and Climate Change. Geophys. Res. Lett. 24: 3057-3060. Trofymow, J., & MacKinnon, A. (1998). Structure, Process, and Diversity in Successional Forests of
Coastal British Columbia: Proceedings of a Workshop 72(2): 40-42. Victoria, B.C.: Northwest Science.
Trofymow, T., Blackwell, J., & Blackwell, B. (1998). Changes in Ecosystem Mass and Carbon Distributions
in Coastal Forest Chronosequences. Victoria, B.C. UNEP World Conservation Monitoring Centre. (2008). Carbon and Biodiversity: a demonstration Atlas.
UNEP-WCMC, Cambridge, U.K. 25 pp. http://www.unep-wcmc.org
Wenger, K.F. (ed). (1984). Forestry handbook (2nd edition). New York: John Wiley and Sons. White A. M., Cannell, G. R. &. Friend, A. D. (1999). Climate change impacts on ecosystems and the
terrestrial carbon sink: a new assessment. Global Environ. Change, 9 (Suppl. 1): S21- S30. Wilson, S., & Hebda, R. (2008). Mitigating and Adapting to Climate Change through the Conservation of
Nature in British Colombia. Land Trust Alliance of British Colombia. www.landtrustalliance.bc.ca/research

129
Allen L. (2001), The Global Financial System (1750-2000), reaction books, ISBN:1-86189-109-1, p356
Bayon, R., A. Hawn, K. Hamilton (2007), Voluntary Carbon Markets, An International Business guide to What They Are and How they Work, Earthscan, ISBN- 978-1-84407-417-0, p164
Broecker W.S., R. Kunzig (2008), Fixing Climate; What past Climate Changes reveal about the current threat- and How to counter it, Hill and Wang, ISBN 13: 978-0-8090-4501-3, p253
Brundtland G.H. et al. (1987), Our Common Future; The World commission on Environment and Development, Oxford university Press, ISBN: 0-19-282080-X, p400 Diamond, J. (2005), Collapse; How Societies Choose to Fail or Succeed, The Penguin Group, ISBN: 0-14-30.3655-6, p575
Fagan B. (2008), The Great Warming; Climate change and the Rise and Fall of Civilizations, Bloomsbury Press, ISBN 978-1-59691-392-9, p282 Flannery, T. (2005), The Weather Makers, The Penguin group, ISBN-13:978-0-713-99930-3 p341
Grubb M., C. Vrolijk, D. Brack (1999), The Kyoto Protocol, A guide and Assessment, the Royal institute of International affairs, ISBN:1-85383-581-1, p342
Hawken P., A. Lovins, L. Hunter Lovins (1999), Natural Capitalism; Creating the Next Industrial revolution, Little, Brown and Company, ISBN:0-316-35316-7, p396
Houghton, J. (2004), Global Warming the Complete Briefing Third Edition, Cambridge university

130
Press, ISBN: 0-521-52874-7, p351
Kimble. J.M., C.W. Rice, D. Reed, S. Mooney, R.F. Follett, R. Lal, Soil Carbon Management; Economic, Environmental, and Societal Benefits, (2007) CRC Press, ISBN-13: 978-1-4200-4407-2, p268
Kolbert. E. (2006), Field notes from a Catastrophe; Man, nature and Climate change, Bloomsbury Press, ISBN 10:1-59691-125-5, p255
Lovelock, L. (2006), The Revenge of Gaia, The Penguin Group, ISBN-13: 978-0-713-99914-3, p176
Lovelock, J. (2009) The Vanishing Face of Gaia; A Final Warning, Allen Lane, ISBN: 978-1-846- 14185-0, p178
Lynas, M. (2007), Six Degrees; Our Future on a Hotter Planet, Fourth Estate, ISBN -13: 978-0-00- 720904, p358 Monbiot G. (2006), HEAT; How to stop the planet from burning, Double Day Canada, ISBN-13: 978-0-385-66221-5, p277
Nordhause T., M. Shellenberger (2007), Break Through; From the Death of Environmentalism to Politics of Possibility, Houghton Mifflin, ISBN-13: 978-0-618-65825-1
Pearce F. (2007), The Last Generation; How Nature Will Take Her Revenge for Climate Change, Key porter, ISBN-13: 978-1-55263-870-5, p324
Ponting C. (1991), A Green History of the World; The Environment and the Collapse of the Great Civilizations, the Penguin Group, ISBN: 0-14-01.7660-8 p430

131
Sayer, J.A., S. Maginnis (2005), Forest in Landscapes, Ecosystem Approaches to Sustainability, Earthscan, ISBN: 978-1-84407-195-1, p254
Streck C., R. O’Sullivan, T. Janson-Smith, R Tarasofsky (2008), Climate Change and Forests, Brooking institution press, ISBN-978-0-8157-8192-9, p346
Swingland, I.R. (2002), Capturing Carbon and Conserving Biodiversity; The Market Approach, Earthscan, ISBN: 1 85383 950 7, p368
Weaver, A. (2008), Keeping Our Cool; Canada in a warming world, The Penguin Group, ISBN978- 0-670-06800-5, p323 Williams M. (2006), Deforesting the Earth; From Prehistory to Global Crisis; an Abridgment. The University of Chicago Press, ISBN: 0-226-89947-0, p543
Wilson E. O. (2002), The Future of Life, Alfred A Knopf, ISBN: 0-679-45078-5 p229 Wright, R. (2004), A Short History of Progress, House of Anansi Press, ISBN: 0-88784-70604, p211

132
Appendix 2: Abbreviations and Acronyms
AESP Accumulated ecological service potential AF&PA American Forest & Paper Association ANSI American National Standards Institute AFULO Agriculture, Forestry and Other Land Use ARR Afforestation/Reforestation/Restoration AWG-LCA Ad Hoc Working group on Long-term Cooperative action BEC Biogeoclimatic Ecosystem Classification system C carbon CARB California Air Resources Board CBM-CFS2 Carbon Budget Model Canadian Forest Service 2 CCAR California Climate Action Registry CDM Clean Development Mechanism CSA Canadian Standards Association CFS Canadian Forest Service CH4 methane CO2 carbon dioxide ES Ecosystem service value FCSC Forest Carbon Standards Committee FACE Forest Absorbing Carbon Emissions FIA Forest Inventory Assessment
[http://fia.fs.fed.us/program-features/rpa/] FPP Forest Project Protocol FPS Forest Protection System GDP Gross Domestic Product GHG greenhouse gas GRP General Reporting Protocol HFC hydrofluorocarbon ICCS International Panel of Climate Change Scientists IPCC Intergovernmental Panel on Climate Change ISO International Organization for Standardization JI Joint Implementation MEA Millennium ecosystem assessment N2O nitrous oxide NGO Non-governmental organisation LTABC Land Trust Alliance of British Columbia PFC perfluorocarbon PCT Pacific Carbon Trust

133
PDD Project design documents REDD Reduced Emissions from Deforestation & (forest) Degradation Reserve Climate Action Reserve RPF Registered Professional Forester, SF6 sulfur hexafluoride SCC Standards Council of Canada UNFCCC United Nations Framework Convention on Climate Change UNEP-WCMC United Nations Environment Programme World Conservation
Monitoring Centre USFS United States Forest Service WRI World Resource Institute WCI Western Climate Initiative

134
Appendix 3: Glossary For the purposes of this paper, the following terms94 are defined as indicated.
A Absolute emissions target: “a fixed number of tons of CO2 equivalent, to be achieved at some point in the future (usually expressed as a change relative to a base year that has a known quantity)” (WRI, Target: Intensity1) Activity-shifting leakage: The displacement of activities from inside the project’s physical boundaries to locations outside of the project’s boundaries as a direct result of the project activity. (CCAR) Adaptation: Changing behavior to adjust to the predicted changes in the natural environment due to climate change. “Adjustment in natural or human systems in response to actual or expected climatic stimuli or their effects, which moderates harm or exploits beneficial opportunities” (IPCC2) Additionality: Emissions reductions achieved through a given project over and above those that would otherwise have occurred in the absence of the project under a business-as-usual scenario. Additionality is a criterion for approval of project-based activities under the Clean Development Mechanism of the Kyoto Protocol as well as for offset projects allowed for credit under emissions trading programs. (CARB3) Forest project practices that exceed the baseline characterization, including any applicable mandatory land use laws and regulations (CCAR). Afforestation: Planting trees where none existed before. “The process of establishing and growing forests on bare or cultivated land, which has not been forested in recent history” (World Bank). Article 3.3 of the Kyoto Protocol limits afforestation to activities since 1990. (CARB) The establishment and subsequent maintenance of native tree cover on lands that were previously forested but have had less than 10% tree canopy cover for a minimum time of ten years or have been subject to a significant disturbance within the last ten years that is not the result of intentional or grossly negligent acts of the landowner. (CCAR) Avoided conversion: A project consisting of specific conservation actions to prevent the site- specific clearing and conversion of native forests to a non-forest use, such as agriculture or other commercial development. (CCAR) Allocation: “The process by which emissions allowances are initially distributed under an emissions cap-and-trade system. Authorizations to emit can initially be distributed in a number of ways. See “auctioning,” “benchmarking,” “grandfathering,” and “updating.”” (CARB)
94 This paper adopts the definitions outlined below, which are subject to revision as the international political,
regulatory and methodological framework evolves.

135
Allometric equation: An equation that utilizes the genotypical relationship among tree components to estimate characteristics of one tree component from another. Allometric equations allow the below ground root volume to be estimated using the above ground bole volume. (CCAR) Allowance: “A government issued authorization to emit a certain amount. In greenhouse gas markets, an allowance is commonly denominated as one ton of CO2e per year. See also “permit” and “credits (a.k.a. carbon credits).” The total number of allowances allocated to all entities in a cap-and-trade system is determined by the size of the overall cap on emissions.” (CARB) Annex I Countries/Parties: “Group of countries included in Annex I (as amended in 1998) to the United Nations Framework Convention on Climate Change (UNFCCC), including all the developed countries in the Organization of Economic Co-operation and Development, and economies in transition. By default, the other countries are referred to as Non-Annex I countries. Under Articles 4.2 (a) and 4.2 (b) of the Convention, Annex I countries commit themselves specifically to the aim of returning individually or jointly to their 1990 levels of greenhouse gas emissions.” (CARB) Anthropogenic emissions: Human-caused emissions of greenhouse gas emissions. “Emissions of greenhouse gases, greenhouse gas precursors, and aerosols associated with human activities. These include burning of fossil fuels (coal, oil and natural gas) for energy, deforestation, and land-use changes that result in net increase in emissions” (IPCC). Auctioning: “A method for distributing emission allowances in a cap-and-trade system whereby allowances are sold to the highest bidder. This method of allocation may be combined with other forms of allowance allocation.” (CARB)
B Banking: “The carry-over of unused allowances or offset credits from one compliance period to the next”. (CARB) Baseline is the sum of carbon stock changes that would occur within the boundary of the project area in the absence of the proposed REDD or ARR or IFM project activity. (BioCF) Baseline scenario: BCreg: “In relation to a project, means one or more hypotheses that Are made in pat on the assumption that the project is not carried out. Are abut activities that will have a effect on greenhouse gas emissions or removals, and Enable the estimation of baseline emissions and baseline removals.” GHG Protocol: “A hypothetical scenario for what GHG emissions, removals or storage would have been in the absence of the GHG project or project activity.” It is often used to measure GHG emission reductions or removals from an offset project, which are determined as the difference between actual emissions and the baseline scenario. BioCF: the expected change in land use and land cover (LU/LC) within the boundary of the project area in the absence of any project activity designed to reduce emissions

136
from deforestation, forest degradation, or enhance carbon stocks. Baseline emissions: In relation to a project, means am estimate of greenhouse gas emissions from all selected sources and reservoirs, assuming the project is not carried out. (BC offset) Base year emissions: GHG emissions in a specified (usually historical) year, against which future emissions are measured. Emission targets are often defined relative to base year emissions, e.g., 10% below 1990 emission levels. Benchmarking: “An allowance allocation method in which allowances are distributed by setting a level of permitted emissions per unit of input or output.” (CARB) Biological emissions: For the purposes of the forest protocol, biological emissions are GHG emissions that are released directly from forest biomass, both live and dead, including forest soils. In the first three years of reporting the only biological emission type that is required to be reported for forest entities and projects is CO2 , as identified in the Quantification Section of the protocol. Biological emissions are deemed to occur when the reported tonnage of carbon stocks decline at the project or entity level in comparison to the reported tonnage of the previous year. Biomass: The total mass of living organisms in a given area or volume; recently dead plant material is often included as dead biomass. Bole: A trunk or main stem of a tree. For the purposes of the Protocol, any tree bole with a minimum diameter of three inches should be included in the inventory to estimate carbon stocks. Broad Category is the term used in this methodology to identify three main categories of LU/LC-change: deforestation, forest degradation and forest regeneration.
C Category of LU/LC-Change (or simply “category”): the change from one LU/LC class to another that occurs during a given period of time. Category is the term used in IPCC reports to refer to specific sources of emissions or removals of greenhouse gases. Under the AFOLU sector, “categories” are land-use / land-cover (LU/LC) transitions. RED methodologies deal with the following categories: (a) Forest Land to Forest Land (degradation and regeneration of forest land remaining forest land) (b) Forest Land to Crop Land (deforestation followed by agriculture) (c) Forest Land to Grass Land (deforestation followed by pasture) (d) Forest Land to Settlements (deforestation followed by settlements) (e) Forest Land to Wetlands (deforestation followed by wetlands) (f) Forest Land to Other Land (deforestation followed by other land) Activities that convert non forest land back to forest (Crop Land to Forest Land, Grass Land to Forest Land, etc.) are considered afforestation and reforestation. Cap and trade system: “A system designed to limit and reduce emissions. Cap and trade regulation creates a single market mechanism as opposed to a command-and-control approach that prescribes reductions on a source-by-source basis. Cap and trade

137
regulation sets an overall limit on emissions and allows entities subject to the system to comply by undertaking emission reduction projects at their covered facilities and/or by purchasing emission allowances (or credits) from other entities that have generated emission reductions in excess of their compliance obligations.” (CARB) Carbon: In the case of forests, a carbon pool is the forest biomass, which can be subdivided into smaller pools. These pools may include aboveground or below-ground biomass or roots, litter, soil, bole, branches and leaves, among others. (CCAR) Carbon pool: A reservoir that has the ability to accumulate and store carbon or release (CCAR) Carbon stocks: The carbon contained in identified forest biomass categories (i.e., carbon pools), such as above and below ground biomass, at a specific point in time. Certification: The process used to ensure that a given participant’s greenhouse gas emissions or emissions reductions has met the minimum quality standard and complied with the Registry’s procedures and protocols for calculating and reporting GHG emissions and emission reductions. (CCAR) Carbon Density: the amount of carbon (as CO2e) per hectare (ha-1) estimated to be present in the accounted carbon pools of a LU/LC Class. (BioCF) Carbon Dioxide (CO2): A naturally occurring gas (0.03% of atmosphere) that is also a by-product of burning fossil fuels and biomass, land-use changes, and other industrial processes. It is the principal anthropogenic greenhouse gas. It is the reference gas against which other greenhouse gases are measured and therefore has a Global Warming Potential of 1. (IPCC) Carbon Dioxide Equivalent (CO2e): the mass of carbon dioxide that would produce the same global warming impact as a given mass of another greenhouse gas, as determined using the 100-year time horizon global warming potential (BCreg) “The universal unit of measurement to indicate the global warming potential (GWP) of each of the six greenhouse gases, expressed in terms of the GWP of one unit of carbon dioxide.” (GHG Protocol) Expressing all GHGs in terms of tonnes of CO2e allows the different gases to be aggregated. (BioCF) Carbon Intensity: “The relative amount of carbon emitted per unit of energy or fuels consumed” (IPCC). A Low Carbon Fuel Standard would set limits on the carbon intensity of fuels, measured in grams per gigajoule. Carbon Neutral: An organization is carbon neutral if it has (1) calculated the total emissions for which it is responsible, (2) pursued actions to minimize those emissions, and (3) applied emissions offsets to net those emissions to zero. Carbon sequestration: The process of increasing the carbon stored in a reservoir other than the atmosphere. “Biological approaches to sequestration include direct removal of carbon dioxide from the atmosphere through land-use change, afforestation, reforestation, and practices that enhance soil carbon in agriculture. This removal is considered temporary as the carbon dioxide returns to the atmosphere when plants die or are burned. Physical approaches include separation and disposal of carbon dioxide from flue gases or from processing fossil fuels to produce hydrogen- and carbon dioxide-rich fractions and long-term storage in underground in depleted oil and gas

138
reservoirs, coal seams, and saline aquifers.” (IPCC) Carbon Stock: the carbon density of an area times the number of hectares in the area. Clean Development Mechanism (CDM): “One of the three market mechanisms established by the Kyoto Protocol to provide flexibility for compliance. The CDM is designed to promote sustainable development in developing countries and assist Annex I Parties in meeting their greenhouse gas emission reduction commitments. It enables industrialized countries to invest in emission reduction projects in developing countries and to share credits for the GHG reductions achieved.” (CARB) Climate: “The long-term statistical average of weather-related aspects of a region including typical weather patterns, the frequency and intensity of storms, cold spells, and heat waves. Climate is not the same as weather. A description of the climate of a certain place would include the averages and extremes of such things as temperature, rainfall, humidity, evapotranspiration and other variables that can be determined from past weather records during a specified interval of time.” (CARB) Climate Change: “Refers to changes in long-term trends in the average climate, such as changes in average temperatures.” (CARB) Command and Control: “A system of regulation that prescribes emission limits and compliance methods on a facility-by-facility or source-by-source basis and that has been the traditional approach to reducing air pollution.” (CARB) Conservation: Specific actions that prevent the conversion of native forest to a non-forest use, i.e., residential or commercial development or agriculture. (CCAR) Conservation-Based Forest Management: The natural forest management of native forest where commercial and/or noncommercial harvest and regeneration are practiced. (CCAR) Conservative: In relation to a greenhouse gas reduction, means a greenhouse gas reduction that is likely to have been overestimated. (BCreg) Controlled source, sink or reservoirs: (BCreg) In relation to a proponent, means a greenhouse gas emissions source, sink and reservoir that is controlled, directly or indirectly, by proponent by legal, financial or any other means. Chlorofluorocarbons (CFCs): “Gaseous, synthetic substances composed of chlorine, fluorine and carbon. CFCs have been used as refrigerants, aerosol propellants, and cleaning solvents, and in the manufacture of plastic foam. As well as causing ozone depletion in the stratosphere, CFCs are greenhouse gases. Their use is being phased out under the Montreal Protocol. Some of their replacements are "ozone-friendly" but are, nonetheless, potent greenhouse gases.” (CARB) Credits (a.k.a. carbon credits): “Credits can be distributed by the government for reductions achieved by offset projects or by achieving environmental performance beyond a regulatory standard.” (CARB)
D Deforestation: the direct, human-induced and long-term (or permanent) conversion of forest land to non-forest land It occurs when at least one of the parameter values used to define “forest land” is reduced from above the threshold for defining “forest” to below

139
this threshold for a period of time that is longer than the period of time used to define “temporarily un-stocked”. For example, if a country defines a forest as having a crown cover greater than 30% and “temporarily un-stocked” as a maximum period of 3 years, then deforestation would not be recorded until the crown cover is reduced below 30% for at least three consecutive years95. Country should develop and report criteria by which temporary removal or loss of tree cover can be distinguished from deforestation. (BioCF) Direct emissions: Greenhouse gas emissions from sources that are owned or controlled by the reporting entity (CCAR)
E Entity: The basic unit of participation in the Registry, which includes a corporation or other legally constituted body, and city or county, and each state government agency. Entity non- biological baseline: Datum against which a forest entity can measure its nonbiological GHG emissions. (CCAR) Eligible Land: To avoid double counting of emission reductions, land areas previously registered should be transparently reported and excluded from the project area. (BioCF) Emission Factor: the difference between the carbon density of the two LU/LC classes descr Emissions: “The release of substances (e.g., greenhouse gases) into the atmosphere. Emissions occur both through natural processes and as a result of human activities.” (CARB) Equity Share: Fractional percentage or share of an ownership interest. (CCAR)
95 Deforestation can be the result of an abrupt event (deforestation = forest € non-forest), in which case the change in land-cover and land-use occurs immediately and simultaneously; or of a process of progressive degradation (deforestation = forest € degraded forest € non-forest), in which case the change in land-cover occurs when one of the parameters used for defining “forest land” falls below its minimum threshold, but the change in land-use may have already occurred or will occur later (e.g. use of the land for the production of crops or grazing animals). Land-use is thus not a reliable indicator for identifying a forest class or for defining a category of change.
96 Forest area and carbon stock losses due to natural disturbances (landslides, consequences of volcanic eruptions, and see level rise, among other) are not considered “deforestation”.
97 According to IPCC (GPG LUUCF, 2003, Chapter 4.2.6.2.) “The identification of units of land subject to deforestation activities requires the delineation of units of land that:
(a) Meet or exceed the size of the country’s minimum forest area (i.e., 0.05 to 1 ha); and (b) Have met the definition of forest on 31 December 1989; and (c) Have ceased to meet the definition of forest at some time after 1 January 1990 as the result of direct
human-induced deforestation.”

140
Emissions Cap: “A mandated constraint in a scheduled timeframe that puts a "ceiling" on the total amount of anthropogenic greenhouse gas emissions that can be released into the atmosphere.” (CARB) Emission Factor: “A factor allowing GHG emissions to be estimated from a unit of available activity data (e.g., tonnes of fuel consumed, tonnes of product produced) and absolute GHG emissions” (GHG Protocol) Emission Offset/ reduction: (BCreg) Baseline emissions minus project emissions. Offsets are voluntary project-based emission reductions or removals that are used to meet voluntary or regulatory emission reduction obligations. Offset programs usually establish a number of specific eligibility criteria, and often require that offsets be real, quantifiable, verifiable or verified, surplus or additional, permanent and unique. “Offsets are calculated relative to a baseline that represents a hypothetical scenario for what emissions would have been in the absence of the mitigation project that generates the offsets.” (GHG Protocol) Emission Reductions (ERs): “The measurable reduction of release of greenhouse gases into the atmosphere from a specified activity or over a specified area, and a specified period of time” (World Bank) Emissions trading: “The process or policy that allows the buying and selling of credits or allowances created under an emissions cap.” (CARB) European Union Emissions Trading Scheme (EU ETS): “The world’s largest greenhouse gas emissions trading system is the European Union’s Emissions Trading Scheme, which limits CO2 emissions from 12,000 facilities in the 25 EU member states. Launched in 2005, the ETS covers electricity and major industrial sectors (including oil, iron and steel, cement, and pulp and paper) that together produce nearly half the EU’s CO2 emissions. ETS rules are set at the regional level but decisions on emission allowance allocation are left to member states. An initial phase runs through 2007; a second will coincide with the Kyoto Protocol compliance period (2008-2012). Excess emissions incur a penalty (100 Euros/ton in phase II) and must be made up in the next phase. EU policymakers have said the ETS will continue beyond 2012 with or without new international climate agreements.” (CARB). Forest: (CCAR) Lands that support, or can support, at least 10 percent tree canopy cover and that allow for management of one or more forest resources, including timber, fish and wildlife, biodiversity, water quality, recreation, aesthetics and other public benefits. (CCAR) Land with woody vegetation consistent with the thresholds used to define “forest land” where the RED project activity will be implemented. Areas covered with planted forests as well as with any other anthropogenic vegetation type that meet the definition of “forest” since the earliest date of the historical reference period used to assess deforestation can be considered “forest land”. Hence, “forests” can be natural, semi-natural, or anthropogenic and they may include primary or old-growth forests (intact or logged), secondary forests, planted forests, agro- forestry and silvo-pastoral systems.

141
(BioCF) Land with woody vegetation consistent with the thresholds used to define “forest land” in the country where the RED project activity will be implemented. Where the country has adopted a forest definition for the Kyoto Protocol, the minimum thresholds of the vegetation indicators (minimum area, tree crown cover and height) used for defining “forests”, as communicated by the DNA consistent with decision 11/CP.7 and 19/CP.9, should be used. Otherwise, the definition used to define “Forest Land” in national GHG inventory should be used. Land defined as “forest land” can include areas that do not, but at maturity in situ could potentially reach, the thresholds used to define “forest land”. To distinguish between “non- forest” (and hence “deforested”) and “temporarily un-stocked” areas in managed forests, the definition of “forest” should include the maximum period of time that the woody vegetation can remain below the thresholds used to define “forest land”. This maximum period can be specific for each category of land-use / land-cover change (LU/LC-change). For instance, it could be zero years for conversion from “forest land to crop land”, but up to 5 or more years for transitions between forest classes (e.g., age classes)98. Areas covered with planted forests as well as with any other anthropogenic vegetation type that meet the definition of “forest” since the earliest date of the historical reference period used to assess deforestation can be considered “forest land”. Hence, “forests” can be natural, semi-natural, or anthropogenic and they may include primary or old-growth forests (intact or logged), secondary forests, planted forests, agro-forestry and silvo-pastoral systems. Forest degradation: “forest land remaining forest land” but gradually losing carbon stocks as a consequence of direct-human intervention (e.g., logging, fuel-wood collection, fire, grazing, etc.)99 Units of forest land subject to degradation are allocated to different forest classes over time, with each successive class having a lower carbon density than the previous one. The difference in average carbon density between two contiguous forest classes should be at least 10%. The difference refers to the upper and lower levels of the confidence intervals of the two contiguous forest classes in the degradation sequence.
98 Project proponents should report on how they distinguish between deforestation and areas that remain forests but where tree cover has been removed temporarily, notably areas that have been harvested or have been subject to other human or natural disturbance but for which it is expected that forest will be replanted or regenerate naturally. See IPCC GPG LULUCF, 2003, Chapter. 4.2.6.2.1 for further guidance on this issue.
99 According to IPCC GPG LLUCF “forest degradation” is “a direct, human-induced, long-term (persisting for X years or more) or at least Y% of forest carbon stock [and forest values] since time T and not qualifying as deforestation”. Note that X, Y% and T are not quantified. See IPCC 2003 (Report on Definitions and Methodological Options to Inventory Emissions from Direct Human-induced Degradation of Forests and Devegetation of Other Vegetation Types, Chapter 2.2) for a discussion on the definition of “forest degradation”, in particular Table 2.1 for alternative definitions of direct human-induced forest degradation.

142
Forest management: Areas subject to sustainable forest management (with logging activities) represent a particular class of “degraded forest”. An undisturbed natural forest that will be subject to sustainable forest management will lose part of its carbon, but the loss will partially recover over time. In the long-term, a sustainable harvesting and re-growth cycle will maintain a constant average carbon density in the forest. Since this average carbon density is lower than in the original forest, sustainably managed forests can be considered a degraded forest class. Depending on the magnitude and timeframe of the carbon stock changes, managed forests could be classified into one single “managed forest” class (with a carbon density equivalent to the average of the entire management cycle) or to different sub-classes representing different average carbon densities (Figure A1-2). (BioCF) Forest Regeneration: “forest land remaining forest land” but gradually enhancing its carbon stock as a consequence of direct-human intervention. Units of forest land subject to regeneration are allocated to different forest classes over time, with each successive forest class having a higher carbon density than the previous one. The difference in average carbon density between two contiguous forest classes should be at least 10%. The difference refers to the upper and lower levels of the confidence intervals of the two forest classes. (BioCF) Forest entity: An entity, as defined in this section, including a private individual that owns at least 100 acres of trees Forest entity baseline qualitative characterization: A 100-year projection of the forest entity’s management practices. (CCAR) Forest management: The commercial or noncommercial harvest and regeneration of forest. (CCAR) Forest project: A planned set of activities to remove, reduce or prevent carbon dioxide emissions in the atmosphere by conserving and/or increasing on-site forest carbon stocks. Forest project baseline qualitative characterization: A long-term projection of the forest management practices (or absence thereof) that would have occurred within a project’s boundaries in the absence of the project. Such baseline projections shall be based on the policy guidance, provided by project type, in the Forest Project Protocol and shall serve as the basis for quantifying the project’s baseline. Forest project greenhouse gas reduction: Removals or reductions of CO2 and prevented CO2 emissions resulting from Registry-approved Forest projects. GHG reductions are calculated as gains in carbon stocks over time relative to the project baseline. Greenhouse Gases: (GHG) For the purposes of the Registry, GHGs are the six gases identified in the Kyoto Protocol: Carbon Dioxide (CO2), Nitrous Oxide(N20), Methane (CH4), Hydrofluorocarbons (HFCs), Perfluorocarbons (PFCs), and Sulphur Hexafluoride (SF6).GHG reductions: see forest project GHG reductions (CCAR) Frontier Deforestation: the conversion of forest land to non-forest land occurring when the agricultural frontier expands as a result of improved access to forest into areas with relatively little human activity. (BioCF)

143
G Global Warming: The trend of rising Earth's average surface temperature caused predominantly by increased concentrations of GHGs in the atmosphere. Strictly speaking, global warming refers only to warming trends. However, the term "global warming" has become a popular term encompassing all aspects of climate change, including, for example, the potential changes in precipitation that will be brought about by an increase in global temperatures. The term is used interchangeably with the term, "climate change." (CARB) Global Warming Potential (GWP): “Greenhouse gases differ in their effect on the Earth’s radiation balance depending on their concentration, residence time in the atmosphere, and physical properties with respect to absorbing and emitting radiant energy. By convention, the effect of carbon dioxide is assigned a value of one (1) (i.e., the GWP of carbon dioxide =1) and the GWPs of other gases are expressed relative to carbon dioxide. For example, in the U.S. national inventory, the GWP of nitrous oxide is 310 and that of methane 21, indicating that a tonne of nitrous oxide has 310 times the effect on warming as a ton of carbon dioxide. Slightly different GWP values for greenhouse gases have been estimated in other reports. Some industrially produced gases such as sulfur hexafluoride (SF6), perfluorocarbons (PFCs), and hydrofluorocarbons (HFCs) have extremely high GWPs. Emissions of these gases have a much greater effect on global warming than an equal emission (by mass) of the naturally occurring gases. Most of these gases have GWPs of 1,300 - 23,900 times that of CO2. The US and other Parties to the UNFCCC report national greenhouse gas inventories using GWPs from the IPCC's Second Assessment Report (SAR). SAR GWPs are also used for the Kyoto Protocol and the EU ETS. GWPs indicated in this document also refer to the IPCC’s Second Assessment Report.” (CARB) Grandfathering: “A method by which emission allowances are freely distributed to entities covered under an emissions trading program based on historic emissions.” (CARB) Greenhouse Effect: “The heat-trapping effect of atmospheric greenhouse gases (e.g., water vapor, carbon dioxide, methane, etc.) that keeps the Earth's temperature about 60°F warmer than it would be otherwise. These gases absorb infra-red radiation emitted by the Earth and retard the loss of energy from the Earth system into space. The natural greenhouse effect has been a property of Earth’s atmosphere for millions of years and is responsible for maintaining the Earth’s surface at a temperature that makes it habitable for human beings. The Earth is currently experiencing an enhanced greenhouse effect due to an increase in atmospheric concentrations of greenhouse gases emitted by human activities.” (CARB) Greenhouse gases (GHGs): “Greenhouse gases include a wide variety of gases that trap heat near the Earth’s surface, slowing its escape into space. Greenhouse gases include carbon dioxide, methane, nitrous oxide and water vapor and other gases. While greenhouse gases occur naturally in the atmosphere, human activities also result in additional greenhouse gas emissions. Humans have also manufactured some gaseous compounds not found in nature that also slow the release of radiant energy into space.”

144
(CARB) Greenhouse gas reduction: a) a reduction of greenhouse gas emissions, or b) an enhancement of greenhouse gas removals. (BCreg) Gross CO2 emissions: The total greenhouse gas emissions (measured in CO2e) in a given period and specific area or region that does not include sinks of greenhouse gas emissions in that area or region. H Historical Reference Period: a time period preceding the starting date of the proposed RED project activity. It is analyzed to determine the magnitude of deforestation and forest degradation in the reference region and to identify agents and drivers of DD and the chain of events leading to land-use / land-cover change. In order to be useful for understanding recent and likely future DD trends, the starting date of the historical reference period should be selected between 10 and 15 years in the past, and the end date as close as possible to present (BioCF). Hydrofluorocarbons (HFCs): “One of the six primary GHGs. Synthetic industrial gases, primarily used in refrigeration and other applications as commercial substitutes for chlorofluorocarbons (CFCs). There are no natural sources of HFCs. The atmospheric lifetime of HFCs is decades to centuries, and they have "global warming potentials" thousands of times that of CO2, depending on the gas. HFCs are among the six greenhouse gases to be curbed under the Kyoto Protocol.” (CARB) I Intensity-Based Target: “Intensity targets are expressed as emissions per unit of output (e.g., GDP, physical production). An intensity target seeks to achieve a particular emissions rate, or level of performance, rather than a specific level of emissions” (WRI, Target: Intensity) Intergovernmental Panel on Climate Change (IPCC): “Recognizing the problem of potential global climate change, the World Meteorological Organization (WMO) and the United Nations Environment Programme (UNEP) established the Intergovernmental Panel on Climate Change (IPCC) in 1988. It is open to all members of the UN and WMO. The role of the IPCC is to assess on a comprehensive, objective, open and transparent basis the scientific, technical and socio- economic information relevant to understanding the scientific basis of risk of human-induced climate change, its potential impacts and options for adaptation and mitigation. The IPCC does not carry out research nor does it monitor climate related data or other relevant parameters. It bases its assessment mainly on peer reviewed and published scientific/technical literature.” (CARB) Inventory: “A greenhouse gas inventory is an accounting of the amount of greenhouse gases emitted to or removed from the atmosphere over a specific period of time (e.g., one year). A greenhouse gas inventory also provides information on the activities that cause emissions and removals, as well as background on the methods used to make the calculations. Policy makers use greenhouse gas inventories to track emission trends, develop strategies and policies and assess progress. Scientists use greenhouse

145
gas inventories as inputs to atmospheric and economic models” (CARB) Improved Forest management (IFM): The management of either private or public lands for commercial or noncommercial harvest and regeneration of native trees when employing natural forest management practices. Natural forest management practices are forest management practices that promote and maintain native forests comprised of multiple ages and mixed native species at multiple scales from the harvest unit (less than 40 acres) up to the watershed spatial scale (third or fourth order watershed level) approximately 10,000 acres in size (CCAR) IPCC Guidelines: The IPCC Guidelines for National Greenhouse Gas Inventories provide internationally accepted methodologies for estimating national inventories of anthropogenic emissions by sources and removals by sinks of greenhouse gases. The IPCC Guidelines were prepared in response to an invitation by the Parties to the UNFCCC, for fulfilling their commitments under the UNFCCC on reporting on inventories of anthropogenic emissions by sources and removals by sinks of greenhouse gases not controlled by the Montreal Protocol.” (CARB)
J Joint Implementation (JI): “A mechanism under the Kyoto Protocol through which a developed country can receive "emissions reduction units" (ERUs) when it helps to finance projects that reduce net greenhouse gas emissions in another developed country (in practice, the recipient state is likely to be a country with an "economy in transition"). An Annex I Party must meet specific eligibility requirements to participate in joint implementation.” (CARB)
K Kyoto Mechanisms: “Three procedures established under the Kyoto Protocol to increase the flexibility and reduce the costs of reducing greenhouse-gas emissions; they are the Clean Development Mechanism (CDM), emissions trading, and joint implementation (JI).” (CARB) Kyoto Protocol: “An international agreement signed at the Third Conference of the Parties to the UN Framework Convention on Climate Change in Kyoto, Japan (December 1997). The Protocol sets binding emission targets for industrialized countries that would reduce their collective emissions by 5.2 percent, on average, below 1990 levels by 2012.” (CARB)
L Leakage: “Leakage occurs when activities that reduce greenhouse gas emissions (or increase carbon in plants and soils) in one place and time result in increases of emissions (or loss of soil or plant carbon) elsewhere or at later times. For example, a steel firm in a country covered by the Kyoto Protocol makes reductions by closing one facility and replacing its output with production from a steel plant operating in another country that

146
does not have a GHG constraint. Similarly, a forest can be protected in one location and cause harvesting of forests elsewhere.” (CARB) Leakage is the decrease in carbon stocks and the increase in GHG emissions attributable to the implementation of the RED or AR project activity that occurs outside the boundary of the project area. (BioCF) Leakage belt: the geographical area surrounding or adjacent to the project area in which displacement of pre-project activities from inside to outside de project area are likely to occur. (BioCF) LU/LC Class (or simply “class”): a unique combination of land use and land cover having a specific carbon density. (BioCF) LU/LC Polygon: a discrete area falling into a single LU/LC class. (BioCF)
M Market Leakage: The creation of greenhouse gas emissions outside of a project’s boundaries through substitution or replacement due to the project activity impacting an established market for goods. (BioCf) Methane (CH4): “One of the six greenhouse gases to be curbed under the Kyoto Protocol. Atmospheric CH4 is produced in nature, but human related sources such as landfills, livestock feedlots, natural gas and petroleum systems, coal mines, rice fields, and wastewater treatment plants also generate substantial CH4 emissions. CH4 has a relatively short atmospheric lifetime of approximately 10 years, but its 100-year GWP is currently estimated to be approximately 21 times that of CO2.” (CARB) Metric Ton (tonne): Standard “measurement for the quantity of GHG emissions, equivalent to about 2,204.6 pounds or 1.1 short tons”. (CCAR) Mitigation: In the context of climate change, a human intervention to reduce the sources or enhance the sinks of greenhouse gases. Examples include using fossil fuels more efficiently for industrial processes or electricity generation, switching from oil to natural gas as a heating fuel, improving the insulation of buildings, and expanding forests and other "sinks" to remove greater amounts of carbon dioxide from the atmosphere. (UNFCC5) Monitoring period: the period of time (in years) between two monitoring and verification events. Typically, it is a fraction of the crediting period. The minimum duration is one year, and the maximum is the duration of the crediting period (BioCF). Mosaic Deforestation: the conversion of forest land to non-forest land occurring in a patchy pattern where human population and associated agricultural activities and infrastructure (roads, towns, etc.) are spread out across the landscape and most areas of forest within such a configured region or country are practically already accessible. (BioCF)
N Net CO2e emissions: Difference between sources and sinks of greenhouse gas emissions (measured in CO2e) in a given period and specific area or region. Nitrous Oxide (N2O): “One of the six greenhouse gases to be curbed under the Kyoto

147
Protocol. N2O is produced by natural processes, but substantial emissions are also produced by such human activities as farming and fossil fuel combustion. The atmospheric lifetime of N2O is approximately 100 years, and its 100-year GWP is currently estimated to be 310 times that of CO2.” (CARB)
O Ownership: in relation to a greenhouse gas reduction, includes an established right to claim legal or commercial benefits arising from the achievement of the reduction. (BCreg) Offset: “Projects undertaken outside the coverage of a mandatory emissions reduction system for which the ownership of verifiable GHG emission reductions can be transferred and used by a regulated source to meet its emissions reduction obligation. If offsets are allowed in a cap-and-trade program, credits would be granted to an uncapped source for the emissions reductions a project (or plant or soil carbon sink) achieves. A capped source could then acquire these credits as a method of compliance under a cap.” (CARB)
P Perfluorocarbons (PFCs): “PFCs are among the six greenhouse gases to be curbed under the Kyoto Protocol. PFCs are synthetic industrial gases generated as a by-product of aluminum smelting and uranium enrichment. They also are used in the manufacture of semiconductors. There are no natural sources of PFCs. PFCs have atmospheric lifetimes of thousands to tens of thousands of years and 100-year GWPs thousands of times that of CO2, depending on the specific PFC.” (CARB) Point of Regulation: “The point of program enforcement, or where specific emitting entities covered under a cap-and-trade program are required to surrender enough allowances to match their actual emissions within a compliance period.” (CARB) Planned Deforestation: the legally authorized conversion of forest land to non-forest land occurring in a discrete area of land. Deforestation within an area can be planned (designated and sanctioned) or unplanned (unsanctioned). Planned deforestation can include a wide variety of activities such as national resettlement programs from non-forested to forested regions; a component of a national land plan to reduce the forest estate and convert it to other industrial- scale production of goods; or plans to convert well-managed community-owned forests to other non-forest uses. Other forms of planned deforestation could also include decisions by individual landowners, whose land is legally zoned for agriculture, to convert their say selectively logged forest to crop production. These planned deforestation activities would be a component of some land planning or management document and could be readily verified. (BioCF) Project: means a course of action undertaken to achieve a greenhouse gas reduction (BCreg) Project Activity: the series of planned steps and activities by which the proponent intends to reduce deforestation and forest degradation and/or enhance forest regeneration. (BCreg) Project Area is the area or areas of land on which the proponent will undertake the project activities. No lands on which the project activity will not be undertaken can be included in the project area (BCreg). Project emissions: means an estimate of greenhouse gas emissions from all selected sources and reservoirs;(BCreg) Project developer: An entity that undertakes a project activity, as identified in the Forest Project Protocol. A project developer may be an independent third party or the

148
forest entity. Project reduction: means the total of the emissions reduction and the removals enhancement, less any discounts applied in accordance with a risk-mitigation and contingency plan referred to in section 3 (2) (r) (BCreg) Project removals: means an estimate of removals by all selected sinks and reservoirs; (BCreg) Project report: means a report prepared in accordance with section 5or 7 whichever applies to the project;(BCreg) Project start date: means the date on which the project begins active operation;(BCreg) Project Scenario is the expected change in land use and land cover within the boundary of the project area resulting from the undertaking of the project activity. Project Term or project period: The period during which a proponent carries out a project. (BCreg) The period of time over which the proponents plan to undertake the project activity on the project area. The project term will be chosen by the proponents, typically as a multiple of the crediting period. (BioCF) R Radiative forcing: “the difference between the incoming radiation energy and the outgoing radiation energy in a given climate system. A positive forcing (more incoming energy) tends to warm the system, while a negative forcing (more outgoing energy) tends to cool it” (wikipedia- IPCC’s definition was not English) Removal’s enhancement: Baseline removals minus projects removals (BCreg) Removals: the reduction of atmospheric concentrations of greenhouse gases through a) the removal of greenhouse gases from the atmosphere and b) the storage or sequestration of carbon or greenhouse gases in a reservoir (BCreg). Reforestation: Planting of forests on lands that have recently previously contained forests but that have been converted to some other use. Article 3.3 of the Kyoto Protocol limits reforestation to planting forests on lands that have not been forested since 1990. (BioCF) The establishment and subsequent maintenance of native tree cover on lands that were previously forested but have had less than 10% tree canopy cover for a minimum time of ten years. This activity is also a type of project that can be registered in the Registry. (CCAR) Regional Greenhouse Gas Initiative (RGGI): “The Regional Greenhouse Gas Initiative (RGGI) is establishing the first mandatory U.S. cap and trade program for carbon dioxide, and currently includes ten Northeastern and mid-Atlantic states. The governors of Connecticut, Delaware, Maine, New Hampshire, New Jersey, New York, and Vermont established RGGI in December 2005. Massachusetts, Rhode Island and Maryland joined in early 2007. Additional states can join the program with the agreement of the participating states. RGGI sets a cap on carbon dioxide emissions from power plants and allows sources to trade emission allowances. The program will cap emissions at current levels in 2009 and then reduce emissions 10% by 2019. Each state that intends to participate in RGGI must adopt a model rule through legislation or regulation and determine how to distribute emissions allowances. Member states agree to set aside at least 25% of

149
their emission allowances for public benefit.” (CARB) Registries, registry systems: “Electronic databases that track and record emissions and emission allowance holdings, retirements, cancellations and transfers.” (CARB) Reservoir: “A component of the climate system, other than the atmosphere, which has the capacity to store, accumulate, or release” carbon or a greenhouse gas. “Oceans, soils, and forests are examples of reservoirs of carbon.” (IPCC) Reference Region: the spatial delimitation of the analytic domain from which information about deforestation and degradation agents, drivers and LU/LC-change is obtained, projected into the future and monitored. The reference region includes the project area 100 and is defined by the project proponent using transparent criteria. It must contain LU/LC classes and deforestation agents and drivers similar to those found in the project area under the baseline and project scenarios.
S Standing dead biomass: Standing dead tree or section thereof, regardless of species, with minimum diameter of three inches. (CCAR) Sequestration: The process of increasing the carbon content of a carbon reservoir other than the atmosphere. Biological approaches to sequestration include direct removal of CO2 from the atmosphere through land-use changes3 and changes in forest management. (CCAR) Sink: “Any process, activity or mechanism that removes a greenhouse gas” from the atmosphere” to a reservoir (IPCC) Source: “Any process, activity, or mechanism that releases a greenhouse gas” emission. (IPCC) Stock: “The absolute quantity of substance of concern, held within a reservoir at a specified time, is called the stock. The term also means an artificial or natural storage place for water, such as a lake, pond, or aquifer, from which the water may be withdrawn for such purposes as water supply or irrigation” (IPCC) Sulfur Hexafluoride (SF6): One of the six greenhouse gases to be curbed under the Kyoto Protocol. SF6 is a synthetic industrial gas largely used in heavy industry to insulate high-voltage equipment and to assist in the manufacturing of cable-cooling systems. There are no natural sources of SF6. SF6 has an atmospheric lifetime of 3,200 years. Its 100-year GWP is currently estimated to be 22,200 times that of CO2.” (CARB) Stand Model: the term used in approved A/R methodologies to describe the unique combination of the natural features of a forest stand, such as its species composition and growth, and the management applied to it during its life cycle (BioCF).
100 The methodology thus adopts a so called “Stratified Regional Baseline” (SRB) approach, which has been
recommended in recent literature (Sataye & Andrasko, 2007), (Brown, et al., 2007)

150
T Tree: A woody perennial plant, typically large and with a well-defined stem or stems carrying a more or less definite crown with the capacity to attain a minimum diameter at breast height of 3 inches and a minimum height of 15 feet at maturity with no branches within 4.5 feet of the ground. (CCAR) U United Nations Framework Convention on Climate Change (UNFCCC): The Convention was adopted on 9 May 1992 in New York and signed at the 1992 Earth Summit in Rio de Janeiro by more than 150 countries and the European Community. Its objective is the “stabilization of greenhouse gas concentrations in the atmosphere at a level that would prevent dangerous anthropogenic interference with the climate system.” It contains commitments for all Parties. Under the Convention, Parties included in Annex 1 aimed to reduce greenhouse gas emissions. The Convention entered into force in March 1994. (IPCC)
V Validation body and verification body: (a) a team that includes (i) a person who is authorized to act as an auditor of a company under section 205 of the Business Corporations Act, and (ii) at least one qualified professional, or (b) a body accredited, in accordance with ISO 14065, by a member of the International Accreditation Forum to use ISO 14064-3; Validation period: the period beginning on the project start date and ending on the date the validation expires. (2) In this regulation, an expression formed by juxtaposing ISO and a number refers to a standard made by the ISO, as amended from time to time, and named in part by that number. Verification: “The act of checking or testing, by an independent and certified party, to ensure that an emission reduction project actually achieves emission reductions commensurate with the credits it receives.” (CARB)
W Western Climate Initiative (WCI): A collaboration launched in February 2007 to meet regional challenges raised by climate change. WCI is identifying, evaluating and implementing collective and cooperative ways to reduce greenhouse gases in the region. Membership in the WCI presently consists of six U.S. states (Arizona, California, New Mexico, Oregon, Utah and Washington State) and two Canadian provinces (BC and Manitoba). The partners set an overall regional goal in August 2007 for reducing greenhouse gas emissions, and by August 2008 they will complete the design of a market-based mechanism to help achieve that reduction goal.6
1. Herzog, Timothy, Kevin A Baumert and Jonathan Pershing “Target: Intensity. An Analysis of Greenhouse
Gas Intensity Targets.” World Resources Institute. 2. Glossary of Terms used in the IPCC Third Assessment Report.

151
3. Market Advisory Committee to the California Air Resources Board. “Recommendations for Designing a Greenhouse Gas Cap-and-Trade System for California.” June 30, 2007.
4. World Business Council for Sustainable Development and World Resources Institute. GHG Protocol: “Corporate Accounting and Reporting Standards.”
5. United Nations Framework Convention on Climate Change. “Glossary of climate change acronyms” 6. Western Climate Initiative. “About WCI.”

152
Appendix 4: BC Emission Offset Regulation
PROVINCE OF BRITISH COLUMBIA
ORDER OF THE LIEUTENANT GOVERNOR IN COUNCIL
Order in Council No.905, Approved and Ordered DEC- 8 2006
Lieutenant Governor
Executive Council Chambers, Victoria
On the recommendation of the undersigned, the Lieutenant Governor, by and with the advice and consent of the Executive Council, orders that the attached Emission Offsets Regulation is made.
Minister of Environment Presiding Member Of the Executive Council
(This part is for administrative purposes only and is not part of the Order.)
Authority under which Order is made:
Act and section:- Greenhouse Gas Reduction Targets Act, S.B.C. 2007, c. 42, s. 12
Other (specify):-
November 14, 2008 R/121412008/27

153
EMISSION OFFSETS REGULATION
Contents 1 Definitions and interpretation 2 How measurements of greenhouse gas reductions and removals are to be expressed 3 Project plans 4 Validation of project plan 5 Project reports 6 Verification of project reports 7 Protocols and guidelines 8 Recognition of emission offsets 9 Records
10 Qualified professionals 11 Amendment 12 Transition
Definitions and interpretation
1 (1) In this regulation:
"Act" means the Greenhouse Gas Reduction Targets Act;
"baseline emissions", in relation to a project, means an estimate of greenhouse gas emissions from all selected sources and reservoirs, assuming the project is not carried out;
"baseline removals", in relation to a project, means an estimate of removals by all selected sinks and reservoirs, assuming the project is not carried out;
"baseline scenario", in relation to a project, means one or more hypotheses that (a) are made, in part, on the assumption that the project is not carried out, (b) are about activities that will have an effect on greenhouse gas emissions or
removals, and (c) enable the estimation of baseline emissions and baseline removals;
"carbon dioxide equivalent" has the same meaning as in the Carbon Neutral Government Regulation;
"conservative", in relation to a greenhouse gas reduction, means a greenhouse gas reduction that is unlikely to have been overestimated;
"controlled source, sink or reservoir", in relation to a proponent, means a greenhouse gas emissions source, sink or reservoir that is controlled, directly or indirectly, by the proponent by legal, financial or any other means;
"director" has the same meaning as in the Carbon Neutral Government Regulation;
"emissions reduction" means baseline emissions minus project emissions;
"greenhouse gas reduction" means (a) a reduction of greenhouse gas emissions, or (b) an enhancement of greenhouse gas removals;
"ISO" means the International Organization for Standardization;
ownership", in relation to a greenhouse gas reduction, includes an established right to claim legal or commercial benefits arising from the achievement of the reduction;
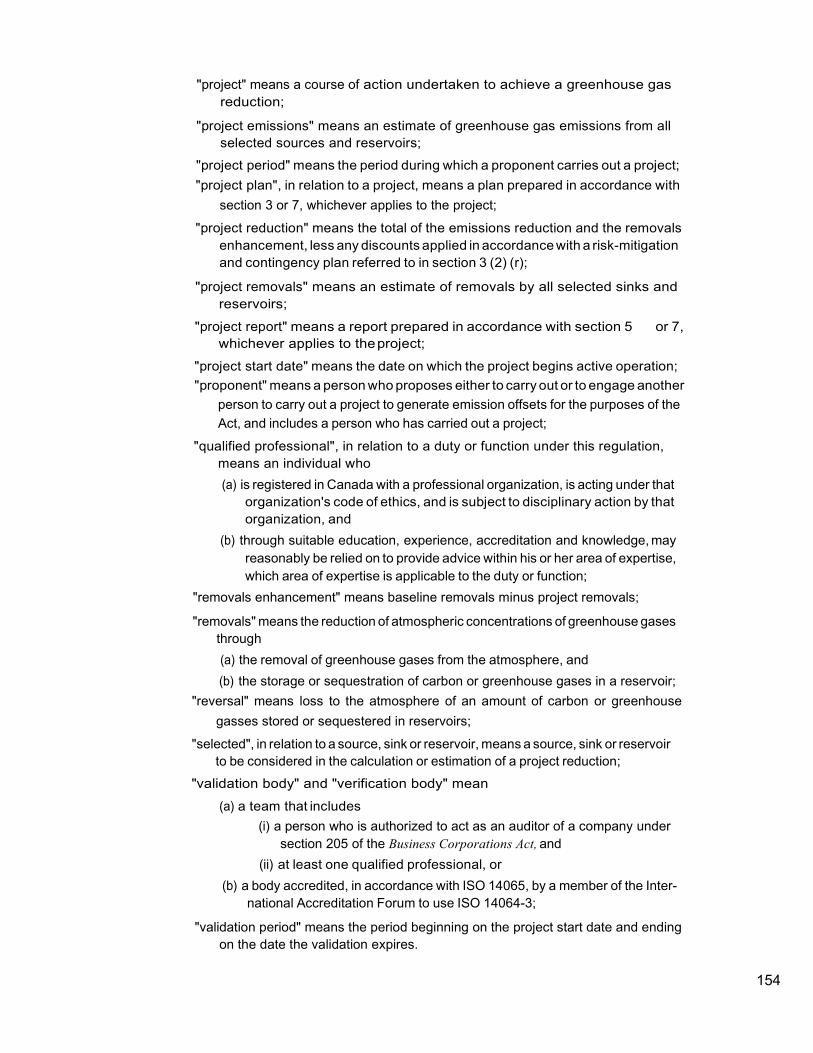
154
"project" means a course of action undertaken to achieve a greenhouse gas reduction;
"project emissions" means an estimate of greenhouse gas emissions from all selected sources and reservoirs;
"project period" means the period during which a proponent carries out a project; "project plan", in relation to a project, means a plan prepared in accordance with
section 3 or 7, whichever applies to the project;
"project reduction" means the total of the emissions reduction and the removals enhancement, less any discounts applied in accordance with a risk-mitigation and contingency plan referred to in section 3 (2) (r);
"project removals" means an estimate of removals by all selected sinks and reservoirs;
"project report" means a report prepared in accordance with section 5 or 7, whichever applies to the project;
"project start date" means the date on which the project begins active operation; "proponent" means a person who proposes either to carry out or to engage another
person to carry out a project to generate emission offsets for the purposes of the Act, and includes a person who has carried out a project;
"qualified professional", in relation to a duty or function under this regulation, means an individual who (a) is registered in Canada with a professional organization, is acting under that
organization's code of ethics, and is subject to disciplinary action by that organization, and
(b) through suitable education, experience, accreditation and knowledge, may reasonably be relied on to provide advice within his or her area of expertise, which area of expertise is applicable to the duty or function;
"removals enhancement" means baseline removals minus project removals;
"removals" means the reduction of atmospheric concentrations of greenhouse gases through (a) the removal of greenhouse gases from the atmosphere, and (b) the storage or sequestration of carbon or greenhouse gases in a reservoir;
"reversal" means loss to the atmosphere of an amount of carbon or greenhouse gasses stored or sequestered in reservoirs;
"selected", in relation to a source, sink or reservoir, means a source, sink or reservoir to be considered in the calculation or estimation of a project reduction;
"validation body" and "verification body" mean
(a) a team that includes (i) a person who is authorized to act as an auditor of a company under
section 205 of the Business Corporations Act, and (ii) at least one qualified professional, or
(b) a body accredited, in accordance with ISO 14065, by a member of the Inter- national Accreditation Forum to use ISO 14064-3;
"validation period" means the period beginning on the project start date and ending on the date the validation expires.

155
(2) In this regulation, an expression formed by juxtaposing ISO and a number refers to a standard made by the ISO, as amended from time to time, and named in part by that number.
How measurements of greenhouse gas reductions and removals are to be expressed
2 For the purposes of the Act, reductions and removals must be expressed in tonnes of each specific greenhouse gas measured in carbon dioxide equivalent.
Project plans
3 (1) A proponent must (a) prepare a project plan, and (b) submit the project plan to a validation body for review under section 4.
(2) Subject to section 7, a project plan must contain all of the following: (a) the title of the project and a statement of the project's purposes and
objectives; (b) the name and address of the proponent and of any other person responsible for
carrying out the project; (c) a description of the roles and responsibilities of persons responsible for
carrying out the project; (d) contact information for persons who can provide information regarding any
government programs providing financial or other assistance for the carrying out of the project;
(e) a technical description of the project and an explanation of how carrying out the project will achieve a greenhouse gas reduction;
(f) project identification information, including geographical information about the location where the project will be carried out and any other information allowing for the unique identification of the project;
(g) a chronological plan for the project, including the anticipated or actual project start date;
(h) Identification of protocols the proponent intends to comply with to quantify the project reduction and a justification for selecting the protocols and, if applicable, adjusting the protocols;
(i) a description of the project's baseline scenario, including (i) a description of potential baseline scenarios considered when
selecting the project's baseline scenario, (ii) a description of the assumptions on which the baseline scenario is
based and a justification of the reasonableness of those assumptions, and
(iii) a statement of the period of time for which the baseline scenario applies;
(j) an assertion by the proponent that the baseline scenario will result in a conservative estimate of the greenhouse gas reduction to be achieved by the project, considering
(i) existing or proposed regulatory requirements relevant to any aspect of the baseline scenario,
(ii) provincial or federal incentives relevant to any aspect of the baseline scenario, including tax incentives or grants that may be available,
(iii) the financial implications of carrying out a course of action referred

156
(iv) to in the baseline scenario, and
(v) any other factor relevant to justify the claim that the baseline scenario is reasonably likely to occur if the project is not carried out;
(k) an assertion by the proponent that there are financial, technological or other obstacles to carrying out the project that are overcome or partially overcome by the incentive of having a greenhouse gas reduction recognized as an emission offset under the Act, and a justification for the assertion;
(l) an assertion by the proponent that the project start date is no earlier than November 29, 2007;
(m) identification of the project's selected sources, sinks and reservoirs and an explanation of why those sources, sinks and reservoirs were selected;
(n) for each selected source, sink or reservoir,
(i) a description of the methods to be used
(A) to make estimates or measurements for the purposes of calculating emissions reduction and removals enhancement,
(B) to undertake any relevant data collection and monitoring, including a description of quality assurance and quality control provisions to be complied with,
(ii) a description of the frequencies by which measurement and monitoring will be undertaken, and
(iii) a justification of the methods described in subparagraph (i) and the frequencies described in subparagraph (ii);
(o) an assertion by the proponent that
(i) the proponent's selected sources, sinks and reservoirs, and
(ii) the methods referred to in paragraph (n) (i),
will ensure that the total of the emission reduction and the removals enhancement is an accurate and a conservative estimation of the greenhouse gas reduction, with respect to which the proponent has ownership, that is to be achieved during the validation period from controlled sources, sinks or reservoirs in British Columbia, taking into account increases in emissions or reductions in removals, as compared to the baseline scenario, from sources, sinks or reservoirs other than controlled sources, sinks or reservoirs;
(p) the estimated project reduction for each year of the project during the validation period, a description of the formulae used in the estimation and the calculations used in making the estimation;
(q) an assertion by the proponent that the proponent, with respect to the (r) greenhouse gas reduction to be achieved by carrying out the project, has a (s) superior claim of ownership of the reduction to that of any other person; (t) if the project involves
(i) the capture and storage or capture and sequestration of a greenhouse gas emissions from a source,
(ii) removals by controlled sinks, or
(iii) avoided emissions from controlled reservoirs,

157
a risk-mitigation and contingency plan for the purpose of ensuring that the atmospheric effect of a greenhouse gas reduction achieved by the project will endure for a period
(iv) comparable to the period that the atmospheric effect of a greenhouse gas reduction achieved by carrying out projects not of a type referred to in subparagraph (i), (ii) or (iii) will endure, or
(v) of at least 100 years; (u) if paragraph (r) applies to the project, an assertion by the proponent that the
plan referred to in paragraph (r) is reasonably likely to achieve the purpose referred to in that paragraph;
(v) the results of an assessment of the uncertainty associated with the estimation of the greenhouse gas reduction to be achieved by carrying out the project, and, if no guideline issued under section 7 (4) for the purposes of this paragraph applies to the project, a description of the procedures used to conduct the assessment;
(w) a description of any analysis undertaken to determine the environmental impact of carrying out the project;
(x) a description of any consultations undertaken respecting the project and a summary of the results of the consultations;
(y) an assertion by the proponent that the project plan meets the requirements of this regulation.
(3) A risk-mitigation and contingency plan referred to in subsection (2) (r) (a) must be for the project period and for a reasonable period of time after that,
and
(b) may include any of the following:
(i) a plan for the maintenance and long-term protection of controlled sinks and reservoirs and for keeping records related to that maintenance and protection;
(ii) a description of legal means taken for the long-term protection of selected sinks and reservoirs;
(iii) to identify any reversal, a plan for monitoring selected sinks and reservoirs and for keeping records relating to the carrying out of the monitoring;
(iv) a description of any contractual or other arrangements for securities, contingency funds, or set-asides to address the risk of a reversal;
(v) a description of any discounts to be applied in the calculation of project reductions;
(vi) a description of any arrangements made to replace emission offsets in the event of a reversal.
Validation of project plan
4 (1) Subject to subsections (2) to (4), a validation body may validate a submitted project plan if the validation body is satisfied that the project plan, including the assertions in the project plan, is fair and reasonable.
(2) A validation body may not make a validation under subsection (1) if the

158
validation body considers that the project plan is subject to material errors, omissions or misrepresentations.
(3) For the purposes of subsection (2), a project plan is subject to material errors, omissions or misrepresentations if
(a) the aggregate or individual effect of an error, omission or misrepresentation related to the project plan make it probable that the judgment of a reasonable person judging an assertion required to be in the project plan would have been changed or influenced by the error, omission or misrepresentation, or
(b) the errors, omissions or misrepresentations are material as determined in accordance with a guideline, if any, issued by the director under section 7 (4).
(4) A validation body may only validate a project plan in a manner consistent with ISO 14064-3.
(5) If a validation body makes a validation under subsection (1), a member of the validation body must sign a statement of assurance that includes all of the following:
(a) name, address and other contact information for the validation body; (b) date of the statement of assurance; (c) a statement that the validation is made in a manner consistent with
ISO 14064-3 and in accordance with this regulation; (d) a description of the work the validation body performed to make the
validation, including a description of (i) the techniques and processes used to test the greenhouse gas
information and associated assertions, and (ii) any additional information, not in the project plan, directly or
indirectly relied on by the validation body in the course of making the validation;
(e) a statement that the project plan, including the assertions in the project plan, is fair and reasonable;
(f) an assertion that the person signing the statement of assurance is or represents a validation body under this regulation.
(6) If a validation body makes a validation under subsection (1), a member of the validation body must sign a cover letter, to be attached to the statement of assurance referred to in subsection (5), that includes a description of all of the following:
(a) the education, experience, accreditation, professional designation and knowledge of the individuals carrying out the validation, including areas of competency relevant to the project;
(b) any relevant accreditation that the validation body holds; (c) the procedures or policies complied with by the validation body and the
individuals referred to in paragraph (a) to ensure their independence and the lack of any conflicts of interest;
(d) a description of the quality assurance and quality control, record keeping and data management procedures used by the validation body.
Subject to subsection (8), a validation made under subsection (1) expires 10 years after the date of the statement of assurance referred to in subsection (5).

159
(7) The director may order that the validation period for a project or any class of projects expires on a date or after a period of time specified in the order.
(8) An order made under subsection (8) does not apply to a project for which a project plan was validated under subsection (1) before the order was made.
(9) A signed statement of assurance for a project, including the attached cover letter referred to in subsection (6), is to be considered a part of the project's project plan for the purposes of sections 5 (2) (b) and 9.
Project reports
5 (1) A proponent must (a) prepare a project report, (b) submit the project report and a copy of the project's validated project plan
to a verification body for review.
(2) Subject to section 7, a project report must contain all of the following: (a) an assertion of the project start date; (b) an assertion by the proponent that the project's project plan was validated
in accordance with this regulation;
(c) an assertion by the proponent that the period covered by the report is within the validation period and within the period referred to in section 3 (2) (i) (iii);
(d) an assertion by the proponent that the project was carried out as described in the project plan, except as described in the project report;
(e) an assertion of the project reduction, emissions reduction and removals enhancement;
(f) calculations supporting the assertions referred to in paragraph (e), including calculations for each selected source, sink or reservoir;
(g) an assertion by the proponent that the proponent, with respect to the greenhouse gas reduction to be recognized as emission offsets for the purposes of the Act, has a superior claim of ownership of that reduction to that of any other person; (h) evidence to support the assertion referred to in paragraph (g); (i) an assertion that the project report complies with this regulation.
Verification of project reports
6 (1) Subject to subsections (2) to (4), a verification body may verify a submitted project report if the verification body is satisfied that
(a) the assertions in the project report are materially correct and are a fair and reasonable representation of the project's greenhouse gas reduction, and
(b) there have been no material changes to how the project was carried out compared to the description of the project in the validated project plan, taking into account any guidelines issued by the director under section 7 (4) for the purposes of this subsection.
(2) A verification body may not make a verification under subsection (1) if the verifi- cation body considers the project report is subject to material errors, omissions or

160
misrepresentations.
(3) For the purposes of subsection (2), a project report is subject to material errors, omissions or misrepresentations if
(a) the individual or aggregate effect of an error, omission or misrepresentation related to the project report make it probable that the judgment of a reasonable person judging an assertion required to be in the project report would have been changed or influenced by the error, omission or misrepresentation,
(b) the individual or aggregate effect of an error, omission or misrepresentation related to the project report could have resulted in an overestimation of project reductions by more than 5%, or
(c) the errors, omissions or misrepresentations are material as determined in accordance with a guideline, if any, issued by the director under section 7 (4).
(4) A verification body may only make a verification under subsection (1) in a manner consistent with ISO 14064-3.
(5) If a verification body makes a verification under subsection (1), a member of the verification body must sign a statement of assurance that includes all of the following: (a) name, address and other contact information for the verification body; (b) date of the statement of assurance; (c) a statement that the verification is made in a manner consistent with
ISO 14064-3 and in accordance with this regulation; (d) identification of the project's asserted project reduction for the period
covered by the project report against which the verification testing was conducted;
(e) a description of the work the verification body performed to make the verification, including a description of
(i) the techniques and processes used to test the greenhouse gas information and associated project reduction assertion, and
(ii) any additional information, not in the project report, directly of indirectly relied on by the verification body in the course of making the verification;
(f) a statement that the assertions in the project report are materially correct and are a fair representation of the project's greenhouse gas reduction;
(g) an assertion that the person signing the statement of assurance is or represents a verification body under this regulation.
(6) If a verification body makes a verification under subsection (1), a member of the verification body must sign a cover letter, to be attached to the statement of assurance referred to in subsection (5), that includes a description of all of the following: (a) the education, experience, accreditation, professional designation and
knowledge of the individuals carrying out the verification, including areas of competency relevant to the project;
(b) any relevant accreditation that the verification body holds;

161
(c) the procedures or policies complied with by the verification body and the individuals referred to in paragraph (a) to ensure their independence and the lack of any conflicts of interest;
(d) a description of the quality assurance and quality control, record keeping and data management procedures used by the verification body.
(7) A signed statement of assurance for a project, including the attached cover letter referred to in subsection (6), is to be considered part of the project's project report for the purposes of section 9.
Protocols and guidelines
7 (1) The director may establish or designate a protocol for any aspect of the carrying out of a project in a class of projects, including, without limitation, a protocol in relation to any of the following:
(a) the selection of sources, sinks or reservoirs; (b) greenhouse gas reduction from sources, sinks or reservoirs other than
controlled sources, sinks or reservoirs; (c) baseline scenarios; (d) quantification of greenhouse gas reductions; (e) data management; (f) monitoring greenhouse gas sources, sinks and reservoirs; (g) evidence of ownership.
(2) In designating a protocol for the purposes of subsection (1), the director may
(a) designate the protocol as it is amended from time to time, and (b) make any amendments to the protocol that the director considers necessary,
(3) Subject to subsections (5) to (7), if the director establishes or designates a protocol under subsection (1) for a class of projects, a proponent of a project within that class must (a) comply with the protocol despite anything in section 3 or 5, and (b) comply with section 3 and 5 to the extent that it is not inconsistent with the
protocol.
(4) The director may issue a guideline for the purposes of section 3 (2) (t), 4 (3) (b) or 6 (1) (b) or (3) (c), and a person to whom section 3 (2) (t) applies or who is exercising a power referred to in section 4 (3) (b) or 6 (1) (b) or (3) (c) must comply with the applicable guideline.
(5) The director must provide public notice, in any form the director considers appro- priate, of a protocol established or designated under subsection (1) or a guideline issued under subsection (4), and the protocol or the guideline comes into effect 3 months after the date the notice was first given.
(6) A protocol established or designated under subsection (1) or a guideline issued under subsection (4) does not apply to a project for which a project plan was validated before the protocol or guideline comes into effect.
(7) If the director has provided public notice under subsection (5) with respect to a protocol, but the protocol is not yet in force,
(a) a proponent may comply with the protocol as though it is in force, and (b) subsection (3) applies with respect to the proponent's project as though the

162
protocol is in force.
Recognition of emission offsets 8 A greenhouse gas reduction is recognized as an equivalent amount of emission offsets
for the purposes of the Act if (a) the greenhouse gas reduction is equal to the project reduction in a project
report verified in accordance with this regulation, (b) the proponent of the project has transferred any title the proponent has in
the greenhouse gas reduction to the Pacific Carbon Trust, and (c) the greenhouse gas reduction has not previously been recognized as an
emission offset under the Act or another emission-offset recognition scheme or for the purposes of another voluntary or mandatory greenhouse gas reduction program.
Records
9 (1) A proponent must retain, in both paper and electronic form, its project plan and project report for not less than ten years after the date of either its validation or verification, whichever is applicable.
(2) A proponent, on the request of the director, must provide to the director a copy of the proponent's
(a) project plan, (b) project report, or (c) records referred to in section 3 (3) (b) (i) or (iii) within 60 days of the date of the request.
Qualified professionals
10 The director may request evidence of a person's qualifications to act as a qualified professional for the purposes of this regulation and may determine that the person is not qualified to perform the functions of a qualified professional if the director is not satisfied that the person possesses the necessary qualifications,
Amendment
11 Effective on July 1, 2010,
(a) section 1 (1) is amended by repealing the definitions of "qualified professional" and "validation body" and "verification body" and substituting the following:
"validation body" and "verification body" mean a body accredited, in accordance with ISO 14065, by a member of the International Accreditation Forum to use ISO 14064-3;, and
(b) section 10 is repealed.
Transition
12 If a public sector organization has an agreement in place with the Pacific Carbon Trust for application on behalf of the public sector organization of a greenhouse gas reduction to be verified in accordance with section 6 by December 31, 2012, the proposed greenhouse gas reduction is recognized as an emission offset for the purposes of offsetting the public sector organization's PSO greenhouse gas emissions for the 2008, 2009, 2010 and 2011 calendar years to the extent that

163
(a) the Pacific Carbon Trust has in place contracts with one or more proponents to deliver emission offsets from identified projects, and
(b) the identified projects have validated project plans.

164
Conservation Offsets in BC
Appendix 5: Comparing CCAR and VCS standards
In this appendix we will compare the California Climate Action Registry protocol (CCAR) and Voluntary Carbon Standard (VCS).
Some of the acronyms in this section are unique to the VCS and not used elsewhere in the document. They are defined at the end of this appendix.
Both the protocol and standard provide tools and set rules under which possible projects can generate carbon credits. At the moment the VCS standard allows the CCAR protocol as a methodology. This means that credits that comply with the CCAR protocol can be registered under VCS and thus sold as Voluntary Carbon Units, but not the other way around.
VCS probably recognizes the CCAR protocol as a methodology because the simplified methods proposed in the CCAR protocol are very conservative. Project developer’s choice involves a simplified CCAR protocol or a more complex VCS standard with possibly more credits. The less complex process may bring in fewer carbon credits but involve less cost. The VCS more rigorous rules and demands may deliver more Carbon credits but on small projects, net less profit. Both the CCAR and the VCS standards permit the three main pathways to creating carbon credits-- ARR, IFM, REDD and are interesting to compare.
The basic steps for both the VSC standard and the CCAR protocol are similar. These comparisons are in Tables 1 to Table 6. Please note that the tables do not review all the rules/constraints/demand of both standard or protocol. We have selected some of the main differences to help elect an option.
Table 1 shows the differences in eligible activities, their definition, and the main constraints.
Table 2 shows the differences in required and optional carbon pools. Table 3 shows the differences in the additionality rules and tests. Table 4 shows the differences in the baseline determinations. Table 5 shows the differences in the leakage assessment between CCAR protocol and VCS standard.
Table 6 shows the differences in the Risk assessment determination. (Please note that because the risk assessment within the CCAR protocol is an extensive methodology it was not summarized in a table.)
Eligible activities
Both CCAR and VCS recognize the three forestry and land use methods to sequester carbon, ARR, IFM, REDD. In this respect a major distinction from CCAR is the open character of the VCS standard, where project developers are asked to develop their own methodologies within the boundaries of the VCS standard. Within

165
the CCAR protocol, the User is asked to follow the predetermined steps of the CCAR methodology.
Table 1: the differences in eligible activities, their definition, and main constraints between the CCAR protocol and the VCS standard
Protocols CCAR (California Climate
Action Registry) VCS (Voluntary Carbon Standard)
Document Revised Forest Project
Protocol Dec 2008 Voluntary carbon standard 2007.1 2008
Length of project 100 years Validator determines length of project
elig
ible
Act
iviti
es
Afforestation, Reforestation (ARR)
Reforestation projects must demonstrate that under baseline circumstances, the project area would remain out of forest cover for at least the next 10 years.
Establishing, increasing or restoring vegetative cover through the planting, sowing or human-assisted natural regeneration of woody vegetation to increase carbon stocks in woody biomass and, in certain cases, soils.
Improved forest management (IFM)
Area size from 40 acres to approx 10000. On which management converts in Natural Forest management. Promoting and maintain native forests. Different approach in private and public
Four approaches: 1. Conversion from conventional logging to Reduced Impact Logging (RIL); 2. Conversion of logged forests to protected forests (LtPF) including: a. protecting currently logged or degraded forests from further logging; and, b. protecting unlogged forests that would be logged in the absence of carbon finance; 3. Extending the rotation age of even rotation aged managed forests (ERA); and, 4. Conversion of low-productive forests to high- productive forests (LtHP).
REDD/Risk of Conversion
A project consisting of specific conservation actions to prevent the site-specific clearing and conversion of native forests to a non-forest use, such as agriculture or other commercial development.
Three approaches. 1 Avoided planned deforestation 2. Unplanned frontier deforestation 3. Unplanned mosaic deforestation
Pools
The required pools in the calculation of the baseline as well as the ex ante project carbon stocks are more extensive in the CCAR then in the VCS. The VCS gives the project developer more freedom to choose and requires an explanation why he/she choose certain pools or did not. This might be an advantage to projects were the measurement of carbon content in some pools are difficult and therefore prohibitively expensive.
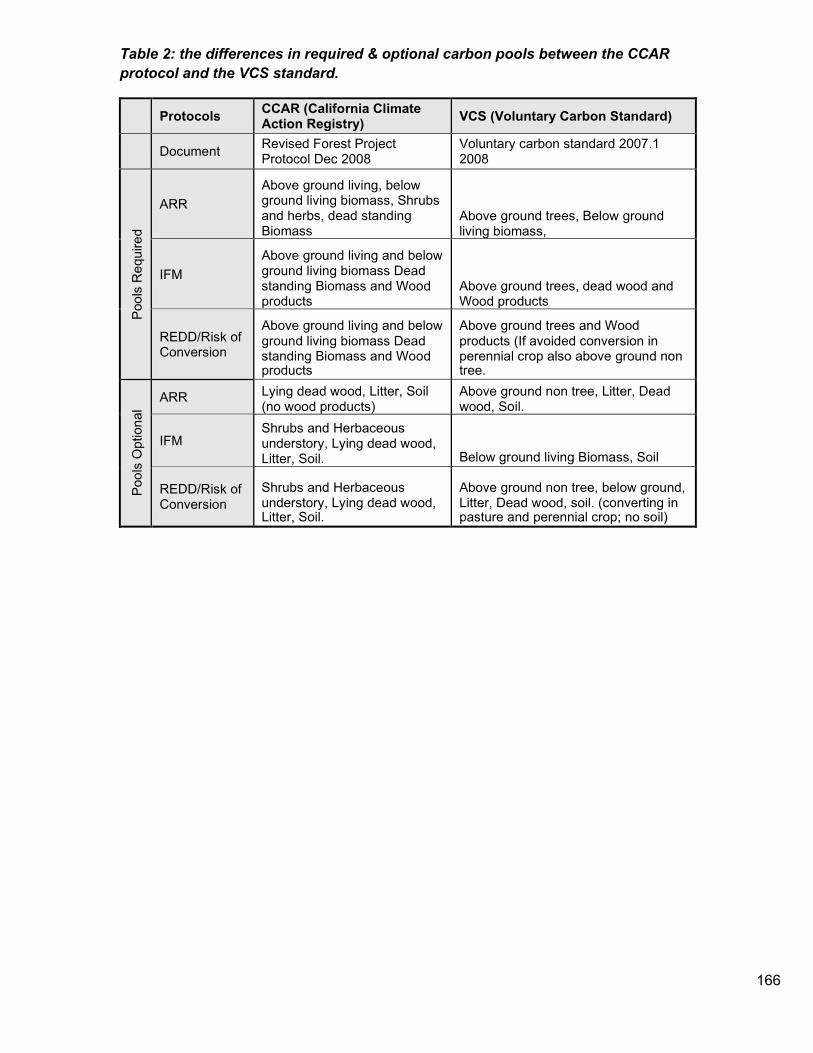
166
Table 2: the differences in required & optional carbon pools between the CCAR protocol and the VCS standard.
Protocols CCAR (California Climate
Action Registry) VCS (Voluntary Carbon Standard)
Document Revised Forest Project
Protocol Dec 2008 Voluntary carbon standard 2007.1 2008
Pool
s R
equi
red
ARR Above ground living, below ground living biomass, Shrubs and herbs, dead standing Biomass
Above ground trees, Below ground living biomass,
IFM Above ground living and below ground living biomass Dead standing Biomass and Wood products
Above ground trees, dead wood and Wood products
REDD/Risk of Conversion
Above ground living and below ground living biomass Dead standing Biomass and Wood products
Above ground trees and Wood products (If avoided conversion in perennial crop also above ground non tree.
Pool
s O
ptio
nal
ARR Lying dead wood, Litter, Soil (no wood products)
Above ground non tree, Litter, Dead wood, Soil.
IFM
Shrubs and Herbaceous understory, Lying dead wood, Litter, Soil.
Below ground living Biomass, Soil
REDD/Risk of Conversion
Shrubs and Herbaceous understory, Lying dead wood, Litter, Soil.
Above ground non tree, below ground, Litter, Dead wood, soil. (converting in pasture and perennial crop; no soil)

167
Additionality
Additionality is a very important requirement and often difficult to prove. In general, both the CCAR and the VCS have the same basic requirements, each project needs demonstrate its dependence of the carbon credits generated by the project itself and be truly non ‘Business as usual’. Within the VCS the test is given to show additionality while within the CCAR the project developer has to independently develop sufficient proof of additionality.
Table 3: the differences in the additionality rules and tests between the CCAR protocol and the VCS standard.
Protocols CCAR (California Climate Action Registry) VCS (Voluntary Carbon Standard)
Document Revised Forest Project
Protocol Dec 2008 Voluntary carbon standard 2007.1 2008
Def
initi
on
Additionality
Forest project practices that exceed the baseline characterization, including any applicable mandatory land use laws and regulations.
Same as CCAR not provided explicitly
No tests are given.
1.The project test: Each project has to prove it can overcome a barrier by generating carbon credits. This can be: Investment barrier, Technological barrier, Institutional barrier
Testing for additionality
Creditable GHG reductions must be above and beyond any reductions that would have occurred under “business as usual,” where the climate change mitigation benefits of an activity are presumably not considered.
2. Performance test (no projects have been approved yet) The emissions generated per unit output by the project shall be below the level that has been approved by the VCS Program for the product, service, sector or industry, as the level defined to ensure that the project is not business-as-usual
3. Technology test (No projects have been approved yet)
These project types are defined as those in which all projects would also be deemed additional using Additionality test 1 and will be determined on a case by case basis.

168
Baseline
There are no large general differences in this key methodological aspect.
The most notable differences can be found in the REDD projects baseline determination where the CCAR methodology tool is “simple “compared to the three options given by VCS. Within VCS a methodology has to be chosen that fits one of the three REDD categories however have several options may qualify more projects.
In the Table 5 comparison also, some of the emerging standard models used in developing the PDD and business cases are also noted.
Table 4: A comparison between the baseline determination between the CCAR protocol and the VCS standard.
Protocols CCAR (California Climate
Action Registry) VCS (Voluntary Carbon Standard)
Document Revised Forest Project
Protocol Dec 2008 Voluntary carbon standard 2007.1 2008
Proj
ect B
asel
ine
ARR
Current inventory is used in model to predict future vegetations and thus amount of carbon
General Baseline rules
IFM
Determines using current inventories, practice, legal requirements and known parameter from similar forest area under similar management.
Documented history to show for normal practice. Baseline management meets legal and environmental standards.
REDD/Risk of Conversion
Immediate threat. (Risk =0) baseline: threat is executed. Including rate. Providing proof of proposed conversion
Risk of conversion. Amount of possible emitted GHG * % risk conversion determined by given protocol.
APD (avoided planned deforestation): proof of the projects additionality, Rate of conversion based on common practice. Wood products Include baseline! AUFDD (avoided unplanned frontier deforestation and degradation): Proof of development in the geographic area including proof of development of possible Infrastructure. AUMDD (avoided unplanned mosaic deforestation and degradation): Proof with historical rate of development that project area will be converted. Projects need to re-assess project baseline every 10 years.

169
Models Used Empirical Based Models, Examples: CACTOS<CRYPTOS, FVS, SPS, FPS, FREIGHTS. Other models need to be peer reviewed and undergo sensitivity analysis
The most conservative baseline scenario according to ISO rules
Confidence Level Required
90% If sampling error is greater than 5% on either side that amount will be deducted from the carbon stock.
95% lower confidence interval for the pool and 95% higher confidence interval for leakage discount.

170
Leakage assessment
Within the CCAR the Leakage assessment follows an easily understood methodology tool but one that is very conservative and has high discount for leakage. The VCS standard does not have an approved methodology yet and asks the project developer to write their own. This is usually a fairly difficult task. The VCS has a market leakage discount method but CCAR’s default calculation is very conservative.
Table 5: A comparison of the leakage assessment criteria between the CCAR protocol and the VCS standard
Protocols CCAR (California Climate Action Registry)
VCS (Voluntary Carbon Standard)
Document Revised Forest Project
Protocol Dec 2008
% Voluntary carbon standard 2007.1 2008
L e a k a g e
Active viable cropland 24%
Leakage assessment needs to be conducted and needs double approval
Grazing area canopy 30-40% 10% Grazing area canopy 40-50% 20%
ARR Grazing area canopy 50-60% 30% Grazing area canopy 60-70% 40%
Grazing area canopy >70% 50% Other 0% With Improved Forest Like above or use of default market
leakage: If timber harvest shift to: 1. Within country similar carbon
dense forest -40%, 2. Within country less carbon
dense -20% 3. Within country more carbon
dense -70%, 4. Outside country 0%
management. Converting in
protected Non harvest 2% of
IFM
current CO2 and discount each Year! All other leakage possibilities will have to be
2%/ year
monitored during projected
and deducted from carbon
gain
Through risk analysis
60/ 50/ 40% or 0%
reduction rate determined. All Like Above: Avoided planned
REDD other leakage possibilities will have to be monitored during
deforestation (APD): Monitoring the former owner of the area and deduct
projected and deducted from from net carbon benefits. carbon gain
AUFDD (avoided unplanned frontier deforestation and degradation) and AUMDD (avoided unplanned mosaic deforestation and degradation), implement activities to minimize leakage, monitor and account leakage.
Risk assessment.
Perhaps the biggest difference between the CCAR and the VCS standard is in the risk assessment criteria. The CCAR is very conservative and results in a high discount for future risks. Another major difference arises from the fact that only the VCS releases the discounted credits over time as risk naturally declines over the project period.

171
Table 6: Comparison of the Risk assessments between the CCAR protocol and the VCS standard
Protocols Document
CCAR (California Climate Action VCS (Voluntary Carbon Standard) Registry) Revised Forest Project Protocol Voluntary carbon standard 2007.1 Dec 2008 2008
ARR
See protocol for risk assessment High = 40-60% Medium =20-40% Low=10-20%
IFM See protocol for risk assessment High = 40-60% Medium =15-40% Low=10-15%
REDD See protocol for risk assessment See Buffer example
APD-H=20-30,M=10-20,L=10 AUFDD-H=25-35,M=10-25,L=10 AUMDD-H=30-40,M=10-30,L=10
(Please note that the risk assessment within the CCAR protocol is an extensive methodology and so was not put in the table)
Clearly the choice of standard will have a considerable impact on the project values, and choices have to be made reflecting on all of the differences between regulatory options in order to assure that the highest value is captured.
Recommendations: Comparative accounting of projects using different standards or protocols reveals considerable variability in the value recognized. At this point potential for forgone opportunity or lost value is high, consequently it is recommended that each conservation trust
• secure some dedicated professional capacity which can compare values in different regulatory jurisdictions and markets,
• continuing to support consensus building among trusts to work common cause with the provincial government to capture the highest potential conservation credits within the provinces regulatory developments for the best long term future,
• an analysis of each trust’s portfolios to carve out inventory best suited for
different markets, including perhaps a portion of portfolio that may only qualify for early action direct marketing by the trust.

172
Appendix 6: A North American Standard Forest Methodology
In 2008, in anticipation of a common North American trading platform, the Canadian and US Forest Service and the Canadian Institute of Foresters, the Society of American Foresters and the American Association of Forests have formed a Forest Carbon Standards Committee (FCSC) is to develop and maintain consensus standards for the measurement, reporting, and verification of forest carbon emission reduction projects (e.g., offsets) under current and emerging greenhouse gas emission reduction programs in Canada and the United States. Draft standards are expected in 2009. The FCSC will offer policy makers forest carbon offset standards101 that have high environmental integrity, are scientifically sound, and offer transaction efficiency in light of known forest science and practice, in the hope that consistent approaches across the two countries can be achieved.
These standards will be developed under procedures adopted by the American Forest & Paper Association (AF&PA), an American National Standards Institute (ANSI) accredited standards development organization, with efforts to be consistent with procedures of the Canadian Standards Association (CSA), an accredited standards development organization of the Standards Council of Canada (SCC). In addition to AF&PA, other sponsoring organizations include the Society of American Foresters, the Forest Products Association of Canada, and the Canadian Institute of Forestry. These organizations invited a diverse set of participants to join the FCSC, representing a balance of organizational interests and scientific knowledge. The FCSC currently has 45 participants (including one of the authors, Brinkman). Interest categories have been defined as follows:
• Producers – individuals or organizations that produce, measure, monitor, and
sell forest carbon offsets. • Users – individuals or organizations that verify, approve, register, broker, or
purchase forest carbon offsets, or establish public policy or rules that may refer to the standard.
• General interest – individuals or organizations that monitor the environmental integrity and/or public interest impact of the forest carbon offsets produced under the guidance of the standard.
101 While these standards will focus on forest projects developed for qualification as offsets under future cap and trade programs, the principles and methods involved may be adapted or modified to encourage other types of forest-based carbon emission reduction programs.

173
The Committee will produce a set of standards that will cover various types of forestry projects, which were provisionally identified as:
• Afforestation • Reforestation • Forest Management • Forest Protection • Urban Forestry Four Technical Task Committees will assemble comparisons of existing protocol and standards approaches and consider innovative approaches in the following areas:
1. Baselines, additionality: establishment of base case (base year, baseline, BAU,
etc.), additionality (amount of change vis-à-vis base case that is allowed for crediting). Evaluate the different approaches in terms of:
o (a) ability to ensure real and additional GHG emission reductions; o (b) dependence on real, measured amounts relative to the project; o (c) relevance to project owner’s management control and action; o (d) ability of independent third-party verifiers to verify accuracy of
reported amounts; o (e) possibility of unintended environmental and economic consequences; and o (f) transaction efficiency.
2. Permanence, Leakage: Identify methods to address risk of reversals (loss of previously reported carbon sequestration amounts) and leakage (carbon-emitting activities elsewhere caused by project action). Evaluate options in terms of:
o (a) ability to ensure real and permanent GHG emission reductions; o (b) effectiveness and efficiency in addressing and mitigating risk; o (c) relevance to project owner’s management control and action; o (d) ability of independent third-party verifiers to verify accuracy of
reported amounts; o (e) possibility of unintended environmental and economic consequences; and o (f) transaction efficiency.
3. Quantification (Measuring, Monitoring, Verification): Address measurement, reporting and verification of sequestration amounts. Include details on reporting requirements (frequency of reporting and verification, public disclosure, etc.) and on carbon pools and emissions included (required and optional). Evaluate the different approaches in terms of:
o (a) good accounting principles (transparency, completeness, consistency, accuracy, repeatability, uncertainty);
o (b) feasibility (available scientific methods, cost, transaction efficiency); and o (c) ability of independent third-party verifiers to verify accuracy of reported
amounts. 4. Sustainability, Co-Benefits, and Environmental Impacts: Address how to
demonstrate sustainability and encourage co-benefits within forest carbon sequestration projects designed for market trading. Evaluate different approaches in terms of:
o (a) likely impact on the environment, economy, and society; o (b) consistency with known forestry science and practice; o (c) relevance to project owner’s management control and action; and o (d) relevance to the compliance credibility of the reported carbon amounts
and the demands of offset purchasers

174
5. Integration Task Committee Completed Technical Task Committee draft recommendations will be reviewed by an Integration Task Committee established by the Chairman, with anticipated interaction between the Integration Task Committee and Technical Task Committees. The Integration Task Committee will present the final report in September 2009.
One of the authors is on the Sustainability committee, and other members of his firm are on the Quantification committee.

175
Appendix 7: A Provisional Framework for Evaluating Project Carbon and Ecosystem Service Values
In this appendix, we propose a provisional practical framework and method by which land trusts and other land managing agencies (in British Columbia) can establish the value of their project, monitor it and report on its progress. Valuation frameworks and protocols are still under development and basic data are lacking for the carbon and ecosystem service valuation of many ecosystems particularly in BC. As outlined in Chapter 5 valuations can be obtained in various ways such as reference to case studies102 combining default values (IPCC FAR biome values) and site-specific research.
The method proposed here has the advantages that it can be implemented immediately and does not require that monetary values be established for ecological services, though such values can be used and included, when available and appropriate. Although our method is based on an index, the values behind the index involve, or can involve real repeatable standard measurements appropriate to the ecosystem service of interest. Thus, they can be verified and reported credibly. Furthermore, the index can be treated as a numerical value and projected and accumulated into the future thus providing opportunities for the comparison of choices and demonstration of additionality and accounting for leakage and risk. These are key components of offset projects.
We hope that as the data base builds from using the method, it can become more and more specific and easy to use.
The framework and its parts are based upon principles and assumptions outlined in Chapter 3 and 5 (Carbon) and 4 (Ecosystem Services). Consistent offset analyses, evaluated into the future, allow the investor to compare options to their objectives and facilitate the tracking necessary to establish whether or not a project is meeting its targets and that the investment is paying off.
The framework is limited to valuation without the business extension to a market. It is limited to measurement and relative valuation of the components of an offset project, not how much the investment community will pay at a given time and under a given set of circumstances. That largely “monetary” value will vary according to some of the factors described in steps 8-10 in Chapter 4.
102 (Nelson et al. 2009), (Morrison, et al.)

176
Some key principles:
1. The objective value of a project depends on the sum of accumulated benefits over an interval of time. See Wilson and Hebda (2008 Figure 2) for this concept as applied to carbon and conservation). In other words, the longer the services are delivered the more valuable the project is. With time, the different outcomes of choices or scenarios readily become apparent.
2. Not all services have monetary equivalents, nevertheless there are accepted and standard quantitative ways of measuring many of them.
3. Project values, goals and locations are unique. Thus, explicit choices have to be made concerning which ecosystem services are combined in a project and what their relative importance is.
4. A valuation framework needs to be flexible because jurisdictional requirements and interests of potential supporters and investors vary widely.
5. Measurement methods for different services vary widely yet can be internally consistent.
6. All services require a mechanism to account for risks (discounting).103
The following are key steps in the analysis (see Chapter 4 for more detail)
Steps:
1. Identify project boundaries and objectives.
2. Define the project objectives in terms of ecosystem service goals like water supply, biodiversity, timber products, carbon sequestration, carbon sink etc.
2. Assign the relative contribution (assigning the proportion) of each service to the project value. For example: Is the Carbon value as important as all the other ecosystem services? Is water quality and supply more important than biodiversity? If so, is it twice as important or three times or what? The services have to be realistic (=deliverable) at a meaningful level.104
3. Chose the specific method of establishing value for each service by consulting experts or literature.
4. Establish the starting point value for each ES.
5. Establish a total starting point valuation by summing the value for each service according to your weighting (=project goals and objectives).
103 (CCAR, 2008). (Mason, Lippke, Zobrist, & Bloxton Jr., 2006) 104 See discussion in World Resources Institute report by (Ranganathan , et al., 2008)

177
6. Establish a total starting point valuation by summing the value for each service according to your weighting (=project goals and objectives).
7. Forecast accumulation or decrease in value of each ES into the future using models or trends (establish trajectories) and develop scenario testing. 105
8. Calculate the accumulated value of the project at different times in the future compared to not doing the project (=baseline). In other words, sum the annual values over the interval of the duration of the project.
9. Describe the project in terms of accumulated benefits of both carbon and ecosystem services.
10. Monitor, carry out accounting and report project values to meet any regulatory needs, to report to the investors and to make adaptive changes.
Helpful reports on how to approach elements of this process include Ranganthan et al. (2008 WRI report), Nelson et al. 2009 for the Willamette River watershed in Oregon, Morisson et al. nd for Sunshine Coast Community Forest.
This valuation tool is "quasi-mathematical", allowing the use of monetary values when they are available and appropriate and allocating qualitative ranking numbers (based on measured values) to begin an exploratory scoping exercise (see Morrison et al. nd for one type of ranking method). The approach seeks to
• be highly flexible and allow for incorporating a risk or discount factor • permit the inclusion of as wide a range of elements as judged important to a
specific project or agency. • allow for changes in standards and methods for determining values.
Components of the valuation The provisional valuation tool consists of two major components consistent with the breakdown of the analysis in the body of the report: Chapters 3 and 5 carbon (greenhouse gas value) and Chapter 4 other ecosystem services.
Carbon sequestration or emission (CE) value is defined here to include all GHGs expressed in CO2 equivalent (CO2e) and represents the current rate of removal or emission avoidance of atmospheric CO2 calculated on the basis of the value of a ton of CO2 at the time of valuation or according to the circumstances of valuation. Expressed as the potential accumulated emissions/sequestration over time it is called Accumulated Emissions AE. Using the methods and equations in Chapter 5 it can be expressed in tonnes per hectare.
105 (see Nelson et al. 2009 for a regional example)

178
The Ecosystem Service value (ES), like the carbon emissions value, represents the current amount of delivered ecological services or benefits. For a project, it is called the accumulated ecological services (AES) or benefits over time. Using the methods reviewed in Chapter 4, each service can either be calculated in monetary terms or expressed based on an index. Similar concepts are used by the Business and Biodiversity Offsets Program (UNEP/CBD/COP/9/Inf/29) for other ecosystem services. The use of indexes for establishing relative value when comparing scenarios is well demonstrated in a couple of regional analyses such as Morrison et al. (nd) and Nelson et al. (2009).
The framework that follows separates carbon services from other ecosystem services because the protocols and methods for carbon valuation are relatively well developed and linked to specific offset markets whereas the much broader and more complex ecosystem service offset market is less standardized.
Furthermore, this tool leads to a valuation based largely on the first seven steps in Chapter 4. It does not incorporate the complexities of the business framework and context present in the last three steps. Those complexities and protocols influence the monetary value but do not influence the actual quantity and objective character of the ecosystem services themselves. In other words, one can carry out a valuation of water supply, biodiversity and other services without having to calculate what they are worth in the context of the business and social atmosphere of the day. The volume yield of water and number of rare species can be determined without monetary valuation.
Establishing Current value Please note that symbolic notations are used because of the space that would be taken up if we used phrases.
The current value of a project is designated as PV (Project Value) at the time (t1 or year0) (=start time). PVt1 includes the project’s Carbon Emission or sequestration value (CEt1) plus the project’s Ecosystem Service value (ESt1) or
PVyear0 = CEyear0 + ESyear0
which is the starting point value of the project. This is not the baseline value or business-as- usual value as defined and described in Chapter 3. That baseline value is a projection of future value and conditions should the project not be undertaken. In this case the value being defined reflects the conditions at the inception of the project. It is a measured or modeled value but is not a forecast value or projected value.
The future value of the project is designated the Accumulated Project Value (APV) which is the key factor for carrying out comparisons for investment, and which changes with time as ecosystem service benefits and carbon emission benefits accumulate or decline.

179
It is expressed as:
APVyear x = ACE yearx+ AESyearx
“Year x” indicates how many years the project has been underway. APV accumulates year after year up to the time horizon at which the value is being determined. It can consist of the sum of the ecosystem benefits, avoided emissions and or sequestered carbon.
Where there is a monetary value such as in carbon (CO2 e) you do not have to convert this component of the APV to an index value (see following) unless the carbon value was in direct conflict/competition with another ES value which cannot be expressed in monetary terms. Coast conifer forest in various states of disturbance with optimal sink value of up to 1000 tonnes per hectare (See Wilson and Hebda 2008) may have, for example community-based forestry jobs as a conflicting value. In that case monetary yield from carbon offsets may need to be compared to the monetary yield from timber harvest.
Table 1. Hypothetical relationship of logging jobs and carbon offset value based on assumed relative ranking, but without assigned monetary valuation. The index value is based on an estimated measurement of carbon stocks in relationship to jobs created by logging at different intensities. The real monetary value of each varies with the market value of timber, the cost of removing it, the traded value of a tonne of CO2 offsets and other factors.
Stored carbon in metric tones /hectare
Index value Jobs created with logging
Compound index value
800-1000 undisturbed Old Growth
5 0 5
600-800 4 1 5
400-600 3 2 5
200-400 2 3 5
0-200 converted forest 1 4 5
Using the method described in the following paragraphs ACE and AES have equal weight, a choice perhaps similar to that consistent with land trust objectives. However, when bringing a project on stream for investment, a political or consultative process may have to be engaged to recalibrate the project goals to meet market interests or regulatory requirements. Some land trust supporters may find on the other hand that biodiversity and carbon returns are in conflict and the weighting may shift in favour of ecosystem services. In BC coastal forest ecosystems, with good design it is possible for biodiversity services and carbon service to be strongly positively correlated. In such a case, old growth forest conservation both maintains carbon sinks and a range of biodiversity values. The use of an indexing tool as proposed permits some

180
examination of the links between monetary and non-monetary benefits through changing the weights assigned to each of components of the valuation.
Community forest projects can also combine carbon and biodiversity along with other ecosystem service values such as timber harvest. An indexed valuation can combine more values in future scenarios and provide the venue for debating relative offset benefits.
Carbon emission value and accumulated emissions CE and ACE reflect the annual CO2 (GHG) mitigation and accumulated future mitigation potential of the project. Calculating these values can be as simple or complex as desired or practical (see Chapter 5). It makes sense to keep the ex-ante (projected) values no more complex than necessary to secure eligibility and validation for both voluntary and compliance markets. Once actual offsets are being translated into tradable credits, it is necessary to have specific highly defensible accurate data and analyses. The methodology for that level of specificity has to be designed into the Project Design Document at the beginning of the project.
As described in Chapter 5, there are three options involving progressively more effort (and cost) to establish carbon content and sequestration rates: an accepted or proxy value for you ecosystem, calibrated model or models, or field measurements and models for the basic compartments or pools of an ecosystem (whether under strong human influence or not) and the fluxes of carbon or CO2 between the components and in or out of the atmosphere or hydrosphere (see Figure in Part 2 carbon). As mentioned already Grieg and Bull's (2009) summary review lists and explains several widely used and accepted methods for doing carbon accounting.
CE can be calculated using simple carbon (C) pool and flux models which are based on annual (or other suitable time interval) changes in the carbon content of a project area (ecosystem or ecosystems).
Csoil +Cliving biomass +Cdead biomass
after one year CEyear1 = (Csoil +Cliving biomass +Cdead biomass) year1 – (Csoil +Cliving biomass +Cdead biomass)year0
The difference between the two years can be established by simple measurements of each component at a fixed time each year or determined by the adjusting the values of each pool according to the flux to or form the pool (annual rate of loss or gain) based on models or flux measurements.
On the negative side (losses as CO2):
C living biomass to atmosphere,
which includes the above ground losses through

181
respiration Csoil to atmosphere
which includes below ground losses to respiration (decomposition)
Cgroundwater
which includes dissolved organic matter leached from the system through ground water. Dissolved organic carbon (DOC) can enter the ground water and marine systems and go into permanent storage there—this constant flow has been given the name conservation carbon because Dissolved Organic carbon is a carbon capture and storage function of healthy ecosystems that continue in perpetuity.
and on the positive side:
Cphotosynthesis
the amount of CO2 turned to biomass through photosynthesis
The climate-related CE benefits can all be measured from classical forest mensuration techniques and in the cases where they are difficult to measure estimated from default values or have values developed for them from models based on similar sites. Measurement protocols would follow recommended standards from Chapter 3, 5.
As noted earlier, two ways of determining what the net atmospheric GHG effect are:
1. by measuring the amount of CO2e in the pools every five to ten years and assuming any decline in the total has been lost to the atmosphere as emissions, or;
2. by modeling and monitoring the flux of carbon from the atmosphere and into the atmosphere.
The measurement of the carbon stock (=sink value) of the project would provide the starting point value CEyear1.
Carbon flux measurements have been suggested for use by regions and countries to monitor compliance where there is some uncertainty as to the reliability of the project proponents. However, flux measurements are a secondary check, and are not at this time expected to be used for direct monitoring, because of the high degree of variability depending on weather conditions. The US committed $1.5 billion in 2007 to build a global satellite monitoring system to monitor land use change flux (which can be linked to carbon emissions). However, the implementation of the system still faces some problems.
Empirical equations for carbon are typically expanded to include component terms, in the case of Cbiomass such as leaves and stems and roots.
Simple Carbon Emission (CE) Equations: 1) Using the carbon pool method

182
CE over an interval = Carbon sink at start - Carbon sink at time of measurement
Or CE = C@t1 - C@t2
Or subdividing into pools
CE= Carbon biomass@t1 + Carbon soil@t1 + Carbon dead@t1 - (Carbon biomass@t2 + Carbon soil@t2 + Carbon dead@t2)
2) Using the flux method
When developing a project proposal, obviously, measurements cannot be made into the future, so they have to be projected or forecast. These projections are sometimes referred to as ex- ante. Projections forecasting the rate of change in the pools have to reflect fluxes between GHG pools and in particular to and from the atmosphere. The understanding of these fluxes is changing with emerging science and within these dynamics there are ways to manage a project to improve both ecosystem health and climate value.
In the simplest terms the net flux of carbon, CE, (loss or gain) per year is (in this case the first year)
CEyear1 = Cyear1 photosynthesis - Cyear1 respiration or decomposition
The potential emission or sequestration of C would then be the sum of absorption less emissions over the number of years from the start of the project, for example in year five
ACE@year5 = CEyear1+CEyear+CEyear3+CEyear4 + CEyear5
Real examples of these kinds of calculations often find that an equation applicable to only one area of project may be very complex, longer than fits on a computer screen, as each of the components are added or subtracted for each of the subsets and pools. The key concept is these carbon equations Accumulated Carbon Emissions (ACE) or Carbon Sequestration (the negative of CEP). At the time of starting point calculation there will be a carbon value (the sink value) to the site with a net carbon flux (either positive or negative) relative to the atmosphere. The ACE will be the anticipated or modeled value of carbon lost to or removed from the atmosphere after an interval of time calculated in CO2 equivalents. Flux dynamics are not all simple additions and subtractions. Within soil, for example, microbial activity can respond more dynamically to small changes, and more complex physics equations are required to capture this complexity.
Leakage Modeling the leakage requires some understanding of market dynamics and the factors that can influence activities outside of the project boundaries as a result of the project. Conceptually a leakage component may have the flux equation below.
CEt1 = Ct1 photosynthesis - (CEt1 soil respiration + CEt1 living biomass + Carbon dead t1 + Ct1 leakage)

183
Leakage calculations are always negative. They cannot ever be positive as the project climate benefits are constrained to fluxes within its boundaries where the project proponent is assumed to have control. Rarely are there deemed to be ‘positive’ leakage benefits from a project, but when you recognize the complexity of the butterfly effect in chaos theory, and then imagine arriving at an adequate level of certainty in determining the deemed benefits outside of the project boundary, taking into account all other factors and effects, there really cannot be positive leakage.
ACE could be changed from the rate determined at the time of project inception by various management activities or interventions such as in-planting of young trees, fertilization, reduction of disturbance activity such as grazing in an interior or forest. The ACE of a site could also be negatively impacted by factors such as fire and pest out breaks not factored into the equation. In the first case, the accumulating benefits resulting from the management change have to be built into the trajectory curves used to establish ACE. In the second case as discounting mechanism (discussed later in this appendix has to be included.
Ecosystem Services Valuation Equation Ecosystem service values and accumulated values (= changes) (AES) are calculated conceptually in a manner similar to those for carbon (see Business and Biodiversity Offsets program which even uses similar language: UNEP/CBD/COP/9/Inf/29). The method involves calculating the original monetary or starting point (at project inception) value of ecosystem services or converting the value (by some standard measure) into an index and then summing the key indexed values into a composite index). Then one can determine the rate at which the values (or index) grows or shrinks (based on rate curves for each key ecosystem service).
A full empirical equation would include all of the services or "values" where real dollar values can be calculated and are appropriate (water supply and perhaps quality for example). For many services (biodiversity values) only a qualitative assessment (based on the best available science) can be made. Under such circumstances one option is using an index of components.
Weighting ecosystem service components, (presumably according to your goals) allows you to rank them in comparison to each other and assign relative values. This is a useful exercise and will eventually give some guidance to decision making. In this process, for example, water quantity services could be ranked twice as important as timber values in a community forest. Weighting helps in cross-project and scenario comparison. The forest management plan for the Sunshine Coast Community Forest (Morrison et al. nd) uses a multi-value analysis where weighting is expressed through a set of different strategic objectives for different scenarios and involving different parcels of land in the analysis.

184
An Example Ecosystem Services Index This example Ecosystem Service Index (ESI) allows ecosystem values to be established, compared and aggregated. The example index for each service is based on a scale of 1-5 (see example of Carbon value in Appendix 8 Table-1), that reflects the condition of the service from best to worst: 5 being the best possible condition (maximum volume of water for example, maximum legal timber harvest), 1 being the worst condition (little or no water, no timber harvest). Each ecosystem service has its own internally consistent method for measurement so that it is accountable in a standard manner for example the simplified biodiversity value classification in Appendix Table 2).
Table 2. A simple index scale for biodiversity services.
Index Value Species condition Process condition 5 All keystone and rare species
present, few or no invasives All processes present
4 All keystone species, 50% rare species; minor invasives
All processes, but some at 80%
3 Some keystone species missing , most rare species absent, invasive species common but not transforming ecosystem structure
Several essential processes not functional (e.g., trophic web, hydrology)
2 Many keystone species absent, no rare species, many invasives altering structure
Most processes not functioning, highly degraded
1 Converted to non-native ecosystem or human construction
Most basic ecological processes absent
A simplified equation for the value of a typical conservation offset project including climate change adaptation values might be:
ESt1 = ESbiodiversityyear0 + ESwater qualityyear0 + ESClimate change adaptationyear0 + ES ethical values(aesthetic)year0 +ES intergenerationalyear0 Where year0 is the starting point time horizon, or the project startdate. A community forest might have an equation that includes EStimber and ESnon-timber forest products and might combine natural service values into a single ESbiodiversity term. In the case of a conservation project for an old growth forest stand, the component indexes might be all 5's and the ESyear0 (first equation) would 5+5+5+5+5= 25 if all were equally weighted. For a 60-year-old stand conservation project, because it is species poor, has relatively uniform structure, but provides a reliable clean water supply the index values at project start (=year0) might be 3+5+4+3+4= 19.

185
It is worth repeating that for each category, the index value is independently established based on criteria suitable and accepted for the attribute (see CCAR 2008). Thus, it is accountable and credible. Even if the ecosystem service has no strictly quantitative measure as of yet, such as "resilience" a five-category scale for resilience based on a verbal description of assessable attributes (yes or no answers for example) can be constructed and used in the index.
Following the approach for establishing a baseline trajectory for carbon value, Ecosystem Service component trajectories can be developed for future times and conditions and projected into the future. These can then be turned into index values and summed year by year (just as emission or sequestration of CO2 is) for the total value at a future time horizon.
The accumulated ecosystem benefits or Accumulated Ecosystem Services is then forecast, by summing the annual benefits provided (ESyear1+ESyear2+ESyear3+ESyear4 and so forth). This growing sum of values is the projected return on the investment in the project. On this basis the potential Ecosystem Service value in the fifth year is
AESyear5 = ESyear1+ESyear2+ESyear3+ESyear4+ESyear5
As mentioned already measurability of each component is important for tracking, monitoring and to satisfy investors. Even though each component is not measured in the same way, such as in dollars, the same components are measured the same way and there for the valuation of scenarios of comparison of projects is objects as long as the same weighting for each component is used.
Accounting for risk Each of the components of an Ecosystem Services equation can be discounted either individually or collectively through a discount factor. The possibility of a fire for example might have to be discounted in both the Accumulated Carbon Emissions and Accumulated Ecosystem Services. The California protocol (CCAR 2008) lists many risk factors that apply to both carbon offsets and ecosystem offsets. Risk might be accounted for by simply a proportional reduction of value such as a factor or 0.9 where there is one in ten chance that forest stand might be consumed by fire 106 include a discounting for selected forest values. Hebda et al. 2000 used a modified repeat random burn model to asses the area of bog ecosystem needed so that considering the present- day rate of burn, a sustainable area of climax bog ecosystem would remain after 100 years.
Combining ACE and AES At the outset the intent is to provide opportunities for investment in both carbon off-set and ecosystem service values to the contributor or investor in a project. To do this ACE
106 (Mason, Lippke, Zobrist, & Bloxton Jr., 2006)

186
and AES could be examined separately and an informed decision made. The two potentials could be combined as equals or at varying proportions according to major intended role of a site or changing concerns. For example, climate change adaptation services (if considered as an Ecosystem Service) may become much more important than sequestration and sink values (ACE) in the future for adaptation purposes.
This might occur when populations of a rare native species begin going extinct and protecting a surviving population in a conservation area (biological refugium) becomes critical. Tables provide a simple way to compare ecosystem valuations, particularly when looking at choices of use for a land parcel or comparing one project to another. For a coastal old growth forest patch the value at time of inception can be represented by the equation:
Project Value (PV) = 5CE(emission) + EStimber+ 1ESnon-timber Forest products + 2ES biodiversity+ 1ESclimate change adaptation + ES intergeneration.
Table 3: Comparative project value at time of initiation for old growth coast forest according to use (=year 1).
Scenario Carbon Timber NTFP Biodiversity Climate
Change adaptation
Intergeneration Total index value
Offset index value,1
Preservation Scenario
5x5=25 0 0 2x5=10 5 5 45 45
Community Forest (Conservation with NTFP and selective logging scenario)
4x5=20
lower biomass because of timber removal
2 2 sustainable harvest
2x5=10 4 5 43 39
Conversion scenario
5x2
some carbon remains in soil to be emitted over next decade
5 5 1 1 1 20 13
1. only carbon and non-economy ES included

187
Table 4: Project value after 30 years for Old growth coast forest after choices made in
Scenario Year 10 Year 20 Year 30 Preservation Scenario
45x10=450 45x20=900 900+55x10=1450
adaptation value has increased as climate change impacts have intensified
Community Forest (conserve)
43x10=430 860 860+ 0x10=1260
Conversion 20x10=200 200+ 13x10= 330 No economic benefit, more carbon lost
330+130=460
For an offset project the key attribute is the difference between choices (the equivalent of additionality) and how those differences accumulate into the future (see table below for the potential offset values of the project: Table 5: Differences in accumulated offset values of a project comparing preservation to conservation to conversion of coastal old growth for three different time horizons. Based on simple linear trends and differences without discounting.
Choice made Original offset value
difference Ten years (Accumulated project@year10 offset value)
Twenty years (Accumulated project@year10 offset value)
Preserve vs Convert 45-13=32 320 640
Preserve vs Conserve 43-39=6 60 120
Conserve vs Convert 39-13=26 260 520
Appendix 8 Table 5 demonstrates how offset value accumulates over time compared to a project where the ecosystem is converted. Even choices that include commercial benefits, where the ecosystem is conserved (community forest), can offer major addition offsets compared to a conversion or serious degradation of an ecosystem. Carbon emissions and biodiversity trajectories can be used to show that for reforestation and improved management projects the index value increases in the decades following project initiation in comparison to not doing the project. The offsets (investment yield) being sold in such cases do not accrue until sometime in the future. The valuation tool can be used to demonstrate this through increases in the index values in the right-hand columns compared to the valuation at project start in Appendix 8 table 3. Index units can be turned to monetary value if such a valuation is available. For example, if carbon is being sequestered or not emitted then the value can be

188
calculated using the going rate for avoided tonne of emission. As noted previously the real value is influenced by many other business and social factors. These can be applied once the valuation of components using standard measurement protocols is used whether or not those are scaled to an index value.

189
Appendix 8: Beginner’s Introduction to Offsetting The verb offsetting is used to describe the act of mitigating a damaging activity like carbon emissions or destruction of habitat. Conservation offsets include any protection of a natural area and its carbon for carbon emissions elsewhere or other ecosystem damage. BC has had a form of conservation offsets for years with the Columbia Trust’s policy of buying habitat to offset the damage of the Columbia dams. Recently, in California, land conservation of a redwood forest has been used to offset carbon emissions by an energy company.
The fundamental principle of carbon accounting for conservation purposes is that units of living carbon can be stored or released in ecosystems and these units can be measured and valued in exactly the same manner that units of ancient carbon are stored or released in fossil fuels, measured and valued. Living carbon is stored in various pools of ecosystems, e.g., trees, other plants, canopies and the soil. To generate a carbon credit, a deliberate action is taken that reduces the release of that carbon into the atmosphere. This carbon activity (which is often called a modality in climate change vocabulary) might mean anything from complete conservation of the land to improving forest management where soil is less disturbed and fewer trees are removed than business-as-usual clear cutting. The objective of all carbon activities, whether through scrubbing smokestacks, reducing gas consumption or protecting forests, is to reduce the overall emissions of carbon in the atmosphere. Inclusion of certain activities in a regulatory framework is made on its efficacy to bring down emissions by changing behaviour, so that there is an incentive for people take a carbon stewardship action versus a business-as-usual scenario. As a result, carbon credits are subjected to various tests. Does this activity lead to a net reduction in emissions in the global commons of the atmosphere? So is this activity different from business-as-usual activities (baseline) and generate carbon credits in addition (additionality) to what would have happened if that action hadn’t taken place? Will this activity lead to a “leakage” of carbon being emitted elsewhere? For example, carbon emissions released in the course of the activity or other forests being logged. Will this carbon be stored in that ecosystem permanently (permanence) for the next 100 years?
Credits/offsets for emissions can be bought and traded on different types of markets. There is a growing interest from both voluntary and compliance markets in projects that avoid deforestation and natural area degradation. Regardless of whether the voluntary or compliance market is chosen, projects must have credible, accountable, affordable and trackable methods that meet widely accepted standards so that projects can be assessed, ranked, and their progress evaluated.
The means by which carbon compliance markets or registries (like the California Climate Action Registry (CARR) or the Pacific Carbon Trust (PCT)) assess land for offsets is on a project-by-project basis. Projects can be one large property or an amalgamation of properties. Projects are referred to as Forest Projects but are also known by the acronym PDD for Project Design Development. Forest Projects, are one means, (alongside other technological projects for avoiding emissions, e.g., energy projects), by which the originators (whoever originates the project, which could be land managers from any sector) apply to the markets or carbon registries for carbon credits.

190
Each registry has a set of tools or protocols to assist the originators in calculating, reporting and verifying the emission inventories. For example, in the international scene the default tool/protocol through the United Nation’s Framework Convention for Climate Change (NFCCC) for conserving natural areas is called Reducing Emissions from Deforestation and Degradation (REDD). In California, REDD standards are adapted specifically for California under what is called Forest Project Protocols. These protocols require a series of measurements to be taken that quantify the carbon emissions avoided by proceeding with a decision to protect or restore the natural area. The tools/protocols are set into a framework of legislation allowing the buying and selling of carbon for that particular activity, e.g., conserving natural forests. The tools/protocols also set the standards, which determine the methods of valuing, verifying and validating the amount of carbon stored. Each registry has their own methods for these procedures, which typically meet or exceed the default values or international standards set by the UNFCCC.
Once a project is initiated, there is a whole list of criteria to be met, including passing tests of permanence, leakage and additionality. One of the most onerous standards is demonstrating permanence. How will the avoided emissions be permanently stored for the next 100 years? The current standard in California for ensuring permanence for conserving natural areas is the placing of a legally-binding conservation covenant (known as easement in the US) that provides legal assurance of permanent avoidance of emissions. Once the carbon has been valued, verified and validated, they become carbon credits. These carbon credits are what are sold in either voluntary or compliance markets to offset a company/individual’s emissions. Carbon credits in the compliance markets have registered serial numbers similar to money so there is an ability to resell the same credits.