
Credence Newsletter Week 22Aug_to_28Aug
22
* M ACROECONOMIC DATA * INDIAN EQUITY * INDIAN DERIVATIVES * US EQUITY * EUROPEAN EQUITY * DEBT M ARKET * FOREX M ARKET * COMMODITY M ARKET * VALUE BASED STOCK PICKS CREDENCE CAPITAL M ANISH | N AVIN | R AHUL | R AVI | VIJAY DEVVRAT | H ARSH | MUSTAFA | N ALINI | R ACHITA | SRINATH | V ATSAL | Y ASH Copyright © reserved Credence Capital , IIM Lucknow | Email: [email protected] WITH REGARDS, TEAM CREDENCE C C IIM LUCKNOW WEEKLY NEWSLETTER 22ND AUG – 26TH AUG, 2011 27ND A UGUST , 2011 WEEKLY COMMENTARY & ANALYSIS
-
Upload
j-nipun-kumar -
Category
Documents
-
view
220 -
download
0
Transcript of Credence Newsletter Week 22Aug_to_28Aug

8/4/2019 Credence Newsletter Week 22Aug_to_28Aug
http://slidepdf.com/reader/full/credence-newsletter-week-22augto28aug 1/22
* M ACROECONOMIC DATA * INDIAN EQUITY * INDIAN DERIVATIVES
* US EQUITY * EUROPEAN EQUITY * DEBT M ARKET * FOREX M ARKET * COMMODITY M ARKET * VALUE BASED STOCK PICKS
C REDENCE C APITAL
M ANISH | N AVIN | R AHUL | R AVI | VIJAY DEVVRAT | H ARSH | MUSTAFA | N ALINI | R ACHITA | SRINATH | V ATSAL | Y ASH
Copyright © reserved Credence Capital , IIM Lucknow | Email : [email protected]
WITH REGARDS, TEAM CREDENCE
CCIIM LUCKNOW
WEEKLY NEWSLETTER 22 ND AUG – 26 TH AUG, 2011
27 ND AUGUST, 2011
WEEKLY COMMENTARY & ANALYSIS

8/4/2019 Credence Newsletter Week 22Aug_to_28Aug
http://slidepdf.com/reader/full/credence-newsletter-week-22augto28aug 2/22
MACROECONOMYUNITED STATESHIGHLIGHTS THIS WEEK: Bernanke speech, US GDP Q2 2011
“The Near - and Longer-Term Prospects for the U.S. Economy ”
Ben Bernanke delivered the speech named “The Near- and Longer-TermProspects for the U.S. Economy” on 26 Aug’11 addressing select banks andtop economists. No hint of QE3 was given. Inflation expected to settle at 2%or lower in coming quarters. Bernanke called on Congress and the WhiteHouse to resist austerity measures in the short-term, warning that bigspending cuts will threaten the fragile recovery. Recovery expected to pick
up in the second half of 2011. Economic growth is making little impact onunemployment which is hovering around 9%. He urged that fiscal policyshould follow a sustainable path. Options on easing expected to bediscussed in September FOMC meeting.
US Q2 GDP increased at 1%Second quarter GDP increased at an annual rate of 1 percent. The figurescame in even lower than the 1.1 percent growth generally predicted.Downward pressure from: cuts to state and local government spending,Exports, Private inventory investment Upward pressure from:-consumer spending (financial services and insurance sectors, with healthcare spending)-Non-residential fixed investment (structures, equipment and software)
M ACROECONOMIC DATA
CC

8/4/2019 Credence Newsletter Week 22Aug_to_28Aug
http://slidepdf.com/reader/full/credence-newsletter-week-22augto28aug 3/22
MACROECONOMYThe "core" price index, which excludes the volatile food and energy sectors,rose 2.6 percent. The increase was, higher than the 2.4 percent increaseseen in the first quarter. Real personal consumption expendituresincreased 0.4 percent in the second quarter compared to a 2.1 percent increase in the first.
U.S. Consumer Sentiment Index Upwardly Revised To 55.7 in August U.S. Manufactured durable goods increased by $7.7 billion/4% to$201.5 billion in July Initial Jobless Claims increased from 412k to 417k last week
EURO REGIONHighlights this week: Monthly report on monetary indicators,
Eurocoin indicator, U.K. Q2 GDP growth
MONTHLY REPORT ON M3, M1
This monthly report is about M3, M1 and loans to private sector in theEuro area. This upcoming report will refer to July 2011. Eurozone moneysupply growth improved slightly in July, while the increase in lending toprivate sector eased. The broad monetary aggregate, M3, advanced at apace of 2 percent in July after rising 1.9 percent in June.
M ACROECONOMIC DATA
CC

8/4/2019 Credence Newsletter Week 22Aug_to_28Aug
http://slidepdf.com/reader/full/credence-newsletter-week-22augto28aug 4/22
MACROECONOMYEconomists were looking for 2.2 percent expansion. On the other hand, theannual growth in M1 slowed to 0.9 percent from 1.2 percent in theprevious month. he annual growth rate of credit extended to the privatesector decreased to 1.9 percent in July, from 2.2 percent in the previousmonth, while the increase in loans to general government rose to 4.9percent from 4.7 percent.
Euro-Coin Indicator Declines for Third Month
The Eurocoin indicator, compiled by the CEPR and central bank of ITALY, is
used to estimate Q-O-Q growth in gross domestic product, excludingseasonal variations and short-run volatility. Economic growth in the euro zone continued to slow in August as businessconfidence weakened. There were falls in a large number of the sources of data that contribute to the Eurocoin, particularly significant share pricesand business and consumer confidence. The growth continued to slowmoving through the third quarter.(Pressure is likely to build up on the ECB not to continue with its rateincreases since April in the coming months)
U.K. Q2 Growth at 0.2%U.K. reported weak growth data. The recovery was pulled down by
production, though the dominant service sector managed to expand
M ACROECONOMIC DATA
CC

8/4/2019 Credence Newsletter Week 22Aug_to_28Aug
http://slidepdf.com/reader/full/credence-newsletter-week-22augto28aug 5/22
MACROECONOMY
M ACROECONOMIC DATA
CC
As compared to last year, the economy expanded by 0.7%.Consumer spending is a major factor pulling down economic
expansion. It in turn is affected by high inflation,unemployment and limited wage rise.Inflation in July, as measured by the government's preferredConsumer Prices Index, increased to 4.4% from 4.2% in June.This is more than double the 2% target rate.

8/4/2019 Credence Newsletter Week 22Aug_to_28Aug
http://slidepdf.com/reader/full/credence-newsletter-week-22augto28aug 6/22
MACROECONOMYINDIAHIGHLIGHTS THIS WEEK: Food Inflation data, RBI Report
FOOD INFLATION INCREASES TO 9.80%
India's annual food inflation rate for the week ended August 13 increasedto 9.8%, rise in the prices of fruits, onion, vegetables, egg, fish, rice andpotato. It remained in single digit for the 22nd consecutive week. Annualinflation rate of food article prices, as measured by the wholesale priceindex, or WPI, (with base year 2004-05) for the week ended August 13 roseto 9.80 percent from 9.03 percent in last week. Last year the figure was
14.56 %The 'Food Articles' group index increased by 0.42 percent, due to higherprices of fish-inland, mutton, gram, fruits and vegetables, egg, bajra andmasur. However, the prices of chicken, jowar and moong declined. Annualinflation for "Non-Food Articles" increased to 17.80 percent from 16.07 inthe preceding week.
Index for “NON FOOD ARTICLES” increased by 1.63 percent, on higherprices of flowers, raw silk, gingerseed, fodder, raw cotton, mustard seed,groundnut seed and linseed, while those of gingelly seed, gaurseed, rawrubber and copra dropped.Annual rate of inflation for FUEL AND POWER for the week ended August 13 unchanged at their previous week's level of 13.13 percent Index for "Minerals" dropped by 0.31 percent on lower prices of crudepetroleum.
M ACROECONOMIC DATA
CC
8/4/2019 Credence Newsletter Week 22Aug_to_28Aug
http://slidepdf.com/reader/full/credence-newsletter-week-22augto28aug 7/22
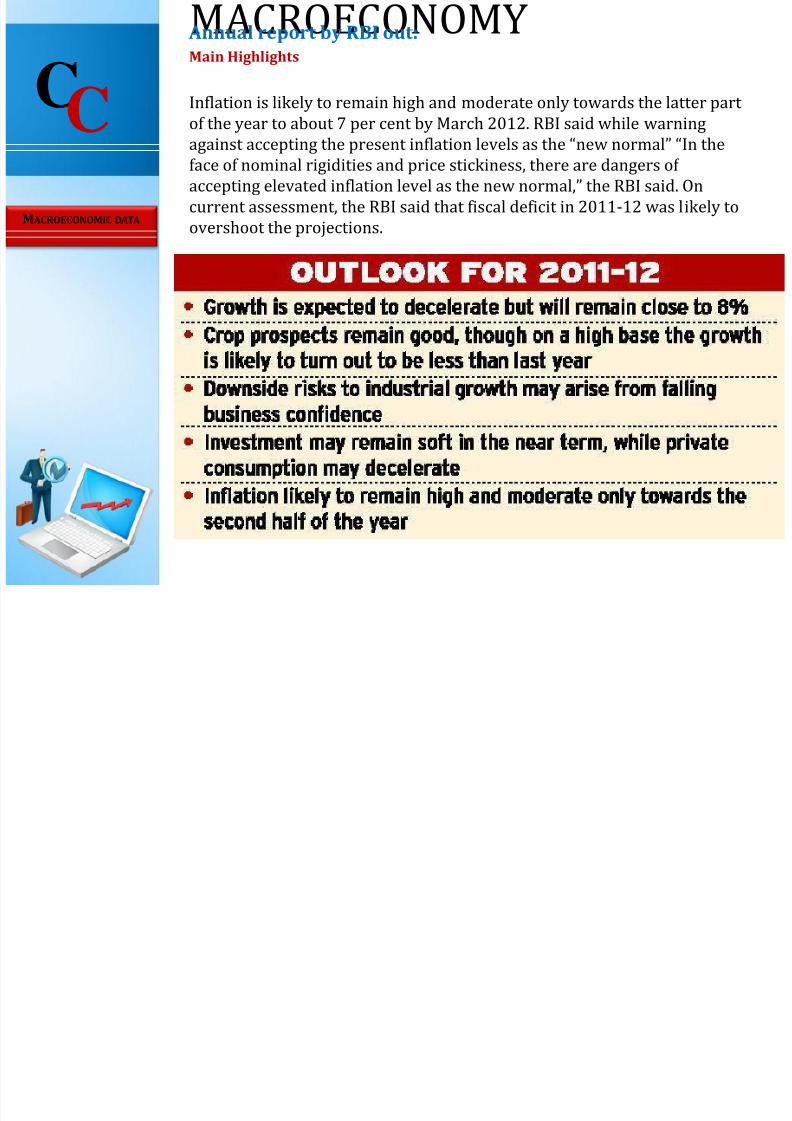
MACROECONOMY Annual report by RBI out:Main Highlights
Inflation is likely to remain high and moderate only towards the latter part of the year to about 7 per cent by March 2012. RBI said while warningagainst accepting the present inflation levels as the “new normal” “In theface of nominal rigidities and price stickiness, there are dangers of accepting elevated inflation level as the new normal,” the RBI said. Oncurrent assessment, the RBI said that fiscal deficit in 2011-12 was likely toovershoot the projections.M ACROECONOMIC DATA
CC

8/4/2019 Credence Newsletter Week 22Aug_to_28Aug
http://slidepdf.com/reader/full/credence-newsletter-week-22augto28aug 8/22
MACROECONOMYJAPANHIGHLIGHTS THIS WEEK: Core CPI
July Core CPI rises 0.1 pct Y-o-Y on higher energy pricesJapan's core consumer prices rose 0.1 percent in July from a year earlier
on higher energy prices. CORE CPI (in case of Japan, includes oil but excludes fruits, vegetables and sea food) rose by 0.1%.The CORE-COREinflation index, which excludes food and energy prices and is similar to thecore index used in the United States, fell 0.5 percent in July from a yearearlier.The government sharply revised down this year's CPI data earlier this
month after changing the base year to 2004-05 and the componentsmaking up the index to better reflect trends in consumer spending. Thegovernment revises the base year for the data once every five years.
$100 B Package for Companies to Deal with Yen's Strength
The Fin Min of Japan announces a $100 Billion credit facility for investorsinvesting abroad. The yen that declined slightly against most majorcurrencies in early Asian deals in response to Moody's downgrade of Japan's sovereign rating, rebounded after the government unveiled a $100billion program to deal with the yen's rise.
(On August 4th, the Finance Ministry intervened in the forex market for thefirst time since March to halt the appreciation of yen)
M ACROECONOMIC DATA
CC

8/4/2019 Credence Newsletter Week 22Aug_to_28Aug
http://slidepdf.com/reader/full/credence-newsletter-week-22augto28aug 9/22
INDIAN EQUITY
Continued volatility amidst uncertaintyFollowing the global slowdown fears, Indian equity
markets continued their downward trend after aquick pullback on 23 rd August, by and largetracking global sentiments
• Shares of Reliance ADAG companies lost 32%in market cap over the last month. The total
market cap of the group is Rs 57,389cr as of Friday’s close
• Good rains this year are expected to boost rural income, leading to greater ruraldemand. As a result, shares of FMCGs andtwo-wheeler companies are expected togenerate buying interest over the short term.
The upcoming festive season is also expectedto boost sales of Auto companies.
• Tata Steel lost 25% over the last month,amidst worries of an adverse impact of theeurozone debt crisis on its Europeanoperations
• Tree House Education and Accessories was
listed on Friday and ended 12% lower due toprofit booking and offloading by bank. It hasa market cap of Rs. 455cr and operates thelargest number of pre-schools in India(CRISIL Report, Dec 2010)
• Mundra Port and SEZ rose 3% over the week,on a 20% growth in net profit and a 27% rise
in sales Q-on-Q
Aug 22 Aug 23 Aug 24 Aug 25-3.00%
-2.00%
-1.00%
0.00%
1.00%
2.00%
3.00%
4.00%Nifty
Bank Nifty
CNX Energy
CNX IT
CNX PSECNX FMCG
CNX Pharma
DateFII Activity DII Activity
Buy Sell Net Buy Sell Net
26-Aug 2146 2372 -226 1169 776 393
25-Aug 3103 4543 -1441 1272 887 385
24-Aug 1854 2737 -883 1162 601 561
23-Aug 2578 2678 -100 928 626 303
22-Aug 1489 2276 -786 1024 881 143
FII & DII Activity: FII selling continued amidst redemption pressures back home while DIIs
continued to buy, considering the cheap valuationsavailable

8/4/2019 Credence Newsletter Week 22Aug_to_28Aug
http://slidepdf.com/reader/full/credence-newsletter-week-22augto28aug 10/22
• Nifty Put Call ratio (OI) is 1.21 compared to 1.03 onAug 19, 2011 which represents a substantial increase.
This indicates building of more PUTs as compared toCALLs signalling a downward movement in themarkets in the coming week • Strong OI addition to the tune of 3mm shares wereadded in Nifty Sep CALLs ranging from 4,800 – 5,000strikes. Call build-up was also seen at the 5,300strike price indicating bullishness in certain
segments of the market. Maximum CALL OI for Sepmonth stands at the level of 5,000. This indicatespullback if any in the markets to be short-lived up to4,950 levels• Notable build-up in PUTs was Nifty Sep 4,200 PUTsadding 1.8mm shares in OI. Relatively high PUTbuild-up was also seen at the strike prices of 4,400 – 4,500. This indicates that the support is sliding downas compared to last week. Maximum PUT OI for Sepmonth stands at the levels of 4,600• Thus key levels to watch out for the 50-share Niftythis week are 4,950 on the upside and 4,600 on thedownside
0
500000
1000000
1500000 CALL OI buildup
-1000000
0
1000000
2000000
4000 4100 4200 4300 4400 4500 4600 4700 4800 4900
PUT OI buildup
INDIAN DERIVATIVES

8/4/2019 Credence Newsletter Week 22Aug_to_28Aug
http://slidepdf.com/reader/full/credence-newsletter-week-22augto28aug 11/22
• Nifty Futures OI for the Sep series added 2.6mm shares,while for the Oct series added 1.5 lakh shares in OI. A
decline in both price with open interest build-upindicates that new short positions are being opened. Aslong as this trend continues, it is a bearish sign. The NiftyFutures ended with a discount of 0.9 points below theSPOT markets• The India VIX increased 14% during the week to closeat 33.26 on Friday. These levels are similar to what wasseen in the days immediately after the US downgrade• FIIs were net buyers in the F&O markets to the tune of Rs 1,767 crores• NSE will launch derivative contracts on S&P 500 andDow Jones from Monday which will help Indian investorsto bet on these stock markets
• August Series expired with Nifty loosing 12% & Bank Nifty loosing 15% in the series• Index Futures Rollover stood at 71%, with Nifty IndexRolls at 75% & Bank Nifty Index Rolls at 65%.• Stock Futures Rollover was better than 3 month avg at 84%• Nifty Index will start the new series with 22mm sharesof OI which is better than the 3 month avg, so overall we
are moving into September series with short-side biasafter the rollover activity
INDIAN DERIVATIVES
FII activity (Rs incrores) BUY SELL NET
INDEX FUTURES 3307.91 2713.68 594.24INDEX OPTIONS 11849.04 10525.57 1323.46STOCK FUTURES 1588.97 1715.27 -126.30STOCK OPTIONS 261.22 286.00 -24.78Total 17007.14 15240.52 1766.62
0.81.15
1.5
22-Aug-11 23-Aug-11 24-Aug-11 25-Aug-11 26-Aug-11
PCR

8/4/2019 Credence Newsletter Week 22Aug_to_28Aug
http://slidepdf.com/reader/full/credence-newsletter-week-22augto28aug 12/22
US EQUITY
This week the US equity markets saw anuptrend rally backed by higher than averagevolumes due to the better than expected dataof Europe and China and Ben Bernanke'sspeech at Jackson Hole meeting. The marketsopened for the Monday trading session just above the previous week’s and remainednearly flat with very low trading volumes.The investors chose to steer away due touncertainties in the European economy.
The European Purchasing Manager’s Index(PMI), an indicator of the healthmanufacturing industry, was reported at 51.1,while that of China rose to 49.8 in August from 49.3 in July. These numbers were strongenough to pull the markets. Dow was upnearly 1.8%, while the broader S&P 500 wasup 2.0 per cent, and the tech-heavy NASDAQjumped 2.4 per cent. The markets againslipped a few point from the peak on theanticipation of Ben Bernanke's speech onFriday.
Deals at Wall Street • Warren Buffett owned Berkshire Hathaway Inc will buy
$5 billion of preferred shares and will receive warrants tobuy 700 million shares of Bank of America.
• Dell gained after the companyannounced it finalized itsacquisition of Force10Networks.

8/4/2019 Credence Newsletter Week 22Aug_to_28Aug
http://slidepdf.com/reader/full/credence-newsletter-week-22augto28aug 13/22
US EQUITY The Jackson Hole Meeting In his speech on Friday, Fed Chairman BenBernanke didn’t mention anything about the
QE3, but the major highlight of the speechwas the extension of the September meet totwo days - Sept. 20 and 21 - to review theconsequences of further easing.Bernanke acknowledged that the recovery forthe US had been slower than expected. Heattributed some of the persistent weakness in
the process to the deep slump in the housingmarket and the financial crisis of Eurozoneand US.Shortly afterwards, the government releaseda report that revised the second-quartereconomic growth, i.e., GDP, to 1%, from 1.3%.The real GDP growth reported was a meagre0.4% in the first quarter and year-on-yearGDP growth at 1.5%. The CommerceDepartment report showed that the increasein exports was lowered to 3.1% from 6.0%.Inventories increased by $40.6 billion, but that was less than the prior estimate of $49.6billion.
On the upside, consumer spending rose 0.4% in the secondquarter instead of 0.1% as initially reported. The core
personal consumption expenditure index - an inflation gaugethat excludes food and energy prices - rose 2.2%The bad numbers were not as bad as expected, but thepositives were better than expected. These numbers, alongwith an assurance by Fed to take long term measures toreverse the downturn and accelerate the growth providedthe much needed confidence boost amongst investors, whichpulled up the US markets.
DJIA was up 134 (+1.2%) to 11,284S&P 500 was up 17 (+1.5%) to 1,176NASDAQ was up 60 (+2.5%) to 2,479

8/4/2019 Credence Newsletter Week 22Aug_to_28Aug
http://slidepdf.com/reader/full/credence-newsletter-week-22augto28aug 14/22
EUROPEAN EQUITY European markets this week started on strongnote. Defensive health care stocks led thegains whereas cyclical stocks, such as banks
and autos, came under pressure. Oil and gasalso posted gains on hope conflict resolutionin Libya. The U.K.’s FTSE 100 index added1.1% to 5095.30, France’s CAC-40 indexclosed up 1.1% at 3051.36, but Germany’s DAX fell 0.1% to 5473.78, its lowest closesince Feb. 5, 2010. Oil majors like Total added2.3%, while RepsolYPF gained 2.8%.European indices ended a choppy session onTuesday. Mixed bag of economic dataconfronted the markets. Strong manufacturingdata from China gave lift off to basic resourcesand auto sectors. The euro zone’s compositePMI held at 51.1 in August, against expectations for a reading of 50 European
stocks racked up healthy gains Wednesdaygaining signals from strong U.S. data andanticipating further monetary stimulus in theworld’s largest economy. The U.K. ’S FTSE 100index added 1.5% to 5205.85, France’s CAC-40index ended up 1.8% at 3139.55 andGermany’s DAX rose 2.7% to 5681.08.
-2.00%
-1.50%
-1.00%
-0.50%
0.00%
0.50%
1.00%
1.50%
2.00%
2.50%
3.00%EUROPEAN INDICES
DAX
FTSE
CAC 40

8/4/2019 Credence Newsletter Week 22Aug_to_28Aug
http://slidepdf.com/reader/full/credence-newsletter-week-22augto28aug 15/22
EUROPEAN EQUITY On Thursday, markets feel amid weak signalsfrom banking system. Athens, bank shares fellsharply. Alpha Bank dropped 9.1%, National
Bank of Greece feel 4.8%.and EFG Eurobank Ergasias fell 5.6%. Three-session winningstreak ended after changing direction inafternoon trading amid speculation that Germany would introduce a ban on short-selling financial shares. Germany’s DAX 30index closed down 1.7% at 5584.14. WarrenBuffett’s $ 5 billion investment in Bank of America failed to stoke investors’ appetite forrisk ahead of Federal Reserve Chairman BenBernanke’s speech on FridayEuropean markets closed in the red on Fridaydue to disappointment. Markets wereexpecting announcement of fresh stimulusfrom Ben Bernanke meet at Jackson Hole
meeting. Steep declines were seen among thebanks , with Royal Bank of Scotland the topblue-chip faller, off 5.2 percent, while LloydsBanking Group lost 4.1 percent . The pan-European FTSEurofirst 300 lost 0.9%,although an extension of a ban on short sellingof financial shares and related derivatives wasseen supporting hard-pressed banking stocks.
France, Italy and Spain Extend Short-sellingBans : Some European governments extended aban on short selling of financial shares seeking tokeep a lid on volatility in European banking stocksamid bearishness. France, Italy and Spainannounced they were extending bans, whileBelgium’s stock market regulator, which hadimposed an indefinite ban two weeks ago, said it would lift the short-selling ban only when market conditions allow. The moves extend restrictions
investors making certain types of bearish bets, asconcerns have swirled about banks’ holdings of troubled government bonds and the weakness inthe overall economy. Short selling, a tradingstrategy that pays off if stocks fall, is widelyregarded in the investment community and inacademia as a legitimate, and even healthy, way formarkets to function.France was the focus of much of the wild swings inbanking stocks earlier this month,with shares in the second-largest listed bank Société GénéraleSA falling more than 20%at one point on 10 th August.
8/4/2019 Credence Newsletter Week 22Aug_to_28Aug
http://slidepdf.com/reader/full/credence-newsletter-week-22augto28aug 16/22
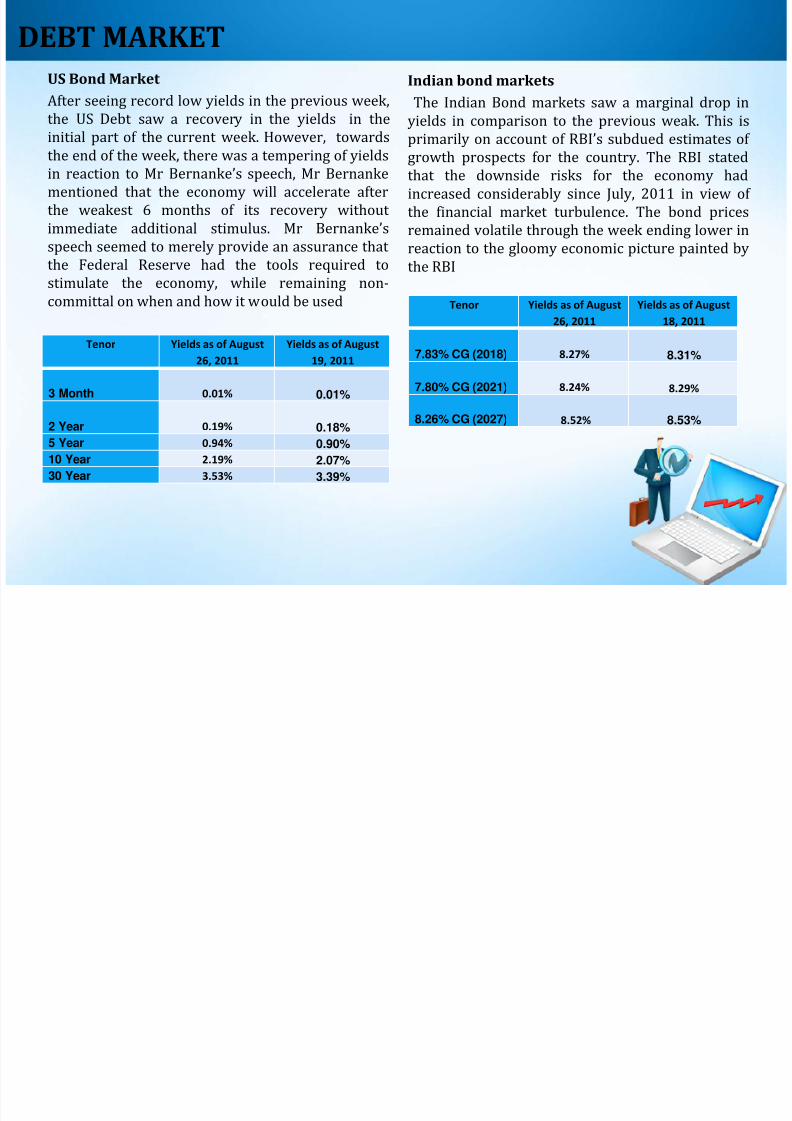
DEBT MARKETUS Bond Market After seeing record low yields in the previous week,the US Debt saw a recovery in the yields in the
initial part of the current week. However, towardsthe end of the week, there was a tempering of yieldsin reaction to Mr Bernanke’s speech, Mr Bernankementioned that the economy will accelerate afterthe weakest 6 months of its recovery without immediate additional stimulus. Mr Bernanke’s speech seemed to merely provide an assurance that the Federal Reserve had the tools required tostimulate the economy, while remaining non-committal on when and how it would be used
US Treasury yieldsTenor Yields as of August26, 2011
Yields as of August19, 2011
3 Month 0.01% 0.01%
2 Year 0.19% 0.18% 5 Year 0.94% 0.90% 10 Year 2.19% 2.07% 30 Year 3.53% 3.39%
Indian bond markets The Indian Bond markets saw a marginal drop in
yields in comparison to the previous weak. This is
primarily on account of RBI’s subdued estimates of growth prospects for the country. The RBI statedthat the downside risks for the economy hadincreased considerably since July, 2011 in view of the financial market turbulence. The bond pricesremained volatile through the week ending lower inreaction to the gloomy economic picture painted bythe RBI
Tenor Yields as of August26, 2011
Yields as of August18, 2011
7.83% CG (2018) 8.27% 8.31%
7.80% CG (2021) 8.24% 8.29%
8.26% CG (2027) 8.52% 8.53%

8/4/2019 Credence Newsletter Week 22Aug_to_28Aug
http://slidepdf.com/reader/full/credence-newsletter-week-22augto28aug 17/22
FOREIGN EXCHANGE • A volatile dollar index in the last week touched ahighest of 74.46 as against the last week’s close of 73.98 as a sharp reaction to Bernanke’s speech onFriday. Even as the market had positioned itself at 74levels ahead of his speech, waiting for a rebound of asink, a no-show from the speech, while increasetrading volumes, did not result a very huge change inthe dollar index value. Overall, however, the dollarindex closed at approximately 30 points lower thanthe week’s opening.• In the European markets, the Pound Sterling gainedslightly against the dollar, albeit in nominal terms,gaining about 1 basis point through the week. Themarket apprehension behind a weakening Europeaneconomy continue to linger and the market does not seem to react to the positive industrial data beingfloated by the governmental agencies across the media
as expected• The Indian rupee continued its downward ridelosing up to 76 basis points against the close of last week. The rupee to dollar rate recorded a value of 46.26 at the close of the week from a previous week closing of INR 45.66 per US dollar in the spot market.The flight of capital from the downward trending
Indian markets has continued towards the safer havenof the US.
The Japanese Yen closed at marginally the same levelsas its close last week. The Yen closed at a level of 76.50against the dollar from the 76.73 levels of last week.Significant trading and volatility was observed on 24thand 25th August surrounding the speech by Bernanke.The exchange rate saw a lowest level of 77.58 duringthe week and a highest level of 76.47

8/4/2019 Credence Newsletter Week 22Aug_to_28Aug
http://slidepdf.com/reader/full/credence-newsletter-week-22augto28aug 18/22
METALS & OILGoldGold had an extremely volatile week, startingoff with the yellow metal hitting life highs at $1899.4/oz, correcting mid-week to $1,760/ozbefore rebounding back to close the week at $1,831/oz. The correction mid-week was dueto profit-taking after the dream-runwitnessed in gold. The correction wasimmediately bought into by investors, as pooremployment numbers in USA once again
raised concerns about global growth andinvestors rushed to the seek safety in gold.
SilverSilver also had an extremely volatile week,mapping the moves made by gold. The metalhit a 3 month high of $43.3, before
experiencing a bout of correction until $39.4,only to bounce back and close the week at $40.95. In the domestic markets, silver closedthe week at Rs.63,490. Silver ended up losing4.18% week-on-week.

8/4/2019 Credence Newsletter Week 22Aug_to_28Aug
http://slidepdf.com/reader/full/credence-newsletter-week-22augto28aug 19/22
METALS & OILCrude OilCrude Oil had a news filled week, leading crudeto close the week about 3.71% higher. There was
news midweek about the end of Col. Gaddhafi’s regime in Libya, leading to downward pressureon the price of crude oil. However, thistemporary weakness was bought into, withtraders realizing it would take some time beforeLibya’s supply to the world markets can berestored. Also, in the US there was an unexpecteddecline in the supply of crude oil of 2.2 millionbarrels for the week ended Aug. 19, causingcrude to rise further. In the domestic markets,crude closed the week at Rs.3,944 / bbl.
Copper: Copper closed the week with gains of 3.3%. Stock of copper at LME warehouses fell by 475 tonneson Thursday, after a reported 1700 tonnes gain
last week. Supply issues in Chile continued tolend support to Copper prices, where workers at Collahuasi copper mine in Chilehave threatened aone-day stoppage on Sept.2. The prices of copperwere further buoyed by the prospect of increaseddemand from China and a slight decrease in thedollar. In the MCX Exchange, copper closed theweek at Rs.416.2/kg.
Commodity International Prices(USD)
MCX (INR) (Sep)
Gold 1831 / oz. 27,612 / 10 grams
Silver 40.95 / troy ounce 63,490 / kg
Copper 8,924 / ton 416.2 / kg Zinc 2,214 / ton 103.7 / kg
Aluminium 2,368.5 / ton 108.1 / kg
Oil 85.44 / bbl 3944 / bbl.
Zinc / Aluminium:Aluminium stock at LME rose by 7300 tonnes on Thursday afterrising by 105625 tonnes last week. The prices of aluminiumremained flat, closing the week with a 0.3% gain. Aluminium
prices are expected to derive support from power rationing inChina's western provinces, which will affect the ramp-up of sparesmelting capacity. Further growth in aluminium supply fromChina is likely to be limited in the next couple of quarters.Zinc stock fell by 2850 tonnes on Thursday after a 5950 tonnesdrop last week. The prices of zinc also was up for the week by3.18%. According to latest monthly bulletin from the Lisbon-based International Lead and Zinc Study Group (ILZSG) the global
zinc market was in surplus by 223,000 tonnes in the first half of 2011.

8/4/2019 Credence Newsletter Week 22Aug_to_28Aug
http://slidepdf.com/reader/full/credence-newsletter-week-22augto28aug 20/22
VALUE BASED STOCK PICKS
In the current bearish scenario markets one can always find stocks which have attractivevaluations because they have taken a beating due to market sentiments and other globaleconomic factors. There are some stocks among these which have seen good fundamental
growth. Such stocks are called Green shoots and they a positive outlook. As a measure ofvaluation we have looked at Price/Earnings ratio while for fundamentals quarterly EBITDA andsales growth on a year-on-year basis have been considered.
CompanyBSE Market Cap (Rs. in Cr) PE (x)
QuarterlyEBITDAGrowth(YoY)%
Quarterly SalesGrowth (YoY) %
% Fall from 3Year High
Power FinanceCorporation Ltd 17541.87 6.6 20.09 20.93 -64.49
Rural ElectrificationCorporation Ltd 16357.27 6.6 21.37 22.9 -57.7
JSW Steel Ltd 13567.93 7 34.52 53.12 -53.8Reliance InfrastructureLtd 11057.97 7 50.74 38.36 -68.08
IRB InfrastructureDevelopers Ltd 4663.01 9.9 32 56.5 -53.41
UCO Bank 4063.19 4.3 44.2 27.26 -56.43
Shree Renuka SugarsLtd 3611.59 8.2 172.08 12.03 -55.75IL&FS TransportationNetworks Ltd 3464.81 7.8 27.1 40.85 -50.24
IFCI Ltd 2589.82 3.6 30.74 21.81 -53.11United Bank of India 2469.49 4.5 33.59 27.91 -50.27

8/4/2019 Credence Newsletter Week 22Aug_to_28Aug
http://slidepdf.com/reader/full/credence-newsletter-week-22augto28aug 21/22
VALUE BASED STOCK PICKS
Given below are stocks which have a high valuations despite negative fundamental growth . P/Emultiple of the stocks is more than 20 . Sales and EBITDA growth is negative for these stocks
Company BSE Market Cap (Rs. in Cr) PE (x) Quarterly EBITDA Growth (YoY)% Quarterly Sales Growth (YoY) %% Fall from 3Year High
Ranbaxy Laboratories Ltd 19,096.06 30.8 -29.05 -2.32 -25.5
Reliance Natural Resources Ltd 6,883.69 105.4 -25.83 -24.27 -62.43
UTV Software Communications Ltd 3,823.89 41.9 -99.11 -0.87 -11.97
Alstom Projects India Ltd 3,344.63 21.2 -63.25 -19.86 -42.2
Financial Technologies (India) Ltd 3,287.39 984.3 -1.38 -6.86 -56.82
Monsanto India Ltd 1,531.83 54.3 -15.52 -8.15 -20.99
MVL Ltd 1,379.75 77.3 -41.11 -28.38 -58.58
Vaarad Ventures Ltd 1,378.94 483.8 -72.48 -90.38 -31.99
C

8/4/2019 Credence Newsletter Week 22Aug_to_28Aug
http://slidepdf.com/reader/full/credence-newsletter-week-22augto28aug 22/22
*
C REDENCE C APITAL
M ANISH | N AVIN | R AHUL | R AVI | VIJAY DEVVRAT | H ARSH | MUSTAFA | N ALINI | R ACHITA | SRINATH | V ATSAL | Y ASH
Copyright © reserved Credence Capital , IIM Lucknow | Email : [email protected]
WITH REGARDS, TEAM CREDENCE
CCIIM LUCKNOW
WEEKLY NEWSLETTER 22 ND AUG – 26 TH AUG, 2011
27 ND AUGUST, 2011