CREDDS hWld’F ?Can REDD Save the World’s Forests? a case ... · 2 Using REDD to address...
20
C REDD S h W ld’ F ? Can REDD Save the World’s Forests? a case of Indonesia a case of Indonesia Fitrian Ardiansyah Program Director - Climate & Energy WWF-Indonesia International Forum for Sustainable Asia and the Pacific IGES 26-27 June 2009 Japan IGES, 26-27 June 2009, Japan [email protected] About me and WWF About me and WWF • Educated as an environmental • Established in 1961, "World Wildlife Fund“ economist (the ANU, Canberra) • Indonesia Official Delegate/ "World Wide Fund For Nature" (works in 100 countries, 5 million supporters). • WWF’s mission is to stop the degradation of the • Indonesia Official Delegate/ Negotiator to UNFCCC – on REDD/LULUCF planet’s natural environment and to build a future in which humans live in harmony with nature • 2002-2006 (Forest Program Coordinator, WWF-Indonesia) 2007-present (Program WWF’s projects around the world and Indonesia Director, Climate & Energy, WWF-Indonesia) • Expert Member of IFCA • Expert Member of IFCA (Indonesia Forest and Climate Alliance) • Former Executive Board Member of the Roundtable on Sustainable Palm Oil (RSPO)
Transcript of CREDDS hWld’F ?Can REDD Save the World’s Forests? a case ... · 2 Using REDD to address...
C REDD S h W ld’ F ?Can REDD Save the World’s Forests?a case of Indonesiaa case of Indonesia
Fitrian Ardiansyah
Program Director - Climate & Energy
WWF-Indonesia
International Forum for Sustainable Asia and the Pacific
IGES 26-27 June 2009 JapanIGES, 26-27 June 2009, Japan
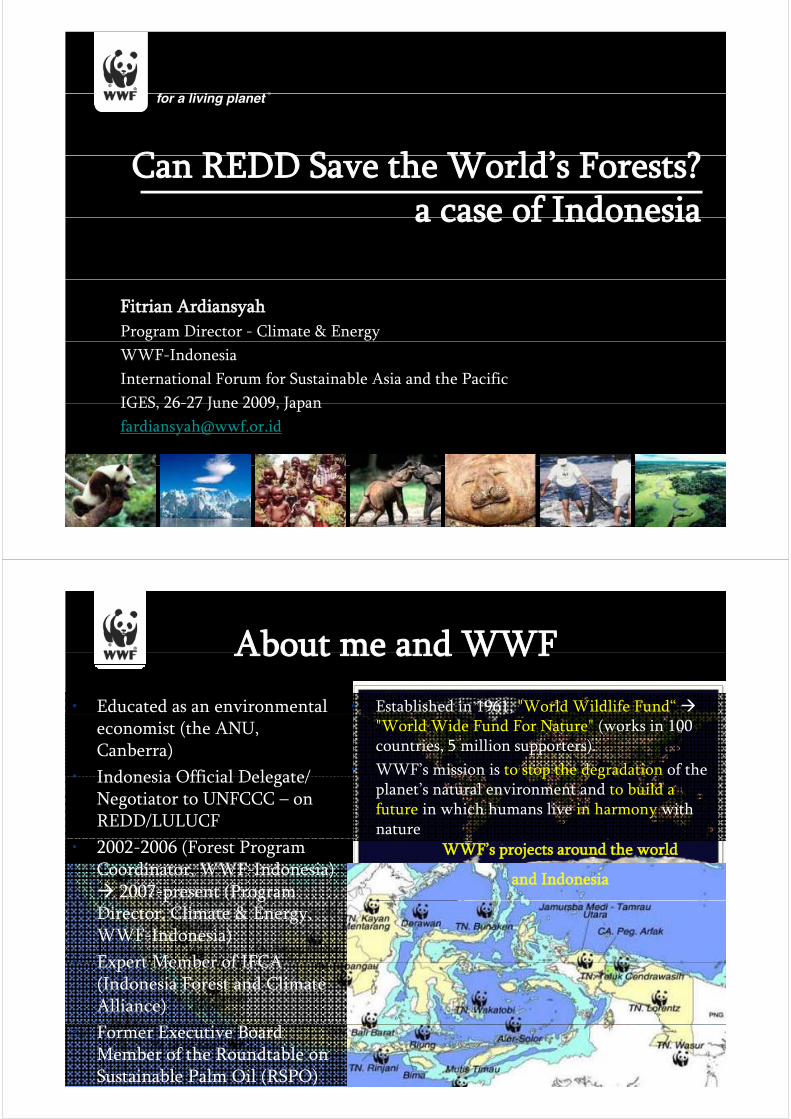
About me and WWFAbout me and WWF
• Educated as an environmental • Established in 1961, "World Wildlife Fund“
economist (the ANU, Canberra)
• Indonesia Official Delegate/
"World Wide Fund For Nature" (works in 100 countries, 5 million supporters).
• WWF’s mission is to stop the degradation of the • Indonesia Official Delegate/ Negotiator to UNFCCC – on REDD/LULUCF
p gplanet’s natural environment and to build a future in which humans live in harmony with nature
• 2002-2006 (Forest Program Coordinator, WWF-Indonesia)
2007-present (Program
WWF’s projects around the world
and Indonesiap ( g
Director, Climate & Energy, WWF-Indonesia)
• Expert Member of IFCA• Expert Member of IFCA (Indonesia Forest and Climate Alliance)
• Former Executive Board Member of the Roundtable on Sustainable Palm Oil (RSPO)
Contents
1. Deforestation, GHG emission and REDD
2 Using REDD to address deforestation2. Using REDD to address deforestation
3. Indonesia’s readiness for REDD
1 D f t ti GHG1. Deforestation, GHG emission and REDD
Scientific noteScientific note…
Sumber: Stern’s Slide
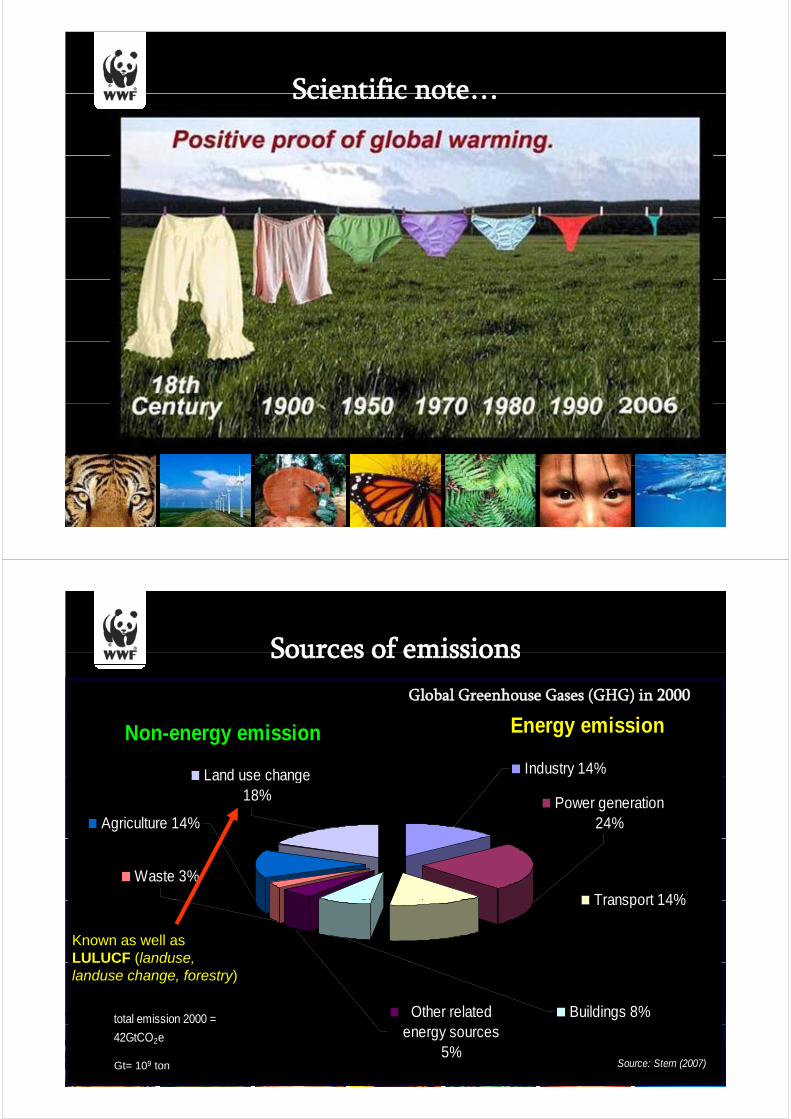
Sources of emissionsSources of emissions
Global Greenhouse Gases (GHG) in 2000
Industry 14%Land use change
Non-energy emission Energy emission
Power generation 24%
yLand use change 18%
Agriculture 14%
Transport 14%
Waste 3%
Transport 14%
Known as well as LULUCF (landuse,
Sumber: Stern’s SlideOther related Buildings 8%total emission 2000 =
LULUCF (landuse, landuse change, forestry)
energy sources 5%
42GtCO2e
Source: Stern (2007)Gt= 109 ton
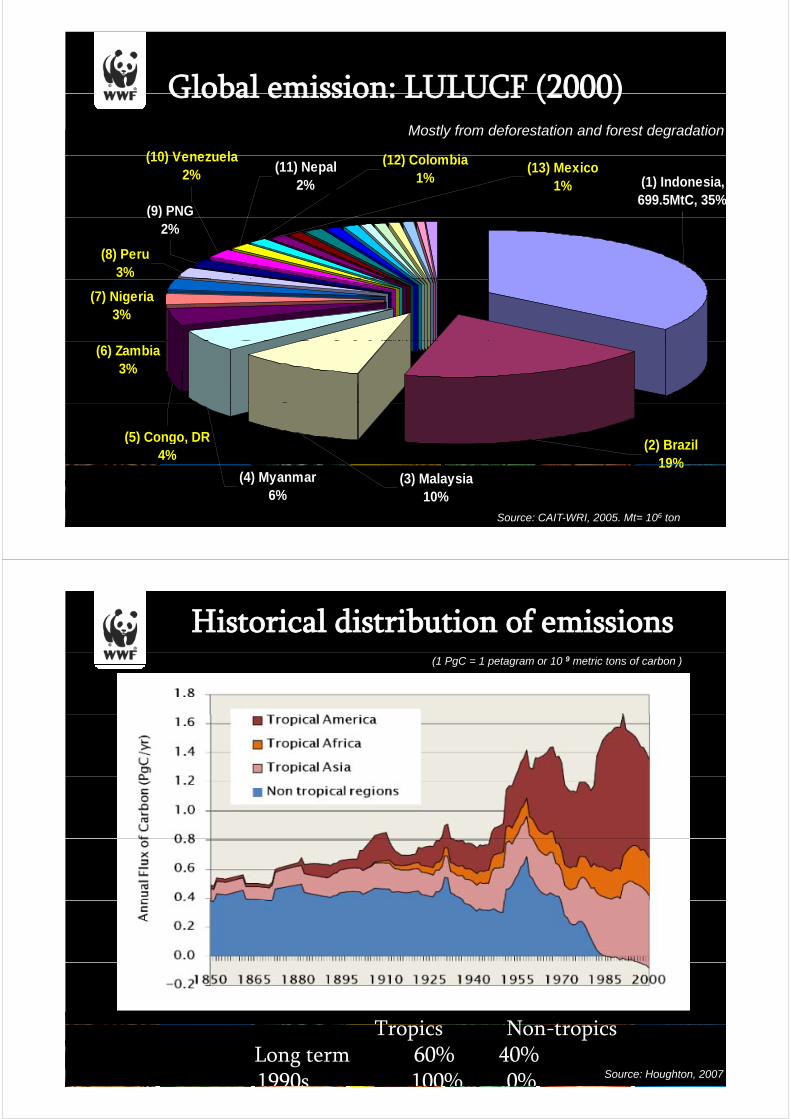
Global emission: LULUCF (2000)Global emission: LULUCF (2000)
(10) Venezuela (12) C l bi
Mostly from deforestation and forest degradation
(1) Indonesia, 699.5MtC, 35%
(10) Venezuela2%
(9) PNG
(13) Mexico1%
(12) Colombia1%
(11) Nepal2%
( )2%
(8) Peru3%
(7) Nigeria3%
(6) Zambia3%
Sumber: Stern’s Slide(2) Brazil19%
(5) Congo, DR 4% 19%
(3) Malaysia10%
(4) Myanmar6%
Source: CAIT-WRI, 2005. Mt= 106 ton
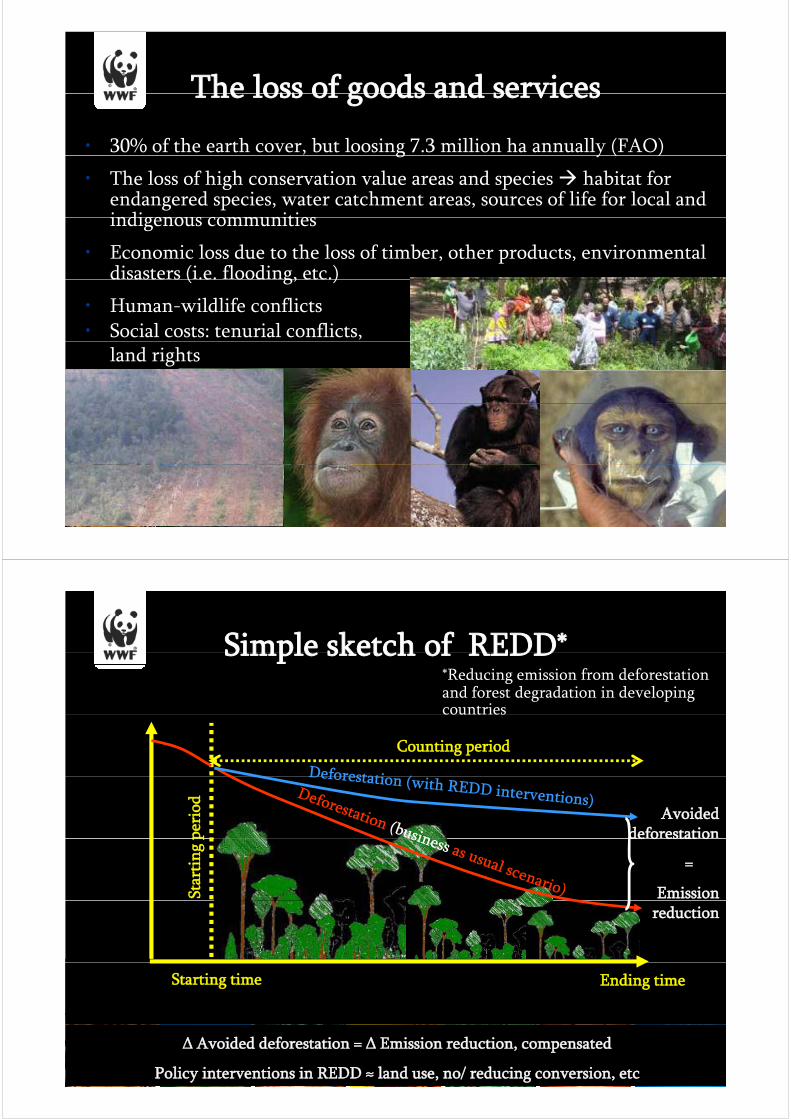
Historical distribution of emissions(1 PgC = 1 petagram or 10 9 metric tons of carbon )
T i N t iTropics Non-tropicsLong term 60% 40%1990s 100% 0% Source: Houghton, 2007
The loss of goods and servicesThe loss of goods and services
• 30% of the earth cover, but loosing 7.3 million ha annually (FAO)g y ( )
• The loss of high conservation value areas and species habitat for endangered species, water catchment areas, sources of life for local and indigenous communitiesindigenous communities
• Economic loss due to the loss of timber, other products, environmental disasters (i.e. flooding, etc.)d saste s ( .e. ood g, etc.)
• Human-wildlife conflicts• Social costs: tenurial conflicts,
land rights
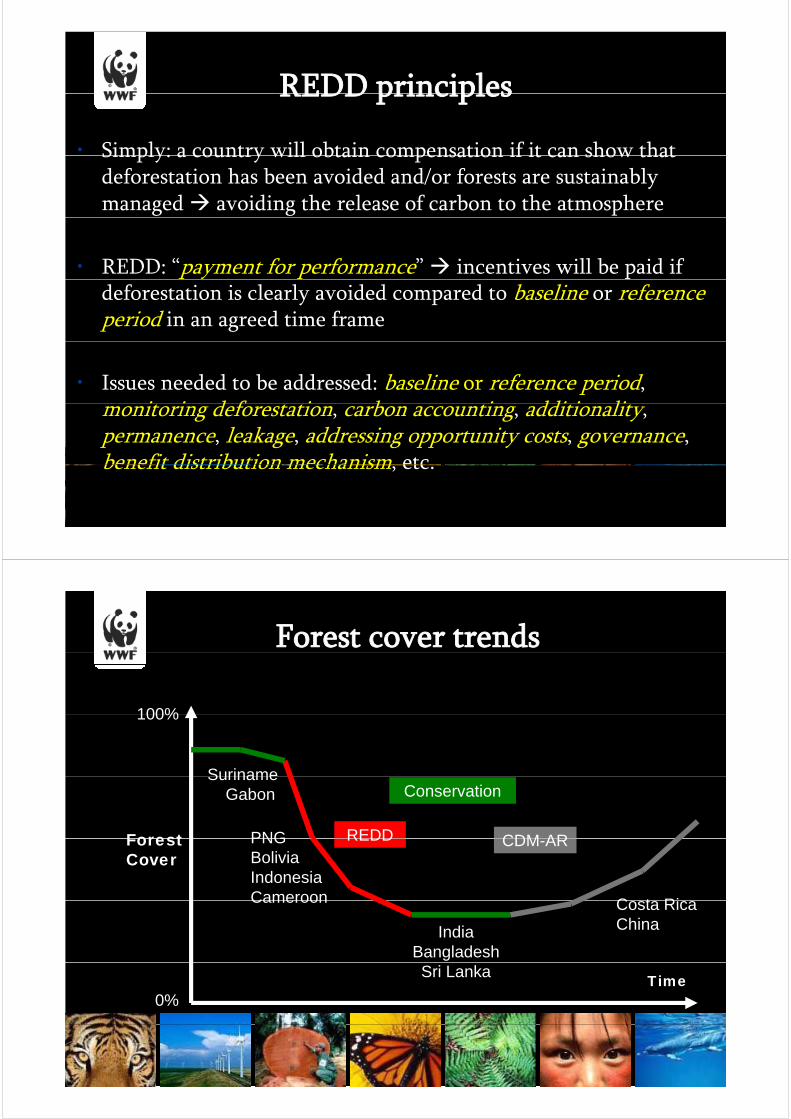
Simple sketch of REDD*Simple sketch of REDD*Reducing emission from deforestation and forest degradation in developing countries
Counting period
Avoided deforestationp
erio
d
de o estat o
=
Emission Star
tin
g p
reduction
Starting time Ending time
Δ Avoided deforestation = Δ Emission reduction, compensated
Policy interventions in REDD ≈ land use, no/ reducing conversion, etc
REDD principlesREDD principles
• Simply: a country will obtain compensation if it can show thatSimply: a country will obtain compensation if it can show that deforestation has been avoided and/or forests are sustainably managed avoiding the release of carbon to the atmosphere
• REDD: “payment for performance” incentives will be paid if deforestation is clearly avoided compared to baseline or reference period in an agreed time frame
• Issues needed to be addressed: baseline or reference period, i i d f i b i ddi i limonitoring deforestation, carbon accounting, additionality,
permanence, leakage, addressing opportunity costs, governance, benefit distribution mechanism etcbenefit distribution mechanism, etc.
Forest cover trends
100%100%
Suriname
Forest PNG
SurinameGabon
REDD
Conservation
CDM ARForestCover
PNGBoliviaIndonesiaCameroon C t Ri
REDD CDM-AR
Cameroon
IndiaBangladesh
Costa RicaChina
TimeSri Lanka
0%
UNFCCC NegotiationUNFCCC Negotiation
Decision 2/CP.13 in Bali (2007) SBSTA Conclusion – REDD in Poznan (2008) SBSTA Conclusion & Draft Decision /CP 15 inPoznan (2008) SBSTA Conclusion & Draft Decision -/CP.15 in Bonn (2009), covering:
• Voluntary preparing for compliance in post 2012• Support for capacity building, technical assistance, transfer of technology
esp. for data collection, emission estimation, robust and transparent national and sub-national forest monitoring systems and reporting, and h i l i f d i i i ithe implementation of demonstration activities
• Policy approaches: REDD+ deforestation, degradation, conservation, sustainable management of forests and enhancement of forest carbon
kstocks. • National and sub-national approaches• Positive incentives: market and non-market (REDD fund)( )• The needs to have full and effective participation of local and indigenous
communities• The use of the Revised 1996 IPCC Guidelines and Good Practice• The use of the Revised 1996 IPCC Guidelines and Good Practice
Guidance for LULUCF to estimate forest-related emissions by sources and removals by sinks
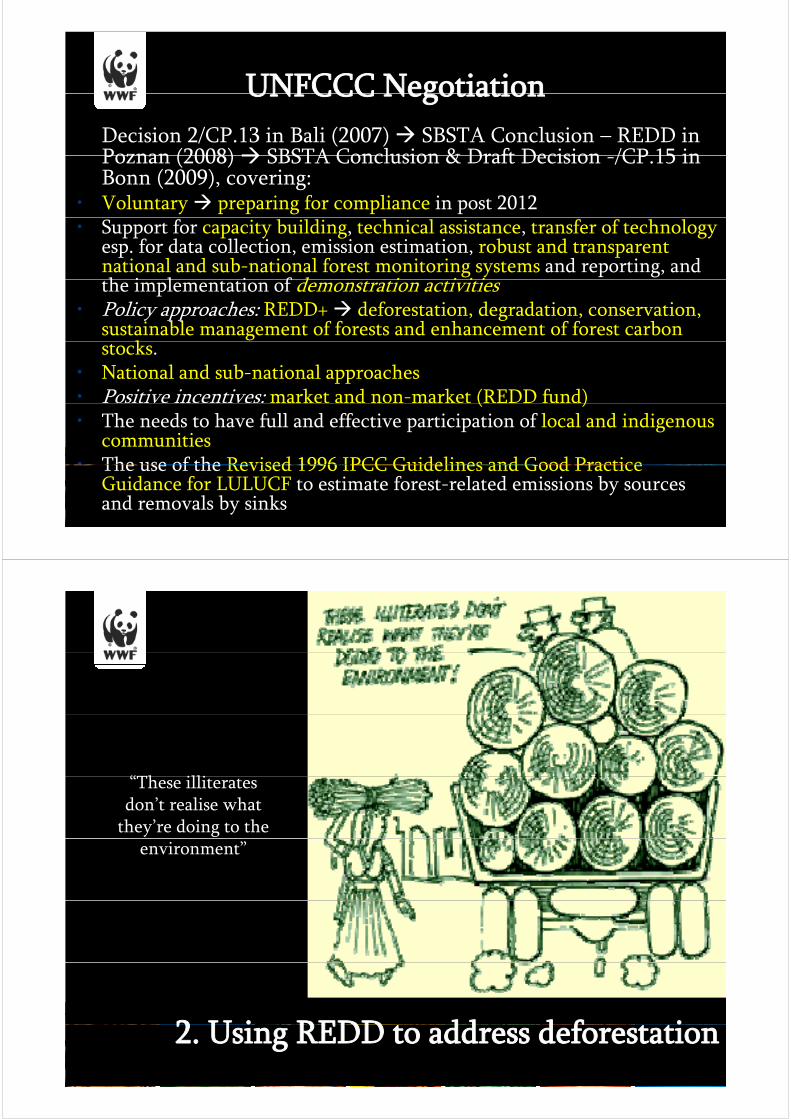
“Th illi“These illiterates don’t realise what
they’re doing to the environment”
2 U i REDD dd d f i2. Using REDD to address deforestation
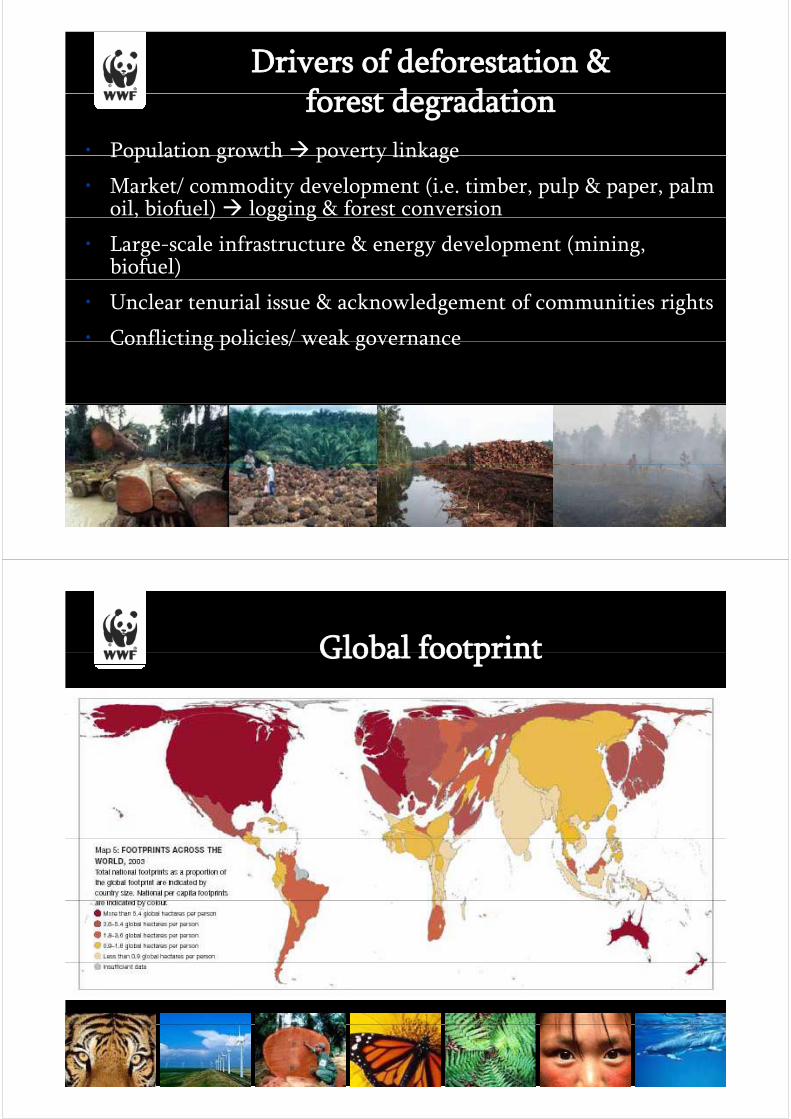
Drivers of deforestation & f d d iforest degradation
• Population growth poverty linkagePopulation growth poverty linkage
• Market/ commodity development (i.e. timber, pulp & paper, palm oil, biofuel) logging & forest conversion, ) gg g
• Large-scale infrastructure & energy development (mining, biofuel)
• Unclear tenurial issue & acknowledgement of communities rights
• Conflicting policies/ weak governanceConflicting policies/ weak governance
Global footprintGlobal footprint
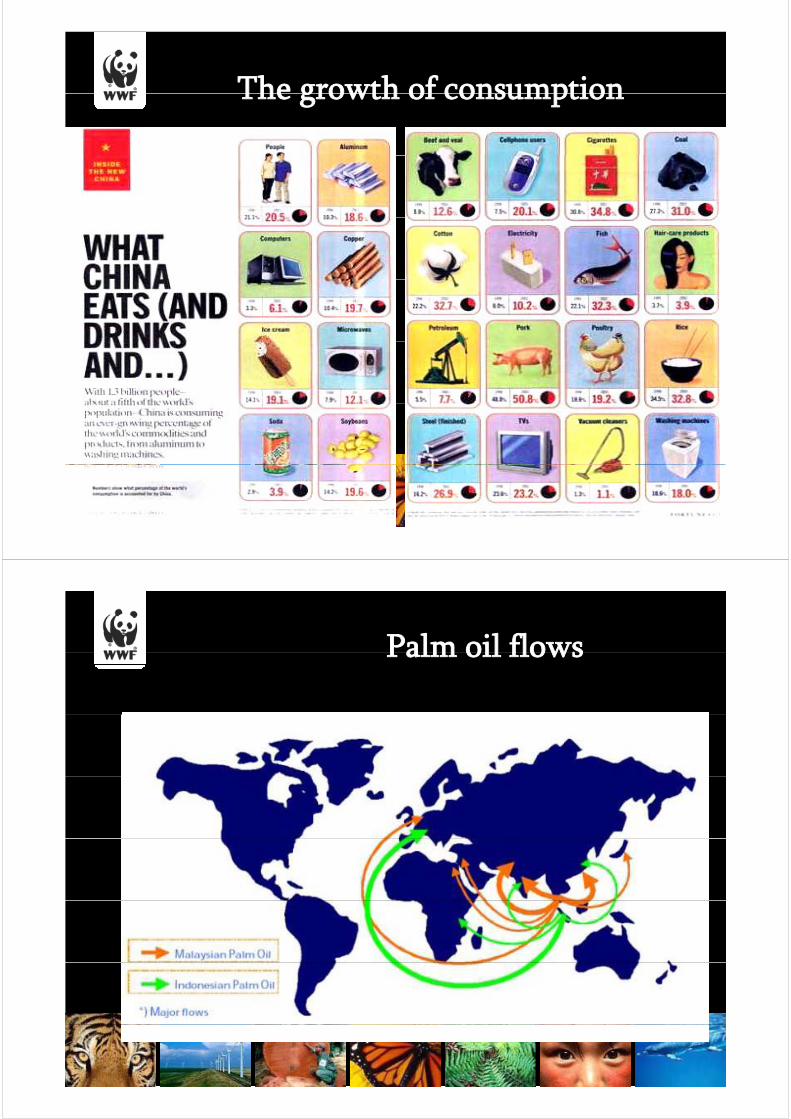
The growth of consumptionThe growth of consumption
Palm oil flowsPalm oil flows
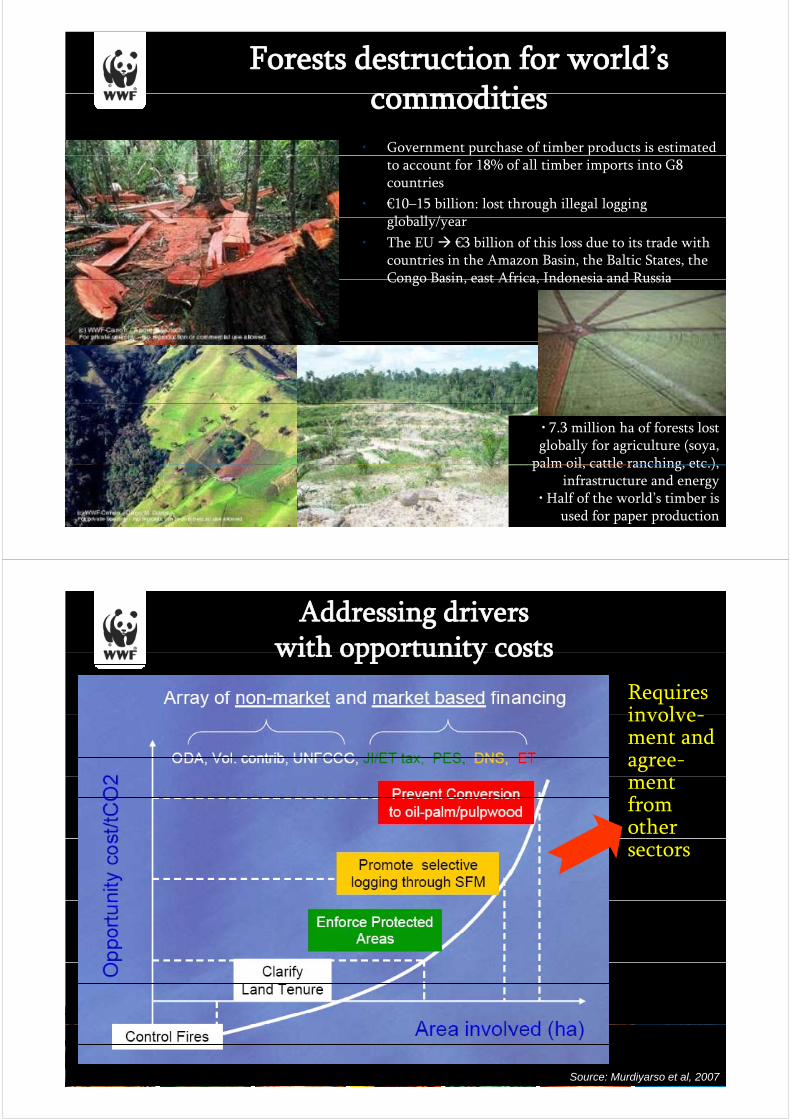
Forests destruction for world’s mm diticommodities
• Government purchase of timber products is estimated to account for 18% of all timber imports into G8 countries
• €10–15 billion: lost through illegal logging l b ll /globally/year
• The EU €3 billion of this loss due to its trade with countries in the Amazon Basin, the Baltic States, the Congo Basin east Africa Indonesia and RussiaCongo Basin, east Africa, Indonesia and Russia
• 7.3 million ha of forests lost globally for agriculture (soya,
palm oil cattle ranching etc )palm oil, cattle ranching, etc.), infrastructure and energy
• Half of the world’s timber is used for paper production
Addressing drivers with opportunity costswith opportunity costs
Requires involveinvolve-ment and agree-ment from other sectors
Source: Murdiyarso et al, 2007
Policy interventions and benefit distribution mechanism
REDD k if d i h l li• REDD cannot work if not supported with clear policy interventions e.g., land use (areas to be and not to be converted), investment, sectors coordination, market, etc., , ,
• Reducing transaction costs (proportion for the broker, government, concessionaires, communities?).
• Ensuring equity of impacts (for different actors):
- improving livelihoods of the rural poor
b fi f bi di i i l i ( h d- co-benefits for biodiversity, environmental services (watershed, etc.).
• Who is going to “pay”? realising the promises of ODA voluntaryWho is going to pay ? realising the promises of ODA, voluntary markets and targeting binding agreement for Kyoto (Post 2012).
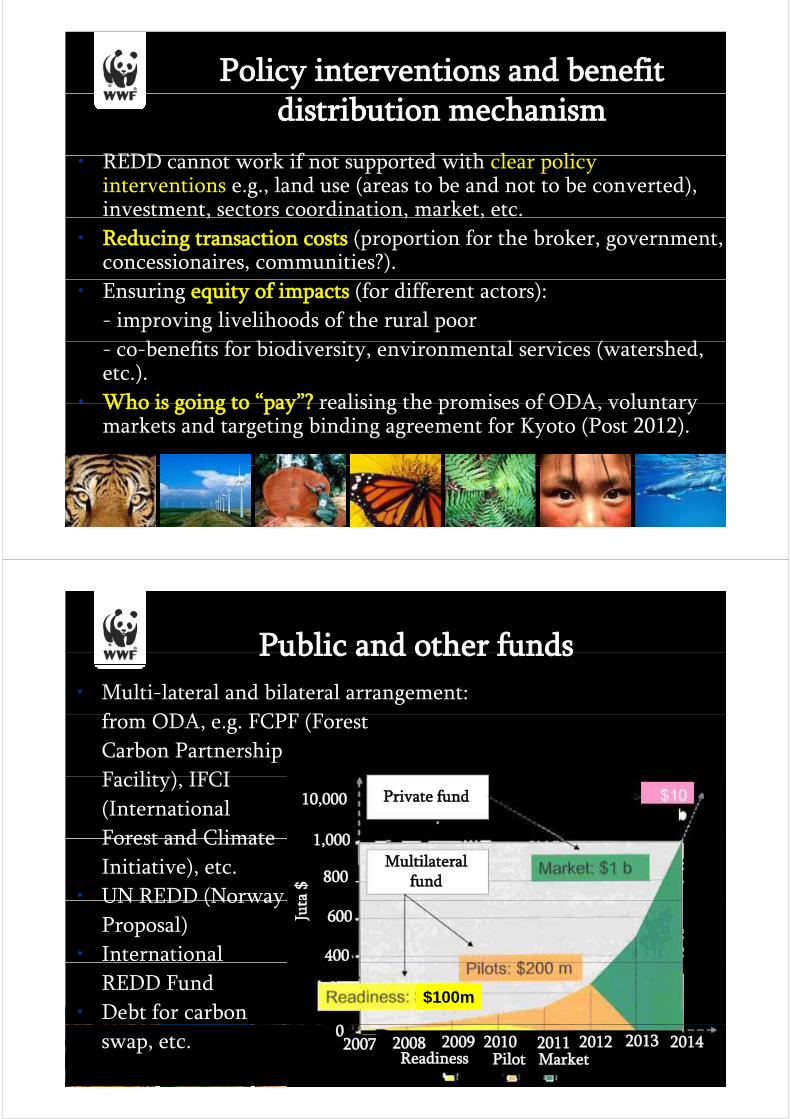
Public and other fundsPublic and other funds
• Multi-lateral and bilateral arrangement:
f ODA FCPF (Ffrom ODA, e.g. FCPF (Forest
Carbon Partnership
Facilit ) IFCIFacility), IFCI
(International
Forest and Climate
Private fund
1 000
10,000
Forest and Climate
Initiative), etc.
• UN REDD (Norway
Multilateral fund
a $ 800
1,000
UN REDD (Norway
Proposal)
• International
Jut
400
600
REDD Fund
• Debt for carbon $100m
swap, etc.Readiness Pilot Market
02007 2008 2009 2010 2011 2012 2013 2014
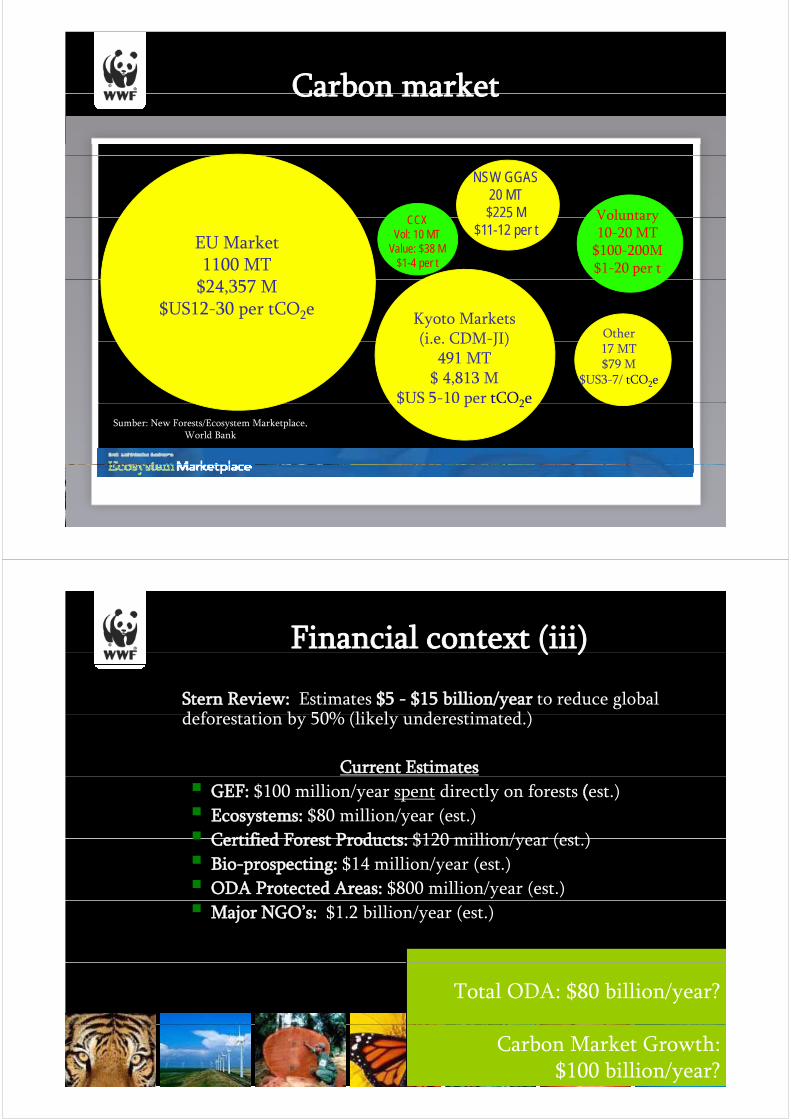
Carbon marketCarbon market
CCX Voluntary
NSW GGAS20 MT$225 M
EU Market1100 MT
$
CCXVol: 10 MT
Value: $38 M$1-4 per t
Voluntary10-20 MT
$100-200M$1-20 per t
$ 5$11-12 per t
$24,357 M$US12-30 per tCO2e
OtherKyoto Markets(i e CDM-JI)
17 MT$79 M
$US3-7/ tCO2e
(i.e. CDM JI)491 MT
$ 4,813 M$US 5-10 per tCO2e$ p 2
Sumber: New Forests/Ecosystem Marketplace, World Bank
Financial context (iii)( )
Stern Review: Estimates $5 - $15 billion/year to reduce global d f t ti b 50% (lik l d ti t d )deforestation by 50% (likely underestimated.)
Current Estimates
GEF: $100 million/year spent directly on forests (est.)
Ecosystems: $80 million/year (est.)
Certified Forest Products: $120 million/year (est )Certified Forest Products: $120 million/year (est.)
Bio-prospecting: $14 million/year (est.)
ODA Protected Areas: $800 million/year (est.)
Major NGO’s: $1.2 billion/year (est.)
Total ODA: $80 billion/year?
Carbon Market Growth: $100 billion/year?
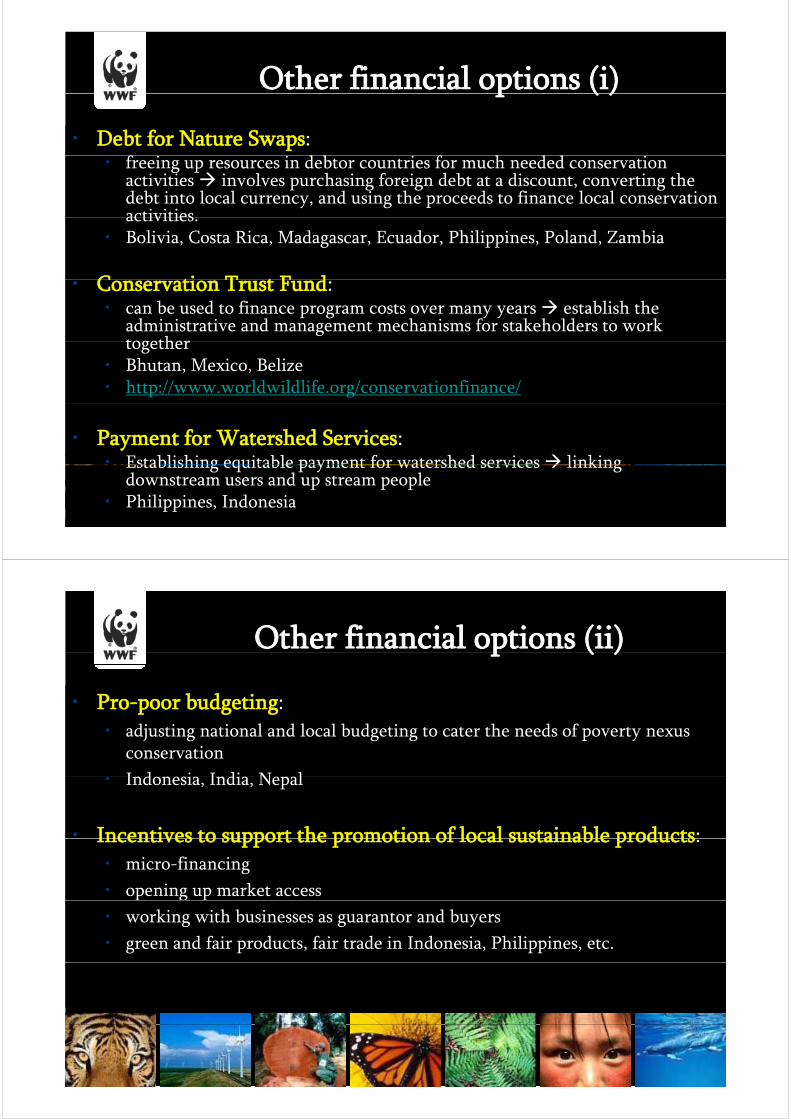
Other financial options (i)p ( )
• Debt for Nature Swaps: f d b f h d d• freeing up resources in debtor countries for much needed conservation activities involves purchasing foreign debt at a discount, converting the debt into local currency, and using the proceeds to finance local conservation activitiesactivities.
• Bolivia, Costa Rica, Madagascar, Ecuador, Philippines, Poland, Zambia
C ti T t F d• Conservation Trust Fund:• can be used to finance program costs over many years establish the
administrative and management mechanisms for stakeholders to work togethertogether
• Bhutan, Mexico, Belize• http://www.worldwildlife.org/conservationfinance/
• Payment for Watershed Services:• Establishing equitable payment for watershed services linkingEstablishing equitable payment for watershed services linking
downstream users and up stream people• Philippines, Indonesia
Other financial options (ii)p ( )
• Pro-poor budgeting: • adjusting national and local budgeting to cater the needs of poverty nexus
conservation
Indonesia India Nepal• Indonesia, India, Nepal
• Incentives to support the promotion of local sustainable products:Incentives to support the promotion of local sustainable products:• micro-financing
• opening up market access
• working with businesses as guarantor and buyers
• green and fair products, fair trade in Indonesia, Philippines, etc.
Other opportunitiespp
• More funding and support for integration of g pp gbiodiversity and climate change existing work: climate and orangutan in the corridor of BK and DSg
• Linking conservation and the provision of renewable energy Gold Standard CDM for micro-hydro,energy Gold Standard CDM for micro hydro, biomass, etc.
• Ecological footprint assessment: national and island• Ecological footprint assessment: national and island levels
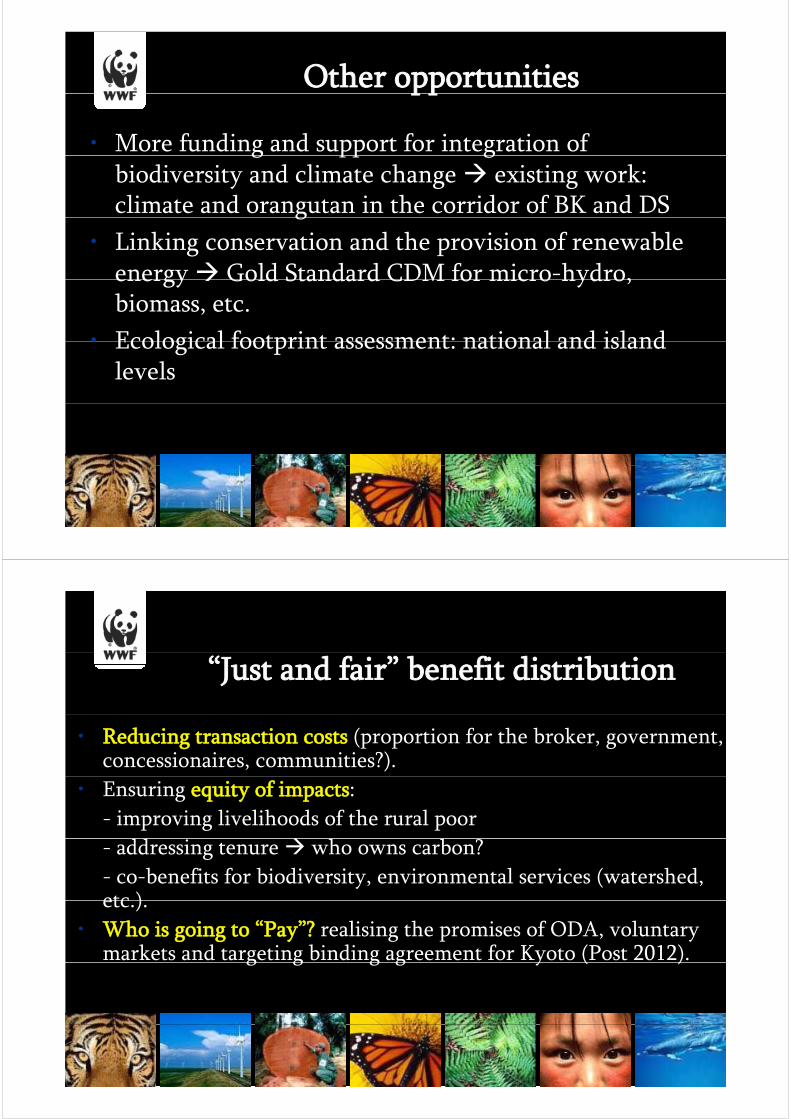
“Just and fair” benefit distribution
• Reducing transaction costs (proportion for the broker, government, concessionaires, communities?).
• Ensuring equity of impacts:
- improving livelihoods of the rural poor
- addressing tenure who owns carbon?
- co-benefits for biodiversity, environmental services (watershed, etc )etc.).
• Who is going to “Pay”? realising the promises of ODA, voluntary markets and targeting binding agreement for Kyoto (Post 2012).g g g g y ( )
At consumer countries
Create Best Market Link
- Bilateral governmental dialogue
- Develop responsible guidelinep p g
Purchasing Policy
- Sustainable criteria (following FSC/timber&paper, g p pRSPO/palm oil, RSB/biofuel)
Industry awareness
3. Indonesia’s di freadiness for REDD
Political and policy context (i)Political and policy context (i)
• Commitment to reduce hotspots of forest and land fires down toCommitment to reduce hotspots of forest and land fires down to 50% by the RI’s President.
• Establishment and the work of IFCA (Indonesia Forest Climate Alliance) led by Ministry of Forestry guiding & navigating the process of REDD readiness (architecture, strategy & stakeholders), pilot and implementation.
• Declaration of the Governors of Aceh, Papua and Papua Barat on Cli Ch A il 26 2007 i l i i A hClimate Change, April 26, 2007 moratorium logging in Aceh, proposal for stopping conversion in Papua, pilot development Declaration of 10 Governors of Sumatra to save the remainingDeclaration of 10 Governors of Sumatra to save the remaining forests and important ecosystems, October 2008.
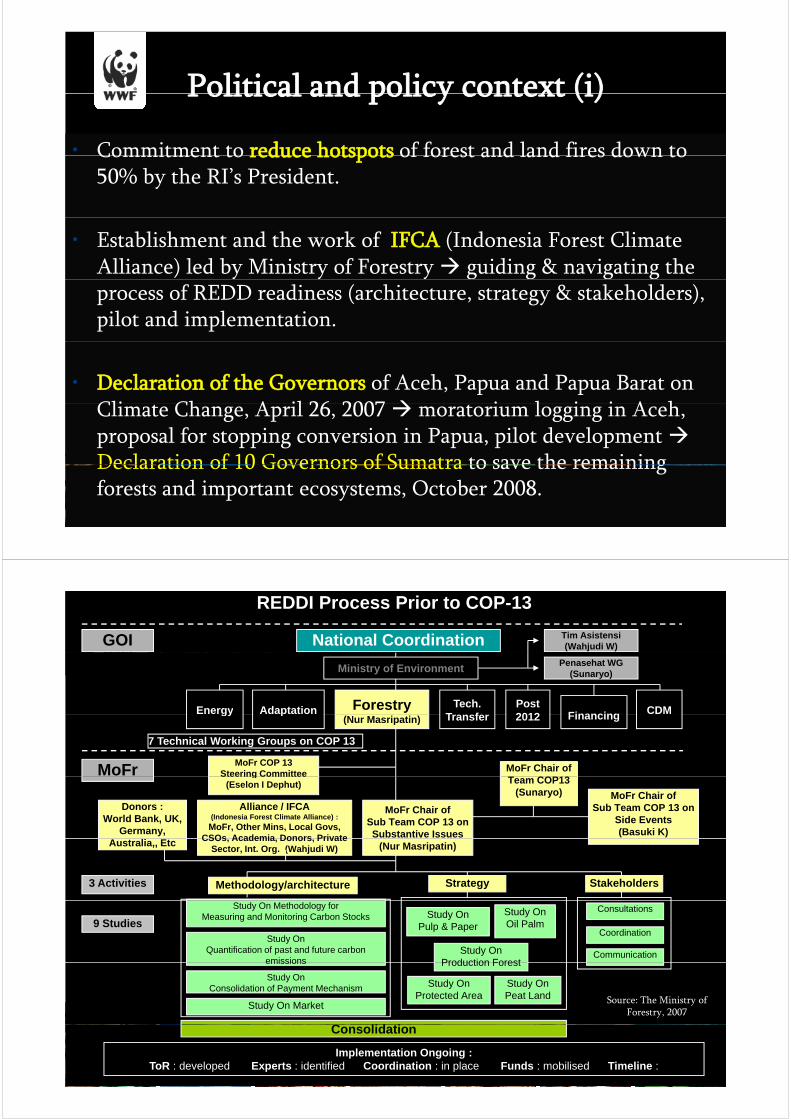
REDDI Process Prior to COP-13
GOI National Coordination Tim Asistensi (Wahjudi W)
Ministry of Environment
Energy Adaptation Forestry Tech. Transfer
Post 2012 Financing CDM
Penasehat WG(Sunaryo)
7 Technical Working Groups on COP 13
MoFr COP 13Steering Committee MoFr MoFr Chair of
T COP13
gy p(Nur Masripatin) Transfer 2012 Financing
Donors :World Bank, UK,
Germany,
Stee g Co ttee(Eselon I Dephut)
MoFr Chair ofSub Team COP 13 on Substantive Issues
Team COP13(Sunaryo) MoFr Chair of
Sub Team COP 13 on Side Events(Basuki K)
Alliance / IFCA(Indonesia Forest Climate Alliance) :
MoFr, Other Mins, Local Govs, CSOs Academia Donors PrivateAustralia,, Etc (Nur Masripatin)
StakeholdersStrategyMethodology/architecture
CSOs, Academia, Donors, Private Sector, Int. Org. (Wahjudi W)
3 Activities
Study On Methodology forMeasuring and Monitoring Carbon Stocks
Study OnQuantification of past and future carbon
emissions
Consultations
Coordination
Communication
Study OnPulp & Paper
Study OnProduction Forest
Study OnOil Palm9 Studies
emissions
Study OnConsolidation of Payment Mechanism Study On
Peat LandStudy On
Protected Area
C lid i
Production Forest
Study On Market Source: The Ministry of Forestry, 2007
Implementation Ongoing :ToR : developed Experts : identified Coordination : in place Funds : mobilised Timeline :
Consolidation
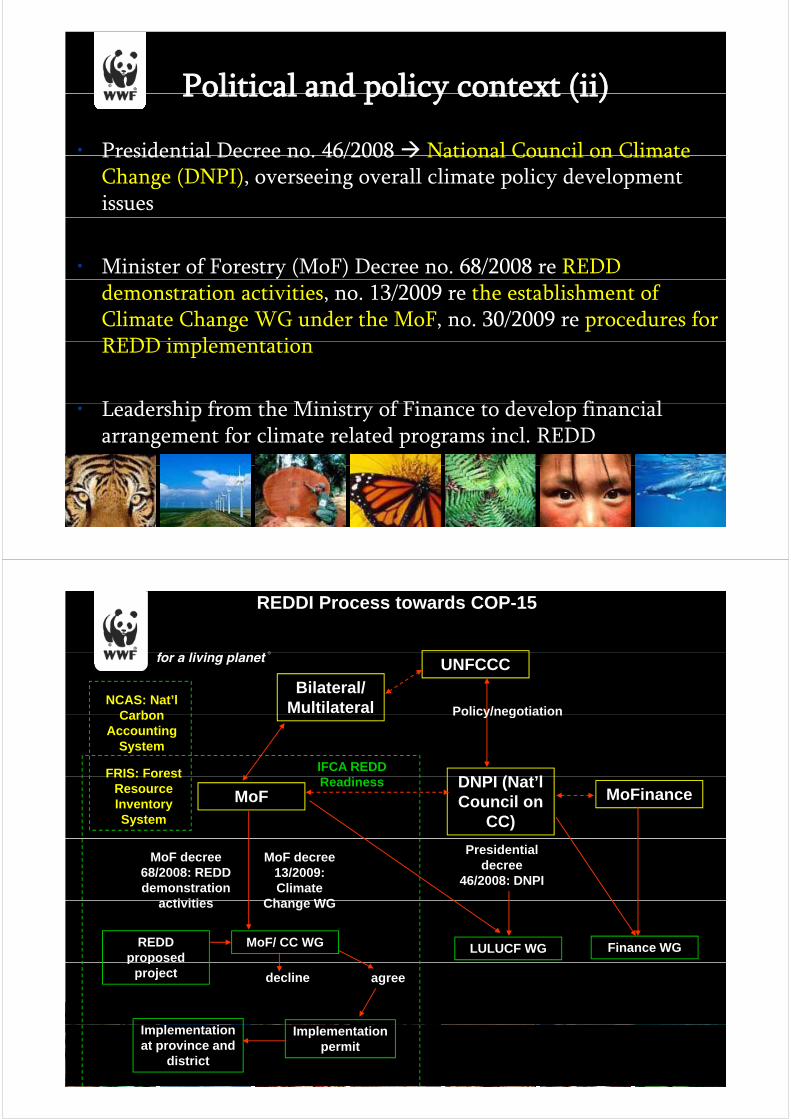
Political and policy context (ii)Political and policy context (ii)
• Presidential Decree no. 46/2008 National Council on ClimatePresidential Decree no. 46/2008 National Council on Climate Change (DNPI), overseeing overall climate policy development issues
• Minister of Forestry (MoF) Decree no. 68/2008 re REDD demonstration activities, no. 13/2009 re the establishment of Climate Change WG under the MoF, no. 30/2009 re procedures for REDD i l t tiREDD implementation
L d hi f h Mi i f Fi d l fi i l• Leadership from the Ministry of Finance to develop financial arrangement for climate related programs incl. REDD
REDDI Process towards COP-15
UNFCCC
Bilateral/ Multilateral Policy/negotiation
NCAS: Nat’l Carbon
DNPI (N t’l
Policy/negotiationCarbon Accounting
System
FRIS: Forest IFCA REDD DNPI (Nat’l Council on
CC)
MoF MoFinanceFRIS: Forest
Resource Inventory System
Readiness
MoF decree 68/2008: REDD demonstration
ti iti
MoF decree 13/2009: Climate
Ch WG
Presidential decree
46/2008: DNPI
activities Change WG
REDD proposed
MoF/ CC WG LULUCF WG Finance WGp p
project decline agree
Implementation permit
Implementation at province and
district
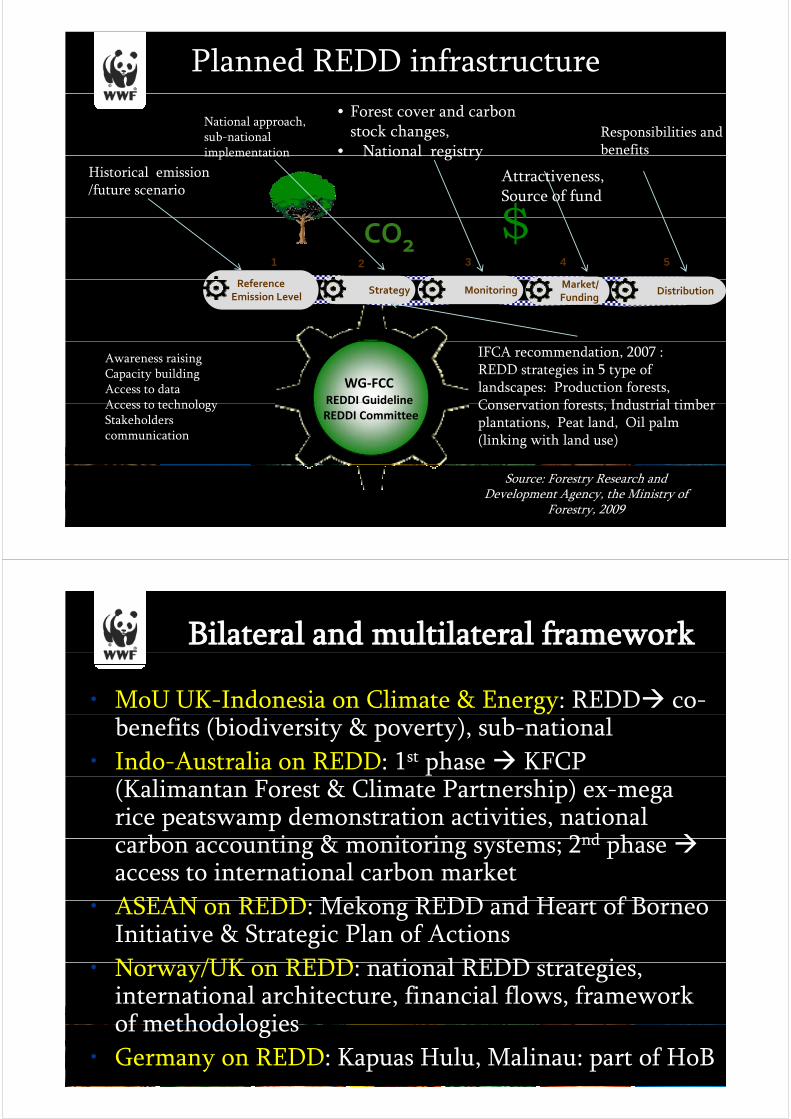
Planned REDD infrastructure
• Forest cover and carbon stock changes,
• National registry
National approach,sub-nationalimplementation
Responsibilities and benefits
$Historical emission/future scenario
National registryimplementation
Attractiveness,Source of fund
CO2$
f
1 2 3 4 5
Reference Emission Level
Strategy MonitoringMarket/Funding
Distribution
WG‐FCCREDDI Guideline
Awareness raisingCapacity buildingAccess to dataAccess to technology
IFCA recommendation, 2007 : REDD strategies in 5 type of landscapes: Production forests, Conservation forests Industrial timberREDDI Guideline
REDDI CommitteeAccess to technologyStakeholders communication
Conservation forests, Industrial timber plantations, Peat land, Oil palm (linking with land use)
Source: Forestry Research and Development Agency, the Ministry of
Forestry, 2009
Bilateral and multilateral framework
• MoU UK-Indonesia on Climate & Energy: REDD co-benefits (biodiversity & poverty), sub-national
• Indo-Australia on REDD: 1st phase KFCP (Kalimantan Forest & Climate Partnership) ex-mega rice peatswamp demonstration activities, national
b i & i i 2nd hcarbon accounting & monitoring systems; 2nd phase access to international carbon market
ASEAN REDD M k REDD d H t f B• ASEAN on REDD: Mekong REDD and Heart of Borneo Initiative & Strategic Plan of Actions
N /UK REDD ti l REDD t t i• Norway/UK on REDD: national REDD strategies, international architecture, financial flows, framework of methodologiesof methodologies
• Germany on REDD: Kapuas Hulu, Malinau: part of HoB
Contributing to policies, negotiation d itiand capacities
• Components need to be focused: p
Baseline, benefit sharing mechanism, institutional arrangement, methodologiesg
• No carbon credits provided during demonstration activitiesactivities
• Roles and challenges for WWF:
1 D l i b li d th d l1. Developing baseline and methodology,
2. Project planning (developing ideas, PDD, etc..),
3 P li f l i (i l i h i i i i l3. Policy formulation (implementation mechanism, institutional arrangement, benefit sharing).
4 Monitoring4. Monitoring.
• Capacities building when dealing with partners
Actors involved or influencing REDDActors involved or influencing REDD
• Opportunity costs: commodities (palm oil, pulp and paper, mining, energy), infrastructure, settlements, etc.mining, energy), infrastructure, settlements, etc.
• Policy approaches: land use, administrative (central/ local)
• Positive incentives: finance trade etcPositive incentives: finance, trade, etc.
• Entities: corporations, governments, donor communities, local communities, NGOs, academia, ,
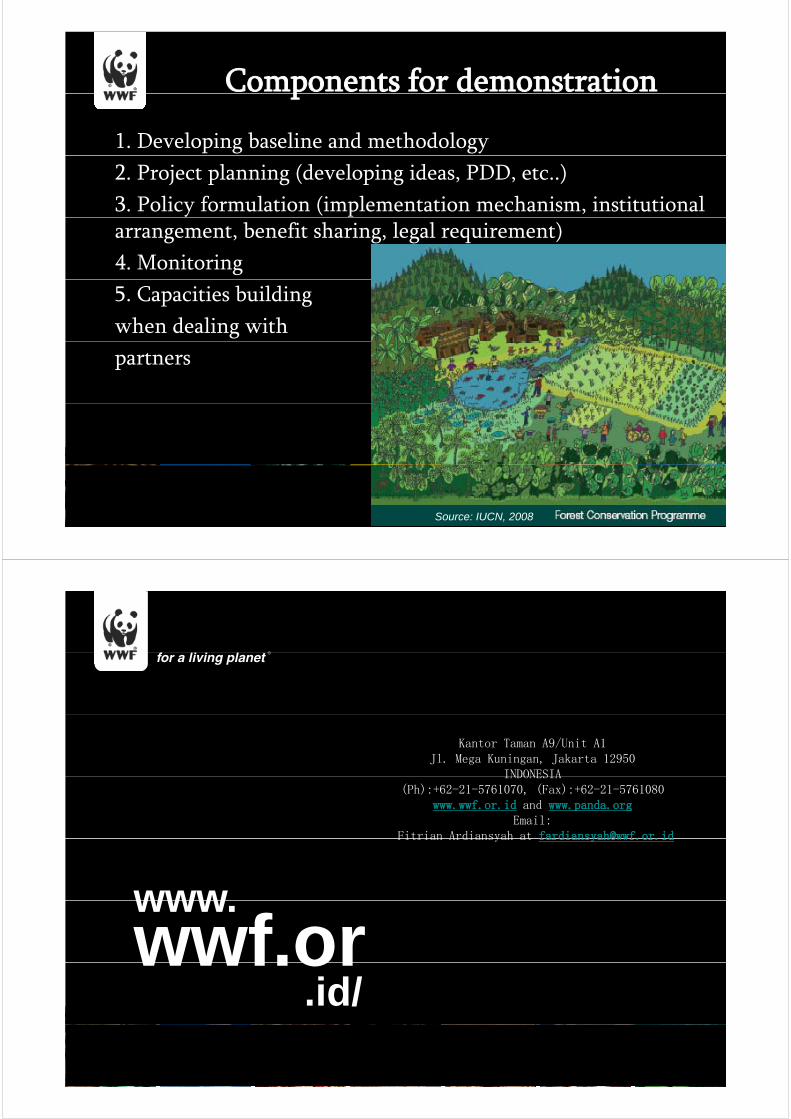
Components for demonstrationp
1. Developing baseline and methodology
2. Project planning (developing ideas, PDD, etc..)
3. Policy formulation (implementation mechanism, institutional arrangement, benefit sharing, legal requirement)
4. Monitoring
5. Capacities building
when dealing with
partners
Source: IUCN, 2008
Kantor Taman A9/Unit A1Jl. Mega Kuningan, Jakarta 12950
INDONESIAINDONESIA(Ph):+62-21-5761070, (Fax):+62-21-5761080
www.wwf.or.id and www.panda.orgEmail:
Fitrian Ardiansyah at [email protected]
www
Fitrian Ardiansyah at [email protected]
www.wwf.or
.id/wwf.or