Blocks to Creativity and Innovation. Tools to Release Creativity and Innovation

QUALITY & INNOVATION STRATEGY
PROGRAM : EXECUTIVE DIPLOMA PROGRAM TUTOR : MR. ZAIPUL ANWAR ZAINU
DATE : 13 & 27 SEPT. 2008 DUTY MANAGER : MR. CHEEVENUE : CPD MANAGEMENT
SATURDAY 13 SEPT Introduction Brain & Mind Component of
Creativity & Attitude
LUN
CH
QUALITY MANAGEMENT & ASSURANCEDAY / DATE 8.30 - 10.00 10.15 - 11.45 12.00 - 1.30 1.30 - 2.15 2.15 - 3.45 4.00 - 6.30
SATURDAY 27 SEPT
Quality Tools & Techniques
LUN
CH
Quality Tools & Techniques
Case Study
Quality Systems and Standards
Quality Management - Introduction
CREATIVITY AND INNOVATION STRATEGY
CIS Tools
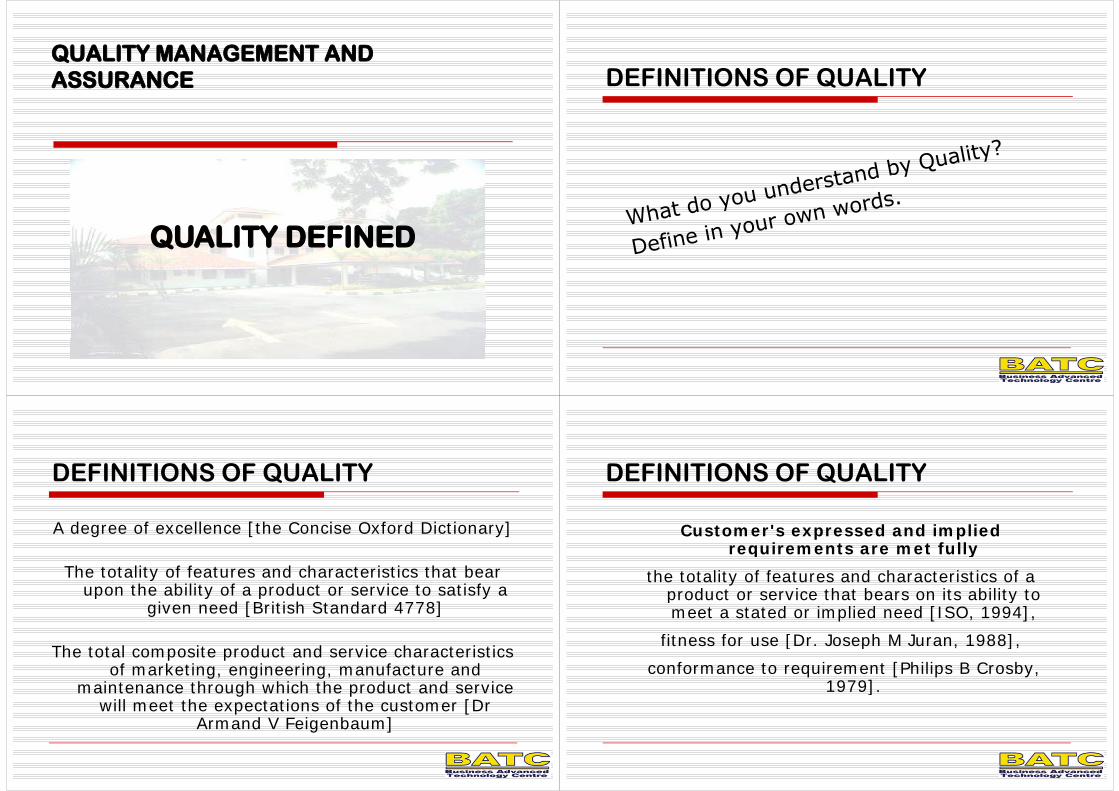
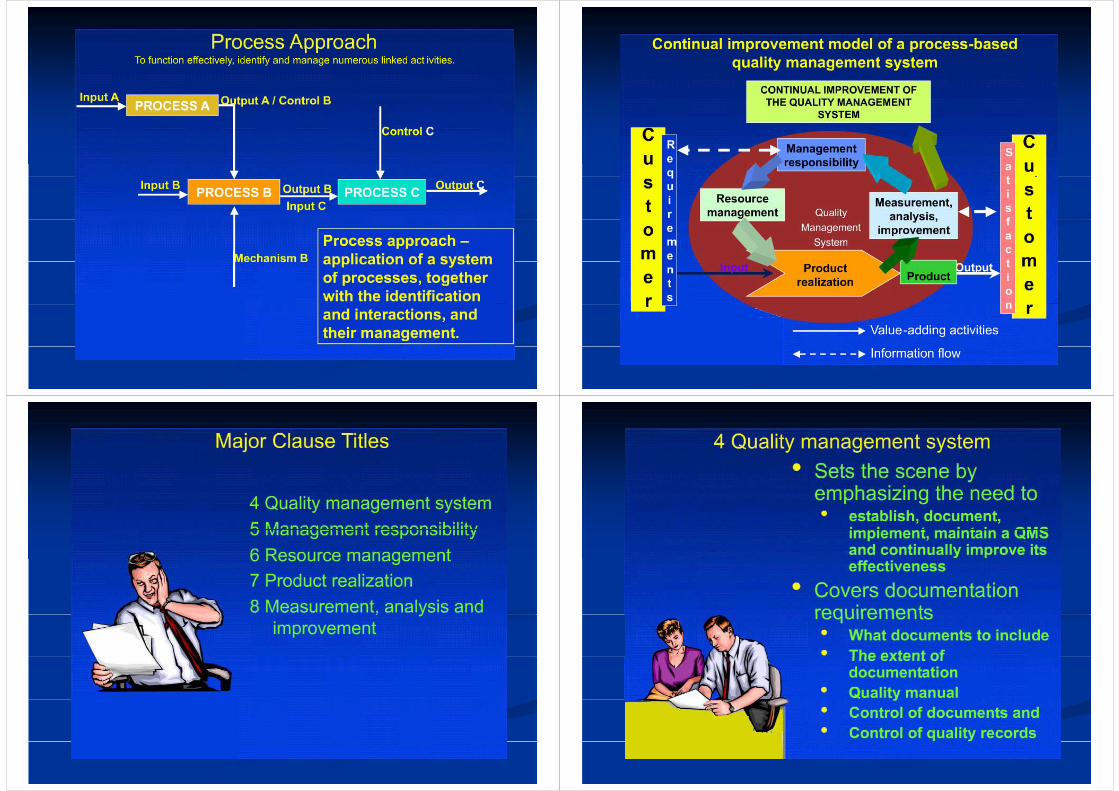
QUALITY MANAGEMENT AND QUALITY MANAGEMENT AND ASSURANCE
QUALITY DEFINEDQUALITY DEFINED
DEFINITIONS OF QUALITY
DEFINITIONS OF QUALITY
A degree of excellence [the Concise Oxford Dictionary]
The totality of features and characteristics that bear upon the ability of a product or service to satisfy a upon the ability of a product or service to satisfy a
given need [British Standard 4778]
The total composite product and service characteristics of marketing, engineering, manufacture and
maintenance through which the product and service maintenance through which the product and service will meet the expectations of the customer [Dr
Armand V Feigenbaum]
DEFINITIONS OF QUALITY
Customer's expressed and implied requirements are met fullyrequirements are met fully
the totality of features and characteristics of a product or service that bears on its ability to product or service that bears on its ability to meet a stated or implied need [ISO, 1994],
fitness for use [Dr Joseph M Juran 1988] fitness for use [Dr. Joseph M Juran, 1988],
conformance to requirement [Philips B Crosby, 1979]1979].

Extended definitions
Quality meaning getting everyone to do what they have agreed to do and to do it right the first time is the skeletal structure of an organization, finance is the
nourishment, and relationships are the soul CrosbyCrosby
extra-ordinary customer satisfactionyor
delighting the customersextra little things
Customer-based definitions• Edwards [1968] Quality consists of the capacity to
satisfy wants...• Gilmore [1974] Quality is the degree to which a• Gilmore [1974] Quality is the degree to which a
specific product satisfies the wants of a specificconsumer.
• Kuehn & Day [1962] In the final analysis of themarketplace, the quality of a product depends onhow well it fits patterns of consumer preferences.how well it fits patterns of consumer preferences.
• Juran [1988] Quality is fitness for use.• Oakland [1989] The core of a total quality approach
is to identify and meet the requirements of bothinternal and external customers.
Manufacturing & service-based definitions
C b [1979] Q lit [ ]• Crosby [1979] Quality [means]conformance to requirements
• Price [1985] Do it right first time• Price [1985] Do it right first time
Value-based definitions
• Broh [1982] Quality is the degree of excellence at anacceptable price and the control of variability at anacceptable costacceptable cost.
• Feigenbaum [1983] Quality is the degree to which aspecific product conforms to a design or specification
• Newell & Dale [1991] Quality must be achieved in fivebasic areas: people, equipment, methods, materialsand the environment to ensure customer’s need areand the environment to ensure customer s need aremet.Kanji [1990] Quality is to satisfy customers’ j [ ] Q y yrequirements continually; TQM is to achieve quality at low cost by involving everyone’s daily commitment.

Perceptions of Quality
JAPAN – SONY, TOYOTA
GERMANY BMW MERCEDESGERMANY – BMW, MERCEDES
SWITZERLAND – WATCHES
USA – MCDONALDS
UK – TESCOUK TESCO
TAIWAN – ACER
SINGAPORE – SIA
Perceptions of Quality
MALAYSIA – ?
UTM – ?
YOUR COMPANY ?YOUR COMPANY – ?
What? How? Why?What? How? Why?
A FURTHER DEFINITION …
The organisation must establish what the customerThe organisation must establish what the customerbelieves is important and base its activities on the
customers’ perception of company quality measurablesmeasurables

QUALITY MANAGEMENT AND ASSURANCE
WHY QUALITYWHY QUALITY- the requirements -the requirements
WHY QUALITY
Linking Quality to Business PerformanceQuality to:Quality to:
Customers (internal and external)Service / Product ProvidersStakeholdersSociety
Who is the customer?
The External Customers
BUT
Also the internal customersThe person who receives your workThe person who receives your workThe person who receives instructions from you
QUALITY PHILOSOPHIES
Inspection [1950’s] Quality Control [1960’s]
Quality Assurance [1970’s]Total Quality [1980’s]
C ti I t [1990’ ]Continuous Improvement [1990’s]
Knowledge Management [2000’s]

INSPECTION
After-the-fact screeningExpensiveExpensiveFallibleInternal and introspective
Rework
BusinessProcess Inspector CUSTOMER
Good
Bad
Scrap
INSPECTION
After-the-fact screeningExpensiveExpensiveFallibleInternal and introspective
Rework
BusinessProcess Inspector CUSTOMER
Good
Bad
Scrap
Problems with the Inspection Model
Too late100% routine inspection doesn’t workExpensive
I tInspectorScrap, rework, unhappy customers
Rework
Creates a barrier between the operator
d th t
BusinessProcess Inspector CUSTOMER
Good
and the customer BadScrap
Alternatives to 100% InspectionApplication of Statistical Process ControlDeveloped from 1924 by Dr Walter Shewhart, Bell Telephone Laboratories U S ATelephone Laboratories, U.S.A.Book “Economic Control of Quality of Manufactured Product” published in 1931p

QUALITY CONTROL
Self-inspectionGreater process controlDrawing control systemsProduct testing
BusinessProcess CUSTOMER
SPC
Good Product
QUALITY CONTROL
Self-inspectionGreater process controlDrawing control systemsProduct testing
BusinessProcess CUSTOMER
SPC
Good Product
QUALITY ASSURANCE
Documentation systemsThird party auditsp yBasic quality costsShift to prevention
ISO
TOTAL QUALITY
Organizational changePlanning and peopleg p pAdvanced quality toolsElimination of wastePeople

GLOBAL QUALITY EXPERIENCE
Japan – Quality (1950’s)J T l Q li (1960’ )Japan – Total Quality (1960’s)USA – Pacific Basin …Europe (1980’s)Developing Countries (1990’s)
QUALITY GURUS – The American
DEMING JURAN FEIGENBAUM
1909 – 1993‘The Statistician’
1904 –‘The Other Samurai’
1916 –‘The Implementer’
JUSEPDCA
14 Points
JUSEQuality Trilogy
10 St
ASQCMBNQA
Total Quality Control14 PointsDeadly Diseases
Action Plan
10 StepsRecipe for Action
‘A History of
Total Quality Control9 M’s
Quality-Related Action PlanSystem of Profound
Knowledge
A History of Managing for
Quality’
Quality Related Costs
10 Benchmarks
QUALITY GURUS - THE JAPANESE
ISHIKAWA SHINGO TAGUCHI
1915 – 1989‘The Practitioner’
1909 –1990‘Th C lt t’
1924 –‘The Professor’
The PractitionerFishbone Diagram
Company-wide
‘The Consultant’Practical Prevention
Poka-Yoke
Quality LossSystem, Parameter
and Tolerance QualityQuality Circles
7 Tools
Poka YokeZero Quality Control
JIT / SMED
and Tolerance Design
Orthogonal Arrays7 Tools
WHY ZERO DEFECTS?Ask yourself! Is it necessary to go for ZERO defects?Is it necessary to go for ZERO defects?Why isn’t 99.9% good enough? It is impossible to be 100% defect free!It is impossible to be 100% defect free!
BUT IS IT?BUT IS IT?
Here are some examples of what life would be like if 99.9% were good enough.like if 99.9% were good enough.

WHY ZERO DEFECTS?Five minutes of unsafe drinking water every month!Two unsafe landings per week at world major airports!Twenty thousand incorrect drug prescriptions every year!Fifty newborn babies dropped at birth by doctors/nurses every months!every months!Twenty-two thousand checques deducted from wrong bank accounts each day!yFive hundred incorrect surgical operations each month!Thirty-two thousand missed heartbeats per person every
!year!
WHY ZERO DEFECTS?
Suddenl the quest for Suddenly the quest for ZEROZERO defectsZEROZERO defects
makes a lot more makes a lot more sense!sense!

QUALITYQUALITYQUALITY QUALITY PLANNINGPLANNINGPLANNINGPLANNING
By By yyZaipul AnwarZaipul Anwar
Business & Advanced Technology Centre,Business & Advanced Technology Centre,U i iti T k l i M l iU i iti T k l i M l iUniversiti Teknologi MalaysiaUniversiti Teknologi Malaysia
QUALITY PLANNINGQUALITY PLANNINGQUALITY PLANNINGQUALITY PLANNING
WhatWhat IsIs QualityQuality Planning?Planning?WhatWhat IsIs QualityQuality Planning?Planning?Quality planning is the activity of Quality planning is the activity of
determining customer needs and determining customer needs and d l i th d t d d l i th d t d developing the products and processes developing the products and processes required to meet those needsrequired to meet those needs
QUALITY PLANNINGQUALITY PLANNINGQUALITY PLANNINGQUALITY PLANNING
ForFor managersmanagers toto provideprovide thisthis leadershipleadership requiresrequiresthatthat theythey
UnderstandUnderstand howhow qualityquality planningplanning isis beingbeing donedoneUnderstandUnderstand howhow qualityquality planningplanning isis beingbeing donedoneUnderstandUnderstand howhow qualityquality planningplanning shouldshould bebe donedoneq yq y p gp gProvide the needed infrastructure and resourcesProvide the needed infrastructure and resources
The leadership for change must come from the The leadership for change must come from the The leadership for change must come from the The leadership for change must come from the managersmanagers
QUALITY PLANNINGQUALITY PLANNINGQUALITY PLANNINGQUALITY PLANNING
MULTIPLEMULTIPLE LEVELSLEVELS OFOF QUALITYQUALITY PLANNINGPLANNINGTheThe workerworker levellevel..ThTh d t t ld t t l l ll lTheThe departmentaldepartmental levellevel..The multifunctional levelThe multifunctional levelThe multifunctional levelThe multifunctional level
This level is concerned with broadThis level is concerned with broad processes, processes, h d t d l t it t h d t d l t it t such as new product development, recruitment, such as new product development, recruitment,
purchasing, and billing. Such processes thread purchasing, and billing. Such processes thread their way through multiple company functionstheir way through multiple company functions
The corporate or divisional levelThe corporate or divisional levelThe corporate or divisional levelThe corporate or divisional level

QUALITY PLANNINGQUALITY PLANNINGQUALITY PLANNINGQUALITY PLANNING
OUR ROLEOUR ROLE
CustomerCustomer ProcessorProcessor SupplierSupplier
OUR OUR PROCESS (ES)PROCESS (ES)
Our Our SupplierSupplier
Our Our InputsInputs
Our Our Product (s)Product (s)
Our Our CustomerCustomerPROCESS (ES)PROCESS (ES)SupplierSupplier InputsInputs Product (s)Product (s)
Th Q lit Pl i diTh Q lit Pl i diThe Quality Planning diagramThe Quality Planning diagram
ToTo illustrate,illustrate, thethe companycompany isis aa processorprocessor teamteam..InIn itsits rolerole asas aa customercustomer itit receivesreceives suchsuch inputsinputsasasasas
Information concerning client needs, Information concerning client needs, competitive products, and government competitive products, and government regulationsregulationsggMoneyMoney fromfrom salessales andand investorsinvestorsP h dP h d dd dd iiPurchasedPurchased goodsgoods andand servicesservicesFeedbackFeedback fromfrom customerscustomers
Th Q lit Pl i diTh Q lit Pl i diThe Quality Planning diagramThe Quality Planning diagram
In its role as a In its role as a processorprocessor, , the company converts the company converts these and other inputs into products such as these and other inputs into products such as sales contracts purchase orders saleable goods sales contracts purchase orders saleable goods sales contracts, purchase orders, saleable goods sales contracts, purchase orders, saleable goods and services, invoices, and reports of many and services, invoices, and reports of many kindskinds
Th Q li Pl i diTh Q li Pl i diThe Quality Planning diagramThe Quality Planning diagram
I it l I it l lili th th In its role as In its role as suppliersupplier, , the company the company provides clients with goods services, and provides clients with goods services, and p g ,p g ,invoices, and provides suppliers with invoices, and provides suppliers with purchase orders payments and feedback purchase orders payments and feedback purchase orders, payments, and feedback. purchase orders, payments, and feedback. Information is provided to allInformation is provided to allpp

Existing Product and ProcessExisting Product and Process
Identify Customers
NT
List of Customers
Discover Customers’ Needs
REM
EN List of Customers’ Needs (in their language)
TranslateTHE THE
MEA
SUR a s ate
Customers’ Needs (In our language)QUALITY QUALITY PLANNING PLANNING
PPLY
M Develop Product
Product FeaturesROAD MAPROAD MAP
AP
Develop Process
Process Features (process ready to produce)Process Features (process ready to produce)
Transfer to Operations
QUALITY PLANNINGQUALITY PLANNINGQUALITY PLANNINGQUALITY PLANNING
Existing Product and ProcessExisting Product and ProcessINPUTINPUT
Identify CustomersIdentify CustomersPROCESSPROCESS
OUTPUTOUTPUT List of CustomersList of Customers
InputInput--output diagram for identifying customersoutput diagram for identifying customers
•• The The input input is the subject matter of the planningis the subject matter of the planning——the product (or the product (or process) under considerationprocess) under considerationprocess) under considerationprocess) under consideration
•• The The process process consists of the activities conducted to discover who is consists of the activities conducted to discover who is affected by the productaffected by the productaffected by the productaffected by the product
•• The The output output is a list of those who are affectedis a list of those who are affected——the customersthe customers
Fl Ch tiFl Ch tiFlow ChartingFlow ChartingA MacroA Macro--level Flow Chartinglevel Flow Charting B. MicroB. Micro--level Flow Chartinglevel Flow ChartingA. MacroA. Macro level Flow Chartinglevel Flow Charting B. MicroB. Micro level Flow Chartinglevel Flow Charting
Source: AT&T Network Operations GroupSource: AT&T Network Operations Group
••Provides understanding of the wholeProvides understanding of the whole
••Identifies customers previously neglectedIdentifies customers previously neglected
Identifies opportunities for improvementIdentifies opportunities for improvement••Identifies opportunities for improvementIdentifies opportunities for improvement
Pareto analysis of customers and Pareto analysis of customers and yysales volumesales volume
Use of the Pareto principleUse of the Pareto principle
Useful Useful 100100
Use of the Pareto principleUse of the Pareto principle••AA relativerelative fewfew (“vital(“vital few”),few”),
hh ff hh ii ff tt ManyMany
PercentPercent
eacheach ofof whomwhom isis ofof greatgreatimportanceimportance toto usus..
••A relatively large number of A relatively large number of
Vital FewVital Few
PercentPercent••A relatively large number of A relatively large number of customers, each of whom customers, each of whom is only of modest is only of modest Vital FewVital Few
SalesSalesCustomersCustomers00
is only of modest is only of modest importance to us (the importance to us (the “useful many”)“useful many”)useful many )useful many )

Use of the Pareto principle Use of the Pareto principle --p pp pexampleexample
ForFor example,example, twotwo typestypes ofof clientsclients bookbook hotelhotel roomsrooms::TravellersTravellers whowho arrivearrive oneone byby oneone atat randomrandomPlannersPlanners ofof meetingsmeetings andand conventionsconventions whowho bookbook blocksblocksPlannersPlanners ofof meetingsmeetings andand conventionsconventions whowho bookbook blocksblocksofof roomsrooms farfar inin advanceadvance
ThTh ll ff titi dd titiTheThe plannersplanners ofof meetingsmeetings andand conventionsconventionsconstituteconstitute thethe vitalvital--fewfew customerscustomers.. TheseThese plannersplannersppreceivereceive specialspecial attentionattention fromfrom thethe hotelhotel.. TheThetravellerstravellers areare thethe usefuluseful manymany andand theythey receivereceivetravellerstravellers areare thethe usefuluseful many,many, andand theythey receivereceivestandardisedstandardised attentionattention
A Customer Is a Cast of A Customer Is a Cast of CharactersCharacters
InternalInternal CustomersCustomersInternalInternal customerscustomers includeinclude thethe managersmanagers ofof thetheaffectedaffected departmentsdepartments TheirTheir influenceinfluence onon qualityqualityaffectedaffected departmentsdepartments.. TheirTheir influenceinfluence onon qualityqualityisis considerableconsiderable..Internal customers also include the work force. Internal customers also include the work force. Individually they are among the useful many Individually they are among the useful many Individually, they are among the useful many. Individually, they are among the useful many. Collectively, they are one of the vital fewCollectively, they are one of the vital few
A Customer Is a Cast of A Customer Is a Cast of CharactersCharacters
ConsumersConsumersSuppliersSuppliers faceface thesethese realitiesrealities inin variousvarious waysways::
11 Accept some consumer perceptions bias and all Accept some consumer perceptions bias and all 1.1. Accept some consumer perceptions, bias and all, Accept some consumer perceptions, bias and all, and then design products and practices to respond and then design products and practices to respond t th tit th tito those consumer perceptions.to those consumer perceptions.
2.2. Try to change consumer perceptions by such Try to change consumer perceptions by such y g p p yy g p p ymethods as providing demonstrations or methods as providing demonstrations or opportunities for trial use of products.opportunities for trial use of products.opportunities for trial use of products.opportunities for trial use of products.
3.3. Publish technological data and propaganda to Publish technological data and propaganda to ti l t h i titi l t h i tistimulate changes in perceptions.stimulate changes in perceptions.
Classification Based on UseClassification Based on Use
ProcessorsProcessors.. TheyThey useuse aa productproduct asas inputsinputs toto theirtheir processprocess.. TheyThey thenthenff ddi i lddi i l ii ff hi hhi h hh llll hh l il i ddperformperform additionaladditional processingprocessing afterafter whichwhich theythey sellsell thethe resultingresulting productproduct toto
theirtheir customerscustomers.. InIn consequence,consequence, thethe initialinitial productproduct affectsaffects multiplemultiple levelslevelsofof customerscustomersofof customerscustomers..MerchantsMerchants.. TheyThey buybuy aa productproduct forfor resaleresale.. AsAs partpart ofof thethe resaleresale theythey maymayperformperform somesome processingprocessing alongalong withwith breakingbreaking bulkbulk andand repackagingrepackaging AsAsperformperform somesome processingprocessing alongalong withwith breakingbreaking bulkbulk andand repackagingrepackaging.. AsAswithwith thethe processors,processors, thethe initialinitial productproduct affectsaffects multiplemultiple levelslevels ofof customerscustomers::thethe merchant,merchant, thethe merchant’smerchant’s clients,clients, andand soso onon throughthrough thethe distributiondistribution,, ,, ggchainchain..UltimateUltimate usersusers.. TheyThey areare thethe finalfinal destinationdestination ofof thethe productproduct.. InIn somesomeyy ppproductproduct lineslines therethere isis aa marketmarket forfor usedused products,products, soso thatthat therethere areare multiplemultipletierstiers ofof ultimateultimate usersusers..TheThe publicpublic.. MembersMembers ofof thethe publicpublic maymay bebe affectedaffected byby aa companycompany eveneventhoughthough theythey dodo notnot buybuy itsits productsproducts.. TheThe mostmost obviousobvious impactsimpacts relaterelate toto
d td t f tf t tt dd tt thth i ti t ThTh thth i ti tproductproduct safetysafety oror toto damagedamage toto thethe environmentenvironment.. ThereThere areare otherother impactsimpactsasas wellwell..

WhatWhat rolerole shouldshould managersmanagers playplay atat eacheach stepstep ofofthth l il i ??thethe planningplanning process?process?
What role should managers play with respect to the What role should managers play with respect to the What role should managers play with respect to the What role should managers play with respect to the quality planning process generally?quality planning process generally?auditing of the qualityauditing of the quality--planning process planning process
(the quality(the quality planning process generally specific planning process generally specific (the quality(the quality--planning process generally, specific planning process generally, specific elements of the qualityelements of the quality--planning process)planning process)
managers should assure that the methods in use managers should assure that the methods in use for identifying customers are able to for identifying customers are able to provide the provide the for identifying customers are able to for identifying customers are able to provide the provide the quality planners with the essential customer quality planners with the essential customer basebase
Existing Product and ProcessExisting Product and Process
Identify Customers
NT
List of Customers
Discover Customers’ Needs
REM
EN List of Customers’ Needs (in their language)
TranslateTHE THE
MEA
SUR a s ate
Customers’ Needs (In our language)QUALITY QUALITY PLANNING PLANNING
PPLY
M Develop Product
Product FeaturesROAD MAPROAD MAP
AP
Develop Process
Process Features (process ready to produce)Process Features (process ready to produce)
Transfer to Operations
InputInput--output diagram for output diagram for pp p gp gidentifying customers’ needsidentifying customers’ needs
List of Customers INPUT
Discover Customers’ Needs PROCESS
Customers’ NeedsOUTPUT(in their language) OUTPUT
Discovery of customers’ needs is the second step on Discovery of customers’ needs is the second step on the qualitythe quality--planning road mapplanning road map
Types of customers’ needsTypes of customers’ needs
SS
ypyp
StatedStated NeedsNeeds andand RealReal NeedsNeedsPerceivedPerceived NeedsNeedsPerceivedPerceived NeedsNeedsCulturalCultural NeedsNeedsNeedsNeeds TraceableTraceable toto UnintendedUnintendedUUUseUse

M h d f Di iM h d f Di iMethods for Discovering Methods for Discovering C stomers’ NeedsC stomers’ NeedsCustomers’ NeedsCustomers’ Needs
BeBe aa CustomerCustomerCommunicate with CustomersCommunicate with CustomersMarketMarket ResearchResearchSi l tSi l t C t ’C t ’ UUSimulateSimulate Customers’Customers’ UseUse
Customers’Customers’ NeedsNeeds AreAre aa MovingMoving TargetTarget
A ROLE FOR MANAGERSA ROLE FOR MANAGERS
VisitsVisits withwith keykey customerscustomersReviewReview ofof reportsreports onon marketmarket researches,researches, sales,sales,customercustomer serviceservice productproduct dissatisfactionsdissatisfactions etcetccustomercustomer service,service, productproduct dissatisfactions,dissatisfactions, etcetc..AttendanceAttendance atat industryindustry conferencesconferences andand showsshows
Existing Product and ProcessExisting Product and Process
Identify Customers
NT
List of Customers
Discover Customers’ Needs
REM
EN List of Customers’ Needs (in their language)
TranslateTHE THE
MEA
SUR a s ate
Customers’ Needs (In our language)QUALITY QUALITY PLANNING PLANNING
PPLY
M Develop Product
Product FeaturesROAD MAPROAD MAP
AP
Develop Process
Process Features (process ready to produce)Process Features (process ready to produce)
Transfer to Operations
InputInput--output diagram for output diagram for l il itranslationtranslation
INPUTCustomers’ Needs(in their language)
Translate
(in their language)
TranslatePROCESS
Customers’ Needs(in our language)OUTPUT
CustomerCustomer needsneeds maymay bebe statedstated inin anyany ofof severalseveral languageslanguages::11.. TheThe customer’scustomer’s languagelanguage22.. TheThe producerproducer oror supplier’ssupplier’s (“our”)(“our”) languagelanguagepp pppp ( )( ) g gg g3.3. A common languageA common language

Common languages in the Common languages in the g gg gcompanycompany
Upper Management: gLanguage of
Money
Middle Management: Must be Bilingual
Lower Management and Non-supervisors:
Language of Things
A Role for ManagersA Role for Managersgg
M h ld l t thi l ti b M h ld l t thi l ti b Managers should accelerate this evolution by Managers should accelerate this evolution by creating project teams whose missions are creating project teams whose missions are g p jg p jdirected at directed at establishing the needed glossaries, establishing the needed glossaries, standardisation and measurementstandardisation and measurementstandardisation, and measurement.standardisation, and measurement.
Spreadsheet: Customer needsSpreadsheet: Customer needsSpreadsheet: Customer needsSpreadsheet: Customer needs
NEEDS TRANSLATION
NEEDS TRANSLATIONSecondary Tertiary
Low purchase price
NEEDS TRANSLATION
Warranty coverage L th fWarranty coverage Length of Warranty
Existing Product and ProcessExisting Product and Process
Identify Customers
NT
List of Customers
Discover Customers’ Needs
REM
EN List of Customers’ Needs (in their language)
TranslateTHE THE
MEA
SUR a s ate
Customers’ Needs (In our language)QUALITY QUALITY PLANNING PLANNING
PPLY
M Develop Product
Product FeaturesROAD MAPROAD MAP
AP
Develop Process
Process Features (process ready to produce)Process Features (process ready to produce)
Transfer to Operations

InputInput--output diagram for output diagram for pp p gp gproduct developmentproduct development
INPUTCustomers’ Needs(in units of measure) INPUT(in units of measure)
Develop Product PROCESS
Product FeaturesOUTPUT
P d t d l t i th ti it f d t i i th P d t d l t i th ti it f d t i i th Product development is the activity of determining the Product development is the activity of determining the product features that respond to customer needsproduct features that respond to customer needs
Th i l f i litTh i l f i litThe spiral of progress in qualityThe spiral of progress in quality
FEEDBACKMAINTENANCE
USERETAILRETAIL
WHOLESALE
Di i liDi i li ff d i id i i ddDisciplinesDisciplines forfor determiningdetermining productproductfeaturesfeatures includeinclude thethe qualityquality--orientedorientedfeaturesfeatures includeinclude thethe qualityquality orientedorienteddisciplinesdisciplines
M d lM d l dd d td t tt ff l til ti dd di tidi ti d td tModelsModels andand datadata systemssystems forfor evaluatingevaluating andand predictingpredicting productproductreliabilityreliability andand maintainabilitymaintainabilityPP bilitbilit t dit di ff l til ti dd di tidi ti d ibilitd ibilitProcessProcess--capabilitycapability studiesstudies forfor evaluatingevaluating andand predictingpredicting producibilityproducibilityExperimentsExperiments forfor discoveringdiscovering thethe optimumoptimum resultresult attainableattainable fromfrom
lti llti l ii i bli blmultiplemultiple convergingconverging variablesvariablesSpreadsheetsSpreadsheets forfor assemblingassembling numerousnumerous interrelatedinterrelated datadata intointocondensedcondensed easyeasy toto graspgrasp formsformscondensed,condensed, easyeasy--toto--graspgrasp formsformsMethodsMethods forfor evaluatingevaluating costcost ofof poorpoor qualityquality
ffMethodsMethods forfor guardingguarding againstagainst humanhuman errorerrorDecision trees, flow diagrams, and still other aids to quality analysis Decision trees, flow diagrams, and still other aids to quality analysis
d d i i kid d i i kiand decision makingand decision making
ProductProduct FeaturesFeatures:: TheThe CriteriaCriteriaProductProduct FeaturesFeatures:: TheThe CriteriaCriteria
MeetsMeets thethe needsneeds ofof ourour customerscustomers.. “Needs”“Needs” here,here, meansmeans allallcustomers’customers’ needsneeds:: statedstated perceivedperceived realreal andand culturalculturalcustomerscustomers needsneeds:: stated,stated, perceived,perceived, real,real, andand culturalcultural..MeetsMeets ourour needsneeds asas aa suppliersupplier includingincluding thethe needsneeds ofof ourour internalinternalcustomerscustomerscustomerscustomers..MeetsMeets competitioncompetition.. TheThe factfact thatthat aa productproduct meetsmeets customercustomerneedsneeds doesdoes notnot assureassure thatthat customerscustomers willwill buybuy itit;; aa competitor’scompetitor’sneedsneeds doesdoes notnot assureassure thatthat customerscustomers willwill buybuy itit;; aa competitor scompetitor sproductproduct maymay bebe better,better, oror givegive betterbetter valuevalue.. Hence,Hence, meetingmeetingcompetitioncompetition isis anan importantimportant criterioncriterion forfor productproduct developersdeveloperscompetitioncompetition isis anan importantimportant criterioncriterion forfor productproduct developersdevelopers..Minimises the combined costs. Minimises the combined costs. Customers and suppliers incur Customers and suppliers incur costs when they use or supply the product and each tries to costs when they use or supply the product and each tries to costs when they use or supply the product, and each tries to costs when they use or supply the product, and each tries to keep their respective costs to a minimum. However, the true keep their respective costs to a minimum. However, the true optimum as viewed by society is to minimize the combined costsoptimum as viewed by society is to minimize the combined costsoptimum as viewed by society is to minimize the combined costsoptimum as viewed by society is to minimize the combined costs

P d t D iP d t D iProduct DesignProduct Design
AnAn essentialessential partpart ofof productproduct developmentdevelopment (i(i..ee..,,providingproviding thethe productproduct featuresfeatures requiredrequired toto meetmeetcustomercustomer needs)needs) isis productproduct designdesign AsAs usedused hereherecustomercustomer needs)needs) isis productproduct designdesign.. AsAs usedused here,here,productproduct designdesign isis thethe activityactivity ofof definingdefining thethe productproductfeaturesfeatures requiredrequired meetingmeeting customercustomer needsneedsfeaturesfeatures requiredrequired meetingmeeting customercustomer needsneeds..ProductProduct designdesign isis aa creativecreative processprocess basedbased largelylargelygg pp g yg yonon technologicaltechnological oror functionalfunctional expertiseexpertise.. TheThedesignersdesigners areare designdesign engineersengineers systemssystems analystsanalystsdesignersdesigners areare designdesign engineers,engineers, systemssystems analysts,analysts,andand stillstill otherother plannersplanners.. TheThe endend resultsresults ofof productproductdesigndesign areare specifications,specifications, drawings,drawings, andand proceduresprocedures
Existing Product and ProcessExisting Product and Process
Identify Customers
NT
List of Customers
Discover Customers’ Needs
REM
EN List of Customers’ Needs (in their language)
TranslateTHE THE
MEA
SUR a s ate
Customers’ Needs (In our language)QUALITY QUALITY PLANNING PLANNING
PPLY
M Develop Product
Product FeaturesROAD MAPROAD MAP
AP
Develop Process
Process Features (process ready to produce)Process Features (process ready to produce)
Transfer to Operations
InputInput--output diagram for output diagram for pp p gp gprocess developmentprocess developmentp pp p
INPUTProduct Goal INPUT
Develop Process PROCESS
Process Features OUTPUT
A A process process is “a systematic series of actions directed to the is “a systematic series of actions directed to the A A process process is a systematic series of actions directed to the is a systematic series of actions directed to the achievement of a goal.” As used here, the term includes all functions, achievement of a goal.” As used here, the term includes all functions,
nonnon--manufacturing as well as manufacturing It also includes the manufacturing as well as manufacturing It also includes the nonnon--manufacturing as well as manufacturing. It also includes the manufacturing as well as manufacturing. It also includes the human forces as well as the physical facilitieshuman forces as well as the physical facilities
Process DevelopmentProcess DevelopmentProcess DevelopmentProcess Development
Process development Process development is a generic term that includes the activities of is a generic term that includes the activities of Process development Process development is a generic term that includes the activities of is a generic term that includes the activities of product design review, choice of process, and process design, product design review, choice of process, and process design, provision of facilities, and provision of software (methods, procedures, provision of facilities, and provision of software (methods, procedures, provision of facilities, and provision of software (methods, procedures, provision of facilities, and provision of software (methods, procedures, cautions). cautions). Our emphasis is on process design which is defined as follows: Our emphasis is on process design which is defined as follows: the the Our emphasis is on process design, which is defined as follows: Our emphasis is on process design, which is defined as follows: the the activity of defining the specific means to be used by the operating activity of defining the specific means to be used by the operating forces for meeting the product goalsforces for meeting the product goals. . forces for meeting the product goalsforces for meeting the product goals. . This definition covers This definition covers
(a) (a) the physical equipment to be provided; the physical equipment to be provided; (a) (a) the physical equipment to be provided; the physical equipment to be provided; (b)(b) the associated software (the brain and nervous system of the the associated software (the brain and nervous system of the
i t) d i t) d equipment); and equipment); and (c) (c) information on how to operate, control, and maintain the information on how to operate, control, and maintain the
equipmentequipment

Process CapabilityProcess Capabilityp yp y
In the case of process development a major aid for In the case of process development a major aid for di ti i “ bilit ” di ti i “ bilit ” th i h t bilit th i h t bilit prediction is “process capability”: prediction is “process capability”: the inherent ability the inherent ability
of a process to carry out its intended missionof a process to carry out its intended missionp yp yExample Example -- Engineers who design goods are aided Engineers who design goods are aided b t bl th t t t th ti f t i l d b t bl th t t t th ti f t i l d by tables that set out the properties of materials and by tables that set out the properties of materials and the failure rates of componentsthe failure rates of componentsthe failure rates of componentsthe failure rates of components
Process DesignProcess Designgg
The end result of process design is a definition of The end result of process design is a definition of th t b d b th ti f f th t b d b th ti f f the means to be used by the operating forces for the means to be used by the operating forces for meeting the product goals. meeting the product goals. g p gg p gTo arrive at this definition the process designers To arrive at this definition the process designers
i i i t i ll k l d f th i i i t i ll k l d f th require various inputs, especially knowledge of the require various inputs, especially knowledge of the product quality goals, of the operating conditions, product quality goals, of the operating conditions, product quality goals, of the operating conditions, product quality goals, of the operating conditions, and of the capability of alternative processesand of the capability of alternative processes
Process DesignProcess DesignMost major processes consist of multiple operations (also Most major processes consist of multiple operations (also
gg
called steps, tasks, unit processes, etc.). called steps, tasks, unit processes, etc.). Examples of such operations are opening the mail and heat Examples of such operations are opening the mail and heat Examples of such operations are opening the mail and heat Examples of such operations are opening the mail and heat
treating. Such operations are linked together in various treating. Such operations are linked together in various ways mainly by a combination of a procession and an ways mainly by a combination of a procession and an ways, mainly by a combination of a procession and an ways, mainly by a combination of a procession and an assembly treeassembly tree
In-House Dept.
Supplier Dept.
S b A bl
p
SUPPLIER DEPARTMENT
To Test and Usage
Sub- Assembly Dept.
IN HOUSE DEPARTMENTS
Final Assembly
To Test and Usage
FIGURE 22 The procession
IN HOUSE DEPARTMENTS Usage
Spreadsheet: Product features and Spreadsheet: Product features and process process
PRODUCT PRODUCT PROCESS FEATURES —PRODUCT FEATURE
PRODUCT GOAL
PROCESS FEATURES
Wave Solder Conditions Parts Bin
S CArrangement Solder Temp Contact Time Alloy Purity Identity of
components 100% correct part numbers inserted
**
Component 100% correct * Component polarity
100% correct orientation
Continuity of solder joints
100% continuity ** ** ** solder joints
Key: ** Strong relationship y g p * Weak relationship

Existing Product and ProcessExisting Product and Process
Identify Customers
NT
List of Customers
Discover Customers’ Needs
REM
EN List of Customers’ Needs (in their language)
TranslateTHE THE
MEA
SUR a s ate
Customers’ Needs (In our language)QUALITY QUALITY PLANNING PLANNING
PPLY
M Develop Product
Product FeaturesROAD MAPROAD MAP
AP
Develop Process
Process Features (process ready to produce)Process Features (process ready to produce)
Transfer to Operations
Transfer to operationsTransfer to operationsTransfer to operationsTransfer to operations
Transfer to operations Transfer to operations incl des a transfer of incl des a transfer of Transfer to operations Transfer to operations includes a transfer of includes a transfer of responsibility from the planners to the operating responsibility from the planners to the operating p y p p gp y p p gmanagersmanagersP f f bilit b id d b P f f bilit b id d b Proof of process capability can be provided by Proof of process capability can be provided by direct measurement of the process (if feasible)direct measurement of the process (if feasible)p ( )p ( )Other waysOther ways
The dry runThe dry runThe pilot testThe pilot testThe pilot testThe pilot testThe Acceptance testThe Acceptance testSimulationSimulation
AUDITING OF THE QUALITYAUDITING OF THE QUALITY--PLANNING PROCESSPLANNING PROCESS
TheThe analysisanalysis shouldshould concentrateconcentrate onon providingproviding answersanswers toto resultsresultsTheThe analysisanalysis shouldshould concentrateconcentrate onon providingproviding answersanswers toto resultsresults--orientedoriented questionsquestions suchsuch as,as,
HowHow wellwell werewere customers’customers’ needsneeds met?met?HowHow wellwell werewere customerscustomers needsneeds met?met?HowHow lengthylengthy waswas thethe cyclecycle time?time?HowHow extensiveextensive waswas thethe redoingredoing ofof priorprior work?work?HowHow extensiveextensive waswas thethe redoingredoing ofof priorprior work?work?
TheThe analysisanalysis shouldshould alsoalso examineexamine thethe qualityquality--planningplanning processprocess usedused totosecuresecure thesethese resultsresults HereHere thethe needneed isis toto provideprovide answersanswers toto questionsquestionssecuresecure thesethese resultsresults.. HereHere thethe needneed isis toto provideprovide answersanswers toto questionsquestionssuchsuch as,as,
WhatWhat specificspecific featuresfeatures ofof thethe qualityquality planningplanning processprocess seemedseemed toto havehaveWhatWhat specificspecific featuresfeatures ofof thethe qualityquality--planningplanning processprocess seemedseemed toto havehavebeenbeen associatedassociated withwith wellwell--plannedplanned projects?projects?WhatWhat specificspecific obstaclesobstacles werewere encounteredencountered byby thethe planners?planners?WhatWhat specificspecific obstaclesobstacles werewere encounteredencountered byby thethe planners?planners?What can be done to help the planners (e.g., superior data base and What can be done to help the planners (e.g., superior data base and training)?training)?training)?training)?
QUALITY CIRCLESQUALITY CIRCLES
The World Turned Upside Down!The World Turned Upside Down!
QUALITY CIRCLESQUALITY CIRCLES
The World Turned Upside Down!The World Turned Upside Down!
CUSTOMER FOCUSED /CUSTOMER FOCUSED /
CEO
CONTROL
OPERATORS
CUSTOMER FOCUSED /CUSTOMER FOCUSED /CONTINUOUS IMPROVEMENTCONTINUOUS IMPROVEMENT
SNR MGTSUPERVISORS
OPERATORS
MANAGEMENTMANAGEMENT
SUPERVISORS
OPERATORS
SNR MGT
OPERATORSCOACHMASS PRODUCTIVITY /MASS PRODUCTIVITY /
SCIENTIFIC MANAGEMENTSCIENTIFIC MANAGEMENT
CEO
SCIENTIFIC MANAGEMENTSCIENTIFIC MANAGEMENT

QUALITY CIRCLESQUALITY CIRCLESQUALITY CIRCLESQUALITY CIRCLES
By By Zaipul AnwarZaipul Anwar
Business & Advanced Technology Centre,Business & Advanced Technology Centre,Universiti Teknologi MalaysiaUniversiti Teknologi Malaysia
OverviewOverview
What are Quality Circles?What are Quality Circles?Summary of History and Practices Summary of History and Practices How Do Quality Circles Work?How Do Quality Circles Work?yyHow Can They be Used in an Organization?How Can They be Used in an Organization?Example and ActivityExample and ActivityExample and ActivityExample and ActivityProblems with Quality CirclesProblems with Quality CirclesBibliographyBibliography
Summary of History andSummary of History andSummary of History and Summary of History and PracticesPractices
Quality Circles were first seen in the United Quality Circles were first seen in the United States in the 1950’sStates in the 1950’sCircles were developed by Dr Kaoru IshikawaCircles were developed by Dr Kaoru IshikawaCircles were developed by Dr, Kaoru Ishikawa Circles were developed by Dr, Kaoru Ishikawa in Japan in the 1960’sin Japan in the 1960’sCircles were reCircles were re--exported to the US in the early exported to the US in the early 1970’s1970’s
Summary of History andSummary of History andSummary of History and Summary of History and Practices (continue)Practices (continue)( )( )
1980’s brought Total Quality Management and a 1980’s brought Total Quality Management and a reduction in the use of Quality Circlesreduction in the use of Quality CirclesQ yQ yQuality Circles can be a useful tool if used Quality Circles can be a useful tool if used properlyproperlyproperlyproperly

Summary of History andSummary of History andSummary of History and Summary of History and Practices (continue)Practices (continue)( )( )
Inspection (1950’s) Quality Control (1960’s)
Quality Assurance (1970’s)Total Quality (1980’s)
“World Class”Zero Defect,
Customer Focus,Quick Response (1990’s)
2000’s ?Quick Response (1990’s)
Wh t i Q lit Cir l ?Wh t i Q lit Cir l ?What is a Quality Circle?What is a Quality Circle?
Voluntary groups of employees who work on similar Voluntary groups of employees who work on similar tasks or share an area of responsibilitytasks or share an area of responsibilityThey agree to meet on a regular basis to discuss & solve They agree to meet on a regular basis to discuss & solve problems related to work.problems related to work.ppThey operate on the principle that employee They operate on the principle that employee participation in decisionparticipation in decision--making and problemmaking and problem--solving solving p pp p g pg p ggimproves the quality of workimproves the quality of workThe reduction, by their efforts, The reduction, by their efforts, of the countless number of problems which impede the of the countless number of problems which impede the p pp peffectiveness of their workeffectiveness of their workEncourage circles to elect their own leaders towards the end Encourage circles to elect their own leaders towards the end ggof the training periodof the training period
What is a Quality Circle? What is a Quality Circle? (continue)(continue)
Frequency and duration of meetings is set by the groupFrequency and duration of meetings is set by the groupCircle should be autonomous in that it should select the Circle should be autonomous in that it should select the problems that it wishes to solve problems that it wishes to solve QCCs useful for QCCs useful for
ll lflf d l d l dd l d l dmutualmutual--selfself--development and process control and development and process control and improvement within their workshop.improvement within their workshop.Utilising basic 7 QC Tools.Utilising basic 7 QC Tools.Japanese experience indicated that 95% of the Japanese experience indicated that 95% of the J p pJ p pproblems in the workshop can be solved through 7 problems in the workshop can be solved through 7 QC ToolsQC ToolsQQ
The Japanese description of the The Japanese description of the effectiveness of a quality circle is effectiveness of a quality circle is
pr dpr dexpressed as:expressed as:
“It is better for one hundred people to take one step “It is better for one hundred people to take one step than for one person to take a hundred’than for one person to take a hundred’

The World Turned Upside Down!The World Turned Upside Down!
CEO
CONTROL CUSTOMER FOCUSED /CONTINUOUS IMPROVEMENT
CEO
SNR MGTSUPERVISORS
OPERATORS
MANAGEMENTMANAGEMENT
SUPERVISORS
SUPERVISORS
OPERATORS
SNR MGT
OPERATORSCOACHMASS PRODUCTIVITY /
SCIENTIFIC MANAGEMENT
CEO
SCIENTIFIC MANAGEMENT
How Do Quality Circles Work?How Do Quality Circles Work?How Do Quality Circles Work?How Do Quality Circles Work?
All b f l dAll b f l dAll members of a Circle need to receive trainingAll members of a Circle need to receive trainingMembers need to be empoweredMembers need to be empoweredppMembers need to have the support of Senior Members need to have the support of Senior ManagementManagementManagementManagementCharacteristicsCharacteristics
V lV lVolunteersVolunteersSet Rules and PrioritiesSet Rules and PrioritiesDecisions made by ConsensusDecisions made by ConsensusUse of organized approaches to ProblemUse of organized approaches to Problem--SolvingSolvingg ppg pp gg
Formation of Quality CirclesFormation of Quality Circles
Start on the Shop FloorStart on the Shop FloorppBase Circle on TrainingBase Circle on TrainingAllow the Circle to Form ItselfAllow the Circle to Form ItselfDo The Training ProperlyDo The Training ProperlyDo The Training ProperlyDo The Training ProperlySupport with Information RequiredSupport with Information RequiredProvide Skills and ExperienceProvide Skills and Experience
Requirements of Quality CirclesRequirements of Quality Circles
Management SupportManagement SupportT i iT i iTrainingTrainingRecognition SystemRecognition Systemg yg y

How Can They be Used in an How Can They be Used in an Organization?Organization?
Increase ProductivityIncrease ProductivityyyImprove QualityImprove QualityB E l M lB E l M lBoost Employee MoraleBoost Employee Morale
The Premise of Quality CirclesThe Premise of Quality CirclesThe Premise of Quality CirclesThe Premise of Quality Circles
Much of the trouble originated from the gulf Much of the trouble originated from the gulf between management and shop floorbetween management and shop floorOperators were frequently well aware of theOperators were frequently well aware of theOperators were frequently well aware of the Operators were frequently well aware of the cause of quality problems and, with modern cause of quality problems and, with modern st nd rds of ed tion often kne ho tost nd rds of ed tion often kne ho tostandards of education, often knew how to standards of education, often knew how to cure themcure them
Team ExerciseTeam Exercise
Break down into teams of 6Break down into teams of 6--8 people8 peopleBreak down into teams of 6Break down into teams of 6 8 people8 peopleEstablish a leader and rules for your CircleEstablish a leader and rules for your CircleHave a brainstorming and problemHave a brainstorming and problem--solving solving session to resolve the issue on the next slidesession to resolve the issue on the next slide
Team ExerciseTeam ExerciseA Collegiate class on Statistical Analysis has a total A Collegiate class on Statistical Analysis has a total enrollment of 45 people. enrollment of 45 people. Average attendance is 18 studentsAverage attendance is 18 studentsThe class consists mainly of lectures The class consists mainly of lectures c ss c s s s y c sc ss c s s s y c sHow can the professor of this class improve the quality How can the professor of this class improve the quality of this course and increase student involvement?of this course and increase student involvement?of this course and increase student involvement?of this course and increase student involvement?

The Benefits of Quality CirclesThe Benefits of Quality CirclesThe Benefits of Quality CirclesThe Benefits of Quality Circles
A Direct PayA Direct Pay--off (cost/benefits)off (cost/benefits)An Operator To Manager Dialogue (involvement, An Operator To Manager Dialogue (involvement, participation, communication)participation, communication)p p , )p p , )A Manager To Manager Dialogue (awareness)A Manager To Manager Dialogue (awareness)An Operator to Operator Dialogue (attitudes)An Operator to Operator Dialogue (attitudes)A Quality Mindedness (product quality andA Quality Mindedness (product quality andA Quality Mindedness (product quality and A Quality Mindedness (product quality and reliability, prevention of nonreliability, prevention of non--conformance)conformance)Th P l D l f h P i iTh P l D l f h P i iThe Personal Development of the ParticipantsThe Personal Development of the Participants
Reasons for failure of Reasons for failure of Quality CirclesQuality Circles
Inadequate TrainingInadequate TrainingUnsure of PurposeUnsure of PurposeN t t l V l tN t t l V l tNot truly VoluntaryNot truly VoluntaryLack of Management InterestLack of Management InterestggQuality Circles are not really empowered to Quality Circles are not really empowered to make decisionsmake decisionsmake decisions.make decisions.
Reasons for failure of Reasons for failure of Quality Circles Quality Circles (continue)(continue)
They have not had enough trainingThey have not had enough trainingy g gy g gThey have not been given sufficient They have not been given sufficient autonomyautonomyThe Quality Circles have been started in The Quality Circles have been started in Q yQ yisolation and not part of a wider programme isolation and not part of a wider programme of Companyof Company--wide Continuous Improvementwide Continuous Improvementof Companyof Company wide Continuous Improvementwide Continuous Improvement
Bibli hBibli hBibliographyBibliographyC l R b E 1999C l R b E 1999 M i Q lit F d H A iM i Q lit F d H A iCole, Robert E. 1999. Cole, Robert E. 1999. Managing Quality Fads: How American Managing Quality Fads: How American Business Learned to Play the Quality Game. Business Learned to Play the Quality Game. New York, NY: Oxford New York, NY: Oxford PressPress..Aubrey, Charles A. 1988. Aubrey, Charles A. 1988. Teamwork: Involving People in Quality Teamwork: Involving People in Quality and Productivity Improvement.and Productivity Improvement. Milwaukee, WI: Quality Press.Milwaukee, WI: Quality Press.Foster S Thomas 2001Foster S Thomas 2001 Managing Quality: An IntegrativeManaging Quality: An IntegrativeFoster, S. Thomas. 2001. Foster, S. Thomas. 2001. Managing Quality: An Integrative Managing Quality: An Integrative Approach.Approach. Upper Saddle River, NJ: Prentice Hall. Author Upper Saddle River, NJ: Prentice Hall. Author Unknown. 1984. Unknown. 1984. Quality Circles in the Community College Quality Circles in the Community College [online]. [online]. Available online viaAvailable online viaAvailable online via Available online via http://www.ed.gov/databases/ERIC_Digests/ed353008.htmlhttp://www.ed.gov/databases/ERIC_Digests/ed353008.htmlAuthor Unknown. 1994. Author Unknown. 1994. Kaizen and Quality CirclesKaizen and Quality Circles [online]. [online]. A il bl li iA il bl li iAvailable online via Available online via http://sol.brunel.ac.uk/~jarvis/bola/quality/circles.htmlhttp://sol.brunel.ac.uk/~jarvis/bola/quality/circles.html

QUALITYQUALITYQUALITY QUALITY IMPROVEMENT TEAMSIMPROVEMENT TEAMSIMPROVEMENT TEAMSIMPROVEMENT TEAMS
QUALITY IMPROVEMENT QUALITY IMPROVEMENT TEAMSTEAMS
Team formed where there is a specific problem Team formed where there is a specific problem h l ti i lik l t id i i lh l ti i lik l t id i i lwhose solution is unlikely to reside in a single whose solution is unlikely to reside in a single
department and which is large enough to justify department and which is large enough to justify h bli h f l hh bli h f l hthe establishment of a team to resolve the the establishment of a team to resolve the
problemproblemFor example (the combined actions of For example (the combined actions of Production, Testing, Technical Departments as Production, Testing, Technical Departments as g pg pwell as the Supplier for persistent equipment well as the Supplier for persistent equipment breakdown)breakdown)))
CHARACTERISTICS OF QITSCHARACTERISTICS OF QITSCHARACTERISTICS OF QITSCHARACTERISTICS OF QITS
Set up by management Set up by management InterInter--departmental departmental Group is usually formed to resolve a problemGroup is usually formed to resolve a problemGroup is usually formed to resolve a problem Group is usually formed to resolve a problem identified by othersidentified by othersTeam is usually disbanded once the problem Team is usually disbanded once the problem solvedsolvedv dv d
BENEFITS OF QITSBENEFITS OF QITSBENEFITS OF QITSBENEFITS OF QITSBreakBreak DownDown InterInter DepartmentalDepartmental BarriersBarriersBreakBreak DownDown InterInter--DepartmentalDepartmental BarriersBarriers
QITQIT processprocess isis partpart ofof teamteam buildingbuilding andand ownershipownership ofof thethep blp blproblemproblem
SolutionsSolutions AreAre MoreMore GlobalGlobal InIn ConceptConceptoptimisedoptimised forfor corporatecorporate ratherrather thanthan departmentaldepartmental goalsgoals
ImprovedImproved CommunicationsCommunicationsppsolutionssolutions areare soughtsought forfor thethe corporatecorporate goodgood ratherrather thanthan totoshiftshift blameblame
ImprovedImproved ProblemProblem SolvingSolvingtt dd ff bilbil titi ii blbl l il icreatecreate aa degreedegree ofof mobilemobile expertiseexpertise inin problemproblem solvingsolving
withinwithin thethe companycompany

THE QIT PROCESSTHE QIT PROCESSTHE QIT PROCESSTHE QIT PROCESS
Adequate training in appropriate skills must Adequate training in appropriate skills must be provided before the QIT starts workbe provided before the QIT starts workTo deny the team the problemTo deny the team the problem solving toolssolving toolsTo deny the team the problemTo deny the team the problem--solving tools solving tools it needs to carry out the task is inviting failure it needs to carry out the task is inviting failure
hi h ill ff l h i dhi h ill ff l h i dwhich will affect not only the issue under which will affect not only the issue under consideration but the credibility of the QIT consideration but the credibility of the QIT process itselfprocess itself
THE QIT PROCESSTHE QIT PROCESSTHE QIT PROCESSTHE QIT PROCESS
Identify the Project And Form The TeamIdentify the Project And Form The TeamDefine The Problem AccuratelyDefine The Problem AccuratelyIdentify And Verify Root CausesIdentify And Verify Root CausesIdentify And Verify Root CausesIdentify And Verify Root CausesPlan And Implement Corrective ActionPlan And Implement Corrective ActionStandardise And Seek Other ApplicationsStandardise And Seek Other ApplicationsConduct A Review Of The ProjectConduct A Review Of The ProjectConduct A Review Of The ProjectConduct A Review Of The Project

The Basic Seven (B7) The Basic Seven (B7) ( )( )Tools of QualityTools of Quality
"As much as 95% of quality related problems in the factory can be solved "As much as 95% of quality related problems in the factory can be solved with seven fundamental quantitative tools." with seven fundamental quantitative tools." -- Kaoru IshikawaKaoru Ishikawa
ByByBy By Zaipul AnwarZaipul Anwar
Business & Advanced Technology Centre,Business & Advanced Technology Centre,Universiti Teknologi MalaysiaUniversiti Teknologi MalaysiaUniversiti Teknologi MalaysiaUniversiti Teknologi Malaysia
Wh h B i S T l fWh h B i S T l fWhat are the Basic Seven Tools of What are the Basic Seven Tools of Quality?Quality?Quality?Quality?
Fishbone DiagramsFishbone DiagramsHistogramsHistogramsHistogramsHistogramsPareto AnalysisPareto AnalysisFlowchartsFlowchartsScatter PlotsScatter PlotsScatter PlotsScatter PlotsRun ChartsRun ChartsControl ChartsControl Charts
Wh did h B i SWh did h B i SWhere did the Basic Seven come Where did the Basic Seven come from?from?from?from?
Kaoru IshikawaKaoru IshikawaKaoru IshikawaKaoru IshikawaKnown for “Democratizing Statistics”Known for “Democratizing Statistics”
The Basic Seven Tools made statistical analysis less complicated The Basic Seven Tools made statistical analysis less complicated y py pfor the average personfor the average person
Good Visual Aids make statistical and quality control more Good Visual Aids make statistical and quality control more comprehendiblecomprehendiblecomprehendible.comprehendible.
The Basic Seven (B7) The Basic Seven (B7) ( )( )Tools of QualityTools of Quality
Fi hb DiFi hb DiFishbone DiagramsFishbone Diagrams
No statistics involvedNo statistics involved
Maps out a process/problemMaps out a process/problem
Makes improvement easierMakes improvement easier
Looks like a “Fish Skeleton”Looks like a “Fish Skeleton”

Fishbone Diagram Overview Fishbone Diagram Overview (1 of 2)(1 of 2)
DefinitionDefinitionUsesUsesIshikawaIshikawa
Use within organizationsUse within organizationsb fitb fitbenefitsbenefits
Creation of the DiagramCreation of the DiagramggSteps 1Steps 1--99
Fishbone Diagram Overview Fishbone Diagram Overview (2 of 2)(2 of 2)
Example Example Service exampleService example
ExerciseExerciseExerciseExerciseHam IndustriesHam Industries
Fishbone (Cause and Effect or Ishikawa)Fishbone (Cause and Effect or Ishikawa)Fishbone (Cause and Effect or Ishikawa) Fishbone (Cause and Effect or Ishikawa) Diagrams Diagrams (1 of 4)(1 of 4)
Named after Kaoru IshikawaNamed after Kaoru IshikawaJ Q lit iJ Q lit iJapanese Quality pioneerJapanese Quality pioneer
Resembles skeleton of a fishResembles skeleton of a fishFocus on causes rather than symptoms of a problemFocus on causes rather than symptoms of a problemEmphasizes gro p comm nication and brainstormingEmphasizes gro p comm nication and brainstormingEmphasizes group communication and brainstorming Emphasizes group communication and brainstorming Stimulates discussionStimulates discussion
Fishbone (Cause and Effect or Ishikawa)Fishbone (Cause and Effect or Ishikawa)Fishbone (Cause and Effect or Ishikawa) Fishbone (Cause and Effect or Ishikawa) Diagrams Diagrams (2 of 4)(2 of 4)
One of Seven basic tools of Japanese QualityOne of Seven basic tools of Japanese QualityOne of Seven basic tools of Japanese QualityOne of Seven basic tools of Japanese QualityLeads to increased understanding of complex Leads to increased understanding of complex g pg pproblemsproblemsVi l d i l lVi l d i l lVisual and presentational toolVisual and presentational tool

Fishbone (Cause and Effect or Ishikawa)Fishbone (Cause and Effect or Ishikawa)Fishbone (Cause and Effect or Ishikawa) Fishbone (Cause and Effect or Ishikawa) Diagrams Diagrams (3 of 4)(3 of 4)
T i ll d h lkb dT i ll d h lkb dTypically done on paper or chalkboardTypically done on paper or chalkboardRecently some computer programs have beenRecently some computer programs have beenRecently some computer programs have been Recently some computer programs have been created to make Fishbone Diagramscreated to make Fishbone Diagrams
Ishikawa EnvironmentIshikawa Environment
Use in Organizations Use in Organizations (1 of 2)(1 of 2)
Can be used to improve any product, process, or Can be used to improve any product, process, or iiserviceservice
Any area of the company that is experiencing a Any area of the company that is experiencing a y p y p gy p y p gproblemproblemI l t ll l tI l t ll l tIsolates all relevant causesIsolates all relevant causes
Use in Organizations Use in Organizations (2 of 2)(2 of 2)
Helps bring a problem into light Helps bring a problem into light Group discussion and brainstormingGroup discussion and brainstormingFinds reasons for quality variations, and theFinds reasons for quality variations, and theFinds reasons for quality variations, and the Finds reasons for quality variations, and the relationships between themrelationships between them
Creating Fishbone DiagramsCreating Fishbone DiagramsCreating Fishbone Diagrams Creating Fishbone Diagrams (1 of 4)(1 of 4)
•• As a group:As a group:bli h bl ( ff )bli h bl ( ff )1. Establish problem (effect)1. Establish problem (effect)--state in clear termsstate in clear termsstate in clear termsstate in clear terms--agreed upon by entire agreed upon by entire
groupgroupg pg p
2. Problem becomes the 2. Problem becomes the “h d” f h fi h“h d” f h fi h“head” of the fish“head” of the fish
--draw line to head (“backbone”) draw line to head (“backbone”) d w d ( b b )d w d ( b b )

Creating a Fishbone DiagramCreating a Fishbone DiagramCreating a Fishbone Diagram Creating a Fishbone Diagram (2 of 4)(2 of 4)
3.3. Decide major causes of the problemDecide major causes of the problem-- by brainstormingby brainstorming-- if the effect or problem is part of a process the major if the effect or problem is part of a process the major steps in the process can be usedsteps in the process can be used
4. Connect major causes to backbone of the 4. Connect major causes to backbone of the fish with slanting arrowsfish with slanting arrowsfish with slanting arrowsfish with slanting arrows
Creating a Fishbone DiagramCreating a Fishbone DiagramCreating a Fishbone Diagram Creating a Fishbone Diagram (3 of 4)(3 of 4)
5. Brainstorm secondary causes 5. Brainstorm secondary causes for each of the for each of the major causesmajor causesmajor causesmajor causes6. Connect these secondary causes to their 6. Connect these secondary causes to their yyrespective major causesrespective major causes7 Repeat steps 5 & 6 for sub7 Repeat steps 5 & 6 for sub causes dividingcauses dividing7. Repeat steps 5 & 6 for sub7. Repeat steps 5 & 6 for sub--causes dividing causes dividing with increased specificity with increased specificity
-- usually four or five levelsusually four or five levels
Creating a Fishbone DiagramCreating a Fishbone DiagramCreating a Fishbone Diagram Creating a Fishbone Diagram (4 of 4)(4 of 4)
8. Analyze and evaluate causes and sub8. Analyze and evaluate causes and sub--causescauses--may require the use of statistical, analytical, and graphical toolsmay require the use of statistical, analytical, and graphical tools
9 Decide and take action9 Decide and take action9. Decide and take action9. Decide and take action
Example Example (1 of 4)(1 of 4)
Step 1 & 2:Step 1 & 2:
Poor Service(“backbone”)( )
(“head”)

Example Example (2 of 4)(2 of 4)
Step 3 & 4:Step 3 & 4:
ResponsivenessAAppearance
Poor Service
ReliabilityAttention
Example Example (3 of 4)(3 of 4)
Step 5, 6, & 7:Step 5, 6, & 7:
ResponsivenessAppearancetimei t time
personnelfacility
equipment
Poor Service
Oaccuracy
courtesyOne on one service
dependability
Attention Reliability
Example Example (4 of 4)(4 of 4)
Step 8 & 9:Step 8 & 9:Use tools to analyze and evaluate causesUse tools to analyze and evaluate causes
Pareto diagrams, charts, and graphsPareto diagrams, charts, and graphsStatistical analysis for causes in processesStatistical analysis for causes in processes
Decide and take actionDecide and take actionUse fishbone diagram, analysis and evaluations to find causes that can Use fishbone diagram, analysis and evaluations to find causes that can be fixedbe fixedT k i li i d fi blT k i li i d fi blTake action to eliminate and fix problem causesTake action to eliminate and fix problem causes
Summary Summary (1 of 3)(1 of 3)
•• Fishbone DiagramsFishbone Diagrams-- visual diagram visual diagram -- resembles fish skeletonresembles fish skeleton-- identifies the causes of a problem (effect), and their identifies the causes of a problem (effect), and their relationshipsrelationshipse a o s pse a o s ps
-- created by Kaoru Ishikawa for Quality Managementcreated by Kaoru Ishikawa for Quality Management

Summary Summary (2 of 3)(2 of 3)
Organizational UsesOrganizational UsesIncreases communication about problemsIncreases communication about problemsUsed to improve any product, process, or serviceUsed to improve any product, process, or serviceUsed to improve any product, process, or serviceUsed to improve any product, process, or serviceImportant part of quality managementImportant part of quality management
Summary Summary (3 of 3)(3 of 3)
Creation of Fishbone diagramsCreation of Fishbone diagramsProblem or effect is head of fishProblem or effect is head of fishIdentify major, secondary and tertiary causes, andIdentify major, secondary and tertiary causes, andIdentify major, secondary and tertiary causes, and Identify major, secondary and tertiary causes, and attach to backbone identifying relationshipsattach to backbone identifying relationshipsA l d E l lA l d E l lAnalyze and Evaluate resultsAnalyze and Evaluate resultsAct to fix the problem(s)Act to fix the problem(s)p ( )p ( )
ExerciseExerciseCreate a Fishbone (cause and effect, Ishikawa) Create a Fishbone (cause and effect, Ishikawa) Diagram for the following:Diagram for the following:Diagram for the following:Diagram for the following:
Management at Ham Industries has noticed that the productivity of its Management at Ham Industries has noticed that the productivity of its workers is well below the standard. After interviewing its employees, it was workers is well below the standard. After interviewing its employees, it was noticed that a vast majority felt dissatisfied and unhappy with their work. noticed that a vast majority felt dissatisfied and unhappy with their work. Your boss has asked you and a group of your peers to find the causes ofYour boss has asked you and a group of your peers to find the causes ofYour boss has asked you and a group of your peers to find the causes of Your boss has asked you and a group of your peers to find the causes of worker dissatisfaction . Include all possible causes to at least the secondary worker dissatisfaction . Include all possible causes to at least the secondary level.level.
BibliographyBibliography//home.t//home.t--online.de/home/kfmaas/q_ishika.htmlonline.de/home/kfmaas/q_ishika.htmlwww zi unizh ch/software/unix/statmath/sas/sasdoc/qcwww zi unizh ch/software/unix/statmath/sas/sasdoc/qcwww.zi.unizh.ch/software/unix/statmath/sas/sasdoc/qcwww.zi.unizh.ch/software/unix/statmath/sas/sasdoc/qc
/chap17/sect1.htm/chap17/sect1.htmd i k/ b /b / 9j 00001/ 9j 0000110 hd i k/ b /b / 9j 00001/ 9j 0000110 hwww.dti.gov.uk/mbp/bpgt/m9ja00001/m9ja0000110.htwww.dti.gov.uk/mbp/bpgt/m9ja00001/m9ja0000110.ht
mlmlFoster, S. Thomas. Managing Quality: An Integrative Foster, S. Thomas. Managing Quality: An Integrative
Approach. 2001, PrenticeApproach. 2001, Prentice--Hall Hall pppp

The Basic Seven (B7) The Basic Seven (B7) ( )( )Tools of QualityTools of Quality
HistogramsHistograms
B hB hBar chartBar chart
Used to graphically represent groups of dataUsed to graphically represent groups of data
OverviewOverview
1)1) What is a Histogram?What is a Histogram?2)2) What are some possible uses for a Histogram?What are some possible uses for a Histogram?2)2) What are some possible uses for a Histogram?What are some possible uses for a Histogram?3)3) Where did the Histogram come from?Where did the Histogram come from?gg4)4) How do Histograms work?How do Histograms work?
A l ld lA l ld l5)5) A real world example.A real world example.6)6) An exercise.An exercise.))
What is a Histogram?What is a Histogram?
A Hi i i i f b h iA Hi i i i f b h iA Histogram is a variation of a bar chart in A Histogram is a variation of a bar chart in which data values are grouped together and put which data values are grouped together and put g p g pg p g pinto different classes. into different classes.
This grouping allows you see how frequently This grouping allows you see how frequently data in each class occur in the data set.data in each class occur in the data set.
Wh t i Hi t ( t )Wh t i Hi t ( t )What is a Histogram (cont.)What is a Histogram (cont.)
Higher barsHigher bars represent represent more datamore data valuesvalues in a in a llclass.class.
Lower barsLower bars representrepresent fewer datafewer data valuesvalues in ain aLower barsLower bars represent represent fewer datafewer data valuesvalues in a in a class.class.On the next slide is an example of what a On the next slide is an example of what a Histogram looks likeHistogram looks likeHistogram looks like. Histogram looks like.
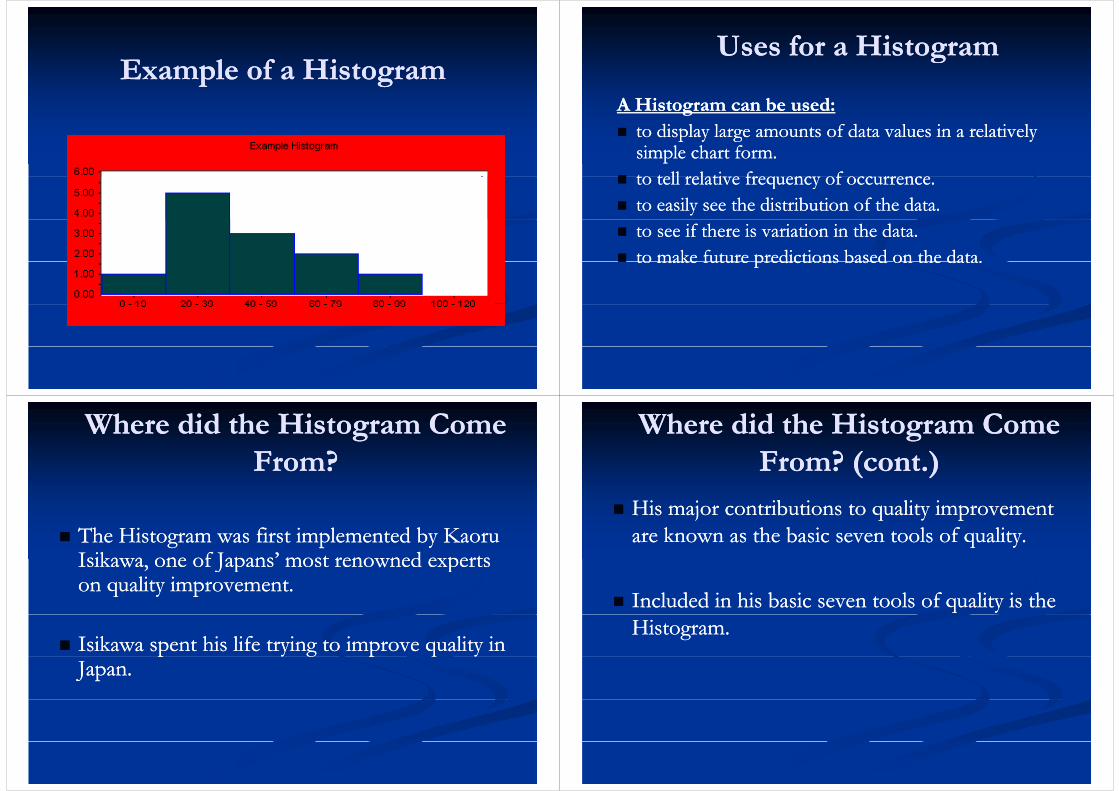
Example of a HistogramExample of a HistogramUses for a HistogramUses for a HistogramUses for a Histogram Uses for a Histogram
A Histogram can be used:A Histogram can be used:to display large amounts of data values in a relativelyto display large amounts of data values in a relativelyto display large amounts of data values in a relatively to display large amounts of data values in a relatively simple chart form.simple chart form.to tell relative frequency of occurrenceto tell relative frequency of occurrenceto tell relative frequency of occurrence.to tell relative frequency of occurrence.to easily see the distribution of the data.to easily see the distribution of the data.to see if there is variation in the data.to see if there is variation in the data.to make future predictions based on the data.to make future predictions based on the data.to make future predictions based on the data. to make future predictions based on the data.
Where did the Histogram Come Where did the Histogram Come From?From?
Th Hi fi i l d b KTh Hi fi i l d b KThe Histogram was first implemented by Kaoru The Histogram was first implemented by Kaoru Isikawa, one of Japans’ most renowned experts Isikawa, one of Japans’ most renowned experts J p pJ p pon quality improvement.on quality improvement.
Isikawa spent his life trying to improve quality in Isikawa spent his life trying to improve quality in Japan. Japan.
Where did the Histogram Come Where did the Histogram Come From? (cont.)From? (cont.)
His major contributions to quality improvement His major contributions to quality improvement k h b i l f lik h b i l f liare known as the basic seven tools of quality.are known as the basic seven tools of quality.
Included in his basic seven tools of quality is the Included in his basic seven tools of quality is the Histogram.Histogram.

H d Hi t W k?H d Hi t W k?How do Histograms Work?How do Histograms Work?
First, you need need to pick a process to analyze.First, you need need to pick a process to analyze.N d l f d l 100 dN d l f d l 100 dNext, you need a large amount of data, at least 100 data Next, you need a large amount of data, at least 100 data values so that patterns can become visible.values so that patterns can become visible.Then, you need to assemble a table of the data values Then, you need to assemble a table of the data values that you collected with regards to frequency of datathat you collected with regards to frequency of datathat you collected with regards to frequency of data that you collected with regards to frequency of data values.values.
How do Histograms Work? How do Histograms Work? (cont)(cont)
Next, you need to calculate some statistics for the Next, you need to calculate some statistics for the Histogram including: mean minimum maximumHistogram including: mean minimum maximumHistogram, including: mean, minimum, maximum, Histogram, including: mean, minimum, maximum, standard deviation, class width, number of classes, standard deviation, class width, number of classes, k d k ik d k iskewness, and kurtosis.skewness, and kurtosis.
Then, you actually create the Histogram using these Then, you actually create the Histogram using these statisticsstatisticsstatistics. statistics.
How do Histograms Work? How do Histograms Work? (cont)(cont)
After you have created a Histogram it willAfter you have created a Histogram it willAfter you have created a Histogram, it will After you have created a Histogram, it will take one of five shapes:take one of five shapes:
N l Di ib iN l Di ib iNormal DistributionNormal Distribution::
How do Histograms Work? How do Histograms Work? (cont)(cont)
P iti l Sk dP iti l Sk dPositively SkewedPositively Skewed::
N i l Sk dN i l Sk dNegatively SkewedNegatively Skewed::

How do Histograms Work? How do Histograms Work? (cont)(cont)
BiBi Modal DistributionModal Distribution::BiBi--Modal DistributionModal Distribution::
M ltiM lti M d l Di t ib tiM d l Di t ib tiMultiMulti--Modal DistributionModal Distribution::
How do Histograms Work? How do Histograms Work? (cont)(cont)
Once your Histogram is complete, you can Once your Histogram is complete, you can analyze its shape as well as the statistics that youanalyze its shape as well as the statistics that youanalyze its shape, as well as the statistics that you analyze its shape, as well as the statistics that you came up with. came up with.
This analysis will help you to make betterThis analysis will help you to make betterThis analysis will help you to make better This analysis will help you to make better decisions toward quality improvements.decisions toward quality improvements.
ConstructingConstructing a Histograma HistogramFrom a set of data computeFrom a set of data compute
sumsummean (x)mean (x)mean (x)mean (x)MaxMaxMinMinRange (maxRange (max--min)min)
ConstructingConstructing a Histograma HistogramUse range to estimate beginning and end Use range to estimate beginning and end Calculate the width of each column by dividing Calculate the width of each column by dividing the range by the number of columnsthe range by the number of columnsthe range by the number of columnsthe range by the number of columns
Range = Width# of Columns
Width

Acme Pizza ExampleAcme Pizza ExampleLet’s say the owner wants a distribution of Let’s say the owner wants a distribution of A ’ Th d Ni h S lA ’ Th d Ni h S lAcme’s Thursday Night SalesAcme’s Thursday Night Sales
Data Set from last Thursday(slices)Data Set from last Thursday(slices)y( )y( )0 2 1 2 2 4 1 3 1 2 1 2 2 4 3 4 1 4 3 2 2 3 2 1 2 2 1 2 2 1 4 2 2 1 2 1 2 2 1 2 1 2 1 2 1 2 1 0 2 1 2 2 4 1 3 1 2 1 2 2 4 3 4 1 4 3 2 2 3 2 1 2 2 1 2 2 1 4 2 2 1 2 1 2 2 1 2 1 2 1 2 1 2 1
2 1 2 2 2 1 2 1 2 1 1 2 2 2 3 1 4 2 2 3 2 2 2 1 2 3 2 2 4 2 2 4 4 1 2 2 2 3 2 2 1 2 2 4 2 1 2 2 1 2 2 2 1 2 1 2 1 1 2 2 2 3 1 4 2 2 3 2 2 2 1 2 3 2 2 4 2 2 4 4 1 2 2 2 3 2 2 1 2 2 4 2 1 2 4 2 1 7 2 1 2 2 3 1 2 1 1 2 1 2 2 2 1 2 2 1 2 1 2 2 2 4 2 44 2 1 7 2 1 2 2 3 1 2 1 1 2 1 2 2 2 1 2 2 1 2 1 2 2 2 4 2 44 2 1 7 2 1 2 2 3 1 2 1 1 2 1 2 2 2 1 2 2 1 2 1 2 2 2 4 2 44 2 1 7 2 1 2 2 3 1 2 1 1 2 1 2 2 2 1 2 2 1 2 1 2 2 2 4 2 4
Acme Pizza ExampleAcme Pizza ExampleMean = 2.032258 Mean = 2.032258 M 7M 7Max = 7 Max = 7 Min = 0 Min = 0 Range = 7 Range = 7
QuestionQuestionQQFor 7 columns what would the width be?For 7 columns what would the width be?
Range/Columns=7/7=1 sliceRange/Columns 7/7 1 slice
Acme Pizza ExampleAcme Pizza Example
Histogram6570
Histogram
50
60
3330
40
812
10
20
30
0 0 10
10
1 2 3 4 5 6 71 2 3 4 5 6 7
Slices of Pizza
Constructing a HistogramConstructing a HistogramHow is this helpful to Acme?How is this helpful to Acme?
2 slices of pizza most common order placed2 slices of pizza most common order placed2 slices of pizza most common order placed2 slices of pizza most common order placedDistribution of sales useful for forecasting next Distribution of sales useful for forecasting next Th d ’ l i h d dTh d ’ l i h d dThursday’s late night demandThursday’s late night demand
If you were an Acme manager how could you apply this If you were an Acme manager how could you apply this information?information?information?information?

The Basic Seven (B7) The Basic Seven (B7) ( )( )Tools of QualityTools of Quality
Pareto AnalysisPareto Analysis
Very similar to HistogramsVery similar to HistogramsVery similar to HistogramsVery similar to Histograms
Use of the 80/20 ruleUse of the 80/20 rule
Use of percentages to show importanceUse of percentages to show importance
P t A l i h t itPareto Analysis, how to use it
1. Gather facts about the problem, using Check Sheets or Brainstorming, depending on the availability of information.
2. Rank the contributions to the problem in order of frequency.
3. Draw the value (errors, facts, etc) as a bar chart.
4. It can also be helpful to add a line showing the cumulative percentage of errors as each category is added This helps topercentage of errors as each category is added. This helps to identify the categories contributing to 80% of the problem.
5. Review the chart – if an 80/20 combination is not obvious, you may need to redefine your classifications and go back to S 1 2Stage 1 or 2.
Acme Pizza (Example 1)Acme Pizza (Example 1)SlicesSlices FrequencyFrequency %%
00 11 3300 11 .3.311 3333 13.0913.0922 6565 25.7925.7933 88 3.173.1744 1212 4.764.7655 00 0066 00 0077 11 3377 11 .3.3
Acme Pizza (Example 1)Acme Pizza (Example 1)The completed Pareto Analysis results in the following graph:The completed Pareto Analysis results in the following graph:
50
60
70
30
40
50
10
20
30
01 2 3 4 5 6 72 1 4 3 7 5 6
Slices of Pizza

Acme Pizza (part 2)Acme Pizza (part 2)Critical ThinkingCritical Thinking
How does the Pareto Analysis differ from the How does the Pareto Analysis differ from the Histogram?Histogram?Histogram?Histogram?
How can this be a useful tool to the Acme boss?How can this be a useful tool to the Acme boss?
A series of Pareto charts drill down to more detail (Example 2) :
Fault by Main Cause1st level A l i
40
50
60
70
60
80
100
rcen
t
ount
Analysisgives “Design” as main cause of failure
2nd level Analysis gives breakdown of “Design”
0
10
20
30
0
20
40 Per
Co
Design Faults
Design
Design
ComponentBuild
Other
57 13 4 275.0 17.1 5.3 2.6
75.0 92.1 97.4 100.0
DefectCount
PercentCum %
40
50
60
80
100
nt
10
20
30
20
40
60
Perc
en
Cou
nt
Connect Module
Torque Motors
Cold Start
Transducer Module
ASIC CalibrationIOP Imon
21 10 8 8 5 3 236.8 17.5 14.0 14.0 8.8 5.3 3.5
36.8 54.4 68.4 82.5 91.2 96.5 100.0
0 0
DefectCount
PercentCum %
The Basic Seven (B7) The Basic Seven (B7) ( )( )Tools of QualityTools of Quality
FlowchartsFlowcharts
A hi l i f PROCESSA hi l i f PROCESSA graphical picture of a PROCESSA graphical picture of a PROCESS
Process Decision
The process flow
FlowchartsFlowchartsDon’t Forget to:Don’t Forget to:
Define symbols before beginningDefine symbols before beginningy g gy g g
S iS iStay consistentStay consistent
Check that process is accurateCheck that process is accurate
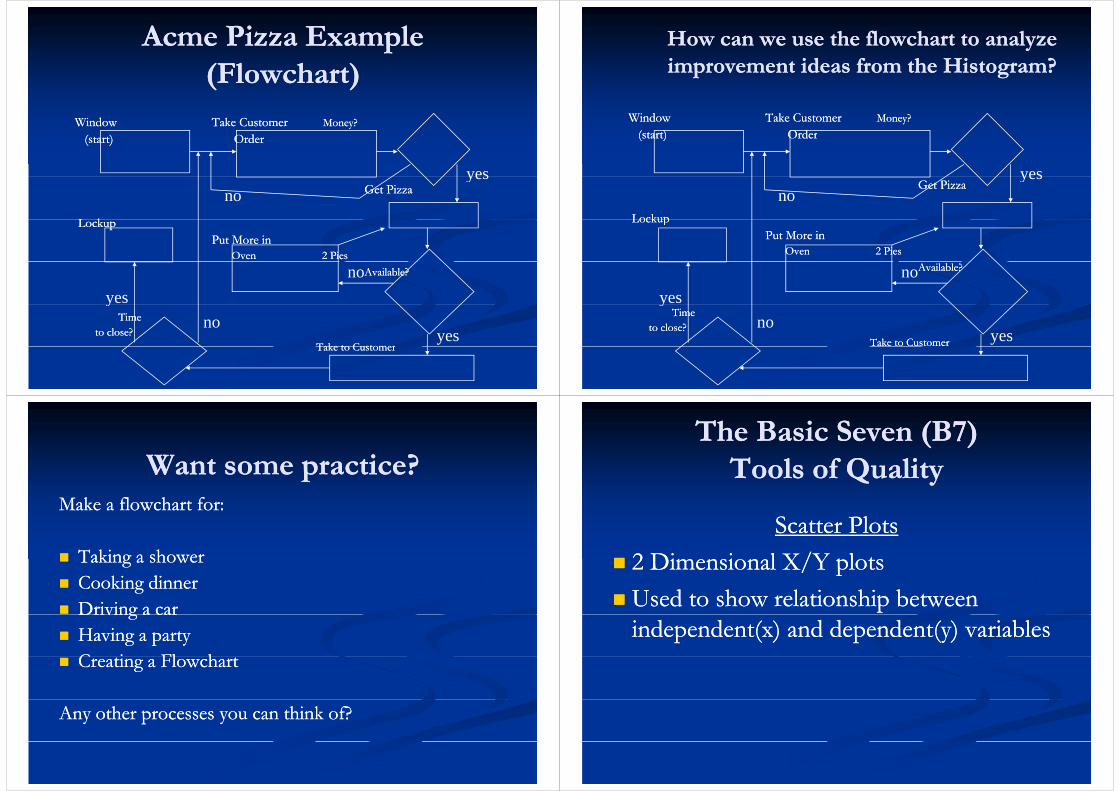
Acme Pizza Example Acme Pizza Example pp(Flowchart)(Flowchart)
WindowWindow Take CustomerTake Customer Money?Money?dd(start)(start) OrderOrder
yesGet PizzaGet Pizza
L kL k
noyes
LockupLockupPut More inPut More in
OvenOven 2 Pies2 PiesAvailable?Available?no
yesTimeTime
to close?to close?Take to CustomerTake to Customer
yesno
y
Take to CustomerTake to Customer
How can we use the flowchart to analyze How can we use the flowchart to analyze yyimprovement ideas from the Histogram?improvement ideas from the Histogram?
WindowWindow Take CustomerTake Customer Money?Money?(start)(start) OrderOrder(start)(start) OrderOrder
yesGet PizzaGet Pizza
LockupLockup
noyes
LockupLockupPut More inPut More in
OvenOven 2 Pies2 PiesAvailable?Available?no
yesTimeTime
to close?to close?Take to CustomerTake to Customer yes
noy
Want some practice?Want some practice?Make a flowchart for:Make a flowchart for:
Taking a showerTaking a showerCooking dinnerCooking dinnerDriving a carDriving a carDriving a carDriving a carHaving a partyHaving a partyC i Fl hC i Fl hCreating a FlowchartCreating a Flowchart
Any other processes you can think of?Any other processes you can think of?
The Basic Seven (B7) The Basic Seven (B7) ( )( )Tools of QualityTools of Quality
Scatter PlotsScatter PlotsScatter PlotsScatter Plots2 Dimensional X/Y plots2 Dimensional X/Y plots/ p/ pUsed to show relationship between Used to show relationship between independent(x) and dependent(y) variablesindependent(x) and dependent(y) variables

Acme Pizza Acme Pizza (Scatter Diagram)(Scatter Diagram)
Min tes CookingMin tes Cooking Defecti e PiesDefecti e PiesMinutes CookingMinutes Cooking Defective PiesDefective Pies1010 114545 884545 883030 557575 20207575 20206060 14142020 442020 442525 66
In this simple example, you can find the existing relationship without much In this simple example, you can find the existing relationship without much difficulty but…difficulty but…
Scatter DiagramsScatter Diagrams
25E i di20
25•Easier to see direct relationship
10
15
5
10
00 20 40 60 80
Time Cooking (minutes)
Scatter DiagramsScatter DiagramsAs a quality toolAs a quality tool
What does this tell Acme management about What does this tell Acme management about their processes?their processes?their processes?their processes?Improvements?Improvements?
20
25
10
15
20
0
5
10
00 20 40 60 80
Time Cooking (minutes)
The Basic Seven (B7) The Basic Seven (B7) ( )( )Tools of QualityTools of Quality
Run chartsRun chartsTimeTime--based (xbased (x--axis)axis)
CyclicalCyclical
Look for patternsLook for patternsLook for patternsLook for patterns

Run ChartsRun ChartsSlices/hour
8 9 10 11 12 1 2 3 4 8 9 10 11 12 1 2 3 4 8 9 10 11 12 1 2 3 4 Time8 9 10 11 12 1 2 3 4 8 9 10 11 12 1 2 3 4 8 9 10 11 12 1 2 3 4PM- AM PM- AM PM- AM
Thursday
Week 1
Thursday
Week 2
Thursday
Week 3
The Basic Seven (B7) The Basic Seven (B7) ( )( )Tools of QualityTools of Quality
Control ChartsControl ChartsDeviation from MeanDeviation from Mean
Upper and Lower Spec’sUpper and Lower Spec’s
RangeRangeRangeRange
Control ChartsControl ChartsUpper LimitUpper Limit
XX
Lower LimitLower Limit
Unacceptable deviation
Control ChartsControl Charts
Acme Pizza Management wants to getAcme Pizza Management wants to get in on the control chart action
•Average Diameter = 16 inchesAverage Diameter 16 inches
•Upper Limit = 17 inchesUpper Limit 17 inches
•Lower Limit = 15 inches•Lower Limit = 15 inches

Acme example Acme example ppControl ChartsControl Charts
Upper LimitUpper Limit17 inches17 inches
X16 i h X16 inches=
Lower LimitLower Limit15 Inches15 Inches15 Inches15 Inches
Small Pie
Acme example #50Acme example #50ppControl ChartsControl Charts
•Pies within specifications were t blacceptable
O b ll ll i i•One abnormally small pie is “uncommon”uncommon
•Should be examined for quality control•Should be examined for quality control
Logical Order for B7 ToolsLogical Order for B7 ToolsLogical Order for B7 ToolsLogical Order for B7 Tools
Big Picture
Data Collection
Data Analysis
ProblemIdentification Prioritization
FlowChart
CheckSheet Histograms
Cause& Pareto
AnalysisChart Sheet gEffect Analysis
ScatterDiagramsDiagrams
ControlCharts
SummarySummaryBasic Seven Tools of QualityBasic Seven Tools of Quality
Measuring dataMeasuring dataMeasuring dataMeasuring data
Quality AnalysisQuality Analysis
“D i d i i ”“D i d i i ”“Democratized statistics”“Democratized statistics”

BibliographyBibliography
Foster, Thomas. Foster, Thomas. Managing Quality. An IntegrativeApproachManaging Quality. An IntegrativeApproach. Upper Saddle River : . Upper Saddle River : P i H llP i H ll 20012001Prentice Hall, Prentice Hall, 2001.2001.
Stevenson, William. “Supercharging Your Pareto Analysis.” Stevenson, William. “Supercharging Your Pareto Analysis.” Quality ProgressQuality Progress, p g g y, p g g y Q y gQ y gOctober 2000: October 2000: 5151--55.55.
““Dr Kaoru Ishikawa ” InternetDr Kaoru Ishikawa ” InternetDr Kaoru Ishikawa. Internet Dr Kaoru Ishikawa. Internet “http://www.dti.gov.uk/mbp/bpgt/m9ja00001/m9ja0000110.html.” 16 “http://www.dti.gov.uk/mbp/bpgt/m9ja00001/m9ja0000110.html.” 16
February 2001.February 2001.
“Chemical and Process Engineering.” Internet. “Chemical and Process Engineering.” Internet. “http://lorien.ncl.ac.uk/ming/spc/spc8.htm.” 17 “http://lorien.ncl.ac.uk/ming/spc/spc8.htm.” 17 February 2001.February 2001.

Introduction Introduction to to
ISO 9001:2000ISO 9001:2000ISO 9001:2000ISO 9001:2000
By:By:Zaipul AnwarZaipul Anwar
Manager R & D DeptManager R & D DeptManager, R & D Dept.Manager, R & D Dept.Business & Advanced Technology CentreBusiness & Advanced Technology Centre
UTMUTM