Creativity and Financial Incentives - UCSB's Department...
58
Creativity and Financial Incentives November 11, 2014 Gary Charness* and Daniela Grieco + Abstract: Creativity is a complex and multi-dimensional phenomenon with tremendous economic importance. Yet, despite this importance, there is very little work on the topic in the economics literature. In this paper, we consider the effect of incentives on creativity. We present a first series of experiments on individual creativity where subjects face creativity tasks where, in one case, ex-ante goals and constraints are imposed on their answers, and in the other case no restrictions apply. The effects of financial incentives in stimulating creativity in both types of tasks is then tested, together with the impact of personal features like risk and ambiguity aversion. Our findings show that, in general, financial incentives affect “closed” (constrained) creativity, but do not facilitate “open” (unconstrained) creativity. However, in the latter case incentives do play a role for ambiguity-averse agents, who tend to be significantly less creative and seem to need extrinsic motivation to exert effort in a task whose odds of success they don’t know. The second set of experiments aims at exploring group creativity in contexts where the “corporate culture” is either cooperative or individualistic. Our results show that, in the case of closed tasks, financial incentives and collectivist attitudes foster creativity, but only with cooperative corporate culture. Keywords: creativity; incentives; corporate culture; competition; cooperation; ambiguity. JEL codes: A13, C91, C92, D03, O39 * UCSB + Bocconi University Acknowledgments: For valuable comments we would like to thank Doug Bernheim, Anat Bracha, Christiane Bradler, Francesco Bripi, Alessandra Casella, Vince Crawford, Stefano DellaVigna, Catherine Eckel, Ernst Fehr, Drew Fudenberg, Uri Gneezy, Peter Hammond, Botond Koszegi, Christine Lauritzen, John List, Ulrike Malmendier, Meg Meyer, Susanne Neckermann, Charlie Plott, Antonio Rangel, Luca Rigotti, Kelly Shue, Bruno Strulovici, Nora Szech, Verena Utikal, Marie Claire Villeval, Alistair Wilson, and participants at seminars at the UCSB Psychology Department, UCSD, Columbia University, the University of Pittsburgh, the ZEW Workshop on Incentives and Innovation in Mannheim, the 2013 Herbert Simon Society Conference in New York, the 2013 ESA Conference in Zurich, the 2014 UCSB Conference on Behavioral and Experimental Economics, the 2014 Spring School on Experimental Economics at UCSD, the 2014 Experimental Methods and Policy Conference in Curacao, the University of Oxford, the 2014 Stanford Institute for Theoretical Economics (Psychology and Economics), the 2014 CESifo conference in Munich, and the University of Lyon (GATE)
-
Upload
phungkhuong -
Category
Documents
-
view
215 -
download
0
Transcript of Creativity and Financial Incentives - UCSB's Department...
Creativity and Financial Incentives
November 11, 2014
Gary Charness* and Daniela Grieco+
Abstract: Creativity is a complex and multi-dimensional phenomenon with tremendous economic importance. Yet, despite this importance, there is very little work on the topic in the economics literature. In this paper, we consider the effect of incentives on creativity. We present a first series of experiments on individual creativity where subjects face creativity tasks where, in one case, ex-ante goals and constraints are imposed on their answers, and in the other case no restrictions apply. The effects of financial incentives in stimulating creativity in both types of tasks is then tested, together with the impact of personal features like risk and ambiguity aversion. Our findings show that, in general, financial incentives affect “closed” (constrained) creativity, but do not facilitate “open” (unconstrained) creativity. However, in the latter case incentives do play a role for ambiguity-averse agents, who tend to be significantly less creative and seem to need extrinsic motivation to exert effort in a task whose odds of success they don’t know. The second set of experiments aims at exploring group creativity in contexts where the “corporate culture” is either cooperative or individualistic. Our results show that, in the case of closed tasks, financial incentives and collectivist attitudes foster creativity, but only with cooperative corporate culture.
Keywords: creativity; incentives; corporate culture; competition; cooperation; ambiguity.
JEL codes: A13, C91, C92, D03, O39 * UCSB + Bocconi University
Acknowledgments: For valuable comments we would like to thank Doug Bernheim, Anat Bracha, Christiane Bradler, Francesco Bripi, Alessandra Casella, Vince Crawford, Stefano DellaVigna, Catherine Eckel, Ernst Fehr, Drew Fudenberg, Uri Gneezy, Peter Hammond, Botond Koszegi, Christine Lauritzen, John List, Ulrike Malmendier, Meg Meyer, Susanne Neckermann, Charlie Plott, Antonio Rangel, Luca Rigotti, Kelly Shue, Bruno Strulovici, Nora Szech, Verena Utikal, Marie Claire Villeval, Alistair Wilson, and participants at seminars at the UCSB Psychology Department, UCSD, Columbia University, the University of Pittsburgh, the ZEW Workshop on Incentives and Innovation in Mannheim, the 2013 Herbert Simon Society Conference in New York, the 2013 ESA Conference in Zurich, the 2014 UCSB Conference on Behavioral and Experimental Economics, the 2014 Spring School on Experimental Economics at UCSD, the 2014 Experimental Methods and Policy Conference in Curacao, the University of Oxford, the 2014 Stanford Institute for Theoretical Economics (Psychology and Economics), the 2014 CESifo conference in Munich, and the University of Lyon (GATE)
1
1. Introduction
Creativity is a vital input into the well-being and success of a society, contributing in
economic, social, and aesthetic dimensions. According to Henri Poincaré, creativity represents
the “ability to unite pre-existing elements in new combinations that are useful”. It seems that
creativity implies (a) a combination of existing things that should be (b) recognized in its utility
by peers. A culture without creativity becomes stagnant.
One focus in economics has traditionally been on innovation and economic growth.
According to Feinstein (2009), “innovation is widely recognized to be the source of much, if not
most, economic growth.” Since creativity is central to research endeavors, facilitating creativity
(and therefore innovation) would appear to be an important component in the design of economic
institutions. Because technical progress drives the long-term growth of advanced economies, a
central goal of growth theory has long been to get inside the black box of innovation (Weitzman,
1998). Not only does drastic innovation represent a crucial device for a firm to establish a
performance gap with its competitors - increasing perspective profits and market share - but it
also enhances social welfare and promotes expected long-term growth by introducing new
products, satisfying unaddressed needs, and pushing process efficiency.
The stock market appears to value innovators, since stock prices typically reflect these
expectations. Forbes annually publishes a list of the most innovative companies by calculating
the “innovation premium” the stock market gives a company because investors expect it to
launch new offerings and enter new markets that will generate bigger income streams.
Management and strategy consulting firms like Booz & Company have shown over the past
years that what matters for a firm’s financial performance is how companies “spend money and

2
resources on innovation efforts, as well as the quality of their talent, processes, and decision
making” (from booz.com).
While the fields of cognitive and social psychology (and others) have long considered
aspects of creativity, there has been little research on this topic in the economic literature.
Perhaps the one exception is Feinstein (2006), which “provides an integrative framework for
thinking about and describing the creative development of individuals in many fields.” However,
this conceptual discussion provides no empirical tests. Insights from the psychology literature
could be valuable for generating richer economic models with more predictive power.
Conversely, a deeper understanding of how economic incentives and conditions can affect
creativity could potentially enrich psychological models.
Economists are typically concerned with incentives, which are usually (but not always)
financial in nature. On one hand, achievements such as the Manhattan Project suggest that
providing incentives can greatly facilitate creative solutions. Historically, prizes have been used
to stimulate many discoveries.1 In the same vein, the patent system was developed with the aim
of providing a strong incentive to produce novel ideas and products without the gains from doing
so being appropriated by other entities. Of course creativity also extends into other areas with
economic importance, such as art, music, dance, and writing. It may be the case that artists and
perhaps even academic researchers may not need financial incentives to produce creative art or
research, respectively: ideas seem to arrive at their own rate, independently of direct incentives
1 These include Archimedes’ method for measuring the volume of the king’s crown, the canning process to preserve food needed by Napoleon's troops, the invention of margarine that was challenged by Napoleon III who offered a prize to any chemist who would develop a cheap butter substitute to feed France's armies, and the smallpox vaccine that was developed in pursuit of a financial prize offered by the English Parliament.

3
but possibly affected by interaction with others.2 There is also the notion from social psychology
(see for example the seminal work by Deci and Ryan, 1985) that extrinsic reward can crowd out
intrinsic motivation, so that providing financial rewards be counterproductive.3 Thus, the effects
of economic incentives on creativity it is not obvious. Empirical evidence is clearly needed, and
there is very little work linking creativity and incentives. Since it is difficult to perform clean
tests using field data, controlled experiments provide a promising avenue for exploring this issue.
Creativity within an organizational context also has great importance in our
contemporary corporate world. A great deal of creative work conducted in organizations is the
product of multiple individuals working closely together. One consideration can be termed
“corporate culture”. In its most general sense, corporate culture describes and governs the ways
a company's owners and employees think, feel and act. The Kreps (1990) model of corporate
culture considers that formal contracts may be ineffective in some settings, that events may be
unforeseen, and that there may be multiple equilibria. In the latter case, which equilibrium is
coordinated upon may be determined by the underlying corporate culture. One dimension is
concerned with whether people work independently or in teams. We are interested in studying
how interaction within groups affects creativity levels, and whether an “individualistic” or a
“cooperative” corporate culture is more conducive to creative performance.4 Do we observe a
greater degree of creativity when individuals compete with each other across groups or in an
environment where individuals help each other and share the benefits of each member’s effort? 2 In fact, until 2007, French artists could benefit from a form of subsidy that was reserved to the so-called “intermittent du spectacle” (an arts and entertainment industry worker who receives payments and benefits during periods of unemployment), that was aimed to sustain French culture and that has been criticized for being unable to promote quality. 3 Hennessey and Amabile (2010) review the creativity literature in social psychology and state (p. 581) that historically: “High levels of extrinsic motivation were thought to preclude high levels of intrinsic motivation; as extrinsic motivators and constraints were imposed, intrinsic motivation (and creativity) would necessarily decrease.” 4 The topic of group decision-making and performance relative to that of individuals has increasingly become a focus in economics. See Charness and Sutter (2012) for an extensive discussion.

4
We take the view that creativity is multi-dimensional. Indeed, while there may well be
many dimensions (see Sternberg, e.g.), we operationalize two types of creativity. With “closed”
creativity, there is a specific and delineated goal. Examples could be finding a way to decrease
the size of a computer or developing a new drug for a specific purpose. In this case, we
suspected that financial incentives would be useful. On the other hand, “open” creativity could
be considered to represent unfettered thinking outside the box, so that here is no obvious
underlying ex-ante goal or direction. Our measure of this form of creativity seems to overlap
with previous definitions of conceptual creativity. We suspected that directly incentivizing open
creativity would be ineffective (or possibly even counter-productive).
We present two sets of experiments. In the first set, the experiment consisted of two
types of tasks (verbal and mathematical) aiming at measuring these forms of creativity.
Participants were randomly assigned to one of two conditions: they could receive a flat payment
(“no incentives”) for completing the task, or be remunerated according to their performance
ranking within a group of peers. In addition, people completed a questionnaire, including two
incentivized questions designed to capture risk and ambiguity attitudes.
Our results are striking and confirm our main hypothesis. We find that monetary
incentives are effective in stimulating creativity when ex-ante goals are specifically set and the
nature of the task is more well-defined. So when society has a clear objective in view, it does
appear useful to reward creativity that helps to achieve this objective. On the other hand,
incentives for performance with respect to open creativity generally provide no benefit in our

5
setting. However, an exception applies to ambiguity-averse people, who tend to otherwise avoid
the less-defined open-creativity tasks.5
The second set of experiments investigates creativity in groups, and we experimentally
model polar extremes (individualistic vs. cooperative) of corporate culture by incorporating two
different payment schemes. In the individualistic condition, each member of a group is paid on
the basis of his or her individual performance ranking relative to individuals in other groups who
performed the same task. In contrast, in the cooperative condition, performance rankings are
aggregated for each group and are compared to aggregated rankings of other groups.6
Once again, our results are quite clear and, in this case, somewhat surprising. Despite
the inherent free-rider problem when the metric is overall group performance, our findings show
that financial incentives are effective in a group context, but only with a cooperative corporate
culture. It is possible that the intrinsic motivation of “doing well for the team” overcomes this
free-rider effect, as we observe no significant difference between creative performance with flat
payment and with incentives. So perhaps incentives “crowd in” in the cooperative, but not the
individualistic, culture. Additionally, a positive attitude toward collectivism is a powerful
determinant of higher creative performance in the cooperative setting, consistent with the notion
that concern for the well-being of the group fosters self-improvement.
The remainder of this paper is organized as follows. We discuss related literature in
Section 2, and present the experimental design and experimental results for our test of individual
5 Even though ambiguity-averse individuals might be very creative in such tasks, the uncertainty surrounding them might cause them to simply not take them on. Incentives could potentially overcome this reluctance, so that ambiguity-averse people might effectively be influenced by extrinsic rewards in this context. 6 Since the closed task in the individual-level investigation appeared to be more sensitive to financial incentives, we choose to present closed tasks to participants belonging to a group.

6
creativity in Section 3. The design details and results of our experiment on creativity in groups
are described in Section 4, and Section 5 presents a discussion and concludes.
2. Related literature
2.1. Definitions and dimensions of creativity
Until the middle of the 20th century, creativity was studied as a minor topic within a
number of various disciplines such as psychology, sociology, and cognitive science. The turning
point for the emergence of creativity as a separate sphere of study can be traced back to the
seminal works of Guilford (1950) and Torrance (1962, 1974, 1989), who attempted to measure
creativity from a psychometric perspective. The Torrance test of creative thinking compares
“convergent” to “divergent” thinking and is still a reference tool for measuring creativity. At the
same time, personality tests were developed with the aim of identifying potentially-relevant traits
as characteristics of creative people, such as independence of judgment, self-confidence,
openness to experience, balanced personalities, attraction to complexity, aesthetic orientation,
and risk taking (see, e.g., Sternberg, 1985). While certain aspects of creativity studies are still
being debated, significant advancements have been made (Simonton, 2000). The challenge of
investigating creative potential using conceptual and experimental approaches towards problem-
solving processes is more recent, beginning with Nielsen et al. (2008)’s research.
For our purpose, creativity can be defined as “the production of novel and useful ideas in
any domain” (e.g. Stein, 1974; Woodman et al., 1993). In contrast, innovation represents the
successful implementation of creative ideas within an organization; creativity by individuals and
teams is therefore the starting point for innovation. Given the necessity of generating creative
ideas repeatedly, firms have traditionally relied on an internal staff of professional inventors in
R&D labs (Schulze and Hoegl, 2008). More recently, many organizations have turned to
7
employee suggestion schemes (Ohly et al., 2013) or to outsourcing of creative ideas in an
attempt to get fresh hints (Surowiecki, 2004).
Sternberg (1999) outlines a typology of creativity based upon the outcome of the creative
process and contrasts forward incrementation to conceptual replication. Although this
categorization is useful, it focuses upon the end product, leading to two problems. First, only
ideas that reach the end of the process are studied, so that the sample is biased toward more
successful ideas. Second, the categorization encourages retrospective analysis of the process,
which may lead to bias in recollection.
Galenson (2004)’s research on creativity identified two creative methods or styles:
conceptual and experimental. The former corresponds to the generation of a new idea (a kind of
deductive process), the latter is a new combination of existing items (an inductive or synthetic
process that relies on experience). The former corresponds to divergent thinking, while the latter
is a form of convergent thinking. Although creativity tasks are usually categorized as either
convergent or divergent, most creative problems contain elements of both (Nielsen et al. 2008).
Convergent tasks require a single correct response, whereas divergent tasks require producing
many different correct answers (Hudson, 1966; Runco, 2006 and 2007).
Fiore and Schooler (2001) borrow the concept of “problem space” from information-
processing theory and use it to emphasize the need of distinguishing between ill- and well-
structured problems. Besides the dimension of convergent versus divergent, problems might
differ because they are delimited by clear versus ambiguous constraints: participants can be
required to consider only the given set of variables, or to also account for all the possibilities that
might help in completing the task.

8
2.2. Tasks for measuring creativity
The specific task one chooses to measure creativity is of course a critical issue (see
Sternberg, 1988): due to the multi-dimensional nature of creativity, it is very difficult to find a
task that measures it unequivocally. Therefore, the task must be tailored to the research question,
with an effort made to establish a dialogue between the research question and the task.
Individual creativity is traditionally measured by tests in the psychological domain like
Guilford’s individual's performance on intelligence tests (1950, 1962), Torrance’s creativity test
(1974), or the more recent Mayer et al. (2003)’s insight test.
Divergent tasks consist of multiple-use tasks (like “List as many uses for a paper
clip/rubber band as you can think of”) and attribute tasks (like “List as many things that are
blue/have wheels as you can think of”). Convergent tasks use remote associates and verbal
insight problems (like “What word are all three of these words - cream, skate, water - related
to?”). Studies like Bowden and Jung-Beeman (2003) and Dow and Mayer (2004) use remote
associations and verbal-insight problems (like “Marsha and Marjorie were born on the same day
of the same month of the same year to the same mother and the same father, yet they are not
twins. How is that possible?”). Ariely et al. (2009) use as a creativity task the “Packing
Quarters” game: participants are asked to fit nine metal pieces of quarter circles into a frame
within a given time. To fit all nine, the pieces have to be packed in a particular, “creative” way.7
In problem-finding research, scholars examine the degree to which the problem has been
formulated before the creator begins the process.
In general, researchers propose a continuum ranging from closed to open problems: a true
closed problem is one that is presented to the participant, when the method for solving the
7 Here very large financial incentives led to poorer performance than modest stakes.
9
problem is known (convergent, in Torrance’s terminology); open problems occur when the
participant is required to find, invent, or discover the problems (divergent). In the perspective of
Dual Process Theory (e.g. Stanovich and West, 2000; Kahneman, 2011), closed tasks -
characterized by specific directions to follow - could exert a signal to use the cognitive system to
proceed rationally, slowly and according to logical standards. Open tasks, on the contrary cause
one to proceed in a much more unplanned and unaware manner. Dillon (1982) argues that most
artistic endeavors generally represent open problems; responses to a suggestion scheme illustrate
outcomes of organizational open problems.8
2.3. Motivation and incentives to creativity
A big question underlies involvement in the creative process. Why do people engage in
creative activity? Motivations might depend on internal sources, such as a need for self-
actualization or simply the joy one receives from being creative. Alternatively, creative behavior
might be a response to an external demand perhaps reflecting a job description, an experimental
requirement, or environmental needs. Both intrinsic and extrinsic motivations appear to play
roles as determinants of creative behavior. A number of studies show the importance of high
intrinsic motivation consisting of the excitement and challenge of engaging in a creative activity.
On the other hand, there is little agreement among scholars on the effectiveness of financial
incentives (and, more generally, rewards and extrinsic motivations) on creative performance.
Despite the conventional wisdom in economics, financial incentives are not always
helpful and may even be counterproductive. Deci and Ryan (1985) report an experiment in
which children’s intrinsic motivation to engage in an activity is undermined by financial rewards. 8 Psychologists rely also on some “disposal measures” that are based on self-reported descriptions of subject’s own personality: Gough (1979)’s Creative Personality Scale, Hocevar (1980)’s Creative Behaviour Inventory, and Kirton (1976)’s Creative Cognitive Style (see Gino and Ariely, 2011).

10
Similarly, Gneezy and Rustichini (2000) show that paying only a small wage for charitable work
can lead to lower productivity than relying completely on intrinsic motivation and paying
nothing. Paying an excessive amount can also lead to poor outcomes due to a sense of pressure,
as suggested by the aforementioned results in Ariely et al. (2009).
Amabile (1989, 1996)’s seminal studies both on children and adults show that
crowding out can occur in the presence of monetary incentives, which seem to undermine
intrinsic motivation and affect creative performance negatively. According to Kohn (1993): “It
is simply not possible to bribe people to be creative” (p. 294). In the same vein, Hennessey and
Amabile (1998) conclude “the preponderance of the evidence demonstrates that working for
reward, under circumstances that are likely to occur naturally in classrooms and workplaces
every day, can be damaging to both intrinsic interest and creativity” (p. 675).
Nevertheless, some empirical research shows positive effects of rewards on creativity
(Eisenberger et al, 1998; Eisenberger and Rhoades, 2001), although these results seems to be
driven by very specific contexts or derived under experimental conditions not fully consonant
with the methods of modern experimental economics. The use of reward has been possibly
confounded with the presence of cues indicating the appropriateness and desirability of a creative
performance (Winston and Baker, 1985). In addition, many studies use the promise of a reward
(aimed at establishing reward expectancy), but given the reputation for deception by researchers
in psychology, it is unclear how credible these promises are to the subjects.
Since establishing purpose and intention to be creative is important for creative
accomplishment (Nickerson, 1999), rewards given explicitly to prize creativity may foster such a
creative orientation and push the focus on the creative question. Consistent with this notion,
Collins and Amabile (1999) show that rewarding children’s creativity can be successful if
11
combined with intensive cognitive training designed to encourage a focus on the assigned task
rather than on the reward. With an “algorithmic” task (where the pattern of solution is clear and
straightforward), such as making a collage after being told precisely how to make a creative one,
external constraints like rewards led to enhanced performance. Furthermore, rewards can be
used for directing adults’ attention and stimulating their effort in engaging in information search
and other tedious procedures necessary to deal with long-term creative projects.
2.4. Creativity and corporate culture
Adding to the traditional psychological approach to individual creativity (Barron, 1955;
MacKinnon, 1965), scholars in management science have assumed that the social environment
can influence both the level and the frequency of creative behavior. Organizational creativity is
a function of the creative outputs of its component groups and contextual influences
(organizational culture, reward systems, resource constraints, the larger environment outside the
system, and so on) and represents a complex individual-situation interaction (Woodman and
Schoenfeldt, 1989).
An important dimension in organizational settings is known in economics as corporate
culture. Among others, possible definitions of corporate culture rely on “shared meanings,
central values, assumptions and beliefs” (Brown, 1995). Culture strength is typically measured
as the consistency of survey responses within a company: questions are related to aspects like
clarity of shared goals, communication, fairness of rewards, innovation and risk taking (see
Gordon and DiTomaso, 1992). A relevant question is which type of corporate culture is most
effective in inducing creativity. In some organizational cultures, individuals’ creativity may
determine the emergence of positive externalities (individuals’ creativity levels are

12
complementary, with the emergence of synergies); in other organizational cultures, negative
externalities (substitutes) might arise.
In general, the mechanism through which group creativity develops is ambiguous: on
one side, the group may exhibit inertial behavior; on the other, the group may be more proactive
as risk sharing is possible (Cooper and Kagel, 2005). Furthermore, in the group there might be
the chance of investing in larger ideas with respect to what happens individually. Like several
strategic decisions, creative problem-solving by corporations is often done within a group or
team framework. According to the business-strategy literature, performance differences across
firms, even when operating in the same industry, can be attributed to organizational or corporate
culture, defined as a “a strong set of managerial values that define the way to conduct business”
(see e.g. Barney, 1986).
There is mixed evidence on the comparison between individual and group performance.
Although the conventional wisdom among psychologists is that groups outperform individuals,
research on creative problem-solving shows that the performance of individuals is generally
better than that of groups. Intuitively, a team should be more likely to solve a problem that its
smartest member would be if acting alone (Shaw, 1932) since one might expect some other
group members to produce thoughtful work and reject incorrect solutions (Davis, 1992).
Nonetheless, groups are also characterized by a relative inefficiency caused by lower effort due
to free-riding and shirking or by coordination issues involved in combining members’
contributions and in diminishing marginal productivity (e.g. Treffinger et al. 2006).
Furthermore, as emphasized by Goncalo and Staw (2006), studies on creativity at the
group level have highlighted a potential tradeoff between social control and creativity. A long
tradition of research has shown that people often conform to the majority view, even when they

13
know it is wrong (Asch, 1956). However, some organizational scholars (e.g. O’Reilly and
Chatman, 1996) have argued that people in collectivistic cultures have a stronger concern for the
well-being of the group, which stimulates individual effort and performance.
In general, corporate culture differs from the culture of other groups in that there is an
entity (i.e. the firm) that may wish to influence the evolution of its culture in order to increase
profits or achieve other goals. By comparing the performance of groups or teams, one can
identify the presence of positive, negative, or zero synergies for groups.
3. Individual creativity
The first set of our experiments involves asking individuals to perform a task in a creative
manner. The experiment has a 2x2 design, consisting of two real-effort tasks (closed vs. open)
and two treatments (incentives vs. flat payments). Each participant was assigned to only one of
the four treatments. The relative creativity of each participant is evaluated by peers and by
externals judges (blind to treatments and conditions), in line with Poincaré’s definition
emphasizing that the “new combination” should be recognized in its utility by peers and with
Amabile’s notion of “social consensus”. We provided no guidance concerning evaluating
creativity; when asked, we simply stated that this was for each participant to judge.
3.1. Tasks
We capture experimental creativity by using “combination” tasks, and conceptual
creativity by asking for the development of a totally new product or vision. Subjects had 20
minutes to complete the chosen task.
Closed task
In the closed condition, people were asked to choose from the following questions:
14
1. “Choose a combination of words to create an interesting story.” The words supplied are: house, zero, forgive, curve, relevance, cow, tree, planet, ring, send. Participants were told that they must use these words along with any other combination of words that they wished. (verbal) 2. “Starting from the number 27, obtain the number 6 by using at least two different numerical operations.” Possible answers include: (27:3) – 3 = 6, or [(27 + 3): 2 – 12]! = 6. (math)
Open task
In the open condition, people were asked to choose from the following questions:
1.“If you had the talent to invent things just by thinking of them, what would you create?”
2.“Imagine and describe a town, city, or society in the future.”
Participants were told that the creativity of their output would be ranked in relation to that of the
other four people in the group. People in another mutually-anonymous five-person group (in
order to avoid strategic effects on the evaluations) performed this ranking.
We consider our treatments to be something of a minimal intervention, in the sense that
the tasks, while different in some dimensions, are not dissimilar in others.
3.2. Treatments
Incentives treatment
In the incentive treatment, we paid people on the basis of the assessments made. In each
group, the person with the best ranking received an additional $15, the person with the second-
best ranking received an additional $12, the person with the third-best rating received an
additional $9, the person with the fourth-best ranking received an additional $6, and the person
with the worst ranking received an additional $3; these payments were made in addition to the
standard $5 payment for showing up on time to the experiment).
No-incentives treatment
In the no-incentive treatment, we paid people a flat amount of $9 (plus the $5 show-up
fee) for completing the response. The tasks were identical to those in the incentives treatment.

15
In both cases, people were told that the five individuals in another group would anonymously
rank the creativity of their work.9
A major advantage of having evaluations by peers is that they are most likely to be
attuned to what is perceived to be creative in the relevant reference group (recall that “creativity
should be recognized in its utility by peers”). Nevertheless, to perform rankings across sessions,
it was necessary to later have the responses evaluated by external judges, who were blind to
treatments and conditions.
3.3. Risk and ambiguity attitude
In our questionnaire (presented after completing the task), we requested demographic
information and also asked subjects to answer two incentivized questions on risk and ambiguity
attitude (Gneezy and Potters, 1997; Charness and Gneezy, 2010): each individual is endowed
with 100 units and could invest any portion in a risky asset that had a 50 percent chance of
success and paid 2.5 times the amount invested if successful and nothing if unsuccessful; the
individual retains whatever units were not invested. Participants were told that two different
people (one for the risk-aversion question and one for the ambiguity-aversion question) would be
chosen at random in each session for actual payoff implementation of these choices, and a coin
would be flipped after the session to determine success or failure for these investors. This
procedure provides a measure of risk aversion for each individual: the higher the investment, the
less risk averse is the individual. The question on ambiguity attitude is identical except that we
did not tell people the probability that the investment would be successful.
9 We ranked people in the no-incentives condition to control for the possibility that people care about their rank per se, as in Charness, Masclet, and Villeval (2014).

16
3.4. Questionnaire
The questionnaire is comprised of:
- 10 questions on creative and cognitive style and sensation-seeking attitude, based on Nielsen at
al. (2008)’s questions on creative style and on Zuckerman et al. (1964)’s questions on sensation-
seeking attitude. Zuckerman et al. (1964)’s sensation-seeking scale was originally comprised of
34 items written on a forced-choice form. We consider only a selection of the items pertaining to
preferences for the new and unfamiliar as opposed to the familiar, preferences for irregularity as
opposed to regularity and routine, social values based on the stimulation value of other persons
as opposed to their reliability and predictability, preferences for security as opposed to
adventure, and need for general excitement.
- Seven questions on demographic features: gender, age, major, number of siblings, birth-order,
right or left-handed, married/divorced/unmarried parents plus other six questions on past
involvement in creative activities, as in Hocevar (1980). This inventory originally included a list
of 77 activities and accomplishments that are commonly considered to be creative (e.g., painted
an original picture, wrote an original computer program, excluding school or university work);
for each item, participants indicated the frequency of the behavior in their adolescent and adult
life. The scoring rule was to sum up each participant’s ratings for the activities included in the
inventory. In our questionnaire, the inventory is scored for creativity in six areas: art, crafts,
performing arts, math-science, literature, and music.
3.5. Procedures
The experiments on individual creativity were conducted at the University of California,
Santa Barbara. There were 14 pen-and-paper sessions, with a total of 236 participants. There
were 97 people who faced the closed task, with 53 in the no-incentives condition and 44 in the
incentives condition; there were 139 people who faced the open task, with 70 in the no-

17
incentives condition and 69 in the incentives condition.10 The subjects were undergraduate
students (42% from Social Sciences, 40% from Hard Sciences and 18% from Humanities), with
57.2% females. We employed a between-subjects design: no individual participated in more than
one session. In each session, the participants were paid a $5 show-up fee, plus their earnings
from the experiment. At the beginning of each session, written instructions were distributed to
the participants and read aloud by the experimenter. All subjects completed a final questionnaire
containing demographic information, personality details and the two incentivized questions
measuring risk and ambiguity aversion. The sessions took approximately one hour, with average
earnings of about $15.
3.6. Results
3.6.1. Creativity evaluation
As mentioned, people in one group evaluated and ranked the individual responses from
people in another group: rankings exhibit a fair degree of consistency (Cronbach’s alpha = .536).
To make comparisons across treatments, we had two external judges - blind to treatments
- assess all of the answers on a 1-10 scale with no indication of any specific criteria to be
followed but to their own taste for creativity: the two judges’ evaluations exhibited a good
degree of consistency (Cronbach’s alpha = .619). Our creativity score is the average of the two
independent evaluations and is highly correlated with the group ranking (Spearman correlation
test, with coef. = .518, p = 0.000).11
10 These numbers are not evenly divisible by 5 because: (a) one subject’s answer in Session 3 was unreadable; (b) one subject in Session 6 did not give us back the sheet containing his answer; and (c) two subjects in Session 14 did not show up. 11 Throughout the paper, we round all p-values to three decimal places.

18
In addition to subjective evaluations, we introduce two objective measurements of
creativity effort that reflect the number of words used in the answers to the verbal task and the
number of operations used in the answers in the math task. With closed creativity, participants
used an average number of 200 words (std. dev. = 95.60) or 51 mathematical operations (std.
dev. = 68.36); with open creativity, answers had an average of 210 words (std. dev. = 81.23).
For the closed task, we also sought objective determinants for creativity assessments. We
had two other judges (different from the ones who assigned the creativity score) classify the
answers according to the two-fold taxonomy shown below. For the verbal task, the judges used
this taxonomy to identify the specific meaning according to which each of the words the subjects
had used, and to assign a score reflecting the degree of originality of the meaning they selected.12
[TABLE 1]
For the math task, the judges assigned a score that reflected the complexity of each
operation used.13
[TABLE 2]
In the case of closed verbal creativity, participants obtained an average taxonomy score
of 17.75 (std. dev. = 9.41); for closed math creativity, the taxonomy score was on average 8.67
(std. dev. = 6.13).
We were pleased to find that the taxonomy score is quite significantly correlated with our
creativity score (Spearman correlation test, with coef. = .346, p = 0.001). This implies that the
12 Meanings are ordered according to WordReference.com's ranking in use frequency: for each word, the score increases in the originality of the meaning used. 13 Operations are grouped and ordered according to the school level in which they are typically taught: the subject earns the score corresponding to the maximum level she reaches, no matter the number of operations in each set.
19
subjective creativity coding is indeed meaningful and the taxonomy score offers an objective
metric that can be readily employed in this environment.
3.6.2. Role of financial incentives
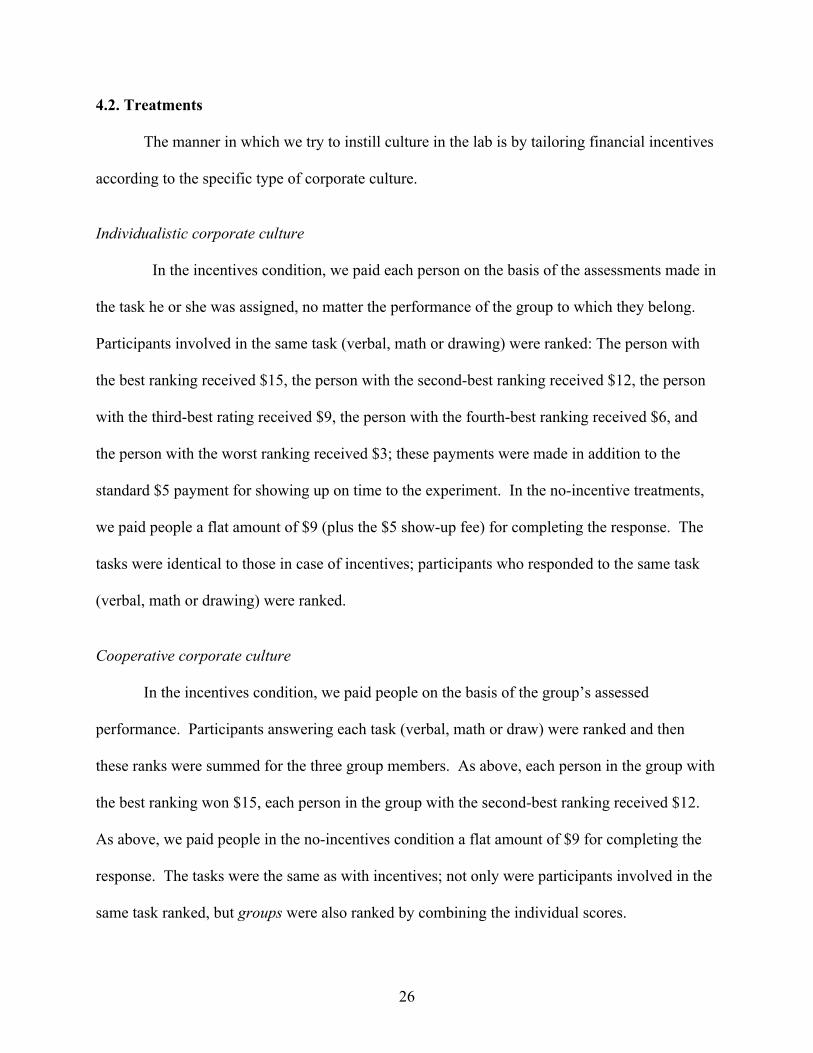
The introduction of financial incentives has a positive effect on the level of creativity
when the task is characterized by the presence of ex-ante goals and constraints. In the closed
condition, participants whose pay depended upon their ranking14 (incentives treatment) are more
creative than subjects who receive a flat payment (no-incentives treatment): the average level of
creativity score increases with incentives from 5.075 to 5.909 and this difference is significant
(Wilcoxon rank-sum test on individual averages, Z = -2.673, p = 0.007).15 There is no significant
difference between the creativity scores for incentivized and non-incentivized open tasks or
between these scores and the score for non-incentivized closed creativity.16
Figure 1 summarizes previous results, and Table 3 reports summary statistics on the
creativity score according to the task and the treatment.
[FIGURE 1]
[TABLE 3]
We see a dramatic and distinctive effect of incentives on individual creativity with a
more-defined task. To the best of our knowledge, this is the first study to find such an effect17.
It is worth noting that, whereas incentives matter in determining the creativity score,
neither the effort nor the taxonomy score is fostered by incentives. For the verbal task, the 14 Our payoff structure is a relatively soft tournament scheme. We might expect to find even stronger results with sharper marginal differences in payoffs. 15 All statistical tests are two-tailed unless otherwise specified. 16 The respective test statistics are Z = 0.532, 0.298 and -0.195, with p-values 0.594, 0.832 and 0.845. 17 Eckartz et al. (2012) use a scrabble-type task, finding that incentives have very small effects and that differences in performance are predominantly related to individual skills. On the contrary, Bradler et al. (2013) provide evidence that routine as well as creative task performance increase significantly under the tournament scheme, whereas unconditional gift triggers higher effort only in tasks while creative performance is not affected.

20
average effort is 222.0 with flat payment and 171.38 with incentives (Z = 1.889, p = 0.058,
Wilcoxon rank-sum test using individual averages); the average taxonomy score is 18.44
with flat payment and 16.82 with incentives (Z = 0.826, p = 0.408). For the math task, the
average effort is 66.00 with flat payment and 91.90 with incentives (Z = -0.418, p = 0.675,
Wilcoxon rank-sum test using individual averages);18 the average taxonomy score is 9.19
with flat payment and 7.60 with incentives (Z = 0.496, p = 0.620). One interpretation is that
it is the subjective component of creativity evaluation - the one that is difficult to capture by
means of objective criteria like the ones we introduced - that is fostered by financial
incentives. Other explanations can be related to the effectiveness of financial incentives in
promoting the “quality” of the creativity effort creativity instead of the effort itself.
In the open condition, the average creativity score with incentives is not significantly
different from that in the no-incentives treatment: the average level of creativity score is 5.079
and 5.150, respectively, and there is no significant difference (Wilcoxon rank-sum test on
individual averages, with Z = 0.532, p = 0.594). Also note that the creativity scores in both parts
(combined) of the open condition are nearly the same as the score in the closed condition without
incentives (Z = 0.060 and p = 0.952, respectively. As per Dillon (1982), most artistic endeavors
generally represent open problems so that perhaps a true artist cannot be incentivized; artistic
talent may simply be lacking. But “thinking harder” with open tasks does not help and could
conceivably hurt (via the so-called creative blockage).
A possible explanation of the ineffectiveness of incentives in the open task is that
incentives are likely to work better if the task objectives are defined more precisely and are
18 While it may seem that there should be a significant difference for the math task, the lack of significance is driven by extreme values and by the limited number of observations. The lack of statistical significance is confirmed by the median test and the Kolmogorov-Smirnov tests (p = 0.903 and p = 0.586, respectively).

21
consequently perceived as clearer (as happens with closed creativity) because the evaluation
process is easier to forecast for the subject who will experience it. Delfgaauw et al.
(forthcoming) conduct a field experiment in a retail chain to test the prediction of tournament
theory and find that noise dilutes incentives to perform because it reduces the marginal effect of
effort on the probability of winning
3.6.3. Incentives and risk/ambiguity aversion
This section provides a deeper analysis of the role of monetary incentives and individual
attitudes towards risk and ambiguity.
We characterize investment choices in the ambiguous lottery in terms of risk aversion
and ambiguity aversion. Furthermore, we consider the interaction between the presence of
monetary incentives and risk/ambiguity aversion. Finally, we introduce the “ambiguity-risk gap”,
which represents the difference between the amount a subject decided to invest in the ambiguity
lottery and the amount she decided to invest in the risky lottery. One hundred and thirteen
people showed no ambiguity-risk gap; of the rest, 99 people invested more with risk than with
ambiguity, while 24 people invested less with risk than with ambiguity. This is significantly
different from random behavior (Z = 6.763, p = 0.000, binomial test).
Overall, the average investment with risk was 63.34 and the average investment with
ambiguity was 51.04, a considerable difference (t = 6.899, p = 0.000, one-sample t test). We
find the familiar pattern that men invest more than women under risk (71.41 versus 57.26, Z =
3.930, p = 0.000, ranksum test); however, the difference is diminished into statistical
insignificance under ambiguity (53.43 versus 49.23, Z = 0.897, p = 0.370). So our evidence
suggests that men are relatively more sensitive to ambiguity (relative to risk preferences) than
women; to the best of our knowledge there is no previous evidence on this issue.

22
When considering closed creativity, the main engine for creativity is incentives. Table 4
shows that financial incentives per se matter (p = 0.051), as neither risk- or ambiguity-aversion
nor the gap between ambiguity and risk nor or any interaction between risk, ambiguity and
incentives is significant. Participants putting more effort in the task (using a higher number of
words or operation) and selecting more original meanings or more sophisticated operations -
according to an object classification like the taxonomy we provided to the second group of
judges - are the people who receive a significantly higher creativity score.19
[TABLE 4]
While at first blush incentives appear to be ineffective in shaping open creativity,
further analysis indicates that the relationship between creativity and incentives is mediated
by ambiguity attitude. The regression in Table 5 examines the role of risk and ambiguity
aversion, as well as interactions between these attitudes and financial incentives.
[TABLE 5]
Ambiguity (but not risk) plays a twofold role: the more a subjects prefers ambiguity to
risk, given the degree of risk-aversion, the higher her creativity score in open tasks (p = 0.025,
from this regression).20 Furthermore, subjects who showed a non-negative ambiguity-risk gap
reach a significantly higher creativity score than subjective with a negative ambiguity-risk gap:
the average score is 5.30 versus 4.82, and this difference is significant (Z = -1.980, p = 0.047,
Wilcoxon rank-sum test using individual averages).
19 Since the creativity score is correlated with effort and taxonomy score, it seems that, on some level, judges’ creativity evaluations reflect these objective measurements. But of course the correlation is not perfect; we suspect that there is some residual that matters in a creativity evaluation and cannot be readily captured by objective measures. Perhaps it is this residual that is enhanced by monetary incentives. 20 One could speculate that the ability to deal with uncertainty (“letting go”) is related to one’s talent in an open task.

23
Additionally, ambiguity interacts with financial incentives. Although in general financial
incentives do not succeed in stimulating open creativity, we find that ambiguity-averse people
are more sensitive to financial incentives (p = 0.062 from this regression): since open creativity
has no definite goals in terms of outcome, subjects do not face clearly their probability of
success. Uncertainty about probability is a definition of ambiguity (Ellsberg, 1961): ambiguity-
averse subjects might be less attracted to this type of creative task, but incentives might be used
to stimulate creativity and compensate this effect.
3.6.4. Personality features and previous measures of creativity
We now focus on the role of demographic features and personal attitudes like creative/
cognitive style and sensation-seeking mind-set. We report supplemental regression tables for
open and closed creativity in Appendix A.
Regarding closed creativity, we observe that neither creative style nor preferences for
sensation-seeking nor involvement in artistic tasks plays a role. Among demographic variables,
we find only that the number of siblings seems to affect creativity negatively and significantly (p
= 0.014 from the regression in Table A1). Nevertheless, all in all, closed creativity appears to
respond to financial incentives, but little else.
Turning to open creativity, two significant effects do emerge. First, the more a subject’s
creative style can be described as conceptual rather than experimental, the higher the creativity
score in open tasks. This classification is based on work by Nielsen et al. (2008), which
introduces operational definitions of Galenson (2004)’s creative methods: conceptual creative
people have definite goals and methods, whereas experimentally creative people do not have
24
clearly established methods, use trial and error, and do not have specific goals.21 Consistent with
these definitions, our data show that open creativity seems to be a form of experimental
creativity: in our regression in Table A2, the more the subject exhibits a creative style that can be
described as conceptual, the lower the score for open creativity (p = 0.045). Second, students
majoring in the hard sciences are more creative (p = 0.052).22
Summing up, we considered the fit of our measures of creativity with previous measures
of creative style and personality, finding that open creativity overlaps somewhat with Galenson
(2004)’s definition of experimental creativity.
4. Corporate creativity
The second set of our experiments involves asking individuals belonging to groups of
three people to perform a task in a creative manner. The experiment has a 2x2 design, varying
different types of corporate culture (individualistic versus cooperative) and incentives versus flat
payments. The payoff structure was the same as in the individual treatments, so that average
earnings from the creative tasks were identical across the incentivized and non-incentivized
treatments. Each participant completed an assigned closed real-effort task; no person
participated in more than one session. While in principle group members could communicate
and even switch tasks with each other, our anecdotal evidence is that switching tasks was rare.
Being assigned to a task rather than choosing it could affect behavior and performance.23
21 Schweitzer et al. (2014) show that goal setting is very effective in motivating constructive effort (although it is often associated with unethical behavior when people fall short of their goals). 22 This could be due to the fact that 51.42 percent of subjects majoring in hard sciences choose the math task - for which they are likely to have more expertise – with respect to other subjects who choose the math task only in 25 percent of the cases (Wilcoxon rank-sum test with Z=-2.596, p = 0.005, one-tailed test). 23 Babcock, Bedard, Charness, Hartman, and Royer (2013) provide a clean test (with no selection bias) showing that people who select a task have better performance than those who were assigned the same task.
25
As in our experiments on individual creativity, relative creativity of each participant is
evaluated by peers and by two external judges (blind to treatments and conditions). Once again,
we provided no guidance concerning how to evaluate creativity.
4.1. Tasks
We use the same closed tasks as with individual creativity (verbal and math): since we
have groups of three people, we add a drawing task so that each member of the group faces a
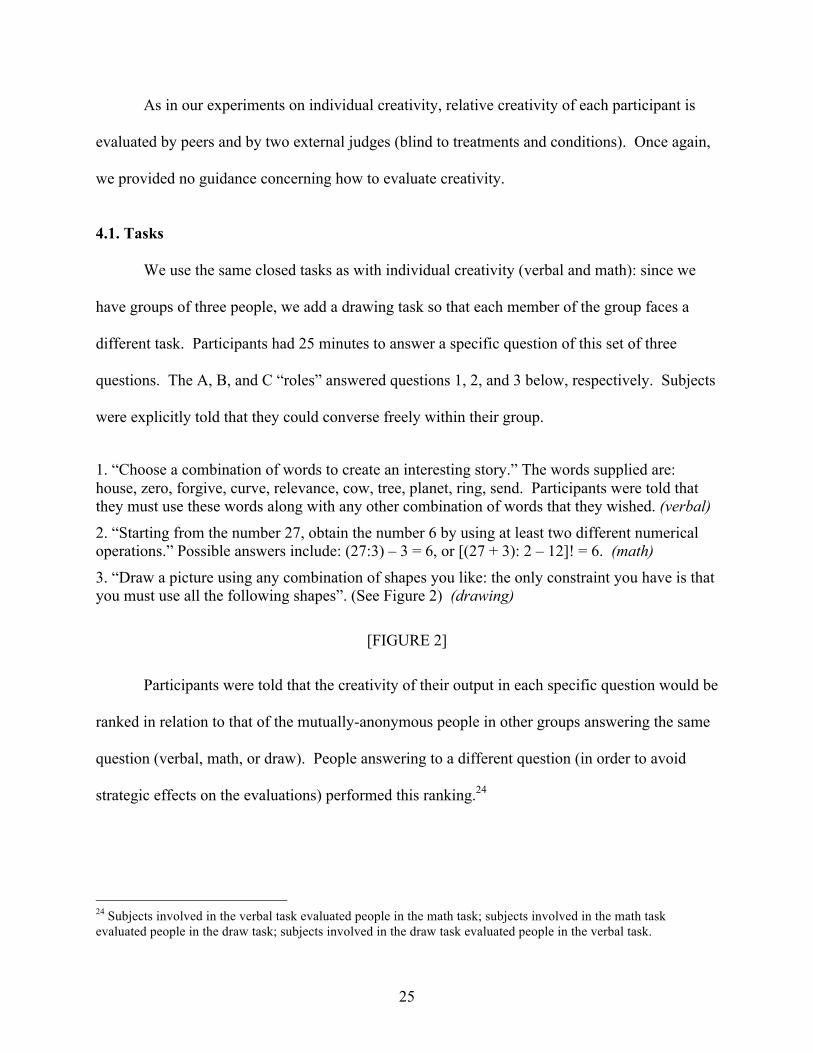
different task. Participants had 25 minutes to answer a specific question of this set of three
questions. The A, B, and C “roles” answered questions 1, 2, and 3 below, respectively. Subjects
were explicitly told that they could converse freely within their group.
1. “Choose a combination of words to create an interesting story.” The words supplied are: house, zero, forgive, curve, relevance, cow, tree, planet, ring, send. Participants were told that they must use these words along with any other combination of words that they wished. (verbal)
2. “Starting from the number 27, obtain the number 6 by using at least two different numerical operations.” Possible answers include: (27:3) – 3 = 6, or [(27 + 3): 2 – 12]! = 6. (math)
3. “Draw a picture using any combination of shapes you like: the only constraint you have is that you must use all the following shapes”. (See Figure 2) (drawing)
[FIGURE 2]
Participants were told that the creativity of their output in each specific question would be
ranked in relation to that of the mutually-anonymous people in other groups answering the same
question (verbal, math, or draw). People answering to a different question (in order to avoid
strategic effects on the evaluations) performed this ranking.24
24 Subjects involved in the verbal task evaluated people in the math task; subjects involved in the math task evaluated people in the draw task; subjects involved in the draw task evaluated people in the verbal task.
26
4.2. Treatments
The manner in which we try to instill culture in the lab is by tailoring financial incentives
according to the specific type of corporate culture.
Individualistic corporate culture
In the incentives condition, we paid each person on the basis of the assessments made in
the task he or she was assigned, no matter the performance of the group to which they belong.
Participants involved in the same task (verbal, math or drawing) were ranked: The person with
the best ranking received $15, the person with the second-best ranking received $12, the person
with the third-best rating received $9, the person with the fourth-best ranking received $6, and
the person with the worst ranking received $3; these payments were made in addition to the
standard $5 payment for showing up on time to the experiment. In the no-incentive treatments,
we paid people a flat amount of $9 (plus the $5 show-up fee) for completing the response. The
tasks were identical to those in case of incentives; participants who responded to the same task
(verbal, math or drawing) were ranked.
Cooperative corporate culture
In the incentives condition, we paid people on the basis of the group’s assessed
performance. Participants answering each task (verbal, math or draw) were ranked and then
these ranks were summed for the three group members. As above, each person in the group with
the best ranking won $15, each person in the group with the second-best ranking received $12.
As above, we paid people in the no-incentives condition a flat amount of $9 for completing the
response. The tasks were the same as with incentives; not only were participants involved in the
same task ranked, but groups were also ranked by combining the individual scores.

27
4.3. Questionnaire: collectivism vs. individualism
Questions to measure risk and ambiguity aversion, demographic features and attitude
towards novelty and sensation-seeking are the same as the ones used in the questionnaire for
individual creativity. In addition, we present subjects with three further questions inspired by
Wagner (1995)’s measure of collectivist attitude (versus individualistic attitude) aimed at
capturing a person’s preference for working in teams and sharing a group’s value.
4.4. Procedure
The experiments were conducted at the University of California, Santa Barbara. There
were 12 pen-and-paper sessions, with a total of 174 participants. There were 93 people in the
individualistic corporate culture treatment, with 48 in the incentives condition and 45 in the non-
incentives condition; 81 people in the cooperative culture treatment, with 39 in the incentives
condition and 42 in the no-incentives condition. The subjects were students (33 percent from
Social Sciences, 46 percent from Hard Sciences and 21 percent from Humanities), with 56.4
percent females. We used a between-subjects design, and no one participated in more than one
session. Participants were paid a $5 show-up fee, plus their earnings from the experiment.
At the beginning of each session, participants were welcomed and the instructions were
handed to them in written form before being read aloud by the experimenter. Each three-person
group was seated separately from the other groups, with the group members seated in a row in
seats about two feet apart. All subjects completed the final questionnaire. The sessions took
approximately one hour, with average earnings of about $15.

28
4.5. Results
4.5.1. Creativity evaluation
As mentioned above, people who answered to a task (verbal, math, or draw) evaluated
and ranked the individual responses from people who answered one of the other two tasks. The
rankings exhibit a high level of consistency (Cronbach’s alpha = .713). To make comparisons
across treatments, we had two external judges - blind to treatments - evaluate all of the answers
on a 1-10 scale. As above, our creativity score is the average of the two independent evaluations.
The two external judges’ evaluations also exhibited a high degree of consistency
(Cronbach’s alpha = .685) and are correlated with the rankings (Spearman correlation test, with
coef.= .159, p = 0.049) although the correlation is weaker than in case of individual creativity.
In addition to the objective measures on the number of words and operations used for
individual creativity, we introduce a further measure of effort related to the drawing task; it
consists of counting the number of shapes (circles, triangles and squares) used in the answers.
On average, participants produced answers containing 225 words (std. dev. = 124.43), 55
operations (std. dev. = 96.47), and 71 shapes (std. dev. = 73.13). The taxonomy score was on
average 17.81 (std. dev. = 9.41) for the verbal task; in case of math answers, the taxonomy score
was on average 5.87 (std. dev. = 4.14). The taxonomy score is significantly correlated with our
creativity score (Spearman correlation test, with coef. = .173, p = 0.008).
4.5.2. Role of financial incentives and corporate culture
Figure 3 and Table 6 show a clear pattern. The average creativity scores for the four
treatments are nearly identical, except that the average score with a cooperative corporate culture
and incentives is much higher. In the presence of incentives, the average creativity score is
significantly higher in case of cooperative culture (Wilcoxon rank-sum test on individual

29
averages, with Z = -4.527, p = 0.000). With individualistic corporate culture, incentives do not
affect the creativity score significantly (Wilcoxon rank-sum test on individual averages, with Z =
0.232, p = 0.816), while they do in case of cooperative corporate culture (Wilcoxon rank-sum
test on individual averages, with Z = 4.067, p = 0.000).
[FIGURE 3]
[TABLE 6]
In comparison with individual creativity, the effort and taxonomy scores are more
affected by incentives. The average effort in the verbal task is 176.76 with flat pay and 269.74
with incentives (Z = -2.482, p = 0.013, Wilcoxon rank-sum test on individual averages); the
average taxonomy score is 15.24 with flat payment and 20.10 with incentives (Z = -1.846, p =
0.064). In the math task, the average effort is 97.55 with flat payment and 17.26 with incentives
(Z = 1.621, p = 0.104, Wilcoxon rank-sum test using individual averages);25 the average
taxonomy score is 5.12 with flat payment and 6.72 with incentives (Z = -1.859, p = 0.063).
We report a regression for the determinants of the creativity score in Table 7. We see
that incentives per se have no significant effect and that there is no difference between the
creativity scores for cooperative and individualistic corporate cultures when no financial
incentives are provided. However, there is a strong effect for the interaction between incentives
and cooperative culture. As before, participants selecting more original meanings or more
sophisticated operations - according to an object classification like the taxonomy we provided to
the second group of judges - are the people who receive a significantly higher creativity score.
However, we find no effect from the effort measure.
25 At first glance, this large difference in math effort scores seems rather surprising. What drives this is that subjects tend to choose fewer, but more original, operations in the presence of incentives.

30
[TABLE 7]
4.5.3. Incentives, risk/ambiguity aversion, and collectivism
Eighty-one people showed no ambiguity-risk gap; of the rest, 62 people invested more
with risk than with ambiguity, while 8 people invested less with risk than with ambiguity.26 This
is significantly different from random behavior (Z = 6.454, p = 0.000, binomial test). Overall,
the average investment with risk was 62.84 and the average investment with ambiguity was
52.28. We replicate the familiar pattern that men invest more than women under risk (67.84
versus 59.55, Z = -0.62, p = 0.052, ranksum test); the difference again diminishes into statistical
insignificance under ambiguity (53.40 versus 52.27, Z = 0.114, p = 0.454). These data confirm
our previous finding that men are relatively more sensitive to ambiguity than women.
Collectivism is a dummy variable ranging from zero (high level of individualism) to
three (high level of collectivism): nine percent of subjects exhibited the maximum degree of
individualism, 13 percent showed the maximum degree of collectivism, 47 percent were
moderately collectivist and 31 percent strongly collectivist. A positive attitude towards
collectivism significantly increases the creativity score in the cooperative treatment.
When considering cooperative culture, a main engine for creativity is incentives. Table 8
shows that financial incentives per se matter (p = 0.000). However, here neither risk aversion
nor ambiguity-aversion nor the gap between ambiguity and risk (or any interaction between risk,
ambiguity and incentives) is significant.
[TABLE 8]
26 We have data on risk and ambiguity attitude for 151 subjects only, due to a production error in Session 3.

31
With respect to individualistic corporate culture, Table 9 shows that the preference for
ambiguity relative to risk seems to be slightly associated with higher creativity (p = 0.073;
neither preference for risk nor ambiguity interacts significantly with financial incentives.
[TABLE 9]
4.5.4. Personal features
Preference for sensation and adventure positively affect creative performance, but only in
the case of cooperative corporate culture. As illustrated above, sensation-seeking is built to
measure some kind of preference for novelty and discovery. It seems that a good disposition for
sensation promotes performance in cooperative culture, but do not affect performance in the
individualistic corporate culture). As in the case of individual creativity, there is no gender
effect; age, major and family features do not play any role. We report a regression on
demographic features, personal attitudes and group creativity in Table A3.
5. Discussion
Our results are clear. In an individual framework, creativity is the same across all
conditions except that it is markedly higher when there is a closed task and extrinsic incentives
are provided. In a group activity, where the sense of being in a group was reinforced by
physical proximity, we see that creativity is higher if and only if the group shares a common and
incentivized outcome. In this section, we discuss our results and relate them to previous work.
First, contrary to the predictions of much of the relevant literature in psychology, we see
no evidence at all that providing financial incentives has a harmful effect on creativity, whether
this is with closed or open tasks, or in an individual or group setting. This is good news, in that
if true, providing financial rewards for creative performance will only be costly to the extent of
the cost for the rewards. One might argue that there is little or no intrinsic motivation in the first

32
place, but this belies the mental effort most people put into the task when there was a flat
payment and the work per se clearly did not benefit the researchers.27,28
According to Baer et al. (2003), the inconsistent relationship between rewards and
creativity could result from the interaction between intrinsic and extrinsic motivations: creativity
is enhanced by intrinsic motivations that are boosted by the presence of extrinsic rewards. A
relevant dimension is that of cognitive style, either innovative or adaptive. Intrinsic motivational
qualities are likely to be stronger for people who have an innovative style than for those who
have an adaptive style, as the latter tend to perceive their jobs as being instrumental for obtaining
extrinsic rewards. This fits well with our results on individual creativity, as providing financial
incentives has no beneficial effect in the more innovative open task, but does have an effect in
the more adaptive closed task. Perhaps when employers wish to stimulate employees’ creativity
in organizations, monetary incentives should be offered not only according to the type of job, but
also according to an individual’s cognitive style. Another possible explanation grounds on the
“short-term” structure of our incentive mechanism: Ederer and Manso (2013) find that long-term
(vs. short-term) reward is able to motivate what they call “exploration”, that presents similarities
with our open creativity (whereas “exploitation” resembles closed creativity).
When creativity is sought within a team or a corporate context, financial incentives are
effective when the environment rules promote cooperation among co-members; competition
seems to be detrimental for creativity and crowd-out incentives. Achieving a goal for the team’s
sake improves individual performance, especially when the subject expresses a positive attitude
27 In Appendix B, we present some examples of the responses made by the participants. 28 Of course, it may also be possible to “crowd-in” intrinsic motivation. For example, Charness and Gneezy (2009) found strong effects from paying students to go to the gym multiple times and exercise. The main driver of this result was that people who had not previously been regular gym attendees continued to go to the gym after the payment period had ended.

33
in favor a collectivistic view of life. While there is a possible temptation to free-ride when
evaluation is done at the group level, a cooperative pay structure can also have a positive effect
on group creativity due to more socially-oriented people being positively influenced by factors
such as the attractiveness of group cohesion and the sense of everyone sharing the same fate.
Perhaps there is a role for social preferences in terms of providing for the benefit of
others and thus overcoming the urge to free-ride on the efforts of others; this is consistent with
the idea that people with collectivist attitudes are more motivated by social-efficiency issues, as
in Charness and Rabin (2002). We note again that people with collectivist attitudes are relatively
more creative when the environment is characterized by cooperative corporate culture.29 The
group results suggest that sorting agents on the basis of attitudes towards social welfare (social
preferences) could be important for creativity (and performance) in organizational settings.
In a similar vein, Azoulay et al. (2011) consider the impact of incentives on scientific
exploration in two medical institutes. Where the corporate culture promoted cooperation among
peers, tolerated early failure, and gave great freedom to experiment, investigators produced high-
impact articles at a much higher rate than a control group of similarly accomplished scientists
where the degree of competition was high and individuals were subject to both short review
cycles and renewal policies unforgiving of failure. Boudreau et al. (2012) provide evidence that
higher rivalry reduces the performance of all competitors in a contest with less uncertain
problems (like the ones in our closed task). Chen et al. (2012) show that individual intra-group
tournament pay increases individual efforts but is not able to enhance the creativity of group
solutions relative to individual piece-rate pay. In general, our findings are consistent with
29 The average creativity score in the cooperative treatments was 0.451 higher for people with more collectivist attitudes than for people with less collectivist attitudes, while this difference-in-difference was only 0.015 in the individualistic treatments.

34
previous investigations in suggesting that motivating independent individual efforts does not
enhance group creativity, whereas incentives better promote group creativity by stimulating
group cohesion.
One puzzle is why individuals in the individualistic group setting don’t respond to
incentives to the closed task, as they do in the individual treatment. Amabile (1996) provides a
possible explanation regarding worse creative performance for individuals in groups than on
their own. She suggests that this may reflect the degree of anonymity characterizing the
interaction: creative performance suffers when others observe this or even with physical
proximity. As might be expected, this effect is stronger in the individualistic group setting that in
the individual one.30 Bracha and Fershtman (2013) report a similar result from their experiment:
under competitive tournament incentives, subjects devote less time to tasks requiring cognitive
engagement - with respect to time devoted to more practical, “labor” effort - and have a lower
success rate than when they are provided with a pay-for-performance incentive scheme. They
appear to “work harder, but not smarter”. The authors explain this finding referring to the
psychological literature on “choking under pressure”: pressure in various forms, including
answering in front of an audience, competition, and large stakes, may be detrimental for
performance in various task. Is this effect overtaken by the positive feelings arising from the
sense of belonging to a group, such that - as we observe in case of cooperative corporate culture -
it disappears? More research is needed to support this conjecture in our setting.
30 A second consideration is that tasks were chosen (from two options) with individuals but were assigned with groups. However, it is not clear how this would change the effect of incentives. It is possible that stronger social pressure emerges when subjects are part of even such a weak group, driving their performance more than monetary prizes. One might expect the same influence with cooperate corporate culture, but the sense of being on a team could overcome this.

35
For both individual and group creativity, we use subjective measurement (participants
and external judges’ evaluation) together with objective measurement (number of
words/operations used and score based on a fixed taxonomy). When judges are free to evaluate
the degree of creativity of the answers with no indication of which criteria to follow, they appear
to effectively share certain objective principles, but also focus on something that is idiosyncratic
and therefore difficult to capture. Interestingly, our findings suggest it is the latter component
that is more reactive to financial incentives.
Implications for innovation
A natural consideration for economists is the implication of our findings for innovation.31
Patents have been used to prize innovators through the creation of (temporary) market power, yet
there is a debate focused on the tradeoff between the gains generated by innovation - with the
consequent need to provide incentives for stimulating R&D investment - and the costs of patent
monopoly power (Gilbert and Shapiro, 1990). Following Kremer and Glennerster (2004)’s
taxonomy of government interventions, the patent system is the more familiar “pull” program;
these pay off only if an innovation is developed, whereas “push” programs subsidize the search
for a socially-desirable innovation - such as a vaccine - whether or not the search is successful.
Kremer and Glennerster advocate a monetary prize large enough to get the attention of the
pharmaceutical companies and have them investing in the discovery of a new effective vaccine.
For what concerns the internal organization of a firm (such as the way that research
activities are financed, the allocation of control over the R&D process, the specific share of
property rights on innovations, and the structure of the monetary compensations to the inventors
31 Our results also offer implications for incentivizing artistic and musical creativity, topics of interest to economists.

36
and to the managers responsible for corporate R&D) has been shown to contribute to shaping the
frequency and size of innovation (e.g. Aghion and Tirole, 1994; Lerner and Wulf, 2007).
We find that providing incentives can indeed have favorable effects for innovation when
the goal is already delineated, as is often the case with incremental innovations. On the other
hand, drastic innovations are typically less defined ex ante. In a similar vein, Hellmann and
Thiele (2011) provide a theoretical model that shows that incentive contracts are feasible for
those tasks that are well understood and measurable ex ante. To the extent that drastic
innovations map onto what we have termed an open task (and people are not too ambiguity-
averse), direct incentives seem unnecessary. Instead, firms and governments may wish to simply
support or subsidize basic research, which is executed without any specific applications or
products in mind and need to have a long-term scope.32 Since innovation involves the
exploration of untested approaches that are likely to fail, incentive schemes that punish failures
with low rewards and termination may have adverse effects on innovation: as shown by Manso
(2011), the optimal incentive scheme that motivates innovation should exhibit substantial
tolerance for early failure and reward for long-term success.
The corporate-culture treatments also have implications for innovation. The only
difference in creativity across our polar extremes of corporate culture is across incentive
conditions with cooperative corporate culture. We find that team creativity is greatly enhanced
in this case, particularly for people who have collectivist attitudes (as defined by Wagner, 1995).
So it seems that innovation in corporate environments (with closed tasks) is indeed sensitive to
32 Basic research lays the foundation for advancements in knowledge that lead to applied gains later on, occasionally as a result of unexpected discoveries.

37
environmental factors. The recommendation coming out of our results is to have (group-minded
people) work together as a true team and providing them with financial incentives.
Consistently, in organizational studies on how to promote team innovation, empirical
results have identified the roles of developing a team climate of trust and openness (Anderson
and West, 1998), vision and shared objectives (West, 1990), and team collaboration (West and
Wallace, 1991). In particular, goal interdependence describes the extent to which team
members’ goals and rewards are related such that each team member can only reach her goal if
the other team members achieve their goals as well (e.g. Van der Vegt and Van de Vliert, 2002).
With cooperative goals in place, team members want each other to perform effectively for their
mutual benefit. Individuals “pull together, help each other, and discuss different viewpoints to
optimize performance” (Hülsheger et al., 2009), which favors both each team member and the
team as a whole (Tjosvold et al., 2004; Van der Vegt and Janssen, 2003) in engaging in critical
discussions and the synthesis of different viewpoints; both mechanisms are shown to stimulate
innovation (Bledow et al. 2009).
Although conflict among team members - especially minority dissent - has been shown
to reduce conformity and consensus-seeking and to enhance divergent thinking and thereby
innovation (De Dreu and West, 2001), competing on prizes within the team may cause negative
psychological reactions, absorb energy, and distract team members from performing their task
(Carnevale and Probst, 1998).
6. Conclusion
Creativity is a main driver of the world’s economy. Without creativity in areas such as
science, technology, and the arts, our lives would be considerably poorer economically and
aesthetically. From an economist’s standpoint, one critical question is whether it is possible to

38
incentivize creativity. We investigate whether incentives for performance can lead to higher
levels of creativity both at the individual and at the group levels. To the best of our knowledge,
we are the first to do so following a rigorous experimental procedure.
We consider two forms of creativity in a laboratory environment. When a task is closed,
i.e. delineated with specific ex-ante goals, we find evidence that in fact it is possible to
successfully induce a higher degree of creativity with financial incentives. This result is
applicable to a wide range of economic environments, particularly when a clear need has been
identified. However, we find no evidence that paying for performance induces creativity that is
relatively unconstrained and non-goal-oriented (except with a high degree of ambiguity-
aversion). In this case, it doesn’t pay to provide performance incentives. Perhaps the best that
can be done to achieve creativity in these realms is to create a research environment where funds
are available as needed for talented researchers. This seems preferable to having competitions
for research grants, as this latter approach seems much more conducive to incremental advances.
It also may be possible to enhance corporate creativity with closed tasks, as we have
identified one condition in which this is sharply higher. We find that the best results are
achieved with incentivized teams who share the same payoffs and whose members have a team-
oriented outlook. This suggests management and personnel policies that combine incentivized
pay with hiring the appropriate set of workers.
We naturally do not claim to have provided the last word on the relationship between
incentives and creativity. Nevertheless, we at least offer some novel and insightful results. We
provide clean experimental evidence concerning the impact of financial rewards on creativity,
which certainly points to the need for further research on this vitally important issue.

39
References
Aghion, P. and Tirole, J. (1994). The management of innovation. The Quarterly Journal of Economics, 109, 1185-1209.
Albert, R. S. and Runco, M. A. (1999). The history of creativity research. In R.S. Sternberg (Ed.). Handbook of Human Creativity, 16-31. New York: Cambridge University Press
Amabile, T. M. (1989). Growing Up Creative: Nurturing a Lifetime of Creativity. Norwalk, CT, US: Crown House Publishing Limited.
Amabile, T. M. (1996). Creativity In Context: Update To The Social Psychology Of Creativity. Boulder: Westview Press.
Anderson, N. R. and West, M. A. (1998). Measuring climate for work group innovation: development and validation of the team climate inventory. Journal of Organizational Behavior, 19(3), 235-258.
Ariely, D., Gneezy, U., Loewenstein G. and Mazar, N. (2009). Large stakes and big mistakes. The Review of Economic Studies, 76, 451-469.
Asch, S. E. (1956). Studies of independence and conformity: A minority of one against a unanimous majority. Psychological Monographs: General and Applied, 70(9), 1-70.
Azoulay, P., Graff Zivin, J. S. and Manso, G. (2011). Incentives and creativity: Evidence from the academic life sciences. RAND Journal of Economics, 42(3), 527-554.
Babcock, P., Bedard, K., Charness, G., Hartman, J., and Royer, H. (2013). Letting down the team? Evidence of social Effects of team incentives. Mimeo.
Barney, J. (1986). Organizational culture: Can it be a source of sustained competitive advantage? Academy of Management Review, 11, 656-665.
Barron, F. (1955). The disposition towards originality. Journal of Abnormal Psychology, 51, 478-485.
Baer, M., Oldham, G. R. and Cummings, A. (2003). Rewarding creativity: when does it really matter? The Leadership Quarterly, 14(4), 569-586.
Bledow, R., Frese, M., Anderson, N., Erez, M. and Farr, J. (2009). A dialectic perspective on innovation: Conflicting demands, multiple pathways, and ambidexterity. Industrial and Organizational Psychology: Perspectives on Science and Practice, 2, 363-373.
Boudreau, K. J., Lacetera, N. and Lakhani, K. R. (2011). Incentives and problem uncertainty in innovation contests: An empirical analysis. Management Science, 57(5), 843-863.
Bowden, E. M. and Jung-Beeman, M. J. (2003). Aha! Insight experience correlates with solution activation in the right hemisphere. Psychonomic Bulletin & Review, 10, 730-737.
Bracha, A. and Fershtman, C. (2013). Incentives: Working harder or working smarter? Management Science, 59(4), 771-781.
Bradler, C., Neckermann, S. and Warnke, A. J. (2013). Incentives and creativity, mimeo. Brown, A. (1995). Organisational Culture. London: Pitman Publishing. Carnevale, P. J. and Probst, T. M. (1998). Social values and social conflict in creative problem
solving and categorization. Journal of Personality and Social Psychology, 74, 1300–1309.

40
Charness, G. and Gneezy, U. (2009). Incentives to exercise. Econometrica, 77, 909-931. Charness, G., Masclet, D., and Villeval, M.C. (2014). The dark side of status. Management
Science, 60, 38-55. Charness, G. and Sutter, M. (2012). Groups make better self-interested decisions. Journal of
Economic Perspectives, 26, 157-176. Chen, C. X., Williamson, M. G. and Zhou, F. H. (2012). Reward system design and group
creativity: An experimental investigation. The Accounting Review, 87(6), 1885-1911. Collins, M. A. and Amabile, T. M. (1999). Motivation and creativity. In R. J. Sternberg (Ed.),
Handbook of Creativity (pp. 297-312). Cambridge, England: Cambridge University Press. Cooper, D. J. and Kagel, J. H. (2005). Are two heads better than one? Team versus individual
play in signaling games. American Economic Review, 95(3), 477-509. Davis, J. H. (1992). Some compelling intuitions about group consensus decisions, theoretical and
empirical research, and interpersonal aggregation phenomena: Selected examples, 1950-1990. Organizational Behavior and Human Decision Processes, 52(1), 3-38.
Deci, E. and Ryan, R. (1985). Intrinsic Motivation and Self-determination in Human Behavior. New York: Plenum.
De Dreu, C. K. W. and West, M. A. (2001). Minority dissent and team innovation: The importance of participation in decision making. Journal of Applied Psychology, 86, 1191-1201.
Delfgaauw, J., Dur, R., Non, A. and Verbeke, W. (forthcoming). The effects of prize spread and noise in elimination tournaments: A natural field experiment. Journal of Labor Economics.
Dillon, J. T. (1982). Problem finding and solving. Journal of Creative Behavior, 16, 97-111. Dow, G. T. and Mayer, R. E. (2004). Teaching students to solve insight problems: Evidence for
domain specificity in creativity training. Creativity Research Journal, 16, 389-402. Eckartz, K., Kirchkamp, O. and Schunk, D. (2012). How do incentives affect creativity?, CESifo
Working Paper Series 4049, CESifo Group Munich. Ederer, F. and Manso, G. (2013). Is Pay-for-Performance Detrimental to Innovation?.
Management Science, 59(7), 1496-1513. Eisenberger, R., Armeli, S. and Pretz, J. (1998). Can the promise of reward increase creativity?
Journal of Personality and Social Psychology, 74, 704–714. Eisenberger, R. and Rhoades, L. (2001). Incremental effects of reward on creativity. Journal of
Personality and Social Psychology, 81, 728–741. Ellsberg, D. (1961). Risk, ambiguity, and the Savage axioms. Quarterly Journal of Economics,
75(4), 643-669. Feinstein, J.S. (2006). The Nature of Creative Development, Stanford: Stanford University Press. Feinstein, J.S. (2009). Creativity & The Economic System. In Kerr, B. (Ed.). Encyclopedia of
Giftedness, Creativity, and Talent. New York: Sage Publications.
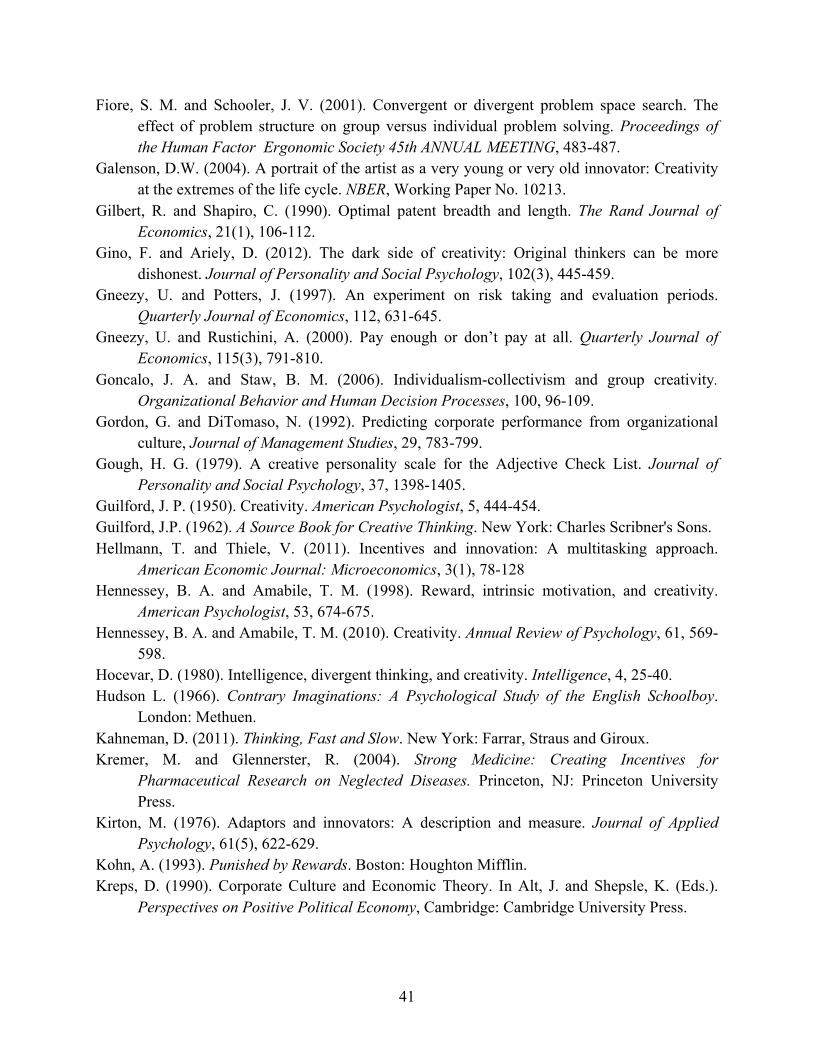
41
Fiore, S. M. and Schooler, J. V. (2001). Convergent or divergent problem space search. The effect of problem structure on group versus individual problem solving. Proceedings of the Human Factor Ergonomic Society 45th ANNUAL MEETING, 483-487.
Galenson, D.W. (2004). A portrait of the artist as a very young or very old innovator: Creativity at the extremes of the life cycle. NBER, Working Paper No. 10213.
Gilbert, R. and Shapiro, C. (1990). Optimal patent breadth and length. The Rand Journal of Economics, 21(1), 106-112.
Gino, F. and Ariely, D. (2012). The dark side of creativity: Original thinkers can be more dishonest. Journal of Personality and Social Psychology, 102(3), 445-459.
Gneezy, U. and Potters, J. (1997). An experiment on risk taking and evaluation periods. Quarterly Journal of Economics, 112, 631-645.
Gneezy, U. and Rustichini, A. (2000). Pay enough or don’t pay at all. Quarterly Journal of Economics, 115(3), 791-810.
Goncalo, J. A. and Staw, B. M. (2006). Individualism-collectivism and group creativity. Organizational Behavior and Human Decision Processes, 100, 96-109.
Gordon, G. and DiTomaso, N. (1992). Predicting corporate performance from organizational culture, Journal of Management Studies, 29, 783-799.
Gough, H. G. (1979). A creative personality scale for the Adjective Check List. Journal of Personality and Social Psychology, 37, 1398-1405.
Guilford, J. P. (1950). Creativity. American Psychologist, 5, 444-454. Guilford, J.P. (1962). A Source Book for Creative Thinking. New York: Charles Scribner's Sons. Hellmann, T. and Thiele, V. (2011). Incentives and innovation: A multitasking approach.
American Economic Journal: Microeconomics, 3(1), 78-128 Hennessey, B. A. and Amabile, T. M. (1998). Reward, intrinsic motivation, and creativity.
American Psychologist, 53, 674-675. Hennessey, B. A. and Amabile, T. M. (2010). Creativity. Annual Review of Psychology, 61, 569-
598. Hocevar, D. (1980). Intelligence, divergent thinking, and creativity. Intelligence, 4, 25-40. Hudson L. (1966). Contrary Imaginations: A Psychological Study of the English Schoolboy.
London: Methuen. Kahneman, D. (2011). Thinking, Fast and Slow. New York: Farrar, Straus and Giroux. Kremer, M. and Glennerster, R. (2004). Strong Medicine: Creating Incentives for
Pharmaceutical Research on Neglected Diseases. Princeton, NJ: Princeton University Press.
Kirton, M. (1976). Adaptors and innovators: A description and measure. Journal of Applied Psychology, 61(5), 622-629.
Kohn, A. (1993). Punished by Rewards. Boston: Houghton Mifflin. Kreps, D. (1990). Corporate Culture and Economic Theory. In Alt, J. and Shepsle, K. (Eds.).
Perspectives on Positive Political Economy, Cambridge: Cambridge University Press.

42
Lerner, J. and Wulf, J. (2007). Incentives and innovation: A multitasking approach. The Review of Economics and Statistics, 89(4), 634-644.
Mayer, R., Dow, G. and Mayer, S. (2003). Multimedia learning in interactive self-explaining environment: What works in the design of agent-based microworlds? Journal of Educational Psychology, 95(4), 806-813.
MacKinnon, D. W. (1965). Personality and the realization of creative potential. American Psychologist, 20, p. 273-281.
Manso, G (2011). Motivating innovation. The Journal of Finance, LXVI(5), 1823-1860. Nickerson, R. S. (1999). Enhancing creativity. In Sternberg, R. J. (Ed.). Handbook of Creativity
(pp. 392-430). Cambridge, England: Cambridge University Press. Nielsen, B.D., Pickett, C.L. and Simonton, D.K. (2008). Conceptual versus experimental
creativity: Which works best on convergent and divergent thinking tasks? Psychology of Aesthetics, Creativity, and the Arts, 2(3), 131-138.
Ohly, S., Leach, D. and Zou, Q. (2013). Suggestion-making in organizations: A review and a multilevel model. Unpublished Manuscript.
O’Reilly C. A. and Chatman, J. A. (1996). Culture as social control: Corporations, cults and commitment. In Cummings, L. L. and Staw, B. M. (Eds.) Research in Organizational Behavior, 18, 157-200. Greenwich, CT: JAI Press.
Runco, M. A. (2006). Creativity: Theories and Themes: Research, Development, and Practice. San Diego: Academic Press.
Runco, M. A. (2007). Correcting the research on creativity. Creativity Research Journal, 17, 321-327.
Schulze, A. and Hoegl, M. (2008). Organizational knowledge creation and the generation of new product ideas: A behavioral approach. Research Policy, 37(10), 1742-1750.
Schweitzer, M. E., Ordóñez, L. and Douma, B. (2004). Goal setting as a motivator of unethical behavior. Academy of Management Journal, 47 (3), 422-432.
Shaw, M. (1932). A comparison of individuals and small groups in the rational solution of complex problems. American Journal of Psychology, 44(3), 491–504.
Simonton, D. K. (2000). Creativity: Cognitive, personal, developmental, and social aspects. American Psychologist, 55, 151-158.
Stanovich, K. E. and West, R. F. (2000). Individual difference in reasoning: Implications for the rationality debate? Behavioural and Brain Sciences, 23, 645-726.
Stein, M. (1974). Stimulating Creativity. New York: Academic Press. Sternberg, R. J. (1985). Beyond IQ: A Triarchic Theory of Intelligence. Cambridge: Cambridge
University Press. Sternberg, R. J. (1988). Mental self-government: A theory of intellectual styles and their
development. Human Development, 31,197-224. Sternberg, R. J. (Ed.) (1999). Handbook of Creativity. New York: Cambridge University Press. Sternberg, R. J. (2006). The Nature of Creativity. Creativity Research Journal, 18, 87-98.

43
Sternberg, R. J. and Lubart, T. I. (1991). An investment theory of creativity and its development. Human Development, 34, 1-31.
Surowiecki, J. (2004). The Wisdom of Crowds: Why the Many are Smarter than the Few and How Collective Wisdom Shapes Business, Economies, and Nations. New York: Random House.
Tjosvold, D., Tang, M. M. L. and West, M. (2004). Reflexivity for team innovation in China. Group and Organization Management, 29, 540-559.
Torrance, E. P. (1962). Guiding Creative Talent. Englewood Cliffs, NJ: Prentice Hall. Torrance, E. P. (1974). The Torrance Tests of Creative Thinking. Norms-Technical Manual
Research Edition. Verbal Tests, Forms A and B- Figural Tests, Forms A and B. Princeton, NJ: Personnel Press.
Torrance, E. P. (1989). The nature of creativity as manifest in its testing. In R.J. Sternberg (Ed.), The Nature of Creativity: Contemporary Perspectives. New York: Cambridge University Press.
Treffinger, D. J., Isaksen, S. G. and Dorval, K. B. (2006). Creative Problem Solving: An Introduction. Waco, TX: Prufrock.
Van der Vegt, G. S. and Janssen, O. (2003). Joint impact of interdependence and group diversity on innovation. Journal of Management, 29, 729-751.
Van der Vegt, G. and Van de Vliert, E. (2002). Intragroup interdependence and effectiveness: Review and proposed directions for theory and practice. Journal of Managerial Psychology, 17, 50–67.
Weitzman, M. L. (1998). Recombinant growth. The Quarterly Journal of Economics, 113(2), 331-360.
West, M. A. (1990). The social psychology of innovation in groups. In M. A. West and Farr J. L. (Eds.). Innovation and Creativity in Work: Psychological and Organizational Strategies, 309-333. London: Wiley.
West, M. A, Sacramento, C. A. and Fay D. (2005). Creativity and innovation in work groups: the paradoxical role of demands. In Creativity and Innovation in Organizational Teams, Thompson, L. and Choi, H. S. (eds.), pp. 137–59. Mahwah, NJ: Erlbaum.
West, M. A. and Wallace, M. (1991). Innovation in health care teams. British Journal of Social Psychology, 21, 303-315.
Winston, A. S. and Baker, J. E. (1985). Behavior analytic studies of creativity: A critical review. Behavior Analyst, 8, 191-205.
Woodman, R. W., Sawyer, J. E. and Griffin, R. W. (1993). Toward a theory of organizational creativity. The Academy of Management Review, 18(2), 293-321.
Woodman. R. W. and Schoenfeldt, L. F. (1989). Individual differences in creativity: An interactionist perspective. In J. A. Glover. R. R. Ronning. and C. R. Reynolds (Eds.), Handbook of Creativity: 77-92. New York: Plenum Press.
Zuckerman, M., Kolin, E. A., Price, L. and Zoob, I. (1964). Development of a sensation-seeking scale. Journal of Consulting Psychology, 28(6), 477-482.
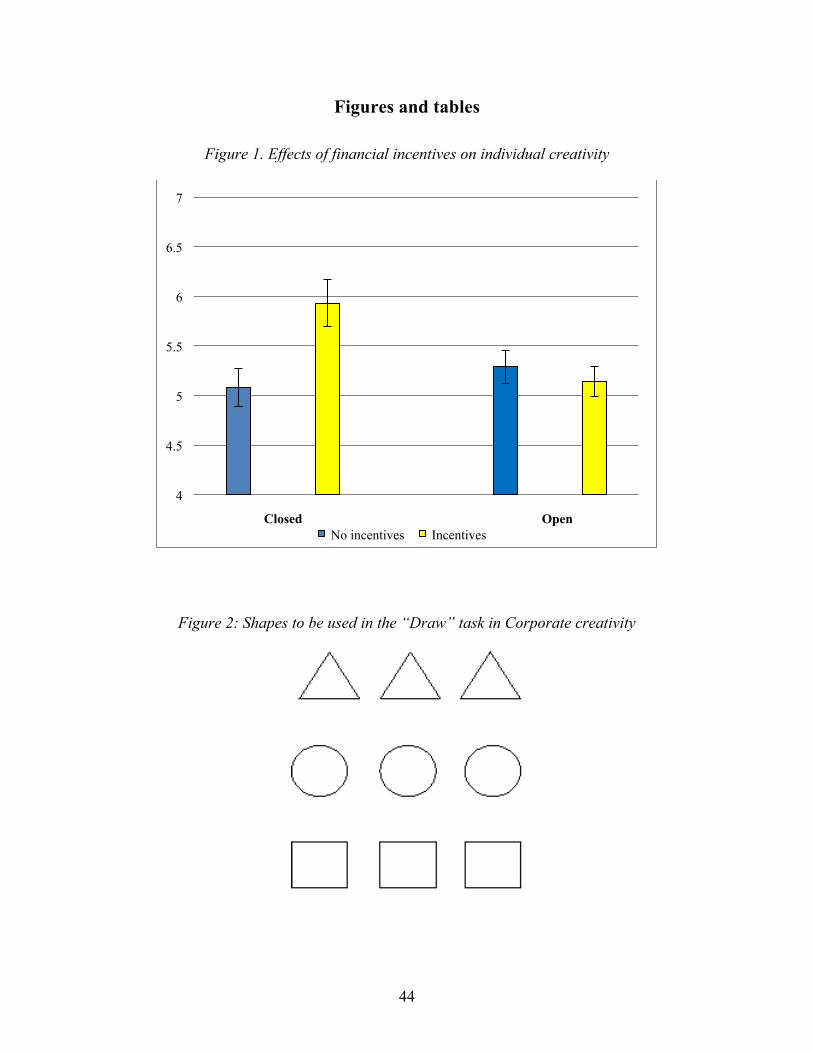
44
Figures and tables
Figure 1. Effects of financial incentives on individual creativity
Figure 2: Shapes to be used in the “Draw” task in Corporate creativity
4
4.5
5
5.5
6
6.5
7
No incentives Incentives Closed Open

45
Figure 3: Effects of financial incentives on corporate creativity
Table 1. Taxonomy – verbal closed task
Word / Meaning Score Word / Meaning Score
House
cow
1. residence building 1 1. female bovine 1 2. verb: keep in a dwelling 2 2. figurative: unpleasant/fat woman 2 3. verb: provide a storage place 3 3. figurative: person who eats a lot 3 4. family/household 4 4. others 10 5. shelter 5
6. legislative body 6 tree 7. members of a college 7 meaning 8. convent, abbey, church 8 1. plant 1 9. others 10 2. diagram 2
3. tree-like shrub 3
zero
4. tree-like stand 4 1. number 1 5. others 10 2. figurative: starting point, absence 2
3. figurative: unimportant person 3 planet 4. verb: change to zero 4 meaning 5. others 10 1. Mars, Venus… 1
2. others 10
forgive
ring
4
4.5
5
5.5
6
6.5
7
No Incentives Incentives Competitive culture Cooperative culture
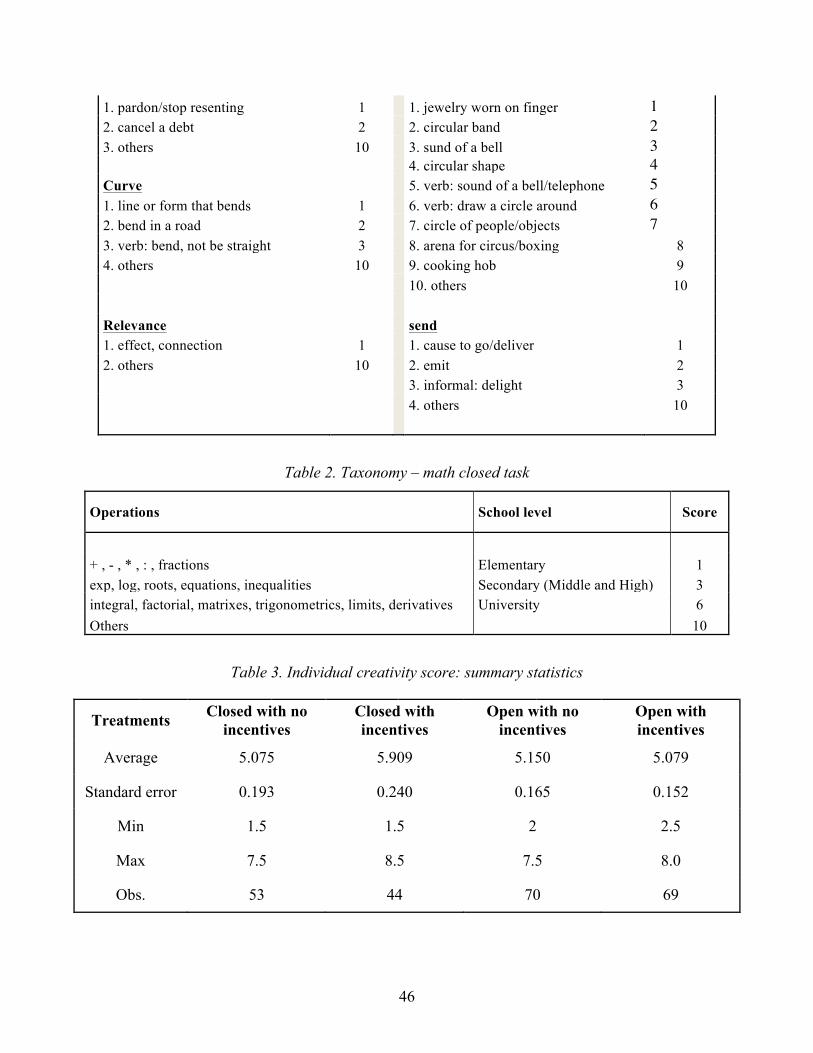
46
1. pardon/stop resenting 1 1. jewelry worn on finger 1 2. cancel a debt 2 2. circular band 2 3. others 10 3. sund of a bell 3
4. circular shape 4
Curve
5. verb: sound of a bell/telephone 5 1. line or form that bends 1 6. verb: draw a circle around 6 2. bend in a road 2 7. circle of people/objects 7 3. verb: bend, not be straight 3 8. arena for circus/boxing 8 4. others 10 9. cooking hob 9
10. others 10
Relevance
send
1. effect, connection 1 1. cause to go/deliver 1 2. others 10 2. emit 2
3. informal: delight 3
4. others 10
Table 2. Taxonomy – math closed task
Operations School level Score
+ , - , * , : , fractions Elementary 1 exp, log, roots, equations, inequalities Secondary (Middle and High) 3 integral, factorial, matrixes, trigonometrics, limits, derivatives University 6 Others 10
Table 3. Individual creativity score: summary statistics
Treatments Closed with no incentives
Closed with incentives
Open with no incentives
Open with incentives
Average 5.075 5.909 5.150 5.079
Standard error 0.193 0.240 0.165 0.152
Min 1.5 1.5 2 2.5
Max 7.5 8.5 7.5 8.0
Obs. 53 44 70 69

47
Table 4. Closed creativity: Determinants of creativity score
Creativity Score Tobit regression Incentives 1.621** (.765)
Effort
0.004*** (.001) Taxonomy score 0.042*** (.015) Risk aversion -0.006 (.008) Ambiguity-risk gap -0.004 (.009) Incentives*Ambiguity-aversion 0.011 (.012) Constant 3.244*** (.922) Log-likelihood -132.54 LR Chi(2) 30.35 N. of obs. 81
Controls: gender, age, major, creative style, sensation-seeking attitude, past involvement in artistic tasks
*** significant at 1%; ** significant at 5%; * significant at 10%.

48
Table 5. Open creativity: Determinants of creativity score
Creativity Score Tobit regression Incentives 0.459 (.508) Risk aversion -0.008
Ambiguity-risk gap
(.005)
0.015** (.006) Incentives*Ambiguity-aversion 0.016* (.008) Constant 4.86 (.503) Log-likelihood -222.13 Chi(2) 11.19 N. of obs. 134 Controls: gender, age, creative style, sensation-seeking attitude
*** significant at 1%; ** significant at 5%; * significant at 10%.
Table 6. Group creativity score: summary statistics
Treatments Individualistic with incentives
Cooperative with incentives
Individualistic with flat pay
Cooperative with flat pay
Average 4.760 6.141 4.700 4.756
Std. error 0.182 0.200 0.219 0.227
Min 2.5 4 2.5 2.5
Max 7.5 9 8 8.5
Obs. 48 39 45 39

49
Table 7. Group creativity: Determinants of creativity score
Creativity Score Tobit regression
Incentives .450 (.368) Cooperative corporate culture .118 (.408) Incentives*cooperative corporate culture 1.151** (.560) Effort -.001 (.001) Taxonomy score .040** (.018) Creative style -.074 (.096) Sensation seeking -.043 (.182) Past involvement in artistic tasks .218 (.106) Constant 3.498*** (.979)
Log-likelihood -142.33 LR Chi(2) 41.19 N. of obs. 89 These are two-sided Tobit regressions. The dependent variable ranges from 1 to 10. The variable "Incentives" is a dummy that equals 1 in case of subjects' payment based on performance, and 0 in case of flat payment. The variable "Cooperative corporate culture" is a dummy that equals 1 in case of cooperative corporate culture, and 0 in case of individualistic corporate culture. Controls include gender, age, personal and family characteristics.
*** significant at 1%; ** significant at 5%; * significant at 10%.

50
Table 8. Cooperative corporate culture: Determinants of creativity score
Creativity Score Tobit regression Incentives 1.809*** (.339) Risk-aversion -.000 (.006) Ambiguity-risk gap .000 (.007) Collectivism .397* (.225) Constant 3.966*** (.989) Log-likelihood -92.12 Chi(2) 32.64 N. of obs. 59
Controls: gender, age, major, creative style, sensation-seeking attitude, past involvement in artistic tasks
*** significant at 1%; ** significant at 5%; * significant at 10%.

51
Table 9. Individualistic corporate culture: Determinants of creativity score
Creativity Score Tobit regression Incentives .200 (.375) Risk-aversion .000 (.005) Ambiguity-risk gap .015* (.201) Collectivism -.000 (.201) Constant 6.329*** (1.776) Log-likelihood -122.16 Chi(2) 7.90 N. of obs. 70
Controls: gender, age, major, creative style, sensation-seeking attitude, past involvement in artistic tasks
*** significant at 1%; ** significant at 5%; * significant at 10%.
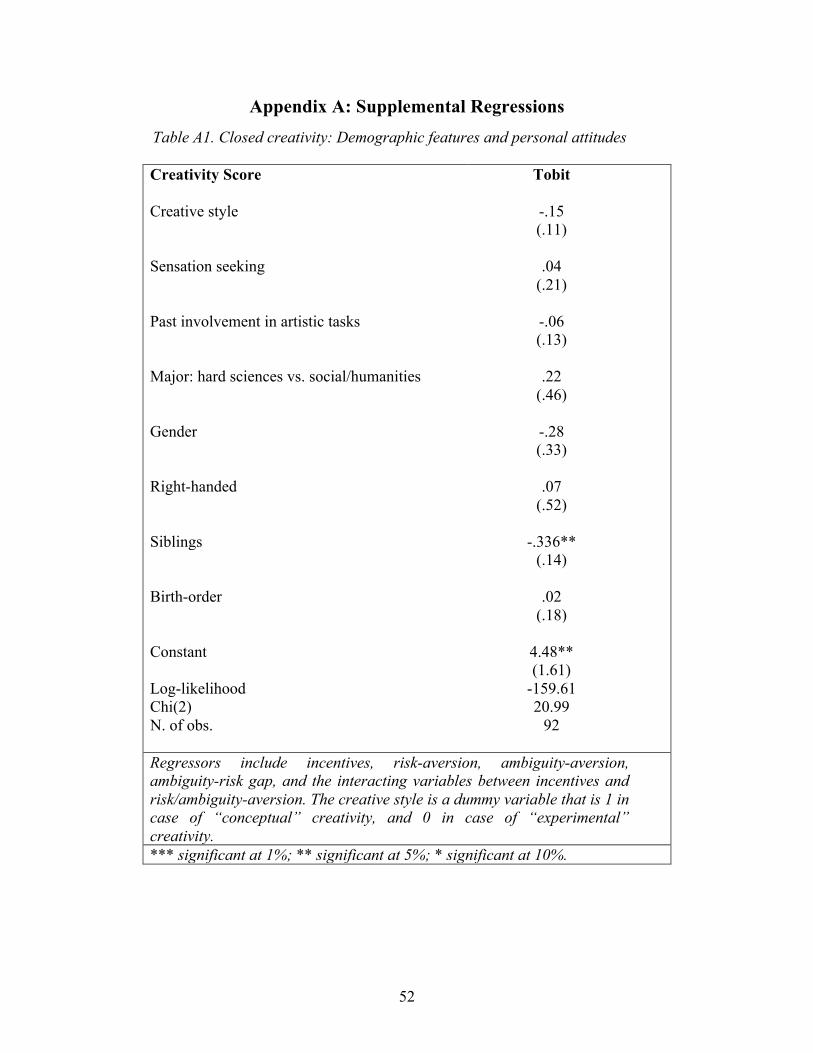
52
Appendix A: Supplemental Regressions Table A1. Closed creativity: Demographic features and personal attitudes
Creativity Score Tobit Creative style -.15 (.11) Sensation seeking .04 (.21) Past involvement in artistic tasks -.06 (.13) Major: hard sciences vs. social/humanities .22 (.46) Gender -.28 (.33) Right-handed .07 (.52) Siblings -.336** (.14) Birth-order .02 (.18) Constant 4.48** (1.61) Log-likelihood -159.61 Chi(2) 20.99 N. of obs. 92 Regressors include incentives, risk-aversion, ambiguity-aversion, ambiguity-risk gap, and the interacting variables between incentives and risk/ambiguity-aversion. The creative style is a dummy variable that is 1 in case of “conceptual” creativity, and 0 in case of “experimental” creativity. *** significant at 1%; ** significant at 5%; * significant at 10%.

53
Table A2. Open creativity: Demographic features and personal attitudes
Creativity Score Tobit Creative style -.16** (.08) Sensation seeking .16 (.17) Past involvement in artistic tasks .11 (.09) Major: sciences vs. social/humanities .68* (.34) Gender .11 (.23) Right-handed .39 (.41) Siblings -.04 (.07) Birth-order .09 (.13) Constant 2.88** (1.03) Log-likelihood -204.90 Chi(2) 20.13 N. of obs. 127
Regressors include: incentives, risk-aversion, ambiguity-aversion, ambiguity-risk gap, and the interacting variables between incentives and risk/ambiguity-aversion. The creative style is a dummy variable
that is 1 in case of “conceptual” creativity, and 0 in case of “experimental” creativity.
*** significant at 1%; ** significant at 5%; * significant at 10%.

54
Table A3. Group creativity: Demographic features and personal attitudes
Creativity Score Tobit Creative style .000 (.09) Sensation seeking .119 (.16) Past involvement in artistic tasks .050 (.09) Major: sciences vs. social/humanities .344 (.27) Gender .129 (.27) Right-handed -.727* (.41) Siblings .130 (.12) Birth-order -.094 (.16) Constant 4.723*** (.79) Log-likelihood -223.52 Chi(2) 21.86 N. of obs. 128
Regressors include: incentives, risk-aversion, ambiguity-aversion, ambiguity-risk gap, the interacting variables between incentives and
risk/ambiguity-aversion, and collectivism. The creative style is a dummy variable that is 1 in case of “conceptual” creativity, and 0 in
case of “experimental” creativity. *** significant at 1%; ** significant at 5%; * significant at 10%.

55
Appendix B
B1: Example of an answer to the closed task (verbal)

56
B2: Example of an answer to the closed task (math)

57
B3: Example of an answer to the open task