Creative Europe Programme of the European ... - Home: ACE
110
ARCHITECTS’ COUNCIL OF EUROPE 2020 MIRZA & NACEY RESEARCH Co-funded by the Creative Europe Programme of the European Union
Transcript of Creative Europe Programme of the European ... - Home: ACE

ARCHITECTS’COUNCIL OF EUROPE
2020
MIRZA & NACEY RESEARCH
Co-funded by the Creative Europe Programme
of the European Union

MIRZA & NACEY RESEARCH
II
FINAL-13.04.21
APRIL 2021© Mirza & Nacey Research Ltd
Research undertaken by:Mirza & Nacey Research LtdSouthdown HouseFord ArundelWest SussexBN18 0DEUnited Kingdom
Tel: +44 1243 555302www.mirza-nacey.com
Research commissioned by:The Architects’ Council of Europe29 Rue Paul Emile JansonB-1050 Brusselswww. ace-cae.eu
Foreword 2Key statistics 3
1: ARCHITECTS IN EUROPE1.1 Numbers 111.2 Profile 131.3 Employment status 141.4 Field of employment 151.5 Years qualified 171.6 Age Profile 18
2: ARCHITECTURE – THE MARKET2.1 Economic background 222.2 Construction market 232.3 Architectural market 272.4 Market by building sector 292.5 Market by service 312.6 Future prospects 32
3: ARCHITECTURE – THE PRACTICE3.1 Profile 373.2 Legal formation 393.3 Practice turnover 403.4 How practices charge 413.5 Hourly rates 42
THE ARCHITECTURAL PROFESSION IN EUROPE 2020CONTENTS
Photo credits for front cover: Olympic Stadium Helsinki refurbishment, FinlandArchitect: K2S and NRTPhotograph: Paula Huotelin
1
2
3
4
I 3.6 Turnover from outside country 433.7 Associations 443.8 Branch offices 453.9 Public bids & Design Competitions 463.10 Certification work 493.11 Post Occupancy Evaluation 50
4: ARCHITECTS – THE INDIVIDUAL4.1 Earnings 534.2 Earnings by field of employment 554.3 Earnings by age 564.4 Earnings by gender 574.5 Studying and working in another European country 594.6 Retirement 634.7 Hours worked 654.8 CPD 664.9 Mitigating Climate Change 674.10 Digitalisation in architecture 69
COUNTRY PROFILES 72
APPENDIXSurvey methodology & Notes 105
Co-funded by the Creative Europe Programme of the European Union
The European Commission support for the production of this publication does not constitute an endorsement of the contents which reflects the views only of the authors and the Commission cannot be held responsi ble for any use which may be made of the information contained therein.
I - 1THE ARCHITECTURAL PROFESSION IN EUROPE 2020

MIRZA & NACEY RESEARCH
FOREWORD
Georg PendlACE President
We are pleased to present the 7th edition of our Sector Study. We have again enjoyed strong participation, by some 25 600 architects from all over Europe. This means, the answers are statistically relevant, and it means this work is seen as important for many of our colleagues. I recall that such studies are a basic starting point for an organisation aspiring to represent the interests of the architects. First of all, we need to know who we are, then we can draw our conclusions to inform our next steps. Again, as in the previous years, we see the profession - by a huge majority - to be made up of micro- and small enterprises. But this doesn’t mean that such offices are unable to design relatively large projects: a fact that is not so well known, but actually the reality. We need to underline this, especially with regard to public procurement issues, where we face a tendency to exclude smaller entities.
I would like to draw your attention to the launch of our Observatory. Based on the biennial Sector Study, you can browse through this database in an easy and even playful way to find out facts, statistics, basic as well as detailed information about the European architects. This is a unique tool offered by the profession at European level. I have experienced very positive feedback and great interest whenever I have presented the Sector Studies at various events. I hope we will get even better feedback for this Observatory.
One significant new issue is the New European Bauhaus initiative and I would like to draw your attention to the State of the Union speech of the European Commission President Ursula Van der Leyen on 16 September 2020. For the first time,
architects are mentioned as a potential driving force within the Green Deal and in the field of the built environment and its renovation. This marks a remarkable step for us and we are looking forward to the next phase.
Besides sending a letter to the European Commission President offering our readiness to contribute, as a representative organisation, I have also written to many potential partners, organisations and stakeholders to initiate a joint effort to use this opportunity for all creative professions. Our pro-activity in this has led to the initiation of the New European Bauhaus Collective, currently consisting of 11 European organisations representing colleagues from various fields.
Background
Europe’s architects during the pandemic
The Covid-19 crisis is the cognitive filter through which this year’s survey results will inevitably be viewed. The social and economic costs, the disruption and the continuing uncertainty each impact on this year’s results. The Covid-19 crisis has affected how architects work, where they work and indeed whether they work at all.
This year’s survey spans both the periods before and during the Covid-19 crisis. Practices’ financial data generally refer to the 12 months before Covid-19; while business sentiment is recorded during or after the first lockdown. Any major effects on the level of part-time working or unemployment are unlikely to have been recorded in this year’s survey so the results show only the earliest effects of the pandemic on the profession. There are new questions in this year’s survey that show how the profession has adapted to the newly evolving digital environment and how the profession is creating sustainable architecture.
I - 2THE ARCHITECTURAL PROFESSION IN EUROPE 2020

MIRZA & NACEY RESEARCH
560 000 architects in EuropeNumbers have stopped growing Total number of architects grew by 14% between 2008 and 2018 but remains unchanged since 2018.
Five countries dominateTwo thirds of Europe’s architects are from five countries.
the number of architects in Europe 2020
560 000
I - 3THE ARCHITECTURAL PROFESSION IN EUROPE 2020

MIRZA & NACEY RESEARCH
Architects contribute €17 billion to Europe’s economy
International perspective22% of architects were educated in another country. 29% have seriously considered working in another country.
Architects contribute €17 billion to Europe’s economyTotal value of private practice fee income. Up by 4% since 2018.
Sustainable architecture57% of architects ‘frequently’ design Low Energy buildings.
Architects export 3% of workProportion of work which is international.
Private housing is the most important sector87% of architectural practices are involved in designing private housing, which provides 54% of average practice turnover.
I - 4THE ARCHITECTURAL PROFESSION IN EUROPE 2020

MIRZA & NACEY RESEARCH
Covid-19 has changed how, where and whether architects workPractices are temporarily cutting backThe pandemic has disrupted employment for a significant number of private practice staff.
More architects are unemployed/not workingBig jump from 2% in 2018 to 7% now. Some architects are unemployed due to Covid-19 but the underlying rate of unemployment was rising before the pandemic hit.
Fewer architects are working full-time5% of those normally working full-time are now working part-time due to Covid-19.
Sentiment has fallenMore architects expect workloads to fall in next 12 months.
2% in 2018
202020182016201420122010
-3
-19
-14
+3
+8
+17
Redundant
Stopped work
Working fewer hours21%
3%
4%
75% working full-time in 2020
7% in 2020
I - 5THE ARCHITECTURAL PROFESSION IN EUROPE 2020

MIRZA & NACEY RESEARCH
Architects are well placed for the recovery
BIM
31%3D Modelling
62%Rendering
44%
Common data environment
16%Building performance
12%Parametric design
12%
Enthusiastic adoption of Digitalisation toolsArchitects are much more likely to use new tools out of personal or business interest than due to client or regulatory requirements.
Architects have shown themselves to be extremely willing to learn, more than half of those using each tool are self-taught.
Sustainable Architecture is embedded in architects’ daily behaviourA majority of architects are creating sustainable architecture through Low Energy buildings and other measures.
Low Energy buildings
57%
Plus Energy buildings
10%
Circular Design
15%nZEB
15%
Proportion of architects ’frequently’ using these digital tools Proportion of architects ‘frequently’ using these concepts
I - 6THE ARCHITECTURAL PROFESSION IN EUROPE 2020

MIRZA & NACEY RESEARCH
ArchitectsPersons who are recognised as Architects under the European Union Professional Qualifications Directive and professionally and academically qualified and generally registered / licensed / recognised to practice architecture in the jurisdiction in which they are residing.
Architectural studentsFull-time or part-time students following a recognised course of architectural studies leading to a qualification listed in Annexe V7 of the Qualifications Directive (2013/55/EC).
Architectural StaffComprises Principals; Partners & Directors; Associates: Architects; Technical staff.
Architectural PracticesThe form or structure through which architects practice the architectural profession. It includes sole principals partnerships and limited companies.
Sole PrincipalAn Architect working independently who provides a full range of architectural services to clients.
TurnoverThe total income earned through the provision of services by an architectural practice in a tax year. Excludes VAT.
Not Economically ActiveNot engaged in the practice of architecture or any directly associated activity such as research or teaching. Includes architects who are retired and who are unemployed.
Freelance ArchitectAn architect who contracts his/her services to an architectural practice or organisation and does not accept commissions directly from clients.
DEFINITIONSStatistical Definitions: Confidence LevelThe likelihood that the results are real and repeatable and have not occurred randomly. If the Confidence Level is 50% then the results would be random. We select a Confidence Level of 95% which suggests if you repeat this exercise there is a 95% chance you will achieve similar results.
MeanA type of average where individual data are added together and then divided by the number of pieces of data.
MedianA type of average calculated by placing all individual data in order of magnitude and selecting the middle value.
QuartileAn indication of the bottom or top quarter of the sample calculated by placing all individual data in order of magnitude. The Lower Quartile is the value one quarter of the way up and the Upper Quartile is the value three quarters of the way up this list of data. We have marked countries where accuracy is greater than plus or minus 10 with an asterisk to recommend caution when interpreting the findings. We generally avoid referring to these countries within the text commentary although all countries are included in the charts and maps.
Design questions, identify targets, review questions and method.
Member Organisations translate questionnaire and invite their architect members to participate in the survey.
Architects across Europe complete the questionnaire.
Returned data is cleaned. Data analysis including weighting. Report writing.
Feedback from Member Organisations.Report published. ACE Observatory updated.
HOW THE ACE SECTOR STUDY IS PRODUCED
Survey Framework
Publishing
Data Selection
Data Collection
Analysis & Report
I - 7THE ARCHITECTURAL PROFESSION IN EUROPE 2020

MIRZA & NACEY RESEARCH
THE ACE OBSERVATORY
The Architectural profession in Europe in ‘one click’
All the data presented in this report is available online. The ACE Observatory provides a single entry point through which users can search, access and compare a multitude of statistical information regarding European Architects, the architectural market and architectural practices taken from the ACE Sector Studies since 2010.
The ACE Observatory has been divided into 3 sections : Architects, Practices and Market. The homepage is an overview of the latest data for Europe.
Each section includes multiple topics. To view more details about each topic click on ‘more’.
All data can be interrogated by individual country as well as for the whole of Europe. Some practice data can be viewed by size of practice, architect demographic data can be examined by gender and age.
www.aceobservatory.com
Home page Provides a quick overview of all the data across Europe for all topics covered by the Sector Study.
Select to view any country from the drop-down
View data for different years
View and download the data as tables
Main elements of the ACE Observatory
Topic page
Some topics such as Salaries have further filters to allow selection of
data by age gender etc
I - 8THE ARCHITECTURAL PROFESSION IN EUROPE 2020

Kirkkonummi Library, FinlandArchitect: JKMMArchitectsPhotograph: Maurizio Tami

MIRZA & NACEY RESEARCH
560 000 Total number of architects
42%Female architects
29%Employees in private practice
75%Employed full-time
34%Aged under 40
42%Partners, Directors, Sole Principals
CHAPTER 1 - SUMMARY
1 - 10THE ARCHITECTURAL PROFESSION IN EUROPE 2020

MIRZA & NACEY RESEARCH
There are an estimated 559 070 architects in Europe-31. Italy has the largest number of architects with 152,000 architects. The second highest number of architects is in German which has 118,000 architects.
Three other countries with high numbers of architects are Spain (48,000), the United Kingdom (43,000) and France (30,000). Between them, these five countries are home to 70 per cent of Europe’s architects.
1.1 THE NUMBER OF ARCHITECTS IN EUROPEAcross Europe there is 1.0 architect for every 1,000 people in the population. This ratio is more than twice as high as the European average in Italy and Portugal but less than half in Poland, Latvia, France, Czechia, Slovakia and Bulgaria.
Since this survey started in 2008, the number of architects in Europe has grown consistently – until this year. The 2020 figure is about the same as the previous (2018) survey figure. The number of architects in some southern European countries – notably Italy and Spain –
CHART 1-1ESTIMATED NUMBER OF ARCHITECTS 2020
CHART 1-2NUMBER OF ARCHITECTS PER 1000 POPULATION
has fallen back; elsewhere the number is unchanged; while in some central and northern European countries the number of architects continues to grow – such as Germany, Austria, Luxembourg, the United Kingdom and Ireland.
number of architects, 000s
ACE COLOURFOR COUNTRIES
CHAPTER
0 20 40 60 80 100 120 140 160Estonia
LatviaCyprus
MaltaLuxembourg
LithuaniaSloveniaSlovakiaBulgariaCroatiaIrelandFinlandNorwayCzechiaAustria
SwedenHungary
SwitzerlandSerbia
NetherlandsDenmarkRomania
PolandBelgiumGreece
PortugalFrance
United KingdomSpain
GermanyItaly
Base: all 31 European countries
General notes for all tables and charts:EUROPE-31 = all ACE member countries.EUROPE-26 = all participants in the 2020 survey.The total Europe-26 figure is weighted to reflect the total architectural population in all participating countries; weighting process described in Appendix.Some countries have small samples these are marked *.Germany survey figures throughout have been provided by the BAK which included the ACE survey questions in its own survey.
1.51.00.5architects per 1000
population
1 - 11THE ARCHITECTURAL PROFESSION IN EUROPE 2020

MIRZA & NACEY RESEARCH
TABLE 1-1ESTIMATED NUMBER OF ARCHITECTS IN EACH COUNTRY AND NUMBER OF ARCHITECTS PER 1000 POPULATION
Population source: Eurostat population as at 1 January 2020 copyright (c) Eurostat
Number of Architects source: Mirza & Nacey estimates. The starting point was data compiled for the 2008 Sector Study which itself was based on the research publication produced by COAC - Architectural Practice Around the World research by the Col-legi d’Arquitectes de Catalunya (COAC) based on information supplied by national institutes and associations of architects of the individual countries. For the 2008 ACE report this data from COAC was updated using a mixture of primary and secondary sources including Member Organisations’ websites and email contact with Member Organisations. Final figures are Mirza & Nacey best estimates based on these several different sources. All figures are ‘latest available’.
number of architects population architects per 1000 populationAustria 5800 8 901 064 0.7Belgium 15 100 11 549 888 1.3Bulgaria 2 100 6 951 482 0.3Croatia 2 700 4 058 165 0.7Cyprus 950 888 005 1.1Czechia 4 000 10 693 939 0.4Denmark 10 400 5 822 763 1.8Estonia 800 1 328 976 0.6Finland 3 800 5 525 292 0.7France 30 000 67 098 824 0.4Germany 117 500 83 166 711 1.4Greece 17 800 10 709 739 1.7Hungary 7 300 9 769 526 0.7Ireland 3500 4 963 839 0.7Italy 152 200 60 244 639 2.5Latvia 810 1 907 675 0.4Lithuania 1 450 2 794 090 0.5Luxembourg 1 100 626 108 1.8Malta 1 000 514 564 1.9Netherlands 10 400 17 407 585 0.6Norway 4 000 5 367 580 0.7Poland 14 000 37 958 138 0.4Portugal 26 000 10 295 909 2.5Romania 10 500 19 317 984 0.5Serbia 8 000 6 926 705 1.2Slovakia 1 800 5 457 873 0.3Slovenia 1 460 2 095 861 0.7Spain 47 600 47 329 981 1.0Sweden 7 000 10 327 589 0.7Switzerland 7 500 8 606 033 0.9United Kingdom 42 500 67 025 542 0.6EUROPE - 31 - 2020 559 070 535 632 069 1.0EUROPE - 31 - 2018 557 700 533 427 181 1.0EUROPE - 31 - 2016 547 100 530 331 562 1.0EUROPE - 31 - 2014 534 100 527 331 308 1.0EUROPE - 31 - 2012 509 930 526 727 609 1.0EUROPE - 31 - 2010 488 500 519 521 581 0.9
0
100
200
300
400
500
600
202020182016201420122010
tota
l num
ber o
f arc
hite
cts,
000
s
CHART 1-3CHANGE IN ESTIMATED NUMBER OF ARCHITECTS IN EUROPE-31 2010 TO 2020
Table 1-1 Base: all 31 European countries
Base: all 31 European countries
1 - 12THE ARCHITECTURAL PROFESSION IN EUROPE 2020

MIRZA & NACEY RESEARCH
per cent gender of architects
male female other/prefer not to say
Austria 81 19 1Belgium* 55 45 0Croatia 38 62 0Czechia 71 29 0Denmark 49 51 0Estonia* 73 27 0Finland 46 53 1France 60 40 0Germany** 66 34 0Greece 43 57 1Hungary* 71 29 0Ireland 62 37 1Italy 56 44 0Lithuania* 64 36 0Luxembourg 68 31 1Netherlands* 70 30 0Norway 55 44 1Poland* 42 58 0Portugal 54 46 0Romania 56 44 1Serbia* 33 67 0Slovakia 80 20 1Slovenia 46 54 0Spain 66 34 0Sweden 41 58 1United Kingdom 67 32 12020 EUROPE-26*** 58 42 12018 EUROPE-26*** 61 39 n/a2016 EUROPE-27*** 62 38 n/a2014 EUROPE-26*** 61 39 n/a2012 EUR-25 *** 64 36 n/a2010 EUR- 23 *** 69 31 n/a
1.2 PROFILE OF ARCHITECTSCHART 1-4GENDER SPLIT ALL RESPONDING ARCHITECTS
TABLE 1-2GENDER OF ARCHITECTS ANALYSED BY COUNTRY
* caution - small sample. ** Germany figures provided by BAK*** weighted to reflect the total architectural population in all participating countries; weighting process described in Appendix
A majority of the profession is still male, but the profession is becoming more balanced. The proportion of female architects has increased from 31 per cent in 2010 to 42 per cent now. A majority of architects are female in Serbia, Croatia, Sweden, Finland, Greece, Denmark and Slovenia. A very small proportion, about 1 per cent, of architects describe themselves as non-binary or prefer not to say. In no country does this proportion exceed 1 per cent.
CHART 1-5PROPORTION OF FEMALE ARCHITECTS
female
male
male femaleother/prefer not to say
503520 n/a% female
1 - 13THE ARCHITECTURAL PROFESSION IN EUROPE 2020

MIRZA & NACEY RESEARCH
1.3 EMPLOYMENT STATUS
Covid-19
Covid-19
w
orking full-time
wor
king
par
t-tim
e
not working retired
CHART 1-6EMPLOYMENT STATUS OF ARCHITECTS
TABLE 1-3EMPLOYMENT STATUS OF ARCHITECTS ANALYSED BY COUNTRY
per cent working full-time working part-time not working retired
due to Covid-19 other reasons due to Covid-19 other reasonsAustria 73 7 16 1 1 2Belgium* 86 5 9 1 0 0Croatia 82 4 7 1 3 4Czechia 75 3 11 0 1 10Denmark 81 1 16 1 1 1Estonia* n/a n/a n/a n/a n/a n/aFinland 90 2 5 0 1 1France 79 6 8 1 2 3Germany** 76 12 n/a 4 n/a n/aGreece 78 4 8 5 4 2Hungary* 61 0 5 2 32 0Ireland 79 6 9 3 2 1Italy 70 6 13 3 6 3Lithuania* 64 14 14 0 7 0Luxembourg 79 11 8 1 0 1Netherlands* 60 6 27 0 6 0Norway 80 4 7 1 2 7Poland* 87 4 6 2 1 0Portugal 79 6 6 2 6 1Romania 79 7 6 2 3 2Serbia* 93 0 7 0 0 0Slovakia 74 6 8 1 1 9Slovenia 88 1 8 0 1 1Spain 68 12 11 4 6 1Sweden 71 10 6 4 8 2United Kingdom 66 8 13 3 4 62020 EUROPE-26 *** 75 5 11 2 5 22018 EUROPE-26 *** 77 n/a 19 n/a 2 12016 EUROPE-27 *** 77 n/a 15 n/a 6 32014 EUROPE-26 *** 78 n/a 15 n/a 5 22012 EUROPE-25 *** 76 n/a 15 n/a 6 22010 EUROPE-23 *** 84 n/a 11 n/a 4 1
* caution - small sample ** Germany figures provided by BAK*** weighted to reflect the total architectural population in all participating countries. The weighting process is explained in the Appendix.
Three quarters of architects work full-time. Fewer architects are working full-time this year than previously. This is almost certainly due to the pandemic. Sixteen per cent of architects are working part-time while 7 per cent are unemployed or not working for other reasons such as caring responsibilities.
However, around one third of architects working part-time and not working are doing so as a result of the Covid-19 pandemic. The highest proportion of architects who are working part-time as a result of the pandemic are in Spain, Luxembourg, Sweden and Lithuania (small sample size).
1 - 14THE ARCHITECTURAL PROFESSION IN EUROPE 2020

MIRZA & NACEY RESEARCH
1.4 FIELD OF EMPLOYMENTCHART 1-7FIELD OF EMPLOYMENT
employees
other publiceducation
local authority/government
other private
freelance
in house
salariedprivate practice
associate
partner/director
sole principal
Thirty three per cent of architects describe themselves as Sole Principals, making this the largest employment group in the profession. In some countries - such as France, Austria, Luxembourg, Greece or Slovakia, more than 50 per cent of the profession are Sole Principals. Nine per cent of architects are Partners & Directors, so along with Sole Principals, 42 per cent of architects run their own practices and businesses.
Architects working in private practice as Associates or salaried architects make up 29 per cent of the profession. The highest
CHART 1-8MAIN EMPLOYMENT FIELD BY COUNTRY
0 20 40 60 80 100Lithuania
FinlandDenmarkSwedenNorway
PortugalIreland
GermanyCroatia
United KingdomEstonia
HungarySpain
RomaniaSerbiaPoland
NetherlandsItaly
Czech RepublicSloveniaBelgiumSlovakia
FranceGreece
LuxembourgAustria
per cent respondents
proportion of architects working as salaried staff or Associates in private practice can be found in Poland, Croatia, Norway and Sweden.
Seven per cent of architects describe themselves as Freelance, with significant numbers in Belgium, Lithuania, Czechia, Spain and Portugal.
The public sector employs 13 per cent of Europe’s architects. It is the largest employer of architects in Denmark and Finland.
other public
local & central government
other private
freelance
private practice salaried employees
partner/director
sole principal
other public
local & central government
other privatefreelance
private practice salaried employees
partner/director
sole principal
1 - 15THE ARCHITECTURAL PROFESSION IN EUROPE 2020

MIRZA & NACEY RESEARCH
per cent
sole
pr
inci
pal
partn
er
dire
ctor
asso
ciat
e
priv
ate
prac
tice
sala
ried
empl
oyee
s
in-h
ouse
agen
cy *
*
freel
ance
/sh
ort-t
erm
co
ntra
ct
othe
r pr
ivat
e
loca
l au
thor
ity
cent
ral g
ovt
educ
atio
n
othe
r pub
lic
Austria 73 23 0 3 0 0 1 0 0 0 1 1Belgium* 43 10 6 12 0 0 18 6 1 2 0 2Croatia 22 24 6 38 0 0 3 3 2 1 1 1Czechia 39 10 10 16 0 0 13 3 4 0 2 3Denmark 10 5 3 35 1 0 1 10 22 3 8 4Estonia* 27 27 18 18 0 0 0 0 9 0 0 0Finland 9 16 3 36 2 0 0 2 23 1 4 5France 55 7 14 9 0 0 4 4 2 0 1 4Germany 22 9 0 37 13 0 2 1 13 1 0 1Greece 56 2 6 16 0 0 9 1 4 3 2 2Hungary* 31 7 7 7 2 0 7 17 5 5 2 10Ireland 21 18 11 29 1 0 1 2 8 6 3 2Italy 39 4 7 9 2 0 13 13 4 1 2 4Lithuania* 8 31 8 23 0 0 23 0 8 0 0 0Luxembourg 56 21 15 1 0 0 5 1 0 0 0 0Netherlands* 38 17 8 19 0 0 0 10 0 2 4 2Norway 14 19 9 38 1 0 2 4 8 2 1 3Poland* 35 8 5 41 1 0 5 0 1 1 1 1Portugal 15 10 4 36 1 0 12 3 13 1 2 3Romania 33 14 6 34 0 0 4 3 2 0 2 1Serbia* 33 7 0 40 0 0 0 0 0 13 7 0Slovakia 55 14 8 5 1 0 11 2 2 0 2 1Slovenia 40 15 4 20 6 0 2 6 6 0 0 1Spain 32 12 6 21 1 0 12 2 7 0 2 6Sweden 13 8 5 55 0 0 1 1 13 3 1 1United Kingdom 25 18 11 29 1 0 2 6 3 0 3 12020 EUROPE-26 33 9 6 23 4 0 7 6 7 1 2 32018 EUROPE-26 29 9 5 20 4 0 14 5 7 1 2 42016 EUROPE-27 26 8 6 16 1 10 15 5 6 1 3 32014 EUROPE-26 29 9 7 20 2 7 8 4 7 1 2 32012 EUROPE-25 32 11 7 16 2 8 10 5 5 1 1 32010 EUROPE-23 39 12 6 16 1 4 11 4 3 1 2 2
TABLE 1-4ARCHITECTS’ FIELD OF EMPLOYMENT BY COUNTRY
* caution - small sample ** ‘agency’ was offered as a staff category in previous surveys but was removed from 2018
1 - 16THE ARCHITECTURAL PROFESSION IN EUROPE 2020

MIRZA & NACEY RESEARCH
1.5 YEARS QUALIFIED AS AN ARCHITECT
per cent number of years qualified as an architect1 2 3 to 5 6 to 9 10 to 14 15 to 19 20 to 24 25 +
Austria 4 4 9 9 18 14 15 28Belgium* 5 5 13 15 13 9 9 30Croatia 0 1 14 19 16 13 8 31Czechia 0 0 5 12 20 16 11 36Denmark 3 6 9 9 10 10 14 38Estonia* n/a n/a n/a n/a n/a n/a n/a n/aFinland 0 3 6 9 14 13 18 37France 4 3 10 11 17 11 14 31Germany 2 1 6 10 15 17 16 32Greece 3 3 11 16 19 13 8 28Hungary* 0 0 10 0 5 7 7 71Ireland 1 0 8 14 14 10 16 37Italy 1 3 13 12 16 14 14 25Lithuania* n/a n/a n/a n/a n/a n/a n/a n/aLuxembourg 4 4 1 9 16 23 20 24Netherlands* 4 4 4 9 4 13 19 43Norway 3 2 10 8 13 18 16 31Poland* 5 11 19 25 13 8 11 9Portugal 3 6 16 14 18 14 13 16Romania 1 1 20 23 16 15 8 16Serbia* 0 7 7 7 33 20 13 13Slovakia 0 1 1 7 17 14 19 41Slovenia 1 2 7 5 25 19 21 20Spain 4 7 20 12 15 11 13 18Sweden 2 3 13 12 15 16 11 27United Kingdom 4 3 9 9 9 11 10 452020 EUR-26 2 3 11 12 15 14 14 282018 EUR-26 3 3 9 11 18 17 12 282016 EUR-27 3 4 10 13 19 14 10 272014 EUR-26 3 3 9 15 19 14 12 272012 EUR-25 3 4 12 16 19 11 11 242010 EUR-23 3 5 16 14 12 9 12 28
25+
20-24
15-19
10-14
6-9
3-5
21
CHART 1-9NUMBER OF YEARS ARCHITECTS HAVE BEEN QUALIFIED
There is a wealth of experience within the profession. Despite many more young architects emerging in recent years, the experience profile has changed little over the past ten years.
Over a quarter of architects have at least 25 years’ post-qualification experience; more than one half have at least 15 years of experience. Just 16 per cent of architects have been qualified for 5 years or less.
More than half of architects in countries including Denmark, Finland, Ireland, Lithuania, Netherlands, Slovakia and the United Kingdom have 20 years or more experience. Countries with the largest proportion of architects with less experience include Portugal, Romania and Spain.
TABLE 1-5NUMBER OF YEARS QUALIFIED AS AN ARCHITECT ANALYSED BY COUNTRY
* caution - small sample
1 - 17THE ARCHITECTURAL PROFESSION IN EUROPE 2020

MIRZA & NACEY RESEARCH
1.6 AGE PROFILE OF ARCHITECTS
CHART 1-10AGE PROFILE OF ARCHITECTS
The age profile of the profession has changed very little during the last ten years. There are similar numbers of architects in each five year age group between ages 30 and 54.
Countries with the youngest populations of architects include Poland, Romania, Portugal, Spain, Serbia and Belgium (although some of these countries have small sample sizes).
CHART 1-11PROPORTION OF ARCHITECTS AGED UNDER 40
per c
ent a
rchi
tect
s
age0
5
10
15
20
65+60-6455-5950-5445-4940-4435-3930-34<30
504025 n/a % under 40
1 - 18THE ARCHITECTURAL PROFESSION IN EUROPE 2020

MIRZA & NACEY RESEARCH
per cent age of architects<30 30-34 35-39 40-44 45-49 50-54 55-59 60-64 65+
Austria 0 3 6 10 21 21 11 16 13Belgium* 23 15 12 6 14 8 9 9 3Croatia 4 23 14 17 7 6 14 5 10Czechia 2 12 18 19 13 7 8 8 13Denmark 7 13 12 8 12 7 12 16 12Estonia* n/a n/a n/a n/a n/a n/a n/a n/a n/aFinland 3 9 10 10 14 17 17 12 7France 4 10 14 12 14 11 11 11 12Germany 4 10 11 14 15 17 16 10 4Greece 6 12 23 18 12 7 8 9 4Hungary* 0 7 5 10 7 12 5 17 38Ireland 3 11 15 16 17 11 11 9 9Italy 5 16 14 10 14 14 11 8 7Lithuania* n/a n/a n/a n/a n/a n/a n/a n/a n/aLuxembourg 1 10 16 18 21 13 11 8 3Netherlands* 11 9 7 7 11 13 15 17 11Norway 4 15 12 17 11 8 6 12 15Poland* 32 25 13 7 6 5 7 4 1Portugal 14 19 17 17 13 7 6 4 3Romania 8 34 16 14 7 5 3 5 7Serbia* n/a n/a n/a n/a n/a n/a n/a n/a n/aSlovakia 1 7 11 17 17 9 12 10 15Slovenia 0 8 20 18 26 7 7 11 2Spain 17 18 13 15 13 9 5 5 4Sweden 5 15 14 16 11 11 10 11 8United Kingdom 5 11 10 13 10 8 11 12 202020 EUROPE-26 7 13 14 12 13 13 12 9 72018 EUR-26 7 11 13 15 15 13 11 9 62016 EUR-27 8 13 15 15 13 11 10 8 62014 EUR-26 7 12 15 16 13 13 11 7 62012 EUR-25 9 15 16 14 13 12 10 6 42010 EUR-23 10 15 15 10 12 12 12 8 4
TABLE 1-6AGE OF ARCHITECTS ANALYSED BY COUNTRY
* caution - small sample
CHART 1-12POPULATION PYRAMID - ANALYSIS OF ARCHITECTS BY AGE AND GENDER
25-29
30-34
35-39
40-44
45-49
50-54
55-59
60-64
65+
per cent males
051015202530
0510152025 0 5 10 15 20 25
25-29
30-34
35-39
40-44
45-49
50-54
55-59
60-64
65+
per cent females
1 - 19THE ARCHITECTURAL PROFESSION IN EUROPE 2020

Schloßstraße 24 Frankfurt GermanyArchitect: Stefan Forster ArchitektenPhotograph: Lisa Farkas

MIRZA & NACEY RESEARCH
€1914 billion Value of construction market
€17 billion Value of architectural market
56% Building design work
54%Private housing work
-19 Future sentiment is weak
3%Work from outside own country
CHAPTER 2 - SUMMARY
2 - 21THE ARCHITECTURAL PROFESSION IN EUROPE 2020

MIRZA & NACEY RESEARCH
2.1 ECONOMIC BACKGROUNDGovernments across Europe are spending eye-watering sums of money to support their economies. The succession of stop-go policies has revealed inconsistencies and abrupt changes; policies are being re-written continuously. The lockdowns of Spring 2020 sent Europe’s Gross Domestic Product sharply negative. As the economy re-opened, the service and manufacturing sectors adapted quickly. Pent-up demand from consumers, coupled with a backlog of orders and improving global trade, resulted in an economic rebound in Quarter 2.
Fiscal policy has been used by European governments to provide targeted support. During lockdown and subsequent restrictions, governments have used cash to support short-time working, postponing tax collection and providing loans and grants to business. The recovery phase after lockdown included the bringing forward of public investment or boosting public investment in areas like infrastructure. The rise in public debt and deficits is only a long-term possibility because real interest rates are zero or
6.0
6.5
7.0
7.5
8.0
SepSep
% unemployment rate
20202019
CHART 2-1 MONTHLY UNEMPLOYMENT RATE EUROPE-31
Source: Eurostat
negative, and because central banks around the world share this common approach. The 19 countries of the Eurozone have agreed emergency measures including the provision of recovery funds. Principally aimed at minimising divergence within the Eurozone, the ECB’s approach is designed to facilitate cheaper supplies of funds from which individual governments can borrow.
But there remain many perils ahead. A second wave is gathering traction in much of Europe during Quarter 3, further national lockdowns have become necessary and there are concerns about shortages of doctors and other medical staff in some countries particularly in central and eastern Europe. While the future is perilously difficult to predict, forecasts released in Quarter 3 2020 from the International Monetary Fund (IMF) and the Organisation for Economic Co-operation and Development (OECD) suggest an economic re-bound for Europe in 2021. Countries which had recorded the sharpest downturn in 2020 look set to see the strongest recover in 2021, according to the forecasters.
GDP projections
-10
-8
-6
-4
-2
0
2
4
6
212019
-15
-12
-9
-6
-3
0
3
6
9
212019-10
-8
-6
-4
-2
0
2
4
6
212019
% change
CHART 2-3 CHANGE IN GDP - PROJECTIONS 2020 & 2021. EURO AREA & SELECTED COUNTRIES
white shading = range of projections for five largest economies DE, FR, IT, UK, ES Source: IMF World Economic Outlook October 2020
3000
3500
4000
Q2Q1Q4Q3Q2Q1
GDP €billion
2019 2020
CHART 2-2 QUARTERLY GDP EUROPE-31
2019 actual
2020 OECD
2020 IMF
2021 OECD
2021 IMF
France 1.5 -9.5 -9.8 5.8 6.0Germany 0.6 -5.4 -6.0 4.6 4.2Italy 0.3 -10.5 -10.6 5.4 5.2Spain 2.0 n/a -12.8 n/a 7.2United Kingdom 1.5 -10.1 -9.8 7.6 5.9
EURO AREA 1.3 -7.9 -8.3 5.1 5.2
Sources:OECD Interim Economic Outlook Forecasts September 2020 International Monetary Fund. 2020. World Economic Outlook:A Long and Difficult Ascent. Washington DC, October 2020
TABLE 2-1 CHANGE IN GDP - PROJECTIONS 2020 & 2021
Source: Eurostat
2 - 22THE ARCHITECTURAL PROFESSION IN EUROPE 2020

MIRZA & NACEY RESEARCH
2.2 THE CONSTRUCTION MARKET IN EUROPECHART 2-5ESTIMATED SIZE OF EUROPE CONSTRUCTION MARKET 2020
0 50 100 150 200 250 300 350 400Malta
CyprusEstonia
LithuaniaLatvia
SloveniaLuxembourg
CroatiaGreece
BulgariaSerbia
SlovakiaHungary
IrelandPortugalCzechiaFinland
RomaniaDenmark
AustriaNorway
SwitzerlandBelgiumSwedenPoland
NetherlandsSpain
ItalyFrance
United KingdomGermany
€ 000 million, current prices
Base: all 31 European countriesSource: Mirza & Nacey estimates based on data sourced from Eurostat updated using the most recent Eurostat Construction Output Production Indices.
The total value of the European construction market (‘EUROPE - 31’) is estimated to be worth €1,914 billion in 2020. This includes civil engineering and infrastructure work.
Output is dominated by five countries - Germany, the United Kingdom, France, Italy and Spain. Together, these countries account for more than half of Europe’s total construction output. When measured per head of the general population, the highest values per head are recorded in Luxembourg and Norway.
In a new analysis for this year’s survey we have measured construction output per architect. Norway, the Netherlands and Finland emerge as having the highest values of construction output per architect.
80
100
120
Q2Q1Q4Q3Q2Q12019 2020
Index
CHART 2-4 QUARTERLY CONSTRUCTION OUTPUT EUROPE-31
Source: Eurostat
2 - 23THE ARCHITECTURAL PROFESSION IN EUROPE 2020
MIRZA & NACEY RESEARCH
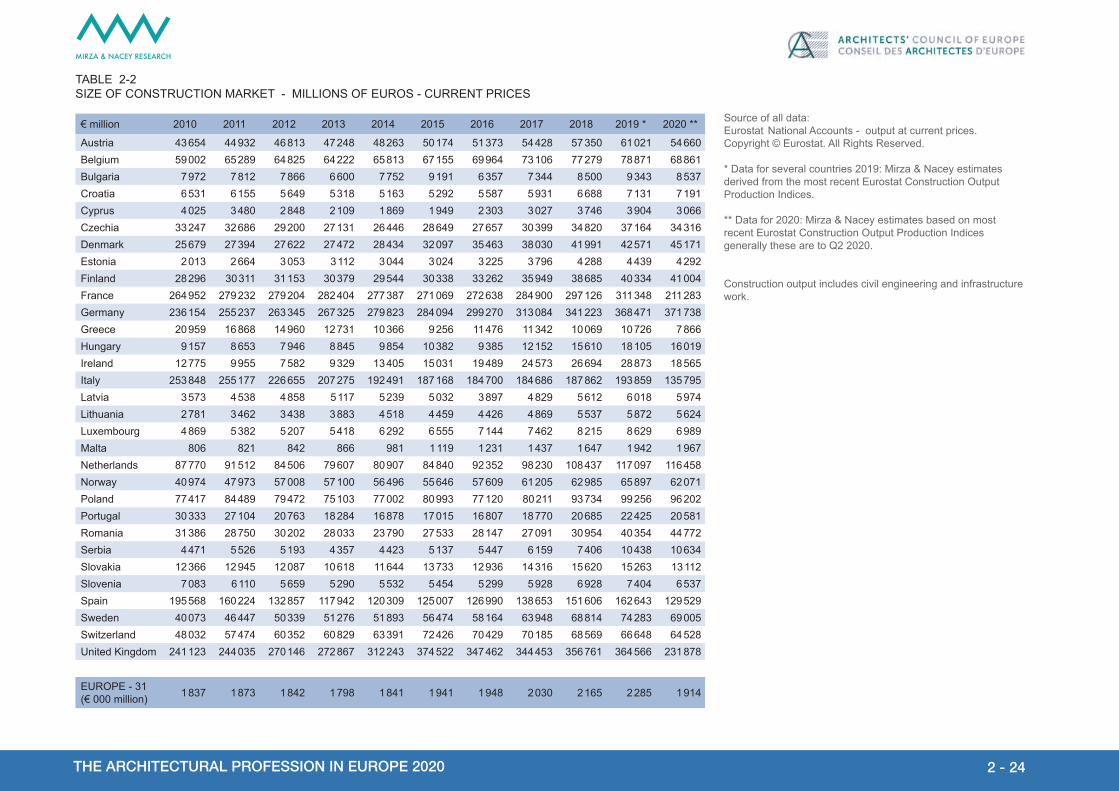
TABLE 2-2SIZE OF CONSTRUCTION MARKET - MILLIONS OF EUROS - CURRENT PRICES
Source of all data: Eurostat National Accounts - output at current prices. Copyright © Eurostat. All Rights Reserved.
* Data for several countries 2019: Mirza & Nacey estimates derived from the most recent Eurostat Construction Output Production Indices.
** Data for 2020: Mirza & Nacey estimates based on most recent Eurostat Construction Output Production Indices generally these are to Q2 2020.
Construction output includes civil engineering and infrastructure work.
€ million 2010 2011 2012 2013 2014 2015 2016 2017 2018 2019 * 2020 **
Austria 43 654 44 932 46 813 47 248 48 263 50 174 51 373 54 428 57 350 61 021 54 660 Belgium 59 002 65 289 64 825 64 222 65 813 67 155 69 964 73 106 77 279 78 871 68 861 Bulgaria 7 972 7 812 7 866 6 600 7 752 9 191 6 357 7 344 8 500 9 343 8 537 Croatia 6 531 6 155 5 649 5 318 5 163 5 292 5 587 5 931 6 688 7 131 7 191 Cyprus 4 025 3 480 2 848 2 109 1 869 1 949 2 303 3 027 3 746 3 904 3 066 Czechia 33 247 32 686 29 200 27 131 26 446 28 649 27 657 30 399 34 820 37 164 34 316 Denmark 25 679 27 394 27 622 27 472 28 434 32 097 35 463 38 030 41 991 42 571 45 171 Estonia 2 013 2 664 3 053 3 112 3 044 3 024 3 225 3 796 4 288 4 439 4 292 Finland 28 296 30 311 31 153 30 379 29 544 30 338 33 262 35 949 38 685 40 334 41 004 France 264 952 279 232 279 204 282 404 277 387 271 069 272 638 284 900 297 126 311 348 211 283 Germany 236 154 255 237 263 345 267 325 279 823 284 094 299 270 313 084 341 223 368 471 371 738 Greece 20 959 16 868 14 960 12 731 10 366 9 256 11 476 11 342 10 069 10 726 7 866 Hungary 9 157 8 653 7 946 8 845 9 854 10 382 9 385 12 152 15 610 18 105 16 019 Ireland 12 775 9 955 7 582 9 329 13 405 15 031 19 489 24 573 26 694 28 873 18 565 Italy 253 848 255 177 226 655 207 275 192 491 187 168 184 700 184 686 187 862 193 859 135 795 Latvia 3 573 4 538 4 858 5 117 5 239 5 032 3 897 4 829 5 612 6 018 5 974 Lithuania 2 781 3 462 3 438 3 883 4 518 4 459 4 426 4 869 5 537 5 872 5 624 Luxembourg 4 869 5 382 5 207 5 418 6 292 6 555 7 144 7 462 8 215 8 629 6 989 Malta 806 821 842 866 981 1 119 1 231 1 437 1 647 1 942 1 967 Netherlands 87 770 91 512 84 506 79 607 80 907 84 840 92 352 98 230 108 437 117 097 116 458 Norway 40 974 47 973 57 008 57 100 56 496 55 646 57 609 61 205 62 985 65 897 62 071 Poland 77 417 84 489 79 472 75 103 77 002 80 993 77 120 80 211 93 734 99 256 96 202 Portugal 30 333 27 104 20 763 18 284 16 878 17 015 16 807 18 770 20 685 22 425 20 581 Romania 31 386 28 750 30 202 28 033 23 790 27 533 28 147 27 091 30 954 40 354 44 772 Serbia 4 471 5 526 5 193 4 357 4 423 5 137 5 447 6 159 7 406 10 438 10 634 Slovakia 12 366 12 945 12 087 10 618 11 644 13 733 12 936 14 316 15 620 15 263 13 112 Slovenia 7 083 6 110 5 659 5 290 5 532 5 454 5 299 5 928 6 928 7 404 6 537 Spain 195 568 160 224 132 857 117 942 120 309 125 007 126 990 138 653 151 606 162 643 129 529 Sweden 40 073 46 447 50 339 51 276 51 893 56 474 58 164 63 948 68 814 74 283 69 005 Switzerland 48 032 57 474 60 352 60 829 63 391 72 426 70 429 70 185 68 569 66 648 64 528 United Kingdom 241 123 244 035 270 146 272 867 312 243 374 522 347 462 344 453 356 761 364 566 231 878
EUROPE - 31(€ 000 million) 1 837 1 873 1 842 1 798 1 841 1 941 1 948 2 030 2 165 2 285 1 914
2 - 24THE ARCHITECTURAL PROFESSION IN EUROPE 2020

MIRZA & NACEY RESEARCH
CHART 2-7CHANGES IN CONSTRUCTION OUTPUT 2019 TO 2020
CHART 2-6CHANGE IN CONSTRUCTION OUTPUT IN EUROPE-31 2010 TO 2020
Base for both map above and chart left: all 31 European countriesSource: Mirza & Nacey estimates based on data sourced from Eurostat updated using the most recent Eurostat Construction Output Production Indices.
Construction output in Europe-31 had been rising year on year between 2015 and 2019. A series of five consecutive annual increases were starting to make up for the recession following the Financial Crisis. The pandemic has turned this around, with a predicted reduction in output of 16 per cent for 2020. It is important to note that the 2020 estimates are based only on the first two quarters of the year.
€ 00
0 m
illio
n, c
urre
nt p
rices
0
500
1000
1500
2000
2500
2019181716151413121110
+3-3-15% decrease % increase
+15
2 - 25THE ARCHITECTURAL PROFESSION IN EUROPE 2020

MIRZA & NACEY RESEARCH
construction output (estimated
€ million)
population (number as at 01.01.2020)
construction output per head of population (€)
architects (estimated number)
construction output per
architect (€)Austria 54 660 8 901 064 6 141 5 800 9 424 163 Belgium 68 861 11 549 888 5 962 15 100 4 560 323 Bulgaria 8 537 6 951 482 1 228 2 100 4 065 342 Croatia 7 191 4 058 165 1 772 2 700 2 663 407 Cyprus 3 066 888 005 3 453 950 3 227 295 Czechia 34 316 10 693 939 3 209 4 000 8 578 885 Denmark 45 171 5 822 763 7 758 10 400 4 343 335 Estonia 4 292 1 328 976 3 229 800 5 364 656 Finland 41 004 5 525 292 7 421 3 800 10 790 650 France 211 283 67 098 824 3 149 30 000 7 042 754 Germany 371 738 83 166 711 4 470 117 500 3 163 724 Greece 7 866 10 709 739 735 17 800 441 932 Hungary 16 019 9 769 526 1 640 7 300 2 194 371 Ireland 18 565 4 963 839 3 740 3 500 5 304 282 Italy 135 795 60 244 639 2 254 152 200 892 214 Latvia 5 974 1 907 675 3 132 810 7 375 878 Lithuania 5 624 2 794 090 2 013 1 450 3 878 724 Luxembourg 6 989 626 108 11 163 1 100 6 353 654 Malta 1 967 514 564 3 822 1 000 1 966 750 Netherlands 116 458 17 407 585 6 690 10 400 11 197 896 Norway 62 071 5 367 580 11 564 4 000 15 517 835 Poland 96 202 37 958 138 2 534 14 000 6 871 562 Portugal 20 581 10 295 909 1 999 26 000 791 583 Romania 44 772 19 317 984 2 318 10 500 4 264 038 Serbia 10 634 6 926 705 1 535 8 000 1 329 227 Slovakia 13 112 5 457 873 2 402 1 800 7 284 201 Slovenia 6 537 2 095 861 3 119 1 460 4 477 687 Spain 129 529 47 329 981 2 737 47 600 2 721 200 Sweden 69 005 10 327 589 6 682 7 000 9 857 818 Switzerland 64 528 8 606 033 7 498 7 500 8 603 685 United Kingdom 231 878 67 025 542 3 460 42 500 5 455 962 EUROPE - 31 - 2020 1 914 225 535 632 069 3 574 559 070 3 423 946
TABLE 2-3ESTIMATED SIZE OF CONSTRUCTION MARKET 2020 BY COUNTRY AND COMPARATIVE VALUES
Source: Construction output and population data - Eurostat Copyright © Eurostat. All Rights Reserved. Data for 2020 are Mirza & Nacey estimates based on most recent Eurostat Construction Output Production Indices. The total for EUROPE-31 is Mirza & Nacey estimate.
Construction output includes civil engineering and infrastructure work.
2 - 26THE ARCHITECTURAL PROFESSION IN EUROPE 2020
MIRZA & NACEY RESEARCH
2.3 THE ARCHITECTURAL MARKET IN EUROPE
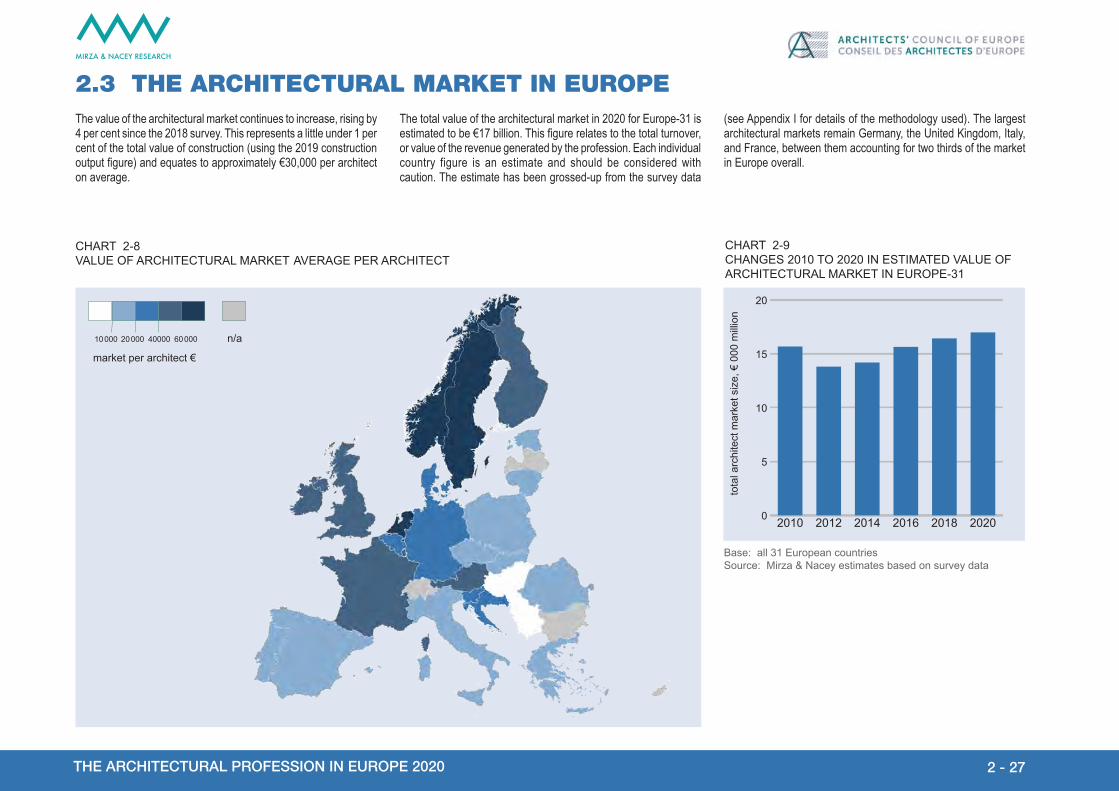
CHART 2-8VALUE OF ARCHITECTURAL MARKET AVERAGE PER ARCHITECT
The value of the architectural market continues to increase, rising by 4 per cent since the 2018 survey. This represents a little under 1 per cent of the total value of construction (using the 2019 construction output figure) and equates to approximately €30,000 per architect on average.
CHART 2-9CHANGES 2010 TO 2020 IN ESTIMATED VALUE OF ARCHITECTURAL MARKET IN EUROPE-31
0
5
10
15
20
202020182016201420122010
tota
l arc
hite
ct m
arke
t siz
e, €
000
mill
ion
The total value of the architectural market in 2020 for Europe-31 is estimated to be €17 billion. This figure relates to the total turnover, or value of the revenue generated by the profession. Each individual country figure is an estimate and should be considered with caution. The estimate has been grossed-up from the survey data
(see Appendix I for details of the methodology used). The largest architectural markets remain Germany, the United Kingdom, Italy, and France, between them accounting for two thirds of the market in Europe overall.
Base: all 31 European countriesSource: Mirza & Nacey estimates based on survey data
10 000 n/a
market per architect €
20 000 40000 60 000
2 - 27THE ARCHITECTURAL PROFESSION IN EUROPE 2020

MIRZA & NACEY RESEARCH
CHART 2-10ESTIMATED VALUE OF ARCHITECTURAL MARKET
2020 2018 2016 2014 2012 2010
market size
(€000s)
value per architect
(€)
value per 1000
population (€)
architectural market as per cent
construction
market size
(€000s)
market size
(€000s)
market size
(€000s)
market size
(€000s)
market size
(€000s)
Austria 340 391 58 688 38 242 0.56 287 174 279 307 281 241 262 774 256 292Belgium* 577 331 38 234 49 986 0.73 569 489 610 346 436 306 529 292 556 280Croatia 59 518 22 044 14 666 0.83 59 602 54 841 44 798 50 235 64 290Czechia 74 016 18 504 6 921 0.20 112 931 92 210 139 458 153 433 73 045Denmark 333 893 32 105 57 343 0.78 429 470 482 321 392 062 447 607 308 697Estonia* 12 505 15 631 9 409 0.28 16 730 14 396 16 330 29 277 12 667Finland 165 869 43 650 30 020 0.41 188 952 178 017 133 689 161 704 117 456France 1 527 379 50 913 22 763 0.49 961 483 984 215 907 837 1 254 376 1 301 699Germany 4 576 636 38 950 55 030 1.24 4 970 740 5 015 212 5 047 349 4 192 657 4 094 601Greece 190 789 10 718 17 815 1.78 82 696 n/a 102 646 170 961 289 623Hungary* 58 988 8 081 6 038 0.33 47 024 33 267 n/a 60 566 n/aIreland 169 174 48 335 34 081 0.59 149 498 110 600 90 682 112 102 172 362Italy 2 982 972 19 599 49 514 1.54 2 072 306 1 758 087 1 916 761 2 775 280 2 708 910Lithuania* 21 388 14 750 7 655 0.36 16 850 10 641 n/a 9 676 11 455Luxembourg 65 533 59 576 104 668 0.76 49 588 68 308 49 361 38 264 n/aNetherlands* 704 365 67 727 40 463 0.60 782 773 939 867 910 000 807 000 976 000Norway 245 511 61 378 45 740 0.37 340 447 n/a n/a n/a n/aPoland* 228 586 16 328 6 022 0.23 208 042 212 481 n/a 210 575 258 803Portugal 427 214 16 431 41 494 1.91 348 279 276 051 176 636 261 110 n/aRomania 182 265 17 359 9 435 0.45 135 682 76 954 79 471 90 111 63 551Serbia* 77 970 9 746 11 256 0.75 n/a n/a n/a n/a n/aSlovakia 28 709 15 949 5 260 0.19 n/a 22 058 15 211 n/a 41 000Slovenia 39 713 27 201 18 948 0.54 30 396 35 700 24 874 42 110 10 359Spain 593 043 12 459 12 530 0.36 555 550 461 124 332 999 336 420 n/aSweden 420 937 60 134 40 759 0.57 532 201 470 484 347 110 330 785 356 300United Kingdom 2 124 952 49 999 31 704 0.58 2 265 051 2 169 202 1 978 835 2 006 403 1 955 9292020 EUROPE-26 16 229 648 29 686 31 406 0.742018 EUROPE-26 15 198 352 28 262 30 184 0.8 15 198 3522016 EUROPE-27 15 603 101 27 300 26 651 0.9 15 603 1012014 EUROPE-26 14 340 253 26 109 27 176 0.9 14 340 2532012 EUROPE-25 14 424 668 27 770 25 870 1.0 14 424 6682010 EUROPE-23 14 636 411 33 253 28 716 1.1 14 636 411
‘Market size’ refers to the architectural market as measured as the sum of the turnover earned by private architectural practices in each country. Data refers to 2019/20. The market size has been estimated see Appendix for an explanation of the methodology.* caution - small sample
TABLE 2-4ESTIMATED SIZE OF ARCHITECTURAL MARKET 2020 BY COUNTRY AND COMPARATIVE VALUES
0 500 1000 1500 2000 2500 3000 3500 4000 4500 5000
Estonia
Lithuania
Slovakia
Slovenia
Hungary
Croatia
Luxembourg
Czechia
Serbia
Finland
Ireland
Romania
Greece
Poland
Norway
Denmark
Austria
Sweden
Portugal
Belgium
Spain
Netherlands
France
United Kingdom
Italy
Germany
€ million
2 - 28THE ARCHITECTURAL PROFESSION IN EUROPE 2020
MIRZA & NACEY RESEARCH
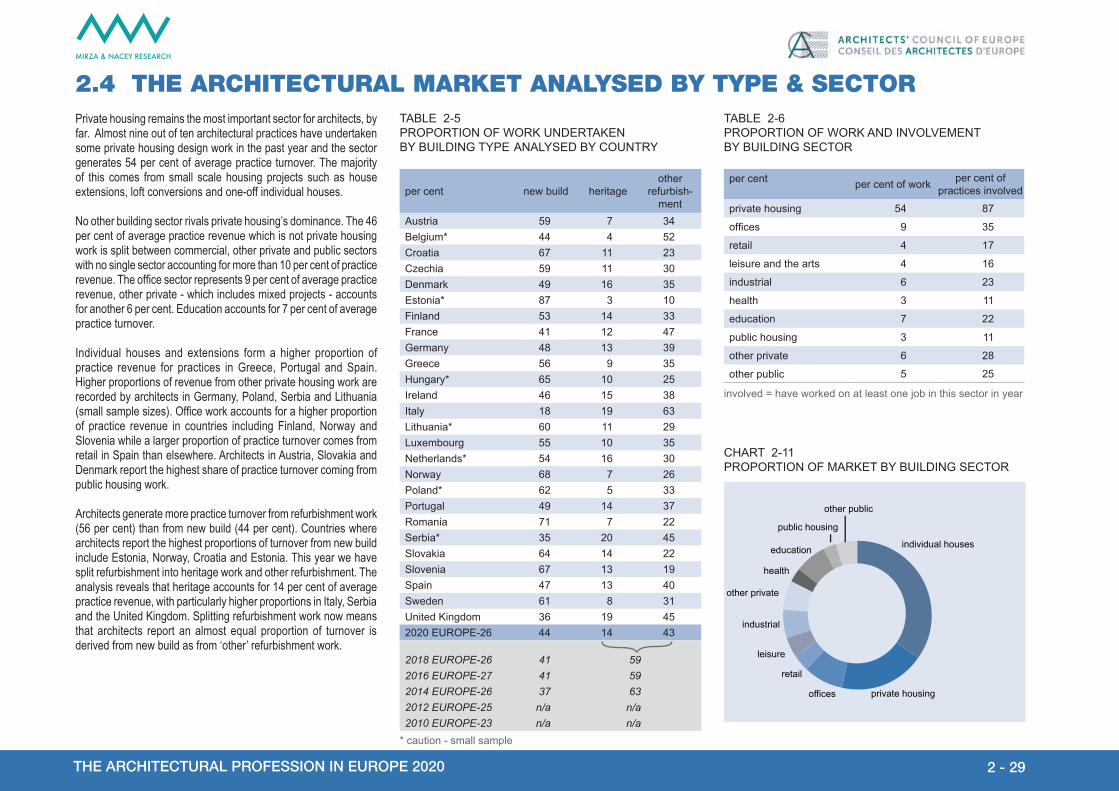
2.4 THE ARCHITECTURAL MARKET ANALYSED BY TYPE & SECTOR
per cent per cent of work per cent of practices involved
private housing 54 87
offices 9 35
retail 4 17
leisure and the arts 4 16
industrial 6 23
health 3 11
education 7 22
public housing 3 11
other private 6 28
other public 5 25
other public
public housing
education
health
other private
industrial
leisure
retail
offices private housing
individual houses
Private housing remains the most important sector for architects, by far. Almost nine out of ten architectural practices have undertaken some private housing design work in the past year and the sector generates 54 per cent of average practice turnover. The majority of this comes from small scale housing projects such as house extensions, loft conversions and one-off individual houses.
No other building sector rivals private housing’s dominance. The 46 per cent of average practice revenue which is not private housing work is split between commercial, other private and public sectors with no single sector accounting for more than 10 per cent of practice revenue. The office sector represents 9 per cent of average practice revenue, other private - which includes mixed projects - accounts for another 6 per cent. Education accounts for 7 per cent of average practice turnover.
Individual houses and extensions form a higher proportion of practice revenue for practices in Greece, Portugal and Spain. Higher proportions of revenue from other private housing work are recorded by architects in Germany, Poland, Serbia and Lithuania (small sample sizes). Office work accounts for a higher proportion of practice revenue in countries including Finland, Norway and Slovenia while a larger proportion of practice turnover comes from retail in Spain than elsewhere. Architects in Austria, Slovakia and Denmark report the highest share of practice turnover coming from public housing work.
Architects generate more practice turnover from refurbishment work (56 per cent) than from new build (44 per cent). Countries where architects report the highest proportions of turnover from new build include Estonia, Norway, Croatia and Estonia. This year we have split refurbishment into heritage work and other refurbishment. The analysis reveals that heritage accounts for 14 per cent of average practice revenue, with particularly higher proportions in Italy, Serbia and the United Kingdom. Splitting refurbishment work now means that architects report an almost equal proportion of turnover is derived from new build as from ‘other’ refurbishment work.
TABLE 2-5PROPORTION OF WORK UNDERTAKEN BY BUILDING TYPE ANALYSED BY COUNTRY
CHART 2-11PROPORTION OF MARKET BY BUILDING SECTOR
per cent new build heritageother
refurbish-ment
Austria 59 7 34Belgium* 44 4 52Croatia 67 11 23Czechia 59 11 30Denmark 49 16 35Estonia* 87 3 10Finland 53 14 33France 41 12 47Germany 48 13 39Greece 56 9 35Hungary* 65 10 25Ireland 46 15 38Italy 18 19 63Lithuania* 60 11 29Luxembourg 55 10 35Netherlands* 54 16 30Norway 68 7 26Poland* 62 5 33Portugal 49 14 37Romania 71 7 22Serbia* 35 20 45Slovakia 64 14 22Slovenia 67 13 19Spain 47 13 40Sweden 61 8 31United Kingdom 36 19 452020 EUROPE-26 44 14 43
2018 EUROPE-26 41 592016 EUROPE-27 41 592014 EUROPE-26 37 632012 EUROPE-25 n/a n/a2010 EUROPE-23 n/a n/a
TABLE 2-6PROPORTION OF WORK AND INVOLVEMENT BY BUILDING SECTOR
* caution - small sample
involved = have worked on at least one job in this sector in year
2 - 29THE ARCHITECTURAL PROFESSION IN EUROPE 2020

MIRZA & NACEY RESEARCH
CHART 2-12 PROPORTION OF WORK UNDERTAKEN IN EACH MAIN BUILDING SECTOR RANKED IN ORDER OF HIGHEST PRIVATE HOUSING WORK per cent
indi
vidu
al
hous
es
exte
nsio
ns
loft
conv
ersi
ons
priv
ate
hous
ing
offic
es
reta
il
leis
ure
indu
stria
l
heal
th
educ
atio
n
publ
ic h
ousi
ng
othe
r priv
ate
othe
r pub
lic
TOTA
L
Austria 32 12 7 3 3 4 4 8 14 6 8 100Belgium* 54 16 4 2 0 3 2 5 12 1 1 100Croatia 45 19 3 3 2 10 0 2 1 6 11 100Czechia 35 14 9 3 6 3 2 5 2 7 14 100Denmark 31 11 14 4 4 1 2 7 15 9 4 100Estonia* 24 12 36 4 2 2 0 10 4 6 0 100Finland 24 12 16 2 4 2 4 11 8 9 10 100France 35 16 6 5 3 4 4 6 5 7 9 100Germany 29 23 11 2 5 7 4 10 2 5 3 100Greece 63 5 3 6 5 4 1 3 1 7 3 100Hungary* 38 7 5 2 4 9 6 3 2 9 14 100Ireland 43 11 8 5 5 3 5 6 5 6 4 100Italy 42 18 5 7 3 5 2 2 1 10 7 100Lithuania* 36 22 13 5 3 6 0 0 3 9 4 100Luxembourg 50 12 8 3 2 4 2 7 4 4 5 100Netherlands* 37 11 7 6 6 12 7 1 2 9 3 100Norway 30 14 13 4 3 8 4 10 4 4 7 100Poland* 26 23 3 3 1 5 4 2 9 3 20 100Portugal 56 11 5 7 2 4 3 1 1 5 4 100Romania 39 13 7 6 5 9 4 5 4 6 2 100Serbia* 17 33 5 8 0 0 0 0 0 0 37 100Slovakia 27 7 10 8 5 8 2 2 14 8 11 100Slovenia 53 5 14 4 2 6 1 2 1 6 5 100Spain 54 1 4 10 1 3 2 1 1 10 13 100Sweden 25 19 12 4 6 3 2 13 4 4 7 100United Kingdom 51 14 5 3 5 3 3 2 5 6 2 1002020 EUROPE-26 35 19 9 4 4 6 3 7 3 6 5 1002018 EUROPE-26 36 18 8 5 4 6 3 6 3 8 4 1002016 EUROPE-27 39 16 7 7 4 5 3 4 2 9 6 1002014 EUROPE-26 40 13 6 6 3 6 3 5 3 7 9 1002012 EUROPE-25 42 9 6 6 3 5 2 4 3 9 11 1002010 EUROPE-23 30 14 8 5 4 6 4 6 6 7 10 100
TABLE 2-7PROPORTION OF WORK UNDERTAKEN BY BUILDING SECTOR ANALYSED BY COUNTRY
* caution - small sample
per cent total market
0 20 40 60 80 100
publiccommercial &other private
privatehousing
Slovakia
Estonia
Finland
Denmark
Austria
Sweden
Norway
Hungary
Netherlands
Czech Republic
Poland
Serbia
France
Germany
Romania
Ireland
Spain
Slovenia
Lithuania
Italy
Luxembourg
Croatia
United Kingdom
Portugal
Greece
Belgium
2 - 30THE ARCHITECTURAL PROFESSION IN EUROPE 2020

MIRZA & NACEY RESEARCH
building design
land
scap
e de
sign
certi
ficat
ion
BIM
co
-ord
inat
ion
per cent
conc
ept
desi
gn
deta
iled
desi
gn
inte
rior
desi
gn
feas
ibili
ty
stud
ies
proj
ect
man
age-
men
t
urba
n pl
anni
ng
prop
erty
va
luat
ion
othe
r se
rvic
e
TOTA
L
Austria 29 44 2 3 5 6 2 2 0 0 7 100Belgium* 29 44 1 8 5 5 2 0 1 2 3 100Croatia 26 42 4 11 2 2 4 1 0 0 7 100Czechia 27 39 4 9 0 6 9 0 0 1 4 100Denmark 23 30 9 5 1 16 0 1 0 0 14 100Estonia* 43 38 1 8 0 7 0 2 0 0 0 100Finland 29 41 3 7 2 4 6 1 0 1 6 100France 40 29 1 8 9 5 3 0 0 0 5 100Germany 34 16 1 4 2 2 1 3 1 0 36 100Greece 27 35 1 12 1 7 0 2 0 1 13 100Hungary* 27 46 0 3 0 3 7 0 5 0 8 100Ireland 30 39 2 6 5 4 1 2 0 0 10 100Italy 19 32 3 12 5 9 2 3 4 0 12 100Lithuania* 13 53 6 9 2 10 1 0 0 3 3 100Luxembourg 43 28 3 3 6 7 4 1 1 1 4 100Netherlands* 31 38 1 6 7 11 2 1 0 2 1 100Norway 38 31 3 6 4 2 9 1 0 2 3 100Poland* 36 47 2 7 3 1 1 0 1 1 2 100Portugal 52 24 1 8 3 3 3 1 1 1 4 100Romania 29 40 1 8 5 4 6 1 0 0 6 100Serbia* 9 10 2 43 0 10 26 0 0 0 0 100Slovakia 23 44 4 9 2 9 6 0 0 1 2 100Slovenia 23 39 1 8 4 12 5 1 1 0 6 100Spain 19 49 0 5 2 3 4 5 3 0 9 100Sweden 29 40 1 5 5 4 6 1 0 1 9 100United Kingdom 29 42 1 3 7 8 1 2 0 0 7 1002020 EUR-26 31 25 1 6 3 5 2 2 2 0 22 100
2018 EUR-26 67 2 10 3 4 3 2 2 n/a 7 1002016 EUR-27 62 2 11 3 4 3 3 2 n/a 9 1002014 EUR-26 57 3 11 4 5 4 4 2 n/a 11 1002012 EUR-25 50 2 14 6 7 6 n/a n/a n/a 16 1002010 EUR-23 69 2 8 4 6 7 n/a n/a n/a 4 100
2.5 THE ARCHITECTURAL MARKET ANALYSED BY TYPE OF SERVICE
CHART 2-13PROPORTION OF MARKET BY TYPE OF SERVICE
others
certification
planningproject management
feasibility studies
interior designlandscape design
building design:concept design
building design:detailed design
Nearly one third of practice turnover comes from concept design and another quarter from detailed design. Together, these two aspects of building design provide the majority of average practice turnover. Architects in Germany, Denmark, Italy and Serbia (small sample) report the lowest proportion of turnover derived from building design, although in all but one of these countries building design still accounts for more than 50 per cent of average practice revenue.
A wide range of other services account for the remainder of practice turnover. Interior design accounts for a higher proportion of practice turnover in Italy, Greece and Serbia.
TABLE 2-8PROPORTION OF WORK UNDERTAKEN BY EACH SERVICE TYPE
* caution - small sample
2 - 31THE ARCHITECTURAL PROFESSION IN EUROPE 2020

MIRZA & NACEY RESEARCH
2.6 FUTURE PROSPECTS & THE IMPACT OF COVID-19Future sentiment is strongly negative in this year’s survey. The ‘balance’ statistic - the difference between architects who expect workloads to increase and those expecting a decrease - has swung from the most positive reading ever in the 2018 survey to its most negative reading this year. The figure is -19, lower even
CHART 2-15WORKLOAD PREDICTIONS FOR 2021
CHART 2-14CHANGE IN WORKLOAD PREDICTIONS (BALANCE FIGURE).ALL SURVEY COUNTRIES 2010 TO 2020 SURVEYS (workload predictions made in survey year for the following year)
-20
-10
0
10
20
202020182016201420122010
‘bal
ance
’ fig
ure
than the 2012 figure. The ‘balance’ figure is most strongly negative in Germany, Portugal, Ireland and the United Kingdom but is, in fact, positive in a handful of countries including Norway, Finland, Greece and Luxembourg.
In a new question in this year’s survey, respondents refined their response by private or public sector. The private sector ‘balance’ figure is positive in Norway, Luxembourg, Sweden, Greece and Italy; while the public sector ‘balance’ figure is positive only in Denmark and Norway.
The ‘balance’ statistic is calculated by subtracting the per cent of respondents who predict workloads will fall from those who predict a rise
+4-4-20 n/a% decrease % increase
+20 +40-40
2 - 32THE ARCHITECTURAL PROFESSION IN EUROPE 2020

MIRZA & NACEY RESEARCH
workload precitions - all work all work private sector public sector
per cent per cent of Principals who expect their practice workloads to change over the coming 12 months
balance balance balance
rise no change fallAustria 17 40 43 -26 -39 -21Belgium* 31 43 26 +5 -4 -13Croatia 24 37 39 -16 -20 -47Czechia 14 61 25 -12 -20 -20Denmark 26 37 37 -11 -16 +11Estonia* 0 40 60 -60 0 -40Finland 23 60 18 +5 0 -2France 26 40 34 -9 -5 -20Germany 8 44 49 -41 -37 -35Greece 33 41 26 +7 +5 -15Hungary* 24 33 43 -19 -32 -20Ireland 22 27 51 -30 -32 -20Italy 31 37 33 -2 +2 -22Lithuania* 38 25 38 0 -13 -17Luxembourg 27 50 23 +4 +7 -21Netherlands* 17 40 43 -27 -28 -30Norway 38 49 13 +26 +25 +9Poland* 41 32 27 +14 0 -14Portugal 17 32 51 -33 -34 -35Romania 31 36 34 -3 -8 -6Serbia* 33 33 33 0 0 -50Slovakia 20 47 32 -12 -12 -15Slovenia 19 52 29 -10 -9 -30Spain 16 23 61 -46 -46 -34Sweden 26 44 30 -4 +4 -6United Kingdom 21 28 51 -30 -25 -292020 EUROPE-26 22 37 41 -19 -21 -252018 EUROPE-26 32 53 15 +17 n/a n/a2016 EUROPE-27 31 46 23 +8 n/a n/a2014 EUROPE-26 28 47 25 +3 n/a n/a2012 EUROPE-25 21 43 35 -14 n/a n/a2010 EUROPE-23 24 44 32 -8 n/a n/a
TABLE 2-9FUTURE WORKLOAD PROSPECTS FOR 2021 ANALYSED BY COUNTRY
CHART 2-16FUTURE WORKLOAD PROSPECTS FOR 2021
balance’ statistic is calculated by subtracting the per cent of respondents who predict workloads will fall from those who predict a rise* caution - small sample
per cent expecting work to:-80 -40 0 40
Spain
Estonia
Ireland
United Kingdom
Portugal
Germany
Netherlands
Hungary
Austria
Croatia
Lithuania
Denmark
France
Romania
Serbia
Italy
Slovakia
Sweden
Slovenia
Poland
Greece
Belgium
Czechia
Luxembourg
Finland
Norway
rise in 2021fall in 2021
Countries ranked in order of the ‘balance’ statistic. The difference between the bars above and 100% = per cent expecting ‘no change’.
2 - 33THE ARCHITECTURAL PROFESSION IN EUROPE 2020

MIRZA & NACEY RESEARCH
per cent per cent of practice staff who have since 01 March 2020 ...
been made redundant/been released from a contract
stopped work completely but remain employed by the practice
working fewer hours but remain employed by the practice
Austria 1.5 2.3 19.7Belgium* 1.8 0.4 18.4Croatia 3.6 0.5 57.8Czechia 0.4 0.6 9.7Denmark 0.0 0.0 12.7Estonia* 2.0 2.0 0.2Finland 4.7 0.1 11.0France 1.4 4.3 18.9Germany 1.2 2.4 12.0Greece 1.0 5.2 26.4Hungary* 8.8 6.5 21.9Ireland 4.2 4.2 16.1Italy 4.7 3.2 22.0Lithuania* 3.7 0.7 8.7Luxembourg 1.8 4.5 25.4Netherlands* 0.4 0.0 12.0Norway 0.3 1.0 13.3Poland* 1.1 0.1 14.3Portugal 6.5 4.6 28.0Romania 3.1 3.2 17.0Serbia* 0.0 0.0 0.0Slovakia 1.3 2.6 7.6Slovenia 10.7 2.8 29.2Spain 4.8 2.2 16.6Sweden 0.7 0.0 0.0United Kingdom 1.8 11.4 16.52020 EUROPE-26 3.4 3.9 20.52018 and earlier n/a n/a n/a
TABLE 2-10IMPACT OF COVID-19 ON PRACTICE STAFFING ANALYSED BY COUNTRY
CHART 2-17IMPACT OF COVID-19 ON PRACTICE STAFFING
* caution - small sample
per cent total market
0 20 40 60 80 100
Croatia
Slovenia
Portugal
Hungary
Greece
Luxembourg
Italy
United Kingdom
France
Ireland
Spain
Austria
Romania
Belgium
Finland
Germany
Poland
Norway
Lithuania
Denmark
Netherlands
Slovakia
Czechia
Estonia
Sweden
Serbia
fewer hours &remain employed
stopped work &remain employed
redundant
no change to employment
per cent of staff in practice
A very substantial proportion of staff working in private practices have experienced major changes to their working hours as a result of the Covid-19 pandemic. Since March, 3.4 per cent of private practice staff have been made redundant from Europe’s practices. This is a significant proportion. The highest rates are reported by practices in
Slovenia, Hungary (small sample) and Portugal. Nearly 4 per cent of practice staff including 11 per cent in the United Kingdom - have stopped work completely but remain employed by the practice. This includes where the salary is paid for by the Government. A very substantial proportion of staff - one in five - is working fewer hours.
The remaining 72 per cent of private practice staff remain employed as usual although this figure includes the substantial number of Sole Principals and Partners & Directors in smaller practices who would be expected to remain employed as normal in any circumstances.
2 - 34THE ARCHITECTURAL PROFESSION IN EUROPE 2020

Primary School Dorf Lauterach, AustriaArchitect : Wolfgang Feyferlik/ Susanne FritzerPhotograph: Maurizio Tam

MIRZA & NACEY RESEARCH
111 000Total number of practices
€253 000 Average revenue per practice
3-5 staff size
13% Offer Post Occupancy Evaluation
7% Of practices work
in another European country last 12 months
€79 Hourly rate for Partners & Directors
30% Success rate for public sector
Architectural Design Competitions
CHAPTER 3 - SUMMARY
3 - 36THE ARCHITECTURAL PROFESSION IN EUROPE 2020

MIRZA & NACEY RESEARCH
CHART 3-2AVERAGE SIZE OF ARCHITECTURAL PRACTICES
3.1 PROFILE OF ARCHITECTURAL PRACTICESThe fall in the number of practices seen in the 2018 survey has continued in 2020. This changing dynamic reflects the economic cycle; during and after recessions we typically see large number of new practices being established. As the economy strengthens, these practices merge or become larger. Most of the drop in practice numbers is due to there being fewer one or two person practices, whose owners may have returned to work in larger practices or whose practices have grown organically.
0
50
100
150
200
202020182016201420122010
tota
l num
ber o
f arc
hite
ctur
al p
ract
ices
, 000
s
Architectural practices this year remain strongly skewed towards the smallest size groups; almost two thirds are 1 person practices. However, at the other end of the size range there are about twice as many practices with more than 30 staff than there were two years ago. Furthermore, more architects are employed in these largest practices; the proportion has grown from 11 per cent in 2018 to 18 per cent now.
CHART 3-1CHANGE IN ESTIMATED NUMBER OF PRACTICES IN EUROPE-31 2010 TO 2020
The information in this section is based on the questionnaires completed by Principals. These include Sole Principals, Freelancers and Partners & Directors in Private Practice.
The number of practices has been estimated by creating a model and then inserting data from the survey. The model is described in Appendix I
432 n/aaverage number
of staff
3 - 37THE ARCHITECTURAL PROFESSION IN EUROPE 2020

MIRZA & NACEY RESEARCH
TABLE 3-1ESTIMATED NUMBER AND SIZE OF ARCHITECTURAL PRACTICES
per cent architects employed0 5 10 15 20 25
over 50 staff
31 to 50 staff
11 to 30 staff
6 to 10 staff
3 to 5 staff
2 staff
1 staff
per cent architectural practices0 10 20 30 40 50 60 70 80
over 50 staff
31 to 50 staff
11 to 30 staff
6 to 10 staff
3 to 5 staff
2 staff
1 staffnumber (estimate)
size of architectural practice (number of architectural staff) TOTAL
1 staff 2 staff 3 to 5 staff 6 to 10 staff 11 to 30 staff 31 to 50 staff over 50 staffAustria 1 343 355 285 103 27 2 1 2 116 Belgium* 3 302 387 348 136 42 20 3 4 238 Croatia 441 156 169 49 15 0 1 831 Czechia 264 198 323 38 29 0 0 850 Denmark 997 165 330 97 69 6 3 1 667 Estonia* 74 10 11 4 6 1 1 106 Finland 309 103 165 48 23 0 1 649 France 2 437 771 801 376 256 35 30 4 708 Germany 21 302 3 808 2 558 649 147 20 8 28 492 Greece 4 817 680 463 103 32 2 1 6 097 Hungary* 659 163 111 24 14 2 1 973 Ireland 312 137 123 54 22 5 1 653 Italy 16 286 3 776 3 836 1 110 863 170 92 26 134 Lithuania* 346 39 30 6 2 0 0 423 Luxembourg 169 48 59 24 7 1 0 308 Netherlands* 1 859 223 434 143 95 8 10 2 772 Norway 207 166 116 93 25 12 2 620 Poland* 2 690 768 394 125 75 13 6 4 070 Portugal 1 449 167 446 188 270 12 29 2 562 Romania 1 330 391 593 110 85 0 5 2 514 Serbia* 969 304 396 105 46 9 6 1 835 Slovakia 168 123 85 25 6 1 1 409 Slovenia 257 71 88 28 3 0 0 447 Spain 4 386 2 207 1 429 502 39 3 1 8 567 Sweden 607 121 100 48 31 6 8 923 United Kingdom 5 158 1 177 1 165 341 232 92 59 8 224 2020 EUR-26 72 138 16 517 14 857 4 530 2 460 419 270 111 187 per cent of practices 65 15 13 4 2 <1 <1 100
2018 EUR-26 94 129 18 158 14 910 4 069 1 724 228 139 133 354 2016 EUR-27 114 247 21 319 16 706 4 243 1 516 202 108 158 342 2014 EUR-26 120 242 22 423 16 066 3 151 1 069 100 30 163 0782012 EUR-25 98 193 28 134 22 663 5 247 1 305 151 35 155 725 2010 EUR-23 86 049 19 477 18 963 5 814 1 973 279 83 132 643
CHART 3-3PRACTICES ANALYSED BY SIZE
CHART 3-4PROPORTION OF ARCHITECTS EMPLOYED IN PRACTICES OF DIFFERENT SIZES
‘architectural staff’ includes principals partners & directors; associates; salaried architects; technical staff; permanent and freelance.* caution - small sample Row or column totals may not add precisely due to rounding.
3 - 38THE ARCHITECTURAL PROFESSION IN EUROPE 2020
MIRZA & NACEY RESEARCH
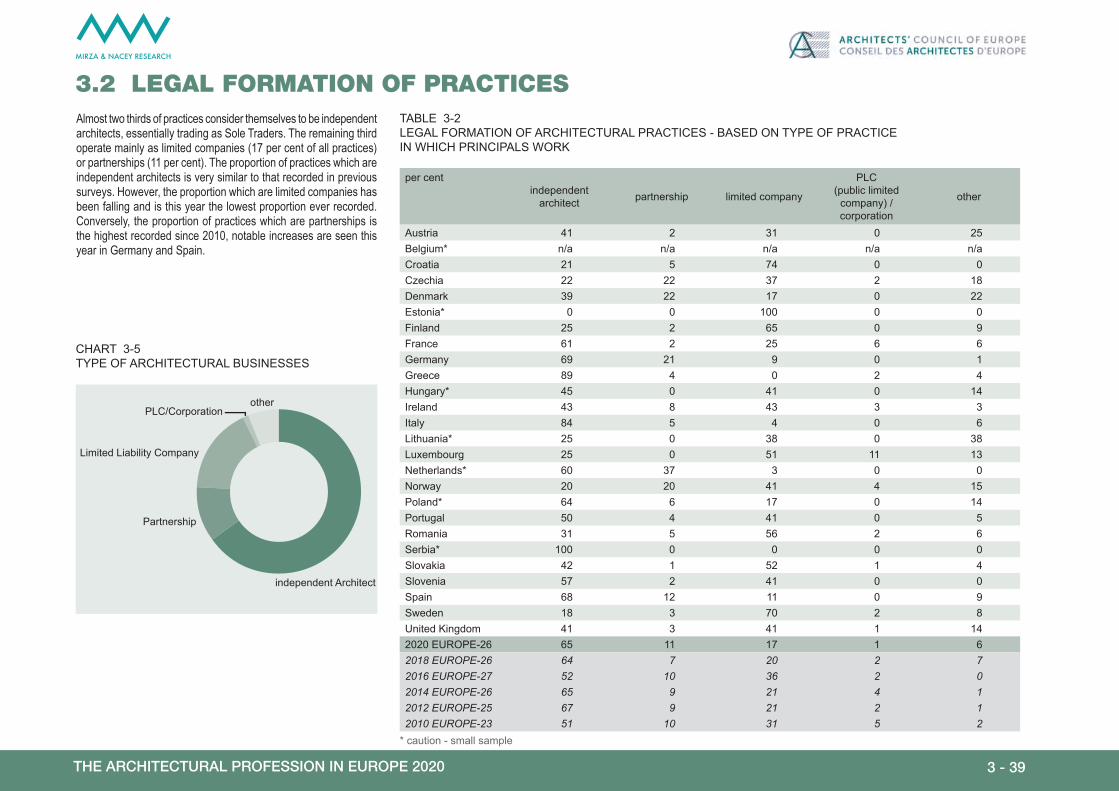
Almost two thirds of practices consider themselves to be independent architects, essentially trading as Sole Traders. The remaining third operate mainly as limited companies (17 per cent of all practices) or partnerships (11 per cent). The proportion of practices which are independent architects is very similar to that recorded in previous surveys. However, the proportion which are limited companies has been falling and is this year the lowest proportion ever recorded. Conversely, the proportion of practices which are partnerships is the highest recorded since 2010, notable increases are seen this year in Germany and Spain.
3.2 LEGAL FORMATION OF PRACTICESTABLE 3-2LEGAL FORMATION OF ARCHITECTURAL PRACTICES - BASED ON TYPE OF PRACTICE IN WHICH PRINCIPALS WORK
per centindependent
architect partnership limited company
PLC (public limited
company) / corporation
other
Austria 41 2 31 0 25Belgium* n/a n/a n/a n/a n/aCroatia 21 5 74 0 0Czechia 22 22 37 2 18Denmark 39 22 17 0 22Estonia* 0 0 100 0 0Finland 25 2 65 0 9France 61 2 25 6 6Germany 69 21 9 0 1Greece 89 4 0 2 4Hungary* 45 0 41 0 14Ireland 43 8 43 3 3Italy 84 5 4 0 6Lithuania* 25 0 38 0 38Luxembourg 25 0 51 11 13Netherlands* 60 37 3 0 0Norway 20 20 41 4 15Poland* 64 6 17 0 14Portugal 50 4 41 0 5Romania 31 5 56 2 6Serbia* 100 0 0 0 0Slovakia 42 1 52 1 4Slovenia 57 2 41 0 0Spain 68 12 11 0 9Sweden 18 3 70 2 8United Kingdom 41 3 41 1 142020 EUROPE-26 65 11 17 1 62018 EUROPE-26 64 7 20 2 72016 EUROPE-27 52 10 36 2 02014 EUROPE-26 65 9 21 4 12012 EUROPE-25 67 9 21 2 12010 EUROPE-23 51 10 31 5 2
CHART 3-5TYPE OF ARCHITECTURAL BUSINESSES
otherPLC/Corporation
Limited Liability Company
Partnership
independent Architect
* caution - small sample
3 - 39THE ARCHITECTURAL PROFESSION IN EUROPE 2020

MIRZA & NACEY RESEARCH
3.3 PRACTICE TURNOVERTABLE 3-3AVERAGE TURNOVER PER PRACTICE ANALYSED BY COUNTRY AND PRACTICE SIZETURNOVER EXCLUDES VAT€ average (mean) turnover: size of practice (number of architectural staff)
1 2 3 to 5 6 to 10 11 to 30 31 to 50 51+Austria 68 911 114 795 278 678 712 736 1 704 832 n/a n/aBelgium* 59 869 110 702 256 517 358 000 n/a n/a n/aCroatia 16 935 34 416 117 584 n/a n/a n/a n/aCzechia 21 721 30 118 101 989 184 213 n/a n/a n/aDenmark 52 815 68 485 n/a n/a n/a n/a n/aEstonia* n/a n/a n/a n/a n/a n/a n/aFinland 69 469 105 643 163 704 714 173 2 424 667 n/a n/aFrance 59 548 133 002 245 400 804 667 1 837 176 n/a n/aGermany 95 824 169 809 374 237 811 537 1 444 585 5 187 507 11 495 214Greece 12 406 37 500 88 167 n/a n/a n/a n/aHungary* 15 673 n/a 98 691 n/a n/a n/a n/aIreland 57 538 109 358 329 445 665 332 1 665 831 n/a n/aItaly 32 747 76 913 115 783 385 514 n/a 2 146 400 6 888 400Lithuania* n/a n/a n/a n/a n/a n/a n/aLuxembourg 84 542 140 569 292 000 574 571 1 359 500 n/a n/aNetherlands* 66 643 140 766 n/a n/a n/a n/a n/aNorway 48 476 n/a n/a n/a 2 017 225 n/a n/aPoland* 27 698 29 096 112 801 132 786 n/a n/a n/aPortugal 20 418 53 628 103 943 294 549 629 710 n/a n/aRomania 23 457 30 419 80 404 128 313 n/a n/a n/aSerbia* n/a n/a n/a n/a n/a n/a n/aSlovakia 26 601 32 875 89 451 214 423 n/a n/a n/aSlovenia 55 293 50 346 135 000 n/a n/a n/a n/aSpain 29 881 63 453 108 500 213 000 n/a n/a n/aSweden 45 963 66 180 330 545 801 321 2 123 115 4 174 949 26 207 906United Kingdom 42 780 100 255 151 510 655 326 1 888 359 n/a n/a2020 EUR-26 64 946 122 130 253 441 634 732 1 559 226 4 109 345 14 223 3142018 EUR-26 66 180 115 601 228 107 554 285 1 364 204 2 555 257 18 655 1382016 EUR-27 48 025 117 358 218 397 551 141 1 758 965 5 710 433 12 133 6892014 EUR-26 40 646 87 651 169 450 520 474 1 743 964 9 309 970 15 570 1152012 EUR-25 41 755 78 648 166 607 437 493 1 397 166 3 626 922 16 538 3012010 EUR-23 48 295 93 826 192 685 463 320 1 167 050 3 471 360 10 613 801
Figures are averages (means) and refer to the 12 months ending 01 May 2020 or the year 2019/20 or latest accounting year. Figures are unadjusted for PPP.Turnover excludes VAT.The minimum number of responses to give a reliable answer is 10. But for smaller countries we have extended this to 5 and in very exceptional cases to 4. Where there are fewer than four responses or where the figure varies excessively from the mean we mark the data as n/a.
Turnover relates to the revenue earned by practices, measured before tax. The average turnover per practice rises in line with practice size, which is why average turnover is reported for a variety of practice sizes rather than as a single figure. There is less information for the largest practice size groups due to smaller sample sizes and there is also more variation within these size groups.
Compared with the previous survey, average practice turnover has increased in all but the very largest and very smallest size groups. Over the two years, average turnover for practices with between 3 and 30 staff has increased by between 11 and 15 per cent. Average turnover for 1 person practices is lower by 2 per cent. This year’s rises continue the longer-term pattern of rising average turnover values for most size groups. The last survey saw a particularly large increase in the 1 person size group which may account for this year’s small fall there. Average turnover values for the very largest size groups are affected by variability in the composition of the survey respondents so it is not surprising that average turnovers there are less likely to show a consistent pattern.
* caution - small sample
3 - 40THE ARCHITECTURAL PROFESSION IN EUROPE 2020
MIRZA & NACEY RESEARCH
per cent current jobs method of calculating charge
per cent of contract value lump sum hourly charge
no charge agreed (effectively “at risk”)
other method
Austria 56 19 22 2 2Belgium* 41 27 27 2 4Croatia 17 33 7 15 29Czechia 32 46 16 1 5Denmark 22 28 43 1 7Estonia* 0 76 22 1 1Finland 10 36 41 3 11France 62 26 6 1 5Germany 5 9 21 2 63Greece 31 51 3 2 12Hungary* 51 30 9 1 9Ireland 33 47 12 2 6Italy 36 38 6 6 12Lithuania* 26 24 24 0 26Luxembourg 52 22 13 1 12Netherlands* 6 52 32 2 8Norway 5 32 58 0 5Poland* 30 25 23 3 19Portugal 35 39 7 4 15Romania 20 37 14 3 26Serbia* 7 17 33 0 43Slovakia 37 31 16 5 12Slovenia 32 41 11 3 14Spain 45 29 5 6 14Sweden 1 29 65 1 4United Kingdom 27 44 21 2 72020 EUROPE-26 28 30 15 4 232018 EUROPE-26 32 28 13 3 252016 EUROPE-27 45 34 14 7 n/a2014 EUROPE-26 47 32 14 7 n/a2012 EUROPE-25 43 36 12 9 n/a2010 EUROPE-23 49 29 18 5 n/a
TABLE 3-4HOW CHARGES ARE CALCULATED
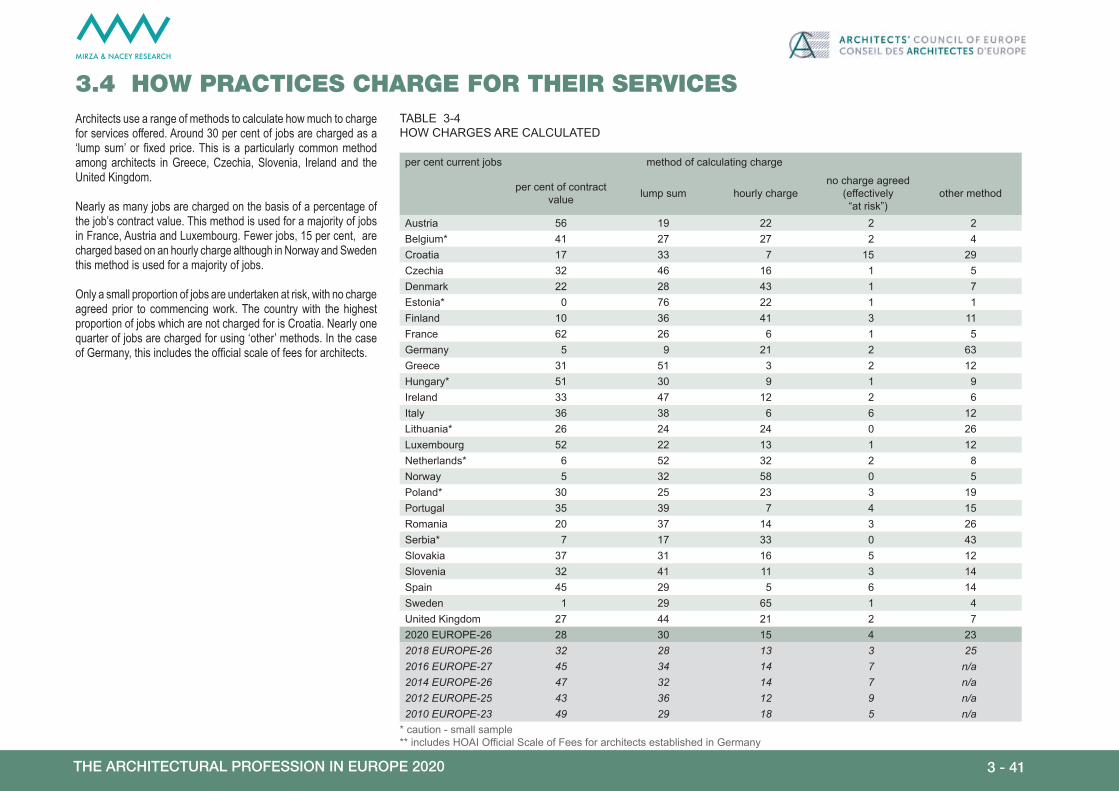
Architects use a range of methods to calculate how much to charge for services offered. Around 30 per cent of jobs are charged as a ‘lump sum’ or fixed price. This is a particularly common method among architects in Greece, Czechia, Slovenia, Ireland and the United Kingdom.
Nearly as many jobs are charged on the basis of a percentage of the job’s contract value. This method is used for a majority of jobs in France, Austria and Luxembourg. Fewer jobs, 15 per cent, are charged based on an hourly charge although in Norway and Sweden this method is used for a majority of jobs.
Only a small proportion of jobs are undertaken at risk, with no charge agreed prior to commencing work. The country with the highest proportion of jobs which are not charged for is Croatia. Nearly one quarter of jobs are charged for using ‘other’ methods. In the case of Germany, this includes the official scale of fees for architects.
3.4 HOW PRACTICES CHARGE FOR THEIR SERVICES
* caution - small sample** includes HOAI Official Scale of Fees for architects established in Germany
3 - 41THE ARCHITECTURAL PROFESSION IN EUROPE 2020

MIRZA & NACEY RESEARCH
3.5 HOURLY CHARGE-OUT RATES
Data is expressed in Euros but each country’s figure has been adjusted using an index of Purchasing Power Parity (PPP). This index takes account of price level differences across countries. We have used an index sourced from Eurostat whose Comparative Price Level Indices assess the price level of each country in the comparison of European countries. Each country’s average hourly rates figure is divided by one hundredth of the country’s index value to create the PPP adjusted figure. * caution - small sample
€ average (median) hourly charge-out rates adjusted for PPP unadjusted for PPP
principals architect employees
technologists principals architect employees
technologists
Austria 92 83 69 100 90 75Belgium* 64 61 50 71 70 55Croatia 26 20 20 20 13 13Czechia 34 23 20 23 16 14Denmark 95 81 74 134 114 104Estonia* n/a n/a n/a n/a n/a n/aFinland 82 65 53 95 78 60France 83 74 55 85 80 60Germany 81 67 52 85 70 55Greece 33 18 18 30 20 20Hungary* 77 62 26 48 38 16Ireland 80 64 48 100 80 60Italy 49 35 30 40 35 30Lithuania* 77 46 31 50 30 20Luxembourg 95 68 51 120 85 65Netherlands* 89 76 58 100 85 65Norway 79 76 69 113 108 98Poland* 38 17 13 21 9 7Portugal 41 29 29 35 25 25Romania 23 15 10 11 11 5Serbia* n/a n/a n/a n/a n/a n/aSlovakia 43 29 22 30 20 15Slovenia 47 35 26 40 30 20Spain 49 31 27 45 29 25Sweden 82 71 63 103 90 80United Kingdom 83 73 54 96 85 622020 EUROPE-26 79 62 52 84 65 552018 EUROPE-26 74 62 49 80 65 512016 EUROPE-27 70 57 45 75 60 462014 EUROPE-26 64 53 43 67 55 452012 EUROPE-25 54 44 29 55 43 302010 EUROPE-23 66 56 43 75 63 50
There is a very wide variation in the average hourly charge-out rates reported by architects. Even adjusting for PPP, the hourly charge-out rates for Principals vary from around €20 to over €80 per hour. Nevertheless, recent rises in reported rates - both adjusted and unadjusted - have continued in the latest period so the 2020 average hourly rates figures for Europe overall are the highest reported in the last ten years. Average rates for Principals (adjusted for PPP) have increased by 20 per cent since 2010.
TABLE 3-5AVERAGE HOURLY CHARGE-OUT RATES ADJUSTED TO TAKE ACCOUNT OF PURCHASING POWER PARITY (PPP)
CHART 3-6AVERAGE HOURLY CHARGE-OUT RATES FOR PRINCIPALS ADJUSTED FOR PPP
average rate € adjusted for PPP0 20 40 60 80 100
Serbia
Estonia
Romania
Croatia
Greece
Czechia
Poland
Portugal
Slovakia
Slovenia
Spain
Italy
Belgium
Hungary
Lithuania
Norway
Ireland
Germany
Finland
Sweden
United Kingdom
France
Netherlands
Austria
Luxembourg
Denmark
n/an/a
Average hourly rates refer to the average charged to clients for an hour of the architect’s work before tax.
3 - 42THE ARCHITECTURAL PROFESSION IN EUROPE 2020

MIRZA & NACEY RESEARCH
TABLE 3-6PROPORTION OF PRACTICE TURNOVER DERIVED FROM OUTSIDE THE COUNTRY ANALYSED BY COUNTRY
In a new question for the 2020 survey, architects report that 3 per cent of their practice turnover comes from international work, defined as being work on jobs located outside the practice’s own country. Seven per cent of practices are involved in international work, most undertaking jobs in other parts of Europe but the range of job locations is truly worldwide.
3.6 TURNOVER FROM OUTSIDE OWN COUNTRY
* caution - small sample
per cent
own
coun
try
othe
r EU
co
untry
othe
r E
urop
e ou
tsid
e E
U
Asi
a
Mid
dle
Eas
t
Afri
ca
Nor
th
Am
eric
a
Sou
th
Am
eric
a
Aus
tralia
/N
ew
Zeal
and
TOTA
L
Austria 96 2 1 0 0 0 0 0 0 100Belgium* 94 5 0 1 0 0 0 0 0 100Croatia 95 3 0 0 0 1 0 0 1 100Czechia 98 1 1 0 0 0 0 0 0 100Denmark 93 6 0 0 0 0 0 0 0 100Estonia* 100 0 0 0 0 0 0 0 0 100Finland 99 0 0 0 0 0 0 0 0 100France 98 1 0 0 0 0 0 0 0 100Germany 98 1 0 0 0 0 0 0 0 100Greece 96 1 0 1 0 0 1 0 0 100Hungary* 94 0 6 0 0 0 0 0 0 100Ireland 95 3 1 0 0 0 0 0 1 100Italy 97 1 0 0 0 0 0 0 0 100Lithuania* 84 16 0 0 0 0 0 0 0 100Luxembourg 89 10 0 0 0 1 0 0 0 100Netherlands* 98 1 0 1 0 0 0 0 0 100Norway 96 2 1 0 0 0 0 0 1 100Poland* 99 1 0 0 0 0 0 0 0 100Portugal 93 3 0 0 1 2 1 0 0 100Romania 97 2 0 0 0 0 0 0 0 100Serbia* 100 0 0 0 0 0 0 0 0 100Slovakia 96 4 0 0 0 0 0 0 0 100Slovenia 94 5 1 0 0 0 0 0 0 100Spain 100 0 0 0 0 0 0 0 0 100Sweden 99 1 0 0 0 0 0 0 0 100United Kingdom 95 2 0 0 2 0 1 0 0 1002020 EUR-26 97 2 <1 <1 <1 <1 <1 <1 <1 100
2018 EUR-26 95.8 2.8 1.4 1002016 EUR-27 95.7 2.7 1.6 1002014 EUR-26 93.6 3.7 2.7 1002012 EUR-25 94.4 n/a n/a 1002010 EUR-23 92.3 n/a n/a 100
CHART 3-7ORIGIN OF INTERNATIONAL WORK
Australia/New Zealand
South AmericaNorth America
Africa
Middle East
Asia
Europe outside EU
EuropeanUnion
per cent per cent of market per cent of practices involved
own country 97 99
other EU country 2 6
other Europe outside EU <1 1
Asia <1 1
Middle East <1 1
Africa <1 1
North America <1 1
South America <1 <1
Australia/New Zealand <1 <1
TABLE 3-7TURNOVER SHARE AND INVOLVEMENT IN INTERNATIONAL WORK
involved = have worked for at least one of these clients in year
3 - 43THE ARCHITECTURAL PROFESSION IN EUROPE 2020

MIRZA & NACEY RESEARCH
3.7 ASSOCIATIONS
per cent no formal association
have a formal association
with architect / practice in same country
with architect / practice in another country both
Austria 87 10 1 2Belgium* 86 10 4 0Croatia 31 54 0 14Czechia 84 14 1 1Denmark 89 11 0 0Estonia* 80 20 0 0Finland 45 49 2 4France 88 10 0 1Germany 85 14 1 1Greece 69 22 2 7Hungary* 78 22 0 0Ireland 83 9 3 5Italy 77 20 1 2Lithuania* 38 63 0 0Luxembourg 90 8 0 1Netherlands* 86 11 4 0Norway 82 16 0 2Poland* 69 29 0 3Portugal 89 7 3 1Romania 78 19 1 2Serbia* 67 33 0 0Slovakia 88 11 1 0Slovenia 60 38 0 2Spain 94 6 0 0Sweden 92 6 2 1United Kingdom 91 6 3 12020 EUROPE-26 82 15 1 12018 EUROPE-26 83 15 1 12016 EUROPE-27 80 17 2 12014 EUROPE-26 84 14 2 12012 EUROPE-25 79 18 2 12010 EUROPE-23 82 15 2 2
TABLE 3-8PROPORTION OF PRACTICES HAVING A FORMAL ASSOCIATION WITH ANOTHER PRACTICE
CHART 3-8 PROPORTION OF PRACTICES HAVING A FORMAL ASSOCIATION WITH ANOTHER PRACTICE
per cent practices0 20 40 60 80 100
both same & otherother countrysame country
Spain
Sweden
United Kingdom
Luxembourg
Portugal
Denmark
France
Slovakia
Austria
Belgium
Netherlands
Germany
Czechia
Ireland
Norway
Estonia
Romania
Hungary
Italy
Greece
Poland
Serbia
Slovenia
Finland
Lithuania
Croatia
* caution - small sample
3 - 44THE ARCHITECTURAL PROFESSION IN EUROPE 2020

MIRZA & NACEY RESEARCH
3.8 BRANCH OFFICES
per cent work in branch office for those who work in branch head office is located in...same country as where branch office is located
same country as where architect is established
Austria 2 83 100Belgium* 9 87 86Croatia 7 89 87Czechia 6 81 81Denmark 13 74 80Estonia* 0 100 100Finland 8 71 60France 3 93 96Germany 5 74 73Greece 4 97 95Hungary* 11 83 100Ireland 10 94 92Italy 2 97 95Lithuania* 8 100 100Luxembourg 6 71 69Netherlands* 4 57 50Norway 16 73 72Poland* 6 73 80Portugal 10 90 85Romania 6 79 70Serbia* 14 58 100Slovakia 7 86 88Slovenia 1 100 100Spain 4 63 69Sweden 12 59 59United Kingdom 11 93 952020 EUROPE-26 5 86 862018 EUROPE-26 6 91 902016 EUROPE-27 6 95 952014 EUROPE-26 6 96 962012 EUROPE-25 6 90 912010 EUROPE-23 12 89 98
A relatively small proportion of architects work in a branch office. The proportion is 5 per cent, similar to previous years. More architects from Norway, Serbia (small sample), Denmark and Sweden work in a branch office than elsewhere.
It remains the case that for nearly all, 86 per cent, of architects who work in a branch office, the head office is located in the same country as the branch office and the same country as where the architect is established. However, this proportion has been falling steadily since 2014, when the proportion was 96 per cent.
TABLE 3-9PROPORTION OF ARCHITECTS WORKING IN BRANCH OFFICE AND LOCATION OF BRANCH OFFICE’S HEAD OFFICE
Overall, 18 per cent of practices in Europe have an association with another practice (table 3-9). In most cases, this is an association with a practice in the same country. About half or more architects in Finland, Croatia and Lithuania (small sample) have an association with another practice in the same country. At least 8 per cent of architects in Croatia, Greece and Ireland have an association with an architectural practice in another country.
3.7 ASSOCIATIONS (continued)
* caution - small sample
3 - 45THE ARCHITECTURAL PROFESSION IN EUROPE 2020

MIRZA & NACEY RESEARCH
3.9 PUBLIC BIDS & ARCHITECTURAL DESIGN COMPETITIONSOnly a minority of practices participate in Architectural Design competitions. This year’s proportion of 13 per cent is very similar to the 2018 figure. Competitions with a pre-selection procedure are the most likely to be entered, followed by open competitions and invited competitions. But significantly, out of all competitions entered, about three quarters are public sector competitions.
Competition success rates are 30 per cent for public sector competitions and 44 per cent for private sector. Success rates for both sectors have fallen compared with the previous survey. There is considerable variation in the success rates recorded by architects in different countries, and several countries report public sector competition success rates in excess of 50 per cent. Practices invested a considerable amount of time preparing competition entries, averaging 300 hours per practice amongst those who entered.
Practices made, on average, 0.9 bids for projects advertised in the OJEU during the past year. This is very similar to the figure reported in the 2018 survey. A majority of architects said that they had experienced difficulties as part of the bidding process for OJEU advertised projects. More than one in three architects felt the process was too onerous or that they did not fulfil the minimum turnover threshold. More than 30 per cent thought the bidding process was too costly, or that they had insufficient past experience. One in five felt the timetable was too tight and nearly as many thought the tender documentation was not sufficiently clear.
CHART 3-11ARCHITECTURAL DESIGN COMPETITIONS ENTERED LAST 12 MONTHS - SUCCESS RATES
0 20 40 60 80 100
public
private
othercompetition
invitedcompetition
pre-selectionprocedure
opencompetition
per cent each type of Architectural Design Competition entered, last 12 months
private publicsuccessful bids:all bids:
private public
CHART 3-10DIFFICULTIES EXPERIENCED BY PRACTICES IN THE OJEU BIDDING PROCESS
per cent / number % practices participating in
Architectural Design Competition
average number of bids for OJEU
projects
Austria 27 1.1Belgium* 18 1.4Croatia 3 0.2Czechia 9 0.2Denmark 6 0.1Estonia* 20 0.2Finland 22 0.6France 18 2.1Germany 13 0.8Greece 4 0.8Hungary* 22 0.9Ireland 29 3.8Italy 12 0.8Lithuania* 33 1.0Luxembourg 22 1.5Netherlands* 7 2.2Norway 18 0.9Poland* 33 9.1Portugal 4 0.1Romania 3 0.1Serbia* 0 0.0Slovakia 11 0.7Slovenia 14 0.3Spain 17 0.4Sweden 20 3.2United Kingdom 13 0.82020 EUROPE-26 13 0.92018 EUROPE-26 12 2.32016 EUROPE-27 20 n/a2014 EUROPE-26 n/a n/a2012 EUROPE-25 n/a n/a2010 EUROPE-23 n/a n/a
TABLE 3-10ENTERING ARCHITECTURAL DESIGN COMPETITIONSAND BIDDING FOR PROJECTS ADVERTISED IN OJEU
did not enter an Architectural Design Competition
entered an Architectural Design Competition
CHART 3-9PRACTICES ENTERING ARCHITECTURAL DESIGN COMPETITIONS LAST 12 MONTHS
0 10 20 30 40 50
other difficulties
not fulfillingPII criteria
tender docu-mentation not clear
timetable too tight
insufficientpast experience
too costly
not fulfillingturnover threshold
too onerous
per cent of practices
* caution - small sample
3 - 46THE ARCHITECTURAL PROFESSION IN EUROPE 2020

MIRZA & NACEY RESEARCH
TABLE 3-11TYPE OF ARCHITECTURAL DESIGN COMPETITION ENTERED LAST 12 MONTHS ANALYSED BY COUNTRY
per cent Architectural Design Competitions entered last 12 months
open competition
competition with
pre-selection procedure
invited competition
other competition ALL ALL public ALL private
Austria 34 27 33 5 100 77 23Belgium* 11 41 40 8 100 78 22Croatia 12 44 41 4 100 7 93Czechia 53 9 21 17 100 63 37Denmark 27 9 18 45 100 45 55Estonia* 91 0 9 0 100 91 9Finland 55 19 19 7 100 77 23France 36 43 3 18 100 75 25Germany 28 45 21 7 100 82 18Greece 50 25 25 0 100 75 25Hungary* 37 19 44 0 100 30 70Ireland 25 34 36 5 100 51 49Italy 48 14 13 25 100 83 17Lithuania* 50 21 29 0 100 57 43Luxembourg 32 43 17 8 100 80 20Netherlands* 5 33 60 2 100 22 78Norway 20 47 27 7 100 70 30Poland* 19 0 33 48 100 43 57Portugal 29 12 49 10 100 58 42Romania 51 9 9 31 100 53 47Serbia* n/a n/a n/a n/a n/a n/a n/aSlovakia 56 9 32 3 100 79 21Slovenia 67 7 13 13 100 77 23Spain 61 22 17 0 100 83 17Sweden 12 23 54 11 100 78 22United Kingdom 34 22 34 11 100 40 602020 EUROPE-26 28 38 25 10 100 73 272018 EUROPE-26 15 63 17 5 100 63 372016 EUROPE-27 36 28 24 12 100 73 272014 EUROPE-26 n/a n/a n/a n/a n/a 82 182012 EUROPE-25 n/a n/a n/a n/a n/a n/a n/a2010 EUROPE-23 n/a n/a n/a n/a n/a n/a n/a
* caution - small sample
per cent Architectural Design Competitions entered last 12 months
success rate - public
success rate - private
Austria 31 35Belgium* 46 42Croatia 88 28Czechia 30 81Denmark 60 83Estonia* 30 0Finland 37 50France 24 10Germany 34 42Greece 33 n/aHungary* 75 63Ireland 27 52Italy 35 39Lithuania* 38 67Luxembourg 33 18Netherlands* 54 80Norway 26 58Poland* 50 62Portugal 57 75Romania 79 79Serbia* n/a n/aSlovakia 27 63Slovenia 32 67Spain 64 48Sweden 32 42United Kingdom 21 652020 EUROPE-26 30 442018 EUROPE-26 43 582016 EUROPE-27 31 482014 EUROPE-26 n/a n/a2012 EUROPE-25 n/a n/a2010 EUROPE-23 n/a n/a
* caution - small sample
TABLE 3-12ARCHITECTURAL DESIGN COMPETITION SUCCESS RATES
3 - 47THE ARCHITECTURAL PROFESSION IN EUROPE 2020

MIRZA & NACEY RESEARCH
TABLE 3-13INVESTMENT AND REWARDS: PARTICIPATION IN ARCHITECTURAL DESIGN COMPETITIONS LAST 12 MONTHS ANALYSED BY COUNTRY
average (mean) per practice
all Architectural Design Competitions entered last 12 months Architectural Design Competition prize money
number of hours spent participating in Architectural Design
Competitions
average total financial cost** per practice of
participating €
average fee turnover per practice from successful
Architectural Design Competitions €
average build cost per practice of won
projects € million
receive prize money -per cent of ALL practices which were successful at Architectural Design
Competitions
average prize money (excluding zero) €
Austria 586 32 590 235 275 15.2 31 9 577Belgium* 449 15 530 174 421 4.4 26 5 158Croatia 228 13 043 n/a n/a 25 10 797Czechia 201 4 644 22 123 8.2 25 7 056Denmark 204 7 593 n/a n/a n/a n/aEstonia* 1 188 22 125 250 000 8.0 67 28 500Finland 333 23 386 30 286 33.3 24 23 117France 297 28 459 269 611 15.7 16 20 930Germany 810 51 703 961 627 44.7 68 60 001Greece 59 15 656 n/a n/a n/a n/aHungary* 44 1 169 598 2.1 25 1 138Ireland 105 11 835 606 482 20.4 2 769Italy 53 1 580 28 043 5.0 9 6 000Lithuania* 402 7 750 100 000 5.0 40 4 000Luxembourg 819 46 160 717 333 13.9 24 20 636Netherlands* 688 68 792 8 333 10.8 11 10 000Norway 676 38 897 171 156 20.0 14 7 733Poland* 116 2 039 249 138 0.2 20 3 093Portugal 98 2 647 40 000 1.4 6 15 133Romania 63 1 240 54 894 0.9 12 227Serbia* 30 500 n/a n/a 100 1 000Slovakia 150 3 371 21 412 8.9 31 4 660Slovenia 189 5 167 61 100 5.0 15 4 700Spain 134 6 159 24 328 2.2 4 23 667Sweden 1 070 32 262 201 744 11.0 14 22 364United Kingdom 35 2 320 847 233 16.4 2 1892020 EUROPE-26 297 17 490 317 263 16.1 19 20 5072018 EUROPE-26 288 14 266 217 442 11.2 19 17 9552016 EUROPE-27 424 12 624 113 822 11.6 17 13 1102014 EUROPE-26 n/a n/a n/a n/a n/a n/a2012 EUROPE-25 n/a n/a n/a n/a n/a n/a2010 EUROPE-23 n/a n/a n/a n/a n/a n/a
* caution - small sample ** includes staff costs
3 - 48THE ARCHITECTURAL PROFESSION IN EUROPE 2020

MIRZA & NACEY RESEARCH
TABLE 3-14ARCHITECTURAL PRACTICES OFFERING CERTIFICATION SERVICES ANALYSED BY COUNTRY
per cent of practices who offer service
type of certification offered
building energy rating health & safety fire safety final certification of whole building
Austria 10 4 2 21Belgium* 14 3 4 1Croatia 15 0 5 3Czechia 17 1 16 11Denmark 10 0 5 0Estonia* 0 0 0 0Finland 0 2 0 5France 10 3 6 7Germany 12 10 6 15Greece 39 13 11 15Hungary* 23 5 18 5Ireland 10 22 25 70Italy 34 13 11 20Lithuania* 0 0 0 0Luxembourg 36 4 3 12Netherlands* 20 17 17 3Norway 6 6 9 11Poland* 24 11 14 11Portugal 18 9 18 13Romania 17 8 25 12Serbia* 0 0 0 0Slovakia 25 0 10 7Slovenia 10 5 5 7Spain 78 24 22 61Sweden 3 6 2 8United Kingdom 6 4 1 332020 EUROPE-26 25 11 10 202018 EUROPE-26 41 29 24 372016 EUROPE-27 44 26 26 n/a2014 EUROPE-26 42 24 35 n/a2012 EUROPE-25 n/a n/a n/a n/a2010 EUROPE-23 n/a n/a n/a n/a
3.10 CERTIFICATION WORK
per cent practices offering certification service0 5 10 15 20 25
final certification
fire safety
health & safety
building energyrating
The extent to which architects offer certification services appears to vary more between different countries than for any other topic covered in this survey. About one quarter of Europe’s architects offer a building energy rating service, ranging between 78 per cent in Spain and zero in several other countries. The final certification of the whole building is offered by 20 per cent of architects but again this varies hugely between countries, ranging from over 50 per cent of architects in Ireland and Spain to below 5 per cent in several countries. Fewer practices, around one in ten, offer fire safety or health and safety certification. Again, practices in Spain and Ireland are amongst those most likely to offer this.
CHART 3-12CERTIFICATION SERVICES OFFERED
* caution - small sample
3 - 49THE ARCHITECTURAL PROFESSION IN EUROPE 2020

MIRZA & NACEY RESEARCH
TABLE 3-15ARCHITECTURAL PRACTICES OFFERING POE ANALYSED BY COUNTRY
per cent of practices who offer service
offer a Post Occupancy Evaluation
Stage at which architects agreed to undertake the POE:
Design phase Construction phase after CompletionAustria 14 46 31 23Belgium* 10 11 11 78Croatia 6 100 0 0Czechia 1 67 33 0Denmark 6 0 0 100Estonia* 0 n/a n/a n/aFinland 9 20 40 40France 10 41 7 52Germany 8 43 18 39Greece 18 33 17 50Hungary* 27 25 25 50Ireland 17 52 4 44Italy 12 39 25 36Lithuania* 13 0 100 0Luxembourg 17 54 8 38Netherlands* 25 56 0 44Norway 11 50 0 50Poland* 13 60 20 20Portugal 26 22 19 58Romania 35 28 23 49Serbia* 0 n/a n/a n/aSlovakia 7 18 45 36Slovenia 7 56 0 44Spain 15 30 10 60Sweden 4 43 14 43United Kingdom 24 39 9 522020 EUROPE-26 13 38 18 452018 EUROPE-26 13 n/a n/a n/a2016 EUROPE-27 n/a n/a n/a n/a2014 EUROPE-26 n/a n/a n/a n/a2012 EUROPE-25 n/a n/a n/a n/a2010 EUROPE-23 n/a n/a n/a n/a
3.11 POST OCCUPANCY EVALUATION (POE)
* caution - small sample
per cent practices offering feedback0 10 20 30 40 50 60 70 80
social value
life cycle costs
occupant satisfaction
indoor environment quality
fabric performance
energy performance
CHART 3-13TYPE OF FEEDBACK TYPICALLY INCLUDED IN POE
A Post Occupancy Evaluation (POE) makes it possible to find out whether the building performs energetically in the way it was designed by the architect. Thirteen per cent of architects in Europe offer a POE, including a quarter or more of architects in Romania, Hungary, Portugal, the Netherlands and the United Kingdom. Of those architects who do offer a POE, nearly half (45 per cent) made the decision to undertake the POE after completion. Slightly fewer came to an agreement during the Design phase, but far fewer (18 per cent) during the construction phase.
Several different types of feedback are typically included in the POE undertaken by architects. About two thirds of architects say their POEs typically include feedback on energy performance and occupant satisfaction. More than 40 per cent of architects include an analysis of fabric performance and indoor environment quality. But only about 30 per cent of respondents say the POEs they offer typically include feedback on life cycle costs or social value.
3 - 50THE ARCHITECTURAL PROFESSION IN EUROPE 2020

Gullkronan Senior HousingHelsinki, FinlandArchitect: Huttunen-Lipasti ArchitectsPhotograph: Maurizio Tami

MIRZA & NACEY RESEARCH
8% Average earnings have increased
€50 000 Average earnings for Partners & Directors
22% Studied in another country 6%
Worked in another European countryin the last 12 months
47 Weekly hours worked
by Partners & Directors
20Hours CPD per year
CHAPTER 4 - SUMMARY
D R A F T
4 - 52THE ARCHITECTURAL PROFESSION IN EUROPE 2020

MIRZA & NACEY RESEARCH
4.1 EARNINGSArchitects’ earnings have increased strongly since the last survey, rising by 8 per cent to reach a Europe average of €35,220 (adjusted for PPP). Average earnings are rising across the board in the private sector; Partners & Directors and Freelance architects have seen the largest income growth. This means that average earnings for Partners & Directors has exceeded €50,000 for the first time in this survey.
CHART 4-2RANGE OF AVERAGE PRE-TAX EARNINGS FOR ALL FULL-TIME ARCHITECTS ADJUSTED FOR PPP
CHART 4-1CHANGE IN ALL ARCHITECTS’ AVERAGE PRE-TAX EARNINGS (ALL SURVEY COUNTRIES) 2010 TO 2020
Average earnings for Sole Principals are higher by 11 per cent and have risen by 12 per cent for salaried architects working in private practice. Sole Principals earn an average €38,225, higher than the €32,006 recorded by private practice salaried architects. The differential in earnings between Partners & Directors and salaried architects in private practice is 36 per cent. Sole Principals earn 24 per cent less than Partners & Directors.
0
5000
10000
15000
20000
25000
30000
35000
40000
202020182016201420122010aver
age
pre-
tax
earn
ings
€ a
djus
ted
for P
PP
AVERAGE EARNINGS ARE ADJUSTED FOR PPPThe adjustment of average earnings for Purchasing Power Parity (PPP) takes account of differing price levels in the surveyed countries adjusting each country’s average earnings figure by its PPP index. Earnings figures in the country pages are not adjusted.
Earnings data are converted from local currencies to Euros using exchange rate as at 01.05.20.
All earnings are before tax.
n/aaverage earnings
PPP €
20 000 30000 40 000
Salaries reported by architects working in the public sector have not increased by as much as in the private sector. Average earnings are up by just 2 per cent but have fallen by 2 per cent for architects in local, regional or central government. This is the only employment field to report falling salaries compared with the 2018 survey.
D R A F T
4 - 53THE ARCHITECTURAL PROFESSION IN EUROPE 2020

MIRZA & NACEY RESEARCH
€ average (median) pre-tax earnings 2020 average (median) pre-tax earnings adjusted for PPP
adjusted for PPP
unadjusted for PPP 2018 2016 2014 2012 2010
Austria 43 629 47 500 46 168 47 529 42 095 42 174 38 925Belgium* 33 424 38 500 32 520 35 481 30 192 28 354 28 384Croatia 24 173 16 196 17 844 19 338 17 946 18 078 18 892Czechia 28 221 19 473 27 375 17 518 13 150 19 410 21 268Denmark 41 736 60 398 42 684 39 478 43 187 42 543 37 843Estonia* 38 217 30 000 21 401 19 947 22 215 12 776 15 318Finland 45 008 55 000 41 735 41 771 40 486 38 339 35 601France 32 169 35 000 28 998 27 986 27 498 27 326 28 871Germany 57 143 60 000 54 286 n/a 43 350 46 422 39 932Greece 15 421 13 000 15 421 n/a 16 145 18 927 20 534Hungary* 25 707 17 692 20 566 19 609 n/a 13 678 n/aIreland 47 847 58 500 39 872 40 816 38 103 36 847 40 200Italy 25 717 27 000 24 728 24 777 27 132 24 248 18 779Lithuania* 44 892 29 000 20 124 n/a n/a n/a 10 252Luxembourg 55 004 69 800 56 738 58 725 48 701 46 267 n/aNetherlands* 48 976 56 000 44 524 39 047 54 496 n/a n/aNorway 50 939 72 432 46 965 n/a n/a n/a n/aPoland* 22 932 12 888 15 010 17 489 n/a 22 045 24 935Portugal 14 101 12 000 14 101 14 833 13 433 13 714 n/aRomania 19 048 10 000 10 273 15 274 9 822 10 844 8 172Serbia* 13 619 7 000 n/a n/a n/a n/a n/aSlovakia 28 944 20 000 n/a 18 018 15 581 n/a 16 378Slovenia 35 170 30 000 28 136 24 406 19 808 17 964 29 240Spain 32 503 30 000 26 002 24 390 28 354 20 534 n/aSweden 37 559 47 137 33 052 41 216 35 890 35 649 36 612United Kingdom 38 916 45 376 40 862 38 871 37 582 48 242 45 922
2020 EUROPE-26** (2018-26 2016-27 2014-26 2012-25 2010-23 2008-17)
35 220 36 740 32 731 32 068 29 070 29 014 29 493
TABLE 4-1AVERAGE PRE-TAX EARNINGS OF ALL FULL-TIME ARCHITECTS ANALYSED BY COUNTRY
* caution - small sample ** The 2020 EUROPE-26 figure is weighted to reflect the total architectural population in all participating countriesEarnings data converted from local currencies to Euros exchange rate as at 01.05.20
CHART 4-3AVERAGE PRE-TAX EARNINGS ALL FULL-TIME ARCHITECTS ADJUSTED FOR PURCHASING POWER PARITY (PPP)
average pre-tax earnings, € adjusted for PPP0 10000 20000 30000 40000 50000 60000
Serbia
Portugal
Greece
Romania
Poland
Croatia
Hungary
Italy
Czechia
Slovakia
France
Spain
Belgium
Slovenia
Sweden
Estonia
United Kingdom
Denmark
Austria
Lithuania
Finland
Ireland
Netherlands
Norway
Luxembourg
Germany
D R A F T
4 - 54THE ARCHITECTURAL PROFESSION IN EUROPE 2020

MIRZA & NACEY RESEARCH
4.2 EARNINGS BY FIELD OF EMPLOYMENT
* caution - small sample Earnings data converted from local currencies to Euros exchange rate as at 01.05.20 and then adjusted for PPP
TABLE 4-2AVERAGE PRE-TAX EARNINGS ANALYSED BY COUNTRY AND FIELD OF EMPLOYMENT (ADJUSTED FOR PPP)
€ average (median) pre-tax earnings adjusted for PPP
sole principal
partner/ director
ALL Prin-cipals
private practice salaried
employees
freelance other private
ALL private
local / central gov’t
other public
ALL public
Austria 36 934 48 753 43 629 n/a n/a n/a 43 860 n/a n/a n/a Belgium* 30 435 31 617 31 165 39 140 31 481 24 842 32 656 n/a n/a 48 713 Croatia 27 698 28 706 27 698 20 144 n/a n/a 24 173 15 551 n/a 28 283 Czechia 28 221 47 130 32 172 28 983 22 577 n/a 28 221 32 991 33 866 33 866 Denmark 53 593 18 497 42 684 38 814 n/a 64 501 39 364 47 427 20 394 42 684 Estonia* n/a n/a n/a n/a n/a n/a 47 771 n/a n/a n/a Finland 56 465 63 011 57 283 42 553 n/a 49 100 45 807 44 190 46 236 44 190 France 27 574 33 088 27 574 34 944 20 221 27 574 32 169 41 603 38 603 41 360 Germany 64 810 85 714 69 524 47 619 46 667 66 667 55 238 60 952 66 667 61 683 Greece 17 794 26 097 17 794 14 235 11 269 n/a 14 828 18 980 n/a 16 607 Hungary* 38 818 n/a 39 862 n/a n/a n/a 31 363 n/a n/a 23 651 Ireland 47 847 63 796 56 619 39 872 n/a 44 258 43 860 51 834 59 609 52 632 Italy 29 674 44 510 29 674 24 728 21 365 24 728 26 113 24 728 28 684 25 717 Lithuania* n/a n/a n/a 23 220 n/a n/a 44 892 n/a n/a n/a Luxembourg 53 980 75 650 59 102 39 401 n/a n/a 55 004 n/a n/a n/a Netherlands* 69 012 49 866 66 785 31 167 n/a n/a 49 421 n/a n/a n/a Norway 36 127 56 358 50 939 50 578 n/a n/a 50 578 50 758 54 190 51 083 Poland* 25 017 65 462 27 310 18 763 23 266 n/a 22 932 n/a n/a n/aPortugal 14 101 17 626 17 626 13 161 11 751 11 751 14 101 19 824 22 562 19 843 Romania 19 157 23 755 21 073 14 794 15 860 28 471 19 157 4 598 4 109 4 497 Serbia* n/a n/a n/a 14 981 n/a n/a 14 981 n/a n/a n/a Slovakia 36 179 50 651 36 179 30 391 28 944 n/a 30 029 n/a 17 366 20 260 Slovenia 39 742 48 754 41 032 20 516 n/a 17 585 35 170 n/a n/a n/a Spain 32 503 32 503 32 503 27 086 24 377 n/a 28 711 44 962 54 171 48 754 Sweden 37 906 52 733 45 822 34 704 n/a 30 723 36 057 40 113 45 972 40 564 United Kingdom 37 943 48 645 38 916 37 943 n/a 60 806 38 916 47 185 51 564 48 645 2020 EUR-26 38 225 50 194 40 131 32 006 31 358 38 820 34 584 37 490 41 862 38 504 2018 EUR-26 34 322 38 960 35 995 28 492 21 668 29 674 31 122 38 200 37 587 37 773 2016 EUR-27 35 679 49 640 39 643 29 732 19 822 27 750 34 277 34 563 29 732 33 3792014 EUR-26 29 070 38 760 31 977 28 571 19 380 29 636 29 070 31 159 31 372 31 2242012 EUR-25 29 098 39 767 29 098 28 167 19 399 29 098 28 487 32 004 29 098 30 8072010 EUR-23 30 144 40 000 33 364 27 556 25 416 32 517 29 852 34 223 27 556 31 957
CHART 4-4PRE-TAX EARNINGS BY FIELD OF EMPLOYMENT (ADJUSTED FOR PPP)
aver
age
pre-
tax
earn
ings
€' a
djus
ted
for P
PP
other
publi
c
local
autho
rity/
gove
rnmen
t
other
priva
te
freela
nce
salar
ied
priva
te pr
actic
e
partn
er/di
recto
r
sole
princ
ipal
010000
20000
30000
40000
50000
60000
other publiclocal authority /government
other privatefreelancesalariedprivate practice
partner/directorsole principal
D R A F T
4 - 55THE ARCHITECTURAL PROFESSION IN EUROPE 2020

MIRZA & NACEY RESEARCH
4.3 EARNINGS BY AGECHART 4-5AVERAGE PRE-TAX EARNINGS BY AGE (ADJUSTED FOR PPP)
€ 2020 2018EUR-26MEDIAN
2016 EUR-27MEDIAN
2014 EUR-26MEDIAN
2012 EUR-25MEDIAN
2010EUR-23MEDIAN
lower quartile
MEDIAN upper quartile
<30 18 962 24 341 29 282 14 185 16 848 14 241 14 549 15 615
30-34 21 875 28 777 37 285 25 231 22 995 14 763 19 399 24 550
35-39 24 744 33 094 42 913 29 504 26 759 30 189 24 902 30 075
40-44 27 876 37 233 50 563 33 038 29 732 32 704 29 098 33 364
45-49 27 617 39 261 54 795 36 960 36 022 38 611 33 800 33 364
50-54 31 481 46 143 62 200 40 469 40 634 44 025 36 081 34 317
55-59 29 009 43 014 62 401 44 577 42 440 44 824 38 797 35 119
60-64 29 940 42 879 62 537 40 844 42 751 48 264 41 370 40 875
65+ 30 734 46 501 68 120 32 375 39 374 29 151 37 354 36 095
TABLE 4-3AVERAGE PRE-TAX EARNINGS ANALYSED BY AGE (ADJUSTED FOR PPP)
aver
age
pre-
tax
earn
ings
€ a
djus
ted
for P
PP
65 an
d ove
r
60-6
455
-59
50-5
445
-49
40-4
435
-39
30-3
4
unde
r 30
0
10000
20000
30000
40000
50000
65 and over60-6455-5950-5445-4940-4435-3930-34under 30
Architects’ average earnings rise as age increases, although there is a peak at age 50-54 and a second peak at age 65+. Although this second peak is based on a much smaller number of respondents than the first peak.
The rises by age are most steep amongst the younger age groups, for example average earnings rise by 15 per cent between ages under 30 and 30 to 34. Average earnings have increased for all but one age group compared with the 2018 survey. Architects aged under 30 have seen the largest rise while average earnings for architects aged 55 to 64 record a small decrease.
Earnings data converted from local currencies to Euros exchange rate as at 01.05.20 and then adjusted for PPP
CHART 4-6CHANGE IN ARCHITECTS’ AVERAGE PRE-TAX EARNINGS SELECTED AGES 2010-20
0
10000
20000
30000
40000
50000
202020182016201420122010aver
age
pre-
tax
earn
ings
€ a
djus
ted
for P
PP
50-54
40-44
30-34 D R A F T
4 - 56THE ARCHITECTURAL PROFESSION IN EUROPE 2020

MIRZA & NACEY RESEARCH
4.4 EARNINGS BY GENDER
* full-time equivalent (FTE) based on converting part-time earnings to a working week of 37.5 hours
€ 2020 2018EUR-27MEDIAN
2016 EUR-27MEDIAN
2014 EUR-26MEDIAN
2012 EUR-26MEDIAN
2010 EUR-23MEDIAN
lower quartile
MEDIAN upper quartile
Full time male 26 383 38 601 56 150 37 095 36 664 32 213 30 948 32 149
female 22 606 31 411 41 518 27 711 24 777 24 225 21 680 21 866
Part time FTE* male 22 164 33 870 53 793 32 395 27 874 30 105 34 099 37 936
female 20 011 28 484 40 408 31 806 24 777 23 750 24 137 25 862
TABLE 4-4AVERAGE PRE-TAX EARNINGS ANALYSED BY GENDER AND FULL-TIME OR PART-TIME WORKING (ADJUSTED FOR PPP AND PART-TIME EARNINGS ADJUSTED TO FULL-TIME EQUIVALENT)
Average earnings for both male and female architects have trended up over the entire survey period. Since the 2018 survey, average male architects’ full-time earnings have increased by 4 per cent while the average for female architects has out-paced this rate of growth, rising by 13 per cent. Consequently, the gender pay gap has reduced from 25 per cent in 2018 to 21 per cent now. The pay gap remains, however. Only in Spain and Croatia is there parity in average earnings between the genders, although it is approaching parity in Finland, Norway, Poland, the United Kingdom and Slovakia. The pay gap is widest in Austria and the Netherlands (small sample).
The gender pay gap broadly widens with age. All age groups record higher average earnings for male architects than females which is a step backward from the 2018 survey. However, taken overall, the gender pay gap has reduced slightly in all three private practice employment fields compared with the 2018 survey. Longer term, private practice salaried shows the greatest move towards parity out of the three employment fields.
0
5000
10000
15000
20000
25000
30000
35000
40000
aver
age
pre-
tax
earn
ings
€ a
djus
ted
for P
PP
female
male
CHART 4-7AVERAGE PRE-TAX EARNINGS OF MALE AND FEMALE ARCHITECTS WORKING FULL-TIME (ADJUSTED FOR PPP)
CHART 4-8CHANGE IN MALE / FEMALE ARCHITECTS’ AVERAGE PRE-TAX FULL-TIME EARNINGS 2010-20
0
10000
20000
30000
40000
50000
202020182016201420122010aver
age
pre-
tax
earn
ings
€ a
djus
ted
for P
PP
male
female
Earnings data converted from local currencies to Euros exchange rate as at 01.05.20 and then adjusted for PPP
-30 -20 -10 0 10 20 30
65+
60-64
55-59
50-54
45-49
40-44
35-39
30-34
under 30
male earnings higherfemale earnings higher
equality
per cent difference between average male and female pre-tax earnings, € adjusted for PPP
CHART 4-9DIFFERENCE BETWEEN MALE AND FEMALE ARCHITECTS’ AVERAGE PRE-TAX EARNINGS BY AGE
D R A F T
4 - 57THE ARCHITECTURAL PROFESSION IN EUROPE 2020
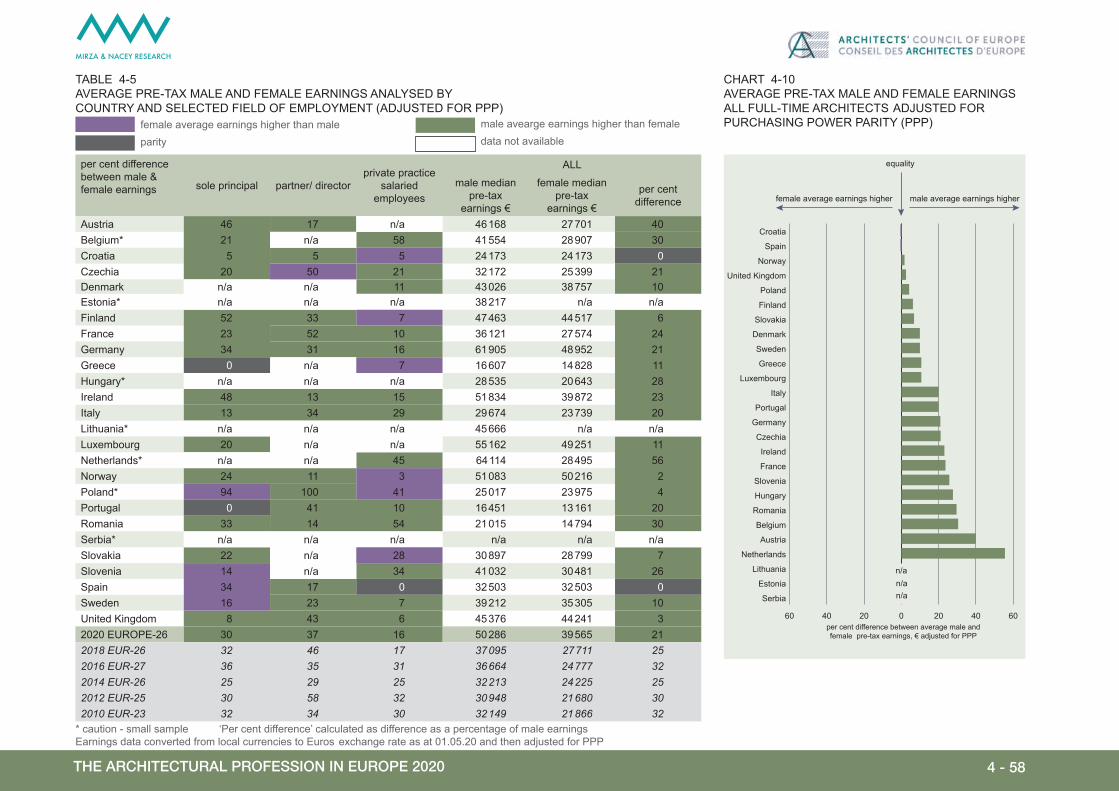
MIRZA & NACEY RESEARCH
TABLE 4-5AVERAGE PRE-TAX MALE AND FEMALE EARNINGS ANALYSED BY COUNTRY AND SELECTED FIELD OF EMPLOYMENT (ADJUSTED FOR PPP)
per cent difference between male & female earnings sole principal partner/ director
private practice salaried
employees
ALL
male median pre-tax
earnings €
female median pre-tax
earnings €
per cent difference
Austria 46 17 n/a 46 168 27 701 40Belgium* 21 n/a 58 41 554 28 907 30Croatia 5 5 5 24 173 24 173 0Czechia 20 50 21 32 172 25 399 21Denmark n/a n/a 11 43 026 38 757 10Estonia* n/a n/a n/a 38 217 n/a n/aFinland 52 33 7 47 463 44 517 6France 23 52 10 36 121 27 574 24Germany 34 31 16 61 905 48 952 21Greece 0 n/a 7 16 607 14 828 11Hungary* n/a n/a n/a 28 535 20 643 28Ireland 48 13 15 51 834 39 872 23Italy 13 34 29 29 674 23 739 20Lithuania* n/a n/a n/a 45 666 n/a n/aLuxembourg 20 n/a n/a 55 162 49 251 11Netherlands* n/a n/a 45 64 114 28 495 56Norway 24 11 3 51 083 50 216 2Poland* 94 100 41 25 017 23 975 4Portugal 0 41 10 16 451 13 161 20Romania 33 14 54 21 015 14 794 30Serbia* n/a n/a n/a n/a n/a n/aSlovakia 22 n/a 28 30 897 28 799 7Slovenia 14 n/a 34 41 032 30 481 26Spain 34 17 0 32 503 32 503 0Sweden 16 23 7 39 212 35 305 10United Kingdom 8 43 6 45 376 44 241 32020 EUROPE-26 30 37 16 50 286 39 565 212018 EUR-26 32 46 17 37 095 27 711 25 2016 EUR-27 36 35 31 36 664 24 777 32 2014 EUR-26 25 29 25 32 213 24 225 25 2012 EUR-25 30 58 32 30 948 21 680 30 2010 EUR-23 32 34 30 32 149 21 866 32
* caution - small sample ‘Per cent difference’ calculated as difference as a percentage of male earningsEarnings data converted from local currencies to Euros exchange rate as at 01.05.20 and then adjusted for PPP
CHART 4-10AVERAGE PRE-TAX MALE AND FEMALE EARNINGS ALL FULL-TIME ARCHITECTS ADJUSTED FOR PURCHASING POWER PARITY (PPP)
per cent difference between average male and female pre-tax earnings, € adjusted for PPP
Serbia
Estonia
Lithuania
Netherlands
Austria
Belgium
Romania
Hungary
Slovenia
France
Ireland
Czechia
Germany
Portugal
Italy
Luxembourg
Greece
Sweden
Denmark
Slovakia
Finland
Poland
United Kingdom
Norway
Spain
Croatia
male average earnings higherfemale average earnings higher
equality
60 40 20 0 20 40 60
n/an/a
n/a
female average earnings higher than male parity
male avearge earnings higher than femaledata not available
D R A F T
4 - 58THE ARCHITECTURAL PROFESSION IN EUROPE 2020

MIRZA & NACEY RESEARCH
More than one in five architects has studied in another European country. Relatively high proportions of architects from all countries have undertaken at least some of their studies in another country.
The majority of those studying in another country took advantage of the Erasmus scheme; most of the remainder funded their time abroad themselves. Spain, Italy and the United Kingdom emerge as being the most popular destinations for study, closely followed by Germany and France.
Given such an internationally educated profession it is not surprising to find that a substantial proportion of architects have chosen to seek employment in another country. In the last 12 months, 9 per cent of architects have worked in another country. A further 29 per cent of architects have ‘seriously considered’ working in another country, two thirds of whom considered a European country and one third a country outside Europe. The most popular destinations in the past year have been France, Germany and Italy.
4.5 STUDYING & WORKING IN ANOTHER EUROPEAN COUNTRY
per cent architects0 20 40 60 80 100
Italy
Lithuania
Slovakia
Hungary
Netherlands
Germany
United Kingdom
Romania
Denmark
Belgium
Croatia
Austria
France
Spain
Slovenia
Estonia
Portugal
Poland
Finland
Czechia
Serbia
Ireland
Greece
Sweden
Norway
Luxembourgper cent educated
in different country
how education was funded
Eras-mus
ex-change
self- funded other
Austria 25 32 7 64 14Belgium* 24 71 16 45 10Croatia 25 17 7 56 34Czechia 32 62 13 24 7Denmark 24 43 20 29 31Estonia* 27 33 67 0 0Finland 30 53 11 39 21France 25 66 8 30 16Germany 20 n/a n/a n/a n/aGreece 45 16 2 68 27Hungary* 20 43 14 14 29Ireland 40 17 4 64 24Italy 14 70 4 27 15Lithuania* 14 100 0 0 0Luxembourg 90 3 2 80 31Netherlands* 20 22 22 56 11Norway 57 29 18 43 25Poland* 29 74 0 26 13Portugal 27 65 4 44 12Romania 24 67 12 40 20Serbia* 33 20 40 40 40Slovakia 16 48 7 37 37Slovenia 27 48 4 39 17Spain 26 77 10 30 8Sweden 47 44 18 29 25United Kingdom 20 20 8 61 302020 EUROPE-26 22 56 8 36 172018 EUROPE-26 20 n/a n/a n/a n/a2016 EUROPE-27 18 n/a n/a n/a n/a2014 EUROPE-26 18 n/a n/a n/a n/a2012 EUROPE-25 n/a n/a n/a n/a n/a2010 EUROPE-23 n/a n/a n/a n/a n/a
TABLE 4-6PROPORTION OF ARCHITECTS WHO HAVE STUDIED IN ANOTHER EUROPEAN COUNTRY
* caution - small sample
CHART 4-12ARCHITECTS WHO WERE AT LEAST PARTLY EDUCATED IN ANOTHER EUROPEAN COUNTRY
per cent architects0 5 10 15 20 25
outside Europe
inside Europe
worked
studied
considered working:
0 20 40 60 80 1000
5
10
15
20
25
30
per cent architects studying in another country
per c
ent a
rchi
tect
s w
orki
ng in
ano
ther
cou
ntry
CY
LU
NLSI
IE
NO
GR
EEPL
IT
inside Europe outside Europe
CHART 4-11PROPORTION OF ARCHITECTS WHO HAVE STUDIED / WORKED OR SERIOUSLY CONSIDERED WORKING IN ANOTHER COUNTRY IN LAST 12 MONTHS
D R A F T
4 - 59THE ARCHITECTURAL PROFESSION IN EUROPE 2020

MIRZA & NACEY RESEARCH
* caution - small sample
per cent worked in another country in last 12 months All why went to work in another country have seriously considered working in
another country last 12 months (%)
inside Europe outside Europe most popular destinations sent by practice
made positive decision to find work other country inside
Europecountry outside
Europe
Austria 13 2 DE 38 31 15 23 12 2Belgium* 10 4 NL 53 41 12 12 15 3Croatia 3 3 DE 17 17 0 67 23 5Czechia 8 1 AT 21 37 0 47 17 4Denmark 3 2 UK NO 83 17 0 0 13 5Estonia* 0 0 n/a n/a n/a n/a 9 9Finland 4 2 CH 18 36 18 36 8 4France 6 5 20 40 12 40 12 9Germany 4 2 n/a n/a n/a n/a 5 3Greece 4 2 RO BG 10 10 10 70 24 11Hungary* 2 0 0 0 100 0 19 5Ireland 9 4 UK 24 38 27 22 17 8Italy 5 3 DE 15 49 23 22 23 12Lithuania* 0 7 0 0 0 100 13 7Luxembourg 32 2 BE FR DE 15 33 19 37 20 4Netherlands* 27 4 BE 17 42 25 25 18 6Norway 6 1 18 27 9 45 9 5Poland* 5 1 CH DE DK 20 40 0 40 28 9Portugal 6 4 7 46 43 15 27 11Romania 6 2 UK 7 56 15 26 31 8Serbia* 7 7 0 0 100 0 50 13Slovakia 7 1 CZ 23 62 15 8 16 2Slovenia 10 2 AT 22 22 33 22 22 5Spain 5 3 IT UK FR 32 26 16 32 27 11Sweden 3 1 UK 18 41 6 47 11 4United Kingdom 7 3 31 28 8 38 20 112020 EUROPE-26 6 3 21 37 20 28 18 8
2018 EUROPE-26 6 2 n/a n/a n/a n/a 19 10
2016 EUROPE-27 5 n/a n/a n/a n/a n/a 362014 EUROPE-26 5 n/a n/a n/a n/a n/a 352012 EUROPE-25 n/a n/a n/a n/a n/a n/a 352010 EUROPE-23 n/a n/a n/a n/a n/a n/a n/a
TABLE 4-7PROPORTION OF ARCHITECTS WHO HAVE WORKED OR SERIOUSLY CONSIDERED WORKING IN ANOTHER COUNTRY IN ANOTHER COUNTRY (LAST 12 MONTHS)
D R A F T
4 - 60THE ARCHITECTURAL PROFESSION IN EUROPE 2020

MIRZA & NACEY RESEARCH
per cent of those who have studied or worked in another country*
studied worked in last 12 months
Spain 17.6 2.9Italy 12.3 10.5United Kingdom 10.0 7.7Germany 9.5 16.3France 9.2 11.1Portugal 6.2 1.4Belgium 5.6 5.9Netherlands 4.6 6.2Austria 3.3 1.7Switzerland 2.9 4.9Poland 2.7 0.9Denmark 2.5 2.0Greece 2.1 2.4Norway 1.6 2.8Sweden 1.5 1.8Finland 1.1 0.6Czechia 1.0 0.6Ireland 1.0 2.9Slovenia 0.8 0.1Hungary 0.6 0.9Romania 0.6 3.0Bulgaria 0.4 0.6Lithuania 0.2 0.3North Macedonia 0.2 0.2Luxembourg 0.1 1.9Slovakia 0.1 0.7Bosnia 0.1 0.0Malta 0.1 1.2Estonia 0.1 0.1Croatia 0.1 0.1Serbia 0.0 0.3Cyprus 0.0 0.8Latvia 0.0 0.5Others 1.7 6.7
TABLE 4-8COUNTRIES OUTSIDE OWN COUNTRY IN WHICH ARCHITECTS HAVE STUDIED OR WORKED
CHART 4-13COUNTRIES OUTSIDE OWN COUNTRY IN WHICH ARCHITECTS HAVE STUDIED
* per cent of ALL architects from countries responding to this survey who have studied / worked in each of these countries in last 12 months. Based on grossing-up survey results.
CHART 4-14COUNTRIES OUTSIDE OWN COUNTRY IN WHICH ARCHITECTS HAVE WORKED IN LAST 12 MONTHS
others
Spain
IrelandRomania
SwitzerlandBelgium
NetherlandsUnited Kingdom
Italy
France
Germanyothers
Switzerland
Austria
Netherlands
Belgium
Portugal
France Germany
UnitedKingdom
Italy
Spain
per cent architects0 10 20 30 40 50 60
other
self-funded
exchange schemethrough university
Erasmus scheme
CHART 4-15HOW ARCHITECTS WHO HAVE STUDIED IN ANOTHER COUNTRY FUNDED THEIR STUDIES
D R A F T
4 - 61THE ARCHITECTURAL PROFESSION IN EUROPE 2020

MIRZA & NACEY RESEARCH
per cent
unab
le to
find
w
ork
insu
ffici
ent
lang
uage
sk
ills
insu
ffici
ent
know
ledg
e of
pla
nnin
g / b
uild
ing
regu
latio
ns
arch
itect
ural
qu
alifi
catio
n is
sues
findi
ng ri
ght
arch
itect
ural
pa
rtner
finan
ce
prac
tical
re
loca
tion
or p
erso
nal
issu
es
know
ledg
e of
lo
cal m
arke
t
know
ledg
e of
loca
l fee
sc
ales
/ ta
riffs
PII
cove
r for
w
ork
in o
ther
E
urop
ean
coun
tries
Austria 8 14 42 6 18 8 35 40 16 9Belgium* 8 23 58 11 19 19 35 44 29 14Croatia 8 29 44 16 15 17 40 29 10 4Czechia 13 43 55 16 14 11 40 34 14 14Denmark 11 12 27 6 2 8 44 12 5 1Estonia* 18 18 36 0 27 18 45 36 18 9Finland 11 21 32 9 12 8 44 25 10 7France 11 36 44 9 21 14 37 40 18 11Germany 20 27 34 20 11 9 43 21 12 13Greece 20 22 36 11 17 18 57 20 8 8Hungary* 15 31 46 5 28 15 23 33 26 18Ireland 18 32 33 9 9 12 49 27 13 13Italy 6 34 25 5 18 17 58 17 6 4Lithuania* 8 38 62 0 46 15 38 38 8 8Luxembourg 13 2 15 6 11 15 28 28 11 21Netherlands* 9 18 44 15 18 12 47 41 12 6Norway 15 13 31 5 7 16 48 15 7 3Poland* 11 38 53 14 9 9 24 30 8 5Portugal 18 21 29 6 11 17 46 22 10 6Romania 17 18 43 19 17 16 48 31 16 10Serbia* 23 23 46 23 38 15 46 15 15 0Slovakia 14 45 39 10 15 10 36 29 11 7Slovenia 30 36 51 12 7 11 55 27 9 16Spain 32 45 45 9 13 15 21 22 9 9Sweden 8 10 16 6 2 3 38 15 3 3United Kingdom 26 43 39 10 10 13 40 30 16 152020 EUROPE-26 15 31 35 11 15 14 44 24 11 92018 EUROPE-26 15 32 32 11 13 14 46 23 10 92016 EUROPE-27 25 36 38 16 n/a n/a 46 29 12 112014 EUROPE-26 18 38 37 11 n/a n/a 47 26 11 102012 EUROPE-25 19 39 35 11 n/a n/a 66 n/a n/a n/a2010 EUROPE-23 n/a n/a n/a n/a n/a n/a n/a n/a n/a n/a
The 29 per cent of architects who have ‘seriously considered’ working in another country were asked why they did not, ultimately, decide to work internationally. Practical, personal or relocation issues are the most common reason why architects decided not to work in another country. Out of those who had ‘seriously considered’ working elsewhere, 44 per cent say practical issues were the main hurdle. More than one third, 35 per cent, say that the biggest hurdle is not having enough regulatory knowledge - planning or building regulations. Nearly as many cite insufficient language skills as being a major concern. About one quarter feel they did not have enough knowledge of the local market.
TABLE 4-9MAIN CONCERNS ABOUT WORKING IN ANOTHER COUNTRY CITED BY ARCHITECTS WHO HAVE NOT WORKED IN ANOTHER COUNTRY
per cent architects 0 10 20 30 40 50
no issues
PII insurancequalification
fee scale knowledgefinance
finding right partnerunable to find workmarket knowledge
language
building regulations knowledge
relocation / personal
have not worked in another country last 12 months
have worked in another country last 12 months
concerns expressed by architects who ...
CHART 4-16MAIN CONCERNS - WORKING IN ANOTHER COUNTRY
* caution - small sample
D R A F T
4 - 62THE ARCHITECTURAL PROFESSION IN EUROPE 2020

MIRZA & NACEY RESEARCH
4.6 RETIREMENTTABLE 4-10AGE AT WHICH ARCHITECTS EXPECT TO RETIRE ANALYSED BY COUNTRY
CHART 4-17AGE AT WHICH ARCHITECTS EXPECT TO RETIRE
per cent under 50 50-54 55-59 60-64 65-69 70-74 75-79 80-84 85 or over never
Austria 0 0 0 9 43 27 7 3 0 11Belgium* 0 0 2 9 53 20 9 1 0 7Croatia 2 1 4 21 32 13 4 1 0 22Czechia 0 0 0 11 27 19 8 3 1 29Denmark 0 0 1 10 44 33 10 0 0 3Estonia* 0 0 0 20 30 0 20 0 10 20Finland 0 1 1 18 56 9 6 3 1 5France 1 1 3 22 41 15 4 2 1 10Germany 0 0 0 7 78 9 2 1 1 1Greece 1 0 1 13 46 16 5 2 1 17Hungary* 0 0 3 15 31 13 3 10 5 21Ireland 0 0 1 12 46 20 7 1 1 11Italy 0 0 1 13 34 22 7 2 1 20Lithuania* 0 0 0 7 50 14 7 7 7 7Luxembourg 1 1 3 27 49 3 5 0 0 10Netherlands* 0 2 0 6 50 25 2 2 0 13Norway 0 0 1 4 49 31 4 2 1 8Poland* 2 2 1 17 26 10 5 1 1 35Portugal 1 1 4 14 40 11 3 2 2 21Romania 1 1 5 19 23 13 5 3 3 25Serbia* 0 0 13 13 53 13 0 0 0 7Slovakia 1 1 1 18 30 19 5 3 2 19Slovenia 0 1 2 13 35 19 8 1 1 19Spain 0 1 2 10 52 16 5 2 1 13Sweden 0 0 1 14 61 14 3 2 1 3United Kingdom 0 0 3 16 33 21 8 2 1 152020 EUR-26 0 0 2 12 48 17 5 2 1 132018 EUR-26 0 1 2 13 38 20 6 2 1 172016 EUR-27 1 2 3 14 35 18 6 2 1 182014 EUR-26 1 1 2 15 38 15 6 2 1 192012 EUR-25 1 1 2 14 34 16 6 2 2 232010 EUR-23 2 3 5 20 37 13 4 1 1 14
* caution - small sample
0
10
20
30
40
50
Never
85 or over
80-84
75-79
70-74
65-69
60-64
55-59
50-54
under 50
per c
ent r
espo
nden
ts
never
85 or over80-84
75-7970-74
65-6960-64
55-5950-54
under 50
Almost half of architects expect to retire at age 65 to 69. A substantial minority, 13 per cent, say they will ‘never’ retire. Fourteen per cent expect to retire before they are 65 years old. Countries where more than a quarter of architects expect to retire before the age of 65 include Luxembourg, Croatia, France and Romania. More than 40 per cent of architects in several countries including Norway, Denmark, Italy and the United Kingdom do not expect to retire before they are at least 70 years old.
D R A F T
4 - 63THE ARCHITECTURAL PROFESSION IN EUROPE 2020
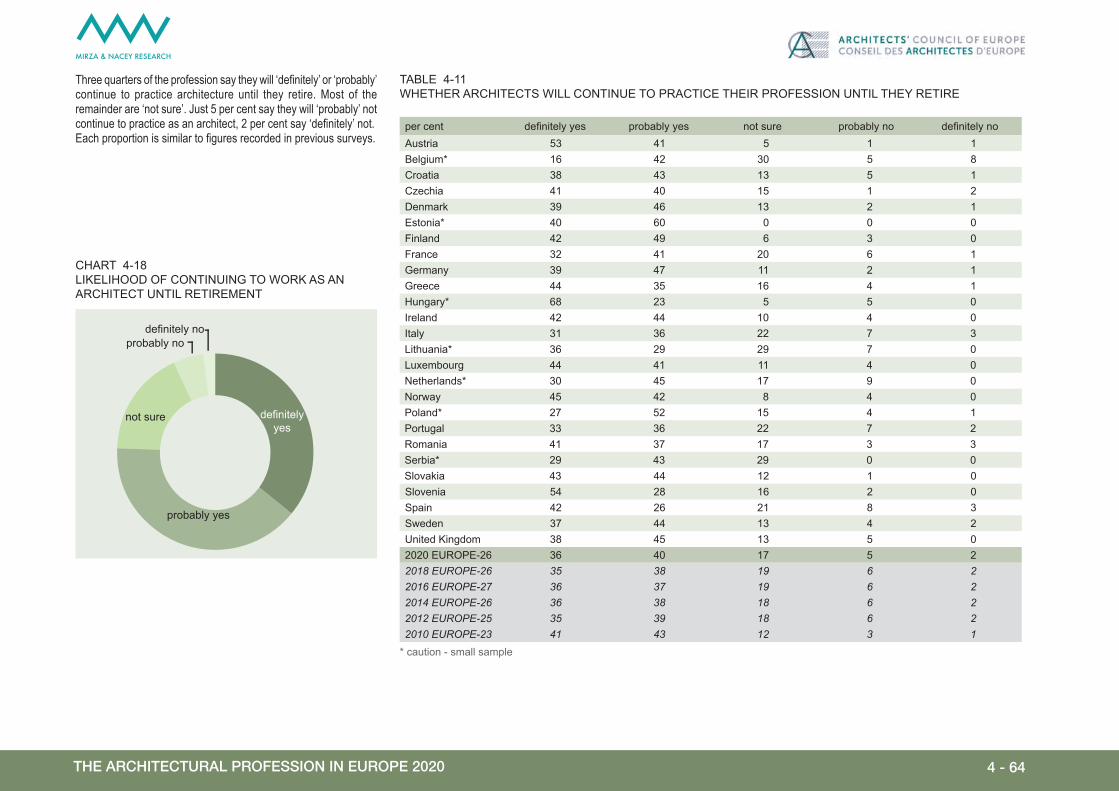
MIRZA & NACEY RESEARCH
definitely noprobably no
not sure
probably yes
definitelyyes
TABLE 4-11WHETHER ARCHITECTS WILL CONTINUE TO PRACTICE THEIR PROFESSION UNTIL THEY RETIRE
CHART 4-18LIKELIHOOD OF CONTINUING TO WORK AS AN ARCHITECT UNTIL RETIREMENT
per cent definitely yes probably yes not sure probably no definitely noAustria 53 41 5 1 1Belgium* 16 42 30 5 8Croatia 38 43 13 5 1Czechia 41 40 15 1 2Denmark 39 46 13 2 1Estonia* 40 60 0 0 0Finland 42 49 6 3 0France 32 41 20 6 1Germany 39 47 11 2 1Greece 44 35 16 4 1Hungary* 68 23 5 5 0Ireland 42 44 10 4 0Italy 31 36 22 7 3Lithuania* 36 29 29 7 0Luxembourg 44 41 11 4 0Netherlands* 30 45 17 9 0Norway 45 42 8 4 0Poland* 27 52 15 4 1Portugal 33 36 22 7 2Romania 41 37 17 3 3Serbia* 29 43 29 0 0Slovakia 43 44 12 1 0Slovenia 54 28 16 2 0Spain 42 26 21 8 3Sweden 37 44 13 4 2United Kingdom 38 45 13 5 02020 EUROPE-26 36 40 17 5 22018 EUROPE-26 35 38 19 6 22016 EUROPE-27 36 37 19 6 22014 EUROPE-26 36 38 18 6 22012 EUROPE-25 35 39 18 6 22010 EUROPE-23 41 43 12 3 1
Three quarters of the profession say they will ‘definitely’ or ‘probably’ continue to practice architecture until they retire. Most of the remainder are ‘not sure’. Just 5 per cent say they will ‘probably’ not continue to practice as an architect, 2 per cent say ‘definitely’ not.Each proportion is similar to figures recorded in previous surveys.
* caution - small sample D R A F T
4 - 64THE ARCHITECTURAL PROFESSION IN EUROPE 2020

MIRZA & NACEY RESEARCH
4.7 HOURS WORKEDTABLE 4-12AVERAGE (MEAN) NUMBER OF HOURS WORKED PER WEEK ANALYSED BY COUNTRY AND FIELD OF EMPLOYMENT
hours / weeksole principal partner/
director
private practice salaried
employees
freelance other private local / central government other public
Austria 49.1 48.3 n/a 43.3 n/a n/a 47.5Belgium* 48.1 47.1 46.9 42.4 43.1 n/a 38.8Croatia 48.2 43.5 44.4 41.1 46.0 43.1 40.0Czechia 47.6 45.3 45.4 45.0 42.6 41.6 43.4Denmark 41.3 40.7 37.0 38.1 38.8 38.0 37.6Estonia* 40.0 40.0 n/a 42.5 n/a 45.0 n/aFinland 42.0 41.0 40.0 38.9 39.2 37.7 39.1France 44.9 41.1 40.6 37.4 41.9 38.7 40.6Germany 50.1 49.4 39.8 39.9 40.4 39.2 39.3Greece 48.7 43.8 48.5 44.2 48.5 39.3 45.5Hungary* 45.1 43.3 n/a 42.5 41.0 45.0 48.8Ireland 42.1 45.6 43.4 40.6 42.5 38.5 40.5Italy 43.6 44.5 41.9 41.0 41.4 36.4 37.1Lithuania* 40.0 39.3 n/a 41.7 60.0 n/a n/aLuxembourg 44.4 44.3 42.8 n/a 43.3 n/a n/aNetherlands* 43.3 46.9 46.7 39.4 n/a n/a 50.0Norway 39.8 41.5 38.7 39.0 39.0 37.8 39.3Poland* 51.1 53.3 40.0 42.0 41.5 n/a 44.0Portugal 44.4 42.7 40.8 40.2 41.1 35.7 38.6Romania 44.1 42.6 45.1 40.7 42.9 39.2 42.5Serbia* 50.0 42.0 n/a 40.0 n/a n/a 40.0Slovakia 46.0 45.0 49.6 49.4 47.3 38.8 42.8Slovenia 46.0 49.0 38.8 41.2 42.9 42.0 40.0Spain 46.2 44.7 41.4 41.3 44.2 39.9 42.0Sweden 42.7 43.6 40.7 40.0 42.5 39.2 39.6United Kingdom 43.2 42.6 40.0 39.6 43.0 38.6 41.42020 EUROPE-26 48.0 47.4 42.2 40.0 40.9 38.6 39.12018 EUROPE-26 48.2 47.7 43.6 44.8 44.8 41.2 41.92016 EUROPE-27 47.2 48.8 43.1 44.5 44.0 40.0 40.02014 EUROPE-26 44.5 45.3 43.9 42.9 44.0 40.3 41.02012 EUROPE-25 45.3 46.1 43.2 40.2 43.1 38.1 38.92010 EUROPE-23 46.2 45.8 41.2 43.9 44.8 38.3 38.4
* caution - small sample
Most architects work more than 40 hours per week. Sole Principals have the longest working week reporting 48 hours per week. Partners & Directors report that they work almost as many hours per week. An average 42 hours per week is reported by private practice salaried architects slightly more than architects who are freelance or working in other private settings. Architects working in the public sector report the shortest working week averaging about 39 hours per week.
It is noticable that salaried employees whether in private practice or the public sector are working fewer hours in this year’s survey than in 2018 almost certainly a direct effect of the Covid-19 pandemic.
D R A F T
4 - 65THE ARCHITECTURAL PROFESSION IN EUROPE 2020

MIRZA & NACEY RESEARCH
4.8 CONTINUING PROFESSIONAL DEVELOPMENT (CPD)Architects are spending an average of 20 hours per year undertaking CPD. This is exactly the same amount of time as in 2018. Sole Principals, Partners & Directors and public sector architects spend rather more hours per year undertaking CPD than private practice salaried architects, those working freelance or architects in other private positions.
There is, however, a wide variation between countries in the amount of time architects spend fulfilling their CPD requirements. The number of hours of CPD per year are greatest in Spain, Ireland and the United Kingdom. Architects in Czechia, Croatia, Estonia and Luxembourg spend the fewest hours per year undertaking CPD.
average (median) number hours CPD per year
Austria 25 Belgium* 20 Croatia 5 Czechia 0 Denmark 20 Estonia* 8 Finland 10 France 12 Germany 20 Greece 10 Hungary* 20 Ireland 40 Italy 30 Lithuania* 12 Luxembourg 8 Netherlands* 28 Norway 10 Poland* 30 Portugal 10 Romania 10 Serbia* 15 Slovakia 10 Slovenia 20 Spain 50 Sweden 16 United Kingdom 36 2020 EUROPE-26 20 2018 EUROPE-26 202016 EUROPE-27 242014 EUROPE-26 202012 EUROPE-25 382010 EUROPE-23 n/a
TABLE 4-13CPD HOURS ANALYSED BY COUNTRY
* caution small sample
average (median) number hours CPD per year
sole principal 25
partner/director 25
private practice salaried employees 20
freelance 20
other private 20
local / central government 24
other public 25
2020 EUROPE-26 20
2018 EUROPE-26 20
2016 EUROPE-27 24
2014 EUROPE-26 20
2012 EUROPE-25 38
2010 EUROPE-23 n/a
TABLE 4-14CPD HOURS AND SPEND ANALYSED BY FIELD OF EMPLOYMENT
D R A F T
4 - 66THE ARCHITECTURAL PROFESSION IN EUROPE 2020

MIRZA & NACEY RESEARCH
4.9 MITIGATING CLIMATE CHANGE A new set of questions for this year’s survey reveals how architects are using sustainable concepts to help mitigate the effects of climate change. Well over half of the profession ‘frequently’ use sustainable concepts in their day to day work.
Fifty seven per cent of architects ‘frequently’ apply the concept of Low Energy building to their work. The proportion is highest among architects in Luxembourg, Croatia and Estonia (small sample).
Smaller proportion of the profession regularly apply the other sustainable development concepts. Fifteen per cent use Circular Design and nZEB frequently, while 10 per cent design Plus Energy buildings frequently.
per cent respondents proportion of architects using the concept frequently
Low Energy Buildings Nearly Zero Energy Buildings (nZEB) Plus Energy buildings Circular Design
Austria 76 18 10 20Belgium* 61 34 11 30Croatia 84 46 15 12Czechia 72 33 10 10Denmark 66 6 15 35Estonia* 89 50 38 14Finland 58 13 7 29France 63 11 20 18Germany 51 7 5 8Greece 66 20 15 13Hungary* 62 39 11 16Ireland 77 65 8 10Italy 57 14 7 11Lithuania* 77 20 42 9Luxembourg 90 35 22 24Netherlands* 56 39 29 55Norway 65 22 27 30Poland* 68 11 6 16Portugal 54 8 16 16Romania 63 15 11 9Serbia* 57 13 20 20Slovakia 78 20 9 11Slovenia 55 21 5 11Spain 51 25 20 14Sweden 52 5 8 28United Kingdom 53 14 6 192020 EUROPE-26 57 15 10 152018 EUROPE-26 n/a n/a n/a n/a2016 EUROPE-27 n/a n/a n/a n/a2014 EUROPE-26 n/a n/a n/a n/a2012 EUROPE-25 n/a n/a n/a n/a2010 EUROPE-23 n/a n/a n/a n/a
TABLE 4-15PROPORTION OF ARCHITECTS USING SUSTAINABLE CONCEPTS FREQUENTLY ANALYSED BY COUNTRY
* caution - small sample
CHART 4-19SUSTAINABLE CONCEPTS USED FREQUENTLY BY ARCHITECTS
per cent architects0 10 20 30 40 50 60
Plus Energy Buildings
Circular Design
Nearly Zero EnergyBuildings (nZEB)
Low Energy Buildings
client or regulatory reasons other reasons
why architects use these concepts:
D R A F T
4 - 67THE ARCHITECTURAL PROFESSION IN EUROPE 2020

MIRZA & NACEY RESEARCH
CHART 4-20HOW ARCHITECTS LEARNED TO DELIVER SUSTAINABLE CONCEPTS
per cent architects0 10 20 30 40 50 60 70 80
Circular Design
Plus Energy Buildings
Nearly Zero EnergyBuildings (nZEB)
Low Energy Buildings
self learning formal training informal training
per cent respondents for those architects using the concept frequentlyuse concept because of client or regulatory
requirementself learning formal training informal training
Low Energy Buildings 64 58 45 41Nearly Zero Energy Buildings (nZEB) 43 57 46 40Plus Energy Buildings 29 59 40 37Circular Design 24 64 28 402018 EUROPE-26 n/a n/a n/a n/a2016 EUROPE-27 n/a n/a n/a n/a2014 EUROPE-26 n/a n/a n/a n/a2012 EUROPE-25 n/a n/a n/a n/a2010 EUROPE-23 n/a n/a n/a n/a
One of the reasons why architects use sustainable concepts is because they are demanded by the client or because it is a regulatory requirement. This may be the main driver behind the widespread adoption of low energy building design; 70 per cent of respondents say that they use this concept because it is demanded by the client or regulations. But client or regulatory demands are behind fewer than half of architects’ decisions to use nZEB and less than 30 per cent of reasons to use Circular Design or Plus Energy.
Architects have used a mix of methods to learn how to deliver these sustainable concepts. In all cases, more than half of architects learned the methods themselves. Fewer received formal or informal training.
TABLE 4-16WHY ARCHITECTS USE THE SUSTAINABLE CONCEPTS AND HOW THEY LEARNED THE CONCEPTS
D R A F T
4 - 68THE ARCHITECTURAL PROFESSION IN EUROPE 2020

MIRZA & NACEY RESEARCH
CHART 4-21ARCHITECTS’ USE OF TOOLS
4.10 DIGITALISATION IN ARCHITECTUREThere has been a proliferation of new digital tools which the architectural profession is adopting. A majority of architects use 3D modelling tools ‘frequently’, and nearly half use rendering tools frequently. About one in three architects frequently use BIM on their projects. Other digital tools are used by a minority of architects.
It is notable that the minority of architects are using these tools because they are a client or regulatory requirement; most architects use the tools out of their own choice.
The vast majority of architects taught themselves how to use these digital tools. No more than 35 per cent received formal training for any of the tools, although more received informal training.
TABLE 4-17HOW ARCHITECTS LEARNED TO USE TOOLS
per cent architects0 20 40 60 80 100
3D printing
augmented/virtual reality
laser scanningsurvey
designcoordination
buildingperformance
parametricdesign
common dataenvironment
BIM
rendering
3D modelling
client or regulatory reasons other reasons
why architects use these tools:
per cent respondents how architects learned to use these tools
self learning formal training informal training
3D modelling tools 71 32 38 Rendering tools 75 25 32 BIM (3D modelling + information inside the model) 59 34 48 Common data environment 63 11 50 Parametric design tool 71 30 31 Building performance simulation and analysis tool 63 35 30 Design coordination tools (eg clash detection) 58 22 48 Laser scanning survey tool 62 21 34 Augmented/virtual reality tool 70 14 34 3D printing tool 66 17 31 D R A F T
4 - 69THE ARCHITECTURAL PROFESSION IN EUROPE 2020

MIRZA & NACEY RESEARCH
per cent respondents proportion of architects using the tool frequently
3D modelling tools
BIM (3D modelling + information
inside the model
Rendering tools
Design coordination
tools (eg clash detection)
Building performance
simulation and analysis tool
Parametric design tool
Laser scanning survey tool 3D printing tool Augmented/
virtual reality toolCommon data environment
Austria 76 35 65 9 6 8 3 18 11 32Belgium* 85 38 50 10 12 8 4 3 3 17Croatia 50 30 87 4 5 8 6 4 7 18Czechia 64 27 60 6 2 5 2 11 6 61Denmark 59 41 31 15 8 13 7 8 6 34Estonia* 100 60 70 60 0 40 10 0 10 40Finland 64 48 40 26 4 16 10 5 5 46France 81 26 63 7 10 7 2 7 7 7Germany 39 19 23 4 3 2 2 3 4 21Greece 58 25 23 22 7 19 33 11 11 26Hungary* 62 29 46 8 3 9 11 6 0 21Ireland 74 46 45 19 13 9 9 6 9 27Italy 62 25 50 7 19 19 15 6 7 9Lithuania* 75 25 25 8 25 8 17 8 17 11Luxembourg 89 45 71 4 21 3 3 9 10 14Netherlands* 84 53 52 19 10 12 14 14 12 35Norway 76 66 49 30 13 9 6 11 14 23Poland* 75 49 56 11 4 11 5 5 11 13Portugal 69 36 50 15 7 19 16 8 8 8Romania 80 48 58 16 14 11 8 8 12 16Serbia* 53 7 80 7 0 29 0 0 7 29Slovakia 80 27 57 6 3 13 6 5 4 17Slovenia 77 42 56 15 2 11 2 6 9 6Spain 72 41 53 8 27 15 3 5 8 11Sweden 80 64 38 34 9 11 5 10 8 2United Kingdom 74 50 43 18 11 9 11 5 12 182020 EUROPE-26 62 31 44 10 12 12 9 6 7 162018 EUROPE-26 n/a n/a n/a n/a n/a n/a n/a n/a n/a n/a2016 EUROPE-27 n/a n/a n/a n/a n/a n/a n/a n/a n/a n/a2014 EUROPE-26 n/a n/a n/a n/a n/a n/a n/a n/a n/a n/a2012 EUROPE-25 n/a n/a n/a n/a n/a n/a n/a n/a n/a n/a2010 EUROPE-23 n/a n/a n/a n/a n/a n/a n/a n/a n/a n/a
TABLE 4-18PROPORTION OF ARCHITECTS USING DIGITALISATION TOOLS FREQUENTLY ANALYSED BY COUNTRY
* caution small sample
D R A F T
4 - 70THE ARCHITECTURAL PROFESSION IN EUROPE 2020

Library Dornbirn, AustriaArchitect: Dietrich Untertrifaller, Christian Schmoelz ArchitectsPhotograph: Maurizio Tami

MIRZA & NACEY RESEARCH
page:
Austria 73Belgium 74Bulgaria 75Croatia 76Cyprus 77Czechia 78Denmark 79Estonia 80Finland 81France 82Germany 83Greece 84Hungary 85Ireland 86Italy 87Latvia 88Lithuania 89Luxembourg 90Malta 91Netherlands 92Norway 93Poland 94Portugal 95Romania 96Serbia 97Slovakia 98Slovenia 99Spain 100Sweden 101Switzerland 102United Kingdom 103
Section 2 Contents
D R A F T
SECTION 2 - 72THE ARCHITECTURAL PROFESSION IN EUROPE 2020 / LA PROFESSION D’ARCHITECTE EN EUROPE 2020

MIRZA & NACEY RESEARCH
Social & Economic Social & Economiqueconstruction / GDP previous year construction / PIB année précédente
Architectural Profession Profession d’architecte
Architectural Market Marché de l’architecture
Field of Employment Domaine d’activité
Aust
ria
2010 2012 2014 2016 2018 2020
Population 8 375 290 8 443 018 8 507 786 8 700 471 8 822 267 8 901 064
GDP PIB € m 279 607 300 712 313 067 339 896 369 899 397 575
GDP/PIB head/habitant € 33 385 35 617 36 798 39 066 41 928 44 666
Construction € m 35 830 39 574 47 832 46 745 58 318 61 021
2010 2012 2014 2016 2018 2020
Architects Architectes 4 500 4 600 4 600 5 200 5 400 5 800
% Male Homme 84 82 82 80 78 81
% Female Femme 16 18 18 20 22 19
% <40 years <40 ans 17 18 20 14 12 8
Practices Bureaux 1 476 1 640 1 842 1 832 1 831 2 116
2010 2012 2014 2016 2018 2020
Market Marché (€ m) 256 263 281 279 287 340
Average turnover per practice (€) : Revenu moyen par bureaux d’architecture (€) :
2 persons personnes 148 967 107 774 140 842 122 690 132 203 114 7956 - 10 persons personnes 614 141 643 469 625 091 696 923 519 913 712 736
per cent pourcentage
2010 2012 2014 2016 2018 2020
Sole Principals Dirigeant unique 65 64 72 68 65 73
Partners & Directors Associé dirigeant 22 25 24 23 32 23
Private practice Salaried Salarié – Secteur privé 5 5 2 5 2 3
Private in-house L’industrie / commerce 1 0 0 0 0 0
Freelance Indépendant 2 2 2 1 1 1
Other Private Autres – Secteur privé 2 2 0 0 0 0
Local / central government Collectivité locale / gouvernement 1 1 0 0 0 0
Other Public Autre – secteur public 2 0 0 2 0 1
Trends 2010-20 Tendances 2010-20
Earnings Revenus
Response Réponse
2010 2012 2014 2016 2018 2020
Participants Répondants 672 583 250 392 380 198
Accuracy of results 95% confidence Précision des résultats: 95% confiance +/-4 +/-4 +/- 6 +/- 4.8 4.8 6.8
0
1000
2000
3000
4000
5000
6000
7000
2020201820162014201220100
100
200
300
400
500
600
700
num
ber a
rchi
tect
s/pr
actic
es n
ombr
e d’
arch
itect
es/b
urea
ux
total market size taille totale du m
arché €m
architects (left axis) architectes (axe de gauche) practices (left axis) bureaux (axe de gauche) market (right axis) marché (axe de droite)
Autric
he
* Earnings values are unadjusted for PPP * Revenu moyen NON ajusté par PPA
Average earnings €* Revenu moyen en € *
2010 2012 2014 2016 2018 2020
Sole Principals Dirigeant unique 40 000 43 000 45 000 50 000 50 000 40000
Partners & Directors Associé dirigeant 42 000 46 300 52 200 59 000 52 750 53900
Private practice Salaried Salarié – Secteur privé 40 000 39 000 43 900 37 650 n/a 60000
Private in-house L’industrie / commerce 40 000 42 000 n/a n/a n/a n/a
Freelance Indépendant 52 500 65 000 31 500 n/a n/a n/a
Other Private Autres – Secteur privé n/a 105000 n/a n/a n/a n/a
Local / central government Collectivité locale / gouvernement n/a 45 000 n/a n/a n/a n/a
Other Public Autre – secteur public 42 000 45 000 n/a n/a n/a n/a D R A F T
SECTION 2 - 73THE ARCHITECTURAL PROFESSION IN EUROPE 2020 / LA PROFESSION D’ARCHITECTE EN EUROPE 2020

MIRZA & NACEY RESEARCH
Social & Economic Social & Economiqueconstruction / GDP previous year construction / PIB année précédente
Architectural Profession Profession d’architecte
Architectural Market Marché de l’architecture
Field of Employment Domaine d’activité
Belg
ium 2010 2012 2014 2016 2018 2020
Population 10 827 000 11 041 266 11 203 992 11 289 853 11 413 058 11 549 888
GDP PIB € m 349 122 369 836 382 692 409 407 439 052 473 085
GDP/PIB head/habitant € 32 246 33 496 34 157 36 263 38 469 40 960
Construction € m 53 699 56 135 66 969 75 711 69 845 77 279
2010 2012 2014 2016 2018 2020
Architects Architectes 13 000 13 200 15 000 15 100 14 800 15 100
% Male Homme 76 72 73 72 68 55
% Female Femme 24 28 27 28 32 45
% <40 years <40 ans 45 54 45 36 47 50
Practices Bureaux 4 167 3 709 3 677 3 350 4 389 4 238
2010 2012 2014 2016 2018 2020
Market Marché (€ m) 556 529 436 610 569 577
Average turnover per practice (€) : Revenu moyen par bureaux d’architecture (€) :
2 persons personnes 116 434 78 786 114 414 365 053 119 917 110 7026 - 10 persons personnes 613 153 439 862 575 696 675 677 n/a 800 000
Trends 2010-20 Tendances 2010-20
Earnings Revenus
Response Réponse
2010 2012 2014 2016 2018 2020
Participants Répondants 756 446 815 496 176 129
Accuracy of results 95% confidence Précision des résultats: 95% confiance +/-3 +/-4.6 +/- 3.3 +/- 4.3 7.3 8.6
0
5000
10000
15000
20000
25000
2020201820162014201220100
200
400
600
800
1000
num
ber a
rchi
tect
s/pr
actic
es n
ombr
e d’
arch
itect
es/b
urea
ux
total market size taille totale du m
arché €m
architects (left axis) architectes (axe de gauche) practices (left axis) bureaux (axe de gauche) market (right axis) marché (axe de droite)
Belg
ique
* Earnings values are unadjusted for PPP * Revenu moyen NON ajusté par PPA
per cent pourcentage
2010 2012 2014 2016 2018 2020
Sole Principals Dirigeant unique 21 15 26 25 35 43
Partners & Directors Associé dirigeant 11 8 11 9 10 10
Private practice Salaried Salarié – Secteur privé 7 7 11 6 10 18
Private in-house L’industrie / commerce 0 0 0 0 1 0
Freelance Indépendant 25 30 22 20 37 18
Other Private Autres – Secteur privé 29 33 24 33 3 6
Local / central government Collectivité locale / gouvernement 2 3 2 4 1 2
Other Public Autre – secteur public 4 4 3 1 2 2
Average earnings €* Revenu moyen en € *
2010 2012 2014 2016 2018 2020
Sole Principals Dirigeant unique 30 000 45 000 35 000 40 000 40 000 34000
Partners & Directors Associé dirigeant 45 000 45 000 45 000 47 400 40 000 35000
Private practice Salaried Salarié – Secteur privé 40 000 47 500 36 000 50 000 38 000 43328
Private in-house L’industrie / commerce 30 000 29 850 n/a n/a n/a n/a
Freelance Indépendant 30 000 30 000 28 000 32 330 34 000 34850
Other Private Autres – Secteur privé 41 891 41 250 30 000 35 000 n/a 27500
Local / central government Collectivité locale / gouvernement 45 000 35 000 32 000 41 000 n/a n/a
Other Public Autre – secteur public 32 330 31 700 40 900 40 852 n/a n/a D R A F T
SECTION 2 - 74THE ARCHITECTURAL PROFESSION IN EUROPE 2020 / LA PROFESSION D’ARCHITECTE EN EUROPE 2020

MIRZA & NACEY RESEARCH
Social & Economic Social & Economiqueconstruction / GDP previous year construction / PIB année précédente
Architectural Profession Profession d’architecte
Architectural Market Marché de l’architecture
Field of Employment Domaine d’activitéB
ulg
ari
a2010 2012 2014 2016 2018 2020
Population 7 563 710 7 327 224 7 245 677 7 153 784 7 050 034 6 951 482
GDP PIB € m 35 558 38 483 39 940 45 287 51 663 60 675
GDP/PIB head/habitant € 4 701 5 252 5 512 6 330 7 328 8 728
Construction € m 3 258 4 859 6 608 7 067 6 775 9 343
2010 2012 2014 2016 2018 2020
Architects Architectes 2 200* 2 200* 2 100* 2 000 2 000 2 100
% Male Homme 50 45 47 46 n/a n/a
% Female Femme 50 55 53 54 n/a n/a
% <40 years <40 ans 45 41 46 45 n/a n/a
Practices Bureaux 763 930 962 856 n/a n/a
2010 2012 2014 2016 2018 2020
Market Marché (€ m) 46 27 20 37 n/a n/a
Average turnover per practice (€) : Revenu moyen par bureaux d’architecture (€) :
2 persons personnes 52 452 17 783 30 893 39 276 n/a n/a6 - 10 persons personnes 92 183 76 255 38 343 n/a n/a n/a
Trends 2010-20 Tendances 2010-20
Earnings Revenus
Response Réponse
2010 2012 2014 2016 2018 2020
Participants Répondants 141 283 83 147 n/a n/a
Accuracy of results 95% confidence Précision des résultats: 95% confiance +/-8 +/-5.5 +/- 10.6 +/- 7.9 n/a n/a
0
1000
2000
3000
4000
5000
2020201820162014201220100
20
40
60
80
100
num
ber a
rchi
tect
s/pr
actic
es n
ombr
e d’
arch
itect
es/b
urea
ux
total market size taille totale du m
arché €m
architects (left axis) architectes (axe de gauche) practices (left axis) bureaux (axe de gauche) market (right axis) marché (axe de droite)
Bulg
arie
* Earnings values are unadjusted for PPP * Revenu moyen NON ajusté par PPA
per cent pourcentage
2010 2012 2014 2016 2018 2020
Sole Principals Dirigeant unique 33 36 24 36 n/a n/a
Partners & Directors Associé dirigeant 9 10 12 7 n/a n/a
Private practice Salaried Salarié – Secteur privé 37 36 43 29 n/a n/a
Private in-house L’industrie / commerce 0 1 0 0 n/a n/a
Freelance Indépendant 15 8 6 16 n/a n/a
Other Private Autres – Secteur privé 3 1 4 3 n/a n/a
Local / central government Collectivité locale / gouvernement 1 5 12 5 n/a n/a
Other Public Autre – secteur public 1 5 0 4 n/a n/a
Average earnings €* Revenu moyen en € *
2010 2012 2014 2016 2018 2020
Sole Principals Dirigeant unique 7 671 12 271 10 225 5 427 n/a n/a
Partners & Directors Associé dirigeant 20 455 14 000 3 476 n/a n/a n/a
Private practice Salaried Salarié – Secteur privé 6 204 4 908 3 460 1 942 n/a n/a
Private in-house L’industrie / commerce 5 881 6 135 n/a n/a n/a n/a
Freelance Indépendant n/a 4 602 7 669 6 130 n/a n/a
Other Private Autres – Secteur privé n/a 2 045 n/a n/a n/a n/a
Local / central government Collectivité locale / gouvernement n/a 2 211 5 317 4 291 n/a n/a
Other Public Autre – secteur public 7 671 6 135 n/a n/a n/a n/a
* revised * révisé
D R A F T
SECTION 2 - 75THE ARCHITECTURAL PROFESSION IN EUROPE 2020 / LA PROFESSION D’ARCHITECTE EN EUROPE 2020

MIRZA & NACEY RESEARCH
Social & Economic Social & Economiqueconstruction / GDP previous year construction / PIB année précédente
Architectural Profession Profession d’architecte
Architectural Market Marché de l’architecture
Field of Employment Domaine d’activité
Cro
ati
a2010 2012 2014 2016 2018 2020
Population 4 425 747 4 398 150 4 246 700 4 190 669 4 105 493 4 058 165
GDP PIB € m 45 779 44 892 43 128 43 847 48 990 53 937
GDP/PIB head/habitant € 10 344 10 207 10 156 10 463 11 933 13 291
Construction € m n/a n/a n/a 6 207 6 046 5 931
2010 2012 2014 2016 2018 2020
Architects Architectes 2 200 2 250 2 200 2 200 2 200 2 700
% Male Homme 44 45 47 41 46 38
% Female Femme 56 55 53 59 54 62
% <40 years <40 ans 31 31 44 40 33 41
Practices Bureaux 605 835 778 695 698 831
2010 2012 2014 2016 2018 2020
Market Marché (€ m) 64 50 45 55 60 60
Average turnover per practice (€) : Revenu moyen par bureaux d’architecture (€) :
2 persons personnes 66 379 74 660 51 000 110 403 56 610 34 4166 - 10 persons personnes 218 190 160 050 157 775 141 135 523 748 307 049
Trends 2010-20 Tendances 2010-20
Earnings Revenus
Response Réponse
2010 2012 2014 2016 2018 2020
Participants Répondants 404 423 93 318 305 169
Accuracy of results 95% confidence Précision des résultats: 95% confiance +/-4 +/-4.3 +/- 9.9 +/- 5.1 5.2 7.3
0
500
1000
1500
2000
2500
3000
3500
4000
2020201820162014201220100
50
100
150
200
250
300
350
400
num
ber a
rchi
tect
s/pr
actic
es n
ombr
e d’
arch
itect
es/b
urea
ux
total market size taille totale du m
arché €m
architects (left axis) architectes (axe de gauche) practices (left axis) bureaux (axe de gauche) market (right axis) marché (axe de droite)
Cro
atie
* Earnings values are unadjusted for PPP * Revenu moyen NON ajusté par PPA
per cent pourcentage
2010 2012 2014 2016 2018 2020
Sole Principals Dirigeant unique 24 25 25 15 15 22
Partners & Directors Associé dirigeant 19 21 21 21 32 24
Private practice Salaried Salarié – Secteur privé 39 36 42 39 38 44
Private in-house L’industrie / commerce 2 0 0 2 1 0
Freelance Indépendant 5 3 1 4 3 3
Other Private Autres – Secteur privé 2 2 2 3 1 3
Local / central government Collectivité locale / gouvernement 4 4 5 7 3 3
Other Public Autre – secteur public 4 8 4 9 7 1
Average earnings €* Revenu moyen en € *
2010 2012 2014 2016 2018 2020
Sole Principals Dirigeant unique 13 746 12 087 15 777 10 392 9 718 18895
Partners & Directors Associé dirigeant 14 090 11 594 12 293 9 985 13 227 19233
Private practice Salaried Salarié – Secteur privé 16 152 14 675 11 044 12 498 11 337 13497
Private in-house L’industrie / commerce 15 464 10 940 n/a 19 304 n/a n/a
Freelance Indépendant 15 121 16 010 n/a n/a n/a n/a
Other Private Autres – Secteur privé 15 945 14 142 n/a 15 044 n/a n/a
Local / central government Collectivité locale / gouvernement 15 670 19 212 14 507 13 047 20 245 10419
Other Public Autre – secteur public 14 433 13 341 n/a 17 680 6 748 n/a D R A F T
SECTION 2 - 76THE ARCHITECTURAL PROFESSION IN EUROPE 2020 / LA PROFESSION D’ARCHITECTE EN EUROPE 2020

MIRZA & NACEY RESEARCH
Social & Economic Social & Economiqueconstruction / GDP previous year construction / PIB année précédente
Architectural Profession Profession d’architecte
Architectural Market Marché de l’architecture
Field of Employment Domaine d’activitéC
ypru
s2010 2012 2014 2016 2018 2020
Population 819 140 862 011 858 000 848 319 864 236 888 005
GDP PIB € m 19 300 19 467 17 567 17 637 19 571 22 287
GDP/PIB head/habitant € 23 561 22 583 20 474 20 791 22 645 25 098
Construction € m 3 930 2 786 1 832 2 056 2 490 3 904
2010 2012 2014 2016 2018 2020
Architects Architectes 600 900 950 950 950 950
% Male Homme n/a n/a n/a 54 80 n/a
% Female Femme n/a n/a n/a 46 20 n/a
% <40 years <40 ans n/a n/a n/a 58 50 n/a
Practices Bureaux n/a n/a n/a 295 225 n/a
2010 2012 2014 2016 2018 2020
Market Marché (€ m) n/a n/a n/a 18 17 n/a
Average turnover per practice (€) : Revenu moyen par bureaux d’architecture (€) :
2 persons personnes n/a n/a n/a n/a n/a n/a6 - 10 persons personnes n/a n/a n/a 150 000 n/a n/a
Trends 2010-20 Tendances 2010-20
Earnings Revenus
Response Réponse
2010 2012 2014 2016 2018 2020
Participants Répondants n/a n/a n/a 59 21 n/a
Accuracy of results 95% confidence Précision des résultats: 95% confiance n/a n/a n/a +/-
12.4 21.2 n/a
Chyp
re
* Earnings values are unadjusted for PPP * Revenu moyen NON ajusté par PPA
per cent pourcentage
2010 2012 2014 2016 2018 2020
Sole Principals Dirigeant unique n/a n/a n/a 30 29 n/a
Partners & Directors Associé dirigeant n/a n/a n/a 9 29 n/a
Private practice Salaried Salarié – Secteur privé n/a n/a n/a 34 29 n/a
Private in-house L’industrie / commerce n/a n/a n/a 2 5 n/a
Freelance Indépendant n/a n/a n/a 9 5 n/a
Other Private Autres – Secteur privé n/a n/a n/a 6 0 n/a
Local / central government Collectivité locale / gouvernement n/a n/a n/a 4 5 n/a
Other Public Autre – secteur public n/a n/a n/a 7 0 n/a
Average earnings €* Revenu moyen en € *
2010 2012 2014 2016 2018 2020
Sole Principals Dirigeant unique n/a n/a n/a 15 000 n/a n/a
Partners & Directors Associé dirigeant n/a n/a n/a n/a 42 500 n/a
Private practice Salaried Salarié – Secteur privé n/a n/a n/a 1 900 n/a n/a
Private in-house L’industrie / commerce n/a n/a n/a n/a n/a n/a
Freelance Indépendant n/a n/a n/a n/a n/a n/a
Other Private Autres – Secteur privé n/a n/a n/a n/a n/a n/a
Local / central government Collectivité locale / gouvernement n/a n/a n/a n/a n/a n/a
Other Public Autre – secteur public n/a n/a n/a n/a n/a n/a
0
300
600
900
1200
1500
2020201820162014201220100
5
10
15
20
25
num
ber a
rchi
tect
s/pr
actic
es n
ombr
e d’
arch
itect
es/b
urea
ux
total market size taille totale du m
arché €m
architects (left axis) architectes (axe de gauche) practices (left axis) bureaux (axe de gauche) market (right axis) marché (axe de droite) D R A F T
SECTION 2 - 77THE ARCHITECTURAL PROFESSION IN EUROPE 2020 / LA PROFESSION D’ARCHITECTE EN EUROPE 2020

MIRZA & NACEY RESEARCH
Social & Economic Social & Economiqueconstruction / GDP previous year construction / PIB année précédente
Architectural Profession Profession d’architecte
Architectural Market Marché de l’architecture
Field of Employment Domaine d’activité
Cze
chia 2010 2012 2014 2016 2018 2020
Population 10 506 813 10 504 203 10 512 419 10 553 843 10 610 055 10 693 939
GDP PIB € m 145 955 154 913 149 491 166 964 191 643 223 945
GDP/PIB head/habitant € 13 891 14 748 14 220 15 820 18 062 20 941
Construction € m 28 987 27 124 27 514 23 658 31 278 37 164
2010 2012 2014 2016 2018 2020
Architects Architectes 3 300 8 000* 8 200 8 300 3 800 ** 4 000
% Male Homme 70 68 62 64 78 71
% Female Femme 30 32 38 36 22 29
% <40 years <40 ans 25 29 46 52 32 32
Practices Bureaux 756 2 031 2 138 1 912 840 850
2010 2012 2014 2016 2018 2020
Market Marché (€ m) 73 153 139 92 62 74
Average turnover per practice (€) : Revenu moyen par bureaux d’architecture (€) :
2 persons personnes 48 487 57 967 n/a n/a n/a 30 1186 - 10 persons personnes 380 286 259 958 n/a n/a 156 584 184 213
Trends 2010-20 Tendances 2010-20
Earnings Revenus
Response Réponse
2010 2012 2014 2016 2018 2020
Participants Répondants 488 446 13 59 153 213
Accuracy of results 95% confidence Précision des résultats: 95% confiance +/-4 +/-4.3 +/- 27.2 +/-
12.7 7.8 6.5
0
2000
4000
6000
8000
2020201820162014201220100
200
400
600
800
num
ber a
rchi
tect
s/pr
actic
es n
ombr
e d’
arch
itect
es/b
urea
ux
total market size taille totale du m
arché €m
architects (left axis) architectes (axe de gauche) practices (left axis) bureaux (axe de gauche) market (right axis) marché (axe de droite)
Tchèquie
* 2012 data revised** 2018 data revised
* Earnings values are unadjusted for PPP * Revenu moyen NON ajusté par PPA
per cent pourcentage
2010 2012 2014 2016 2020 2018
Sole Principals Dirigeant unique 32 30 8 31 32 39
Partners & Directors Associé dirigeant 9 8 17 5 7 10
Private practice Salaried Salarié – Secteur privé 21 30 42 15 24 26
Private in-house L’industrie / commerce 0 0 0 0 0 0
Freelance Indépendant 31 27 17 37 28 13
Other Private Autres – Secteur privé 1 1 8 5 1 3
Local / central government Collectivité locale / gouvernement 4 3 0 2 5 4
Other Public Autre – secteur public 3 1 8 5 3 5
Average earnings €* Revenu moyen en € *
2010 2012 2014 2016 2018 2020
Sole Principals Dirigeant unique 14 570 18 107 n/a 11 089 13 826 19473
Partners & Directors Associé dirigeant 19 427 26 154 n/a n/a 25 315 32520
Private practice Salaried Salarié – Secteur privé 15 271 14 485 4 915 12 531 19 473 19999
Private in-house L’industrie / commerce 14 165 13 294 n/a n/a n/a n/a
Freelance Indépendant n/a 12 011 n/a 6 653 17 526 15578
Other Private Autres – Secteur privé 16 998 14 485 n/a n/a n/a n/a
Local / central government Collectivité locale / gouvernement 14 570 14 888 n/a n/a 24 146 22764
Other Public Autre – secteur public 15 015 14 888 n/a n/a n/a 23367
revised / révisé D R A F T
SECTION 2 - 78THE ARCHITECTURAL PROFESSION IN EUROPE 2020 / LA PROFESSION D’ARCHITECTE EN EUROPE 2020

MIRZA & NACEY RESEARCH
Social & Economic Social & Economiqueconstruction / GDP previous year construction / PIB année précédente
Architectural Profession Profession d’architecte
Architectural Market Marché de l’architecture
Field of Employment Domaine d’activité
Denm
ark 2010 2012 2014 2016 2018 2020
Population 5 534 738 5 580 516 5 627 235 5 707 251 5 781 190 5 822 763
GDP PIB € m 228 371 239 245 248 975 266 179 288 981 312 747
GDP/PIB head/habitant € 41 261 42 871 44 245 46 639 49 986 53 711
Construction € m 20 518 24 924 25 364 31 242 33 425 42 571
2010 2012 2014 2016 2018 2020
Architects Architectes 7 000 9 800* 10 000 10 000 10 300 10 400
% Male Homme 56 56 50 54 56 49
% Female Femme 44 44 50 46 44 51
% <40 years <40 ans 33 27 26 28 26 31
Practices Bureaux 762 1 782 1 759 1 422 1 271 1 667
2010 2012 2014 2016 2018 2020
Market Marché (€ m) 309 448 392 482 429 334
Average turnover per practice (€) : Revenu moyen par bureaux d’architecture (€) :
2 persons personnes 129 768 160 624 151 768 160 743 n/a 68 4856 - 10 persons personnes 1 138 352 771 921 n/a 1004 374 n/a 554 770
Trends 2010-20 Tendances 2010-20
Earnings Revenus
Response Réponse
2010 2012 2014 2016 2018 2020
Participants Répondants 454 743 529 459 247 156
Accuracy of results 95% confidence Précision des résultats: 95% confiance +/-4 +/-3.4 +/- 4.1 +/- 4.5 6.2 7.8
0
2000
4000
6000
8000
10000
12000
14000
16000
2020201820162014201220100
100
200
300
400
500
600
700
800
num
ber a
rchi
tect
s/pr
actic
es n
ombr
e d’
arch
itect
es/b
urea
ux
total market size taille totale du m
arché €m
architects (left axis) architectes (axe de gauche) practices (left axis) bureaux (axe de gauche) market (right axis) marché (axe de droite)
Danem
ark
* 2012 data revised
* Earnings values are unadjusted for PPP * Revenu moyen NON ajusté par PPA
per cent pourcentage
2010 2012 2014 2016 2018 2020
Sole Principals Dirigeant unique 12 12 8 11 11 10
Partners & Directors Associé dirigeant 16 13 9 10 9 5
Private practice Salaried Salarié – Secteur privé 26 29 34 33 32 37
Private in-house L’industrie / commerce 2 2 2 1 3 1
Freelance Indépendant 3 1 1 2 2 1
Other Private Autres – Secteur privé 7 8 5 14 9 10
Local / central government Collectivité locale / gouvernement 23 25 26 19 24 25
Other Public Autre – secteur public 12 10 15 10 10 12
Average earnings €* Revenu moyen en € *
2010 2012 2014 2016 2018 2020
Sole Principals Dirigeant unique 60 449 62 513 53 590 51 051 61 513 75834
Partners & Directors Associé dirigeant 67 165 69 907 80 385 84 502 77 847 26173
Private practice Salaried Salarié – Secteur privé 48 359 60 496 53 858 50 782 59 190 54922
Private in-house L’industrie / commerce 19 478 30 961 n/a n/a n/a n/a
Freelance Indépendant 13 433 64 664 93 783 21 600 n/a n/a
Other Private Autres – Secteur privé 54 538 53 774 62 762 50 651 80 531 91269
Local / central government Collectivité locale / gouvernement 56 419 63 050 56 270 52 797 48 117 67109
Other Public Autre – secteur public 54 721 60 496 64 308 55 753 6 979 28857 D R A F T
SECTION 2 - 79THE ARCHITECTURAL PROFESSION IN EUROPE 2020 / LA PROFESSION D’ARCHITECTE EN EUROPE 2020

MIRZA & NACEY RESEARCH
Social & Economic Social & Economiqueconstruction / GDP previous year construction / PIB année précédente
Architectural Profession Profession d’architecte
Architectural Market Marché de l’architecture
Field of Employment Domaine d’activité
Est
onia 2010 2012 2014 2016 2018 2020
Population 1 340 127 1 339 662 1 315 819 1 315 944 1 319 133 1 328 976
GDP PIB € m 13 846 15 951 18 613 20 252 23 615 28 112
GDP/PIB head/habitant € 10 332 11 907 14 146 15 389 17 902 21 153
Construction € m 1 843 2 572 3 208 2 768 4 574 4 439
2010 2012 2014 2016 2018 2020
Architects Architectes 600 600 800 800 800 800
% Male Homme 67 69 85 73 74 73
% Female Femme 33 31 15 27 26 27
% <40 years <40 ans 29 12 30 32 19 20
Practices Bureaux 145 172 252 246 161 106
2010 2012 2014 2016 2018 2020
Market Marché (€ m) 13 29 16 14 17 13
Average turnover per practice (€) : Revenu moyen par bureaux d’architecture (€) :
2 persons personnes n/a 57 574 31 250 n/a n/a 50 0006 - 10 persons personnes n/a 116 288 221 324 280 000 n/a 200 000
Trends 2010-20 Tendances 2010-20
Earnings Revenus
Response Réponse
2010 2012 2014 2016 2018 2020
Participants Répondants 33 51 20 55 23 11
Accuracy of results 95% confidence Précision des résultats: 95% confiance +/-17 +/-13.1 +/- 21.7 +/- 12.8 20.2 29.4
0
300
600
900
1200
1500
2020201820162014201220100
30
60
90
120
150
num
ber a
rchi
tect
s/pr
actic
es n
ombr
e d’
arch
itect
es/b
urea
ux
total market size taille totale du m
arché €m
architects (left axis) architectes (axe de gauche) practices (left axis) bureaux (axe de gauche) market (right axis) marché (axe de droite)
Esto
nie
* Earnings values are unadjusted for PPP * Revenu moyen NON ajusté par PPA
per cent pourcentage
2010 2012 2014 2016 2018 2020
Sole Principals Dirigeant unique 28 26 35 15 27 27
Partners & Directors Associé dirigeant 9 21 29 36 9 27
Private practice Salaried Salarié – Secteur privé 41 47 35 27 41 36
Private in-house L’industrie / commerce 0 0 0 0 0 0
Freelance Indépendant 6 5 0 4 9 0
Other Private Autres – Secteur privé 3 0 0 0 5 0
Local / central government Collectivité locale / gouvernement 9 2 0 4 9 9
Other Public Autre – secteur public 3 0 0 15 0 0
Average earnings €* Revenu moyen en € *
2010 2012 2014 2016 2018 2020
Sole Principals Dirigeant unique n/a 7 200 35 500 n/a n/a n/a
Partners & Directors Associé dirigeant n/a 20 000 13 000 22 000 n/a n/a
Private practice Salaried Salarié – Secteur privé 11 504 13 500 17 750 15 000 18 100 n/a
Private in-house L’industrie / commerce n/a 10 000 n/a n/a n/a n/a
Freelance Indépendant 15 786 n/a n/a n/a n/a n/a
Other Private Autres – Secteur privé n/a n/a n/a n/a n/a n/a
Local / central government Collectivité locale / gouvernement n/a n/a n/a n/a n/a n/a
Other Public Autre – secteur public 11 504 10 080 n/a n/a n/a n/a D R A F T
SECTION 2 - 80THE ARCHITECTURAL PROFESSION IN EUROPE 2020 / LA PROFESSION D’ARCHITECTE EN EUROPE 2020

MIRZA & NACEY RESEARCH
Social & Economic Social & Economiqueconstruction / GDP previous year construction / PIB année précédente
Architectural Profession Profession d’architecte
Architectural Market Marché de l’architecture
Field of Employment Domaine d’activité
Fin
land
2010 2012 2014 2016 2018 2020
Population 5 351 427 5 401 267 5 451 270 5 487 308 5 513 130 5 525 292
GDP PIB € m 176 132 189 368 193 443 209 149 223 843 240 556
GDP/PIB head/habitant € 32 913 35 060 35 486 38 115 40 602 43 537
Construction € m 32 298 33 922 30 292 30 558 33 745 40 334
2010 2012 2014 2016 2018 2020
Architects Architectes 3 050 3 250 3 300 3 500 3 600 3 800
% Male Homme 56 54 53 47 48 46
% Female Femme 44 46 47 53 52 53
% <40 years <40 ans 26 27 20 25 19 23
Practices Bureaux 363 661 717 528 336 649
2010 2012 2014 2016 2018 2020
Market Marché (€ m) 117 162 134 178 189 166
Average turnover per practice (€) : Revenu moyen par bureaux d’architecture (€) :
2 persons personnes 164 423 131 209 155 000 173 545 n/a 105 6436 - 10 persons personnes 501 783 629 257 1 082 500 701 972 600 778 714 173
Trends 2010-20 Tendances 2010-20
Earnings Revenus
Response Réponse
2010 2012 2014 2016 2018 2020
Participants Répondants 560 384 411 418 271 219
Accuracy of results 95% confidence Précision des résultats: 95% confiance +/-4 +/-4.7 +/- 4.5 +/- 4.5 5.7 6.4
0
2000
4000
6000
8000
10000
2020201820162014201220100
100
200
300
400
500
num
ber a
rchi
tect
s/pr
actic
es n
ombr
e d’
arch
itect
es/b
urea
ux
total market size taille totale du m
arché €m
architects (left axis) architectes (axe de gauche) practices (left axis) bureaux (axe de gauche) market (right axis) marché (axe de droite)
Fin
lande
* Earnings values are unadjusted for PPP * Revenu moyen NON ajusté par PPA
per cent pourcentage
2010 2012 2014 2016 2018 2020
Sole Principals Dirigeant unique 15 13 15 12 9 9
Partners & Directors Associé dirigeant 14 11 5 9 7 16
Private practice Salaried Salarié – Secteur privé 29 40 39 38 43 39
Private in-house L’industrie / commerce 1 1 1 0 1 2
Freelance Indépendant 2 0 1 1 0 0
Other Private Autres – Secteur privé 3 3 5 4 5 2
Local / central government Collectivité locale / gouvernement 26 21 26 25 9 24
Other Public Autre – secteur public 11 11 9 11 25 8
Average earnings €* Revenu moyen en € *
2010 2012 2014 2016 2018 2020
Sole Principals Dirigeant unique 45 000 50 000 49 500 54 500 77 500 70000
Partners & Directors Associé dirigeant 52 000 70 000 80 000 74 000 90 000 80423
Private practice Salaried Salarié – Secteur privé 42 500 42 500 45 500 45 750 50 000 51725
Private in-house L’industrie / commerce 25 000 n/a n/a n/a n/a 68500
Freelance Indépendant 44 000 36 600 n/a n/a n/a n/a
Other Private Autres – Secteur privé 47 000 49 000 50 250 55 900 74 100 50000
Local / central government Collectivité locale / gouvernement 46 250 52 000 50 750 50 000 52 500 54000
Other Public Autre – secteur public 45 000 48 000 53 000 54 000 50 000 59000 D R A F T
SECTION 2 - 81THE ARCHITECTURAL PROFESSION IN EUROPE 2020 / LA PROFESSION D’ARCHITECTE EN EUROPE 2020

MIRZA & NACEY RESEARCH
Social & Economic Social & Economiqueconstruction / GDP previous year construction / PIB année précédente
Architectural Profession Profession d’architecte
Architectural Market Marché de l’architecture
Field of Employment Domaine d’activité
Fra
nce
2010 2012 2014 2016 2018 2020
Population 64 713 762 65 397 912 65 856 609 66 661 621 67 221 943 67 098 824
GDP PIB € m 1 946 564 1 996 583 2 059 852 2 181 064 2 291 705 2 425 708
GDP/PIB head/habitant € 30 080 30 530 31 278 32 718 34 092 36 151
Construction € m 245 485 241 930 271 139 282 377 276 669 311 348
2010 2012 2014 2016 2018 2020
Architects Architectes 29 700 29 900 29 800 30 000 30 000 30 000
% Male Homme 73 67 62 64 63 60
% Female Femme 27 33 38 36 37 40
% <40 years <40 ans 29 30 24 34 25 29
Practices Bureaux 7 891 7 968 8 302 7 753 8 033 4 708
2010 2012 2014 2016 2018 2020
Market Marché (€ m) 1 302 1 254 908 984 961 1 527
Average turnover per practice (€) : Revenu moyen par bureaux d’architecture (€) :
2 persons personnes 196 787 169 294 177 150 120 936 117 254 133 0026 - 10 persons personnes 774 945 883 467 812 891 837 225 696 475 804 667
Trends 2010-20 Tendances 2010-20
Earnings Revenus
Response Réponse
2010 2012 2014 2016 2018 2020
Participants Répondants 1 202 957 690 1 018 1 551 750
Accuracy of results 95% confidence Précision des résultats: 95% confiance +/-2 +/- 3.1 +/- 3.7 +/- 3.0 2.4 3.5
0
10000
20000
30000
40000
50000
2020201820162014201220100
500
1000
1500
2000
2500
num
ber a
rchi
tect
s/pr
actic
es n
ombr
e d’
arch
itect
es/b
urea
ux
total market size taille totale du m
arché €m
architects (left axis) architectes (axe de gauche) practices (left axis) bureaux (axe de gauche) market (right axis) marché (axe de droite)
Fra
nce
* Earnings values are unadjusted for PPP * Revenu moyen NON ajusté par PPA
per cent pourcentage
2010 2012 2014 2016 2018 2020
Sole Principals Dirigeant unique 28 26 29 26 37 55
Partners & Directors Associé dirigeant 5 5 6 6 6 7
Private practice Salaried Salarié – Secteur privé 16 17 20 17 18 23
Private in-house L’industrie / commerce 0 0 1 0 0 0
Freelance Indépendant 21 20 19 27 28 4
Other Private Autres – Secteur privé 23 26 20 18 5 4
Local / central government Collectivité locale / gouvernement 2 3 2 3 2 2
Other Public Autre – secteur public 4 4 3 2 5 5
Average earnings €* Revenu moyen en € *
2010 2012 2014 2016 2018 2020
Sole Principals Dirigeant unique 30 000 30 000 30 000 25 000 30 000 30000
Partners & Directors Associé dirigeant 33 000 42 000 45 000 39 022 38 164 36000
Private practice Salaried Salarié – Secteur privé 39 000 38 000 30 000 41 432 36 000 38039
Private in-house L’industrie / commerce 28 000 25 000 n/a n/a n/a n/a
Freelance Indépendant 32 250 32 500 22 474 24 000 27 000 22000
Other Private Autres – Secteur privé 41 400 37 200 30 500 26 000 41 000 26500
Local / central government Collectivité locale / gouvernement 36 600 47 714 40 500 41 500 45 000 45000
Other Public Autre – secteur public 33 000 30 250 42 030 34 650 43 000 42000 D R A F T
SECTION 2 - 82THE ARCHITECTURAL PROFESSION IN EUROPE 2020 / LA PROFESSION D’ARCHITECTE EN EUROPE 2020

MIRZA & NACEY RESEARCH
* 2016& 2018 - source: BAK survey * 2016 & 2018 - source: enquête BAK
Social & Economic Social & Economiqueconstruction / GDP previous year construction / PIB année précédente
Architectural Profession Profession d’architecte
Architectural Market Marché de l’architecture
Field of Employment Domaine d’activité
Germ
any
2010 2012 2014 2016 2018 2020
Population 81 802 257 81 843 743 80 780 000 82 162 000 82 850 000 83 166 711
GDP PIB € m 2 432 382 2 592 600 2 737 600 3 032 820 3 277 340 3 449 050
GDP/PIB head/habitant € 29 735 31 677 33 890 36 913 39 558 41 472
Construction € m 225 973 247 633 250 337 279 619 306 168 368 471
2010 2012 2014 2016* 2018* 2020*
Architects Architectes 100 500 101 600 107 200 109 200 111 200 117 500
% Male Homme 79 64 57 66 62 66
% Female Femme 21 36 43 34 38 34
% <40 years <40 ans 14 35 41 23 21 25
Practices Bureaux 35 021 37 026 41 117 40 558 33 440 28 492
2010 2012 2014 2016 2018 2020
Market Marché (€ m) 4 095 4 193 5 047 5 015 4 971 4 577
Average turnover per practice (€) : Revenu moyen par bureaux d’architecture (€) :
2 persons personnes 86 449 94 088 114 326 154 763 181 955 169 8096 - 10 persons personnes 633 444 440 416 623 935 654 293 786 041 811 537
Trends 2010-20 Tendances 2010-20
Earnings Revenus
Response Réponse
2010 2012 2014 2016 2018 2020
Participants Répondants 393 840 1 392 6 029 13 120 14 064
Accuracy of results 95% confidence Précision des résultats: 95% confiance +/-5 +/- 3.4 +/- 2.6 +/- 1.2 0.8 0.8
0
20000
40000
60000
80000
100000
120000
140000
160000
180000
200000
2020201820162014201220100
1000
2000
3000
4000
5000
6000
7000
8000
9000
10000
num
ber a
rchi
tect
s/pr
actic
es n
ombr
e d’
arch
itect
es/b
urea
ux
total market size taille totale du m
arché €m
architects (left axis) architectes (axe de gauche) practices (left axis) bureaux (axe de gauche) market (right axis) marché (axe de droite)
Alle
magne
* Earnings values are unadjusted for PPP * Revenu moyen NON ajusté par PPA
per cent pourcentage
2010 2012 2014 2016* 2018* 2020*
Sole Principals Dirigeant unique 62 32 20 27 24 22
Partners & Directors Associé dirigeant 10 14 8 10 10 9
Private practice Salaried Salarié – Secteur privé 14 26 40 33 34 37
Private in-house L’industrie / commerce 3 7 8 12 14 13
Freelance Indépendant 3 4 1 4 2 2
Other Private Autres – Secteur privé 2 6 6 n/a 1 1
Local / central government Collectivité locale / gouvernement 2 8 12
1414 14
Other Public Autre – secteur public 2 4 4 1 1
Average earnings €* Revenu moyen en € *
2010 2012 2014 2016** 2018** 2020**
Sole Principals Dirigeant unique 43 500 50 000 55 000 55 940 63 202 68262
Partners & Directors Associé dirigeant 50 000 60 000 70 660 65 100 74 500 90000
Private practice Salaried Salarié – Secteur privé 34 290 37 200 36 000 n/a 48 000 50000
Private in-house L’industrie / commerce 25 000 40 000 n/a n/a 72 000 75000
Freelance Indépendant 50 000 54 500 67 000 39 012 40 000 49000
Other Private Autres – Secteur privé 42 976 50 000 58 500 n/a 61 331 70000
Local / central government Collectivité locale / gouvernement 48 100 50 000 53 000 n/a 60 397 64000
Other Public Autre – secteur public 42 488 48 000 55 000 n/a 65 000 70000
* 2016-2020 - source: BAK survey * 2016-2020 - source: enquête BAK
** 2016& 2018 - source: BAK survey ** 2016 & 2018 - source: enquête BAK D R A F T
SECTION 2 - 83THE ARCHITECTURAL PROFESSION IN EUROPE 2020 / LA PROFESSION D’ARCHITECTE EN EUROPE 2020

MIRZA & NACEY RESEARCH
Social & Economic Social & Economiqueconstruction / GDP previous year construction / PIB année précédente
Architectural Profession Profession d’architecte
Architectural Market Marché de l’architecture
Field of Employment Domaine d’activité
Gre
ece
2010 2012 2014 2016 2018 2020
Population 11 295 002 11 290 785 10 992 589 10 793 526 10 738 868 10 709 739
GDP PIB € m 232 767 215 088 182 054 175 697 180 218 187 457
GDP/PIB head/habitant € 20 608 19 050 16 562 16 278 16 782 17 503
Construction € m 19 573 12 110 10 927 12 926 9 621 11 342
2010 2012 2014 2016 2018 2020
Architects Architectes 15 800 16 400 17 600 18 200 18 500 17 800
% Male Homme 43 41 42 n/a 45 43
% Female Femme 57 59 58 n/a 55 57
% <40 years <40 ans 52 56 50 n/a 39 42
Practices Bureaux 3 818 5 219 5 661 n/a 5 325 6 097
2010 2012 2014 2016 2018 2020
Market Marché (€ m) 289 171 103 n/a 83 191
Average turnover per practice (€) : Revenu moyen par bureaux d’architecture (€) :
2 persons personnes 50 720 33 861 18 929 n/a 18 833 37 5006 - 10 persons personnes 190 067 71 500 55 643 n/a n/a 356 667
Trends 2010-20 Tendances 2010-20
Earnings Revenus
Response Réponse
2010 2012 2014 2016 2018 2020
Participants Répondants 314 490 344 n/a 299 194
Accuracy of results 95% confidence Précision des résultats: 95% confiance +/-6 +/- 4.4 +/- 5.2 n/a 5.6 7
0
5000
10000
15000
20000
25000
2020201820162014201220100
100
200
300
400
500
num
ber a
rchi
tect
s/pr
actic
es n
ombr
e d’
arch
itect
es/b
urea
ux
total market size taille totale du m
arché €m
architects (left axis) architectes (axe de gauche) practices (left axis) bureaux (axe de gauche) market (right axis) marché (axe de droite)
Grè
ce
* Earnings values are unadjusted for PPP * Revenu moyen NON ajusté par PPA
per cent pourcentage
2010 2012 2014 2016 2018 2020
Sole Principals Dirigeant unique 49 56 51 n/a 44 56
Partners & Directors Associé dirigeant 5 6 6 n/a 2 2
Private practice Salaried Salarié – Secteur privé 17 14 16 n/a 21 22
Private in-house L’industrie / commerce 0 0 1 n/a 0 0
Freelance Indépendant 9 6 9 n/a 10 9
Other Private Autres – Secteur privé 3 3 2 n/a 3 1
Local / central government Collectivité locale / gouvernement 10 7 8 n/a 11 7
Other Public Autre – secteur public 7 8 8 n/a 7 3
Average earnings €* Revenu moyen en € *
2008 2010 2012 2014 2016 2020
Sole Principals Dirigeant unique 30 000 20 000 12 000 n/a 10 000 15000
Partners & Directors Associé dirigeant 42 500 22 500 30 000 n/a n/a 22000
Private practice Salaried Salarié – Secteur privé 14 700 13 200 13 200 n/a 13 500 12000
Private in-house L’industrie / commerce 13 100 10 000 n/a n/a n/a n/a
Freelance Indépendant n/a 13 200 10 000 n/a 7 500 9500
Other Private Autres – Secteur privé 20 000 19 000 13 500 n/a n/a n/a
Local / central government Collectivité locale / gouvernement 20 000 20 000 21 600 n/a 15 000 16000
Other Public Autre – secteur public 20 000 18 000 19 320 n/a 15 000 n/a D R A F T
SECTION 2 - 84THE ARCHITECTURAL PROFESSION IN EUROPE 2020 / LA PROFESSION D’ARCHITECTE EN EUROPE 2020

MIRZA & NACEY RESEARCH
Social & Economic Social & Economiqueconstruction / GDP previous year construction / PIB année précédente
Architectural Profession Profession d’architecte
Architectural Market Marché de l’architecture
Field of Employment Domaine d’activité
Hungary 2010 2012 2014 2016 2018 2020
Population 10 013 000 9 962 000 9 879 000 9 830 485 9 778 371 9 769 526
GDP PIB € m 97 095 100 513 97 948 109 674 124 050 146 062
GDP/PIB head/habitant € 9 697 10 090 9 915 11 157 12 686 14 951
Construction € m 8 131 7 496 8 520 7 559 14 655 18 105
2010 2012 2014 2016 2018 2020
Architects Architectes 4 000 4 000 4 100 4 200 4 200 7 300
% Male Homme n/a 67 n/a 72 75 71
% Female Femme n/a 33 n/a 28 25 29
% <40 years <40 ans n/a 27 n/a 25 n/a 12
Practices Bureaux n/a 699 n/a 1 356 869 973
2010 2012 2014 2016 2018 2020
Market Marché (€ m) n/a 61 n/a 33 47 59
Average turnover per practice (€) : Revenu moyen par bureaux d’architecture (€) :
2 persons personnes n/a 17 311 n/a 32 253 30 442 41 4406 - 10 persons personnes n/a 146 850 n/a n/a n/a 462 215
Trends 2010-20 Tendances 2010-20
Earnings Revenus
Response Réponse
2010 2012 2014 2016 2018 2020
Participants Répondants n/a 191 n/a 158 56 47
Accuracy of results 95% confidence Précision des résultats: 95% confiance n/a +/- 6.9 n/a +/- 7.6 13.0 14.2
0
2000
4000
6000
8000
10000
202020182016201420122010num
ber a
rchi
tect
s/pr
actic
es n
ombr
e d’
arch
itect
es/b
urea
ux
total market size taille totale du m
arché €m architects (left axis) architectes (axe de gauche) practices (left axis) bureaux (axe de gauche) market (right axis) marché (axe de droite)
0
100
200
300
400
500
Hongrie
* Earnings values are unadjusted for PPP * Revenu moyen NON ajusté par PPA
per cent pourcentage
2010 2012 2014 2016 2018 2020
Sole Principals Dirigeant unique n/a 25 n/a 5 14 31
Partners & Directors Associé dirigeant n/a 9 n/a 1 7 7
Private practice Salaried Salarié – Secteur privé n/a 27 n/a 19 50 14
Private in-house L’industrie / commerce n/a 5 n/a 1 2 2
Freelance Indépendant n/a 8 n/a 11 13 7
Other Private Autres – Secteur privé n/a 3 n/a 39 4 17
Local / central government Collectivité locale / gouvernement n/a 12 n/a 13 5 10
Other Public Autre – secteur public n/a 11 n/a 12 5 12
Average earnings €* Revenu moyen en € *
2010 2012 2014 2016 2018 2020
Sole Principals Dirigeant unique n/a 8 021 n/a 12 819 n/a 24067
Partners & Directors Associé dirigeant n/a 7 528 n/a n/a n/a n/a
Private practice Salaried Salarié – Secteur privé n/a 7 810 n/a 10 896 11 476 n/a
Private in-house L’industrie / commerce n/a 6 332 n/a n/a n/a n/a
Freelance Indépendant n/a 14 072 n/a n/a 24 226 n/a
Other Private Autres – Secteur privé n/a 12 664 n/a 9 614 n/a n/a
Local / central government Collectivité locale / gouvernement n/a 10 554 n/a 11 537 n/a n/a
Other Public Autre – secteur public n/a 8 795 n/a 9 614 n/a n/arevised / révisé D R A F T
SECTION 2 - 85THE ARCHITECTURAL PROFESSION IN EUROPE 2020 / LA PROFESSION D’ARCHITECTE EN EUROPE 2020

MIRZA & NACEY RESEARCH
Social & Economic Social & Economiqueconstruction / GDP previous year construction / PIB année précédente
Architectural Profession Profession d’architecte
Architectural Market Marché de l’architecture
Field of Employment Domaine d’activité
Irela
nd
2010 2012 2014 2016 2018 2020
Population 4 455 780 4 495 351 4 604 029 4 658 530 4 838 259 4 963 839
GDP PIB € m 155 491 156 438 164 050 255 815 294 110 356 051
GDP/PIB head/habitant € 34 896 34 800 35 632 54 913 60 788 71 729
Construction € m 14 250 11 662 10 301 24 200 24 519 28 873
2010 2012 2014 2016 2018 2020
Architects Architectes 2 600 2 600 2 600 2 500 2 500 3 500
% Male Homme 70 69 71 68 69 62
% Female Femme 30 31 29 32 31 37
% <40 years <40 ans 42 36 19 26 28 28
Practices Bureaux 824 1 027 752 754 636 653
2010 2012 2014 2016 2018 2020
Market Marché (€ m) 172 112 91 111 149 169
Average turnover per practice (€) : Revenu moyen par bureaux d’architecture (€) :
2 persons personnes 116 390 101 324 85 367 121 967 206 000 109 3586 - 10 persons personnes 718 106 501 000 554 417 503 143 463 134 665 332
Trends 2010-20 Tendances 2010-20
Earnings Revenus
Response Réponse
2010 2012 2014 2016 2018 2020
Participants Répondants 547 361 267 322 162 403
Accuracy of results 95% confidence Précision des résultats: 95% confiance +/-4 +/- 4.8 +/- 5.7 +/- 5.1 7.4 4.6
0
1000
2000
3000
4000
5000
6000
7000
2020201820162014201220100
100
200
300
400
500
600
700
num
ber a
rchi
tect
s/pr
actic
es n
ombr
e d’
arch
itect
es/b
urea
ux
total market size taille totale du m
arché €m
architects (left axis) architectes (axe de gauche) practices (left axis) bureaux (axe de gauche) market (right axis) marché (axe de droite)
Irlande
* Earnings values are unadjusted for PPP * Revenu moyen NON ajusté par PPA
per cent pourcentage
2010 2012 2014 2016 2018 2020
Sole Principals Dirigeant unique 26 26 26 26 22 21
Partners & Directors Associé dirigeant 28 26 27 22 22 18
Private practice Salaried Salarié – Secteur privé 26 26 25 32 43 39
Private in-house L’industrie / commerce 1 0 0 0 1 1
Freelance Indépendant 3 2 2 3 1 1
Other Private Autres – Secteur privé 2 4 0 2 2 2
Local / central government Collectivité locale / gouvernement 9 9 13 9 7 13
Other Public Autre – secteur public 6 6 3 4 3 4
Average earnings €* Revenu moyen en € *
2010 2012 2014 2016 2018 2020
Sole Principals Dirigeant unique 40 000 25 000 35 000 40 000 50 000 57500
Partners & Directors Associé dirigeant 55 000 45 000 45 000 58 000 60 000 79408
Private practice Salaried Salarié – Secteur privé 45 000 42 000 43 000 44 343 48 000 50000
Private in-house L’industrie / commerce 23 500 31 000 n/a n/a n/a n/a
Freelance Indépendant 66 500 55 194 22 500 n/a n/a n/a
Other Private Autres – Secteur privé 72 000 76 000 n/a 52 000 n/a 55500
Local / central government Collectivité locale / gouvernement 74 000 71 000 67 550 69 000 70 000 65000
Other Public Autre – secteur public 50 250 43 000 70 000 56 500 73 000 74750 D R A F T
SECTION 2 - 86THE ARCHITECTURAL PROFESSION IN EUROPE 2020 / LA PROFESSION D’ARCHITECTE EN EUROPE 2020

MIRZA & NACEY RESEARCH
Social & Economic Social & Economiqueconstruction / GDP previous year construction / PIB année précédente
Architectural Profession Profession d’architecte
Architectural Market Marché de l’architecture
Field of Employment Domaine d’activité
Italy 2010 2012 2014 2016 2018 2020
Population 60 340 328 60 850 782 60 782 668 60 665 551 60 483 973 60 244 639
GDP PIB € m 1 553 350 1 580 220 1 560 024 1 642 444 1 724 955 1 789 747
GDP/PIB head/habitant € 25 743 25 969 25 666 27 074 28 519 29 708
Construction € m 185 616 180 233 184 111 202 126 195 035 193 859
2010 2012 2014 2016 2018 2020
Architects Architectes 145 000 147 000 153 000 157 000 160 000 152 200
% Male Homme 70 63 62 59 57 56
% Female Femme 30 37 38 41 43 44
% <40 years <40 ans 58 34 23 28 27 35
Practices Bureaux 53 081 58 397 56 284 55 720 41 242 26 134
2010 2012 2014 2016 2018 2020
Market Marché (€ m) 2 709 2 775 1 917 1 758 2 072 2 983
Average turnover per practice (€) : Revenu moyen par bureaux d’architecture (€) :
2 persons personnes 52 108 60 380 50 006 49 171 51 843 76 9136 - 10 persons personnes 470 573 253 669 208 189 164 400 139 833 385 514
Trends 2010-20 Tendances 2010-20
Earnings Revenus
Response Réponse
2010 2012 2014 2016 2018 2020
Participants Répondants 124 14004 8 167 12568 9 018 5 221
Accuracy of results 95% confidence Précision des résultats: 95% confiance +/-9 +/- 0.8 +/- 1.1 +/- 0.8 1.0 1.3
0
40000
80000
120000
160000
200000
240000
2020201820162014201220100
1000
2000
3000
4000
5000
6000
num
ber a
rchi
tect
s/pr
actic
es n
ombr
e d’
arch
itect
es/b
urea
ux
total market size taille totale du m
arché €m
architects (left axis) architectes (axe de gauche) practices (left axis) bureaux (axe de gauche) market (right axis) marché (axe de droite)
Italie
* Earnings values are unadjusted for PPP * Revenu moyen NON ajusté par PPA
per cent pourcentage
2010 2012 2014 2016 2018 2020
Sole Principals Dirigeant unique 39 46 47 39 34 39
Partners & Directors Associé dirigeant 10 6 6 4 5 4
Private practice Salaried Salarié – Secteur privé 20 17 15 13 13 16
Private in-house L’industrie / commerce 1 2 2 2 2 2
Freelance Indépendant 16 13 13 20 21 13
Other Private Autres – Secteur privé 9 9 8 10 10 13
Local / central government Collectivité locale / gouvernement 3 4 5 5 6 5
Other Public Autre – secteur public 2 4 4 6 9 7
Average earnings €* Revenu moyen en € *
2010 2012 2014 2016 2018 2020
Sole Principals Dirigeant unique 20 000 27 000 30 000 27 500 27 500 30000
Partners & Directors Associé dirigeant 27 900 34 500 36 000 35 000 30 000 45000
Private practice Salaried Salarié – Secteur privé 15 750 24 000 27 778 24 000 22 000 25000
Private in-house L’industrie / commerce 15 000 20 000 n/a 25 000 28 000 28000
Freelance Indépendant 22 000 25 000 20 000 18 000 20 000 21800
Other Private Autres – Secteur privé 30 000 30 000 26 000 22 000 21 000 25000
Local / central government Collectivité locale / gouvernement n/a 28 000 30 000 30 000 30 000 25000
Other Public Autre – secteur public 20 000 25 000 26 000 27 000 30 000 30000 D R A F T
SECTION 2 - 87THE ARCHITECTURAL PROFESSION IN EUROPE 2020 / LA PROFESSION D’ARCHITECTE EN EUROPE 2020

MIRZA & NACEY RESEARCH
Social & Economic Social & Economiqueconstruction / GDP previous year construction / PIB année précédente
Architectural Profession Profession d’architecte
Architectural Market Marché de l’architecture
Field of Employment Domaine d’activité
Latv
ia 2010 2012 2014 2016 2018 2020
Population 2 248 374 2 042 371 2 001 468 1 968 957 1 934 379 1 907 675
GDP PIB € m 16 693 21 338 23 372 24 349 27 033 30 463
GDP/PIB head/habitant € 7 425 10 447 11 677 12 366 13 975 15 969
Construction € m 3 737 3 705 5 481 3 491 6 518 6 018
2010 2012 2014 2016 2018 2020
Architects Architectes 900 900 900 900 820 810
% Male Homme n/a n/a 42 n/a n/a n/a
% Female Femme n/a n/a 58 n/a n/a n/a
% <40 years <40 ans n/a n/a 29 n/a n/a n/a
Practices Bureaux n/a n/a 245 n/a n/a n/a
2010 2012 2014 2016 2018 2020
Market Marché (€ m) n/a n/a 23 n/a n/a n/a
Average turnover per practice (€) : Revenu moyen par bureaux d’architecture (€) :
2 persons personnes n/a n/a n/a n/a n/a n/a6 - 10 persons personnes n/a n/a 678 886 n/a n/a n/a
Trends 2010-20 Tendances 2010-20
Earnings Revenus
Response Réponse
2010 2012 2014 2016 2018 2020
Participants Répondants 5 n/a 36 n/a n/a n/a
Accuracy of results 95% confidence Précision des résultats: 95% confiance +/-44 n/a +/- 16.0 n/a n/a n/a
0
500
1000
1500
2000
2500
202020182016201420122010num
ber a
rchi
tect
s/pr
actic
es n
ombr
e d’
arch
itect
es/b
urea
ux
total market size taille totale du m
arché €m
architects (left axis) architectes (axe de gauche) practices (left axis) bureaux (axe de gauche) market (right axis) marché (axe de droite)
0
200
400
600
800
1000
n/an/a
Letto
nie
* Earnings values are unadjusted for PPP * Revenu moyen NON ajusté par PPA
per cent pourcentage
2010 2012 2014 2016 2018 2020
Sole Principals Dirigeant unique n/a n/a 15 n/a n/a n/a
Partners & Directors Associé dirigeant n/a n/a 31 n/a n/a n/a
Private practice Salaried Salarié – Secteur privé n/a n/a 31 n/a n/a n/a
Private in-house L’industrie / commerce n/a n/a 0 n/a n/a n/a
Freelance Indépendant n/a n/a 0 n/a n/a n/a
Other Private Autres – Secteur privé n/a n/a 12 n/a n/a n/a
Local / central government Collectivité locale / gouvernement n/a n/a 12 n/a n/a n/a
Other Public Autre – secteur public n/a n/a 0 n/a n/a n/a
Average earnings €* Revenu moyen en € *
2010 2012 2014 2016 2018 2020
Sole Principals Dirigeant unique n/a n/a 19 200 n/a n/a n/a
Partners & Directors Associé dirigeant n/a n/a 4 275 n/a n/a n/a
Private practice Salaried Salarié – Secteur privé n/a n/a 3 350 n/a n/a n/a
Private in-house L’industrie / commerce n/a n/a n/a n/a n/a n/a
Freelance Indépendant n/a n/a n/a n/a n/a n/a
Other Private Autres – Secteur privé n/a n/a 6 000 n/a n/a n/a
Local / central government Collectivité locale / gouvernement n/a n/a 1 060 n/a n/a n/a
Other Public Autre – secteur public n/a n/a n/a n/a n/a n/a D R A F T
SECTION 2 - 88THE ARCHITECTURAL PROFESSION IN EUROPE 2020 / LA PROFESSION D’ARCHITECTE EN EUROPE 2020

MIRZA & NACEY RESEARCH
Social & Economic Social & Economiqueconstruction / GDP previous year construction / PIB année précédente
Architectural Profession Profession d’architecte
Architectural Market Marché de l’architecture
Field of Employment Domaine d’activité
Lit
huania 2010 2012 2014 2016 2018 2020
Population 3 329 039 3 199 771 2 943 472 2 888 558 2 808 901 2 794 090
GDP PIB € m 25 820 30 705 34 631 37 331 42 191 48 797
GDP/PIB head/habitant € 7 756 9 596 11 765 12 924 15 020 17 465
Construction € m 3 203 3 378 3 733 3 479 4 984 4 869
2010 2012 2014 2016 2018 2020
Architects Architectes 1 500 1 500 1 350 1 350 1 400 1 450
% Male Homme 68 86 n/a 50 52 64
% Female Femme 32 14 n/a 50 48 36
% <40 years <40 ans 36 37 n/a 38 43 n/a
Practices Bureaux 282 422 n/a 337 359 423
2010 2012 2014 2016 2018 2020
Market Marché (€ m) 11 10 n/a 11 17 21
Average turnover per practice (€) : Revenu moyen par bureaux d’architecture (€) :
2 persons personnes 29 148 n/a n/a 26 566 25 106 50 0006 - 10 persons personnes 82 324 n/a n/a 178 349 119 063 550 000
Trends 2010-20 Tendances 2010-20
Earnings Revenus
Response Réponse
2010 2012 2014 2016 2018 2020
Participants Répondants 26 22 n/a 143 122 17
Accuracy of results 95% confidence Précision des résultats: 95% confiance +/-19 +/- 20.7 n/a +/- 7.8 8.5 23.6
0
500
1000
1500
2000
2500
2020201820162014201220100
10
20
30
40
50
num
ber a
rchi
tect
s/pr
actic
es n
ombr
e d’
arch
itect
es/b
urea
ux
total market size taille totale du m
arché €m
architects (left axis) architectes (axe de gauche) practices (left axis) bureaux (axe de gauche) market (right axis) marché (axe de droite)
Litu
anie
* Earnings values are unadjusted for PPP * Revenu moyen NON ajusté par PPA
per cent pourcentage
2010 2012 2014 2016 2018 2020
Sole Principals Dirigeant unique 28 24 n/a 14 21 8
Partners & Directors Associé dirigeant 28 43 n/a 3 12 31
Private practice Salaried Salarié – Secteur privé 20 19 n/a 22 43 31
Private in-house L’industrie / commerce 4 0 n/a 0 1 0
Freelance Indépendant 8 5 n/a 15 14 23
Other Private Autres – Secteur privé 8 5 n/a 36 1 0
Local / central government Collectivité locale / gouvernement 4 5 n/a 6 2 8
Other Public Autre – secteur public 0 0 n/a 5 5 0
Average earnings €* Revenu moyen en € *
2010 2012 2014 2016 2018 2020
Sole Principals Dirigeant unique 8 689 n/a n/a n/a 15 000 n/a
Partners & Directors Associé dirigeant n/a n/a n/a n/a 18 000 n/a
Private practice Salaried Salarié – Secteur privé 5 792 n/a n/a n/a 12 000 15000
Private in-house L’industrie / commerce n/a n/a n/a n/a n/a n/a
Freelance Indépendant n/a n/a n/a n/a 10 000 n/a
Other Private Autres – Secteur privé n/a n/a n/a n/a n/a n/a
Local / central government Collectivité locale / gouvernement n/a n/a n/a n/a n/a n/a
Other Public Autre – secteur public 6 951 n/a n/a n/a n/a n/a D R A F T
SECTION 2 - 89THE ARCHITECTURAL PROFESSION IN EUROPE 2020 / LA PROFESSION D’ARCHITECTE EN EUROPE 2020

MIRZA & NACEY RESEARCH
Social & Economic Social & Economiqueconstruction / GDP previous year construction / PIB année précédente
Architectural Profession Profession d’architecte
Architectural Market Marché de l’architecture
Field of Employment Domaine d’activité
Luxe
mbourg 2010 2012 2014 2016 2018 2020
Population 502 066 524 853 549 680 576 249 602 005 626 108
GDP PIB € m 40 267 42 822 45 478 51 216 55 299 63 516
GDP/PIB head/habitant € 80 202 81 588 82 736 88 879 91 859 101 446
Construction € m 5 202 5 306 5 579 7 284 7 616 8 629
2010 2012 2014 2016 2018 2020
Architects Architectes * 600 680 900 950 950 1 100
% Male Homme n/a 72 75 74 68 68
% Female Femme n/a 28 25 26 32 31
% <40 years <40 ans 0 38 22 14 22 28
Practices Bureaux n/a 166 244 190 268 308
2010 2012 2014 2016 2018 2020
Market Marché (€ m) n/a 38 49 68 50 66
Average turnover per practice (€) : Revenu moyen par bureaux d’architecture (€) :
2 persons personnes n/a 154 000 231 165 138 750 n/a 140 5696 - 10 persons personnes n/a 683 115 486 532 443 100 n/a 574 571
Trends 2010-20 Tendances 2010-20
Earnings Revenus
Response Réponse
2010 2012 2014 2016 2018 2020
Participants Répondants n/a 89 130 86 28 80
Accuracy of results 95% confidence Précision des résultats: 95% confiance n/a +/- 9.7 +/- 8.0 +/- 10.1 18.3 10.6
0
500
1000
1500
2020201820162014201220100
30
60
90
num
ber a
rchi
tect
s/pr
actic
es n
ombr
e d’
arch
itect
es/b
urea
ux
total market size taille totale du m
arché €m
architects (left axis) architectes (axe de gauche) practices (left axis) bureaux (axe de gauche) market (right axis) marché (axe de droite)
Luxe
mbourg
* Earnings values are unadjusted for PPP * Revenu moyen NON ajusté par PPA
per cent pourcentage
2010 2012 2014 2016 2018 2020
Sole Principals Dirigeant unique n/a 39 34 22 39 56
Partners & Directors Associé dirigeant n/a 24 28 39 25 21
Private practice Salaried Salarié – Secteur privé n/a 10 19 14 18 16
Private in-house L’industrie / commerce n/a 0 0 1 0 0
Freelance Indépendant n/a 9 9 8 14 5
Other Private Autres – Secteur privé n/a 19 9 15 0 1
Local / central government Collectivité locale / gouvernement n/a 0 0 0 0 0
Other Public Autre – secteur public n/a 0 0 0 4 0
Average earnings €* Revenu moyen en € *
2010 2012 2014 2016 2018 2020
Sole Principals Dirigeant unique n/a 56 000 56 000 52 050 50 000 68500
Partners & Directors Associé dirigeant n/a 75 000 70 000 88 000 82 500 96000
Private practice Salaried Salarié – Secteur privé n/a 82 000 48 000 90 750
100 000 50000
Private in-house L’industrie / commerce n/a 31 000 n/a n/a n/a n/a
Freelance Indépendant n/a 50 000 57 000 60 000 n/a n/a
Other Private Autres – Secteur privé n/a n/a 60 000 80 000 n/a n/a
Local / central government Collectivité locale / gouvernement n/a n/a n/a n/a n/a n/a
Other Public Autre – secteur public n/a 56 400 n/a n/a n/a n/a
* 2008-12 = architects who are obliged to register. 2014 onwards includes voluntary registrations.
D R A F T
SECTION 2 - 90THE ARCHITECTURAL PROFESSION IN EUROPE 2020 / LA PROFESSION D’ARCHITECTE EN EUROPE 2020

MIRZA & NACEY RESEARCH
Social & Economic Social & Economiqueconstruction / GDP previous year construction / PIB année précédente
Architectural Profession Profession d’architecte
Architectural Market Marché de l’architecture
Field of Employment Domaine d’activité
Malt
a2010 2012 2014 2016 2018 2020
Population 414 372 420 085 425 384 434 403 475 701 514 564
GDP PIB € m 6 235 6 499 7 263 8 788 11 140 13 390
GDP/PIB head/habitant € 15 046 15 471 17 073 20 231 23 417 26 022
Construction € m 503 501 744 1 043 1 300 1 942
2010 2012 2014 2016 2018 2020
Architects Architectes 650 650 650 650-950* 1 000 1 000
% Male Homme n/a 76 73 64 64 n/a
% Female Femme n/a 24 27 36 36 n/a
% <40 years <40 ans 0 56 52 58 67 n/a
Practices Bureaux n/a 146 130 99 150 n/a
2010 2012 2014 2016 2018 2020
Market Marché (€ m) n/a 16 13 10 19 n/a
Average turnover per practice (€) : Revenu moyen par bureaux d’architecture (€) :
2 persons personnes n/a 86 125 24 500 n/a n/a n/a6 - 10 persons personnes n/a n/a 375 000 n/a n/a n/a
Trends 2010-20 Tendances 2010-20
Earnings Revenus
Response Réponse
2010 2012 2014 2016 2018 2020
Participants Répondants n/a 41 74 45 66 n/a
Accuracy of results 95% confidence Précision des résultats: 95% confiance n/a +/- 14.8 +/- 10.7 +/- 14.1 11.7 n/a
0
500
1000
1500
2020201820162014201220100
20
40
60
num
ber a
rchi
tect
s/pr
actic
es n
ombr
e d’
arch
itect
es/b
urea
ux
total market size taille totale du m
arché €m
architects (left axis) architectes (axe de gauche) practices (left axis) bureaux (axe de gauche) market (right axis) marché (axe de droite)
Malte
* Earnings values are unadjusted for PPP * Revenu moyen NON ajusté par PPA
per cent pourcentage
2010 2012 2014 2016 2018 2020
Sole Principals Dirigeant unique n/a 18 17 9 21 n/a
Partners & Directors Associé dirigeant n/a 16 5 5 8 n/a
Private practice Salaried Salarié – Secteur privé n/a 29 35 41 41 n/a
Private in-house L’industrie / commerce n/a 0 6 0 2 n/a
Freelance Indépendant n/a 3 6 5 3 n/a
Other Private Autres – Secteur privé n/a 11 6 7 8 n/a
Local / central government Collectivité locale / gouvernement n/a 8 19 18 8 n/a
Other Public Autre – secteur public n/a 16 5 16 11 n/a
Average earnings €* Revenu moyen en € *
2010 2012 2014 2016 2018 2020
Sole Principals Dirigeant unique n/a 25 000 25 000 n/a 45 000 n/a
Partners & Directors Associé dirigeant n/a 45 000 57 500 n/a n/a n/a
Private practice Salaried Salarié – Secteur privé n/a 25 000 21 750 21 300 25 000 n/a
Private in-house L’industrie / commerce n/a 50 000 n/a n/a n/a n/a
Freelance Indépendant n/a 45 000 40 843 n/a n/a n/a
Other Private Autres – Secteur privé n/a 25 000 32 500 n/a 47 919 n/a
Local / central government Collectivité locale / gouvernement n/a 21 300 30 000 28 950 28 000 n/a
Other Public Autre – secteur public n/a 25 000 40 000 38 500 26 500 n/a
* revosed
revised / révisé D R A F T
SECTION 2 - 91THE ARCHITECTURAL PROFESSION IN EUROPE 2020 / LA PROFESSION D’ARCHITECTE EN EUROPE 2020

MIRZA & NACEY RESEARCH
Social & Economic Social & Economiqueconstruction / GDP previous year construction / PIB année précédente
Architectural Profession Profession d’architecte
Architectural Market Marché de l’architecture
Field of Employment Domaine d’activité
Neth
erl
ands
2010 2012 2014 2016 2018 2020
Population 16 577 612 16 730 348 16 829 289 16 979 120 17 118 084 17 407 585
GDP PIB € m 585 318 606 111 602 658 676 531 737 048 810 247
GDP/PIB head/habitant € 35 308 36 228 35 810 39 845 43 057 46 546
Construction € m 75 162 76 913 70 385 100 870 107 798 117 097
2010 2012* 2014* 2016 2018 2020
Architects Architectes 9 900 10 700 10 900 11 200 10 600 10 400
% Male Homme 81 79 79 80 77 70
% Female Femme 19 21 21 20 23 30
% <40 years <40 ans 32 35 35 39 25 26
Practices Bureaux 3 255 n/a 3 714 3 692 3 428 2 772
2010 2012* 2014* 2016 2018 2020
Market Marché (€ m) 976 807 910 940 783 704
Average turnover per practice (€) : Revenu moyen par bureaux d’architecture (€) :
2 persons personnes 228 532 85 000 105 000 134 649 105 581 140 7666 - 10 persons personnes 835 500 550 000 560 000 520 133 531 529 709 500
Trends 2010-20 Tendances 2010-20
Earnings Revenus
Response Réponse
2010 2012 2014 2016 2018 2020
Participants Répondants 214 n/a 10 482 464 49
Accuracy of results 95% confidence Précision des résultats: 95% confiance +/-7 n/a +/- 31.0 +/- 4.4 4.4 14
0
2000
4000
6000
8000
10000
12000
14000
16000
2020201820162014201220100
200
400
600
800
1000
1200
1400
1600
num
ber a
rchi
tect
s/pr
actic
es n
ombr
e d’
arch
itect
es/b
urea
ux
total market size taille totale du m
arché €m
architects (left axis) architectes (axe de gauche) practices (left axis) bureaux (axe de gauche) market (right axis) marché (axe de droite)
Pays-B
as
* Earnings values are unadjusted for PPP * Revenu moyen NON ajusté par PPA
2012/14: BNA Annual Benchmark Research 2012 151 / 2014 135 Participants Répondants
* 2012 / 2014: BNA Annual Benchmark Research
per cent pourcentage
2010 2012* 2014* 2016 2018 2020
Sole Principals Dirigeant unique 20 20 20 9 28 38
Partners & Directors Associé dirigeant 21 20 18 9 18 17
Private practice Salaried Salarié – Secteur privé 8 10 10 3 18 27
Private in-house L’industrie / commerce 0 2 2 2 2 0
Freelance Indépendant 7 40 45 12 22 0
Other Private Autres – Secteur privé 41 5 2 61 4 10
Local / central government Collectivité locale / gouvernement 0 1 1 2 3 2
Other Public Autre – secteur public 3 2 2 3 5 6
Average earnings €* Revenu moyen en € *
2010 2012* 2014* 2016 2018 2020
Sole Principals Dirigeant unique 45 000 41 000 40 000 50 000 60 000 77500
Partners & Directors Associé dirigeant 71 000 70 000 70 000 56 850 60 000 56000
Private practice Salaried Salarié – Secteur privé 60 000 41 000 40 000 47 500 45 000 35000
Private in-house L’industrie / commerce 50 000 50 000 50 000 49 000 n/a n/a
Freelance Indépendant 64 500 47 000 47 500 29 500 42 500 n/a
Other Private Autres – Secteur privé n/a 44 000 45 000 40 000 50 000 n/a
Local / central government Collectivité locale / gouvernement 83 000 46 000 45 000 n/a 60 000 n/a
Other Public Autre – secteur public 55 000 55 000 55 000 62 500 55 000 n/a
* 2012 / 2014: BNA Annual Benchmark Research
* 2012 / 2014: BNA Annual Benchmark Research
D R A F T
SECTION 2 - 92THE ARCHITECTURAL PROFESSION IN EUROPE 2020 / LA PROFESSION D’ARCHITECTE EN EUROPE 2020
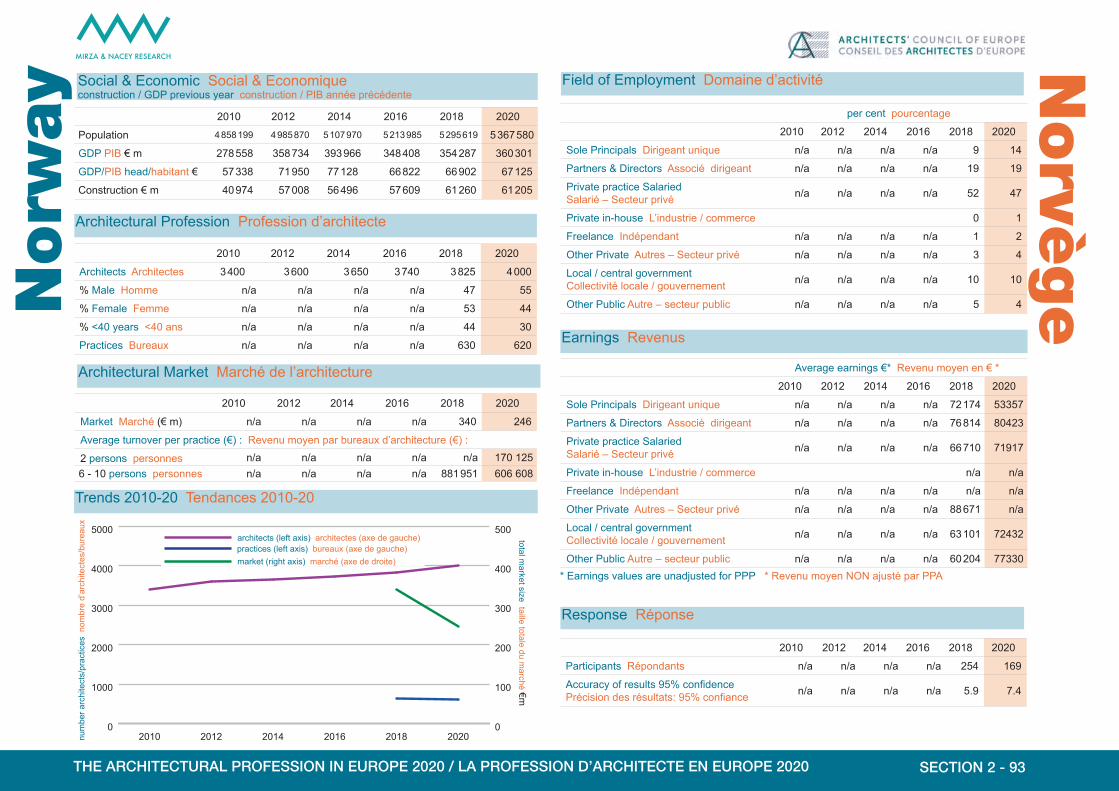
MIRZA & NACEY RESEARCH
Social & Economic Social & Economiqueconstruction / GDP previous year construction / PIB année précédente
Architectural Profession Profession d’architecte
Architectural Market Marché de l’architecture
Field of Employment Domaine d’activité
Norw
ay
2010 2012 2014 2016 2018 2020
Population 4 858 199 4 985 870 5 107 970 5 213 985 5 295 619 5 367 580
GDP PIB € m 278 558 358 734 393 966 348 408 354 287 360 301
GDP/PIB head/habitant € 57 338 71 950 77 128 66 822 66 902 67 125
Construction € m 40 974 57 008 56 496 57 609 61 260 61 205
2010 2012 2014 2016 2018 2020
Architects Architectes 3 400 3 600 3 650 3 740 3 825 4 000
% Male Homme n/a n/a n/a n/a 47 55
% Female Femme n/a n/a n/a n/a 53 44
% <40 years <40 ans n/a n/a n/a n/a 44 30
Practices Bureaux n/a n/a n/a n/a 630 620
2010 2012 2014 2016 2018 2020
Market Marché (€ m) n/a n/a n/a n/a 340 246
Average turnover per practice (€) : Revenu moyen par bureaux d’architecture (€) :
2 persons personnes n/a n/a n/a n/a n/a 170 1256 - 10 persons personnes n/a n/a n/a n/a 881 951 606 608
Trends 2010-20 Tendances 2010-20
Earnings Revenus
Response Réponse
2010 2012 2014 2016 2018 2020
Participants Répondants n/a n/a n/a n/a 254 169
Accuracy of results 95% confidence Précision des résultats: 95% confiance n/a n/a n/a n/a 5.9 7.4
Norvè
ge
* Earnings values are unadjusted for PPP * Revenu moyen NON ajusté par PPA
per cent pourcentage
2010 2012 2014 2016 2018 2020
Sole Principals Dirigeant unique n/a n/a n/a n/a 9 14
Partners & Directors Associé dirigeant n/a n/a n/a n/a 19 19
Private practice Salaried Salarié – Secteur privé n/a n/a n/a n/a 52 47
Private in-house L’industrie / commerce 0 1
Freelance Indépendant n/a n/a n/a n/a 1 2
Other Private Autres – Secteur privé n/a n/a n/a n/a 3 4
Local / central government Collectivité locale / gouvernement n/a n/a n/a n/a 10 10
Other Public Autre – secteur public n/a n/a n/a n/a 5 4
Average earnings €* Revenu moyen en € *
2010 2012 2014 2016 2018 2020
Sole Principals Dirigeant unique n/a n/a n/a n/a 72 174 53357
Partners & Directors Associé dirigeant n/a n/a n/a n/a 76 814 80423
Private practice Salaried Salarié – Secteur privé n/a n/a n/a n/a 66 710 71917
Private in-house L’industrie / commerce n/a n/a
Freelance Indépendant n/a n/a n/a n/a n/a n/a
Other Private Autres – Secteur privé n/a n/a n/a n/a 88 671 n/a
Local / central government Collectivité locale / gouvernement n/a n/a n/a n/a 63 101 72432
Other Public Autre – secteur public n/a n/a n/a n/a 60 204 77330
0
1000
2000
3000
4000
5000
2020201820162014201220100
100
200
300
400
500
num
ber a
rchi
tect
s/pr
actic
es n
ombr
e d’
arch
itect
es/b
urea
ux
total market size taille totale du m
arché €m
architects (left axis) architectes (axe de gauche) practices (left axis) bureaux (axe de gauche) market (right axis) marché (axe de droite) D R A F T
SECTION 2 - 93THE ARCHITECTURAL PROFESSION IN EUROPE 2020 / LA PROFESSION D’ARCHITECTE EN EUROPE 2020

MIRZA & NACEY RESEARCH
Social & Economic Social & Economiqueconstruction / GDP previous year construction / PIB année précédente
Architectural Profession Profession d’architecte
Architectural Market Marché de l’architecture
Field of Employment Domaine d’activité
Pola
nd
2010 2012 2014 2016 2018 2020
Population 38 167 329 38 208 618 n/a 37 967 209 37 976 687 37 958 138
GDP PIB € m 353 306 370 014 n/a 427 737 467 167 532 329
GDP/PIB head/habitant € 9 257 9 684 n/a 11 266 12 301 14 024
Construction € m 61 695 68 723 n/a 61 170 103 477 99 256
2010 2012 2014 2016 2018 2020
Architects Architectes 13 500 13 700 n/a 14 000 14 000 14 000
% Male Homme 54 55 n/a 54 59 42
% Female Femme 46 45 n/a 46 41 58
% <40 years <40 ans 54 51 n/a 66 72 70
Practices Bureaux 4 330 4 423 n/a 4 138 4 146 4 070
2010 2012 2014 2016 2018 2020
Market Marché (€ m) 259 211 n/a 212 208 229
Average turnover per practice (€) : Revenu moyen par bureaux d’architecture (€) :
2 persons personnes 35 645 24 566 n/a 19 624 n/a 29 0966 - 10 persons personnes 208 280 132 438 n/a 199 662 n/a 132 786
Trends 2010-20 Tendances 2010-20
Earnings Revenus
Response Réponse
2010 2012 2014 2016 2018 2020
Participants Répondants 704 560 n/a 201 36 85
Accuracy of results 95% confidence Précision des résultats: 95% confiance +/-4 +/- 4.1 n/a +/- 6.9 16.3 10.6
Polo
gne
* Earnings values are unadjusted for PPP * Revenu moyen NON ajusté par PPA
per cent pourcentage
2010 2012 2014 2016 2018 2020
Sole Principals Dirigeant unique 45 41 n/a 35 34 35
Partners & Directors Associé dirigeant 13 14 n/a 11 16 8
Private practice Salaried Salarié – Secteur privé 26 27 n/a 29 44 46
Private in-house L’industrie / commerce 1 2 n/a 0 0 1
Freelance Indépendant 5 5 n/a 12 3 5
Other Private Autres – Secteur privé 5 3 n/a 6 0 0
Local / central government Collectivité locale / gouvernement 4 5 n/a 7 0 2
Other Public Autre – secteur public 1 2 n/a 2 3 2
Average earnings €* Revenu moyen en € *
2010 2012 2014 2016 2018 2020
Sole Principals Dirigeant unique 13 604 14 453 n/a 12 208 n/a 14060
Partners & Directors Associé dirigeant 22 674 23 487 n/a 40 047 n/a 36789
Private practice Salaried Salarié – Secteur privé 12 697 11 804 n/a 4 929 8 436 10545
Private in-house L’industrie / commerce n/a n/a n/a n/a
Freelance Indépendant 14 864 9 154 n/a 4 381 n/a 13076
Other Private Autres – Secteur privé 21 414 19 223 n/a 799 n/a n/a
Local / central government Collectivité locale / gouvernement 13 730 8 672 n/a 11 078 n/a n/a
Other Public Autre – secteur public 8 818 1 349 n/a n/a n/a n/a
0
3000
6000
9000
12000
15000
18000
21000
2020201820162014201220100
50
100
150
200
250
300
350
num
ber a
rchi
tect
s/pr
actic
es n
ombr
e d’
arch
itect
es/b
urea
ux
total market size taille totale du m
arché €m
architects (left axis) architectes (axe de gauche) practices (left axis) bureaux (axe de gauche) market (right axis) marché (axe de droite) D R A F T
SECTION 2 - 94THE ARCHITECTURAL PROFESSION IN EUROPE 2020 / LA PROFESSION D’ARCHITECTE EN EUROPE 2020

MIRZA & NACEY RESEARCH
Social & Economic Social & Economiqueconstruction / GDP previous year construction / PIB année précédente
Architectural Profession Profession d’architecte
Architectural Market Marché de l’architecture
Field of Employment Domaine d’activité
Port
ugal
2010 2012 2014 2016 2018 2020
Population 10 637 713 10 541 840 10 427 301 10 341 330 10 291 027 10 295 909
GDP PIB € m 172 670 170 907 165 690 179 540 194 614 213 301
GDP/PIB head/habitant € 16 232 16 212 15 890 17 361 18 911 20 717
Construction € m 25 246 22 671 18 710 16 342 17 832 22 425
2010 2012 2014 2016 2018 2020
Architects Architectes 13 000 17 100 21 200 22 200 23 000 26 000
% Male Homme n/a 56 57 55 54 54
% Female Femme n/a 44 43 45 46 46
% <40 years <40 ans n/a 73 68 53 46 50
Practices Bureaux n/a 3 226 4 462 3 479 3 356 2 562
2010 2012 2014 2016 2018 2020
Market Marché (€ m) n/a 261 177 276 348 427
Average turnover per practice (€) : Revenu moyen par bureaux d’architecture (€) :
2 persons personnes n/a 35 078 38 123 46 334 32 997 53 6286 - 10 persons personnes n/a 508 499 223 173 207 800 183 540 294 549
Trends 2010-20 Tendances 2010-20
Earnings Revenus
Response Réponse
2010 2012 2014 2016 2018 2020
Participants Répondants n/a 1 678 1 836 718 1 508 1 532
Accuracy of results 95% confidence Précision des résultats: 95% confiance n/a +/- 2.2 +/- 2.2 +/- 3.6 2.4 2.4
0
5000
10000
15000
20000
25000
30000
35000
2020201820162014201220100
100
200
300
400
500
600
700
num
ber a
rchi
tect
s/pr
actic
es n
ombr
e d’
arch
itect
es/b
urea
ux
total market size taille totale du m
arché €m
architects (left axis) architectes (axe de gauche) practices (left axis) bureaux (axe de gauche) market (right axis) marché (axe de droite)
Portu
gal
* Earnings values are unadjusted for PPP * Revenu moyen NON ajusté par PPA
per cent pourcentage
2010 2012 2014 2016 2018 2020
Sole Principals Dirigeant unique n/a 11 9 11 13 15
Partners & Directors Associé dirigeant n/a 12 10 10 10 10
Private practice Salaried Salarié – Secteur privé n/a 35 37 33 31 39
Private in-house L’industrie / commerce n/a 1 2 1 1 1
Freelance Indépendant n/a 15 13 18 17 12
Other Private Autres – Secteur privé n/a 6 4 3 3 3
Local / central government Collectivité locale / gouvernement n/a 13 21 17 18 15
Other Public Autre – secteur public n/a 7 5 6 6 5
Average earnings €* Revenu moyen en € *
2010 2012 2014 2016 2018 2020
Sole Principals Dirigeant unique n/a 13 000 12 835 14 000 11 520 12000
Partners & Directors Associé dirigeant n/a 14 300 14 125 14 400 15 000 15000
Private practice Salaried Salarié – Secteur privé n/a 10 600 9 500 9 600 10 200 11079
Private in-house L’industrie / commerce n/a 10 850 n/a n/a 10 000 14400
Freelance Indépendant n/a 11 900 10 833 11 000 13 200 10000
Other Private Autres – Secteur privé n/a 15 521 11 000 12 250 10 600 9800
Local / central government Collectivité locale / gouvernement n/a 18 150 16 820 16 407 16 780 16870
Other Public Autre – secteur public n/a 12 000 16 400 20 940 15 000 18865 D R A F T
SECTION 2 - 95THE ARCHITECTURAL PROFESSION IN EUROPE 2020 / LA PROFESSION D’ARCHITECTE EN EUROPE 2020

MIRZA & NACEY RESEARCH
Social & Economic Social & Economiqueconstruction / GDP previous year construction / PIB année précédente
Architectural Profession Profession d’architecte
Architectural Market Marché de l’architecture
Field of Employment Domaine d’activité
Rom
ania 2010 2012 2014 2016 2018 2020
Population 21 462 186 21 355 849 19 942 642 19 759 968 19 523 621 19 317 984
GDP PIB € m 123 134 136 479 142 245 160 353 187 940 223 337
GDP/PIB head/habitant € 5 737 6 391 7 133 8 115 9 626 11 561
Construction € m 19 877 22 034 31 461 30 014 24 414 40 354
2010 2012 2014 2016 2018 2020
Architects Architectes 5 500 7 400 7 400 7 600 9 900 10 500
% Male Homme 53 56 55 77 55 56
% Female Femme 47 44 45 23 45 44
% <40 years <40 ans 48 47 42 33 61 59
Practices Bureaux 1 697 1 851 2 037 1 666 2 407 2 514
2010 2012 2014 2016 2018 2020
Market Marché (€ m) 64 90 79 77 136 182
Average turnover per practice (€) : Revenu moyen par bureaux d’architecture (€) :
2 persons personnes 29 227 52 789 36 042 n/a 20 816 30 4196 - 10 persons personnes 68 073 175 358 257 460 81 265 887 162 128 313
Trends 2010-20 Tendances 2010-20
Earnings Revenus
Response Réponse
2010 2012 2014 2016 2018 2020
Participants Répondants 204 365 245 39 522 349
Accuracy of results 95% confidence Précision des résultats: 95% confiance +/-7 +/- 5.0 +/- 6.2 +/- 15.7 4.2 5.2
0
5000
10000
15000
2020201820162014201220100
100
200
300
num
ber a
rchi
tect
s/pr
actic
es n
ombr
e d’
arch
itect
es/b
urea
ux
total market size taille totale du m
arché €m
architects (left axis) architectes (axe de gauche) practices (left axis) bureaux (axe de gauche) market (right axis) marché (axe de droite)
Roum
anie
* Earnings values are unadjusted for PPP * Revenu moyen NON ajusté par PPA
per cent pourcentage
2010 2012 2014 2016 2018 2020
Sole Principals Dirigeant unique 28 23 26 33 26 33
Partners & Directors Associé dirigeant 12 20 22 26 19 14
Private practice Salaried Salarié – Secteur privé 37 26 27 13 37 40
Private in-house L’industrie / commerce 2 1 1 0 1 0
Freelance Indépendant 10 3 1 0 10 4
Other Private Autres – Secteur privé 4 21 17 15 3 3
Local / central government Collectivité locale / gouvernement 2 1 2 8 1 2
Other Public Autre – secteur public 5 5 5 5 4 3
Average earnings €* Revenu moyen en € *
2010 2012 2014 2016 2018 2020
Sole Principals Dirigeant unique 4 699 11 349 7 753 9 155 10 363 10833
Partners & Directors Associé dirigeant 5 286 7 149 6 890 12 141 5 866 13693
Private practice Salaried Salarié – Secteur privé 5 286 5 517 2 300 2 900 3 522 7722
Private in-house L’industrie / commerce 3 552 6 755 n/a n/a n/a n/a
Freelance Indépendant 5 874 4 053 n/a n/a 6 203 4200
Other Private Autres – Secteur privé 11 445 3 242 3 615 n/a 14 506 14862
Local / central government Collectivité locale / gouvernement 3 524 1 430 n/a n/a n/a 2400
Other Public Autre – secteur public 4 699 6 485 7 003 n/a 1 296 1630 D R A F T
SECTION 2 - 96THE ARCHITECTURAL PROFESSION IN EUROPE 2020 / LA PROFESSION D’ARCHITECTE EN EUROPE 2020

MIRZA & NACEY RESEARCH
Social & Economic Social & Economiqueconstruction / GDP previous year construction / PIB année précédente
Architectural Profession Profession d’architecte
Architectural Market Marché de l’architecture
Field of Employment Domaine d’activité
Serb
ia 2010 2012 2014 2016 2018 2020
Population 7 306 677 7 216 649 7 146 759 7 076 372 7 001 444 6 926 705
GDP PIB € m 31 546 35 432 36 427 35 740 36 795 45 970
GDP/PIB head/habitant € 4 317 4 910 5 097 4 733 5 255 6 637
Construction € m 4 471 5 526 4 357 1 945 6 727 10 438
2010 2012 2014 2016 2018 2020
Architects Architectes n/a n/a 8 000 8 000 8 000 8 000
% Male Homme n/a n/a n/a n/a n/a 33
% Female Femme n/a n/a n/a n/a n/a 67
% <40 years <40 ans n/a n/a n/a n/a n/a 50
Practices Bureaux n/a n/a n/a n/a n/a 1 835
2010 2012 2014 2016 2018 2020
Market Marché (€ m) n/a n/a n/a n/a n/a 78
Average turnover per practice (€) : Revenu moyen par bureaux d’architecture (€) :
2 persons personnes n/a n/a n/a n/a n/a 14 0006 - 10 persons personnes n/a n/a n/a n/a n/a 111 000
Trends 2010-20 Tendances 2010-20
Earnings Revenus
Response Réponse
2010 2012 2014 2016 2018 2020
Participants Répondants n/a n/a n/a n/a n/a 15
Accuracy of results 95% confidence Précision des résultats: 95% confiance n/a n/a n/a n/a n/a 25.3
0
3000
6000
9000
12000
15000
2020201820162014201220100
50
100
150
200
250
num
ber a
rchi
tect
s/pr
actic
es n
ombr
e d’
arch
itect
es/b
urea
ux
total market size taille totale du m
arché €m
architects (left axis) architectes (axe de gauche) practices (left axis) bureaux (axe de gauche) market (right axis) marché (axe de droite)
Serb
ie
* Earnings values are unadjusted for PPP * Revenu moyen NON ajusté par PPA
Average earnings €* Revenu moyen en € *
2010 2012 2014 2016 2018 2020
Sole Principals Dirigeant unique n/a n/a n/a n/a n/a n/a
Partners & Directors Associé dirigeant n/a n/a n/a n/a n/a n/a
Private practice Salaried Salarié – Secteur privé n/a n/a n/a n/a n/a 7700
Private in-house L’industrie / commerce n/a n/a n/a n/a n/a n/a
Freelance Indépendant n/a n/a n/a n/a n/a n/a
Other Private Autres – Secteur privé n/a n/a n/a n/a n/a n/a
Local / central government Collectivité locale / gouvernement n/a n/a n/a n/a n/a n/a
Other Public Autre – secteur public n/a n/a n/a n/a n/a n/a
per cent pourcentage
2010 2012 2014 2016 2018 2020
Sole Principals Dirigeant unique n/a n/a n/a n/a n/a 33
Partners & Directors Associé dirigeant n/a n/a n/a n/a n/a 7
Private practice Salaried Salarié – Secteur privé n/a n/a n/a n/a n/a 40
Private in-house L’industrie / commerce n/a n/a n/a n/a n/a 0
Freelance Indépendant n/a n/a n/a n/a n/a 0
Other Private Autres – Secteur privé n/a n/a n/a n/a n/a 0
Local / central government Collectivité locale / gouvernement n/a n/a n/a n/a n/a 13
Other Public Autre – secteur public n/a n/a n/a n/a n/a 7
D R A F T
SECTION 2 - 97THE ARCHITECTURAL PROFESSION IN EUROPE 2020 / LA PROFESSION D’ARCHITECTE EN EUROPE 2020

MIRZA & NACEY RESEARCH
Social & Economic Social & Economiqueconstruction / GDP previous year construction / PIB année précédente
Architectural Profession Profession d’architecte
Architectural Market Marché de l’architecture
Field of Employment Domaine d’activité
Slo
vakia 2010 2012 2014 2016 2018 2020
Population 5 424 925 5 404 322 5 415 949 5 426 252 5 443 120 5 457 873
GDP PIB € m 65 592 71 730 72 134 78 686 84 851 93 865
GDP/PIB head/habitant € 12 091 13 273 13 319 14 501 15 589 17 198
Construction € m 13 335 12 761 12 343 12 418 15 430 15 263
2010 2012 2014 2016 2018 2020
Architects Architectes 1 600 1 600 1 750 1 650 1 730 1 800
% Male Homme 85 n/a 79 77 n/a 80
% Female Femme 15 n/a 21 23 n/a 20
% <40 years <40 ans 27 n/a 28 33 n/a 19
Practices Bureaux 294 n/a 487 449 n/a 409
2010 2012 2014 2016 2018 2020
Market Marché (€ m) 41 n/a 15 22 n/a 29
Average turnover per practice (€) : Revenu moyen par bureaux d’architecture (€) :
2 persons personnes n/a n/a 23 254 45 100 n/a 32 8756 - 10 persons personnes n/a n/a 41 577 202 667 n/a 214 423
Trends 2010-20 Tendances 2010-20
Earnings Revenus
Response Réponse
2010 2012 2014 2016 2018 2020
Participants Répondants 34 n/a 416 143 n/a 187
Accuracy of results 95% confidence Précision des résultats: 95% confiance +/-17 n/a +/- 4.2 +/- 7.8 n/a 6.8
0
1000
2000
3000
4000
5000
2020201820162014201220100
50
100
150
200
250
num
ber a
rchi
tect
s/pr
actic
es n
ombr
e d’
arch
itect
es/b
urea
ux
total market size taille totale du m
arché €m
architects (left axis) architectes (axe de gauche) practices (left axis) bureaux (axe de gauche) market (right axis) marché (axe de droite)
Slo
vaquie
* Earnings values are unadjusted for PPP * Revenu moyen NON ajusté par PPA
Average earnings €* Revenu moyen en € *
2010 2012 2014 2016 2018 2020
Sole Principals Dirigeant unique 15 000 n/a 10 000 14 700 n/a 25000
Partners & Directors Associé dirigeant 38 000 n/a 11 500 10 800 n/a 34500
Private practice Salaried Salarié – Secteur privé 13 650 n/a 13 000 13 000 n/a 21000
Private in-house L’industrie / commerce 13 000 n/a n/a n/a n/a n/a
Freelance Indépendant n/a n/a 9 928 8 725 n/a 20000
Other Private Autres – Secteur privé n/a n/a 21 500 n/a n/a n/a
Local / central government Collectivité locale / gouvernement n/a n/a 12 657 n/a n/a n/a
Other Public Autre – secteur public 16 378 n/a 10 000 n/a n/a 12000
per cent pourcentage
2010 2012 2014 2016 2018 2020
Sole Principals Dirigeant unique 31 n/a 38 35 n/a 55
Partners & Directors Associé dirigeant 13 n/a 10 19 n/a 14
Private practice Salaried Salarié – Secteur privé 22 n/a 17 10 n/a 13
Private in-house L’industrie / commerce 0 n/a 0 1 n/a 1
Freelance Indépendant 22 n/a 26 24 n/a 11
Other Private Autres – Secteur privé 3 n/a 4 4 n/a 2
Local / central government Collectivité locale / gouvernement 3 n/a 3 5 n/a 2
Other Public Autre – secteur public 6 n/a 3 2 n/a 3
D R A F T
SECTION 2 - 98THE ARCHITECTURAL PROFESSION IN EUROPE 2020 / LA PROFESSION D’ARCHITECTE EN EUROPE 2020

MIRZA & NACEY RESEARCH
Social & Economic Social & Economiqueconstruction / GDP previous year construction / PIB année précédente
Architectural Profession Profession d’architecte
Architectural Market Marché de l’architecture
Field of Employment Domaine d’activité
Slo
venia 2010 2012 2014 2016 2018 2020
Population 2 046 976 2 055 496 2 061 085 2 064 188 2 066 880 2 095 861
GDP PIB € m 35 800 36 172 35 275 38 570 43 000 48 393
GDP/PIB head/habitant € 17 489 17 598 17 115 18 685 20 804 23 090
Construction € m 6 585 4 864 5 522 4 339 7 309 7 404
2010 2012 2014 2016 2018 2020
Architects Architectes 1 250 1 250 1 300 1 350 1 380 1 460
% Male Homme 50 57 44 48 52 46
% Female Femme 50 43 56 52 48 54
% <40 years <40 ans 43 33 33 24 43 29
Practices Bureaux 186 417 578 444 386 447
2010 2012 2014 2016 2018 2020
Market Marché (€ m) 10 42 25 36 30 40
Average turnover per practice (€) : Revenu moyen par bureaux d’architecture (€) :
2 persons personnes n/a n/a 29 050 62 595 n/a 50 3466 - 10 persons personnes n/a n/a n/a 115 800 168 750 300 000
Trends 2010-20 Tendances 2010-20
Earnings Revenus
Response Réponse
2010 2012 2014 2016 2018 2020
Participants Répondants 43 37 53 111 46 89
Accuracy of results 95% confidence Précision des résultats: 95% confiance +/-15 +/-
15.9 +/- 13.2 +/- 9.0 14.2 10.1
0
500
1000
1500
2000
2500
2020201820162014201220100
20
40
60
80
100
num
ber a
rchi
tect
s/pr
actic
es n
ombr
e d’
arch
itect
es/b
urea
ux
total market size taille totale du m
arché €m
architects (left axis) architectes (axe de gauche) practices (left axis) bureaux (axe de gauche) market (right axis) marché (axe de droite)
Slo
vénie
* Earnings values are unadjusted for PPP * Revenu moyen NON ajusté par PPA
per cent pourcentage
2010 2012 2014 2016 2018 2020
Sole Principals Dirigeant unique 21 34 30 20 33 40
Partners & Directors Associé dirigeant 24 19 33 17 13 15
Private practice Salaried Salarié – Secteur privé 36 25 13 19 26 24
Private in-house L’industrie / commerce 0 0 0 4 4 6
Freelance Indépendant 10 13 20 19 20 2
Other Private Autres – Secteur privé 2 3 0 14 0 6
Local / central government Collectivité locale / gouvernement 5 3 3 6 4 6
Other Public Autre – secteur public 2 3 3 3 0 1
Average earnings €* Revenu moyen en € *
2010 2012 2014 2016 2018 2020
Sole Principals Dirigeant unique 24 000 20 500 24 000 20 000 34 500 33600
Partners & Directors Associé dirigeant 17 000 33 000 14 400 20 000 n/a 41000
Private practice Salaried Salarié – Secteur privé 30 000 4 493 13 200 15 000 n/a 17500
Private in-house L’industrie / commerce 7 550 7 750 n/a n/a n/a n/a
Freelance Indépendant n/a 22 000 20 000 12 830 21 000 n/a
Other Private Autres – Secteur privé n/a 13 500 n/a 14 000 n/a 15000
Local / central government Collectivité locale / gouvernement n/a 1 200 n/a n/a n/a n/a
Other Public Autre – secteur public 25 000 15 000 n/a n/a n/a n/a D R A F T
SECTION 2 - 99THE ARCHITECTURAL PROFESSION IN EUROPE 2020 / LA PROFESSION D’ARCHITECTE EN EUROPE 2020

MIRZA & NACEY RESEARCH
Social & Economic Social & Economiqueconstruction / GDP previous year construction / PIB année précédente
Architectural Profession Profession d’architecte
Architectural Market Marché de l’architecture
Field of Employment Domaine d’activité
Spain 2010 2012 2014 2016 2018 2020
Population 45 989 016 46 196 277 46 507 760 46 438 422 46 659 302 47 329 981
GDP PIB € m 1 048 883 1 063 355 1 022 988 1 075 639 1 166 319 1 244 772
GDP/PIB head/habitant € 22 807 23 018 21 996 23 163 24 996 26 300
Construction € m 191 820 156 525 162 642 131 177 146 327 162 643
2010 2012 2014 2016 2018 2020
Architects Architectes 50 000 51 000 51 700 53 800 55 700 47 600
% Male Homme n/a 75 71 72 65 66
% Female Femme n/a 25 29 28 35 34
% <40 years <40 ans n/a 56 41 50 42 48
Practices Bureaux n/a 8 153 7 742 8 077 10 337 8 567
2010 2012 2014 2016 2018 2020
Market Marché (€ m) n/a 336 333 461 556 593
Average turnover per practice (€) : Revenu moyen par bureaux d’architecture (€) :
2 persons personnes n/a 58 452 42 864 29 855 47 953 63 4536 - 10 persons personnes n/a 193 125 153 339 286 250 n/a 213 000
Trends 2010-20 Tendances 2010-20
Earnings Revenus
Response Réponse
2010 2012 2014 2016 2018 2020
Participants Répondants n/a 184 645 383 194 259
Accuracy of results 95% confidence Précision des résultats: 95% confiance n/a +/- 7.2 +/- 3.8 +/- 5.0 7.0 6.1
0
10000
20000
30000
40000
50000
60000
70000
2020201820162014201220100
100
200
300
400
500
600
700
num
ber a
rchi
tect
s/pr
actic
es n
ombr
e d’
arch
itect
es/b
urea
ux
total market size taille totale du m
arché €m
architects (left axis) architectes (axe de gauche) practices (left axis) bureaux (axe de gauche) market (right axis) marché (axe de droite)
Esp
agne
* Earnings values are unadjusted for PPP * Revenu moyen NON ajusté par PPA
per cent pourcentage
2010 2012 2014 2016 2018 2020
Sole Principals Dirigeant unique n/a 21 17 14 28 32
Partners & Directors Associé dirigeant n/a 11 7 6 10 12
Private practice Salaried Salarié – Secteur privé n/a 5 11 14 20 26
Private in-house L’industrie / commerce n/a 0 0 0 1 1
Freelance Indépendant n/a 14 12 13 22 12
Other Private Autres – Secteur privé n/a 48 40 44 3 2
Local / central government Collectivité locale / gouvernement n/a 1 7 6 7 7
Other Public Autre – secteur public n/a 1 6 3 9 8
Average earnings €* Revenu moyen en € *
2010 2012 2014 2016 2018 2020
Sole Principals Dirigeant unique n/a 30 250 30 000 15 000 29 100 30000
Partners & Directors Associé dirigeant n/a 18 000 25 000 25 000 26 000 30000
Private practice Salaried Salarié – Secteur privé n/a 16 000 30 000 24 000 18 000 26000
Private in-house L’industrie / commerce n/a 15 000 n/a n/a n/a n/a
Freelance Indépendant n/a 26 400 20 000 21 000 20 000 22500
Other Private Autres – Secteur privé n/a 20 000 25 000 20 500 23 000 n/a
Local / central government Collectivité locale / gouvernement n/a 4 200 40 304 52 000 39 000 41500
Other Public Autre – secteur public n/a 20 000 36 000 41 000 33 600 50000 D R A F T
SECTION 2 - 100THE ARCHITECTURAL PROFESSION IN EUROPE 2020 / LA PROFESSION D’ARCHITECTE EN EUROPE 2020
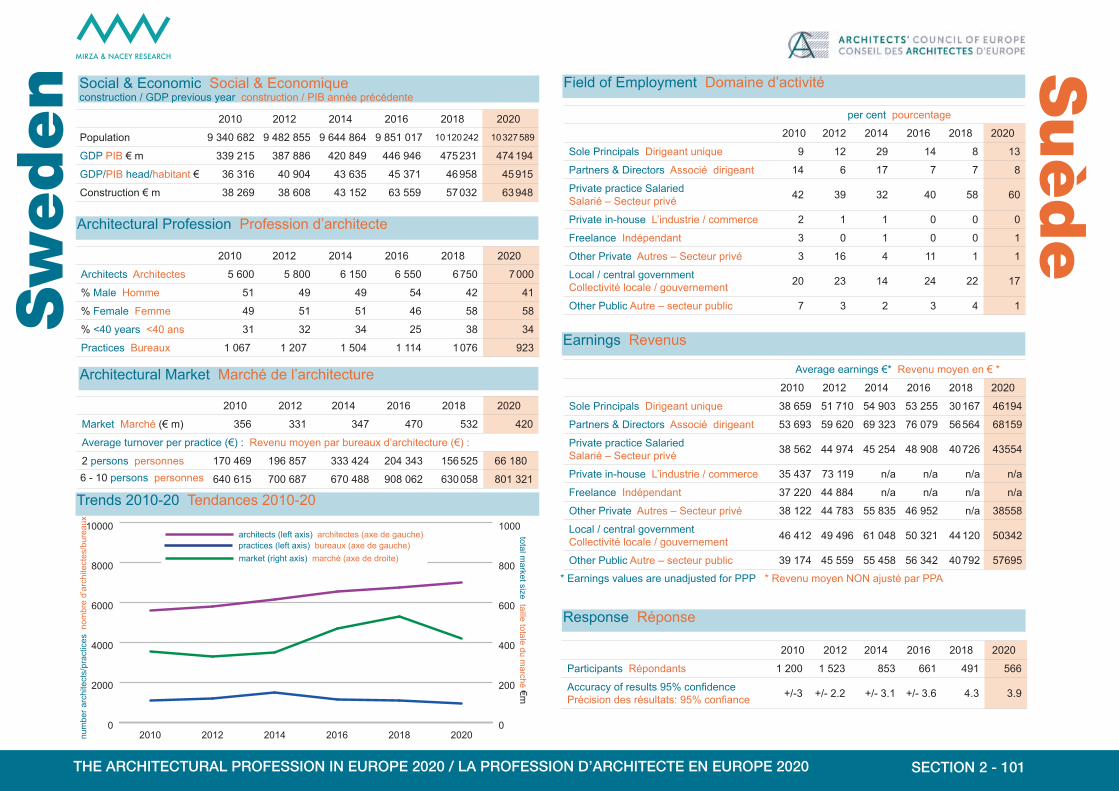
MIRZA & NACEY RESEARCH
Social & Economic Social & Economiqueconstruction / GDP previous year construction / PIB année précédente
Architectural Profession Profession d’architecte
Architectural Market Marché de l’architecture
Field of Employment Domaine d’activité
Sw
eden
2010 2012 2014 2016 2018 2020
Population 9 340 682 9 482 855 9 644 864 9 851 017 10 120 242 10 327 589
GDP PIB € m 339 215 387 886 420 849 446 946 475 231 474 194
GDP/PIB head/habitant € 36 316 40 904 43 635 45 371 46 958 45 915
Construction € m 38 269 38 608 43 152 63 559 57 032 63 948
2010 2012 2014 2016 2018 2020
Architects Architectes 5 600 5 800 6 150 6 550 6 750 7 000
% Male Homme 51 49 49 54 42 41
% Female Femme 49 51 51 46 58 58
% <40 years <40 ans 31 32 34 25 38 34
Practices Bureaux 1 067 1 207 1 504 1 114 1 076 923
2010 2012 2014 2016 2018 2020
Market Marché (€ m) 356 331 347 470 532 420
Average turnover per practice (€) : Revenu moyen par bureaux d’architecture (€) :
2 persons personnes 170 469 196 857 333 424 204 343 156 525 66 1806 - 10 persons personnes 640 615 700 687 670 488 908 062 630 058 801 321
Trends 2010-20 Tendances 2010-20
Earnings Revenus
Response Réponse
2010 2012 2014 2016 2018 2020
Participants Répondants 1 200 1 523 853 661 491 566
Accuracy of results 95% confidence Précision des résultats: 95% confiance +/-3 +/- 2.2 +/- 3.1 +/- 3.6 4.3 3.9
0
2000
4000
6000
8000
10000
2020201820162014201220100
200
400
600
800
1000
num
ber a
rchi
tect
s/pr
actic
es n
ombr
e d’
arch
itect
es/b
urea
ux
total market size taille totale du m
arché €m
architects (left axis) architectes (axe de gauche) practices (left axis) bureaux (axe de gauche) market (right axis) marché (axe de droite)
Suède
* Earnings values are unadjusted for PPP * Revenu moyen NON ajusté par PPA
per cent pourcentage
2010 2012 2014 2016 2018 2020
Sole Principals Dirigeant unique 9 12 29 14 8 13
Partners & Directors Associé dirigeant 14 6 17 7 7 8
Private practice Salaried Salarié – Secteur privé 42 39 32 40 58 60
Private in-house L’industrie / commerce 2 1 1 0 0 0
Freelance Indépendant 3 0 1 0 0 1
Other Private Autres – Secteur privé 3 16 4 11 1 1
Local / central government Collectivité locale / gouvernement 20 23 14 24 22 17
Other Public Autre – secteur public 7 3 2 3 4 1
Average earnings €* Revenu moyen en € *
2010 2012 2014 2016 2018 2020
Sole Principals Dirigeant unique 38 659 51 710 54 903 53 255 30 167 46194
Partners & Directors Associé dirigeant 53 693 59 620 69 323 76 079 56 564 68159
Private practice Salaried Salarié – Secteur privé 38 562 44 974 45 254 48 908 40 726 43554
Private in-house L’industrie / commerce 35 437 73 119 n/a n/a n/a n/a
Freelance Indépendant 37 220 44 884 n/a n/a n/a n/a
Other Private Autres – Secteur privé 38 122 44 783 55 835 46 952 n/a 38558
Local / central government Collectivité locale / gouvernement 46 412 49 496 61 048 50 321 44 120 50342
Other Public Autre – secteur public 39 174 45 559 55 458 56 342 40 792 57695 D R A F T
SECTION 2 - 101THE ARCHITECTURAL PROFESSION IN EUROPE 2020 / LA PROFESSION D’ARCHITECTE EN EUROPE 2020

MIRZA & NACEY RESEARCH
Social & Economic Social & Economiqueconstruction / GDP previous year construction / PIB année précédente
Architectural Profession Profession d’architecte
Architectural Market Marché de l’architecture
Field of Employment Domaine d’activité
Sw
itze
rland
2010 2012 2014 2016 2018 2020
Population 7 785 806 7 954 662 8 136 689 8 325 194 8 482 152 8 606 033
GDP PIB € m 367 134 474 689 489 673 604 510 601 327 628 107
GDP/PIB head/habitant € 47 154 59 674 60 181 72 612 70 893 72 984
Construction € m 46 326 n/a 47 311 70 218 75 721 68 569
2010 2012 2014 2016 2018 2020
Architects Architectes 5 300 5 400 7 200 7 300 7 400 7 500
% Male Homme n/a n/a 73 n/a n/a n/a
% Female Femme n/a n/a 28 n/a n/a n/a
% <40 years <40 ans n/a n/a 33 n/a n/a n/a
Practices Bureaux n/a n/a 1 629 n/a n/a n/a
2010 2012 2014 2016 2018 2020
Market Marché (€ m) n/a n/a 624 n/a n/a n/a
Average turnover per practice (€) : Revenu moyen par bureaux d’architecture (€) :
2 persons personnes n/a n/a 187 577 n/a n/a n/a6 - 10 persons personnes n/a n/a 962 959 n/a n/a n/a
Trends 2010-20 Tendances 2010-20
Earnings Revenus
Response Réponse
2010 2012 2014 2016 2018 2020
Participants Répondants n/a n/a 200 n/a n/a n/a
Accuracy of results 95% confidence Précision des résultats: 95% confiance n/a n/a +/- 6.8 n/a n/a n/a
0
2000
4000
6000
8000
10000
12000
14000
16000
202020182016201420122010num
ber a
rchi
tect
s/pr
actic
es n
ombr
e d’
arch
itect
es/b
urea
ux
total market size taille totale du m
arché €m
architects (left axis) architectes (axe de gauche) practices (left axis) bureaux (axe de gauche) market (right axis) marché (axe de droite)
0
n/an/a
200
400
600
800
1000
1200
1400
1600
Suisse
* Earnings values are unadjusted for PPP * Revenu moyen NON ajusté par PPA
per cent pourcentage
2010 2012 2014 2016 2020 2020
Sole Principals Dirigeant unique n/a n/a 22 n/a n/a n/a
Partners & Directors Associé dirigeant n/a n/a 37 n/a n/a n/a
Private practice Salaried Salarié – Secteur privé n/a n/a 21 n/a n/a n/a
Private in-house L’industrie / commerce n/a n/a 1 n/a n/a n/a
Freelance Indépendant n/a n/a 3 n/a n/a n/a
Other Private Autres – Secteur privé n/a n/a 11 n/a n/a n/a
Local / central government Collectivité locale / gouvernement n/a n/a 5 n/a n/a n/a
Other Public Autre – secteur public n/a n/a 2 n/a n/a n/a
Average earnings €* Revenu moyen en € *
2010 2012 2014 2016 2018 2020
Sole Principals Dirigeant unique n/a n/a 90 175 n/a n/a n/a
Partners & Directors Associé dirigeant n/a n/a 98 373 n/a n/a n/a
Private practice Salaried Salarié – Secteur privé n/a n/a 69 271 n/a n/a n/a
Private in-house L’industrie / commerce n/a n/a n/a n/a n/a n/a
Freelance Indépendant n/a n/a 59 024 n/a n/a n/a
Other Private Autres – Secteur privé n/a n/a 90 175 n/a n/a n/a
Local / central government Collectivité locale / gouvernement n/a n/a 111 489 n/a n/a n/a
Other Public Autre – secteur public n/a n/a n/a n/a n/a n/a D R A F T
SECTION 2 - 102THE ARCHITECTURAL PROFESSION IN EUROPE 2020 / LA PROFESSION D’ARCHITECTE EN EUROPE 2020
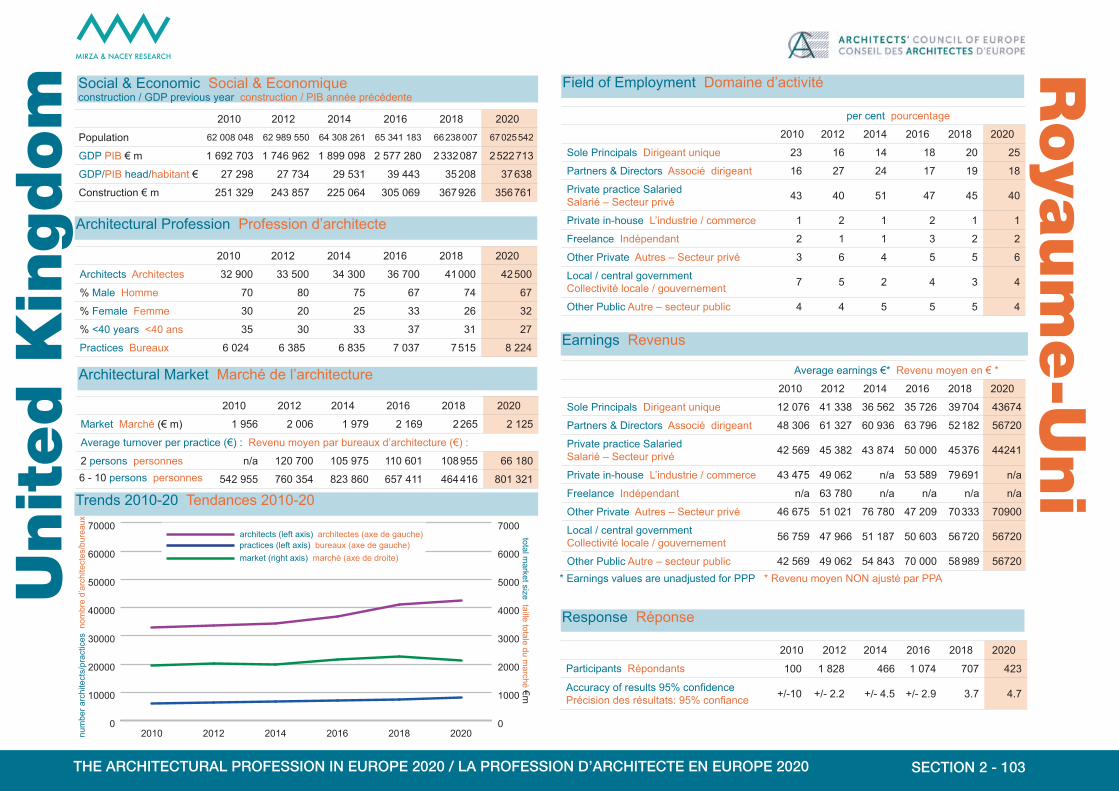
MIRZA & NACEY RESEARCH
Social & Economic Social & Economiqueconstruction / GDP previous year construction / PIB année précédente
Architectural Profession Profession d’architecte
Architectural Market Marché de l’architecture
Field of Employment Domaine d’activité
Unit
ed K
ingdom 2010 2012 2014 2016 2018 2020
Population 62 008 048 62 989 550 64 308 261 65 341 183 66 238 007 67 025 542
GDP PIB € m 1 692 703 1 746 962 1 899 098 2 577 280 2 332 087 2 522 713
GDP/PIB head/habitant € 27 298 27 734 29 531 39 443 35 208 37 638
Construction € m 251 329 243 857 225 064 305 069 367 926 356 761
2010 2012 2014 2016 2018 2020
Architects Architectes 32 900 33 500 34 300 36 700 41 000 42 500
% Male Homme 70 80 75 67 74 67
% Female Femme 30 20 25 33 26 32
% <40 years <40 ans 35 30 33 37 31 27
Practices Bureaux 6 024 6 385 6 835 7 037 7 515 8 224
2010 2012 2014 2016 2018 2020
Market Marché (€ m) 1 956 2 006 1 979 2 169 2 265 2 125
Average turnover per practice (€) : Revenu moyen par bureaux d’architecture (€) :
2 persons personnes n/a 120 700 105 975 110 601 108 955 66 1806 - 10 persons personnes 542 955 760 354 823 860 657 411 464 416 801 321
Trends 2010-20 Tendances 2010-20
Earnings Revenus
Response Réponse
2010 2012 2014 2016 2018 2020
Participants Répondants 100 1 828 466 1 074 707 423
Accuracy of results 95% confidence Précision des résultats: 95% confiance +/-10 +/- 2.2 +/- 4.5 +/- 2.9 3.7 4.7
0
10000
20000
30000
40000
50000
60000
70000
2020201820162014201220100
1000
2000
3000
4000
5000
6000
7000
num
ber a
rchi
tect
s/pr
actic
es n
ombr
e d’
arch
itect
es/b
urea
ux
total market size taille totale du m
arché €m
architects (left axis) architectes (axe de gauche) practices (left axis) bureaux (axe de gauche) market (right axis) marché (axe de droite)
Roya
um
e-U
ni
* Earnings values are unadjusted for PPP * Revenu moyen NON ajusté par PPA
per cent pourcentage
2010 2012 2014 2016 2018 2020
Sole Principals Dirigeant unique 23 16 14 18 20 25
Partners & Directors Associé dirigeant 16 27 24 17 19 18
Private practice Salaried Salarié – Secteur privé 43 40 51 47 45 40
Private in-house L’industrie / commerce 1 2 1 2 1 1
Freelance Indépendant 2 1 1 3 2 2
Other Private Autres – Secteur privé 3 6 4 5 5 6
Local / central government Collectivité locale / gouvernement 7 5 2 4 3 4
Other Public Autre – secteur public 4 4 5 5 5 4
Average earnings €* Revenu moyen en € *
2010 2012 2014 2016 2018 2020
Sole Principals Dirigeant unique 12 076 41 338 36 562 35 726 39 704 43674
Partners & Directors Associé dirigeant 48 306 61 327 60 936 63 796 52 182 56720
Private practice Salaried Salarié – Secteur privé 42 569 45 382 43 874 50 000 45 376 44241
Private in-house L’industrie / commerce 43 475 49 062 n/a 53 589 79 691 n/a
Freelance Indépendant n/a 63 780 n/a n/a n/a n/a
Other Private Autres – Secteur privé 46 675 51 021 76 780 47 209 70 333 70900
Local / central government Collectivité locale / gouvernement 56 759 47 966 51 187 50 603 56 720 56720
Other Public Autre – secteur public 42 569 49 062 54 843 70 000 58 989 56720 D R A F T
SECTION 2 - 103THE ARCHITECTURAL PROFESSION IN EUROPE 2020 / LA PROFESSION D’ARCHITECTE EN EUROPE 2020

MIRZA & NACEY RESEARCH
Appendix
I - 104THE ARCHITECTURAL PROFESSION IN EUROPE 2020

MIRZA & NACEY RESEARCH
A1 SURVEY METHODOLOGY
respondents to Architects’ survey
respondents to Principals’ survey
total number of replies
Austria 6 192 198 Belgium 53 76 129 Croatia 129 40 169 Czechia 110 103 213 Denmark 135 21 156 Estonia 6 5 11 Finland 162 57 219 France 233 517 750 Germany 9 316 4 748 14 064 Greece 148 46 194 Hungary 25 22 47 Ireland 242 161 403 Italy 3 282 1 939 5 221 Lithuania 8 9 17 Luxembourg 4 76 80 Netherlands 19 30 49 Norway 122 47 169 Poland* 48 37 85 Portugal 1 040 492 1 532 Romania 168 181 349 Serbia 12 3 15 Slovakia 43 144 187 Slovenia 30 59 89 Spain 140 119 259 Sweden 426 140 566
United Kingdom 225 198 423
2020 EUROPE-26 16 141 9 465 25 606
TABLE A-1ON-LINE SURVEY RESPONSE
The 2020 Sector Study was commissioned by the Architects’ Council of Europe (ACE) the representative body for the architectural profession at European level whose Members are the national representative and registration bodies of the profession in all EU Member States, Accession States, Norway and Switzerland. It repeats and updates the previous biennial Sector Studies the first of which was in 2008. All 31 countries from which the ACE drew its membership at the time of the Study in 2020 were invited to participate and 26 countries took part.
The direct cooperation of the Member Organisations of the ACE made it possible to carry out the Study and the results obtained belong to them and to the ACE.
We are extremely grateful to the thousands of architects who participated in this survey. Most respondents completed all sections of the questionnaire. The huge number of respondents to this survey and the quality of the information provided ensures the results have statistical significance and allow us to build up a credible, historical data series about the architectural profession in Europe.
* per cent response amongst those countries where total number contacted by email was known
I - 105THE ARCHITECTURAL PROFESSION IN EUROPE 2020

MIRZA & NACEY RESEARCH
The Sector Study was aimed at 31 countries:
Austria Belgium Bulgaria Croatia Cyprus Czechia Denmark Estonia Finland France Germany Greece Hungary Ireland Italy Latvia Lithuania Luxembourg Malta Netherlands Norway Poland Portugal Romania Serbia Slovakia Slovenia Spain Sweden Switzerland United Kingdom
In this report when data refers to all of these countries it is labelled ‘EUROPE - 31’. Totals for countries that participated in the survey are labelled ‘EUROPE - 26’.
This year’s Sector Study builds upon the experience of the previous Studies. The research methodology remains a statistical survey of architects throughout Europe the aim being to create national and Europe-wide statistics of the profession sourced from original primary research conducted directly amongst architects themselves. This approach is favoured due to the fact that although several countries do have their own statistical data about the profession many more do
CHART A-1COUNTRIES PARTICIPATING IN THE 2020 SURVEY
not. Further whilst much of the data held by Member Organisations is excellent at a national level when we attempt to look at the profession across Europe there are many gaps and inconsistencies. For that reason the Sector Study seeks the same information directly from architects in all ACE member countries.
As in previous years the best way of obtaining this information is with the co-operation of Member Organisations. We are immensely grateful for the help they have provided.
The research reported here is based on an on-line questionnaire survey which was conducted amongst the architect members of 26 ACE member countries. At least one Member Organisation in each of the 31 ACE member countries was invited to participate. This year the questionnaire was changed very slightly with some additional questions and some removed. The questionnaire was available to respondents in 20 different languages.
I - 106THE ARCHITECTURAL PROFESSION IN EUROPE 2020

MIRZA & NACEY RESEARCH
The survey methodology was as follows:
1. Member Organisations were asked to identify all their members for whom an email address was available. Member Organisations then allocated identification numbers to each member - the purpose being to identify who responds so they do not need to receive a ‘reminder’.
2. Member Organisations constructed and sent out an email which included a link to the on-line questionnaire. Two ‘reminder’ emails were sent out to architects who did not respond.
3. Architects were guided to the on-line survey form which could be read and completed in any one of twenty different languages. The information they provided was submitted electronically to the research team; no-one at either the Member Organisation or the ACE saw the personal reply.
4. All data was aggregated and analysed by the research team.
In some countries architects were invited by their Member Organisation to participate by way of an email newsletter rather than a direct link. It was therefore not possible to identify and ‘remind’ non-participants.
Substantial work by the Member Organisations was undertaken in identifying the sample and subsequently organising the contact with their members; we are very grateful indeed for all the help and support these 26 Member Organisations have provided. A number of Member Organisations in other countries spent considerable time in attempting to participate ultimately without success; we thank them too.
Responses to the survey were received electronically. 11 500 architects replied directly to the ACE questionnaire, and a further 14 000 architects responded to the same questions included in the BAK survey.
The response is considered satisfactory for the level of analysis undertaken. The statistical validity of these results is accurate to within + / - 0.5 per cent at the 95 per cent confidence level. The accuracy varies for each individual country and these + / - levels should be regarded very carefully when making comparisons between countries. Where the accuracy range is wider than +/- 10 we have indicated with an asterisk that the data should be considered with caution.
accuracy within range of plus or minus: (%) *
Austria 6.8Belgium 8.6Croatia 7.3Czechia 6.5Denmark 7.8Estonia 29.4Finland 6.4France 3.5Germany 0.8Greece 7.0Hungary 14.2Ireland 4.6Italy 1.3Lithuania 23.6Luxembourg 10.6Netherlands 14.0Norway 7.4Poland 10.6Portugal 2.4Romania 5.2Serbia 25.3Slovakia 6.8Slovenia 10.1Spain 6.1Sweden 3.9United Kingdom 4.72020 EUROPE-26 0.6
TABLE A-2 STATISTICAL VALIDITY: ACCURACY OF RESULTS PLUS OR MINUS XX PER CENT AT THE 95% CONFIDENCE LEVEL
* this means we are 95 per cent confident that the results are accurate to within + or - 1 per cent overall or within + or - xx per cent for each individual country
I - 107THE ARCHITECTURAL PROFESSION IN EUROPE 2020

MIRZA & NACEY RESEARCH
A2 METHODOLOGICAL NOTES1. Method for weighting the ‘All’ figureThe ‘EUROPE-26’ figure in several profiling tables in chapter 1 is weighted to reflect the total architectural population in all countries surveyed.
For each country individually we take the percentage breakdown from the on-line survey (e.g. per cent male and per cent female) and apply those proportions to the total number of architects in each country. This gives us the number of male architects and female architects in each country. These individual country male and female figures are then summed to provide the weighted total number (‘All’) of male architects and total number of female architects. Finally the total number of males and females is expressed as a percentage of the total number of Architects.
2. Cautionary note: employment status It is possible there has been an under-reporting of retired architects. Experience in undertaking a regular survey of architects in the UK suggests retired architects are less likely to participate in on-line surveys. Whilst the survey was conducted amongst all members of participating institutes including retired people it is likely that retired people may not have felt the survey was relevant to them and declined to participate.
3. Description of the Model created to estimate the number of architectural practices.(i) identify the number of economically active architects in each country – see item 2(ii) estimate the number of economically active architects who are in private practice: source - survey results(iii) estimate the number of architects working in each private practice size group and country: source - survey results(iv) calculate the average number of architects per practice by size group for each country: source - survey results(v) estimate the number of practices that each number of architects represents in each size group and country: source - survey resultse.g. if we have 300 architects working in the 3-5 size group for a given country and from survey data we know that on average
4 architects work in those practices we can estimate that there are 75 practices in this size group ie 300 architects working in practices comprising 4 architects gives us 75 practices.(vi) adding the number of practices in each size group gives the total number of practices per country
4. Description of method used to calculate size of architectural market(i) use the estimates of the number of practices in each size group (see note 4 above)(ii) multiply the number of practices by the average turnover for practices in that size group - repeat separately for each size group and each country(iii) each country’s market size is calculated by adding together the values for each size group(iv) very occasionally the data is refined with reference to previous years’ data
5. Minimum cell sizesThe minimum number of responses used in each ‘cell’ (a segment of a statistical table) is generally 10. For the smaller countries a minimum cell size of 5 is applied and in exceptional cases this is extended to 4 where the variance is low.
I - 108THE ARCHITECTURAL PROFESSION IN EUROPE 2020