Creation of a 50-Year Rainfall Database, Annual Rainfall ...
32
- 1 - Technical Report No. 102 June 2003 Creation of a 50-Year Rainfall Database, Annual Rainfall Climatology, and Annual Rainfall Distribution Map for Guam Mark A. Lander and Charles P. Guard1
Transcript of Creation of a 50-Year Rainfall Database, Annual Rainfall ...

- 1 -
Technical Report No. 102 June 2003
Creation of a 50-Year Rainfall Database,
Annual Rainfall Climatology, and Annual Rainfall
Distribution Map for Guam
Mark A. Lander and
Charles P. Guard1

i
Creation of a 50-Year Rainfall Database, Annual Rainfall Climatology, and Annual Rainfall Distribution Map for Guam
By
Mark A. Lander and
Charles P. Guard1
University of Guam Water and Environmental Research Institute
of the Western Pacific UOG Station, Mangilao, Guam 96923
Technical Report No. 102 June 2003
The activities on which this report is based were financed in part by the Department of the Interior, U.S. Geological Survey, through the University of Guam Water and Environmental Research Institute of the Western Pacific. The contents of this report do not necessarily reflect the views and policies of the Department of the Interior, nor does the mention of trade name or commercial products constitute their endorsement by the United States Government. 1 Current affiliation: National Weather Service Forecast Office, Barrigada, Guam.

Since the early 1950s, there has Guam, especially by the US militaSince 1950, over 60 government-sGuam. Unfortunately, the length cases incomplete, and in some cas The few rainfall distribution studata. As a result, the rainfall distrsimplified or incorrectly analyzedlargely ignored. The purpose of this study is to eacceptable data to build a 50-yearThe resulting database provides a rainfall distribution map for the is
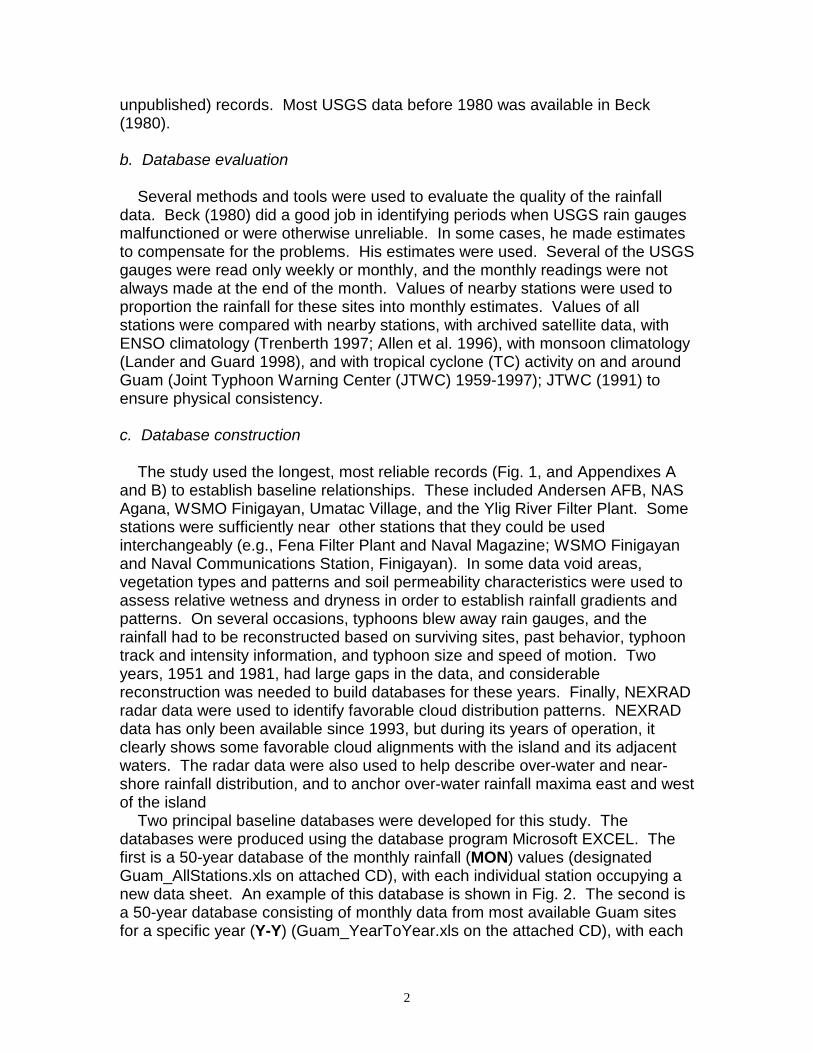
Photo of Mt. Alutom, Guam
Abstract
been considerable interest in the rainfall on ry and the US Geological Survey (USGS). ponsored rain gauge sites have operated on of record of most of the sites is short, in many es unreliable.
dies for Guam have been based on limited ibution patterns have been greatly over-, and the actual rainfall gradients have been
valuate the available data, then to use the rainfall database for selected sites on Guam. long-term rainfall climatology and an annual land.
ii
, by S. Khosrowpanah

iii
Table of Contents Page Abstract . . . . . . . . . . . . . . . . . . . . . . . . . . . . . . . . . . . . . . . . . . . . . . . . . . . . . . . . . . . . . . . . ii List of Figures . . . . . . . . . . . . . . . . . . . . . . . . . . . . . . . . . . . . . . . . . . . . . . . . . . . . . . . . . . . iv Introduction . . . . . . . . . . . . . . . . . . . . . . . . . . . . . . . . . . . . . . . . . . . . . . . . . . . . . . . . . . . . . 1 Methodology . . . . . . . . . . . . . . . . . . . . . . . . . . . . . . . . . . . . . . . . . . . . . . . . . . . . . . . . . . . . 1 Data sources . . . . . . . . . . . . . . . . . . . . . . . . . . . . . . . . . . . . . . . . . . . . . . . . . . . . . . 1 Database evaluation . . . . . . . . . . . . . . . . . . . . . . . . . . . . . . . . . . . . . . . . . . . . . . . 2 Database construction . . . . . . . . . . . . . . . . . . . . . . . . . . . . . . . . . . . . . . . . . . . . . . 2 Analysis . . . . . . . . . . . . . . . . . . . . . . . . . . . . . . . . . . . . . . . . . . . . . . . . . . . . . . . . . . 7 Results and Discussion . . . . . . . . . . . . . . . . . . . . . . . . . . . . . . . . . . . . . . . . . . . . . . . . . . . . 10 Rainfall patterns and a long-term annual rainfall distribution map for Guam . . . 10 Rainfall Climatology . . . . . . . . . . . . . . . . . . . . . . . . . . . . . . . . . . . . . . . . . . . . . . . . 10 Inter-decadal variations . . . . . . . . . . . . . . . . . . . . . . . . . . . . . . . . . . . . . . . . . . . . . 12 Comparisons with earlier rainfall distribution maps . . . . . . . . . . . . . . . . . . . . . . . 14 Summary and Further Research . . . . . . . . . . . . . . . . . . . . . . . . . . . . . . . . . . . . . . . . . . . . . . 15 References . . . . . . . . . . . . . . . . . . . . . . . . . . . . . . . . . . . . . . . . . . . . . . . . . . . . . . . . . . . . . . 20 Appendix A . . . . . . . . . . . . . . . . . . . . . . . . . . . . . . . . . . . . . . . . . . . . . . . . . . . . . . . . . . . . A1 – A3 Appendix B . . . . . . . . . . . . . . . . . . . . . . . . . . . . . . . . . . . . . . . . . . . . . . . . . . . . . . . . . . . . B1 – B2 Appendix C . . . . . . . . . . . . . . . . . . . . . . . . . . . . . . . . . . . . . . . . . . . . . . . . . . . . . . . . . . . . . . C1 Compact Disc containing rainfall data . . . . . . . . . . . . . . . . . . . . . . . . . . . Attached to inside of
front cover
iv
List of Figures Figure Page 1. Sites used in the preparation of the rainfall chart shown in Fig. 4. Actual rain gages are at sites indicated by the red dots. Smallest red dots indicate a highly broken or less than 20 years of record; medium red dots indicate at least 20 years of nearly continuous and reliable rain records; large red dots indicate 50 years of nearly continuous and reliable rain records. Small blue triangles are locations where rainfall amounts were interpolated for analysis of Fig. 4. Every location is listed in Appendix A, and the periods of record for sites with rainfall data are listed in Appendix B. . . . . . . . . . . . . . . . . . . . . . . . . . . . . . . . . . . . . . . . . . . . . . . . . . . . . 3 2. Example of the MON database for NAS Tiyan. Dark blue dates indicate that the data were checked twice or more from two or more sources. Black data is original, verified data. Red data is data that was missing and has been constructed, or data that was assessed to be too high or two low and was reconstructed. Red data in the bold annual total column indicates that data for one or more months has been constructed/reconstructed. Red triangles indicate that the data has an attached comment. . . . . . . . . . . . . . . . . . . . . . . . . . . . . . . . . . . . . . 5 3. Example of the Y-Y database for 1979. Black data are original, verified data. Red data are data that were missing and had to be constructed, or data that were assessed to be too high or two low and were reconstructed. Red data in the bold annual total column indicate that data for one or more months was constructed/reconstructed. Red triangles indicate that the sample has an attached comment. Comments in the month row indicate typhoon and monsoon activity. Upper left text (blue) indicates the ENSO status. . . . . . . . . . . . . . . . . . . . . . . . . . . . 6 4. Annual rainfall distribution map for Guam based on the composting of 50 annual analyses from the newly developed 1950-1999 rainfall database. Isohyets are in inches. . . . . . . . . . . . . . . . . . . . . . . . . . . . . . . . . . . 8 5. Annual rainfall distribution map for Guam based on the compositing of 50 annual analyses from the newly developed 1950-1999 rainfall database. Isohyets are in millimeters at the indicated color-coded intervals. This map was produced by the Spatial Climate Analysis Service (Oregon State University) using the MON rainfall data as input. . . . . . . . . . . . . . . . . . . . . . . . . . . . . . . . . . . . . . . . . . . . . . . . . . . . . . . . . . . . . . . . . . . . 9 6. Three days of integrated rainfall (22 May 2002 through 25 May 2002) showing the possible effect of Guam on the large-scale rainfall pattern in a condition of widespread showers. Note the concentration of rainfall on the lee side of the island (western side in east wind conditions), and the banded swath of max and min rainfall to the east of Guam. . . . . . . . . . . . . . . . . . . . . . . . . . . . . . . . . . . . . . . . . . . . . . . . . . . . . . . . . . . . . . . . . . . . . . 11 7. A five-month moving average of the monthly rainfall anomaly at the WSMO, Taguac, Guam. . . . . . . . 12 8. Running accumulations of the rank of each month’s rainfall for the period 1950 to 2000 (annual cycle not removed). Complete records were available from Andersen AFB and from the U.S. Naval Air Station (Tiyan). Prominent features include the extreme dryness of the 1950s and a very wet period in the early 1960s. Recent prominent anomalies include relative dryness from late 1992 through 1995, and a wet period during 1996 and 1997. These anomalies are related to El Niño. . . . . . . . . . . . . . . . . . . . . . . . . . . . . . . . . . . 13 9. Guam’s rainfall distribution during the dry season (left panel) and the wet season (right panel) of 1952 as analyzed by Jordan (1955). . . . . . . . . . . . . . . . . . . . . . . . . . . . . . . . . . . . . . . . . . . . . . . . . . . . . . . . . . . . . . . 14 10. Guam annual rainfall (inches). This map, produced by the Natural Resources Conservation Service (NRCS) (1987), is currently used as the official rainfall distribution for Guam building codes and storm drainage practices. . . . . . . . . . . . . . . . . . . . . . . . . . . . . . . . . . . . . . . . . . . . . . . . . . . . . . . . . . . . . . . . . . . . . . 15
v
Figure Page 11. Rainfall deposited on Guam during the near passage of tropical cyclones. (a) Rainfall associated with near passage of typhoon Wilda as estimated by NEXRAD during the period 0220 UTC – 2147 UTC 24 October, 1994. Outer contour is 2 inches, light blue indicates 3 to 4 inches, dark blue indicates 4 inches or more. (b) The rainfall measured on Guam during the same time period. (c) Rainfall associated with the near passage of Tropical Storm Verne as estimated by NEXRAD during the period 0420 UTC 18 Oct – 0105 UTC 20 October. Outer contour is 2 inches, light blue indicates 2 to 3 inches and dark blue indicates 3 inches or more. (d) The rainfall measured on Guam for the same period. . . . . . . . . . . . . . . . . . . . . . . . . . . . . . . . . . . . . . . . . 17 12. (a) Rainfall measured during the passage of Typhoon Pongsona over Guam. (b) Schematic diagram shows rainfall expected as a function of path taken through eye wall. . . . . . . . . . . . . . . . . . . . . . . . . . . . . . . . . . . . . 18 13. A time series of the rainfall accumulated at Andersen AFB during the passage of Typhoon Pongsona. Note the cessation of rain as the eye passes over. Rain rates exceeded 7 inches per hour in the first half of the storm. (Data Source: NASA TRMM rain gage network). . . . . . . . . . . . . . . . . . . . . . . . . . . . . . . . . . . . . . . . 19

1
1. Introduction. Since the early 1950s, there has been considerable interest in the rainfall on Guam, especially by the US military and the US Geological Survey (USGS). This is apparent from the number of rain gauge sites established and maintained by the various agencies. In the mid-1950s, the US National Weather Service (NWS) established a a Meterological Observatory (WSMO) at Finagayan, Guam, which eventually became the site with the most complete database. This site was dis-established in March 1995 and the NWS moved to Tiyan (the site of the deactivated Naval Air Station). Since 1950, over 60 government-sponsored rain gauge sites have operated on Guam. Unfortunately, the length of record of most of the sites is short, in many cases incomplete, and in some cases unreliable. While there have been a few rainfall distribution studies for Guam (e. g., Jordan 1955, and Natural Resources Conservation Service (NRCS) 1987), these studies have been based on limited data. As a result, the rainfall distribution patterns have been greatly over-simplified or incorrectly analysed, and the actual rainfall gradients have been largely ignored. The purpose of this study is to evaluate the available data, then to use the acceptable data to build a 50-year rainfall database for selected sites on Guam. The resulting database provides a long-term rainfall climatology and an annual rainfall distribution map for the island. The methodology used to construct and analyze the 50-year rainfall database from existing data is discussed in Section 2. The results of the analyses and a discussion of the rainfall patterns, long-term climatology, and decadal variations are presented in Section 3. Section 4 summarizes the results and identifies further research that is need. 2. Methodology a. Data sources For reasons of equipment standardization and calibration, and data reliability, only data from US and cooperating Government of Guam agencies were used. Numerous sources of documentation had to be used in order to recover these data. These sources included commercial rainfall databases (e.g., EarthInfo, Inc. 2000), official climatology documents (e.g., National Climatic Data Center (NCDC) 1956-99), previous studies (e.g., NRCS 1987), and original rainfall records (e.g., Navy, Air Force and NWS). Descriptions of the rainfall data used in this report, and associated metadata, are found in the Appendixes A, B and C. While commercial databases were used as the initial database source, they contained many data gaps. Many of the NWS cooperative rain gauges and the military rain gauges did not meet the NCDC publishing deadlines. While they were eventually published as "late reports", the commercial databases did not capture these late data. These were extracted by the authors from available "late data" reports. Much of the military data did not even make the late reports, and these had to be recovered from military sources, often from old official (but
2
unpublished) records. Most USGS data before 1980 was available in Beck (1980). b. Database evaluation Several methods and tools were used to evaluate the quality of the rainfall data. Beck (1980) did a good job in identifying periods when USGS rain gauges malfunctioned or were otherwise unreliable. In some cases, he made estimates to compensate for the problems. His estimates were used. Several of the USGS gauges were read only weekly or monthly, and the monthly readings were not always made at the end of the month. Values of nearby stations were used to proportion the rainfall for these sites into monthly estimates. Values of all stations were compared with nearby stations, with archived satellite data, with ENSO climatology (Trenberth 1997; Allen et al. 1996), with monsoon climatology (Lander and Guard 1998), and with tropical cyclone (TC) activity on and around Guam (Joint Typhoon Warning Center (JTWC) 1959-1997); JTWC (1991) to ensure physical consistency. c. Database construction The study used the longest, most reliable records (Fig. 1, and Appendixes A and B) to establish baseline relationships. These included Andersen AFB, NAS Agana, WSMO Finigayan, Umatac Village, and the Ylig River Filter Plant. Some stations were sufficiently near other stations that they could be used interchangeably (e.g., Fena Filter Plant and Naval Magazine; WSMO Finigayan and Naval Communications Station, Finigayan). In some data void areas, vegetation types and patterns and soil permeability characteristics were used to assess relative wetness and dryness in order to establish rainfall gradients and patterns. On several occasions, typhoons blew away rain gauges, and the rainfall had to be reconstructed based on surviving sites, past behavior, typhoon track and intensity information, and typhoon size and speed of motion. Two years, 1951 and 1981, had large gaps in the data, and considerable reconstruction was needed to build databases for these years. Finally, NEXRAD radar data were used to identify favorable cloud distribution patterns. NEXRAD data has only been available since 1993, but during its years of operation, it clearly shows some favorable cloud alignments with the island and its adjacent waters. The radar data were also used to help describe over-water and near-shore rainfall distribution, and to anchor over-water rainfall maxima east and west of the island Two principal baseline databases were developed for this study. The databases were produced using the database program Microsoft EXCEL. The first is a 50-year database of the monthly rainfall (MON) values (designated Guam_AllStations.xls on attached CD), with each individual station occupying a new data sheet. An example of this database is shown in Fig. 2. The second is a 50-year database consisting of monthly data from most available Guam sites for a specific year (Y-Y) (Guam_YearToYear.xls on the attached CD), with each

3
13.2
13.25
13.3
13.35
13.4
13.45
13.5
13.55
13.6
13.65
13.7
144.5 144.6 144.7 144.8 144.9 145Longitude
Lat
itu
de
Figure 1. Sites used in the preparation of the rainfall chart shown in Fig. 4. Actual rain gages are at sites indicated by the red dots. Smallest red dots indicate a highly broken or less than 20 years of record; medium red dots indicate at least 20 years of nearly continuous and reliable rain records; large red dots indicate 50 years of nearly continous and reliable rain records. Small blue triangles are locations where rainfall amounts were interpolated for analysis of Fig. 4. Every location is listed in Appendix A, and the periods of record for sites with rainfall data are listed in Appendix B. year comprising a new data sheet. An example of this database is shown in Fig. 3. The MON database was used primarily to ascertain missing data. This guided the search for sources to recover the missing data. This database was also used to verify the validity of site locations. For example, Fleet Weather Central (FWC) was collocated with the Naval Air Station until 1 January 1973 and with Nimitz Hill for the remainder of its existence. These two different sites are 8 km apart. The Y-Y database was used primarily to ascertain data quality and to reconstruct missing and unrepresentative data. This database allowed the easy comparison of nearby stations, in order to evaluate the data in terms of synoptic conditions, climatic conditions, and tropical cyclone and monsoon events. In applying the databases, users can use the entire, reconstructed database (red and black) or the unchanged data (black). The data values that were changed are in most cases shown in the comments, and can be reinserted if desired. Comments associated with reconstructed data frequently contain the

4
phrase “estimated from nearby stations”. The reconstruction of the data is, admittedly, subjective. It considers the value of the data with respect to the values at other stations, then determines whether or not the differences are realistic based on past characteristics under similar synoptic conditions, climatic conditions, and the occurrence of tropical cyclone and monsoon events. When available, daily rainfall records were reviewed to better evaluate the existing monthly records. Synoptic conditions consider various rainfall regimes, which have different spatial and temporal rainfall characteristics. Different rainfall regimes include trade wind, shearline, tropical thunderstorm, monsoon and peripheral typhoon, and typhoon core. Monsoon and El Niño conditions were separated into event intensity (weak, moderate, strong) where possible. Climatic conditions consider the values of equatorial sea surface temperature distribution and the value of the Southern Oscillation Index (SOI). El Niño years, El Niño +1 years (drought years), La Niña years, and El Niño neutral years have specific types of rainfall characteristics. Where possible, comments on monsoon and tropical cyclone activity are shown at the appropriate month on the Y-Y database. Larger differences are acceptable in the dry season where trade wind showers are not so uniform, and in transition seasons, where thunderstorms and heavy rainshowers display favorable locations and high gradients. Large differences are less acceptable under monsoon conditions or dry-season shearline conditions, where the rainfall is more uniform. The proximity of tropical cyclone eyewalls and rainbands to the stations also plays a role in determining the acceptable range of differences from nearby and islandwide stations. The rainfall distribution, in many respects, is heavily dependent on wind speed and direction, but a comprehensive wind statification was beyond the scope of this study. Instead, the synoptic situation was used to ascertain the major wind effects. The reconstructed data are not expected to be exact, but are deemed considerably more accurate and representative than the replaced or missing data. Attached comments also give an indication of how much the raw data may be in error. For example, a comment may state: “8.53: too low by a factor of 3; estimated from nearby stations”. On several occasions, reconstructed missing data were later replaced with later discovered missing data and were, in nearly all cases, found to be very representative. In some cases, newly discovered USGS data, nearly collocated with a reconstructed source, was substituted for the reconstructed value. In these cases, the reconstructed value was also shown to be very representative. As more and more information was learned about the rainfall characteristics of each station, reconstructed data were sometimes refined to reflect the effects of these characteristics. Once all of the quality changes were made in Y-Y, the MON database was modified with the changes in the Y-Y database. The MON database is treated as the primary 50-year monthly rainfall database for Guam.

5
Figure 2. Example of the MON database for NAS Tiyan. Dark blue dates indicate that the data were checked twice or more from two or more data sources. Black data are original, verified data. Red data are data that were missing and had to be constructed, or data that were assessed to be too high or two low and were reconstructed. Red data in the bold annual total column indicates that data for one or more months was constructed/reconstructed. Red triangles indicate that the data sample has an attached comment.

6
Figure 3. Example of the Y-Y database for 1979. Black data are original, verified data. Red data are data that were missing and had to be constructed, or data that were assessed to be too high or two low and were reconstructed. Red data in the bold annual total column indicates that data for one or more months was constructed/reconstructed. Red triangles indicate that the data sample has an attached comment. Comments in the month row indicate typhoon and monsoon activity. Upper left text (blue) indicates the ENSO status.
7
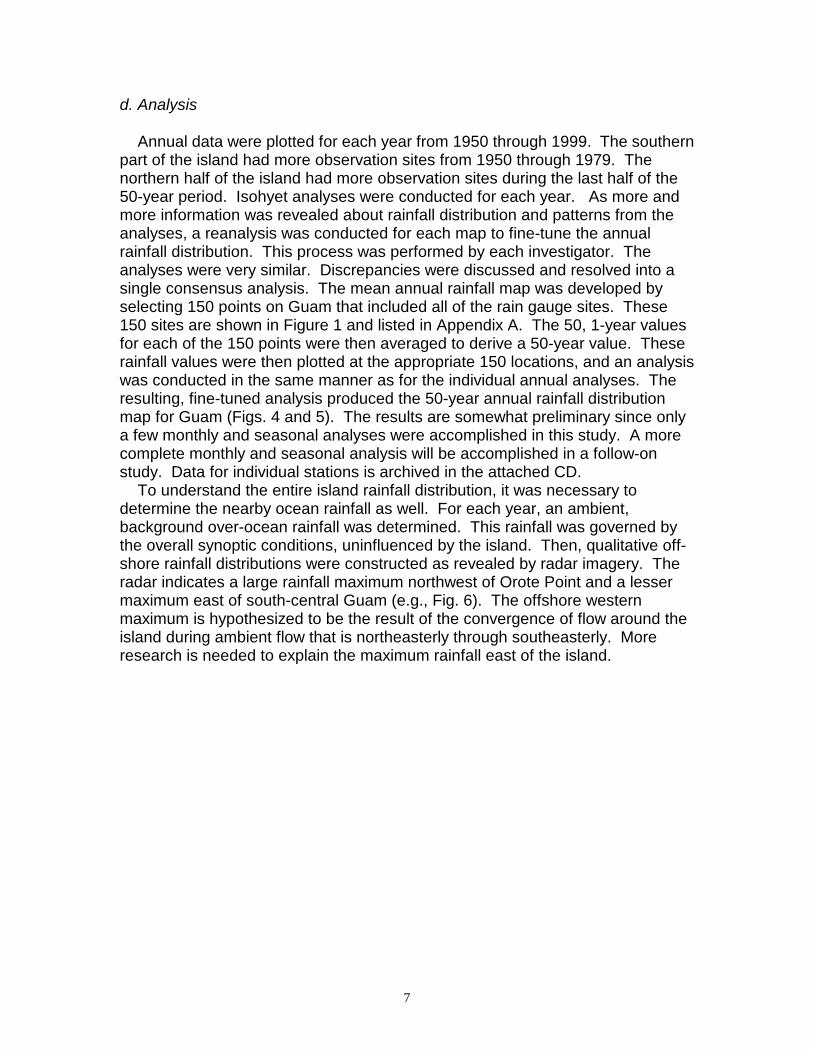
d. Analysis Annual data were plotted for each year from 1950 through 1999. The southern part of the island had more observation sites from 1950 through 1979. The northern half of the island had more observation sites during the last half of the 50-year period. Isohyet analyses were conducted for each year. As more and more information was revealed about rainfall distribution and patterns from the analyses, a reanalysis was conducted for each map to fine-tune the annual rainfall distribution. This process was performed by each investigator. The analyses were very similar. Discrepancies were discussed and resolved into a single consensus analysis. The mean annual rainfall map was developed by selecting 150 points on Guam that included all of the rain gauge sites. These 150 sites are shown in Figure 1 and listed in Appendix A. The 50, 1-year values for each of the 150 points were then averaged to derive a 50-year value. These rainfall values were then plotted at the appropriate 150 locations, and an analysis was conducted in the same manner as for the individual annual analyses. The resulting, fine-tuned analysis produced the 50-year annual rainfall distribution map for Guam (Figs. 4 and 5). The results are somewhat preliminary since only a few monthly and seasonal analyses were accomplished in this study. A more complete monthly and seasonal analysis will be accomplished in a follow-on study. Data for individual stations is archived in the attached CD. To understand the entire island rainfall distribution, it was necessary to determine the nearby ocean rainfall as well. For each year, an ambient, background over-ocean rainfall was determined. This rainfall was governed by the overall synoptic conditions, uninfluenced by the island. Then, qualitative off-shore rainfall distributions were constructed as revealed by radar imagery. The radar indicates a large rainfall maximum northwest of Orote Point and a lesser maximum east of south-central Guam (e.g., Fig. 6). The offshore western maximum is hypothesized to be the result of the convergence of flow around the island during ambient flow that is northeasterly through southeasterly. More research is needed to explain the maximum rainfall east of the island.
8
Figure 4. Annual rainfall distribution map for Guam based annual analyses from the newly developed 1950-1999 rainfainches.
105
100
9590
100105
95
90
85
100
105110
105 10095
90
8595
90
95
100
95100
105
95100
105
110
115105
115105
100
9590
95
100
MAX
MIN
MAX
MIN
MIN
MAX
MIN
MIN
0
10on the compositing of 50 ll database. Isohyets are in
MIN

9
Figure 5. Annual rainfall distribution map for Guam based on the compositing of 50 annual analyses from the newly developed 1950-1999 rainfall database. Isohyets are in millimeters at the indicated color-coded intervals. This map was produced by the Spatial Climate Analysis Service (Oregon State University) using the MON rainfall data as input. 3. Results and Discussion

10
a. Rainfall patterns and a long-term annual rainfall distribution map for Guam The annual rainfall distribution maps for Guam (Figs 4 and 5) show that the major rainfall patterns are generally oriented north-northeast—south-southwest, with maxima and strong rainfall gradients located along the western and southern mountains. Another maximum lies in the central part of the north end of the island. Minima lie in the center of the island, southwest of Mount Santa Rosa, south of Ritidian Point, and over extreme southern Guam. Again, these are oriented in a general northnortheast--southsouthwest manner. Year-to-year similarities and differences were found to coincide with varying synoptic situations. The greatest deviations from the average map occurred when tropical cyclone events had a major contribution to the rainfall. Radar and satellite imagery indicate the presence of two significant off-shore maxima. One is in a northeast-southwest oriented band with a western boundary that begins about 50 km east of south-central Guam. Another is a more concentrated area of enhanced rainfall stretching in a narrow band from the western tip of Orote Point to about 50 km northwest of Orote Point (e.g., Fig 6). While not yet rigorously quantified, event-by-event examinations reveal that rainfall totals offshore to the west of the Orote Point are substantially greater than those on the island. Most lightning flashes observed from Guam are offshore west of Orote Point. An offshore minimum of rainfall is commonly observed on radar between Guam’s eastern shore and the previously mentioned maximum 50 km out to sea. This is often manifested in the decay of showers and thunderstorms as they move toward the island from the east or southeast. The analysis of the average annual rainfall over the open ocean, unperturbed by the island, is estimated to be about 100 inches. b. Rainfall climatology At the Taguac Weather Service Meteorological Observatory (WSMO), the mean annual rainfall during the period 1957-92 was 101.84 inches with a standard deviation of 22.2 inches. The mean dry-season (January through June) rainfall was 31.63 inches with a standard deviation of 16.62 inches; the mean wet-season (July through December) rainfall was 70.21 inches with a standard deviation of 9.79 inches. The wet-season/dry-season split of the annual total is thus about 70% and 30%, respectively. The driest annual total in the time series is the 67.06 inches recorded in 1983. The WSMO was deactivated in 1995, so it was not recording during 1998—which, at other long-term stations, was Guam’s driest year in the past century. The wettest annual total in the time series is the 165.91 inches recorded during 1976. The wettest dry season (93.89 inches) occurred in 1976, and the driest dry season (9.59 inches) occurred in 1983. The wettest wet season (92.08 inches) occurred in 1962, and the driest wet season (50.50 inches) occurred in 1973. Nearly all extremely dry years on Guam occur during the year following an El Niño event.

The lowoccurs in MAugust; hoSeptembethrough JuMay, July, monthly timinches durrecorded dGuam’s re A five-mthe period year-to-yeaof the dries1983, 1988
S
Figure 6. the possiblshowers. Neast wind c
INCHE
11
est mean (4.06 inches) and median (2.66 inches) monthly rainfall arch. The highest mean monthly rainfall (15.17 inches) occurs in
wever, the highest median monthly rainfall (14.40 inches) occurs in r. Monthly rainfall values below one inch have occurred in February ne. Monthly rainfall values above 20 inches have occurred in January, August, September, October, and December. The lowest value of the e series of the rainfall at the Taguac WSMO is the reading of 0.50
ing April 1965. The highest monthly value is the 40.13 inches uring May 1976, of which Typhoon Pamela contributed 27.01 inches—cord 24-hour rainfall. onth moving average of the monthly rainfall anomaly at the WSMO for 1960-99 (Fig. 7) shows high year-to-year variability. Much of this r variability is related to the irregular recurrence of El Niño, with some t years occurring in the year following EL Niño (e.g., 1966, 1973, , and 1998).
(Guam)
WEST SIDE MAX
EAST SIDE MAXBEAM BLOCK
EAST SIDE MIN
Three days of integrated rainfall (22 May 2002 through 25 May 2002) showing e effect of Guam on the large-scale rainfall pattern in a condition of widespread ote the concentration of rainfall on the lee side of the island (western side in
onditions), and the banded swaths of max and min rainfall to the east of Guam.

12
Guam Rain Anomaly (5-month Moving Average)
-6
-4
-2
0
2
4
6
8
1960 1965 1970 1975 1980 1985 1990 1995
Inch
es
Figure 7. A five-month moving average of the monthly rainfall anomaly at the WSMO, Taguac, Guam. c. Inter-decadal variations There is intense pressure on the scientific community to predict the long-term fate of earth’s climate (e.g., global warming); and further, to show the impact of such long-term climate change at regional scales (e.g., the tropical Pacific islands, Antarctica, and the world’s grain belt). It has been suggested by some (e.g., Morrissey and Graham 1996) that the hydrologic cycle of the western Pacific may change in a warmer world in a manner that would see tropical islands in the northwest part of the basin (e.g., Yap, Palau, Guam and the CNMI) become drier while islands of the central equatorial and South Pacific (e.g., Kiribati southeastward through the Society Islands) become wetter. As research continues on the problem of long-term climate change, attention has recently been focused on climate fluctuations at periods of one to several decades. These inter-decadal climate variations are troubling because they may mask, or may be mistaken for, longer-term climate changes. A plethora of local and regional climate patterns have been defined, for example: the Pacific Decadal Oscillation (PDO) (Minobe 1997), the North Atlantic Oscillation (NAO) (Uppenbrink 1999), and the Southern Oscillation. Nearly all of these have prominent inter-decadal variations. Any projections of a change in the hydrologic
13
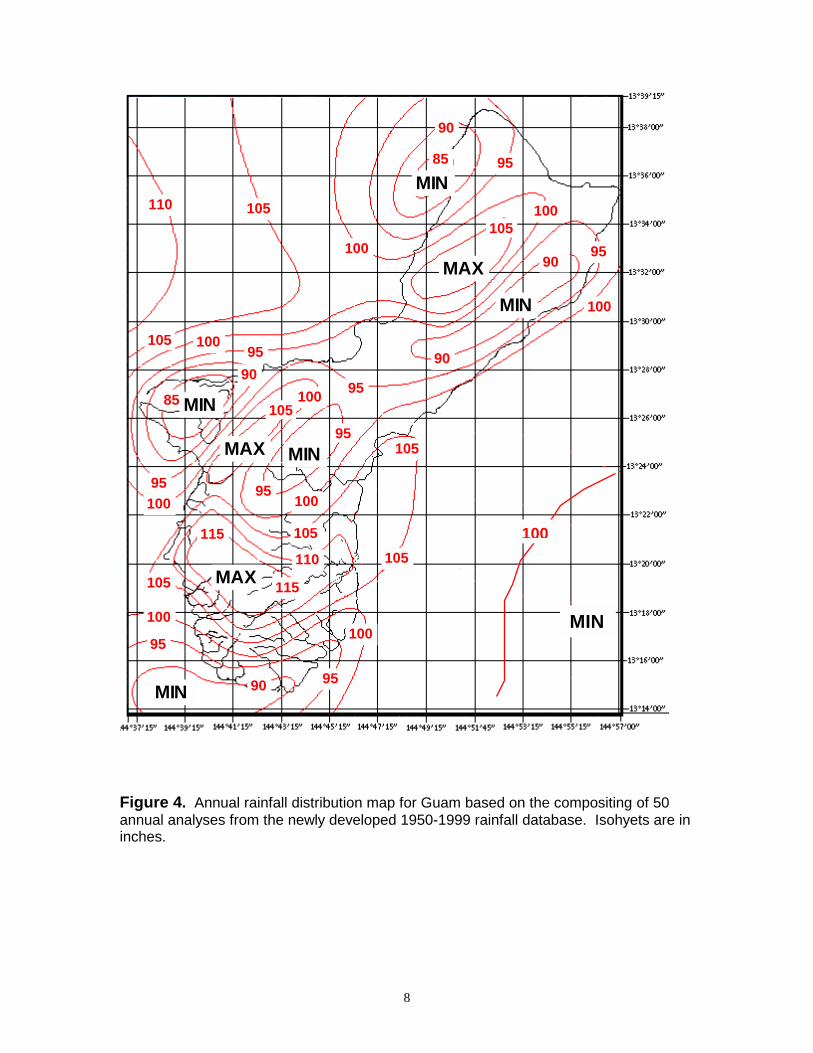
cycle in the western Pacific in a warmer world must take account of the presence of susbstantial inter-decadal variations of rainfall, as observed on Guam. The 50-year record allowed some assessment of interdecadal variations in Guam’s rainfall. The 1950s was a very dry decade, as indicated by the sharp downward slope of the running accululations of rainfall anomalies shown in Fig. 8. The late 1960s to the mid-1970s were slightly drier than the long-term average, while the 1980s through the early 1990s were slightly wetter than the long-term average The period 1960-65 was very wet as indicated by the sharp rise of the running accumulation of the rainfall anomalies shown in Fig. 8. The distribution of these long-term trends are consistent at both Tiyan and Andersen AFB (the two stations with the longest complete rainfall records on Guam). Superimposed on the long-term rise and fall of the integrated rainfall are sharp peaks and troughs that are primarily associated with ENSO: the period from the end of the El Niño year through the year following El Niño tends to be very dry. Figure 8. Running accumulations of the rank (lowest month = -305, highest month = +306) of each month’s rainfall for the period 1950 to 2000 (annual cycle not removed). Complete records were available from Andersen AFB and from the Naval Air Station (NAS) at Tiyan. Prominent features include the extreme dryness of the 1950s and a very wet period in the early 1960s. Recent prominent rainfall fluctuations include relative dryness from late 1992 through 1995, and a wet period during 1996 and 1997. These fluctuations are related to El Niño. d. Comparisons with earlier annual rainfall distribution maps
Integrated Rank
-7000
-6000
-5000
-4000
-3000
-2000
-1000
0
1000
2000
1950 1955 1960 1965 1970 1975 1980 1985 1990 1995 2000-3500
-3000
-2500
-2000
-1500
-1000
-500
0
500
1000
ANDERSEN AFB
NAS (Tiyan)

14
Figure 9 shows the annualy rainfall distribution analysis of Jordan (1955) and Figure 10 shows that of NRCS (1987). There are several differences between the distributions indicated by these studies and the distributions from our study. That of Jordan for the dry season and the wet season of 1952 shows two maxima over the southern mountains and another maximum over northern Guam in the dry season (Jan-Apr), but very small amounts of rain. The wet season (Jul – Oct) had much more rain that was more widespread in distribution with smaller rainfall gradients (as a percentage of the maximum). The analysis of the NRCS is for the entire year, and uses many years of data. The rainfall distribution is qualitatively similar to that of both Jordan and this study. However, when compared with the analysis in this study, several differences are apparent. The maximum area in the south is much larger in NRCS analysis. In addition, the isohyets across central Guam are perpendicular to those in our analysis (i.e, orientation of the isohyets is east-west as opposed to northeast-southwest orientation of our isohyets). Furthermore, our analysis indicates several maxima and minima on the island, and the maximum rain region in southern Guam extends further to the coast. Figure 9. Guam’s rainfall distribution during the dry season (left panel) and the wet season (right panel) of 1952 as analyzed by Jordan (1955).
88
8
8
88
66
6
64
4
1010 1952
DRY SEASON (Jan - Apr)
50
5050
50
45
4545
45
45
4555
1952WET SEASON (Jul - Oct)

15
Figure 10. Guam annual rainfall (inches). This map, produced by the Natural Resources Conservation Service (NRCS) (1987), is currently used as the official rainfall distribution for Guam building codes and storm drainage practices. 4. Summary and Further Research A careful analysis of all available rainfall data collected by US and Government of Guam agencies since 1950 reveals that the rainfall distribution patterns on Guam are much more complex than previously indicated. In addition, the data show that the rainfall gradients and the patterns are strongly influenced by the northeast-southwest orientation of the island, the shape of the island, and the terrain of the island. The analysis of annual rainfall over the open ocean, unperturbed by the island, is found to be about 100 inches. The analysis further shows that there are several rainfall maxima and minima on the island. The maxima are in the north-central part of Guam, down the western mountains, across the southern mountains, and up the southeast coastline. The minima are located southwest of Mount Santa Rosa to Tiyan, south of Ritidian Point, Orote Point to Cabras Island, south-central Guam east of Fena Lake and northeast toward Barrigada, and southwestern Guam and Cocos Island. The strongest rainfall gradients are located along and parallel to the major mountain ranges. Strong gradients are also seen where terrain produces a rain shadow. Mount Santa Rosa and Mount Barrigada produce strong rain shadows, primarily during northeasterly and easterly flow during the drier months. In the future, Guam’s NEXRAD may prove to be crucial in solving once and for all, and in very high detail, the spatial pattern of rainfall near and over Guam. A
100
9595
95
95
95
95
100
100
105
110
90
9090
< 90
GUAM ANNUAL RAINFALL (INCHES)
NRCS 1985NRCS 1987

16
coordinated effort to acquire and analyze the radar data for monthly, seasonal, and annual rainfall distributions is recommended. Also, when enough data has been collected, one may further analyze the radar data for rainfall patterns segregated by meteorological criteria (e.g., windspeed and direction). The radar has already shown that the common assumption that rainfall on Guam is governed largely by elevation – as it is on most of the Hawaiian Islands – is wrong during most major precipitation events (Fig. 11a,b). For example, rainfall during typhoons is hardly affected by the topography of Guam at all. These most extreme of Guam’s rain events have rainfall distributions that are related to the structure of the typhoon. During direct passages of typhoons over Guam, the heaviest rain tends to fall in the regions just near the edge of the eye, where the longest duration of heaviest rain is experienced. There are slightly lower amounts in areas that experience the eye, and rapid drop-off of amounts as one moves outward from the eye wall cloud (Fig. 12a,b). Even though the NEXRAD could provided extensive spatial coverage of Guam’s rainfall, an expansion of rain gage coverage on Guam (or keeping the existing gages operating) is necessary to establish the numerical value of short- and long-term rainfall amounts. Rain gages are still very important even with precipitation-estimating radar, since the radar rain-rate algorithms often yield erroneous rainfall magnitudes (usually underestimates of 10-15%), while producing an accurate representation of the spatial pattern and gradients of rainfall. Also, there are several places on Guam, and just offshore of the island, where beam blockage prevents NEXRAD from obtaining accurate rain-rate measurements. The National Weather Service is continuing to expand its cooperative observer network, and the UOG is expanding its on-campus rain gage network and other cooperating observers around the island. Though often overlooked in the age of ground radar and space-based rain-rate retrievals, the necessity of a surface rain gage network should not be underestimated. Further studies, will provide monthly and seasonal (wet, dry, and spring and fall transitions) rainfall distribution maps, and will reveal differences in rainfall distribution patterns during El Niño, La Niña, and "normal" years. Also of interest are the highest values of short-term rainfall rates. It is likely that the peak short-term (1-hr, 3-hr, and 6-hr) rain events, and the peak daily rain totals occur during the direct passages of typhoons over the island. During the year 2002, Guam experienced the eye passage of two typhoons: Chataan (July) and Pongsona (December). Each of these typhoons produced phenomenal short-term rainfall rates that exceeded currently accepted 100-yr return-period values (Guam Storm Drainage Manual 1985). Hourly rainfall rates in excess of 6 inches were measured in the peak accumulation regions of each of these typhoons. Three-hourly rates approached 15 inches, and 24 hour totals were in excess of 20 inches (Fig. 13a). Some stream flows were at record levels in each of these typyhoons. As a first approximation, the swath of heaviest rain in a typhoon is found at that location that takes the longest path through the eye wall cloud, and does not go into the rain-free eye (Fig. 13b). An analysis of peak rain rates on Guam and Saipan is planned in a separate report.
17
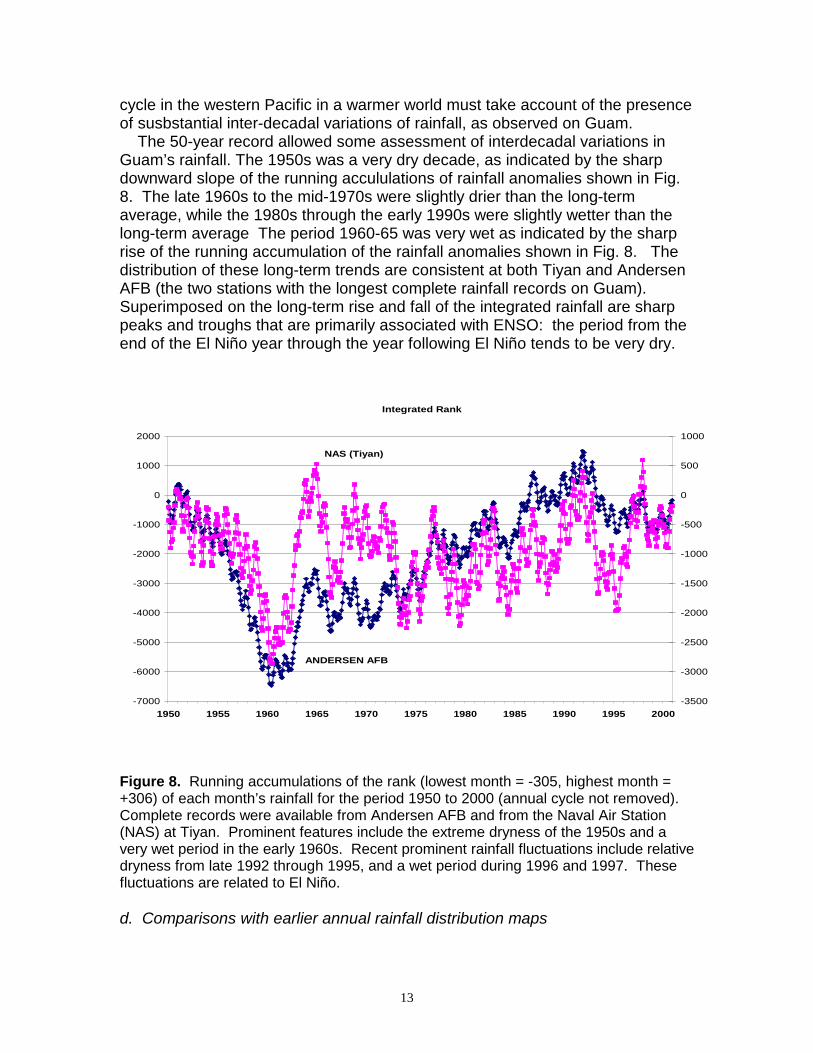
Figure 11. Rainfall deposited on Guam during the near passage of tropical cyclones. (a) Rainfall associated with near passage of typhoon Wilda as estimated by NEXRAD during the period 0220 UTC – 2147 UTC 24 October, 1994. Outer contour is 2 inches, light blue inidicates 3 to 4 inches, dark blue indicates 4 inches or more. (b) The rainfall measured on Guam during the same time period. (c) Rainfall associated with the near passage of Tropical Storm Verne as estimated by NEXRAD during the period 0420 UTC 18 Oct – 0105 UTC 20 October. Outer contour is 2 inches, light blue indicates 2 to 3 inches and dark blue indicates 3 inches or more. (d) The rainfall measured on Guam for the same period.
4.222.85
4.95
3.192.88
33
333
2
2
2 2
2
2
< 2
4
(a) (b)
3.123.47
3.85
3.783.01
1.67
(c) (d)
4.95
3.193
2
2
1 11
< 1"
1 - 2"
(a)

18
Figure 12. (a) Rainfall measured during the passage of Typhoon Pongsona over Guam. (b) Schematic diagram shows rainfall expected as a function of path taken through eye wall.
CASE 1:
EYE WALL THICKNESSEQUALS 0.5 EYE DIAMETER
CASE 2:
EYE WALL THICKNESSEQUALS 0.25 EYE DIAMETER
No Rain
Max Rain
71% of Max Rain
61% of Max Rain
67% of Max Rain
Max Rain58% of Max Rain
No Rain
22
23
2323
max
2221
20
19
2220
1816
141210864
212019
1816
1412
10
8
6
4
22
21
20
19Typhoon PongsonaStorm Total RainfallMidnight-to-midnight07-08 December, 2002
23
EDGE OF EYE
PATH OFEYE CENTER
(b)

19
0
5
10
15
20
25
0 1 2 3 4 5 6 7 8 9 10 11 12 13 14 15 16 17 18 19 20 21 22 23 24LOCAL TIME (08 DEC 2002)
RAIN
FALL
(INC
HES)
PONGSONA RAINFALL TIME SERIESAT ANDERSEN AFB
EYE PASSAGE
Figure 13. A time series of the rainfall accumulated at Andersen AFB during the passage of Typhoon Pongsona. Note the cessation of rain as the eye passes over. Rain rates exceeded 7 inches per hour in the first half of the storm. (Data Source: NASA TRMM rain gage network).
20
References
Allan, R., J. Lindesay, and D. Parker, 1996: El Niño, Southern Oscillation & Climate Variability. CSIRO Publishing, Collingwood, Victoria, Australia, 405 pp. Beck, D. A., 1980: Rainfall Observations for Guam, 1950-1979. US Geological Survey, Guam Sub-District, Department of the Interior, Washington, DC, 430 pp. Jordan, C. L., 1955: Some features of the rainfall at Guam. Bull. Amer. Meteoro. Soc., 36, 446-455. JTWC, 1980-1997: Annual Tropical Cyclone Reports. Naval Oceanography Command Center/Joint Typhoon Warning Center, COMNAVMARIANAS, FPO AP 96540-0051. JTWC, 1959-1979: Annual Typhoon Reports. Naval Oceanography Command Center/Joint Typhoon Warning Center, COMNAVMARIANAS, FPO AP 96540-0051. JTWC, (1991): Tropical cyclones affecting Guam (1671-1990). Naval Oceanography Command Center/Joint Typhoon Warning Center, Edited by F. Wells, COMNAVMARIANAS, FPO AP 96540-0051, 45 pp + updates to 1999. Lander, M. A., and C. P. Guard, 1998: High wave events on Guam: NAVSTA Family Housing Project. Prepared for Moffatt and Nichols Engineers, Long Beach, CA., 66 pp. Minobe, S., 1997: A 50-70 year climatic oscillation over the North Pacific and North America. Geophys. Res. Let., 24, 683-686. Morrissey, M.L., and N.E., Graham, 1996: Recent trends in rain gauge precipitation measurements from the tropical Pacific: Evidence for an enhanced hydrologic cycle. Bull. Amer. Meteoro. Soc., 77, 1207-1219. Natural Resources Conservation Service (NRCS), 1987: Field Office Technical Guide Archive, Section I: Climate Data. U.S. Department of Agriculture, Natural Resources Conservation Service. See also electronic archives of NRCS for the Pacific Basin: http://www.nrcs.usda.gov/technical/efotg/. Trenberth, K.E., 1997: The definition of El Niño. Bull. Amer. Meteoro. Soc., 78, 2771-2777. Uppenbrink, J., 1999: Climate variability - The North Atlantic Oscillation, Science, 283, 948-949. U.S. Army Corps of Engineers, 1980: Guam Storm Drainage Manual. U.S. Army Corps of Engineers, Honolulu, HI. Ward, P. E., S. H. Hoffard, and D. A. Davis, 1965: Hydrology of Guam in Geology and Hydrology of Guam, Mariana Islands. Geological Survey Professional Paper 403-H. US Government Printing Office, Washington, DC. 28 pp.

i
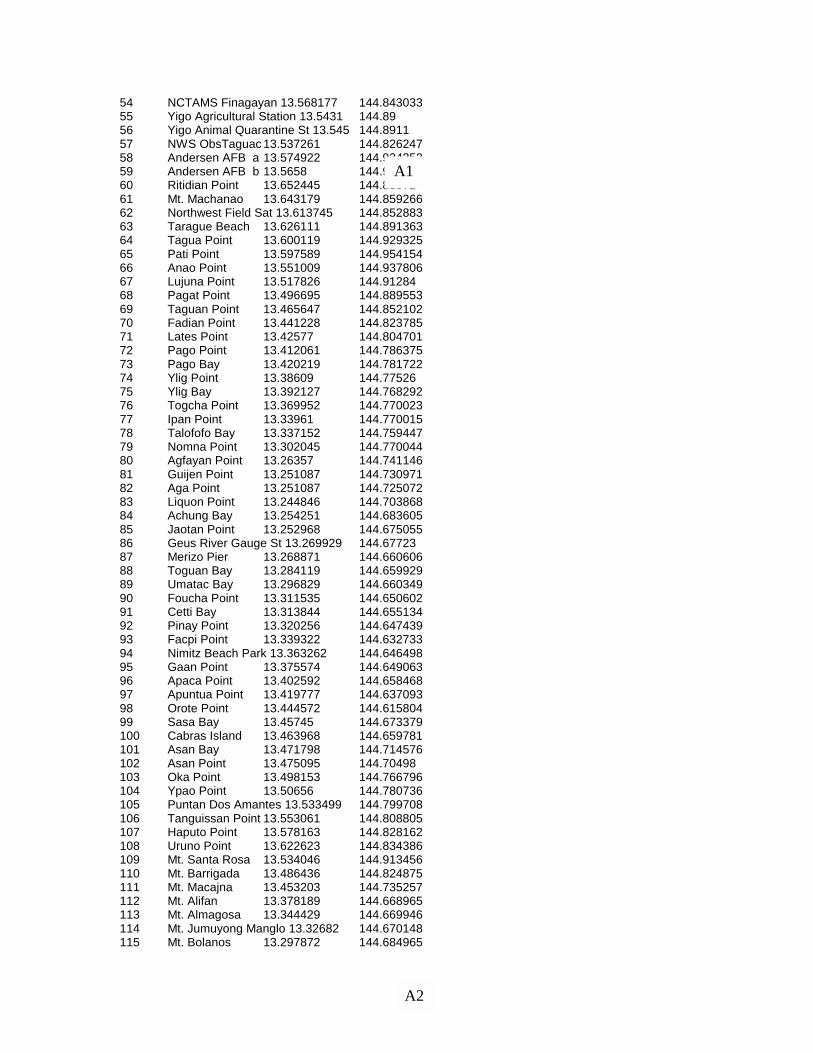
APPENDIX A Rainfall data locations Location Latitude Longitude 1 Cocos Island 13.234415 144.643848 2 Inarajan 13.2717 144.7472 3 Inarajan Ag Station 13.277 144.75 4 Umatac Fire Station 13.298191 144.656907 5 Umatac Village 13.295318 144.661625 6 Umatac #6 Village 13.2981 144.6603 7 Umatac Valley 13.297591 144.664199 8 Umatac PUAG 13.283 144.667 9 Fintasa River 13.2833 144.735 10 Inarajan-NASA 13.308594 144.73594 11 Malojloj 13.299521 144.760062 12 Mt. LamLam 13.338467 144.663041 13 Almagosa Springs 13.344943 144.674793 14 Imong River 13.338038 144.698812 15 Camp Dealey 13.350265 144.766428 16 Fena Dam 13.357854 144.704002 17 Fena River 13.355967 144.719829 18 Lost River 13.3591 144.7083 19 Talofofo 13.354222 144.753663 20 Talofofo Golf Course 13.3667 144.733 21 Hughes Farm 13.3708 144.7419 22 Windward Hills 13.374968 144.730295 23 Agat 13.384318 144.655363 24 Naval Magazine 13.3836 144.6828 25 Fena Filter Plant 13.3861 144.6825 26 Ylig Filter Plant 13.3978 144.7508 27 Apra Heights 13.4031 144.685 28 Gorco Refinery 13.4164 144.6883 29 Mt. Tenjo 13.419318 144.697097 30 Mt. Alutom 13.431113 144.710307 31 Pago River 13.4217 144.7681 32 Sumay 13.439938 144.648746 33 BMP Camp 2 13.4347 144.6931 34 Mt. Chacho 13.43566 144.708635 35 Pago River (upstream) 13.4369 144.7503 36 Mangilao Ag Station 13.4492 144.7983 37 Mangilao Forest Service 13.45 144.817 38 Piti 13.4583 144.6878 39 Piti Agricultural Station 13.4628 144.6908 40 Nimitz Hill 13.470269 144.747228 41 Agana Springs 13.462356 144.758041 42 Adelup Reservoir 13.468739 144.730401 43 Adelup Point 13.479199 144.726611 44 Fort Apugan 13.462515 144.72498 45 Agana Navy Yard 13.478515 144.750893 46 Barrigada Booster Station 13.4745 144.7692 47 Tamuning (ACEORP) 13.4817 144.7786 48 Naval Air Station A 13.4806 144.7847 49 Naval Air Station B 13.480186 144.802139 50 Tamuning (USGS) 13.4853 144.7811 51 Naval Medical Center 13.4961 144.78 52 Harmon Field 13.496432 144.806517 53 Dededo (PUAG) 13.5167 144.8469
A1
ii
54 NCTAMS Finagayan 13.568177 144.843033 55 Yigo Agricultural Station 13.5431 144.89 56 Yigo Animal Quarantine St 13.545 144.8911 57 NWS ObsTaguac 13.537261 144.826247 58 Andersen AFB a 13.574922 144.924252 59 Andersen AFB b 13.5658 144.9178 60 Ritidian Point 13.652445 144.86072 61 Mt. Machanao 13.643179 144.859266 62 Northwest Field Sat 13.613745 144.852883 63 Tarague Beach 13.626111 144.891363 64 Tagua Point 13.600119 144.929325 65 Pati Point 13.597589 144.954154 66 Anao Point 13.551009 144.937806 67 Lujuna Point 13.517826 144.91284 68 Pagat Point 13.496695 144.889553 69 Taguan Point 13.465647 144.852102 70 Fadian Point 13.441228 144.823785 71 Lates Point 13.42577 144.804701 72 Pago Point 13.412061 144.786375 73 Pago Bay 13.420219 144.781722 74 Ylig Point 13.38609 144.77526 75 Ylig Bay 13.392127 144.768292 76 Togcha Point 13.369952 144.770023 77 Ipan Point 13.33961 144.770015 78 Talofofo Bay 13.337152 144.759447 79 Nomna Point 13.302045 144.770044 80 Agfayan Point 13.26357 144.741146 81 Guijen Point 13.251087 144.730971 82 Aga Point 13.251087 144.725072 83 Liquon Point 13.244846 144.703868 84 Achung Bay 13.254251 144.683605 85 Jaotan Point 13.252968 144.675055 86 Geus River Gauge St 13.269929 144.67723 87 Merizo Pier 13.268871 144.660606 88 Toguan Bay 13.284119 144.659929 89 Umatac Bay 13.296829 144.660349 90 Foucha Point 13.311535 144.650602 91 Cetti Bay 13.313844 144.655134 92 Pinay Point 13.320256 144.647439 93 Facpi Point 13.339322 144.632733 94 Nimitz Beach Park 13.363262 144.646498 95 Gaan Point 13.375574 144.649063 96 Apaca Point 13.402592 144.658468 97 Apuntua Point 13.419777 144.637093 98 Orote Point 13.444572 144.615804 99 Sasa Bay 13.45745 144.673379 100 Cabras Island 13.463968 144.659781 101 Asan Bay 13.471798 144.714576 102 Asan Point 13.475095 144.70498 103 Oka Point 13.498153 144.766796 104 Ypao Point 13.50656 144.780736 105 Puntan Dos Amantes 13.533499 144.799708 106 Tanguissan Point 13.553061 144.808805 107 Haputo Point 13.578163 144.828162 108 Uruno Point 13.622623 144.834386 109 Mt. Santa Rosa 13.534046 144.913456 110 Mt. Barrigada 13.486436 144.824875 111 Mt. Macajna 13.453203 144.735257 112 Mt. Alifan 13.378189 144.668965 113 Mt. Almagosa 13.344429 144.669946 114 Mt. Jumuyong Manglo 13.32682 144.670148 115 Mt. Bolanos 13.297872 144.684965
A1
A2

iii
116 Mt. Ilicho 13.293196 144.683722 117 Mt. Schroeder 13.282463 144.677014 118 Mt. Sasalaguan 13.277452 144.690489 119 Mt. Finansanta 13.274729 144.686831 120 Mt. Patsud 13.292186 144.75247 121 Perez Acres 13.523073 144.883376 122 Latte Heights 13.498576 144.866171 123 NCTAMS Barrigada 13.470617 144.818223 124 San Antonio Barrigada 13.464633 144.805894 125 Chalan Pago 13.436947 144.774259 126 Ordot 13.445568 144.758775 127 Sinajana 13.459379 144.751526 128 Upper Sigua Falls 13.426352 144.710179 129 13° 20 ‘ --144° 44’ 13.333333 144.733333 130 Junction Rt 4A & Rt 17 13.371048 144.740581 131 Junction Rt 1 & Rt 3 13.522044 144.821312 132 Lower Sigua Falls 13.428191 144.724991 133 Tarzan Falls 13.394522 144.718269 134 Talofofo Falls 13.321676 144.734515 135 Inarajan Falls 13.288708 144.71848 136 Fintasa River Falls 13.287864 144.73172 137 Imong River Falls 13.328058 144.693371 138 Morrow Lake 13.369092 144.700528 139 Maina 13.466456 144.734027 140 Agana Heights 13.463282 144.744449 141 Y-sengsong 13.540133 144.859489 142 South Finagayan 13.547951 144.83345 143 Potts Junction 13.588081 144.862704 144 Chaguian 13.568724 144.889585 145 Mataguak 13.553608 144.882745 146 Junction Rt 2A & Rt 5 13.408724 144.673463 147 Baza Gardens 13.375783 144.747966 148 Yona 13.407952 144.774474 149 Toto 13.463325 144.779835 150 Glass Breakwater Mid 13.46281 144.634475
A2
A3
iv
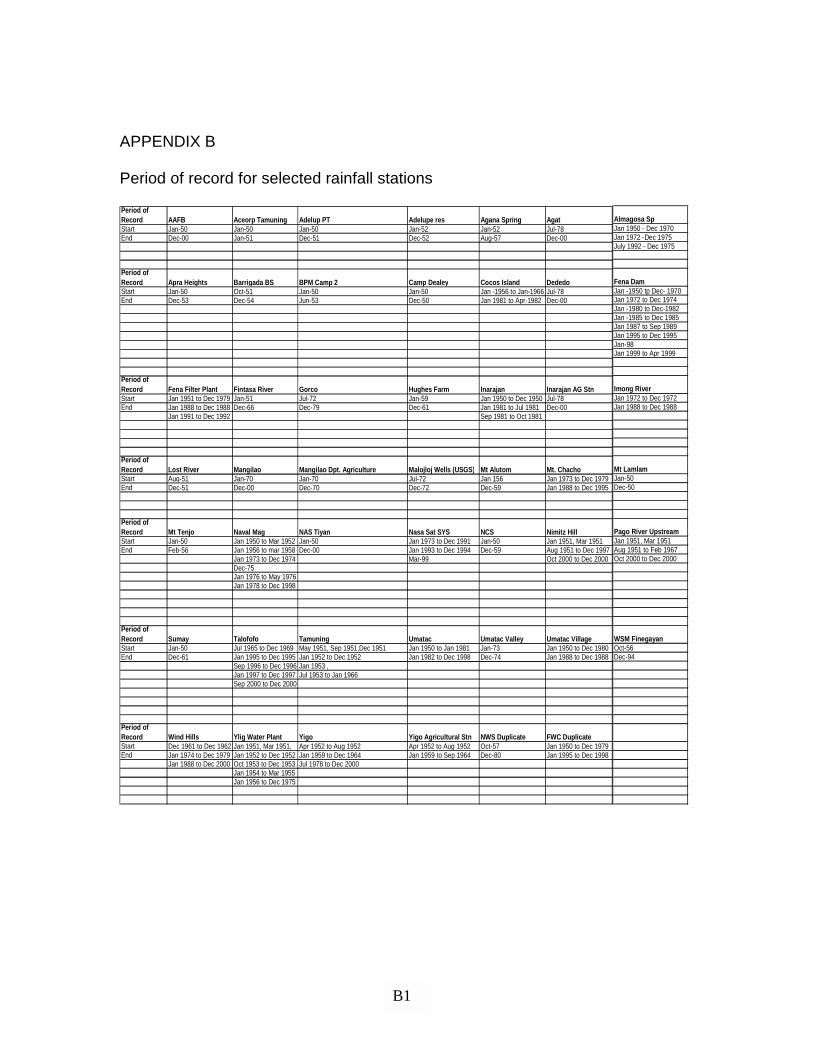
APPENDIX B Period of record for selected rainfall stations Period of Record AAFB Aceorp Tamuning Adelup PT Adelupe res Agana Spring AgatStart Jan-50 Jan-50 Jan-50 Jan-52 Jan-52 Jul-78End Dec-00 Jan-51 Dec-51 Dec-52 Aug-57 Dec-00
Period of Record Apra Heights Barrigada BS BPM Camp 2 Camp Dealey Cocos Island DededoStart Jan-50 Oct-51 Jan-50 Jan-50 Jan -1956 to Jan-1966 Jul-78End Dec-53 Dec-54 Jun-53 Dec-50 Jan 1981 to Apr-1982 Dec-00
Period of Record Fena Filter Plant Fintasa River Gorco Hughes Farm Inarajan Inarajan AG StnStart Jan 1951 to Dec 1979 Jan-51 Jul-72 Jan-59 Jan 1950 to Dec 1950 Jul-78End Jan 1988 to Dec 1988 Dec-66 Dec-79 Dec-61 Jan 1981 to Jul 1981 Dec-00
Jan 1991 to Dec 1992 Sep 1981 to Oct 1981
Period of Record Lost River Mangilao Mangilao Dpt. Agriculture Malojloj Wells (USGS) Mt Alutom Mt. ChachoStart Aug-51 Jan-70 Jan-70 Jul-72 Jan 156 Jan 1973 to Dec 1979End Dec-51 Dec-00 Dec-70 Dec-72 Dec-59 Jan 1988 to Dec 1995
Period of Record Mt Tenjo Naval Mag NAS Tiyan Nasa Sat SYS NCS Nimitz HillStart Jan-50 Jan 1950 to Mar 1952 Jan-50 Jan 1973 to Dec 1991 Jan-50 Jan 1951, Mar 1951End Feb-56 Jan 1956 to mar 1958 Dec-00 Jan 1993 to Dec 1994 Dec-59 Aug 1951 to Dec 1997
Jan 1973 to Dec 1974 Mar-99 Oct 2000 to Dec 2000Dec-75Jan 1976 to May 1976Jan 1978 to Dec 1998
Period of Record Sumay Talofofo Tamuning Umatac Umatac Valley Umatac VillageStart Jan-50 Jul 1965 to Dec 1969 May 1951, Sep 1951,Dec 1951 Jan 1950 to Jan 1981 Jan-73 Jan 1950 to Dec 1980End Dec-61 Jan 1995 to Dec 1995 Jan 1952 to Dec 1952 Jan 1982 to Dec 1998 Dec-74 Jan 1988 to Dec 1988
Sep 1996 to Dec 1996 Jan 1953 ,Jan 1997 to Dec 1997 Jul 1953 to Jan 1966Sep 2000 to Dec 2000
Period of Record Wind Hills Ylig Water Plant Yigo Yigo Agricultural Stn NWS Duplicate FWC DuplicateStart Dec 1961 to Dec 1962 Jan 1951, Mar 1951, Apr 1952 to Aug 1952 Apr 1952 to Aug 1952 Oct-57 Jan 1950 to Dec 1979End Jan 1974 to Dec 1979 Jan 1952 to Dec 1952 Jan 1959 to Dec 1964 Jan 1959 to Sep 1964 Dec-80 Jan 1995 to Dec 1998
Jan 1988 to Dec 2000 Oct 1953 to Dec 1953 Jul 1978 to Dec 2000Jan 1954 to Mar 1955Jan 1956 to Dec 1975
Almagosa SpJan 1950 - Dec 1970Jan 1972 -Dec 1975July 1992 - Dec 1975
Fena DamJan -1950 tp Dec- 1970Jan 1972 to Dec 1974Jan -1980 to Dec-1982Jan -1985 to Dec 1985Jan 1987 to Sep 1989Jan 1995 to Dec 1995Jan-98Jan 1999 to Apr 1999
Imong RiverJan 1972 to Dec 1972Jan 1988 to Dec 1988
Mt LamlamJan-50Dec-50
Pago River UpstreamJan 1951, Mar 1951Aug 1951 to Feb 1967Oct 2000 to Dec 2000
WSM FinegayanOct-56Dec-94
B1

v
Period of Record Mt Tenjo Naval Mag NAS Tiyan Nasa Sat SYSStart Jan-50 Jan 1950 to Mar 1952 Jan-50 Jan 1973 to Dec 1991End Feb-56 Jan 1956 to mar 1958 Dec-00 Jan 1993 to Dec 1994
Jan 1973 to Dec 1974 Mar-99Dec-75Jan 1976 to May 1976Jan 1978 to Dec 1998
Period of Record Sumay Talofofo Tamuning UmatacStart Jan-50 Jul 1965 to Dec 1969 May 1951, Sep 1951,Dec 1951 Jan 1950 to Jan 1981 End Dec-61 Jan 1995 to Dec 1995 Jan 1952 to Dec 1952 Jan 1982 to Dec 1998
Sep 1996 to Dec 1996 Jan 1953 ,Jan 1997 to Dec 1997 Jul 1953 to Jan 1966Sep 2000 to Dec 2000
Period of Record Wind Hills Ylig Water Plant Yigo Yigo Agricultural StnStart Dec 1961 to Dec 1962 Jan 1951, Mar 1951, Apr 1952 to Aug 1952 Apr 1952 to Aug 1952End Jan 1974 to Dec 1979 Jan 1952 to Dec 1952 Jan 1959 to Dec 1964 Jan 1959 to Sep 1964
Jan 1988 to Dec 2000 Oct 1953 to Dec 1953 Jul 1978 to Dec 2000Jan 1954 to Mar 1955Jan 1956 to Dec 1975
Pago River UpstreamJan 1951, Mar 1951Aug 1951 to Feb 1967Oct 2000 to Dec 2000
WSM FinegayanOct-56Dec-94
B2

vi
APPENDIX C A comparison of Guam’s longest rain records (monthly means) with other islands of Micronesia. Average Jan Feb Mar Apr May Jun Jul Aug Sep Oct Nov Dec Annual
Johnston(Hawaii) 1.56 1.66 2.38 2.46 1.98 1.00 1.02 2.14 2.20 3.16 4.25 3.12 26.93PagoPago(AMS) 12.59 12.76 11.26 12.04 9.92 7.38 6.28 6.71 6.69 10.79 10.84 14.54 121.80AAFB(Guam) 5.70 5.22 4.09 4.87 6.60 6.34 10.92 13.42 13.32 12.89 9.09 5.97 98.43NAS(Guam) 4.45 3.74 2.98 3.91 6.05 6.47 10.53 13.73 13.49 12.04 8.20 5.39 90.98WSMO(Guam) 5.55 5.11 4.45 4.71 7.10 6.49 11.78 14.59 15.02 12.74 9.06 6.44 103.04UMATAC (Village) 5.22 3.57 3.40 3.98 5.87 6.31 10.71 14.40 14.69 13.15 9.95 5.99 97.26Ylig River (Filter) 4.88 3.48 3.26 4.16 5.46 5.84 10.63 13.40 14.05 12.71 9.11 6.26 93.04Capitol Hill (CNMI) 4.00 3.00 2.50 3.50 5.50 5.80 9.00 12.50 13.50 12.00 7.30 4.80 83.40Rota Airport(CNMI) 5.28 4.67 3.69 4.53 6.33 6.21 10.44 13.19 13.37 12.67 8.64 5.68 94.70Saipan Intl Airport(CNMI) 3.20 2.40 2.00 2.80 4.40 4.65 8.10 12.50 13.50 10.80 5.80 3.85 74.00Tinian(CNMI) 4.00 3.00 2.50 3.50 5.50 5.80 9.00 12.50 13.50 12.00 7.30 4.80 83.40Wake(Marshalls) 1.16 1.60 2.23 2.51 1.74 3.19 4.02 6.16 5.07 4.33 2.79 1.78 36.58Ailinglapalap(Marshalls) 6.50 4.69 6.19 8.92 10.58 10.61 11.72 10.82 12.13 12.88 11.73 9.98 116.75Chuuk (WSO) 10.68 6.18 8.34 12.35 12.23 11.72 12.10 14.57 11.53 13.42 10.33 10.84 134.31Kapingamarangi (Pohnpei) 10.45 10.27 13.88 13.59 10.34 7.25 10.43 6.16 5.89 4.82 8.19 8.75 110.02Koror(Palau) 10.70 9.12 8.20 8.67 11.99 17.27 18.04 14.95 11.86 13.87 11.32 11.98 147.97Kwajalein(Marshalls) 4.56 3.23 4.10 7.55 9.98 9.62 10.44 10.11 11.83 11.91 10.66 8.10 102.09Kosrae(Kosrae) 14.39 16.35 18.67 21.66 18.80 19.00 17.00 16.50 17.20 16.20 15.90 14.50 206.17Majuro WSO(Marshalls) 8.43 6.15 8.28 10.28 11.18 11.59 13.00 11.52 12.42 13.84 12.80 11.85 131.34Nukuoro(Pohnpei) 11.75 10.55 13.60 15.00 14.75 12.20 14.40 11.35 11.00 10.75 12.00 12.00 149.35Pingelap(Pohnpei) 12.36 12.21 14.49 17.15 17.06 16.26 15.93 14.86 14.97 14.81 14.24 13.37 177.71Pohnpei WSO(Pohnpei) 13.07 10.80 13.54 16.44 19.12 17.14 18.39 16.53 16.06 16.71 15.74 15.22 188.76Polowat(Chuuk) 8.00 6.25 6.25 6.00 9.00 12.50 14.00 15.00 13.25 12.00 9.25 9.2 120.70Tamil(Yap) 7.33 5.98 5.96 5.76 9.06 12.69 14.54 15.20 13.51 11.97 9.07 8.99 120.06Ulithi(Yap) 6.23 5.08 5.07 4.90 7.70 10.79 12.36 12.92 11.48 10.17 7.71 7.64 102.05Utirik(Marshalls) 3.88 2.75 3.49 6.42 8.48 8.18 8.87 8.59 10.06 10.12 9.06 6.89 86.79Wotje(Marshalls) 4.33 2.91 3.90 7.17 9.48 9.14 9.92 9.60 11.24 11.31 10.13 7.70 96.83Woleai Atoll(Yap) 10.68 7.50 8.30 11.00 12.20 13.00 14.00 14.70 11.70 13.60 10.80 11.45 138.93Yap WSO Ap(Yap) 7.33 5.98 5.96 5.76 9.06 12.69 14.54 15.20 13.51 11.97 9.07 8.99 120.06
C1