Creating Value: Using ROI with Accountable care for Market ... · Using ROI with Accountable care...
96
Creating Value: Using ROI with Accountable care for Market Differentiation Victor Buzachero Corporate Senior Vice President Innovation, Human Resources & Performance Management Scripps Health Patti Phillips, Ph.D. President ROI Institute
Transcript of Creating Value: Using ROI with Accountable care for Market ... · Using ROI with Accountable care...

Creating Value: Using ROI with
Accountable care for Market Differentiation
Victor Buzachero Corporate Senior Vice President Innovation, Human Resources & Performance Management Scripps Health
Patti Phillips, Ph.D. President ROI Institute

Road Map
2
The change upon us… The Healthcare PACMAN 1
Quality, Cost, Health… the Triple Aim 2
ROI – why now? 3
ROI defined 4
Case studies 5

Learning Objectives
• Identify reasons for use of, and barriers to,
Return On Investment calculation
• Provide a consistent methodology for measuring
Return On Investment for use in health care
decision making and resource allocation
• Illustrate through health care case studies,
application of the Return On Investment
methodology
3

Waste in the Health System
4
2009 US Healthcare Spending
Necessary Spending
Waste* (Avoidable)
*Unnecessary services, excessive administrative costs, fraud, and other problems
75,000 preventable deaths
Financial Healthcare Projections
5
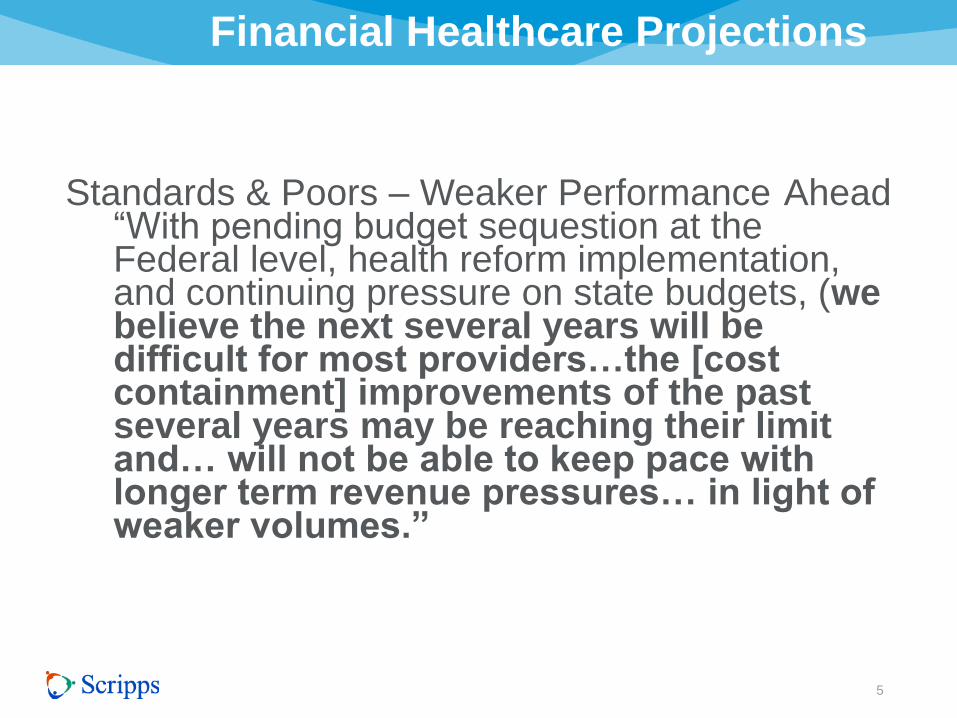
Standards & Poors – Weaker Performance Ahead “With pending budget sequestion at the Federal level, health reform implementation, and continuing pressure on state budgets, (we believe the next several years will be difficult for most providers…the [cost containment] improvements of the past several years may be reaching their limit and… will not be able to keep pace with longer term revenue pressures… in light of weaker volumes.”

Financial Healthcare Projections
6
Fitch (2013 Outlook)
“…believe that the next level of cost reduction
within the industry will need to be realized from a
change in care delivery operating model through
integrating clinical operations, implementing
standardized protocols, coordinating care, and
managing population health care, which will be
more difficult to accomplish.”

7 7
Healthcare Pac-Man

Net Social Value Added by Health System
8
The “Net Social Value Added” by Health Care – not to be confused with
its “Gross Value Added” – probably has turned negative.
Net Social Value Added by the Health System
Gross Social Value Added by the Health System
Social Opportunity Imposed by the
Health System on Society
Healthcare providers and their patients – and producers of medical technology – naturally focus on this gross value added.
Increasingly, leaders in business and government think of these social opportunity costs of health care.
© Copyright Uwe Reinhardt, 2012

9
What Are the Social Opportunity Costs of Healthcare?
• Neglecting the education of our young
• Neglecting science and R&D
• Neglecting our infrastructure
• Neglecting our national security
• Impairing our general standard of living
This is really what PacMan is chewing up.
© Copyright Uwe Reinhardt, 2012

Milliman: Allocation of Medical Costs 2012
10
and Who Actually Pays for the Employer’s Premium Contribution
Employee Out-of-Pocket: $3,470 or 17%
Employee Premium: $5,114 or 25%
Employer Premium: $12,144 or 58%
17%
25% 58%
Source: Milliman Medical Index 2012

Pay Increases Offset by Higher Benefit Costs
11
Although a median-income U.S. family of four with employer-based health insurance saw its gross annual income increase from $76,000 in 1999 to $99,000 in 2009 (in current dollars), this gain was largely offset by increased spending to pay for health care.
Monthly spending increases occurred in the family’s health insurance premiums (from $490 to $1,115), out-of-pocket health spending (from $135 to $235), and taxes devoted to health care (from $345 to $440). After accounting for price increases in other goods and services, the family had $95 more in monthly income to devote to non-health spending in 2009 than in 1999.
By contrast, had the rate of health care cost growth not exceeded general inflation, the family would have had $545 more per month instead of $95—a difference of nearly $5,400 per year. Even the $95 gain was artificial, because tax collections in 2009 were insufficient to cover actual increases in federal health spending. As a result, we argue, the burdens imposed on all payers by steadily rising health care spending can no longer be ignored.
© Copyright Uwe Reinhardt, 2012
Institute for Healthcare Improvement: The Triple Aim
12
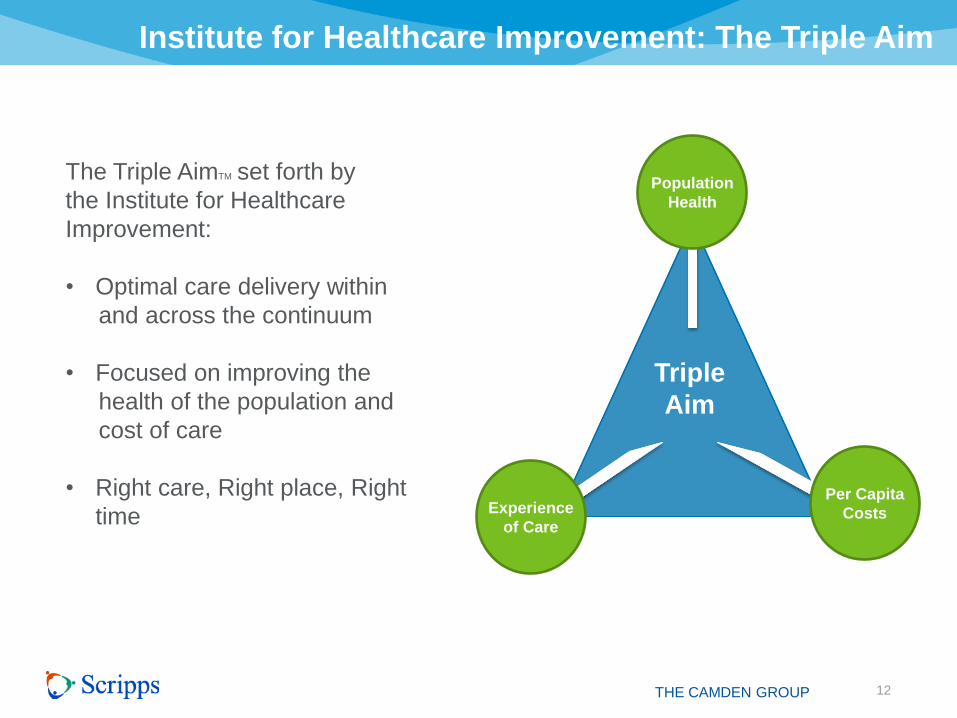
The Triple AimTM set forth by
the Institute for Healthcare
Improvement:
• Optimal care delivery within
and across the continuum
• Focused on improving the
health of the population and
cost of care
• Right care, Right place, Right
time
Triple
Aim
Population
Health
Experience
of Care
Per Capita
Costs
THE CAMDEN GROUP
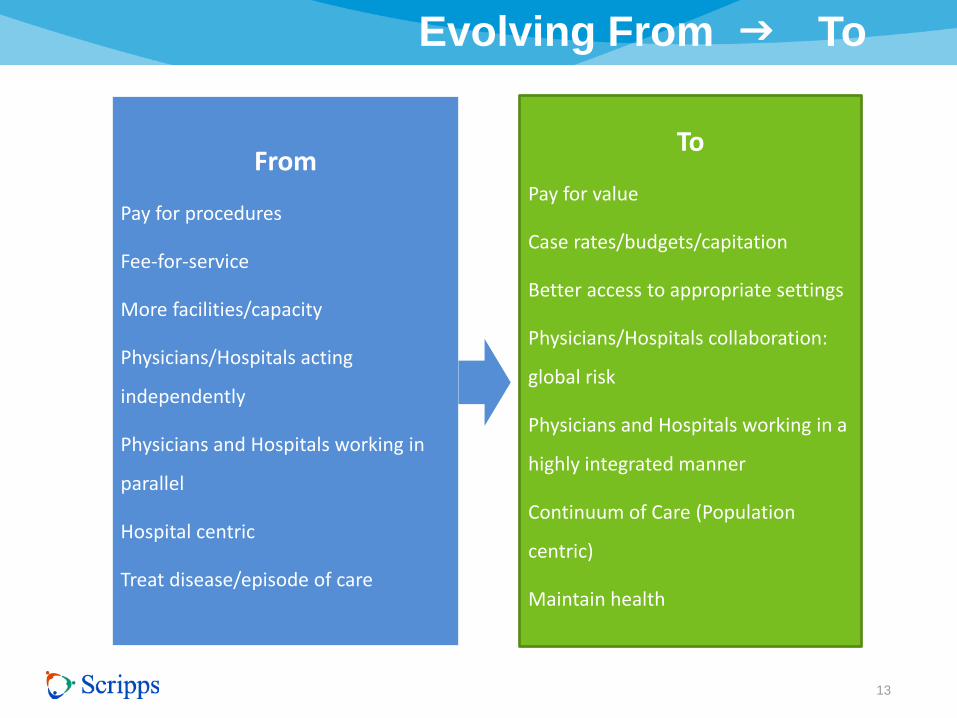
Evolving From g To
13
To
Pay for value
Case rates/budgets/capitation
Better access to appropriate settings
Physicians/Hospitals collaboration:
global risk
Physicians and Hospitals working in a
highly integrated manner
Continuum of Care (Population
centric)
Maintain health
From
Pay for procedures
Fee-for-service
More facilities/capacity
Physicians/Hospitals acting
independently
Physicians and Hospitals working in
parallel
Hospital centric
Treat disease/episode of care
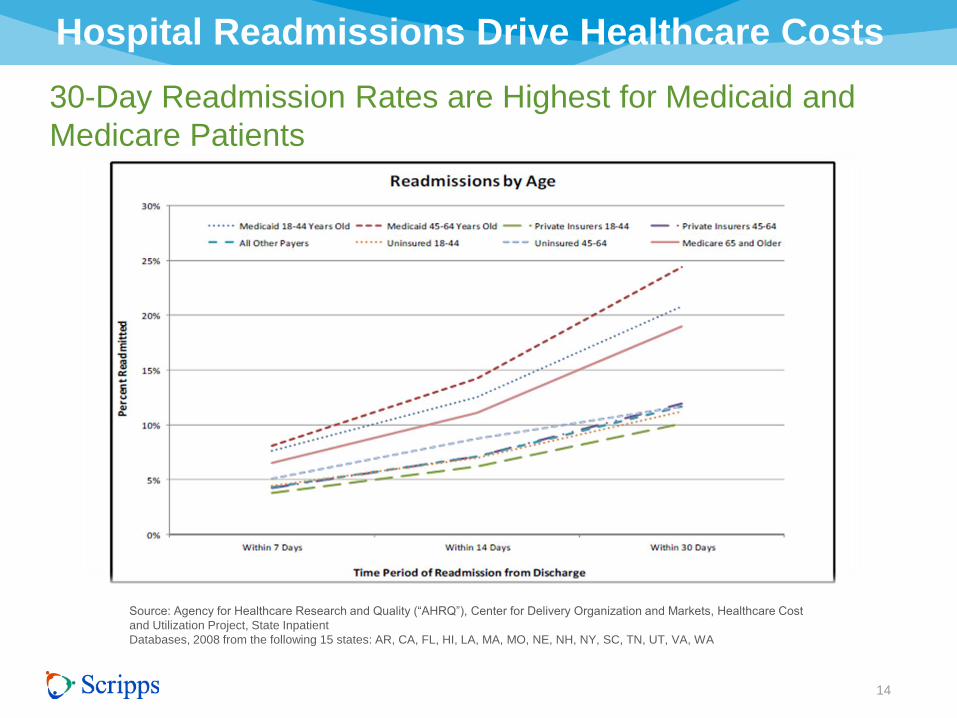
Hospital Readmissions Drive Healthcare Costs
14
30-Day Readmission Rates are Highest for Medicaid and
Medicare Patients
Source: Agency for Healthcare Research and Quality (“AHRQ”), Center for Delivery Organization and Markets, Healthcare Cost
and Utilization Project, State Inpatient
Databases, 2008 from the following 15 states: AR, CA, FL, HI, LA, MA, MO, NE, NH, NY, SC, TN, UT, VA, WA

Accountable Care: How Do You Generate Savings
15 THE CAMDEN GROUP
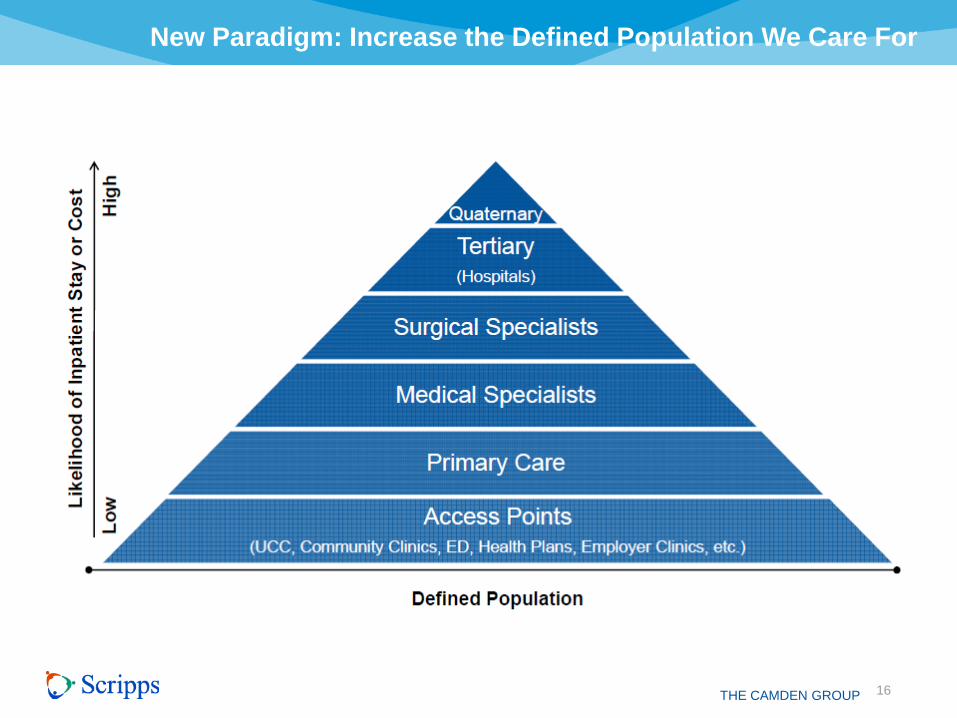
New Paradigm: Increase the Defined Population We Care For
16 THE CAMDEN GROUP

Scripps Employee Health Plan Risk Stratification Approach $20 Million Opportunity
17
?
•Case and Care Management
•Clinical Program Focused
Intervention
•Case Care Coordination Nurse
•Network Negotiations
•Registries
•Quality Metric Selection/Review
•Physician Advisory
•Pilot Definition
•Interventions
•Nurse Lines Follow Up/Compliance
•Care Coordination Nurse
•Coaching
•Nurse Lines Follow Up/Compliance
•Mommies to Be
•24 hour Authorization Line
•Benefit Verification/
Eligibility
•Physician Consult
•Claims Processing/
Online Survey
•Testing/Assessments
•Credentialing/Privileging
•Milliman Well Managed
Clinical Protocols
•Physician Review/
Care Gaps
•Physician Review
•Immunizations
•Well Care
Check Ups
≤ 5%
Catastrophic
Case
Management
10%
Complex Care
Management
30 - 40%
Disease Management
Intervention
60 – 80%
Utilization and Concurrent Review
Management (UR)
Ambulatory/Inpatient/Pharmacy
70 – 80%
Population Health Management
100%
Biometric Testing/Screening Claims Data Health Risk Appraisal

Strategy: Guiding Principles
18
• Move to population health • Strong primary care base (need numbers)
• Use nurse practitioners • Use telehealth/IT
• Move to risk payment/GLOBAL payment • Move to expanded access points (capture the population) • Improve quality (top decile) • Reduce cost (target Medicare) • Be pluralistic
• All payers: narrow networks? • Multiple providers to the hospital (separate risk
performance) • Shared risk pools to link with physician organizations
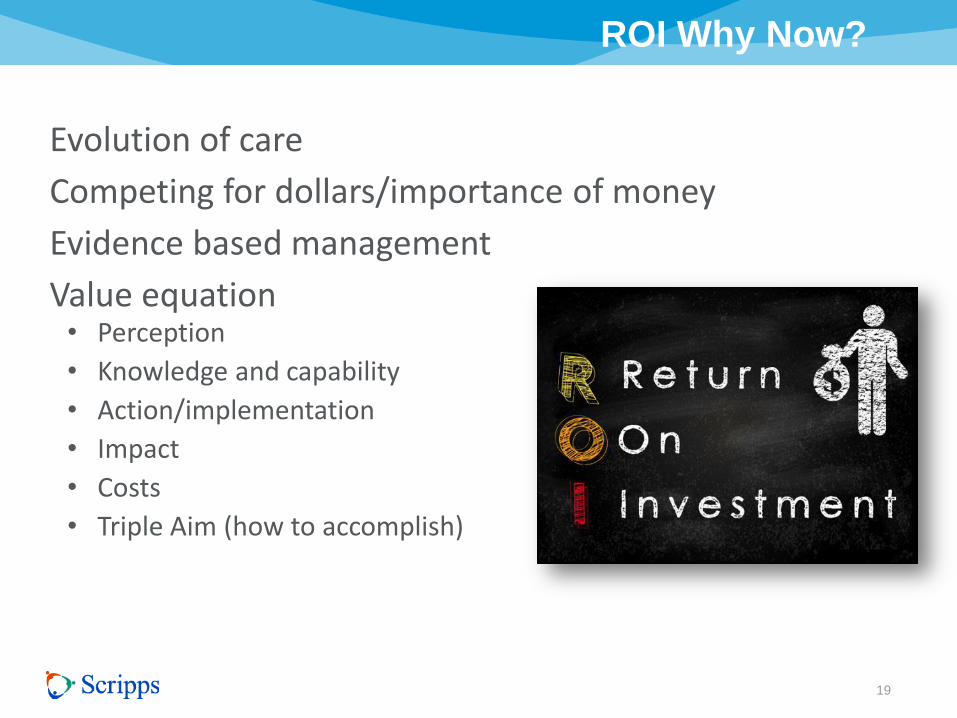
ROI Why Now?
19
Evolution of care
Competing for dollars/importance of money
Evidence based management
Value equation • Perception
• Knowledge and capability
• Action/implementation
• Impact
• Costs
• Triple Aim (how to accomplish)
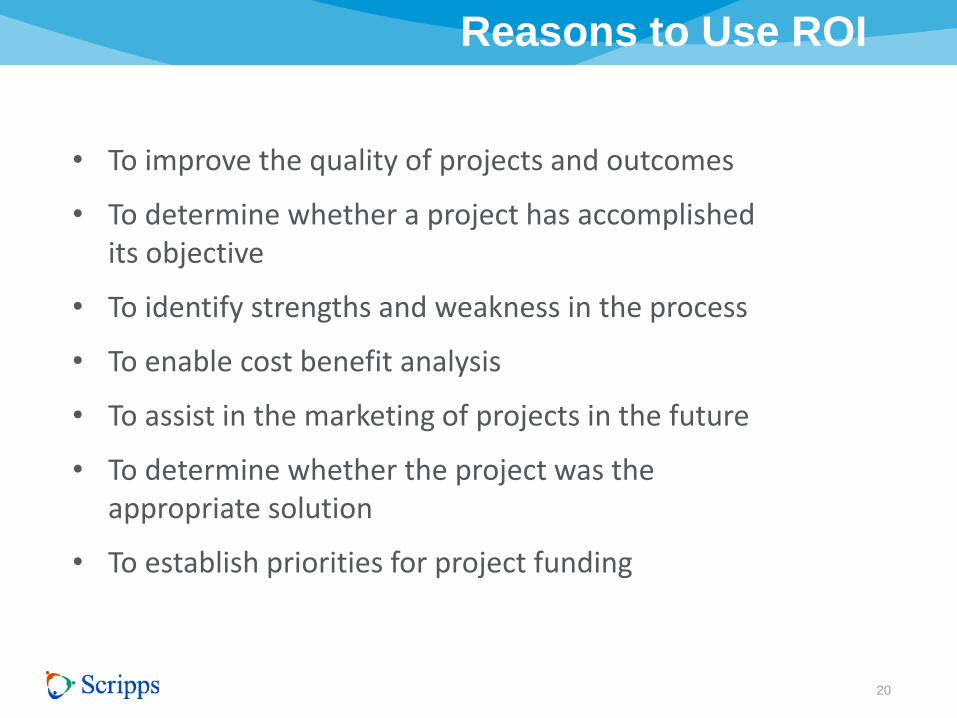
Reasons to Use ROI
20
• To improve the quality of projects and outcomes
• To determine whether a project has accomplished its objective
• To identify strengths and weakness in the process
• To enable cost benefit analysis
• To assist in the marketing of projects in the future
• To determine whether the project was the appropriate solution
• To establish priorities for project funding
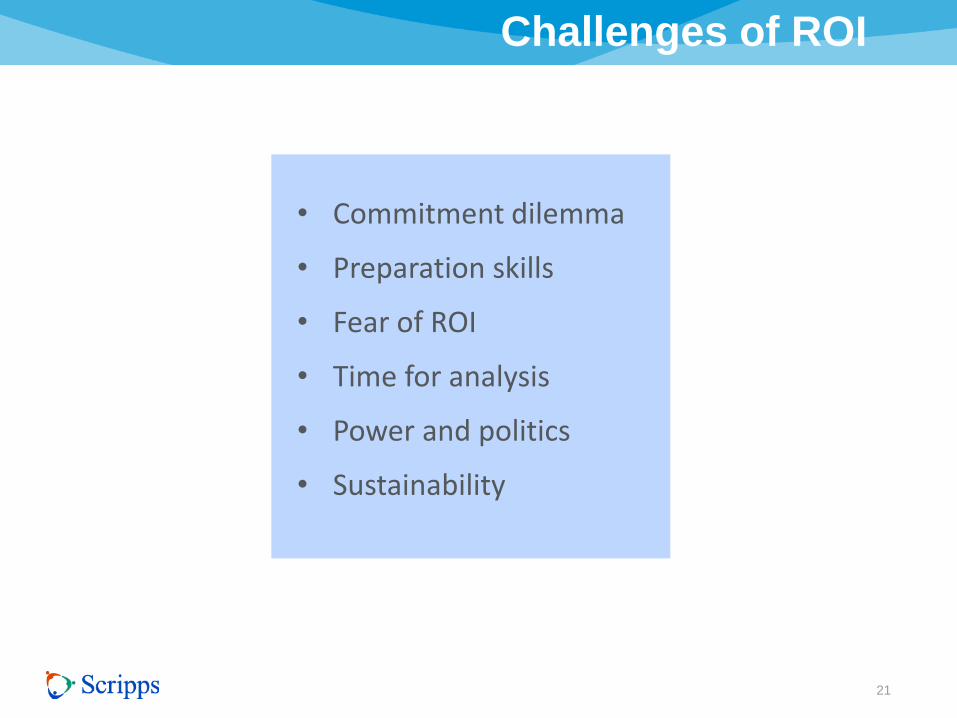
Challenges of ROI
21
• Commitment dilemma
• Preparation skills
• Fear of ROI
• Time for analysis
• Power and politics
• Sustainability

Issues with ROI
22
• Lack of business alignment
• Inappropriate solutions to problems
• Lack of participant engagement
• Lack of focus on business results
• Failure to prepare the environment
• Lack of accountability
• Failure to isolate the effect of the project
• Lack of involvement of key executives
• Failure to connect project to money
• Measuring incrementally

ROI Defined
23
• Methodology
• Process model
• Business alignment
• Guiding principles
• Basics
• ROI calculation

ROI Methodology
24
Costs Reaction Learning Impact ROI Application
&
Implementation
INPUTS OUTCOMES
Making it affordable
The perceptions of those involved
The capability to do it properly
Making it work and making it better
Patient outcomes, safety, productivity, efficiency, satisfaction
Access
The people we serve
Monetary benefits vs. costs
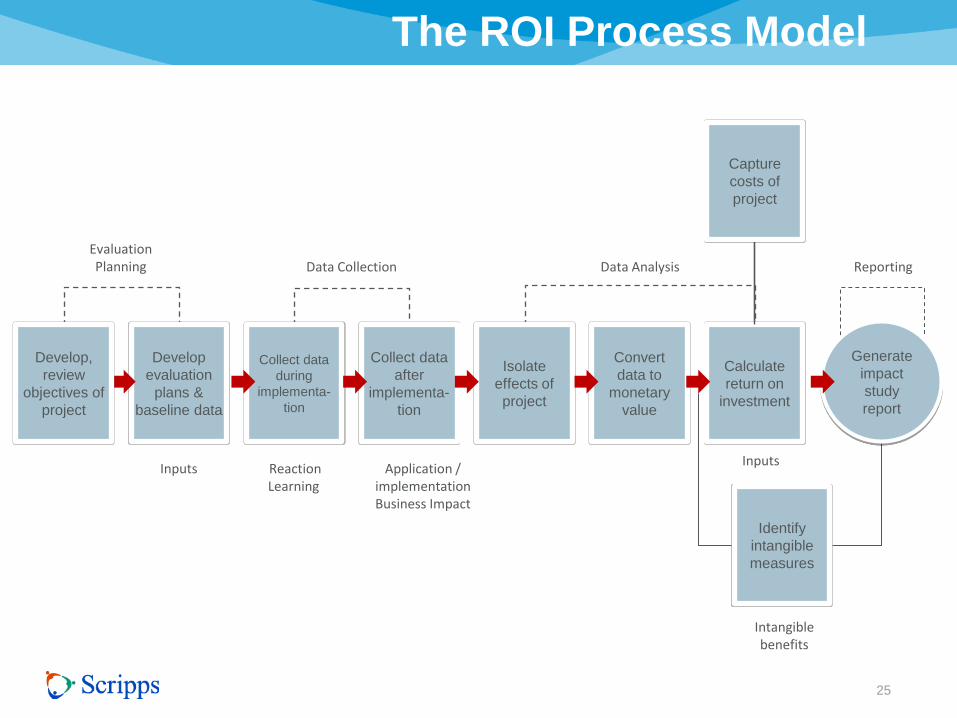
The ROI Process Model
25
Develop
evaluation
plans &
baseline data
Collect data
during
implementa-
tion
Collect data
after
implementa-
tion
Isolate
effects of
project
Convert
data to
monetary
value
Calculate
return on
investment
Generate
impact
study
report
Identify
intangible
measures
Inputs Reaction Learning
Application / implementation Business Impact
Evaluation Planning Data Collection Data Analysis Reporting
Inputs
Capture
costs of
project
Develop,
review
objectives of
project
Intangible benefits
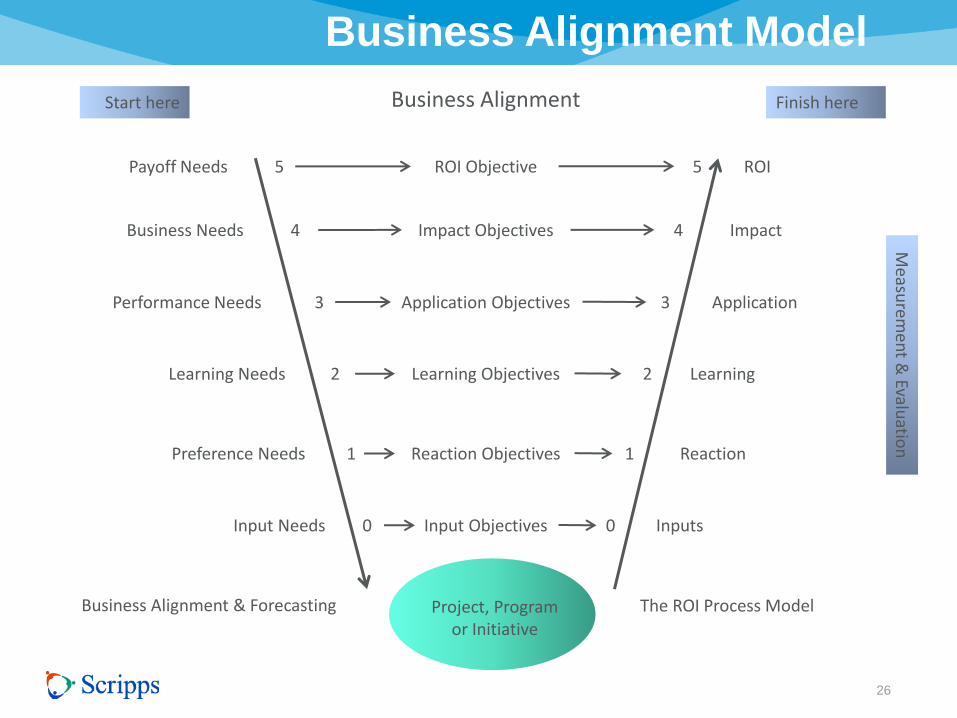
Business Alignment Model
26
Business Alignment Start here Finish here
Payoff Needs
Business Needs
Performance Needs
Learning Needs
Preference Needs
Input Needs
Business Alignment & Forecasting
ROI
Impact
Application
Learning
Reaction
Inputs
The ROI Process Model
ROI Objective
Impact Objectives
Application Objectives
Learning Objectives
Reaction Objectives
Input Objectives
5
4
3
2
1
0
5
4
3
2
1
0
Measu
remen
t & Evalu
ation
Project, Program or Initiative

ROI Basics and Methodology
27
Level 1 - Reaction to the project
Level 2 - Learning how to make the project successful
Level 3 - Applying/implementing the project successfully
Level 4 - Improving one or more impact measures
Level 5 - Calculating the financial ROI
Intangible benefits - Impact data not converted to money
Level 0 - Input into the project
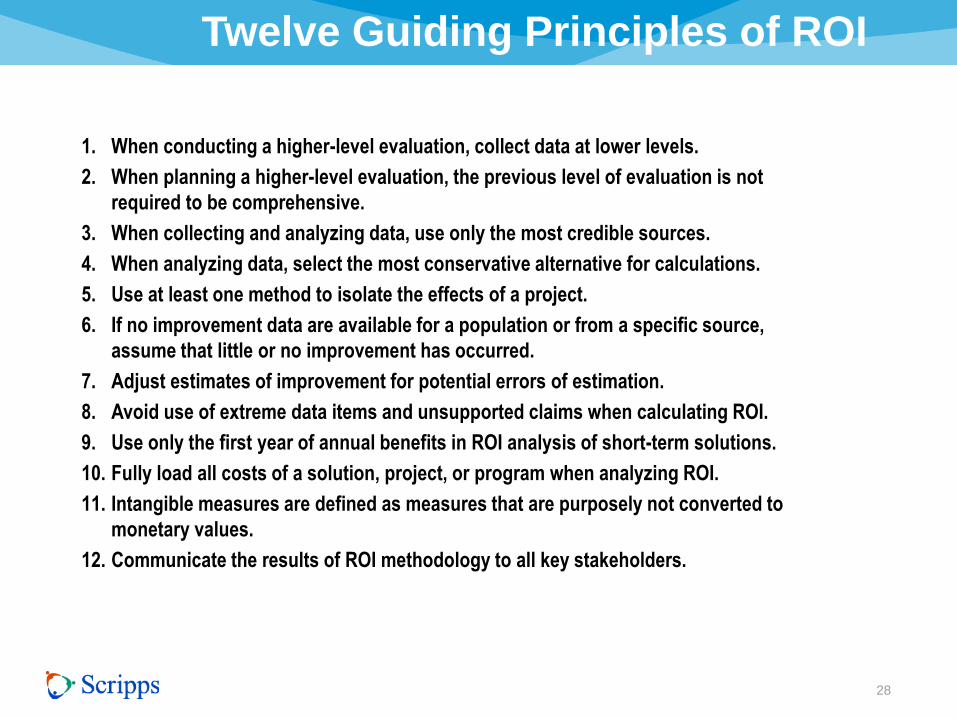
Twelve Guiding Principles of ROI
28
1. When conducting a higher-level evaluation, collect data at lower levels.
2. When planning a higher-level evaluation, the previous level of evaluation is not
required to be comprehensive.
3. When collecting and analyzing data, use only the most credible sources.
4. When analyzing data, select the most conservative alternative for calculations.
5. Use at least one method to isolate the effects of a project.
6. If no improvement data are available for a population or from a specific source,
assume that little or no improvement has occurred.
7. Adjust estimates of improvement for potential errors of estimation.
8. Avoid use of extreme data items and unsupported claims when calculating ROI.
9. Use only the first year of annual benefits in ROI analysis of short-term solutions.
10. Fully load all costs of a solution, project, or program when analyzing ROI.
11. Intangible measures are defined as measures that are purposely not converted to
monetary values.
12. Communicate the results of ROI methodology to all key stakeholders.
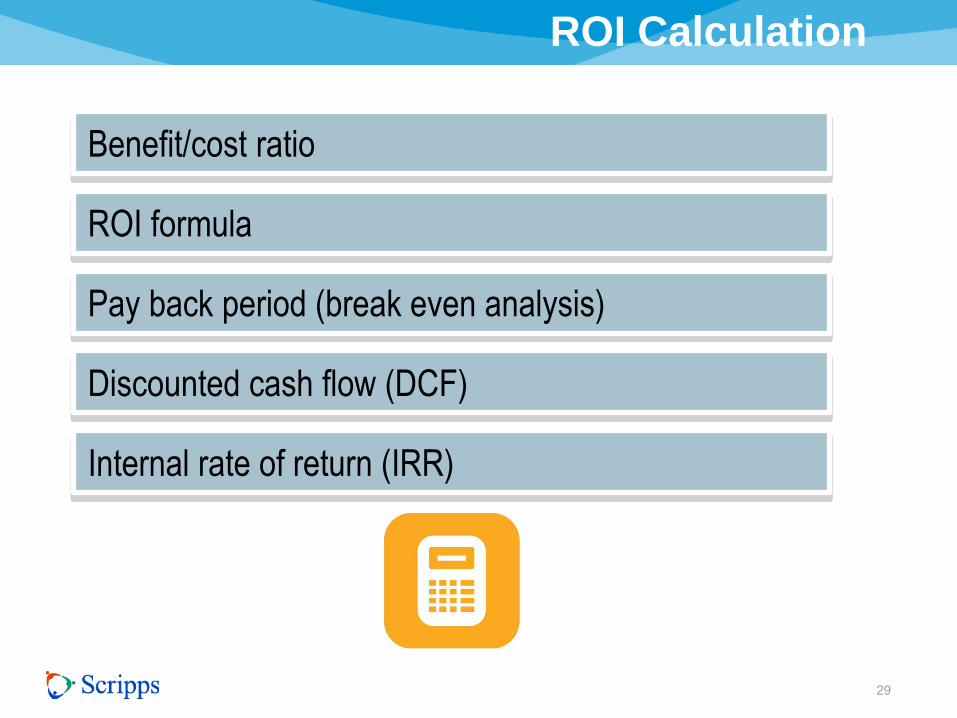
ROI Calculation
29
Benefit/cost ratio
ROI formula
Pay back period (break even analysis)
Discounted cash flow (DCF)
Internal rate of return (IRR)

ROI Calculation
30
Benefit/cost ratio
BCR = Project Monetary Benefits
Project Costs

ROI Calculation
31
ROI formula
ROI % = Net Project Benefits
Project Costs X 100
Net project benefits = project monetary benefits minus project costs

ROI Calculation
32
Payback period (break even analysis)
Payback period =
Total Investment Annual Savings
Years

Measuring Reactions & Learning
33
Support
Adjustment
Predicative capability (effectiveness correlation to reaction) • Project relevant
• Project necessary
• Project important for success of me and organization
• Intend to make successful
• Recommend project
Learning critical for execution of projects • Knowledge and skills
• Understanding
• Comprehension
• Confidence
• Awareness
• Context
• Readiness
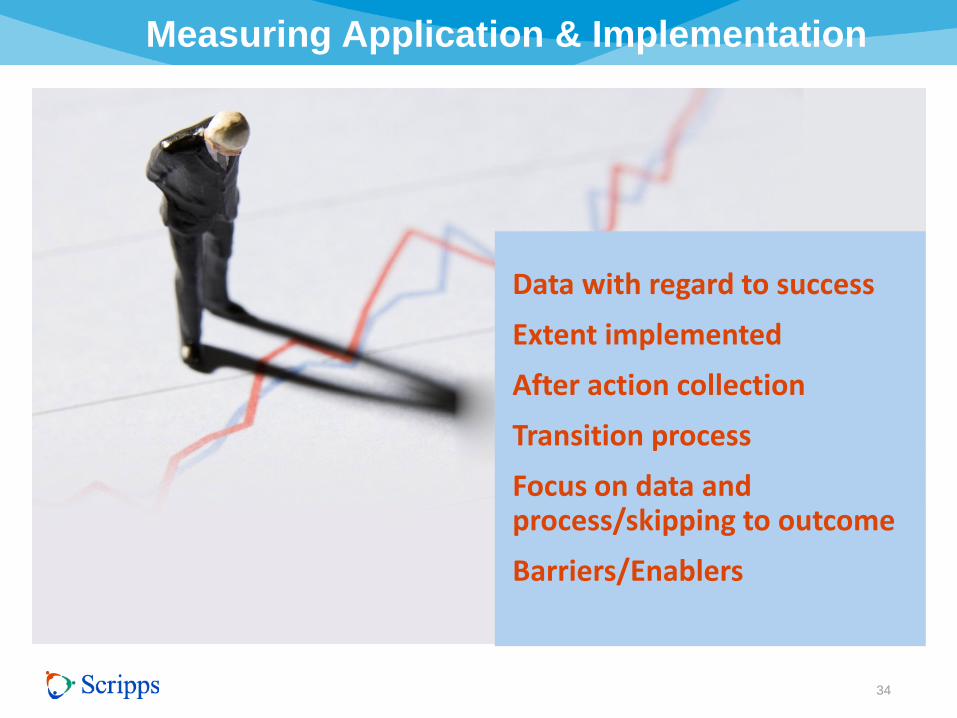
Measuring Application & Implementation
34
Data with regard to success
Extent implemented
After action collection
Transition process
Focus on data and process/skipping to outcome
Barriers/Enablers

Barriers of Measurement
35
–Lack supervisory support
–Not needed
–Lack resources
–Culture support
–No opportunity to use
–No time
–No tools/templates
–Lack technology
–Lack system or processes
–Competing practices
–No value
–Job changes
–Work not appropriate
–Funding exhausted
–Cost

Business Impact
36
Strategic
Operational
Tactical

Measures at Different Levels
37
Impact Measures
Corporate/
Headquarter Level
Business Unit/
Hospital Level
Operating Unit/
Department Level
Strategic
Operational
Tactical
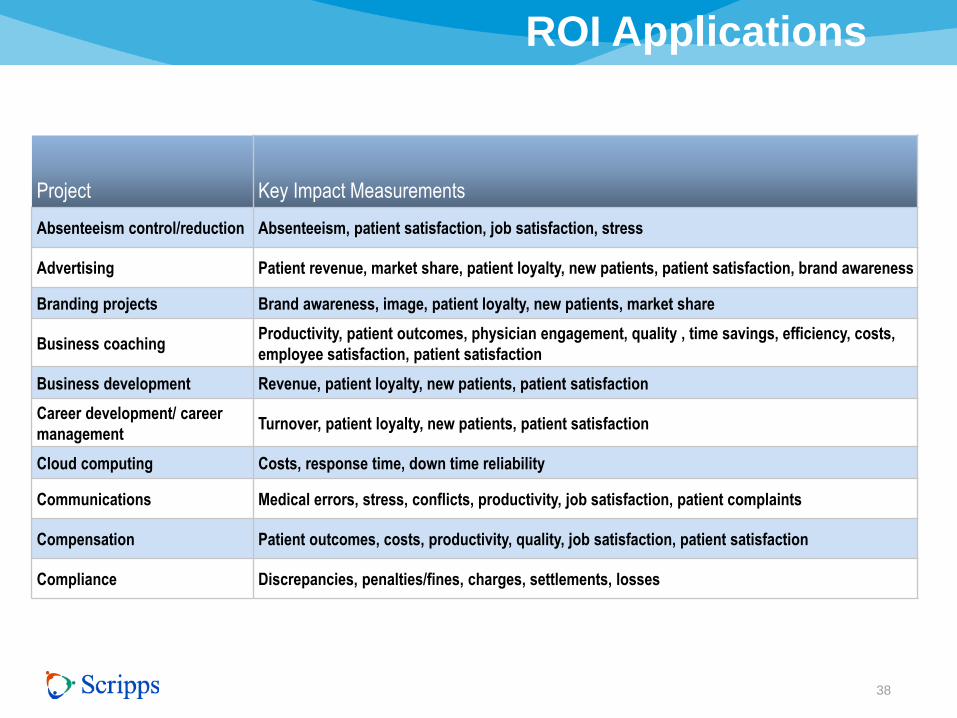
ROI Applications
38
Project Key Impact Measurements
Absenteeism control/reduction Absenteeism, patient satisfaction, job satisfaction, stress
Advertising Patient revenue, market share, patient loyalty, new patients, patient satisfaction, brand awareness
Branding projects Brand awareness, image, patient loyalty, new patients, market share
Business coaching Productivity, patient outcomes, physician engagement, quality , time savings, efficiency, costs,
employee satisfaction, patient satisfaction
Business development Revenue, patient loyalty, new patients, patient satisfaction
Career development/ career
management Turnover, patient loyalty, new patients, patient satisfaction
Cloud computing Costs, response time, down time reliability
Communications Medical errors, stress, conflicts, productivity, job satisfaction, patient complaints
Compensation Patient outcomes, costs, productivity, quality, job satisfaction, patient satisfaction
Compliance Discrepancies, penalties/fines, charges, settlements, losses
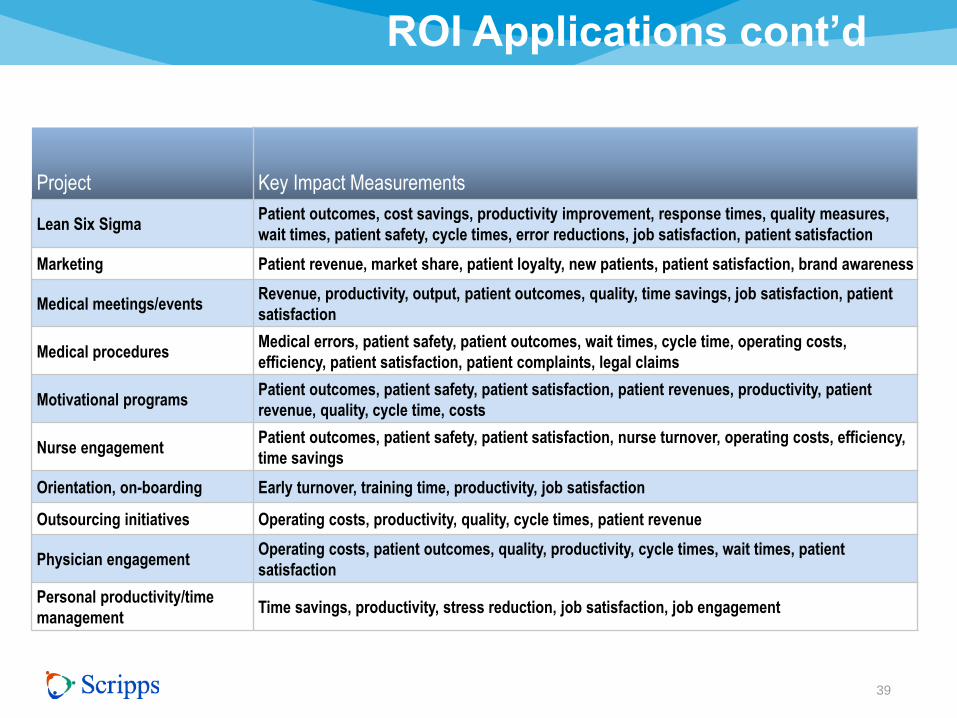
ROI Applications cont’d
39
Project Key Impact Measurements
Lean Six Sigma Patient outcomes, cost savings, productivity improvement, response times, quality measures,
wait times, patient safety, cycle times, error reductions, job satisfaction, patient satisfaction
Marketing Patient revenue, market share, patient loyalty, new patients, patient satisfaction, brand awareness
Medical meetings/events Revenue, productivity, output, patient outcomes, quality, time savings, job satisfaction, patient
satisfaction
Medical procedures Medical errors, patient safety, patient outcomes, wait times, cycle time, operating costs,
efficiency, patient satisfaction, patient complaints, legal claims
Motivational programs Patient outcomes, patient safety, patient satisfaction, patient revenues, productivity, patient
revenue, quality, cycle time, costs
Nurse engagement Patient outcomes, patient safety, patient satisfaction, nurse turnover, operating costs, efficiency,
time savings
Orientation, on-boarding Early turnover, training time, productivity, job satisfaction
Outsourcing initiatives Operating costs, productivity, quality, cycle times, patient revenue
Physician engagement Operating costs, patient outcomes, quality, productivity, cycle times, wait times, patient
satisfaction
Personal productivity/time
management Time savings, productivity, stress reduction, job satisfaction, job engagement
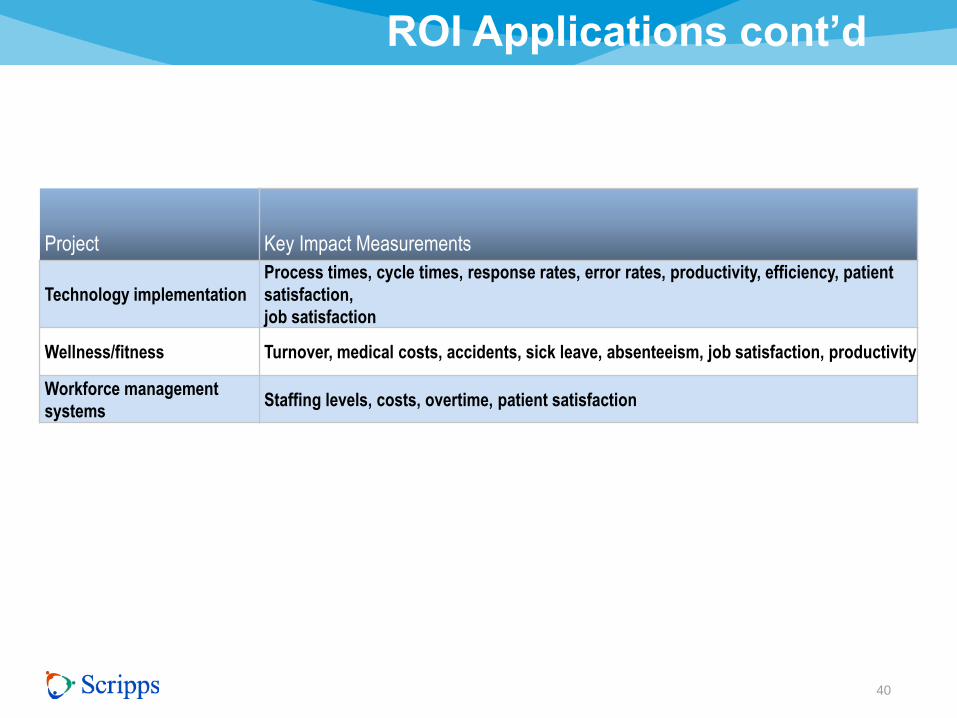
ROI Applications cont’d
40
Project Key Impact Measurements
Technology implementation
Process times, cycle times, response rates, error rates, productivity, efficiency, patient
satisfaction,
job satisfaction
Wellness/fitness Turnover, medical costs, accidents, sick leave, absenteeism, job satisfaction, productivity
Workforce management
systems Staffing levels, costs, overtime, patient satisfaction
Isolation / Attribution
41
–Experimental vs. control
group
–Trend line
–Forecasting – mathematical
interpretation
–Calculating impact of other
factors
–Participant/expert estimates

CFO Money
42
“Show me the money”
Value equals money
Converting to dollars
Converting to Money
43
–Focus on unit of measure
–Value of unit
–Calculate the change
–Determine annual value
–Calculate annual value of
improvement

Tips for Dollars
44
– Standard values
(output/quality/time)
– Historical costs
– Expert input
– External databases
– Link to other measures
– Participant estimates
– Management estimates
– Start with most accurate
– Consider availability
– Broadest perspective
– Multiple techniques
– Credibility test
– Adjustments
• Time value of money

Intangibles
45
• Drivers of the project
• Invisible advantage
• Knowledge and technology age built upon
• Many have been converted to money
• Dominant business investment
Include: • Brand
• Innovation
• Creativity
• Satisfaction
• Engagement
• Employability
• Leadership
• Organizational and development
• Human life

Branding and Image
46
Metric Definition Issues Purpose
Awareness Percentage of total population who are
aware of a brand or organization Is awareness prompted or unprompted
Consideration of who has heard
of the brand
Top of mind First brand to be considered May be subject to most recent advertising
or experience Saliency of brand
Knowledge
Percentage of population who know
a service, have recollection of its
advertising
Not a formal metric, is knowledge prompted
or unprompted?
Extent of familiarity with service beyond
name recognition
Beliefs
Patients’/consumers’ view of service,
generally captured via survey
responses, often through patients
on a scale
Patients/consumers may hold beliefs with
varying degrees of conviction Perception of brand by attribute
Purchasing intentions Probability of intention to purchase
To estimate probability of purchase, aggregate and analyze ratings of stated
intentions (for example, top two boxes)
Measures pre-shopping disposition
to purchase
Willingness to
recommend
Generally measured by ratings on scale
of 1 to 5 Nonlinear in impact
Shows strength of loyalty, potential
impact on others
Customer satisfaction
Generally measured on scale of 1 to 5, in
which patients declare satisfaction with
brand in general or with specific
attributes
Subject to response bias; captures views of
current patients, not lost patients;
satisfaction is function of expectations
Indicates likelihood of repurchase;
reports of dissatisfaction show aspects
requiring improvement to enhance loyalty
Willingness to search
Percentage of patients willing to delay
purchases, change stores, or reduce
quantities to avoid switching brands
Hard to capture Indicates importance of distribution
coverage
Loyalty Measures include willingness to pay
premium, to search, to stay
“Loyalty” itself not a formal metric, but
specific metrics do measure aspects of this
dynamic. New product entries may alter
loyalty levels
Indication of base future patient revenue
stream

Forecasting / Pro-forma
47
Steps • Situation
• Predict/future
• Observe current
• Describe new
• Objectives
• Estimates
• Confidence intervals
• Convert to dollars
• Measure impact
• Time value of money
• Fully loaded costs
• Calculate forecast ROI
• Sensitivity analysis
• Communication
• Intangibles
Expense
High risk and uncertainty
Pre/post comparison
Models
Timing

Case Study #1
48
Wellness and Prevention
• Background
• Action
• Results

Comprehensive Wellness 2007
49
• Health Risk Appraisal
• Biometric and Physical Assessment
• Health Coaching
• Wellness Intervention
• Fitness Center
• Eat Well Offerings
• Nutrition and Weight Counseling
• Stress Management
• Smoking Cessation

Background
50
• 70% plus participation rate (90% Today)
• 48% Highly engaged (60% Today)
• Designed to avoid or minimize high risk
factors to lower cost of employer paid
Health Insurance

Action
51
• Evaluate and measure prevalence
of Health risk
factors and related dollars costs
• Risk precedes costs based upon
flow of Medical and
Pharmaceutical costs before and
after high cost
• Avoid one risk factor reduces cost
from $231-$320 per individual

Methodology
52
• Completed Health Risk appraisal (Annually) and
trended over time
• Clinical Biometric Test (Annually) and trended over time
• Health Plan costs per year and costs per risk factors
calculated along with cost per member per month-
trended over time
• Data classified into risk factor for disease state
• Participant stratified by member of risk factor
Methodology
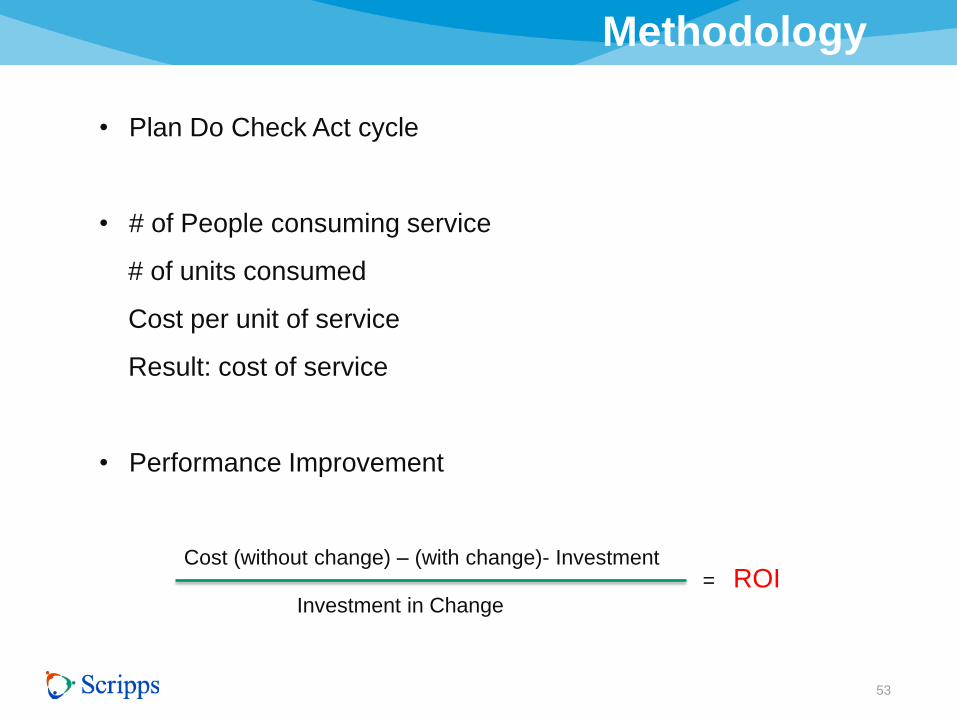
53
• Plan Do Check Act cycle
• # of People consuming service
# of units consumed
Cost per unit of service
Result: cost of service
• Performance Improvement
Cost (without change) – (with change)- Investment
Investment in Change
= ROI

Population Risk Management
54
Unhealthy
Unwell
High Risk
High use
Unhealthy
Well
Moderate to high risk
Moderate to low use
Low risk
Low use
Healthy and well

Risk Migration
55
0
5
10
15
20
25
30
35
40
45
50
06 07 08 09 10
High
Medium
Low
33.4
37
29.7
32.1
37.2
30.7
25.6
36.7 37.7
23.6
39.6 39.8
21.6
35.4
43.0
%
Years

Medical Costs PEPM
8,400
8,500
8,600
8,700
8,800
8,900
9,000
9,100
FY 08 FY 09 FY 10
56
$9,037
$8,971
$8,668
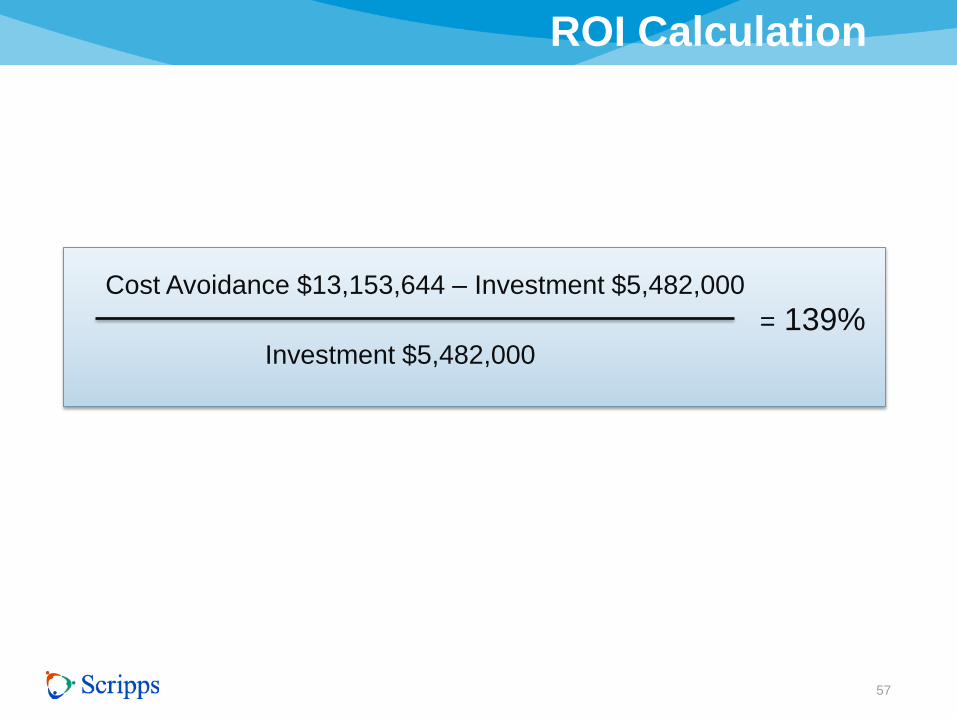
ROI Calculation
57
Cost Avoidance $13,153,644 – Investment $5,482,000
Investment $5,482,000
= 139%
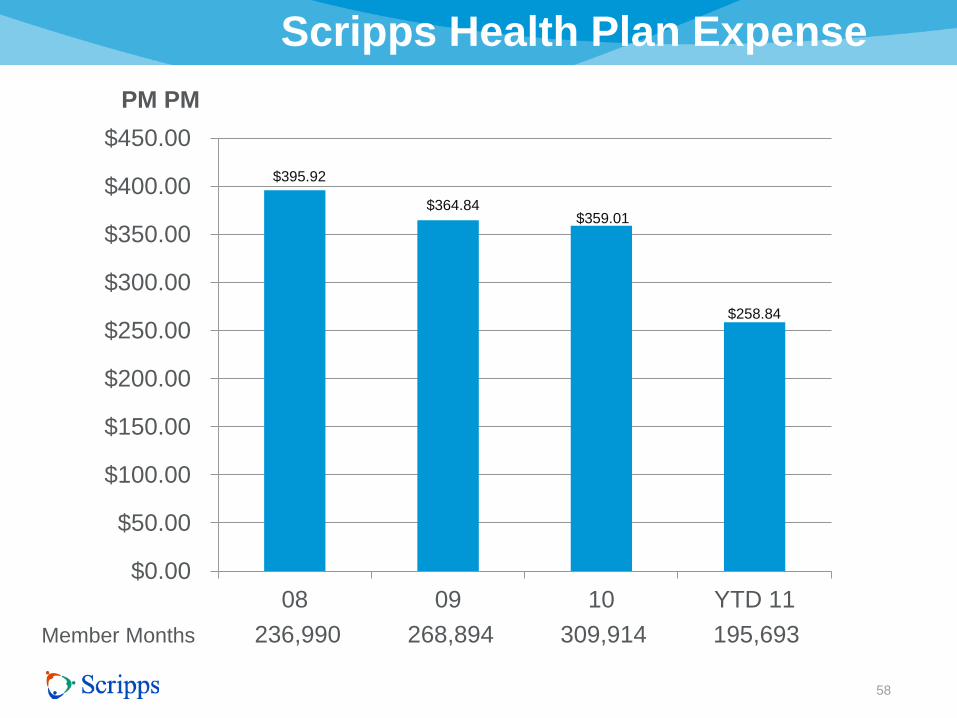
Scripps Health Plan Expense
$0.00
$50.00
$100.00
$150.00
$200.00
$250.00
$300.00
$350.00
$400.00
$450.00
08 09 10 YTD 11
58
PM PM
Member Months 236,990 268,894 309,914 195,693
$395.92
$364.84 $359.01
$258.84
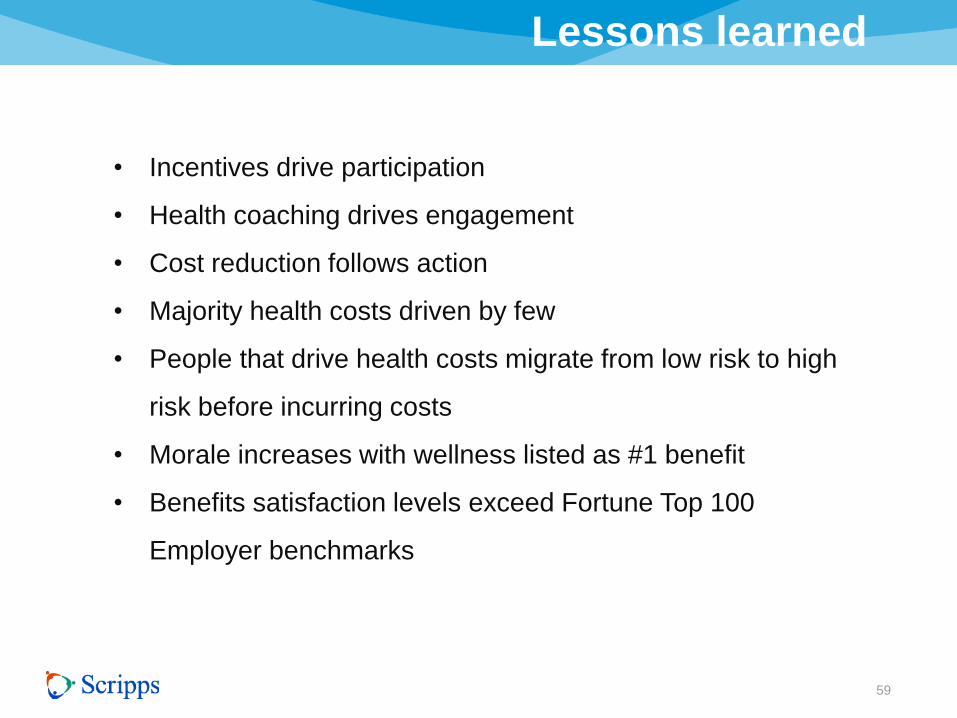
Lessons learned
59
• Incentives drive participation
• Health coaching drives engagement
• Cost reduction follows action
• Majority health costs driven by few
• People that drive health costs migrate from low risk to high
risk before incurring costs
• Morale increases with wellness listed as #1 benefit
• Benefits satisfaction levels exceed Fortune Top 100
Employer benchmarks
Case Study #2
60
Emergency Department Redesign
• Background
• Action
• Results

Case Study #2
61
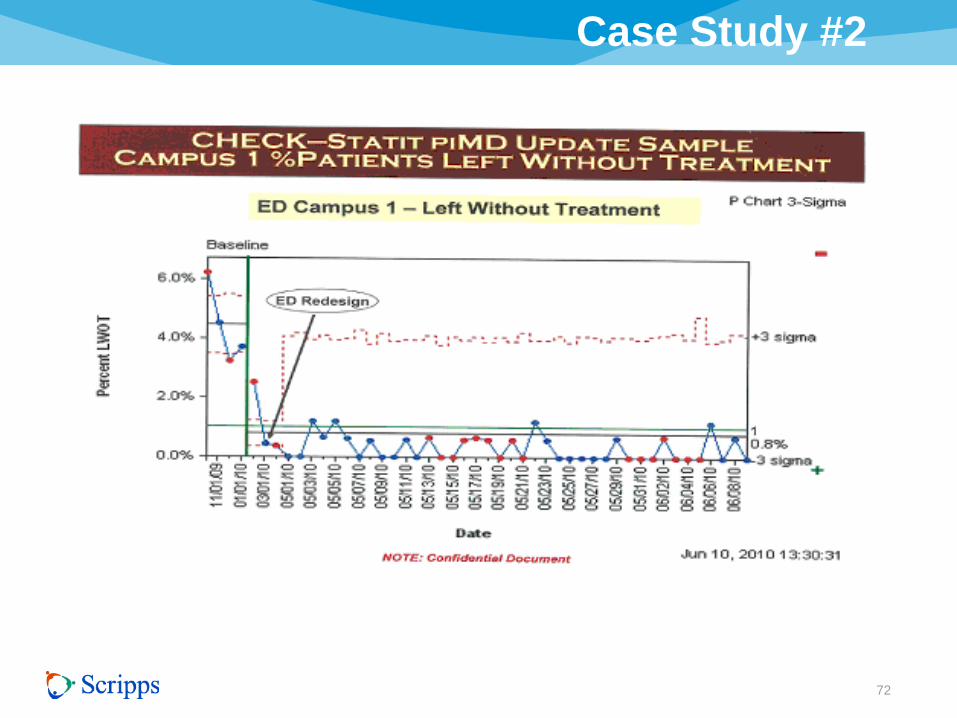
Background
• ED waits > 4 hours
• 4 to 5% left without treatment
• Bypass hours
• Lower Patient Satisfaction
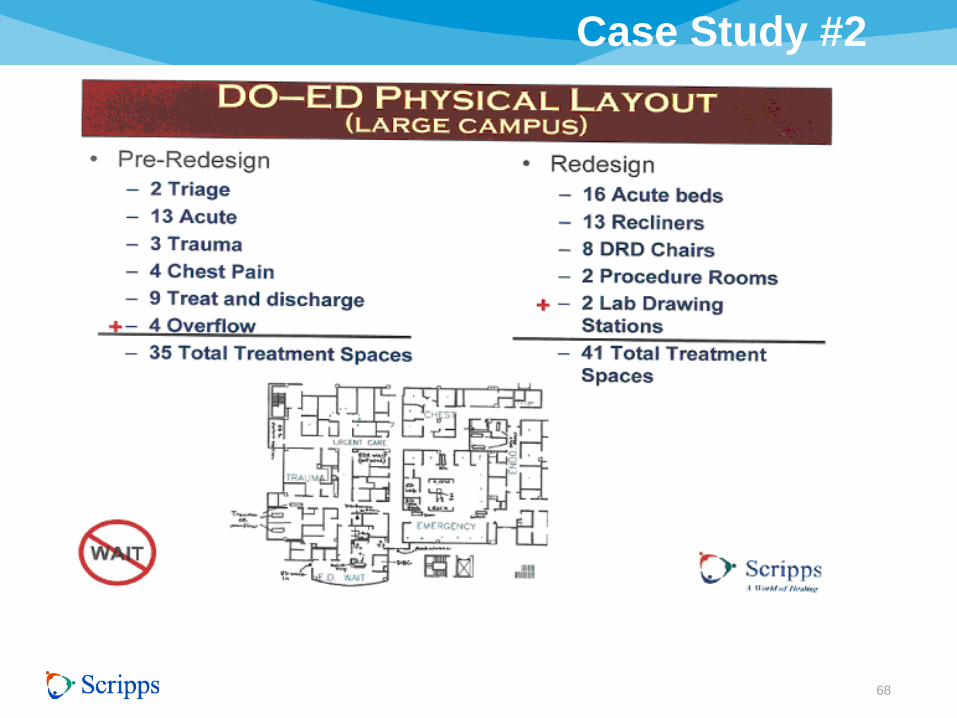
• “Game Changer” redesign

Case Study #2
62
Action • Purpose - Timely Access
• Objective: – Reduce wait times
– Eliminate LWOT
– Increase Patient Satisfaction
• Kaizen – Rapid Cycle – Tested process/computer simulation
– Systems interdependency
– Problem solving
– Support for implementation
– Metric Driven
– One week event (40 participants) • Education
• Process and data analysis
• Process layout redesign

Case Study #2
63
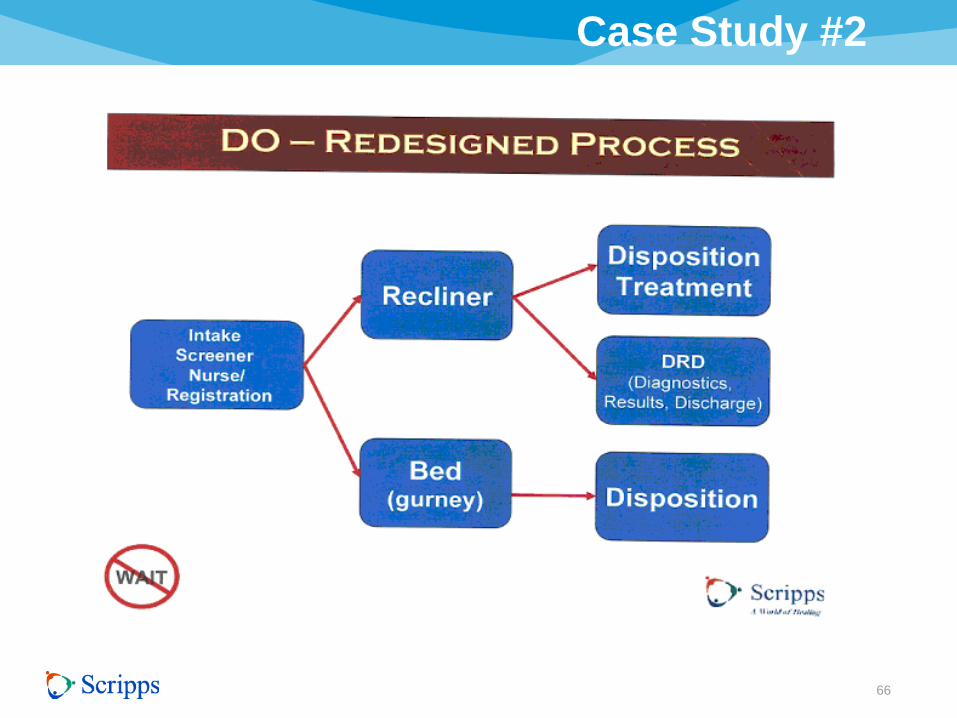
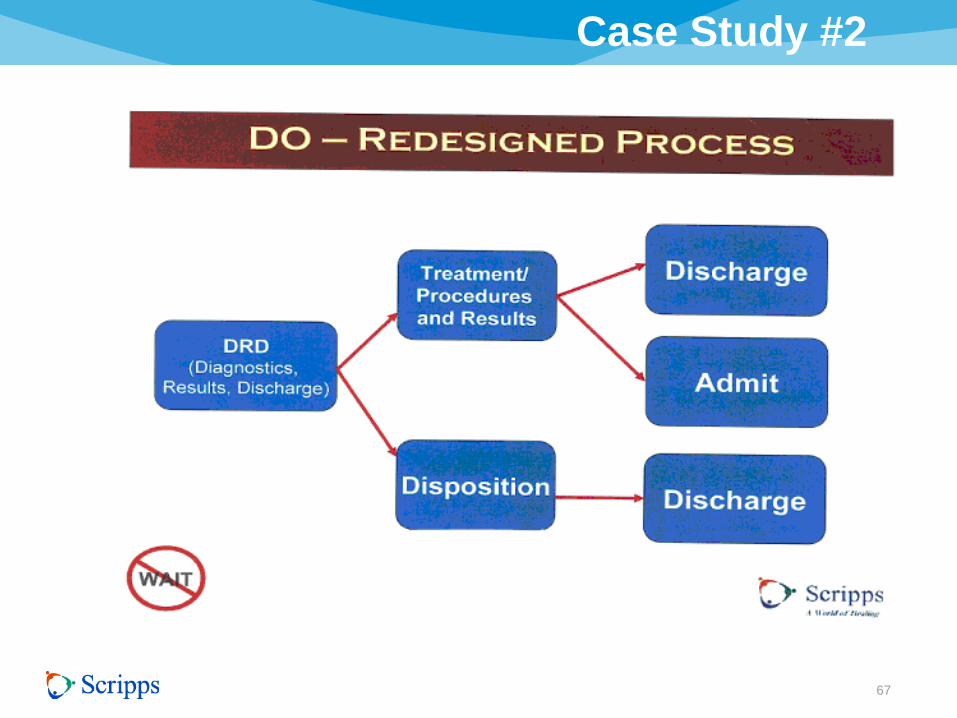
Paradigm Shift
• Triage replaced by intake process
• Intake by MD and Nurse
• Most patients do not require a bed
• Staffing to anticipate surge rather than to
catch up
• Patients needs first

Case Study #2
64

Case Study #2
65
Case Study #2
66
67
Case Study #2
68
Case Study #2

69
Case Study #2

70
Case Study #2
Evaluation Methodology
• The Measurement methods were developed to
measure progress towards the goal. The
measures are:
– Average door to intake interval time
– Outpatient average length of stay
– Inpatient average length of stay
– Percentage left without treatment
– Total by pass hours
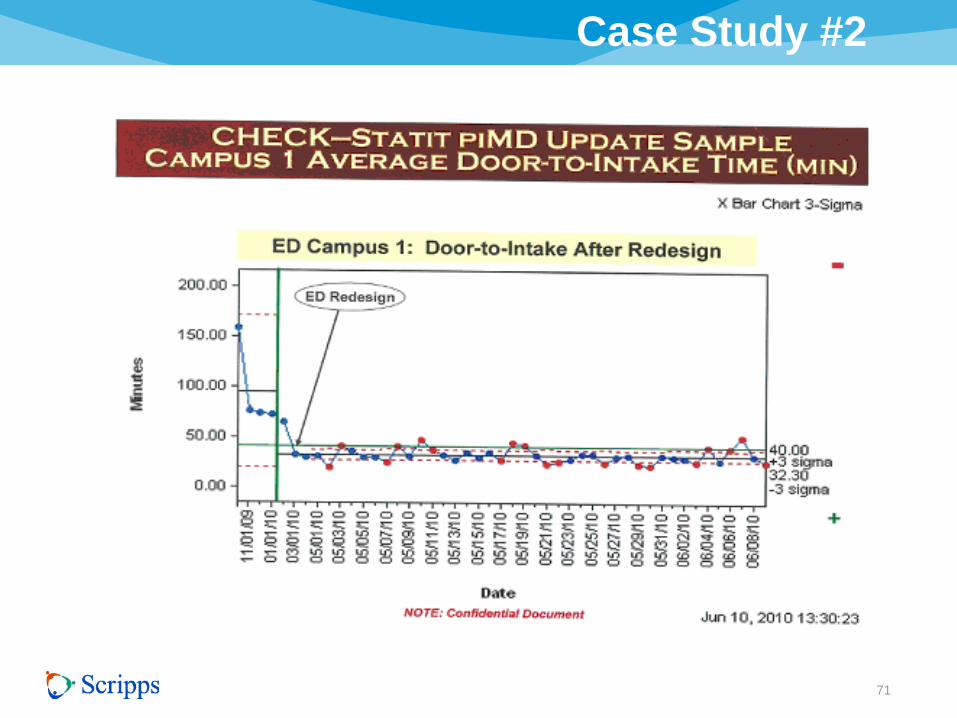
71
Case Study #2
72
Case Study #2

73
Case Study #2

74
Case Study #2
75
Case Study #2
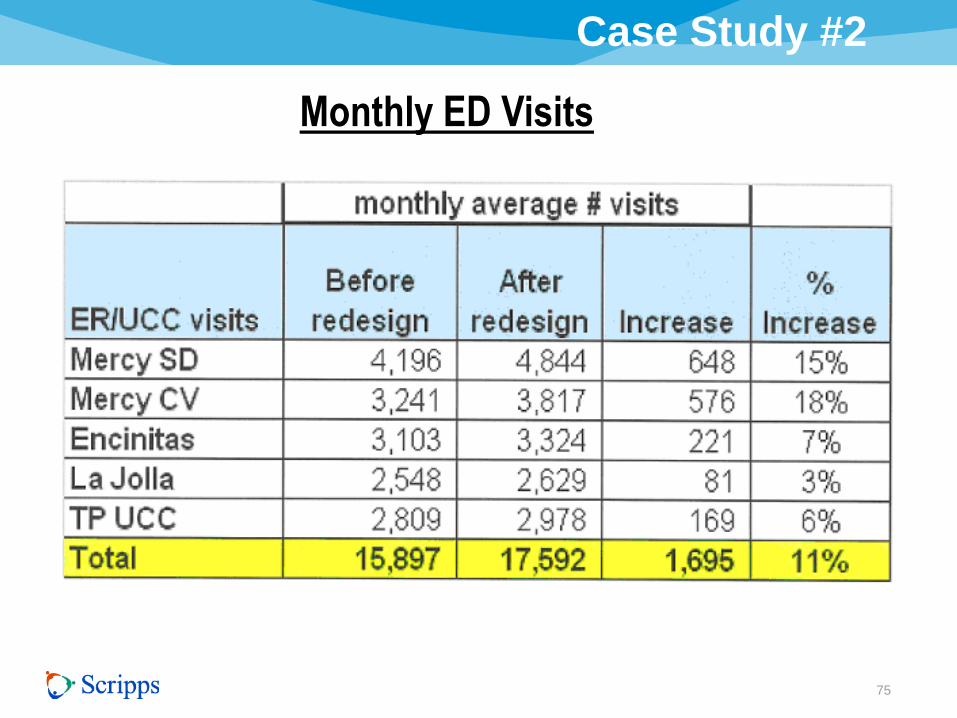
Monthly ED Visits

76
Case Study #2
Investment was comprised of consulting fees of $750,000,
team Kaizen event costs of $250,000 and furniture costs of
$50,000 for total cost of $1,050,000.
$6,346,409 (Net income increase) - $1,050,000 (Costs)
$1,050,000 (Costs)
• Loss of Nurses
• Adjustment

77
Case Study #2
Lessons Learned • Shorter wait times increased patient throughput;
therefore, revenue due to higher volumes per the increased capacity.
• Less “left without treatment” increased revenue.
• Case mix (payor types) improved due to increased access for patients due to less ED bypass (diversion) time and greater numbers of ambulance visits (paying patients).
• Patient satisfaction increased due to short wait times.
• A systems approach is necessary to reduce variation.
• Cost of lost Nurses

Case Study #3
78
Horizontal Management Structure
• Background
• Action
• Results

Case Study #3
79
Background
• Fragmented System
• Variation of systems and practices
• 150 million cost reduction to reach Medicare
break even

One Scripps: Four Divisions
80
ENCINITAS
GREEN
LA JOLLA
MERCY
MEDICAL
FOUNDATION
CO
RP
OR
AT
E
ME
DIC
AL
DIV
ISIO
N
CLIN
ICA
L
OP
ER
AT
ION
S
DIV
ISIO
N
SU
PP
OR
T
SE
RV
ICE
S
DIV
ISIO
N
AD
MIN
IST
RA
TIV
E
SE
RV
ICE
S
DIV
ISIO
N
NEW Horizontal
Management
Structure Reviews processes and practices
across the system
Reduce NON-VALUE ADDED
VARIATION
Improve QUALITY
Reduce COST

Horizontal Organization
81
PHARMACY
NURSING
IMAGING
LABORATORY
FOOD & NUTRITION
ED / URGENT CARE
GI
CATH LAB
OR
SPD
HOSPITALIST/INTENSIVIST
Fun
ctio
nal/H
oriz
onta
l Ser
vice
s
Community /
Home Medical
Groups /
Foundation
Encinitas La Jolla Mercy
San Diego
Mercy
Chula Vista
Green
Geographic Locations

82
Role
• Reduce variation in labor, supplies, services, processes and technology
• Improve capacity and throughput
• Recommend capital for respective area
Membership
• Administrative and clinical leaders from respective area from each site
• Physicians (where co-management is needed)
Horizontal Co-Management Committees

Clinical Care Lines
83
Role
• Set priorities for clinical care line
– Clinical guideline development
– Reduce variation in clinical
workflow
• Monitor performance and goal
achievement
• Program development
– New services / Change in
services
– Volume growth / Aggregation
Membership
• Physicians
• RNs/APNs
• Care line workgroup chairs
Aligned Resources
• Marketing
• Finance
• Supply Chain
Management
• Research
• Project Mgmt.
• Pharmacy
• Education
• Nursing Leadership
Linkage
• Data Analytics
Horizontal: Approach and Tools
84
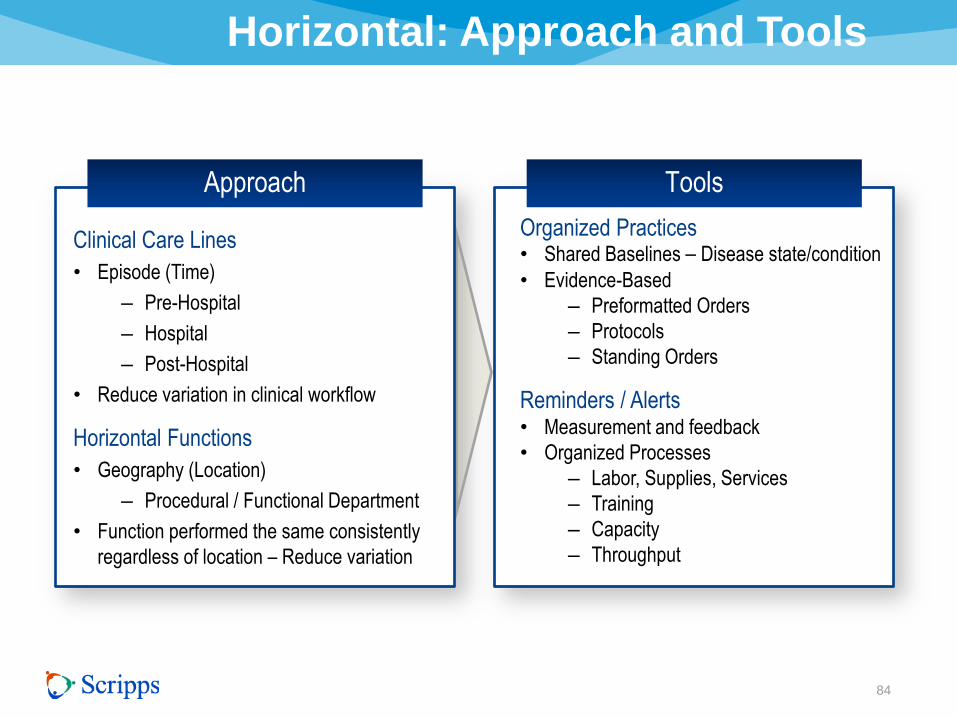
Approach Tools
Clinical Care Lines
• Episode (Time)
– Pre-Hospital
– Hospital
– Post-Hospital
• Reduce variation in clinical workflow
Horizontal Functions
• Geography (Location)
– Procedural / Functional Department
• Function performed the same consistently
regardless of location – Reduce variation
Organized Practices • Shared Baselines – Disease state/condition
• Evidence-Based
– Preformatted Orders
– Protocols
– Standing Orders
Reminders / Alerts • Measurement and feedback
• Organized Processes
– Labor, Supplies, Services
– Training
– Capacity
– Throughput
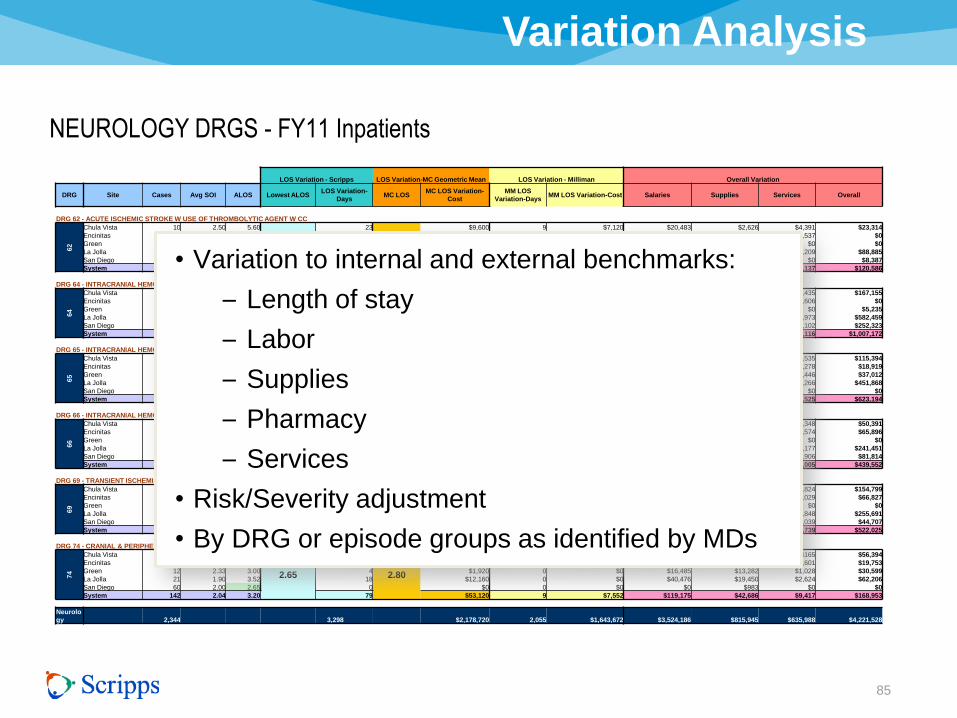
Variation Analysis
85
LOS Variation - Scripps LOS Variation-MC Geometric Mean LOS Variation - Milliman Overall Variation
DRG Site Cases Avg SOI ALOS Lowest ALOS LOS Variation-
Days MC LOS
MC LOS Variation-
Cost
MM LOS
Variation-Days MM LOS Variation-Cost Salaries Supplies Services Overall
DRG 62 - ACUTE ISCHEMIC STROKE W USE OF THROMBOLYTIC AGENT W CC
62
Chula Vista 10 2.50 5.60
3.33
23
4.40
$9,600 9 $7,120 $20,483 $2,626 $4,391 $23,314
Encinitas 18 2.56 3.33 0 $0 0 $0 $0 $0 $7,537 $0
Green 3 2.67 2.00 0 $0 0 $0 $0 $0 $0 $0
La Jolla 9 2.33 8.56 47 $29,920 35 $27,688 $64,947 $12,498 $15,209 $88,885
San Diego 16 2.38 3.94 10 $0 0 $0 $12,101 $2,986 $0 $8,387
System 56 2.46 4.68 79 $39,520 44 $34,808 $97,530 $18,110 $27,137 $120,586
DRG 64 - INTRACRANIAL HEMORRHAGE OR CEREBRAL INFARCTION W MCC
64
Chula Vista 70 3.40 7.23
4.32
203
4.60
$147,200 218 $174,080 $165,448 $36,044 $22,435 $167,155
Encinitas 55 3.31 5.04 39 $19,200 50 $40,320 $0 $0 $44,606 $0
Green 34 3.29 4.32 0 $0 7 $5,536 $16,279 $16,531 $0 $5,235
La Jolla 53 3.34 9.75 288 $218,560 299 $238,912 $427,254 $124,216 $73,973 $582,459
San Diego 90 3.58 6.27 175 $120,000 193 $154,560 $204,933 $106,280 $14,102 $252,323
System 302 3.41 6.66 705 $504,960 767 $613,408 $813,914 $283,072 $155,116 $1,007,172
DRG 65 - INTRACRANIAL HEMORRHAGE OR CEREBRAL INFARCTION W CC
65
Chula Vista 125 2.41 5.26
3.18
260
3.70
$156,400 143 $114,400 $187,817 $6,314 $5,535 $115,394
Encinitas 94 2.44 3.18 0 $0 0 $0 $0 $39,013 $43,278 $18,919
Green 83 2.60 3.59 34 $0 0 $0 $73,715 $14,808 $4,446 $37,012
La Jolla 93 2.48 6.80 336 $230,320 249 $199,072 $411,659 $42,641 $60,266 $451,868
San Diego 101 2.48 4.12 95 $33,840 0 $0 $68,092 $0 $0 $0
System 496 2.47 4.64 725 $420,560 392 $313,472 $741,282 $102,776 $113,525 $623,194
DRG 66 - INTRACRANIAL HEMORRHAGE OR CEREBRAL INFARCTION W/O CC/MCC
66
Chula Vista 49 1.84 3.53
1.88
81
2.30
$48,240 0 $0 $51,756 $0 $6,348 $50,391
Encinitas 49 1.88 2.53 32 $9,040 0 $0 $46,475 $3,560 $23,574 $65,896
Green 48 1.85 1.88 0 $0 0 $0 $0 $7,556 $0 $0
La Jolla 58 1.98 3.98 122 $78,080 0 $0 $170,244 $45,160 $35,177 $241,451
San Diego 76 1.75 2.93 81 $38,560 0 $0 $76,303 $8,570 $8,906 $81,814
System 280 1.85 3.00 316 $173,920 0 $0 $344,777 $64,846 $74,005 $439,552
DRG 69 - TRANSIENT ISCHEMIA
69
Chula Vista 109 2.13 3.06
1.43
177
1.80
$109,440 93 $74,560 $133,781 $9,341 $17,824 $154,799
Encinitas 42 1.98 2.21 33 $13,920 1 $480 $49,625 $4,542 $15,029 $66,827
Green 23 2.00 1.43 0 $0 0 $0 $0 $1,297 $0 $0
La Jolla 81 2.14 2.88 117 $69,760 55 $43,840 $190,870 $21,542 $47,848 $255,691
San Diego 67 2.07 2.16 49 $19,520 0 $0 $41,447 $0 $7,039 $44,707
System 322 2.09 2.60 375 $212,640 149 $118,880 $415,722 $36,722 $87,739 $522,025
DRG 74 - CRANIAL & PERIPHERAL NERVE DISORDERS W/O MCC
74
Chula Vista 36 2.06 3.97
2.65
48
2.80
$33,760 9 $7,552 $47,848 $8,971 $165 $56,394
Encinitas 13 2.15 3.31 9 $5,280 0 $0 $14,365 $0 $5,601 $19,753
Green 12 2.33 3.00 4 $1,920 0 $0 $16,485 $13,282 $1,028 $30,599
La Jolla 21 1.90 3.52 18 $12,160 0 $0 $40,476 $19,450 $2,624 $62,206
San Diego 60 2.00 2.65 0 $0 0 $0 $0 $983 $0 $0
System 142 2.04 3.20 79 $53,120 9 $7,552 $119,175 $42,686 $9,417 $168,953
Neurolo
gy 2,344 3,298 $2,178,720 2,055 $1,643,672 $3,524,186 $815,945 $635,988 $4,221,528
• Variation to internal and external benchmarks:
– Length of stay
– Labor
– Supplies
– Pharmacy
– Services
• Risk/Severity adjustment
• By DRG or episode groups as identified by MDs
NEUROLOGY DRGS - FY11 Inpatients

Horizontal / Clinical Care: Critical to Future
86
Physician Co-Management
Engineer and Systemize Care
Accelerate Transformational Change
Reduce Variation in Care, Outcomes and Costs
Improve Value

Medical Management Compact
87
Legend
Design Review Implement
Approve/ Manage Process
Care Line/Horizontal
Co-Management SWOS
Content
Management
Tool
LJ P&T Divisions / Sections
ME P&T Divisions / Sections
GR P&T Divisions / Sections
EN P&T Divisions / Sections
Systemwide Clinical Practice
Council
MECs Delegate Authority for
SWOS
SW Medical Management
Council ME MEC
GR MEC
LJ MEC
EN MEC
Consent
IMPLEMENT
GOAL = 30 Days
TARGET = 60 Days
THRESHOLD = 90 Days
Concurrent,
Time
Limited
Feedback
<30 Days
(Two
Cycles)
Develop/
Recommend
Timeline
1. SWOS
Development 1 Day
2. Feedback (2
cycles)
30
Days
3. Endorse/
Approve 1 Cycle
4. Accept /
Ratify 1 Cycle
5. Implement TBD
Medical Management Compact:
Process for Development, Review, Implementation of Systemwide Order Sets

Horizontal Management Initiatives
88
Reducing Labor Costs
Emergency Department Redesign
PCI Cost Variation
Float Pools
Radiation Safety
System Ancillary Scheduling
Appropriate Utilization
Care Management Redesign
Staffing at 50th percentile Solucient benchmark database Patient centered all Emergency Departments – reduced LWOTs
and wait time to below 30 min
Reduced cost and variation in PCI – transition majority of volume
to same day
Allows for core staffing at lower levels and flexibility to adjust
to volume
Implemented single scheduling function in system for ancillary
services so patients can receive range of options in location
and times
Reducing radiation and improving quality – standard radiation
safety approach at each hospital Developing appropriateness criteria for imaging procedures
Navigator-based, utilizing bedside rounds with care team
following patients 30 days post discharge; results include
reduced LOS and readmits and improved patient satisfaction
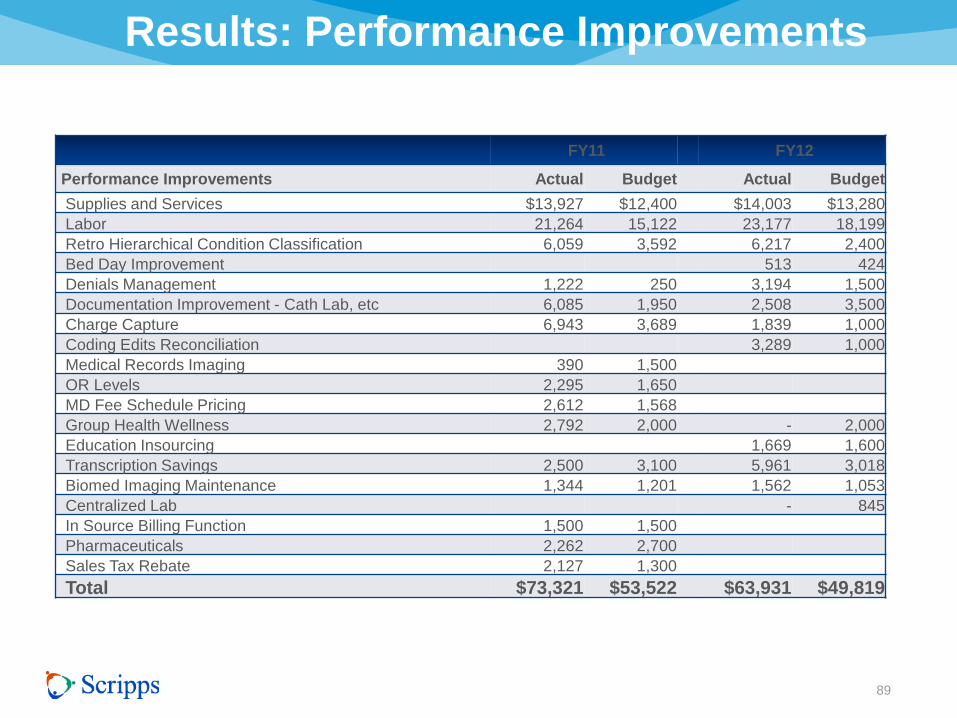
89
($ thousands)
FY11 FY12
Performance Improvements Actual Budget Actual Budget
Supplies and Services $13,927 $12,400 $14,003 $13,280
Labor 21,264 15,122 23,177 18,199
Retro Hierarchical Condition Classification 6,059 3,592 6,217 2,400
Bed Day Improvement 513 424
Denials Management 1,222 250 3,194 1,500
Documentation Improvement - Cath Lab, etc 6,085 1,950 2,508 3,500
Charge Capture 6,943 3,689 1,839 1,000
Coding Edits Reconciliation 3,289 1,000
Medical Records Imaging 390 1,500
OR Levels 2,295 1,650
MD Fee Schedule Pricing 2,612 1,568
Group Health Wellness 2,792 2,000 - 2,000
Education Insourcing 1,669 1,600
Transcription Savings 2,500 3,100 5,961 3,018
Biomed Imaging Maintenance 1,344 1,201 1,562 1,053
Centralized Lab - 845
In Source Billing Function 1,500 1,500
Pharmaceuticals 2,262 2,700
Sales Tax Rebate 2,127 1,300
Total $73,321 $53,522 $63,931 $49,819
Results: Performance Improvements

ROI Calculation
90
Cost Reduction $136 Million – Cost to implement $4.50 million
Investment $4.50 Million = 292%

Results
91
Co-Management
New Decision-making Structure Aligns Resources
Structure to Reduce Waste
Cultural Change

Victor Buzachero
92
Mr. Buzachero joined Scripps Health in September 2001 and has since led Scripps Health to
national recognition as a top employer by AARP the past ten years, Working Mother Magazine for
the past seven years and Fortune Magazine’s Top 100 Employers for six consecutive years. He has
led several new and successful initiatives including a comprehensive employee wellness program,
implementing an annual management cycle that integrates strategic planning, capital planning,
operations planning, performance management, and talent management, as well as decertifying the
California Nurses Association to maintain the only non-union health system in California. Vic’s
leadership has helped grow Scripps Health to a $2.6 billion dollar integrated delivery health system.
Prior to coming to Scripps Health, Vic held top executive level positions at organizations such as
Providence Health System, Banner Health System, Presbyterian Health System (Texas Health
Resources) and Baptist Health System. During his tenure at these organizations Vic developed and
successfully implemented programs including leadership development, service excellence, reduction
in employee turnover, improved employee satisfaction as well as an E Health strategy. Additionally,
he served as Vice President of Marketing (hospital acquisitions) for Quorum Health and was co-
owner and principal of a national labor relations and executive compensation consultancy. In 1999
Franklin Covey honored Vic with the “Organization of Excellence” award for his prominent efforts in
organizational development and effectiveness and, in 2011, Vic was honored by HR Executive
Magazine as a top HR Executive for the year.
Vic is frequently sought out to speak at the national level on ROI in health care, work force initiatives
and labor relations among many other topics. He is the former chairman of the American Hospital
Association Solutions Board in addition to serving on other boards.

Patti Phillips, Ph.D.
93
Dr. Patti Phillips is president and CEO of the ROI Institute, Inc., the leading source of ROI competency building, implementation support,
networking, and research. A renowned expert in measurement and evaluation, she helps organizations implement the ROI Methodology in 50
countries around the world.
Since 1997, following a 13-year career in the electric utility industry, Phillips has embraced the ROI Methodology by committing herself to
ongoing research and practice. To this end, she has implemented ROI in private sector and public sector organizations. She has conducted
ROI impact studies on programs such as leadership development, sales, new-hire orientation, human performance improvement, K-12
educator development, and educators’ National Board Certification mentoring.
Phillips teaches others to implement the ROI Methodology through the ROI Certification process, as a facilitator for ASTD’s ROI and
Measuring and Evaluating Learning Workshops, and as professor of practice for The University of Southern Mississippi Gulf Coast Campus
Ph.D. in Human Capital Development program. She also serves as adjunct faculty for the UN System Staff College in Turin, Italy, where she
teaches the ROI Methodology through their Evaluation and Impact Assessment Workshop and Measurement for Results-Based
Management. She serves on numerous doctoral dissertation committees, assisting students as they develop their own research on
measurement, evaluation, and ROI.
Phillips’s academic accomplishments include a Ph.D. in International Development and a master’s degree in Public and Private Management. She
is a certified in ROI evaluation and has been awarded the designations of Certified Professional in Learning and Performance and Certified
Performance Technologist.
She, along with her husband Jack Phillips, contributes to a variety of journals and has authored a number of books on the subject of accountability
and ROI, including Survey Basics (ASTD, 2013); Measuring the Success of Coaching (ASTD, 2012); 10 Steps to Successful Business Alignment
(ASTD, 2012); The Bottomline on ROI 2nd Edition (HRDQ, 2012); Measuring Leadership Development: Quantify your Program’s Impact and ROI
on Organizational Performance (McGraw-Hill, 2012); Measuring ROI in Learning and Development: Case Studies from Global Organizations (ASTD
, 2011);The Green Scorecard: Measuring the ROI in Sustainability Initiatives (Nicholas Brealey, 2011); Return on Investment in Meetings and
Events: Tools and Techniques to Measure the Success of All Types of Meetings and Events (Elsevier, 2008); Show Me the Money: How to
Determine ROI in People, Projects, and Programs (Berrett-Koehler, 2007); The Value of Learning (Pfeiffer, 2007); Return on Investment Basics
(ASTD, 2005); Proving the Value of HR: How and Why to Measure ROI (SHRM, 2005); Make Training Evaluation Work (ASTD, 2004); The Bottom
Line on ROI (Center for Effective Performance, 2002), which won the 2003 ISPI Award of Excellence; ROI at Work (ASTD, 2005); the ASTD In
Action casebooks Measuring ROI in the Public Sector (2002), Retaining Your Best Employees (2002), and Measuring Return on Investment Vol. III
(2001); the ASTD Infoline series, including Planning and Using Evaluation Data (2003), Managing Evaluation Shortcuts (2001), and Mastering ROI
(1998); and The Human Resources Scorecard: Measuring Return on Investment (Butterworth-Heinemann, 2001). Patti Phillips can be reached at

Contact Information
94
Victor Buzachero,
Corporate Senior Vice President
for Innovation, Human Resources
and Performance Management
Scripps Health
14081 Collins Ranch Place
San Diego, CA 92130
858-678-6168
Patti J. Phillips, PhD,
President
ROI Institute, Inc.
350 Crossbrook Drive
Chelsea, AL 35043
205-678-8101

Bibliography
95
• Reinhardt, Uwe, Presentation, Health Solutions Council, U.S. Chamber of Commerce, June
2012.
• Congressional Budget Office, Total Revenue and Outlays (Percentage of gross domestic
product), 1971-2021, February 15, 2011.
• Milliman Medical Index 2012, Allocation of 2012 medical costs.
• Healthcare Advisory Board Company, 2012 National Presentation Series.
• Best Care at Lower Cost: The Path to Continuously Learning Health Care in America, The
National Academics Press, 2012, Washington, D.C.
• Institute for Healthcare Improvement Triple AIM Initiative,
www.ihi.org/offerings/initaitive/tripleaim/pages .
• Phillips, Jack, Ph.D., Buzachero, Victor, Phillips, Patti Pulliam, Ph.D., Phillips, Zack L., RCP,
RRT, Measuring ROI in Healthcare, McGraw Hill, 2013.
• ROI Institute, Inc. Birmingham, Alabama

96
Questions?