Creating value Leadership and strategy Operating ... · PDF fileCreating value Leadership and...
249
Operating environment Risk and responsibility Creating value Leadership and strategy People and environment Financial statements Integrated Report for the year ended 31 March 2013
Transcript of Creating value Leadership and strategy Operating ... · PDF fileCreating value Leadership and...

Operating environment Risk and responsibilityCreating value Leadership and strategy People and environment Financial statements
Integrated Report for the year ended 31 March
2013

CONTENTS1 Commitment to integrated
reporting Risk and responsibility Group annual financial statements
2 The year at a glance 34 Our material risks 113 Financial overview
Creating value for our stakeholders 38 Enterprise risk management 124 Directors’ responsibility statement
5 Integrated performance indicators 46 Governance 124 Preparer and supervisor of annual
financial statements
6 Our business 59 Aligning governance, risk and controls 125 Remuneration Committee report
7 Our philosophy 60 Board of directors and Executive Committee 126 Remuneration report
8 Our value to society 64 Stakeholder engagement 136 Social and Ethics Committee report
Leadership and strategic objectives People and the environment 137 Audit Committee report
10 Chairman’s report 74 Our people 139 Certificate from group company secretary
14 Performance against strategic objectives 80 Occupational health and
safety 140 Directors’ report
18 Group chief executive officer’s report 88 Empowerment 142 Independent auditors’ report
Operating environment 91 Procurement and supply chain 144 Consolidated annual financial
statements
23 Industry overview 96 CSI and value to society 149 Notes to consolidated annual financial statements
25 Review of Telkom’s operations 98 Environmental management 240 Definitions
32 Awards and achievements 103 Product responsibility Administration Inside back cover
107 GRI index
1 Telkom Integrated Report 2013
Operating environment Risk and responsibilityCreating value Leadership and strategy People and environment Financial statements
This report provides an overview of Telkom SA SOC Limited’s
business activities including all operating subsidiaries, for
the year ended 31 March 2013. It details the Group’s
financial statements and looks at the Group’s prospects for
the next financial year. The previous reporting period ended
31 March 2012 was covered in the 2012 Telkom integrated
report. There were no significant changes from the previous
reporting period in the scope, boundary or measurement
method applied in the report.
This report includes an overview of the business operations
as well as the financial statements relating to the Group’s
activities over the period. It has been prepared in
accordance with the Global Reporting Initiative 3 guidelines
and represents a balanced and reasonable presentation
of Telkom’s financial, economic, environmental and social
performance.
While this document is designed to be an integrated
report, a more focused description of Telkom’s sustainable
development activities can be found in the “People
and environment” section. This section includes data and
information based only on operations within the Republic of
South Africa for the year ended 31 March 2013. The South
African operating subsidiaries Swiftnet (Pty) Limited (trading
as Fastnet Wireless Service) and Trudon (Pty) Limited have
been included in this report unless otherwise stated.
The data relating to the Broad-Based Black Economic
Empowerment (B-BBEE) scorecard also reflects data from
the current reporting cycle.
ABOUT THIS REPORTThis is Telkom’s third integrated report which continues to
be guided by best practice as outlined in the Companies Act
and King III. Telkom is aware of the need to improve the
service experience at every level. Since this report is one way
of achieving this, we hope to have provided a transparent
document that lays out the risks and opportunities ahead,
and a clear picture of how we are shaping and fulfilling our
strategies to fit an ever-evolving telecoms environment.
The guidance set out by King III states that companies should
openly portray the relevant risks, opportunities, governance
processes and strategies so that stakeholders can make well-
informed choices in their dealings with the Group. We could
not agree more and hence have laid out a clear structure and
easy way to use this report by referring to the sections listed
on the contents page. There are also a number of references
that we have included to make it easier for you to refer to
places of interest elsewhere in the report, or ways in which
you can access additional information.
Telkom SA SOC Limited is the registered name of the
organisation and is listed on the Johannesburg Stock
Exchange. For ease of reference we have used Telkom or “the
Group” to represent the Company and its Group entities.
All subsidiaries, business divisions and products are referred
to by their branded names for easy recognition.
If you have any recommendations or suggestions as to how
we can improve on our reporting, please refer to the last
page of this report for the relevant contact details.
FORWARD-LOOKING STATEMENTMany of the statements included in this document, as well
as oral statements that may be made by us or by officers,
directors, prescribed officers or employees acting on behalf
of us, constitute or are based on forward-looking statements.
All statements, other than statements of historical facts,
including, among others, statements regarding our
convergence and other strategies, future financial position
and plans, objectives, capital expenditures, projected costs
and anticipated cost savings and financing plans, as well as
projected levels of growth in the communications market,
are forward-looking statements. Forward-looking statements
can generally be identified by the use of terminology such as
“may”, “will”, “should”, “expect”, “envisage”, “intend”, “plan”,
“project”, “estimate”, “anticipate”, “believe”, “hope”, “can”, “is
designed to” or similar phrases, although the absence of such
words does not necessarily mean that a statement is not
forward looking. These forward-looking statements involve a
number of known and unknown risks, uncertainties and other
factors that could cause our actual results and outcomes to
be materially different from historical results or from any
future results expressed or implied by such forward-looking
statements. The factors that could cause our actual results or
outcomes to differ materially from our expectations include,
but are not limited to, those risks identified commencing
on page 34.
We caution you not to place undue reliance on these
forward-looking statements. All written and oral forward-
looking statements attributable to us, or persons acting on
our behalf, are qualified in their entirety by these cautionary
statements. Moreover, unless we are required by law to
update these statements, we will not necessarily update
any of these statements after the date of this document,
either to conform them to actual results or to changes in our
expectations.
SCOPE OF THE REPORT
GRI
COMMITMENT TO INTEGRATED REPORTING
Please refer to Telkom’s sustainability assurance
statements which can be found on our website:
www.telkom.co.za/ir
WEB: please visit www.telkom.co.za/ir
GRI: please refer to pages 107 to 111 for
Telkom’s Global Reporting Initiative (GRI)
index.
Key
2 Telkom Integrated Report 2013
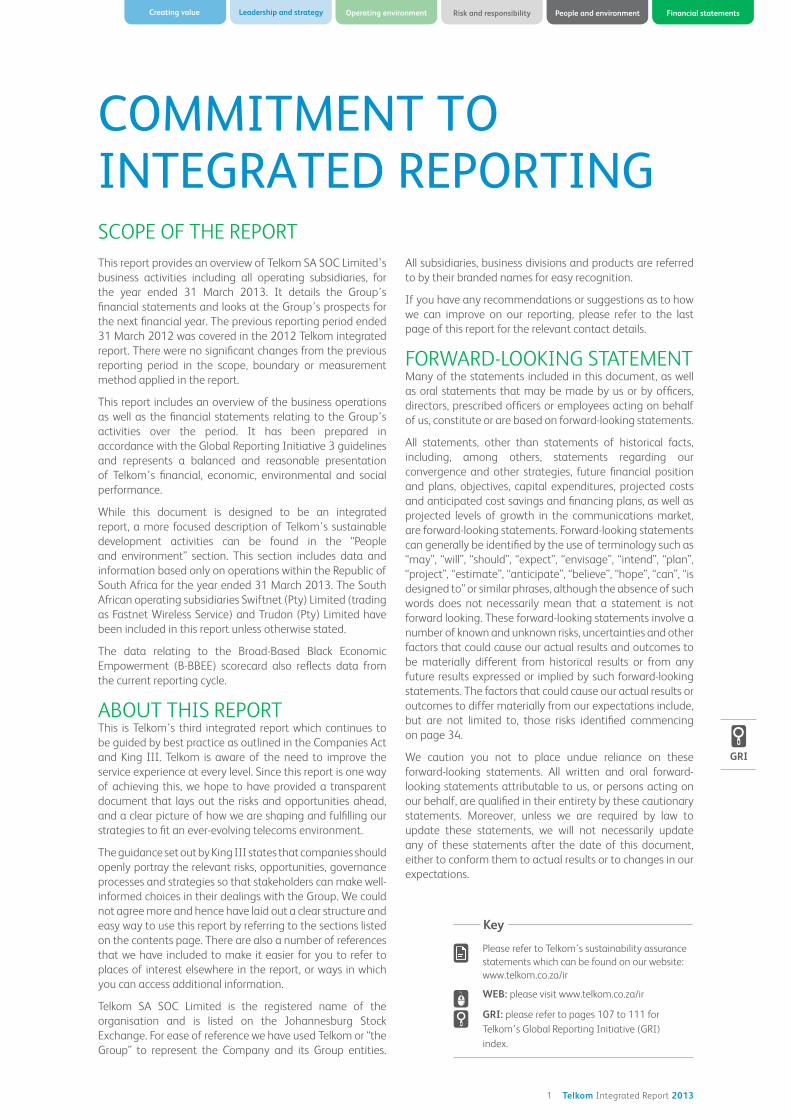
Net debt decreased to R2.1 billion
Free cash flow increased to R2.1 billion
Operating costs, excluding the R12 billion impairment increased to R32.0 billion
Revenue decreased to R32.5 billion
1 000
2 000
3 000
4 000
5 000
6 000
4,783
5,738
2012 2013
ZAR MillionCapital expenditure
0
5
10
15
20
25
30
35 33,079 32,501
2012 2013
ZAR MillionOperating revenue
1 000
2 000
3 000
4 000
5 000
6 000
7 000
8 000
6,704
7,651
2012 2013
ZAR Million
Cash flows from operating activities before dividend paid
0
100
200
300
400
500
324.7
87.0
2012 2013
Cents per share HEPS
0
4
8
12
16
8,5467,109
2012 2013
ZAR MillionEBITDA
THE YEAR AT A GLANCE
0
30
60
90
120
150
10.4
74.0
2012 2013
Cents per share (*excludes the R12 billion impairment charge)
BEPS*
46.0%
18.6%
2.2%1.7%
Operating environment Risk and responsibilityCreating value Leadership and strategy People and environment Financial statements
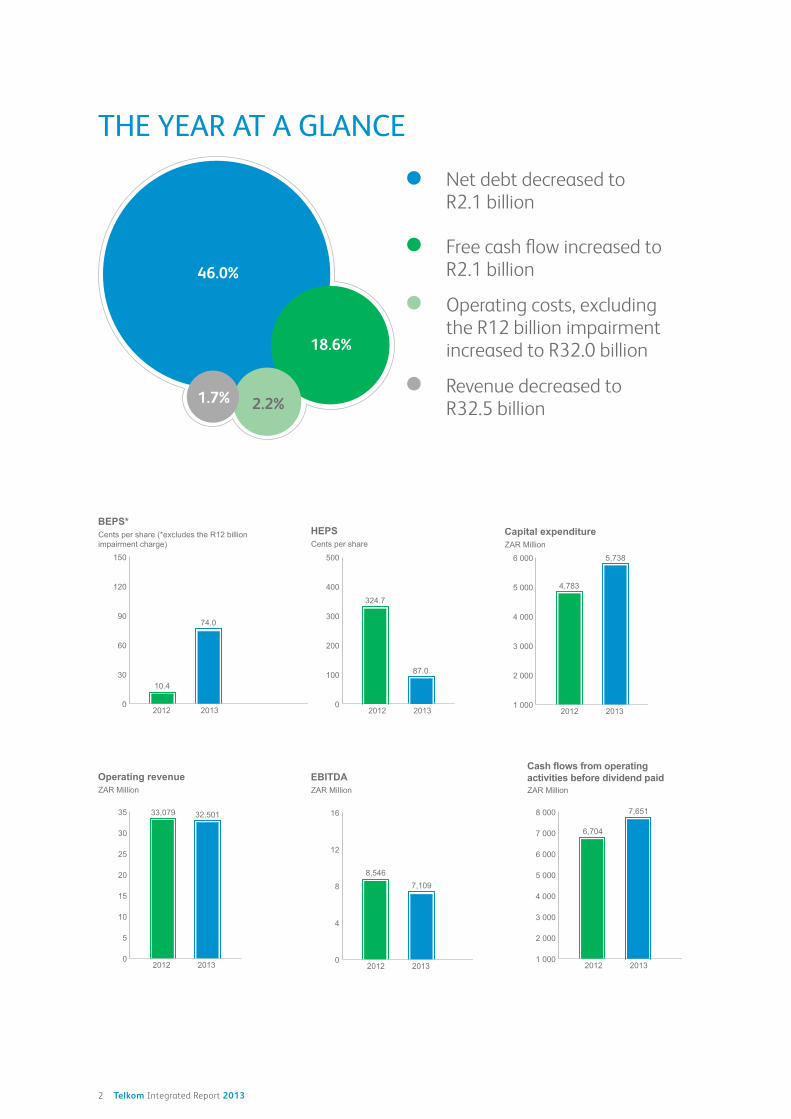
Share performance 2012 2013 %
Number of ordinary shares in issue 520,783,900 520,783,900 –
Weighted number of ordinary shares in issue 510,593,816 510,593,816 –
Headline earnings per share (cents) 324.7 87.0 (73.2)
Dividends per share (cents) 145.0 – –
Market capitalisation at 31 March (Rm) 12,499 7,812 (37.5)
Number of ordinary shares traded (‘000) 290,691 365,034 25.6
Highest price traded (R) 38.49 24.45 (36.5)
Lowest price traded (R) 24.00 13.50 (43.8)
Closing price at 31 March (R) 24.00 15.00 (37.5)
0
500
1 000
1 500
2 000
2 500
3 000
2012/04/02 2012/05/02 2012/06/02 2012/07/02 2012/08/02 2012/09/02 2012/10/02 2012/11/02 2012/12/02 2013/01/02 2013/02/02 2013/03/02
Telkom (TKG) share price for the year ended 31 March 2013
cent
s
3 Telkom Integrated Report 2013

4 Telkom Integrated Report 2013
CREATING VALUE FOR
OUR STAKEHOLDERS

5 Telkom Integrated Report 2013
Operating environment Risk and responsibilityCreating value Leadership and strategy People and environment Financial statements
GRI
INTEGRATED PERFORMANCE INDICATORS
(In ZAR millions unless otherwise stated) Year ended 31 March % change
Financial 2013 2012 2011 12/13
Operating revenue 32,501 33,079 33,308 (1.7)
EBITDA 7,109 8,546 9,370 (16.8)
Opex as a % of operating revenue1 98.3 94.5 88.4 (4.0)
Capex as a % of operating revenue 17.7 14.5 13.6 22.1
Cash flow from operating activities 7,474 5,892 5,188 26.8
Free cash flow 2,132 1,797 2,233 18.6
Headline earnings per share from continuing
operations (cents) 87.0 324.7 484.8 (73.2)
Basic earnings per share from continuing
operations (cents)1 74.0 10.4 481.2 611.5
Year ended 31 March % change
Economic 2013 2012 2011 12/13
Distributed to employees 9,861 8,636 9,716 14.2
Capital expenditure 5,738 4,783 4,541 20.0
Distributed to government 1,111 1,089 1,264 2.0
Distributed to providers of finance 660 765 898 (13.7)
B-BBEE score (%) 76.98 79.25 76.60 (2.9)
B-BBEE level 3 3 3 –
B-BBEE procurement spend 14,436 12,293 12,263 17.4
B-BBEE enterprise development cumulative spend 114 100 76 14.0
Year ended 31 March % change
Social – Employees 2013 2012 2011 12/13
Number of group employees 22,192 22,045 24,028 0.7
Revenue per employee (R) 1,463,877 1,500,522 1,386,216 (2.4)
Employee turnover (%) 2.80 2.31 2.65 21.2
Women representation in senior
management (%) 27 25 29 8.0
Black representation in senior
management (%) 53 53 51 –
Total training days 92,751 101,628 114,500 (8.7)
Lost time injury frequency rate 1.42 1.44 1.37 (1.4)
Year ended 31 March % change
Social – Communities 2013 2012 2011 12/13
Active mobile subscribers 1,534,265 1,483,401 473,604 3.4
Fixed access lines (thousands) 3,800 3,995 4,152 (4.9)
Telkom Foundation total spend 42 41 37 2.4
Year ended 31 March % change
Environment 2013 2012 2011 12/13
Electricity consumption (KWh) 658,636,533 669,235,368 700,940,529 1.6
Co2 emissions (tonnes) 769,216 776,715 790,626 1.0
Recycled copper (tonnes) 1,231 1,279 1,387 (3.8)
Recycled optic fibre (tonnes) 281 251 203 12.0
1 Excluding the R12 billion impairment charge.

6 Telkom Integrated Report 2013
OUR BUSINESS
Telkom is a leading communications services provider in South Africa. We provide fixed-
line, mobile, ICT and data services to the business and consumer markets and offer a
wide range of products to suit the needs of our customers. We operate in nine different
countries across Africa, with South Africa making up 98.9% of Telkom’s total revenue.
As of 31 March 2013, the Group had approximately 3.8 million telephone access lines in
service and 73,400 ports connected via MSAN access.
The announcement of the Convergence Strategy in July 2012 triggered a change in the
way Telkom is managed from a financial reporting perspective as it is now managed as
a single business, based on a common network, providing a complete service to various
types of customers. In order to meet the needs of their different customer profiles, Telkom
markets products based on the service lines listed below:
TELKOM CONSUMER
TELKOM BUSINESS
TELKOM GROUP
TELKOM WHOLESALE
AND NETWORKS
Products:Telkom Consumer and Retail Services serves residential customers across South Africa.
Telkom Mobile was launched in October 2010 to provide mobile connectivity solutions to South African consumers.
Products:Telkom Business is dedicated to serving small and medium enterprises (SMEs), large corporations, government organisations and global enterprises.
Cybernest is Telkom’s data centre offering which consists of basic hosting as well as cooling, power and backup power, managed and fully managed hosting and disaster recovery.
Telkom Business Mobile provides mobile connectivity solutions to our Business customers.
Products:Telkom Wholesale and Networks is South Africa’s leading provider of ICT wholesale facilities, services and solutions to mobile cellular operators, international ICT companies, services providers, fixed-line operators and broadcasters, both locally and internationally. The Networks section provides and maintains the infrastructure which supports the Company’s revenue generating capability.
Trudon (Pty) Limited (64.9%) (revenue contribution: R1,140 million) provides yellow and white page directory services, an electronic directory service, 10118 ‘The
online web directory service.
Swiftnet (Pty) Limited (wholly-owned subsidiary) (revenue contribution: R94 million) provides a suite of services including traditional connectivity services for point-of sale, managed SIM services and
Private Network Services.
iWayAfrica Group (wholly-owned subsidiary) (revenue contribution: R358 million) is an integration of Africa Online Limited and MWEB Africa Limited.
GRI
The Telkom Group consists of Telkom SA SOC Limited and the following subsidiaries:
Information is provided on these subsidiaries in the Integrated Report, however are insufficiently material to be
considered a separate segment for the purposes of IFRS 8 Operating Segments.
7 Telkom Integrated Report 2013
Operating environment Risk and responsibilityCreating value Leadership and strategy People and environment Financial statements
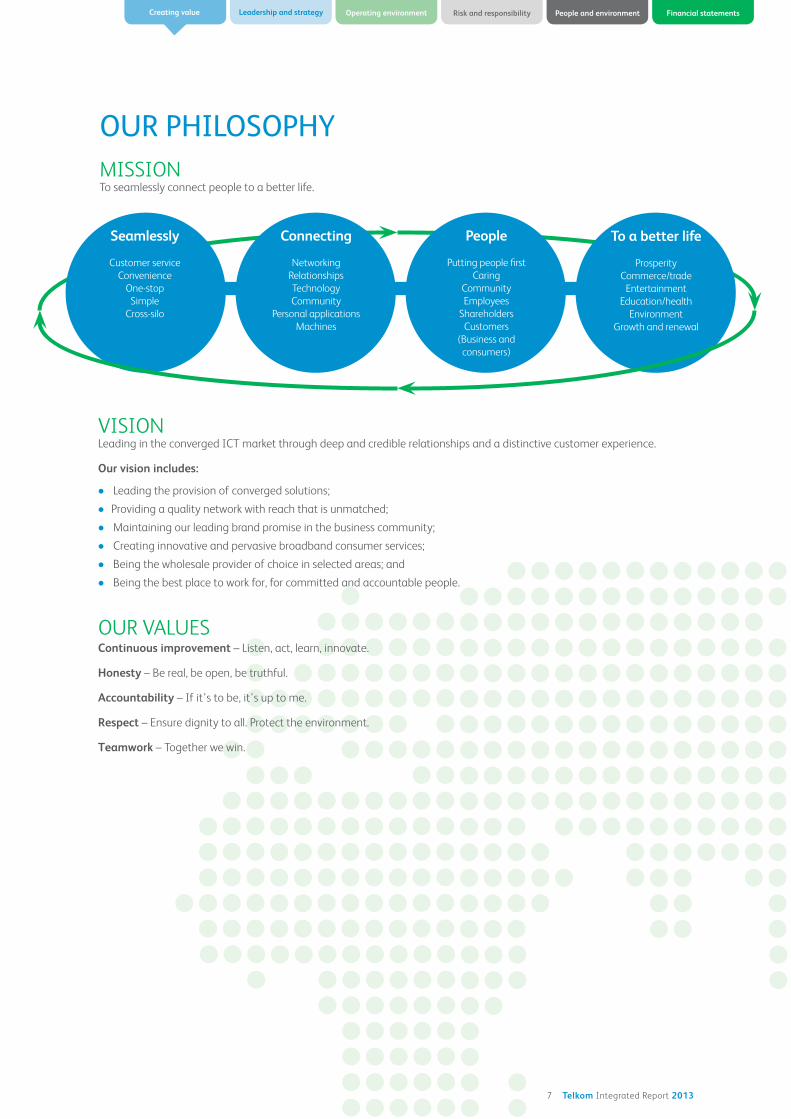
OUR PHILOSOPHY
Connecting
Networking
Relationships
Technology
Community
Personal applications
Machines
People
Putting people first
Caring
Community
Employees
Shareholders
Customers
(Business and
consumers)
Seamlessly
Customer service
Convenience
One-stop
Simple
Cross-silo
To a better life
Prosperity
Commerce/trade
Entertainment
Education/health
Environment
Growth and renewal
MISSIONTo seamlessly connect people to a better life.
Leading in the converged ICT market through deep and credible relationships and a distinctive customer experience.
Our vision includes:
Leading the provision of converged solutions;
Providing a quality network with reach that is unmatched;
Maintaining our leading brand promise in the business community;
Creating innovative and pervasive broadband consumer services;
Being the wholesale provider of choice in selected areas; and
Being the best place to work for, for committed and accountable people.
Continuous improvement – Listen, act, learn, innovate.
Honesty – Be real, be open, be truthful.
Accountability – If it’s to be, it’s up to me.
Respect – Ensure dignity to all. Protect the environment.
Teamwork – Together we win.

8 Telkom Integrated Report 2013
OUR VALUE TO SOCIETY
Telkom adds significant value to South African society. Our business operations
directly contribute value to the economy as a whole, and the extensive reach of our
products and services are indirectly integral to the functioning and development
of society.
2013 2012
Rm Rm
Value added
Revenue 32,501 33,079
Net costs of services and other operating expenses* (15,933) (17,583)
Investment income 301 238
Other income 402 579
17,271 16,313
Value distributedTo employees as salaries, wages and other benefits 9,861 8,636
To government as taxation and dividends 1,111 1,089
To providers of finance as finance expense 660 765
5,535 5 ,644
Net earnings retained (19) 53
Non-controlling interest 123 126
17,271 16,313
The amounts reflected above have been extracted from the Telkom SA SOC Limited
consolidated annual financial statements for the year end 31 March 2013 and
excludes the R12 billion impairment charge. For a full appreciation of the Financial
Results readers should refer to pages 113 to 239.
* Included in the figure above is the following distributions:
Distributed to suppliers 15,891 16,435
Distributed to corporate social investment through Telkom Foundation 42 41
To employees as salaries, wages and other benefits
To government as taxation and dividends
To providers of finance as finance expense
Value reinvested
Non-controlling interest
2012 2013
GRI

9 Telkom Integrated Report 2013
Operating environment Risk and responsibilityCreating value Leadership and strategy People and environment Financial statements
LEADERSHIP AND
STRATEGIC OBJECTIVES
10 Telkom Integrated Report 2013
INTRODUCTION AND
The 2013 financial year was a challenging one in the wake
of the failed strategic equity shareholding transaction
with Korea Telecom. The resultant discontent and loss
in shareholder confidence led to a major overhaul of the
Telkom board. These events revealed the extent of the
deterioration of the relationship between government,
Telkom’s major shareholder, and the Board. Subsequently,
concerns were raised over Telkom’s strategic direction,
management stability and long-term commercial viability.
This has emphasised the importance of rebuilding mutual
trust between shareholders and seeking alignment with our
key stakeholders.
The financial results for 2013 are indicative of the challenges
the Group faced over the period. Headline earnings of
87 cents per share and a return on equity of 2.1%, excluding
the impairment charge, were reported for the year.
The Board took the decision to make a R12 billion
impairment to the carrying value of the assets of the
Group, bringing the net asset value per share to R34 (2012:
R57). For a considerable period of time, Telkom’s shares
have been trading far below their net asset value. The non-
cash impairment also took into account the impact that
changes in technology, competition from mobile operators
and the evolving regulatory landscape have had on the
Group’s financial returns, particularly on legacy assets, over
the past decade.
As the chairman of Telkom, I acknowledge the complexities
of turning around our performance. Bold decisions such as
the one to impair the Group’s legacy assets are needed to
achieve this. While we need to act with urgency, the trust
of our stakeholders will only be restored over time and on
delivery of sustained results.
My priority as chairman is to work with the Board and our
new GCEO, Sipho Maseko on the following three core areas
that I have identified:
The need for a stable and effective board and
management team;
Building a constructive relationship with our major
shareholder, the South African government and other
stakeholders alike; and
Jabulane A Mabuza
Chairman
“As the chairman of Telkom, I acknowledge the complexities of turning
around our performance. While we need to act with urgency, the trust
of our stakeholders will only be restored over time and on delivery of
sustained results.”
Jab
Cha
CHAIRMAN’S REPORT
GRI

11 Telkom Integrated Report 2013
Operating environment Risk and responsibilityCreating value Leadership and strategy People and environment Financial statements
Crafting and executing a compelling strategy that will
allow Telkom to deliver solid returns and contribute to
South Africa’s economy.
MAINTAINING GOOD
Effective corporate governance is largely dependent on
the skills, experience and capabilities of the individuals
on the Board. Their ability to work effectively with the
management team is integral to enabling improved
company performance and sustaining value for
shareholders.
The Telkom board was reconstituted last year following
a turbulent period. An intensive process was undertaken
to appoint individuals with the requisite expertise, skills
and track records to guide the Group through this time
of change and uncertainty. In maintaining balance and
diversity, it was necessary to reinforce the non-executive
presence on the Board.
The appointments of Kholeka Mzondeki, Leslie Maasdorp,
Clive Fynn, Susan Botha, Khanyisile Kweyama, Louis von
Zeuner and Fagmeedah Petersen, should provide a level of
comfort and assurance to our shareholders.
Following reconstitution of the Board we embarked on the
process of appointing a new GCEO and identified Sipho
Maseko as our preferred candidate. I am confident that he
is the right person to lead the Group in its transformation.
The stability and determination of the current Board
leaves me with no doubt of its ability to successfully fulfil
its mandate and respond to the challenges that lie ahead.
RELATIONSHIP WITH
The ongoing deterioration of Telkom’s financial
performance underpins the need for measures that will
transform Telkom into a commercially viable business.
A constructive relationship with our major shareholder,
the government, is critical to achieving long-term financial
success. This is particularly important, given government’s
other roles as industry regulator, policy maker and
significant buyer of ICT products and services.
As a board we acknowledge the role that Telkom has to play
in supporting South Africa’s socio-economic development.
Going forward, we want to achieve alignment of strategic
intent regarding our social obligations that does not
jeopardise our long-term financial health. I cannot
emphasise enough how critical it is to strike this balance.
To do so will require an easing of regulatory constraints and
the freedom to pursue a commercially-led strategy.
The onerous policy and regulatory burdens such as the
current interconnection rate dispensation, the threats of
Local Loop Unbundling (LLU), increased spectrum fees,
service charters and pay phone obligations continue
to place a significant financial burden on the Group.
Effectively addressing these issues is a top priority for the
Board and management, and is paramount in realising a
turnaround in Telkom’s strategic and financial position.
The Board is committed to the application of commercial
principles to decisions regarding strategy. This has
ramifications in the rollout of national broadband as, while
we believe Telkom will need to play a leading role in this, we
must ensure that our participation will be commercially led.
As a commercial entity, Telkom needs to operate in viable
segments of the market. In areas where it does not make
financial sense for us to do business, we require the support
of government.
REPOSITIONING TELKOM There has been much conjecture about the role that
government will play in Telkom’s strategic direction, but I
would like to be clear that it is the role of the Board and
management to inform strategy. I do however recognise
that in order to be successful, the support of our major
shareholder is required.
Telkom is embarking on a transformation journey. We
are in the process of reviewing the group strategy.
This repositioning is aimed at improving the Group’s
financial performance and providing clear strategic
direction. The Board is committed to supporting
management in taking the necessary steps to address
the major challenges that have impacted the financial
performance of the Group in recent years.
Telkom’s fibre infrastructure is unrivalled. To take advantage
of this unique capability, we must ensure that we have the
best available network in South Africa. In the year under
review, we made great strides in our transition to becoming
IP compliant. We continued to channel significant capital
expenditure into the transformation of our networks.
These investments will allow Telkom to fully exploit the
convergence opportunity, which is the core of our value
proposition over the long term.
We are aware that from a service perspective we need to
improve our brand and reputation if we are to meet and
exceed the needs of our customers. This can be achieved
by upholding exceptional levels of service and affecting a
significant cultural shift in the way we operate. We recognise
that one of our material limitations is execution capability.
This needs to be addressed with urgency, particularly in the
ICT space, to regain our competitiveness in the consumer
market and to expand our Business service portfolio.
Strategically repositioning Telkom through its
transformation programme requires dedication and focus
in executing those key projects that will unlock value over
time. I am confident that our current management team
has the capability to address the many challenges and
opportunities that lie ahead.
South Africa needs a commercially viable and successful
Telkom that will better equip us to accelerate government’s
social objectives, benefit shareholders and meet the needs
of all stakeholders.
12 Telkom Integrated Report 2013
APPRECIATIONLastly, I would like to thank my predecessor, Lazarus Zim,
as well as the following directors: Neo Dongwana,
Dr Sibusiso Sibisi, Nomavuso Mnxasana and Julia Hope,
who served on the Telkom board during the past year, for
their invaluable contribution to Telkom. I welcome our
new directors to the Group and look forward to navigating
Telkom through the year ahead.
Thank you to the management team, particularly the
outgoing GCEO Nombulelo Moholi for leading the Group
with sincere professionalism and dedication. On behalf of
the Board we wish her all the best for the future.
I am immensely privileged to be chairman of Telkom at
such an exciting time in its history. To all our employees,
I recognise that many mistakes have been made in the
past, but now is the time to look forward with clarity and
determination to make this organisation one of which we
can be proud. Thank you all for your loyalty and support
over the past year.
Jabulane A Mabuza
Chairman
CHAIRMAN’S REPORT
13 Telkom Integrated Report 2013
Operating environment Risk and responsibilityCreating value Leadership and strategy People and environment Financial statements
Lead in convergence
Lead in data
Performance
againststrategicobjectives

14 Telkom Integrated Report 2013
PERFORMANCE AGAINST STRATEGIC OBJECTIVES
TELKOM BUSINESS
HIGHLIGHTS
Concluded important strategic growth deals with key enterprise and public sector clients;
Improved customer satisfaction and service perception metrics across all business segments;
Launched 20 Mbps and 40 Mbps broadband access through NGN;
Successfully enabled Convergence Sales through External Sales Agents (ESAs) via Usage Based Commissions; and
In partnership with the Department of Communication we began the process of connecting 1,500 schools to make
e-learning and e-education accessible.
CHALLENGES Maturity in voice is hampering revenue growth; and
Slow initial uptake of Business Mobile offering.
OBJECTIVE PERFORMANCE
Launch productised cloud services expansion of SaaS product portfolio.
Achieved 144% growth in Cybernest external revenue.
Cybernest launched Do Business into the workplace
services space.
50% of ICT product normalisation initiative completed.
Cybernest launched public cloud offering targeted at the
SMB market.
Launch pre-packaged and tailor-made FMC bundles
Launched Single Bill service, further extending
convergence offering.
Created capability for customers to create own
converged deals or add mobile to their current
Telkom account.
Launched approximately 60 bundles, including
Cloud products.
Launched Hosted Business Telephony, creating a “cloud
platform” for customers to adopt converged business
solutions with embedded unified communications.
Enabled the sale of 42,000 FMC bundles across business
and consumer customers.
Repositioning our fibre portfolio, making it easier and cheaper for our customers to access fibre services to satisfy their ever increasing demand for bandwidth
New fibre prices were introduced in October 2012.
High end Diginet services to Metro Ethernet offered with
initial focus on sites where fibre infrastructure exists.
Migrated existing fibre-based services such as Megalines
and ATM Express to Metro Ethernet services.
Retail Metro Ethernet services revenue doubled during
the financial year.
Pilot and launch high-speed broadband access based on the Next Generation Network programme
High-speed (20 Mbps and 40 Mbps) broadband access
successfully piloted from October 2012 to February 2013.
High-speed broadband access and related Telkom
Internet bundles successfully launched in March 2013.

15 Telkom Integrated Report 2013
Operating environment Risk and responsibilityCreating value Leadership and strategy People and environment Financial statements
TELKOM CONSUMER AND RETAIL
HIGHLIGHTS Achieved 5.2% growth in the ADSL broadband subscribers;
Implemented aggressive retention programmes; and
Exceeded targeted retail channel growth.
CHALLENGES Need to differentiate entry-level broadband offering from our competitors;
Declining fixed-voice usage continues to pressurise revenue; and
Pay phone business is being pressurised by fixed-mobile substitution.
OBJECTIVE PERFORMANCE
Rationalise and simplify fixed voice portfolio
Reduced the voice product catalogue from 47 to seven.
Launched simplified and enhanced Unlimited Anytime
calling plan.
Improve broadband and Internet product proposition to sufficiently differentiate from mobile
Improved entry-level broadband proposition by increasing
speed from 384 Kbps to 1 Mbps.
Implemented a complete change in the ISP technology
and business model enabling the introduction of soft
capped products and a significant reduction in uncapped
prices.
Launched NGNEC product options (20 Mbps and 40 Mpbs
ADSL and Telkom Internet product bundles).
Launch new FMC and content services for broadband
Launched an enhanced Telkom-Mix 2.
Introduced mobile data add-on as a standard feature of
Broadband Simple bundle.
Increase retail footprint Increased retail footprint with 38 new Telkom Express
stores and presence in 18 DionWired stores and in
10 Pick n Pay Hyper stores.
Improve customer service and experience Integrated the ADSL and ISP activation process to enhance
customer service experience.
Simplified the process to upgrade and downgrade services.
Simplified Telkom invoices.
Increased social media presence.
Enhanced self-help capability and simplified the
fault-logging process.
16 Telkom Integrated Report 2013
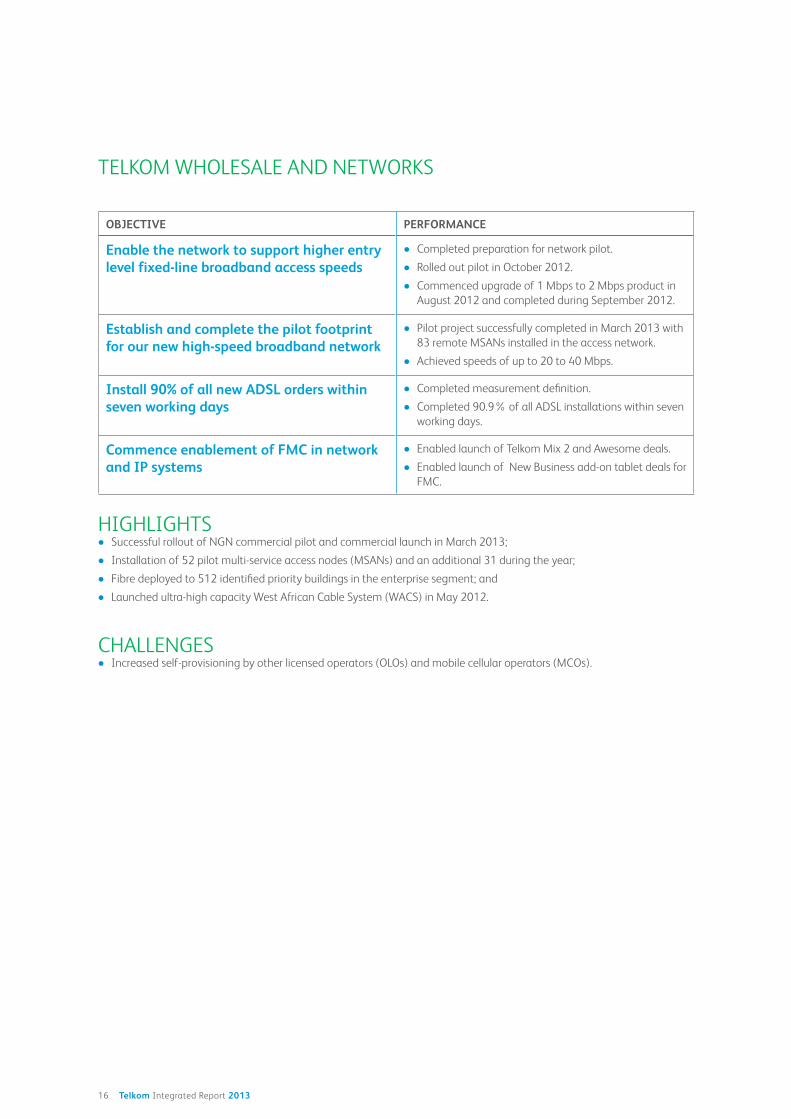
TELKOM WHOLESALE AND NETWORKS
HIGHLIGHTS Successful rollout of NGN commercial pilot and commercial launch in March 2013;
Installation of 52 pilot multi-service access nodes (MSANs) and an additional 31 during the year;
Fibre deployed to 512 identified priority buildings in the enterprise segment; and
Launched ultra-high capacity West African Cable System (WACS) in May 2012.
CHALLENGES Increased self-provisioning by other licensed operators (OLOs) and mobile cellular operators (MCOs).
OBJECTIVE PERFORMANCE
Enable the network to support higher entry level fixed-line broadband access speeds
Completed preparation for network pilot.
Rolled out pilot in October 2012.
Commenced upgrade of 1 Mbps to 2 Mbps product in
August 2012 and completed during September 2012.
Establish and complete the pilot footprint for our new high-speed broadband network
Pilot project successfully completed in March 2013 with
83 remote MSANs installed in the access network.
Achieved speeds of up to 20 to 40 Mbps.
Install 90% of all new ADSL orders within seven working days
Completed measurement definition.
Completed 90.9% of all ADSL installations within seven
working days.
Commence enablement of FMC in network and IP systems
Enabled launch of Telkom Mix 2 and Awesome deals.
Enabled launch of New Business add-on tablet deals for
FMC.

17 Telkom Integrated Report 2013
Operating environment Risk and responsibilityCreating value Leadership and strategy People and environment Financial statements
TELKOM MOBILE
HIGHLIGHTS Three-month LTE trial was launched to gated communities in November 2012;
Exceeded target to reduce EBITDA loss by 20%;
Significant improvement to debtors’ book.
CHALLENGES Gaining market share in a mature and highly penetrated mobile market; and
Fierce price-driven competition.
OBJECTIVE PERFORMANCE
Build mobile network 2,299 base stations acquired, with 1,985 sites integrated.
Launched LTE in November 2012.
651 LTE sites were integrated into the network.
Launched new price offering to consumers in May 2013.
649 Wi-Fi access points installed with free unlimited
WiFi made available to Telkom Mobile subscribers in
April 2013.
Expand mobile retail footprint 38 Telkom Express stores built and launched successfully
in malls countrywide.
Increased the number of flagship stores to nine.
Entered into a service provider agreement with
Nashua Mobile.
Launched 11 Smart Internet and 10 Smart Internet Saver
data offerings with 10 GB product modified.
Grew active subscribers by 3.4% to 1.53 million from
1.48 million in the prior year.
76% and 92% of voice and data subscribers active on
Mobile’s own network, respectively – end March 2013.
Cost optimisation Improved billing process and software.
Enhanced credit management.
Improved call centre customer experience.

18 Telkom Integrated Report 2013
INTRODUCTIONBefore I begin with the review of Telkom’s performance
for the year, I would like to express my condolences on
behalf of the Board and management team to the families
of the two members of staff, Captain Phopolo Phenya
and Mokopa Phillip Swarts, who lost their lives in vehicle
accidents during the year. Fatalities are unacceptable in
the workplace and we need to ensure that our people are
operating in a safe work environment. I will pay particular
attention to issues of workplace safety going forward.
Telkom’s performance trajectory has been disappointing
in recent years. The erosion of traditional revenue streams
in the telecoms industry globally has proven exceptionally
challenging for fixed-line incumbents. The contribution of
strategic errors and poor decisions towards the Group’s
current financial state must also be acknowledged. This
has also resulted in a loss of confidence of our stakeholders.
I am determined that we will not repeat the mistakes of the
past, and while I recognise the challenges that Telkom faces,
the potential of its people, technology and infrastructure
places it in an inherently unique position within the ICT
industry. This opportunity needs to be harnessed to evolve
our business into one that better meets the needs of all
stakeholder groups: our shareholders, customers, employees
and the broader society that Telkom reaches.
As the newly appointed group chief executive officer,
I am committed to the transformation of Telkom’s financial
performance, restoring confidence of government and our
shareholders and rejuvenating Telkom as a national asset.
FINANCIAL PERFORMANCE The 2013 financial results re-affirm the need to act with
urgency to turn around the Group’s performance. Headline
earnings from continuing operations for the year was
237.7 cents per share (73.2%) lower than the prior year.
The decline in headline earnings was largely a result of the
for the Competition Tribunal fines and continued pressure
on our fixed voice revenues.
Basic earnings per share was affected by a R12 billion
impairment charge on the carrying value of the Group’s
legacy assets resulting in a basic loss per share of
2,276 cents. The impairment charge is a non-cash item
and did not impact the significant cash flow (EBITDA) that
the Group generates from its operations.
Revenue for the year continued to decline. The Group
reported revenue of R32.5 billion, versus R33.1 billion in the
prior period as a result of sustained pressure on fixed-line
operations. Expenses, excluding the R12 billion impairment
of legacy assets, grew 2.2% to R32.0 billion primarily due
to provisions for voluntary severance and early retirement
packages, as well as a provision for the Competition
Tribunal fines.
Sipho N Maseko
Group chief executive officer
“Despite the current financial position, I see a significant opportunity
to transform Telkom into a profitable and sustainable business able to
support South Africa’s economic development.”
GROUP CHIEF EXECUTIVE OFFICER’S REPORT
GRI
Scan this picture to view our GCEO’s interview
and access the online report using Layar.
19 Telkom Integrated Report 2013
Operating environment Risk and responsibilityCreating value Leadership and strategy People and environment Financial statements
Lower revenue and higher operating costs placed strain on
EBITDA, which declined 16.8% to R7,109 million. Notably,
however, free cash flow remained strong at R2,132 million
after capital investment of R5,738 million, which increased
20% year-on-year. This can be largely attributed to the
substantial investment in the upgrade of the Group’s
network. The Group is lowly geared, with year-on-year net
debt decreasing 46.0% to R2.1 billion which places us in a
solid position to fund our capital expenditure programme.
The Board has reviewed its dividend policy and has chosen
to withhold payment of dividends until the Group’s
financials show sufficient signs of recovery.
Telkom Business is the Group’s largest revenue generator.
This year the business achieved a number of strategic
growth deals with key clients across the enterprise and
public sector segments.
Through the upgrade of our networks, we were able to
provide our customers with faster, better quality broadband.
Telkom has an unrivalled network of more than 147,000
cable kilometres of terrestrial fibre which is now widely
available to business customers in metro areas across the
country. This will secure Telkom Business’ leadership in the
data market, thereby preserving existing revenues.
The network upgrade attained full momentum
during the financial year under review. We were
able to put in place 83 fully operational MSANs.
The commercial pilot of this upgrade, consisting of
437 customers, delivered broadband speeds of up to
40 Mbps to 66% of the participants.
While migrating customers onto our IP network, we
experienced a fall out rate of less than 5%. This is
a tremendous achievement when compared with
international benchmarks. We will continue the network
migration during the next financial year and preparation of
sites is already underway.
The Consumer business continues to face significant
challenges of declining fixed-line usage and revenues.
This has necessitated consolidation and innovation to
defend and grow the subscriber base. Rationalisation of
the Consumer voice portfolio has assisted in streamlining
the product offering and allowed us to maintain focus on
profitable products and services.
While it is encouraging that Telkom Mobile exceeded the
targeted 20% reduction in EBITDA losses for the financial year,
it continues to face formidable competition from established
players in the market. We are undertaking a thorough strategic
review of the business to manage the inherent risk around
building a mobile business as the fourth entrant. It is our view
that mobile is vital to our future, especially from a revenue
growth and convergence perspective.
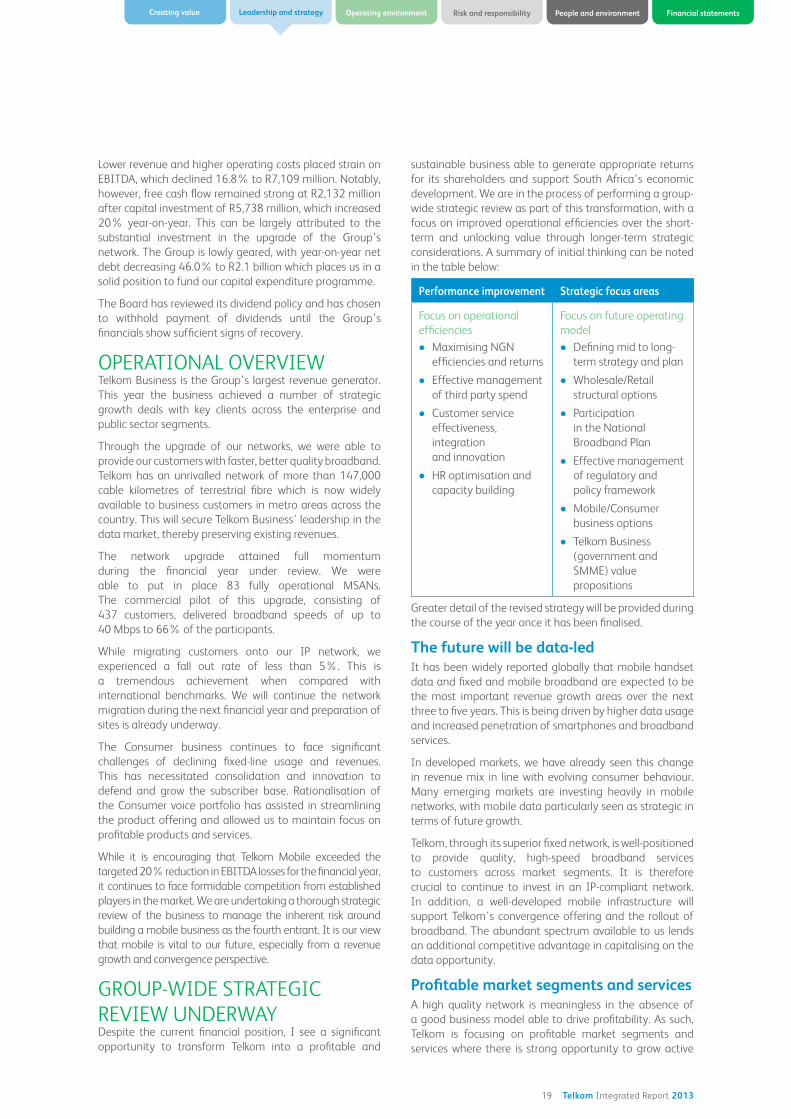
GROUP-WIDE STRATEGIC
Despite the current financial position, I see a significant
opportunity to transform Telkom into a profitable and
sustainable business able to generate appropriate returns
for its shareholders and support South Africa’s economic
development. We are in the process of performing a group-
wide strategic review as part of this transformation, with a
focus on improved operational efficiencies over the short-
term and unlocking value through longer-term strategic
considerations. A summary of initial thinking can be noted
in the table below:
Performance improvement Strategic focus areas
Focus on operational
efficiencies
Focus on future operating
model
Maximising NGN
efficiencies and returns
Effective management
of third party spend
Customer service
effectiveness,
integration
and innovation
HR optimisation and
capacity building
Defining mid to long-
term strategy and plan
Wholesale/Retail
structural options
Participation
in the National
Broadband Plan
Effective management
of regulatory and
policy framework
Mobile/Consumer
business options
Telkom Business
(government and
SMME) value
propositions
Greater detail of the revised strategy will be provided during
the course of the year once it has been finalised.
The future will be data-ledIt has been widely reported globally that mobile handset
data and fixed and mobile broadband are expected to be
the most important revenue growth areas over the next
three to five years. This is being driven by higher data usage
and increased penetration of smartphones and broadband
services.
In developed markets, we have already seen this change
in revenue mix in line with evolving consumer behaviour.
Many emerging markets are investing heavily in mobile
networks, with mobile data particularly seen as strategic in
terms of future growth.
Telkom, through its superior fixed network, is well-positioned
to provide quality, high-speed broadband services
to customers across market segments. It is therefore
crucial to continue to invest in an IP-compliant network.
In addition, a well-developed mobile infrastructure will
support Telkom’s convergence offering and the rollout of
broadband. The abundant spectrum available to us lends
an additional competitive advantage in capitalising on the
data opportunity.
Profitable market segments and servicesA high quality network is meaningless in the absence of
a good business model able to drive profitability. As such,
Telkom is focusing on profitable market segments and
services where there is strong opportunity to grow active
20 Telkom Integrated Report 2013
users, average revenue per user (ARPU) and stimulate
uptake of value added services.
From a wholesale perspective, we need to employ
strategies that stimulate widespread data growth in line
with government’s broadband strategy, thereby working
towards South Africa’s developmental objectives. By
reducing the incentive to self-provide, we will also be able
to defend and grow our Wholesale business.
Focus on operational efficiencyTo improve our performance in the short-term we are
reviewing the business from an operational standpoint.
Measures to achieve cost reduction and greater efficiency
and the identification of growth opportunities, as noted in
the table above, have been initiated. Our focus areas in this
regard are the effective management of third party spend,
HR optimisation and capacity building, rationalising the
property portfolio, consolidating the pay phone business
and exploring IT adjacencies. We also intend to maximise
NGN efficiencies and returns, and improve customer service
effectiveness.
STAKEHOLDER RELATIONSRestoring our relationship with governmentOne of my top priorities is to rebuild Telkom’s relationship
with government and other key stakeholders. My early
engagements have confirmed that there is substantial
goodwill and commitment regarding Telkom within
government. We are committed to working with government
to discharge our duties as a national incumbent and,
through this, re-invigorate the relationship.
I see Telkom playing a meaningful part in the rollout
of broadband, however we are mindful of the financial
implications involved and we need to guard against any
adverse effects to our long-term financial health. We have
submitted a proposal to government, which is currently
under review. We look forward to further engagements to
arrive at a workable and sustainable solution for all parties
involved. This will also ensure that the expectations of our
minority shareholders are met.
As part of Telkom’s broader role in South Africa’s
development, working with government to provide
broadband connectivity in schools has been a key focus.
In conjunction with the Department of Communication
(DoC), Telkom Business is in the process of connecting
1,500 schools across the country, making e-learning and
e-education accessible. We are committed to continued
collaboration to drive such developments forward.
Mobilising our peoplePeople are Telkom’s greatest asset. The voluntary
retrenchment programme that we started in 2013 was, as
expected, a difficult but necessary exercise. It is therefore
critical that we continue to build upon our relationships
with our people, particularly during these times of change.
We will continue to make efforts to increase our levels of
employee engagement, satisfaction and motivation to
participate in Telkom’s transformation in the years ahead.
Over the course of the year, a reduction in the number
of health and safety incidents of 6% was achieved. It is
unacceptable however, that we suffered two fatalities
during the year and it is my commitment going forward to
ensure that our people operate in a safe environment.
Delivering quality customer serviceI cannot emphasise enough the importance of our
customers. The perceptions of both our business and
consumer clients regarding our reputation and the value of
our products and services, is central to our success. Our core
focus has therefore been to drive quality and innovation
to ensure that our customers’ ever-changing needs are
consistently met. To achieve this, we need to instil a culture
of customer centricity among our employees. It is my
hope that, in the years to come, Telkom will report much
improved measures in terms of quality of customer service.
Competition law complianceSettlement discussions with the Competition Commission
were initiated and successfully concluded in April 2013. This
ruling related to the case between Telkom and the South
and various other complainants pertaining to alleged anti-
competitive behaviour between 1999 and 2002. Telkom
and the Commission agreed to withdraw their respective
appeals against the Tribunal’s initial ruling in August 2012,
resulting in the said ruling remaining unaltered. Accordingly,
Telkom will pay the fine that was awarded by the Tribunal in
the sum of R 449 million.
We have also subsequently negotiated to settle a second
claim relating to a Multiple Complaints Referral by several
complainants including Internet Solutions (Pty) Limited, the
internet division of MultiChoice Subscriber Management
Internet Service Providers Association.
As part of this settlement, Telkom is required to pay a
penalty of R200 million which has been fully provided for.
The settlement also requires an undertaking by Telkom
regarding the functional separation between the Group’s
retail and wholesale divisions.
We are committed to understanding the unique
responsibility that we have as the national incumbent. We
acknowledge that past actions of the Group have had a
negative impact on our business and we take accountability
for this. We have been and will continue to uphold
responsible conduct and compliance in all our businesses.
Asymmetric termination rates critical to sustainable competitionI strongly believe that the current interconnection rate
dispensation hampers competition and new entrants such
GROUP CHIEF EXECUTIVE OFFICER’S REPORT
21 Telkom Integrated Report 2013
Operating environment Risk and responsibilityCreating value Leadership and strategy People and environment Financial statements
as Telkom Mobile should be allowed to compete on a level
playing field. The current interconnection rates are set at
an inappropriate level and are discriminatory towards
less established market participants. We have proposed
simplified and converged mobile termination rates (MTR)
and fixed termination rates (FTR) to the regulator. To this
end, Telkom will participate at public hearings to be held
by the Portfolio Committee on Communications on
this topic and will also participate in the Independent
Communications Authority of South Africa’s (ICASAs)
process of reviewing the existing regulations, including
their “Cost to Communicate” programme.
We are also engaging with the regulator on issues relating
to spectrum licensing fees and access, LLU, and relief
of universal service obligations as we believe these to be
unnecessary burdens on Telkom’s already strained financial
position. I intend to deal with all regulatory matters
assertively, decisively and expediently going forward.
APPRECIATIONI would like to thank the Board and our chairman, Jabulane
Mabuza, for appointing me to lead Telkom through this
period of transition. I would like to congratulate my
predecessor Nombulelo Moholi for making progress in
key areas, despite the complexities of our operating
environment.
I acknowledge the hard work that remains in transforming
the business into a highly profitable one that earns a position
of leadership in its chosen segments. A fundamental
weakness of ours has been our inability to execute and
deliver results. With tenacity and renewed focus on
execution, I am confident that we can turn around Telkom’s
performance. Doing so requires the setting out of clearly
defined objectives and performance measures. Developing
a successful track record of execution will rebuild our
credibility among our stakeholders.
It is up to each and every Telkom employee to rise to this
challenge and take an active role in re-invigorating our
company.
Sipho N Maseko
Group chief executive officer

22 Telkom Integrated Report 2013
OPERATING
ENVIRONMENT

23 Telkom Integrated Report 2013
While traditional telecoms revenue growth has continued
its decline over the last year across the globe, the explosion
of internet applications and rapid innovation in smartphone
capability, LTE and the Cloud, is revolutionising the sector,
driving growth in data-intense pockets of the market.
However, monetising this growth in data demand has proved
difficult as customers are demanding more minutes and
higher bandwidth while spending less and less. Adding to this
pressure, telecoms operators are also seeing an increase in
their cost base as inflation, regulation and capital expenditure
take their toll on the bottom line.
Increasing competition from non-traditional players such
as Internet companies like Google and Skype, retailers,
media players, and handset manufacturers is also placing
traditional telecoms operators under pressure.
However, a number of adjacencies such as ICT services and
content do offer additional grounds for operators to grow
revenues and defend their existing franchise. Capturing
these will require telecoms players to explore new business
models, including selected partnerships, which will enable
them to tap into innovations and aggregate the most
relevant services and applications.
Further to this, the business-to-business ICT space represents
an attractive opportunity, expected to grow faster than
business-to-consumer and to provide a way for telecoms
companies to deepen their enterprise customer relationships.
is expected to remain robust in South Africa, passing 50%
before the end of 20171.
Many telecoms operators around the world are already
deploying or planning to deploy fibre networks as consumer
demand for high-speed data access and volumes continues
to rise.
In South Africa, the telecoms market mirrors the global
industry. Between 2013 and 2018, fixed and mobile voice
market revenues are expected to decline by 3% and 2%
per annum2, respectively, while demand for data, IT services
Penetration of fixed broadband services is low among
South African households. This suggests an opportunity
for growth in the fixed broadband market, which Telkom is
well-positioned to exploit, given its extensive infrastructure
across the country.
Conversely, mobile broadband penetration in South Africa is
high. Unlike in developed countries, mobile broadband usage
dominates fixed. However, the recent decline in MTR has
put increasing pressure on mobile ARPUs. Less established
mobile operators, including Telkom Mobile, are engaging the
regulator on this issue.
1 Source: Business Monitor International, South Africa telecommunications report, Q3 2013.
2 Source: Pyramid; Ovum; IDC.
Over the next decade, a larger ecosystem of disruptive
see the introduction of a broader field of competitors to the
local telecoms market.
COMPETITION It is anticipated that the other licensed operators (OLOs)
and internet service providers (ISPs) will increasingly move
into the corporate and voice service markets, with telecoms
service providers expanding into managed data networks
and international traffic markets. Over the next few years
the formation of alliances between smaller licensed
operators, established telecoms service providers and
content providers, to focus on the delivery of converged
services, can be expected.
Market consolidation is also anticipated, with Telkom’s
competitors expected to grow through mergers,
acquisitions and alliances. Furthermore, the entry of
multinational corporations into South Africa will provide an
incentive for their service providers to establish or enhance
their presence in South Africa.
The effect of declining demand for voice on revenue has
been further compounded by fixed-mobile substitution
and growing customer demand for faster data services at
cheaper rates. This has prompted highly aggressive and
targeted pricing tactics by OLOs and ISPs, which could greatly
intensify with the forthcoming launch of fibre services. This
pricing pressure is particularly disadvantageous for Telkom,
given its service obligations as the national incumbent, and
the associated cost base.
The South African mobile market is already a contested space,
most of the market share. The price competition seen in the
fixed market is also active in the mobile arena as competitors
vie for a greater portion of the market. As the fourth entrant
into the market space, Telkom Mobile has chosen to follow a
niched approach to its target market that will place it out of
Global trends have shown that fixed-line operators have
benefitted from spectrum constraints placed on mobile
operators, which have forced them to offload data onto fixed
networks. Accordingly, Telkom as both a fixed and mobile
operator is better insulated than its mobile competitors in
this regard. The Group’s complement of mobile and fixed
services also means that Telkom is well-placed to satisfy
the recent explosive growth in data demand with unique
converged solutions.
Telkom is the only player with developed fixed and mobile
infrastructure and is plugged into main business areas in
South Africa enabling easy provision of bundled services.
The integrated use of mobile and fixed is pivotal to the
achievement of meaningful socio-economic development
INDUSTRY OVERVIEW
Operating environment Risk and responsibilityCreating value Leadership and strategy People and environment Financial statements

24 Telkom Integrated Report 2013
in South Africa and in fulfilling government’s service delivery
objectives. Telkom’s unique infrastructure and network
places it in a strong position to support e-enablement in
South Africa, which has the ability to empower businesses
through the integration of technology into their operations.
Despite Telkom’s differentiated position within the
telecoms market, there are a number of regulatory issues
affecting its ability to compete on a level playing field.
INFLUENCING COMPETITIONTelkom continues to engage with the ICASA on a variety
of issues including local loop unbundling, the access line
deficit, interconnection rates, spectrum fees, licence fees
and quality of service issues.
Self-provision and fixed-line voice competitionAs the incumbent fixed-line operator in South Africa, fixed-
line voice revenue remains at the core of our business. The
playing field was changed with the introduction of Neotel,
which competes with us in all markets, and the granting
of an electronic communications network service (ECNS)
licences to the State-owned Broadband Infraco (Pty)
Limited, whose main objective is the provision of wholesale
bandwidth to other licensees at cost-based prices. Other
licensees, including the mobile operators, who used to
obtain their transmission infrastructure from Telkom, are
now adequately licensed to provide their own infrastructure
and also to provide it to other licensees, in competition with
Telkom’s network services.
Spectrum licence fees The Administrative Incentive Pricing basis for spectrum
licence fees was introduced through regulation by ICASA
in 2010 to incentivise spectrum users to make the most
effective and efficient use of the radio frequency spectrum,
specifically with regard to spectrum use in rural areas.
Telkom has paid spectrum licence fees of R100 million for
the 2013 period. The Authority also intends amending
Telkom’s radio frequency spectrum licences in order to
capture Telkom’s current use of spectrum. Following these
activities the total fees payable should remain below
R100 million.
Review of universal service obligationsIn August 2010, ICASA issued a discussion document on the
review of universal service and access obligations (USAOs).
As indicated in last year’s report, we have submitted our
views on the proposed USAO model to ICASA but no further
progress has taken place. We are still of the view that there
will need to be further consultations with ICASA before
the regulations are finalised. The latest consultation with
the Minister of Communications on a national broadband
strategy for South Africa may also result in a rethink of the
concept of universal service and access and Telkom has
made suggestions to the Minister in this regard to achieve
a more balanced obligation regime on operators.
Price controlsWe have filed our retail tariffs in accordance with the
regulations governing the standard terms and conditions
for individual licences, which contemplate that such tariffs
be filed with ICASA but do not require ICASA approval to
be implemented.
Local loop unbundlingLLU in its original form is a regulatory remedy that enables
telecommunications operators to access customers and
competitively provide broadband services to them over
the ‘last mile’ infrastructure of an incumbent operator.
This was deemed necessary by regulators when there
were no efficient alternative methods to enable this form
of competition among operators. However, other forms of
wholesale services are now available, including BitStream,
which can give operators access to Telkom’s broadband
infrastructure without requiring the physical unbundling of
the loop.
After a lengthy consultation process, ICASA has come
to the conclusion that LLU is a fairly complex and costly
process that will require ICASA to conduct a regulatory
impact assessment, as well as a market review to determine
the necessity and scope of any LLU remedy, before it can be
mandated by regulation. ICASA, however, has suggested
that in the interim a BitStream product should be offered
by Telkom from 1 November 2012 subject to the recovery
of Telkom’s Access Line Deficit (ALD). However, since ICASA
has not yet agreed to a process to recover the ALD, Telkom
has not been obligated to introduce BitStream.
Mobile and fixed-line termination ratesICASA has imposed a three-year glide-path for new
termination rates, which came into effect on 1 March 2010.
From 1 March 2013, Telkom’s fixed termination rates were
reduced to R0.19 (between 0N area codes) and R0.12 (within
and MTN were set at R0.40. There will also be no difference
between peak and off-peak rates for call termination services.
The smaller players – being ourselves (Telkom Mobile) and
Cell C – are entitled to charge up to 10% more for calls
terminated on each of our respective networks.
INDUSTRY OVERVIEW
25 Telkom Integrated Report 2013
Operating environment Risk and responsibilityCreating value Leadership and strategy People and environment Financial statements
TELKOM BUSINESSTelkom Business aims to be the leading provider of fixed and
converged communication and network services to the South
African business market, and to drive transformation in IT
through the Cloud.
During the year under review Telkom Business successfully
launched initiatives to create and maintain market leadership
in voice and data, convergence, broadband, ISP and value
added services.
We were able to deliver pleasing performance for the period
under review and will continue to focus on profitable products
and services that ensure consistently solid performance for
customers and shareholders year after year.
We concluded important strategic growth deals with key
clients across our enterprise and public sector segments, which
included a number of top JSE listed companies and various
government departments. These deals mark solid progress
towards sustainable growth and market leadership for Telkom
Business.
The delivery of sustainable growth hinges on service
perceptions and customer satisfaction. Improving these
metrics has been challenging, but over the period we
succeeded in moving the dial across all five of the customer
groups. We exceeded our targeted improvement, most
notably among our large, medium and small business
customers. Customer satisfaction in our enterprise segment is
now at global benchmark levels.
We saw a rise in operational expenditure for the year resulting
from investment in new capabilities and channels. Despite this
we were able to contain expenditure below inflation.
During the year we were able to elevate our broadband value
proposition through a variety of major initiatives. Foremost is
Telkom’s NGN project which enabled the introduction of high-
speed 20 Mbps and 40 Mbps broadband services for the mass
rollout of this broadband network upgrade will continue over
the next two years.
The NGN project also includes the deployment of fibre and
the migration of copper data services to fibre. Fibre is now
widely available to business customers in metro areas across
the country.
NGN is a key part of Telkom’s strategy for sustainability and
growth; it will secure a leadership position within the Business
data market and preserve existing revenues. NGN offers
customers much higher speeds and will significantly improve
the reliability of the network.
In line with market requirements, more competitive products
for our ISP, Telkom Internet, were launched during the year with
soft caps and better value uncapped products being made
available in March. Hosting Internet Access was also launched
as a more cost effective internet access option for customers
hosting their infrastructure in the Telkom data centre.
services. The new network also enables Telkom Business
to offer best in breed converged, Unified Communications
(UC) and networked ICT infrastructure services. This is an
opportunity to up sell bandwidth.
SIP trunking was introduced as a NGN alternative to ISDN
Primary Rate services and has been well received, with several
key customers having already migrated to this new voice
technology.
Growing Telkom Business Mobile on the path to convergence
is a key driver of the Telkom Business strategy. We are in
the process of building out our LTE mobile network in South
Africa. Our mobile capabilities, coupled with our fibre based
infrastructure, demonstrate Telkom’s ability to offer seamless
connectivity in support of genuine convergence.
Initial uptake of Business Mobile services has been slow, but
we achieved moderate, encouraging growth in the year under
review. In the year ahead we will grow ARPU through more
compelling voice offers, with a strong focus on convergence.
Converged products and capabilities that offer savings when
buying both fixed and mobile offerings were introduced.
These capabilities include single bill and single point of sale for
our customers. Until now, Telkom Business has been offering
bundled solutions, however the year ahead will see the
introduction of more integrated fixed, mobile and IT service
offerings that unlock the true value of convergence for our
customers.
Our vision is to transform the way that IT is delivered through
the Cloud and through convergence. We view IT services as a
natural adjacency to Telkom’s fixed and mobile services that
will complete our convergence value proposition. We intend
to drive the development of IT services through our Cybernest
business.
Our roadmap to UC as a Service is evolving fast and a full
suite of hosted and enterprise based UC and Collaboration
solutions will be available in the 2014 financial year. Telkom
already offers a range of solutions in both the hosted and
premise based areas, catering for business needs ranging from
medium sized companies through to large enterprises.
In a drive to improve operational efficiencies and reduce IT
complexity, Telkom Business simplified its product portfolio,
removing 450 offerings from the system. We will continue to
identify and retire products and services that are underutilised
or obsolete.
As part of Telkom’s broader role in South Africa’s development,
working with government to provide broadband connectivity
in schools has been a key focus. In conjunction with
the Department of Communication, Telkom Business is in
the process of connecting 1,500 schools across the country,
making e-learning and e-education accessible.
REVIEW OF TELKOM’S OPERATIONS

26 Telkom Integrated Report 2013
We have observed strong growth in the data centre and
IT markets. Telkom Business intends to grow organically
into adjacent areas like IaaS, SaaS, LAN and Desktop
Management, cloud services, UC and IT Outsourcing through
closer alignment to our managed IT infrastructure business,
Cybernest.
Pleasing progress was made in aligning Cybernest with
Telkom Business and our sales channels, resulting in Cybernest
performing remarkably well over the period, more than
doubling its revenues and achieving a six-fold year-on-year
increase in total contract value sold.
By leveraging the scale of Telkom’s infrastructure, Cybernest
will transform the way that IT and cloud services are delivered
to the business market. With six national data centres, Telkom
has the largest operational data centre capacity in the country,
enabling lower acquisition costs and greater operational
efficiency.
REVIEW OF TELKOM’S OPERATIONS
27 Telkom Integrated Report 2013
Operating environment Risk and responsibilityCreating value Leadership and strategy People and environment Financial statements
The improving accessibility and affordability of data has
been the catalyst for significant growth in broadband
usage in South Africa. This has presented an opportunity
for Telkom to increase its broadband subscriber base and
data related revenues. The sustained trend of fixed-mobile
substitution, although advantageous for our consumer
mobile brand, Telkom Mobile, has been detrimental to fixed
broadband penetration and, consequently, to our fixed-line
business, which experienced 6.8% churn during the period.
During the 2013 financial year, continued pressure was
felt on operating revenues from the decline in fixed voice
usage. Despite this, the Consumer business was able to
grow its data revenues year-on-year by 11%. However,
competition in the data market and continued strain posed
by fixed-mobile substitution resulted in relatively flat DSL
subscriber growth.
Convergence is how Telkom plans to reach a balanced
outcome in this situation. By demonstrating the synergies
between fixed and mobile as a converged offering, we aim
to stabilise declining revenues in our fixed-line business
while moving Telkom Mobile to high value segments. Mobile
will enable Telkom to capture broadband market share in
areas without fixed-line access, while fixed broadband can
provide the stability and bandwidth required to support rich
media content.
We are constantly seeking ways to improve our value
proposition and meet the needs of the connected
individual. In a drive to boost the competitiveness of our
ISP offering, Telkom Internet, a number of initiatives were
implemented. This year we were able to increase our
entry-level ADSL speeds, moving the bulk of our customers
from 384 Kbps to 1 Mbps and our 1 Mbps customers to
2 Mbps. We also migrated our Telkom Internet customers
to a new technology model enabling us to provide a
more competitive service and greater value for money. In
February 2013 we implemented price cuts on our uncapped
Internet products of up to 40%. In addition, we enhanced
our capped Internet services with a soft cap. This means
that customers are not limited to local data once reaching
their Internet cap, and can also access international sites.
Telkom commercially launched its NGN programme in
March, which has allowed us to launch our 20 Mbps and
40 Mbps fixed broadband products. During the pilot project
a reduction in faults of 67% was observed. The significantly
faster speeds and reduction in faults enabled by NGN
will allow Telkom Internet to gain market share, improve
customer satisfaction and deliver on our promise of value
for money.
Resolving service related perceptions that could affect the
Telkom brand has been and remains top of mind. As such,
one of our primary strategic focus areas for the year under
review has been customer experience improvement.
A number of service improvement initiatives aimed at
simplifying customer interface processes have been
implemented. The changes include an improved online
fault logging portal as well as our customer service app for
iPad and Android, which has experienced good utilisation
since its launch. Telkom is now active on social media
site, Twitter, facilitating more direct engagement with
customers. We were also able to reduce ADSL installation
times, with 90.9% of installations now being completed
within seven working days.
As a result of these and other initiatives, we have been able
to reduce service related traffic in our retail stores. This has
created room for more in-store transactional activity, which
now accounts for about 50% to 70% of total activity. This
is largely attributed to the expansion of our retail footprint
via third party partnerships, and organic growth through
Telkom’s owned-and-operated channels.
We were able to exceed the target we set of increasing the
total retail channel growth, increasing total Telkom outlets
from 117 to 155. Our partnerships with third party retailers
have facilitated quick expansion in a cost effective manner.
Telkom’s presence within these stores also offers consumers
a new level of convenience through enabling the purchase
of smart devices and connectivity in one place. We now
have a presence in 18 DionWired stores and 10 Pick n Pay
Hyper stores. We will continue to assess similar partnership
opportunities in the year ahead.
Declining fixed-line voice usage and revenues have
necessitated consolidation and innovation to defend and
grow our subscriber base. Rationalising our voice portfolio
has allowed us to streamline our product offering. This has
clarified our value proposition for customers and simplified
our sales activities. We also discontinued some value added
services and integrated others into the basic cost structure
of our voice contracts.
During the year we launched a number of converged
products in the data and voice space across fixed and
mobile. This year, we launched two new Telkom Mix
voice propositions: Telkom Mix 2 and Telkom Mix 3. We
also introduced the Telkom Simple product bundle which
includes Telkom Mobile data as a standard value add,
and an all-inclusive converged voice and data bundle called
The Killer Deal.
Bundles that include streaming devices, such as Boxee,
were introduced towards the end of 2012 and are available
in all TDS stores. By enabling the utilisation of rich media
content, we are able to demonstrate the relevance and
value of high-speed, uncapped, fixed broadband. This area
has the potential to drive broadband growth and is hence a
priority for the Consumer business.
Telkom’s pay phone business has come under significant
pressure as a result of fixed-mobile substitution. During the
year we implemented a commercially led plan to consolidate
our pay phone business and we began removing unprofitable
phones. We have, however, ensured that phones remained in
essential service areas such as prisons, hospitals, clinics, schools
and old age homes. We will continually assess the viability of
our pay phone business and action our strategy accordingly.
but will be offset by increased tariffs on line rentals. During
2013 we began to implement churn reduction initiatives.
This, along with channel improvement and expansion,
enhancements to the Telkom Internet value proposition
and price cuts, is expected to have a positive impact on our
DSL subscriber growth in 2014.

28 Telkom Integrated Report 2013
Central to the 2014 strategy for Mobile is leadership in
broadband, which will position the business to benefit
from the steady growth in data usage and declining voice
utilisation. The successful launch of LTE in South Africa’s
four major metropolitan areas, and continued innovation
in convergence, will see us increasing the value gained on
our investment in Telkom Mobile in the year ahead.
During March we launched Telkom Mobile, a high-quality
network offering great value to data hungry consumers and
those making high volumes of voice calls. It is important
a differentiated core set of products within Telkom Mobile,
developed a strong and loyal following in key segments
of the market and will therefore remain as an important
product for those customers.
The decision to launch Telkom Mobile was informed by
a great deal of investigation into market dynamics, the
benefits of leveraging the strong Telkom brand heritage
and its unrivalled infrastructure. We believe Telkom Mobile
will position the Group uniquely in the convergence arena.
Over the past year we were able to reduce Mobile’s EBITDA
losses from R2.2 billion in 2012 to a loss of R1.7 billion,
exceeding our loss reduction target of 20%. The allocation
of network-related and other costs to Telkom Mobile
was done consistently with the methods applied in
previous years.
In November 2012, Telkom Mobile launched its free five-
month non-commercial LTE trial in select parts of Gauteng.
The trial was an important milestone in demonstrating
Telkom’s ability to bring the fourth-generation (4G)
technology to market.
Mobile’s commercial LTE offering was launched in April
2013 in parts of Johannesburg, Pretoria, Durban and Cape
Town. The commercially-led rollout focuses on communities
without fixed-line access.
Despite this progress, this financial year was a challenging
one for the Mobile business. Being the fourth entrant into
a highly-competitive, price-driven market has demanded
innovative solutions to capture market share and greater
efficiencies to improve profitability.
Our focus for the year ahead is to deliver a value for money
product offering that will allow us to compete on a basis
that is more sustainable than price.
Our value proposition is based firstly on the delivery of
high-speed mobile broadband in areas without fixed-line
broadband, satisfying a latent demand for broadband and
moving our mobile subscriber base of 1.5 million towards
critical mass.
The second pillar of our value proposition is convergence,
which will allow us to further leverage off our existing
fixed-line infrastructure and provide customers with the
24-hour convenience of uninterrupted connectivity.
Accordingly, the year ahead is about ensuring the delivery
of high- speed broadband across our mobile and fixed-line
networks through capacity building, network upgrades and
expansion.
To this end, we were able to integrate 637 base stations
into the field during the year, bringing the total to 1,985. As
at 31 March 2013, Telkom Mobile had 651 integrated LTE
base stations.
Given the sustained trend of fixed-mobile substitution,
convergence provides an opportunity for Telkom to defend
its fixed-line business, while capitalising on the rapid
uptake of mobile in South Africa. Our mobile business is
not viewed as an alternative to our fixed-line operations,
but an opportunity to grow and sustain a single customer
base that uses Telkom’s products and services across both
platforms. We will, therefore, continue to develop and
market fixed-mobile data bundles and converged offerings
in the year ahead.
Declining voice utilisation continues to put pressure on
revenues. Although data is our primary focus going forward,
we will continue to operate at the high end of the voice
market. In October 2012, Mobile introduced its R1,199
African mobile market.
Continued retail channel growth is critical to growing our
mobile customer base. For the consumer mobile business,
expanding Telkom’s retail presence, particularly via third
party partnerships, is an efficient and high impact strategy
to improve accessibility of our mobile offering. For Telkom
Business Mobile, we have entered into a service provider
agreement with Nashua Mobile. Organic growth is also
being pursued through our owned and operated stores.
In the past, driving customer acquisitions via call centres
has focused on the volume of subscribers rather than on
quality. We experienced a significant improvement in
our debtors’ book due to a reduction in call centre driven
sales, the introduction of more stringent credit measures
and a renewed value over volume approach to customer
acquisitions.
TELKOM MOBILE

29 Telkom Integrated Report 2013
Operating environment Risk and responsibilityCreating value Leadership and strategy People and environment Financial statements
TELKOM WHOLESALE AND NETWORKS
Telkom Wholesale and Networks is driving transformation
through the adoption of an IP-compliant network, designed
to enable fixed-mobile convergence and high-speed, quality
broadband.
Telkom’s network and IT transformation programme, NGN,
attained full momentum during the financial year under
review. We were able to put in place 52 fully operational
Multi-Service Access Nodes (MSAN) in five exchange areas
by the second quarter of this financial year. Telkom also
commenced the commercial pilot of the NGN programme
at the beginning of October 2012 which ran through to
the end of February 2013. The participants’ lines were
cut-over from TDM exchanges to the MSANs, enabling
the delivery of traditional voice, high-speed DSL and new
emerging IP-based services from the same hardware. Of
the 437 customers who participated in the commercial
pilot, 66% attained a broadband speed of 40 Mbps.
The NGN pilot verified the considerable cost savings of the
new network, particularly through greater energy efficiency,
reduced maintenance costs and better utilisation of
Telkom’s workforce.
During the migration to MSANs, seven local exchanges,
were completed with high efficiency and low fault rates,
with less than 5% fall out rate and no roll back. This is a
tremendous achievement when compared to international
benchmarks. We will continue to migrate the network
during the next financial year and preparation of sites is
already underway.
In addition to the 52 pilot MSANs, 31 more were deployed
during the year under review and are already fully-
commissioned and integrated into the network. Through
the deployment, we have achieved an average copper loop
length of 800 metres, which will support higher broadband
NGN was commercially launched on 4 March 2013. Future
expansion will focus on high density areas where significant
overhead costs such as trenching can be optimised. In
remote exchange areas, we will rely on our fixed wireless
or satellite broadband capability to meet customers’
connectivity needs.
Telkom Wholesale and Networks is also in the process
of taking fibre deeper into the Telkom network, thanks
to new fibre capabilities and leveraging a mix of access
technologies including very high-speed DSL technology
optic fibre (PON) configuration directly to the customers’
premises. Telkom’s unrivalled fibre network of more than
147,000 kilometres and 16,500 Fibre Distribution Points,
that enable over 107,500 services, is a valuable asset in
terms of providing last mile access.
On the enterprise side, 578 priority buildings have been
identified for fibre deployment. Of the 578 buildings,
512 have already been completed with 66 more planned for
the near future. Telkom will be able to lead in the converged
ICT market and benefit from the strong growth expected
in the enterprise data segment through the provision of a
distinctive customer experience.
However, revenue in the Wholesale business remains
under pressure due to increased self-provisioning by
MCOs. Wholesale is thus reliant on the Networks business
to provide a network that meets its customers’ needs,
is efficiently run, well-maintained and available where
the demand exists. NGN is therefore critical to contain the
effects of self-provisioning and strengthen our position in
the wholesale market. Despite this risk, the full impact of
self-provisioning has not yet been seen.
In the year under review a number of additional
transformation initiatives were successfully completed. In
the fixed-line business uncapped ADSL prices were dropped
by up to 40% in the Consumer division. We raised the
entry-level ADSL speeds from 384 Kbps to 1 Mbps and from
1,024 Kbps to 2 Mbps.
Over the past six months, Telkom has transferred the
remaining 2,700 manual customers served by manual
boards around the country to a modern, automated
technology. The last manual service was decommissioned
in February 2013. The new service is provided by satellite
technology. Previously these customers could only have
basic voice functionality, whereas now they will also
have access to broadband.
In May 2012, Telkom launched the ultra-high capacity
West African Cable System (WACS), linking Southern Africa
and Europe. This is a significant addition to Telkom’s vast
international submarine cable portfolio.
Equipped with extensive undersea cable development and
maintenance experience as well as the availability of the
necessary facilities, Telkom was given the responsibility of
landing WACS in South Africa. Since the landing of the
cable in April 2011, a new Cable Landing Station has been
Landing Station is owned, operated and maintained by
Telkom. However, the costs of the facilities will be shared by
the WACS Consortium parties using the station.
Telkom is pleased to report smooth operations for the
duration of the 2013 African Cup of Nations (AFCON) from
19 January 2013 to 10 February 2013. The Group seamlessly
delivered a range of critical Information Technology and
Telecommunications (IT&T) services for the major sporting
event. Optimal technical services were crucial for the success
of AFCON and Telkom exceeded all expectations.
for the sporting event which facilitated voice, data and video
traffic. This ensured that the Local Organising Committee’s
(LOC) Sandton headquarters were connected in real-time
to the five stadiums: Johannesburg, Nelspruit, Durban,
Port Elizabeth and Rustenburg.

30 Telkom Integrated Report 2013
SUBSIDIARIES
TRUDONTrudon, Telkom’s publisher of local and commercial search
directories, and advertiser, experienced a change in
ownership in the financial year under review. This was as
a result of the TruManCo consortium taking over Truvo’s
minority shareholding.
The appointment of Olaf Brinkman, managing director of
Purple Cow and his firm’s development of the advertising
agency, 360 Eight, will aid Trudon’s communications
strategy. This also forms part of Trudon’s strategic objective
to become a multimedia organisation that successfully sells
across all platforms, offering comprehensive advertising
solutions to the SMME market.
Trudon’s digital platforms matured over the financial year,
which led to a 423% growth in mobile offerings and an
overall online revenue growth rate of 10%, whilst print
revenue remained relatively flat.
the financial year. The mobile application increased by
over 60,000 downloads, suggesting that users are finding
cumulative value in this offering.
The next phase of the Company’s mobile development
plan includes user-engagement by means of a geospatial
offering.
Trudon has made headway in the social media
communications arena this year. This area remains
important for the Company in providing products to the
SMME market and assists in increasing engagement with
customers, creating brand awareness and improving
membership on its Facebook fan page, by 28,000; the
social media site has a total reach of 10 million people.
Phone 7 and Windows 8 is unique in the SMME market,
and has been well received by customers.
Trudon partnered with the Facebook-approved company,
Zibaba, to launch the Facebook Product Suite. The suite of
to increase and generate revenue from online sales by
opening a new sales channel inside one of the most visited
websites on the internet. Advertisers that elect to take the
Facebook Product Suite have the added value of featuring
for Facebook fans to discover businesses, advertise products
and services, take advantage of networking opportunities
and gain direct access to new customers.
Trudon also partnered with Google during the year, as the
search engine’s SMME partner. This partnership helped
generate substantial revenue for the Company for the year.
To grow its product offering further, Trudon launched a
hosted and managed online platform for the Namibian
market. The MySite and Mobisite product was enhanced to
offer users their own domains, which led to an increased
uptake of the product.
Toodu was strategically rebranded to Connecto™ during the
year. The aim of this was to enable both small and large
businesses to engage its customers through an interactive
contact profile sent to their mobile phones. Connecto is
designed to improve customer loyalty and drive continuous
contact with customers.
The decision to expand print products by enlisting the
services of Paarl Media, which has state of the art printing
technology, has seen Trudon producing more high-end
directories lending the Company a competitive advantage.
Telkom’s subsidiary, Trudon (Proprietary) Limited –
Registration number 1992/002329/07 – passed a special
resolution on 8 November 2012, in terms of which it
adopted a new Memorandum of Incorporation.
SWIFTNETSwiftnet continues to offer valuable services in the wireless
data credit clearance and debit card market as well as
refresh programme towards mobile technology to offer
better service coverage and overall service experience
to our customers in the M2M, point-of-sale verification,
security and fleet management services; the business
remained vulnerable to increasing levels of competition
and technology changes in the market.
iiWayAfrica was formed as a result of integrating the
business operations of Africa Online and MWEB Africa.
market in Africa. Due to the advancement of available
technologies across the continent, iWayAfrica has faced
serious competition from cheaper offerings in terms of
fixed and mobile broadband.
We will review our investments in Africa and those we
consider non-core in South Africa. Our aim is to first get the
basics of our core business right in South Africa.GRI

31 Telkom Integrated Report 2013
Operating environment Risk and responsibilityCreating value Leadership and strategy People and environment Financial statements
Telkom new store opening: Centurion

32 Telkom Integrated Report 2013
Telkom received the following awards during the 2013 financial year. These accolades demonstrate our commitment and
the progress we have made in improving the perception of Telkom as a brand and developing our people.
Telkom flexes its muscles at MyBroadband
Conference Telkom has once again demonstrated its prowess in the
South African broadband industry. For the second year
running, Telkom was awarded the Best Fixed Broadband
Service Provider for our upgraded 10 Mbps service.
Telkom ranked among South Africa’s best employers In 2012 Telkom was ranked among South Africa’s top
10 employers in the annual BEST Employer™ campaign
of the Corporate Research Foundation (CRF) Institute
for the third year running. This year, Telkom was
ranked seventh overall in the medium, large and giant
organisations categories. Attributes for which Telkom
was commended include training and development, as
well as the development of succession pools.
Tier III design certification awarded to NBSC 2
data centre
awarded tier III design certification to the NBSC 2 data
centre of Cybernest, Telkom’s data centre operation.
The ranking lends recognition to the data centre’s
concurrently maintainable site infrastructure and its
99.98% availability.
Telkom voted as one of top three most desirable
brands to work for Telkom was voted one of the top three “Most desirable
brands to work for” in the 2012 Sunday Times Top
Brands survey. The Group also made the top 10 in two
other categories: brands that have done most for the
environment and community upliftment.
Virgin Active Sports Industry Award Telkom’s Rural Splash Programme won gold in the
community programme category. The programme
promotes water safety in rural areas in South Africa. It
is one of the ‘Learn to Swim’ initiatives of Swimming
South Africa, which Telkom has supported for many
years.
Public Sector Excellence Award Telkom received a gold award for community
engagement. The Group also received two silver
awards, one for leadership and the other for excellence
in the communications sector.
AWARDS AND ACHIEVEMENTS
GRI

33 Telkom Integrated Report 2013
Operating environment Risk and responsibilityCreating value Leadership and strategy People and environment Financial statements
RISK AND
RESPONSIBILITY

34 Telkom Integrated Report 2013
Identifying, measuring, managing and reporting on
material risks is key to ensuring a sustainable future for
Telkom. Furthermore, highlighting these issues is a critical
aspect of reporting in accordance with the guidelines of
the Global Reporting Initiatives (GRI), King III and the
International Integrated Reporting Council (IIRC). As such,
Telkom undertakes formal risk assessments that are tabled
at Exco for approval throughout the year.
Material risks are established in line with GRI principles
and tests of materiality and relevance. Doing so ensures
that the risks identified are sufficiently important
economic, environmental and social concerns, which could
substantively influence the assessments and decisions
of stakeholders. This process involved the analysis of the
following internal and external factors listed below:
Internal tests Significant risks to Telkom as defined by our Enterprise
Risk Management (ERM) process described on
pages 38 to 45;
Opportunities in Telkom’s core business and how they
can contribute to sustainable development;
Concerns and expectations of our internal and
external stakeholders as identified by our stakeholder
management processes;
Internal and external audit findings;
Strategic focus areas in the group strategy; and
Telkom’s vision, mission, values, policies and objectives.
External tests Review and benchmarking material industry-wide issues
reported by other companies in the telecoms sector;
Key legislation, principles and protocols, including
but not limited to B-BBEE, the UN Global Compact
principles, the Montreal Protocol and the National
Waste Management Act;
Advice from external experts regarding sustainable
development; and
Challenges and emerging issues for the telecoms sector.
Telkom categorises its material sustainability risks into key
focus areas. This provides a context for performance which
is reported back to the Group and its stakeholders. There
are nine sustainability focus areas in this year’s Integrated
Report:
1. B-BBEE
2. Human capital
3. Energy and environmental management
4. Occupational health and safety
(CSI))
6. Procurement and supply chain
7. Product responsibility
8. Ethical conduct and anti-corruption
9. Strategy
The material sustainability risks identified, together with
the related GRI and non-GRI performance indicators have
been summarised in the table on pages 107 to 111.
As part of enabling a sustainable future, closely monitoring
these key material risks needs to become a priority. In
order to do so, we will be monitoring performance in the
nine key areas by way of a scorecard, which will be presented
to the Executive and Social and Ethics Committees on a
quarterly basis.
OUR MATERIAL RISKS
GRI
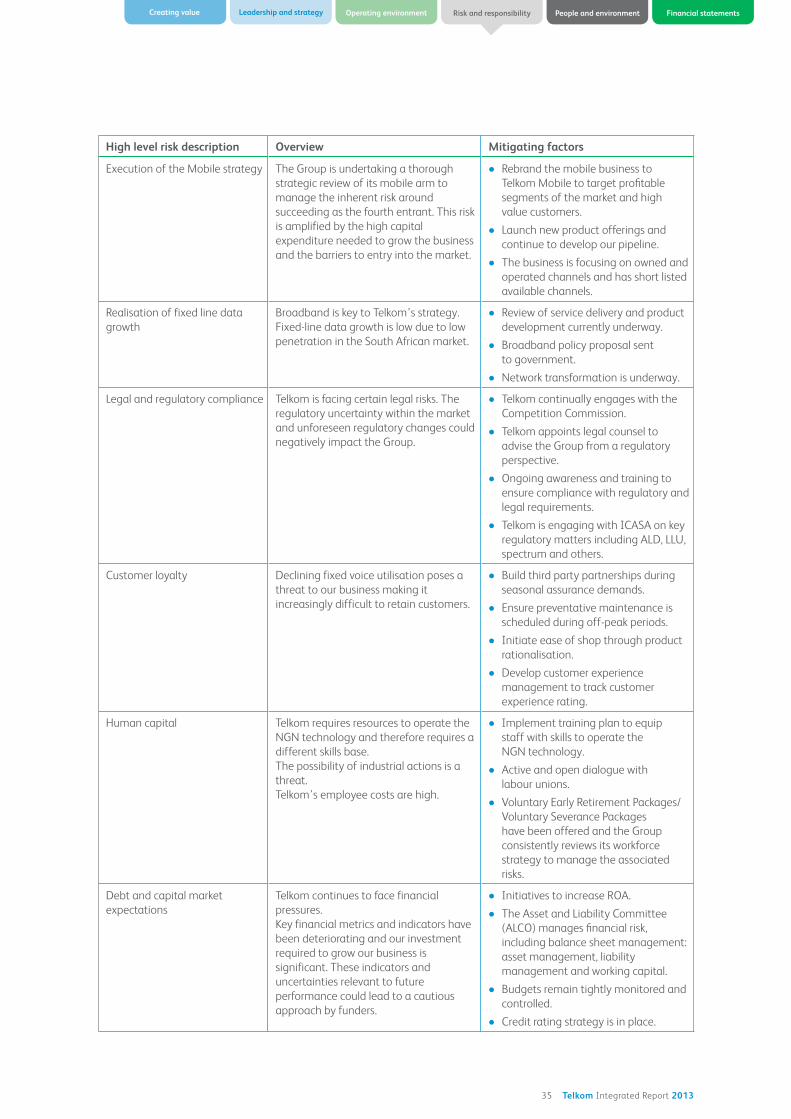
35 Telkom Integrated Report 2013
Operating environment Risk and responsibilityCreating value Leadership and strategy People and environment Financial statements
High level risk description Overview Mitigating factors
Execution of the Mobile strategy The Group is undertaking a thorough
strategic review of its mobile arm to
manage the inherent risk around
succeeding as the fourth entrant. This risk
is amplified by the high capital
expenditure needed to grow the business
and the barriers to entry into the market.
Rebrand the mobile business to
Telkom Mobile to target profitable
segments of the market and high
value customers.
Launch new product offerings and
continue to develop our pipeline.
The business is focusing on owned and
operated channels and has short listed
available channels.
Realisation of fixed line data
growth
Broadband is key to Telkom’s strategy.
Fixed-line data growth is low due to low
penetration in the South African market.
Review of service delivery and product
development currently underway.
Broadband policy proposal sent
to government.
Network transformation is underway.
Legal and regulatory compliance Telkom is facing certain legal risks. The
regulatory uncertainty within the market
and unforeseen regulatory changes could
negatively impact the Group.
Telkom continually engages with the
Competition Commission.
Telkom appoints legal counsel to
advise the Group from a regulatory
perspective.
Ongoing awareness and training to
ensure compliance with regulatory and
legal requirements.
Telkom is engaging with ICASA on key
regulatory matters including ALD, LLU,
spectrum and others.
Customer loyalty Declining fixed voice utilisation poses a
threat to our business making it
increasingly difficult to retain customers.
Build third party partnerships during
seasonal assurance demands.
Ensure preventative maintenance is
scheduled during off-peak periods.
Initiate ease of shop through product
rationalisation.
Develop customer experience
management to track customer
experience rating.
Human capital Telkom requires resources to operate the
NGN technology and therefore requires a
different skills base.
The possibility of industrial actions is a
threat.
Telkom’s employee costs are high.
Implement training plan to equip
staff with skills to operate the
NGN technology.
Active and open dialogue with
labour unions.
have been offered and the Group
consistently reviews its workforce
strategy to manage the associated
risks.
Debt and capital market
expectations
Telkom continues to face financial
pressures.
Key financial metrics and indicators have
been deteriorating and our investment
required to grow our business is
significant. These indicators and
uncertainties relevant to future
performance could lead to a cautious
approach by funders.
Initiatives to increase ROA.
The Asset and Liability Committee
(ALCO) manages financial risk,
including balance sheet management:
asset management, liability
management and working capital.
Budgets remain tightly monitored and
controlled.
Credit rating strategy is in place.

36 Telkom Integrated Report 2013
High level risk description Overview Mitigating factors
Impairment of assets Telkom has a substantial investment in
legacy assets that are carried at historical
cost in the Group’s books. The returns
from these assets will not be realised due
to rapidly changing technology,
competition and regulations.
Took an immediate impairment of
R12 billion during the financial year to
realign the value of the Group’s assets
with market sentiment.
The Group continues to invest large
sums in its new fixed and mobile
network technology to meet customer
needs in respect of data transmission
in particular.
Stakeholder relationship
management
A number of stakeholders are key to
Telkom’s business objectives. These
objectives need to be aligned in order to
achieve a balanced outcome.
A revised stakeholder engagement
plan and matrix has been mapped
out by the Group to manage key
stakeholder relationships.
Occupational health and safety Management of fatalities, lost time
chronic diseases. Absenteeism trends and
management of emerging issues.
Management and control of non-ionising.
Electromagnetic radiation exposure to
employees and third parties.
Occupational health and safety
performance targets for all business
units have been put in place, with
an ultimate goal of maintaining an
incident frequency rate below 4 per
100 and a lost-time injury rate of
below 2 per 100 employees.
Achieved a sick absenteeism rate
(SAR) of less than 2.5% through the
effective implementation of wellness
interventions.
Occupational health and safety
working group has been formed and
terms of reference were approved
to adopt sustainability practices to
monitor and manage associated risks.
Business continuity management
(BCM) readiness and
preparedness
BCM is critical to an organisation of
Telkom’s nature. Telkom management ensures that
business continuity plans are in place
and are implemented.
Competitiveness Market competitiveness continues to pose
a threat in an already-contested mobile
market space. Self-providing by other
operators is also an issue for the Group.
Telkom continues to differentiate its
sales offering by up selling customers
to higher value bundles.
The Group plans to offer greater value
through improvements in its network
through the network upgrade.
Continuously remove obsolete
products from product suite.
Improve product development
processes.
Use new system tools to streamline
processes and respond quicker to
opportunities.
Leadership continuity Leadership continuity is critical to the
success of the Group’s strategic direction. Implement an effective leadership
development programme.
Assessment process to identify
successors for critical senior positions is
being implemented.
Reputation A negative reputation could harm Telkom
and prove detrimental to the business. Telkom has put in place a reputational
tracking survey. The outcome of the
survey will be translated into action
plans.
OUR MATERIAL RISKS

37 Telkom Integrated Report 2013
Operating environment Risk and responsibilityCreating value Leadership and strategy People and environment Financial statements
High level risk description Overview Mitigating factors
Information security Telkom carries large amounts of customer
information over its network, which needs
to be protected against hacking and other
security hazards.
Enhancement of the information
security management system (ISMS).
An approved information security
policy and strategy are in place.
A dedicated Information Security
Council is in place.
IT and network technology This risk relates to the Group’s ability to
generate a return on investment on IT and
network investments.
Telkom has a dedicated steering
committee to monitor and manage
the required outcomes.
The Funding Council and Investment
and Transaction Committee track the
associated benefits of the investment
on an ongoing basis.
B-BBEE Transformation of the ICT sector, the
Telkom Group and the economy. Approval of the B-BBEE policy by Exco
and formation of working groups for
each element on the scorecard.
Allocation of resources towards
meaningful transformation.
Energy and environmental
management
Energy cost and business continuity.
Management of carbon footprint. Cost
and commitment of the implementation
of sustainability initiatives. Telkom’s
geographic foot print (bio-diversity).
Recycling of e-waste and hazardous waste.
An energy and environmental
management working group has
been established and meets on a
monthly basis.
Sustainability strategy in place,
embedding energy and environmental
management across the Group.
Procurement and supply chain Supply chain compliance to
environmental/social criteria.
Ensure business continuity.
Group Procurement Council was
established to oversee compliance and
ensure continuity.
Procurement working group was
formed with terms of reference to
adopt sustainability practices and
supplier development, and to monitor
and manage the associated risks.
Product responsibility Defending profitable revenue through
supply of safe and high quality goods.
Investigate environmentally and socially
responsible products. Legislative
compliance (Consumer Protection Act).
Stringent procurement processes
implemented when acquiring products
from manufacturers.
A National Consumer Commission
complaints register is maintained
which identifies non-compliances
with the Consumer Protection Act
and where there is an urgent need to
address any gaps in existing processes.
Ethical conduct and
anti-corruption
Minimise exposure with regard to fraud
and irregular conduct.
Management of Telkom’s reputation.
Compliance to legislation.
Fraud risk assessments are performed
per service organisation.
Training and awareness of the
business Code of Ethics together with
supplementary policies, such as the
prevention of fraud and corruption
policy, takes place as part of the
ethics programme.
A Telkom crime hotline is in place.
A whistle-blowing policy is in place.
An ethics mailbox is in place to provide
staff with advice on ethical dilemmas.
Implementation of enterprise-wide
compliance programme.
38 Telkom Integrated Report 2013
Our philosophyEffective risk management is critical in managing Telkom’s
risk profile. The realisation of our strategy depends on our
ability to take calculated risks that do not jeopardise the
direct interests of our shareholders, employees, customers,
regulators, broader society and other stakeholders.
Sound risk management helps us anticipate and respond
to changes in our environment and to make informed
decisions under conditions of uncertainty.
At Telkom, we are committed to optimising risk
management in order to achieve our vision and objectives,
and protect our core values. Doing this requires a strategic
and functional approach to risk management. Telkom’s
NGNEC project and the recent investment in Telkom Mobile
were the most significant risks to the Group from a strategy
perspective. The main focus of ERM for 2013 has thus
been to de-risk these strategies as far as possible to provide
sustainable value to the Group.
Telkom has adopted a group-wide approach to risk
management where each risk is managed in an integrated,
structured and systematic process within a unitary framework
aligned with Telkom’s corporate governance responsibilities.
The Board is committed to a process that complies
with the principles of the King III Report on Corporate
Governance 2010 and the COSO Integrated Enterprise Risk
Management Framework of 2004. All divisions, supporting
functions, processes, projects and other controlled entities
are subject to the Enterprise Risk Management Policy.
Telkom’s board of directors holds ultimate responsibility for
the Group’s risk management process and the evaluation
of its effectiveness. Executive management is accountable
for identifying major risks, designing, implementing and
monitoring the risk identification process, and integrating
it into the Group’s day-to-day activities.
It is important that risk management processes become
embedded in the Group’s systems and processes to
ensure current and dynamic responses to risk. All key risks
associated with major changes and significant actions by
Telkom fall within the processes of risk management.
The enterprise risk management divisionThe ERM division set out to achieve the following key
objectives:
Oversight: All critical risks are identified group-wide and
are managed and monitored under a holistic approach
consistent with the Risk Committee approved risk appetite
statement.
Ownership and responsibility: The ownership of risk is
assigned to management individuals who are responsible
for identifying, evaluating, mitigating and reporting risk
exposures.
Assurance: The Board, Exco, Risk Committee, Telkom
Executive Risk Management Council and management
have reasonable assurance that the risk is being
appropriately managed within defined levels to bring value
to the organisation.
To achieve these high-level objectives the Group employs
the following tactics:
De-risking all business plans based on risk appetite and
risk bearing capacity (RBC), through regular assessment
and monitoring with management;
Ensuring timely identification of all risks;
Completing timely, accurate and relevant risk reporting
and monitoring of key risk indicators (KRIs);
Quantifying loss events (Business Continuity
Management (BCM) and insurance);
Assessing unpredictable risks with management and
the Group’s exposure to these risks;
Proactively identifying and addressing bottlenecks in
performance with management; and
Tracking action plans on a monthly basis for
effective mitigation.
In order to optimise the risk management process, Telkom
applies all resources used in its risk management process in
an economic manner. This is to ensure:
The highest standards of service delivery;
A management system that aims to minimise risk and
costs in the interest of all stakeholders;
Education and training of all our staff to ensure
continuous improvement in knowledge, skills and
capabilities to maintain conformance with stakeholders
expectations; and
An environment that promotes the right attitude
and sensitivity towards internal and external
stakeholder satisfaction.
Risk management processThe ERM process is driven by a series of activities and events
designed to integrate ERM within business processes across
the enterprise and ensure that there is standardisation
across all these occurrences.
ERM is not strictly a serial process, where one component
affects only the next. It is a multi-directional, iterative process
in which almost any component can and does influence
another. It is also important to ensure that the ERM process
and risks are re-evaluated and updated on an ongoing
basis to reflect new information and experiences so that all
significant risks are appropriately identified and addressed
and that any material opportunities are not overlooked.
The following cyclical flow depicts the critical enterprise
functional risk management responsibilities undertaken on
an ongoing basis:
ENTERPRISE RISK MANAGEMENT

39 Telkom Integrated Report 2013
Operating environment Risk and responsibilityCreating value Leadership and strategy People and environment Financial statements
Enterprise Risk Management Process
Risk Appetite
Risk Response
ReportingRisk
Identification
MonitoringObjective
Identification
Control Activities
Risk Assessment
MaturityThe rising prominence of governance and risk management is a response to the increasing complexity of large and global
organisations, corporate scandals and the collapse of the banking sector. The table below contextualises GRECS (Governance,
risk, ethics, compliance and sustainability) convergence:
Current state To prevent business failure and non-compliance, companies have expanded their
governance, risk, ethics, compliance and sustainability departments, often resulting
in a web of unco-ordinated structures, policies, committees and reports.
To improve this, internal auditors, risk officers and compliance officers have begun
to work closely to find commonalities among disparate GRECS projects. Some
organisations have formed GRECS committees. Such efforts have increasingly come
under the banner of GRECS convergence.
GRECS convergence is a way to rationalise risk management and controls, providing
management with the information needed to improve business performance and
achieve compliance.
Internal and external influences Business complexity, a desire to reduce organisational risk exposure and improve
corporate performance is fuelling GRECS convergence.
Recent economic events have rekindled interest in corporate governance and
operational risk management among regulators, ratings agencies, politicians, media
and the public.
Executive management and regulators are the main driving forces behind GRECS
convergence across publicly listed companies and State-owned organisations.
Costs and benefits Key benefits of GRECS convergence include the ability to identify and manage risks
more quickly, improve corporate performance and help reduce the costs of duplication.
Rationalising GRECS through integration could go a long way to reduce the ultimate
GRECS cost.
Any move towards GRECS convergence is likely to be a lengthy process that requires
an accompanying shift in corporate culture.
40 Telkom Integrated Report 2013
Telkom’s current state risk maturityA crucial element of a successful and effective ERM
programme is assessing and enhancing the maturity
of the programme across the Group. In this context, as
emphasised in King III, risk is positioned as a cornerstone
of corporate governance and risk governance.
Telkom’s risk appetite has been developed and calculated
and is still to be fully implemented into the business. Because
Telkom’s risk appetite has not been fully operationalised
there might be a misalignment between strategic direction
and risk taking.
During the current year we enhanced our risk methodology
to integrate BCM, insurance and risk finance, compliance
and fraud management into a single risk and reporting
framework.
Key achievements and initiatives in 2013The two most significant strategic initiatives undertaken
from a risk perspective during 2013 were Telkom’s NGNEC
project and the ongoing investment in Telkom Mobile.
NGNECThe NGNEC project was undertaken to modernise Telkom’s
network in order to defend and grow our position in a highly
competitive market. It is therefore critical that this highly
intensive capital investment yields a sustainable outcome
and creates opportunities for the Group. This required ERM
to be implemented throughout the life cycle of the project,
which allowed us to achieve the following:
Strong presence on all steering committees;
Identification, assessment and monitoring of all risks;
Integration of NGNEC risks into business unit’s
risk registers;
Reporting on the risks to all interested parties; and
Actively identifying opportunities.
Telkom mobileTelkom Mobile was established to offset the decline in fixed-
line voice revenues. Given the significant amount of capital
invested in this business, it is imperative that ERM has a
strong presence in the Mobile division. The ERM function
has helped facilitate the following:
Creating a strong presence on all committees
and projects;
De-risking growth in pre-paid, post-paid and data;
Assisting with the identification, assessment and
monitoring of all risks;
Reporting on the risks to all interested parties; and
Focusing on identifying and seizing opportunities.
During the financial year under review we continued
to make progress towards an enhanced ERM programme.
Notable achievements for 2013 include:
Completion of the GRECS convergence project in
November 2012, which has since been operationalised
as business as usual;
Successful integration of business continuity
management (BCM) with the ERM methodology, with
88% of all business continuity plans completed;
Development of a risk appetite framework and
associated monitoring in order to increase the
effectiveness and maturity of risk management;
Development of an enhanced report on risk indicators;
Effectively increased the maturity of ERM;
The formation of a new dedicated Risk Committee,
where previously ERM was dealt with by the Audit and
Risk Committee;
The Risk Committee developed a new Risk Charter,
which monitors BCM, capital expenditure, IT
governance and fraud;
An Asset and Liability Committee (ALCO) was formed
during the year due to manage, monitor and address
the Group’s financial risks. ALCO manages all financial
risk which includes interest rate risk, liquidity risk,
funding, foreign currency exposure risk, treasury credit
risk, credit ratings, and asset and liability management;
An IT Governance Council was established to ensure
the effective and efficient use of IT in enabling Telkom
to achieve its goals, and maintain compliance with
King III Code. It includes a process to ensure effective
evaluation, selection, prioritisation, and funding of
competing IT investments for business benefits; and
Feedback from the 2013 ERM survey, which aimed to
assess the effectiveness of Telkom’s ERM programme
revealed that 77.31% of respondents felt they were
increasingly realising the value that ERM adds to Telkom
as an organisation. This was based on a sample of
119 surveys of which 92 responded compared to only
54 respondents in 2012.
Risk appetite and risk bearing capacityRisk appetite is a measure of the amount of risk the Group is
willing to take in the pursuit of value. Risk bearing capacity
is the maximum amount of risk that Telkom can bear before
it is damaged beyond repair or will at least not be able to
continue the business in a similar fashion as before.
In order to integrate a risk dimension into a business, the
business needs to know how much risk it is willing to take
on and how it wants to balance risks and opportunities.
Defining risk appetite is thus an essential element of an
organisation’s ERM as it establishes a direct link between
its strategic and functional objectives.
A risk appetite framework is therefore a key business
performance tool and is central to strategic planning,
delegation of authorities and establishment of aligned
roles and responsibilities within the Group. Implementation
of processes within the Group requires substantial effort
and resources.
ENTERPRISE RISK MANAGEMENT

41 Telkom Integrated Report 2013
Operating environment Risk and responsibilityCreating value Leadership and strategy People and environment Financial statements
A risk appetite framework is used to evaluate and monitor
Telkom’s risk appetite. This involves:
Development of a risk appetite statement on an
annual basis;
Determination of performance metrics and risk
tolerance limits based on the risk appetite statement;
Embedding the risk appetite framework in risk based
decision-making to monitor performance of the Group
using the metrics and tolerance limits identified;
Reporting of these results to the various governance
structures; and
Revision of risk appetite statements if necessary.
Commitments One of the key objectives for the 2014 financial year is
to continue growing the effectiveness of ERM across the
Group. While significant progress has been made over the
past 12 months, the focus areas for the year ahead include:
Continue to ensure NGNEC and Telkom Mobile result in
sustainable outcomes and opportunities;
Ensure that convergence results in sustainable
outcomes and opportunities;
Facilitate enhanced risk communication, awareness
and training;
Implement risk appetite, RBC and risk tolerance levels
within the Group; and
Reflect a more holistic risk profile in co-operation with
other risk disciplines.
Governance structureThe implementation of an ERM structure that supports the achievement of the enterprise management objectives is essential.
The following diagram depicts the Group ERM structure:
Management
ERM division
Telkom ExecutiveRisk Management Committee
Executive Committee
Risk Committee
Board ofdirectors
Telkom
Business
risks
Corporate
Centre
risks
Consumer
risks
Wholesale
and Network
risks
Telkom
Mobile risks
Telkom
International
risks
Data
Centre
operations
risks
Telkom internal audit

42 Telkom Integrated Report 2013
The board of directors drives total enterprise risk
management through the approval of the ERM policy and
framework.
The Risk Committee convenes on a quarterly basis and
assists the Board in fulfilling its corporate governance
responsibilities by monitoring and reviewing the
identification and management of strategic and functional
risks associated with the Group’s business.
The Executive Committee convenes on a monthly basis
to discuss the strategic risks associated with the Group’s
business, monitors the effectiveness of the risk response
strategies implemented and considers the impact of the
risk profile on future strategic decisions.
The Telkom Executive Risk Management Council convenes on a quarterly basis to examine the risk profile
of the Group, monitors the implementation of actions and
KRIs and gives effect to the risk response strategies.
Enterprise risk management is driven from a centralised
group enterprise risk management division within
the Corporate Centre under the auspices of corporate
governance. The role of this division is to implement,
facilitate and monitor the ERM process, with management,
across all business units of the Group.
Management is the ultimate owner of the risk and
responsible for managing the risk exposure within the
defined risk appetite as approved by the board of directors.
In order to ensure effective reporting and management
of risks, risk has been incorporated into the operating
committees of the various business units. This provides
management of the respective businesses with the
responsibility and accountability to effectively manage
the risk within their domains. This requires a risk profile
submission from the relevant managing directors or chiefs
to the ERM division.
Monitoring and reportingMonitoring of the ERM process and plan is an ongoing
initiative where the relevant committees convene on a
regular basis and interact with management as part of the
combined assurance process.
Furthermore, Telkom’s risk exposure is continually monitored
through the identification and analysis of appropriate
KRIs. KRIs act as early warning signals by highlighting any
changes to the Group’s risk profile. KRIs, controls and action
plans are fundamental components of a comprehensive
and sound risk management practice, which help reduce
losses and prevent risk exposure by proactively dealing with
a risk threat before an event actually occurs.
Reporting of risk information takes place on an ongoing
basis as depicted in the diagram below:
ENTERPRISE RISK MANAGEMENT
Board of directors
Quarterly Risk Reports
RiskCommittee Quarterly Risk Reports
ExecutiveCommittee Monthly Risk Reports
Telkom Executive Risk
Council Quarterly Risk Reports
ManagementMonthly Risk Reports

43 Telkom Integrated Report 2013
Operating environment Risk and responsibilityCreating value Leadership and strategy People and environment Financial statements
ETHICAL CONDUCT AND ANTI-
CORRUPTION Telkom recognises that organisations which conduct
business in an ethical manner, have a far greater potential
for continued success and a sustainable future, than those
that are not. We also recognise that ethical, non-corrupt
employees are vital to Telkom’s success.
The profound negative consequences of unethical conduct
and corrupt behaviour adversely affect companies in a
number of ways (financial losses, fines, penalties and
reputational damage), and it is therefore vital to proactively
manage ethical performance. As such, we are committed to
raising and maintaining our ethics levels across all aspects
of our business.
Progress towards achieving the required level of ethical
behaviour is attained through ongoing employee awareness
and education efforts, and a “zero tolerance” approach to
ethical misconduct. In order to prevent unethical conduct
and corrupt behaviour, and the associated negative
consequences, Telkom has put the following in place to
educate, create awareness, provide advice, and provide
opportunities in reporting unethical behaviour:
Fraud risk assessments are performed per service
organisation and cover all types of fraud risks and
violations of the business Code of Ethics. Line
management will assist with the implementation of
relevant controls to mitigate the risks;
Business Code of Ethics and the supplementary
policies such as the Prevention of Fraud and Corruption
Policy, took place as part of the ethics programme.
Through this programme, a total of 5,230 employees
completed online training, and 467 employees received
training through the induction sessions. The continued
implementation of our programme of measures to raise
awareness, understanding and management of fraud
and corruption during the 2013 financial year should
have a positive impact in reducing the likelihood of this
risk;
Extensive awareness and training sessions are run
throughout the year to communicate critical and
general areas of fraud concerns, the business Code of
Ethics, and the Telkom Crime Hotline. Furthermore, the
whistle-blowing policy has been reviewed and updated
to conform to relevant sections of the Companies Act
of 2008. Awareness of the whistle-blowing hotline has
been improved through a marketing campaign; and
This is also supported through our independent whistle-
blowing hotline, for reporting of matters relating to
unethical behaviour, fraud and corruption. The hotline
received 1,865 calls during the reporting period,
compared to 2,232 calls in the previous period. Our
anti-corruption mailboxes received 988 messages in
the reporting period and 1,119 in the previous period.
The reasons for the decrease in incident reporting
will be investigated in 2014.
Our Ethics Mailbox provides staff with advice on ethical
dilemmas. This mailbox received 90 matters in the 2013
year (only three of which are still to be finalised), compared
to 56 in the previous reporting period. The table on the
following page describes the types of matters that were
dealt with in 2013:

In line with the King III Report’s recommendations for the
management of ethics, Telkom conducted an Ethical Risk
Assessment during the reporting period. The assessment
looked at respondents’ perceptions of the following
key areas: Clarity; Positive role-modelling; Feasibility;
Supportability/Commitment; Transparency; Discussability;
Approachability; and Sanctionability/Enforcement.
The average score for Telkom, across all the dimensions
was 67%. This is an indication that there is room to
improve Telkom’s climate for ethical conduct. The
strongest dimensions were Clarity and Supportability/
Commitment. This means that employees are familiar with
and understand Telkom’s standards of conduct and are
generally motivated to act in ethically responsible ways.
They receive information and guidance with regard to the
ethical expectations at Telkom. They also feel that Telkom’s
values reflect their own, and that they will find support for
ethical behaviour among their peers.
The weakest dimensions were Sanctionability/Enforcement
and Transparency. This indicates that employees are less
convinced that management is aware of what happens
in the organisation. They believe that the existing controls
may not be adequate for detecting violations, and that it
is possible to conceal misconduct within the organisation.
Staff are also not convinced that transgressions will
be consistently sanctioned, or that ethical behaviour
is recognised. Feasibility highlighted concerns around
unrealistic targets being set by senior executives which
compromise ethics. This pressure to achieve business
targets is an important motivator of unethical conduct
in a business environment. Approachability can also be
described as accountability, and refers to the degree to
which employees feel comfortable in reporting misconduct.
Employees felt most comfortable in reporting misconduct
to their direct line manager or the Telkom Crime hotline.
ETHICAL CONDUCT AND ANTI-CORRUPTION
44 Telkom Integrated Report 2013
Type of ethics matters reported 2013 2012
Conflict of interest/Private work 13 7
Unfair treatment 7 10
Gifts 9 5
Share dealing 7 3
Unethical behaviour of management 4 5
Telkom Retirement Fund 1 5
Other, i.e. sponsorships, dress code 36 21
Ethics training 8 0
Compliance 5 0
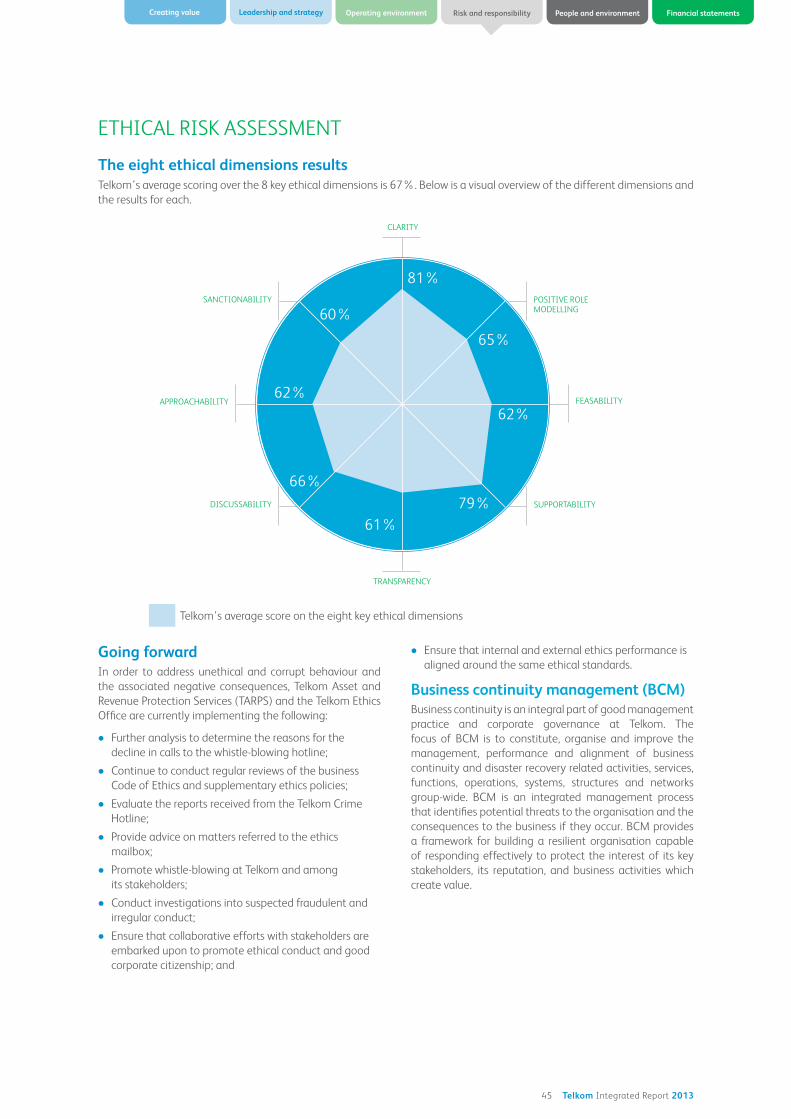
45 Telkom Integrated Report 2013
Operating environment Risk and responsibilityCreating value Leadership and strategy People and environment Financial statements
ETHICAL RISK ASSESSMENT
Going forwardIn order to address unethical and corrupt behaviour and
the associated negative consequences, Telkom Asset and
Revenue Protection Services (TARPS) and the Telkom Ethics
Office are currently implementing the following:
Further analysis to determine the reasons for the
decline in calls to the whistle-blowing hotline;
Continue to conduct regular reviews of the business
Code of Ethics and supplementary ethics policies;
Evaluate the reports received from the Telkom Crime
Hotline;
Provide advice on matters referred to the ethics
mailbox;
Promote whistle-blowing at Telkom and among
its stakeholders;
Conduct investigations into suspected fraudulent and
irregular conduct;
Ensure that collaborative efforts with stakeholders are
embarked upon to promote ethical conduct and good
corporate citizenship; and
Ensure that internal and external ethics performance is
aligned around the same ethical standards.
Business continuity management (BCM)Business continuity is an integral part of good management
practice and corporate governance at Telkom. The
focus of BCM is to constitute, organise and improve the
management, performance and alignment of business
continuity and disaster recovery related activities, services,
functions, operations, systems, structures and networks
group-wide. BCM is an integrated management process
that identifies potential threats to the organisation and the
consequences to the business if they occur. BCM provides
a framework for building a resilient organisation capable
of responding effectively to protect the interest of its key
stakeholders, its reputation, and business activities which
create value.
60%
65%
62%
62%
66%
61%
79%
81%
MODELLING
Telkom’s average score on the eight key ethical dimensions
The eight ethical dimensions resultsTelkom’s average scoring over the 8 key ethical dimensions is 67%. Below is a visual overview of the different dimensions and
the results for each.

46 Telkom Integrated Report 2013
The following statement sets out the corporate governance
framework adopted by the board of Telkom and highlights
the work undertaken by the Board and its committees over
the past financial year.
Approach to governanceCorporate governance is at the core of the Board’s approach
to ensuring a sustainable future for the Company and its
stakeholders, the protection of shareholders’ funds and the
creation and enhancement of shareholder value. Telkom is
committed to ensuring that its policies and practices in the
critical areas of financial reporting, sustainability reporting,
remuneration reporting and general corporate governance
meet high levels of disclosure and compliance.
Compliance with governance standardsThe board of Telkom is fully committed to the values and
principles of good governance espoused in the King Code
on Corporate Governance for South Africa 2009 (“King III”).
As a Company listed on the JSE, Telkom is required generally
either to apply the principles espoused in King III or explain
any non-adherence to such principles.
The Company has reviewed its current corporate
governance policies and practices against the JSE’s
requirements and considers that it substantially met the
principles and recommendations outlined in King III for the
financial period ended 31 March 2013. Instances where the
Company has not applied the principles as outlined in King
III have been identified and explained on pages 57 and 58
of this report.
THE BOARDComposition and membershipTelkom has a unitary board structure comprising fourteen
directors, made up of two executive directors, ten
independent non-executive directors and two non-executive
directors. The Board has adopted a policy of ensuring that
its composition reflects an appropriate mix of skills to
provide the necessary breadth and depth of knowledge
and experience to meet its responsibilities and objectives.
The procedure for the selection and appointment of new
directors and or the re-election of incumbent directors, and
the Board’s policy for the nomination and appointment
of directors, is set out in the Company’s Memorandum
of Incorporation, read together with the Nominations
Committee Charter.
The Nominations Committee, when assisting the Board
in reviewing potential candidates for board appointment
and assessing retiring directors standing for re-election,
considers a number of factors including:
Skills, experience, expertise and personal qualities
and attributes that will best complement the skill set
and characteristics of existing directors and enhance
board effectiveness;
The diversity of the Board;
The capability of the candidate to devote the necessary
time and commitment to the role;
Potential conflicts of interest; and
Independence.
Skills and attributesThe Board recognises that having a range of different
skills, backgrounds and experience represented among its
directors is important to ensuring robust decision-making
processes. The diversity of viewpoints enhances the effective
governance of the Group. The range of skills, backgrounds
and experience currently represented on the Board includes
experience in senior roles in retail, property, banking
and finance, transport, ICT, oil and gas, construction,
management consultancy and telecommunications, as well
as qualifications across a range of fields including business
management, economics, accounting, engineering,
actuarial science, law and the humanities.
Details of the composition of and movements on the
Telkom board of directors during the year under review are
as follows:
GOVERNANCE
GRI

47 Telkom Integrated Report 2013
Operating environment Risk and responsibilityCreating value Leadership and strategy People and environment Financial statements
Director Date of appointment Date of change Nature of change
PL Zim 16 February 2011 24 October 2012 Resignation
Dr SP Sibisi 20 February 2012 24 October 2012 Not elected at AGM
RJ Huntley 20 September 2007 24 October 2012 Resignation
NP Mnxasana 20 February 2012 24 October 2012 Not elected at AGM
PSC Luthuli 29 July 2005 24 October 2012 Retirement by rotation
JN Hope 01 November 2009 24 October 2012 Resignation
20 April 2010 24 October 2012 Retirement by rotation
NP Dongwana 20 February 2012 2 November 2012 Resignation
NT Moholi 01 April 2011 31 March 2013 Resignation
JA Mabuza (Chairman) 14 November 2012
K Mzondeki 14 November 2012
L Maasdorp 16 November 2012
S Botha 10 December 2012
Dr CA Fynn 10 December 2012
K Kweyama 10 December 2012
F Petersen 10 December 2012
LL von Zeuner 10 December 2012
B Du Plessis 02 December 2004
I Kgaboesele 01 July 2011
J Molobela 01 November 2009
N Kapila 16 February 2011
JH Schindehütte 01 August 2011
The Board was led by Mr PL Zim until 24 October 2012
when he resigned. Mr PSC Luthuli was appointed as lead
independent director, a role he played until 24 October
2012 when he retired. Mr JA Mabuza was appointed as
independent non-executive chairman on 14 November
2012. The chairman of the board is appointed on an
annual basis in accordance with the memorandum of
incorporation (MOI) read together with the Nominations
Committee’s terms of reference. In line with best practice,
the roles of the chairman and GCEO are separated. All non-
executive directors are subject to retirement by rotation
and re-election by shareholders in accordance with the
MOI, King III and JSE Listings Requirements.
Details concerning the directors’ qualifications and
experience are included on pages 60 and 61 of this report
and the directors’ records of attendance at board and
committee meetings are included in the respective board
and committee reports.
The role of the boardThe Board’s principal objective is to direct the Group
towards the achievement of its vision while ensuring that
Telkom’s overall activities are properly managed. The
Board is ultimately accountable for the Group’s strategy,
operating performance and financial results. The Board
has adopted a Board Charter which sets out how its role,
powers and responsibilities are exercised, having regard to
principles of good corporate governance, international best
practice and applicable laws.
Responsibilities and objectivesSubject to any limitations imposed by the Companies Act,
JSE Listings Requirements and the MOI, the management
of the business of the Company is vested in the directors.
The roles, powers and responsibilities of the Board are
formalised in the Board Charter, which defines the matters
that are mandated to the Board and its committees. As
set out in the Board Charter, the Board is responsible for,
amongst others:
Scanning the environment to understand and
anticipate economic, industry and competitive threats
likely to affect the Company;
Reviewing and evaluating present and future strengths
and weaknesses of the Company;
Approving and reviewing the Company’s competitive
strategy and adopting business plans and budgets for
the achievement thereof;
Retaining full and effective control of the Company,
monitoring and directing management’s
implementation of Board approved strategies,
structures plans and budgets;
Establishing and monitoring a relevant set of financial
and non-financial measures of indicators to predict,
measure and control the performance of the Company,
its business risk and the ability of the Company to
implement its strategy and achieve its objectives;
Ensuring that appropriate systems are in place to
identify, monitor and manage business risks and to
ensure regulatory and legal compliance and that there
is an effective risk-based internal audit;
Ensuring that a relevant system of policies and
procedures is operative to ensure control and the
devolution of authority and responsibility;
Approving the annual budget;
48 Telkom Integrated Report 2013
Approving specific financial and non-
financial objectives;
Reviewing investment capital and funding proposals;
Defining levels of materiality and authority for
commitments made on behalf of the Company;
Considering the adoption of any significant changes in
accounting policies and practices; the extent of debt
permitted by the Group: AGM agendas; changes to the
MOI and compliance with JSE Listings Requirements
and other relevant regulations;
Reviewing the Company’s audit requirements;
Acting in the interests of the Company’s stakeholders;
Ensuring ethical behaviour and compliance with laws
and regulations and the Company’s own governing
documents, codes of conduct and ethical standards;
Acting as the focal point for, and custodian of,
Corporate Governance by managing its relationship
with management, the shareholders and other
stakeholders of the Company along with sound
Corporate Governance principles;
Ensuring comprehensive reporting to shareholders;
Approving the preliminary financial statements,
annual report and other reports and announcements
to shareholders;
Considering the declaration of dividends;
Reviewing the Board’s composition, structure
and succession;
Reviewing succession planning and endorsing
senior executive appointments and high-level
remuneration issues;
Establishing the measures for, and reviewing the
GCEO’s performance. The chairman of the board shall
conduct the performance assessment of the GCEO;
Reviewing non-executive directors’ remuneration;
Ensuring that information technology (IT) governance
is in place;
Ensuring that the Company is, and is seen to be a
responsible corporate citizen by having regard to
not only the financial aspects of the business of the
Company but also the impact that business operations
have on the environment and the society within which
it operates;
Establishment by the Board of an annual work plan
for each year to ensure that all relevant matters are
covered by the agendas of the meetings planned for
the year. The annual plan must ensure proper coverage
of the matters tabled in the Board charter. The number,
timing and length of meetings, and the agendas are to
be determined in accordance with the annual plan; and
Ensuring that business rescue proceedings commence
as soon as the Company is financially distressed.
Board meetingsBoard meetings are held at least five times a year, one
of which is devoted to strategic review. In addition to
these meetings and whenever circumstances dictate the
necessity, special board meetings are convened. During
the year under review, five scheduled board meetings
were held and seven additional special board meetings
were convened. Details of attendance by each director of
the Board have been set out in the table below. Certain
senior management members attend board meetings
when invited to make presentations on particular issues of
interest to the Board. For a board meeting to constitute a
quorum, a majority of directors are required to attend.
The following table presents the attendance of meetings
held during the period ended 31 March 2013 by directors:
GOVERNANCE

49 Telkom Integrated Report 2013
Operating environment Risk and responsibilityCreating value Leadership and strategy People and environment Financial statements
Director
Scheduled board meetings Special board meetings07 Jun
2012
04 Jul
2012
16 Nov
2012
18 Feb
2013
27 Mar
2013
07 May
2012
28 Aug
2012
14 Sep
2012
29 Oct
2012
03 Nov
2012
10 Dec
2012
13 Dec
2012
JA Mabuza – – � � � – – – – – � �
J Molobela � � � � � � � � � � � *
B Du Plessis � � � � � � � � � � * *
N Kapila � � * � � * * � � * * *
F Petersen – – – � � – – – – – – –
Dr CA Fynn – – – � � – – – – – – –
LL von Zeuner – – – � � – – – – – – –
K Kweyama – – – � � – – – – – – –
I Kgaboesele � � � � � � � � � � � *
S Botha – – – � � – – – – – – –
L Maasdorp – – � � � – – – – – � �
K Mzondeki – – * � � – – – – – � �
JH Schindehütte � � � � � � � � � * * �
NT Moholi � � � � � � � � � � � �
NP Dongwana � � – – – � � � � – – –
SP Sibisi � � – – – � � � – – – –
NP Mnxasana � � – – – � � � – – – –
RJ Huntley � � – – – � � � – – – –
PSC Luthuli � � – – – * � � – – – –
� � – – – � * � – – – –
PL Zim � � – – – � � � – – – –
JN Hope � � – – – � � � – – – –
��Attended in person
* Teleconference
�� Apologies
– Was not a member at this time
(1) Members were not invited as this was a follow up of the meeting held before their appointment date.
Delegation of authorityThe ultimate responsibility for the Group’s operations rests
with the Board. The Board retains effective control through a
well-developed governance structure of board committees,
each specialising in certain areas of the business. Certain
authorities have been delegated to the GCEO to manage
the day-to-day business affairs of the Group. The executive
committee assists the GCEO in discharging his duties and
those of the Board when it is not in session. However, in
terms of statute and the Company’s constitution, read
together with the Delegation of Authority, certain matters
are still reserved for board and/or shareholder approval.
CommitteesWhile at all times the Board retains full responsibility for
guiding and monitoring the Company, in discharging
its responsibilities, it makes use of board committees to
perform certain of its functions and to provide it with
recommendations and advice. The Board has established
the following committees for this purpose:
Audit Committee
Risk Committee
Nominations Committee
Investment and Transactions Committee
Remuneration Committee
Social and Ethics Committee
Audit Committee (formerly part of the Audit and Risk Committee)The Audit Committee is chaired by Mr I Kgaboesele, an
independent non-executive director who is a chartered
accountant by profession. The Committee held four
scheduled meetings and two special meetings during the
financial year.
The Committee’s mandate is defined in its terms of
reference and includes:
Monitoring the integrity of the financial statements of
the Company;
Reviewing the Company’s internal financial
control system;
Monitoring and reviewing the effectiveness and
performance of the Company’s internal audit function;
Making recommendations to the Board in relation to
the appointment of the external auditor and approving
the remuneration and terms of engagement of the
external auditor following their appointment by the
shareholders at a general meeting;
Monitoring the effectiveness of the external auditor’s
performance and their independence and objectivity; GRI
(1)
(1)
(1)
(1)

50 Telkom Integrated Report 2013
Scheduled Audit meetings
Special Audit
meetings
Director04 Jun
2012
06 Sep
2012
13 Nov
2012
18 Mar
2013
25 Apr
2012
15 Feb
2013
I Kgaboesele � � � � � *
B Du Plessis � � � � � *
K Mzondeki – – – � – *
F Petersen – – – � – –
LL von Zeuner – – – � – –
PSC Luthuli � � – – � –
NP Mnxasana � � – – � –
NP Dongwana � � – – � –
��Attended in person
* Teleconference
�� Apologies
– Was not a member at this time
Developing and implementing policy on the
engagement of the external auditor to supply non-
audit services;
Ensuring the safeguarding of assets;
Monitoring compliance with applicable laws,
regulations and standards;
Monitoring the adequacy of corrective action taken in
terms of the recommendations and observations of
internal and external auditors; and
Reviewing financial information and the preparation
of accurate financial reporting and statements in
compliance with all applicable legal requirements and
accounting standards.
As at 31 March 2013, the committee comprised the
following five independent non-executive directors.
I Kgaboesele (chairman)
B du Plessis
K Mzondeki
F Petersen
LL von Zeuner
GOVERNANCE
The Audit Committee evaluates the chief financial
officer’s function as well as conducts a self-evaluation
exercise into its effectiveness, on an annual basis. After
conducting the evaluation of the chief financial officer,
Mr Jacques Schindehütte, the committee confirmed that it
was satisfied with the appropriateness of the expertise and
experience of the chief financial officer.
The internal and external auditors have unlimited access to
the chairman of the Audit Committee.
Inc. is independent in accordance with Section 94(8) of
the Companies Act 71 of 2008, and has recommended
auditors for the Company for the 2014 financial year.
Audit Committee pre-approval policyIn accordance with the Audit Committee pre-approval policy,
all audit and non-audit services performed for the Company
by the independent auditors were pre-approved by the
Telkom Board’s Audit Committee, which concluded that
the provision of such services by the independent auditors
was not incompatible with the maintenance of that firm’s
independence in the conduct of its auditing functions.
The annual audit services engagement terms and fees are
subject to the specific pre-approval of the audit committee.
The Audit Committee may grant general pre-approval for
other audit services that only the independent auditor may
reasonably provide.
Requests or applications for services that require specific
separate approval by the Audit Committee are required to
be submitted to the Audit Committee by both management
and the independent auditors, and must include a detailed
description of the services to be provided and a joint statement
confirming that the provision of the proposed services does
not impair the independence of the independent auditors.
The Audit Committee may delegate pre-approval authority
to one or more of its members. The member, or members,
to whom such authority is delegated, shall report any pre-
approval decisions to the Audit Committee at its next
scheduled meeting. The Audit Committee does not delegate
to management its responsibilities to pre-approve services to
be performed by the independent auditors.
Risk CommitteeThe Risk Committee, which is chaired by Mr LL von Zeuner,
was previously part of the Audit and Risk Committee.
The Risk Committee’s main functions are:
Dealing with governance of risk comprehensively and
reporting to the Board;
Monitoring the implementation of the policy and plan
for risk management taking place by means of risk
management systems and processes;
Ensuring that continuous risk monitoring by
management takes place; and
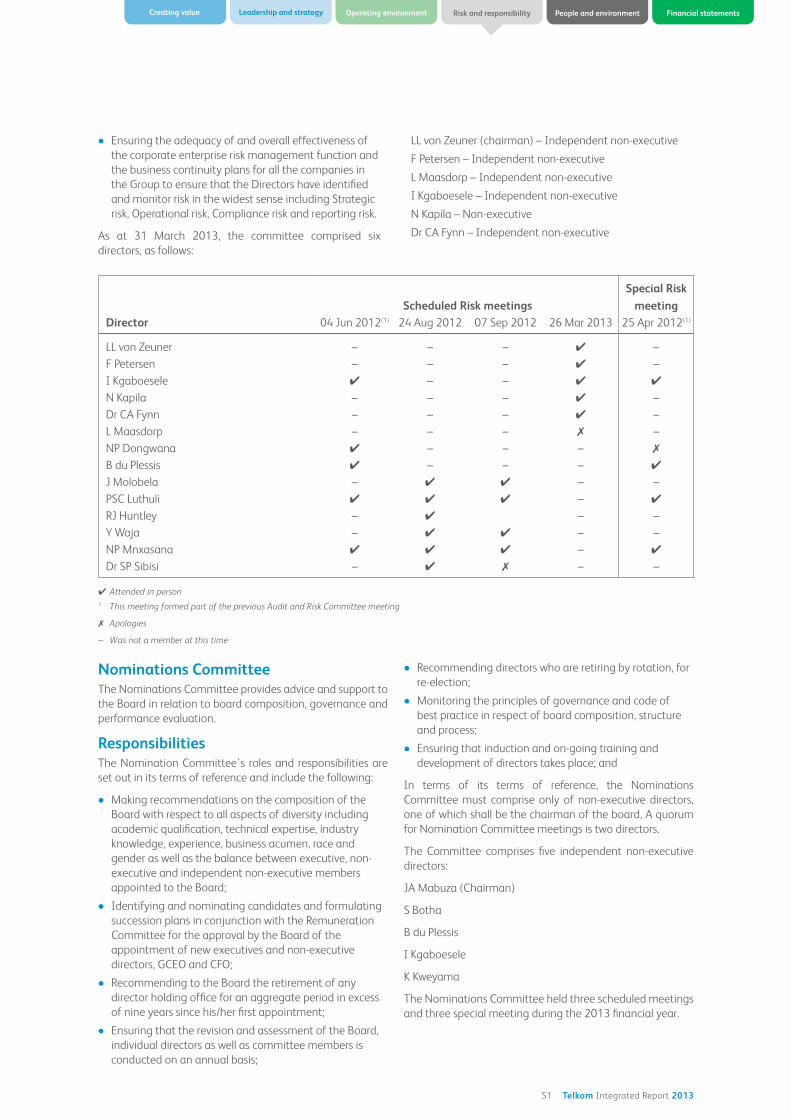
51 Telkom Integrated Report 2013
Operating environment Risk and responsibilityCreating value Leadership and strategy People and environment Financial statements
Ensuring the adequacy of and overall effectiveness of
the corporate enterprise risk management function and
the business continuity plans for all the companies in
the Group to ensure that the Directors have identified
and monitor risk in the widest sense including Strategic
risk, Operational risk, Compliance risk and reporting risk.
As at 31 March 2013, the committee comprised six
directors, as follows:
LL von Zeuner (chairman) – Independent non-executive
F Petersen – Independent non-executive
L Maasdorp – Independent non-executive
I Kgaboesele – Independent non-executive
N Kapila – Non-executive
Dr CA Fynn – Independent non-executive
Scheduled Risk meetings
Special Risk
meetingDirector 04 Jun 2012(1) 24 Aug 2012 07 Sep 2012 26 Mar 2013 25 Apr 2012(1)
LL von Zeuner – – – � –
F Petersen – – – � –
I Kgaboesele � – – � �
N Kapila – – – � –
Dr CA Fynn – – – � –
L Maasdorp – – – � –
NP Dongwana � – – – �
B du Plessis � – – – �
J Molobela – � � – –
PSC Luthuli � � � – �
RJ Huntley – � – –
– � � – –
NP Mnxasana � � � – �
Dr SP Sibisi – � � – –
��Attended in person
1 This meeting formed part of the previous Audit and Risk Committee meeting
�� Apologies
– Was not a member at this time
Nominations CommitteeThe Nominations Committee provides advice and support to
the Board in relation to board composition, governance and
performance evaluation.
ResponsibilitiesThe Nomination Committee’s roles and responsibilities are
set out in its terms of reference and include the following:
Making recommendations on the composition of the
Board with respect to all aspects of diversity including
academic qualification, technical expertise, industry
knowledge, experience, business acumen, race and
gender as well as the balance between executive, non-
executive and independent non-executive members
appointed to the Board;
Identifying and nominating candidates and formulating
succession plans in conjunction with the Remuneration
Committee for the approval by the Board of the
appointment of new executives and non-executive
directors, GCEO and CFO;
Recommending to the Board the retirement of any
director holding office for an aggregate period in excess
of nine years since his/her first appointment;
Ensuring that the revision and assessment of the Board,
individual directors as well as committee members is
conducted on an annual basis;
Recommending directors who are retiring by rotation, for
re-election;
Monitoring the principles of governance and code of
best practice in respect of board composition, structure
and process;
Ensuring that induction and on-going training and
development of directors takes place; and
In terms of its terms of reference, the Nominations
Committee must comprise only of non-executive directors,
one of which shall be the chairman of the board. A quorum
for Nomination Committee meetings is two directors.
The Committee comprises five independent non-executive
directors:
JA Mabuza (Chairman)
S Botha
B du Plessis
I Kgaboesele
K Kweyama
The Nominations Committee held three scheduled meetings
and three special meeting during the 2013 financial year.

52 Telkom Integrated Report 2013
Scheduled Nominations meetings Special Nominations meetingsDirector 22 May 2012 11 Oct 2012 01 Feb 2013 28 May 2012 09 Nov 2012 04 Dec 2012
JA Mabuza – – * – – �
J Molobela � � � * � �
B Du Plessis � � � * � *
I Kgaboesele – * � – � *
NP Mnxasana – � – – – –
PSC Luthuli � * – * – –
JN Hope � � – * – –
PL Zim � � – � – –
S Botha – – – – – –
K Kweyama – – – – – –
��Attended in person
* Teleconference
�� Apologies
– Was not a member at this time
GOVERNANCE
During the year ended 31 March 2013, the Nominations
Committee dealt with the following specific matters in
addition to its normal annual programme:
The appointment of Mr Sipho N Maseko as group chief
executive officer of the Company; and
The appointment of Dr Brian Armstrong as chief
operating officer of the Company.
Investment and Transactions CommitteeThe role of the Investment and Transactions Committee is
defined in its terms of reference and the primary function
of the committee is to assist the Board in evaluating
investments, corporate actions and key funding and
financial proposals.
The Investment and Transactions Committee:
Reviews and recommends to the Board any investment
decision appropriate to the Group’s strategy, gearing
and risk appetite. For clarity, policy proposals will be
drawn up by, and agreed to by the Executive Committee
prior to review by the Investment Committee;
Reviews and recommends to the Board investment
proposals submitted by the Executive Committee
ensuring compliance with the Group’s investment policy
and the Group’s strategy as agreed by the Board;
Monitors the performance of investments against
original investment criteria and pre-investment
assumptions until the conclusion of the first complete
financial year after acquisition. At this stage the
Executive Committee will prepare a formal post-
acquisition review and on-going performance
monitoring will become part of normal reporting to
the Board;
Reviews and recommends to the Board the introduction
of strategic equity partners to the Group;
Reviews a semi-annual report from the chief financial
officer and makes recommendations to the Board if
necessary, concerning the Group’s financial facilities
and financing structures; and
Reviews and recommends to the Board the
performance and strategies of subsidiaries
and investments.
The Investment and Transactions Committee consists of
one executive director and five non-executive directors:
L Maasdorp (chairman) – Independent non-executive
Dr CA Fynn – Independent non-executive
N Kapila – Non-executive
I Kgaboesele – Independent non-executive
K Mzondeki – Independent non-executive
JH Schindehütte – Executive
A quorum for a meeting is a majority of members. The
Investment and Transactions Committee held three
scheduled meetings and three special meetings during the
financial year.

53 Telkom Integrated Report 2013
Operating environment Risk and responsibilityCreating value Leadership and strategy People and environment Financial statements
Scheduled Investment meetings Special Investment meetingsDirector 06 Jun 2012 26 Jul 2012 25 Mar 2013 04 May 2012 21 Jun 2012 27 Sep 2012
L Maasdorp – – � – – –
I Kgaboesele � � � � � �
N Kapila * * � * * *
K Mzondeki – – � – – –
Dr CA Fynn – – � – – –
JH Schindehütte – – � – – –
� � – � * �
RJ Huntley * * – � � �
JN Hope * � – � � �
PSC Luthuli � � – * � �
��Attended in person
* Teleconference
�� Apologies
– Was not a member at this time
Remuneration Committee (Remco) (Formerly Human Resources Review and Remuneration Committee (HRRRC))The role of the committee is to assist the Board to ensure
that the Company remunerates directors and executives
fairly and responsibly in alignment with the creation of long-
term shareholder value and to ensure that the disclosure of
director and senior management remuneration is accurate,
complete and transparent.
The committee consists of non-executive directors
and executive management as provided by its terms
of reference. As at 31 March 2013 the Remuneration
Committee comprised the following members:
S Botha (Chairman) – Independent non-executive
B du Plessis – Independent non-executive
K Kweyama – Independent non-executive
JA Mabuza – Independent non-executive
J Molobela – Non-executive
The Remuneration Committee held four scheduled
meetings during the financial year. A quorum for a meeting
is 50% of members.
Scheduled Remuneration meetingsDirector 01 Jun 12 07 Sep 12 12 Nov 12 19 Mar 13
S Botha – – – �
JA Mabuza – – – *
J Molobela � � * �
K Kweyama – – – �
B Du Plessis � * � �
JN Hope � � – –
NT Moholi � � � –
NP Dongwana � � – –
��Attended in person
* Teleconference
�� Apologies
– Was not a member at this time

54 Telkom Integrated Report 2013
The Committee must perform all the functions necessary to
fulfil its role including the following:
Review the terms upon which executive directors and
senior executives are employed and remunerated;
Review the remuneration of non-executive directors
and make recommendations to the Board;
Approve the disclosure on remuneration of executive
and non-executive directors in the annual report
and the statement of remuneration policy advised
to shareholders;
Determine targets and performance-related incentive
schemes implemented in the Company;
Seek Board and shareholder approval for any long-
term incentive scheme and determine annual grants
and share allocations to executive directors and
senior management;
Review succession and recruitment plans including
performance assessments of executive directors
and senior managers;
Determine the framework and policy for attraction
and retention of key staff;
In fulfilling its duties, the Remco gives consideration
to industry and local benchmarks to ensure that
remuneration packages remain competitive;
Non-executive directors are paid fees for their services
as directors of the Group and for their participation as
members of the Board committees.
The Remuneration Committee employs the services of
specialist consultants in the field of executive remuneration
to assist it when necessary.
During the year ended 31 March 2013, the Remuneration
Committee worked on the following specific matters in
addition to its normal annual programme:
The development of a share incentive schemes
for executive management and employees of the
Company, which are to be tabled at the Annual General
Meeting for shareholder approval.
Social and Ethics Committee (SEC) (formerly Social, Ethics and Sustainability Committee (SESC))In accordance Regulation 43 of the Companies Act, the
committee is responsible for monitoring the Company’s
activities, having regard to any relevant legislation, other
legal requirements or prevailing codes of best practice, with
regard to matters relating to:
Social and economic development, including the
Company’s standing in terms of the goals and
purposes of:
– The 10 principles set out in the United Nations
Global Compact Principles (being those recorded in
Appendix);
– The Organisation for Economic Co-operation and
Development (OECD) recommendations regarding
corruption;
– The Employment Equity Act; and
– The Broad-Based Black Economic Empowerment Act.
Good corporate citizenship, including the Company’s:
– Promotion of equality, prevention of unfair
discrimination, and reduction of corruption;
– Contribution to development of the communities
in which its activities are predominantly conducted
or within which its products or services are
predominantly marketed; and
– Record of sponsorship, donations and charitable
giving.
The environment, health and public safety, including
the impact of the Company’s activities and of its
products or services.
Consumer relationships, including the Company’s
advertising, public relations and compliance with
consumer protection laws.
Labour and employment, including:
– The Company’s standing in terms of the International
Labour Organisation Protocol on decent work and
working conditions; and
– The Company’s employment relationships, and its
contribution toward the educational development of
its employees;
– Drawing matters within its mandate to the attention
of the Board as occasion requires; and
– Reporting, through one of its members, to the
shareholders at the Company’s Annual General
Meeting on the matters within its mandate;
– Considering any other matters as requested by the
Board,
The committee comprises the following non-executive
directors:
J Molobela (chairman) – Non-executive
K Kweyama – Independent non-executive
L Maasdorp – Independent non-executive
F Petersen – Independent non-executive
LL von Zeuner – Independent non-executive
The SEC held three scheduled meetings during the financial
year. A quorum for a meeting is a majority of members.
GOVERNANCE

55 Telkom Integrated Report 2013
Operating environment Risk and responsibilityCreating value Leadership and strategy People and environment Financial statements
Total scheduled meetings
Director
30 May
2012
10 Sep
2012
15 Mar
2013
J Molobela – – �
K Kweyama – – �
L Maasdorp – – �
F Petersen – – �
LL von Zeuner – – �
JN Hope � � –
RJ Huntley � * –
� � –
NP Mnxasana � � –
NP Dongwana � � –
� Attended in person
* Teleconference
� Apologies
– Was not a member
The chairman of the Social and Ethics Committee reports
at the Company’s Annual General Meeting on the matters
within the Committee’s mandate.
The group chief executive officer (GCEO)THE ROLE OF THE GCEO AND MANAGEMENTPursuant to formal delegations of authority, the Board has
delegated the management of day to day operations to
the GCEO. However, ultimate accountability for strategy
and control rests with the board of directors. The Board
approves corporate objectives for the GCEO to satisfy
and, jointly with the GCEO, develops the duties and
responsibilities of the GCEO.
The GCEO is accountable to the Board for the exercise of
the delegated authority and, with the support of the Exco,
must report to the Board on the exercise of the authority
through reports, briefings and presentations.
Responsibilities and objectivesThe day-to-day management and operations of the
Company are the responsibility of the GCEO who reports
to the Board on key management and operational issues,
including:
Developing and implementing corporate strategies and
making recommendations to the Board on significant
corporate strategic initiatives;
Appointing and determining the terms of appointment
of executive and senior management, developing
and maintaining succession plans, and evaluating the
performance of key executives;
Developing Telkom’s annual budget and managing
day-to-day operations within the budget (approved by
the Board);
Maintaining effective risk management and compliance
management frameworks;
Keeping the Board and market fully informed about
material continuous disclosure; and
Managing day-to-day operations in accordance
with standards for social, ethical and
environmental practices.
Director tenure, election and appointmentAt each Annual General Meeting (“AGM”) of the Company,
at least a third of the directors in office must retire
by rotation and those directors may, if eligible, offer
themselves for re-election. Any non-executive director who
would otherwise hold office without re-election beyond the
third AGM since their appointment or last election, or for
at least three years, whichever is the longer, must retire.
Any non-executive director who has been appointed during
the year must stand for election by shareholders at the
next AGM.
Any director who has held office in excess of nine years
in aggregate must also retire, notwithstanding that such
director may have retired at the previous AGM.
Independence of directorsThe majority of Telkom directors are independent non-
executive directors as the term is defined in King III. In
order for a director to be considered independent, the
Board needs to have determined that the director meets
the criteria set out in King III to be regarded as such. An
independent non-executive director is a non-executive
director who:
Is not a representative of a shareholder who has the
ability to control or significantly influence management
or the Board;
Does not have a direct or indirect interest in the
Company (including any parent or subsidiary in a
consolidated group with the Company) which exceeds
5% of the Group’s total number of shares in issue;
Does not have a direct or indirect interest in the
Company which is less than 5% of the Group’s
total number of shares in issue, but is material to his
personal wealth;
Has not been employed by the Company or the
Group of which it currently forms part in any executive
capacity, or appointed as the designated auditor or
partner in the Group’s external audit firm, or senior legal
advisor for the preceding three financial years;
Is not a member of the immediate family of an
individual who is, or has during the preceding three
financial years, been employed by the Company or the
Group in an executive capacity;
Is not a professional advisor to the Company or the
Group, other than as a director;
Is free from any business or other relationship
(contractual or statutory), which could be seen by
an objective outsider to interfere materially with the
individual’s capacity to act in an independent manner,
such as being a director of a material customer of or
supplier to the Company; or
Does not receive remuneration contingent upon the
performance of the Company.GRI

56 Telkom Integrated Report 2013
The Board only considers directors to be independent where
they are independent of management or shareholders and
are free of any business or other relationship that could
materially interfere with, or could reasonably be perceived
to materially interfere with, the exercise of their unfettered
and independent judgment.
Any director who considers that he/she has or may have
a conflict of interest or a material personal interest in any
matter concerning the Company is required to give the
Board notice of such interest.
The Independent non-executive directors and non-
executive directors of the Board periodically meet without
the executive directors or management being present.
Board effectivenessThe chairman is responsible for monitoring the contribution
of individual directors and counselling them on any areas
which might help improve board performance. The
chairman is also responsible for the process of evaluating
the performance of the directors, board committees
and the Board as a whole. The Board engages external
assistance, as appropriate, in reviewing the performance of
the Board.
An appraisal of the effectiveness of the Board was
conducted externally during the latter part of the financial
year. The appraisal was benchmarked against the strategic
requirements of Telkom to ensure the capacity to deliver
these requirements and strengthen the diversity and sector
expertise of directors. Whilst the composition of the Board
has changed substantially since the appraisal, the results
of the appraisal will be a useful tool for learning and will
be instructive in designing the Board’s plans and work
programmes for the future.
Induction and director developmentNew directors receive a letter of appointment which sets
out the Company’s expectations of the role, their duties,
the terms and conditions of their appointment and their
remuneration. The appointment letter forms the initial part
of the programme of induction for directors.
Directors are also expected to participate in all induction
and orientation programmes and continuing education,
training or development programmes arranged for them
by the company secretary. The company secretary, in
consultation with the chairman, oversees and reviews the
director induction process in order to ensure that it remains
effective and up-to-date.
The company secretarial function supports directors by
providing:
Access to information in appropriate form, currency
and quality, including procedures to cover additional
requests of management;
Continuing education to update and enhance their
knowledge as the business environment changes; and
Access to independent professional advice,
where requested.
Company SecretaryAll directors have access to the advice and services of the
group company secretary, who is responsible for ensuring
the proper administration of the Board and Corporate
Governance procedures. The group company secretary
provides guidance to the directors on their responsibilities
within the prevailing regulatory and statutory environment
and the manner in which such responsibilities should be
discharged.
During the year under review Ms Mmathoto Lephadi
resigned as group company secretary and Ms Andisa Ditle
was appointed as acting group company secretary with
effect from 1 November 2012 until 17 March 2013.
company secretary with effect from 18 March 2013.
The Board can confirm that the company secretary
possesses the necessary qualifications, relevant experience
and the competence to discharge her duties. The company
secretary is suitably qualified for the role, maintains an arm’s
length relationship with the Board and is not a director.
Details of the group company secretary’s business address
and the Group’s registered office are set out on the inside
back cover of this integrated report.
Directors’ independent adviceThe directors, the Board and the board committees
are empowered to seek external professional advice, as
considered necessary, at the Company’s expense, subject
to prior consultation with the chairman.
Business code of ethicsETHICS PERFORMANCEThe Business Code of Ethics applies to all employees and
sets out the standards in accordance with which they are
expected to act. The policy is aimed at the maintenance
of standards of honesty, integrity and fair dealing
by all employees in their interaction with customers,
suppliers, the community, competitors and each other
in the performance of their duties and responsibilities.
All employees are provided with a copy of the Code of
Ethics on the commencement of their employment.
The focus in the last year was on establishing a dedicated
ethics function, and raising awareness on the Business Code
of Ethics. An ethics officer was appointed and an ethics
office responsible for the implementation of the Telkom
ethics programme was established. The following initiatives
formed part of the roll-out of Telkom’s ethics programme:
Extensive internal communication on the business code
of ethics and the supplementary policies;
Training and awareness, which included the
development and launch of an online training course;
The introduction of an ethics helpline where
employees could obtain confidential advice on
ethical dilemmas; and
The compilation of an ethics risk and
opportunity profile.
GOVERNANCE
GRI
57 Telkom Integrated Report 2013
Operating environment Risk and responsibilityCreating value Leadership and strategy People and environment Financial statements
In addition to the Business Code of Ethics, there are a range
of activities and compliance programs across the Company
designed to promote and encourage the responsibility
and accountability of individuals for avoiding unethical
practices or reporting such practices should they become
aware of them.
Share dealingsIn line with JSE Listings Requirements and the Group’s
insider trading policy directors and executives who wish to
trade in Telkom securities are required to obtain prior written
approval from the chairman of the board and the group
company secretary before dealing in Telkom securities.
The Group operates closed periods as defined in the
JSE Listings Requirements.
Additional prohibited periods are enforced, when required,
in relation to corporate activities as and when these occur.
Application of King IIITelkom strives to apply the principles of King III to the
extent practical and fit for the business. Telkom recently
completed its own assessment of the application of the
King III principles. The following table outlines areas where,
based on our own assessment, the Company did not apply
the principles of King III, and provides explanations for
each of those instances of non-compliance, as required in
terms of King III:
King III principles Telkom’s explanation
Ensure that collaborative efforts with stakeholders are
embarked upon to promote ethical conduct and good
corporate citizenship; and internal and external ethics
performance is aligned around the same ethical standards.
Telkom is currently considering the implementation
of projects and efforts that will encompass alignment of
internal and external engagement to promote standardised
ethical conduct and good corporate citizenship.
Background and reference checks should be performed
before the nomination and appointment of directors.
Background and reference checks have been performed on
members of the current board of directors and this will be
embedded in the process going forward.
An overview of the Board appraisal process, results and
action plans should be disclosed in the integrated report.
A Board appraisal process which commenced in the
latter part of the year has recently been completed by an
independent service provider and the recommendations are
to be presented to the Board for its consideration.
The nomination for the re-appointment of a director
should only occur after the evaluation of the performance
and attendance of the director.
The MOI requires that one third of directors must retire each
year, and they may be re-elected by shareholders, in line with
the JSE Listings Requirements.
Compliance should be a regular item on the agenda of
the Board; and the Board should disclose details in the
integrated report on how it discharged its responsibility
to establish an effective compliance framework and
processes.
Compliance is a regular item on the agenda of the Board and
the Risk Committee is charged with oversight responsibility
for Compliance. Details of the work of the Risk Committee
are included in this integrated report.
The induction and ongoing training programmes of
directors should incorporate an overview of and any
changes to applicable laws, rules, codes and standards;
and directors should sufficiently familiarise themselves
with the general content of applicable laws, rules, codes
and standards to discharge their legal duties.
The compliance officer together with the company secretary
inform the Board of any changes to applicable laws, rules,
codes and standards and in future will incorporate these in
formalised induction and ongoing training programmes for
directors.
The compliance officer should be a suitably skilled and
experienced person who should have access and interact
regularly on strategic compliance matters with the Board
and/or appropriate board committee and executive
management.
The group executive responsible for this function is suitably
skilled and experienced and does have access to and interacts
with the Risk Committee and executive management on
strategic compliance matters.

58 Telkom Integrated Report 2013
King III principles Telkom’s explanation
The chairman of the board should be an independent
director.
The current chairman is classified as independent in
accordance with the definitions set out in King III.
The chairman should be appointed by the Board every
year (after an assessment of his independence).
The chairman is appointed by the Board until the next annual
general meeting.
A governance framework has not been agreed by the
Group and its subsidiaries.
Telkom has embarked on a GRECS (Governance, Risk, Ethics
Compliance and Sustainability) alignment project, aimed
at providing a structured and co-ordinated framework for
governance management within the Group
The Audit Committee does not comprise of only
independent non-executive directors.
For a portion of the year not all members were independent.
However, when the Board‘s capacity was increased to
14 members, the Audit Committee membership was
aligned to the requirements of the Companies’ Act and
King III respectively.
Material deviations from the Company’s risk limits that
the Board is willing to take should be disclosed in the
integrated report.
The risk appetite strategy and framework have been
developed. The initial risk appetite and risk bearing capacity
figures have been calculated. These are currently in the
process of being benchmarked after which they will be
presented to the Board for approval. A comprehensive dash-
board has been developed to enable the effective monitoring
of these limits going forward.
The Company’s reputation and its linkage with stakeholder
relationships is not a regular board agenda item.
Telkom is currently piloting an approach to measure the
quality of relationships with its stakeholders. Once approved,
these measures will be used to guide discussions at board
level.
We have the following mechanisms in place for shareholders and employees to provide recommendations or direction to
the highest governing body:
Shareholder meetings are held where shareholders have an opportunity to provide input to Telkom.
Investor relations interact with shareholders on an ongoing basis, and the feedback from these interactions is
communicated to the executive committee and the Board.
When both final and interim results are announced, the GCEO and executive management go on shareholder road-
shows to address shareholders and feedback from these road shows is filtered to the Board.
Similarly road-shows are arranged by the GCEO and executive management to address employees on a range of issues
affecting the Company.
GOVERNANCE
GRI
59 Telkom Integrated Report 2013
Operating environment Risk and responsibilityCreating value Leadership and strategy People and environment Financial statements
ALIGNING GOVERNANCE, RISK AND CONTROLSOver the past year Telkom has placed extensive effort on aligning and streamlining the Group’s strategies and operations to enhance its effectiveness, accountability, and transparency to better deliver value going forward.
As Telkom’s strategy and operations shifted in response to market realities, industry regulation and stakeholder expectations, it became even more important for Telkom to maintain a high level of governance, risk management and control systems to demonstrate responsible stewardship. Maintaining high standards included the continued empowerment of assurance providers to independently assess the efficiency and effectiveness of these risk management and control mechanisms.
Telkom Audit Services is governed by an internal audit charter which is approved by the Audit Committee and is reviewed annually. The charter defines the purpose, authority and responsibilities of the function.
Telkom Audit Services, in accordance with best in class practices, is an independent, objective assurance and advisory function designed to add value and improve Telkom’s operations. Telkom Audit Services aims to assist Telkom in accomplishing its objectives by bringing a systematic, disciplined approach to evaluate and improve the effectiveness of governance, risk management and control processes.
The Telkom organisational structure promotes the independence of Telkom Audit Services as a whole and allows it to form its judgments objectively. In order to ensure the independence; permit sufficient objectivity and ensure the accomplishment of audit responsibilities, the group executive (GE): Telkom Audit Services functionally reports to the chairman of the Telkom Audit Committee. The GE: Telkom Audit Services also interacts directly with the Board and reports administratively to the CFO. The GE: Telkom Audit Services has unlimited access to all employees of the company, including the chairman of the Telkom Board, the chairman and members of the Audit Committee as well as the GCEO.
Annually, Telkom Audit Services compiles a comprehensive risk-based audit plan which is derived from various sources of key risks. The assessment and audit plan is validated by executive management and approved by the Audit Committee. The audit plan is benchmarked by our co-sourced service providers against organisations in similar industry verticals and audit functions of a similar nature and size.
Telkom Audit Services also liaises with the external auditors and other assurance providers to enhance efficiencies in terms of combined assurance and test the veracity of the audit plan. The audit plan is reviewed regularly to ensure it remains relevant and responsive, given changes in the operating environment. The Audit Committee approves any changes to the plan.
A summary of audit results, performance against the approved audit plan, and progress on the resolution of management action items is presented quarterly to the Audit Committee and monthly to the Exco.
The Telkom Audit Services team conducts audit work, or any other task, in accordance with the internal auditing standards set by the globally recognised Institute of Internal Auditing (IIA). This requires compliance with the Standards for Professional Practice of Internal Auditing (SPPIA), in particular, the codes of conduct and ethics that are promulgated from time to time by relevant professional bodies, and any other corporate governance initiatives.
Through the use of the company-wide system of management action tracking, Telkom Audit Services continues to monitor the
timely remediation of reported control deficiencies. This system has empowered management to pro-actively manage the establishment of controls in their environments as well as to support the establishment and maintenance of a sound control environment. Telkom Audit Services will continue to provide reports to the Audit Committee and Exco on the status of agreed remedial actions implemented by management.
Telkom Audit Services was assessed as “generally conforms” to the IIA standards by KPMG in an external assurance review in 2010, which is the highest level of conformance as defined by the Standards. Furthermore Telkom Audit Services adopted strategies and techniques aimed at addressing the specific internal audit requirements of King lll, which includes better strategic alignment of the assurance efforts of Telkom Audit Services.
During the year, Telkom Audit Services established a quality assurance function as well as developed a quality assurance and improvement programme (QAIP) to cover all aspects of the internal audit activity. The programme includes both internal and external evaluations which assess the effectiveness and efficiency of the internal audit activity.
The internal audit activities are performed by teams of appropriate, qualified and experienced employees, supplemented by co-sourced service provider resources. This augmentation has enabled sufficient attention being directed towards the growth aspirations of Telkom in areas of new business as well as key capital-intensive programmes, whilst ensuring that existing business areas receive due attention.
The role of Telkom Audit Services and its prominence in improving the control environment has increased through key contributions made towards embedding an effective combined assurance framework and model as well as the piloting of the Control Self-Assessment (CSA) process in selected functional areas.
The 2013 financial year marked a significant transition for Telkom Audit Services from an assurance provider to a control champion. During the year, Telkom Audit Services implemented a strategic change in our stakeholder engagement process and introduced a number of control awareness initiatives that included targeted information sessions, monthly newsletters as well as the establishment of a control advice centre. Telkom Audit Services enjoys a remit that spans the entire company and we have leveraged this unique position to promulgate good control practices that would further improve the operations of Telkom.
The GE: Telkom Audit Services continues to chair the Telkom Combined Assurance Forum (TCAF), which provides a communication platform for the assurance providers in Telkom as well as constituting a springboard for the provision of a written assessment on the effectiveness of the internal control environment. The TCAF under the stewardship of the GE: Telkom Audit Services yielded the following benefits to Telkom during the year that included:
Avoidance of duplication of assurance effort
A better understanding of Telkom’s business operations through sharing of knowledge of the business and emerging and current business issues
Timing assurance efforts to minimise business interruption and avoidance of assurance fatigue on the business
Developing a portfolio view of assurance efforts for management and the Audit Committee.

60 Telkom Integrated Report 2013
SUSAN BOTHABCom (Economics)Independent non-executive directorChairman of the Remuneration Committee
Susan Botha was appointed to the Board in December 2012. She is currently the chairman of Curro Holdings Limited and serves on other boards, including Tiger Brands Limited, Imperial Holdings Limited and Famous Brands Limited.
Ms Botha was previously an executive director of MTN Group Limited and Absa Bank Limited.
She has a Bachelor of Commerce degree in Economics with honours from the University of Stellenbosch. She is also chancellor of Nelson Mandela Metropolitan University.
SIPHO N MASEKOBA (Law), LLBExecutive director, group chief executive officer
Sipho Maseko was appointed as group chief executive officer and an executive director of Telkom in April 2013. Prior to joining Telkom, he served as group chief operating officer and
various roles at BP starting in 1997, serving as the chief executive officer of BP Southern Africa (Pty) Limited from 2008 to 2012 and chief operating officer before this.
Mr Maseko has served as a non-executive director of the Centre for Development and Enterprise’s board since 2009 and the Afrox board since 2012. He also served as chairman of the board of SAPREF between July 2010 and August 2011.
Mr Maseko holds a Bachelor of Arts degree in Law from Wits University and an LLB from the University of Natal.
BRAHM DU PLESSISBA (Law) LLB, LLMIndependent non-executive director
Brahm du Plessis was appointed to the Board in December 2004. A practising advocate at the Johannesburg Bar since 1987, advocate Du Plessis, who holds Bachelor of Arts and a LLB from the University of Stellenbosch and an LLM degree from the London University, has also served as a member of the Johannesburg Bar Council.
JACQUES H SCHINDEHÜTTECA (SA), BCom (Hons), Higher Diploma in Taxation Executive director, chief financial officer
Jacques Schindehütte served his articles with Arthur
He served as chief financial officer of Absa Group Limited from October 1999 to 2010 and was the financial director of the group from 2005 to February 2010.
Prior to joining Absa, Mr Schindehütte was employed by Transnet Limited in a number of senior roles over more than a decade. During his career, he has amassed a broad range of experience from disciplines such as general management, financial services, finance, auditing, marketing, transport, property development and telecommunications, to name but a few.
Mr Schindehütte currently serves on the board and audit committee of JD Group Limited.
He is a chartered accountant, holds a Bachelor of Commerce degree with honours and a higher diploma in taxation.
ITUMELENG KGABOESELE CA (SA), BCom, Post-Graduate Diploma in Accounting Independent non-executive directorChairman of the Audit Committee
Itumeleng Kgaboesele was appointed to the Telkom board in July 2011. He is the co-founder and chief executive officer of Sphere Holdings (Pty) Limited, a leading mid-market investment holding and private equity company.
Prior to founding Sphere in 2003, he spent several years in investment banking in London and Johannesburg and was vice president – Investment Banking at Citi. He represents Sphere on the boards of a number of investments in which Sphere has invested and is also an independent non-executive director of Old Mutual Investment Group.
He is a trustee of the Student Sponsorship Programme and the African Leadership Academy.
Mr Kgaboesele is a chartered accountant (SA). He holds a Bachelor of Commerce degree as well as a Post Graduate Diploma in Accounting from the University of Cape Town.
KHOLEKA MZONDEKIFCCA (UK), BCom, Diploma in Investment ManagementIndependent non-executive director
Ms Kholeka Mzondeki was appointed to the Board in November 2012. She is a qualified UK chartered accountant and has served as financial director at various companies such as 3M and Masana Petroleum Solutions.
Apart from her financial management and strategy experience, she has ICT transformational strategy formulation and implementation experience using technology as a customer value proposition. In 2008 she was a finalist in the Nedbank Business Woman of the
Ms Mzondeki also sits on boards of other JSE listed companies and is a member of the UN World Food programme. She holds a Bachelor of Commerce degree from the University of Botswana and a Diploma in Investment Management from the University of Johannesburg.
JABULANE A MABUZAEffective Leadership Programme, Executive Development Programme: Financial Statement Analysis Chairman of Telkom boardIndependent non-executive director Chairman of the Nominations Committee
Jabulane Mabuza was appointed to the Board in November 2012. He is widely recognised as a successful entrepreneur. Mr Mabuza is also the deputy chairman of Tsogo Sun Holdings and president of Business Unity South Africa (BUSA).
He serves on the boards of ACE Insurance Limited, Eglin Investments No. 44 (Pty) Limited, Hyprop Investments Limited, Kuncedzana Investment Holdings and Lexshell 627 Investments (Pty) Limited, among others. Prior to this, he was managing director of Southern Sun Gaming, group chief executive officer of Tsogo Sun and a chairman of the board of South African Tourism.
Mr Mabuza has attended several executive courses including, the Effective Leadership Programme from the Wharton School of the University of Pennsylvania and the Executive Development Program: Financial Statement Analysis from the John E Anderson Graduate School of Management at the University of California, Los Angeles. Los Angeles.
JABEffeExeFinaChaIndCha
Jabuin Nosuccdepupres
He sEglinInveHoldLimitmanchiefof th
Mr McourProgUnivDeveAnaSchoCalif
JCinE
Ja
HLthFe
Perohdsepn
Ma
Hod
ty) g
al
ent rds
ve
y.
as
S
ng burg
elor
he o
SBCInexCRe
SuthShofaninImFa
MexGLi
ShCoEcthShNU
a in
ve
pointed 2.
d
mpaniesleum
gementhas ICT mulationceer value a finalist
man of the
ds of d is odelor ofniversity
nm the
BOARD OF DIRECTORS
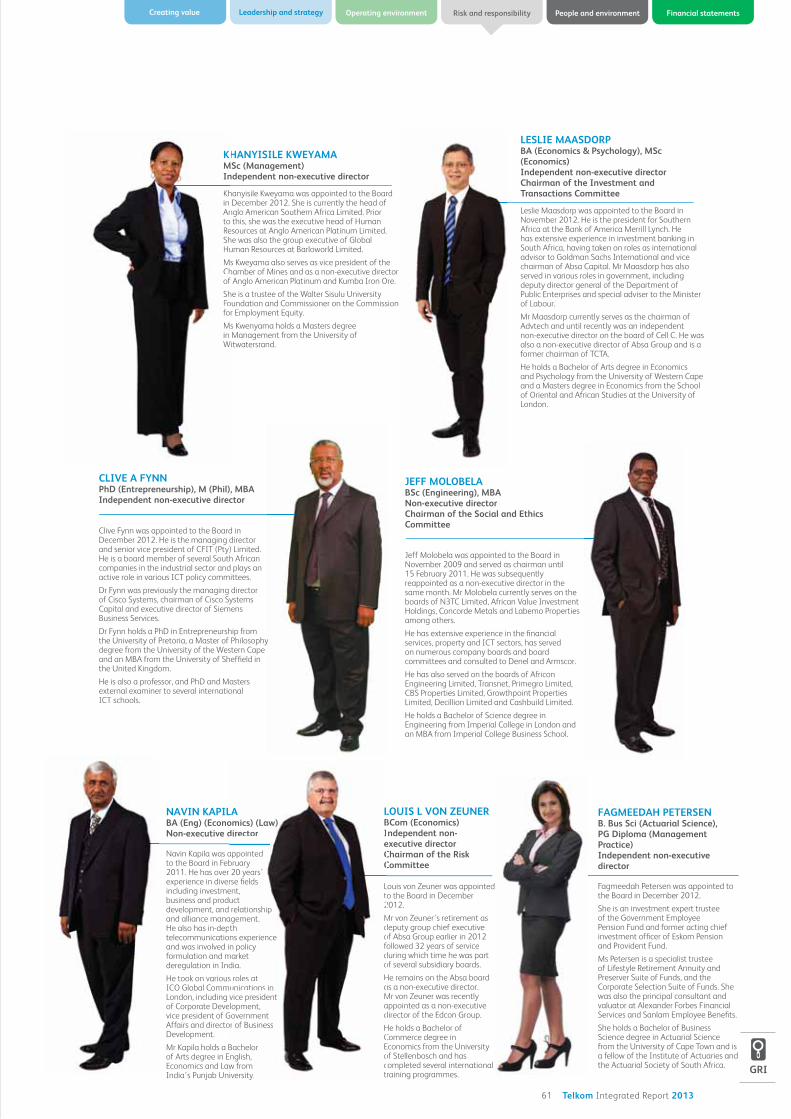
61 Telkom Integrated Report 2013
Operating environment Risk and responsibilityCreating value Leadership and strategy People and environment Financial statements
NAVIN KAPILABA (Eng) (Economics) (Law) Non-executive director
Navin Kapila was appointed to the Board in February 2011. He has over 20 years’ experience in diverse fields including investment, business and product development, and relationship and alliance management. He also has in-depth telecommunications experience and was involved in policy formulation and market deregulation in India.
He took on various roles at ICO Global Communications in London, including vice president of Corporate Development, vice president of Government Affairs and director of Business Development.
Mr Kapila holds a Bachelor of Arts degree in English, Economics and Law from India’s Punjab University.
KHANYISILE KWEYAMAMSc (Management) Independent non-executive director
Khanyisile Kweyama was appointed to the Board in December 2012. She is currently the head of Anglo American Southern Africa Limited. Prior to this, she was the executive head of Human Resources at Anglo American Platinum Limited. She was also the group executive of Global Human Resources at Barloworld Limited.
Ms Kweyama also serves as vice president of the Chamber of Mines and as a non-executive director of Anglo American Platinum and Kumba Iron Ore.
She is a trustee of the Walter Sisulu University Foundation and Commissioner on the Commission for Employment Equity.
Ms Kwenyama holds a Masters degree in Management from the University of Witwatersrand.
LESLIE MAASDORPBA (Economics & Psychology), MSc (Economics)Independent non-executive directorChairman of the Investment and Transactions Committee
Leslie Maasdorp was appointed to the Board in November 2012. He is the president for Southern Africa at the Bank of America Merrill Lynch. He has extensive experience in investment banking in South Africa, having taken on roles as international advisor to Goldman Sachs International and vice chairman of Absa Capital. Mr Maasdorp has also served in various roles in government, including deputy director general of the Department of Public Enterprises and special adviser to the Minister of Labour.
Mr Maasdorp currently serves as the chairman of Advtech and until recently was an independent non-executive director on the board of Cell C. He was also a non-executive director of Absa Group and is a former chairman of TCTA.
He holds a Bachelor of Arts degree in Economics and Psychology from the University of Western Cape and a Masters degree in Economics from the School of Oriental and African Studies at the University of London.
CLIVE A FYNNPhD (Entrepreneurship), M (Phil), MBA Independent non-executive director
Clive Fynn was appointed to the Board in December 2012. He is the managing director and senior vice president of CFIT (Pty) Limited. He is a board member of several South African companies in the industrial sector and plays an active role in various ICT policy committees.
Dr Fynn was previously the managing director of Cisco Systems, chairman of Cisco Systems Capital and executive director of Siemens Business Services.
Dr Fynn holds a PhD in Entrepreneurship from the University of Pretoria, a Master of Philosophy degree from the University of the Western Cape and an MBA from the University of Sheffield in the United Kingdom.
He is also a professor, and PhD and Masters external examiner to several international ICT schools.
JEFF MOLOBELABSc (Engineering), MBANon-executive directorChairman of the Social and Ethics Committee
Jeff Molobela was appointed to the Board in November 2009 and served as chairman until 15 February 2011. He was subsequently reappointed as a non-executive director in the same month. Mr Molobela currently serves on the
Holdings, Concorde Metals and Labemo Properties among others.
He has extensive experience in the financial services, property and ICT sectors, has served on numerous company boards and board committees and consulted to Denel and Armscor.
He has also served on the boards of Africon Engineering Limited, Transnet, Primegro Limited, CBS Properties Limited, Growthpoint Properties Limited, Decillion Limited and Cashbuild Limited.
He holds a Bachelor of Science degree in Engineering from Imperial College in London and an MBA from Imperial College Business School.
LOUIS L VON ZEUNERBCom (Economics)Independent non-executive directorChairman of the Risk Committee
Louis von Zeuner was appointed to the Board in December 2012.
Mr von Zeuner’s retirement as deputy group chief executive of Absa Group earlier in 2012 followed 32 years of service during which time he was part of several subsidiary boards.
He remains on the Absa board as a non-executive director. Mr von Zeuner was recently appointed as a non-executive director of the Edcon Group.
He holds a Bachelor of Commerce degree in Economics from the University of Stellenbosch and has completed several international training programmes.
FAGMEEDAH PETERSENB. Bus Sci (Actuarial Science), PG Diploma (Management Practice) Independent non-executive director
Fagmeedah Petersen was appointed to the Board in December 2012.
She is an investment expert trustee of the Government Employee Pension Fund and former acting chief investment officer of Eskom Pension and Provident Fund.
Ms Petersen is a specialist trustee of Lifestyle Retirement Annuity and Preserver Suite of Funds, and the Corporate Selection Suite of Funds. She was also the principal consultant and valuator at Alexander Forbes Financial Services and Sanlam Employee Benefits.
She holds a Bachelor of Business Science degree in Actuarial Science from the University of Cape Town and is a fellow of the Institute of Actuaries and the Actuarial Society of South Africa.
y
LAomics) (Law) director
appointed bruary 20 years’
rse fields ent, uctrelationship
agement. th ns experiencen policy
market dia.
s roles at unications in vice president lopment,
Governmentor of Business
Bachelor nglish,w from iversity.
LBIeCC
Lt2
Mdofdo
HaMad
HCEoct
KHMIn
Khin AntoReShHu
MChof
ShFofo
Min W
GRI

62 Telkom Integrated Report 2013
SIPHO N MASEKOBA, LLB
Group chief executive officer
Age: 44
Joined Telkom: April 2013
Sipho Maseko was appointed as group chief executive officer and an executive director of Telkom on 1 April 2013. Prior to joining Telkom, he served as group chief operating officer and managing director
starting in 1997, serving as the chief executive officer of BP Southern Africa (Pty) Limited from 2008 to 2012 and chief operating officer before this.
Mr Maseko has served as a non-executive director of the Centre for Development and Enterprise’s board since 2009 and the Afrox board since 2012. He also served as chairman of the board of SAPREF between July 2010 and August 2011.
Mr Maseko holds a Bachelor of Arts degree in Law from Wits University and an LLB from the University of Natal.
DEON FREDERICKSCA (SA), BCom (Business Management) (Hon), ACMA
Deputy to chief financial officer
Age: 52
Joined Telkom: April 1993Deon Fredericks was appointed as deputy to the chief financial officer in August 2011. He previously served as Telkom’s acting chief financial officer, group executive of corporate finance accounting services, and as chief accountant from November 2004 to August 2010.
He originally joined Telkom in 1993 as a senior manager in internal audit and has held several executive positions in the finance department.
Mr Fredericks is a chartered accountant and holds a Bachelor of Commerce degree in Business Management with honours. He is also a member of the Chartered Institute of Management Accountants (UK).
JACQUES H SCHINDEHÜTTECA (SA), BCom (Hons), Higher Diploma in Taxation
Chief financial officer
Age: 54
Joined Telkom: August 2011
Company.
He served as chief financial officer of Absa Group Limited from October 1999 to 2010 and was the financial director of the group from 2005 to February 2010.
Prior to joining Absa, Mr Schindehütte was employed by Transnet Limited in a number of senior roles over more than a decade. During his career, he has amassed a broad range of experience from disciplines such as general management, financial services, finance, auditing marketing, transport, property development and telecommunications, to name but a few.
Mr Schindehütte currently serves on the board and audit committee of JD Group Limited.
He is a chartered accountant, holds a Bachelor of Commerce degree with honours and a higher diploma in taxation.
OUMA RASETHABABProc, LLB (Hons), Higher Diploma in Company Law, LLM
Chief of Regulatory and Corporate Affairs
Age: 52
Joined Telkom: February 2006
Advocate Ouma Rasethaba joined Telkom as group executive of Regulatory and Public Policy in 2006. She was later appointed as chief of corporate governance in November 2007.
Ms Rasethaba is also a former special director of Public Prosecutions at the National Prosecuting authority and has practised as an attorney and advocate.
She holds a LLB with honours and a higher diploma in Company Law.
EXECUTIVE COMMITTEE

63 Telkom Integrated Report 2013
Operating environment Risk and responsibilityCreating value Leadership and strategy People and environment Financial statements
BASHIER SALLIEMDP
Managing director: Wholesale and Networks
Age: 45
Joined Telkom: March 1986Bashier Sallie spent most of his early tenure at Telkom in technology and network services. He was appointed managing director of Wholesale and Networks in May 2011. Bashier held various positions including senior managing executive for Wholesale and Networks since August 2009 and group executive for Information Technology from November 2007. Between January 2002 and October 2007, Mr. Sallie served in managing executive roles in Data and Special Services, Service Management and Field Operations. He also served as the Company’s, acting chief technical officer from March 2007 to October 2007.
BRIAN ARMSTRONGBSc (Engineering), MSc (Engineering), PhD
Chief operating officer
Age: 52
Joined Telkom: May 2011
Brian Armstrong was appointed managing director of Telkom Business in May 2011. In April this year he took on the role of chief operating officer. He previously served as senior managing executive for Enterprise Markets. Prior to joining Telkom, Dr Armstrong was vice president of British Telecoms (BT) for the Middle East and Africa (MEA) region. In this role, he had the responsibility to oversee and grow BT’s activities across the region, extending from North Turkey through to Pakistan in the East and South Africa in the South.
With his 25 years’ experience, Dr Armstrong has served in various positions including, director of the Division for Information and Communications Technology at CSIR and as managing director of AST Networks.
Dr Armstrong has experience in numerous industries, including ICT research and development, telecommunications, technology management, networking services and outsourcing.
He holds a Bachelor of Science degree, a Masters and a PhD in Engineering.
MANELISA MAVUSOBEcon (Rhodes)
Managing director: Consumer Services and Retail
Age: 42
Joined Telkom: November 2009
Manelisa Mavuso was appointed senior managing executive: Consumer Services and Retail at Telkom in 2009, and subsequently appointed as managing director in May 2011.
He is the chairperson of the Brand Council and a trustee of Telkom Foundation. Prior to joining Telkom, Mr Mavuso was director: Marketing at Standard Bank South Africa, managing executive: Marketing at Nedbank Limited and deputy managing director at Ogilvy in Cape Town.
Mr Mavuso recently attended Strategic IQ at Harvard and holds a Bachelor of Commerce degree in Economics.
ATTILA VITAICA, MBA
Managing director: Telkom Mobile
Age: 57
Joined Telkom: November 2012
of Telkom Mobile on 14 November 2012. He has over 25 years’ experience in the telecommunications industry. He
global commercial director, before moving to Hungary where as chief executive officer he set up and managed the operator. Thereafter he moved to Turkey as chief
invest in a number of small technology companies in the UK, providing them with strategic and operations advice. During the same period he also consulted to the telecoms industry.
Orchestra in London from 1992 to 1998 and chairman of the Hungarian Golf Federation from 2003 to 2006. He was appointed OBE in 2005 during which year he also received the Knight’s Cross of Hungary for services
chartered accountant and holds an MBA.
THAMI MSUBOBA (Economics & Administration) (Hons), MDP, MSc (Management Sciences) Chief of Human Resources
Age: 47
Joined Telkom: January 2011
Thami Msubo joined Telkom as chief of Human Resources in January 2011. He was previously chief of Human Resources, Corporate Affairs and Empowerment at Tata. Mr Msubo also has experience in transformation, business culture change, leadership development and organisational development.
He has held senior roles in HR, Corporate Affairs and Transformation in multinational companies abroad and locally in greenfield operations and established companies.
Mr Msubo has served as a member on the board of the World Association for Co-operative Education (WACE). He is former deputy chair of Business Against Crime (BAC), Northern KwaZulu-Natal branch.
Mr Msubo holds a Bachelor of Arts degree in Economics and Administration with honours, a Master of Science in Management Sciences. He also completed a Management Development Programme.

64 Telkom Integrated Report 2013
The focus on stakeholder management has sharpened
as the difficult prevailing economic conditions have
highlighted the importance of stakeholder inclusivity and
responsiveness in achieving strategic objectives.
As stated in the 2012 Integrated Report, we have embarked
on a process to bolster our stakeholder engagements and
processes. Feedback received on last year’s stakeholder
engagement section revealed a need for greater clarity
around the value-add of stakeholder engagements and
how it facilitates the achievement of strategic objectives.
Further areas of improvement as per the 2012 audit
findings suggested that responses to stakeholder issues
and concerns should be tracked, measured and reviewed
at least every quarter and that the mitigating actions are
continually assessed. A further recommendation to ensure
greater robustness was to review the process followed by
stakeholder owners to identify their stakeholders’ issues.
A fully functional stakeholder management working group
was introduced in 2013 and will be responsible for driving
and monitoring our responsiveness to stakeholder issues
and ensuring continuous assessment of the effectiveness
of our responses to stakeholder issues.
Telkom is in the process of implementing an automated
centralised stakeholder issues database that will enable a
common view of material issues across the organisation,
ease of monitoring and evaluation as well as reporting on
stakeholder issues to various structures.
Improvements to stakeholder management reporting
over the last financial year include linking a stakeholder
material issue to specific interventions and the separation
of customer material issues so that each customer
segment and the respective material issues are dealt with
individually.
The 2013 financial year saw an exodus of Telkom board
members when government exercised its rights as majority
shareholder to elect a board that it believed could steer
Telkom in the desired strategic direction. Immediate
stability was brought about with the election of the new
board members and chairman. Following the resignation
of the GCEO, a new GCEO and chief operating officer were
appointed on 1 April 2013. These appointments will further
enable the achievement of top management’s strategic
objectives.
Owing to the changes that occurred at board level during
the reporting year, there were no material issues from the
recently appointed Board, however, the board effectiveness
report highlights the concerns for 2013.
STAKEHOLDER MANAGEMENT
PROGRESS Telkom has placed greater impetus on its approach to
enterprise stakeholder management. The organisation
has over the past few years focused on the alignment of
its stakeholder relationships with its strategic objectives.
Telkom has a dedicated unit that focuses strictly on
stakeholder management and reports into the Social and
Ethics Committee.
STAKEHOLDER ENGAGEMENT
GRI
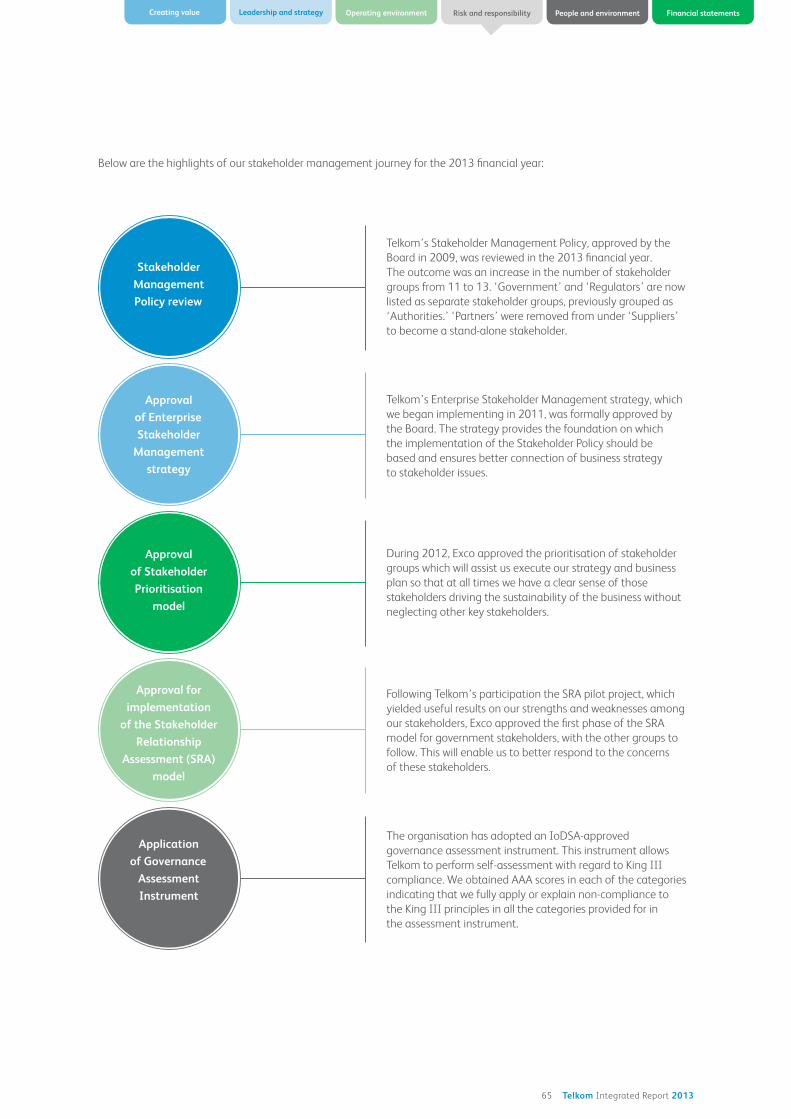
65 Telkom Integrated Report 2013
Operating environment Risk and responsibilityCreating value Leadership and strategy People and environment Financial statements
Below are the highlights of our stakeholder management journey for the 2013 financial year:
Telkom’s Stakeholder Management Policy, approved by the
Board in 2009, was reviewed in the 2013 financial year.
The outcome was an increase in the number of stakeholder
groups from 11 to 13. ‘Government’ and ‘Regulators’ are now
listed as separate stakeholder groups, previously grouped as
‘Authorities.’ ‘Partners’ were removed from under ‘Suppliers’
to become a stand-alone stakeholder.
Telkom’s Enterprise Stakeholder Management strategy, which
we began implementing in 2011, was formally approved by
the Board. The strategy provides the foundation on which
the implementation of the Stakeholder Policy should be
based and ensures better connection of business strategy
to stakeholder issues.
During 2012, Exco approved the prioritisation of stakeholder
groups which will assist us execute our strategy and business
plan so that at all times we have a clear sense of those
stakeholders driving the sustainability of the business without
neglecting other key stakeholders.
Following Telkom’s participation the SRA pilot project, which
yielded useful results on our strengths and weaknesses among
our stakeholders, Exco approved the first phase of the SRA
model for government stakeholders, with the other groups to
follow. This will enable us to better respond to the concerns
of these stakeholders.
The organisation has adopted an IoDSA-approved
governance assessment instrument. This instrument allows
Telkom to perform self-assessment with regard to King III
compliance. We obtained AAA scores in each of the categories
indicating that we fully apply or explain non-compliance to
the King III principles in all the categories provided for in
the assessment instrument.
Stakeholder
Management
Policy review
Approval
of Enterprise
Stakeholder
Management
strategy
Approval
of Stakeholder
Prioritisation
model
Approval for
implementation
of the Stakeholder
Relationship
Assessment (SRA)
model
Application
of Governance
Assessment
Instrument

66 Telkom Integrated Report 2013
Stakeholder 2013 Material issues Telkom response Method of engagement Progress
Enterprise business customers
a. Lack of innovation Telkom has a network
transformation programme
which will provide the
Group with the latitude
for product and service
innovation.
Forums
One-on-one
Website
Perceptions about
overall products and
services improved
from 50% to
57%, according
to our Customer
Loyalty survey:
– Customers believe
that Telkom
products and
services lack
innovation.
– Telkom products
and services are
reliable and add
value.
b. Lack of or
insufficient
communication
We are committed to
improving our existing
communication channels.
Telkom is always seeking
better methods to interact
with customers, e.g. social
media.
Electronic newsletters
including products and
services information to
targeted customers
Presence on
social media
Face-to-face
interaction
Breakfasts
2013 Customer
Loyalty survey shows
critical improvement
in customer
satisfaction with our
communication.
c. Inflexible products
and services
Products and services are
bundled to meet customer
needs.
One-on-one
Ongoing engagement
with account
representatives
Improved products
and services
information
The network upgrade
will be accelerated
over the next three
years and will
improve service
delivery through:
– faster internet
– easy connection
– wireless services
– cellular services
d. Account
management
Telkom has dedicated
representatives for certain
customer accounts.
An escalation process
is also in place to assist
with speedy resolution of
customer queries.
Ongoing engagement
with account
representatives
Overall satisfaction
with account
representatives
improved from 64%
Retail and consumer customers
a. Customer
experience,
broadband, billing
and communication
Telkom has a team in place
to develop an operational
plan to improve service
delivery.
Best practice peer review.
Pinnacle magazine
One-on-one
MI survey
Customer perception
study
The operational plan
is being developed
and will be finalised
in 2014.
STAKEHOLDER ENGAGEMENT
GRI

67 Telkom Integrated Report 2013
Operating environment Risk and responsibilityCreating value Leadership and strategy People and environment Financial statements
Stakeholder 2013 Material issues Telkom response Method of engagement Progress
Wholesale customers
a. Products and
services
Improvement of our
products and services
through technology
and bundling. Telkom is
transforming its technology
to replace existing legacy
technology with a view to
improve its product and
service offering.
Products and
services information
Ongoing engagement
with account managers
Telkom has
successfully
undertaken the
20 Mbps and
40 Mbps broadband
trial plans, which
include locations and
trial objectives. The
project has focused
on FTTx and high-
speed DSL services.
b. Pricing Legacy technologies
inhibit our ability to
reduce prices. The network
transformation programme
will assist us to provide
greater value for money on
products and services.
Products and
services information
One-on-one
engagement
Ongoing engagement
with account managers
Customer satisfaction
improvements of
between 3% and
13% across all
customer segments
was achieved.
Investors a. Lack of clarity/
alignment with
government
Telkom is working with
government to build a
more positive, constructive
relationship. More
regular engagement with
government will help
achieve clarity around
the role of Telkom in
the broadband rollout
and our ability to service
developmental versus
commercial objectives.
The chairman, GCEO
and other Telkom
executives and
representatives interact
with government on a
regular basis
Initial engagements
with government
have been positive.
Positive relationships
with the GCEO
and chairman.
Submission of
national broadband
proposal to
government.
b. Operational
concerns including
historic track record
of poor investment,
high execution risk
and a high cost base
A review of the group
strategy is currently
underway. Telkom is
committed to reporting
on delivery of operational
performance against
financial metrics, e.g. cost
reduction.
One-on-one meetings
Conference calls
Attendance of
conferences
Feedback from
investors has been
positive regarding
recent decision to
impair legacy assets.
Details on the group
strategy will be
provided within the
next 6 to 9 months.

68 Telkom Integrated Report 2013
Stakeholder 2013 Material issues Telkom response Method of engagement Progress
Investors (continued)
c. Risks associated with
the mobile business:
– Telkom’s ability
to fund and
absorb the losses
associated with a
start-up business
– Building a fourth
mobile entrant
in a mature,
competitive
market
Currently reviewing the
mobile business to de-risk
the business case. Mobile is
central to Telkom’s future
and critical to the provision
of converged solutions.
Our focus on profitable
segments of the market
follows a niched approach.
One-on-one meetings
Conference calls
Attendance
of conferences
Investor presentations
An update on the
Mobile business will
be provided to the
market once the
Group strategy is
finalised. This will be
done in the next six to
nine months.
d. Regulatory risks:
competition fines,
lack of sub-1,000
Ghz spectrum, LLU
obligations, etc.
Telkom has taken the
view to settle competition
and other legal issues
expediently where this
is in the best interests
of the Group. We aim to
engage proactively with
the Regulator on issues
impacting the industry.
One-on-one meetings Competition
Commission
fines settled.
ICASA has postponed
LLU for re-assessment.
Government a. Achieving the rollout
of broadband to all
households by 2020
Telkom will seek alignment
with government to ensure
that it fulfils its objectives
as national incumbent.
Telkom seeks to form
a partnership with
government on the
commercial rollout of
broadband.
Participation in
policy forums
– Treasury’s market
sounding
– ICT and job
competitiveness
Inputs and
presentations on NDP
SIP15
ICT Panel Review
Committee and
its processes
Meetings
National broadband
policy document
submitted to
government;
awaiting feedback.
Ongoing engagement
with relevant
government bodies
and stakeholders.
b. Strategy not aligned
to government goals
Ongoing interaction
with government in
order to ensure better
communication and
alignment of objectives.
Meetings
Regulators a. Rollout to
underserviced areas,
particularly rural
communities, at
affordable prices
Promoting Telkom’s
partnership with
government.
Correspondence
Meetings
Recent government
documents show an
understanding of the
critical role Telkom
can play in delivering
telecoms solutions
to under-serviced
areas with support of
government.
b. Quality of service Legal challenge to
regulations. Correspondence
Meetings
c. Increased spectrum
licence fees
Co-operation with ICASA to
reduce financial impact. Correspondence
Meetings
d. Local Loop sub-
leasing (unused
Loops)
This is a work in progress.
Achieved postponement
beyond November 2011.
Correspondence
Meetings
Work in progress
to find alternative
solutions to LLU.
STAKEHOLDER ENGAGEMENT

69 Telkom Integrated Report 2013
Operating environment Risk and responsibilityCreating value Leadership and strategy People and environment Financial statements
Stakeholder 2013 Material issues Telkom response Method of engagement Progress
Regulators (continued)
e. Charging for
numbers
No action by ICASA. Correspondence
Meetings
Work in progress.
f. Increased revenue
from operating
licence fees
Meeting with regulator on
this issue. Formal submissions
Correspondence
Meetings
Employees a. Ageing workforce
retrenchments. Telkom has
performed a qualifications
and skills audit. Currently
implementing a strategic
workforce plan.
Intranet
Performance
management/one-on-
one discussions
Staff meetings
CEO road shows
Electronic Newsletter,
T-News
Online/Telkom Touch
Magazine
DMS/Skytrain
Business Planning/
team building sessions
Culture
Employee Engagement
Survey
will focus mainly
on employees
who have reached
retirement age.
The qualifications
and skills audit will
assist the Group
align skills to
organisational needs
and identify gaps.
These interventions
are critical to
the successful
implementation of
Telkom’s strategic
workforce plan.
b. Job insecurities Employee skills
development through
certified SAQA-accredited
training.
Skills
training programmes
Conferences
Workshops
Telkom provides
internal and external
skills development
interventions that
enable employees
to grow into other
areas of business
where there are
skills shortages.
In 2012 financial year
Telkom trained
4,414 employees
on NGN related
courses, while 6,329
employees were
trained in the 2013
financial year.
c. Job creation Shrinking revenues make
it difficult for Telkom to
make a contribution to the
government’s job creation
agenda. Escalating labour
costs erode profitability
of the Group. Broadband
rollout may assist in this
regard.
One-on-one
with government
Job forum
Transformation forum
The current financial
performance makes
it difficult to create
direct employment.
Empowerment
initiatives like
bursary schemes,
learnerships and
supplier development
programmes.

70 Telkom Integrated Report 2013
Stakeholder 2013 Material issues Telkom response Method of engagement Progress
Employees (continued)
d. Career development
and planning;
succession planning
New succession planning
map approved. Rollout
happening at Executive
and senior management
level.
Succession planning
framework Telkom has career
development and
succession plans
to enable the
nurturing of talent,
retention of critical
skills and leadership
development.
Organised Labour
a. Telkom’s role in
transformation of
society through
universal service and
access
Recognition of the need to
balance financial and social
aspects.
Forums Work in progress,
with positive gains
made in addressing
inequalities and
discrepancies in
remuneration as
well as ensuring
a transformed
environment.
b. Lack of trust by
organised labour
Telkom engages with
organised labour on an
ongoing basis.
HR
Forums
c. Matters relating
to transformation,
diversity,
employment
equity and skills
development
National Equity
and Development
Transformation Forum
address transformation
and diversity. Gender and
Disability Programmes
target specific groupings.
Telkom has appointed
a company to assist in
recruitment of persons with
disability.
Programme on declaration
of disability.
National Equity
and Development
Transformation Forum
Media a. Lack of high-level
executive on/off-the
record engagement
with media and
Telkom GCEO/Exco
team
Telkom has embarked
on a high-level media
engagement process
for Telkom executives to
improve accessibility and
combat negative press.
We began a structured
programme to introduce
new GCEO to key media
audiences.
One-on-one meetings
Media briefings
Press releases
Renewed focus
on engagements
with the media will
ensure that we report
positively in new
financial year.
Fair coverage of
results and the legacy
asset impairment
among business and
ICT media.
GCEO introductory
media road show
successfully executed.
b. Negative
perceptions of
Telkom in the media
STAKEHOLDER ENGAGEMENT
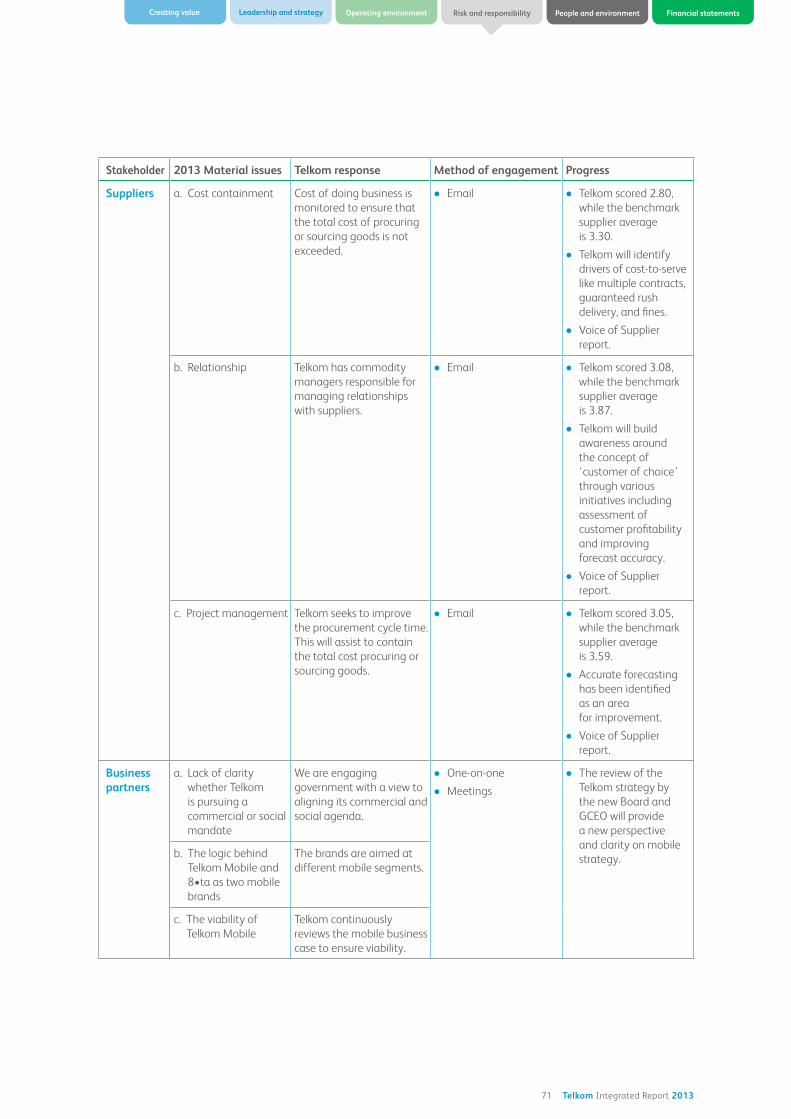
71 Telkom Integrated Report 2013
Operating environment Risk and responsibilityCreating value Leadership and strategy People and environment Financial statements
Stakeholder 2013 Material issues Telkom response Method of engagement Progress
Suppliers a. Cost containment Cost of doing business is
monitored to ensure that
the total cost of procuring
or sourcing goods is not
exceeded.
Email Telkom scored 2.80,
while the benchmark
supplier average
is 3.30.
Telkom will identify
drivers of cost-to-serve
like multiple contracts,
guaranteed rush
delivery, and fines.
report.
b. Relationship Telkom has commodity
managers responsible for
managing relationships
with suppliers.
Email Telkom scored 3.08,
while the benchmark
supplier average
is 3.87.
Telkom will build
awareness around
the concept of
‘customer of choice’
through various
initiatives including
assessment of
customer profitability
and improving
forecast accuracy.
report.
c. Project management Telkom seeks to improve
the procurement cycle time.
This will assist to contain
the total cost procuring or
sourcing goods.
Email Telkom scored 3.05,
while the benchmark
supplier average
is 3.59.
Accurate forecasting
has been identified
as an area
for improvement.
report.
Business partners
a. Lack of clarity
whether Telkom
is pursuing a
commercial or social
mandate
We are engaging
government with a view to
aligning its commercial and
social agenda.
One-on-one
Meetings
The review of the
Telkom strategy by
the new Board and
GCEO will provide
a new perspective
and clarity on mobile
strategy.b. The logic behind
Telkom Mobile and
brands
The brands are aimed at
different mobile segments.
c. The viability of
Telkom Mobile
Telkom continuously
reviews the mobile business
case to ensure viability.

72 Telkom Integrated Report 2013
STAKEHOLDER ENGAGEMENT
Stakeholder 2013 Material issues Telkom response Method of engagement Progress
Opinion makers
a. Lack of continuity
with regards to
the GCEO of the
company
Telkom has appointed the
new GCEO and the COO.
This will assist in ensuring
continuity.
AGM
GCEO road shows
Analyst presentations
Engagements with
government on
Telkom’s role in ICT
aspiration will address
issues of influence. b. The influence of
government on
Telkom
Telkom is engaging with
government with a view to
aligning expectations.
One-on-one
Meetings
Civil society
a. Lack of access to
funding
Telkom Foundation has
a policy which clearly
articulates areas of focus.
Evaluation of proposals
Reviewed
engagements with
civil society to
determine inroads
made and the work
by Telkom Foundation
continues to yield
positive results.
Competitors Local loop unbundling Telkom is engaging relevant
authorities in the sector on
this matter
Submissions
Meetings
Engagements with
Authority are ongoing
Telkom is seen as
monopolistic
Telkom is not a significant
market leader Meetings
73 Telkom Integrated Report 2013
Operating environment Risk and responsibilityCreating value Leadership and strategy People and environment Financial statements
PEOPLE AND THE
ENVIRONMENT
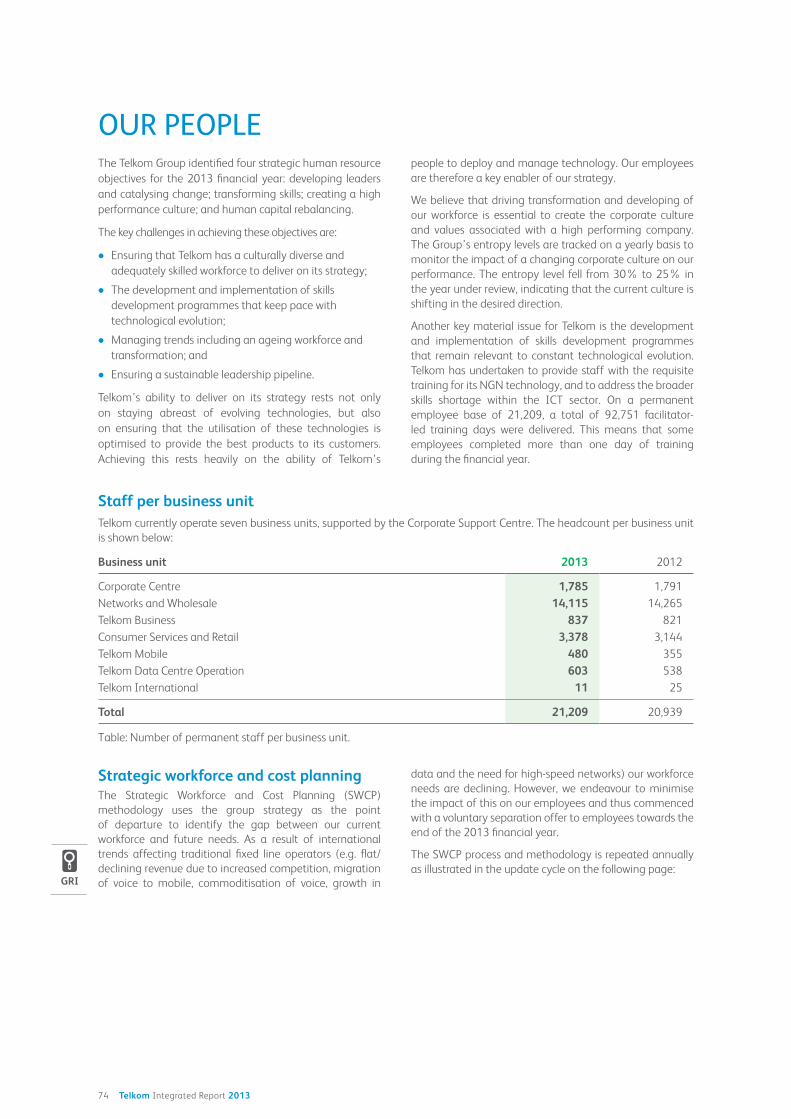
74 Telkom Integrated Report 2013
The Telkom Group identified four strategic human resource
objectives for the 2013 financial year: developing leaders
and catalysing change; transforming skills; creating a high
performance culture; and human capital rebalancing.
The key challenges in achieving these objectives are:
Ensuring that Telkom has a culturally diverse and
adequately skilled workforce to deliver on its strategy;
The development and implementation of skills
development programmes that keep pace with
technological evolution;
Managing trends including an ageing workforce and
transformation; and
Ensuring a sustainable leadership pipeline.
Telkom’s ability to deliver on its strategy rests not only
on staying abreast of evolving technologies, but also
on ensuring that the utilisation of these technologies is
optimised to provide the best products to its customers.
Achieving this rests heavily on the ability of Telkom’s
people to deploy and manage technology. Our employees
are therefore a key enabler of our strategy.
We believe that driving transformation and developing of
our workforce is essential to create the corporate culture
and values associated with a high performing company.
The Group’s entropy levels are tracked on a yearly basis to
monitor the impact of a changing corporate culture on our
performance. The entropy level fell from 30% to 25% in
the year under review, indicating that the current culture is
shifting in the desired direction.
Another key material issue for Telkom is the development
and implementation of skills development programmes
that remain relevant to constant technological evolution.
Telkom has undertaken to provide staff with the requisite
training for its NGN technology, and to address the broader
skills shortage within the ICT sector. On a permanent
employee base of 21,209, a total of 92,751 facilitator-
led training days were delivered. This means that some
employees completed more than one day of training
during the financial year.
Staff per business unitTelkom currently operate seven business units, supported by the Corporate Support Centre. The headcount per business unit
is shown below:
Business unit 2013 2012
Corporate Centre 1,785 1,791
Networks and Wholesale 14,115 14,265
Telkom Business 837 821
Consumer Services and Retail 3,378 3,144
Telkom Mobile 480 355
Telkom Data Centre Operation 603 538
Telkom International 11 25
Total 21,209 20,939
Table: Number of permanent staff per business unit.
Strategic workforce and cost planningThe Strategic Workforce and Cost Planning (SWCP)
methodology uses the group strategy as the point
of departure to identify the gap between our current
workforce and future needs. As a result of international
trends affecting traditional fixed line operators (e.g. flat/
declining revenue due to increased competition, migration
of voice to mobile, commoditisation of voice, growth in
data and the need for high-speed networks) our workforce
needs are declining. However, we endeavour to minimise
the impact of this on our employees and thus commenced
with a voluntary separation offer to employees towards the
end of the 2013 financial year.
The SWCP process and methodology is repeated annually
as illustrated in the update cycle on the following page:
OUR PEOPLE
GRI
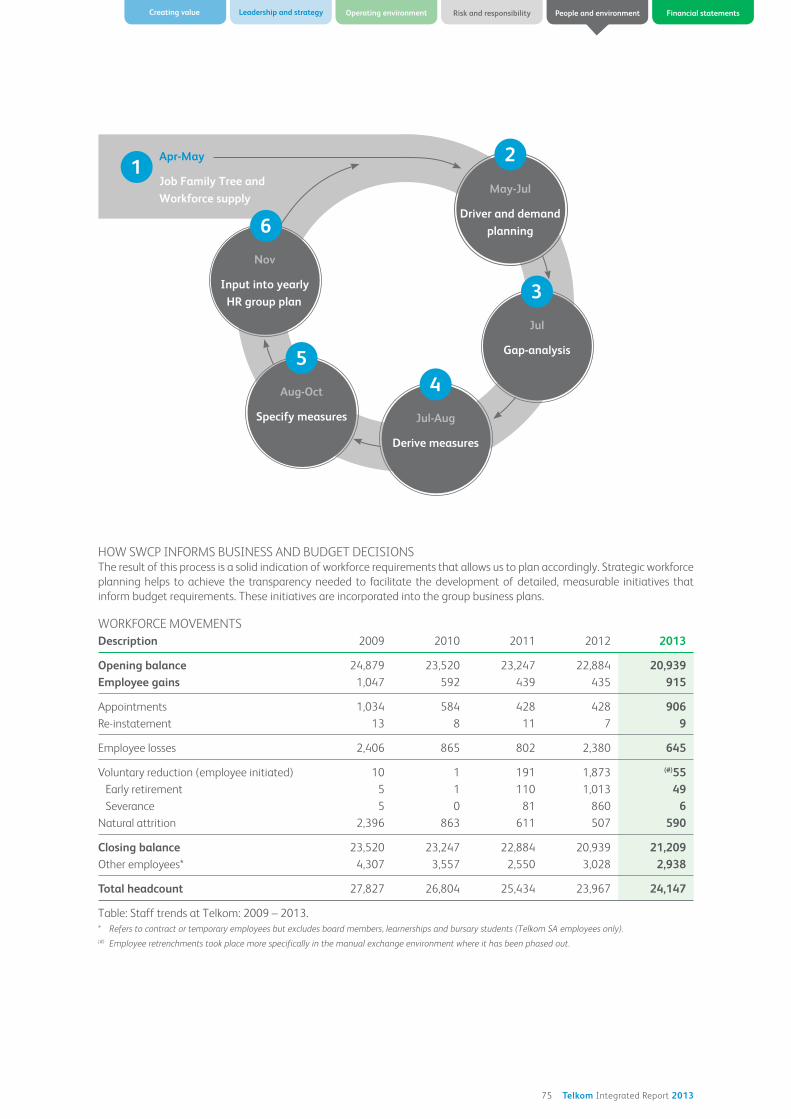
75 Telkom Integrated Report 2013
Operating environment Risk and responsibilityCreating value Leadership and strategy People and environment Financial statements
HOW SWCP INFORMS BUSINESS AND BUDGET DECISIONSThe result of this process is a solid indication of workforce requirements that allows us to plan accordingly. Strategic workforce
planning helps to achieve the transparency needed to facilitate the development of detailed, measurable initiatives that
inform budget requirements. These initiatives are incorporated into the group business plans.
May-Jul
Driver and demand
planning
2
Jul
Gap-analysis
3
Jul-Aug
Derive measures
4Aug-Oct
Specify measures
5
Apr-May
Job Family Tree and
Workforce supply
Nov
Input into yearly
HR group plan
1
6
Description 2009 2010 2011 2012 2013
Opening balance 24,879 23,520 23,247 22,884 20,939Employee gains 1,047 592 439 435 915
Appointments 1,034 584 428 428 906Re-instatement 13 8 11 7 9
Employee losses 2,406 865 802 2,380 645
10 1 191 1,873 (#)55Early retirement 5 1 110 1,013 49Severance 5 0 81 860 6
Natural attrition 2,396 863 611 507 590
Closing balance 23,520 23,247 22,884 20,939 21,209Other employees* 4,307 3,557 2,550 3,028 2,938
Total headcount 27,827 26,804 25,434 23,967 24,147
Table: Staff trends at Telkom: 2009 – 2013.
* Refers to contract or temporary employees but excludes board members, learnerships and bursary students (Telkom SA employees only).
(#) Employee retrenchments took place more specifically in the manual exchange environment where it has been phased out.
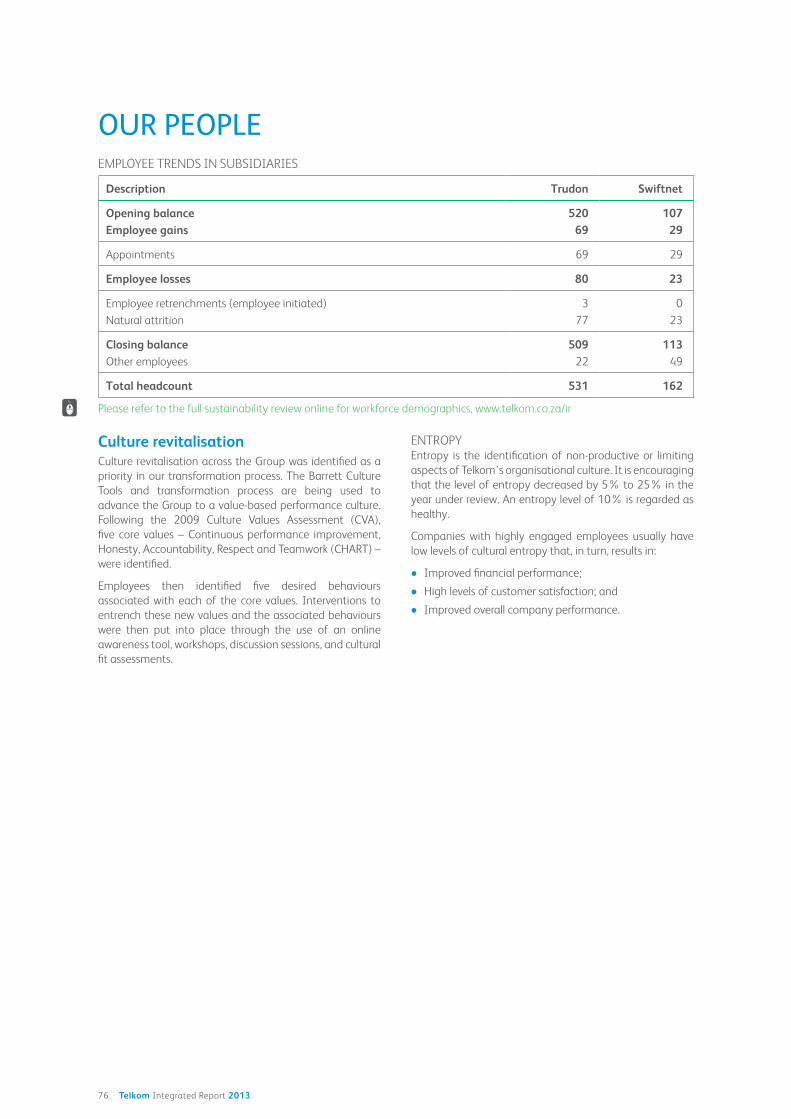
76 Telkom Integrated Report 2013
Description Trudon Swiftnet
Opening balance 520 107Employee gains 69 29
Appointments 69 29
Employee losses 80 23
Employee retrenchments (employee initiated) 3 0
Natural attrition 77 23
Closing balance 509 113Other employees 22 49
Total headcount 531 162
Please refer to the full sustainability review online for workforce demographics, www.telkom.co.za/ir
Culture revitalisationCulture revitalisation across the Group was identified as a
priority in our transformation process. The Barrett Culture
Tools and transformation process are being used to
advance the Group to a value-based performance culture.
five core values – Continuous performance improvement,
Honesty, Accountability, Respect and Teamwork (CHART) –
were identified.
Employees then identified five desired behaviours
associated with each of the core values. Interventions to
entrench these new values and the associated behaviours
were then put into place through the use of an online
awareness tool, workshops, discussion sessions, and cultural
fit assessments.
Entropy is the identification of non-productive or limiting
aspects of Telkom’s organisational culture. It is encouraging
that the level of entropy decreased by 5% to 25% in the
year under review. An entropy level of 10% is regarded as
healthy.
Companies with highly engaged employees usually have
low levels of cultural entropy that, in turn, results in:
Improved financial performance;
High levels of customer satisfaction; and
Improved overall company performance.
OUR PEOPLE

77 Telkom Integrated Report 2013
Operating environment Risk and responsibilityCreating value Leadership and strategy People and environment Financial statements
Diagram: entropy levels for the Group.
Diversity and transformationWe were able to positively influence the Group’s workforce demographics during the financial year.
Status of workforce demographics at 31 March 2013 – Telkom SA
GradesBlack White Foreign nationals Grand
Total
Black Female
Male Female Male Female Male Female Total Total
Top management3 2 2 0 1 0 8 5 2
38% 25% 25% 0% 13% 0% 63% 25%
Senior management51 26 56 13 0 0 146 77 39
35% 18% 38% 9% 0% 0% 53% 27%
Middle management858 347 968 294 20 6 2,493 1,205 647
34% 14% 39% 12% 1% 0% 48% 26%
Junior management8,066 3,679 4,228 1,528 24 2 17,527 11,745 5,209
46% 21% 24% 9% 0% 0% 67% 30%
Operational302 395 71 236 0 1 1,005 697 632
30% 39% 7% 23% 0% 0% 69% 63%
Support11 16 1 1 1 0 30 27 17
37% 53% 3% 3% 3% 0% 90% 57%
Total9,291 4,465 5,326 2, 072 46 9 21,209 13,756 6,546
44% 21% 25% 10% 0% 0% 65% 31%
Please refer to the full sustainability review online for employment equity statistics, www.telkom.co.za/ir
Performance managementAll employees undergo regular performance assessments.
This is a process that involves regular feedback and review
sessions, which provide performance and development
plans.
A short-term incentive plan to reward the achievement of
group and business unit performance targets has been in
place for a number of years. In addition, we embarked on
a process to develop a differentiated reward model, which
is intended to link remuneration to market related salaries
and also differentiate pay based on performance.
For more information refer to the remuneration report
commencing on page 126 of this report.
TALENT, TRAINING AND RETENTION MANAGEMENTDuring the financial year, R255 million (2012: R245 million)
was invested in training.
We recently completed the first phase of the installation
and commissioning of a new training network. This
dedicated training network is a protected simulated
learning environment that poses very limited security risks
to the production network. This network will enable high-
quality training at a significantly lower cost than would be
possible through the use of external vendors.
0
10
20
30
40
50
60
Disaffected
2011 2012
Agnostic
60
27
13
27
60
13
26
59
15
2013
True believers
GRI

78 Telkom Integrated Report 2013
Executive leadership developmentThe development of a sustainable leadership pipeline
is critical to Telkom’s continuity from a human capital
perspective. This has become increasingly pertinent to the
organisation following the resignations of senior leaders
during the 2013 financial year.
A revised succession planning process was implemented
in April 2012. A phased implementation approach was
followed, commencing with succession planning for the
GCEO and Exco roles. Further to this, we have identified
frontline leadership and critical skills positions to ensure
that successors are identified and developed for those
specific areas of the business.
Please refer to the full sustainability review for more
information on people development, www.telkom.co.za/ir
IMPACT OF THE NGNEC ROLLOUTTo ensure staff are prepared for the migration to an IP
network, we commenced training of field staff in NGN skills
to facilitate a smooth transition from legacy technology in
which they were trained and to which they are accustomed.
Since February 2012, 1,267 candidates were trained,
amounting to 6,335 training days. Training is planned
in a just-in-time manner to occur alongside the planned
network rollout over the next three years.
PROGRAMMES FOR SKILLS MANAGEMENT AND
LIFELONG LEARNING
CENTRE OF EXCELLENCE PROGRAMME
This is a collaborative programme between Telkom,
academia, the telecommunications industry and
government to promote research in communication
technology and associated sciences. Sixteen Centres of
Excellence have been established across the country,
making it the largest co-ordinated research effort in ICT
in South Africa. Telkom participates in this collaborative
programme by granting full-time bursars the opportunity to
continue their studies and research via the Telkom Centre of
Excellence programme. At present there are 34 individuals
conducting research at the various Centres of Excellence.
In addition, Telkom provides sponsorship to three universities
(University of KwaZulu-Natal, North West University and
the University of Limpopo). This commitment assists
previously disadvantaged students who fail to meet the
university entrance requirements in gaining eligibility to
study engineering via the bridging programme.
Please refer to the full sustainability review online for
information on graduate development schemes, www.
telkom.co.za/ir
Change managementTelkom carried out various change management
initiatives over the past year at the individual, group
and organisational level to ensure business projects and
initiatives are implemented successfully. Examples are
the implementation of shared services and customer
experience projects as well as other initiatives prompted
by technological, structural and system changes. These
change initiatives help employees to deal with and
understand change.
Telkom established a change management philosophy,
methodology, process and tools based on the Prosci’s
Change Management Model.
Levels
Permanent
employees
(31 March 2013)
Facilitator led
training days
Average
training days
Top management 8 1 0.1
Senior management 146 35 0.2
Middle management 2,493 7,234 3.0
Junior management 17,527 21,170 1.2
Operational 1,005 64,302 63.8
Support 30 9 0.3
Total 21,209 92,751 4.4
Training days per employment category Trudon Swiftnet
Management 3.56 4.20
Specialists 8.48 0.63
Operational 3.32 1.69
Table: Comparison of training days (Telkom SA only)
OUR PEOPLE
GRI

79 Telkom Integrated Report 2013
Operating environment Risk and responsibilityCreating value Leadership and strategy People and environment Financial statements
Employee relationsThe table below records the percentage of employees
covered by collective bargaining agreements.
Type of
employees Union Total %
Bargaining unit
CWU 7,161 38.58
S.A.C.U. 3,819 20.57
Solidarity 2,880 15.52
No union 4,702 25.33
Bargaining unit
total 18,562 100.00
Management
CWU 201 7.59
S.A.C.U. 275 10.39
Solidarity 194 7.33
No union 1,977 74.69
Management total 2,647 100.00
Grand total 21,209
Table: union membership as at 31 March 2013
Please refer to the full sustainability review online for
Telkom’s consultative framework, www.telkom.co.za/ir
In December 2012, 56 man-days were lost as a result of
the Cosatu organised e-toll strike. Man-days are counted on
an individual employee basis, meaning that 56 employees
went on strike for one day.
GRI
80 Telkom Integrated Report 2013
Telkom has implemented occupational safety as a cross-
disciplinary responsibility protecting the safety of employees
at work, as well as the safety of co-workers, family members,
customers, service providers, nearby communities and other
members of public who are also affected. Over the past few
years Telkom has introduced many campaigns, policies,
procedures and programmes to prevent Occupational Health
and Safety (OHS) related incidents.
During this reporting period, our health programmes
focused on a reduction in healthcare costs and absenteeism.
This resulted in improved productivity and contributed
towards the creation of a more supportive and sustainable
working environment. OHS also seeks to assist employees
making choices that facilitate work-life balance and a more
sustainable workforce.
Please refer to the full sustainability review online for
information on meeting GRI LA7 and LA8, www.telkom.co.za/ir
Telkom has education, training, counselling, prevention,
and risk-control programmes in place to assist employees,
their direct dependents and contract workers with serious
diseases. Telkom believes that employees who are physically
and emotionally well, and have a positive and committed
attitude, are more motivated to achieve business success.
This, in turn, can greatly influence productivity, which is a
key aspect in ensuring the sustainability of our business.
and Wellness Workplace programme to keep employees
healthy. This is accomplished by highlighting the
importance of good health through education and regular
screening. The programme also assists employees that are
already at risk of developing chronic lifestyle conditions to
adapt their lifestyles.
South African operations to educate, train, counsel, prevent,
and manage the risk of employees contracting serious
diseases.
The programme includes:
A series of wellness days that aim to:
– Educate and provide information concerning
healthy living and prevention of serious diseases
antigen screening test), high blood pressure,
obesity, type II diabetes, high cholesterol and
cardiac conditions.
tuberculosis, diabetes, cholesterol, blood pressure and
body mass index (BMI):
– In the reporting period, 5,903 employees (3,621 in
(3,952 in 2012) participated in the on-site wellness
screenings.
– The number of employees and dependants tested
for all those tested is 3.21%.
The Thuso 24-hour medical call centre provides
counselling, care and support to Telkom employees and
their immediate dependants in relation to any health
The call centre is staffed by qualified medical professionals
that can assist individuals in any health matter.
As part of our education and awareness strategy, the Thuso
Workplace Programme is included in Telkom’s induction
programme for all newly appointed or recently promoted
employees to educate them about its objectives, roles and
benefits.
nationwide free condom dispensing programme.
In addition, the Telkom Foundation provides funding to
a number of programmes that have education, training,
counselling, prevention, and risk-control programmes
in place to assist communities with serious diseases,
on programmes that address serious diseases amounts to
R1,435,100 (total Telkom Foundation spend is R42 million for
the financial year).
Please refer to the full sustainability review online for details
on the above mentioned programmes, www.telkom.co.za/ir
Telkom’s OHS management system is OHSAS 18001 certified
and aligned to the Telkom Health and Safety Policy (OHSP).
Telkom has a detailed OHS policy which takes a holistic
approach towards ensuring overall compliance with the legal
requirements of the Occupational Health and Safety Act (OHS
Act), 85 of 1993. To maintain compliance with applicable
legislation and the Telkom OHSP, it is imperative that Telkom
initiates OHS performance targets which drive a more specific
approach in managing certain identified legal requirements
and emerging statistical trends. The OHS performance targets
are reviewed periodically to address any current OHS needs.
The respective service organisations within the Group ensure
the implementation and achievement of the Telkom OHS
performance targets on a quarterly basis. The safety, health
and environment (SHE) management division monitors these
targets accordingly and provides support where intervention
is required.
During this reporting cycle, internal OHS legal compliance
audits were carried out on operational managers to determine
a baseline compliance rating for the Group. The methodology
used during the audit programme took a slightly different
approach whereby the audit team utilised each individual
audit session to identify compliance gaps and to coach, train
and support line managers immediately. The response from
line management indicated that the exercise was extremely
well received.
The ultimate goal of this exercise is to maintain an overall
compliance rating of at least 85% and to improve the
incident frequency rate of 2.66 per 100 employees and a
lost time incident frequency rate of 1.42 per 100 employees.
This will ultimately contribute to an improved lost time and
productivity performance for the Group.
Please refer to the full sustainability review online for
information on Telkom’s OHS performance targets,
www.telkom.co.za/ir
OCCUPATIONAL HEALTH AND SAFETY
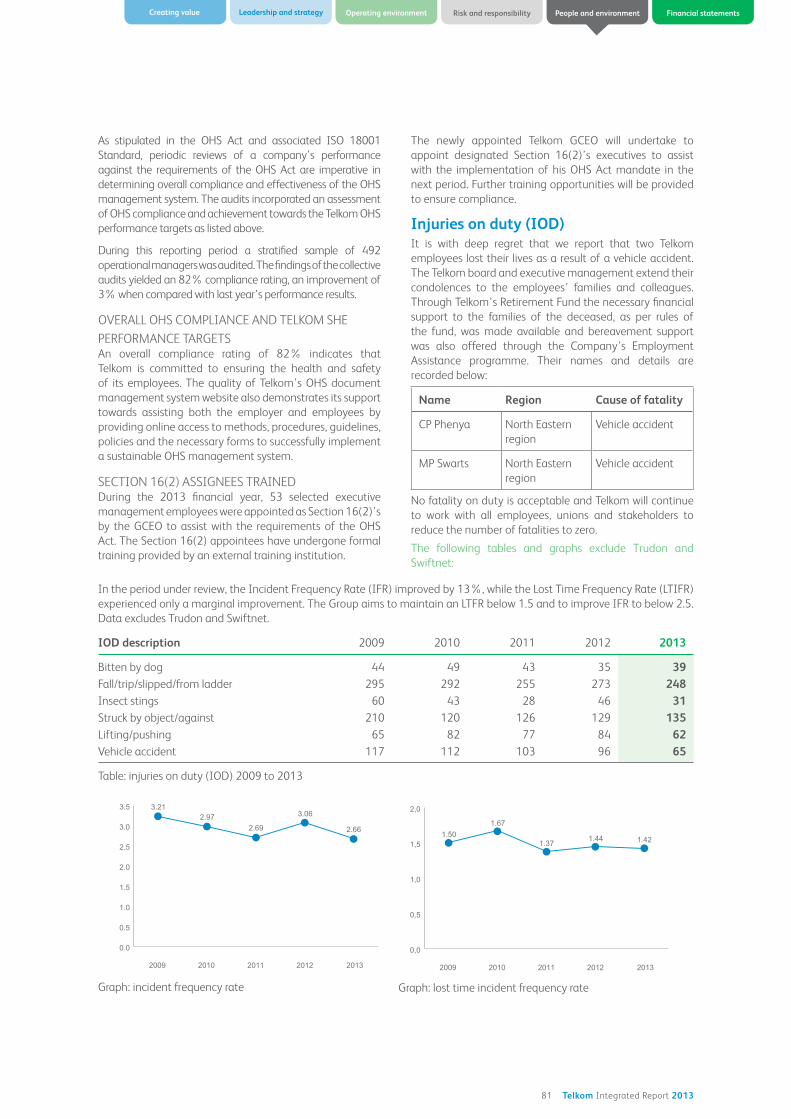
81 Telkom Integrated Report 2013
Operating environment Risk and responsibilityCreating value Leadership and strategy People and environment Financial statements
As stipulated in the OHS Act and associated ISO 18001
Standard, periodic reviews of a company’s performance
against the requirements of the OHS Act are imperative in
determining overall compliance and effectiveness of the OHS
management system. The audits incorporated an assessment
of OHS compliance and achievement towards the Telkom OHS
performance targets as listed above.
During this reporting period a stratified sample of 492
operational managers was audited. The findings of the collective
audits yielded an 82% compliance rating, an improvement of
3% when compared with last year’s performance results.
PERFORMANCE TARGETSAn overall compliance rating of 82% indicates that
Telkom is committed to ensuring the health and safety
of its employees. The quality of Telkom’s OHS document
management system website also demonstrates its support
towards assisting both the employer and employees by
providing online access to methods, procedures, guidelines,
policies and the necessary forms to successfully implement
a sustainable OHS management system.
SECTION 16(2) ASSIGNEES TRAINEDDuring the 2013 financial year, 53 selected executive
management employees were appointed as Section 16(2)’s
by the GCEO to assist with the requirements of the OHS
Act. The Section 16(2) appointees have undergone formal
training provided by an external training institution.
The newly appointed Telkom GCEO will undertake to
appoint designated Section 16(2)’s executives to assist
with the implementation of his OHS Act mandate in the
next period. Further training opportunities will be provided
to ensure compliance.
Injuries on duty (IOD)It is with deep regret that we report that two Telkom
employees lost their lives as a result of a vehicle accident.
The Telkom board and executive management extend their
condolences to the employees’ families and colleagues.
Through Telkom’s Retirement Fund the necessary financial
support to the families of the deceased, as per rules of
the fund, was made available and bereavement support
was also offered through the Company’s Employment
Assistance programme. Their names and details are
recorded below:
Name Region Cause of fatality
CP Phenya North Eastern
region
MP Swarts North Eastern
region
No fatality on duty is acceptable and Telkom will continue
to work with all employees, unions and stakeholders to
reduce the number of fatalities to zero.
The following tables and graphs exclude Trudon and
Swiftnet:
In the period under review, the Incident Frequency Rate (IFR) improved by 13%, while the Lost Time Frequency Rate (LTIFR)
experienced only a marginal improvement. The Group aims to maintain an LTFR below 1.5 and to improve IFR to below 2.5.
Data excludes Trudon and Swiftnet.
IOD description 2009 2010 2011 2012 2013
Bitten by dog 44 49 43 35 39Fall/trip/slipped/from ladder 295 292 255 273 248Insect stings 60 43 28 46 31Struck by object/against 210 120 126 129 135Lifting/pushing 65 82 77 84 62
117 112 103 96 65
Table: injuries on duty (IOD) 2009 to 2013
0.0
0.5
1.0
1.5
2.0
2.5
3.0
3.5
20132012201120102009
3.212.97
2.69
3.06
2.66
Graph: incident frequency rate
0,0
0,5
1,0
1,5
2,0
20132012201120102009
1.501.67
1.37 1.44 1.42
Graph: lost time incident frequency rate

82 Telkom Integrated Report 2013
OCCUPATIONAL HEALTH AND SAFETY
Graph: number of lost days as a result of IOD
Graph: number of lost days per 100 employees
Graph: IOD costs (Rm)
Over the past five years we have observed a significant
reduction in the number of days lost as a result of incidents
on duty (28%) and in days lost per 100 employees (39%).
This resulted in a 3.8% decrease in the total cost-to-company
of incidents on duty.
Fall injuries are the leading cause of IOD at Telkom. Our
challenge will be to drive behavioural change to reduce the
incident rate further.
PROGRAMMEThe purpose of Telkom’s Medical Surveillance programme
is to identify medical conditions that could lead to an
occupational disease. Risk based medical surveillance fit-
for-duty medicals are conducted at the following intervals:
Pre-placement;
Periodic/transfer;
Return to work after injury or prolonged illness; and
Exiting employment at Telkom.
The following information is taken into consideration when
determining the type of medical surveillance programme
required:
The type of work an employee is performing;
Duration of the task;
The materials being used; and
The potential for exposure.
The specific test results and other medical information
revealed through testing are confidential and stays between
the employee and the occupational medicine practitioner.
Clinical case management A total of 165 cases were seen by our occupational medical
practitioner between April 2012 and March 2013. The
graph on the following page illustrates the most prevalent
diagnoses of clinical case referrals in the 2013 financial
year:
0
5 000
10 000
15 000
20132012201120102009
10,852
9,207
7,759 7,204 6,767
Num
ber o
f day
s
0.0
10.0
20.0
30.0
40.0
50.0
20132012201120102009
39.0
34.330.5 30.1
28.0
Num
ber o
f day
s
0
10
20
30
40
50
20132012201120102009
40.6
35.1
25.3 26.3 26.1
R m
illio
n
GRI

83 Telkom Integrated Report 2013
Operating environment Risk and responsibilityCreating value Leadership and strategy People and environment Financial statements
Graph: Clinical Case Management: 165 cases
Medical surveillance, or screening, is a statutory requirement.
Medical screening takes place at timed intervals that are
determined by risk based criteria to ensure that employees
are medically fit to perform their inherent duties and
are not subjected to health hazards. This demonstrates
preventative action being taken to avert future incidents.
The frequency of the medical surveillance is based on the
applicable laws and regulations as well as determined by
Telkom’s occupational medical practitioner. Thus, not all
employees will be screened in terms of medical surveillance
during the course of any given year; this will also depend
largely on an employee’s risk profile.
The following different types of medical screening are
performed on site by occupational health practitioners:
Pre-employment;
Working-at-height medicals (mast and towers);
Periodic medicals, which include medical screening for
occupational diseases (depending on the risk exposure,
the frequency can vary from annually to every two
years);
Exit medicals;
Transfer (departmental) medicals;
Forklift medical screening;
Audio screening (call centre environments) as a result of
exposure to sound levels that exceed an eight-hour time
weighted average of 85 dBA – initial baseline exam);
Biological monitoring – Lead exposure; and
Asbestos – AR:9.
A total of 4,130 medical examinations were performed in
the different risk categories during the year.
Graph: types of medical screening for the period April 2012
to March 2013
The table below indicates the medical screening trends at
Telkom:
Trends Concerns
Obesity Weighing above 110kg –
no weight management
programme enforced
Hypertension Uncontrolled, defaulters and
lack of follow-up to ensure the
effective management of
the condition
Psychological
problems
Employees using anti-
depressant without follow-up
care from the treating doctors
and Telkom OMP
Diabetes Type II and insulin-
dependent – lack of follow-up
and monitoring of employees
suffering from diabetes.
Programme is important for all
climbers and drivers
Ageing workforce
with chronic medical
problems
Above 50-year olds allowed to
climb masts and towers
No enforcement
of medical
recommendations
by OHP
Line managers seem to not
be taking responsibility for
ensuring that employees with
medical condition adhere to
recommendations
Telkom has an extensive EMF radiation exposure prevention
programme in place to protect employees and communities
at risk of exposure. All radiation zones on Telkom premises
are demarcated to warn employees.
A further mitigating action put in place is to switch off
power before employees enter these danger zones.
0
500
1 000
1 500
2 000
2 500
3 000
3 500
ExitPre-employment
PeriodicForklift
83
2,864
13
801
142 95 132
Working at Asbestos and Audiology
Num
ber o
f med
ical
scr
eeni
ngs
0
10
20
30
40
50
60
17
52
15
25
56
Num
ber o
f cas
es
Psy
chia
tric
ca
ses
IOD
- M
usc
o s
kele
tal
Co
mm
un
ica
ble
:
Pri
ma
ry h
ea
lth
care
an
d
ag
ing
wo
rkfo
rce
Ep
ilep
sy

84 Telkom Integrated Report 2013
OCCUPATIONAL HEALTH AND SAFETYTelkom also has a well-defined audit programme in place
which audits radiation patterns to ensure third parties are
not be affected by Telkom’s EMF operations. Readings
are taken annually and stored on a database for future
reference. Where third parties have raised concerns,
new tests are taken and the results reported back to the
concerned party via Telkom’s Legal Services. There were
no reported cases of EMF radiation levels exceeding the
prescribed limits as per the International Commission on
Non-Ionising Radiation Protection (ICNIRP) specification.
Occupational hygiene
Occupational hygiene surveys were conducted as part
of Telkom’s responsibility to provide a healthy and safe
working environment.
Three types of surveys are conducted as part of our
programme:
1. Ad hoc – These surveys are requested by Telkom
employees or health and safety representatives.
Telkom’s service provider call centre is contacted
directly to conduct surveys including: temperature, dust,
illumination, water and diesel fumes surveys.
2. Scheduled surveys – Buildings are identified and a list is
sent to Telkom’s service provider. The service provider
contracts the appointed vendors to conduct these
scheduled surveys, which include: Indoor Air Quality
(IAQ), water, and temperature surveys.
3. Pre and Post-surveys – These surveys are conducted as
part of the service providers’ statutory contract with
Telkom. These are performed prior to the relocation of
employees or construction of a building, and then again
after the employees have been relocated.
The following types of surveys are conducted by Approved
Inspection Authorities:
Type of survey Description
IAQ Carbon dioxide
Carbon monoxide
Relative humidity
Air temperature
The main purpose of the survey is to:
Quantify employee exposures to specific occupational health hazards; and
Comprehensively assess the risks associated with all significant occupational
health hazards to which employees are exposed as a result of their work.
Water Water quality: pH, turbidity
and total dissolved solids
Macro determinants: chloride
Micro determinants: iron
Bacteriological limits: ecoli
The main purpose of the survey is to:
Determine the quality of the drinking water supplied to Telkom employees;
Evaluate and check whether the distribution system performs correctly; and
Propose the necessary recommendations to ensure compliance to
statutory requirements.
Water samples are analysed by a SANAS accredited Micro Laboratory and according
to SANS 241 –1 and 2:2011 (Edition 1).
Illumination
Lux levels
The main purpose of this survey is to:
Assess the lighting levels in accordance with the schedule as stipulated in the
Environmental Regulations for Workplaces under the OHS Act, 85 of 1993.
Ergonomics The goal of ergonomics is to:
Create an environment that is well-suited to a user’s physical needs; and
Ensure compliance to the OHS Act, 85 of 1993.
Noise The main purpose of this survey is to:
Assess whether noise levels emitted at a source exceeds exposure limits in
accordance with the OHS Act, 85 of 1993, as well as recommended SANS
Standards; and
Prevent hearing impairment by proactively identifying excessive exposure.
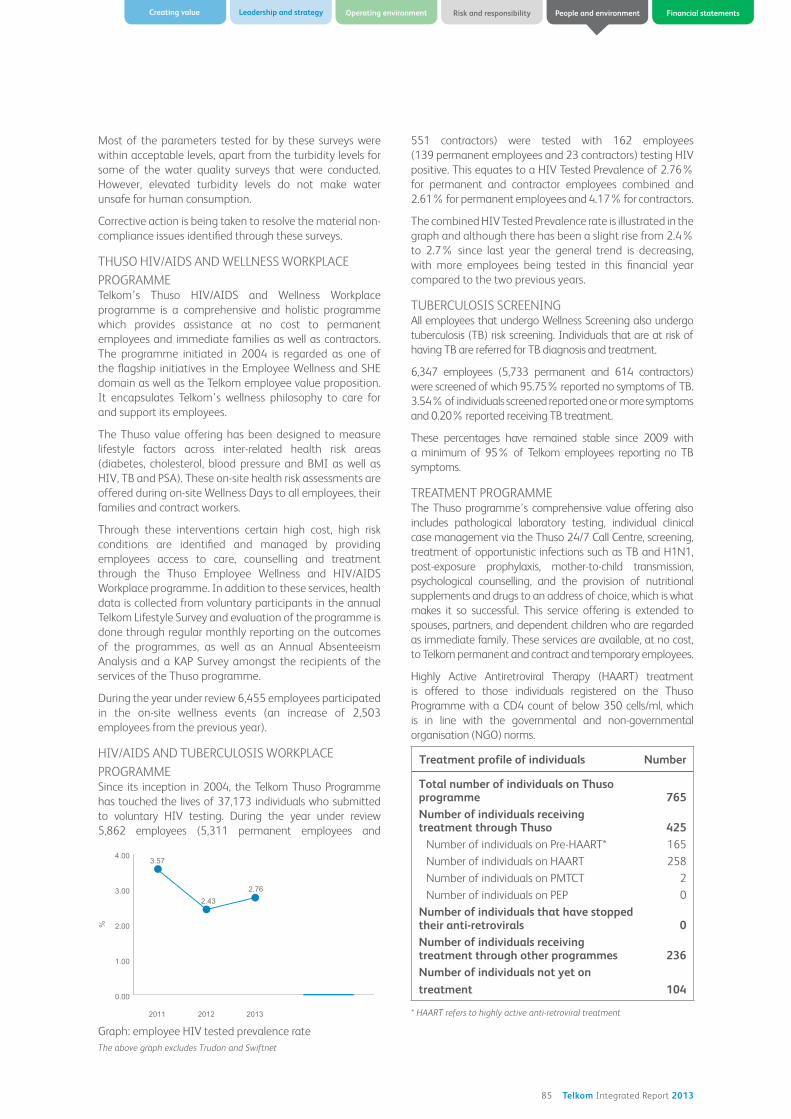
85 Telkom Integrated Report 2013
Operating environment Risk and responsibilityCreating value Leadership and strategy People and environment Financial statements
Most of the parameters tested for by these surveys were
within acceptable levels, apart from the turbidity levels for
some of the water quality surveys that were conducted.
However, elevated turbidity levels do not make water
unsafe for human consumption.
Corrective action is being taken to resolve the material non-
compliance issues identified through these surveys.
PROGRAMME
programme is a comprehensive and holistic programme
which provides assistance at no cost to permanent
employees and immediate families as well as contractors.
The programme initiated in 2004 is regarded as one of
the flagship initiatives in the Employee Wellness and SHE
domain as well as the Telkom employee value proposition.
It encapsulates Telkom’s wellness philosophy to care for
and support its employees.
The Thuso value offering has been designed to measure
lifestyle factors across inter-related health risk areas
(diabetes, cholesterol, blood pressure and BMI as well as
offered during on-site Wellness Days to all employees, their
families and contract workers.
Through these interventions certain high cost, high risk
conditions are identified and managed by providing
employees access to care, counselling and treatment
Workplace programme. In addition to these services, health
data is collected from voluntary participants in the annual
Telkom Lifestyle Survey and evaluation of the programme is
done through regular monthly reporting on the outcomes
of the programmes, as well as an Annual Absenteeism
Analysis and a KAP Survey amongst the recipients of the
services of the Thuso programme.
During the year under review 6,455 employees participated
in the on-site wellness events (an increase of 2,503
employees from the previous year).
PROGRAMMESince its inception in 2004, the Telkom Thuso Programme
has touched the lives of 37,173 individuals who submitted
5,862 employees (5,311 permanent employees and
551 contractors) were tested with 162 employees
for permanent and contractor employees combined and
2.61% for permanent employees and 4.17% for contractors.
graph and although there has been a slight rise from 2.4%
to 2.7% since last year the general trend is decreasing,
with more employees being tested in this financial year
compared to the two previous years.
TUBERCULOSIS SCREENINGAll employees that undergo Wellness Screening also undergo
tuberculosis (TB) risk screening. Individuals that are at risk of
having TB are referred for TB diagnosis and treatment.
6,347 employees (5,733 permanent and 614 contractors)
were screened of which 95.75% reported no symptoms of TB.
3.54% of individuals screened reported one or more symptoms
and 0.20% reported receiving TB treatment.
These percentages have remained stable since 2009 with
a minimum of 95% of Telkom employees reporting no TB
symptoms.
TREATMENT PROGRAMMEThe Thuso programme’s comprehensive value offering also
includes pathological laboratory testing, individual clinical
case management via the Thuso 24/7 Call Centre, screening,
treatment of opportunistic infections such as TB and H1N1,
post-exposure prophylaxis, mother-to-child transmission,
psychological counselling, and the provision of nutritional
supplements and drugs to an address of choice, which is what
makes it so successful. This service offering is extended to
spouses, partners, and dependent children who are regarded
as immediate family. These services are available, at no cost,
to Telkom permanent and contract and temporary employees.
Highly Active Antiretroviral Therapy (HAART) treatment
is offered to those individuals registered on the Thuso
Programme with a CD4 count of below 350 cells/ml, which
is in line with the governmental and non-governmental
organisation (NGO) norms.
Treatment profile of individuals Number
Total number of individuals on Thuso programme 765Number of individuals receiving treatment through Thuso 425
Number of individuals on Pre-HAART* 165
Number of individuals on HAART 258
Number of individuals on PMTCT 2
Number of individuals on PEP 0
Number of individuals that have stopped their anti-retrovirals 0Number of individuals receiving treatment through other programmes 236Number of individuals not yet on
treatment 104
* HAART refers to highly active anti-retroviral treatment
0.00
1.00
2.00
3.00
4.00
201320122011
3.57
2.432.76
%
The above graph excludes Trudon and Swiftnet

86 Telkom Integrated Report 2013
OCCUPATIONAL HEALTH AND SAFETYThe successful Thuso Post-Exposure Prophylaxis (PEP)
programme provides 24-hour assistance via the call centre
bursts. Individuals that become exposed have immediate
access to the clinical call centre for advice and support and
are proud to report that through this intervention we have
We are also able to report that our extensive counselling
of mother-to-child transmission has ensured that, since the
born.
EDUCATIONCondom distribution is an important component of any
our workplace prevention programme. For the year under
review we distributed 2,157,502 condoms nationally, which
is an increase of 1,903,215 from the previous cycle.
Telkom hosts a series of Wellness Days across its operations
on a regular basis. During the year under review, we also
targeted specific functional units and regional sites with
the objective of providing business-specific health profiles.
The regional sites included remote or rural sites (less than
10 employees) that could not previously be reached due
to distance and cost. These employees were afforded
the opportunity to participate in the Thuso programme
through the service of locally based medical practitioners.
Employees are also able participate in Telkom’s annual Lifestyle
Survey, which focuses on issues such as alcohol consumption,
smoking, physical activity, stress and chronic diseases.
Telkom provides psychological care and support to its
employees and their families to help them deal with personal,
family and work related psycho-social problems, and to
optimise psychological wellbeing. Research indicates a positive
correlation between psycho-social wellness and productivity,
and therefore demonstrates the strategic importance of the
EAP as a management tool.
Numerous factors can influence the psycho-social well-being
of an individual. In the past year, high levels of personal stress,
marital and family difficulties, depression and finances were
among the problems that were referred to the EAP for care
and support. Employees experiencing trauma caused by hi-
jacking, robberies, accidents and other crises were also referred
to the EAP for counselling and therapy. These are the main
causes for the rise in EAP referrals for this reporting cycle.
During the 2013 financial year, 983 individual and
131 group counselling requests were received. On average, 93
referrals were recorded each month. A total of 3,896 individual
sessions were conducted at a cost of R2,115,440 for the period.
As in the previous financial year, the majority of the referred
cases were crises and trauma related (27%), while 21.5%
were attributed to marital and family related challenges.
Due to the sensitivity of many cases (medical conditions,
personal finances, unwillingness to indicate the kind of
problems experienced) 30.6% of the referrals did not specify
the reason for the request for counselling.
Psychological problems such as stress, anxiety and depression
made up a further 12.7% of the referrals received by the
EAP office. Poor performance, absenteeism and incapacity
accounted for a further 5.6% of the referrals and the
remaining 2.6% were for substance abuse and other psycho-
social related issues.
4.3
4.4
4.5
4.6
4.7
4.8
20132012201120102009
4.80
4.65
4.564.51
4.61
4.9
Num
ber o
f ref
erra
ls/1
00 e
mpl
oyee
s
Graph: EAP/100 employees
The above graph excludes Trudon and Swiftnet
0
500
1000
1500
20132012201120102009
1,3371,216 1,161
1,081 1,114
Num
ber o
f ref
erra
ls
Graph: EAP referrals
The above graph excludes Trudon and Swiftnet

87 Telkom Integrated Report 2013
Operating environment Risk and responsibilityCreating value Leadership and strategy People and environment Financial statements
Network Field Operations (36.8%), Customer Services (9.1%),
Network Infrastructure Provisioning (7.5%), Network Core
Operations (6.4%), Consumer Markets (4%) and Telkom
Direct Shops (3.8%) were the predominant users of Telkom’s
EAP services.
The EAP is not only responsible for the psychological care
and support of its employees, but also strives to equip them
with the necessary competencies to counteract the stresses
and strains of daily living. Financial and stress management
workshops, as well as psychological resilience and work-life
balance interventions, were conducted as preventative and
enabling interventions during the past year.

88 Telkom Integrated Report 2013
EMPOWERMENTAt Telkom, our commitment to Broad-Based Black Economic
Empowerment (B-BBEE) goes beyond transforming the
organisation’s culture and staff profile. Through our
business dealings, our procurement and our engagement
with stakeholders, we aim to promote a sustainable
empowerment process that benefits South Africa and the
ICT sector as a whole.
We are certified as a level 3 B-BBEE contributor by the
National Empowerment Rating Agency. Recognition as a
value-added supplier ensures that our clients and customers
can recognise 137.5% of all procurement spent with us.
The categories listed below show how we scored against
our transformation objectives over the 2013 financial year.
Employment equity, skills development and preferential
procurement targets have been set at business unit level
– Telkom South Africa, Telkom International, Data Centre
Operations and the Corporate Centre. All targets are
monitored monthly at business unit level and quarterly at
group level via an internally-developed BEE system across
all B-BBEE ownership scorecard elements.
Telkom Group B-BBEE sustainability performance
ELEMENT Weighting score for 2012 Score for 2013
Ownership 20 5.19 4.64
Management control 10 11 11
Employment equity 10 5.52 5.81
Skills development 17 10.64 8.08
Preferential procurement development 20 23.90 24.46
Enterprise development 11 11 11
Socio-economic development 12 12 12
The Telkom subsidiaries, Trudon and Swiftnet, achieved level 5 and level 6 contributor statuses, respectively. Telkom will
continue to work with the management teams of both companies to support their efforts in improving their overall scores
going forward.
Ownership points
Ownership
AchievableAchieved
2008 2009 2010 2011 2012 2013
20 7.24 15.39 6.37 5.39 5.19 4.64
Our equity ownership contribution declined marginally from 5.19 points in 2012 to 4.64 points in 2013 as a result of share
dealing by black beneficiaries holding Telkom shares, directly or indirectly.
Management control points
Management control
AchievableAchieved
2008 2009 2010 2011 2012 2013
10 11 9.63 9.13 10.83 11 11
Telkom has maintained its score of 11 points on the management control element.

89 Telkom Integrated Report 2013
Operating environment Risk and responsibilityCreating value Leadership and strategy People and environment Financial statements
Employment equity points
Employment equity
AchievableAchieved
2008 2009 2010 2011 2012 2013
15 7.86 9.41 9.97 10.17 5.52 5.81
Our employment equity performance for 2013 improved to 5.81 points, from 5.52 points in 2012 as a result of increased
recruitment at middle management level as well as a marginal improvement in the female to male employee ratio at this
level. We will continue to focus on these areas while particular attention will need to be placed on the disabled employee
category as we continued to score poorly in this area.
Skills development points
Skills development
Achievable
Achieved
2008 2009 2010 2011 2012 2013
15 10.48 9.36 9.65 10.41 10.64 8.08
Our skills development score has deteriorated from 10.64 points in 2012 to 8.08 points in 2013.
Enterprise developments points
Enterprise development
AchievableAchieved
2008 2009 2010 2011 2012* 2013*
15 0 5.3 15 15 11 11
*ICT Sector Code
We maintained a maximum score of 11 points for enterprise development, spending a total of R119 million on enterprise
development initiatives during the 2013 financial year. This equated to enterprise development spend of 7.97% of net profit
after tax against a target of 5% net profit after tax (NPAT) in line with ICT Sector Code. For more details refer to Procurement
and supply chain section on pages 91 to 95.
Preferential procurement points
Preferential procurement
AchievableAchieved
2008 2009 2010 2011 2012* 2013*
20 18.19 19.2 19.67 19.79 23.90 24.46
*ICT Sector Code
We were very pleased to record that our consistently high score on the preferential procurement element of the scorecard
improved from 23.9 points to 24.46 points out of a possible 20 (excluding the bonus points). Telkom performed exceptionally
well in this area during this reporting period. For more details refer to Procurement and supply chain section on pages 91 to 95.
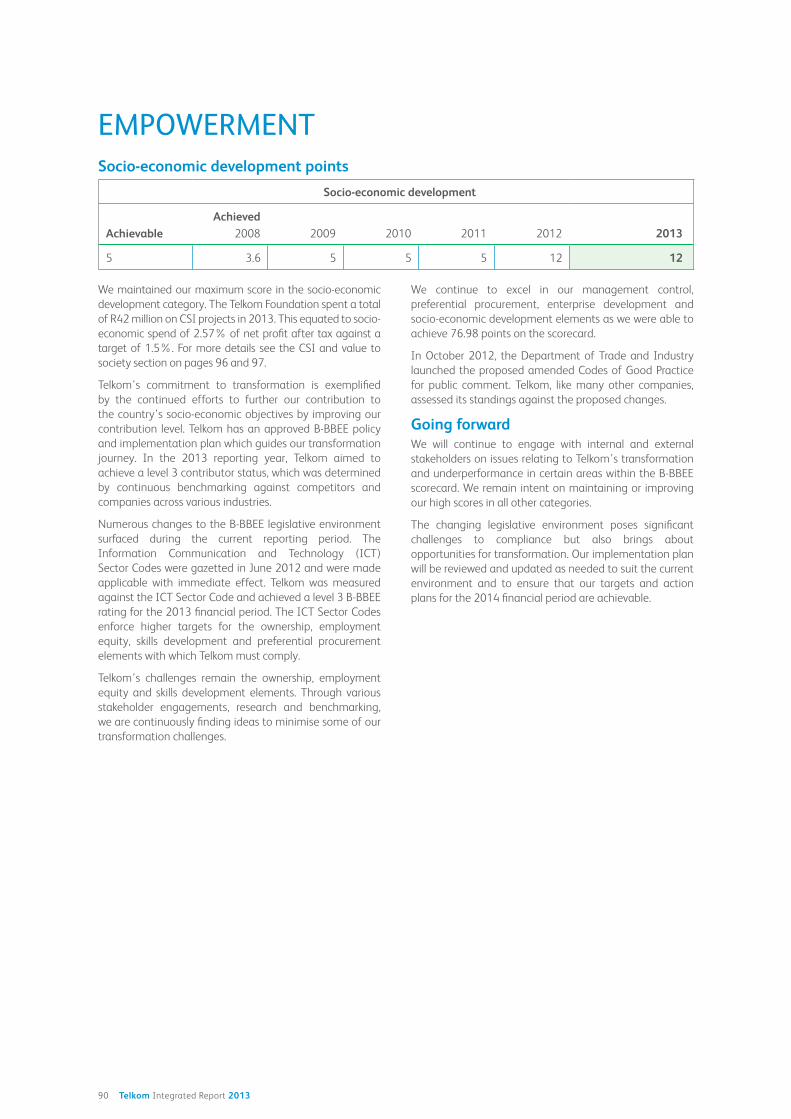
90 Telkom Integrated Report 2013
EMPOWERMENT
We maintained our maximum score in the socio-economic
development category. The Telkom Foundation spent a total
of R42 million on CSI projects in 2013. This equated to socio-
economic spend of 2.57% of net profit after tax against a
target of 1.5%. For more details see the CSI and value to
society section on pages 96 and 97.
Telkom’s commitment to transformation is exemplified
by the continued efforts to further our contribution to
the country’s socio-economic objectives by improving our
contribution level. Telkom has an approved B-BBEE policy
and implementation plan which guides our transformation
journey. In the 2013 reporting year, Telkom aimed to
achieve a level 3 contributor status, which was determined
by continuous benchmarking against competitors and
companies across various industries.
Numerous changes to the B-BBEE legislative environment
surfaced during the current reporting period. The
Information Communication and Technology (ICT)
Sector Codes were gazetted in June 2012 and were made
applicable with immediate effect. Telkom was measured
against the ICT Sector Code and achieved a level 3 B-BBEE
rating for the 2013 financial period. The ICT Sector Codes
enforce higher targets for the ownership, employment
equity, skills development and preferential procurement
elements with which Telkom must comply.
Telkom’s challenges remain the ownership, employment
equity and skills development elements. Through various
stakeholder engagements, research and benchmarking,
we are continuously finding ideas to minimise some of our
transformation challenges.
We continue to excel in our management control,
preferential procurement, enterprise development and
socio-economic development elements as we were able to
achieve 76.98 points on the scorecard.
In October 2012, the Department of Trade and Industry
launched the proposed amended Codes of Good Practice
for public comment. Telkom, like many other companies,
assessed its standings against the proposed changes.
Going forwardWe will continue to engage with internal and external
stakeholders on issues relating to Telkom’s transformation
and underperformance in certain areas within the B-BBEE
scorecard. We remain intent on maintaining or improving
our high scores in all other categories.
The changing legislative environment poses significant
challenges to compliance but also brings about
opportunities for transformation. Our implementation plan
will be reviewed and updated as needed to suit the current
environment and to ensure that our targets and action
plans for the 2014 financial period are achievable.
Socio-economic development points
Socio-economic development
AchievableAchieved
2008 2009 2010 2011 2012 2013
5 3.6 5 5 5 12 12
91 Telkom Integrated Report 2013
Operating environment Risk and responsibilityCreating value Leadership and strategy People and environment Financial statements
PROCUREMENT AND SUPPLY CHAIN
During the year under review, Telkom Group including
subsidiaries Trudon and Swifnet has spent a total of
R21.3 billion on the procurement of capital items, goods
and services. Telkom remained committed to upholding solid
corporate governance in terms of fair, transparent, responsible
and accountable tendering processes, which ensured that,
where appropriate, tender requests were published weekly
on our tender bulletin on the Telkom website. During the past
year we launched a stand alone e-sourcing/auction platform,
which resulted in more competitive bidding, improved
efficiencies as well as a reduction in the use of paper as part
of the administrative process.
With the exception of requests for quotations (RFQs)
and emergency purchases, in the majority of cases the
tender process is initiated at business unit level where the
specification of goods or services required are formulated.
The most suitable sourcing processes are determined by
subject matter specialists from whom the appropriate
pre-qualification criteria, high-level criteria and associated
weightings are set by the Subject Matter Expert Evaluation
Team (SMEET). Prior to publication, a recommendation to
publish is channelled to the relevant Category Sourcing
Team (CST) for their support before being approved by
the Group Procurement Council (GPC). The evaluation
process is fully aligned to and meets the requirements of
the Preferential Procurement Policy Framework Act (PPPFA).
Upon receipt of the tender responses the SMEET compile a
shortlist of potential suppliers based upon the evaluation of
the pre-qualification criteria. A suitable recommendation to
short-list and proceed with full paper evaluations is submitted
to both the CST and the GPC for approval prior to proceeding
with final evaluation. Following the selection of the successful
bid or bidders, a recommendation to award is made to the
CST, GPC and other designated authority for their support and
approval in terms of the Telkom delegation of authority. The
subject matter specialists debrief the unsuccessful bidders in
order to address any concerns regarding their responses to the
tender.
During the period under review there were approximately
8,000 trade vendors on the Telkom database. The number
of active contracts was in the order of 600.
Engaging with suppliers and building their capacityTo ensure continuity in delivery, pricing and quality
throughout the supply chain, Telkom interacts with its
supplier base to improve performance through collaboration
and discussion of operational issues. Such collaboration
is designed to better anticipate challenges and manage
supply chain risks.
On a quarterly basis Telkom’s procurement services
department evaluates the performance of the top 40
to 50 suppliers (based on strategic importance and
spend volumes) in terms of their delivery, quality and
Black Economic Empowerment. A full assessment of late
deliveries is performed and suppliers are engaged to
resolve any operational issues. Penalties for non-delivery
or late delivery are consistently imposed to ensure on-time
delivery is achieved. Telkom has aligned its payment policies
for procurement to enable quicker payments to Exempted
Micro Enterprise (EME)/Qualifying Small Enterprise (QSE)
suppliers. During the period under review, payment was
made within 10 days of receipt of invoice to 88% of active
Black EME/QSE suppliers.
Where possible, Telkom seeks to diversify supplier risk by
using at least two suppliers for critical network related
products. Where diversified risk is not required, measures
are put in place to encourage the entrance of new,
preferably local, suppliers into the market. For this purpose,
Telkom offers regular training for potential local suppliers.
We also hold annual supplier engagement sessions aimed
at resolving technical issues with mainly medium-spend
suppliers. Telkom also trains and educates suppliers in SHE
issues as well as supplier quality requirements associated
with doing business with Telkom.
Among the topics addressed with our suppliers during the
various feedback sessions and general engagement are:
Timely delivery;
E-auctions and their impact;
Litigation issues;
Guidance on ethical business practices;
Correct and timely payments;
Strategic partnerships and B-BBEE compliance;
Guidance on procurement governance issues;
Supplier development with specific focus on quality
assurance through a programme called PCR (process
controlled release); and
Telkom’s supplier code of conduct.
In line with the Group’s broader developmental mandate
Telkom continues to expand its implementation of BEE
commitment plans to ensure that our suppliers are
contracted on all seven pillars of B-BBEE aspects to achieve
meaningful transformation in the industry.
In order to transform Telkom’s procurement services
into a world class operation, various memberships with
international and local bodies are in place. These assist in
ensuring that opportunities such as category management
are brought to the fore and fully utilised.
Preferential procurement: a tool for economic transformationPreferential Procurement is one of the main elements on the
B-BBEE scorecard driving transformation in organisations.
This element has a weight of 20 points on the B-BBEE
scorecard (ICT codes), excluding six available bonus points.
Over the past decade, Telkom has demonstrated best
practice in the area of Preferential Procurement, creating
a new generation of pioneering black businesses in the
country’s ICT sector.
During the 2013 financial year, Telkom procured
R4,602 million from black-owned companies, equating
to 27.89%, R1,746 million from QSE/EME companies,
R925 million from black female-owned companies and
R14,463 million from B-BBEE compliant companies,
this amounts to 87.66% of the Group’s total measured
procurement spend.

92 Telkom Integrated Report 2013
PROCUREMENT AND SUPPLY CHAINTelkom is pleased to record that a consistently high score
on the Preferential Procurement element of the scorecard
of 18.46 points out of a possible 20 (excluding the bonus
points) was achieved. Telkom performed exceptionally well
during this reporting period, achieving a total Preferential
Procurement score of 24.46 points, inclusive of bonus
points. This is an achievement that few South African
companies could match. During the 2013 financial year
Telkom procured 82.97% of all goods and services locally
compared to 82.53% in 2012.
Years
Local
Procurement %
International
Procurement % Total %
2013 82.97 17.03 100.00
2012 82.53 17.47 100.00
Enterprise development: core to social engineeringA key pillar of Telkom’s preferential procurement strategy
is the creation of world-class black-owned companies.
This requires strong partnerships and commitment to
create sustainable enterprises by continuously building the
capacity of its black suppliers through multiple Enterprise
Development Initiatives. For Telkom, supplier development
is part of our development mandate to encourage black
production, stimulate the growth of small and medium
enterprises, create jobs and provide critical ICT intensive
skills for the economy. It is a transformative tool intended
to stimulate economic and social development in a broad
context. We seek to shift procurement from established
companies and bring new players into our supply chain.
This is a long-term sustainable strategy that embraces
the principles of economic growth and development.
Furthermore, in line with the country’s macro economic
objective to increase employment, Telkom encourages
multinational suppliers to partner with local black suppliers.
These partnerships will lead to job creation and an
improvement in the country’s GDP.
Telkom maintained a maximum score of 11 points
for Enterprise Development, spending a total of
R119 million on Enterprise Development initiatives during
the 2013 financial year. Telkom initiated various supplier
development initiatives to ensure sustainability of Black
Qualifying Small Enterprises (QSE) and Exempt Micro
Enterprise (EME) through:
Five days early payment after presentation of the
correct invoice;
Sponsoring of 20 leading Black QSE/EME suppliers
to exhibit their products and services at the Smart
Procurement, Enterprise Development Expo 2012;
Regional Information Sessions “Empowering Business
with Success Basics”;
Launch of ICT incubation programme facilitated by The
Bandwidth Barn;
Free professional Supplier Quality
Management support;
Entrepreneurial and technical training;
Financial and professional support to Delta Florist.
GRI
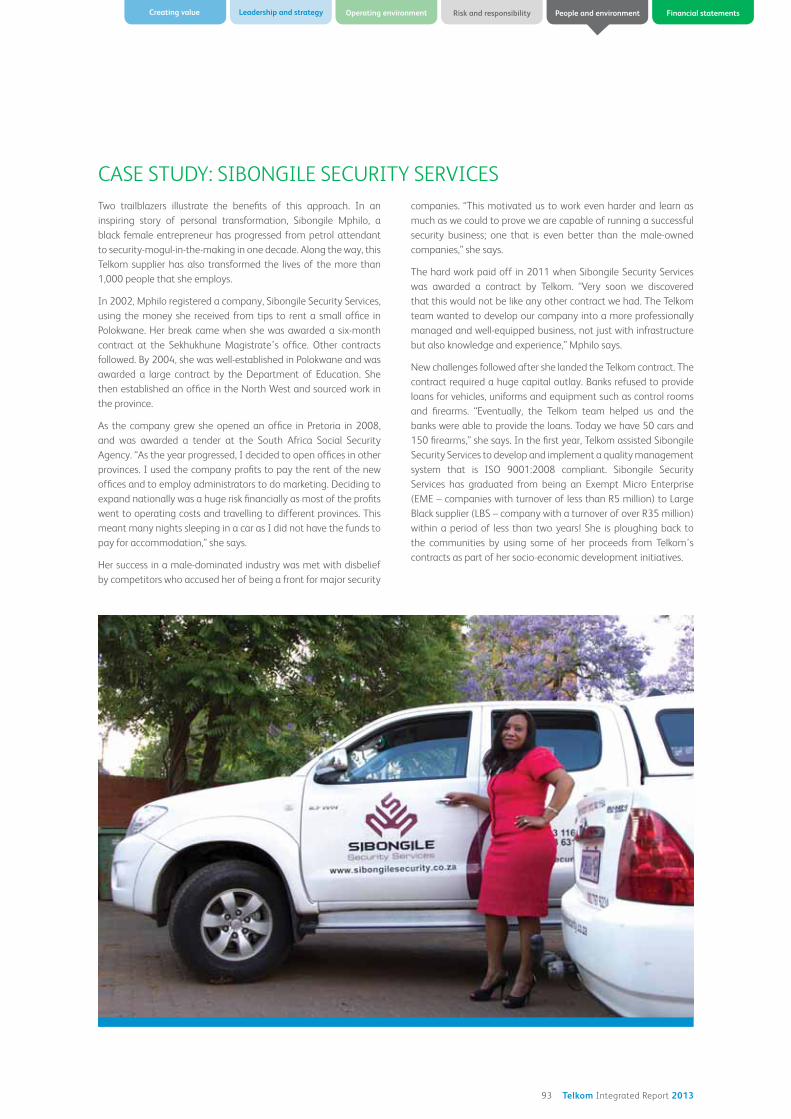
93 Telkom Integrated Report 2013
Operating environment Risk and responsibilityCreating value Leadership and strategy People and environment Financial statements
Two trailblazers illustrate the benefits of this approach. In an
inspiring story of personal transformation, Sibongile Mphilo, a
black female entrepreneur has progressed from petrol attendant
to security-mogul-in-the-making in one decade. Along the way, this
Telkom supplier has also transformed the lives of the more than
1,000 people that she employs.
In 2002, Mphilo registered a company, Sibongile Security Services,
using the money she received from tips to rent a small office in
Polokwane. Her break came when she was awarded a six-month
contract at the Sekhukhune Magistrate’s office. Other contracts
followed. By 2004, she was well-established in Polokwane and was
awarded a large contract by the Department of Education. She
then established an office in the North West and sourced work in
the province.
As the company grew she opened an office in Pretoria in 2008,
and was awarded a tender at the South Africa Social Security
Agency. “As the year progressed, I decided to open offices in other
provinces. I used the company profits to pay the rent of the new
offices and to employ administrators to do marketing. Deciding to
expand nationally was a huge risk financially as most of the profits
went to operating costs and travelling to different provinces. This
meant many nights sleeping in a car as I did not have the funds to
pay for accommodation,” she says.
Her success in a male-dominated industry was met with disbelief
by competitors who accused her of being a front for major security
companies. “This motivated us to work even harder and learn as
much as we could to prove we are capable of running a successful
security business; one that is even better than the male-owned
companies,” she says.
The hard work paid off in 2011 when Sibongile Security Services
that this would not be like any other contract we had. The Telkom
team wanted to develop our company into a more professionally
managed and well-equipped business, not just with infrastructure
but also knowledge and experience,” Mphilo says.
New challenges followed after she landed the Telkom contract. The
contract required a huge capital outlay. Banks refused to provide
loans for vehicles, uniforms and equipment such as control rooms
and firearms. “Eventually, the Telkom team helped us and the
banks were able to provide the loans. Today we have 50 cars and
150 firearms,” she says. In the first year, Telkom assisted Sibongile
Security Services to develop and implement a quality management
system that is ISO 9001:2008 compliant. Sibongile Security
Services has graduated from being an Exempt Micro Enterprise
(EME – companies with turnover of less than R5 million) to Large
Black supplier (LBS – company with a turnover of over R35 million)
within a period of less than two years! She is ploughing back to
the communities by using some of her proceeds from Telkom’s
contracts as part of her socio-economic development initiatives.
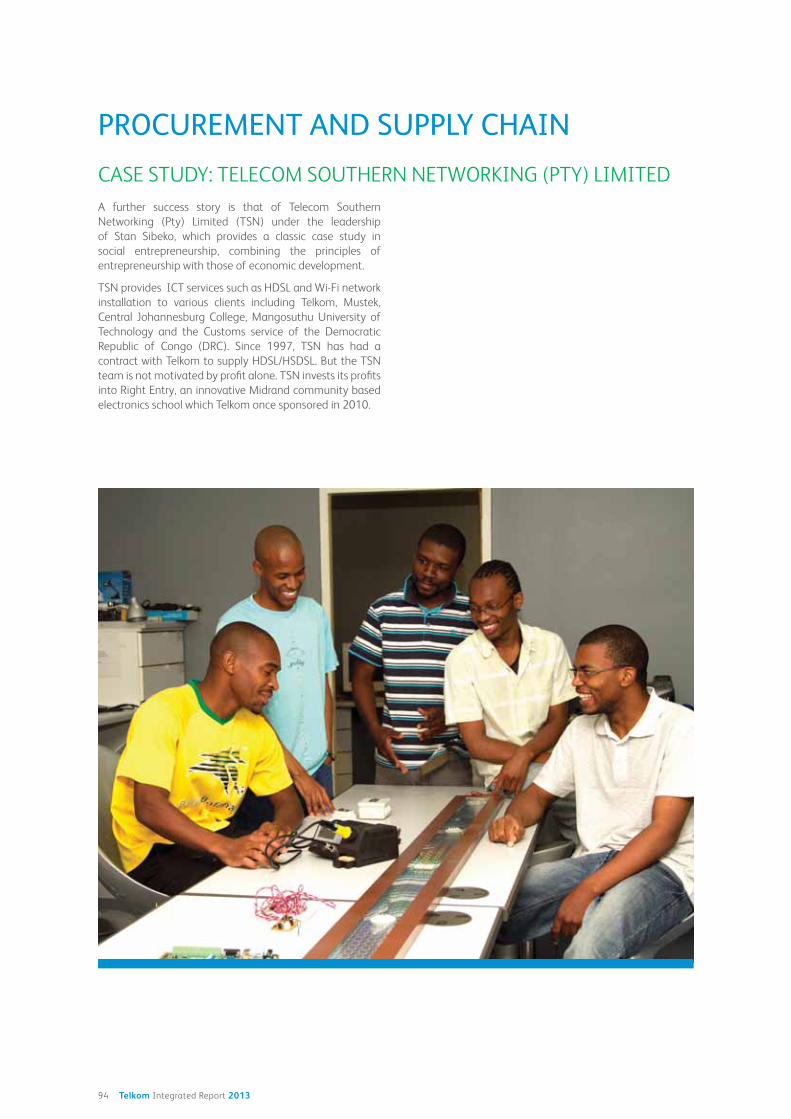
94 Telkom Integrated Report 2013
PROCUREMENT AND SUPPLY CHAIN
A further success story is that of Telecom Southern
Networking (Pty) Limited (TSN) under the leadership
of Stan Sibeko, which provides a classic case study in
social entrepreneurship, combining the principles of
entrepreneurship with those of economic development.
TSN provides ICT services such as HDSL and Wi-Fi network
installation to various clients including Telkom, Mustek,
Central Johannesburg College, Mangosuthu University of
Technology and the Customs service of the Democratic
Republic of Congo (DRC). Since 1997, TSN has had a
contract with Telkom to supply HDSL/HSDSL. But the TSN
team is not motivated by profit alone. TSN invests its profits
into Right Entry, an innovative Midrand community based
electronics school which Telkom once sponsored in 2010.
95 Telkom Integrated Report 2013
Operating environment Risk and responsibilityCreating value Leadership and strategy People and environment Financial statements
TELKOM SHOWCASES BLACK-
OWNED SUPPLIERS AT
Telkom sponsored 20 of its leading black suppliers to exhibit
their products and services at the Enterprise Development
Expo 2012, held in Midrand in November. These suppliers
are involved in areas such as installation and maintenance
services, network technologies, IT services and security.
While the Enterprise Development Expo was an opportunity
for these suppliers to gain valuable exposure to other large
South African organisations by networking with their peers,
it held multiple benefits for Telkom as well:
Telkom was able to showcase its preferential
procurement strategy and its leading black-
owned suppliers;
The expenditure on the Expo contributed towards the
Enterprise Development element of Telkom’s B-BBEE
scorecard; and
The Expo provided Telkom with an opportunity to
market its Telkom Business offering to all the attending
suppliers and procurement professionals.
Telkom has also taken out a one-year subscription for each
supplier on the Supply Chain Network e-portal. This means
that their contact information will be at the fingertips of
many more South African companies over the coming
year. Telkom’s procurement team will utilise the e-portal to
gain access to verified company profiles, which will assist
in increasing the pool of Black QSE/EME and black female-
owned companies in all sectors.
The feedback from the suppliers chosen for the Expo has
been enthusiastic:
“We made use of every minute we spent on the exhibition
floor to market ourselves. Our interaction with fellow
exhibitors has re-ignited our passion and drive to co-
operate with each other on projects and share expertise,”
said Lesedi Rakgokong, MD of Puisano Telecom, which
supplies Telkom and others with specialised ICT services.
company and opening us up to new opportunities. Even
as I write this letter, we are already processing an order
from one of the other companies hosted by Telkom,” said
Buti Kgobisa, CEO of AFT Optiroad, a supplier of micro-
ducting technology to terrestrial telecommunications
companies operators in the country.
Over the next few years, Telkom will be addressing a number
of continuing challenges in the area of B-BBEE within the
ICT Sector.
COMPLIANCEDuring the reporting period Telkom formed the Supplier
Code of Conduct, which is to be applied when engaging with
suppliers. The code will be implemented by the Procurement
division once it has gained approval from Exco. All suppliers
are required to adhere to the code through our annual
supplier commitment plans. The Procurement division will
monitor and compile progress reports on supplier Code
of Conduct commitment. Any matters identified on non-
conformance with the code will be referred to TARPS or
the Ethics office. Telkom encourages external surveys to be
conducted in order to test adherence to the Code.
The Procurement Services Policy serves as a standard for
Telkom as and when goods and/or services are procured.
This includes requirements for consultancy services and the
sourcing of competitive bids in relation to possible joint
ventures or partnerships. Subject to Telkom’s Delegation
of Authority, the policy applies to all Telkom employees
and/or end-users that participate and/or are involved in the
procurement of goods and/or services.
Bidding companies are obliged to comply with all applicable
occupational health and safety and environmental
management legislation and corresponding regulations in
terms of all tenders. Bidders are required to complete the
necessary statement of compliance relating to the relevant
policy, procedure and legislation.
The quality of goods and/or services to be supplied
and/or rendered by the bidders may be
benchmarked against the standard as required by
Telkom and the bidder will be graded accordingly.
Telkom is committed to the promotion of the principles of
B-BEEE when procuring goods and/or services. Bidders are
evaluated in accordance with the applicable and relevant
Telkom policies, for example the Preferential Procurement
Policy.
Procurement Services supports local businesses in the supply
chain through a deliberate and committed effort toward
promoting the purchase of locally manufactured goods and
services where available and practical. In cases where the
supply of goods is deemed vital to production, dual supply
strategies are adopted around local suppliers in order to
ensure continuity and least cost. The spending against
these suppliers fluctuates in accordance with their ability to
deliver. Monthly spend reports provide an indication of the
total spend between local and international suppliers.

96 Telkom Integrated Report 2013
We are able to fulfil our commitment responsible corporate
citizenship through the Telkom Foundation. The Foundation
is responsible for the implementation of Telkom’s CSI
initiatives across the country. Telkom believes in going
beyond the selling of products and services to communities
by caring for their needs and investing in them as well. Our
initiatives provide sustainable development solutions to
community challenges, and in building communities for
future generations.
The initiatives implemented by the Foundation are in line with
government imperatives of Broad-Based Black Economic
Empowerment which promotes social responsibility to
previously disadvantaged communities. Through the
Foundation, Telkom is able to create awareness around
the importance of corporate social responsibility among
employees, clients, suppliers and communities at large.
Telkom is committed to the development of sustainable
programmes aimed at equipping communities with key
skills, knowledge and resources. The main objectives are
to address social inequalities and provide access to the
previously disadvantaged. Within these objectives, the core
focus areas are education, community relief programmes
(health and poverty alleviation) and strategic development
of community entrepreneurs.
FOCUS AREASIn considering the needs of communities and government
priorities, the Telkom Foundation committed to making
a contribution to sustainable development in the
following focus areas: education, entrepreneurship, social
development, and staff volunteerism.
Socio-economic landscape Department of Basic Education statistics revealed that the
2011 national percentages of grade 3 learners who did
not achieve the minimum scores in literacy and numeracy
were 53% and 66%, respectively. Only 30% and 34%
of students achieved a pass rate of 40% and above for
Maths and Science, respectively, in the 2011 National
Senior Certificate examination. These results signal major
challenges regarding the quality of teaching and learning
in schools.
The unemployment rate was reported at more than 20%
in 2011 with over 50% represented by 17 to 25 year
olds, including graduates. The number of people living in
need and in receipt of government grants in 2011 was
15 million out of a population of 52 million. The affected
communities also required support through community
based organisations.
InitiativesTo contribute toward the improvement in the quality of
teaching and learning, the Telkom Foundation partnered
with the Department of Basic Education, various non-profit
organisations and schools to implement learner and teacher
development programmes. Learner interventions focused on
providing extra tuition in maths, science, and literacy and
on improving access to educational resources, with a strong
focus on ICT. Teacher development focused on improving
content knowledge, pedagogics, mentorship and ICT.
The Foundation also contributed to job creation initiatives
for youth and women by providing entrepreneurial training
to unemployed youth, aspiring entrepreneurs, women
and unemployed graduates. This training and mentorship
initiative was rolled out in Gauteng, Free State and the
Northern Cape.
The Foundation contributed to social development
and health through its Social Development and Staff
partner and provide funding support to organisations
working in the fields of home based care, orphans and
vulnerable children, terminal illnesses, disability, income
generation and welfare.
Spend by focus areaR42 million was spent on projects during the 2013 financial
year and the breakdown per focus area is shown below:
Spend by province The Telkom Foundation has a national footprint and the
financial contribution in each province is shown below
based on a total spend of R42 million:
Project highlightsEDUCATION Educator Mentorship and Development Programme
The Educator Mentorship and Development Programme
(EMDP) is a partnership between the Telkom Foundation
and the Central University of Technology (CUT) to develop,
empower and mentor educators in science, technology, english
CSI AND VALUE TO SOCIETY
Social development
Education
Staff volunteerism
Entrepreneurship
Other
KZN
EC
FS
NC
WC
NW
GP
MP
LIM
NAT
GRI

97 Telkom Integrated Report 2013
Operating environment Risk and responsibilityCreating value Leadership and strategy People and environment Financial statements
and mathematics (STEM). The EMDP consists of training and
mentorship for 25 STEM educators in three primary schools
in Mangaung in the Free State province. The EMDP utilises
retired educators to provide critical support that enhances the
quality of teaching and learning. The programme will enter its
final year in 2013 and continues to stimulate the interest of
learners in subjects and careers within the fields of ICT.
Schools Connectivity
The Telkom Foundation is in partnership with the
Department of Basic Education to enhance the quality
of teaching and learning in rural schools through the
provision of computers and interactive boards. The
Telkom Foundation has donated computers and Internet
connectivity to more than 700 schools, with more schools
being added to the list every year. In 2011, 45 schools were
provided with full computer labs and in 2012, 21 schools
were provided with full labs and more than 60 schools were
given interactive white board packages. All the schools that
have received full computer labs have also been provided
with furniture for the ICT laboratories. In addition, as of
2011, each school that has received ICT equipment has
also been offered an opportunity for training on computer
literacy for two teachers.
Partnership with Mindset Network
To maximise the use of the ICT labs, Telkom Foundation
works with its partners to provide content that is relevant
and aligned to the curriculum. As part of the schools
connectivity project, the Foundation partnered with Mindset
Network, a non-profit organisation that specialises in digital
content to install satellite dishes and digital equipment with
content to 45 schools in five provinces. The content is purely
on Maths and Science.
Multi-grades Mobile Units
The Telkom Foundation, through its partnership with
the Department of Basic Education, implemented the
ICT and Literacy Mobile Units project to assist 50 multi-
grade schools in Limpopo, Eastern Cape, KwaZulu-Natal,
Mpumalanga and North West provinces. This project
provided multi-grade classrooms with a mobile trolley
materials and content.
Rally to Read
To contribute to improving literacy, the Foundation
partnered with Read Educational Trust and Bidvest in the
Rally to Read programme which provides literacy resources
and educator training to rural disadvantaged schools across
South Africa. The main target for the project is Grade R and
other Foundation grades. The Rally to Read programme has
reached over 37,000 learners. The Foundation is the sole
sponsor of the programme in the Limpopo province and
than 10,000 learners.
National Teaching Awards
As part of its strategy around teacher development, the
Foundation partnered with the Department of Basic
Education and sponsored the 2012 National Teaching
Awards. The National Teaching Awards promote excellence
in teaching by recognising the hard work of teachers in
various categories. The National Teaching Awards had
13 categories for 2012 including the following that were
sponsored by the Foundation: Excellence in Grade R
Teaching, Excellence in ICT Enhanced Teaching, Prof Kader
Asmal Lifetime Achievement Award.
Entrepreneurship ProgrammeTraining and Mentorship
The Foundation partnered with the University of Pretoria
to deliver a range of entrepreneurship training programmes
to youth and women in particular. The programme has
benefited 350 youth and women, unemployed graduates,
entrepreneurs, and aspiring entrepreneurs in Gauteng, Free
State and Northern Cape. The programme offers training
and mentorship to ensure that beneficiaries establish and
grow sustainable businesses that also provide employment.
Social Development The Foundation supports organisations that work with
the disadvantaged and vulnerable communities in deep
rural areas of our country through the Social Development
programme. It has provided support of more than
R5 million within the 2013 financial year to
community-based organisations supporting needy
communities in various focus areas including: poverty
vulnerable children, and people living with disabilities.
Staff VolunteerismAdopt-A-Project
Adopt-A-Project is a voluntary programme for the senior
leadership of Telkom to participate in community
development and empowerment through the donation
of funds from the Telkom Foundation and being patrons
of deserving community development projects of their
choice. Through this programme, the senior leadership
also avail their time, skills and resources to their projects.
During the 2013 financial year, the programme contributed
approximately R3 million to more than 30 projects.
Going forward The Telkom Foundation will continue to work with CSI and
continued pursuit of strategic partnerships that enhance the
impact and outcomes of the Foundation’s investments. The
Foundation is repositioning itself to ensure that its projects
are designed to deliver maximum impact and transform, in
a meaningful way, the lives of the disadvantaged.

98 Telkom Integrated Report 2013
STATEMENTTelkom’s Environmental Policy Statement (EPS)
demonstrates Telkom’s commitment and due regard
towards ensuring a sustainable future for generations to
follow. Telkom’s geographical footprint is significant, albeit
the nature of its impact is considered as negligible. Due to
technological advancement and changing business trends,
the Telkom EPS is due for review during the 2014 reporting
cycle and will be endorsed by the newly appointed GCEO.
ISO 14001 certificationTelkom’s Environmental Management System (EMS) is
currently ISO 14001 certified. The purpose of complying with
this international standard is that it specifies requirements
for an EMS which enables an organisation to develop and
implement a policy which defines objectives and targets
while at the same time ensuring compliance with legislated
requirements. It also provides for the opportunity to clearly
define and quantify significant environmental aspects and
their potential impacts. From this, control measures are
implemented, monitored and measured to constitute a
continual improvement cycle. As the ISO 14001 standard is
designed to ensure continual improvement, certification is
awarded over a three-year cycle. In the 2014 financial year,
Telkom will apply for recertification to ensure a sustainable
commitment to ongoing environmental consideration
towards the way we conduct ourselves throughout our
business imperatives to continually support our reputation
as a responsible corporate citizen.
In order to sustain the ISO standards, annual surveillance
audits are conducted by the external verification authority
each year during the three year accreditation period.
Telkom’s EMS achieved the ISO 14001 second surveillance
audit requirements.
Environmental trainingTelkom’s EMS incorporates training and awareness as
an ongoing process in which both formal training and
awareness campaigns are provided. Telkom supports
the South Africa environmental calendar from which one
campaign per quarter is communicated and employees are
encouraged to participate.
ComplianceThere were no significant fines or sanctions for non-
compliance with environmental laws and regulations
during the reporting cycle.
Telkom did not encounter any environmental management
related fines or sanctions for non-compliance, which
demonstrates that the EMS methods, procedures and
applicable protocols are meeting the desired conformance
requirements.
BiodiversityBiodiversity management in Telkom is defined as those
interventions which ensure that the impact of our
infrastructure causes minimal impact relative to the
protection of species and natural ecosystems of our
country’s environment. A holistic conservation approach
is paramount to Telkom’s EMS. Over a number of years
Telkom has actively involved itself in various biodiversity
initiatives, namely:
The management of red billed buffalo weaver
occupancy on mast infrastructure in the
Mpumalanga area;
The preservation of the sociable weaver nests on
telephone routes in the Northern Cape;
The prevention of blue crane collisions on telephone
routes in the Free State;
The successful relocation of Angolan free tailed bats
from Telkom network facilities in Mpumalanga;
The rescue and relocation of black eagle chicks from
towers in the Northern Cape; and
The relocation of a telephone route crossing a
migratory bird wetland in Mpumalanga.
The Telkom environmental management team have over
the past few years developed methods and controls to
manage the encroachment of various species on Telkom
infrastructure. Line managers are now in a position to
manage such interventions independently.
During this financial year, Telkom successfully engaged
in an environmental/social responsibility project in the
Wakkerstroom town of Mpumalanga, internationally
recognised as a haven for migratory birds. The project
entailed working with two local NGOs the Wakkerstroom
Natural Heritage Association and BirdLife South Africa.
The objective of the project was to relocate a telephone
route from a wetland which would significantly enhance
the wetland biodiversity and aesthetic value of the
surroundings. The removal and relocation of the route
was undertaken successfully. The Telkom Foundation also
contributed a significant amount to fund the refurbishment
of a walkway that leads to a bird hide situated adjacent
to the wetland. The project generated significant interest
South African businesses commitment to social upliftment
and sustainability within the communities in which
they operate.
ENVIRONMENTAL MANAGEMENT
GRI
99 Telkom Integrated Report 2013
Operating environment Risk and responsibilityCreating value Leadership and strategy People and environment Financial statements
In spite of the fact that the telecommunications sector
is a relatively low-impact industry when it comes to
energy usage and carbon emissions, there are significant
opportunities to reduce costs and achieve carbon savings
from energy efficiency, thereby ensuring a sustainable
future. In addition, the telecoms sector has the unique
potential to enable significant carbon savings across
many sectors through communications technology
offerings (such as creating opportunities for customers to
dematerialise their businesses and reducing the need for
travel by providing alternative communication methods).
The telecommunications sector is also an expanding
sector, with energy demands that will continue to grow.
Nevertheless, Telkom is working to balance its current energy
requirements with the necessity of ensuring a sustainable
future as it relates to climate change and energy security.
Security of energy supply in South Africa is a major issue.
Furthermore, we recognise the environmental, social and
economic threat posed by climate change and the need
for co-ordinated global action to reduce greenhouse gas
emissions. As such, Telkom acknowledges the importance
of their contribution to reducing South Africa’s carbon
emissions, in line with the draft National Energy Efficiency
Strategy, in order to ensure a sustainable future.
CARBON FOOTPRINTAs part of managing our contribution to addressing climate
change, Telkom has measured and calculated its carbon
footprint for the third year. The Greenhouse Gas Protocol
(GHG Protocol) was used as the basis for calculating the
carbon footprint. In order to improve the credibility of our
reporting, we obtained reasonable assurance in a statement
of verification by independent assurance providers CA-
Governance, using the ISO 14064-3 standards.
The boundary for the carbon footprint is Telkom South
Africa; as well as the South African operations of the
subsidiaries Swiftnet and Trudon.
The carbon footprint includes the following scopes as per
the GHG Protocol:
Scope 1: Direct greenhouse gas emissions (GHG) from
sources owned or controlled by Telkom;
Scope 2: Indirect GHG emissions from the generation of
electricity consumed by Telkom; and
Scope 3: Other indirect GHG emissions as a
consequence of the activities of Telkom, but not from
sources owned or controlled by Telkom.
The carbon footprint was calculated using emission
factors provided by the United Kingdom’s Department for
Environment, Food and Rural Affairs (DEFRA). Our overall
scope 1, 2 and 3 carbon footprint is 769,216 tCO2e. The
table on the following page provides a breakdown of
emissions per scope.

100 Telkom Integrated Report 2013
Initiatives to reduce Greenhouse Gas emissions and reductions achievedWe are aware that as a growing sector, and as a solutions
provider to other sectors, our energy demands will increase.
Nevertheless, we recognise that we need to manage our
energy usage and carbon emissions in order to ensure a
sustainable future. Telkom has therefore put the following
in place to minimise our carbon footprint and educate and
create awareness among our stakeholders:
We reported for the third year to the Carbon Disclosure
project on our carbon management and emissions.
This demonstrates our commitment to reducing
emissions and provides investors and other stakeholders
with insight into the meaning of climate change for
our business.
We signed the NBI’s Energy Efficiency Leadership
Network Pledge. As such we have publically pledged to
plan for energy efficiency improvement supported by
an energy management system, develop company level
targets to help deliver on the National Energy Efficiency
Strategy, and clearly report on progress in reaching
the targets. In addition, we have committed to carbon
reduction skills development and capacity building.
During 2012 we adopted a board-approved
sustainability strategy that formalises and gives
direction to our carbon management.
Over the past five years Telkom has embarked on a
national rollout of energy efficiency initiatives in Telkom
facilities, known as Project Neon. This has included a
phased rollout of energy efficient lighting interventions,
using Eskom’s Performance Contracting Funding Model.
Telkom has begun implementing an initiative to phase
in upgraded digital primary and secondary switching
units which use less power.
In order to increase awareness of climate change,
newsletters are sent to Telkom employees, highlighting
2012 Emissions
(tCO2e)
2013 Emissions(tCO
2e)
Scope 1
Diesel consumed in generators1 5,979 6,923 Refrigerant gases2 44,964 44,619 Swiftnet delivery trucks 84 42 Forklifts – Stannic fleet3 54 64
Scope 2
Electricity consumption (Telkom SA)4 662,543 652,050 Electricity consumption (Trudon) 3,092 3,108 Electricity consumption (Swiftnet) 292 307
Scope 3
Air travel5 3,387 3,198 Car hire6 234 199 Business travel in employee owned cars7 8,011 8,502 Stannic fleet card8 3,387 4,740 Debis fleet9 32,766 31,467 TFMC fleet10 4,973 4,964 Layisha logistics 3,637 3,372 Trudon delivery trucks11 3,312 5,661
Total Scope 1, 2 and 3 emissions (tCO2e) 776,715 769,216
1 Diesel used in generators is based on issued quantities for use in generators and forklifts.2 The refrigerant gas value provided is the total consumption (kg) from several different types of refrigerant gases, each of which have their own global
warming potential (GWP).3 Forklifts – Stannic Fleet – Stannic fleet cards value provided is the total litres of petrol or diesel consumed in Telkom owned motor vehicles.4 Electricity consumption for the 2012/13 financial year is calculated using the Eskom 2012 generation emission factor of 0.99 tCO
2e/MWh.
5 2012 Air travel has been restated due to a previous calculation error. The air travel value provided is the total passenger kilometres travelled, which is split
between long-haul and short-haul flights and the specific flight class when calculating the associated carbon emissions.6 The car hire value provided is the total kilometres travelled in hire cars, which is split according to fuel type and engine size when calculating the
associated carbon emissions.7 The Telkom employee business travel value provided is the total kilometres travelled in employee owned motor vehicles, which is split according to fuel
type and engine size when calculating the associated carbon emissions.8 Stannic fleet cards value provided is the total litres of petrol or diesel consumed in Telkom employee owned motor vehicles for business travel.9 The Debis vehicle fleet value provided is the total kilometres travelled by Telkom employees in Debis fleet vehicles, which is split according to fuel type
and engine size when calculating the associated carbon emissions.10 The TFMC fleet value provided is the total litres of fuel used in TFMC, Telkom’s facility management provider’s fleet motor vehicles, which is split
according to fuel type when calculating the associated carbon emissions.11 Trudon delivery trucks has been restated due to a previous calculation error.
ENVIRONMENTAL MANAGEMENT
GRI
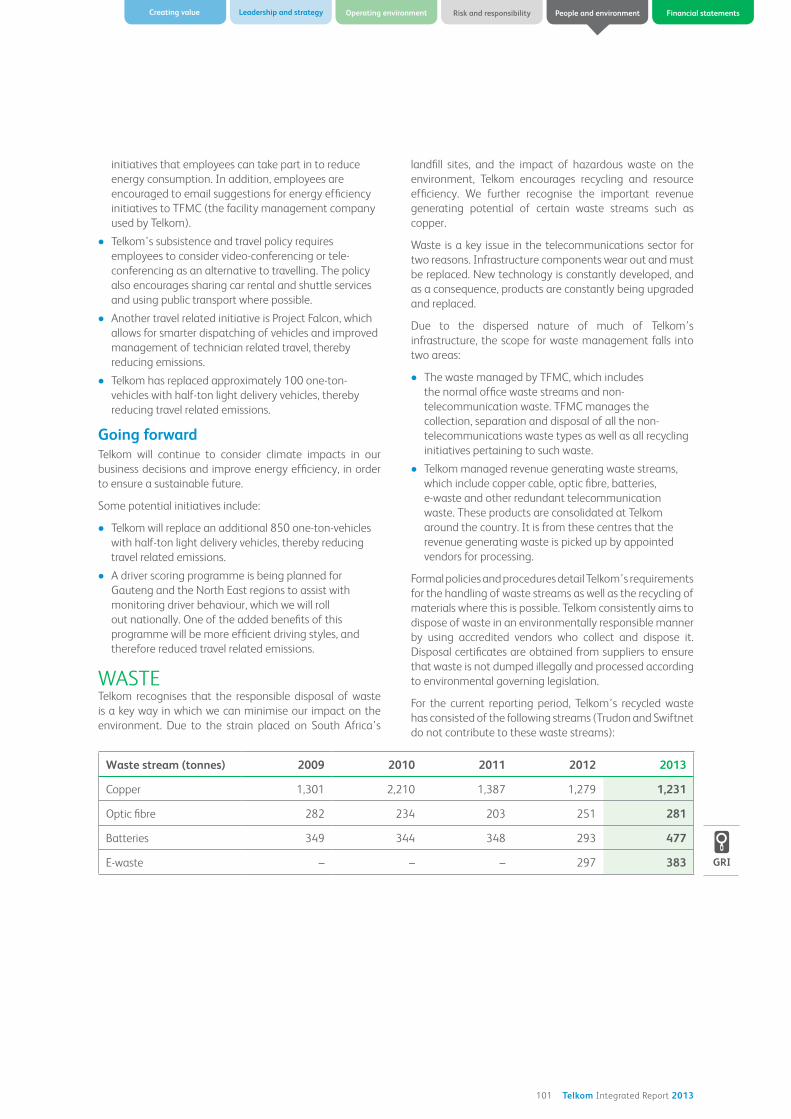
101 Telkom Integrated Report 2013
Operating environment Risk and responsibilityCreating value Leadership and strategy People and environment Financial statements
initiatives that employees can take part in to reduce
energy consumption. In addition, employees are
encouraged to email suggestions for energy efficiency
initiatives to TFMC (the facility management company
used by Telkom).
Telkom’s subsistence and travel policy requires
employees to consider video-conferencing or tele-
conferencing as an alternative to travelling. The policy
also encourages sharing car rental and shuttle services
and using public transport where possible.
Another travel related initiative is Project Falcon, which
allows for smarter dispatching of vehicles and improved
management of technician related travel, thereby
reducing emissions.
Telkom has replaced approximately 100 one-ton-
vehicles with half-ton light delivery vehicles, thereby
reducing travel related emissions.
Going forwardTelkom will continue to consider climate impacts in our
business decisions and improve energy efficiency, in order
to ensure a sustainable future.
Some potential initiatives include:
Telkom will replace an additional 850 one-ton-vehicles
with half-ton light delivery vehicles, thereby reducing
travel related emissions.
A driver scoring programme is being planned for
Gauteng and the North East regions to assist with
monitoring driver behaviour, which we will roll
out nationally. One of the added benefits of this
programme will be more efficient driving styles, and
therefore reduced travel related emissions.
WASTETelkom recognises that the responsible disposal of waste
is a key way in which we can minimise our impact on the
environment. Due to the strain placed on South Africa’s
landfill sites, and the impact of hazardous waste on the
environment, Telkom encourages recycling and resource
efficiency. We further recognise the important revenue
generating potential of certain waste streams such as
copper.
Waste is a key issue in the telecommunications sector for
two reasons. Infrastructure components wear out and must
be replaced. New technology is constantly developed, and
as a consequence, products are constantly being upgraded
and replaced.
Due to the dispersed nature of much of Telkom’s
infrastructure, the scope for waste management falls into
two areas:
The waste managed by TFMC, which includes
the normal office waste streams and non-
telecommunication waste. TFMC manages the
collection, separation and disposal of all the non-
telecommunications waste types as well as all recycling
initiatives pertaining to such waste.
Telkom managed revenue generating waste streams,
which include copper cable, optic fibre, batteries,
e-waste and other redundant telecommunication
waste. These products are consolidated at Telkom
around the country. It is from these centres that the
revenue generating waste is picked up by appointed
vendors for processing.
Formal policies and procedures detail Telkom’s requirements
for the handling of waste streams as well as the recycling of
materials where this is possible. Telkom consistently aims to
dispose of waste in an environmentally responsible manner
by using accredited vendors who collect and dispose it.
Disposal certificates are obtained from suppliers to ensure
that waste is not dumped illegally and processed according
to environmental governing legislation.
For the current reporting period, Telkom’s recycled waste
has consisted of the following streams (Trudon and Swiftnet
do not contribute to these waste streams):
Waste stream (tonnes) 2009 2010 2011 2012 2013
Copper 1,301 2,210 1,387 1,279 1,231
Optic fibre 282 234 203 251 281
Batteries 349 344 348 293 477
E-waste – – – 297 383 GRI

102 Telkom Integrated Report 2013
It is important to note that while these materials constitute
the majority of Telkom’s recyclable revenue generating
waste stream by volume, their quantity is not necessarily
influenced primarily by our resource efficiency initiatives.
In the case of copper and optic fibre recycling volumes are
driven primarily by the amount of damage inflicted upon
our infrastructure during the theft of copper cable. Batteries
are used at sites where direct current power is needed as an
alternative source to alternating current power.
Batteries are scrapped by technical staff in the regions
and brought to the different Reverse Logistics yards
for selling. Batteries are only scrapped when they are
not further suitable for recharging or are damaged.
Batteries are sold to specific buyers with a disposal
certificate supplied to Telkom for every lot sold.
E-waste is consolidated at our Boksburg yard and is
sold via auctions.
Copper – The majority of the recycled copper is
recovered from the field after dead-line route recoveries.
Copper is sold to Sindawonye and reworked into
other products.
Optic fibre is sold to Sindawonye through an existing
or optic fibre. These are then either reworked into other
products or sold individually. Kevlar and optic fibre
are used at the Thembani social upliftment project.
This initiative is an outstanding example of what
social commitment is and in so doing creating work
opportunities as well as supporting the special needs of
the Bedford community or families especially women
and children using the redundant Telkom cable.
Other recycled waste (steel, wood, tools, leather,
furniture, etc.) is sold to Telkom staff or externally via
tender or offer to purchase.
WATERTelkom recognises the potential limiting effect that
water could have on economic expansion. It is of utmost
importance that this resource be optimally utilised to the
benefit of all current and future consumers and users.
Our aim as a responsible water consumer is to maximise the
value we obtain from our water resources while seeking to
avoid long-term net harm. We recognise that we act within
a broader strategic water-resource framework. Hence
Telkom strives to protect the quality of our water resources,
use water wisely and aims eventually to develop alternative
water resources.
During the reporting period, Telkom has facilitated an
awareness programme and application of functional,
efficient techniques to assist in the reduction of water
consumption that will ultimately modify effective
behavioural changes. These techniques will support
Telkom’s ongoing commitment towards the philosophy of
environmental sustainability.
An understanding of the potential benefits associated
with conservative water management, will ultimately
enhance Telkom’s commitment towards environmental
sustainability of the organisation and within the South
African context, while also committing itself to support and
to work together with the Department of Water Affairs in
managing South African water resources for an equitable
and sustainable future.
ENVIRONMENTAL MANAGEMENT
103 Telkom Integrated Report 2013
Operating environment Risk and responsibilityCreating value Leadership and strategy People and environment Financial statements
The business sustainability of Telkom depends on our
management of the aspects of our services and products
that directly affect our customers including health and
safety, information and labelling, marketing, and privacy.
Customer satisfaction is a key concern for Telkom, and
we aim to tailor our products and services to meet the
customer needs while considering sustainable health and
safety related matters.
Product and service labellingCONSUMER PROTECTION ACTIn terms of the Consumer Protection Act, 68 of 2008 (“the
Act”), consumers have the right to fair value, good quality
and safety. Section 61 of the Act states that a producer,
importer, distributor or retailer of any goods is liable for any
harm caused by the supply of goods or product failure which
result in the death or injury or illness or loss/physical damage
to property and any economic loss arising from such injury,
death or losses or physical damage to property. As a retailer
of goods and products, it is imperative that Telkom ensures
that it does not supply unsafe or defective goods and that
there are adequate warnings to the consumer pertaining
to any hazard arising from or associated with the use of
the goods.
During the reporting year Telkom was not involved in
any litigation or pending litigation relating to any harm
envisaged under Section 61 which arose as a consequence
of any product/goods supplied to a consumer. Telkom has
not been found guilty of breaching any of the provisions
relating to non-compliance with the provisions of
Section 61, during the reporting period.
REGULATIONSIn November 2011, Telkom received notice from ICASA
regarding Telkom’s non-compliance with regard to the
End-User and Subscriber Service Charter Regulations as
published in Government Gazette No. 32431 on 24 July
2009 (‘the Regulation’) and advised that the Authority is
referring this matter to the Complaints and Compliance
Committee for a formal hearing to be held in respect of the
following:
Regulation 4.9(a): “…maintain an average of 90% fault
clearance rate for all faults reported within three (3)
days”; and
Regulation 4.9(b): must clear “the remaining ten
percent (10%) of faults reported… within six (6) days
of the reporting of the fault”.
In respect of the aforementioned Regulation, for the
2009/2010 reporting period, Telkom did not meet the
mandatory percentages as prescribed in respect of the fault
clearance rate. A licensee who is held to be non-compliant
by the Complaints and Compliance Committee (CCC) may
be liable to a fine.
CCC outcome and recommendationKey aspects of the CCC judgment are as follows:
ICASA’s failure to determine a format for the reporting
is a fatal flaw to its case against Telkom;
ICASA had failed to prove non-compliance on the part
of Telkom on the balance of probabilities;
Non-compliance is not capable of being discerned
clearly from the report submitted by Telkom. It is not
possible, therefore, to consider levying a penalty that is
consistent with the degree of non-compliance; and
The Regulations as they stand are problematic and are
not capable of implementation.
The CCC further made the following recommendations
to ICASA:
ICASA determines and make available a standard
format to all its licensees. Licensees should be afforded
the opportunity to study the format so that they can
raise any issues that they may have;
Since the Charter regulations as they stand are
problematic and are not capable of implementation,
ICASA should review them;
ICASA should approach Telkom to stop its Court action
with an undertaking that ICASA will review the Charter
regulations; and
If ICASA is considering bringing other licensees in
front of the CCC on similar charges, it should consider
suspending them until the Charter regulations
are reviewed.
Thus, Telkom was not penalised for this contravention
and ICASA is drafting the revised regulations for public
comments.
Customer privacySouth African legislation governing consumer protection
and customer privacy has evolved rapidly in the past few
years and Telkom is focused on aligning its business practices
with the requirements. Telkom’s primary obligation to
respect customer privacy emanates from the provisions of
the Electronic Communications Act, 36 of 2005, and Code
of Conduct, End-User and Subscriber Service Charter.
Requests for any confidential information relating to
a customer’s personal details are handled by each of
Telkom’s regional nodal points. These nodal points deal
with any requests or subpoenas for customer information.
There have been no breaches of customer privacy or losses
of customer data during the reporting period.
PRODUCT RESPONSIBILITY
GRI

104 Telkom Integrated Report 2013
Competition law complianceSettlement discussions with the Competition Commission
were initiated and successfully concluded in April 2013. This
ruling related to the case between Telkom and the South
and various other complainants pertaining to alleged anti-
competitive behaviour between 1999 and 2002. Telkom
and the Commission agreed to withdraw their respective
appeals against the Tribunal’s initial ruling in August 2012,
resulting in the said ruling remaining unaltered. Accordingly,
Telkom will pay the fine that was awarded by the Tribunal in
the sum of R 449 million.
We have also subsequently negotiated to settle a second
claim relating to a Multiple Complaints Referral by several
complainants including Internet Solutions (Pty) Limited, the
internet division of Multi-choice Subscriber Management
Internet Service Providers Association.
As part of this settlement, Telkom is required to pay a
penalty of R200 million which has been fully provided for.
The settlement also requires an undertaking by Telkom
regarding the functional separation between the Group’s
retail and wholesale divisions.
We are committed to understanding the unique
responsibility that we have as the national incumbent. We
acknowledge that past actions of the Group have had a
negative impact on our business and we take accountability
for this. We have been and will continue to uphold
responsible conduct and compliance in all our businesses.
Read more in note 38 of the consolidated annual financial
statements.
CUSTOMER SATISFACTIONTelkom conducts regular customer satisfaction surveys
by means of targeted and random telephone interviews.
These reach approximately 120,000 people per annum.
By their very nature, random surveys may reach some
customers whose numbers are not listed for such purposes,
potentially giving rise to concerns about breaches in the
security of customer data privacy.
Since 1997, all surveys have been conducted by research
providers accredited by the SA Marketing Research
Association (SAMRA) whose code of conduct commits all
practitioners never to allow personal data collected in the
process of market research “to be used for the purpose
other than the market research”. All market research survey
work and the statistical results generated are audited on a
random basis by third parties for purposes of data quality
and data security. The information generated by market
research surveys is used to inform Telkom’s advertising
tracking programmes, sponsorship and branding initiatives
in addition to customer loyalty measurements.
Telkom has a national customer care management centre
to deal with customer complaints that may have been
received through Telkom’s call centres. These complaints
are then handled by escalation advisors. Any request
for information from an outside party is governed by the
Promotion of Access to Information Act, which gives effect
to the public’s right of access to information from public
and private bodies; taking into consideration appropriate
provisions within the Act. Telkom keeps a record of the
requests received each year and it reports annually to the
Human Rights Commission with regards to these requests.
The primary aim of the customer loyalty management
(CLM) research conducted by Telkom is to determine
our customers’ satisfaction with their designated main
customer contact (for example, the account manager in
the enterprise environment), as well as with products and
services offered by Telkom.
Specific objectives are to:
Measure the impact that overall quality of service and
value for money have on loyalty and commitment
towards Telkom;
Determine the perceptions of service while interacting
with Telkom at the different touchpoints: pricing, main
customer contact (account manager, service delivery
manager, account representative, business consultant,
call centre agent, Telkom Direct Stores agent),
technical support/technician, customised solutions,
communication, ordering process, products and
services, invoicing and billing/Telkom account, dispute
resolution and Cybernest;
Obtain an overall comparison of Telkom with other
service providers;
Establish the likelihood of switching from Telkom to
another service provider; and
Determine the overall experience with installations
and repairs.
Fieldwork takes place on an annual basis and was
conducted between August and December 2012 by means
of telephonic interviews. Approximately 10,000 customers
who had contact with Telkom, were interviewed.
Results are reported as either “Top 2 Box” scores or “Top 3
Box” scores. This means the percentage of customers that
rated Telkom as “very good” and “excellent” or as “good”,
“very good” and “excellent” (respectively) out of a 5-point
excellence scale (excellent; very good; good; poor; very
poor).
Telkom clients included in the survey:
Enterprise markets, government sales and wholesale services: All customers are given the
opportunity to take part in the survey. Customer
contact lists are provided by key role players within
the different environments.
Medium and large business: All Medium and Large
Business customers who had contact with a Telkom
sales representative within the month prior to fieldwork,
form part of the universe with whom telephonic
interviews are conducted.
Small business and residential: A representative
sample of Small Business and Residential customers
who logged faults, had a billing enquiry or required
a service activation is extracted on a weekly basis
and telephonic interviews are conducted with
these customers.
PRODUCT RESPONSIBILITY
GRI

105 Telkom Integrated Report 2013
Operating environment Risk and responsibilityCreating value Leadership and strategy People and environment Financial statements
Model explanationThe loyalty model shows how loyal customers are towards
Telkom and how to improve on loyalty levels. A set
of questions was asked of customers, each indicative of
a different aspect within the loyalty model. Behaviours
indicative of loyalty include customers saying that they
would recommend, continue using or increase the volume
of business they do with Telkom, as well as the likelihood
of actively searching for an alternative communication
provider. A lower score is desirable when asking customers
whether they would actively search for an alternative
provider. Based on answers to these four questions,
customers are grouped into different loyalty segments:
Definition of loyalty segments:
Passionate customers are extremely positive in their
responses and show no negative perceptions. They are
most likely to express the desired loyalty behaviours.
Favourable customers are mostly positive and show
only modest negative perceptions towards Telkom. They
are likely to display loyal behaviour in their interactions
with Telkom, although not to the degree of those
classified as Passionate.
Fence-sitter customers currently have a neutral stance
towards Telkom. Their perceptions of loyalty in the
future will determine whether they move into the more
favourable or vulnerable loyalty categories.
Vulnerable customers do not hold a strong allegiance
to Telkom and are likely to hold negative perceptions
towards the Company.
Defector customers have negative perceptions
of Telkom and are less likely to remain loyal.
Unclassified customers are those who cannot be
classified into any of the above loyalty segments.
Top line findings including customer satisfaction statisticsThe graph on the following page reflects the combined
results of all divisions, excluding Wholesale Services, Telkom
Most of the results show significant improvements, with
pricing and the service delivery manager ratings remaining
stable.
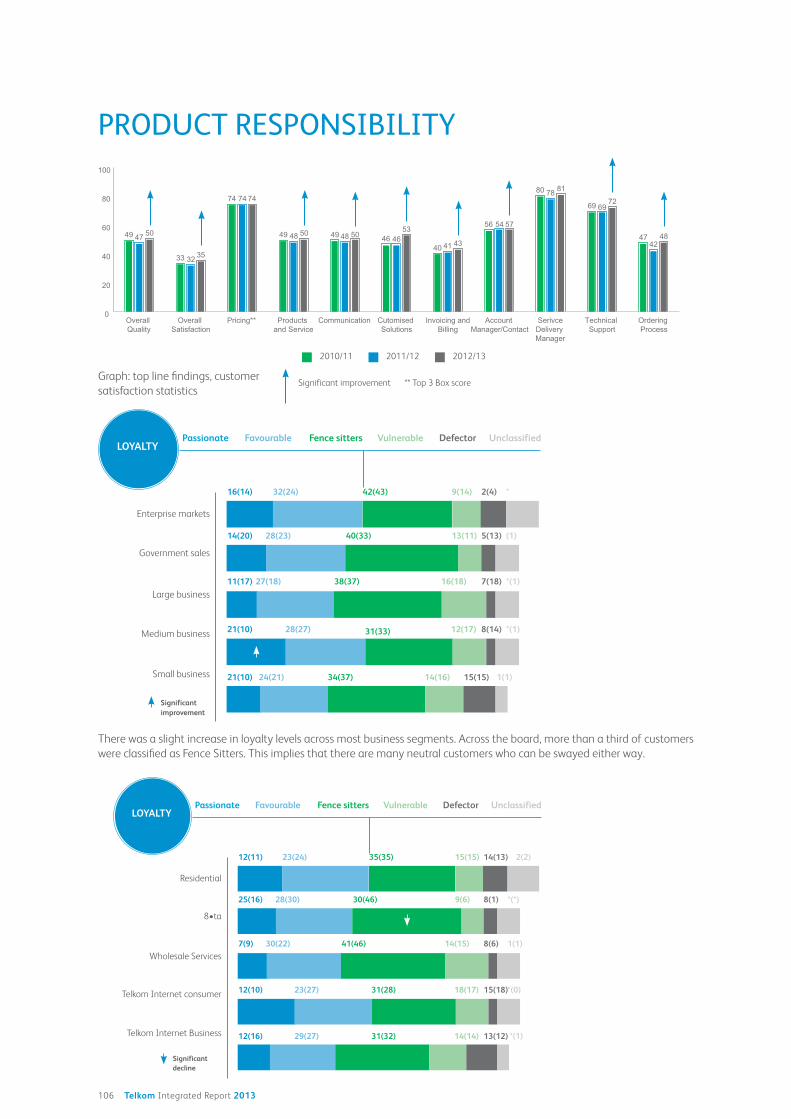
106 Telkom Integrated Report 2013
There was a slight increase in loyalty levels across most business segments. Across the board, more than a third of customers
were classified as Fence Sitters. This implies that there are many neutral customers who can be swayed either way.
PRODUCT RESPONSIBILITY
Residential
8 ta
Wholesale Services
Telkom Internet consumer
Telkom Internet Business
Passionate Favourable Fence sitters Vulnerable Defector Unclassified
12(11) 23(24) 35(35) 15(15) 14(13) 2(2)
25(16) 28(30) 30(46) 9(6) 8(1) *(*)
7(9) 30(22) 41(46) 14(15) 8(6) 1(1)
12(10) 23(27) 31(28) 18(17) 15(18)*(0)
12(16) 29(27) 31(32) 14(14) 13(12) *(1)
LOYALTY
Significant decline
Enterprise markets
Government sales
Large business
Medium business
Small business
Passionate Favourable Fence sitters Vulnerable Defector Unclassified
16(14) 32(24) 42(43) 9(14) 2(4) *
14(20) 28(23) 40(33) 13(11) 5(13) (1)
11(17) 27(18) 38(37) 16(18) 7(18) *(1)
21(10) 28(27) 31(33) 12(17) 8(14) *(1)
21(10) 24(21) 34(37) 14(16) 15(15) 1(1)
LOYALTY
Significant improvement
0
20
40
60
80
100
Overall Quality
Overall Satisfaction
Pricing** Products and Service
Communication Cutomised Solutions
Invoicing andBilling
Account Manager/Contact
SerivceDelivery Manager
Technical Support
Ordering Process
49
33 32 35
74 74 74
49 48 50 49 48 50 46 4653
40 41 43
56 54 57
80 78 81
69 6972
4742
4847 50
2010/11 2011/12 2012/13
Significant improvement ** Top 3 Box scoreGraph: top line findings, customer
satisfaction statistics

107 Telkom Integrated Report 2013
Operating environment Risk and responsibilityCreating value Leadership and strategy People and environment Financial statements
GRI INDEX
Indicator
name Indicator description
Page
number
Fully met/
partially met
Profile disclosures
1.1 Statement from the most senior decision-maker of the organisation (e.g. CEO,
Chair, or equivalent senior position) about the relevance of sustainability to the
organisation and its strategy.
The statement should present the overall vision and strategy for the short term,
medium term (e.g. three to five years), and long-term, particularly with regard to
managing the key challenges associated with economic, environmental, and social
performance.
The statement should include:
Strategic priorities and key topics for the short and medium term with regard to
sustainability, including respect for internationally agreed standards and how
they relate to long-term organisational strategy and success;
Broader trends (e.g. macro-economic or political) affecting the organisation and
influencing sustainability priorities;
Key events, achievements, and failures during the reporting period;
Outlook on the organisation’s main challenges and targets for the next year and
goals for the coming three to five years; and
Other items pertaining to the organisation’s strategic approach.
10 – 12
18 – 21
Fully met
2.1 Name of the organisation. 1 Fully met
2.2 Primary brands, products, and/or services. The reporting organisation should
indicate the nature of its role in providing these products and services, and the
degree to which it utilises outsourcing.
6 Fully met
2.3 Operational structure of the organisation, including main divisions, operating
companies, subsidiaries, and joint ventures.
6, 30 Fully met
2.4 Location of organisation’s headquarters. Inside back
cover
Fully met
2.5 Number of countries where the organisation operates, and names of countries with
either major operations or that are specifically relevant to the sustainability issues
covered in the report.
6 Fully met
2.6 Nature of ownership and legal form. The Group is
domiciled
in South
Africa and
listed on the
JSE Limited.
Fully met
2.7 Markets served (including geographic breakdown, sectors served, and types of
customers/beneficiaries).
6 Fully met

108 Telkom Integrated Report 2013
Indicator
name Indicator description
Page
number
Fully met/
partially met
2.8 Scale of the reporting organisation, including:
Number of employees;
Number of operations;
Net sales (for private sector organisations) or net revenues (for public
sector organisations);
Total capitalisation broken down in terms of debt and equity (for private sector
organisations); and
Quantity of products or services provided.
In addition to the above, reporting organisations are encouraged to provide
additional information, as appropriate, such as:
Total assets;
Beneficial ownership (including identity and percentage of ownership of largest
shareholders); and
Breakdowns by country/region of the following:
– Sales/revenues by countries/regions that make up 5% or more of total
revenues;
– Costs by countries/regions that make up 5% or more of total revenues; and
– Employees.
74, 8, 5 Fully met
2.9 Significant changes during the reporting period regarding size, structure, or
ownership, including:
The location of, or changes, in operations, including facility openings, closings,
and expansions; and
Changes in the share capital structure and other capital formation, maintenance
and alteration operations (for private sector organisations).
There have
been no
significant
changes
regarding size,
structure or
ownership
during the
reporting
period.
Fully met
2.10 Awards received in the reporting period. 32 Fully met
3.1 Reporting period (e.g. fiscal/calendar year) for information provided. 1 Fully met
3.2 Date of most recent previous report (if any). 1 Fully met
3.3 Reporting cycle (annual, biennial, etc). 1 Fully met
3.4 Contact point for questions regarding the report or its contents. Inside back
cover
Fully met
3.5 Process for defining report content, including:
Determining materiality;
Prioritising topics within the report; and
Identifying stakeholders the organisation expects to use the report.
Include an explanation of how the organisation has applied the ‘Guidance on
Defining Report Content’ and the associated principles.
34, 64 Fully met
3.6 Boundary of the report (e.g., countries, divisions, subsidiaries, leased facilities, joint
ventures, suppliers). See GRI Boundary Protocol for further guidance.
1 Fully met
3.7 State any specific limitations on the scope or boundary of the report.
If boundary and scope do not address the full range of material economic,
environmental, and social impacts of the organisation, state the strategy and
projected timeline for providing complete coverage.
1 Fully met
3.8 Basis for reporting on joint ventures, subsidiaries, leased facilities, outsourced
operations, and other entities that can significantly affect comparability from
period to period and/or between organisations.
1 Fully met
GRI INDEX

109 Telkom Integrated Report 2013
Operating environment Risk and responsibilityCreating value Leadership and strategy People and environment Financial statements
Indicator
name Indicator description
Page
number
Fully met/
partially met
3.10 Explanation of the effect of any restatements of information provided in earlier
reports, and the reasons for such restatement (e.g. mergers/acquisitions, change of
base years/periods, nature of business, measurement methods).
Apart from a
reclassification
(see page
148) there
have been no
restatements
of information
provided in
previous
reports.
Fully met
3.11 Significant changes from previous reporting periods in the scope, boundary, or
measurement methods applied in the report.
1 Fully met
3.12 Table identifying the location of the Standard Disclosures in the report. Identify the
page numbers or web links where the following can be found:
Strategy and Analysis 1.1 – 1.2;
Organisational Profile 2.1 – 2.10;
Report Parameters 3.1 – 3.13;
Governance, Commitments, and Engagement 4.1 – 4.17;
Disclosure of Management Approach, per category;
Core Performance Indicators;
Any GRI Additional Indicators that were included; and
Any GRI Sector Supplement Indicators included in the report.
107 – 111 Fully met
4.1 Governance structure of the organisation, including committees under the highest
governance body responsible for specific tasks, such as setting strategy or
organisational oversight.
Describe the mandate and composition (including number of independent
members and/or non-executive members) of such committees and indicate any
direct responsibility for economic, social, and environmental performance.
46 – 58 Fully met
4.2 Indicate whether the Chair of the highest governance body is also an Executive
Officer (and, if so, the function within the organisation’s management and the
reasons for this arrangement).
58 Fully met
4.3 For organisations that have a unitary board structure, state the number of
members of the highest governance body that are independent and/or non-
executive members.
State how the organisation defines ‘independent’ and ‘non-executive’.
This element applies only for organisations that have unitary board structures.
See the glossary for a definition of ‘independent’.
46, 55 – 56 Fully met
4.4 Mechanisms for shareholders and employees to provide recommendations or
direction to the highest governance body. Include reference to processes regarding:
The use of shareholder resolutions or other mechanisms for enabling minority
shareholders to express opinions to the highest governance body;
Informing and consulting employees about the working relationships with
formal representation bodies such as organisation level ‘work councils’, and
representation of employees in the highest governance body; and
Identify topics related to economic, environmental, and social performance
raised through these mechanisms during the reporting period.
58 Fully met
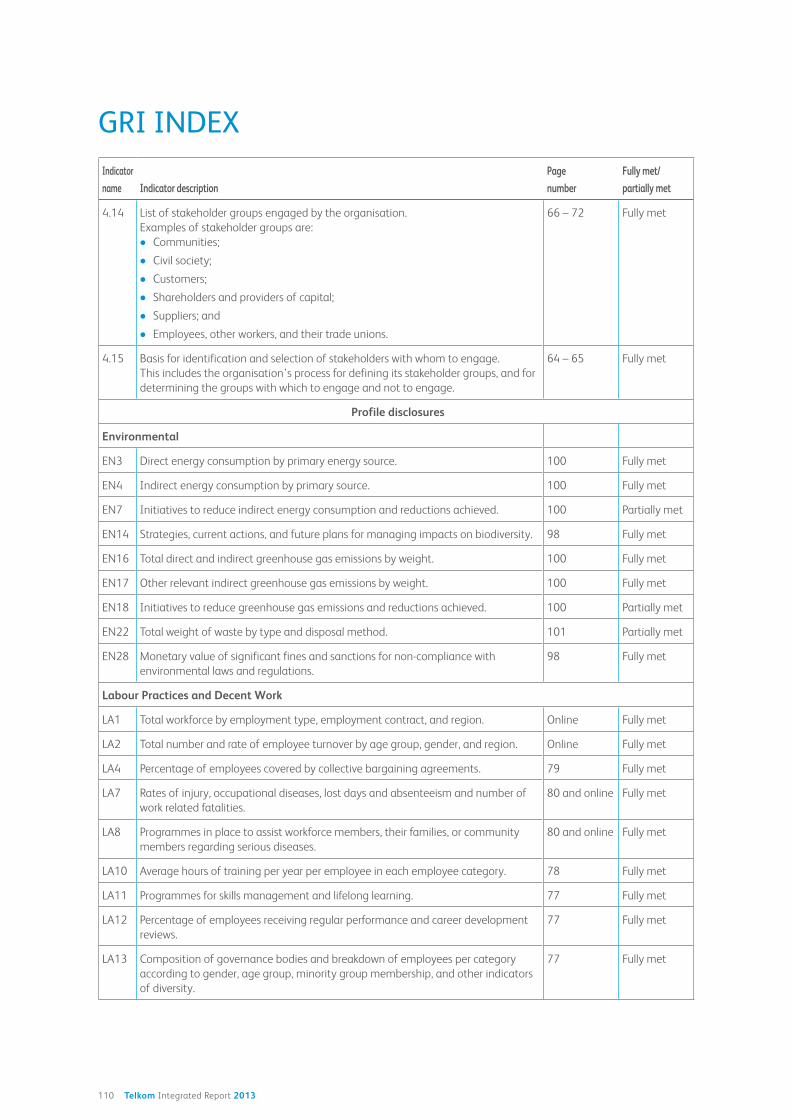
110 Telkom Integrated Report 2013
Indicator
name Indicator description
Page
number
Fully met/
partially met
4.14 List of stakeholder groups engaged by the organisation.
Examples of stakeholder groups are:
Communities;
Civil society;
Customers;
Shareholders and providers of capital;
Suppliers; and
Employees, other workers, and their trade unions.
66 – 72 Fully met
4.15 Basis for identification and selection of stakeholders with whom to engage.
This includes the organisation’s process for defining its stakeholder groups, and for
determining the groups with which to engage and not to engage.
64 – 65 Fully met
Profile disclosures
Environmental
EN3 Direct energy consumption by primary energy source. 100 Fully met
EN4 Indirect energy consumption by primary source. 100 Fully met
EN7 Initiatives to reduce indirect energy consumption and reductions achieved. 100 Partially met
EN14 Strategies, current actions, and future plans for managing impacts on biodiversity. 98 Fully met
EN16 Total direct and indirect greenhouse gas emissions by weight. 100 Fully met
EN17 Other relevant indirect greenhouse gas emissions by weight. 100 Fully met
EN18 Initiatives to reduce greenhouse gas emissions and reductions achieved. 100 Partially met
EN22 Total weight of waste by type and disposal method. 101 Partially met
EN28 Monetary value of significant fines and sanctions for non-compliance with
environmental laws and regulations.
98 Fully met
Labour Practices and Decent Work
LA1 Total workforce by employment type, employment contract, and region. Online Fully met
LA2 Total number and rate of employee turnover by age group, gender, and region. Online Fully met
LA4 Percentage of employees covered by collective bargaining agreements. 79 Fully met
LA7 Rates of injury, occupational diseases, lost days and absenteeism and number of
work related fatalities.
80 and online Fully met
LA8 Programmes in place to assist workforce members, their families, or community
members regarding serious diseases.
80 and online Fully met
LA10 Average hours of training per year per employee in each employee category. 78 Fully met
LA11 Programmes for skills management and lifelong learning. 77 Fully met
LA12 Percentage of employees receiving regular performance and career development
reviews.
77 Fully met
LA13 Composition of governance bodies and breakdown of employees per category
according to gender, age group, minority group membership, and other indicators
of diversity.
77 Fully met
GRI INDEX
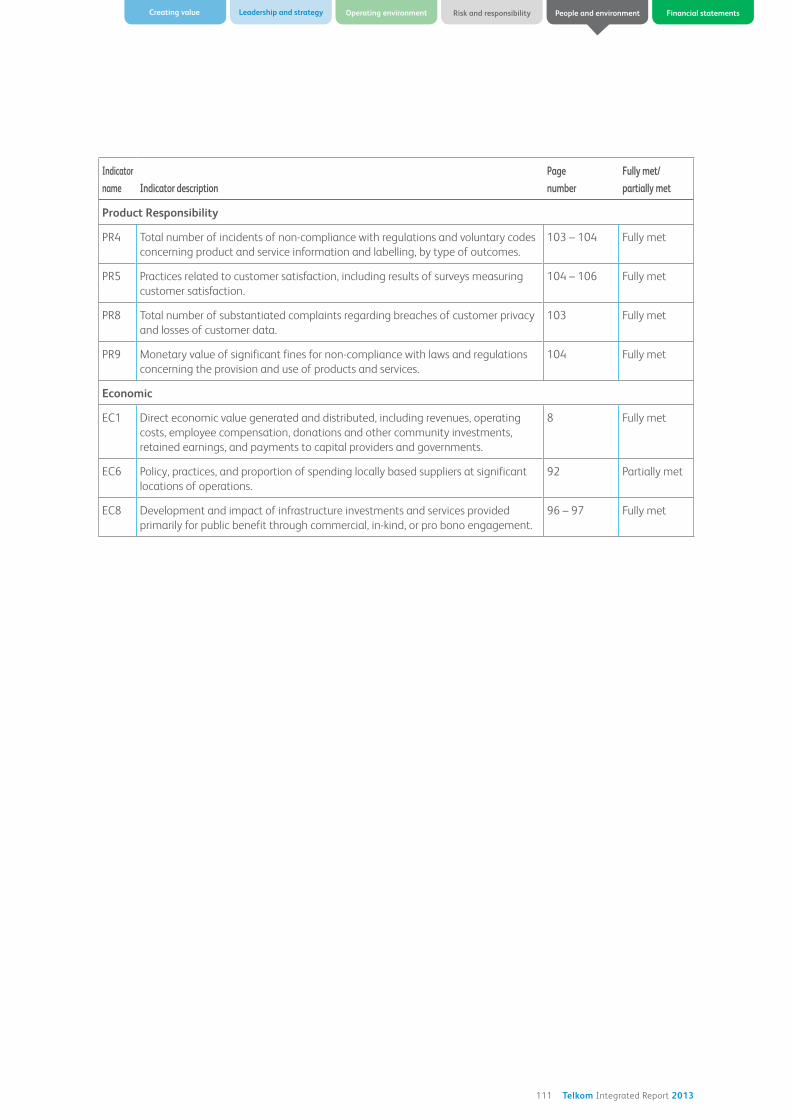
111 Telkom Integrated Report 2013
Operating environment Risk and responsibilityCreating value Leadership and strategy People and environment Financial statements
Indicator
name Indicator description
Page
number
Fully met/
partially met
Product Responsibility
PR4 Total number of incidents of non-compliance with regulations and voluntary codes
concerning product and service information and labelling, by type of outcomes.
103 – 104 Fully met
PR5 Practices related to customer satisfaction, including results of surveys measuring
customer satisfaction.
104 – 106 Fully met
PR8 Total number of substantiated complaints regarding breaches of customer privacy
and losses of customer data.
103 Fully met
PR9 Monetary value of significant fines for non-compliance with laws and regulations
concerning the provision and use of products and services.
104 Fully met
Economic
EC1 Direct economic value generated and distributed, including revenues, operating
costs, employee compensation, donations and other community investments,
retained earnings, and payments to capital providers and governments.
8 Fully met
EC6 Policy, practices, and proportion of spending locally based suppliers at significant
locations of operations.
92 Partially met
EC8 Development and impact of infrastructure investments and services provided
primarily for public benefit through commercial, in-kind, or pro bono engagement.
96 – 97 Fully met

112 Telkom Integrated Report 2013
GROUP ANNUAL FINANCIAL
STATEMENTS
STATEMENTS
STATEMENTS

113 Telkom Integrated Report 2013
Operating environment Risk and responsibilityCreating value Leadership and strategic People and environment Financial statements
FINANCIAL OVERVIEW
SALIENT FEATURES Generated free cash flow of R2.1 billion
5.2% growth in ADSL subscribers
22.6% decrease in mobile EBITDA losses
46.0% decrease in net debt
Net debt to EBITDA remains 0.3x
EBITDA margin decreased to 21.9% from 25.8%
R12 billion impairment of the carrying value of the
legacy network
The 2013 financial results reaffirm the need to act with
urgency to turn our Group’s performance around. The Board
decided to impair the carrying value of the assets of the
Group by R12 billion for the year ended 31 March 2013.
The impairment review was prompted by the considerable
period of time that Telkom’s shares have been trading at
significantly lower value compared to its net asset value.
After the impairment the net asset value per share is
R34. The impairment takes into account the impact on
the financial returns of the Group in light of technology
changes, competition from mobile operators and evolving
regulatory landscape over more than a decade. These
factors have eroded the returns from legacy assets.
The impairment charge is a non-cash item and it will not
impact the significant cash flow (EBITDA), which the Group
generates from its operations. It is akin to an accelerated
depreciation charge, which has no impact on Telkom’s
strong cash position, low indebtedness and ability to
fund its capital programme from its own resources. Basic
earnings per share from continuing operations, however,
has been adversely impacted by the once off non-cash
impairment charge and is therefore 2,286 cents per share
lower than the comparative period for the year ended
31 March 2013. Excluding the R12 billion impairment
charge, basic earnings per share is 63.6 cents higher than
the prior year.
The non-cash impairment charge is excluded from headline
earnings per share from continuing operations, which is
237.7 cents per share (73.2%) lower than the prior year.
The decline in headline earnings is largely as a result of the
cost of VSPs and a provision for the Competition Tribunal
fines and continued pressure on our fixed voice revenues.
The Board is committed to taking the necessary steps
to address the major challenges that have impacted
the financial performance of the Group in recent years.
To this end, management aims to strengthen customer
relationships and to improve operational efficiency.
The Board is also currently reviewing the strategy and
execution plans of the Group with a view to improving the
return on invested capital. Shareholders will be informed of
progress on these matters in due course.
Results from operationsThe impairment discussed above has no bearing on the
results from operations for the year under review and has
accordingly been excluded.
The Group recorded a profit after tax of R501 million excluding
the R12 billion impairment charge (2012: R179 million)
and an EBITDA of R7,109 million (2012: R8,546 million).
The results for the year include a provision of R592 million
for the settlement of the long-standing dispute with the
Competition Commission and the net cost of R434 million
for VSPs.
Revenue has declined by 1.7% as a result of a 4.7% decline
in fixed voice revenue. Data revenue constituted 33.2% of
group revenue and increased by 5.5%. Lower prices on
data due to competitive offerings continue to negate the
volume growth experienced in this area.
Operating expenses excluding depreciation increased by
2.7% as a consequence of a rise in employee expenses of
14.2%.
Employee expenses were impacted by a 6.5% average salary
increase, and the VSP payments.
The Group recorded cost savings on payments to other
operators in the fixed-line business of approximately
R748 million, being a direct result of the lower
mobile termination rates and lower operating costs
in our mobile business mainly due to lower subscriber
acquisition costs.
The Group continues to generate strong cash flows, with
free cash flow of R2.1 billion for the year. The Group’s
capital structure remains solid, with net debt decreasing to
R2.1 billion at year-end.
The payment of an ordinary dividend has been considered
with reference to Telkom’s current and expected future
challenges, performance, debt and cash flow levels.
Telkom’s strategic objectives of network transformation
and the building of its mobile business will see dividends
being considered on an annual basis based on the
performance of the Group. The Board has decided not to
declare a dividend in respect of the financial year ended
31 March 2013.
Segment structureDuring the year under review the Group’s segment structure
was changed to better reflect the chief operating decision
makers’ (Executive Committee) assessment of the Group’s
performance. Due to the Convergence Strategy announced
in July 2012, the Executive Committee now manages
the business on a combined basis, thereby combining the
previously reported Telkom Fixed-Line and Telkom Mobile
segments. This reflects the financial information reviewed
by the Executive Committee when making decisions about
performance and resource allocation and is consistent
with the manner in which the Telkom network generates
revenue, i.e. on a combined basis.
The Telkom segment provides fixed-line access, fixed-line
usage, data communications services (through Telkom and
Cybernest), mobile voice services and handset sales.
Due to the Group’s convergence strategy, key performance
indicators are measured and evaluated on an overall
basis. This report, however, provides further details of the
fixed-line business that provides fixed-line access and data
communications services through Telkom South Africa, and
Pg: 25

114 Telkom Integrated Report 2013
FINANCIAL OVERVIEW
the mobile business that provides mobile voice services,
data services and handset sales through Telkom Mobile.
The contribution of the iWayAfrica, Trudon and Swiftnet
subsidiaries are also shown separately.
Operating revenueGroup operating revenue decreased by 1.7% to
R32,501 million (2012: R33,079 million) for the year ended
31 March 2013. The decrease is mainly due to lower fixed-
line voice usage revenue, partially offset by an increase in
mobile and data revenue.
We have changed the revenue presentation to align to
internal business focus areas. Voice revenue is classified
as usage or subscription revenue and customer premises
equipment and sales revenue is disclosed separately.
Prior year numbers have been restated to reflect the new
presentation format.
The following table shows operating revenue broken down
by major revenue streams and as a percentage of total
revenue and the percentage change by major revenue
stream for the years indicated.
Group operating revenue Year ended 31 March
In ZAR millions 2013
% of
revenue 2012
% of
revenue %
Voice 16,818 51.8 17,668 53.4 (4.8)
Fixed-line usage 8,591 26.5 9,501 28.7 (9.6)
Fixed-line subscriptions 7,743 23.8 7,643 23.1 1.3
Mobile voice and subscriptions 484 1.5 524 1.6 (7.6)
Interconnection 1,597 4.9 1,855 5.6 (13.9)
Fixed-line domestic 562 1.7 633 1.9 (11.2)
Fixed-line international 959 3.0 1,120 3.4 (14.4)
Mobile interconnection 76 0.2 102 0.3 (25.5)
Data 10,801 33.2 10,237 31.0 5.5
Data connectivity 5,595 17.2 5,339 16.1 4.8
Leased line facilities 1,963 6.0 2,051 6.2 (4.3)
Internet access and related services 1,617 5.0 1,649 5.0 (1.9)
Managed data network services 1,005 3.1 899 2.7 11.8
Multi-media services 52 0.2 52 0.2 –
Mobile data 364 1.1 163 0.5 123.3
Cybernest 205 0.6 84 0.3 144.0
Customer premises equipment sales
and rentals 1,466 4.5 1,401 4.2 4.6
Sales 327 1.0 430 1.3 (23.9)
Rentals 704 2.2 652 1.9 8.0
Mobile handset and equipment sales 435 1.3 319 1.0 36.4
Other 227 0.7 284 0.9 (20.1)
iWayAfrica 358 1.1 364 1.1 (1.6)
Trudon 1,140 3.5 1,166 3.5 (2.2)
Swiftnet 94 0.3 104 0.3 (9.6)
Total 32,501 100.0 33,079 100.0 (1.7)

115 Telkom Integrated Report 2013
Operating environment Risk and responsibilityCreating value Leadership and strategic People and environment Financial statements
VOICEVoice revenue consists of revenue from local, long distance,
fixed-to-mobile, fixed-to-fixed and international outgoing
calls. Traffic revenue is principally a function of tariffs and
the volume, duration and mix between relatively more
expensive domestic long distance, international and fixed-
to-mobile calls and relatively less expensive local calls.
The following table sets forth information related to our
fixed-line voice usage revenue for the years indicated.
2013 2012
Rm Rm %
Fixed-line voice usage
revenue 8,591 9,501 (9.6)
Total traffic volumes
(millions of minutes)1 18,425 19,372 (4.9)
Notes:1 Traffic is calculated by dividing total traffic revenue by the weighted
average tariff during the relevant period. Traffic includes dial up
internet traffic. International outgoing mobile traffic is based on the
traffic registered through the respective exchanges and reflected in
interconnection invoices.
Fixed-line voice usage revenue decreased 9.6% to
R8,591 million (2012: R9,501 million) largely as a result of
a 4.9% decrease in voice minutes mainly due to continued
mobile substitution, the impact of the decrease in fixed
termination rates of approximately R136 million from 1 April
2012 and a decrease of approximately R118 million relating
to the pass through of 33% of the decrease in mobile
termination rates to fixed-line customers from 1 August 2012.
The 4.9% decrease in the number of lines also contributed to
the decrease.
Telkom filed a 1.7% overall decrease in basic voice and data
services, including the decrease in mobile termination rates,
effective 1 August 2011 with ICASA and a 1.2% overall
increase in basic voice and data services effective 1 August
2012.
On 1 August 2011 we decreased the price of local peak
calls after the first unit by 3.2% to 42.0 cents per minute
(VAT inclusive). The price of local off peak calls remained
unchanged at 20.7 cents per minute. On 1 August 2012 the
price of local peak and off peak calls remained unchanged.
The fixed-line long distance tariffs decreased 12.3% to
57.0 cents per minute on 1 August 2011 and remained
unchanged on 1 August 2012.
The minimum charge to all international destinations
decreased 12.3% on 1 August 2011, and tariffs to most
international destinations such as Zimbabwe, the UK
and USA were decreased. Although the minimum charge
to all international destinations remained unchanged
on 1 August 2012, tariffs to certain destinations were
increased and others were decrease. Some popular
destinations like the United Kingdom and United States of
America remained unchanged.
Revenue from subscriptions consists of revenue from
installation and reconnection fees, monthly rental charges,
revenue from subscription based calling plans and value
added voice services for post-paid and prepaid PSTN lines,
including ISDN channels and private pay phones. Revenue
from subscription-based calling plans includes revenue
from Telkom’s subscription-based plans, Telkom Closer and
Supreme Call, which are bundled products on post-paid
PSTN lines that include discounted rates and free minutes
for a fixed monthly subscription fee.
Fixed-line subscriptions revenue is principally a function
of the number and mix of residential and business lines in
service, the number of private pay phones in service and
the corresponding charges. The following table sets forth
information related to our fixed-line voice subscription
revenue during the years indicated.
2013 2012 %
Fixed-line subscription
revenue (Rm) 7,743 7,643 1.3
Fixed access lines
(thousands, except
percentages)1 3,800 3,995 (4.9)
Postpaid PSTN2 2,427 2,499 (2.9)
ISDN channels 756 767 (1.4)
Prepaid PSTN 522 623 (16.2)
Private pay phones 95 106 (10.4)
Notes:1 Fixed-line subscription access lines are comprised of PSTN lines,
including ISDN lines and private pay phones, but excluding internal
lines in service and public pay phones. Each analogue PSTN line
includes one access channel, each basic rate ISDN line includes two
access channels and each primary rate ISDN line includes 30 access
channels.2 Excluding ISDN channels. PSTN lines are provided using copper cable,
DECT and fibre.
Fixed-line subscriptions revenue increased 1.3% to
R7,743 million (2012: R7,643 million) as a result of a 5%
and 6% increase in residential and prepaid line rental tariffs
effective 1 August 2011 and 1 August 2012, respectively,
partially offset by the decrease in the number of lines.
The post-paid residential and business line rental both
increased by 5% and 6% on 1 August 2011 and 1 August
2012, respectively. In the 2013 financial year, revenue from
subscription-based calling plans decreased primarily due to
a decrease in traffic, partially offset by a 4.6% increase in
customers subscribing to these packages.
The decrease in the number of post-paid lines in service
in the 2013 financial year was primarily as a result of a
decrease in residential prepaid and post-paid PSTN lines as
well as a decrease in business PSTN lines, partially offset
by an increase in ADSL lines. The decrease in business lines
was mainly due to mobile substitution and the use of other
technologies such as voice over IP. The decrease in prepaid
PSTN lines in the 2013 financial year was primarily due to
the migration of customers to calling plan packages. Private
pay phones decreased as we continue to optimise our pay
phone base.
Mobile voice and subscription revenue decreased 7.6% and
interconnection revenue decreased 25.5% as a result of a
15.3% decrease in the number of post-paid subscribers as
well as a 17.1% decrease in blended ARPU. The decrease
in post-paid subscribers was due to a cleanup of debtors
and an improvement to the credit vetting systems.

116 Telkom Integrated Report 2013
FINANCIAL OVERVIEW
INTERCONNECTIONWe generate revenue from interconnection services for
traffic from calls made by other operators’ customers that
terminate on or transit through our network. Revenue from
interconnection services includes payments from mobile
domestic, fixed domestic and international operators
regardless of where the traffic originates or terminates.
Interconnection revenue from domestic operators includes
revenue for call termination from mobile domestic networks,
as well as access to other services, such as emergency
services and directory enquiry services.
Fixed-line domestic interconnection revenue decreased
11.2% to R562 million (2012: R633 million) primarily due
to the 18% average decrease in fixed termination rates.
Interconnection revenue from international mobile
operators includes international outgoing calls from mobile
domestic networks and amounts paid by foreign operators
for the use of our network to terminate calls made by
customers of such operators and payments from foreign
operators for interconnection hubbing traffic through our
network to other foreign networks.
Fixed-line international interconnection revenue decreased
by 14.4% to R959 million (2012: R1,120 million) largely as
a result of the loss of traffic due to competitors using their
own routes.
DATAData services comprise data transmission services,
including leased lines and packet based services, managed
data networking services and Internet access and related
information technology services. In addition, data services
include revenue from ADSL. Revenue from data services is
mainly a function of the number of subscriptions, tariffs,
bandwidth and distance.
The slow data growth is mainly as a result of pricing
pressures, increased self-provisioning by mobile operators
and lower Internet access revenue. ADSL subscribers
increased 5.2% to 870,505 when compared to the previous
year. Data, however, continues to be an area of growth.
Telkom is also heavily focused on increasing broadband
and data related revenue to diversify its reliance away from
fixed-line voice.
Data connectivity revenue comprises revenue from our
services such as Diginet, DSL, IPLC and Megalines.
Revenue from data connectivity services increased due to
an increase in ADSL revenue as a result of an increase in
the number of subscribers and growth in Diginet revenue,
partially offset by a decrease in IPLC revenue.
Data connectivity increased 4.8% to R5,595 million (2012:
R5,339 million) mainly as a result of a 5.2% increase in the
number of ADSL subscribers to 870,505 (2012: 827,091).
Revenue from mobile leased line facilities decreased 4.3%
to R1,963 million (2012: R2,051 million) due to continued
self provisioning by other operators.
Internet access revenue decreased 1.9% due to a decreased
in wholesale internet exchange ports leased.
Managed data network services revenue increased 11.8%
to R1,005 million (2012: R899 million) as a result of a
13.9% increase in the number of sites to 44,328 (2012:
38,902).
Mobile data revenue increased 123.3% due to an increase
in the number of data subscribers and the data deals and
promotional products launched during the year in line with
our strategy to focus on data.
Cybernest’s data revenue increased 144.0% to R205 million
(2012: R84 million) as a result of good traction in the IT
market with key strategic wins.
CUSTOMER PREMISES EQUIPMENT SALES
AND RENTALSCustomer premises equipment sales decreased 23.9% to
R327 million (2012: R430 million) due to the discontinuation
of the sale of PC and gaming equipment as it does not form
part of Telkom’s core business.
Customer premises equipment rentals increased 8.0% to
R704 million (2012: R652 million) due to an increase in tariffs.
Mobile handset and equipment sales revenue increased
36.4% mainly as a result of the bulk sales of Apple handsets
to an Apple authorised distributor.
OTHEROther revenue includes revenue relating to co-location
of other licensed operators on Telkom owned properties,
the sale of materials and revenue related to the recovery
of costs for work performed on behalf of other licensed
operators. Other revenue decreased 20.1% to R227 million
(2012: R284 million) due to lower revenue recognised from
expired cards, partially offset by higher co-location revenue.
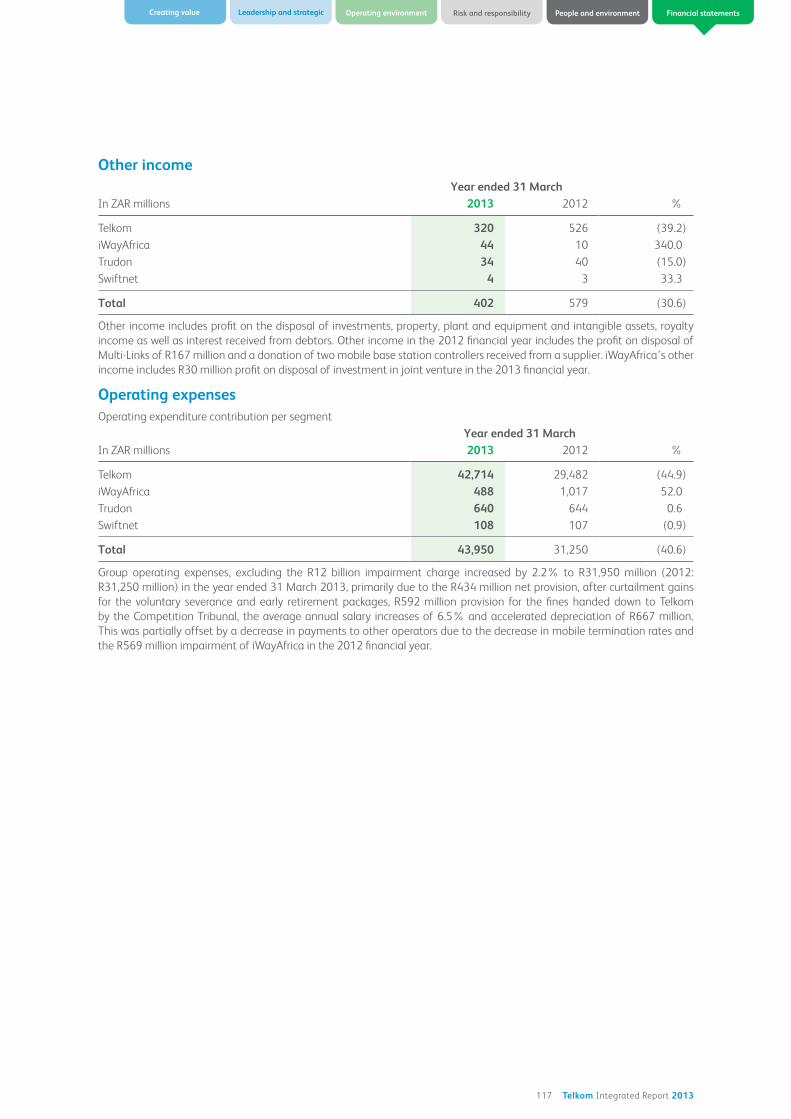
117 Telkom Integrated Report 2013
Operating environment Risk and responsibilityCreating value Leadership and strategic People and environment Financial statements
Other income Year ended 31 March
In ZAR millions 2013 2012 %
Telkom 320 526 (39.2)
iWayAfrica 44 10 340.0
Trudon 34 40 (15.0)
Swiftnet 4 3 33.3
Total 402 579 (30.6)
Other income includes profit on the disposal of investments, property, plant and equipment and intangible assets, royalty
income as well as interest received from debtors. Other income in the 2012 financial year includes the profit on disposal of
Multi-Links of R167 million and a donation of two mobile base station controllers received from a supplier. iWayAfrica’s other
income includes R30 million profit on disposal of investment in joint venture in the 2013 financial year.
Operating expensesOperating expenditure contribution per segment
Year ended 31 MarchIn ZAR millions 2013 2012 %
Telkom 42,714 29,482 (44.9)
iWayAfrica 488 1,017 52.0
Trudon 640 644 0.6
Swiftnet 108 107 (0.9)
Total 43,950 31,250 (40.6)
Group operating expenses, excluding the R12 billion impairment charge increased by 2.2% to R31,950 million (2012:
R31,250 million) in the year ended 31 March 2013, primarily due to the R434 million net provision, after curtailment gains
for the voluntary severance and early retirement packages, R592 million provision for the fines handed down to Telkom
by the Competition Tribunal, the average annual salary increases of 6.5% and accelerated depreciation of R667 million.
This was partially offset by a decrease in payments to other operators due to the decrease in mobile termination rates and
the R569 million impairment of iWayAfrica in the 2012 financial year.

118 Telkom Integrated Report 2013
FINANCIAL OVERVIEW
Telkom operating expenditure
Year ended 31 MarchIn ZAR millions 2013 2012 %
Employee expenses 9,493 8,294 (14.5)
Salaries and wages 7,285 6,754 (7.9)
Benefits 1,975 2,017 2.1
Workforce reduction expenses 753 29 (2,496.6)
Employee related expenses capitalised (520) (506) 2.8
Payments to other network operators 4,430 5,250 15.6
Mobile network operators 2,897 3,599 19.5
International network operators 904 1,045 13.5
Fixed-line network operators 368 320 (15.0)
Data commitments 261 286 8.7
Selling, general and administrative expenses 6,743 6,760 0.3
Materials and maintenance 3,104 2,671 (16.2)
Marketing 937 1,009 7.1
Bad debts 315 550 42.7
Other 2,387 2,530 5.7
Service fees 3,075 2,955 (4.1)
Property management 1,659 1,502 (10.5)
Consultants, security and other 1,416 1,453 2.5
Operating leases 880 756 (16.4)
Buildings 385 282 (36.5)
Equipment 35 29 (20.7)
Vehicles 460 445 (3.4)
Depreciation, amortisation, impairments and write-offs 18,093 5,467 (230.9)
Depreciation 5,044 4,535 (11.2)
Amortisation 873 657 (32.9)
Write-offs 12,176 275 (4,327.6)
Total 42,714 29,482 (44.9)

119 Telkom Integrated Report 2013
Operating environment Risk and responsibilityCreating value Leadership and strategic People and environment Financial statements
EMPLOYEE EXPENSESEmployee expenses consist mainly of salaries and wages
for employees, including bonuses and other incentives,
benefits and workforce reduction expenses. Employee
expenses increased by 14.5% in the year ended 31 March
2013, primarily due to the R434 million net cost relating
to voluntary severance and early retirement packages, the
average annual salary increase of 6.5% and a higher bonus
provision. 1,411 bargaining unit and 178 management
employees exited up to 31 May 2013 as part of the process.
PAYMENTS TO OTHER NETWORK OPERATORSPayments to other network operators include settlement
payments paid to the three South African mobile
communications network operators, Neotel for terminating
calls on their networks and to international network
operators for terminating outgoing international calls
and traffic transiting through their networks. Payments to
mobile operators decreased 19.5% due to the reduction
in mobile termination rates from 73 cents to 56 cents with
effect from 1 March 2012.
SELLING, GENERAL AND ADMINISTRATIVE
EXPENSESSelling, general and administrative expenses include
materials and maintenance costs, marketing expenditures,
debtors impairment, theft, losses and other expenses,
including obsolete stock and cost of sales. Selling, general
and administrative expenses decreased by 0.3% to
R6,743 million (2012: R6,760 million).
Materials and maintenance expenses include subcontractor
payments and consumables required to maintain our
network.
Materials and maintenance increased 16.2% mainly due to
expenditure on data processing equipment for the mobile
business systems and on the integration of independent
business systems as well growth in external customer
infrastructure by Cybernest.
Marketing expenses decreased 7.1% due to lower
marketing expenditure by Telkom Mobile as we refocus the
business.
Bad debts decreased 42.7% due to an improvement to the
mobile credit vetting systems. Debtor’s impairment as a
percentage of revenue improved from 1.8% in the 2012
financial year to 1.0% in the 2013 financial year.
The decrease in the other category was primarily as a result
of a decrease in mobile sales acquisition cost as we refocus
our convergence strategy, partially offset by the provision
for the fines imposed by the Competition Tribunal and a
higher spectrum license fee provision due to the change in
the regulation.
SERVICE FEESService fees include payments in respect of the management
of our properties, to total facilities management
company, a facilities and property management company,
consultants and security. Consultants comprise fees paid
to collection agents and to providers of other professional
services and external auditors. Security refers to services to
safeguard the network and contracts to ensure a safe work
environment, such as guard services.
Property management expenses increased 10.5% mainly
due to annual increases in electricity and water.
Our carbon footprint and electricity consumption is
calculated on page 100.
Lower consulting fees was incurred in the current year
as the prior year included fees relating to the Multi-Links
transaction, strategic workforce planning and increasing
efficiencies through a shared services centre, partially offset
by higher mobile consulting fees for building capacity in
marketing, sales, network and commercial areas.
OPERATING LEASESOperating leases include payments in respect of equipment,
buildings and vehicles.
Operating leases increased 16.4% as a result of an increase
in the number of mobile sites acquired and higher building
leases.
Vehicle leases increased as a result of inflation and fuel
increases, partially offset by a 10.2% reduction in the
number of vehicles from 7,606 to 6,833.
DEPRECIATION, AMORTISATION, IMPAIRMENT AND
WRITE-OFFSDepreciation increased 11.2% due to accelerated
depreciation as a result of the review of the useful lives of the
existing network equipment as we invest to transform into
a commercially led next generation network. Amortisation
also increased 32.9% as a result of the review of the useful
lives of the existing software systems. Impairments and
write-offs increased significantly due to the impairment of
legacy assets.
Details of operating expenditure related to our mobile
business that is included in Telkom’s operating expenditure
are provided below for additional information.

120 Telkom Integrated Report 2013
FINANCIAL OVERVIEW
Mobile operating expenses Year ended 31 March
In ZAR millions 2013 2012 %
Employee expenses 329 195 (68.7)
Payments to other network operators 482 449 (7.3)
Selling, general and administrative expenses 1,787 2,428 26.4
Service fees 249 152 (63.8)
Operating leases 187 99 (88.9)
Depreciation, amortisation, impairments and write-offs 372 219 (69.9)
Total 3,406 3,542 3.8
Investment incomeInvestment income consists of interest received on short-term investments and bank accounts. Investment income increased
by 26.5% to R301 million (2012: R238 million) as a result of higher cash balances.
Finance charges and fair value movementsFinance charges include interest paid on local and foreign borrowings, amortised discounts on bonds and commercial
paper bills, fair value gains and losses on financial instruments and foreign exchange gains and losses on foreign currency
denominated transactions and balances.
Foreign exchange and fair value losses decreased significantly to a gain of R397 million (2012: loss of R1,107 million).
The decrease was mainly due to the cumulative amount of exchange differences of R1,292 million previously recognised in
equity, recognised in profit and loss on disposal of Multi-Links in the prior year. A higher fair value gain on assets held by the
Cell Captive also contributed. The interest expense decreased 13.7% to R660 million (2012: R765 million) mainly as a result
of a 7.4% decrease in interest-bearing debt and lower interest rates.
TaxationThe consolidated tax expense from continuing operations decreased to R490 million (2012: R595 million) due to lower
taxable profit in the 2013 financial year and secondary tax on companies included in the prior year. The consolidated effective
tax rate for the year ended 31 March 2013, excluding the R12 billion impairment charge and non-deductable Competition
Commission fines is 50.6%. The consolidated effective tax rate for the 2012 financial year was 33.4% if the effect of the sale
of Multi-Links and the group impairment of iWayAfrica is excluded. The higher effective tax rate in the 2013 financial year is
mainly as a result of higher non-deductable expenditure including the provision for the Competition Tribunal fines.
Non-controlling interestsNon-controlling interests in the income of subsidiaries decreased to R123 million in the year ended 31 March 2013 (2012:
R126 million) due to the lower net profit of Trudon.

121 Telkom Integrated Report 2013
Operating environment Risk and responsibilityCreating value Leadership and strategic People and environment Financial statements
LIQUIDITY AND CAPITAL RESOURCESGroup liquidity and capital resourcesThe following table shows information regarding our consolidated cash flows for the periods indicated.
2013
Rm
Reclassified(1)
2012
%Rm
Cash flows from operating activities 7,474 5,892 26.9
Cash flows from investing activities (5,519) (4,907) 12.5
Cash flows from financing activities (731) (1,586) (53.9)
Net decrease in cash and cash equivalents 1,224 (601) (303.7)
Effect of foreign exchange differences (5) (7) (28.6)
Net cash and cash equivalents at the beginning of the year 1,165 1,773 (34.3)
Net cash and cash equivalents at the end of the year 2,384 1,165 104.6
(1) Repurchase agreements were reclassified from financing activities to investing activities.
Cash flows from operating activitiesOur primary sources of liquidity are cash flows from
operating activities and borrowings. We intend to fund our
expenses, indebtedness and working capital requirements
from cash generated from our operations and from capital
raised in the markets. The year on year increase in cash
flows from operating activities in the 2013 financial year is
mainly due to higher non-cash items such as the provision
for the Competition Tribunal fines, voluntary severance and
early retirement packages and the post retirement medical
aid provision, lower dividends paid in the 2013 financial
year as well as lower taxation paid, partially offset by lower
cash received from customers due to lower revenue.
Cash flows from investing activitiesCash flows from investing activities relate primarily to
investments in our network. Cash flow invested in property,
plant, equipment and intangible assets were 20.4% higher
than the previous year, partially offset by a decrease in our
investment in repurchase agreements.
Cash flows from financing activitiesCash flows from financing activities are primarily a function
of borrowing activities. In the 2013 financial year, loans
repaid exceeded loans raised by R701 million due to the
repayment of the TL12 bond of R1,060 million.
Working capitalWe had negative consolidated working capital of
approximately R1.5 billion as of 31 March 2013, compared
to consolidated working capital of approximately
R497 million as of 31 March 2012.
The decrease in working capital in the 2013 financial year
was primarily due to the syndicated loan of R2.0 billion
reaching maturity in December 2013 and classified as a
current liability. Telkom’s Group cash flows from operations,
together with the credit facilities will be sufficient to meet
Telkom’s present working capital requirements for the
12 months from the date of this integrated report.
We intend to fund current liabilities through a combination
of operating cash flows and with borrowings available
under existing credit facilities. We had R6.5 billion
available under existing credit facilities as of 31 March 2013.
We had cash and net financial assets of R4.5 billion
available at 31 March 2013 (2012: R3.2 billion).

122 Telkom Integrated Report 2013
FINANCIAL OVERVIEW
Debt maturityThe following table sets forth our consolidated indebtedness including finance leases as of 31 March 2013:
Interest payment dates
Interestrate/
coupon(%)
Outstan-ding as
of 31 March
2013ZAR
(inmillions)
Nominalamountoutstan-
ding asof
31 March 2013
ZAR
MaturingYear ended 31 March
2014
ZAR
2015
ZAR
2016
ZAR
2017
ZAR
2018
ZAR
After
2018
ZAR
TELKOMBonds11.90% unsecured local
bond due 29 April 2015
(TL15)1, 3 29 Apr & 29 Oct 11,9 1,160 1,160 – – 1,160 – – –
6% unsecured local bond
due 24 February 2020
(TL20)1, 4 22-Feb 6 1,570 2,500 – – – – – 2,500
Syndicated loan due
17 December 2013 Quarterly 7,11 1,998 2,000 2,000 – – – – –
Commercial paper bills 6,3 496 500 500
EURO loans5 Quarterly
0.1% –
1.4% 90 90 – – – – – 90
USD loans Sept and March 2,50% 571 607 207 206 181 13 – –
Finance leases6 n/a
13.43% –
37.78% 766 766 55 79 109 144 187 192
Total Telkom 6,651 7,623 2,762 285 1,450 157 187 2,782
OTHERTrudon (Pty) Limited
Finance leases n/a
5.0% –
10.0% 4 4 2 2 – – – –
iWayAfrica Group n/a 0 2 2 2
Total other 6 6 4 2 – – – –
Grand total 6,657 7,629 2,766 287 1,450 157 187 2,782
1 Listed on the Bond Exchange of South Africa.
2 The TL12 was issued on April 29, 2009 at a yield to maturity of 12.47% and listed on the Bond Exchange of South Africa.
3 The TL15 was issued on April 29, 2009 at a yield to maturity of 11.91% and listed on the Bond Exchange of South Africa.
4 The TL20 was issued on February 22, 2000 at a yield to maturity of 15.00%. The TL20 bond was listed on the Bond Exchange of South Africa with effect
of April 1, 2005.
5 R90 million of Telkom’s indebtedness outstanding as of March 31, 2013 was guaranteed by the Government of the Republic of South Africa. EURO loans
converted at the spot rate.
6 Finance leases are mostly secured by land and buildings.
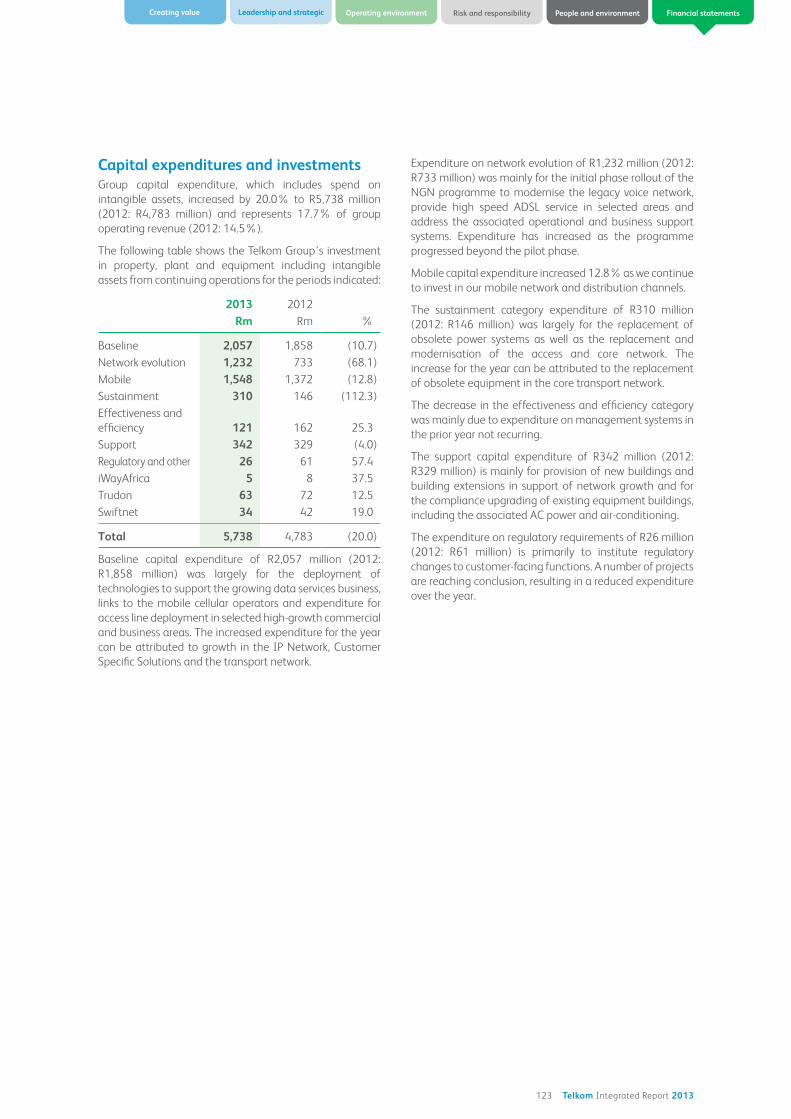
123 Telkom Integrated Report 2013
Operating environment Risk and responsibilityCreating value Leadership and strategic People and environment Financial statements
Capital expenditures and investmentsGroup capital expenditure, which includes spend on
intangible assets, increased by 20.0% to R5,738 million
(2012: R4,783 million) and represents 17.7% of group
operating revenue (2012: 14.5%).
The following table shows the Telkom Group’s investment
in property, plant and equipment including intangible
assets from continuing operations for the periods indicated:
2013 2012
Rm Rm %
Baseline 2,057 1,858 (10.7)
Network evolution 1,232 733 (68.1)
Mobile 1,548 1,372 (12.8)
Sustainment 310 146 (112.3)
Effectiveness and
efficiency 121 162 25.3
Support 342 329 (4.0)
Regulatory and other 26 61 57.4
iWayAfrica 5 8 37.5
Trudon 63 72 12.5
Swiftnet 34 42 19.0
Total 5,738 4,783 (20.0)
Baseline capital expenditure of R2,057 million (2012:
R1,858 million) was largely for the deployment of
technologies to support the growing data services business,
links to the mobile cellular operators and expenditure for
access line deployment in selected high-growth commercial
and business areas. The increased expenditure for the year
can be attributed to growth in the IP Network, Customer
Specific Solutions and the transport network.
Expenditure on network evolution of R1,232 million (2012:
R733 million) was mainly for the initial phase rollout of the
NGN programme to modernise the legacy voice network,
provide high speed ADSL service in selected areas and
address the associated operational and business support
systems. Expenditure has increased as the programme
progressed beyond the pilot phase.
Mobile capital expenditure increased 12.8% as we continue
to invest in our mobile network and distribution channels.
The sustainment category expenditure of R310 million
(2012: R146 million) was largely for the replacement of
obsolete power systems as well as the replacement and
modernisation of the access and core network. The
increase for the year can be attributed to the replacement
of obsolete equipment in the core transport network.
The decrease in the effectiveness and efficiency category
was mainly due to expenditure on management systems in
the prior year not recurring.
The support capital expenditure of R342 million (2012:
R329 million) is mainly for provision of new buildings and
building extensions in support of network growth and for
the compliance upgrading of existing equipment buildings,
including the associated AC power and air-conditioning.
The expenditure on regulatory requirements of R26 million
(2012: R61 million) is primarily to institute regulatory
changes to customer-facing functions. A number of projects
are reaching conclusion, resulting in a reduced expenditure
over the year.
124 Telkom Integrated Report 2013
The directors are responsible for the preparation of the annual financial statements of the Company and the Group.
The directors are also responsible for maintaining a sound system of internal controls to safeguard shareholders’ investments
and the Group’s assets.
In presenting the accompanying financial statements, International Financial Reporting Standards have been followed and
applicable accounting policies have been used, incorporating prudent judgements and estimates.
The external auditors are responsible for independently auditing and reporting on the annual financial statements.
In order for the directors to discharge their responsibilities, management continues to develop and maintain a system of
internal control aimed at reducing the risk of error or loss in a cost-effective manner. The internal controls include a risk-based
system of internal auditing and administrative controls designed to provide reasonable but not absolute assurance that
assets are safeguarded and that transactions are executed and recorded in accordance with generally accepted business
practices and the Group’s policies and procedures.
The directors, primarily through the Audit Committee, which consists of independent non-executive directors, meet periodically
with the external and internal auditors, as well as executive management to evaluate matters concerning accounting policies,
internal controls, auditing and financial reporting.
The directors are of the opinion, based on the information and explanations given by management and internal audit that
the internal accounting controls are adequate, so that the financial records may be relied on for preparing the financial
statements and maintaining accountability for assets and liabilities. The directors are satisfied that the Company and the
Group have adequate resources to continue in operational existence for the foreseeable future. Accordingly, Telkom SA SOC
Limited continues to adopt the going concern basis in preparing the annual financial statements.
Against this backdrop, the directors of the Group accept responsibility for the annual financial statements, which were
approved by the board of directors on 13 June 2013 and are signed on their behalf by:
Jabu A Mabuza Sipho N Maseko Jacques Schindehütte
Chairman of the Group chief executive officer Chief financial officer
Telkom board group
Pretoria
13 June 2013
PREPARER AND SUPERVISOR OF ANNUAL
FINANCIAL STATEMENTS
These consolidated annual financial statements were prepared by Mr Robin Coode (group executive accounting) and
supervised by Mr Deon Fredericks (deputy chief financial officer).
DIRECTORS’ RESPONSIBILITY STATEMENT
125 Telkom Integrated Report 2013
Operating environment Risk and responsibilityCreating value Leadership and strategic People and environment Financial statements
Dear shareholder,
This remuneration report is intended to provide an overview and understanding of the Group’s remuneration principles and
policies with specific emphasis on the non-executive directors, executive directors, Executive Committee and prescribed officers
in the Group. The Group adopted the governance and disclosure requirements stipulated in the King Code of Governance
Principles for South Africa 2009 (King III) and incorporated the required information in this report.
The Remuneration Committee remains mindful of the remuneration trends in the global environment and carefully
considers all practices against the business and set remuneration levels within the context of overall company performance.
The Remuneration Committee is mindful of the responsibility to protect and promote shareholders’ interests in setting
executive remuneration and is accountable for the structure and quantum of remuneration.
Susan Botha
Chairman of the Remuneration Committee
13 June 2013
REMUNERATION COMMITTEE REPORT

126 Telkom Integrated Report 2013
This report sets out the Group’s remuneration policy for
executive and non-executive directors and executive
management and provides detail of their remuneration
and share interests for the financial year ended 31 March
2013.
Role of the Remuneration Committee and terms of referenceThe Remuneration Committee (Remco) acts on behalf
of the Board in setting remuneration policy and oversee
executive remuneration for executive directors and senior
executives, monitoring the execution of the remuneration
policy and making recommendations to the Board on the
total remuneration of the Chairman, group CEO, members
of the Board and senior executives.
The committee shall:
Determine the remuneration policy for all employees
including the remuneration of executive directors and
senior executives. The remuneration structure is aligned
with strategy, agreed risk appetite which reward success
fairly and avoid paying more than what is necessary.
The objectives of the policy are:
– To promote sustainable value creation through
transparent alignment with agreed corporate strategy;
– To ensure proper risk management processes
are in place to ensure that remuneration are
appropriately aligned with both short and long-term
performances;
– To ensure that all employees:
o Are remunerated competitively and fair relative
to industry benchmarks;
o Are provided with appropriate incentives to
encourage enhanced performance; and
o Are rewarded for their individual contributions to
the success of the company.
– To ensure that remuneration is affordable and
reasonable in terms of sustainable value creation for
shareholders.
Determine the total individual remuneration package
of each of the executive directors including, guaranteed
package, benefits in kind, short term incentive
payments and share options:
– Annually review, through performance appraisals
conducted by the GCEO, the performance of senior
executives and review their guaranteed packages
based on the extent to which senior executives have
met their performance targets, goals and objectives;
– Approve annual guaranteed package increases
for all other management and bargaining unit
employees
Determine targets for any performance related
incentive schemes implemented in the Group.
Seek board and shareholder approval for any long-
term incentive scheme and determine annual grants
and share allocations to executive directors and
senior executives.
Review annually the terms and conditions upon which
the executive directors are employed and remunerated.
Ensure that contractual terms on termination and any
payments made are fair to both the individual and
the Group.
Review succession plans of executive directors and
senior executive.
Remco held four scheduled meetings and no special
meetings during the financial year. A quorum for a meeting
is 50% of the members.
Members of RemcoThe committee consists of non-executive directors.
Executive management attends by invitation as provided
for in the Group’s MOI. Ms S Botha, an independent non-
executive director, was appointed chairman of Remco as
of 18 February 2013. For the 2013 financial year Remco
comprised the following non-executive directors (three of
which are independent):
S Botha (Independent chairman-appointed with effect
from 18 February 2013)
B du Plessis (Independent)
K Kweyama (Independent – appointed with effect from
18 February 2013)
JA Mabuza (Appointed with effect from 18 February 2013)
J Molobela
JN Hope (Resigned with effect from 24 October 2012)
PL Zim (Retired with effect from 24 October 2012)
By invitation
NT Moholi (Resigned as group chief executive officer with
effect from 31 March 2013)
TE Msubo (Chief of Human Resources)
JH Schindehütte (Chief of Finance)
JC Smit (Group executive: total remuneration and
performance management)
Remuneration policyThe Telkom remuneration strategy is designed to attract,
retain and motivate high-calibre talent in a challenging ICT
environment.
The market environment that Telkom operates in is
characterised by:
Intensifying competition with mobile operators and
new entrants to the market which continues to put
pressure on the Group.
As the market expands with operators in all spheres of
our business, the challenge of retaining experienced
executive leadership, as well as attracting new talent
required for the new and growing areas of our business,
such as data and FMC increases.
This requires a competitive and attractive remuneration
offering, to ensure that Telkom continues to draw, motivate
and retain the best talent to drive group strategy and
deliver operational results.
The remuneration structure is designed to ensure that
individual contribution is rewarded and aligned to strategic,
operating and financial performance, for long-term
REMUNERATION REPORT
127 Telkom Integrated Report 2013
Operating environment Risk and responsibilityCreating value Leadership and strategic People and environment Financial statements
sustainability as well as short-term business plan deliverables, for profitability, both of which are imperative to shareholder
interest and value creation.
We follow a holistic balance approached across the following remuneration elements:
Elements Type Desired outcome
Guaranteed Package (GP) Fixed Influenced by the scope of the role and the knowledge,
skills and experience required.
Salary levels are positioned at market median.
Short-term Incentives (STI) Variable Delivers reward on achievement of annual performance
targets. The level of achievement determines the
level of payment against each weighted company
performance measure.
Long-term Incentives (LTI) Variable Motivate long-term sustainable stretch performance;
align the interests of management with those of
shareholders.
Our general philosophy, which is aligned with market
practice, is to reward all Telkom employees on total
earnings of market median. To ensure we remunerate
employees competitively we use regular market and
industry benchmarks – peer group and ICT industry.
REMUNERATION OBJECTIVESAs we approach the rejuvenation of Telkom, the
remuneration policy is designed to compete for talent
in a competitive labour market in order for Telkom to
successfully achieve the following objectives:
Be an integral part of an overall human resources
strategy, geared to support business strategies;
Value creation;
Establish a formal, transparent and fair reward strategy;
Control and manage total cost of employment;
Retain competent employees to enhance
business performance;
Motivate individual and team performance to drive
shareholder value and employee engagement;
Differentiate payment based on individual
performance; and
Maintain a balance between guaranteed remuneration,
short-term incentives and long-term incentives.
REMUNERATION PRINCIPLESTelkom recognises that in this competitive environment, we
need to differentiate based on strategic roles and growing
areas of the business to value employee contribution.
Therefore, our remuneration and reward policies and
practices must be based on the following principles:
Designed to motivate and reinforce
superior performance;
Encourage the development of organisational, team
and individual performance;
Develop competencies required to meet future
business needs;
Based on the premise that employees should share in
the success of the Group;
Aim to get the appropriate remuneration mix to ensure
Telkom’s business plan objectives are met; and
Be fair and non-discriminatory.
Guaranteed packagesGuaranteed packages (GP) are influenced by the scope of
the role and the knowledge, skills and experience required
of the position holder and reflects the market median
determined through external market research that yields
market data and appropriate salary ranges for specific
positions.
Employees do not have a right to annual guaranteed
package increases. Annual increases are subject to industry
market conditions, employee performance, internal equity,
strategic investments and the Group’s overall financial
position and the ability to pay. Guaranteed packages are
reviewed against individual performance, and set against
market median. GP is determined on a total-cost-to-
company basis. GP consists of a basic pensionable salary,
retirement provision and flexible benefits which includes a
non-pensionable allowance and a travel allowance where
applicable.
Employees can structure their guaranteed packages
within the framework of the applicable policies, practices
and regulatory requirements. Remuneration adjustments
outside the annual remuneration review process may
be considered under exceptional circumstances and will
be subject to the agreed authorisation.
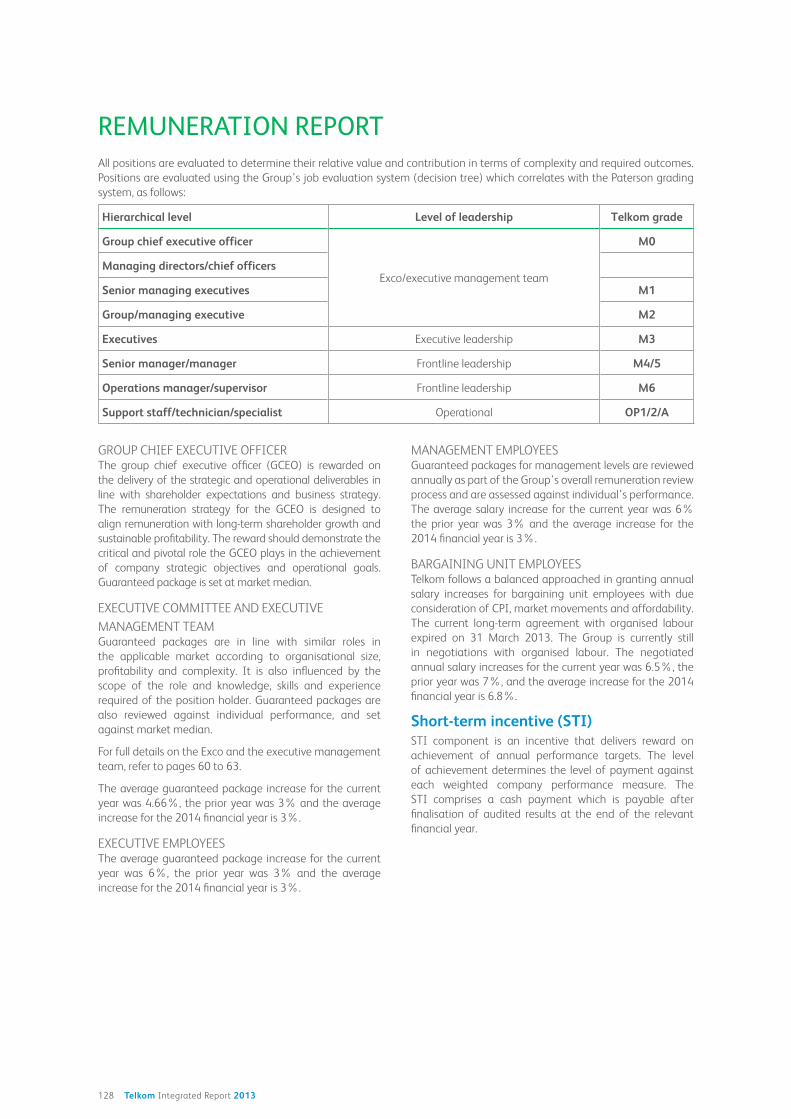
128 Telkom Integrated Report 2013
REMUNERATION REPORT
All positions are evaluated to determine their relative value and contribution in terms of complexity and required outcomes.
Positions are evaluated using the Group’s job evaluation system (decision tree) which correlates with the Paterson grading
system, as follows:
Hierarchical level Level of leadership Telkom grade
Group chief executive officer
Exco/executive management team
M0
Managing directors/chief officers
Senior managing executives M1
Group/managing executive M2
Executives Executive leadership M3
Senior manager/manager Frontline leadership M4/5
Operations manager/supervisor Frontline leadership M6
Support staff/technician/specialist Operational OP1/2/A
GROUP CHIEF EXECUTIVE OFFICERThe group chief executive officer (GCEO) is rewarded on
the delivery of the strategic and operational deliverables in
line with shareholder expectations and business strategy.
The remuneration strategy for the GCEO is designed to
align remuneration with long-term shareholder growth and
sustainable profitability. The reward should demonstrate the
critical and pivotal role the GCEO plays in the achievement
of company strategic objectives and operational goals.
Guaranteed package is set at market median.
EXECUTIVE COMMITTEE AND EXECUTIVE
MANAGEMENT TEAMGuaranteed packages are in line with similar roles in
the applicable market according to organisational size,
profitability and complexity. It is also influenced by the
scope of the role and knowledge, skills and experience
required of the position holder. Guaranteed packages are
also reviewed against individual performance, and set
against market median.
For full details on the Exco and the executive management
team, refer to pages 60 to 63.
The average guaranteed package increase for the current
year was 4.66%, the prior year was 3% and the average
increase for the 2014 financial year is 3%.
EXECUTIVE EMPLOYEESThe average guaranteed package increase for the current
year was 6%, the prior year was 3% and the average
increase for the 2014 financial year is 3%.
MANAGEMENT EMPLOYEESGuaranteed packages for management levels are reviewed
annually as part of the Group’s overall remuneration review
process and are assessed against individual’s performance.
The average salary increase for the current year was 6%
the prior year was 3% and the average increase for the
2014 financial year is 3%.
BARGAINING UNIT EMPLOYEESTelkom follows a balanced approached in granting annual
salary increases for bargaining unit employees with due
consideration of CPI, market movements and affordability.
The current long-term agreement with organised labour
expired on 31 March 2013. The Group is currently still
in negotiations with organised labour. The negotiated
annual salary increases for the current year was 6.5%, the
prior year was 7%, and the average increase for the 2014
financial year is 6.8%.
Short-term incentive (STI)STI component is an incentive that delivers reward on
achievement of annual performance targets. The level
of achievement determines the level of payment against
each weighted company performance measure. The
STI comprises a cash payment which is payable after
finalisation of audited results at the end of the relevant
financial year.
129 Telkom Integrated Report 2013
Operating environment Risk and responsibilityCreating value Leadership and strategic People and environment Financial statements
The objectives of the STI plan are as follows:
To support the achievement of the Group’s annual
performance targets including the priority focus areas
and annual business plan targets;
To encourage over achievement of group results;
To drive a strong performance culture whereby
recognising and rewarding exceptional performance
of the Group, teams and of individuals;
Adequately differentiate between exceptional and
mediocre performance
Reward team and individual contribution and
performance: “what is good for shareholders, customers
and employees”;
More emphasis is placed on divisional performance to
support the overall business strategy and create a clear
line of site especially for lower level employees; and
Individual measures will ensure that employees have
better line of sight and fully understand the impact
of their performance on the award, which will have a
positive impact on individual and team performance.
In line with the new remuneration policy approved by
shareholders, overall company performance will be
measured at group, business unit and divisional level as
indicated below:
UnitGroup target
Business unit target
Divisional target Total
Business unit (30/70) 30% 60% 10% 100%Corporate Centre (70/30) 70% 20% 10% 100%
The performance of the Group and business units will be
measured against the following indicators:
GROUP LEVEL Earnings before interest and taxation measured on
Group level
Profits after Tax (PAT)
BUSINESS UNIT LEVELS Revenue, OPEX and CAPEX
Performance drivers - customer satisfaction (Net
Promoter Score), Turnaround Strategy implementation
and organisational transformation
Divisional specific measures are measured on
divisional level
The rules, targets and measurements are tabled annually
on recommendation of Remco to the Board for approval,
subject to the actual audited company performance
reflected in the plan under review.
Short-term incentive plan awarded for the 2013 financial yearFor the purpose of calculating the Company performance
against the short term incentive plan, the cost relating
to voluntary severance and early retirement packages of
R434 million and the provision of R592 million for the fines
handed down to Telkom by the Competition Tribunal were
excluded.
The average overall achievements of performance targets
for financial year 2013 are reflected below:
Business unit/Corporate Centre Actual achievement
Wholesale and networks 92% – 97%
Data centre operations 85% – 92%
Telkom business 89% – 98%
Consumer services 78% – 94%
Mobile 84%
GCEO office 96% – 194%
Chief financial office 96% – 104%
Chief of Regulatory 92% – 99%
Chief of HR 95% – 97%
Bargaining unit 88%
The board of directors has decided to pay employees an
incentive to recognise their efforts under challenging
circumstances. To this effect an average incentive was
approved of 50% for both management and bargaining
unit employees and 45% for the executive committee
and executive management team (2012: 42.75% for the
bargaining unit employees and 30.54% for management,
Exco and executive management employees).
Long-term incentive awardsCurrently no long-term incentive (LTI) share plan is in
place. The initial shareholder concerns with the 2012
LTI submission as well as proposed changes to address
and accommodate shareholders are highlighted on the
following page.

130 Telkom Integrated Report 2013
REMUNERATION REPORT
Issues raised Revised position
Limited consultation Proper engagement
with influential/majority
shareholders
Performance conditions not
challenging enough:
TSR – CPI +2%
Profit after tax + 5%
EBITDA + 5%
Basket of measures:
HEPS, BEPS and TSR
TSR risk free rate plus risk
margin of 6% per annum
70% retention focus vs
only 30% performance
conditions
No retention only
performance conditions
(100%)
The Group will submit a share incentive plan to the
2013 Annual General Meeting, scheduled for 27 September
2013, for shareholder approval.
The proposed share incentive plans is structured to optimise
the Group’s overall position, while providing benefits that
will assist the Group attract, retain and incentivise executives
and top talented employees. The plan is designed to
support the principle of alignment between management
and shareholder interests with the aim to ultimately ensure
growth in shareholder value. The objectives are to motivate
long-term sustainable performance, align the interests of
top management with those of shareholders and retain
business critical and top talented employees.
The plan will consist of the following share based incentive
plans: the share appreciation right scheme and forfeitable
share plan for senior management (M4 and higher)
a forfeitable share plan for employees below senior
management levels (employee shared owner plan(ESOP))
(M5 and lower).
SHARE APPRECIATION RIGHT SCHEME (SARS)Eligible employees will receive annual grants of
share appreciation rights, which are rights to receive shares
equal to the value of the difference between the exercise
price and the grant price. Vesting of the rights is subject to
specific performance conditions.
When the holder elects to exercise the vested right, the
company settles the difference between the market price
on grant date and the exercise price in equity.
FORFEITABLE SHARE PLANForfeitable share plan entails a free transfer of shares to an
employee, under the condition of forfeiture in the case that:
Termination of service before the vesting/release
date; and
The Group’s pre-determined performance levels.
From grant date, the employee has shareholder rights in
respect of the forfeitable shares to receive dividend rights
and voting rights.
PERFORMANCE CONDITIONS FOR VESTING
The following financial measures must be achieved for
forfeitable share in order for awards to be vested:
TOTAL SHAREHOLDER RETURN Total shareholder return targets a risk free rate plus
a risk margin of 6% per annum to be achieved for
the three year period for a member to qualify for
full vesting.
A minimum achievement (hurdle) of a risk free rate plus
a risk premium of 2% needs to be achieved before any
vesting occurs.
A linear sliding scale to be applied for total shareholder
return achieved between risk free plus 2% and risk free
plus 6% performance levels to determine vesting.
Free cash flow.
EBITDA.
Net Promoter Score (NPS).
The Board will annually determine performance conditions
for each allocation.
LIMITS TO THE PROPOSED INCENTIVE SHARE PLANSThe aggregate number of shares which may be allocated
under the long-term incentive plan (LTIP) when added
to the total number of conditional awards, which have
been allocated previously under the LTIP and any shares
allocated to employees under any other managerial scheme
operated by the Group, shall not exceed 26,039,195 shares
equating to approximately 10% of the current number of
issued ordinary shares of the Group.
The maximum number of shares allocated to all unvested
awards granted to any participant, in respect of the LTIP and
any other managerial scheme operated by the Group, shall
not exceed 5,207,839 shares, representing approximately
1% of the current issued ordinary share capital of the Group.
Remco may not grant conditional awards to an employee in
any financial year if it would at the proposed date of grant
because the face value of the grant which such employee
has been granted in that financial year to exceed 120%
of the employee’s guaranteed package at the proposed
date of grant. In order to enhance the Company’s ability
to attract external candidates, Remco has the discretion to
increase such limit to 240% in the year of appointment of
an employee.
Shareholding/ownership guidelineThe Board wants to encourage individual shareholding in
the Company to align shareholder interest and reinforce
long-term decision making. Top Management – Exco
members, managing/group executives and executives (M3
and higher) are expected to purchase a number of shares
with the following minimum shareholding:
Grade
LTIShare to purchase over
a 3 year period
Allocation
% of GP% of GP Year 1 Year 2 Year 3
M0 100% 15% 5% 5% 5%
M1 80% 15% 5% 5% 5%
M2 60% 15% 5% 5% 5%
M3 40% 15% 5% 5% 5%
131 Telkom Integrated Report 2013
Operating environment Risk and responsibilityCreating value Leadership and strategic People and environment Financial statements
The shareholding requirements are the criteria to
participate in the FSP scheme. No shares will vest until the
minimum requirements have been met.
The total number of shares purchased after 3 years which
is equal to 15% of GP should be retained for a minimum
period of:
50% for 24 months
50% for 12 months
In addition, the above shareholding requirements by
executives to demonstrate their commitment and
alignment with shareholder interests, the company will
make a loan facility available to executives to purchase
additional shares. The loan will be at a rate of 0%
interest and the executive should retain these shares until
retirement. The maximum loan granted will be equal to
1x guaranteed package. Fringe benefit tax will apply to the
loan amount.
What can shareholders expect going forward? The Company’s remuneration policy will be more
performance driven.
Strong alignment between interest of executive
directors, Exco and senior executives with those
of shareholders.
Substantial emphasis on the link between pay
and performance together with executive share
ownership requirements.
External appointmentsExecutive directors are not permitted to hold more than
one external directorship of listed companies or offices
without the prior approval of the Board. To avoid conflict of
company interest or impair the executive directors’ ability to
render productive service to Telkom, the executive directors
may not accept membership of a board of directors without
prior written permission. In the case of a member of the
executive committee permission should be obtained from
the GCEO. Telkom may withdraw permission to serve on
a board of directors at any stage. Executive directors may
accept compensation flowing from directorship. However,
such compensation should be declared when applying for
permission. Board meetings may be attend in members’
own time by taking vacation leave.
Service agreementsNT Moholi announced on 5 November 2012 that she has
notified the board of directors of her intention to step down
before the end of her contract period and therefore requested
early termination of employment contract. She resigned as
GCEO and director effective 31 March 2013 – contracted
termination date. As part of the separation agreement
signed with the employee, the employee acknowledged
that she remains bound by the restraint of trade agreement
that she signed on the 8th of April 2009 and 14th of April
2011 respectively. The restraint period is for a 24 month
period from the date of termination of the employment
contract. In accordance with the restraint agreement and
for the duration of the restraint period the Employee shall
not , whether as proprietor, partner, director, shareholder,
employee, member, consultant, contractor, financier, agent,
representative, assistant or otherwise and whether for reward
or not, directly or indirectly, carry on or be interested or
engaged in or concerned with, or employed by any company,
close corporation, firm, undertaking or concern carried on in
the territory, which engages in any way in, the competitive
activity or provides services which are the same as or similar
to the competitive activity of the Company.
Telkom entered into a full-time employment contract with
SN Maseko effective from 1 April 2013, with a termination
clause subject to three (3) calendar months’ notice given
on either side.
Executive
directors
Year of
employ-
ment
Year first
appointed
to the
Board
Year
due for
re-election
SN Maseko 2013 2013 2014
JH Schindehütte 2011 2011 2016
Retention and restraint agreementsIn order to ensure that Telkom attracts highly skilled
and experienced ICT business leaders Telkom can sign
retention and/or restraint of trade agreement for specific
candidates in specific roles. The main objective is to
protect Telkom’s interest with reference to trade secrets
and confidential information. Confidential information to
include, inter alia, information relating to Telkom strategic
objectives, information relating to business activities,
technical, scientific commercial, financial and market
information, business data and plans, designs, drawings,
and technical requirements and specifications of Telkom.
After termination of the employment contract and for the
duration of the restraint period the employee shall not
carry on or be interested or engaged in/or concerned with
or employed by any company which engaged in any way
in, the competitive activity or provides services which are
the same as or similar to the competitive activity.
No retention agreements were signed with any of the
executive committee members during the financial year.
Sign-on bonusSign-on bonuses may be allocated on the discretion of
the GCEO on recommendation of executive committee
members, to prospective staff members who meet specific
criteria. The intention of the sign-on bonus is to act as a
recruitment incentive to assist in talent attraction and
compensate for potential loss of benefits from previous
employer. The full sign-on bonus amount will be recovered
if the individual terminate his/her employment contract.
Telkom paid a sign-on bonus to A Vitai, MD Telkom Mobile,
in November 2012. The bonus will be recovered should he
resign from his position before 31 October 2015.
Non-executive directors’ remuneration key principles and policiesThe board of directors, on the recommendation of Remco,
determines the fees of the non-executive directors. These
fees are set out on pages 132 and 133 and in note 39 in the
consolidated annual financial statements.

132 Telkom Integrated Report 2013
REMUNERATION REPORT
Fees for Telkom’s non-executive directors are determined
by the board of directors based on market practice, within
the restrictions contained in Telkom’s MOI. Telkom’s non-
executive directors receive no other pay or benefits other
than directors’ fees, with the exception of reimbursement
of expenses incurred in connection with their directorships.
The non-executive directors do not participate in the long-
term incentive share plan or in the short-term incentive plan
outlined herein and are not eligible for pension scheme
membership.
The remuneration structure is considered to be fair and
reasonable and in the best interest of the Group.
Service agreementsPL Zim had a service agreement with Telkom effective from
16 February 2011, which had a one-year term, expiring
15 February 2012. On 8 February 2012, shareholders were
advised that PL Zim has been reappointed as chairman
with immediate effect. On 9 September 2012, PL Zim
has informed the board of directors of his retirement as
chairman and director with effect from 24 October 2012.
Telkom entered into a service agreement with JA Mabuza
effective from 16 November 2012, which has a one-year
term, expiring 15 October 2013.
Board of directors
Year firstappointed to
the Board
PL Zim (former chairman) 2011
JA Mabuza (chairman) 2012
S Botha 2012
B du Plessis 2004
N Dongwana 2012
Dr CA Fynn 2012
JN Hope 2009
RJ Huntley 2007
N Kapila 2011
I Kgaboesele 2011
K Kweyama 2012
PSC Luthuli 2005
L Maasdorp 2012
N Mnxasana 2012
NT Moholi 2011
J Molobela 2009
K Mzondeki 2012
F Petersen 2012
JH Schindehütte 2011
Dr S Sibisi 2012
LL von Zeuner 2012
Y Waja 2010
NON-EXECUTIVE DIRECTORS’ REMUNERATIONNon-executive directors’ fees effectively 1 April 2012 were as follows:
Non-executive directors’ fees R per annum
2013 2012
Chairman of the Board 1,110,000 1,110,000
Non-executive director of the Board 325,000 325,000
International board member 449,811 449,811
Audit Committee chairman 200,000 200,000
Audit Committee member 120,000 120,000
Risk Committee chairman 200,000 200,000
Risk Committee member 120,000 120,000
Remuneration Committee chairman 200,000 200,000
Remuneration Committee member 120,000 120,000
Nominations Committee chairman 120,000 80,000
Nominations Committee member 90,000 60,000
Investment and Transactions Committee chairman 120,000 80,000
Investment and Transactions Committee member 90,000 60,000
Social and Ethics Committee chairman 200,000 200,000
Social and Ethics Committee member 120,000 120,000

133 Telkom Integrated Report 2013
Operating environment Risk and responsibilityCreating value Leadership and strategic People and environment Financial statements
Board meetings – five scheduled per annum.
Special board meetings fee:
Chairman – R20,000 per meeting
Ordinary board member – R15,000 per meeting
International board member – R15,000 per meeting
Board sub-committee meetings:
Four scheduled committee meetings are held per annum by the Audit, Risk, Remuneration and Social and
Ethics Committees.
Three scheduled committee meetings held per annum by the Nominations and Investment and
Transactions Committees.
Special committee meeting fee is R15,000 per meeting.
Where any board member voluntarily attends a committee meeting that they are not a member of, there is no fees payable
for their attendance.
All fees are paid proportionally to the period in which office is held.
REMUNERATION AND BENEFITS AWARDED TO PRESCRIBED
OFFICERS DURING 2013Executive directors’ remunerationRemuneration and benefits paid and short-term incentives approved in respect of the 2013 financial year are set out in the
following table:
Rand
Guaranteed
package
Short-term
incentive
Fringe and
other benefits
Total
2013
Total
2012
Executive directorsNT Moholi 6,402,150 2,659,133 2,575,420(1) 11,636,703 12,067,321
JH Schindehütte 4,976,250 2,237,760 1,193,339(2) 8,407,349 8,384,458
Total 11,378,400 4,896,893 3,768,759 20,044,052 20,451,779
(1) Represents four months’ salary in lieu of notice pay in accordance with initial fixed term employment contract and accrued leave on date of exit.
(2) Includes a settling-in allowance of R1,181,375.
Executive committee and prescribed officers (excluding executive directors)The aggregate remuneration and benefits paid, short-term incentives approved and for the 2013 financial year are set out in
the following table:
Executive committee
Guaranteed
package
Short-term
incentive
Fringe and
other benefits
Total
2013
Total
2012
A Vitai 1,833,333 689,700 5,948,333(1) 8,471,366 -
BC Armstrong 3,537,432 1,222,536 958,061(2) 5,718,029 10,472,579
DJ Fredericks 3,162,000 1,179,300 680,074(3) 5,021,374 7,886,290
JM Mavuso 2,931,497 905,481 11,964 3,848,942 8,280,935
TE Msubo 2,996,632 1,079,866 11,964 4,088,462 4,558,954
MB Sallie 3,336,218 1,167,409 11,964 4,515,591 9,820,143
GJ Rasethaba 2,582,987 900,119 11,964 3,495,070 5,425,393
MJ Nzeku 660,621 – 13,000,000(4) 13,660,621 3,848,278
P Marais 6,050,160
Total 21,040,720 7,144,411 20,634,324 48,819,455 56,342,732
(1) Includes a sign-on bonus of R5,500,000.(2) Represents an acting allowance – acting MD DCO.(3) Includes an acting allowance – acting MD Telkom International.(4) Represents an early retirement settlement. The amount included severance pay, short-term incentive, accrued leave and contribution to legal costs
incurred in the arbitration dispute between Telkom and employee.

134 Telkom Integrated Report 2013
REMUNERATION REPORT
Executive management team31 March 2013
Rand
Guaranteed
package
Short-term
incentive
Fringe and
other benefits
Total
2013
Total
2012
Executive management team 65,003,020 13,910,442 49,933,872 128,847,333 81,284,461
Number of employees 33 32
Non-executive directorsThe following table details emoluments paid to non-executive directors for services rendered:
Non-executive directors
Directors’
fees
Committee
and special
meeting fees
Total
2013
Total
2012
PL Zim (chairman) 156,667 627,422 784,089 1,520,000
JA Mabuza (chairman) 145,000 422,290 567,290 –
S Botha 50,000 101,943 151,943 –
B du Plessis 455,000 325,000 780,000 820,000
NP Dongwana 185,000 192,005 377,005 62,401
Dr CA Fynn 60,000 101,943 161,943 –
JN Hope 330,000 183,705 513,705 760,000
RJ Huntley 305,000 183,705 488,705 970,000
PG Joubert 325,417
N Kapila(1) 285,000 449,811 734,811 704,811
I Kgaboesele 490,000 325,000 815,000 428,750
KT Kweyama – 101,943 101,943 –
PSC Luthuli 330,000 183,705 513,705 955,000
LW Maasdorp 85,000 128,004 213,004 –
NP Mnxasana 245,000 183,705 428,705 47,401
J Molobela 470,000 325,000 795,000 775,000
KW Mzondeki 105,000 128,004 233,004 –
F Petersen 90,000 101,943 191,943 –
S Sibisi 60,000 183,705 243,705 52,401
LL von Zeuner 110,000 101,943 211,943 –
Y Waja 310,000 183,705 493,705 760,000
Total 4,266,667 4,534,481 8,801,148 8,181,181
(1) N Kapila is a foreign director with Indian nationality.

135 Telkom Integrated Report 2013
Operating environment Risk and responsibilityCreating value Leadership and strategic People and environment Financial statements
DIRECTORS’ SHAREHOLDING AS AT 31 MARCH 2013
Beneficial Non-beneficialNumber of shares Direct Indirect Direct Indirect
ExecutiveNT Moholi 37,004 – – –Non-executiveJ Molobela 267 – – –K Mzondeki 267 – – –Dr CA Fynn 202 – – –
Total 37,740 – – –
DIRECTORS’ SHAREHOLDING AS AT 31 MARCH 2012
Beneficial Non-beneficialNumber of shares Direct Indirect Direct Indirect
ExecutiveNT Moholi 37,004 – – –
Non-executive
J Molobela 267 – – –
NP Mnxasana 160 – – –
Total 37,431 – – –
DIRECTORS’ INTERESTS IN CONTRACTSThe directors of the Group annually and as required declare their interest in any transaction with the Group in terms of the
Companies Act, 2008. In accordance with the Companies Act, 2008, Telkom SA SOC Limited maintains a register of directors’
interests in contracts.
None of the directors declared an interest in any contract during the year under review.
136 Telkom Integrated Report 2013
SOCIAL AND ETHICS COMMITTEE REPORT
INTRODUCTIONThe Social and Ethics Committee presents its report for the
financial year ended 31 March 2013. The report is presented
in accordance with the Company’s memorandum of
incorporation, the requirements of the Companies Act, 71 of
2008 (“the Companies Act”) section 72(4) read together
with regulation 43 of the Companies Act Regulations, 2011
(“Regulations”), and in respect of any other duties assigned
to the committee by the Board.
MEMBERSHIPThe membership of the committee comprised the following
non-executive directors of which three are independent:
J Molobela (chairman)
L Maasdorp
K Kweyama
F Petersen
LL von Zeuner
ResignationsJ Huntley – 24 October 2012 – resigned
JN Hope – 24 October 2012 – resigned
NP Mnxasana – 24 October 2012 – not re-elected by
shareholders
Y Waja – 24 October 2012 – retired
NP Dongwana – 2 November 2012 – resigned
In addition, the GCEO; the CFO, chief of Regulatory and
Corporate Affairs and chief of Human Resources are also
permanent invitees to meetings.
Qualification details of the current members of the Social
and Ethics Committee are set out on page 61.
Details of meeting attendance can be found on page 55.
DUTIES PERFORMEDDuring the financial year ended 31 March 2013, the
committee convened three times to discharge both its
statutory and board responsibilities. As an overview only,
and not to be regarded as an exhaustive list, the committee
carried out the following duties:
Reviewed the sustainability issues and plan for
the Group;
Assessed the effectiveness of the Group’s B-BBEE plan
as pertains to transformation of the organisation;
Reviewed the charitable giving function which
is implemented through the Foundation to
ensure alignment of the function with the overall
company strategy;
Reviewed the Group’s human resources operations
report as it pertains to labour practices and decent work;
Discussed the 54 pieces of legislation falling under the
ambit of the committee identified by management;
The committee further discussed the impact and
controls of non-compliance to each of the legislation;
Obtained regular updates from management regarding
compliance matters;
Obtained regular updates from management regarding
Telkom’s compliance with the JSE SRI and the Group’s
plan to address gaps identified during the review;
Reviewed the adequacy and effectiveness of the
Business Code of Ethics and other policies relevant to
the committee;
The committee has received regular reports on matters
relating to the management of the Group’s ethics,
which included updates on matters reported to the
ethics helpline/mailbox;
The committee received reports on matters relating
to the prevention, detection and investigation of
fraudulent activity or misconduct within Telkom,
including corrupt activities;
The committee has received reports on matters relating
to consumer complaints and satisfied itself that the
Group was not in breach of the Consumer Protection
Act through these complaints; and
The committee has received reports on matters relating
to sponsorships awarded by Telkom.
The committee has received and dealt with matters
reported through the ‘whistle-blowing line’.
CONCLUSIONThe committee is satisfied that it has fulfilled its obligations
in respect of the Social and Ethics Committee terms of
reference and work plan as well as its mandate according
to the Companies Act.
J MolobelaChairman of the Social and Ethics Committee
13 June 2013

137 Telkom Integrated Report 2013
Operating environment Risk and responsibilityCreating value Leadership and strategic People and environment Financial statements
INTRODUCTIONThe Audit Committee presents its report for the financial
year ended 31 March 2013. The report is presented
in accordance with the Group’s memorandum of
incorporation, the requirements of the Companies Act, 71 of
2008 (the Companies Act), as well as the recommendations
contained in the third King Report on Governance for South
Africa (King III). Amongst others, the Audit Committee’s
operations are also guided by a formal charter that is in line
with the JSE Listings Requirements.
MEMBERSHIPThe membership of the committee comprised the following
independent non-executive directors:
I Kgaboesele (chairman)
B du Plessis
K Mzondeki
F Petersen
LL von Zeuner
RESIGNATIONSPSC Luthuli – 24 October 2012 – retired
NP Mnxasana – 24 October 2012 – not re-elected by
shareholders
NP Dongwana – 2 November 2012 – resigned
In addition, the chief executive officer; the chief financial
officer, head of internal audit, head of risk management
and the external auditors are also permanent invitees to
meetings.
Qualification details of the current members of the Audit
Committee are set out on pages 60 and 61.
Details of meeting attendance can be found on page 50.
DUTIES PERFORMEDDuring the financial year ended 31 March 2013, the
committee convened six times to discharge both its
statutory and board responsibilities. As an overview only,
and not to be regarded as an exhaustive list, the committee
carried out the following duties:
Reviewed the appropriateness of the identified
significant risks and the management and
control thereof;
Discussed the Group’s major risk exposures and the
steps management had undertaken to mitigate them;
Reviewed the Group’s statement on internal control
systems prior to endorsement by the Board;
Satisfied itself that the internal audit coverage plans
made provision for effectively addressing the risk areas
of the business;
Considered the results of work performed by, and the
conclusions of, the internal audit function, in relation to:
– Corporate governance;
– Risk management;
– Financial systems, internal control and reporting; and
– Internal financial controls;
Assessed and evaluated the independence and
effectiveness of the internal auditor functions, in
accordance with its mandate;
Assessed the effectiveness of the combined
assurance forum;
Reviewed the performance and expertise of the chief
financial officer;
Responsible for the appointment of independent
external auditors, retention, compensation, resignation
or dismissal of the external auditors, as well as their
terms of engagement and oversight of the work of the
external auditors who report directly to the committee;
Considered any material problems, reservations and
observations, or any potentially contentious accounting
treatments or judgements, or significant unusual
transactions, or going concern issues arising from the
external audit;
Reviewed and recommended for adoption by the
Board the interim and annual financial information
that is publicly disclosed, including the integrated
annual report;
Reviewed the adequacy of management’s corrective
action taken in response to significant internal and
external audit findings;
Obtained regular updates from management regarding
compliance matters;
Obtained regular updates on the status of material
open litigation and other proceedings and the
related reserves;
Reviewed the adequacy and effectiveness of the control
framework and governance structures implemented
within the IT environment; and
The committee has received reports on matters relating
to ethical conduct and the prevention, detection and
investigation of fraudulent activity or misconduct within
Telkom Group companies, received and dealt with
concerns and complaints through “whistle-blowing”
mechanisms that were reported to the committee by
the head of risk management.
The committee is satisfied that it has fulfilled its obligations
in respect of the Audit Committee charter.
CONCLUSIONBased on the results of the formal documented review of the
Group’s system of internal controls and risk management,
including the design, implementation and effectiveness of
the internal financial controls conducted by Telkom audit
services during the 2013 financial year and considering
information and explanations given by management and
discussions with the external auditor on the results of the
audit, the Audit Committee has considered all significant
control matters and associated action plans. Having regard
to the aforementioned, nothing has come to the attention
of the Audit Committee that leads it to conclude that the
Group’s system of internal controls and risk management
are not effective and that the internal financial controls
do not form a sound basis for the preparation of reliable
financial statements.
AUDIT COMMITTEE REPORT
138 Telkom Integrated Report 2013
The Audit Committee is satisfied that Ernst & Young
Inc. is independent and was appointed in terms of the
requirements of section 90(2) of the Companies Act,
No. 71 of 2008 and nominated the re-appointment of
Ernst & Young Inc. as registered auditors for the 2014
financial year.
The Audit Committee recommended the consolidated
annual financial statements and the integrated report for
the year ended 31 March 2013 for approval by the board
of directors on 13 June 2013.
I KgaboeseleChairman of the Audit Committee
13 June 2013
AUDIT COMMITTEE REPORT

139 Telkom Integrated Report 2013
Operating environment Risk and responsibilityCreating value Leadership and strategic People and environment Financial statements
I hereby certify in accordance with section 88(2)(e) of the Companies Act, No. 71 of 2008, the Group has lodged with the
Registrar of Companies all such returns as are required of a public company in terms of this Act and that all such returns are,
to the best of my knowledge and belief, true, correct and up to date.
I further hereby certify that Telkom SA SOC Limited and its directors have, during the 12 months ended 31 March 2013,
complied with all Listings Requirements and every disclosure requirement for continued listing on the JSE Limited imposed by
the JSE Limited during that period.
X MakasiGroup company secretary
13 June 2013
CERTIFICATE FROM GROUP COMPANY SECRETARY
140 Telkom Integrated Report 2013
To the members of Telkom SA SOC Limited
The directors have pleasure in submitting the annual
financial statements of the Company and the Group for the
year ended 31 March 2013.
NATURE OF BUSINESSTelkom is a leading integrated communications service
provider in South Africa and on the African continent.
FINANCIAL RESULTSLoss from continuing operations for the year ended
31 March 2013 was R11,499 million (2012: R179 million
profit) representing basic earnings per share from continuing
operations of 2,276.2 cents loss per share (2012: 10.4 cents
profit per share). Full details of the financial position and
results of the Group are set out in the accompanying
Company and Group annual financial statements.
DIVIDENDSThe ordinary dividend has been considered with reference
to Telkom’s current and expected future challenges,
performance, debt and cash flow levels. Telkom’s strategic
objectives of network transformation and the building of
its mobile business will see dividends being considered on
an annual basis based on the performance of the Group.
Telkom has decided not to declare a dividend in respect
of the financial year ended 31 March 2013. While our
current financial position should allow us to fund network
transformation and build our data driven mobile offering,
the Board has decided that it is prudent to allow for more
internally generated funding for the capital expenditures
planned over the next three years. This will better position
Telkom to weather uncertainties as we advance our value
building strategy.
SUBSIDIARIES, ASSOCIATES
AND OTHER INVESTMENTSParticulars of the material subsidiaries of the Group are set
out in note 16 of the accompanying Group annual financial
statements.
The attributable interest of the Group in the after-tax
earnings from continuing operations of its subsidiaries for
the year ended 31 March 2013 were:
2013 2012
Rm Rm
Aggregate amount
of profit/(loss) after
taxation 558 (70)
SHARE CAPITALDetails of the authorised, issued and unissued share capital
of the Company as at 31 March 2013, are contained in
note 24 of the accompanying Group annual financial
statements.
SHARE REPURCHASEThe Company did not repurchase any shares during the
year under review.
BORROWING POWERSIn terms of the Company’s memorandum of incorporation,
Telkom has unlimited borrowing powers subject to the
restrictive financial covenants of the TL20 bond and
syndicated loans.
CAPITAL EXPENDITURE
AND COMMITMENTSDetails of the Company and Group’s capital commitments
on property, plant and equipment as well as intangible
assets are set out in note 37 of the accompanying Group
annual financial statements.
Details of the Company and Group’s capital expenditure on
property, plant and equipment as well as intangibles are set
out in notes 13 and 14 of the accompanying Group annual
financial statements.
REPORT ON OTHER LEGAL AND
REGULATORY REQUIREMENTSAs mentioned in note 38 to the consolidated financial
statements in the report on the SAVA matter, the
Competition Tribunal found Telkom to be in contravention
of section 8(b) and section 8(d)(i) of the Competition Act
and imposed an administrative penalty of R449 million on
Telkom. Telkom appealed the matter and the Competition
Commission filed a cross-appeal but, pursuant to
settlement discussions between the parties, the respective
appeals were subsequently withdrawn. Accordingly, the
Competition Tribunal’s award stands unaltered.
As a result of the Competition Tribunal’s finding of a
contravention of the Competition Act by Telkom, Telkom’s
external auditors, Ernst & Young Inc., reported a reportable
irregularity (RI) to the Independent Regulatory Board for
Auditors (IRBA). In response to a request from Ernst &
Young Inc. for further information regarding the RI, Telkom
confirmed that the RI is no longer taking place and that
there are no losses to be recovered pursuant to the RI. The
auditors have reported this in their findings to IRBA and it is
expected that the RI will be finalised on this basis.
As mentioned in note 38 to the consolidated financial
statements in the report on the Multiple Complaints
Referral matter, the CC signed a settlement agreement on
13 June 2013, in an attempt to settle the MIV referral. In
terms of this settlement agreement, Telkom has admitted
that its conduct during the complaint period amounted
to a contravention of sections 8(c) (margin squeeze) and
8(d)(iii) (bundling and tying) of the Competition Act. Telkom
furthermore committed to certain price reductions over the
next three years, behavioural remedies which include a
form of functional separation between its wholesale and
retail business and has agreed to pay an administrative
DIRECTORS’ REPORT
141 Telkom Integrated Report 2013
Operating environment Risk and responsibilityCreating value Leadership and strategic People and environment Financial statements
penalty of R200 million, payable in three equal instalments.
This settlement agreement is subject to confirmation by
the CT and Telkom is awaiting a date on which the CT will
hear the matter.
As a result of the admissions by Telkom in the
abovementioned settlement agreement, Telkom’s external
auditors, Ernst & Young Inc., reported an RI to the IRBA.
EVENTS SUBSEQUENT
TO REPORTING DATEEvents subsequent to the reporting date are set out in
note 43 of the accompanying Group annual financial
statements.
DIRECTORATEThe following changes occurred in the composition of the
board of directors from 1 April 2012 to the date of this
report:
AppointmentsJA Mabuza (chairman) 14 November 2012
K Mzondeki 14 November 2012
L Maasdorp 16 November 2012
S Botha 10 December 2012
Dr CA Fynn 10 December 2012
K Kweyama 10 December 2012
F Petersen 10 December 2012
LL von Zeuner 10 December 2012
SN Maseko 1 April 2013
ResignationsPL Zim 24 October 2012
Dr SP Sibisi 24 October 2012
RJ Huntley 24 October 2012
NP Mnxasana 24 October 2012
PSC Luthuli 24 October 2012
JN Hope 24 October 2012
Y Waja 24 October 2012
NP Dongwana 2 November 2012
NT Moholi 31 March 2013
The board of directors at the date of this report is as follows:
JA Mabuza (chairman)
SN Maseko ( group chief executive
officer)
JH Schindehütte (chief financial officer)
S Botha
B du Plessis
Dr CA Fynn
N Kapila
I Kgaboesele
K Kweyama
L Maasdorp
J Molobela
K Mzondeki
F Petersen
LL von Zeuner
Details of each director may be found on pages 60 and 61
of this integrated report.
DIRECTORS’ INTERESTSAt 31 March 2013, none of Telkom’s directors other than
NT Moholi, J Molobela, K Mzondeki and Dr CA Fynn held any
direct and indirect, beneficial and non-beneficial interests in
the share capital of the Company. NT Moholi, J Molobela,
K Mzondeki and Dr CA Fynn directly held 37,004, 276, 276
and 202 ordinary shares in Telkom, respectively.
Details of the company secretary’s business address and
the Group’s registered office are set out on the inside back
cover of this integrated report.
142 Telkom Integrated Report 2013
INDEPENDENT AUDITOR’S REPORT
143 Telkom Integrated Report 2013
Operating environment Risk and responsibilityCreating value Leadership and strategic People and environment Financial statements


144 Telkom Integrated Report 2013
STATEMENTS OF PROFIT OR LOSS AND OTHER
COMPREHENSIVE INCOME
for the year ended 31 March 2013
Group Company2013 2012 2013 2012
Notes Rm Rm Rm Rm
Continuing operationsTotal revenue 4.1 33,119 33,668 31,909 32,262
Operating revenue 4.2 32,501 33,079 30,972 31,510
Other income 5 402 579 395 437
Operating expenses 43,950 31,250 42,835 30,979
Employee expenses 6.1 9,861 8,636 9,490 8,291
Payments to other operators 6.2 4,678 5,484 4,479 5,288
Selling, general and administrative expenses 6.3 7,216 7,193 6,825 8,224
Service fees 6.4 3,103 2,974 3,068 2,952
Operating leases 6.5 936 825 880 757
Depreciation, amortisation, impairment, write-offs
and losses 6.6 18,156 6,138 18,093 5,467
Results from operating activities (11,047) 2,408 (11,468) 968
Investment income 7 301 238 581 367
Finance charges and fair value movements 8 263 1,872 542 745
Interest 660 765 654 763
Foreign exchange (gains)/losses and fair value
movements (397) 1,107 (112) (18)
(Loss)/profit before taxation (11,009) 774 (11,429) 590
Taxation 9 490 595 326 766
(Loss)/profit from continuing operations (11,499) 179 (11,755) (176)
Loss from discontinued operations 10 – 269 – –
Loss for the year (11,499) (90) (11,755) (176)
Other comprehensive incomeItems that may be reclassified subsequently to profit or lossExchange differences on translating foreign operations (3) (30) – –
Available-for-sale investment – (5) – –
Items that may not be reclassified subsequently to profit or lossDefined benefit plan actuarial (losses)/gains (284) 65 (284) 64
Defined benefit plan asset limitations (38) – (38) –
Income tax relating to components of other
comprehensive income 11 90 (18) 90 (18)
Other comprehensive (loss)/income for the year, net of taxation (235) 12 (232) 46
Total comprehensive loss for the year (11,734) (78) (11,987) (130)
(Loss)/profit attributable to:Owners of Telkom (11,622) (216) (11,755) (176)
Non-controlling interests 123 126 – –
Loss for the year (11,499) (90) (11,755) (176)
Total comprehensive (loss)/income attributable to:Owners of Telkom (11,857) (204) (11,987) (130)
Non-controlling interests 123 126 – –
Total comprehensive loss for the year (11,734) (78) (11,987) (130)
Total operationsBasic and diluted loss per share (cents) 12 (2,276.2) (42.3)
Continuing operationsBasic and diluted (loss)/earnings per share (cents) 12 (2,276.2) 10.4
Dividend per share (cents) 36 – 145 – 145

145 Telkom Integrated Report 2013
Operating environment Risk and responsibilityCreating value Leadership and strategic People and environment Financial statements
STATEMENTS OF FINANCIAL POSITION
at 31 March 2013
Group Company
2013 2012 2013 2012
Notes Rm Rm Rm Rm
ASSETSNon-current assets 29,989 42,362 28,301 40,906
Property, plant and equipment 13 24,524 36,155 24,359 35,979
Intangible assets 14 2,581 3,555 2,425 3,418
Investments in subsidiaries 16.1 – – 237 202
Other investments 16.2 2,492 2,260 928 968
Deferred expenses 17 50 47 50 47
Other financial assets 22 83 48 83 48
Finance lease receivables 18 219 244 219 244
Deferred taxation 19 40 53 – –
Current assets 11,638 10,206 10,598 9,238
Inventories 20 1,166 993 1,026 879
Income tax receivable 35 16 26 – –
Current portion of finance lease receivables 18 131 128 131 128
Trade and other receivables 21 5,804 5,696 5,059 4,951
Other financial assets 22 2,134 2,195 2,124 2,185
Cash and cash equivalents 23 2,387 1,168 2,258 1,095
Total assets 41,627 52,568 38,899 50,144
EQUITY AND LIABILITIESEquity attributable to owners of the parent 17,850 29,707 15,120 27,107
Share capital 24 5,208 5,208 5,208 5,208
Treasury shares 25 (771) (771) (775) (775)
Non-distributable reserves 26 2,164 1,887 – –
Retained earnings 11,249 23,383 10,687 22,674
Non-controlling interests 27 379 434 – –
Total equity 18,229 30,141 15,120 27,107
Non-current liabilities 10,268 12,718 10,218 12,672
Interest-bearing debt 28 3,899 5,897 3,895 5,891
Other financial liabilities 22 12 26 12 26
Employee related provisions 29 5,150 4,880 5,131 4,860
Non-employee related provisions 29 238 36 228 34
Deferred revenue 17 952 1,132 952 1,132
Deferred taxation 19 17 747 – 729
Current liabilities 13,130 9,709 13,561 10,365
Trade and other payables 31 4,661 4,291 5,167 5,005
Shareholders for dividend 36 22 23 22 23
Current portion of interest-bearing debt 28 2,758 1,289 2,756 1,287
Current portion of employee related provisions 29 2,605 1,652 2,577 1,631
Current portion of non-employee related provisions 29 786 240 786 231
Current portion of deferred revenue 17 1,740 1,995 1,699 1,968
Income tax payable 35 501 87 494 85
Current portion of other financial liabilities 22 54 129 57 133
Credit facilities utilised 23 3 3 3 2
Total liabilities 23,398 22,427 23,779 23,037
Total equity and liabilities 41,627 52,568 38,899 50,144
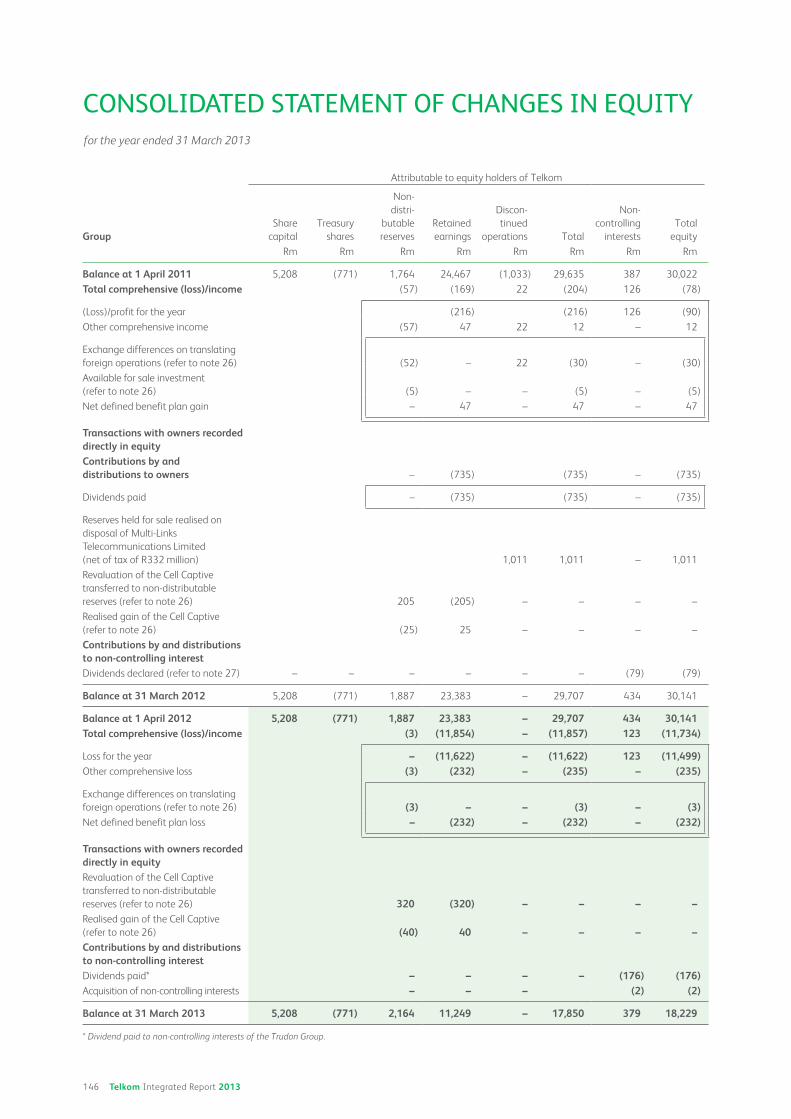
146 Telkom Integrated Report 2013
Attributable to equity holders of Telkom
GroupShare
capital
Treasury
shares
Non-
distri-
butable
reserves
Retained
earnings
Discon-
tinued
operations Total
Non-
controlling
interests
Total
equity
Rm Rm Rm Rm Rm Rm Rm Rm
Balance at 1 April 2011 5,208 (771) 1,764 24,467 (1,033) 29,635 387 30,022
Total comprehensive (loss)/income (57) (169) 22 (204) 126 (78)
(Loss)/profit for the year (216) (216) 126 (90)
Other comprehensive income (57) 47 22 12 – 12
Exchange differences on translating
foreign operations (refer to note 26) (52) – 22 (30) – (30)
Available for sale investment
(refer to note 26) (5) – – (5) – (5)
Net defined benefit plan gain – 47 – 47 – 47
Transactions with owners recorded directly in equityContributions by and distributions to owners – (735) (735) – (735)
Dividends paid – (735) (735) – (735)
Reserves held for sale realised on
disposal of Multi-Links
Telecommunications Limited
(net of tax of R332 million) 1,011 1,011 – 1,011
Revaluation of the Cell Captive
transferred to non-distributable
reserves (refer to note 26) 205 (205) – – – –
Realised gain of the Cell Captive
(refer to note 26) (25) 25 – – – –
Contributions by and distributions to non-controlling interestDividends declared (refer to note 27) – – – – – – (79) (79)
Balance at 31 March 2012 5,208 (771) 1,887 23,383 – 29,707 434 30,141
Balance at 1 April 2012 5,208 (771) 1,887 23,383 – 29,707 434 30,141Total comprehensive (loss)/income (3) (11,854) – (11,857) 123 (11,734)
Loss for the year – (11,622) – (11,622) 123 (11,499)Other comprehensive loss (3) (232) – (235) – (235)
Exchange differences on translating
foreign operations (refer to note 26) (3) – – (3) – (3)Net defined benefit plan loss – (232) – (232) – (232)
Transactions with owners recorded directly in equityRevaluation of the Cell Captive
transferred to non-distributable
reserves (refer to note 26) 320 (320) – – – –Realised gain of the Cell Captive
(refer to note 26) (40) 40 – – – –Contributions by and distributions to non-controlling interestDividends paid* – – – – (176) (176)Acquisition of non-controlling interests – – – (2) (2)
Balance at 31 March 2013 5,208 (771) 2,164 11,249 – 17,850 379 18,229
* Dividend paid to non-controlling interests of the Trudon Group.
for the year ended 31 March 2013
CONSOLIDATED STATEMENT OF CHANGES IN EQUITY

147 Telkom Integrated Report 2013
Operating environment Risk and responsibilityCreating value Leadership and strategic People and environment Financial statements
Attributable to equity holders of Telkom
CompanyShare
capital
Treasury
shares
Retained
earnings Total
Rm Rm Rm Rm
Balance at 1 April 2011 5,208 (775) 23,559 27,992
Total comprehensive loss (130) (130)
Loss for the year (176) (176)Other comprehensive income 46 46
Net defined benefit plan gain 46 46
Transactions with owners recorded directly in equityContributions by and distributions to owners (755) (755)
Dividends paid (755) (755)
Balance at 31 March 2012 5,208 (775) 22,674 27,107
Balance at 1 April 2012 5,208 (775) 22,674 27,107Total comprehensive loss (11,987) (11,987)
Loss for the year (11,755) (11,755)Other comprehensive loss (232) (232)
Net defined benefit plan loss (232) (232)
Balance at 31 March 2013 5,208 (775) 10,687 15,120

148 Telkom Integrated Report 2013
STATEMENTS OF CASH FLOWS
for the year ended 31 March 2013
Group Company
Reclassified Reclassified
2013 2012 2013 2012
Notes Rm Rm Rm Rm
Cash flows from operating activities 7,474 5,892 7,412 5,924
Cash receipts from customers 31,693 32,634 30,244 31,203
Cash paid to suppliers and employees(23,209) (24,911) (22,411) (23,688)
Cash generated from operations 32 8,484 7,723 7,833 7,515
Interest received 520 484 430 445
Dividend received 33 – – 325 146
Finance charges paid 34 (666) (564) (625) (674)
Taxation paid 35 (687) (939) (550) (753)
Cash generated from operations before dividend paid 7,651 6,704 7,413 6,679
Dividend paid 36 (177) (812) (1) (755)
Cash flows from investing activities (5,519) (4,907) (5,519) (5,056)
Proceeds on disposal of property, plant and
equipment and intangible assets 39 105 39 103
Proceeds on disposal of investment 31 – – –
Additions to property, plant and equipment and
intangible assets (5,627) (4,675) (5,557) (4,514)
Decrease/(increase) in repurchase agreements* 29 (337) 30 (337)
Loans repaid by joint venture 9 – – –
Loans advanced to subsidiaries – – (31) (308)
Cash flows from financing activities (731) (1,586) (729) (1,467)
Loans raised 2,042 1,092 2,042 1,092
Loans repaid (2,743) (2,345) (2,743) (2,343)
Finance lease capital repaid (189) (177) (187) (175)
Settlement/(purchases) of derivatives 159 (156) 159 (41)
Net increase/(decrease) in cash and cash equivalents 1,224 (601) 1,164 (599)
Net cash and cash equivalents at beginning of year 1,165 1,773 1,093 1,699
Effect of foreign exchange rate differences on
cash and cash equivalents (5) (7) (2) (7)
Net cash and cash equivalents at end of year** 23 2,384 1,165 2,255 1,093
* Repurchase agreements were reclassified from financing activities to investing activities.
** For cash flow activities on discontinued operations refer to note 10.GRI

149 Telkom Integrated Report 2013
Operating environment Risk and responsibilityCreating value Leadership and strategic People and environment Financial statements
NOTES TO THE CONSOLIDATED ANNUAL FINANCIAL
STATEMENTSfor the year ended 31 March 2013
1. CORPORATE INFORMATION
Telkom SA SOC Limited (Telkom) is a company incorporated and domiciled in the Republic of South Africa (South Africa) whose shares are publicly
traded. The main objective of Telkom, its subsidiaries, joint venture and associate (the Group) is to supply telecommunication, multimedia,
technology, information and other related information technology services to Telkom’s customers, as well as mobile communication services,
in South Africa and certain other African countries. The Group’s services and products include:
Fixed-line retail voice services to post-paid, pre-paid and private pay phone customers using PSTN (Public Switched Telephone Network)
lines, including ISDN (Integrated Services Digital Network) lines, and the sale of subscription based value added voice services and
calling plans;
Fixed-line customer premises equipment rental and sales services both voice and data needs and these include PABX, Computers,
Routers, Modems, Telephone handsets and other ancillary equipment;
Interconnection services, including terminating and transiting traffic from South African mobile operators, as well as from international
operators and transiting traffic from mobile to international destinations;
Fixed-line data services, including domestic and international data transmission services, such as point-to-point leased lines, ADSL
(Asymmetrical Digital Subscriber Line) services, packet based services, managed data networking services and Internet access and
related information technology services;
Data Centre Operations includes e-commerce, application service provider, hosting, data storage, email and security services;
W-CDMA (Wideband Code Division Multiple Access), a 3G next generation network, including fixed voice services, data services and
nomadic voice services;
Mobile communication services, including voice services, data services and handset sales through its mobile brand called Telkom Mobile;
and
Other services including directory services, through Trudon (Pty) Ltd, wireless data services, through Swiftnet (Pty) Ltd and Internet
services outside South Africa, through the iWayAfrica Group.
Convergence is one of our key strategic initiatives in building a sustainable future for Telkom. We will lead the provision of Converged Services
in South Africa in support of our mission statement: Seamlessly connecting people to a better life. Our strategy is to transform Telkom into
an integrated fixed, mobile, IT and content provider, leveraging our unique strengths in the fixed, mobile and IT markets in order to drive
sustainable revenue growth, defend our core business and create efficiencies over the longer term.
2. SIGNIFICANT ACCOUNTING POLICIES
Basis of preparationThe consolidated annual financial statements comply with International Financial Reporting Standards (IFRS) of the International Accounting
Standards Board (IASB) and the Companies Act of South Africa, 2008.
The consolidated annual financial statements are presented in South African rand, which is the Group’s functional currency. All financial
information presented in rand has been rounded to the nearest million.
The financial statements are prepared on the historical cost basis, with the exception of certain financial instruments initially (and sometimes
subsequently) measured at fair value. Details of the Group’s significant accounting policies are set out below, and are consistent with those
applied in the previous financial year, except for the following standards which were early adopted:
IAS 1 Presentation of Financial Statements: Presentation of items of other comprehensive income
IAS 1 Presentation of Financial Statements: Clarification of the requirements for comparative information
IFRS 10 Consolidated Financial Statements
IFRS 11 Joint Arrangements
IFRS 12 Disclosure of Interests in Other Entities
IFRS 13 Fair Value Measurement
IAS 27 Separate Financial Statements
IAS 28 Investments in Joint Ventures and Associates
Adoption of amendments to standards, new standards and new interpretations
IFRS 10 Consolidated Financial Statements
IFRS 10 replaces the part of IAS 27 Consolidated and Separate Financial Statements that deals with consolidated financial statements and
SIC-12 Consolidation – Special Purpose Entities. IFRS 10 builds on existing principles by identifying the concept of control as the determining
factor in whether an entity should be included within the consolidated financial statements of the parent company. The standard provides
additional guidance to assist in the determination of control where this is difficult to assess. Management assessed whether or not the Group
has control over its investees (previously consolidated or not) in accordance with the new definition of control and the related guidance set
out in IFRS 10. The standard had no impact on the Group as entities controlled and consolidated by Telkom have not changed as a result of
adopting IFRS 10. There are no additional entities that require consolidation as a result of the adoption of IFRS 10.

150 Telkom Integrated Report 2013
NOTES TO THE CONSOLIDATED ANNUAL FINANCIAL
STATEMENTS for the year ended 31 March 2013
2. SIGNIFICANT ACCOUNTING POLICIES (continued)
Adoption of amendments to standards, new standards and new interpretations (continued)
IFRS 11 Joint Arrangements
IFRS 11 replaces IAS 31 Interests in Joint Ventures and SIC-13 Jointly Controlled Entities – Non-Monetary Contributions by Venturers.
IFRS 11 deals with how a joint arrangement of which two or more parties have joint control should be classified. There are two types of joint
arrangements under IFRS 11: joint operations and joint ventures. These two types of joint arrangements are distinguished by parties’ rights
and obligations under the arrangements. The previous accounting policy under IAS 31 was to equity account for joint ventures. Management
reviewed and assessed the legal form of the contractual arrangements in relation to the Group’s investments in joint arrangements. The
application of IFRS 11 has changed the classification of the Group’s investment in the Number Portability Company, which was classified as
a jointly controlled entity under the previous standard and was accounted for using the equity method. Under IFRS 11 the Number Portability
Company is classified as an associate and will continue to be accounted for using the equity method.
IFRS 12 Disclosure of Interests in Other Entities
IFRS 12 specifies the minimum disclosures that are applicable to entities that have interests in subsidiaries, joint arrangements, associates or
unconsolidated structured entities. The objective of IFRS 12 is that entities should disclose information that helps users of financial statements
evaluate the nature of and risks associated with its interests in other entities and the effects of those interests on their financial statements.
The adoption of the new standard has resulted in comprehensive disclosures relating to Subsidiaries, Joint arrangements, Associates and
unconsolidated structured entities in the consolidated annual financial statements.
Consolidated financial statements, joint arrangements and disclosure of interests in other entities: Transition Guidance
The amendments provide additional transition relief for entities adopting IFRS 10, 11 and 12 by limiting the requirement to provide adjusted
comparative information to only the immediately preceding comparative period. Amendments to IFRS 11 and 12 eliminate the requirement
to provide comparative information for periods prior to the immediately preceding comparative period. The amendment also makes provision
for interests in investees that were disposed of during a previous reporting period, such that consolidation would not occur with either IAS 27/
SIC-12 or IFRS 10 at the date of initial application. As such arrangements disposed of by Telkom prior to 1 April 2012 were not re-assessed.
IFRS 12 was also amended to no longer require the disclosure of comparative information for unconsolidated structured entities. The
transitional guidance had no impact on the Group.
IFRS 13 Fair Value Measurement
IFRS 13 provides a new definition of fair value and a single source of guidance for all fair value measurements used in IFRS financial
statements. The proposed disclosures increase transparency about fair value measurements, including the valuation techniques and inputs
used to measure fair value. The standard will have a potential fair value impact on non-recurring, non-financial assets and liabilities that are
measured at fair value less cost to sell (ie. IFRS 5 and IAS 36) and fair value disclosure impact for IFRS 13. The Group is already complying
with enhanced disclosures. A large amount of disclosures are required for instruments categorised under level 3 of the hierarchy. Currently,
there are no recurring fair value measurements falling under level 3 but new items falling under this category will trigger additional disclosure
requirements in the future. IFRS 13 also requires various disclosures on items not measured at fair value, but for which fair value needs to be
disclosed. These additional disclosures are provided in note 15. The standard had no material impact on the Group.
IAS 1 (amendment) Presentation of Financial Statements
The amendments to IAS 1 retain the option to present profit or loss and other comprehensive income in either a single continuous statement
or in two separate but consecutive statements. The amendments require additional disclosures to be made in the other comprehensive income
section such that items of other comprehensive income are grouped into two categories: (a) items that will not be reclassified subsequently
to profit or loss and (b) items that might be reclassified subsequently to profit or loss when specific conditions are met. Income tax on items
of other comprehensive income is required to be allocated on the same basis. Entities also have the option of changing the title of the
‘Statement of comprehensive income’ to ‘Statement of profit or loss and other comprehensive income’. Telkom opted to change the name
accordingly. The amendments resulted in a change in presentation but had no impact on the recognition or measurement of items in the
financial statements. The relevant disclosures are provided in the Statement of profit or loss and other comprehensive income.
The annual improvements project amendment also clarifies the difference between voluntary additional comparative information and the
minimum required comparative information. The requirements for comparative information have been clarified in two areas. Firstly, when
an entity voluntarily presents comparative information in excess of the minimum requirements, the additional comparative information
disclosed need not represent a full set of financial statements, but must include notes. Secondly, when there is a change in accounting policy,
retrospective restatement or reclassification, an entity must present a third statement of financial position at the beginning of the preceding
period, but need not present notes for the opening statement (of financial position). The Group will apply the amendments when appropriate.
IAS 27 (amendment) Separate Financial Statements
The revised IAS 27 supersedes the previous IAS 27 (2008). The standard requires an entity that prepares separate financial statements, to
account for the investments in subsidiaries, joint ventures and associates either at cost or in accordance with IAS 39/IFRS 9. The adoption
of the standard had no impact on the Group as the Group already accounts for all investments either at cost or in accordance with IAS 39.
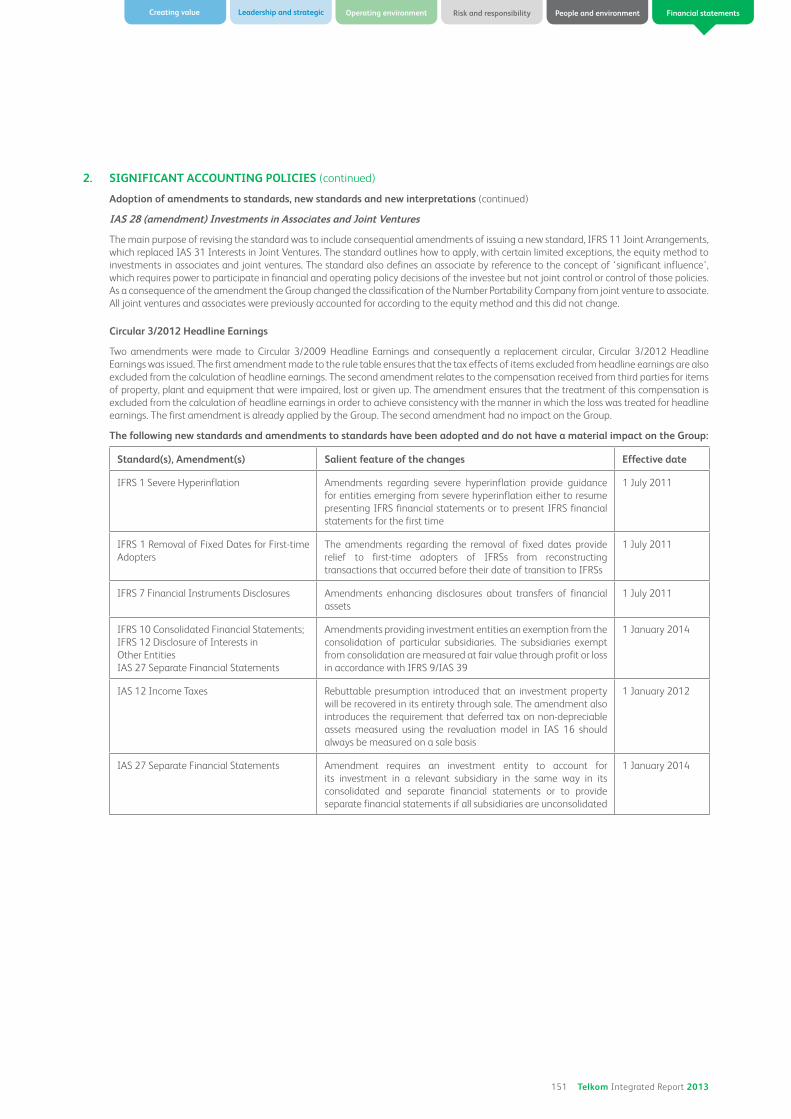
151 Telkom Integrated Report 2013
Operating environment Risk and responsibilityCreating value Leadership and strategic People and environment Financial statements
2. SIGNIFICANT ACCOUNTING POLICIES (continued)
Adoption of amendments to standards, new standards and new interpretations (continued)
IAS 28 (amendment) Investments in Associates and Joint Ventures
The main purpose of revising the standard was to include consequential amendments of issuing a new standard, IFRS 11 Joint Arrangements,
which replaced IAS 31 Interests in Joint Ventures. The standard outlines how to apply, with certain limited exceptions, the equity method to
investments in associates and joint ventures. The standard also defines an associate by reference to the concept of ‘significant influence’,
which requires power to participate in financial and operating policy decisions of the investee but not joint control or control of those policies.
As a consequence of the amendment the Group changed the classification of the Number Portability Company from joint venture to associate.
All joint ventures and associates were previously accounted for according to the equity method and this did not change.
Circular 3/2012 Headline Earnings
Two amendments were made to Circular 3/2009 Headline Earnings and consequently a replacement circular, Circular 3/2012 Headline
Earnings was issued. The first amendment made to the rule table ensures that the tax effects of items excluded from headline earnings are also
excluded from the calculation of headline earnings. The second amendment relates to the compensation received from third parties for items
of property, plant and equipment that were impaired, lost or given up. The amendment ensures that the treatment of this compensation is
excluded from the calculation of headline earnings in order to achieve consistency with the manner in which the loss was treated for headline
earnings. The first amendment is already applied by the Group. The second amendment had no impact on the Group.
The following new standards and amendments to standards have been adopted and do not have a material impact on the Group:
Standard(s), Amendment(s) Salient feature of the changes Effective date
IFRS 1 Severe Hyperinflation Amendments regarding severe hyperinflation provide guidance
for entities emerging from severe hyperinflation either to resume
presenting IFRS financial statements or to present IFRS financial
statements for the first time
1 July 2011
IFRS 1 Removal of Fixed Dates for First-time
Adopters
The amendments regarding the removal of fixed dates provide
relief to first-time adopters of IFRSs from reconstructing
transactions that occurred before their date of transition to IFRSs
1 July 2011
IFRS 7 Financial Instruments Disclosures Amendments enhancing disclosures about transfers of financial
assets
1 July 2011
IFRS 10 Consolidated Financial Statements;
IFRS 12 Disclosure of Interests in
Other Entities
IAS 27 Separate Financial Statements
Amendments providing investment entities an exemption from the
consolidation of particular subsidiaries. The subsidiaries exempt
from consolidation are measured at fair value through profit or loss
in accordance with IFRS 9/IAS 39
1 January 2014
IAS 12 Income Taxes Rebuttable presumption introduced that an investment property
will be recovered in its entirety through sale. The amendment also
introduces the requirement that deferred tax on non-depreciable
assets measured using the revaluation model in IAS 16 should
always be measured on a sale basis
1 January 2012
IAS 27 Separate Financial Statements Amendment requires an investment entity to account for
its investment in a relevant subsidiary in the same way in its
consolidated and separate financial statements or to provide
separate financial statements if all subsidiaries are unconsolidated
1 January 2014

152 Telkom Integrated Report 2013
for the year ended 31 March 2013
NOTES TO THE CONSOLIDATED ANNUAL FINANCIAL
STATEMENTS
2. SIGNIFICANT ACCOUNTING POLICIES (continued)
Standards and interpretations in issue not yet adopted and not yet effective
The following new standards, amendments to standards and interpretations in issue have not yet been adopted and are not yet effective. All standards are effective for annual periods beginning on or after the effective date.
Pronouncement Title Effective date
IFRS 1 First-time Adoption of IFRS Amendments permits the repeated application of IFRS 1,
borrowing costs on certain qualifying assets
1 January 2013
IFRS 1 First-time Adoption of IFRS Amendment addresses how a first-time adoptee would account for
a government loan with a below market rate of interest
1 January 2013
IFRS 7 Financial Instruments Disclosures Amendments enhancing disclosures about offsetting of financial
assets and financial liabilities
1 January 2013
IFRS 7 Financial Instruments Disclosures Amendments requiring disclosures about the initial application
of IFRS 9
1 January 2015
IFRS 9 Financial Instruments Classification and measurement of financial assets and financial
liabilities and derecognition requirements
1 January 2015
IAS 16 Property, Plant and Equipment Classification of service equipment 1 January 2013
IAS 19 Employee Benefits* Amended Standard resulting from the Post-Employment Benefits,
Short-Term Employee Benefits and Termination Benefits projects
1 January 2013
IAS 32 Financial Instruments: Presentation Amendments to clarify tax effect of distribution to holders of
equity instruments
1 January 2013
IAS 32 Financial Instruments: Presentation Amendments to application guidance on the offsetting of financial
assets and financial liabilities and the related net credit exposure
1 January 2014
IAS 34 Interim Financial Reporting Amendments to clarify interim reporting segment information for
total assets in order to enhance consistency with the requirements
of IFRS 8
1 January 2013
IAS 36 Impairment of Assets Amendment to disclosures of the recoverable amount of impaired
non-financial assets as a consequence of issuing IFRS 13 Fair Value
Measurement.
1 January 2014
IFRIC 20 Stripping Costs in the Production
Phase of a Surface Mine
Stripping costs in the production phase of a surface mine 1 January 2013
* The adoption will affect Telkom significantly in the 2014 financial year.
Change in accounting policy
The Group has early adopted IFRS 10 Consolidated Financial Statements, IFRS 11 Joint Arrangements and IFRS 12 Disclosure of Interests in
Other Entities, as well as consequential amendments to IAS 28 Investments in Associates and Joint Ventures from 1 April 2012.
IFRS 10 Consolidated Financial Statements
As a result of the adoption of IFRS 10, the Group changed is accounting policy with respect to determining whether it has control over
and consequently whether it consolidates its investees. IFRS 10 introduces a new control model that is applicable to all investees, including
structured entities. The change in policy has no impact on the Group as entities that were previously controlled by Telkom when applying the
old control definition did not change as a result of changing the policy to comply with IFRS 10.
IFRS 11 Joint Arrangements
Under IFRS 11 the Group classifies its interests in joint arrangements as either joint operations or joint ventures depending on the Group’s
rights to the assets and obligations for the liabilities of the arrangements. When making this assessment, the Group considers the structure
of the arrangements, the legal form of any separate vehicles, the contractual terms of the arrangements and other facts and circumstances.
The Group has re-evaluated its joint arrangements, resulting in the reclassification of the Number Portability Company from a joint venture to
an associate. Notwithstanding the reclassification, the investment continues to be recognised by applying the equity method and there has
been no impact on the assets, liabilities and comprehensive income of the Group.
153 Telkom Integrated Report 2013
Operating environment Risk and responsibilityCreating value Leadership and strategic People and environment Financial statements
2. SIGNIFICANT ACCOUNTING POLICIES (continued)
Change in accounting policy (continued)
IAS 27 (amendment) Separate Financial Statements
The revised IAS 27 supersedes the previous IAS 27 (2008). The standard requires an entity that prepares separate financial statements,
to account for the investments in subsidiaries, joint ventures and associates either at cost or in accordance with IAS 39/IFRS 9. The adoption
of the standard will not have an impact on the Group as the Group already accounts for all investments either at cost or in accordance
with IAS 39.
Significant accounting judgements, estimates and assumptions
The preparation of financial statements requires the use of estimates and assumptions that affect the reported amounts of assets and
liabilities and disclosure of contingent assets and liabilities at the date of the financial statements and the reported amounts of revenue and
expenses during the reporting periods. Although these estimates and assumptions are based on management’s best knowledge of current
events and actions that the Group may undertake in the future, actual results may ultimately differ from those estimates and assumptions.
The presentation of the results of operations, financial position and cash flows in the financial statements of the Group is dependent upon
and sensitive to the accounting policies, assumptions and estimates that are used as a basis for the preparation of these financial statements.
Management has made certain judgements in the process of applying the Group’s accounting policies. These, together with the key estimates
and assumptions concerning the future, and other key sources of estimation uncertainty at the reporting date, are as follows:
Property, plant and equipment and intangible assets
The useful lives of assets are based on management’s estimation. Management considers the impact of changes in technology, customer
service requirements, availability of capital funding and required return on assets and equity to determine the optimum useful life expectation
for each of the individual categories of property, plant and equipment and intangible assets. Due to the rapid technological advancement in
the telecommunications industry as well as Telkom’s plan to migrate to a next generation network over the next few years, the estimation of
useful lives could differ significantly on an annual basis due to unexpected changes in the roll-out strategy. The impact of the change in the
expected useful life of property, plant and equipment is described more fully in note 13. The estimation of residual values of assets is also
based on management’s judgement whether the assets will be sold or used to the end of their useful lives and what their condition will be like
at that time. Changes in the useful lives and/or residual values are accounted for as a change in accounting estimates.
For intangible assets that incorporate both a tangible and intangible portion, management uses judgement to assess which element is more
significant to determine whether it should be treated as property, plant and equipment or intangible assets.
Asset retirement obligations
Management’s judgement is exercised when determining whether an asset retirement obligation exists, and in determining the expected
future cash flows and the discount rate used to determine its present value when the obligation to dismantle or restore the site arises, as well
as the estimated useful life of the related asset.
Impairments of property, plant and equipment and intangible assets
Management is required to make judgements concerning the cause, timing and amount of impairment as indicated on notes 13 and 14.
In the identification of impairment indicators, management considers the impact of changes in current competitive conditions, cost of capital,
availability of funding, technological obsolescence, discontinuance of services, market changes, legal changes, operating environments and
other circumstances that could indicate that an impairment exists. The Group applies the impairment assessment to its cash-generating
units. This requires management to make significant judgements concerning the existence of impairment indicators, identification of cash-
generating units, remaining useful lives of assets and estimates of projected cash flows and fair value less costs of disposal. Management’s
analysis of cash-generating units involves an assessment of a group of assets’ ability to independently generate cash inflows and involves
analysing the extent to which different products make use of the same assets. Management’s judgement is also required when assessing
whether a previously recognised impairment loss should be reversed.
Where impairment indicators exist, the determination of the recoverable amount of a cash-generating unit requires management to make
assumptions to determine the fair value less costs of disposal and value in use. Recoverable amount is calculated using the discounted
cash flow valuation method – also when fair value less costs of disposal is used. Key assumptions on which management has based its
determination of recoverable amount include the existence of binding sale agreements, the weighted average cost of capital, projected
revenues, gross margins, average revenue per customer, capital expenditure, expected customer bases and market share.
In calculating value-in-use, consideration is given to the completion of a network that is still partially completed at the date of performing
the impairment test. Significant judgement is applied in determining if network expansion should be treated as the completion of a partially
completed asset or the enhancement of an asset (which cash flows are not allowed to be considered in calculation of value-in-use). Refer to
notes 13 and 14.
Impairment of receivables
An impairment loss is recognised on trade receivables that are assessed to be impaired (refer to notes 15 and 21). The impairment is based
on an assessment of the extent to which customers have defaulted on payments already due and an assessment on their ability to make
payments based on their credit worthiness and historical write-offs experience. Should the assumptions regarding the financial condition of
the customer change, actual write-offs could differ significantly from the impairment loss recognised.
154 Telkom Integrated Report 2013
2. SIGNIFICANT ACCOUNTING POLICIES (continued)
Significant accounting judgements, estimates and assumptions (continued)
Customer relationship periods
The average customer relationship periods for Wholesale, Voice and Non-Voice services are utilised to amortise the deferred installation
revenue and cost. Management makes judgements about the customer relationship period estimate based on the historical churn
information. The churn is determined by considering the service installation and disconnection dates, the weighted customer base ageing
and the service connection status of the customers. Changes in average customer relationships periods are accounted for as a change in
accounting estimates.
Deferred taxation asset
Management’s judgement is exercised when determining the probability of future taxable profits which will determine whether deferred
taxation assets should be recognised or derecognised. The realisation of deferred taxation assets will depend on whether it is possible to
generate sufficient taxable income, taking into account any legal restrictions on the length and nature of the taxation asset. When deciding
whether to recognise unutilised deferred taxation credits as deferred tax assets, management needs to determine the extent that the future
obligations are likely to be available for set-off against the deferred taxation asset. In the event that the assessment of the future obligation
and future utilisation changes, the change in the recognised deferred taxation asset is recognised in profit or loss.
Taxation
The taxation rules and regulations in South Africa as well as the other African countries within which the Group operates are highly complex
and subject to interpretation. Additionally, for the foreseeable future, management expects South African taxation laws to further develop
through changes in South Africa’s existing taxation structure as well as clarification of the existing taxation laws through published
interpretations and the resolution of actual tax cases. Refer to notes 9 and 19.
The growth of the Group, following its geographical expansion into other African countries over the past few years, has made the estimation
and judgement required in recognising and measuring deferred taxation balances more challenging. The resolution of taxation issues is not
always within the control of the Group and it is often dependent on the efficiency of the legal processes in the relevant taxation jurisdictions
in which the Group operates. Issues can, and often do, take many years to resolve. Payments in respect of taxation liabilities for an accounting
period result from payments on account and on the final resolution of open items. As a result there can be substantial differences between
the taxation charge in the consolidated statement of profit or loss and other comprehensive income and the current taxation payments.
Group entities are regularly subject to evaluation, by the relevant tax authorities, of their historical income tax filings and in connection with
such reviews. Disputes can arise with the taxing authorities over the interpretation or application of certain tax rules to the business of the
relevant group entities. Management makes judgement that is consistent with the principles and interpretations of the relevant countries’ tax
laws in determining the Group’s provision for income taxes for which the ultimate tax determination is uncertain during the ordinary course
of business.
Deferred taxation rate
Management makes judgements on the tax rate applicable based on the Group’s expectations at reporting date on how the asset is expected
to be recovered or the liability is expected to be settled.
Employee benefits
The Group provides defined benefit plans for certain post-employment benefits. The obligation and assets related to each of the post-
retirement benefits are determined through an actuarial valuation. The actuarial valuation relies heavily on assumptions as disclosed in
note 30. The assumptions determined by management make use of information obtained from the Group’s employment agreements with
staff and pensioners, market related returns on similar investments, market related discount rates and other available information. The
assumptions concerning the expected return on assets and expected change in liabilities are determined on a uniform basis, considering long-
term historical returns and future estimates of returns and medical inflation expectations. In the event that further changes in assumptions
are required, the future amounts of post-employment benefits may be affected materially.
The discount rate reflects the average timing of the estimated defined benefit payments. The discount rate is based on long-term South
African Government bonds with the longest maturity period as reported by the Bond Exchange of South Africa. The discount rate is expected
to follow the trend of inflation.
The overall expected rate of return on assets is determined based on the market prices prevailing at that date, applicable to the period over
which the obligation is to be settled.
Leases
The Group provides customer specific solutions to certain entities using access network equipment and involving leases with the Group acting
as the lessor. The Group has determined, based on an evaluation of the terms and conditions of the arrangements that it retains, all the
significant risks and rewards of ownership of this equipment and accounts for the contracts as finance leases. The determination of whether
an arrangement is, or contains, a lease is based on the substance of the arrangement at inception date, whether fulfilment of the arrangement
is dependent on the use of a specific asset or assets or the arrangement conveys a right to use the asset, even if that right is not explicitly
specified in an arrangement. This can be the case for fibre optical cables. Judgement is applied in determining if a fibre arrangement specifies
the fibre/spectrum/wavelength or merely capacity. If a portion is not physically distinct, it is not considered to be a specified asset.
for the year ended 31 March 2013
NOTES TO THE CONSOLIDATED ANNUAL FINANCIAL
STATEMENTS
155 Telkom Integrated Report 2013
Operating environment Risk and responsibilityCreating value Leadership and strategic People and environment Financial statements
2. SIGNIFICANT ACCOUNTING POLICIES (continued)
Significant accounting judgements, estimates and assumptions (continued)
Provisions
For other provisions, estimates are made of legal or constructive obligations resulting in the raising of provisions, and the expected date of
probable outflow of economic benefits to assess whether the provision should be discounted. Refer to note 29. Liabilities provided for legal
matters require judgements regarding projected outcomes and ranges of losses based on historical experience and recommendations of
legal counsel. Litigation is however unpredictable and actual costs incurred could differ materially from those estimated at the reporting date.
Contingent liabilities
On an ongoing basis the Group is a party to various legal disputes, the outcomes of which cannot be assessed with a high degree of certainty.
A liability is recognised where, based on the Group’s legal views and advice, it is considered probable that an outflow of resources will be
required to settle a present obligation that can be measured reliably. Disclosure of other contingent liabilities is made in note 38 unless the
possibility of a loss arising is considered remote.
Segment information
For judgements, estimates and assumptions relating to Operating Segments refer to note 3.
Summary of significant accounting policies
Classification of associates
Telkom holds 20% ownership of the investment in the Number Portability Company. The Group has determined that it has significant
influence because it has the right to appoint directors and has representation on the board of the Number Portability Company but decisions
taken by the company does not require unanimous consent from investors.
Basis of consolidation
The consolidated financial statements incorporate the financial statements of Telkom and entities (including special purpose entities)
controlled by Telkom, its subsidiaries and associates as well as its joint ventures.
Subsidiaries
Subsidiaries are investees controlled by the Group. The Group controls an investee when it is exposed to, or has rights to, variable returns from
its involvement with the investee and has the ability to affect those returns through its power over the investee. The Group consolidates the
financial statements of subsidiaries from the date the control of the subsidiary commences until the date that control ceases.
Transactions with non-controlling interests
Acquisitions of non-controlling interests are accounted for as transactions with equity holders in their capacity as equity holders and therefore
no goodwill is recognised as a result of such transactions.
Non-controlling interests in subsidiaries are identified separately from the Group’s equity. The interests of non-controlling shareholders are
initially measured either at fair value or at the non-controlling interests’ proportionate share of the fair value of the acquiree’s identifiable net
assets. The choice of measurement basis is made on an acquisition by acquisition basis. Subsequent to acquisition, the carrying amount of
non-controlling interests is the amount of those interests at initial recognition plus the non-controlling interests’ share of subsequent changes
in equity. Total comprehensive income is attributed to non-controlling interests even if this results in the non-controlling interests having a
deficit balance.
Changes in the Group’s interests in subsidiaries that do not result in a loss of control are accounted for as equity transactions. The carrying
amounts of the Group’s interests and the non-controlling interests are adjusted to reflect the changes in their relative interests in the
subsidiaries. Any difference between the amount by which the non-controlling interests are adjusted and the fair value of the consideration
paid or received is recognised directly in equity and attributed to equity owners of Telkom.
When the Group loses control of a subsidiary, profit or loss on disposal is calculated as the difference between: (i) the aggregate of the fair
value of the consideration received and the fair value of any retained interest and (ii) the previous carrying amount of the assets (including
goodwill), and liabilities of the subsidiary and any non-controlling interests. Amounts previously recognised in other comprehensive income
in relation to the subsidiary are accounted for (ie. reclassified to profit or loss or transferred directly to retained earnings) in the same manner
as would be required if the relevant assets or liabilities were disposed of. The fair value of any investment retained in the former subsidiary at
the date when control is lost is regarded as the fair value on initial recognition for subsequent accounting under IAS 39 Financial Instruments:
Recognition and Measurement or, when applicable, the cost on initial recognition of an investment in an associate or joint venture.
Joint arrangements
A joint arrangement is an arrangement where two or more parties have joint control over another entity. In a joint arrangement parties are
bound by a contractual arrangement that gives two or more of the parties joint control of the arrangement. A joint arrangement is classified
and accounted for as either a joint operation or joint venture.
In a joint operation parties that have joint control of the arrangement have rights to the assets, and obligations for the liabilities, relating
to the arrangement. These parties are the joint operators. The Group recognises its own assets, liabilities, revenues and expenses that are
incurred or earned separately to other joint operators. Otherwise the Group recognises its share of assets, liabilities, revenues and expenses
when these items are incurred jointly.
156 Telkom Integrated Report 2013
2. SIGNIFICANT ACCOUNTING POLICIES (continued)
Summary of significant accounting policies (continued)
Joint arrangements (continued)
In a joint venture parties that jointly control the joint arrangement have rights to the net assets of the arrangement. These parties are called
joint venturers. The Group accounts for the joint venture using the equity method. Under the equity accounting method, the investment
in the joint venture is carried in the statement of financial position at cost plus post-acquisition changes in the Group’s share of the net
assets of the joint venture. The share of the profit of the joint venture is shown on the face of the statement of profit or loss and other
comprehensive income.
Where necessary, adjustments are made to the financial statements of subsidiaries and joint ventures to bring the accounting policies used
in line with those used by the Group.
Associates
An associate is an entity over which the Group has significant influence. The Group has significant influence over an associate when it has the
power to participate in the financial and operating policy decisions of the investee. The Group recognises its interests in associates by applying
the equity method.
Structured entities
A structured entity is an entity designed so that its activities are not governed by way of voting rights. The Group assesses power over such
investees by considering factors such as the purpose and design of the investee; its practical ability to direct the activities of the investee; the
nature of its relationship with the investee; and the size of its exposure to the variability of returns of the investee. Controlled structured entities
are consolidated from the day they meet the control criteria definition for a structured entity until they cease to be controlled by the entity.
Relationships with unconsolidated structured entities are disclosed.
Business combinations
Acquisitions of subsidiaries and businesses are accounted for using the acquisition method. The consideration for each acquisition is measured
at the aggregate of the fair values (at acquisition date) of assets given, liabilities incurred or assumed, and equity instruments issued by the
Group in exchange for control of the acquiree and non-controlling interest.
Any contingent consideration to be transferred by the acquirer is recognised at fair value at the date of acquisition. Subsequent changes in
such fair values are adjusted against the consideration transferred only where they qualify as measurement period adjustments. All other
subsequent changes in the fair value of contingent consideration classified as an asset or liability are accounted for in accordance with
relevant IFRSs. Changes in the fair value of contingent consideration classified as equity are not recognised.
If the initial accounting for a business combination is incomplete by the end of the reporting period in which the combination occurs, the
group reports provisional amounts for the items for which the accounting is incomplete. Those provisional amounts are adjusted during
the measurement period, or additional assets or liabilities are recognised, to reflect new information obtained about facts and circumstances
that existed as of the acquisition date that, if known, would have affected the amounts recognised as of that date.
The measurement period is the period from the date of acquisition to the date the Group obtains complete information about facts and
circumstances that existed as of the acquisition date – and is subject to a maximum of one year.
Any transaction costs that the Group incurs in connection with the business combination such as legal fees, due diligence fees and other
professional and consultation fees are expensed as incurred.
A contingent liability of the acquiree is assumed in a business combination only if such a liability represents a present obligation which arises
as a result of a past event, and its fair value can be measured reliably.
Business combinations in which all of the combining entities or businesses are ultimately controlled by the same party/parties both before and
after the business combinations (and where control is not transitory) are referred to as common control business combinations. The carrying
amounts of the acquired entity are the consolidated carrying amounts as reflected in the consolidated financial statements of the selling
entity. The excess of the cost of the transaction over the acquirer’s proportionate share of the net asset value acquired in common control
transactions, is allocated to equity.
Investments in subsidiaries, associates and joint ventures
Investments in subsidiaries, structured entities, associates and joint ventures are carried at cost and adjusted for any impairment losses.
Goodwill
Goodwill arising in a business combination is recognised as an asset at the date of acquisition.
Goodwill is measured as the excess of the sum of the consideration transferred, the amount of any non-controlling interests in the acquiree,
and the fair value of the acquirer’s previously held equity interest in the acquiree (if any) over the net fair value of the acquiree’s identifiable
net assets.
If the Group’s interest in the fair value of the acquiree’s identifiable net assets exceeds the sum of the consideration transferred, the amount
of any non-controlling interests in the acquiree and the fair value of the acquirer’s previously held equity interest in the acquiree, the excess is
recognised immediately in profit or loss as a bargain purchase gain.
Goodwill is not amortised but is reviewed for impairment at least annually. An impairment loss recognised for goodwill is not reversed in a
subsequent period.
On disposal of a subsidiary, the attributable amount of goodwill is included in the determination of profit or loss on disposal.
for the year ended 31 March 2013
NOTES TO THE CONSOLIDATED ANNUAL FINANCIAL
STATEMENTS
157 Telkom Integrated Report 2013
Operating environment Risk and responsibilityCreating value Leadership and strategic People and environment Financial statements
2. SIGNIFICANT ACCOUNTING POLICIES (continued)
Summary of significant accounting policies (continued)
Revenue recognition
Revenue comprises the fair value of the consideration received or receivable for the sale of goods and services in the ordinary course of the
Group’s activities. Revenue is shown net of value added tax, returns and rebates and after eliminating sales within the Group.
Revenue is recognised when there is evidence of an arrangement, collectability is probable, and the delivery of the product or service has
occurred. In certain circumstances revenue is split into separately identifiable components and recognised when the related components are
delivered in order to reflect the substance of the transaction. The consideration of each component is allocated on a relative fair value basis.
Dealer incentives
The Group provides incentives to its dealers by means of trade discounts. Incentives are based on sales volume and value of transactions.
Revenue is recognised gross of discounts to the extent that the discounts are not granted to the customer. Revenue is recognised net of
discounts when the discounts are granted to the customer.
Retail voice
The Group provides telephone and data communication services under post-paid and pre-paid payment arrangements. Revenue includes fees
for installation and activation, which are deferred over the expected customer relationship period. Costs incurred on first-time installations
that form an integral part of the network are capitalised and depreciated over the expected average customer relationship period. All other
installation and activation costs are expensed as incurred.
Post-paid and pre-paid service arrangements include subscription fees, typically monthly fees, which are recognised over the subscription
period.
Pre-paid
Pre-paid traffic service revenue collected in advance is deferred and recognised based on actual usage or upon expiration of the usage period,
whichever comes first. The terms and conditions of certain pre-paid products allow for the carry over of unused minutes. Revenue related to
the carry over of unused minutes is deferred until usage or expiration.
Pay phones
Pay phone service coin revenue is recognised when the service is provided.
Pay phone service card revenue collected in advance is deferred and recognised based on actual usage or upon expiration of the usage period,
whichever comes first.
Post-paid
Revenue related to local, long distance, network-to-network, roaming and international call connection services is recognised when the call is
placed or the connection provided.
Interconnection
Interconnection revenue for call termination, call transit, and network usage is recognised as the traffic flow occurs.
Customer premises equipment
Revenue related to sale of communication equipment, products and value-added services is recognised upon delivery and acceptance of the
product or service by the customer.
Data
The Group provides data communication services under post-paid and pre-paid payment arrangements. Revenue includes fees for installation
and activation, which are deferred over the expected average customer relationship period. Costs incurred on first-time installations that form
an integral part of the network are capitalised and depreciated over the life of the expected average customer relationship period. All other
installation and activation costs are expensed as incurred. Post-paid and pre-paid service arrangements include subscription fees, typically
monthly fees, which are recognised over the subscription period.
Directory services
Included in Other South African revenue are directory services. Revenue is recognised when printed directories are released for distribution, as
the significant risks and rewards of ownership have been transferred to the buyer. Electronic directories’ revenue is recognised on a monthly
basis, as earned.
Sundry revenue
Sundry revenue is recognised when the economic benefit flows to the Group and the earnings process is complete.
158 Telkom Integrated Report 2013
2. SIGNIFICANT ACCOUNTING POLICIES (continued)
Summary of significant accounting policies (continued)
Deferred revenue and expenses
Activation revenue and costs are deferred and recognised systematically over the expected duration of the customer relationship because it is
considered to be part of the customers’ ongoing rights to telecommunication services and the operator’s continuing involvement. Any excess
of the costs over revenues is expensed immediately.
Post-paid contract and pre-paid products
Contract products are defined as arrangements with multiple deliverables. The arrangement consideration is allocated to each deliverable,
based on the fair value of each deliverable on a selling price stand-alone basis as a percentage of the aggregated fair value of individual
deliverables.
Revenue from the handset is recognised when the handset is delivered.
Monthly service revenue received from the customer is recognised in the period in which the service is delivered.
Airtime revenue is recognised on the usage basis commencing on activation date. Unused airtime is deferred in full and recognised in the
month of usage or on termination of the contract by the subscriber.
Revenue from the sale of pre-paid products is recognised when the product is delivered to the customer.
Revenue from the sale of pre-paid airtime is deferred until such time as the customer uses the airtime, or the credit expires.
Free minutes are accounted for as a separate identifiable deliverable and revenue allocated to free minutes is deferred and recognised
when the free minutes are used, or expire.
Roaming agreements
Amounts paid to other mobile operators in terms of roaming agreements are expensed at the earlier of minutes being utilised or expiry
thereof. A pre-payment to this effect is recognised if it is probable that the Group will obtain future economic benefits from such unused
minutes.
Equipment sales
For equipment sales made to intermediaries, revenue is recognised if the significant risks associated with the equipment are transferred to the
intermediary and the intermediary has no general right of return. If the significant risks are not transferred, revenue recognition is deferred
until sale of the equipment to an end-customer by the intermediary or the expiry of the right of return.
Customer loyalty programmes
The free minutes (award credits) granted to Telkom Mobile pre-paid customers are accounted for as a separately identifiable component of a
sales transaction in which they are granted. Award credits are determined by reference to their fair value. The fair value of award credits takes
into account the amount of discounts or incentives that would otherwise be offered to customers who have not earned award credits from
the initial sale transaction. Revenue from award credits is deferred and recognised as revenue when the customer redeems the award credit.
Connection incentives
Intermediaries and customers are paid cash as a connection incentive. Cash incentives paid to intermediaries are expensed in the period in
which they are incurred. Cash incentives paid to customers are recognised as intangible assets and expensed over the contract period.
Interest on debtors’ accounts
Interest is raised on overdue accounts by using the effective interest rate method and recognised in profit or loss.
Marketing
Marketing costs are recognised as an expense when incurred.
Incentives
Incentives paid to service providers and dealers for products delivered to the customer are expensed as incurred. Incentives paid to service
providers and dealers for services delivered are expensed in the period that the related revenue is recognised.
Taxation
Current taxation
The charge for current taxation is based on the results for the year and is adjusted for non-taxable income and non-deductible expenditure.
Current taxation is measured at the amount expected to be paid to the taxation authorities, using taxation rates and laws that have been
enacted or substantively enacted by the reporting date. The Group periodically evaluates positions taken in tax returns with respect to
situations in which applicable tax regulation is subject to interpretation, and the Group establishes provisions where appropriate on the basis
of the amounts expected to be paid to tax authorities.
for the year ended 31 March 2013
NOTES TO THE CONSOLIDATED ANNUAL FINANCIAL
STATEMENTS

159 Telkom Integrated Report 2013
Operating environment Risk and responsibilityCreating value Leadership and strategic People and environment Financial statements
2. SIGNIFICANT ACCOUNTING POLICIES (continued)
Summary of significant accounting policies (continued)
Taxation (continued)
Deferred taxation
Deferred taxation is accounted for using the statement of financial position liability method on all temporary differences at the reporting date
between the tax bases of assets and liabilities and their carrying amounts for financial reporting purposes.
Deferred taxation is not provided on the initial recognition of goodwill or initial recognition of assets or liabilities which is not a business
combination and at the time of the transaction affects neither accounting nor taxable profit or loss.
A deferred taxation asset is recognised to the extent that it is probable that future taxable profits will be available against which the associated
unused tax losses, unused tax credits and deductible temporary differences can be utilised. The carrying amount of deferred taxation assets
is reviewed at each reporting date and is reduced to the extent that it is no longer probable that the related tax benefit will be realised. In
respect of deductible temporary differences associated with investments in subsidiaries and joint ventures, deferred income taxation assets
are recognised only to the extent that it is probable that temporary differences will reverse in the foreseeable future and taxable profit will
be available against which temporary differences can be utilised. Deferred taxation is not recognised in respect of temporary differences
associated with investments in subsidiaries and interest in joint ventures, when the timing of the reversal of the temporary differences can be
controlled and it is probable that the temporary differences will not reverse in the foreseeable future.
Deferred taxation relating to equity items or other comprehensive income is recognised directly in other comprehensive income and not in
profit or loss.
Deferred taxation assets and liabilities are measured at the taxation rates that are expected to apply to the period when the asset is realised
or the liability is settled, based on taxation rates (and taxation laws) that have been enacted or substantively enacted by the reporting date.
Deferred taxation assets and deferred taxation liabilities are offset, if a legally enforceable right exists to set-off current taxation assets against
current taxation liabilities and the deferred taxes relate to the same taxable entity and the same taxation authority.
Secondary taxation on companies/Dividends tax
Secondary taxation on companies (STC) was provided for at a rate of 10% on the amount by which dividends declared by the Group
exceeded dividends received. Previously deferred taxation on unutilised STC credits was recognised to the extent that STC payable on future
dividend payments was likely to be available for set-off. The new withholding tax on dividends is effective for dividends declared on or after
1 April 2012 at a rate of 15%. All tax credits as at 31 March 2012 were utilised in full with the declaration of the dividend on 8 July 2011.
Property, plant and equipment
At initial recognition acquired property, plant and equipment are recognised at their purchase price, including import duties and non-
refundable purchase taxes, after deducting trade discounts and rebates. The recognised cost includes any directly attributable costs for
preparing the asset for its intended use.
The cost of an item of property, plant and equipment is recognised as an asset if it is probable that the future economic benefits associated
with the item will flow to the Group and the cost of the item can be measured reliably.
Property, plant and equipment is stated at historical cost less accumulated depreciation and any accumulated impairment losses. Each
component of an item of property, plant and equipment with a cost that is significant in relation to the total cost of the item is depreciated
separately. Depreciation is charged from the date the asset is available for use on a straight-line basis over the estimated useful life and ceases
at the earlier of the date that the asset is classified as held for sale and the date the asset is derecognised. Idle assets continue to attract
depreciation.
The estimated useful life of individual assets and the depreciation method thereof are reviewed on an annual basis at reporting date.
The depreciable amount is determined after taking into account the residual value of the asset. The residual value is the estimated
amount that the Group would currently obtain from the disposal of the asset, after deducting the estimated cost of disposal, if the assets
were already of the age and in the condition expected at the end of its useful life. The residual values of assets are reviewed on an annual
basis at reporting date.
Assets under construction represents freehold buildings, operating software, network and support equipment and includes all direct
expenditure as well as related borrowing costs capitalised, but excludes the costs of abnormal amounts of waste material, labour, or other
resources incurred in the production of self-constructed assets.
Freehold land is stated at cost and is not depreciated. Amounts paid by the Group on improvements to assets which are held in terms of
operating lease agreements are depreciated on a straight-line basis over the shorter of the remaining useful life of the applicable asset or the
remainder of the lease period. Where it is reasonably certain that the lease agreement will be renewed, the lease period equals the period of
the initial agreement plus the renewal periods.
The estimated useful lives applied are provided in note 6.
An item of property, plant and equipment is derecognised upon disposal or when no future economic benefits are expected from its use
or disposal. Any gain or loss arising on derecognition of the asset (calculated as the difference between the net disposal proceeds and the
carrying amount of the asset) is included in profit or loss in the year the asset is derecognised.
Assets held under finance leases are depreciated over their expected useful lives on the same basis as owned assets or, where shorter, the term
of the relevant lease if there is no reasonable certainty that the Group will obtain ownership by the end of the lease term.

160 Telkom Integrated Report 2013
2. SIGNIFICANT ACCOUNTING POLICIES (continued)
Summary of significant accounting policies (continued)
Intangible assets
At initial recognition acquired intangible assets are recognised at their purchase price, including import duties and non-refundable purchase
taxes, after deducting trade discounts and rebates. The recognised cost includes any directly attributable costs for preparing the asset for
its intended use. Internally generated intangible assets are recognised at cost comprising all directly attributable costs necessary to create
and prepare the asset to be capable of operating in the manner intended by management. Licences, software, trademarks, copyrights and
other intangible assets are carried at cost less accumulated amortisation and any accumulated impairment losses. Amortisation commences
when the intangible assets are available for their intended use and is recognised on a straight-line basis over the assets’ expected useful lives.
Amortisation ceases at the earlier of the date that the asset is classified as held for sale and the date that the asset is derecognised.
The residual value of intangible assets is the estimated amount that the Group would currently obtain from the disposal of the asset, after
deducting the estimated cost of disposal, if the asset were already of the age and in the condition expected at the end of its useful life. Due
to the nature of the asset the residual value is assumed to be zero unless there is a commitment by a third party to purchase the asset at the
end of its useful life or when there is an active market that is likely to exist at the end of the asset’s useful life, which can be used to estimate
the residual values. The residual values of intangible assets, the amortisation methods used and their useful lives are reviewed on an annual
basis at reporting date.
Intangible assets with indefinite useful lives, for example goodwill, and intangible assets not yet available for use (under construction), are
tested for impairment annually either individually or at the cash-generating unit level. Such intangible assets are not amortised. The useful life
of an intangible asset with an indefinite life is reviewed annually to determine whether indefinite life assessment continues to be supportable.
If not, the change in the useful life assessment from indefinite to finite is made on a prospective basis.
Assets under construction represent application and other non-integral software and includes all direct expenditure as well as related borrowing
costs capitalised, but excludes the costs of abnormal amounts of waste material, labour, or other resources incurred in the production of
self-constructed assets.
Intangible assets are derecognised when they have been disposed of or when the asset is permanently withdrawn from use and no future
economic benefit is expected from its disposal. Any gains or losses on the retirement or disposal of assets are recognised in profit or loss in
the year in which they arise.
The expected useful lives applied are provided in note 6.
Asset retirement obligations
Asset retirement obligations related to property, plant and equipment are recognised at the present value of expected future cash flows when
the obligation to dismantle or restore the site arises. The increase in the related asset’s carrying value is depreciated over its estimated useful
life. The unwinding of the discount is included in finance charges and fair value movements. Changes in the measurement of an existing
liability that result from changes in the estimated timing or amount of the outflow of resources required to settle the liability, or a change in
the discount rate are accounted for as increases or decreases to the original cost of the recognised assets. If the amount deducted exceeds
the carrying amount of the asset, the excess is recognised immediately in profit or loss.
Non-current assets held for sale
Non-current assets and disposal groups are classified as held for sale if their carrying amount will be recovered through a sale transaction
rather than through continuing use. This condition is regarded as met only when the sale is highly probable and the asset (or disposal group)
is available for immediate sale in its present condition. Management must be committed to the sale, which should be expected to qualify for
recognition as a complete sale within one year from the date of classification.
In the statement of profit or loss and other comprehensive income of the reporting period, and of the comparable period of the previous
year, income and expenses from discontinued operations are reported separately from income and expenses from continuing operations,
down to the level of profit after taxes. The resulting profit or loss after tax is reported separately in the statement of profit or loss and other
comprehensive income.
Non-current assets (and disposal groups) classified as held for sale are measured at the lower of the assets’ previous carrying amount and
fair value less costs to sell and are not depreciated or amortised subsequent to classification as held for sale. Only those assets within the
measurement scope of IFRS 5 are measured in terms of IFRS 5. Refer to note 10.
Impairment of property, plant and equipment and intangible assets
The Group regularly reviews its non-financial assets and cash-generating units for any indication of impairment. When indicators, including
changes in technology, market, economic, legal and operating environments, availability of funding or discontinuance of services occur and
could result in changes of the asset’s or cash-generating unit’s estimated recoverable amount, an impairment test is performed.
Intangible assets that have an indefinite useful life, for example goodwill, are tested annually for impairment.
The recoverable amount of assets or cash-generating units is measured using the higher of the fair value less costs of disposal and its value in
use, which is the present value of projected cash flows covering the remaining useful lives of the assets. The discount rate used is the discount
rate that reflects current market assessments of the time value of money and the risks specific to the asset. Impairment losses are recognised
when the asset’s carrying value exceeds its estimated recoverable amount. Where applicable, the recoverable amount is determined for the
cash-generating unit to which the asset belongs.
for the year ended 31 March 2013
NOTES TO THE CONSOLIDATED ANNUAL FINANCIAL
STATEMENTS

161 Telkom Integrated Report 2013
Operating environment Risk and responsibilityCreating value Leadership and strategic People and environment Financial statements
2. SIGNIFICANT ACCOUNTING POLICIES (continued)
Summary of significant accounting policies (continued)
Impairment of property, plant and equipment and intangible assets (continued)
Previously recognised impairment losses, other than goodwill, are reviewed annually for any indication that they may no longer exist or may
have decreased. If any such indication exists, the recoverable amount of the asset is estimated. Such impairment losses are reversed in profit
or loss if the recoverable amount has increased as a result of a change in the estimates used to determine the recoverable amount, but not
to an amount higher than the carrying amount that would have been determined (net of depreciation or amortisation) had no impairment
loss been recognised in prior years.
Repairs and maintenance
The Group expenses all costs associated with day-to-day repairs and maintenance, unless it is probable that such costs would result in future
economic benefits flowing to the Group, and the costs can be reliably measured.
Borrowing costs
Financing costs directly associated with the acquisition or construction of assets that require more than three months to complete and place
in service are capitalised at interest rates relating to loans specifically raised for that purpose, or at the weighted average borrowing rate where
the general pool of Group borrowings was utilised. Other borrowing costs are expensed as incurred.
Inventories
Merchandise, installation material and maintenance inventories are stated at the lower of cost, determined on a weighted average basis and
estimated net realisable value. Write-down of inventories arises when, for example, goods are damaged or when net realisable value is lower
than carrying value.
Telkom Mobile’s inventory cost is determined according to the First-In-First-Out basis.
Financial instruments
Recognition and initial measurement
All financial instruments are initially recognised at fair value, plus, in the case of financial assets and liabilities not at fair value through profit or
loss, transaction costs that are directly attributable to the acquisition or issue. Financial instruments are recognised when the Group becomes
a party to the contractual arrangements. All regular way transactions are accounted for on settlement date. Regular way purchases or sales
are purchases or sales of financial assets that require delivery of assets within the period generally established by regulation or convention in
the marketplace.
Subsequent measurement
Subsequent to initial recognition, the Group classifies financial assets as ‘at fair value through profit or loss’, ‘held-to-maturity investments’,
‘loans and receivables’, or ‘available-for-sale’. Financial liabilities are classified as ‘at fair value through profit or loss’ or ‘other financial
liabilities’. The measurement of each is set out below and presented in a table in note 15.
Fair value measurement
The fair value of financial assets and liabilities that are actively traded in financial markets is determined by reference to quoted market prices
at the close of business on the reporting date. Where there is no active market, fair value is determined using valuation techniques such as
discounted cash flow analysis that maximise the use of relevant observable inputs and minimises the use of unobservable inputs.
The Group recognises transfers between levels of the fair value hierarchy as of the end of the reporting period during which the event or
change in circumstances that caused the transfer has occurred.
Financial assets at fair value through profit or loss
The Group classifies financial assets that are held for trading in the category ‘financial assets at fair value through profit or loss’. Financial
assets are classified as held for trading if they are acquired for the purpose of selling in the future. Derivatives and embedded derivatives not
designated as hedges are also classified as held for trading. On remeasurement to fair value the gains or losses on held for trading financial
assets are recognised in finance charges and fair value movements for the year. The Group has not designated any financial assets upon initial
recognition as at fair value through profit or loss.
Held-to-maturity financial assets
The Group classifies non-derivative financial assets with fixed or determinable payments and fixed maturity dates as held-to-maturity when
the Group has the positive intention and ability to hold the instrument to maturity. These assets are subsequently measured at amortised
cost. Amortised cost is computed as the amount initially recognised minus principal repayments, plus or minus the cumulative amortisation
using the effective interest rate method. This calculation includes all fees paid or received between parties to the contract. For investments
carried at amortised cost, gains and losses are recognised in profit or loss when the investments are sold or impaired as well as through the
amortisation process.
162 Telkom Integrated Report 2013
2. SIGNIFICANT ACCOUNTING POLICIES (continued)
Summary of significant accounting policies (continued)
Financial instruments (continued)
Loans and receivables
Loans and receivables are non-derivative financial assets with fixed or determinable payments that are not quoted in an active market. They
are included in current assets, except for maturities greater than 12 months after the end of the reporting period. Loans and receivables are
carried at amortised cost using the effective interest rate method.
Financial liabilities at fair value through profit or loss
Financial liabilities are classified as at fair value through profit or loss (FVTPL) where the financial liability is held for trading.
A financial liability is classified as held for trading:
If it is acquired for the purpose of settling in the near term; or
If it is a derivative that is not designated and effective as a hedging instrument.
Financial liabilities at FVTPL are stated at fair value, with any resultant gains or losses recognised in profit or loss. The net gain or loss recognised
in profit or loss incorporates any interest paid on the financial liability.
Other financial liabilities
Other financial liabilities are subsequently measured at amortised cost, with interest expense recognised in finance charges and fair value
movements, on an effective interest rate basis.
The effective interest rate is the rate that accurately discounts estimated future cash payments through the expected life of the financial
liability, or, where appropriate, a shorter period.
Financial guarantee contracts
A financial guarantee contract is initially measured at fair value. It is subsequently measured at the higher of the amount determined in
accordance with IAS 37 Provisions, Contingent Liabilities and Contingent Assets or the amount initially recognised less, when appropriate,
cumulative amortisation, recognised in accordance with IAS 18 Revenue.
Cash and cash equivalents
Cash and cash equivalents are subsequently measured at amortised cost. This comprises cash on hand, deposits held on call and term deposits
with an initial maturity of less than three months when entered into.
For the purpose of the statement of cash flows, cash and cash equivalents consist of cash and cash equivalents defined above, net of credit
facilities utilised.
Repurchase agreements
Securities sold under repurchase agreements are not derecognised. These transactions are treated as collateralised arrangements and
classified as non-trading financial liabilities and carried at amortised cost.
Securities purchased under repurchase agreements are not recognised. These transactions are treated as collateralised lending arrangements
and classified as loans and receivables.
All associated finance charges are expensed in profit or loss.
Capital and money market transactions
New bonds and commercial paper bills issued are subsequently measured at amortised cost using the effective interest rate method.
Derecognition
A financial instrument or a portion of a financial instrument is derecognised and a gain or loss recognised when the Group’s contractual rights
expire, financial assets are transferred or financial liabilities are extinguished. On derecognition of a financial asset or liability, the difference
between the consideration and the carrying amount on the settlement date is included in finance charges and fair value movements for
the year.
Bonds and commercial paper bills are derecognised when the obligation specified in the contract is discharged. The difference between the
carrying value of the bond and the amount paid to extinguish the obligation is included in finance charges and fair value movements for
the year.
Impairment of financial assets
At each reporting date an assessment is made of whether there are any indicators of impairment of a financial asset or a group of financial
assets based on observable data about one or more loss events that occurred after the initial recognition of the asset or the group of assets.
For loans and receivables carried at amortised cost, if there is objective evidence that an impairment loss has been incurred, the amount
of the loss is measured at the difference between the asset’s carrying amount and the present value of estimated future cash flows. Evidence
of impairment may include indications that the debtors or a group of debtors is experiencing significant financial difficulty, default or
delinquency in interest or capital payments and the probability that they will enter bankruptcy. The carrying amount of the asset is reduced
through the use of an allowance account and the amount of the loss is recognised in profit or loss.
for the year ended 31 March 2013
NOTES TO THE CONSOLIDATED ANNUAL FINANCIAL
STATEMENTS

163 Telkom Integrated Report 2013
Operating environment Risk and responsibilityCreating value Leadership and strategic People and environment Financial statements
2. SIGNIFICANT ACCOUNTING POLICIES (continued)
Summary of significant accounting policies (continued))
Financial instruments (continued)
Impairment of financial assets (continued)
If, in a subsequent period, the amount of the impairment loss for financial assets decreases and the decrease can be related objectively to
an event occurring after the impairment was recognised, the previously recognised impairment loss is reversed. Any subsequent reversal of
an impairment loss is recognised in profit or loss, to the extent that the carrying value of the asset does not exceed the value that would have
been its amortised cost at the reversal date.
Remeasurement of embedded derivatives
The Group assesses whether an embedded derivative is required to be separated from the host contract and accounted for as a derivative
when it first becomes party to the contract. The Group re-assesses the contract when there is a change in the terms of the contract which
significantly modifies the cash flows that would otherwise be required under the contract.
Financial instruments: Disclosures
The Group groups its financial instruments into classes of similar instruments and where disclosure is required, it discloses them by class. It also
discloses information about the nature and extent of risks arising from its financial instruments as indicated in note 15.
Foreign currencies
Each entity within the Group determines its functional currency. The Group’s presentation currency is the South African Rand (ZAR).
Transactions denominated in foreign currencies are measured at the rate of exchange at transaction date. Monetary items denominated in
foreign currencies are remeasured at the rate of exchange at settlement date or reporting date whichever occurs first. Exchange differences on
the settlement or translation of monetary assets and liabilities are included in finance charges and fair value movements in the period in which
they arise. Non-monetary items that are measured in terms of historical cost in a foreign currency are translated using the exchange rates as at
the dates of the initial transactions. Non-monetary items measured at fair value in a foreign currency are translated using the exchange rates
at the date when the fair value is determined.
The assets and liabilities of foreign operations are translated to ZAR at the rate of exchange prevailing at the reporting date and their profits
and losses are translated at exchange rates prevailing at the dates of the transactions. The exchange differences arising on the translation
are recognised in other comprehensive income. On disposal of the foreign operation, the component of other comprehensive income relating
to that particular foreign operation is recognised in profit or loss.
Treasury shares
Where the Group acquires, or in substance acquires, its own shares, such shares are measured at acquisition cost and disclosed as a reduction
of equity. No gain or loss is recognised in profit or loss on the purchase, sale, issue or cancellation of the Group’s own equity instruments. Such
shares are not remeasured for changes in fair value.
Where the Group chooses or is required to buy equity instruments from another party to satisfy its obligations to its employees under the
share-based payment arrangement by delivery of its own shares, the transaction is accounted for as equity-settled. This applies regardless of
whether the employee’s rights to the equity instruments were granted by the Group itself or by its shareholders or was settled by the Group
itself or its shareholders.
Leases
A lease is classified as a finance lease if it transfers substantially all the risks and rewards incidental to ownership. All other leases are classified
as operating leases.
Where the Group enters into a service agreement as a supplier or a customer that depends on the use of a specific asset, and conveys the
right to control the use of the specific asset, the arrangement is assessed to determine whether it contains a lease. Once it has been concluded
that an arrangement contains a lease, it is assessed against the criteria in IAS 17 to determine if the arrangement should be recognised as a
finance lease or operating lease. This also applied when assessing indefeasible rights to use (IRUs).
The land and buildings elements of a lease of land and buildings are considered separately for the purposes of lease classification unless it is
impracticable to do so.
Lessee
Operating lease payments are recognised in profit or loss on a straight-line basis over the lease term unless another systematic basis is more
representative of the time pattern of the Group’s benefit.
Assets acquired in terms of finance leases are capitalised at the lower of fair value or the present value of the minimum lease payments at
inception of the lease and depreciated over the lesser of the useful life of the asset or the lease term. The capital element of future obligations
under the leases is included as a liability in the statement of financial position. Lease finance costs are amortised in profit or loss over the lease
term using the interest rate implicit in the lease. Where a sale and leaseback transaction results in a finance lease, any excess of sale proceeds
over the carrying amount is deferred and recognised in profit or loss over the term of the lease.
164 Telkom Integrated Report 2013
2. SIGNIFICANT ACCOUNTING POLICIES (continued)
Summary of significant accounting policies (continued)
Lessor
Operating lease revenue is recognised in profit or loss on a straight-line basis over the lease term.
Assets held under a finance lease are recognised in the statement of financial position and presented as a receivable at an amount equal to
the net investment in the lease. The recognition of finance income is based on a pattern reflecting a constant periodic rate of return on the
net investment in the finance lease.
Employee benefits
Post-employment benefits
The Group provides defined benefit and defined contribution plans for the benefit of employees. These plans are funded by the employees and
the Group, taking into account recommendations of the independent actuaries. The post-retirement telephone rebate liability is unfunded.
Defined contribution plans
The Group’s funding of the defined contribution plans is charged to employee expenses in the same year as the related service is provided.
Defined benefit plans
The Group provides defined benefit plans for pension, retirement, post-retirement medical aid benefits and telephone rebates to qualifying
employees. The Group’s net obligation in respect of defined benefits is calculated separately for each plan by estimating the amount of future
benefits earned in return for services rendered.
The amount reported in the statement of financial position represents the present value of the defined benefit obligations, calculated by using
the projected unit credit method, as adjusted for unrecognised past service costs and reduced by the fair value of the related plan assets. The
amount of any surplus recognised and reflected as a defined benefit asset is limited to unrecognised actuarial losses and past service costs
plus the present value of available refunds and reductions in future contributions to the plan. To the extent that there is uncertainty as to the
entitlement to the surplus, no asset is recognised. No gain is recognised solely as a result of an actuarial loss in the current period and no loss is
recognised solely as a result of an actuarial gain in the current period. The effects of this asset limitation is recognised in other comprehensive
income.
The Group accounts for actuarial gains and losses recognised directly in other comprehensive income in the period in which they occur.
The Group believes that recognising actuarial gains and losses in other comprehensive income results in better disclosures in the statement
of financial position and is consistent with the requirements of the IAS 19 amendment that will become effective in the 2014 financial year.
Past service costs are recognised immediately to the extent that the benefits are vested, otherwise they are recognised on a straight-line basis
over the average period the benefits become vested.
Leave benefits
Annual leave entitlement is provided for over the period that the leave accrues and is subject to a cap of 22 days.
Short-term employee benefits
The cost of all short-term employee benefits is recognised during the year the employees render services, unless the Group uses the services of
employees in the construction of an asset and the benefits received meet the recognition criteria of an asset, at which stage it is included as
part of the related property, plant and equipment or intangible asset item.
Voluntary employee severance package costs are payable when employment is terminated by the Group before the normal retirement age or
when an employee accepts voluntary redundancy in exchange for benefits. Voluntary employee severance package benefits are recognised
when the entity is demonstrably committed to the plan and it is probable that the expenses will be incurred. In the case of an offer made
to encourage voluntary redundancy, the measurement of termination benefits is based on the number of employees expected to accept
the offer.
Provisions
Provisions are recognised when the Group has a present obligation (legal or constructive) as a result of a past event, it is probable that an
outflow of resources will be required to settle the obligation, and a reliable estimate can be made of the amount of the obligation. Provisions
are reviewed at each reporting date and adjusted to reflect the current best estimate. Where the effect of the time value of money is material,
the amount of the provision is the present value of the expenditures expected to be required to settle the obligation.
Present obligations arising under onerous contracts are recognised and measured as a provision. An onerous contract is considered to exist
where the Group has a contract under which the unavoidable costs of meeting the obligations under the contract exceed the economic
benefits expected to be received under it.
for the year ended 31 March 2013
NOTES TO THE CONSOLIDATED ANNUAL FINANCIAL
STATEMENTS

165 Telkom Integrated Report 2013
Operating environment Risk and responsibilityCreating value Leadership and strategic People and environment Financial statements
3. SEGMENT INFORMATION
During the year under review the Group’s segment structure was changed to better reflect the Chief operating decision maker’s (Executive
Committee) assessment of the Group’s performance. Due to the Convergence Strategy announced in July 2012, the Executive Committee now
manages the business on a combined basis, thereby combining the previously reported Telkom Fixed-Line and Telkom Mobile segments. This
reflects the financial information reviewed by the Executive Committee when making decisions about performance and resource allocation
and is consistent with the manner in which the Telkom network generates revenue, ie. on a combined basis. As a result separate Fixed-Line
and Mobile information is no longer provided. No Group’s geographical information is provided as the majority of the Group’s operations are
carried out in South Africa.
The Telkom segment provides fixed-line access, fixed-line usage, data communications services (through Telkom and Cybernest), mobile voice
services and handset sales.
4. REVENUE
Revenue recognition
The Group provides fixed-line, mobile and data communication services and communication related products. The Group provides such
services to business, residential, pay phone and mobile customers. Revenue represents the fair value of fixed or determinable consideration
that has been received or is receivable.
Group Company
2013 2012 2013 2012
Rm Rm Rm Rm
4.1 Total revenue 33,119 33,668 31,909 32,262
Operating revenue 32,501 33,079 30,972 31,510
Other income (excluding profit on disposal of
property, plant and equipment,
intangible assets, investments and profit on
disposal of subsidiary, refer to note 5) 317 351 356 385
Investment income (refer to note 7) 301 238 581 367
4.2 Operating revenue 32,501 33,079 30,972 31,510
Voice* 16,818 17,668 16,818 17,668
Interconnection* 1,597 1,855 1,597 1,855
Data* 10,801 10,237 10,813 10,258
Customer premises equipment* 1,466 1,401 1,466 1,401
Sundry revenue 1,819 1,918 278 328
Operating revenue decreased mainly due to a reduction in retail voice revenue due to lower usage and retail rates. Interconnection revenue
also decreased due to lower rates and volumes. These were partly offset by an increase in mobile revenue due to growth.
* The categories of revenue were changed retrospectively to enhance the Group’s revenue disclosure. In the prior year subscriptions, Telkom mobile,
connections and other usage as well as traffic revenue streams were disclosed. This was reclassified to voice, data, interconnection and customer premises
equipment.
Group Company
2013 2012 2013 2012
Rm Rm Rm Rm
5. OTHER INCOME 402 579 395 437
Other income (included in Total revenue, refer to note 4) 317 351 356 385
Interest received from trade receivables 199 245 213 215
Interest received from subsidiaries – – – 7
Sundry income 118 106 143 163
Profit on disposal of property, plant and equipment and
intangible assets 39 53 39 52
Profit on disposal of investments 16 8 – –
Profit on disposal of joint venture 30 – – –
Profit on disposal of subsidiary – 167 – –
In the prior year Multi-Links Telecommunications Ltd was sold for USD300. The profit on disposal of subsidiary is due to the carrying amount
of total liabilities exceeding total assets.
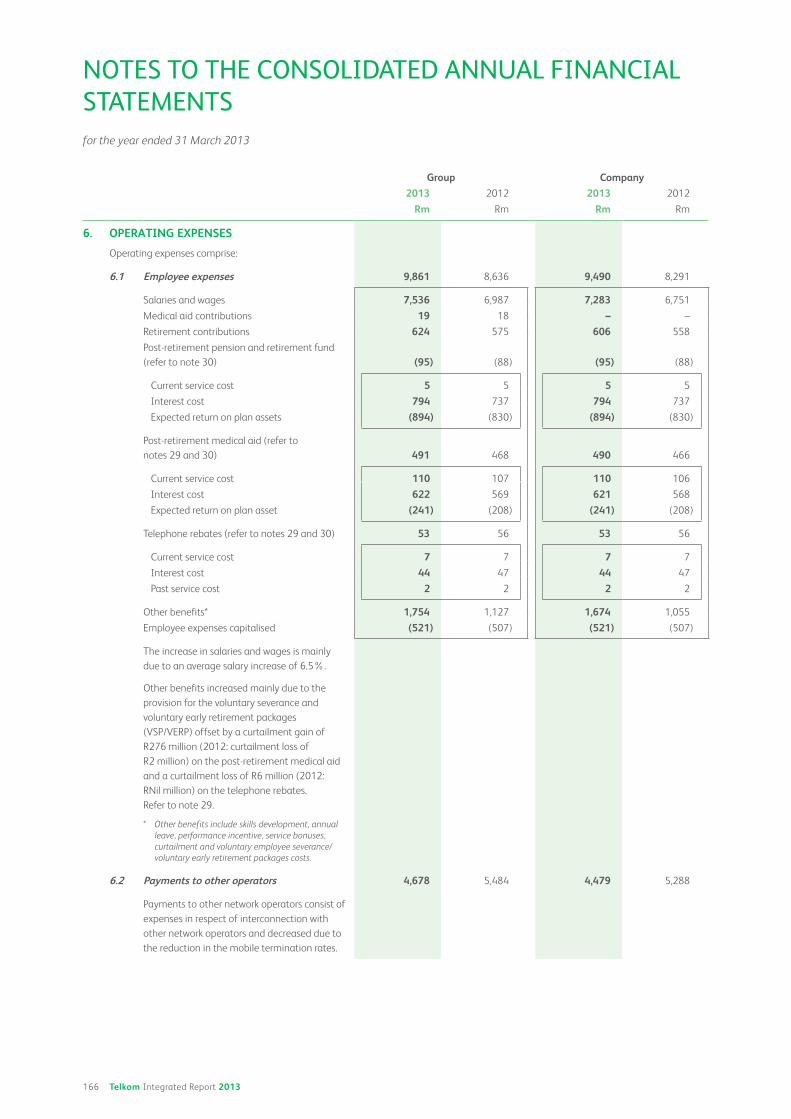
166 Telkom Integrated Report 2013
Group Company
2013 2012 2013 2012
Rm Rm Rm Rm
6. OPERATING EXPENSES
Operating expenses comprise:
6.1 Employee expenses 9,861 8,636 9,490 8,291
Salaries and wages 7,536 6,987 7,283 6,751
Medical aid contributions 19 18 – –
Retirement contributions 624 575 606 558
Post-retirement pension and retirement fund
(refer to note 30) (95) (88) (95) (88)
Current service cost 5 5 5 5
Interest cost 794 737 794 737
Expected return on plan assets (894) (830) (894) (830)
Post-retirement medical aid (refer to
notes 29 and 30) 491 468 490 466
Current service cost 110 107 110 106
Interest cost 622 569 621 568
Expected return on plan asset (241) (208) (241) (208)
Telephone rebates (refer to notes 29 and 30) 53 56 53 56
Current service cost 7 7 7 7
Interest cost 44 47 44 47
Past service cost 2 2 2 2
Other benefits* 1,754 1,127 1,674 1,055
Employee expenses capitalised (521) (507) (521) (507)
The increase in salaries and wages is mainly
due to an average salary increase of 6.5%.
Other benefits increased mainly due to the
provision for the voluntary severance and
voluntary early retirement packages
(VSP/VERP) offset by a curtailment gain of
R276 million (2012: curtailment loss of
R2 million) on the post-retirement medical aid
and a curtailment loss of R6 million (2012:
RNil million) on the telephone rebates.
Refer to note 29.
* Other benefits include skills development, annual
leave, performance incentive, service bonuses,
curtailment and voluntary employee severance/
voluntary early retirement packages costs.
6.2 Payments to other operators 4,678 5,484 4,479 5,288
Payments to other network operators consist of
expenses in respect of interconnection with
other network operators and decreased due to
the reduction in the mobile termination rates.
for the year ended 31 March 2013
NOTES TO THE CONSOLIDATED ANNUAL FINANCIAL
STATEMENTS

167 Telkom Integrated Report 2013
Operating environment Risk and responsibilityCreating value Leadership and strategic People and environment Financial statements
Group Company
2013 2012 2013 2012
Rm Rm Rm Rm
6. OPERATING EXPENSES (continued)
6.3 Selling, general and administrative expenses 7,216 7,193 6,825 8,224
Selling and administrative expenses* 2,384 1,588 2,111 2,713
Maintenance 3,112 2,684 3,102 2,672
Marketing 956 1,059 934 1,025
Mobile direct costs and dealer incentives 312 1,019 312 1,019
Fixed-line dealer incentives 51 153 51 153
Impairment of receivables* 401 690 315 642
Selling and administrative expenses increased
due to the provision for the Competition
Commission fines.
Maintenance costs increased due to the
expenditure on the integration of independent
business systems.
Mobile direct costs and fixed-line dealer
incentives decreased due to lower sale
acquisition costs incurred as a direct result of
the refocus of the company strategy.
Included in mobile direct costs is amortisation
of R137 million (2012: R43 million) relating to
the connection incentive bonus (refer to
note 14).
* Included in impairment of receivables is bad debts
recovered of R181 million for the Group and
Company. In the 2012 financial year for selling
and administrative expenses is an amount of
R93 million for bad debts recovered for Group
and Company.
6.4 Service fees 3,103 2,974 3,068 2,952
Facilities and property management 1,660 1,505 1,659 1,503
Consultancy services 409 506 388 497
Security and other 972 895 969 892
Auditors’ remuneration 62 68 52 60
6.5 Operating leases* 936 825 880 757
Land and buildings 422 331 385 282
Transmission and data lines 18 19 – –
Equipment 36 30 35 29
Vehicles 460 445 460 446
* Operating lease commitments are disclosed in
note 37.
6.6 Depreciation, amortisation, impairment and write-offs 18,156 6,138 18,093 5,467
Depreciation of property, plant and equipment 5,072 4,608 5,045 4,556
Amortisation of intangible assets 906 707 871 657
Impairment of property, plant and equipment
and intangible assets 12,000 569 12,000 –
Write-offs of property, plant and equipment
and intangible assets 178 254 177 254
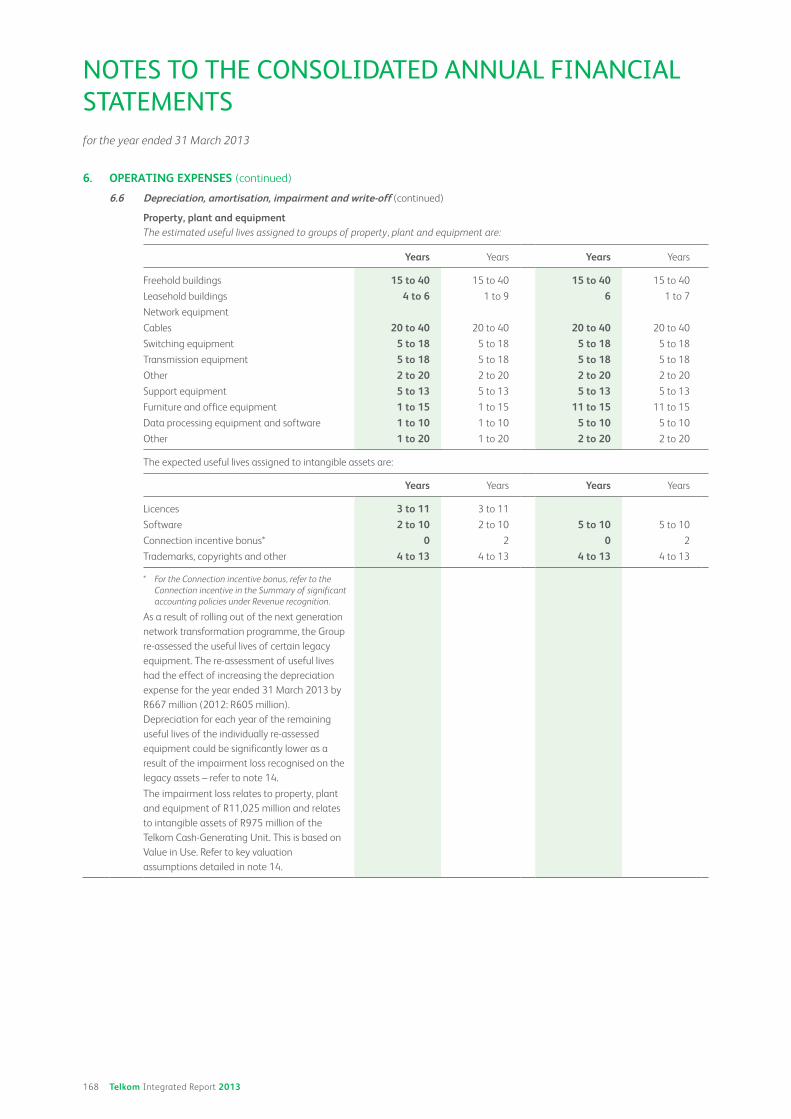
168 Telkom Integrated Report 2013
6. OPERATING EXPENSES (continued)
6.6 Depreciation, amortisation, impairment and write-off (continued)
Property, plant and equipmentThe estimated useful lives assigned to groups of property, plant and equipment are:
Years Years Years Years
Freehold buildings 15 to 40 15 to 40 15 to 40 15 to 40
Leasehold buildings 4 to 6 1 to 9 6 1 to 7
Network equipment
Cables 20 to 40 20 to 40 20 to 40 20 to 40
Switching equipment 5 to 18 5 to 18 5 to 18 5 to 18
Transmission equipment 5 to 18 5 to 18 5 to 18 5 to 18
Other 2 to 20 2 to 20 2 to 20 2 to 20
Support equipment 5 to 13 5 to 13 5 to 13 5 to 13
Furniture and office equipment 1 to 15 1 to 15 11 to 15 11 to 15
Data processing equipment and software 1 to 10 1 to 10 5 to 10 5 to 10
Other 1 to 20 1 to 20 2 to 20 2 to 20
The expected useful lives assigned to intangible assets are:
Years Years Years Years
Licences 3 to 11 3 to 11
Software 2 to 10 2 to 10 5 to 10 5 to 10
Connection incentive bonus* 0 2 0 2
Trademarks, copyrights and other 4 to 13 4 to 13 4 to 13 4 to 13
* For the Connection incentive bonus, refer to the
Connection incentive in the Summary of significant
accounting policies under Revenue recognition.
As a result of rolling out of the next generation
network transformation programme, the Group
re-assessed the useful lives of certain legacy
equipment. The re-assessment of useful lives
had the effect of increasing the depreciation
expense for the year ended 31 March 2013 by
R667 million (2012: R605 million).
Depreciation for each year of the remaining
useful lives of the individually re-assessed
equipment could be significantly lower as a
result of the impairment loss recognised on the
legacy assets – refer to note 14.
The impairment loss relates to property, plant
and equipment of R11,025 million and relates
to intangible assets of R975 million of the
Telkom Cash-Generating Unit. This is based on
Value in Use. Refer to key valuation
assumptions detailed in note 14.
for the year ended 31 March 2013
NOTES TO THE CONSOLIDATED ANNUAL FINANCIAL
STATEMENTS
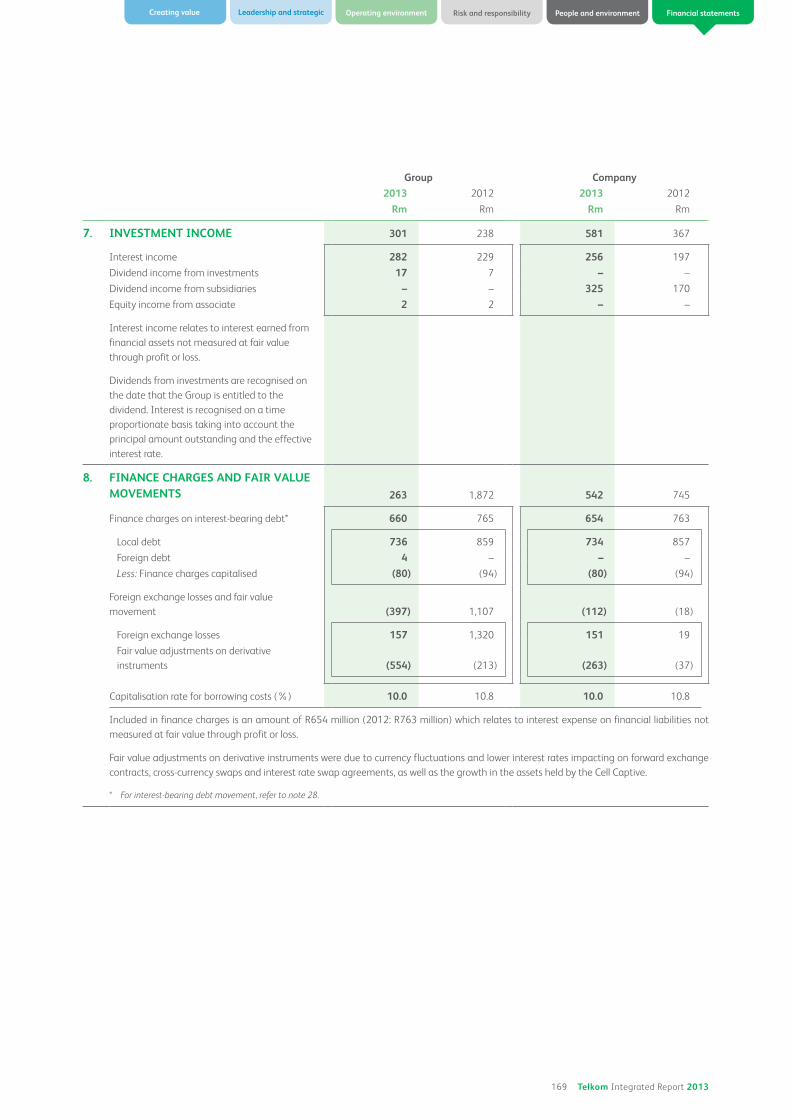
169 Telkom Integrated Report 2013
Operating environment Risk and responsibilityCreating value Leadership and strategic People and environment Financial statements
Group Company
2013 2012 2013 2012
Rm Rm Rm Rm
7. INVESTMENT INCOME 301 238 581 367
Interest income 282 229 256 197
Dividend income from investments 17 7 – –
Dividend income from subsidiaries – – 325 170
Equity income from associate 2 2 – –
Interest income relates to interest earned from
financial assets not measured at fair value
through profit or loss.
Dividends from investments are recognised on
the date that the Group is entitled to the
dividend. Interest is recognised on a time
proportionate basis taking into account the
principal amount outstanding and the effective
interest rate.
8. FINANCE CHARGES AND FAIR VALUE MOVEMENTS 263 1,872 542 745
Finance charges on interest-bearing debt* 660 765 654 763
Local debt 736 859 734 857
Foreign debt 4 – – –
Less: Finance charges capitalised (80) (94) (80) (94)
Foreign exchange losses and fair value
movement (397) 1,107 (112) (18)
Foreign exchange losses 157 1,320 151 19
Fair value adjustments on derivative
instruments (554) (213) (263) (37)
Capitalisation rate for borrowing costs (%) 10.0 10.8 10.0 10.8
Included in finance charges is an amount of R654 million (2012: R763 million) which relates to interest expense on financial liabilities not
measured at fair value through profit or loss.
Fair value adjustments on derivative instruments were due to currency fluctuations and lower interest rates impacting on forward exchange
contracts, cross-currency swaps and interest rate swap agreements, as well as the growth in the assets held by the Cell Captive.
* For interest-bearing debt movement, refer to note 28.
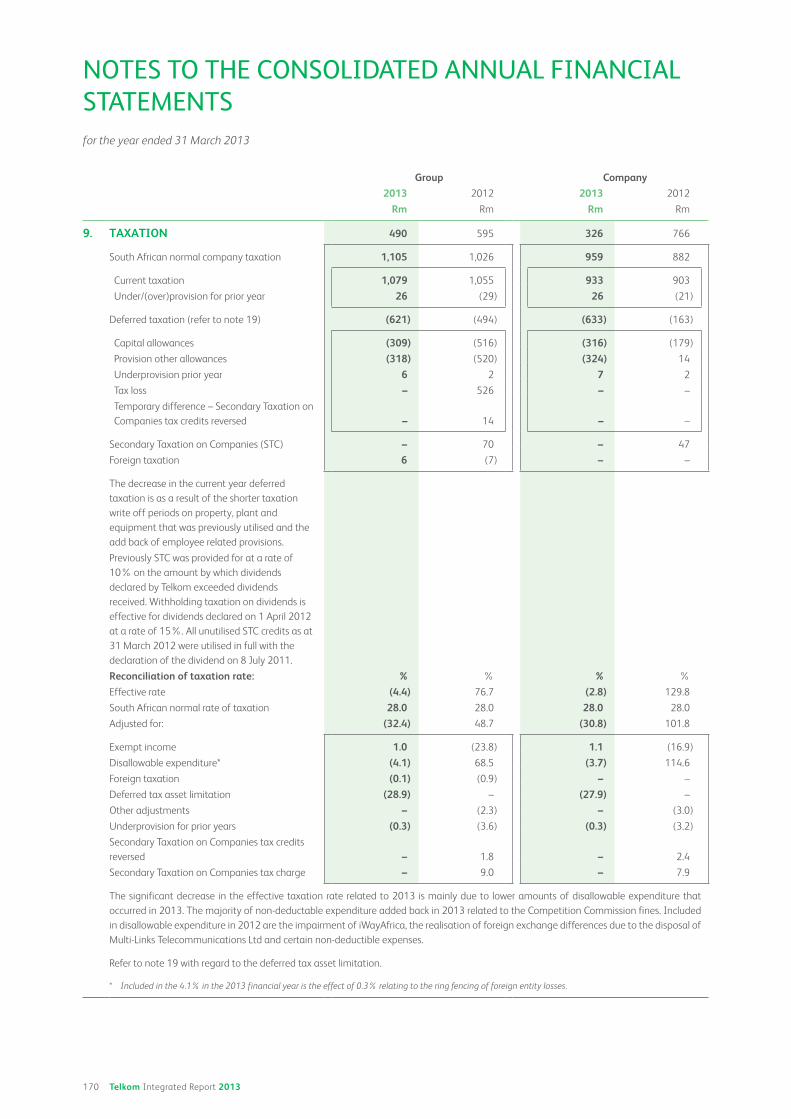
170 Telkom Integrated Report 2013
Group Company
2013 2012 2013 2012
Rm Rm Rm Rm
9. TAXATION 490 595 326 766
South African normal company taxation 1,105 1,026 959 882
Current taxation 1,079 1,055 933 903
Under/(over)provision for prior year 26 (29) 26 (21)
Deferred taxation (refer to note 19) (621) (494) (633) (163)
Capital allowances (309) (516) (316) (179)
Provision other allowances (318) (520) (324) 14
Underprovision prior year 6 2 7 2
Tax loss – 526 – –
Temporary difference – Secondary Taxation on
Companies tax credits reversed – 14 – –
Secondary Taxation on Companies (STC) – 70 – 47
Foreign taxation 6 (7) – –
The decrease in the current year deferred
taxation is as a result of the shorter taxation
write off periods on property, plant and
equipment that was previously utilised and the
add back of employee related provisions.
Previously STC was provided for at a rate of
10% on the amount by which dividends
declared by Telkom exceeded dividends
received. Withholding taxation on dividends is
effective for dividends declared on 1 April 2012
at a rate of 15%. All unutilised STC credits as at
31 March 2012 were utilised in full with the
declaration of the dividend on 8 July 2011.
Reconciliation of taxation rate: % % % %
Effective rate (4.4) 76.7 (2.8) 129.8
South African normal rate of taxation 28.0 28.0 28.0 28.0
Adjusted for: (32.4) 48.7 (30.8) 101.8
Exempt income 1.0 (23.8) 1.1 (16.9)
Disallowable expenditure* (4.1) 68.5 (3.7) 114.6
Foreign taxation (0.1) (0.9) – –
Deferred tax asset limitation (28.9) – (27.9) –
Other adjustments – (2.3) – (3.0)
Underprovision for prior years (0.3) (3.6) (0.3) (3.2)
Secondary Taxation on Companies tax credits
reversed – 1.8 – 2.4
Secondary Taxation on Companies tax charge – 9.0 – 7.9
The significant decrease in the effective taxation rate related to 2013 is mainly due to lower amounts of disallowable expenditure that
occurred in 2013. The majority of non-deductable expenditure added back in 2013 related to the Competition Commission fines. Included
in disallowable expenditure in 2012 are the impairment of iWayAfrica, the realisation of foreign exchange differences due to the disposal of
Multi-Links Telecommunications Ltd and certain non-deductible expenses.
Refer to note 19 with regard to the deferred tax asset limitation.
* Included in the 4.1% in the 2013 financial year is the effect of 0.3% relating to the ring fencing of foreign entity losses.
for the year ended 31 March 2013
NOTES TO THE CONSOLIDATED ANNUAL FINANCIAL
STATEMENTS

171 Telkom Integrated Report 2013
Operating environment Risk and responsibilityCreating value Leadership and strategic People and environment Financial statements
2013 2012
Rm Rm
10. DISCONTINUED OPERATIONMulti-Links Telecommunications Ltd (Multi-Links)
On 26 November 2010, Telkom announced that the Board had mandated management to
review options for the exit of the CDMA business of Multi-Links in Nigeria.
On 10 June 2011, the Telkom Board decided to stop funding Multi-Links after the deal to sell
the CDMA business of Multi-Links to Visafone Communications fell through as a result of
certain conditions precedent to the transaction not being met.
On 26 June 2011, the Telkom Board made a decision to sell the entire issued share capital of
Multi-Links to Hip Oils Topco Ltd. The sale was conditional on, inter alia, regulatory approvals.
The entire business was classified as held for sale at this date.
Multi-Links’ assets and liabilities were remeasured to the lower of carrying amount and fair
value less costs to sell at the date of held for sale classification, 26 June 2011, and the
effective date of disposal 3 October 2011.
Analysis of the results of the discontinued operations:
Revenue* – 158
Expenses* – (427)
Loss before taxation of the discontinued operations – (269)
Taxation – –
Loss after taxation of the discontinued operations – (269)
* Revenue comprises operating revenue, other income and investment income. Expenses comprises
operating expenses, finance charges and impairment of RNil million (2012: R198 million).
For the 2012 financial year, the carrying amount and fair value less costs to sell were both
negative, thus limited to nil.
The net cash flows attributable to the operating, investing and financing activities of discontinued operations:
Operating cash flows – (75)
Investing cash flows – (21)
Financing cash flows – 143
Total cash inflow* – 47
* Cash flows included for 2012 are up to 3 October 2011.
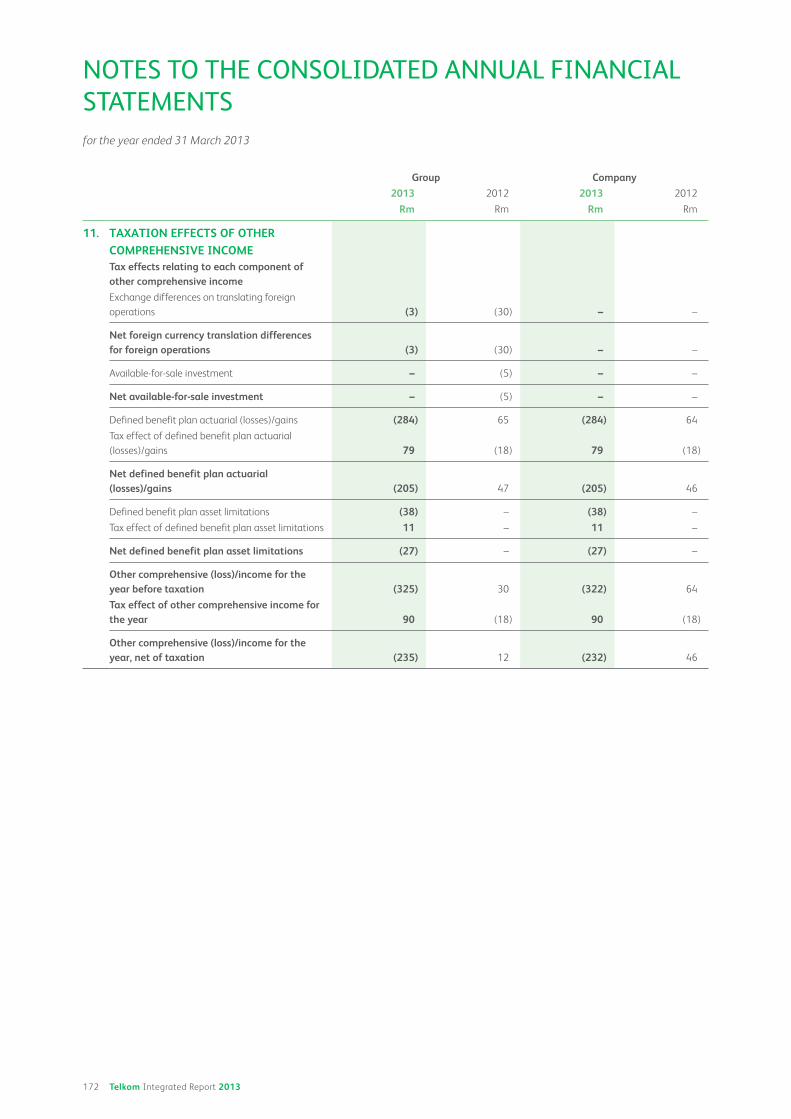
172 Telkom Integrated Report 2013
Group Company
2013 2012 2013 2012
Rm Rm Rm Rm
11. TAXATION EFFECTS OF OTHER
COMPREHENSIVE INCOMETax effects relating to each component of other comprehensive income
Exchange differences on translating foreign
operations (3) (30) – –
Net foreign currency translation differences for foreign operations (3) (30) – –
Available-for-sale investment – (5) – –
Net available-for-sale investment – (5) – –
Defined benefit plan actuarial (losses)/gains (284) 65 (284) 64
Tax effect of defined benefit plan actuarial
(losses)/gains 79 (18) 79 (18)
Net defined benefit plan actuarial (losses)/gains (205) 47 (205) 46
Defined benefit plan asset limitations (38) – (38) –
Tax effect of defined benefit plan asset limitations 11 – 11 –
Net defined benefit plan asset limitations (27) – (27) –
Other comprehensive (loss)/income for the year before taxation (325) 30 (322) 64
Tax effect of other comprehensive income for the year 90 (18) 90 (18)
Other comprehensive (loss)/income for the year, net of taxation (235) 12 (232) 46
for the year ended 31 March 2013
NOTES TO THE CONSOLIDATED ANNUAL FINANCIAL
STATEMENTS

173 Telkom Integrated Report 2013
Operating environment Risk and responsibilityCreating value Leadership and strategic People and environment Financial statements
Group
Restated2013 2012
12. EARNINGS PER SHARE
Total operations
Basic and diluted loss per share (cents) (2,276.2) (42.3)
The calculation of earnings per share is based on a loss attributable to equity holders of
Telkom of R11,622 million (2012: R216 million) and 510,593,816 (2012: 510,593,816)
weighted average number of ordinary shares in issue.
Headline earnings and diluted headline earnings per share (cents)* 87.0 310.8
The calculation of headline earnings per share is based on headline earnings of R444 million
(2012: R1,587 million) and 510,593,816 (2012: 510,593,816) weighted average number of
ordinary shares in issue.
Continuing operations
Basic and diluted (loss)/earnings per share (cents) (2,276.2) 10.4
The calculation of earnings per share is based on a loss attributable to equity holders of
Telkom of R11,622 million (2012: profit of R53 million) and 510,593,816 (2012:
510,593,816) weighted average number of ordinary shares in issue.
Headline earnings and diluted headline earnings per share (cents)* 87.0 324.7
The calculation of headline earnings per share is based on headline earnings of R444 million
(2012: R1,658 million) and 510,593,816 (2012: 510,593,816) weighted average number of
ordinary shares in issue.
Discontinued operations
Basic and diluted loss per share (cents) – (52.7)
The calculation of earnings per share is based on loss attributable to equity holders of Telkom
of RNil million (2012: R269 million) and 510,593,816 (2012: 510,593,816) weighted average
number of ordinary shares in issue.
Headline loss and diluted headline loss per share (cents)* – (13.9)
The calculation of headline earnings per share is based on headline loss of RNil million
(2012: R71 million) and 510,593,816 (2012: 510,593,816) weighted average number of
ordinary shares in issue.
Reconciliation of weighted average number of ordinary shares: Number of shares
Number of
shares
Ordinary shares in issue (refer to note 24) 520,783,900 520,783,900
Weighted average number of treasury shares (refer to note 25) (10,190,084) (10,190,084)
Weighted average number of shares outstanding 510,593,816 510,593,816
* The disclosure of headline earnings is a requirement of the JSE Limited and is not a recognised measure under IFRS. It has been calculated in accordance
with the South African Institute of Chartered Accountants’ Circular 3/2012 issued in this regard.
Total operationsRm
GrossRmNet *
2013
Reconciliation between earnings and headline earnings:
Loss for the year (11,499)
Non-controlling interests (123)
Loss attributable to owners of Telkom (11,622)
Profit on disposal of property, plant and equipment and intangible assets (39) (32)
Profit on disposal of joint venture (30) (30)
Write-offs of property, plant and equipment and intangible assets 178 128
Impairment loss on property, plant and equipment and intangible assets** 12,000 12,000
Headline earnings 444
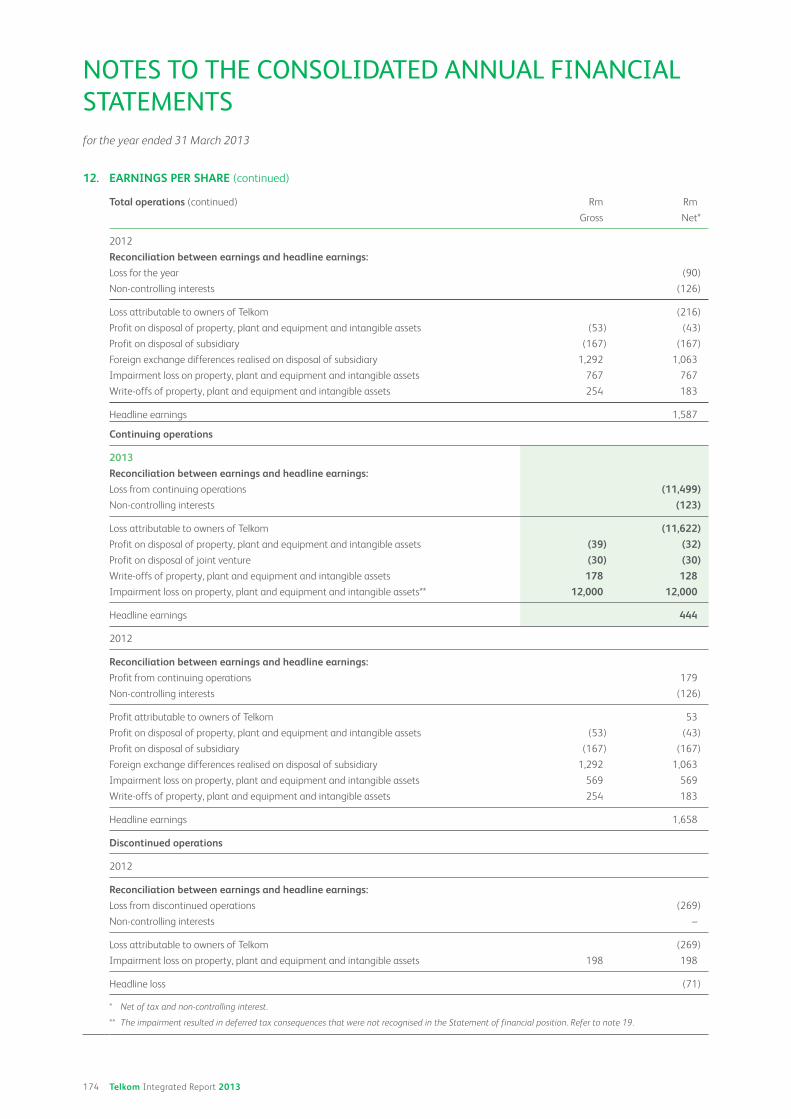
174 Telkom Integrated Report 2013
12. EARNINGS PER SHARE (continued)
Total operations (continued) Rm Rm
Gross Net*
2012
Reconciliation between earnings and headline earnings:
Loss for the year (90)
Non-controlling interests (126)
Loss attributable to owners of Telkom (216)
Profit on disposal of property, plant and equipment and intangible assets (53) (43)
Profit on disposal of subsidiary (167) (167)
Foreign exchange differences realised on disposal of subsidiary 1,292 1,063
Impairment loss on property, plant and equipment and intangible assets 767 767
Write-offs of property, plant and equipment and intangible assets 254 183
Headline earnings 1,587
Continuing operations
2013
Reconciliation between earnings and headline earnings:
Loss from continuing operations (11,499)
Non-controlling interests (123)
Loss attributable to owners of Telkom (11,622)
Profit on disposal of property, plant and equipment and intangible assets (39) (32)
Profit on disposal of joint venture (30) (30)
Write-offs of property, plant and equipment and intangible assets 178 128
Impairment loss on property, plant and equipment and intangible assets** 12,000 12,000
Headline earnings 444
2012
Reconciliation between earnings and headline earnings:
Profit from continuing operations 179
Non-controlling interests (126)
Profit attributable to owners of Telkom 53
Profit on disposal of property, plant and equipment and intangible assets (53) (43)
Profit on disposal of subsidiary (167) (167)
Foreign exchange differences realised on disposal of subsidiary 1,292 1,063
Impairment loss on property, plant and equipment and intangible assets 569 569
Write-offs of property, plant and equipment and intangible assets 254 183
Headline earnings 1,658
Discontinued operations
2012
Reconciliation between earnings and headline earnings:
Loss from discontinued operations (269)
Non-controlling interests –
Loss attributable to owners of Telkom (269)
Impairment loss on property, plant and equipment and intangible assets 198 198
Headline loss (71)
* Net of tax and non-controlling interest.
** The impairment resulted in deferred tax consequences that were not recognised in the Statement of financial position. Refer to note 19.
for the year ended 31 March 2013
NOTES TO THE CONSOLIDATED ANNUAL FINANCIAL
STATEMENTS

175 Telkom Integrated Report 2013
Operating environment Risk and responsibilityCreating value Leadership and strategic People and environment Financial statements
13. INTRODUCTION TO THE PROPERTY, PLANT AND EQUIPMENT AND INTANGIBLE ASSETS NOTES
Summary of property, plant and equipment and intangible assets carrying values
Group
Carrying value at
beginningof year Additions Transfers
Foreigncurrency
trans-lation Disposals
Depre-ciation/Amorti-
sationWrite-
offs
Carryingvalue
beforeimpair-
mentImpair-
ment
Carryingvalue at
end of year
Rm Rm Rm Rm Rm Rm Rm Rm Rm Rm
2013
Property, plant and equipment 36,155 4,777 (107) (5) (22) (5,072) (177) 35,549 (11,025) 24,524
Intangible assets 3,555 961 86 – (1) (1,044) (1) 3,556 (975) 2,581
39,710 5,738 (21) (5) (23) (6,116) (178) 39,105 (12,000) 27,105
2012
Property, plant and equipment 37,304 4,022 (17) 7 (130) (4,613) (146) 36,427 (272) 36,155
Intangible assets 3,965 813 17 96 – (744) (89) 4,058 (503) 3,555
41,269 4,835 – 103 (130) (5,357) (235) 40,485 (775) 39,710
Company
Carrying value at
beginningof year Additions Transfers
Foreigncurrency
trans-lation Disposals
Depre-ciation/Amorti-
sationWrite-
offs
Carryingvalue
beforeimpair-
mentImpair-
ment
Carryingvalue at
end of year
Rm Rm Rm Rm Rm Rm Rm Rm Rm Rm
2013
Property, plant and equipment 35,979 4,734 (85) – (22) (5,045) (177) 35,384 (11,025) 24,359
Intangible assets 3,418 905 85 – – (1,008) – 3,400 (975) 2,425
39,397 5,639 – – (22) (6,053) (177) 38,784 (12,000) 26,784
2012
Property, plant and equipment 36,861 3,967 (17) – (130) (4,556) (146) 35,979 – 35,979
Intangible assets 3,445 745 17 – – (700) (89) 3,418 – 3,418
40,306 4,712 – – (130) (5,256) (235) 39,397 – 39,397

176 Telkom Integrated Report 2013
13. PROPERTY, PLANT AND EQUIPMENT
2013 2012
Group Cost
Accumu-lated
depre-ciation
andwrite-
offs
Carryingvalue
beforeimpair-
mentImpair-
mentCarrying
value Cost
Accumu-
lated
depre-
ciation
and
write-
offs
Carrying
value
before
impair-
ment
Impair-
ment
Carrying
value
Rm Rm Rm Rm Rm Rm Rm Rm Rm Rm
Freehold land and buildings 6,404 (2,905) 3,499 (1,101) 2,398 5,898 (2,637) 3,261 (34) 3,227
Leasehold buildings 558 (445) 113 – 113 553 (424) 129 (2) 127
Network equipment 64,740 (37,071) 27,669 (9,158) 18,511 63,507 (34,508) 28,999 (175) 28,824
Support equipment 3,856 (2,768) 1,088 (356) 732 3,751 (2,628) 1,123 – 1,123
Furniture and office equipment 325 (264) 61 (19) 42 328 (251) 77 (4) 73
Data processing equipment and
software 5,271 (4,105) 1,166 (346) 820 5,440 (4,026) 1,414 (12) 1,402
Under construction 1,823 (11) 1,812 – 1,812 1,236 – 1,236 (41) 1,195
Other 561 (420) 141 (45) 96 755 (567) 188 (4) 184
83,538 (47,989) 35,549 (11,025) 24,524 81,468 (45,041) 36,427 (272) 36,155
Company Cost
Accumu-lated
depre-ciation
andwrite-
offs
Carryingvalue
beforeimpair-
mentImpair-
mentCarrying
value Cost
Accumu-
lated
depre-
ciation
and
write-
offs
Carrying
value
before
impair-
ment
Impair-
ment
Carrying
value
Rm Rm Rm Rm Rm Rm Rm Rm Rm Rm
Freehold land and buildings 6,404 (2,905) 3,499 (1,101) 2,398 5,898 (2,671) 3,227 – 3,227
Leasehold buildings 436 (323) 113 – 113 432 (306) 126 – 126
Network equipment 64,255 (36,770) 27,485 (9,158) 18,327 62,974 (34,344) 28,630 – 28,630
Support equipment 3,856 (2,768) 1,088 (356) 732 3,750 (2,628) 1,122 – 1,122
Furniture and office equipment 296 (242) 54 (18) 36 300 (230) 70 – 70
Data processing equipment and
software 5,075 (4,010) 1,065 (346) 719 5,255 (3,952) 1,303 – 1,303
Under construction 1,939 – 1,939 – 1,939 1,316 – 1,316 – 1,316
Other 551 (410) 141 (46) 95 746 (561) 185 – 185
82,812 (47,428) 35,384 (11,025) 24,359 80,671 (44,692) 35,979 – 35,979
The impairment loss of R12 billion was allocated to the asset categories of the cash-generating unit on a pro rata basis in line with the
requirements of IAS 36. R11,025 million of the impairment was processed to property, plant and equipment and R975 million to intangible
assets. The allocation basis will be reviewed and if necessary adjusted in future reporting periods.
Fully depreciated assets with a cost of R2,205 million (2012: R2,509 million) were derecognised in the 2013 financial year. This has reduced
both the cost price and accumulated depreciation of property, plant and equipment.
The Company Capital expenditure under property, plant and equipment relates to expansions of R2,255 million and maintenance of
R2,477 million (2012 expansions: R1,682 million and maintenance: R2,283 million).
Property, plant and equipment with a carrying value of R89 million (2012: R104 million) has been pledged as security. Details of the loans are
disclosed in note 28.
for the year ended 31 March 2013
NOTES TO THE CONSOLIDATED ANNUAL FINANCIAL
STATEMENTS

177 Telkom Integrated Report 2013
Operating environment Risk and responsibilityCreating value Leadership and strategic People and environment Financial statements
13. PROPERTY, PLANT AND EQUIPMENT (continued)
The carrying amounts of property, plant and equipment can be reconciled as follows:
Group
Carrying value at
beginningof year Additions* Transfers**
Foreigncurrency
trans-lation Disposals
Depre-ciation***
Write-offs
Carryingvalue
beforeimpair-
mentImpair-
ment***
Carryingvalue at
end of year
Rm Rm Rm Rm Rm Rm Rm Rm Rm Rm
2013
Freehold land and buildings 3,227 374 159 – (1) (252) (8) 3,499 (1,101) 2,398
Leasehold buildings 127 4 – – – (18) – 113 – 113
Network equipment 28,824 2,458 636 (4) (21) (4,069) (155) 27,669 (9,158) 18,511
Support equipment 1,123 137 68 – – (236) (4) 1,088 (356) 732
Furniture and office equipment 73 1 2 – – (15) – 61 (19) 42
Data processing equipment and
software 1,402 156 34 – – (418) (8) 1,166 (346) 820
Under construction 1,195 1,627 (1,004) (1) – – (5) 1,812 – 1,812
Other 184 20 (2) – – (64) 3 141 (45) 96
36,155 4,777 (107) (5) (22) (5,072) (177) 35,549 (11,025) 24,524
2012
Freehold land and buildings 3,181 197 124 – (3) (235) (3) 3,261 (34) 3,227
Leasehold buildings 133 – – – – (4) – 129 (2) 127
Network equipment 28,992 2,578 1,182 6 (127) (3,554) (78) 28,999 (175) 28,824
Support equipment 1,267 108 31 – – (293) 10 1,123 – 1,123
Furniture and office equipment 91 2 1 – – (17) – 77 (4) 73
Data processing equipment and
software 1,695 171 35 – – (442) (45) 1,414 (12) 1,402
Under construction 1,751 932 (1,418) 1 – – (30) 1,236 (41) 1,195
Other 194 34 28 – – (68) – 188 (4) 184
37,304 4,022 (17) 7 (130) (4,613) (146) 36,427 (272) 36,155
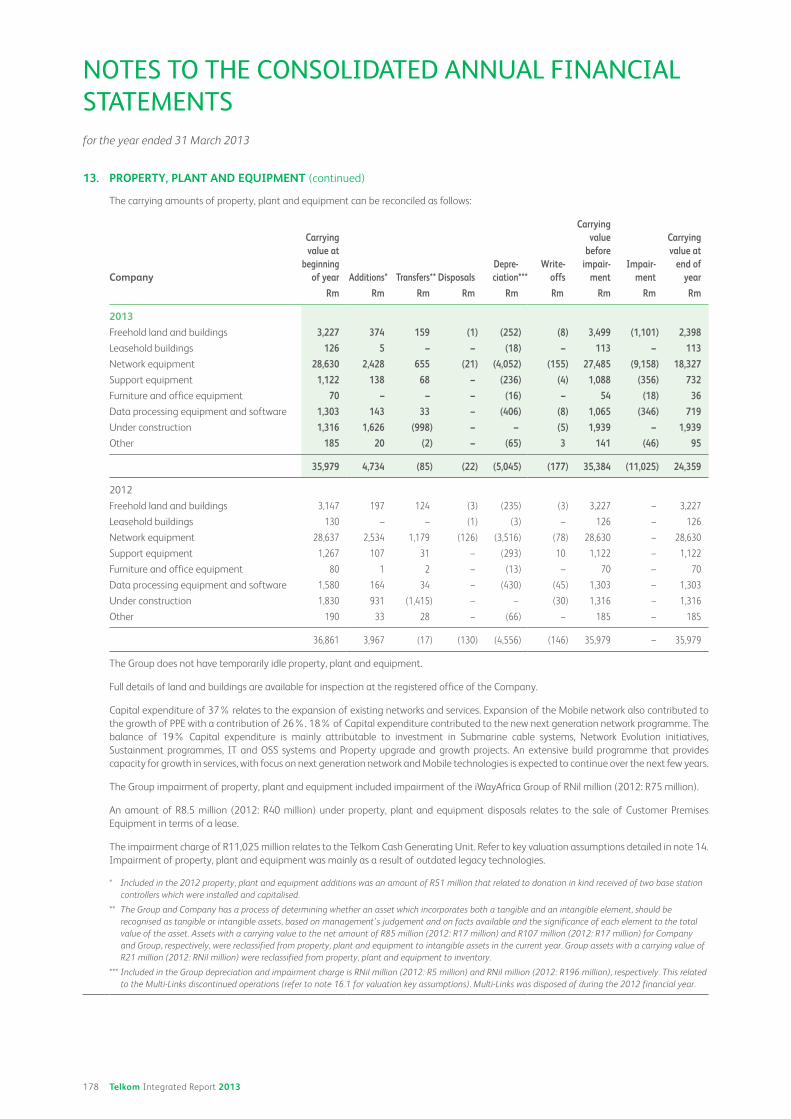
178 Telkom Integrated Report 2013
13. PROPERTY, PLANT AND EQUIPMENT (continued)
The carrying amounts of property, plant and equipment can be reconciled as follows:
Company
Carrying value at
beginningof year Additions* Transfers** Disposals
Depre-ciation***
Write-offs
Carryingvalue
beforeimpair-
mentImpair-
ment
Carryingvalue at
end of year
Rm Rm Rm Rm Rm Rm Rm Rm Rm
2013
Freehold land and buildings 3,227 374 159 (1) (252) (8) 3,499 (1,101) 2,398
Leasehold buildings 126 5 – – (18) – 113 – 113
Network equipment 28,630 2,428 655 (21) (4,052) (155) 27,485 (9,158) 18,327
Support equipment 1,122 138 68 – (236) (4) 1,088 (356) 732
Furniture and office equipment 70 – – – (16) – 54 (18) 36
Data processing equipment and software 1,303 143 33 – (406) (8) 1,065 (346) 719
Under construction 1,316 1,626 (998) – – (5) 1,939 – 1,939
Other 185 20 (2) – (65) 3 141 (46) 95
35,979 4,734 (85) (22) (5,045) (177) 35,384 (11,025) 24,359
2012
Freehold land and buildings 3,147 197 124 (3) (235) (3) 3,227 – 3,227
Leasehold buildings 130 – – (1) (3) – 126 – 126
Network equipment 28,637 2,534 1,179 (126) (3,516) (78) 28,630 – 28,630
Support equipment 1,267 107 31 – (293) 10 1,122 – 1,122
Furniture and office equipment 80 1 2 – (13) – 70 – 70
Data processing equipment and software 1,580 164 34 – (430) (45) 1,303 – 1,303
Under construction 1,830 931 (1,415) – – (30) 1,316 – 1,316
Other 190 33 28 – (66) – 185 – 185
36,861 3,967 (17) (130) (4,556) (146) 35,979 – 35,979
The Group does not have temporarily idle property, plant and equipment.
Full details of land and buildings are available for inspection at the registered office of the Company.
Capital expenditure of 37% relates to the expansion of existing networks and services. Expansion of the Mobile network also contributed to
the growth of PPE with a contribution of 26%. 18% of Capital expenditure contributed to the new next generation network programme. The
balance of 19% Capital expenditure is mainly attributable to investment in Submarine cable systems, Network Evolution initiatives,
Sustainment programmes, IT and OSS systems and Property upgrade and growth projects. An extensive build programme that provides
capacity for growth in services, with focus on next generation network and Mobile technologies is expected to continue over the next few years.
The Group impairment of property, plant and equipment included impairment of the iWayAfrica Group of RNil million (2012: R75 million).
An amount of R8.5 million (2012: R40 million) under property, plant and equipment disposals relates to the sale of Customer Premises
Equipment in terms of a lease.
The impairment charge of R11,025 million relates to the Telkom Cash Generating Unit. Refer to key valuation assumptions detailed in note 14.
Impairment of property, plant and equipment was mainly as a result of outdated legacy technologies.
* Included in the 2012 property, plant and equipment additions was an amount of R51 million that related to donation in kind received of two base station
controllers which were installed and capitalised.
** The Group and Company has a process of determining whether an asset which incorporates both a tangible and an intangible element, should be
recognised as tangible or intangible assets, based on management’s judgement and on facts available and the significance of each element to the total
value of the asset. Assets with a carrying value to the net amount of R85 million (2012: R17 million) and R107 million (2012: R17 million) for Company
and Group, respectively, were reclassified from property, plant and equipment to intangible assets in the current year. Group assets with a carrying value of
R21 million (2012: RNil million) were reclassified from property, plant and equipment to inventory.
*** Included in the Group depreciation and impairment charge is RNil million (2012: R5 million) and RNil million (2012: R196 million), respectively. This related
to the Multi-Links discontinued operations (refer to note 16.1 for valuation key assumptions). Multi-Links was disposed of during the 2012 financial year.
for the year ended 31 March 2013
NOTES TO THE CONSOLIDATED ANNUAL FINANCIAL
STATEMENTS
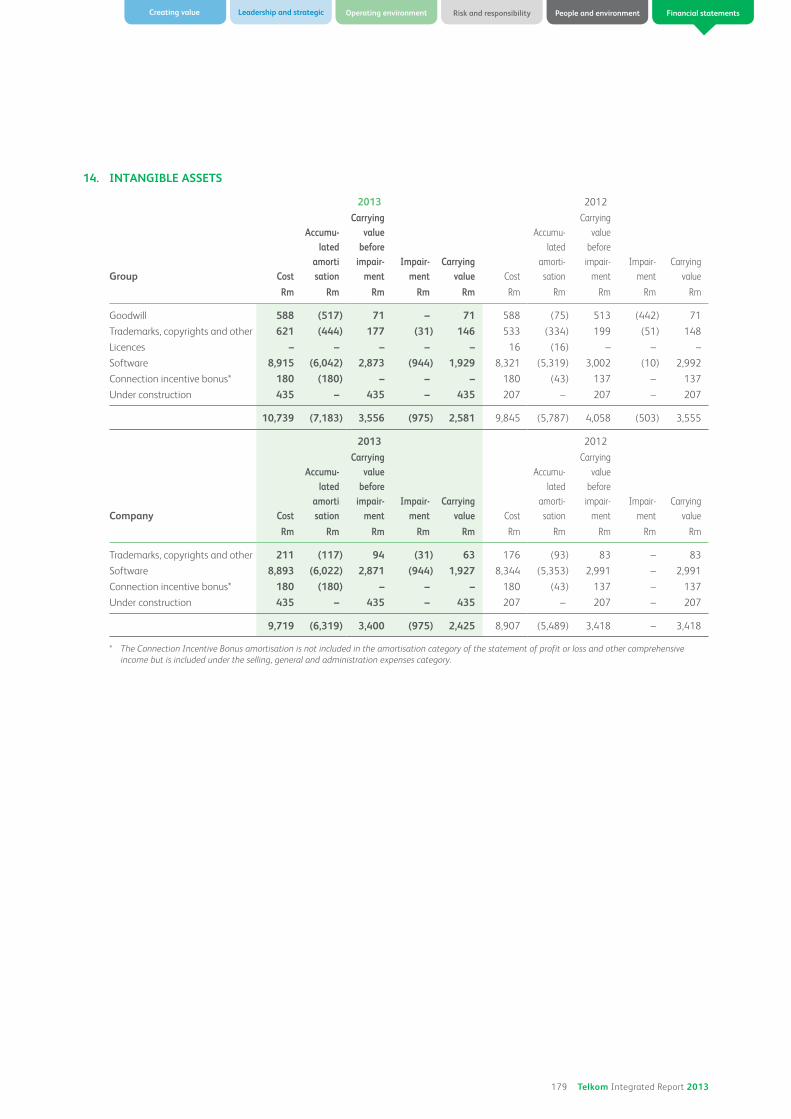
179 Telkom Integrated Report 2013
Operating environment Risk and responsibilityCreating value Leadership and strategic People and environment Financial statements
14. INTANGIBLE ASSETS
2013 2012
Group Cost
Accumu-lated
amortisation
Carryingvalue
beforeimpair-
mentImpair-
mentCarrying
value Cost
Accumu-
lated
amorti-
sation
Carrying
value
before
impair-
ment
Impair-
ment
Carrying
value
Rm Rm Rm Rm Rm Rm Rm Rm Rm Rm
Goodwill 588 (517) 71 – 71 588 (75) 513 (442) 71
Trademarks, copyrights and other 621 (444) 177 (31) 146 533 (334) 199 (51) 148
Licences – – – – – 16 (16) – – –
Software 8,915 (6,042) 2,873 (944) 1,929 8,321 (5,319) 3,002 (10) 2,992
Connection incentive bonus* 180 (180) – – – 180 (43) 137 – 137
Under construction 435 – 435 – 435 207 – 207 – 207
10,739 (7,183) 3,556 (975) 2,581 9,845 (5,787) 4,058 (503) 3,555
2013 2012
Company Cost
Accumu-lated
amortisation
Carryingvalue
beforeimpair-
mentImpair-
mentCarrying
value Cost
Accumu-
lated
amorti-
sation
Carrying
value
before
impair-
ment
Impair-
ment
Carrying
value
Rm Rm Rm Rm Rm Rm Rm Rm Rm Rm
Trademarks, copyrights and other 211 (117) 94 (31) 63 176 (93) 83 – 83
Software 8,893 (6,022) 2,871 (944) 1,927 8,344 (5,353) 2,991 – 2,991
Connection incentive bonus* 180 (180) – – – 180 (43) 137 – 137
Under construction 435 – 435 – 435 207 – 207 – 207
9,719 (6,319) 3,400 (975) 2,425 8,907 (5,489) 3,418 – 3,418
* The Connection Incentive Bonus amortisation is not included in the amortisation category of the statement of profit or loss and other comprehensive
income but is included under the selling, general and administration expenses category.
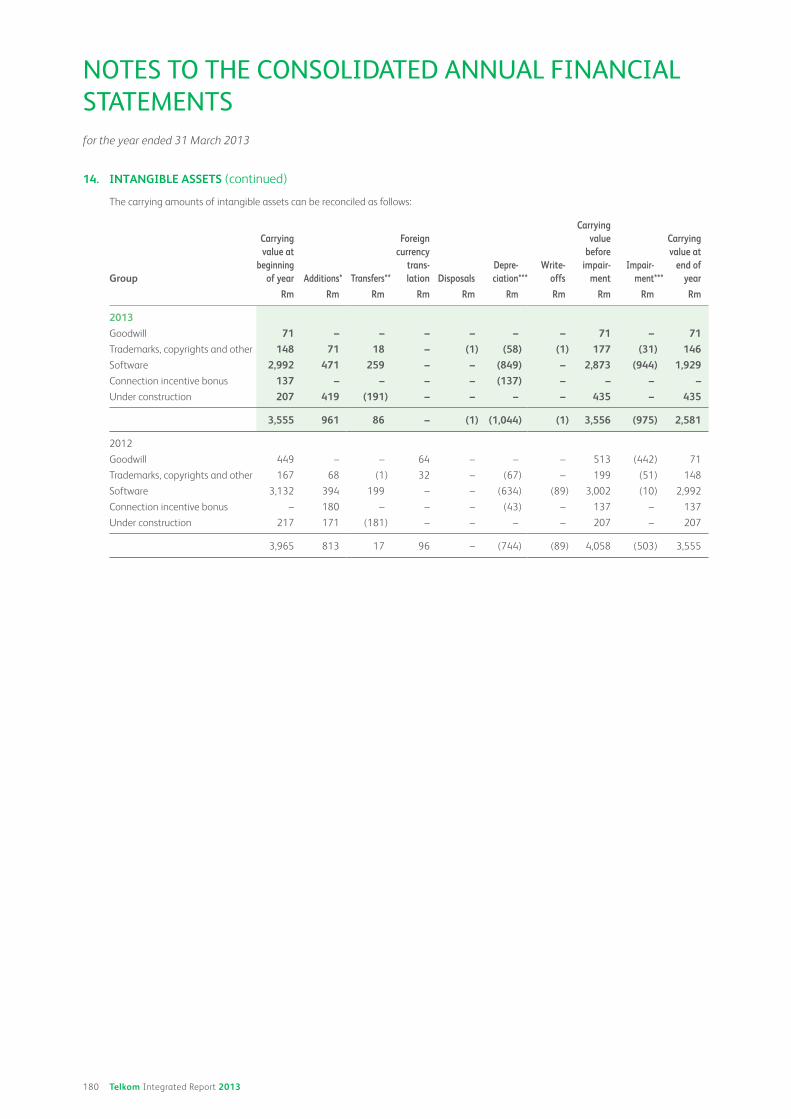
180 Telkom Integrated Report 2013
14. INTANGIBLE ASSETS (continued)
The carrying amounts of intangible assets can be reconciled as follows:
Group
Carrying value at
beginningof year Additions* Transfers**
Foreigncurrency
trans-lation Disposals
Depre-ciation***
Write-offs
Carryingvalue
beforeimpair-
mentImpair-
ment***
Carryingvalue at
end of year
Rm Rm Rm Rm Rm Rm Rm Rm Rm Rm
2013
Goodwill 71 – – – – – – 71 – 71
Trademarks, copyrights and other 148 71 18 – (1) (58) (1) 177 (31) 146
Software 2,992 471 259 – – (849) – 2,873 (944) 1,929
Connection incentive bonus 137 – – – – (137) – – – –
Under construction 207 419 (191) – – – – 435 – 435
3,555 961 86 – (1) (1,044) (1) 3,556 (975) 2,581
2012
Goodwill 449 – – 64 – – – 513 (442) 71
Trademarks, copyrights and other 167 68 (1) 32 – (67) – 199 (51) 148
Software 3,132 394 199 – – (634) (89) 3,002 (10) 2,992
Connection incentive bonus – 180 – – – (43) – 137 – 137
Under construction 217 171 (181) – – – – 207 – 207
3,965 813 17 96 – (744) (89) 4,058 (503) 3,555
for the year ended 31 March 2013
NOTES TO THE CONSOLIDATED ANNUAL FINANCIAL
STATEMENTS
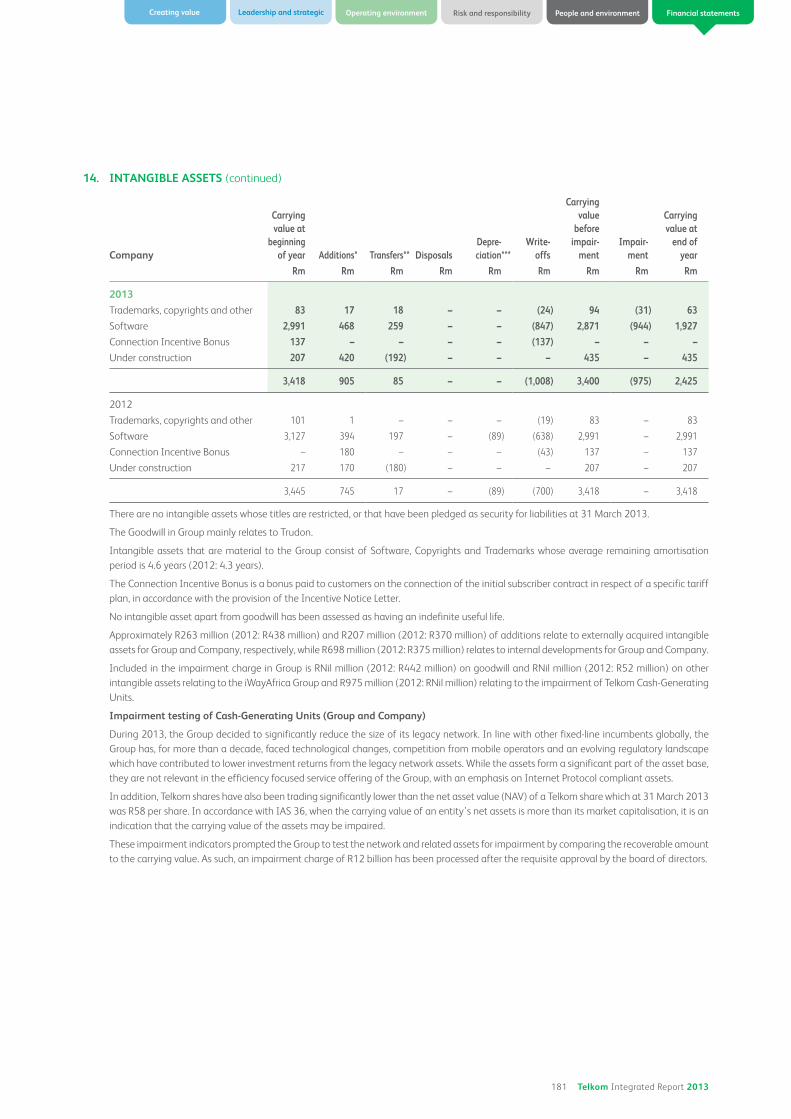
181 Telkom Integrated Report 2013
Operating environment Risk and responsibilityCreating value Leadership and strategic People and environment Financial statements
14. INTANGIBLE ASSETS (continued)
Company
Carrying value at
beginningof year Additions* Transfers** Disposals
Depre-ciation***
Write-offs
Carryingvalue
beforeimpair-
mentImpair-
ment
Carryingvalue at
end of year
Rm Rm Rm Rm Rm Rm Rm Rm Rm
2013
Trademarks, copyrights and other 83 17 18 – – (24) 94 (31) 63
Software 2,991 468 259 – – (847) 2,871 (944) 1,927
Connection Incentive Bonus 137 – – – – (137) – – –
Under construction 207 420 (192) – – – 435 – 435
3,418 905 85 – – (1,008) 3,400 (975) 2,425
2012
Trademarks, copyrights and other 101 1 – – – (19) 83 – 83
Software 3,127 394 197 – (89) (638) 2,991 – 2,991
Connection Incentive Bonus – 180 – – – (43) 137 – 137
Under construction 217 170 (180) – – – 207 – 207
3,445 745 17 – (89) (700) 3,418 – 3,418
There are no intangible assets whose titles are restricted, or that have been pledged as security for liabilities at 31 March 2013.
The Goodwill in Group mainly relates to Trudon.
Intangible assets that are material to the Group consist of Software, Copyrights and Trademarks whose average remaining amortisation
period is 4.6 years (2012: 4.3 years).
The Connection Incentive Bonus is a bonus paid to customers on the connection of the initial subscriber contract in respect of a specific tariff
plan, in accordance with the provision of the Incentive Notice Letter.
No intangible asset apart from goodwill has been assessed as having an indefinite useful life.
Approximately R263 million (2012: R438 million) and R207 million (2012: R370 million) of additions relate to externally acquired intangible
assets for Group and Company, respectively, while R698 million (2012: R375 million) relates to internal developments for Group and Company.
Included in the impairment charge in Group is RNil million (2012: R442 million) on goodwill and RNil million (2012: R52 million) on other
intangible assets relating to the iWayAfrica Group and R975 million (2012: RNil million) relating to the impairment of Telkom Cash-Generating
Units.
Impairment testing of Cash-Generating Units (Group and Company)
During 2013, the Group decided to significantly reduce the size of its legacy network. In line with other fixed-line incumbents globally, the
Group has, for more than a decade, faced technological changes, competition from mobile operators and an evolving regulatory landscape
which have contributed to lower investment returns from the legacy network assets. While the assets form a significant part of the asset base,
they are not relevant in the efficiency focused service offering of the Group, with an emphasis on Internet Protocol compliant assets.
In addition, Telkom shares have also been trading significantly lower than the net asset value (NAV) of a Telkom share which at 31 March 2013
was R58 per share. In accordance with IAS 36, when the carrying value of an entity’s net assets is more than its market capitalisation, it is an
indication that the carrying value of the assets may be impaired.
These impairment indicators prompted the Group to test the network and related assets for impairment by comparing the recoverable amount
to the carrying value. As such, an impairment charge of R12 billion has been processed after the requisite approval by the board of directors.
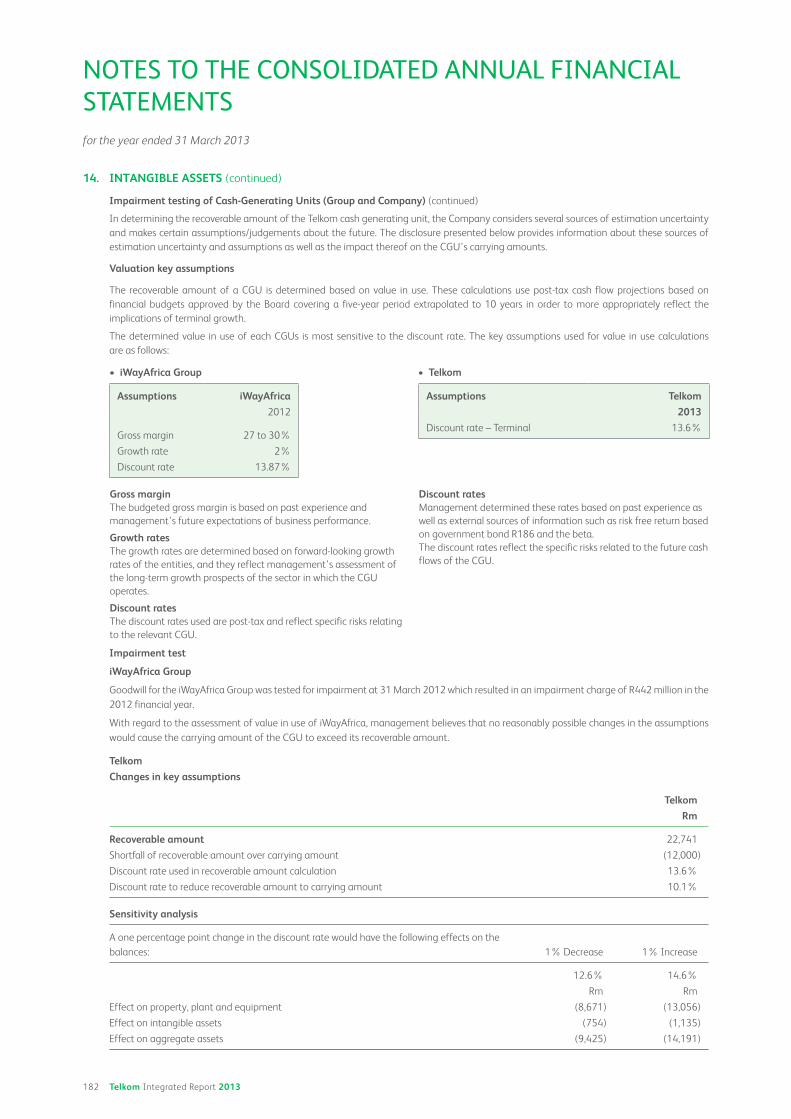
182 Telkom Integrated Report 2013
14. INTANGIBLE ASSETS (continued)
Impairment testing of Cash-Generating Units (Group and Company) (continued)
In determining the recoverable amount of the Telkom cash generating unit, the Company considers several sources of estimation uncertainty
and makes certain assumptions/judgements about the future. The disclosure presented below provides information about these sources of
estimation uncertainty and assumptions as well as the impact thereof on the CGU’s carrying amounts.
Valuation key assumptions
The recoverable amount of a CGU is determined based on value in use. These calculations use post-tax cash flow projections based on
financial budgets approved by the Board covering a five-year period extrapolated to 10 years in order to more appropriately reflect the
implications of terminal growth.
The determined value in use of each CGUs is most sensitive to the discount rate. The key assumptions used for value in use calculations
are as follows:
Assumptions iWayAfrica Assumptions Telkom
2012 2013
Gross margin 27 to 30%Discount rate – Terminal 13.6%
Growth rate 2%
Discount rate 13.87%
Gross marginThe budgeted gross margin is based on past experience and
management’s future expectations of business performance.
Growth ratesThe growth rates are determined based on forward-looking growth
rates of the entities, and they reflect management’s assessment of
the long-term growth prospects of the sector in which the CGU
operates.
Discount ratesThe discount rates used are post-tax and reflect specific risks relating
to the relevant CGU.
Discount ratesManagement determined these rates based on past experience as
well as external sources of information such as risk free return based
on government bond R186 and the beta.
The discount rates reflect the specific risks related to the future cash
flows of the CGU.
Impairment test
iWayAfrica Group
Goodwill for the iWayAfrica Group was tested for impairment at 31 March 2012 which resulted in an impairment charge of R442 million in the
2012 financial year.
With regard to the assessment of value in use of iWayAfrica, management believes that no reasonably possible changes in the assumptions
would cause the carrying amount of the CGU to exceed its recoverable amount.
Telkom
Changes in key assumptions
Telkom
Rm
Recoverable amount 22,741
Shortfall of recoverable amount over carrying amount (12,000)
Discount rate used in recoverable amount calculation 13.6%
Discount rate to reduce recoverable amount to carrying amount 10.1%
Sensitivity analysis
A one percentage point change in the discount rate would have the following effects on the
balances: 1% Decrease 1% Increase
12.6% 14.6%
Rm Rm
Effect on property, plant and equipment (8,671) (13,056)
Effect on intangible assets (754) (1,135)
Effect on aggregate assets (9,425) (14,191)
for the year ended 31 March 2013
NOTES TO THE CONSOLIDATED ANNUAL FINANCIAL
STATEMENTS

183 Telkom Integrated Report 2013
Operating environment Risk and responsibilityCreating value Leadership and strategic People and environment Financial statements
15. FINANCIAL INSTRUMENTS AND RISK MANAGEMENT
Financial risk management objectives and policies
The Group’s principal financial liabilities, other than derivatives, comprise interest-bearing debt and trade and other payables. The main
purpose of these financial liabilities is to raise finances for the Group’s operations. The Group has finance lease receivables, trade and other
receivables and cash and cash receivables and short-term deposits that arise directly from its operations. The Group also enters into derivative
transactions as hedging instruments.
The Group is exposed to market risk, credit risk and liquidity risk. The Group’s senior management oversees the management of these risks,
supported by a financial Risk Committee that advises on financial risks and the appropriate financial risk governance framework. The financial
Risk Committee provides assurance to the Group’s senior management that the Group’s financial risk-taking activities are governed by
appropriate policies and procedures and that financial risks are identified, measured and managed in accordance with Group policies and
Group risk appetite. All derivative activities for risk management purposes are carried out by specialist teams that have the appropriate skills,
experience and supervision.
Risk management
Exposure to continuously changing market conditions has made management of financial risk critical for the Group. Treasury policies, risk
limits and control procedures are continuously monitored by the board of directors through its Audit Committee and Risk Committee.
The Group holds or issues financial instruments to finance its operations, for the temporary investment of short-term funds and to
manage currency and interest rate risks. In addition, financial instruments for example trade receivables and payables arise directly from the
Group’s operations.
The Group finances its operations primarily by a mixture of issued share capital, retained earnings, long-term and short-term loans. The Group
uses derivative financial instruments to manage its exposure to market risks from changes in interest and foreign exchange rates. The
derivatives used for this purpose are principally interest rate swaps, cross-currency swaps and forward exchange contracts. The Group does not
speculate in derivative instruments.
The table below sets out the Group’s classification of financial assets and liabilities:
2013 Notes
At fair value
through profit
or loss held
for trading
Financial
liabilities at
amortised
cost
Held-to-
maturity
Loans and
receivables
Total
carrying
value Fair value
Rm Rm Rm Rm Rm Rm
Classes of financial instruments per
statement of financial position
Assets 2,727 – 1,980 8,004 12,711 12,711
Other investments* 16.2 2,490 – – – 2,490 2,490
Trade and other receivables** 21 – – – 5,267 5,267 5,267
Other financial assets 22 237 – 1,980 – 2,217 2,217
Forward exchange contracts 132 – – – 132 132
Cross-currency swaps 105 – – – 105 105
Repurchase agreements – – 1,980 – 1,980 1,980
Finance lease receivables 18 – – – 350 350 350
Cash and cash equivalents 23 – – – 2,387 2,387 2,387
Liabilities (66) (11,343) – – (11,409) (12,413)
Interest-bearing debt 28 – (6,657) – – (6,657) (7,661)
Trade and other payables 31 – (4,661) – – (4,661) (4,661)
Shareholders for dividend 36 – (22) – – (22) (22)
Other financial liabilities 22 (66) – – – (66) (66)
Interest rate swaps (51) – – – (51) (51)
Forward exchange contracts (15) – – – (15) (15)
Credit facilities utilised 23 – (3) – – (3) (3)
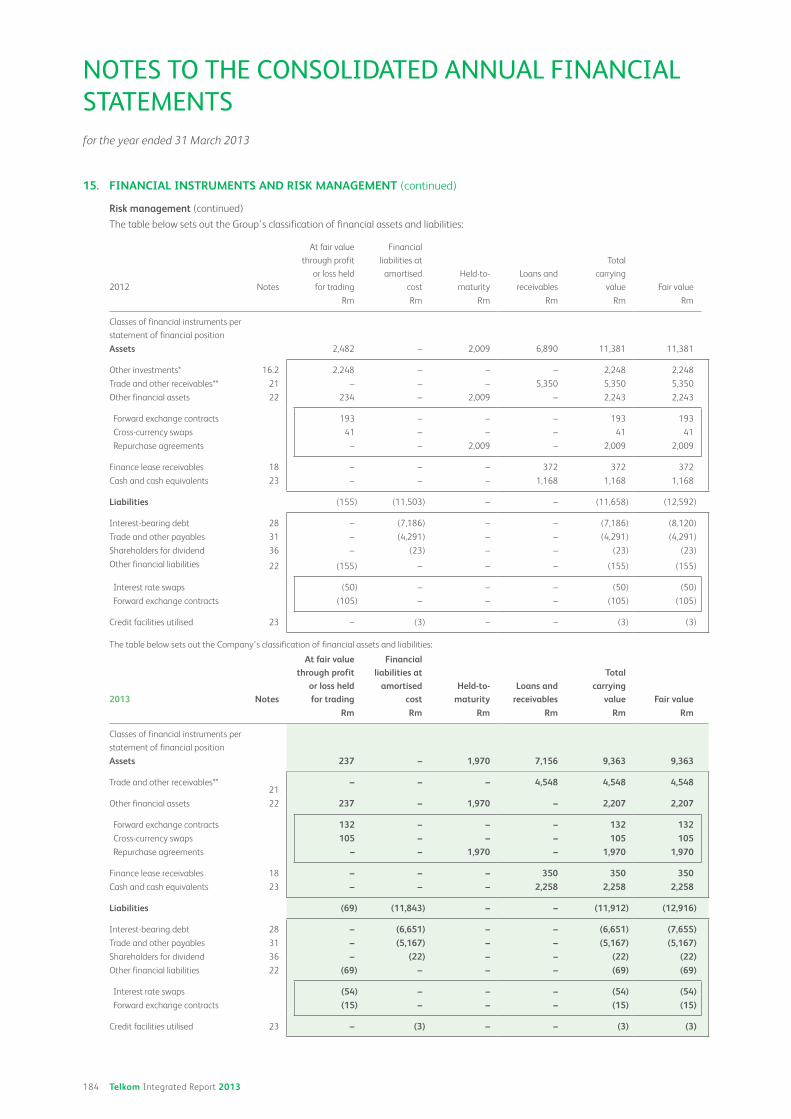
184 Telkom Integrated Report 2013
15. FINANCIAL INSTRUMENTS AND RISK MANAGEMENT (continued)
Risk management (continued)
The table below sets out the Group’s classification of financial assets and liabilities:
2012 Notes
At fair value
through profit
or loss held
for trading
Financial
liabilities at
amortised
cost
Held-to-
maturity
Loans and
receivables
Total
carrying
value Fair value
Rm Rm Rm Rm Rm Rm
Classes of financial instruments per
statement of financial position
Assets 2,482 – 2,009 6,890 11,381 11,381
Other investments* 16.2 2,248 – – – 2,248 2,248
Trade and other receivables** 21 – – – 5,350 5,350 5,350
Other financial assets 22 234 – 2,009 – 2,243 2,243
Forward exchange contracts 193 – – – 193 193
Cross-currency swaps 41 – – – 41 41
Repurchase agreements – – 2,009 – 2,009 2,009
Finance lease receivables 18 – – – 372 372 372
Cash and cash equivalents 23 – – – 1,168 1,168 1,168
Liabilities (155) (11,503) – – (11,658) (12,592)
Interest-bearing debt 28 – (7,186) – – (7,186) (8,120)
Trade and other payables 31 – (4,291) – – (4,291) (4,291)
Shareholders for dividend 36 – (23) – – (23) (23)
Other financial liabilities 22 (155) – – – (155) (155)
Interest rate swaps (50) – – – (50) (50)
Forward exchange contracts (105) – – – (105) (105)
Credit facilities utilised 23 – (3) – – (3) (3)
The table below sets out the Company’s classification of financial assets and liabilities:
2013 Notes
At fair value
through profit
or loss held
for trading
Financial
liabilities at
amortised
cost
Held-to-
maturity
Loans and
receivables
Total
carrying
value Fair value
Rm Rm Rm Rm Rm Rm
Classes of financial instruments per
statement of financial position
Assets 237 – 1,970 7,156 9,363 9,363
Trade and other receivables**21
– – – 4,548 4,548 4,548
Other financial assets 22 237 – 1,970 – 2,207 2,207
Forward exchange contracts 132 – – – 132 132
Cross-currency swaps 105 – – – 105 105
Repurchase agreements – – 1,970 – 1,970 1,970
Finance lease receivables 18 – – – 350 350 350
Cash and cash equivalents 23 – – – 2,258 2,258 2,258
Liabilities (69) (11,843) – – (11,912) (12,916)
Interest-bearing debt 28 – (6,651) – – (6,651) (7,655)
Trade and other payables 31 – (5,167) – – (5,167) (5,167)
Shareholders for dividend 36 – (22) – – (22) (22)
Other financial liabilities 22 (69) – – – (69) (69)
Interest rate swaps (54) – – – (54) (54)
Forward exchange contracts (15) – – – (15) (15)
Credit facilities utilised 23 – (3) – – (3) (3)
for the year ended 31 March 2013
NOTES TO THE CONSOLIDATED ANNUAL FINANCIAL
STATEMENTS
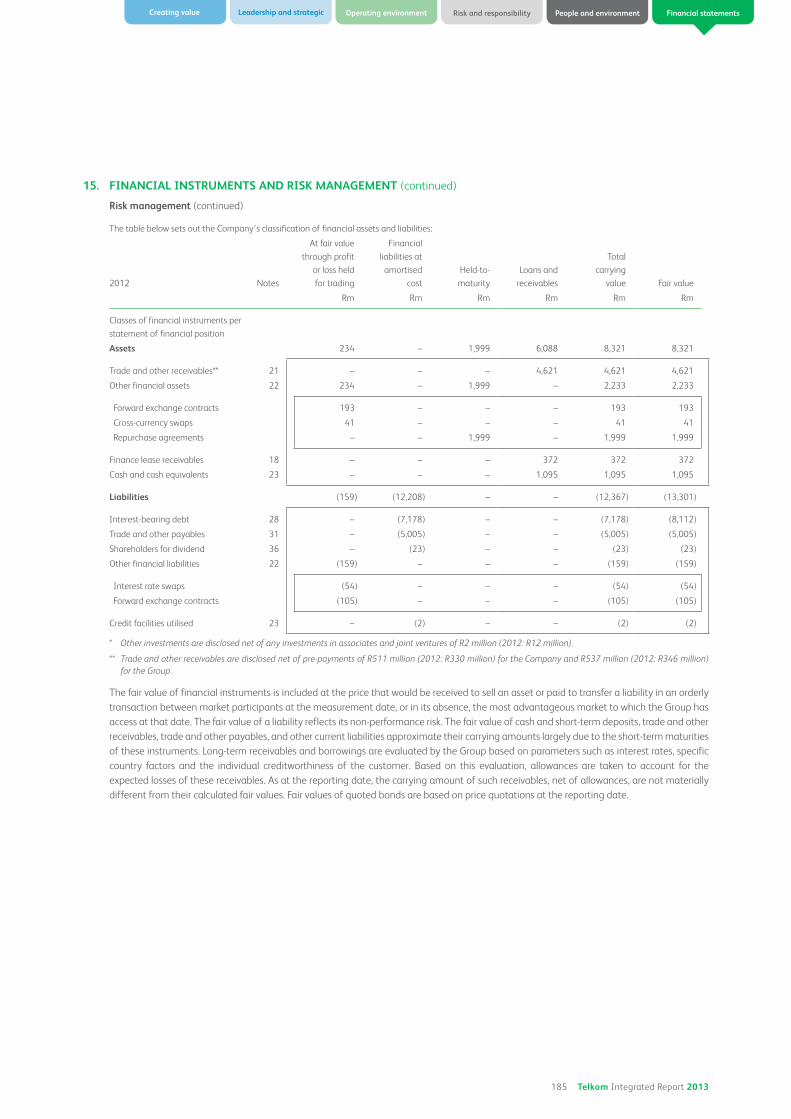
185 Telkom Integrated Report 2013
Operating environment Risk and responsibilityCreating value Leadership and strategic People and environment Financial statements
15. FINANCIAL INSTRUMENTS AND RISK MANAGEMENT (continued)
Risk management (continued)
The table below sets out the Company’s classification of financial assets and liabilities:
2012 Notes
At fair value
through profit
or loss held
for trading
Financial
liabilities at
amortised
cost
Held-to-
maturity
Loans and
receivables
Total
carrying
value Fair value
Rm Rm Rm Rm Rm Rm
Classes of financial instruments per
statement of financial position
Assets 234 – 1,999 6,088 8,321 8,321
Trade and other receivables** 21 – – – 4,621 4,621 4,621
Other financial assets 22 234 – 1,999 – 2,233 2,233
Forward exchange contracts 193 – – – 193 193
Cross-currency swaps 41 – – – 41 41
Repurchase agreements – – 1,999 – 1,999 1,999
Finance lease receivables 18 – – – 372 372 372
Cash and cash equivalents 23 – – – 1,095 1,095 1,095
Liabilities (159) (12,208) – – (12,367) (13,301)
Interest-bearing debt 28 – (7,178) – – (7,178) (8,112)
Trade and other payables 31 – (5,005) – – (5,005) (5,005)
Shareholders for dividend 36 – (23) – – (23) (23)
Other financial liabilities 22 (159) – – – (159) (159)
Interest rate swaps (54) – – – (54) (54)
Forward exchange contracts (105) – – – (105) (105)
Credit facilities utilised 23 – (2) – – (2) (2)
* Other investments are disclosed net of any investments in associates and joint ventures of R2 million (2012: R12 million).
** Trade and other receivables are disclosed net of pre-payments of R511 million (2012: R330 million) for the Company and R537 million (2012: R346 million)
for the Group.
The fair value of financial instruments is included at the price that would be received to sell an asset or paid to transfer a liability in an orderly
transaction between market participants at the measurement date, or in its absence, the most advantageous market to which the Group has
access at that date. The fair value of a liability reflects its non-performance risk. The fair value of cash and short-term deposits, trade and other
receivables, trade and other payables, and other current liabilities approximate their carrying amounts largely due to the short-term maturities
of these instruments. Long-term receivables and borrowings are evaluated by the Group based on parameters such as interest rates, specific
country factors and the individual creditworthiness of the customer. Based on this evaluation, allowances are taken to account for the
expected losses of these receivables. As at the reporting date, the carrying amount of such receivables, net of allowances, are not materially
different from their calculated fair values. Fair values of quoted bonds are based on price quotations at the reporting date.

186 Telkom Integrated Report 2013
15. FINANCIAL INSTRUMENTS AND RISK MANAGEMENT (continued)
15.1 Fair value of financial instruments
Valuation techniques and assumptions applied for the purposes of measuring fair value
The carrying amount of financial instruments approximates fair value, with the exception of interest-bearing debt which is at
amortised cost.
The fair value of financial assets and financial liabilities that are traded in active markets are based on quoted market prices or dealer
price quotations. Listed investments, Cell Captive’s absolute portfolios and some borrowings are traded in active markets. For all other
financial instruments the Group determines fair values using other valuation techniques as outlined below. The value is not necessarily
indicative of the amounts that the Group could realise in the normal course of business.
Type of financial instrumentFair value at
31 March 2013 Valuation technique Significant inputs
Receivables, bank balances, repurchase
agreements, and other liquid funds, payables
and accruals, credit facilities utilised and
shareholders for dividends
R7,788 million Undiscounted future estimated
cash flows due to short-term
maturities of these instruments
Probability of default
Derivatives R171 million Discounted cash flows Yield curves
Market interest rate
Market foreign exchange rate
Borrowings R7,661 million Discounted cash flows Market interest rate
Fair value hierarchy
The following table presents the Group’s assets and liabilities that are measured at fair value at reporting date. The different levels
have been defined as follows:
*Level 1: Quoted prices in active markets for identical assets or liabilities.
*Level 2: Inputs other than quoted prices, that are observable for the asset or liability.
Level 3: Inputs for the asset or liability that are not based on observable market data.
Group Total Level 1 Level 2 Level 3
2013 Rm Rm Rm Rm
Assets measured at fair value
Cross-currency swaps 105 – 105 –
Forward exchange contracts 132 – 132 –
Investment in Cell Captive 2,490 589 1,901 –
Transfer to level 1* – 1,901 (1,901) –
Liabilities measured at fair value
Interest rate swaps (51) – (51) –
Forward exchange contracts (15) – (15) –
Liabilities measured at amortised cost
Interest-bearing debt (7,661) (3,882) (3,779) –
2012
Assets measured at fair value
Cross-currency swaps 41 – 41 –
Forward exchange contracts 193 – 193 –
Investment in Cell Captive 2,248 518 1,730 –
Liabilities measured at fair value
Interest rate swaps (50) – (50) –
Forward exchange contracts (105) – (105) –
Liabilities measured at amortised cost
Interest-bearing debt (8,120) (4,545) (3,575) –
for the year ended 31 March 2013
NOTES TO THE CONSOLIDATED ANNUAL FINANCIAL
STATEMENTS
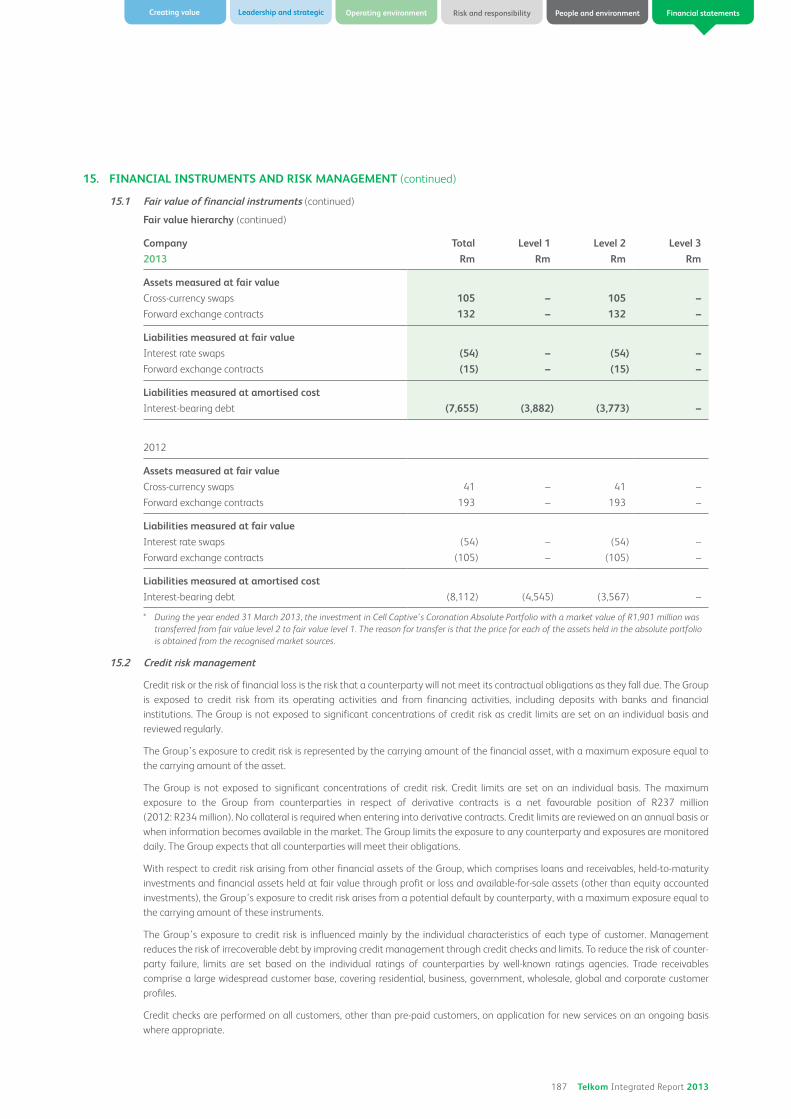
187 Telkom Integrated Report 2013
Operating environment Risk and responsibilityCreating value Leadership and strategic People and environment Financial statements
15. FINANCIAL INSTRUMENTS AND RISK MANAGEMENT (continued)
15.1 Fair value of financial instruments (continued)
Fair value hierarchy (continued)
Company Total Level 1 Level 2 Level 3
2013 Rm Rm Rm Rm
Assets measured at fair value
Cross-currency swaps 105 – 105 –
Forward exchange contracts 132 – 132 –
Liabilities measured at fair value
Interest rate swaps (54) – (54) –
Forward exchange contracts (15) – (15) –
Liabilities measured at amortised cost
Interest-bearing debt (7,655) (3,882) (3,773) –
2012
Assets measured at fair value
Cross-currency swaps 41 – 41 –
Forward exchange contracts 193 – 193 –
Liabilities measured at fair value
Interest rate swaps (54) – (54) –
Forward exchange contracts (105) – (105) –
Liabilities measured at amortised cost
Interest-bearing debt (8,112) (4,545) (3,567) –
* During the year ended 31 March 2013, the investment in Cell Captive’s Coronation Absolute Portfolio with a market value of R1,901 million was
transferred from fair value level 2 to fair value level 1. The reason for transfer is that the price for each of the assets held in the absolute portfolio
is obtained from the recognised market sources.
15.2 Credit risk management
Credit risk or the risk of financial loss is the risk that a counterparty will not meet its contractual obligations as they fall due. The Group
is exposed to credit risk from its operating activities and from financing activities, including deposits with banks and financial
institutions. The Group is not exposed to significant concentrations of credit risk as credit limits are set on an individual basis and
reviewed regularly.
The Group’s exposure to credit risk is represented by the carrying amount of the financial asset, with a maximum exposure equal to
the carrying amount of the asset.
The Group is not exposed to significant concentrations of credit risk. Credit limits are set on an individual basis. The maximum
exposure to the Group from counterparties in respect of derivative contracts is a net favourable position of R237 million
(2012: R234 million). No collateral is required when entering into derivative contracts. Credit limits are reviewed on an annual basis or
when information becomes available in the market. The Group limits the exposure to any counterparty and exposures are monitored
daily. The Group expects that all counterparties will meet their obligations.
With respect to credit risk arising from other financial assets of the Group, which comprises loans and receivables, held-to-maturity
investments and financial assets held at fair value through profit or loss and available-for-sale assets (other than equity accounted
investments), the Group’s exposure to credit risk arises from a potential default by counterparty, with a maximum exposure equal to
the carrying amount of these instruments.
The Group’s exposure to credit risk is influenced mainly by the individual characteristics of each type of customer. Management
reduces the risk of irrecoverable debt by improving credit management through credit checks and limits. To reduce the risk of counter-
party failure, limits are set based on the individual ratings of counterparties by well-known ratings agencies. Trade receivables
comprise a large widespread customer base, covering residential, business, government, wholesale, global and corporate customer
profiles.
Credit checks are performed on all customers, other than pre-paid customers, on application for new services on an ongoing basis
where appropriate.

188 Telkom Integrated Report 2013
15. FINANCIAL INSTRUMENTS AND RISK MANAGEMENT (continued)
15.2 Credit risk management (continued)
The Group establishes an allowance for impairment that represents its estimate of incurred losses in respect of trade and other
receivables. The collective loss allowance is determined based on historical data of payment statistics for similar financial assets as well
as expected future cash flows – refer to note 21.
Given the deterioration of credit markets, stricter objectives, polices and processes were applied for managing and measuring the risk
than in the previous period.
Credit risk from balances with banks and financial institutions is managed by the Group’s treasury department in accordance with the
Group’s policy. Investments of surplus funds are made only with approved counterparties and within credit limits assigned to each
counterparty. Counterparty credit limits are reviewed by the Group’s board of directors annually or when the need arises. The limits
are set to minimise the concentration of risks and therefore mitigate financial loss through potential counterparty failure. The
Company policy is in line with the Group policy.
The maximum exposure to credit risk for financial assets at the reporting date by type of instrument and counterparty was:
Group – Carrying amount Company – Carrying amount
2013 2012 2013 2012
Rm Rm Rm Rm
Trade receivables (refer to note 21)
Telkom SA 4,166 4,344 3,853 3,966
Business and residential 1,573 1,587 1,609 1,622
Global, corporate and wholesale 1,968 2,026 2,013 2,070
Government 393 629 402 643
Other customers 232 102 237 104
Impairment of Company trade
receivables (refer to note 21) – – (408) (473)
International 140 99 – –
South Africa 779 784 – –
Impairment of Group trade receivables
(refer to note 21) (548) (583) – –
Sub-total for trade receivables 4,537 4,644 3,853 3,966
Other receivables* 730 706 695 655
Derivatives 237 234 237 234
Investments and loans receivable** 2,490 2,248 – –
Finance lease receivables 350 372 350 372
Cash 2,384 1,168 2,255 1,093
10,728 9,372 7,390 6,320
* Other receivables for Group are disclosed net
of pre-payments of R537 million (2012:
R346 million) and Company of R511 million
(2012: R330 million).
** Investments are disclosed net of equity
investments of R2 million (2012: R12 million).
The ageing of trade receivables at the
reporting date was:
Not past due/current 3,551 3,749 2,982 3,221
Past due but not impaired
21 to 60 days 535 590 510 548
61 to 90 days 88 153 72 131
91 to 120 days 93 146 77 97
120+ days 818 589 620 442
5,085 5,227 4,261 4,439
for the year ended 31 March 2013
NOTES TO THE CONSOLIDATED ANNUAL FINANCIAL
STATEMENTS
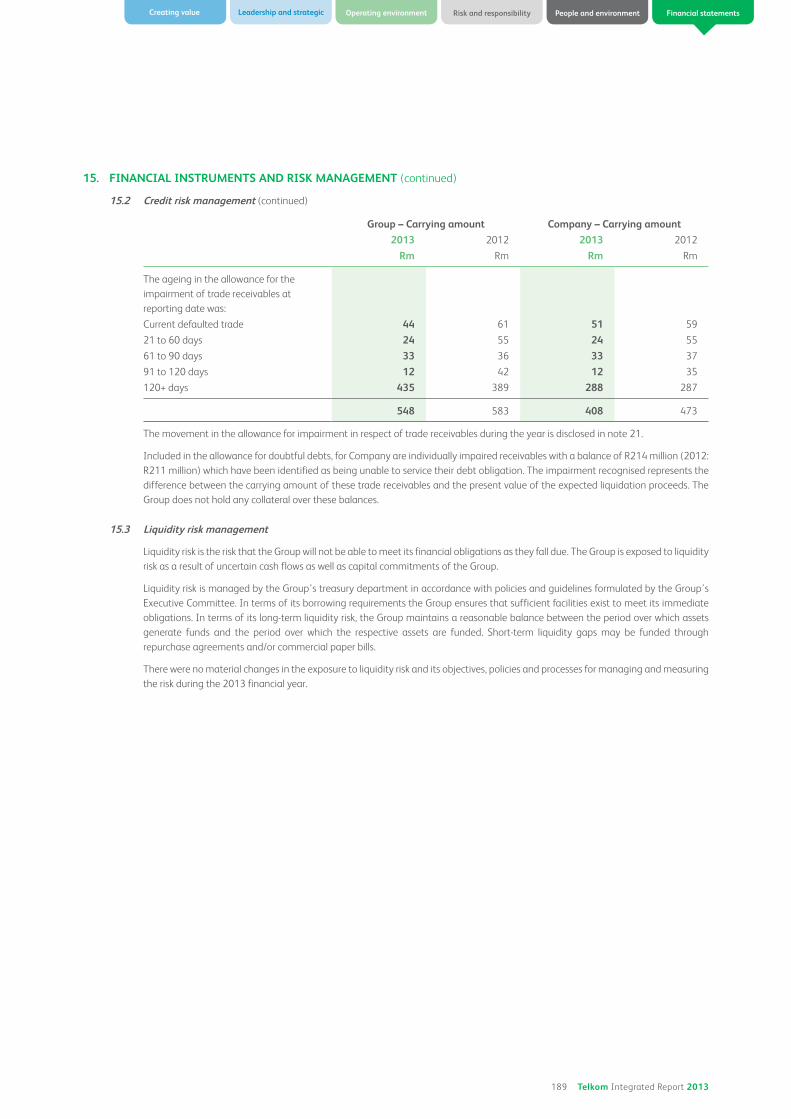
189 Telkom Integrated Report 2013
Operating environment Risk and responsibilityCreating value Leadership and strategic People and environment Financial statements
15. FINANCIAL INSTRUMENTS AND RISK MANAGEMENT (continued)
15.2 Credit risk management (continued)
Group – Carrying amount Company – Carrying amount
2013 2012 2013 2012
Rm Rm Rm Rm
The ageing in the allowance for the
impairment of trade receivables at
reporting date was:
Current defaulted trade 44 61 51 59
21 to 60 days 24 55 24 55
61 to 90 days 33 36 33 37
91 to 120 days 12 42 12 35
120+ days 435 389 288 287
548 583 408 473
The movement in the allowance for impairment in respect of trade receivables during the year is disclosed in note 21.
Included in the allowance for doubtful debts, for Company are individually impaired receivables with a balance of R214 million (2012:
R211 million) which have been identified as being unable to service their debt obligation. The impairment recognised represents the
difference between the carrying amount of these trade receivables and the present value of the expected liquidation proceeds. The
Group does not hold any collateral over these balances.
15.3 Liquidity risk management
Liquidity risk is the risk that the Group will not be able to meet its financial obligations as they fall due. The Group is exposed to liquidity
risk as a result of uncertain cash flows as well as capital commitments of the Group.
Liquidity risk is managed by the Group’s treasury department in accordance with policies and guidelines formulated by the Group’s
Executive Committee. In terms of its borrowing requirements the Group ensures that sufficient facilities exist to meet its immediate
obligations. In terms of its long-term liquidity risk, the Group maintains a reasonable balance between the period over which assets
generate funds and the period over which the respective assets are funded. Short-term liquidity gaps may be funded through
repurchase agreements and/or commercial paper bills.
There were no material changes in the exposure to liquidity risk and its objectives, policies and processes for managing and measuring
the risk during the 2013 financial year.
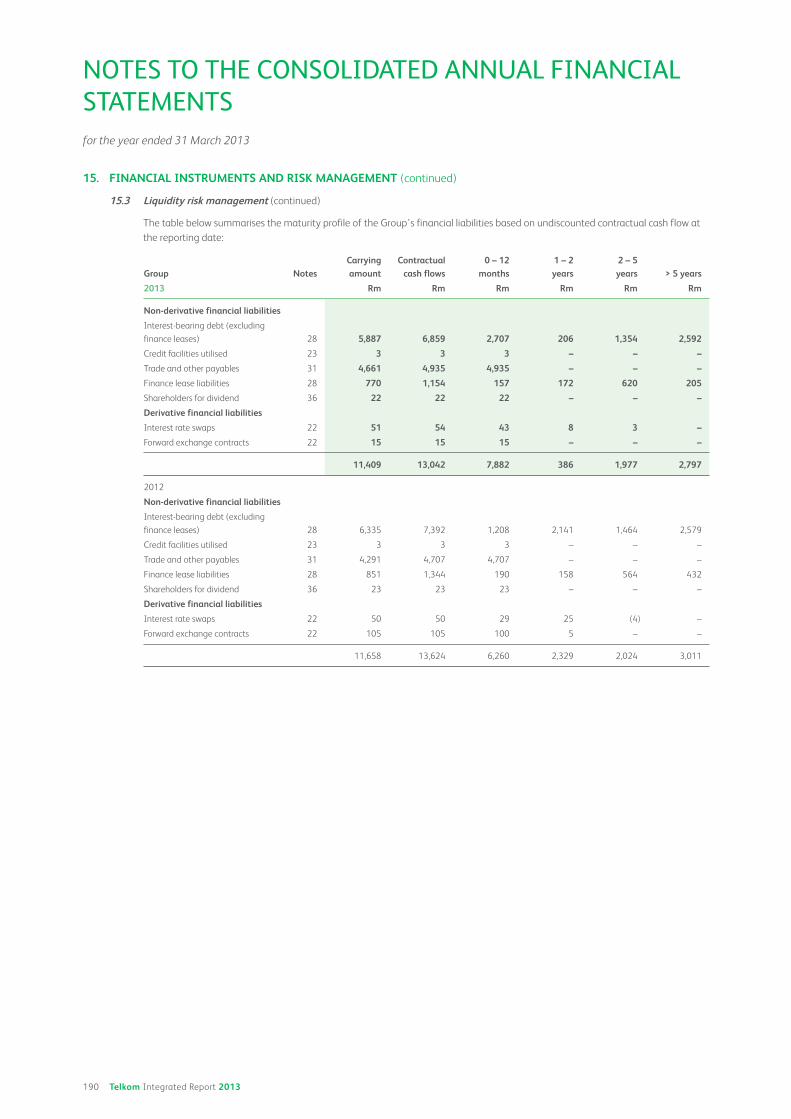
190 Telkom Integrated Report 2013
15. FINANCIAL INSTRUMENTS AND RISK MANAGEMENT (continued)
15.3 Liquidity risk management (continued)
The table below summarises the maturity profile of the Group’s financial liabilities based on undiscounted contractual cash flow at
the reporting date:
Group Notes
Carrying
amount
Contractual
cash flows
0 – 12
months
1 – 2
years
2 – 5
years > 5 years
2013 Rm Rm Rm Rm Rm Rm
Non-derivative financial liabilities
Interest-bearing debt (excluding
finance leases) 28 5,887 6,859 2,707 206 1,354 2,592
Credit facilities utilised 23 3 3 3 – – –
Trade and other payables 31 4,661 4,935 4,935 – – –
Finance lease liabilities 28 770 1,154 157 172 620 205
Shareholders for dividend 36 22 22 22 – – –
Derivative financial liabilities
Interest rate swaps 22 51 54 43 8 3 –
Forward exchange contracts 22 15 15 15 – – –
11,409 13,042 7,882 386 1,977 2,797
2012
Non-derivative financial liabilities
Interest-bearing debt (excluding
finance leases) 28 6,335 7,392 1,208 2,141 1,464 2,579
Credit facilities utilised 23 3 3 3 – – –
Trade and other payables 31 4,291 4,707 4,707 – – –
Finance lease liabilities 28 851 1,344 190 158 564 432
Shareholders for dividend 36 23 23 23 – – –
Derivative financial liabilities
Interest rate swaps 22 50 50 29 25 (4) –
Forward exchange contracts 22 105 105 100 5 – –
11,658 13,624 6,260 2,329 2,024 3,011
for the year ended 31 March 2013
NOTES TO THE CONSOLIDATED ANNUAL FINANCIAL
STATEMENTS

191 Telkom Integrated Report 2013
Operating environment Risk and responsibilityCreating value Leadership and strategic People and environment Financial statements
15. FINANCIAL INSTRUMENTS AND RISK MANAGEMENT (continued)
15.3 Liquidity risk management (continued)
The table below summarises the maturity profile of the Company’s financial liabilities based on undiscounted contractual cash flow
at the reporting date:
Company Notes
Carrying
amount
Contractual
cash flows
0 – 12
months
1 – 2
years
2 – 5
years > 5 years
2013 Rm Rm Rm Rm Rm Rm
Non-derivative financial liabilities
Interest -bearing debt (excluding
finance leases) 28 5,885 6,857 2,707 206 1,354 2,590
Credit facilities utilised 23 3 3 3 – – –
Trade and other payables 31 5,167 5,441 5,441 – – –
Finance lease liabilities 28 766 1,150 155 170 620 205
Shareholders for dividend 36 22 22 22 – – –
Derivative financial liabilities
Interest rate swaps 22 54 57 43 8 6 –
Forward exchange contracts 22 15 15 15 – – –
11,912 13,545 8,386 384 1,980 2,795
2012
Non-derivative financial liabilities
Interest-bearing debt (excluding
finance leases) 28 6,332 7,390 1,208 2,141 1,463 2,578
Credit facilities utilised 23 2 2 2 – – –
Trade and other payables 31 5,005 5,422 5,422 – – –
Finance lease liabilities 28 845 1,337 187 155 564 431
Shareholders for dividend 36 23 23 23 – – –
Derivative financial liabilities
Interest rate swaps 22 54 54 33 25 (4) –
Forward exchange contracts 22 105 105 100 5 – –
12,366 14,333 6,975 2,326 2,023 3,009
15.4 Market risk
Market risk is the risk that the fair value of future cash flows of a financial instrument will fluctuate because of changes in market prices.
The objective of market risk management is to manage and control market risk exposure. Market prices comprise three types of risk:
interest rate risk, currency risk, commodity price risk and other price risk, such as equity risk. Financial instruments affected by market
risk include loans and borrowings, deposits, available-for-sale investments, and derivative financial instruments.
Changes in the market prices have an impact on the values of the underlying derivatives and an analysis has been prepared on the
basis of changes in one variable and all other variables remaining constant.
Interest rate risk management
Interest rate risk is the risk that the fair value or future cash flows of a financial instrument will fluctuate because of changes in market
interest rates. Interest rate risk arises from the repricing of the Group’s forward cover and floating rate debt.
The Group’s policy is to manage interest cost through the utilisation of a mix of fixed and floating rate debt. In order to manage this
mix in a cost efficient manner and to hedge specific exposure in the interest rate repricing profile of the existing borrowings, the Group
makes use of interest rate swaps. Fixed rate debt represents approximately 83.3% (2012: 88%) of the total debt. The debt profile of
mainly fixed rate debt has been maintained to limit the Group’s exposure to interest rate increases.
The guideline is to target a fixed/floating debt ratio of 65% fixed, but adjusted to market conditions. In a scenario of low interest rates,
a higher ratio may be established.

192 Telkom Integrated Report 2013
15. FINANCIAL INSTRUMENTS AND RISK MANAGEMENT (continued)
15.4 Market risk (continued)
Interest rate risk management (continued)
The table below summarises the interest rate swaps outstanding as at the reporting date:
Group Company
Average maturity
Notional amount
Rm
Average maturity
Notional amount
Rm
2013
Interest rate swaps outstanding
Pay fixed and receive floating 0 to 4 years 1,750 0 to 4 years 1,750
2012
Interest rate swaps outstanding
Pay fixed 1 to 5 years 1,750 1 to 5 years 1,750
Pay fixed and receive floating
The floating rate is based on the three-month JIBAR, and is settled in arrears. The interest rate swaps are used to manage interest rate
risk on debt instruments.
Foreign currency exchange rate risk management
Foreign currency risk is the risk that the fair value of future cash flows of a financial instrument will fluctuate because of changes in
exchange rates. The Group manages its foreign currency exchange rate risk by economically hedging all identifiable exposures via
various financial instruments suitable to the Group’s risk exposure.
The Group enters into forward exchange contracts and cross-currency swaps to hedge foreign currency exposure on the Group’s
operations and liabilities.
There were no changes in the objectives, policies and processes for managing and measuring the risk from the previous period.
The following table details the forward exchange contracts and cross-currency swaps outstanding at the reporting date:
Group Company
Purchased
Foreign contract value
MilForward value
Rm
Foreign contract value
MilForward value
Rm
2013
Currency:
USD 280 2,504 280 2,504
Euro 25 298 25 298
Other 5 73 5 73
2,875 2,875
Cross-currency swaps
USD 46 322 46 322
2012
Currency:
USD 275 2,185 269 2,179
Euro 40 434 40 434
Other 5 57 5 57
2,676 2,670
Cross-currency swaps
USD 67 466 67 466
for the year ended 31 March 2013
NOTES TO THE CONSOLIDATED ANNUAL FINANCIAL
STATEMENTS

193 Telkom Integrated Report 2013
Operating environment Risk and responsibilityCreating value Leadership and strategic People and environment Financial statements
Group Company
Sell
Foreign contract value
MilForward value
Rm
Foreign contract value
MilForward value
Rm
2013
Currency:
USD 21 186 21 186
Euro 12 142 12 142
Other 3 37 3 37
365 365
2012
Currency:
USD 161 1,441 161 1,441
Euro 3 33 3 33
Other 1 16 1 16
1,490 1,490
The Group has various monetary assets and liabilities in currencies other than the Group’s functional currency. The following table
represents the net currency exposure (net carrying amount of foreign denominated monetary assets and liabilities) of the Group
according to the different foreign currencies:
Group Company
Euro
United States Dollar Other Euro
United States Dollar Other
Rm Rm Rm Rm Rm Rm
2013
Net foreign currency monetary assets/(liabilities)
Functional currency of company operation
South African Rand (110) (410) (14) (110) (410) (14)
2012
Net foreign currency monetary assets/(liabilities)
Functional currency of company operation
South African Rand 294 514 (1) 294 514 (1)
Sensitivity analysis
Interest rate and foreign currency risk
An interest rate sensitivity analysis is based on an increase or decrease of 1% (100 basis points) in market interest rates and the
prevailing information as at the reporting date.
The analysis assumes that all other variables remain constant. The analysis and changes in interest rates is performed on the same
basis as was used in prior years.
If interest rates had been 100 basis points higher/lower and all other variables were held constant, the Group’s and Company’s profit
for the year ended 31 March 2013 would increase/decrease by R34 million (2012: increase by R42 million and decrease by R42 million).
15. FINANCIAL INSTRUMENTS AND RISK MANAGEMENT (continued)
15.4 Market risk (continued)
The following table details the forward exchange contracts and cross-currency swaps outstanding at the reporting date:

194 Telkom Integrated Report 2013
15. FINANCIAL INSTRUMENTS AND RISK MANAGEMENT (continued)
15.4 Market risk (continued)
Sensitivity analysis (continued)
Interest rate and foreign currency risk (continued)
The following table illustrates the sensitivity to a 100 basis points change in the interest rates on profit before tax:
Group Company
movement movement
+ 1% – 1% + 1% – 1%
Classes of financial instruments per statement of financial position
Profit Rm
Profit Rm
Profit Rm
Profit Rm
2013
Assets
Other financial assets 11 (11) 11 (11)
Cross-currency swaps 2 (2) 2 (2)
Forward exchange contract 9 (9) 9 (9)
Liabilities
Other financial liabilities 23 (23) 23 (23)
Interest rate swaps23 (23) 23 (23)
34 (34) 34 (34)
Group Company
movement movement
+ 1% – 1% + 1% – 1%
Classes of financial instruments per statement of financial position
Profit
Rm
Profit
Rm
Profit
Rm
Profit
Rm
2012
Assets
Other financial assets 6 (6) 6 (6)
Cross-currency swaps 2 (2) 2 (2)
Forward exchange contract 4 (4) 4 (4)
Liabilities
Other financial liabilities36 (36) 36 (36)
Interest rate swaps 36 (36) 36 (36)
42 (42) 42 (42)
Foreign exchange currency risk
If exchange rates had been 10% higher/lower and all other variables were held constant, the Group’s profit for the year ended
31 March 2013 would decrease/increase by R233 million (2012: increase/decrease by R149 million) and Company by R233 million
(2012: increase/decreases by R106 million).
for the year ended 31 March 2013
NOTES TO THE CONSOLIDATED ANNUAL FINANCIAL
STATEMENTS

195 Telkom Integrated Report 2013
Operating environment Risk and responsibilityCreating value Leadership and strategic People and environment Financial statements
15. FINANCIAL INSTRUMENTS AND RISK MANAGEMENT (continued)
15.4 Market risk (continued)
Sensitivity analysis (continued)
Foreign exchange currency risk (continued)
The following table illustrates the sensitivity to a reasonably possible change in the exchange rates before tax, with all other variables
held constant:
Group Company
+ 10% movement – 10% movement + 10% movement – 10% movement
(Depreciation) (Appreciation) (Depreciation) (Appreciation)
Classes of financial instruments per statement of financial position Rm Rm Rm Rm
2013
Assets
Other financial assets 302 (302) 302 (302)
Forward exchange contract 258 (258) 258 (258)
Cross-currency swaps 44 (44) 44 (44)
Cash and cash equivalents 1 (1) 1 (1)
Liabilities (70) 70 (70) 70
Interest-bearing debt (70) 70 (70) 70
233 (233) 233 (233)
2012
Assets
Trade and other receivables 64 (64) – –
Other financial assets 173 (173) 173 (173)
Forward exchange contract 125 (125) 125 (125)
Cross-currency swaps 48 (48) 48 (48)
Cash and cash equivalents 1 (1) 1 (1)
Liabilities (89) 89 (67) 67
Interest-bearing debt (67) 67 (67) 67
Trade and other payables (22) 22 – –
149 (149) 107 (107)
15.5 Equity price risk
The Group’s listed and unlisted equity securities are susceptible to market price risk arising from uncertainties about future values of
the investment securities. Changes in the fair value of equity securities held by the Group will fluctuate because of changes in market
prices, caused by factors specific to the individual equity issuer, or factors affecting all similar equity securities traded on the market.
The Group is not exposed to commodity price risk. The Group manages the equity price risk through diversification and placing limits
on individual and total equity instruments. Reports on the equity portfolio are submitted to the Group’s senior management on a
regular basis. The Group’s board of directors reviews and approves all equity investment decisions.
At the reporting date, the total amount for local equity investments was R3,285 million (2012: R2,716 million). A 5% increase in the
local and foreign equity portfolios at the reporting date would have increased profit or loss by R110 million (2012: R95 million) before
tax. An equal and opposite change would have decreased profit or loss.
There will be no other impact on equity as the equity securities are classified as at fair value through profit or loss. The analysis
assumes that all other variables remain constant and is performed on the same basis as the prior year.
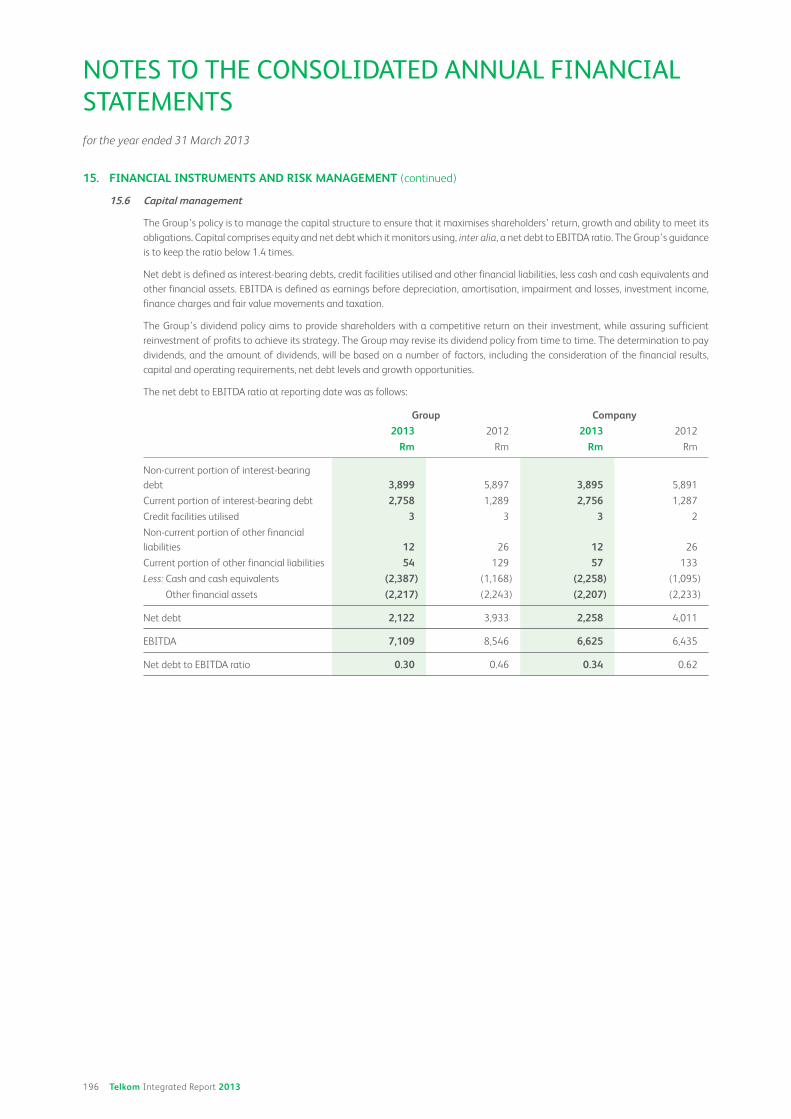
196 Telkom Integrated Report 2013
15. FINANCIAL INSTRUMENTS AND RISK MANAGEMENT (continued)
15.6 Capital management
The Group’s policy is to manage the capital structure to ensure that it maximises shareholders’ return, growth and ability to meet its
obligations. Capital comprises equity and net debt which it monitors using, inter alia, a net debt to EBITDA ratio. The Group’s guidance
is to keep the ratio below 1.4 times.
Net debt is defined as interest-bearing debts, credit facilities utilised and other financial liabilities, less cash and cash equivalents and
other financial assets. EBITDA is defined as earnings before depreciation, amortisation, impairment and losses, investment income,
finance charges and fair value movements and taxation.
The Group’s dividend policy aims to provide shareholders with a competitive return on their investment, while assuring sufficient
reinvestment of profits to achieve its strategy. The Group may revise its dividend policy from time to time. The determination to pay
dividends, and the amount of dividends, will be based on a number of factors, including the consideration of the financial results,
capital and operating requirements, net debt levels and growth opportunities.
The net debt to EBITDA ratio at reporting date was as follows:
Group Company
2013 2012 2013 2012
Rm Rm Rm Rm
Non-current portion of interest-bearing
debt 3,899 5,897 3,895 5,891
Current portion of interest-bearing debt 2,758 1,289 2,756 1,287
Credit facilities utilised 3 3 3 2
Non-current portion of other financial
liabilities 12 26 12 26
Current portion of other financial liabilities 54 129 57 133
Less: Cash and cash equivalents (2,387) (1,168) (2,258) (1,095)
Other financial assets (2,217) (2,243) (2,207) (2,233)
Net debt 2,122 3,933 2,258 4,011
EBITDA 7,109 8,546 6,625 6,435
Net debt to EBITDA ratio 0.30 0.46 0.34 0.62
for the year ended 31 March 2013
NOTES TO THE CONSOLIDATED ANNUAL FINANCIAL
STATEMENTS

197 Telkom Integrated Report 2013
Operating environment Risk and responsibilityCreating value Leadership and strategic People and environment Financial statements
Company
2013 2012
Rm Rm
16. INVESTMENTS16.1 Investments in subsidiaries 237 202
Trudon (formerly known as TDS Directory Operations) Proprietary Limited
64.9% shareholding at cost 167 167
Swiftnet Proprietary Limited 25 25
100% shareholding at cost 25 25
Rossal No 65 Proprietary Limited
100% shareholding at cost (R100) – –
Acajou Investments Proprietary Limited
100% shareholding at cost (R100) – –
Intekom Proprietary Limited
100% shareholding at cost 10 10
Q-Trunk Proprietary Limited* – –
100% shareholding at cost 10 10
Loan – –
Impairment (10) (10)
iWayAfrica* 35 –
100% shareholding at cost 150 150
Loan 305 270
Impairment of loan (270) (270)
Impairment of investment (150) (150)
Telkom International Proprietary Limited*– –
100% shareholding at cost (R100) – –
Loan 2,481 2,481
Impairment of loan (2,481) (2,481)
Available-for-sale
Unlisted investment
Rascom*
0.69% interest in Regional African Satellite Communications Organisation,
headquartered in Abidjan, Ivory Coast, at cost – –
Cost 1 1
Impairment (1) (1)
The aggregate directors’ valuation of the above investments is R3,606 million (2012: R3,682 million) based on net asset value.
Investments and loans key assumptions*
Loans and investments are tested for impairment losses whenever there are impairment indicators, by comparing the recoverable
amounts of the cash-generating units (CGU) with the carrying amounts of the investments and loans.
For continuing operations the recoverable amount of a CGU is determined based on value in use calculations. Value in use is based on
the discounted cash flow method.
The key assumptions used for value-in-use calculations are as follows:
Gross margin % 27 to 30
Growth rate % 2,0
Discount rate % 13.87

198 Telkom Integrated Report 2013
16. INVESTMENTS (continued)
16.1 Investments in subsidiaries (continued)
Investments and loans key assumptions (continued)
Gross margin
The budgeted gross margin is based on past experience and management’s future expectations of business performance.
Growth rates
The growth rates are determined based on the forward-looking Consumer Price Index, and reflect management’s assessment of the
long-term growth prospects of the sector in which the CGU operates.
Discount rates
The discount rates used are post-tax and reflect specific risks relating to the relevant cash-generating units.
Sensitivity to changes in assumptions
Management believes that no reasonably possible changes in the assumptions would cause the carrying amount of the continuing
cash-generating unit to exceed their recoverable amount in the short term.
Disposal of Multi-Links
2013 2012
Rm Rm
Multi-Links Telecommunications Limited – –
25% shareholding at cost – 1,339
100% 550,000 10% non-cumulative preference shares at par NGN1.00 and a
premium of NGN 99,999.00 – 2,674
Equity capital contribution – 999
Multi-Links guarantee – 10
Loan/equity contribution – 3,135
Impairment of investment, loan and guarantee – (8,157)
Multi-Links had issued 550,000 10% non-cumulative preference shares at NGN1.00 each at a Premium of NGN99,999.00. Telkom SA
had acquired all the shares for NGN55 billion (USD365,448,505).
The 75% shareholding in Multi-Links Telecommunications Limited was an indirect investment through Telkom International
Proprietary Limited, while 25% was held directly by Telkom.
In September 2009, Telkom amended the terms and conditions of the USD loans advanced to Multi-Links, so that a portion of the loan
balance becomes interest free with no repayment terms. Multi-Links repaid a portion of the loans outstanding (USD361,793,945). The
remaining outstanding amount was then split between debt and equity components – in terms of IAS 39.
On 31 March 2011, Telkom and Visafone Communications Limited (Visafone) entered into a legally binding agreement regarding the
sale of Multi-Links’ CDMA business to Visafone for an enterprise value of USD52 million through a number of transaction steps.
On 3 October 2011 Multi-Links was sold to Helios Towers Nigeria Limited.
Group Company
2013 2012 2013 2012
Rm Rm Rm Rm
16.2 Other investments 2,492 2,260 928 968
At fair value through profit and loss and cost 2,490 2,248 928 959
Linked insurance policies – Coronation 2,490 2,248 – –
Cell Captive Cost – – 928 959
Investment in associate 2 10 – 9
Equity investment in Number Portability
Company 2 10 – 9
Investment in joint venture – 2 – –
Equity investment in Satellite Data
Networks Mauritius (Pty) Ltd – 2 – –
for the year ended 31 March 2013
NOTES TO THE CONSOLIDATED ANNUAL FINANCIAL
STATEMENTS

199 Telkom Integrated Report 2013
Operating environment Risk and responsibilityCreating value Leadership and strategic People and environment Financial statements
16. INVESTMENTS (continued)
16.2 Other investments (continued)
Linked insurance policies – Coronation
The fair value through profit or loss investment is used to fund the post-retirement medical aid liability. These investments are made
through a Cell Captive in which Telkom holds 100% of the preference shares, and represent the fair value of the underlying investments
of the Cell Captive.
Telkom bears all the risks and rewards of the investment, as the returns/losses on the preference shares are dependant on the
performance of the underlying investments made by the Cell Captive. On this basis, Telkom as the preference shareholder receives any
residual gains or losses made by the Cell Captive. The ordinary shareholders of the Cell Captive do not bear any of the risks and
rewards. The Cell Captive has been consolidated in full.
Investment in associate
The Number Portability Company (NPC) was incorporated in response to Regulations of 2005 that required a national centralised
database of ported numbers for mobile numbers. The NPC was previously classified as a joint venture jointly controlled by Vodacom,
MTN and Cell C. The investment has been reclassified to an associate in line with the requirements of the revised IAS 28 Investments
in Associates and Joint Ventures and IFRS 11 Joint Arrangements.
Investment in joint venture
Satellite Data Networks Mauritius (Pty) Ltd was a joint venture within the iWayAfrica Group. The joint venture was disposed of during
the financial year.
Group Company
2013 2012 2013 2012
Rm Rm Rm Rm
17. DEFERRED EXPENSES AND DEFERRED
REVENUEDeferred expense 50 47 50 47
Non-current deferred expenses 50 47 50 47
Telkom Pension Fund asset 50 47 50 47
Deferred revenue 2,692 3,127 2,651 3,100
Non-current deferred revenue 952 1,132 952 1,132
Current portion of deferred revenue 1,740 1,995 1,699 1,968
Included in deferred revenue is profit on the sale and leaseback of certain Telkom buildings of R64 million (2012: R75 million) and short-term
portion of R11 million (2012: R11 million). A profit of R11 million per annum is recognised in income on a straight-line basis, over the period
of the lease ending 2019.

200 Telkom Integrated Report 2013
18. FINANCE LEASE RECEIVABLES
The Group provides voice and non-voice services through the use of router and PABX equipment that is dedicated to specific customers. The
disclosed information relates to those arrangements which were assessed to be finance leases in terms of IAS 17.
Group Total < 1 year 1 to 5 years > 5 years
Rm Rm Rm Rm
2013
Minimum lease payments receivable
Lease payments receivable 409 161 248 –
Unearned finance income (59) (30) (29) –
Present value of minimum lease income 350 131 219 –
Lease receivables 350 131 219 –
2012
Minimum lease payments receivable
Lease payments receivable 442 163 279 –
Unearned finance income (70) (35) (35) –
Present value of minimum lease income 372 128 244 –
Lease receivables 372 128 244 –
Company Total < 1 year 1 to 5 years > 5 years
Rm Rm Rm Rm
2013
Minimum lease payments receivable
Lease payments receivable 409 161 248 –
Unearned finance income (59) (30) (29) –
Present value of minimum lease income 350 131 219 –
Lease receivables 350 131 219 –
2012
Minimum lease payments receivable
Lease payments receivable 442 163 279 –
Unearned finance income (70) (35) (35) –
Present value of minimum lease income 372 128 244 –
Lease receivables 372 128 244 –
for the year ended 31 March 2013
NOTES TO THE CONSOLIDATED ANNUAL FINANCIAL
STATEMENTS

201 Telkom Integrated Report 2013
Operating environment Risk and responsibilityCreating value Leadership and strategic People and environment Financial statements
Group Company
2013 2012 2013 2012
Rm Rm Rm Rm
19. DEFERRED TAXATION23 (694) – (729)
Opening balance (694) (838) (729) (873)
Profit and loss movements 621 494 633 162
Capital allowances 309 516 316 141
Provisions and other allowances 318 520 324 37
Underprovision prior year (6) (2) (7) (2)
Tax losses – (526) – –
Secondary taxation on companies (STC)
credit utilised – (14) – (14)
Other adjustment 6 – 6 –
Deferred taxation realised on foreign operations – (332) – –
Other comprehensive income tax impact (refer
to note 11) 90 (18) 90 (18)
The balance comprises: 23 (694) – (729)
Capital allowances (3,034) (3,343) (3,014) (3,330)
Provisions and other allowances 2,803 2,642 2,767 2,601
OCI 247 – 247 –
Tax losses 7 7 – –
Deferred taxation balance is made up as follows: 23 (694) – (729)
Deferred taxation assets 40 53 – –
Deferred taxation liabilities (17) (747) – (729)
Unutilised STC credits – – – –
Previously STC was provided for at a rate of 10% on the amount by which dividends declared exceeded dividends received in the specified
dividend cycle. The deferred taxation asset was raised in 2011 and was utilised in 2012. The asset was released as a taxation expense when
dividends were declared.
The deferred taxation liability decreased mainly due to the shorter taxation write-off periods on property, plant and equipment that was
previously utilised and add back of employee related provisions.
Deferred taxation realised on foreign operations relates to the foreign exchange losses on the disposal of Multi-Links Telecommunications Ltd.
Deferred tax assets are recognised for deductible temporary differences to the extent of the related tax benefit through future taxable profits
is probable. The Group did not recognise deferred tax assets of R3,200 million (2012: RNil million) in respect of temporary differences
amounting to R11,300 million that can be carried forward against future taxable income.

202 Telkom Integrated Report 2013
Group Company
2013 2012 2013 2012
Rm Rm Rm Rm
20. INVENTORIES 1,166 993 1,026 879
Gross inventories 1,473 1,259 1,330 1,144
Write-down of inventories to net realisable value (307) (266) (304) (265)
Inventories consist of the following categories: 1,166 993 1,027 879
Installation material, maintenance material and
network equipment
Merchandise
739427
685
308
739288
713
166
Write-down of inventories to net realisable value 307 266 304 265
Opening balance 266 271 265 271
Charged to selling, general and administrative
expenses 133 209 131 208
Inventories written-off (92) (214) (92) (214)
Increase in gross inventory is mainly due to the increase in stock holding for Installation and Maintenance, Merchandise, Minor material, CPE
work in progress and Non-Warehouse stock provision. This is offset by a decrease in repair stock holding and Merchandise stock provision.
The write-down of inventory is mainly due to the provision for technology obsolescence and slow-moving stock.
Group Company
2013 2012 2013 2012
Rm Rm Rm Rm
21. TRADE AND OTHER RECEIVABLES 5,804 5,696 5,059 4,951
Trade receivables 4,537 4,644 3,853 3,966
Gross trade receivables 5,085 5,227 4,261 4,439
Impairment of receivables (548) (583) (408) (473)
Prepayments and other receivables 1,267 1,052 1,206 985
Impairment of allowance account for receivables 548 583 408 473
Opening balance 583 496 473 355
Charged to selling, general and administrative
expenses 582 690 496 642
Transfer to disposal group held for sale – (16) – –
Receivables written-off (617) (587) (561) (524)
The repayment terms of trade receivables vary between 21 days and 30 days from date of invoice. Interest charged varies between prime + 1%
and 18%, depending on the contract.
Refer to note 15.2 for detailed credit risk analysis.
for the year ended 31 March 2013
NOTES TO THE CONSOLIDATED ANNUAL FINANCIAL
STATEMENTS

203 Telkom Integrated Report 2013
Operating environment Risk and responsibilityCreating value Leadership and strategic People and environment Financial statements
Group Company
2013 2012 2013 2012
Rm Rm Rm Rm
22. OTHER FINANCIAL ASSETS AND LIABILITIES
Other financial assets consist of: 83 48 83 48
Total other financial assets 2,217 2,243 2,207 2,233
– Repurchase agreements 1,980 2,009 1,970 1,999
– Derivative instrument 237 234 237 234
Forward exchange contract 132 193 132 193
Cross currency swaps 105 41 105 41
Less: Current portion of other financial assets 2,134 2,195 2,124 2,185
– Repurchase agreements 1,980 2,009 1,970 1,999
– Derivative instrument 154 186 154 186
Forward exchange contract 132 186 132 186
Cross currency swaps 22 – 22 –
Repurchase agreements:
The Group manages a portfolio of repurchase
agreements, with a view to generating additional
investment income on the favourable interest
rates and security provided on these instruments.
They are short term, usually seven days and are
held to maturity.
Financial instruments:
Financial assets consists of forward exchange
contracts of R132 million (2012: R193 million)
and cross currency swaps of R105 million
(2012: R41 million).
Derivative instruments:
Derivative assets at fair value consists of forward
exchange contracts of R132 million (2012:
R193 million) and cross currency swaps of
R105 million (2012: R41 million).
Other financial liabilities consist of:
At fair value through profit or loss (12) (26) (12) (26)
Total other financial liabilities (66) (155) (69) (159)
– Derivative instrument (66) (155) (69) (159)
Forward exchange contract (15) (105) (15) (105)
Interest rate swap (51) (50) (54) (54)
Less: Current portion of other financial liabilities (54) (129) (57) (133)
– Derivative instrument (54) (129) (57) (133)
Forward exchange contract (15) (100) (15) (100)
Interest rate swap (39) (29) (42) (33)
Financial liabilities consists of interest rate swaps of R51 million (2012: R50 million) for the Group and R54 million (2012: R54 million) for the
Company and forward exchange contracts of R15 million (2012: R105 million) for the Group and the Company.
Hedging activities and derivativesThe Group uses forward exchange contracts, interest rate swaps and cross currency swaps to economically hedge some of its transaction
exposures. However hedge accounting is not applied.

204 Telkom Integrated Report 2013
Group Company
2013 2012 2013 2012
Rm Rm Rm Rm
23. NET CASH AND CASH EQUIVALENTSCash shown as current assets 2,387 1,168 2,258 1,095
Cash and bank balances 234 713 137 666
Short-term deposits 2,153 455 2,121 429
Credit facilities utilised (3) (3) (3) (2)
Net cash and cash equivalents 2,384 1,165 2,255 1,093
Undrawn borrowing facilities 6,450 6,500 6,450 6,500
The undrawn borrowing facilities are unsecured and bear interest at a rate that will be mutually agreed between the borrower and lender at
the time of drawdown. These facilities are subject to annual review and are in place to ensure liquidity. At 31 March 2013, R4,000 million
(2012: R4,000 million) of these undrawn facilities were committed.
Short-term deposits
Short-term deposits are made mostly for varying periods of between one day and three months, depending on the immediate cash
requirements of the Group, and earn interest at the respective short-term deposit rates.
Borrowing powers
To borrow money, Telkom’s directors may mortgage or encumber Telkom’s property or any part thereof and issue debentures, whether secured
or unsecured, whether outright or as security for debt, liability or obligation of Telkom or any third party. For this purpose the borrowing powers
of Telkom are unlimited, but are subject to the restrictive financial covenants as well as specific restructive clauses in the current funding
arrangements.
Net cash and cash equivalents increased due to higher cash generated from operations.
Group Company
2013 2012 2013 2012
Rm Rm Rm Rm
24. SHARE CAPITALAuthorised and issued share capital is made up
as follows:
Authorised
1,000,000,000 ordinary shares of R10 each 10,000 10,000 10,000 10,000
Issued and fully paid
520,783,900 (2012: 520,783,900)
ordinary shares of R10 each 5,208 5,208 5,208 5,208
The following table illustrates the movement
within the number of shares issued:
Number of shares
Number of
shares
Number of shares
Number of
shares
Shares in issue at beginning of year 520,783,900 520,783,900 520,783,900 520,783,900
Shares in issue at end of year 520,783,900 520,783,900 520,783,900 520,783,900
The unissued shares are under the control of the directors until the next Annual General Meeting. The directors have been given the authority
by the shareholders to buy back Telkom’s own shares up to a limit of 20% of the current issued share capital.
Capital management
Refer to note 15.6 for detailed capital management disclosure.
for the year ended 31 March 2013
NOTES TO THE CONSOLIDATED ANNUAL FINANCIAL
STATEMENTS

205 Telkom Integrated Report 2013
Operating environment Risk and responsibilityCreating value Leadership and strategic People and environment Financial statements
Group Company
2013 2012 2013 2012
Rm Rm Rm Rm
25. TREASURY SHARES (771) (771) (775) (775)
The reserve represents amounts paid by Telkom
to Rossal No 65 Proprietary Limited and Acajou
Investments Proprietary Limited, subsidiaries for
the acquisition of Telkom’s shares to be utilised
in terms of the Telkom Conditional Share Plan.
The Telkom Conditional Share Plan was closed in
June 2010. The future use of the remaining
shares is subject to management review.
At 31 March 2013, 2,046,528 (2012: 2,046,528)
and 8,143,556 (2012: 8,143,556) ordinary
shares in Telkom, with a fair value of R31 million
(2012: R49 million) and R122 million (2012:
R195 million) are held as treasury shares by its
subsidiaries Rossal No 65 Proprietary Limited and
Acajou Investments Proprietary Limited,
respectively (refer to note 12).
Although the treasury shares are held by a
separate subsidiary, the value is shown as a
separate reserve at Company level.
26. NON-DISTRIBUTABLE RESERVES 2,164 1,887
Opening balance 1,887 1,764
Movement during year 277 123
Foreign currency translation reserve
(net of tax of RNil million; 2012: RNil million) (3) (52)
Available-for-sale investment – (5)
Gains of the Cell Captive reserve (40) (25)
Revaluation of the Cell Captive reserve 320 205
The balance comprises: 2,164 1,887
Foreign currency translation reserve (126) (123)
Cell Captive reserve 2,290 2,010
The Group has a consolidated Cell Captive, used
as an investment to fund Telkom’s post-
retirement medical aid liability.
The earnings from the Cell Captive are
recognised in profit or loss and then transferred
to non-distributable reserves.
The available-for-sale investment is a re-
insurance premium of the Cell Captive
recognised directly in equity.
27. NON-CONTROLLING INTEREST 379 434
Balance at beginning of year 434 387
Share of earnings 123 126
Acquisition of non-controlling interest (2) –
Dividend declared (176) (79)

206 Telkom Integrated Report 2013
Group Company
2013 2012 2013 2012
Rm Rm Rm Rm
28. INTEREST-BEARING DEBTNon-current interest-bearing debt 3,899 5,897 3,895 5,891
Total interest-bearing debt (refer to note 15) 6,657 7,186 6,651 7,178
Gross interest-bearing debt 6,855 7,392 6,853 7,389
Discount on debt instruments issued (968) (1,057) (968) (1,057)
Finance leases 770 851 766 846
Less: Current portion of interest-bearing debt (2,758) (1,289) (2,756) (1,287)
Local debt (2,494) (1,060) (2,494) (1,060)
Call borrowings (1,998) (1,060) (1,998) (1,060)
Commercial paper bills (496) – (496) –
Foreign debt (207) (148) (207) (148)
Finance leases (57) (81) (55) (79)
Total interest-bearing debt is made up as
follows: 6,657 7,186 6,651 7,179
(a) Local debt 5,224 5,709 5,224 5,709
Locally registered Telkom debt instruments 5,224 5,709 5,224 5,709
Name, maturity, rate p.a., nominal value
TL12, 2012, 12.45%, RNil million (2012:
R1,060 million) – 1,060 – 1,060
TL15, 2015, 11.9%, R1,160 million (2012:
R1,160 million) 1,160 1,159 1,160 1,159
TL20, 2020, 6%, R2,500 million (2012:
R2,500 million) 1,570 1,495 1,570 1,495
Other local loans, 2013, 6.3%,
R500 million (2012: RNil) 496 – 496 –
Syndicated loans, 2013, 7.11%,
R2,000 million (2012: R2,000 million) 1,998 1,995 1,998 1,995
Total Group interest-bearing debt is made
up of R6,657 million debt at amortised cost
(2012: R7,186 million debt at amortised
cost). Finance costs accrued on debt are
included in trade and other payables
(refer to note 31).
for the year ended 31 March 2013
NOTES TO THE CONSOLIDATED ANNUAL FINANCIAL
STATEMENTS
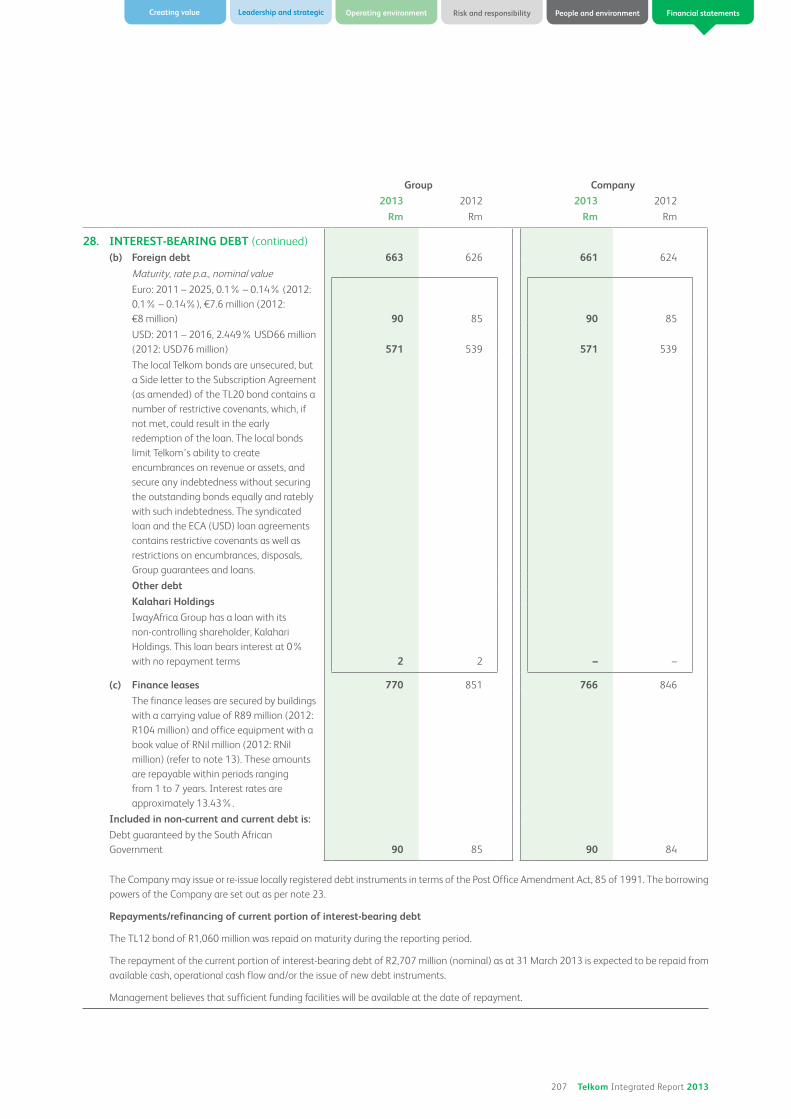
207 Telkom Integrated Report 2013
Operating environment Risk and responsibilityCreating value Leadership and strategic People and environment Financial statements
Group Company
2013 2012 2013 2012
Rm Rm Rm Rm
28. INTEREST-BEARING DEBT (continued)
(b) Foreign debt 663 626 661 624
Maturity, rate p.a., nominal value
Euro: 2011 – 2025, 0.1% – 0.14% (2012:
0.1% – 0.14%), €7.6 million (2012:
€8 million) 90 85 90 85
USD: 2011 – 2016, 2.449% USD66 million
(2012: USD76 million) 571 539 571 539
The local Telkom bonds are unsecured, but
a Side letter to the Subscription Agreement
(as amended) of the TL20 bond contains a
number of restrictive covenants, which, if
not met, could result in the early
redemption of the loan. The local bonds
limit Telkom’s ability to create
encumbrances on revenue or assets, and
secure any indebtedness without securing
the outstanding bonds equally and ratebly
with such indebtedness. The syndicated
loan and the ECA (USD) loan agreements
contains restrictive covenants as well as
restrictions on encumbrances, disposals,
Group guarantees and loans.
Other debt
Kalahari Holdings
IwayAfrica Group has a loan with its
non-controlling shareholder, Kalahari
Holdings. This loan bears interest at 0%
with no repayment terms 2 2 – –
(c) Finance leases 770 851 766 846
The finance leases are secured by buildings
with a carrying value of R89 million (2012:
R104 million) and office equipment with a
book value of RNil million (2012: RNil
million) (refer to note 13). These amounts
are repayable within periods ranging
from 1 to 7 years. Interest rates are
approximately 13.43%.
Included in non-current and current debt is:
Debt guaranteed by the South African
Government 90 85 90 84
The Company may issue or re-issue locally registered debt instruments in terms of the Post Office Amendment Act, 85 of 1991. The borrowing
powers of the Company are set out as per note 23.
Repayments/refinancing of current portion of interest-bearing debt
The TL12 bond of R1,060 million was repaid on maturity during the reporting period.
The repayment of the current portion of interest-bearing debt of R2,707 million (nominal) as at 31 March 2013 is expected to be repaid from
available cash, operational cash flow and/or the issue of new debt instruments.
Management believes that sufficient funding facilities will be available at the date of repayment.
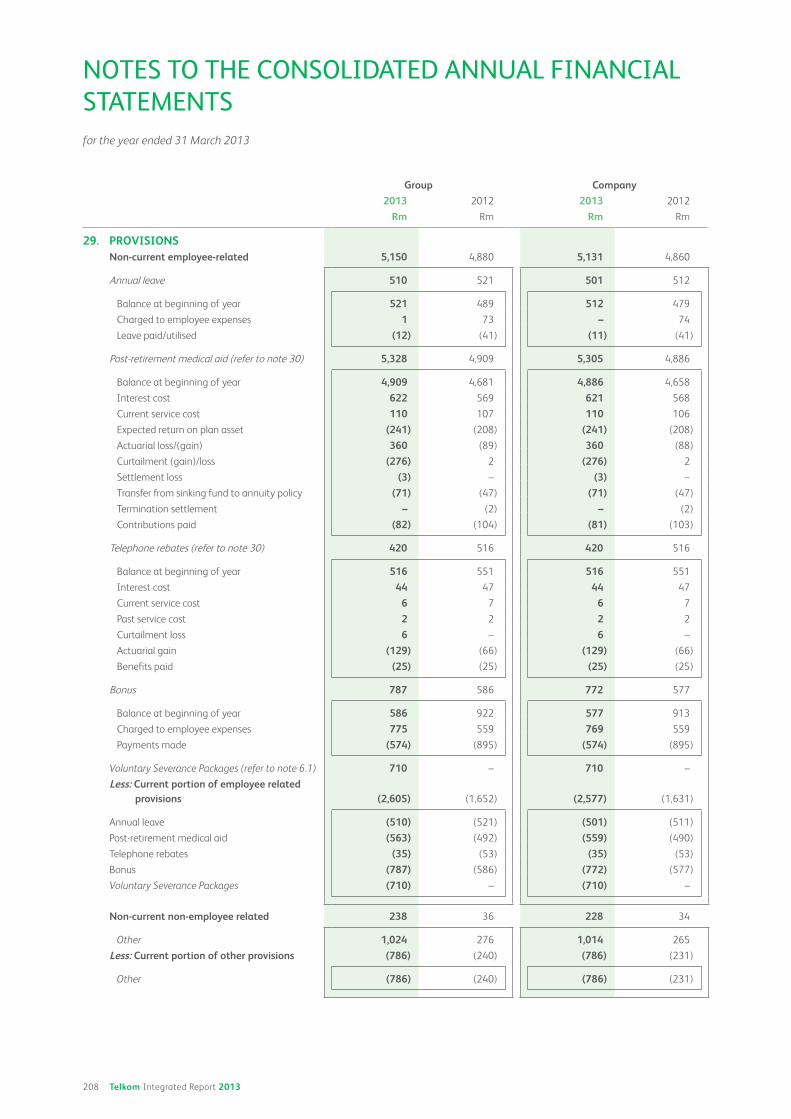
208 Telkom Integrated Report 2013
Group Company
2013 2012 2013 2012
Rm Rm Rm Rm
29. PROVISIONSNon-current employee-related 5,150 4,880 5,131 4,860
Annual leave 510 521 501 512
Balance at beginning of year 521 489 512 479
Charged to employee expenses 1 73 – 74
Leave paid/utilised (12) (41) (11) (41)
Post-retirement medical aid (refer to note 30) 5,328 4,909 5,305 4,886
Balance at beginning of year 4,909 4,681 4,886 4,658
Interest cost 622 569 621 568
Current service cost 110 107 110 106
Expected return on plan asset (241) (208) (241) (208)
Actuarial loss/(gain) 360 (89) 360 (88)
Curtailment (gain)/loss (276) 2 (276) 2
Settlement loss (3) – (3) –
Transfer from sinking fund to annuity policy (71) (47) (71) (47)
Termination settlement – (2) – (2)
Contributions paid (82) (104) (81) (103)
Telephone rebates (refer to note 30) 420 516 420 516
Balance at beginning of year 516 551 516 551
Interest cost 44 47 44 47
Current service cost 6 7 6 7
Past service cost 2 2 2 2
Curtailment loss 6 – 6 –
Actuarial gain (129) (66) (129) (66)
Benefits paid (25) (25) (25) (25)
Bonus 787 586 772 577
Balance at beginning of year 586 922 577 913
Charged to employee expenses 775 559 769 559
Payments made (574) (895) (574) (895)
Voluntary Severance Packages (refer to note 6.1) 710 – 710 –
Less: Current portion of employee related provisions (2,605) (1,652) (2,577) (1,631)
Annual leave (510) (521) (501) (511)
Post-retirement medical aid (563) (492) (559) (490)
Telephone rebates (35) (53) (35) (53)
Bonus (787) (586) (772) (577)
Voluntary Severance Packages (710) – (710) –
Non-current non-employee related 238 36 228 34
Other 1,024 276 1,014 265
Less: Current portion of other provisions (786) (240) (786) (231)
Other (786) (240) (786) (231)
for the year ended 31 March 2013
NOTES TO THE CONSOLIDATED ANNUAL FINANCIAL
STATEMENTS
209 Telkom Integrated Report 2013
Operating environment Risk and responsibilityCreating value Leadership and strategic People and environment Financial statements
29. PROVISIONS (continued)
Annual leave
In terms of the Telkom’s policy, employees are entitled to accumulate vested leave benefits not taken within a leave cycle, to a cap of 22 days
(2012: 22 days) which must be taken within an 18-month (2012: 19-month) leave cycle. The leave cycle is reviewed annually and is in
accordance with legislation.
Bonus
The bonus scheme consists of performance bonuses which are dependent on the achievement of certain financial and non-financial targets.
The bonus is payable annually to all qualifying employees after the Company’s results have been made public.
Other
Non-employee related provisions increased due to the fines imposed by the Competition Commission.
Other provisions contain provisions for certain legal matters that have been disclosed in the contingencies note (refer to note 38).
30. EMPLOYEE BENEFITS
The Group provides benefits for all its permanent employees through the Telkom Pension Fund and the Telkom Retirement Fund. Membership
to one of the funds is compulsory. In addition, certain retired employees receive medical aid benefits and a telephone rebate. The liabilities for
all of the benefits are actuarially determined in accordance with accounting requirements each year. In addition, statutory funding valuations
for the retirement and pension funds are performed at intervals not exceeding three years.
At 31 March 2013 the Group employed 22,192 (2012: 22,045) employees and the Company employed 21,209 (2012: 20,939) employees.
Actuarial valuations were performed by qualified actuaries to determine the benefit obligation, plan asset and service costs for the pension
and retirement funds for each of the financial periods presented.
The Telkom Pension Fund
The Telkom Pension Fund is a defined benefit fund that was created in terms of the Post Office Amendment Act, 85 of 1991.
The latest actuarial valuation performed at 31 March 2013 indicates that the pension fund is in a surplus position of R100 million. The
recognition of the surplus is limited due to the application of the asset limitation criteria in IAS 19 Employee Benefits. The Telkom Pension Fund
is closed to new members.

210 Telkom Integrated Report 2013
30. EMPLOYEE BENEFITS (continued)
The Telkom Pension Fund (continued)
The funded status of the Telkom Pension Fund is disclosed below. Group Company
2013 2012 2013 2012
Rm Rm Rm Rm
The Telkom Pension Fund
The net periodic pension costs includes the following components:
Interest cost on projected benefit obligations 22 20 22 20
Service cost on projected benefit obligations 5 5 5 5
Expected returns on plan assets (35) (30) (35) (30)
Net periodic pension gain recognised in profit
and loss (8) (5) (8) (5)
The net periodic other comprehensive income includes the following components:
Actuarial (gain)/loss (33) 6 (33) 6
Asset limitation in terms of IAS 19.58(b) 38 1 38 1
Net periodic pension expense recognised in other
comprehensive income 5 7 5 7
Cumulative actuarial loss (18) (51) (18) (51)
Pension fund contributions (2) (2) (2) (2)
The status of the pension plan obligation is as follows:
At beginning of year 242 224 242 224
Interest cost 22 20 22 20
Current service cost 5 5 5 5
Employee contributions 2 2 2 2
Benefits paid (13) (7) (13) (7)
Curtailment gain (4) – (4) –
Actuarial loss/(gain) 8 (2) 8 (2)
Benefit obligation at end of year 262 242 262 242
Plan assets at fair value:
At beginning of year 301 284 301 284
Expected return on plan assets 35 30 35 30
Benefits paid (13) (7) (13) (7)
Contributions 2 2 2 2
Curtailment loss (4) – (4) –
Actuarial gain/(loss) 41 (8) 41 (8)
Plan assets at end of year 362 301 362 301
Present value of funded obligation 262 242 262 242
Fair value of plan assets (362) (301) (362) (301)
Fund surplus (100) (59) (100) (59)
Asset limitation in terms of IAS 19.58(b) 50 12 50 12
Recognised net asset (refer to note 17) (50) (47) (50) (47)
Expected return on plan assets 35 30 35 30
Actuarial gain/(loss) on plan assets 41 (8) 41 (8)
Actual return on plan assets 76 22 76 22
for the year ended 31 March 2013
NOTES TO THE CONSOLIDATED ANNUAL FINANCIAL
STATEMENTS

211 Telkom Integrated Report 2013
Operating environment Risk and responsibilityCreating value Leadership and strategic People and environment Financial statements
Group Company
2013 2012 2013 2012
30. EMPLOYEE BENEFITS (continued)
The Telkom Pension Fund (continued)
Principal actuarial assumptions were as follows:
Discount rate (%) 7.6 8.9 7.6 8.9
Yield on government bonds (%) 7.6 8.9 7.6 8.9
Long-term return on equities (%) 11.6 12.9 11.6 12.9
Long-term return on cash (%) 6.9 8.4 6.9 8.4
Expected return on plan assets (%) 10.8 11.7 10.8 11.7
Salary inflation rate (%) 7.1 7.4 7.1 7.4
Pension increase allowance (%) 5.6 3.8 5.6 3.8
The overall long-term expected rate of return on
assets is 10.8%. This is based on the portfolio as
a whole and not the sum of the returns of
individual asset categories. The expected return
takes into account the asset allocation of the
Telkom Pension Fund and expected long-term
return of these assets, of which South African
Equities and Bonds are the largest contributors.
The assumed rates of mortality are determined
by reference to the SA85-90 (Light) ultimate
table, as published by the Actuarial Society of
South Africa, for pre-retirement purposes and the
PA(90) ultimate table, minus one year age rating
as published by the Institute and Faculty of
Actuaries in London and Scotland, for retirement
purposes.
Funding level per statutory actuarial
valuation (%) 100 100 100 100
The number of employees registered under the
Telkom Pension Fund 95 100 95 100
The fund portfolio consists of the following:
Equities (%) 59 51 59 51
Bonds (%) 9 14 9 14
Cash (%) 7 10 7 10
Foreign investments (%) 25 25 25 25
The total expected contributions payable to the
pension fund for the year ending 31 March 2014
are R1.8 million.
The Telkom Retirement Fund
The Telkom Retirement Fund was established on 1 July 1995 as a hybrid defined benefit and defined contribution plan. Existing employees
were given the option to either remain in the Telkom Pension Fund or to be transferred to the Telkom Retirement Fund. All pensioners of
the Telkom Pension Fund and employees who retired after 1 July 1995 were transferred to the Telkom Retirement Fund. Upon transfer the
government ceased to guarantee the deficit in the Telkom Retirement Fund. Subsequent to 1 July 1995 further transfers of existing employees
occurred. As from 1 September 2009 all new appointments will belong to the Telkom Retirement Fund but will not be able to retire from the
Telkom Retirement Fund at retirement age. These members would be required to purchase their pensions from an insurance company.
The Telkom Retirement Fund is a defined contribution fund with regards to in-service members. On retirement, an employee is transferred
from the defined contribution plan to a defined benefit plan. Telkom, as a guarantor, is contingently liable for any deficit in the Telkom
Retirement Fund. Moreover, all of the assets in the fund, including any potential excess belong to the participants of the scheme. Telkom is
unable to benefit from the excess in the form of future reduced contributions.
Telkom guarantees any actuarial shortfall of the pensioner pool in the retirement fund. This liability is initially funded through assets of the
retirement fund.
The Telkom Retirement Fund is governed by the Pension Funds Act, 24 of 1956. In terms of section 37A of this Act, the pension benefits
payable to the pensioners cannot be reduced. If therefore the present value of the funded obligation was to exceed the fair value of plan
assets, Telkom would be required to fund the statutory deficit.

212 Telkom Integrated Report 2013
Group Company
2013 2012 2013 2012
Rm Rm Rm Rm
30. EMPLOYEE BENEFITS (continued)
The Telkom Retirement Fund (continued)
The funded status of the Telkom Retirement Fund
is disclosed below:
The net periodic retirement costs include the following components:
Interest cost on projected benefit obligations 772 717 772 717
Expected return on plan assets (859) (800) (859) (800)
Net periodic pension expense recognised in profit
and loss (87) (83) (87) (83)
The net periodic other comprehensive income includes the following components:
Actuarial loss (87) (83) (87) (83)
Net periodic pension expense recognised in other
comprehensive income (87) (83) (87) (83)
Cumulative actuarial loss (1,997) (1,910) (1,997) (1,910)
Retirement fund contributions 606 558 606 558
Benefit obligation:
At beginning of year 9,015 8,654 9,015 8,654
Interest cost 772 717 772 717
Benefits paid (740) (647) (740) (647)
Liability for new pensioners 195 26 195 26
Curtailment loss – 17 – 17
Actuarial loss 1,462 248 1,462 248
Benefit obligation at end of year 10,704 9,015 10,704 9,015
Plan assets at fair value:
At beginning of year 9,015 8,654 9,015 8,654
Expected return on plan assets 859 800 859 800
Benefits paid (740) (647) (740) (647)
Asset backing new pensioners’ liabilities 195 26 195 26
Curtailment gain – 17 – 17
Actuarial gain 1,375 165 1,375 165
Plan assets at end of year 10,704 9,015 10,704 9,015
Present value of funded obligation 10,704 9,015 10,704 9,015
Fair value of plan assets (10,704) (9,015) (10,704) (9,015)
Unrecognised net asset – – – –
Expected return on plan assets 859 800 859 800
Actuarial gain on plan assets 1,375 165 1,375 165
Actual return on plan assets 2,234 965 2,234 965
Included in the fair value of plan assets is:
Office buildings occupied by Telkom 831 791 831 791
Telkom shares 27 34 27 34
The Telkom Retirement Fund invests its funds in South Africa and internationally. Twelve fund managers invest in South Africa and five of
these managers specialise in trades with bonds on behalf of the Retirement Fund.
for the year ended 31 March 2013
NOTES TO THE CONSOLIDATED ANNUAL FINANCIAL
STATEMENTS

213 Telkom Integrated Report 2013
Operating environment Risk and responsibilityCreating value Leadership and strategic People and environment Financial statements
Group Company
2013 2012 2013 2012
30. EMPLOYEE BENEFITS (continued)
The Telkom Retirement Fund (continued)
Principal actuarial assumptions were as follows:
Discount rate (%) 7.6 8.9 7.6 8.9
Yield on government bonds (%) 7.6 8.9 7.6 8.9
Long-term return on equities (%) 11.6 12.9 11.6 12.9
Long-term return on cash (%) 6.9 8.4 6.9 8.4
Expected return on plan assets (%) 9.3 9.9 9.3 9.9
Pension increase allowance (%) 5.6 5.0 5.6 5.0
The overall long-term expected rate of return on
assets is 9.3%. This is based on the portfolio as a
whole and not the sum of the returns of
individual asset categories. The expected return
takes into account the asset allocation of the
Retirement Fund and expected long-term return
on these assets, of which South African equities,
foreign investments and SA fixed interest bonds
are the largest contributors.
The assumed rates of mortality are determined
by reference to the SA85-90 (Light) ultimate
table, as published by the Actuarial Society of
South Africa, for pre-retirement purposes and the
PA(90) ultimate table, minus one year age rating
as published by the Institute and Faculty of
Actuaries in London and Scotland, for retirement
purposes.
Funding level per statutory actuarial valuation (%) 100 100 100 100
The number of pensioners registered under the
Telkom Retirement Fund 13,136 13,379 13,136 13,379
The number of in-service employees registered
under the Telkom Retirement Fund 21,257 20,864 21,257 20,864
The fund portfolio consists of the following:
Equities (%) 37 29 37 29
Bonds (%) 63 68 63 68
Cash (%) – 3 – 3
The expected contributions payable to the Retirement Fund for the year ending 31 March 2014 are R51 million.
Medical benefits
Telkom makes certain contributions to medical funds in respect of current and retired employees. The scheme is a defined benefit plan. The
expense in respect of current employees’ medical aid is disclosed in note 6.1. The amounts due in respect of post-retirement medical benefits
to current and retired employees have been actuarially determined and provided for as set out in note 29. Telkom has terminated future post-
retirement medical benefits in respect of employees joining after 1 July 2000.
There are three major categories of members entitled to the post-retirement medical aid: pensioners who retired before 1994 (‘Pre-94’);
those who retired after 1994 (‘Post-94’); and the in-service members. The Post-94 and the in-service members’ liability is subject to a Rand
cap, which increases as per Board’s approval.
Eligible employees must be employed by Telkom until retirement age to qualify for the post-retirement medical aid benefit. The most recent
actuarial valuation of the benefit was performed as at 31 March 2013.
Telkom has allocated certain investments to fund this liability as set out in note 16.2. The annuity policy of the Cell Captive investment is the
medical plan asset.

214 Telkom Integrated Report 2013
Group Company
2013 2012 2013 2012
Rm Rm Rm Rm
30. EMPLOYEE BENEFITS (continued)
Medical benefits (continued)
Medical aid
Benefit obligation:
At beginning of year 7,142 6,775 7,119 6,752
Interest cost 622 569 621 568
Current service cost 110 107 110 106
Actuarial loss/(gain) 510 (17) 510 (16)
Curtailment (gain)/loss (276) 2 (276) 2
Termination settlement (3) (2) (3) (2)
Benefits paid from plan assets (202) (188) (202) (188)
Contributions paid by Telkom (82) (104) (81) (103)
Benefit obligation at end of year 7,821 7,142 7,798 7,119
Plan assets at fair value:
At beginning of year 2,233 2,094 2,233 2,094
Expected return on plan assets 241 208 241 208
Benefits paid from plan assets (202) (188) (202) (188)
Transfer from sinking fund to annuity policy 71 47 71 47
Actuarial gain 150 72 150 72
Plan assets at end of year 2,493 2,233 2,493 2,233
Present value of funded obligation 7,821 7,142 7,798 7,119
Fair value of plan assets (2,493) (2,233) (2,493) (2,233)
Liability as disclosed in the statement of financial
position (refer to note 29) 5,328 4,909 5,305 4,886
The net periodic other comprehensive income includes the following components:
Actuarial (loss)/gain (360) 89 (360) 88
Net periodic pension expense and income
recognised in other comprehensive income (360) 89 (360) 88
Cumulative actuarial loss (2,670) (2,310) (2,670) (2,310)
Plan assets at fair value:
Expected return on plan assets 241 208 241 208
Actuarial gain on plan assets 150 72 150 72
Actual return on plan assets 391 280 391 280
Principal actuarial assumptions were as follows:
Discount rate (%) 7.6 8.9 7.6 8.9
Expected return on plan assets (%) 10.4 11.3 10.4 11.3
The expected return on plan assets assumption
rate has been derived by considering the actual
asset allocation and the expected long term real
return of each asset class using the actuarial
asset liability model.
Salary inflation rate (%) 7.1 7.4 7.1 7.4
Medical inflation rate (%) 7.6 7.9 7.6 7.9
The assumed rates of mortality are determined by reference to the SA85-90 (Light) ultimate table, as published by the Actuarial Society of
South Africa, for pre-retirement purposes and the PA(90) ultimate table, minus one year age rating as published by the Institute and Faculty
of Actuaries in London and Scotland, for retirement purposes.
for the year ended 31 March 2013
NOTES TO THE CONSOLIDATED ANNUAL FINANCIAL
STATEMENTS
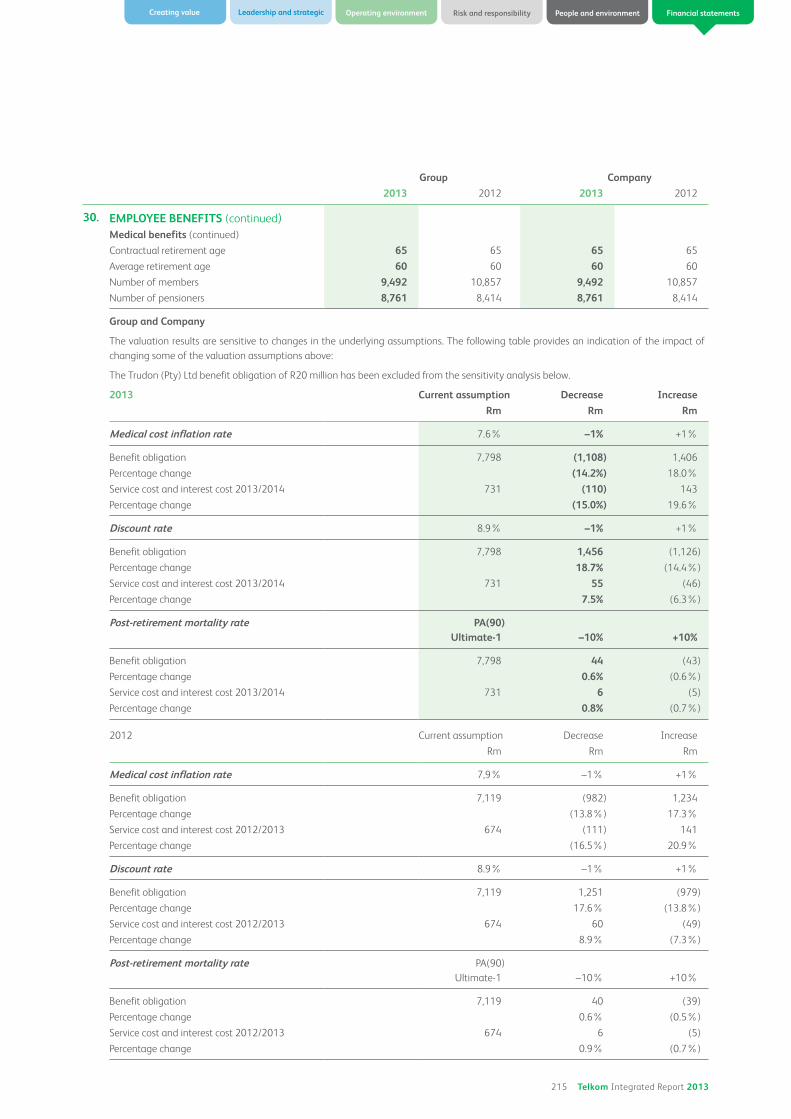
215 Telkom Integrated Report 2013
Operating environment Risk and responsibilityCreating value Leadership and strategic People and environment Financial statements
Group Company
2013 2012 2013 2012
30. EMPLOYEE BENEFITS (continued)
Medical benefits (continued)
Contractual retirement age 65 65 65 65
Average retirement age 60 60 60 60
Number of members 9,492 10,857 9,492 10,857
Number of pensioners 8,761 8,414 8,761 8,414
Group and Company
The valuation results are sensitive to changes in the underlying assumptions. The following table provides an indication of the impact of
changing some of the valuation assumptions above:
The Trudon (Pty) Ltd benefit obligation of R20 million has been excluded from the sensitivity analysis below.
2013 Current assumption Decrease Increase
Rm Rm Rm
Medical cost inflation rate 7.6% –1% +1%
Benefit obligation 7,798 (1,108) 1,406
Percentage change (14.2%) 18.0%
Service cost and interest cost 2013/2014 731 (110) 143
Percentage change (15.0%) 19.6%
Discount rate 8.9% –1% +1%
Benefit obligation 7,798 1,456 (1,126)
Percentage change 18.7% (14.4%)
Service cost and interest cost 2013/2014 731 55 (46)
Percentage change 7.5% (6.3%)
Post-retirement mortality rate PA(90) Ultimate-1 –10% +10%
Benefit obligation 7,798 44 (43)
Percentage change 0.6% (0.6%)
Service cost and interest cost 2013/2014 731 6 (5)
Percentage change 0.8% (0.7%)
2012 Current assumption Decrease Increase
Rm Rm Rm
Medical cost inflation rate 7,9% –1% +1%
Benefit obligation 7,119 (982) 1,234
Percentage change (13.8%) 17.3%
Service cost and interest cost 2012/2013 674 (111) 141
Percentage change (16.5%) 20.9%
Discount rate 8.9% –1% +1%
Benefit obligation 7,119 1,251 (979)
Percentage change 17.6% (13.8%)
Service cost and interest cost 2012/2013 674 60 (49)
Percentage change 8.9% (7.3%)
Post-retirement mortality rate PA(90)
Ultimate-1 –10% +10%
Benefit obligation 7,119 40 (39)
Percentage change 0.6% (0.5%)
Service cost and interest cost 2012/2013 674 6 (5)
Percentage change 0.9% (0.7%)

216 Telkom Integrated Report 2013
Group Company
2013 2012 2013 2012
Rm Rm Rm Rm
30. EMPLOYEE BENEFITS (continued)
Medical benefits (continued)
The fund portfolio consists of the following:
Equities (%) 53 48 53 48
Bonds (%) 9 17 9 17
Cash and money market investments (%) 10 12 10 12
Foreign investments (%) 28 23 28 23
Telephone rebates
Telkom provides telephone rebates to its
pensioners who joined prior to 1 August 2009.
The most recent actuarial valuation was
performed as at 31 March 2013. Eligible
employees must be employed by Telkom until
retirement age to qualify for the telephone
rebates. The scheme is a defined benefit plan.
The status of the telephone rebate liability is
disclosed below:
Benefit obligation 521 558 521 558
Unrecognised past service cost (5) (7) (5) (7)
Current service cost 6 7 6 7
Interest cost 44 47 44 47
Actuarial gain (129) (66) (129) (66)
Past service cost 2 2 2 2
Curtailment loss 6 – 6 –
Benefits paid (25) (25) (25) (25)
Liability as disclosed in the statement of financial
position (refer to note 29) 420 516 420 516
The net periodic other comprehensive income includes the following components:
Actuarial gain 129 66 129 66
Net periodic pension income recognised in other
comprehensive income 129 66 129 66
Cumulative actuarial gain/(loss) 32 (97) 32 (97)
Principal actuarial assumptions were as follows:
Discount rate (%) 7.6 8.9 7.6 8.9
Rebate inflation rate (%) – 3.4 – 3.4
Contractual retirement age 65 65 65 65
Average retirement age 60 60 60 60
The assumed rates of mortality are determined
by reference to the standard published mortality
table PA(90) ultimate standard tables, as
published by the Institute and Faculty of
Actuaries in London and Scotland, rated down
one year to value the pensioners.
Number of members 14,447 15,294 14,447 15,294
Number of pensioners 10,090 10,863 10,090 10,863
for the year ended 31 March 2013
NOTES TO THE CONSOLIDATED ANNUAL FINANCIAL
STATEMENTS
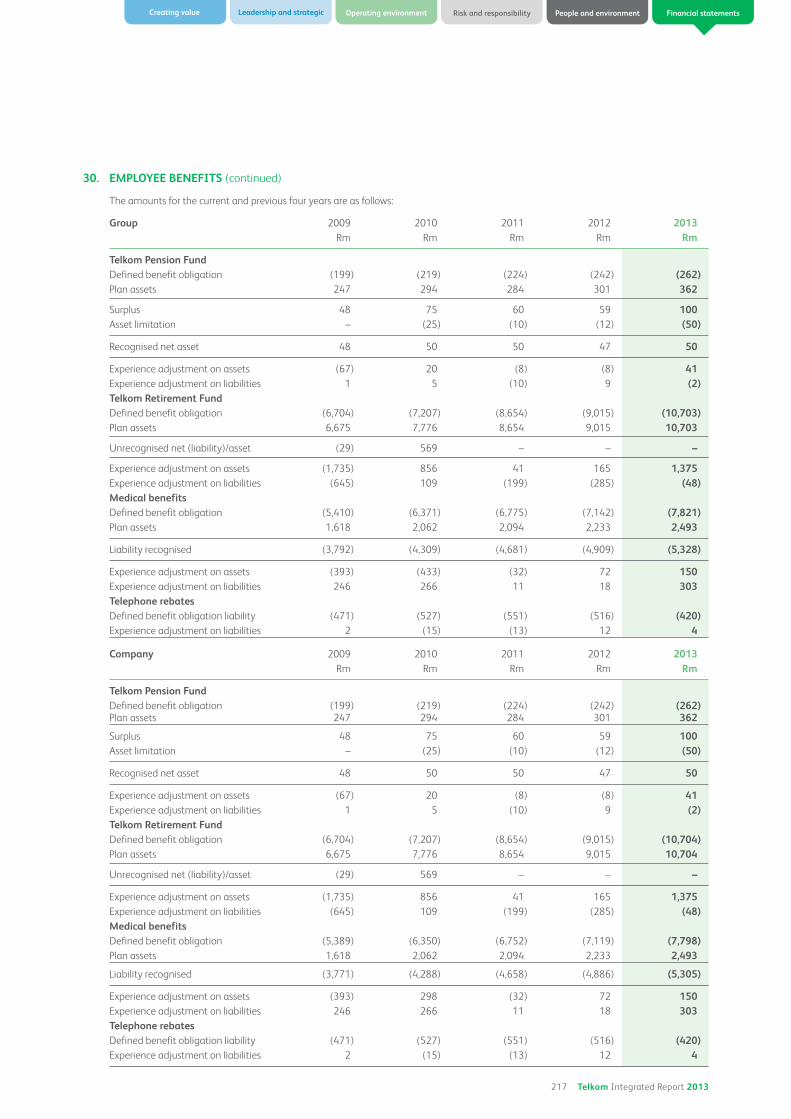
217 Telkom Integrated Report 2013
Operating environment Risk and responsibilityCreating value Leadership and strategic People and environment Financial statements
30. EMPLOYEE BENEFITS (continued)
The amounts for the current and previous four years are as follows:
Group 2009 2010 2011 2012 2013Rm Rm Rm Rm Rm
Telkom Pension FundDefined benefit obligation (199) (219) (224) (242) (262)Plan assets 247 294 284 301 362
Surplus 48 75 60 59 100Asset limitation – (25) (10) (12) (50)
Recognised net asset 48 50 50 47 50
Experience adjustment on assets (67) 20 (8) (8) 41Experience adjustment on liabilities 1 5 (10) 9 (2)Telkom Retirement FundDefined benefit obligation (6,704) (7,207) (8,654) (9,015) (10,703)Plan assets 6,675 7,776 8,654 9,015 10,703
Unrecognised net (liability)/asset (29) 569 – – –
Experience adjustment on assets (1,735) 856 41 165 1,375Experience adjustment on liabilities (645) 109 (199) (285) (48)Medical benefitsDefined benefit obligation (5,410) (6,371) (6,775) (7,142) (7,821)Plan assets 1,618 2,062 2,094 2,233 2,493
Liability recognised (3,792) (4,309) (4,681) (4,909) (5,328)
Experience adjustment on assets (393) (433) (32) 72 150Experience adjustment on liabilities 246 266 11 18 303Telephone rebatesDefined benefit obligation liability (471) (527) (551) (516) (420)Experience adjustment on liabilities 2 (15) (13) 12 4
Company 2009 2010 2011 2012 2013Rm Rm Rm Rm Rm
Telkom Pension FundDefined benefit obligation (199) (219) (224) (242) (262)Plan assets 247 294 284 301 362
Surplus 48 75 60 59 100Asset limitation – (25) (10) (12) (50)
Recognised net asset 48 50 50 47 50
Experience adjustment on assets (67) 20 (8) (8) 41Experience adjustment on liabilities 1 5 (10) 9 (2)Telkom Retirement FundDefined benefit obligation (6,704) (7,207) (8,654) (9,015) (10,704)Plan assets 6,675 7,776 8,654 9,015 10,704
Unrecognised net (liability)/asset (29) 569 – – –
Experience adjustment on assets (1,735) 856 41 165 1,375Experience adjustment on liabilities (645) 109 (199) (285) (48)Medical benefitsDefined benefit obligation (5,389) (6,350) (6,752) (7,119) (7,798)Plan assets 1,618 2,062 2,094 2,233 2,493
Liability recognised (3,771) (4,288) (4,658) (4,886) (5,305)
Experience adjustment on assets (393) 298 (32) 72 150Experience adjustment on liabilities 246 266 11 18 303Telephone rebatesDefined benefit obligation liability (471) (527) (551) (516) (420)Experience adjustment on liabilities 2 (15) (13) 12 4
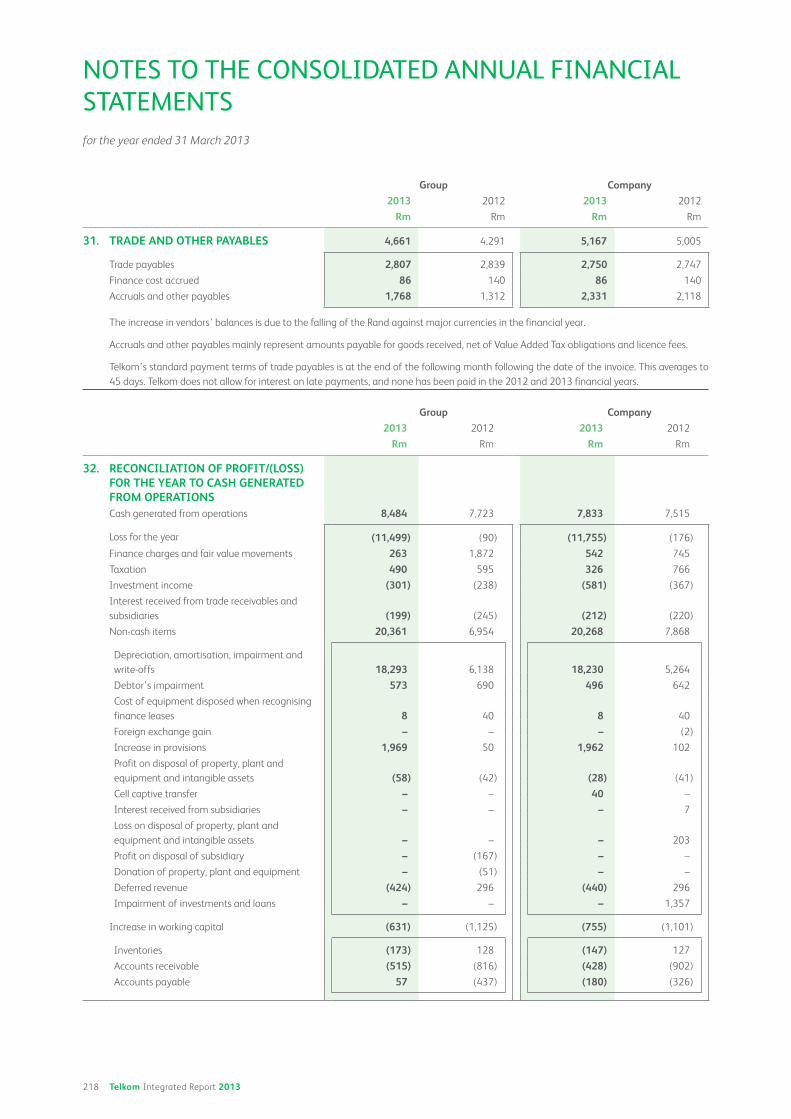
218 Telkom Integrated Report 2013
Group Company
2013 2012 2013 2012
Rm Rm Rm Rm
31. TRADE AND OTHER PAYABLES 4,661 4,291 5,167 5,005
Trade payables 2,807 2,839 2,750 2,747
Finance cost accrued 86 140 86 140
Accruals and other payables 1,768 1,312 2,331 2,118
The increase in vendors’ balances is due to the falling of the Rand against major currencies in the financial year.
Accruals and other payables mainly represent amounts payable for goods received, net of Value Added Tax obligations and licence fees.
Telkom’s standard payment terms of trade payables is at the end of the following month following the date of the invoice. This averages to
45 days. Telkom does not allow for interest on late payments, and none has been paid in the 2012 and 2013 financial years.
Group Company
2013 2012 2013 2012
Rm Rm Rm Rm
32. RECONCILIATION OF PROFIT/(LOSS) FOR THE YEAR TO CASH GENERATED FROM OPERATIONSCash generated from operations 8,484 7,723 7,833 7,515
Loss for the year (11,499) (90) (11,755) (176)
Finance charges and fair value movements 263 1,872 542 745
Taxation 490 595 326 766
Investment income (301) (238) (581) (367)
Interest received from trade receivables and
subsidiaries (199) (245) (212) (220)
Non-cash items 20,361 6,954 20,268 7,868
Depreciation, amortisation, impairment and
write-offs 18,293 6,138 18,230 5,264
Debtor’s impairment 573 690 496 642
Cost of equipment disposed when recognising
finance leases 8 40 8 40
Foreign exchange gain – – – (2)
Increase in provisions 1,969 50 1,962 102
Profit on disposal of property, plant and
equipment and intangible assets (58) (42) (28) (41)
Cell captive transfer – – 40 –
Interest received from subsidiaries – – – 7
Loss on disposal of property, plant and
equipment and intangible assets – – – 203
Profit on disposal of subsidiary – (167) – –
Donation of property, plant and equipment – (51) – –
Deferred revenue (424) 296 (440) 296
Impairment of investments and loans – – – 1,357
Increase in working capital (631) (1,125) (755) (1,101)
Inventories (173) 128 (147) 127
Accounts receivable (515) (816) (428) (902)
Accounts payable 57 (437) (180) (326)
for the year ended 31 March 2013
NOTES TO THE CONSOLIDATED ANNUAL FINANCIAL
STATEMENTS

219 Telkom Integrated Report 2013
Operating environment Risk and responsibilityCreating value Leadership and strategic People and environment Financial statements
Group Company
2013 2012 2013 2012
Rm Rm Rm Rm
33. DIVIDEND RECEIVED – – 325 146
Dividend received from subsidiaries – – 325 146
34. FINANCE CHARGES PAID (666) (564) (625) (674)
Finance charges and fair value movements per
statement of profit or loss and other
comprehensive income (263) (1,872) (542) (745)
Non-cash items (403) 1,308 (83) 71
Movements in interest accruals (54) 4 (54) (4)
Net discount amortised 118 71 118 70
Borrowing costs capitalised (80) (94) (80) –
Capitalised finance leases 108 116 108 –
Capitalised foreign exchange – 35 – –
Fair value adjustment (572) (192) (312) (74)
Cash effects of foreign exchange rates 2 – 2 7
Foreign exchange differences realised on
disposal of subsidiary – 1,292 – –
Unrealised foreign exchange loss 75 76 135 72
35. TAXATION PAID (687) (939) (550) (753)
Tax (payable)/receivable at beginning of year (61) 89 (85) 91
Current taxation (1,111) (1,019) (959) (882)
Secondary taxation on companies – (70) – (47)
Tax payable at end of year 485 61 494 85
36. DIVIDEND PAID (177) (812) (1) (754)
Dividend payable at beginning of year (23) (21) (23) (21)
Declared during the year – dividend on ordinary
shares: – (735) – (756)
Final dividend for 2011: 145 cents – (735) – (756)
Dividends paid to non-controlling interests (176) (79) – –
Dividend payable at end of year 22 23 22 23

220 Telkom Integrated Report 2013
Group Company
2013 2012 2013 2012
Rm Rm Rm Rm
37. COMMITMENTSCapital commitments authorised 7,542 7,480 7,501 7,400
Telkom 7,293 6,768 7,294 6,768
Other 249 712 207 632
International – 2 – –
South Africa 249 710 207 632
Commitments against authorised capital
expenditure 2,855 827 2,854 821
Telkom 2,829 789 2,829 789
Other 26 38 25 32
International – – – –
South Africa 26 38 25 32
Authorised capital expenditure not yet
contracted 4,687 6,653 4,646 6,579
Telkom 4,464 5,979 4,464 5,979
Other 223 674 182 600
International – 2 – –
South Africa 223 672 182 600
Capital commitments are largely attributable to purchases of property, plant and equipment and software (included in intangible assets).
Management expects these commitments to be financed from internally generated cash and borrowings.
Total <1 year 1 to 5 years >5 years
Rm Rm Rm Rm
Group
Operating lease commitments and receivables
2013
Land and buildings 1,321 340 772 209
Rental receivable on buildings (522) (226) (288) (8)
Customer premises equipment receivables (40) (22) (18) –
Total 759 92 466 201
2012
Land and buildings 675 197 378 100
Vehicles 311 311 – –
Equipment 6 6 – –
Rental receivable on buildings (403) (154) (249) –
Customer premises equipment receivables (42) (30) (12) –
Total 547 330 117 100
for the year ended 31 March 2013
NOTES TO THE CONSOLIDATED ANNUAL FINANCIAL
STATEMENTS

221 Telkom Integrated Report 2013
Operating environment Risk and responsibilityCreating value Leadership and strategic People and environment Financial statements
Total <1 year 1 to 5 years >5 years
Rm Rm Rm Rm
37. COMMITMENTS (continued)
Company
Operating lease commitments and receivables
2013
Land and buildings 1,164 309 670 185
Rental receivable on buildings (522) (226) (288) (8)
Customer premises equipment receivables (40) (22) (18) –
Total 602 61 364 177
2012
Land and buildings 504 167 284 53
Vehicles 311 311 – –
Equipment 6 6 – –
Rental receivable on buildings (403) (154) (249) –
Customer premises equipment receivables (42) (30) (12) –
Total 376 300 23 53
Operating leases
The Group leases certain buildings, vehicles and equipment. The majority of the lease terms negotiated for equipment related premises are
ten years with other leases signed for five and three years. The majority of the leases contain an option clause entitling Telkom to renew the
lease agreements for a period usually equal to the main lease term.
The minimum lease payments under these agreements are subject to annual escalations, which range from 6% to 15%.
Penalties in terms of the lease agreements are only payable should Telkom vacate a premises and negotiate to terminate the lease agreement
prior to the expiry date, in which case the settlement payment will be negotiated in accordance with the market conditions of the premises.
Future minimum lease payments under operating leases are included in the above note. Onerous leases for buildings, of which the Company
has no further use, no possibility of sub-lease and no option to cancel are provided for in full and included in other provisions.
Telkom is in negotiations with various suppliers to renew the commitments.
Total <1 year 1 to 5 years >5 years
Rm Rm Rm Rm
Group finance lease commitments
2013
Building
Minimum lease payments 1,153 157 792 204
Finance charges (383) (100) (271) (12)
Finance lease obligation 770 57 521 192
2012
Building
Minimum lease payments 1,297 143 722 432
Finance charges (490) (106) (332) (52)
Finance lease obligation 807 37 390 380
Vehicles
Minimum lease payments 47 47 – –
Finance charges (3) (3) – –
Finance lease obligation 44 44 – –

222 Telkom Integrated Report 2013
Total <1 year 1 to 5 years >5 years
Rm Rm Rm Rm
37. COMMITMENTS (continued)
Company finance lease commitments
2013
Building
Minimum lease payments 1,149 155 790 204
Finance charges (383) (100) (271) (12)
Finance lease obligation 766 55 519 192
2012
Building
Minimum lease payments 1,290 141 718 431
Finance charges (489) (106) (331) (52)
Finance lease obligation 801 35 387 379
Vehicles
Minimum lease payments 47 47 – –
Finance charges (3) (3) – –
Finance lease obligation 44 44 – –
Finance leases
Finance leases on vehicles relates to the lease of Swap bodies. The lease term for the Swap bodies is April 2008 to March 2013 and Telkom is
in negotiations with various suppliers to renew the commitments in this regard.
A major portion of the finance leases relates to the sale and lease-back of the Group’s office buildings. The lease term negotiated for the
buildings is for a period of 25 years ending 2019. The minimum lease payments are subject to an annual escalation of 10% p.a. Telkom has
the right to sub-let part of the buildings. In case of breach of contract, the lessor is entitled to cancel the lease agreement and claim damages.
Telkom has the option to renew the lease and the first option to purchase the buildings. Telkom expects to pay R1,15 billion on these buildings
over the next six years. Refer to note 18 for lease payments.
Telkom has a commitment to migrate customers to new cable systems with regard to long-term capacity leases on cables when the existing
cables are decommissioned before the lease period expires. Refer to note 18 for lease payments.
There are no major restrictions imposed by lease arrangements.
for the year ended 31 March 2013
NOTES TO THE CONSOLIDATED ANNUAL FINANCIAL
STATEMENTS
223 Telkom Integrated Report 2013
Operating environment Risk and responsibilityCreating value Leadership and strategic People and environment Financial statements
38. CONTINGENCIES
Contingent liabilities
Competition matters
Telkom is a party to a number of legal proceedings filed by several parties with the South African Competition Commission (CC) alleging anti-
competitive practices described below. Some of the complaints filed at the CC have been referred by the CC to the Competition Tribunal (CT)
for adjudication.
Should the CT find that Telkom committed a prohibited practice as set out in the Competition Act for each of the cases, the CT may impose a
maximum administrative penalty of 10% of Telkom’s annual turnover in the Republic of South Africa and its exports from the Republic of
South Africa during Telkom’s preceding financial year. However, Telkom has been advised by external legal counsel that the CT has to date not
imposed the maximum penalty on any offender in respect of the contraventions being accused of.
The South African Value Added Network Services (SAVA) and Omnilink
This matter relates to the complaints filed by SAVA in May 2002 and a complaint filed by Omnilink (in August 2002) against Telkom at the CC,
regarding certain alleged anti-competitive practices by Telkom. These complaints were referred by the CC to the CT in February 2004.
The matter was heard by the CT during 2011 and 2012.
The CT handed down a judgement on 7 August 2012. Telkom was found to be in contravention of section 8(b) (refusal to provide essential
facilities) and section 8(d)(i) (inducing customers not to deal with competitors), and imposed an administrative penalty of R449 million.
Telkom appealed the matter and the CC filed a cross-appeal. Pursuant to discussions between Telkom and the CC aimed at arriving at an
amicable settlement, the parties reached agreement in March 2013 that, subject to confirmation by the Competition Appeal Court (CAC),
each party would withdraw its appeal and cross-appeal, respectively, and each party to pay its own costs. The withdrawal of the appeals were
approved by the CAC on 12 April 2013 which was communicated to Telkom on 16 April 2013. Accordingly, Telkom will pay the fine that was
originally awarded by the Tribunal in the sum of R449 million, 50% of which is payable within six months from date of the withdrawal and the
balance to be paid within 18 months of the said date of confirmation of the withdrawal.
Internet Solutions
This matter deals with the self-referred parts of the Internet Solutions (IS) complaint filed at the CC in December 2007 alleging certain anti-
competitive practices by Telkom, such as excessive pricing, margin squeeze, bundling and price discrimination. Certain parts of this complaint
were referred to the CT by the CC and these are dealt with in the Multiple Complaints Referral below. The non-referred parts of the IS complaint
were self-referred by IS. IS alleged contraventions of the following sections of the Competition Act by Telkom: section 8(a) – excessive pricing,
section 8(d) – exclusionary conduct and section 9 – price discrimination. IS requested an administrative penalty in respect of each of its two
complaints, namely price discrimination in respect of Resell DSL and a complaint in respect of Telkom’s VPN Supreme product (this complaint
also involves a complaint of alleged excessive pricing and price discrimination as regards the VPN Supreme product).
After various amendments to IS papers, IS amendment application was heard by the CT and dismissed with costs. In August 2012, IS filed an
appeal against the CT’s order. IS has not yet filed the record. There is no further development in this matter.
Competition Commission Multiple Complaints Referral
The CC served a notice of motion on Telkom on 26 October 2009, in which it referred complaints against Telkom by MWeb and IS as well as
the Internet Service Providers’ Association (“ISPA”), MWeb, IS and Verizon respectively, to the CT. The CC alleged certain anti-competitive
practices by Telkom.
Pursuant to discussions between the parties, the CC signed a settlement agreement with Telkom on 13 June 2013, in an attempt to settle the
MIV referral. In terms of this settlement agreement, Telkom has admitted that its conduct during the complaint period amounted to a
contravention of sections 8(c) (margin squeeze) and 8(d)(iii) (bundling and tying) of the Competition Act. Telkom furthermore committed to
certain price reductions over the next three years, behavioural remedies which include a form of functional separation between its wholesale
and retail business and has agreed to pay an administrative penalty of R200 million, payable in three equal instalments. This settlement
agreement is subject to confirmation by the CT and Telkom is awaiting a date on which the CT will hear the matter.
224 Telkom Integrated Report 2013
38. CONTINGENCIES (continued)
Contingent liabilities (continued)
Competition Commission Multiple Complaints Referral (continued)
As part of the discovery process to prepare for trial, Telkom and the CC each filed applications to compel the discovery of certain further
documentation from each other and the applications were heard by the CT on 25 January 2013. Telkom’s application to compel further and
better discovery was dismissed by the CT in a ruling handed down in February 2013. Telkom appealed this ruling, and the appeal has yet to be
finalised. In further preparation for the hearing of the main matter, the CC has filed its factual and expert witness statements. Telkom has not
filed its witness statements due to the issues around the discovery process not being finalised. The hearing of the matter, which was previously
set down for June 2013, has been postponed by agreement between the parties but a new date has not yet been set. Notwithstanding the
above, the parties are exploring settlement discussions.
Phutuma Networks (Pty) Ltd (Phutuma)
Phutuma filed a complaint at the CC early in 2010, wherein Phutuma alleged that Telkom has contravened section 8(c) of the Competition Act
by abusing its dominant position in engaging in anti-competitive conduct in the telegraphic and telex maritime services market. The CC in June
2010 decided not to refer the complaint to the CT. However, Phutuma self-referred its complaint to the CT in July 2010, alleging that Telkom
engaged in an exclusionary act by appointing Network Telex in 2007 without any formal procurement process. Telkom filed certain preliminary
points, which were upheld by the CT in March 2011. Phutuma’s self-referral was dismissed with costs. Phutuma appealed this decision to the
Competition Appeal Court (CAC) which was dismissed with costs on 20 November 2012 and accordingly this matter is disposed of.
Matters before ICASA
Phutuma Networks (Pty) Ltd (Phutuma)
Phutuma filed a complaint against Telkom at the Complaints and Compliance Committee (CCC) of ICASA in February 2010. In July 2010, the
CCC expressed the view that they lacked jurisdiction to rule on certain of the complaints, which relied on legislation over which the CCC does
not have jurisdiction. The CCC requested Phutuma to amend its complaint to address these issues. Phutuma consequently filed an amended
complaint sheet, but at a hearing in March 2011, the CCC ruled that the second complaint sheet suffered from the same defects as the
original complaint. Phutuma then provided the CCC with a fresh complaint. In terms of the complaint as currently constituted, Phutuma’s
complaint currently consists of six (6) complaints, namely:
First Complaint: Telkom breached condition 4 of its Individual Electronic Communication Network Services (IECNS) licence relating to
universal service obligations in that the service which Telkom is giving does not conform to the “ITU Standards”.
Second Complaint: Telkom breached condition 4.2.2 of its Individual Electronic Communications Services IECS licence and condition 3.2.2 of
its (IECNS) licence in that there is no stipulation in Telkom’s arrangement with Network Telex to ensure that the exercise by Network Telex
of Telkom’s function under its licence do not contravene any of the conditions of its licence.
Third Complaint: Telkom has contravened section 16(6) of the Electronic Communications Act (ECA) in that it has allegedly ceded or
transferred part of both its IECS and IECNS licence to Network Telex without the prior written approval of ICASA.
Fourth Complaint: Telkom breached section 67 of the ECA read with section 2 thereof in that Telkom substantially lessened or prevented
competition by giving undue preference to Network Telex and by causing undue discrimination against the complainant and did not promote
open, fair and non-discriminatory access to electronic communications services by simply appointing Network Telex and appointing a non-
BEE, being Network Telex.
Fifth Complaint: Telkom breached condition 4.4 of its IECS licence and condition 3.4 of its IECNS licence and/or contravened section 15(1)
and section 80(1) of the Postal Services Act in that Telkom allegedly entrusted the delivery of telegrams to Network Telex.
Sixth Complaint: Telkom breached condition 4.2.3 of its IECS licence and condition 3.2.3 of its IECNS licence in that it failed to act against
Network Telex despite the latter’s known contravention of the Postal Services Act.
The matter was set down for hearing before the CCC in April 2013. At the commencement of the hearing, Phutuma applied for a postponement,
due to a lack of legal representation. The matter was postponed for hearing in August 2013.
End-User and Service Charter Regulations
Allegations have been made at the CCC regarding Telkom’s alleged non-compliance with the requirements of the End-User and Service
Charter Regulations relating to the clearance of reported faults. A hearing has taken place and the CCC has ruled that Telkom is not in breach
of the regulations and recommend that ICASA review the regulations which, as they stand, are not capable of implementation. Telkom,
however has already initiated administrative review proceedings seeking to set-aside the applicability of the Regulations since the CCC ruling
is not binding on ICASA and the risk remains for similar referrals. No further development in this matter.
for the year ended 31 March 2013
NOTES TO THE CONSOLIDATED ANNUAL FINANCIAL
STATEMENTS

225 Telkom Integrated Report 2013
Operating environment Risk and responsibilityCreating value Leadership and strategic People and environment Financial statements
38. CONTINGENCIES (continued)
Contingent liabilities (continued)
Neotel (Pty) Ltd (Neotel)
On 2 December 2011, the CCC notified Telkom of having received ICASA’s referral of notification of dispute. A dispute was lodged by Neotel
that broadly relates to Telkom’s alleged refusal to lease its unbundled local loop (LLU) constituting a portion of Telkom’s electronic
communication network.
The CCC heard arguments from both parties in the above matter in May 2012. At the culmination of proceedings, the CCC ruled that Neotel’s
request to access Telkom’s local loop was a valid request and that Telkom’s response to the same was inadequate. However, the CCC also ruled
that there currently exists no regulatory framework to give practical effect to LLU. In the circumstances the CCC has ordered that Telkom and
Neotel reconsider the issue and revert to ICASA within three months and that ICASA consider the matter within the context of its December
2011 LLU Determinations. Telkom has instituted High Court proceedings to interdict ICASA from implementing the CCC order and further to
have the CCC order reviewed and set aside. No further development in this matter.
Supplier dispute
Radio Surveillance Security Services (Pty) Ltd (RSSS)
During September 2011 RSSS served two summons on Telkom for the sum of R215,661,866 (including VAT) and R9,913,782 (including VAT),
respectively. In the summons for R215,661,866 RSSS alleged that Telkom was indebted to it for the rendering and upgrading of 440 alarm
systems previously purchased by Telkom, to be M3010 compliant and for which services Telkom was indebted to it.
Telkom neither concluded any written contract with RSSS for the provision of these alleged services nor did Telkom place any orders or accepted
any quotations in respect of these services. In the summons for R9,913,782 RSSS claimed that Telkom was liable for rentals, monitoring and
maintenance of alarm systems which were rented and/or purchased from RSSS. Both actions are defended. During November 2011 RSSS
withdrew both actions against Telkom in terms of a settlement agreement. Telkom was of the view that the dispute was settled on the basis
that RSSS withdraw its summons and each party pays its own legal costs. RSSS reissued summons in both matters in December 2011. The
smaller claim was settled. The larger claim is being defended. An exception was filed by Telkom and is set down for hearing in August 2013.
High Court
Phutuma Networks (Pty) Ltd (Phutuma)
In August 2009 Phutuma served a summons on Telkom, claiming for damages arising from a tender published by Telkom in November 2007
for the outsourcing of the telex and Gentex services and for the provision of a solution to support the maritime industry requirements. The
tender was cancelled in June 2009, without any award being made, due to the expiration of the validity period of the tender. According to
Phutuma, Telkom had awarded the tender to a third party outside a fair, transparent, competitive and cost effective procurement process,
hence it has claimed damages of R3,730,433,545.00, alternatively R5,513,876,290.00, and further alternatively R1,771,683,580.00 plus
interest at 15.5% per annum to date of payment from April 2008, alternatively from 30 April 2009 being the date of notice in terms of
Act 40 of 2002, further alternatively from date of service of this summons plus legal costs. At the hearing in October 2011, Phutuma brought
an application to compel Telkom to make better discovery of documents and also applied for a postponement of the trial. The court dismissed
Phutuma’s application for better discovery but granted a postponement of the trial with costs in favour of Telkom. The trial was re-enrolled for
hearing from 20 May 2013. On 21 May 2013, Phutuma’s second set of attorneys withdrew as attorneys of record without divulging the
reasons for same. Phutuma on 22 May 2013, with a new counsel again applied for a postponement of the trial which was refused by the court.
Since Phutuma could not establish the facts in support of its case to the satisfaction of the court, the court granted absolution from the
instance plus costs. Phutuma has filed a notice of appeal against the judgement.
Bihati Solutions (Pty) Ltd (Bihati) and Merid Trading (Pty) Ltd (Merid)
This matter arose from the award of a tender by Telkom in November 2008 for the construction of network services, after the validity period
had expired. Telkom successfully applied to the High Court to set aside its award. Bihati’s application to review and set aside Telkom’s
subsequent decision to set aside its own award and for an order compelling Telkom to commence with the negotiations in respect of the
award, was dismissed. Both Merid and Bihati filed appeals in the Supreme Court of Appeals against the decisions of the North Gauteng High
Court. The appeals which were set down in August 2012 were withdrawn by Bihati and Merid after a settlement agreement was concluded
with Telkom. The matter is finalised.
ZTE Mzanzi South Africa (Pty) Ltd (ZTE)
During 2011, Telkom awarded the MSAN tender to Huawei Technologies Africa and Alcatel-Lucent. In March 2012, ZTE successfully obtained
an interdict restraining Telkom from implementing the tender and concluding any agreements with the successful bidders. The High Court
granted the interim interdict in favour of ZTE. Telkom filed an application for leave to appeal to the Supreme Court of Appeal, which was
granted in May 2012. On 4 March 2013, the Supreme Court of Appeal upheld Telkom’s appeal with costs which included the costs of two
counsel in the lower court.

226 Telkom Integrated Report 2013
38. CONTINGENCIES (continued)
High Court (continued)
African Pre-paid Services Nigeria Limited (APSN) v Multi-Links: Arbitration matter
Multi-Links, a previously wholly-owned subsidiary of Telkom in Nigeria, concluded a Super Dealer agreement with African Pre-paid Services
(APS), in December 2008 in terms of which APS was appointed for an initial period of 10 years to sell, market and procure customers for Multi-
Links range of products and services in Nigeria (the agreement). On 29 May 2009, APS ceded and assigned all of its rights and obligations in
terms of the agreement to APSN. On 26 November 2010 APSN cancelled the agreement on the basis of an alleged repudiation by Multi-Links
of the agreement. On 13 June 2011 APSN launched arbitration proceedings in South Africa (as per contract) against Multi-Links claiming
damages (9 claims) in the total sum of USD481,199,101. Multi-Links is defending the matter and has filed a counterclaim in the amount of
USD123 million. Telkom sold its shareholding in Multi-Links to HIP Oils Topco Ltd (HIP Oils) on 3 October 2011. In terms of an indemnity
contained in the Sale and Purchase agreement between Telkom and HIP Oils concluded in August 2011, Telkom is liable for all amounts in
excess of USD10 million in respect of the claim between APSN and Multi-Links. In October 2012, APSN reduced its claim to USD457 million.
The arbitration which was set down for hearing in November 2012, was adjourned to enable Multi-Links to file a special plea in relation to
certain information regarding irregularities which came to the notice of Multi-Links in October 2012. The matter has been re-enrolled for
hearing from February 2014 to April 2014. MLT has applied to the High Court in terms of section 3(2) of the Arbitration Act to stay the
arbitration hearing pending the outcome of the damages action against Blue Label Telecoms and others. The application is opposed.
OTHER
HIP Oils Topco Ltd (HIP Oils)
With the sale of Telkom’s shares in Multi-Links to HIP Oils, Telkom provided a taxation indemnity and a “creditors” indemnity to HIP Oils and
Multi-Links where such liability or obligation was incurred prior to 3 October 2011 and to the extent that such liability exceed the amounts set
out in Schedule 4 (creditors’ list) to the Sale and Purchase Agreement.
Telkom has undertaken to indemnify any actual or contingent liabilities, obligations or other indebtedness of any nature owed or owing to
trade, financial and other creditors of Multi-Links where such liability, obligation or other indebtedness was incurred and not disclosed to
HIP Oils prior to the completion date.
Consumer Protection Act (CPA)/National Consumer Commission (NCC)
In August 2011 the NCC served compliance notices on Telkom for both fixed-line and mobile services to be brought in line with CPA. The NCC
filed an objection to these compliance notices and filed applications on the NCC for the setting aside of both notices. In February 2013 the
National Consumer Tribunal cancelled both compliance notices on the basis that they were defective.
Contingent assets
High Court
Former Senior Executive of Telkom
Telkom has issued a summons against a former senior executive of Telkom in April 2013, claiming an amount of US$6 million, for damages
suffered as a result of certain irregularities. The summons is based on two claims, namely:
(a) a claim for US$1 million which Telkom was compelled to pay to a third party as a consequence of the defendant, acting outside of his
authority, by signing a financial guarantee binding Telkom jointly and severally for the obligations of Multi-Links (a previous subsidiary
of Telkom); and
(b) a claim for US$5 million arising from the defendant’s conduct whilst at Multi-Links, in authorising a telecommunications operator to
earmark and make a payment of US$5 million to a third party, instead of Telkom. The payment was due to Telkom in terms of a traffic
termination agreement. The matter is being defended.
Blue Label Telecoms Limited and Five Others
On 17 May 2013, Telkom (and Multi-Links Telecommunications, Nigeria) issued a summons against Blue Label Telecoms Limited and certain
subsidiaries of Blue Label and individuals, including a former senior executive of Telkom, claiming an amount of US$528,071,116.00 being
damages suffered by Telkom arising out of a Super Dealer Agreement (SDA) concluded between African Pre-paid Services (Pty) Ltd (a
subsidiary of Blue Label) and Multi-Links. The damages claim is based, inter alia, on a breach of a duty of care and misrepresentations made
by Blue Label at the time that the SDA was concluded with Multi-Links. The claim against the former senior executive of Telkom is based on a
breach of his fiduciary duty owed to Telkom and Multi-Links. Multi-Links is also claiming several millions US Dollars for damages suffered. In
addition, as part of the relief sought by Multi-Links, the court has been requested to declare that the SDA dated 1 December 2008 between
Multi-Links and APS and the purported cession thereof to African Pre-paid Services Nigeria, to be void ab initio. To find jurisdiction, against
APSN , MLT and Telkom had obtained a High Court order. APSN has applied to the High Court to set aside the jurisdiction order.
for the year ended 31 March 2013
NOTES TO THE CONSOLIDATED ANNUAL FINANCIAL
STATEMENTS

227 Telkom Integrated Report 2013
Operating environment Risk and responsibilityCreating value Leadership and strategic People and environment Financial statements
38. CONTINGENCIES (continued)
Contingent assets (continued)
High Court (continued)
Multi-Links (MLT)
Telkom is claiming an amount of US$20.5 million from MLT in respect of amounts due by MLT to Telkom with regards to the provision of
resources, legal costs and an interest free loan.
Tax matters
During the period commencing May 2007 to October 2011, Telkom provided a loan totalling US$531 million to Multi-Links. In October 2011,
Telkom and Telkom International disposed of their shares in Multi-Links and sold their rights in respect of the Multi-Links Loan to an unconnected
third party for a consideration of US$100. The amount was received by Telkom during its year of assessment ended 31 March 2012.
In determining the taxable income for the Annual Financial Statements ended 31 March 2012, Telkom included a foreign exchange (FX) gain
to the value of R247 million on the realisation of the loan. Telkom subsequently obtained external tax advice, including two Senior Counsel
opinions, which support the contention that instead of a FX gain of R247 million a FX loss of R3.9 billion should be realised. The 2012 tax
return has been submitted on the basis of the Senior Counsel opinions obtained. Since the tax treatment of the R3.9 billion loss is based on an
unique set of circumstances and a complex legislative environment the financial statement adjustments will only be recognised once the
Telkom interpretation has been accepted by SARS or in the case of a dispute has been positively resolved in the Tax Court.
The Group is regularly subject to an evaluation, by tax authorities, of its direct and indirect tax filings. The consequence of such reviews is that
disputes can arise with tax authorities over the interpretation or application of certain tax rules applicable to the Group’s business. These
disputes may not necessarily be resolved in a manner that is favourable to the Group. Additionally, the resolution of the disputes could result
in an obligation to the Group.
39. DIRECTORS’ INTERESTS AND PRESCRIBED OFFICERS
Group and Company
Beneficial Non-beneficial
Number of shares Notes Direct Indirect Direct Indirect
Directors’ shareholding
2013
Executive
NT Moholi 1 37,004 – – –
Total 37,004 – – –
Non-executive
J Molobela 267 – – –
K Mzondeki 2 267 – – –
Dr CA Fynn 3 202 – – –
736 – – –
2012
Executive
NT Moholi 37,004 – – –
Total 37,004 – – –
Non-executive
J Molobela 267 – – –
NP Mnxasana 4 160 – – –
427 – – –
1. Resigned as Telkom Group CEO on 31 March 2013.
2. Appointed as Telkom independent non-executive director on 14 November 2012.
3. Appointed as Telkom independent non-executive director on 10 December 2012.
4. Resigned as Telkom independent non-executive director on 24 October 2012.

228 Telkom Integrated Report 2013
2013 2012
Rm Rm
39. DIRECTORS’ INTERESTS AND PRESCRIBED OFFICERS (continued)
Directors’ emoluments 29 28
Executive
For services as directors 20 20
Non-executive
For other services 9 8
Group and Company Fees RemunerationPerformance
bonusFringe and
other benefits* Total
R R R R R
2013
Emoluments per director:
Non-executive 4,266,667 4,534,481 – – 8,801,148
NP Dongwana 185,000 192,005 – – 377,005
B du Plessis 455,000 325,000 – – 780,000
JN Hope 330,000 183,705 – – 513,705
RJ Huntley 305,000 183,705 – – 488,705
N Kapila 285,000 449,811 – – 734,811
PSC Luthuli 330,000 183,705 – – 513,705
I Kgaboesele 490,000 325,000 – – 815,000
NP Mnxasana 245,000 183,705 – – 428,705
J Molobela 470,000 325,000 – – 795,000
SP Sibisi 60,000 183,705 – – 243,705
Y Waja 310,000 183,705 – – 493,705
PL Zim 156,667 627,422 – – 784,089
JA Mabuza 145,000 422,290 – – 567,290
KW Mzondeki 105,000 128,004 – – 233,004
LW Maasdorp 85,000 128,004 – – 213,004
S Botha 50,000 101,943 – – 151,943
Dr CA Fynn 60,000 101,943 – – 161,943
KT Kweyama – 101,943 – – 101,943
F Petersen 90,000 101,943 – – 191,943
LL von Zeuner 110,000 101,943 – – 211,943
Executive – 11,378,400 4,896,893 3,768,759 20,044,052
NT Moholi (CEO) – 6,402,150 2,659,133 2,575,420 11,636,703
JH Schindehütte (CFO) – 4,976,250 2,237,760 1,193,339 8,407,349
Total emoluments – paid by
Telkom 4,266,667 15,912,881 4,896,893 3,768,759 28,845,200
for the year ended 31 March 2013
NOTES TO THE CONSOLIDATED ANNUAL FINANCIAL
STATEMENTS

229 Telkom Integrated Report 2013
Operating environment Risk and responsibilityCreating value Leadership and strategic People and environment Financial statements
39. DIRECTORS’ INTERESTS AND PRESCRIBED OFFICERS (continued)
Group and Company Fees Remuneration
Performance
bonus
Fringe and
other benefits* Total
R R R R R
2012
Emoluments per director:
Non-executive 4,001,181 4,180,000 – – 8,181,181
NP Dongwana 37,401 25,000 – – 62,401
B du Plessis 325,000 495,000 – – 820,000
JN Hope 325,000 435,000 – – 760,000
RJ Huntley 325,000 645,000 – – 970,000
PG Joubert 135,417 190,000 – – 325,417
N Kapila 449,811 255,000 – – 704,811
PSC Luthuli 325,000 630,000 – – 955,000
I Kgaboesele** 243,750 185,000 – – 428,750
NP Mnxasana 37,401 10,000 – – 47,401
J Molobela 325,000 450,000 – – 775,000
SP Sibisi 37,401 15,000 – – 52,401
Y Waja 325,000 435,000 – – 760,000
PL Zim 1,110,000 410,000 – – 1,520,000
Executive – 7,461,720 3,129,613 9,860,446 20,451,779
NT Moholi (CEO) – 5,121,720 2,253,013 4,692,588 12,067,321
JH Schindehütte (CFO) – 2,340,000 876,600 5,167,858 8,384,458
Total emoluments – paid
by Telkom 4,001,181 11,641,720 3,129,613 9,860,446 28,632,960
* Included in fringe and other benefits is a pension contribution for NT Moholi of R665,824 (2012: R665,824), a restraint of trade of RNil million
(2012: R3,404,300), a leave gratuity of R429,406 (2012: RNil million) and a notice pay of R2,134,050 (2012: RNil million), JH Schindehütte, a pension
contribution of R488,992 (2012: R304,200), a sign-on bonus of RNil million (2012: R4,500,000) and a settling-in allowance of R1,181,375 (2012: RNil million).
** Paid to Sphere Holdings (Pty) Limited.
Emoluments per prescribed officer:
Group and Company Notes Remuneration*Incentive
bonusFringe and
other benefits** TotalPension- TRF13%***
R R R R R
2013
Emoluments per
prescribed officer:
A Vitai 1 1,833,333 689,700 5,948,333 8,471,366 –
BC Armstrong 3,537,432 1,222,536 958,061 5,718,029 321,906
DJ Fredericks 2 3,162,000 1,179,300 680,074 5,021,374 338,874
JM Mavuso 2,931,497 905,481 11,964 3,848,942 228,657
TE Msubo 2,996,632 1,079,866 11,964 4,088,462 233,737
MB Sallie 3,336,218 1,167,409 11,964 4,515,591 281,910
GJ Rasethaba 2,582,987 900,119 11,964 3,495,070 194,757
MJ Nzeku 3 660,621 – 13,000,000 13,660,621 57,540
Total emoluments – paid
by Telkom 21,040,720 7,144,411 20,634,324 48,819,455 1,657,381
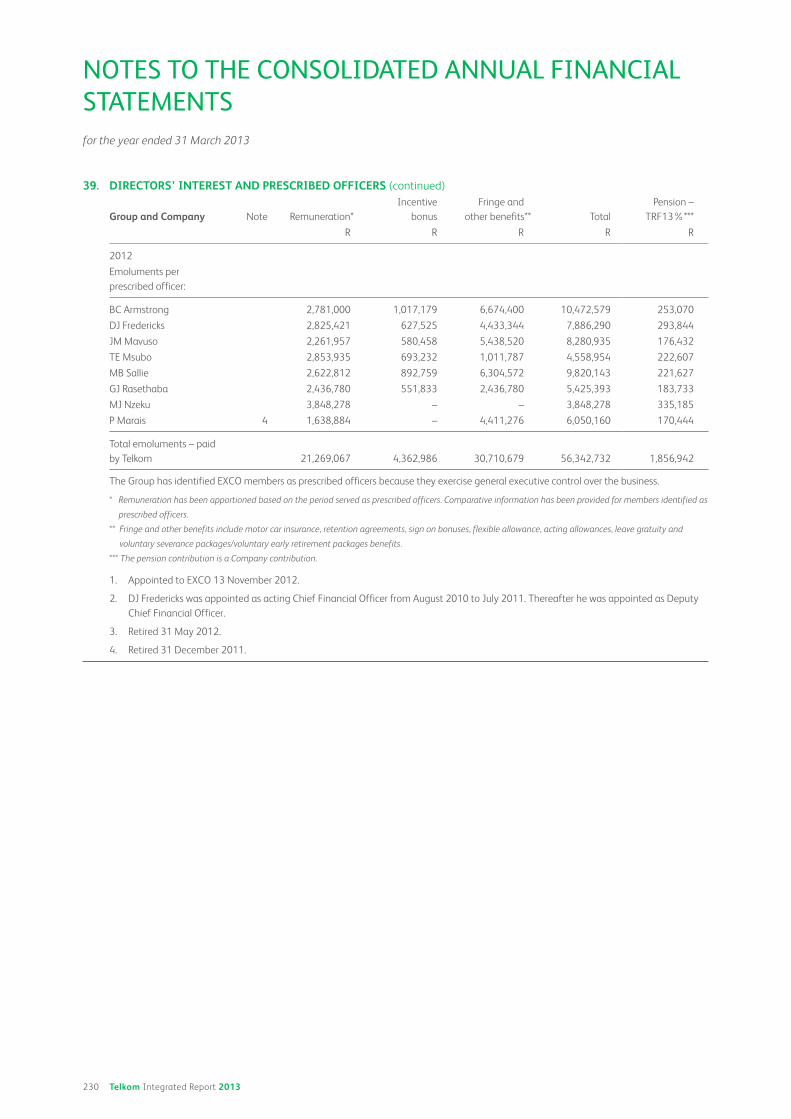
230 Telkom Integrated Report 2013
39. DIRECTORS’ INTEREST AND PRESCRIBED OFFICERS (continued)
Group and Company Note Remuneration*
Incentive
bonus
Fringe and
other benefits** Total
Pension –
TRF13%***
R R R R R
2012
Emoluments per
prescribed officer:
BC Armstrong 2,781,000 1,017,179 6,674,400 10,472,579 253,070
DJ Fredericks 2,825,421 627,525 4,433,344 7,886,290 293,844
JM Mavuso 2,261,957 580,458 5,438,520 8,280,935 176,432
TE Msubo 2,853,935 693,232 1,011,787 4,558,954 222,607
MB Sallie 2,622,812 892,759 6,304,572 9,820,143 221,627
GJ Rasethaba 2,436,780 551,833 2,436,780 5,425,393 183,733
MJ Nzeku 3,848,278 – – 3,848,278 335,185
P Marais 4 1,638,884 – 4,411,276 6,050,160 170,444
Total emoluments – paid
by Telkom 21,269,067 4,362,986 30,710,679 56,342,732 1,856,942
The Group has identified EXCO members as prescribed officers because they exercise general executive control over the business.
* Remuneration has been apportioned based on the period served as prescribed officers. Comparative information has been provided for members identified as
prescribed officers.
** Fringe and other benefits include motor car insurance, retention agreements, sign on bonuses, flexible allowance, acting allowances, leave gratuity and
voluntary severance packages/voluntary early retirement packages benefits.
*** The pension contribution is a Company contribution.
1. Appointed to EXCO 13 November 2012.
2. DJ Fredericks was appointed as acting Chief Financial Officer from August 2010 to July 2011. Thereafter he was appointed as Deputy
Chief Financial Officer.
3. Retired 31 May 2012.
4. Retired 31 December 2011.
for the year ended 31 March 2013
NOTES TO THE CONSOLIDATED ANNUAL FINANCIAL
STATEMENTS
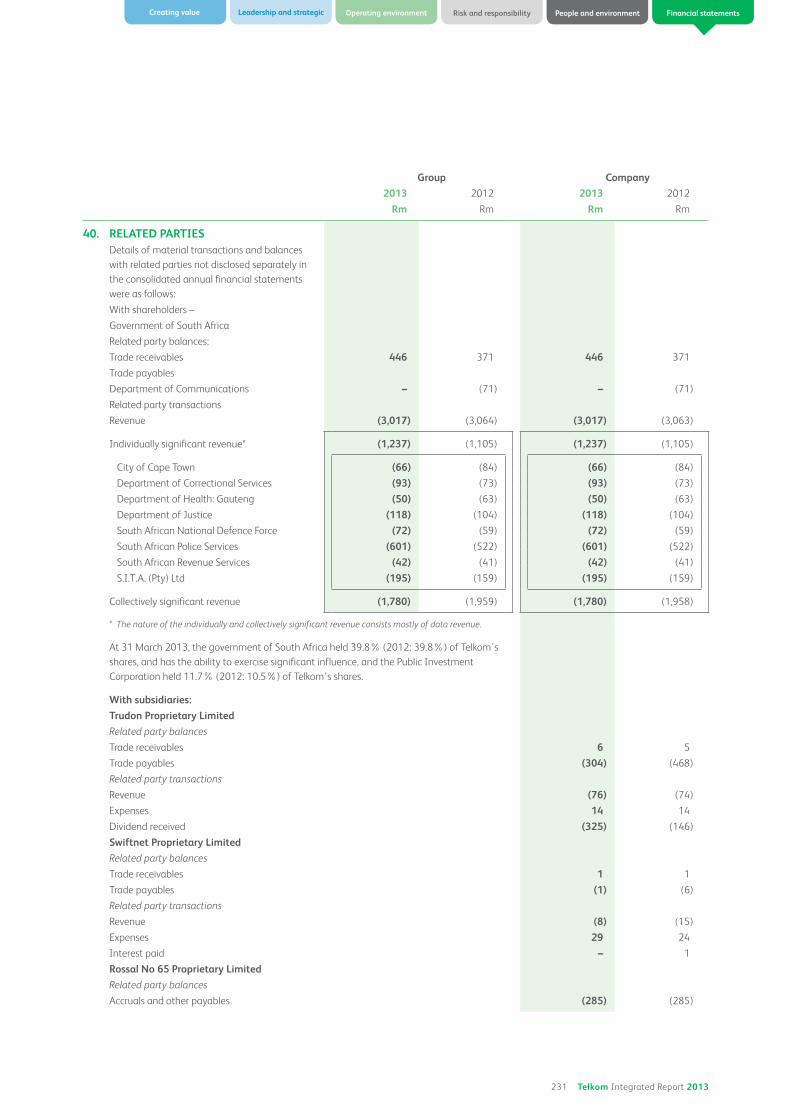
231 Telkom Integrated Report 2013
Operating environment Risk and responsibilityCreating value Leadership and strategic People and environment Financial statements
Group Company
2013 2012 2013 2012
Rm Rm Rm Rm
40. RELATED PARTIESDetails of material transactions and balances
with related parties not disclosed separately in
the consolidated annual financial statements
were as follows:
With shareholders –
Government of South Africa
Related party balances:
Trade receivables 446 371 446 371
Trade payables
Department of Communications – (71) – (71)
Related party transactions
Revenue (3,017) (3,064) (3,017) (3,063)
Individually significant revenue* (1,237) (1,105) (1,237) (1,105)
City of Cape Town (66) (84) (66) (84)
Department of Correctional Services (93) (73) (93) (73)
Department of Health: Gauteng (50) (63) (50) (63)
Department of Justice (118) (104) (118) (104)
South African National Defence Force (72) (59) (72) (59)
South African Police Services (601) (522) (601) (522)
South African Revenue Services (42) (41) (42) (41)
S.I.T.A. (Pty) Ltd (195) (159) (195) (159)
Collectively significant revenue (1,780) (1,959) (1,780) (1,958)
* The nature of the individually and collectively significant revenue consists mostly of data revenue.
At 31 March 2013, the government of South Africa held 39.8% (2012: 39.8%) of Telkom’s
shares, and has the ability to exercise significant influence, and the Public Investment
Corporation held 11.7% (2012: 10.5%) of Telkom’s shares.
With subsidiaries:
Trudon Proprietary Limited
Related party balances
Trade receivables 6 5
Trade payables (304) (468)
Related party transactions
Revenue (76) (74)
Expenses 14 14
Dividend received (325) (146)
Swiftnet Proprietary Limited
Related party balances
Trade receivables 1 1
Trade payables (1) (6)
Related party transactions
Revenue (8) (15)
Expenses 29 24
Interest paid – 1
Rossal No 65 Proprietary Limited
Related party balances
Accruals and other payables (285) (285)

232 Telkom Integrated Report 2013
Group Company
2013 2012 2013 2012
Rm Rm Rm Rm
40. RELATED PARTIES (continued)
With subsidiaries (continued)
Rossal No 65 Proprietary Limited (continued)
Related party transactions
Dividend paid – 3
Dividend received – (7)
Acajou Investments Proprietary Limited
Related party balances
Accruals and other payables (163) (164)
Related party transactions
Dividend paid – 17
Dividend received – (17)
Intekom Proprietary Limited
Related party balances
Accruals and other payables (69) (58)
Related party transactions
Expenses 16 14
Q-Trunk Proprietary Limited
Related party balances
Loan to subsidiary 4 9
Impairment of loan (4) (9)
The loan is unsecured, interest free and has no fixed repayment terms.
The loan has been subordinated in favour of other creditors.
Related party transactions
Expenses 5 5
Special purpose entity – Cell Captive
Related party balances
Investment – sinking fund (refer to note 16.2) 928 959
Africa Online Limited (Africa Online)
Related party balances
Loan to subsidiary 297 264
Impairment of loan (262) (264)
Trade receivables 32 26
Impairment of trade and other receivables (32) –
Trade payables (1) –
Related party transactions
Revenue (2) (3)
Expenses 5 4
Investment income until September 2011 – (5)
The loan is unsecured, interest free and has no fixed repayment terms.
Multi-Links Telecommunications Limited (Multi-Links)
Related party balances
Impairment of loan, guarantee, trade receivables
and trade payables – (319)
Telkom International Proprietary Limited
Related party transactions
Loan to subsidiary 2,481 2,481
Impairment of loan (2,481) (2,481)
The loan was unsecured, interest free and repayment terms had been negotiated.
for the year ended 31 March 2013
NOTES TO THE CONSOLIDATED ANNUAL FINANCIAL
STATEMENTS

233 Telkom Integrated Report 2013
Operating environment Risk and responsibilityCreating value Leadership and strategic People and environment Financial statements
Group Company
2013 2012 2013 2012
Rm Rm Rm Rm
40. RELATED PARTIES (continued)
With subsidiaries (continued)
iWayAfrica Proprietary Limited (Formerly MWeb Africa Proprietary Limited)
Related party balances
Loan to subsidiary 98 98
Impairment of loan (98) (98)
Other receivables 49 39
Impairment of trade and other receivables (49) (27)
The loan is unsecured, interest free and has no fixed repayment terms.
Related party transactions
Revenue (5) (7)
Expenses 3 –
Investments income – (2)
Telkom Foundation
Related party balances
Sundry provision (9) (10)
Related party transactions
Expenses 52 36
Telkom Management Services Proprietary Limited
Related party balances
Loan to subsidiary 45 45
Impairment of loan (45) (45)
The loan is unsecured, interest free and has no fixed repayment terms.
The sales to and purchases from related parties of telecommunication services are made at normal market prices. Except as indicated above,
outstanding balances at year-end are unsecured, interest free and settlement occurs in cash. There have been no guarantees provided or
received for any related party receivables or payables. Except as indicated above, for the year ended 31 March 2013, the company has not
made any impairment of amounts owed by related parties. This assessment is undertaken each financial year through examining the
financial position of the related party and the market in which the related party operates.
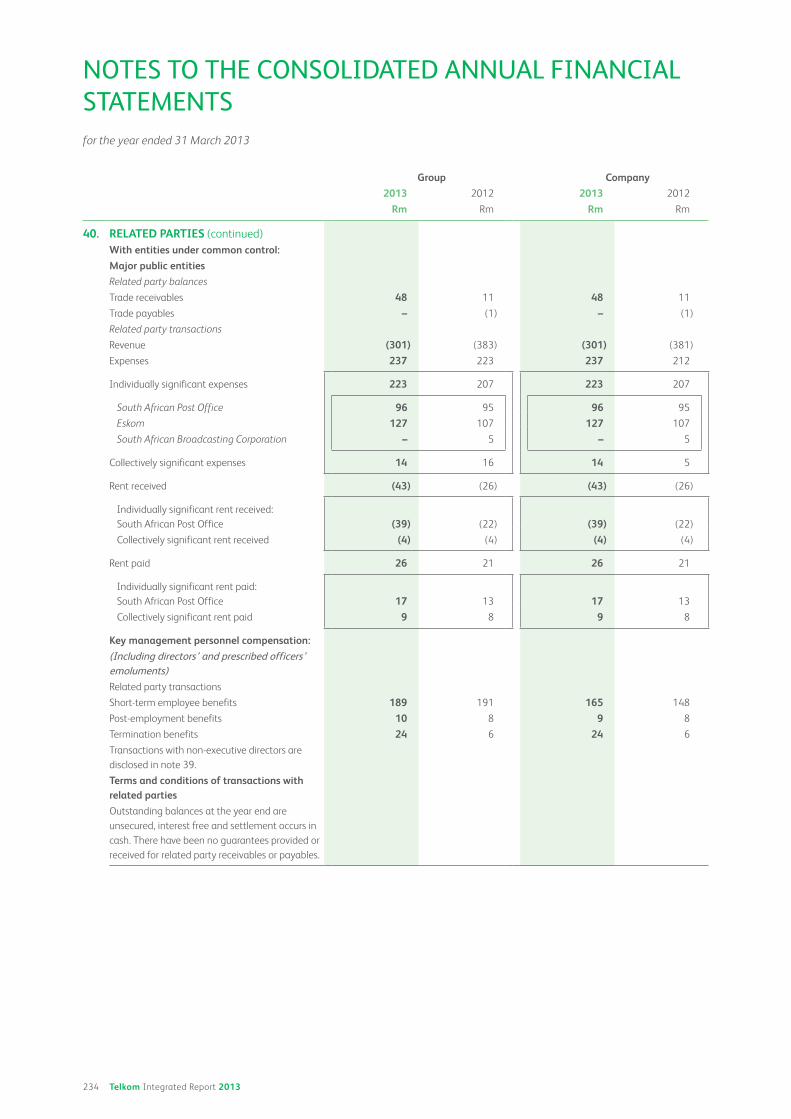
234 Telkom Integrated Report 2013
Group Company
2013 2012 2013 2012
Rm Rm Rm Rm
40. RELATED PARTIES (continued)
With entities under common control:
Major public entities
Related party balances
Trade receivables 48 11 48 11
Trade payables – (1) – (1)
Related party transactions
Revenue (301) (383) (301) (381)
Expenses 237 223 237 212
Individually significant expenses 223 207 223 207
South African Post Office 96 95 96 95
Eskom 127 107 127 107
South African Broadcasting Corporation – 5 – 5
Collectively significant expenses 14 16 14 5
Rent received (43) (26) (43) (26)
Individually significant rent received:
South African Post Office (39) (22) (39) (22)
Collectively significant rent received (4) (4) (4) (4)
Rent paid 26 21 26 21
Individually significant rent paid:
South African Post Office 17 13 17 13
Collectively significant rent paid 9 8 9 8
Key management personnel compensation:
(Including directors’ and prescribed officers’
emoluments)
Related party transactions
Short-term employee benefits 189 191 165 148
Post-employment benefits 10 8 9 8
Termination benefits 24 6 24 6
Transactions with non-executive directors are
disclosed in note 39.
Terms and conditions of transactions with related parties
Outstanding balances at the year end are
unsecured, interest free and settlement occurs in
cash. There have been no guarantees provided or
received for related party receivables or payables.
for the year ended 31 March 2013
NOTES TO THE CONSOLIDATED ANNUAL FINANCIAL
STATEMENTS
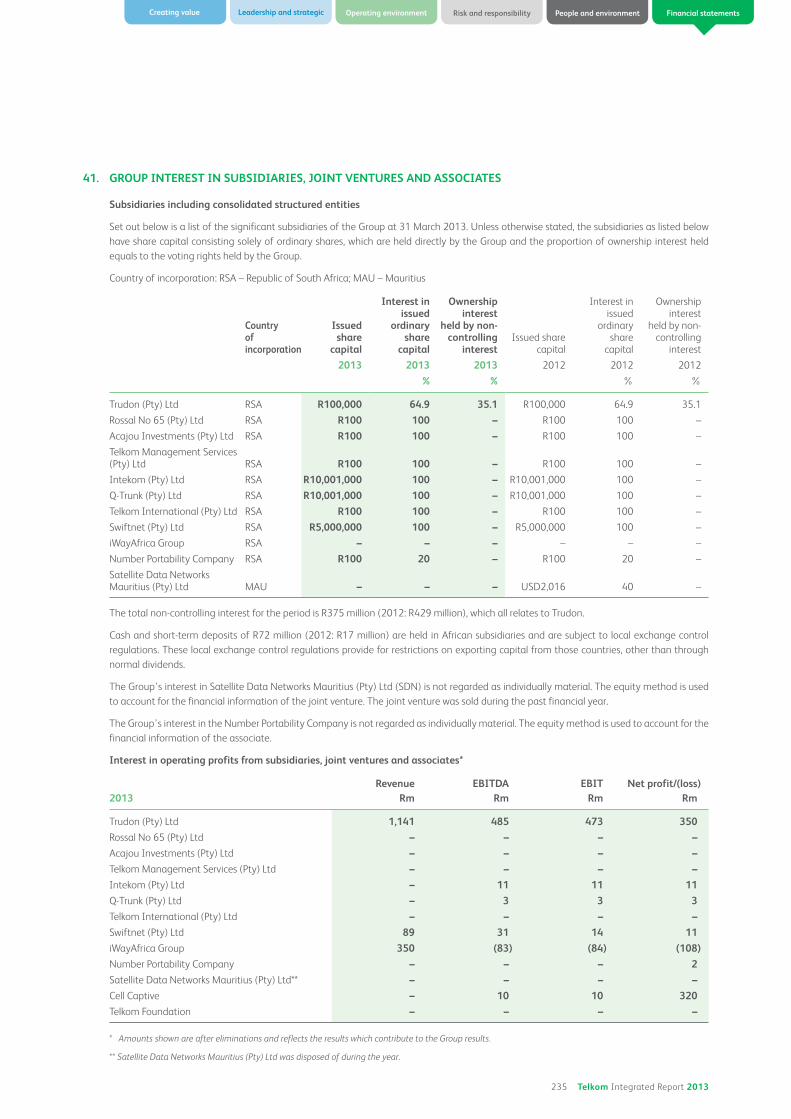
235 Telkom Integrated Report 2013
Operating environment Risk and responsibilityCreating value Leadership and strategic People and environment Financial statements
41. GROUP INTEREST IN SUBSIDIARIES, JOINT VENTURES AND ASSOCIATES
Subsidiaries including consolidated structured entities
Set out below is a list of the significant subsidiaries of the Group at 31 March 2013. Unless otherwise stated, the subsidiaries as listed below
have share capital consisting solely of ordinary shares, which are held directly by the Group and the proportion of ownership interest held
equals to the voting rights held by the Group.
Country of incorporation: RSA – Republic of South Africa; MAU – Mauritius
Country of incorporation
Issued share
capital
Interest in issued
ordinary share
capital
Ownership interest
held by non-controlling
interestIssued share
capital
Interest in issued
ordinary share
capital
Ownership interest
held by non-controlling
interest
2013 2013 2013 2012 2012 2012
% % % %
Trudon (Pty) Ltd RSA R100,000 64.9 35.1 R100,000 64.9 35.1
Rossal No 65 (Pty) Ltd RSA R100 100 – R100 100 –
Acajou Investments (Pty) Ltd RSA R100 100 – R100 100 –
Telkom Management Services (Pty) Ltd RSA R100 100 – R100 100 –
Intekom (Pty) Ltd RSA R10,001,000 100 – R10,001,000 100 –
Q-Trunk (Pty) Ltd RSA R10,001,000 100 – R10,001,000 100 –
Telkom International (Pty) Ltd RSA R100 100 – R100 100 –
Swiftnet (Pty) Ltd RSA R5,000,000 100 – R5,000,000 100 –
iWayAfrica Group RSA – – – – – –
Number Portability Company RSA R100 20 – R100 20 –
Satellite Data Networks Mauritius (Pty) Ltd MAU – – – USD2,016 40 –
The total non-controlling interest for the period is R375 million (2012: R429 million), which all relates to Trudon.
Cash and short-term deposits of R72 million (2012: R17 million) are held in African subsidiaries and are subject to local exchange control
regulations. These local exchange control regulations provide for restrictions on exporting capital from those countries, other than through
normal dividends.
The Group’s interest in Satellite Data Networks Mauritius (Pty) Ltd (SDN) is not regarded as individually material. The equity method is used
to account for the financial information of the joint venture. The joint venture was sold during the past financial year.
The Group’s interest in the Number Portability Company is not regarded as individually material. The equity method is used to account for the
financial information of the associate.
Interest in operating profits from subsidiaries, joint ventures and associates*
2013Revenue
RmEBITDA
RmEBIT
RmNet profit/(loss)
Rm
Trudon (Pty) Ltd 1,141 485 473 350
Rossal No 65 (Pty) Ltd – – – –
Acajou Investments (Pty) Ltd – – – –
Telkom Management Services (Pty) Ltd – – – –
Intekom (Pty) Ltd – 11 11 11
Q-Trunk (Pty) Ltd – 3 3 3
Telkom International (Pty) Ltd – – – –
Swiftnet (Pty) Ltd 89 31 14 11
iWayAfrica Group 350 (83) (84) (108)
Number Portability Company – – – 2
Satellite Data Networks Mauritius (Pty) Ltd** – – – –
Cell Captive – 10 10 320
Telkom Foundation – – – –
* Amounts shown are after eliminations and reflects the results which contribute to the Group results.
** Satellite Data Networks Mauritius (Pty) Ltd was disposed of during the year.
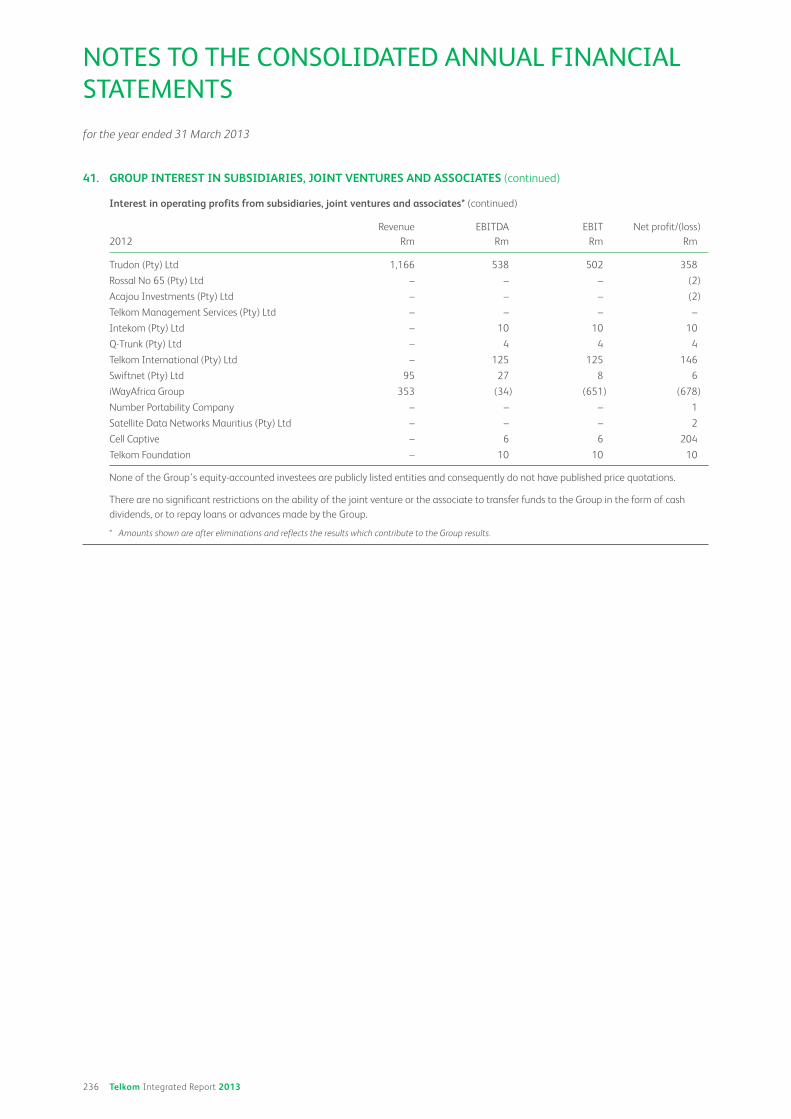
236 Telkom Integrated Report 2013
41. GROUP INTEREST IN SUBSIDIARIES, JOINT VENTURES AND ASSOCIATES (continued)
Interest in operating profits from subsidiaries, joint ventures and associates* (continued)
2012
Revenue
Rm
EBITDA
Rm
EBIT
Rm
Net profit/(loss)
Rm
Trudon (Pty) Ltd 1,166 538 502 358
Rossal No 65 (Pty) Ltd – – – (2)
Acajou Investments (Pty) Ltd – – – (2)
Telkom Management Services (Pty) Ltd – – – –
Intekom (Pty) Ltd – 10 10 10
Q-Trunk (Pty) Ltd – 4 4 4
Telkom International (Pty) Ltd – 125 125 146
Swiftnet (Pty) Ltd 95 27 8 6
iWayAfrica Group 353 (34) (651) (678)
Number Portability Company – – – 1
Satellite Data Networks Mauritius (Pty) Ltd – – – 2
Cell Captive – 6 6 204
Telkom Foundation – 10 10 10
None of the Group’s equity-accounted investees are publicly listed entities and consequently do not have published price quotations.
There are no significant restrictions on the ability of the joint venture or the associate to transfer funds to the Group in the form of cash
dividends, or to repay loans or advances made by the Group.
* Amounts shown are after eliminations and reflects the results which contribute to the Group results.
for the year ended 31 March 2013
NOTES TO THE CONSOLIDATED ANNUAL FINANCIAL
STATEMENTS

237 Telkom Integrated Report 2013
Operating environment Risk and responsibilityCreating value Leadership and strategic People and environment Financial statements
42. SIGNIFICANT EVENTS
Resignation of Chairman of the Telkom Board
On 9 September 2012, Mr Lazarus Zim informed the Telkom Board of his retirement as chairman and director with effect from 24 October 2012.
Resignation of Telkom Group Chief Executive Officer
Telkom announced on 5 November 2012 that the Group Chief Executive Officer, Ms Nombulelo Moholi notified the Board of her intention to
step down as Group Chief Executive Officer. Ms Nombulelo Moholi stepped down as GCEO on 31 March 2013.
Resignation of Independent non-executive directors
On 1 October 2012, Ms Jacky Huntley and Ms Julia Hope informed the Telkom Board of their retirement as directors with effect from
24 October 2012. Mrs NP Dongwana informed the Telkom Board of her resignation as director effective 2 November 2012.
Resignation of company secretary
Ms Mmathotho Lephadi resigned as company secretary of Telkom with effect from 31 October 2012. Ms Andisa Ditle was appointed acting
company secretary with effect from 1 November 2012.
Results of the Telkom Annual General Meeting regarding directors’ appointments
The ordinary resolution to appoint Dr Sibusiso Sibisi and Ms NP Mnxasana as directors and to re-elect Mr PSC Luthuli and Mr Y Waja as
directors was not passed by the requisite majority of shareholders. The ordinary resolution for the election of Mr PSC Luthuli as member and
chairperson of the Audit Committee and Ms NP Mnxasana as member of the Audit Committee were withdrawn, given their non-appointment
as directors. Mr PSC Luthuli, Mr Y Waja, Ms NP Mnxasana and Dr Sibusiso Sibisi resigned as independent non-executive directors with effect
from 24 October 2012.
Appointment of independent non-executive directors
Telkom announced on 14 November 2012 that Mr Jabulane Albert Mabuza and Ms Kholeka Mzondeki, on 16 November 2012 that
Mr Leslie Maasdorp, and on 10 December 2012 that Ms Susan Botha, Dr Clive Adrian Fynn, Ms Khanyisile Kweyama, Ms Fagmeedah Petersen
and Mr Louis Leon von Zeuner, were appointed as independent non-executive directors with immediate effect. Ms Mzondeki was also
appointed as a member of the Audit Committee of the Company on 10 December 2012 and Ms Fagmeedah Petersen and Mr Louis
Leon von Zeuner were also appointed as members of the Audit Committee of the Company on 18 February 2013.
Appointment of Chairman of the Telkom Board
On 16 November 2012 Telkom announced the appointment of Mr JA Mabuza as chairman of the Telkom Board with immediate effect.
Appointment of company secretary
Telkom announced on 7 March 2013 the appointment of Ms Xoliswa Makasi as company secretary of Telkom with effect from 18 March 2013.
Voluntary severance and early retirement packages on offer
Telkom announced on 11 March 2013 that the Company had approved the offering of Voluntary Severance Packages (VSPs) and Voluntary
Early Retirement Packages (VERPs) to both management and bargaining unit employees. Employees were invited to apply for a VSP or VERP
between April 2013 and August 2013.
Appointments of CEO and COO
Telkom announced on 28 March 2013 that the board of directors had appointed Mr Sipho Maseko as Group Chief Executive Officer and
Executive Director with effect from 1 April 2013. Telkom also announced the appointment of Dr Brian Armstrong as Group Chief Operating
Officer.
43. SUBSEQUENT EVENTS
Other matters
The directors are not aware of any other matter or circumstance since the financial year ended 31 March 2013 and the date of this report, or
otherwise dealt with in the financial statements, which significantly affects the financial position of the Group and the results of its operations.

238 Telkom Integrated Report 2013
44. SHAREHOLDER ANALYSIS
Number of
shareholders Percentage Holdings Percentage
Range of shareholders
1 – 100 shares 56,208 69.59 1,928,584 0.37
101 – 1,000 shares 22,189 27.47 5,898,754 1.13
1,001 – 10,000 shares 1,764 2.18 4,669,394 0.90
10,001 – 50,000 shares 227 0.28 5,606,293 1.08
50,001 – 100,000 shares 112 0.14 8,267,691 1.59
100,001 – 1,000,000 shares 218 0.27 65,945,711 12.66
1,000,001 and more shares 55 0.07 428,467,471 82.27
80,773 100.00 520,783,898 100.00
Type of shareholder
Banks 105 0.13 87,446,483 16.79
Close corporations 43 0.05 85,009 0.02
Endowment funds 145 0.18 1,776,162 0.34
Individuals 78,418 97.08 14,026,754 2.69
Insurance companies 35 0.04 15,128,425 2.91
Investment companies 28 0.03 9,512,900 1.83
Medical aid schemes 10 0.01 750,769 0.14
Mutual funds 151 0.19 73,305,281 14.08
Nominees and trusts 1,499 1.86 1,474,230 0.28
Other corporations (including the Government of
the Republic of South Africa) 62 0.08 207,130,134 39.77
Own holdings 2 0.00 10,190,084 1.96
Retirement funds 212 0.26 98,491,783 18.91
Private companies 58 0.07 1,428,631 0.27
Public companies 5 0.02 37,253 0.01
80,773 100.00 520,783,898 100.00
for the year ended 31 March 2013
NOTES TO THE CONSOLIDATED ANNUAL FINANCIAL
STATEMENTS
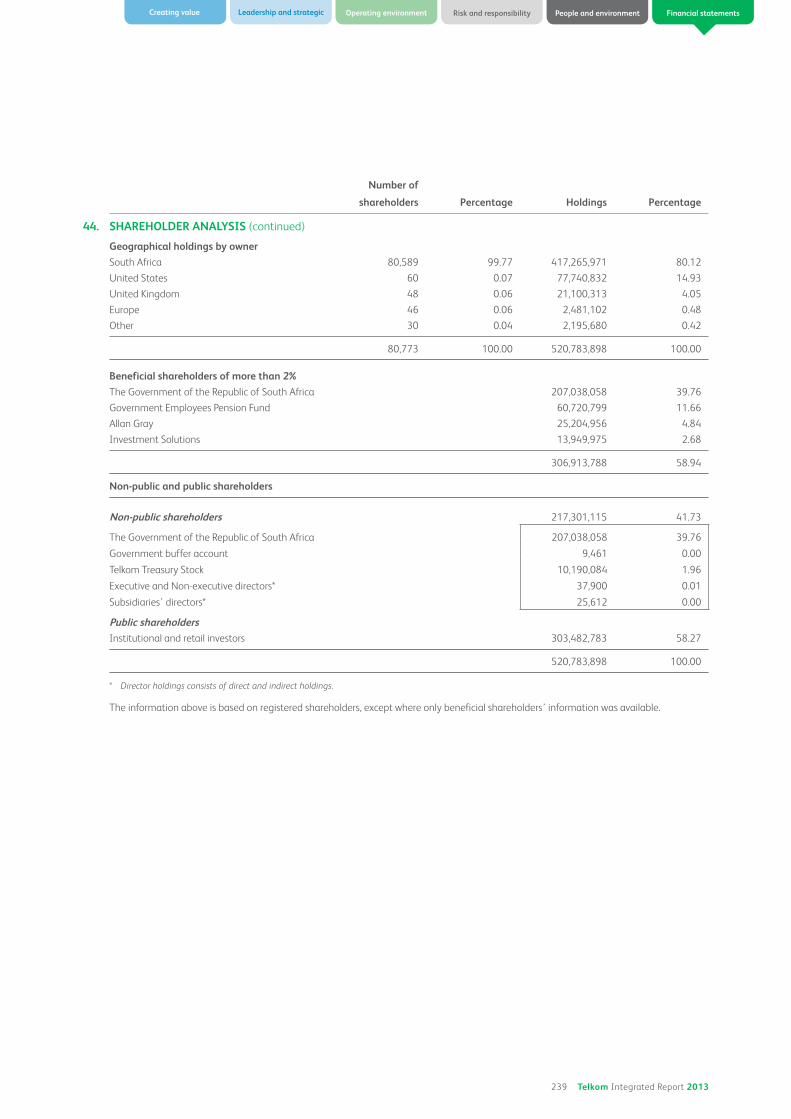
239 Telkom Integrated Report 2013
Operating environment Risk and responsibilityCreating value Leadership and strategic People and environment Financial statements
Number of
shareholders Percentage Holdings Percentage
44. SHAREHOLDER ANALYSIS (continued)
Geographical holdings by owner
South Africa 80,589 99.77 417,265,971 80.12
United States 60 0.07 77,740,832 14.93
United Kingdom 48 0.06 21,100,313 4.05
Europe 46 0.06 2,481,102 0.48
Other 30 0.04 2,195,680 0.42
80,773 100.00 520,783,898 100.00
Beneficial shareholders of more than 2%
The Government of the Republic of South Africa 207,038,058 39.76
Government Employees Pension Fund 60,720,799 11.66
Allan Gray 25,204,956 4.84
Investment Solutions 13,949,975 2.68
306,913,788 58.94
Non-public and public shareholders
Non-public shareholders 217,301,115 41.73
The Government of the Republic of South Africa 207,038,058 39.76
Government buffer account 9,461 0.00
Telkom Treasury Stock 10,190,084 1.96
Executive and Non-executive directors* 37,900 0.01
Subsidiaries’ directors* 25,612 0.00
Public shareholders
Institutional and retail investors 303,482,783 58.27
520,783,898 100.00
* Director holdings consists of direct and indirect holdings.
The information above is based on registered shareholders, except where only beneficial shareholders’ information was available.

240 Telkom Integrated Report 2013
3GThe generic term, 3G, is used to denote the next generation of mobile systems designed to support high-speed data transmission (144 Kbps
and higher) and Internet Protocol (IP) based services in fixed, portable and mobile environments. As envisaged by the ITU, the 3G system will
integrate different service coverage zones and be a global platform and the necessary infrastructure for the distribution of converged service,
whether mobile or fixed, voice or data, telecommunications, content or computing.
ACCESS NETWORKThe Access Network is the portion of the communications network that connects the subscriber (consumer/business) to the service provider’s
local exchange, commonly termed the local loop, last mile or first mile.
ADSL (ASYMMETRICAL DIGITAL SUBSCRIBER LINE)ADSL is a broadband access standard which uses existing copper lines to offer high-speed digital connections over the local loop. ADSL
transmits data asymmetrically, meaning that the bandwidth usage is much higher in one direction than the other. ADSL provides greater
bandwidth from the exchange to the customer (ie. downloading) than from the customer to the exchange (ie. sending).
ADSL2+ADSL2+ double the bandwidth used for downstream data transmission, effectively doubling the maximum downstream data rates, while also
offering the ADSL2 standard’s improvements.
ARPUAverage monthly revenue per customer, or ARPU, is calculated by dividing the average monthly revenue during the period by the average
monthly total reported customer base during the period.
ATM (ASYNCHRONOUS TRANSFER MODE)ATM is a high-speed Wide Area Network (WAN), connection oriented, packet-switching data communications protocol that allows voice, data
and video to be delivered across existing local and Wide Area Networks. ATM divides data into cells and can handle data traffic in bursts. It is
asynchronous, in that the stream of cells from one particular user is not necessarily continuous.
BANDWIDTHBandwidth is a measure of the quantity of signals that can travel over a transmission medium such as copper or a glass fibre strand. It is the
space available to carry a signal. The greater the bandwidth, the greater the information carrying capacity. Bandwidth is measured in bits
per second.
BEPSBasic earnings per share.
BNG TECHNOLOGYThe Broadband Network Gateway (BNG) is a multi-service edge router. The BNG multi-service edge router replace the Broadband Remote
Access Services (BRAS) in the network architecture and significantly enhances the features to support consumer-residential services, Carrier
Ethernet and IP VPN business services, as the aggregation router in mobile backhaul applications, or as a mobile gateway for wireless networks.
BROADBANDBroadband is a method of measuring the capacity of different types of transmission. Digital bandwidth is measured in the rate of
bits transmitted per second (bps). For example, an individual ISDN channel has a bandwidth of 64 Kbps, meaning that it transmits 64,000 bits
(digital signals) every second.
CAGRCompound Annual Growth Rate.
CARRIER PRE-SELECTIONCarrier pre-selection is usually initiated by the telecoms regulator. It enables individuals to choose which telecom will carry their traffic (mainly
long distance) by a signalling contract rather than having to dial extra digits.
CDMA (CODE DIVISION MULTIPLE ACCESS)CDMA is one of many technologies for digital transmission of radio signals between, for example, mobile telephones and radio base stations.
In CDMA, which is a spread-spectrum modulation technology, each call is assigned a unique “pseudorandom” sequence of frequency shifts
that serve as a code to distinguish it. The mobile phone is then instructed to decipher only a particular code to pluck, as it were, the right
conversation off the air.
DEFINITIONS

241 Telkom Integrated Report 2013
Operating environment Risk and responsibilityCreating value Leadership and strategic People and environment Financial statements
CIRCUITA circuit is a connection or line between two points. This connection can be made through various media, including copper, coaxial cable, fibre
or microwave. A telephone exchange is a circuit switch.
DECT (DIGITAL ENHANCED CORDLESS TELECOMMUNICATIONS)DECT is the standard for cordless telephones. DECT phones communicate using the PSTN (Public Switched Telephone Network) through a
small base station in the home or office and have a working radius of between 50 and 300 metres.
DSLAMThe Digital Subscriber Line Access Multiplexer (DSLAM) is a network device that receives signals from multiple customer Digital Subscriber
Line (DSL) connections, and puts these signals on a high-speed backbone line using multiplexing techniques.
DWDM TECHNOLOGYDense Wavelength Division Multiplexing (DWDM) is a fibre optic transmission techniques that makes it possible to transmit data
simultaneously, for different sources, using a separate light wavelength for each source across a single fibre. This technology increases the
capacity of the fibre infrastructure without the operator having to deploy additional fibres.
EBITDAEBITDA represents profit for the year before taxation, finance charges, investment income and depreciation, amortisation, impairment and
write-offs.
EDGE (ENHANCED DATA FOR GSM EVOLUTION)EDGE is a technology designed to enhance GSM and TDMA systems with respect to data rates and is widely considered to be the GSM
evolution beyond GPRS. It enhances the data capabilities of GSM and TDMA systems by altering the RF modulation scheme to allow greater
data rates per time slot. Because it uses a different modulation technique across the air-interface, EDGE requires different mobile terminals/
handsets than those designed for the GSM air-interface.
EFFECTIVE TAX RATEThe effective tax rate is the tax charge in the statement of profit or loss divided by pre-tax profit.
ETHERNETEthernet is a protocol that defines how data is transmitted to and received from LANs. It is the most prevalent LAN protocol, with speeds
of up to 10 Mbps.
EVDO (EVOLUTION-DATA OPTIMISED OR EVOLUTIONDATA ONLY)EVDO is a telecommunications standard for the wireless transmission of data through radio signals, typically for broadband internet access.
It uses multiplexing techniques including code division multiple access (CDMA) as well as time division multiple access (TDMA) to maximise
both individual users’ throughput and the overall system throughput.
FDPSFibre optic Distribution Points (FDPs) is the fibre endpoint in the Access Network closest to the customer from which Telkom will build out the
last mile to the customer premise.
FIBRE OPTICSFibre optics is where messages or signals are sent via light rather than electrical signals down a very thin strand of glass. Light transmission
enables much higher data rates than conventional wire, coaxial cable and many forms of radio. Signals travel at the speed of light and do not
generate nor are subject to interference.
FIBRE RINGSFibre rings have come to be used in many fibre networks as it provides more network resiliency: if there is a failure along a route and a ring is
broken, the direction of the traffic can be reversed and the traffic will still reach its final destination.
FIXED ACCESS LINESFixed access lines comprise public switched telecommunications network lines, or PSTN lines, including integrated services digital network
channels, or ISDN channels, and public and private pay phones, but excluding internal lines in service.
FIXED ACCESS LINES PER EMPLOYEETo calculate the number of access lines per employee the total number of access lines is divided by the number of employees at the end
of the period.

242 Telkom Integrated Report 2013
DEFINITIONS
FIXED-LINE PENETRATIONFixed-line penetration or teledensity is based on the total number of telephone lines in service at the end of the period per 100 persons in
the population of South Africa. Population is the estimated South African population at the mid-year in the periods indicated as published by
Statistics South Africa, a South African Government department.
FIXED-LINE TRAFFICFixed-line traffic, other than international outgoing mobile traffic, international interconnection traffic and international Voice over Internet
Protocol traffic, is calculated by dividing traffic operating revenue for the particular category by the weighted average tariff for such category
during the relevant period. Fixed-line international outgoing mobile traffic and international interconnection traffic are based on the traffic
registered through the respective exchanges and reflected in international interconnection invoices. International Voice over Internet Protocol
traffic is based on the traffic reflected in invoices.
FMCFixed Mobile Convergence (FMC) is an environment/infrastructure that enable the transparent use of voice and data applications across fixed
and mobile access points.
FRAME RELAYFrame relay is a widely implemented telecommunications service designed for cost-efficient data transmission for data traffic between local
area networks and between end-points in a wide area network. The network effectively provides a permanent circuit, which means that the
customer sees a continuous, dedicated connection, but does not pay for a full-time leased line.
FTRFixed termination rates
FTTXFibre to the X (FTTx) refers to all possible fibre optic topologies, from a service provider to its customers, based on the location of the fibre’s
termination point. These include fibre-to-the-curb (FTTC: fibre-to-the-home (FTTH); fibre-to-the-building (FTTB); fibre-to-thepremise (FTTP);
et al.
GPRS (GENERAL PACKET RADIO SERVICE)GPRS is a packet rather than a circuit-based technology. GPRS allows for faster data transmission speed to both GSM and TDMA (IS-136)
networks. GPRS is a packet-switched technology that overlays the circuit-switched GSM network. The service can be introduced to cellular
networks by infrastructure.
GSM (GLOBAL SYSTEM FOR MOBILE)GSM is a second generation digital mobile cellular technology using a combination of frequency division multiple access
(FDMA) and time division multiple access (TDMA). GSM operates in several frequency bands: 400 MHz, 900 MHz and
1800 MHz. On the TDMA side, there are eight timeslots or channels carrying calls, which operate on the same frequency. Unlike other cellular
systems, GSM provides a high degree of security by using subscriber identity module (SIM) cards and GSM encryption.
HEPSHeadline earnings per share.
HSDPAHigh Speed Downlink Packet Access.
IASInternational Accounting Standards.
IFRSInternational Financial Reporting Standards.
INTERCONNECTIONInterconnection refers to the joining of two or more networks. Networks need to interconnect to enable traffic to be transmitted to and
from destinations. The amounts paid and received by the operators vary according to distance, time, the direction of traffic, and the type of
networks involved.
INTEREST COVERInterest cover is calculated by dividing EBIT by the net interest charge in the statement of profit or loss. It is a measure of income gearing.
ISDN (INTEGRATED SERVICES DIGITAL NETWORK)ISDN is a data communications standard used to transmit digital signals over ordinary copper telephone cables. This is one technology for
overcoming the “last mile” of copper cables from the local exchange to the subscriber’s premises, which has proved a bottleneck for internet
access, for example. ISDN allows to carry voice and data simultaneously, in each of at least two channels capable of carrying 64 Kbps. It
provides up to 128 Kbps and a total capacity of 144 Kbps exist.
243 Telkom Integrated Report 2013
Operating environment Risk and responsibilityCreating value Leadership and strategic People and environment Financial statements
ITU (INTERNATIONAL TELECOMMUNICATIONS UNION)ITU is the global technical standard-setting body for telecommunications services.
LAN (LOCAL AREA NETWORK)A LAN is a group of devices that communicate with each other within a limited geographic area, such as an office.
LEASED LINEA leased line is a telecommunications transmission circuit that is reserved by a communications provider for the private use of a customer.
LIBORLondon Interbank Offer Rate.
LOCAL LOOPThe local loop is the final connection between the exchange and the home or office. It is also known as the last mile.
LTE (LONG-TERM EVOLUTION)Long-term evolution, marketed as 4G LTE, is a standard for wireless communication of high-speed data for mobile phones and data terminals.
MICROWAVEMicrowave is radio transmission using very short wavelengths.
MMS (MULTIMEDIA MESSAGING SERVICES)MMS, a service developed jointly together with 3GPP, allows users to combine sounds with images and text when sending messages, much
like the text-only SMS.
MCO Mobile cellular operators
MOBILE CHURNChurn is calculated by dividing the average monthly number of disconnections during the period by the average monthly total reported
customer base during the period.
MSANThe multi-Service Access Node provides the boundary between customer interface and the transport network. It makes it possible to offer the
customer traditional voice, high-speed DSL and new emerging IP-based services all delivered from the same hardware.
MTRMobile termination rates
NET DEBTNet debt is all interest-bearing debt finance (long-term and short-term) less cash and marketable securities.
NET DEBT TO TOTAL EQUITYNet debt to total equity is a measure of book leverage (gearing): net debt in the statement of financial position divided by total equity (the
sum of shareholders’ funds plus minority interests).
NGN (NEXT GENERATION NETWORK)A Next Generation Network is a packet-based network able to provide services including telecommunication services and able to make use of
multiple broadband, QoS-enabled transport technologies. It offers unrestricted access by users to different service providers.
NOCThe Network Operations Centre (NOC) is the place from which network support staff monitors and maintains the telecommunications
network.
244 Telkom Integrated Report 2013
DEFINITIONS
OPERATING FREE CASH FLOWOperating free cash flow is defined as cash flow from operating activities, after interest and taxation, before dividends paid, less cash flow
from investing activities.
OLO Other licensed operator.
PACKET SWITCHINGPacket switching is designed specifically for data traffic, as it cuts the information up into small packets, which are each sent across the
network separately and are then re-assembled at the final destination. This allows more users to share a given amount of bandwidth. X.25,
ATM and frame relay are all packet switching techniques.
POP (POINT OF PRESENCE)A POP is a service provider’s location for connecting to users. Generally, POPs refer to the location where people can dial into the provider’s
computer. Most providers have several POPs to allow low cost local access via telephone lines.
PSTN (PUBLIC SWITCHED TELEPHONE NETWORK)The PSTN is a collection of interconnected voice telephone networks, either for a given country or the whole world. It is the sum of the parts.
It was originally entirely analogue, but is now increasingly digital (indeed in many developed countries digitisation has reached 100%); these
networks can be either state-owned or commercially owned. PSTN is distinct from closed private networks (although these may interconnect
to the PSTN) and from public data networks (PDN).
REVENUE PER FIXED ACCESS LINERevenue per fixed access line is calculated by dividing total fixed-line revenue during the period, excluding data and directories and other
revenue, by the average number of fixed access lines during the period.
ROA (RETURN ON ASSETS)Return on assets is calculated by dividing operating profit by assets affecting operating profit.
SDH (SYNCHRONOUS DIGITAL HIERARCHY)SDH is used in most modern systems, where multimedia can be transmitted at high speeds. The networks are shaped in a ring, so that if there
is a problem, the traffic can be redirected in the other direction and the caller will not detect the interruption.
SMS (SHORT MESSAGE SERVICE)SMS refers to short, usually text-based messages sent by or to a wireless subscriber. They are not delivered to the recipient instantly and have
some degree of transmission time delay. SMS messages are usually limited to total character lengths of 140 to 160 characters.
SWITCHA switch is a computer that acts as a conduit and director of traffic. It is a means of sharing resources as a network.
TOTAL INTEREST-BEARING DEBTTotal interest-bearing debt is defined as short and long-term interest-bearing debt, including credit facilities, finance leases and other financial
liabilities.
TRANSMISSION NETWORKThe transmission network is the portion of the communications network, consisting of digital communication equipment, intended to
function as the transport infrastructure for all telecommunication services.
UCUnified Communications (UC) is the integration of enterprise communications activities which enables situational awareness across people
and information within those activities; it also makes it possible to deliver these services seamlessly across multiple applications and platforms.
VOIP (VOICE OVER INTERNET PROTOCOL)Voice over Internet Protocol is a protocol enabling voice calls to be made over the internet. Rather than a dedicated circuit being set up
between the caller and receiver, as with ordinary phone calls, the voice conversation is digitised and transmitted over Internet Protocol using
packet-switched data networks.
WAN (WIDE AREA NETWORK)A WAN comprises LANs in different geographic locations that are connected, often over the public network.
WAP (WIRELESS APPLICATION PROTOCOL)WAP is an application environment designed to bridge the gap between the mobile and Internet worlds. It is a set of communication protocols
for wireless devices designed to provide vendor-neutral and technology-neutral access to the Internet and advanced telecommunications
services.

Operating environment Risk and responsibilityCreating value Leadership and strategic People and environment Financial statements
ADMINISTRATION
COMPANY REGISTRATION NUMBER1991/005476/30
HEAD OFFICETelkom Towers North
152 Johannes Ramokhoase Street (formerly Proes Street)
Pretoria, 0002
POSTAL ADDRESSTelkom SA SOC Limited
Private Bag X881
Pretoria, 0001
TELKOM REGISTER HELPLINE0861 100 948
COMPANY SECRETARYXoliswa Mpongoshe Makasi
Tel: +27 12 311 3911
MEDIA RELATIONSPynee Chetty
Tel: +27 12 311 5247
UNITED STATES ADR DEPOSITARYThe Bank of New York Mellon
Shareholder Relations Department
PO Box 11258
New York
NY 10286-1258
Tel: +1 888 643 4269
CORPORATE COMMUNICATIONSPraveen Naidoo
Tel : +27 12 311 7720
REGULATORY AND PUBLIC POLICYAdv. Ouma Rasethaba
Tel : +27 12 311 4785
SUSTAINABILITYCharmaine Houvet
Tel : +27 12 311 4906
AUDITORSErnst & Young Inc.
Wanderers Office Park
52 Corlett Drive
Illovo, 2196
Private Bag X14
Northlands, 2116
Tel: +27 11 772 3000
Fax: +27 11 772 4000
TRANSFER AGENTSComputershare Investor Services (Pty) Limited
70 Marshall Street
Johannesburg, 2001
PO Box 61051
Marshalltown, 2107
BUSINESS CALL CENTRE10217
INVESTOR RELATIONSNwabisa Piki
Tel: +27 12 311 3911
SPONSORThe Standard Bank of South Africa Limited
Standard Bank Centre
5 Simmonds Street
Johannesburg, 2001