Creating Strong Momentum - Retail Food Group
120
Creating Strong Momentum RETAIL FOODGROUP ANNUAL REPORT FINANCIAL YEAR ENDED 30 JUNE 2010
Transcript of Creating Strong Momentum - Retail Food Group

CreatingStrongMomentumRetailFoodGRoupannual RepoRt FinanCial yeaR ended 30 june 2010
Re
tailF
oo
dG
Ro
up
an
nu
alR
ep
oR
t2
010
Retail Food Group Limited ACN 106 840 082
Retail Food Group LimitedRFG House26 Railway StreetSouthport QLD 4215Phone: (07) 5591 3242Fax: (07) 5591 9021Website: www.rfg.com.au
Retail Food GRoup deSiGnS, developS and ManaGeS Retail FRanChiSe SySteMS and iS the intelleCtual pRopeRty owneR and liCenSoR oF the donut KinG, bb’S CaFé, bRuMby’S baKeRieS, MiChel’S patiSSeRie and biG dad’S pieS FRanChiSe SySteMS.
FoR the 5th ConSeCutive yeaR SinCe liStinG (in june 2006), Retail Food GRoup Continued to deliveR enhanCed peRFoRManCe and ReCoRd outCoMeS FoR all StaKeholdeRS.
npat and epS 5 yeaR CuMulative annual GRowth RateS (CaGR) oF 50.2% and 38.9% ReSpeCtively, ReinFoRCeS Retail Food GRoup aS an enteRpRiSe with FRanChiSe SySteMS, buSineSS Model and Revenue StReaMS Capable oF SiGniFiCant GRowth.
0
5
10
15
20
25
30
35
FY06 FY07 FY08 FY09 FY10 FY09 FY10
Net Debt ReductionNet Operating Cashflows
0
5
10
15
20
25
30
FY06 FY07 FY08 FY09 FY10 FY07 FY08 FY09 FY10
DPSEPS (Basic)
0
200
400
600
800
1000
1200
FY06 FY07 FY08 FY09 FY10
Outlets
0
100
200
300
400
500
600
700
FY06 FY07 FY08 FY09 FY10
Network Sales
0
20
40
60
80
100
120
140
FY06 FY07 FY08 FY09 FY10 FY09 FY10
Adj.RevenueRevenue
0
5
10
15
20
25
30
FY06 FY07 FY08 FY09 FY10 FY09 FY10
Core NPATNPAT
RETAIL FOOD GROUP LIMITED - ANNUAL REPORT 30 JUNE 2010 RETAIL FOOD GROUP LIMITED - ANNUAL REPORT 30 JUNE 2010
($m)
($m) ($m)
($m) ($m)
($m)
($m)
(cents) (cents)

RETAIL FOOD GROUP LIMITED - ANNUAL REPORT 30 JUNE 2010
Donut King
Australia’s largest specialty donut and coffee chain.
Network Sales
FY10 156m
big DaD’s pies
South East Queensland-centric franchisee concentration, famous for their hearty Big Pies.
Network Sales
FY10 4m
FY09 149m
FY08 144m
bb’s cafe
Specialty local cafe franchise in Australia & New Zealand.
Network Sales
FY10 32m
FY09 34m
FY08 34m
bRuMbY’s baKeRies& bRuMbY’s go!
Australia’s second largest specialty bread and savoury retail franchise chain, includes Brumby’s GO! sub-brand.
Network Sales
FY10 236m
FY09 234m
FY08 215m
Michel’s patisseRie
Australia’s largest specialty coffee and cake retailer.
Network Sales
FY10 213m
FY09 215m
FY08 199m

Creating OutletGrowth

During FY10, Donut King’s organic growth performance exceeded that of RFG’s other franchise systems.
Outlet numbers increased to 358 in FY10 as a result of organic outlet growth (19 openings) and the strategic acquisition of 23 DCM Coffee & Donuts (DCM) franchised outlets. The DCM acquisition enables RFG and its franchisees to convert 23 outlets into Donut King outlets.
Whilst Donut King continues to be Australia’s largest specialty donut and coffee chain, its international footprint is also growing with ten outlets now established in China. Additional outlets are also scheduled to be commissioned in Papua New Guinea, New Zealand and Saudi Arabia under recently consummated master license agreements.
Donut King reported positive average weekly sales (AWS) growth in FY10 assisted by a 3.7% increase in average transaction values (ATV) and improved merchandising and promotional activity that included:
• thenationallaunchofDonutKing’sowncoffeebrand – “Royal Bean”;
• the introductionofa comprehensive trainingprogram which has to date facilitated the accreditation of over 250 qualified Baristas; and
• reinvigorationofdonutcategories.
Donut King continues to offer affordability and value coupled with an enduring but also evolving menu.
FY10 HigHligHts• 358 outlets including 10 located in China;
• networksalesof$155.9million;
• average weekly sales of $9,357 per outlet(FY09:$9,256);
• average transaction value of $5.11 (FY09:$4.93);
• RoyalBeancoffeesalesvolumeincreaseof9%;and
• internationalmasterlicensesgrantedforPapuaNew Guinea and Saudi Arabia.

Creating Positive Relationships

Despite the highly competitive café environment in which it operates, the bb’s café system continued to report positive average weekly sales growth aided by ’value’ based offers directed at attracting new custom such as the launch of a new coffee loyalty card. bb’s continues to put franchisees at the heart of its communication strategy, with its recent rebrand of “My Local Café.”
Whilst outlet numbers declined by two (with 38 outlets now operating in Australia and 22 in New Zealand), the system retains its solid foundation for enhanced future performance.
The bb’s café system in New Zealand has performed particularly well in that soft economic market where recovery lags behind Australia. Domestic operations were also positive.
FY10 HigHligHts60outlets;•
networksalesof$32.3million;•
average weekly sales (Australia only) of • $11,329peroutlet(FY09:$11,242);and
averagetransactionvalueof$7.41(FY09:• $7.16).

Creating More Value Everyday

During FY10, the benefits of system scale (330 outlets) enabled Brumby’s Bakeries franchisees to enjoy improved input costs whilst continued recipe enhancement positioned the brand’s offer as a ‘high fibre’ staple. Brumby’s sub-brand; Brumby’s GO! has continued to perform well in the growing health and convenience sector.
Brumby’s Bakeries average weekly sales growth of 0.6%was assistedby a5.6% increase in averagetransaction values and the successful “You’ll Get More” promotion. Providing customers “more value” has been a strategic part of meeting current consumer’s demands.
Franchisee relationships were fortified through the acquisition in 2H10 of the master license territories of North Queensland, New Zealand, Western Australia and the Northern Territory. South Australia (comprising 18 outlets) now remains alone as the only domestic territory subject to a master franchisee arrangement.
FY10 HigHligHts330 outlets;•
networksalesof$235.5million;•
average weekly sales (Australia only) of • $13,488peroutlet(FY09:$13,410);
averagetransactionvalueof$5.81• (FY09:$5.65);
acquired Master Rights in WA, NT, FNQ and • NZ; and
Brumby’s GO! has the highest average weekly • salesbrand(FY10:$15,850)ofallRFG franchise systems.

Creating AwardWinning Coffee
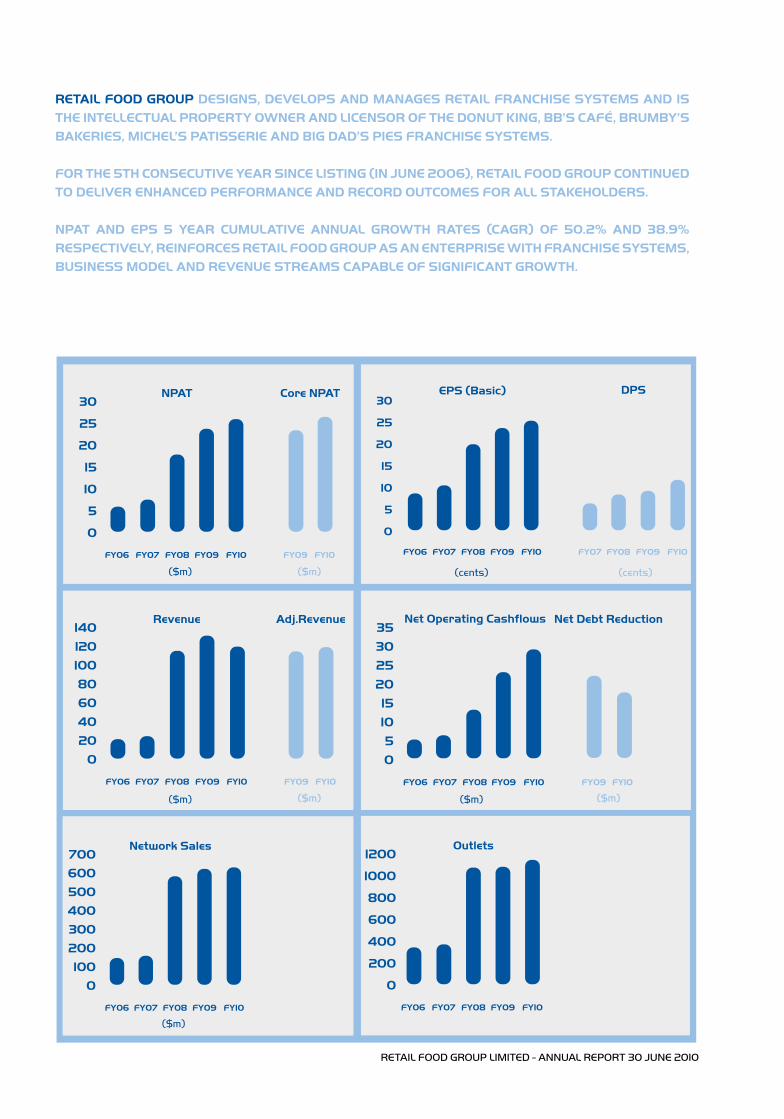
The Michel’s Patisserie system continues its transition from a ‘wholesale margin model’ to a traditional royalty franchise model with over 200 outlets now converted and a further 50 outlet transitions anticipated during FY11.
During FY10, improved logistics and bakery management practices significantly aided product consistency and quality. Coupled with a newly developed $10 party cake offering and a tieredpricing strategy, these improvements have driven growth in both average weekly sales and average transaction values.
Michel’s Patisserie prides itself on the delivery of superior hot beverages for sophisticated coffee drinkers. In fact, in June 2010, Michel’s Patisserie was voted “The Best Tasting Coffee Franchise” by Choice Magazine.
Fortifying the Michel’s Patisserie point of difference – that is, next day delivered ‘special order’ cakes and bakery products - remains a key to the continuing success of Michel’s Patisserie as one Australia’s largest ‘coffee and cake’ retailers.
FY10 HigHligHts337 outlets;•
networksalesof$213.3million;•
average weekly sales (Australia only) of • $12,140peroutlet(FY09:$11,868);
averagetransactionvalueof$6.35(FY09:• $6.08);and
60%conversiontotheRoyaltySystemmodel• with strong positive franchisee feedback.

Creating The Biggest & The Best

Big Dad’s Pies is the most recent system to fall under the Company’s retail food franchise system umbrella having been acquired in April 2010. The system will be developed, enhanced and aligned with the Brumby’s Bakeries business.
The rationale for the acquisition of the Big Dad’s Pies system included:
the proliferation of the system outside of • shopping centres;
the initial franchise investment cost being less • than$250,000;and
intellectual property, including recipes • derivatives which can transfer to the Brumby’s Bakeries and Michel’s Patisserie systems.
The store network is South East Queensland centric but situated in locations considered non-traditional in comparison to the Company’s remaining systems. When coupled with lower establishment costs and a quality pastry menu, Big Dad’s Pies represents an opportunity to drive organic growth in markets not previously pursued by RFG.
Since acquiring the system, RFG has focused on product innovation and value whilst delivering on Big Dad’s Pies promise of ‘the biggest and the best’.
FY10 HigHligHts37 outlets acquired;•
reductionininputcostsof6%throughRetail• Food Group’s improved purchasing power;
introduction of an extended menu including • rolls, hot chips and new and improved pies; and
re-invigoration of the Big Dad’s Pies brand • image.

xii RETAIL FOOD GROUP LIMITED - ANNUAL REPORT 30 JUNE 2010
chaiRMan'sRepoRtJOhN cOwLEy, AM

chaiRMan'sRepoRt
xiiixiiiRETAIL FOOD GROUP LIMITED - ANNUAL REPORT 30 JUNE 2010
Dear Shareholder,
It is my pleasure, on behalf of your Board, to present to you Retail Food Group’s Annual Report for the financial year ended 30 June 2010.
It is no secret that the retail marketplace remains a challenged environment adversely influenced by various macro and micro economic factors having root domestically and abroad.
The following pages of this Report bear testimony not only to the manner in which those challenges have been managed by RFG, but also how they have been overcome. They point to a Company whose business model and franchise systems have not only been proven strong and durable, but which have been toughened by experience to provide a potent foundation for future growth.
With these thoughts foremost in mind, it is with significant personal satisfaction that I note the Company achieved FY10 profitaftertaxof$26million–anincreaseof10.6%(or$2.5million) over the FY09 result.
Earnings per share (EPS) of 25.3cps were up 6.8% onFY09 (23.7cps), and when coupled with continuing strong cashflows, provided for a 27% increase in the dividend to shareholders (on a full year basis) from 9.25cps to 11.75cps.
The foregoing results represent the fifth consecutive occasion since listing on the ASX where the Company has delivered record profit and return for its shareholders. Indeed, the underlying strength of the Company’s NPAT and EPS is best demonstrated by RFG’s five year NPAT and EPS cumulative average growth rates (CAGR) of 50.2% and 38.9% respectively.
RFG’s FY10 results have been driven by solid growth in revenues (on an adjustedbasis 4%over theprevious correspondingperiod (PCP)) together with expense rationalizations, without impacting upon franchisee service delivery or personnel compliment, that have resulted in the Company’s cost of doingbusinessbeingreducedby23%(or$7.3m)overPCP.
During FY10 RFG acquired the Brumby’s master franchises for New Zealand, Western Australia, the Northern Territory and North Queensland. These activities returned to the Company unfettered control over the vast bulk of the Brumby’s Bakeries network with only South Australia (18 outlets) now operated under a master franchise.
The Company’s acquisition of DCM Coffee & Donuts and Big Dad’s Pies bolstered outlet growth, increasing total outlet population amongst all brands to over 1,100 stores. Outlets in the DCM Coffee & Donuts system will be converted to the Company’s other systems with the Big Dad’s Pies transaction providing RFG with an original retail concept having a growth path and potential franchisee market falling outside of that to which the Company’s existing systems are accustomed too.
Of particular note, the Company’s net debt was reduced by 19.5%(or$17.7m)overthecourseofFY10notwithstandingsome$11.5moffreecashflowwasappliedtotheacquisitiveactivity mentioned above.
The subject of debt was further addressed in August 2010 at which time RFG announced the appointment of the National Australia Bank as its future debt facility provider (with full refinance and transfer of the Company’s banking facility having now been attended). This transaction gave certainty to shareholders, given maturation of existing facilities later this calendar year, whilst aligning RFG with a robust banking partner.
Franchise system performance has been augmented at customer interface by product enhancement and menu development, community engagement via the Company’s support for the Heartkids charity, enhanced franchisee training and a focus on value, reward and service.
These endeavours have driven solid growth in total network sales (1.4% over PCP), weighted average weekly salesamongst franchised outlets (1.6% over PCP) andweightedaverage transaction values (3.2% over PCP).
Retail Food Group has created a solid foundation for success built on the strength of a robust business model, innovative product offering and iconic retail food franchise systems.
It is steadfastly focused on extracting maximum returns from those traditional business drivers, and building upon novel revenue generators such as wholesale coffee operations, whilst not diminishing support or service for its franchisee community.
The Company is therefore confident of delivering future enhanced performance and value outcomes for all stakeholders.
In closing, RFG’s achievements are a result of the continued efforts of management and staff, and importantly, its many franchisees. I would like to take this opportunity to thank each of them for their valued contribution to the Company’s success.
I would also like to thank you, as a valued shareholder, for your commitment to the Company.
John Cowley, AMChairmanRetail Food Group Limited

xiv RETAIL FOOD GROUP LIMITED - ANNUAL REPORT 30 JUNE 2010
ManagingDiRectoR'sRepoRtANThONy JAMEs (TONy) ALFORD

xvRETAIL FOOD GROUP LIMITED - ANNUAL REPORT 30 JUNE 2010
ManagingDiRectoR'sRepoRt
iNtRODUCtiON
FY10: for the 5th consecutive year subsequent to listing (in June 2006), Retail Food group limited (RFg or the Company) continued the delivery of enhanced performance and record outcomes for all stakeholders.
Notwithstanding a second year of challenging economic conditions resulting in severe disruptions to retailing, consumer spend and confidence, the Company’s franchise systems and business model achieved record earnings before interest and tax (EBIT), net profit after tax (NPAT), earnings per share (EPS) and importantly, dividend per share (DPS).
These robust outcomes were a consequence of driving the performance of RFG’s franchise systems, liberating further integration synergies, lowering the cost of doing business, accelerating the Michel’s Patisserie model transition, and execution of small acquisition opportunity.
RFG is the intellectual property owner of five full format franchise systems, four of which operate as traditional royalty based systems. The fifth, Michel’s Patisserie, is currently transitioning to that model from a wholesale margin regime.
Absent the multiple franchise system strategy engaged by RFG, the quantum of historical growth and plethora of future opportunity would simply not exist.
The benefit of such growth and opportunity does not accrue solely to RFG and its shareholders. Importantly it also protects, insulates and nurtures our franchisee community who in reality drive the Company’s positive outcomes.
The unique relationship between franchisor and franchisee is mutually beneficial and there exists few other business models where the profitability and wellbeing of the customer (our franchisees) directly correlates to the profitability of the service provider (being RFG). Such a relationship is not only perfectly synergistic it is indeed symbiotic.
sUstAiNED PERFORMANCE
$2.5 million increase in NPAt to $26.0 million and EPs growth of 6.8% confirmed the Company’s ability to deliver consistent growth.
FY10 NPAT of $26.0 million represented a 10.6% increaseover FY09 and was facilitated by an 8.9% uplift in Franchise Revenue partly offset by a 15.9% reduction in Wholesale / Retail receipts - a result of the programmed transition of Michel’s Patisserie franchisees to the Royalty Model and the commissioning of third party direct invoicing to franchisees.
RFG’s record NPAT was underpinned by:
• newoutletsderivedfromorganicandacquisition activity;
• (franchiseoutlet)networksalesof$640.6million,an increaseof$8.6milliononthepreviouscorresponding period (‘pcp’);
• increasesinlicensingandproductprocurement revenues;
• liberationandrealizationoffurtheracquisitionsynergies while continuing an increased investment in franchisee service initiatives;
• executionofmarketinginitiativeswhichhas;
resulted in positive average weighted weekly sales - (AWS) growth over the five franchise systems, largely as a consequence of
successfully increasing average transaction values - (ATV) which also fortifies franchisees against decreased shopping centre foot traffic; and,
• postacquisitioncontributionsfromDCMCoffee& Donuts, Big Dad’s Pies and the Brumby’s Bakeries master territories.
Earnings per share (EPS) for FY10 of 25.3 cents represents a 6.8%increaseonFY09(23.7cents).
EPS from Core Operations(3) was 25.6 cents, an increase of8.5% on pcp.
Positive movements in all key performance indicators were driven by increased revenue from the franchise systems with a lowering of the CODB – again a substantial benefit of scale brought about by acquisition activity.
The most satisfying of the KPI’s was the conversion rate of gross operating cashflow to EBITDA which exceeded 98% (FY09: 97.6%)andistestamenttotherobustnessoftheCompany’sbusiness model which features:
strong, consistent and recurrent cashflows; allied with•
low capital expenditure requirements.•
Notably, the achievement of a net operating cash flow in an amountof$29.2m,anincreaseof25.9%(or$6m)overFY09,provided opportunity:
for continued voluntary core debt reduction totaling • $10.0million(tofullyhedgedpositionof$85.2million), thus
decreasingtheCompany’sgearingratiofrom45.7%to• 34.4%(5);
for the declaration of a final dividend for the year of • 6.50centspershare(cps),whichtogetherwiththe interim dividend of 5.25cps represented an 27.0% increase over FY09;
to undertake franchise system acquisitions totaling • $14.3mofwhich$11.5mwassettledbycash;and,
toincreasecashonhandby142.6%(or$7.7m)to • $13.1m.
xvi
ManagingDiRectoR'sRepoRt
RETAIL FOOD GROUP LIMITED - ANNUAL REPORT 30 JUNE 2010
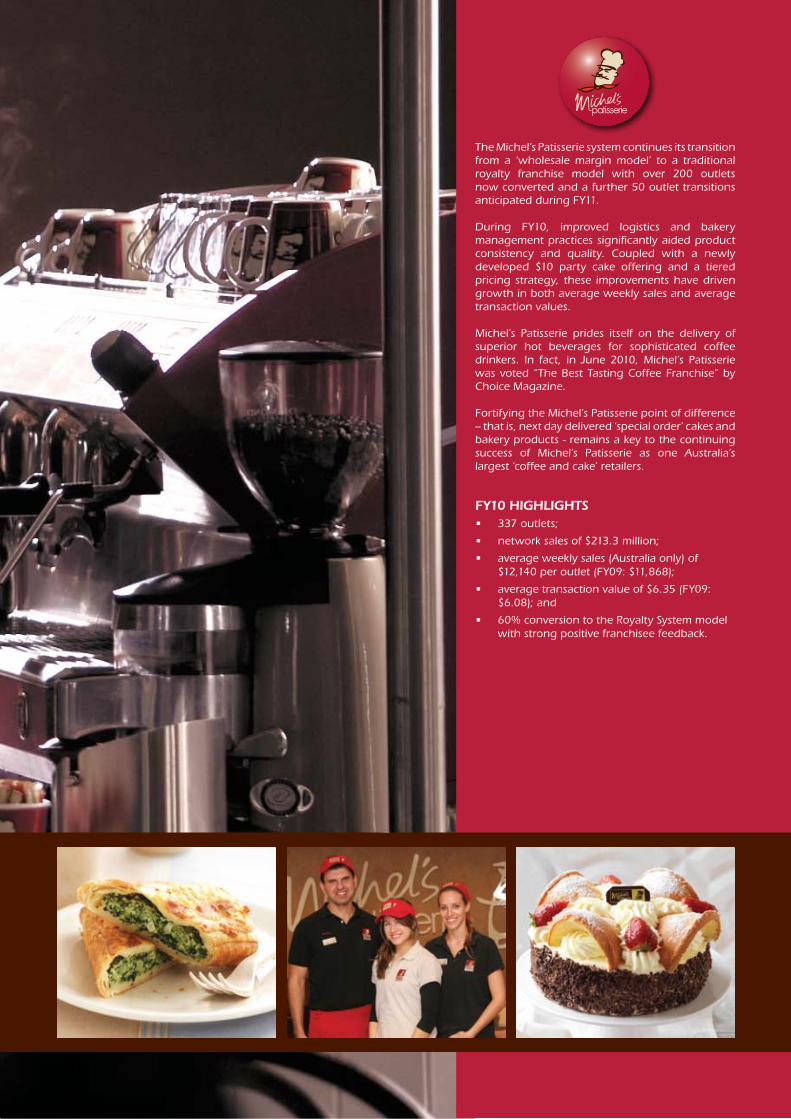
Statutory Results Core Operations (1)
FY09 FY10 PCP % FY09 FY10 PCP %
Franchise Network Sales (2)
$632.0m $640.6m 1.4%
Total Revenue (3)
$130.5m $118.6m (9.1%) $130.5m $118.6m (9.1%)
Adjusted Revenue (4)
$114.0m $118.6m 4.0%
EBIT $40.3m $43.8m 8.7% $40.1m $44.3m 10.5%
NPAT $23.5m $26.0m 10.6% $23.4m $26.4m 12.8%
Basic EPS 23.7 cps 25.3 cps 6.8% 23.6cps 25.6cps 8.5%
Dividend (paid and payable) 9.25 cps 11.75 cps 27.0%
Franchised Outlets 1,063 1,121 5.5%
New Outlets (5)
59 97
Excludesrevenuederivedfrommarketingactivities(FY10:$15.4m;FY09:$12.6m).(1)
Adjusted Revenue is presented for FY09 which normalises the reported FY09 Total Revenue by excluding:(2)
salesrevenueof$3.1mderivedbytheCMF,priortoitsdisposalinJanuary2009;and
salesrevenueof$13.4mderivedfromthewholesalebakerysupplytoMichel’sPatisserieoutletsinFY09,whichtransitioned(duringFY10)fromthe wholesale supply and distribution model to the traditional royalty based model.
Results from ‘Core Operations’ excludes amounts recognised in the income statement relating to the pre-tax impact of:(3)
derivativefinancialinstruments(interestrateswaps)(FY10:$0.5mloss;FY09:$1.0mloss).InterestrateswapsweredesignatedashedgesinJuly2008 reducing ongoing volatility in the income statement; and
non-recurringgainondisposalofCentralManufacturingFacility(CMF)(FY10:$nil;FY09:$1.1mgain).
During FY10, the Group acquired the DCM Coffee & Donuts (23 franchised outlets at control date) and Big Dad’s Pies (37 franchised outlets at control (4)date) franchise systems.
Net debt equals total debt less cash and cash equivalents.(5)
The weighted average ATV increase of 3.2% over FY09 also fortified the Company’s franchisee community against intense retail competition, decreased discretionary spending and decline in shopping centre foot traffic.
The successful execution of marketing initiatives designed to maintain and increase franchisee AWS and ATV protects franchisee profitability and the Company’s revenue.
Significant development and enhancement of the Company’s coffee roasting assets was undertaken during FY10.
The tangible results of sustained marketing, intense R&D, appointment of additional Barista trainers and increased franchisee training participation included:
new coffee blends for each of the franchise systems;•
commissioning of the largest coffee marketing initiatives • in the history of Michel’s Patisserie;
Michel’s Patisserie being awarded the “Best Tasting • Coffee Franchise” by Choice Magazine;
an 8% increase (over FY09) in coffee volumes, including•
an 11% increase in Donut King volumes after the launch • of the “Royal Bean” sub-brand; and
increased franchisee recognition of the importance • of coffee to their business (evidenced with 91,500 additional hours of coffee training undertaken by franchisees).
OPERAtiONAl PERFORMANCE - FRANCHisE sYstEMs
During FY10, the franchise systems under RFg stewardship achieved positive growth outcomes including net outlet, AWs, and AtV growth. Furthermore, the Company significantly enhanced its coffee roasting operations and progressed the Michel’s Patisserie model transition.
As detailed above, the Company’s FY10 (and historical) performance continued to be underpinned by increased franchise outlet network sales which is a function of:
new outlet growth, and•
sustaining franchisee AWS.•
During FY10, RFG devoted considerable additional resources to driving network sales by increasing AWS and growing ATV across all franchise systems.
The weighted AWS increase across the Company’s franchise systems (excluding the recent acquisitions of Big Dad’s Pies and DCMCoffee&Donuts)of1.6%wasanacceptableachievementand was supported by positive AWS growth (albeit modest) in all systems during FY10. Once again, such positive operational outcomes bear testimony to the Company’s position that those franchise systems under its stewardship have to date been remarkably resilient to significant changes in consumer sentiment, discretionary spend, economic uncertainty and retail confusion.

ManagingDiRectoR'sRepoRt
xviixviiRETAIL FOOD GROUP LIMITED - ANNUAL REPORT 30 JUNE 2010
The contractual and voluntary conversion of Michel’s Patisserie franchises to a traditional royalty model continued to gain momentum throughout FY10 with in excess of 200 outlets having been transitioned.
Additionally, the escalating number of franchisee conversions enabled RFG to commence the second phase of the Michel’s Patisserie transition model with Queensland being the first State to achieve direct “bakery to franchise” distribution. As well as acquiring the Big Dad’s Pies and DCM Coffee & Donuts businesses during FY10, RFG also attended upon the acquisition of four of the five Brumby’s Bakeries Master Franchise Licences with only the small territory of South Australia (18 outlets) now remaining under subfranchisor control.
Each acquisition was EPS accretive and collectively represented (on a full year basis) an EV/EBITDA multiple of circa 3 times.
The Big Dad’s Pies franchise system will be developed and aligned to the Brumby’s Bakery system while the DCM Coffee & Donuts outlets will be converted to Donut King.
During FY10 RFG has once again been able to financially and commercially support its franchisees while developing revenue strategy expansion which results in reducing reliance on any one business driver.
FRANCHisED OUtlEt EXPANsiON
Notwithstanding severely reduced traditional site opportunities, RFg achieved both new and acquired outlet growth of 97 resulting in a total outlet population increase to 1,122 at financial year close.
FY10 outlet growth of 97 was achieved by:
Organic: 37 •
BDP acquisition: 37•
DCM acquisition: 23•
Outlet closures for FY10 were 39, a reduction from 48 inFY09 and a result of the substantial completion of the Michel’s Patisserie and Brumby’s Bakeries legacy closures. During the financial year RFG achieved a net outlet population increase of 59 outlets and so far as its four pre-FY10 operated franchise systems are concerned, new outlet metrics were:
Donut King: +19 (including 1 DCM Coffee & Donuts • conversion)
Michel’s Patisserie: +7•
Brumby’s Bakeries: +10, and •
bb’s café: +1. •
As at 30 June 2010, RFG had 1,122 franchised outlets, comprising:
Donut King: 358 outlets, a net increase of 33 outlets • over pcp (including the DCM Coffee & Donuts outlets programmed for conversion to Donut King);
Michel’s Patisserie: 337 outlets, a net decrease of 8 • outlets over pcp;
Brumby’s Bakeries: 330 outlets, a net decrease of 1 • outlet over pcp;
bb’scafé:60outlets,anetdecreaseof2outletsover• pcp; and
Big Dad’s Pies: 37 outlets acquired in April 2010.•
The majority of the Company’s franchisee outlet population is positioned within shopping centres and, similar to FY09, a continuing issue which stymies organic growth is stagnant lessor development activity.
Retarded shopping centre growth or redevelopment and the consequential reduction in premium site opportunity, also impacts upon franchisee inquiry, and ultimately, the conversion rate.
That said, there is now evidence of renewed shopping centre development, refurbishment and extension activity and same should positively impact organic growth in 1H12.
One positive feature resulting from stagnant shopping centre development activity – similar to the Company’s successful endeavors to increase ATV to fortify against reduced shopping centre traffic flow – has been the Company’s focus on non-traditional site opportunities including:
acquisition of BDP – low franchise investment cost and • populated outside of shopping centres;
reinvigoration of Brumby’s Go – 5 additional outlets • commissioned during FY10, all outside shopping centres and increasing population to 10;
menu enhancement – significant investment in R&D • resulted in menu update and additional product offer to each franchise system;
franchise modification to complement specific retail • environments - e.g. service station precincts, DFO, airports;
store in store commercialization - e.g. IGA; and •
“strip” site proliferation – modification of franchise • systems for sustainability outside of shopping centres.
Ultimately, RFG and its franchisees will be further strengthened by this current retail and landlord development malaise as both have facilitated an investment by the Company into alternative drivers of organic growth.

ManagingDiRectoR'sRepoRt
xviii RETAIL FOOD GROUP LIMITED - ANNUAL REPORT 30 JUNE 2010xviii
gROWtH stRAtEgiEs
the Company continues to employ significant resources in developing and enhancing system, franchisee and resultantly RFg and shareholder outcomes.
As noted above, during FY10 RFG increased its investment of financial resources and human capital in the maintenance, enhancement and development of franchisee operational service systems.
Together with robust negotiations with input suppliers to sustain franchisee margins and profitability, increasing service delivery initiatives and frequency, and development of a plethora of online training material, RFG has both nurtured and supported its franchisee community such that franchisee stress was minimized during a second year of retail uncertainty.
Franchisee financial health and wellbeing remains a priority for RFG and these initiatives will be further enhanced during FY11.
Ultimately this type of investment strengthens our franchisees and the franchise systems in which they participate.
During the financial year RFG also restructured its New Zealand operations as a consequence of the Brumby’s Bakeries master franchise acquisition. During FY11 those initiatives should result in a strengthened bb’s café and Brumby’s system in that country while facilitating the exploitation of the Company’s other franchise systems.
As detailed in RFG’s FY09 Annual Report, the international exploitation and commercialization of the Company’s franchise systems remains a significant untapped opportunity that RFG intended to pursue.
In this respect RFG has granted Master Licence rights in respect of:
PNG - Donut King;•
PNG - Brumby’s Bakeries; and•
Saudi Arabia - Donut King. •
During FY10 the number of Donut King outlets commissioned in China increased to 10 (from 4 in FY09). The MasterFranchisee has now resolved to initiate single unit franchising to proliferate the system outside of Shanghai with three sub franchised Donut King outlets programmed for FY11 outside of this city.
RFG continues to entertain strong inquiry in respect of international territorial master licensing and the Company is presently engaged in a number of negotiations. In circumstances where financial and commercial terms are acceptable to RFG, FY11 should witness the granting of further territorial licences.
FY11 iNitiAtiVEs
RFg commenced FY11 with the appointment of a new transaction banker, the initiation of a 3 year term debt facility, the acquisition of a National Office and training Academy and driving positive franchisee outcomes with strong marketing and enhanced franchisee servicing.
Banking Facilities
At the conclusion of an evaluation process which entailed submissions from Australia’s major trading banks, RFG resolved to appoint the NAB as both its debt facility and transaction banker.
Settlement on both matters occurred in August with the salient metrics as follows:
Debt Facility(i)
Outgoing Facility banker: CBA;•
New Facility banker: NAB;•
Term: 3 years;•
Facility:$85m;•
Current net debt (14/10/10): $72.2m (after 7• th Octoberdividendpaymentofcirca$5.5m);
No mandatory principal repayment requirements; •however
Provides for voluntary facility reductions;•
Covenants consistent with outgoing facility and •limited to interest cover, leverage and gearing;
Step down margin to 1.5% over BBSY; and •
Receptive and committed to assisting RFG in growth •aspirations.
Transaction Banking(ii)
Outgoing Transaction banker: ANZ;•
New Transaction banker: NAB;•
Reduced transaction and other fees;•
Streamlined transactional banking platform;•
Superior merchant pricing for RFG franchisees,•
Superior credit and debt facilities for new and •existing franchisees.
National Office & Training Academy
The Company settled the acquisition of the property situate 1 Olympic Circuit Southport on the 17th September 2010.
A substantial refurbishment of the building has been initiated and the intention is to relocate both national headquarters and the franchisee training academy from the existing Railway Street, Southport premises in the 3Q11.
The refurbished premises will provide for additional staff to be located on the Gold Coast and for a substantial increase in annual franchisee training intakes – which has been severely curtailed given the restricted training facilities in the Railway Street premises.
Further, as a consequence of the enlarged Training Academy, component Brumby’s Bakeries franchisee training will be conducted “in house” for the first time in its history.

ManagingDiRectoR'sRepoRt
xixxixRETAIL FOOD GROUP LIMITED - ANNUAL REPORT 30 JUNE 2010
Marketing & Franchise initiatives
RFG’s franchisee community will throughout FY11 be once again operating in both a challenging and uncertain retail environment. The Company’s focus is therefore to appropriately position its franchise systems by developing and executing upon various measures designed to sustain growth for its franchisee community which ultimately results in financial benefit to RFG and its shareholders.
A number of initiatives have been resolved to be progressively implemented during FY11, some of which include:
Launch of RFG’s first corporate charity, Heartkids which • will be collectively driven by all of the franchise systems under the Company’s stewardship; and in so doing
Attract new customers not previously engaged with • RFG’s franchise systems;
Commissioning of new retail technology platforms, • including
On line ordering; -
Loyalty programs; -
Digital in store menu boards, and -
Next generation point of sale and information - management systems.
Product innovation, including•
Introduction of an exclusive gourmet range of - filled breads to the Michel’s Patisserie and bb’s café systems;
Extended Donut King menu to include “kids - centric” and adult meal time offer;
Launch of Brumby’s unique “super breads” range; -
Introduction of a enhanced Michel’s Patisserie - proprietary cake offer;
Introduction of the proprietary bb’s café petite - savoury and sweet menu, and
Continuation of the “value” strategy including - bundling and tiered pricing initiatives.
Continuation of Coffee revitalization, including•
Launch of Barista Choice wholesale channel range - of coffee blends in November;
Appointment of National Manager for the - wholesale channel;
On line and in store coffee training to support - circa 20,000 franchisees and their staff, and
Hot beverage marketing initiatives in FY11 to be - largest in the Company’s history.
Progress the development of non-traditional site • opportunities;
Continuation of negotiations with respect to • international licensing opportunities for Donut King, Michel’s Patisserie, bb’s café and Brumby’s Bakeries systems;
Continue to increase field staff for franchisee support • which in the last 12 months has witnessed a significant “health” uptick from the perspective of the franchisee community.
Debt & Dividends
RFG forecasts a continuation of robust cashflow throughout FY11.
In this respect the Company will continue to reduce net debt towardstheFY12targetof$50mandprogressively increasethe dividend payout ratio in FY11 to circa 55% (with an FY12 targetof60%).
Acquisition Activity
As has been successfully demonstrated in each financial year since Listing, RFG remains actively engaged in the evaluation of a number of promising acquisition opportunities.
As previously reported, the Company undertakes a robust assessment of the target and considers the acquisition in terms of the potential to provide immediate EPS enhancement but which are capable of providing additional scale, synergies, organic growth and intellectual property enhancement.
Present acquisition opportunity is robust and RFG continues to evaluate a number of assets.
1Q11
Whilst RFG’s franchise systems have over the past two years performed well when one considers the depressed economic conditions in which they have operated, FY11 results will once again be predominantly dependent upon the strength of the domestic economy.
The Company will provide an update during the AGM of trading and performance, however 1Q11 results provide confidence that the growth strategies employed by the Company will once again underpin strong annual performance.
That said, the Company remains focused on driving further growth and enhanced outcomes for all stakeholders via a range of initiatives which include development of new products and menu innovation, continuation of product bundling, strengthening franchisee health and profitability, further expansion of coffee operations, supply chain efficiencies and structural enhancement, reinvigoration of the Brumby’s Go! concept and organic growth in non-traditional sites.
Anthony James (Tony) AlfordManaging Director & Chief Executive OfficerRetail Food Group Limited

xx RETAIL FOOD GROUP LIMITED - ANNUAL REPORT 30 JUNE 2010

RETAIL FOOD GROUP LIMITED - ANNUAL REPORT 30 JUNE 2010
annualFinancialRepoRtRetailFooDgRoupliMiteD
Financial YeaR enDeD 30 june 2010acn 106 840 082
1
contents
suMMaRY Financial inFoRMation 2
coRpoRate DiRectoRY 3
coRpoRate goVeRnance stateMent 4
DiRectoRs' RepoRt 14
auDitoR's inDepenDence DeclaRation 35
inDepenDent auDitoR’s RepoRt 36
DiRectoRs' DeclaRation 38
inDex to Financial stateMents 39
stateMent oF coMpRehensiVe incoMe 40
stateMent oF Financial position 41
stateMent oF changes in eQuitY 42
stateMent oF cash FloWs 43
notes to the Financial stateMents 44
aDDitional stocK exchange inFoRMation 94

SUMMARYFINANCIALINFORMATION
2 RETAIL FOOD GROUP LIMITED - ANNUAL REPORT 30 JUNE 2010
REPORTED CORE OPERATIONS (1)
FY06 FY07 FY08 FY09 FY10 FY09 FY10
Financial
Network Sales (2) $143.1m $158.2m $592.0m $632.0m $640.6m
Total Revenue (3) $20.5m $23.6m $114.1m $130.5m $118.6m $130.5m $118.6m
Adjusted Revenue (4) $114.0m $118.6m
EBITDA $9.9m $12.4m $35.7m $41.6m $44.9m $41.5m $45.4m
EBIT $9.8m $12.2m $34.4m $40.3m $43.8m $40.1m $44.3m
NPAT $5.9m $7.5m $17.6m $23.5m $26.0m $23.4m $26.4m
Basic EPS 8.6 cps 10.5 cps 19.9 cps 23.7 cps 25.3 cps 23.6 cps 25.6 cps
Operating
Network Sales Growth 10.4% 10.6% 274.2% 6.8% 1.4%
Total Revenue Growth 12.0% 15.1% 383.5% 14.4% (9.1%) 14.4% (9.1%)
Adjusted Revenue Growth 4.0%
EBITDA Growth 8.8% 25.3% 187.9% 16.5% 7.9% 23.9% 9.4%
EBIT Growth 10.1% 24.5% 182.0% 17.2% 8.7% 24.5% 10.5%
NPAT Growth 27.1% 134.7% 33.4% 10.6% 51.9% 12.8%
Basic EPS Growth 22.1% 89.5% 19.1% 6.8% 35.6% 8.5%
Dividend (paid & payable) 6.25 cps 8.5 cps 9.25 cps 11.75 cps
Franchised Outlets 332 360 1,052 1,063 1,122
New Outlets (5) 27 37 742 59 97
(1) Results from ‘Core Operations’ exclude amounts recognised in the income statement relating to the pre-tax impact of:
derivative financial instruments (interest rate swaps) (FY10: $0.5m loss; FY09: $1.0m loss); and,
non-recurring gain on disposal of Central Manufacturing Facility (CMF) (FY10: $nil; FY09: $1.1m gain).
(2) Derived from financial information including franchisee-reported turnover and not subject to audit.
(3) Excludes revenue derived from marketing activities (FY10: $15.4m; FY09: $12.6m; FY08: $10.3m; FY07: $6.2m; FY06: $6.4m).
(4) Adjusted Revenue is presented for FY09 which normalises the reported FY09 Total Revenue by excluding:
sales revenue of $3.1m derived by the CMF, prior to its disposal in January 2009; and,
sales revenue of $13.4m derived from the wholesale bakery supply to Michel’s Patisserie outlets in FY09, which
transitioned (during FY10) from the wholesale supply and distribution model to the traditional royalty based model.
(5) During FY10, the Group acquired the DCM Coffee & Donuts (23 franchised outlets at control date) and Big Dad’s Pies
(37 franchised outlets at control date) franchise systems.

CORPORATEDIRECTORY
RETAIL FOOD GROUP LIMITED - ANNUAL REPORT 30 JUNE 2010 3
Directors Mr John Thomas Cowley
Chairman & Independent Director
Mr Anthony James Alford
Managing Director & Chief Executive Officer
Mr Nigel Norman Nixon
Executive Director & Corporate Counsel
Mr Colin Cameron Archer
Independent Director
Mr Bruce Alan Hancox
Independent Director
Company Secretary Mr Anthony Mark Connors
Registered Office Alfords
Level 1 HQ Robina
58 Riverwalk Avenue
Robina QLD 4226
Principal Place Of Business RFG House
26 Railway Street
Southport QLD 4215
Share Register Computershare Investor Services
Level 19, 307 Queen Street
Brisbane QLD 4000
Solicitors McCullough Robertson Lawyers
Level 11, 66 Eagle Street
Brisbane QLD 4000
Auditors Deloitte Touche Tohmatsu
Level 25, 123 Eagle Street
Brisbane QLD 4000
Bankers National Australia Bank Limited
Level 20, 100 Creek Street
Brisbane QLD 4000
Stock Exchange Listings Retail Food Group Limited shares are listed on the Australian Securities Exchange
(ASX:RFG).
Website Address www.rfg.com.au

CORPORATEGOVERNANCESTATEMENT
4 RETAIL FOOD GROUP LIMITED - ANNUAL REPORT 30 JUNE 2010
Overview Retail Food Group Limited (the Company) and the Board of Directors (the Board) are committed to achieving and demonstrating the highest standards of corporate governance. The Board endorses the 2nd edition of the Australian Securities Exchange (ASX) Corporate Governance Council’s Corporate Governance Principles and Recommendations (ASX Principles) issued by the ASX Corporate Governance Council in August 2007. Set out below is a table describing the various ASX Principles and statements as to the Group’s compliance or otherwise with them. Terms used in the table have the meanings given to them in the ASX Principles unless otherwise defined.
Principle Number Best Practice Recommendation Compliance Reason For
Non-Compliance
1. Lay Solid Foundations For Management And Oversight
1.1 Establish the functions reserved to the Board and those delegated to senior executives and disclose these functions.
Refer page 6 Complied
1.2 Disclose the process for evaluating the performance of senior executives. Refer page 26 Complied
1.3 Provide the information in the Guide to reporting on Principle 1. Refer pages 6, 26 Complied
2. Structure The Board To Add Value
2.1 A majority of the Board should be independent Directors. Refer page 6, 7 Complied
2.2 The Chair should be an independent Director. Refer page 6, 7 Complied
2.3 The roles of the Chair and Chief Executive Officer should not be exercised by the same individual.
Refer page 7 Complied
2.4 The Board should establish a nomination committee. Refer page 8 Complied
2.5 Disclose the process for evaluating the performance of the Board, its committees and individual Directors.
Refer page 8 Complied
2.6 Provide the information in the Guide to reporting on Principle 2. Refer page 8 Complied
3. Promote Ethical And Responsible Decision-Making
3.1 Establish a code of conduct and disclose the code or summary of the code as to:
the practices necessary to maintain confidence in the Company’s integrity;
the practices necessary to take into account their legal obligations and the reasonable expectations of their stakeholders; and
the responsibility and accountability of individuals for reporting and investigating reports of unethical practices.
Refer page 9 Complied
3.2 Establish a policy concerning trading in Company securities by Directors, senior executives and employees, and disclose the policy or a summary of that policy.
Refer page 9, 10 Complied
3.3 Provide the information in the Guide to reporting on Principle 3. Refer page 9 Complied
4. Safeguard Integrity In Financial Reporting
4.1 The Board should establish an audit committee. Refer page 10 Complied
4.2 The audit committee should be structured so that it:
consists only of non-executive Directors;
consists of a majority of independent Directors;
is chaired by an independent Chair, who is not Chair of the Board; and
has at least three members.
Refer page 10 Complied
4.3 The audit committee should have a formal Charter. Refer page 10 Complied
4.4 Provide the information in the Guide to reporting on Principle 4. Refer page 10 Complied

CORPORATEGOVERNANCESTATEMENT
RETAIL FOOD GROUP LIMITED - ANNUAL REPORT 30 JUNE 2010 5
Principle Number Best Practice Recommendation Compliance Reason For
Non-Compliance
5. Make Timely And Balanced Disclosures
5.1 Establish written procedures designed to ensure compliance with ASX Listing Rule disclosure requirements and to ensure accountability at a senior executive level for that compliance and disclose those policies or a summary of those policies.
Refer page 11 Complied
5.2 Provide the information in the Guide to reporting on Principle 5. Refer page 11 Complied
6. Respect The Rights Of Shareholders
6.1 Design a communication policy for promoting effective communication with shareholders and encouraging their participation at general meetings and disclose their policy or a summary of that policy.
Refer page 11 Complied
6.2 Provide the information in the Guide to reporting on Principle 6. Refer page 11 Complied
7. Recognise And Manage Risk
7.1 Establish policies for the oversight and management of material business risks and disclose a summary of those policies.
Refer page 12 Complied
7.2 The Board should require management to design and implement the risk management and internal control system to manage the Company’s material business risks and report to it on whether those risks are being managed effectively. The Board should disclose that management has reported to it as to the effectiveness of the Company’s management of its material business risks.
Refer page 12 Complied
7.3 The Board should disclose whether it has received assurance from the Chief Executive Officer (or equivalent) and the Chief Financial Officer (or equivalent) that the declaration provided in accordance with section 295A of the Corporations Act is founded on a sound system of risk management and internal control and that the system is operating effectively in all material respects in relation to financial reporting risks.
Refer page 12 Complied
7.4 Provide the information in the Guide to reporting on Principle 7. Refer page 12 Complied
8. Remunerate Fairly And Responsibly
8.1 The Board should establish a remuneration committee. Refer page 12 Complied
8.2 Clearly distinguish the structure of non-executive Directors’ remuneration from that of executive Directors and senior executives.
Refer page 13 Complied
8.3 Provide the information in the Guide to reporting on Principle 8. Refer page 12 Complied
The Board has in place Corporate Governance practices that it considers to be the most appropriate for the Company and its controlled entities which are together referred to as the Group in this statement. The Board continues to review its governance framework and practices to ensure they meet the interests of shareholders. This statement describes the main Corporate Governance practices in place during the year. The Board maintains a comprehensive set of policies to assist in the discharge of its Corporate Governance responsibilities, including:
Code of Conduct;
Board Charter;
Board Nomination Charter;
Audit & Risk Compliance Committee Charter;
Remuneration Committee Charter;
Standing Rules of Committee Charter;
Continuous Disclosure Policy;
Remuneration Policy;
Appointment of Directors Policy;
Share Trading Policy; and
Shareholder Communications Policy. Copies are available from the Company’s registered office or may be downloaded from the Company’s website under the Investor Media section.
CORPORATEGOVERNANCESTATEMENT
6 RETAIL FOOD GROUP LIMITED - ANNUAL REPORT 30 JUNE 2010
Principle 1: Lay Solid Foundations For Management And Oversight The Directors are responsible to the shareholders for promoting and managing the performance of the Group in both the short and longer term. Their focus is to enhance the interests of shareholders and other key stakeholders and to ensure the Group is properly managed. The responsibilities of the Board include:
chart strategy and set financial targets for the Group;
monitor the implementation and execution of strategy and performance against financial targets;
appoint and oversee the performance of senior management; and
to take and fulfill an effective leadership role in relation to the Group. The Board has reserved to itself, in addition to those matters reserved to it by law, the following matters and all power and authority in relation to those matters:
composition of the Board itself (including appointment and retirement or removal of Directors);
oversight of the Group including its control and accountability systems;
appointing and removing the Chief Executive Officer;
ratifying the appointment and, where appropriate, the removal of the Chief Financial Officer and the Company Secretary;
reviewing and overseeing the operation of systems of risk management and internal compliance and control, codes of ethics and conduct, and legal and regulatory compliance;
input into and final approval of management’s development of corporate strategy and performance objectives;
monitoring senior management’s performance and implementation of strategy, and ensuring appropriate resources are available;
approving and monitoring the progress of major capital expenditure, capital management, acquisitions and divestitures;
approving and monitoring financial and other reporting;
performance of investment and treasury functions;
monitoring industry developments relevant to the Group and its business;
developing suitable key indicators of financial performance for the Group and its business;
the overall corporate governance of the Group including strategic direction, establishing goals for management and monitoring the achievement of these goals; and
oversight of committees. The Board has delegated specific responsibilities to various Board Committees who act, subject to the terms of their respective charters, in an advisory capacity subject to the oversight of the Board. Day to day management of the Group’s affairs and the implementation of the corporate strategy and policy initiatives are formally delegated by the Board to the Chief Executive Officer and senior management of the Group. These delegations are reviewed as appropriate. The Board generally meets on a monthly basis. On an annual basis, the Board sets financial and non-financial performance targets for the Chief Executive Officer and senior management and performance is assessed against these performance targets. A performance assessment for the Chief Executive Officer and senior management last took place in January 2010. Principle 2: Structure The Board To Add Value The Board operates in accordance with the broad principles set out in its charter. The charter details the Board’s composition and responsibilities. Board Composition The composition of the Board is determined according to the following principles:
the Board must comprise members with a broad range of experience, expertise, skills and contacts relevant to the Group and its business;
there must be at least four Directors;
the number of Directors may be increased where the Board considers that additional expertise is required in specific areas or when an outstanding candidate is identified;
the Chairman must be a non-executive Director who is also independent; and
at least half of the Board must be non-executive Directors at least two of whom must also be independent.

CORPORATEGOVERNANCESTATEMENT
RETAIL FOOD GROUP LIMITED - ANNUAL REPORT 30 JUNE 2010 7
Directors’ Independence The Board has adopted specific principles in relation to Directors’ independence. These state that when determining independence, a Director must be a non-executive and the Board should consider whether the Director:
is a substantial shareholder of the Company or an officer of, or otherwise associated directly with, a substantial shareholder of the Company;
is employed, or has previously been employed in an executive capacity by the Company, and there has not been a period of at least three (3) years between ceasing such employment and serving on the Board;
has within the last three (3) years been a principal of a professional advisor or a significant consultant to the Group, or an employee significantly associated with the service provided except in circumstances where the advisor might be considered to be independent notwithstanding their position as a professional advisor due to the fact that fees payable by the Group to the advisor’s firm represent an insignificant component of its overall revenue;
is a significant supplier or customer of the Group, or an officer of or otherwise associated directly or indirectly with a significant supplier or customer of the Group;
has a material contractual relationship with the Group other than as a Director;
is free from any interest and any business or other relationship, which could, or could reasonably be perceived to, materially interfere with the Director’s ability to act in the best interests of the Group; and
has served on the Board for a period which could, or could reasonably be perceived to, materially interfere with the Director’s ability to act in the best interests of the Group.
The Board assesses independence each year. To enable this process, the Directors must provide all information that may be relevant to the assessment. Board Members The names, skills and experience of the Directors in office at the date of this Statement, and the period of office of each Director, are set out in the Directors’ Report. At the date of signing the Directors’ Report, the Board comprised two executive Directors and three non-executive Directors (including the Chairman). The three non-executive Directors have no relationships adversely affecting independence and so are deemed independent under the principles set out above. Mr Anthony (Tony) Alford, an executive Director, is a substantial shareholder of the Company and accordingly he is not considered to be independent of the Group based on the ASX guidelines. Mr Alford has a long association with Retail Food Group and the Board considers that it is in the best interests of all shareholders to have a Director with Mr Alford’s industry and business expertise and Group history as a member of the Board. Mr Nigel Nixon, an executive Director, is a substantial shareholder of the Company and accordingly he is not considered to be independent of the Group based on the ASX guidelines. Mr Nixon previously held the position of joint master franchisee of the Donut King franchise system and the Board considers that it is in the best interests of all shareholders to have a Director with Mr Nixon’s industry and business expertise and Group history as a member of the Board. Term Of Office The Company’s Constitution requires that one third (or the nearest number thereto but not less than one third) of the Directors, other than the Managing Director, must retire from office at each Annual General Meeting of the Company. The Director/s who must retire is that Director/s who has been in office longest since last being elected. Director/s retiring by rotation are eligible for re-election. Chairman And Chief Executive Officer The Chairman is responsible for leading the Board, ensuring Directors are properly briefed in all matters relevant to their role and responsibilities, facilitating Board discussions and managing the Board’s relationship with the Group’s senior management. In accepting the position, the Chairman has acknowledged that it will require significant time commitment and has confirmed that other positions will not hinder his effective performance in the role of the Chairman. The Chief Executive Officer is responsible for implementing Group strategies and policies. The Board charter specifies that these (the role of the Chairman and Chief Executive Officer) are separate roles to be undertaken by separate people. Induction The induction provided to new Directors enables them to actively participate in Board decision-making as soon as possible. It ensures that they have a full understanding of the Group’s financial position, strategies, operations and risk management policies. It also explains the respective rights, duties, responsibilities and roles of the Board.

CORPORATEGOVERNANCESTATEMENT
8 RETAIL FOOD GROUP LIMITED - ANNUAL REPORT 30 JUNE 2010
Commitment The Board held eleven Board meetings during FY10. Non-executive Directors are expected to spend at least 20 days a year preparing for and attending Board and Committee meetings and associated activities. The number of meetings of the Company’s Board of Directors and each Board Committee held during the year ended 30 June 2010, and the number of meetings attended by each Director is disclosed on page 15. The commitments of non-executive Directors are considered by the Nominations Committee prior to the Director’s appointment to the Board and are reviewed each year as part of the annual performance assessment. Prior to appointment or being submitted for re-election, each non-executive Director is required to specifically acknowledge that they have and will continue to have the time available to discharge their responsibilities to the Company. Independent Professional Advice Directors have the right, in connection with their duties and responsibilities, to seek independent professional advice at the Group’s expense. Prior approval of the Chairman is required, but this will not be unreasonably withheld. The advice obtained must be made available to all Board members in due course, where appropriate. Board Performance The Board undertakes an annual self assessment of the performance of the Board as a whole, its Committees, the Chairman, individual Directors and governance processes that support Board work. Performance of individual Directors is assessed against a range of dimensions including the ability of the Director to consistently create shareholder value, to contribute to the development of strategies and risk identification, to provide clarity of direction to senior management, to listen to the views of fellow Directors and members of management and key third party stakeholders and to provide the time commitment to ensure the discharge of duties and obligations to the Group. Board Committees The Board has established a number of committees to assist in the execution of its duties and to allow detailed consideration of complex issues. Current committees of the Board are the Nominations, Remuneration and Audit and Risk Management Committees. The Nominations and Remuneration Committees are majority comprised of non-executive Directors. The Audit & risk Management Committee is entirely comprised of non-executive Directors. Each Committee has its own written charter setting out its role and responsibilities, composition, structure, membership requirements and the manner in which the committee is to operate. All of these charters are reviewed on an annual basis. All matters determined by the committees are submitted to the Board as recommendations for Board consideration. Minutes of committee meetings are tabled at the subsequent Board meeting. Nominations Committee The Board has a Nominations Committee to assist the Board and make recommendations to it in relation to the appointment of new Directors (both executive and non-executive) and senior management. The Nominations Committee consists of the following Directors:
Mr John Cowley (Chairman);
Mr Colin Archer;
Mr Bruce Hancox; and
Mr Nigel Nixon (resigned from committee on 27 November 2009). Details of these Directors’ attendance at Nominations Committee meetings are set out in the Directors’ Report on page 15. Functions performed by the Committee include the following:
developing of suitable criteria (as regards experience, expertise, skills, qualifications, contacts or other qualities) for Board candidates;
identifying individuals who, by virtue of their experience, expertise, skills, qualifications, contacts or other qualities, are suitable candidates for appointment to the Board or to any relevant management position;
recommending individuals accordingly for consideration by the Board;
establishing procedures, for recommendation to the Chairman, for the proper oversight of the Board and senior management; and
ensuring that the performance of each Director, and of all members of senior management, is reviewed and assessed each year in accordance with procedures adopted by the Board.

CORPORATEGOVERNANCESTATEMENT
RETAIL FOOD GROUP LIMITED - ANNUAL REPORT 30 JUNE 2010 9
Nominations Committee (cont.) When a new Director is to be appointed, the Committee reviews the range of skills, experience and expertise on the Board, identifies its needs and prepares a short-list of candidates with appropriate skills and experience. Where necessary, advice may be sought from independent search consultants. The Board then appoints the most suitable candidate who must submit themselves to shareholders for election at the first Annual General Meeting following their appointment. New Directors are provided with a letter of appointment setting out the Company’s expectations including involvement with committee work, their responsibilities, remuneration, including superannuation and expenses, requirement to disclose their interests and any matters which affect the Director’s independence. New Directors are also provided with all relevant policies including the Company’s share trading policy, a copy of the Company’s Constitution, organisational chart and details of indemnity and insurance arrangements. A formal induction program which covers the operation of the Board and its Committees and financial, strategic, operations and risk management issues is also provided to ensure that Directors have significant knowledge about the Group and the industry within which it operates. New Directors are advised of the time commitment required of them in order to appropriately discharge their responsibilities as a Director of the Company. Directors are required to confirm that they have sufficient time to meet this requirement. The Committee also assumes responsibility for overseeing management succession planning, including the implementation of appropriate executive development programmes and ensuring adequate arrangements are in place, so that appropriate candidates are recruited for later promotion to senior positions. The Committee has an advisory role, consistent with its purpose of assisting the Board in relation to the matters with which it is charged with responsibility, and does not have any power to commit the Board to any recommendation or decision made by it but may nevertheless consult independent external expert advisers as it may consider appropriate for the proper performance of its function and charge the costs to the Group. Principle 3: Promote Ethical And Responsible Decision-Making Code Of Conduct The Company has developed a Code of Conduct (the Code) which has been fully endorsed by the Board and applies to all Directors and employees. The Code is regularly reviewed by the Board and updated as necessary. The Code draws together all of the Group’s practices and policies. The Code reflects the Group’s values of:
respect for others;
honesty, integrity and accountability;
leadership and teamwork;
diligence and care in the performance of duties; and,
an acknowledgement of the service orientated nature of the Group’s core franchising business. It reinforces the need for Directors, employees, consultants and all other representatives of the Group to always act in good faith, in the Group’s best interests and in accordance with all applicable policies, procedures, laws and regulations relevant to the regions in which the Group operates. Trading In Company Securities By Directors, Senior Management And Employees The Company has a detailed Trading Policy which regulates dealings by Directors, senior management and employees in shares, options and other securities issued in the Company. The Code of Conduct for Transactions in Securities provides that trading is normally permitted during the four weeks immediately following the announcement of the Company’s half and full year results and during the four weeks following the Company’s Annual General Meeting (or such other times as the Board may agree from time to time). In such instances trading is only permitted where such persons are not privy to price sensitive information or where such trading is not for short term or speculative gain.
CORPORATEGOVERNANCESTATEMENT
10 RETAIL FOOD GROUP LIMITED - ANNUAL REPORT 30 JUNE 2010
Trading In Company Securities By Directors, Senior Management And Employees (cont.) The sale of securities is also permitted with the written authority of the Board where, for example, it can be shown that the securities are being sold:
to realise cash in time of need;
for asset portfolio management purposes;
to enable the disposer to realign business investments;
as a consequence of the disposer determining to change his or her investment weighting; or,
where the securities are transferred from one member of a family or trust to another when to delay the transaction to the next permitted trading period would be detrimental to the family’s affairs,
and provided that such trading is not considered to be:
contrary to law;
for speculative gain;
to take advantage of insider knowledge; and,
perceived by the public, press, other shareholders or ASX as unfair. No person to whom the Code applies can sell more than $200,000 worth of securities without having first sought counsel from the Company’s Chairman as to the form and timing of the sale of such securities. Principle 4: Safeguard Integrity In Financial Reporting Audit And Risk Management Committee The Board has an Audit and Risk Management Committee to advise on the establishment and maintenance of a framework of internal control and appropriate ethical standards for the management of the Company. The Audit and Risk Management Committee consists of the following Directors:
Mr Colin Archer (Committee Chairman);
Mr John Cowley; and
Mr Bruce Hancox. Details of these Directors’ qualifications and attendance at Audit and Risk Management Committee meetings are set out in the Directors’ Report on pages 14 and 15, respectively. All members of the Audit and Risk Management Committee are financially literate and have an appropriate understanding of the Group’s business. The Audit and Risk Management Committee has a formal charter and internal control framework. The Committee charter requires that Committee meetings are convened at least four times each year. The Committee has responsibility for the following:
ensuring an appropriate Board and Committee structure is in place so as to facilitate a proper review function by the Board;
monitoring the establishment of an appropriate internal control framework, including information systems, and its operation and considering enhancements;
monitoring corporate risk assessment and compliance with internal controls;
overseeing business continuity planning and risk mitigation arrangements;
assessing the objectivity and performance of the internal audit function and considering enhancements;
reviewing reports on any material defalcations, frauds and thefts from the Group;
reviewing reports on the adequacy of insurance coverage;
monitoring compliance with relevant legislative and regulatory requirements (including continuous disclosure obligations) and declarations by the Company Secretary in relation to those requirements;
reviewing significant transactions which are not a normal part of the Group’s business;
reviewing the nomination, performance and independence of the external auditors, including recommendations to the Board for the appointment or removal of any external auditor;
liaising with the external auditor and ensuring that the annual audit is conducted in an effective manner that is consistent with Committee members’ information and knowledge and is adequate for shareholder needs;
reviewing management processes supporting external reporting;
reviewing financial statements and other financial information distributed externally;
preparing and recommending for approval by the Board the corporate governance statement for inclusion in the annual report or any other public document;
reviewing external audit reports to ensure that, where major deficiencies or breakdowns in controls or procedures have been identified, appropriate and prompt remedial action is taken by management; and
reviewing and monitoring compliance with the Code of Ethics.

CORPORATEGOVERNANCESTATEMENT
RETAIL FOOD GROUP LIMITED - ANNUAL REPORT 30 JUNE 2010 11
Audit And Risk Management Committee (cont.) In fulfilling its responsibilities, the Audit and Risk Management Committee:
receives regular reports from management and the external auditor;
meets with the external auditor at least twice a year, or more frequently if necessary;
reviews any significant disagreements between the external auditor and management irrespective of whether they have been resolved; and
meets separately with the external auditor at least twice a year without the presence of management. The Audit and Risk Management Committee has authority, within the scope of its responsibilities, to seek any information it requires from any employee or external party. The Audit and Risk Management Committee reports to, and makes recommendations to the Board in relation to each of its functions. The Audit and Risk Management Committee charter is available on the Group’s corporate website. External Auditor The Company and Audit and Risk Management Committee policy is to appoint an external auditor who clearly demonstrates quality and independence. The performance of the external auditor is reviewed annually. Deloitte Touche Tohmatsu (Deloitte) was appointed as the external auditor in 2003. It is Deloitte’s policy to rotate audit engagement partners on listed companies at least every five years, and in accordance with that policy a new audit engagement partner was introduced for the year ended 30 June 2007. An analysis of fees paid to the external auditor, including a break-down of fees for non-audit services, is provided in the Directors’ Report and in the notes to the financial statements. It is the policy of the external auditor to provide an annual declaration of their independence to the Audit and Risk Management Committee. The external auditor is requested to attend the Annual General Meeting and be available to answer shareholder questions about the conduct of the audit and the preparation and content of the audit report. Principle 5: Make Timely And Balanced Disclosures The Group has an established policy and procedure for timely disclosure of material information concerning the Group. This includes internal reporting procedures to ensure that any required market announcements are reported to the Company Secretary in a timely manner. The Company Secretary has been nominated as the person responsible for communication with the ASX. This role includes co-ordinating information disclosure to the ASX, analysts, brokers, shareholders, the media and the public. Following confirmation from the ASX that such information has been released by it. All information disclosed to the ASX is posted on the Group’s corporate website as soon as it is disclosed to the ASX. When analysts are briefed following half year and full year results announcements, the material used in the presentations is released to the ASX prior to the commencement of the briefing. This information is also posted on the Group’s corporate website. Procedures have also been established for reviewing whether any price sensitive information has been inadvertently disclosed and, if so, this information is also immediately released to the market. The Group is committed to ensuring that all stakeholders and the market are provided with relevant and accurate information regarding its activities in a timely manner. A copy of the Continuous Disclosure Policy is available on the Group’s corporate website. Principle 6: Respect The Rights Of Shareholders The Group aims to keep shareholders informed of the Group’s performance and all major developments in an ongoing manner. Information is communicated to shareholders through:
the Annual Report and Financial Reports (including the Full Year Financial Report, the Preliminary Final Report, and the Half-Year Financial Report) which are published on the Group’s corporate website and distributed to shareholders where nominated;
the Annual General Meeting, and any other formally convened Company meetings; and
all other information released to the ASX is posted to the Group’s corporate website. The Group’s corporate website maintains, at a minimum, information about the last three years’ press releases or announcements. A copy of the Shareholder Communications Policy is available on the Group’s corporate website.
CORPORATEGOVERNANCESTATEMENT
12 RETAIL FOOD GROUP LIMITED - ANNUAL REPORT 30 JUNE 2010
Principle 7: Recognise And Manage Risk The Board, through the Audit and Risk Management Committee, is responsible for ensuring the adequacy of the Group’s risk management and compliance framework and system of internal controls and for regularly reviewing its effectiveness. Considerable importance is placed on maintaining a strong control environment. There is an organisation structure with clearly drawn lines of accountability and delegation of authority. The Board actively promotes a culture of quality and integrity. The Group has implemented a risk management system based on ASX Corporate Governance Principles and Recommendations. The framework is based around the following risk activities:
risk identification: identify all significant foreseeable risks associated with business activities in a timely and consistent manner;
risk evaluation: evaluate risks using an agreed risk assessment criteria;
risk treatment/mitigation: develop mitigation plans for risk areas where the residual risk is greater than tolerable risk levels; and
risk monitoring and reporting: report risk management activities and risk specific information to appropriate levels of management in a timely manner.
The Chief Executive Officer and Chief Financial Officer, and other senior management are responsible for identifying, evaluating and monitoring risk in accordance with the risk management framework. Senior management are responsible for the accuracy and validity of risk information reported to the Board and also for ensuring clear communication of the Board and senior management’s position on risk throughout the Group. In particular, at the Board and senior management strategy planning sessions held throughout the year, the Chief Executive Officer and senior management review and identify key business and financial risks which could prevent the Group from achieving its objectives. Additionally, a formal risk assessment process is part of each major capital acquisition with ongoing reviews undertaken of major business acquisitions, major capital expenditures or significant business initiatives. Certification Of Financial Reports The Chief Executive Officer and Chief Financial Officer state in writing to the Board each reporting period that:
the Company’s financial reports are complete and present a true and fair view, in all material respects, of the financial condition and operational results of the Company and are in accordance with the relevant Accounting Standards; and,
the above statement is founded on a sound system of risk management and internal compliance and control which implements the policies adopted by the Board and that the Company’s risk management and internal compliance and control is operating efficiently and effectively in all material respects.
Principle 8: Remunerate Fairly And Responsibly Remuneration Committee The Board has a Remuneration Committee to assist the Board and report to it on remuneration and issues relevant to remuneration policies and practices including those for senior management and non-executive Directors. Its current members are:
Mr John Cowley (Chairman);
Mr Colin Archer;
Mr Bruce Hancox; and
Mr Nigel Nixon (resigned from committee on 27 November 2009). Details of these Directors’ attendance at Remuneration Committee meetings are set out in the Directors’ Report on page 15. The Committee has responsibility for the following:
reviewing and evaluating market practices and trends in relation to remuneration relevant to the Group;
reviewing and making recommendations to the Board in relation to the Group’s remuneration policies;
reviewing and making recommendations to the Board in relation to the Group’s remuneration practices;
overseeing the performance of the Chief Executive Officer and Chief Financial Officer and other members of senior management and non-executive Directors;
reviewing and making recommendations to the Board in relation to the remuneration of the Chief Executive Officer and Chief Financial Officer and other members of senior management and of non-executive Directors; and
preparing for the Board any report that may be required under applicable legal or regulatory requirements in relation to remuneration matters.

CORPORATEGOVERNANCESTATEMENT
RETAIL FOOD GROUP LIMITED - ANNUAL REPORT 30 JUNE 2010 13
Remuneration Committee (cont.) The Committee reviews and sets key performance indicators (KPI’s) relating to financial and non-financial targets for senior management at the commencement of each financial year. The Remuneration Committee reports to, and makes recommendations to the Board in relation to each of its functions. Further information of Directors’ and executives’ remuneration, including principles used to determine remuneration, is set out in the Directors’ Report under the heading “Remuneration Report”. The Remuneration Committee charter is available on the Group’s corporate website. Structure Of Remuneration Details of the nature and amount of each element of remuneration for Directors and senior management of the Group are set out in the “Remuneration Report” section of the Directors’ Report. Remuneration for executive Directors and senior management are appropriately structured for each executive based on the duties allocated to them, the size of the Group’s business and the industry in which the Group operates. Service contracts outline the components of compensation paid to the executives (including executive Directors), but do not prescribe how compensation levels are modified year to year. Compensation levels are reviewed each year to take into account cost-of-living changes, any change in the scope of the role performed by the executive and any changes required to meet the principles of the Remuneration Policy. Fees and payments to non-executive Directors reflect the demands which are made on, and the responsibilities of, the Directors. Non-executive Directors’ fees and payments are reviewed annually by the Board. Non-executive Director remuneration takes the form of a set fee plus superannuation entitlements, however, may comprise other benefits or rewards in certain circumstances. The maximum aggregate amount of fees that can be paid to non-executive Directors is subject to approval by shareholders at the Annual General Meeting. The maximum amount which has been approved by the Company’s shareholders for payment to non-executive Directors is $400,000. Fees for non-executive Directors are not linked to the performance of the Group. However, to align Directors’ interests with shareholder interests, the Directors are encouraged to hold shares in the Company and are granted share options.

DIRECTORS’REPORT
14 RETAIL FOOD GROUP LIMITED - ANNUAL REPORT 30 JUNE 2010
The Directors of Retail Food Group Limited (referred to hereafter as the Company) submit herewith the annual financial report of the Company for the financial year ended 30 June 2010. In order to comply with the provisions of the Corporations Act 2001, the Directors report as follows: Information About The Directors And Senior Management The names and particulars of the Directors of the Company during or since the end of the financial year are:
Name Particulars
Mr John Cowley Independent non-executive Chairman, joined the Board on 13 October 2005. Mr Cowley is a member of the Audit and Risk Management Committee, and Chairman of the Nominations and Remuneration Committees. Mr Cowley has significant corporate and media experience having been involved in the media industry for more than 40 years. Mr Cowley is a member of the Order of Australia (General Division). Mr Cowley was re-elected to the Board at the Company’s AGM held on 27 November 2009 following retirement by rotation.
Mr Anthony (Tony) Alford Chief Executive Officer and Managing Director, Bachelor of Business (Accountancy), CPA. Mr Alford joined the Board on 28 October 2003. He has been an accountant in public practice for in excess of 20 years. Mr Alford commenced his involvement with Retail Food Group in 1994 in an advisory role, thereafter becoming the Group Financial Controller. In December 1999, he was appointed Managing Director of the Group.
Mr Nigel Nixon Corporate Counsel and Executive Director, Solicitor of the Supreme Court of Queensland and the Australian Capital Territory. Mr Nixon joined the Board on 29 November 2003. Mr Nixon is a former joint master franchisee of the Donut King South East Queensland and Northern New South Wales franchise territory, having acquired the master franchise in August 1995. He also has experience in the operation of other franchise systems. Mr Nixon joined Retail Food Group in August 2002. Mr Nixon was a member of the Nominations and Remuneration Committees until 27 November 2009. Mr Nixon was re-elected to the Board at the Company’s AGM held on 27 November 2009 following retirement by rotation.
Mr Colin Archer Independent non-executive Director, Bachelor of Economics, CA, joined the Board on 12 April 2006. He has been an accountant in public practice for in excess of 25 years. Mr Archer is a Chartered Accountant, registered auditor and tax agent. He specialises in management and letting rights, property trusts, mergers and acquisitions and corporate governance. Mr Archer is Chairman of the Audit and Risk Management Committee and a member of the Nominations and Remuneration Committees. Mr Archer was re-elected to the Board at the Company’s AGM held on 27 November 2008 following retirement by rotation.
Mr Bruce Hancox Independent non-executive Director, joined the Board 14 December 2007. Mr Hancox has over 35 years corporate experience in manufacturing and retailing including 19 years with Brierley Investments Limited where he occupied the position of Chief Executive Officer and Chairman of the Board. He is a member of the Company’s Nominations, Remuneration and Audit and Risk Management Committees. Mr Hancox was elected to the Board at the Company’s AGM held on 27 November 2008.
Directorships Of Other Listed Companies Directorships of other listed companies held by Directors in the 3 years immediately before the end of the financial year are as follows:
Name Company Period Of Directorship
Mr John Cowley Oaks Hotels and Resorts Limited Since 2 November 2005
Mr Colin Archer Oaks Hotels and Resorts Limited Since 24 April 2005

DIRECTORS’REPORT
RETAIL FOOD GROUP LIMITED - ANNUAL REPORT 30 JUNE 2010 15
Directors’ Shareholdings The following table sets out each Director’s relevant interest in shares and options in shares of the Company as at the date of this report.
Directors
Fully Paid Ordinary Shares
Executive Share Options
Number Number
Mr John Cowley 59,586 129,433
Mr Anthony (Tony) Alford 23,510,743 10,000
Mr Nigel Nixon 5,649,625 110,332
Mr Colin Archer 323,618 36,100
Mr Bruce Hancox - -
Remuneration Of Directors And Senior Management Information about the remuneration of Directors and senior management is set out in the “Remuneration Report” of this Directors’ Report. Share Options Granted To Directors And Senior Management Nil share options were granted to Directors during or since the end of the financial year. During and since the end of the financial year an aggregate of 130,000 share options were granted to the following senior management of the Company as part of their remuneration:
Directors And Senior Management Number Options Granted Issuing Entity Number Ordinary
Shares Under Option
Mr Anthony Mark Connors 20,000 Retail Food Group Limited 20,000
Mr Gary Best 50,000 Retail Food Group Limited 50,000
Mr Damien Peters 25,000 Retail Food Group Limited 25,000
Ms Tracey Catterall 5,000 Retail Food Group Limited 5,000
Mr Gary Alford 15,000 Retail Food Group Limited 15,000
Mr Gavin Nixon 15,000 Retail Food Group Limited 15,000
Directors’ Meetings The following table sets out the number of Directors’ meetings (including meetings of Committees of Directors) held during the financial year and the number of meetings attended by each Director (while they were a Director or Committee member). During the financial year, 11 Board meetings, 5 Audit and Risk Management Committee meetings, 2 Remuneration Committee meetings and 2 Nominations Committee meetings were held.
Directors Board of Directors Audit Committee Remuneration Committee
Nominations Committee
Held Attended Held Attended Held Attended Held Attended
Mr John Cowley 11 10 5 5 2 2 2 2
Mr Anthony (Tony) Alford 11 11 n/a n/a n/a n/a n/a n/a
Mr Nigel Nixon (1) 11 10 n/a n/a n/a n/a n/a n/a
Mr Colin Archer 11 11 5 5 2 2 2 2
Mr Bruce Hancox 11 11 5 5 2 2 2 2
(1) Resigned from Remuneration and Nominations Committees on 27 November 2009.

DIRECTORS’REPORT
16 RETAIL FOOD GROUP LIMITED - ANNUAL REPORT 30 JUNE 2010
Company Secretary The Company Secretary is Anthony Mark Connors. Mr Connors was appointed as Company Secretary on 26 April 2006 having prior to and since that time acted as the Company’s Legal Counsel. Mr Connors is a Solicitor of the Supreme Court of Queensland. Principal Activities The Group’s principal activities during the course of the financial year were:
the intellectual property ownership of the Donut King, bb’s café, Brumby’s Bakeries, Michel’s Patisserie and Big Dad’s Pies franchise systems;
development and management of the Donut King, bb’s café, Brumby’s Bakeries, Michel’s Patisserie and Big Dad’s Pies franchise systems throughout Australia and New Zealand, and international licensor throughout the rest of world; and,
development and management of the Coffee Roasting Facility and the wholesale supply of certain products to the Donut King, bb’s café, Brumby’s Bakeries, Michel’s Patisserie and Big Dad’s Pies franchise systems.
Changes In State Of Affairs No significant changes in the nature of the Group’s core business activities occurred during the financial year other than with respect to:
the acquisition of the:
‐ DCM Coffee & Donuts franchise system on 13 January 2010;
‐ Brumby’s Bakeries master franchise territories for North Queensland and New Zealand on 15 January 2010;
‐ Brumby’s Bakeries master franchise territories for Western Australia and the Northern Territory on 16 February 2010; and,
‐ Big Dad’s Pies franchise system on 1 April 2010.
the continuing structural enhancement of the Michel’s Patisserie franchise system from a wholesale supply and distribution model to a traditional royalty based model.
Review Of Operations And Financial Condition Group Overview The retail trade performance of the Group’s five franchise systems continued to be resilient in FY10, delivering excellent results and sustained shareholder value. Net Profit After Tax (NPAT) of $26.0 million was up 10.6% (or $2.5 million) on the prior year. NPAT from Core Operations of $26.4 million was up 12.8% (or $3.0 million) on the prior year. Total network sales across the Group’s five franchise systems for FY10 was $640.6 million, an increase of $8.6 million over the previous year. Network sales increased as a consequence of:
increases in weighted average weekly sales (AWS) and average transaction values (ATV) across all five brands;
maintenance of customer counts across the respective systems; and,
37 new outlet commissionings. Earnings per share (EPS) for the year increased 6.8% (or 1.6 cents) to 25.3 cents. The Directors declared a fully franked final ordinary dividend of 6.25 cents per share, taking the full year dividend to 11.75 cents per share, an increase of 27.0% on the prior year. Acquisitions DCM Coffee & Donuts Franchise System On 27 November 2009, the Company announced that it had reached an agreement, subject to normal contractual terms and finalisation of due diligence enquiry, by which the DCM Coffee & Donuts franchise system would be acquired. The DCM Coffee & Donuts franchise system represents a direct competitor to the Donut King franchise system and comprised 23 coffee/donut outlets in NSW. The DCM Coffee & Donuts franchise system was acquired for re-branding and integration into the Donut King franchise system, thereby accelerating total Donut King outlet population growth whilst affording DCM Coffee & Donuts franchisees the opportunity to partake in the benefits that accrue from membership in a nationally established and iconic retail franchise brand. Settlement was completed on 13 January 2010, with control of the franchise system transferring to the Group at that time. The purchase price was $2.4 million, consisting of $2.1 million cash and scrip in the Company to the value of $0.3 million.

DIRECTORS’REPORT
RETAIL FOOD GROUP LIMITED - ANNUAL REPORT 30 JUNE 2010 17
Review Of Operations And Financial Condition (cont.) Acquisitions (cont.) Brumby’s Bakeries North Queensland & New Zealand Master Territory Acquisition On 27 November 2009, the Group announced that it had reached an agreement, subject to normal contractual terms and finalisation of due diligence enquiry, by which the Brumby’s Bakeries master franchise territories for North Queensland and New Zealand would be acquired. The acquisition consisted of the purchase of the master license rights from the vendor for the geographical territories of Far North Queensland and New Zealand, and the assignment of the existing franchise agreements held by the vendor to the Group. At the date of control, there were 37 outlets within the Far North Queensland territory and a further 19 outlets in New Zealand. Settlement was completed on 15 January 2010, with control of the master franchise territories transferring to the Group at that time. The purchase price was $4.0 million, consisting of $2.68 million cash and scrip in the Company to the value of $1.32 million. Brumby’s Bakeries Western Australia & Northern Territory Master Territory Acquisition On 7 January 2010, the Group announced that it had reached an agreement, subject to normal contractual terms and finalisation of due diligence enquiry, by which the Brumby’s Bakeries master franchise territories for Western Australia and the Northern Territory would be acquired. The acquisition consisted of the purchase of the master license rights from the vendor for the geographical territories of Western Australia and the Northern Territory, and the assignment of the existing franchise agreements held by the vendor to the Group. At the date of control, there were 50 outlets within the Western Australian territory and a further 8 outlets in the Northern Territory. Settlement was completed on 16 February 2010, with control of the master franchise territories transferring to the Group at that time. The purchase price was $4.81 million, consisting of $3.62 million cash and scrip in the Company to the value of $1.19 million. Big Dad’s Pies Franchise System On 23 December 2009, the Group announced it had reached an agreement, subject to normal contractual terms and finalization of due diligence enquiry, by which the South East Queensland based 37 outlet Big Dad’s Pies franchise system would be acquired. Settlement was completed on 1 April 2010, with control of the franchise system transferring to the Group at that time, for a cash consideration of $3.1 million. Earnings Performance Total revenue (excluding marketing) for FY10 was $118.6 million, or $11.9 million (9.1%) less than FY09 total revenue. The decrease in total revenue is a consequence of:
the planned and profitable sale of the Group’s Centralised Manufacturing Facility (CMF) in January 2009, which contributed $3.1 million in wholesale revenue to the FY09 result; and,
the strategic transition of the Michel’s Patisserie franchise system from a wholesale bakery supply and distribution model to a traditional royalty based model typically operated by the Group.
After excluding the above impacts from FY09 total revenue ($16.5 million in aggregate), FY10 total revenue increased by 4.0% ($4.6 million) when compared to the normalised FY09 result. The Group is organised into two major operating divisions – franchising operations and wholesale / retail operations. Franchising Operations Franchising Operations incorporates the development and management of the Group’s five retail franchise systems – Donut King, bb’s café, Brumby’s Bakeries, Michel’s Patisserie and Big Dad’s Pies – and involves the following principal activities:
the establishment and grant of new franchises;
the administration of royalties collection, supplier licensing, franchisee compliance, franchisee training and administration; and
the performance of marketing and promotional activities, brand development and awareness, and product research and development.
Segment revenue for FY10 was $61.3 million (FY09: $56.3 million), representing growth of $5.0 million (or 8.9%), and was driven by new outlet openings, growth in average weekly sales (of which the Group earns a royalty), and the additional business attributable to four acquisitions completed by the Group during FY10. Segment revenue includes revenues derived from marketing activities of $15.4 million (FY09: $12.6 million).

DIRECTORS’REPORT
18 RETAIL FOOD GROUP LIMITED - ANNUAL REPORT 30 JUNE 2010
Review Of Operations And Financial Condition (cont.) Earnings Performance (cont.) Wholesale / Retail Operations Wholesale / Retail Operations incorporates the development and management of the Group’s Procurement & Distribution division, Wholesale & Manufacturing division and Non-Voluntary Company Store division. These divisions are managed and reported separately to the Franchising Operations segment, and involve the following principal activities:
the procurement, sale and distribution of bakery and other related items to Michel’s Patisserie franchisees;
the manufacture and sale of roasted coffee and related products to franchisees and external customers;
the interim operation of non-voluntary company owned or company managed stores across each of the five franchise systems; and
the sale of turn-key and company owned stores. Segment revenue for FY10 was $72.5 million (FY09: $86.2 million), representing a decline of $13.7 million. As noted previously, segment revenue for FY09 includes:
sales revenue of $3.1million derived by the CMF, prior to its disposal in January 2009; and
sales revenue of $13.4 million derived from the wholesale bakery supply to Michel’s Patisserie outlets in FY09, which transitioned (during FY10) from the wholesale supply and distribution model to the traditional royalty based model.
After excluding the above impacts from FY09 total revenue ($16.5 million in aggregate), FY10 segment revenue increased by 4.0% ($2.8 million) when compared to the normalised FY09 segment result. A review of consolidated revenues and results by segment is set out below:
Segment Segment Revenues Segment Result
FY10 $’000
FY09 $’000
FY10 $’000
FY09 $’000
Franchising Operations 61,340 56,250 30,133 25,470
Wholesale / Retail Operations 72,493 86,209 15,488 17,082
133,833 142,459 45,621 42,552
Unallocated 193 628 (9,050) (10,634)
Profit before tax 36,571 31,918
Income tax expense (10,552) (8,399)
Revenue and NPAT for the year 134,026 143,087 26,019 23,519
Consolidated Result Net Profit After Tax (NPAT) of $26.0 million was up 10.6% (or $2.5 million) on the prior year. Ignoring the impacts of derivative financial instruments (interest rate swaps) (FY10: $0.5 million loss; FY09: $1.0 million loss) and non-recurring gains (FY10: $nil, FY09: $1.1 million gain), NPAT from Core Operations of $26.4 million represents a 12.8% increase on underlying NPAT achieved in FY09. Other highlights included:
gross margin expansion to 63.9% (based on combined performance of wholesale/retail and franchising operations segments) reflected benefits of Michel’s Patisserie system conversion and related distribution savings, as well as increasing contribution from coffee operations;
significant overhead expense reduction of $7.3 million (22.7%) achieved through deliberate expense liberation and further cost base reductions extracted from historical acquisitions – notably without impacting franchisee support functions;
voluntary debt reduction of $10.0 million during the year contributed $1.2 million to EBT and supports the Group’s active debt management strategy based on voluntary debt reductions; and,
strong earnings performance supporting cash flows and allows increasing dividend payout ratio with record dividend to shareholders.

DIRECTORS’REPORT
RETAIL FOOD GROUP LIMITED - ANNUAL REPORT 30 JUNE 2010 19
Review Of Operations And Financial Condition (cont.) Financial Position and Cash Flows Total net assets of $138.8 million have increased by $31.8 million (29.7%) from FY09 reflecting the Group’s reducing working capital requirements and well managed debt and equity structures. Overall increase in cash holdings by $7.7 million in FY10 reflects continuing strong cash flows – a feature of Retail Food Group’s business model – supported by balanced investment and financing activities. Cash inflows from operating activities for FY10 were $29.2 million, an increase of 25.9% on FY09 ($6.0 million), and reflected a conversion to EBITDA of 98.2% (FY09: 97.6%). Surplus free cash from operations was used to fund:
strategic acquisition of four major Brumby’s Bakeries master franchise territories and two further small franchise systems requiring $11.5 million cash consideration;
further voluntary debt reduction of $10.0 million (to the then hedged limit of $86.0 million); and,
capital expenditure of $0.6 million invested to expand coffee operation infrastructure.
Share placements totaling $8.9 million were conducted in conjunction with DRP activities during FY10 and supported the increased dividend payout ratio to 53%.
Debt Structure As at 30 June 2010, the Group’s total debt was $86.0 million (excluding deferred borrowing costs), following further voluntary repayments of $10.0 million during FY10, funded from free operating cash flows. The Group’s core debt is shown as a current liability in the Statement of Financial Position, reflecting its maturity date of 5 December 2010. As previously disclosed at the Group’s November 2009 Annual General Meeting, the decision to delay refinancing of the debt facility until 1Q11 and allow the debt to become current reflects:
the Company’s strategic endeavors to derive maximum benefit from existing margins applicable under the CBA facility agreement; and,
the receipt of a strong and positive response from senior banking institutions to refinance the totality of the Group’s debt. The foregoing strategy enabled the Group to focus on the continued reduction of core debt borrowings on favourable loan terms and margins, thus enabling the Company to potentially take advantage of improved margins anticipated from reduced debt levels and any easing of pressure on bank lending margins. The foregoing is consistent with the Group’s stated capital management policies and is totally compliant with lending covenants. Notably, during FY10, the Group’s net debt reduced by $17.7 million (19.5%). The Group holds interest rate swaps to manage interest rate exposure. At 30 June 2010, these swaps had a notional principal of $85.2 million and a weighted average interest rate of 7.06%. In July 2008, the Group designated the interest rate swaps as hedges, reducing the ongoing volatility in the income statement. The aggregate fair value of the Group’s interest rate swaps at 30 June 2010 was $3.7 million payable (FY09: $5.6 million payable). The Group’s leverage ratio of 1.89 times and gearing ratio of 34.4% reflect the execution of an active debt management strategy throughout FY10 and in preparation for refinance of the debt facility prior to 5 December 2010.

DIRECTORS’REPORT
20 RETAIL FOOD GROUP LIMITED - ANNUAL REPORT 30 JUNE 2010
Review Of Operations And Financial Condition (cont.) Performance Indicators New Outlets New outlets for FY10 totaled 97 and were derived from:
60 by franchise system acquisition – during FY10, the Group acquired the DCM Coffee & Donuts (23 franchised outlets at control date) and Big Dad’s Pies (37 franchised outlets at control date) franchise systems; and,
37 by organic growth. FY10 organic outlet growth of 37 was reflective of depressed shopping centre development and reduced premium site opportunities.
Franchise System Details
Donut King 19 new outlet commissionings (FY09: 24) and 9 outlet closures (FY09: 6) resulting in organic Donut King net system growth during FY10 of 10 (or 3.1%).
The Donut King franchise system was fortified in FY10 by the acquisition of the DCM Coffee & Donuts franchise system consisting of 23 outlets. DCM Coffee & Donuts franchise system was acquired for re-branding and integration into the Donut King franchise system, thereby accelerating total Donut King outlet population growth whilst affording DCM Coffee & Donuts franchisees the opportunity to partake in the benefits that accrue from membership in a nationally established and iconic retail franchise brand. As at 30 June 2010, 1 outlet had been converted to Donut King.
As at 30 June 2010 there were 348 Donut King outlets operating in Australia with net outlet growth being experienced in Queensland, Victoria and New South Wales. As at 30 June 2010 there were 10 Donut King outlets located in China.
Brumby’s Bakeries 10 new outlet commissionings (FY09: 19) and 11 outlet closures (FY09: 17) resulting in Brumby’s Bakeries net system reduction during FY10 of 1 (or 0.3%). As at 30 June 2010 there were 312 Brumby’s Bakeries outlets operating in Australia with outlet commissionings growth being experienced primarily in Queensland, Victoria and Western Australia. As at 30 June 2010 there were 18 Brumby’s Bakeries outlets located in New Zealand.
Michel’s Patisserie 7 new outlets commissionings (FY09: 13) and 15 legacy outlet closures (FY09: 16) resulting in Michel’s Patisserie net system reduction during FY10 of 8 (or 2.3%). As at 30 June 2010 there were 332 Michel’s Patisserie outlets operating in Australia with outlet commissionings growth being experienced primarily in Victoria, South Australia and Western Australia. In New South Wales, outlet numbers declined. As at 30 June 2010 there were 5 Michel’s Patisserie outlets located in New Zealand.
bb’s café 1 new commissioning (FY09: 3) and 3 outlet closures (FY09: 9) resulting in bb’s café net system reduction during FY10 of 2 (or 3.2%). As at 30 June 2010 there were 60 bb’s café outlets (FY09: 62), 22 of which are located in New Zealand (FY09: 22).
Big Dad’s Pies The franchise system was acquired on 1 April 2010, with 37 outlets operating located in South East Queensland. As at 30 June 2010 there were 37 Big Dad’s Pies outlets located in Queensland.

DIRECTORS’REPORT
RETAIL FOOD GROUP LIMITED - ANNUAL REPORT 30 JUNE 2010 21
Review Of Operations And Financial Condition (cont.) Performance Indicators (cont.) Outlet Average Weekly Sales (AWS) & Average Transaction Values (ATV)
Franchise System Average Weekly Sales (AWS) Average Transaction Value (ATV)
2008
$
2009
$
2010
$
2008
$
2009
$
2010
$
Donut King 9,183 9,256 9,357 4.59 4.93 5.11
Growth 2.3% 0.8% 1.1% 4.8% 7.4% 3.7%
bb’s café 10,274 11,242 11,329 6.75 7.16 7.41
Growth 4.7% 9.4% 0.8% 5.6% 7.9% 3.4%
Brumby’s Bakeries 12,630 13,410 13,488 5.35 5.65 5.81
Growth 7.8% 6.2% 0.6% 8.9% 5.6% 5.6%
Michel’s Patisserie 11,394 11,868 12,140 5.93 6.08 6.08
Growth 1.4% 4.2% 2.3% 3.3% 2.5% 2.5%
Big Dad’s Pies 7,652
Growth
The Group’s five franchise systems exhibited positive weighted average weekly sales growth of 1.6% growth in FY10, and weighted average transaction value (ATV) growth of 3.2%, compared to FY09. Donut King outlet average weekly sales growth of 1.1% was assisted by a 3.7% increase in average transaction values reflecting the success of key promotions and improved merchandising emphasising yeast donuts. The bb’s café outlet average weekly sales growth for Australian outlets was 0.8% on FY09 reflecting customer recognition of broad offers and focus on lunch time value offers. Brumby’s Bakeries outlet average weekly sales growth of 0.6% was assisted by a 5.6% increase in average transaction values reflecting improved product bundling and enhanced menu offerings. Michel’s Patisserie outlet average weekly sales growth of 2.3% was assisted by a 2.5% increase in average transaction values reflecting a number of successful coffee promotions and other combination menu offers. Donut King, bb’s café and Michel’s Patisserie outlets are predominantly located in shopping centres, where the Group has focused on initiatives which drive average transaction values to compensate for lower traffic flows over the past 2 to 3 years. Future Developments Performance Indicators New Outlet Growth Total outlets for the Group as at 30 June 2011 are forecast to be 1,132 a net increase of 10 stores based on forecast organic new store growth of 40 outlets, and 30 forecast closures. This conservative forecast recognises the present impact on the Group of stagnant shopping centre development and reduced premium site opportunities. The Group anticipates improved shopping centre development activity to positively impact organic outlet growth during the first quarter of the FY12 financial year. Of the 23 DCM Coffee & Donuts acquired in January 2010, one conversion to Donut King have been completed, and a further two are underway.
FY11 Outlets Forecast Donut King
bb's café Brumby’s Bakeries
Michel’s Patisserie
Big Dad’s Pies
Total
Beginning stores 358 60 330 337 37 1,122
Commissionings 15 1 11 11 2 40
Closures (10) (3) (9) (8) - 30
Net growth anticipated 5 (2) 2 3 2 10
Closing stores 362 58 332 340 39 1,132

DIRECTORS’REPORT
22 RETAIL FOOD GROUP LIMITED - ANNUAL REPORT 30 JUNE 2010
Future Developments (cont.) Performance Indicators (cont.) Outlet Average Weekly Sales (AWS) and Average Transaction Values (ATV) The maintenance of positive weighted average AWS growth across all systems in FY10 continues to support the proposition that the Group’s five franchise systems are resilient to significant changes in economic conditions. In addition, an increasing ATV fortifies franchisee and outlet performance against increasing competition and decline in retail traffic flow. The Group views FY11 as being a continuation of the very challenging economic and retail environment experienced in FY10. Initiatives remain focused on sustaining and enhancing franchisee average weekly sales (AWS), and increasing average transaction value (ATV). Operational and Financial Targets In FY11, management’s focus will continue to be on sustaining growth and positioning the Group and its franchisees to emerge in good order from the current challenging economic environment. The transition of the remaining 130 Michel’s Patisserie franchisees from the acquired “wholesale-distribution” based system to a traditional “royalty-based” system will continue. Growth strategies will continue to be directed towards:
the development of non-traditional site opportunities, including Brumby’s Bakeries;
the completion of further international licensing opportunities for the Donut King, Brumby’s, Michel’s and bb’s café systems;
further expansion of coffee domestically and internationally, with the appointment of a National Sales Manager for wholesale coffee;
increasing field staff to fortify franchisee health;
integration of the DCM Coffee & Donuts into Donut King;
development of new products and menu innovations; and,
maximising supply-chain efficiencies across all systems,
for the benefit of all concerned stakeholders. The Group also expects the strong cash flows of FY10 to continue in FY11, with a view to further reducing its net debt position and progressively increasing the dividend payout ratio to approximately 55%. The Group continues to investigate and evaluate potential retail food franchise system acquisitions. These acquisition targets include both competitor and complementary systems which provide system growth opportunities, synergies, intellectual property enhancement, and are value accretive. In this pursuit, the Company will keep the market and its shareholders informed in accordance with its reporting obligations. Disclosure of further information on likely developments in the operations of the Group and the expected results of operations have not been included in this report as the Directors believe it would be likely to result in unreasonable prejudice to the Group.

DIRECTORS’REPORT
RETAIL FOOD GROUP LIMITED - ANNUAL REPORT 30 JUNE 2010 23
Significant Events After The Balance Date There has not been any matter or circumstance occurring, other than that referred to in this Directors’ Report, the financial statements or notes thereto, that has arisen since the end of the financial year, that has significantly affected, or in the reasonable opinion of the Directors, may significantly affect the operations of the Group, the results of those operations, or the state of affairs of the group in future financial years, other than the following: Final Dividend On 17 August 2010, the Board of Directors declared a final dividend for the financial year ended 30 June 2010, as set out in the “Dividends” section of this report. Debt Facility Management On 7 July 2010, as part of the Group’s Debt Facility management strategy, the Group terminated the following financial instruments:
interest rate swap with a notional principal value of $22.8 million (as at 30 June 2010) and a termination date of 30 March 2011; and,
interest rate cap with a notional principal value of $7.8 million (as at 30 June 2010) and a termination date of 30 June 2012.
In consideration of the termination of the interest rate swap, the Group paid the CBA the sum of $0.2 million. No fee was payable in respect of the interest rate cap termination. The terminations enabled the Group to make a further voluntary debt reduction of $9.0 million, also on 7 July 2010, thereby reducing the drawn amount of the Group’s Debt Facility to $77.0 million. The facility remains hedged to $62.4 million and is subject to an overall average weighted interest rate of 6.9%. Debt Facility Refinance During FY10, the Group continued to evaluate a number of refinancing submissions received in respect of its Debt Facility. On 17 August 2010, the Company announced the appointment of the National Australia Bank (NAB) as its future debt facility provider and transaction banker. That appointment has now been affirmed with refinance and transfer of the Company’s banking facility completed on 31 August 2010. Key facets of the new facility include:
an $85.0 million Senior Debt Facility;
a three year term;
a structure that allows for voluntary debt retirement;
covenants consistent with those under the former facility and limited to interest cover, leverage and gearing; and,
a step down margin to 150 basis points over BBSY. The transaction banking facilities encompasses:
reduced transaction fees;
new corporate streamlined transactional banking platform;
superior merchant pricing for the Group’s franchisees; and,
superior funding arrangements for new and existing franchisees. Acquisition Of Property For National Office On 1 September 2010, the Group announced that it had entered into a contract to for the acquisition of a property situated at Olympic Court, Southport, which will, after refurbishment, be a dedicated special purpose facility to house the Company’s National Office. Settlement of the transaction is anticipated on or before 17 September 2010. The acquisition, refurbishment and fitout costs of the building are anticipated to be in the order of $4.5 million and will be funded from cash reserves and current banking facilities. It is anticipated that RFG will relocate to the Olympic Court premises in the later part of 2H11. Environmental Regulations The Group, due to the nature of its operations is not required to be environmentally licensed nor is it subject to any conditions which have been imposed by an environmental regulator specifically related to the Group or its operations. In circumstances where the nature of the Group’s operations requires, the Group is committed to compliance with all prescribed environmental laws and regulations.

DIRECTORS’REPORT
24 RETAIL FOOD GROUP LIMITED - ANNUAL REPORT 30 JUNE 2010
Dividends Dividends paid or declared by the Company to members since the end of the previous financial year were:
Dividend Details Cents Per Share
Total Amount
$’000
Franked / Unfranked
Payment Date
Declared and paid during the financial year
Final 2009 dividend 4.750 4,765 100% Franked 9 October 2009
Interim 2010 dividend 5.250 5,441 100% Franked 8 April 2010
10,206
Declared after the end of the financial year
Final 2010 dividend 6.500 6,934 100% Franked 7 October 2010
In respect of the financial year ended 30 June 2009, as detailed in the Directors’ Report for that financial year, a final dividend of 4.75 cents per share (based on 100,324,698 shares on issue), franked to 100% at 30% corporate income tax rate was paid on 9 October 2009. The final dividend was approved by the Directors following the conclusion of the 30 June 2009 financial year and therefore was not provided for in the Company’s financial report. It was resolved that the final dividend would constitute an eligible dividend for the purpose of the Company’s dividend reinvestment plan. In respect of profits of the financial year ended 30 June 2010, an interim dividend of 5.25 cents per share (based on 103,623,966 shares on issue), franked to 100% at 30% corporate income tax rate was paid on 8 April 2010. The interim dividend was approved by the Directors on 16 February 2010 and it was resolved that the interim dividend would constitute an eligible dividend for the purposes of the Company’s dividend reinvestment plan. In respect of profits of the financial year ended 30 June 2010, a final dividend of 6.50 cents per share (based on 106,680,807 shares on issue), franked to 100% at 30% corporate income tax rate will be paid on 7 October 2010. The final dividend was approved by the Directors on 17 August 2010 and therefore was not provided for in the Company’s financial report. It was resolved that the final dividend would constitute an eligible dividend for the purposes of the Company’s dividend reinvestment plan. Shares Under Option Or Issued On Exercise Of Options Details of unissued shares or interests under option as at the date of this report are:
Issuing Entity No. Of Shares Under Option
Class Of Shares Exercise Price Of Options
Expiry Date Of Options
Retail Food Group Limited 194,000 Ordinary $1.00 31/07/11
Retail Food Group Limited 294,666 Ordinary $1.00 31/07/12
Retail Food Group Limited 109,896 Ordinary $1.15 31/07/11
Retail Food Group Limited 107,397 Ordinary $1.15 31/07/12
Retail Food Group Limited 107,406 Ordinary $1.15 31/07/13
Retail Food Group Limited 150,834 Ordinary $1.32 31/07/12
Retail Food Group Limited 80,000 Ordinary $1.32 31/07/13
Retail Food Group Limited 120,000 Ordinary $1.32 31/07/14
Retail Food Group Limited 160,000 Ordinary $1.50 16/02/12
The holders of such options do not have the right, by virtue of the option, to participate in any share issue or interest issue of the Company. Details of shares or interests issued during or since the end of the financial year as a result of exercise of an option are:
Issuing Entity No. Of Shares Under Option
Class Of Shares Amount Paid For Shares
Amount Unpaid On Shares
Retail Food Group Limited 1,300,336 Ordinary $1,427,696 $nil

DIRECTORS’REPORT
RETAIL FOOD GROUP LIMITED - ANNUAL REPORT 30 JUNE 2010 25
Indemnification Of Officers And Auditors During the financial year, the Company paid a premium in respect of a contract insuring the Directors of the Company (as named above), the Company Secretary, and all executive officers of the Company and of any related body corporate against a liability incurred as such a Director, Secretary or executive officer to the extent permitted by the Corporations Act 2001. The contract of insurance prohibits disclosure of the nature of the liability and the amount of the premium. The Company has also entered into a Deed Poll indemnifying the Directors, officers and certain other parties in respect of certain claims that may be raised against them relative to the operations of the Company, its former and current subsidiaries. To the maximum permitted by the Corporations Act, the Deed Poll indemnifies those persons (in it) from liabilities incurred as a consequence of the acts of those persons including the giving of personal guarantees on behalf of the Company and its former and current subsidiaries. The Company has not otherwise, during or since the end of the financial year, indemnified or agreed to indemnify an officer or auditor of the Company or of any related body corporate against a liability incurred as such an officer or auditor. Non-audit Services Details of amounts paid or payable to the auditor for non-audit services provided during the year by the auditor are outlined in note 37 to the financial statements. The Directors are satisfied that the provision of non-audit services, during the year, by the auditor (or by another person or firm on the auditor’s behalf) is compatible with the general standard of independence for auditors imposed by the Corporations Act 2001. The Directors are of the opinion that the services as disclosed in note 37 to the financial statements do not compromise the external auditor’s independence, based on advice received from the Audit Committee, for the following reasons:
all non-audit services have been reviewed and approved to ensure that they do not impact the integrity and objectivity of the auditor; and
none of the services undermine the general principles relating to auditor independence as set out in Code of Conduct APES 110 Code of Ethics for Professional Accountants issued by the Accounting Professional & Ethical Standards Board, including reviewing or auditing the auditor’s own work, acting in a management or decision-making capacity for the Company, acting as advocate for the Company or jointly sharing economic risks and rewards.
Auditor’s Independence Declaration The auditor’s independence declaration is included on page 35 of the financial report. Rounding Off Of Amounts The Company is a company of the kind referred to in ASIC Class Order 98/0100, dated 10 July 1998, and in accordance with that Class Order amounts in the Directors’ report and the financial report are rounded off to the nearest thousand dollars, unless otherwise indicated.

DIRECTORS’REPORT
26 RETAIL FOOD GROUP LIMITED - ANNUAL REPORT 30 JUNE 2010
Remuneration Report This Remuneration Report, which forms part of the Directors’ Report, sets out information about the remuneration of Retail Food Group Limited’s Directors and its senior management for the financial year ended 30 June 2010. The prescribed details for each person covered by this report are contained below under the following headings:
Director and senior management details;
remuneration policy;
relationship between the remuneration policy and Group performance;
remuneration of Directors and senior management; and,
key terms of employment contracts. The information provided in this Remuneration Report has been audited as required by section 308(3C) of the Corporations Act 2001. 1. Director And Senior Management Details The Company does not remunerate any of its Directors, key management personnel or specific executives. Rather, the Directors, key management personnel and specific executives are remunerated via subsidiaries of the Company. Hence, separate remuneration disclosure for the Company is not required. The following persons acted as Directors of the Company during or since the end of the financial year:
Mr John Cowley (Chairman)
Mr Anthony (Tony) Alford (Managing Director and Chief Executive Officer) *
Mr Nigel Nixon *
Mr Colin Archer
Mr Bruce Hancox. The term ‘senior management’ is used in this remuneration report to refer to the following persons. Except as noted, the named persons held their current position for the whole of the financial year and since the end of the financial year:
Mr Anthony Mark Connors (Company Secretary and Legal Counsel)
Mr Gary Best (Chief Operating Officer) *
Mr Damien Peters (Chief Financial Officer) *
Ms Tracey Catterall (Chief Marketing Officer)
Mr Gary Alford (Head of Strategy – Franchise) *
Mr Gavin Nixon (Property Director). * denotes one of the 5 highest paid executives of the Group, as required to be disclosed under the Corporations Act 2001. 2. Remuneration Policy The Group considers it critical to its long term success, and the building of shareholder value, that it attracts, retains and motivates appropriate personnel to lead, manage and serve the Group in an increasingly congested and competitive marketplace. The objectives of the Group’s remuneration policy are to:
motivate executive and non-executive personnel to successfully manage and lead the Group with a view to driving long term growth and shareholder value;
drive successful performance and achievement of long and short term goals and otherwise reinforce the objectives of the Group;
deliver competitive remuneration packages necessary to attract and retain appropriate personnel;
ensure fair remuneration having regard to duties, responsibilities and other demands;
ensure flexibility to enable the Group to cope with planned or unforeseen threats and opportunities;
ensure compliance with relevant laws; and to
ensure sustainable value for all stakeholders. When determining executive remuneration packages, the Group may have regard to:
the need to attract, retain and motivate appropriate personnel;
market practices;
alternative benefits including incentive programs, fringe benefits and equity schemes;
assessment of individual performance against set goals and targets; and,
scope of responsibility, duties and other demands. Executive remuneration shall generally take the form of a base salary plus superannuation, however, may comprise performance bonuses and other benefits or rewards in certain circumstances.

DIRECTORS’REPORT
RETAIL FOOD GROUP LIMITED - ANNUAL REPORT 30 JUNE 2010 27
Remuneration Report (cont.) 2. Remuneration Policy (cont.) When determining non-executive remuneration packages, the Group may have regard to:
the need to attract, retain and motivate appropriately qualified and experienced Directors with diverse backgrounds and experiences best suited to ensure the Board is comprised of a range of skills necessary to properly understand the business environment in which the Group operates;
the scope and complexity of the responsibilities assumed by such Directors in connection with the oversight and leadership of the Group;
comparative market practices; and,
alternative benefits including equity schemes. Role of the Remuneration Committee The Board has a Remuneration Committee to assist the Board and report to it on remuneration and issues relevant to remuneration policies and practices including those for senior management and non-executive Directors. Among the functions performed by the Committee are the following:
review and evaluation of market practices and trends on remuneration matters;
recommendations to the Board in relation to the Group’s remuneration policies and practices;
oversight of the performance of the Chief Executive Officer, Chief Financial Officer and other members of senior management and non-executive Directors; and,
recommendations to the Board in relation to the remuneration of senior management and non-executive Directors. The Remuneration Committee has adopted the following policies for which it will have regard to when determining the remuneration of executives and senior management members:
annual review of executive and senior management member packages by reference to Group performance, executive performance, comparable information from industry sectors and other listed companies;
the need to attract, retain and motivate the highest caliber executives and reward them for performance which results in long-term growth in shareholder value;
all bonuses, options and incentives must be linked to pre-determined performance criteria; and,
any changes must be referential to measurable performance criteria. 3. Relationship Between Remuneration Policy And Group Performance The compensation structures outlined below are designed to attract suitably qualified executives, reward the achievement of strategic objectives, and to achieve the broader outcome of long term success and the building of shareholder value. The compensation structures take into account:
the capability and experience of the executive;
the executive’s ability to control and deliver the Group’s forecast results;
the attainment of pre-determined KPIs developed specially for the executive’s role;
the Group’s performance including:
‐ the Group’s earnings;
‐ the growth in earnings per share and return on shareholder wealth; and,
the amount of incentives within each executive’s remuneration package. Remuneration packages include a mix of fixed and variable compensation and short-term and long-term performance-based incentives. The mix of these components is based on the role the individual performs. In addition to their salaries, the Group also provides non-cash benefits to its executives, and contributes to a post-employment superannuation plan on their behalf. Fixed Compensation Fixed compensation consists of base compensation (which is calculated on a total cost basis and includes any fringe benefits tax (FBT) charges related to employee benefits including motor vehicles), as well as employer contributions to superannuation funds. Compensation levels are reviewed annually by the Remuneration Committee and the Chief Executive Officer, through a process that considers the individual, the achievement of pre-determined KPIs, and the overall performance of the Group. An executive’s remuneration is also reviewed on promotion. Executives receive a superannuation guarantee contribution required by the government which is currently 9%, and do not receive any other retirement benefits. Some individuals, however, have chosen to sacrifice part of their salary to increase payments towards superannuation.
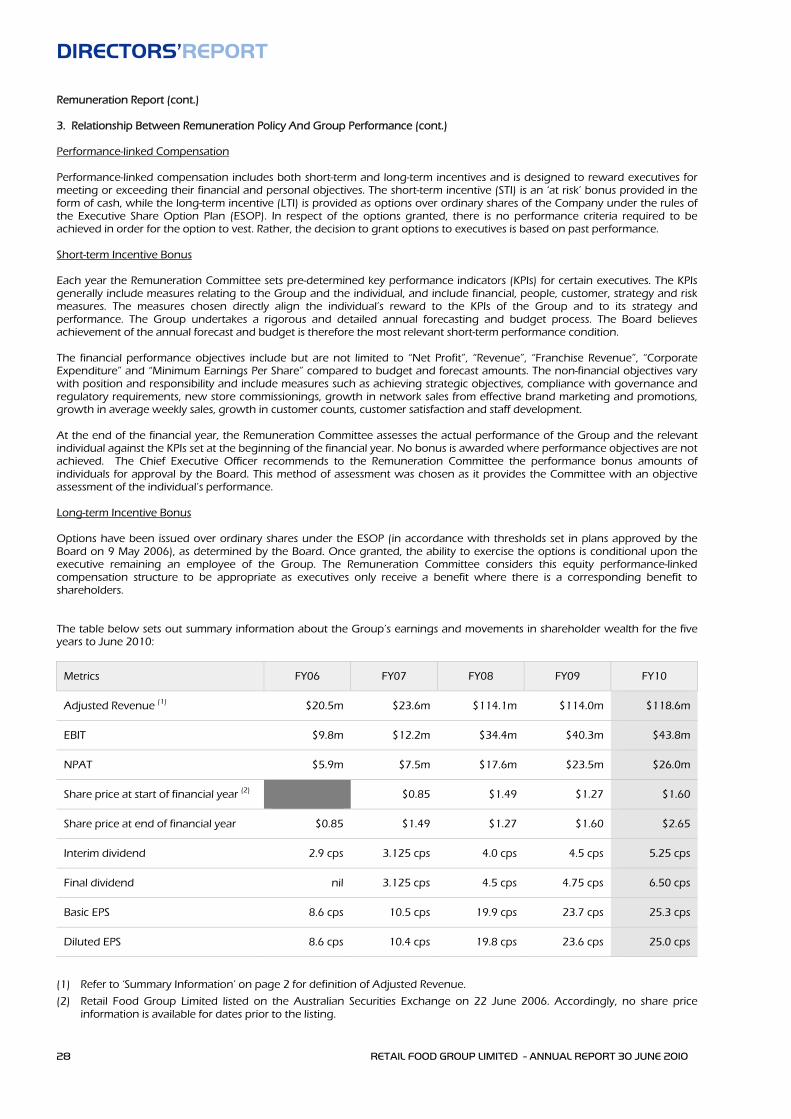
DIRECTORS’REPORT
28 RETAIL FOOD GROUP LIMITED - ANNUAL REPORT 30 JUNE 2010
Remuneration Report (cont.) 3. Relationship Between Remuneration Policy And Group Performance (cont.) Performance-linked Compensation Performance-linked compensation includes both short-term and long-term incentives and is designed to reward executives for meeting or exceeding their financial and personal objectives. The short-term incentive (STI) is an ‘at risk’ bonus provided in the form of cash, while the long-term incentive (LTI) is provided as options over ordinary shares of the Company under the rules of the Executive Share Option Plan (ESOP). In respect of the options granted, there is no performance criteria required to be achieved in order for the option to vest. Rather, the decision to grant options to executives is based on past performance. Short-term Incentive Bonus Each year the Remuneration Committee sets pre-determined key performance indicators (KPIs) for certain executives. The KPIs generally include measures relating to the Group and the individual, and include financial, people, customer, strategy and risk measures. The measures chosen directly align the individual’s reward to the KPIs of the Group and to its strategy and performance. The Group undertakes a rigorous and detailed annual forecasting and budget process. The Board believes achievement of the annual forecast and budget is therefore the most relevant short-term performance condition. The financial performance objectives include but are not limited to “Net Profit”, “Revenue”, “Franchise Revenue”, “Corporate Expenditure” and “Minimum Earnings Per Share” compared to budget and forecast amounts. The non-financial objectives vary with position and responsibility and include measures such as achieving strategic objectives, compliance with governance and regulatory requirements, new store commissionings, growth in network sales from effective brand marketing and promotions, growth in average weekly sales, growth in customer counts, customer satisfaction and staff development. At the end of the financial year, the Remuneration Committee assesses the actual performance of the Group and the relevant individual against the KPIs set at the beginning of the financial year. No bonus is awarded where performance objectives are not achieved. The Chief Executive Officer recommends to the Remuneration Committee the performance bonus amounts of individuals for approval by the Board. This method of assessment was chosen as it provides the Committee with an objective assessment of the individual’s performance. Long-term Incentive Bonus Options have been issued over ordinary shares under the ESOP (in accordance with thresholds set in plans approved by the Board on 9 May 2006), as determined by the Board. Once granted, the ability to exercise the options is conditional upon the executive remaining an employee of the Group. The Remuneration Committee considers this equity performance-linked compensation structure to be appropriate as executives only receive a benefit where there is a corresponding benefit to shareholders. The table below sets out summary information about the Group’s earnings and movements in shareholder wealth for the five years to June 2010:
Metrics FY06 FY07 FY08 FY09 FY10
Adjusted Revenue (1) $20.5m $23.6m $114.1m $114.0m $118.6m
EBIT $9.8m $12.2m $34.4m $40.3m $43.8m
NPAT $5.9m $7.5m $17.6m $23.5m $26.0m
Share price at start of financial year (2) $0.85 $1.49 $1.27 $1.60
Share price at end of financial year $0.85 $1.49 $1.27 $1.60 $2.65
Interim dividend 2.9 cps 3.125 cps 4.0 cps 4.5 cps 5.25 cps
Final dividend nil 3.125 cps 4.5 cps 4.75 cps 6.50 cps
Basic EPS 8.6 cps 10.5 cps 19.9 cps 23.7 cps 25.3 cps
Diluted EPS 8.6 cps 10.4 cps 19.8 cps 23.6 cps 25.0 cps
(1) Refer to ‘Summary Information’ on page 2 for definition of Adjusted Revenue.
(2) Retail Food Group Limited listed on the Australian Securities Exchange on 22 June 2006. Accordingly, no share price information is available for dates prior to the listing.

DIRECTORS’REPORT
RETAIL FOOD GROUP LIMITED - ANNUAL REPORT 30 JUNE 2010 29
Remuneration Report (cont.) 4. Remuneration Of Directors And Senior Management
FY10 Short-term Employment Benefits
Post Employment
Benefits
Share-based
Payments Total Consisting
of Options Salary &
Fees Bonus Other Super-
annuation Options
$ $ $ $ $ $ %
Non-Executive Directors
Mr John Cowley 68,808 - - 6,193 3,253 78,254 4.2
Mr Colin Archer 56,881 - - 5,119 3,181 65,181 4.9
Mr Bruce Hancox 62,000 - - - - 62,000 -
Executive Directors and senior management
Mr Anthony (Tony) Alford * 491,000 120,000 - 16,200 6,215 633,415 1.0
Mr Nigel Nixon * 350,000 50,000 1,141 - 6,127 407,268 1.5
Mr Anthony Mark Connors 178,899 15,000 - 16,101 33,693 243,693 13.8
Mr Gary Best * 229,358 21,588 - 20,642 75,270 346,858 21.7
Mr Damien Peters * 160,550 48,750 415 14,450 37,536 261,701 14.4
Ms Tracey Catterall 112,004 4,000 1,800 10,080 6,911 134,795 5.1
Mr Gary Alford * 196,329 10,000 914 17,670 26,912 251,825 10.7
Mr Gavin Nixon 205,000 5,000 4,200 - 26,824 241,024 11.1
* denotes one of the 5 highest paid executives of the Group, as required to be disclosed under the Corporations Act 2001.
FY09 Short-term Employment Benefits
Post Employment
Benefits
Share-based
Payments Total Consisting
of Options Salary &
Fees Bonus Other Super-
annuation Options
$ $ $ $ $ $ %
Non-Executive Directors
Mr John Cowley 67,538 - - 6,078 9,502 83,118 11.4
Mr Colin Archer 55,928 - - 5,034 8,581 69,543 12.3
Mr Bruce Hancox 60,961 - - - - 60,961 -
Executive Directors and senior management
Mr Anthony (Tony) Alford * 450,000 - - 22,777 16,994 489,711 3.5
Mr Nigel Nixon * 332,692 - 15,911 - 15,867 364,470 4.4
Mr Anthony Mark Connors 175,723 - - 15,815 14,877 206,415 7.2
Mr Gary Best * 209,597 - - 18,864 16,304 244,765 6.7
Mr Damien Peters 157,374 10,000 1,800 14,164 8,335 191,673 4.3
Ms Nicole Dodd 128,699 - - 11,583 14,463 154,745 9.3
Mr Gary Alford * 208,309 - 6,460 18,748 16,534 250,051 6.6
Mr Gavin Nixon * 196,346 - 4,200 - 15,407 215,953 7.1
Mr Andre Nell 170,000 - - 19,800 - 189,800 -
* denotes one of the 5 highest paid executives of the Group, as required to be disclosed under the Corporations Act 2001.

DIRECTORS’REPORT
30 RETAIL FOOD GROUP LIMITED - ANNUAL REPORT 30 JUNE 2010
Remuneration Report (cont.) 4. Remuneration Of Directors And Senior Management (cont.) No Director or senior management person appointed during the period received a payment as part of his or her remuneration for agreeing to hold the position. The relative proportions of remuneration that are linked to performance and those that are fixed are as follows:
Fixed Short-Term Incentive Long-Term Incentive
FY10 FY09 FY10 FY09 FY10 FY09
Non-Executive Directors
Mr John Cowley 95.8% 88.6% - - 4.2% 11.4%
Mr Colin Archer 95.1% 87.7% - - 4.9% 12.3%
Mr Bruce Hancox 100.0% 100.0% - - - -
Executive Directors and senior management
Mr Anthony (Tony) Alford 80.1% 96.5% 18.9% - 1.0% 3.5%
Mr Nigel Nixon 86.2% 95.6% 12.3% - 1.5% 4.4%
Mr Anthony Mark Connors 80.0% 92.8% 6.2% - 13.8% 7.2%
Mr Gary Best 72.1% 93.3% 6.2% - 21.7% 6.7%
Mr Damien Peters 67.0% 90.4% 18.6% 5.2% 14.4% 4.3%
Ms Tracey Catterall 91.9% - 3.0% - 5.1% -
Mr Gary Alford 85.3% 93.4% 4.0% - 10.7% 6.6%
Mr Gavin Nixon 86.8% 92.9% 2.1% - 11.1% 7.1%
Bonuses The Board ratified a recommendation from the Remuneration Committee on 25 January 2010 which provided for the grant of cash bonuses to certain Directors and senior management for their performance during the year ended 30 June 2009. The amounts were determined after performance reviews were completed by the Chief Executive Officer and approved by the Remuneration Committee. No other executives were eligible for bonuses during FY10.
Short-term Incentive Bonus
Included In Remuneration
Vested In Year (1)
Forfeited In Year (2)
$ % %
Non-Executive Directors
Mr John Cowley - - -
Mr Colin Archer - - -
Mr Bruce Hancox - - -
Executive Directors and senior management
Mr Anthony (Tony) Alford 120,000 100 -
Mr Nigel Nixon 50,000 100 -
Mr Anthony Mark Connors 15,000 100 -
Mr Gary Best 21,588 46.5 53.5
Mr Damien Peters 48,750 100 -
Ms Tracey Catterall 4,000 28.4 71.6
Mr Gary Alford 10,000 22.3 77.7
Mr Gavin Nixon 5,000 100 -
(1) Amounts included in compensation for the financial year represent the amount that vested in the financial year based on achievement of personal goals and satisfaction of specified performance criteria. No amounts vest in future financial years in respect of the bonus schemes for the current financial year.
(2) The amounts forfeited are due to the performance criteria not being met in relation to the current financial year.

DIRECTORS’REPORT
RETAIL FOOD GROUP LIMITED - ANNUAL REPORT 30 JUNE 2010 31
Remuneration Report (cont.) 4. Remuneration Of Directors And Senior Management (cont.) Executive Share Option Plan The Group has an ownership-based compensation scheme for Directors, executives and senior employees of the Group. In accordance with the provisions of ‘ESOP’, Directors, executives and senior employees may be granted options to purchase parcels of ordinary shares on terms resolved upon by the Board. Certain Directors and senior management have also been granted options pursuant to the terms of formal Option Deeds which are outside the scope of, but substantially in accordance with, the terms of the ESOP. Each share option granted converts into one ordinary share on exercise. No amounts are paid or payable by the option-holder on grant of the option. The options carry neither rights to dividends nor voting rights. Options may be exercised at any time from the date of vesting to the date of their expiry. All share options are non-transferable in accordance with the provisions of the ESOP. During the financial year, the following share-based payment arrangements were in existence:
Option Series Grant Date Expiry Date Grant Date Fair Value
Exercise Price Vesting Date
Tier 1A 01/08/06 31/07/10 $0.1480 $1.00 01/08/07
Tier 1B 01/08/06 31/07/11 $0.1704 $1.00 01/08/08
Tier 1C 01/08/06 31/07/12 $0.1849 $1.00 01/08/09
Tier 2A 01/08/07 31/07/11 $0.5813 $1.15 01/08/08
Tier 2B 01/08/07 31/07/12 $0.5918 $1.15 01/08/09
Tier 2C 01/08/07 31/07/13 $0.5927 $1.15 01/08/10
Tier 3A 01/08/08 31/07/12 $0.2768 $1.32 01/08/09
Tier 3B 01/08/08 31/07/13 $0.3068 $1.32 01/08/10
Tier 3C 01/08/08 31/07/14 $0.3250 $1.32 01/08/11
Tier 4A 01/04/08 31/03/11 $0.1782 $1.67 01/04/08
Tier 5A 01/04/08 31/03/12 $0.1909 $1.92 01/04/09
Tier 6A 17/02/10 16/02/12 $1.3822 $1.50 17/02/10
There are no performance criteria that need to be met in relation to the options granted before the beneficial interest vests in the recipient, other than the continued service of the Director, executive or senior management to the Group. Options are forfeited if the Director, executive or senior management ceases to be employed by the Group prior to the exercise of the option.

DIRECTORS’REPORT
32 RETAIL FOOD GROUP LIMITED - ANNUAL REPORT 30 JUNE 2010
Remuneration Report (cont.) 4. Remuneration Of Directors And Senior Management (cont.) Executive Share Option Plan (cont.) The following grants of share-based payment compensation to Directors and senior management relate to the financial year:
Name Option Series During The Financial Year
No. Granted No. Vested % Of Grant Vested
% Of Grant Forfeited
Mr John Cowley
Tier 1C - 46,666 100% -
Tier 2B - 7,033 100% -
Tier 3A - 5,000 100% -
Mr Anthony (Tony) Alford
Tier 1C - 70,000 100% -
Tier 2B - 13,333 100% -
Tier 3A - 10,000 100% -
Mr Nigel Nixon
Tier 1C - 53,666 100% -
Tier 2B - 13,333 100% -
Tier 3A - 10,000 100% -
Mr Colin Archer
Tier 1C - 33,334 100% -
Tier 2B - 7,033 100% -
Tier 3A - 5,000 100% -
Mr Anthony Mark Connors
Tier 1C - 39,334 100% -
Tier 2B - 13,333 100% -
Tier 3A - 10,000 100% -
Tier 6A 20,000 20,000 100% -
Mr Gary Best
Tier 1C - 60,000 100% -
Tier 2B - 13,333 100% -
Tier 3A - 10,000 100% -
Tier 6A 50,000 50,000 100% -
Mr Damien Peters Tier 3A - 15,004 100% -
Tier 6A 25,000 25,000 100% -
Ms Tracey Catterall Tier 6A 5,000 5,000 100% -
Mr Gary Alford
Tier 1C - 63,334 100% -
Tier 2B - 13,333 100% -
Tier 3A - 10,000 100% -
Tier 6A 15,000 15,000 100% -
Mr Gavin Nixon
Tier 1C - 47,000 100% -
Tier 2B - 13,333 100% -
Tier 3A - 10,000 100% -
Tier 6A 15,000 15,000 100% - During the financial year, the following Directors and senior management exercised options that were granted to them as part of their remuneration. Each option converts into one ordinary share of Retail Food Group Limited.
Name No. Of Options Exercised
No. Of Ordinary Shares Issued
Amount Paid Amount Unpaid
Mr Anthony (Tony) Alford 93,333 93,333 $98,533 $nil
Mr Anthony Mark Connors 39,333 39,333 $39,333 $nil
Mr Gary Best 133,333 133,333 $135,333 $nil

DIRECTORS’REPORT
RETAIL FOOD GROUP LIMITED - ANNUAL REPORT 30 JUNE 2010 33
Remuneration Report (cont.) 4. Remuneration Of Directors And Senior Management (cont.) Executive Share Option Plan (cont.) The following table summarises the value of options granted, exercised or lapsed to Directors and senior management during the financial year:
Value Of Options
Granted At The Grant Date (1)
Value Of Options
Exercised At The Exercise
Date
Value Of Options Lapsed At The Date Of
Lapse
$ $ $
Non-Executive Directors
Mr John Cowley - - -
Mr Colin Archer - - -
Mr Bruce Hancox - - -
Executive Directors and senior management
Mr Anthony (Tony) Alford - 143,200 -
Mr Nigel Nixon - - -
Mr Anthony Mark Connors 28,000 74,339 -
Mr Gary Best 70,000 215,600 -
Mr Damien Peters 35,000 - -
Ms Tracey Catterall 7,000 - -
Mr Gary Alford 21,000 - -
Mr Gavin Nixon 21,000 - -
(1) The value of options granted during the year is recognised in compensation over the vesting period of the grant, in accordance with Australian accounting standards.
5. Key Terms Of Employment Contracts The employment specifics of the non-executive Directors are as follows:
Name Particulars
Mr John Cowley No written employment contract has been entered into with the Company.
Mr Colin Archer The letter of appointment entered into with the Company requires the Director to give notice of resignation in accordance with the Company’s Constitution. The Company may also terminate the Director’s appointment in accordance with the Company’s Constitution.
Mr Bruce Hancox No written employment contract has been entered into with the Company.
Fees and payments to non-executive Directors reflect the demands which are made on, and the responsibilities of, the Directors. Non-executive Directors’ fees and payments are reviewed annually by the Board. Non-executive Director remuneration takes the form of a set fee plus superannuation entitlements, however, may comprise other benefits or rewards in certain circumstances. The maximum aggregate amount of fees that can be paid to non-executive Directors is subject to approval by shareholders at the Annual General Meeting. The maximum amount which has been approved by the Company’s shareholders for payment to non-executive Directors is $400,000. Fees for non-executive Directors are not linked to the performance of the Group. However, to align Directors’ interests with shareholder interests, the Directors are encouraged to hold shares in the Company and are granted share options.

DIRECTORS’REPORT
34 RETAIL FOOD GROUP LIMITED - ANNUAL REPORT 30 JUNE 2010
Remuneration Report (cont.) 5. Key Terms Of Employment Contracts (cont.) The employment specifics of the executive Directors and senior management are as follows:
Name Particulars
Mr Anthony (Tony) Alford The contract of employment entered into with RFGA Management Pty Ltd (subsidiary of the Company) required the employee to give a minimum of three (3) months notice to the employer. RFGA Management Pty Ltd could terminate the employee by giving at least six (6) months notice or payment of the equivalent salary of the required notice in lieu.
Mr Nigel Nixon The contract of employment entered into with RFGA Management Pty Ltd (subsidiary of the Company) required the employee to give a minimum of three (3) months notice to the employer. RFGA Management Pty Ltd could terminate the employee by giving at least six (6) months notice or payment of the equivalent salary of the required notice in lieu.
Mr Anthony Mark Connors No written employment contract has been entered into with the Company or its subsidiaries.
Mr Gary Best The contract of employment entered into with RFGA Management Pty Ltd (subsidiary of the Company) required the employee to give a minimum of three (3) months notice to the employer. RFGA Management Pty Ltd could terminate the employee by giving at least six (6) months notice or payment of the equivalent salary of the required notice in lieu.
Mr Damien Peters No written employment contract has been entered into with the Company or its subsidiaries.
Ms Tracey Catterall
The contract of employment entered into with RFGA Management Pty Ltd (subsidiary of the Company) requires the employee to give a minimum of one (1) month notice to the employer. RFGA Management Pty Ltd may terminate the employee by giving at least 1 (1) month notice or payment of the equivalent salary of the required notice in lieu.
Mr Gary Alford
The contract of employment entered into with RFGA Management Pty Ltd (subsidiary of the Company) requires the employee to give a minimum of three (3) months notice to the employer. RFGA Management Pty Ltd may terminate the employee by giving at least three (3) months notice or payment of the equivalent salary of the required notice in lieu.
Mr Gavin Nixon No written employment contract has been entered into with the Company.
The Directors believe that the compensation for each executive is appropriate for the duties allocated to them, the size of the Group’s business and the industry in which the Group operates. The service contracts outline the components of compensation paid to the executives (including executive Directors), but do not prescribe how compensation levels are modified year to year. Compensation levels are reviewed each year to take into account cost-of-living changes, any change in the scope of the role performed by the executive and any changes required to meet the principles of the Remuneration Policy. This Directors’ report is signed in accordance with a resolution of Directors made pursuant to s.298(2) of the Corporations Act 2001. On behalf of the Directors RETAIL FOOD GROUP LIMITED
A J (TONY) ALFORD Managing Director and CEO Southport, 16th September 2010

AUDITOR’SINDEPENDENCEDECLARATION
RETAIL FOOD GROUP LIMITED - ANNUAL REPORT 30 JUNE 2010 35
The Board of Directors Retail Food Group Limited RFG House 26 Railway Street Southport QLD 4215 16 September 2010
Dear Directors,
Retail Food Group Limited In accordance with section 307C of the Corporations Act 2001, I am pleased to provide the following declaration of independence to the Directors of Retail Food Group Limited. As lead audit partner for the audit of the financial statements of Retail Food Group Limited for the financial year ended 30 June 2010, I declare that to the best of my knowledge and belief, there have been no contraventions of:
(i) the auditor independence requirements of the Corporations Act 2001 in relation to the audit; and
(ii) any applicable code of professional conduct in relation to the audit. Yours sincerely
DELOITTE TOUCHE TOHMATSU
M G Sheerin Partner Chartered Accountants Liability limited by a scheme approved under Professional Standards Legislation.
Deloitte Touche Tohmatsu ABN 74 490 121 060 Riverside Centre Level 25 123 Eagle Street Brisbane QLD 4000 GPO Box 1463 Brisbane QLD 4001 Australia DX 115 Tel: +61 (0) 7 3308 7000 Fax: +61 (0) 7 3308 7001 www.deloitte.com.au

INDEPENDENTAUDITOR’SREPORT TO THE MEMBERS OF RETAIL FOOD GROUP LIMITED
36 RETAIL FOOD GROUP LIMITED - ANNUAL REPORT 30 JUNE 2010
Independent Auditor’s Report to the Members of Retail Food Group Limited Report on the Financial Report We have audited the accompanying financial report of Retail Food Group Limited, which comprises the statement of financial position as at 30 June 2010, and the statement of comprehensive income, the statement of cash flows and the statement of changes in equity for the year ended on that date, notes comprising a summary of significant accounting policies and other explanatory information, and the directors’ declaration of the consolidated entity comprising the company and the entities it controlled at the year’s end or from time to time during the financial year as set out on pages 38 to 93. Directors’ Responsibility for the Financial Report The directors of the company are responsible for the preparation and fair presentation of the financial report in accordance with Australian Accounting Standards (including the Australian Accounting Interpretations) and the Corporations Act 2001. This responsibility includes establishing and maintaining internal control relevant to the preparation and fair presentation of the financial report that is free from material misstatement, whether due to fraud or error; selecting and applying appropriate accounting policies; and making accounting estimates that are reasonable in the circumstances. In Note 2, the directors also state, in accordance with Accounting Standard AASB 101 ‘Presentation of Financial Statements’, that compliance with the Australian equivalents to International Financial Reporting Standards ensures that the financial report, comprising the financial statements and notes, complies with International Financial Reporting Standards. Auditor’s Responsibility Our responsibility is to express an opinion on the financial report based on our audit. We conducted our audit in accordance with Australian Auditing Standards. These Auditing Standards require that we comply with relevant ethical requirements relating to audit engagements and plan and perform the audit to obtain reasonable assurance whether the financial report is free from material misstatement. An audit involves performing procedures to obtain audit evidence about the amounts and disclosures in the financial report. The procedures selected depend on the auditor’s judgement, including the assessment of the risks of material misstatement of the financial report, whether due to fraud or error. In making those risk assessments, the auditor considers internal control relevant to the entity’s preparation and fair presentation of the financial report in order to design audit procedures that are appropriate in the circumstances, but not for the purpose of expressing an opinion on the effectiveness of the entity’s internal control. An audit also includes evaluating the appropriateness of accounting policies used and the reasonableness of accounting estimates made by the directors, as well as evaluating the overall presentation of the financial report. We believe that the audit evidence we have obtained is sufficient and appropriate to provide a basis for our audit opinion. Liability limited by a scheme approved under Professional Standards Legislation.
Deloitte Touche Tohmatsu ABN 74 490 121 060 Riverside Centre Level 25 123 Eagle Street Brisbane QLD 4000 GPO Box 1463 Brisbane QLD 4001 Australia DX 115 Tel: +61 (0) 7 3308 7000 Fax: +61 (0) 7 3308 7001 www.deloitte.com.au

INDEPENDENTAUDITOR’SREPORT TO THE MEMBERS OF RETAIL FOOD GROUP LIMITED
RETAIL FOOD GROUP LIMITED - ANNUAL REPORT 30 JUNE 2010 37
Auditor’s Independence Declaration In conducting our audit, we have complied with the independence requirements of the Corporations Act 2001. Auditor’s Opinion In our opinion: (a) the financial report of Retail Food Group Limited is in accordance with the Corporations Act 2001, including:
(i) giving a true and fair view of the consolidated entity’s financial position as at 30 June 2010 and of its performance for the year ended on that date; and
(ii) complying with Australian Accounting Standards (including the Australian Accounting Interpretations) and the Corporations Regulations 2001; and
(b) the financial report also complies with International Financial Reporting Standards as disclosed in Note 2. Report on the Remuneration Report We have audited the Remuneration Report included in pages 26 to 34 of the directors’ report for the year ended 30 June 2010. The directors of the company are responsible for the preparation and presentation of the Remuneration Report in accordance with section 300A of the Corporations Act 2001. Our responsibility is to express an opinion on the Remuneration Report, based on our audit conducted in accordance with Australian Auditing Standards. Auditor’s Opinion In our opinion the Remuneration Report of Retail Food Group Limited for the year ended 30 June 2010, complies with section 300A of the Corporations Act 2001.
DELOITTE TOUCHE TOHMATSU
M G Sheerin Partner Chartered Accountants Brisbane, 16 September 2010

DIRECTORS’DECLARATION
38 RETAIL FOOD GROUP LIMITED - ANNUAL REPORT 30 JUNE 2010
The Directors declare that:
(i) in the Directors’ opinion, there are reasonable grounds to believe that the Company will be able to pay its debts as and when they become due and payable;
(ii) in the Directors’ opinion, the attached financial statements are in compliance with International Financial Reporting Standards, as stated in note 2 to the financial statements;
(iii) in the Directors’ opinion, the attached financial statements and notes thereto are in accordance with the Corporations Act 2001, including compliance with accounting standards and giving a true and fair view of the financial position and performance of the consolidated entity; and
(iv) the Directors have been given the declarations required by s.295A of the Corporations Act 2001.
Signed in accordance with a resolution of the Directors made pursuant to s.295(5) of the Corporations Act 2001. On behalf of the Directors
RETAIL FOOD GROUP LIMITED A J (TONY) ALFORD Managing Director and CEO Southport, 16th September 2010

INDEXTOFINANCIALSTATEMENTS
RETAIL FOOD GROUP LIMITED - ANNUAL REPORT 30 JUNE 2010 39
Contents Page
Statement Of Comprehensive Income 40
Statement Of Financial Position 41
Statement Of Changes In Equity 42
Statement Of Cash Flows 43
Notes To The Financial Statements 44
1 General Information 44
2 Significant Accounting Policies 44
3 Adoption Of New And Revised Accounting Standards 54
4 Critical Accounting Judgments And Key Sources Of Estimation Uncertainty 55
5 Segment Information 56
6 Revenue 58
7 Other Gains And Losses 58
8 Finance Costs 58
9 Income Taxes 59
10 Profit For The Year From Continuing Operations 62
11 Earnings Per Share 62
12 Trade And Other Receivables 63
13 Other Financial Assets 64
14 Inventories 65
15 Other Assets 65
16 Property, Plant And Equipment 65
17 Intangible Assets 66
18 Assets Pledged As Security 67
19 Trade And Other Payables 67
20 Borrowings 68
21 Provisions 68
22 Other Liabilities 69
23 Issued Capital 69
24 Reserves 71
25 Retained Earnings 71
26 Dividends 72
27 Contingent Liabilities 72
28 Leases 73
29 Commitments For Expenditure 73
30 Subsidiaries 74
31 Acquisitions 76
32 Cash And Cash Equivalents 79
33 Financial Instruments 80
34 Share-based Payments 85
35 Key Management Personnel Compensation 88
36 Related Party Transactions 88
37 Remuneration Of Auditors 92
38 Events After The Reporting Date 92
39 Parent Entity Disclosures 93
Additional Stock Exchange Information 94
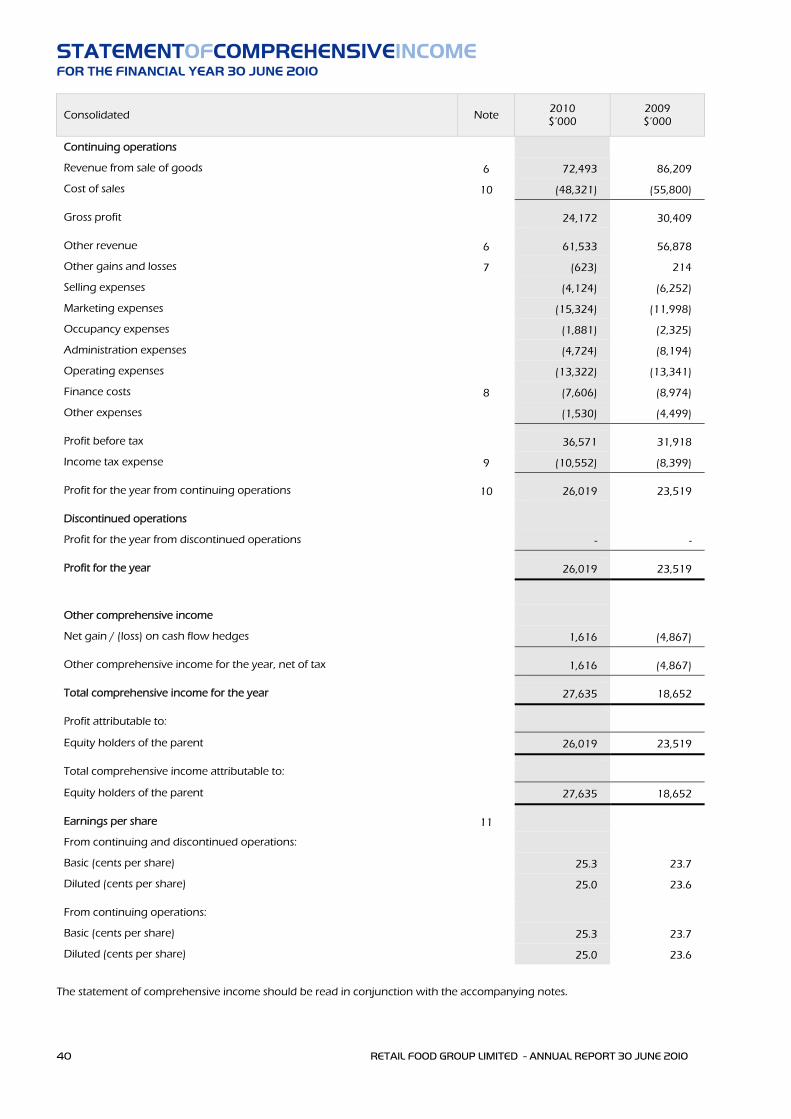
STATEMENTOFCOMPREHENSIVEINCOME FOR THE FINANCIAL YEAR 30 JUNE 2010
40 RETAIL FOOD GROUP LIMITED - ANNUAL REPORT 30 JUNE 2010
Consolidated Note 2010 $’000
2009 $’000
Continuing operations
Revenue from sale of goods 6 72,493 86,209
Cost of sales 10 (48,321) (55,800)
Gross profit 24,172 30,409
Other revenue 6 61,533 56,878
Other gains and losses 7 (623) 214
Selling expenses (4,124) (6,252)
Marketing expenses (15,324) (11,998)
Occupancy expenses (1,881) (2,325)
Administration expenses (4,724) (8,194)
Operating expenses (13,322) (13,341)
Finance costs 8 (7,606) (8,974)
Other expenses (1,530) (4,499)
Profit before tax 36,571 31,918
Income tax expense 9 (10,552) (8,399)
Profit for the year from continuing operations 10 26,019 23,519
Discontinued operations
Profit for the year from discontinued operations - -
Profit for the year 26,019 23,519
Other comprehensive income
Net gain / (loss) on cash flow hedges 1,616 (4,867)
Other comprehensive income for the year, net of tax 1,616 (4,867)
Total comprehensive income for the year 27,635 18,652
Profit attributable to:
Equity holders of the parent 26,019 23,519
Total comprehensive income attributable to:
Equity holders of the parent 27,635 18,652
Earnings per share 11
From continuing and discontinued operations:
Basic (cents per share) 25.3 23.7
Diluted (cents per share) 25.0 23.6
From continuing operations:
Basic (cents per share) 25.3 23.7
Diluted (cents per share) 25.0 23.6
The statement of comprehensive income should be read in conjunction with the accompanying notes.

STATEMENTOFFINANCIALPOSITION AS AT 30 JUNE 2010
RETAIL FOOD GROUP LIMITED - ANNUAL REPORT 30 JUNE 2010 41
Consolidated Note 2010 $’000
2009 $’000
Current assets
Cash and cash equivalents 32 13,105 5,414
Trade and other receivables 12 13,094 14,975
Other financial assets 13 2,591 831
Inventories 14 2,299 1,888
Other 15 432 69
Total current assets 31,521 23,177
Non-current assets
Property, plant and equipment 16 2,749 3,330
Deferred tax assets 9 2,104 3,159
Intangible assets 17 207,118 192,808
Total non-current assets 211,971 199,297
Total assets 243,492 222,474
Current liabilities
Trade and other payables 19 7,474 7,681
Borrowings 20 85,852 -
Current tax liabilities 9 4,963 2,825
Provisions 21 1,855 2,552
Other 22 788 1,110
Total current liabilities 100,932 14,168
Non-current liabilities
Borrowings 20 - 95,480
Provisions 21 293 221
Other 22 3,462 5,589
Total non-current liabilities 3,755 101,290
Total liabilities 104,687 115,458
Net assets 138,805 107,016
Equity
Issued capital 23 95,146 80,959
Reserves 24 (2,472) (4,261)
Retained earnings 25 46,131 30,318
Total equity 138,805 107,016
The statement of financial position should be read in conjunction with the accompanying notes.

STATEMENTOFCHANGESINEQUITY FOR THE FINANCIAL YEAR ENDED 30 JUNE 2010
42 RETAIL FOOD GROUP LIMITED - ANNUAL REPORT 30 JUNE 2010
Consolidated Fully Paid Ordinary
Shares
Equity Settled Employee Benefits Reserve
Hedging Reserve
Retained Earnings
Total
$’000 $’000 $’000 $’000 $’000
Balance as at 1 July 2008 78,453 476 - 15,710 94,639
Profit for the year - - - 23,519 23,519
Other comprehensive income - - (4,867) - (4,867)
Total comprehensive income - - (4,867) 23,519 18,652
Issue of ordinary shares under DRP 2,075 - - - 2,075
Recognition of share-based payments - 207 - - 207
Issue of shares under executive share option plan 354 - - - 354
Transfer from equity-settled employee benefits reserve 77 (77) - - -
Payment of dividends - - - (8,911) (8,911)
Balance as at 30 June 2009 80,959 606 (4,867) 30,318 107,016
Profit for the year - - - 26,019 26,019
Other comprehensive income - - 1,616 - 1,616
Total comprehensive income - - 1,616 26,019 27,635
Issue of ordinary shares 12,124 - - - 12,124
Share issue costs (204) - - - (204)
Related income tax 61 - - - 61
Issue of ordinary shares under DRP 1,326 - - - 1,326
Recognition of share-based payments - 363 - - 363
Issue of shares under executive share option plan 690 - - - 690
Transfer from equity-settled employee benefits reserve 190 (190) - - -
Payment of dividends - - - (10,206) (10,206)
Balance as at 30 June 2010 95,146 779 (3,251) 46,131 138,805
The statement of changes in equity should be read in conjunction with the accompanying notes.

STATEMENTOFCASHFLOWS FOR THE FINANCIAL YEAR ENDED 30 JUNE 2010
RETAIL FOOD GROUP LIMITED - ANNUAL REPORT 30 JUNE 2010 43
Consolidated Note 2010 $’000
2009 $’000
Cash flows from operating activities
Receipts from customers 147,726 157,439
Payments to suppliers and employees (103,618) (116,809)
Interest and other costs of finance paid (6,877) (9,603)
Income taxes paid (7,990) (7,853)
Net cash provided by operating activities 29,241 23,174
Cash flows from investing activities
Interest received 154 457
Amounts advanced to related parties (39) (2,283)
Proceeds from repayment of related party loans 41 2,207
Amounts (advanced to) / received from other entities (348) 648
Payments for property, plant and equipment (644) (1,847)
Proceeds from sale of property, plant and equipment 23 6,486
Proceeds from sale of business - 1,100
Payment for intangible assets 31 (5,200) -
Payment for businesses 31 (6,300) (299)
Net cash (used in) / provided by investing activities (12,313) 6,469
Cash flows from financing activities
Proceeds from issues of equity securities 10,004 354
Payment for share issue costs (204) -
Proceeds from borrowings - 1,284
Payment for debt issue costs (157) -
Repayment of borrowings (10,000) (23,133)
Dividends paid (8,880) (6,836)
Net cash used in financing activities (9,237) (28,331)
Net increase in cash and cash equivalents 7,691 1,312
Cash and cash equivalents at the beginning of year 5,414 4,102
Cash and cash equivalents at the end of year 32 13,105 5,414
The statement of cash flows should be read in conjunction with the accompanying notes.

NOTESTOTHEFINANCIALSTATEMENTS
44 RETAIL FOOD GROUP LIMITED - ANNUAL REPORT 30 JUNE 2010
1. General Information Retail Food Group Limited (the Company) is a public company listed on the Australian Securities Exchange (ASX: RFG), incorporated in Australia and operating in Australia and New Zealand. Retail Food Group Limited’s registered office and its principal place of business are as follows:
Registered Office Principal Administration Office
Alfords
Level 1 HQ Robina
58 Riverwalk Avenue
Robina QLD 4226
RFG House
26 Railway Street
Southport QLD 4215
The principal activities of the Company and its subsidiaries (the Group) during the course of the financial year were:
the intellectual property ownership of the Donut King, bb’s café, Brumby’s Bakeries, Michel’s Patisserie and Big Dad’s Pies franchise systems;
development and management of the Donut King, bb’s café, Brumby’s Bakeries, Michel’s Patisserie and Big Dad’s Pies franchise systems throughout Australia and New Zealand, and international licensor throughout the rest of world; and,
development and management of the Coffee Roasting Facility and the wholesale supply of certain products to the Donut King, bb’s café, Brumby’s Bakeries, Michel’s Patisserie and Big Dad’s Pies franchise systems.
2. Significant Accounting Policies 2.1 Statement Of Compliance These financial statements are general purpose financial statements which has been prepared in accordance with the Corporations Act 2001, Accounting Standards and Interpretations, and complies with other requirements of the law. The financial statements comprise the consolidated financial statements of the Group. Accounting Standards include Australian equivalents to International Financial Reporting Standards (A-IFRS). Compliance with A-IFRS ensures that the financial statements and notes of the Company and the Group comply with International Financial Reporting Standards (IFRS). The financial statements were authorised for issue by the Directors on 16 September 2010. 2.2 Basis Of Preparation The financial report has been prepared on the basis of historical cost, except for the revaluation of certain financial instruments. Cost is based on the fair values of the consideration given in exchange for assets. All amounts are presented in Australian dollars, unless otherwise noted. The Company is a company of the kind referred to in ASIC Class Order 98/0100, dated 10 July 1998, and in accordance with that Class Order amounts in the financial report are rounded off to the nearest thousand dollars, unless otherwise indicated. Early Adoption Of Accounting Standards The Directors have elected not to early adopt Accounting Standards that are not applicable to the reporting period ended 30 June 2010. Going Concern Basis The financial report has been prepared on a going concern basis. As a consequence of the Group’s Debt Facility with the Commonwealth Bank of Australia (CBA) maturing on 5 December 2010, as at 30 June 2010, the Group had a net current asset deficiency of $69.4 million resulting from the reclassification of the Group’s $86.0 million core debt borrowings as a current liability in the Statement of Financial Position. On 17 August 2010, the Company announced the appointment of the National Australia Bank (NAB) as its future debt facility provider and transaction banker. The NAB Debt Facility, being $85.0 million with a term of 3 years from Senior Debt Facility, was affirmed on 31 August 2010 with refinance and transfer of the Company’s banking facility completed on that date. At the date of transfer, the Group’s core debt borrowings totalled $77.0 million following a further $9.0 million voluntary debt reduction undertaken in July 2010 in advance of the refinance completion. Accordingly, the Directors are of the opinion that the going concern basis is appropriate for the preparation of the financial report.

NOTESTOTHEFINANCIALSTATEMENTS
RETAIL FOOD GROUP LIMITED - ANNUAL REPORT 30 JUNE 2010 45
2. Significant Accounting Policies (cont.) The following significant accounting policies have been adopted in the preparation and presentation of the financial report: (a) Basis Of Consolidation
The consolidated financial statements incorporate the financial statements of the Company and entities controlled by the Company (its subsidiaries) (referred to as ‘the Group’ in these financial statements). Control is achieved where the Company has the power to govern the financial and operating policies of an entity so as to obtain benefits from its activities. The results of subsidiaries acquired or disposed of during the year are included in the consolidated statement of comprehensive income from the effective date of acquisition or up to the effective date of disposal, as appropriate. Where necessary, adjustments are made to the financial statements of subsidiaries to bring their accounting policies into line with those used by other members of the Group. All intra-group transactions, balances, income and expenses are eliminated in full on consolidation.
(b) Borrowing Costs Borrowing costs directly attributable to the acquisition, construction or production of qualifying assets, which are assets that necessarily take a substantial period of time to get ready for their intended use or sale, are added to the cost of those assets, until such time as the assets are substantially ready for their intended use or sale. Investment income earned on the temporary investment of specific borrowings pending their expenditure on qualifying assets is deducted from the borrowing costs eligible for capitalisation. All other borrowing costs are recognised in profit or loss in the period in which they are incurred.
(c) Business Combinations Acquisitions of subsidiaries and businesses are accounted for using the acquisition method. The consideration for each acquisition is measured at the aggregate of the fair values (at the date of exchange) of assets given, liabilities incurred or assumed, and equity instruments issued by the Group in exchange for control of the acquiree. Acquisition-related costs are recognised in profit or loss as incurred. Where applicable, the consideration for the acquisition includes any asset or liability resulting from a contingent consideration arrangement, measured at its acquisition-date fair value. Subsequent changes in such fair values are adjusted against the cost of the acquisition where they qualify as measurement period adjustments (see below). All other subsequent changes in the fair value of contingent consideration classified as an asset or liability are accounted for in accordance with relevant Standards. Changes in the fair value of contingent consideration classified as equity are not recognised. Where a business combination is achieved in stages, the Group’s previously held interests in the acquired entity are remeasured to fair value at the acquisition date (i.e. the date the Group attains control) and the resulting gain or loss, if any, is recognised in profit or loss. Amounts arising from interests in the acquiree prior to the acquisition date that have been recognised in other comprehensive income are reclassified to profit or loss, where such treatment would be appropriate if that interest were disposed of. The acquiree’s identifiable assets, liabilities and contingent liabilities that meet the conditions for recognition under AASB 3 (2008) are recognised at their fair value at the acquisition date, except that:
deferred tax assets or liabilities and liabilities or assets related to employee benefit arrangements are recognised and measured in accordance with AASB 112 ‘Income Taxes’ and AASB 119 ‘Employee Benefits’ respectively;
liabilities or equity instruments related to the replacement by the Group of an acquiree’s share-based payment awards are measured in accordance with AASB 2 ‘Share-based Payment’; and,
assets (or disposal groups) that are classified as held for sale in accordance with AASB 5 ‘Non-current Assets Held for Sale and Discontinued Operations’ are measured in accordance with that Standard.
If the initial accounting for a business combination is incomplete by the end of the reporting period in which the combination occurs, the Group reports provisional amounts for the items for which the accounting is incomplete. Those provisional amounts are adjusted during the measurement period (see below), or additional assets or liabilities are recognised, to reflect new information obtained about facts and circumstances that existed as of the acquisition date that, if known, would have affected the amounts recognised as of that date. The measurement period is the period from the date of acquisition to the date the Group obtains complete information about facts and circumstances that existed as of the acquisition date – and is subject to a maximum of one year.

NOTESTOTHEFINANCIALSTATEMENTS
46 RETAIL FOOD GROUP LIMITED - ANNUAL REPORT 30 JUNE 2010
2. Significant Accounting Policies (cont.)
(d) Cash And Cash Equivalents Cash comprises cash on hand and demand deposits. Cash equivalents are short-term, highly liquid investments that are readily convertible to known amounts of cash, which are subject to an insignificant risk of changes in value and have a maturity of three months or less at the date of acquisition. Bank overdrafts are shown within borrowings in current liabilities in the balance sheet.
(e) Derivative Financial Instruments
The Group has entered into interest rate swaps to manage its exposure to interest rate risk. The Group has not entered into any other derivative financial instruments. Further details of derivative financial instruments are disclosed in note 33. Derivatives are initially recognised at fair value at the date the derivative contract is entered into and are subsequently remeasured to their fair value at the end of each reporting period. The resulting gain or loss is recognised in profit or loss immediately unless the derivative is designated and effective as a hedging instrument, in which event, the timing of the recognition in profit or loss depends on the nature of the hedge relationship. The Group designates certain derivatives as either hedges of the fair value of recognised assets or liabilities or firm commitments (fair value hedges), hedges of highly probable forecast transactions or hedges of foreign currency risk of firm commitments (cash flow hedges), or hedges of net investments in foreign operations. A derivative with a positive fair value is recognised as a financial asset; a derivative with a negative fair value is recognised as a financial liability. A derivative is presented as a non-current asset or a non-current liability if the remaining maturity of the instrument is more than 12 months and it is not expected to be realised or settled within 12 months. Other derivatives are presented as current assets or current liabilities. Hedge Accounting At the inception of the hedge relationship, the Group documents the relationship between the hedging instrument and hedged item, along with its risk management objectives and its strategy for undertaking various hedge transactions. Furthermore, at the inception of the hedge and on an ongoing basis, the Group documents whether the hedging instrument is highly effective in offsetting changes in fair values or cash flows of the hedged item. Note 33 sets out details of the fair values of the derivative instruments used for hedging purposes. Cash Flow Hedges The effective portion of changes in the fair value of derivatives that are designated and qualify as cash flow hedges is recognised in other comprehensive income. The gain or loss relating to the ineffective portion is recognised immediately in profit or loss and is separately disclosed. Amounts previously recognised in other comprehensive income and accumulated in equity are reclassified to profit or loss in the periods when the hedged item is recognised in profit or loss, in the same line of the statement of comprehensive income as the recognised hedged item. However, when the forecast transaction that is hedged results in the recognition of a non-financial asset or a non-financial liability, the gains and losses previously accumulated in equity are transferred from equity and included in the initial measurement of the cost of the non-financial asset or non-financial liability. Hedge accounting is discontinued when the Group revokes the hedging relationship, when the hedge instrument expires or is sold, terminated, or exercised, or when it no longer qualifies for hedge accounting. Any gain or loss accumulated in equity at that time remains in equity and is recognised when the forecast transaction is ultimately recognised in profit or loss. When a forecast transaction is no longer expected to occur, the gain or loss accumulated in equity is recognised immediately in profit or loss.
(f) Employee Benefits
A liability is recognised for benefits accruing to employees in respect of wages and salaries, annual leave and long service leave when it is probable that settlement will be required and they are capable of being measured reliably. Liabilities recognised in respect of short-term employee benefits are measured at their nominal values using the remuneration rate expected to apply at the time of settlement. Liabilities recognised in respect of long-term employee benefits are measured as the present value of the estimated future cash outflows to be made by the Group in respect of services provided by employees up to the reporting date. Contributions to defined contribution retirement benefit plans are recognised as an expense when employees have rendered service entitling them to the contributions.

NOTESTOTHEFINANCIALSTATEMENTS
RETAIL FOOD GROUP LIMITED - ANNUAL REPORT 30 JUNE 2010 47
2. Significant Accounting Policies (cont.)
(g) Financial Assets All financial assets are recognised and derecognised on trade date where the purchase or sale of a financial asset is under a contract whose terms require delivery of the financial asset within the timeframe established by the market concerned, and are initially measured at fair value, plus transaction costs, except for those financial assets classified as at fair value through profit or loss, which are initially measured at fair value. Financial assets are classified into the following specified categories: financial assets ‘at fair value through profit or loss’ (FVTPL), ‘held-to-maturity’ investments, ‘available-for-sale’ (AFS) financial assets and ‘loans and receivables’. The classification depends on the nature and purpose of the financial assets and is determined at the time of initial recognition. Effective Interest Method The effective interest method is a method of calculating the amortised cost of a debt instrument and of allocating interest income over the relevant period. The effective interest rate is the rate that exactly discounts estimated future cash receipts (including all fees on points paid or received that form an integral part of the effective interest rate, transaction costs and other premiums or discounts) through the expected life of the debt instrument, or (where appropriate) a shorter period, to the net carrying amount on initial recognition. Income is recognised on an effective interest basis for debt instruments other than those financial assets classified as at FVTPL. Loans And Receivables Trade receivables, loans, and other receivables that have fixed or determinable payments that are not quoted in an active market are classified as ‘loans and receivables’. Loans and receivables are measured at amortised cost using the effective interest method, less any impairment. Interest income is recognised by applying the effective interest rate, except for short-term receivables when the recognition of interest would be immaterial. Impairment Of Financial Assets Financial assets, other than those at FVTPL, are assessed for indicators of impairment at the end of each reporting period. Financial assets are considered to be impaired when there is objective evidence that, as a result of one or more events that occurred after the initial recognition of the financial asset, the estimated future cash flows of the financial asset have been affected. For financial assets carried at amortised cost, the amount of the impairment loss recognised is the difference between the asset’s carrying amount and the present value of estimated future cash flows, discounted at the financial asset’s original effective interest rate. The carrying amount of the financial asset is reduced by the impairment loss directly for all financial assets with the exception of trade receivables, where the carrying amount is reduced through the use of an allowance account. When a trade receivable is considered uncollectible, it is written off against the allowance account. Subsequent recoveries of amounts previously written off are credited against the allowance account. Changes in the carrying amount of the allowance account are recognised in profit or loss. When an AFS financial asset is considered to be impaired, cumulative gains or losses previously recognised in other comprehensive income are reclassified to profit or loss in the period. With the exception of AFS equity instruments, if, in a subsequent period, the amount of the impairment loss decreases and the decrease can be related objectively to an event occurring after the impairment was recognised, the previously recognised impairment loss is reversed through profit or loss to the extent that the carrying amount of the investment at the date the impairment is reversed does not exceed what the amortised cost would have been had the impairment not been recognised. In respect of AFS equity securities, impairment losses previously recognised in profit or loss are not reversed through profit or loss. Any increase in fair value subsequent to an impairment loss is recognised in other comprehensive income. Derecognition Of Financial Assets The Group derecognises a financial asset only when the contractual rights to the cash flows from the asset expire, or when it transfers the financial asset and substantially all the risks and rewards of ownership of the asset to another entity. If the Group neither transfers nor retains substantially all the risks and rewards of ownership and continues to control the transferred asset, the Group recognises its retained interest in the asset and an associated liability for amounts it may have to pay. If the Group retains substantially all the risks and rewards of ownership of a transferred financial asset, the Group continues to recognise the financial asset and also recognises a collateralised borrowing for the proceeds received.

NOTESTOTHEFINANCIALSTATEMENTS
48 RETAIL FOOD GROUP LIMITED - ANNUAL REPORT 30 JUNE 2010
2. Significant Accounting Policies (cont.)
(h) Financial Liabilities And Equity Instruments Issued By The Group Classification As Debt Or Equity Debt and equity instruments are classified as either financial liabilities or as equity in accordance with the substance of the contractual arrangement. Equity Instruments An equity instrument is any contract that evidences a residual interest in the assets of an entity after deducting all of its liabilities. Equity instruments issued by the Group are recognised at the proceeds received, net of direct issue costs. Financial Guarantee Contract Liabilities Financial guarantee contract liabilities are measured initially at their fair values, if not designated as at FVTPL, are subsequently measured at the higher of:
the amount of the obligation under the contract, as determined in accordance with AASB 137 ‘Provisions, Contingent Liabilities and Contingent Assets’; and,
the amount initially recognised less, where appropriate, cumulative amortisation, recognised in accordance with the revenue recognition policies set out at note 2.2(s).
Financial Liabilities Financial liabilities are classified as either financial liabilities ‘at FVTPL’ or ‘other financial liabilities’. Financial Liabilities At FVTPL Financial liabilities are classified as at FVTPL when the financial liability is either held for trading or it is designated as at FVTPL. A financial liability is classified as held for trading if:
it has been acquired principally for the purpose of repurchasing it in the near term; or,
on initial recognition it is part of a portfolio of identified financial instruments that the Group manages together and has a recent actual pattern of short-term profit-taking; or,
it is a derivative that is not designated and effective as a hedging instrument. A financial liability other than a financial liability held for trading may be designated as at FVTPL upon initial recognition if:
such designation eliminates or significantly reduces a measurement or recognition inconsistency that would otherwise arise; or,
the financial liability forms part of a group of financial assets or financial liabilities or both, which is managed and its performance is evaluated on a fair value basis, in accordance with the Group's documented risk management or investment strategy, and information about the grouping is provided internally on that basis; or,
it forms part of a contract containing one or more embedded derivatives, and AASB 139 ‘Financial Instruments: Recognition and Measurement’ permits the entire combined contract (asset or liability) to be designated as at FVTPL.
Financial liabilities at FVTPL are stated at fair value, with any gains or losses arising on remeasurement recognised in profit or loss. Fair value is determined in the manner described in note 33. Other Financial Liabilities Other financial liabilities, including borrowings, are initially measured at fair value, net of transaction costs. Other financial liabilities are subsequently measured at amortised cost using the effective interest method, with interest expense recognised on an effective yield basis. The effective interest method is a method of calculating the amortised cost of a financial liability and of allocating interest expense over the relevant period. The effective interest rate is the rate that exactly discounts estimated future cash payments through the expected life of the financial liability, or (where appropriate) a shorter period, to the net carrying amount on initial recognition. Derecognition Of Financial Liabilities The Group derecognises financial liabilities when, and only when, the Group’s obligations are discharged, cancelled or they expire.

NOTESTOTHEFINANCIALSTATEMENTS
RETAIL FOOD GROUP LIMITED - ANNUAL REPORT 30 JUNE 2010 49
2. Significant Accounting Policies (cont.)
(i) Foreign Currencies
The individual financial statements of each group entity are presented in the currency of the primary economic environment in which the entity operates (its functional currency). For the purpose of the consolidated financial statements, the results and financial position of each group entity are expressed in Australian dollars (‘$’), which is the functional currency of the Company and the presentation currency for the consolidated financial statements. In preparing the financial statements of the individual entities, transactions in currencies other than the entity’s functional currency (foreign currencies) are recognised at the rates of exchange prevailing at the dates of the transactions. At the end of each reporting period, monetary items denominated in foreign currencies are retranslated at the rates prevailing at that date. Non-monetary items carried at fair value that are denominated in foreign currencies are retranslated at the rates prevailing at the date when the fair value was determined. Non-monetary items that are measured in terms of historical cost in a foreign currency are not retranslated. Exchange differences are recognised in profit or loss in the period in which they arise except for:
exchange differences on foreign currency borrowings relating to assets under construction for future productive use, which are included in the cost of those assets when they are regarded as an adjustment to interest costs on those foreign currency borrowings;
exchange differences on transactions entered into in order to hedge certain foreign currency risks; and,
exchange differences on monetary items receivable from or payable to a foreign operation for which settlement is neither planned nor likely to occur (therefore forming part of the net investment in the foreign operation), which are recognised initially in other comprehensive income and reclassified from equity to profit or loss on disposal or partial disposal of the net investment.
For the purpose of presenting consolidated financial statements, the assets and liabilities of the Group’s foreign operations are expressed in Australian dollars using exchange rates prevailing at the end of the reporting period. Income and expense items are translated at the average exchange rates for the period, unless exchange rates fluctuated significantly during that period, in which case the exchange rates at the dates of the transactions are used. Exchange differences arising, if any, are recognised in other comprehensive income and accumulated in equity.
(j) Goods And Services Tax Revenues, expenses and assets are recognised net of the amount of goods and services tax (GST), except:
where the amount of GST incurred is not recoverable from the taxation authority, it is recognised as part of the cost of acquisition of an asset or as part of an item of expense; or,
for receivables and payables which are recognised inclusive of GST.
The net amount of GST recoverable from, or payable to, the taxation authority is included as part of receivables or payables.
Cash flows are included in the statement of cash flows on a gross basis. The GST component of cash flows arising from investing and financing activities which is recoverable from, or payable to, the taxation authority is classified within operating cash flows.
(k) Goodwill
Goodwill arising in a business combination is recognised as an asset at the date that control is acquired (the acquisition date). Goodwill is measured as the excess of the sum of the consideration transferred, the amount of any non-controlling interests in the acquiree, and the fair value of the acquirer’s previously held equity interest in the acquiree (if any) over the net of the acquisition-date amounts of the identifiable assets acquired and the liabilities assumed. If, after reassessment, the Group’s interest in the fair value of the acquiree’s identifiable net assets exceeds the sum of the consideration transferred, the amount of any non-controlling interests in the acquiree and the fair value of the acquirer’s previously held equity interest in the acquiree (if any), the excess is recognised immediately in profit or loss as a bargain purchase gain. Goodwill is not amortised but is reviewed for impairment at least annually. For the purpose of impairment testing, goodwill is allocated to each of the Group’s cash-generating units expected to benefit from the synergies of the combination. Cash-generating units to which goodwill has been allocated are tested for impairment annually, or more frequently when there is an indication that the unit may be impaired. If the recoverable amount of the cash-generating unit is less than its carrying amount, the impairment loss is allocated first to reduce the carrying amount of any goodwill allocated to the unit and then to the other assets of the unit pro-rata on the basis of the carrying amount of each asset in the unit. An impairment loss recognised for goodwill is not reversed in a subsequent period. On disposal of a subsidiary, the attributable amount of goodwill is included in the determination of the profit or loss on disposal.

NOTESTOTHEFINANCIALSTATEMENTS
50 RETAIL FOOD GROUP LIMITED - ANNUAL REPORT 30 JUNE 2010
2. Significant Accounting Policies (cont.)
(l) Impairment Of Tangible And Intangible Assets Excluding Goodwill At the end of each reporting period, the Group reviews the carrying amounts of its tangible and intangible assets to determine whether there is any indication that those assets have suffered an impairment loss. If any such indication exists, the recoverable amount of the asset is estimated in order to determine the extent of the impairment loss (if any). Where it is not possible to estimate the recoverable amount of an individual asset, the Group estimates the recoverable amount of the cash-generating unit to which the asset belongs. Where a reasonable and consistent basis of allocation can be identified, corporate assets are also allocated to individual cash-generating units, or otherwise they are allocated to the smallest group of cash-generating units for which a reasonable and consistent allocation basis can be identified. Intangible assets with indefinite useful lives and intangible assets not yet available for use are tested for impairment at least annually, and whenever there is an indication that the asset may be impaired. Recoverable amount is the higher of fair value less costs to sell and value in use. In assessing value in use, the estimated future cash flows are discounted to their present value using a pre-tax discount rate that reflects current market assessments of the time value of money and the risks specific to the asset for which the estimates of future cash flows have not been adjusted. If the recoverable amount of an asset (or cash-generating unit) is estimated to be less than its carrying amount, the carrying amount of the asset (or cash-generating unit) is reduced to its recoverable amount. An impairment loss is recognised immediately in profit or loss, unless the relevant asset (or cash generating unit) is carried at a revalued amount, in which case the impairment loss is treated as a revaluation decrease. Where an impairment loss subsequently reverses, the carrying amount of the asset (or cash-generating unit) is increased to the revised estimate of its recoverable amount, but so that the increased carrying amount does not exceed the carrying amount that would have been determined had no impairment loss been recognised for the asset (or cash-generating unit) in prior years. A reversal of an impairment loss is recognised immediately in profit or loss, unless the relevant asset is carried at a revalued amount, in which case the reversal of the impairment loss is treated as a revaluation increase.
(m) Intangible Assets Intangible Assets Acquired Separately Intangible assets acquired separately are carried at cost less accumulated amortisation and accumulated impairment losses. Amortisation is recognised on a straight-line basis over their estimated useful lives. The estimated useful life and amortisation method are reviewed at the end of each annual reporting period, with the effect of any changes in estimate being accounted for on a prospective basis. Intangible Assets Acquired In A Business Combination Intangible assets acquired in a business combination and recognised separately from goodwill are initially recognised at their fair value at the acquisition date (which is regarded as their cost). Subsequent to initial recognition, intangible assets acquired in a business combination are reported at cost less accumulated amortisation and accumulated impairment losses, on the same basis as intangible assets that are acquired separately. Franchise Networks And Intellectual Property Intangible assets include franchise networks (consisting of identifiable franchise systems and brand names) and intellectual property (consisting of trademarks, recipes, manuals and systems). Franchise networks are indentified and recognised at the time of a business combination and recorded at their fair value, if their fair value can be measured reliably. Franchise networks acquired separately and intellectual property are recorded at cost. Franchise networks and intellectual property are not amortised on the basis that they have an indefinite life and are reviewed annually in accordance with note 2.2(l). Expenditure incurred in maintaining intangible assets is expensed in the period in which it is occurred.
(n) Inventories Inventories are stated at the lower of cost and net realisable value. Costs, including an appropriate portion of fixed and variable overhead expenses, are assigned to inventories by the method most appropriate to each particular class of inventory, with all categories being valued on a first in first out basis. Net realisable value represents the estimated selling price for inventories less all estimated costs of completion and costs necessary to make the sale.

NOTESTOTHEFINANCIALSTATEMENTS
RETAIL FOOD GROUP LIMITED - ANNUAL REPORT 30 JUNE 2010 51
2. Significant Accounting Policies (cont.)
(o) Leasing Leases are classified as finance leases whenever the terms of the lease transfer substantially all the risks and rewards of ownership to the lessee. All other leases are classified as operating leases. Group As Lessor Rental income from operating leases is recognised on a straight-line basis over the term of the relevant lease. Group As Lessee Operating lease payments are recognised as an expense on a straight-line basis over the lease term, except where another systematic basis is more representative of the time pattern in which economic benefits from the leased asset are consumed. Contingent rentals arising under operating leases are recognised as an expense in the period in which they are incurred. In the event that lease incentives are received to enter into operating leases, such incentives are recognised as a liability. The aggregate benefit of incentives is recognised as a reduction of rental expense on a straight-line basis, except where another systematic basis is more representative of the time pattern in which economic benefits from the leased asset are consumed.
(p) Non-current Assets Held For Sale Non-current assets and disposal groups are classified as held for sale if their carrying amount will be recovered principally through a sale transaction rather than through continuing use. This condition is regarded as met only when the sale is highly probable and the non-current asset (or disposal group) is available for immediate sale in its present condition. Management must be committed to the sale, which should be expected to qualify for recognition as a completed sale within one year from the date of classification.
(q) Property, Plant And Equipment Land and buildings held for use in the production or supply of goods or services, or for administrative purposes, are stated in the statement of financial position at cost. Properties in the course of construction for production, supply or administrative purposes, or for purposes not yet determined, are carried at cost, less any recognised impairment loss. Cost includes professional fees and, for qualifying assets, borrowing costs capitalised in accordance with the Group’s accounting policy. Depreciation of these assets, on the same basis as other property assets, commences when the assets are ready for their intended use. Freehold land is not depreciated. Fixtures and equipment are stated at cost less accumulated depreciation and accumulated impairment losses. Depreciation is recognised so as to write off the cost or valuation of assets (other than freehold land and properties under construction) less their residual values over their useful lives, using the straight-line method. The estimated useful lives, residual values and depreciation method are reviewed at each year end, with the effect of any changes in estimate accounted for on a prospective basis. The gain or loss arising on the disposal or retirement of an item of property, plant and equipment is determined as the difference between the sales proceeds and the carrying amount of the asset and is recognised in profit or loss. The following useful lives are used in the calculation of depreciation:
buildings 40 years
leasehold improvements 5 – 10 years
plant and equipment 2 – 10 years

NOTESTOTHEFINANCIALSTATEMENTS
52 RETAIL FOOD GROUP LIMITED - ANNUAL REPORT 30 JUNE 2010
2. Significant Accounting Policies (cont.)
(r) Provisions Provisions are recognised when the Group has a present obligation (legal or constructive) as a result of a past event, it is probable that the Group will be required to settle the obligation, and a reliable estimate can be made of the amount of the obligation. The amount recognised as a provision is the best estimate of the consideration required to settle the present obligation at the end of the reporting period, taking into account the risks and uncertainties surrounding the obligation. Where a provision is measured using the cash flows estimated to settle the present obligation, its carrying amount is the present value of those cash flows. When some or all of the economic benefits required to settle a provision are expected to be recovered from a third party, a receivable is recognised as an asset if it is virtually certain that reimbursement will be received and the amount of the receivable can be measured reliably. Onerous Contracts Present obligations arising under onerous contracts are recognised and measured as provisions. An onerous contract is considered to exist where the Group has a contract under which the unavoidable costs of meeting the obligations under the contract exceed the economic benefits expected to be received under it. Make-good Make-good obligations arising under leases are recognised and measured as provisions. Make-good refer to obligations in respect of restoring sites to their original condition when the premises are vacated. Management has estimated the provision based on historical data in relation to store closure numbers and costs, as well as future trends that could differ from historical amounts. Contingent Liabilities Acquired In A Business Combination Contingent liabilities acquired in a business combination are initially measured at fair value at the acquisition date. At the end of subsequent reporting periods, such contingent liabilities are measured at the higher of the amount that would be recognised in accordance with AASB 137 ‘Provisions, Contingent Liabilities and Contingent Assets’ and the amount initially recognised less cumulative amortisation recognised in accordance with AASB 118 ‘Revenue’.
(s) Revenue Revenue is measured at the fair value of the consideration received or receivable. Sale Of Goods Revenue from the sale of goods is recognised when all the following conditions are satisfied:
the Group has transferred to the buyer the significant risks and rewards of ownership of the goods;
the Group retains neither continuing managerial involvement to the degree usually associated with ownership nor effective control over the goods sold;
the amount of revenue can be measured reliably;
it is probable that the economic benefits associated with the transaction will flow to the entity; and,
the costs incurred or to be incurred in respect of the transaction can be measured reliably.
Franchise Income Franchisor income is recognised on an accrual basis in accordance with the substance of the relevant agreement. Royalty revenue is recognised on an accrual basis in accordance with the substance of the relevant agreement (provided that it is probable that the economic benefits will flow to the Group and the amount of revenue can be measured reliably). Dividend And Interest Income Dividend revenue from investments is recognised when the shareholder’s right to receive payment has been established. Interest revenue is recognised when it is probable that the economic benefits will flow to the Group and the amount of revenue can be measured reliably. Interest revenue is accrued on a time basis, by reference to the principal outstanding and at the effective interest rate applicable, which is the rate that exactly discounts estimated future cash receipts through the expected life of the financial asset to that asset’s net carrying amount on initial recognition.

NOTESTOTHEFINANCIALSTATEMENTS
RETAIL FOOD GROUP LIMITED - ANNUAL REPORT 30 JUNE 2010 53
2. Significant Accounting Policies (cont.)
(t) Share-based Payments Equity-settled share-based payments to employees and others providing similar services are measured at the fair value of the equity instrument at the grant date. Details regarding the determination of the fair value of equity-settled share-based transactions are set out in note 34. The fair value determined at the grant date of the equity-settled share-based payments is expensed on a straight-line basis over the vesting period, based on the Group’s estimate of equity instruments that will eventually vest. At the end of each reporting period, the Group revises its estimate of the number of equity instruments expected to vest. The impact of the revision of the original estimates, if any, is recognised in profit or loss such that the cumulative expense reflects the revised estimate, with a corresponding adjustment to the equity-settled employee benefits reserve. Equity-settled share-based payment transactions with parties other than employees are measured at the fair value of the goods or services received, except where that fair value cannot be estimated reliably, in which case they are measured at the fair value of the equity instruments granted, measured at the date the entity obtains the goods or the counterparty renders the service.
(u) Taxation Income tax expense represents the sum of the tax currently payable and deferred tax. Current Tax The tax currently payable is based on taxable profit for the year. Taxable profit differs from profit as reported in the consolidated statement of comprehensive income because of items of income or expense that are taxable or deductible in other years and items that are never taxable or deductible. The Group’s liability for current tax is calculated using tax rates that have been enacted or substantively enacted by the end of the reporting period. Deferred Tax Deferred tax is recognised on temporary differences between the carrying amounts of assets and liabilities in the financial statements and the corresponding tax bases used in the computation of taxable profit. Deferred tax liabilities are generally recognised for all taxable temporary differences. Deferred tax assets are generally recognised for all deductible temporary differences to the extent that it is probable that taxable profits will be available against which those deductible temporary differences can be utilised. Such deferred tax assets and liabilities are not recognised if the temporary difference arises from goodwill or from the initial recognition (other than in a business combination) of other assets and liabilities in a transaction that affects neither the taxable profit nor the accounting profit. Deferred tax liabilities are recognised for taxable temporary differences associated with investments in subsidiaries and associates, and interests in joint ventures, except where the Group is able to control the reversal of the temporary difference and it is probable that the temporary difference will not reverse in the foreseeable future. Deferred tax assets arising from deductible temporary differences associated with such investments and interests are only recognised to the extent that it is probable that there will be sufficient taxable profits against which to utilise the benefits of the temporary differences and they are expected to reverse in the foreseeable future. The carrying amount of deferred tax assets is reviewed at the end of each reporting period and reduced to the extent that it is no longer probable that sufficient taxable profits will be available to allow all or part of the asset to be recovered. Deferred tax assets and liabilities are measured at the tax rates that are expected to apply in the period in which the liability is settled or the asset realised, based on tax rates (and tax laws) that have been enacted or substantively enacted by the end of the reporting period. The measurement of deferred tax liabilities and assets reflects the tax consequences that would follow from the manner in which the Group expects, at the end of the reporting period, to recover or settle the carrying amount of its assets and liabilities. Deferred tax assets and liabilities are offset when there is a legally enforceable right to set off current tax assets against current tax liabilities and when they relate to income taxes levied by the same taxation authority and the Group intends to settle its current tax assets and liabilities on a net basis. Current And Deferred Tax For The Period Current and deferred tax are recognised as an expense or income in profit or loss, except when they relate to items that are recognised outside profit or loss (whether in other comprehensive income or directly in equity), in which case the tax is also recognised outside profit or loss, or where they arise from the initial accounting for a business combination. In the case of a business combination, the tax effect is included in the accounting for the business combination.

NOTESTOTHEFINANCIALSTATEMENTS
54 RETAIL FOOD GROUP LIMITED - ANNUAL REPORT 30 JUNE 2010
3. Adoption Of New And Revised Accounting Standards 3.1 Standards And Interpretations Adopted In The Current Period The Group has adopted all of the new and revised Standards and Interpretations issued by the AASB that are relevant to its operations and effective for the current reporting period. The adoption of new Standards and Interpretations during the current reporting period did not have any material effect on the reported results or financial position of the Group. The following new and revised Standards and Interpretations have been adopted in the current period and have affected the presentation and disclosure of amounts in these financial statements.
Standard / Interpretation Impact
AASB 101 ‘Presentation of Financial Statements’ (as revised in September 2007), AASB 2007-8 ‘Amendments to Australian Accounting Standards arising from AASB 101’ and AASB 2007-10 ‘Further Amendments to Australian Accounting Standards arising from AASB 101’
The Group has applied the revised AASB 101 (September 2007) which became effective on 1 January 2009. The revised Standard requires the separate presentation of a statement of comprehensive income and a statement of changes in equity. As a consequence, the Group has had to change the format and content of its financial statements and has introduced terminology changes (including revised titles for the financial statements). Comparative information has also been re-presented so that it is also in conformity with the revised Standard.
AASB 8 ‘Operating Segments’ The Group has adopted AASB 8 from 1 July 2009. AASB 8 replaces AASB 114 ‘Segment Reporting’. The new Standard requires a ‘management approach’, under which segment information is presented on the same basis as that used for internal reporting purposes. This has resulted in no change to the number of reportable segments presented, as the information used for internal reporting purposes is consistent with the prior years’ reportable segment information. In addition, the segments are reported in a manner that is consistent with the internal reporting provided to the chief operating decision maker.
AASB 2009-2 ‘Amendments to Australian Accounting Standards – Improving Disclosures about Financial Instruments’
The amendments to AASB 7 ‘Financial Instruments: Disclosures’ expand the disclosures required in respect of fair value measurements and liquidity risk. The Group has elected not to provide comparative information for these expanded disclosures in the current year in accordance with the transitional reliefs offered in these amendments.
3.2 Standards And Interpretations In Issue Not Yet Adopted At the date of authorization of the financial statements, the Standards and Interpretations listed below were in issue but not yet effective. Initial application is not expected to have any material impact on the financial statements of the Group.
Standard / Interpretation Effective For Annual Reporting Periods
Beginning On Or After
Expected To Be Initially Applied In The Financial
Year Beginning
AASB 2009-5 ‘Further Amendments to Australian Accounting Standards arising from the Annual Improvement Process’
1 January 2010 30 June 2011
AASB 2009-8 ‘Amendments to Australian Accounting Standards – Group Cash-Settled Share-based Payment Transactions’
1 January 2010 30 June 2011
AASB 2009-10 ‘Amendments to Australian Accounting Standards – Classification of Rights Issues’
1 February 2010 30 June 2011
AASB 9 ‘Financial Instruments’, AASB 2009-11 ‘Amendments to Australian Accounting Standards arising from AASB 9’
1 January 2013 30 June 2014
AASB 124 ‘Related Party Disclosures’ (revised December 2009), AASB 2009-12 ‘Amendments to Australian Accounting Standards’
1 January 2011 30 June 2012
Interpretation 19 ‘Extinguishing Financial Liabilities with Equity Instruments’, AASB 2009-13 ‘Amendments to Australian Accounting Standards arising from Interpretation 19’
1 July 2010 30 June 2011
AASB 2009-14 ‘Amendments to Australian Interpretation – Prepayments of a Minimum Funding Requirement’
1 January 2011 30 June 2012

NOTESTOTHEFINANCIALSTATEMENTS
RETAIL FOOD GROUP LIMITED - ANNUAL REPORT 30 JUNE 2010 55
3. Adoption Of New And Revised Accounting Standards (cont.) 3.2 Standards And Interpretations In Issue Not Yet Adopted (cont.)
Standard / Interpretation Effective For Annual Reporting Periods
Beginning On Or After
Expected To Be Initially Applied In The Financial
Year Beginning
AASB 2010-1 ‘Amendments to Australian Accounting Standards – Limited Exemption from Comparative AASB 7 Disclosures for First-time Adopters’
1 July 2010 30 June 2011
AASB 2010-2 ‘Amendments to Australian Accounting Standards arising from Reduced Disclosure Requirements’
1 July 2013 30 June 2014
AASB 2010-3 ‘Amendments to Australian Accounting Standards arising from the Annual Improvements Project’
1 July 2010 30 June 2011
AASB 2010-4 ‘Further Amendments to Australian Accounting Standards arising from the Annual Improvements Project’
1 January 2011 30 June 2012
The following IASB Standards and IFRIC Interpretations are also in issue but not yet effective, although Australian equivalent Standards / Interpretations have not yet been issued.
Standard / Interpretation Effective For Annual Reporting Periods
Beginning On Or After
Expected To Be Initially Applied In The Financial
Year Beginning
Nil
4. Critical Accounting Judgments And Key Sources of Estimation Uncertainty In the application of the Group’s accounting policies, which are described in note 2, the Directors are required to make judgements, estimates and assumptions about the carrying amounts of assets and liabilities that are not readily apparent from other sources. The estimates and associated assumptions are based on historical experience and other factors that are considered to be relevant. Actual results may differ from these estimates. The estimates and underlying assumptions are reviewed on an ongoing basis. Revisions to accounting estimates are recognised in the period in which the estimate is revised if the revision affects only that period, or in the period of the revision and future periods if the revision affects both current and future periods. Further details of the nature of these assumptions and conditions may be found in the relevant notes to the financial statements. 4.1 Deferred Tax Assets Deferred tax assets are recognised for deductible temporary differences as management considers that it is probable that future taxable profits will be available to utilise those temporary differences. 4.2 Taxation The Group's accounting policy for taxation requires management's judgment as to the types of arrangements considered to be a tax on income in contrast to an operating cost. Judgment is also required in assessing whether deferred tax assets and certain deferred tax liabilities are recognised on the balance sheet. Deferred tax assets, including those arising from unrecouped tax losses, capital losses and temporary differences, are recognised only where it is considered more likely than not that they will be recovered, which is dependent on the generation of sufficient future taxable profits. Deferred tax liabilities arising from temporary differences in investments, caused principally by retained earnings held in foreign tax jurisdictions, are recognised unless repatriation of retained earnings can be controlled and are not expected to occur in the foreseeable future. Assumptions about the generation of future taxable profits and repatriation of retained earnings depend on management's estimates of future cash flows. These depend on estimates of future production and sales volumes, operating costs, restoration costs, capital expenditure, dividends and other capital management transactions. Judgements are also required about the application of income tax legislation. These judgements and assumptions are subject to risk and uncertainty, hence there is a possibility that changes in circumstances will alter expectations, which may impact the amount of deferred tax assets and deferred tax liabilities recognised on the balance sheet and the amount of other tax losses and temporary differences not yet recognised. In such circumstances, some or all of the carrying amounts of recognised deferred tax assets and liabilities may require adjustment, resulting in a corresponding credit or charge to the statement of comprehensive income.

NOTESTOTHEFINANCIALSTATEMENTS
56 RETAIL FOOD GROUP LIMITED - ANNUAL REPORT 30 JUNE 2010
4. Critical Accounting Judgments And Key Sources of Estimation Uncertainty (cont.) 4.3 Impairment Of Non-financial Assets Other Than Goodwill And Indefinite Life Intangible Assets The Group assesses impairment of all assets at the end of each reporting period by evaluating conditions specific to the Group and to the particular asset that may lead to impairment. These include product and manufacturing performance, technology, economic and political environments and future product expectations. If an impairment trigger exists, the recoverable amount of the asset is determined. Management does not consider that there have been any indicators of impairment and as such these assets have not been tested for impairment in this financial period. 4.4 Impairment Of Goodwill And Indefinite Life Intangible Assets The Group tests annually whether goodwill and indefinite life intangibles have suffered any impairment, in accordance with the accounting policy stated in note 2.2(k) and 2.2(l). The recoverable amounts of cash-generating units have been determined based on value-in-use calculations. These calculations require the use of assumptions. Refer to note 17 for details of these assumptions. 4.5 Share-based Payment Transactions The Group measures the cost of equity-settled transactions with employees by reference to the fair value of the equity instruments at the date at which they are granted. The fair value is determined by using the Black-Scholes model, with the assumptions detailed in note 34. The accounting estimates and assumptions relating to equity-settled share-based payments would have no impact on the carrying amounts of assets and liabilities within the next annual reporting period but may impact expenses and equity. 4.6 Estimation Of Useful Lives Of Assets The estimation of the useful lives of assets has been based on historical experience as well as manufacturers' warranties (for plant and equipment), lease terms (for leased equipment) and turnover policies (for motor vehicles). In addition, the condition of the assets is assessed at least once per year and considered against the remaining useful life. Adjustments to useful lives are made when considered necessary. 4.7 Onerous Lease Provisions And Make-good Provisions A provision has been made for the present value of future lease payments that the Group is presently obliged to make payments under non-cancellable onerous lease contracts relating to certain loss-making non-voluntary company stores. A provision has been made for the present value of the Director’s best estimate of the future sacrifice of economic benefits that will be required to restore site occupied by the loss-making non-voluntary company stores that existed at the end of the reporting period, to a condition specified in the relevant lease agreement. The estimate has been made on the basis of quotes obtained from restoration specialists or past experience. The calculation of both provisions requires assumptions such as the likelihood of sale of the non-voluntary company store, the estimated lease termination costs, and the expected costs of making-good the premises. These uncertainties may result in future actual expenditure differing from the amounts currently provided. The provision recognised for each site is periodically reviewed and updated based on the facts and circumstances available at the time. 5. Segment Information 5.1 Adoption of AASB 8 ‘Operating Segments’ The Group has adopted AASB 8 ‘Operating Segments’ with effect from 1 July 2009. AASB 8 requires operating segments to be identified on the basis of internal reports about components of the group that are reviewed regularly by the chief operating decision maker in order to allocate resources to the segments and to assess their performance. In contrast, the predecessor Standard (AASB 114 ‘Segment Reporting’) required an entity to indentify two sets of segments (business and geographical), using a risks and returns approach, with the entity’s ‘system of internal financial reporting to key management personnel’ serving only as the starting point for the identification of such segments. This has resulted in no change to the number of reportable segments presented, as the information used for internal reporting purposes is consistent with the prior years’ reportable segment information. In addition, the segments are reported in a manner that is consistent with the internal reporting provided to the chief operating decision maker.

NOTESTOTHEFINANCIALSTATEMENTS
RETAIL FOOD GROUP LIMITED - ANNUAL REPORT 30 JUNE 2010 57
5. Segment Information (cont.) 5.2 Products And Services From Which Reportable Segments Derive Their Revenues For management purposes, the Group is organised into two major operating divisions – franchising operations and wholesale / retail operations. These divisions are the basis on which the Group reports its primary segment information. The Group’s reportable segments under AASB 8, and the principal products and services of each, are as follows:
Segment Description
Franchising Operations Franchising operations incorporates the development and management of the Group’s five retail franchise systems – Donut King, bb’s café, Brumby’s Bakeries, Michel’s Patisserie and Big Dad’s Pies – and involves the following principal activities:
the establishment and grant of new franchises;
the administration of royalties collection, supplier licensing, franchise compliance, franchise training and administration; and,
the performance of marketing and promotional activities, brand development and awareness, and product research and development.
Wholesale / Retail Operations
Wholesale / Retail Operations incorporates the development and management of the Group’s Procurement & Distribution division, Wholesale & Manufacturing division and Non-Voluntary Company Store division. These divisions are managed and reported separate to the Franchising Operations segment, and involve the following principal activities:
the procurement, sale and distribution of bakery and other related items to Michel’s Patisserie franchisees;
the manufacture and sale of roasted coffee and related products to franchisees and external customers;
the interim operation of non-voluntary company owned or company managed stores across each of the five franchise systems; and,
the sale of turn-key and company owned stores.
5.3 Segment Revenues And Results The following is an analysis of the Group’s revenue and results from continuing operations by reportable segment:
Segment Segment Revenues Segment Profit
FY10 $’000
FY09 $’000
FY10 $’000
FY09 $’000
Franchising Operations 61,340 56,250 30,133 25,470
Wholesale / Retail Operations 72,493 86,209 15,488 17,082
133,833 142,459 45,621 42,552
Hedge ineffectiveness on cash flow hedges (529) (953)
Interest revenue 155 151 155 151
Finance costs (7,606) (8,974)
Unallocated 38 477 (1,070) (858)
Profit before tax 36,571 31,918
Income tax expense (10,552) (8,399)
Revenue and profit for the year 134,026 143,087 26,019 23,519
Revenue reported above represents revenue generated from external customers. The accounting policies of the reportable segments are the same as the Group’s accounting policies described in note 2. Segment profit represents the profit earned by each segment without allocation of gains derived / losses incurred from derivative financial instruments, interest revenue, finance costs, depreciation, corporate expenses and income tax expense. This is the measure reported to the chief operating decision maker for the purpose of resource allocation and assessment of segment performance. 5.4 Geographical Information An insignificant portion of the Group’s activities are located outside of Australia, and hence no geographical information has been disclosed.
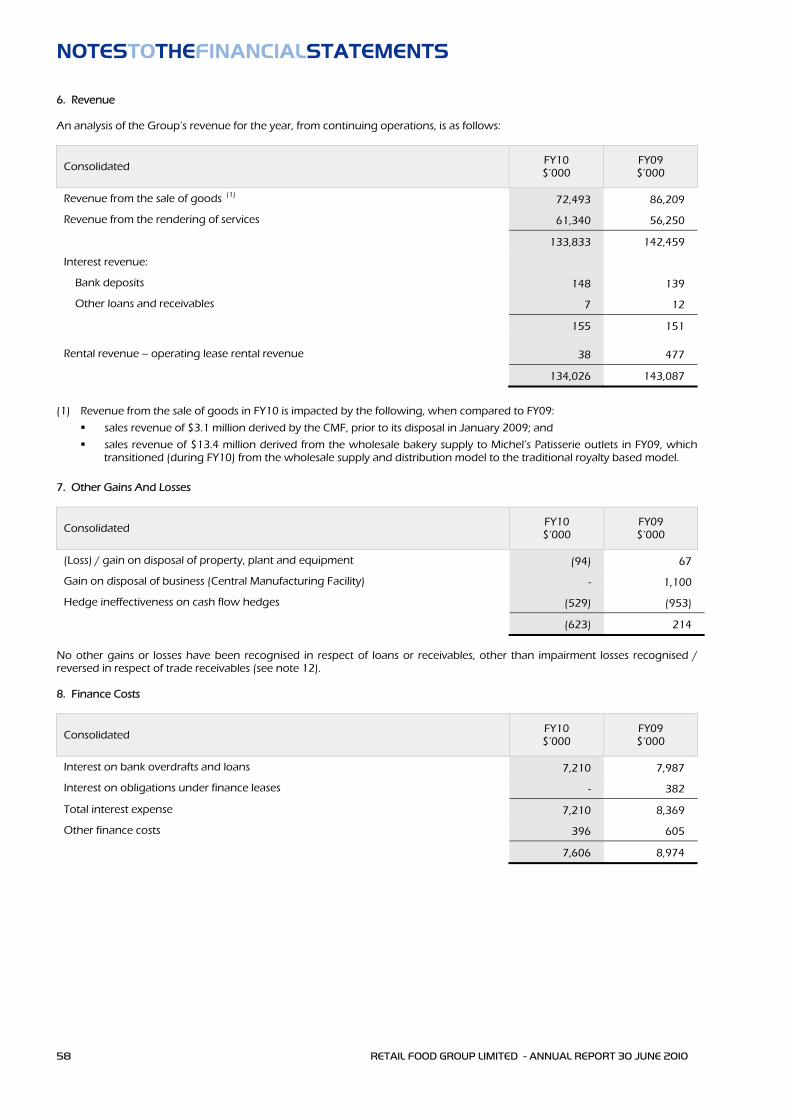
NOTESTOTHEFINANCIALSTATEMENTS
58 RETAIL FOOD GROUP LIMITED - ANNUAL REPORT 30 JUNE 2010
6. Revenue An analysis of the Group’s revenue for the year, from continuing operations, is as follows:
Consolidated FY10 $’000
FY09 $’000
Revenue from the sale of goods (1) 72,493 86,209
Revenue from the rendering of services 61,340 56,250
133,833 142,459
Interest revenue:
Bank deposits 148 139
Other loans and receivables 7 12
155 151
Rental revenue – operating lease rental revenue 38 477
134,026 143,087
(1) Revenue from the sale of goods in FY10 is impacted by the following, when compared to FY09:
sales revenue of $3.1 million derived by the CMF, prior to its disposal in January 2009; and
sales revenue of $13.4 million derived from the wholesale bakery supply to Michel’s Patisserie outlets in FY09, which transitioned (during FY10) from the wholesale supply and distribution model to the traditional royalty based model.
7. Other Gains And Losses
Consolidated FY10 $’000
FY09 $’000
(Loss) / gain on disposal of property, plant and equipment (94) 67
Gain on disposal of business (Central Manufacturing Facility) - 1,100
Hedge ineffectiveness on cash flow hedges (529) (953)
(623) 214
No other gains or losses have been recognised in respect of loans or receivables, other than impairment losses recognised / reversed in respect of trade receivables (see note 12). 8. Finance Costs
Consolidated FY10 $’000
FY09 $’000
Interest on bank overdrafts and loans 7,210 7,987
Interest on obligations under finance leases - 382
Total interest expense 7,210 8,369
Other finance costs 396 605
7,606 8,974
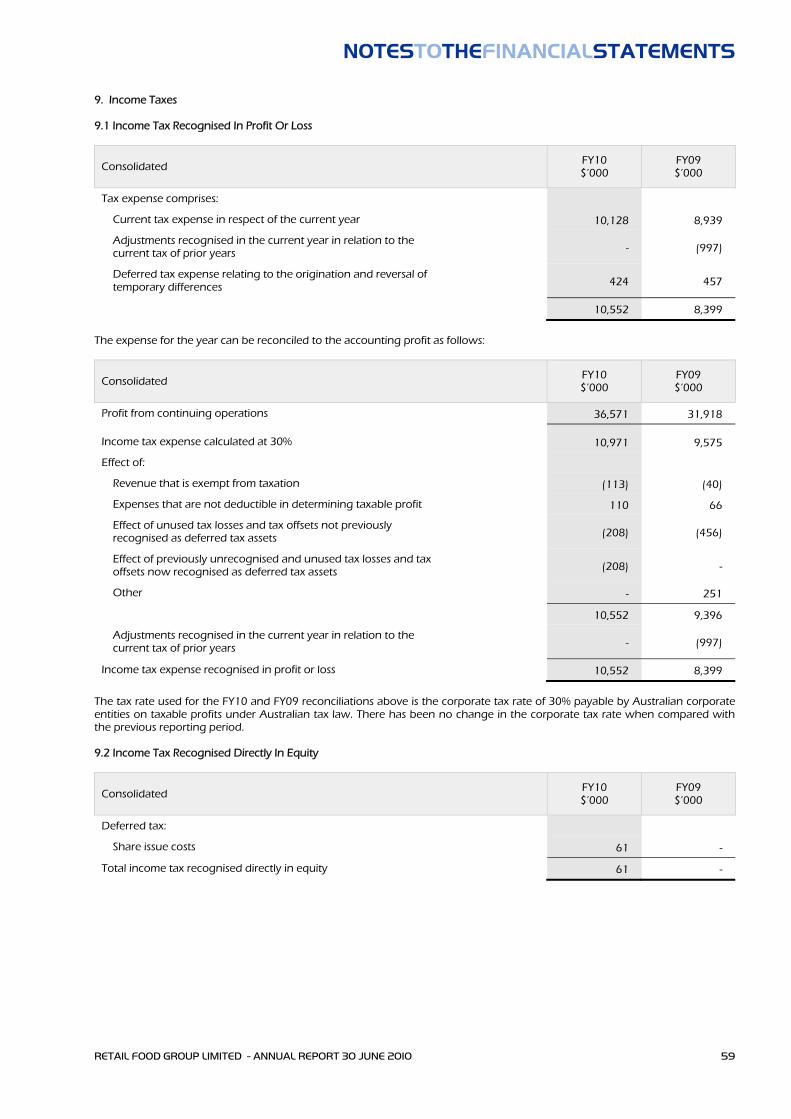
NOTESTOTHEFINANCIALSTATEMENTS
RETAIL FOOD GROUP LIMITED - ANNUAL REPORT 30 JUNE 2010 59
9. Income Taxes 9.1 Income Tax Recognised In Profit Or Loss
Consolidated FY10 $’000
FY09 $’000
Tax expense comprises:
Current tax expense in respect of the current year 10,128 8,939
Adjustments recognised in the current year in relation to the current tax of prior years - (997)
Deferred tax expense relating to the origination and reversal of temporary differences 424 457
10,552 8,399
The expense for the year can be reconciled to the accounting profit as follows:
Consolidated FY10 $’000
FY09 $’000
Profit from continuing operations 36,571 31,918
Income tax expense calculated at 30% 10,971 9,575
Effect of:
Revenue that is exempt from taxation (113) (40)
Expenses that are not deductible in determining taxable profit 110 66
Effect of unused tax losses and tax offsets not previously recognised as deferred tax assets
(208) (456)
Effect of previously unrecognised and unused tax losses and tax offsets now recognised as deferred tax assets
(208) -
Other - 251
10,552 9,396
Adjustments recognised in the current year in relation to the current tax of prior years
- (997)
Income tax expense recognised in profit or loss 10,552 8,399
The tax rate used for the FY10 and FY09 reconciliations above is the corporate tax rate of 30% payable by Australian corporate entities on taxable profits under Australian tax law. There has been no change in the corporate tax rate when compared with the previous reporting period. 9.2 Income Tax Recognised Directly In Equity
Consolidated FY10 $’000
FY09 $’000
Deferred tax:
Share issue costs 61 -
Total income tax recognised directly in equity 61 -

NOTESTOTHEFINANCIALSTATEMENTS
60 RETAIL FOOD GROUP LIMITED - ANNUAL REPORT 30 JUNE 2010
9. Income Taxes (cont.) 9.3 Income Tax Recognised In Other Comprehensive Income
Consolidated FY10 $’000
FY09 $’000
Deferred tax:
Interest rate swap (693) 2,086
Total income tax recognised in other comprehensive income (693) 2,086
9.4 Current Tax Liabilities
Consolidated FY10 $’000
FY09 $’000
Income tax payable 4,963 2,825
4,963 2,825
9.5 Deferred Tax Balances
Consolidated – FY10 Opening Balance
Charged To Income
Credited To Equity
Recognised In Other
Comprehensive Income
Closing Balance
$’000 $’000 $’000 $’000 $’000
Temporary differences
Intangible assets (376) - - - (376)
Employee benefits 465 25 - - 490
Provisions 385 (203) - - 182
Doubtful debts 557 (293) - - 264
IPO listing costs 136 (136) - - -
Share issue costs 197 (78) 61 - 181
Interest rate swap 1,677 112 - (693) 1,096
Other 118 (59) - - 59
3,159 (632) 61 (693) 1,896
Unused tax losses and credits
Other – ‘black hole’ expenses - 208 - - 208
- 208 - - 208
3,159 (424) 61 (693) 2,104

NOTESTOTHEFINANCIALSTATEMENTS
RETAIL FOOD GROUP LIMITED - ANNUAL REPORT 30 JUNE 2010 61
9. Income Taxes (cont.) 9.5 Deferred Tax Balances (cont.)
Consolidated – FY09 Opening Balance
Charged To Income
Credited To Equity
Recognised In Other
Comprehensive Income
Closing Balance
$’000 $’000 $’000 $’000 $’000
Temporary differences
Property, plant and equipment (117) 117 - - -
Intangible assets (376) - - - (376)
Employee benefits 429 36 - - 465
Provisions 1,046 (661) - - 385
Doubtful debts 282 275 - - 557
IPO listing costs 270 (134) - - 136
Share issue costs 263 (66) - - 197
Interest rate swap (445) 36 - 2,086 1,677
Other 178 (60) - - 118
1,530 (457) - 2,086 3,159
Deferred tax balances are presented in the statement of financial position as follows:
Consolidated FY10 $’000
FY09 $’000
Deferred tax assets 2,104 3,159
Deferred tax liabilities - -
2,104 3,159
9.6 Tax Consolidation Relevance Of Tax Consolidation To The Group The Company and its wholly-owned Australian resident entities have formed a tax-consolidated group with effect from 1 July 2003 and are therefore taxed as a single entity from that date. The head entity within the tax-consolidated group is Retail Food Group Limited. The members of the tax-consolidated group are indentified in note 30. Tax expense / income, deferred tax liabilities and deferred tax assets arising from temporary differences of the members of the tax-consolidated group are recognised in the separate financial statements of the members of the tax-consolidated group using the ‘separate taxpayer within group’ approach by reference to the carrying amounts in the separate financial statements of each entity and the tax values applying under tax consolidation. Current tax liabilities and assets and deferred tax assets arising from unused tax losses and relevant tax credits of the members of the tax-consolidated group are recognised by the Company (as head entity in the tax-consolidation group). Due to the existence of a tax funding agreement between the entities in the tax-consolidated group, amounts are recognised as payable to or receivable by the Company and each member of the Group in relation to the tax contribution amounts paid or payable between the parent entity and the other members of the tax-consolidated group in accordance with the arrangement. Nature Of Tax Funding Arrangements And Tax Sharing Arrangements Entities within the tax-consolidation group have entered into a tax funding agreement and a tax-sharing agreement with the head entity. Under the terms of the tax funding arrangement, Retail Food Group Limited and each of the entities in the tax-consolidated group has agreed to pay a tax equivalent payment to or from the head entity, based on the current tax liability or current tax asset of the entity. The tax sharing agreement entered into between members of the tax-consolidated group provides for the determination of the allocation of income tax liabilities between the entities should the head entity default on its tax payment obligations or if an entity should leave the tax-consolidated group. No amounts have been recognised in the financial statements in respect of this agreement as payment of any such amounts under the tax sharing agreement is considered remote.

NOTESTOTHEFINANCIALSTATEMENTS
62 RETAIL FOOD GROUP LIMITED - ANNUAL REPORT 30 JUNE 2010
10. Profit For The Year From Continuing Operations Profit for the year from continuing operations has been arrived at after charging (crediting):
Consolidated FY10 $’000
FY09 $’000
Cost of sales 48,321 55,800
Inventory write-down of inventory to net realisable value 300 -
Impairment of trade receivables 543 2,778
Depreciation of property, plant and equipment 1,108 1,335
Employee benefits expenses:
Post employment benefits (defined contribution plans) 1,234 1,417
Share-based payments (equity-settled share-based payments) 363 207
Termination benefits 97 162
Other employee benefits (wages and salaries) 18,758 18,465
20,452 20,271
11. Earnings Per Share
Consolidated FY10 Cents Per Share
FY09 Cents Per Share
Basic earnings per share
From continuing operations 25.3 23.7
From discontinued operations - -
25.3 23.7
Diluted earnings per share
From continuing operations 25.0 23.6
From discontinued operations - -
25.0 23.6
11.1 Basic Earnings Per Share The earnings and weighted average number of ordinary shares used in the calculation of basic earnings per share are as follows:
Consolidated FY10 $’000
FY09 $’000
Profit for the year 26,019 23,519
Earnings used in the calculation of basic EPS 26,019 23,519
Adjustments to exclude profit from discontinued operations - -
Earnings used in the calculation of basic EPS from continuing operations 26,019 23,519
FY10
No. ‘000 FY09
No. ‘000
Weighted average number of ordinary shares for the purpose of basic EPS 102,922 99,236

NOTESTOTHEFINANCIALSTATEMENTS
RETAIL FOOD GROUP LIMITED - ANNUAL REPORT 30 JUNE 2010 63
11. Earnings Per Share (cont.) 11.2 Diluted Earnings Per Share The earnings and weighted average number of ordinary shares used in the calculation of diluted earnings per share are as follows:
Consolidated FY10 $’000
FY09 $’000
Profit for the year 26,019 23,519
Earnings used in the calculation of diluted EPS 26,019 23,519
Adjustments to exclude profit from discontinued operations - -
Earnings used in the calculation of diluted EPS from continuing operations 26,019 23,519
FY10
No. ‘000 FY09
No. ‘000
Weighted average number of ordinary shares for the purpose of basic EPS 102,922 99,236
Shares deemed to be issued for no consideration in respect of executive options 1,031 374
Weighted average number of ordinary shares for the purpose of diluted EPS 103,953 99,610
The following potential ordinary shares are not dilutive and are therefore excluded from the weighted average number of ordinary shares for the purpose of diluted EPS:
FY10
No. ‘000 FY09
No. ‘000
Executive share options - 692
12. Trade And Other Receivables
Consolidated FY10 $’000
FY09 $’000
Trade receivables 10,509 12,758
Allowance for doubtful debts (880) (1,856)
9,629 10,902
Accrued income 3,083 3,957
Sundry debtors 382 116
13,094 14,975
Trade receivables disclosed above are classified as loans and receivables and are therefore measured at amortised cost. The average credit period on sales of goods and rendering of services is 30 days. No interest is charged. The Group has recognised an allowance for estimated irrecoverable trade receivable amounts arising from the past sale of goods and rendering of services, determined by reference to past default experience. Trade receivables disclosed above include amounts (see below for aged analysis) that are past due at the end of the reporting period but against which the Group has not recognised an allowance for doubtful receivables because there has not been a significant change in credit quality and the amounts are still considered recoverable. The Group holds collateral over the majority of these balances in the form of the franchised outlets.

NOTESTOTHEFINANCIALSTATEMENTS
64 RETAIL FOOD GROUP LIMITED - ANNUAL REPORT 30 JUNE 2010
12. Trade And Other Receivables (cont.) 12.1 Ageing Of Past Due But Not Impaired
Consolidated FY10 $’000
FY09 $’000
31 – 60 days 904 1,187
61 – 90 days 500 755
91 + days 4,808 5,542
6,212 7,484
12.2 Movement In The Allowance For Doubtful Debts
Consolidated FY10 $’000
FY09 $’000
Balance at the beginning of the year 1,856 939
Impairment losses recognised on receivables 543 2,778
Amounts written off as uncollectable (1,519) (1,861)
Balance at the end of the year 880 1,856
In determining the recoverability of a trade receivable, the Group considers any change in the credit quality of the trade receivable from the date credit was initially granted up to the end of the reporting period. The concentration of credit risk is limited due to the customer base being large and unrelated. Accordingly, the Directors believe that there is no further credit provision required in excess of the allowance for doubtful debts. Included in the allowance for doubtful debts are individually impaired trade receivables amounting to $880 thousand (FY09: $1,856 thousand). The impairment recognised represents the difference between the carrying amount of these trade receivables and the present value of the estimated recoverable amount. The Group holds collateral over these balances in the form of the franchised outlets. 12.3 Ageing Of Impaired Trade Receivables
Consolidated FY10 $’000
FY09 $’000
1 – 30 days - 15
31 – 60 days - 55
61 – 90 days 8 69
91 + days 872 1,717
880 1,856
13. Other Financial Assets
Consolidated FY10 $’000
FY09 $’000
Loans and receivables carried at amortised cost
Vendor finance (1) 1,073 725
Loans to associated national marketing funds (2) 1,468 54
Other 50 52
2,591 831
(1) Vendor finance represents short-term funding provided to franchisees for the purpose of acquiring a franchised outlet, and are secured by the franchised outlet, including the business and shop fittings.
(2) Loans to associated national marketing funds represents short-term funding provided to certain marketing funds associated with the Group’s five franchise systems. Typically, amounts outstanding are repaid within 30 days by the relevant marketing fund.

NOTESTOTHEFINANCIALSTATEMENTS
RETAIL FOOD GROUP LIMITED - ANNUAL REPORT 30 JUNE 2010 65
14. Inventories
Consolidated FY10 $’000
FY09 $’000
Stock held for wholesale supply 537 787
Equipment held for resale - 59
Stores held for resale 1,762 1,042
2,299 1,888
The cost of inventories recognised as an expense during the period in respect of continuing operations was $48,321 thousand (FY09: $55,800 thousand). Additionally, an amount of $300 thousand (FY09: $nil) has been expensed in the year in respect of write-downs of stores held for resale to their assessed net realizable value. 15. Other Assets
Consolidated FY10 $’000
FY09 $’000
Current
Prepayments 275 69
Other 157 -
432 69
16. Property, Plant And Equipment
Consolidated Land & Buildings At Cost
Leasehold Improvements
At Cost
Plant & Equipment
At Cost
Motor Vehicles At Cost
Total
$’000 $’000 $’000 $’000 $’000
Gross carrying amount
Balance as at 1 July 2008 - 2,030 6,497 214 11,326
Additions - 59 1,788 - 1,847
Disposals - (1,693) (2,925) (79) (7,282)
Transfers - - (112) 112 -
Balance as at 1 July 2009 - 396 5,248 247 5,891
Additions - 12 632 - 644
Disposals - - (120) (13) (133)
Balance as at 30 June 2010 - 408 5,760 234 6,402
Accumulated depreciation
Balance as at 1 July 2008 - (170) (1,823) (96) (2,089)
Disposals - 136 681 46 863
Transfers - - 61 (61) -
Depreciation expense - (108) (1,189) (38) (1,335)
Balance as at 1 July 2009 - (142) (2,270) (149) (2,561)
Disposals - - 13 3 16
Depreciation expense - (50) (1,029) (29) (1,108)
Balance as at 30 June 2010 - (192) (3,286) (175) (3,653)
Net book value
As at 30 June 2009 - 254 2,978 98 3,330
As at 30 June 2010 - 216 2,474 59 2,749

NOTESTOTHEFINANCIALSTATEMENTS
66 RETAIL FOOD GROUP LIMITED - ANNUAL REPORT 30 JUNE 2010
17. Intangible Assets
Consolidated Goodwill Indefinite Life Finite Life Total
Franchise Networks
Intellectual Property Rights
Other
$’000 $’000 $’000 $’000 $’000
Gross carrying amount
Balance as at 1 July 2008 23,438 165,367 3,695 21 192,521
Acquisitions through business combinations
308 - - - 308
Balance as at 1 July 2009 23,746 165,367 3,695 21 192,829
Additions - 5,500 - - 5,500
Acquisitions through business combinations
- 8,600 - 210 8,810
Balance as at 30 June 2010 23,746 179,467 3,695 231 207,139
Accumulated amortisation
Balance as at 1 July 2008 - - - (21) (21)
Balance as at 1 July 2009 - - - (21) (21)
Balance as at 30 June 2010 - - - (21) (21)
Net book value
As at 30 June 2009 23,746 165,367 3,695 - 192,808
As at 30 June 2010 23,746 179,467 3,695 210 207,118
17.1 Determination As Indefinite Life No amortisation is provided against the carrying value of franchise networks and intellectual property rights on the basis that these assets are considered to have an indefinite life. Key factors taken into account in assessing the useful life of franchise networks and intellectual property rights were:
these assets are all well established and have experienced strong sales and profit growth over time;
none of the assets have a foreseeable limit as to when they will stop generating net cash inflows to the Group in the future; and,
there are currently no legal, technical or commercial obsolescence factors applying to the assets or products to which they attach which indicate that the life should be considered limited.
Specifically, in respect of the intellectual property rights, the Group holds a significant number of registered trademarks for each franchise network. Since inception, all of the trademarks have demonstrated significant growth and this growth is forecast to continue. It is noted that the trademark registrations have a finite legal life; however renewal of the registrations is simple with little cost involved. Management oversees the registration of the trademarks as well as the protection of these trademarks. The Group intends to renew all trademarks as they expire and has the infrastructure and allocated resources to ensure this occurs. Therefore, consistent with AASB 138 ‘Intangible Assets’, the Group treats each of its franchise networks and intellectual property rights as having an indefinite life. All such assets are tested for impairment annually. 17.2 Allocation Of Goodwill To Cash-Generating Units Goodwill has been allocated for impairment testing purposes to the following cash-generating units:
Goodwill Allocation FY10 $’000
FY09 $’000
Donut King franchise system 246 246
bb's café franchise system 62 62
Michel’s Patisserie franchise system 23,438 23,438
23,746 23,746

NOTESTOTHEFINANCIALSTATEMENTS
RETAIL FOOD GROUP LIMITED - ANNUAL REPORT 30 JUNE 2010 67
17. Intangible Assets (cont.) 17.3 Allocation Of Indefinite Life Intangible Assets To Cash-Generating Units
Indefinite Life Intangibles Allocation FY10 $’000
FY09 $’000
Donut King franchise system 38,323 35,923
bb's café franchise system 6,106 6,106
Brumby’s Bakeries franchise system 53,433 44,833
Michel’s Patisserie franchise system 82,200 82,200
Big Dad’s Pies franchise system 3,100 -
183,162 169,062
17.4 Assessments Of Cash-Generating Units The operations in each of the five franchise systems are similar, and their recoverable amounts are based on similar assumptions. The recoverable amounts of the five franchise systems (each identified as a CGU) are based primarily on a value in use calculation which uses cash flow projections based on the financial budget approved by the Board for FY11 as the year one cash flow. The key assumptions used in the value in use calculation for the various significant cash-generating units are budgeted system cash flows that are assumed to increase, driven by higher average weekly sales, increased market share, increased customer counts and new store commissionings. The cash flows in years two to five are based on the expected average percentage growth rates (Donut King – 3%; bb’s café – 1.5%; Brumby’s Bakeries – 3%; Michel’s Patisserie – 3%; Big Dad’s Pies – 3%) for the individual brand. The growth rates applied are based on management’s estimate of forecast cash flow by franchise system after considering FY10 with the FY11 budget year. Management believes the growth rates applied are reasonable considering forecast sales growth and forecast store count growth. A pre-tax discount rate of 17.5% has been used in preparing the value in use calculations. An indefinite terminal cash flow calculation has been applied for cash flows beyond year five, using the year five cash flow as a base. A growth rate of 2.5% has been used in determining the terminal value for the Donut King, Brumby’s Bakeries, Michel’s Patisserie and Big Dad’s Pies franchise systems. For the bb’s café franchise system a growth rate of 1.5% has been used in determining the terminal value. Management believes that any reasonable change in the key assumptions on which the recoverable amounts are based would not cause the system’s carrying amount to exceed its recoverable amount. 18. Assets Pledged As Security In accordance with the security arrangements of liabilities, as disclosed in note 20 to the financial statements, all non-current assets of the Group, except goodwill and deferred taxes, have been pledged as security. The holder of the security does not have the right to sell or repledge the assets other than in an event of default. 19. Trade And Other Payables
Consolidated FY10 $’000
FY09 $’000
Trade payables (1) 4,723 6,094
Accruals and other creditors 2,732 1,353
Goods and services tax (GST) payable 19 234
7,474 7,681
(1) The average credit period on purchases is 30 days. The Group has financial risk management policies in place to ensure
that all payables are paid within the credit timeframe.

NOTESTOTHEFINANCIALSTATEMENTS
68 RETAIL FOOD GROUP LIMITED - ANNUAL REPORT 30 JUNE 2010
20. Borrowings
Consolidated FY10 $’000
FY09 $’000
Secured at amortised cost
Current
Bank loans (1) 85,852 -
85,852 -
Non-current
Bank loans (1) - 95,480
- 95,480
85,852 95,480
(1) Interest-only variable interest rate facilities agreement with Commonwealth Bank of Australia (CBA), with a maturity of 5
December 2010. The Company hedges the loan via an interest rate swap exchanging the variable rate interest for a fixed rate interest. Secured by the non-current assets, excluding goodwill and deferred tax assets.
As a consequence of the Group’s Debt Facility with the Commonwealth Bank of Australia (CBA) maturing on 5 December 2010, as at 30 June 2010, the Group’s $86.0 million core debt borrowings is classified as a current liability in the Statement of Financial Position. Subsequent to year end, the Company announced the appointment of the National Australia Bank (NAB) as its future debt facility provider and transaction banker. The NAB Debt Facility, being $85.0 million with a term of 3 years from Senior Debt Facility, was affirmed on 31 August 2010 with refinance and transfer of the Company’s banking facility completed on that date. At the date of transfer, the Group’s core debt borrowings totalled $77.0 million following a further $9.0 million voluntary debt reduction undertaken in July 2010 in advance of the refinance completion. 21. Provisions
Consolidated FY10 $’000
FY09 $’000
Current
Employee benefits (1) 1,340 1,362
Onerous leases and make-good (2) 400 450
Contract termination costs (3) - 140
Legal claims (4) 115 600
1,855 2,552
Non-current
Employee benefits (1) 293 221
293 221
2,148 2,773
Onerous Leases and Make-
Good
Contract Termination
Costs
Legal Claims
$’000 $’000 $’000
Balance at 1 July 2009 450 140 600
Additional provisions recognised 224 - -
Payments made (274) (140) (85)
Reductions resulting from remeasurement or settlement without cost - - (400)
Balance at 30 June 2010 400 - 115
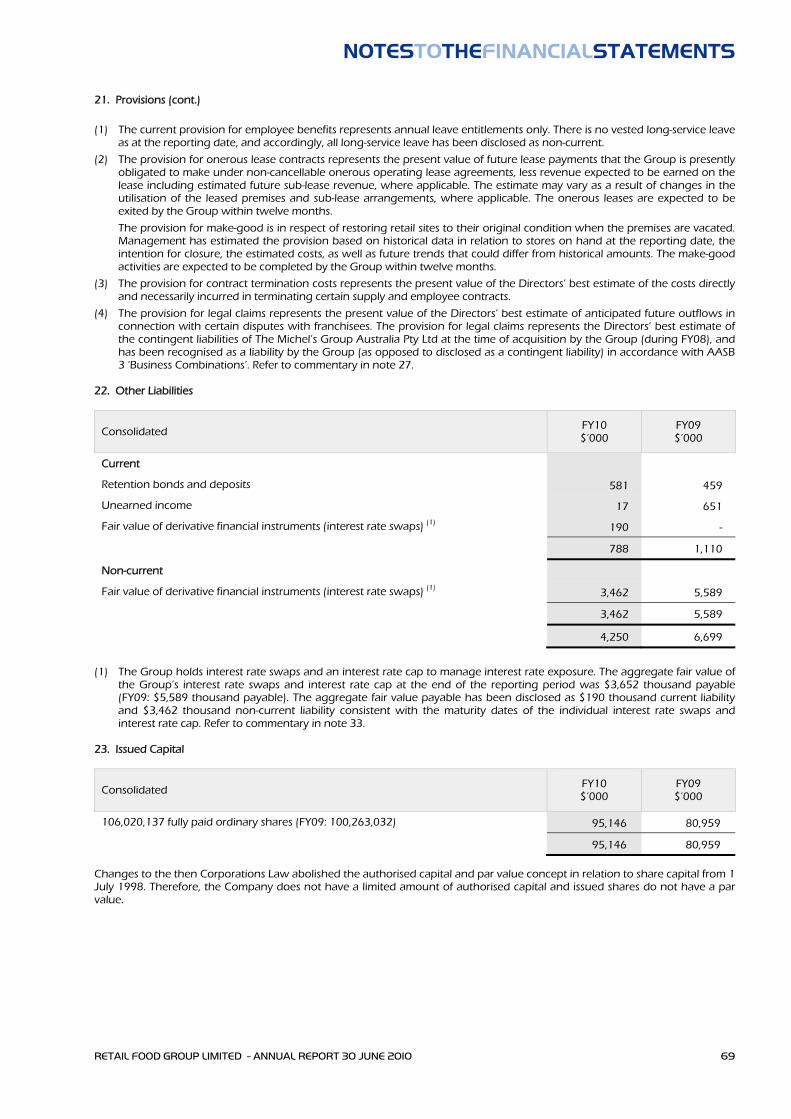
NOTESTOTHEFINANCIALSTATEMENTS
RETAIL FOOD GROUP LIMITED - ANNUAL REPORT 30 JUNE 2010 69
21. Provisions (cont.)
(1) The current provision for employee benefits represents annual leave entitlements only. There is no vested long-service leave as at the reporting date, and accordingly, all long-service leave has been disclosed as non-current.
(2) The provision for onerous lease contracts represents the present value of future lease payments that the Group is presently obligated to make under non-cancellable onerous operating lease agreements, less revenue expected to be earned on the lease including estimated future sub-lease revenue, where applicable. The estimate may vary as a result of changes in the utilisation of the leased premises and sub-lease arrangements, where applicable. The onerous leases are expected to be exited by the Group within twelve months.
The provision for make-good is in respect of restoring retail sites to their original condition when the premises are vacated. Management has estimated the provision based on historical data in relation to stores on hand at the reporting date, the intention for closure, the estimated costs, as well as future trends that could differ from historical amounts. The make-good activities are expected to be completed by the Group within twelve months.
(3) The provision for contract termination costs represents the present value of the Directors’ best estimate of the costs directly and necessarily incurred in terminating certain supply and employee contracts.
(4) The provision for legal claims represents the present value of the Directors’ best estimate of anticipated future outflows in connection with certain disputes with franchisees. The provision for legal claims represents the Directors’ best estimate of the contingent liabilities of The Michel’s Group Australia Pty Ltd at the time of acquisition by the Group (during FY08), and has been recognised as a liability by the Group (as opposed to disclosed as a contingent liability) in accordance with AASB 3 ‘Business Combinations’. Refer to commentary in note 27.
22. Other Liabilities
Consolidated FY10 $’000
FY09 $’000
Current
Retention bonds and deposits 581 459
Unearned income 17 651
Fair value of derivative financial instruments (interest rate swaps) (1) 190 -
788 1,110
Non-current
Fair value of derivative financial instruments (interest rate swaps) (1) 3,462 5,589
3,462 5,589
4,250 6,699
(1) The Group holds interest rate swaps and an interest rate cap to manage interest rate exposure. The aggregate fair value of the Group’s interest rate swaps and interest rate cap at the end of the reporting period was $3,652 thousand payable (FY09: $5,589 thousand payable). The aggregate fair value payable has been disclosed as $190 thousand current liability and $3,462 thousand non-current liability consistent with the maturity dates of the individual interest rate swaps and interest rate cap. Refer to commentary in note 33.
23. Issued Capital
Consolidated FY10 $’000
FY09 $’000
106,020,137 fully paid ordinary shares (FY09: 100,263,032) 95,146 80,959
95,146 80,959
Changes to the then Corporations Law abolished the authorised capital and par value concept in relation to share capital from 1 July 1998. Therefore, the Company does not have a limited amount of authorised capital and issued shares do not have a par value.

NOTESTOTHEFINANCIALSTATEMENTS
70 RETAIL FOOD GROUP LIMITED - ANNUAL REPORT 30 JUNE 2010
23. Issued Capital (cont.)
FY10 FY09
No. ‘000 $’000 No. ‘000 $’000
Fully paid ordinary shares (1)
Balance at beginning of financial year 100,263 80,959 98,350 78,453
Issue of ordinary shares (2) 4,601 12,124 - -
Share issue costs (2) - (204) - -
Related income tax (2) - 61 - -
Issue of ordinary shares under DRP (3) 516 1,326 1,567 2,075
Issue of shares under executive share option plan (4) 640 690 346 354
Transfer from equity-settled employee benefits reserve
- 190 - 77
Balance at end of financial year 106,020 95,146 100,263 80,959
(1) Fully paid ordinary shares carry one vote per share and carry the right to dividends.
(2) Issue of ordinary shares:
DRP Shortfall Placements:
a. On 5 October 2009, the Company announced a capital raising of $4,336 thousand which approximated the dollar value of RFG’s FY09 final dividend less the value of shares to be issued to shareholders participating in the Company’s Dividend Reinvestment Plan (DRP). On 12 October 2009, a total of 1,727,579 fully-paid ordinary shares in the Company were issued at $2.51 per share, being the same price applicable to DRP participating shares. Costs of $93 thousand were incurred in relation to the DRP Shortfall Placement.
b. On 26 March 2010, the Company announced a capital raising of $4,978 thousand which approximated the dollar value of RFG’s FY10 interim dividend less the value of shares to be issued to shareholders participating in the Company’s Dividend Reinvestment Plan (DRP). On 31 March 2010, a total of 1,900,000 fully-paid ordinary shares in the Company were issued at $2.62 per share, being the same price applicable to DRP participating shares. Costs of $111 thousand were incurred in relation to the DRP Shortfall Placement.
Acquisition Consideration:
c. On 13 January 2010, the Company completed the acquisition of the DCM Coffee & Donuts franchise system. The acquisition price of $2,400 thousand included the issuance of shares in the Company to the value of $300 thousand. Accordingly, on that date, a total of 106,383 fully-paid ordinary shares in the Company were issued at $2.82 per share, being the volume weighted market price for all RFG shares sold on the ASX during the 5 trading days immediately preceding the Completion Date.
d. On 15 January 2010, the Company completed the acquisition of the Brumby’s Bakeries master franchise territories for North Queensland and New Zealand. The acquisition price of $4,000 thousand included the issuance of shares in the Company to the value of $1,320 thousand. Accordingly, on that date, a total of 447,458 fully-paid ordinary shares in the Company were issued at $2.95 per share, being the volume weighted market price for all RFG shares sold on the ASX during the 5 trading days immediately preceding the Completion Date.
e. On 16 February 2010, the Company completed the acquisition of the Brumby’s Bakeries master franchise territories for Western Australia and the Northern Territory. The acquisition price of $4,810 thousand included the issuance of shares in the Company to the value of $1,190 thousand. Accordingly, on that date, a total of 420,495 fully-paid ordinary shares in the Company were issued at $2.83 per share, being the volume weighted market price for all RFG shares sold on the ASX during the 5 trading days immediately preceding the Completion Date.
(3) Issue of ordinary shares under Dividend Reinvestment Plan (DRP):
a. On 9 October 2009, the Company issued a total of 209,687 fully-paid ordinary shares in accordance with the DRP, attributable to the payment of the final dividend for the financial year ended 30 June 2009. The issue price of the shares was $2.51 per share.
b. On 8 April 2010, the Company issued a total of 305,837 fully-paid ordinary shares in accordance with the DRP, attributable to the payment of the interim dividend for the financial year ended 30 June 2010. The issue price of the shares was $2.62 per share.
(4) Issue of ordinary shares under Executive Share Option Plan (ESOP):
a. During the year a total of 639,666 shares were issued following the exercise of options.
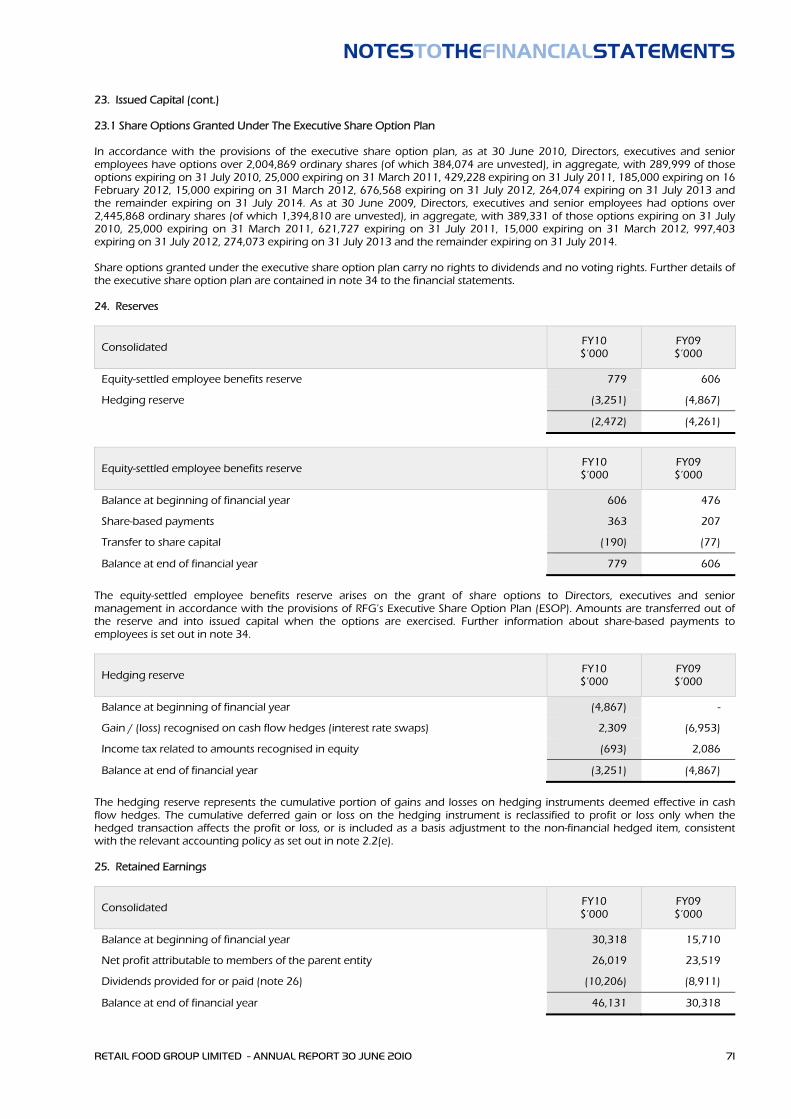
NOTESTOTHEFINANCIALSTATEMENTS
RETAIL FOOD GROUP LIMITED - ANNUAL REPORT 30 JUNE 2010 71
23. Issued Capital (cont.)
23.1 Share Options Granted Under The Executive Share Option Plan In accordance with the provisions of the executive share option plan, as at 30 June 2010, Directors, executives and senior employees have options over 2,004,869 ordinary shares (of which 384,074 are unvested), in aggregate, with 289,999 of those options expiring on 31 July 2010, 25,000 expiring on 31 March 2011, 429,228 expiring on 31 July 2011, 185,000 expiring on 16 February 2012, 15,000 expiring on 31 March 2012, 676,568 expiring on 31 July 2012, 264,074 expiring on 31 July 2013 and the remainder expiring on 31 July 2014. As at 30 June 2009, Directors, executives and senior employees had options over 2,445,868 ordinary shares (of which 1,394,810 are unvested), in aggregate, with 389,331 of those options expiring on 31 July 2010, 25,000 expiring on 31 March 2011, 621,727 expiring on 31 July 2011, 15,000 expiring on 31 March 2012, 997,403 expiring on 31 July 2012, 274,073 expiring on 31 July 2013 and the remainder expiring on 31 July 2014. Share options granted under the executive share option plan carry no rights to dividends and no voting rights. Further details of the executive share option plan are contained in note 34 to the financial statements. 24. Reserves
Consolidated FY10 $’000
FY09 $’000
Equity-settled employee benefits reserve 779 606
Hedging reserve (3,251) (4,867)
(2,472) (4,261)
Equity-settled employee benefits reserve FY10 $’000
FY09 $’000
Balance at beginning of financial year 606 476
Share-based payments 363 207
Transfer to share capital (190) (77)
Balance at end of financial year 779 606
The equity-settled employee benefits reserve arises on the grant of share options to Directors, executives and senior management in accordance with the provisions of RFG’s Executive Share Option Plan (ESOP). Amounts are transferred out of the reserve and into issued capital when the options are exercised. Further information about share-based payments to employees is set out in note 34.
Hedging reserve FY10 $’000
FY09 $’000
Balance at beginning of financial year (4,867) -
Gain / (loss) recognised on cash flow hedges (interest rate swaps) 2,309 (6,953)
Income tax related to amounts recognised in equity (693) 2,086
Balance at end of financial year (3,251) (4,867)
The hedging reserve represents the cumulative portion of gains and losses on hedging instruments deemed effective in cash flow hedges. The cumulative deferred gain or loss on the hedging instrument is reclassified to profit or loss only when the hedged transaction affects the profit or loss, or is included as a basis adjustment to the non-financial hedged item, consistent with the relevant accounting policy as set out in note 2.2(e). 25. Retained Earnings
Consolidated FY10 $’000
FY09 $’000
Balance at beginning of financial year 30,318 15,710
Net profit attributable to members of the parent entity 26,019 23,519
Dividends provided for or paid (note 26) (10,206) (8,911)
Balance at end of financial year 46,131 30,318

NOTESTOTHEFINANCIALSTATEMENTS
72 RETAIL FOOD GROUP LIMITED - ANNUAL REPORT 30 JUNE 2010
26. Dividends
Company FY10 FY09
Cents Per Share
Total $’000
Cents Per Share
Total $’000
Recognised amounts
Fully paid ordinary shares
Final dividend – fully franked at 30% tax rate (1) 4.750 4,765 4.500 4,431
Interim dividend – fully franked at 30% tax rate (2) 5.250 5,441 4.500 4,480
10.000 10,206 9.000 8,911
Unrecognised amounts
Fully paid ordinary shares
Final dividend – fully franked at 30% tax rate(3) 6.500 6,934 4.750 4,765
(1) In respect of the financial year ended 30 June 2009, as detailed in the Directors’ report for that financial year, a final dividend of 4.75 cents per share (based on 100,324,698 shares on issue), franked to 100% at 30% corporate income tax rate was paid on 9 October 2009. The final dividend was approved by the Directors following the conclusion of the 30 June 2009 financial year and therefore was not provided for in the Company’s financial report. It was resolved that the final dividend would constitute an eligible dividend for the purpose of the Company’s dividend reinvestment plan.
(2) In respect of profits of the financial year ended 30 June 2010, an interim dividend of 5.25 cents per share (based on 103,623,966 shares on issue), franked to 100% at 30% corporate income tax rate was paid on 8 April 2010. The interim dividend was approved by the Directors on 16 February 2010 and it was resolved that the interim dividend would constitute an eligible dividend for the purposes of the Company’s dividend reinvestment plan.
(3) In respect of profits of the financial year ended 30 June 2010, a final dividend of 6.50 cents per share (based on 106,680,807 shares on issue), franked to 100% at 30% corporate income tax rate will be paid on 7 October 2010. The final dividend was approved by the Directors on 17 August 2010 and therefore was not provided for in the Company’s financial report. It was resolved that the final dividend would constitute an eligible dividend for the purposes of the Company’s dividend reinvestment plan.
Company FY10 $’000
FY09 $’000
Adjusted franking account balance 25,647 18,063
27. Contingent Liabilities
Consolidated FY10 $’000
FY09 $’000
Contingent liabilities
Financial guarantees (1) 924 814
Rental guarantees (2) 812 891
1,736 1,705
(1) During FY08, RFGA Management Pty Ltd, a subsidiary of Retail Food Group Limited, guaranteed the repayment of borrowings in the amount of $814 thousand made by the Australia and New Zealand Banking Group (the ANZ Bank) to certain franchisees. The guarantees had been given as security in respect of loans made by the ANZ Bank to enable certain franchisees to commission their outlets. Each guarantee is expected to be extinguished without cost to the Group during FY11.
During FY10, Michel’s Patisserie Operations Pty Ltd, a subsidiary of Retail Food Group Limited, guaranteed the repayment of a trade balance in the amount of $110 thousand by a supplier relating to raw materials required by the Group. The guarantee had been given as security in respect of an amount owed. The guarantee is expected to be extinguished without cost to the Group during FY11.
(2) The Group, via various subsidiaries, is guarantor to a number of leases occupied and licensed to franchisees. No liabilities have been recognised as part of these rental guarantees.

NOTESTOTHEFINANCIALSTATEMENTS
RETAIL FOOD GROUP LIMITED - ANNUAL REPORT 30 JUNE 2010 73
27. Contingent Liabilities (cont.) 27.1 Other - Franchisee Disputation The Group is currently in dispute with certain franchisees over minor matters. No liability has been recognised in relation to these matters as the Directors are confident that these matters will be successfully resolved. The Group is presently involved in a number of disputes with various current and former Michel’s Patisserie franchisees over a variety of matters including but not limited to claims of misleading and deceptive conduct alleged to have occurred prior to Retail Food Group Limited’s acquisition of The Michel’s Group Australia Pty Ltd (TMGA). As at 30 June 2010, three (3) former franchisees have commenced separate litigation actions against subsidiaries of TMGA, among others, in connection with these disputes. Mediations have been concluded in connection with each of the aforementioned matters; with all being successfully resolved. A small number of other franchisees have served Notices of Dispute activating the mediation process under the Franchising Code of Conduct. As a consequence of the foregoing disputation, as part of acquisition accounting completed in respect of TMGA, a provision of $1.0 million was recognised at the acquisition date. At 30 June 2010, this amount stands at $115 thousand and is included in the current provision balance, as set out in note 21. Any litigious proceedings arising from the Notices of Dispute will be vigorously defended. 28. Leases 28.1 Leasing Arrangements Operating leases relate to property leases (company stores and office premises) with lease terms of mainly five years, motor vehicle leases with lease terms of three years and office equipment leases with lease terms between two and four years. The Group does not have an option to purchase the leased asset at the expiry of the lease period. 28.2 Payments Recognised As An Expense
Consolidated FY10 $’000
FY09 $’000
Minimum lease payments 3,924 4,944
3,924 4,944
28.3 Non-cancellable Operating Lease Commitments
Consolidated FY10 $’000
FY09 $’000
Not longer than 1 year 2,282 3,171
Longer than 1 year and not longer than 5 years 6,522 4,246
Longer than 5 years 580 1,170
9,384 8,587
28.4 Liabilities Recognised In Respect Of Non-cancellable Operating Leases
Consolidated FY10 $’000
FY09 $’000
Onerous leases and make-good (note 21) 400 450
400 450
29. Commitments For Expenditure
Consolidated FY10 $’000
FY09 $’000
Plant and equipment (not longer than 1 year) - 147
- 147

NOTESTOTHEFINANCIALSTATEMENTS
74 RETAIL FOOD GROUP LIMITED - ANNUAL REPORT 30 JUNE 2010
30. Subsidiaries
Name Of Entity Country Of Incorporation
Ownership Interest
FY10 (%) FY09 (%)
Parent entity
Retail Food Group Limited (1) Australia
Subsidiaries
Aroma Grande Pty Ltd (2) Australia 100 100
Barista Pty Ltd (2) Australia 100 100
BB System Lease Pty Ltd (2) Australia 100 100
BBH System Lease Pty Ltd(2) Australia 100 100
bb's Bagel Pty Ltd (2) Australia 100 100
bb's café System Pty Ltd (2) Australia 100 100
bb's Plantation Pty Ltd (2) Australia 100 100
BDP Franchise Pty Ltd (2) Australia 100 -
BDP Leasing Pty Ltd (2) Australia 100 -
BDP System Pty Ltd (2) Australia 100 -
Biloela Coffee Pty Ltd (2) Australia 100 100
Booming Pty Ltd (2) Australia 100 100
Breadsmith Pty Ltd (2) Australia 100 100
Bruffin Pty Ltd (2) Australia 100 100
Brumby's Bakeries Franchise Pty Ltd (formerly Regional Franchisor Pty Ltd) (2) Australia 100 100
Brumby's Bakeries Holdings Pty Ltd (2) Australia 100 100
Brumby's Bakeries Pty Ltd (2) Australia 100 100
Brumby's Bakeries System Pty Ltd (formerly RFG Investments Pty Ltd) (2) Australia 100 100
Caffe Coffee Pty Ltd (2) Australia 100 100
Cappuccino Frappe Pty Ltd (2) Australia 100 100
Chatslease Pty Ltd (2) Australia 100 100
Cheddarmite Pty Ltd (2) Australia 100 100
Choppa Loaf Pty Ltd (2) Australia 100 100
Coleville Enterprises Pty Ltd (2) Australia 100 100
DCM System Lease Pty Ltd (formerly DK System Lease Pty Ltd) (2) Australia 100 100
DCM System Pty Ltd (formerly DK Franchisor Pty Ltd) (2) Australia 100 100
DK Chadstone Pty Ltd (2) Australia 100 -
DK China Pty Ltd (2) Australia 100 100
Donquay Pty Ltd (2) Australia 100 100
Donut King Franchise Pty Ltd (2) Australia 100 100
Donut King Holdings Pty Ltd (2) Australia - 100
Donut King System Pty Ltd (2) Australia 100 100
Donut Mac Pty Ltd (2) Australia 100 100
Donut Management Pty Ltd (2) Australia 100 100
Donutcino Pty Ltd (2) Australia 100 100
Frapaccino Pty Ltd (2) Australia 100 100

NOTESTOTHEFINANCIALSTATEMENTS
RETAIL FOOD GROUP LIMITED - ANNUAL REPORT 30 JUNE 2010 75
30. Subsidiaries (cont.)
Name Of Entity Country Of Incorporation
Ownership Interest
FY10 (%) FY09 (%)
Frosty Cappuccino Pty Ltd (2) Australia 100 100
Fuznik Pty Ltd (2) Australia 100 100
Hot Dog Construction Zone (Aust) Pty Ltd (2) Australia 100 100
International Franchisor Pty Ltd (2) Australia 100 100
Jonamill Pty Ltd (2) Australia 100 100
Michel's Leasing Pty Ltd (2) Australia 100 100
Michel’s Leasing QLD Pty Ltd (2) Australia 100 100
Michel's Leasing Regional Pty Ltd (2) Australia 100 100
Michel's Leasing VIC Pty Ltd (2) Australia 100 -
Michel's Patisserie (SA) Pty Ltd (2) Australia 100 100
Michel's Patisserie (VQ) Pty Ltd (2) Australia 100 100
Michel's Patisserie (VQL) Pty Ltd (2) Australia 100 100
Michel's Patisserie (WA) Pty Ltd (2) Australia 100 100
Michel's Patisserie Management Pty Ltd (2) Australia 100 100
Michel's Patisserie Operations Pty Ltd (2) Australia 100 100
Michel's Patisserie System Pty Ltd (2) Australia 100 100
MP System Lease Pty Ltd (2) Australia 100 100
Mule Enterprises Pty Ltd (2) Australia 100 100
Regional Franchising Systems Pty Ltd (2) Australia 100 100
RFG Finance Pty Ltd (2) Australia 100 100
RFGA Equitech Pty Ltd (formerly RFGA CMF Pty Ptd) (2) Australia 100 100
RFGA Holdings (Aust) Pty Ltd (2) Australia 100 100
RFGA Holdings Pty Ltd (2) Australia 100 100
RFGA Management Pty Ltd (2) Australia 100 100
RFGA Master Lease Pty Ltd (2) Australia 100 100
Roasted Beans Pty Ltd (2) Australia 100 100
Rouse Hill Leasing Pty Ltd (2) Australia 100 100
Snowycold No 1 Pty Ltd (2) Australia 100 100
Snowycold Pty Ltd (2) Australia 100 100
Strawberry Cushion Pty Ltd (2) Australia 100 100
Systems Franchisor Pty Ltd (2) Australia 100 100
Tear'n'Share Pty Ltd (2) Australia 100 100
The Big Mule Trust (2) Australia 100 100
The Bread Centre Securities Trust (2) Australia 100 100
The Donquay Trust (2) Australia 100 100
The Michel's Group Australia Pty Ltd (2) Australia 100 100

NOTESTOTHEFINANCIALSTATEMENTS
76 RETAIL FOOD GROUP LIMITED - ANNUAL REPORT 30 JUNE 2010
30. Subsidiaries (cont.)
Name Of Entity Country Of Incorporation
Ownership Interest
FY10 (%) FY09 (%)
bb's Coffee and Bake (NZ) Leasing Limited New Zealand 100 100
bb's New Zealand Ltd New Zealand 100 100
Brumby's Bakeries (NZ) Ltd New Zealand 100 100
Brumby's Bakeries System (NZ) Limited New Zealand 100 -
Michel's Patisserie Systems (NZ) Limited New Zealand 100 100
MP (NZ) Leasing Limited New Zealand 100 100
RFG (NZ) Holdings Limited New Zealand 100 100
RFG (NZ) Limited New Zealand 100 100
(1) Retail Food Group Limited is the head entity within the tax consolidated group.
(2) These companies are members of the tax consolidated group.
31. Acquisitions 31.1 FY10 Acquisitions
Name Of Businesses / Intangible Assets
Acquired
Principal Activity Date Of Acquisition
Total Cost Of Acquisition
Cash Cost Of Acquisition
Scrip Cost Of Acquisition
$’000 $’000 $’000
Acquisition of businesses
Brumby’s Bakeries North Queensland & New Zealand
Sub-Franchisor of the Brumby’s Bakeries franchise system for the territories of North Queensland & New Zealand Master Territory
15 January 2010
4,000 2,680 1,320
Brumby’s Bakeries Western Australia & the Northern Territory
Sub-Franchisor of the Brumby’s Bakeries franchise system for the territories of Western Australia & the Northern Territory
16 February 2010
4,810 3,620 1,190
8,810 6,300 2,510
Acquisition of intangible assets
DCM Coffee & Donuts Franchise network comprising the DCM Coffee & Donuts franchise system
13 January 2010 2,400 2,100 300
Big Dad’s Pies Franchise network comprising the Big Dad’s Pies franchise system
1 April 2010 3,100 3,100 -
5,500 5,200 300
Total consideration: 14,310 11,500 2,810
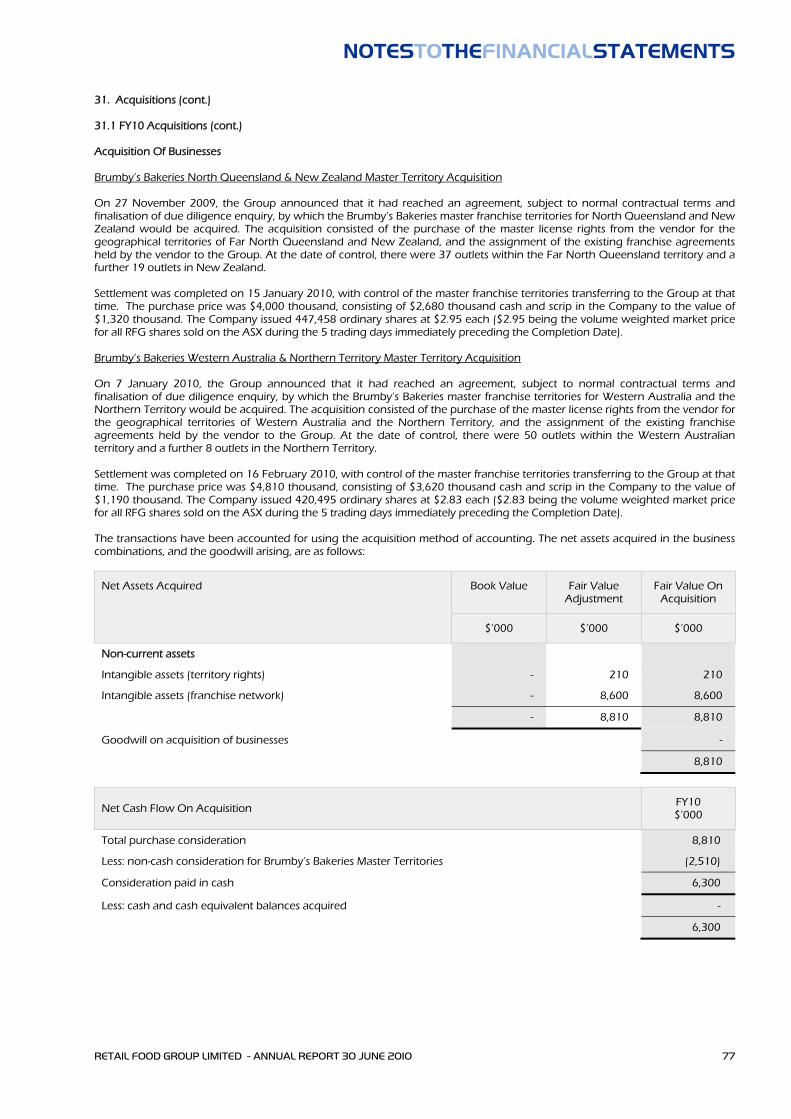
NOTESTOTHEFINANCIALSTATEMENTS
RETAIL FOOD GROUP LIMITED - ANNUAL REPORT 30 JUNE 2010 77
31. Acquisitions (cont.) 31.1 FY10 Acquisitions (cont.) Acquisition Of Businesses Brumby’s Bakeries North Queensland & New Zealand Master Territory Acquisition On 27 November 2009, the Group announced that it had reached an agreement, subject to normal contractual terms and finalisation of due diligence enquiry, by which the Brumby’s Bakeries master franchise territories for North Queensland and New Zealand would be acquired. The acquisition consisted of the purchase of the master license rights from the vendor for the geographical territories of Far North Queensland and New Zealand, and the assignment of the existing franchise agreements held by the vendor to the Group. At the date of control, there were 37 outlets within the Far North Queensland territory and a further 19 outlets in New Zealand. Settlement was completed on 15 January 2010, with control of the master franchise territories transferring to the Group at that time. The purchase price was $4,000 thousand, consisting of $2,680 thousand cash and scrip in the Company to the value of $1,320 thousand. The Company issued 447,458 ordinary shares at $2.95 each ($2.95 being the volume weighted market price for all RFG shares sold on the ASX during the 5 trading days immediately preceding the Completion Date). Brumby’s Bakeries Western Australia & Northern Territory Master Territory Acquisition On 7 January 2010, the Group announced that it had reached an agreement, subject to normal contractual terms and finalisation of due diligence enquiry, by which the Brumby’s Bakeries master franchise territories for Western Australia and the Northern Territory would be acquired. The acquisition consisted of the purchase of the master license rights from the vendor for the geographical territories of Western Australia and the Northern Territory, and the assignment of the existing franchise agreements held by the vendor to the Group. At the date of control, there were 50 outlets within the Western Australian territory and a further 8 outlets in the Northern Territory. Settlement was completed on 16 February 2010, with control of the master franchise territories transferring to the Group at that time. The purchase price was $4,810 thousand, consisting of $3,620 thousand cash and scrip in the Company to the value of $1,190 thousand. The Company issued 420,495 ordinary shares at $2.83 each ($2.83 being the volume weighted market price for all RFG shares sold on the ASX during the 5 trading days immediately preceding the Completion Date). The transactions have been accounted for using the acquisition method of accounting. The net assets acquired in the business combinations, and the goodwill arising, are as follows:
Net Assets Acquired Book Value Fair Value Adjustment
Fair Value On Acquisition
$’000 $’000 $’000
Non-current assets
Intangible assets (territory rights) - 210 210
Intangible assets (franchise network) - 8,600 8,600
- 8,810 8,810
Goodwill on acquisition of businesses -
8,810
Net Cash Flow On Acquisition FY10 $’000
Total purchase consideration 8,810
Less: non-cash consideration for Brumby’s Bakeries Master Territories (2,510)
Consideration paid in cash 6,300
Less: cash and cash equivalent balances acquired -
6,300

NOTESTOTHEFINANCIALSTATEMENTS
78 RETAIL FOOD GROUP LIMITED - ANNUAL REPORT 30 JUNE 2010
31. Acquisitions (cont.) 31.1 FY10 Acquisitions (cont.) Acquisition Of Intangible Assets DCM Coffee & Donuts Franchise System On 27 November 2009, the Group announced that it had reached an agreement, subject to normal contractual terms and finalisation of due diligence enquiry, by which the DCM Coffee & Donuts franchise system would be acquired. The DCM Coffee & Donuts franchise system represents a direct competitor to the Donut King franchise system and comprises 23 coffee/donut outlets in NSW. The DCM Coffee & Donuts franchise system was acquired for re-branding and integration into the Donut King franchise system, thereby accelerating total Donut King outlet population growth whilst affording DCM Coffee & Donuts franchisees the opportunity to partake in the benefits that accrue from membership in a nationally established and iconic retail franchise brand. Settlement was completed on 13 January 2010, with control of the franchise system transferring to the Group at that time. The purchase price was $2,400 thousand, consisting of $2,100 thousand cash and scrip in the Company to the value of $300 thousand. The Company issued 106,383 ordinary shares at $2.82 each ($2.82 being the volume weighted market price for all RFG shares sold on the ASX during the 5 trading days immediately preceding the Completion Date). Big Dad’s Pies Franchise System On 23 December 2009, the Group announced it had reached an agreement, subject to normal contractual terms and finalization of due diligence enquiry, by which the South East Queensland based 37 outlet Big Dad’s Pies franchise system would be acquired. Settlement was completed on 1 April 2010, following the completion of due diligence, with control of the franchise system transferring to the Group at that time, for a cash consideration of $3,100 thousand. 31.2 FY09 Acquisitions
Name Of Business Acquired Principal Activity Date Of Acquisition
Proportion Of Shares Acquired
Cost Of Acquisition
(%) $’000
Caffe Coffee Pty Ltd
[formerly 50% owned joint venture entity]
Operator of the Coffee Roasting Facility (CRF)
(bulk coffee roasting facility)
1 June 2009 100% 300
During FY07, RFG established a bulk coffee roasting facility (CRF) with Koffee-Tek Pty Ltd, an Australian domiciled coffee blender and roaster. On 1 June 2009, the Group exercised its right under the CRF Joint Venture Agreement to acquire Koffee-Tek’s 50% interest in Caffe Coffee Pty Ltd (Caffe Coffee), being the joint venture entity responsible for the operation of the CRF. The transaction has been accounted for using the acquisition method of accounting. The net assets acquired in the business combination, and the goodwill arising, are as follows:
Net Assets Acquired Book Value Fair Value Adjustment
Fair Value On Acquisition
$’000 $’000 $’000
Current assets
Cash and other cash equivalents 1 - 1
Trade and other receivables 210 - 210
Inventories 118 - 118
Other 18 - 18
Current liabilities
Trade and other payables (355) - (355)
(8) - (8)
Goodwill on acquisition of business 308
300

NOTESTOTHEFINANCIALSTATEMENTS
RETAIL FOOD GROUP LIMITED - ANNUAL REPORT 30 JUNE 2010 79
31. Acquisitions (cont.) 31.2 FY09 Acquisitions (cont.)
Net Cash Flow On Acquisition FY09 $’000
Total purchase consideration 300
Less: non-cash consideration for Caffe Coffee -
Consideration paid in cash 300
Less: cash and cash equivalent balances acquired (1)
299
Goodwill arose in the business combination because the cost of the combination included a control premium paid to acquire Caffe Coffee. In addition, the consideration paid for the combination effectively included amounts in relation to the benefit from expected synergies, revenue growth and future market development and the assembled workforce of Caffe Coffee. These benefits are not recognised separately from goodwill as the future economic benefits arising from them cannot be reliably measured. Included in the FY09 net profit for the period since acquisition is $20 thousand attributable to the additional business generated by Caffe Coffee. 32. Cash And Cash Equivalents 32.1 Reconciliation Of Cash And Cash Equivalents For the purposes of the statement of cash flows, cash and cash equivalents includes cash on hand and in banks and investments in money market instruments, net of outstanding bank overdrafts. Cash and cash equivalents at the end of the reporting period as shown in the statement of cash flows can be reconciled to the related items in the statement of financial positions as follows:
Consolidated FY10 $’000
FY09 $’000
Cash and bank balances 13,105 5,414
13,105 5,414
32.2 Financing Facilities
Consolidated FY10 $’000
FY09 $’000
Secured bank overdraft facility, reviewed annually and payable at call:
amount used - -
amount unused 100 100
100 100
Secured bank loan facility:
amount used (before deducting debt issue costs) 86,000 96,000
amount unused 9,000 24,000
95,000 120,000
Secured ancillary bank facilities (guarantees):
amount used 812 891
amount unused 188 109
1,000 1,000
The Group has access to financing facilities at reporting date as indicated above. The Group expects to meet its other obligations from operating cash flows and proceeds of maturing financial assets.

NOTESTOTHEFINANCIALSTATEMENTS
80 RETAIL FOOD GROUP LIMITED - ANNUAL REPORT 30 JUNE 2010
32. Cash And Cash Equivalents (cont.) 32.3 Reconciliation Of Profit For The Period To Net Cash Flows From Operating Activities
Consolidated FY10 $’000
FY09 $’000
Profit for the year 26,019 23,519
Loss / (gain) on disposal of property, plant and equipment 94 (67)
Gain on disposal of business (Central Manufacturing Facility) - (1,100)
Depreciation of non-current assets 1,108 1,335
Equity-settled share-based payment 363 207
Interest income received and receivable (155) (452)
Amortisation of borrowing costs 396 605
Hedge ineffectiveness on cash flow hedges 529 953
Increase / (decrease) in current tax liability 2,138 89
Increase / (decrease) in deferred tax balances 424 457
Movements in working capital:
Trade and other receivables 1,881 (4)
Inventories (411) (443)
Other assets (1,801) 1,388
Trade and other payables (207) (1,130)
Provisions (625) (1,703)
Other liabilities (512) (480)
Net cash generated by operating activities 29,241 23,174
33. Financial Instruments 33.1 Capital Risk Management The Group manages its capital to ensure that entities in the Group will be able to continue as a going concern while maximising the return to stakeholders through the optimisation of the debt and equity balance. The Group’s and the Company’s overall strategy remains unchanged from FY09. The capital structure of the Group consists of net debt (borrowings disclosed in note 20, offset by cash and cash equivalents) and equity of the Group (comprising issued capital, reserves and retained earnings, as disclosed in notes 23, 24 and 25). The Group is not subject to any externally imposed capital requirements. Operating cash flows are used to maintain and expand the Group’s assets, as well as to make the routine outflows of tax, dividends and repayment of debt. The Group’s policy is to borrow centrally; using a variety of capital market issues and borrowing facilities, to meet anticipated funding requirements. 33.2 Gearing Ratio The Group’s management and Board review the capital structure on an annual basis. As a part of this review, management and the Board considers the cost of capital and the risks associated with each class of capital. The Group has a target gearing ratio of 40 - 60% as the proportion of net debt to equity. Based on recommendations of management and the Board, the Group will balance its overall capital structure through the payment of dividends, and new share issues as well as the issue of new debt or the redemption of existing debt.
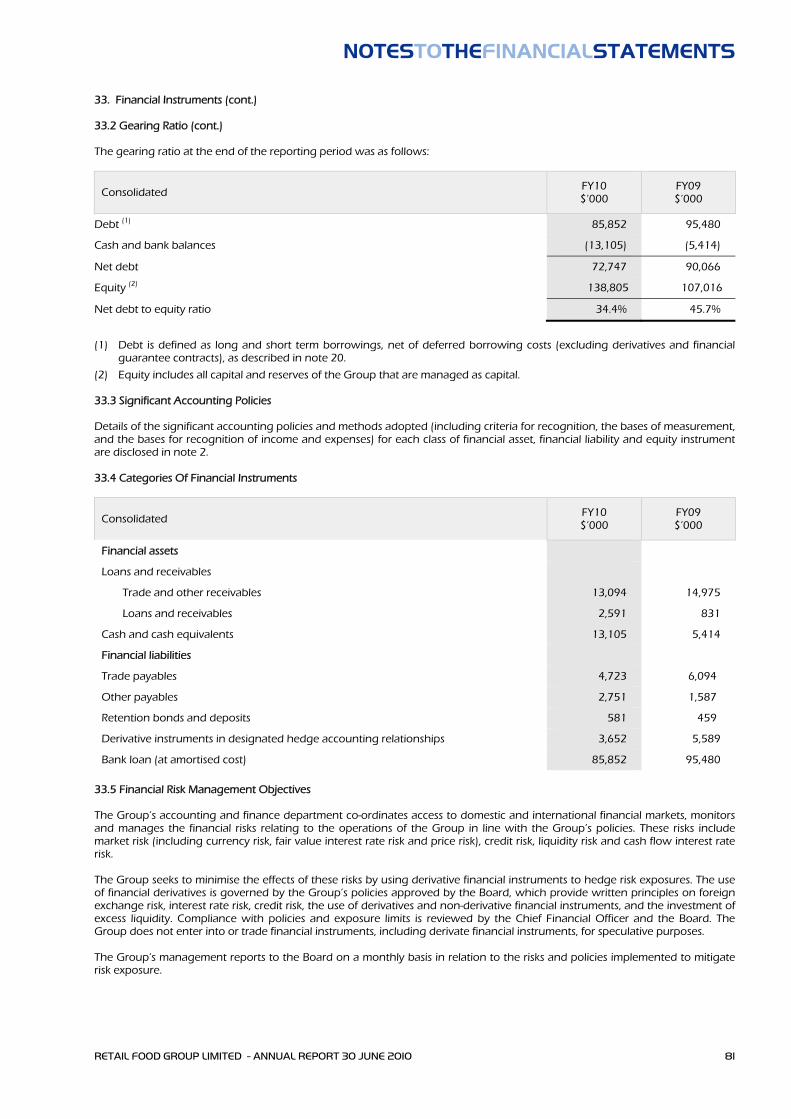
NOTESTOTHEFINANCIALSTATEMENTS
RETAIL FOOD GROUP LIMITED - ANNUAL REPORT 30 JUNE 2010 81
33. Financial Instruments (cont.) 33.2 Gearing Ratio (cont.) The gearing ratio at the end of the reporting period was as follows:
Consolidated FY10 $’000
FY09 $’000
Debt (1) 85,852 95,480
Cash and bank balances (13,105) (5,414)
Net debt 72,747 90,066
Equity (2) 138,805 107,016
Net debt to equity ratio 34.4% 45.7%
(1) Debt is defined as long and short term borrowings, net of deferred borrowing costs (excluding derivatives and financial guarantee contracts), as described in note 20.
(2) Equity includes all capital and reserves of the Group that are managed as capital. 33.3 Significant Accounting Policies Details of the significant accounting policies and methods adopted (including criteria for recognition, the bases of measurement, and the bases for recognition of income and expenses) for each class of financial asset, financial liability and equity instrument are disclosed in note 2. 33.4 Categories Of Financial Instruments
Consolidated FY10 $’000
FY09 $’000
Financial assets
Loans and receivables
Trade and other receivables 13,094 14,975
Loans and receivables 2,591 831
Cash and cash equivalents 13,105 5,414
Financial liabilities
Trade payables 4,723 6,094
Other payables 2,751 1,587
Retention bonds and deposits 581 459
Derivative instruments in designated hedge accounting relationships 3,652 5,589
Bank loan (at amortised cost) 85,852 95,480
33.5 Financial Risk Management Objectives The Group’s accounting and finance department co-ordinates access to domestic and international financial markets, monitors and manages the financial risks relating to the operations of the Group in line with the Group’s policies. These risks include market risk (including currency risk, fair value interest rate risk and price risk), credit risk, liquidity risk and cash flow interest rate risk. The Group seeks to minimise the effects of these risks by using derivative financial instruments to hedge risk exposures. The use of financial derivatives is governed by the Group’s policies approved by the Board, which provide written principles on foreign exchange risk, interest rate risk, credit risk, the use of derivatives and non-derivative financial instruments, and the investment of excess liquidity. Compliance with policies and exposure limits is reviewed by the Chief Financial Officer and the Board. The Group does not enter into or trade financial instruments, including derivate financial instruments, for speculative purposes. The Group’s management reports to the Board on a monthly basis in relation to the risks and policies implemented to mitigate risk exposure.

NOTESTOTHEFINANCIALSTATEMENTS
82 RETAIL FOOD GROUP LIMITED - ANNUAL REPORT 30 JUNE 2010
33. Financial Instruments (cont.) 33.6 Market Risk The Group’s activities expose it primarily to the financial risk of changes in interest rates (refer note 33.7). The Group enters into a variety of derivative financial instruments to manage its exposure to interest rate risk, including interest rate swaps to mitigate the risk of rising interest rates. The Group has minor financial risk to changes in foreign exchange rates in respect of the operations in New Zealand and China, however, these risks are considered to be insignificant given the small size of the operations in those countries. At a Group level, market risk exposures are measured using sensitivity analysis. 33.7 Interest Rate Risk Management The Group is exposed to interest rate risk as it borrows funds at variable (floating) interest rates. The Group holds interest rate swap contracts to manage interest rate exposure. Hedging activities are evaluated regularly to align with interest rate views and defined risk appetite; ensuring optimal hedging strategies are applied, by either positioning the balance sheet or protecting interest rate expense through different interest rate cycles. Interest Rate Sensitivity Analysis The sensitivity analysis below have been determined based on the exposure to interest rates for both derivative and non-derivative instruments at the end of the reporting period. For floating rate liabilities, the analysis is prepared assuming the amount of the liability outstanding at the end of the reporting period was outstanding for the whole year. A 100 basis point increase or decrease is used when reporting interest rate risk internally to key management personnel and represents management’s assessment of the possible change in interest rates. If interest rates had been 100 basis points higher/lower and all other variables were held constant, the Group’s:
net profit would decrease by $9 thousand (FY09: $104 thousand) and increase by $9 thousand (FY09: $130 thousand). This is mainly attributable to the Group’s exposure to interest rates on its variable rate borrowings.
hedge reserve would decrease (favourable) by $910 thousand (FY09: $1,730 thousand) and increase (unfavourable) by $897 thousand (FY09: $1,528 thousand).
The Group’s sensitivity to interest rates has decreased during the current period mainly due to the reduction in total debt, combined with a reduction in the ‘unhedged’ portion of total debt, that is, an overall increase in the interest rate swaps to swap floating rate debt to fixed, primarily caused by the reduction in total debt, and the maintenance of the total hedged amount. Interest Rate Swap Contracts Under interest rate swap contracts, the Group agrees to exchange the difference between fixed and floating rate interest amounts calculated on agreed notional principal amounts. Such contracts enable the Group to mitigate the risk of changing interest rates on the Group’s cash flows. The average interest rate is based on the outstanding balances at the end of the reporting period. The following table details the notional principal amounts and remaining terms of interest rate swap contracts outstanding as at the end of the reporting period:
Outstanding floating for fixed contracts
Average Contracted Fixed Interest Rate
Notional Principal Amount
Fair Value Asset / (Liability)
FY10 %
FY09 %
FY10 $’000
FY09 $’000
FY10 $’000
FY09 $’000
Less than 1 year 6.13 - 22,800 - (190) -
1 to 2 years 7.27 6.13 19,887 34,800 (774) (1,149)
2 to 3 years 7.47 7.27 42,513 22,647 (2,689) (1,388)
3 to 4 years - 7.47 - 34,153 - (3,073)
85,200 91,600 (3,653) (5,610)
All interest rate swap contracts exchanging floating rate interest amounts for fixed rate interest amounts are designated as cash flow hedges in order to reduce the Group’s cash flow exposure resulting from variable interest rates on borrowings. The interest rate swaps and the interest payments on the loan occur simultaneously and the amount deferred in equity is recognised in profit or loss over the period that the floating interest payments on debt impact profit or loss. The interest rate swaps settle on a quarterly basis. The Group will settle the difference between the fixed and floating interest rate on a net basis.

NOTESTOTHEFINANCIALSTATEMENTS
RETAIL FOOD GROUP LIMITED - ANNUAL REPORT 30 JUNE 2010 83
33. Financial Instruments (cont.) 33.7 Interest Rate Risk Management (cont.) Interest Rate Cap Contract Under an interest rate cap contract, the Group receives payment (based on a notional amount) at the end of each quarter in which the interest rate exceeds the agreed strike price. Such a contract enables the Group to mitigate the risk of rising interest rates on a portion of the floating interest debt held and participate in any fall in interest rates below the agreed strike price applicable to that debt. The average interest rate is based on the outstanding balances at the end of the reporting period.
Interest rate cap at 7.27%
Average Contracted Fixed Interest Rate
Notional Principal Amount
Fair Value Asset / (Liability)
FY10 %
FY09 %
FY10 $’000
FY09 $’000
FY10 $’000
FY09 $’000
1 to 2 years 7.27 - 7,800 - 1 -
2 to 3 years - 7.27 - 8,400 - 21
7,800 8,400 1 21
33.8 Credit Risk Management Credit risk refers to the risk that a counterparty will default on its contractual obligations resulting in financial loss to the Group. The Group has adopted a policy of only dealing with creditworthy counterparties and obtaining sufficient collateral, where appropriate, as a measure of mitigating the risk of financial loss from defaults. Credit exposure is reviewed continually. Trade receivables consist of a large number of unrelated customers. Ongoing credit evaluation is performed on the financial conditions of accounts receivable and, where appropriate, additional collateral is obtained for balances identified as “at risk”. Often this collateral is in the form of franchised outlets. The credit risk on liquid funds and derivative financial instruments is limited because the counterparties are banks with high credit ratings, assigned by international credit rating agencies. Except as detailed in the following table, the carrying amount of financial assets recognised in the financial statements, which is net of any allowances for losses, represents the Group’s maximum exposure to credit risk without taking account of the value of any collateral obtained:
Financial assets and other credit exposures FY10 $’000
FY09 $’000
Contingent liabilities
Financial guarantees 924 814
Rental guarantees 812 891
1,736 1,705
33.9 Liquidity Risk Management Ultimate responsibility for liquidity risk management rests with the Board, which has established an appropriate liquidity risk management framework for the management of the Group’s short, medium and long-term funding and liquidity management requirements. The Group manages liquidity risk by maintaining adequate cash reserves, banking facilities and undrawn borrowing facilities, by continuously monitoring forecast and actual cash flows, and matching the maturity profiles of financial assets and liabilities. Note 32.2 sets out details of additional undrawn facilities that the Group has at its disposal to further reduce liquidity risk. Liquidity And Interest Rate Risk Tables The following table details the Group’s remaining contractual maturity for its non-derivative financial liabilities with agreed repayment periods. The information has been presented based on the undiscounted cash flows of financial liabilities based on the earliest date on which the Group can be required to pay. The table includes both interest and principal cash flows. To the extent that interest cash flows are at floating rate, the undiscounted amount is derived from interest rate curves at the end of the reporting period. The contractual maturity is based on the earliest date on which the Group may be required to pay.

NOTESTOTHEFINANCIALSTATEMENTS
84 RETAIL FOOD GROUP LIMITED - ANNUAL REPORT 30 JUNE 2010
33. Financial Instruments (cont.) 33.9 Liquidity Risk Management (cont.)
Consolidated Weighted Average Effective
Interest Rate
Less Than 1 Year
1 – 5 Years
More Than 5 Years
% $’000 $’000 $’000
FY10
Trade payables - 4,723 - -
Other payables - 2,751 - -
Retention bonds and deposits - 581 - -
Bank loan 7.1 88,544 - -
Financial guarantee contracts - 924 - -
97,523 - -
FY09
Trade payables - 6,094 - -
Other payables - 1,587 - -
Retention bonds and deposits - 459 - -
Bank loan 6.8 7,589 99,522 -
Financial guarantee contracts - 814 - -
16,543 99,522 -
The maximum amount the Group could be forced to settle under the financial guarantee contracts if the fully guaranteed amount is claimed by the counterparty to the guarantee is $924 thousand (FY09: $814 thousand). At the end of the reporting period, it was not considered probable that the counterparty to the financial guarantee contract will claim under the contract. The following table details the Group’s expected maturity for its non-derivative financial assets. The information has been presented based on the undiscounted contractual maturities of the financial assets including interest that will be earned on those assets. The inclusion of information on non-derivative financial assets is necessary in order to understand the Group’s liquidity risk management as the liquidity is managed on a net asset and liability basis.
Consolidated Weighted Average Effective
Interest Rate
Less Than 1 Year
1 – 5 Years
More Than 5 Years
% $’000 $’000 $’000
FY10
Cash and cash equivalents - 13,105 - -
Loans and receivables - 15,685 - -
28,790 - -
FY09
Cash and cash equivalents - 5,414 - -
Loans and receivables - 15,806 - -
21,220 - -
The Group has access to financing facilities as described in note 32.2, of which $9,288 thousand were unused at the end of the reporting period (FY09: $24,209 thousand). The Group expects to meet its other obligations from operating cash flows and proceeds of maturing financial assets. Refer to note 38 for details regarding Debt Facility Refinance.

NOTESTOTHEFINANCIALSTATEMENTS
RETAIL FOOD GROUP LIMITED - ANNUAL REPORT 30 JUNE 2010 85
33. Financial Instruments (cont.) 33.10 Fair Value Of Financial Instruments The fair values of derivative instruments are determined as follows:
the fair value of interest rate swaps is the estimated amount that the Group and the Company would receive or pay to terminate the interest rate swap at the end of the reporting period, taking into account the current interest rate.
The Directors consider that the carrying amount of financial assets and financial liabilities recorded in the financial statements approximate to their fair values. As of 1 July 2009, the Group has adopted the amendment to AASB 7 ‘Financial Instruments: Disclosures’ which requires disclosure of fair value measurements by level of the following fair value measurement hierarchy:
quoted prices (unadjusted) in active markets for identical assets or liabilities (level 1);
inputs other than quoted prices included within level 1 that are observable for the asset or liability, either directly (as prices) or indirectly (derived from prices) (level 2), and,
inputs for the asset or liability that are not based on observable market data (unobservable inputs) (level 3).
As at 30 June 2010, the Group has outstanding interest rate swaps which are classified as level 2 financial instruments. There are no level 1 or level 3 financial instruments. Refer notes 22 or 33.7 for the fair value of the interest rate swaps. 33.11 Foreign Currency Risk Management The Group’s Australian operations are predominantly in Australian dollars and there is limited foreign currency exchange risk associated with the Australian business. The Group’s New Zealand operations are predominantly in New Zealand dollars. Due to the insignificant contribution of the New Zealand operations to the Group, the risk of exposure of movements in foreign currencies is considered insignificant. 34. Share-based Payments 34.1 Executive Share Option Plan The Group has an ownership-based compensation scheme for Directors, executives and senior employees. In accordance with the provisions of RFG’s Executive Share Option Plan (ESOP), Directors, executives and senior employees may be granted options to purchase parcels of ordinary shares on terms resolved upon by the Board. Certain employees and Directors have also been granted options pursuant to the terms of formal Option Deeds which are outside the scope of, but substantially in accordance with, the terms of the ESOP. Each share option granted converts into one ordinary share of Retail Food Group Limited on exercise. No amounts are paid or payable by the recipient on grant of the option. The options carry neither rights to dividends nor voting rights. Options may be exercised at any time from the date of vesting to the date of their expiry. The following share-based payment arrangements were in existence during the current and prior reporting periods:
Option Series Number Grant Date Expiry Date Vesting Date Exercise Price
Grant Date Fair Value
Tier 1A 786,663 01/08/06 31/07/10 01/08/07 $1.00 $0.1480
Tier 1B 639,999 01/08/06 31/07/11 01/08/08 $1.00 $0.1704
Tier 1C 640,002 01/08/06 31/07/12 01/08/09 $1.00 $0.1849
Tier 2A 304,062 01/08/07 31/07/11 01/08/08 $1.15 $0.5813
Tier 2B 150,730 01/08/07 31/07/12 01/08/09 $1.15 $0.5918
Tier 2C 150,740 01/08/07 31/07/13 01/08/10 $1.15 $0.5927
Tier 3A 283,339 01/08/08 31/07/12 01/08/09 $1.32 $0.2768
Tier 3B 123,333 01/08/08 31/07/13 01/08/10 $1.32 $0.3068
Tier 3C 123,334 01/08/08 31/07/14 01/08/11 $1.32 $0.3250
Tier 4A 25,000 01/04/08 31/03/11 01/04/08 $1.67 $0.1782
Tier 5A 15,000 01/04/08 31/03/12 01/04/09 $1.92 $0.1909
Tier 6A 212,000 17/02/10 16/02/12 17/02/10 $1.50 $1.3822

NOTESTOTHEFINANCIALSTATEMENTS
86 RETAIL FOOD GROUP LIMITED - ANNUAL REPORT 30 JUNE 2010
34. Share-based Payments (cont.) 34.2 Fair Value Of Share Options Granted In The Year The weighted average fair value of the share options granted during the financial year is $1.3822 (FY09: $0.2950). Options were priced using the Black-Scholes model. Where relevant, the expected life used in the model has been adjusted based on management’s best estimate for the effects of non-transferability, exercise restrictions and behavioral considerations. Expected volatility is based on the historical share price volatility for a period consistent with the option life. To allow for the effects of early exercise, it was assumed that executives and senior employees would exercise the options at the mid-point of the expiry period (i.e. mid-point between the grant date and the expiry date).
Inputs Tier 1A Tier 1B Tier 1C Tier 2A Tier 2B Tier 2C Tier 3A Tier 3B Tier 3C Tier 4A Tier 5A Tier 6A
Grant date share price $0.84 $0.84 $0.84 $1.65 $1.65 $1.65 $1.275 $1.275 $1.275 $1.39 $1.39 $2.90
Exercise price $1.00 $1.00 $1.00 $1.15 $1.15 $1.15 $1.32 $1.32 $1.32 $1.67 $1.92 $1.50
Expected volatility 45.0% 45.0% 45.0% 45.0% 45.0% 45.0% 44.0% 44.0% 44.0% 42.0% 42.0% 42.0%
Option life 2.5 yrs 3.5 yrs 4.5 yrs 2.5 yrs 3.5 yrs 4.5 yrs 2.5 yrs 3.5 yrs 4.5 yrs 1.5 yrs 2.5 yrs 1.0 yrs
Dividend yield 6.50% 6.50% 6.50% 6.50% 6.50% 6.50% 6.50% 6.50% 6.50% 5.50% 5.50% 3.62%
Risk-free interest rate 5.17% 5.17% 5.17% 6.39% 6.39% 6.39% 6.03% 6.03% 6.03% 6.09% 6.09% 4.47%
34.3 Movements In Share Options During The Financial Year The following reconciles the outstanding share options granted under the ESOP at the beginning and the end of the financial year:
FY10 FY09
Number Of Options
Weighted Average
Exercise Price
Number Of Options
Weighted Average
Exercise Price
Balance at beginning of the financial year 2,445,868 $1.11 2,342,197 $1.05
Granted during the financial year 212,000 $1.50 530,006 $1.32
Forfeited during the financial year (13,333) $1.25 (80,000) $1.17
Exercised during the financial year (639,666) $1.08 (346,335) $1.02
Expired during the financial year - - - -
Balance at end of the financial year 2,004,869 $1.16 2,445,868 $1.11
Exercisable at end of the financial year 1,620,795 $1.14 1,051,058 $1.06

NOTESTOTHEFINANCIALSTATEMENTS
RETAIL FOOD GROUP LIMITED - ANNUAL REPORT 30 JUNE 2010 87
34. Share-based Payments (cont.) 34.4 Share Options Exercised During The Financial Year The following share options were exercised during the financial year:
FY10 – Option Series Number Exercised
Exercise Date Share Price At Exercise Date
Tier 1A – Issued 1 August 2006 13,333 20/08/2009 $2.18
33,333 14/10/2009 $2.62
13,333 29/10/2009 $2.60
39,333 16/02/2010 $2.89
Tier 1B – Issued 1 August 2006 33,333 5/11/2009 $2.41
33,333 15/01/2010 $3.00
60,000 7/05/2010 $2.65
Tier 1C – Issued 1 August 2006 25,000 25/09/2009 $2.56
70,000 29/09/2009 $2.59
20,000 5/11/2009 $2.41
33,334 16/02/2010 $2.89
13,334 30/03/2010 $2.63
60,000 11/05/2010 $2.61
Tier 2A – Issued 1 August 2007 13,333 21/07/2009 $1.85
15,000 29/10/2009 $2.60
17,500 17/11/2009 $2.65
6,667 30/03/2010 $2.63
13,333 7/05/2010 $2.65
Tier 2B – Issued 1 August 2007 10,000 25/09/2009 $2.56
13,333 29/09/2009 $2.59
6,667 30/03/2010 $2.63
Tier 3A – Issued 1 August 2008 10,000 29/09/2009 $2.59
10,000 1/10/2009 $2.64
13,334 13/10/2009 $2.58
15,000 29/10/2009 $2.60
17,500 20/11/2009 $2.70
3,333 30/03/2010 $2.63
Tier 6A – Issued 17 February 2010 12,000 16/03/2010 $2.78
15,000 8/04/2010 $2.55
639,666
FY09 – Option Series Number Exercised
Exercise Date Share Price At Exercise Date
Tier 1A – Issued 1 August 2006 100,667 2/04/2009 $1.43
Tier 1B – Issued 1 August 2006 70,000 8/08/2008 $1.28
25,000 26/09/2008 $1.36
100,667 2/04/2009 $1.43
Tier 2A – Issued 1 August 2007 10,000 26/09/2008 $1.36
40,001 2/04/2009 $1.43
346,335

NOTESTOTHEFINANCIALSTATEMENTS
88 RETAIL FOOD GROUP LIMITED - ANNUAL REPORT 30 JUNE 2010
34. Share-based Payments (cont.) 34.5 Share Options Outstanding At The End Of The Financial Year The following share options were outstanding at the end of the financial year:
FY10 FY09
Number Outstanding
Remaining Life
(in days)
Number Outstanding
Remaining Life
(in days)
Tier 1A 289,999 31 389,331 396
Tier 1B 269,333 396 395,999 761
Tier 1C 370,000 762 591,668 1,127
Tier 2A 159,895 396 225,728 761
Tier 2B 120,730 762 150,730 1,127
Tier 2C 144,074 1,127 150,740 1,492
Tier 3A 185,838 762 255,005 1,127
Tier 3B 120,000 1,127 123,333 1,492
Tier 3C 120,000 1,492 123,334 1,857
Tier 4A 25,000 274 25,000 639
Tier 5A 15,000 640 15,000 1,005
Tier 6A 185,000 596 n/a n/a
2,004,869 2,445,868
35. Key Management Personnel Compensation The aggregate compensation made to key management personnel of the Group is set out below:
Consolidated FY10 $
FY09 $
Short-term employee benefits 2,393,637 2,251,538
Post-employment benefits 106,455 132,863
Share-based payment 225,922 136,864
2,726,014 2,521,265
Detailed remuneration disclosures are provided in the “Remuneration Report”, contained in the Directors’ Report. 36. Related Party Transactions Balances and transactions between the Company and its subsidiaries, which are related parties of the Company, have been eliminated on consolidation and are not disclosed in this note. Details of transactions between the Group and other related parties are disclosed below. 36.1 Equity Interests In Related Parties Equity Interests In Subsidiaries Details of the percentage of ordinary shares held in subsidiaries are disclosed in note 30 to the financial statements. Equity Interests In Associates And Joint Ventures There are no equity interests in associates or joint ventures. Equity Interests In Other Related Parties There are no equity interests in other related parties.

NOTESTOTHEFINANCIALSTATEMENTS
RETAIL FOOD GROUP LIMITED - ANNUAL REPORT 30 JUNE 2010 89
36. Related Party Transactions (cont.) 36.2 Transactions With Key Management Personnel Key Management Personnel Compensation Details of key management personnel compensation are disclosed in note 35 to the financial statements. Loans To Key Management Personnel There were no loans outstanding at the end of the financial year (FY09: $nil) to key management personnel or their related parties. Key Management Personnel Equity Holdings Fully paid ordinary shares of Retail Food Group Limited:
FY10 Balance 1 July 2009
Granted As Compensation
Received On Exercise Of
Options
Net Other Change
Balance 30 June
2010
Balance Held
Nominally
Number Number Number Number Number Number
Mr John Cowley 57,330 - - 2,256 59,586 -
Mr Anthony (Tony) Alford 24,145,476 - 93,333 (14,733) 24,224,076 758,454
Mr Nigel Nixon 5,649,083 - - 542 5,649,625 2,698,201
Mr Colin Archer 221,397 - - 2,221 223,618 -
Mr Bruce Hancox - - - - - -
Mr Anthony Mark Connors 9,900 - 39,333 (47,333) 1,900 -
Mr Gary Best 1,445,092 - 133,333 (345,546) 1,232,879 -
Mr Damien Peters - - - - - -
Ms Tracey Catterall - - - - - -
Mr Gary Alford 1,524,534 - - (96,601) 1,427,933 -
Mr Gavin Nixon 5,635,329 - - 542 5,635,871 2,812,666
38,688,141 - 265,999 (498,652) 38,455,488 6,269,321
FY09 Balance 1 July 2008
Granted As Compensation
Received On Exercise Of
Options
Net Other Change
Balance 30 June
2009
Balance Held
Nominally
Number Number Number Number Number Number
Mr John Cowley 53,633 - - 3,697 57,330 -
Mr Anthony (Tony) Alford 23,362,795 - 83,333 699,348 24,145,476 957,396
Mr Nigel Nixon 5,355,600 - 120,668 172,815 5,649,083 2,698,201
Mr Colin Archer 217,760 - - 3,637 221,397 -
Mr Bruce Hancox - - - - - -
Mr Anthony Mark Connors 9,900 - - - 9,900 -
Mr Gary Best 1,437,800 - - 7,292 1,445,092 -
Mr Damien Peters - - - - - -
Ms Nicole Dodd 2,039 - - 141 2,180 -
Mr Gary Alford 1,486,512 - - 38,022 1,524,534 -
Mr Gavin Nixon 5,355,600 - 107,334 172,395 5,635,329 2,812,666
Mr Andre Nell - - - - - -
37,281,639 - 311,335 1,097,347 38,690,321 6,468,263

NOTESTOTHEFINANCIALSTATEMENTS
90 RETAIL FOOD GROUP LIMITED - ANNUAL REPORT 30 JUNE 2010
36. Related Party Transactions (cont.) 36.2 Transactions With Key Management Personnel (cont.) Key Management Personnel Equity Holdings (cont.) Executive share options of Retail Food Group Limited:
FY10 B
alan
ce
1 Ju
ly 2
009
Gra
nte
d A
s C
om
pen
satio
n
Exer
cise
d
Net
Oth
er
Ch
ang
e
Bal
ance
30 J
un
e 2
010
Bal
ance
Ves
ted
30 J
un
e 2
010
Ves
ted
Bu
t No
t Ex
erci
sab
le
Ves
ted
An
d
Exer
cisa
ble
Op
tion
s V
este
d
Du
rin
g T
he
Year
Number Number Number Number Number Number Number Number Number
Mr John Cowley 176,100 - - - 176,100 159,066 - 159,066 58,699
Mr Anthony (Tony) Alford 126,667 - (93,333) - 33,334 - - - 93,333
Mr Nigel Nixon 110,332 - - - 110,332 76,999 - 76,999 76,999
Mr Colin Archer 136,100 - - - 136,100 119,066 - 119,066 45,367
Mr Bruce Hancox - - - - - - - - -
Mr Anthony Mark Connors 188,000 20,000 (39,333) - 168,667 135,333 - 135,333 82,667
Mr Gary Best 190,000 50,000 (133,333) - 106,667 73,333 - 73,333 133,333
Mr Damien Peters 75,004 25,000 - - 100,004 80,004 - 80,004 40,004
Ms Tracey Catterall - 5,000 - - 5,000 5,000 - 5,000 5,000
Mr Gary Alford 260,000 15,000 - - 275,000 241,666 - 241,666 101,667
Mr Gavin Nixon 103,666 15,000 - - 118,666 85,333 - 85,333 85,333
1,365,869 130,000 (265,999) - 1,229,870 975,800 - 975,800 722,402
FY09
Bal
ance
1 Ju
ly 2
008
Gra
nte
d A
s C
om
pen
satio
n
Exer
cise
d
Net
Oth
er
Ch
ang
e
Bal
ance
30 J
un
e 2
009
Bal
ance
Ves
ted
30 J
un
e 2
009
Ves
ted
Bu
t No
t Ex
erci
sab
le
Ves
ted
An
d
Exer
cisa
ble
Op
tion
s V
este
d
Du
rin
g T
he
Year
Number Number Number Number Number Number Number Number Number
Mr John Cowley 161,100 15,000 - - 176,100 100,367 - 100,367 53,700
Mr Anthony (Tony) Alford 180,000 30,000 (83,333) - 126,667 - - - 83,333
Mr Nigel Nixon 201,000 30,000 (120,668) - 110,332 - - - 60,334
Mr Colin Archer 121,100 15,000 - - 136,100 73,699 - 73,699 40,366
Mr Bruce Hancox - - - - - - - - -
Mr Anthony Mark Connors 158,000 30,000 - - 188,000 91,999 - 91,999 52,666
Mr Gary Best 160,000 30,000 - - 190,000 73,333 - 73,333 73,333
Mr Damien Peters 40,000 35,004 - - 75,004 40,000 - 40,000 15,000
Ms Nicole Dodd 40,000 30,000 - - 70,000 46,666 - 46,666 46,666
Mr Gary Alford 230,000 30,000 - - 260,000 139,999 - 139,999 76,666
Mr Gavin Nixon 181,000 30,000 (107,334) - 103,666 - - - 60,334
Mr Andre Nell - - - - - - - - -
1,472,200 275,004 (311,335) - 1,435,869 566,063 - 566,063 562,398
During the financial year, 265,999 options (FY09: 311,335) were exercised by key management personnel at an exercise price of $1.00 per option for 229,333 ordinary shares (FY09: 271,334), $1.15 per option for 26,666 (FY09: 40,001), and $1.32 per option for 10,000 (FY09: nil) ordinary shares in Retail Food Group Limited. No amounts remain unpaid on the options exercised during the financial year at year end. Details of the Executive Share Option Plan and of share options granted during FY10 and FY09 are contained in note 34.
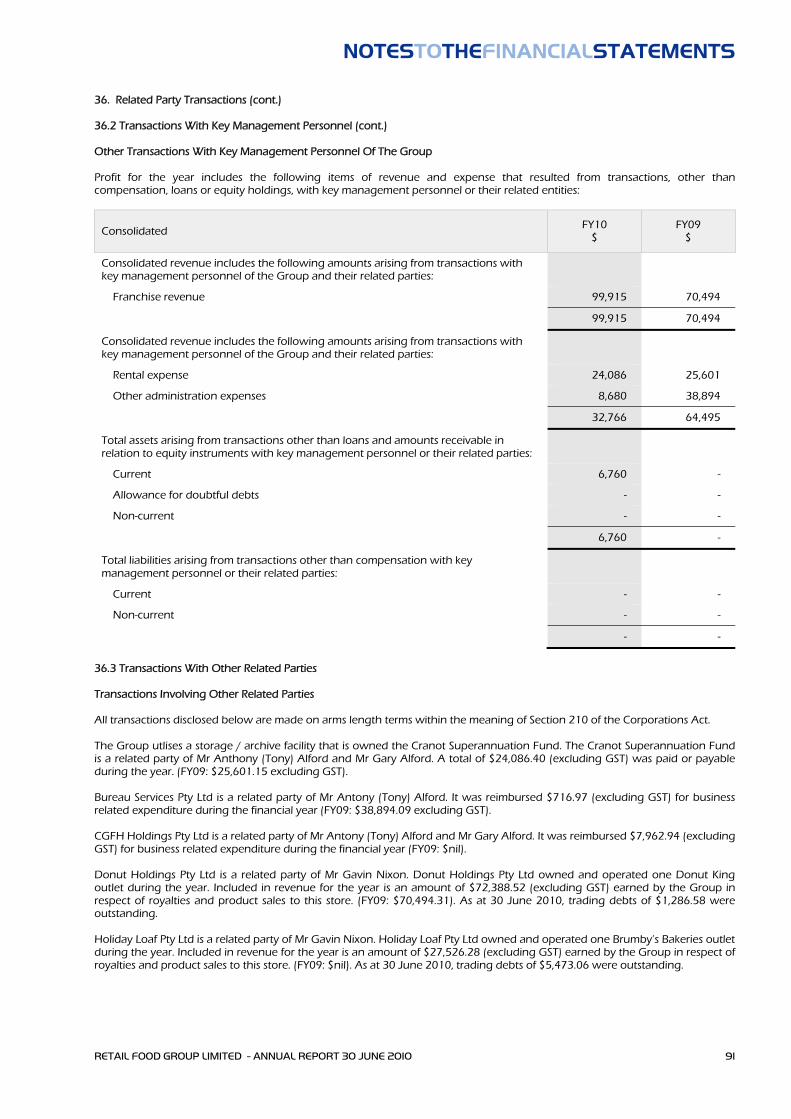
NOTESTOTHEFINANCIALSTATEMENTS
RETAIL FOOD GROUP LIMITED - ANNUAL REPORT 30 JUNE 2010 91
36. Related Party Transactions (cont.) 36.2 Transactions With Key Management Personnel (cont.) Other Transactions With Key Management Personnel Of The Group Profit for the year includes the following items of revenue and expense that resulted from transactions, other than compensation, loans or equity holdings, with key management personnel or their related entities:
Consolidated FY10 $
FY09 $
Consolidated revenue includes the following amounts arising from transactions with key management personnel of the Group and their related parties:
Franchise revenue 99,915 70,494
99,915 70,494
Consolidated revenue includes the following amounts arising from transactions with key management personnel of the Group and their related parties:
Rental expense 24,086 25,601
Other administration expenses 8,680 38,894
32,766 64,495
Total assets arising from transactions other than loans and amounts receivable in relation to equity instruments with key management personnel or their related parties:
Current 6,760 -
Allowance for doubtful debts - -
Non-current - -
6,760 -
Total liabilities arising from transactions other than compensation with key management personnel or their related parties:
Current - -
Non-current - -
- -
36.3 Transactions With Other Related Parties Transactions Involving Other Related Parties All transactions disclosed below are made on arms length terms within the meaning of Section 210 of the Corporations Act. The Group utlises a storage / archive facility that is owned the Cranot Superannuation Fund. The Cranot Superannuation Fund is a related party of Mr Anthony (Tony) Alford and Mr Gary Alford. A total of $24,086.40 (excluding GST) was paid or payable during the year. (FY09: $25,601.15 excluding GST). Bureau Services Pty Ltd is a related party of Mr Antony (Tony) Alford. It was reimbursed $716.97 (excluding GST) for business related expenditure during the financial year (FY09: $38,894.09 excluding GST). CGFH Holdings Pty Ltd is a related party of Mr Antony (Tony) Alford and Mr Gary Alford. It was reimbursed $7,962.94 (excluding GST) for business related expenditure during the financial year (FY09: $nil). Donut Holdings Pty Ltd is a related party of Mr Gavin Nixon. Donut Holdings Pty Ltd owned and operated one Donut King outlet during the year. Included in revenue for the year is an amount of $72,388.52 (excluding GST) earned by the Group in respect of royalties and product sales to this store. (FY09: $70,494.31). As at 30 June 2010, trading debts of $1,286.58 were outstanding. Holiday Loaf Pty Ltd is a related party of Mr Gavin Nixon. Holiday Loaf Pty Ltd owned and operated one Brumby’s Bakeries outlet during the year. Included in revenue for the year is an amount of $27,526.28 (excluding GST) earned by the Group in respect of royalties and product sales to this store. (FY09: $nil). As at 30 June 2010, trading debts of $5,473.06 were outstanding.

NOTESTOTHEFINANCIALSTATEMENTS
92 RETAIL FOOD GROUP LIMITED - ANNUAL REPORT 30 JUNE 2010
37. Remuneration Of Auditors
Consolidated FY10 $
FY09 $
Auditor of the parent entity
Audit of the financial report 193,500 203,000
Review of the half-year financial report 40,000 45,000
233,500 248,000
The auditor of Retail Food Group Limited is Deloitte Touche Tohmatsu. 38. Events After The Reporting Period Final Dividend On 17 August 2010, the Board of Directors declared a final dividend for the financial year ended 30 June 2010, as set out in the “Dividends” section of this financial report. Debt Facility Management On 7 July 2010, as part of the Group’s Debt Facility management strategy, the Group terminated the following financial instruments:
interest rate swap with a notional principal value of $22.8 million (as at 30 June 2010) and a termination date of 30 March 2011; and,
interest rate cap with a notional principal value of $7.8 million (as at 30 June 2010) and a termination date of 30 June 2012.
In consideration of the termination of the interest rate swap, the Group paid the CBA the sum of $0.2 million. No fee was payable in respect of the interest rate cap termination. The terminations enabled the Group to make a further voluntary debt reduction of $9.0 million, also on 7 July 2010, thereby reducing the drawn amount of the Group’s Debt Facility to $77.0 million. The facility remains hedged to $62.4 million and is subject to an overall average weighted interest rate of 6.9%. Debt Facility Refinance During FY10, the Group continued to evaluate a number of refinancing submissions received in respect of its Debt Facility. On 17 August 2010, the Company announced the appointment of the National Australia Bank (NAB) as its future debt facility provider and transaction banker. That appointment has now been affirmed with refinance and transfer of the Company’s banking facility completed on 31 August 2010. Key facets of the new facility include:
an $85.0 million Senior Debt Facility;
a three year term;
a structure that allows for voluntary debt retirement;
covenants consistent with those under the former facility and limited to interest cover, leverage and gearing; and,
a step down margin to 150 basis points over BBSY.
The transaction banking facilities encompasses:
reduced transaction fees;
new corporate streamlined transactional banking platform;
superior merchant pricing for the Group’s franchisees; and,
superior funding arrangements for new and existing franchisees.
Acquisition Of Property For National Office On 1 September 2010, the Group announced that it had entered into a contract to for the acquisition of a property situated at Olympic Court, Southport, which will, after refurbishment, be a dedicated special purpose facility to house the Company’s National Office. Settlement of the transaction is anticipated on or before 17 September 2010. The acquisition, refurbishment and fitout costs of the building are anticipated to be in the order of $4.5 million and will be funded from cash reserves and current banking facilities. It is anticipated that RFG will relocate to the Olympic Court premises in the later part of 2H11.

NOTESTOTHEFINANCIALSTATEMENTS
RETAIL FOOD GROUP LIMITED - ANNUAL REPORT 30 JUNE 2010 93
39. Parent Entity Disclosures The parent entity in the Group is Retail Food Group Limited. 39.1 Financial Position
Parent Entity FY10 $’000
FY09 $’000
Assets
Current assets 25,099 25,001
Non-current assets 172,618 160,604
Total assets 197,717 185,605
Liabilities
Current liabilities 91,166 2,825
Non-current liabilities 3,462 101,069
Total liabilities 94,628 103,894
Equity
Issued capital 95,146 80,959
Retained earnings 10,415 5,013
Reserves
Equity-settled employee benefits 779 606
Hedging reserve (3,251) (4,867)
Total equity 103,089 81,711
39.2 Financial Performance
Parent Entity FY10 $’000
FY09 $’000
Profit for the year 15,608 13,005
Other comprehensive income 1,616 (4,867)
Total comprehensive income 17,224 8,138
39.3 Other Commitments The parent entity has no contingent liabilities or expenditure commitments as at 30 June 2010 (FY09: nil).

ADDITIONALSTOCKEXCHANGEINFORMATION AS AT 31 AUGUST 2010
94 RETAIL FOOD GROUP LIMITED - ANNUAL REPORT 30 JUNE 2010
Number Of Holders Of Equity Securities Ordinary Share Capital 106,516,807 fully paid ordinary shares are held by 2,074 individual shareholders.
All issued ordinary shares carry one vote per share. Options
572,666 options granted on 1 August 2006 are held by 8 individual option holders
384,699 options granted on 1 August 2007 are held by 15 individual option holders
390,834 options granted on 1 August 2008 are held by 18 individual option holders
160,000 options granted on 17 February 2010 are held by 10 individual option holders
Options do not carry a right to vote. Distribution Of Holders Of Equity Securities
Total Holders Fully Paid Ordinary
Shares
Fully Paid Ordinary
Shares
% Issued Capital
Total Holders Options
Options
1 – 1,000 544 272,657 0.26 - -
1,001 – 5,000 840 2,392,142 2.25 1 5,000
5,001 – 10,000 334 2,565,116 2.41 3 30,000
10,001 – 100,000 295 7,575,691 7.11 10 314,434
100,001 and over 61 93,711,201 87.97 8 1,158,765
2,074 106,516,807 100.00 22 1,508,199
Holding less than a marketable parcel 147 13,965
Substantial Shareholders
Ordinary Shareholders Fully Paid Partly Paid
Number Percentage Number Percentage
Mr Anthony (Tony) Alford (1) 23,510,743 22.1% - -
Thorney Holdings Pty Ltd / Thorney Pty Ltd 9,747,172 9.2% - -
K2 Asset Management Pty Ltd 9,397,367 8.8% - -
Acorn Capital Limited 9,332,259 8.8% - -
Gotham City Limited 7,000,000 6.6% - -
Brecot Pty Ltd 5,510,867 5.2% - -
(1) Shareholding includes interests or control in the shareholdings and interests held by CGFH C2 Pty Ltd, Alfords Holdings
(Qld) Pty Ltd and others as disclosed in latest Appendix 3Y.

ADDITIONALSTOCKEXCHANGEINFORMATION AS AT 31 AUGUST 2010
RETAIL FOOD GROUP LIMITED - ANNUAL REPORT 30 JUNE 2010 95
Twenty Largest Holders Of Quoted Equity Instruments
Ordinary Shareholders Fully Paid Partly Paid
Number Percentage Number Percentage
1. HSBC Custody Nominees (Australia) Limited 12,582,917 11.8% - -
2. National Nominees Limited 10,355,532 9.7% - -
3. ANZ Nominees Limited 9,139,416 8.6% - -
4. CGFH C2 Pty Ltd 9,001,959 8.5% - -
5. Alfords Holdings (Qld) Pty Ltd 8,009,777 7.5% - -
6. Gotham City Limited 7,000,000 6.6% - -
7. Cogent Nominees Limited 6,006,770 5.6% - -
8. JP Morgan Nominees Australia Limited 5,725,609 5.4% - -
9. Brecot Pty Ltd 5,510,867 5.2% - -
10. Anttra Pty Ltd 3,730,698 3.5% - -
11. UBS Nominees Pty Ltd 2,295,454 2.2% - -
12. Citicorp Nominees Pty Ltd 1,932,652 1.8% - -
13. WSS Holdings (Aust) Pty Ltd 1,176,539 1.1% - -
14. AMA Holdings (Qld) Pty Ltd 1,151,372 1.1% - -
15. Risby Investments Pty Ltd 982,008 0.9% - -
16. FTT Holdings Pty Ltd 893,961 0.8% - -
17. C G F H Holdings Pty Ltd 794,116 0.7% - -
18. Saga Investments Pty Ltd 783,846 0.7% - -
19. BHM Enterprises Pty Ltd 750,770 0.7% - -
20. Bexlie Holdings (Qld) Pty Ltd 691,563 0.6% - -
Total 88,515,826 83.1% - -
Company Secretary Registered Office Principal Administration Office
Share Registry
Mr Anthony Mark Connors
RFG House
26 Railway Street
Southport QLD 4215
Alfords
Level 1 HQ Robina
58 Riverwalk Avenue
Robina QLD 4226
RFG House
26 Railway Street
Southport QLD 4215
Computershare Investor Services
Level 19, 307 Queen Street
Brisbane QLD 4000

RETAIL FOOD GROUP LIMITED - ANNUAL REPORT 30 JUNE 2010

Retail Food GRoup deSiGnS, developS and ManaGeS Retail FRanChiSe SySteMS and iS the intelleCtual pRopeRty owneR and liCenSoR oF the donut KinG, bb’S CaFé, bRuMby’S baKeRieS, MiChel’S patiSSeRie and biG dad’S pieS FRanChiSe SySteMS.
FoR the 5th ConSeCutive yeaR SinCe liStinG (in june 2006), Retail Food GRoup Continued to deliveR enhanCed peRFoRManCe and ReCoRd outCoMeS FoR all StaKeholdeRS.
npat and epS 5 yeaR CuMulative annual GRowth RateS (CaGR) oF 50.2% and 38.9% ReSpeCtively, ReinFoRCeS Retail Food GRoup aS an enteRpRiSe with FRanChiSe SySteMS, buSineSS Model and Revenue StReaMS Capable oF SiGniFiCant GRowth.
0
5
10
15
20
25
30
35
FY06 FY07 FY08 FY09 FY10 FY09 FY10
Net Debt ReductionNet Operating Cashflows
0
5
10
15
20
25
30
FY06 FY07 FY08 FY09 FY10 FY07 FY08 FY09 FY10
DPSEPS (Basic)
0
200
400
600
800
1000
1200
FY06 FY07 FY08 FY09 FY10
Outlets
0
100
200
300
400
500
600
700
FY06 FY07 FY08 FY09 FY10
Network Sales
0
20
40
60
80
100
120
140
FY06 FY07 FY08 FY09 FY10 FY09 FY10
Adj.RevenueRevenue
0
5
10
15
20
25
30
FY06 FY07 FY08 FY09 FY10 FY09 FY10
Core NPATNPAT
RETAIL FOOD GROUP LIMITED - ANNUAL REPORT 30 JUNE 2010 RETAIL FOOD GROUP LIMITED - ANNUAL REPORT 30 JUNE 2010
($m)
($m) ($m)
($m) ($m)
($m)
($m)
(cents) (cents)

CreatingStrongMomentumRetailFoodGRoupannual RepoRt FinanCial yeaR ended 30 june 2010
Re
tailF
oo
dG
Ro
up
an
nu
alR
ep
oR
t2
010
Retail Food Group Limited ACN 106 840 082
Retail Food Group LimitedRFG House26 Railway StreetSouthport QLD 4215Phone: (07) 5591 3242Fax: (07) 5591 9021Website: www.rfg.com.au