Creating Shareholder Value Through Market Dominance Call/100300_20020918.pdf · Creating...
26
Creating Shareholder Value Through Creating Shareholder Value Through Market Dominance Market Dominance Presentation by Presentation by Mr. Mr. Sumant Sumant Sinha Sinha President President – – Corporate Finance, The Aditya Birla Group Corporate Finance, The Aditya Birla Group Kotak Kotak Securities’ Investor Conference, New Delhi Securities’ Investor Conference, New Delhi September 2002 September 2002
Transcript of Creating Shareholder Value Through Market Dominance Call/100300_20020918.pdf · Creating...

Creating Shareholder Value Through Creating Shareholder Value Through Market DominanceMarket Dominance
Presentation byPresentation byMr. Mr. SumantSumant SinhaSinha
President President –– Corporate Finance, The Aditya Birla GroupCorporate Finance, The Aditya Birla Group
KotakKotak Securities’ Investor Conference, New DelhiSecurities’ Investor Conference, New DelhiSeptember 2002September 2002
2
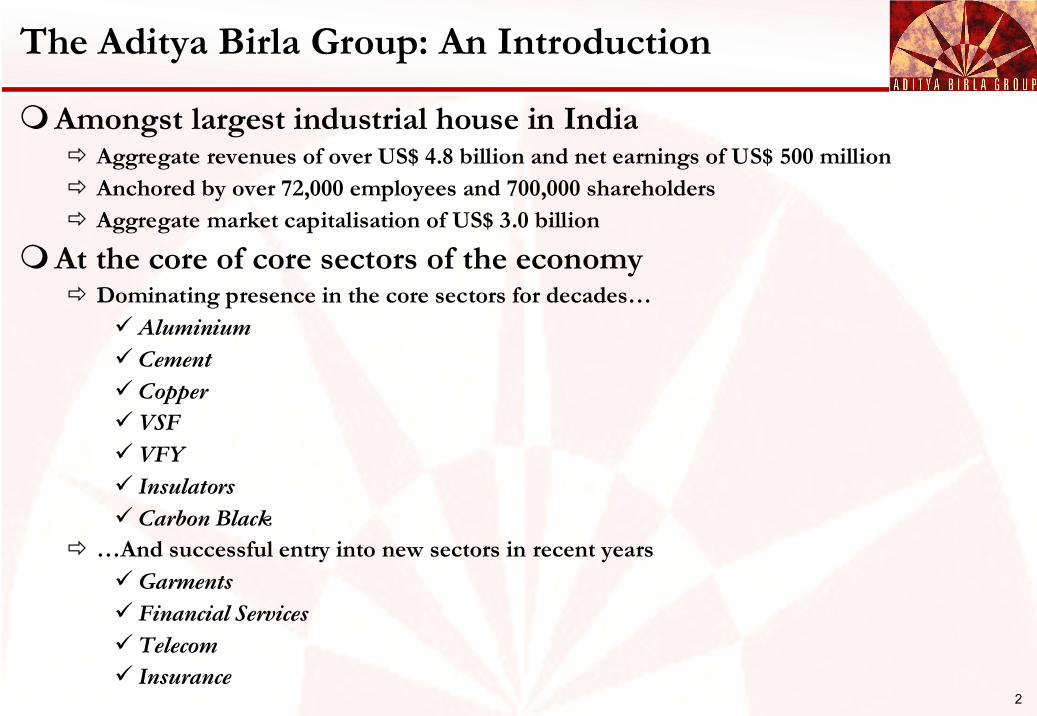
The Aditya Birla Group: An Introduction
Amongst largest industrial house in IndiaAggregate revenues of over US$ 4.8 billion and net earnings of US$ 500 millionAnchored by over 72,000 employees and 700,000 shareholdersAggregate market capitalisation of US$ 3.0 billion
At the core of core sectors of the economyDominating presence in the core sectors for decades…
AluminiumCementCopperVSFVFYInsulatorsCarbon Black
…And successful entry into new sectors in recent yearsGarmentsFinancial ServicesTelecomInsurance
3
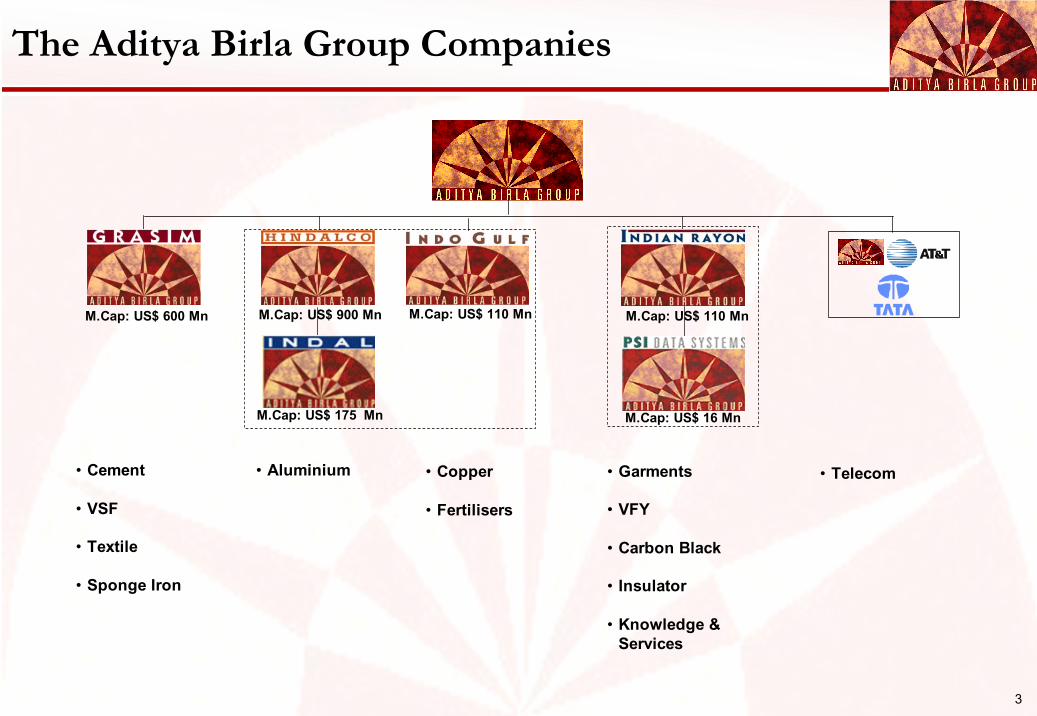
• Telecom• Cement
• VSF
• Textile
• Sponge Iron
• Aluminium • Garments
• VFY
• Carbon Black
• Insulator
• Knowledge & Services
• Copper
• Fertilisers
The Aditya Birla Group Companies
M.Cap: US$ 900 MnM.Cap: US$ 600 Mn
M.Cap: US$ 175 Mn
M.Cap: US$ 110 MnM.Cap: US$ 110 Mn
M.Cap: US$ 16 Mn
4
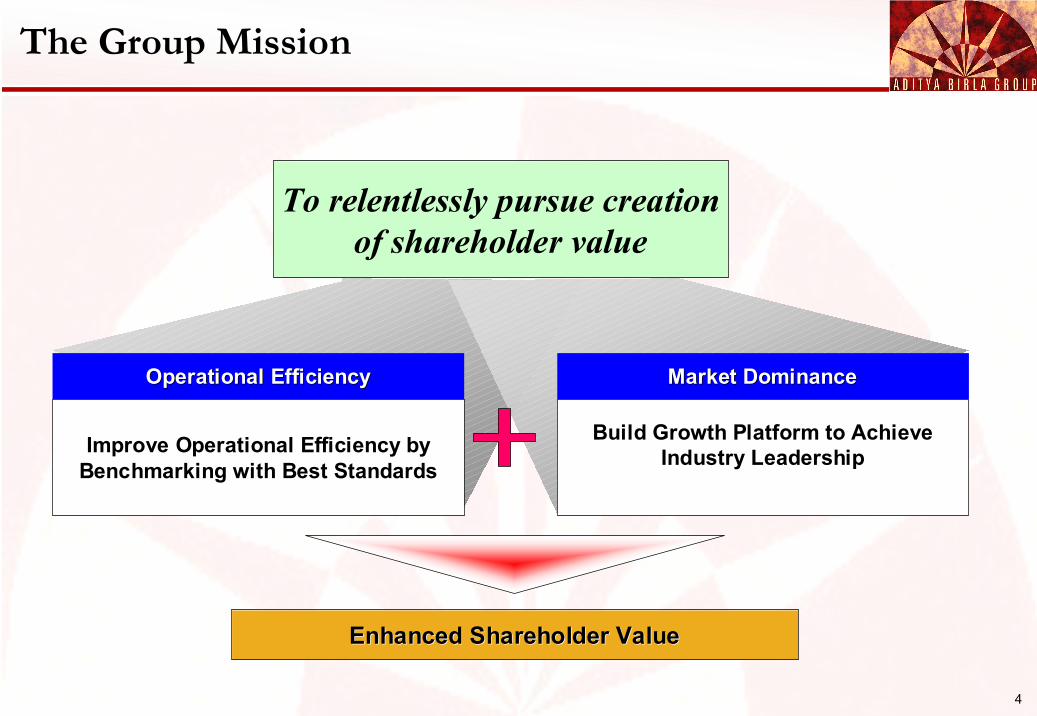
Enhanced Shareholder ValueEnhanced Shareholder Value
To relentlessly pursue creation of shareholder value
The Group Mission
Improve Operational Efficiency by Benchmarking with Best Standards
Operational EfficiencyOperational Efficiency
Build Growth Platform to Achieve Industry Leadership
Market DominanceMarket Dominance
5
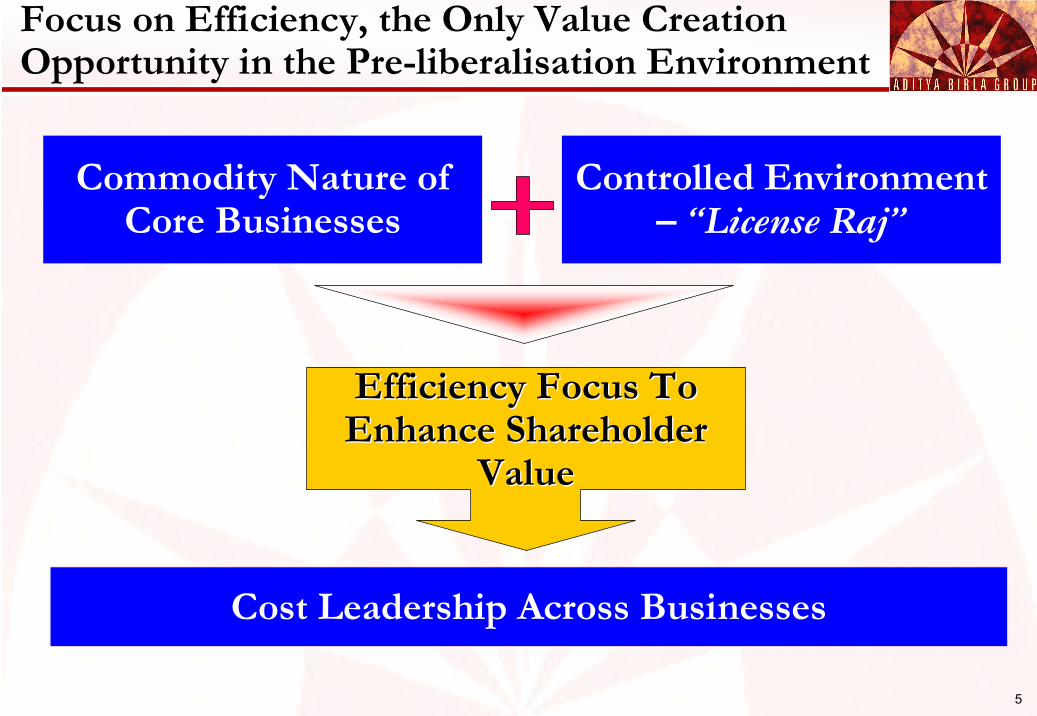
Focus on Efficiency, the Only Value Creation Opportunity in the Pre-liberalisation Environment
Controlled Environment – “License Raj”
Commodity Nature of Core Businesses
Efficiency Focus To Efficiency Focus To Enhance Shareholder Enhance Shareholder
ValueValue
Cost Leadership Across Businesses
6
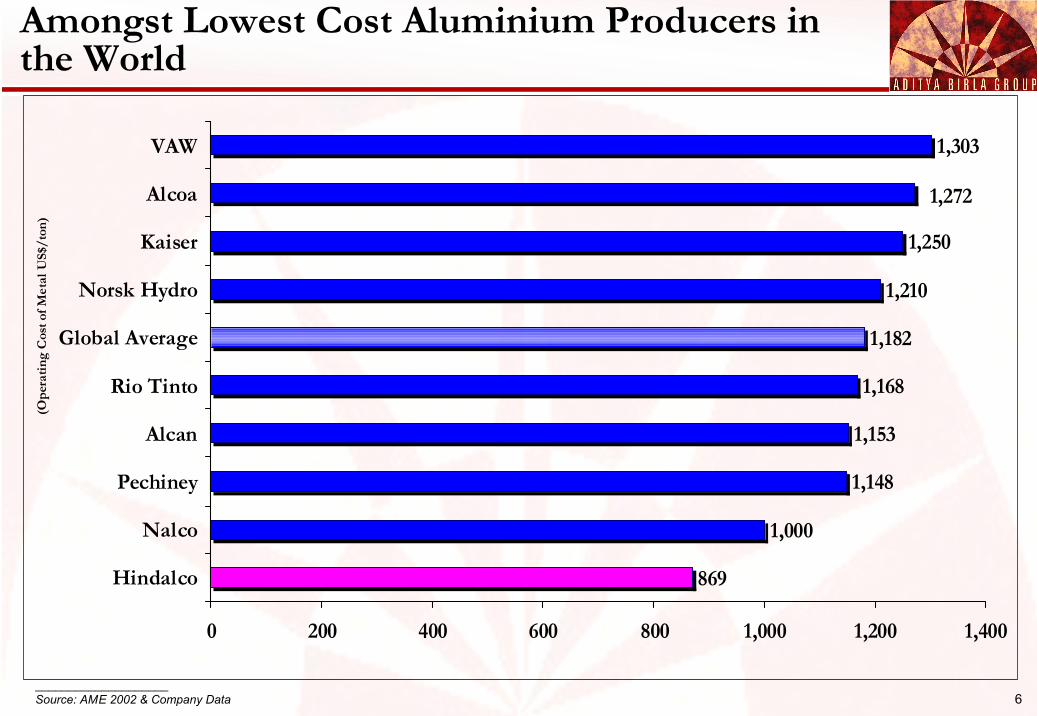
869
1,000
1,148
1,153
1,168
1,182
1,210
1,250
1,303
1,272
0 200 400 600 800 1,000 1,200 1,400
Hindalco
Nalco
Pechiney
Alcan
Rio Tinto
Global Average
Norsk Hydro
Kaiser
Alcoa
VAW
(Ope
ratin
g C
ost o
f Met
al U
S$/t
on)
Amongst Lowest Cost Aluminium Producers in the World
____________________Source: AME 2002 & Company Data

7
96
96.5
97
97.5
98
98.5
99
Birla C
oppe
rOns
anSa
ganose
kiPa
sarToy
oNor
ddeu
tsch
Harjav
alta
Huelva
Hurley
SAN
(%)
0500
100015002000250030003500400045005000
Huelva
Birla C
oppe
rHarj
avalt
aSa
ganos
eki
Toyo
Pasar
Onsan
Hurley
SAN
Nordd
eutsc
h
(MJ/T)
____________________Source: BROOK HUNT
____________________Source: BROOK HUNT
Globally Benchmarked Efficiencies in Copper
Metal RecoveryMetal Recovery Energy ConsumptionEnergy Consumption
8
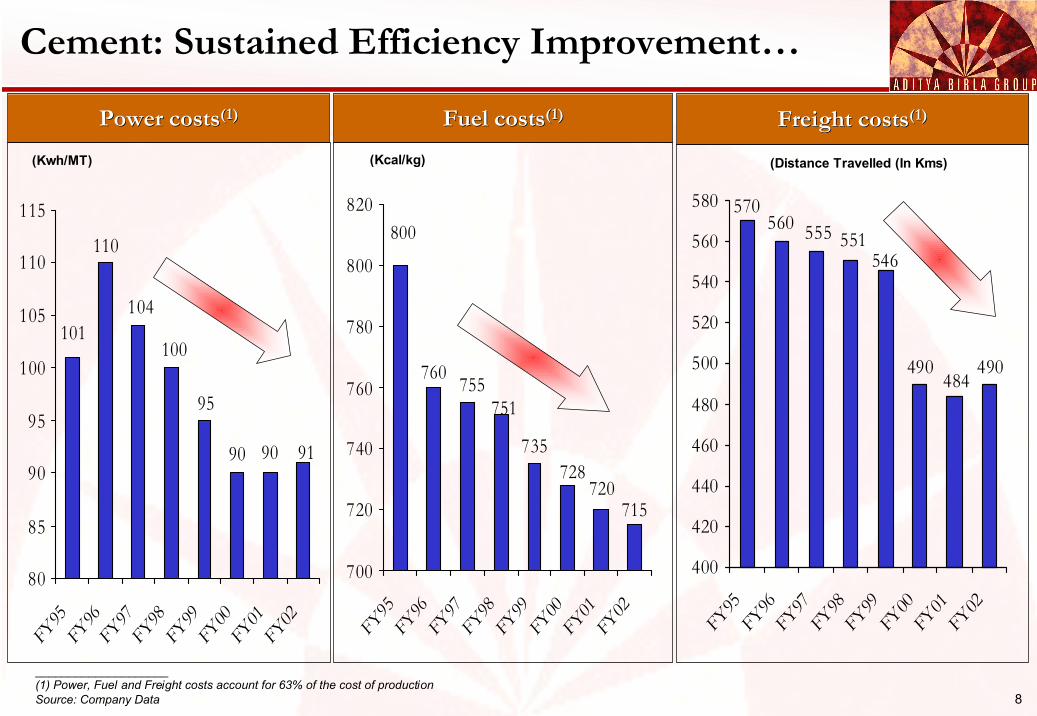
Fuel costsFuel costs(1)(1)
715720
728735
751755760
800
700
720
740
760
780
800
820
FY95FY
96FY
97FY98FY
99FY
00FY01FY
02
(Kcal/kg)
Power costsPower costs(1)(1)
919090
95
100
104
110
101
80
85
90
95
100
105
110
115
FY95
FY96
FY97FY98FY
99FY
00FY
01FY02
(Kwh/MT)
Freight costsFreight costs(1)(1)
490484
490
546551555560
570
400
420
440
460
480
500
520
540
560
580
FY95FY96FY97FY
98FY99FY
00FY
01FY02
(Distance Travelled (In Kms)
Cement: Sustained Efficiency Improvement…
____________________(1) Power, Fuel and Freight costs account for 63% of the cost of productionSource: Company Data
9
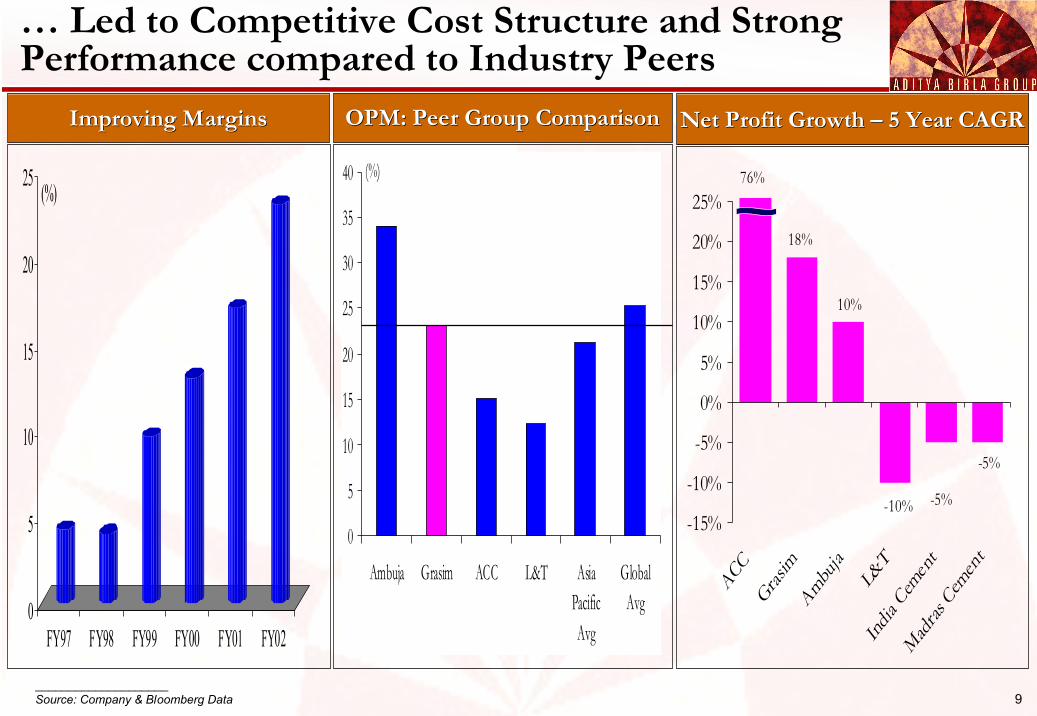
Improving MarginsImproving Margins OPM: Peer Group ComparisonOPM: Peer Group Comparison Net Profit Growth Net Profit Growth –– 5 Year CAGR5 Year CAGR
… Led to Competitive Cost Structure and Strong Performance compared to Industry Peers
0
5
10
15
20
25
FY97 FY98 FY99 FY00 FY01 FY02
(%)
0
5
10
15
20
25
30
35
40
Ambuja Grasim ACC L&T AsiaPacificAvg
GlobalAvg
(%)
-5%
-5%-10%
10%
18%
76%
-15%
-10%
-5%
0%
5%
10%
15%
20%
25%
ACCGras
imAmbu
jaL&
TIn
dia C
emen
tM
adras
Cem
ent
____________________Source: Company & Bloomberg Data
10
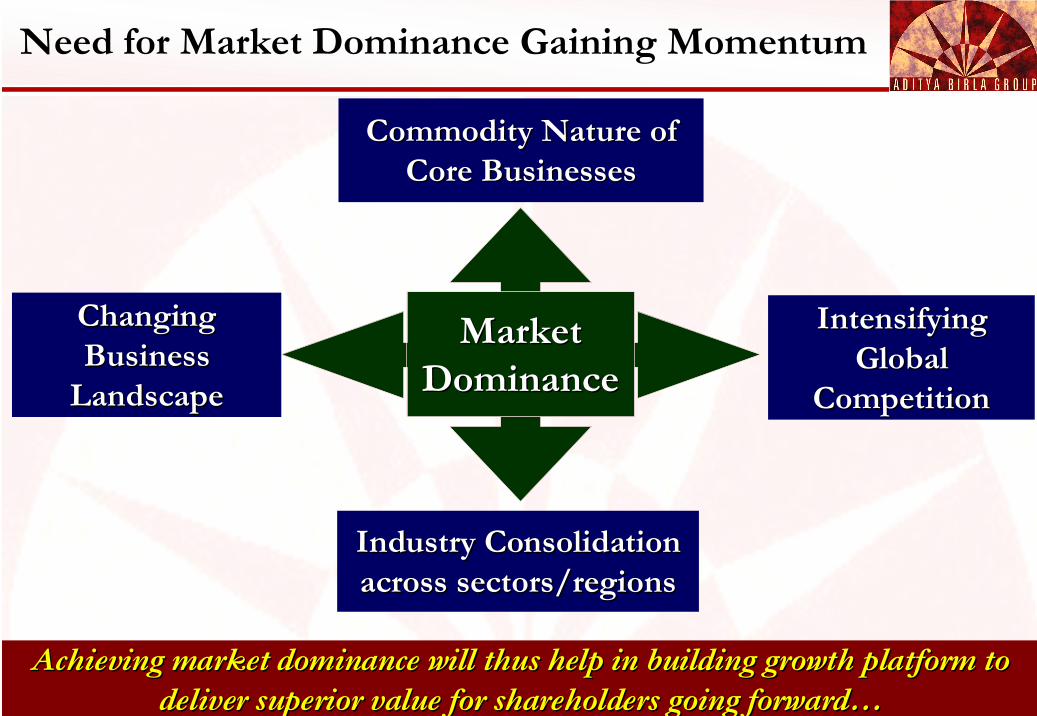
Need for Market Dominance Gaining Momentum
Market Market DominanceDominance
Commodity Nature of Commodity Nature of Core BusinessesCore Businesses
Industry Consolidation Industry Consolidation across sectors/regionsacross sectors/regions
Changing Changing Business Business
LandscapeLandscape
Intensifying Intensifying Global Global
CompetitionCompetition
Achieving market dominance will thus help in building growth plaAchieving market dominance will thus help in building growth platform to tform to deliver superior value for shareholders going forward…deliver superior value for shareholders going forward…
Several Proactive Measures Taken in Recent Years
to Achieve Market Dominance in Key Businesses
12
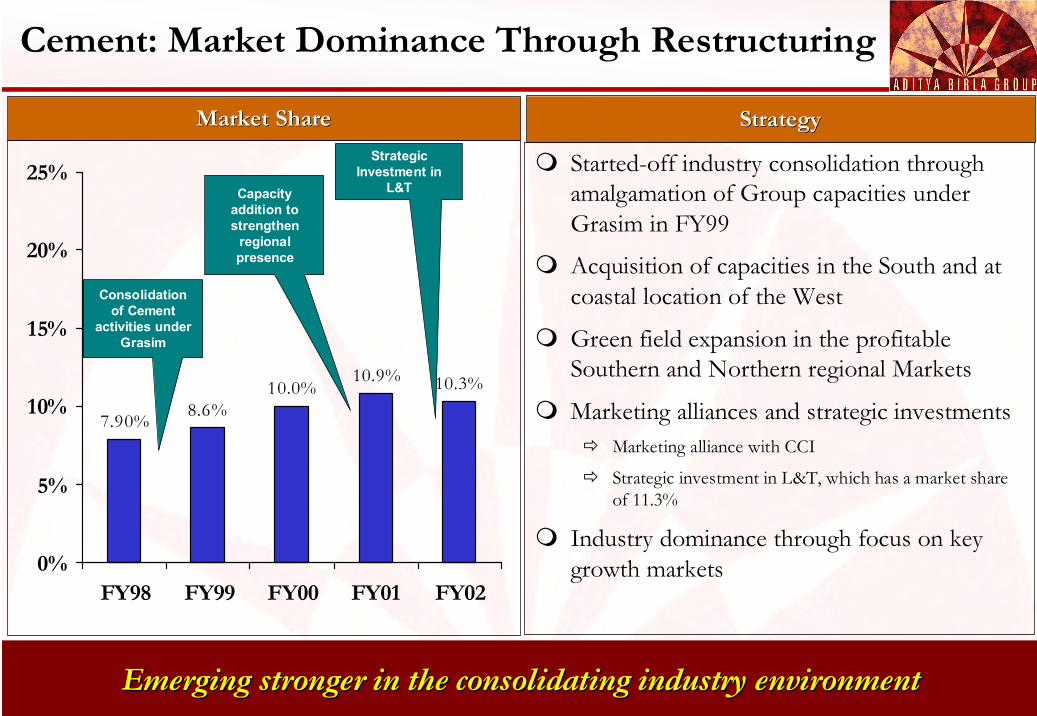
7.90% 8.6%10.0%
10.9% 10.3%
0%
5%
10%
15%
20%
25%
FY98 FY99 FY00 FY01 FY02
Consolidation of Cement
activities under Grasim
StrategyStrategy
Started-off industry consolidation through amalgamation of Group capacities under Grasim in FY99
Acquisition of capacities in the South and at coastal location of the West
Green field expansion in the profitable Southern and Northern regional Markets
Marketing alliances and strategic investmentsMarketing alliance with CCI
Strategic investment in L&T, which has a market share of 11.3%
Industry dominance through focus on key growth markets
Market ShareMarket Share
Capacity addition to strengthen
regional presence
Strategic Investment in
L&T
Emerging stronger in the consolidating industry environmentEmerging stronger in the consolidating industry environment
Cement: Market Dominance Through Restructuring
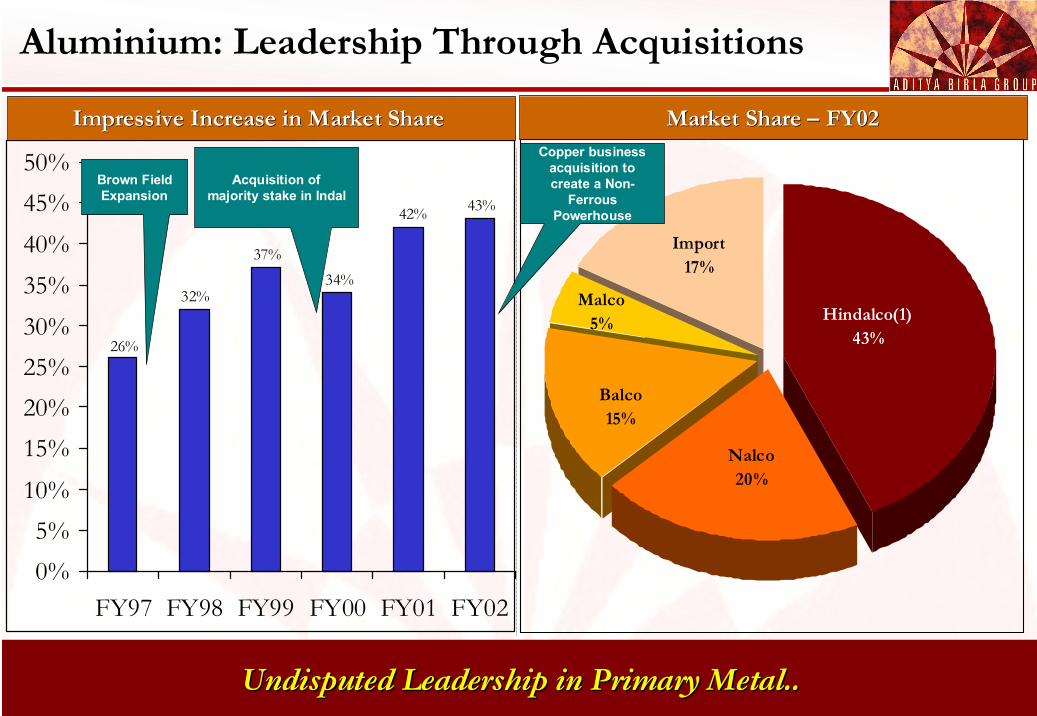
13Undisputed Leadership in Primary Metal..Undisputed Leadership in Primary Metal..
Aluminium: Leadership Through Acquisitions
43%42%
34%37%
32%
26%
0%5%
10%
15%20%25%30%35%40%45%50%
FY97 FY98 FY99 FY00 FY01 FY02
Brown Field Expansion
Acquisition of majority stake in Indal
Hindalco(1)43%
Nalco20%
Balco15%
Malco5%
Import17%
Copper business acquisition to create a Non-
Ferrous Powerhouse
Impressive Increase in Market Share Impressive Increase in Market Share Market Share Market Share –– FY02FY02
14
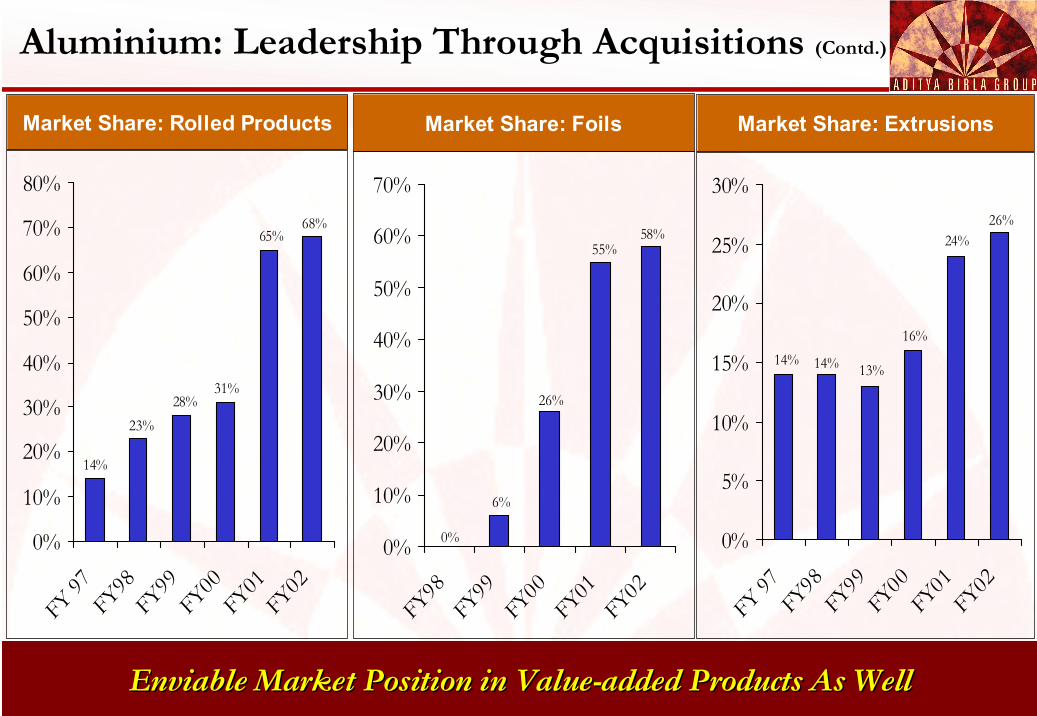
Market Share: Foils
58%55%
26%
0%
6%
0%
10%
20%
30%
40%
50%
60%
70%
FY98FY
99FY
00FY01FY02
Market Share: Extrusions
26%24%
16%
13%14%14%
0%
5%
10%
15%
20%
25%
30%
FY 97FY
98FY
99FY
00FY
01FY02
Market Share: Rolled Products
68%65%
31%28%
23%
14%
0%
10%
20%
30%
40%
50%
60%
70%
80%
FY 97FY98FY99FY00FY01FY02
Enviable Market Position in ValueEnviable Market Position in Value--added Products As Welladded Products As Well
Aluminium: Leadership Through Acquisitions (Contd.)
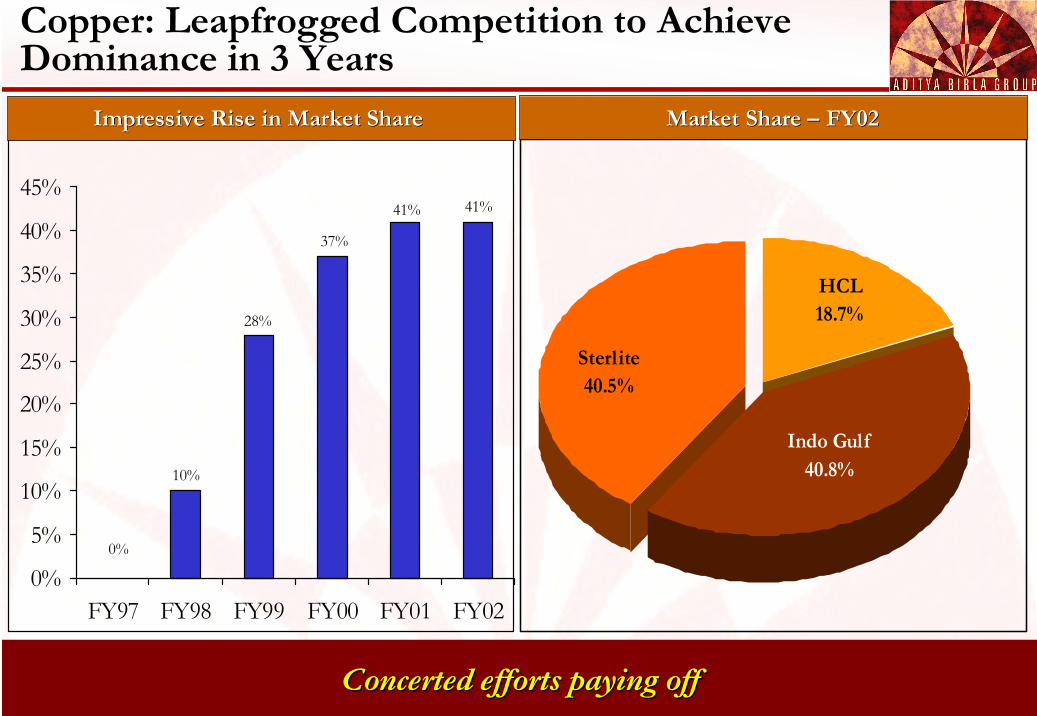
15Concerted efforts paying offConcerted efforts paying off
Copper: Leapfrogged Competition to Achieve Dominance in 3 Years
41%41%
37%
28%
0%
10%
0%
5%
10%
15%
20%
25%
30%
35%
40%
45%
FY97 FY98 FY99 FY00 FY01 FY02
Sterlite40.5%
Indo Gulf40.8%
HCL18.7%
Impressive Rise in Market Share Impressive Rise in Market Share Market Share Market Share –– FY02FY02
16
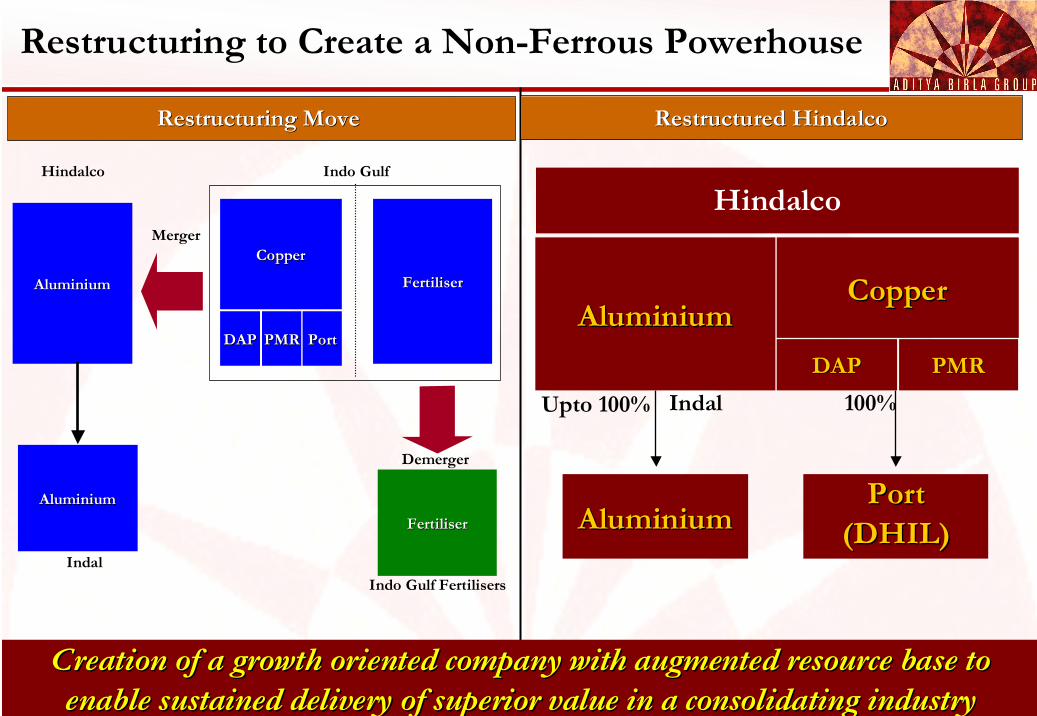
AluminiumAluminium
AluminiumAluminium
Hindalco
Indal
CopperCopper
DAPDAP PMRPMR PortPort
FertiliserFertiliser
Indo Gulf
Merger
FertiliserFertiliser
Demerger
Indo Gulf Fertilisers
Restructuring to Create a Non-Ferrous Powerhouse
Restructuring Move Restructuring Move
Upto 100%
AluminiumAluminiumPortPort
(DHIL)(DHIL)
100%Indal
AluminiumAluminiumCopperCopper
DAPDAP PMRPMR
HindalcoHindalco
Restructured HindalcoRestructured Hindalco
Creation of a growth oriented company with augmented resource baCreation of a growth oriented company with augmented resource base to se to enable sustained delivery of superior value in a consolidating ienable sustained delivery of superior value in a consolidating industry ndustry
17
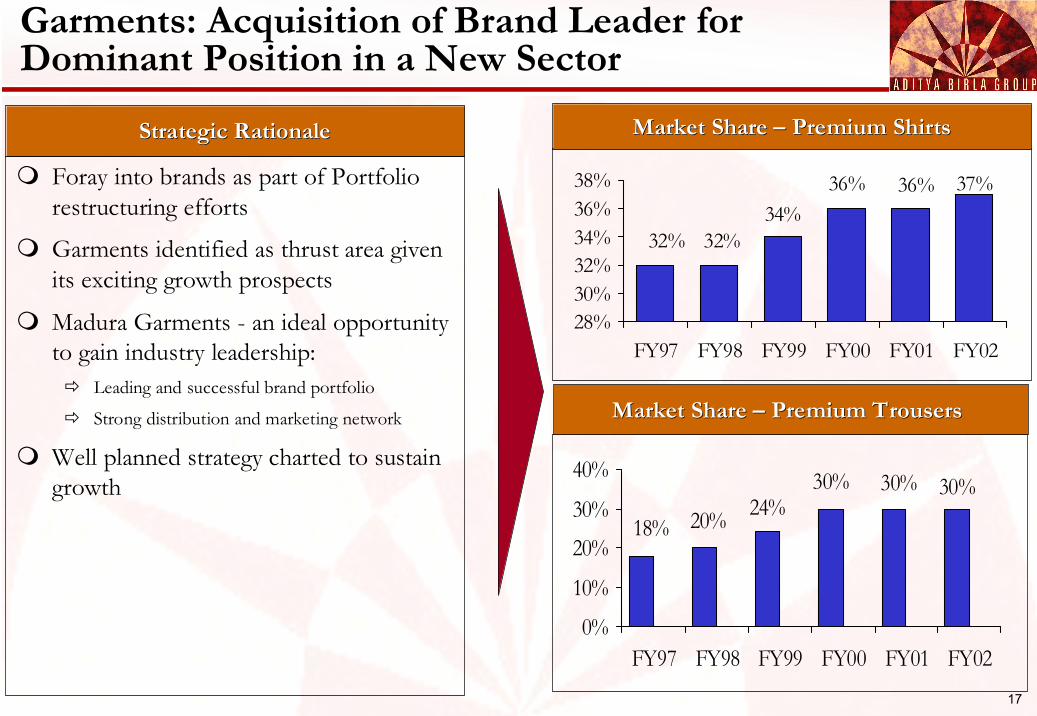
Strategic RationaleStrategic Rationale
Foray into brands as part of Portfolio restructuring efforts
Garments identified as thrust area given its exciting growth prospects
Madura Garments - an ideal opportunity to gain industry leadership:
Leading and successful brand portfolio
Strong distribution and marketing network
Well planned strategy charted to sustain growth
37%36%36%34%
32% 32%
28%30%32%34%36%38%
FY97 FY98 FY99 FY00 FY01 FY02
Market Share Market Share –– Premium ShirtsPremium Shirts
30%20%18%
24%30% 30%
0%
10%
20%30%
40%
FY97 FY98 FY99 FY00 FY01 FY02
Market Share Market Share –– Premium Trousers Premium Trousers
Garments: Acquisition of Brand Leader for Dominant Position in a New Sector
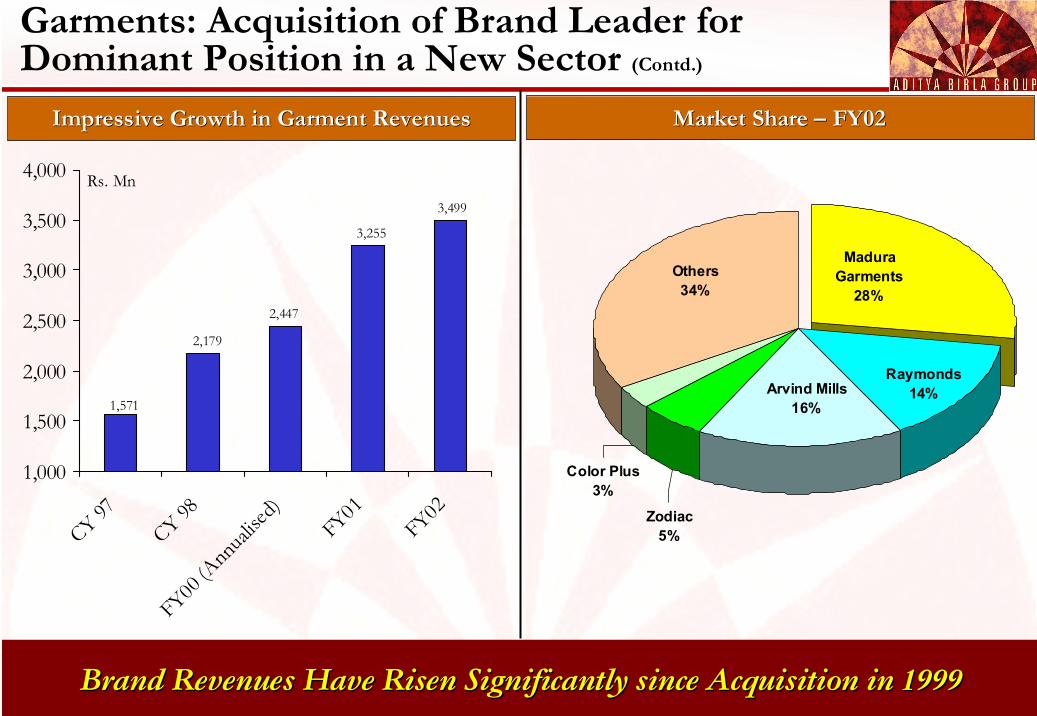
18Brand Revenues Have Risen Significantly since Acquisition in 199Brand Revenues Have Risen Significantly since Acquisition in 19999
Garments: Acquisition of Brand Leader for Dominant Position in a New Sector (Contd.)
Impressive Growth in Garment RevenuesImpressive Growth in Garment Revenues Market Share Market Share –– FY02FY02
3,499
3,255
2,447
1,571
2,179
1,000
1,500
2,000
2,500
3,000
3,500
4,000
CY 97
CY 98FY00
(Ann
ualise
d)
FY01
FY02
Rs. Mn
Arvind Mills16%
Raymonds14%
Zodiac5%
Color Plus3%
Madura Garments
28%Others34%
19
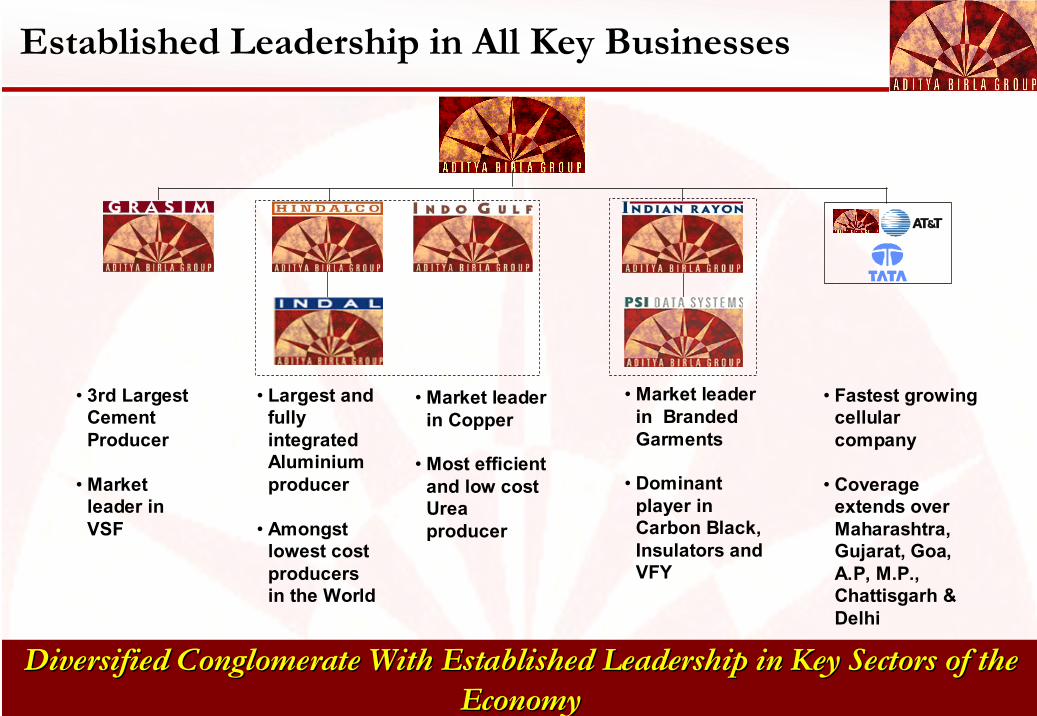
• Fastest growing cellular company
• Coverage extends over Maharashtra, Gujarat, Goa, A.P, M.P., Chattisgarh & Delhi
• 3rd Largest Cement Producer
• Market leader in VSF
• Largest and fully integrated Aluminium producer
• Amongst lowest cost producers in the World
• Market leader in Branded Garments
• Dominant player in Carbon Black, Insulators and VFY
• Market leader in Copper
• Most efficient and low cost Urea producer
Diversified Conglomerate With Established Leadership in Key SectDiversified Conglomerate With Established Leadership in Key Sectors of the ors of the EconomyEconomy
Established Leadership in All Key Businesses
20
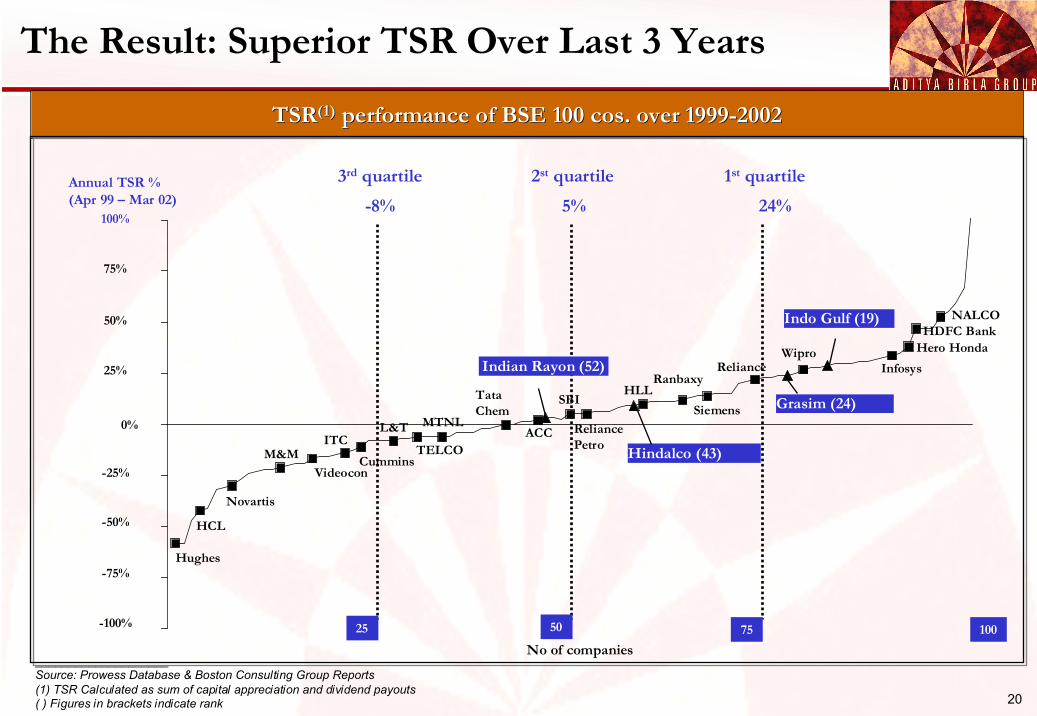
The Result: Superior TSR Over Last 3 Years
TSRTSR(1)(1) performance of BSE 100 cos. over 1999performance of BSE 100 cos. over 1999--20022002
Annual TSR % (Apr 99 – Mar 02)
Hughes
Indian Rayon (52)
HDFC BankWipro
Grasim (24)L&T ACC
Hindalco (43)
25 50 75 100
25%
50%
75%
100%
-100%
-75%
-50%
-25%
No of companies
Novartis
ITC
HLLSiemens
ReliancePetro
Hero Honda
-8% 5% 24%1st quartile 2st quartile 3rd quartile
0%
HCL
M&MVideocon
CumminsTELCO
MTNL
TataChem
SBIRanbaxy
Indo Gulf (19)
Infosys
NALCO
Reliance
____________________Source: Prowess Database & Boston Consulting Group Reports(1) TSR Calculated as sum of capital appreciation and dividend payouts( ) Figures in brackets indicate rank
21
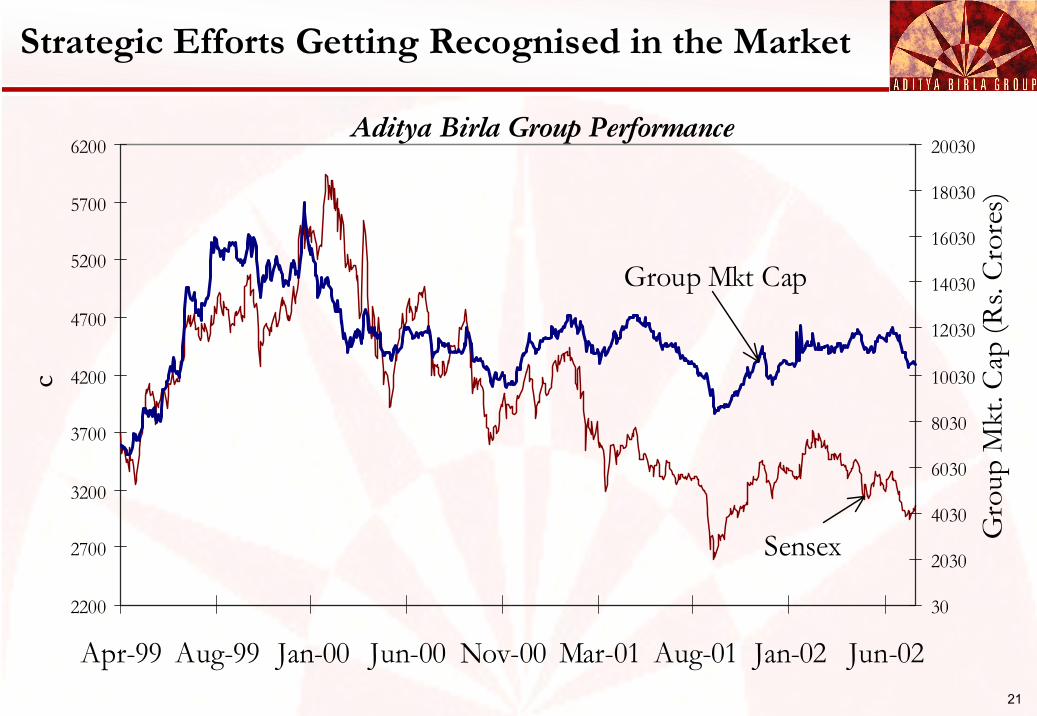
Strategic Efforts Getting Recognised in the Market
2200
2700
3200
3700
4200
4700
5200
5700
6200
Apr-99 Aug-99 Jan-00 Jun-00 Nov-00 Mar-01 Aug-01 Jan-02 Jun-02
c
30
2030
4030
6030
8030
10030
12030
14030
16030
18030
20030
Gro
up M
kt. C
ap (R
s. C
rore
s)
Aditya Birla Group Performance
Sensex
Group Mkt Cap
22
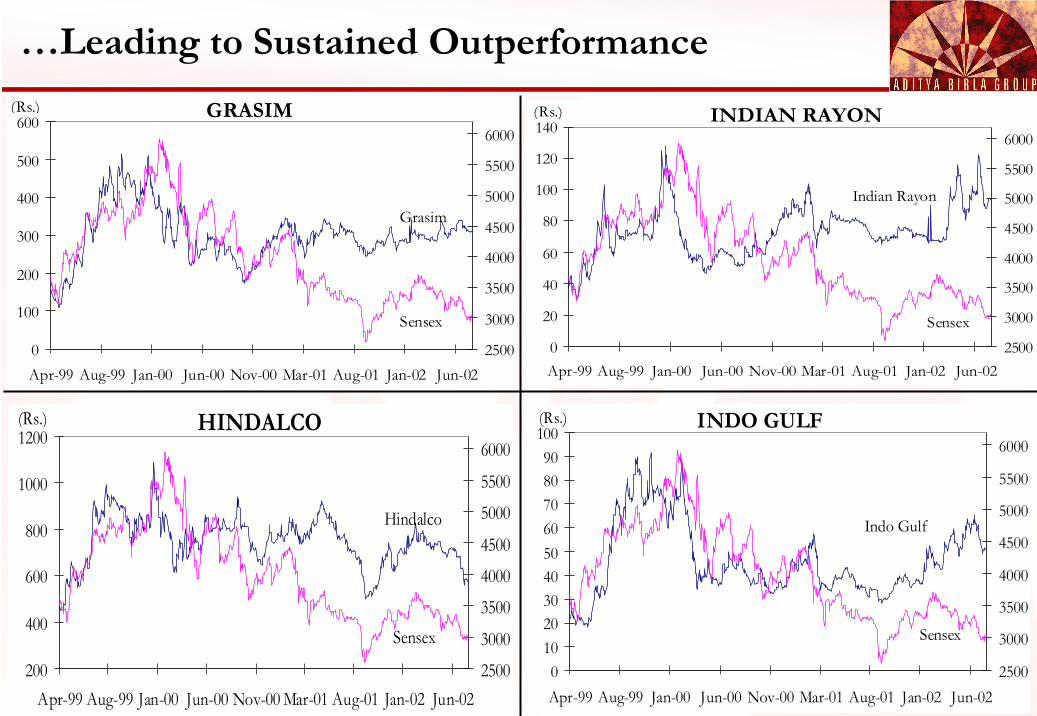
…Leading to Sustained Outperformance
0
100
200
300
400
500
600
Apr-99 Aug-99 Jan-00 Jun-00 Nov-00 Mar-01 Aug-01 Jan-02 Jun-022500
3000
3500
4000
4500
5000
5500
6000
Grasim
Sensex
(Rs.) GRASIM
200
400
600
800
1000
1200
Apr-99 Aug-99 Jan-00 Jun-00 Nov-00 Mar-01 Aug-01 Jan-02 Jun-022500
3000
3500
4000
4500
5000
5500
6000
Hindalco
Sensex
HINDALCO(Rs.)
0
20
40
60
80
100
120
140
Apr-99 Aug-99 Jan-00 Jun-00 Nov-00 Mar-01 Aug-01 Jan-02 Jun-022500
3000
3500
4000
4500
5000
5500
6000
Indian Rayon
Sensex
INDIAN RAYON(Rs.)
0102030405060708090
100
Apr-99 Aug-99 Jan-00 Jun-00 Nov-00 Mar-01 Aug-01 Jan-02 Jun-022500
3000
3500
4000
4500
5000
5500
6000
Indo Gulf
Sensex
(Rs.) INDO GULF
23
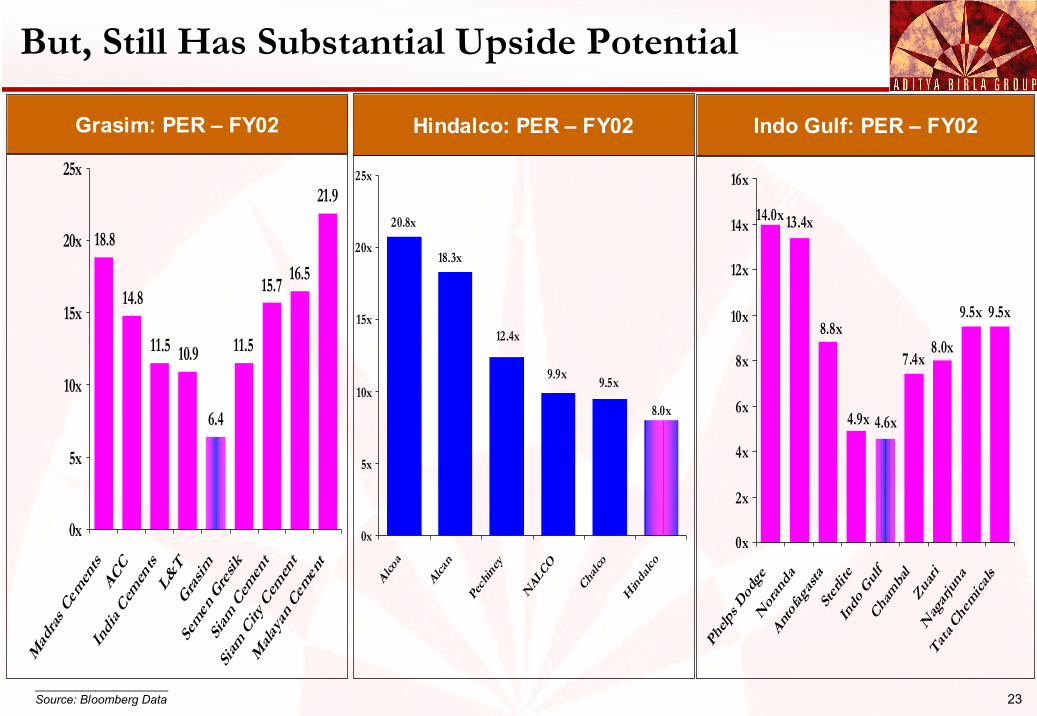
But, Still Has Substantial Upside Potential
Grasim: PER – FY02
18.8
14.8
11.5 10.9
6.4
11.5
15.7 16.5
21.9
0x
5x
10x
15x
20x
25x
Mad
ras C
emen
tsACC
Indi
a Cem
ents
L&T
Grasim
Semen
Gre
sikSia
m Cem
ent
Siam
City
Cem
ent
Mala
yan C
emen
t
Hindalco: PER – FY02
8.0x
9.5x9.9x
12.4x
18.3x
20.8x
0x
5x
10x
15x
20x
25x
Alcoa
Alcan
Pech
iney
NALCO
Chalco
Hindalc
o
Indo Gulf: PER – FY02
9.5x9.5x
8.0x7.4x
14.0x 13.4x
8.8x
4.9x 4.6x
0x
2x
4x
6x
8x
10x
12x
14x
16x
Phelp
s Dod
geN
oran
daAnto
fagas
taSte
rlite
Indo
Gulf
Cham
bal
Zuari
Nag
arjun
a
Tata C
hemica
ls
____________________Source: Bloomberg Data
24
Geography specific businesses - build and retain dominanceCement, Garments, Fertilisers and Carbon Black
Global businesses - domestic dominance coupled with cost leadership Aluminium, Copper, Viscose Staple Fibre, and Insulators
Growth through brownfield as well as inorganic opportunities Under leveraged Balance Sheets
Strong cash flows
Heightened awareness of growth imperatives
Emerging opportunities to support aggressive plansOn-going consolidation in key business sectors in India
Government dis-investment programme
Going Forward…Enhanced Dominance in Key Businesses
25
Shareholder value enhancement to remain the focal point for all decisionsCVA to drive decision making across all levels of organisation
Dispassionate evaluation of all businesses Continued value creation across companiesEarly identification of businesses with declining prospects for appropriate actionDivest value destroying businesses at an appropriate time
Listed companies to focus on identified core businesses No fresh crossholdings and concerted efforts to reduce existing crossholdings
Going Forward…Shareholder Value Will Be Key Criteria for Decisions

Thank YouThank You