CREATING A STRATEGIC PLAN ROADMAP - MarshBerry€¦ · CREATING A STRATEGIC PLAN ROADMAP Get a...
20
www.MarshBerry.com CREATING A STRATEGIC PLAN ROADMAP Get a handle on what it takes to create a strategic plan that’s focused, relevant, aligned and actionable. Page 2 SEPTEMBER 2017 Lost in TRANSLATION Page 5 STRATEGY Changes the Buyer Landscape Page 8 Addressing Non-Producing PRODUCERS Page 10 QUARTER In Review Q&A Page 14 BROKER Tearsheet Page 15
Transcript of CREATING A STRATEGIC PLAN ROADMAP - MarshBerry€¦ · CREATING A STRATEGIC PLAN ROADMAP Get a...

www.MarshBerry.com
CREATING A STRATEGIC PLAN ROADMAP
Get a handle on what it takes to create a strategic plan that’s focused, relevant, aligned and actionable. Page 2
S E P T E M B E R 2 0 1 7
Lost inTRANSLATION
Page 5
STRATEGY Changes the Buyer
LandscapePage 8
Addressing Non-Producing
PRODUCERSPage 10
QUARTER In Review Q&A
Page 14
BROKER Tearsheet
Page 15

MARSHBERRYlearn. improve. realize.
800.426.2774 MarshBerry.com
Securities offered through MarshBerry Capital, Inc., Member FINRA and SIPC, and an affiliate of Marsh, Berry & Company, Inc. 28601 Chagrin Blvd., Suite 400, Woodmere, Ohio 44122 (440.354.3230).
Marsh, Berry & Company, Inc. is honored to be the investment banking firm that brokered the transactions that brought these 24 agencies and one networking organization together to form Alera Group1, as funded by Genstar Capital.
HAS ACQUIRED A&B Insurance and
Financial, Inc., AB Capital Group, LLC, Insurance
Exchange, LLC, & Smart Choice Health Plans, LLC
dba Florida Health Team, LLC
HAS ACQUIRED C.M. Smith
Agency, Inc.
HAS ACQUIRED Coury Health Services, Inc.
HAS ACQUIRED Hampson
Mowrer Agency, Inc. dba Hampson
Mowrer Kreitz Agency
HAS ACQUIRED K.B. Group
Services, Inc. dba Group
Services, Inc.
HAS ACQUIRED Shirazi Benefits,
LLC
HAS ACQUIRED American Insurance
Administrators, Inc. dba AIA
Benefits Resource Group
HAS ACQUIRED Centennial Group
Benefits and Insurance
Services, Inc.
HAS ACQUIRED Forum
Benefits, Inc.
HAS ACQUIRED HP Planning, LLC (dba CBP and/or Creative Benefit
Planning)
HAS ACQUIRED
Pentra, Inc.
HAS ACQUIRED Shirazi-Miller Benefits, LLC
HAS ACQUIRED Benefit Advisors
Network, LLCdba BAN
HAS ACQUIRED Beacon Retiree Benefits Group,
LLC
HAS ACQUIRED
MFG Retirement Systems, Inc. dba
PWA Insurance Services
HAS ACQUIRED TRUEBenefits,
LLC
HAS ACQUIRED
Benico, Ltd.
HAS ACQUIRED INGROUP
Associates, Inc.
HAS ACQUIRED Robert G. Relph Agency, Inc. (dba
Relph Benefit Advisors) & Flexible
Benefits System, Inc.
HAS ACQUIRED Virtus Benefits,
LLC
HAS ACQUIRED
Brown & Noyes, LLC dba Ardent Solutions
HAS ACQUIRED Corporate Plans, Inc. dba CPI-HR
HAS ACQUIRED GCG Financial,
Inc.
HAS ACQUIRED J.A. Counter &
Associates, Inc.
HAS ACQUIRED Silberstein
Insurance Group, LLC
1 Marsh, Berry & Company, Inc. was financial adviser to the participating selling organizations. These organizations were acquired by Alera Group effective December 30, 2016.

1CounterPoint September 2017
CONTRIBUTING AUTHORSBRIAN EGGLESTON, National Organic Growth Consultant
DUSTIN GIOVANNELLI, Consultant
ERIC HALLINAN, Vice President
KYLE HOEFT, Senior Consultant
ALBERT LLOYD, Executive Vice President
JORDAN VICTOR, Data Analyst
COUNTERPOINT EDITORIAL BOARDMEGAN BOSMA, Senior Vice President
LAUREN BYERS, Vice President, Marketing
ALISON WOLF, Director, Research
ABOUT COUNTERPOINTCounterPoint is the proprietary publication of MarshBerry. The magazine offers eleven editions annually and is published for independent insurance agents and brokers, national brokers, private equity firms, banks & credit unions, insurance carriers and specialty distributors.
SEPT
EMBE
R SP
OT
LIG
HT
So, What’s the Plan?As summer starts to fade away, football season comes rolling right in — just as mother nature intended it. And while some can’t wait to see your team dominate the gridiron, some hail from cities that have less than stellar expectations this year. Yes, anything can happen in a football season, but as realists, we can’t afford the emotional baggage that goes along with lofty ambitions untethered to reality.
“Rebuilding” is a word that you’ve probably all used to describe your favorite team’s outlook at one point or another. While it can be a tough pill to swallow, all of the great franchises in sports history have put meticulous effort into building a sustainable culture of winning. It’s not uncommon to have a great season due to an ultra-high performer or sometimes just dumb luck. But the teams that can win consistently have outlined a strategy and started drafting and training talent that complement their strategy years before the players ever hit the field.
IF YOU WANT THE SAME KIND OF CONSISTENT, SUPERIOR PERFORMANCE FROM YOUR AGENCY, WE BELIEVE YOU HAVE TO GO THE EXTRA MILE AND INTENTIONALLY PLAN FOR IT. Whether you’re rebuilding to become a playoff contender or trying to take your current team to the Super Bowl, it’s not likely to happen if you haven’t created a playbook.
This issue of CounterPoint discusses how to create and customize a plan specific to your agency. Too many times management confuses this exercise with arbitrary goal-setting. A strategic plan is a comprehensive roadmap that outlines how you’re going to achieve your goals in three, five, or ten years down the road. It also identifies threats/weaknesses and ways to help mitigate those risks before they become crippling.
Perhaps even more valuable, effective communication of a strategic plan can help motivate employees to take an active role in achieving the agency’s vision. n

SEPT
EMBE
R F
EA
TU
RE
2 September 2017 CounterPoint
Get a handle on what it takes to create a strategic plan that’s focused, relevant, aligned
and actionable. Yes, we’re talking about a strategic plan you’ll actually use and that your
team will execute. Ready to get started?
by Albert A. Lloyd, Executive Vice President440.392.6562 | [email protected]
CREATING A STRATEGIC PLAN ROADMAP
Securities offered though MarshBerry Capital, Inc., Member FINRA and SIPC, and an affiliate of Marsh, Berry & Co., Inc. 28601 Chagrin Blvd., Suite 400, Woodmere, Ohio 44122 • 440-354-3230

3CounterPoint September 2017
ALIGNED: Your strategic plan is not a document that exists in a vacuum. It should align with your culture, your values, your mission statement and vision.
ACTIONABLE: What good is your plan if it lacks steps for accomplishing objectives? The strategic plan should assign responsibilities and have individuals held accountable to predetermined dates for the objectives.
Ready to get started?
Getting Started: Set the Tone for Strategic Planning First, consider the strategic planning meeting location — and rather than a meeting, stage this as a retreat.
The purpose is to focus on the plan, and that means getting out of the office and away from daily distractions. Select an off-site location and set ground rules. For example, allow for breaks to check cell phones and email, but request that everyone unplug during the session so they can completely tune in to the process. Communicate that being part of the strategic planning group is a privilege, not an obligation.
Next, select the facilitator. This person is responsible for keeping discussions on track and encouraging productive conversations.
Sometimes, there is a person in-house who can effectively take on the facilitator role. Many times, agencies find value in an outside facilitator leading the discussions. An outside facilitator can serve as an unbiased third party who can redirect discussions that are not related to the plan, and constructively drive conversations that do benefit the plan.
Next, you will need a watchdog who will champion the agenda, planning process and accountability.
This may or may not be the facilitator. In fact, this person may very well be involved in creating the agenda,
We also know that many strategic plans are created with enthusiasm and good intentions, and then they are set aside. They fall deeper to the bottom of a pile of daily tasks and fires that must be put out. The energy generated during the strategic planning session quickly fades and there’s failure to execute.
We’ve all been there. So, rather than focusing on the purpose of the plan, and why all agencies of all sizes need one, let’s dig into the “how” of creating an effective strategic plan that can be successfully implemented. For many businesses, the thought of starting the strategic planning process is daunting. What’s first? What’s next? We’ll answer those questions. For other agencies, the question is who? Who will be responsible for carrying out the plan, for making sure that it doesn’t just collect dust? Still others struggle with getting everyone in the agency on the same page. After all, a strategic plan cannot be executed by one individual. Everyone must understand goals and objectives, along with their individual roles in making the plan come to life to be a living, breathing document.
All of this is easier said than done. That’s why we’re going to provide you with a strategic planning roadmap that will help guide you through the steps of creating a plan that is focused, relevant, aligned and actionable.
FOCUSED: A strategic plan should state and prioritize objectives so there is a clear understanding of what the agency is working toward.
RELEVANT: Your strategic plan should live in the present and address the future, capturing where the agency is today, where it wants to go and how it will get there.
SUCCESSFUL BUSINESS OWNERS AND INDUSTRY LEADERS WILL TELL YOU THAT STRATEGIC PLANNING IS ESSENTIAL TO HELPING ACHIEVE GOALS.
Securities offered though MarshBerry Capital, Inc., Member FINRA and SIPC, and an affiliate of Marsh, Berry & Co., Inc. 28601 Chagrin Blvd., Suite 400, Woodmere, Ohio 44122 • 440-354-3230

4 September 2017 CounterPoint
coordinating meals, developing audio visual presentations as well as any additional logistics. All of these details and more can be outlined during a pre-planning meeting. The pre-planning meeting includes an overview of the process, expectations and how objectives will be captured, as well as accountability.
Pre-planning also includes determining participants in the strategic planning retreat, and engaging those individuals to discuss the upcoming strategic planning process.
You should include key decision-makers, those who hold positions of authority and potentially the management team. Do you have an executive committee or board of directors? If not, in our experience, this is a good time to consider establishing those committees, and creating formal corporate governance policies and procedures. An adviser can walk you through this process if it’s new territory.
Where Are We Today? Begin by reviewing your mission statement. Does it still capture the essence of the agency? Is it relevant?
Find and review example mission statements from other firms and determine if yours might need revamping. A mission statement defines what you are and keeps you focused on developing, prioritizing and achieving your goals. Language should be concise. All important decisions should be made with the mission statement in mind, which is why we recommend providing cards with your mission statement for your team to carry with them. They can refer to it as a reminder of the organization’s purpose.
Once the mission statement is firmed up, dig into where the agency stands today. Begin with a SWOT analysis that addresses your agency’s Strengths, Weaknesses, Opportunities and Threats. Further, a PEST (Political, Economic, Social & Technological) analysis can unearth outside factors that impact external opportunities and threats.
The SWOT and PEST analyses can be used to create objectives. You’ll talk about how consumer needs, competition, rates, industry changes, government intervention and the economy impact your agency. What must be done to manage these pressures and succeed? How can the agency capitalize on these external factors to benefit the business? (Use a white board or flip chart to get everyone’s ideas socialized.) Your objectives should be consistent with the agency’s mission statement, specific and measurable. They should be attainable goals that you can track. Additionally, your objectives should be challenging. This is not designed to be a breeze. You’re stretching the business
to move to the next level. But for now, focus on discussion. You’ll dig into creating objectives a bit later.
This brings in a critical discussion that should take place during the “Where are we today?” evaluation. What about perpetuation? What are the departing shareholder(s) goals and desires for perpetuation? Where does the agency stand in this process?
Also, address the agency’s financials — break out the financial statements and review actual performance as well as projected performance. Compare the organization to benchmarks. You’ll want to identify the growth required to achieve your plan, as well as the reality of achieving planned growth.
Talk about the talent pool. Do you have the right people in the right places? Who is doing what, and why? This is also time to either create an organizational chart, review your current one, and potentially look to create what it might look like in five years. Where are voids in the five-year organizational chart? Leverage these voids to create a five-year hiring plan. Be sure to move into conversations about what talent you’ll need to reach your goals when you address where you want to go in the future.
As you evaluate your strengths and weaknesses, and consider external factors, conduct an exercise to see how your participants feel about what is being discussed.
We call this “Take A Panel.” Here is how it works: First, grant amnesty — let everyone know that their insight matters and they can be honest about their feelings. Then, take a panel (page) from your flip chart pad and a marker, and distribute one to each participant.
Ask everyone to write responses to these five questions on their flip chart panels:
1 Where is the agency now?
2 Where do you see the agency in five years?
3 What are the agency’s three biggest strengths?
4 What are the agency’s three biggest weaknesses?
5 The Wish: If you had one wish (and only one wish) to change something about the agency, what would it be?
Next, each person should tape their flip chart page to the wall and present their answers to the five questions to the strategic planning group. The facilitator then presents the feedback recorded to the whole group, paying close attention to common themes. This consolidated information is used to create the “Take A Panel Roll-Up.” It is essentially an inventory
Continued on Page 6
Securities offered though MarshBerry Capital, Inc., Member FINRA and SIPC, and an affiliate of Marsh, Berry & Co., Inc. 28601 Chagrin Blvd., Suite 400, Woodmere, Ohio 44122 • 440-354-3230

METRICLOST IN TRANSLATION: HOW ARE YOU GOING TO ACHIEVE GROWTH GOALS WITHOUT A CLEAR PLAN?Strategic Planning is an important concept to incorporate into your agency’s management practices. Part of Strategic Planning is building a road map for growth. Many agencies can set growth goals and budgets based on past performance and market averages, which is okay. It is easy to assume what these goals can or should be, but we believe agencies should strategically plan how the growth goals will be supported by their staff.
The following demonstrates three different methods of strategic planning and the resulting outcome in agency growth at year end. We start with the average Total Commissions and Fees and number of Production Personnel from MarshBerry’s proprietary financial management system, Perspective for High Performance (PHP). The three levels of strategic planning then follow.
n SHOOT FROM THE HIP: These are agencies who pick up the dart, close their eyes, and throw - hoping they hit a good number on the dart board. These agencies may think back to how their organization grew the previous year, may have read a few articles, and take a guess at what they think they will grow by (usually assuming above average performance). According to PHP, the Average firm had organic growth of 3.83% and High Growth were at 12.38%. Most firms believe they can achieve better than average growth. Therefore, we selected 10% in this example. Agencies who strategically plan this way may believe their organization will be fine by year-end based on their projected net growth of $1,330,000.
n REALITY: Uses the same approach as “Shoot from the Hip” agencies, but factors in possible market considerations such as bankruptcies of insureds, agency commission rate changes, premium rate changes, or simply the nonrenewal of policies. We combined these into an estimated 90% retention of business. Combining this, with the actual average organic growth of 3.83% from PHP, you can see that agencies using the “Reality” method may be blindsided at the end of the year with negative growth because they did not consider market factors and growing at the average rate. Hopefully, agencies using this method would then make adjustments to understand what they must do to obtain a positive year-end growth.
n BEST METHOD: Combines market factors with individual producer goals. MarshBerry’s Sales Performance database shows that on average, producers’ reported new business goals calculate out to 13.76% of their total book of business. So, after considering market factors and IF every producer reaches their new business goal, the net agency growth totals to $500,000 or almost 4%. These are the agencies who pick up the dart, take a shooting stance, aim at their target, and hit the bullseye.
As you can see, setting growth goals can be somewhat complicated when considering all the different factors. If your agency falls under the “Shoot from the Hip” or “Reality” category, we suggest rethinking your planning practices. n
OF TH
E MO
NTH
5CounterPoint September 2017
“Average” is the average of all agencies in the database while “High Growth” is defined as the top 25% of reported organic growth.
* Source: MarshBerry’s Sales Performance Database
** MarshBerry’s proprietary financial management system Perspective for High Performance (PHP)
BoB: Book of Business
For Illustration Purposes.
Agency Total Commissions & Fees Total Production Personnel (FTE)
MarshBerry Average** $13,300,000 20
Shoot from the Hip Reality Best Method
Basis for Determining “Growth” Agency Goal Market Considered Goal (i.e. 90% retention)
Producer New Business Build-up +
Market Consideration (i.e. 90% retention)
Calculating Factors Considered 10% 90% Retention / 3.8%** Growth
90% Retention / 13.76%* Producer New Business Goals as % of Total BoB
Expected Year End Results $14,630,000 $12,500,000 $13,800,000
Net Agency Total Commissions & Fees Growth $1,330,000 -$800,000 $500,000
Net Book of Business Growth Per Producer $65,500 -$40,000 $25,000
6 September 2017 CounterPoint
CREATING A STRATEGIC ROADMAPContinued from Page 4
of everyone’s responses to the five questions. One column should list the “stroke count,” or number of times a common idea is listed. The other column names the idea. For example, the stroke count column might indicate that five participants said “strong leadership” is a strength. And, so on…
What these Take A Panel and Take A Panel Roll-Up exercises do is assemble participants’ ideas into a practical guide for future discussion and goal-setting. It also is a great gauge to see if the group is or is not aligned in thinking. The exercise is also important for ensuring that every voice is heard. We recommend leaving the posted panels on the wall for the length of the meeting so these insights can be referred to throughout the strategic planning session.
Where Do We Want To Go?After reviewing financials, assessing the existing talent and where you stand as a business (just to name a few), you can begin assembling objectives that are focused, relevant, aligned and actionable.
You want to develop long and short-term objectives. Annual objectives can be achieved in the next year. Long-range objectives involve more complex projects, transitions or implementing new systems that could take two to five years. Be realistic when setting timelines for objectives. Ask if any objective can realistically be completed in one year? Or, can you fast-track a certain priority project to complete it sooner because it will greatly impact growth? This is where your priority list comes into play. Work from top to bottom and, again, be honest with the task at hand.
How Do We Get There? Consider all the steps required to accomplish each long-term goal. What resources are required? Who’s accountable to lead the charge? What will it cost, and how will you measure progress?
Start with your list of objectives, then build each one out to include details that identify the true scope of what you want to accomplish.
Next, address the who. Who is assigned to work on each objective? Break down tasks and figure out which team members will take on each role. Who will lead the effort and ultimately be held responsible for executing the objective?
Very important: How will you measure performance? Are there metrics you will watch, or are there specific tasks that must be completed that signal positive movement? Every objective
must be measurable with checkpoints so your team can assess where they stand in terms of progress.
Many times, strategic plans are created during a meeting with key leaders and decision makers, but the objectives are not communicated to the rest of the team. Spend time discussing how the plan will be rolled out agency-wide, and how you will motivate everyone on your staff to embrace the plan, even if they were not involved in creating it. While an agency meeting can introduce the plan, small group gatherings with leadership can engage employees on a more personal level. Consider using a motto, like “10 x 20” if your goal is to reach $10 million in revenue by 2020. Come up with a catchphrase that you can use to name the plan and promote it internally to employees.
Finally, what are the incentives and penalties for achieving or ignoring objectives identified in the strategic plan?
Answer these questions:
1 How can the staff be rewarded?
2 How can the behavior be repeated?
3 Should we charge $20.00 to an individual for each ignored objective?
We all like to be appreciated for our hard work. Staff incentives for meeting strategic plan objectives can go a long way toward building positive morale and ongoing engagement in reaching plan goals. Likewise, penalties can serve as a barometer to identify who is not serious about getting the agency to the next level. Individuals who habitually ignore their assigned objectives should be removed from the strategic planning group and replaced. Remember, being part of a strategic planning group is a privilege not an obligation.
Celebrate your successes. A strategic plan provides opportunities to reflect on how far you’ve come when you review objectives and performance, and see how your team has come together to grow the agency. Refer to the plan often. Keep the strategic plan out and in the open.
For example, lay the strategic plan on the upper left corner of your office desk, not on a shelf. This will help ensure you are always seeing and thinking about it, rather than it gathering dust on the shelf. Make it your roadmap to growth and success.
Finally, let us know how the process is going for you. We want to hear about your wins and your challenges. Executing on a strategic plan is hard work. With this roadmap in hand and the support of your team and advisers, you can help transform your business and unlock its true potential. n
Securities offered though MarshBerry Capital, Inc., Member FINRA and SIPC, and an affiliate of Marsh, Berry & Co., Inc. 28601 Chagrin Blvd., Suite 400, Woodmere, Ohio 44122 • 440-354-3230

Register Now Open!MarshBerry’s 2017 Peak Performance event is set for January 28-30, 2018, at the Hyatt Centric Park City.MarshBerry’s Peak Performance event is the preeminent event for specialty distributors and specialty carriers in the insurance space. This intimate networking opportunity allows executives to learn and help improve their business while enjoying the slopes of Park City, Utah.
www.MarshBerry.com/Peak Interested in being a sponsor for 2018? Contact Jessica Stogran at [email protected] or 440.392.6558 for details.
7CounterPoint September 2017
Mark your calendars for MarshBerry’s 360 Seminar series. Registration opens this Fall.
05.08.18
CHI
05.03.18
NYC
05.10.18
LV
SAVE THE DATE
MarshBerry’s Intellectual Capital Team Launches New Channel ChecksA Channel Check is a “light survey” using primary research*, conducted by MarshBerry, to gather opinions on relevant topics from within the industry.
Our first edition focuses on cyber insurance which is currently considered a relatively small market. However, we see it as a growing space and area of opportunity, especially for commercial clients.
The Cyber Insurance Channel Check addresses:n How are agencies/brokers selling cyber, and n How can one convince clients of cyber related risks and why
they need coverage?
Download your complimentary copy at www.MarshBerry.com/Cyber. Need help identifying where your agency should focus? Contact us for a strategy consultation at 800.426.2774 or visit us online at www.MarshBerry.com.*Primary research is defined as discussions used to gather specific perspectives related to an industry trend and/or market participant. It can involve questionnaires, surveys or interviews with individuals or small groups. It may or may not be used for exploratory purposes and is not intended to be used to assist in making investment decisions.
Securities offered though MarshBerry Capital, Inc., Member FINRA and SIPC, and an affiliate of Marsh, Berry & Co., Inc. 28601 Chagrin Blvd., Suite 400, Woodmere, Ohio 44122 • 440-354-3230

8 September 2017 CounterPoint
Strategy Changes the Buyer Landscapeby Eric Hallinan, Vice President 949.234.9652 | [email protected]
THE PAST TEN YEARS HAVE SHOWN US THAT THE TOP BUYERS ARE DRIVING MOST OF THE ACQUISITION ACTIVITY.
DEA
LMAK
ERS
DIA
LO
GU
E
Securities offered through MarshBerry Capital, Inc., Member FINRA and SIPC, and an affiliate of Marsh, Berry & Company, Inc. 28601 Chagrin Blvd., Suite 400, Woodmere, OH 44122 • 440.354.3230.
Over the last ten years it has been widely reported that the number of buyers and the total deal count of announced insurance agency transactions has gone up. The story is even more interesting when reviewing the activity of the top ten buyers.
New Buyers AppearThe most obvious detail in the chart above is the fact that new companies appear and old companies drop off. Some of the companies that appear didn’t exist in 2006, like Marsh & McLennan Companies, Inc. in the 2011 list or Alera Group, Inc. in the 2016 list. Others that appear later did not have a refined, strategic acquisition plan at the time. Compared to 2006, in 2011 there were four new companies on the list (the bolded entries in the chart), and in 2016 there were five new companies. Also note the lack of financial institutions in the 2011 and 2016 lists.
Count and Concentration of Deals with Top Ten Goes UpThe top ten buyers announced 72 deals in 2006, 105 deals in 2011, and 221 deals in 2016. As a percentage of total announced deals, the top ten buyers announced 31% of the deals of 2006, 39% of the deals of 2011, and 50% of the deals of 2016. Not only are the total number of deals increasing among the top ten buyers, but the concentration of total deals among the top ten buyers is also increasing.
Level of Sophistication RequiredThe number of deals announced by the top ten buyers in 2016 compared to 2011 more than doubled (105 compared to 221). Eight of the top ten averaged more than one deal per month, with the top five buyers announcing two or three deals per month. In our experience, extraordinary corporate sophistication and dedication is required
TOP TEN BUYERS BY DEAL COUNT2006 2011 2016
Brown & Brown, Inc. 12 Hub International Limited 26 Acrisure, LLC 38Arthur J. Gallager & Co. 11 Arthur J. Gallager & Co. 17 Hub International Limited 31
USI Holdings Corporation 10 Brown & Brown, Inc. 16 BroadStreet Partners, Inc. 28
Hub International Limited 9 Digital Insurance, Inc. 9 AssuredPartners, Inc. 26
Stewart Information Services Corp. 6 Confie Seguros Insurance Services 9 Alera Group, Inc. 24
Wells Fargo & Company 5 Marsh & McLennan Companies, Inc. 7 Arthur J. Gallager & Co. 23
Hilb Rogal & Hobbs Company 5 Bollinger, Inc. 6 Confie Seguros Insurance Services 17
NFP Corp. 5 USI Holdings Corporation 6 Hilb Group LLC 15
Bollinger, Inc. 5 Undisclosed Buyer 5 USI Holdings Corporation 10
Tompkins Trustco, Inc. 4 Ascension Insurance, Inc. 4 Risk Strategies Company, LLC 9
Total of Top 10 72 Total of Top 10 105 Total of Top 10 221
Total 2006 Deal Count 233 Total 2011 Deal Count 268 Total 2016 Deal Count 443
Top 10 Buyers % of Total Deals 31% Top 10 Buyers % of Total Deals 39% Top 10 Buyers % of Total Deals 50%
Source: MarshBerry proprietary database, S&P Global Market Intelligence, Insurance Journal, and other publicly available sources

PEER EXCHANGE NETWORK NEWS
INTERESTED IN LEARNING MORE ABOUT OUR PEER EXCHANGE NETWORKS? Please contact Tommy McDonald today at [email protected]
APPEX: Using Data to Determine Your Next MoveOctober 17-20 • The Westin Kierland Resort & Spa, Scottsdale, AZ
What to watch for: n THE STATE OF THE INDUSTRY
presented by John Wepler, Chairman & CEO, Marsh, Berry & Company, Inc.
MarshBerry examines the playing field for current factors affecting the insurance industry, providing our outlook and what to expect in the year ahead.
n MONEYBALL: THE ART OF WINNING AN UNFAIR GAME Presented by Paul DePodesta, Cleveland Browns Chief Strategy Officer, Entrepreneur & Subject of Moneyball
Paul DePodesta has made a career of evaluating, measuring, and assigning value to talent, as documented in Michael Lewis’s book Moneyball: The Art of Winning an Unfair Game. The Moneyball methodology has become a mainstay strategy for business leaders looking for new approaches to overhauling stagnant systems.Formerly the Vice President of Player Development and Amateur Scouting for the New York Mets, DePodesta in 2015 helped lead the team to the World Series for the first time since 2000. In January 2016, DePodesta joined the NFL’s Cleveland Browns as Chief Strategy Officer, where he applies a version of the Moneyball methodology to the Browns’ front office, roster, and culture.
Register now! www.MarshBerry.com/FA17APPEX
9CounterPoint September 2017
to complete that many deals. These top buyers are executing on a deliberate acquisition strategy that requires specialized employees and processes, focuses on moving quicker, and have more collective knowledge about transactions.
We are seeing that this level of sophistication often makes it difficult for other buyers, like regional independent agencies, to compete for deals. For those that want to be acquirers, there are still ways to get transactions done. It takes a strategic acquisition plan and vision that deliberately attempts to maximize strengths while trying to mitigate weaknesses when compared to other buyers. Such a strategic plan would include, but not be limited to:
n Emphasizing the importance of building a reputation as a buyer and developing credibility with potential sellers. n An opportunistic approach to the marketplace that is willing to take some risks.n A demonstration to sellers of the capability to buy, flexibility, and being easy to work with. That might mean buying
something that others have passed on, or possibly offering a higher-than-intended price. n Understanding that building relationships is key. Take the time to establish strong rapport with potential sellers and
demonstrate to them that you are their “ideal” perpetuation plan.
We believe the top buyers will continue to drive much of the acquisition activity and that there will continue to be new companies entering the top ten list while others drop off. But there are still tens of thousands of insurance agencies throughout the United States and other buyers will also complete many deals. We believe that building a strategic acquisition plan is key. nSources: S&P Global Market Intelligence, Insurance Journal and other publicly available sources.Securities offered through MarshBerry Capital, Inc., Member FINRA and SIPC, and an affiliate of Marsh, Berry & Company, Inc. 28601 Chagrin Blvd., Suite 400, Woodmere, OH 44122 • 440.354.3230.

10 September 2017 CounterPoint
My Producer Retired Three Years Ago but Still Hasn’t Told Me
Addressing Non-Producing Producersby Brian Eggleston, National Organic Growth Consultant 616.828.5533 | [email protected]
Is every person at your agency with the title of ‘Producer’ actually producing? In many firms there are producers that have grown their book of business but have since become complacent and now focus more on client management versus writing new business.
THESE PRODUCERS ARE OFTEN THE BIGGEST THREAT TO A FIRMS COMMISSION GROWTH.What’s in a title?The main responsibility of a producer is to sell and generate new business. Many firms have people with the ‘Producer’ title that have minimal new business production each year. Contrary to what you may wonder, the producer isn’t retired, they have simply evolved into a non-producing producer.
Identifying producersThe first step is to identify the actual producers in your organization. Ask yourself, of all of the people within my organization with the title of producer, who hit the minimum new business goal in the previous year?
Firms often keep people in the producer role because they are good people. Attributes of a top producer are: generating new business, being highly driven, demonstrating motivation and have a desire to sell and close business. They are typically extremely competitive and independent. The most common mistake agencies make is paying and treating non-producing producers as true producers. Ultimately, this approach damages an organization’s culture and productivity, simultaneously increasing payroll and obstructing profits and growth.
Engage sellingAfter identifying the true producers, organizations then need to look inward and assess motivation through new business production goals and compensation plans, as well as a culture of accountability within the firm. An organization should have a sales culture, complete with realistic targets and objectives for each producer that align with the organization’s overall growth goals. The Producer’s goals should be married to their compensation.
MarshBerry recommends three new business goals for experienced producers: 1 A MINIMUM NEW BUSINESS REQUIREMENT GOAL
2 AN ORGANIZATIONAL GOAL
3 A STRETCH GOALFOR
THE
RE
CO
RD
ORGANIC GROWTH RATE
AND NEW BUSINESS PRODUCTION
Source: MarshBerry’s proprietary financial management system Perspectives for High Performance (PHP) TTM 6/30/2017 preliminary. Data as of 8/14/2017.

11CounterPoint September 2017
Open and clear conversations surrounding the organization’s growth and how the producer’s goals align creates more engagement from the produce and emboldens motivation and viability of the firm. Each Producer should be held to a minimum new business goal. According to MarshBerry’s proprietary benchmarking program, Perspectives for High Performance (PJP), high growth firms have a minimum annual new business requirement above $95,000 of revenue each year. If the minimum goal is not met their renewal commission percentage should drop; there should be a negative consequence for not hitting the minimum goal. The goals should also include an organizational goal component. That would consist of an agreement that the producer did his/her job, which would not result in a negative or positive outcome. The third goal would be a stretch goal. If the producer is well beyond their organizational goal they should be incentivized and rewarded for going above and beyond. This is typically 20-30% higher than the organizational goal. The stretch goal should still be an attainable goal yet exceeds the organizational goal and reflects a best-case scenario for the producer.
Accountability accelerates performanceA manager should review the goals and progress with the producer on a quarterly basis and hold producers accountable to them.
Far too often agencies set goals but never discuss them, let alone enforce them. High growth firms that regularly identify producers within their organization, set realistic but aggressive new business goals, then hold them accountable have a 50% higher organic growth rate. n“High Growth” is defined as the top 25% of reported organic growth.
“The Carrot”REWARD – POSITIVE CONSEQUENCES
Minimum Requirement Example: $83,750
Miss Minimum of $83,750
CURRENT SPLIT YEAR 1 YEAR 2 YEAR 3
New Business Commission 40% 40% 40% 40%
Renewal Commission 25% 20% 15% 10%
Organizational Goal: Goal varies by Producer, we have seen this
typically 20% of the prior year’s book.
Exceed Organizational Goal by:
CURRENT SPLIT 20% 30% 40%
New Business Commission 40% 45% 50% 55%
Renewal Commission 25% 25% 25% 25%
SEASONED PRODUCER ACCOUNTABILITY
“The Stick”NEGATIVE CONSEQUENCES
For illustrative purposes only.
S&P Global Market Intelligence and MarshBerry Host 11th Annual Insurance Brokerage Summit: Sink or SailNovember 8-9 , National Harbor, MDThe 11th Annual Insurance Brokerage Summit, in partnership with MarshBerry, brings together top industry executives, advisers and analysts for an open and informed discussion of strategic planning, growth, and the outlook for Merger & Acquisition (M&A)* in the insurance distribution marketplace.
Register today at: www.MarshBerry.com/BrokerageSummitUse discount code IBMB200 and receive $200 off your conference registration.*Securities offered through MarshBerry Capital, Inc., Member FINRA and SIPC, and an affiliate of Marsh, Berry & Company, Inc. 28601 Chagrin Blvd., Suite 400, Woodmere, OH 44122 • 440.354.3230.

in Partnership with Insurance JournalMarshBerry and Insurance Journal have joined forces to bring a series of online technical training courses designed specifically to provide new producers in the Property & Casualty insurance industry the knowledge they need to develop a foundation for success.
This 15-hour, 8-week program is authored and instructed by Christopher J. Boggs, CPCU, ARM, ALCM, one of the top insurance educators in the country. In addition to the 8-week program, subscribers also have access to the entire catalog of courses and live webinars.
For more information, and to view a current training curriculum, visit: www.MarshBerry.com/training-portal
Property & Casualty Insurance Training for New Producers
12 September 2017 CounterPoint
TRAINING OPPORTUNITIES
SALESPRO PRODUCER TRAINING WORKSHOPDouble-digit Organic Growth continues to be a challenge throughout the insurance industry, but the High-Growth Agencies are consistently writing 20% new business as a percentage of prior year total commissions and fees — what can you do to achieve these same results?
Get producers to actually produce and motivate the service team to cross sell and retain more business.
Start by sending your producers to our SalesPro Producer Training Workshop in Cleveland on October 5-6! Learn how top producers in the industry are averaging over $185k of new business per year by implementing a defined sales process, better qualifying target accounts, and uncovering prospect pains to provide the competitive advantage to win the account.
For more info and to register, log on to: www.MarshBerry.com/FallSalesPro
THE ART AND SCIENCE OF MENTORING PRODUCERSJoin MarshBerry October 16 – 17 in Scottsdale, AZ for The Art & Science of Mentoring Workshop. Designed specifically for executives in the insurance distribution space, this workshop provides an overview of sales leadership best practices and enables attendees to build a comprehensive development plan for their production staff, allowing the agency to achieve their organic growth goals.
Participants will leave with a detailed mentoring plan for new producers, an understanding of what is needed for successful mentorship, and tactics to filter out under performers. The session will force attendees to take a step back from their business and realistically and objectively assess their own agency’s sales culture to find out what’s working, what’s broken, and what needs to be implemented to drive more new business production.
For more info and to register, log on to: www.MarshBerry.com/Mentor

CONGRATULATIONS to the following organizations
that were recently represented by MarshBerry in their transaction:
A U G U S T 2 0 1 7
Hub International Limited HAS ACQUIRED THE ASSETS OF
East West Insurance Services, Inc. from East West Bank1
Hub International Limited HAS ACQUIRED
Rogers, Gunter, Vaughn Insurance, Inc.2
Hub International Limited HAS ACQUIRED
Coordinated Resources Group, LLC2
1MarshBerry represented the Seller in this transaction. 2MarshBerry represented the Buyer in this transaction
Securities offered through MarshBerry Capital, Inc., Member FINRA and SIPC, and an affiliate of Marsh, Berry & Company, Inc. 28601 Chagrin Blvd., Suite 400, Woodmere, OH 44122 • 440.354.3230.
NOW AVAILABLE2017 MarshBerry Organic Growth Trends Report MarshBerry has released its biennial Organic Growth Trends Report. The goal of the report is to identify organic growth trends, as well as to provide insight into the relationship between Talent Acquisition and Sales Performance management and determine any differences between “High Growth” and the “Average” of all responding agencies.
Interested in learning more? Log on to www.MarshBerrycom/2017GrowthTrends for additional details and cost.
13CounterPoint September 2017
Are You Achieving the Levels of Organic Growth You Should Be?In 2016, our Sales Performance team helped clients produce 17.9% new business as a percentage of prior year’s commissions & fees, while the industry average remains around 12.7.
What’s stopping you from driving more predictable, profitable organic growth?
Overcome your Organic Growth challenges with our Sales Performance solutions:
n Sales culture analytical and onsite assessment
n Sales management recommendations
n Onsite sales training workshops
n One-on-one sales coaching for new & seasoned producers
n Pipeline management
n Compensation modeling
Want to learn about these solutions? Contact us at 440.392.6559.

QU
ARTE
R IN
RE
VIE
W
14 September 2017 CounterPoint
Q&A with John Wepler1 What area do public brokers feel will present one of the
biggest challenges for the industry and its clients in the next three years?
Answer: The Technological Arms Race One could argue that every twelve to twenty-four months, computers, tablets, and phones seem to double
their capabilities and often so do the information technologies that use them. Looking back to 2000, business leaders had to consider what their “World Wide Web” strategy would be during their Monday morning meeting. The insurance distribution space is no exception to technological advancements and it’s not just hardware or software either. People often overlook the human capital element. For example, Marsh & McLennan Companies, Inc. (“MMC”) recently hired two new positions which included a Chief Digital Officer (CDO) and Chief Data and Analytics Officer (CDAO) to oversee “strategic design, development, and delivery of digital capabilities, data analytics and client-facing technology.” We believe that the winners in the technological arms race will be the firms that have a proven ability to adapt to technological advancements, synthesize client data, leverage software that streamlines back office support, and invest in human capital to support its investment.
Brown & Brown, Inc. (“BRO”) is also making investments in technology by moving to a unified retail agency management platform. BRO also estimates that the impact of its investment in technology related infrastructure will be approximately 70 basis points for the second quarter of 2017. From a client perspective, one must not only navigate demographic and economic hurdles, but also competitive disruption and exponential changes in technology. Aon PLC (“AON”) recently announced that they are making strategic investments in high-growth areas such as data analytics to “improve the firm’s growth profile driven by new business generation, strong retention rates, and increased operating leverage” all in an effort to position the firm for long-term growth. MMC continues to invest in technology and data analytics to drive innovation and foster growth. They recently launched Mercer Digital, an integrated business across health, wellness, and benefits platforms, to better leverage digital capabilities. MMC also continues to broaden its participation in the technology and innovation arms race by partnering with a private equity firm that is solely focused on early stage tech companies development in the insurance industry.
2 What is the outlook on the current rate environment for the remainder of 2017? We are seeing that many brokers are experiencing an increased rate environment outside of the United States.
Arthur J. Gallagher & Co. (“AJG”) observed rate increases in Australia and New Zealand of 4%-5% during the second quarter alone. MMC noted similar rate increases in Australia. Domestically, the rate environment has continued to grow, albeit at a much more somber pace than its international counterpart, averaging 1%-2% according to many of the public brokers. A specific area that continues to experience strong rate increases is personal lines. BRO suggests that a potential contributing factor to the continued rate increases in personal lines pertains to the aggregate increase in distracted driving incidents, specifically young adults. BRO recently published that they are beginning to see carriers draw a hard line on lowering personal auto premium rates, in fact, clients are experiencing rising personal auto rates anywhere between 1%-5%.
The overall broker outlook is that rates across all lines will continue to have marginal increases throughout the remainder of 2017, especially in personal lines. As more and more drivers hit the roadways, more and more claims will likely be submitted, forcing an increase in carriers loss ratios and subsequently another round of increases in premium.
Sources: Data for Aon PLC, Arthur J. Gallagher & Co., Brown & Brown, Inc., and Marsh & McLennan Companies was obtained through the 2Q17 public investor calls for each organization as well as other publicly available sources. S&P Global Market Intelligence
Securities offered through MarshBerry Capital, Inc., Member FINRA Member SIPC and an affiliate of Marsh, Berry & Company, Inc., 28601 Chagrin Blvd., Suite 400, Woodmere, Ohio 44122 440.354.3230. Marsh, Berry & Co., Inc. and MarshBerry Capital, Inc. do not provide tax or legal advice. These professionals should be consulted before implementing changes to your tax or legal matters.

BROKER TEARSHEET
BROKERAon
CorporationArthur J.
Gallagher & Co.
Brown & Brown, Inc.
Marsh & McLennan
Companies, Inc.
Willis Towers Watson
PLC
Ticker AON AJG BRO MMC WLTW
Total Revenue LTM (in $ mil) 10,851 4,300 1,827 13,509 7,911
Number of Employees (FTEs)1 72,000 24,790 8,297 60,000 41,000
Number of Offices1 500 650 241 600 400
Revenue per Employee ($) 150,708 173,465 220,239 225,150 192,951
Revenue per Office ($) $21,702,000 $6,615,692 $7,582,253 $22,515,000 $19,777,500
ENTERPRISE VALUE2
Common Stock Price ($) 132.95 57.25 43.07 77.96 145.46
Number of Shares Outstanding (in 000s) 255,700 180,164 139,999 512,804 134,595
Market Capitalization (in $ mil) 33,995 10,314 6,030 39,978 19,578
Plus: Total Debt (in $ mil) 5,923 3,113 985 5,641 4,182
Plus: Preferred Stock & Minority Interest in Subsidiaries (in $ mil) 66 65 0 81 181
Less: Cash & Short Term Investments (in $ mil) 684 588 600 966 852
Equals: Enterprise Value (in $ mil) $39,300 $12,905 $6,415 $44,734 $23,089
BOOK OF BUSINESS VALUE
Market Capitalization (in $ mil) 33,995 10,314 6,030 39,978 19,578
Less: Tangible Net Worth (in $ mil) -3,594 -1,742 -906 -2,980 -4,278
Equals: Book of Business Value (in $ mil) $37,589 $12,056 $6,936 $42,958 $23,856
ORGANIC GROWTH
Organic Growth3 3.0% 4.4% 1.6% 3.0% 2.0%
Total Growth4 -14.1% 5.8% 4.4% 3.6% -1.6%
The Broker Tear Sheet has been prepared by Marsh, Berry & Co., Inc. This is an overview and analysis of the five publicly traded insurance brokers, and is not intended to provide investment recommendations on any company. It is not a research report; as such term is defined by applicable laws and regulations. It is not to be construed as an offer to buy or sell or a solicitation of an offer to buy or sell any securities, financial instruments or to participate in any particular trading strategy. This tear sheet is distributed with the understanding that the publisher and distributor are not rendering legal, accounting, financial or other advice and assume no liability in connection with its use. This tear sheet does not rate or recommend securities of individual companies, nor does it contain sufficient information upon which to make an investment decision. These materials are based solely on information contained in publicly available documents and certain other information provided to Marsh, Berry & Co., Inc., and Marsh, Berry & Co., Inc. has not independently attempted to investigate or to verify such information. Marsh, Berry & Co., Inc. has relied, without independent investigation, upon the accuracy, completeness and reasonableness of such information and therefore has assumed no obligation to update this data for financial restatements. These materials are intended for your benefit and use and may not be reproduced, disseminated, quoted or referred to, in whole or in part, or used for any other purpose, without the prior written consent of Marsh, Berry & Co., Inc. Nothing herein shall constitute a recommendation or opinion to buy or sell any security of any publicly traded entity mentioned in this document. Numbers may not add up due to rounding, however, this does not materially affect the data integrity.
The Broker Tear Sheet is a proprietary quarterly report from MarshBerry that highlights critical ratios and statistics on the performance and market value of the five publicly traded insurance brokers. The information is compiled from a number of credible sources including: S&P Global Market Intelligence, Yahoo! Finance, Morningstar and Reuters reports along with company websites.
The one and five year Financial Performance Indicators are updated after each broker’s year end filing (Q4), while the remaining metrics are updated on a quarterly basis.
S E P T E M B E R 2 0 1 7
Q2 2017 Snapshot (as of 06.30.17)
Securities offered through MarshBerry Capital, Inc., Member FINRA, Member SIPC, and an affiliate of Marsh, Berry & Co., Inc. 28601 Chagrin Blvd., Suite 400, Woodmere, Ohio 44122 • 440.354.3230
1 Number of employees and number of offices are estimates based on data provided in annual reports, S&P Global Market Intelligence and on corporate websites by each company. 2 Numbers may not add up due to rounding.3Both Organic Growth and Total Growth represent the most recent quarter (MRQ) in comparison to the same period for the prior year for all reported segments. As such, the difference is comprised of growth by acquisition and disposition of applicable business units for the MRQ. It could include items such as contingent revenue, acquisition revenue and disposed revenue from those that would exclude it from their organic growth calculation. Organic Growth calculations vary by broker (see reverse side).4Total growth for Willis Towers Watson PLC includes merger effective January 4, 2016

*WLTW includes financial information from the merger between Willis Towers Watson PLC and Towers Watson that was effective January 4, 2016.5As reported in the MD&A published by each company; and calculated and reported slightly differently by each. AON: Includes all revenue except business unit transfers, unusual items and reimbursable expenses. AJG: Includes base organic commission & fee revenue and excludes supplemental and contingent commission revenue, impact of prior year large account wins, run-off related to the New South Wales Workers’ Compensation Scheme, South Australia ramp up fees and New Zealand claims administration. BRO: Includes total commissions excludes profit sharing and guaranteed supplemental commissions. MMC: Includes all segments of revenue, using consistent currency translation (excluding divestitures, transfers among business units, acquisitions, and deconsolidation of Marsh India). WLTW: Includes total commissions & fees (excludes goodwill impairment charges, debt extinguishment, investment income, and other income). All broker organic growth calculations exclude the impact of foreign currency translation, divestitures, transfers, disposed operations, and the first twelve months of acquisition commission & fee revenue.6EBITDA is not adjusted to include the add-back of non-recurring expenses written off throughout the year.
TERMINOLOGY KEY: LTM: LAST 12 MONTHS (06.30.17); CAGR: COMPOUND ANNUAL GROWTH RATE (06.30.17); EBITDA: EARNINGS BEFORE INTEREST, TAXES, DEPRECIATION & AMORTIZATION; NM: NON-MEASURABLE; YOY: YEAR OVER YEAR
EBITDA6 LTM (in $ mil)
Marsh & McLennan 3,243 Aon 2,164 *Willis Towers Watson 1,419 AJ Gallagher 849 Brown & Brown 579
Median 1,419
EBITDA YOY Growth as of 06.30.17
*Willis Towers Watson 98.0%AJ Gallagher 11.9%Marsh & McLennan 7.4%Brown & Brown 3.7%Aon -8.2%
Median 7.4%
EBITDA Growth 5 Year CAGR
*Willis Towers Watson 19.2%AJ Gallagher 17.6%Brown & Brown 10.2%Marsh & McLennan 9.9%Aon 2.2%
Median 10.2%
EBITDA Margin LTM
Brown & Brown 31.7%Marsh & McLennan 24.0%Aon 19.9%AJ Gallagher 19.7%*Willis Towers Watson 17.9%
Median 19.9%
EBITDA Margin 5 Year Average
Brown & Brown 32.4%Aon 21.1%Marsh & McLennan 21.0%AJ Gallagher 18.4%*Willis Towers Watson 15.2%
Median 21.0%
PROFIT
Organic GrowthQuarter End 2Q175
AJ Gallagher 4.4%Marsh & McLennan 3.0%Aon 3.0%*Willis Towers Watson 2.0%Brown & Brown 1.6%
Median 3.0%
Revenue YOY Growth as of 12.31.16
*Willis Towers Watson 102.4%Brown & Brown 6.4%AJ Gallagher 3.6%Marsh & McLennan 2.1%Aon -0.5%
Median 3.6%
Revenue Growth 5 Year CAGR
*Willis Towers Watson 17.9%AJ Gallagher 14.8%Brown & Brown 11.8%Marsh & McLennan 2.7%Aon 0.6%
Median 11.8%
Total Revenue LTM (in $ mil)
Marsh & McLennan 13,509 Aon 10,851 *Willis Towers Watson 7,911 AJ Gallagher 4,300 Brown & Brown 1,827
Median 7,911
GROWTHOrganic Growth Year to
Date as of 06.30.175
*Willis Towers Watson 4.0%Aon 4.0%AJ Gallagher 3.6%Marsh & McLennan 3.0%Brown & Brown 2.5%
Median 3.6%
Tangible Net Worth (in $ mil)
Brown & Brown (906)AJ Gallagher (1,742)Marsh & McLennan (2,980)Aon (3,594)*Willis Towers Watson (4,278)
Median (2,980)
Working Capital/LTM Revenue
Aon 20.5%Brown & Brown 19.7%*Willis Towers Watson 15.2%Marsh & McLennan 11.3%AJ Gallagher 5.8%
Median 15.2%
Days of Working Capital
Brown & Brown 93.9 Aon 82.6 *Willis Towers Watson 58.7 Marsh & McLennan 51.2 AJ Gallagher 23.1
Median 58.7
BALANCE SHEETTangible Net Worth
as % of Revenue
Marsh & McLennan -22.1%Aon -33.1%AJ Gallagher -40.5%Brown & Brown -49.6%*Willis Towers Watson -54.1%
Median -40.5%
Debt to LTM EBITDA (Lower performance is usually best)
Brown & Brown 1.7 Marsh & McLennan 1.7 Aon 2.7 *Willis Towers Watson 2.9 AJ Gallagher 3.7
Median 2.7
Market Cap (in $ mil)
Marsh & McLennan 39,978 Aon 33,995 *Willis Towers Watson 19,578 AJ Gallagher 10,314 Brown & Brown 6,030
Median 19,578
Book of Biz Value as Multiple of LTM EBITDA
Aon 17.4 *Willis Towers Watson 16.8 AJ Gallagher 14.2 Marsh & McLennan 13.2 Brown & Brown 12.0
Median 14.2
Enterprise Value as Multiple of LTM EBITDA
Aon 18.2 *Willis Towers Watson 16.3 AJ Gallagher 15.2 Marsh & McLennan 13.8 Brown & Brown 11.1
Median 15.2
Price-Earnings Multiple
*Willis Towers Watson 41.1 Brown & Brown 23.2 AJ Gallagher 23.1 Marsh & McLennan 21.5 Aon 18.9
Median 23.1
VALUEBook of Biz Value as
Multiple of LTM Revenue
Brown & Brown 3.8 Aon 3.5 Marsh & McLennan 3.2 *Willis Towers Watson 3.0 AJ Gallagher 2.8
Median 3.2
Dividend Yield Quarter End 2Q17
AJ Gallagher 2.7%Marsh & McLennan 1.9%*Willis Towers Watson 1.4%Brown & Brown 1.3%Aon 1.0%
Median 1.4%
RETURNEarnings Yield
Quarter End 2Q17
AJ Gallagher 1.7%Marsh & McLennan 1.3%Brown & Brown 1.1%*Willis Towers Watson 0.2%Aon -0.2%
Median 1.1%
Price Per Share Growth LTM
Aon 21.7%AJ Gallagher 20.3%*Willis Towers Watson 17.0%Brown & Brown 14.9%Marsh & McLennan 13.9%
Median 17.0%
Price Per Share Growth 5 Year CAGR
Aon 19.0%Marsh & McLennan 16.4%Brown & Brown 14.7%AJ Gallagher 9.2%*Willis Towers Watson 3.5%
Median 14.7%
Total Return LTM
AJ Gallagher 23.3%Aon 22.6%*Willis Towers Watson 19.1%Brown & Brown 17.7%Marsh & McLennan 16.8%
Median 19.1%
Securities offered through MarshBerry Capital, Inc., Member FINRA, Member SIPC, and an affiliate of Marsh, Berry & Co., Inc. 28601 Chagrin Blvd., Suite 400, Woodmere, Ohio 44122 • 440.354.3230No portion of this publication may be reproduced without express written consent from Marsh, Berry & Company, Inc. All rights reserved © 2017.
Q2 2017 Financial Performance Indicators (as of 06.30.17)

2016 DealsA
MARSHBERRY
EVERYONE ELSE
Merger & Acquisition Transactions in Insurance Brokerage 1999-2016Ranked by Total Number of Deals
1999-2016 Completed Transactions
Completed transactions in the United States as reported by S&P Global Market Intelligence, February 1, 2017
MOST ACTIVE: ADVISER RANKINGS
• 602B total Merger & Acquisition (M&A) transactions advised on since 1999, representing 28% of total tracked M&A deal flow receiving advisory credit since 1999 as reported by S&P Global Market Intelligence.
• $4.1B in advised transaction value since 2012C
• 325 M&A transactions since 1995 with the 100 largest brokers of U.S. business as identified by Business Insurance, and over 205 Bank-Related Insurance M&A transactions since 1997
• Completed more than 275 diagnostic and confirmatory due diligence projects over the last thirteen years
Securities offered through MarshBerry Capital, Inc., Member FINRA and SIPC, and an affiliate of Marsh, Berry & Company, Inc. 28601 Chagrin Blvd., Suite 400, Woodmere, Ohio 44122 (440.354.3230).
A Completed transactions (insurance brokerage) involving a financial adviser in the United States for 2016 as reported by S&P Global Market Intelligence, February 1, 2017.
B These totals include certain transactions completed by Marsh, Berry & Company, Inc. professionals while employed at another firm, whereby substantially all of the assets were acquired by Marsh, Berry & Company, Inc.
C Based upon maximum possible purchase price; MarshBerry advised deals through 12/31/16.
CHALK IT UP TO MARSHBERRY.
#1 M&A RANKING BY S&P GLOBAL MARKET INTELLIGENCE
602B
70
800.426.2774 • www.MarshBerry.com
This data displays a snapshot at a particular point in time of the number of deals as reported by S&P Global Market Intelligence. It has not been updated to reflect subsequent changes, if any.
MARSHBERRYlearn. improve. realize.
28601 Chagrin Blvd., Ste. 400 Woodmere, OH 44122
www.MarshBerry.com
@marshberryinc
facebook.com/MarshBerry
linkedin.com/company/ MarshBerry
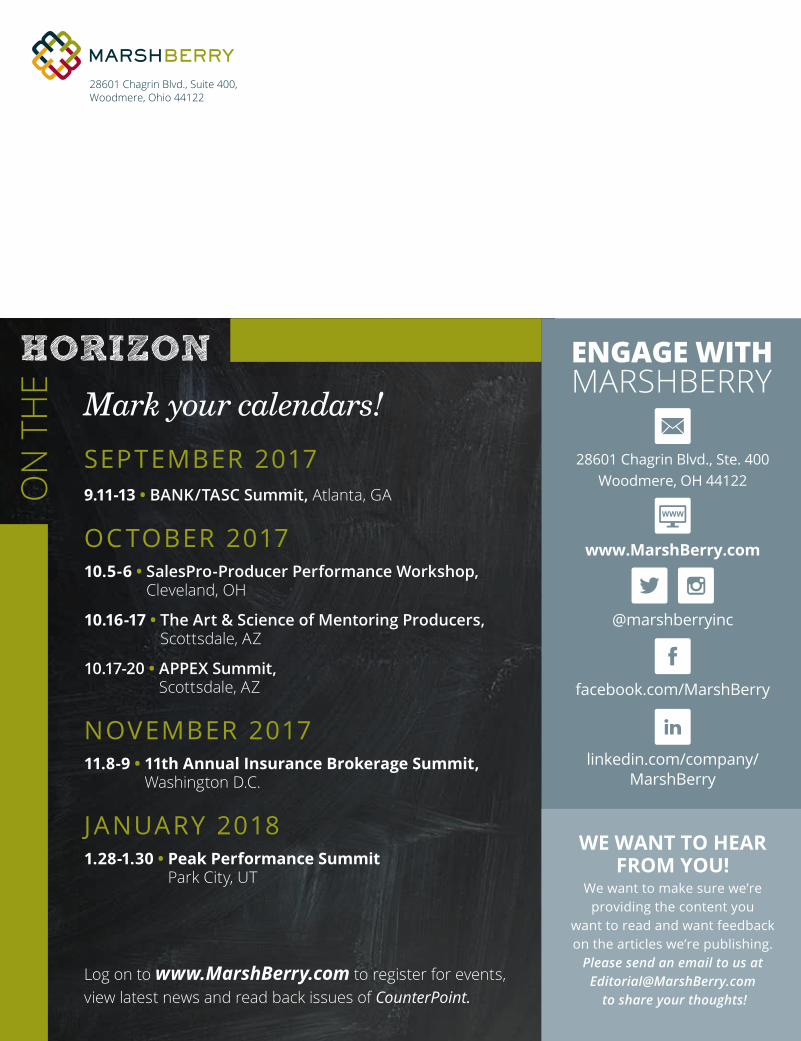
Mark your calendars!
SEPTEMBER 20179.11-13 • BANK/TASC Summit, Atlanta, GA
OC TOBER 201710.5-6 • SalesPro-Producer Performance Workshop,
Cleveland, OH
10.16-17 • The Art & Science of Mentoring Producers, Scottsdale, AZ
10.17-20 • APPEX Summit, Scottsdale, AZ
NOVEMBER 201711.8-9 • 11th Annual Insurance Brokerage Summit,
Washington D.C.
JANUARY 20181.28-1.30 • Peak Performance Summit
Park City, UT
28601 Chagrin Blvd., Suite 400, Woodmere, Ohio 44122
ENGAGE WITH MARSHBERRY
HORIZON
ON
TH
E
Log on to www.MarshBerry.com to register for events, view latest news and read back issues of CounterPoint.
WE WANT TO HEAR FROM YOU!
We want to make sure we’re providing the content you
want to read and want feedback on the articles we’re publishing.
Please send an email to us at [email protected]
to share your thoughts!