Created by Tom Wegleitner, Centreville, Virginia Section 2-4 Measures of Center.
29
Created by Tom Wegleitner, Centreville, Virginia Section 2-4 Measures of Center
-
Upload
osborne-griffith -
Category
Documents
-
view
227 -
download
0
Transcript of Created by Tom Wegleitner, Centreville, Virginia Section 2-4 Measures of Center.

Created by Tom Wegleitner, Centreville, Virginia
Section 2-4Measures of Center

Definition
Measure of CenterThe value at the center or middle of a data set

Arithmetic Mean
(Mean)
the measure of center obtained by adding the values and dividing the total by the number of values
Definition

Notation
denotes the addition of a set of values
x is the variable usually used to represent the individual data values
n represents the number of values in a sample
N represents the number of values in a population

Notation
µ is pronounced ‘mu’ and denotes the mean of all values in a population
x =n
xis pronounced ‘x-bar’ and denotes the mean of a set of sample values
x
Nµ =
x

Definitions Median
the middle value when the original data values are arranged in order of increasing (or decreasing) magnitude
often denoted by x (pronounced ‘x-tilde’)~
is not affected by an extreme value

Finding the Median
If the number of values is odd, the median is the number located in the exact middle of the list
If the number of values is even, the median is found by computing the mean of the two middle numbers

5.40 1.10 0.42 0.73 0.48 1.10 0.66
0.42 0.48 0.66 0.73 1.10 1.10 5.40
(in order - odd number of values)
exact middle MEDIAN is 0.73
5.40 1.10 0.42 0.73 0.48 1.10
0.42 0.48 0.73 1.10 1.10 5.40
0.73 + 1.10
2
(even number of values – no exact middleshared by two numbers)
MEDIAN is 0.915

Definitions Mode
the value that occurs most frequently
The mode is not always unique. A data set may be:Bimodal
MultimodalNo Mode
denoted by M
the only measure of central tendency that can be used with nominal data

a. 5.40 1.10 0.42 0.73 0.48 1.10
b. 27 27 27 55 55 55 88 88 99
c. 1 2 3 6 7 8 9 10
Examples
Mode is 1.10
Bimodal - 27 & 55
No Mode
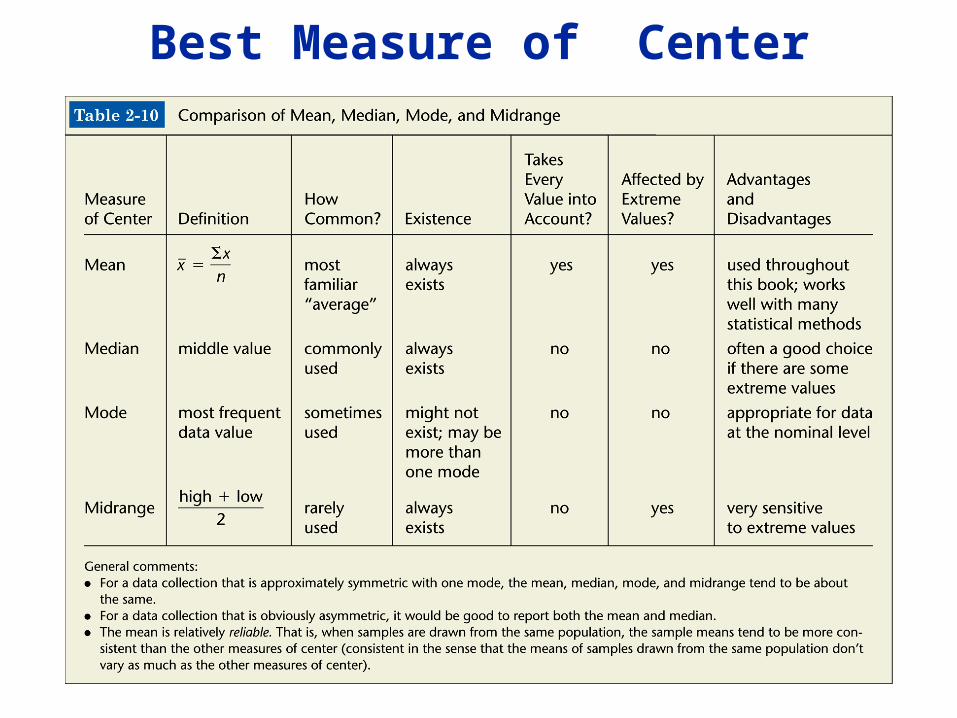
Best Measure of Center

SymmetricData is symmetric if the left half
of its histogram is roughly a mirror image of its right half.
SkewedData is skewed if it is not
symmetric and if it extends more to one side than the other.
Definitions

Skewness Figure 2-11

Created by Tom Wegleitner, Centreville, Virginia
Section 2-5 Measures of Variation

Measures of Variation
Because this section introduces the concept of variation, this is one of the most important sections in the entire book

Definition
The range of a set of data is the difference between the highest value and the lowest value
valuehighest lowest
value

Definition
The standard deviation of a set of sample values is a measure of variation of values about the mean

Sample Standard Deviation Formula
Formula 2-4
(x - x)2
n - 1S =

Sample Standard Deviation (Shortcut Formula)
Formula 2-5
n (n - 1)s =
n (x2) - (x)2

Standard Deviation - Key Points
The standard deviation is a measure of variation of all values from the mean
The value of the standard deviation s is usually positive
The value of the standard deviation s can increase dramatically with the inclusion of one or more outliers (data values far away from all others)
The units of the standard deviation s are the same as the units of the original data values
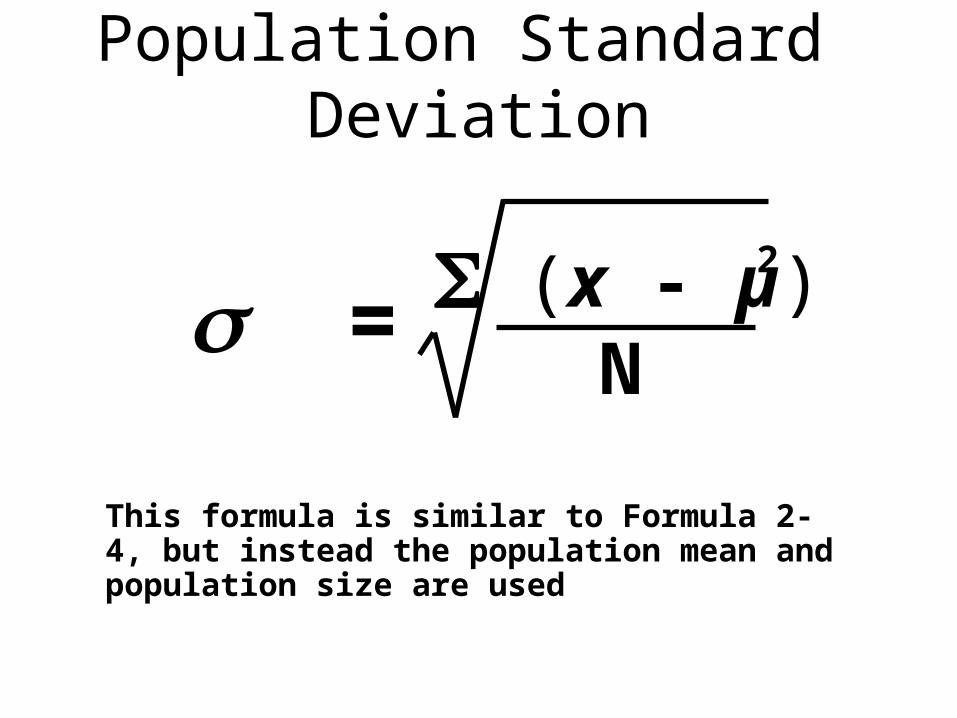
Population Standard Deviation
2 (x - µ)
N =
This formula is similar to Formula 2-4, but instead the population mean and population size are used
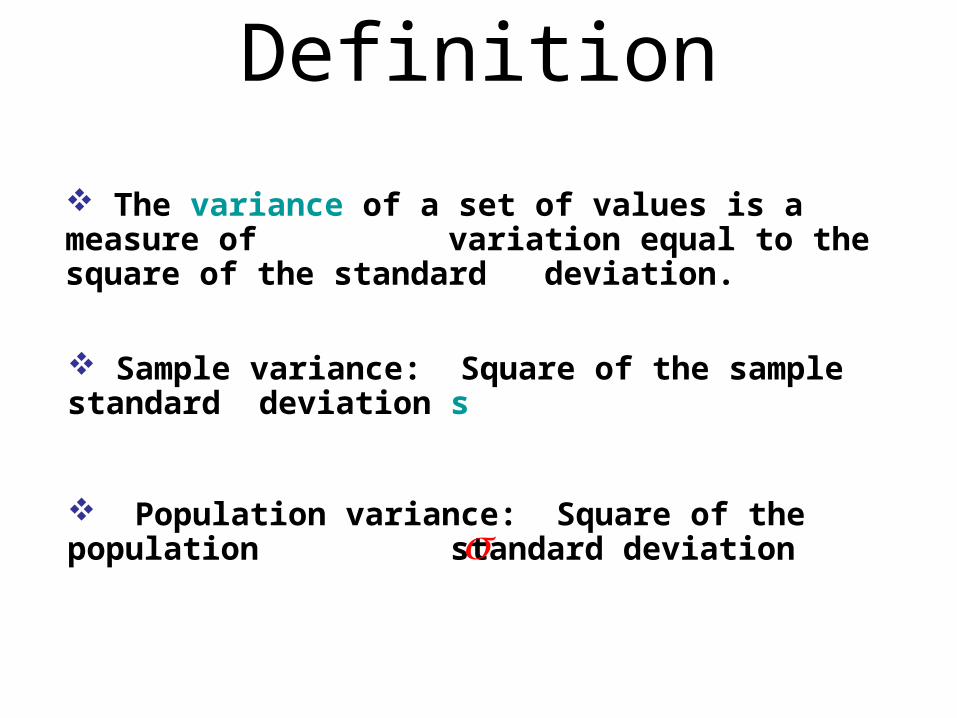
Population variance: Square of the population standard deviation
Definition
The variance of a set of values is a measure of variation equal to the square of the standard deviation.
Sample variance: Square of the sample standard deviation s

Variance - Notation
standard deviation squared
s
2
2
}Notation
Sample variance
Population variance

Definition
The coefficient of variation (or CV) for a set of sample or population data, expressed as a percent, describes the standard deviation relative to the mean
100%s
xCV =
100%CV =
Sample Population

Definition
Empirical (68-95-99.7) Rule
For data sets having a distribution that is approximately bell shaped, the following properties apply:
About 68% of all values fall within 1 standard deviation of the mean
About 95% of all values fall within 2 standard deviations of the mean
About 99.7% of all values fall within 3 standard deviations of the mean

The Empirical Rule
FIGURE 2-13

The Empirical Rule
FIGURE 2-13

The Empirical Rule
FIGURE 2-13

Definition
Measure of CenterThe value at the center or middle of a data set