CRD OD Survey DailyTravelCharacteristicsReport
117
2011 CRD Origin-Destinatio n Household Travel Survey Daily Travel Characteristics Report Prepared for the Capital Regional District Prepared by R.A. Malatest & Associates Ltd. September 2012 Contact Information: Andreas Rose, Research Associate R.A. Malatest & Associates Ltd. Phone: (800) 665-5848 Fax: (888) 384-2774 E-mail: [email protected] 858 Pandora Avenue 1201, 415 Yonge St 300, 10621 – 100 Avenue 500, 294 Albert Street 206, 255 Lacewood Drive Victoria, BC V8W 1P4 Toronto, ON M5B 2E7 Edmonton, AB T5J 0B3 Ottawa, ON K1P 6E6 Halifax, NS B3M 4G2
-
Upload
jared-makori -
Category
Documents
-
view
215 -
download
0
Transcript of CRD OD Survey DailyTravelCharacteristicsReport
7/27/2019 CRD OD Survey DailyTravelCharacteristicsReport
http://slidepdf.com/reader/full/crd-od-survey-dailytravelcharacteristicsreport 1/117
2011 CRD Origin-Destination Household Travel Survey
Daily Travel Characteristics Report
Prepared for the
Capital Regional District
Prepared by
R.A. Malatest & Associates Ltd.

7/27/2019 CRD OD Survey DailyTravelCharacteristicsReport
http://slidepdf.com/reader/full/crd-od-survey-dailytravelcharacteristicsreport 2/117
i
7/27/2019 CRD OD Survey DailyTravelCharacteristicsReport
http://slidepdf.com/reader/full/crd-od-survey-dailytravelcharacteristicsreport 3/117
ii
2011 CRD OD Survey Highlights
In autumn 2011, the Capital Regional District (CRD) conducted a comprehensive trip diary (origin-
destination, or O-D) survey. The survey profiles residents’ travel behaviour. The profile will aid the CRD
in its Regional Growth Strategy, the Regional Transportation Plan, and other ongoing sustainable
planning initiatives. The 2011 survey updates surveys that were conducted in 2006 and 2001.
The 2011 study area of the survey consisted of all 13 incorporated municipalities in the CRD, the Juan de
Fuca Electoral Area, Salt Spring Island, and the southern part of the Cowichan Valley Regional District
(CVRD), south of Cowichan Valley Highway (Highway 18) / Herd Road. Most of the reporting described
below covers the 13 incorporated municipalities and the Juan de Fuca Electoral Area: this area
corresponds to the area that is covered by the Regional Growth Strategy and is defined as the “Regional
Planning Area” (RPA). Households from Salt Spring Island and the CVRD were included in order to build a
better picture of travel between these regions and the RPA, and of the travel patterns of Salt Spring
Island residents. The Southern Gulf Islands and northern CVRD were not included.
The survey was conducted of a random sample of 6,328 households in the study area. The final sample
was 6,172 households after data cleaning and validation – households with too much missing or poor
data were removed. This represents a sample rate of about 3.5% of all households in the study area. The
2006 OD survey, by comparison, had 3,821 completed and valid weekday returns for a sample rate of
2.4% of all households in the study area at that time.
The 2011 sample results were expanded to represent demographic and travel characteristics for the
study area.

7/27/2019 CRD OD Survey DailyTravelCharacteristicsReport
http://slidepdf.com/reader/full/crd-od-survey-dailytravelcharacteristicsreport 4/117
iii
• Almost two of every five people had full time employment (39.1%). Another 14.0% had part
time employment (meaning that over half the population had full or part time employment);
19.4% were students; and 19.8% were retired.
• Among the employed population, office employment was the greatest component, at 37.5%;
followed by health care and social assistance (12.3%), industrial employment (11.7%) and retail
and wholesale employment (11.5%).
• RPA households had 240,474 vehicles, for an average of 1.57 vehicles per household. This rate is
an indicator of mobility and of mode choice: the more vehicles available to a household, the
more likely they will be used as the mode of travel. Also important is the number of vehicles
available for each household member.
• Close to half of all households (47.4%) have at least one vehicle for every household
member. Of these, 6.0% have more than one vehicle for each individual, whereas 41.4%
(i.e., two out of five households overall) have exactly one vehicle for each person.
• Just over one in ten households (11.1%) do not have any vehicles. This means that
household members are ‘captive’ to other modes (i.e., transit, walking, cycling or
sharing a ride with someone else). Most 0-vehicle households are 1-person households.
Travel Highlights
Key findings of the 2011 survey follow.
• Study area residents made over 1 million trips daily in the RPA (where ‘daily’ is measured as the
24-hour working weekday period over which the respondents’ trips were recorded).
• The average daily trip rate per person is a key travel indicator. It is calculated in two ways:
di idi th t t l b f t i b th l ti ith d ith t hild (0 10

7/27/2019 CRD OD Survey DailyTravelCharacteristicsReport
http://slidepdf.com/reader/full/crd-od-survey-dailytravelcharacteristicsreport 5/117
iv
• As can be seen in the figure below, auto driver is the dominant mode, capturing two thirds of all
daily trips (64.0%). Auto passenger is next at 13.1%. This represents an average auto occupancy
of 1.20; however, a more accurate
calculation for this factor should
be derived from observed
screenline classification counts1.
Walking is next, at 12.6% of all
trips, and is the second-mostprevalent mode during the midday
inter-peak (e.g., people walking to
and from lunch). Transit is
strongest during the peak periods
and midday inter-peak, with a
6.3% share overall.
• The next figure breaks down the daily trip purpose. People’s travel typically represents a ‘tour’
that starts and ends at home – for example, home to work to restaurant for lunch to work to
shopping and finally return to home. Each of these trips is categorized as an individual trip. As
the figure shows, the ‘return
home’ trip dominates (i.e.,
virtually all tours end at home),at 37.5% of all trips. This is
followed by the trip to work
(16 0%) shopping (13 0%) and

7/27/2019 CRD OD Survey DailyTravelCharacteristicsReport
http://slidepdf.com/reader/full/crd-od-survey-dailytravelcharacteristicsreport 6/117
v
• Auto driver is the dominant mode for most trip purposes, notably the commute to work
(69.9%). Auto passenger is strongest for other school, at 32.9%, followed by dining /
restaurant at 20.9%.
• Transit’s share is strongest for post-secondary school (almost half, or 49.0%) and other
school (15.9%). The share to work is 8.1%.
• The walk share is strongest for other school (25.4%), dining / restaurant (23.0% - e.g., the
mid-day lunch at work), and other (25.2%).
• Cycling is strongest for other school (5.3%), post-secondary school (5.0%) and the workcommute, for which the share is 4.9%.
• Over the course of the day, park and ride usage – people transferring from auto / motorcycle to
bus or bus to auto / motorcycle – recorded 3,114 trips. Of these, 57.5% took place at official and
unofficial lots, with the remaining transfers occurring elsewhere (e.g., at or near bus stops).
• For travellers who took transit, an important indication of the level of service that is available to
them is the number of transfers they make en route to their destination. The large majority –
86.2% - took a single bus to their destination on the given trip. No transfers were made. Another
12.1% transferred to a second bus, and 1.6% took three buses, and 0.02% took four buses.
• Vehicle availability is an important determinant of mode choice. A little less than one-quarter
(23.0%) of all trips involved modes of transportation other than an automobile (or motorcycle or
scooter. For just under two of every five non-auto trips (38.4%), a vehicle was available: this
means that the traveller had a choice of mode. For the remaining 61.6%, a vehicle was not
available for the trip – i.e., the household does not own a vehicle or someone else required the
vehicle – and so that individual was ‘captive’ to transit, walking or cycling.
A i f 2011 i di t ith th f th 2006 d 2001 i ld l
7/27/2019 CRD OD Survey DailyTravelCharacteristicsReport
http://slidepdf.com/reader/full/crd-od-survey-dailytravelcharacteristicsreport 7/117
vi
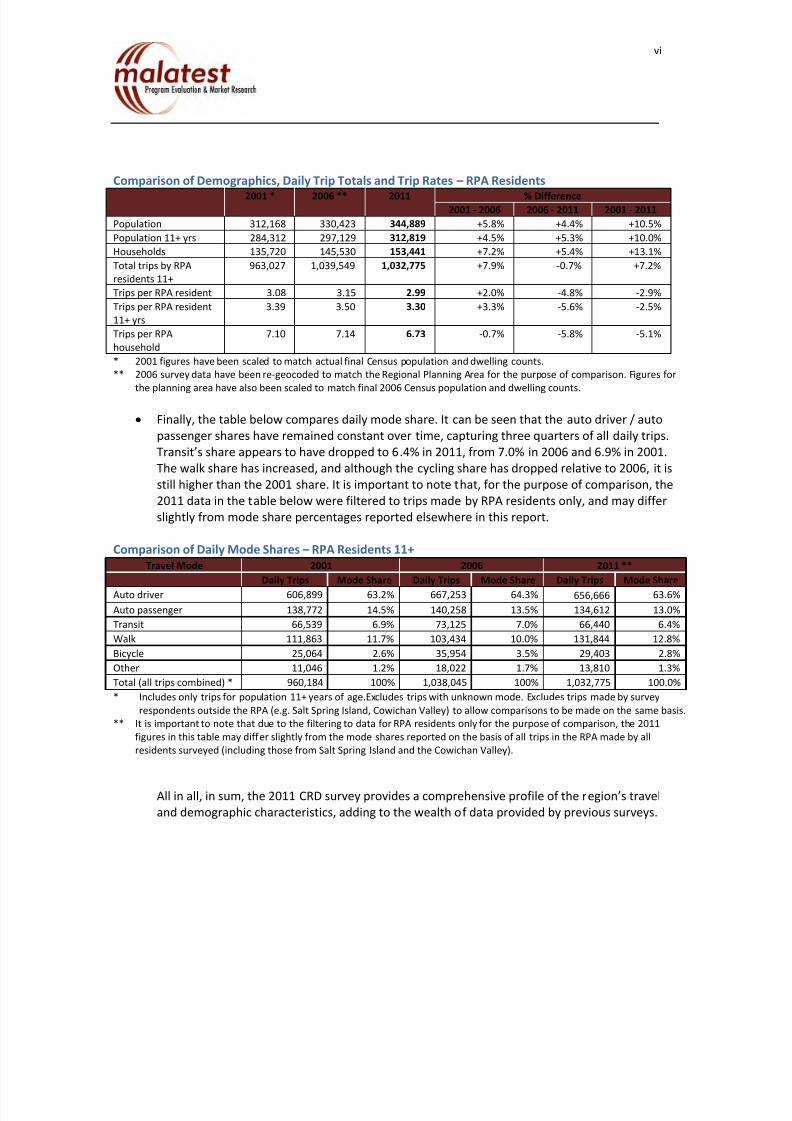
Comparison of Demographics, Daily Trip Totals and Trip Rates – RPA Residents2001 * 2006 ** 2011 % Difference
2001 - 2006 2006 - 2011 2001 - 2011
Population 312,168 330,423 344,889 +5.8% +4.4% +10.5%
Population 11+ yrs 284,312 297,129 312,819 +4.5% +5.3% +10.0%
Households 135,720 145,530 153,441 +7.2% +5.4% +13.1%
Total trips by RPA
residents 11+
963,027 1,039,549 1,032,775 +7.9% -0.7% +7.2%
Trips per RPA resident 3.08 3.15 2.99 +2.0% -4.8% -2.9%
Trips per RPA resident
11+ yrs
3.39 3.50 3.30 +3.3% -5.6% -2.5%
Trips per RPA
household
7.10 7.14 6.73 -0.7% -5.8% -5.1%
* 2001 figures have been scaled to match actual final Census population and dwelling counts.
** 2006 survey data have been re-geocoded to match the Regional Planning Area for the purpose of comparison. Figures for
the planning area have also been scaled to match final 2006 Census population and dwelling counts.
• Finally, the table below compares daily mode share. It can be seen that the auto driver / auto
passenger shares have remained constant over time, capturing three quarters of all daily trips.
Transit’s share appears to have dropped to 6.4% in 2011, from 7.0% in 2006 and 6.9% in 2001.
The walk share has increased, and although the cycling share has dropped relative to 2006, it is
still higher than the 2001 share. It is important to note that, for the purpose of comparison, the
2011 data in the table below were filtered to trips made by RPA residents only, and may differ
slightly from mode share percentages reported elsewhere in this report.
Comparison of Daily Mode Shares – RPA Residents 11+
Travel Mode 2001 2006 2011 **

7/27/2019 CRD OD Survey DailyTravelCharacteristicsReport
http://slidepdf.com/reader/full/crd-od-survey-dailytravelcharacteristicsreport 8/117
vii
Table of Contents
2011 CRD OD Survey Highlights....................................................................................................... ii
1 Introduction .................................................................................................................................... 1
1.1 Purpose of Report ............................................................................................................................. 1
1.2 Conduct of the CRD O-D Household Travel Survey ........................................................................... 2
1.3 Report Organization .......................................................................................................................... 3
1.4 Acknowledgements ........................................................................................................................... 3
2 Data Processing and Analysis ................................................................................................... 4
2.1 Overview of Data Collected .............................................................................................................. 4
2.2 Data Expansion.................................................................................................................................. 5
2.3 Statistical Validity .............................................................................................................................. 6
3 Regional Characteristics ........................................................................................................... 10
3.1 Introduction .................................................................................................................................... 10
3.2 Demographic Characteristics .......................................................................................................... 11
3.3 Travel Characteristics ...................................................................................................................... 18
3.3.1 Trip Totals and Trip Rates ....................................................................................................... 18
3.3.2 Trip Origins and Destinations .................................................................................................. 20
3.3.3 Comparison With Trip Rates From Other Surveys ................................................................... 24
3.3.4 Travel Mode and Trip Purpose ................................................................................................ 25
3.3.5 AM Travel Characteristics ....................................................................................................... 31
3.3.6 PM Travel Characteristics........................................................................................................ 32
3.3.7 Other Mode Use Characteristics ............................................................................................. 37
3.3.8 Major Desire Lines ................................................................................................................... 39
3 3 9 C i ith th 2001 d 2006 T l S 41

7/27/2019 CRD OD Survey DailyTravelCharacteristicsReport
http://slidepdf.com/reader/full/crd-od-survey-dailytravelcharacteristicsreport 9/117
viii
List of FiguresFigure 1. Study Area ...................................................................................................................................... 2
Figure 2. Weekday - Daily Mode Share ....................................................................................................... 27
Figure 3. Weekday - Daily Trip Purpose Distribution .................................................................................. 28
Figure 4. PM Peak Period – Trip Purpose Distribution ................................................................................ 29Figure 5. Variation in Trip Purpose by Time of Day .................................................................................... 29
Figure 6. Weekday Daily – Number of Buses Taken ................................................................................... 38
Figure 7. Prominent Desire Lines in the Regional Planning Area ................................................................ 40
List of TablesTable 1. Sampling Error by District ................................................................................................................ 8
Table 2. Scope of the Study Area – Total Population, Households and Vehicles ....................................... 13
Table 3. Regional Planning Area – Total Population, Households and Vehicles ......................................... 13
Table 4. Key Demographic Indicators ......................................................................................................... 13
Table 5. Population by Age Category .......................................................................................................... 14
Table 6. Occupational Status ...................................................................................................................... 14
Table 7. Occupation Type ........................................................................................................................... 15
Table 8. Type of Dwelling ............................................................................................................................ 15
Table 9. Household Size by Vehicles per Household .................................................................................. 16
Table 10. Vehicles by Fuel Type .................................................................................................................. 16
T bl 11 V hi l b O hi 17

7/27/2019 CRD OD Survey DailyTravelCharacteristicsReport
http://slidepdf.com/reader/full/crd-od-survey-dailytravelcharacteristicsreport 10/117
ix
Table 30. Weekday AM Peak Period – Mode Shares for Each Trip Purpose .............................................. 31
Table 31. Weekday PM Peak Period - Trip Purpose by Travel Mode ......................................................... 32
Table 32. Weekday PM Peak Period - Mode Shares for Each Trip Purpose ............................................... 32
Table 33. Weekday PM Peak and Daily Average Trip Lengths .................................................................... 33
Table 34. Weekday PM Peak Period – Mode Use by Age Group ................................................................ 34
Table 35. Weekday PM Peak Period – Mode Share by Age Group ............................................................. 34
Table 36. Weekday PM Peak Period – Trip Purpose by Age Group ............................................................ 34
Table 37. Weekday PM Peak Period – Trip Purpose Distribution by Age Group ........................................ 35Table 38. Weekday PM Peak Period – Trip Purpose by Origin Land Use .................................................... 35
Table 39. Weekday PM Peak Period – Trip Purpose by Destination Land Use ........................................... 36
Table 40. Weekday PM Peak Period – Land Use at Trip Origin .................................................................. 36
Table 41. Weekday PM Peak Period – Land Use at Trip Destination .......................................................... 36
Table 42. Weekday Daily - Usage of Park and Ride Facilities ...................................................................... 37
Table 43. Weekday Daily Average Reported Vehicle Occupancy ............................................................... 38
Table 44. Weekday Daily Relationship to Other Vehicle Occupants .......................................................... 39
Table 45. Weekday Daily Vehicle Availability for This Trip ......................................................................... 39Table 46. Comparison of Demographics, Daily Trip Totals and Trip Rates – RPA Residents ...................... 41
Table 47. Comparison of Daily Trip Totals and Rates by Age Category – RPA Residents ........................... 42
Table 48. Comparison of Daily Mode Shares – Trips by RPA Residents 11+ ............................................... 42
Table 49. Comparison of Daily Trip Purposes – Trips by RPA Residents 11+ .............................................. 43
Table 50. Comparison of Daily Trip Lengths by Mode (Straight-Line Distance) – RPA Residents 11+ ........ 44
Table 51. Comparison of Daily Trip Lengths by Purpose (Straight-Line Distance) – RPA Residents 11+ .... 44
Table 52. Key to District, Sub-Regional, Municipal and Regional Summaries ............................................ 46
Table 53. Person-Trip OD – Daily (24 hour) .............................................................................................. 104Table 54. Person-Trip OD – AM Peak Period (3 hour) .............................................................................. 105
Table 55. Person-Trip OD – Mid-day (inter-peak) ..................................................................................... 106
Table 56 Person-Trip OD – PM Peak Period (3 hour) 107

7/27/2019 CRD OD Survey DailyTravelCharacteristicsReport
http://slidepdf.com/reader/full/crd-od-survey-dailytravelcharacteristicsreport 11/117
2011 CRD Household Travel Survey – Daily Travel Characteristics
1
1 Introduction
1.1 Purpose of Report The Capital Regional District (CRD) is the regional government for 13 municipalities and three electoral
areas that are located on the southern tip of Vancouver Island. Among the CRD’s many responsibilities
are the Regional Growth Strategy, the regional sustainability program, and the Regional Transportation
Plan, all of which are under the purview of the CRD’s Regional Planning Division. The Division also tracks
growth trends and sustainability indicators, and maintains a series of forecasting models for its work
(notably including the regional travel demand forecasting model). An important input to all of these is a
profile residents’ travel behaviour, and how this changes over time. Origin-destination (O-D) surveys are
commonly used by the CRD and urban areas around the world to develop these profiles.2
This report presents the results of the 2011 CRD Origin-Destination Household Travel Survey . The survey
was conducted in autumn 2011 by R.A. Malatest & Associates Ltd. in association with HDR Inc. and David
Kriger Consultants Inc. The 2011 O-D survey is the latest in a series of CRD travel surveys, which include
surveys in 2006 and 2001.
The 2011 study area consists of all incorporated municipalities in the CRD, the Juan de Fuca Electoral
Area, Salt Spring Island, and the southern part of the Cowichan Valley Regional District (CVRD) south of
Cowichan Valley Highway (Highway 18) / Herd Road. Most of the reporting in this report covers the
thirteen incorporated municipalities and the Juan de Fuca Electoral Area: this area corresponds to that
which is covered by the Regional Growth Strategy and is referred to in this report as the “Regional
Planning Area” (RPA). Households from Salt Spring Island and the southern portion of the CVRD were
included in order to build a better picture of travel from those regions to and from the RPA, and of the
travel patterns of Salt Spring Island residents (see Section 4 of this report summary statistics for Salt

7/27/2019 CRD OD Survey DailyTravelCharacteristicsReport
http://slidepdf.com/reader/full/crd-od-survey-dailytravelcharacteristicsreport 12/117
2011 CRD Household Travel Survey – Daily Travel Characteristics
2
Figure 1. Study Area

7/27/2019 CRD OD Survey DailyTravelCharacteristicsReport
http://slidepdf.com/reader/full/crd-od-survey-dailytravelcharacteristicsreport 13/117
2011 CRD Household Travel Survey – Daily Travel Characteristics
3
The survey was conducted from October –December 2011; that is, during the time of year when travel
behaviour is considered to be at its most stable since vacations are over, school is in session (as are
other activities), there are no major holiday periods that change travel patterns and winter weather has
not yet arrived. (The same generally is true for the spring as well.) All respondents with listed phone
numbers were notified by mail that their household had been randomly selected, while random digit
dial (RDD) phone numbers were generated in order to reach households with unlisted numbers. During
survey administration, survey completions were monitored to ensure that survey targets by district
were met. About 93.6% of the households provided their responses as part of a telephone interview.The remainder responded via the internet. The processing of the survey data, to prepare them for this
report, is summarized in Chapter 2, and is detailed separately in an accompanying report, 2011 CRD
Origin-Destination Household Travel Survey - Method .
It should be noted that the survey is household-based. As such, it focused on the movement of people
and accordingly did not capture commercial trips (that is, trips that are made to move goods or to
provide services).
1.3 Report OrganizationThe report contains five chapters. After this introductory chapter, chapter 2 provides some background
information on the preparation of the data for this report. Chapter 3 summarizes the main demographic
and travel characteristics for the Regional Planning Area, and provides some comparisons with previous
CRD surveys and with surveys elsewhere. Chapter 4 presents demographic and travel details for sub-
areas of the region. Finally, Chapter 5 presents origin-destination (O-D) trip matrices for different time
periods of the day.
1.4 Acknowledgements

7/27/2019 CRD OD Survey DailyTravelCharacteristicsReport
http://slidepdf.com/reader/full/crd-od-survey-dailytravelcharacteristicsreport 14/117
2011 CRD Household Travel Survey – Daily Travel Characteristics
4
2 Data Processing and Analysis
2.1 Overview of Data Collected
The majority of the survey data collected as part of the 2011 CRD Origin-Destination Household Travel
Survey was obtained from households in the study area between October 5 and December 7, 2011. A
small number of surveys was completed between December 8 and 17 to obtain additional surveys for a
few districts. Generally balanced numbers of surveys were obtained for each day of the week from
Monday to Friday. Taken as a whole, the data may be considered to be representative of the travel in
the region on an average fall weekday in 2011.
A total of 21,801 listed and randomly generated phone numbers were randomly selected and used in
survey administration, in a ratio of 1 randomly generated phone number for every 5 listed phone
numbers, to ensure that households with unlisted landlines could be given the opportunity to
participate. The survey was conducted primarily via the telephone, but also with the option to complete
the survey online (6.4% of survey completions). In total, 6,328 households participated, exceeding the
target of 6,039 surveys. The valid survey response rate was 36.2%3 after accounting for not-in-service
numbers and non-qualifiers (phone numbers of businesses; households determined to be outside the
study area).
The survey captured information on:
• household characteristics (number of persons, number of vehicles, etc),
• householder demographics and the locations of schools and workplaces (as applicable), and
i d b h h ld 11 f ld h f f ll 24 h f 4 00

7/27/2019 CRD OD Survey DailyTravelCharacteristicsReport
http://slidepdf.com/reader/full/crd-od-survey-dailytravelcharacteristicsreport 15/117
2011 CRD Household Travel Survey – Daily Travel Characteristics
5
locations that could not be geocoded, or refused to answer certain questions). There was some
tolerance to include small numbers of records with missing information if the associated individuals
otherwise had trips with good information. However, if a given individual had 50% or more trips with
poor or refused information, or refused to give any trip information at all, all of that individual’s trips
were flagged for removal from the analysis and the person was considered to have unknown mobility on
their travel day (with adjustments made for this during the data expansion – see following section).
Within any given household, if more than 50% of householders had unknown mobility on their travel
day or refused to provide key demographic information for use in the data expansion, the entirehousehold was removed from the final dataset.
The trip data were validated with a battery of trip logic tests (e.g., testing for zero-length trips; persons
without drivers’ licenses reporting trips as auto drivers; etc.) to ensure that the final dataset was
internally coherent.
After data cleaning, coding, and validation, the final dataset for the 2011 survey is comprised of
information for 6,172 households, 13,986 people and 40,973 trips.
2.2 Data Expansion
Data weighting is used to adjust survey respondents’ contributions to the overall survey results by a
multiplication factor in such a way as to compensate for both planned for and unexpected
disproportionate results. The sampling plan oversampled certain geographic districts with smaller
populations in order to obtain better data for areas with smaller populations. In addition to this planned
for disproportion by district, the unweighted survey data may also prove less than representative due tonon-response bias, which occurs when certain types of household and/or individual are less likely to
respond to the survey.

7/27/2019 CRD OD Survey DailyTravelCharacteristicsReport
http://slidepdf.com/reader/full/crd-od-survey-dailytravelcharacteristicsreport 16/117
2011 CRD Household Travel Survey – Daily Travel Characteristics
6
An iterative proportional fitting (IPF) method was employed to balance household weights and person
weights for the multiple factors described above. In this method, incremental adjustments to the
household weights are made in succession, including a composite adjustment to each household weight
to account for the disproportionate distribution by age/gender amongst the members of each
household. Any number of controls can be introduced. Each successive adjustment to balance a given
control may slightly or significantly unbalance the correction previously introduced for a different
control (which would normally be a disadvantage for multiplicative weighting). However, iteratively
cycling through each control results in convergence to a solution where all household and populationcontrols have expected distributions (to within reasonable tolerance). In this manner, all persons within
each household carry the same base weight as the household, although it may be noted that small
calibrations were made separately to the records at the household level and at the person level to
ensure that the weighted counts of total households and of total persons matched Census figures4.
Following the data expansion, trip correction factors were introduced to correct for the following:
• A correction factor to account for disproportionate distribution (if any) of survey responses by
weekday (Monday through Friday) in each district;
• A correction factor to account for persons in each age/gender group within each district who
have unknown mobility (e.g., respondent refused to provide trip data, or too many trips with
poor or refused information);
The above correction factors were applied to the trip expansion factors only.
The expanded survey responses for household, person, and trip characteristics were compared to
Census and other benchmark data (e.g., transit ridership and boardings) in order to validate the data
expansion. Some under-representation of transit ridership was noted although total boardings appeared
to be more in line. It may be noted that the data expansion cannot compensate for all possible
distortions due to non-response bias or coverage error; furthermore, survey samples, even large
l bj t t d f t ti ti l li N th l th d d d t

7/27/2019 CRD OD Survey DailyTravelCharacteristicsReport
http://slidepdf.com/reader/full/crd-od-survey-dailytravelcharacteristicsreport 17/117
2011 CRD Household Travel Survey – Daily Travel Characteristics
7
households and single-person households, the data expansion addresses this, in part, by
weighting for age and household size.
• Non-response bias. Non-response bias occurs when individuals who do not participate in a
survey differ in relevant ways from individuals who do participate. For example, younger people
are often less inclined to participate in surveys. The survey had a robust response rate for a
general population survey (with completions obtained for 36% of valid phone numbers drawn),
which helps to control for non-response bias. This bias has also been addressed, in part, throughthe data expansion process, including the weighting by age and gender.
• Measurement error. This type of error is associated with the failure of survey instruments to
capture correct information (e.g., through misunderstanding of survey questions). To control for
this, the questionnaire and associated materials were developed based on previously well-
tested survey questions, were thoroughly reviewed for content and meaning, and field tested
with a sample of respondents before full survey administration. Telephone interviewers were
trained on the objectives of the survey, definitions of key terms, the intent of survey questions,
and how to address different trip circumstances described by respondents. During surveyadministration, 10% of interviews were monitored by a supervisor to ensure consistent
application of questions.
• Processing error. Processing errors include data entry, coding, editing, and imputation errors.
This potential source of error was addressed through comprehensive training of survey staff and
geocoders, continuous quality management practices, and thorough data validation.
• Sampling error. Sampling error refers to the variability that occurs by chance because a sample
was surveyed rather than the complete population. As best as possible, sampling error wascontrolled for in the sample design by over-sampling from districts with smaller populations (as
a strictly proportional sample design would have resulted in very few completions for smaller
districts)

7/27/2019 CRD OD Survey DailyTravelCharacteristicsReport
http://slidepdf.com/reader/full/crd-od-survey-dailytravelcharacteristicsreport 18/117
2011 CRD Household Travel Survey – Daily Travel Characteristics
8
Table 1. Sampling Error by District
District Geography
Population
(2011
Census)
Households
(2011
Census)
O-D Surveys
Completed
Sampling
Rate (% of
Households
Sampled)
Margin
of
Error
(± %)*
Individual Districts
1 Salt Spring Island Electoral Area 10,234 4,662 398 8.5% 4.7%
2 Town of Sidney 11,178 5,328 182 3.4% 7.1%
3
District of North Saanich, Tsyecum First
Nation, Pauquachin First Nation 11,527 4,623 159 3.4% 7.6%
4
District of Central Saanich, Tsartlip First
Nation, Tsawout First Nation 18,463 7,655 238 3.1% 6.3%
5** Downtown Victoria 7,971 4,870 105 2.2% 9.5%
6 Victoria North 29,167 14,233 375 2.6% 5.0%
7 Victoria South 42,879 23,854 664 2.8% 3.7%
8 Saanich North 18,019 7,242 235 3.2% 6.3%
9 Saanich East 62,837 26,514 703 2.7% 3.6%
10 Saanich West 28,896 11,634 299 2.6% 5.6%
11 District of Oak Bay 18,015 7,764 406 5.2% 4.7%
12 Township of Esquimalt 16,209 8,038 355 4.4% 5.1%
13
Townof View Royal, Esquimalt Nation,
Songhees First Nation 11,059 4,787 223 4.7% 6.4%
14** District of Highlands 2,120 779 44 5.6% 14.4%
15 City of Langford 29,228 11,680 545 4.7% 4.1%

7/27/2019 CRD OD Survey DailyTravelCharacteristicsReport
http://slidepdf.com/reader/full/crd-od-survey-dailytravelcharacteristicsreport 19/117
2011 CRD Household Travel Survey – Daily Travel Characteristics
9
Survey results for districts with higher sampling errors should be interpreted with caution.5
However, it
should be noted that reporting by given districts includes trips made by residents from outside the
district. For example, while the survey sample for residents of Downtown Victoria is modest (105
surveys), the reporting on trips within the district is based on a considerably larger sample of households
whose householders travelled to Downtown Victoria.
When making comparisons to previous survey cycles, the reader is asked to keep in mind thatdifferences in methodology and in geographic scope may influence the comparability of the survey
results from different survey cycles, although many aspects of the surveys were very similar.
Furthermore, the previous survey cycles had smaller samples and somewhat lower overall response
rates (relative to the number of phone listings drawn for recruitment for the survey). Some apparent
differences between survey cycles may be within the margins of error of the different survey cycles. To
facilitate comparisons, where possible, 2001 and 2006 data has been recalibrated (for example, to
adjust for overestimation of population in earlier cycles). Also where possible, comparisons have been
made using equivalent parameters. For future survey cycles, general consistency with past surveyadministration and data processing methods is recommended.
Notwithstanding potential sources of survey error, given the large number of survey completions
(6,172), the strong response rate (36.2%), and the close attention given to coding and data validation,
the 2011 origin-destination data set may be considered a robust data set, and is of considerable value
for transportation planning in the region.

7/27/2019 CRD OD Survey DailyTravelCharacteristicsReport
http://slidepdf.com/reader/full/crd-od-survey-dailytravelcharacteristicsreport 20/117
2011 CRD Household Travel Survey – Daily Travel Characteristics
10
3 Regional Characteristics
3.1 IntroductionThis chapter profiles the RPA area as a whole. To set the stage, it first describes the scope of the study
area, then presents in more detail the RPA’s demographics: these describe “who” is travelling. The
remainder of the chapter then profiles the RPA’s travel characteristics and relates these back to thedemographics and, for comparison, to previous CRD surveys and to surveys elsewhere in Canada.
Presentation of Regional Characteristics
It should be noted that the results presented in this chapter cover the Regional Planning Area (RPA),
which includes the Capital Region with the exception of Salt Spring Island and the Southern Gulf Islands.
For the purposes of this transportation study, First Nations lands within the general boundaries of the
RPA (see Figure 1, page 2) are included in the parameters of the reporting. In terms of the district
system used for the study, this means that districts 2-19 are included, but not districts 1 and 20,respectively. District 21, which is used to identify travel beyond the study area, is also excluded. Trips
made by residents of districts 1 and 20 are included if they are made to, from or within the Regional
Planning Area.
Some of the characteristics presented below are similar to those that were presented in the CRD 2006
and 2001 survey reports. These help describe how conditions have changed over time. However, it is
important to note that the areas surveyed in each of the surveys are not always contiguous and,
accordingly, the comparisons must be approached with caution. Moreover, as explained elsewhere,
differences in survey method, sample size, sampling method and so on similarly can render comparisons
to be inexact. To facilitate comparisons, the data expansion for 2006 and 2011 data was rescaled, as
b t ibl t dd ti ti f l ti i b th l H it b t d th t

7/27/2019 CRD OD Survey DailyTravelCharacteristicsReport
http://slidepdf.com/reader/full/crd-od-survey-dailytravelcharacteristicsreport 21/117
2011 CRD Household Travel Survey – Daily Travel Characteristics
11
3.2 Demographic CharacteristicsThe importance of presenting the RPA’s demographics is twofold. First, it profiles the area’s residents:
these are the people who are making the trips.
Second, the demographics help explain the reasons for travelling and the travel choices that people
make. These explanations, in turn, enable a further understanding of the travel characteristics. Of
particular importance to travel are the following demographics:
• Population. The total number of residents of the area, comprising both genders and all age
groups. Note that the survey does not typically include itinerant (temporary) residents or
visitors. Also, trips made into the RPA by people who live outside the study area are not
included (e.g., for work), although trips made by study area residents beyond the area’s
boundaries are included. Trips made by study area residents in districts 1 and 20, which are
outside the RPA, are part of the survey data, but only their trips into or within the RPA are
reported here.
• Households. This represents a group of people who are living together in a dwelling unit.
Commonly, they are related to each other – i.e., a family – but this is not always the case – e.g.,
two students who share an apartment. For the purposes of travel behaviour, what matters is
that they make a number of decisions together, for the household as a whole. The household
typically pools its resources to purchase goods and services for the household as a whole (e.g.,
furniture, weekly groceries, etc.). Although individuals make their own trips – e.g., two spouses
commute separately to their respective workplaces – their travel choices may be linked, if they
are in the same household – for example, one spouse may require the household’s automobile
for her work, while the other spouse can walk or take transit. The number of persons per
household is an indicator of travel activity, again since each individual travels for his / her own
h h h d h h ld l b d f

7/27/2019 CRD OD Survey DailyTravelCharacteristicsReport
http://slidepdf.com/reader/full/crd-od-survey-dailytravelcharacteristicsreport 22/117
2011 CRD Household Travel Survey – Daily Travel Characteristics
12
for the household’s trips, as opposed to other modes such as transit, walking or cycling. Hence
the number of vehicles per household is an important indicator of travel mode choice.
• Population 11+. The 2011 survey accounted for the travel only of people who were 11 years of
age and older, for two reasons: young children typically do not travel independently (or, if they
are travelling by themselves, their trips tend to be very localized); and, experience has shown
that many parents are reluctant to divulge their children’s travel activities, for reasons of
personal security. The use of a minimum age is common practice for an OD survey, and the 10or 11 years age threshold has been commonly used in Canadian practice (although some surveys
have used 5 years as the threshold: see section 3.3.3). The number of people aged 11+ per
household is an indicator of the composition of the household (i.e., a higher proportion means
fewer child-oriented trips, on average).
• Employment, or workers. This represents the number of residents in area who are employed,
whether in full time or part time jobs. The depiction of ‘workers’ refers to where they live; and
this is different from jobs, which is a measure of the workplace (i.e., where they work). Thenumber of workers per household is an indicator of the important home-to-work commute
which comprises a significant proportion of peak period travel activity.
Table 2 summarizes the study area population, household and vehicle characteristics for 2011, 2006 and
2001. As noted earlier, it is important to understand that the actual boundary of the study area
extended north of the CRD to include portions of the southern CVRD, and includes Salt Spring Island, in
order to obtain good information on the generation of trips to and from the CRD Regional Planning Area
by residents of these areas. However, it is only trips to, from, or within the Regional Planning Area thatare reported on.
T bl 3 id b tt i l it i th h t i ti f

7/27/2019 CRD OD Survey DailyTravelCharacteristicsReport
http://slidepdf.com/reader/full/crd-od-survey-dailytravelcharacteristicsreport 23/117
2011 CRD Household Travel Survey – Daily Travel Characteristics
13
Table 2. Scope of the Study Area – Total Population, Households and Vehicles
Survey Year PopulationPopulation
11+
Employment
(Workers)Households Vehicles
2011 406,485 367,851 212,372 178,571 290,638
2006 371,070 N/A 193,656 160,524 253,550
2001 345,050 N/A 151,590 146,140 211,640• Note: Geographies are not identical among survey years. Hence, parameters may not be directly comparable.
The 2011 study area includes Salt Spring Island and the southern part of the CVRD including Duncan.
• The 2006 study area included Salt Spring Island and a smaller portion of the southern CVRD (Cowichan Valley Subdivision C).
Data expansion was based on estimates rather than actual 2006 Census counts, and appears to have overestimated the
number of persons in the study area by 4.1% for the 2006 study area and 6.3% for the RPA alone.
• The 2001 study area effectively included only the RPA as there only 2 surveys were obtained for Cowichan Valley
Subdivision C, and Salt Spring Island was excluded by design. Again, data expansion used estimates rather than Census
counts, overestimating population in by 5.6% for the stated study area and 10.6% for the RPA (the effective study area).
Table 3. Regional Planning Area – Total Population, Households and Vehicles
Survey YearPopulation
(Census)Population 11+
Employment
(Workers)
Households
(Census)Vehicles
2011 344,889 312,819 183,284 153,441 240,474
2006 330,423 297,129 (est.) 173,209 145,530 223,135
2001 312,168 284,312 (est.) 158,271 135,720 210,773
• 2006 survey data has been re-geocoded to match the Regional Planning Area for the purpose of comparison.
2006 figures have also been scaled to match actual 2006 Census population and dwelling counts.
• 2001 figures have been scaled to match actual 2001 Census population and dwelling counts.
Table 4 Key Demographic Indicators

7/27/2019 CRD OD Survey DailyTravelCharacteristicsReport
http://slidepdf.com/reader/full/crd-od-survey-dailytravelcharacteristicsreport 24/117
2011 CRD Household Travel Survey – Daily Travel Characteristics
14
Table 5 breaks down the population by age cohort. The largest cohort is 25-64 years, at just over half
(56.5%) of the population: together with seniors (65+, at 18.7%), these two cohorts comprise three
quarters of the population. Young children (0 – 10 years), whose travel activities were not surveyed,
comprise 9.1%.
Table 5. Population by Age Category
Age Group Population %
0 to 10 31,487 9.1%
11 to 17 23,889 6.9%
18 to 24 30,409 8.8%
25 to 64 194,675 56.5%
65+ 64,429 18.7%Total (all ages) 344,889 100.0%
Table 6 summarizes the occupational status, or primary activity, of each household member, including
young children. Almost two of every five individuals are employed full-time. Another one in five (19.4%)
are students, and another one in five (19.8%) are retired. Part-time employed people represent 14.0%. It
should be noted that there is some overlap in the categories, meaning that people could report both
being a student and another occupational status: this is important because it exposes trips made by
these individuals that otherwise might not be apparent (e.g., a student going to a part-time job; a retireewho also attends school). A small percent of individuals are counted as both a full-time or part-time
student and employed in a job (whether full-time or part-time) – 17,791 individuals, or 5.2% of the total.
Of these individuals 11 042 are full time students with part time jobs

7/27/2019 CRD OD Survey DailyTravelCharacteristicsReport
http://slidepdf.com/reader/full/crd-od-survey-dailytravelcharacteristicsreport 25/117
2011 CRD Household Travel Survey – Daily Travel Characteristics
15
Among those who reported full or part time employment, Table 7 records the occupation type. Overall,
37.5% of all respondents recorded office employment . The next highest categories were health care
and social assistance (12.3%), industrial employment (11.7%), and retail and wholesale (11.5%):
combined, these three categories represented another 35.5% of all employment. This information will
be of use in calibrating the transportation model for the region.
Table 7. Occupation Type
Occupation Type Number %
Industrial employment (10 *) 21,531 11.7%
Office employment (20) 68,648 37.5%
Accommodation and food services (31) 12,298 6.7%
Other main services (32) 11,049 6.0%
Retail and wholesale employment (40) 21,128 11.5%
Arts, entertainment and recreation (50) 7,326 4.0%
Health care and social assistance (60) 22,621 12.3%School employment (70) 13,876 7.6%
Commercial driver (77) 3,379 1.8%
Other / unsure 442 0.2%
Decline / don’t know 985 0.5%
Total, full time and part time employed 183,284 100.0% **
* Occupation classification code used in survey. For reference only.
** Percentages might not sum to 100% due to rounding.
Table 8 lists the number of dwelling units by type. Just over half the dwelling units are single-detached
(56%) hil l t 32% t t / d i i (i hi h d it b ildi )
7/27/2019 CRD OD Survey DailyTravelCharacteristicsReport
http://slidepdf.com/reader/full/crd-od-survey-dailytravelcharacteristicsreport 26/117
2011 CRD Household Travel Survey – Daily Travel Characteristics
16
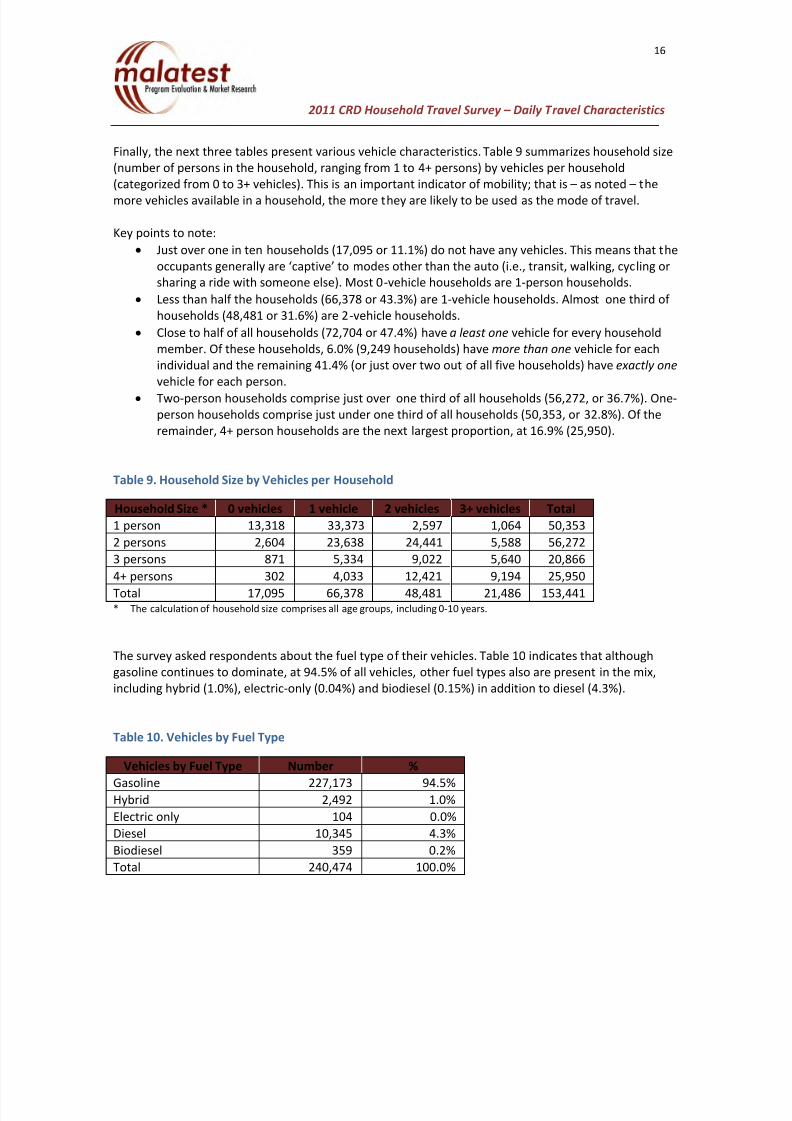
Finally, the next three tables present various vehicle characteristics.Table 9 summarizes household size
(number of persons in the household, ranging from 1 to 4+ persons) by vehicles per household
(categorized from 0 to 3+ vehicles). This is an important indicator of mobility; that is – as noted – the
more vehicles available in a household, the more they are likely to be used as the mode of travel.
Key points to note:
• Just over one in ten households (17,095 or 11.1%) do not have any vehicles. This means that the
occupants generally are ‘captive’ to modes other than the auto (i.e., transit, walking, cycling orsharing a ride with someone else). Most 0-vehicle households are 1-person households.
• Less than half the households (66,378 or 43.3%) are 1-vehicle households. Almost one third of
households (48,481 or 31.6%) are 2-vehicle households.
• Close to half of all households (72,704 or 47.4%) have a least one vehicle for every household
member. Of these households, 6.0% (9,249 households) have more than one vehicle for each
individual and the remaining 41.4% (or just over two out of all five households) have exactly one
vehicle for each person.
• Two-person households comprise just over one third of all households (56,272, or 36.7%). One-person households comprise just under one third of all households (50,353, or 32.8%). Of the
remainder, 4+ person households are the next largest proportion, at 16.9% (25,950).
Table 9. Household Size by Vehicles per Household
Household Size * 0 vehicles 1 vehicle 2 vehicles 3+ vehicles Total
1 person 13,318 33,373 2,597 1,064 50,3532 persons 2,604 23,638 24,441 5,588 56,272
3 persons 871 5,334 9,022 5,640 20,866
4 302 4 033 12 421 9 194 25 950

7/27/2019 CRD OD Survey DailyTravelCharacteristicsReport
http://slidepdf.com/reader/full/crd-od-survey-dailytravelcharacteristicsreport 27/117
2011 CRD Household Travel Survey – Daily Travel Characteristics
17
Table 11 indicates that only a small proportion of vehicles are leased (2.2%), with the remainder being
owned by the respondents.
Table 11. Vehicles by Ownership
Vehicles by ownership Number %
Owned 235,502 97.9%Leased 4,972 2.2%
Total 240,474 100.0% *
* Percentages might not sum to 100% due to rounding.

7/27/2019 CRD OD Survey DailyTravelCharacteristicsReport
http://slidepdf.com/reader/full/crd-od-survey-dailytravelcharacteristicsreport 28/117
2011 CRD Household Travel Survey – Daily Travel Characteristics
18
3.3 Travel Characteristics
Presentation of Regional Travel Characteristics
As noted in the previous section, it should be noted that the results presented below cover the Regional
Planning Area. In terms of the district system used for the study, this means that districts 2-19 are
included, but not districts 1 (Salt Spring Island), 20 (southern CVRD), and 21 (external to study area).
Trips made by residents of districts 1 and 20 are included if they are made to, from or within the RPA.
3.3.1 Trip Totals and Trip Rates
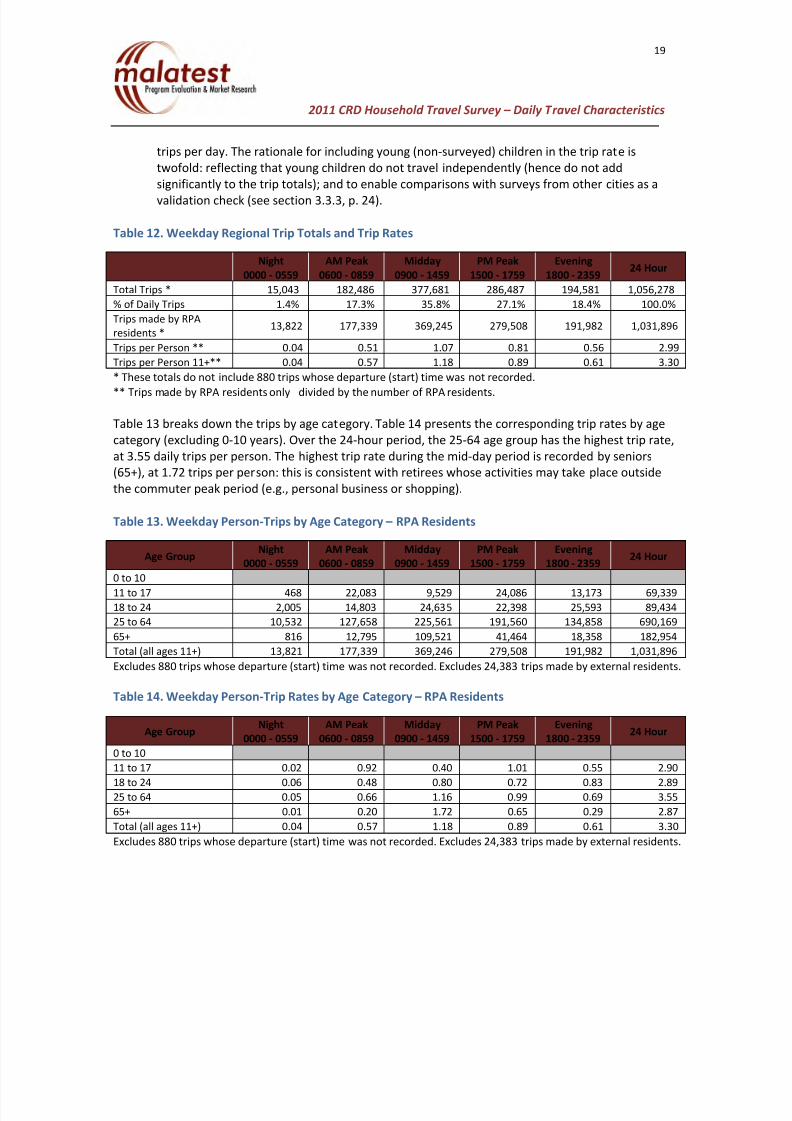
Table 12 presents several important pieces of information. The table summarizes the number of trips in
the RPA made by study area residents on a ‘typical’ working weekday. Here, the term typical means that
the results from all surveys, which were conducted over several weeks in autumn 2011, have been
combined to represent a single day.
The table breaks down activity by time period. Key points to note:• Study area residents made over 1 million trips daily (where ‘daily’ is measured as the 24-hour
working weekday period over which the respondents’ trips were recorded). Of the estimated
1.056M trips in the RPA, 1.032M were made by residents of the RPA. The other 24,383 were
reported by survey respondents who live in the South CVRD and Salt Spring Island.
• The table defines several time periods during the day. The two commuter peak periods are
defined as:
o AM peak period: 0600 to 0859.
o PM peak period: 1500 to 1759.
These durations have been defined by the CRD as a function of observed travel on the region’s
t t ti t k Th i t t ith li d ti ( d ith d ti i th
7/27/2019 CRD OD Survey DailyTravelCharacteristicsReport
http://slidepdf.com/reader/full/crd-od-survey-dailytravelcharacteristicsreport 29/117
2011 CRD Household Travel Survey – Daily Travel Characteristics
19
trips per day. The rationale for including young (non-surveyed) children in the trip rate is
twofold: reflecting that young children do not travel independently (hence do not add
significantly to the trip totals); and to enable comparisons with surveys from other cities as a
validation check (see section 3.3.3, p. 24).
Table 12. Weekday Regional Trip Totals and Trip Rates
Night0000 - 0559
AM Peak0600 - 0859
Midday0900 - 1459
PM Peak1500 - 1759
Evening1800 - 2359
24 Hour
Total Trips * 15,043 182,486 377,681 286,487 194,581 1,056,278
% of Daily Trips 1.4% 17.3% 35.8% 27.1% 18.4% 100.0%
Trips made by RPA
residents *13,822 177,339 369,245 279,508 191,982 1,031,896
Trips per Person ** 0.04 0.51 1.07 0.81 0.56 2.99
Trips per Person 11+** 0.04 0.57 1.18 0.89 0.61 3.30
* These totals do not include 880 trips whose departure (start) time was not recorded.
** Trips made by RPA residents only divided by the number of RPA residents.
Table 13 breaks down the trips by age category. Table 14 presents the corresponding trip rates by age
category (excluding 0-10 years). Over the 24-hour period, the 25-64 age group has the highest trip rate,
at 3.55 daily trips per person. The highest trip rate during the mid-day period is recorded by seniors
(65+), at 1.72 trips per person: this is consistent with retirees whose activities may take place outside
the commuter peak period (e.g., personal business or shopping).
Table 13. Weekday Person-Trips by Age Category – RPA Residents
Age GroupNight
0000 - 0559
AM Peak
0600 - 0859
Midday
0900 - 1459
PM Peak
1500 - 1759
Evening
1800 - 235924 Hour

7/27/2019 CRD OD Survey DailyTravelCharacteristicsReport
http://slidepdf.com/reader/full/crd-od-survey-dailytravelcharacteristicsreport 30/117
2011 CRD Household Travel Survey – Daily Travel Characteristics
20
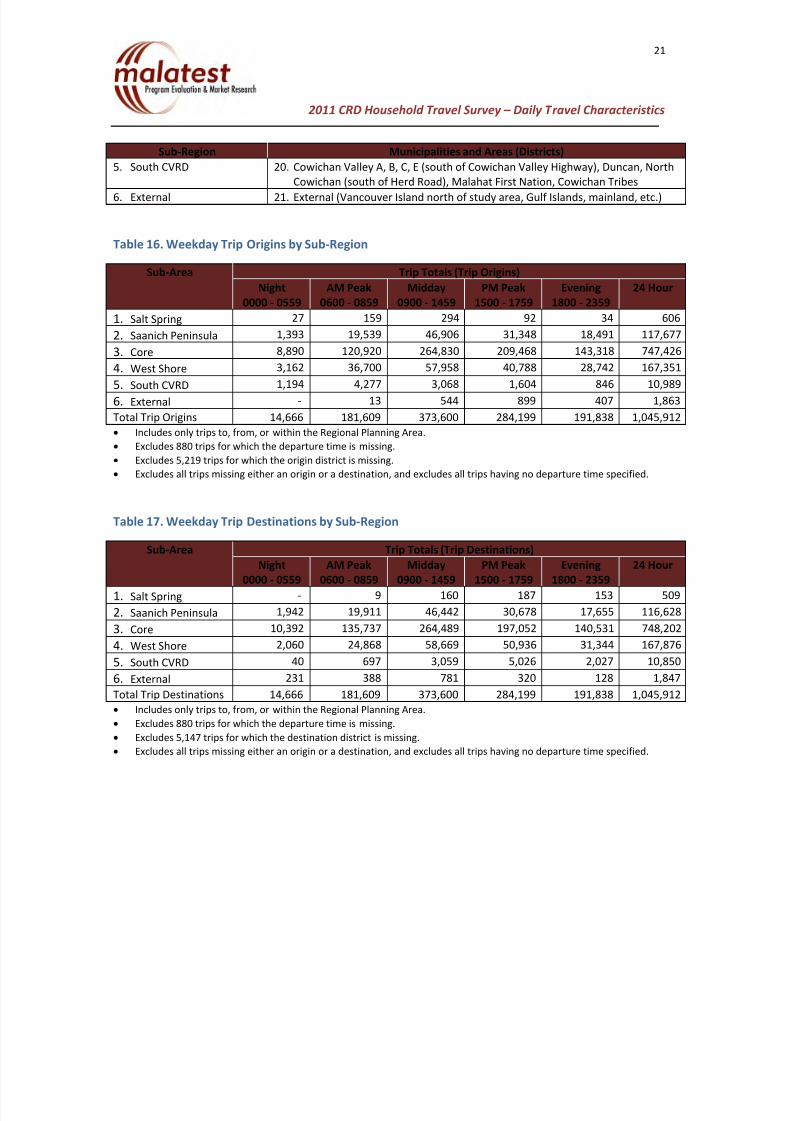
3.3.2 Trip Origins and Destinations
This section summarizes the trip origins and destinations. As Table 15 indicates, the origins and
destinations for the 21 districts are grouped into 6 sub-regions: this is analogous to the aggregations
presented for the 2006 and 2001 surveys; however, the actual groupings are different. As a result, sub-
regional comparisons with the previous surveys are not made.
The Saanich Peninsula, Core, and West Shore sub-regions together comprise the Regional Planning Area
that corresponds to the CRD’s Regional Growth Strategy.
The results are presented in the next several tables. All tables present only trips that originate in, are
destined to, or are entirely within the Regional Planning Area (i.e., excludes trips entirely within Salt
Spring Island or CVRD regions and other trips entirely external to the Regional Planning Area). Table 16
expresses all trips by the sub-region of origin (where the trips begin), by time of day.Table 17 expresses
all trips by the sub-region of destination (where the trip ends), by time of day.
It should be noted that some of the tables are accompanied by qualifying notes. The notes indicate thatsome trips were not included in the tabulation. This is because they are missing certain pieces of
information – for example, the start (departure) or end times, or the origin or destination coordinate.
Thus, although the trip exists, for these tabulations it is not included since it cannot be categorized
accordingly. This is a common occurrence in any O-D survey of this size. These remain the only trips for
which the missing data could not be recovered, after an extensive data editing process (described
elsewhere). It is important to note that, overall, the difference is very small, at less than 0.5%; and since
the impacted trips are distributed across the study throughout the day, any potential impacts are
diffused, hence can be considered to be negligible.
Table 15. Sub-Region and District Definitions
7/27/2019 CRD OD Survey DailyTravelCharacteristicsReport
http://slidepdf.com/reader/full/crd-od-survey-dailytravelcharacteristicsreport 31/117
2011 CRD Household Travel Survey – Daily Travel Characteristics
21
Sub-Region Municipalities and Areas (Districts)
5. South CVRD 20. Cowichan Valley A, B, C, E (south of Cowichan Valley Highway), Duncan, North
Cowichan (south of Herd Road), Malahat First Nation, Cowichan Tribes
6. External 21. External (Vancouver Island north of study area, Gulf Islands, mainland, etc.)
Table 16. Weekday Trip Origins by Sub-Region
Sub-Area Trip Totals (Trip Origins)
Night
0000 - 0559
AM Peak
0600 - 0859
Midday
0900 - 1459
PM Peak
1500 - 1759
Evening
1800 - 2359
24 Hour
1. Salt Spring 27 159 294 92 34 606
2. Saanich Peninsula 1,393 19,539 46,906 31,348 18,491 117,677
3. Core 8,890 120,920 264,830 209,468 143,318 747,426
4. West Shore 3,162 36,700 57,958 40,788 28,742 167,351
5. South CVRD 1,194 4,277 3,068 1,604 846 10,989
6. External - 13 544 899 407 1,863
Total Trip Origins 14,666 181,609 373,600 284,199 191,838 1,045,912
• Includes only trips to, from, or within the Regional Planning Area.
• Excludes 880 trips for which the departure time is missing.
• Excludes 5,219 trips for which the origin district is missing.
• Excludes all trips missing either an origin or a destination, and excludes all trips having no departure time specified.
Table 17. Weekday Trip Destinations by Sub-Region
Sub-Area Trip Totals (Trip Destinations)
Night AM Peak Midday PM Peak Evening 24 Hour

7/27/2019 CRD OD Survey DailyTravelCharacteristicsReport
http://slidepdf.com/reader/full/crd-od-survey-dailytravelcharacteristicsreport 32/117
2011 CRD Household Travel Survey – Daily Travel Characteristics
22
Table 18 combines total daily (24 hour) trip origins and destinations into a single table. It shows the
number of trips moving between each origin-destination combination: for example, there are 29,928
trips originating in the Saanich Peninsula (sub-region 2) and destined to the Core (sub-region 3). Note
that the table also indicates travel that is internal to each sub-region: for example, 117,752 trips start
and end within West Shore (sub-region 4). Table 19 and Table 20 list the daily auto-driver trips and
transit person-trips, respectively.
Table 18. Weekday Daily - Total Person-Trips by Sub-Region
Sub-Area
Trip Origin
Trip Destination
Salt Spring Saanich
Peninsula
Core West Shore South
CVRD
External Total Trips
1. Salt Spring N/A 252 285 69 N/A N/A 606
2. Saanich Peninsula 283 81,983 29,928 4,121 965 396 117,677
3. Core 132 29,209 668,052 42,540 7,080 1,202 748,213
4. West Shore 94 3,614 42,904 117,752 2,805 249 167,418
5.
South CVRD N/A 1,384 6,748 2,882 N/A N/A 11,0146. External N/A 247 1,035 581 N/A N/A 1,863
Total Trips 509 116,690 748,952 167,944 10,850 1,847 1,046,792
• Includes only trips to, from, or within the Regional Planning Area (N/A = not applicable).
• Excludes 10,366 trips for which the origin or destination is missing.
Table 19. Weekday Daily - Auto Driver Trips by Sub-Region
Sub-Area Trip Destination
Trip Origin
Salt Spring Saanich
Peninsula
Core West Shore South
CVRD
External Total Trips
1. Salt Spring N/A 214 170 43 N/A N/A 428
2. Saanich Peninsula 217 55,971 22,072 3,370 765 229 82,624
3 Core 95 22 123 389 859 32 180 5 983 898 451 138

7/27/2019 CRD OD Survey DailyTravelCharacteristicsReport
http://slidepdf.com/reader/full/crd-od-survey-dailytravelcharacteristicsreport 33/117
2011 CRD Household Travel Survey – Daily Travel Characteristics
23
Finally, sub-regional trip origins and destinations for the PM peak period are for all trips, auto-driver
trips and transit person-trips in Table 21, Table 22 and Table 23, respectively.
Table 21. Weekday PM Peak Period - Total Person-Trips by Sub-Region
Sub-Area Trip Destination
Trip Origin
Salt Spring Saanich
Peninsula
Core West Shore South
CVRD
External Total Trips
1. Salt Spring N/A 75 16 - N/A N/A 92
2. Saanich Peninsula 74 21,538 8,391 1,213 133 - 31,348
3. Core 87 8,311 179,907 17,496 3,377 290 209,468
4. West Shore 26 483 7,819 30,914 1,516 30 40,788
5. South CVRD N/A 196 519 888 N/A N/A 1,604
6. External N/A 75 399 425 N/A N/A 899
Total Trips 187 30,678 197,052 50,936 5,026 320 284,199
• Includes only trips to, from, or within the Regional Planning Area (N/A = not applicable).
• Excludes trips for which either origin or destination are missing.
Table 22. Weekday PM Peak Period - Auto Driver Trips by Sub-Region
Sub-Area Trip Destination
Trip Origin
Salt Spring Saanich
Peninsula
Core West Shore South
CVRD
External Total Trips
1. Salt Spring - 57 16 - - - 73
2. Saanich Peninsula 74 15,840 6,059 1,085 133 - 23,1903. Core 78 6,123 103,040 12,828 2,736 183 124,989
4. West Shore 13 317 5,726 22,110 1,380 23 29,570
5. South CVRD - 124 471 566 - - 1,161

7/27/2019 CRD OD Survey DailyTravelCharacteristicsReport
http://slidepdf.com/reader/full/crd-od-survey-dailytravelcharacteristicsreport 34/117
2011 CRD Household Travel Survey – Daily Travel Characteristics
24
3.3.3 Comparison With Trip Rates From Other Surveys
Table 24 compares daily person- and household-trip rates from the 2001, 2006 and 2011 CRD surveys
with rates from other surveys across Canada. The other surveys were selected to approximate areas of
comparable size (e.g., London, Waterloo and Niagara in Ontario); proximity (Nanaimo and Vancouver);
other western cities (Edmonton and Winnipeg); and a selection of large areas in eastern Canada
(Toronto, Ottawa-Gatineau, Montréal and Québec City). In some cases, data for the two most recent
surveys are provided; and it can be seen that some rates increase (e.g., Québec City) while others have
dropped (e.g., Vancouver).
As noted in the table, the rates are not always directly comparable – in particular, some rates exclude
children below a specified age while others include them. However, overall they are indicative; and they
show that the 2011 CRD trip rates are reasonable and are consistent with the findings of other cities.
Table 24. Comparison with Surveys from Other Canadian cities
CityYear of
Survey
Daily Person Trip
Rate
Daily Household
Trip RatePopulation
CRD
2011
2006
2001
2.99 *
3.15 **
3.08 **
6.73
7.14 **
7.10 **
344,889
330,423 **
312,168 **
Nanaimo 2012 2.84 * 6.69 103,484
Vancouver (TransLink)2008
2004
2.65
3.17
6.93
6.99
2,476,392
2,132,800Edmonton 2005 3.63 8.6 1,005,500
City of Winnipeg 2007 2.83 * 5.92 632,970
London (Ontario) 2010 2 32 *** 6 4 291 555 ***

7/27/2019 CRD OD Survey DailyTravelCharacteristicsReport
http://slidepdf.com/reader/full/crd-od-survey-dailytravelcharacteristicsreport 35/117
2011 CRD Household Travel Survey – Daily Travel Characteristics
25
* Data are for population 11+ (CRD 2011, Nanaimo, Winnipeg, Ottawa-Gatineau).
** Data for 2001 and 2006 are for the Regional Planning Area, which is not the complete area that was
reported on in 2006. Overall person trip rates and household trip rates have been recalibrated to be
based on only trips made by population 11+ for the purpose of comparison. (Figures reported in
previous cycles were based on the trips of all persons including those 10 and under and population
totals included portions of the CVRD. In the 2001 and 2006 reports, the person trip rates reported were
3.35 and 3.34, respectively; while the household trip rates reported were 7.92 and 7.97, respectively).
*** Data are for population 15+ (London).
**** Data are for population 5+ (Montréal, Québec City).
Sources:
• CRD: 2006 and 2001 CRD Origin and Destination Household Survey Final Reports, March 2007 and December
2002, TSi (Halcrow)
• Nanaimo: 2012 Household Travel Survey , August 2012, HDR and RA Malatest.
• TransLink: Greater Vancouver Trip Diary Survey 2004 Summary (no date) and 2008 Regional Trip Diary Survey:
Final Reports, February 2010, Halcrow/Mustel. Note: results for 2011 Trip Diary Survey are not yet available.
• City of Edmonton: 2005 Household Travel Survey, Summary Report on Weekday Travel by Residents of the
Edmonton Region, July 2006, ISL/Banister.
• City of Winnipeg: 2007 Winnipeg Area Travel Survey Results – Final Report , July 2009, RA Malatest and iTRANS
(HDR).
• City of London: 2010 Working Paper: Household Travel Survey , November 2010, AECOM.
• Region of Waterloo: 2006, 2001 & 1996 Travel Survey Summaries, October 2008, Data Management Group,
University of Toronto.
• Region of Niagara: 2006, 2001 & 1996 Travel Survey Summaries.
• City of Toronto: 2006, 2001 & 1996 Travel Survey Summaries.
• City of Kingston: 2008, Model Development Report , July 2009, AECOM.• Ottawa-Gatineau: 2005 Origin-Destination Survey summary of Results, December 2006, RA Malatest and
iTRANS (HDR).
• Montréal: Enquête Origine-Destination 2003; La mobilité des personnes dans la région de Montréal and

7/27/2019 CRD OD Survey DailyTravelCharacteristicsReport
http://slidepdf.com/reader/full/crd-od-survey-dailytravelcharacteristicsreport 36/117
2011 CRD Household Travel Survey – Daily Travel Characteristics
26
When interpreting the survey results generally, it is important to bear in mind that the survey results
represent the travel of individuals 11 years of age and older, as the trips of most young children will be
captured in the travel of the adults or older siblings they travel with (also, many survey respondents
prefer not to provide information on the travel patterns of their young children). This is particularly
salient when reviewing the results by trip purpose: trips with the purpose of ‘other school’ exclude
those for young school age children; although, it may be noted that many of these trips are captured in
the travel of adults picking up and dropping off children. As with previous sections, only trips to, from, or
within the CRD Regional Planning Area are reported on below.
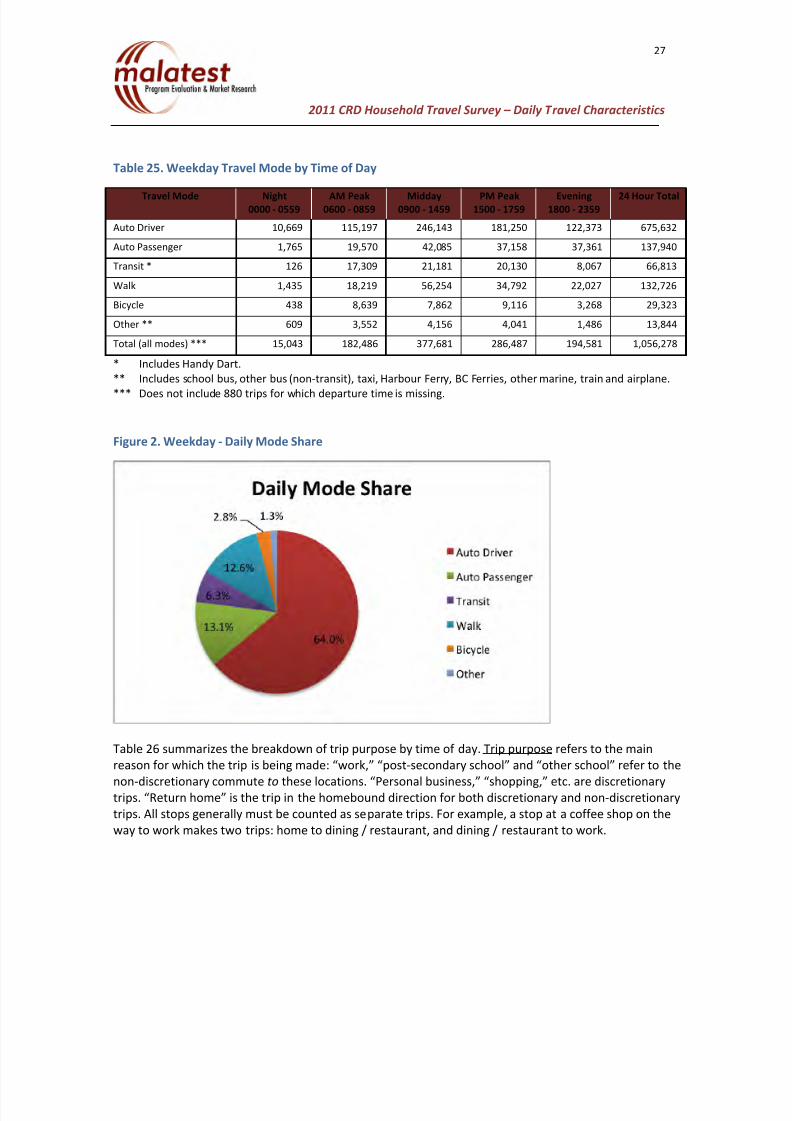
Table 25 summarizes travel modes by time of day. As can be seen from Figure 2, auto driver is the
dominant mode, capturing two thirds of all daily trips (64.0%). Auto driver is the dominant mode at any
time, with auto passenger next at 13.1%. This represents an average auto occupancy of 1.20; however, a
more accurate calculation for this factor should be derived from observed screenline classification
counts7. Walking is next, at 12.6% of all trips, and is the second-most prevalent mode during the midday
inter-peak (e.g., people walking to and from lunch). Transit is strongest during the peak periods and
midday inter-peak, with a 6.3% share overall.
Primary modes
Some trips use more than one mode. As a result, the question arises as to which mode should be
considered as ‘primary,’ for purposes of reporting. The following hierarchy is used in this report, and has
been retained from the 2006 and 2001 CRD summaries. Note that this hierarchy is independent of the
order in which the modes are used in the trip:
• For any combination of modes with transit, transit is the primary mode. An important example
is park and ride (e.g., auto to transit, or transit to auto – see also Table 42). Note that transitincludes Handy Dart.
• For any combination of modes with school buses (except transit), school bus is the primary
d ( l ifi d d “ th ” d b l )
7/27/2019 CRD OD Survey DailyTravelCharacteristicsReport
http://slidepdf.com/reader/full/crd-od-survey-dailytravelcharacteristicsreport 37/117
2011 CRD Household Travel Survey – Daily Travel Characteristics
27
Table 25. Weekday Travel Mode by Time of Day
Travel Mode Night
0000 - 0559
AM Peak
0600 - 0859
Midday
0900 - 1459
PM Peak
1500 - 1759
Evening
1800 - 2359
24 Hour Total
Auto Driver 10,669 115,197 246,143 181,250 122,373 675,632
Auto Passenger 1,765 19,570 42,085 37,158 37,361 137,940
Transit * 126 17,309 21,181 20,130 8,067 66,813
Walk 1,435 18,219 56,254 34,792 22,027 132,726
Bicycle 438 8,639 7,862 9,116 3,268 29,323
Other ** 609 3,552 4,156 4,041 1,486 13,844
Total (all modes) *** 15,043 182,486 377,681 286,487 194,581 1,056,278
* Includes Handy Dart.
** Includes school bus, other bus (non-transit), taxi, Harbour Ferry, BC Ferries, other marine, train and airplane.
*** Does not include 880 trips for which departure time is missing.
Figure 2. Weekday - Daily Mode Share

7/27/2019 CRD OD Survey DailyTravelCharacteristicsReport
http://slidepdf.com/reader/full/crd-od-survey-dailytravelcharacteristicsreport 38/117
2011 CRD Household Travel Survey – Daily Travel Characteristics
28
Table 26. Weekday Trip Purpose by Time of Day
Trip Purpose Night
0000 - 0559
AM Peak
0600 - 0859
Midday
0900 - 1459
PM Peak
1500 - 1759
Evening
1800 - 2359
24 Hour
Total
Work 7,233 90,473 54,201 11,557 5,433 168,896
Post-secondary school - 6,467 8,583 839 209 16,098
Other school 11 21,625 2,602 232 121 24,590
Personal business 273 6,295 40,806 13,011 5,095 65,480
Recreation / social 1,420 7,707 36,097 24,561 30,728 100,513
Dining / restaurant 314 2,118 18,525 7,133 11,228 39,318
Shopping 26 4,416 78,539 37,317 16,909 137,208
Pick-up / drop-off psgr 1,082 28,533 27,004 24,570 16,694 97,883
Return home 4,571 13,126 106,962 164,888 106,748 396,295
Other 112 1,725 4,362 2,380 1,417 9,997
Total (all purposes) 15,043 182,486 377,681 286,487 194,581 1,056,278* Does not include 880 trips for which the departure time is missing.
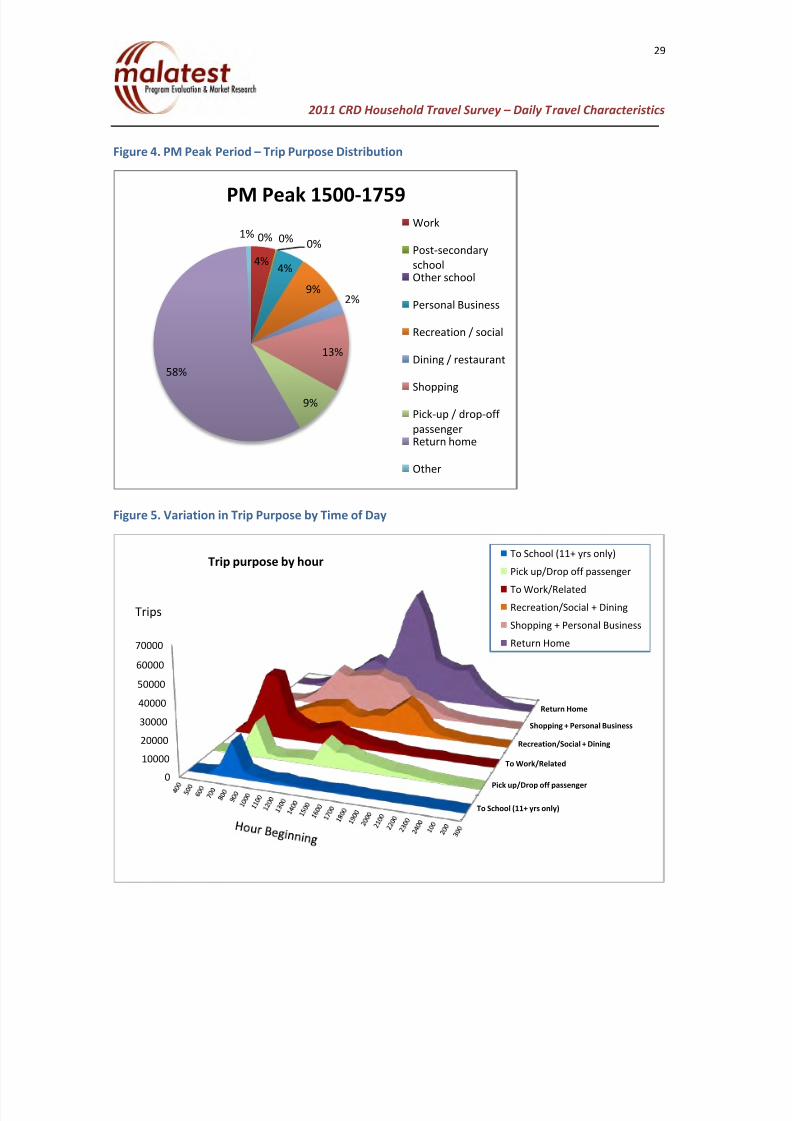
As Figure 3 indicates, the return home purpose is the most predominant, at over one third of all trips
(37.5%). The commute to work is next, at 16.0%, followed by shopping (13.0%) and recreation / social
(9.5%). Table 26 shows that the commutes to work, other school and post-secondary school dominate in
the AM peak period: also important is the pick-up / drop-off purpose (e.g., taking a child to daycare). By
comparison, as shown in Figure 4, during the PM peak period the return home purpose dominates,
followed by shopping, pick-up /drop-off and recreation / social. Figure 5 on the following pagehighlights the variation in trip purposes by time of day – some categories have been grouped for the
purpose of illustration.
7/27/2019 CRD OD Survey DailyTravelCharacteristicsReport
http://slidepdf.com/reader/full/crd-od-survey-dailytravelcharacteristicsreport 39/117
2011 CRD Household Travel Survey – Daily Travel Characteristics
29
Figure 4. PM Peak Period – Trip Purpose Distribution
Figure 5. Variation in Trip Purpose by Time of Day
0%
4%
0%0%
4%
9%2%
13%
9%
58%
1%
PM Peak 1500-1759
Work
Post-secondary
schoolOther school
Personal Business
Recreation / social
Dining / restaurant
Shopping
Pick-up / drop-off
passengerReturn home
Other
Trip purpose by hourTo School (11+ yrs only)
Pick up/Drop off passenger

7/27/2019 CRD OD Survey DailyTravelCharacteristicsReport
http://slidepdf.com/reader/full/crd-od-survey-dailytravelcharacteristicsreport 40/117
2011 CRD Household Travel Survey – Daily Travel Characteristics
30
Table 27 and Table 28 summarize daily trip purpose, respectively, by mode and by percent mode share.
Key points to note:
• Auto driver is the dominant mode for most trip purposes, notably the commute to work
(69.9%). Auto passenger is strongest for other school, at 32.9%, followed by dining / restaurant
at 20.9%.
• Transit’s share is strongest for post-secondary school (almost half, or 49.0%) and other school
(15.9%). The share to work is 8.1%.• The walk share is strongest for other school (25.4%), dining / restaurant (23.0% - e.g., the mid-
day lunch at work), and other (25.2%).
• Cycling is strongest for other school (5.3%), post-secondary school (5.0%) and the work
commute, for which the share is 4.9%.
Table 27. Weekday Daily - Trip Purpose by Travel Mode – Daily Trip Totals
Auto Driver Auto
Passenger
Transit Walk Bicycle Other Total
Work 118,188 10,277 13,613 17,305 8,306 1,355 169,043
Post-secondary school 4,816 1,318 7,895 925 799 344 16,098
Other school 2,221 8,100 3,908 6,254 1,308 2,861 24,652
Personal business 41,786 9,098 3,311 9,387 1,039 934 65,555
Recreation / social 63,309 18,393 4,566 10,744 2,078 1,585 100,676
Dining / restaurant 20,207 8,227 1,349 9,033 382 144 39,342
Shopping 90,381 18,462 2,517 23,265 2,013 724 137,362
Pick-up / drop-off psgr 83,487 9,409 125 3,864 952 65 97,902
Return home 246,813 53,184 29,130 49,432 12,217 5,755 396,532
Other 4,925 1,484 572 2,517 342 156 9,997
T t l 676 135 137 952 66 985 132 726 29 436 13 924 1 057 158

7/27/2019 CRD OD Survey DailyTravelCharacteristicsReport
http://slidepdf.com/reader/full/crd-od-survey-dailytravelcharacteristicsreport 41/117
2011 CRD Household Travel Survey – Daily Travel Characteristics
31
3.3.5 AM Travel Characteristics
Historically, much of CRD’s planning efforts have addressed the PM peak period, during which the
largest concentration of travel occurs and trip purposes (hence modes, trip origins and trip destinations)
are diverse. As a result, previous survey reports and this one focus on that time period. However, for
comparison of mode shares by trip purpose, it is useful also to present results for the AM peak period.
These are shown in Table 29 and Table 30. Of note, it can be seen that the transit share increases to
9.5%, with the commutes to post-secondary school (45.4%), other school (16.2%) and work (10.7%)
being the most important. The cycling share also increases, notably to shopping (6.6%), work (6.5%) andother school (5.1%). The walk share is slightly lower than it is over the course of the day, with other
school being most prevalent (26.6%).
Table 29. Weekday AM Peak Period – Trip Purpose by Travel Mode
Auto Driver Auto
Passenger
Transit Walk Bicycle Other Total
Work 62,047 5,847 9,676 6,358 5,883 662 90,473
Post-secondary school 1,916 531 2,937 551 395 137 6,467Other school 1,195 7,445 3,510 5,752 1,109 2,613 21,625
Personal business 4,613 950 185 534 - 12 6,295
Recreation / social 5,652 802 426 632 75 120 7,707
Dining / restaurant 1,744 134 41 174 25 - 2,118
Shopping 3,473 304 - 348 291 - 4,416
Pick-up / drop-off psgr 23,796 2,646 24 1,709 358 - 28,533
Return home 10,153 699 249 1,516 503 7 13,126
Other 607 212 261 645 - - 1,725
Total 115,197 19,570 17,309 18,219 8,639 3,552 182,486
Table 30 Weekday AM Peak Period – Mode Shares for Each Trip Purpose

7/27/2019 CRD OD Survey DailyTravelCharacteristicsReport
http://slidepdf.com/reader/full/crd-od-survey-dailytravelcharacteristicsreport 42/117
2011 CRD Household Travel Survey – Daily Travel Characteristics
32
3.3.6 PM Travel Characteristics
Table 31 and Table 32 present trip purpose by mode and mode share, respectively. Here, transit’s share
is strongest for post-secondary school (42.9%), return home (9.6%), to work (5.8%) and recreation /
social (5.6%). Walking is strongest for dining / restaurant (22.1% - e.g., a snack or drink after work),
other school (17.9%), other (17.8%), personal business (16.7% - e.g., go the bank before going home
from work) and to work (14.8%). Cycling is strongest for other (11.8%) and other school (6.1%).
Table 31. Weekday PM Peak Period - Trip Purpose by Travel Mode
Auto Driver Auto
Passenger
Transit Walk Bicycle Other Total
Work 8,317 630 666 1,711 150 84 11,557
Post-secondary school 237 241 360 - - - 839
Other school 38 67 - 42 14 70 232
Personal business 7,885 1,611 789 2,175 393 159 13,011
Recreation / social 14,133 5,524 1,382 2,858 462 202 24,561
Dining / restaurant 3,546 1,724 287 1,576 - - 7,133
Shopping 25,442 5,579 629 4,923 391 353 37,317
Pick-up / drop-off psgr 21,422 2,424 15 426 271 13 24,570
Return home 99,265 18,809 15,850 20,659 7,156 3,149 164,888
Other 964 547 153 423 280 13 2,380
Total 181,250 37,158 20,130 34,792 9,116 4,041 286,487
Table 32. Weekday PM Peak Period - Mode Shares for Each Trip Purpose
Auto Driver Auto
Passenger
Transit Walk Bicycle Other Total
Work 72.0% 5.5% 5.8% 14.8% 1.3% 0.7% 100.0%
P t d h l 28 3% 28 8% 42 9% 100 0%

7/27/2019 CRD OD Survey DailyTravelCharacteristicsReport
http://slidepdf.com/reader/full/crd-od-survey-dailytravelcharacteristicsreport 43/117
2011 CRD Household Travel Survey – Daily Travel Characteristics
33
for both time periods. Cycling trips are four times longer than walk trips, but are about half the length of
transit trips.
By purpose, the longest PM peak period trips are to school (post-secondary and other), return home and
other. Daily, the longest trips are to post-secondary school (but not other school), at 7.7 km, and work,
at 7.6 km. The shortest PM peak period trips are for shopping, personal business, and dining /
restaurant (which may also reflect the inclusion of these activities in the ‘return home’ trip chain). Daily,
the shortest trips are for other school, at about two thirds of the overall daily average (3.9 km v. 5.7 km),dining / restaurant, and shopping.
Table 33. Weekday PM Peak and Daily Average Trip Lengths
Travel Mode Trip Length (km)* Trip Purpose Trip Length (km)
PM Pk Pd 24 Hour PM Pk Pd 24 Hour
Auto Driver 6.5 6.3 Work 6.0 7.6
Auto Passenger 6.9 6.5 Post-secondary school 8.5 7.7
Transit 7.1 7.0 Other school 10.9 3.9
Walk 0.9 0.8 Personal Business 4.4 5.7
Bicycle 3.7 3.3 Recreation / social 5.6 5.9
Other 6.7 6.7 Dining / restaurant 4.9 4.1
Total (all modes) 5.9 5.7 Shopping 4.1 4.2
Pick-up / drop-off psgr 5.3 5.0
Return home 6.7 6.0
Other 6.1 6.2
Total (all purposes) 5.9 5.7* Trip length computed as the straight-line distance (“as the crow flies”) between X,Y coordinates of trip origin and destination.
Table 34 and Table 35 break down PM peak period mode use and mode share respectively by age
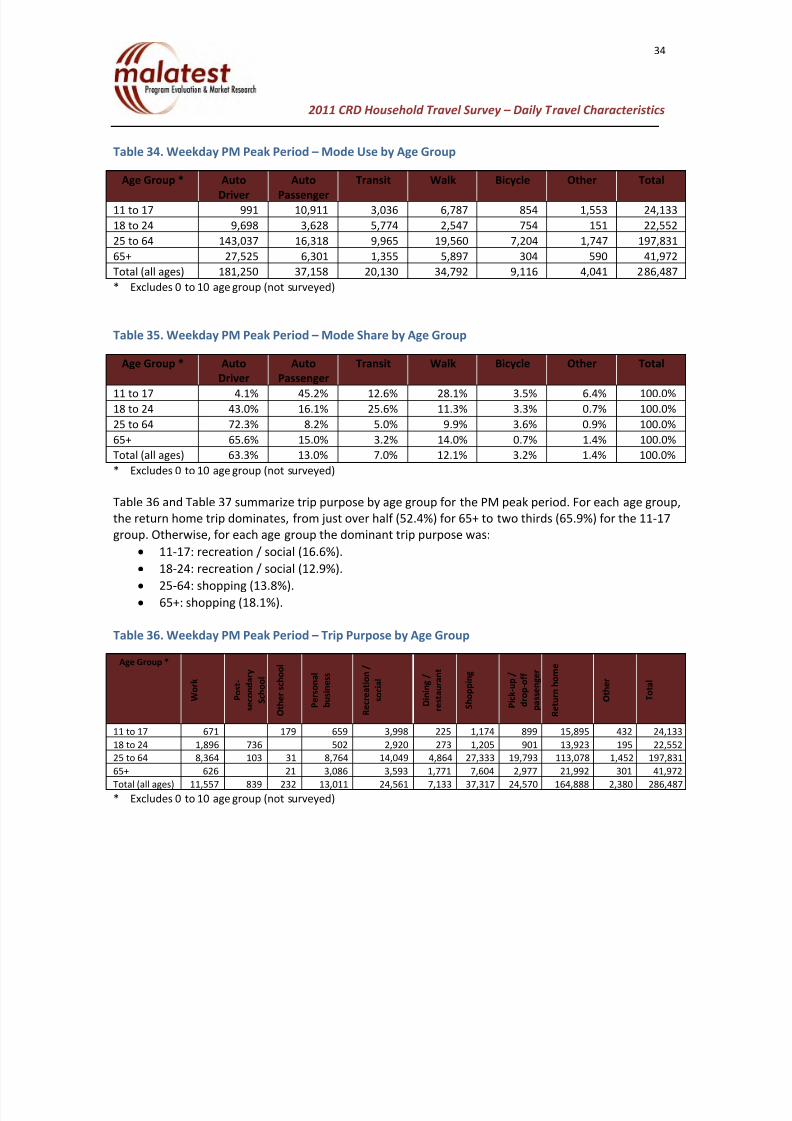
7/27/2019 CRD OD Survey DailyTravelCharacteristicsReport
http://slidepdf.com/reader/full/crd-od-survey-dailytravelcharacteristicsreport 44/117
2011 CRD Household Travel Survey – Daily Travel Characteristics
34
Table 34. Weekday PM Peak Period – Mode Use by Age Group
Age Group * Auto
Driver
Auto
Passenger
Transit Walk Bicycle Other Total
11 to 17 991 10,911 3,036 6,787 854 1,553 24,133
18 to 24 9,698 3,628 5,774 2,547 754 151 22,552
25 to 64 143,037 16,318 9,965 19,560 7,204 1,747 197,831
65+ 27,525 6,301 1,355 5,897 304 590 41,972
Total (all ages) 181,250 37,158 20,130 34,792 9,116 4,041 286,487
* Excludes 0 to 10 age group (not surveyed)
Table 35. Weekday PM Peak Period – Mode Share by Age Group
Age Group * Auto
Driver
Auto
Passenger
Transit Walk Bicycle Other Total
11 to 17 4.1% 45.2% 12.6% 28.1% 3.5% 6.4% 100.0%18 to 24 43.0% 16.1% 25.6% 11.3% 3.3% 0.7% 100.0%
25 to 64 72.3% 8.2% 5.0% 9.9% 3.6% 0.9% 100.0%
65+ 65.6% 15.0% 3.2% 14.0% 0.7% 1.4% 100.0%
Total (all ages) 63.3% 13.0% 7.0% 12.1% 3.2% 1.4% 100.0%
* Excludes 0 to 10 age group (not surveyed)
Table 36 and Table 37 summarize trip purpose by age group for the PM peak period. For each age group,
the return home trip dominates, from just over half (52.4%) for 65+ to two thirds (65.9%) for the 11-17
group. Otherwise, for each age group the dominant trip purpose was:
• 11-17: recreation / social (16.6%).
• 18-24: recreation / social (12.9%).

7/27/2019 CRD OD Survey DailyTravelCharacteristicsReport
http://slidepdf.com/reader/full/crd-od-survey-dailytravelcharacteristicsreport 45/117
2011 CRD Household Travel Survey – Daily Travel Characteristics
35
Table 37. Weekday PM Peak Period – Trip Purpose Distribution by Age Group
Age Group *
W o r k
P o s t -
s e c o n d a r y
S c h o o l
O t h e r s c h o o l
P e r s o n a l
b u s i n e s s
R e c r e a t i o n /
s o c i a l
D i n i n g /
r e s t a u r a n t
S h o p p i n g
P i c k - u p /
d r o p - o f f
p a s s e n g e r
R e t u r n h o m e
O t h e r
T o t a l
11 to 17 2.8% - 0.7% 2.7% 16.6% 0.9% 4.9% 3.7% 65.9% 1.8% 100.0%
18 to 24 8.4% 3.3% - 2.2% 12.9% 1.2% 5.3% 4.0% 61.7% 0.9% 100.0%
25 to 64 4.2% 0.1% 0.0% 4.4% 7.1% 2.5% 13.8% 10.0% 57.2% 0.7% 100.0%
65+ 1.5% - 0.1% 7.4% 8.6% 4.2% 18.1% 7.1% 52.4% 0.7% 100.0%
Total (all ages) 4.0% 0.3% 0.1% 4.5% 8.6% 2.5% 13.0% 8.6% 57.6% 0.8% 100.0%
* Excludes 0 to 10 age group (not surveyed)
The next series of tables summarizes PM peak period travel by land use at the origin or destination.
Whereas the land uses described in the 2006 and 2001 surveys were self-reported by the respondents,
the 2011 survey matched the origin and destination’s geocodes to a land use database supplied by the
CRD. The database contains 213 detailed categories which, for consistency with the previous surveys,were then grouped according to the 9 categories shown in the tables below. As each origin or
destination was assigned the land use of the closest parcel to the origin or destination X,Y coordinates,
and some X,Y coordinates are imprecise (e.g., respondent preferred to provide an intersection rather
than disclose a specific location), and furthermore some land uses are ‘mixed use’ (e.g., office and
residential), the coding may yield small numbers of incongruous purposes and origins/destinations (e.g.,
very small number of ‘return home’ trips destined for office land uses). The land use coding will be of
use in the calibration of the transportation model for the region.
Table 38 tabulates PM peak period trips by purpose and origin land use. Table 39 presents the
corresponding information by destination land use. Table 40 and Table 41 show the distribution of land
uses by origin and destination respectively

7/27/2019 CRD OD Survey DailyTravelCharacteristicsReport
http://slidepdf.com/reader/full/crd-od-survey-dailytravelcharacteristicsreport 46/117
2011 CRD Household Travel Survey – Daily Travel Characteristics
36
Table 39. Weekday PM Peak Period – Trip Purpose by Destination Land Use
Destination Land
Use
W o r k
P o s t -
s e c o n d a r y
S c h o o l
O t h e r s c h o o l
P e r s o n a l
b u s i n e s s
R e c r e a t i o n /
s o c i a l
D i n i n g /
r e s t a u r a n t
S h o p p i n g
P i c k - u p /
d r o p - o f f
p a s s e n g e r
R e t u r n h o m e
O t h e r T
o t a l
Residential 1,909 0 39 1,734 7,772 306 3,820 6,924 148,881 603 171,988
Agricultural 182 0 0 212 289 33 295 215 2,006 0 3,232
Industrial 365 0 0 207 616 78 207 1,100 745 67 3,386
Office 789 0 10 827 1,003 363 592 1,347 870 204 6,005
Schools 1,014 839 161 174 1,783 0 111 5,687 192 131 10,091
Hospitals 498 0 0 497 343 0 0 510 173 41 2,063
Retail 3,830 0 7 6,157 3,692 3,692 27,606 3,742 2,571 759 52,055
Other Commercial 1,453 0 0 1,658 2,103 2,192 3,212 1,651 2,062 93 14,425
Other 1,365 0 14 1,365 6,486 384 1,134 2,931 3,056 347 17,083
Total * 11,407 839 232 12,831 24,087 7,048 36,978 24,106 160,556 2,244 280,328
* Does not include 6,159 trips for which no land use code was available for the destination.
Table 40. Weekday PM Peak Period – Land Use at Trip Origin
Origin Land Use Person-Trips %
Residential 85,081 30.1%
Agricultural 3,457 1.2%
Industrial 7,142 2.5%
Office 17,808 6.3%
Schools 42,695 15.1%
Hospitals 6,369 2.3%
Retail 75,959 26.9%
Other Commercial 23 376 8 3%

7/27/2019 CRD OD Survey DailyTravelCharacteristicsReport
http://slidepdf.com/reader/full/crd-od-survey-dailytravelcharacteristicsreport 47/117
2011 CRD Household Travel Survey – Daily Travel Characteristics
37
3.3.7 Other Mode Use Characteristics
The 2011 survey asked about several other attributes of people’s trips. All of these are important to
understanding how different modes are used. The key points are summarized below.
Table 42 summarizes the usage of the area’s Park and Ride facilities – that is, the location where people
who used both auto/motorbike and transit transferred (whether from auto/motorbike to transit, or
from transit to motorbike/auto). It can be seen that activity ranged up to 728 trips at Juan de Fuca East
and West. Also important is the amount of ‘informal’ transferring that occurs: over two fifths of thetransfers occurred outside park and ride lots (1,324 trips or 42.5%).
The park and ride data are important to the forecasting of and planning for park and ride.
Table 42. Weekday Daily - Usage of Park and Ride Facilities
Location Official / Unofficial
P+R
Number of trips *
Sooke P+R Official 188
Saseenos Unofficial -
Seventeen Mile House Unofficial -
Langford P+R Official 67
Peatt Road Unofficial -
Juan de Fuca East & West Official 728
Helmcken Official 149
Beaver Lake Unofficial 26McTavish Official 352
Frayne Road Official 81
C bbl Hill Offi i l 48

7/27/2019 CRD OD Survey DailyTravelCharacteristicsReport
http://slidepdf.com/reader/full/crd-od-survey-dailytravelcharacteristicsreport 48/117
2011 CRD Household Travel Survey – Daily Travel Characteristics
38
Figure 6. Weekday Daily – Number of Buses Taken
The next three tables consider auto usage. Table 43 indicates the number of occupants in the vehicle,
when respondents recorded a trip by auto. The numbers include the driver. It can be seen that well over
half (58.6%) of the person-trips by auto had only the driver as the occupant. Another 30.4% had the
driver and one passenger. Note that these occupancies may include young children in the respondent’s
household, whose trips were not surveyed; and also trips made with people from other households(carpools), whose own trips were surveyed only if that household was sampled. (Again, it should be
noted that the most accurate depiction of vehicle occupancy is derived from observed screenline
classification counts )

7/27/2019 CRD OD Survey DailyTravelCharacteristicsReport
http://slidepdf.com/reader/full/crd-od-survey-dailytravelcharacteristicsreport 49/117
2011 CRD Household Travel Survey – Daily Travel Characteristics
39
Table 44 records the relationship of the traveller to other vehicle occupants. This is important for
understanding the dynamics of ridesharing, which differ between same household and multiple
households insofar as who is involved in the choices of mode (I will drop off my spouse at his workplace
on the way to mine), route (it is slightly out of my way) and time (I will carpool with my co-worker who
lives a few blocks from me, and I must be ready to be picked up at 7:45 am). It can be seen that over
four of every five multi-occupant vehicle trips was made with a member of the same household (82.9%).
Table 44. Weekday Daily Relationship to Other Vehicle Occupants
Relationship to Other Vehicle Occupants Number of trips
Yes, member of respondent’s household 238,448
No, not member of respondent’s household 49,023
Decline / don’t know 49,935
Total trips 337,406
Finally, for trips made by modes other than the automobile (or motorcycle or scooter), Table 45
tabulates whether or not a vehicle was available. Vehicle availability is an important determinant of
mode choice. For just under two of every five non-auto trips (38.4%), a vehicle was available: this means
that the traveller had a choice of mode. For the remaining 61.6%, a vehicle was not available for the trip
– i.e., the household does not own a vehicle or someone else required the vehicle – and so that
individual was ‘captive’ to transit, walking or cycling.

7/27/2019 CRD OD Survey DailyTravelCharacteristicsReport
http://slidepdf.com/reader/full/crd-od-survey-dailytravelcharacteristicsreport 50/117
2011 CRD Household Travel Survey – Daily Travel Characteristics
40
Figure 7. Prominent Desire Lines in the Regional Planning Area

7/27/2019 CRD OD Survey DailyTravelCharacteristicsReport
http://slidepdf.com/reader/full/crd-od-survey-dailytravelcharacteristicsreport 51/117
2011 CRD Household Travel Survey – Daily Travel Characteristics
41
3.3.9 Comparison with the 2001 and 2006 Travel Surveys
Presentation of Comparisons
The following tables compare the 2011 results with those from the 2001 and 2006 surveys. Due to the
differences in the sampling frames in the three survey cycles, for the purposes of comparison, all three
datasets have been filtered to include only households/residents within the Regional Planning Area and
only trips made by residents of the RPA (i.e., excludes all trips made by residents of the South CVRD and
Salt Spring Island, even those within the RPA), and only trips made by persons 11 years of age or older.
The 2001 and 2006 datasets both over-estimated population counts, therefore, the data have been
recalibrated to match actual Census counts for those years: as a result, the results presented here are
not necessarily the same as those presented in the 2001 and 2006 survey reports.
Table 46 compares key demographic statistics, daily trip totals and trip rates. Keeping in mind that these
totals are based on RPA residents’ travel, as noted above, the table indicates that:
• Total population (all ages and 11+) and households have increased, with total population andhouseholds increasing faster from 2001 to 2006, and population 11+ increasing faster between
2006 and 2011. Overall, between 2001 and 2011, population increased by 10.5%.
• In the 10 years from 2001 to 2011, total trips also rose but at a more modest increase of 7.2%.
While the survey results suggest that most of this increase took place between 2001 and 2006, it
may be that the 2006 survey overstated the number of trips (as population did not increase as
dramatically in the same period).
• Similarly, after an increase in trip rates per resident, per resident 11+ and per household from
2001 to 2006, there was a reduction from 2006 to 2011, with 2011 trip rates in all threecategories being lower than the 2001 rates, especially the household trip rate (-5.1%).
I i l f i fl d b d h h i h

7/27/2019 CRD OD Survey DailyTravelCharacteristicsReport
http://slidepdf.com/reader/full/crd-od-survey-dailytravelcharacteristicsreport 52/117
2011 CRD Household Travel Survey – Daily Travel Characteristics
42
One such examination is offered by a review of trips and trip rates by age category. This is summarized
in Table 47. It can be seen, however, that the aforementioned increase to 2006 and reduction in 2011
holds true across all age categories.
Table 47. Comparison of Daily Trip Totals and Rates by Age Category – RPA Residents
Age Group * 2001 2006 2011
Population Daily Trips Trip
Rates
Population Daily Trips Trip
Rates
Population Daily Trips Trip
Rates
0 to 10 30,263 89,395 2.95 33,294 102,553 3.08 32,070
11 to 17 24,263 68,530 2.82 25,100 75,223 3.00 23,925 69,370 2.90
18 to 24 29,120 85,983 2.95 29,500 97,419 3.30 30,981 89,879 2.90
25 to 64 171,492 624,632 3.64 185,636 697,262 3.76 194,250 690,515 3.55
65+ 56,588 182,980 3.23 56,893 169,847 2.99 63,664 183,010 2.87
Total (all ages) 311,726 1,051,520 3.37 330,423 1,142,304 3.46 344,889 N/A N/A
Total (Residents11+) **
/*** 284,312 963,027 3.39 297,129 1,039,549 3.50 312,819 1,032,775 3.30
* Trips to, from, or within the RPA made by RPA residents. 2001 and 2006 trips for the 5-12 age group were apportioned to
0 to 10 and 11 to 17 categories.
** For 2001 and 2006, total for persons 11+ may differ from sum of individual categories due to respondents with unknown
age groups, or estimation procedures to account for missing data.
*** Excludes trips made by survey respondents outside the RPA (e.g. Salt Spring Island, Cowichan Valley). 2001 and 2006
expansion factors have been recalibrated for the purpose of comparison.
Table 48 compares daily mode share. It can be seen that the auto driver / auto passenger shares have
remained constant over time, capturing three quarters of all daily trips. Transit’s share has dropped to
6.4% in 2011, from 7.0% in 2006 and 6.9% in 2001. The walk share has increased, and although the
cycling share has dropped relative to 2006, it is still higher than the 2001 share.

7/27/2019 CRD OD Survey DailyTravelCharacteristicsReport
http://slidepdf.com/reader/full/crd-od-survey-dailytravelcharacteristicsreport 53/117
2011 CRD Household Travel Survey – Daily Travel Characteristics
43
Table 49 compares daily trip purposes for people 11+. The distributions are reasonably consistent over
time, with the exception of personal business, whose share has dropped to 6.2% in 2011 (compared
with 9.1% in 2006 and 8.2% in 2001), and other, whose share varies considerably among the three years
(although is never greater than 3.4%, in 2001).
Table 49. Comparison of Daily Trip Purposes – Trips by RPA Residents 11+
Trip Purpose 2001 2006 2011
Daily Trips %
Distribution
Daily Trips %
Distribution
Daily Trips %
Distribution
Work 157,566 16.4% 176,404 17.0% 161,784 15.7%
Post-secondary
school18,890 2.0% 19,237 1.9% 15,883 1.5%
Other school 21,913 2.3% 28,238 2.7% 24,641 2.4%
Personal business 78,654 8.2% 94,212 9.1% 64,532 6.2%
Recreation / social 84,526 8.8% 102,614 9.9% 98,745 9.6%
Dining / restaurant 35,727 3.7% 37,786 3.6% 38,402 3.7%
Shopping 106,541 11.1% 120,079 11.6% 133,908 13.0%
Pick-up / drop-off
passenger78,879 8.2% 96,297 9.3% 96,255 9.3%
Return home 347,373 36.1% 363,672 35.0% 388,930 37.7%
Other 32,957 3.4% 1,011 0.1% 9,695 0.9%
Total (all trips
combined)*963,027 100% 1,039,549 100% 1,032,775 100.00%
* Excludes trips made by survey respondents outside the RPA (e.g. Salt Spring Island, Cowichan Valley) to allow
comparisons to be made on the same basis. 2001 and 2006 expansion factors have been recalibrated for the
purpose of comparison.
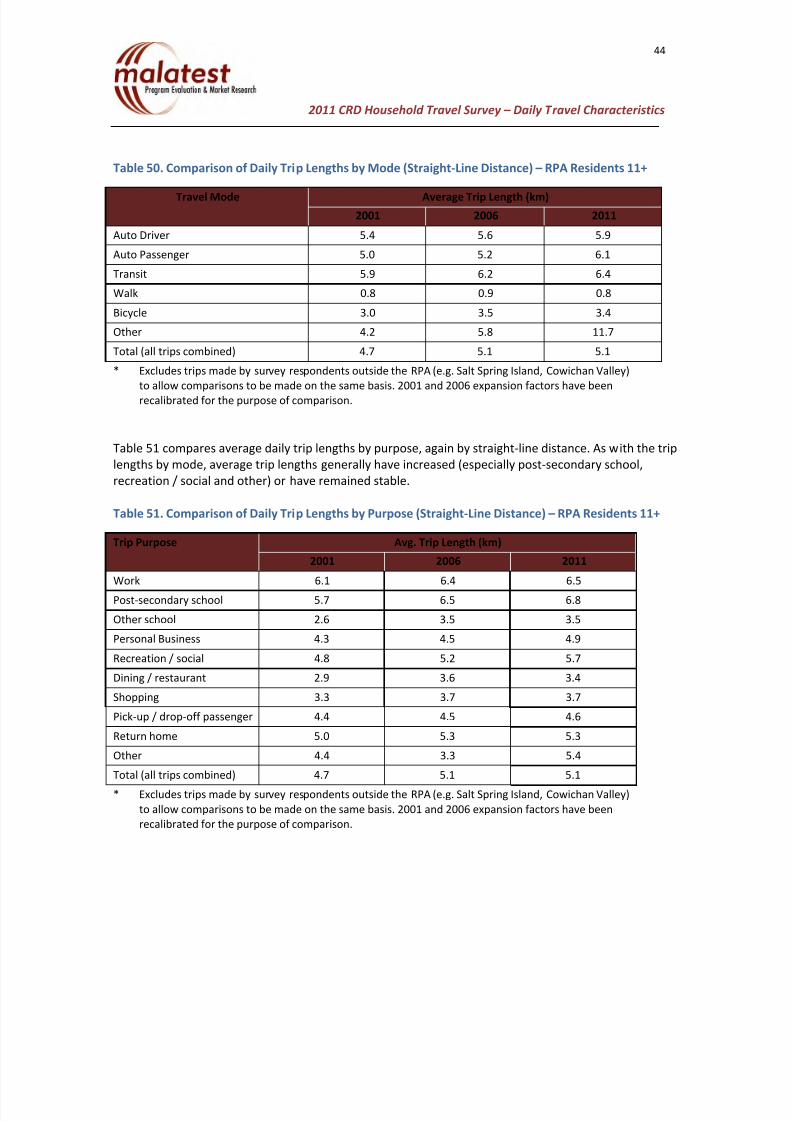
7/27/2019 CRD OD Survey DailyTravelCharacteristicsReport
http://slidepdf.com/reader/full/crd-od-survey-dailytravelcharacteristicsreport 54/117
2011 CRD Household Travel Survey – Daily Travel Characteristics
44
Table 50. Comparison of Daily Trip Lengths by Mode (Straight-Line Distance) – RPA Residents 11+
Travel Mode Average Trip Length (km)
2001 2006 2011
Auto Driver 5.4 5.6 5.9
Auto Passenger 5.0 5.2 6.1
Transit 5.9 6.2 6.4
Walk 0.8 0.9 0.8
Bicycle 3.0 3.5 3.4
Other 4.2 5.8 11.7
Total (all trips combined) 4.7 5.1 5.1
* Excludes trips made by survey respondents outside the RPA (e.g. Salt Spring Island, Cowichan Valley)
to allow comparisons to be made on the same basis. 2001 and 2006 expansion factors have been
recalibrated for the purpose of comparison.
Table 51 compares average daily trip lengths by purpose, again by straight-line distance. As with the trip
lengths by mode, average trip lengths generally have increased (especially post-secondary school,
recreation / social and other) or have remained stable.
Table 51. Comparison of Daily Trip Lengths by Purpose (Straight-Line Distance) – RPA Residents 11+
Trip Purpose Avg. Trip Length (km)
2001 2006 2011

7/27/2019 CRD OD Survey DailyTravelCharacteristicsReport
http://slidepdf.com/reader/full/crd-od-survey-dailytravelcharacteristicsreport 55/117
2011 CRD Household Travel Survey – Daily Travel Characteristics
45
4 Sub-Area Demographic and Travel Summaries
Detailed demographic and travel characteristics are presented on the following pages for four levels of
geographies:
• 21 districts, as defined in section 3.3.2 to summarize the trip origins and destinations. These are
the basic analytical units that were used for the survey sampling and for this report.
• 5 sub-regions, as defined in the same section.• 2 municipal aggregations, corresponding to the municipal boundaries of the City of Victoria
(districts 5-7) and the District of Saanich (districts 8-10).
• 2 regional aggregations, comprising the entire study area (districts 1-20 / sub-regions 1-5) and
the Regional Planning Area (districts 2-19 / sub-regions 2-4).
The 20 districts in the study area can be grouped into the sub-regions, the municipal aggregations and
the regional aggregations. Table 52 shows the equivalencies among the four levels. Note that there is no
summary for the external areas (district 21 / sub-region 6), although internal-external and external-
internal trips are included in each of the summaries.
One pair of pages is provided for each summary. The information presented in each summary is similar
to that presented in the Chapter 3 region-wide summaries. Each pair of pages has the same format, so
as to provide detailed characteristics while enabling a quick comparison among different geographies.
Each pair of pages presents:
• A map of the relevant district, sub-region, municipality or region.
• Demographic characteristics of the district’s residents.
• Jobs in each district also are noted: this refers to the number of workplaces within the district

7/27/2019 CRD OD Survey DailyTravelCharacteristicsReport
http://slidepdf.com/reader/full/crd-od-survey-dailytravelcharacteristicsreport 56/117
2011 CRD Household Travel Survey – Daily Travel Characteristics
46
• Breakdown of trips by purpose, for the 24 hours, AM peak period (06:00 to 08:59) and PM peak
period (15:00 to 17:59). The breakdown distinguishes among trips originating from and destined
to the district; trips made entirely within the district are categorized as well.
• Breakdown of trips by mode of travel, for the 24 hours, AM peak period and PM peak period,
categorized from, to and within the district. Trips are categorized according to the primary mode
of use (see section 3.3.4). The shares of each mode are calculated for each category.
The statistics reported in the two-page summaries are based on the survey results, and not externalsources. For household and population counts, the survey statistics match the 2011 Census counts of
dwelling occupied by usual residents and 2011 population counts, as these were controls used in the
weighting for data expansion.
While other controls were also included in the data weighting (dwelling size, general dwelling type, age,
gender), given the number of controls, the survey results do not necessarily match all controls used in
the weighting. Also, the survey results may not always match other external benchmark statistics from
other sources such as the Labour Force Survey, although often they may be close.
Some respondents refused to answer certain questions; some statistics are based only on those who
provided valid answers, and for the different measures reported there may be slight variations in totals.
Table 52. Key to District, Sub-Regional, Municipal and Regional Summaries
Districts * Sub-Regions Municipalities Regions
1. Salt Spring Island Electoral Area 1. Salt Spring
(see summary
for District 1)
1. Study Area
(D1 – D20)
2. Regional

7/27/2019 CRD OD Survey DailyTravelCharacteristicsReport
http://slidepdf.com/reader/full/crd-od-survey-dailytravelcharacteristicsreport 57/117
2011 CRD Household Travel Survey – Daily Travel Characteristics
47
Districts * Sub-Regions Municipalities Regions
20. South CVRD (Cowichan Valley A, B, C, E (south of Cowichan
Valley Highway), Duncan, North Cowichan (south of Herd
Road), Malahat First Nation, Cowichan Tribes)**
5. CVRD (see
summary for
District 20)
21. External (Vancouver Island north of study area, Gulf Islands,
mainland, etc.)***
6. External
* Identical to Municipalities / Areas as listed in Table 15.
** The geographic survey frame for the South CVRD survey district was defined based on proximity to the CRD,
not on standard administrative boundaries; therefore, the results for this district, while informative, shouldnot be taken to represent the travel characteristics of all households in the CVRD.
*** External (District 21 / Sub-Region 6) does not have a separate summary. However, external trips to/from
the other districts, sub-regions and regions are included in the respective summaries.

7/27/2019 CRD OD Survey DailyTravelCharacteristicsReport
http://slidepdf.com/reader/full/crd-od-survey-dailytravelcharacteristicsreport 58/117
6WXG\$UHD'LVWULFW
Demographic Characteristics
Population ϰϬϲϰϴϱ Actively Travelled ϯϯϵϴϯϯ
Employed Population ϮϭϮϯϳϮ Number of Vehicles ϮϵϬϲϯϴ
Households ϭϳϴϱϳϭ Area (ha) ϮϳϳϰϰϮ
J obs in District ϭϵϱϯϴϱ
Occupation
Status (age 11+) Male Female Total %
Full Time Employed ϴϳϴϮϴ ϲϴϭϴϳ ϭϱϲϬϭϱ ϰϮй
Part Time Employed ϭϵϯϮϯ ϯϳϬϯϰ ϱϲϯϱϳ ϭϱй
Student Ϯϳϭϯϳ ϯϬϬϮϯ ϱϳϭϲϬ ϭϲй
Retiree ϯϳϭϱϴ ϰϱϰϰϱ ϴϮϲϬϯ ϮϮй
Homemaker ϭϬϲϴ ϭϮϳϰϭ ϭϯϴϬϵ ϰй
Other ϭϬϰϬϵ ϭϭϬϭϱ ϮϭϰϮϱ ϲй
Total: ϭϳϰϵϭϭ ϭϵϮϵϰϬ ϯϲϳϴϱϭ ϭϬϬй
Traveller Characteristics Male Female Total
Licensed Drivers ϭ ϰϲϬ ϴϰ ϭ ϱϳϭ ϰϳ ϯ ϬϯϮ ϯϭ
Trips made by residents ϭϮϬϳϯϭϴ
Selected Indicators 7,090 Household Size Total й
Daily Trips per Person (age 11+) Ϯϵϳ 1 person ϱϳϬϭϰ ϯϮй
Vehicles per Person ϬϳϮ 2 persons ϲϲϰϯϮ ϯϳй
Number of Persons per Household ϮϮϴ 3 persons Ϯϰϯϱϲ ϭϰй
Daily Trips per Household ϲϳϲ 4+persons ϯϬϳϲϵ ϭϳй
Vehicles per Household ϭϲϯ Total: ϭϳϴϱϳϭ ϭϬϬй
Workers per Household ϭϭϵ
Population Density (Pop/ha) ϭϰϳ Households by Vehicle Availability Total й
Employment Density (J obs/ha) ϬϳϬ 0 vehicles ϭϴϲϵϴ ϭϬй
2 vehicles ϱϳϵϯϵ ϯϮй
3+vehicles Ϯϴϯϵϳ ϭϲй
Total: ϭϳϴϱϳϭ ϭϬϬй
55 - 64
65+
Population
Explanatory Notes
Information on this page is for households/residents of the entire study area, whichincludes Districts 2-19 within the CRD Regional Planning Area and Districts 1 and 20outside the Regional Planning Area. These results are based on a survey sample of 3.5% of households in this geography and are subject to a margin of sampling error of

7/27/2019 CRD OD Survey DailyTravelCharacteristicsReport
http://slidepdf.com/reader/full/crd-od-survey-dailytravelcharacteristicsreport 59/117
Travel Patterns
Trips by Trip Purpose Trips by Primary Travel Mode
24 Hours Districts
ϮϮϲϮ ϯϮй ϯϯϲ ϰй ϭϴϭϴϮϳ ϭϱй Auto Driver ϱϴϯϯ ϴϮй ϲϮϲϭ ϴϬй ϳϲϳϰϵϯ ϲϱй
ϭϲϬ Ϯй Ϭ Ϭй ϭϲϱϵϮ ϭй Auto Passenger ϵϰϮ ϭϯй ϭϭϴϲ ϭϱй ϭϲϬϭϭϰ ϭϰй
ϭϮ Ϭй ϭϭ Ϭй Ϯϴϰϲϰ Ϯй Transit ϳϵ ϭй ϮϮ Ϭй ϲϳϮϳϲ ϲй
ϵϵϱ ϭϰй ϭϲϲ Ϯй ϳϯϰϱϳ ϲй Bicycle ϰϳ ϭй Ϭ Ϭй Ϯϵϵϳϯ ϯй
ϭϮϴϯ ϭϴй Ϭ Ϭй ϭϭϮϭϲϲ ϭϬй Walk Ϭ Ϭй Ϭ Ϭй ϭϯϴϴϳϲ ϭϮй
ϱϲ ϭй ϰϵ ϭй ϰϰϱϮϲ ϰй Other ϮϮϵ ϯй ϯϯϬ ϰй ϭϲϰϬϬ ϭй
ϭϭϴϳ ϭϳй ϱϰϱ ϳй ϭϱϳϮϵϵ ϭϯй Total: ϳϭϯϬ ϭϬϬй ϳϴϬϬ ϭϬϬй ϭϭϴϬϭϯϮ ϭϬϬй
ϳϰϬ ϭϬй ϭϭϳϲ ϭϱй ϭϬϵϮϴϮ ϵй
ϳϵ ϭй ϱϭϴϴ ϲϳй ϰϰϱϮϵϳ ϯϴй
Other ϯϱϱ ϱй ϯϮϵ ϰй ϭϭϮϮϮ ϭй
Total: ϳϭϯϬ ϭϬϬй ϳϴϬϬ ϭϬϬй ϭϭϴϬϭϯϮ ϭϬϬй
AM Peak (06:00 - 08:59) AM Peak (06:00 - 08:59)
ϭϰϬϵ ϲϱй ϭϳϴ ϱϵй ϵϲϳϱϮ ϰϴй Auto Driver ϭϵϲϳ ϵϭй Ϯϵϴ ϵϴй ϭϯϬϵϱϱ ϲϱй
ϭϱϭ ϳй Ϭ Ϭй ϲϲϭϱ ϯй Auto Passenger ϭϴϱ ϵй ϳ Ϯй ϮϮϬϲϭ ϭϭй
ϭϮ ϭй Ϭ Ϭй Ϯϱϭϭϰ ϭϮй Transit Ϭ Ϭй Ϭ Ϭй ϭϳϯϯϳ ϵй
ϱϱ ϯй Ϭ Ϭй ϲϳϬϳ ϯй Bicycle Ϭ Ϭй Ϭ Ϭй ϴϳϰϬ ϰй
ϰϳ Ϯй Ϭ Ϭй ϴϳϮϭ ϰй Walk Ϭ Ϭй Ϭ Ϭй ϭϵϭϲϬ ϵй
Ϭ Ϭй Ϭ Ϭй Ϯϱϲϯ ϭй Other Ϭ Ϭй Ϭ Ϭй ϰϱϴϱ Ϯй
Ϯϱϱ ϭϮй Ϭ Ϭй ϱϰϳϲ ϯй Total: ϮϭϱϮ ϭϬϬй ϯϬϱ ϭϬϬй ϮϬϮϴϯϵ ϭϬϬй
ϭϲϮ ϴй Ϭ Ϭй ϯϯϮϭϵ ϭϲй
Ϭ Ϭй ϱϰ ϭϴй ϭϱϵϬϮ ϴй
Other ϲϭ ϯй ϳϮ Ϯϰй ϭϳϲϵ ϭй
Total: ϮϭϱϮ ϭϬϬй ϯϬϱ ϭϬϬй ϮϬϮϴϯϵ ϭϬϬй
PM Peak (15:00 - 17:59) PM Peak (15:00 - 17:59)
ϭϰ ϭй ϭϭϱ ϯй ϭϮϱϬϰ ϰй Auto Driver ϵϰϬ ϳϵй ϯϭϮϵ ϴϭй ϮϬϱϰϳϬ ϲϰй
Ϭ Ϭй Ϭ Ϭй ϵϳϮ Ϭй Auto Passenger ϭϲϳ ϭϰй ϲϴϲ ϭϴй ϰϮϲϴϰ ϭϯй
Ϭ Ϭй ϭϭ Ϭй Ϯϱϲ Ϭй Transit ϳϵ ϳй Ϭ Ϭй ϮϬ ϭϳϱ ϲй
Work
Post-secondary School
Other School
tŝƚŚŝŶŝƐƚƌŝĐƚ
Personal Business
Recreation / social
Dining / restaurant
Shopping
Pick-up / drop-off
Return Home
&ƌŽŵŝƐƚƌŝĐƚ dŽŝƐƚƌŝĐƚ tŝƚŚŝŶŝƐƚƌŝĐƚ &ƌŽŵŝƐƚƌŝĐƚ dŽŝƐƚƌŝĐƚ
From District To District Within District
Work
Post-secondary School
To District Within District
Other School
Shopping
Passenger
Return Home
From District
To District Within District
Dining / restaurant
From District To District Within District From District
Work
Post-secondary School
Other School
Personal Business
Recreation / social
ϮϲϬ ϮϮй ϯϱ ϭй ϭϰϰϲϮ ϱй Bicycle Ϭ Ϭй Ϭ Ϭй ϵϱϭϴ ϯй
Ϯϲϲ ϮϮй Ϭ Ϭй Ϯϴϱϭϱ ϵй Walk Ϭ Ϭй Ϭ Ϭй ϯϲϱϲϰ ϭϭй
Ϭ Ϭй ϭϯ Ϭй ϴϭϮϴ ϯй Other Ϭ Ϭй ϱϮ ϭй ϰϳϵϱ Ϯй
ϰϬϱ ϯϰй ϮϬϳ ϱй ϰϮϯϯϵ ϭϯй Total: ϭϭϴϲ ϭϬϬй ϯϴϲϳ ϭϬϬй ϯϭϵϮϬϳ ϭϬϬй
ϴϲ ϳй ϳϱϰ ϭϵй Ϯϲϵϴϳ ϴй
ϳϵ ϳй Ϯϲϲϰ ϲϵй ϭϴϮϲϱϴ ϱϳй
Other ϳϲ ϲй ϲϵ Ϯй Ϯϯϴϱ ϭй
Total: ϭϭϴϲ ϭϬϬй ϯϴϲϳ ϭϬϬй ϯϭϵϮϬϳ ϭϬϬй
Peak Period (%) dŽƚĂů йŽĨϮϰ, ŽƵƌƐ t ŝƚŚŝŶŝƐƚ ƌŝĐƚ ;йͿ Transit Modal Share
24 Hours ϭϭϵϱϬϲϭ ϵϵй 24 Hours
AM Peak Period ϮϬϱϮϵϲ ϭϳй ϵϵй AM Peak Period ϵй
ϲйϬйϭй
Ϭй Ϭй
tŝƚŚŝŶŝƐƚƌŝĐƚ
Personal Business
Recreation / social
Dining / restaurant
Shopping
Pick-up / drop-off
Return Home
&ƌŽ ŵŝƐƚƌŝĐƚ d ŽŝƐƚƌŝĐƚ

7/27/2019 CRD OD Survey DailyTravelCharacteristicsReport
http://slidepdf.com/reader/full/crd-od-survey-dailytravelcharacteristicsreport 60/117
6WXG\$UHD5HJLRQDO3ODQQLQJ$UHD'LVWULFW
Demographic Characteristics
Population ϯϰϰϴϴϵ Actively Travelled ϮϵϭϵϰϬ
Employed Population ϭϴϯϮϴϰ Number of Vehicles ϮϰϬϰϳϰ
Households ϭϱϯϰϰϭ Area (ha) ϮϬϬϭϭϭ
J obs in District ϭϳϱϲϯϭ
Occupation
Status (age 11+) Male Female Total %
Full Time Employed ϳϱϰϮϰ ϱϵϰϲϲ ϭϯϰϴϵϬ ϰϯй
Part Time Employed ϭϲϯϴϬ ϯϮϬϭϱ ϰϴϯϵϰ ϭϱй
Student Ϯϰϭϵϴ Ϯϱϵϲϵ ϱϬϭϲϳ ϭϲй
Retiree ϯϬϱϬϳ ϯϳϵϰϭ ϲϴϰϰϴ ϮϮй
Homemaker ϯϵϱ ϭϬϮϮϰ ϭϬϲϭϵ ϯй
Other ϴϴϳϰ ϵϮϭϳ ϭϴϬϵϮ ϲй
Total: ϭϰ ϴϰϬϬ ϭ ϲϰ ϰϭ ϵ ϯϭ Ϯϴϭ ϵ ϭ ϬϬй
Traveller Characteristics Male Female Total
Licensed Drivers ϭϮϯϴϮϮ ϭϯϯϮϵϭ Ϯϱϳϭϭϰ
Trips made by residents ϭϬϯϯϵϮϮ
Selected Indicators 7,090 Household Size Total й
Daily Trips per Person (age 11+) ϯϬϬ 1 person ϱϬϯϱϯ ϯϯй
Vehicles per Person ϬϳϬ 2 persons ϱϲϮϳϮ ϯϳй
Number of Persons per Household ϮϮϱ 3 persons ϮϬϴϲϲ ϭϰй
Daily Trips per Household ϲϳϰ 4+persons ϮϱϵϱϬ ϭϳй
Vehicles per Household ϭϱϳ Total: ϭϱϯϰϰϭ ϭϬϬй
Workers per Household ϭϭϵ
Population Density (Pop/ha) ϭϳϮ Households by Vehicle Availability Total й
Employment Density (J obs/ha) Ϭϴϴ 0 vehicles ϭϳϬϵϱ ϭϭй
2 vehicles ϰϴϰϴϭ ϯϮй
3+vehicles Ϯϭϰϴϲ ϭϰй
Total: ϭϱϯϰϰϭ ϭϬϬй
55 - 64
65+
Population
Explanatory Notes
Information on this page is specific to households/residents of the CRD RegionalPlanning Area (Districts 2-19). These results are based on a survey sample of 3.5% of households in this geography and are subject toa marginof sampling error of

7/27/2019 CRD OD Survey DailyTravelCharacteristicsReport
http://slidepdf.com/reader/full/crd-od-survey-dailytravelcharacteristicsreport 61/117
Travel Patterns
Trips by Trip Purpose Trips by Primary Travel Mode
24 Hours Districts
ϭϰϳϱ ϭϭй ϱϮϮϭ ϯϵй ϭϲϬϯϰϳ ϭϲй Auto Driver ϭϬϳϰϲ ϴϭй ϭϬϰϲϯ ϳϴй ϲϰϳϴϴϰ ϲϰй
Ϭ Ϭй ϮϬϮ Ϯй ϭϱϴϲϭ Ϯй Auto Passenger ϭϲϯϳ ϭϮй ϮϯϵϮ ϭϴй ϭϯϮϯϮϳ ϭϯй
Ϭ Ϭй ϲϮ Ϭй Ϯϰϰϵϯ Ϯй Transit ϱϳϴ ϰй ϯϯϴ ϯй ϲϱϳϵϴ ϲй
ϯϴϰ ϯй ϳϳϬ ϲй ϲϯϴϯϭ ϲй Bicycle ϭϬϭ ϭй ϱϰ Ϭй ϮϵϬϱϲ ϯй
ϭϰϵϵ ϭϭй ϭϰϵϵ ϭϭй ϵϱϳϲϴ ϵй Walk Ϭ Ϭй Ϭ Ϭй ϭϯϭϳϵϯ ϭϯй
ϳϭ ϭй Ϯϭϳ Ϯй ϯϴϳϰϮ ϰй Other ϭϰϰ ϭй Ϯϯϲ Ϯй ϭϯϮϰϲ ϭй
ϭϬϮϵ ϴй ϭϴϮϰ ϭϰй ϭϯϯϬϰϱ ϭϯй Total: ϭϯϮϬϲ ϭϬϬй ϭϯϰϴϯ ϭϬϬй ϭϬϮϬϭϬϯ ϭϬϬй
ϵϳϯ ϳй ϲϲϵ ϱй ϵϱϭϭϳ ϵй
ϳϲϰϮ ϱϴй Ϯϴϵϱ Ϯϭй ϯϴϯϰϳϬ ϯϴй
Other ϭϯϰ ϭй ϭϮϯ ϭй ϵϰϮϴ ϭй
Total: ϭϯϮϬϲ ϭϬϬй ϭϯϰϴϯ ϭϬϬй ϭϬϮϬϭϬϯ ϭϬϬй
AM Peak (06:00 - 08:59) AM Peak (06:00 - 08:59)
ϱϵϲ 55% ϯϮϮϬ 72% ϴϲϭϳϯ 49% Auto Driver ϵϭϱ ϴϰй ϯϲϬϰ ϴϭй ϭϭϬϭϰϰ ϲϯй
Ϭ 0% ϮϬϮ 5% ϲϮϲϱ 4% Auto Passenger ϭϳϴ ϭϲй ϲϮϮ ϭϰй ϭϴϲϳϯ ϭϭй
Ϭ 0% ϰϬ 1% ϮϭϱϮϲ 12% Transit Ϭ Ϭй ϮϬϭ ϱй ϭϳϬϱϲ ϭϬй
ϭϬϰ 9% ϵ 0% ϲϭϳϭ 4% Bicycle Ϭ Ϭй Ϭ Ϭй ϴϲϮϰ ϱй
ϯϬ 3% ϰϳϭ 11% ϳϬϴϰ 4% Walk Ϭ Ϭй Ϭ Ϭй ϭϴϭϯϳ ϭϬй
Ϭ 0% ϰϱ 1% ϮϬϱϲ 1% Other Ϭ Ϭй ϮϮ Ϭй ϯϰϯϮ Ϯй
ϭϳϳ 16% ϭϵϰ 4% ϰϬϮϴ 2% Total: ϭϬϵϯ ϭϬϬй ϰϰϱϬ ϭϬϬй ϭϳϲϬϲϲ ϭϬϬй
ϯϲ 3% ϭϴϯ 4% ϮϴϭϲϬ 16%
ϭϱϭ 14% ϰϵ 1% ϭϮϵϭϰ 7%
Other Ϭ 0% ϯϲ 1% ϭϲϴϵ 1%
Total: 1,093 100% 4,450 100% 176,066 100%
PM Peak (15:00 - 17:59) PM Peak (15:00 - 17:59)
ϲϵ ϭй Ϯϯϴ ϵй ϭϭϭϮϯ ϰй Auto Driver ϰϲϮϭ ϴϰй ϭϴϮϵ ϳϬй ϭϳϯϭϮϵ ϲϯй
Ϭ Ϭй Ϭ Ϭй ϴϯϵ Ϭй Auto Passenger ϱϲϯ ϭϬй ϲϲϬ Ϯϱй ϯϱϱϰϭ ϭϯй
Ϭ Ϭй ϭϭ Ϭй ϮϮϬ Ϭй Transit ϯϭϴ ϲй Ϭ Ϭй ϭϵ ϳϴϭ ϳй
Work
Post-secondary School
Other School
tŝƚŚŝŶŝƐƚƌŝĐƚ
Personal Business
Recreation / social
Dining / restaurant
Shopping
Pick-up / drop-off
Return Home
&ƌŽŵŝƐƚƌŝĐƚ dŽŝƐƚƌŝĐƚ tŝƚŚŝŶŝƐƚƌŝĐƚ &ƌŽŵŝƐƚƌŝĐƚ dŽŝƐƚƌŝĐƚ
From District To District Within District
Work
Post-secondary School
To District Within District
Other School
Shopping
Passenger
Return Home
From District
To District Within District
Dining / restaurant
From District To District Within District From District
Work
Post-secondary School
Other School
Personal Business
Recreation / social
ϳ Ϭй ϯϬ ϭй ϭϮϳϭϳ ϱй Bicycle Ϭ Ϭй ϱϰ Ϯй ϵϬϰϰ ϯй
Ϯϵϳ ϱй ϳϭ ϯй ϮϯϵϰϬ ϵй Walk Ϭ Ϭй Ϭ Ϭй ϯϰϲϭϴ ϭϯй
ϱϮ ϭй ϭϯ Ϭй ϳϬϮϯ ϯй Other ϯϭ ϭй ϱϮ Ϯй ϯϵϱϴ ϭй
Ϯϱϭ ϱй ϳϮϴ Ϯϴй ϯϱϴϵϲ ϭϯй Total: ϱϱϯϯ ϭϬϬй Ϯϱϵϱ ϭϬϬй ϮϳϲϬϳϬ ϭϬϬй
ϯϮϵ ϲй ϭϳϲ ϳй ϮϯϳϯϮ ϵй
ϰϰϴϳ ϴϭй ϭϮϳϰ ϰϵй ϭϱϴϯϴϵ ϱϳй
Other ϰϮ ϭй ϱϰ Ϯй Ϯϭϵϭ ϭй
Total: ϱϱϯϯ ϭϬϬй Ϯϱϵϱ ϭϬϬй ϮϳϲϬϳϬ ϭϬϬй
Peak Period (%) dŽƚĂů
йŽĨϮϰ,ŽƵƌƐ tŝƚŚŝŶŝ ƐƚƌŝĐƚ;йͿ Transit Modal Share
24 Hours ϭϬϰϲϳϵϮ ϵϳй 24 Hours
AM Peak Period ϭϴϭϲϬϵ ϭϳй ϵϳй AM Peak Period
ϲй
ϭϬй
ϰй
Ϭй
ϯй
ϱй
tŝƚŚŝŶŝƐƚƌŝĐƚ
Personal Business
Recreation / social
Dining / restaurant
Shopping
Pick-up / drop-off
Return Home
& ƌŽ ŵ ŝ Ɛƚ ƌŝ Đƚ dŽ ŝƐ ƚƌ ŝĐ ƚ

7/27/2019 CRD OD Survey DailyTravelCharacteristicsReport
http://slidepdf.com/reader/full/crd-od-survey-dailytravelcharacteristicsreport 62/117
6XE$UHD6DDQLFK3HQLQVXOD'LVWULFW
Demographic Characteristics
Population ϰϭϭϲϴ Actively Travelled ϯϰϮϴϬ
Employed Population ϭϵϰϰϭ Number of Vehicles ϯϮϴϬϰ
Households ϭϳϲϬϲ Area (ha) ϵϭϱϳ
J obs in District ϭϴϯϴϱ
Occupation
Status (age 11+) Male Female Total %
Full Time Employed ϴϮϲϴ ϱϭϳϮ ϭϯϰϰϬ ϯϰй
Part Time Employed ϭϵϲϮ ϰϬϰϬ ϲϬϬϮ ϭϱй
Student ϮϯϱϬ Ϯϰϯϯ ϰϳϴϯ ϭϮй
Retiree ϰϵϱϰ ϲϯϴϰ ϭϭϯϯϵ Ϯϵй
Homemaker ϴϴ ϭϰϲϮ ϭϱϰϵ ϰй
Other ϳϰϳ ϭϭϮϵ ϭϴϳϲ ϱй
Total: ϭϴϯϲϵ ϮϬ ϲϮϬ ϯϴϵϴϵ ϭϬϬй
Traveller Characteristics Male Female Total
Licensed Drivers ϭ ϱϯϲ ϵ ϭ ϲϳϬ ϳ ϯ ϮϬϳ ϲ
Trips made by residents ϭϮϭϮϰϭ
Selected Indicators 7,090 Household Size Total й
Daily Trips per Person (age 11+) Ϯϵϱ 1 person ϰϱϱϱ Ϯϲй
Vehicles per Person ϬϴϬ 2 persons ϳϯϳϴ ϰϮй
Number of Persons per Household Ϯϯϰ 3 persons Ϯϯϭϯ ϭϯй
Daily Trips per Household ϲϴϵ 4+persons ϯϯϲϭ ϭϵй
Vehicles per Household ϭϴϲ Total: ϭϳϲ Ϭϲ ϭ ϬϬй
Workers per Household ϭϭϬ
Population Density (Pop/ha) ϰϱϬ Households by Vehicle Availability Total й
Employment Density (J obs/ha) ϮϬϭ 0 vehicles ϵϮϭ ϱй
2 vehicles ϲϲϯϴ ϯϴй
3+vehicles ϯϴϲϲ ϮϮй
Total: ϭϳϲ Ϭϲ ϭ ϬϬй
55 - 64
65+
Population
Explanatory Notes
Information on this page is specific to households/residents of the SaanichPeninsula Sub-Area (Districts 2-4). These results are based on a survey sampleof 3.3% of households in this geography and are subject to a margin of samplingerror of approximately± 4 0% at a 95% confidence level (19 times out of 20)
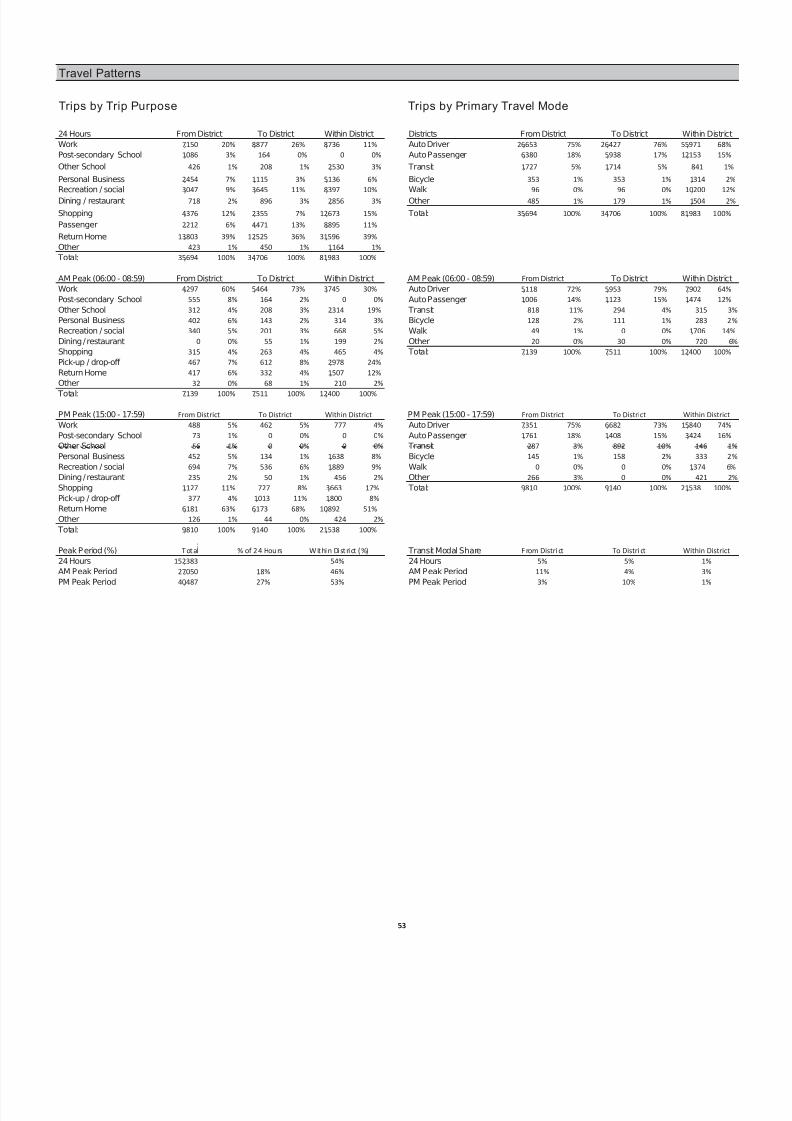
7/27/2019 CRD OD Survey DailyTravelCharacteristicsReport
http://slidepdf.com/reader/full/crd-od-survey-dailytravelcharacteristicsreport 63/117
Travel Patterns
Trips by Trip Purpose Trips by Primary Travel Mode
24 Hours Districts
ϳϭϱϬ ϮϬй ϴϴϳϳ Ϯϲй ϴϳϯϲ ϭϭй Auto Driver Ϯϲϲϱϯ ϳϱй ϮϲϰϮϳ ϳϲй ϱϱϵϳϭ ϲϴй
ϭϬϴϲ ϯй ϭϲϰ Ϭй Ϭ Ϭй Auto Passenger ϲϯϴϬ ϭϴй ϱϵϯϴ ϭϳй ϭϮϭϱϯ ϭϱй
ϰϮϲ ϭй ϮϬϴ ϭй ϮϱϯϬ ϯй Transit ϭϳϮϳ ϱй ϭϳϭϰ ϱй ϴϰϭ ϭй
Ϯϰϱϰ ϳй ϭϭϭϱ ϯй ϱϭϯϲ ϲй Bicycle ϯϱϯ ϭй ϯϱϯ ϭй ϭϯϭϰ Ϯй
ϯϬϰϳ ϵй ϯϲϰϱ ϭϭй ϴϯϵϳ ϭϬй Walk ϵϲ Ϭй ϵϲ Ϭй ϭϬϮϬϬ ϭϮй
ϳϭϴ Ϯй ϴϵϲ ϯй Ϯϴϱϲ ϯй Other ϰϴϱ ϭй ϭϳϵ ϭй ϭϱϬϰ Ϯй
ϰϯϳϲ ϭϮй Ϯϯϱϱ ϳй ϭϮϲϳϯ ϭϱй Total: ϯϱϲϵϰ ϭϬϬй ϯϰϳϬϲ ϭϬϬй ϴϭϵϴϯ ϭϬϬй
ϮϮϭϮ ϲй ϰϰϳϭ ϭϯй ϴϴϵϱ ϭϭй
ϭϯϴϬϯ ϯϵй ϭϮϱϮϱ ϯϲй ϯϭϱϵϲ ϯϵй
Other ϰϮϯ ϭй ϰϱϬ ϭй ϭϭϲϰ ϭй
Total: ϯϱϲϵϰ ϭϬϬй ϯϰϳϬϲ ϭϬϬй ϴϭϵϴϯ ϭϬϬй
AM Peak (06:00 - 08:59) AM Peak (06:00 - 08:59)
ϰϮϵϳ ϲϬй ϱϰϲϰ ϳϯй ϯϳϰϱ ϯϬй Auto Driver ϱϭϭϴ ϳϮй ϱϵϱϯ ϳϵй ϳϵϬϮ ϲϰй
ϱϱϱ ϴй ϭϲϰ Ϯй Ϭ Ϭй Auto Passenger ϭϬϬϲ ϭϰй ϭϭϮϯ ϭϱй ϭϰϳϰ ϭϮй
ϯϭϮ ϰй ϮϬϴ ϯй Ϯϯϭϰ ϭϵй Transit ϴϭϴ ϭϭй Ϯϵϰ ϰй ϯϭϱ ϯй
ϰϬϮ ϲй ϭϰϯ Ϯй ϯϭϰ ϯй Bicycle ϭϮϴ Ϯй ϭϭϭ ϭй Ϯϴϯ Ϯй
ϯϰϬ ϱй ϮϬϭ ϯй ϲϲϴ ϱй Walk ϰϵ ϭй Ϭ Ϭй ϭϳϬϲ ϭϰй
Ϭ Ϭй ϱϱ ϭй ϭϵϵ Ϯй Other ϮϬ Ϭй ϯϬ Ϭй ϳϮϬ ϲй
ϯϭϱ ϰй Ϯϲϯ ϰй ϰϲϱ ϰй Total: ϳϭϯϵ ϭϬϬй ϳϱϭϭ ϭϬϬй ϭϮϰϬϬ ϭϬϬй
ϰϲϳ ϳй ϲϭϮ ϴй Ϯϵϳϴ Ϯϰй
ϰϭϳ ϲй ϯϯϮ ϰй ϭϱϬϳ ϭϮй
Other ϯϮ Ϭй ϲϴ ϭй ϮϭϬ Ϯй
Total: ϳϭϯϵ ϭϬϬй ϳϱϭϭ ϭϬϬй ϭϮϰϬϬ ϭϬϬй
PM Peak (15:00 - 17:59) PM Peak (15:00 - 17:59)
ϰϴϴ ϱй ϰϲϮ ϱй ϳϳϳ ϰй Auto Driver ϳϯϱϭ ϳϱй ϲϲϴϮ ϳϯй ϭϱϴϰϬ ϳϰй
ϳϯ ϭй Ϭ Ϭй Ϭ Ϭй Auto Passenger ϭϳϲϭ ϭϴй ϭϰϬϴ ϭϱй ϯϰϮϰ ϭϲй
ϱϲ ϭй Ϭ Ϭй Ϭ Ϭй Transit Ϯϴϳ ϯй ϴϵϮ ϭϬй ϭϰϲ ϭй
Work
Post-secondary School
Other School
tŝƚŚŝŶŝƐƚƌŝĐƚ
Personal Business
Recreation / social
Dining / restaurant
Shopping
Pick-up / drop-off
Return Home
&ƌŽŵŝƐƚƌŝĐƚ dŽŝƐƚƌŝĐƚ tŝƚŚŝŶŝƐƚƌŝĐƚ &ƌŽŵŝƐƚƌŝĐƚ dŽŝƐƚƌŝĐƚ
From District To District Within District
Work
Post-secondary School
To District Within District
Other School
Shopping
Passenger
Return Home
From District
To District Within District
Dining / restaurant
From District To District Within District From District
Work
Post-secondary School
Other School
Personal Business
Recreation / social
ϰϱϮ ϱй ϭϯϰ ϭй ϭϲϯϴ ϴй Bicycle ϭϰϱ ϭй ϭϱϴ Ϯй ϯϯϯ Ϯй
ϲϵϰ ϳй ϱϯϲ ϲй ϭϴϴϵ ϵй Walk Ϭ Ϭй Ϭ Ϭй ϭϯϳϰ ϲй
Ϯϯϱ Ϯй ϱϬ ϭй ϰϱϲ Ϯй Other Ϯϲϲ ϯй Ϭ Ϭй ϰϮϭ Ϯй
ϭϭϮϳ ϭϭй ϳϮϳ ϴй ϯϲϲϯ ϭϳй Total: ϵϴϭϬ ϭϬϬй ϵϭϰϬ ϭϬϬй Ϯϭϱϯϴ ϭϬϬй
ϯϳϳ ϰй ϭϬϭϯ ϭϭй ϭϴϬϬ ϴй
ϲϭϴϭ ϲϯй ϲϭϳϯ ϲϴй ϭϬϴϵϮ ϱϭй
Other ϭϮϲ ϭй ϰϰ Ϭй ϰϮϰ Ϯй
Total: ϵϴϭϬ ϭϬϬй ϵϭϰϬ ϭϬϬй Ϯϭϱϯϴ ϭϬϬй
Peak Period (%) d Žƚ Ăů
й ŽĨ Ϯ ϰ ,ŽƵ ƌƐ t ŝƚ Śŝ Ŷ ŝ Ɛƚ ƌŝ Đƚ ; йͿ Transit Modal Share
24 Hours ϭϱϮϯϴϯ ϱϰй 24 Hours
AM Peak Period ϮϳϬϱϬ ϭϴй ϰϲй AM Peak Period
ϱй
ϭϭй
ϭй
ϯй
ϱй
ϰй
tŝƚŚŝŶŝƐƚƌŝĐƚ
Personal Business
Recreation / social
Dining / restaurant
Shopping
Pick-up / drop-off
Return Home
& ƌŽŵŝƐƚƌŝ Đƚ dŽŝƐƚƌŝ Đƚ

7/27/2019 CRD OD Survey DailyTravelCharacteristicsReport
http://slidepdf.com/reader/full/crd-od-survey-dailytravelcharacteristicsreport 64/117
6XE$UHD&RUH'LVWULFW
Demographic Characteristics
Population ϮϯϱϬϱϮ Actively Travelled ϮϬϬϬϳϭ
Employed Population ϭϮϱϲϰϱ Number of Vehicles ϭϱϯϰϰϴ
Households ϭϬϴϵϯϲ Area (ha) ϭϲϬϬϭ
J obs in District ϭϯϲϬϰϳ
Occupation
Status (age 11+) Male Female Total %
Full Time Employed ϱϬϮϱϯ ϰϭϱϬϰ ϵϭϳϱϳ ϰϯй
Part Time Employed ϭϭϱϵϰ ϮϮϮϵϱ ϯϯϴϴϵ ϭϲй
Student ϭϳϮϵϬ ϭϴϴϲϲ ϯϲϭϱϲ ϭϳй
Retiree ϮϬϴϯϱ ϮϲϬϵϴ ϰϲϵϯϯ ϮϮй
Homemaker Ϯϭϭ ϲϭϯϵ ϲϯϱϭ ϯй
Other ϲϱϯϵ ϲϴϱϭ ϭϯϯϵϬ ϲй
Total: ϭ Ϭϭ ϭϰ ϲ ϭ ϭϯϵ ϳϵ Ϯ ϭϱ ϭϮ ϱ ϭ ϬϬй
Traveller Characteristics Male Female Total
Licensed Drivers ϴ ϯϰϴ ϯ ϵ ϬϯϬ Ϭ ϭ ϳϯϳ ϴϰ
Trips made by residents ϳϭϴϬϯϳ
Selected Indicators 7,090 Household Size Total й
Daily Trips per Person (age 11+) ϯϬϱ 1 person ϰϬϭϴϬ ϯϳй
Vehicles per Person Ϭϲϱ 2 persons ϯϴϵϴϳ ϯϲй
Number of Persons per Household Ϯϭϲ 3 persons ϭϯϴϮϳ ϭϯй
Daily Trips per Household ϲϱϵ 4+persons ϭϱϵϰϯ ϭϱй
Vehicles per Household ϭϰϭ Total: ϭ Ϭϴϵ ϯϲ ϭ ϬϬ й
Workers per Household ϭϭϱ
Population Density (Pop/ha) ϭϰϲϵ Households by Vehicle Availability Total й
Employment Density (J obs/ha) ϴϱϬ 0 vehicles ϭϱϱϰϵ ϭϰй
2 vehicles Ϯϵϱϯϵ Ϯϳй
3+vehicles ϭϭϯϴϴ ϭϬй
Total: ϭ Ϭϴϵ ϯϲ ϭ ϬϬ й
55 - 64
65+
Population
Explanatory Notes
Information on this page is specific to households/residents of the Core Sub-Area(Districts 5-13). These results are based on a survey sample of 3.1% of householdsin this geography and are subject to a margin of sampling error of approximately±1 7% at a 95% confidence level (19 times out of 20)

7/27/2019 CRD OD Survey DailyTravelCharacteristicsReport
http://slidepdf.com/reader/full/crd-od-survey-dailytravelcharacteristicsreport 65/117
Travel Patterns
Trips by Trip Purpose Trips by Primary Travel Mode
24 Hours Districts
ϭϮϱϭϯ ϭϲй ϮϲϬϮϬ ϯϮй ϭϬϯϳϵϭ ϭϲй Auto Driver ϲϭϮϳϵ ϳϲй ϲϭϭϴϮ ϳϲй ϯϴϵϴϱϵ ϱϴй
Ϯϳϭ Ϭй Ϯϴϰϵ ϰй ϭϮϲϱϴ Ϯй Auto Passenger ϭϭϵϴϳ ϭϱй ϭϮϰϳϯ ϭϱй ϳϴϴϳϵ ϭϮй
ϯϮϳ Ϭй ϭϯϵϰ Ϯй ϭϱϳϵϯ Ϯй Transit ϱϰϴϬ ϳй ϱϱϬϰ ϳй ϱϯϮϲϵ ϴй
Ϯϳϭϰ ϯй ϱϱϵϵ ϳй ϰϰϯϮϳ ϳй Bicycle ϳϯϵ ϭй ϲϳϮ ϭй ϮϱϲϬϱ ϰй
ϴϮϳϴ ϭϬй ϲϴϭϲ ϴй ϲϯϭϴϴ ϵй Walk ϭϯϵ Ϭй ϭϯϵ Ϭй ϭϭϮϱϬϭ ϭϳй
ϭϲϯϲ Ϯй ϭϵϵϰ Ϯй Ϯϴϰϰϰ ϰй Other ϱϯϴ ϭй ϵϯϬ ϭй ϳϵϯϵ ϭй
ϴϵϲϬ ϭϭй ϲϯϲϴ ϴй ϴϲϴϰϮ ϭϯй Total: ϴϬϭϲϮ ϭϬϬй ϴϬϵϬϬ ϭϬϬй ϲ ϲϴϬϱϮ ϭϬϬй
ϳϭϱϱ ϵй ϱϴϮϵ ϳй ϱϴϳϱϴ ϵй
ϯϳϲϬϲ ϰϳй Ϯϯϭϳϰ Ϯϵй ϮϰϴϰϬϱ ϯϳй
Other ϳϬϭ ϭй ϴϱϳ ϭй ϱϴϰϳ ϭй
Total: ϴϬϭϲϮ ϭϬϬй ϴϬϵϬϬ ϭϬϬй ϲϲϴϬϱϮ ϭϬϬй
AM Peak (06:00 - 08:59) AM Peak (06:00 - 08:59)
ϳϭϭϲ ϲϴй ϭϳϱϵϱ ϳϬй ϱϰϯϲϭ ϰϵй Auto Driver ϴϰϴϴ ϴϭй ϭϴϲϯϯ ϳϰй ϲϯϭϳϲ ϱϳй
ϭϴϳ Ϯй ϭϱϲϲ ϲй ϰϲϭϰ ϰй Auto Passenger ϭϮϴϬ ϭϮй Ϯϴϭϱ ϭϭй ϭϬϲϭϵ ϭϬй
Ϯϲϲ ϯй ϭϬϲϰ ϰй ϭϯϵϱϳ ϭϯй Transit ϱϭϬ ϱй ϯϭϵϳ ϭϯй ϭϮϳϯϲ ϭϮй
ϯϴϮ ϰй ϭϬϮϬ ϰй ϯϲϯϯ ϯй Bicycle ϭϯϴ ϭй ϯϯϱ ϭй ϳϲϰϮ ϳй
ϰϵϰ ϱй ϵϭϲ ϰй ϰϱϳϯ ϰй Walk ϰϮ Ϭй ϵϮ Ϭй ϭϰϳϴϴ ϭϯй
ϯϬ Ϭй ϳϮ Ϭй ϭϰϮϯ ϭй Other ϯϬ Ϭй Ϯϯϰ ϭй ϭϰϳϬ ϭй
ϭϲϯ Ϯй Ϯϵϳ ϭй Ϯϱϳϯ Ϯй Total: ϭϬϰϴϵ ϭϬϬй ϮϱϯϬϱ ϭϬϬй ϭ ϭϬϰϯϮ ϭϬϬй
ϴϯϬ ϴй ϭϳϰϵ ϳй ϭϲϲϰϵ ϭϱй
ϵϮϬ ϵй ϳϯϯ ϯй ϳϲϭϵ ϳй
Other ϭϬϬ ϭй Ϯϵϰ ϭй ϭϬϯϬ ϭй
Total: ϭϬϰϴϵ ϭϬϬй ϮϱϯϬϱ ϭϬϬй ϭϭϬϰϯϮ ϭϬϬй
PM Peak (15:00 - 17:59) PM Peak (15:00 - 17:59)
ϭϬϲϱ ϰй ϭϬϵϱ ϲй ϳϬϭϲ ϰй Auto Driver Ϯϭϵϰϵ ϳϰй ϭϮϱϵϱ ϳϯй ϭϬϯϬϰϬ ϱϳй
ϭϲ Ϭй ϭϬϬ ϭй ϲϴϱ Ϭй Auto Passenger ϯϴϭϴ ϭϯй ϯϰϯϳ ϮϬй ϮϬϯϮϭ ϭϭй
Ϭ Ϭй ϭϭϭ ϭй ϵϰ Ϭй Transit ϯ ϭϵϱ ϭϭй ϲϭϱ ϰй ϭϱ ϲϵϳ ϵй
Work
Post-secondary School
Other School
tŝƚŚŝŶŝƐƚƌŝĐƚ
Personal Business
Recreation / social
Dining / restaurant
Shopping
Pick-up / drop-off
Return Home
&ƌŽŵŝƐƚƌŝĐƚ dŽŝƐƚƌŝĐƚ tŝƚŚŝŶŝƐƚƌŝĐƚ &ƌŽŵŝƐƚƌŝĐƚ dŽŝƐƚƌŝĐƚ
From District To District Within District
Work
Post-secondary School
To District Within District
Other School
Shopping
Passenger
Return Home
From District
To District Within District
Dining / restaurant
From District To District Within District From District
Work
Post-secondary School
Other School
Personal Business
Recreation / social
ϱϳϭ Ϯй ϳϭϬ ϰй ϴϳϬϵ ϱй Bicycle ϯϳϬ ϭй ϭϳϳ ϭй ϳϵϲϰ ϰй
ϮϭϬϲ ϳй ϭϲϬϯ ϵй ϭϱϴϵϯ ϵй Walk Ϭ Ϭй Ϭ Ϭй ϯϬϳϬϰ ϭϳй
Ϯϳϯ ϭй ϱϴϯ ϯй ϱϯϬϴ ϯй Other ϮϮϴ ϭй ϯϮϭ Ϯй ϮϭϴϬ ϭй
ϯϭϯϯ ϭϭй ϭϱϯϯ ϵй ϮϯϬϬϭ ϭϯй Total: Ϯϵϱϲϭ ϭϬϬй ϭϳϭϰϱ ϭϬϬй ϭ ϳϵϵϬϳ ϭϬϬй
ϮϰϮϴ ϴй ϭϯϭϲ ϴй ϭϱϭϳϳ ϴй
ϭϵϵϬϭ ϲϳй ϵϵϬϳ ϱϴй ϭϬϮϲϯϱ ϱϳй
Other ϲϳ Ϭй ϭϴϲ ϭй ϭϯϵϬ ϭй
Total: Ϯϵϱϲϭ ϭϬϬй ϭϳϭϰϱ ϭϬϬй ϭϳϵϵϬϳ ϭϬϬй
Peak Period (%) d Žƚ Ăů
й ŽĨ Ϯ ϰ ,Ž Ƶƌ Ɛ t ŝƚ Śŝ Ŷ ŝ Ɛƚ ƌŝ Đƚ ;й Ϳ Transit Modal Share
24 Hours ϴϮϵϭϭϯ ϴϭй 24 Hours
AM Peak Period ϭϰϲϮϮϲ ϭϴй ϳϲй AM Peak Period
ϳй
ϱй
ϴй
ϭϮй
ϳй
ϭϯй
tŝƚŚŝŶŝƐƚƌŝĐƚ
Personal Business
Recreation / social
Dining / restaurant
Shopping
Pick-up / drop-off
Return Home
& ƌŽ ŵ ŝ Ɛƚ ƌŝ Đƚ d Ž ŝ Ɛƚ ƌŝ Đƚ

7/27/2019 CRD OD Survey DailyTravelCharacteristicsReport
http://slidepdf.com/reader/full/crd-od-survey-dailytravelcharacteristicsreport 66/117
6XE$UHD:HVW6KRUH'LVWULFW
Demographic Characteristics
Population ϲϴϲϲϵ Actively Travelled ϱϳϱϴϵ
Employed Population ϯϴϭϵϳ Number of Vehicles ϱϰϮϮϮ
Households Ϯϲϴϵϵ Area (ha) ϭϳϰϵϱϯ
J obs in District ϮϭϮϬϬ
Occupation
Status (age 11+) Male Female Total %
Full Time Employed ϭϲϵϬϯ ϭϮϳϵϭ Ϯϵϲϵϯ ϰϵй
Part Time Employed ϮϴϮϰ ϱϲϴϬ ϴϱϬϰ ϭϰй
Student ϰϱϱϴ ϰϲϳϭ ϵϮϮϵ ϭϱй
Retiree ϰϳϭϴ ϱϰϱϵ ϭϬϭϳϲ ϭϳй
Homemaker ϵϲ ϮϲϮϯ Ϯϳϭϵ ϱй
Other ϭϱϴϴ ϭϮϯϴ ϮϴϮϱ ϱй
Total: ϮϵϰϬϱ ϯϬ ϲϱϭ ϲϬϬϱϲ ϭϬϬй
Traveller Characteristics Male Female Total
Licensed Drivers Ϯ ϰϵϳϬ Ϯ ϲϮϴ ϰ ϱ ϭϮϱ ϰ
Trips made by residents ϭϵϰϲϰϱ
Selected Indicators 7,090 Household Size Total й
Daily Trips per Person (age 11+) Ϯϴϯ 1 person ϱϲϭϴ Ϯϭй
Vehicles per Person Ϭϳϵ 2 persons ϵϵϬϴ ϯϳй
Number of Persons per Household Ϯϱϱ 3 persons ϰϳϮϳ ϭϴй
Daily Trips per Household ϳϮϰ 4+persons ϲϲϰϲ Ϯϱй
Vehicles per Household ϮϬϮ Total: Ϯϲϴ ϵϵ ϭϬ Ϭй
Workers per Household ϭϰϮ
Population Density (Pop/ha) Ϭϯϵ Households by Vehicle Availability Total й
Employment Density (J obs/ha) ϬϭϮ 0 vehicles ϲϮϱ Ϯй
2 vehicles ϭϮϯϬϰ ϰϲй
3+vehicles ϲϮϯϮ Ϯϯй
Total: Ϯϲϴ ϵϵ ϭϬ Ϭй
55 - 64
65+
Population
Explanatory Notes
Information on this page is specific to households/residents of the West Shore Sub-Area (Districts 14-19). These results are based on a survey sample of 5.3% of households in this geography and are subject to a margin of sampling error of approximately± 2.5% at a 95% confidence level (19 times out of 20).

7/27/2019 CRD OD Survey DailyTravelCharacteristicsReport
http://slidepdf.com/reader/full/crd-od-survey-dailytravelcharacteristicsreport 67/117
Travel Patterns
Trips by Trip Purpose Trips by Primary Travel Mode
24 Hours Districts
ϭϳϯϲϬ ϯϱй ϱϴϳϯ ϭϮй ϭϮϮϳϮ ϭϬй Auto Driver ϯϳϵϯϵ ϳϲй ϯϳϵϳϴ ϳϲй ϴϲϵϮϵ ϳϰй
ϭϱϲϬ ϯй ϭϬϳ Ϭй Ϯϴϱ Ϭй Auto Passenger ϳϰϰϳ ϭϱй ϴϭϱϴ ϭϲй ϭϳϭϭϴ ϭϱй
ϵϴϬ Ϯй ϭϵϮ Ϭй ϰϰϯϴ ϰй Transit ϯϱϭϬ ϳй ϯϮϱϴ ϲй ϭϱϰϵ ϭй
Ϯϵϰϭ ϲй ϭϳϴϭ ϰй ϲϲϰϯ ϲй Bicycle ϯϳϯ ϭй ϯϵϰ ϭй ϳϳϯ ϭй
ϰϭϬϭ ϴй ϰϵϲϲ ϭϬй ϭϬϮϱϱ ϵй Walk ϰϮ Ϭй ϰϮ Ϭй ϴϴϭϱ ϳй
ϭϭϰϭ Ϯй ϳϱϭ ϭй ϰϬϭϴ ϯй Other ϯϱϱ ϭй ϯϲϮ ϭй Ϯϱϲϴ Ϯй
ϯϭϳϰ ϲй ϴϱϴϯ ϭϳй ϭ ϴϬϰϵ ϭϱй Total: ϰϵϲϲϳ ϭϬϬй ϱϬϭϵϯ ϭϬϬй ϭϭϳϳϱϮ ϭϬϬй
ϰϭϴϬ ϴй Ϯϵϰϯ ϲй ϭϰϴϵϬ ϭϯй
ϭϯϱϵϯ Ϯϳй Ϯϰϱϱϲ ϰϵй ϰϲϭϬϵ ϯϵй
Other ϲϯϲ ϭй ϰϰϮ ϭй ϳϵϭ ϭй
Total: ϰϵϲϲϳ ϭϬϬй ϱϬϭϵϯ ϭϬϬй ϭ ϭϳϳϱϮ ϭϬϬй
AM Peak (06:00 - 08:59) AM Peak (06:00 - 08:59)
ϭϮϬϱϵ ϳϮй ϯϬϯϲ ϲϯй ϱϭϵϮ Ϯϲй Auto Driver ϭϮϮϴϵ ϳϰй ϯϵϵϴ ϴϯй ϭϰϬϴϳ ϳϬй
ϴϬϴ ϱй Ϯϯ Ϭй ϭϬϭ ϭй Auto Passenger ϭϳϬϴ ϭϬй ϰϵϵ ϭϬй Ϯϳϲϱ ϭϰй
ϳϳϰ ϱй ϭϮϬ Ϯй ϯϵϬϯ ϭϵй Transit ϮϮϬϴ ϭϯй Ϯϰϳ ϱй ϰϲϵ Ϯй
ϲϵϴ ϰй ϮϮϰ ϱй ϴϰϲ ϰй Bicycle ϮϬϳ ϭй Ϯϳ ϭй ϮϮϱ ϭй
ϭϵϴ ϭй ϯϱϲ ϳй ϴϰϭ ϰй Walk ϰϮ Ϭй ϰϮ ϭй ϭϱϬϴ ϴй
ϱϮ Ϭй Ϭ Ϭй ϯϱϯ Ϯй Other ϭϵϵ ϭй ϳ Ϭй ϵϵϯ ϱй
ϵϮ ϭй Ϯϴ ϭй ϱϵϱ ϯй Total: ϭϲϲϱϯ ϭϬϬй ϰϴϮϭ ϭϬϬй ϮϬϬϰϳ ϭϬϬй
ϭϮϳϭ ϴй ϯϱϱ ϳй ϲϬϬϬ ϯϬй
ϰϳϲ ϯй ϲϰϳ ϭϯй ϮϭϮϲ ϭϭй
Other ϮϮϱ ϭй ϯϮ ϭй ϵϭ Ϭй
Total: ϭϲϲϱϯ ϭϬϬй ϰϴϮϭ ϭϬϬй ϮϬϬϰϳ ϭϬϬй
PM Peak (15:00 - 17:59) PM Peak (15:00 - 17:59)
ϰϲϯ ϱй ϲϮϵ ϯй ϭϯϴϮ ϰй Auto Driver ϳϰϲϬ ϳϲй ϭϰϲϵϬ ϳϯй ϮϮϭϭϬ ϳϮй
Ϯϳ Ϭй ϭϲ Ϭй ϯϴ Ϭй Auto Passenger ϮϬϯϬ Ϯϭй ϮϴϲϬ ϭϰй ϰϳϱϭ ϭϱй
ϱϲ ϭй ϭϭ Ϭй ϭϱ Ϭй Transit ϯϮϴ ϯй ϭ ϵϴϱ ϭϬй ϰϰϱ ϭй
Work
Post-secondary School
Other School
tŝƚŚŝŶŝƐƚƌŝĐƚ
Personal Business
Recreation / social
Dining / restaurant
Shopping
Pick-up / drop-off
Return Home
&ƌŽŵŝƐƚƌŝĐƚ dŽŝƐƚƌŝĐƚ tŝƚŚŝŶŝƐƚƌŝĐƚ &ƌŽŵŝƐƚƌŝĐƚ dŽŝƐƚƌŝĐƚ
From District To District Within District
Work
Post-secondary School
To District Within District
Other School
Shopping
Passenger
Return Home
From District
To District Within District
Dining / restaurant
From District To District Within District From District
Work
Post-secondary School
Other School
Personal Business
Recreation / social
Ϯϳϵ ϯй ϰϴϬ Ϯй ϭϬϳϲ ϯй Bicycle ϯϮ Ϭй Ϯϲϳ ϭй ϮϬϬ ϭй
ϭϬϬϴ ϭϬй ϭϰϰϯ ϳй Ϯϲϰϳ ϵй Walk Ϭ Ϭй Ϭ Ϭй Ϯϱϯϵ ϴй
ϯϰϳ ϰй ϭϴϯ ϭй ϰϱϱ ϭй Other Ϯϱ Ϭй Ϯϭϵ ϭй ϴϳϬ ϯй
ϳϬϰ ϳй ϯϭϴϭ ϭϲй ϰϱϭϵ ϭϱй Total: ϵϴϳϰ ϭϬϬй ϮϬϬϮϮ ϭϬϬй ϯϬϵϭϰ ϭϬϬй
ϵϬϭ ϵй ϭϮϮϰ ϲй ϯϯϳϴ ϭϭй
ϲϬϬϭ ϲϭй ϭϮϳϵϭ ϲϰй ϭϳϮϲϲ ϱϲй
Other ϴϴ ϭй ϲϯ Ϭй ϭϯϴ Ϭй
Total: ϵϴϳϰ ϭϬϬй ϮϬϬϮϮ ϭϬϬй ϯϬϵϭϰ ϭϬϬй
Peak Period (%) d Žƚ Ăů
й ŽĨ Ϯ ϰ ,ŽƵ ƌƐ t ŝƚ Śŝ Ŷ ŝ Ɛƚ ƌŝ Đƚ ; йͿ Transit Modal Share
24 Hours Ϯϭϳϲϭϭ ϱϰй 24 Hours
AM Peak Period ϰϭϱϮϭ ϭϵй ϰϴй AM Peak Period
ϭй
Ϯй
ϳй
ϭϯй
ϲй
ϱй
tŝƚŚŝŶŝƐƚƌŝĐƚ
Personal Business
Recreation / social
Dining / restaurant
Shopping
Pick-up / drop-off
Return Home
&ƌŽŵŝ ƐƚƌŝĐƚ dŽŝƐƚ ƌŝĐƚ

7/27/2019 CRD OD Survey DailyTravelCharacteristicsReport
http://slidepdf.com/reader/full/crd-od-survey-dailytravelcharacteristicsreport 68/117
'LVWULFW6DOW6SULQJ,VODQG(OHFWRUDO$UHD
Demographic Characteristics
Population ϭϬϮϯϰ Actively Travelled ϳϴϰϳ
Employed Population ϰϴϱϲ Number of Vehicles ϴϰϳϳ
Households ϰϲϲϮ Area (ha) ϭϴϱϳϬ
J obs in District ϯϵϱϰ
Occupation
Status (age 11+) Male Female Total %
Full Time Employed ϭϳϲϯ ϭϯϰϭ ϯϭϬϰ ϯϯй
Part Time Employed ϲϴϲ ϭϬϲϲ ϭϳϱϮ ϭϵй
Student ϰϲϴ ϱϳϭ ϭϬϯϵ ϭϭй
Retiree ϭϮϱϴ ϭϯϮϯ Ϯϱϴϭ Ϯϳй
Homemaker ϰϰ ϰϭϯ ϰϱϳ ϱй
Other Ϯϴϯ ϰϯϱ ϳϭϴ ϴй
Total: ϰϯϴϮ ϱϬϮϴ ϵϰϭϬ ϭϬϬй
Traveller Characteristics Male Female Total
Licensed Drivers ϯϴϲϬ ϰϮϮϴ ϴϬϴϴ
Trips made by residents ϮϴϬϱϯ
Selected Indicators 7,090 Household Size Total й
Daily Trips per Person (age 11+) Ϯϳϰ 1 person ϭϰϲϯ ϯϭй
Vehicles per Person Ϭϴϯ 2 persons ϭϵϯϰ ϰϭй
Number of Persons per Household ϮϮϬ 3 persons ϲϬϵ ϭϯй
Daily Trips per Household ϲϬϮ 4+persons ϲϱϲ ϭϰй
Vehicles per Household ϭϴϮ Total: ϰϲϲϮ ϭϬϬй
Workers per Household ϭϬϰ
Population Density (Pop/ha) Ϭϱϱ Households by Vehicle Availability Total й
Employment Density (J obs/ha) ϬϮϭ 0 vehicles ϭϳϬ ϰй
2 vehicles ϭϴϱϬ ϰϬй
3+vehicles ϴϰϵ ϭϴй
Total: ϰϲϲϮ ϭϬϬй
55 - 64
65+
Population
Explanatory Notes
District 1, Salt Spring Island EA, is not part of the CRD Regional P lanning Area, but ispart of the broader study area.
Information on this page is specific to the households/residents of this district. These

7/27/2019 CRD OD Survey DailyTravelCharacteristicsReport
http://slidepdf.com/reader/full/crd-od-survey-dailytravelcharacteristicsreport 69/117
Travel Patterns
Top Five Destinations o f Trips f rom Salt Spring Island Electoral Area Summary of Trips to and fr om Salt Spring Island Electoral Area
AM Peak Period AM Peak Per iod (06:00 - 08:59) Destinations of Origins of
Trips From Trips To
Districts District % Total District % Total
Salt Spring Island E lectoral Area ϯϰϯϳ ϵϯй ϯϰϯϳ ϵϴй
Town of Sidney ϭϯ Ϭй ϵ Ϭй
District of North Saanich with Tsyecum FN, Pauquachin FN ϴ Ϭй Ϭ Ϭй
District of Central Saanich with Tsartlip FN, Tsawout FN Ϭ Ϭй Ϭ Ϭй
Downtown ϱϰ ϭй Ϭ Ϭй
Victoria North Ϭ Ϭй Ϭ Ϭй
Victoria South ϯϬ ϭй Ϭ Ϭй
Saanich North Ϭ Ϭй Ϭ Ϭй
Saanich East ϭϲ Ϭй Ϭ Ϭй
Saanich West Ϭ Ϭй Ϭ Ϭй
District of Oak Bay ϯϵ ϭй Ϭ Ϭй
Township of Esquimalt Ϭ Ϭй Ϭ Ϭй
Town of View Royal with Esquimalt Nation, Songhees FN Ϭ Ϭй Ϭ Ϭй
District of Highlands Ϭ Ϭй Ϭ Ϭй
City of Langford Ϭ Ϭй Ϭ Ϭй
City of Colwood Ϭ Ϭй Ϭ Ϭй
District of Metchosin with Scia’new FN Ϭ Ϭй Ϭ Ϭй
District of Sooke with T’souke FN Ϭ Ϭй Ϭ Ϭй
J uan de Fuca Electoral Area with Pacheedaht FN Ϭ Ϭй Ϭ Ϭй
South CVRD with Malahat FN, Cowichan Tribes ϴϬ Ϯй ϲϭ Ϯй
External ϭϮ Ϭй Ϭ Ϭй
Total ϯϲϴϵ ϯϱϬϳ
Trips by Trip Purpose Trips by Primary Travel Mode
24 Hours 24 Hours
ϮϬϳ Ϯϭй ϳϬ ϴй ϯϱϬϱ ϭϰй Auto Driver ϲϲϵ ϲϴй ϲϭϭ ϲϵй ϭϳϱϱϯ ϳϮй
ϭϯ ϭй Ϭ Ϭй Ϭ Ϭй Auto Passenger ϮϮϰ Ϯϯй ϭϵϯ ϮϮй ϯϯϴϮ ϭϰй
To District Within DistrictFrom District To District Within District From District
Work
Post-secondary School
rans
ϭϵϭ ϮϬй ϯϳ ϰй ϭϴϰϱ ϴй Bicycle Ϭ Ϭй Ϭ Ϭй ϰϰϯ Ϯй
ϭϳϲ ϭϴй ϭϵ Ϯй Ϯϲϭϳ ϭϭй Walk Ϭ Ϭй Ϭ Ϭй ϭϳϭϮ ϳ й
ϯϴ ϰй Ϭ Ϭй ϰϵϲ Ϯй Other ϲϳ ϳй ϳϲ ϵй ϴϯϲ ϯй
ϵϴ ϭϬй ϱϳ ϲй ϯϴϭϱ ϭϲй Total: ϵϳϳ ϭϬϬй ϴϴϴ ϭϬϬй Ϯϰϯϱϭ ϭϬϬй
ϳϰ ϴй ϭϲ Ϯй ϭϳϱϱ ϳй
ϭϭϴ ϭϮй ϲϬϯ ϲϴй ϵϮϵϯ ϯϴй
Other Ϯϴ ϯй ϴϱ ϭϬй ϰϮϰ Ϯй Total: ϵϳϳ ϭϬϬй ϴϴϴ ϭϬϬй Ϯϰϯϱϭ ϭϬϬй
AM Peak (06:00 - 08:59) AM Peak (06:00 - 08:59)
ϳϰ Ϯϵй ϳϬ ϭϬϬй ϭϰϬϭ ϰϭй Auto Driver ϭϯϱ ϱϰй ϯϵ ϱϱй Ϯϰϰϯ ϳϭй
From District To District Within District
Work
To District Within District
Shopping
Pick-up / drop-off Passenger
Return Home
From District
Dining / restaurant
er c oo
Personal Business
Recreation / social

7/27/2019 CRD OD Survey DailyTravelCharacteristicsReport
http://slidepdf.com/reader/full/crd-od-survey-dailytravelcharacteristicsreport 70/117
'LVWULFW7RZQRI6LGQH\
Demographic Characteristics
Population ϭϭϭϳϴ Actively Travelled ϵϮϱϱ
Employed Population ϰϴϰϰ Number of Vehicles ϳϵϵϬ
Households ϱϯϮϴ Area (ha) ϱϬϴ
J obs in District ϰϮϱϱ
Occupation
Status (age 11+) Male Female Total %
Full Time Employed ϮϮϯϬ ϭϱϭϱ ϯϳϰϱ 37%
Part Time Employed ϮϯϮ ϴϲϳ ϭϬϵϵ 11%
Student ϯϲϴ ϰϱϱ ϴϮϯ 8%
Retiree ϭϰϳϯ ϮϮϰϵ ϯϳϮϮ 37%
Homemaker Ϭ ϰϯϵ ϰϯϵ 4%
Other ϮϮϱ ϰϬϮ ϲϮϳ 6%
Total: ϰϰϴϯ ϱϳϬϱ ϭϬϭϴϴ ϭϬϬй
Traveller Characteristics Male Female Total
Licensed Drivers ϯϵϵϯ ϰϲϯϳ ϴϲϯϬ
Trips made by residents ϯϭϵϲϭ
Selected Indicators 7,090 Household Size Total й
Daily Trips per Person (age 11+) Ϯϴϲ 1 person ϭϵϱϱ 37%
Vehicles per Person Ϭϳϭ 2 persons Ϯϭϲϵ 41%
Number of Persons per Household ϮϭϬ 3 persons ϱϰϴ 10%
Daily Trips per Household ϲϬϬ 4+persons ϲϱϳ 12%
Vehicles per Household ϭϱϬ Total: 5,328 100%
Workers per Household Ϭϵϭ
Population Density (Pop/ha) ϮϮϬϬ Households by Vehicle Availability Total й
Employment Density (J obs/ha) ϴϯϴ 0 vehicles ϯϱϮ 7%
2 vehicles ϭϲϱϲ 31%
3+vehicles ϱϲϱ 11%
Total: 5,328 100%
55 - 64
65+
Population
Explanatory Notes
Information on this page is specific to the households/residents of this district. These results are based on a survey sample of 3.4% of households in this districtand are subject to a margin of sampling error of approximately ± 7.1% at a 95%confidence level (19 times out of 20).

7/27/2019 CRD OD Survey DailyTravelCharacteristicsReport
http://slidepdf.com/reader/full/crd-od-survey-dailytravelcharacteristicsreport 71/117
Travel Patterns
Top Five Destinations of Trips from Town of Sidney Summary of Trips to and from Town of Sidney
AM Peak Period AM Peak Per iod (06:00 - 08:59) Destinations of Origins of
Trips From Trips To
Districts District % Total District % Total
Salt Spring Island E lectoral Area ϵ Ϭй ϭϯ Ϭй
Town of Sidney ϭϱϮϵ ϯϲй ϭϱϮϵ ϰϬй
District of North Saanich with Tsyecum FN, Pauquachin FN ϭϭϳϬ Ϯϳй ϲϲϮ ϭϳй
District of Central Saanich with Tsartlip FN, Tsawout FN ϱϬϬ ϭϮй ϯϴϳ ϭϬй
Downtown ϰϬϰ ϵй Ϭ Ϭй
Victoria North ϭϴϮ ϰй ϭϬϲ ϯй
Victoria South ϴϴ Ϯй Ϯϱ ϭй
Saanich North ϭϯ Ϭй ϭϭϭ ϯй
Saanich East ϭϵϴ ϱй ϮϵϮ ϴй
Saanich West ϮϮ ϭй ϭϲϬ ϰй
District of Oak Bay ϰϴ ϭй ϭϬϵ ϯй
Township of Esquimalt ϯϲ ϭй ϳ Ϭ й
Town of View Royal with Esquimalt Nation, Songhees FN ϭϵ Ϭй ϴϮ ϮйDistrict of Highlands Ϭ Ϭй ϯϴ ϭй
City of Langford Ϭ Ϭй ϭϵϬ ϱй
City of Colwood ϮϬ Ϭй ϳϲ Ϯй
District of Metchosin with Scia’new FN Ϭ Ϭй ϭϰ Ϭй
District of Sooke with T’souke FN ϭϮ Ϭй ϯϭ ϭй
J uan de Fuca Electoral Area with Pacheedaht FN Ϭ Ϭй ϴ Ϭй
South CVRD with Malahat FN, Cowichan Tribes ϭϵ Ϭй Ϭ Ϭ й
External Ϭ Ϭй Ϭ Ϭй
Total ϰϮϲϴ ϯϴϯϴ
Trips by Trip Purpose Trips by Primary Travel Mode
24 Hours 24 Hours
ϯϬϵϳ ϭϳй ϯϬϴϮ ϭϳй ϭϲϯϮ ϴй Auto Driver ϭϰϬϰϰ ϳϲй ϭϰϬϱϬ ϳϲй ϭϬϴϳϰ ϱϱй
ϭϴϳ ϭй Ϭ Ϭй Ϭ Ϭй Auto Passenger ϯϭϲϲ ϭϳй ϯϮϰϴ ϭϳй Ϯϰϵϭ ϭϯй
To District Within DistrictFrom District To District Within District From District
Work
Post-secondary School
rans
ϴϴϭ ϱй ϭϱϱϳ ϴй ϭϴϮϴ ϵй Bicycle ϭϴϬ ϭй ϭϴϬ ϭй ϲϰϵ ϯй
ϭϱϰϴ ϴй Ϯϯϰϯ ϭϯй ϭϱϮϬ ϴй Walk ϭϱϳ ϭй ϯϬϯ Ϯй ϱϲϱϵ Ϯϵй
ϯϰϮ Ϯй ϴϮϰ ϰй ϭϬϲϳ ϱй Other ϭϵϳ ϭй Ϯϰϱ ϭй ϭϬϴ ϭй
ϭϭϱϱ ϲй ϯϬϰϰ ϭϲй ϱϲϵϬ Ϯϵй Total: ϭϴϰϴϬ ϭϬϬй ϭϴϱϴϳ ϭϬϬй ϭϵϳϴϭ ϭϬϬй
ϭϱϴϳ ϵй ϭϴϲϵ ϭϬй ϭϭϲϰ ϲй
ϵϮϬϱ ϱϬй ϱϱϴϵ ϯϬй ϲϰϲϴ ϯϯй
Other ϭϴϯ ϭй ϭϵϲ ϭй ϯϯϮ Ϯй Total: ϭϴϰϴϬ ϭϬϬй ϭϴϱϴϳ ϭϬϬй ϭϵϳϴϭ ϭϬϬй
AM Peak (06:00 - 08:59) AM Peak (06:00 - 08:59)
ϭϲϰϳ ϲϬй ϭϰϲϰ ϲϯй ϱϮϬ ϯϰй Auto Driver ϮϬϬϯ ϳϯй ϭϵϱϲ ϴϱй ϲϴϴ ϰϱй
From District To District Within District
Work
To District Within District
Shopping
Pick-up / drop-off Passenger
Return Home
From District
Dining / restaurant
er c oo
Personal Business
Recreation / social

7/27/2019 CRD OD Survey DailyTravelCharacteristicsReport
http://slidepdf.com/reader/full/crd-od-survey-dailytravelcharacteristicsreport 72/117
'LVWULFW'LVWULFWRI1RUWK6DDQLFKZLWK7V\HFXP)13DXTXDFKLQ)1
Demographic Characteristics
Population ϭϭϱϮϳ Actively Travelled ϵϲϬϭ
Employed Population ϱϮϲϰ Number of Vehicles ϭϬϬϰϯ
Households ϰϲϮϯ Area (ha) ϰϬϮϱ
J obs in District ϱϮϵϭ
Occupation
Status (age 11+) Male Female Total %
Full Time Employed Ϯϭϴϭ ϭϬϴϱ ϯϮϲϲ ϯϭй
Part Time Employed ϳϯϵ ϭϮϱϵ ϭϵϵϴ ϭϵй
Student ϲϲϲ ϳϲϱ ϭϰϯϮ ϭϰй
Retiree ϭϱϰϭ ϭϳϴϲ ϯϯϮϳ ϯϮй
Homemaker Ϭ ϱϭϯ ϱϭϯ ϱй
Other ϭϵϱ ϮϬϯ ϯϵϴ ϰй
Total: ϱϮϯϮ ϱϯϮϳ ϭϬϱϱϵ ϭϬϬй
Traveller Characteristics Male Female Total
Licensed Drivers ϰϳϰϯ ϰϴϮϵ ϵϱϳϮ
Trips made by residents ϯϱϴϭϭ
Selected Indicators 7,090 Household Size Total й
Daily Trips per Person (age 11+) ϯϭϭ 1 person ϳϴϯ ϭϳй
Vehicles per Person Ϭϴϳ 2 persons Ϯϭϰϵ ϰϲй
Number of Persons per Household Ϯϰϵ 3 persons ϲϳϬ ϭϱй
Daily Trips per Household ϳϳϱ 4+persons ϭϬϮϭ ϮϮй
Vehicles per Household Ϯϭϳ Total: ϰϲϮϯ ϭϬϬй
Workers per Household ϭϭϰ
Population Density (Pop/ha) Ϯϴϲ Households by Vehicle Availability Total й
Employment Density (J obs/ha) ϭϯϭ 0 vehicles Ϯϰ ϭй
2 vehicles Ϯϭϰϯ ϰϲй
3+vehicles ϭϰϯϯ ϯϭй
Total: ϰϲϮϯ ϭϬϬй
55 - 64
65+
Population
Explanatory Notes
Information on this page is specific to the households/residents of this district. These results are based on a survey sample of 3.4% of households in this districtand are subject to a margin of sampling error of approximately ± 7.6% at a 95%confidence level (19 times out of 20)

7/27/2019 CRD OD Survey DailyTravelCharacteristicsReport
http://slidepdf.com/reader/full/crd-od-survey-dailytravelcharacteristicsreport 73/117
Travel Patterns
AM Peak Period AM Peak Peri od (06:00 - 08:59) Destinations of Origins of
Trips From Trips To
Districts District % Total District % Total
Salt Spring Island Electoral Area Ϭ Ϭй ϴ Ϭй
Town of Sidney ϲϲϮ ϭϮй ϭϭϳϬ ϮϬй
District of North Saanich with Tsyecum FN, Pauquachin FN ϭϵϱϯ ϯϲй ϭϵϱϯ ϯϰй
District of Central Saanich with Tsartlip FN, Tsawout FN ϱϭϵ ϭϬй ϴϳϱ ϭϱй
Downtown ϯϭϰ ϲй Ϭ Ϭ й
Victoria North ϲϵ ϭй ϭϬϮ Ϯй
Victoria South Ϯϳϲ ϱй ϴϱ ϭй
Saanich North ϭϵϲ ϰй ϮϬϴ ϰй
Saanich East ϲϳϱ ϭϮй ϯϯϬ ϲй
Saanich West ϭϵϯ ϰй Ϯϵϰ ϱй
District of Oak Bay ϳϴ ϭй ϳϳ ϭй
Township of Esquimalt ϭϯϯ Ϯй ϭϳϲ ϯй
Town of View Royal with Esquimalt Nation, Songhees FN ϯϳ ϭй Ϭ ϬйDistrict of Highlands Ϭ Ϭй Ϭ Ϭй
City of Langford Ϯϲ Ϭй ϱϱ ϭй
City of Colwood Ϯϴ ϭй ϭϭϬ Ϯй
District of Metchosin with Scia’new FN ϭϳ Ϭй Ϭ Ϭй
District of Sooke with T’souke FN Ϯϭ Ϭй Ϯϭ Ϭй
J uan de Fuca Electoral Area with Pacheedaht FN Ϯϯ Ϭй ϭϭϬ Ϯй
South CVRD with Malahat FN, Cowichan Tribes ϭϵ Ϭй ϭϳϴ ϯй
External ϭϳϴ ϯй Ϭ Ϭ й
Total ϱϰϭϳ ϱϳϱϬ
Trips by Trip Purpose Trips by Primary Travel Mode
24 Hours 24 Hours
ϯϬϲϲ ϭϮй ϰϯϯϴ ϭϴй ϭϬϲϴ ϭϱй Auto Driver ϭϴϯϵϵ ϳϰй ϭϴϬϴϳ ϳϳй ϱϲϳϲ ϳϴй
ϯϵϬ Ϯй Ϭ Ϭй Ϭ Ϭй Auto Passenger ϰϳϯϴ ϭϵй ϰϬϴϲ ϭϳй ϳϵϲ ϭϭй
Summary of Trips to and from District of North Saanich with Tsyecum FN,
Pauquachin FN
Top Five Origins of Trips to Distric t of North Saanich with Tsyecum FN,
Pauquachin FN
To District Within DistrictFrom District To District Within District From District
Work
Post-secondary School
rans
ϭϳϵϴ ϳй ϰϬϬ Ϯй ϰϬϬ ϲй Bicycle ϭϱϭ ϭй ϭϳϰ ϭй ϭϮϲ Ϯй
ϮϬϬϳ ϴй ϯϯϮϮ ϭϰй ϭϮϬϯ ϭϳй Walk Ϯϰϲ ϭй ϭϭϴ ϭй ϰϭϲ ϲй
ϵϭϮ ϰй ϭϭϳ Ϭй ϭϰϵ Ϯй Other ϱϳϬ Ϯй ϮϯϮ ϭй Ϯϯϭ ϯй
ϰϵϰϰ ϮϬй ϱϴϵ ϯй ϭϴ Ϭй Total: ϮϰϴϮϳ ϭϬϬй Ϯϯϱϲϴ ϭϬϬй ϳϮϰϰ ϭϬϬй
ϭϵϭϴ ϴй ϰϯϵϯ ϭϵй ϭϭϵϵ ϭϳй
ϵϭϰϰ ϯϳй ϵϱϵϮ ϰϭй Ϯϲϴϲ ϯϳй
Other ϮϬϯ ϭй ϰϰϲ Ϯй Ϯϭϱ ϯй Total: ϮϰϴϮϳ ϭϬϬй Ϯϯϱϲϴ ϭϬϬй ϳϮϰϰ ϭϬϬй
AM Peak (06:00 - 08:59) AM Peak (06:00 - 08:59)
ϭϰϲϯ ϰϮй ϮϬϮϮ ϱϯй ϲϰϳ ϯϯй AutoDriver Ϯϰϰϰ ϳϭй Ϯϵϯϵ ϳϳй ϭϮϵϵ ϲϳй
From District To District Within District
Work
To District Within District
Shopping
Pick-up / drop-off Passenger
Return Home
From District
Dining / restaurant
er c oo
Personal Business
Recreation / social

7/27/2019 CRD OD Survey DailyTravelCharacteristicsReport
http://slidepdf.com/reader/full/crd-od-survey-dailytravelcharacteristicsreport 74/117
'LVWULFW'LVWULFWRI&HQWUDO6DDQLFKZLWK7VDUWOLS)17VDZRXW)1
Demographic Characteristics
Population ϭϴϰϲϯ Actively Travelled ϭϱϰϮϱ
Employed Population ϵϯϯϯ Number of Vehicles ϭϰϳϳϭ
Households ϳϲϱϱ Area (ha) ϰϲϮϰ
J obs in District ϴϴϯϴ
Occupation
Status (age 11+) Male Female Total %
Full Time Employed ϯϴϱϳ ϮϱϳϮ ϲϰϮϵ ϯϴй
Part Time Employed ϵϵϭ ϭϵϭϯ ϮϵϬϰ ϭϳй
Student ϭϯϭϱ ϭϮϭϯ ϮϱϮϴ ϭϱй
Retiree ϭϵϰϬ ϮϯϱϬ ϰϮϵϬ Ϯϱй
Homemaker ϴϴ ϱϭϬ ϱϵϴ ϰй
Other ϯϮϳ ϱϮϱ ϴϱϮ ϱй
Total: ϴϭϯϰ ϴϳϱϵ ϭϲϴϵϮ ϭϬϬй
Traveller Characteristics Male Female Total
Licensed Drivers ϲϲϯϮ ϳϮϰϮ ϭϯϴϳϰ
Trips made by residents ϱϯϰϲϴ
Selected Indicators 7,090 Household Size Total й
Daily Trips per Person (age 11+) ϮϵϬ 1 person ϭϴϭϲ Ϯϰй
Vehicles per Person ϬϴϬ 2 persons ϯϬϲϬ ϰϬй
Number of Persons per Household Ϯϰϭ 3 persons ϭϬϵϱ ϭϰй
Daily Trips per Household ϲϵϴ 4+persons ϭϲϴϰ ϮϮй
Vehicles per Household ϭϵϯ Total: ϳϲϱϱ ϭϬϬй
Workers per Household ϭϮϮ
Population Density (Pop/ha) ϯϵϵ Households by Vehicle Availability Total й
Employment Density (J obs/ha) ϭϵϭ 0 vehicles ϱϰϱ ϳй
2 vehicles Ϯϴϯϵ ϯϳй
3+vehicles ϭϴϲϴ Ϯϰй
Total: ϳϲϱϱ ϭϬϬй
55 - 64
65+
Population
Explanatory Notes
Information on this page is specific to the households/residents of this district. These results are based on a survey sample of 3.1% of households in this districtand are subject to a margin of sampling error of approximately ± 6.3% at a 95%confidence level (19 times out of 20)

7/27/2019 CRD OD Survey DailyTravelCharacteristicsReport
http://slidepdf.com/reader/full/crd-od-survey-dailytravelcharacteristicsreport 75/117
Travel Patterns
AM Peak Period AM Peak Peri od (06:00 - 08:59) Destinations of Origins of
Trips From Trips To
Districts District % Total District % Total
Salt Spring Island E lectoral Area Ϭ Ϭй Ϭ Ϭй
Town of Sidney ϯϴϳ ϰй ϱϬϬ ϱй
District of North Saanich with Tsyecum FN, Pauquachin FN ϴϳϱ ϵй ϱϭϵ ϱй
District of Central Saanich with Tsartlip FN, Tsawout FN ϰϴϬϲ ϰϵй ϰϴϬϲ ϰϳй
Downtown ϰϲϲ ϱй Ϭ Ϭй
Victoria North ϯϳϯ ϰй ϰϴϳ ϱй
Victoria South ϯϵϬ ϰй ϱϭϯ ϱй
Saanich North ϲϵϲ ϳй ϳϰϴ ϳй
Saanich East ϱϰϴ ϲй ϴϴϴ ϵй
Saanich West ϳϲϲ ϴй ϳϵϭ ϴй
District of Oak Bay ϮϮϯ Ϯй ϲϬ ϭй
Township of Esquimalt ϵϮ ϭй ϮϬϲ Ϯй
Town of View Royal with Esquimalt Nation, Songhees FN ϭϮϰ ϭй ϭϬϱ ϭйDistrict of Highlands Ϭ Ϭй Ϭ Ϭй
City of Langford Ϯϯ Ϭй Ϯϳϭ ϯй
City of Colwood Ϭ Ϭй ϵϵ ϭ й
District of Metchosin with Scia’new FN ϰϭ Ϭй Ϭ Ϭй
District of Sooke with T’souke FN Ϭ Ϭй ϲϱ ϭ й
J uan de Fuca Electoral Area with Pacheedaht FN Ϭ Ϭй Ϭ Ϭй
South CVRD with Malahat FN, Cowichan Tribes ϰϲ Ϭй Ϯϲϯ ϯй
External Ϭ Ϭй Ϭ Ϭй
Total ϵϴϱϰ ϭϬϯϮϮ
Trips by Trip Purpose Trips by Primary Travel Mode
24 Hours 24 Hours
ϱϬϳϮ ϮϬй ϱϱϰϯ ϮϮй ϭϵϱϭ ϵй Auto Driver ϭϵϯϱϰ ϳϳй ϭϵϰϯϱ ϳϳй ϭϰϮϳϳ ϲϰй
ϱϬϵ Ϯй ϭϲϰ ϭй Ϭ Ϭй Auto Passenger ϰϬϱϰ ϭϲй ϰϭϴϭ ϭϳй ϯϮϴϴ ϭϱй
Top Five Origins of Trips to Distric t of Central Saanich wi th Tsartlip FN,
Tsawout FNSummary of Trips to and from District of Central Saanich with Tsartlip FN,
Tsawout FN
To District Within DistrictFrom District To District Within District From District
Work
Post-secondary School
rans
ϭϰϴϰ ϲй ϴϲϳ ϯй ϭϮϬϬ ϱй Bicycle ϯϰϮ ϭй ϯϭϵ ϭй Ϯϭϵ ϭй
ϯϰϰϭ ϭϰй ϭϵϮϴ ϴй ϭϳϮϲ ϴй Walk ϭϱϯ ϭй ϭϯϱ ϭй ϯϲϲϱ ϭϲй
ϰϲϰ Ϯй ϵϱϰ ϰй ϲϰϬ ϯй Other Ϯϭϵ ϭй ϮϬϰ ϭй ϲϲϰ ϯй
Ϯϯϯϭ ϵй Ϯϳϳϲ ϭϭй Ϯϵϭϭ ϭϯй Total: Ϯϰϵϴϴ ϭϬϬй Ϯϱϭϱϯ ϭϬϬй ϮϮϯϱϳ ϭϬϬй
ϮϮϵϭ ϵй ϭϳϵϯ ϳй Ϯϵϰϴ ϭϯй
ϴϲϵϯ ϯϱй ϭ Ϭϱϴϯ ϰϮй ϵϮϬϯ ϰϭй
Other ϯϴϭ Ϯй ϭϱϯ ϭй Ϯϳϯ ϭй Total: Ϯϰϵϴϴ ϭϬϬй Ϯϱϭϱϯ ϭϬϬй ϮϮϯϱϳ ϭϬϬй
AM Peak (06:00 - 08:59) AM Peak (06:00 - 08:59)
ϯϬϮϵ ϲϬй ϯϴϮϭ ϲϵй ϳϯϲ ϭϱй Auto Driver ϰϬϭϱ ϴϬй ϰϰϬϮ ϴϬй ϮϱϳϬ ϱϯй
From District To District Within District
Work
To District Within District
Shopping
Passenger
Return Home
From District
Dining / restaurant
er c oo
Personal Business
Recreation / social
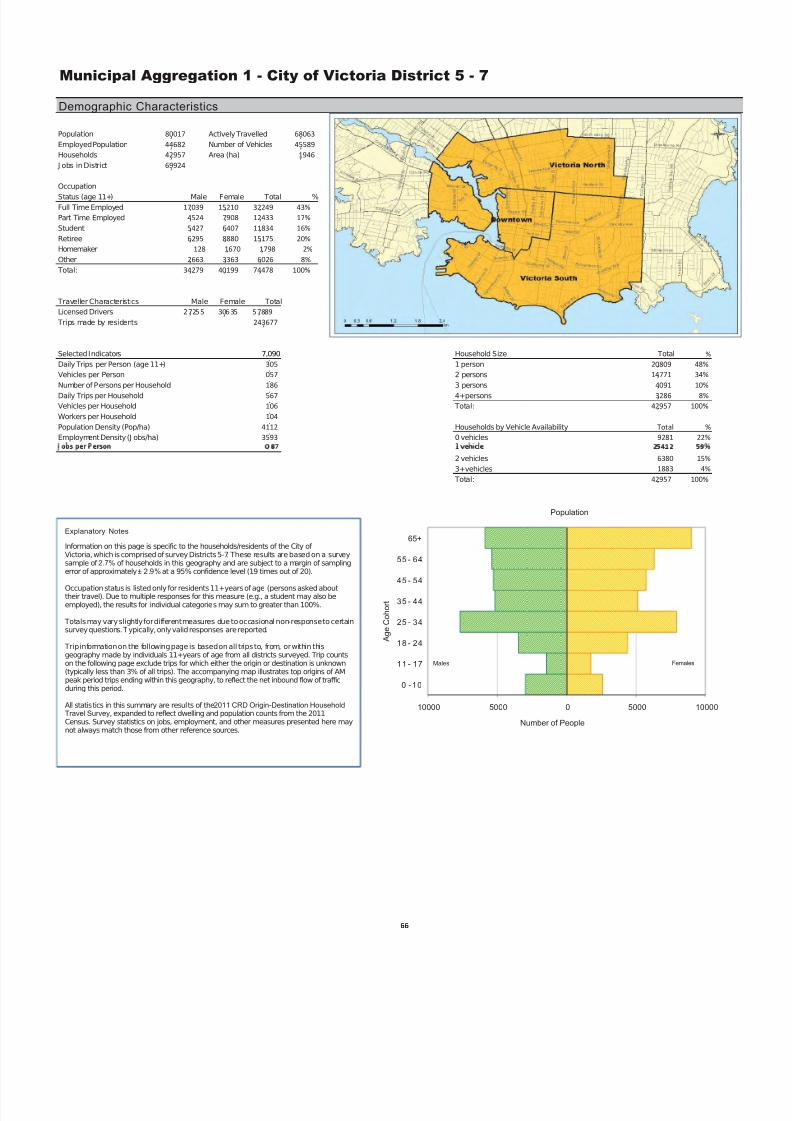
7/27/2019 CRD OD Survey DailyTravelCharacteristicsReport
http://slidepdf.com/reader/full/crd-od-survey-dailytravelcharacteristicsreport 76/117
0XQLFLSDO$JJUHJDWLRQ&LW\RI9LFWRULD'LVWULFW
Demographic Characteristics
Population ϴϬϬϭϳ Actively Travelled ϲϴϬϲϯ
Employed Population ϰϰϲϴϮ Number of Vehicles ϰϱϱϴϵ
Households ϰϮϵϱϳ Area (ha) ϭϵϰϲ
J obs in District ϲϵϵϮϰ
Occupation
Status (age 11+) Male Female Total %
Full Time Employed ϭϳϬϯϵ ϭϱϮϭϬ ϯϮϮϰϵ ϰϯй
Part Time Employed ϰϱϮϰ ϳϵϬϴ ϭϮϰϯϯ ϭϳй
Student ϱϰϮϳ ϲϰϬϳ ϭϭϴϯϰ ϭϲй
Retiree ϲϮϵϱ ϴϴϴϬ ϭϱϭϳϱ ϮϬй
Homemaker ϭϮϴ ϭϲϳϬ ϭϳϵϴ Ϯй
Other Ϯϲϲϯ ϯϯϲϯ ϲϬϮϲ ϴй
Total: ϯϰϮϳϵ ϰϬϭϵϵ ϳϰϰϳϴ ϭϬϬй
Traveller Characteristics Male Female Total
Licensed Drivers Ϯ ϳϮϱ ϱ ϯϬϲ ϯϱ ϱ ϳϴϴϵ
Trips made by residents Ϯϰϯϲϳϳ
Selected Indicators 7,090 Household Size Total й
Daily Trips per Person (age 11+) ϯϬϱ 1 person ϮϬϴϬϵ ϰϴй
Vehicles per Person Ϭϱϳ 2 persons ϭϰϳϳϭ ϯϰй
Number of Persons per Household ϭϴϲ 3 persons ϰϬϵϭ ϭϬй
Daily Trips per Household ϱϲϳ 4+persons ϯϮϴϲ ϴй
Vehicles per Household ϭϬϲ Total: ϰϮϵϱϳ ϭϬϬй
Workers per Household ϭϬϰ
Population Density (Pop/ha) ϰϭϭϮ Households by Vehicle Availability dŽƚĂů й
Employment Density (J obs/ha) ϯϱϵϯ 0 vehicles ϵϮϴϭ ϮϮй
2 vehicles ϲϯϴϬ ϭϱй
3+vehicles ϭϴϴϯ ϰй
Total: ϰϮϵϱϳ ϭϬϬй
55 - 64
65+
Population
Explanatory Notes
Information on this page is specific to the households/residents of the City of Victoria, which is comprised of survey Districts 5-7. These results are based on a surveysample of 2.7% of households in this geography and are subject to a margin of samplingerror of approximately ± 2.9%at a 95% confidence level (19 times out of 20).

7/27/2019 CRD OD Survey DailyTravelCharacteristicsReport
http://slidepdf.com/reader/full/crd-od-survey-dailytravelcharacteristicsreport 77/117
Travel Patterns
AM Peak Period AM Peak Per iod (06:00 - 08:59) Destinations of Origins of
Trips From Trips To
Districts District % Total District % Total
Salt Spring Island E lectoral Area Ϭ Ϭй ϴϰ Ϭй
Town of Sidney ϭϯϭ Ϭй ϲϳϯ ϭйDistrict of North Saanich with Tsyecum FN, Pauquachin ϭϴϳ Ϭй ϲϱϵ ϭй
District of Central Saanich with Tsartlip FN, Tsawout FN ϭϬϬϬ ϯй ϭϮϮϵ Ϯй
City of Victoria ϮϬϳϯϱ ϱϰй ϮϬϳϯϱ ϯϴй
Saanich North ϵϲϳ ϯй Ϯϭϴϰ ϰй
Saanich East ϰϱϰϲ ϭϮй ϵϱϯϲ ϭϳй
Saanich West ϮϴϮϴ ϳй ϰϵϳϴ ϵй
District of Oak Bay ϰϮϲϯ ϭϭй ϯϲϯϬ ϳй
Township of Esquimalt ϮϮϭϲ ϲй ϮϵϲϬ ϱй
Town of View Royal with Esquimalt Nation, Songhees FN ϯϵϴ ϭй ϭϮϯϲ Ϯй
District of Highlands ϭϬ Ϭй ϭϱϵ Ϭй
City of Langford Ϯϵϯ ϭй ϯϬϰϮ ϲй
City of Colwood ϯϮϴ ϭй ϭϴϯϴ ϯйDistrict of Metchosin with Scia’new FN ϵ Ϭй Ϯϱϴ Ϭй
District of Sooke with T’souke FN ϮϮϭ ϭй ϲϮϯ ϭй
J uan de Fuca Electoral Area with Pacheedaht FN ϲ Ϭй ϭϮϵ Ϭй
South CVRD with Malahat FN, Cowichan Tribes ϲϴ Ϭй ϭϮϮϵ Ϯй
External Ϭ Ϭй ϭϯ Ϭй
Total ϯϴϮϬϲ ϱϱϭϵϳ
Trips by Trip Purpose Trips by Primary Travel Mode
24 Hours 24 Hours
ϭϳϴϮϳ ϭϯй ϯϳϲϳϳ Ϯϴй ϯϬϭϰϴ ϭϴй Auto Driver ϴϵϰϳϰ ϲϲй ϴϵϱϳϱ ϲϲй ϲϵϯϲϳ ϰϬй
ϱϰϬϲ ϰй Ϯϰϴ Ϭй ϭϰϭ Ϭй Auto Passenger ϭϳϳϮϴ ϭϯй ϭϴϰϳϲ ϭϰй ϭϲϭϯϯ ϵйϭϴϱϵ ϭй ϭϰϳϭ ϭй ϭϱϴϭ ϭй Transit ϭϲϱϭϵ ϭϮй ϭϲϯϲϵ ϭϮй ϭϬϯϰϬ ϲй
ϲϲϱϵ ϱй ϭϮϳϭϬ ϵй ϭϮϵϭϮ ϴй Bicycle ϰϳϭϰ ϯй ϰϱϳϬ ϯй ϳϲϳϭ ϰй
ϭϬϳϳϱ ϴй ϭ ϮϱϮϯ ϵй ϭ ϰϳϮϳ ϵй Walk ϱϬϱϵ ϰй ϰϰϯϲ ϯй ϲϰϵϬϭ ϯϴй
Top Five Origins of Trips to City of Victo ria District 5 - 7 Summary of Trips to and fr om City of Victo ria District 5 - 7
To District Within DistrictFrom District To District Within District From District
Work
Post-secondary SchoolOther School
Personal Business
Recreation / social
ϭϯϬϮϭ ϭϬй ϭϳϭϮϵ ϭϯй ϮϳϮϴϮ ϭϲй Total: ϭϯϰϴϯϳ ϭϬϬй ϭϯϰϵϰϯ ϭϬϬй ϭϳϭϯϰϳ ϭϬϬй
ϭϬϲϬϮ ϴй ϭ ϭϵϯϮ ϵй ϭ ϭϴϱϭ ϳй
ϲϰϮϯϮ ϰϴй ϯϯϴϳϭ Ϯϱй ϱϴϱϱϱ ϯϰй
Other ϭϭϱϮ ϭй ϭϰϬϴ ϭй ϮϬϬϬ ϭй
Total: ϭϯϰϴϯϳ ϭϬϬй ϭϯϰϵϰϯ ϭϬϬй ϭϳϭϯϰϳ ϭϬϬй
AM Peak (06:00 - 08:59) AM Peak (06:00 - 08:5
ϵϳϭϳ ϱϲй Ϯϰϴϭϳ ϳϮй ϭϮϮϰϳ ϱϵй Auto Driver ϭϭϰϳϭ ϲϲй ϮϮϰϱϮ ϲϱй ϳϱϯϱ ϯϲй
ϭϲϱϭ ϵй Ϯϯϯ ϭй ϵϵ Ϭй Auto Passenger ϭϱϴϮ ϵй ϯϳϯϴ ϭϭй ϭϰϳϰ ϳй
ϭϱϲϰ ϵй ϭϮϲϰ ϰй ϭϱϭϱ ϳй Transit ϯϮϬϯ ϭϴй ϱϮϭϱ ϭϱй ϮϳϰϮ ϭϯй
Ϯϯϳ ϭй ϮϬϲϯ ϲй ϰϳϴ Ϯй Bicycle ϱϳϴ ϯй ϮϮϵϳ ϳй ϭϵϮϭ ϵйPersonal Business
From District To District Within District
Work
Post-secondary School
To District Within District
Other School
Shopping
Pick-up / drop-off Passenger
Return Home
From District

7/27/2019 CRD OD Survey DailyTravelCharacteristicsReport
http://slidepdf.com/reader/full/crd-od-survey-dailytravelcharacteristicsreport 78/117
'LVWULFW'RZQWRZQ
Demographic Characteristics
Population ϳϵϳϭ Actively Travelled ϲϳϲϲ
Employed Population ϰϱϬϵ Number of Vehicles ϯϳϲϴ
Households ϰϴϳϬ Area (ha) ϭϴϱ
J obs in District Ϯϴϴϰϳ
Occupation
Status (age 11+) Male Female Total %
Full Time Employed ϭϴϱϰ ϭϲϳϳ ϯϱϯϭ ϰϳй
Part Time Employed Ϯϵϭ ϲϴϲ ϵϳϴ ϭϯй
Student ϮϮϳ ϱϭϲ ϳϰϯ ϭϬй
Retiree ϱϴϲ ϳϲϮ ϭϯϰϴ ϭϴй
Homemaker ϭϵ ϭϴϳ ϮϬϲ ϯй
Other ϲϰϴ ϱϰϱ ϭϭϵϯ ϭϲй
Total: ϯϲϮϳ ϯϵϮϯ ϳϱϱϬ ϭϬϬй
Traveller Characteristics Male Female Total
Licensed Drivers ϮϴϬϮ ϯϯϮϰ ϲϭϮϲ
Trips made by residents Ϯϯϲϳϯ
Selected Indicators 7,090 Household Size Total й
Daily Trips per Person (age 11+) Ϯϵϳ 1 person ϮϴϮϲ ϱϴй
Vehicles per Person Ϭϰϳ 2 persons ϭϱϳϵ ϯϮй
Number of Persons per Household ϭϲϰ 3 persons Ϯϰϰ ϱй
Daily Trips per Household ϰϴϲ 4+persons ϮϮϭ ϱй
Vehicles per Household Ϭϳϳ Total: ϰϴϳϬ ϭϬϬй
Workers per Household Ϭϵϯ
Population Density (Pop/ha) ϰϯϬϵ Households by Vehicle Availability Total й
Employment Density (J obs/ha) ϭϱϱϵϯ 0 vehicles ϭϰϵϴ ϯϭй
2 vehicles ϴϰ Ϯй
3+vehicles ϭϱϲ ϯй
Total: ϰϴϳϬ ϭϬϬй
55 - 64
65+
Population
Explanatory Notes
Information on this page is specific to the households/residents of this district. Theseresults are based on a survey sample of 2.2% of households in this district . Theseresults are subject to a margin of sampling error of approximately ± 9.5% at a 95%confidence level (19 times out of 20), and should be interpreted with caution.

7/27/2019 CRD OD Survey DailyTravelCharacteristicsReport
http://slidepdf.com/reader/full/crd-od-survey-dailytravelcharacteristicsreport 79/117
Travel Patterns
AM Peak Period AM Peak Peri od (06:00 - 08:59) Destinations of Origins of
Trips From Trips To
Districts District % Total District % Total
Salt Spring Island Electoral Area Ϭ Ϭй ϱϰ Ϭ й
Town of Sidney Ϭ Ϭй ϰϬϰ Ϯй
District of North Saanich with Tsyecum FN, Pauquachin FN Ϭ Ϭй ϯϭϰ ϭй
District of Central Saanich with Tsartlip FN, Tsawout FN Ϭ Ϭй ϰϲϲ Ϯй
Downtown ϵϬϭ ϭϳй ϵϬϭ ϰй
Victoria North ϲϴϱ ϭϯй Ϯϳϳϱ ϭϯй
Victoria South ϵϱϭ ϭϴй ϰϬϬϯ ϭϴй
Saanich North ϮϬϳ ϰй ϭϬϭϳ ϱй
Saanich East ϴϲϱ ϭϲй ϰϬϴϮ ϭϵй
Saanich West ϱϬϭ ϵй ϭϵϱϰ ϵй
District of Oak Bay ϯϯϭ ϲй ϭϮϯϵ ϲй
Township of Esquimalt ϳϵϵ ϭϱй ϭϭϳϮ ϱй
Town of View Royal with Esquimalt Nation, Songhees FN Ϭ Ϭй ϯϴϰ ϮйDistrict of Highlands Ϭ Ϭй ϭϮ Ϭ й
City of Langford ϱϯ ϭй ϭϮϲϳ ϲй
City of Colwood Ϯϭ Ϭй ϴϳϵ ϰй
District of Metchosin with Scia’new FN Ϭ Ϭй ϭϭϰ ϭй
District of Sooke with T’souke FN ϭϰ Ϭй Ϯϯϱ ϭй
J uan de Fuca Electoral Area with Pacheedaht FN Ϭ Ϭй ϰϳ Ϭ й
South CVRD with Malahat FN, Cowichan Tribes ϭϱ Ϭй ϲϬϯ ϯй
External Ϭ Ϭй ϭϯ Ϭ й
Total ϱϯϰϮ Ϯϭϵϯϯ
Trips by Trip Purpose Trips by Primary Travel Mode
24 Hours 24 Hours
ϲϵϯϲ ϭϭй ϮϰϭϴϮ ϯϳй ϰϱϵϳ ϭϵй Auto Driver ϯϰϳϯϲ ϱϯй ϯϰϴϴϴ ϱϯй ϯϬϲϳ ϭϮй
ϳϱϰ ϭй ϯϬϬ Ϭй Ϭ Ϭй Auto Passenger ϳϳϯϴ ϭϮй ϳϳϮϯ ϭϮй ϴϱϴ ϯй
Within District To District Within District From District To District
Work
Post-secondary School
Top Five Origins of Trips to Downtown Summary of Trips to and from Downtown
From District
rans
ϮϮϰϬ ϯй ϲϳϮϰ ϭϬй ϯϭϰϯ ϭϯй Bicycle Ϯϯϭϵ ϰй Ϯϱϵϵ ϰй ϲϯϴ ϯй
ϯϳϯϭ ϲй ϴϭϭϰ ϭϮй Ϯϭϰϲ ϵй Walk ϴϱϵϮ ϭϯй ϴϰϱϬ ϭϯй ϭϵϰϰϱ ϳϵй
ϭϲϲϲ ϯй ϱϴϵϭ ϵй ϯϭϴϱ ϭϯй Other ϭϮϱϲ Ϯй ϴϱϱ ϭй ϱϭϳ Ϯй
ϲϬϮϳ ϵй ϳϵϭϯ ϭϮй ϲϬϱϱ Ϯϱй Total: ϲϱϮϭϬ ϭϬϬй ϲϱϯϵϯ ϭϬϬй Ϯϰϲϱϭ ϭϬϬй
ϯϳϳϮ ϲй ϱϬϰϱ ϴй ϱϵϬ Ϯй
ϯϵϯϳϵ ϲϬй ϱϯϴϰ ϴй ϰϳϮϮ ϭϵй
Otherϱϯϲ ϭй ϭϯϬϵ Ϯй Ϯϭϯ ϭй
Total: ϲϱϮϭϬ ϭϬϬй ϲϱϯϵϯ ϭϬϬй Ϯϰϲϱϭ ϭϬϬй
AM Peak (06:00 - 08:59) AM Peak (06:00 - 08:59)
ϮϱϬϯ ϱϲй ϭϲϰϵϳ ϳϴй ϳϬϰ ϳϴй AutoDriver Ϯϴϱϳ ϲϰй ϵϮϮϲ ϰϰй Ϯϴϭ ϯϭй
Within DistrictFrom District To District Within District From District To District
Shopping
Pick-up / drop-off Passenger
Return Home
Work
er c oo
Personal Business
Recreation / social
Dining / restaurant

7/27/2019 CRD OD Survey DailyTravelCharacteristicsReport
http://slidepdf.com/reader/full/crd-od-survey-dailytravelcharacteristicsreport 80/117
'LVWULFW9LFWRULD1RUWK
Demographic Characteristics
Population Ϯϵϭϲϳ Actively Travelled Ϯϰϱϵϵ
Employed Population ϭϲϭϴϭ Number of Vehicles ϭϲϱϱϰ
Households ϭϰϮϯϯ Area (ha) ϳϳϰ
J obs in District ϮϬϭϴϴ
Occupation
Status (age 11+) Male Female Total %
Full Time Employed ϲϱϮϮ ϱϰϯϵ ϭϭϵϲϭ ϰϱй
Part Time Employed ϭϰϲϴ ϮϳϱϮ ϰϮϮϬ ϭϲй
Student ϭϵϭϯ Ϯϱϱϵ ϰϰϳϮ ϭϳй
Retiree Ϯϯϴϯ Ϯϴϵϭ ϱϮϳϰ ϮϬй
Homemaker ϰϳ ϮϵϮ ϯϯϵ ϭй
Other ϭϭϰϭ ϴϵϯ ϮϬϯϯ ϴй
Total: ϭϮϳϮϳ ϭϯϵϯϵ Ϯϲϲϲϲ ϭϬϬй
Traveller Characteristics Male Female Total
Licensed Drivers ϵ ϲϴ ϴ ϭ Ϭϳϳϰ Ϯ Ϭϰϲ Ϯ
Trips made by residents ϴϰϵϮϱ
Selected Indicators 7,090 Household Size Total й
Daily Trips per Person (age 11+) Ϯϵϭ 1 person ϱϵϭϯ ϰϮй
Vehicles per Person Ϭϱϳ 2 persons ϱϬϱϬ ϯϱй
Number of Persons per Household ϮϬϱ 3 persons ϭϴϮϯ ϭϯй
Daily Trips per Household ϱϵϳ 4+persons ϭϰϰϲ ϭϬй
Vehicles per Household ϭϭϲ Total: ϭϰϮϯϯ ϭϬϬй
Workers per Household ϭϭϰ
Population Density (Pop/ha) ϯϳϲϴ Households by Vehicle Availability Total й
Employment Density (J obs/ha) ϮϲϬϴ 0 vehicles Ϯϱϴϳ ϭϴй
2 vehicles Ϯϵϴϯ Ϯϭй
3+vehicles ϳϳϵ ϱй
Total: ϭϰϮϯϯ ϭϬϬй
55 - 64
65+
Population
Explanatory Notes
Information on this page is specific to the households/residents of this district. These results are based on a survey sample of 2.6% of households in this districtand are subject to a margin of sampling error of approximately ± 5.0% at a 95%confidence level (19 times out of 20)

7/27/2019 CRD OD Survey DailyTravelCharacteristicsReport
http://slidepdf.com/reader/full/crd-od-survey-dailytravelcharacteristicsreport 81/117
Travel Patterns
AM Peak Period AM Peak Peri od (06:00 - 08:59) Destinations of Origins of
Trips From Trips To
Districts District % Total District % Total
Salt Spring Island E lectoral Area Ϭ Ϭй Ϭ Ϭй
Town of Sidney ϭϬϲ ϭй ϭϴϮ ϭй
District of North Saanich with Tsyecum FN, Pauquachin FN ϭϬϮ ϭй ϲϵ Ϭй
District of Central Saanich with Tsartlip FN, Tsawout FN ϰϴϳ ϯй ϯϳϯ Ϯй
Downtown Ϯϳϳϱ ϮϬй ϲϴϱ ϰй
Victoria North Ϯϴϵϲ Ϯϭй Ϯϴϵϲ ϭϵй
Victoria South ϭϳϱϵ ϭϯй ϭϳϯϬ ϭϭй
Saanich North ϭϬϲ ϭй ϰϲϱ ϯй
Saanich East ϮϬϴϲ ϭϱй Ϯϱϳϴ ϭϳй
Saanich West ϭϮϲϯ ϵй ϮϬϰϴ ϭϯй
District of Oak Bay ϴϵϲ ϲй ϰϬϯ ϯй
Township of Esquimalt ϴϲϯ ϲй ϭϬϰϮ ϳй
Town of View Royal with Esquimalt Nation, Songhees FN ϭϬϴ ϭй ϱϬϬ ϯйDistrict of Highlands ϭϬ Ϭй ϴϬ ϭй
City of Langford ϭϳϳ ϭй ϭϭϱϱ ϴй
City of Colwood ϭϮϰ ϭй ϰϵϭ ϯй
District of Metchosin with Scia’new FN Ϭ Ϭй ϭϯϭ ϭй
District of Sooke with T’souke FN ϮϬϳ ϭй ϭϵϲ ϭй
J uan de Fuca Electoral Area with Pacheedaht FN ϲ Ϭй ϰϲ Ϭй
South CVRD with Malahat FN, Cowichan Tribes ϯϲ Ϭй Ϯϳϳ Ϯй
External Ϭ Ϭй Ϭ Ϭй
Total ϭϰϬϬϲ ϭϱϯϰϳ
Trips by Trip Purpose Trips by Primary Travel Mode
24 Hours 24 Hours
ϭϮϰϲϯ ϭϳй ϭϱϴϬϵ Ϯϭй ϯϰϳϲ ϭϯй Auto Driver ϰϵϬϬϯ ϲϱй ϰϴϳϰϮ ϲϱй ϭϭϰϱϮ ϰϰй
Ϯϯϯϰ ϯй ϳϰ Ϭй Ϭ Ϭй Auto Passenger ϭϬϲϵϴ ϭϰй ϭϬϱϯϬ ϭϰй ϮϭϭϬ ϴй
Top Five Origins of Trips to Victoria North Summary of Trips to and from Victoria North
To District Within DistrictFrom District To District Within District From District
Work
Post-secondary School
rans
ϯϴϲϳ ϱй ϱϰϮϱ ϳй ϭϲϱϯ ϲй Bicycle ϯϱϬϯ ϱй ϯϮϱϰ ϰй ϭϮϰϳ ϱй
ϲϵϳϱ ϵй ϱϳϲϰ ϴй ϭϱϱϮ ϲй Walk ϱϭϲϱ ϳй ϱϬϮϵ ϳй ϭ ϬϬϱϵ ϯϵй
ϭϴϬϭ Ϯй ϯϭϴϰ ϰй ϭϳϲϳ ϳй Other ϵϮϯ ϭй ϭϯϱϯ Ϯй ϱϬϭ Ϯй
ϳϵϱϵ ϭϭй ϭϰϰϲϬ ϭϵй ϱϮϭϬ ϮϬй Total: ϳϱϮϰϲ ϭϬϬй ϳϰϳϭϴ ϭϬϬй Ϯϱϳϳϴ ϭϬϬй
ϲϴϮϱ ϵй ϲϯϴϳ ϵй ϮϮϬϬ ϵй
ϯϭϯϮϵ ϰϮй ϮϮϰϮϴ ϯϬй ϵϳϭϱ ϯϴй
Other ϱϯϲ ϭй ϳϱϱ ϭй ϭϳϱ ϭй
Total: ϳϱϮϰϲ ϭϬϬй ϳϰϳϭϴ ϭϬϬй Ϯϱϳϳϴ ϭϬϬй
AM Peak (06:00 - 08:59) AM Peak (06:00 - 08:59)
ϲϰϬϯ ϱϴй ϴϯϵϰ ϲϳй ϭϮϰϳ ϰϯй Auto Driver ϱϳϲϲ ϱϮй ϴϵϮϱ ϳϮй ϭϱϱϰ ϱϰй
From District To District Within District
Work
To District Within District
Shopping
Pick-up / drop-off Passenger
Return Home
From District
Dining / restaurant
er c oo
Personal Business
Recreation / social

7/27/2019 CRD OD Survey DailyTravelCharacteristicsReport
http://slidepdf.com/reader/full/crd-od-survey-dailytravelcharacteristicsreport 82/117
'LVWULFW9LFWRULD6RXWK
Demographic Characteristics
Population ϰϮϴϳϵ Actively Travelled ϯϲϲϵϳ
Employed Population Ϯϯϵϵϯ Number of Vehicles ϮϱϮϲϳ
Households Ϯϯϴϱϰ Area (ha) ϵϴϳ
J obs in District ϮϬϴϴϵ
Occupation
Status (age 11+) Male Female Total %
Full Time Employed ϴϲϲϯ ϴϬϵϰ ϭϲϳϱϳ ϰϮй
Part Time Employed Ϯϳϲϱ ϰϰϳϬ ϳϮϯϲ ϭϴй
Student ϯϮϴϳ ϯϯϯϮ ϲϲϭϵ ϭϲй
Retiree ϯϯϮϲ ϱϮϮϳ ϴϱϱϯ Ϯϭй
Homemaker ϲϮ ϭϭϵϭ ϭϮϱϯ ϯй
Other ϴϳϰ ϭϵϮϲ Ϯϳϵϵ ϳй
Total: ϭϳϵϮϲ ϮϮ ϯϯϳ ϰϬϮϲϯ ϭϬϬй
Traveller Characteristics Male Female Total
Licensed Drivers ϭϰϳ ϲϱ ϭ ϲϱϯ ϳ ϯϭϯ Ϭϭ
Trips made by residents ϭϯϱϬϳϵ
Selected Indicators 7,090 Household Size Total й
Daily Trips per Person (age 11+) ϯϭϱ 1 person ϭϮϬϳϬ ϱϭй
Vehicles per Person Ϭϱϵ 2 persons ϴϭϰϮ ϯϰй
Number of Persons per Household ϭϴϬ 3 persons ϮϬϮϰ ϴй
Daily Trips per Household ϱϲϲ 4+persons ϭϲϭϵ ϳй
Vehicles per Household ϭϬϲ Total: Ϯ ϯϴϱ ϰ ϭ ϬϬй
Workers per Household ϭϬϭ
Population Density (Pop/ha) ϰϯϰϰ Households by Vehicle Availability Total й
Employment Density (J obs/ha) Ϯϭϭϲ 0 vehicles ϱϭϵϳ ϮϮй
2 vehicles ϯϯϭϰ ϭϰй
3+vehicles ϵϰϴ ϰй
Total: Ϯ ϯϴϱ ϰ ϭ ϬϬй
55 - 64
65+
Population
Explanatory Notes
Information on this page is specific to the households/residents of this district. These results are based on a survey sample of 2.8% of households in this districtand are subject to a margin of sampling error of approximately ± 3.7% at a 95%confidence level (19 times out of 20)

7/27/2019 CRD OD Survey DailyTravelCharacteristicsReport
http://slidepdf.com/reader/full/crd-od-survey-dailytravelcharacteristicsreport 83/117
Travel Patterns
AM Peak Period AM Peak Per iod (06:00 - 08:59) Destinations of Origins of
Trips From Trips To
Districts District % Total District % Total
Salt Spring Island E lectoral Area Ϭ Ϭй ϯϬ Ϭй
Town of Sidney Ϯϱ Ϭй ϴϴ Ϭй
District of North Saanich with Tsyecum FN, P auquachin F ϴϱ Ϭй Ϯϳϲ Ϯй
District of Central Saanich with Tsartlip FN, Tsawout FN ϱϭϯ ϯй ϯϵϬ Ϯй
Downtown ϰϬϬϯ Ϯϭй ϵϱϭ ϱй
Victoria North ϭϳϯϬ ϵй ϭϳϱϵ ϭϬй
Victoria South ϱϬϯϲ Ϯϳй ϱϬϯϲ Ϯϴй
Saanich North ϲϱϰ ϯй ϳϬϮ ϰй
Saanich East ϭϱϵϱ ϴй Ϯϴϳϳ ϭϲй
Saanich West ϭϬϲϱ ϲй ϵϳϲ ϱй
District of Oak Bay ϯϬϯϲ ϭϲй ϭϵϴϴ ϭϭй
Township of Esquimalt ϱϱϰ ϯй ϳϰϲ ϰй
Town of View Royal with Esquimalt Nation, Songhees FN ϮϵϬ Ϯй ϯϱϯ ϮйDistrict of Highlands Ϭ Ϭй ϲϳ Ϭй
City of Langford ϲϯ Ϭй ϲϮϬ ϯй
City of Colwood ϭϴϯ ϭй ϰϲϴ ϯй
District of Metchosin with Scia’new FN ϵ Ϭй ϭϯ Ϭй
District of Sooke with T’souke FN Ϭ Ϭй ϭϵϮ ϭй
J uan de Fuca Electoral Area with Pacheedaht FN Ϭ Ϭй ϯϲ Ϭй
South CVRD with Malahat FN, Cowichan Tribes ϭϳ Ϭй ϯϰϵ Ϯй
External Ϭ Ϭй Ϭ Ϭй
Total ϭϴϴϱϴ ϭϳϵϭϳ
Trips by Trip Purpose Trips by Primary Travel Mode
24 Hours 24 Hours
ϭϰϲϵϵ ϮϬй ϭϯϵϱϳ ϭϵй ϱϴϬϱ ϭϰй Auto Driver ϰϮϲϴϯ ϱϴй ϰϮϴϵϮ ϱϴй ϭϳϵϬϬ ϰϯй
Ϯϰϱϵ ϯй ϭϲ Ϭй Ϭ Ϭй Auto Passenger ϴϵϰϱ ϭϮй ϵϴϳϲ ϭϯй ϯϱϭϮ ϴй
Top Five Destinations of Trips from Victoria South Summary of Trips to and from Victoria South
To District Within DistrictFrom District To District Within District From District
Work
Post-secondary School
rans
ϲϬϵϳ ϴй ϲϭϬϲ ϴй ϮϱϳϮ ϲй Bicycle ϯϮϭϰ ϰй ϯϬϯϵ ϰй ϭϰϲϱ ϯй
ϳϯϳϰ ϭϬй ϱϵϱϬ ϴй ϯϳϮϰ ϵй Walk ϵϰϯϭ ϭϯй ϵϬϴϱ ϭϮй ϭϳϮϲϴ ϰϭй
ϰϬϳϯ ϲй ϭϭϯϲ Ϯй ϮϵϲϮ ϳй Other ϲϰϮ ϭй ϳϴϴ ϭй ϰϰϬ ϭй
ϵϭϭϯ ϭϮй ϰϴϯϰ ϳй ϱϵϰϬ ϭϰй Total: ϳϯϯϮϮ ϭϬϬй ϳϯϳϳϱ ϭϬϬй ϰϭϵϳϳ ϭϬϬй
ϱϲϵϮ ϴй ϲϭϴϲ ϴй ϯϯϳϰ ϴй
Ϯϭϱϭϴ Ϯϵй ϯϰϬϱϰ ϰϲй ϭϲϭϮϯ ϯϴй
Other ϭϬϴϬ ϭй ϯϰϰ Ϭй ϲϭϮ ϭй
Total: ϳϯϯϮϮ ϭϬϬй ϳϯϳϳϱ ϭϬϬй ϰϭϵϳϳ ϭϬϬй
AM Peak (06:00 - 08:59) AM Peak (06:00 - 08:59)
ϴϴϳϵ ϲϰй ϳϵϵϰ ϲϮй ϮϮϮϴ ϰϰй AutoDriver ϲϱϲϳ ϰϴй ϴϬϮϬ ϲϮй ϭϵϴϬ ϯϵй
From District To District Within District
Work
To District Within District
Shopping
Pick-up / drop-off Passenger
Return Home
From District
Dining / restaurant
er c oo
Personal Business
Recreation / social

7/27/2019 CRD OD Survey DailyTravelCharacteristicsReport
http://slidepdf.com/reader/full/crd-od-survey-dailytravelcharacteristicsreport 84/117
0XQLFLSDO$JJUHJDWLRQ'LVWULFWRI6DDQLFK'LVWULFW
Demographic Characteristics
Population ϭϬϵϳϱϮ Actively Travelled ϵϯϮϮϭ
Employed Population ϱϳϴϯϲ Number of Vehicles ϳϲϲϴϰHouseholds ϰϱϯϵϬ Area (ha) ϭϬϳϬϮ
J obs in District ϯϴϳϲϴ
Occupation
Status (age 11+) Male Female Total %
Full Time Employed ϮϯϱϯϮ ϭϴϴϭϭ ϰϮϯϰϯ ϰϯй
Part Time Employed ϱϯϮϮ ϭϬϭϳϭ ϭϱϰϵϮ ϭϲй
Student ϴϳϰϰ ϵϰϳϭ ϭϴϮϭϱ ϭϴй
Retiree ϵϵϭϯ ϭϭϯϵϱ ϮϭϯϬϴ Ϯϭй
Homemaker ϱϮ ϯϬϴϲ ϯϭϯϴ ϯй
Other Ϯϳϱϲ Ϯϰϴϵ ϱϮϰϱ ϱй
Total: ϰϳϯϯϮ ϱϮϭϵϭ ϵϵϱϮϯ ϭϬϬй
Traveller Characteristics Male Female Total
Licensed Drivers ϯ ϵϳϮ ϭ ϰϮϰ ϳϰ ϴ Ϯϭϵ ϰ
Trips made by residents ϯϯϰϳϳϱ
Selected Indicators 7,090 Household Size Total й
Daily Trips per Person (age 11+) ϯϬϱ 1 person ϭϮϰϱϯ Ϯϳй
Vehicles per Person ϬϳϬ 2 persons ϭϲϱϳϱ ϯϳй
Number of Persons per Household ϮϰϮ 3 persons ϲϵϲϬ ϭϱй
Daily Trips per Household ϳϯϴ 4+persons ϵϰϬϮ Ϯϭй
Vehicles per Household ϭϲϵ Total: ϰϱϯϵϬ ϭϬϬй
Workers per Household ϭϮϳ
Population Density (Pop/ha) ϭϬϮϲ Households by Vehicle Availability Total й
Employment Density (J obs/ha) ϯϲϮ 0 vehicles ϯϴϳϮ ϵй
2 vehicles ϭϲϭϰϰ ϯϲй
3+vehicles ϳϭϳϮ ϭϲй
Total: ϰϱϯϵϬ ϭϬϬй
55 - 64
65+
Population
Explanatory Notes
Information on this page is specific to the households/residents of the District of Saanich, which is comprised of survey Districts 8-10. These results are based on asurvey sample of 2.7% of households in this geography and are subject to a margin of sampling error of approximately ± 2.7%at a 95% confidence level (19 times out of 20).

7/27/2019 CRD OD Survey DailyTravelCharacteristicsReport
http://slidepdf.com/reader/full/crd-od-survey-dailytravelcharacteristicsreport 85/117
Travel Patterns
AM Peak Period AM Peak Per iod (06:00 - 08:59) Destinations of Origins of
Trips From Trips To
Districts District % Total District % Total
Salt Spring Island E lectoral Area Ϭ Ϭй ϭϲ Ϭй
Town of Sidney ϱϲϯ ϭй ϮϯϮ ϬйDistrict of North Saanich with Tsyecum FN, P auquachin F ϴϯϭ ϭй ϭϬϲϯ Ϯй
District of Central Saanich with Tsartlip FN, Tsawout FN ϮϰϮϳ ϰй ϮϬϬϵ ϰй
Downtown ϳϬϱϯ ϭϮй ϭϱϳϯ ϯй
Victoria North ϱϬϵϭ ϴй ϯϰϱϱ ϳй
Victoria South ϰϱϱϱ ϴй ϯϯϭϯ ϲй
District of Saanich Ϯϵϱϳϵ ϰϵй Ϯϵϱϳϵ ϱϳй
District of Oak Bay ϰϰϭϬ ϳй ϭϲϯϭ ϯй
Township of Esquimalt ϮϬϰϯ ϯй ϭϮϱϯ Ϯй
Town of View Royal with Esquimalt Nation, Songhees FN ϵϱϬ Ϯй ϭϳϴϴ ϯй
District of Highlands Ϭ Ϭй ϭϮϱ Ϭй
City of Langford ϭϭϴϱ Ϯй ϯϬϬϲ ϲй
City of Colwood ϳϬϰ ϭй ϭϭϬϮ Ϯй
District of Metchosin with Scia’new FN ϲϳ Ϭй ϮϬϬ Ϭй
District of Sooke with T’souke FN ϳϰ Ϭй ϯϮϵ ϭй
J uan de Fuca Electoral Area with Pacheedaht FN ϲϳ Ϭй ϭϮϯ Ϭй
South CVRD with Malahat FN, Cowichan Tribes ϭϲϭ Ϭй ϴϲϬ Ϯй
External ϭϳϬ Ϭй Ϭ Ϭй
Total ϱϵϵϯϬ ϱϭϲϱϴ
Trips by Trip Purpose Trips by Primary Travel Mode
24 Hours 24 Hours
ϯϭϭϲϮ Ϯϯй ϭϵϴϯϭ ϭϱй ϭϲϴϵϮ ϭϬй Auto Driver ϵϯϮϰϵ ϲϵй ϵϯϬϵϳ ϲϵй ϭϭϯϬϵϳ ϲϳй
ϯϮϵϬ Ϯй ϯϳϮϱ ϯй ϮϯϰϬ ϭй Auto Passenger ϭϴϰϴϴ ϭϰй ϭϵϭϭϳ ϭϰй ϮϭϯϭϬ ϭϯйϮϮϱϭ Ϯй Ϯϲϳϰ Ϯй ϳϭϴϰ ϰй Transit ϭϯϰϱϮ ϭϬй ϭϮϵϲϵ ϭϬй ϲϭϮϲ ϰй
ϵϭϵϳ ϳй ϲϵϮϯ ϱй ϵϰϳϴ ϲй Bicycle ϰϰϯϵ ϯй ϰϮϲϯ ϯй ϰϲϵϬ ϯй
ϭϲϭϴϵ ϭϮй ϭϬϮϵϴ ϴй ϭϳϭϳϬ ϭϬй Walk ϯϴϴϵ ϯй ϰϮϰϭ ϯй ϮϭϳϲϮ ϭϯй
Top Five Destinations o f Trips from Distri ct of Saanich Distric t 8 - 10 Summary of Trips to and fr om District of Saanich District 8 - 10
To District Within DistrictFrom District To District Within District From District
Work
Post-secondary SchoolOther School
Personal Business
Recreation / social
ϭϱϱϭϯ ϭϮй ϭϰϰϵϮ ϭϭй Ϯϰϱϰϯ ϭϱй Total: ϭϯϰϳϳϭ ϭϬϬй ϭϯϰϵϳϯ ϭϬϬй ϭϲϴϰϴϳ ϭϬϬй
ϭϭϲϬϲ ϵй ϭϭϱϮϵ ϵй ϭ ϴϭϳϰ ϭϭй
ϰϬϯϲϱ ϯϬй ϲϬϴϱϰ ϰϱй ϲϲϭϭϭ ϯϵй
Other ϭϬϲϴ ϭй ϭϭϵϯ ϭй ϭϭϮϲ ϭй
Total: ϭϯϰϳϳϭ ϭϬϬй ϭϯϰϵϳϯ ϭϬϬй ϭ ϲϴϰϴϳ ϭϬϬй
AM Peak (06:00 - 08:59) AM Peak (06:00 - 08:59)
ϮϬϰϰϱ ϲϳй ϭϭϱϰϭ ϱϮй ϴϭϵϴ Ϯϴй Auto Driver ϮϬϰϴϱ ϲϳй ϭϱϯϭϱ ϲϵй ϭϴϭϰϯ ϲϭй
ϭϰϳϱ ϱй ϭϵϵϰ ϵй ϴϰϭ ϯй Auto Passenger Ϯϰϯϵ ϴй Ϯϯϱϰ ϭϭй ϯϳϭϯ ϭϯй
ϭϳϳϲ ϲй ϮϯϮϭ ϭϭй ϲϱϬϱ ϮϮй Transit ϯϳϴϯ ϭϮй ϯϭϲϲ ϭϰй ϭϰϭϮ ϱй
ϭϭϵϲ ϰй ϱϯϰ Ϯй ϭϭϳϴ ϰй Bicycle Ϯϰϯϱ ϴй ϲϵϵ ϯй ϭϱϵϵ ϱйPersonal Business
From District To District Within District
WorkPost-secondary School
To District Within District
Other School
Shopping
Pick-up / drop-off Passenger
Return Home
From District

7/27/2019 CRD OD Survey DailyTravelCharacteristicsReport
http://slidepdf.com/reader/full/crd-od-survey-dailytravelcharacteristicsreport 86/117
'LVWULFW6DDQLFK1RUWK
Demographic Characteristics
Population ϭϴϬϭϵ Actively Travelled ϭϰϴϬϯ
Employed Population ϵϰϬϴ Number of Vehicles ϭϱϬϳϵHouseholds ϳϮϰϮ Area (ha) ϰϴϵϲ
J obs in District ϲϳϱϳ
Occupation
Status (age 11+) Male Female Total %
Full Time Employed ϯϰϴϮ Ϯϴϵϲ ϲϯϳϴ ϯϵй
Part Time Employed ϭϬϱϭ ϭϵϳϵ ϯϬϯϬ ϭϴй
Student ϭϭϬϳ ϭϯϯϮ Ϯϰϯϵ ϭϱй
Retiree ϮϯϬϱ ϮϭϬϮ ϰϰϬϴ Ϯϳй
Homemaker ϱϮ ϱϯϯ ϱϴϲ ϰй
Other Ϯϭϭ ϰϮϲ ϲϯϳ ϰй
Total: ϳϴϮϵ ϴϲϳϮ ϭϲϱϬϬ ϭϬϬй
Traveller Characteristics Male Female Total
Licensed Drivers ϲ ϳϵϴ ϳϱϵϰ ϭϰ ϯϵϮ
Trips made by residents ϱϯϴϯϯ
Selected Indicators 7,090 Household Size Total й
Daily Trips per Person (age 11+) Ϯϵϵ 1 person ϭϰϵϲ Ϯϭй
Vehicles per Person Ϭϴϰ 2 persons ϯϬϮϳ ϰϮй
Number of Persons per Household Ϯϰϵ 3 persons ϭϬϳϲ ϭϱй
Daily Trips per Household ϳϰϯ 4+persons ϭϲϰϯ Ϯϯй
Vehicles per Household ϮϬϴ Total: ϳ ϮϰϮ ϭϬϬй
Workers per Household ϭϯϬ
Population Density (Pop/ha) ϯϲϴ Households by Vehicle Availability Total й
Employment Density (J obs/ha) ϭϯϴ 0 vehicles ϯϯϰ ϱй
2 vehicles ϯϭϵϭ ϰϰй
3+vehicles ϭϴϬϬ Ϯϱй
Total: ϳ ϮϰϮ ϭϬϬй
55 - 64
65+
Population
Explanatory Notes
Information on this page is specific to the households/residents of this district. These results are based on a survey sample of 3.2% of households in this districtand are subject to a margin of sampling error of approximately ± 6.3% at a 95%confidence level (19 times out of 20)

7/27/2019 CRD OD Survey DailyTravelCharacteristicsReport
http://slidepdf.com/reader/full/crd-od-survey-dailytravelcharacteristicsreport 87/117
Travel Patterns
AM Peak Period AM Peak Peri od (06:00 - 08:59) Destinations of Origins of
Trips From Trips To
Districts District % Total District % Total
Salt Spring Island Electoral Area Ϭ Ϭй Ϭ Ϭй
Town of Sidney ϭϭϭ ϭй ϭϯ Ϭй
District of North Saanich with Tsyecum FN, Pauquachin FN ϮϬϴ Ϯй ϭϵϲ ϯй
District of Central Saanich with Tsartlip FN, Tsawout FN ϳϰϴ ϴй ϲϵϲ ϭϬй
Downtown ϭϬϭϳ ϭϭй ϮϬϳ ϯй
Victoria North ϰϲϱ ϱй ϭϬϲ Ϯй
Victoria South ϳϬϮ ϴй ϲϱϰ ϵй
Saanich North ϭϵϮϱ ϮϮй ϭϵϮϱ Ϯϴй
Saanich East ϭϵϵϳ ϮϮй ϭϲϭϯ Ϯϯй
Saanich West ϳϯϬ ϴй ϳϵϮ ϭϭй
District of Oak Bay ϯϰϵ ϰй ϭϭϴ Ϯй
Township of Esquimalt ϭϯϬ ϭй ϯϲ ϭй
Town of View Royal with Esquimalt Nation, Songhees FN ϭϰϲ Ϯй ϮϬϱ ϯйDistrict of Highlands Ϭ Ϭй ϰϴ ϭй
City of Langford ϭϬϵ ϭй Ϯϰϯ ϯй
City of Colwood ϵϱ ϭй Ϯϴ Ϭй
District of Metchosin with Scia’new FN Ϭ Ϭй ϮϬ Ϭй
District of Sooke with T’souke FN Ϭ Ϭй ϱϲ ϭй
J uan de Fuca Electoral Area with Pacheedaht FN ϱϰ ϭй Ϭ Ϭй
South CVRD with Malahat FN, Cowichan Tribes ϰϵ ϭй Ϭ Ϭй
External ϳϰ ϭй Ϭ Ϭй
Total ϴϵϬϵ ϲϵϱϱ
Trips by Trip Purpose Trips by Primary Travel Mode
24 Hours 24 Hours
ϳϬϮϳ ϮϬй ϰϱϯϴ ϭϯй ϳϰϬ ϱй Auto Driver Ϯϴϭϭϵ ϳϴй Ϯϳϵϲϯ ϳϴй ϭϭϯϵϰ ϳϭй
ϴϬϱ Ϯй ϳϳ Ϭй Ϭ Ϭй Auto Passenger ϱϭϱϯ ϭϰй ϱϭϭϴ ϭϰй ϭϵϰϮ ϭϮй
Top Five Destinations of Trips from Saanich North Summary of Trips to and fro m Saanich North
To District Within DistrictFrom District To District Within District From District
Work
Post-secondary School
rans
ϮϳϬϴ ϴй ϭϱϳϯ ϰй ϳϮϰ ϱй Bicycle ϰϳϳ ϭй ϰϱϬ ϭй Ϯϯϯ ϭй
ϯϳϴϯ ϭϭй ϱϵϬϰ ϭϳй ϭϴϲϬ ϭϮй Walk ϰϭϭ ϭй Ϯϵϭ ϭй ϭ ϯϴϳ ϵй
ϳϱϵ Ϯй ϭϯϯϬ ϰй ϳϬϱ ϰй Other ϭϮϲ Ϭй ϭϮϮ Ϭй ϴϭϱ ϱй
ϯϯϰϭ ϵй ϰϳϭϭ ϭϯй ϮϴϬϰ ϭϴй Total: ϯϱϴϲϯ ϭϬϬй ϯϱϲϳϬ ϭϬϬй ϭϱϵϱϯ ϭϬϬй
ϯϳϮϮ ϭϬй Ϯϲϴϰ ϴй ϭϴϮϲ ϭϭй
ϭϯϬϯϯ ϯϲй ϭϰϭϳϯ ϰϬй ϲϮϬϰ ϯϵй
Other Ϯϳϲ ϭй ϭϵϮ ϭй ϭϴϲ ϭй
Total: ϯϱϴϲϯ ϭϬϬй ϯϱϲϳϬ ϭϬϬй ϭϱϵϱϯ ϭϬϬй
AM Peak (06:00 - 08:59) AM Peak (06:00 - 08:59)
ϰϭϴϵ ϲϬй Ϯϯϯϳ ϰϲй ϭϵϵ ϭϬй AutoDriver ϱϰϮϬ ϳϴй ϯϴϱϳ ϳϳй ϭϬϯϭ ϱϰй
From District To District Within District
Work
To District Within District
Shopping
Pick-up / drop-off Passenger
Return Home
From District
Dining / restaurant
er c oo
Personal Business
Recreation / social

7/27/2019 CRD OD Survey DailyTravelCharacteristicsReport
http://slidepdf.com/reader/full/crd-od-survey-dailytravelcharacteristicsreport 88/117
'LVWULFW6DDQLFK(DVW
Demographic Characteristics
Population ϲϮϴϯϳ Actively Travelled ϱϯϲϵϵ
Employed Population ϯϯϬϰϮ Number of Vehicles ϰϬϰϯϵHouseholds Ϯϲϱϭϰ Area (ha) ϯϰϭϴ
J obs in District ϮϭϮϬϮ
Occupation
Status (age 11+) Male Female Total %
Full Time Employed ϭϯϮϵϭ ϭϬϴϳϳ Ϯϰϭϲϴ ϰϮй
Part Time Employed ϯϮϯϲ ϱϲϯϳ ϴϴϳϰ ϭϱй
Student ϱϭϲϱ ϱϲϯϰ ϭϬϳϵϵ ϭϵй
Retiree ϱϲϱϴ ϳϭϳϴ ϭϮϴϯϲ ϮϮй
Homemaker Ϭ ϭϰϴϬ ϭϰϴϬ ϯй
Other ϭϱϴϵ ϭϭϱϮ Ϯϳϰϭ ϱй
Total: ϮϳϮϬϭ ϯϬϮϭϲ ϱϳϰϭϳ ϭϬϬй
Traveller Characteristics Male Female Total
Licensed Drivers Ϯ Ϯϲϯ ϳ Ϯϯϵ ϳϰ ϰ ϲϲϭϭ
Trips made by residents ϭϵϯϬϵϰ
Selected Indicators 7,090 Household Size Total й
Daily Trips per Person (age 11+) ϯϬϳ 1 person ϳϵϱϭ ϯϬй
Vehicles per Person Ϭϲϰ 2 persons ϵϱϬϰ ϯϲй
Number of Persons per Household Ϯϯϳ 3 persons ϯϵϯϳ ϭϱй
Daily Trips per Household ϳϮϴ 4+persons ϱϭϮϯ ϭϵй
Vehicles per Household ϭϱϯ Total: Ϯϲϱϭϰ ϭϬϬй
Workers per Household ϭϮϱ
Population Density (Pop/ha) ϭϴϯϴ Households by Vehicle Availability Total й
Employment Density (J obs/ha) ϲϮϬ 0 vehicles Ϯϴϳϰ ϭϭй
2 vehicles ϵϮϮϳ ϯϱй
3+vehicles ϯϬϮϭ ϭϭй
Total: Ϯϲϱϭϰ ϭϬϬй
55 - 64
65+
Population
Explanatory Notes
Information on this page is specific to the households/residents of this district. These results are based on a survey sample of 2.7% of households in this districtand are subject to a margin of sampling error of approximately ±3.6% at a 95%confidence level (19 times out of 20)

7/27/2019 CRD OD Survey DailyTravelCharacteristicsReport
http://slidepdf.com/reader/full/crd-od-survey-dailytravelcharacteristicsreport 89/117
Travel Patterns
AM Peak Period AM Peak Peri od (06:00 - 08:59) Destinations of Origins of
Trips From Trips To
Districts District % Total District % Total
Salt Spring Island Electoral Area Ϭ Ϭй ϭϲ Ϭй
Town of Sidney ϮϵϮ ϭй ϭϵϴ ϭй
District of North Saanich with Tsyecum FN, Pauquachin FN ϯϯϬ ϭй ϲϳϱ Ϯй
District of Central Saanich with Tsartlip FN, Tsawout FN ϴϴϴ ϯй ϱϰϴ Ϯй
Downtown ϰϬϴϮ ϭϮй ϴϲϱ ϯй
Victoria North Ϯϱϳϴ ϳй ϮϬϴϲ ϳй
Victoria South Ϯϴϳϳ ϴй ϭϱϵϱ ϲй
Saanich North ϭϲϭϯ ϱй ϭϵϵϳ ϳй
Saanich East ϭϰϯϰϯ ϰϭй ϭϰϯϰϯ ϱϬй
Saanich West Ϯϯϲϴ ϳй ϭϲϳϭ ϲй
District of Oak Bay ϯϮϵϴ ϵй ϭϭϲϭ ϰй
Township of Esquimalt ϵϭϰ ϯй ϱϵϴ Ϯй
Town of View Royal with Esquimalt Nation, Songhees FN ϱϰϯ Ϯй ϱϮϬ ϮйDistrict of Highlands Ϭ Ϭй ϯϵ Ϭй
City of Langford ϰϵϮ ϭй ϭϮϮϯ ϰй
City of Colwood ϯϭϲ ϭй ϰϲϭ Ϯй
District of Metchosin with Scia’new FN ϰϮ Ϭй ϲϬ Ϭй
District of Sooke with T’souke FN Ϭ Ϭй ϮϰϮ ϭй
J uan de Fuca Electoral Area with Pacheedaht FN Ϭ Ϭй ϭϮϯ Ϭй
South CVRD with Malahat FN, Cowichan Tribes ϭϭϮ Ϭй ϰϴϵ Ϯй
External ϵϲ Ϭй Ϭ Ϭй
Total ϯϱϭϴϮ ϮϴϵϬϵ
Trips by Trip Purpose Trips by Primary Travel Mode
24 Hours 24 Hours
ϮϬϯϰϵ Ϯϭй ϭϯϬϴϵ ϭϰй ϳϮϱϮ ϵй Auto Driver ϲϳϭϭϭ ϳϬй ϲϳϭϭϭ ϳϬй ϰϲϱϮϬ ϲϬй
Ϯϵϵϭ ϯй Ϯϰϭϳ ϯй ϳϯϵ ϭй Auto Passenger ϭϮϰϴϲ ϭϯй ϭϮϵϮϮ ϭϯй ϵϭϯϵ ϭϮй
Top Five Destinations o f Trips f rom Saanich East Summary of Trips to and fro m Saanich East
To District Within DistrictFrom District To District Within District From District
Work
Post-secondary School
rans
ϱϵϬϳ ϲй ϲϯϬϱ ϳй ϰϯϴϴ ϲй Bicycle ϯϮϮϯ ϯй ϯϮϰϳ ϯй ϮϵϬϮ ϰй
ϭϯϮϱϯ ϭϰй ϲϭϯϱ ϲй ϳϱϴϰ ϭϬй Walk Ϯϴϲϱ ϯй ϯϮϬϲ ϯй ϭϱϯϴϯ ϮϬй
ϮϵϭϮ ϯй Ϯϲϵϰ ϯй ϮϴϮϭ ϰй Other ϳϬϭ ϭй ϳϯϴ ϭй ϲϬϲ ϭй
ϭϭϲϲϴ ϭϮй ϭϭϬϵϮ ϭϮй ϭϭϲϮϯ ϭϱй Total: ϵϱϱϯϭ ϭϬϬй ϵϲϬϮϲ ϭϬϬй ϳϳϲϳϳ ϭϬϬй
ϳϲϭϭ ϴй ϵϮϱϲ ϭϬй ϳϲϬϲ ϭϬй
ϮϴϯϱϬ ϯϬй ϰϮϮϲϳ ϰϰй ϯϭϬϯϰ ϰϬй
Other ϳϬϲ ϭй ϵϴϲ ϭй ϰϱϴ ϭй
Total: ϵϱϱϯϭ ϭϬϬй ϵϲϬϮϲ ϭϬϬй ϳϳϲϳϳ ϭϬϬй
AM Peak (06:00 - 08:59) AM Peak (06:00 - 08:59)
ϭϮϳϳϭ ϲϭй ϳϭϲϮ ϰϵй ϯϮϵϯ Ϯϯй AutoDriver ϭϯϴϲϯ ϲϳй ϭϬϳϴϬ ϳϰй ϴϬϭϴ ϱϲй
From District To District Within District
Work
To District Within District
Shopping
Pick-up / drop-off Passenger
Return Home
From District
Dining / restaurant
er c oo
Personal Business
Recreation / social

7/27/2019 CRD OD Survey DailyTravelCharacteristicsReport
http://slidepdf.com/reader/full/crd-od-survey-dailytravelcharacteristicsreport 90/117
'LVWULFW6DDQLFK:HVW
Demographic Characteristics
Population Ϯϴϴϵϲ Actively Travelled Ϯϰϳϭϵ
Employed Population ϭϱϯϴϲ Number of Vehicles ϮϭϭϲϳHouseholds ϭϭϲϯϰ Area (ha) Ϯϯϴϴ
J obs in District ϭϬϴϬϵ
Occupation
Status (age 11+) Male Female Total %
Full Time Employed ϲϳϱϵ ϱϬϯϴ ϭϭϳϵϳ ϰϲй
Part Time Employed ϭϬϯϰ Ϯϱϱϱ ϯϱϴϵ ϭϰй
Student ϮϰϳϮ ϮϱϬϱ ϰϵϳϳ ϭϵй
Retiree ϭϵϱϬ Ϯϭϭϰ ϰϬϲϱ ϭϲй
Homemaker Ϭ ϭϬϳϯ ϭϬϳϯ ϰй
Other ϵϱϲ ϵϭϭ ϭϴϲϳ ϳй
Total: ϭϮϯϬϯ ϭϯϯϬϯ ϮϱϲϬϲ ϭϬϬй
Traveller Characteristics Male Female Total
Licensed Drivers ϭ ϬϮϴ ϲ ϭ ϬϵϬϱ Ϯ ϭϭϵ ϭ
Trips made by residents ϴϳϴϰϴ
Selected Indicators 7,090 Household Size Total й
Daily Trips per Person (age 11+) ϯϬϰ 1 person ϯϬϬϲ Ϯϲй
Vehicles per Person Ϭϳϯ 2 persons ϰϬϰϰ ϯϱй
Number of Persons per Household Ϯϰϴ 3 persons ϭϵϰϴ ϭϳй
Daily Trips per Household ϳϱϱ 4+persons Ϯϲϯϲ Ϯϯй
Vehicles per Household ϭϴϮ Total: ϭ ϭϲϯ ϰ ϭϬ Ϭй
Workers per Household ϭϯϮ
Population Density (Pop/ha) ϭϮϭϬ Households by Vehicle Availability Total й
Employment Density (J obs/ha) ϰϱϯ 0 vehicles ϲϲϱ ϲй
2 vehicles ϯϳϮϲ ϯϮй
3+vehicles Ϯϯϱϭ ϮϬй
Total: ϭ ϭϲϯ ϰ ϭϬ Ϭй
55 - 64
65+
Population
Explanatory Notes
Information on this page is specific to the households/residents of this district. These results are based on a survey sample of 2.6% of households in this districtand are subject to a margin of sampling error of approximately ± 5.6% at a 95%confidence level (19 times out of 20)

7/27/2019 CRD OD Survey DailyTravelCharacteristicsReport
http://slidepdf.com/reader/full/crd-od-survey-dailytravelcharacteristicsreport 91/117
Travel Patterns
AM Peak Period AM Peak Peri od (06:00 - 08:59) Destinations of Origins of
Trips From Trips To
Districts District % Total District % Total
Salt Spring Island Electoral Area Ϭ Ϭй Ϭ Ϭй
Town of Sidney ϭϲϬ ϭй ϮϮ Ϭй
District of North Saanich with Tsyecum FN, Pauquachin FN Ϯϵϰ Ϯй ϭϵϯ ϭй
District of Central Saanich with Tsartlip FN, Tsawout FN ϳϵϭ ϱй ϳϲϲ ϱй
Downtown ϭϵϱϰ ϭϮй ϱϬϭ ϯй
Victoria North ϮϬϰϴ ϭϯй ϭϮϲϯ ϴй
Victoria South ϵϳϲ ϲй ϭϬϲϱ ϳй
Saanich North ϳϵϮ ϱй ϳϯϬ ϱй
Saanich East ϭϲϳϭ ϭϭй Ϯϯϲϴ ϭϱй
Saanich West ϰϭϰϬ Ϯϲй ϰϭϰϬ Ϯϲй
District of Oak Bay ϳϲϯ ϱй ϯϱϮ Ϯй
Township of Esquimalt ϭϬϬϬ ϲй ϲϭϵ ϰй
Town of View Royal with Esquimalt Nation, Songhees FN Ϯϲϭ Ϯй ϭϬϲϯ ϳйDistrict of Highlands Ϭ Ϭй ϯϴ Ϭй
City of Langford ϱϴϯ ϰй ϭϱϰϭ ϭϬй
City of Colwood Ϯϵϯ Ϯй ϲϭϯ ϰй
District of Metchosin with Scia’new FN Ϯϱ Ϭй ϭϮϬ ϭй
District of Sooke with T’souke FN ϳϰ Ϭй ϯϮ Ϭй
J uan de Fuca Electoral Area with Pacheedaht FN ϭϮ Ϭй Ϭ Ϭй
South CVRD with Malahat FN, Cowichan Tribes Ϭ Ϭй ϯϳϬ Ϯй
External Ϭ Ϭй Ϭ Ϭй
Total ϭϱϴϯϴ ϭϱϳϵϰ
Trips by Trip Purpose Trips by Primary Travel Mode
24 Hours 24 Hours
ϭϭϲϯϵ ϮϬй ϭ ϬϬϱϳ ϭϳй ϭϬϰϳ ϱй Auto Driver ϰϬϴϰϭ ϳϭй ϰϬϴϰϱ ϳϭй ϭϮϯϲϮ ϲϬй
ϲϴϯ ϭй ϮϰϮϬ ϰй ϰϭϭ Ϯй Auto Passenger ϴϴϮϲ ϭϱй ϵϬϱϰ ϭϲй ϮϮϱϯ ϭϭй
Top Five Destinations o f Trips f rom Saanich West Summary of Trips to and fro m Saanich West
To District Within DistrictFrom District To District Within District From District
Work
Post-secondary School
rans
ϯϴϯϳ ϳй ϮϯϬϬ ϰй ϭϭϭϭ ϱй Bicycle ϭϰϴϭ ϯй ϭϯϬϵ Ϯй ϴϭϯ ϰй
ϱϯϳϲ ϵй ϰϰϴϭ ϴй ϭϱϬϰ ϳй Walk ϭϱϴϴ ϯй ϭϳϭϵ ϯй ϰϬϭϳ ϭϵй
ϮϬϲϴ ϰй ϭϬϰϭ Ϯй ϯϯϭ Ϯй Other ϱϬϲ ϭй ϱϬϲ ϭй Ϭ Ϭй
ϳϰϰϳ ϭϯй ϱϲϯϮ ϭϬй ϯϭϳϯ ϭϱй Total: ϱϳϲϮϮ ϭϬϬй ϱϳϱϮϮ ϭϬϬй Ϯ ϬϲϭϮ ϭϬϬй
ϱϳϮϯ ϭϬй ϱϬϯϵ ϵй ϯϮϵϯ ϭϲй
ϭϵϰϯϴ ϯϰй ϮϰϴϳϬ ϰϯй ϴϰϭϳ ϰϭй
Other ϰϲϲ ϭй ϯϵϲ ϭй ϭϬϮ Ϭй
Total: ϱϳϲϮϮ ϭϬϬй ϱϳϱϮϮ ϭϬϬй ϮϬϲϭϮ ϭϬϬй
AM Peak (06:00 - 08:59) AM Peak (06:00 - 08:59)
ϳϱϱϬ ϲϱй ϲϭϬϴ ϱϮй ϲϰϭ ϭϱй AutoDriver ϴϮϭϯ ϳϬй ϳϲϴϵ ϲϲй ϮϬϴϯ ϱϬй
From District To District Within District
Work
To District Within District
Shopping
Passenger
Return Home
From District
Dining / restaurant
er c oo
Personal Business
Recreation / social

7/27/2019 CRD OD Survey DailyTravelCharacteristicsReport
http://slidepdf.com/reader/full/crd-od-survey-dailytravelcharacteristicsreport 92/117
'LVWULFW'LVWULFWRI2DN%D\
Demographic Characteristics
Population ϭϴϬϭϱ Actively Travelled ϭϱϯϴϮ
Employed Population ϴϬϵϰ Number of Vehicles ϭϮϭϱϮHouseholds ϳϳϲϰ Area (ha) ϭϬϱϴ
J obs in District ϭϬϰϲϮ
Occupation
Status (age 11+) Male Female Total %
Full Time Employed ϯϭϭϱ ϮϰϬϰ ϱϱϭϵ ϯϯй
Part Time Employed ϴϳϴ ϭϲϵϳ Ϯϱϳϱ ϭϲй
Student ϭϰϴϵ ϭϯϱϯ Ϯϴϰϯ ϭϳй
Retiree Ϯϭϴϴ ϯϬϱϯ ϱϮϰϭ ϯϮй
Homemaker ϭϯ ϳϯϵ ϳϱϮ ϱй
Other ϮϮϬ ϯϮϳ ϱϰϳ ϯй
Total: ϳϰϴϬ ϵϬϰϯ ϭϲϱϮϰ ϭϬϬй
Traveller Characteristics Male Female Total
Licensed Drivers ϲϮϵϴ ϳϮϭϳ ϭϯϱϭϱ
Trips made by residents ϱϵϵϮϯ
Selected Indicators 7,090 Household Size Total й
Daily Trips per Person (age 11+) ϯϯϯ 1 person ϮϱϲϬ ϯϯй
Vehicles per Person Ϭϲϳ 2 persons Ϯϳϲϲ ϯϲй
Number of Persons per Household ϮϯϮ 3 persons ϵϵϭ ϭϯй
Daily Trips per Household ϳϳϮ 4+persons ϭϰϰϳ ϭϵй
Vehicles per Household ϭϱϳ Total: ϳϳϲϰ ϭϬϬй
Workers per Household ϭϬϰ
Population Density (Pop/ha) ϭϳϬϯ Households by Vehicle Availability Total й
Employment Density (J obs/ha) ϵϴϵ 0 vehicles ϴϲϯ ϭϭй
2 vehicles Ϯϳϭϲ ϯϱй
3+vehicles ϵϰϲ ϭϮй
Total: ϳϳϲϰ ϭϬϬй
55 - 64
65+
Population
Explanatory Notes
Information on this page is specific to the households/residents of this district. These results are based on a survey sample of 5.2% of households in this districtand are subject to a margin of sampling error of approximately ± 4.7% at a 95%confidence level (19 times out of 20)
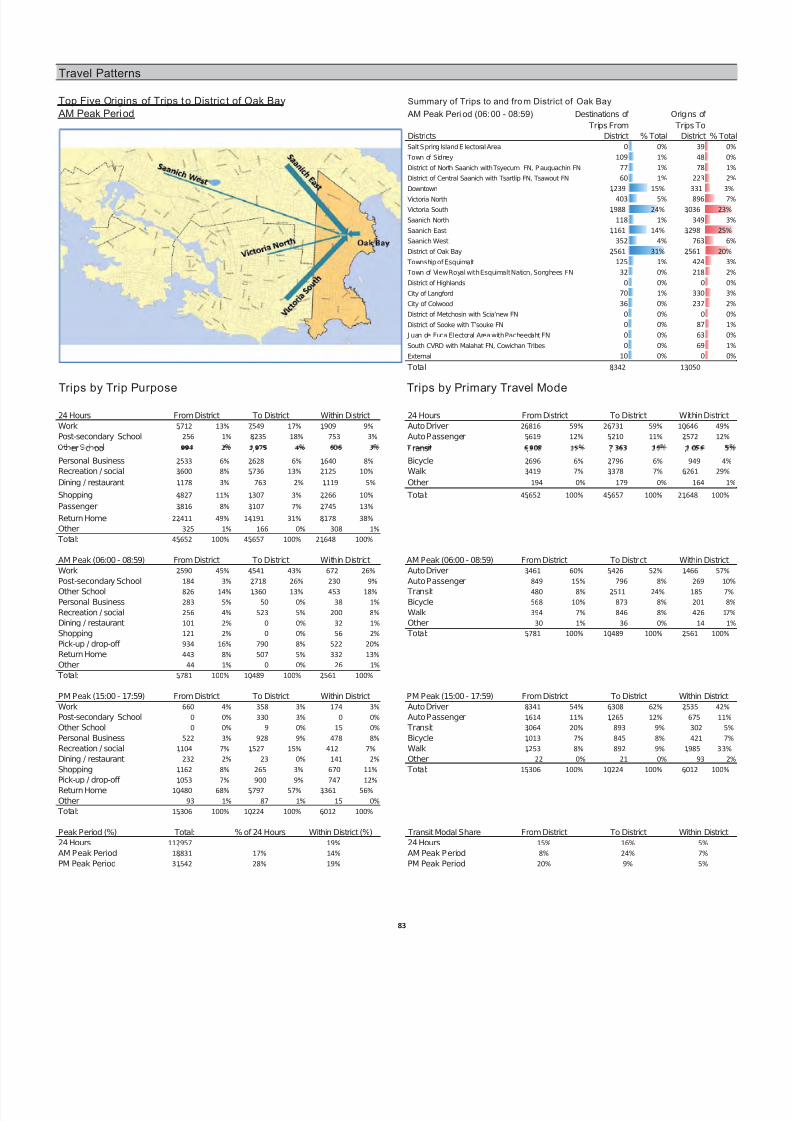
7/27/2019 CRD OD Survey DailyTravelCharacteristicsReport
http://slidepdf.com/reader/full/crd-od-survey-dailytravelcharacteristicsreport 93/117
Travel Patterns
AM Peak Period AM Peak Peri od (06:00 - 08:59) Destinations of Origins of
Trips From Trips To
Districts District % Total District % Total
Salt Spring Island E lectoral Area Ϭ Ϭй ϯϵ Ϭй
Town of Sidney ϭϬϵ ϭй ϰϴ Ϭй
District of North Saanich with Tsyecum FN, Pauquachin FN ϳϳ ϭй ϳϴ ϭй
District of Central Saanich with Tsartlip FN, Tsawout FN ϲϬ ϭй ϮϮϯ Ϯй
Downtown ϭϮϯϵ ϭϱй ϯϯϭ ϯй
Victoria North ϰϬϯ ϱй ϴϵϲ ϳй
Victoria South ϭϵϴϴ Ϯϰй ϯϬϯϲ Ϯϯй
Saanich North ϭϭϴ ϭй ϯϰϵ ϯй
Saanich East ϭϭϲϭ ϭϰй ϯϮϵϴ Ϯϱй
Saanich West ϯϱϮ ϰй ϳϲϯ ϲй
District of Oak Bay Ϯϱϲϭ ϯϭй Ϯϱϲϭ ϮϬй
Township of Esquimalt ϭϮϱ ϭй ϰϮϰ ϯй
Town of View Royal with Esquimalt Nation, Songhees FN ϯϮ Ϭй Ϯϭϴ ϮйDistrict of Highlands Ϭ Ϭй Ϭ Ϭй
City of Langford ϳϬ ϭй ϯϯϬ ϯй
City of Colwood ϯϲ Ϭй Ϯϯϳ Ϯй
District of Metchosin with Scia’new FN Ϭ Ϭй Ϭ Ϭй
District of Sooke with T’souke FN Ϭ Ϭй ϴϳ ϭй
J uan de Fuca Electoral Area with Pacheedaht FN Ϭ Ϭй ϲϯ Ϭй
South CVRD with Malahat FN, Cowichan Tribes Ϭ Ϭй ϲϵ ϭй
External ϭϬ Ϭй Ϭ Ϭй
Total ϴϯϰϮ ϭϯϬϱϬ
Trips by Trip Purpose Trips by Primary Travel Mode
24 Hours 24 Hours
ϱϳϭϮ ϭϯй ϳϱϰϵ ϭϳй ϭϵϬϵ ϵй Auto Driver Ϯϲϴϭϲ ϱϵй Ϯϲϳϯϭ ϱϵй ϭϬϲϰϲ ϰϵй
Ϯϱϲ ϭй ϴϮϯϱ ϭϴй ϳϱϯ ϯй Auto Passenger ϱϲϭϵ ϭϮй ϱϮϭϬ ϭϭй ϮϱϳϮ ϭϮй
Top Five Origins of Trips to Distric t of Oak Bay Summary of Trips to and fro m District of Oak Bay
To District Within DistrictFrom District To District Within District From District
Work
Post-secondary School
rans
Ϯϱϯϯ ϲй ϮϲϮϴ ϲй ϭϲϰϬ ϴй Bicycle Ϯϲϵϲ ϲй Ϯϳϵϲ ϲй ϵϰϵ ϰй
ϯϲϬϬ ϴй ϱϳϯϲ ϭϯй ϮϭϮϱ ϭϬй Walk ϯϰϭϵ ϳй ϯϯϳϴ ϳй ϲϮϲϭ Ϯϵй
ϭϭϳϴ ϯй ϳϲϯ Ϯй ϭϭϭϵ ϱй Other ϭϵϰ Ϭй ϭϳϵ Ϭй ϭϲϰ ϭй
ϰϴϮϳ ϭϭй ϭϯϬϳ ϯй ϮϮϲϲ ϭϬй Total: ϰϱϲϱϮ ϭϬϬй ϰϱϲϱϳ ϭϬϬй Ϯϭϲϰϴ ϭϬϬй
ϯϴϭϲ ϴй ϯϭϬϳ ϳй Ϯϳϰϱ ϭϯй
ϮϮϰϭϭ ϰϵй ϭϰϭϵϭ ϯϭй ϴϭϳϴ ϯϴй
Other ϯϮϱ ϭй ϭϲϲ Ϭй ϯϬϴ ϭй
Total: ϰϱϲϱϮ ϭϬϬй ϰϱϲϱϳ ϭϬϬй Ϯϭϲϰϴ ϭϬϬй
AM Peak (06:00 - 08:59) AM Peak (06:00 - 08:59)
ϮϱϵϬ ϰϱй ϰϱϰϭ ϰϯй ϲϳϮ Ϯϲй AutoDriver ϯϰϲϭ ϲϬй ϱϰϮϲ ϱϮй ϭϰϲϲ ϱϳй
From District To District Within District
Work
To District Within District
Shopping
Passenger
Return Home
From District
Dining / restaurant
er c oo
Personal Business
Recreation / social

7/27/2019 CRD OD Survey DailyTravelCharacteristicsReport
http://slidepdf.com/reader/full/crd-od-survey-dailytravelcharacteristicsreport 94/117
'LVWULFW7RZQVKLSRI(VTXLPDOW
Demographic Characteristics
Population ϭϲϮϬϵ Actively Travelled ϭϯϳϮϭ
Employed Population ϴϴϴϮ Number of Vehicles ϭϬϵϱϮHouseholds ϴϬϯϴ Area (ha) ϳϵϲ
J obs in District ϭϭϳϮϳ
Occupation
Status (age 11+) Male Female Total %
Full Time Employed ϯϵϰϴ ϯϬϰϱ ϲϵϵϯ ϰϳй
Part Time Employed ϰϰϰ ϭϰϰϱ ϭϴϴϵ ϭϯй
Student ϴϲϭ ϴϬϱ ϭϲϲϲ ϭϭй
Retiree ϭϰϱϬ ϭϲϰϬ ϯϬϴϵ Ϯϭй
Homemaker ϭϮ ϱϭϬ ϱϮϮ ϰй
Other ϳϰϯ ϯϵϱ ϭϭϯϵ ϴй
Total: ϳϮϱϬ ϳϰϴϱ ϭ ϰϳϯϱ ϭϬϬй
Traveller Characteristics Male Female Total
Licensed Drivers ϲ ϯϬ Ϭ ϱϳ ϭϳ ϭ ϮϬϭ ϴ
Trips made by residents ϰϲϬϬϱ
Selected Indicators 7,090 Household Size Total й
Daily Trips per Person (age 11+) Ϯϴϰ 1 person ϯϬϲϵ ϯϴй
Vehicles per Person Ϭϲϴ 2 persons Ϯϵϴϲ ϯϳй
Number of Persons per Household ϮϬϮ 3 persons ϭϬϰϵ ϭϯй
Daily Trips per Household ϱϳϮ 4+persons ϵϯϰ ϭϮй
Vehicles per Household ϭϯϲ Total: ϴ Ϭϯ ϴ ϭ ϬϬ й
Workers per Household ϭϭϬ
Population Density (Pop/ha) ϮϬϯϲ Households by Vehicle Availability Total й
Employment Density (J obs/ha) ϭϰϳϯ 0 vehicles ϭϮϬϴ ϭϱй
2 vehicles ϮϮϱϳ Ϯϴй
3+vehicles ϲϵϱ ϵй
Total: ϴ Ϭϯ ϴ ϭ ϬϬ й
55 - 64
65+
Population
Explanatory Notes
Information on this page is specific to the households/residents of this district. These results are based on a survey sample of 4.4% of households in this districtand are subject to a margin of sampling error of approximately ± 5.1% at a 95%confidence level (19 times out of 20).

7/27/2019 CRD OD Survey DailyTravelCharacteristicsReport
http://slidepdf.com/reader/full/crd-od-survey-dailytravelcharacteristicsreport 95/117
Travel Patterns
AM Peak Period AM Peak Peri od (06:00 - 08:59) Destinations of Origins of
Trips From Trips To
Districts District % Total District % Total
Salt Spring Island E lectoral Area Ϭ Ϭй Ϭ Ϭй
Town of Sidney ϳ Ϭй ϯϲ Ϭ й
District of North Saanich with Tsyecum FN, Pauquachin FN ϭϳϲ Ϯй ϭϯϯ ϭй
District of Central Saanich with Tsartlip FN, Tsawout FN ϮϬϲ Ϯй ϵϮ ϭй
Downtown ϭϭϳϮ ϭϯй ϳϵϵ ϳй
Victoria North ϭϬϰϮ ϭϮй ϴϲϯ ϳй
Victoria South ϳϰϲ ϵй ϱϱϰ ϱй
Saanich North ϯϲ Ϭй ϭϯϬ ϭй
Saanich East ϱϵϴ ϳй ϵϭϰ ϴй
Saanich West ϲϭϵ ϳй ϭϬϬϬ ϴй
District of Oak Bay ϰϮϰ ϱй ϭϮϱ ϭй
Township of Esquimalt ϯϮϭϱ ϯϳй ϯϮϭϱ Ϯϳй
Town of View Royal with Esquimalt Nation, Songhees FN ϵϮ ϭй ϲϴϳ ϲйDistrict of Highlands Ϭ Ϭй ϲϮ ϭ й
City of Langford ϭϬϲ ϭй ϭϬϭϬ ϴй
City of Colwood Ϯϭϵ Ϯй ϵϮϴ ϴй
District of Metchosin with Scia’new FN ϲϴ ϭй ϲϯ ϭй
District of Sooke with T’souke FN Ϭ Ϭй ϰϭϭ ϯй
J uan de Fuca Electoral Area with Pacheedaht FN Ϭ Ϭй ϲϱ ϭ й
South CVRD with Malahat FN, Cowichan Tribes ϰϬ Ϭй ϴϬϳ ϳй
External Ϭ Ϭй Ϭ Ϭй
Total ϴϳϲϲ ϭϭϴϵϰ
Trips by Trip Purpose Trips by Primary Travel Mode
24 Hours 24 Hours
ϱϴϬϯ ϭϵй ϵϴϰϭ ϯϭй ϮϬϳϮ ϭϰй Auto Driver ϮϮϮϵϵ ϳϮй ϮϮϱϴϮ ϳϭй ϴϬϲϬ ϱϱй
ϱϬϮ Ϯй Ϭ Ϭй Ϭ Ϭй Auto Passenger ϯϳϮϰ ϭϮй ϯϱϵϬ ϭϭй ϭϬϯϳ ϳй
Top Five Origins of Trips to Township of Esquimalt Summary of Trips to and from Township of Esquimalt
To District Within DistrictFrom District To District Within District From District
Work
Post-secondary School
rans
Ϯϯϯϱ ϴй ϭϮϲϬ ϰй ϮϬϳ ϭй Bicycle ϲϵϳ Ϯй ϴϯϰ ϯй Ϯϱϱ Ϯй
Ϯϰϳϳ ϴй ϯϲϬϴ ϭϭй ϭϲϯϬ ϭϭй Walk ϳϳϭ Ϯй ϵϲϰ ϯй ϰϴϱϵ ϯϯй
ϭϯϮϭ ϰй ϯϴϬ ϭй ϱϱϰ ϰй Other ϱϭϰ Ϯй ϱϵϮ Ϯй ϯϰϰ Ϯй
ϯϬϮϲ ϭϬй ϭϯϱϯ ϰй Ϯϭϯϵ ϭϱй Total: ϯϬϵϮϵ ϭϬϬй ϯϭϱϵϬ ϭϬϬй ϭϰϳϱϯ ϭϬϬй
ϯϮϮϵ ϭϬй Ϯϯϳϯ ϴй ϭϰϱϵ ϭϬй
ϭϭϴϲϱ ϯϴй ϭϭϵϮϰ ϯϴй ϱϳϰϮ ϯϵй
Other Ϯϯϳ ϭй ϭϳϬ ϭй ϮϮϯ Ϯй
Total: ϯϬϵϮϵ ϭϬϬй ϯ ϭϱϵϬ ϭϬϬй ϭϰϳϱϯ ϭϬϬй
AM Peak (06:00 - 08:59) AM Peak (06:00 - 08:59)
ϯϲϯϲ ϲϲй ϲϯϲϵ ϳϯй ϭϮϵϴ ϰϬй AutoDriver ϯϳϴϱ ϲϴй ϲϴϭϬ ϳϴй ϭϱϲϭ ϰϵй
From District To District Within District
Work
To District Within District
Shopping
Pick-up / drop-off Passenger
Return Home
From District
Dining / restaurant
er c oo
Personal Business
Recreation / social

7/27/2019 CRD OD Survey DailyTravelCharacteristicsReport
http://slidepdf.com/reader/full/crd-od-survey-dailytravelcharacteristicsreport 96/117
'LVWULFW7RZQRI9LHZ5R\DOZLWK(VTXLPDOW1DWLRQ6RQJKHHV)1
Demographic Characteristics
Population ϭϭϬϱϵ Actively Travelled ϵϲϴϱ
Employed Population ϲϭϱϮ Number of Vehicles ϴϬϳϬHouseholds ϰϳϴϳ Area (ha) ϭϰϵϵ
J obs in District ϱϭϲϳ
Occupation
Status (age 11+) Male Female Total %
Full Time Employed Ϯϲϭϴ ϮϬϯϰ ϰϲϱϮ ϰϳй
Part Time Employed ϰϮϱ ϭϬϳϰ ϭϰϵϵ ϭϱй
Student ϳϲϵ ϴϮϵ ϭϱϵϴ ϭϲй
Retiree ϵϵϬ ϭϭϯϬ ϮϭϮϬ Ϯϭй
Homemaker ϲ ϭϯϰ ϭϰϬ ϭй
Other ϭϱϳ Ϯϳϲ ϰϯϯ ϰй
Total: ϰϴϬϰ ϱϬϲϭ ϵϴϲϱ ϭϬϬй
Traveller Characteristics Male Female Total
Licensed Drivers ϯϵϭϬ ϰϮϱϳ ϴ ϭϲϳ
Trips made by residents ϯϯϲϱϴ
Selected Indicators 7,090 Household Size Total й
Daily Trips per Person (age 11+) ϯϬϰ 1 person ϭϮϴϵ Ϯϳй
Vehicles per Person Ϭϳϯ 2 persons ϭϴϴϵ ϯϵй
Number of Persons per Household Ϯϯϭ 3 persons ϳϯϱ ϭϱй
Daily Trips per Household ϳϬϯ 4+persons ϴϳϰ ϭϴй
Vehicles per Household ϭϲϵ Total: ϰϳ ϴϳ ϭ ϬϬ й
Workers per Household ϭϮϵ
Population Density (Pop/ha) ϳϯϴ Households by Vehicle Availability Total й
Employment Density (J obs/ha) ϯϰϱ 0 vehicles ϯϮϱ ϳй
2 vehicles ϮϬϰϯ ϰϯй
3+vehicles ϲϵϮ ϭϰй
Total: ϰϳ ϴϳ ϭ ϬϬ й
55 - 64
65+
Population
Explanatory Notes
Information on this page is specific to the households/residents of this district. These results are based on a survey sample of 4.7% of households in this districtand are subject to a margin of sampling error of approximately ± 6.4% at a 95%confidence level (19 times out of 20)
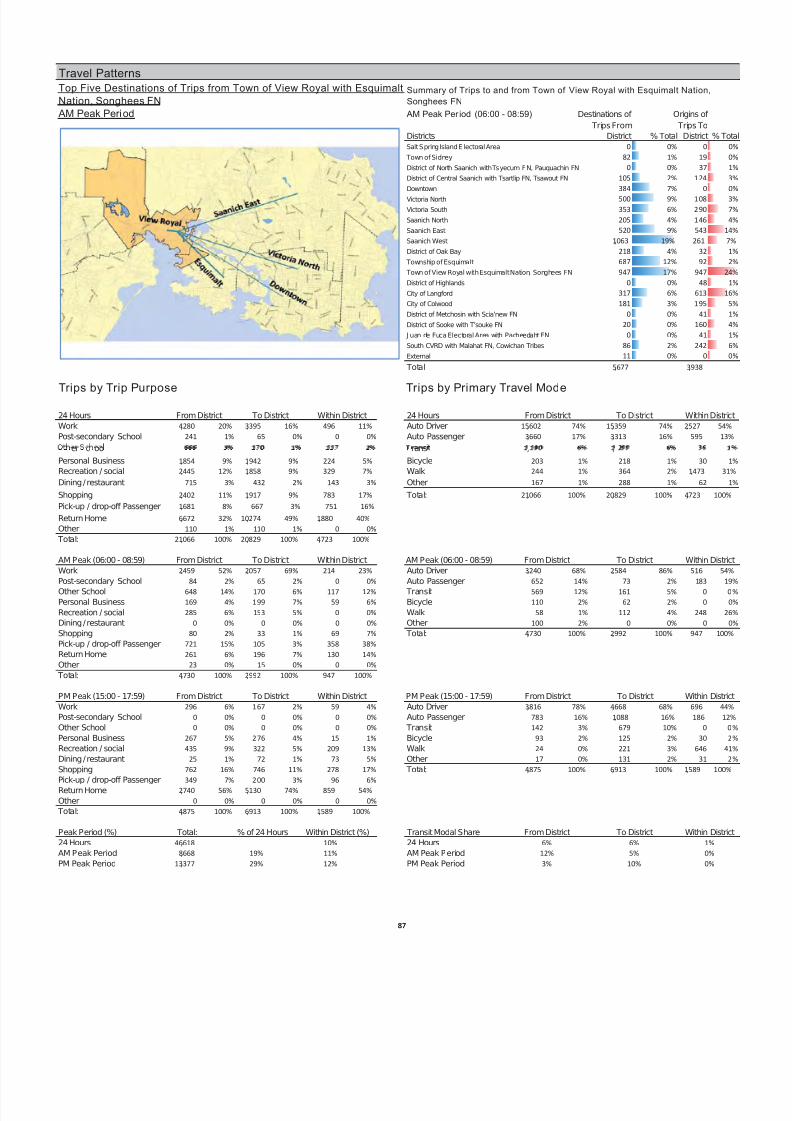
7/27/2019 CRD OD Survey DailyTravelCharacteristicsReport
http://slidepdf.com/reader/full/crd-od-survey-dailytravelcharacteristicsreport 97/117
Travel Patterns
AM Peak Period AM Peak Per iod (06:00 - 08:59) Destinations of Origins of
Trips From Trips To
Districts District % Total District % Total
Salt Spring Island E lectoral Area Ϭ Ϭй Ϭ Ϭй
Town of Sidney ϴϮ ϭй ϭϵ Ϭй
District of North Saanich with Tsyecum FN, Pauquachin FN Ϭ Ϭй ϯϳ ϭй
District of Central Saanich with Tsartlip FN, Tsawout FN ϭϬϱ Ϯй ϭ Ϯϰ ϯй
Downtown ϯϴϰ ϳй Ϭ Ϭй
Victoria North ϱϬϬ ϵй ϭ Ϭϴ ϯй
Victoria South ϯϱϯ ϲй Ϯ ϵϬ ϳй
Saanich North ϮϬϱ ϰй ϭ ϰϲ ϰй
Saanich East ϱϮϬ ϵй ϱϰϯ ϭϰй
Saanich West ϭϬϲϯ ϭϵй Ϯϲϭ ϳй
District of Oak Bay Ϯϭϴ ϰй ϯϮ ϭй
Township of Esquimalt ϲϴϳ ϭϮй ϵϮ Ϯй
Town of View Royal with Esquimalt Nation, Songhees FN ϵϰϳ ϭϳй ϵϰϳ ϮϰйDistrict of Highlands Ϭ Ϭй ϰϴ ϭй
City of Langford ϯϭϳ ϲй ϲϭϯ ϭϲй
City of Colwood ϭϴϭ ϯй ϭ ϵϱ ϱй
District of Metchosin with Scia’new FN Ϭ Ϭй ϰϭ ϭй
District of Sooke with T’souke FN ϮϬ Ϭй ϭϲϬ ϰй
J uan de Fuca Electoral Area with Pacheedaht FN Ϭ Ϭй ϰϭ ϭй
South CVRD with Malahat FN, Cowichan Tribes ϴϲ Ϯй ϮϰϮ ϲй
External ϭϭ Ϭй Ϭ Ϭй
Total ϱϲϳϳ ϯϵϯϴ
Trips by Trip Purpose Trips by Primary Travel Mode
24 Hours 24 Hours
ϰϮϴϬ ϮϬй ϯϯϵϱ ϭϲй ϰϵϲ ϭϭй Auto Driver ϭϱϲϬϮ ϳϰй ϭϱϯϱϵ ϳϰй ϮϱϮϳ ϱϰй
Ϯϰϭ ϭй ϲϱ Ϭй Ϭ Ϭй Auto Passenger ϯϲϲϬ ϭϳй ϯϯϭϯ ϭϲй ϱϵϱ ϭϯй
Top Five Destinations of Trips from Town of View Royal with Esquimalt
Nation, Songhees FNSummary of Trips to and from Town of View Royal with Esquimalt Nation,
Songhees FN
To District Within DistrictFrom District To District Within District From District
Work
Post-secondary School
rans
ϭϴϱϰ ϵй ϭϵϰϮ ϵй ϮϮϰ ϱй Bicycle ϮϬϯ ϭй Ϯϭϴ ϭй ϯϬ ϭй
Ϯϰϰϱ ϭϮй ϭϴϱϴ ϵй ϯϮϵ ϳй Walk Ϯϰϰ ϭй ϯϲϰ Ϯй ϭϰϳϯ ϯϭй
ϳϭϱ ϯй ϰϯϮ Ϯй ϭϰϯ ϯй Other ϭϲϳ ϭй Ϯϴϴ ϭй ϲϮ ϭй
ϮϰϬϮ ϭϭй ϭϵϭϳ ϵй ϳϴϯ ϭϳй Total: ϮϭϬϲϲ ϭϬϬй ϮϬϴϮϵ ϭϬϬй ϰϳϮϯ ϭϬϬй
ϭϲϴϭ ϴй ϲϲϳ ϯй ϳϱϭ ϭϲй
ϲϲϳϮ ϯϮй ϭϬϮϳϰ ϰϵй ϭϴϴϬ ϰϬй
Other ϭϭϬ ϭй ϭϭϬ ϭй Ϭ Ϭй
Total: ϮϭϬϲϲ ϭϬϬй ϮϬϴϮϵ ϭϬϬй ϰϳϮϯ ϭϬϬй
AM Peak (06:00 - 08:59) AM Peak (06:00 - 08:59)
Ϯϰϱϵ ϱϮй ϮϬϱϳ ϲϵй Ϯϭϰ Ϯϯй Auto Driver ϯϮϰϬ ϲϴй Ϯϱϴϰ ϴϲй ϱϭϲ ϱϰй
From District To District Within District
Work
To District Within District
Shopping
Pick-up / drop-off Passenger
Return Home
From District
Dining / restaurant
er c oo
Personal Business
Recreation / social

7/27/2019 CRD OD Survey DailyTravelCharacteristicsReport
http://slidepdf.com/reader/full/crd-od-survey-dailytravelcharacteristicsreport 98/117
'LVWULFW'LVWULFWRI+LJKODQGV
Demographic Characteristics
Population ϮϭϮϬ Actively Travelled ϭϳϱϵ
Employed Population ϭϯϮϯ Number of Vehicles ϮϭϮϵHouseholds ϳϳϵ Area (ha) ϯϴϮϭ
J obs in District ϯϵϯ
Occupation
Status (age 11+) Male Female Total %
Full Time Employed ϲϲϮ ϯϲϬ ϭϬϮϮ ϱϮй
Part Time Employed Ϯϴ Ϯϳϯ ϯϬϭ ϭϱй
Student ϵϰ ϮϭϮ ϯϬϲ ϭϲй
Retiree ϵϴ ϭϰϱ Ϯϰϯ ϭϮй
Homemaker Ϭ ϲϯ ϲϯ ϯй
Other ϳϴ ϲϲ ϭϰϰ ϳй
Total: ϵϱϵ ϭϬϬϲ ϭϵϲϲ ϭϬϬй
Traveller Characteristics Male Female Total
Licensed Drivers ϴϱϵ ϴϰϱ ϭϳϬϰ
Trips made by residents ϲϯϬϱ
Selected Indicators 7,090 Household Size Total й
Daily Trips per Person (age 11+) Ϯϵϳ 1 person ϭϬϰ ϭϯй
Vehicles per Person ϭϬϬ 2 persons ϯϮϰ ϰϮй
Number of Persons per Household ϮϳϮ 3 persons ϭϮϮ ϭϲй
Daily Trips per Household ϴϬϵ 4+persons ϮϮϵ Ϯϵй
Vehicles per Household Ϯϳϯ Total: ϳϳϵ ϭϬϬй
Workers per Household ϭϳϬ
Population Density (Pop/ha) Ϭϱϱ Households by Vehicle Availability Total й
Employment Density (J obs/ha) ϬϭϬ 0 vehicles Ϭ Ϭй
2 vehicles ϰϬϲ ϱϮй
3+vehicles ϯϰϳ ϰϱй
Total: ϳϳϵ ϭϬϬй
55 - 64
65+
Population
Explanatory Notes
Information on this page is specific to the households/residents of this district. These results are based on a survey sample of 5.6% of households in this districtand are subject to a margin of sampling error of approximately ± 14.4% at a 95%confidence level (19 times outof 20). Due to the high margin of error, these
T l P tt
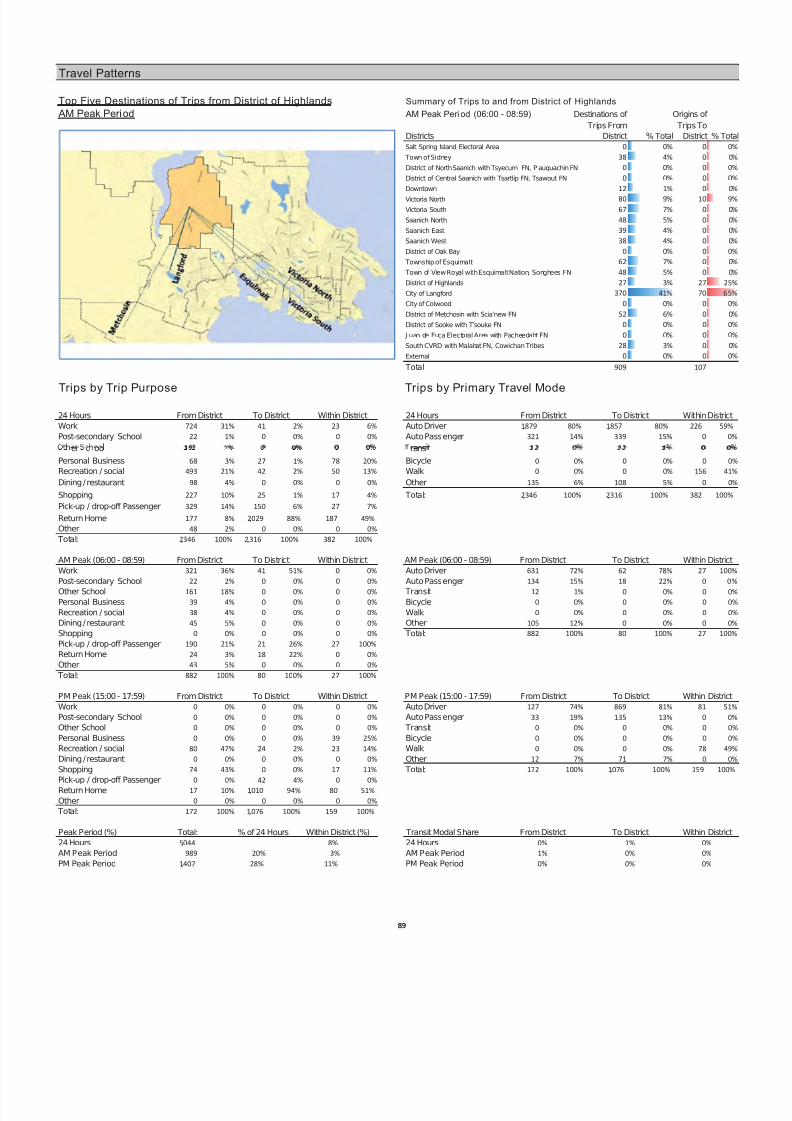
7/27/2019 CRD OD Survey DailyTravelCharacteristicsReport
http://slidepdf.com/reader/full/crd-od-survey-dailytravelcharacteristicsreport 99/117
Travel Patterns
AM Peak Period AM Peak Peri od (06:00 - 08:59) Destinations of Origins of
Trips From Trips To
Districts District % Total District % Total
Salt Spring Island Electoral Area Ϭ Ϭй Ϭ Ϭй Town of Sidney ϯϴ ϰй Ϭ Ϭй
District of North Saanich with Tsyecum FN, Pauquachin FN Ϭ Ϭй Ϭ Ϭй
District of Central Saanich with Tsartlip FN, Tsawout FN Ϭ Ϭй Ϭ Ϭй
Downtown ϭϮ ϭй Ϭ Ϭй
Victoria North ϴϬ ϵй ϭϬ ϵй
Victoria South ϲϳ ϳй Ϭ Ϭй
Saanich North ϰϴ ϱй Ϭ Ϭй
Saanich East ϯϵ ϰй Ϭ Ϭй
Saanich West ϯϴ ϰй Ϭ Ϭй
District of Oak Bay Ϭ Ϭй Ϭ Ϭй
Township of Esquimalt ϲϮ ϳй Ϭ Ϭй
Town of View Royal with Esquimalt Nation, Songhees FN ϰϴ ϱй Ϭ ϬйDistrict of Highlands Ϯϳ ϯй Ϯϳ Ϯϱй
City of Langford ϯϳϬ ϰϭй ϳϬ ϲϱй
City of Colwood Ϭ Ϭй Ϭ Ϭй
District of Metchosin with Scia’new FN ϱϮ ϲй Ϭ Ϭй
District of Sooke with T’souke FN Ϭ Ϭй Ϭ Ϭй
J uan de Fuca Electoral Area with Pacheedaht FN Ϭ Ϭй Ϭ Ϭй
South CVRD with Malahat FN, Cowichan Tribes Ϯϴ ϯй Ϭ Ϭй
External Ϭ Ϭй Ϭ Ϭй
Total ϵϬϵ ϭϬϳ
Trips by Trip Purpose Trips by Primary Travel Mode
24 Hours 24 Hours
ϳϮϰ ϯϭй ϰϭ Ϯй Ϯϯ ϲй Auto Driver ϭϴϳϵ ϴϬй ϭϴϱϳ ϴϬй ϮϮϲ ϱϵй
ϮϮ ϭй Ϭ Ϭй Ϭ Ϭй Auto Passenger ϯϮϭ ϭϰй ϯϯϵ ϭϱй Ϭ Ϭй
Top Five Destinations of Trips from District of Highlands Summary of Trips to and from District of Highlands
To District Within DistrictFrom District To District Within District From District
Work
Post-secondary School
rans
ϲϴ ϯй Ϯϳ ϭй ϳϴ ϮϬй Bicycle Ϭ Ϭй Ϭ Ϭй Ϭ Ϭй
ϰϵϯ Ϯϭй ϰϮ Ϯй ϱϬ ϭϯй Walk Ϭ Ϭй Ϭ Ϭй ϭϱϲ ϰϭй
ϵϴ ϰй Ϭ Ϭй Ϭ Ϭй Other ϭϯϱ ϲй ϭϬϴ ϱй Ϭ Ϭй
ϮϮϳ ϭϬй Ϯϱ ϭй ϭϳ ϰй Total: Ϯϯϰϲ ϭϬϬй Ϯϯϭϲ ϭϬϬй ϯϴϮ ϭϬϬй
ϯϮϵ ϭϰй ϭϱϬ ϲй Ϯϳ ϳй
ϭϳϳ ϴй ϮϬϮϵ ϴϴй ϭϴϳ ϰϵй
Other ϰϴ Ϯй Ϭ Ϭй Ϭ Ϭй
Total: Ϯϯϰϲ ϭϬϬй Ϯ ϯϭϲ ϭϬϬй ϯϴϮ ϭϬϬй
AM Peak (06:00 - 08:59) AM Peak (06:00 - 08:59)
ϯϮϭ ϯϲй ϰϭ ϱϭй Ϭ Ϭй AutoDriver ϲϯϭ ϳϮй ϲϮ ϳϴй Ϯϳ ϭϬϬй
From District To District Within District
Work
To District Within District
Shopping
Pick-up / drop-off Passenger
Return Home
From District
Dining / restaurant
er c oo
Personal Business
Recreation / social
'L W L W &LW I / I G

7/27/2019 CRD OD Survey DailyTravelCharacteristicsReport
http://slidepdf.com/reader/full/crd-od-survey-dailytravelcharacteristicsreport 100/117
'LVWULFW&LW\RI/DQJIRUG
Demographic Characteristics
Population ϮϵϮϮϴ Actively Travelled ϮϰϱϬϬ
Employed Population ϭϲϵϯϵ Number of Vehicles ϮϮϴϲϱHouseholds ϭϭϲϴϬ Area (ha) ϰϭϬϬ
J obs in District ϭϭϰϬϭ
Occupation
Status (age 11+) Male Female Total %
Full Time Employed ϳϯϲϯ ϲϭϰϭ ϭϯϱϬϰ ϱϯй
Part Time Employed ϭϮϰϴ Ϯϭϴϴ ϯϰϯϲ ϭϰй
Student ϮϭϬϯ ϭϵϳϯ ϰϬϳϲ ϭϲй
Retiree ϭϱϱϳ ϮϬϰϳ ϯϲϬϱ ϭϰй
Homemaker ϰϵ ϵϲϰ ϭϬϭϯ ϰй
Other ϲϬϬ ϰϱϵ ϭϬϱϴ ϰй
Total: ϭϮϮ ϲϳ ϭ ϯϬϲϰ Ϯϱϯ ϯϭ ϭϬ Ϭй
Traveller Characteristics Male Female Total
Licensed Drivers ϭϬϱϮϮ ϭϭϬϬϵ ϮϭϱϯϮ
Trips made by residents ϴϯϮϵϳ
Selected Indicators 7,090 Household Size Total й
Daily Trips per Person (age 11+) Ϯϴϱ 1 person Ϯϱϲϵ ϮϮй
Vehicles per Person Ϭϳϴ 2 persons ϰϭϬϭ ϯϱй
Number of Persons per Household ϮϱϬ 3 persons ϮϭϭϮ ϭϴй
Daily Trips per Household ϳϭϯ 4+persons Ϯϴϵϳ Ϯϱй
Vehicles per Household ϭϵϲ Total: ϭ ϭϲϴϬ ϭ ϬϬ й
Workers per Household ϭϰϱ
Population Density (Pop/ha) ϳϭϯ Households by Vehicle Availability Total й
Employment Density (J obs/ha) Ϯϳϴ 0 vehicles ϰϱϯ ϰй
2 vehicles ϱϭϱϰ ϰϰй
3+vehicles Ϯϱϲϭ ϮϮй
Total: ϭ ϭϲϴϬ ϭ ϬϬ й
55 - 64
65+
Population
Explanatory Notes
Information on this page is specific to the households/residents of this district. These results are based on a survey sample of 4.7% of households in this districtand are subject to a margin of sampling error of approximately ± 4.1% at a 95%confidence level (19 times out of 20).
T l P tt

7/27/2019 CRD OD Survey DailyTravelCharacteristicsReport
http://slidepdf.com/reader/full/crd-od-survey-dailytravelcharacteristicsreport 101/117
Travel Patterns
AM Peak Period AM Peak Peri od (06:00 - 08:59) Destinations of Origins of
Trips From Trips To
Districts District % Total District % Total
Salt Spring Island Electoral Area Ϭ Ϭй Ϭ Ϭй Town of Sidney ϭϵϬ ϭй Ϭ Ϭй
District of North Saanich with Tsyecum FN, Pauquachin FN ϱϱ Ϭй Ϯϲ Ϭй
District of Central Saanich with Tsartlip FN, Tsawout FN Ϯϳϭ Ϯй Ϯϯ Ϭй
Downtown ϭϮϲϳ ϴй ϱϯ Ϭй
Victoria North ϭϭϱϱ ϳй ϭϳϳ ϭй
Victoria South ϲϮϬ ϰй ϲϯ Ϭй
Saanich North Ϯϰϯ ϭй ϭϬϵ ϭй
Saanich East ϭϮϮϯ ϳй ϰϵϮ ϰй
Saanich West ϭϱϰϭ ϵй ϱϴϯ ϱй
District of Oak Bay ϯϯϬ Ϯй ϳϬ ϭй
Township of Esquimalt ϭϬϭϬ ϲй ϭϬϲ ϭй
Town of View Royal with Esquimalt Nation, Songhees FN ϲϭϯ ϰй ϯϭϳ ϯй
District of Highlands ϳϬ Ϭй ϯϳϬ ϯй
City of Langford ϲϭϳϱ ϯϳй ϲϭϳϱ ϰϵй
City of Colwood ϭϳϮϳ ϭϬй ϮϮϴϮ ϭϴй
District of Metchosin with Scia’new FN ϭϱϬ ϭй ϳϱϵ ϲй
District of Sooke with T’souke FN ϭϬϲ ϭй ϯϲϰ ϯй
J uan de Fuca Electoral Area with Pacheedaht FN ϴ Ϭй ϭϭϵ ϭй
South CVRD with Malahat FN, Cowichan Tribes ϭϮϰ ϭй ϱϳϮ ϱй
External Ϭ Ϭй Ϭ Ϭй
Total ϭϲϴϳϵ ϭϮϲϲϭ
Trips by Trip Purpose Trips by Primary Travel Mode
24 Hours 24 Hours
ϵϴϭϬ Ϯϭй ϳϮϬϯ ϭϱй ϯϲϰϰ ϵй Auto Driver ϯϱϱϵϰ ϳϱй ϯϱϳϭϭ ϳϱй Ϯϴϱϰϲ ϳϬй
ϵϴϬ Ϯй ϭϲ Ϭй ϱϵ Ϭй Auto Passenger ϳϵϴϲ ϭϳй ϴϯϴϯ ϭϴй ϱ ϲϭϭ ϭϰй
Top Five Destinations of Trips from City of Langford Summary of Trips to and from City of Langford
To District Within DistrictFrom District To District Within District From District
Work
Post-secondary School
rans
ϮϬϲϱ ϰй Ϯϲϰϱ ϲй ϮϬϭϵ ϱй Bicycle ϮϮϳ Ϭй ϮϮϳ Ϭй ϭϮϳ Ϭй
ϯϴϰϭ ϴй ϯϳϭϭ ϴй ϯϮϳϲ ϴй Walk ϰϭϭ ϭй ϰϭϵ ϭй ϱϮϭϰ ϭϯй
ϭϭϵϳ ϯй ϴϵϭ Ϯй ϭϳϭϭ ϰй Other ϰϳϵ ϭй ϱϮϵ ϭй ϴϱϴ Ϯй
ϯϯϮϮ ϳй ϭϭϭϰϯ Ϯϯй ϵϱϱϮ Ϯϰй Total: ϰϳϭϱϬ ϭϬϬй ϰϳϱϰϲ ϭϬϬй ϰϬϲϭϯ ϭϬϬй
ϰϮϴϴ ϵй ϯϳϵϱ ϴй ϰϲϲϰ ϭϭй
ϮϬϯϲϰ ϰϯй ϭϲϳϬϴ ϯϱй ϭϰϭϴϯ ϯϱй
Other ϯϰϮ ϭй ϯϭϯ ϭй Ϯϭϵ ϭй
Total: ϰϳϭϱϬ ϭϬϬй ϰϳϱϰϲ ϭϬϬй ϰϬϲϭϯ ϭϬϬй
AM Peak (06:00 - 08:59) AM Peak (06:00 - 08:59)
ϲϳϰϱ ϲϯй ϯϭϵϵ ϰϵй ϭϯϯϳ ϮϮй AutoDriver ϳϵϬϰ ϳϰй ϰϳϯϭ ϳϯй ϰ ϮϬϬ ϲϴй
From District To District Within District
Work
To District Within District
Shopping
Pick-up / drop-off Passenger
Return Home
From District
Dining / restaurant
er c oo
Personal Business
Recreation / social
'L W L W &LW I & O G

7/27/2019 CRD OD Survey DailyTravelCharacteristicsReport
http://slidepdf.com/reader/full/crd-od-survey-dailytravelcharacteristicsreport 102/117
'LVWULFW&LW\RI&ROZRRG
Demographic Characteristics
Population ϭϲϬϵϯ Actively Travelled ϭϯϵϲϵ
Employed Population ϴϳϯϵ Number of Vehicles ϭϮϭϯϬHouseholds ϲϬϵϲ Area (ha) ϭϳϳϰ
J obs in District ϰϬϳϵ
Occupation
Status (age 11+) Male Female Total %
Full Time Employed ϯϵϯϮ ϯϬϵϴ ϳϬϯϬ ϱϬй
Part Time Employed ϳϮϯ ϵϴϳ ϭϳϬϵ ϭϮй
Student ϭϭϬϱ ϭϬϱϴ ϮϭϲϮ ϭϱй
Retiree ϭϭϮϮ ϭϰϰϮ Ϯϱϲϰ ϭϴй
Homemaker Ϭ ϲϰϵ ϲϰϵ ϱй
Other ϯϴϳ ϮϮϰ ϲϭϭ ϰй
Total: ϲϴϱϳ ϳϭϯϮ ϭϯϵϴϵ ϭϬϬй
Traveller Characteristics Male Female Total
Licensed Drivers ϱϳ ϭϱ ϲϭϴ ϵ ϭ ϭϵϬ ϰ
Trips made by residents ϰϲϮϵϴ
Selected Indicators 7,090 Household Size Total й
Daily Trips per Person (age 11+) Ϯϴϴ 1 person ϭϭϭϰ ϭϴй
Vehicles per Person Ϭϳϱ 2 persons Ϯϭϱϳ ϯϱй
Number of Persons per Household Ϯϲϰ 3 persons ϭϭϴϭ ϭϵй
Daily Trips per Household ϳϱϵ 4+persons ϭϲϰϰ Ϯϳй
Vehicles per Household ϭϵϵ Total: ϲϬϵϲ ϭϬϬй
Workers per Household ϭϰϯ
Population Density (Pop/ha) ϵϬϳ Households by Vehicle Availability Total й
Employment Density (J obs/ha) ϮϯϬ 0 vehicles ϭϬϴ Ϯй
2 vehicles Ϯϲϴϰ ϰϰй
3+vehicles ϭϰϮϰ Ϯϯй
Total: ϲϬϵϲ ϭϬϬй
55 - 64
65+
Population
Explanatory Notes
Information on this page is specific to the households/residents of this district. These results are based on a survey sample of 5.4% of households in this districtand are subject to a margin of sampling error of approximately ± 5.2% at a 95%confidence level (19 times out of 20)
Travel Patterns

7/27/2019 CRD OD Survey DailyTravelCharacteristicsReport
http://slidepdf.com/reader/full/crd-od-survey-dailytravelcharacteristicsreport 103/117
Travel Patterns
AM Peak Period AM Peak Peri od (06:00 - 08:59) Destinations of Origins of
Trips From Trips To
Districts District % Total District % Total
Salt Spring Island E lectoral Area Ϭ Ϭй Ϭ Ϭй Town of Sidney ϳϲ ϭй ϮϬ Ϭй
District of North Saanich with Tsyecum FN, Pauquachin FN ϭϭϬ ϭй Ϯϴ Ϭй
District of Central Saanich with Tsartlip FN, Tsawout FN ϵϵ ϭй Ϭ Ϭй
Downtown ϴϳϵ ϵй Ϯϭ Ϭй
Victoria North ϰϵϭ ϱй ϭϮϰ Ϯй
Victoria South ϰϲϴ ϱй ϭϴϯ ϯй
Saanich North Ϯϴ Ϭй ϵϱ ϭй
Saanich East ϰϲϭ ϱй ϯϭϲ ϱй
Saanich West ϲϭϯ ϲй Ϯϵϯ ϱй
District of Oak Bay Ϯϯϳ Ϯй ϯϲ ϭй
Township of Esquimalt ϵϮϴ ϭϬй Ϯϭϵ ϯй
Town of View Royal with Esquimalt Nation, Songhees FN ϭϵϱ Ϯй ϭϴϭ ϯй
District of Highlands Ϭ Ϭй Ϭ Ϭй
City of Langford ϮϮϴϮ Ϯϰй ϭϳϮϳ Ϯϳй
City of Colwood Ϯϯϴϳ Ϯϱй Ϯϯϴϳ ϯϳй
District of Metchosin with Scia’new FN ϭϲϲ Ϯй ϰϳϴ ϳй
District of Sooke with T’souke FN ϰϴ ϭй ϭϱϴ Ϯй
J uan de Fuca Electoral Area with Pacheedaht FN Ϭ Ϭй ϭϭϮ Ϯй
South CVRD with Malahat FN, Cowichan Tribes ϰϲ Ϭй ϱϳ ϭй
External ϭϬ Ϭй Ϭ Ϭй
Total ϵϱϮϯ ϲϰϯϲ
Trips by Trip Purpose Trips by Primary Travel Mode
24 Hours 24 Hours
ϲϲϰϬ Ϯϰй Ϯ ϳϰϬ ϭϬй ϳϬϮ ϳй Auto Driver Ϯϭϱϱϲ ϳϳй Ϯϭϱϰϲ ϳϲй ϳϴϯϬ ϳϰй
ϯϱϭ ϭй ϯϬϮ ϭй ϭϱ Ϭй Auto Passenger ϯϵϴϮ ϭϰй ϰϬϵϯ ϭϱй ϭϭϭϵ ϭϭй
Top Five Destinations of Trips from City of Colwood Summary of Trips to and from City of Colwo od
To District Within DistrictFrom District To District Within District From District
Work
Post-secondary School
rans
ϭϵϮϰ ϳй ϭϭϲϬ ϰй ϱϳϱ ϱй Bicycle ϯϰϭ ϭй ϯϯϰ ϭй ϭϳϬ Ϯй
ϮϬϲϲ ϳй ϯϳϬϵ ϭϯй ϭϬϱϰ ϭϬй Walk ϰϲϭ Ϯй ϰϱϯ Ϯй ϭϮϰϱ ϭϮй
ϱϳϮ Ϯй ϳϳϲ ϯй ϱϱϱ ϱй Other ϰϳϵ Ϯй ϰϰϯ Ϯй ϭϮϱ ϭй
ϯϮϲϵ ϭϮй ϮϮϵϮ ϴй ϵϲϯ ϵй Total: ϮϴϬϲϱ ϭϬϬй Ϯϴϭϵϵ ϭϬϬй ϭϬϱϰϲ ϭϬϬй
Ϯϳϭϱ ϭϬй Ϯϴϭϲ ϭϬй ϮϬϮϮ ϭϵй
ϵϮϱϰ ϯϯй ϭϯϱϲϳ ϰϴй ϰϭϰϴ ϯϵй
Other ϯϮϱ ϭй Ϯϲϭ ϭй ϳϴ ϭй
Total: ϮϴϬϲϱ ϭϬϬй Ϯϴϭϵϵ ϭϬϬй ϭϬϱϰϲ ϭϬϬй
AM Peak (06:00 - 08:59) AM Peak (06:00 - 08:59)
ϰϮϴϱ ϲϬй ϭϱϯϭ ϯϴй ϯϱϭ ϭϱй Auto Driver ϱϬϲϵ ϳϭй ϯϮϲϮ ϴϭй ϭϲϭϴ ϲϴй
From District To District Within District
Work
To District Within District
Shopping
Passenger
Return Home
From District
Dining / restaurant
er c oo
Personal Business
Recreation / social
'LVWULFW 'LVWULFW RI 0HWFKRVLQ ZLWK 6FLD·QHZ )1

7/27/2019 CRD OD Survey DailyTravelCharacteristicsReport
http://slidepdf.com/reader/full/crd-od-survey-dailytravelcharacteristicsreport 104/117
'LVWULFW'LVWULFWRI0HWFKRVLQZLWK6FLD·QHZ)1
Demographic Characteristics
Population ϱϭϮϳ Actively Travelled ϰϭϱϰ
Employed Population ϮϲϲϮ Number of Vehicles ϰϭϱϰHouseholds ϭϴϴϱ Area (ha) ϳϯϵϴ
J obs in District ϭϮϴϳ
Occupation
Status (age 11+) Male Female Total %
Full Time Employed ϭϮϮϵ ϴϭϯ ϮϬϰϯ ϰϰй
Part Time Employed ϴϵ ϱϯϭ ϲϮϬ ϭϯй
Student ϯϬϯ ϯϮϲ ϲϮϴ ϭϰй
Retiree ϲϮϮ ϱϭϱ ϭϭϯϴ Ϯϱй
Homemaker Ϭ ϮϮϯ ϮϮϯ ϱй
Other ϲϳ ϳϱ ϭϰϮ ϯй
Total: ϮϮϴϴ Ϯϯϰϱ ϰϲϯϮ ϭϬϬй
Traveller Characteristics Male Female Total
Licensed Drivers ϭϴϵϴ ϮϬϵϵ ϯϵϵϳ
Trips made by residents ϭϰϲϭϱ
Selected Indicators 7,090 Household Size Total й
Daily Trips per Person (age 11+) Ϯϴϱ 1 person ϯϱϴ ϭϵй
Vehicles per Person Ϭϴϭ 2 persons ϳϵϭ ϰϮй
Number of Persons per Household ϮϳϮ 3 persons Ϯϵϴ ϭϲй
Daily Trips per Household ϳϳϱ 4+persons ϰϯϵ Ϯϯй
Vehicles per Household ϮϮϬ Total: ϭϴ ϴϱ ϭ ϬϬ й
Workers per Household ϭϰϭ
Population Density (Pop/ha) Ϭϲϵ Households by Vehicle Availability Total й
Employment Density (J obs/ha) Ϭϭϳ 0 vehicles Ϭ Ϭй
2 vehicles ϳϴϯ ϰϮй
3+vehicles ϲϯϵ ϯϰй
Total: ϭϴ ϴϱ ϭ ϬϬ й
55 - 64
65+
Population
Explanatory Notes
Information on this page is specific to the households/residents of this district. Theseresults are based on a survey sample of 5.0% of households in this district. Theseresults are subject to a margin of sampling error of approximately ± 9.8% at a 95%confidence level (19 times out of 20), and should be interpreted with caution.
Travel Patterns

7/27/2019 CRD OD Survey DailyTravelCharacteristicsReport
http://slidepdf.com/reader/full/crd-od-survey-dailytravelcharacteristicsreport 105/117
Travel Patterns
AM Peak Period AM Peak Peri od (06:00 - 08:59) Destinations of Origins of
Trips From Trips To
Districts District % Total District % Total
Salt Spring Island Electoral Area Ϭ Ϭй Ϭ Ϭй Town of Sidney ϭϰ ϭй Ϭ Ϭй
District of North Saanich with Tsyecum FN, Pauquachin FN Ϭ Ϭй ϭϳ Ϯй
District of Central Saanich with Tsartlip FN, Tsawout FN Ϭ Ϭй ϰϭ ϰй
Downtown ϭϭϰ ϲй Ϭ Ϭй
Victoria North ϭϯϭ ϲй Ϭ Ϭй
Victoria South ϭϯ ϭй ϵ ϭй
Saanich North ϮϬ ϭй Ϭ Ϭй
Saanich East ϲϬ ϯй ϰϮ ϱй
Saanich West ϭϮϬ ϲй Ϯϱ ϯй
District of Oak Bay Ϭ Ϭй Ϭ Ϭй
Township of Esquimalt ϲϯ ϯй ϲϴ ϳй
Town of View Royal with Esquimalt Nation, Songhees FN ϰϭ Ϯй Ϭ Ϭй
District of Highlands Ϭ Ϭй ϱϮ ϲй
City of Langford ϳϱϵ ϯϳй ϭϱϬ ϭϲй
City of Colwood ϰϳϴ Ϯϯй ϭϲϲ ϭϴй
District of Metchosin with Scia’new FN ϭϴϭ ϵй ϭϴϭ ϮϬй
District of Sooke with T’souke FN ϰϲ Ϯй ϭϯϳ ϭϱй
J uan de Fuca Electoral Area with Pacheedaht FN Ϭ Ϭй ϯϱ ϰй
South CVRD with Malahat FN, Cowichan Tribes Ϭ Ϭй Ϭ Ϭй
External Ϭ Ϭй Ϭ Ϭй
Total ϮϬϰϭ ϵϮϮ
Trips by Trip Purpose Trips by Primary Travel Mode
24 Hours 24 Hours
ϭϱϱϲ Ϯϲй ϲϵϲ ϭϮй ϭϰϲ ϭϭй Auto Driver ϰϴϱϬ ϴϮй ϰϴϮϲ ϴϭй ϵϬϰ ϲϵй
ϱϬ ϭй Ϭ Ϭй Ϭ Ϭй Auto Passenger ϴϲϰ ϭϱй ϵϭϵ ϭϱй ϭϴϵ ϭϱй
Top Five Destinations of Trips from District of Metchosin with Scia’new
FN Summary of Trips to and from District of Metchosin with Scia’new FN
To District Within DistrictFrom District To District Within District From District
Work
Post-secondary School
rans
ϲϭϮ ϭϬй ϮϴϮ ϱй ϴϮ ϲй Bicycle ϭϱ Ϭй ϭϱ Ϭй ϯ ϱ ϯй
ϱϱϴ ϵй Ϯϵϯ ϱй ϵϵ ϴй Walk Ϭ Ϭй Ϭ Ϭй ϭϮϮ ϵй
ϭϵϮ ϯй ϭϮϮ Ϯй Ϭ Ϭй Other ϭϮϮ Ϯй ϭϯϯ Ϯй ϱϬ ϰй
ϳϭϱ ϭϮй ϴϲ ϭй ϴ ϭй Total: ϱϵϯϯ ϭϬϬй ϱϵϯϴ ϭϬϬй ϭϯϬϭ ϭϬϬй
ϳϴϰ ϭϯй ϰϴϱ ϴй Ϯϴϯ ϮϮй
ϭϬϵϴ ϭϵй ϯϵϲϬ ϲϳй ϲϬϮ ϰϲй
Other ϳϵ ϭй Ϭ Ϭй Ϭ Ϭй
Total: ϱϵϯϯ ϭϬϬй ϱϵϯϴ ϭϬϬй ϭϯϬϭ ϭϬϬй
AM Peak (06:00 - 08:59) AM Peak (06:00 - 08:59)
ϴϮϱ ϰϰй ϰϴϲ ϲϲй ϯϯ ϭϴй AutoDriver ϭϯϯϲ ϳϮй ϳϬϵ ϵϲй ϭϬϬ ϱϱй
From District To District Within District
Work
To District Within District
Shopping
Pick-up / drop-off Passenger
Return Home
From District
Dining / restaurant
er c oo
Personal Business
Recreation / social
'LVWULFW 'LVWULFW RI 6RRNH ZLWK 7·VRXNH )1
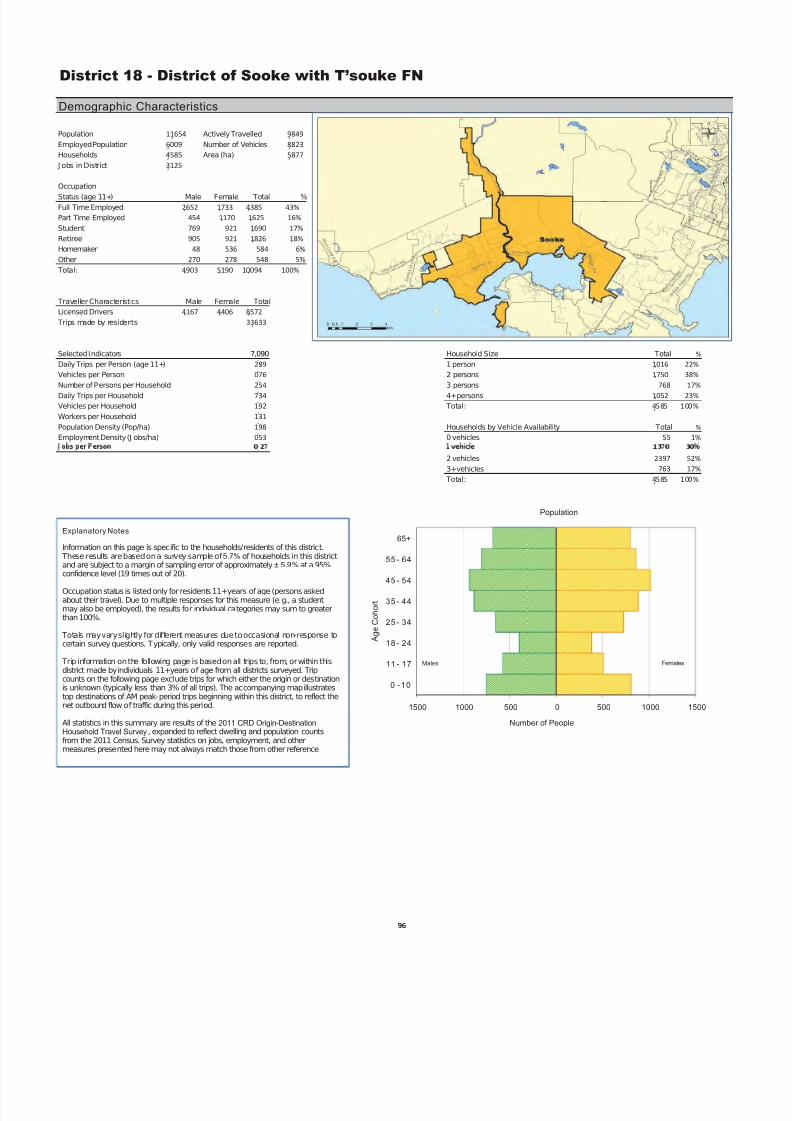
7/27/2019 CRD OD Survey DailyTravelCharacteristicsReport
http://slidepdf.com/reader/full/crd-od-survey-dailytravelcharacteristicsreport 106/117
'LVWULFW'LVWULFWRI6RRNHZLWK7·VRXNH)1
Demographic Characteristics
Population ϭϭϲϱϰ Actively Travelled ϵϴϰϵ
Employed Population ϲϬϬϵ Number of Vehicles ϴϴϮϯHouseholds ϰϱϴϱ Area (ha) ϱϴϳϳ
J obs in District ϯϭϮϱ
Occupation
Status (age 11+) Male Female Total %
Full Time Employed ϮϲϱϮ ϭϳϯϯ ϰϯϴϱ ϰϯй
Part Time Employed ϰϱϰ ϭϭϳϬ ϭϲϮϱ ϭϲй
Student ϳϲϵ ϵϮϭ ϭϲϵϬ ϭϳй
Retiree ϵϬϱ ϵϮϭ ϭϴϮϲ ϭϴй
Homemaker ϰϴ ϱϯϲ ϱϴϰ ϲй
Other ϮϳϬ Ϯϳϴ ϱϰϴ ϱй
Total: ϰϵϬϯ ϱϭϵϬ ϭϬϬϵϰ ϭϬϬй
Traveller Characteristics Male Female Total
Licensed Drivers ϰϭϲϳ ϰϰϬϲ ϴϱϳϮ
Trips made by residents ϯϯϲϯϯ
Selected Indicators 7,090 Household Size Total й
Daily Trips per Person (age 11+) Ϯϴϵ 1 person ϭϬϭϲ ϮϮй
Vehicles per Person Ϭϳϲ 2 persons ϭϳϱϬ ϯϴй
Number of Persons per Household Ϯϱϰ 3 persons ϳϲϴ ϭϳй
Daily Trips per Household ϳϯϰ 4+persons ϭϬϱϮ Ϯϯй
Vehicles per Household ϭϵϮ Total: ϰϱ ϴϱ ϭ ϬϬ й
Workers per Household ϭϯϭ
Population Density (Pop/ha) ϭϵϴ Households by Vehicle Availability Total й
Employment Density (J obs/ha) Ϭϱϯ 0 vehicles ϱϱ ϭй
2 vehicles Ϯϯϵϳ ϱϮй
3+vehicles ϳϲϯ ϭϳй
Total: ϰϱ ϴϱ ϭ ϬϬ й
55 - 64
65+
Population
Explanatory Notes
Information on this page is specific to the households/residents of this district. These results are based on a survey sample of 5.7% of households in this districtand are subject to a margin of sampling error of approximately ± 5.9% at a 95%confidence level (19 times out of 20)
Travel Patterns

7/27/2019 CRD OD Survey DailyTravelCharacteristicsReport
http://slidepdf.com/reader/full/crd-od-survey-dailytravelcharacteristicsreport 107/117
Travel Patterns
AM Peak Period AM Peak Peri od (06:00 - 08:59) Destinations of Origins of
Trips From Trips To
Districts District % Total District % Total
Salt Spring Island Electoral Area Ϭ Ϭй Ϭ Ϭй
Town of Sidney ϯϭ ϭй ϭϮ Ϭй
District of North Saanich with Tsyecum FN, Pauquachin FN Ϯϭ Ϭй Ϯϭ Ϭй
District of Central Saanich with Tsartlip FN, Tsawout FN ϲϱ ϭй Ϭ Ϭй
Downtown Ϯϯϱ ϰй ϭϰ Ϭй
Victoria North ϭϵϲ ϯй Ϯ Ϭϳ ϱй
Victoria South ϭϵϮ ϯй Ϭ Ϭй
Saanich North ϱϲ ϭй Ϭ Ϭй
Saanich East ϮϰϮ ϰй Ϭ Ϭй
Saanich West ϯϮ ϭй ϳϰ Ϯй
District of Oak Bay ϴϳ ϭй Ϭ Ϭй
Township of Esquimalt ϰϭϭ ϳй Ϭ Ϭй
Town of View Royal with Esquimalt Nation, Songhees FN ϭϲϬ ϯй ϮϬ ϬйDistrict of Highlands Ϭ Ϭй Ϭ Ϭй
City of Langford ϯϲϰ ϲй ϭ Ϭϲ Ϯй
City of Colwood ϭϱϴ ϯй ϰϴ ϭй
District of Metchosin with Scia’new FN ϭϯϳ Ϯй ϰϲ ϭй
District of Sooke with T’souke FN ϯϯϲϲ ϱϳй ϯϯϲϲ ϳϲй
J uan de Fuca Electoral Area with Pacheedaht FN ϭϭϳ Ϯй ϱϬϯ ϭϭй
South CVRD with Malahat FN, Cowichan Tribes ϰϳ ϭй Ϭ Ϭй
External Ϭ Ϭй Ϭ Ϭй
Total ϱϵϭϱ ϰϰϭϳ
Trips by Trip Purpose Trips by Primary Travel Mode
24 Hours 24 Hours
ϯϮϳϴ ϯϴй ϲϳϲ ϴй ϭϲϳϮ ϭϬй Auto Driver ϲϲϯϬ ϳϲй ϲϲϱϬ ϳϲй ϭϮϳϴϱ ϳϯй
ϯϬϰ ϯй Ϭ Ϭй Ϭ Ϭй Auto Passenger ϭϮϲϬ ϭϰй ϭϯϬϵ ϭϱй Ϯϲϵϲ ϭϱй
Top Five Destinations of Trips from District of Sooke with T’souke FN Summary of Trips to and from District of Sooke with T’souke FN
To District Within DistrictFrom District To District Within District From District
Work
Post-secondary School
ϭϲϰ Ϯй Ϯϰϵ ϯй ϴϲϳ ϱй Transit ϲϵϵ ϴй ϲϬϵ ϳй ϭϬϲ ϭй
ϳϱϯ ϵй ϲϮϱ ϳй ϴϵϰ ϱй Bicycle ϭϳ Ϭй ϭϳ Ϭй Ϯϭϯ ϭ й
ϱϲϮ ϲй ϴϰϳ ϭϬй ϭϳϱϰ ϭϬй Walk Ϭ Ϭй Ϭ Ϭй ϭϮϰϯ ϳй
ϭϬϳ ϭй ϵϴ ϭй ϱϵϲ ϯй Other ϭϮϱ ϭй ϭϴϴ Ϯй ϯϲϰ Ϯй
ϵϬϮ ϭϬй ϲϭϭ ϳй ϭϳϰϮ ϭϬй Total: ϴϳϯϬ ϭϬϬй ϴϳϳϯ ϭϬϬй ϭϳϰϬϳ ϭϬϬй
ϱϮϭ ϲй ϱϯϱ ϲй Ϯϴϰϴ ϭϲй
Ϯϭϭϰ Ϯϰй ϱϬϳϬ ϱϴй ϲϳϲϱ ϯϵй
Other Ϯϰ Ϭй ϲϯ ϭй ϮϳϬ Ϯй
Total: ϴϳϯϬ ϭϬϬй ϴϳϳϯ ϭϬϬй ϭϳϰϬϳ ϭϬϬй
AM Peak (06:00 - 08:59) AM Peak (06:00 - 08:59)
ϭϴϲϰ ϳϯй ϯϴϱ ϯϳй ϳϴϭ Ϯϯй AutoDriver ϭϵϲϲ ϳϳй ϲϮϲ ϲϬй ϮϰϵϮ ϳϰй
From District To District Within District
Work
To District Within District
Shopping
Pick-up / drop-off Passenger
Return Home
From District
Dining / restaurant
Other School
Personal Business
Recreation / social
'LVWULFW -XDQ GH )XFD (OHFWRUDO $UHD ZLWK 3DFKHHGDKW )1
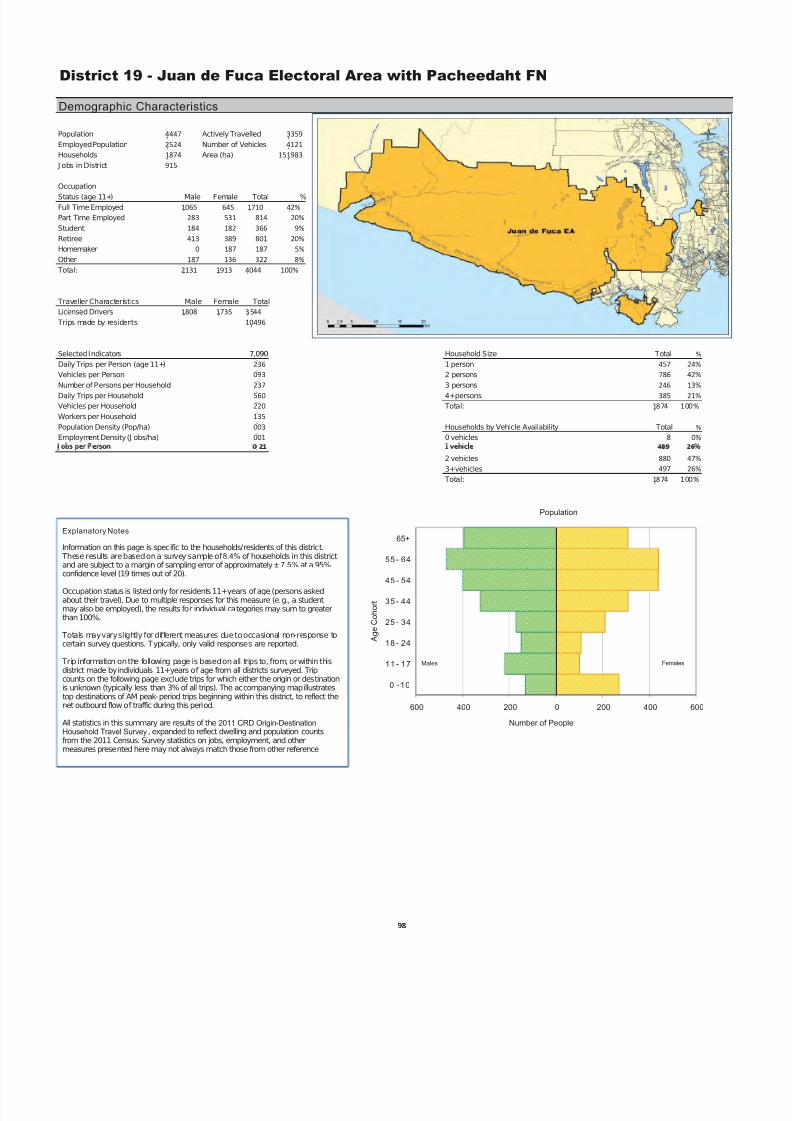
7/27/2019 CRD OD Survey DailyTravelCharacteristicsReport
http://slidepdf.com/reader/full/crd-od-survey-dailytravelcharacteristicsreport 108/117
'LVWULFW-XDQGH)XFD(OHFWRUDO$UHDZLWK3DFKHHGDKW)1
Demographic Characteristics
Population ϰϰϰϳ Actively Travelled ϯϯϱϵ
Employed Population ϮϱϮϰ Number of Vehicles ϰϭϮϭHouseholds ϭϴϳϰ Area (ha) ϭϱϭϵϴϯ
J obs in District ϵϭϱ
Occupation
Status (age 11+) Male Female Total %
Full Time Employed ϭϬϲϱ ϲϰϱ ϭϳϭϬ ϰϮй
Part Time Employed Ϯϴϯ ϱϯϭ ϴϭϰ ϮϬй
Student ϭϴϰ ϭϴϮ ϯϲϲ ϵй
Retiree ϰϭϯ ϯϴϵ ϴϬϭ ϮϬй
Homemaker Ϭ ϭϴϳ ϭϴϳ ϱй
Other ϭϴϳ ϭϯϲ ϯϮϮ ϴй
Total: Ϯϭϯϭ ϭϵϭϯ ϰϬϰϰ ϭϬϬй
Traveller Characteristics Male Female Total
Licensed Drivers ϭϴϬϴ ϭϳϯϱ ϯ ϱϰϰ
Trips made by residents ϭϬϰϵϲ
Selected Indicators 7,090 Household Size Total й
Daily Trips per Person (age 11+) Ϯϯϲ 1 person ϰϱϳ Ϯϰй
Vehicles per Person Ϭϵϯ 2 persons ϳϴϲ ϰϮй
Number of Persons per Household Ϯϯϳ 3 persons Ϯϰϲ ϭϯй
Daily Trips per Household ϱϲϬ 4+persons ϯϴϱ Ϯϭй
Vehicles per Household ϮϮϬ Total: ϭϴ ϳϰ ϭ ϬϬ й
Workers per Household ϭϯϱ
Population Density (Pop/ha) ϬϬϯ Households by Vehicle Availability Total й
Employment Density (J obs/ha) ϬϬϭ 0 vehicles ϴ Ϭй
2 vehicles ϴϴϬ ϰϳй
3+vehicles ϰϵϳ Ϯϲй
Total: ϭϴ ϳϰ ϭ ϬϬ й
55 - 64
65+
Population
Explanatory Notes
Information on this page is specific to the households/residents of this district. These results are based on a survey sample of 8.4% of households in this districtand are subject to a margin of sampling error of approximately ± 7.5% at a 95%confidence level (19 times out of 20)
Travel Patterns

7/27/2019 CRD OD Survey DailyTravelCharacteristicsReport
http://slidepdf.com/reader/full/crd-od-survey-dailytravelcharacteristicsreport 109/117
Travel Patterns
AM Peak Period AM Peak Per iod (06:00 - 08:59) Destinations of Origins of
Trips From Trips To
Districts District % Total District % Total
Salt Spring Island E lectoral Area Ϭ Ϭй Ϭ Ϭй
Town of Sidney ϴ ϭй Ϭ Ϭй
District of North Saanich with Tsyecum FN, Pauquachin FN ϭϭϬ ϴй Ϯϯ ϳй
District of Central Saanich with Tsartlip FN, Tsawout FN Ϭ Ϭй Ϭ Ϭй
Downtown ϰϳ ϯй Ϭ Ϭй
Victoria North ϰϲ ϯй ϲ Ϯй
Victoria South ϯϲ ϯй Ϭ Ϭй
Saanich North Ϭ Ϭй ϱϰ ϭϳй
Saanich East ϭϮϯ ϵй Ϭ Ϭй
Saanich West Ϭ Ϭй ϭϮ ϰй
District of Oak Bay ϲϯ ϰй Ϭ Ϭй
Township of Esquimalt ϲϱ ϱй Ϭ Ϭй
Town of View Royal with Esquimalt Nation, Songhees FN ϰϭ ϯй Ϭ ϬйDistrict of Highlands Ϭ Ϭй Ϭ Ϭй
City of Langford ϭϭϵ ϴй ϴ Ϯй
City of Colwood ϭϭϮ ϴй Ϭ Ϭй
District of Metchosin with Scia’new FN ϯϱ Ϯй Ϭ Ϭй
District of Sooke with T’souke FN ϱϬϯ ϯϱй ϭϭϳ ϯϲй
J uan de Fuca Electoral Area with Pacheedaht FN ϭϬϱ ϳй ϭϬϱ ϯϮй
South CVRD with Malahat FN, Cowichan Tribes ϭϯ ϭй Ϭ Ϭй
External ϴ ϭй Ϭ Ϭй
Total ϭϰϯϯ ϯϮϱ
Trips by Trip Purpose Trips by Primary Travel Mode
24 Hours 24 Hours
ϭϯϮϮ ϯϮй ϰϴϵ ϭϮй ϭϭϰ ϭϱй Auto Driver ϯϯϳϰ ϴϭй ϯϯϯϭ ϴϬй ϲϵϱ ϵϮй
ϲϯ Ϯй Ϭ Ϭй Ϭ Ϭй Auto Passenger ϱϭϰ ϭϮй ϱϵϰ ϭϰй Ϯϰ ϯй
Top Five Destinations o f Trips f rom Juan de Fuca Electoral Area with
Pacheedaht FNSummary of Trips t o and from Juan de Fuca Electoral Area with Pacheedaht
FN
To District Within DistrictFrom District To District Within District From District
Work
Post-secondary School
Ϯϰϱ ϲй Ϭ Ϭй Ϭ Ϭй Transit ϭϰϳ ϰй ϭϭϲ ϯй Ϭ Ϭй
ϱϬϳ ϭϮй Ϯϴ ϭй ϴ ϭй Bicycle Ϭ Ϭй Ϯϳ ϭй Ϭ Ϭй
ϰϲϰ ϭϭй Ϯϰϲ ϲй ϭϯϵ ϭϴй Walk Ϭ Ϭй Ϭ Ϭй ϲ ϭй
ϭϮϱ ϯй ϭϯ Ϭй ϴ ϭй Other ϭϱϲ ϰй ϭϬϬ Ϯй ϯϭ ϰй
ϰϳϰ ϭϭй ϭϱϵ ϰй ϯϰ ϰй Total: ϰϭϵϬ ϭϬϬй ϰϭϲϴ ϭϬϬй ϳϱϲ ϭϬϬй
ϰϳϳ ϭϭй ϵϲ Ϯй ϭϭϮ ϭϱй
ϰϴϬ ϭϭй ϯϭϭϱ ϳϱй ϯϯϮ ϰϰй
Other ϯϰ ϭй ϮϮ ϭй ϴ ϭй
Total: ϰϭϵϬ ϭϬϬй ϰϭϲϴ ϭϬϬй ϳϱϲ ϭϬϬй
AM Peak (06:00 - 08:59) AM Peak (06:00 - 08:59)
ϲϰϭ ϰϴй ϭϲ ϳй ϲϴ ϲϱй AutoDriver ϵϯϵ ϳϭй ϭϲϰ ϳϱй ϵϰ ϴϵй
From District To District Within District
Work
To District Within District
Shopping
Pick-up / drop-off Passenger
Return Home
From District
Dining / restaurant
Other School
Personal Business
Recreation / social
'LVWULFW 6RXWK &95' ZLWK 0DODKDW )1 &RZLFKDQ 7ULEHV

7/27/2019 CRD OD Survey DailyTravelCharacteristicsReport
http://slidepdf.com/reader/full/crd-od-survey-dailytravelcharacteristicsreport 110/117
'LVWULFW6RXWK&95'ZLWK0DODKDW)1&RZLFKDQ7ULEHV
Demographic Characteristics
Population ϱϭϯϲϮ Actively Travelled ϰϬϬϰϲ
Employed Population ϮϰϮϯϮ Number of Vehicles ϰϭϲϴϳHouseholds ϮϬϰϲϴ Area (ha) ϱϴϳϲϭ
J obs in District ϭϱϴϬϬ
Occupation
Status (age 11+) Male Female Total %
Full Time Employed ϭϬϲϰϭ ϳϯϴϬ ϭϴϬϮϭ ϰϬй
Part Time Employed ϮϮϱϴ ϯϵϱϯ ϲϮϭϬ ϭϰй
Student Ϯϰϳϭ ϯϰϴϯ ϱϵϱϰ ϭϯй
Retiree ϱϯϵϯ ϲϭϴϭ ϭϭϱϳϰ Ϯϱй
Homemaker ϲϮϵ ϮϭϬϰ Ϯϳϯϯ ϲй
Other ϭϮϱϮ ϭϯϲϯ Ϯϲϭϱ ϲй
Total: ϮϮϭϮϵ Ϯϯϰϵϯ ϰϱϲϮϮ ϭϬϬй
Traveller Characteristics Male Female Total
Licensed Drivers ϭ ϴϰϬ ϭ ϭ ϵϲϮ ϴ ϯ ϴϬϮ ϵ
Trips made by residents ϭϰϱϯϰϮ
Selected Indicators 7,090 Household Size Total й
Daily Trips per Person (age 11+) Ϯϴϯ 1 person ϱϭϵϳ Ϯϱй
Vehicles per Person Ϭϴϭ 2 persons ϴϮϮϳ ϰϬй
Number of Persons per Household Ϯϱϭ 3 persons Ϯϴϴϭ ϭϰй
Daily Trips per Household ϳϭϬ 4+persons ϰϭϲϯ ϮϬй
Vehicles per Household ϮϬϰ Total: Ϯ Ϭϰϲ ϴ ϭϬ Ϭй
Workers per Household ϭϭϴ
Population Density (Pop/ha) Ϭϴϳ Households by Vehicle Availability Total й
Employment Density (J obs/ha) ϬϮϳ 0 vehicles ϭϰϯϯ ϳй
2 vehicles ϳϲϬϵ ϯϳй
3+vehicles ϲϬϲϭ ϯϬй
Total: Ϯ Ϭϰϲ ϴ ϭϬ Ϭй
55 - 64
65+
Population
Explanatory Notes
District 20, the South CVRD, is not part of the CRD Regional Planning Area, but is partof the broader study area. The geographic survey frame for this district was chosenbased on proximity to the CRD, not administrative boundaries; therefore, the surveyresults for this district should not be taken to be representative of the populationcharacteristicsandtravelbehavioursoftheentireCVRD.
Travel Patterns

7/27/2019 CRD OD Survey DailyTravelCharacteristicsReport
http://slidepdf.com/reader/full/crd-od-survey-dailytravelcharacteristicsreport 111/117
AM Peak Period AM Peak Peri od (06:00 - 08:59) Destinations of Origins of
Trips From Trips To
Districts District % Total District % Total
Salt Spring Island Electoral Area ϲϭ Ϭй ϴϬ Ϭй Town of Sidney Ϭ Ϭй ϭϵ Ϭй
District of North Saanich with Tsyecum FN, Pauquachin F ϭϳϴ ϭй ϭϵ Ϭй
District of Central Saanich with Tsartlip FN, Tsawout FN Ϯϲϯ ϭй ϰϲ Ϭй
Downtown ϲϬϯ Ϯй ϭϱ Ϭй
Victoria North Ϯϳϳ ϭй ϯϲ Ϭй
Victoria South ϯϰϵ ϭй ϭϳ Ϭй
Saanich North Ϭ Ϭй ϰϵ Ϭй
Saanich East ϰϴϵ Ϯй ϭϭϮ ϭй
Saanich West ϯϳϬ Ϯй Ϭ Ϭй
District of Oak Bay ϲϵ Ϭй Ϭ Ϭй
Township of Esquimalt ϴϬϳ ϯй ϰϬ Ϭй
Town of View Royal with Esquimalt Nation, Songhees FN ϮϰϮ ϭй ϴϲ ϬйDistrict of Highlands Ϭ Ϭй Ϯϴ Ϭй
City of Langford ϱϳϮ Ϯй ϭϮϰ ϭй
City of Colwood ϱϳ Ϭй ϰϲ Ϭй
District of Metchosin with Scia’new FN Ϭ Ϭй Ϭ Ϭй
District of Sooke with T’souke FN Ϭ Ϭй ϰϳ Ϭй
J uan de Fuca Electoral Area with Pacheedaht FN Ϭ Ϭй ϭϯ Ϭй
South CVRD with Malahat FN, Cowichan Tribes ϭϴϬϱϯ ϳϱй ϭϴϬϱϯ ϵϰй
External ϭϳϱϮ ϳй Ϯϵϭ Ϯй
Total Ϯϰϭϰϯ ϭϵϭϮϭ
Trips by Trip Purpose Trips by Primary Travel Mode
24 Hours 24 Hours
ϲϴϮϰ ϰϭй ϭϮϴϴ ϴй ϭϭϳϯϬ ϭϬй Auto Driver ϭϯϰϱϯ ϴϮй ϭϰϮϮϮ ϴϰй ϴϯϬϮϭ ϳϰй
ϯϱϬ Ϯй Ϭ Ϭй ϱϮϴ Ϭй Auto Passenger Ϯϰϯϵ ϭϱй ϭϵϱϵ ϭϮй ϮϭϬϰϳ ϭϵй
Top Five Destinations of Trips f rom South CVRD with Malahat FN,
Cowichan TribesSummary of Trips to and fro m South CVRD with Malahat FN, Cowichan
Tribes
To District Within DistrictFrom District To District Within District From District
Work
Post-secondary School
ϰϬ Ϭй ϭϭ Ϭй ϯϯϭϬ ϯй Transit Ϯϵϵ Ϯй ϰϵϮ ϯй Ϯϯϴ Ϭй
ϭϰϬϵ ϵй ϯϰϴ Ϯй ϲϳϵϮ ϲй Bicycle ϱϰ Ϭй ϱϰ Ϭй ϯϲϱ Ϭ й
ϮϭϵϬ ϭϯй ϭϬϲϰ ϲй ϭϭϭϵϵ ϭϬй Walk Ϭ Ϭй Ϭ Ϭй ϱϯϳϭ ϱй
ϮϮϯ ϭй ϭϬϴ ϭй ϱϬϭϯ ϰй Other Ϯϱϴ Ϯй Ϯϱϴ Ϯй ϮϬϳϵ Ϯй
Ϯϲϰϭ ϭϲй ϭϮϰϰ ϳй ϭϳϴϱϴ ϭϲй Total: ϭϲϱϬϯ ϭϬϬй ϭϲϵϴϱ ϭϬϬй ϭϭϮϭϮϮ ϭϬϬй
ϴϱϴ ϱй ϭϲϱϱ ϭϬй ϭϭϮϰϱ ϭϬй
ϭϲϰϬ ϭϬй ϭϭϬϭϭ ϲϱй ϰϯϮϭϮ ϯϵй
Other ϯϯϬ Ϯй Ϯϱϴ Ϯй ϭϮϯϰ ϭй
Total: ϭϲϱϬϯ ϭϬϬй ϭϲϵϴϱ ϭϬϬй ϭ ϭϮϭϮϮ ϭϬϬй
AM Peak (06:00 - 08:59) AM Peak (06:00 - 08:59
ϰϰϱϲ ϳϯй ϲϬϲ ϱϳй ϱϰϲϭ ϯϬй AutoDriver ϱϮϱϮ ϴϲй ϵϵϭ ϵϯй ϭϰϬϯϯ ϳϴй
From District To District Within District
Work
To District Within District
Shopping
Pick-up / drop-off Passenger
Return Home
From District
Dining / restaurant
Other School
Personal Business
Recreation / social
102

7/27/2019 CRD OD Survey DailyTravelCharacteristicsReport
http://slidepdf.com/reader/full/crd-od-survey-dailytravelcharacteristicsreport 112/117
2011 CRD Household Travel Survey – Daily Travel Characteristics
103

7/27/2019 CRD OD Survey DailyTravelCharacteristicsReport
http://slidepdf.com/reader/full/crd-od-survey-dailytravelcharacteristicsreport 113/117
2011 CRD Household Travel Survey – Daily Travel Characteristics
5 Origin-Destination MatricesThe following tables or “origin-destination matrices” tally total person-trips at the district level. The
matrices included external trips; hence they have a dimension of 21 x 21.
Four matrices are presented:
• Table 53 - 24 hour
• Table 54 - AM peak period (3 hours, 06:00 – 08:59)
• Table 55- Mid-day (inter-peak, 09:00 – 14:59)
• Table 56- PM peak period (3 hours, 15:00 – 18:59)
104

7/27/2019 CRD OD Survey DailyTravelCharacteristicsReport
http://slidepdf.com/reader/full/crd-od-survey-dailytravelcharacteristicsreport 114/117
2011 CRD O-D Household Travel Survey
Table 53. Person-Trip OD – Daily (24 hour)
Origin/Destination 1 2 3 4 5 6 7 8 9 10 11 12 13 14 15 16 17 18 19 20 21 Total
Salt Spring Island EA 1 24,351 162 74 16 109 21 58 42 39 17 6 36 26 284 87 25,328
Sidney 2 165 19,781 8,787 3,177 868 740 785 779 1,417 236 273 151 74 48 479 223 28 82 83 36 48 38,261
North Saanich
Tsyecum, Pauquachin
3 102 8,398 7,244 4,327 683 931 1,090 1,313 2,982 1,099 747 510 226 111 719 242 234 88 192 484 348 32,071
Central Saanich,
Tsartlip, Tsawout
4 16 3,495 4,417 22,357 1,247 2,382 1,182 3,918 2,389 2,242 651 335 676 60 961 226 233 113 445 47,345
Downtown Victoria 5 66 657 493 1,223 24,651 10,756 17,734 2,446 10,780 5,153 4,823 4,242 1,314 83 2,531 1,466 36 335 249 704 120 89,861
Victoria North 6 927 979 2,416 9,308 25,778 12,474 3,417 18,025 8,821 5,751 4,713 1,687 199 3,210 1,283 217 659 135 927 98 101,024
Victoria South 7 26 653 680 1,281 16,190 12,480 41,977 1,900 12,132 4,824 14,187 2,764 1,335 104 1,435 1,370 56 516 57 1,218 114 115,299
Saanich North 8 838 1,200 4,009 2,467 2,833 2 ,248 15,953 10,627 5,349 1,500 907 1,181 39 1,263 845 37 104 158 184 74 51,817
Saanich East 9 12 1,540 2,264 2,604 11,417 17,156 12,142 10,706 77,677 11,094 12,079 3,374 2,491 29 4,362 1,897 221 666 145 965 367 173,207
Saanich West 10 10 507 946 2,125 5,554 9,748 3,920 5,060 11,409 20,612 2,096 4,934 3,254 28 4,424 1,798 186 262 28 976 357 78,234
Oak Bay 11 391 592 659 5,036 4,492 14,360 1,386 12,156 2,872 21,648 982 731 6 964 448 94 12 69 391 10 67,300
Esquimalt (Township) 12 17 235 403 364 4,922 4,852 2,565 811 3,590 4,070 1,041 14,753 1,671 147 2,602 1,695 150 462 101 1 ,205 26 45,682
View Royal, Esquimalt
Nation, Songhees
13 145 96 981 1,565 1,942 1,002 1,194 2,045 3,498 490 2,209 4,723 12 3,234 1,473 290 279 68 510 35 25,789
Highlands 14 6 48 111 82 123 127 71 146 63 6 143 48 382 1,014 228 52 77 2,728
Langford 15 46 235 775 822 2,763 3,253 1,377 1,278 4,460 4,654 1,000 2,422 3,363 1,187 40,613 12,235 2,237 2,102 416 2,391 132 87,763
Colwood 16 15 86 254 229 1,444 1, 209 1,090 725 1,663 1,741 537 1,700 1,611 179 12,817 10,546 1,340 701 429 248 46 38,611
Metchosin, Scia’new 17 37 142 266 129 222 13 57 196 194 0 171 187 2,524 1,256 1,301 429 110 7,234
Sooke, T’souke 18 26 128 103 113 444 552 683 122 703 98 128 498 326 0 1,787 701 405 17,407 1,849 47 18 26,137
Juan de Fuca EA,
Pacheedaht
19 57 209 185 145 143 50 204 113 69 99 72 457 280 120 1,891 756 42 53 4,946
South CVRD 20 294 859 525 924 768 654 218 941 1,121 184 1,393 544 77 2,270 459 47 29 112,122 5,195 128,625
External 21 85 48 184 15 54 113 126 218 120 281 57 26 38 458 75 49 5,852 n/d 7,800
Total 25,239 38,367 30,813 47,510 90,043 100,496 115,751 51,623 173,703 78,134 67,305 46,343 25,552 2, 697 88,160 38,744 7,239 26,180 4,924 129,107 7,130 1,195,061
Excludes 12,257 trips for which either origin or destination is unknown. Shaded cells are trips entirely outside districts 2-19 (RPA). No data on external-external trips entirely outside districts 1-20 (the study area).
105

7/27/2019 CRD OD Survey DailyTravelCharacteristicsReport
http://slidepdf.com/reader/full/crd-od-survey-dailytravelcharacteristicsreport 115/117
2011 CRD O-D Household Travel Survey
Table 54. Person-Trip OD – AM Peak Period (3 hour)
Origin/Destinat ion 1 2 3 4 5 6 7 8 9 10 11 12 13 14 15 16 17 18 19 20 21 Total
Salt Spring Island EA1 3,437 13 8 54 30 16 39 80 12 3,689
Sidney2 9 1,529 1,170 500 404 182 88 13 198 22 48 36 19 20 12 19 4,268
North Saanich Tsyecum,
Pauquachin 3 662 1,953 519 314 69 276 196 675 193 78 133 37 26 28 17 21 23 19 178 5,417
Central Saanich, Tsartlip,
Tsawout 4 387 875 4,806 466 373 390 696 548 766 223 92 124 23 41 46 9,854
Downtown Victoria5 901 685 951 207 865 501 331 799 53 21 14 15 5,342
Victoria North6 106 102 487 2,775 2,896 1,759 106 2,086 1,263 896 863 108 10 177 124 207 6 36 14,006
Victoria South7 25 85 513 4,003 1,730 5,036 654 1,595 1,065 3,036 554 290 63 183 9 17 18,858
Saanich North8 111 208 748 1,017 465 702 1,925 1,997 730 349 130 146 109 95 54 49 74 8, 909
Saanich East 9 292 330 888 4,082 2,578 2,877 1,613 14,343 2,368 3,298 914 543 492 316 42 112 96 35,182
Saanich West10 160 294 791 1,954 2,048 976 792 1,671 4,140 763 1,000 261 583 293 25 74 12 15,838
Oak Bay11 109 77 60 1,239 403 1,988 118 1,161 352 2,561 125 32 70 36 10 8,342
Esquimalt (Township)12 7 176 206 1,172 1,042 746 36 598 619 424 3,215 92 106 219 68 40 8,766
View Royal, Esquimalt
Nation, Songhees 13 82 105 384 500 353 205 520 1,063 218 687 947 317 181 20 86 11 5,677
Highlands14 38 12 80 67 48 39 38 62 48 27 370 52 28 909
Langford15 190 55 271 1,267 1,155 620 243 1,223 1,541 330 1,010 613 70 6,175 1,727 150 106 8 124 16,879
Colwood16 76 110 99 879 491 468 28 461 613 237 928 195 2,282 2,387 166 48 46 10 9,523
Metchosin, Scia’new17 14 114 131 13 20 60 120 63 41 759 478 181 46 2,041
Sooke, T’souke18 31 21 65 235 196 192 56 242 32 87 411 160 364 158 137 3,366 117 47 5,915
Juan de Fuca EA,
Pacheedaht 19 8 110 47 46 36 123 63 65 41 119 112 35 503 105 13 8 1,433
South CVRD20 61 178 263 603 277 349 489 370 69 807 242 572 57 18,053 1,752 24,143
External21 13 291 n/d 305
Total 3,507 3,838 5,750 10,322 21,933 15,347 17,917 6,955 28,909 15,794 13,050 11,894 3,938 107 12,661 6,436 922 4,417 325 19,121 2,152 205,296
Excludes 979 trips for which either origin or destination is unknown. Shaded cells are trips entirely outside districts 2-19 (RPA). No data on external-external trips entirely outside districts 1-20 (the study area).
2011 CRD O D H h ld T l S
106

7/27/2019 CRD OD Survey DailyTravelCharacteristicsReport
http://slidepdf.com/reader/full/crd-od-survey-dailytravelcharacteristicsreport 116/117
2011 CRD O-D Household Travel Survey
Table 55. Person-Trip OD – Mid-day (inter-peak)
Origin/Destinat ion 1 2 3 4 5 6 7 8 9 10 11 12 13 14 15 16 17 18 19 20 21 Total
Salt Spring Island EA1 9,926 92 19 56 21 11 26 6 36 26 117 34 10,372
Sidney2 67 10,862 3,284 1,155 292 269 221 321 851 107 121 63 10 90 58 66 17,836
North Saanich Tsyecum,
Pauquachin 3 10 4,000 2,910 1,178 128 513 159 331 848 227 264 103 16 261 85 100 44 148 17 11,343
Central Saanich, Tsartlip,
Tsawout 4 1,703 1,511 9,078 560 830 361 1,049 602 508 350 36 270 239 77 192 36 324 17,727
Downtown Victoria5 20 98 68 396 13,448 3,717 6,216 498 2,346 1,100 1,590 1,041 481 36 373 188 4 9 91 134 41 31,894
Victoria North6 135 505 581 3,041 10,561 4,282 1,070 6,512 2,751 2,941 1,867 443 51 1,190 352 52 132 25 135 36,627
Victoria South7 9 268 434 360 6,432 4,601 17,086 451 4,889 1,467 5,846 794 317 487 478 18 53 301 114 44,403
Saanich North8 388 337 1,356 911 1,065 601 5,810 3,854 2,008 647 519 431 34 566 290 17 21 18,856
Saanich East 9 2 629 568 563 3,577 6,892 3,593 3,758 25,738 3,937 4,645 955 695 8 1,635 525 47 128 37 407 270 58,608
Saanich West10 36 361 538 1,496 3,549 1,217 1,998 4,205 7,010 549 1,484 886 6 1,548 413 28 112 195 137 25,768
Oak Bay11 196 258 178 1,893 2,057 4,481 679 3,960 869 9,066 128 206 405 69 12 69 286 24,812
Esquimalt (Township)12 67 52 92 2,257 2,152 694 469 911 1,424 392 4,325 571 31 817 302 24 78 329 14,988
View Royal, Esquimalt
Nation, Songhees 13 19 16 186 933 584 308 461 677 1,182 160 679 1,590 1,018 638 226 14 22 147 14 8,873
Highlands14 6 11 70 5 60 39 25 6 28 114 123 57 49 592
Langford15 46 45 266 290 504 881 489 521 1,383 1,435 271 696 1,130 127 16,589 4,348 974 854 88 529 120 31,587
Colwood16 88 41 320 355 213 385 511 358 202 229 608 19 5,110 3,276 542 120 63 48 19 12,506
Metchosin, Scia’new17 23 142 192 16 77 31 66 64 129 1,030 356 601 29 37 2,794
Sooke, T’souke18 62 38 11 73 177 102 42 300 27 41 10 95 0 877 287 83 5,560 795 18 8,597
Juan de Fuca EA,
Pacheedaht 19 70 115 41 33 22 31 10 32 259 142 19 722 325 29 32 1,882
South CVRD20 65 459 103 257 161 141 151 306 254 50 11 124 42 794 215 39,386 1,845 44,364
External21 22 109 15 22 121 76 46 57 13 58 18 8 1,808 n/d 2,374
Total 10,173 18,636 11,496 16,311 36,379 38,508 40,292 18,137 58,096 24,810 27,197 13,033 8,036 484 33,506 12,173 2,929 7,886 1,691 44,370 2,661 426,804
Excludes 4,837 trips for which either origin or destination is unknown. Shaded cells are trips entirely outside districts 2-19 (RPA). No data on external-external trips entirely outside districts 1-20 (the study area).
2011 CRD O D H h ld T l S
107

7/27/2019 CRD OD Survey DailyTravelCharacteristicsReport
http://slidepdf.com/reader/full/crd-od-survey-dailytravelcharacteristicsreport 117/117
2011 CRD O-D Household Travel Survey
Table 56. Person-Trip OD – PM Peak Period (3 hour)
Origin/Destinat ion 1 2 3 4 5 6 7 8 9 10 11 12 13 14 15 16 17 18 19 20 21 Total
Salt Spring Island EA1 7,142 57 19 16 86 14 7,334
Sidney2 44 4,861 2,903 952 131 202 126 352 346 101 63 52 27 11 90 50 14 52 17 10,395
North Saanich
Tsyecum, Pauquachin 3 21 2,328 1,495 1,376 141 238 274 379 700 296 152 26 40 81 226 59 16 68 45 60 8,021
Central Saanich,
Tsartlip, Tsawout 4 8 907 1,472 5,243 90 822 334 1,619 638 776 35 199 231 60 241 135 65 57 12,932
Downtown Victoria5 38 341 331 491 5,001 3,905 6,296 1,079 4,777 1,887 1,723 1,400 525 36 1,473 1,067 32 207 155 556 79 31,399
Victoria North6 224 166 785 2,164 6,568 3,419 1,396 4,896 2,150 982 1,007 530 99 1,029 465 21 273 29 517 26,720
Victoria South7 17 201 97 261 3,293 3,002 11,378 532 3,731 1,428 3,682 663 526 79 644 382 13 333 21 375 30,659
Saanich North8 150 208 1,154 261 453 533 4,000 2,651 1,717 369 166 307 6 300 243 20 44 35 118 12,735
Saanich East 9 11 372 1,035 757 1,861 4,736 3,847 3,535 21,596 2,018 2,434 526 705 1,410 575 80 384 71 249 46,202
Saanich West10 10 61 209 510 1,230 1,276 1,037 1,462 2,890 5,180 332 1,157 1,372 22 1,754 728 100 32 16 347 184 19,908
Oak Bay11 68 123 299 1,008 1,438 5,282 375 4,174 921 6,012 458 352 6 345 260 94 104 21,318
Esquimalt (Township)12 11 24 111 67 998 1,037 598 217 1,353 1,203 62 3,892 797 116 1,364 908 25 319 101 836 26 14,064
View Royal, Esquimalt
Nation, Songhees 13 16 251 82 424 113 254 424 580 89 585 1,589 12 1,112 407 26 212 10 277 6,464
Highlands14 10 159 85 78 331
Langford15 129 142 574 508 146 290 895 949 251 326 867 477 10,780 2,780 661 740 167 1,500 13 22,195
Colwood16 20 14 80 184 138 224 270 509 49 203 512 35 2,825 3,027 423 325 348 16 17 9,219
Metchosin, Scia’new17 41 17 47 8 43 17 613 280 320 309 58 1,754
Sooke, T’souke18 26 35 36 64 179 70 112 0 11 20 286 148 82 4,773 555 6,398
Juan de Fuca EA,
Pacheedaht 19 49 16 40 36 28 50 91 2 13 28 335 205 891
South CVRD
20 158 56 140 5 92 30 49 87 120 65 71 35 772 34 47 28,841 853 31,456
External21 45 75 41 113 7 96 22 80 26 14 368 30 28 2,923 3,867
Total 7,532 9,694 8,465 12,519 17,024 25,218 33,680 15,904 49,669 20,012 16,235 10,808 8,502 1,235 25,714 11,670 1,955 8,517 1,845 36,877 1,186 324,260