Crash Reduction Factors PUBLISH - Oregon
184
UPDATE AND ENHANCEMENT OF ODOT’S CRASH REDUCTION FACTORS Final Report SPR 612 by Christopher M. Monsere, Ph.D., P.E., Research Assistant Professor Robert L. Bertini, Ph.D., P.E., Associate Professor Aaron Breakstone, Carolyn Bonner, Peter Bosa, David de la Houssaye, Zachary Horowitz Department of Civil & Environmental Engineering Portland State University and Kate Hunter-Zaworski, Associate Professor Department of Civil, Construction, & Environmental Engineering Oregon State University for Oregon Department of Transportation Research Unit 200 Hawthorne SE, Suite B-240 Salem OR 97301-5192 and Federal Highway Administration 400 Seventh Street SW Washington, DC 20590-0003 June 2006
Transcript of Crash Reduction Factors PUBLISH - Oregon

UPDATE AND ENHANCEMENT OF ODOT’S CRASH REDUCTION FACTORS
Final Report
SPR 612
by
Christopher M. Monsere, Ph.D., P.E., Research Assistant Professor Robert L. Bertini, Ph.D., P.E., Associate Professor
Aaron Breakstone, Carolyn Bonner, Peter Bosa, David de la Houssaye, Zachary Horowitz Department of Civil & Environmental Engineering
Portland State University and
Kate Hunter-Zaworski, Associate Professor Department of Civil, Construction, & Environmental Engineering
Oregon State University
for
Oregon Department of Transportation Research Unit
200 Hawthorne SE, Suite B-240 Salem OR 97301-5192
and
Federal Highway Administration
400 Seventh Street SW Washington, DC 20590-0003
June 2006


i
1. Report No. FHWA-OR-DR-06-11
2. Government Accession No.
3. Recipient’s Catalog No.
5. Report Date June 2006
4. Title and Subtitle Update and Enhancement of ODOT’s Crash Reduction Factors
6. Performing Organization Code
7. Author(s) Christopher M. Monsere, Robert L. Bertini, Aaron Breakstone, Carolyn Bonner, Peter Bosa, Zachary Horowitz, David de la Houssaye Department of Civil & Environmental Engineering, Portland State University, Portland, OR 97207 Kate Hunter-Zaworski, Department of Civil, Construction, & Environmental Engineering, Oregon State University, Corvallis, OR 97331
8. Performing Organization Report No.
10. Work Unit No. (TRAIS)
9. Performing Organization Name and Address Oregon Department of Transportation Research Unit 200 Hawthorne Ave. SE, Suite B-240 Salem, OR 97301-5192
11. Contract or Grant No. SPR 612
13. Type of Report and Period Covered Final Report
12. Sponsoring Agency Name and Address Oregon Department of Transportation Federal Highway Administration Research Unit and 400 Seventh Street SW 200 Hawthorne Ave. SE, Suite B-240 Washington, DC 20590-0003 Salem, OR 97301-5192
14. Sponsoring Agency Code
15. Supplementary Notes
16. Abstract Appropriate selection of cost-effective countermeasures for highway safety improvement projects requires an estimate of the safety effects of alternative designs. The Oregon Department of Transportation (ODOT), like many agencies, makes these estimates using crash reduction factors (CRFs). Since the development of ODOT’s original database in the early 1990s, there have been substantial methodological improvements in the evaluation of engineering countermeasures that have resulted in a wealth of new published research. This study provided a comprehensive update to ODOT’s CRFs database. The CRFs were updated via a thorough review and quality assessment of recent literature and input from an expert advisory group. Results will be incorporated into ODOT’s safety project analysis tools and will be processed and disseminated through ODOT’s regional offices and other local agencies using an interactive web page. The CRF website will allow users to search interactively for effective countermeasures for a particular highway safety improvement project based on key parameters and directly accessing the literature review database. This report provides a summary of national and international concurrent and complementary research, discusses the methodology used to review CRFs, and outlines development of an interactive web page.
17. Key Words Highway safety, Improvements, Intelligent transportation systems, Research, Traffic engineering, Crash Reduction Factors
18. Distribution Statement Copies available from NTIS, and online at http://www.oregon.gov//ODOT/TD/TP_RES/
19. Security Classification (of this report) Unclassified
20. Security Classification (of this page) Unclassified
21. No. of Pages 155 + appendices
22. Price
Technical Report Form DOT F 1700.7 (8-72) Reproduction of completed page authorized A Printed on recycled paper

ii
SI* (MODERN METRIC) CONVERSION FACTORS APPROXIMATE CONVERSIONS TO SI UNITS APPROXIMATE CONVERSIONS FROM SI UNITS
Symbol When You Know Multiply By To Find Symbol Symbol When You Know Multiply By To Find Symbol
LENGTH LENGTH
In inches 25.4 millimeters mm mm millimeters 0.039 inches in Ft feet 0.305 meters m m meters 3.28 feet ft Yd yards 0.914 meters m m meters 1.09 yards yd Mi miles 1.61 kilometers km km kilometers 0.621 miles mi
AREA AREA in2 square inches 645.2 millimeters squared mm2 mm2 millimeters squared 0.0016 square inches in2
ft2 square feet 0.093 meters squared m2 m2 meters squared 10.764 square feet ft2
yd2 square yards 0.836 meters squared m2 ha hectares 2.47 acres ac ac acres 0.405 hectares ha km2 kilometers squared 0.386 square miles mi2
mi2 square miles 2.59 kilometers squared km2 VOLUMEVOLUME mL milliliters 0.034 fluid ounces fl oz
fl oz fluid ounces 29.57 milliliters mL L liters 0.264 gallons gal gal gallons 3.785 liters L m3 meters cubed 35.315 cubic feet ft3
ft3 cubic feet 0.028 meters cubed m3 m3 meters cubed 1.308 cubic yards yd3
yd3 cubic yards 0.765 meters cubed m3 MASSNOTE: Volumes greater than 1000 L shall be shown in m3. g grams 0.035 ounces oz
MASS kg kilograms 2.205 pounds lb oz ounces 28.35 grams g Mg megagrams 1.102 short tons (2000 lb) T lb pounds 0.454 kilograms kg TEMPERATURE (exact) T short tons (2000 lb) 0.907 megagrams Mg °C Celsius temperature 1.8 + 32 Fahrenheit °F
TEMPERATURE (exact)
°F Fahrenheit temperature
5(F-32)/9 Celsius temperature °C
* SI is the symbol for the International System of Measurement (4-7-94 jbp)

iii
ACKNOWLEDGEMENTS
The authors gratefully acknowledge the financial support provided by the Oregon Department of Transportation (ODOT). In particular, the technical advisory committee has provided helpful oversight: Tim Burks, ODOT Traffic Management, Doug Bish, ODOT Traffic Management, Cynthia Buswell, ODOT Region 2, Anne Holder, ODOT Transportation Safety, Nick Fortey, FHWA, and Angela Kargill, ODOT Region 2. We also acknowledge the support of Barnie Jones, Rob Edgar, and Mark Joerger of ODOT Research. We acknowledge the support of our research team members including Carolyn Bonner (now with Ferguson and Associates), Beth Wemple at Kittelson and Associates, Inc., John McGill at Synectics Transportation Consultants, Inc., and Matt Little of Oregon State University. Finally, Margaret Parkhill of iTrans graciously shared with the team their compiled research bibliography.
DISCLAIMER
This document is disseminated under the sponsorship of the Oregon Department of Transportation and the United States Department of Transportation in the interest of information exchange. The State of Oregon and the United States Government assume no liability of its contents or use thereof. The contents of this report reflect the view of the authors who are solely responsible for the facts and accuracy of the material presented. The contents do not necessarily reflect the official views of the Oregon Department of Transportation or the United States Department of Transportation. The State of Oregon and the United States Government do not endorse products of manufacturers. Trademarks or manufacturers’ names appear herein only because they are considered essential to the object of this document. This report does not constitute a standard, specification, or regulation.

iv

v
UPDATE AND ENHANCEMENT OF ODOT’S CRASH REDUCTION FACTORS
TABLE OF CONTENTS
1.0 INTRODUCTION..................................................................................................................1 1.1 RESEARCH OBJECTIVES ................................................................................................2 1.2 RELATIONSHIP TO OTHER RESEARCH EFFORTS ....................................................2 1.3 BENEFITS...........................................................................................................................3 1.4 ORGANIZATION OF REPORT.........................................................................................4
2.0 METHODOLOGY ................................................................................................................5 2.1 LITERATURE REVIEW ....................................................................................................5 2.2 RESEARCH EVALUATION..............................................................................................6
2.2.1 Simple before-and-after study .....................................................................................7 2.2.2 Comparison group .......................................................................................................7 2.2.3 Cross sectional studies.................................................................................................8 2.2.4 Empirical Bayes...........................................................................................................8
2.3 COUNTERMEASURE SYNTHESIS.................................................................................8
3.0 COUNTERMEASURES WITH ROBUST RESEARCH ..................................................9 3.1 DESIGN IMPROVEMENT.................................................................................................9
3.1.1 Add left-turn bay, signalized intersection ...................................................................9 3.1.2 Add Left-turn bay, unsignalized intersection ............................................................11 3.1.3 Add right-turn lane on major road, signalized intersection.......................................13 3.1.4 Add right-turn lane on major road, unsignalized intersection...................................15 3.1.5 Install roundabout ......................................................................................................17
3.1.5.1 Install roundabout, prior stop control ...................................................................17 3.1.5.2 Install roundabout, prior signal control ................................................................18
3.1.6 Add two-way left-turn lane .......................................................................................19 3.1.7 Improve horizontal curve geometry ..........................................................................22 3.1.8 Improve superelevation on curves.............................................................................25 3.1.9 Install centerline rumble strips ..................................................................................27 3.1.10 Install passing lane ....................................................................................................29 3.1.11 Install shoulder rumble strips ....................................................................................31 3.1.12 Increase width of paved shoulder ..............................................................................33 3.1.13 Increase lane width ....................................................................................................36
3.2 MARKINGS OR SIGNS ...................................................................................................39 3.2.1 Convert to 4-way stop from 2-way stop ....................................................................39
3.3 OPERATIONS/ITS............................................................................................................40 3.3.1 Install automated enforcement of red light violations ...............................................40 3.3.2 Install traffic signal....................................................................................................42 3.3.3 Lengthen the yellow change interval to ITE guidelines............................................43

vi
3.3.4 Remove traffic signal from one-way street ...............................................................44 3.4 PEDESTRIAN ...................................................................................................................45
3.4.1 Provide mid-block pedestrian refuge.........................................................................45 3.5 ROADSIDE IMPROVEMENT.........................................................................................47
3.5.1 Install new guardrail ..................................................................................................47
4.0 COUNTERMEASURES WITH LIMITED RESEARCH ...............................................49 4.1 DESIGN IMPROVEMENT...............................................................................................49
4.1.1 Convert 4-lane section to 3 lanes...............................................................................49 4.1.2 Improve intersection sight distance/clear sight triangles...........................................51 4.1.3 Install barrier .............................................................................................................53
4.2 OPERATIONS/ITS............................................................................................................55 4.2.1 Change left-turn phasing ...........................................................................................55 4.2.2 Provide illumination for intersection.........................................................................56 4.2.3 Provide illumination on highway sections ................................................................58
4.3 ROADSIDE IMPROVEMENT.........................................................................................59 4.3.1 Improve roadside hazard rating .................................................................................59
5.0 COUNTERMEASURES WITH DISCUSSION ONLY ...................................................63 5.1 DESIGN IMPROVEMENT...............................................................................................63
5.1.1 Add raised or painted islands ....................................................................................63 5.1.2 Convert 4-leg intersection to offset T-intersections ..................................................65 5.1.3 Improve intersection skew angle ...............................................................................67 5.1.4 Offset opposing left-turn lanes ..................................................................................69 5.1.5 Provide acceleration/deceleration lane ......................................................................71 5.1.6 Separate grades by constructing interchange ............................................................73 5.1.7 Convert two-way to one-way street...........................................................................74 5.1.8 Improve vertical alignment........................................................................................75 5.1.9 Close driveways near intersection/increase driveway spacing..................................76 5.1.10 Install non-traversable curbed median.......................................................................78 5.1.11 Pavement treatments to increase friction...................................................................80
5.2 MARKINGS OR SIGNS ...................................................................................................81 5.2.1 Install stop ahead sign ...............................................................................................81 5.2.2 Install transverse rumble strip in advance of stop controlled intersection ................82 5.2.3 Install turning guide lines for multiple left-turn lanes...............................................83 5.2.4 Provide advance intersection warning sign ...............................................................84 5.2.5 Install durable pavement markings............................................................................85 5.2.6 Install edge line profile markings or rumble strips....................................................86 5.2.7 Provide advance curve warning pavement markings ................................................87
5.3 OPERATIONS/ITS............................................................................................................88 5.3.1 Change signal cycle length........................................................................................88 5.3.2 Convert signal from incandescent to LED ................................................................89 5.3.3 Increase size of signal head .......................................................................................90 5.3.4 Install dynamic advance warning flashers “Red Signal Ahead” ...............................91 5.3.5 Install flashing beacon at intersection .......................................................................92 5.3.6 Provide all-red signal phase.......................................................................................93 5.3.7 Provide traffic coordination for progression .............................................................94

vii
5.3.8 Install advanced ice warning system .........................................................................95 5.3.9 Provide automated speed enforcement ......................................................................96 5.3.10 Provide variable speed limits.....................................................................................97 5.3.11 Install ramp metering.................................................................................................98
5.4 PEDESTRIAN .................................................................................................................100 5.4.1 Install advanced stop bar for cross walk..................................................................100 5.4.2 Install passive pedestrian detection .........................................................................101 5.4.3 Reduce pedestrian crossing distance .......................................................................102 5.4.4 Install pedestrian countdown signals.......................................................................103 5.4.5 Install Pedestrian-only signals .................................................................................104 5.4.6 Restrict right turn on red..........................................................................................106 5.4.7 Construct pedestrian grade separation.....................................................................108 5.4.8 Install flashing lights in crosswalk ..........................................................................109 5.4.9 Install illumination for marked crosswalks .............................................................110 5.4.10 Pedestrian fencing or barrier ...................................................................................111 5.4.11 Provide marked mid-block crosswalk .....................................................................112
5.5 RAILROAD CROSSING ................................................................................................114 5.5.1 Construct railroad grade separation (overpass or underpass)..................................114 5.5.2 Install active warning device ...................................................................................115
5.6 ROADSIDE IMPROVEMENT.......................................................................................118 5.6.1 Eliminate shoulder drop-off or provide wedge .......................................................118
5.7 TRAFFIC CALMING .....................................................................................................119 5.7.1 Install chicanes or serpentine roadway....................................................................119 5.7.2 Install speed tables and or bumps............................................................................120 5.7.3 Narrow travel lanes..................................................................................................121
6.0 CASE STUDY ....................................................................................................................122 6.1 URBAN INTERSECTION SAFETY STUDY ...............................................................122
6.1.1 Existing crash patterns.............................................................................................124 6.1.2 Collision diagrams...................................................................................................125
6.2 USING THE WEBSITE ..................................................................................................126
7.0 CONCLUSIONS AND RECOMMENDATIONS...........................................................130
8.0 REFERENCES...................................................................................................................132
APPENDIX

viii
List of Tables
Table 3.1: Left-turn bay on major road, signalized, 3-leg intersection, recommended CRFs ............................10 Table 3.2: Left-turn bay on major road, signalized, 4-leg intersection, recommended CRFs ............................10 Table 3.3: Left-turn bay on major road, unsignalized, 3-leg intersection, recommended CRFs........................11 Table 3.4: Left-turn bay on major road, unsignalized, 4-leg intersection, recommended CRFs........................11 Table 3.5: Right-turn lane on major road, signalized intersection recommended CRFs*..................................13 Table 3.6: Right-turn lane on major road, unsignalized intersection recommended CRFs*..............................15 Table 3.7: Roundabout, prior stop control, single lane, recommended CRFs .....................................................17 Table 3.8: Roundabout, prior stop control, multilane, recommended CRFs .......................................................17 Table 3.9: Roundabout, prior signal control, recommended CRFs ......................................................................18 Table 3.10: Add two-way left turn lane, 20 driveways per mile, recommended CRFs........................................20 Table 3.11: Add two-way left turn lane, 40 driveways per mile, recommended CRFs........................................20 Table 3.12: Add two-way left turn lane, 60 driveways per mile, recommended CRFs........................................20 Table 3.13: Improve superelevation from 0.02 to 0.08 ...........................................................................................26 Table 3.14: Improve superelevation from 0.04 to 0.08 ...........................................................................................26 Table 3.15: Improve superelevation from 0.06 to 0.08 ...........................................................................................26 Table 3.16: Centerline rumble strips, recommended CRFs*.................................................................................27 Table 3.17: Passing lane, one-way, recommended CRFs* .....................................................................................29 Table 3.18: Passing lane, two-way, recommended CRFs* .....................................................................................29 Table 3.19: Shoulder rumble strips, recommended CRFs* ...................................................................................31 Table 3.20: AMF for shoulder type on two-lane rural highways ..........................................................................34 Table 3.21: Widen paved shoulder from 2 to 8 feet, ADT >2000. recommended CRFs......................................34 Table 3.22: Widen paved shoulder from 4 to 8 feet, ADT>2000, recommended CRFs.......................................34 Table 3.23: Widen paved shoulder from 6 to 8 feet, ADT >2000, recommended CRFs......................................34 Table 3.24: Increase lane width from 9 to 12 feet, ADT >2000, recommended CRFs.........................................37 Table 3.25: Increase lane width from 10 to 12 feet, ADT >2000, recommended CRFs.......................................37 Table 3.26: Increase lane width from 11 to 12 feet, ADT >2000, recommended CRFs.......................................37 Table 3.27: Convert to 4-way stop from 2-way stop, recommended CRFs ..........................................................39 Table 3.28: Install automated enforcement of red light violations, recommended CRFs ...................................40 Table 3.29: Install traffic signal, 3-leg intersection, recommended CRFs ............................................................42 Table 3.30: Install traffic signal, 4-leg intersection, recommended CRFs ............................................................42 Table 3.31: Lengthen yellow change interval to ITE guidelines, recommended CRFs .......................................43 Table 3.32: Remove traffic signal from one-way street, recommended CRFs .....................................................44 Table 3.33: Provide mid-block pedestrian refuge, recommended CRFs* ............................................................45 Table 3.34: Install new guardrail recommended CRFs*........................................................................................47 Table 4.1: Convert 4-Lane Section to 3 Lanes, Recommended CRFs...................................................................49 Table 4.2: AMFs for intersection sight distance .....................................................................................................51 Table 4.3: Improve intersection sight distance in 1 quadrant, recommended CRFs...........................................52 Table 4.4: Improve intersection sight distance in 2 quadrant, recommended CRFs...........................................52 Table 4.5: Improve intersection sight distance in 3 quadrant, recommended CRFs...........................................52 Table 4.6: Improve intersection sight distance in 4 quadrant, recommended CRFs...........................................52 Table 4.7: Install barrier, recommended CRFs ......................................................................................................53 Table 4.8: Change from permissive to protected left-turn phasing, recommended CRFs..................................55 Table 4.9: Change from protected/permissive to protected left-turn phasing, recommended CRFs.................55 Table 4.10: Provide illumination for intersection, recommended CRFs ..............................................................56 Table 4.11: Provide illumination on highway sections, recommended CRFs.......................................................58 Table 4.12: Description of roadside hazard rating, with AMF..............................................................................60 Table 4.13: Improve roadside hazard rating by 1 ratings, recommended CRFs.................................................60 Table 4.14: Improve roadside hazard rating by 2 ratings, recommended CRFs.................................................60 Table 4.15: Improve roadside hazard rating by 3 ratings, recommended CRFs.................................................60 Table 6.1: Crashes by type, 2000-2004...................................................................................................................124 Table 6.2: Crashes by driver error, 2000-2004 .....................................................................................................124 Table 6.3: Crashes by severity, 2000-2004.............................................................................................................124 Table 6.4: Crash environmental data ....................................................................................................................125

ix
List of Figures Figure 3.1: Left-turn bay, signalized intersection..........................................................................................................9 Figure 3.2: Left-turn bay, unsignalized intersection ....................................................................................................11 Figure 3.3: Right-turn lane on major road, signalized intersection..............................................................................13 Figure 3.4: Right-turn lane on major road, unsignalized intersection..........................................................................15 Figure 3.5: Roundabout ...............................................................................................................................................17 Figure 3.6: Two-way left-turn lane..............................................................................................................................19 Figure 3.7: CRF for addition of a TWLTL..................................................................................................................20 Figure 3.8: AMF for changes in horizontal curvature w/o spiral.................................................................................23 Figure 3.9: AMF for changes in horizontal curvature w/ spiral...................................................................................23 Figure 3.10: AMF for superelevation deficiency.........................................................................................................26 Figure 3.11: Centerline rumble strips ..........................................................................................................................27 Figure 3.12: Passing lane.............................................................................................................................................29 Figure 3.13: Shoulder Rumble Strips ..........................................................................................................................31 Figure 3.14: AMF for paved shoulder widths on two-lane rural highways (Harwood et al 2000) .............................34 Figure 3.15: AMF for lane width.................................................................................................................................37 Figure 3.16: Automated enforcement of red light violations.......................................................................................40 Figure 3.17: Mid-block pedestrian refuge ...................................................................................................................45 Figure 3.18: New guardrail..........................................................................................................................................47 Figure 4.1: Median barrier...........................................................................................................................................53 Figure 4.2: Illumination for intersection......................................................................................................................56 Figure 5.1: Raised or painted islands...........................................................................................................................63 Figure 5.2: Convert 4-leg intersection to offset T-intersections ..................................................................................65 Figure 5.3: Intersection skew angle .............................................................................................................................67 Figure 5.4: Offset opposing left-turn lanes ..................................................................................................................69 Figure 5.5: Acceleration/deceleration lane ..................................................................................................................71 Figure 5.6: Separate grades by constructing interchange ............................................................................................73 Figure 5.7: Driveways near intersection, driveway spacing ........................................................................................76 Figure 5.8: Non-traversable curbed median.................................................................................................................78 Figure 5.9: Stop ahead sign .........................................................................................................................................81 Figure 5.10: Transverse rumble strip in advance of stop controlled intersection ........................................................82 Figure 5.11: Turning guide lines for multiple left-turn lanes.......................................................................................83 Figure 5.12: Install edge line profile markings or rumble strips..................................................................................86 Figure 5.13: Advance curve warning pavement markings ..........................................................................................87 Figure 5.14: Change signal cycle length......................................................................................................................88 Figure 5.15: Increase size of signal head.....................................................................................................................90 Figure 5.16: Dynamic advance warning flashers “Red Signal Ahead” .......................................................................91 Figure 5.17: Flashing beacon at intersection ...............................................................................................................92 Figure 5.18: Variable speed limits...............................................................................................................................97 Figure 5.19: Ramp metering ........................................................................................................................................98 Figure 5.20: Advanced stop bar for cross walk .........................................................................................................100 Figure 5.21: Passive pedestrian detection..................................................................................................................101 Figure 5.22: Reduce pedestrian crossing distance .....................................................................................................102 Figure 5.23: Pedestrian countdown signals ...............................................................................................................103 Figure 5.24: Pedestrian-only signals..........................................................................................................................104 Figure 5.25: Restrict right turn on red .......................................................................................................................106 Figure 5.26: Pedestrian grade separation...................................................................................................................108 Figure 5.27: Flashing lights in crosswalk ..................................................................................................................109 Figure 5.28: Pedestrian fencing or barrier .................................................................................................................111 Figure 5.29: Marked mid-block crosswalk ................................................................................................................112 Figure 5.30: Active warning device...........................................................................................................................115 Figure 5.31: Eliminate shoulder drop-off or provide wedge .....................................................................................118 Figure 5.32: Install chicanes or serpentine roadway..................................................................................................119 Figure 5.33: Install speed tables and or bumps..........................................................................................................120

x
Figure 6.1: Intersection of Tualatin-Valley Highway and Murray Boulevard in Beaverton, OR..............................123 Figure 6.2: Collision diagram showing high crash locations.....................................................................................126 Figure 6.3: Sample CRF website screen captures......................................................................................................128

1
1.0 INTRODUCTION
Developing a transportation system that balances safety, mobility, and efficiency is a primary objective of most transportation agencies. Most will identify safety as a top priority or goal. In spite of these objectives, there are still unacceptably high numbers of traffic-related fatalities and injuries on U.S. highways – upwards of 42,000 fatalities and almost 3 million injuries per year (NHTSA 2003). Nearly every state has a highway safety improvement program, many of which were implemented with federal guidance following the passage of the Highway Safety Act of 1966. Typical state approaches to highway safety improvement include the following steps (Davis 2000):
1. Identification of hazardous roadway locations using crash records; 2. Detailed engineering study of selected hazardous locations to identify roadway design
problems; 3. Identification of potential countermeasures; 4. Assessment of the costs and benefits of potential countermeasures; 5. Implementation of countermeasures with the highest net benefits; 6. Assessment of countermeasure effectiveness following implementation.
Identification and implementation of countermeasures are keys to safety improvement planning. The estimated economic benefits clearly depend on expected crash reductions from each countermeasure, yet these projections are considered the least certain element of the safety improvement planning process (Pfefer 1999). These projections are called crash reduction factors (CRFs) and are estimates of the expected reduction in different crash types following the implementation of a particular countermeasure. Alternatively, some literature and some states may discuss CRFs as accident reduction factors (ARF) or accident modification factors (AMF) or crash modification factors (CMF). AMFs are becoming the manner in which safety effectiveness is reported in the literature and in new federally supported research. An AMF of 1.00 implies no safety effect; greater than 1.00 is a increase in crashes and less than one is a decrease. However, AMFs are related to CRFs simply by the formula CRF = 1- AMF.
CRFs are used by many states, including Oregon, as a tool to evaluate the cost-benefit relationships between various roadway improvements and their effectiveness in reducing crashes and/or reducing the severity of those crashes. Although a need was recognized for a comprehensive national list of crash reduction factors 30 years ago (Strathman, et al. 2001), responsibility for their development has, until recently, remained with individual states. Most states have compiled their lists from the literature coupled with evaluations of their own projects. Considerable variation still exists among states in the countermeasures used and the quality and sources of research used to determine crash reduction factors (Strathman, et al. 2001). Few states have had the resources, expertise, or a sufficient number of applications to conduct statistically valid studies of these countermeasures, resulting in the need for sharing of countermeasure data between states.

2
The Oregon Department of Transportation (ODOT) has used its current list of countermeasures since the early 1990’s. ODOT’s existing list contains approximately 70 total countermeasures divided into categories that often do not clearly relate to particular situations or crash types. These countermeasures are currently used in Oregon’s Countermeasure Analysis Tool (an intranet-based tool used to perform benefit-cost analyses of safety projects). The current list lacks documentation for individual project engineers to make judgments about the applicability of the particular countermeasure, and the descriptions do not always make clear the methods, resources, or statistical reliability of analyses used to develop the CRF.
A need was recognized to compile and present countermeasures in a way that would make it less cumbersome for ODOT engineers and planners to search for applicable countermeasures for a given situation, and to have a greater degree of confidence in the CRF described. This project improved the categorization scheme of approximately 94 countermeasures for easier lookup, and provided easy access to a summary of the existing research and where applicable, the effectiveness of each countermeasure where credible research is available. .
1.1 RESEARCH OBJECTIVES
The primary objective of this research was to provide an updated, comprehensive list of crash reduction factors for ODOT engineers and planners. This updated list would improve the chances of selecting the best safety improvement countermeasure and enhancing project development for the funding provided. A secondary objective was to document key aspects of the CRFs so engineers would be better informed when selecting the appropriate countermeasures. The final objective was to clearly document the methodology and sources to enable easy updating of the database in the future. Much new research is being performed; the advantage of a well-designed database is that this new research can be easily incorporated as it is published..
1.2 RELATIONSHIP TO OTHER RESEARCH EFFORTS
Fortunately, countermeasures for highway safety improvement, and research into their effectiveness, have become a major focus in transportation research and planning in recent years. The American Association of State Highway and Transportation Officials (AASHTO) Strategic Highway Safety Plan (SHSP) and the Federal Highway Administration’s adoption of the “Vital Few” approach, along with work toward developing a Highway Safety Manual, have provided motivation for these efforts. Currently, there are many relevant safety-related research efforts underway at the state, national, and international levels. One key project to evaluate countermeasures, sponsored by the National Cooperative Highway Research Program (NCHRP), was recently completed. Project 17-25, “Crash Reduction Factors for Traffic Engineering and ITS Improvements,” had as its objective to “develop reliable CRFs for traffic engineering, operations, and ITS improvements.” Its results were published in NCHRP Research Results Digest 299 (NCHRP 2005)
The Highway Safety Manual (HSM) will incorporate safety performance into the elements involved in highway planning, design, maintenance, construction and operation decisions of state

3
roads and highways. The HSM will be a comprehensive source for safety knowledge much like the Highway Capacity Manual (HCM) is for traffic operations. The HSM is being developed by the Task Force for the Development of the HSM, a committee of the Transportation Research Board. NCHRP 17-25 is coordinating closely with the HSM. Another effort, Safety Analyst, is a software package under development by the Federal Highway Administration (FHWA) in partnership with thirteen state Departments of Transportation. The vision is to “provide state-of-the-art analytical tools for use in the decision-making process to identify and manage a system-wide program of site-specific improvements to enhance highway safety by cost-effective means” (Safety Analyst 2005). The tool will provide a method for network screening, countermeasure selection, and cost-benefit analysis.
Finally, there are numerous print-based guidebooks and manuals available that comprise a “toolbox” for practitioners, particularly those attempting to incorporate low-cost safety improvements into their projects. NCHRP has produced a series of guides for highway and road design as part of the AASHTO initiative to implement the SHSP, listing countermeasures by crash type and evaluating each, based on the extent of their application and studies of effectiveness. There are 13 guides available as part of NCHRP Report 500, Guidance for Implementation of the AASHTO Strategic Highway Safety Plan:
1. Volume 01: A Guide for Addressing Aggressive-Driving Collisions 2. Volume 02: A Guide for Addressing Collisions Involving Unlicensed Drivers and
Drivers with Suspended or Revoked Licenses 3. Volume 03: A Guide for Addressing Collisions with Trees in Hazardous Locations 4. Volume 04: A Guide for Addressing Head-On Collisions 5. Volume 05: A Guide for Addressing Unsignalized Intersection Collisions 6. Volume 06: A Guide for Addressing Run-Off-Road Collisions 7. Volume 07: A Guide for Reducing Collisions on Horizontal Curves 8. Volume 08: A Guide for Reducing Collisions Involving Utility Poles 9. Volume 09: A Guide for Reducing Collisions Involving Older Drivers 10. Volume 10: A Guide for Reducing Collisions Involving Pedestrians 11. Volume 11: A Guide for Increasing Seat Belt Use 12. Volume 12: A Guide for Reducing Collisions at Signalized Intersections 13. Volume 13: A Guide for Reducing Collisions Involving Heavy Trucks
The need for reliable CRFs has clearly been recognized. There is also research underway to evaluate individual strategies, and the body of literature is expanding rapidly. This project drew on many of these reports to develop a list of crash reduction factors and used them selectively for data on crash reduction percentages.
1.3 BENEFITS
It is hoped that the development of a comprehensive CRF database for ODOT use, with additional supporting guidance, will result in an enhanced safety management tool and more effective project selection. Access to a web-based format will benefit many local agencies and consultants in Oregon since many lack resources or staff time to compile current crash reduction factors. This is especially important for ODOT with new project delivery mechanisms that will

4
require the involvement of more consultant staff. Ultimately, a better understanding of the possible relationships between different types of countermeasures and safety outcomes will enhance the safety and mobility of all users of the transportation system.
1.4 ORGANIZATION OF REPORT
This report begins with a discussion of the research and synthesis methodology in Chapter 2. The effort described draws heavily on methods in NCHRP Project 17-25 and currently being used in the Highway Safety Manual update. In Chapters 3, 4, and 5 the recommended countermeasures to be included in ODOT’s final list are presented. This research includes an extensive literature review for each countermeasure.
Countermeasures are presented in one of three chapters depending on the rating of the research reviewed. Those countermeasures with reliable research documenting their effectiveness are presented in Chapter 3. Those with limited research but still with adequate information to present crash reduction factors are presented in Chapter 4. Those for which research exists but reliable crash reduction factors cannot be presented are documented in Chapter 5.
Chapter 6 describes a simple case study and documents how one might use the website developed for this project in a safety investigation. Chapter 7 presents conclusions, recommendations, and a brief discussion of suggestions for future research. The report also contains a bibliography to be used as a resource for subsequent research and applications. All references are included in the chapters for the individual studies reviewed.

5
2.0 METHODOLOGY
In this chapter the research methodology is documented. The research reviewed a number of existing countermeasure syntheses from other states and agencies as well as a number of other publications. A list of countermeasures was then generated using ODOT’s existing list as a starting point. These countermeasures were then modified, and the list was finalized. A detailed literature review was conducted for each countermeasure, and these studies were reviewed and summarized. The results were then synthesized into the best available knowledge, and CRFs were estimated.
2.1 LITERATURE REVIEW
This research effort began with a complete listing of ODOT’s crash reduction factors, beginning with ODOT’s original list, and incorporating lists from other states and from the literature (Pline 1992; Agent, et al. 1996; Ogden 1996; Tople 1998; SEMCOG 1998; Robertson 2000; Huang, et al. 2001a; Ohio DOT 2003; ITE 2004a; NCHRP 2003a-h; and ITE 2004b). A literature review and synthesis was performed, resulting in a list with over 200 countermeasures currently in use.
The CRFs were evaluated and ranked with the following considerations:
• The CRFs are methodologically and statistically valid; • The applicability of the CRF is known and documented; • The CRFs reflect improvements or combinations of improvements that are of interest to
DOTs; • The CRFs represent the different crash categories that reflect the impact of the
improvement. These countermeasures were first categorized based on roadway section or intersection, then on type, as follows:
• Design improvement • Markings or signs • Operations/Intelligent Transportation Systems • Pedestrian • Railroad crossing • Roadside improvement • Traffic calming
For each countermeasure, the crash types addressed by the countermeasure were assigned. Up to six different crash types could be assigned to a countermeasure. This classification scheme did not necessarily relate to the CRF values that were ultimately recommended, but it served as a

6
general category of effectiveness to help in the search function. Further, each of the CRFs was categorized as to whether it applied to an urban or rural setting. Crash type categories include:
• Pedestrian • Angle • Head-on • Rear-end • Sideswipe-meeting • Sideswipe-overtaking • Turning • Parking maneuver • Non-collision • Fixed object • All crash types
Finally, typical errors and other contributing factors were assigned to each countermeasure (up to four for each countermeasure).
• Driver inattention • Excessive speed • Weather • Visibility • Turning volumes • Geometry • Congestion • Access management
By assigning countermeasures multiple categories; the web-based search component was made more dynamic.
2.2 RESEARCH EVALUATION
It is well documented in the literature that many past safety analyses were of poor quality because their methodology did not account for some rather common problems with crash data or trends. In the CRF literature, the most common study type is the simple before-and-after comparison. A countermeasure is employed, and crash data are taken after the implementation of the countermeasure and compared to crash data before its implementation. Typically, a two- to three-year period before and after implementation of the countermeasure is used to compare crash rates. Shen and Gan (2003) and Hauer (2005) discuss several recognized problems with this approach, including:
• Regression to the mean: a phenomenon in which a countermeasure is assumed to be implemented in response to or during a period of unusually high crash rates, thus the crash rates in the after period could be assumed to be lower even without the countermeasure as they approach the historical mean for the location.

7
• Crash migration: a controversial phenomenon in which a treatment in one area results in higher crash rates in another area. For example, when a curve is flattened, crashes on that particular curve might be reduced while a resulting increase in speed (caused by the flatter curve) might increase crashes on the next curve.
• Maturation: the prospect that a before-and-after study might fail to recognize pre-existing trends in crashes at that location. Other factors could be causing a year-to-year reduction in crashes, such as weather, traffic flow, crash reporting practices, etc. Changes in these factors could result in a downward (or upward) trend in crashes before the countermeasure, which could be expected to continue without the improvement.
• External causal factors: separated into two main groups – those that can be recognized, measured and understood (such as traffic volume growth), and less recognizable factors such as weather or economic conditions. While the first group can be compensated for in a before-after study, those in the second group could contribute to any observed effect of a treatment, potentially changing between the before and after time periods and affecting the results of the study.
As part of the critical review, research on each countermeasure and resulting CRFs were evaluated on a Likert scale (with 1 representing lowest quality through 5 representing highest quality) for quality and thoroughness. This was based on the type of study (see below), the extent of the research, and the quality of the citations. If the source or study quality was not verifiable, the study received a score of 1. The notion of ranking studies was synergistic with the methodologies used in NCHRP Project 17-25 and Project 17-27 but was developed independently.
A brief summary of the types of studies to be found in the literature is provided in the following subsections. The most common study type is the simple before-and-after comparison, called the naïve before-and-after study by Hauer (1997). Increasingly common and more reliable, other methods of study include the before-and-after with comparison group method and the before-and-after study with Empirical Bayes (EB) method. These study designs are considered to be somewhat more effective in accounting for some of the above issues. In the end, the categorization of the state of the knowledge by NCHRP Project 17-25 was heavily used.
2.2.1 Simple before-and-after study
In this analysis, crash data is taken after the implementation of the countermeasure and compared to crash data collected before its implementation. Typically, a two- to three-year period before and after the countermeasure is implemented is used to compare crash rates. In most cases, the site is chosen for its crash performance in the past and regression-to-the-mean is likely to be present. Adjustments for volume, weather, and other factors are usually not taken into account. These studies are considered to be the least reliable of the study types but were rated based on evidence provided by the researchers to address the above limitations.
2.2.2 Comparison group
A before-and-after with comparison group study employs a group of control sites without treatment to compare with the treated site. The control sites must have similar geography and

8
traffic volume characteristics. This method improves on the simple before-and-after model by predicting expected crashes at the treated site. However, the results are only as good as the quality of the relationship between the control sites and the treated site.
2.2.3 Cross sectional studies
In these studies, multivariate regression models are constructed to estimate the effects of various roadway design features and crash performance. They have the methodological advantage of being able to avoid many of the problems with regression-to-the mean but have the additional problem of sorting out the influence of each variable in the analysis. For example, many roadway attributes are correlated (a roadway with these design standards also is likely to have paved shoulders) and these interactions need to be properly designated and controlled. Most safety researchers recommend interpreting the results of these models with care.
2.2.4 Empirical Bayes
The Empirical Bayes (EB) method, considered to be the most accurate and robust, attempts to statistically predict the number of crashes at a given location during the after period had no treatment been done. There are three assumptions made here (Hauer 1997):
1. The number of crashes at any site follows a Poisson distribution. 2. The means for a population of systems can be approximated by a Gamma distribution. 3. Changes from year to year from different factors are similar for all reference sites.
The EB methodology uses historical crash data for a treated site in combination with reference data for other sites with similar geometric characteristics to estimate crashes at the treated site without application of any countermeasure.
2.3 COUNTERMEASURE SYNTHESIS
This report provides a brief summary of research for each countermeasure and some reflection of the validity of each study. Where reliable research is available, the database includes the best estimate of a percentage reduction in crashes for each countermeasure. Some of these values in the literature refer to all crashes, while others refer to a particular crash type. Some differentiate between fatal, injury, and property damage crashes, although this differentiation has been rare in the literature. For a few countermeasures in Chapter 4, a synthesis of studies was used to present a CRF. Most other CRFs rely on one or two high quality studies.

9
3.0 COUNTERMEASURES WITH ROBUST RESEARCH
This chapter includes details for countermeasures with robust research, including the primary categories of design improvement, markings or signs, operations/ITS, pedestrian and roadside improvement. For the countermeasures in this section, the safety effects of the treatment have been quantified by substantive research. In most cases, only one study is listed as reviewed because previous research efforts have clearly identified these studies as the best. As the knowledge base on safety grows, it is likely that more information will be available on the countermeasures in this chapter and values incorporated within can be improved. Transportation professionals using this section are urged to obtain the most current available knowledge about these countermeasures.
3.1 DESIGN IMPROVEMENT
3.1.1 Add left-turn bay, signalized intersection
Main Category: Intersection Character: Both Crash Types Addressed: Rear-End, Sideswipe – Overtaking, Turning Other Causes: Turning Volumes, Congestion
Figure 3.1: Left-turn bay, signalized intersection
Summary discussion: The installation of left-turn bays at signalized intersections has proven effective at addressing safety problems associated with left-turning vehicles. This treatment can reduce conflicts between left-turning and through vehicles by removing the former from the through-traffic stream. Left-turn bays can also reduce conflicts with opposing through traffic, since having a
10
sheltered location may allow drivers waiting to make left turns during non-protected green intervals to feel less pressure to complete their turns. Left-turn bays are particularly effective at improving safety when installed in conjunction with raised medians at signalized intersections featuring high-volume and high-speed approaches. These CRFs apply to one approach.
Table 3.1: Left-turn bay on major road, signalized, 3-leg intersection, recommended CRFs Character Crash Type Fatal Injury PDO All Crashes Urban All Crash Types - - - 7% Rural All Crash Types - - - 15%
Table 3.2: Left-turn bay on major road, signalized, 4-leg intersection, recommended CRFs Character Crash Type Fatal Injury PDO All Crashes Urban All Crash Types 9% 9% - 10% Rural All Crash Types - - - 18%
Reviewed study title: Harwood, D.W., K.M. Bauer, I.B. Potts, D.J. Torbic, K.R. Richard, E.R. Kohlman Rabbani, E. Hauer, and L. Elefteriadou. Safety Effectiveness of Intersection Left- and Right-Turn Lanes. Federal Highway Administration. McLean, VA. 2002.
Study type: Empirical-Bayes Before-After Study rating: 5 This report presents the results of a comprehensive before-after evaluation of the safety effects of providing left- and right-turn lanes for at-grade intersections. Geometric design, traffic control, traffic volume, and crash data were gathered for 280 improved intersections and 300 similar intersections that were not improved during the study period. An observational before-after evaluation of these projects was performed using several evaluation approaches: the yoked comparison (or matched-pair) approach, the comparison group approach, and the Empirical Bayes approach. The research concluded that the Empirical Bayes method provided the most accurate and reliable results. In urban areas, this study found reductions of 7% and 10% for all crashes at signalized 3-leg and 4-leg intersections, respectively, and 9% for fatal and injury crashes at signalized 4-leg intersections. In rural areas, this study found reductions of 15% for all crashes at 3-leg intersections and 18% for all crashes at 4-leg intersections.

11
3.1.2 Add Left-turn bay, unsignalized intersection
Main Category: Intersection Character: Both Crash Types Addressed: Rear-End, Sideswipe – Overtaking, Turning Other Causes: Turning Volumes, Congestion
Figure 3.2: Left-turn bay, unsignalized intersection
Summary discussion: A high proportion of collisions at unsignalized intersections are related to left-turn maneuvers. A key strategy for reducing the occurrence of such collisions is the provision of exclusive left-turn bays. This treatment can reduce conflicts between left-turning and through vehicles by removing the former from the through-traffic stream. Left-turn bays can also reduce conflicts with opposing through traffic, since having a sheltered location may allow drivers waiting to make left turns to feel less pressure to complete their turns. Left-turn bays are particularly effective at improving safety when installed in conjunction with raised medians at unsignalized intersections featuring high-volume and high-speed approaches. These CRFs apply to one approach.
Table 3.3: Left-turn bay on major road, unsignalized, 3-leg intersection, recommended CRFs Character Crash Type Fatal Injury PDO All Crashes Rural All Crash Types 55% 55% - 44% Urban All Crash Types - - -- 33%
Table 3.4: Left-turn bay on major road, unsignalized, 4-leg intersection, recommended CRFs Character Crash Type Fatal Injury PDO All Crashes Rural All Crash Types 35% 35% - 28% Urban All Crash Types 29% 29% - 27%

12
Reviewed study title: Harwood, D.W., K.M. Bauer, I.B. Potts, D.J. Torbic, K.R. Richard, E.R. Kohlman Rabbani, E. Hauer, and L. Elefteriadou. Safety Effectiveness of Intersection Left- and Right-Turn Lanes. Federal Highway Administration. McLean, VA. 2002.
Study type: Empirical-Bayes Before-After Study rating: 5 This report presents the results of a comprehensive before-after evaluation of the safety effects of providing left- and right-turn lanes for at-grade intersections. Geometric design, traffic control, traffic volume, and crash data were gathered for 280 improved intersections and 300 similar intersections that were not improved during the study period. An observational before-after evaluation of these projects was performed using several evaluation approaches: the yoked comparison (or matched-pair) approach, the comparison group approach, and the Empirical Bayes approach. The research concluded that the Empirical-Bayes method provided the most accurate and reliable results. In rural areas, this study found reductions of 44% and 28% for all crashes at unsignalized 3-leg and 4-leg intersections, respectively, and reductions of 55% and 35% for fatal and injury crashes at unsignalized 3-leg and 4-leg intersections, respectively. In urban areas, this study found reductions of 33% and 27% for all crashes at unsignalized 3-leg and 4-leg intersections, respectively, and reductions of 29% for fatal and injury crashes at unsignalized 4-leg intersections.

13
3.1.3 Add right-turn lane on major road, signalized intersection
Main Category: Intersection Character: Urban Crash Types Addressed: Angle, Rear-End, Sideswipe – Overtaking, Turning Other Causes: Turning Volumes, Congestion
Figure 3.3: Right-turn lane on major road, signalized intersection
Summary discussion: Providing right-turn lanes at signalized intersections can reduce collisions between right-turning and following through vehicles, particularly on high-volume and high-speed roads. However, it is important to note that the installation of right-turn lanes at signalized intersections carries the potential to create other safety and/or operational problems such as vehicles in right-turn lanes blocking cross-street driver’s line of sight, and decreased distance to roadside objects if installation of right-turn lanes was accomplished by shoulder re-striping. Sufficient guidance through the intersection is an important consideration with exclusive right-turn lanes. In some instances, channelization may be desirable. In addition, raised islands can serve as a refuge for pedestrians, an important consideration when right-turn lanes result in increased crossing distances and pedestrian exposure to traffic. These CRFs apply to one approach.
Table 3.5: Right-turn lane on major road, signalized intersection recommended CRFs* Character Crash Type Fatal Injury PDO All Crashes Urban All Crash Types 9% 9% - 4%
* for 4-leg intersections only Reviewed study title: Harwood, D.W., K.M. Bauer, I.B. Potts, D.J. Torbic, K.R. Richard, E.R. Kohlman Rabbani, E. Hauer, and L. Elefteriadou. Safety Effectiveness of Intersection Left- and Right-Turn Lanes. Federal Highway Administration. McLean, VA. 2002.

14
Study type: Empirical-Bayes Before-After Study rating: 5 This report presents the results of a comprehensive before-after evaluation of the safety effects of providing left- and right-turn lanes for at-grade intersections. Geometric design, traffic control, traffic volume, and crash data were gathered for 280 improved intersections and 300 similar intersections that were not improved during the study period. An observational before-after evaluation of these projects was performed using several evaluation approaches: the yoked comparison (or matched-pair) approach, the comparison group approach, and the Empirical Bayes approach. The research concluded that the Empirical Bayes method provided the most accurate and reliable results. This study found reductions of 4% for all crashes when adding right turn lanes at signalized 4-leg intersections, and reductions of 9% for fatal and injury crashes.

15
3.1.4 Add right-turn lane on major road, unsignalized intersection
Main Category: Intersection Character: Rural Crash Types Addressed: Turning, Angle, Rear-End, Sideswipe - Over Other Causes: Turning Volumes, Congestion
Figure 3.4: Right-turn lane on major road, unsignalized intersection
Summary discussion: A large number of collisions at unsignalized intersections (especially those with high-volume and high-speed approaches) are related to right-turn maneuvers. A key strategy for reducing the occurrence of such collisions is the provision of exclusive right-turn lanes. Right-turn lanes can reduce the potential for rear-end collisions by separating decelerating right-turning vehicles from the through-traffic stream. However, the installation of right-turn lanes has the potential for creating other safety and/or operational problems at unsignalized intersections. Examples of such problems include, but are not limited to, vehicles in right-turn lanes blocking cross-street, right-turning drivers’ views of through traffic; and decreased distance to roadside objects where installation of right-turn lanes is accompanied by shoulder re-striping. These CRFs apply to one approach.
Table 3.6: Right-turn lane on major road, unsignalized intersection recommended CRFs* Character Crash Type Fatal Injury PDO All Crashes Rural All Crash Types 23% 23% - 14%
* only applicable to 4-leg intersections Reviewed study title: Harwood, D.W., K.M. Bauer, I.B. Potts, D.J. Torbic, K.R. Richard, E.R. Kohlman Rabbani, E. Hauer, and L. Elefteriadou. Safety Effectiveness of Intersection Left- and Right-Turn Lanes. Federal Highway Administration. McLean, VA. 2002.

16
Study type: Empirical-Bayes Before-After Study rating: 5 This report presents the results of a comprehensive before-after evaluation of the safety effects of providing left- and right-turn lanes for at-grade intersections. Geometric design, traffic control, traffic volume, and crash data were gathered for 280 improved intersections and 300 similar intersections that were not improved during the study period. An observational before-after evaluation of these projects was performed using several evaluation approaches: the yoked comparison (or matched-pair) approach, the comparison group approach, and the Empirical Bayes approach. The research concluded that the Empirical Bayes method provided the most accurate and reliable results. This study found reductions of 14% for all crashes when adding right turn lanes at unsignalized 4-leg intersections, and reductions of 23% for fatal and injury crashes.

17
3.1.5 Install roundabout
Main Category: Intersection Character: Both Crash Types Addressed: Angle, Turning Other Causes: Speed, Driver Inattention
Figure 3.5: Roundabout
Summary discussion: A roundabout brings together conflicting traffic streams, allows them to safely merge and traverse an intersection and exit in their desired directions. Depending on the widths of the approach roadway, entry, and circulatory roadway, one or more vehicle streams may travel through a roundabout. Roundabouts can improve the safety of intersections by eliminating or altering conflict types, reducing speed differentials, and forcing drivers to decrease speeds. While the installation of roundabouts does not always result in lower crash frequencies, it can typically be expected to reduce injury rates. The safety performance of small- and medium-capacity roundabouts is generally better than that of large or multilane roundabouts, and single-lane roundabouts have been found to perform better than two-way stop-controlled intersections.
3.1.5.1 Install roundabout, prior stop control
Table 3.7: Roundabout, prior stop control, single lane, recommended CRFs Character Crash Type Fatal Injury PDO All Crashes Urban All Crash Types - 88% - 72% Rural All Crash Types - 82% - 58%
Table 3.8: Roundabout, prior stop control, multilane, recommended CRFs
Character Crash Type Fatal Injury PDO All Crashes Urban All Crash Types - - - 5%

18
3.1.5.2 Install roundabout, prior signal control
Table 3.9: Roundabout, prior signal control, recommended CRFs Character Crash Type Fatal Injury PDO All Crashes Urban All Crash Types - 74% - 35%
Reviewed study title: Persaud, B.N., R.A. Retting, P.E. Garder, and D. Lord. Observational Before-After Study of the Safety Effect of U.S. Roundabout Conversions Using the Empirical Bayes Method. Transportation Research Record. No. 1751. Transportation Research Board. Washington, DC. 2001.
Study type: Empirical Bayes Before-After Study rating: 5 This before-after study was conducted using the Empirical Bayes procedure, which accounts for regression to the mean and traffic volume changes that usually accompany conversion of intersections to roundabouts. The results are consistent with other international studies and suggest that roundabout installation could be promoted as an effective safety treatment for intersections. This study found reductions of 35% for all crash severities and 74% for injury crashes when installing roundabouts at intersections with prior signal control. At intersections with prior stop control, the study found the following reductions: 5% for all crashes at multilane intersections; injury (88%) and all crashes (72%) at single-lane intersections in urban environments; and injury (82%) and all crashes (58%) at single-lane intersections in rural environments.

19
3.1.6 Add two-way left-turn lane
Main Category: Roadway Section Character: Both Crash Types Addressed: Rear-End, Turning Other Causes: Congestion, Access Management
Figure 3.6: Two-way left-turn lane
Summary discussion: Putting two-way left-turn lanes (TWLTLs) in place is usually undertaken to address traffic operations (i.e. improved access) rather than safety concerns. When they are implemented in response to a safety concern, TWLTLs are often targeted at reducing driveway-related turning and rear-end collisions in urban environments. This treatment applies to the addition of TWLTL to existing sections. The CRF was developed from mostly urban/suburban research but should be useable in rural areas. In rural areas, TWLTL conversions/additions may have a positive effect on head-on crashes by providing a buffer between opposing directions of travel and thus keeping errant vehicles from encroaching into opposing traffic lanes. The CRF is a function of driveway density, measured as driveways per mile (excluding intersections) and is applied to all crashes. The function does not estimate an effect for driveway densities less than 5 per mile.
Recommended crash reduction factor(s): As mentioned, the CRF is calculated as function of driveway density. In other applications of this CRF, it has been a challenge to define the number of driveways. The original work in Harwood, et al. presents the function for an accident modification factor (AMF), which can be converted to a crash reduction factor with the formula CRF = 1 – AMF. The function for the CRF is then:
CRF = 1 – (1-0.7PDPLT/D) where

20
PD = driveway-related crashes as a proportion of the total, which can be estimated by (0.0047DD +0.0024DD2) / (1.199 +0.0047DD +0.0024DD2) where DD is driveways per mile;
PLT/D = left-turn crashes correctable by the addition of a TWLTL, estimated as 0.5.
This function has been calculated for a range of driveway densities and is shown in Figure 3.7. Note that the expected change in the number of crashes varies widely for driveway densities less than 40 per mile but fairly flat after 100 driveways per mile. Three CRFs are presented but the analyst is encouraged to calculate the CRF for their exact site condition from the formula or using the graph.
CRF - ADD TWLTL AS FUNCTION OF DRIVEWAY DENSITY
0%
5%
10%
15%
20%
25%
30%
35%
40%
0 50 100 150 200 250 300 350 400
Driveway Density (per mile)
CRF
Figure 3.7: CRF for addition of a TWLTL
Table 3.10: Add two-way left turn lane, 20 driveways per mile, recommended CRFs Character Crash Type Fatal Injury PDO All Crashes Both All Crashes - - - 16%
Table 3.11: Add two-way left turn lane, 40 driveways per mile, recommended CRFs Character Crash Type Fatal Injury PDO All Crashes Both All Crashes - - - 27%
Table 3.12: Add two-way left turn lane, 60 driveways per mile, recommended CRFs Character Crash Type Fatal Injury PDO All Crashes Both All Crashes - - - 31%
21
Reviewed study title: Harwood, D.W., F.M. Council, E. Hauer, W.E. Hughes, and A. Vogt. Prediction of the Expected Safety Performance of Rural Two-Lane Highways. Federal Highway Administration. McLean, VA. 2000.
Study type: Expert Panel Study rating: 4 This report presents an algorithm for estimating the safety performance of an existing or proposed rural two-lane highway. The crash prediction algorithm consists of base models and crash modification factors for roadway segments and at-grade intersections. The base models estimate the safety performance of a roadway or intersection for a set of assumed base conditions. The crash modification factors adjust the base model predictions to account for the safety effects of various treatments for roadway segments and at-grade intersections. The algorithm can be used to compare the anticipated safety performance of two or more geometric alternatives for a proposed highway improvement. The algorithm also includes an Empirical Bayes procedure that permits use of the safety predictions in conjunction with historical crash data.

22
3.1.7 Improve horizontal curve geometry
Main Category: Roadway Section Character: Rural Crash Types Addressed Non-Collision, Fixed Object, Head-On, Sideswipe-Meeting Other Causes: Geometry, Excessive Speed Summary discussion: Certain crash types are far more prevalent on curves than on tangents. While numerous strategies have demonstrated some effectiveness, noteworthy crash reductions can be realized on curves through improving horizontal curve geometry, also known as curve flattening. Improving horizontal curve geometry necessitates reconstructing a road section and modifying its alignment, which makes this strategy a high-cost alternative. However, since this is a proven strategy with a potential for substantial crash reductions, it should be considered as a treatment alternative for locations with a significant number of ROR and/or head-on crash problems. Not surprisingly, research has indicated that the safety effect of curve flattening will depend rather heavily on the magnitude of curve radius reduction performed. The CRF for curve reduction must be calculated and uses the before and after curve length and radius. This CRF is only applicable to rural two-lane roads and applies to all crashes.
Recommended crash reduction factor(s): The CRF for changes in horizontal curvature is presented in Harwood, et al. as a function of curve radius and length. Because these two parameters are so variable in any design, no standard CRFs are given. Instead the analyst must calculate a CRF based on the before and after design conditions using the following procedure:
CRF = 1- (AMFAFTER / AMFBEFORE) where AMF is given by:
AMF = (1.55LC + 80.2 / R -0.012 S) / 1.55LC where
LC = length of horizontal curve in miles (excluding spiral) R = radius of curvature in feet S = 1 if spiral transition curve, 0 otherwise.
For a number of degree of curvatures and lengths, the AMF is calculated and shown in Figure 3.8 and Figure 3.9, assuming both spiral transitions curve are present or not.

23
AMF - Horizontal Curves w/o Spiral
1
1.1
1.2
1.3
1.4
1.5
1.6
1.7
1.8
1.9
2
0 500 1,000 1,500 2,000 2,500 3,000 3,500 4,000 4,500 5,000
Length of Curve (ft)
AMF
2 DEG4 DEG6 DEG8 DEG10 DEG12 DEG14 DEG16 DEG18 DEG
20
180
Figure 3.8: AMF for changes in horizontal curvature w/o spiral
AMF - Horizontal Curves w/ Spiral
1
1.1
1.2
1.3
1.4
1.5
1.6
1.7
1.8
1.9
2
0 500 1,000 1,500 2,000 2,500 3,000 3,500 4,000 4,500 5,000
Length of Curve (ft)
AMF
2 DEG4 DEG6 DEG8 DEG10 DEG12 DEG14 DEG16 DEG18 DEG
20
180
Figure 3.9: AMF for changes in horizontal curvature w/ spiral

24
As an example, the following conditions are provided to calculate the expected CRF: :
Before curve parameters – 8 degree of curve, 1000 feet in length, spiral present After curve parameters – 6 degree of curve, 1250 feet in length, spiral present
For the function, note that R, radius of curvature in feet, can be determined by (5,729.578 / D). Substituting these values in the AMF equation yields an AMF for the before curve of 1.34 and an AMF for the after curve of 1.19. These values could also be read off the figure. The CRF to improve this curve would then be 11% (1 – (1.19/1.34)). Likewise, calculations can be made for any combination of curve parameters. The CRF applies to all crashes that occur on the curve.
Reviewed study title: Harwood, D.W., F.M. Council, E. Hauer, W.E. Hughes, and A. Vogt. Prediction of the Expected Safety Performance of Rural Two-Lane Highways. Federal Highway Administration. McLean, VA. 2000. Study type: Expert Panel Study rating: 4 This report presents an algorithm for estimating the safety performance of an existing or proposed rural two-lane highway. The crash prediction algorithm consists of base models and crash modification factors for roadway segments and at-grade intersections. The base models estimate the safety performance of a roadway or intersection for a set of assumed base conditions. The crash modification factors adjust the base model predictions to account for the safety effects of various treatments for roadway segments and at-grade intersections. The algorithm can be used to compare the anticipated safety performance of two or more geometric alternatives for a proposed highway improvement. The algorithm also includes an Empirical Bayes procedure that permits use of the safety predictions in conjunction with historical crash data.

25
3.1.8 Improve superelevation on curves
Main Category: Roadway Section Character: Rural Crash Types Addressed Non-Collision, Fixed Object, Head-On, Sideswipe-Meet Other Causes: Excessive Speed Summary discussion: Many curves may have inadequate superelevation due to vehicles traveling at higher speeds than the curves were originally designed for, a loss of effective superelevation following resurfacing, or changes in design policy after construction. Curves with inadequate superelevation may experience elevated crash frequencies, particularly where actual superelevation is less than optimal (as recommended by AASHTO policy). Additionally, there appears to be no effect on safety when actual superelevation is greater than recommended. Therefore, it can be concluded that safety along curves with less than optimal superelevation will be enhanced when the superelevation is improved or restored. The CRF is determined by the amount of superelevation deficiency present that will be improved in the after condition by improving the superelevation to recommended policy values in the ODOT Highway Design Manual. This CRF should only be applied to rural two-lane roadways and is applicable to all crashes, and the deficiency must be greater than 0.01.
Recommended crash reduction factor(s): The AMF is a combination of three linear functions depending on the superelevation deficiency. For a deficiency between 0.01 and 0.02 the AMF is given as (1.00 + 6(SD – 0.01) and for a deficiency greater than 0.02 is given as (1.00 + 3(SD – 0.02), where SD is the superelevation deficiency. These AMF values are shown in Figure 3.10 for a range of superelevation deficiencies. As in the horizontal curve example, the CRF is calculated as CRF = 1- (AMFAFTER / AMFBEFORE) where the AMFAFTER is assumed to be 1.00. Given that current highway design policy is an 8% maximum superelevation in snow and ice areas on rural two-lane highways, three CRFs are calculated below. However, the analyst could calculate a CRF from Figure 3.10 or the above equations for their specific change in superelevations.

26
AMF - SUPERELEVATION
1.00
1.05
1.10
1.15
1.20
1.25
1.30
0 0.01 0.02 0.03 0.04 0.05 0.06 0.07 0.08
Superelevation Deficiency
AMF
Figure 3.10: AMF for superelevation deficiency
Table 3.13: Improve superelevation from 0.02 to 0.08 Character Crash Type Fatal Injury PDO All Crashes Rural All Crashes - - - 15%
Table 3.14: Improve superelevation from 0.04 to 0.08 Character Crash Type Fatal Injury PDO All Crashes Rural All Crashes - - - 11%
Table 3.15: Improve superelevation from 0.06 to 0.08 Character Crash Type Fatal Injury PDO All Crashes Rural All Crashes - - - 6%
Reviewed study title: Harwood, D.W., F.M. Council, E. Hauer, W.E. Hughes, and A. Vogt. Prediction of the Expected Safety Performance of Rural Two-Lane Highways. Federal Highway Administration. McLean, VA. 2000.
Study type: Expert Panel Study rating: 4 This report presents an algorithm for estimating the safety performance of an existing or proposed rural two-lane highway. The crash prediction algorithm consists of base models and crash modification factors for roadway segments and at-grade intersections. The base models estimate the safety performance of a roadway or intersection for a set of assumed base conditions. The crash modification factors adjust the base model predictions to account for the safety effects of various treatments for roadway segments and at-grade intersections. The algorithm can be used to compare the anticipated safety performance of two or more geometric alternatives for a proposed highway improvement. The algorithm also includes an Empirical Bayes procedure that permits use of the safety predictions in conjunction with historical crash data.

27
3.1.9 Install centerline rumble strips
Main Category: Roadway Section Character: Rural Crash Types Addressed: Head-On, Sideswipe-Meet Other Causes: Driver Inattention
Figure 3.11: Centerline rumble strips
Summary discussion: Centerline rumble strips are typically installed on undivided roadways to reduce head-on and sideswipe crashes related to vehicle intrusion into the opposing traffic lane. They are intended to alert drowsy or otherwise inattentive drivers through tactile and auditory stimulation when their vehicles begin to encroach upon the opposing lane. In addition, centerline rumble strips may also discourage drivers from cutting across the inside of a curve. Depending on the jurisdiction, they are installed either along the width of the centerline or on either side of it, continuously or according to a skip pattern. The current research is only applicable to two-lane rural roadways.
Table 3.16: Centerline rumble strips, recommended CRFs*
Character Crash Type Fatal Injury PDO All Crashes Rural All Crash Types - 14% - 12% Rural Head-On - 25% - 21% Rural Sideswipe-Meet - 25% - 21%
* only applicable to two-lane roads Reviewed study title: Persaud, B.N., R.A. Retting, and C. Lyon. Crash Reduction Following Installation of Centerline Rumble Strips on Rural Two-Lane Roads. Insurance Institute for Highway Safety. Arlington, VA. 2003.

28
Study type: Empirical Bayes Before-After Study rating: 4 This report describes an evaluation of the safety effects of centerline rumble strips along undivided rural two-lane roads. Data were analyzed for approximately 210 miles of treated roads in seven states before and after installation of centerline rumble strips. An Empirical Bayes before-and-after procedure was employed to properly account for regression to the mean while normalizing for differences in traffic volume and other factors between the before and after periods. This study found reductions following installation of centerline rumble strips in all crash types for both injury (5%-23%) and all crash severities (7%-18%), and grouped crash reductions for head-on and sideswipe-meeting crashes (6%-44% injury, 8%-42% all severities).

29
3.1.10 Install passing lane
Main Category: Roadway Section Character: Rural Crash Types Addressed: Head-On, Sideswipe-Meeting, Fixed Object, Non-Collision Other Causes: Congestion, Geometry
Figure 3.12: Passing lane
Summary discussion: Alternating passing/climbing lanes or short four-lane sections that allow passing in both directions are aimed at improving two-lane locations that experience many passing- or climbing-related collisions. The addition of passing lanes is designed to reduce passing-related, head-on crashes and should positively affect nonpassing head-on collisions as well, since the passing lanes provide extra “clear zone” for vehicles inadvertently leaving their through lanes. It may also affect other types of crashes, such as rear-end crashes involving turning vehicles, since the passing lane provides protection for the left-turning vehicle. Climbing lanes are designed to reduce rear-end crashes resulting from sudden speed differentials between heavier and lighter vehicles on grades, yet they often have spillover benefits similar to those listed above. This strategy is relatively expensive and time-consuming since it requires lane construction and additional right-of-way, but it is less expensive than full-scale realignment or reconstruction.
Table 3.17: Passing lane, one-way, recommended CRFs* Character Crash Type Fatal Injury PDO All Crashes Rural All Crash Types - - - 25%
* single direction of travel
Table 3.18: Passing lane, two-way, recommended CRFs* Character Crash Type Fatal Injury PDO All Crashes Rural All Crash Types - - - 35%
* short four-lane section

30
Reviewed study title: Harwood, D.W., F.M. Council, E. Hauer, W.E. Hughes, and A. Vogt. Prediction of the Expected Safety Performance of Rural Two-Lane Highways. Federal Highway Administration. McLean, VA. 2000.
Study type: Expert Panel Study rating: 4 This report presents an algorithm for estimating the safety performance of an existing or proposed rural two-lane highway. The crash prediction algorithm consists of base models and crash modification factors for roadway segments and at-grade intersections. The base models estimate the safety performance of a roadway or intersection for a set of assumed base conditions. The crash modification factors adjust the base model predictions to account for the safety effects of various treatments for roadway segments and at-grade intersections. The algorithm can be used to compare the anticipated safety performance of two or more geometric alternatives for a proposed highway improvement. The algorithm also includes an Empirical Bayes procedure that permits use of the safety predictions in conjunction with historical crash data. This study found reductions in all crashes for installation of individual, one-way passing lanes (25%) as well as dual passing lanes resulting in short, four-lane sections (35%).

31
3.1.11 Install shoulder rumble strips
Main Category: Roadway Section Character: Rural Crash Types Addressed: Non-Collision, Fixed Object, Head-On, Sideswipe-Meet Other Causes: Driver Inattention
Figure 3.13: Shoulder Rumble Strips
Summary discussion: Shoulder rumble strips are designed to provide an audible and tactile signal to drowsy, impaired, or otherwise inattentive drivers that they are leaving the roadway. While they are designed primarily to reduce ROR crashes, shoulder rumble strips can also reduce head-on crashes that occur when a vehicle leaves the roadway and its driver overcompensates while trying to recover control. The effectiveness of shoulder rumble strips has only been studied for ROR crashes on freeways. Research has generally combined urban and rural freeways, but safety improvements related to shoulder rumble strips are generally less pronounced on urban freeways. One would expect shoulder rumble strips to be effective on two-lane rural highways, however their performance in such situations has not yet been thoroughly evaluated. Concerns associated with this countermeasure include potential incompatibility with bicycles and motorcycles, difficulties related to snow and ice removal, and noise issues.
Table 3.19: Shoulder rumble strips, recommended CRFs*
Character Crash Type Fatal Injury PDO All Crashes Rural Non-Collision - 7% - 21% Rural Fixed Object - 7% - 21%
* only applicable to rural freeways

32
Reviewed study title: Griffith, M.S. Safety Evaluation of Rolled-In Continuous Shoulder Rumble Strips Installed on Freeways. Transportation Research Record. No. 1665. Transportation Research Board. Washington, DC. 1999. p. 28-34. Study type: Before-After Comparison Group Study rating: 4 This analysis estimates the safety effects of continuous shoulder rumble strips (CSRS) on freeways. The study relied on data from the Highway Safety Information System for two states (California and Illinois) and consisted of before-and-after evaluations of CSRS projects with the use of different comparison groups. This study found reductions of 21% in all fixed object and non-collision crashes and 7% in injury fixed object and non-collision crashes.

33
3.1.12 Increase width of paved shoulder
Main Category: Roadway Section Character: Rural Crash Types Addressed: Non-Collision, Fixed Object, Head-On, Sideswipe-Meet Other Causes: Geometry Summary discussion: While they are often warranted individually or together, there is uncertainty concerning the safety effectiveness of shoulder widening and paving. While the majority of studies have demonstrated noteworthy crash reductions following shoulder widening and/or paving, a few have shown no significant improvements or possibly even increases in crashes. However, the increasing shoulder width up to 8ft as well as paving the shoulder is known to have positive effect on safety. What is clear is that the effectiveness of shoulder widening and paving varies depending on previous and resulting shoulder width as well as the ADT of the treated roadway section. The CRF is for widening paved shoulders on rural two-lane highways. The CRF is a function of volume; however, the CRFs shown are only for volumes above 2,000 ADT.
Recommended crash reduction factor(s): The AMF for changes in shoulder width and type is given as
AMF = (AMFWRA AMFTRA – 1.0) * PRA + 1.0 where
AMFWRA is calculated by dividing the AMF in the after condition by the AMF in the before condition for shoulder width, which can be obtained from Figure 3.14.
AMFTRA is calculated by dividing the AMF in the after condition by the AMF in the before condition for shoulder type, which can be obtained from Table 3.20.
PRA = the proportion total crashes to related crashes, given as 0.35.
Once the AMF has been determined, the CRF can be calculated by (1-AMF). For example, on a road with 10,000 ADT a paved shoulder width of 4 feet is provided on both directions. If the paved shoulders are improved to 8 feet the CRF would be 9%, calculated as (1-{[(0.87/1.15)(1.00/1.00) – 1.0)]*0.35 + 1.0}). The analyst could calculate a CRF for any combination using the methodology. A composite shoulder is 50% paved and 50% turf. These CRFs only apply to rural two-lane roadways.

34
Figure 3.14: AMF for paved shoulder widths on two-lane rural highways (Harwood et al 2000)
Table 3.20: AMF for shoulder type on two-lane rural highways Shoulder width (ft) Shoulder
type 0 1 2 3 4 6 8 10
Paved 1.00 1.00 1.00 1.00 1.00 1.00 1.00 1.00
Gravel 1.00 1.00 1.01 1.01 1.01 1.02 1.02 1.03
Composite 1.00 1.01 1.02 1.02 1.03 1.04 1.06 1.07
Turf 1.00 1.01 1.03 1.04 1.05 1.08 1.11 1.14
Table 3.21: Widen paved shoulder from 2 to 8 feet, ADT >2000. recommended CRFs Character Crash Type Fatal Injury PDO All Crashes Rural All Crash Types - - - 12%
Table 3.22: Widen paved shoulder from 4 to 8 feet, ADT>2000, recommended CRFs Character Crash Type Fatal Injury PDO All Crashes Rural All Crash Types - - - 9%
Table 3.23: Widen paved shoulder from 6 to 8 feet, ADT >2000, recommended CRFs Character Crash Type Fatal Injury PDO All Crashes Rural All Crash Types - - - 5%
Reviewed study title: Harwood, D.W., F.M. Council, E. Hauer, W.E. Hughes, and A. Vogt. Prediction of the Expected Safety Performance of Rural Two-Lane Highways. Federal Highway Administration. McLean, VA. 2000.

35
Study type: Expert Panel Study rating: 4 This report presents an algorithm for estimating the safety performance of an existing or proposed rural two-lane highway. The crash prediction algorithm consists of base models and crash modification factors for roadway segments and at-grade intersections. The base models estimate the safety performance of a roadway or intersection for a set of assumed base conditions. The crash modification factors adjust the base model predictions to account for the safety effects of various treatments for roadway segments and at-grade intersections. The algorithm can be used to compare the anticipated safety performance of two or more geometric alternatives for a proposed highway improvement. The algorithm also includes an Empirical Bayes procedure that permits use of the safety predictions in conjunction with historical crash data.

36
3.1.13 Increase lane width
Main Category: Roadway Section Character: Rural Crash Types Addressed: Sideswipe-Meeting, Head-On, Sideswipe - Overtaking Other Causes: Geometry Summary discussion: The width of travel lanes can have an effect on the safety of the roadway. The AASHTO standard in most cases is 12-foot lanes, but there is some debate over whether these actually have the best safety performance, as some have suggested that 11-foot lanes may be preferable. In some instances, widening lanes from 10 or 11 to 12 feet on major roads can improve safety. In other cases, it may desirable to narrow lanes for speed control on more residential-type streets. The CRFs for lane widening are based on an expert panel review and apply to rural two and multilane facilities.
Recommended crash reduction factor(s): The AMF for changes in lane width and type is given as
AMF = f * (AMFRA – 1.0) * PRA + 1.0 where
AMFRA is calculated by dividing the AMF in the after condition by the AMF in the before condition for shoulder width, which can be obtained from Figure 3.15.
PRA = the proportion of total crashes to related crashes, given as 0.35
f = factor for roadway type, 1.0 for two-lane, 0.75 for multilane undivided, and 0.50 for divided
Once the AMF has been determined, the CRF can be calculated by (1-AMF). For example, the CRF to improve lane width from 11 feet to 12 feet on a paved rural two-lane highway would be 2%, calculated by (1-{1.0*[(1.00/1.05) – 1.0)]*0.35 + 1.0}). A number of CRFs for rural two-lane highway lane width improvement are calculated; however, the analyst could calculate AMF specific to the case.

37
Figure 3.15: AMF for lane width
Table 3.24: Increase lane width from 9 to 12 feet, ADT >2000, recommended CRFs Character Crash Type Fatal Injury PDO All Crashes Rural All Crash Types - - - 12%
Table 3.25: Increase lane width from 10 to 12 feet, ADT >2000, recommended CRFs Character Crash Type Fatal Injury PDO All Crashes Rural All Crash Types - - - 8%
Table 3.26: Increase lane width from 11 to 12 feet, ADT >2000, recommended CRFs Character Crash Type Fatal Injury PDO All Crashes Rural All Crash Types - - - 2%
Reviewed study title: Harwood, D.W., F.M. Council, E. Hauer, W.E. Hughes, and A. Vogt. Prediction of the Expected Safety Performance of Rural Two-Lane Highways. Federal Highway Administration. McLean, VA. 2000. Study type: Expert Panel Study rating: 4 This report presents an algorithm for estimating the safety performance of an existing or proposed rural two-lane highway. The crash prediction algorithm consists of base models and crash modification factors for roadway segments and at-grade intersections. The base models estimate the safety performance of a roadway or intersection for a set of assumed base conditions. The crash modification factors adjust the base model predictions to account for the

38
safety effects of various treatments for roadway segments and at-grade intersections. The algorithm can be used to compare the anticipated safety performance of two or more geometric alternatives for a proposed highway improvement. The algorithm also includes an Empirical Bayes procedure that permits use of the safety predictions in conjunction with historical crash data.
Reviewed study title: Harwood, D.W., E.R. Rabbani, K.R. Richard, H.W. McGee, and G.L. Gittings. Systemwide Impact of Safety and Traffic Operations Design Decisions for 3R Projects. NCHRP Report 486. National Cooperative Research Program. Transportation Research Board. Washington, DC. 2003. Study type: Expert Panel Study rating: 4 This study develops a resource allocation process that optimizes systemwide safety for a set of potential resurfacing projects within a specified improvement budget. The project objective was met with the development of the Resurfacing Safety Resource Allocation Program (RSRAP), which was included was included with the report on CD-ROM.

39
3.2 MARKINGS OR SIGNS
3.2.1 Convert to 4-way stop from 2-way stop
Main Category: Intersection Character: Urban Crash Types Addressed: Angle, Turning, Pedestrian Other Causes: Excessive Speed, Turning Volumes Summary discussion: Converting to 4-way from 2-way stop control can reduce the occurrence of crashes of various types at unsignalized intersections by increasing order, reducing through and turning speeds, and minimizing any undesirable effects of restrictions on sight distance. However, these conversions are only recommended at intersections whose approaches feature moderate and somewhat balanced traffic volumes. When these conditions are not met, converting to 4-way stop control may result in unnecessary delays and drivers intentionally ignoring the stop control. When it is undertaken at appropriate locations, the greatest benefits stemming from conversion to 4-way from 2-way stop control appear to be associated with angle, pedestrian, and turning crashes, and especially those involving injuries.
Table 3.27: Convert to 4-way stop from 2-way stop, recommended CRFs Character Crash Type Fatal Injury PDO All Crashes Urban All Crash Types - 71% - 47% Urban Angle - - - 72% Urban Rear-End - - - 13% Urban Turning - - - 20% Urban Pedestrian - - - 39%
Reviewed study title: Lovell, J. and E. Hauer. The Safety Effect of Conversion to All-Way Stop Control. Transportation Research Record. No. 1068. Transportation Research Board. Washington, DC. 1986. p. 103-107. Study type: Before-After Study rating: 4 For the purposes of this study, the authors reanalyzed and debiased data from three recent studies to account for the potential for regression-to-the-mean; then they assembled and examined a new data set. Analysis revealed that the reductions reported in earlier studies were quite real and were confirmed by the new data. The empirical information contained in the data sets was captured in likelihood functions, and the four functions were joined. This study found overall reductions in both injury (71%) and all (47%) crashes following conversion to all-way from 2-way stop, and reductions by type in angle (72%), rear-end (13%), turning-related (20%), and pedestrian (39%) crashes.

40
3.3 OPERATIONS/ITS
3.3.1 Install automated enforcement of red light violations
Main Category: Intersection Character: Urban Crash Types Addressed: Angle, Rear-End, Turning Other Causes: Driver Inattention, Excessive Speed
Figure 3.16: Automated enforcement of red light violations
Summary discussion: Automated enforcement of red light violations is a well-documented approach to improving safety that has been shown to substantially decrease violations at treated intersections and may decrease those at nearby intersections. This decrease in red-light-running violations has been shown to result in decreases in angle crashes of all severities; however, an increase in rear-end crashes is a common side-effect. While there are clear advantages as far as safety and cost effectiveness are concerned, there is also a degree of controversy surrounding the use of automated enforcement. Specific legislation may be necessary to enable automated enforcement in some jurisdictions.
Table 3.28: Install automated enforcement of red light violations, recommended CRFs Character Crash Type Fatal Injury PDO All Crashes Urban All Crash Types - 14% - 9% Urban Rear-End - -24% - -15% Urban Angle - 16% - 25%
Reviewed study title: Council, F.M., B. Persaud, C. Lyon, K. Eccles, M. Griffith, E. Zaloshnja, and T. Miller. Economic Analysis of the Safety Effects of Red Light Camera Programs and the Identification of

41
Factors Associated with the Greatest Benefits. Transportation Research Board 84th Annual Meeting. Washington, DC. 2005. Persaud, B., F.M. Council, C. Lyon, K. Eccles, and M. Griffith. A Multi-Jurisdictional Safety Evaluation of Red Light Cameras. Transportation Research Board 84th Annual Meeting. Washington, DC. 2005. Study type: Empirical Bayes Before-After Study rating: 5 This study measured the effectiveness of red-light-camera (RLC) systems in reducing crashes. The study employed Empirical Bayes before-after research using data from seven jurisdictions across the U.S. at 132 treatment sites. The study found overall crash reductions of 14% for injury crashes and 9% for crashes of all severity levels. Crash effects by type were consistent in direction with those found in many previous studies: reductions in angle crashes (16% injury, 25% all) and increases in rear-end crashes (24% injury, 15% all).

42
3.3.2 Install traffic signal
Main Category: Intersection Character: Urban Crash Types Addressed: Angle, Turning Other Causes: Turning Volumes, Excessive Speed Summary discussion: The installation of a traffic signal can have a positive effect on intersection safety. It requires careful consideration, however, as unwarranted traffic signals have been known to cause an increase in crashes. When a signal is warranted and properly designed, it will typically reduce angle crashes as well as some related to turning movements. However, these reductions are often accompanied by an increase in rear-end crashes.
Table 3.29: Install traffic signal, 3-leg intersection, recommended CRFs Character Crash Type Fatal Injury PDO All Crashes Urban All Crash Types 14% 14% - - Urban Angle 34% 34% - - Urban Rear-End -50% -50% - -
Table 3.30: Install traffic signal, 4-leg intersection, recommended CRFs Character Crash Type Fatal Injury PDO All Crashes Urban All Crash Types 23% 23% - - Urban Angle 67% 67% - - Urban Rear-End -38% -38% - -
Reviewed study title: McGee, H., S. Taori, and B.N. Persaud. Crash Experience Warrant for Traffic Signals. NCHRP Report 491. National Cooperative Highway Research Program. Transportation Research Board. Washington, DC. 2003. Study type: Empirical Bayes Before-After Study rating: 5 This report describes a process for estimating the safety impacts of installing or removing traffic control signals and recommends an improved Crash Experience warrant for the Manual on Uniform Traffic Control Devices (MUTCD). The study includes a model to estimate the number, severity, and types of crashes expected at signalized and stop-controlled intersections and the changes expected from installation or removal of a traffic signal. Conditions under which signal installation or removal is likely to improve or degrade safety are identified, and an improved Crash Experience warrant is recommended. This study reported combined reductions in fatal and injury crashes following signal installation at 3-leg intersections for all crash types (14%) and angle crashes (34%), and a combined increase in fatal and injury crashes of 50% for rear-end crashes. At 4-leg intersections, fatal/injury crashes were reduced by 23% for all crash types and 67% for angle crashes, and fatal/injury rear-end crashes increased by 38%.

43
3.3.3 Lengthen the yellow change interval to ITE guidelines
Main Category: Intersection Character: Urban Crash Types Addressed: Angle, Rear-End, Turning Other Causes: Driver Inattention, Excessive Speed Summary discussion: A properly timed yellow interval is a key safety component of signalized intersections. Yellow intervals that are too short or too long can lead to signal violations, as drivers develop expectancies of what the yellow interval should be based on past experiences and behave accordingly. Based in part on various research conducted at the Insurance Institute for Highway Safety (IIHS), ITE developed guidelines for establishing the duration of traffic signal change intervals that call for the lengthening of many yellow intervals. In a recent study, IIHS estimated the potential crash effects associated with these modifications, and a modest reduction in injury crashes was observed. It was concluded that although this reduction was noteworthy, it did not amount to a solution, indicating that lengthening the yellow change interval alone will not produce significant crash reductions.
Table 3.31: Lengthen yellow change interval to ITE guidelines, recommended CRFs Character Crash Type Fatal Injury PDO All Crashes Urban All Crash Types - 12% - 8% Urban Rear-End - -8% - -12% Urban Angle - -6% - 4% Urban Pedestrian - 37% - 37%
Reviewed study title: Retting, R.A., J.F. Chapline, and A.F. Williams. Changes in Crash Risk Following Re-timing of Traffic Signal Change Intervals. Accident Analysis and Prevention. 34(2). 2002. p. 215-220. Study type: Before-After Comparison Group Study rating: 4 This study estimated crash effects of modifying the duration of traffic signal change intervals to conform to proposed ITE values. A sample of 122 intersections was identified and randomly assigned to experimental and control groups. Of 51 eligible experimental sites, 40 (78%) needed signal timing changes. The study found overall reductions in injury crashes (12%) and crashes of all severities (8%). Separating crash effects by type yielded reductions of 37% in pedestrian crashes involving injuries and in those of all severities, and of 4% in angle crashes of all severity levels. Increases were reported for angle crashes involving injuries (6%) as well as rear-end crashes (8% injury, 12% all).

44
3.3.4 Remove traffic signal from one-way street
Main Category: Intersection Character: Urban Crash Types Addressed: Rear-End Other Causes: Congestion Summary discussion: Safety and operational problems related to unwarranted signals can frequently be remedied by removing the signals, as long as removal does not create other, more serious problems. This is especially true on one-way streets, where the range of potential conflicts addressed by signalization is generally narrower than on two-way streets. While eliminating signalization at an appropriate intersection may not necessarily reduce the total crash rate, it may be beneficial in terms of crash severity for certain crash types. When the decision is made to remove a signal, the signal heads should be kept in place (set to flash or covered) for at least 90 days once the new traffic control has been installed in order to draw attention to the change in control.
Table 3.32: Remove traffic signal from one-way street, recommended CRFs Character Crash Type Fatal Injury PDO All Crashes Urban All Crash Types - - - 24% Urban Angle - - - 24% Urban Turning - - - 24% Urban Rear-End - - - 20% Urban Pedestrian - - - 18%
Reviewed study title: Persaud, B., E. Hauer, R.A. Retting, R. Vallurupalli, and K. Mucsi. Crash Reductions Related to Traffic Signal Removal in Philadelphia. Accident Analysis and Prevention. 29(6). 1997. p. 803-810. Study type: Empirical Bayes Before-After Study rating: 5 The effect of converting one-way intersections in Philadelphia from signal to multi-way stop sign control on intersection crashes was estimated. Using crash and traffic volume data for a comparison group, regression models were computed to represent the normal crash experience of signal controlled intersections of one-way streets, by impact type, as a function of traffic volume. An empirical Bayesian procedure was used to estimate what would have been the expected number of crashes at the converted intersections had they not been converted. The empirical Bayesian estimates were compared with actual counts of crashes after conversion. Estimated reductions for crashes of all types were 23%-28% for injury crashes and 22%-30% for all crashes. Estimated reductions were also given for the following crash types: angle (16%-28% injury, 19%-29% all), rear-end (18%-45% injury, 16%-48% all), pedestrian (13%-49% injury, 6%-46% all), and fixed object (11%-29% injury, 31%-44% all).

45
3.4 PEDESTRIAN
3.4.1 Provide mid-block pedestrian refuge
Main Category: Intersection Character: Urban Crash Types Addressed: Pedestrian Other Causes: Excessive Speed
Figure 3.17: Mid-block pedestrian refuge
Summary discussion: Mid-block pedestrian refuge islands are commonly found along wide, multi-lane streets where adequate pedestrian protection could not otherwise be provided without adversely affecting traffic flow. While they are devoted primarily to pedestrians, mid-block refuges may also improve motor-vehicle safety through channelization and changes in street character that reduce vehicle speeds. When considering installation of a mid-block pedestrian refuge, there are several issues that should be taken into account: any landscaping on the island should not block sight distance between motorists and pedestrians; turning movements should be carefully evaluated to ensure that motorists are not encouraged to travel on inappropriate routes or make unsafe U-turns; and accessibility must be incorporated into the design by way of curb ramps or cut-throughs. This crash reduction factor applies to locations where existing marked crosswalks exist.
Table 3.33: Provide mid-block pedestrian refuge, recommended CRFs* Character Crash Type Fatal Injury PDO All Crashes Urban Pedestrian - - - 46%
* Existing marked crosswalk

46
Reviewed study title: Zegeer, C.V., R. Stewart, H. Huang, and P. Lagerwey. Safety Effects of Marked Versus Unmarked Crosswalks at Uncontrolled Locations: Executive Summary and Recommended Guidelines. Federal Highway Administration. McLean, VA. 2002. Study type: Study rating: 3 This study involved an analysis of 5 years of pedestrian crashes at 1,000 marked crosswalks and 1,000 matched unmarked comparison sites. All sites in this study had no traffic signal or stop sign on the approaches. Detailed data were collected on traffic volume, pedestrian exposure, number of lanes, median type, speed limit, and other site variables. Poisson and negative binomial regressive models were used. The study results revealed that on two-lane roads, the presence of a marked crosswalk “alone” at an uncontrolled location was associated with no difference in pedestrian crash rate, compared to an unmarked crosswalk. Further, on multi-lane roads with traffic volumes above about 12,000 vehicles per day, having a marked crosswalk alone (without other substantial improvements) was associated with a higher pedestrian crash rate (after controlling for other site factors) compared to an unmarked crosswalk. Raised medians provided significantly lower pedestrian crash rates on multi-lane roads, compared to roads with no raised median.

47
3.5 ROADSIDE IMPROVEMENT
3.5.1 Install new guardrail
Main Category: Roadway Section Character: Both Crash Types Addressed: Non-Collision, Fixed Object Other Causes: Geometry, Excessive Speed
Figure 3.18: New guardrail
Summary discussion: Guardrail installation has been proven to reduce the severity of fixed-object crashes. However, when applying this strategy it is important to consider that guardrails are among the most frequently struck fixed objects in fatal crashes in the U.S. Other concerns related to guardrail installation are sight distance, snow removal, mowing, maintenance, and the costs and risks associated with end treatments. Installing a guardrail may increase crash frequency, but it can be expected to reduce crash severity.
Table 3.34: Install new guardrail recommended CRFs* Character Crash Type Fatal Injury PDO All Crashes Both Fixed Object 44% 47% - -
* installed along embankment Reviewed study title: Elvik, R. and T. Vaa. Handbook of Road Safety Measures. Elsevier. Oxford, UK. 2004. Study type: Meta-Analysis Study rating: 4 This handbook catalogues more than 100 road safety measures whose effects have been evaluated and quantified in studies conducted all over the world. The results of more than 1,700

48
road safety evaluation studies are summarized. The book covers the whole spectrum of road safety measures, ranging from highway engineering and traffic control, through vehicle design, driver training, public information campaigns and police enforcement. The book reports reductions in fatal (44%) and injury (47%) fixed object crashes following installation of a new guardrail along an embankment.
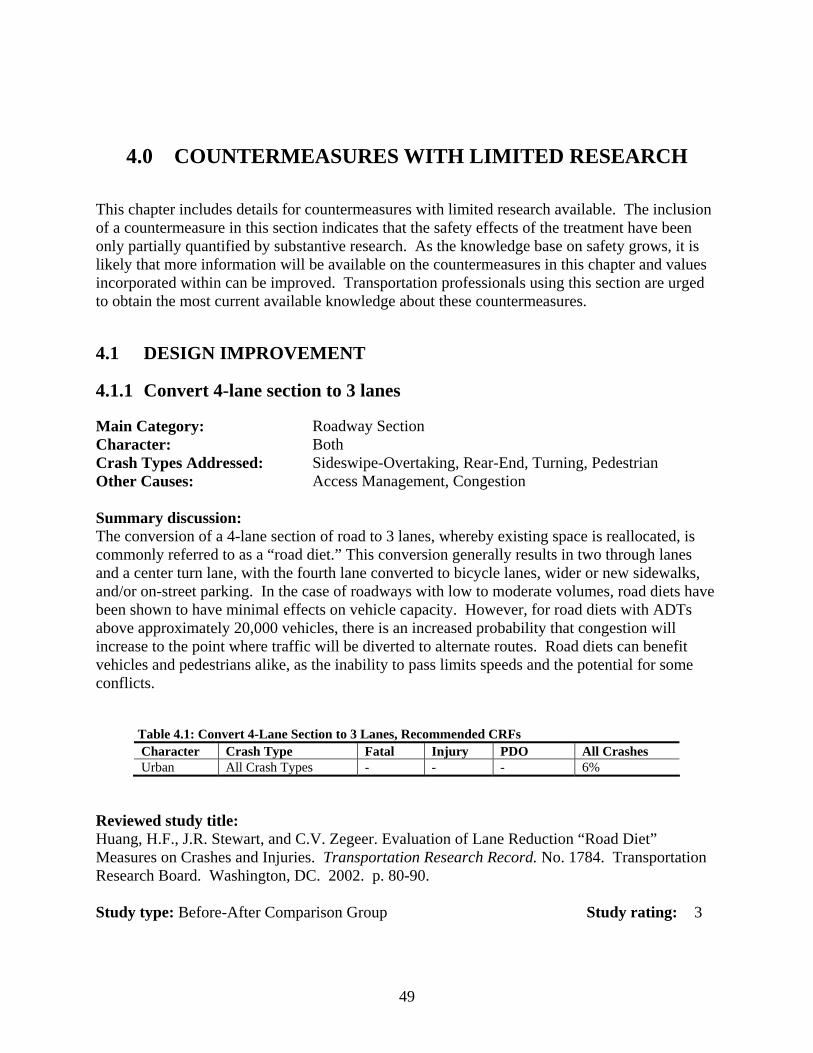
49
4.0 COUNTERMEASURES WITH LIMITED RESEARCH
This chapter includes details for countermeasures with limited research available. The inclusion of a countermeasure in this section indicates that the safety effects of the treatment have been only partially quantified by substantive research. As the knowledge base on safety grows, it is likely that more information will be available on the countermeasures in this chapter and values incorporated within can be improved. Transportation professionals using this section are urged to obtain the most current available knowledge about these countermeasures.
4.1 DESIGN IMPROVEMENT
4.1.1 Convert 4-lane section to 3 lanes
Main Category: Roadway Section Character: Both Crash Types Addressed: Sideswipe-Overtaking, Rear-End, Turning, Pedestrian Other Causes: Access Management, Congestion Summary discussion: The conversion of a 4-lane section of road to 3 lanes, whereby existing space is reallocated, is commonly referred to as a “road diet.” This conversion generally results in two through lanes and a center turn lane, with the fourth lane converted to bicycle lanes, wider or new sidewalks, and/or on-street parking. In the case of roadways with low to moderate volumes, road diets have been shown to have minimal effects on vehicle capacity. However, for road diets with ADTs above approximately 20,000 vehicles, there is an increased probability that congestion will increase to the point where traffic will be diverted to alternate routes. Road diets can benefit vehicles and pedestrians alike, as the inability to pass limits speeds and the potential for some conflicts.
Table 4.1: Convert 4-Lane Section to 3 Lanes, Recommended CRFs Character Crash Type Fatal Injury PDO All Crashes Urban All Crash Types - - - 6%
Reviewed study title: Huang, H.F., J.R. Stewart, and C.V. Zegeer. Evaluation of Lane Reduction “Road Diet” Measures on Crashes and Injuries. Transportation Research Record. No. 1784. Transportation Research Board. Washington, DC. 2002. p. 80-90. Study type: Before-After Comparison Group Study rating: 3

50
This study investigated the actual crash effects of road diets using twelve road diets and 25 comparison sites in cities in California and Washington. Crash data were obtained for the road diet (2,068 crashes) and comparison sites (8,556 crashes), and a before-and-after analysis using a yoked comparison was conducted. In addition, a separate analysis was conducted, in which a negative binomial model was used to control for possible differential changes in average daily traffic, study period, and other factors. This study found a modest reduction in all crashes (0-11%) following conversion.
Reviewed study title: Li, W. and A. Carriquiry. Effect of Four-Lane to Three-Lane Conversions on Crash Frequencies and Crash Rates. In Proceedings of the 2005 Mid-Continent Transportation Research Symposium. Ames, Iowa. 2005. Study type: Full Bayes Study rating: 3 This presentation describes the results of a full Bayes analysis of the safety effectiveness of four-lane to three-lane conversions. This study refuted a previous Federal Highway Administration (FHWA) Highway Safety Information System (HSIS) study that found little safety benefit from such conversions. The FHWA study fitted negative binomial regression models to crash frequencies at each project site, while this one was based on a richer database and a superior statistical analysis. This was the first time that a full Bayes analysis, which shows some distinct advantages over negative binomial regression models, was applied to a safety countermeasure. This study found higher crash reductions for all crashes and reported a 23-28% reduction.

51
4.1.2 Improve intersection sight distance/clear sight triangles
Main Category: Intersection Character: Both Crash Types Addressed: Turning, Rear-End, Angle Other Causes: Visibility, Geometry Summary discussion: At some intersections, crashes related to inadequate sight distance (specifically, angle and turning crashes) can be reduced by improving the sight distance. Since sight distance is a greater issue at intersections with stop control than at signalized intersections, more research has been performed on the effectiveness of improvements to the former. The lowest-cost approach to improving intersection sight distance involves clearing sight triangle obstructions such as vegetation, roadside appurtenances, bus shelters and other structures. However, this can prove difficult when the objects to be removed are located on private property. Another option entails geometric improvements to the intersecting roadways, but due to its costly nature this alternative should only be considered for intersections with persistent crash patterns that cannot be improved otherwise. This CRF applies to rural highways that have stop-control on the minor roadway.
Recommended crash reduction factor(s) In order to determine the CRF for intersection sight distance restrictions, the analyst must calculate a CRF based on the before and after design conditions using the equation:
CRF = 1- (AMFAFTER / AMFBEFORE)
where AMF for the restricted sight distance are given in Harwood, et al. (2000) and presented in the Table 4.2.
Table 4.2: AMFs for intersection sight distance Number of Intersection Quadrants
with Limited Sight Distance AMF
0 1.00
1 1.05
2 1.10
3 1.15
4 1.20
As an example, if intersection sight distance is restricted in 2 quadrants but improved so no intersection quadrant has a sight restriction, the CRF will be 9% calculated as (1-1.00/1.10). This CRF applies to rural highways that have stop-control on the minor roadway.

52
Table 4.3: Improve intersection sight distance in 1 quadrant, recommended CRFs Character Crash Type Fatal Injury PDO All Crashes Rural All Crash Types - - - 5%
Table 4.4: Improve intersection sight distance in 2 quadrant, recommended CRFs Character Crash Type Fatal Injury PDO All Crashes Rural All Crash Types - - - 9%
Table 4.5: Improve intersection sight distance in 3 quadrant, recommended CRFs Character Crash Type Fatal Injury PDO All Crashes Rural All Crash Types - - - 13%
Table 4.6: Improve intersection sight distance in 4 quadrant, recommended CRFs Character Crash Type Fatal Injury PDO All Crashes Rural All Crash Types - - - 17%
Reviewed study title: Harwood, D.W., F.M. Council, E. Hauer, W.E. Hughes, and A. Vogt. Prediction of the Expected Safety Performance of Rural Two-Lane Highways. Turner-Fairbank Highway Research Center, Federal Highway Administration. McLean, VA. 2000. Study type: Expert Panel Study rating: 4 This report presents an algorithm for estimating the safety performance of an existing or proposed rural two-lane highway. The crash prediction algorithm consists of base models and crash modification factors for roadway segments and at-grade intersections. The base models estimate the safety performance of a roadway or intersection for a set of assumed base conditions. The crash modification factors adjust the base model predictions to account for the safety effects of various treatments for roadway segments and at-grade intersections. The algorithm can be used to compare the anticipated safety performance of two or more geometric alternatives for a proposed highway improvement. The algorithm also includes an Empirical Bayes procedure that permits use of the safety predictions in conjunction with historical crash data.

53
4.1.3 Install barrier
Main Category: Roadway Section Character: Rural Crash Types Addressed: Head-On, Non-Collision, Fixed Object Other Causes: Geometry, Excessive Speed
Figure 4.1: Median barrier
Summary discussion: Barrier installation is designed to prevent head-on collisions on multilane roads with narrow or nonexistent medians. This treatment is primarily applicable to certain roadways in rural or outlying suburban locations, characterized by higher speeds and less need for median openings to accommodate intersections and driveways. Candidate roadways tend to be those that have experienced significant traffic growth and increases in serious crashes since original construction, when design assumptions may have led to decisions to forego barriers. The primary concern when considering median barrier installation is that the barrier itself constitutes a potential hazard that will likely produce a certain degree of injury and minor property damage crashes. For this reason, it is important to carefully weigh these costs against the expected benefits of barrier installation in a particular location. This CRF is not specific to the type of barrier (cable, concrete, steel) or the width of the median where these are placed, as the research does not allow that detail. The impact of the barrier on fatal crashes could be more significant, but further research should be pursued.
Table 4.7: Install barrier, recommended CRFs Character Crash Type Fatal Injury PDO All Crashes Rural All Crash Types 60% -20% -40% -24%

54
Reviewed study title: Elvik, R. and T. Vaa. Handbook of Road Safety Measures. Elsevier. Oxford, UK. 2004. Study type: Study rating: 4 This handbook catalogues more than 100 road safety measures whose effects have been evaluated and quantified in studies conducted all over the world. The results of more than 1,700 road safety evaluation studies are summarized. The book covers the whole spectrum of road safety measures, ranging from highway engineering and traffic control, through vehicle design, driver training, public information campaigns and police enforcement.

55
4.2 OPERATIONS/ITS
4.2.1 Change left-turn phasing
Main Category: Intersection Character: Urban Crash Types Addressed: Angle, Turning Other Causes: Turning Volumes Summary discussion: Safety problems encountered by left-turning vehicles at intersections arise from three conflicts: opposing through traffic, traffic in the same direction, and crossing vehicular and pedestrian traffic. A number of studies have shown that providing protected left-turn phasing provides the most effective safety improvements. Protected left-turn phases are warranted based on a number of operational considerations such as turning volumes, visibility, opposing vehicle speed, distance to travel through the intersection. The use of “protected/permitted” phasing is a compromise between fully protected and permitted-only phasing and has less, if any, safety advantage over permissive only phasing. Other phasing such as lead versus lag left turn phasing has not been shown to have significant safety effects. The use of protected phasing will increase delay, which must be considered in the evaluation.
Table 4.8: Change from permissive to protected left-turn phasing, recommended CRFs Character Crash Type Fatal Injury PDO All Crashes Both Turning - - - 70%
Table 4.9: Change from protected/permissive to protected left-turn phasing, recommended CRFs Character Crash Type Fatal Injury PDO All Crashes Both Turning - - - 70%
Reviewed study title: Hauer, E. Left Turn Protection, Safety, Delay and Guidelines: A Literature Review. 2004. Reviewed study type: Study rating: 3 This literature review describes how various decisions about left-turn signal phasing affect safety and delay. The first part is a study-by-study review in chronological order, and the second part summarizes the main results from the review by subject matter. The summary section is organized into three categories: safety, delay, and guidelines. This section presents crash reduction factors from the various studies along with pertinent commentary.

56
4.2.2 Provide illumination for intersection
Main Category: Intersection Character: Rural Crash Types Addressed: All Crash Types Other Causes: Visibility
Figure 4.2: Illumination for intersection
Summary discussion: Providing illumination at unsignalized, unlit intersections with substantial patterns of nighttime crashes can improve safety by increasing awareness on the part of drivers approaching such intersections. Since this is a relatively high-cost strategy, crash data should be thoroughly studied prior to providing lighting at an intersection. Of particular interest in determining whether or not intersection lighting is warranted are patterns of rear-end, angle, or turning-related crashes. Intersection lighting is generally most effective in rural environments; however it has proven effective in certain urban areas as well.
Table 4.10: Provide illumination for intersection, recommended CRFs Character Crash Type Fatal Injury PDO All Crashes Rural All Crash Types 20% 20% - 40% Both All Crash Types - - - 30%
Reviewed study title: Elvik, R. Meta-Analysis of Evaluations of Public Lighting as Accident Countermeasure. Transportation Research Record. No. 1485. Transportation Research Board. Washington, DC. 1995. p. 112-123.

57
Study type: Meta-Analysis Study rating: 3 A meta-analysis of 37 studies evaluating the safety effects of public lighting is reported. The 37 studies contain a total of 142 results. The studies included were reported from 1948 to 1989 in 11 different countries. It was concluded that providing illumination for an intersection can be expected to reduce all nighttime crashes at the intersection by 24%-36%.
Reviewed study title: Preston, H. and T. Schoenecker. Safety Impacts of Street Lighting at Rural Intersections. Minnesota Department of Transportation. St. Paul, MN. 1999. Study type: Before-After Study rating: 2 This study analyzed changes in crash frequencies and other crash characteristics at isolated rural intersections associated with the installation of street lighting. It was found through a comparative analysis of 3,400 rural intersections and a before-after analysis of a sample of 12 intersections that street lighting reduced nighttime crash frequency and severity. It was concluded that the installation of street lighting at rural intersections is a low-cost and effective strategy for mitigating nighttime crashes. This study found reductions in fatal/injury crashes (20%) as well as crashes of all severity levels (40%) following the provision of lighting at an intersection.
Reviewed study title: Walker, F.W. and S.E. Roberts. Influence of Lighting on Accident Frequency at Highway Intersections. Transportation Research Record. No. 562. Transportation Research Board. Washington, DC. 1976. p. 73-78. Study type: Before-After Study rating: 2 This article discusses the findings of a naïve before-after study conducted to determine crash frequency for rural at-grade intersections for 3-year periods immediately before and after installation of lighting. Results from 47 intersections revealed a 49% reduction in night crashes after lighting.

58
4.2.3 Provide illumination on highway sections
Main Category: Roadway Section Character: Both Crash Types Addressed: All Crash Types Other Causes: Visibility Summary discussion: Nighttime driving can prove to be problematic, as the relative absence of visual cues during darkness renders the driving task more difficult. Issues that may pose challenges to drivers include low luminance, low contrast, low spatial frequencies, and driver over-confidence. Object recognition by differences in color and contrast is poor, so luminance contrast is an important factor in nighttime driving. In general, the literature revealed positive effects of lighting on reducing the frequency and severity of crashes on urban streets, regular highways, and at intersections. While several studies concluded that freeway sections with continuous lighting had significantly less crash potential than unlighted ones, others have indicated that the effects were not conclusive.
Table 4.11: Provide illumination on highway sections, recommended CRFs Character Crash Type Fatal Injury PDO All Crashes Both All Crash Types - - - 23%
Reviewed study title: Elvik, R. Meta-Analysis of Evaluations of Public Lighting as Accident Countermeasure. Transportation Research Record. No. 1485. Transportation Research Board. Washington, DC. 1995. p. 112-123. Study type: Meta-Analysis Study rating: 3 This article documents the results of a meta-analysis of 37 studies evaluating the safety effects of public lighting. The included studies, which contain 142 results, were reported from 1948 to 1989 in 11 different countries. It was determined that illuminating highway sections can be expected to produce a reduction of 20%-25% in nighttime crashes.

59
4.3 ROADSIDE IMPROVEMENT
4.3.1 Improve roadside hazard rating
Main Category: Roadway Section Character: Rural Crash Types Addressed: Non-Collision, Fixed Object Other Causes: Geometry Summary discussion: Improving the roadside environment can have a significant effect on safety of the roadway. Vehicles that leave the roadway in a relatively forgiving highway section (flat slopes, obstacle free clear zone, and protection from obstacles that do exist) are much less likely to be involved in a severe crash. However, the detailed estimation of the safety effect of these individual components is difficult and challenging. Further, these improvements are generally considered together. To overcome this challenge, the CRF presented in this report is a function of changes in the “Roadside Hazard Rating (RHR)” which has been developed in previous research. Based on a set of parameters the roadside can be categorized into 7 ratings, with 7 being the most severe roadside and 1 being almost ideal design. These rating are included in the report and in the report Prediction of the Expected Safety Performance of Rural Two-Lane Highways, which also has photos. The CRF presented here estimates the reduction in all crashes on two-lane rural highways.
Recommended crash reduction factors The analyst must calculate a CRF based on the before and after design conditions using the following procedure:
CRF = 1- (AMFAFTER / AMFBEFORE) where AMF for the roadside hazard rating is given as
AMF = exp(-0.6869 + 0.0668*RHR) / exp(-0.4865) where RHR = is the qualitative measure of the roadside hazard, which can be obtained from Table 4.12 or in Prediction of the Expected Safety Performance of Rural Two-Lane Highways, which has photos of typical sections.
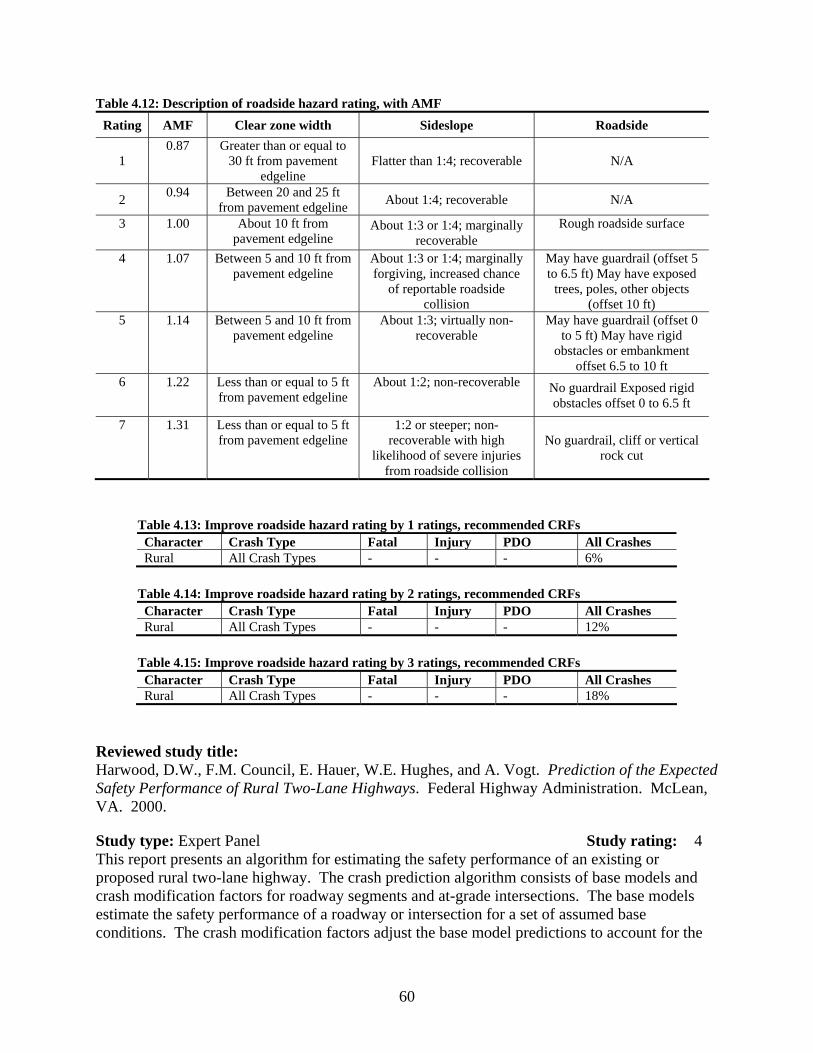
60
Table 4.12: Description of roadside hazard rating, with AMF Rating AMF Clear zone width Sideslope Roadside
1 0.87 Greater than or equal to
30 ft from pavement edgeline
Flatter than 1:4; recoverable N/A
2 0.94 Between 20 and 25 ft from pavement edgeline About 1:4; recoverable N/A
3 1.00 About 10 ft from pavement edgeline
About 1:3 or 1:4; marginally recoverable
Rough roadside surface
4 1.07 Between 5 and 10 ft from pavement edgeline
About 1:3 or 1:4; marginally forgiving, increased chance
of reportable roadside collision
May have guardrail (offset 5 to 6.5 ft) May have exposed
trees, poles, other objects (offset 10 ft)
5 1.14 Between 5 and 10 ft from pavement edgeline
About 1:3; virtually non-recoverable
May have guardrail (offset 0 to 5 ft) May have rigid
obstacles or embankment offset 6.5 to 10 ft
6 1.22 Less than or equal to 5 ft from pavement edgeline
About 1:2; non-recoverable No guardrail Exposed rigid obstacles offset 0 to 6.5 ft
7 1.31 Less than or equal to 5 ft from pavement edgeline
1:2 or steeper; non-recoverable with high
likelihood of severe injuries from roadside collision
No guardrail, cliff or vertical rock cut
Table 4.13: Improve roadside hazard rating by 1 ratings, recommended CRFs Character Crash Type Fatal Injury PDO All Crashes Rural All Crash Types - - - 6%
Table 4.14: Improve roadside hazard rating by 2 ratings, recommended CRFs Character Crash Type Fatal Injury PDO All Crashes Rural All Crash Types - - - 12%
Table 4.15: Improve roadside hazard rating by 3 ratings, recommended CRFs Character Crash Type Fatal Injury PDO All Crashes Rural All Crash Types - - - 18%
Reviewed study title: Harwood, D.W., F.M. Council, E. Hauer, W.E. Hughes, and A. Vogt. Prediction of the Expected Safety Performance of Rural Two-Lane Highways. Federal Highway Administration. McLean, VA. 2000.
Study type: Expert Panel Study rating: 4 This report presents an algorithm for estimating the safety performance of an existing or proposed rural two-lane highway. The crash prediction algorithm consists of base models and crash modification factors for roadway segments and at-grade intersections. The base models estimate the safety performance of a roadway or intersection for a set of assumed base conditions. The crash modification factors adjust the base model predictions to account for the

61
safety effects of various treatments for roadway segments and at-grade intersections. The algorithm can be used to compare the anticipated safety performance of two or more geometric alternatives for a proposed highway improvement. The algorithm also includes an Empirical Bayes procedure that permits use of the safety predictions in conjunction with historical crash data.
Reviewed study title: Zegeer, C.V., J. Hummer, D.W. Reinfurt, L. Herf, and W. Hunter. Safety Effects of Cross-Section Design for Two-Lane Roads. Volumes I and II. Federal Highway Administration. Washington, DC. 1987. Study type: Cross-Sectional Study rating: 2 This study intended to quantify the benefits and costs resulting from lane widening, shoulder widening, shoulder surfacing, side slope flattening, and roadside improvements. Detailed traffic, crash, and roadway data were collected on 4,951 miles of two-lane roads in seven states, and a crash predictive model and statistical tests were used to determine expected crash reductions related to various geometric improvements. Construction cost data from several states were used to develop a cost model for numerous types of roadway and roadside projects.
Reviewed study title: Zegeer, C.V., R. Stewart, D.W. Reinfurt, F.M. Council, T.R. Neuman, E. Hamilton, T. Miller, and W. Hunter. Cost-Effective Geometric Improvements for Safety Upgrading of Horizontal Curves – Final Report. Federal Highway Administration. Washington, DC. 1990. Study type: Cross-Sectional Study rating: 3 The purpose of this study was to determine the horizontal curve features which affect safety and traffic operations and to quantify the effects on accidents of various curve-related improvements. The primary data base developed and analyzed consisted of 10,900 horizontal curves in Washington State. Three existing Federal data bases on curves were also analyzed. Based on statistical analyses and model development, variables found to have a significant effect on accidents include degree of curve, roadway width, curve length, ADT, presence of a spiral, superelevation, and roadside condition. Curve flattening is expected to reduce accidents by up to 80%, depending on the amount of flattening. Widening lanes or shoulders on curves can reduce curve accidents by as much as 33%, while adding spiral transitions on curves was associated with a 5% accident reduction. Improving deficient superelevation can reduce accidents by 10% or more, while the effects of specific roadside improvements were also quantified. An economic analysis was conducted to determine when curve flattening and/or widening are cost effective.

62

63
5.0 COUNTERMEASURES WITH DISCUSSION ONLY
This chapter includes countermeasures with discussion only, since no research is available in the literature to reliably estimate their effectiveness. The categorization of a countermeasure in this section indicates that the safety effects of the treatment have not been adequately quantified by substantive research. However, many of these countermeasures are generally considered good design practice and, as such, a discussion about each of them is presented. As the knowledge base on safety grows, it is likely that more information will be available on the countermeasures in this chapter and they can then be incorporated into the previous chapters. Transportation professionals using this section are urged to obtain the most current available knowledge about these countermeasures.
5.1 DESIGN IMPROVEMENT
5.1.1 Add raised or painted islands
Main Intersection Character: Both Crash Types Addressed: Angle, Head-On, Turning Other Causes: Access Management, Geometry
Figure 5.1: Raised or painted islands
Summary discussion: Traffic islands, or channelization, are important intersection design tools. Providing the driver with additional positive guidance about allowed, desired, and prohibited driver maneuvers can potentially improve the safety and operating efficiency of the intersection. Islands can be painted directly on the roadway surface or raised. Painted or “flush” channelization can be used

64
on high-speed highways to delineate turning lanes, in constrained locations, or where snow removal is a concern. Raised islands, with appropriate channels or curb ramps to accommodate people who use wheelchairs or other mobility devices, should be used where the primary function of the island is to shield pedestrians, locate traffic control devices, or prohibit undesirable traffic movements. In regards to raised islands, there are generally two types: corner islands that separate right-turning vehicles (“pork-chops”); and median or divisional islands that separate opposing traffic flows on an intersection approach. Although islands provide a safe refuge for pedestrians, corner islands that separate right-turning vehicles may make crossing intersections more difficult for pedestrians. Proper placement of crosswalk markings may help.
References: Bowman, B.L. and R.L. Vecellio. Effects of Urban and Suburban Median Types on Both Vehicular and Pedestrian Safety. Transportation Research Record. No. 1445. Transportation Research Board. Washington, DC. 1994. p. 169-179.
Elvik, R. and T. Vaa. Handbook of Road Safety Measures. Elsevier. Oxford, UK. 2004.
Harwood, D.W., K.M. Bauer, I.B. Potts, D.J. Torbic, K.R. Richard, E.R. Kohlman Rabbani, E. Hauer, and L. Elefteriadou. Safety Effectiveness of Intersection Left- and Right-Turn Lanes. Federal Highway Administration. McLean, VA. 2002.

65
5.1.2 Convert 4-leg intersection to offset T-intersections
Main Category: Intersection Character: Rural Crash Types Addressed: Angle, Sideswipe-Meeting, Turning Other Causes: Turning Volumes, Access Management
Figure 5.2: Convert 4-leg intersection to offset T-intersections
Summary discussion: For some unsignalized four-leg intersections with low cross-street through volumes and high-speed major street traffic, one method to address angle and turning crashes is to separate the four-leg intersection into two T-intersections. This strategy should help reduce crashes related to intersection layout, such as angle crashes in which drivers failed to acknowledge through vehicles. Offset T-intersections can be classified as either right-left or left-right, depending on the turning movements required for a through movement on the minor road. If a right-left orientation is provided, the intersections should be sufficiently separated to ensure the provision of adequate turn-lane channelization on the major road. If through volumes are high, the intersection may be safer if left as a conventional four-leg intersection, since offsetting creates a high number of unnecessary turning movements.
References: Elvik, R. and T. Vaa. Handbook of Road Safety Measures. Elsevier. Oxford, UK. 2004.
Bared, J.G. and E.I. Kaisar. Advantages of Offset T-Intersections with Guidelines. In Proceedings of Traffic Safety on Three Continents. Moscow, Russia. 2001.

66
Kulmala, R. Safety at Highway Junctions Based on Predictive Accident Models. Presented at Third International Symposium on Intersections Without Traffic Signals. Portland, OR. 1997. p. 151-157.
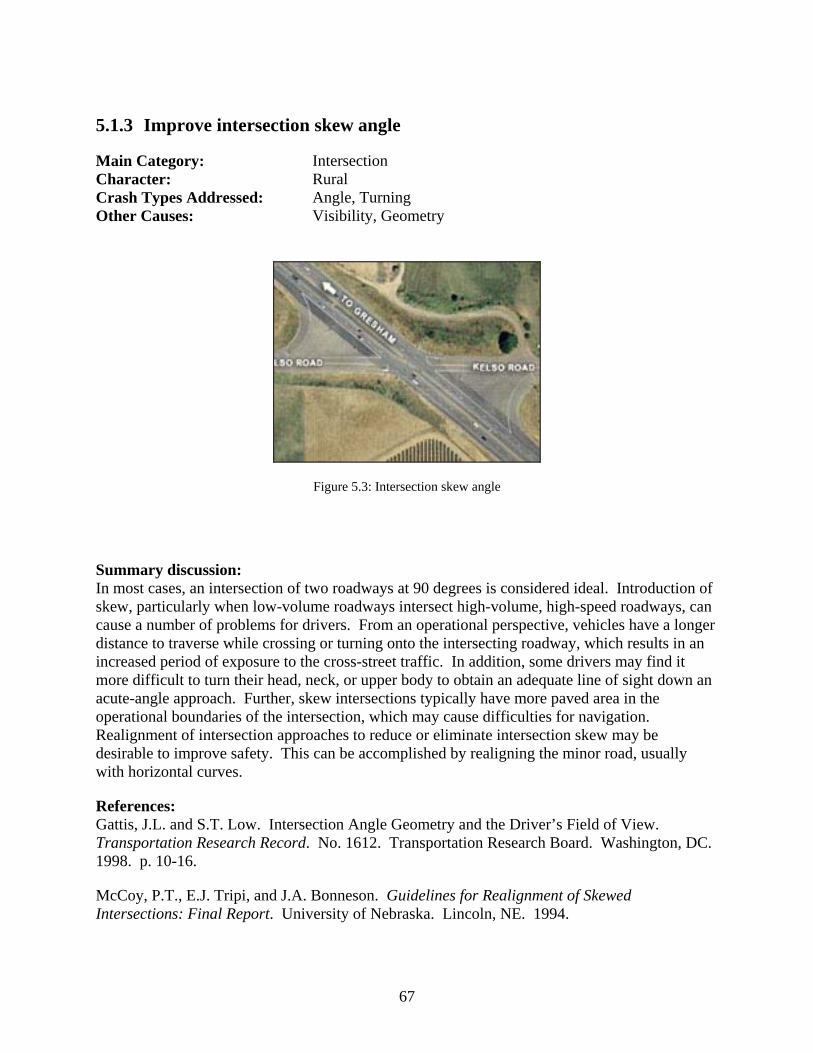
67
5.1.3 Improve intersection skew angle
Main Category: Intersection Character: Rural Crash Types Addressed: Angle, Turning Other Causes: Visibility, Geometry
Figure 5.3: Intersection skew angle
Summary discussion: In most cases, an intersection of two roadways at 90 degrees is considered ideal. Introduction of skew, particularly when low-volume roadways intersect high-volume, high-speed roadways, can cause a number of problems for drivers. From an operational perspective, vehicles have a longer distance to traverse while crossing or turning onto the intersecting roadway, which results in an increased period of exposure to the cross-street traffic. In addition, some drivers may find it more difficult to turn their head, neck, or upper body to obtain an adequate line of sight down an acute-angle approach. Further, skew intersections typically have more paved area in the operational boundaries of the intersection, which may cause difficulties for navigation. Realignment of intersection approaches to reduce or eliminate intersection skew may be desirable to improve safety. This can be accomplished by realigning the minor road, usually with horizontal curves.
References: Gattis, J.L. and S.T. Low. Intersection Angle Geometry and the Driver’s Field of View. Transportation Research Record. No. 1612. Transportation Research Board. Washington, DC. 1998. p. 10-16.
McCoy, P.T., E.J. Tripi, and J.A. Bonneson. Guidelines for Realignment of Skewed Intersections: Final Report. University of Nebraska. Lincoln, NE. 1994.

68
Harwood, D.W., F.M. Council, E. Hauer, W.E. Hughes, and A. Vogt. Prediction of the Expected Safety Performance of Rural Two-Lane Highways. Federal Highway Administration. McLean, VA. 2000.

69
5.1.4 Offset opposing left-turn lanes
Main Category: Intersection Character: Urban Crash Types Addressed: Turning, Angle Other Causes: Geometry, Visibility
Figure 5.4: Offset opposing left-turn lanes
Summary discussion: At locations where left-turn lanes or bays are provided for both directions of traffic, a potential exists for left-turning vehicles to obscure the view of oncoming drivers if both vehicles are in the turn bays. If the intersection is signalized, one alternative may to be install a protected left-turn phase. If this is not desirable or if the intersection is not signalized and right-of-way is available, it may be appropriate to offset the left turn bays so that each driver’s vehicle is to the right of the other’s by painting or installing channelization. This helps improve safety by improving driver acceptance of gaps in opposing through traffic. This is especially true for older drivers who have difficulty judging gaps in front of oncoming vehicles.
References: McCoy, P.T., P.S. Byrd, and G. Pesti. Pavement Markings to Improve Opposing Left-Turn Lane Sight Distance. Mid-America Transportation Center. Lincoln, NE. 1999.
Harwood, D.W., M.T. Pietrucha, M.D. Wooldridge, R.E. Brydia, and K. Fitzpatrick. Median Intersection Design. NCHRP Report 375. National Cooperative Highway Research Program. Transportation Research Board. Washington, DC. 1995.
McCoy, P.T., U.R. Navarro, and W.E. Witt. Guidelines for Offsetting Opposing Left-Turn Lanes on Four-Lane Divided Roadways. Transportation Research Record. No. 1356. Transportation Research Board. 1992. p. 28-36.

70
Joshua, S.C and A.A. Saka. Mitigation of Sight Distance Problem for Unprotected Left-Turning Traffic at Intersections. Transportation Research Record. No. 1356. Transportation Research Board. 1992. p. 73-79.
Harwood, D.W., K.M. Bauer, I.B. Potts, D.J. Torbic, K.R. Richard, E.R. Kohlman Rabbani, E. Hauer, and L. Elefteriadou. Safety Effectiveness of Intersection Left- and Right-Turn Lanes. Federal Highway Administration. McLean, VA. 2002.

71
5.1.5 Provide acceleration/deceleration lane
Main Category: Intersection Character: Rural Crash Types Addressed: Rear-End, Sideswipe - Overtaking Other Causes: Excessive Speed, Geometry
Figure 5.5: Acceleration/deceleration lane
Summary discussion: For vehicles both entering and exiting high-speed roadways that are not access controlled, operational and safety improvements can be gained by separating these movements from the major street through movement. Length of the acceleration or deceleration lane will depend on the design speed of the major road and the entering and exiting speed of the major road traffic. The length of the acceleration lanes should be sufficient to allow adjustments in speeds of through and entering vehicles so that the driver of the entering vehicle can find a gap in the traffic. In some cases the objectives of providing a deceleration lane can be accomplished with a properly designed right-turn lane. These improvements will typically address rear-end crashes between entering and exiting vehicles.
References: Twomey, J.M., M.L. Heckman, J.C. Hayward, and R.J. Zuk. Accidents and Safety Associated with Interchanges. Transportation Research Record. No. 1383. Transportation Research Board. Washington, DC. 1993. p. 100-105.
Bared, J., G.L. Giering, and D.L. Warren. Safety Evaluation of Acceleration and Deceleration Lane Lengths. ITE Journal. 69(6). 1999. p. 50-54.
Harwood, D.W., M.T. Pietrucha, M.D. Wooldridge, R.E. Brydia, and K. Fitzpatrick. Median Intersection Design. NCHRP Report 375. National Cooperative Highway Research Program. Transportation Research Board. Washington, DC. 1995.

72
Neuman, T.R., R. Pfefer, K.L. Slack, K.K. Hardy, D.W. Harwood, I.B. Potts, D.J. Torbic, and E.R. Rabbani. Guidance for Implementation of the AASHTO Strategic Highway Safety Plan. Volume 5: A Guide for Addressing Unsignalized Intersection Collisions. NCHRP Report 500. National Cooperative Highway Research Program. Transportation Research Board. Washington, DC. 2003.
Bauer, K.M. and D.W. Harwood. Statistical Models of Accidents on Interchange Ramps and Speed-Change Lanes. Federal Highway Administration. McLean, VA. 1997.

73
5.1.6 Separate grades by constructing interchange
Main Category: Intersection Character: Rural Crash Types Addressed: Angle, Rear-End, Turning Other Causes: Congestion, Turning Volumes
Figure 5.6: Separate grades by constructing interchange
Summary discussion: When volumes are high enough and crash experience severe, some at-grade intersections may warrant the construction of an interchange, especially on high-speed facilities such as expressways. However, this is obviously an expensive approach and will need to be considered in conjunction with capacity and operational reasons. By separating the grades of intersecting roadways, many conflicting movements are eliminated and the number and severity of crashes – specifically rear-end and angle crashes – should be reduced.
Reference: Bonneson, J.A., P.T. McCoy, and D.S. Eitel. Interchange vs. At-Grade Intersection on Rural Expressways. Transportation Research Record. No. 1395. Transportation Research Board. Washington, DC. 1993. p. 39-47.

74
5.1.7 Convert two-way to one-way street
Main Category: Roadway Section Character: Urban Crash Types Addressed: Turning, Pedestrian, Parking Maneuver Other Causes: Congestion Summary discussion: For the most part, conversion of two-way streets to one-way is done for the purpose of increasing capacity, but it can also improve safety by separating traffic flows. In an urban environment, improved traffic signal progression can be accomplished, which has the potential to reduce rear-end crashes. In addition, the removal of one direction of traffic can improve pedestrian safety by allowing pedestrians to only have to deal with traffic from one direction and providing more gaps for vehicles and pedestrians at unsignalized crossings. If the entire street grid is not converted, care must be taken to maintain driver expectancy in terms of one-way and two-way operations and to provide consistent and visible signing. If not, drivers may not recognize the pattern and make mistakes. Minor sideswipe crashes related to weaving maneuvers as drivers attempt to park or reach a turn lane may also increase on a one-way operation. Finally, pedestrians may not be looking in the correct direction for oncoming vehicles and be involved in collisions. It should also be noted that some argue that the opposite is true – that converting one-way streets to two-way improves safety by slowing traffic.
Reference: Stemley, J. J. One-Way Streets Provide Superior Safety and Convenience. ITE Journal. Washington, DC. August 1998.

75
5.1.8 Improve vertical alignment
Main Category: Roadway Section Character: Rural Crash Types Addressed: All Crash Types Other Causes: Visibility, Excessive Speed Summary discussion: Vertical alignment influences safety by limiting sight distance on crest vertical curves. Long vertical curves can also cause large vehicles to slow on long uphill sections thereby creating differences in travel speed. To a lesser extent, extreme sag vertical curves can affect driver comfort on sag vertical curves. For crest vertical curves with limited sight distance, the potential for improving safety depends on the operating speed of the facility, the length of the sight restriction (measured by deficiency from policy or standard) and the presence of a hazard in the restricted sight area. All of these factors should be considered when evaluating vertical alignment improvements for sight distance. In terms of uphill grades, research has shown that most passenger cars are unaffected by grades below 4-5%, but large commercial vehicles and recreational vehicles are sensitive to grade changes. If the grade is long enough, these vehicles will slow enough to create potential safety problems. This can be mitigated by modifying the alignment or adding climbing lanes. Descending grades may need runaway ramps at appropriate locations. Vertical curves should also be comfortable for the driver, aesthetically pleasing, safe, and capable of facilitating proper drainage.
References: Harwood, D. W., F. M. Council, E. Hauer, W. E. Hughes, and A. Vogt. Prediction of the Expected Safety Performance of Rural Two-Lane Highways. Federal Highway Administration. McLean, VA. 2000.
National Research Council. Practices for Resurfacing, Restoration, and Rehabilitation. Special Report 214. Transportation Research Board. Washington DC. 1987.
Hauer, E. Road Grade and Safety. Unedited draft. 2001.
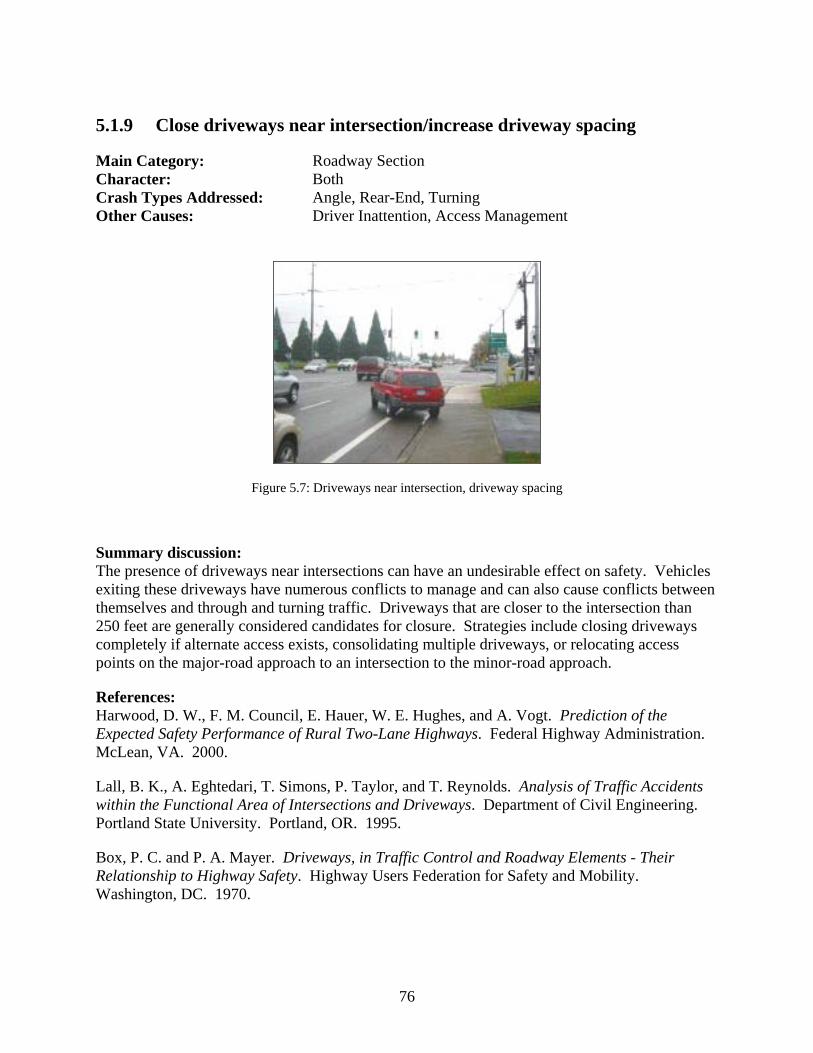
76
5.1.9 Close driveways near intersection/increase driveway spacing
Main Category: Roadway Section Character: Both Crash Types Addressed: Angle, Rear-End, Turning Other Causes: Driver Inattention, Access Management
Figure 5.7: Driveways near intersection, driveway spacing
Summary discussion: The presence of driveways near intersections can have an undesirable effect on safety. Vehicles exiting these driveways have numerous conflicts to manage and can also cause conflicts between themselves and through and turning traffic. Driveways that are closer to the intersection than 250 feet are generally considered candidates for closure. Strategies include closing driveways completely if alternate access exists, consolidating multiple driveways, or relocating access points on the major-road approach to an intersection to the minor-road approach.
References: Harwood, D. W., F. M. Council, E. Hauer, W. E. Hughes, and A. Vogt. Prediction of the Expected Safety Performance of Rural Two-Lane Highways. Federal Highway Administration. McLean, VA. 2000.
Lall, B. K., A. Eghtedari, T. Simons, P. Taylor, and T. Reynolds. Analysis of Traffic Accidents within the Functional Area of Intersections and Driveways. Department of Civil Engineering. Portland State University. Portland, OR. 1995.
Box, P. C. and P. A. Mayer. Driveways, in Traffic Control and Roadway Elements - Their Relationship to Highway Safety. Highway Users Federation for Safety and Mobility. Washington, DC. 1970.

77
Harwood, D. W. Methodology to Predict the Safety Performance of Urban and Suburban Arterials. Project 17-26. National Cooperative Highway Research Program. Transportation Research Board. Washington, DC. 2004.
Hauer, E. Access and Safety. Unpublished web document (http://roadsafetyresearch.com). 2001.

78
5.1.10 Install non-traversable curbed median
Main Category: Roadway Section Character: Urban Crash Types Addressed: Turning, Non-Collision, Fixed Object, Head-On Other Causes: Access Management, Turning Volumes
Figure 5.8: Non-traversable curbed median
Summary discussion: The installation of a curbed median can be used for access management purposes to eliminate turning movements that are particularly hazardous and causing crashes. The median also separates opposing direction traffic and can easily be integrated with pedestrian mid-block crossings and other channelization at intersections. Closing property access can be controversial and time consuming, but formal access management policies can potentially reduce this controversy. Also, even if safety is improved at the location, there is the potential for crashes to migrate to another location where turns are allowed.
References: Bowman, B. L. and R. L. Vecellio. Effects of Urban and Suburban Median Types on Both Vehicular and Pedestrian Safety. Transportation Research Record. No. 1445. Transportation Research Board. Washington, DC. 1994. p. 169-179.
Lienau, K., Safety Effect of Barrier Curb on High Speed Suburban Multilane Highways. 1996, Federal Highway Administration: McLean, Va.
Claessen, J. G. and D. R. Jones. The Road Safety Effectiveness of Raised Wide Medians. In Proceedings of the 17th Australian Road Research Board Conference. 1994.
Plaxico, C. A., M. H. Ray, J. A. Weir, F. Orengo, P. Tiso, H. McGee, F. M. Council, and K. Eccles. Recommended Guidelines for Curbs and Curb-Barrier Installations. NCHRP Project

79
22-17. National Cooperative Highway Research Program. Transportation Research Board. Washington, DC. 2004.
Garner, G. R. and R. C. Deen. Elements of Median Design in Relation to Accident Occurrence. Highway Research Record. No. 432. Washington, DC. 1973. p. 1-11.
Foody, T. J. and T. B. Culp. A comparison of the safety potential of the raised versus depressed median design. Transportation Research Record. No. 514. Transportation Research Board. Washington, DC. 1974. p. 1-14.

80
5.1.11 Pavement treatments to increase friction
Main Category: Roadway Section Character: Both Crash Types Addressed: Rear-End, Non-Collision, Fixed Object Other Causes: Weather, Excessive Speed Summary discussion: On horizontal curves, both superelevation and tire-pavement friction are necessary for vehicles to navigate the curve safely. On all roadway sections, the available stopping distance is also influenced by the amount of tire-pavement friction present. The friction provided by the tire-pavement interaction is most heavily influenced by vehicle speed. However, other factors, including pavement age and structural condition, traffic volume, road surface type and texture, aggregates used, pavement mix characteristics, tire conditions, and presence of surface water can contribute to skid resistance. A vehicle will lose traction when the required frictional force to maintain the travel direction exceeds the available friction at the tire-pavement interface. This can happen on dry pavement at high speeds but is more common on wet pavement where a small amount of water can significantly reduce pavement surface friction. Countermeasures to improve skid resistance include asphalt mixture (type and gradation of aggregate and asphalt content), pavement overlays on concrete or asphalt pavements, and pavement grooving. Proper drainage should also be verified or provided.
References: Dahir, S. H. and W. L. Gramling. Wet-Pavement Safety Programs. NCHRP Synthesis of Highway Practice Report 158. Transportation Research Board. Washington, DC. 1990.
Bray, J. S. Skid Accident Reduction Program (SKARP): Targeted Crash Reductions. Institute of Transportation Engineers 2003 Technical Conference and Exhibit. Fort Lauderdale, FL. 2003.
Neuman, T. R., R. Pfefer, K. L. Slack, K. K. Hardy, F. M. Council, H. McGee, L. Prothe, and K. A. Eccles. Guidance for Implementation of the AASHTO Strategic Highway Safety Plan. Volume 6: A Guide for Addressing Run-off-Road Collisions. NCHRP Report 500. Transportation Research Board. Washington, DC. 2003.
Noyce, D. A., H. U. Bahia, J. M. Yambo, and G. Kim. Incorporating Road Safety into Pavement Management: Maximizing Asphalt Pavement Surface Friction for Road Safety Improvements. (Draft Literature Review & State Surveys). Midwest Regional University Transportation Center. Madison, WI. 2005.
Hanley, K. E., A. R. Gibby, and T. C. Ferrara. Analysis of Accident Reduction Factors on California State Highways. Transportation Research Record. No. 1717. Transportation Research Board. Washington, DC. 2000. p. 37-45.

81
5.2 MARKINGS OR SIGNS
5.2.1 Install stop ahead sign
Main Category: Intersection Character: Both Crash Types Addressed: Rear-End, Angle Other Causes: Driver Inattention, Excessive Speed
Figure 5.9: Stop ahead sign
Summary discussion: At intersections where a number of crashes are caused by drivers on either approach failing to stop at a stop-controlled intersection, one improvement is to install a “STOP AHEAD” sign. This sign can provide advance warning to motorists that they are approaching a stop-controlled intersection. The sign could also reduce rear-end crashes where a driver who has stopped suddenly to comply with a stop sign is struck from behind. This strategy is most appropriate for high-speed, rural, isolated intersections where the intersection may be unexpected or where there may be sight distance issues. In urban areas, there may be too much competing visual information for the sign to be placed effectively. Other strategies include advance transverse rumble strips, oversized stop-signs, “STOP AHEAD” legends on the pavement, flashing overhead beacons, or signalization.
Reference: Zwahlen, H. T. Stop Ahead and Stop Signs and Their Effect on Driver Eye Scanning and Driving Performance. Transportation Research Record. No. 1168. Transportation Research Board. Washington, DC. 1988. p. 16-24.
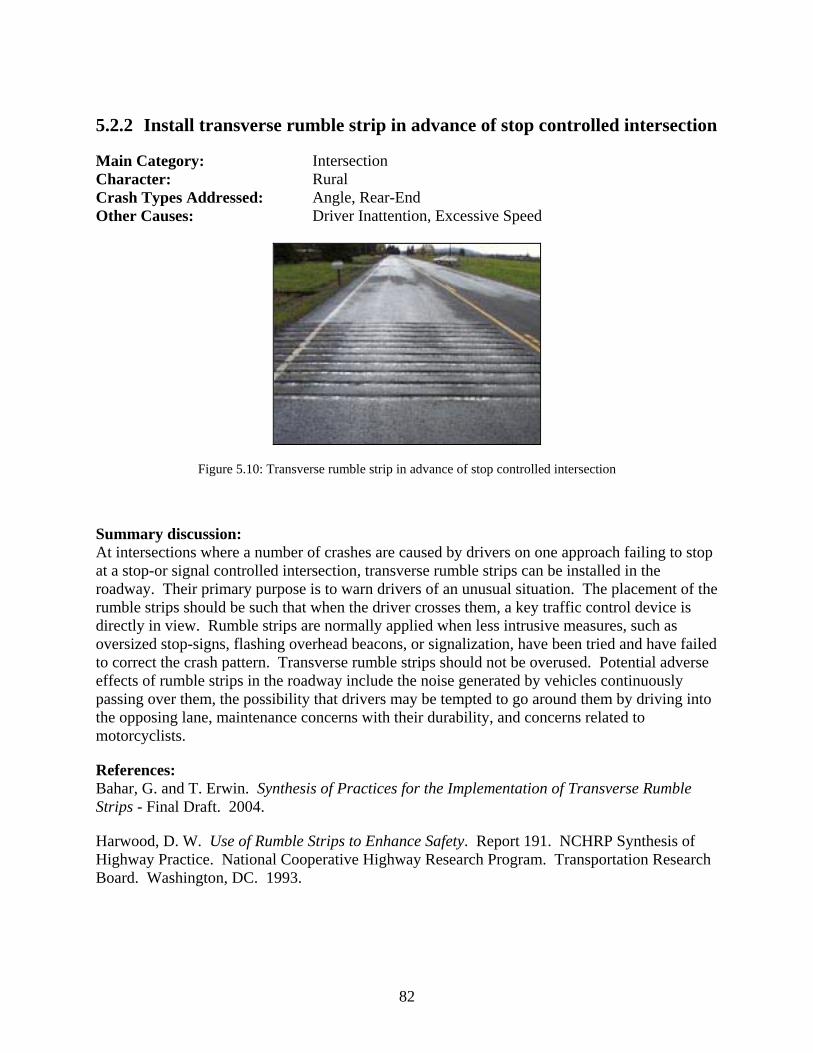
82
5.2.2 Install transverse rumble strip in advance of stop controlled intersection
Main Category: Intersection Character: Rural Crash Types Addressed: Angle, Rear-End Other Causes: Driver Inattention, Excessive Speed
Figure 5.10: Transverse rumble strip in advance of stop controlled intersection
Summary discussion: At intersections where a number of crashes are caused by drivers on one approach failing to stop at a stop-or signal controlled intersection, transverse rumble strips can be installed in the roadway. Their primary purpose is to warn drivers of an unusual situation. The placement of the rumble strips should be such that when the driver crosses them, a key traffic control device is directly in view. Rumble strips are normally applied when less intrusive measures, such as oversized stop-signs, flashing overhead beacons, or signalization, have been tried and have failed to correct the crash pattern. Transverse rumble strips should not be overused. Potential adverse effects of rumble strips in the roadway include the noise generated by vehicles continuously passing over them, the possibility that drivers may be tempted to go around them by driving into the opposing lane, maintenance concerns with their durability, and concerns related to motorcyclists.
References: Bahar, G. and T. Erwin. Synthesis of Practices for the Implementation of Transverse Rumble Strips - Final Draft. 2004.
Harwood, D. W. Use of Rumble Strips to Enhance Safety. Report 191. NCHRP Synthesis of Highway Practice. National Cooperative Highway Research Program. Transportation Research Board. Washington, DC. 1993.
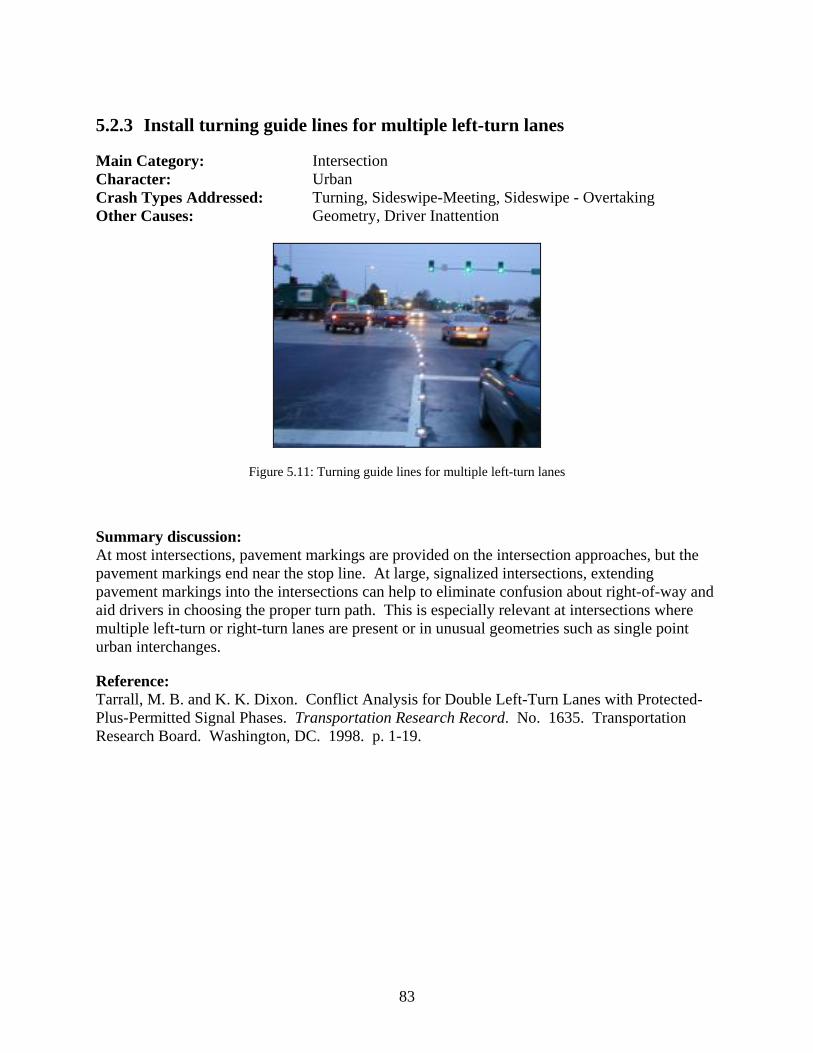
83
5.2.3 Install turning guide lines for multiple left-turn lanes
Main Category: Intersection Character: Urban Crash Types Addressed: Turning, Sideswipe-Meeting, Sideswipe - Overtaking Other Causes: Geometry, Driver Inattention
Figure 5.11: Turning guide lines for multiple left-turn lanes
Summary discussion: At most intersections, pavement markings are provided on the intersection approaches, but the pavement markings end near the stop line. At large, signalized intersections, extending pavement markings into the intersections can help to eliminate confusion about right-of-way and aid drivers in choosing the proper turn path. This is especially relevant at intersections where multiple left-turn or right-turn lanes are present or in unusual geometries such as single point urban interchanges.
Reference: Tarrall, M. B. and K. K. Dixon. Conflict Analysis for Double Left-Turn Lanes with Protected-Plus-Permitted Signal Phases. Transportation Research Record. No. 1635. Transportation Research Board. Washington, DC. 1998. p. 1-19.

84
5.2.4 Provide advance intersection warning sign
Main Category: Intersection Character: Rural Crash Types Addressed: Rear-End, Angle, Sideswipe - Overtaking Other Causes: Driver Inattention Summary discussion: On high-speed rural roadways drivers are often unfamiliar with the location of an intersection. One method to enhance driver knowledge is to provide an advance warning to motorists of an intersection ahead with an advance intersection warning sign. Preferably the warning sign also includes the name of the intersecting street on a placard. This can serve to warn drivers of an upcoming intersection and allow them to prepare if they are turning off the major road at the intersection. Additional enhancements include adding continuous advance-warning flashers to the static warning sign or installing an overhead beacon at the intersection. If the intersection is already signalized, more advanced dynamic warning signs may be considered.
Reference: Gibby, A. R., S. P. Washington, and T. C. Ferrara. Evaluation of High-Speed Isolated Signalized Intersections in California. Transportation Research Record. No. 1376. Transportation Research Board. Washington, DC. 1992. p. 45-56.

85
5.2.5 Install durable pavement markings
Main Category: Roadway Section Character: Both Crash Types Addressed: Head-On, Non-Collision, Fixed Object Other Causes: Visibility Summary discussion: Pavement markings provide the driver with a substantial amount of information required to safely and efficiently navigate the highway system. Traditional paint pavement markings have a short life span and require continual maintenance. Durable products, on the other hand, can last much longer, meaning that markings can be visible for a much longer period of time. In winter conditions markings can be installed in a milled location, allowing them to be long-lasting even in plow areas. Durable markings also have more thickness than painted markings, allowing them to be more visible in wet conditions. There has been limited research on the increased safety effects of these markings.
References: Cuelho, E., J. Stephens, and C. McDonald, A Review of the Performance and Costs of Contemporary Pavement Marking Systems. Western Transportation Institute. Montana State University. Bozeman, MT. 2003.
Al-Masaeid, H. R. and H. Sinha. An Analysis of Accident Reduction Potentials of Pavement Marking. Journal of Transportation Engineering. Vol. 120, No. 5. September/October 1994. p. 723-736.

86
5.2.6 Install edge line profile markings or rumble strips
Main Category: Roadway Section Character: Rural Crash Types Addressed: Non-Collision, Fixed Object Other Causes: Visibility, Inattention
Figure 5.12: Install edge line profile markings or rumble strips
Summary discussion: Similar to shoulder rumble strips, and sometimes referred to as “rumble stripes,” this countermeasure is applicable where there is either no paved shoulder or a limited width of paved shoulder, and widening of the paved shoulder area is not viable. While shoulder rumble strips on rural interstates have been shown to be effective, it is not clear that those benefits will translate to rural highways with limited shoulders. In the rumble-strip approach, a narrow 6-inch rumble strip can be milled in the pavement and then painted with normal edge line markings. Some evaluations suggest success both with increasing delineation of the edge line in wet or dark conditions and providing a warning to inattentive drivers. Another version of this approach is to use raised durable pavement marking on the edge line to provide a similar warning to inattentive drivers. This option is more expensive, and both approaches must consider incompatibility with bicycles, wear from snow removal, maintenance issues, and noise.
References: Taylor, H. W. and L. Meczkowski. Safer Roadsides. Public Roads. 66(4). 2003.
Neuman, T. R., R. Pfefer, K. L. Slack, K. K. Hardy, F. M. Council, H. McGee, L. Prothe, and K. A. Eccles. Guidance for Implementation of the AASHTO Strategic Highway Safety Plan. Volume 6: A Guide for Addressing Run-off-Road Collisions. NCHRP Report 500. National Cooperative Highway Research Program. Transportation Research Board. Washington, DC. 2003.

87
5.2.7 Provide advance curve warning pavement markings
Main Category: Roadway Section Character: Rural Crash Types Addressed: Non-Collision, Fixed Object, Head-On, Sideswipe-Meeting Other Causes: Driver Inattention, Excessive Speed
Figure 5.13: Advance curve warning pavement markings
Summary discussion: For horizontal curves with a history of run-off-the road crashes, one treatment that may be applicable is the placement of a pavement marking on the roadway, indicating that the driver should reduce speed for an upcoming curve. The pavement marking consists of two transverse bars, a “SLOW” legend, and an arrow indicating the direction of the upcoming curve. There is some evidence that drivers respond better to pavement marking, and this design should be accompanied with the traditional advance curve warning signs. Additional delineation of the curve with chevrons and post-mounted delineators should also be considered.
Reference: Agent, K. R. and F. T. Creasey. Delineation of Horizontal Curves. Kentucky Transportation Cabinet. Frankfort, KY. 1986.

88
5.3 OPERATIONS/ITS
5.3.1 Change signal cycle length
Main Category: Intersection Character: Urban Crash Types Addressed: Rear-End, Angle Other Causes: Congestion
Figure 5.14: Change signal cycle length
Summary discussion: For traffic signals, proper signal cycle lengths can reduce driver frustration resulting from excessive delays. Optimal signal timing is a challenging balance between many factors. When drivers experience long delays or are aware that cycles are extraordinarily long, there is some evidence that they may be tempted to run the red light to avoid the extra delay. Cycle lengths that are too short may provide pedestrians with insufficient time to safely cross the intersection, particularly if it has turning lanes. Conversely, a longer cycle length may encourage impatient pedestrians to cross illegally during the red phase. Further complicating the safety considerations that must be balanced, long cycle lengths result in fewer change periods per hour and thus fewer opportunities for red-light running. .
References: Zador, P., H. Stein, S. Shapiro, and P. Tarnoff. Effect of Signal Timing on Traffic Flow and Crashes at Signalized Intersections. Transportation Research Record. No. 1010. Transportation Research Board. Washington, DC. 1984. p. 1-8.
Bamfo, J. K. and E. Hauer. Which is Safer in terms of Right-Angle Vehicle Accidents – Fixed-time or Vehicle-actuated Signal Control? Canadian Multidisciplinary Road Safety Conference X. Toronto, Ontario, Canada. 1997.

89
5.3.2 Convert signal from incandescent to LED
Main Category: Intersection Character: Urban Crash Types Addressed: Angle, Rear-End, Turning Other Causes: Driver Inattention, Visibility Summary discussion: There are a number of benefits associated with light emitting diode (LED) traffic signal modules, including energy efficiency, brightness, and reduced maintenance. The technology of LEDs allows the entire surface of the signal face to be illuminated with equal brightness, which can increase driver awareness of the signal indication, particularly during poor weather or bright sunlight. There is some potential for a glare problem at night because of the brightness, which tends to decrease over time. Finally, LED modules are more directional than traffic-signal optical units with incandescent lamps and installation should be designed to limit movements of the signal lenses to maintain maximum visibility.
References: Iwasaki, R. H. LED Traffic Signals Modules as an Incandescent Lamp Alternative. ITE Journal. 73(4). 2003.
Bullough, J. D., P. R. Boyce, A. Bierman, K. M. Conway, K. Huang, C. P. O’Rourke, C. M. Hunter, and A. Nakata. Response to Simulated Traffic Signals Using Light-Emitting Diode and Incandescent Sources. Transportation Research Record. No. 1724. Transportation Research Board. Washington, DC. 2000. p. 39-46.

90
5.3.3 Increase size of signal head
Main Category: Intersection Character: Urban Crash Types Addressed: Angle, Rear-End, Turning Other Causes: Driver Inattention, Visibility
Figure 5.15: Increase size of signal head
Summary discussion: Two diameters are currently in use for most traffic signal lenses: 8 inches and 12 inches. The 12-inch signal faces are required by the MUTCD for a number of conditions, and most new traffic signal installations use12-inch lenses. For retrofits in many urban areas, there is some evidence that increasing the signal lens diameter from 8 inches to 12 inches produces some safety benefit by improving visibility for the driver, and should reduce red light running and associated angle collisions. The increase in lens size could also include an upgrade to LED and the addition of backplates, which would also increase the signal conspicuity.
Reference: Sayed, T., W. Abdelwahab, and J. Nepomuceno. Safety Evaluation of Alternative Signal Head Design. Transportation Research Record. No. 1635. Transportation Research Board. Washington, DC. 1998. p. 140-146.

91
5.3.4 Install dynamic advance warning flashers “Red Signal Ahead”
Main Category: Intersection Character: Both Crash Types Addressed: Rear-End, Angle Other Causes: Driver Inattention, Excessive Speed
Figure 5.16: Dynamic advance warning flashers “Red Signal Ahead”
Summary discussion: Dynamic advance warning flashers are used to provide advance warning to motorists of an impending traffic signal change (from green to red) ahead. These signs are interconnected with the downstream traffic signal and inform drivers of its status by showing yellow flashing lights or with a changeable message sign. These are typically used on high-speed approaches to an isolated traffic signal where visibility of the signal may be somewhat limited. It is clearly important to time the warning such that it does not encourage drivers to accelerate to the traffic signal to avoid being stopped. The introduction of advance-warning flashers on the approaches to a signalized intersection appears to be associated with a reduction in right-angle collisions.
References: Sayed, T., H. Vahidi, and F. Rodriguez. Advance Warning Flashers: Do They Improve Safety? Transportation Research Record. No. 1692. Transportation Research Board. Washington, DC. 1999. p. 30-38.
Box, P.C. and P.A. Mayer. Intersections, in Traffic Control and Roadway Elements - Their Relationship to Highway Safety. Highway Users Federation for Safety and Mobility. Washington, DC. 1970.
Gibby, A.R., S.P. Washington, and T.C. Ferrara. Evaluation of High-Speed Isolated Signalized Intersections in California. Transportation Research Record. No. 1376. Transportation Research Board. Washington, DC. 1992. p. 45-56.
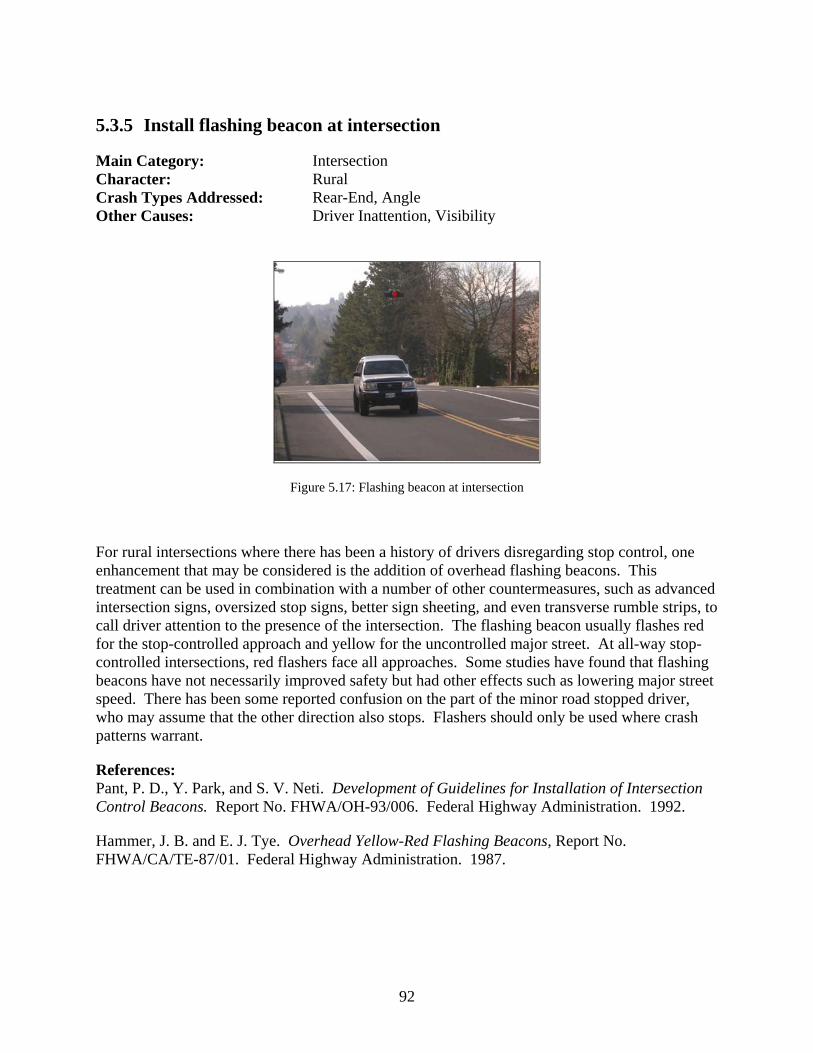
92
5.3.5 Install flashing beacon at intersection
Main Category: Intersection Character: Rural Crash Types Addressed: Rear-End, Angle Other Causes: Driver Inattention, Visibility
Figure 5.17: Flashing beacon at intersection
For rural intersections where there has been a history of drivers disregarding stop control, one enhancement that may be considered is the addition of overhead flashing beacons. This treatment can be used in combination with a number of other countermeasures, such as advanced intersection signs, oversized stop signs, better sign sheeting, and even transverse rumble strips, to call driver attention to the presence of the intersection. The flashing beacon usually flashes red for the stop-controlled approach and yellow for the uncontrolled major street. At all-way stop-controlled intersections, red flashers face all approaches. Some studies have found that flashing beacons have not necessarily improved safety but had other effects such as lowering major street speed. There has been some reported confusion on the part of the minor road stopped driver, who may assume that the other direction also stops. Flashers should only be used where crash patterns warrant.
References: Pant, P. D., Y. Park, and S. V. Neti. Development of Guidelines for Installation of Intersection Control Beacons. Report No. FHWA/OH-93/006. Federal Highway Administration. 1992.
Hammer, J. B. and E. J. Tye. Overhead Yellow-Red Flashing Beacons, Report No. FHWA/CA/TE-87/01. Federal Highway Administration. 1987.

93
5.3.6 Provide all-red signal phase
Main Category: Intersection Character: Both Crash Types Addressed: Angle, Turning Other Causes: Driver Inattention, Excessive Speed Summary discussion: At signalized intersections where there is a pattern of red-light running related crashes, one potential countermeasure may be to add an all-red clearance interval. The red clearance interval is an optional interval that follows the yellow change interval and precedes the next conflicting green interval. The purpose is to provide additional clearance time and allow time for vehicles that entered the intersection during the yellow-change interval to clear the intersection. Because drivers may not notice the all-red indication, there is a potential improvement in safety by making sure all vehicles have cleared the intersections. Innovative signal detection, such as that implemented in the City of Portland, may allow an all-red phase to be operated only when vehicles are in the intersection. A potential drawback is that all-red clearance intervals can reduce intersection capacity and that routine drivers may become accustomed to the additional clearance time, thereby reducing the potential benefits.
References: Souleyrette, R.R., M.M. O’Brien, T. McDonald, H. Preston, and R. Storm. Effectiveness of All-Red Clearance Interval on Intersection Crashes. Minnesota Department of Transportation. St. Paul, MN. 2004.
Roper, B.A., J.D. Fricker, R.E. Montgomery, and K.C. Sinha. The Effects of the All-Red Clearance Interval on Accident Rates in Indiana. In ITE 1991 Compendium of Technical Papers. Washington, DC. 1991.
Retting, R.A. and M. Greene. Influence of Traffic Signal Timing on Red-Light Running and Potential Vehicle Conflicts at Urban Intersections. Transportation Research Record. No. 1595. Transportation Research Board. Washington, DC. 1997.

94
5.3.7 Provide traffic coordination for progression
Main Category: Intersection Character: Urban Crash Types Addressed: Rear-End, Angle, Turning Other Causes: Congestion Summary discussion: In addition to improving capacity and traffic flow, good signal coordination can also generate measurable safety benefits. In a well-progressed system, vehicles travel in platoons that are generally not required to stop at a series of traffic signals. This can potentially reduce rear-end crashes that are caused by stopping for traffic signals. In addition, for pedestrians and vehicles at minor street unsignalized intersections, progression generally creates more and longer gaps in the traffic stream, which can reduce crashes caused by poor gap acceptance and make turning and crossing movements easier and safer.
Reference: Zador, P., H. Stein, S. Shapiro, and P. Tarnoff. Effect of Signal Timing on Traffic Flow and Crashes at Signalized Intersections. Transportation Research Record. No. 1010. Transportation Research Board. Washington, DC. 1984. p. 1-8.

95
5.3.8 Install advanced ice warning system
Main Category: Roadway Section Character: Rural Crash Types Addressed: All Crash Types Other Causes: Weather, Driver Inattention Summary Discussion: Advanced ice warning systems include ice detection systems and dynamic message signs (DMS). The ice detection systems consist of weather and pavement monitoring sensors at a roadway site and a computer at the site and/or at a central location to consolidate the information gathered. In icy conditions, it may be appropriate to consider designing an automated ice warning system that can give a dynamic warning to motorists when conditions are conducive to ice formation. In this system, a Road Weather Information System (RWIS) is utilized, in which pavement temperature and other weather sensors, or Environmental Sensor Stations (ESS), collect data to accurately predict the formation of ice. If the risk of ice formation is detected, a message is transmitted to be displayed on a DMS and/or a simple flashing beacon is activated by sensor technology. There has been limited installation of systems as collision countermeasures primarily because of liability concerns. As a result, there is little evidence of safety improvements, but it is expected that properly designed systems could prove beneficial.
References: Kulmala, R., P. Rama, J.P. Pauwelussen, and H.B. Pacejka. Safety Evaluation in Practice: Weather Warning Systems. Smart Vehicles. Swets & Zeitlinger. Lisse, Netherlands. 1995.
Carson, J. and F. Mannering. The Effect of Ice Warning Signs on Ice-Accident Frequencies and Severities. Accident Analysis and Prevention. 33(1). 2001. p. 99-109.
Lynette, L.C. Best Practices for Road Weather Management, Version 2.0. Report No. FHWA-OP-03-081. Federal Highway Administration. Washington, DC. 2003.

96
5.3.9 Provide automated speed enforcement
Main Category: Roadway Section Character: Both Crash Types Addressed: All Crash Types Other Causes: Excessive Speed, Driver Inattention Summary discussion: Enforcement of traffic regulations is an important part of an overall safety improvement strategy, however limited resources constrain the efforts of police agencies. Speed-enforcement cameras (also known as photo radar) are a potential method to overcome this limitation. The photo radar equipment includes a radar device to measure vehicle speed and a photo device to capture the driver’s image and license plate. The equipment is installed in standard vans and is operated on the same side of the street as traffic. A speed reader board is placed in the back window to inform the driver of his or her vehicle’s measured speed. While a police officer is present in the van to operate the equipment, the citations are issued automatically to every vehicle that passes the van above a certain threshold speed. Evaluations of the effectiveness of these policies appear to indicate that they improve safety, but there are questions regarding privacy issues and perceptions that systems are unfair or intended to generate fine revenue as opposed to addressing safety problems. In some Oregon locations, legislation will need to be changed to allow use of photo radar.
References: Zaidel, D.M. The Impact of Enforcement on Accidents. The “Escape” Project. Technical Research Centre of Finland (VTT). 2002.
Retting, R.A. and C.M. Farmer. Evaluation of Speed Camera Enforcement in the District of Columbia. 82nd Transportation Research Board Annual Meeting. Washington, DC. 2003.
Chen, G., W. Meckle, and J. Wilson. Speed and safety effect of photo radar enforcement on a highway corridor in British Columbia. Accident Analysis & Prevention. Volume 34, Issue 2. March 2002. p. 129-138.

97
5.3.10 Provide variable speed limits
Main Category: Roadway Section Character: Both Crash Types Addressed: All Crash Types Other Causes: Driver Inattention, Excessive Speed
Figure 5.18: Variable speed limits
Summary discussion: The concept of variable speed limits (VSL) is to provide the motorist with reasonable speeds based on time of day, traffic conditions, weather conditions, construction or maintenance activities, and other factors. While variable speed limits are used in Europe, they have not been used extensively in the U.S., with the exception of static changes in school zones and some work zones. The use of VSL has promise for increasing compliance with speeds and hopefully increasing safety, as many traffic situations are dynamic enough to allow for multiple speed limits. Challenges related to implementation include legal and enforcement issues and public acceptance. A number of jurisdictions are presently testing versions of VSL in distinct applications.
References: Elvik, R., P. Christensen, and A. Amundsen. Speed and Road Accidents: an Evaluation of the Power Model. Transportokonomisk Institutt. Oslo, Norway. 2004.
Weiss, A. and J.L. Schifer. Assessment of Variable Speed Limit Implementation Issues. NCHRP Project 3-59. National Cooperative Highway Research Program. Transportation Research Board. Washington, DC. 2001.

98
5.3.11 Install ramp metering
Main Category: Roadway Section Character: Urban Crash Types Addressed: Rear-End, Sideswipe - Over Other Causes: Congestion
Figure 5.19: Ramp metering
Summary discussion: Ramp metering is the use of traffic signals at freeway on-ramps to control the rate at which vehicles enter the freeway. The signals can be set for different metering rates to optimize freeway flow and minimize congestion. Signal timing algorithms and real-time data from mainline loop detectors are often used for more effective results. In practice, ramp metering systems have been successful in reducing congestion and increasing safety. Specifically, it is thought that reduced turbulence in merge zones can lead to reduced sideswipe and rear-end type crashes which are associated with unmetered areas. Such turbulence is generated by platoons of entering vehicles which disrupt mainline flow. Similarly, if metering prevents a bottleneck, one can also expect safer conditions through the reduced variance in speed distributions. Many evaluations have found safety improvements; however users should be cautioned that studies have not been able to fully distinguish between crash causation and other factors when examining crash data in corridors with ramp metering.
References: Drakopoulos, A., M. Patrabansh, and G. Vergou. Evaluation of Ramp Meter Effectiveness for Wisconsin Freeways, a Milwaukee Case Study: Part 2, Ramp Metering Effect on Traffic Operations and Crashes. Wisconsin Department of Transportation, Council on Research. Madison, Wisconsin. 2004.
Newman, Leonard, Alex Dunnet, and Gary Meis. Freeway Ramp Control- What It Can and Cannot Do. Freeway Operation Department, District 7. California Division of Highways. Sacramento, CA. February 1969.

99
Drew, Donald, William McCasland, Charles Pinnell, Joseph Wattleworth. The Development of an Automatic Freeway Merging Control System. Research Report 24-19. Texas Transportation Institute. Texas A&M University. College Station, TX. 1966.
Papageorgiou, M, H. Salem, J. Blosseville. ALINEA: A Local Feedback Control Law for On-Ramp Metering. Transportation Research Record. No. 1320. Transportation Research Board. Washington, DC. 1991.
O’Brien, Amy. New Ramp Metering Algorithm Improves Systemwide Travel Time. TR News. Transportation Research Board. Washington, DC. July-August 2000.
Cambridge Systematics, Inc. Twin Cities Ramp Meter Evaluation, Executive Summary. Minnesota Department of Transportation. St. Paul, MN. 2001.

100
5.4 PEDESTRIAN
5.4.1 Install advanced stop bar for cross walk
Main Category: Intersection Character: Both Crash Types Addressed: Pedestrian Other Causes: Driver Inattention
Figure 5.20: Advanced stop bar for cross walk
Summary discussion: At signalized or mid-block pedestrian crossing locations, the vehicle stop line can be moved 15 to 30 feet further back from the pedestrian crossing to improve visibility of the crossing pedestrians. Advanced stop lines benefit drivers and pedestrians, giving both a clearer view and more time to assess each other’s intentions. At multilane mid-block locations, the advanced stop-bar also allows crossing pedestrians the ability to see vehicles in lanes adjacent to stopped traffic. Studies have found that advanced stop lines result in reduced right-turn-on-red conflicts with cross traffic, more right-turn-on-red vehicles making complete stops behind the stop line, and better driver compliance with the stop bar. Enforcement and education efforts may be necessary to inform motorists of the requirements.
Reference: Van Houten, R. Research on Improving Motorists Yielding At Crosswalks on Multilane Roads with an Uncontrolled Approach. ITE 2001 Annual Meeting and Exhibit. Chicago, IL. 2001.

101
5.4.2 Install passive pedestrian detection
Main Category: Intersection Character: Urban Crash Types Addressed: Pedestrian Other Causes: Driver Inattention
Figure 5.21: Passive pedestrian detection
Summary discussion: In locations where pedestrians of variable walking abilities are expected, providing for passive detection of pedestrians may represent a safety improvement. At a signalized intersection, if pedestrians are detected in the crosswalk the pedestrian clearance interval can be extended to allow these pedestrians to clear the intersections. When no pedestrians are present, signal timings can also be adjusted for the most efficient scenario. Passive detection of pedestrians can also be used at unsignalized locations to trigger active warning devices to communicate to drivers the presence of pedestrians.
References: Hughes, R., H. Huang, C.V. Zegeer, and M.J. Cynecki. Evaluation of Automated Pedestrian Detection at Signalized Intersections. Report No. FHWA-RD-00-097. Turner-Fairbank Highway Research Center. Federal Highway Administration. McLean, VA. August 2001.
Van Houten, R., K. Healey, J.E. Malenfant, and R.A. Retting. Use of Signs and Symbols to Increase the Efficacy of Pedestrian Activated Flashing Beacons at Crosswalks. Transportation Research Record. No. 1636. Transportation Research Board. Washington, DC. 1998. p. 92-95.

102
5.4.3 Reduce pedestrian crossing distance
Main Category: Intersection Character: Both Crash Types Addressed: Pedestrian Other Causes: Geometry
Figure 5.22: Reduce pedestrian crossing distance
Summary discussion: When pedestrians must walk across wide streets they are exposed for a longer length of time, thereby increasing risk. Another problem that pedestrians face when trying to cross a street is visibility. One way to shorten pedestrian crossing distance on streets where parking is permitted is to install curb bulbs, also known as curb extensions and chokers. Curb bulbs project into the street, usually for a distance equal to the depth of a typical parallel parking space, making it easier for pedestrians to see approaching traffic and giving motorists a better view of pedestrians. When motorists are better able to see pedestrians, they have a greater opportunity to stop before a crash can occur. Decreasing crossing distances for pedestrians also decreases the length of the pedestrian phase and the time a right- or left-turning vehicle has to wait for a pedestrian to cross before exiting the roadway, which may increase capacity.
References: Zegeer, C.V., J. Stutts, H. Huang, M.J. Cynecki, R. Van Houten, B. Alberson, R. Pfefer, T.R. Neuman, K.L. Slack, and K.K. Hardy. Guidance for Implementation of the AASHTO Strategic Highway Safety Plan. Volume 10: A Guide for Reducing Collisions Involving Pedestrians. NCHRP Report 500. National Cooperative Highway Research Program. Transportation Research Board. Washington, DC. 2004.
Davies, D.G. Research, Development and Implementation of Pedestrian Safety Facilities in the United Kingdom. Federal Highway Administration. McLean, VA. 1999.

103
5.4.4 Install pedestrian countdown signals
Main Category: Intersection Character: Urban Crash Types Addressed: Pedestrian Other Causes: Geometry
Figure 5.23: Pedestrian countdown signals
Summary discussion: A pedestrian countdown signal contains a timer display and counts down the number of seconds left to finish crossing the street. The purpose of the countdown indication is to enable pedestrians to better judge the remaining amount of time to cross the intersection in light of their abilities. Pedestrian countdown heads can also prompt pedestrians entering the crosswalk during the flashing “don’t walk” (FDW) interval to walk faster to clear the crosswalk prior to the end of the pedestrian clearance interval. They can also reassure pedestrians who are in the crosswalk when the FDW interval appears that they still have time to finish crossing. This can improve signal operations as well as improve pedestrian safety. There is some concern that motorists with the concurrent through movement may accelerate as the pedestrian indication approaches zero with the knowledge that the yellow clearance interval for vehicles will be displayed. However, this issue has not yet been quantified in the research.
References: Leonard, J., M. Juckes, and B. Clement. Behavioural Evaluation of Pedestrians and Motorists towards Pedestrian Countdown Signals. Dessau-Soprin Inc. Laval, Quebec, Canada. 1999.
Eccles, K.A., R. Tao, and B.C. Mangum. Evaluation of Pedestrian Countdown Signals in Montgomery County, Maryland. Presented at the 83rd Transportation Research Board Annual Meeting. Washington, DC. 2004.

104
5.4.5 Install Pedestrian-only signals
Main Category: Intersection Character: Urban Crash Types Addressed: Pedestrian Other Causes:
Figure 5.24: Pedestrian-only signals
Summary discussion: Pedestrian-only signals provide an additional level of safety for mid-block crossings where minor street traffic volumes do not justify the presence of a full traffic signal. They are particularly useful on multilane roads when the volumes of pedestrians are high and the major road is busy. While the inclusion of median refuge islands separates the crossing activity for pedestrians to make it easier to cross wide streets, pedestrian-only signals give pedestrians adequate gaps to cross the street. Most often the signal is activated with a push button call. The disadvantage is that the signal can cause significant delays to major street traffic if it is used often. On wide street crossings, this can be mitigated with a two-stage crossing approach using a refuge median where only one direction of traffic is stopped at a time.
References: Zegeer, C.V., K.S. Opiela, and M.J. Cynecki. Effect of Pedestrian Signals and Signal Timing on Pedestrian Accidents. Transportation Research Record. No. 847. Transportation Research Board. Washington, DC. 1982. p. 62-72.
Van Houten, R., R.A. Retting, J. Van Houten, C.M. Farmer, and J.E.L. Malenfant. Use of Animation in LED Pedestrian Signals to Improve Pedestrian Safety. ITE Journal. 69(2). 1999. p. 30-38.
Van Houten, R., A.R. Retting, C.M. Farmer, and J. Van Houten. Field Evaluation of a Leading Pedestrian Interval Signal Phase at Three Urban Intersections. Transportation Research Record. No. 1734. Transportation Research Board. Washington, DC. 2000. p. 86-92.

105
Zegeer, C.V., K.S. Opiela, and M.J. Cynecki. Pedestrian Signalization Alternatives. Federal Highway Administration. Washington, DC. 1983.
Hunt, J. A Review of the Comparative Safety of Uncontrolled and Signal Controlled Midblock Pedestrian Crossings in Great Britain. 9th International Conference on Road Safety in Europe. Cologne, Germany. 1998.

106
5.4.6 Restrict right turn on red
Main Category: Intersection Character: Urban Crash Types Addressed: Pedestrian, Rear-End Other Causes: Driver Inattention
Figure 5.25: Restrict right turn on red
Summary discussion: Nearly all states allow motorists to turn right on red at any intersection, after coming to a full stop, unless a “NO TURN ON RED” sign prohibits the turn. While allowing right turns on red has operational benefits for signals and motorists, it can increase crash risk for pedestrians. Often motorists will check for conflicting traffic but not verify that a pedestrian is not crossing, even in locations where expectations of pedestrians are relatively high. Further adding to the safety risk is that many motorists fail to come to a complete stop. Consequently, at intersections with high pedestrian volumes and a high potential for conflict, it may be appropriate to restrict right turns on red. This can be accomplished with a sign for all hours of the day or partial hours. Studies have found that electronic signs are more effective than static signs. The right turn restriction with the “red ball” on the sign was found to be slightly more effective than the simple text message sign. Enforcement may be required, as motorists often do not comply with the signed restriction since it fairly unusual.
References: Retting, R.A., M.S. Nitzburg, C.M. Farmer, and R.L. Knoblauch. Field Evaluation of Two Methods for Restricting Right Turn on Red to Promote Pedestrian Safety. ITE Journal. 72(1). 2002. p. 32-36.
Clark, J.E., S. Maghsoodloo, and D.B. Brown. Public Good Relative to Right-Turn-on-Red in South Carolina and Alabama. Transportation Research Record. No. 926. Transportation Research Board. Washington, DC. 1983. p. 24 -31.

107
Preusser, D.F., W.A. Leaf, K.B. DeBartolo, R.D. Blomberg, and M.M. Levy. The Effect of Right-Turn-on-Red on Pedestrian and Bicyclist Accidents. Journal of Safety Research. 13(2). 1982. p. 45-55.
Zegeer, C.V. and M.J. Cynecki. Evaluation of Countermeasures Related to RTOR Accidents that Involve Pedestrians. Transportation Research Record. No. 1059. Transportation Research Board. Washington, DC. 1986. p. 24 -34.
Compton, R.P. and E.V. Milton. Safety Impact of Permitting Right-Turn-On-Red. A Report to Congress by the National Highway Traffic Safety Administration. National Highway Traffic Safety Administration. Washington, DC. 1994.
Lord, D. Synthesis on the Safety of Right Turn on Red in the United States and Canada. 82nd Transportation Research Board Annual Meeting. Washington, DC. 2003.
Campbell, B.J., C.V. Zegeer, H.H. Huang, and M.J. Cynecki. A Review of Pedestrian Safety Research in the United States and Abroad. Federal Highway Administration: McLean, VA. 2004.

108
5.4.7 Construct pedestrian grade separation
Main Category: Roadway Section Character: Both Crash Types Addressed: Pedestrian Other Causes: Congestion
Figure 5.26: Pedestrian grade separation
Summary discussion: At desirable crossing locations where traffic signals are not feasible, it may be appropriate to provide a pedestrian overpass or underpass. However, these solutions are relatively high cost and are usually only used as a last resort or when significant numbers of pedestrians (such as in a tourist area) make the solution more appealing. There are numerous design challenges that must be addressed to ensure that pedestrians use the facility. Total walking time must be similar to the at-grade crossing, and care must be taken to make the walking environment secure from a personal safety perspective. Finally, accommodation of all users may require long approach ramps for overcrossing, which can be a challenge to fit in the design areas. If the crossing can be judiciously designed, an improvement in pedestrian safety is likely.
References: Zegeer, C.V., J. Stutts, H. Huang, M.J. Cynecki, R. Van Houten, B. Alberson, R. Pfefer, T.R. Neuman, K.L. Slack, and K.K. Hardy. Guidance for Implementation of the AASHTO Strategic Highway Safety Plan. Volume 10: A Guide for Reducing Collisions Involving Pedestrians. NCHRP Report 500. National Cooperative Highway Research Program. Transportation Research Board. Washington, DC. 2004.
Swan, S. Treatments of Overpasses and Undercrossing for the Disabled: Early Report on the State-of-the-Art. Transportation Research Record. No. 683. Transportation Research Board. Washington, DC. 1978.

109
5.4.8 Install flashing lights in crosswalk
Main Category: Roadway Section Character: Urban Crash Types Addressed: Pedestrian, Rear-End Other Causes: Driver Inattention, Excessive Speed
Figure 5.27: Flashing lights in crosswalk
Summary discussion: One method of enhancing the safety effectiveness of a marked crosswalk is to install in-pavement lighted markers. This strategy requires embedding lights on both sides of the crosswalk (often LED strobes in raised pavement markers). To activate the device, pedestrians use a push button or are detected passively. Because the devices are in-pavement, visibility is usually limited if there is heavy traffic on the roadway. Some studies have shown these to be effective but have not been conclusive. There is the risk that pedestrians perceive the flashers as operating like traffic signals and thus feel more protected than they actually are. There are a number of maintenance challenges, including the loss of the in-pavement markers when the road is resurfaced or through normal wear and tear.
References: Van Houten, R., K. Healey, J.E. Malenfant, and R.A. Retting. Use of Signs and Symbols to Increase the Efficacy of Pedestrian Activated Flashing Beacons at Crosswalks. Transportation Research Record. No. 1636. Transportation Research Board. Washington, DC. 1998. p. 92-95.
Godfrey, D. and T. Mazella. Kirkland’s Experience with In-Pavement Flashing Lights at Crosswalks. ITE/IMSA Annual Meeting. Lynnwood, WA. 1999.
Huang, H. An Evaluation of Flashing Crosswalks in Gainesville and Lakeland. Florida Department of Transportation. Tallahassee, FL. 2000.

110
5.4.9 Install illumination for marked crosswalks
Main Category: Roadway Section Character: Both Crash Types Addressed: Pedestrian Other Causes: Driver Inattention, Visibility Summary discussion: At marked crosswalks and intersections, it is important to provide adequate lighting so that motorists can see pedestrians. While pedestrians will often assume that they can be seen since they can see the motorist, this is not always the case. Proper lighting design will increase pedestrian safety. In downtown or high pedestrian use areas, continuous streetlights along both sides of arterials may be warranted. Some studies have found significant reductions in pedestrian crashes after illumination; in addition, lighting also increases the personal security of pedestrians.
Reference: Zegeer, C.V., J. Stutts, H. Huang, M.J. Cynecki, R. Van Houten, B. Alberson, R. Pfefer, T.R. Neuman, K.L. Slack, and K.K. Hardy. Guidance for Implementation of the AASHTO Strategic Highway Safety Plan. Volume 10: A Guide for Reducing Collisions Involving Pedestrians. NCHRP Report 500. National Cooperative Highway Research Program. Transportation Research Board. Washington, DC. 2004.

111
5.4.10 Pedestrian fencing or barrier
Main Category: Roadway Section Character: Both Crash Types Addressed: Pedestrian Other Causes: Access Management
Figure 5.28: Pedestrian fencing or barrier
Summary discussion: In locations where it is desirable to restrict or channelize pedestrians to a common crossing location, pedestrian fencing and barriers can be used to restrict pedestrian access. They are most commonly installed in locations where pedestrians may be motivated to cross at locations where it is felt that it is unsafe for them but the desire to cross at those locations is high. Because the barrier will likely force pedestrians to walk longer distances to the crossing, the barrier should be designed to be effective. The barrier can be vegetation or a fence-like material. This is a relatively expensive treatment and should therefore only be considered after other, less costly alternatives have been tried and failed to produce desired results.
Reference: Zegeer, C.V., J. Stutts, H. Huang, M.J. Cynecki, R. Van Houten, B. Alberson, R. Pfefer, T.R. Neuman, K.L. Slack, and K.K. Hardy. Guidance for Implementation of the AASHTO Strategic Highway Safety Plan. Volume 10: A Guide for Reducing Collisions Involving Pedestrians. NCHRP Report 500. National Cooperative Highway Research Program. Transportation Research Board. Washington, DC. 2004.

112
5.4.11 Provide marked mid-block crosswalk
Main Category: Roadway Section Character: Urban Crash Types Addressed: Pedestrian Other Causes:
Figure 5.29: Marked mid-block crosswalk
Summary discussion: The installation of a marked crosswalk at a mid-block location is used to designate the preferred location of pedestrian crossings. There are a number of features that can enhance the safety of the crosswalk by encouraging motorists to yield to pedestrians in the crosswalk. Most simply, a crosswalk consists of pavement markings and associated warning signs which will have varying degrees of visibility to the motorists. A marked crosswalk does not necessarily mean that motorists will yield to pedestrians. For lower volume streets a simple marked crosswalk may not provide additional safety. In general, however, when traffic volumes increase additional safety can be gained by marking the crosswalk; but care must be taken to provide additional enhancements such as curb extensions, median refuges, and additional signing. Crosswalk markings should be visible to motorists, particularly at night. Other enhancements, such as pedestrian-only signals and illumination, may be considered.
References: Zegeer, C.V., J. Stutts, H. Huang, M.J. Cynecki, R. Van Houten, B. Alberson, R. Pfefer, T.R. Neuman, K.L. Slack, and K.K. Hardy. Guidance for Implementation of the AASHTO Strategic Highway Safety Plan. Volume 10: A Guide for Reducing Collisions Involving Pedestrians. NCHRP Report 500. National Cooperative Highway Research Program. Transportation Research Board. Washington, DC. 2004.
Campbell, B.J., C.V. Zegeer, H.H. Huang, and M.J. Cynecki. A Review of Pedestrian Safety Research in the United States and Abroad. Federal Highway Administration. McLean, VA. 2004.
113
Hunt, J. A Review of the Comparative Safety of Uncontrolled and Signal Controlled Midblock Pedestrian Crossings in Great Britain. 9th International Conference on Road Safety in Europe. Cologne, Germany. 1998.
Huang, H.F. and M.J. Cynecki. The Effects of Traffic Calming Measures on Pedestrian and Motorist Behavior. Federal Highway Administration. McLean, VA. 2001.
Zegeer, C.V., R. Stewart, H. Huang, and P. Lagerwey. Safety Effects of Marked Versus Unmarked Crosswalks at Uncontrolled Locations: Executive Summary and Recommended Guidelines. Federal Highway Administration. McLean, VA. 2002.

114
5.5 RAILROAD CROSSING
5.5.1 Construct railroad grade separation (overpass or underpass)
Main Category: Intersection Character: Both Crash Types Addressed: All Crash Types Other Causes: Congestion, Access Management
Summary discussion: When volumes are high enough and crash experience severe, some at-grade intersections between railroads and highways may warrant the construction of a grade separation. However, since this is typically a high cost approach, it will usually be driven in conjunction with other problems such as delays caused by train crossings. Constructing a grade separation is highly dependent on sufficient vehicle and train volumes to justify the investment. Grade separation may be considered when other improvements for safety have not been successful. When a grade separation is constructed, opportunities may arise to close other crossings and further improve safety.
Reference: Highway/Rail Grade Crossing Technical Working Group (TWG). Guidance on Traffic Control Devices at Highway-Rail Grade Crossings. Federal Highway Administration. Washington, DC. November 2002.

115
5.5.2 Install active warning device
Main Category: Intersection Character: Both Crash Types Addressed: Angle Other Causes: Driver Inattention, Visibility
Figure 5.30: Active warning device
Summary discussion: Active warning devices can be installed at highway-rail grade crossings where violations and risky driver behavior create safety problems. Conversion to active warning can generally be expected to improve safety at crossings, with flashing lights representing an upgrade from signs only, and gates leading to even more pronounced benefits. A review of multiple studies found reductions in all crashes of 50% when upgrading from signs to flashing lights and sound signals and 67% when upgrading from signs to gates. The research points to a reduction of 45% when flashing lights and sound signals are supplemented by gates. The effectiveness of these improvements is heavily dependent on road context, however, so the applicability of these reported reductions should be considered limited. References: Elvik, R. and T. Vaa. Handbook of Road Safety Measures. Elsevier. Oxford, United Kingdom. 2004.
Fambro, D.B., K.W. Heathington, and S.H. Richards. Evaluation of Two Active Traffic Control Devices for Use at Railroad-Highway Grade Crossings. Transportation Research Record. No. 1244. Transportation Research Board. Washington, DC. 1989. p. 52-62.
Fambro, D.B., D.A. Noyce, A.H. Frieslaar, and L.D. Copeland. Enhanced Traffic Control Devices and Railroad Operations for Highway-Railroad Grade Crossings: Third-Year Activities. Texas Department of Transportation. Austin, TX. 1997.

116
Hauer, E. and B.N. Persaud. How to Estimate the Safety of Rail-Highway Grade Crossings and the Safety Effects of Warning Devices. Transportation Research Record. No. 1114. Transportation Research Board. Washington, DC. 1987. p. 131-140.
Tustin, B.H., H. Richards, H. McGee, and R. Patterson. Railroad-Highway Grade Crossing Handbook - Second Edition. Federal Highway Administration. McLean, VA. 1986.
Bowman, B.L. The Effectiveness of Railroad Constant Warning Time Systems. Transportation Research Record. No. 1114. Transportation Research Board. Washington, DC. 1987. p. 111-122.
Richards, S.H., K.W. Heathington, and D.B. Fambro. Evaluation of Constant Warning Times Using Train Predictors at a Grade Crossing with Flashing Light Signals. Transportation Research Record. No. 1254. Transportation Research Board. Washington, DC. 1990. p. 60-71.

117

118
5.6 ROADSIDE IMPROVEMENT
5.6.1 Eliminate shoulder drop-off or provide wedge
Main Category: Roadway Section Character: Rural Crash Types Addressed: Non-Collision, Fixed Object, Head-On, Sideswipe-Meeting Other Causes: Geometry
Figure 5.31: Eliminate shoulder drop-off or provide wedge
Summary discussion: Many head-on and run-off-the-road collisions are caused by motorists who could have possibly maintained control of their vehicle but overcorrected after departing the roadway to the right. A contributing factor to this situation can be roadways where an “edge-drop” exists either between the paved travel lane and shoulder or the shoulder and the earth surface. Eliminating these edge drops can reduce run-off-the-road (ROR) and head-on collisions. This can be accomplished either by timely maintenance or as part of resurfacing projects. Some agencies are experimenting with a paving wedge which can create a 45-degree angle on the pavement edge to reduce the possibility of wheels getting caught.
Reference: Neuman, T.R., R. Pfefer, K.L. Slack, K.K. Hardy, F.M. Council, H. McGee, L. Prothe, and K.A. Eccles. Guidance for Implementation of the AASHTO Strategic Highway Safety Plan. Volume 6: A Guide for Addressing Run-off-Road Collisions. NCHRP Report 500. National Cooperative Highway Research Program. Transportation Research Board. Washington, DC. 2003.

119
5.7 TRAFFIC CALMING
5.7.1 Install chicanes or serpentine roadway
Main Category: Roadway Section Character: Urban Crash Types Addressed: All Crash Types Other Causes: Excessive Speed, Driver Inattention
Figure 5.32: Install chicanes or serpentine roadway
Summary discussion: Traffic calming methods traditionally have one of two aims: to reduce the speed and/or the volume of traffic on a road segment. Some methods may address one or both to varying degrees. The most effective traffic calming measures are those that are self-enforcing, meaning that once implemented they do not require enforcement efforts to maintain speed reductions. The introduction of a narrower, curvilinear alignment will slow vehicles as they navigate the street. These horizontal restrictions can be accomplished by either constructing or modifying a street such that it has gentle but alternating horizontal curves, or by using alternating curb bulb outs to produce a similar effect. Landscaping and other amenities can be included in the bulb-outs or space in the serpentine alignment to improve the visual appeal. Installation of chicanes should be coordinated with driveway access and emergency service providers. These are most appropriate on low-volume, local streets. As with other traffic calming measures, diversion of traffic to other streets should be also considered.
Reference: Marek, J. Mid-Block Speed Control: Chicanes and Speed Humps. ITE Journal. 68(11). 1998.

120
5.7.2 Install speed tables and or bumps
Main Category: Roadway Section Character: Urban Crash Types Addressed: All Crash Types Other Causes: Excessive Speed, Driver Inattention
Figure 5.33: Install speed tables and or bumps
Summary discussion: Traffic calming methods traditionally have one of two aims: to reduce the speed and/or the volume of traffic on a road segment. Some methods may address one or both to varying degrees. The most effective traffic calming measures are those that are self-enforcing; meaning that once implemented they do not require enforcement efforts to maintain speed reductions. Speed tables (a long, raised hump in the roadway with a flat section in the middle) and speed bumps (rounded raised areas of pavement typically 12 to 14 feet in length) are generally considered effective at lowering speeds on local and collector streets. They are usually placed at mid-block locations and are not typically used on major roads, bus routes, or primary emergency response routes. When used, their installation should be coordinated with transit agencies and emergency responders. As with other traffic calming measures, diversion of traffic to other streets should be also considered.
Reference: ITE Technical Council Task Force on Speed Humps. Guidelines for the Design and Application of Speed Humps. Washington, DC. 1997.
121
5.7.3 Narrow travel lanes
Main Category: Roadway Section Character: Urban Crash Types Addressed: All Crash Types Other Causes: Excessive Speed, Driver Inattention Summary discussion: Traffic calming methods traditionally have one of two aims: to reduce the speed and/or the volume of traffic on a road segment. Some methods may address one or both to varying degrees. The most effective traffic calming measures are those that are self-enforcing, meaning that once implemented they do not require enforcement efforts to maintain speed reductions. The practice of narrowing lanes can reduce vehicle speeds by increasing friction between vehicles and the surrounding roadside. Narrowing lanes can be achieved by restriping lanes to 10 or 11 feet, adding a bike lane, removing lanes to add other enhancements (sidewalks, parking, bike lanes), adding on-street parking, and other similar approaches. While making lanes narrower will reduce the crossing distances for pedestrians, there are some potential drawbacks. Narrow lanes will also reduce capacity and create congestion, make heavy truck and/or emergency vehicle access difficult, and potentially increase minor crashes related to additional parking. The functional class of roadway, likely vehicle usage, and character of the surrounding land use should be considered when evaluating this alternative.
Reference: Bauer, K.M., D.W. Harwood, W.E. Hughes, and K.R. Richard. Safety Effects of Using Narrow Lanes and Shoulder-Use Lanes to Increase the Capacity of Urban Freeways. Transportation Research Record. No. 1897. Transportation Research Board. Washington, DC. 2004.
Harwood, D.W., F.M. Council, E. Hauer, W.E. Hughes, and A. Vogt. Prediction of the Expected Safety Performance of Rural Two-Lane Highways. Federal Highway Administration. McLean, VA. 2000.
Hauer, E. Lane Width and Safety. 2000.
Curren, J.E. Use of Shoulders and Narrow Lanes to Increase Freeway Capacity. NCHRP Report 369. National Cooperative Highway Research Program. Transportation Research Board. Washington, DC. 1995.

122
6.0 CASE STUDY
In this chapter a simple case study is presented that shows how the crash reduction factors and the interactive query-based website can be used by ODOT engineers and planners. A simple intersection analysis of a state highway and county road is used.
6.1 URBAN INTERSECTION SAFETY STUDY
The intersection of OR-8 (designated SW Tualatin-Valley Highway at this location) and SW Murray Boulevard has been one of the highest crash locations in the City of Beaverton for several years. In 2003 the Oregon Department of Transportation assigned this intersection a SPIS rating of 86.31, one of the higher scores in the state. Murray Boulevard is owned and managed by Washington County. The intersection is located within the City of Beaverton, and the overlap of three jurisdictions poses a unique challenge to the operation of the intersection.
In terms of its physical size and traffic volume, this is one of the largest intersections in Beaverton. The average daily traffic (ADT) volume is approximately 42,000 vehicles per day (2003 data). Several large employers are located within one mile, most notably Nike and Tektronix. Washington County is one of the fastest growing locations in the Portland metropolitan area and should continue to see above average growth in the near term, especially south and west of the intersection.
Tualatin-Valley Highway runs east and west; Murray Boulevard runs north and south. The land use on each quadrant is:
• NW: ARCO gas station with an AM-PM mini-mart • NE: Shell gas station • SE: Toyota dealership • SW: 5-acre lawn which is part of a 43-acre property with a Catholic convent and school
owned by the Sisters of St. Mary of Oregon Approximately 25 feet directly south of and parallel to Tualatin-Valley Highway are railroad tracks owned and operated by Portland & Western Railroad. Trains run several times a day and have a deleterious effect on intersection capacity when in operation. Tualatin-Valley Highway is a seven-lane facility: three lanes of travel in each direction and a left-turn lane. Two of the three lanes in each travel direction are through lanes only; the curbside lane in each direction allows vehicles to turn right as well. Murray Boulevard is a five-lane facility: two travel lanes in each direction and a left-turn lane. The left-hand lane in each direction permits only through movements, while the right-hand lane allows vehicles to travel through the intersection or to turn right. Southbound Murray Boulevard has a designated, separated, right-only turn lane for vehicles turning right onto westbound Tualatin-Valley Highway. A low concrete median (approximately 6 inches high) is located on Tualatin-Valley Highway east of the intersection and

123
extends approximately 400 feet back. This median is covered by reflectors and prevents turns into and out of the Shell gas station.
Sidewalks and curbs are present alongside the roadway on all four approaches and appear to be in good functional condition. A pedestrian island is located between the exclusive right-turn lane from Murray and the southbound through lanes. The crosswalks that serve the western and northern crossings have their terminus on this pedestrian island. The crosswalk is not marked between the pedestrian island and the northwest corner of the intersection. Sight distance and visibility on all approaches appear to be very good and adequate for the posted speeds: 40 mph on Murray Boulevard, and 45 mph on Tualatin-Valley Highway. Lane markings are in generally good condition. Bike lanes are present on all four approaches, and they are at least the required minimum width of 4 feet. There is also a bus pullout area on Murray Boulevard southbound, immediately south of the intersection and the railroad tracks.
The Shell gas station located on the northeast corner has two driveways that allow vehicles to enter and exit the station along Tualatin-Valley Highway. The westernmost driveway is approximately 25 feet from the intersection (Figure 6.1). The ARCO/AM-PM on the northwest corner also has two driveways located on Tualatin-Valley Highway, one of which is located immediately after the termination of the sidewalk curvature. Both gas stations have driveways that provide access to Murray Boulevard. The ARCO/AM-PM access to Murray Boulevard is composed of two driveways separated by about 10 feet of sidewalk. The Shell station has two driveways that provide access to Murray Boulevard; these are separated by about 50 feet of sidewalk.
Figure 6.1: Intersection of Tualatin-Valley Highway and Murray Boulevard in Beaverton, OR

124
6.1.1 Existing crash patterns
The collision data obtained for the intersection of Tualatin-Valley Highway and Murray Boulevard (City of Beaverton and ODOT, 2000-2004) were analyzed using Microsoft Excel and a collision diagram to identify crash patterns that may suggest potential countermeasures. There were a total of 234 crashes during the 5-year study period, 2000-2004. The data is presented first in tabular format, as shown in Tables 6.1 through 6.4. The approximate locations of crashes by type, location and the total number over the 5-year period are displayed on the collision diagram.
Table 6.1: Crashes by type, 2000-2004 Type of Collision Frequency of Crashes Rear-end 115 Turning movement 81 Sideswipe 19 Angle 9 Other 10 Total 234
Table 6.2: Crashes by driver error, 2000-2004 Driver Error Frequency of Crashes Did not yield right-of-way 65 Following too closely 64 Other improper driving 34 Speed too fast for conditions 30 Other 30 Made improper turn 11 Total 234
Table 6.3: Crashes by severity, 2000-2004 Driver Error Frequency of Crashes Fatal 0 Injury A (Severe) 3 Injury B (Moderate) 28 Injury C (Minor) 55 PDO (Property Damage Only) 148 Total 234

125
Table 6.4: Crash environmental data Road Surface Percent of Total Dry 73% Wet 27% Light conditions Day 76% Dark - lit 15% Dark - unlit 4% Dusk 3% Dawn 1% Weather Clear 3% Cloudy 73% Rain 24%
6.1.2 Collision diagrams
The collision diagram developed for the intersection of Tualatin-Valley Highway and Murray Boulevard is shown in Figure 6.2. The collision diagram reveals several locations of interest. The high conflict locations addressed in the next section of this report are:
• Rear-end crashes • Bus stop locations • Driveway conflicts

126
Figure 6.2: Collision diagram showing high crash locations
6.2 USING THE WEBSITE
The online CRF database is provided through an interactive website at the following location: http://its.pdx.edu/CRF/CRFweb/. The interface is designed for new and advanced users. On the opening page, the user is asked for a number of parameters to isolate the list of countermeasures that are most applicable to the intersection or roadway section under study.
First, users are directed to an advanced query page which enables broad queries of the database. For example, one can perform a query for all countermeasures applicable to an urban environment regardless of other characteristics. Users are asked to choose whether they are concerned with an area located within an urban, rural, or both urban and rural setting. In the case study, the intersection is in an urban area. Upon inspection of the crash data and trends, much of the crash data is as expected at an urban intersection. However, the collision diagram and data do indicate that rear-end collisions are the primary crash type that might be addressed.
Based on this observation, an analyst may wish to know the countermeasures in the database that might apply. As shown in Figure 6.3a, the query parameters are set to “urban,” “any countermeasure type,” “all other crash causes,” “intersection,” and “rear-end crashes.” Upon

127
submitting the query, 12 countermeasures that meet the criteria are displayed (as shown in Figure 6.3b). By clicking on each countermeasure, the analyst can see a summary page that lists the specific countermeasure, a picture, corresponding crash reduction factors, applicable use criteria, a brief discussion of the countermeasure, and references used to determine the countermeasure’s CRFs (Figure 6.3c). Those countermeasures presented in Chapter 5 have discussion only (Figure 6.3d).
As one can see, a number of queries and investigations can be performed within the interactive website. This will allow the analyst to “brainstorm” about potential solutions. All references are given, and if further information or the original study is desired it can easily be found. The web database can easily be updated as more current research becomes available. As a tool, the website should have a longer life than the printed report.

128
a) Query Dialog Screen b) Results Page
c) CRF Summary (with CRF) d) CRF Summary (with discussion only)
Figure 6.3: Sample CRF website screen captures

129
130
7.0 CONCLUSIONS AND RECOMMENDATIONS
The objective of this research was to compile the best available data for a comprehensive list of countermeasures and their respective crash reduction factors for ODOT to use in its transportation safety planning and engineering. Several final comments are worth noting. Any analysis of past safety countermeasure research included an assessment of research quality and statistical reliability. However, in the literature there is a wide variation in the reliability of countermeasure studies and their CRFs. Most are simple before-and-after studies, where the prospect of regression to the mean casts doubt on the accuracy of findings. Relatively few countermeasures have been extensively and conclusively studied. Variations in research quality, study conditions and locations (geography, traffic levels, seasonal effects, weather trends, economic trends, etc.), and the effectiveness of countermeasures partially explain the wide ranges in expected CRFs for many countermeasures.
The final database product provides ODOT and local Oregon agencies with an easily searchable reference base for looking up the available data on a wide range of countermeasures. The new flexible database design includes a notation on the reliability of the research and is as specific as possible regarding crash reduction factors and the crash types to which they apply. Actual results from applying these countermeasures should be expected to vary according to the specific circumstances of their application. Any intersection or roadway segment will have different characteristics, and the effects of any countermeasure can be expected to vary. Often countermeasures are used in combination, making precise study of any one countermeasure more difficult. It is important to note that most CRF data should be used only as a guide; professional judgment in particular situations must continue to play a major role in decisions. No list of countermeasures, no matter how carefully researched, can accurately predict impacts on every unique traffic situation. The usefulness of such a list is limited to expected cost/benefit analysis and providing ideas for countermeasures to be applied under specific circumstances.
Finally, given the trends in current and future federally sponsored research work, the Oregon DOT should consider the switch to accident modification factors (AMFs) rather than CRFs.

131
132
8.0 REFERENCES
Agent, K. R. and F. T. Creasey. Delineation of Horizontal Curves. Kentucky Transportation Cabinet. Frankfort, KY. 1986.
Agent, K., N. Stamatiadis, and S. Jones. Development of Accident Reduction Factors. Report KTC-96-13. Kentucky Transportation Center. University of Kentucky. Lexington, KY. 1996.
Al-Masaeid, H. R. and H. Sinha. An Analysis of Accident Reduction Potentials of Pavement Marking. Journal of Transportation Engineering. Vol. 120, No. 5. September/October 1994. p. 723-736.
Bahar, G. and T. Erwin. Synthesis of Practices for the Implementation of Transverse Rumble Strips - Final Draft. 2004.
Bamfo, J. K. and E. Hauer. Which is Safer in terms of Right-Angle Vehicle Accidents – Fixed-time or Vehicle-actuated Signal Control? Canadian Multidisciplinary Road Safety Conference X. Toronto, Ontario, Canada. 1997.
Bared, J., G.L. Giering, and D.L. Warren. Safety Evaluation of Acceleration and Deceleration Lane Lengths. ITE Journal. 69(6). 1999. p. 50-54.
Bared, J.G. and E.I. Kaisar. Advantages of Offset T-Intersections with Guidelines. In Proceedings of Traffic Safety on Three Continents. Moscow, Russia. 2001.
Bauer, K.M. and D.W. Harwood. Statistical Models of Accidents on Interchange Ramps and Speed-Change Lanes. Federal Highway Administration. McLean, VA. 1997.
Bauer, K.M., D.W. Harwood, W.E. Hughes, and K.R. Richard. Safety Effects of Using Narrow Lanes and Shoulder-Use Lanes to Increase the Capacity of Urban Freeways. Transportation Research Record. No. 1897. Transportation Research Board. Washington, DC. 2004.
Bonneson, J.A., P.T. McCoy, and D.S. Eitel. Interchange vs. At-Grade Intersection on Rural Expressways. Transportation Research Record. No. 1395. Transportation Research Board. Washington, DC. 1993. p. 39-47.
Bowman, B. L. and R. L. Vecellio. Effects of Urban and Suburban Median Types on Both Vehicular and Pedestrian Safety. Transportation Research Record. No. 1445. Transportation Research Board. Washington, DC. 1994. p. 169-179.
Bowman, B.L. The Effectiveness of Railroad Constant Warning Time Systems. Transportation Research Record. No. 1114. Transportation Research Board. Washington, DC. 1987. p. 111-122.

133
Bowman, B.L. and R.L. Vecellio. Effects of Urban and Suburban Median Types on Both Vehicular and Pedestrian Safety. Transportation Research Record. No. 1445. Transportation Research Board. Washington, DC. 1994. p. 169-179.
Box, P. C. and P. A. Mayer. Driveways, in Traffic Control and Roadway Elements - Their Relationship to Highway Safety. Highway Users Federation for Safety and Mobility. Washington, DC. 1970.
Box, P.C. and P.A. Mayer. Intersections, in Traffic Control and Roadway Elements - Their Relationship to Highway Safety. Highway Users Federation for Safety and Mobility. 1970.
Bray, J. S. Skid Accident Reduction Program (SKARP): Targeted Crash Reductions. Institute of Transportation Engineers 2003 Technical Conference and Exhibit. Fort Lauderdale, FL. 2003.
Bullough, J. D., P. R. Boyce, A. Bierman, K. M. Conway, K. Huang, C. P. O’Rourke, C. M. Hunter, and A. Nakata. Response to Simulated Traffic Signals Using Light-Emitting Diode and Incandescent Sources. Transportation Research Record. No. 1724. Transportation Research Board. Washington, DC. 2000. p. 39-46.
Cambridge Systematics, Inc. Twin Cities Ramp Meter Evaluation, Executive Summary. Minnesota Department of Transportation. St. Paul, MN. 2001.
Campbell, B.J., C.V. Zegeer, H.H. Huang, and M.J. Cynecki. A Review of Pedestrian Safety Research in the United States and Abroad. Federal Highway Administration. McLean, VA. 2004.
Carson, J. and F. Mannering. The Effect of Ice Warning Signs on Ice-Accident Frequencies and Severities. Accident Analysis and Prevention. 33(1). 2001. p. 99-109.
Chen, G., W. Meckle, and J. Wilson. Speed and safety effect of photo radar enforcement on a highway corridor in British Columbia. Accident Analysis & Prevention. Volume 34, Issue 2. March 2002. p. 129-138.
Claessen, J. G. and D. R. Jones. The Road Safety Effectiveness of Raised Wide Medians. In Proceedings of the 17th Australian Road Research Board Conference. 1994.
Clark, J.E., S. Maghsoodloo, and D.B. Brown. Public Good Relative to Right-Turn-on-Red in South Carolina and Alabama. Transportation Research Record. No. 926. Transportation Research Board. Washington, DC. 1983. p. 24 -31.
Compton, R.P. and E.V. Milton. Safety Impact of Permitting Right-Turn-On-Red. A Report to Congress by the National Highway Traffic Safety Administration. National Highway Traffic Safety Administration. Washington, DC. 1994.
Council, F.M., B. Persaud, C. Lyon, K. Eccles, M. Griffith, E. Zaloshnja, and T. Miller. Economic Analysis of the Safety Effects of Red Light Camera Programs and the Identification of Factors Associated with the Greatest Benefits. Transportation Research Board 84th Annual Meeting. Washington, DC. 2005.

134
Cuelho, E., J. Stephens, and C. McDonald, A Review of the Performance and Costs of Contemporary Pavement Marking Systems. Western Transportation Institute. Montana State University. Bozeman, MT. 2003.
Curren, J.E. Use of Shoulders and Narrow Lanes to Increase Freeway Capacity. NCHRP Report 369. National Cooperative Highway Research Program. Transportation Research Board. Washington, DC. 1995.
Dahir, S. H. and W. L. Gramling. Wet-Pavement Safety Programs. NCHRP Synthesis of Highway Practice Report 158. Transportation Research Board. Washington, DC. 1990.
Davies, D.G. Research, Development and Implementation of Pedestrian Safety Facilities in the United Kingdom. Federal Highway Administration. McLean, VA. 1999.
Davis, G. Accident reduction factors and causal inference in traffic safety studies: A review. Accident Analysis and Prevention. Vol. 32, No. 1. 2000. p. 95-109.
National Research Council. Designing Safer Roads: Practices for Resurfacing, Restoration, and Rehabilitation. Special Report 214. Transportation Research Board. Washington DC. 1987.
Drakopoulos, A., M. Patrabansh, and G. Vergou. Evaluation of Ramp Meter Effectiveness for Wisconsin Freeways, a Milwaukee Case Study: Part 2, Ramp Metering Effect on Traffic Operations and Crashes. Wisconsin Department of Transportation, Council on Research. Madison, Wisconsin. 2004.
Drew, Donald, William McCasland, Charles Pinnell, Joseph Wattleworth. The Development of an Automatic Freeway Merging Control System. Research Report 24-19. Texas Transportation Institute. Texas A&M University. College Station, TX. 1966.
Eccles, K.A., R. Tao, and B.C. Mangum. Evaluation of Pedestrian Countdown Signals in Montgomery County, Maryland. Presented at the 83rd Transportation Research Board Annual Meeting. Washington, DC. 2004.
Elvik, R. Meta-Analysis of Evaluations of Public Lighting as Accident Countermeasure. Transportation Research Record. No. 1485. Transportation Research Board. Washington, DC. 1995. p. 112-123.
Elvik, R. and T. Vaa. Handbook of Road Safety Measures. Elsevier. Oxford, United Kingdom. 2004.
Elvik, R., P. Christensen, and A. Amundsen. Speed and Road Accidents: an Evaluation of the Power Model. Transportokonomisk Institutt. Oslo, Norway. 2004.
Fambro, D.B., D.A. Noyce, A.H. Frieslaar, and L.D. Copeland. Enhanced Traffic Control Devices and Railroad Operations for Highway-Railroad Grade Crossings: Third-Year Activities. Texas Department of Transportation. Austin, TX. 1997.

135
Fambro, D.B., K.W. Heathington, and S.H. Richards. Evaluation of Two Active Traffic Control Devices for Use at Railroad-Highway Grade Crossings. Transportation Research Record. No. 1244. Transportation Research Board. Washington, DC. 1989. p. 52-62.
Foody, T. J. and T. B. Culp. A comparison of the safety potential of the raised versus depressed median design. Transportation Research Record. No. 514. Transportation Research Board. Washington, DC. 1974. p. 1-14.
Garner, G. R. and R. C. Deen. Elements of Median Design in Relation to Accident Occurrence. Highway Research Record. No. 432. 1973. p. 1-11.
Gattis, J.L. and S.T. Low. Intersection Angle Geometry and the Driver’s Field of View. Transportation Research Record. No. 1612. Transportation Research Board. Washington, DC. 1998. p. 10-16.
Gibby, A. R., S. P. Washington, and T. C. Ferrara. Evaluation of High-Speed Isolated Signalized Intersections in California. Transportation Research Record. No. 1376. Transportation Research Board. Washington, DC. 1992. p. 45-56.
Godfrey, D. and T. Mazella. Kirkland’s Experience with In-Pavement Flashing Lights at Crosswalks. ITE/IMSA Annual Meeting. Lynnwood, WA. 1999.
Griffith, M.S. Safety Evaluation of Rolled-In Continuous Shoulder Rumble Strips Installed on Freeways. Transportation Research Record. No. 1665. Transportation Research Board. Washington, DC. 1999. p. 28-34.
Hammer, J. B. and E. J. Tye. Overhead Yellow-Red Flashing Beacons, Report No. FHWA/CA/TE-87/01. Federal Highway Administration. 1987.
Hanley, K. E., A. R. Gibby, and T. C. Ferrara. Analysis of Accident Reduction Factors on California State Highways. Transportation Research Record. No. 1717. Transportation Research Board. Washington, DC. 2000. p. 37-45.
Harwood, D. W. Methodology to Predict the Safety Performance of Urban and Suburban Arterials. Project 17-26. National Cooperative Highway Research Program. Transportation Research Board. Washington, DC. 2004.
Harwood, D. W. Use of Rumble Strips to Enhance Safety. Report 191. NCHRP Synthesis of Highway Practice. National Cooperative Highway Research Program. Transportation Research Board. Washington, DC. 1993.
Harwood, D.W., F.M. Council, E. Hauer, W.E. Hughes, and A. Vogt. Prediction of the Expected Safety Performance of Rural Two-Lane Highways. Publication FHWA-RD-99-207. Turner-Fairbank Highway Research Center, Federal Highway Administration. McLean, VA. 2000.
Harwood, D.W., K.M. Bauer, I.B. Potts, D.J. Torbic, K.R. Richard, E.R. Kohlman Rabbani, E. Hauer, and L. Elefteriadou. Safety Effectiveness of Intersection Left- and Right-Turn Lanes. Federal Highway Administration. McLean, VA. 2002.

136
Harwood, D.W., M.T. Pietrucha, M.D. Wooldridge, R.E. Brydia, and K. Fitzpatrick. Median Intersection Design. NCHRP Report 375. National Cooperative Highway Research Program. Transportation Research Board. Washington, DC. 1995.
Hauer, E. Access and Safety. Unpublished web document (http://roadsafetyresearch.com). 2001.
Hauer, E. Fishing for Safety Information in Murky Waters. Journal of Transportation Engineering. Vol. 131, No. 5. 2005. p. 340-344.
Hauer, E. Lane Width and Safety. Unpublished web document (http://roadsafetyresearch.com). 2000.
Hauer, E. Left Turn Protection, Safety, Delay and Guidelines: A Literature Review. Unpublished web document (http://roadsafetyresearch.com). 2004.
Hauer, E. Observational Before-After Studies in Road Safety. Pergamon Press. New York, NY. 1997.
Hauer, E. Road Grade and Safety. Unedited draft. Unpublished web document (http://roadsafetyresearch.com). 2001.
Hauer, E. and B.N. Persaud. How to Estimate the Safety of Rail-Highway Grade Crossings and the Safety Effects of Warning Devices. Transportation Research Record. No. 1114. Transportation Research Board. Washington, DC. 1987. p. 131-140.
Highway/Rail Grade Crossing Technical Working Group (TWG). Guidance on Traffic Control Devices at Highway-Rail Grade Crossings. Federal Highway Administration. Washington, DC. 2002. November 2002.
Huang, H. An Evaluation of Flashing Crosswalks in Gainesville and Lakeland. Florida Department of Transportation. Tallahassee, FL. 2000.
Huang, H., R. Schneider, C. Zeeger, A. Khattak, V. Amerlynck, and K. Lacy, Identification of Severe Crash Factors and Countermeasures in North Carolina. Highway Safety Research Center. University of North Carolina, for the North Carolina Department of Transportation. Chapel Hill, NC. 2001a.
Huang, H.F. and M.J. Cynecki. The Effects of Traffic Calming Measures on Pedestrian and Motorist Behavior. Federal Highway Administration. McLean, VA. 2001b.
Huang, H.F., J.R. Stewart, and C.V. Zegeer. Evaluation of Lane Reduction “Road Diet” Measures on Crashes and Injuries. Transportation Research Record. No. 1784. Transportation Research Board. Washington, DC. 2002. p. 80-90.
Hughes, R., H. Huang, C.V. Zegeer, and M.J. Cynecki. Evaluation of Automated Pedestrian Detection at Signalized Intersections. Report No. FHWA-RD-00-097. Turner-Fairbank Highway Research Center. Federal Highway Administration. McLean, VA. August 2001.

137
Hunt, J. A Review of the Comparative Safety of Uncontrolled and Signal Controlled Midblock Pedestrian Crossings in Great Britain. 9th International Conference on Road Safety in Europe. Cologne, Germany. 1998.
Institute of Transportation Engineers. Toolbox of Countermeasures and Their Potential Effectiveness to Make Intersections Safer. Issue Briefs. No. 8. 2004a.
Institute of Transportation Engineers. Intersection Safety Resources. Issue Briefs. No. 17. 2004b.
ITE Technical Council Task Force on Speed Humps. Guidelines for the Design and Application of Speed Humps. Washington, DC. 1997.
Iwasaki, R. H. LED Traffic Signals Modules as an Incandescent Lamp Alternative. ITE Journal. 73(4). 2003.
Joshua, S.C and A.A. Saka. Mitigation of Sight Distance Problem for Unprotected Left-Turning Traffic at Intersections. Transportation Research Record. No. 1356. Transportation Research Board. Washington, DC. 1992. p. 73-79.
Kulmala, R. Safety at Highway Junctions Based on Predictive Accident Models. Presented at Third International Symposium on Intersections Without Traffic Signals. Portland, OR. 1997. p. 151-157.
Kulmala, R., P. Rama, J.P. Pauwelussen, and H.B. Pacejka. Safety Evaluation in Practice: Weather Warning Systems. Smart Vehicles. Swets & Zeitlinger. Lisse, Netherlands. 1995.
Lall, B. K., A. Eghtedari, T. Simons, P. Taylor, and T. Reynolds. Analysis of Traffic Accidents within the Functional Area of Intersections and Driveways. Department of Civil Engineering. Portland State University. Portland, OR. 1995.
Leonard, J., M. Juckes, and B. Clement. Behavioural Evaluation of Pedestrians and Motorists towards Pedestrian Countdown Signals. Dessau-Soprin Inc. Laval, Quebec, Canada. 1999.
Li, W. and A. Carriquiry. Effect of Four-Lane to Three-Lane Conversions on Crash Frequencies and Crash Rates. In Proceedings of the 2005 Mid-Continent Transportation Research Symposium. Ames, IA. 2005.
Lienau, K. Safety Effect of Barrier Curb on High Speed Suburban Multilane Highways. Federal Highway Administration. McLean, VA. 1996.
Lord, D. Synthesis on the Safety of Right Turn on Red in the United States and Canada. 82nd Transportation Research Board Annual Meeting. Washington, DC. 2003.
Lovell, J. and E. Hauer. The Safety Effect of Conversion to All-Way Stop Control. Transportation Research Record. No. 1068. Transportation Research Board. Washington, DC. 1986. p. 103-107.

138
Lynette, L.C. Best Practices for Road Weather Management, Version 2.0. Report No. FHWA-OP-03-081. Federal Highway Administration. Washington, DC. 2003.
Marek, J. Mid-Block Speed Control: Chicanes and Speed Humps. ITE Journal. 68(11). 1998.
McCoy, P.T., E.J. Tripi, and J.A. Bonneson. Guidelines for Realignment of Skewed Intersections: Final Report. University of Nebraska. Lincoln, NE. 1994.
McCoy, P.T., P.S. Byrd, and G. Pesti. Pavement Markings to Improve Opposing Left-Turn Lane Sight Distance. Mid-America Transportation Center. Lincoln, NE. 1999.
McCoy, P.T., U.R. Navarro, and W.E. Witt. Guidelines for Offsetting Opposing Left-Turn Lanes on Four-Lane Divided Roadways. Transportation Research Record. No. 1356. Transportation Research Board. Washington, DC. 1992. p. 28-36.
McGee, H., S. Taori, and B.N. Persaud. Crash Experience Warrant for Traffic Signals. NCHRP Report 491. National Cooperative Highway Research Program. Transportation Research Board. Washington, DC. 2003.
National Cooperative Highway Research Program. Guidance for Implementation of the AASHTO Strategic Highway Safety Plan. Report 500, Volume 3: A Guide for Addressing Collisions with Trees in Hazardous Locations. Transportation Research Board. Washington, DC. 2003a.
National Cooperative Highway Research Program. Guidance for Implementation of the AASHTO Strategic Highway Safety Plan. Report 500, Volume 4: A Guide for Addressing Head-On Collisions. Transportation Research Board. Washington, DC. 2003b.
National Cooperative Highway Research Program. Guidance for Implementation of the AASHTO Strategic Highway Safety Plan. Report 500, Volume 5: A Guide for Addressing Unsignalized Intersection Collisions. Transportation Research Board. Washington, DC. 2003c.
National Cooperative Highway Research Program. Guidance for Implementation of the AASHTO Strategic Highway Safety Plan. Report 500, Volume 6: A Guide for Addressing Run-Off-Road Collisions. Transportation Research Board. Washington, DC. 2003d.
National Cooperative Highway Research Program. Guidance for Implementation of the AASHTO Strategic Highway Safety Plan. Report 500, Volume 7: A Guide for Addressing Collisions on Horizontal Curves. Transportation Research Board. Washington, DC. 2003e.
National Cooperative Highway Research Program. Guidance for Implementation of the AASHTO Strategic Highway Safety Plan. Report 500, Volume 8: A Guide for Addressing Collisions Involving Utility Poles. Transportation Research Board. Washington, DC. 2003f.
National Cooperative Highway Research Program. Guidance for Implementation of the AASHTO Strategic Highway Safety Plan. Report 500, Volume 10: A Guide for Addressing Collisions Involving Pedestrians. Transportation Research Board. Washington, DC. 2003g.

139
National Cooperative Highway Research Program. Guidance for Implementation of the AASHTO Strategic Highway Safety Plan. Report 500, Volume 12: A Guide for Reducing Collisions at Signalized Intersections. Transportation Research Board. Washington, DC. 2003h.
National Cooperative Highway Research Program. “Crash Reduction Factors for Traffic Engineering and ITS Improvements.” Research in Progress, Project 17-25. http://www4.trb.org/trb/crp.nsf/All+Projects/NCHRP+17-25. Accessed May 2005.
National Highway Traffic Safety Administration. 2002 Annual Assessment of Motor Vehicle Crashes. http://www-nrd.nhtsa.dot.gov/pdf/nrd-30/NCSA/Rpts/2003/Assess02.pdf. 2003.
Neuman, T. R., R. Pfefer, K. L. Slack, K. K. Hardy, F. M. Council, H. McGee, L. Prothe, and K. A. Eccles. Guidance for Implementation of the AASHTO Strategic Highway Safety Plan. Volume 6: A Guide for Addressing Run-off-Road Collisions. NCHRP Report 500. Transportation Research Board. Washington, DC. 2003.
Neuman, T. R., R. Pfefer, K. L. Slack, K. K. Hardy, F. M. Council, H. McGee, L. Prothe, and K. A. Eccles. Guidance for Implementation of the AASHTO Strategic Highway Safety Plan. Volume 6: A Guide for Addressing Run-off-Road Collisions. NCHRP Report 500. National Cooperative Highway Research Program. Transportation Research Board. Washington, DC. 2003.
Neuman, T.R., R. Pfefer, K.L. Slack, K.K. Hardy, D.W. Harwood, I.B. Potts, D.J. Torbic, and E.R. Rabbani. Guidance for Implementation of the AASHTO Strategic Highway Safety Plan. Volume 5: A Guide for Addressing Unsignalized Intersection Collisions. NCHRP Report 500. National Cooperative Highway Research Program. Transportation Research Board. Washington, DC. 2003.
Newman, Leonard, Alex Dunnet, and Gary Meis. Freeway Ramp Control- What It Can and Cannot Do. Freeway Operation Department, District 7. California Division of Highways. February 1969.
Noyce, D. A., H. U. Bahia, J. M. Yambo, and G. Kim. Incorporating Road Safety into Pavement Management: Maximizing Asphalt Pavement Surface Friction for Road Safety Improvements. (Draft Literature Review & State Surveys). Midwest Regional University Transportation Center. Madison, WI. 2005.
O’Brien, Amy. New Ramp Metering Algorithm Improves Systemwide Travel Time. TR News. Transportation Research Board. Washington, DC. July-August 2000.
Ogden, K. Safer Roads: A Guide to Road Safety Engineering. Ashgate Publishing Ltd. United Kingdom. 1996.
Ohio Department of Transportation. Crash Reduction Factors Table. 2003. http://www.dot.state.oh.us/roadwaysafety/PDF_Files/Crash%20Reduction%20Factors%20Table%202003.pdf. Accessed February 27, 2006.

140
Pant, P. D., Y. Park, and S. V. Neti. Development of Guidelines for Installation of Intersection Control Beacons. Report No. FHWA/OH-93/006. Federal Highway Administration. 1992.
Papageorgiou, M, H. Salem, J. Blosseville. ALINEA: A Local Feedback Control Law for On-Ramp Metering. Transportation Research Record. No. 1320. Transportation Research Board. Washington, DC. 1991.
Persaud, B., E. Hauer, R.A. Retting, R. Vallurupalli, and K. Mucsi. Crash Reductions Related to Traffic Signal Removal in Philadelphia. Accident Analysis and Prevention. 29(6). 1997. p. 803-810.
Persaud, B., F.M. Council, C. Lyon, K. Eccles, and M. Griffith. A Multi-Jurisdictional Safety Evaluation of Red Light Cameras. Transportation Research Board 84th Annual Meeting. Washington, DC. 2005.
Persaud, B.N., R.A. Retting, and C. Lyon. Crash Reduction Following Installation of Centerline Rumble Strips on Rural Two-Lane Roads. Insurance Institute for Highway Safety. Arlington, VA. 2003.
Persaud, B.N., R.A. Retting, P.E. Garder, and D. Lord. Observational Before-After Study of the Safety Effect of U.S. Roundabout Conversions Using the Empirical Bayes Method. Transportation Research Record. No. 1751. Transportation Research Board. Washington, DC. 2001.
Pfefer, R., T. Neuman, and R. Raub. Improved Safety Information to Support Highway Design. Report 430. National Cooperative Highway Research Program. Transportation Research Board. Washington, DC. 1999.
Plaxico, C. A., M. H. Ray, J. A. Weir, F. Orengo, P. Tiso, H. McGee, F. M. Council, and K. Eccles. Recommended Guidelines for Curbs and Curb-Barrier Installations. NCHRP Project 22-17. National Cooperative Highway Research Program. Transportation Research Board. Washington, DC. 2004.
Pline, J., Ed. Traffic Engineering Handbook, 4th ed. Institute of Transportation Engineers. Prentice Hall. Englewood Cliffs, NJ. 1992.
Preston, H. and T. Schoenecker. Safety Impacts of Street Lighting at Rural Intersections. Minnesota Department of Transportation. St. Paul, MN. 1999.
Preusser, D.F., W.A. Leaf, K.B. DeBartolo, R.D. Blomberg, and M.M. Levy. The Effect of Right-Turn-on-Red on Pedestrian and Bicyclist Accidents. Journal of Safety Research. 13(2). 1982. p. 45-55.
Retting, R.A. and C.M. Farmer. Evaluation of Speed Camera Enforcement in the District of Columbia. 82nd Transportation Research Board Annual Meeting. Washington, DC. 2003.
141
Retting, R.A. and M. Greene. Influence of Traffic Signal Timing on Red-Light Running and Potential Vehicle Conflicts at Urban Intersections. Transportation Research Record. No. 1595. Transportation Research Board. Washington, DC. 1997.
Retting, R.A., J.F. Chapline, and A.F. Williams. Changes in Crash Risk Following Re-timing of Traffic Signal Change Intervals. Accident Analysis and Prevention. 34(2). 2002. p. 215-220.
Retting, R.A., M.S. Nitzburg, C.M. Farmer, and R.L. Knoblauch. Field Evaluation of Two Methods for Restricting Right Turn on Red to Promote Pedestrian Safety. ITE Journal. 72(1). 2002. p. 32-36.
Richards, S.H., K.W. Heathington, and D.B. Fambro. Evaluation of Constant Warning Times Using Train Predictors at a Grade Crossing with Flashing Light Signals. Transportation Research Record. No. 1254. Transportation Research Board. Washington, DC. 1990. p. 60-71.
Robertson, H., Ed. Manual of Transportation Engineering Studies. Institute of Transportation Engineers. Washington, DC. 2000.
Roper, B.A., J.D. Fricker, R.E. Montgomery, and K.C. Sinha. The Effects of the All-Red Clearance Interval on Accident Rates in Indiana. In ITE 1991 Compendium of Technical Papers. Washington, DC. 1991.
Safety Analyst. Federal Highway Administration. http://www.safetyanalyst.org/index.htm. Accessed May 1, 2005.
Sayed, T., H. Vahidi, and F. Rodriguez. Advance Warning Flashers: Do They Improve Safety? Transportation Research Record. No. 1692. Transportation Research Board. Washington, DC. 1999. p. 30-38.
Sayed, T., W. Abdelwahab, and J. Nepomuceno. Safety Evaluation of Alternative Signal Head Design. Transportation Research Record. No. 1635. Transportation Research Board. Washington, DC. 1998. p. 140-146.
Shen, J. and A. Gan. Development of Crash Reduction Factors: Methods, Problems, and Research Needs. Transportation Research Record. No. 1840. Transportation Research Board, Washington, DC. 2003.
Souleyrette, R.R., M.M. O’Brien, T. McDonald, H. Preston, and R. Storm. Effectiveness of All-Red Clearance Interval on Intersection Crashes. Minnesota Department of Transportation. St. Paul, MN. 2004.
Southeast Michigan Council of Governments (SEMCOG). SEMCOG Traffic Safety Manual, 3rd Edition. 1998.
Stemley, J. J. One-Way Streets Provide Superior Safety and Convenience. ITE Journal. Washington, DC. August 1998.
142
Strathman, J., K. Duecker, J. Zhang, and T. Williams, Analysis of Design Attributes and Crashes on the Oregon Highway System. Report No. FHWA-OR-RD-02-01. Oregon Department of Transportation, Research Unit. Salem, OR. 2001.
Swan, S. Treatments of Overpasses and Undercrossing for the Disabled: Early Report on the State-of-the-Art. Transportation Research Record. No. 683. Transportation Research Board. Washington, DC. 1978.
Tarrall, M. B. and K. K. Dixon. Conflict Analysis for Double Left-Turn Lanes with Protected-Plus-Permitted Signal Phases. Transportation Research Record. No. 1635. Transportation Research Board. Washington, DC. 1998. p. 1-19.
Taylor, H. W. and L. Meczkowski. Safer Roadsides. Public Roads. 66(4). 2003.
Tople, A. Development of South Dakota Accident Reduction Factors. Report SD98-13. South Dakota Department of Transportation. 1998. http://ntl.bts.gov/reports/SD98-13final.pdf. Accessed February 27, 2006.
Tustin, B.H., H. Richards, H. McGee, and R. Patterson. Railroad-Highway Grade Crossing Handbook - Second Edition. Federal Highway Administration. McLean, VA. 1986.
Twomey, J.M., M.L. Heckman, J.C. Hayward, and R.J. Zuk. Accidents and Safety Associated with Interchanges. Transportation Research Record. No. 1383. Transportation Research Board. Washington, DC. 1993. p. 100-105.
Van Houten, R. Research on Improving Motorists Yielding At Crosswalks on Multilane Roads with an Uncontrolled Approach. ITE 2001 Annual Meeting and Exhibit. Chicago, IL. 2001.
Van Houten, R., A.R. Retting, C.M. Farmer, and J. Van Houten. Field Evaluation of a Leading Pedestrian Interval Signal Phase at Three Urban Intersections. Transportation Research Record. No. 1734. Transportation Research Board. Washington, DC. 2000. p. 86-92.
Van Houten, R., K. Healey, J.E. Malenfant, and R.A. Retting. Use of Signs and Symbols to Increase the Efficacy of Pedestrian Activated Flashing Beacons at Crosswalks. Transportation Research Record. No. 1636. Transportation Research Board. Washington, DC. 1998. p. 92-95.
Van Houten, R., R.A. Retting, J. Van Houten, C.M. Farmer, and J.E.L. Malenfant. Use of Animation in LED Pedestrian Signals to Improve Pedestrian Safety. ITE Journal. 69(2). 1999. p. 30-38.
Walker, F.W. and S.E. Roberts. Influence of Lighting on Accident Frequency at Highway Intersections. Transportation Research Record. No. 562. Transportation Research Board. Washington, DC. 1976. p. 73-78.
Weiss, A. and J.L. Schifer. Assessment of Variable Speed Limit Implementation Issues. NCHRP Project 3-59. National Cooperative Highway Research Program. Transportation Research Board. Washington, DC. 2001.

143
Zador, P., H. Stein, S. Shapiro, and P. Tarnoff. Effect of Signal Timing on Traffic Flow and Crashes at Signalized Intersections. Transportation Research Record. No. 1010. Transportation Research Board. Washington, DC. 1984. p. 1-8.
Zaidel, D.M. The Impact of Enforcement on Accidents. The “Escape” Project. Technical Research Centre of Finland (VTT). 2002.
Zegeer, C.V. and M.J. Cynecki. Evaluation of Countermeasures Related to RTOR Accidents that Involve Pedestrians. Transportation Research Record. No. 1059. Transportation Research Board. Washington, DC. 1986. p. 24 -34.
Zegeer, C.V., J. Hummer, D.W. Reinfurt, L. Herf, and W. Hunter. Safety Effects of Cross-Section Design for Two-Lane Roads. Volumes I and II. Federal Highway Administration. Washington, DC. 1987.
Zegeer, C.V., J. Stutts, H. Huang, M.J. Cynecki, R. Van Houten, B. Alberson, R. Pfefer, T.R. Neuman, K.L. Slack, and K.K. Hardy. Guidance for Implementation of the AASHTO Strategic Highway Safety Plan. Volume 10: A Guide for Reducing Collisions Involving Pedestrians. NCHRP Report 500. National Cooperative Highway Research Program. Transportation Research Board. Washington, DC. 2004.
Zegeer, C.V., K.S. Opiela, and M.J. Cynecki. Effect of Pedestrian Signals and Signal Timing on Pedestrian Accidents. Transportation Research Record. No. 847. Transportation Research Board. Washington, DC. 1982. p. 62-72.
Zegeer, C.V., K.S. Opiela, and M.J. Cynecki. Pedestrian Signalization Alternatives. Federal Highway Administration. Washington, DC. 1983.
Zegeer, C.V., R. Stewart, D.W. Reinfurt, F.M. Council, T.R. Neuman, E. Hamilton, T. Miller, and W. Hunter. Cost-Effective Geometric Improvements for Safety Upgrading of Horizontal Curves – Final Report. Federal Highway Administration. Washington, DC. 1990.
Zegeer, C.V., R. Stewart, H. Huang, and P. Lagerwey. Safety Effects of Marked Versus Unmarked Crosswalks at Uncontrolled Locations: Executive Summary and Recommended Guidelines. Federal Highway Administration. McLean, VA. 2002.
Zwahlen, H. T. Stop Ahead and Stop Signs and Their Effect on Driver Eye Scanning and Driving Performance. Transportation Research Record. No. 1168. Transportation Research Board. Washington, DC. 1988. p. 16-24.


APPENDIX


A-1
PHOTO CREDITS
Countermeasure Photo Credit Install Roundabout, Prior Stop Control, Single Lane WSDOT, University Roundabout Add Left-Turn Bay on Major Road, Unsignalized, 3-leg Intersection Bish, Douglas. Oregon DOT Add Left-Turn Bay on Major Road, Signalized, 3-leg Intersection Monsere, C. Portland State University Add Right-Turn Lane on Major Road, Signalized Intersection NCHRP, Report 500 Series Add Right-Turn Lane on Major Road, Unsignalized Intersection NCHRP, Report 500 Series Improve Horizontal Curve Geometry Monsere, C. Portland State University Add Two-way Left Turn Lane, 20 driveways per mile FHWA, Tribal Transportation Widen Paved Shoulder from 2 to 8 feet, ADT >2000 Monsere, C. Portland State University Install Shoulder Rumble Strips Monsere, C. Portland State University Install Passing Lane, One-way Monsere, C. Portland State University Install Centerline Rumble Strips Monsere, C. Portland State University Increase Lane Width from 9 to 12 feet, ADT >2000 FHWA (from N. Fortey) Convert to 4-Way Stop from 2-Way Stop Breakstone, A. Portland State University Install Traffic Signal, 3-leg Intersection Monsere, C. Portland State University Install Traffic Signal, 4-leg Intersection Monsere, C. Portland State University Remove Traffic Signal from One-Way Street Monsere, C. Portland State University Lengthen the Yellow Change Interval to ITE Guidelines Monsere, C. Portland State University Install Automated Enforcement of Red Light Violations Monsere, C. Portland State University Provide Mid-block Pedestrian Refuge www.pedbikeimages.org / Dan Burden Install New Guardrail Monsere, C. Portland State University Improve Intersection Sight Distance in 1 Quadrant NCHRP, Report 500 Series Convert 4-Lane Section to 3 Lanes Monsere, C. Portland State University Install Median Barrier Monsere, C. Portland State University Change from Permissive to Protected Left-Turn Phasing Monsere, C. Portland State University Change from Protected/Permissive or Permissive/Protected to Protected Left-Turn Phasing Monsere, C. Portland State University Provide Illumination for Intersection Monsere, C. Portland State University Provide Illumination on Highway Sections Monsere, C. Portland State University Improve Roadside Hazard Rating by 1 Ratings Buswell, C. ODOT Separate Grades by Constructing Interchange Oregon DOT, Jackson School Road Add Raised or Painted Islands Ronkin, M. Oregon DOT Offset Opposing Left-Turn Lanes Welch, T., Iowa DOT Convert 4-Leg Intersection to Offset T-Intersections Bared and Kaisar Improve Intersection Skew Angle ODOT, Kelso Road Project Provide Acceleration/ deceleration lane FHWA Improve Vertical Alignment Monsere, C. Portland State University Convert Two-way to One-way Street Breakstone, A. Portland State University Close Driveways Near Intersection/Increase Driveway Spacing Horowitz, Z., Portland State University Pavement Treatments to Increase Friction Wisconsin DOT Install Non-Traversable Curbed Median FHWA, Office of Planning Install Stop Ahead Sign FHWA (from N. Fortey)

A-2
Countermeasure Photo Credit Install Transverse Rumble Strip in Advance of Stop Controlled Intersection Monsere, C. Portland State University Install Turning Guide Lines for Multiple Left-turn Lanes FHWA (from N. Fortey) Provide Advance Intersection Warning Sign Monsere, C. Portland State University Provide Advance Curve Warning Pavement Markings NCHRP, Report 500 Series Install Durable Pavement Markings Monsere, C. Portland State University Install Edge Line Profile Markings or Rumble Strips NCHRP, Report 500 Series Provide Traffic Coordination for Progression Monsere, C. Portland State University Provide All Red Signal Phase Monsere, C. Portland State University Install Dynamic Advance Warning Flashers "Red Signal Ahead" Monsere, C. Portland State University Increase Size of Signal Head FHWA (from N. Fortey) Change Signal Cycle Length Wikipedia Install Flashing Beacon at Intersection Monsere, C. Portland State University Convert Signal from Incandescent to LED Monsere, C. Portland State University Provide Variable Speed Limits FHWA, International Install Advanced Ice Warning System Chin, S., National Parks Service Provide Automated Speed Enforcement Wikipedia Install Ramp Metering WSDOT Install Passive Pedestrian Detection www.pedbikeimages.org / Herman Huang Reduce Pedestrian Crossing Distance www.pedbikeimages.org / Dan Burden Install Pedestrian Countdown Signals Monsere, C. Portland State University Install Pedestrian Only Signals www.pedbikeimages.org / Dan Burden Install Advanced Stop Bar for Cross Walk Monsere, C. Portland State University Restrict Right Turn on Red www.pedbikeimages.org / Cara Seiderman Install Flashing Lights in Crosswalk FHWA Construct Pedestrian Grade Separation FHWA, Safety Pedestrian Fencing or Barrier Monsere, C. Portland State University Provide Marked Mid-Block Crosswalk www.pedbikeimages.org / Dan Burden Provide Sidewalks and Walkways Monsere, C. Portland State University
Install Illumination for Marked Crosswalks Institute for Transportation Studies, UC Berkeley
Install Active Warning Device Monsere, C. Portland State University Eliminate Shoulder Dropoff or Provide Wedge NCHRP, Report 500 Series Install Chicanes or Serpentine Roadway NCHRP, Report 500 Series Install Speed Tables and or Bumps Monsere, C. Portland State University

A-3
BIBLIOGRAPHY
ADILimited, Passing Manoeuvres and Passing Lanes: Design, Operational & Safety Evaluations. 1989, Transport Canada Ottawa, Ontario, Canada.
Agent, K. R. and F. T. Creasey. Delineation of Horizontal Curves. Kentucky Transportation Cabinet. Frankfort, KY. 1986.
Agent, K., Stamatiadis, N., Jones, S. (1996) “Development of Accident Reduction Factors.” Kentucky Transportation Center, University of Kentucky, Lexington, KY. Report KTC-96-13.
Al-Masaeid, H. R. and H. Sinha. An Analysis of Accident Reduction Potentials of Pavement Marking. Journal of Transportation Engineering. Vol. 120, No. 5. September/October 1994. p. 723-736.
American Association of State Highway and Transportation Officials. A Policy on Geometric Design of Highways and Streets, 4th ed., Second Printing. Washington, D.C., 2001.
American Association of State Highway and Transportation Officials, Guide for the Development of Bicycle Facilities. Washington, D.C., 1999.
American Association of State Highway and Transportation Officials. Guide for the Planning, Design and Operation of Pedestrian Facilities. Washington, D.C., 2004.
Antonucci, N. D., K. K. Hardy, K. L. Slack, R. Pfefer, and T. R. Neuman. A Guide for Addressing Collisions at Signalized Intersections. In National Cooperative Highway Research Program, Guidance for Implementation of the AASHTO Strategic Highway Safety Plan. Report 500, Volume 12, TRB, National Research Council, Washington, D.C., 2004.
Axelson, P. W., D. A. Chesney, D. V. Galvan, J. B. Kirschbaum, P. E. Longmuir, C. Lyons, and K. M. Wong. Designing Sidewalks and Trails for Access, Part I of II: Review of Existing Guidelines and Practices. Federal Highway Administration: Washington, D.C., 1999.
Bacquie, R., C. Mollett, V. Musacchio, J. Wales, and R. Moraes. Review of Refuge Islands and Split Pedestrian Crossovers - Phase 2. City of Toronto: Toronto, 2001.
Bacquie, R., D. Egan, and L. Ing. Pedestrian Refuge Island Safety Audit. Presented at ITE Spring Conference and Exhibit, Monterey, CA, 2001.
Bahar, G. and M.L. Parkhill, Synthesis of Practices for the Implementation of Centreline Rumble Strips - Final Draft. 2004.
Bahar, G. and T. Erwin, Synthesis of Practices for the Implementation of Transverse Rumble Strips - Final Draft. 2004.

A-4
Bahar, G., C. Mollett, B. Persaud, C. Lyon, A. Smiley, T. Smahel, and H. McGee. Safety Evaluation of Permanent Raised Pavement Markers. In National Cooperative Highway Research Program, Report 518, TRB, National Research Council, Washington, D.C., 2004.
Bamfo, J. K. and E. Hauer. Which is Safer in terms of Right-Angle Vehicle Accidents – Fixed-time or Vehicle-actuated Signal Control? Canadian Multidisciplinary Road Safety Conference X. Toronto, Ontario, Canada. 1997.
Barbaresso, J. C. Relative Accident Impacts of Traffic Control Strategies During Low-Volume Night Time Periods. ITE Journal, Vol. 57, No. 8, 1987, p. 41-46.
Bared, J., G.L. Giering, and D.L. Warren. Safety Evaluation of Acceleration and Deceleration Lane Lengths. ITE Journal. 69(6). 1999. p. 50-54.
Bared, J.G. and E.I. Kaisar. Advantages of Offset T-Intersections with Guidelines. In Proceedings of Traffic Safety on Three Continents. Moscow, Russia. 2001.
Barrett, M. L. and J. G. Pigman. Evaluation of Automated Bridge Deck Anti-icing System. Kentucky Transportation Center, Lexington, KY, 2001.
Bauer, K. M., D. W. Harwood, W. E. Hughes, and K. R. Richard. Safety Effects of Using Narrow Lanes and Shoulder-Use Lanes to Increase the Capacity of Urban Freeways. Transportation Research Record: Journal of the Transportation Research Board, No. 1897, 2004, p. 71-80.
Bauer, K.M. and D.W. Harwood. Statistical Models of Accidents on Interchange Ramps and Speed-Change Lanes. Federal Highway Administration. McLean, VA. 1997.
Berchem, S. and W. O. Somerfeld. Unique Roadway Design Reduces Bus-Bike Conflicts. TR News, Vol. 177, 1985, p. 2-3.
Bhesania, R. R. Impact of Mast-Mounted Signal Heads on Accident Reduction. ITE Journal, Vol. 61, No. 10, 1991, p. 25-29.
Bonneson, J. A., P. T. McCoy, and D. S. Eitel. Interchange vs. At-Grade Intersection on Rural Expressways. Transportation Research Record: Journal of the Transportation Research Board No. 1395, 1993, p. 39-47.
Botma, H. and W. Mulder. Required Widths of Paths, Lanes, Roads and Streets for Bicycle Traffic. Grontmij Consulting Engineers, The Netherlands, 1993.
Bowman, B. L. and R. L. Vecellio. Effects of Urban and Suburban Median Types on Both Vehicular and Pedestrian Safety. Transportation Research Record: Journal of the Transportation Research Board No. 1445, 1994. p. 169-179.
Bowman, B. L. The Effectiveness of Railroad Constant Warning Time Systems. Transportation Research Record: Journal of the Transportation Research Board No. 1114, 1987, p. 111-122.
A-5
Box, P. C. and P. A. Basha. A Study of Accidents with Lead Versus Lag Left-Turn Phasing. ITE Journal, Vol. 7, No. 5, 2003, p. 24-28.
Box, P. C. and P. A. Mayer. Driveways, in Traffic Control and Roadway Elements - Their Relationship to Highway Safety. Highway Users Federation for Safety and Mobility, Washington, D.C., 1970.
Box, P. C. and P. A. Mayer. Intersections, in Traffic Control and Roadway Elements - Their Relationship to Highway Safety. Highway Users Federation for Safety and Mobility, Washington, D.C., 1970.
Box, P. C. Major Road Accident Reduction by Illumination. Transportation Research Record: Journal of the Transportation Research Board No. 1247, 1989, p. 32-38.
Bray, J. S. Skid Accident Reduction Program (SKARP): Targeted Crash Reductions. Presented at Institute of Transportation Engineers 2003 Technical Conference and Exhibit, Fort Lauderdale, FL, 2003.
Brehmer, C. L., K. C. Kacir, D. A. Noyce, and M. P. Manser. Evaluation of Traffic Signal Displays for Protected/Permissive Left-Turn Control. In National Cooperative Highway Research Program, Report 493, TRB, National Research Council, Washington, D.C., 2003.
Brich, S. C. and B. H. Cottrell Jr. Guidelines for the Use of No U-Turn and No-Left Turn Signs. Virginia Department of Transportation, Richmond, VA, 1994.
Brown, M. The Design of Roundabouts - Volume 1. Transport Research Laboratory, Department of Transport, London, 1995.
Brown, M. The Design of Roundabouts - Volume 2. Transport Research Laboratory, Department of Transport, London, 1995.
Bullough, J. D., P. R. Boyce, A. Bierman, K. M. Conway, K. Huang, C. P. O’Rourke, C. M. Hunter, and A. Nakata. Response to Simulated Traffic Signals Using Light-Emitting Diode and Incandescent Sources. Transportation Research Record: Journal of the Transportation Research Board No. 1724, 2000, p. 39-46.
C.R.O.W, Sign Up for the Bike: Design Manual for a Cycle-Friendly Infrastructure. 1994, Centre for Research and Contact Standardization in Civil and Traffic Engineering: The Netherlands.
Cairney, P. Pedestrian Safety in Australia. FHWA, U.S. Department of Transportation, 1999.
Cambridge Systematics, Inc. with SRF Consulting Group, Inc. and N.K.Friedrichs Consulting, Inc. Twin Cities Ramp Meter Evaluation, Executive Summary. Minnesota Department of Transportation.

A-6
Campbell, B. J., C. V. Zegeer, H. H. Huang, and M. J. Cynecki. A Review of Pedestrian Safety Research in the United States and Abroad.. FHWA, U.S. Department of Transportation, 2004.
Carlson, P. J., E. R. Rose, S. T. Chrysler, and A. L. Bischoff. Simplifying Delineator and Chevron Applications for Horizontal Curves. Texas Transportation Institute: College Station, TX, 2004.
Carnahan, C. R., W. C. Fox, K. A. French, W. A. Hange, J. L. Henderson, D. J. P. Hook, A. Imansepahi, S. S. Khattak, J. D. Paulson, J. K. Resseguie, J. M. Richey, and T. D. Searls. Permissive Double Left Turns: Are They Safe? ITE 1995 Compendium of Technical Papers, Washington, D.C., 1995.
Carrasco, O., J. McFadden, and P. Chandhok. Evaluation of the Effectiveness of Shoulder Rumble Strips on Rural Multi-lane Divided Highways in Minnesota. Presented at 83rd Transportation Research Board Annual Meeting, Washington, D.C., 2004.
Carson, J. and F. Mannering. The Effect of Ice Warning Signs on Ice-Accident Frequencies and Severities. Accident Analysis and Prevention, Vol. 33, No. 1, 2001, p. 99-109.
Chen, G., Meckle W. and Wilson, J. Speed and safety effect of photo radar enforcement on a highway corridor in British Columbia. Accident Analysis & Prevention, Volume 34, Issue 2, March 2002, 129-138. 2002.
City of Eugene, 18th Avenue Bike Lanes - One Year Report, Memorandum to City Council. 1980: Eugene, Oregon.
Claessen, J. G. and D. R. Jones. The Road Safety Effectiveness of Raised Wide Medians. Presented at 17th Australian Road Research Board Conference, Australia, 1994.
Clark, J. E., S. Maghsoodloo, and D. B. Brown. Public Good Relative to Right-Turn-on-Red in South Carolina and Alabama. Transportation Research Record: Journal of the Transportation Research Board No. 926, 1983, p. 24-31.
Compton, R. P. and E. V. Milton. Safety Impact of Permitting Right-Turn-On-Red: A Report to Congress by the National Highway Traffic Safety Administration. 1994, National Highway Traffic Safety Administration: Washington, D.C.
Corben, B. F. Crashes at Traffic Signals: Guidelines for a Traffic Engineering Safety Program of Replacing Selected Intersection Signals with Roundabouts. VicRoads and Transport Accident Commission, Victoria, Australia, 1989.
Council, F. M. and B. Persaud, Red Light Camera Safety Evaluation - Experimental Design, Draft Final Report. Appendix A. 2002.
Council, F. M., B. Persaud, C. Lyon, K. Eccles, M. Griffith, E. Zaloshnja, and T. Miller. Economic Analysis of the Safety Effects of Red Light Camera Programs and the Identification of

A-7
Factors Associated with the Greatest Benefits. Presented at 84th Annual Meeting of the Transportation Research Board, Washington, D.C., 2005.
Council, F. M., B. Persaud, K. Eccles, C. Lyon, and M. S. Griffith. Safety Evaluation of Red-Light Cameras. Battelle Memorial Institute, Columbus, OH, 2005.
Cuelho, E., J. Stephens, and C. McDonald. A Review of the Performance and Costs of Contemporary Pavement Marking Systems. Western Transportation Institute: Bozeman, MT, 2003.
Curren, J. E. Use of Shoulders and Narrow Lanes to Increase Freeway Capacity. In National Cooperative Highway Research Program, Report 369, TRB, National Research Council, Washington, D.C., 1995.
Dahir, S. H. and W. L. Gramling. NCHRP Synthesis of Highway Practice Report 158: Wet-Pavement Safety Programs. In National Cooperative Highway Research Program, Report 153, TRB, National Research Council, Washington, D.C., 1990.
Datta, T. K., K. Schattler, and S. Datta. Red Light Violations and Crashes at Urban Intersections. Presented at 79th Annual Meeting of the Transportation Research Board, Washington, D.C., 2000.
Davies, D. G. Research, Development and Implementation of Pedestrian Safety Facilities in the United Kingdom.. FHWA, U.S. Department of Transportation, 1999.
Davis, G. Accident reduction factors and causal inference in traffic safety studies: A review. Accident Analysis and Prevention, Vol. 32, No. 1, 2000, p. 95-109.
Delaware Department of Transportation, Centerline Rumble Strips: The Delaware Experience. 2003.
Donnell, E. T. and J. M. Mason, Jr. Predicting the Severity of Median-Related Crashes in Pennsylvania by Using Logistic Regression. Transportation Research Record: Journal of the Transportation Research Board No. 1897, 2004, p. 55-63.
Donnell, E. T., D. W. Harwood, K. M. Bauer, and J. M. Mason, Jr. Analysis of Highway Median Safety in Pennsylvania. Presented at Institute of Transportation Engineers Spring Conference and Exhibit, Monterey, CA, 2001.
Donnell, E. T., D. W. Harwood, K. M. Bauer, J. M. Mason, Jr., and M. T. Pietrucha. Cross-Median Collisions on Pennsylvania Interstates and Expressways. Transportation Research Record: Journal of the Transportation Research Board No. 1784, 2002, p. 91-99.
Drakopoulos, A., M. Patrabansh and G. Vergou. Evaluation of Ramp Meter Effectiveness for Wisconsin Freeways, a Milwaukee Case Study: Part 2, Ramp Metering Effect on Traffic Operations and Crashes. Wisconsin Department of Transportation, Council on Research, Madison, WI, 2004.
A-8
Drew, Donald; William McCasland; Charles Pinnell; Joseph Wattleworth. The Development of an Automatic Freeway Merging Control System. Research Report 24-19. 1966.
Drummond, K., A. Hoel, and J. S. Miller. Using Simulation to Predict Safety and Operational Impacts of Increasing Traffic Signal Density. Transportation Research Record: Journal of the Transportation Research Board No. 1784, 2004, p. 100-107.
Eccles, K. A., R. Tao, and B. C. Mangum. Evaluation of Pedestrian Countdown Signals in Montgomery County, Maryland. Presented at 83rd Annual Meeting of the Transportation Research Board, Washington, D.C., 2004.
Edminster, R. and D. Koffman. Streets for Pedestrians and Transit: An Evaluation of Three Transit Malls in the United States. Urban Mass Transportation Administration, Washington, D.C., 1979.
Elvik, R. and T. Vaa. Handbook of Road Safety Measures. Elsevier, Oxford, 2004.
Elvik, R. Effects on Road Safety of Converting Intersections to Roundabouts: A Review of Evidence from Non-US Studies. Presented at 82nd Annual Meeting of the Transportation Research Board, Washington, D.C., 2003.
Elvik, R. Meta-Analysis of Evaluations of Public Lighting as Accident Countermeasure. Transportation Research Record: Journal of the Transportation Research Board No. 1485, 1995, p. 112-123.
Elvik, R. The Safety Value of Guardrails and Crash Cushions: A Meta-Analysis Of Evidence From Evaluation Studies. Accident Analysis and Prevention, Vol. 27, No. 4, 1995, p. 523-536.
Elvik, R., P. Christensen and A. Amundsen. Speed and Road Accidents: An Evaluation of the Power Model. Transportokonomisk Institutt, Oslo, Norway, 2004.
Fambro, D. B., D. A. Noyce, A. H. Frieslaar, and L. D. Copeland. Enhanced Traffic Control Devices and Railroad Operations for Highway-Railroad Grade Crossings: Third-Year Activities. Texas Department of Transportation, Austin, TX, 1997.
Fambro, D. B., K. W. Heathington, and S. H. Richards. Evaluation of Two Active Traffic Control Devices for Use at Railroad-Highway Grade Crossings. Transportation Research Record: Journal of the Transportation Research Board No. 1244, 1989, p. 52-62.
Federal Highway Administration, Technical Advisory: Shoulder Rumble Strips. 2001 [Available from: http://www.fhwa.dot.gov/legsregs/directives/techadvs/t504035.htm].
Federal Highway Administration. Prediction of the Expected Safety Performance of Rural Two-Lane Highways. Publication FHWA-RD-99-207. FHWA, U.S. Department of Transportation, 1999.

A-9
Fitzpatrick, K., K. Balke, D. W. Harwood, and I. B. Anderson. Accident Mitigation Guide for Congested Rural Two-Lane Highways. In National Cooperative Highway Research Program, Report 440, TRB, National Research Council, Washington, D.C., 2000.
Flannery, A. and L. Elefteriadou. A Review of Roundabout Safety Performance in the United States. Presented at 69th Annual Meeting of the Institute of Transportation Engineers, Las Vegas, NV, 1999.
Flannery, A. Geometric Design and Safety Aspects of Roundabouts. Transportation Research Record: Journal of the Transportation Research Board No. 1751, 2001, p. 76-81.
Foody, T. J. and T. B. Culp. A comparison of the safety potential of the raised versus depressed median design. Transportation Research Record: Journal of the Transportation Research Board No. 514, 1974, p. 1-14.
Friar, S. and R. Decker. Evaluation of a Fixed Anti-Icing Spray System. Transportation Research Record: Journal of the Transportation Research Board No. 1672, 1999, p. 34-41.
Gains, A., B. Heydecker, J. Shrewsbury, and S. Robertson. The National Safety Camera Programme: Three Year Evaluation Report. PA Consulting Group, London, 2004.
Garber, N. J. and S. Srinivasan. Effectiveness of Changeable Message Signs in Controlling Vehicle Speeds at Work Zones: Phase II. Virginia Transportation Research Council, Charlottesville, VA, 1998.
Garber, N. J. and S. Srinivasan. Influence of Exposure Duration on the Effectiveness of Changeable Message Signs in Controlling Vehicle Speeds at Work Zones. Department of Transportation, University of Virginia, Charlottesville, VA, 1998.
Garber, N. J., J. S. Miller, S. Eslambolchi, R. Khandelwal, M. Mattingly, K. M. Sprinkle, and P. L. Wachendorf. An Evaluation of Red Light Camera (Photo-Red) Enforcement Programs in Virginia: A Report in Response to a Request by Virginia’s Secretary of Transportation. Virginia Transportation Research Council, Charlottesville, VA, 2005.
Garber, N., and L. Hoel. Traffic and Highway Engineering, 2nd ed. PWS Publishing Co., Boston, MA, 1996.
Garder, P. Pedestrian Safety at Traffic Signals. Accident Analysis and Prevention, Vol. 21, No. 5, 1989, p. 435-444.
Garder, P. Rumble Strips or Not Along Wide Shoulders Designated for Bicycle Traffic? Transportation Research Record: Journal of the Transportation Research Board No. 1502, 1995, p. 1-7.
Garner, G. R. and R. C. Deen. Elements of Median Design in Relation to Accident Occurrence. Highway Research Record 432, 1973, p. 1-11.

A-10
Gattis, J. L. and S. T. Low. Intersection Angle Geometry and the Driver’s Field of View. Transportation Research Record: Journal of the Transportation Research Board No. 1612, 1998, p. 10-16.
Gibby, A. R., S. P. Washington, and T. C. Ferrara. Evaluation of High-Speed Isolated Signalized Intersections in California. Transportation Research Record: Journal of the Transportation Research Board No. 1376, 1992, p. 45-56.
Gilfillan, G. Road Safety Benefits Of Liquid Anti-Icing Strategies and Agents. Insurance Corporation of British Columbia, Kamloops, British Columbia, 1999.
Glennon, J. C. Accident Effects of Centerline Markings on Low-Volume Rural Roads. Transportation Research Record: Journal of the Transportation Research Board No. 1027, 1985, p. 7-13.
Gluck, J., H. S. Levinson, and V. Stover. Impact of Access Management Techniques. In National Cooperative Highway Research Program, Report 420, TRB, National Research Council, Washington, D.C., 1999.
Godfrey, D. and T. Mazella. Kirkland’s Experience with In-Pavement Flashing Lights at Crosswalks. Presented at ITE/IMSA Annual Meeting, Lynnwood, WA, 1999.
Griffin, L. I. and R. N. Reinhardt. A Review of Two Innovative Pavement Patterns that Have Been Developed to Reduce Traffic Speeds and Crashes. AAA Foundation for Traffic Safety, Washington, D.C., 1996.
Griffith, M. S. Safety Evaluation of Rolled-In Continuous Shoulder Rumble Strips Installed on Freeways. Transportation Research Record: Journal of the Transportation Research Board No. 1665, 1999, p. 28-34.
Griffith, M. S., Comparison of the Safety of Lighting Options on Urban Freeways. Public Roads, Vol. 58, No. 2, 1994, p. 8-15.
Guidance on Traffic Control Devices at Highway-Rail Grade Crossings, Highway/Rail Grade Crossing Technical Working Group (TWG), Federal Highway Administration, November 2002.
Hammer, J. B., and E. J. Tye, Overhead Yellow-Red Flashing Beacons, Report No.FHWA/CA/TE-87/01, Federal Highway Administration, 1987.
Hanley, K. E., A. R. Gibby, and T. C. Ferrara. Analysis of Accident Reduction Factors on California State Highways. Transportation Research Record: Journal of the Transportation Research Board No. 1717, 2000, p. 37-45.
Harkey, D. and R. Stewart. Bicycle and Motor Vehicle Operations on Wide Curb Lanes, Bicycle Lanes and Paved Shoulders. Presented at Traffic Congestion and Traffic Safety in the 21st Century: Challenges, Innovations and Opportunities, Chicago, IL, 1997.

A-11
Harkey, D. L. and J. R. Stewart. Evaluation of Shared-Use Facilities for Bicycles and Motor Vehicles. Transportation Research Record: Journal of the Transportation Research Board No. 1578, 1997, p. 111-118.
Harwood, D. W. and J. C. Glennon. Framework for Design and Operation of Passing Zones on Two-Lane Highways. Transportation Research Record: Journal of the Transportation Research Board No. 60, 1977, p. 45-50.
Harwood, D. W. Effective Utilization of Street Width on Urban Arterials. In National Cooperative Highway Research Program, Report 330, TRB, National Research Council, Washington, D.C., 1990.
Harwood, D. W. Methodology to Predict the Safety Performance of Urban and Suburban Arterials. National Cooperative Highway Research Program, TRB, National Research Council, Washington, D.C., 2004.
Harwood, D. W. Synthesis of Highway Practice: Use of Rumble Strips to Enhance Safety. In National Cooperative Highway Research Program, Report 191, TRB, National Research Council, Washington, D.C., 1993.
Harwood, D. W., E. R. Rabbani, K. R. Richard, H. W. McGee, and G. L. Gittings. Systemwide Impact of Safety and Traffic Operations Design Decisions for 3R Projects. In National Cooperative Highway Research Program, Report 486, TRB, National Research Council, Washington, D.C., 2003.
Harwood, D. W., F. M. Council, E. Hauer, W. E. Hughes, and A. Vogt. Prediction of the Expected Safety Performance of Rural Two-Lane Highways. FHWA, U.S. Department of Transportation, 2000.
Harwood, D. W., J. M. Mason, R. E. Brydia, M. T. Pietrucha, and G. L. Gittings. Intersection Sight Distance. In National Cooperative Highway Research Program, Report 383, TRB, National Research Council, Washington, D.C., 1996.
Harwood, D. W., K. M. Bauer, I. B. Potts, D. J. Torbic, K. R. Richard, E. R. Kohlman Rabbani, E. Hauer, and L. Elefteriadou. Safety Effectiveness of Intersection Left- and Right-Turn Lanes. . FHWA, U.S. Department of Transportation, 2002.
Harwood, D. W., M. T. Pietrucha, M. D. Wooldridge, R. E. Brydia, and K. Fitzpatrick. Median Intersection Design. In National Cooperative Highway Research Program, Report 375, TRB, National Research Council, Washington, D.C., 1995.
Hassan, Y. and S. M. Easa. Design Considerations of Sight Distance Red Zones on Crest Curves. Journal of Transportation Engineering, Vol. 124, No. 4, 1998, p. 343-351.
Hauer, E. and B. N. Persaud. How to Estimate the Safety of Rail-Highway Grade Crossings and the Safety Effects of Warning Devices. Transportation Research Record: Journal of the Transportation Research Board No. 1114, 1987, p. 131-140.

A-12
Hauer, E. Fishing for Safety Information in Murky Waters. Journal of Transportation Engineering, Vol. 131, No. 5, 2005, p. 340-344.
Hauer, E. Observational Before-After Studies in Road Safety. Pergamon Press, New York, 1997.
Hauer, E., Access and Safety. www.roadsafetyresearch.com. 2001.
Hauer, E., Lane Width and Safety. www.roadsafetyresearch.com. 2000.
Hauer, E., Left Turn Protection, Safety, Delay and Guidelines: A Literature Review. www.roadsafetyresearch.com. 2004.
Hauer, E., Road Grade and Safety. www.roadsafetyresearch.com. 2001.
Hauer, E., Safety of Horizontal Curves. www.roadsafetyresearch.com. 2000.
Hauer, E., Shoulder Width, Shoulder Paving and Safety. www.roadsafetyresearch.com. 2000.
Hauer, E., The Median and Safety. www.roadsafetyresearch.com. 2000.
Heimbach, C. L., W. W. Hunter, and G. C. Chao. Paved Highway Shoulders and Accident Experience. Transportation Engineering Journal, Vol. 4, 1974, p. 889-905.
Herrstedt, L., M. A. Nielsen, L. Agustson, K. M. L. Krogsgaard, E. Jorgensen, and N. O. Jorgensen. Safety of Cyclists in Urban Areas: Danish Experiences. Danish Road Directorate, Copenhagen, Denmark, 1994.
Hickey Jr., J. J. Shoulder Rumble Strip Effectiveness: Drift-off-Road Accident Reductions on the Pennsylvania Turnpike. 1997. Presented at 76th Annual Meeting of the Transportation Research Board, Washington, D.C., 1997.
Hogue, N. L. Crash Reduction Due to the Installation of Red Light Cameras: Guidelines for Site Selection. Texas Transportation Institute, College Station, TX, 2002.
Huang, H. An Evaluation of Flashing Crosswalks in Gainesville and Lakeland. Florida Department of Transportation, Florida, 2000.
Huang, H. F. and M. J. Cynecki. The Effects of Traffic Calming Measures on Pedestrian and Motorist Behavior. FHWA, U.S. Department of Transportation, 2001.
Huang, H. F., J. R. Stewart, and C. V. Zegeer. Evaluation of Lane Reduction “Road Diet” Measures on Crashes and Injuries. Transportation Research Record: Journal of the Transportation Research Board No. 1784, 2002, p. 80-90.
Huang, H. The Effects of No Turn on Red/Yield to Peds Variable Message Signs on Motorist and Pedestrian Behavior. Florida Department of Transportation, Florida, 2000.

A-13
Huang, H., Schneider, R., Zeeger, C., Khattak, A., Amerlynck, V., Lacy, K. (2001) “Identification of Severe Crash Factors and Countermeasures in North Carolina.” University of North Carolina Highway Safety Research Center for the North Carolina Department of Transportation. Chapel Hill, NC.
Hughes, R., H. Huang, C. V. Zegeer, and M. J. Cynecki. Evaluation of Automated Pedestrian Detection at Signalized Intersections. FHWA, U.S. Department of Transportation, 2001.
Hunt, J. A Review of the Comparative Safety of Uncontrolled and Signal Controlled Midblock Pedestrian Crossings in Great Britain. Presented at 9th International Conference on Road Safety in Europe, Cologne, Germany, 1998.
Hunter, W. W. and J. R. Stewart. An Evaluation of Bike Lanes Adjacent To Motor Vehicle Parking. Highway Safety Research Center, University of North Carolina, Chapel Hill, NC, 1999.
Hunter, W. W., D. L. Harkey, and J. R. Stewart. Portland’s Blue Bike Lanes: Improving Safety through Enhanced Visibility. City of Portland, Portland, OR, 1999.
Hunter, W. W., J. R. Stewart, and J. C. Stutts. A Study of Bicycle Lanes Versus Wide Curb Lanes. Transportation Research Record: Journal of the Transportation Research Board No. 1667, 1999, p. 70-77.
Hunter, W. W., J. R. Stewart, J. C. Stutts, H. F. Huang, and W. E. Pein. A Comparative Analysis of Bicycle Lanes versus Wide Curb Lanes: Final Report. FHWA, U.S. Department of Transportation, 1999.
Hunter, W. W., J. R. Stewart, J. C. Stutts, H. H. Huang, and W. E. Pein. Bicycle Lanes Versus Wide Curb Lanes: Operational and Safety Findings and Countermeasure Recommendations. FHWA, U.S. Department of Transportation, 1999.
Institute of Transportation Engineers. Intersection Safety Resources. Issue Briefs, No. 17, 2004.
Institute of Transportation Engineers. Toolbox of Countermeasures and Their Potential Effectiveness to Make Intersections Safer. Issue Briefs, No. 8, 2004.
ITE Technical Council Task Force on Speed Humps, Guidelines for the Design and Application of Speed Humps. ITE Journal, 1993. 63(5): p. 11-17.
Iwasaki, R. H. LED Traffic Signals Modules as an Incandescent Lamp Alternative. ITE Journal, Vol. 73, No. 4, 2003, p. 42-45.
Jensen, S. U. Junctions and Cyclists. Presented at 10th International Bicycle Planning Conference, Barcelona, Spain, 1997.

A-14
Joshua, S. C. and A. A. Saka. Mitigation of Sight Distance Problem for Unprotected Left-Turning Traffic at Intersections. Transportation Research Record: Journal of the Transportation Research Board No. 1356, 1992, p. 73-79.
Kallberg, V. Reflector Posts - Signs of Danger? Transportation Research Record: Journal of the Transportation Research Board No. 1403, 1990, p. 57-66.
Keck, M. E. The Relationship of Fixed and Vehicular Lighting to Accidents. FHWA, U.S. Department of Transportation, 1991.
Khan, A. M., N. M. Holtz, and Z. Yicheng. Cost-Effectiveness of Climbing Lanes: Safety, Level of Service and Cost Factors. Ontario Ministry of Transportation, Downsview, Ontario, 1990.
Khattak, A. and G. Pesti. Bridge Prioritization for Installation of Automatic Anti-icing Systems in Nebraska. Presented at Mid-Continent Transportation Research Symposium, Ames, IA, 2003.
Knoblauch, R. L., B. H. Tustin, S. A. Smith, and M. T. Pietrucha. Investigation of Exposure Based Pedestrian Accident Areas: Crosswalks, Sidewalks, Local Streets and Major Arterials. . FHWA, U.S. Department of Transportation, 1988.
Kroll, B. and M. Ramey. Effects of Bike Lanes on Driver and Bicyclists Behavior. Transportation Research Record: Journal of the Transportation Research Board No. 1502, 1977, p. 8-21.
Kulmala, R. Safety at Highway Junctions Based on Predictive Accident Models. Presented at Third International Symposium on Intersections Without Traffic Signals, Portland OR, 1997. pp 151-157.
Kulmala, R. Safety at Rural Three- and Four-Arm Junctions: Development and Application of Accident Prediction Models. VTT Technical Research Centre of Finland, Espoo, Finland, 1995.
Kulmala, R., P. Rama, J. P. Pauwelussen, and H. B. Pacejka. Safety Evaluation in Practice: Weather Warning Systems. Swets & Zeitlinger, Lisse, Netherlands, 1995.
Lacy, K., R. Srinivasan, C. V. Zegeer, R. Pfefer, T. R. Neuman, K. L. Slack, and K. K. Hardy. A Guide for Addressing Collisions Involving Utility Poles. In National Cooperative Highway Research Program, Guidance for Implementation of the AASHTO Strategic Highway Safety Plan. Report 500, TRB, National Research Council, Washington, D.C., 2004.
Lalani, N. Comprehensive Safety Program Produces Dramatic Results. ITE Journal, Vol. 61, No. 10, 1991, p. 31-34.
Lalani, N. Road Safety at Pedestrian Refuges. Traffic Engineering & Control, Vol. 18, No. 9, 1977, p. 429-431.

A-15
Lall, B. K., A. Eghtedari, T. Simons, P. Taylor, and T. Reynolds. Analysis of Traffic Accidents within the Functional Area of Intersections and Driveways. 1995, Portland State University, Department of Civil Engineering: Portland, OR.
Laursen, J. G. Nordic Experience with the Safety of Bicycling. Bicycle Federation of America, Denmark, 1993.
Lee, J. C., R. H. Wortman, D. J. Hook, and M. J. Poppe. Comparative Analysis of Leading and Lagging Left Turns. Arizona Department of Transportation, Phoenix, 1991.
Leonard, J., M. Juckes, and B. Clement. Behavioural Evaluation of Pedestrians and Motorists towards Pedestrian Countdown Signals. Dessau-Soprin Inc: Laval, Quebec, 1999.
Li, W. and A. Carriquiry. Effect of Four-Lane to Three-Lane Conversions on Crash Frequencies and Crash Rates. Presented at 2005 Mid-Continent Transportation Research Symposium, Ames, IA, 2005.
Lienau, K. Safety Effect of Barrier Curb on High Speed Suburban MultiLane Highways.. FHWA, U.S. Department of Transportation, 1996.
Lipinski, M. E. and R. H. Wortman. Effect of Illumination on Rural At-Grade Intersection Accidents. Transportation Research Record: Journal of the Transportation Research Board No. 611, 1976, p. 25-27.
Little, M. (2004) “Creation of a CRF Matrix for use in Updating ODOT’s Crash Reduction Factor List.” Master’s paper submitted to Oregon State University.
Little, M. Creation of a CRF Matrix for use in updating ODOT’s Crash Reduction Factor List Master’s Report, Oregon State University August 2004
Lord, D. Synthesis on the Safety of Right Turn on Red in the United States and Canada. Presented at 82nd Annual Meeting of the Transportation Research Board, Washington, D.C., 2003.
Lott, D. F. and D. Y. Lott. Differential Effect of Bicycle Lanes on Ten Classes of Bicycle-Automobile Accidents. Transportation Research Record: Journal of the Transportation Research Board No. 605, 1976, p. 20-24.
Lovell, J. and E. Hauer. The Safety Effect of Conversion to All-Way Stop Control. Transportation Research Record: Journal of the Transportation Research Board No. 1068, 1986, p. 103-107.
Ludwig, J. and T. Bremicker. Evaluation of 2.4-m Fences and One-way Gates for Reducing Deer-Vehicle Collisions in Minnesota. Transportation Research Record: Journal of the Transportation Research Board No. 913, 1983, p. 19-22.
Lynette, L.C., Best Practices for Road Weather Management, Version 2.0. Report No. FHWA-OP-03-081, Federal Highway Administration, Washington, D.C., 2003.

A-16
Maccubbin, R. P., B. L. Staples, and A. E. Salwin. Automated Enforcement of Traffic Signals: A Literature Review. FHWA, U.S. Department of Transportation, 2001.
Marek, J. Mid-Block Speed Control: Chicanes and Speed Humps. ITE Journal, Vol. 68, No. 11, 1998.
Mason, J. M., Jr., E. T. Donnell, D. W. Harwood, K. M. Bauer, J. M. Sada, and M. T. Pietrucha. Median Safety Study (Interstates and Expressways). Pennsylvania Transportation Institute, Pennsylvania State University, University Park, PA, 2001.
McCoy, P. T., E. J. Tripi, and J. A. Bonneson. Guidelines for Realignment of Skewed Intersections: Final Report. University of Nebraska, Lincoln, NB, 1994.
McCoy, P. T., P. S. Byrd, and G. Pesti. Pavement Markings to Improve Opposing Left-Turn Lane Sight Distance. Mid-America Transportation Center, Lincoln, NB, 1999.
McCoy, P. T., U. R. Navarro, and W. E. Witt. Guidelines for Offsetting Opposing Left-Turn Lanes on Four-Lane Divided Roadways. Transportation Research Record: Journal of the Transportation Research Board No. 1356, 1992, p. 28-36.
McFadden, J. and H. W. McGee. Synthesis and Evaluation of Red Light Running Automated Enforcement Programs in the United States. FHWA, U.S. Department of Transportation, 1999.
McGee, H. W. and K. A. Eccles. Impact of Red Light Camera Enforcement on Crash Experience. In National Cooperative Highway Research Program Synthesis of Highway Practice, Report 310, TRB, National Research Council, Washington, D.C., 2003.
McGee, H. W. and M. R. Blankenship. Guidelines for Converting Stop to Yield Control at Intersections. In National Cooperative Highway Research Program, Report 320, TRB, National Research Council, Washington, D.C., 1989.
McGee, H., S. Taori, and B. N. Persaud. Crash Experience Warrant for Traffic Signals. In National Cooperative Highway Research Program, Report 491, TRB, National Research Council, Washington, D.C., 2003.
McGinnis, R. G. Strategic Plan for Improving Roadside Safety. In National Cooperative Highway Research Program, Report #, TRB, National Research Council, Washington, D.C., 2001.
McMahon, P. J., C. V. Zegeer, C. Duncan, R. L. Knoblauch, J. R. Stewart, and A. J. Khattak. An Analysis of Factors Contributing to “Walking Along Roadway” Crashes: Research Study and Guidelines for Sidewalks and Walkways. FHWA, U.S. Department of Transportation, 2002.
Miaou, S. P. Measuring the Goodness of Fit of Accident Prediction Models FHWA, U.S. Department of Transportation, 1996.

A-17
Migletz, J., J. K. Fish, and J. L. Graham. Roadway Delineation Practices Handbook. FHWA, U.S. Department of Transportation, 1994.
Ministry of Transportation and Highways of British Columbia, Wildlife Exclusion Fencing Program. 2003. Ministry of Transportation and Highways, Engineering Branch: Victoria, British Columbia, Canada.
Minnesota Department of Transportation. Minnesota DOT Anti-Icing/Deicing System. 2002: Minnesota Department of Transportation.
National Cooperative Highway Research Program. (2003a). Guidance for Implementation of the AASHTO Strategic Highway Safety Plan. Report 500, Volume 3: A Guide for Addressing Collisions with Trees in Hazardous Locations. Transportation Research Board, Washington DC. 2003.
National Cooperative Highway Research Program. (2003b). Guidance for Implementation of the AASHTO Strategic Highway Safety Plan. Report 500, Volume 4: A Guide for Addressing Head-On Collisions. Transportation Research Board, Washington DC.
National Cooperative Highway Research Program. (2003c). Guidance for Implementation of the AASHTO Strategic Highway Safety Plan. Report 500, Volume 5: A Guide for Addressing Unsignalized Intersection Collisions. Transportation Research Board, Washington DC.
National Cooperative Highway Research Program. (2003d). Guidance for Implementation of the AASHTO Strategic Highway Safety Plan. Report 500, Volume 6: A Guide for Addressing Run-Off-Road Collisions. Transportation Research Board, Washington DC.
National Cooperative Highway Research Program. (2003e). Guidance for Implementation of the AASHTO Strategic Highway Safety Plan. Report 500, Volume 7: A Guide for Addressing Collisions on Horizontal Curves. Transportation Research Board, Washington DC.
National Cooperative Highway Research Program. (2003f). Guidance for Implementation of the AASHTO Strategic Highway Safety Plan. Report 500, Volume 8: A Guide for Addressing Collisions Involving Utility Poles. Transportation Research Board, Washington DC.
National Cooperative Highway Research Program. (2003g). Guidance for Implementation of the AASHTO Strategic Highway Safety Plan. Report 500, Volume 10: A Guide for Addressing Collisions Involving Pedestrians. Transportation Research Board, Washington DC.
National Cooperative Highway Research Program. (2003h). Guidance for Implementation of the AASHTO Strategic Highway Safety Plan. Report 500, Volume 12: A Guide for Reducing Collisions at Signalized Intersections. Transportation Research Board, Washington DC.
National Cooperative Highway Research Program. (2005) “Crash Reduction Factors for Traffic Engineering and ITS Improvements.” Research in Progress, Project 17-25. http://www4.trb.org/trb/crp.nsf/All+Projects/NCHRP+17-25. Accessed May 2005.
A-18
National Highway Traffic Safety Administration. (2003) “2002 Annual Assessment of Motor Vehicle Crashes,” http://www-nrd.nhtsa.dot.gov/pdf/nrd-30/NCSA/Rpts/2003/Assess02.pdf
National Research Council. Special Report 214: Designing Safer Roads: Practices for Resurfacing, Restoration, and Rehabilitation. Transportation Research Board, Washington D.C. 1987.
NCHRP, Horizontal Curves: Descriptions of Strategies. HTML Guides 17-18(3).
Neuman, T. R., R. Pfefer, K. L. Slack, K. K. Hardy, D. W. Harwood, I. B. Potts, D. J. Torbic, and E. R. Rabbani. A Guide for Addressing Unsignalized Intersection Collisions. In National Cooperative Highway Research Program, Guidance for Implementation of the AASHTO Strategic Highway Safety Plan. Report 500, Volume 5, TRB, National Research Council, Washington, D.C., 2003.
Neuman, T. R., R. Pfefer, K. L. Slack, K. K. Hardy, F. M. Council, H. McGee, L. Prothe, and K. A. Eccles. A Guide for Addressing Run-off-Road Collisions. In National Cooperative Highway Research Program, Guidance for Implementation of the AASHTO Strategic Highway Safety Plan. Report 500, Volume 6, TRB, National Research Council, Washington, D.C., 2003.
Neuman, T. R., R. Pfefer, K. L. Slack, K. K. Hardy, H. McGee, L. Prothe, K. Eccles, and F. M. Council. A Guide for Addressing Head-On Collisions. In National Cooperative Highway Research Program, Guidance for Implementation of the AASHTO Strategic Highway Safety Plan. Report 500, Volume 4, TRB, National Research Council, Washington, D.C., 2003.
Neuman, T. R., R. Pfefer, K. L. Slack, K. K. Hardy, K. Lacy, and C. Zegeer. A Guide for Addressing Collisions with Trees in Hazardous Locations. In National Cooperative Highway Research Program, Guidance for Implementation of the AASHTO Strategic Highway Safety Plan. Report 500, Volume 3, TRB, National Research Council, Washington, D.C., 2003.
Newman, Leonard, Alex Dunnet, and Gary Meis. Freeway Ramp Control - What It Can and Cannot Do. Freeway Operation Department, District 7, California Division of Highways. February 1969.
Noyce, D. A. and V. V. Elango. Safety Evaluation of Centerline Rumble Strips: A Crash and Driver Behavior Analysis. Presented at 83rd Annual Meeting of the Transportation Research Board, Washington, D.C., 2004.
Noyce, D. A., H. U. Bahia, J. M. Yambo, and G. Kim. Incorporating Road Safety into Pavement Management: Maximizing Asphalt Pavement Surface Friction for Road Safety Improvements (Draft Literature Review & State Surveys). Midwest Regional University Transportation Center, Madison, WI, 2005.
Nystrom, K. Median Barrier Study Warrant Review. California Department of Transportation, Sacramento, CA, 1997.
O’Brien, Amy, “New Ramp Metering Algorithm Improves Systemwide Travel Time”, TR News, July-August 2000, Transportation Research Board.

A-19
Ogden, K. Safer Roads: A Guide to Road Safety Engineering. Ashgate Publishing Ltd., United Kingdom, 1996.
Ohio Department of Transportation. Crash Reduction Factors Table, 2003. http://www.dot.state.oh.us/roadwaysafety/PDF_Files/Crash%20Reduction%20Factors%20Table%202003.pdf. Accessed February 27, 2006.
Oregon Department of Transportation (ODOT) (2002). “Draft Countermeasure Analysis Tool Users Manual”
Outcalt, W. Centerline Rumble Strips. Colorado Department of Transportation: Denver, CO, 2001.
Pant, P. D., Y. Park, and S. V. Neti, Development of Guidelines for Installation of Intersection Control Beacons, Report No. FHWA/OH-93/006, Federal Highway Administration, 1992.
Papageorgiou, M, H. Salem, J. Blosseville. ALINEA: A Local Feedback Control Law for On-Ramp Metering. Transportation Research Record: Journal of the Transportation Research Board No. 1320, 1991.
Pedsafe. U.S. Department of Transportation and Centers for Disease Control. http://www.walkinginfo.org/pedsafe. Accessed May 1, 2005.
Perrillo, K. The Effectiveness and Use of Continuous Shoulder Rumble Strips. FHWA, U.S. Department of Transportation, 1998.
Perrin, J. Animal-Vehicle Accident Analysis. The University of Utah, Salt Lake City, UT, 2003.
Persaud, B. N., G. Bahar, C. J. Mollett, and C. Lyon. Safety Evaluation of Raised Snowplowable Pavement Markers. Presented at 83rd Annual Meeting of the Transportation Research Board, Washington, D.C., 2004.
Persaud, B. N., R. A. Retting, and C. A. Lyon. Crash Reduction Following Installation of Centerline Rumble Strips on Rural Two-Lane Roads. Accident Analysis and Prevention, Vol. 36, No. 1, 2004, p. 1073-1079.
Persaud, B. N., R. A. Retting, and C. Lyon. Crash Reduction Following Installation of Centerline Rumble Strips on Rural Two-Lane Roads. Insurance Institute for Highway Safety, Arlington, VA, 2003.
Persaud, B. N., R. A. Retting, P. E. Garder, and D. Lord. Observational Before-After Study of the Safety Effect of U.S. Roundabout Conversions Using the Empirical Bayes Method. Transportation Research Record: Journal of the Transportation Research Board No. 1751, 2001.
Persaud, B., E. Hauer, R. A. Retting, R. Vallurupalli, and K. Mucsi. Crash Reductions Related to Traffic Signal Removal in Philadelphia. Accident Analysis and Prevention, Vol. 29, No. 6, 1997, p. 803-810.

A-20
Persaud, B., F. M. Council, C. Lyon, K. Eccles, and M. Griffith. A Multi-Jurisdictional Safety Evaluation of Red Light Cameras. Presented at 84th Annual Meeting of the Transportation Research Board, Washington, D.C., 2005.
Pfefer, R., T. Neuman and R. Raub. Improved Safety Information to Support Highway Design. National Cooperative Highway Research Program Report 430, TRB, National Research Council, Washington, D.C., 1999.
Plaxico, C. A., M. H. Ray, J. A. Weir, F. Orengo, P. Tiso, H. McGee, F. M. Council, and K. Eccles. Recommended Guidelines for Curbs and Curb-Barrier Installations. 2004, Transportation Research Board, National Research Council: Washington, D.C.
Pline, J., Ed. Traffic Engineering Handbook, 4th ed. Institute of Transportation Engineers, Prentice Hall, Englewood Cliffs, NJ, 1992.
Potts, I. B., D. W. Harwood, and K. M. Bauer. Effect of Preceding Tangent Length on Safety for Horizontal Curves. Presented at 2nd International Symposium on Highway Geometric Design, Mainz, Germany, 2000.
Preston, H. and T. Schoenecker. Potential Safety Effects of Dynamic Signing at Rural Horizontal Curves. Minnesota Department of Transportation, St. Paul, MN, 1999.
Preusser, D. F., W. A. Leaf, K. B. DeBartolo, R. D. Blomberg, and M. M. Levy. The Effect of Right-Turn-on-Red on Pedestrian and Bicyclist Accidents. Journal of Safety Research, Vol. 13, No. 2, 1982, p. 45-55.
Radwan, A. E. and D. Wing. Safety Effects of Traffic Signal Installations: State of the Art. Arizona Department of Transportation, Phoenix, AZ, 1987.
Ray, M. H. Safety Effectiveness of Upgrading Guardrail Terminals to Report 350 Standards. Transportation Research Record: Journal of the Transportation Research Board No. 1720, 2000.
Ray, M. H., J. Weir, and J. Hop. In-Service Performance of Traffic Barriers. 2002, Transportation Research Board, National Research Council: Washington, D.C.
Reinfurt, D., C. Zegeer, B. Shelton, and T. R. Neuman. Analysis of Vehicle Operations on Horizontal Curves. Transportation Research Record: Journal of the Transportation Research Board No. 1318, 1998.
Retting, R. A. and C. M. Farmer. Evaluation of Speed Camera Enforcement in the District of Columbia. Presented at 82nd Annual Meeting of the Transportation Research Board, Washington, D.C., 2003.
Retting, R. A. and M. Greene. Influence of Traffic Signal Timing on Red-Light Running and Potential Vehicle Conflicts at Urban Intersections. Transportation Research Record: Journal of the Transportation Research Board No. 1595, 1997.

A-21
Retting, R. A. and S. Y. Kyrychenko. Crash Reductions Associated with Red Light Camera Enforcement in Oxnard, California. Insurance Institute for Highway Safety Arlington, VA, 2001.
Retting, R. A., J. F. Chapline, and A. F. Williams. Changes in Crash Risk Following Re-timing of Traffic Signal Change Intervals. Accident Analysis and Prevention, Vol. 34, No. 2, 2002, p. 215-220.
Retting, R. A., M. S. Nitzburg, C. M. Farmer, and R. L. Knoblauch. Field Evaluation of Two Methods for Restricting Right Turn on Red to Promote Pedestrian Safety. ITE Journal, Vol. 72, No. 1, 2002, p. 32-36.
Richards, S. H., K. W. Heathington, and D. B. Fambro. Evaluation of Constant Warning Times Using Train Predictors at a Grade Crossing with Flashing Light Signals. Transportation Research Record: Journal of the Transportation Research Board No. 1254, 1990, p. 60-71.
Roadside Design Guide. 2002, AASHTO: Washington, D.C.
Robertson, H., Ed. Manual of Transportation Engineering Studies. Institute of Transportation Engineers, Washington, D.C., 2000.
Rogness, R. O., D. B. Fambro, and D. S. Turner. Before-After Accident Analysis for Two Shoulder Upgrading Alternatives. Transportation Research Record: Journal of the Transportation Research Board No. 855, 1982, p. 41-47.
Ronkin, M. P. Bike Lane or Shared Roadway? Pro Bike News, Vo. 13, No. 3, 1993, p. 4-5.
Roper, B. A., J. D. Fricker, R. E. Montgomery, and K. C. Sinha. The Effects of the All-Red Clearance Interval on Accident Rates in Indiana. in TE 1991 Compendium of Technical Papers. 1991. Washington, D.C.: ITE 1991 Compendium of Technical Papers.
Ruby, D. E. and A. G. Hobeika. Assessment of Red Light Running Cameras in Fairfax County, Virginia. Transportation Quarterly, Vol. 57, No. 3, 2003, p. 33-48.
Russell, E. R. and M. J. Rys. Centerline Rumble Strips. In National Cooperative Highway Research Program, Report 339, TRB, National Research Council, Washington, D.C., 2005.
Safety Analyst. U.S. Department of Transportation, FHWA. http://www.safetyanalyst.org/index.htm. Accessed May 1, 2005.
Sayed, T., H. Vahidi, and F. Rodriguez. Advance Warning Flashers: Do They Improve Safety? Transportation Research Record: Journal of the Transportation Research Board No. 1692, 1999, p. 30-38.
Sayed, T., W. Abdelwahab, and J. Nepomuceno. Safety Evaluation of Alternative Signal Head Design. Transportation Research Record: Journal of the Transportation Research Board No. 1635, 1998, p. 140-146.

A-22
Science Applications International, C., Synthesis of Shoulder Rumble Strip Practices and Policies. 2001, Federal Highway Administration Washington, D.C.
Scriven, R. W. Raised Median Strips- A Highly Effective Road Safety Measure. Presented at 13th Australian Road Research Board Conference, Australia, 1986.
Seamons, L. L. and R. N. Smith. Past and Current Median Barrier Practice in California. CalTrans, Sacramento, CA, 1991.
Shebeeb, O. Safety and Efficiency for Exclusive Left-Turn Lanes at Signalized Intersections. ITE Journal, Vol. 65, 1995, p. 53-59.
Sheffer, C. and B. N. Janson. Accident and Capacity Comparisons of Leading and Lagging Left-turn Signal Phasings. Presented at 78th Annual Meeting of the Transportation Research Board, Washington, D.C., 1999.
Shen, J. and A. Gan. (2003). “Development of Crash Reduction Factors: Methods, Problems, and Research Needs.” Transportation Research Board, Washington, DC.
Short, M. S., G. A. Woelfl, and C. J. Chang. Effects of Traffic Signal Installation on Accidents. Accident Analysis and Prevention, Vol. 14, No. 2, 1982, p. 135-145.
Smith, D. M., J. McFadden, K. Passetti, and M. Angelastro. Synthesis and Evaluation of Red Light Running Electronic Enforcement Programs in the United States. FHWA, U.S. Department of Transportation, 1999.
Smith, D. M., J. McFaden, and K. A. Passetti. Automated Enforcement of Red Light Running Technology and Programs: A Review. Transportation Research Record: Journal of the Transportation Research Board No. 1734, 2000, p. 29-37.
Smith, R. L. and T. Walsh. Safety Impacts of Bicycle Lanes. Transportation Research Record: Journal of the Transportation Research Board No. 1168, 1988, p. 49-59.
Souleyrette, R. R., M. M. O’Brien, T. McDonald, H. Preston, and R. Storm. Effectiveness of All-Red Clearance Interval on Intersection Crashes. Minnesota Department of Transportation, St. Paul, MN, 2004.
Southeast Michigan Council of Governments (SEMCOG). SEMCOG Traffic Safety Manual, 3rd Edition, 1998.
St. John, A. D. and D. W. Harwood. Safety Considerations for Truck Climbing Lanes on Rural Highways. Transportation Research Record: Journal of the Transportation Research Board No. 1303, 1991, p. 74-82.
Stemley, J. J. One-Way Streets Provide Superior Safety and Convenience. 1998, ITE Washington, D.C.

A-23
Stowe, R. A Benefit/Cost Analysis of Intelligent Transportation System Applications for Winter Maintenance. Presented at 80th Annual Meeting of the Transportation Research Board, Washington D.C., 2001.
Strathman, J., Duecker, K., Zhang, J., and Williams, T. (2001). “Analysis of Design Attributes and Crashes on the Oregon Highway System.” Center for Urban Studies, Portland State University, for Oregon Department of Transportation Research Group and Federal Highway Administration. Washington, DC. 2001.
Swan, S. Treatments of Overpasses and Undercrossing for the Disabled: Early Report on the State-of-the-Art. Transportation Research Record: Journal of the Transportation Research Board No. 683, 1978.
Tarrall, M. B. and K. K. Dixon. Conflict Analysis for Double Left-Turn Lanes with Protected-Plus-Permitted Signal Phases. Transportation Research Record: Journal of the Transportation Research Board No. 1635, 1998, p. 1-19.
Taylor, H. W. and L. Meczkowski. Safer Roadsides. Public Roads, Vol. 66, No. 4, 2003.
Taylor, W. C. and M. K. Jain. Warrants for Passing Lanes. Transportation Research Record: Journal of the Transportation Research Board No. 1303, 1991, p. 83-91.
Texas Transportation Institute, TTI Researchers Study the Effectiveness of Pavement Markings. Texas Transportation Researcher, 2004. 40(1): p. 12-13.
Tople, A. Development of South Dakota Accident Reduction Factors. Report SD98-13. South Dakota Department of Transportation, 1998. http://ntl.bts.gov/reports/SD98-13final.pdf. Accessed February 27, 2006.
Torbic, D. J., D. W. Harwood, R. Pfefer, T. R. Neuman, K. L. Slack, and K. K. Hardy. A Guide for Reducing Collisions on Horizontal Curves. In National Cooperative Highway Research Program, Guidance for Implementation of the AASHTO Strategic Highway Safety Plan. Report 500, Volume 7, TRB, National Research Council, Washington, D.C., 2004.
Torbic, D. J., L. Elefteriadou, and M. El-Gindy. Development of More Bicycle-Friendly Rumble Strip Configurations. Presented at 80th Annual Meeting of the Transportation Research Board, Washington, D.C., 2001.
Transportation Association of Canada, Best Practices for the Implementation of Shoulder and Centreline Rumble Strips. 2001, Transportation Association of Canada: Ottawa, Ontario, Canada.
Tribbet, L., P. McGowen, and J. Mounce. An Evaluation of Dynamic Curve Warning Systems in the Sacramento River Canyon. California Department of Transportation, Sacramento, CA, 2000.
Tustin, B. H., H. Richards, H. McGee, and R. Patterson. Railroad-Highway Grade Crossing Handbook - Second Edition. FHWA, U.S. Department of Transportation, 1986.

A-24
Twomey, J. M., M. L. Heckman, J. C. Hayward, and R. J. Zuk. Accidents and Safety Associated with Interchanges. Transportation Research Record: Journal of the Transportation Research Board No. 1383, 1993, p. 100-105.
Upchurch, J. Comparison of Left-Turn Accident Rates for Different Types of Left-Turn Phasing. Transportation Research Record: Journal of the Transportation Research Board No. 1324, 1991, p. 33-40.
Van Houten, R. Research on Improving Motorists Yielding At Crosswalks on Multilane Roads with an Uncontrolled Approach. ITE 2001 Annual Meeting and Exhibit, Chicago, Illinois, USA 2001.
Van Houten, R., A. R. Retting, C. M. Farmer, and J. Van Houten. Field Evaluation of a Leading Pedestrian Interval Signal Phase at Three Urban Intersections. Transportation Research Record: Journal of the Transportation Research Board No. 1734, 2000, p. 86-92.
Van Houten, R., K. Healey, J. E. Malenfant, and R. A. Retting. Use of Signs and Symbols to Increase the Efficacy of Pedestrian Activated Flashing Beacons at Crosswalks. Transportation Research Record: Journal of the Transportation Research Board No. 1636, 1998, p. 92-95.
Van Houten, R., R. A. Retting, J. Van Houten, C. M. Farmer, and J. E. L. Malenfant. Use of Animation in LED Pedestrian Signals to Improve Pedestrian Safety. ITE Journal, Vol. 69, No. 2, 1999, p. 30-38.
Vogt, A. Crash Models for Rural Intersections: Four-Lane by Two-Lane Stop-Controlled and Two-Lane by Two-Lane Signalized. FHWA, U.S. Department of Transportation, 1999.
Walker, F. W. and S. E. Roberts. Influence of Lighting on Accident Frequency at Highway Intersections. Transportation Research Record: Journal of the Transportation Research Board No. 562, 1976, p. 73-78.
Ward, B. L. Evaluation of a Fixed Anti-Icing Spray Technology (FAST) System. Presented at 81st Annual Meeting of the Transportation Research Board, Washington, D.C., 2002.
Weiss, A. and J. L. Schifer. Assessment of Variable Speed Limit Implementation Issues. 2001, Transportation Research Board, National Research Council Washington, D.C.
Wilbur Smith Associates, Bicycle Boulevard Design Tools and Guidelines. 2000, City of Berkeley Planning and Development Department: Berkeley, Calif.
Xu, L. Right Turns Followed by U-Turns Versus Direct Left Turns: A Comparison of Safety Issues. ITE Journal, Vol. 71, No. 11, 2001, p. 36-43.
Zador, P., H. Stein, S. Shapiro, and P. Tarnoff. Effect of Signal Timing on Traffic Flow and Crashes at Signalized Intersections. Transportation Research Record: Journal of the Transportation Research Board No. 1010, 1984, p. 1-8.

A-25
Zaidel, D.M. The impact of enforcement on accidents. 2002, The “Escape” Project: Technical Research Centre of Finland (VTT).
Zegeer, C. V. and M. J. Cynecki. Determination of Cost-Effective Roadway Treatments for Utility Pole Accidents. Transportation Research Record: Journal of the Transportation Research Board No. 970, 1984, p. 52-64.
Zegeer, C. V. and M. J. Cynecki. Evaluation of Countermeasures Related to RTOR Accidents that Involve Pedestrians. Transportation Research Record: Journal of the Transportation Research Board No. 1059, 1986, p. 24-34.
Zegeer, C. V. and M. R. Parker, Jr. Effect of Traffic and Roadway Features on Utility Pole Accidents. Transportation Research Record: Journal of the Transportation Research Board No. 970, 1984, p. 65-76.
Zegeer, C. V., C. Seiderman, P. Lagerwey, M. J. Cynecki, M. Ronkin, and R. Schneider. Pedestrian Facilities Users Guide - Providing Safety and Mobility. FHWA, U.S. Department of Transportation, 2002.
Zegeer, C. V., D. W. Reinfurt, J. Hummer, L. Herf, and W. Hunter. Safety Effects of Cross-Section Design for Two-Lane Roads. Transportation Research Record: Journal of the Transportation Research Board No. 1195, 1988, p. 20-32.
Zegeer, C. V., J. Hummer, D. W. Reinfurt, L. Herf, and W. Hunter. Safety Effects of Cross-Section Design for Two-Lane Roads - Volumes I and II. FHWA, U.S. Department of Transportation, 1987.
Zegeer, C. V., J. R. Stewart, F. M. Council, D. W. Reinfurt, and E. Hamilton. Safety Effects of Geometric Improvements on Horizontal Curves. Transportation Research Record: Journal of the Transportation Research Board No. 1356, 1992.
Zegeer, C. V., J. Stutts, H. Huang, M. J. Cynecki, R. Van Houten, B. Alberson, R. Pfefer, T. R. Neuman, K. L. Slack, and K. K. Hardy. A Guide for Reducing Collisions Involving Pedestrians. In National Cooperative Highway Research Program, Guidance for Implementation of the AASHTO Strategic Highway Safety Plan. Report 500, Volume 10, TRB, National Research Council, Washington, D.C., 2004.
Zegeer, C. V., K. S. Opiela, and M. J. Cynecki. Effect of Pedestrian Signals and Signal Timing on Pedestrian Accidents. Transportation Research Record: Journal of the Transportation Research Board No. 847, 1982, p. 62-72.
Zegeer, C. V., K. S. Opiela, and M. J. Cynecki. Pedestrian Signalization Alternatives.. FHWA, U.S. Department of Transportation, 1983.
Zegeer, C. V., R. Stewart, H. Huang, and P. Lagerwey. Safety Effects of Marked Versus Unmarked Crosswalks at Uncontrolled Locations: Executive Summary and Recommended Guidelines. FHWA, U.S. Department of Transportation, 2002.

A-26
Zegeer, C.V., R. Stewart, D.W. Reinfurt, F.M. Council, T.R. Neuman, E. Hamilton, T. Miller, and W. Hunter, Cost-Effective Geometric Improvements for Safety Upgrading of Horizontal Curves – Final Report. 1990, Federal Highway Administration.
Zwahlen, H. T. Stop Ahead and Stop Signs and Their Effect on Driver Eye Scanning and Driving Performance. Transportation Research Record: Journal of the Transportation Research Board No. 1168, 1988, p. 16-24.


![Instruction Manual - Oregon Police Traffic Crash Report ... · Police reports of traf¿c crashes are the foundation of traf ... The department shall tabulate and may analy]e crash](https://static.fdocuments.in/doc/165x107/5b5e4a8c7f8b9a6d448bfeac/instruction-manual-oregon-police-traffic-crash-report-police-reports-of.jpg)