
CRANFIELD UNIVERSITY Steven Andrew Fowler THE …
194
CRANFIELD UNIVERSITY Steven Andrew Fowler THE DEVELOPMENT OF SENSORS FOR THE DETECTION OF CLINICALLY RELEVANT SUBSTANCES USING MOLECULAR IMPRINTING CRANFIELD HEALTH PhD THESIS
Transcript of CRANFIELD UNIVERSITY Steven Andrew Fowler THE …
CRANFIELD UNIVERSITY
Steven Andrew Fowler
THE DEVELOPMENT OF SENSORS FOR THE DETECTION OF CLINICALLY
RELEVANT SUBSTANCES USING MOLECULAR IMPRINTING
CRANFIELD HEALTH
PhD THESIS
CRANFIELD UNIVERSITY
CRANFIELD HEALTH
PhD THESIS
Academic year 2006 – 2009
Steven Andrew Fowler
THE DEVELOPMENT OF SENSORS FOR THE DETECTION OF CLINICALLY
RELEVANT SUBSTANCES USING MOLECULAR IMPRINTING
Supervisor: Professor Sergey Piletsky
Industrial supervisor: Dr Peter Laitenberger
Presented 2009
This thesis is submitted in partial fulfilment of the requirements for the Degree of
Doctor of Philosophy (PhD)
© Cranfield University, 2009. All rights reserved. No part of this publication may be
reproduced without the written permission of the copyright holder.

i
Abstract
This thesis investigates the development of sensing devices based on molecularly
imprinted polymers for the detection of clinically relevant analytes. Three analytes
were considered, metronidazole, creatinine and propofol.
A molecularly imprinted polymer (MIP) was computationally designed for
metronidazole and tested using SPE techniques. This polymer was then grafted onto a
transducer surface using an immobilised initiator. Amperometric and impedance
detection of metronidazole were investigated.
The capacitive detection of creatinine was reproduced from the literature (Panasyuk-
Delaney et al., 2002) as this approach could be applied to other MIPs to form a
universal platform for sensor development. However, the sensors produced using this
methodology were difficult to reproduce and attempts to improve them were
unsuccessful. A model for capacitive electrodes was developed to explain the obtained
results.
To address the key challenges found in the aforementioned work, a dual polymerisable
monomer was used as a conductive anchor for the amperometric and impedance
detection of propofol. The developed amperometric sensors demonstrated very high
sensitivity (limit of detection was below 5 µM), although the electrodes lacked in
selectivity.
In conclusion, this thesis illustrates some of the key areas which need to be considered
in the development of MIP-based devices and investigates some innovative solutions to
these problems.

ii
Acknowledgements
I would like to thank my supervisor, Professor S. Piletsky for all his support and
guidance during this PhD. In addition, I would like to thank all of the staff within the
Smart Materials group, especially Dr M. Whitcombe for his advice on chemistry, Dr K.
Karim for his support and Dr E. Piletska and Dr I. Chianella for all their help in the
laboratory.
I would like to extend my gratitude to Sphere Medical for their support and use of their
facilities and knowledge, particularly to Dr P. Laitenberger who has always been
willing to find the time to assist and guide me.
I would like to thank Health Technologies (Knowledge Transfer Network), without
whom this project would not have been possible.
Penultimately, I would like to thank my friends who have helped me to maintain a
modicum of sanity during this PhD. Especially those in the laboratory (Antonio, Prota,
Guapa, Cookie, Ternura and ‘the Greeks’) for their humour and motivation, and Olivier
for the some of the best advice I could have received.
Finally, to my family for always being there, especially Kat without whom this would
not have been possible.

iii
List of contents
Abstract ......................................................................................................................i
Acknowledgements....................................................................................................ii
List of contents .........................................................................................................iii
List of tables ............................................................................................................vii
List of figures .........................................................................................................viii
Notation..................................................................................................................xvi
Chapter 1 - Introduction .............................................................................................1
Chapter 2 - Review of clinical sensing devices and their technology ..........................3
2.1 Introduction................................................................................................3
2.2 Sensors for clinical analysis........................................................................3
2.3 Targets .......................................................................................................7
2.3.1 Blood gas............................................................................................8
2.3.2 Electrolytes.........................................................................................9
2.3.3 Metabolites .......................................................................................10
2.4 Detection Methods ...................................................................................15
2.4.1 Potentiometry ...................................................................................15
2.4.2 Voltammetry.....................................................................................16
2.4.3 Stripping Voltammetry .....................................................................18
2.4.4 Amperometry....................................................................................20
2.4.5 Impedance ........................................................................................20
2.5 Transducers ..............................................................................................22
2.5.1 Material ............................................................................................22
2.5.2 Surface modification.........................................................................24
2.5.3 Geometry..........................................................................................24
2.6 Recognition systems.................................................................................25
2.6.1 Enzyme.............................................................................................25
2.6.2 Immunosensors.................................................................................26
2.6.3 Molecularly imprinted polymers .......................................................28
2.6.4 Conclusions on clinical sensing technology.......................................29

iv
iv
Chapter 3 - Conductometric detection of propofol using molecular imprinting .........31
3.1 Introduction..............................................................................................31
3.1.1 A review of propofol and its detection ..............................................31
3.2 Investigations into the use of molecularly imprinted polymers for the detection of propofol ............................................................................................32
3.2.1 Impedance monitoring and strategies for MIP immobilisation...........33
3.2.2 Sensors .............................................................................................33
3.2.3 Polymer immobilisation....................................................................34
3.2.4 Impedance monitoring ......................................................................38
3.2.5 Investigatory procedures ...................................................................39
3.3 Results of impedance monitoring for immobilised MIP ............................40
3.3.1 Investigation of Abtech sensors with photografted MIP films............40
3.3.2 Initial investigation of deposited MIP films on microchip sensors .....42
3.3.3 Discussion of impedance monitoring using MIP-coated electrodes ...43
3.3.4 Deposited MIP on microchip electrodes............................................44
3.3.5 Conclusion of impedance monitored MIP .........................................44
3.4 Investigation of MIP immobilisation procedure on microchip device........44
3.4.1 Analysis techniques for investigating immobilised MIP ....................45
3.4.2 Results of measurements using MIP-coated microchip device...........47
3.4.3 Discussion of MIP immobilisation of microchip devices...................52
3.4.4 Conclusion of MIP immobilised on microchip device .......................53
3.5 Conclusions on the conductometric detection of propofol .........................53
Chapter 4 - Developing a molecularly imprinted polymer for the detection of antibiotics................................................................................................................................54
4.1 Introduction..............................................................................................54
4.2 Selection of antibiotic for development in MIP based sensor ....................54
4.2.1 Review of MIP design ......................................................................54
4.2.2 Overview of the proposed antibiotics ................................................56
4.3 Antibiotic selection...................................................................................60
4.3.1 Methodologies for antibiotic selection...............................................60
4.3.2 Results of antibiotic selection............................................................61
4.3.3 Discussion of antibiotic and monomer selection................................64
4.3.4 Conclusion of antibiotic selection .....................................................65
4.4 Computational design and testing of MIP with selective properties for metronidazole ......................................................................................................65
v
v
4.4.1 Investigatory techniques ...................................................................65
4.4.2 Result of MIP design and testing.......................................................68
4.4.3 Discussion of MIP design and testing................................................74
4.4.4 Conclusion........................................................................................74
4.5 Investigation into the detection of metronidazole using immobilised MIP.75
4.5.1 Methodologies for the immobilisation and detection of metronidazole75
4.5.2 Results of the immobilisation and detection of metronidazole ...........77
4.5.3 Discussion ........................................................................................85
4.5.4 Conclusion of metronidazole detection and MIP grafting ..................86
4.6 Chapter conclusion ...................................................................................87
Chapter 5 - Exploration into the capacitive detection of therapeutic compounds using molecularly imprinting technology...........................................................................88
5.1 Introduction..............................................................................................88
5.2 Review of capacitive sensors ....................................................................88
5.2.1 Capacitive devices using molecularly imprinted polymers ................90
5.3 Reproduction of a capacitive MIP device for the detection of creatinine. ..95
5.3.1 Methodology ....................................................................................95
5.3.2 Results of reproduced creatinine specific capacitive device...............98
5.3.3 Discussion on the performance of the capacitive creatinine devices 104
5.3.4 Conclusion...................................................................................... 106
5.4 Investigation of an improved creatinine selective device......................... 106
5.4.1 Surface pre-treatment for thiol self-assembly .................................. 106
5.4.2 Improved methodology for capacitive detection of creatinine.......... 107
5.4.3 Results of improved methodology for creatinine detection .............. 108
5.4.4 Discussion of improved methodology for creatinine detection......... 109
5.4.5 Conclusion of improved methodology for the detection of creatinine113
5.5 Conclusion of the capacitive detection of creatinine................................ 114
Chapter 6 - Detection of propofol with the controlled growth of MIP onto a conducting polymer anchor ...................................................................................................... 115
6.1 Introduction............................................................................................ 115
6.2 Review of relevant compounds and their chemistry ................................ 115
6.2.1 Iniferters ......................................................................................... 115
6.2.2 N-phenylethylene diamine methacrylamide (NPEDMA)................. 117
6.3 Growing polymer from an electropolymerised NPEDMA layer .............. 120

vi
vi
6.3.1 Methodology of polymer immobilisation with a NPEDMA anchor . 120
6.3.2 Results of polymer immobilisation with a NPEDMA anchor........... 123
6.3.3 Discussion of polymer immobilisation with a NPEDMA anchor ..... 126
6.3.4 Conclusion of polymer immobilisation with NPEDMA anchor ....... 127
6.4 Impedance detection of creatinine and propofol with NPEDMA anchored MIP 127
6.4.1 Methodology for the impedance detection of creatinine and propofol127
6.4.2 Results of the impedance detection of creatinine and NPEDMA ..... 128
6.4.3 Discussion on the impedance detection of creatinine and propofol .. 130
6.4.4 Conclusion on the impedance detection of creatinine and propofol . 130
6.5 The electrochemical detection of propofol .............................................. 131
6.5.1 Methodology for detection of propofol............................................ 131
6.5.2 Results of the investigation into the detection of propofol ............... 132
6.5.3 Discussion of the electrochemical detection of propofol.................. 140
6.5.4 Conclusion on the electrochemical detection of propofol ................ 142
6.6 Investigation into the amperometric detection of propofol with a MIP covered electrode ............................................................................................................ 142
6.6.1 Methodology for the amperometric detection of propofol................ 143
6.6.2 Results from the detection of propofol ............................................ 144
6.6.3 Discussion of the selective detection of propofol............................. 151
6.6.4 Conclusion on detection of propofol ............................................... 152
6.7 Chapter conclusion ................................................................................. 153
Chapter 7 - General conclusion and further work ................................................... 155
7.1 General conclusion ................................................................................. 155
7.2 Suggestions for further work................................................................... 157
Reference............................................................................................................... 159
Publications ........................................................................................................... 174

vii
List of tables
Table 2.1 – Summary of VIA Medical’s blood gas and electrolyte monitoring systems analytes. Including the analyte range and sensitivity.Skoog, 2000 #144.................... 6
Table 2.2 – Normal range values for blood-gas and electrolyte measurements. a Meyerhoff, 1993 #249, b Pfeiffer, 1997 #71, c Berger, 1997 #56, d Eggenstein, 1999 #274 and e Berberich, 2005 #32...................................................................... 8
Table 2.3 – Examples of enzymes, reactions and buffer solutions used in the production of metabolite sensors Suzuki, 2001 #34. Activity is quoted in enzyme units per cm2.................................................................................................................................... 11
Table 2.4 – A summary of stripping analysis techniques Wang, 2000 #3. ................ 19
Table 3.1 – Propofol polymerisation mixture............................................................... 33
Table 3.2 – Composition of grafting polymerisation mixture....................................... 36
Table 3.3 – Protocol for deposition of NIP and MIP mixtures. .................................... 38
Table 4.1 – Table of top five computationally calculated monomers with the strongest binding for metronidazole, gentamicin and cefoxitin. Value in brackets is the binding
score (Kcal/mol). (DEAEM – 2-diethylaminoethyl methacrylate, EGMP – ethylene glycol methacrylate phosphate, VP – vinylpyridine, AMPSA – 2-acrylamido-2-methyl-1-propanesulphonic acid). ........................................................................................... 61
Table 4.2 – Table of NIP compositions for highest binding monomers from computational analysis (monomer : cross-linker, 1:4.2). Initiator – 2-2-dimethoxy-2-phenylacetopenon, cross-linker – EGDMA, porogen – DMF....................................... 66
Table 4.3 – Table of MIP compositions based on EGMP and itaconic acid monomers for the selective binding of metronidazole. Initiator – AIBN, cross-linker – EGDMA, porogen – DMF........................................................................................................... 73
Table 4.4 – Composition of grafting polymerisation mixture (template : monomer : cross-linker, 2:2:17). ................................................................................................... 76
Table 5.1 – Summary of MIP-based capacitive devices. (CV – cyclic voltammetry, MBI – mercaptobenzimidazole, DA – Dopamine, SAM – self assembled monolayer, MBA – N,N-methylenediacrylamide, AMPS – 2-acrylamido-2-methyl-1-propane sulfonic acid, o-PD – o-phenylenediamine)................................................................. 92
Table 5.2 – Composition of creatinine-imprinted polymer........................................... 96
Table 6.1 – Propofol polymerisation mixture............................................................. 122

viii
List of figures
Figure 2.1 – Illustration of complications occurring from the positioning of implanted clinical devices, a) Platelet adhesion, b) the ‘wall effect’ and c) vasoconstriction. Frost, 2002 #128. .................................................................................................................. 4
Figure 2.2 – Schematic of potentiometric electrochemical cell as illustrated Wang, 2000 #3. .................................................................................................................... 15
Figure 2.3 – Schematic of electrochemical system and its corresponding circuit.......... 21
Figure 2.4 – Potential windows of platinum, mercury and carbon electrodes in various electrolytes. Wang, 2006 #63 .................................................................................. 23
Figure 2.5 – Two immunosensor strategies; a) sandwich technique and b) competitive technique .................................................................................................................... 27
Figure 2.6 – Illustration of the preparation of molecular imprinted polymers............... 28
Figure 3.1 – The structure of propofol. ........................................................................ 31
Figure 3.2 – Schematic representation of microchip with its two sensor configurations. The parallel electrodes are highlighted on the right. .................................................... 34
Figure 3.3 – Covalent immobilisation of vinyl groups onto SiO2 surface. a) activation of silanol groups, b) derivatisation of surface with vinyl-silane and c) free radical formation in polymer solution. .................................................................................... 35
Figure 3.4 – Schematic of polymerisation using a grafted initiator. A) polymerisation and B) final sensor. .................................................................................................... 36
Figure 3.5 – Schematic of polymer deposition technique, a) pre-polymerisation mixture being deposited and b) deposited polymerisation mixture being polymerised by UV radiation...................................................................................................................... 37
Figure 3.6 – Circuit diagrams of the impedance monitoring system and the simplified system assuming negligible capacitive effect at high frequencies. Reference resistance (rref), electrode resistance (relec), solution resistance (rsol) and electrode capacitance (Celec). ......................................................................................................................... 39
Figure 3.7 – Schematic of flow cell sensor. ................................................................. 40
Figure 3.8 – Response of microchip sensor to varying concentrations of propofol (Red – MIP, Blue – NIP). ...................................................................................................... 41
Figure 3.9 – Response of bare microchip sensor to varying concentrations of propofol.................................................................................................................................... 42
Figure 3.10 – Impedance response of a bare microchip sensor to propofol (100 µM). Propofol introduced at t = 100 s for 50 s and at 200 s for 100 s with no flow. .............. 42

ix
Figure 3.11 – Impedance response of a molecularly imprinted microchip sensor (with 1% PVA) to propfol (100 µM). Propofol introduced at t = 100 s for 50 s and at 200 s for 100 s with no flow. ................................................................................................ 43
Figure 3.12 – Nyquist plot and equivalent circuit of a Randles cell. Rs – solution resistance, Rt – charge transfer resistance and Cdl – double layer capacitance. ............. 45
Figure 3.13 – Impedance spectrum of deposited MIP (5 l) microchip electrodes with varied polymerisation times and distances. Polymerisation time; blue – 1 minute, red – 5 minutes and green – 10 minutes. Polymerisation distance; square – 1 cm, diamond – 3 cm and triangle – 5 cm. ........................................................................................... 47
Figure 3.14 – Impedance spectrum of deposited MIP (5 nl volume of monomer mixture) microchip electrodes as shown in Figure 3.13 with varied y-axis scale. Polymerisation time; red – 5 minutes and green – 10 minutes. Polymerisation distance; diamond – 3 cm and triangle – 5 cm...................................................................................................... 48
Figure 3.15 – Nyquist plot of MIP (5 nl volume of monomer mixture) deposited microchip electrode, polymerised for 5 minutes at a distance of 1 cm.......................... 48
Figure 3.16 – Nyquist plot of bare and deposited MIP (5 nl volume of monomer mixture) microchip electrode in PBS (pH 7.5) and 100 µM propofol. Blue – MIP in PBS, orange – MIP in propofol, red – bare in PBS and green – bare in propofol. ........ 49
Figure 3.17 – Nyquist plot of bare and deposited MIP (20 nl volume of monomer mixture) microchip electrode in PBS (pH 7.5) and 100 µM propofol. Blue – MIP in PBS, orange – MIP in propofol, red – bare in PBS and green – bare in propofol. ........ 49
Figure 3.18 – Bode plot of bare and deposited MIP (5 nl volume of monomer mixture) microchip electrode in PBS (pH 7.5) and 100 µM propofol. Blue – MIP, red – bare, line – impedance and square – phase. .......................................................................... 50
Figure 3.19 – Bode plot of bare and deposited MIP (20 nl volume of monomer mixture) microchip electrode in PBS (pH 7.5) and 100 µM propofol. Blue – MIP, red – bare, line – impedance and square – phase. .......................................................................... 50
Figure 3.20 – Cyclic voltammetry (50 mVs-1) of bare and deposited MIP (5 nl volume of monomer mixture) microchip electrode. Blue – bare in PBS, red – MIP in PBS and green – MIP in propofol. ............................................................................................. 51
Figure 3.21 – Cyclic voltammetry (50 mVs-1) of bare and deposited MIP (20 nl volume of monomer mixture) microchip electrode. Blue – bare in PBS, red – MIP in PBS and green – MIP in propofol. ............................................................................................. 52
Figure 4.1 – Illustration of the complex metonidazole reduction.................................. 57
Figure 4.2 – A schematic of cephalosporin general structure (left) and cefoxitin (right).................................................................................................................................... 58
Figure 4.3 – Illustration of gentamicin......................................................................... 59
Figure 4.4 – Model of metronidazole in highest binding conformation as calculated using Leapfrog (Sybyl), the monomer is DEAEM+. Hydrogen bonds (blue dashed line), carbon atoms (white), nitrogen atoms (blue), oxygen atoms (red), phosphorus atoms (orange) and hydrogen atoms (cyan). ................................................................ 62
x
Figure 4.5 – Model of gentamicin in highest binding conformation as calculated using Leapfrog (Sybyl), the monomer is DEAEM+. Hydrogen bonds (blue dashed line), carbon atoms (white), nitrogen atoms (blue), oxygen atoms (red), phosphorus atoms (orange) and hydrogen atoms (cyan). .......................................................................... 62
Figure 4.6 – Model of cefoxitin in highest binding conformation as calculated using Leapfrog (Sybyl), the monomer is EGMP-. Hydrogen bonds (blue dashed line), carbon atoms (white), nitrogen atoms (blue), oxygen atoms (red), phosphorus atoms (orange) and hydrogen atoms (cyan). ........................................................................................ 63
Figure 4.7 – Model of cefoxitin in a binding conformation as calculated using Leapfrog (Sybyl), the monomer is EGMP. Hydrogen bonds (blue dashed line), carbon atoms (white), nitrogen atoms (blue), oxygen atoms (red), phosphorus atoms (orange) and hydrogen atoms (cyan)................................................................................................ 63
Figure 4.8 – Solubility of metronidazole, cefoxitin and gentamicin in DMF (blue) and acetonitrile (red) expressed as a percentage of total MIP mass..................................... 64
Figure 4.9 – Volume of metronidazole (50 µL) at 50% breakthrough of the SPE cartridge. Standard NIP mixture (blue) and NIP mixture with assumed extra functionality (red) as explained below......................................................................... 68
Figure 4.10 – Percentage of uric acid (50 µL) bound to the SPE cartridge. Standard NIP mixture (blue) and NIP mixture with assumed extra functionality (red). ...................... 69
Figure 4.11 – Percentage of ascorbic acid (50 µL) bound to the SPE cartridge. Standard NIP mixture (blue) and NIP mixture with assumed extra functionality (red)................ 70
Figure 4.12 – Predicted monomer-template complex showing a binding ratio for metronidazole : EGMP of 1:2. Hydrogen bonds (blue dashed line), carbon atoms (white), nitrogen atoms (blue), oxygen atoms (red), phosphorus atoms (orange) and hydrogen atoms (cyan)................................................................................................ 70
Figure 4.13 – Predicted monomer-template complex showing a binding ratio for metronidazole : itaconic acid of 1:2. Hydrogen bonds (blue dashed line), carbon atoms (white), nitrogen atoms (blue), oxygen atoms (red), phosphorus atoms (orange) and hydrogen atoms (cyan)................................................................................................ 71
Figure 4.14 – Imprinting factor at 50% breakthrough. Monomer : template ratio; 1:2 (blue), 1:3 (green) and 1:4 (red). Predicted functional groups: 1 – X, 2 – X’ and 3 – X’’.................................................................................................................................... 71
Figure 4.15 – Plot of forward scans from cyclic voltammograms (small plot) of metronidazole with increasing concentrations 0, 10, 25, 50 100 and 360 µM (arrow going down) using platinum microchip electrodes. Arrow indicates increasing concentration. ............................................................................................................. 78
Figure 4.16 – Amperometric (-750 mV) response to metronidazole (228 µM) injections, also including noise from the injector.......................................................................... 79
Figure 4.17 – Amperometric (-300 mV) response to metronidazole (228 µM) injections, also including noise from the injector.......................................................................... 79
Figure 4.18 – Cyclic voltammetry of metronidazole (100 µM) in PBS (pH 7.5) with (red) and without (blue) degassing. ............................................................................. 80

xi
Figure 4.19 – Cyclic voltammetry of PBS (pH 7.5) with (red) and without (blue) degassing. ................................................................................................................... 80
Figure 4.20 – Cyclic voltammetry of metronidazole (200 µM) in PBS (pH 7.5) with (red) and without (blue) degassing on carbon paste electrode. ..................................... 81
Figure 4.21 – Cyclic voltammetry of PBS (pH 7.5) with (red) and without (blue) degassing on carbon paste electrode. ........................................................................... 81
Figure 4.22 – Microscope images of microchip electrodes pre (a & b) and post (c & d) polymerisation (for 2 hours). Images b and d were taken using a darkfield filter......... 82
Figure 4.23 – AFM imaged of thermally grafted polymer on microchip electrodes shown in Figure 4.22................................................................................................... 82
Figure 4.24 – Nyquist plot of bare microchip sensor (blue) and with immobilised SAM (red) and polymer grafted for 2 hours (green) in PBS (pH 7.5). ................................... 83
Figure 4.25 – Change in impedance observed for a NIP coated microchip electrodes to consecutive injections of metronidazole at concentrations of 1, 10, 25, 50 and 100 µM. At each concentration, the injection was repeated three times...................................... 84
Figure 4.26 – Change in impedance observed for a MIP coated microchip electrodes to consecutive injections of metronidazole at concentrations of 1, 10, 25, 50 and 100 µM. At each concentration, the injection was repeated three times...................................... 84
Figure 5.1 – Schematic of experimental setup for two electrode impedance monitoring.................................................................................................................................... 98
Figure 5.2 – Contact angle of electrode surface at various stages thought out the polymer immobilisation. ............................................................................................. 98
Figure 5.3 – AFM images of A) topography and B) deflection of a bare gold electrode surface. ....................................................................................................................... 99
Figure 5.4 – AFM images of A) topography and B) deflection of a thiolated gold electrode surface. ...................................................................................................... 100
Figure 5.5 – AFM images of A) topography and B) deflection of a NIP coated gold electrode surface. ...................................................................................................... 100
Figure 5.6 – AFM of topography of scratched (1 µm x 1 µm) NIP coating and corresponding profile plots. Profile 1 – red, 2 – blue and 3 – green........................... 101
Figure 5.7 – Bode plot demonstrating the variation in impedance during various stages of the grafting polymerisation. Blue – bare gold, red – thiolated gold and green – grafted polymer......................................................................................................... 101
Figure 5.8 – Bode plot demonstrating the variation in phase during various stages of the grafting polymerisation. Blue – bare gold, red – thiolated gold and green – grafted polymer. ................................................................................................................... 102
Figure 5.9 – Example sensor response to alternative injections of creatinine and creatine (3 x 200 µL, 3 x 500 µL and 3 x 1000 µL) in 25 mM phosphate buffer with 100 mM NaCl at pH 7.5. ......................................................................................................... 102
Figure 5.10 – Response of NIP sensor to changes in concentration of creatinine (blue) and creatine (red) from 100 µM to 2000 µM. ............................................................ 103

xii
Figure 5.11 – Response of MIP sensor to changes in concentration of creatinine (blue) and creatine (red) from 100µM to 2000 µM. ............................................................. 104
Figure 5.12 – NIP (diamond) and metronidazole-MIP (square) capacitive changes to additions of metronidazole (blue) and imidazole (red)............................................... 105
Figure 5.13 – Bode plot of thiol (Blue) and MIP (Red) coated electrodes (impedance – square, phase – diamond) created using the improved self assembly procedure. ........ 108
Figure 5.14 – Example response to 100 µM additions of creatinine to three-electrodes prepared using the original protocol with initial capacitances of 500 nF (blue), 293 nF (red) and 119 nF (green). .......................................................................................... 109
Figure 5.15 – Illustration of capacitive device with the selective layer modelled as a Randles cell. ............................................................................................................. 110
Figure 5.16 – Illustration of capacitive device produced using a thiol insulating layer to anchor a thin polymer film. θ is the percentage of the surface (covered with polymer) which affects the capacitance. This is dependent on polymer coverage and porosity.. 112
Figure 6.1 – Schematic of dithiocarbamate polymerisation........................................ 116
Figure 6.2 – Proposed NPEDMA electropolymerisation, based on the electropolymerisation of diphenylamine-4-sulphonic acid Wen, 2002 #470........... 119
Figure 6.3 – Experimental setup for iniferter attachment and polymer grafting.......... 121
Figure 6.4 – Cyclic voltammetric scans of NPEDMA being electropolymerised (50 mV s-1). Consecutive cyclic scans 1 (blue), 2 (red), 3 (green) and 15 (purple). ... 123
Figure 6.5 – CV of MIP coated electrodes polymerised at a distance of 1 cm from light source for 5 minutes (blue), 10 minutes (green) and 30 minutes (red)........................ 124
Figure 6.6 – Bode plot of MIP (blue) polymerised for 10 minutes at a distance of 1 cm, NPEDMA (green) and bare (red) gold electrodes in PBS (pH 7.5). ........................... 124
Figure 6.7 – Nyquist plot of MIP (blue) polymerised for 10 minutes at a distance of 1 cm, NPEDMA (green) and bare (red) gold electrodes in PBS (pH 7.5)................... 125
Figure 6.8 – CV of MIP coated electrodes polymerised for a period of 10 minutes at a distance of 3 cm (blue), 2 cm (green) and 1 cm (red)................................................. 125
Figure 6.9 – CV of MIP coated electrodes polymerised at a distance of 3 cm for of period of 1 minute (blue), 3 minutes (green) and 10 minutes (red)............................. 126
Figure 6.10 – Capacitive step response of a NIP electrode, polymerised for 10 minutes at a distance of 3 cm to additions of creatinine (3 x 200 µL, 3 x 500 µL and 3 x 1000 µL). The resulting calibration curve is shown in Figure 6.12. ................................... 128
Figure 6.11 – Capacitive step response of a MIP electrode, polymerised for 10 minutes at a distance of 1 cm to additions of propofol (3 x 200 µL, 3 x 500 µL and 3 x 1000 µL). The resulting calibration curve is shown in Figure 6.13............................................. 129
Figure 6.12 – Calibration curves of capacitive NIP (red) and MIP (blue) electrodes in creatinine (square) and creatine (diamond). The NIP and MIP electrodes were polymerised for 10 minutes at a distance of 3 cm. ..................................................... 129

xiii
Figure 6.13 – Calibration curves of capacitive NPEDMA (green), NIP (red) and MIP (blue) electrodes. The NIP and MIP electrodes were polymerised for 10 minutes at a distance of 1 cm. ....................................................................................................... 130
Figure 6.14 – Cyclic voltammogram performed in 50% PBS (pH 7.5) and 50% methanol (blue) and with 5 mM propofol, scans 1 (red), 5 (green), 10 (blue) and 15 (purple). .................................................................................................................... 132
Figure 6.15 – Chart showing the peak oxidation potential of propofol (5 mM) with background subtraction. The potential from the first (red and blue) and fifteen scan (yellow and green) is shown for different electrolytic conditions (HClO4 or PBS) containing 50% methanol (red and yellow) or 50% acetonitrile (blue and green)....... 133
Figure 6.16 – Chart showing the oxidation current of propofol (5 mM) at the peak oxidation current with background subtraction. The current from the first scan is shown for different electrolytic conditions (HClO4 or PBS) containing either 50% methanol (yellow) or 50% acetonitrile (red). ............................................................................ 133
Figure 6.17 – Square wave voltammetry of propofol in 50% ACN and 50% PBS (pH 7.5). Arrow indicates increasing concentrations of propofol (0, 50, 100, 500, 1000, 5000 µM).................................................................................................................. 134
Figure 6.18 – Square wave voltammetry of propofol in 50% ACN and 50% of 55 mM HClO4 in deionised water. Arrows indicates increasing concentrations of propofol (0, 50, 100, 500, 1000, 5000 µM). .................................................................................. 135
Figure 6.19 – Calibration plot of peak response from SWV of propofol in PBS (blue) at pH 7.5 and HClO4 (red) on bare gold electrodes........................................................ 135
Figure 6.20 – Square wave voltammetry of gold electrode in 10 mM KFe(CN)6 before (red) and after the oxidation of 1 mM propofol by cyclic voltammetry in 55 mM HClO4 with varying amounts of acetonitrile (blue). The arrow indicates increasing concentrations of acetonitrile from 10 to 50 %. ......................................................... 136
Figure 6.21 – Square wave voltammetry of gold electrode in 10 mM KFe(CN)6 before (red) and after the oxidation of 1 mM propofol by cyclic voltammetry in PBS (pH 7.5) with varying amounts of acetonitrile (blue). The arrow indicates increasing concentrations of acetonitrile from 10 to 50 %. ......................................................... 137
Figure 6.22 – Cyclic voltammetry (scan no. 1 of 15) of 1 mM propofol in 55 mM HClO4 with 10% (blue), 20% (red), 30% (green), 40% (purple) and 50% (light blue) acetonitrile. ............................................................................................................... 138
Figure 6.23 – Cyclic voltammetry (scan no. 15) of 1 mM propofol in 55 mM HClO4 with 10% (blue), 20% (red), 30% (green), 40% (purple) and 50% (light blue) acetonitrile. ............................................................................................................... 138
Figure 6.24 – Chart showing the peak oxidation potential of propofol (5 mM) with background subtraction. The potential from the first (red) and last scan (yellow) is shown for different electrolytic conditions (HClO4 or PBS) containing 50% acetonitrile.................................................................................................................................. 139
Figure 6.25 – Chart showing the oxidation current of propofol (5 mM) at the peak oxidation current with background subtraction of a NPEDMA coated electrode. The

xiv
peak current from the first scan is shown for different electrolytic conditions (HClO4 or PBS) containing 50% acetonitrile.............................................................................. 139
Figure 6.26 – Difference in currents between square wave voltammograms of bare gold electrode (blue) and NPEDMA coated electrode (red) with and without 1 mM propofol in PBS (PH 7.5) with 10% acetonitrile. ..................................................................... 140
Figure 6.27 – Cyclic voltammetry of 5 mM propofol in 50% acetonitrile and 50% deionised water with 25 mM HClO4. The first scan is shown in red. ........................ 141
Figure 6.28 – Schematic of experimental setup using a custom flow cell for the amperometric detection of propofol. ......................................................................... 144
Figure 6.29 – Amperometric response the bare gold electrodes at 522 mV to porpofol. Additions of 47.62, 43.29, 20.20, 9.77, 3.85, 1.91, 0.95 µM propofol were made. ..... 144
Figure 6.30 – Amperometric response of NPEDMA coated electrodes at 522 mV to porpofol. Additions of 1.25, 1.25, 2.48, 2.48, 4.90, 4.85, 11.93, 11.64, 22.46, 21.44, 40.06 µM propofol were made. ................................................................................. 145
Figure 6.31 – Amperometric response of MIP coated electrodes to various additions of propofol with resulting concentrations of 1.25, 1.25, 2.48, 2.48, 4.90, 4.85, 11.93, 11.64, 22.46, 21.44, 40.06, 36.70 µM. The MIP layers were polymerised at a distance of 1 cm for 10 (blue), 5 (red) and 3 (green) minutes. .............................................................. 145
Figure 6.32 – Amperometric response of MIP coated electrodes, polymerised for 1 minute at a distance of 1 cm, to various additions of propofol resulting in a concentration of 1.25, 1.25, 2.48, 2.48, 4.90, 4.85, 11.93, 11.64, 22.46, 21.44, 40.06, 36.70 µM. ................................................................................................................. 146
Figure 6.33 – Calibration plot of amperometric response of NIP (blue) and MIP (red) electrodes to injections of propofol in PBS (pH 7.5) with 10% acetonitrile. The polymers layer were prepared at a distance of 3 cm for 1 (square), 2 (diamond) and 3 (triangle) minutes. The arrow indicates increasing polymerisation times. ................. 147
Figure 6.34 – Amperometric response of MIP (blue) and NIP (red) electrodes polymerised for 3 minutes to injections of propofol (5 µM, 10 µM, 25 µM, 50 µM and 100 µM).................................................................................................................... 147
Figure 6.35 – Amperometric response of MIP (blue) and NIP (red) electrodes polymerised for 1 minute to injections of propofol (5 µM, 10 µM, 25 µM, 50 µM and 100 µM).................................................................................................................... 148
Figure 6.36 – Calibration plot of amperometric response to NIP coated electrodes with a flow rate of 7 µLs-1. Polymerised for 1 minute (blue) and 3 minutes (red) at a distance of 3 cm (square), 5 cm (diamond) and 10 cm (triangle). ............................................ 148
Figure 6.37 – Calibration plot of amperometric response to MIP coated electrodes with a flow rate of 7 µLs-1. Polymerised for 1 minute (green), 2 minutes (red) and 3 minutes (blue) at a distance of 3 cm (square), 5 cm (diamond) and 10 cm (triangle). The arrow shows increasing UV exposure.................................................................................. 149
Figure 6.38 – Calibration plot of amperometric response of ascorbic acid injections at 7 µLs-1 on MIP (blue) and NIP (red) electrodes polymerised for 1 minute at a distance of 3 cm...................................................................................................................... 150

xv
Figure 6.39 – Calibration plot of amperometric response of ascorbic acid injections at 7 µLs-1 on MIP (blue) and NIP (red) electrodes polymerised for 3 minutes at a distance of 3 cm...................................................................................................................... 150

xvi
Notation
AC Alternating current
AFM Atomic force microscopy
AMPSA 2-acrylamido-2-methyl-1-propanesulphonic acid
ANN Artificial neural networks
APTES Aminopropyltriethoxysilane
ATES Allyltriethoxysilane
CV Cyclic voltammetry
DEAEM Diethylamino ethylmethacrylate
DMF Dimethylformamide
DPV Differential pulse voltammetry
ECE Electrochemical-chemical-electrochemical (reaction)
EGDMA Ethleneglycol dimethacrylate
HCl Hydrochloric acid
HClO4 Perchloric acid
HF Hydrofluoric acid
IDE Inter-digitated electrode
IgG Immunoglobulins
ISFET Ion-sensitive field effect transistor
MIP Molecularly imprinted polymer
MS Mass spectroscopy
NaOH Sodium hydroxide
NIP Non-imprinted polymer

xvii
NO Nitric oxide
PBS Phosphate buffer saline
PCO2 Partial pressure of carbon dioxide
PLS Partial least squares
PO2 Partial pressure of oxygen
SAM Self-assembled monolayer
SPE Solid phase extraction
SWV Square wave voltammetry
UV Ultra violet

1
Chapter 1 - Introduction
“Science may set limits to knowledge, but should not set limits to imagination.”
Bertrand Russell (1872 - 1970)
The aim of this thesis is to investigate the possibility of developing a sensing device
based on molecularly imprinted technology for the selective detection of clinically
relevant analytes. The development of a real-time microchip-based sensing device
produced by Sphere Medical (Cambridge, UK) served as the transducer platform for
this investigation. The sensor chip is based on Sphere’s Proxima system and is
primarily an electrochemical platform which can currently monitor glucose, pH, pO2,
pCO2, K+, Ca2+, Na2+, haematocrit and lactate using potentiometric, amperometric or
conductometric techniques.
Molecularly imprinted polymers (MIP) have selective properties for a chosen analyte
which is present when the MIP is formed. The removal of the analyte after
polymerisation results in a cross-linked matrix with cavities which have steric and
functional selectivity for the particular analyte employed. By incorporating a MIP onto
Sphere’s electrochemical sensor chip, the range of analytes which can be detected by
the Proxima system could potentially be increased.
Thus, this thesis seeks to investigate: firstly, the development of MIPs for the selective
detection of therapeutic substances; secondly, the immobilisation of MIPs onto
transducer surfaces; thirdly, the detection of target analytes with MIP functionalised
sensors. Finally, the thesis plans to propose a universal methodology which can act as a
platform for the production of MIP-based devices.
The abovementioned aims are addressed in this thesis in the following manner: Firstly,
a review of the current technology and devices being developed for monitoring clinical
parameters was conducted and is outlined in Chapter 2. Secondly, an initial
investigation into the conductive detection of propofol was performed, with the aim of
developing knowledge and skills in MIP sensor development, the results of which
Introduction 2
comprise Chapter 3. Thirdly, an antibiotic was selected and a computationally designed
MIP for the selective detection of this antibiotic was produced and tested. Following
this development the MIP was immobilised onto a sensor platform and the detection of
the antibiotic was investigated: the outcomes of this testing is described in Chapter 4. In
addition, an examination of previously published methodologies for the capacitive
detection of creatinine-based MIP were investigated and optimised, the outcomes of
which are recorded in Chapter 5. In Chapter 6, new innovative materials (Lakshmi et
al., 2009a, Lakshmi et al., 2009b) were employed in the immobilisation and growth of a
MIP for the detection of propofol. In the final chapter of this thesis, conclusions are
drawn on the aforementioned investigations and possible further work is proposed.

3
Chapter 2 - Review of clinical sensing devices and their
technology
“In science the credit goes to the man who convinces the world, not the man to whom
the idea first occurs.” Sir Francis Darwin (1848 - 1925), Eugenics Review, April 1914
2.1 Introduction
This chapter aims to review clinical sensors, the difficulties which are currently faced in
their development and the technologies being used to overcome these difficulties.
2.2 Sensors for clinical analysis
To assist healthcare professionals in effectively managing therapy and to optimise
patient outcomes in a hospital, the monitoring of patients’ clinical parameters is
essential. Currently, chemical parameters and therapeutic drug concentrations are
monitored via blood samples which are assessed in a dedicated laboratory (Hillberg et
al., 2005), a procedure which is both time-consuming and logistically demanding. In
addition, as the administration of therapeutic drugs is based on the average dose, taking
into consideration the mass of the patient, this does not account for variations in a
patients drug absorption, distribution, metabolism or elimination.
A bedside patient monitoring system capable of taking real time measurements of a
patients’ critical chemical parameters would be more ideal. Especially if this
monitoring system was capable of automatically administrating the appropriate
therapeutic substances in the required concentrations. The real time monitoring of
therapeutic drugs is considered to be very important because if the concentration of the
drug is not within the therapeutic window it could have no effect or may even cause
harm to a patient.
In-vivo sensors are being developed to measure parameters within intra-cellular, tissue,
intra vascular, surface skin and gastrointestinal environments (Rolfe, 1988). However,

Sensors for clinical analysis 4
there are still several challenges which hold back this technology. Two of these main
challenges are; i) the stringent quality control required to ensure that any device
produced is suitable for a clinical environment and ii) the biocompatibility of
monitoring biological fluids, where, for example, the device must not be toxic, induce
adverse side effects (i.e. inflammation) or suffer from severe biofouling.
The position of an implanted device on a patient has several inherent challenges which
can have a large impact on the resulting performance of the sensor (Frost and
Meyerhoff, 2002). For example, in intravascular devices if proteins in the blood adsorb
on the surface of the device, this can lead to the adhesion and activation of platelets
(Figure 2.1a) which are highly metabolic and can then alter the localised concentrations
of administered drugs around the sensor. Localised concentrations can also be caused
by the ‘wall effect’ (Figure 2.1b) due to the device touching the endothelial cells on a
blood vessel’s wall. Platelet adhesion, the wall effect and constricted blood flow can
occur in the case of vasoconstriction (Figure 2.1c) where the vessel contracts around the
device, however this is usually due to inflammation. Inflammatory responses also occur
with subcutaneously implanted devices, which leads to mass transport problems and
then, consequently, the device provides wrong readings.
Figure 2.1 – Illustration of complications occurring from the positioning of implanted
clinical devices, a) Platelet adhesion, b) the ‘wall effect’ and c) vasoconstriction. (Frost and
Meyerhoff, 2002).

Sensors for clinical analysis 5
There are numerous strategies that have been investigated to reduce biofouling, several
of which were reviewed by Wisniewski and Reichert (Wisniewski and Reichert, 2000).
One of these strategies is the use of hydrogels like poly(hydroxyethyl methacrylate)
(polyHEMA) and poly(ethylene glycol) (PEG) (Singh et al., 2007), where the
hydrophilic nature of the material is used to reduce protein adsorption and,
consequently, cell adhesion. Other strategies include the use of phosphorylcholine
mimics, which mimic the outer lipid layer of cell membranes. This has been shown by
Yang and co-workers to reduce biofouling for the detection of glucose in blood (Yang
et al., 2000) and reduce the fouling of marine bacteria in the optical detection of oxygen,
as illustrated by Navarro-Villoslada and co-workers (Navarro-Villoslada et al., 2001).
The slow release of anti-fouling agents, such as nitric oxide (NO), has demonstrated a
reduction in platelet aggregation and vasoconstriction (Zhang et al., 2002). Espadas-
Torre and co-workers (Espadas-Torre et al., 1997) sandwiched a NO releasing polymer
between two ion-selective membranes to measure H+ and K+ and Schoenfisch and co-
workers (Schoenfisch et al., 2000) dip coated silicone tubing in NO releasing polymer
used for the detection of pO2. Both of these devices showed a significant reduction in
biofouling.
External devices also allow for more complex separation. For example, in in-vitro
testing where biofouling complications can be overcome by separating the sample
before analysis (Hillberg et al., 2005). External in-situ monitoring devices avoid the
complications of vasoconstriction and also reduce platelet adhesion and the wall effect,
as they are more accessible for cleaning, regeneration and calibration purposes. This
can reduce the effects of biofouling which helps to ensure the sensitivity of the device
and allow adjustment for possible drift.
Microdialysis catheters have been developed for separation and external in-situ
detection. Examples of microdialysis can be seen in Cooney and co-workers’ research
where they utilised a membrane to separate CO2 from a blood reservoir; the dialysate
was then mixed with a reagent and used for the optical monitoring of this gas with an
accuracy of 2 mmHg with a 2 minute response time (Cooney and Towe, 1997). Cooney
and co-workers later combined this technology with a pH sensor in a dual concentric-
flow microdialysis approach (Cooney and Towe, 2000). This measured pH and pCO2
with accuracies of +/- 0.01 pH units (from pH 7.02 – 7.87) and +/- 1.5 mmHg (from 0-

Sensors for clinical analysis 6
80 mmHg), respectively. The design of a generic microdialysis device which
incorporated electropolymerised membranes has been seen by Rhemrev and co-workers
(Rhemrev-Boom et al., 2001), and the study of microdialysis for glucose detection in
both healthy (Wientjes et al., 1998) and type 1 (Lutgers et al., 2000) diabetic subjects
has been reported by Lutgers and Wientjes.
Once a selective sensor with an acceptable level of biofouling has been successfully
produced, assurance needs to be provided for the device to be sterile, non-toxic, blood
compatible and robust in order for it to conform to the required standards for operation
in a clinical environment. One commercial example is the external in-situ blood gas
and electrolyte monitor which was produced by VIA Medical (Skoog, 2000). This
device incorporates conductivity detection for hematocrit, a Clark voltammetric sensor
for pO2 determination, and the other analytes are detected using potentiometry
combined with ion-selective membranes (a summary of these analytes can be seen in
Table 2.1). It operates by drawing blood over the sensors, monitoring the parameters at
37 oC and putting the blood back into the patient while calibrating with an isotonic
solution.
Table 2.1 – Summary of VIA Medical’s blood gas and electrolyte monitoring systems
analytes. Including the analyte range and sensitivity.(Skoog, 2000)
Analyte Range Sensitivity
pO2 20-699 mm Hg 1 mm Hg
pCO2 10-99 mm Hg 1 mm Hg
Na+ 80-190 mM 1 mM
K+ 0.2-9.9 mM 0.1 mM
10-20 mM 1 mM
Ca2+ 0.2-4.25 mM 0.01 mM
pH 6.80-7.70 0.01
Hematocrit 12-70% 1%

Targets 7
Commercial examples of in-vivo testing can be seen with Diametrics Medical’s
Paratrend 7 (Myles et al., 1999) and Neurotrend (Henze et al., 2004). The Paratrend 7
and Neurotrend both measure pO2, pCO2 and pH using optodes based on the florescence
or light absorption of reactive dyes where membranes are utilised for selective
recognition. The surrounding temperature is also measured using a thermocouple. The
Paratrend 7 is an intravascular device designed to be used in a critical care environment
when fast changes in blood gas levels are anticipated or for use over prolonged periods
of time while attaining a large quantity of data on critically ill patients (Ganter et al.,
2004). The Neurotrend is designed to take measurements within the cerebral tissue to
asses the degree and progression of brain injuries.
The knowledge of a patient’s clinical parameters could potentially significantly improve
patient outcomes in a critical care environment. These clinical parameters can be
feasibly attained in near real time by both in-vivo and in-situ devices. However, an in-
situ device that is situated outside the patient allows for easier cleaning, calibration and
replacement, therefore overcoming some of the inherent challenges, for example
biofouling, that occur from measuring analytes in biological media like blood.
2.3 Targets
To improve critical care, the knowledge of concentrations and variations in a patient’s
critical parameters is vital as this will allow clinicians to administer the appropriate
treatment when it is required. These critical parameters can be divided into three
categories, blood gases, electrolytes and metabolites, examples of these parameters and
their normal clinical concentrations can be seen in Table 2.2.
Targets 8
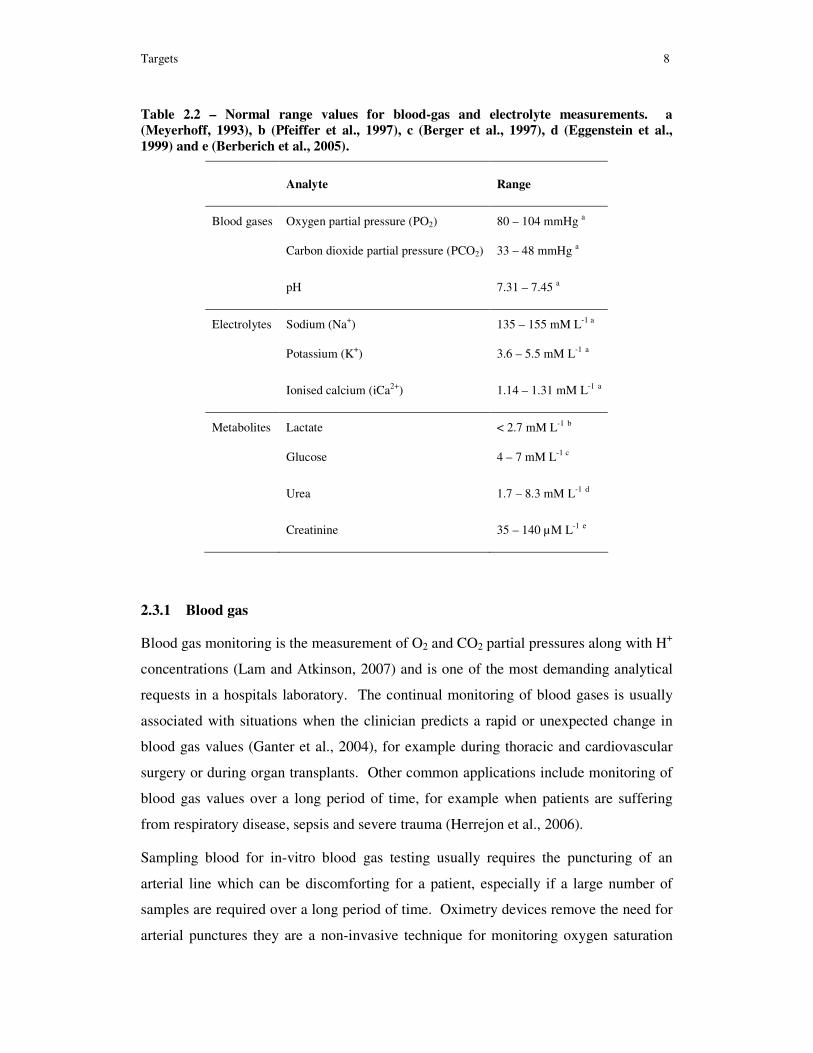
Table 2.2 – Normal range values for blood-gas and electrolyte measurements. a
(Meyerhoff, 1993), b (Pfeiffer et al., 1997), c (Berger et al., 1997), d (Eggenstein et al.,
1999) and e (Berberich et al., 2005).
Analyte Range
Blood gases Oxygen partial pressure (PO2) 80 – 104 mmHg a
Carbon dioxide partial pressure (PCO2) 33 – 48 mmHg a
pH 7.31 – 7.45 a
Electrolytes Sodium (Na+) 135 – 155 mM L-1 a
Potassium (K+) 3.6 – 5.5 mM L-1 a
Ionised calcium (iCa2+) 1.14 – 1.31 mM L-1 a
Metabolites Lactate < 2.7 mM L-1 b
Glucose 4 – 7 mM L-1 c
Urea 1.7 – 8.3 mM L-1 d
Creatinine 35 – 140 µM L-1 e
2.3.1 Blood gas
Blood gas monitoring is the measurement of O2 and CO2 partial pressures along with H+
concentrations (Lam and Atkinson, 2007) and is one of the most demanding analytical
requests in a hospitals laboratory. The continual monitoring of blood gases is usually
associated with situations when the clinician predicts a rapid or unexpected change in
blood gas values (Ganter et al., 2004), for example during thoracic and cardiovascular
surgery or during organ transplants. Other common applications include monitoring of
blood gas values over a long period of time, for example when patients are suffering
from respiratory disease, sepsis and severe trauma (Herrejon et al., 2006).
Sampling blood for in-vitro blood gas testing usually requires the puncturing of an
arterial line which can be discomforting for a patient, especially if a large number of
samples are required over a long period of time. Oximetry devices remove the need for
arterial punctures they are a non-invasive technique for monitoring oxygen saturation

Targets 9
and pressure. Oximetry works by monitoring two different wavelengths which change
in absorbance resulting from variations in the oxygenated and deoxygenated
haemoglobin within the arterial line. Oximetry devices can measure arterial oxygen
saturation within an acceptable sensitivity for medical applications. However, the
difference between oxygen pressure measured using oximetry and the true value is not
accurate enough for medical application (Herrejon et al., 2006).
Transcutaneous devices offer a possible alternative to monitor oxygen pressure at an
acceptable sensitivity. Examples of transcutaneous devices are disposable carbon paste
electrodes produced by Lam and co-workers (Lam and Atkinson, 2007) for monitoring
the partial pressure of oxygen. They measured the oxygen by heating the skin to aid
diffusion of the gases in the blood and then amperometrically reduced the oxygen.
They investigated two different working electrodes, one based on KNO3 and the other
on Nafion, with sensitivities of 33 nA/mmHg and 25 nA/mmHg respectively. Iguchi
and co-workers (Iguchi et al., 2005) constructed an oxygen sensor from non-permeable
and gas-permeable membranes which encased KCl on Pt and Ag/AgCl electrodes. The
device was designed to measure oxygen from the conjunctiva; hence it was very thin
(width 3 mm, thickness 84 µm). It also eradicated skin rashes and skin burns which are
caused by traditional transcutaneous devices due to the adhesion and heating of the
device. It had a 45 second response time with a 0.01-8 mg/L sensitivity range and was
considered stable enough for PO 2 measurements.
The Paratrend 7 (Ganter et al., 2004, Myles et al., 1999, Hwang et al., 2005) and
Neurotrend (Henze et al., 2004, Codman., 2001) are commercial devices for measuring
pH and the partial pressure of oxygen and carbon dioxide. They have been shown to
provide data in excellent agreement with laboratory blood gas analysers and their
mechanisms of operation are described in Section 2.2. However, they are in-situ
devices therefore arterial puncturing is necessary to attain the blood sample.
2.3.2 Electrolytes
The vital electrolytes in blood that are considered to be useful for patient care are K+,
Na+ and Ca2+. These electrolytes are often monitored for intensive care patients and
patients undergoing cardiac surgery and renal dialysis (Gumbrecht et al., 1990).
Traditionally, sensors for such electrolytes use selective glass membranes. However,

Targets 10
these devices are hard to miniaturise for use in arterial lines and arterial line catheters.
Possible alternatives are silicon based potentiometric sensors, ISFETs and optodes,
which have become increasingly popular in recent years.
The miniaturisation of silicon based ion-selective sensors has been hindered due to the
lack of a decent reference electrode (Yoon et al., 2000). However, liquid-free reference
electrodes, which are generally constructed using PVC membranes doped with
electroactive components, have shown promise. Heng and co-workers (Heng and Hall,
2001) produced a photocured membrane on a Ag/AgCl electrode for the detection of
Na+ and K+. These sensors demonstrated potentiometric behaviour comparable to PVC
based ion-selective membrane devices. Scheipers and co-workers (Scheipers et al.,
2001) also produced a liquid-free silicon-based sensor which they used to
simultaneously monitor K+, Na+ and pH in human blood using three integrated sensors
on one chip. The correlation between the sensor and a clinical electrolyte analyser
demonstrated a linear regression of 0.9977 for the K+ measurements.
ISFETs are an attractive platform for electrolyte detection and they lend themselves to
the biosensor market as they can be easily miniaturised and mass produced (Lee et al.,
2000). However, ISFETs tend to have problems with the poor stability of their
reference electrode and drift. Gumbrecht and co-workers (Gumbrecht et al., 1990)
created an ISFET sensor system that utilised an ISFET as the reference, this was
achieved by using the calibration solution as a salt bridge. The system had a 2 minute
calibration time, a 30 second response time and a drift of 0.05 mV/h for the first
200 hours. Also, it did not suffer from clotting problems due to the simple arrangement
of the apparatus.
2.3.3 Metabolites
There are four main metabolites that are of clinical interest: these are lactate, glucose,
urea and creatinine. Each of these metabolites can provide a clinician with initial
information about the health of the patient and thus improve the quality of patient care
and recovery. The mechanism of detecting these metabolites in a sensor format is
generally achieved by using enzymes to produce a detectable compound which has a
concentration related to the concentration of the metabolite. Examples of these
enzymes and their reactions as used by Suzuki and co-workers are shown in Table 2.3.
Targets 11
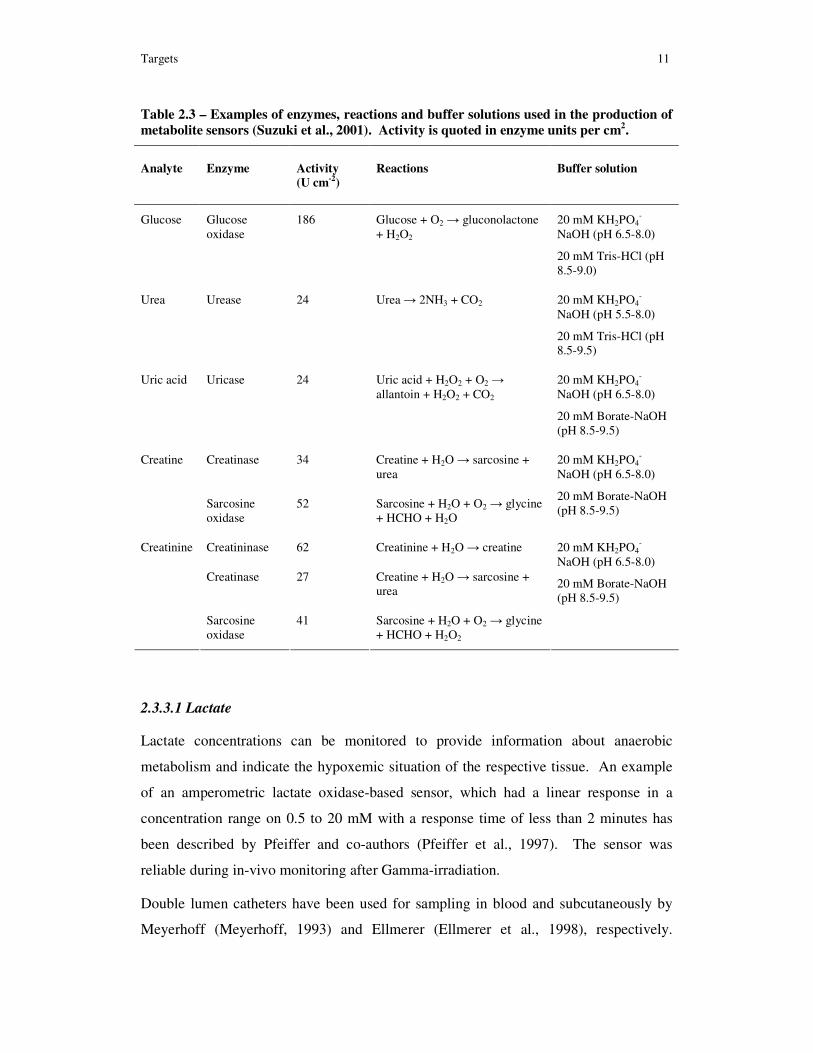
Table 2.3 – Examples of enzymes, reactions and buffer solutions used in the production of
metabolite sensors (Suzuki et al., 2001). Activity is quoted in enzyme units per cm2.
Analyte Enzyme Activity
(U cm-2)
Reactions Buffer solution
Glucose Glucose oxidase
186 Glucose + O2 → gluconolactone + H2O2
20 mM KH2PO4-
NaOH (pH 6.5-8.0)
20 mM Tris-HCl (pH 8.5-9.0)
Urea Urease 24 Urea → 2NH3 + CO2 20 mM KH2PO4-
NaOH (pH 5.5-8.0)
20 mM Tris-HCl (pH 8.5-9.5)
Uric acid Uricase 24 Uric acid + H2O2 + O2 → allantoin + H2O2 + CO2
20 mM KH2PO4-
NaOH (pH 6.5-8.0)
20 mM Borate-NaOH (pH 8.5-9.5)
Creatinase 34 Creatine + H2O → sarcosine + urea
Creatine
Sarcosine oxidase
52 Sarcosine + H2O + O2 → glycine + HCHO + H2O
20 mM KH2PO4-
NaOH (pH 6.5-8.0)
20 mM Borate-NaOH (pH 8.5-9.5)
Creatininase 62 Creatinine + H2O → creatine
Creatinase 27 Creatine + H2O → sarcosine + urea
Creatinine
Sarcosine oxidase
41 Sarcosine + H2O + O2 → glycine + HCHO + H2O2
20 mM KH2PO4-
NaOH (pH 6.5-8.0)
20 mM Borate-NaOH (pH 8.5-9.5)
2.3.3.1 Lactate
Lactate concentrations can be monitored to provide information about anaerobic
metabolism and indicate the hypoxemic situation of the respective tissue. An example
of an amperometric lactate oxidase-based sensor, which had a linear response in a
concentration range on 0.5 to 20 mM with a response time of less than 2 minutes has
been described by Pfeiffer and co-authors (Pfeiffer et al., 1997). The sensor was
reliable during in-vivo monitoring after Gamma-irradiation.
Double lumen catheters have been used for sampling in blood and subcutaneously by
Meyerhoff (Meyerhoff, 1993) and Ellmerer (Ellmerer et al., 1998), respectively.

Targets 12
Meyerhoff’s device had a linear range of 0 and 15 mM with a peak response of
2.2 minutes in blood, but it also had a 4 minute lag time. Hence, it only gave an
estimation of blood lactate, which in turn can give an insight into lactate metabolism.
Ellmerer’s subcutaneous device demonstrated a good correlation when the test subject
was at rest, however when measurements were taken during exercise, the correlation
between the sensor and blood was very poor. This was explained by the measurements
only showing the local concentrations to the device, hence there was no direct
correlation with the lactate levels in blood.
A comparison of double lumen and heparin-coated catheters was conducted by Gfrerer
and co-workers (Gfrerer et al., 1998) who tested their devices during exercise and had a
linear response up to 25 mM with a 95% response in less than 30 seconds. The double
lumen catheter had a correlation coefficient between 0.93 and 0.98 (standard deviation
1.47 mM) whereas the heparin-coated catheter had a correlation coefficient between
0.94 and 0.99 (standard deviation 0.88 mM). Thus, the heparin catheter performed
better and the system was safer and easier to use as it avoids complications in handling
heparin-saline solutions.
2.3.3.2 Glucose
There are significant developments of glucose sensors due to the growing commercial
opportunities. As a result there have been many approaches proposed for glucose
monitoring, for example implanted electrochemical devices, subcutaneous interstitial
fluid microdialysis, capillary filtrate and the transdermal collection of glucose
(Gerritsen et al., 1999). Subcutaneous devices allow good accessibility and are easily
replaced, although they tend to suffer from significant drift. Monitoring the interstitial
fluid also has the advantage of a lower protein concentration when compared to blood.
Interstitial fluid also has a very similar composition to plasma for electrolytes and small
solutes, hence accurate glucose concentration can be attained.
To improve on the presently available glucose monitoring system for diabetics, Kaimori
and co-workers (Kaimori et al., 2006) produced a glucose sensor chip with the world’s
smallest sample volume (200 nL), thus making the lancing less painful. This reduction
in sample volume was achieved by reducing the cavity thickness of the chip sensor to
approximately 50 µM by using adhesive ink. However, the reduction in cavity

Targets 13
thickness requires a high production tolerance as a change in thickness of 4µm was
equivalent to a 5% reduction in current. Despite this, the sensor demonstrated good
performance with a correlation coefficient of 0.98 in blood glucose with a range of 60 to
493 mg dL-1.
As the accuracy and durability of the enzyme glucose devices is well proven in in-vitro,
most of the current development is to optimise a device for long term in-vivo operation.
Woderer (Woderer et al., 2007) and co-workers tested a glucose device consisting of a
sensor foil with a carbon paste glucose oxidase electrode and a Ag/AgCl reference
electrode for amperometric monitoring. Their sensor had a high sensitivity
(0.35 nA mg-1 dL-1) with a 60 second response time: it operated with a single calibration
and showed a good correlation for normal and hypoglycaemic glucose levels. The
hyperglycaemic measurements reflected the blood glucose apart from when the change
in glucose level was very rapid.
2.3.3.3 Urea
The urea cycle is a vital metabolic cycle in humans as it neutralises toxic ammonium
waste products. Thus, the monitoring of blood urea can be used as an indicator of renal
function and liver disease. Currently, most of the urea monitoring devices measure
NH4+ after an enzymatic reaction with urease (Miyahara et al., 1991). Moreover,
monitoring in blood is complicated due to high ionic strength, strong buffering capacity
and high protein concentrations.
The resulting production of NH4+ after the enzymatic reaction of urea with urease
causes local pH changes around the active area of the sensor: these changes in pH are
ideally detected using ISFET technology. Boubriak and co-workers (Boubriak et al.,
1995) used a silicon chip ISFET with an ISFET reference to monitor changes in pH as a
result of the presence of urea. The device had a response time of 1-3 minutes depending
on membrane thickness and a linear response of up to 2 mM. However, the high protein
content in the test serum decreased the response, but it was subsequently found that a
twenty-five fold dilution of the serum produced more reliable measurements. There
was still a high interference from alkali metals in the sample as it was found that
200 mM of NaCl caused a 50% fall in sensor output.

Targets 14
Potentiometry is another alternative method of detecting NH4+ and thus urea. Devices
based on this approach rely on ion selective membranes to separate interfering
substances from the sensor surface. However, Na+ and K+ are not separated in most
NH4+ membranes, as seen with Eggenstien and co-workers’ disposable double matrix
membrane (Eggenstein et al., 1999). Vel Krawczyk and co-workers (vel Krawczyk et
al., 1994) addressed this problem by using an outer hydrophobic gas permeable
membrane and a three-electrode setup during monitoring. With this setup urea
concentrations from 0.05 to 2 mM were monitored with a correlation coefficient of
0.9996 and a sensitivity of 53.3 mV/decade.
2.3.3.4 Creatinine
In the evaluation of muscle disorders and renal dysfunction monitoring the level of
creatinine has become increasing important in the development of patient care as it is
the product of creatine metabolism. The normal range of creatinine in blood is 35–
140 µM; however, if a patient is suffering from a muscle or a kidney disorder it can be
as high as 1 mM (Berberich et al., 2005).
A low cost disposable ISFET based device for the detection of creatinine was produced
by Sant and co-workers (Sant et al., 2004). The device was a pH-ISFET with a dip-
coated enzymatic membrane deposited on the surface, where the reaction of creatinine
deiminase with creatinine leads to creatinine’s hydrolysis and the production of NH3.
Variations in the NH3 levels alter the local pH which is thus related to the creatinine
concentration. A sensitivity of 30 mV/pCreatinine over a range of 10-100 µM was
demonstrated.
An elaborate three-enzyme creatinine sensor converts creatinine to H2O2 which can then
be amperometrically detected. However, these systems are considered to have
decreased sensitivity due to interference of creatine and the complicated sequence of the
three-enzymatic reactions. Berberich and co-workers (Berberich et al., 2005) developed
a three-enzyme sensor by immobilising enzymes in polyurethane membranes; this
immobilisation increased the enzyme half-life from 6 to 80 days. Unfortunately, these
devices displayed a large loss of activity when the enzymes were immobilised on the
sensor chip; this enzyme deactivation was attributed to silver ions from the reference
electrode.
Detection Methods 15
2.4 Detection Methods
There are various electrochemical techniques that can be used for the detection of
analytes, all of which have advantages and disadvantages which depend on the setup of
the electrochemical cell and the selective component within the device. The following
section outlines the fundamental electrochemical techniques and gives examples of how
they have been applied in the detection of therapeutic substances.
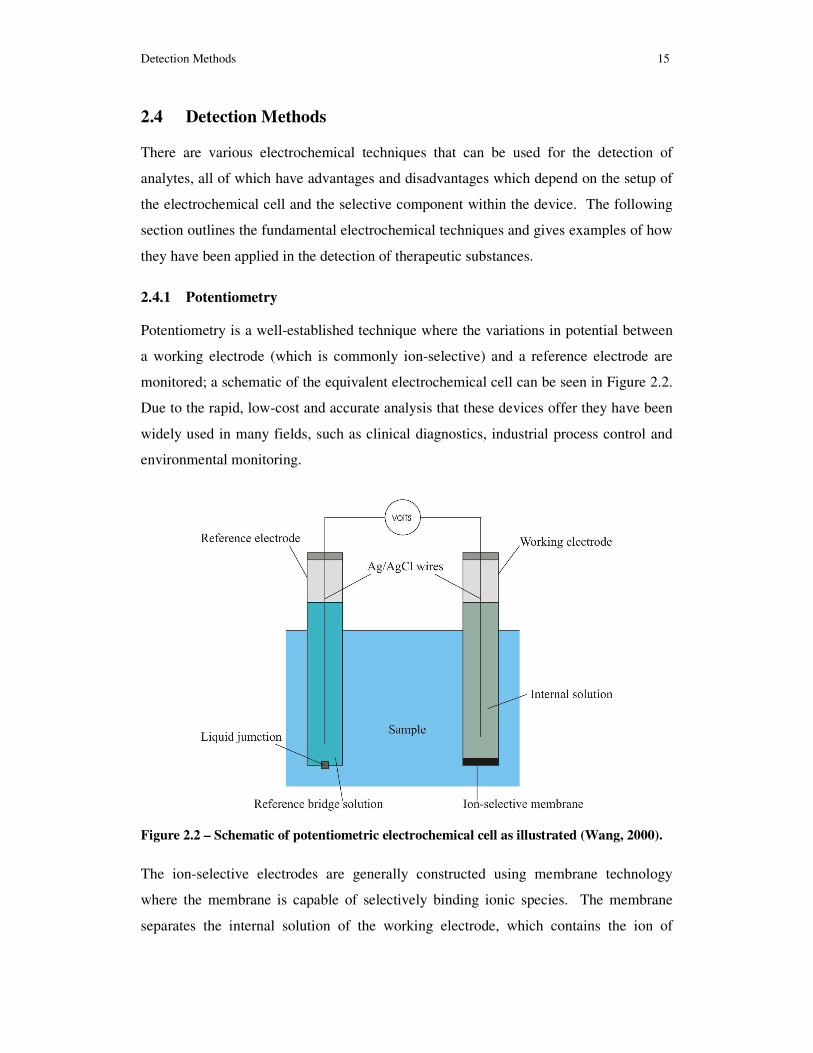
2.4.1 Potentiometry
Potentiometry is a well-established technique where the variations in potential between
a working electrode (which is commonly ion-selective) and a reference electrode are
monitored; a schematic of the equivalent electrochemical cell can be seen in Figure 2.2.
Due to the rapid, low-cost and accurate analysis that these devices offer they have been
widely used in many fields, such as clinical diagnostics, industrial process control and
environmental monitoring.
Figure 2.2 – Schematic of potentiometric electrochemical cell as illustrated (Wang, 2000).
The ion-selective electrodes are generally constructed using membrane technology
where the membrane is capable of selectively binding ionic species. The membrane
separates the internal solution of the working electrode, which contains the ion of

Detection Methods 16
interest at a constant activity, and the sample solution. Selective binding of the ionic
species causes an unequal distribution of the analyte across the membrane boundary and
thus creates a potential gradient (Wang, 2000). As the reference potential is fixed and
activity of the inner solution is constant, the cell potential monitored is proportional to
the activity of the ionic species in the sample. The main source of error with this system
are changes in the reference electrode junction potential, although this is usually
resolved by using an intermediate salt bridge.
The most common example of this traditional addroach is the pH electrode which is
predominantly based on a glass membrane. This is due to the extremely high selectivity
of the electrode for hydrogen ions, its broad response range, and its fast and stable
response. However, recent developments in wafer technology for sensor fabrication
(Schnakenberg et al., 1996) have increased the number of reported chip-based
potentiometric devices which are low-cost and reproducible in batch production.
Potentiometric devices can be incorporated into solid state devices and due to their
small size are ideal for sensor arrays. An example of such a device is the array
developed by Gutierrez and co-workers (Gutierrez et al., 2007) for the monitoring of
urea and alkaline ions (ammonium, potassium, sodium, hydrogen). The array consisted
of twelve individual potentiometric sensors with 7 different membranes coatings. The
data obtained from the array was analysed with artificial neural networks (ANN) and
partial least squares (PLS). Their ammonium transducer lasted for 20 days and the
ANN model was accurate with near unity slopes and a zero intercept. Other examples
of array devices are electronic tongues, an example of which is the tongue created by
Verrelli and co-workers (Verrelli et al., 2007) for identifying defects, fermentation
markers and the storage conditions of wine. They used PLS to analyse their data and
have demonstrated good stability and reproducibility of the device. A good correlation
of the markers H2S and SO2 at low concentrations and acetic acid at high concentrations
was also found.
2.4.2 Voltammetry
Cyclic voltammetry is a versatile and informative technique that can be used to obtain
qualitative information concerning electrochemical reactions. It can expose information
about the thermodynamics, kinetics of heterogeneous electron transfer, coupled

Detection Methods 17
chemical reactions and adsorption processes (Wang, 2000). However, it is rarely used
as a method of detection in a sensing device as other methods have greater advantages.
Nevertheless, it is an invaluable tool for locating the redox potentials of electroactive
species within a given media and thus helping to optimise and understand the principal
reactions of a device.
The technique works by monitoring the current resulting from a potential scan that
follows a triangular waveform. A peak in the monitored current is caused by the
formation of a diffusion layer near the electrode surface, this diffusion layer expands
with continual scanning. The current due to the redox reaction is directly proportional
to the surface concentration of the redox reactant and is proportional to the square root
of the scan rate.
A voltammetric technique which is useful for detection within a device is pulse
voltammetry. This technique is similar to cyclic voltammetry but a step or square signal
is superimposed on the normal linear voltammetric scan, which creates a pulse. The
short pulse duration results in a thinner diffusion layer, hence the faradic current
increases, and by monitoring the current shortly after the pulse the charging current is
close to zero. All this contributes to an increased ratio between the faradic and non-
faradic currents, thus sensitivity can be increased between 5 to 10 times when compared
to normal voltammetry.
An example of the voltammetry was demonstrated by Huang and co-workers (Huang et
al.) who used cyclic voltammetry to investigate the response of tyrosine at a modified
glassy carbon electrode. The cyclic voltammetry study showed an oxidation peak at -
640 mV with a linear response of between 100x10-9 to 50x10-6 mol/L, then using
differential pulse voltammetry (DPV) gained a detection limit of 80x10-9 mol/L.
Similar studies were performed by Shahrokhian and co-workers (Shahrokhian et al.,
2005) who investigated Captopril using carbon paste electrodes with an incorporated
cobalt mediator. In another work Ferancova and co-workers (Ferancova et al., 2001)
incorporated cyclcodextrains into carbon screen printed electrodes to detect tricyclic
antidepressants.

Detection Methods 18
2.4.3 Stripping Voltammetry
Stripping voltammetry essentially consists of two stages. In the first stage there is
deposition of the analyte on the electrode surface; this can be seen as a pre-
concentration. During the second stage, the pre-concentrated analyte is ‘stripped’ from
the electrode surface causing the measurable change. There are several versions of
stripping analysis depending on the nature of the aforementioned stages. These
methods are summarised in Table 2.4.
The use of stripping analysis is extremely useful for the detection of trace metals as it
can achieve favourable signal-to-noise ratios and pre-concentration factors of 100 to
1000. Detection limits when compared to voltammetric measurements can be lowered
by an order of 2 to 3 in magnitude (Wang, 2000). For the stripping of organic
compounds there are two strategies, either adsorptive or cathodic stripping, depending
on whether the analyte of interest has surface-active properties or is capable of forming
insoluble salts (see Table 2.4).
Stripping techniques have been used for the detection of several organic therapeutic
compounds, for example glucose (Ly and Kim, 2006), Ceftazidime (Ferreira et al.,
1997), Benzodiazepines (Hernandez et al., 1988), Cephalothin (Al-ghamdi et al., 2004)
and Prefloxacin (Beltagi, 2003). Ly and co-workers used stripping analysis for the
detection of glucose in drinking water and urine with correlation coefficients of 0.9822
and 0.9996, respectively (Ly and Kim, 2006). The detection of the other
aforementioned compounds was successfully achieved using stripping techniques in
various buffer solutions. However, when measurements were conducted in biological
fluids a pre-accumulation separation was required to remove interfering compounds
which would have otherwise accumulate onto the electrode surface.

Detection Methods 19
Table 2.4 – A summary of stripping analysis techniques (Wang, 2000).
Stripping Technique Analyte Accumulation Stripping
Anodic Stripping Voltammetry Metals Cathodic deposition (for mercury electrode) Mn+ + ne- + Hg → M(Hg)
Anodic scan (for mercury electrode) M(Hg) → Mn+ + ne- + Hg
Potentiometric Stripping Analysis Metals Cathodic deposition (for mercury electrode) Mn+ + ne- + Hg → M(Hg)
Oxidation (by oxidizing agent) M(Hg) + oxidant → Mn+
Adsorptive Stripping Voltammetry and Potentiometry
Metals (Surface-active complex)
Organic compounds (with surface active properties)
Formation and absorption of metal complex Mn+ + nL → MLn
MLn → MLn,ads
Cathodic scan MLn,ads + ne- → Mn+ + nL
Cathodic Stripping Voltammetry Organic and inorganic compounds capable of forming insoluble salts
Anodic deposition (for mercury electrode) An- + Hg → HgA + ne-
Cathodic scan HgA + ne- → An- + Hg

Detection Methods 20
2.4.4 Amperometry
Amperometry is the monitoring of a current produced from faradic reactions at an
electrode surface, when the potential between the electrodes is constant. This constant
potential is ideally the half-wave potential of the analyte being monitored. Thus
electron transfer is energetically more favourable for the analyte, thus inducing an
inherent selectivity. Also taking into consideration mass transport effects, the current
produced is proportional to the concentration of the analyte.
An amperometric biosensor requires an appropriate electrode surface to reduce or
oxidise an electroactive species that has been produced by an immobilised selective
material (Harwood and Pouton, 1996). The operating potential of the device is not only
dependent on the electroactive species, but also on the background current, interfering
reactions, surface reproducibility, mechanical properties and cost (Wang, 1999). In
order to gain the best compromise for the operating potential of a device a mediator is
often used.
A mediator, for example Prussian Blue (Lowinsohn and Bertotti, 2007) or Toluidine
Blue (Vostiar et al., 2002), can be electrochemically deposited on an electrode surface.
Prussian Blue reduces the oxidation potential of hydrogen peroxide which is used for
direct monitoring of glucose and L-Lactate. This reduction in potential makes the
device less sensitive to oxygen fluctuations, reduces running costs and moves the
operating potential away from the half-wave potential of several possible interfering
compounds. Toluidine Blue has amperometric pH-sensitive properties which can be
utilised in a biosensor with selective materials that cause changes in the local pH. A
urea biosensor is an example of this, the enzymatic reaction of urea and urease produces
NH3 which causes a local change in pH.
2.4.5 Impedance
The properties of an electrochemical system can be attained and monitored by
measuring a system’s impedance. The impedance of a system is comprised of real
(resistive) and imaginary (reactive) components. In most electrochemical systems
inductance is assumed to be negligible hence the imaginary component consists purely
of capacitance; this is illustrated in Figure 2.3.

Detection Methods 21
Figure 2.3 – Schematic of electrochemical system and its corresponding circuit.
By either monitoring the impedance while varying the frequency (electrochemical
impedance spectroscopy) or by fixing the frequency and monitoring the impedance over
time changes in both bulk and interfacial electrical properties and processes can be
monitored.
Impedance spectroscopy has been used to measure glucose in PBS by Shervedani and
co-workers (Shervedani et al., 2006). They immobilised glucose oxidase on a gold
electrode surface using a 3-mercaptopropionic acid SAM and parabenzoquinone as an
electron mediator. Increasing levels of glucose leads to a decrease in the faradic charge
transfer resistance via the increased reduction of hydroquinone in the diffusion layer;
this change in faradic resistance can be seen using impedance spectroscopy. Comparing
this approach to an amperometric system reduces the required redox potential (600 to
280 mV) and provides more accurate results; however it was very time-consuming
taking 15 minutes to measure a spectrum over a frequency range of 100 mHz to
10 KHz.
The concept of non-intrusive monitoring of blood glucose concentrations via impedance
measurement was shown to be possible by Caduff and co-workers (Caduff et al., 2003).
They developed a wristwatch-sized device with an open resonant circuit to take the
impedance measurements. They concluded that as glucose did not affect the dielectric
spectrum in the MHz range the concentration could not be measured directly. However

Transducers 22
the electrolyte balance across the tissue membranes caused by variations in glucose
could be monitored. These results followed the variations in blood glucose more
closely than when using interstitial fluid devices to monitor the variation. Tura and co-
worker (Tura et al., 2007) followed this by investigating impedance-based non-intrusive
glucose monitoring confirming Caduff results. They showed that at a lower frequency
(0.1 – 800 Hz) the impedance was directly affected by the glucose concentration and not
reliant on a secondary effect for detection.
Impedance-based devices for monitoring urea have also been investigated: these work
on the basis of urea hydrolysis by urease which causes a local change in pH. Sheppard
and co-workers (Sheppard et al., 1996) modelled the spatial and temporal evolution of
the hydrolysis products to predict the conductivity of such a urea sensor. This model
was tested within a concentration range of 10 µM to 5 mM and the data correlated well
to the actual concentration. The change in pH due to urea hydrolysis was also utilised
by Cortina and co-workers (Cortina et al., 2006) with degrading polymers which were
immobilised on the sensor surface. The polymer degradation caused a measurable
change in capacitance.
2.5 Transducers
The performance of any electrochemical investigation is strongly dependent on the
working electrode. The choice of electrode material will influence the signal to noise
ratio, reproducibility, redox behaviour, charge transfer kinetics and the potential
window. In addition, the electrode geometry can strongly affect the diffusion of
components to the electrode surface.
2.5.1 Material
The material that a working electrode is constructed of is essential for a good response
and reproducible characteristics. One of the most reproducible electrode materials is
mercury when used in a drop electrode, as the electrode surface is constantly renewed.
This renewal means that the surface is not contaminated and the mercury is in a liquid
state it is very smooth with an effective roughness factor of one. Other advantages of
using mercury depend on the analyte; mercury has a high hydrogen overvoltage thus, a
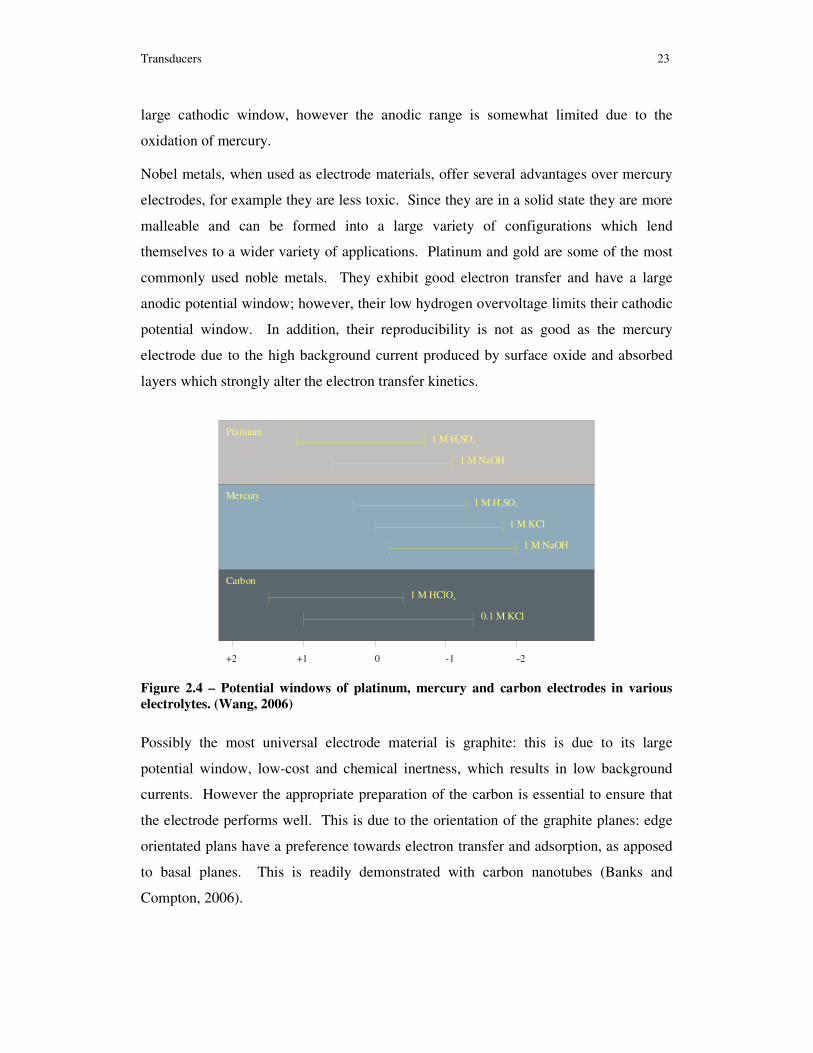
Transducers 23
large cathodic window, however the anodic range is somewhat limited due to the
oxidation of mercury.
Nobel metals, when used as electrode materials, offer several advantages over mercury
electrodes, for example they are less toxic. Since they are in a solid state they are more
malleable and can be formed into a large variety of configurations which lend
themselves to a wider variety of applications. Platinum and gold are some of the most
commonly used noble metals. They exhibit good electron transfer and have a large
anodic potential window; however, their low hydrogen overvoltage limits their cathodic
potential window. In addition, their reproducibility is not as good as the mercury
electrode due to the high background current produced by surface oxide and absorbed
layers which strongly alter the electron transfer kinetics.
+2 +1 0 -1 -2
1 M H SO2 4
1 M NaOH
1 M KCl
1 M HClO4
0.1 M KCl
1 M H SO2 4
1 M NaOH
Platinum
Mercury
Carbon
Figure 2.4 – Potential windows of platinum, mercury and carbon electrodes in various
electrolytes. (Wang, 2006)
Possibly the most universal electrode material is graphite: this is due to its large
potential window, low-cost and chemical inertness, which results in low background
currents. However the appropriate preparation of the carbon is essential to ensure that
the electrode performs well. This is due to the orientation of the graphite planes: edge
orientated plans have a preference towards electron transfer and adsorption, as apposed
to basal planes. This is readily demonstrated with carbon nanotubes (Banks and
Compton, 2006).

Transducers 24
2.5.2 Surface modification
Variations in the electrode surface play an essential role in determining the response of
a system: for example, surface modification can influence the electron transfer, result in
a preferential accumulation, reduce fouling and act as a selective membrane. These can
make the electrode more sensitive and stable, with a higher selectivity. For the
purposes of this review, surface modification by imprinted polymers and biologically
selective components will be considered as recognition systems and reviewed in detail
in Section 2.6.
Self assembled monolayers (SAM) are very versatile materials for modifying electrode
surfaces. There are two main methods of self-assembly: i) the spontaneous chemical
adsorption of alkanethiols on a noble metal surface and ii) the silanation of an activated
surface. Both of these methods can leave an electrode surface with a varied
functionality and hydrophobicity depending on the functionality of the end group. It
also serves as an ideal anchor for growing polymer to further modify a surface.
As well as growing polymer from anchored SAM, other methods such as
electropolymerisation and spin-coating can be used to immobilise polymer. Polymers
have been investigated for their anti-fouling properties (Wisniewski and Reichert,
2000), generally due to their hydrophobic nature but they have also been used in vivo
for releasing anti-fouling compounds, for example NO (Zhang et al., 2002). Polymers
have also been used for immobilising biological recognition compounds and in the
construction of molecularly imprinted polymers to increase the specificity of an
electrode.
2.5.3 Geometry
The geometry of large electrodes does not significantly affect the response of an
electrode. This is because the large surface area of the electrodes dominates the
response and effects, such as diffusion and electron transfer, are more dependent on the
system and on the electrodes material than on the geometry. However, as the electrode
decreases in size geometrical effects become more significant.
Small electrodes do have several advantages, for example higher scan rates can be used
in voltammetry due to the lowered double layer capacitance and the signal to

Recognition systems 25
background noise ratio is improved due to the increased rate of mass transport.
However, microelectrodes, where a dimension is less than 20 µm, can suffer from a
high influences of radial diffusion (Heinze, 1993); this causes a large diffusion layer
relative to the size of the electrode resulting in a sigmoidal voltammogram. This effect
can be lowered by decrease the electrolysis time which in turn results in a reduction in
the thickness of the diffusion layer.
2.6 Recognition systems
A sensor without a recognition element is limited when detecting a specific analyte as it
is reliant on the interactions of the analyte with the transducers surface to distinguish
itself from other compounds in the sample. In certain circumstances, for example if the
analyte forms a complex with the electrode surface or has a distinctive redox potential,
direct detection is possible, but within a complex matrix it becomes extremely difficult
to distinguish the analyte of interest from background interference.
Due to the difficulties of direct detection, recognition elements in biosensors and
chemical-sensors allow the selective detection of the chosen analyte. These recognition
elements, in their simplest form, have a single property that causes a change which can
be detected by a transducer. Most recognition elements fall into three categories;
enzymes, immunosensors and molecular imprinted polymers.
2.6.1 Enzyme
Enzymes are catalytic proteins generally found in biological systems where they play a
vital role in determining the metabolic pathway. Each enzyme has a very high
specificity for its given substrates. However, their uses in biosensing applications are
limited by their narrow operating conditions as they can be easily denatured by changes
and extremes in temperature, chemical conditions (pH, salinity, etc) and organic
solvents.
Possibly the most well known and commercially available enzyme based sensor is the
glucose sensor, which in its simplest form operates on the oxidation of glucose by
glucose oxidase (Harwood and Pouton, 1996). Other common applications on the gas
sensing of ammonia and CO2 are when the enzymatic products of deaminating and
decarboxylating enzymes are used to measure the concentration of NH4+ and CO2,

Recognition systems 26
respectively (Dobay et al., 1999). Enzymatic sensors can be used to detect many
metabolites such as urea, creatinine and uric acid. The finding and synthesising of a
specific enzyme for a chosen analyte which has good electron transfer, stability and
biocompatibility is both extremely difficult and expensive to achieve.
To enhance the enzymes’ life time and their resistance to environmental and chemical
changes during the operation of enzyme-based devices the enzymes are often
immobilised or entrapped (Kobos, 1987), usually directly onto a transducer or in a
membrane. Mediators are also used when enzymes are incorporated within
electrochemical sensors to reduce the operating potential and increase electron transfer.
2.6.2 Immunosensors
Immunosensors are devices that use immunological reactions as the selective element of
the device. Antibodies are immunological proteins that are used to identify alien
entities within bodily fluids. The recognition properties of antibodies are defined by the
hypervariable part which selectively binds to the epitope of an antigen through a highly
specific interaction process, referred to as an induced fit. However as antibodies are
proteins, like enzymes, they can only operate under restricted conditions as they are
easily denatured.
Immunosensors have several advantages over immunoassays, these advantages include
simplification, reduced diagnostic costs, miniaturisation and automation (Wu et al.,
2007). Their general principle of operation is based on two methodologies referred to
as the sandwich and competitive binding systems (Figure 2.5). There are also other
types of immunosensors, such as electroactive labels, metal nanoparticle tracers and
label-free capacitive, impedance and amperometric measurements (Wang, 2006).
In the sandwich system (Figure 2.5a), antigens capable of binding two antibodies are
utilised. These antigens will bind to the immobilised antibody on the transducer and the
labelled secondary antibodies will bind to the immobilised antigen (Wu et al., 2007). In
the competitive binding system (Figure 2.5b) the antigen competes with a labelled
antigen for the immobilised antibodies binding site. Thus the measured quantity of the
labelled antigen remaining after washing is ‘negatively proportional’ to the
concentration of the competing antigen.

Recognition systems 27
Figure 2.5 – Two immunosensor strategies; a) sandwich technique and b) competitive
technique
Most immunosensors can be categorised depending on the transducer used in the
device: one typically distinguishes between optical (optoelectronic), electrochemical
and mass-based, for example piezoelectric, transducers. Optoelectronic immunosensors
tend to have a higher sensitivity than piezoelectric and electrochemical immunosensors
(Kim et al., 2004). However their selectivity can be compromised by colouring
substances and they are not as reproducible as piezoelectric and electrochemical
devices.
Amperometric immunosensors tend to be the most popular as they have a high
sensitivity. For example, they have been used for detecting E. coli (Abdel-Hamid et al.,
1998) using a sandwich approach on carbon rods within a range of 200 to 7000
cells/mL, lactate (Kelly et al., 1998) between 0.005 to 0.12 Units, cocaine (Suleiman
and Xu, 1998) by mounting membrane on an oxygen sensor within a range of 0.1 to
10 µM and rabbit IgG (Darain et al., 2003) by using a competitive assay within a range
of 0.5 to 2 µg/mL. Other electrochemical methods include potentiometric detection,
which has been used to detect human IgG (Brown and Meyerhoff, 1991) and rabbit IgG
(Sole et al., 1998), conductivity used for detecting human IgG and herbicide (Hianik et
al., 1999) and capacitance used for detecting transferrin (Hu et al., 2002).

Recognition systems 28
2.6.3 Molecularly imprinted polymers
Due to the instability and the limitations of biologically derived receptors synthetic
alternatives have been investigated. These alternatives involve the design and
production of synthetic receptors; however this method has proven extremely difficult
for larger or more complex molecules (Haupt and Mosbach, 2000). Another alternative
is to use molecularly imprinted polymers (MIP) which are constructed with the aid of
supramolecular self-assembly to achieve molecular recognition mimicking that of the
antibodies.
The formation of MIP can be illustrated in three stages (Figure 2.6): firstly, the pre-
organisation of chosen functional monomers around a target analyte, also know as the
template, secondly, the fixing of the monomers around the template in the form of a
complex followed by polymerisation with a crosslinker to maintain the orientation of
the complex, and finally, the removal of the analyte after polymerisation by washing the
resultant MIP which has specific binding sites for the template molecule.
Figure 2.6 – Illustration of the preparation of molecular imprinted polymers.
Currently, the mechanisms governing MIP recognition are not thoroughly understood,
for instance a MIP imprinted with tamoxifin has been shown to have a greater affinity
for propanolol despite the differences in molecular structure (Mahony et al., 2005).
This lack of understanding sometimes results in the poor performance of MIP in
practical applications. However, the recent development of computational approaches
to molecular modelling in the design of high performance MIPs offers a possible
solution (Subrahmanyam et al., 2001). These approaches are based on the hypothesis
that a strong monomer-template complex in solution during polymerisation will be
preserved, yielding a specific polymer. The advantages of mechanical and chemical

Recognition systems 29
stability, robustness, price and compatibility with mass production (Li et al., 2005)
makes MIPs a very competitive alternative to biological derived devices.
MIPs have been used for the detection of a large range of clinically relevant compounds
in various ways (Piletsky et al., 2006). For example, Kriz and co-workers used MIP
within a competitive binding assay to detect morphine from 0.1 to 10 µgL-1 (Kriz and
Mosbach, 1995). Piletsky and co-workers monitored the conductivity of imprinted
membranes for L-phenylalanine, atrazine and sialic acid (Piletsky et al., 1998) and also
grafted MIP onto micro-plates for the detection of epinephrine with target applications
for drug screening (Piletsky et al., 2000). Voltammetric techniques incorporating MIPs
have also been used for detecting adenine (Spurlock et al., 1996), cholesterol (Piletsky
et al., 1999) and clenbuterol (Andrea et al., 2001). Custom dyes have been synthesised
and incorporated into MIP for the detection of adenosine (Turkewitsch et al., 1998) and
fructose (Wang et al., 1999). In addition, Thin polymer layers have been grafted for the
capacitive detection of creatinine (Panasyuk-Delaney et al., 2002) and glucose (Cheng
et al., 2001).
2.6.4 Conclusions on clinical sensing technology
Patient care can be enhanced by providing health care professionals with monitoring
systems to observe the essential clinical parameters of their patients. These monitoring
systems require sensing devices with specificity for analytes of interest and responses
which effect the analyte concentrations accordingly. The range of critical parameters
that a clinician may wish to monitor is vast, although there is usually a priority
depending on the treatment and condition of the patient. Several methodologies have
been investigated to monitor these parameters with varying success. However, with
such a large range of targets finding and developing technologies for monitoring these
analytes remains a significant and unresolved challenge.
There are various ways to utilise electrochemical techniques to detect the presence and
concentration of an analyte. The technique chosen is dependent on the redox properties
of the analyte and/or the availability of selective materials, for example membranes,
enzymes and grafted polymers. The consequence of this is that a wide range of possible
solutions can be considered for the detection of an analyte using electrochemical
techniques. It can be seen that choosing the right transducer for a device depends on the

Recognition systems 30
analyte being investigated and the surface modifications required. For most
applications the use of solid state electrodes is preferred and the effects of electrode
materials and geometry need to be considered as this could strongly affect the response.
The analysis of a single compound in a complex matrix, for example blood or plasma, is
difficult due to the interference of the other components; thus a recognition element is
essential for these systems. Although enzymes and antibodies have extremely selective
recognition they have several limitations which can possibly be overcome by using
molecular imprinting.
From this review the possibility of creating a MIP-based electrochemical device to
detect a chosen clinical analyte seems feasible.
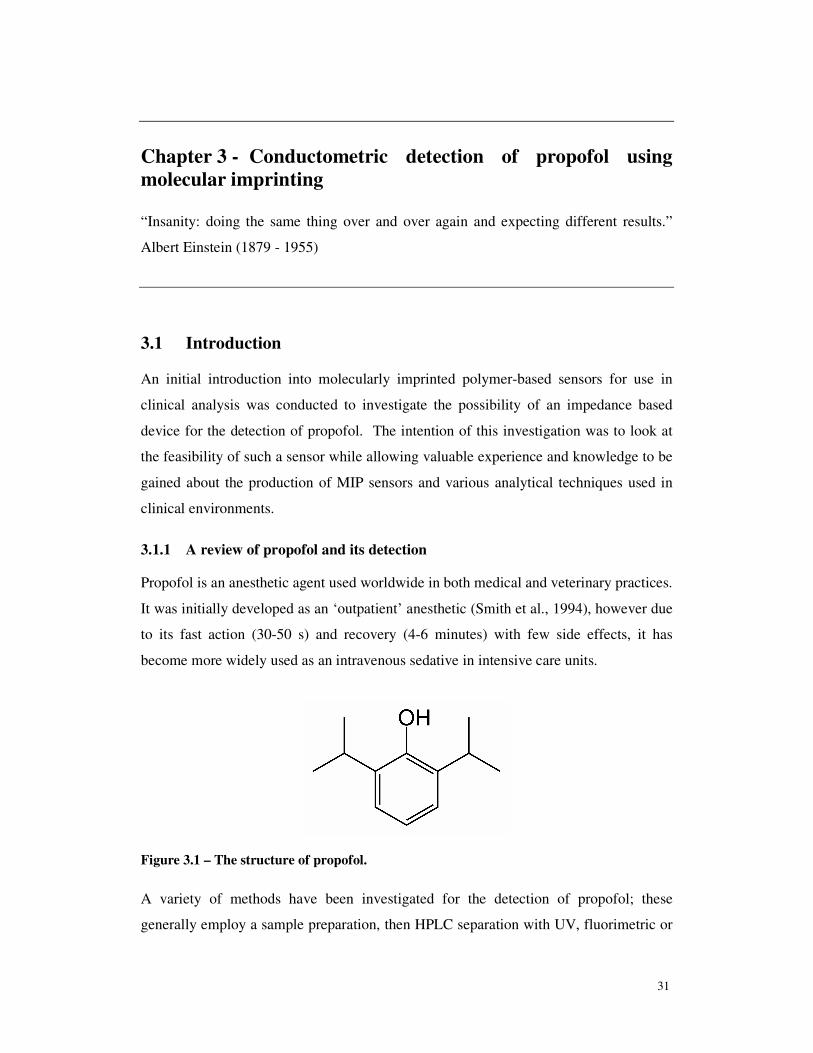
31
Chapter 3 - Conductometric detection of propofol using
molecular imprinting
“Insanity: doing the same thing over and over again and expecting different results.”
Albert Einstein (1879 - 1955)
3.1 Introduction
An initial introduction into molecularly imprinted polymer-based sensors for use in
clinical analysis was conducted to investigate the possibility of an impedance based
device for the detection of propofol. The intention of this investigation was to look at
the feasibility of such a sensor while allowing valuable experience and knowledge to be
gained about the production of MIP sensors and various analytical techniques used in
clinical environments.
3.1.1 A review of propofol and its detection
Propofol is an anesthetic agent used worldwide in both medical and veterinary practices.
It was initially developed as an ‘outpatient’ anesthetic (Smith et al., 1994), however due
to its fast action (30-50 s) and recovery (4-6 minutes) with few side effects, it has
become more widely used as an intravenous sedative in intensive care units.
Figure 3.1 – The structure of propofol.
A variety of methods have been investigated for the detection of propofol; these
generally employ a sample preparation, then HPLC separation with UV, fluorimetric or

Investigations into the use of molecularly imprinted polymers for the detection of propofol 32
electrochemical detection. Plummer and co-workers (Plummer, 1987) found the most
sensitive technique by combining liquid-to-liquid extraction with HPLC fluorescence
detection to obtain a detection limit of 2 ng mL-1. Plummer also expressed a preference
for using whole blood during the analysis, as propofol’s lipophilicity leads to extensive
propofol-blood binding (Bajpai et al., 2004). Solid phase extraction (SPE) has also
been used to separate propofol from plasma (Bajpai et al., 2004) or serum (Eubel et al.,
1990) which is advantageous as it is less time-consuming and can achieve a good
recovery. Using this technique, Bajpai and co-workers used hydrophibic-lipophilic
cartridges with recoveries of greater than 95% and attained a detection limit of
10 ng mL-1 (Bajpai et al., 2004).
The electrochemical detection of propofol has been achieved using both SPE (Benoni et
al., 1990) and liquid-to-liquid extraction (Eubel et al., 1990, Dowrie et al., 1996),
followed by HPLC detection. The latter allowed detection limits of 10 ng mL-1 from a
250 µL sample of plasma or serum and 5 g mL-1 from a 1000 µL sample. An
investigation and optimisation into the detection of purchased propofol on glossy carbon
electrodes showed that increasing the pH above the pKa (11.65), so that the propofol
becomes deprotonated, shifts the potential to a more negative value (Pissinis and
Marioli, 2007). This reduces the background current and increases the sensitivity of
detection.
3.2 Investigations into the use of molecularly imprinted polymers for
the detection of propofol
Prior to this research, Cranfield University performed research on behalf of Sphere
Medical aimed at the development of MIPs for the detection of propofol. In a first
phase of the work computational design of a polymer composition was implemented
and corresponding polymers were synthesised and tested for their affinity to propofol
using solid phase extraction and UV spectroscopy. The best polymers were made using
diethylamino ethylmethacrylate as a functional monomer.
The results from this initial investigation showed that the MIP synthesised had
properties which were in good correlation with the results obtained from the
computational design and the best MIP was produced using the composition shown in
Table 3.1.

Investigations into the use of molecularly imprinted polymers for the detection of propofol 33
Table 3.1 – Propofol polymerisation mixture.
Substance Mass (mg) Role
NIP Diethylamino ethylmethacrylate
(DEAEM)
525 Monomer
Ethleneglycol dimethacrylate
(EGDMA)
3262 Crosslinker
Acentonitrile 3925 Porogen
MIP (as above but with template) Propofol 125 Template
In the following work the aforementioned polymer was immobilised onto an
electrochemical sensor and the detection of propofol, using impedance methods, was
investigated.
3.2.1 Impedance monitoring and strategies for MIP immobilisation
Due to difficulties experienced in previous investigations by Cranfield University and
Sphere Medical in the detection of propofol via its oxidation, an investigation into the
detection of propofol by monitoring variations in impedance was undertaken.
The following is the summary of this investigation which illustrates the immobilisation
of the computationally designed MIP and its response to propofol.
3.2.2 Sensors
The microchip used is a silicon based substrate of approximately 6 mm x 4 mm that
currently has up to six sensors integrated on its surface. The sensors used in this work
consisted of two parallel electrodes (highlighted on the right in Figure 3.2). The test
solutions were delivered to the microchip via a flow cell (Figure 3.7). The other sensors
used for the initial investigation were gold interdigitated microsensor electrodes
supplied by Abtech Scientific (Virginia, US).
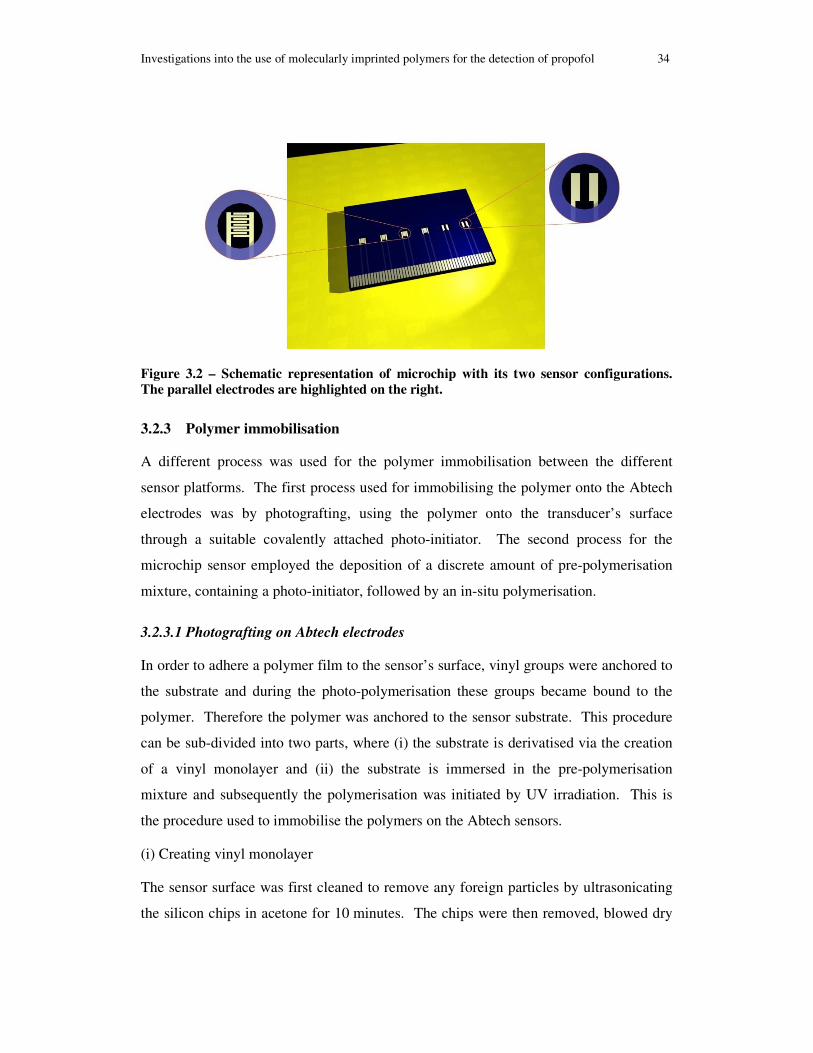
Investigations into the use of molecularly imprinted polymers for the detection of propofol 34
Figure 3.2 – Schematic representation of microchip with its two sensor configurations.
The parallel electrodes are highlighted on the right.
3.2.3 Polymer immobilisation
A different process was used for the polymer immobilisation between the different
sensor platforms. The first process used for immobilising the polymer onto the Abtech
electrodes was by photografting, using the polymer onto the transducer’s surface
through a suitable covalently attached photo-initiator. The second process for the
microchip sensor employed the deposition of a discrete amount of pre-polymerisation
mixture, containing a photo-initiator, followed by an in-situ polymerisation.
3.2.3.1 Photografting on Abtech electrodes
In order to adhere a polymer film to the sensor’s surface, vinyl groups were anchored to
the substrate and during the photo-polymerisation these groups became bound to the
polymer. Therefore the polymer was anchored to the sensor substrate. This procedure
can be sub-divided into two parts, where (i) the substrate is derivatised via the creation
of a vinyl monolayer and (ii) the substrate is immersed in the pre-polymerisation
mixture and subsequently the polymerisation was initiated by UV irradiation. This is
the procedure used to immobilise the polymers on the Abtech sensors.
(i) Creating vinyl monolayer
The sensor surface was first cleaned to remove any foreign particles by ultrasonicating
the silicon chips in acetone for 10 minutes. The chips were then removed, blowed dry

Investigations into the use of molecularly imprinted polymers for the detection of propofol 35
with nitrogen and stored in a Petri dish. Secondly the silanol groups were activated in
order to produce abundance of free hydroxyls (Figure 3.3a) (Williams and Blanch,
1994). This was achieved by immersing the chips in 30% acetic acid in hydrogen
peroxide (30%) at room temperature for 40 minutes and then thoroughly rinsing the
chip with deionised water.
UV Radiation
Polymer solution
OH OH OH OH OH OH
a) b)
O
Si
CH2
O
Si
O
Si
O
Si
O
Si
O
Si
O
Si
O
Si
O
Si
H C2
O
Si
O
SiSi
O
c)
CH2 CH2 CH2 CH2 CH2
H C2 H C2 H C2 H C2H C2
Figure 3.3 – Covalent immobilisation of vinyl groups onto SiO2 surface. a) activation of
silanol groups, b) derivatisation of surface with vinyl-silane and c) free radical formation
in polymer solution.
The hydroxyls on the surface can be chemically derivatised via covalent coupling with
allyltriethoxysilane (ATES) which results in vinyls as the reactive surface group (Figure
3.3b). By submersing the chips in 2% ATES in toluene for three hours this
derivatisation was accomplished. The chips were then rinsed with acetone and blowed
dry in nitrogen to remove any unbound material.
(ii) Polymerisation procedure
The polymer mixture (Table 2.5) was degassed with nitrogen for 10 minutes to remove
dissolved oxygen (as it is a free-radical scavenger). 2 µL of the polymer mixture was

Investigations into the use of molecularly imprinted polymers for the detection of propofol 36
deposited on the sensor and covered with a glass slide, which had been coated in
dichlorodimethlysilane to prevent the slide from adhering to the polymer (Figure 3.4a).
Finally, the sensor was exposed to UV radiation through a low-pass UV filter
(< 350nm). The chip was then rinsed in methanol and dried in nitrogen.
Figure 3.4 – Schematic of polymerisation using a grafted initiator. A) polymerisation and
B) final sensor.
The connections to the IDE sensors are masked off using UV cured adhesive with the
aid of a silicon template to produce the final sensor (Figure 3.4b).
Table 3.2 – Composition of grafting polymerisation mixture.
Substance Mass
(mg)
Role
NIP composition Diethylamino ethylmethacrylate 525 Monomer
Oligourethane Acrylate : TriCethylene dimethacrylate, (15 : 85)
3262 Crosslinker
DMF 3925 Porogen
2-2-dimethoxy-2-phenylacetopenon 77 Initiator
MIP (as above but with template)
Propofol 125 Template
3.2.3.2 Deposition onto microchip sensor
The immobilisation of polymer using photopolymerisation is a quick and effective way
to produce polymer films. The microchip sensors have wells surrounding the electrodes
which allow easy deposition of the polymerisation fluid; the well was originally
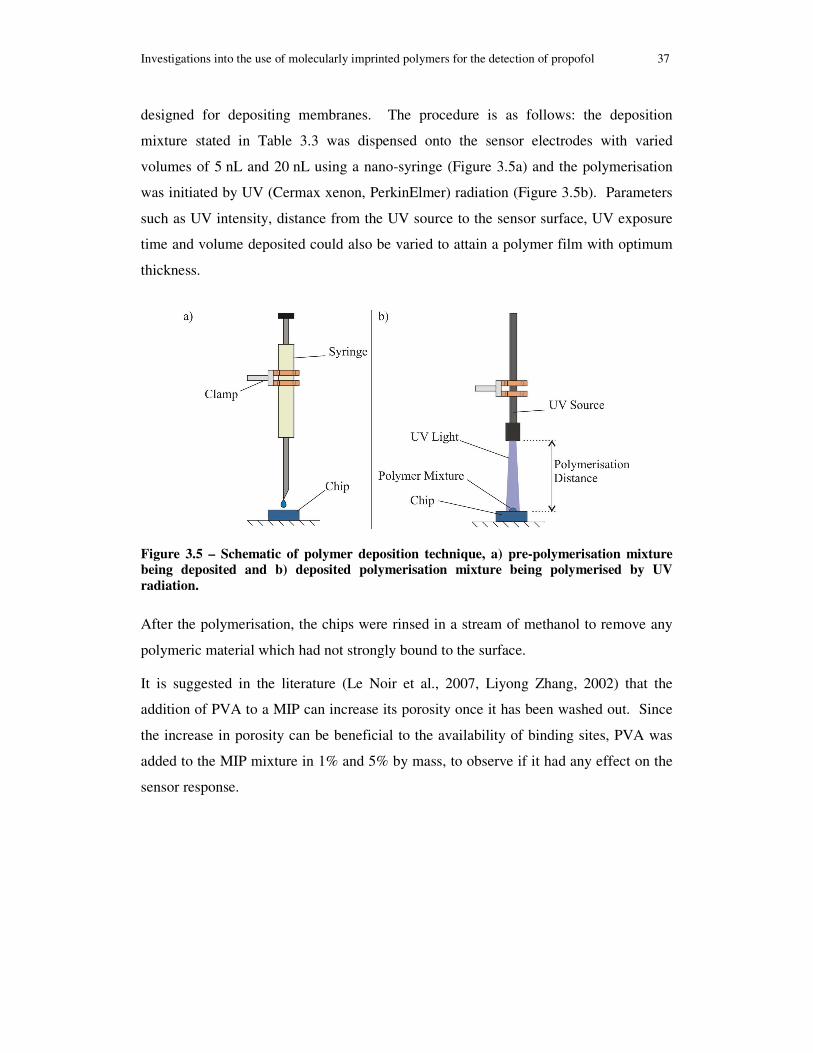
Investigations into the use of molecularly imprinted polymers for the detection of propofol 37
designed for depositing membranes. The procedure is as follows: the deposition
mixture stated in Table 3.3 was dispensed onto the sensor electrodes with varied
volumes of 5 nL and 20 nL using a nano-syringe (Figure 3.5a) and the polymerisation
was initiated by UV (Cermax xenon, PerkinElmer) radiation (Figure 3.5b). Parameters
such as UV intensity, distance from the UV source to the sensor surface, UV exposure
time and volume deposited could also be varied to attain a polymer film with optimum
thickness.
Figure 3.5 – Schematic of polymer deposition technique, a) pre-polymerisation mixture
being deposited and b) deposited polymerisation mixture being polymerised by UV
radiation.
After the polymerisation, the chips were rinsed in a stream of methanol to remove any
polymeric material which had not strongly bound to the surface.
It is suggested in the literature (Le Noir et al., 2007, Liyong Zhang, 2002) that the
addition of PVA to a MIP can increase its porosity once it has been washed out. Since
the increase in porosity can be beneficial to the availability of binding sites, PVA was
added to the MIP mixture in 1% and 5% by mass, to observe if it had any effect on the
sensor response.
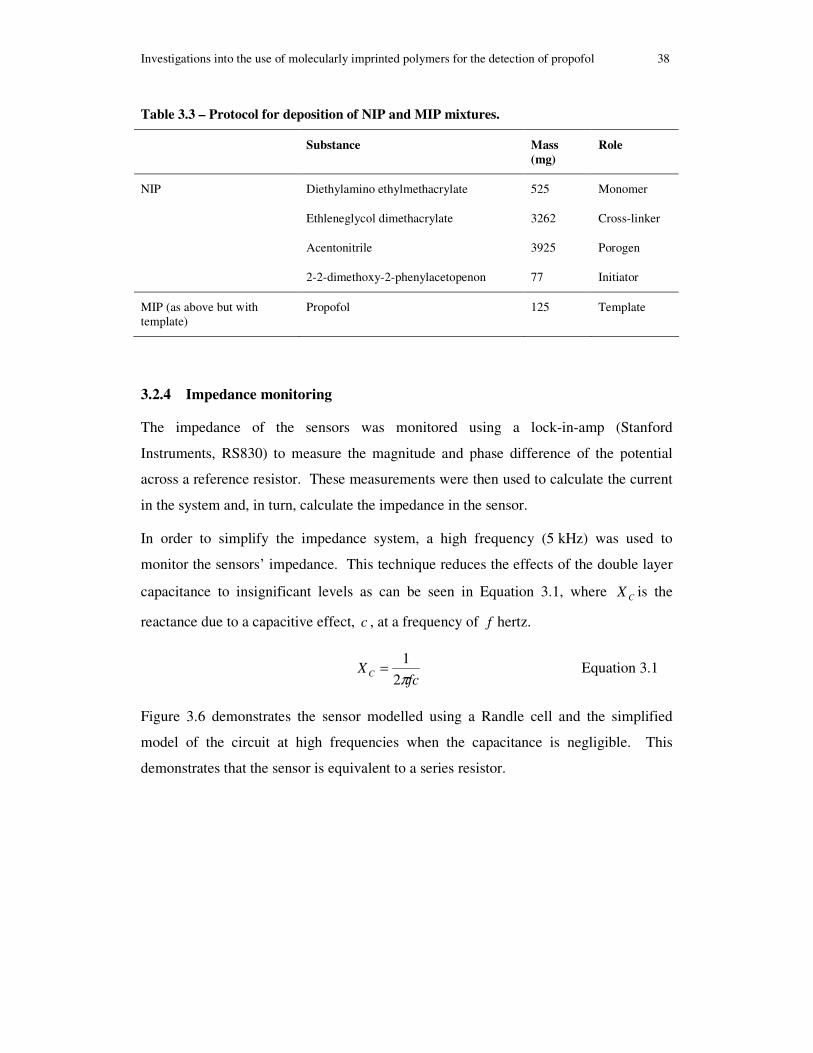
Investigations into the use of molecularly imprinted polymers for the detection of propofol 38
Table 3.3 – Protocol for deposition of NIP and MIP mixtures.
Substance Mass
(mg)
Role
NIP Diethylamino ethylmethacrylate 525 Monomer
Ethleneglycol dimethacrylate 3262 Cross-linker
Acentonitrile 3925 Porogen
2-2-dimethoxy-2-phenylacetopenon 77 Initiator
MIP (as above but with template)
Propofol 125 Template
3.2.4 Impedance monitoring
The impedance of the sensors was monitored using a lock-in-amp (Stanford
Instruments, RS830) to measure the magnitude and phase difference of the potential
across a reference resistor. These measurements were then used to calculate the current
in the system and, in turn, calculate the impedance in the sensor.
In order to simplify the impedance system, a high frequency (5 kHz) was used to
monitor the sensors’ impedance. This technique reduces the effects of the double layer
capacitance to insignificant levels as can be seen in Equation 3.1, where CX is the
reactance due to a capacitive effect, c , at a frequency of f hertz.
fc
X Cπ2
1= Equation 3.1
Figure 3.6 demonstrates the sensor modelled using a Randle cell and the simplified
model of the circuit at high frequencies when the capacitance is negligible. This
demonstrates that the sensor is equivalent to a series resistor.

Investigations into the use of molecularly imprinted polymers for the detection of propofol 39
Figure 3.6 – Circuit diagrams of the impedance monitoring system and the simplified
system assuming negligible capacitive effect at high frequencies. Reference resistance
(rref), electrode resistance (relec), solution resistance (rsol) and electrode capacitance (Celec).
Following Ohm’s, law the impedance can be expressed as;
refref
ref
soucell rr
V
Vr −= Equation 3.2
where, cellr is the sensor resistance, refr is the reference resistance, souV is the source
potential and refV is the potential across the reference resistor.
3.2.5 Investigatory procedures
3.2.5.1 Procedure for testing the Abtech sensors
The conductivity measurements for the Abtech sensors were conducted by submerging
the sensor into a test solution and using the lock-in amplifier to measure the potential
difference across a reference resistor as explained in Section 3.2.4. Each sensor was
washed in 10 mM HCl and 10 mM NaOH with deionised water before and after each
wash to prevent salt formation, and then dried in a stream of nitrogen. To test the
sensor it was immersed in the test solutions with varying concentrations of propofol.
After each test, the chip was washed using the above procedure and once again dried in
a stream of nitrogen. The concentration of the test solution was then changed to the
next concentration and the above process was repeated until all concentrations were
tested.

Results of impedance monitoring for immobilised MIP 40
3.2.5.2 Procedure for testing the flow cell microchip sensors
It was foreseen that during the operation of the final sensor, the test fluid would be
pumped over the microchip sensor and tests were conducted when the fluid was
stationary. To simulate this, the test solution in the experiments was pumped through
the flow cell (Figure 3.7) and tests were taken as the solution was flowing and
stationary.
Figure 3.7 – Schematic of flow cell sensor.
The above was achieved by pumping PBS over the sensor for 100 seconds to attain a
baseline, then the test solution was introduced into the system for 50 seconds at a
constant flow rate and this was then flushed out again with PBS for 50 seconds. The
test solution was once again introduced into the system but this time the pump was
turned off for 100 seconds until the pump was restarted and the flow cell was flushed
out with PBS.
To clean the sensors before and after use and to remove any propofol after injection,
0.1 M HCl in deionised water with 20% methanol and then 0.1 M NaOH in deionised
water with 20% methanol were flushed over the sensor with deionised water used in
between the aforementioned injections to prevent salt formation.
3.3 Results of impedance monitoring for immobilised MIP
3.3.1 Investigation of Abtech sensors with photografted MIP films
As an initial investigation into the possibility of detecting propofol using a
conductometric sensor, the response of a sensor with molecularly imprinted (MIP) and

Results of impedance monitoring for immobilised MIP 41
non-imprinted (NIP) polymers were compared (Figure 3.8). The NIP sensor had a
lower overall resistance than the MIP sensor and both sensors demonstrated an
exponential decrease in resistance, as the concentration of propofol increased. The
change in resistance of the MIP sensor was approximately twice as large as the NIP
sensor’s resistance.
0
10
20
30
40
50
60
70
80
0 50 100 150 200 250 300 350 400
Concentration (µM)
Res
ista
nce
(MΩ
)
Figure 3.8 – Response of microchip sensor to varying concentrations of propofol (Red –
MIP, Blue – NIP).
A bare sensor (Figure 3.9) with no immobilised polymer, had a slight increase in
resistance as the propofol concentrations increased. This could be explained by the
possible adsorption of propofol to the electrode surface thereby decreasing the electron
transfer. However, this increase was minimal and no change was larger than the
standard deviation.
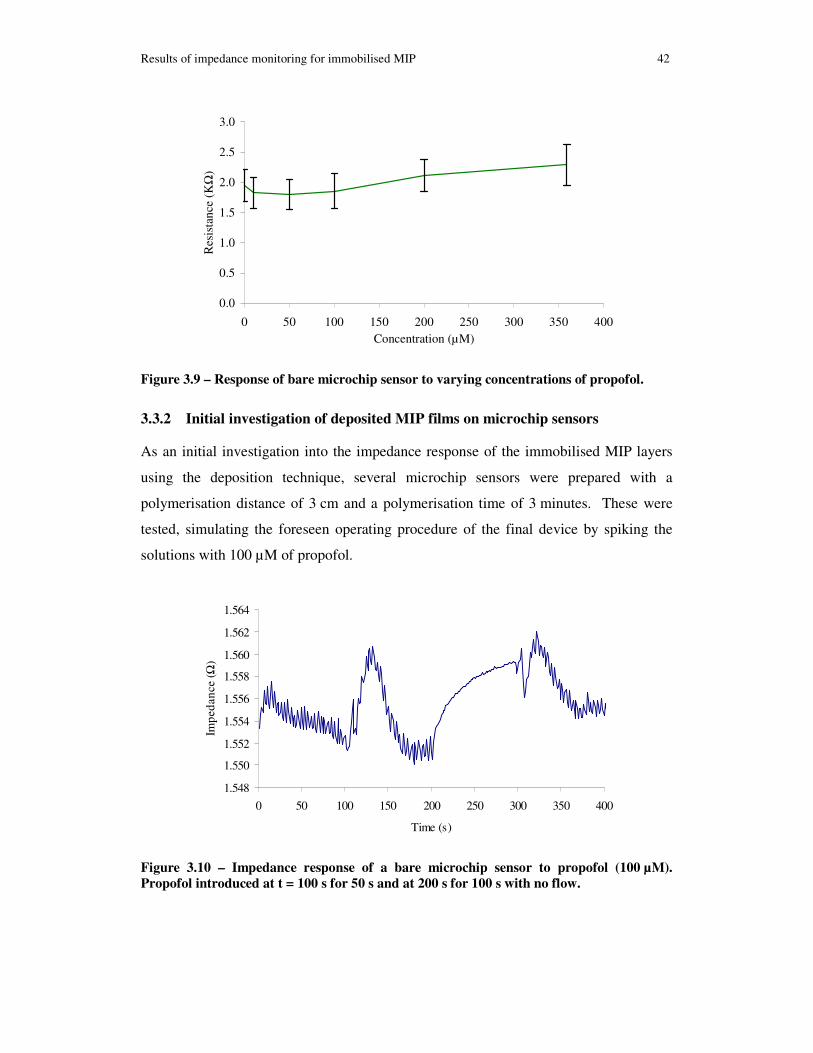
Results of impedance monitoring for immobilised MIP 42
0.0
0.5
1.0
1.5
2.0
2.5
3.0
0 50 100 150 200 250 300 350 400Concentration (µM)
Res
ista
nce
(KΩ
)
Figure 3.9 – Response of bare microchip sensor to varying concentrations of propofol.
3.3.2 Initial investigation of deposited MIP films on microchip sensors
As an initial investigation into the impedance response of the immobilised MIP layers
using the deposition technique, several microchip sensors were prepared with a
polymerisation distance of 3 cm and a polymerisation time of 3 minutes. These were
tested, simulating the foreseen operating procedure of the final device by spiking the
solutions with 100 µM of propofol.
1.548
1.550
1.552
1.554
1.556
1.558
1.560
1.562
1.564
0 50 100 150 200 250 300 350 400
Time (s)
Impe
danc
e (Ω
)
Figure 3.10 – Impedance response of a bare microchip sensor to propofol (100 µM).
Propofol introduced at t = 100 s for 50 s and at 200 s for 100 s with no flow.

Results of impedance monitoring for immobilised MIP 43
An example of the response of a bare microchip electrode can be seen in Figure 3.10.
The peak response from the baseline achieved with 100 µM of propofol in stationary
flow was approximately 7.7 mΩ. The same test was conducted on a microchip with a
MIP layer, however this did not give any variation in the response.
The response of a microchip with an immobilised MIP layer containing 1% PVA can be
seen in Figure 3.11. The peak response of this sensor was negligible when 100 µM of
propofol was injected and it had a response of 8.3 mΩ in stationary flow. The trend of
the 5% PVA MIP was the same as the 1% PVA MIP, however the magnitude of the
change was 6.0 mΩ.
1.206
1.208
1.210
1.212
1.214
1.216
1.218
0 50 100 150 200 250 300 350 400
Time (s)
Impe
danc
e (Ω
)
Figure 3.11 – Impedance response of a molecularly imprinted microchip sensor (with 1%
PVA) to propfol (100 µM). Propofol introduced at t = 100 s for 50 s and at 200 s for 100 s
with no flow.
3.3.3 Discussion of impedance monitoring using MIP-coated electrodes
3.3.3.1 Photografted MIP on Abtech electrodes
The variation in the impedance between the bare and polymer-coated Abtech sensors
can be explained by the decrease in electron transfer, due to the non-conducting
polymer layers immobilised onto the surface.
Both the immobilised NIP and MIP electrodes share a similar trend in their responses to
various concentrations of propofol. The observed trend is an exponential decrease in
resistance as the propofol concentration increases. A possible explanation for this is

Investigation of MIP immobilisation procedure on microchip device 44
that the binding of the propofol to the polymer causes the polymer to swell (Mahony et
al., 2005) leading to an increase in the size of the polymer pores. Thus, making it easier
for the ionic species in the buffer to reach the electrode surface.
The steeper gradient at low concentrations for the MIP microsensor suggests that it has
a higher sensitivity and a larger range to propofol than the NIP. Also, at higher
concentrations, the variation in the NIP becomes less apparent. This is probably due to
the saturation of the NIP polymer with propofol, hence the polymer could not swell
anymore.
3.3.4 Deposited MIP on microchip electrodes
In the flow cell microchip sensor, the bare sensor showed a response (increase in the
impedance of the system) to the presence of propofol when the flow of propofol was
both moving and stationary. The sensors responded to 100 µM concentrations of
propofol demonstrating that the propofol solution has a lower impedance than the PBS
solution.
The response of all the microchip sensors, with the immobilised polymer, had similar
reactions to that of the bare microchip sensor’s. Therefore the immobilised polymer had
no or little effect on the sensor response.
3.3.5 Conclusion of impedance monitored MIP
The results from the Abtech microsensor with the photografted polymer shows promise,
as there was a significant difference between the NIP and MIP responses. However, the
deposited imprinted polymer films on the microchip sensors show little difference.
Thus, the immobilised polymer formed using the deposition technique needs to be
investigated.
3.4 Investigation of MIP immobilisation procedure on microchip
device
The aim of this section is to explore some of the possible areas that will require further
understanding to enable a selective response from the microchip sensor with a deposited
MIP coating. The previous investigations using this procedure to produce a sensor did
not produce a working sensor.

Investigation of MIP immobilisation procedure on microchip device 45
The areas of interest are in identifying the presence and quality of the polymer layer, the
frequency at which any capacitive effects become negligible and, finally, the effect of
varying the polymerisation parameters.
3.4.1 Analysis techniques for investigating immobilised MIP
3.4.1.1 Impedance analysis
Impedance analysis is a useful technique in investigating both interfacial and bulk
electrical properties and processes in an electrochemical system. By monitoring the
impedance of an electrochemical system changes in both capacitance and resistance can
be seen. As the reactance of a system is related to the applied frequency of the source
potential (Equation 3.1), model systems can be fitted to an acquired frequency
spectrum. The simplest model is the Randle cell (Figure 3.12) which consists of three
main components; the solution resistance (Rs), charge transfer resistance (Rt) and the
double layer capacitance (Cdl). These result in a semi-circular response on a Nyquist
plot.
Figure 3.12 – Nyquist plot and equivalent circuit of a Randles cell. Rs – solution
resistance, Rt – charge transfer resistance and Cdl – double layer capacitance.
All impedance analysis was conducted using an ACM AutoACpsp Impedance Analyser.
The impedance was measured between a frequency of 1 to 10000 Hz with a 32 mV
signal amplitude, 0 V offset and an automatic reference resistance.
3.4.1.2 Cyclic voltammetry
All voltammograms were attained using an AutoLab PSTAT10 (Netherlands) between
-600 mV to 1200 mV at a scan rate of 200 mVs-1 in 5 mM K4Fe(CN)64- plus 5 mM
K3Fe(CN)63- in deionised water (from now on referred to as KFe(CN)6).

Investigation of MIP immobilisation procedure on microchip device 46
3.4.1.3 Investigatory procedures
All of the following procedures were conducted on the microchip electrodes (Section
3.2.2) with various polymer coating immobilised by using the deposition technique
explained in Section 0.
3.4.1.4 Procedure for investigating the changes from varying the polymerisation
parameters
The two main polymerisation parameters are i) the polymerisation time which defines
the time of exposure to the UV radiation and ii) the polymerisation distance which alters
the intensity of the UV exposure. The polymerisation distance is illustrated in Figure
3.5. The impedance spectra of several polymerised electrodes were measured. The
polymerisation distances varied between 1 – 5 cm and the polymerisation time varied
between 1 – 10 minutes.
3.4.1.5 Procedure for investigating frequency at which to monitor deposited polymer
layers
Each sensor underwent cyclic voltammetry (CV) and impedance analysis in PBS
(pH 7.5) before and after polymerisation. The various test solutions were delivered to
the flow cell (Figure 3.7) at 3 mLs-1 and left to settle for 1 minute before any
measurements were taken.
Before and after each test the sensors were cleaned using 0.1 M HCl in deionised water
with 20% methanol and then 0.1 M NaOH in deionised water with 20% methanol.
Deionised water was flushed through the system before and after each of the
aforementioned steps to reduce the possibility of salt formation. After cleaning, the test
solution was pumped into the flow cell at 3 mLs-1 and then the device was left for
1 minute to settle before commencing with the measurement.
By comparing the CVs and impedance spectra before and after polymerisation,
variations in the electrochemical properties of the electrodes, for example, charge
transfer resistance, diffusion flux and cell impedance can be investigated. All of these
comparisons will shed light on the polymer that was immobilised on the microchip
electrodes. Also an optimal frequency for impedance monitoring can be acquired when
the capacitive effects are lowest.

Investigation of MIP immobilisation procedure on microchip device 47
3.4.2 Results of measurements using MIP-coated microchip device
An example of the results obtained from sensor microchips coated with polymers
prepared with various polymerisation times and distances can be seen in Figure 3.13
and Figure 3.14. There appears to be no correlation between the polymerisation time
and distance and the impedance spectrum of the sensor. 70% of the sensors produced
demonstrated a purely capacitive response. This shown by the inversely decreasing
impedance with increasing frequency fitting the trend of Equation 3.1.
0
10
20
30
40
50
60
70
1 10 100 1000 10000Frequency (Hz)
Impe
danc
e (MΩ
)
Figure 3.13 – Impedance spectrum of deposited MIP (5 l) microchip electrodes with varied
polymerisation times and distances. Polymerisation time; blue – 1 minute, red – 5 minutes
and green – 10 minutes. Polymerisation distance; square – 1 cm, diamond – 3 cm and
triangle – 5 cm.
Some of the sensors had a trend typical of a Randles cell, these sensors have much
lower impedances and can be seen in more detail in Figure 3.14 with a corresponding
Nyquist plot of the 5 minute 3 cm polymerisation in Figure 3.15. However, there was
no correlation between the polymerisation parameters and the trend of the impedance
spectrums.
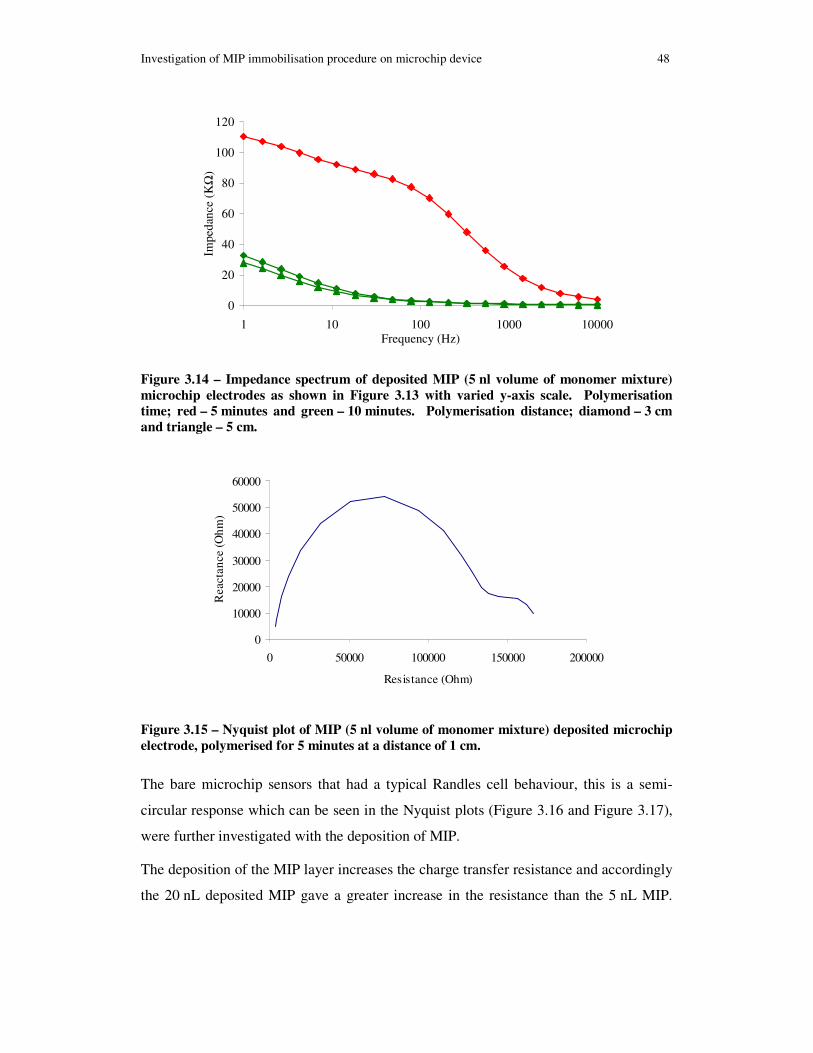
Investigation of MIP immobilisation procedure on microchip device 48
0
20
40
60
80
100
120
1 10 100 1000 10000Frequency (Hz)
Impe
danc
e (KΩ
)
Figure 3.14 – Impedance spectrum of deposited MIP (5 nl volume of monomer mixture)
microchip electrodes as shown in Figure 3.13 with varied y-axis scale. Polymerisation
time; red – 5 minutes and green – 10 minutes. Polymerisation distance; diamond – 3 cm
and triangle – 5 cm.
0
10000
20000
30000
40000
50000
60000
0 50000 100000 150000 200000
Resistance (Ohm)
Rea
ctan
ce (O
hm)
Figure 3.15 – Nyquist plot of MIP (5 nl volume of monomer mixture) deposited microchip
electrode, polymerised for 5 minutes at a distance of 1 cm.
The bare microchip sensors that had a typical Randles cell behaviour, this is a semi-
circular response which can be seen in the Nyquist plots (Figure 3.16 and Figure 3.17),
were further investigated with the deposition of MIP.
The deposition of the MIP layer increases the charge transfer resistance and accordingly
the 20 nL deposited MIP gave a greater increase in the resistance than the 5 nL MIP.

Investigation of MIP immobilisation procedure on microchip device 49
No difference in the impedance spectrums could be seen with the addition of 100 µM of
propofol to the electrolyte on both the bare and MIP sensors.
0
10000
20000
30000
40000
50000
60000
0 20000 40000 60000 80000 100000 120000 140000 160000
Resistance (Ohm)
Rea
ctan
ce (O
hm)
Figure 3.16 – Nyquist plot of bare and deposited MIP (5 nl volume of monomer mixture)
microchip electrode in PBS (pH 7.5) and 100 µM propofol. Blue – MIP in PBS, orange –
MIP in propofol, red – bare in PBS and green – bare in propofol.
0100002000030000400005000060000700008000090000
100000
0 50000 100000 150000 200000 250000
Resistance (Ohm)
Rea
ctan
ce (O
hm)
Figure 3.17 – Nyquist plot of bare and deposited MIP (20 nl volume of monomer mixture)
microchip electrode in PBS (pH 7.5) and 100 µM propofol. Blue – MIP in PBS, orange –
MIP in propofol, red – bare in PBS and green – bare in propofol.
Bode plots (Figure 3.18 and Figure 3.19) of the bare and deposited MIP layers, with
depositied volumes of 5 nL and 20 nL, show that the impedance is mainly resistive (the
phase tends towards 0°) below 100 Hz, capacitive (the phase tends towards 90°) at
5000 Hz and consisting equally of resistive and capacitive components at 1000 Hz.
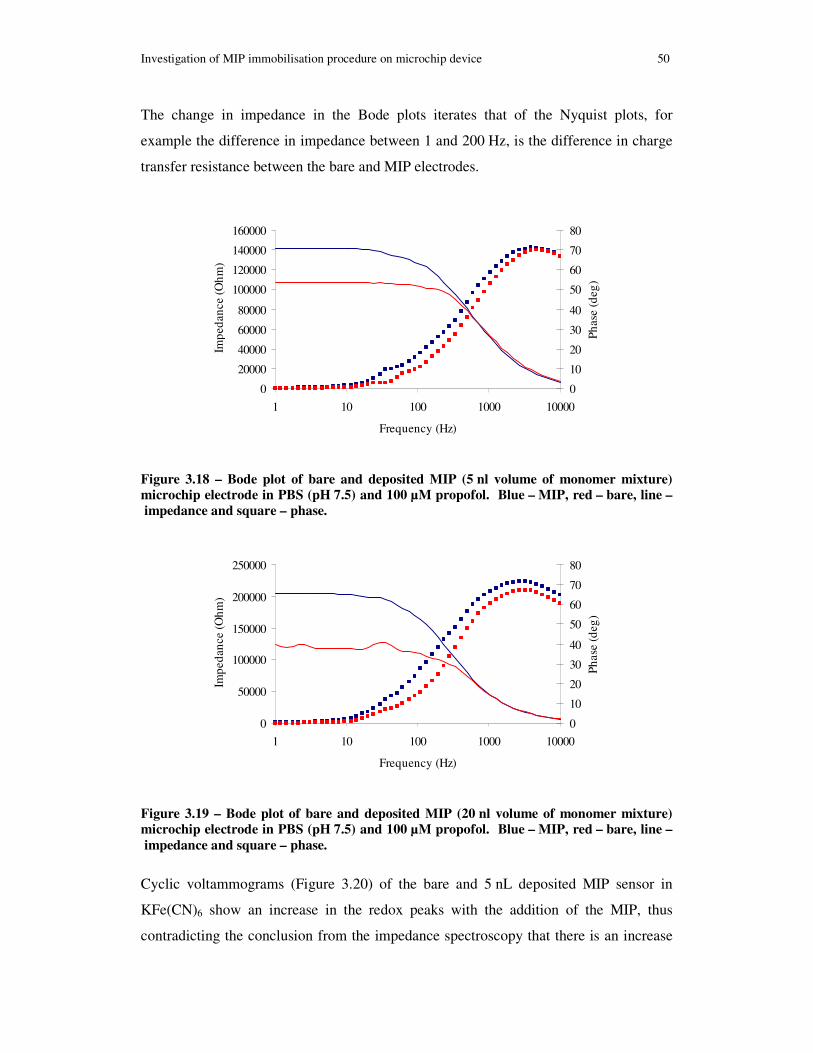
Investigation of MIP immobilisation procedure on microchip device 50
The change in impedance in the Bode plots iterates that of the Nyquist plots, for
example the difference in impedance between 1 and 200 Hz, is the difference in charge
transfer resistance between the bare and MIP electrodes.
0
20000
40000
60000
80000
100000
120000
140000
160000
1 10 100 1000 10000
Frequency (Hz)
Impe
danc
e (O
hm)
0
10
20
30
40
50
60
70
80
Phas
e (d
eg)
Figure 3.18 – Bode plot of bare and deposited MIP (5 nl volume of monomer mixture)
microchip electrode in PBS (pH 7.5) and 100 µM propofol. Blue – MIP, red – bare, line –
impedance and square – phase.
0
50000
100000
150000
200000
250000
1 10 100 1000 10000
Frequency (Hz)
Impe
danc
e (O
hm)
0
10
20
30
40
50
60
70
80
Phas
e (d
eg)
Figure 3.19 – Bode plot of bare and deposited MIP (20 nl volume of monomer mixture)
microchip electrode in PBS (pH 7.5) and 100 µM propofol. Blue – MIP, red – bare, line –
impedance and square – phase.
Cyclic voltammograms (Figure 3.20) of the bare and 5 nL deposited MIP sensor in
KFe(CN)6 show an increase in the redox peaks with the addition of the MIP, thus
contradicting the conclusion from the impedance spectroscopy that there is an increase

Investigation of MIP immobilisation procedure on microchip device 51
in the charge transfer resistance. There is also no difference in the voltammogram when
propofol is introduced to the test solution.
-600
-400
-200
0
200
400
600
-1.0 -0.5 0.0 0.5 1.0 1.5E (V) vs Ag/AgCl
i (nA
)
Figure 3.20 – Cyclic voltammetry (50 mVs-1
) of bare and deposited MIP (5 nl volume of
monomer mixture) microchip electrode. Blue – bare in PBS, red – MIP in PBS and
green – MIP in propofol.
The cyclic voltammograms (Figure 3.21) of the bare electrode used for the 20 nL
deposition had a considerably higher redox peak than the electrodes used for the 5 nL
deposition and the addition of the MIP caused a slight decrease in the current. The
addition of propofol to the 20 nL deposited MIP caused a decrease in the current of the
sensor, however this was only seen on one sensor.
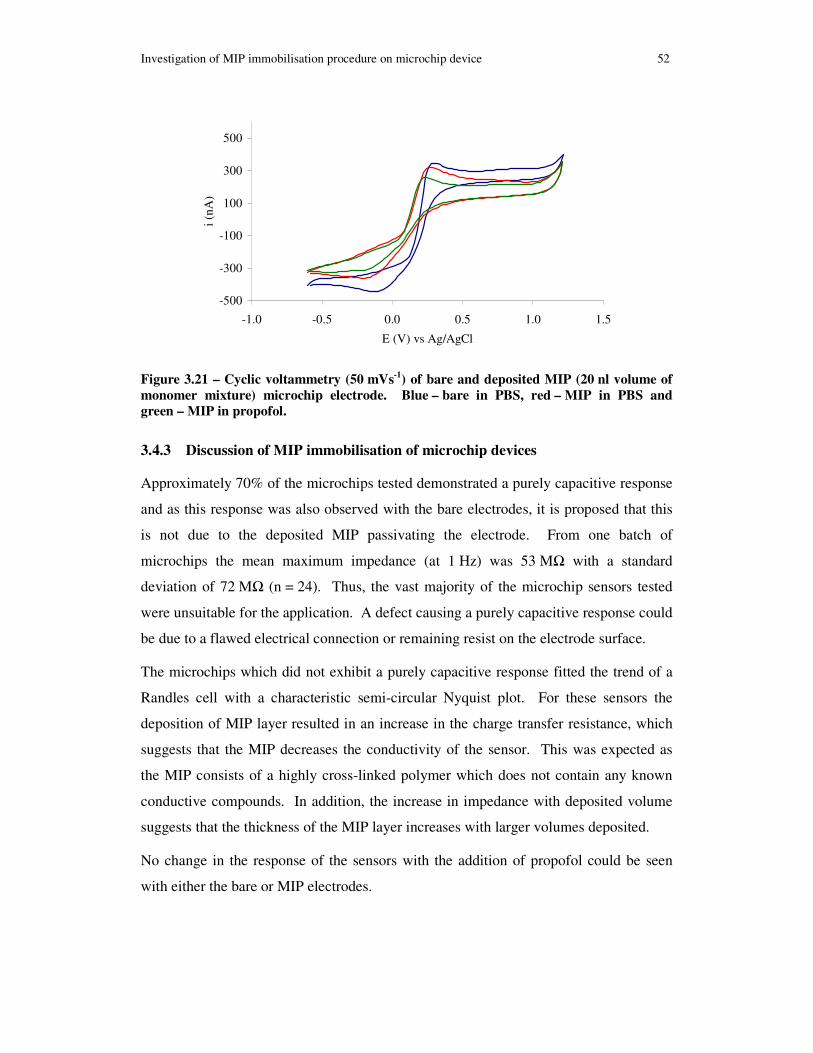
Investigation of MIP immobilisation procedure on microchip device 52
-500
-300
-100
100
300
500
-1.0 -0.5 0.0 0.5 1.0 1.5
E (V) vs Ag/AgCl
i (nA
)
Figure 3.21 – Cyclic voltammetry (50 mVs-1
) of bare and deposited MIP (20 nl volume of
monomer mixture) microchip electrode. Blue – bare in PBS, red – MIP in PBS and
green – MIP in propofol.
3.4.3 Discussion of MIP immobilisation of microchip devices
Approximately 70% of the microchips tested demonstrated a purely capacitive response
and as this response was also observed with the bare electrodes, it is proposed that this
is not due to the deposited MIP passivating the electrode. From one batch of
microchips the mean maximum impedance (at 1 Hz) was 53 MΩ with a standard
deviation of 72 MΩ (n = 24). Thus, the vast majority of the microchip sensors tested
were unsuitable for the application. A defect causing a purely capacitive response could
be due to a flawed electrical connection or remaining resist on the electrode surface.
The microchips which did not exhibit a purely capacitive response fitted the trend of a
Randles cell with a characteristic semi-circular Nyquist plot. For these sensors the
deposition of MIP layer resulted in an increase in the charge transfer resistance, which
suggests that the MIP decreases the conductivity of the sensor. This was expected as
the MIP consists of a highly cross-linked polymer which does not contain any known
conductive compounds. In addition, the increase in impedance with deposited volume
suggests that the thickness of the MIP layer increases with larger volumes deposited.
No change in the response of the sensors with the addition of propofol could be seen
with either the bare or MIP electrodes.

Conclusions on the conductometric detection of propofol 53
3.4.4 Conclusion of MIP immobilised on microchip device
Due to the inconsistencies with the microchip devices it is difficult to draw conclusions
from this investigation regarding the detection of propofol. However, the necessity for
a reliable and reproducible device that is capable of undergoing the polymerisation
conditions has proved to be a significant challenge that must be overcome.
3.5 Conclusions on the conductometric detection of propofol
By taking the previously developed MIP composition and immobilising it onto a
commercial sensor platform, the detection of propofol using impedance monitoring
shows promise. Also, the simplicity of the impedance monitoring, as it does not require
the oxidation or reduction of the target analyte, could resolve problems previously
experienced by Sphere Medical and Cranfield University.
However, the microchip sensor platform in development at Sphere Medical was
unreliable in its performance and lacked reproducibility when it did perform. This
unfortunately renders most of results speculative at best. Therefore, the problems
created by the microchip platform must be resolved before any further studies can be
performed with them.

54
Chapter 4 - Developing a molecularly imprinted polymer for
the detection of antibiotics
“I have not failed. I've just found 10,000 ways that won't work.” (attributed) Thomas
A. Edison (1847 - 1931)
4.1 Introduction
The following investigation shows the selection of an antibiotic as a template for the
development of molecularly imprinted polymers. This included the computational
design of a MIP by the selection of functional monomers which are able to bind
strongly to the antibiotic. These designed MIP are then synthesised and experimentally
tested to find an initial optimal pre-polymerisation mixture. This initial mixture was
immobilised onto Sphere Medical’s microchip electrodes and polymerised to form a
MIP layer. Subsequently, the possibility for electrochemical detection of the chosen
antibiotic was then investigated.
4.2 Selection of antibiotic for development in MIP based sensor
Several antibiotics were proposed for use in a MIP based sensor by a panel of medical
professionals based on the need for their detection and monitoring in an intensive care
environment. Out of these antibiotics one was selected as the best candidate for the
sensor. This selection was based on factors, such as the design and production of the
molecular imprinted polymer (MIP) that will be immobilised on Sphere Medical’s
electrochemical microchip platform to allow selective detection. The following
explains the justification for the antibiotic selection.
4.2.1 Review of MIP design
Initial methodologies at better understanding the assembly of MIPs were based on
thermodynamic modelling (Nicholls, 1998). These studies focused on the energetic
properties of the template-monomer complex. From this modelling five key points were

Selection of antibiotic for development in MIP based sensor 55
derived: I) the more monomers required to form the complex, the less stable the
complex will be, II) the fewer conformations the template can undertake, the better the
definition of the recognition sites, III) the stronger the complex interaction, the more
stable the pre-polymerisation complexes are, IV) the hydrophilic and hydrophobic
interactions between the template and monomers can further influence the stability of
the complex and V) the equilibrium between template and monomer in forming the
complexes will determine the number and heterogeneity of the binding sites.
Other approaches to MIP design involve the use of combinatorial techniques in the hunt
for the best possible MIP. These combinatorial approaches have been semi-automated
and are capable of producing and screening libraries of imprinted polymers (Batra and
Shea, 2003). Not only can they be used to vary the type and concentration of templates
and monomers but also the porogens and cross-linkers can be varied. However, the
most valued benefit of using a combinatorial approach is being able to find unexpected
template-monomer combinations that could not be predicted based on current models
and understanding. Another approach is using chemometrics to take existing
experimental data to help predict possible optimised solutions. Davies and co-workers
(Davies et al., 2004) found this methodology to be useful, especially in optimising
template : monomer : cross-linker ratios, and they also predicted that if used in
combination with a combinatorial method, it could prove very effective.
Despite the fundamental understanding that a thermodynamic approach gives and the
possibility of discovering an ideal MIP that the combinatorial approach offers, neither
of these approaches really ‘design’ a MIP. However, this can be achieved by
computationally modelling of the template-monomer complex to evaluate the best MIP
components.
One of the first methodologies developed for the computational design of MIP was
proposed by Piletsky and co-workers (Piletsky et al., 2001, Subrahmanyam et al., 2001,
Chianella et al., 2006). Their approach was to screen a library of monomers against a
target template and calculate a binding score representing the strength of the complex
formed. This resulted in a ranking of the strongest binding monomers. Using one or
more of the strongest binding monomers, at a time the template was modelled, in a
solution of the monomer, an annealing process was simulated using a dynamics

Selection of antibiotic for development in MIP based sensor 56
package. This predicted the possible template-monomer complex that could form in the
pre-polymerisation solution. This computational methodology forms the foundation of
further MIP design (Wu and Li, 2004, Dong et al., 2005, Liu et al., 2007), with other
software and similar models being implemented to assess the strength of template-
monomer complexes. The most recent advances include the selection and modelling of
porogen (Yao et al., 2008) and cross-linker (Wei et al., 2006) at the same time as the
template-monomer complex.
Another promising approach is the use of NMR to study the pre-polymerised template-
monomer complexes. O’Mahony and co-workers (O'Mahony et al., 2005, O'Mahony et
al., 2006) used this technique and concluded that I) hydrophobic binding leads to higher
binding affinities, II) the templates shape, size and functionality influence MIP
performance, III) the interaction between the monomer and porogen can have a
considerable effect of the MIP performance and IV) more stable complexes give better
selectivity. These points further iterating the conclusions from the thermodynamic
analysis.
Finally, the most successful approach to modelling seems to stem from combining
computational modelling with NMR analysis (Salvador et al., 2007, Farrington and
Regan, 2007). In particular, an iterative process where the computational models of the
pre-polymerisation complexes can be validated using the NMR and the data from the
NMR can be used to refine the computational models, resulted in successfully designed
MIP.
4.2.2 Overview of the proposed antibiotics
The following is a review of three antibiotics initially proposed for this study,
specifically considering their electrochemical detection and the properties required for
MIP production.
4.2.2.1 Metronidazole
Metronidazole is a one of many 5-nitroimidazole drugs that have antibiotic properties.
Their biological action is caused by derivatives, formed by its reduction, which oxidise
DNA, resulting in the DNA becoming damaged (Oliveira Brett et al., 1997b). This
action leads to in metronidazole and its metabolites being suspected to be carcinogens

Selection of antibiotic for development in MIP based sensor 57
and mutagens (Mohamed et al., 2008). Due to the biological action requiring the
reduction of metronidazole, several studies (Oliveira Brett et al., 1997a, Ozkan et al.,
1998, Lu et al., 2004, Mandal, 2004, La-Scalea et al., 1999) have been conducted into
its complex electrochemistry which involves 6 electrons reducing the nitro group (R-
NO2) to an amine derivative (R-NH2) via a hydroxylamine (R-NHOH), see Figure 4.1.
The electrochemical detection of metronidazole has been successfully investigated on
several transducer platforms. However, the most used platform is a glassy carbon
electrode with a limit of detection of 20 µM (Zhi et al., 1998), which with an intensive
surface activation (Ozkan et al., 1998) was increased to 2 µM and was further improved
to 10 nM by adding an accumulation stage (Wang et al., 1993). By modifying a glassy
carbon surface with carbon nanotubes (Lu et al., 2004) the detection limit has been
further improved to 9 nM.
N
N
CH2CH2OH
CH3O2N
N
N
CH2CH2OH
CH3ON2e
2e
N
N
CH2CH2OH
CH3HOHN
N
N
CH2CH2OH
CH3H2N
2e
Figure 4.1 – Illustration of the complex metonidazole reduction.
Investigations into a selective component for the detection of metronidazole include
using a metalloporphyrin incorporated into a carbon paste electrode as a recognition
element (Gong et al., 2003). This had a limit of detection of 58 nM using amperometric
detection with a satisfactory rejection of interfering compounds. Other selective
detection (Mohamed et al., 2008) involved a MIP created by MIP Technologies using a
template that was an analogue of 5-nitroimidazoles. The detection of several 5-
nitroimidazoles, including metronidazole, in egg powder was investigated using solid
phase extraction (SPE) with mass spectroscopy (MS) detection. This methodology was
accurate, sensitive and reproducible to comply with the EU criteria.
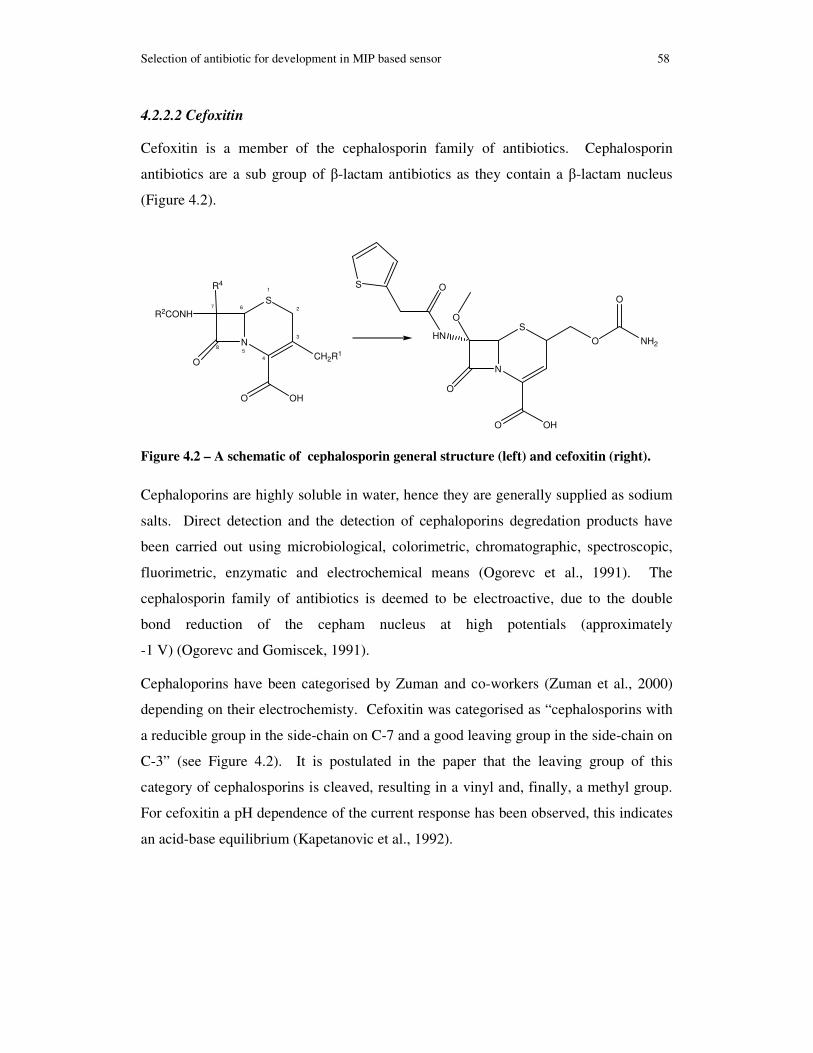
Selection of antibiotic for development in MIP based sensor 58
4.2.2.2 Cefoxitin
Cefoxitin is a member of the cephalosporin family of antibiotics. Cephalosporin
antibiotics are a sub group of β-lactam antibiotics as they contain a β-lactam nucleus
(Figure 4.2).
4
3
2
S
1
7
8N5
6
R2CONH
R4
OCH2R1
S
N
O
O
HN
O OH
OS
O NH2
O
O OH
Figure 4.2 – A schematic of cephalosporin general structure (left) and cefoxitin (right).
Cephaloporins are highly soluble in water, hence they are generally supplied as sodium
salts. Direct detection and the detection of cephaloporins degredation products have
been carried out using microbiological, colorimetric, chromatographic, spectroscopic,
fluorimetric, enzymatic and electrochemical means (Ogorevc et al., 1991). The
cephalosporin family of antibiotics is deemed to be electroactive, due to the double
bond reduction of the cepham nucleus at high potentials (approximately
-1 V) (Ogorevc and Gomiscek, 1991).
Cephaloporins have been categorised by Zuman and co-workers (Zuman et al., 2000)
depending on their electrochemisty. Cefoxitin was categorised as “cephalosporins with
a reducible group in the side-chain on C-7 and a good leaving group in the side-chain on
C-3” (see Figure 4.2). It is postulated in the paper that the leaving group of this
category of cephalosporins is cleaved, resulting in a vinyl and, finally, a methyl group.
For cefoxitin a pH dependence of the current response has been observed, this indicates
an acid-base equilibrium (Kapetanovic et al., 1992).
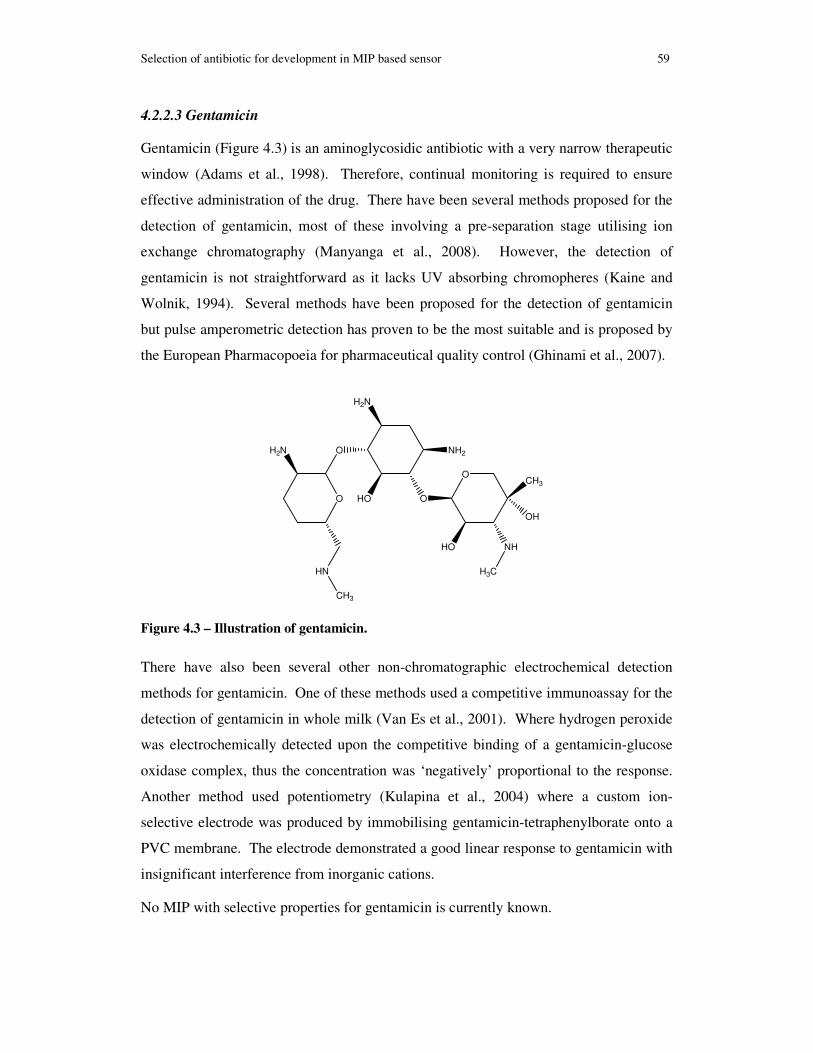
Selection of antibiotic for development in MIP based sensor 59
4.2.2.3 Gentamicin
Gentamicin (Figure 4.3) is an aminoglycosidic antibiotic with a very narrow therapeutic
window (Adams et al., 1998). Therefore, continual monitoring is required to ensure
effective administration of the drug. There have been several methods proposed for the
detection of gentamicin, most of these involving a pre-separation stage utilising ion
exchange chromatography (Manyanga et al., 2008). However, the detection of
gentamicin is not straightforward as it lacks UV absorbing chromopheres (Kaine and
Wolnik, 1994). Several methods have been proposed for the detection of gentamicin
but pulse amperometric detection has proven to be the most suitable and is proposed by
the European Pharmacopoeia for pharmaceutical quality control (Ghinami et al., 2007).
O
HN
CH3
H2N O
H2N
HO
NH2
O
O
HO
CH3
OH
NH
H3C
Figure 4.3 – Illustration of gentamicin.
There have also been several other non-chromatographic electrochemical detection
methods for gentamicin. One of these methods used a competitive immunoassay for the
detection of gentamicin in whole milk (Van Es et al., 2001). Where hydrogen peroxide
was electrochemically detected upon the competitive binding of a gentamicin-glucose
oxidase complex, thus the concentration was ‘negatively’ proportional to the response.
Another method used potentiometry (Kulapina et al., 2004) where a custom ion-
selective electrode was produced by immobilising gentamicin-tetraphenylborate onto a
PVC membrane. The electrode demonstrated a good linear response to gentamicin with
insignificant interference from inorganic cations.
No MIP with selective properties for gentamicin is currently known.
Antibiotic selection 60
4.3 Antibiotic selection
The antibiotic drug was selected based on its suitability for detection and MIP
production. This is divided into two different aspects: firstly, the ability of the antibiotic
to bind to monomers resulting in the pre-polymerisation monomer-template complex.
Secondly, the solubility of the antibiotics in a low polarity solvent is desirable because
this results in less competition during the formation of the monomer-template complex.
4.3.1 Methodologies for antibiotic selection
4.3.1.1 Computational analysis of antibiotic-monomer binding
To assess the functionality and reduce the number of possible monomers to be assessed
in the synthesis of a MIP, the binding strength between the antibiotics and a library of
monomers was computationally assessed. This was achieved using the Leapfrog
algorithm (SybylTM 7.3, Tripos Inc.) to iterate through many possible antibiotic-
monomer binding configurations and allocating a binding score; the higher the binding
score the stronger the complex. The monomers were selected from a library of well-
known, commercially available, monomers which have been used extensively in
previous MIP developments.
4.3.1.2 Antibiotic solubility testing
To test the solubility of the antibiotics, a known mass of the antibiotic was added to a
known mass of solvent and the solubility was visually assessed. To help the antibiotic
dissolve, both mechanical stirring and heating, to a maximum of 50oC, was applied
where appropriate. A general rule for the mass of porogen/solvent and template are
50% and 1% of the total mass, respectively, for a MIP. However, as there needs to be
room for optimisation and an allowance for the monomer to be dissolved in the solution,
a ratio of 2:50 was deemed the minimum requirement for the solubility testing.
4.3.1.2.1 Crown ethers for increasing cefoxitin solubility
Crown ethers are heterocyclic compounds that have a high affinity for certain cations
depending of the size of the cation and the size of the crown ether’s ‘cavity’. Due to the
ring of oxygen atoms, crown ethers act like a Lewis base with extremely strong binding
to the cation, which neutralises the cations charge. The non-polar cation complex is

Antibiotic selection 61
thus soluble in non-polar solvents and, to maintain neutrality, the anion should be
soluble.
By using 15-crown-5 to neutralise the sodium ion supplied in the cefoxitin salt,
cefoxitin should therefore become more soluble in less polar solvents.
4.3.2 Results of antibiotic selection
4.3.2.1 Computational binding analysis of template-monomer binding
The computational binding analysis (Table 4.1) shows that gentamicin has the highest
mean binding score when compared to the other two antibiotics, with cefoxitin being
second. The strongest monomer binding scores for gentamicin and cefoxitin are for
charged monomers. This behaviour is to be expected as both antibiotics have either
polar or charged chemical groups, respectively.
Table 4.1 – Table of top five computationally calculated monomers with the strongest
binding for metronidazole, gentamicin and cefoxitin. Value in brackets is the binding score
(Kcal/mol). (DEAEM – 2-diethylaminoethyl methacrylate, EGMP – ethylene glycol
methacrylate phosphate, VP – vinylpyridine, AMPSA – 2-acrylamido-2-methyl-1-
propanesulphonic acid).
Monomer binding to: Metronidazole Gentamicin Cerfoxitin
Highest binding score DEAEM+ (-58) DEAEM+ (-263) EGMP- (-53)
Bisacrylamide (-33) 4-VP+ (-77) AMPSA (-40)
EGMP (-31) EGMP (-76) Itaconic acid (-36)
Acrlyamide (-29) 2-VP+ (-59) EGMP (-36)
Lowest binding score Itaconic acid (-24) Itaconic acid (-51) Itaconic acid- (-35)
The binding of DEAEM+ to metronidazole and gentamicin is illustrated in Figure 4.4
and Figure 4.5 respectively. For metronidazole and gentamicin, the hydrogen bonding
(blue dashed line) is both between the extra proton on the protonated DEAEM and the
amino group, which is probably due to the negative charge of the lone pair of electrons.
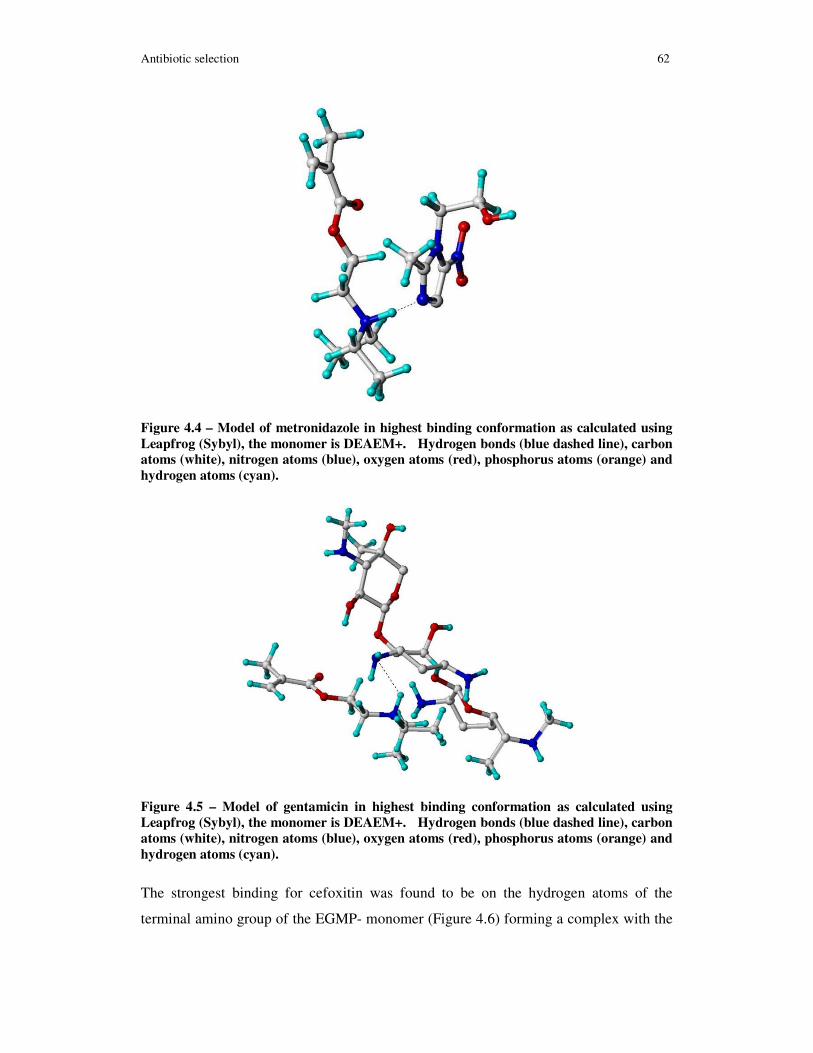
Antibiotic selection 62
Figure 4.4 – Model of metronidazole in highest binding conformation as calculated using
Leapfrog (Sybyl), the monomer is DEAEM+. Hydrogen bonds (blue dashed line), carbon
atoms (white), nitrogen atoms (blue), oxygen atoms (red), phosphorus atoms (orange) and
hydrogen atoms (cyan).
Figure 4.5 – Model of gentamicin in highest binding conformation as calculated using
Leapfrog (Sybyl), the monomer is DEAEM+. Hydrogen bonds (blue dashed line), carbon
atoms (white), nitrogen atoms (blue), oxygen atoms (red), phosphorus atoms (orange) and
hydrogen atoms (cyan).
The strongest binding for cefoxitin was found to be on the hydrogen atoms of the
terminal amino group of the EGMP- monomer (Figure 4.6) forming a complex with the

Antibiotic selection 63
deprotonated oxygen atoms surrounding the phosphorous atom. This should be
compared to the EGMP cefoxitin complex (Figure 4.7), where only one of the
hydrogen’s of the terminal amino group belonging to cefoxitin forms the complex with
the neutral EGMP monomer.
Figure 4.6 – Model of cefoxitin in highest binding conformation as calculated using
Leapfrog (Sybyl), the monomer is EGMP-. Hydrogen bonds (blue dashed line), carbon
atoms (white), nitrogen atoms (blue), oxygen atoms (red), phosphorus atoms (orange) and
hydrogen atoms (cyan).
Figure 4.7 – Model of cefoxitin in a binding conformation as calculated using Leapfrog
(Sybyl), the monomer is EGMP. Hydrogen bonds (blue dashed line), carbon atoms
(white), nitrogen atoms (blue), oxygen atoms (red), phosphorus atoms (orange) and
hydrogen atoms (cyan).

Antibiotic selection 64
4.3.2.2 Antibiotic solubility
Gentamicin was insoluble in both DMF and acetonitrile, despite heating and long
periods of sonication. Metronidazole and cefoxitin both dissolve in the desired
quantities in DMF, although cefoxitin required the assistance of crown ether to achieve
this. None of the antibiotics met the 2:50 ratio set for MIP production in acetonitrile
(Figure 4.8), although metronidazole was not far from this goal and could possibly be
used for making a MIP.
0.0%0.2%0.4%
0.6%0.8%
1.0%
1.2%1.4%
1.6%1.8%2.0%
Metronidazole Cefoxitin Cefoxitin +Crown Ether
Gentamycin
Perc
enta
ge o
f tot
al M
IP m
ass
Figure 4.8 – Solubility of metronidazole, cefoxitin and gentamicin in DMF (blue) and
acetonitrile (red) expressed as a percentage of total MIP mass.
4.3.3 Discussion of antibiotic and monomer selection
From the modelling of the antibiotics, gentamicin has the strongest binding to the
monomers by nearly a factor of five. This is probably due to the large number of
functional groups within the compound. However, these groups also cause a large
quantity of distributed charge around the compound, which would explain why it would
not dissolve in DMF or acetonitrile. Even attempts to extract the gentamicin to its
freebase, with aqueous-organic liquid-to-liquid extraction, failed as the gentamicin did
not dissolve in the immiscible solvent. The large number of functional groups could
also cause significant non-specific binding of gentamicin to a polymer.
Cefoxitin demonstrated fairly strong binding to the monomers in the database and, like
gentamicin, it demonstrated strong binding to charged monomers. This is expected as it

Computational design and testing of MIP with selective properties for metronidazole 65
is a charged molecule itself. This was also reflected in the solubility of cefoxitin in both
DMF and acetonitrile as it was only slightly soluble in DMF. The use of crown ether to
form a complex with the sodium ions of the cefoxitin salt improved its solubility in
DMF considerably and enabled a little cefoxitin to be dissolved in acetonitrile, but not
enough to be useful for MIP production.
The binding strength of the monomers to metronidazole was very similar to cefoxitin.
However, the preferred monomers for complex formation with metronidazole were
neutrally charged. This is different to the other antibiotics but which was expected due
to the neutral nature of metronidazole. Unlike the other antibiotics, metronidazole was
highly soluble in DMF and is considered to be soluble enough in acetonitrile for MIP
production.
4.3.4 Conclusion of antibiotic selection
Two key areas were highlighted for the production of a MIP, I) the ability for forming
an antibiotic-monomer complex and II) the solubility of the antibiotic in low polarity
solvents. From the investigations undertaken metronidazole was chosen as the best
candidate for further investigation. It has a high solubility in acetonitrile and DMF, its
ability to form a pre-polymerisation complex is acceptable and the numerous
electrochemical studies within the literature show great promise for its detection on
Sphere Medical’s microchip sensor.
4.4 Computational design and testing of MIP with selective
properties for metronidazole
In order to assess the monomer-antibiotic interaction experimentally, a non-imprinted
polymer (NIP) was synthesised based on the strong binding monomers from the initial
computational modelling (Section 4.3.1.1). Also, the monomer-template complex was
computationally modelled to predict a possible monomer-template ratio which should
be used to synthesise the MIP and to compare its performance with respect to a
corresponding NIP.
4.4.1 Investigatory techniques
All consumables were supplied by Sigma-Aldrich unless stated otherwise.

Computational design and testing of MIP with selective properties for metronidazole 66
4.4.1.1 Bulk polymer testing
The experimental testing of the bulk polymer was conducted using standard solid phase
extraction (SPE) techniques with UV spectroscopy to measure the extracted solutions.
The specific polymerisation solutions are stated in Table 4.2 and Table 4.3.
4.4.1.1.1 Polymer mixture
The polymerisation mixtures (Table 4.2) are based on general MIP quantities by mass
with the quantity of monomer adjusted in each mixture so that all the mixtures have the
same monomer concentration. Different monomers can be considered to have a greater
number of functional groups than others, thus it is more likely for them to bind to the
template than monomers with less functionality. The monomers with extra functionality
are considered to be EGMP, bisacrylamide and itaconic acid. To fairly assess the
binding of these monomers to the template, it was assumed that these monomers have
twice the functionality, thus they could have two possible binding sites. So, the
polymer was tested with half the standard quantity of monomer for comparison to the
monomers with a proposed functionality of one.
Table 4.2 – Table of NIP compositions for highest binding monomers from computational
analysis (monomer : cross-linker, 1:4.2). Initiator – 2-2-dimethoxy-2-phenylacetopenon,
cross-linker – EGDMA, porogen – DMF.
Mass (g) EGMP Acrylamide Bisacrylamide Itaconic acid DEAEM
Proposed functionality 1 2 1 1 2 1 2 1
Initiator 0.1 0.1 0.1 0.1 0.1 0.1 0.1 0.1
Cross-linker 4 4 4 4 4 4 4 4
Monomer 1 0.5 0.3 0.7 0.4 0.6 0.3 0.9
Porogen 4.9 5.4 5.6 5.2 5.5 5.3 5.6 5.0
Monomer : cross-linker 4.2 8.5 4.2 4.2 8.5 4.2 8.5 4.2
4.4.1.1.2 Polymer preparation
The polymerisation solutions were prepared in small glass vials and degassed with
nitrogen for 10 minutes. They were then sealed and placed in a UV chamber (Hönle

Computational design and testing of MIP with selective properties for metronidazole 67
100, Hönle UV, UK) for 20 minutes to polymerise. Following this, the vials were
placed in an oil bath at 80°C for 18 hours to finish the polymerisation. The solid
polymer was then ground using a milling machine (Ultra Centrifugal Mill ZM 200,
Retsch, DE) and wet sieved in methanol. Particles between 63 to 106 µM were
collected for the SPE.
4.4.1.1.3 Solid phase extraction
The SPE cartridges were packed with 100 mg of polymer and the binding experiments
were carried out using a vacuum manifold. All cartridges were washed using 250 mM
HCl with 50% methanol, then deionised water and finally 100 mM NaOH with 50%
methanol followed again by deionised water. The cartridges were then preconditioned
using phosphate buffer saline (PBS) (pH 7.5) and UV spectrometry was used to test for
any interfering substances. This cleaning procedure was repeated a minimum of three
times or until no interfering substances could be seen by UV.
4.4.1.1.4 Binding capacity
To test the binding capacity, 1 mL of metronidazole (50 µM in PBS, pH 7.5) was
repeatedly passed through the cartridge and the UV absorbance of metronidazole was
measured at 320 nm. This was repeated until the measured absorbance was over 50% of
the maximum absorbance, i.e. the solution was greater than 25 µM; this is defined as the
50% breakthrough point and was calculated by linear interpolation for the comparison
of polymer performance. The comparison between the NIP and MIP is expressed in
term of an imprinting factor; this being the division of MIP / NIP. Thus it represents the
capacity factor of the MIPs with respect to the NIPs.
4.4.1.2 Computational annealing
To predict the ratio of monomer-template complex a dynamics package is used within
Sybyl to simulate an annealing process. The template is surrounded by a solvated
monomer and an annealing process is achieved by stepping the temperature from 600 K
to 300 K in 100 K steps. At the end of the process the position and interaction of the
monomers with the template is assessed and a picture of the pre-polymerisation
complex is obtained.

Computational design and testing of MIP with selective properties for metronidazole 68
4.4.2 Result of MIP design and testing
4.4.2.1 Experimental analysis of metronidazole temple-monomer binding
The top five monomers that demonstrated strongest binding to metronidazole were
experimentally tested using a SPE extraction technique, the results of which can be seen
in Figure 4.9.
0.0
1.0
2.0
3.0
4.0
Acrylam
ide
Bisacry
lamide
DEAEMEGM
P
Itaco
nic ac
id
Vol
ume
(mL
)
Figure 4.9 – Volume of metronidazole (50 µL) at 50% breakthrough of the SPE cartridge.
Standard NIP mixture (blue) and NIP mixture with assumed extra functionality (red) as
explained below.
The 50% breakthrough of the NIP shows that DEAEM has the highest binding capacity
to metronidazole. This is consistent with the computational modelling. However, in
comparison to the other NIPs it was not significantly greater. The bisacrylamide and
EGMP NIP and the acrylamide and itaconic acid NIP have similar breakthrough
volumes. This is also consistent with the model. However, itaconic acid and
acrylamide have greater breakthrough volumes than bisacrylamide and EGMP. This is
not predicted the modelling.

Computational design and testing of MIP with selective properties for metronidazole 69
0%
5%
10%
15%
20%
25%
30%
35%
Acrlyam
ide
Bisacry
lamide
DEAEMEGM
P
Itaco
nic A
cid
% b
ound
Figure 4.10 – Percentage of uric acid (50 µL) bound to the SPE cartridge. Standard NIP
mixture (blue) and NIP mixture with assumed extra functionality (red).
The reduction in monomer concentration, as a result of assuming a functionality of 2,
caused an increase in the binding capacity in all the three cases. It particularly had a
large increase in the binding capacity for bisacrylamide, increasing the capacity by a
factor of 1.6.
It is foreseen that the antibiotic will be detected using electrochemical techniques in a
biological fluid. Two of the worst electrochemically interfering compounds are
ascorbic and uric acid, hence both of these materials were tested to see how they bind to
the NIP (Figure 4.10 and Figure 4.11). Ascorbic acid binds to all of the NIPs. However,
both EGMP and itaconic acid seem to reject ascorbic acid better than the other NIPs.
Excluding DEAEM, the binding of uric acid to the NIP was far less, with EGMP and
itaconic acid giving very good rejection.

Computational design and testing of MIP with selective properties for metronidazole 70
0%
5%
10%
15%
20%
25%
30%
35%
Acrlyam
ide
Bisacry
lamide
DEAEMEGM
P
Itaco
nic A
cid
% b
ound
Figure 4.11 – Percentage of ascorbic acid (50 µL) bound to the SPE cartridge. Standard
NIP mixture (blue) and NIP mixture with assumed extra functionality (red).
4.4.2.2 Computational modelling of monomer-template complex
The predicted monomer-template complex using either EGMP or itaconic acid
monomers with a metronidazole template are shown in Figure 4.12 and Figure 4.13,
respectively. Both complexes show that two monomers can bind to the metronidazole
template to form the complex. In both cases the bonds were formed between the polar
hydroxyl group and the double bonded nitrogen within the aromatic ring of the
metronidazole template.
Figure 4.12 – Predicted monomer-template complex showing a binding ratio for
metronidazole : EGMP of 1:2. Hydrogen bonds (blue dashed line), carbon atoms (white),
nitrogen atoms (blue), oxygen atoms (red), phosphorus atoms (orange) and hydrogen
atoms (cyan).

Computational design and testing of MIP with selective properties for metronidazole 71
Figure 4.13 – Predicted monomer-template complex showing a binding ratio for
metronidazole : itaconic acid of 1:2. Hydrogen bonds (blue dashed line), carbon atoms
(white), nitrogen atoms (blue), oxygen atoms (red), phosphorus atoms (orange) and
hydrogen atoms (cyan).
4.4.2.3 Experimental analysis of MIP for the selective binding of metronidazole
The composition of the MIP synthesised using EGMP and itaconic acid to selectively
bind metronidazole can be seen in Table 4.3. The synthesised MIP, assuming normal
functionality, gave a slightly higher binding capacity but nothing that could be
considered as a vast improvement compared to the NIP. However, the synthesised MIP,
assuming twice the functionality, hence half the monomer content, gave a significantly
higher binding capacity and resulted in a imprinting factor around 1.4.
0.00
0.50
1.00
1.50
EGMP EGMP' ItaconicAcid
ItaconicAcid'
ItaconicAcid''
Impr
inti
ng fa
ctor
Figure 4.14 – Imprinting factor at 50% breakthrough. Monomer : template ratio; 1:2
(blue), 1:3 (green) and 1:4 (red). Predicted functional groups: 1 – X, 2 – X’ and 3 – X’’.

Computational design and testing of MIP with selective properties for metronidazole 72
These better MIPs were also investigated with a monomer : template ratio of 1:3 to
attain a better understanding of how this ratio affects the trend in imprinting factor
(Figure 4.14). For EGMP a monomer : template ratio of 1:3 gave the highest imprinting
factor, which suggests that the optimal ratio is around 1:3. However, for itaconic acid
there was a decrease in imprinting with an increasing ratio, this suggesting that a ratio of
1:2 is more optimal.
To see if there was a trend with modelling greater monomer functionality, itaconic acid
was modelled with having a functionality of 3. However, this led to a decrease in
binding capacity.

Computational design and testing of MIP with selective properties for metronidazole 73
Table 4.3 – Table of MIP compositions based on EGMP and itaconic acid monomers for the selective binding of metronidazole. Initiator –
AIBN, cross-linker – EGDMA, porogen – DMF.
EGMP Itaconic Acid
Proposed functionality 1 1 2 2 2 1 1 2 2 2 3 3
Template : monomer 1:2 1:4 1:2 1:3 1:4 1:2 1:4 1:2 1:3 1:4 1:2 1:4
Mass (g) Mass (g)
Initiator 0.1 0.1 0.1 0.1 0.1 0.1 0.1 0.1 0.1 0.1 0.1 0.1
Cross-linker 4 4 4 4 4 4 4 4 4 4 4 4
Monomer 1 1 0.5 0.5 0.5 0.62 0.62 0.62 0.31 0.31 0.21 0.21
Template 0.41 0.2 0.41 0.27 0.2 0.41 0.2 0.41 0.27 0.2 0.41 0.2
Porogen 4.9 4.9 5.4 5.4 5.4 5.28 5.28 5.59 5.59 5.59 5.59 5.59
Template : Monomer : Cross-linker 1:2:8.5 1:4:17 2:2:17 1:1.5:12.7 1:2:17 1:2:8.5 1:4:17 2:2:17 1:1.5:12.7 1:2:17 1:0.7:8.5 1:1.3:17

Computational design and testing of MIP with selective properties for metronidazole 74
4.4.3 Discussion of MIP design and testing
Following the successful solubility testing, the top monomers from the modelling were
synthesised and experimentally tested. DEAEM was found to be the highest binding
monomer which is consistent with the modelling. The other monomers had similar
break-though capacities, which is consistent with the small range of binding energies
seen in the computational investigation. However, the order of binding strength
between the experimental and computation investigation varied.
The computational modelling of the monomer-template complex showed that the
binding of two monomers to metronidazole was very similar. Both bound with a 1:2
ratio and to the same constituents within the metronidazole structure.
The MIP was initially synthesised with a template : monomer ratio of 1:2 as this was
predicted from the modelling. Most of the MIP tested performed with a similar binding
capacity to that of the NIP, apart from those produced with an assumed functionality of
2, which demonstrated a superior imprinting factor. The MIP with a functionality of 2
effectively has a lower template to monomer ratio. Their increase in performance could
be due to a reduction in non-specific binding which previously masked the selective
response of the MIP with higher template to monomer ratios.
4.4.4 Conclusion
The successful design and testing of MIP has shown that by the screening of monomers,
computational modelling of the monomer-template complex and experimental MIP
testing, a MIP with an increased binding capacity for metronidazole can be synthesised.
This MIP uses itaconic acid as its functional monomer with a template : monomer :
cross-linker ratio of 2:2:17. Although, this may not be an optimal MIP composition for
the detection of metronidazole on a transducer. However, this is a good starting point
for MIP immobilisation experiments allowing for more efficient optimisation and
testing to proceed in a more realistic environment.
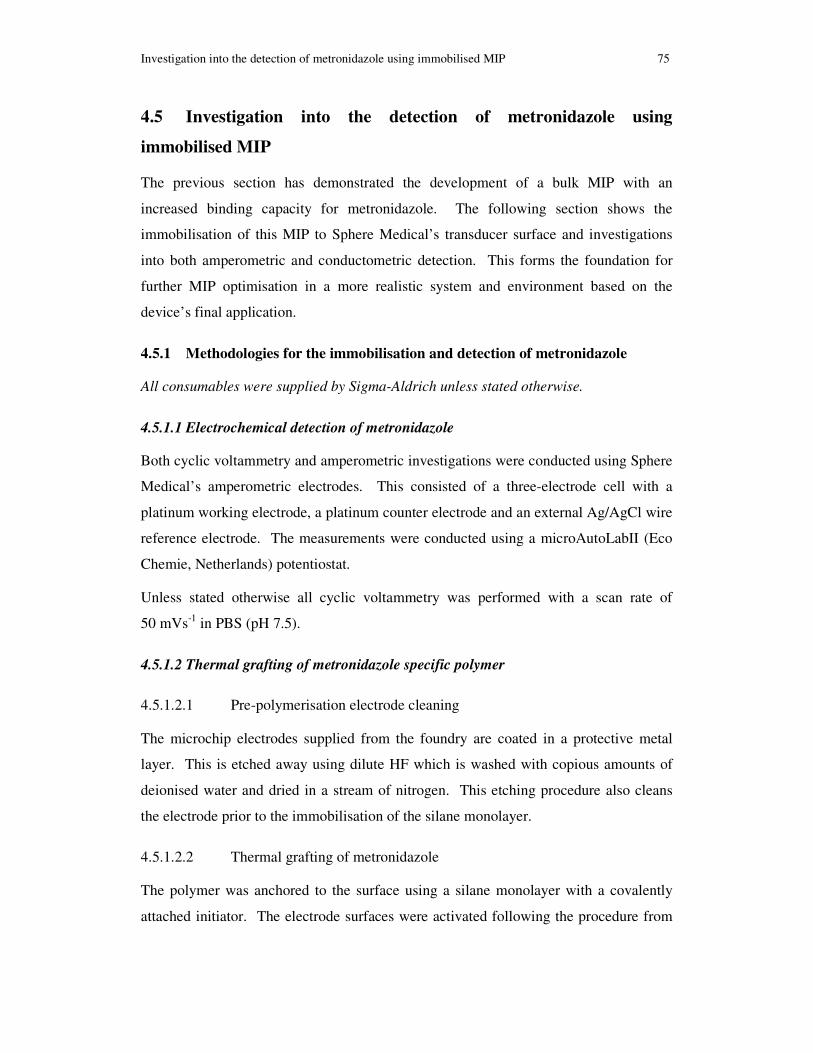
Investigation into the detection of metronidazole using immobilised MIP 75
4.5 Investigation into the detection of metronidazole using
immobilised MIP
The previous section has demonstrated the development of a bulk MIP with an
increased binding capacity for metronidazole. The following section shows the
immobilisation of this MIP to Sphere Medical’s transducer surface and investigations
into both amperometric and conductometric detection. This forms the foundation for
further MIP optimisation in a more realistic system and environment based on the
device’s final application.
4.5.1 Methodologies for the immobilisation and detection of metronidazole
All consumables were supplied by Sigma-Aldrich unless stated otherwise.
4.5.1.1 Electrochemical detection of metronidazole
Both cyclic voltammetry and amperometric investigations were conducted using Sphere
Medical’s amperometric electrodes. This consisted of a three-electrode cell with a
platinum working electrode, a platinum counter electrode and an external Ag/AgCl wire
reference electrode. The measurements were conducted using a microAutoLabII (Eco
Chemie, Netherlands) potentiostat.
Unless stated otherwise all cyclic voltammetry was performed with a scan rate of
50 mVs-1 in PBS (pH 7.5).
4.5.1.2 Thermal grafting of metronidazole specific polymer
4.5.1.2.1 Pre-polymerisation electrode cleaning
The microchip electrodes supplied from the foundry are coated in a protective metal
layer. This is etched away using dilute HF which is washed with copious amounts of
deionised water and dried in a stream of nitrogen. This etching procedure also cleans
the electrode prior to the immobilisation of the silane monolayer.
4.5.1.2.2 Thermal grafting of metronidazole
The polymer was anchored to the surface using a silane monolayer with a covalently
attached initiator. The electrode surfaces were activated following the procedure from

Investigation into the detection of metronidazole using immobilised MIP 76
Section 3.2.3. Following this a SAM of aminopropyl triethoxysilane (APTES) was
assembled on the surface by leaving the activated electrodes in a 2% solution in toluene
for 3 hours. This resulted in reactive amines which allowed the
4,4’-azobis(cyanovaleric acid) initiator to be coupled on the electrode surface for
18 hours using the flowing coupling solution for 18 hours: 20 mM 4,4’-
azobis(cyanovaleric acid), 28 mM1-Hydroxybenzotriazole and 17 mM N-(3-
Dimethylaminopropyl)-N’-ethylcarbodiimide dissolved DMF.
The polymer was then grafted by immersing the initiator functionalised surfaces in the
polymer solution (Table 4.4) which had been degassed for 10 minutes in a stream of
nitrogen. It was then placed on a hot plate at 80°C for 30, 60 120 and 240 minutes.
After the polymerisation, the sensor was then rinsed in methanol and dried in a stream
of nitrogen.
Table 4.4 – Composition of grafting polymerisation mixture (template : monomer : cross-
linker, 2:2:17).
Substance Mass (g)
NIP Itaconic acid 0.62
EGDMA 4
DMF 5.59
MIP (as NIP plus template) Metronidazole 0.41
4.5.1.2.3 Immobilised polymer cleaning
Before testing the sensors with the immobilised polymer, they were cleaned with
successive washing of 250 mM HCl with 50% methanol followed by deionised water
and finally 100 mM NaOH with 50% methanol followed again by deionised water.
This procedure was repeated three times.

Investigation into the detection of metronidazole using immobilised MIP 77
4.5.1.3 Impedance analysis and monitoring of microchip electrodes
4.5.1.3.1 Impedance spectroscopy of electrodes
The impedance analysis was conducted using the procedure from Section 3.4.1.1 over a
frequency range of 1 Hz to 10000 Hz.
4.5.1.3.2 Impedance monitoring of microchip sensors
The impedance monitoring was conducted using the procedure from Section 3.2.4.
4.5.1.4 AFM analysis of polymer coated microchip electrodes
The atomic force microscopy (AFM) analysis was conducted using a PicoScan AFM
(Molecular Imaging, USA) in contact mode with Pointprobe® CONTR probes
(NanoWorld).
An AFM in contact mode works by scanning a fine probe protruding from a silicon
nitrite cantilever over an area of interest. As the probe moves over the surface both
lateral and torque forces are exerted on the probe. These cause the cantilever to bend
and twist. The conformational changes in the cantilever are monitored by reflecting a
laser off the back of the cantilever onto an optical detector. The detectors signal is fed
into a feedback control system to maintain a constant force between the tip and the
surface. The information from this feedback system is used to generate an image of the
surface topography and the probe’s deflection as it moves across the surface.
4.5.2 Results of the immobilisation and detection of metronidazole
4.5.2.1 Electrochemical detection of metronidazole
To detect metronidazole using electrochemical means, the potentials at which it is either
reduced or oxidised need to be established. Using this potential will maximise the
sensitivity and selectively by increasing the magnitude of the response, and by ignoring
other compounds that may react at other potentials. To establish this potential, a cyclic
voltammogram was performed on a bare platinum microchip electrode in different
concentrations of metronidazole (Figure 4.15). It can be seen from this data that there
are redox peaks at -740 mV and at -300 mV which increase and decrease with
increasing concentration of metronidazole, respectively.

Investigation into the detection of metronidazole using immobilised MIP 78
The amperometric detection of metronidazole (228 µM) can be seen in Figure 4.16 and
Figure 4.17 at potentials of -750 mV and -300 mV respectively. At a potential of
-750 mV there is a response to the presence of metronidazole. However, the amplitude
of this response is very small (50 nA) for a 228 µM injection. At the -300 mV there is a
negative step change (25 nA). Both of these responses concur with the cyclic
voltammograms.
-160
-140
-120
-100
-80
-60
-900 -850 -800 -750 -700 -650 -600
E (mV) vs Ag/AgCl
i(nA
)
Figure 4.15 – Plot of forward scans from cyclic voltammograms (small plot) of
metronidazole with increasing concentrations 0, 10, 25, 50 100 and 360 µM (arrow going
down) using platinum microchip electrodes. Arrow indicates increasing concentration.
Interferences are marked in Figure 4.16 and Figure 4.17 which occur when the injection
loop is being filled and when the injector is switch from ‘load’ to ‘inject’.

Investigation into the detection of metronidazole using immobilised MIP 79
200
300
400
500
600
700
800
0 100 200 300 400 500 600 700 800t (s)
i(nA
)
Filling injection loop Injecting loop
Response
Figure 4.16 – Amperometric (-750 mV) response to metronidazole (228 µM) injections,
also including noise from the injector.
100
120
140
160
180
200
220
240
0 200 400 600 800 1000t (s)
i(nA
)
Filling injection loop
Injecting loop
Response
Figure 4.17 – Amperometric (-300 mV) response to metronidazole (228 µM) injections,
also including noise from the injector.
Further testing of metronidazole’s electrochemistry (Figure 4.18) and that of the
supporting electrolyte (Figure 4.19) in both normal and degassed states on the
microchip electrodes showed that across the potential range from -150 to -900 mV, the
degassing affected the resulting current. There is a large peak in the PBS solution at
-300 mV and -750 mV with the significance of each peak being lowered with the
presence of metronidazole.
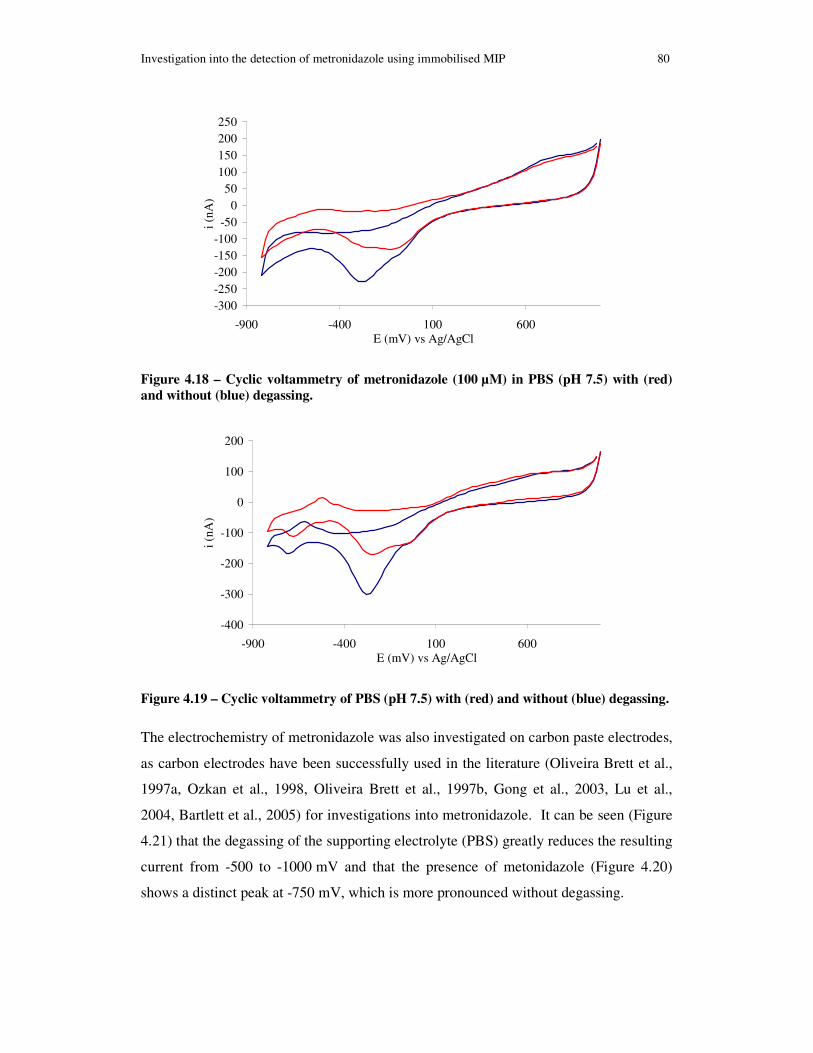
Investigation into the detection of metronidazole using immobilised MIP 80
-300-250-200-150-100
-500
50100150200250
-900 -400 100 600E (mV) vs Ag/AgCl
i (nA
)
Figure 4.18 – Cyclic voltammetry of metronidazole (100 µM) in PBS (pH 7.5) with (red)
and without (blue) degassing.
-400
-300
-200
-100
0
100
200
-900 -400 100 600E (mV) vs Ag/AgCl
i (nA
)
Figure 4.19 – Cyclic voltammetry of PBS (pH 7.5) with (red) and without (blue) degassing.
The electrochemistry of metronidazole was also investigated on carbon paste electrodes,
as carbon electrodes have been successfully used in the literature (Oliveira Brett et al.,
1997a, Ozkan et al., 1998, Oliveira Brett et al., 1997b, Gong et al., 2003, Lu et al.,
2004, Bartlett et al., 2005) for investigations into metronidazole. It can be seen (Figure
4.21) that the degassing of the supporting electrolyte (PBS) greatly reduces the resulting
current from -500 to -1000 mV and that the presence of metonidazole (Figure 4.20)
shows a distinct peak at -750 mV, which is more pronounced without degassing.
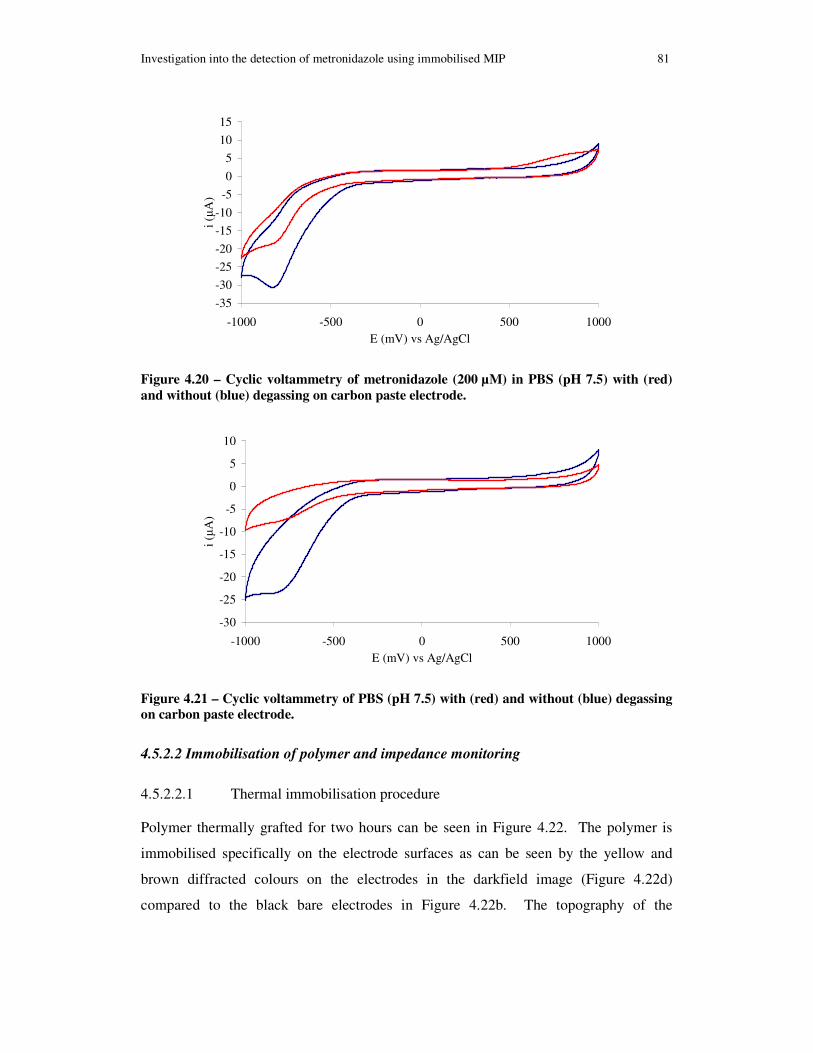
Investigation into the detection of metronidazole using immobilised MIP 81
-35
-30
-25
-20
-15
-10
-5
0
5
10
15
-1000 -500 0 500 1000E (mV) vs Ag/AgCl
i (µ
A)
Figure 4.20 – Cyclic voltammetry of metronidazole (200 µM) in PBS (pH 7.5) with (red)
and without (blue) degassing on carbon paste electrode.
-30
-25
-20
-15
-10
-5
0
5
10
-1000 -500 0 500 1000E (mV) vs Ag/AgCl
i (µ
A)
Figure 4.21 – Cyclic voltammetry of PBS (pH 7.5) with (red) and without (blue) degassing
on carbon paste electrode.
4.5.2.2 Immobilisation of polymer and impedance monitoring
4.5.2.2.1 Thermal immobilisation procedure
Polymer thermally grafted for two hours can be seen in Figure 4.22. The polymer is
immobilised specifically on the electrode surfaces as can be seen by the yellow and
brown diffracted colours on the electrodes in the darkfield image (Figure 4.22d)
compared to the black bare electrodes in Figure 4.22b. The topography of the

Investigation into the detection of metronidazole using immobilised MIP 82
polymerised electrodes (Figure 4.23) shows a fairly smooth surface with varying grain
size.
a. b.
c. d.
Figure 4.22 – Microscope images of microchip electrodes pre (a & b) and post (c & d)
polymerisation (for 2 hours). Images b and d were taken using a darkfield filter.
Figure 4.23 – AFM imaged of thermally grafted polymer on microchip electrodes shown in
Figure 4.22.
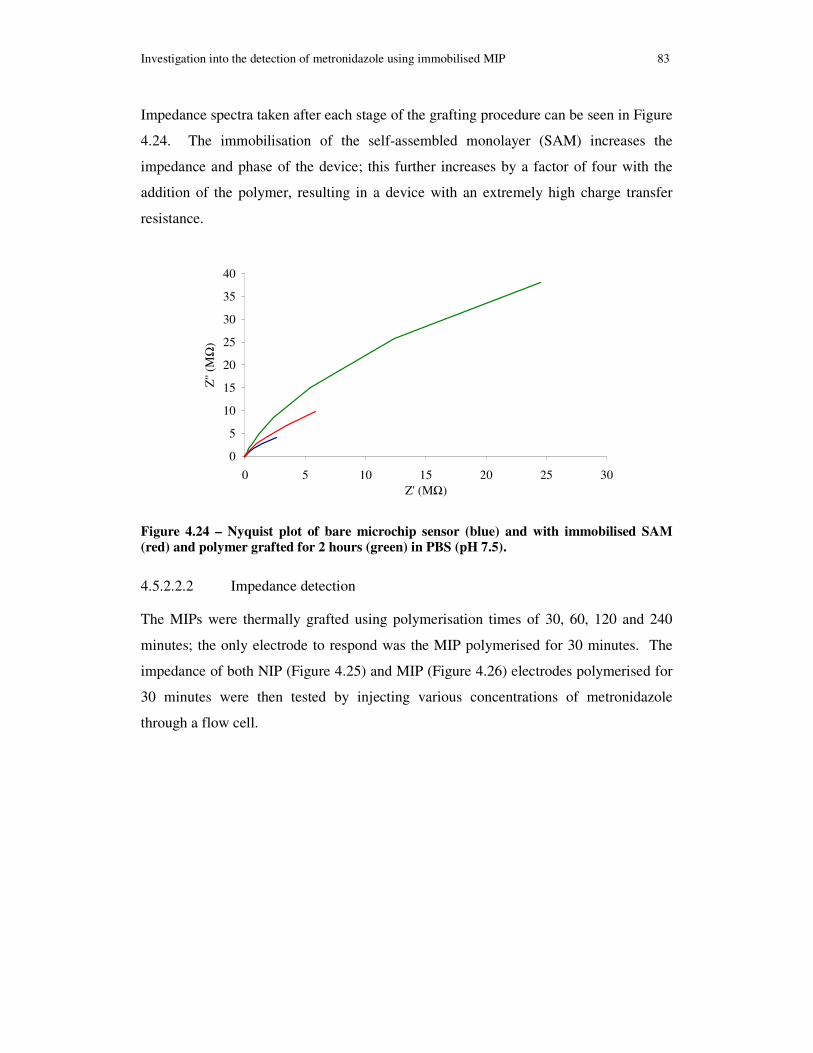
Investigation into the detection of metronidazole using immobilised MIP 83
Impedance spectra taken after each stage of the grafting procedure can be seen in Figure
4.24. The immobilisation of the self-assembled monolayer (SAM) increases the
impedance and phase of the device; this further increases by a factor of four with the
addition of the polymer, resulting in a device with an extremely high charge transfer
resistance.
0
5
10
15
20
25
30
35
40
0 5 10 15 20 25 30Z' (MΩ)
Z''
(MΩ
)
Figure 4.24 – Nyquist plot of bare microchip sensor (blue) and with immobilised SAM
(red) and polymer grafted for 2 hours (green) in PBS (pH 7.5).
4.5.2.2.2 Impedance detection
The MIPs were thermally grafted using polymerisation times of 30, 60, 120 and 240
minutes; the only electrode to respond was the MIP polymerised for 30 minutes. The
impedance of both NIP (Figure 4.25) and MIP (Figure 4.26) electrodes polymerised for
30 minutes were then tested by injecting various concentrations of metronidazole
through a flow cell.

Investigation into the detection of metronidazole using immobilised MIP 84
9650
9652
9654
9656
9658
9660
9662
9664
0 500 1000 1500 2000
t (s)
Z (Ω
)
Figure 4.25 – Change in impedance observed for a NIP coated microchip electrodes to
consecutive injections of metronidazole at concentrations of 1, 10, 25, 50 and 100 µM. At
each concentration, the injection was repeated three times.
The magnitude of the change in impedance for both the MIP and NIP were very similar.
There is a visible change in impedance between 1 µM and 100 µM, however the
difference between 10, 25 and 50 µM is indistinguishable. This is further hindered by
the low sensitivity of the electrodes.
9672
9674
9676
9678
9680
9682
9684
9686
0 500 1000 1500
t (s)
Z (Ω
)
Figure 4.26 – Change in impedance observed for a MIP coated microchip electrodes to
consecutive injections of metronidazole at concentrations of 1, 10, 25, 50 and 100 µM. At
each concentration, the injection was repeated three times.

Investigation into the detection of metronidazole using immobilised MIP 85
4.5.3 Discussion
The initial electrochemical investigation into metronidazole resulted in two oxidation
potentials at -750 mV and -300 mV, which is consistent with the literature (La-Scalea et
al., 1999). However the amperometric detection of metronidazole resulted in a very
poor sensitivity. Moreover, the signal was affected when the injector was being used.
The noise due to the injector being changed to ‘inject’ the sample was similar to the
response to metronidazole, for example at -750 mV there was a peak response and at -
300 mV there was a step change for both the injection and the response. Thus, the
process that occurred due to the sample being injected could be the same as the response
to metronidazole implying that the response to metronidazole is not due to its direct
reduction.
The further testing of the electrochemistry of metronidazole and the supporting
electrolyte show that flushing the solution with nitrogen has a large influence on the
resulting current at large negative potentials and that oxidation peaks exist at -750 and -
300 mV in the supporting electrolyte. This suggests that the reactions at large negative
potentials are due to the reduction of dissolved oxygen, hence, other reactions are
interfering with the detection of metronidazole.
The use of carbon electrodes to investigate the electrochemistry of the supporting
electrolyte show that the peak at -300 mV disappears and the peak at -750 mV is less
significant and becomes insignificant when the solution is flushed with nitrogen.
Hence, the peak at -750 mV is probably due to the reduction of oxygen at the electrode
surface and is thus dependent on the oxygen concentration in the solution. The peak at
-300 mV, which is not visible on the carbon electrodes, is probably due to the reduction
of platinum oxide.
As an attempt to improve the response of metronidazole, other buffers (citrate, britton-
robinson and tris) were tried. However, as the observed peak at -300 mV is a property
of the platinum electrodes, the different buffers did not make any difference.
In addition, it was postulated that the step response seen at -300 mV could be due to the
absorption of metronidazole on the electrodes surface; which could be used to pre-
concentrate metronidazole for stripping analysis. An Adsorption step was attempted,
but no improved response was observed.

Investigation into the detection of metronidazole using immobilised MIP 86
The detection of metronidazole by its direct electrochemical reduction on the platinum
microchip electrodes seems highly improbable, thus the concentration of metronidazole
was monitored by measuring changes in impedance of the polymer which was thermally
grafted onto the microchip electrodes. The polymer was anchored to the electrodes
surface using the silane SAM and were covalently attached to the initiator previously
used in Section 3.2.3.1. However, the UV polymerisation of the polymer solutions
containing metronidazole did not polymerise. As a thermally-initiated polymerisation
did work, this would suggest that metronidazole is absorbing the UV radiation rather
than inhibiting the polymerisation.
Initial thermal polymerisations of 2 hours resulted in a visible polymer layer on the
surface of the electrodes. However, no response or changes could be seen with these
electrodes to injections of metronidazole; presumably because the polymer’s coating
was too thick. To reduce the thickness and provide more control over the
polymerisation, the polymerisation mixture was dissolved to 10% of its original
concentration and microchips were polymerised for 0, 30, 60, 120 and 240 minutes.
However, these sensors all gave very similar responses to injections of metronidazole
suggesting that the coverage of the MIP on the surface was insufficient.
Electrodes which had a polymer grafted for 30 minutes without dilution did respond to
injections of metronidazole. However, their lack of sensitivity meant that distinguishing
between consecutive concentrations of 1, 10, 25, 50 and 100 µM was difficult. Also,
there was no visible difference between changes in impedance between the NIP and the
MIP electrodes.
4.5.4 Conclusion of metronidazole detection and MIP grafting
Although a concentration dependent change in current can be seen, it is not a direct
result of metronidazole’s reduction, as the reduction is interfered or masked by the
platinum electrodes’ electrochemistry. Thus impedance monitoring was investigated as
an alternative.
The procedure for thermally grafting the polymer for impedance monitoring was very
successful as the immobilised polymer showed good coverage of the electrodes.
However, the polymer was initially too thick to gain any response. By reducing the
polymerisation times, less polymer was grafted and a response to the injection of

Chapter conclusion 87
metronidazole could be detected. However, distinguishing between the various injected
concentrations was difficult.
4.6 Chapter conclusion
This chapter shows the systematic selection of a target antibiotic for detection in a MIP-
based electrochemical device, the computational design and testing of the MIP and
finally the immobilisation of the designed MIP and the testing of the device.
The selection of the appropriate antibiotic was based on the functionality and solubility
of the antibiotic for use in MIP synthesis and its electrochemical activity based on a
review of the literature. Although all the antibiotics under consideration had
electroactive properties, they were not all suitable for MIP production, mainly due to
their insolubility in organic solvents.
The computational design and testing of the MIP proved successful as a MIP was
produced with an increased binding capacity for metronidazole. This MIP was not
optimised for use in an electrochemical device as the grafting procedure may produce a
polymer with differing properties and once the MIP is immobilised screening of various
MIP compositions will be far easier and efficient.
The electrochemical detection of metronidazole proved unreliable due to interference at
larger reduction potentials. However, the detection of metronidazole using impedance
monitoring was possible. The grafting of the MIP resulted in visible polymer
specifically immobilised on the platinum electrodes, which proved to be a very reliable
procedure, although the sensitivity of these devices was not sufficiently high to produce
a reliable and usable sensor.

88
Chapter 5 - Exploration into the capacitive detection of
therapeutic compounds using molecularly imprinting
technology
“The important thing in science is not so much to obtain new facts as to discover new
ways of thinking about them.” Sir William Bragg, British physicist (1862 - 1942)
5.1 Introduction
It has been seen in the previous chapters that the ability of detecting an analyte by a
Faradic process is dependent on many factors, including the electrodes’ potential
window and electron transfer, and the pH of the supporting electrolyte, ion
concentration and composition. In addition the preferred conditions of operation of the
sensing device, such as the use of platinum electrodes and a biological electrolyte
(blood, plasma, serum, PBS), put limitations on the detection using a Faradic process.
Therefore, a non-Faradic process was considered.
5.2 Review of capacitive sensors
Initial capacitive devices (Knichel et al., 1995) used redox probes (usually
Fe(CN)64-/3-) where the Faradic processes of the redox probe was hindered by the
selective binding of an antibody to a surface bound epitope. Thus, upon binding a
decrease in capacitance was observed. It was later shown by Rickert and co-workers
(Rickert et al., 1996) that the most reproducible results from a capacitive immunosensor
based device were attained without a redox probe and by building the device in layers.
For example, these layers can be constructed by assembling a thiol monolayer and then
by immobilising a selective biological component.
The capacitive detection of surfactants was achieved by binding them to a hydrophobic
methyl-terminated thiol monolayer in an aqueous environment (Krause et al., 1996).
This resulted in a decrease in the capacitance in a similar fashion to the aforementioned
immunosensor based devices. It was found that the quality of the insulating monolayer

Review of capacitive sensors 89
was essential in the operation of the corresponding device. Defects in the monolayer
would be ‘filled’ by absorbed surfactant, this leaded to strong changes in the local
dielectric constant, therefore producing a large decrease in capacitance. However, these
changes in capacitance were uncontrollable and could cause problems with the
operation of the device.
Mirsky and co-workers investigated several short and long chain monolayers for
antibody immobilisation (Mirsky et al., 1997) and found that short chain monolayers
were unstable as they desorbed from the surface, resulting in capacitive drift and low
sensitivity. They also investigated the desorption of long-chain thiols in various
solvents (aqueous, methanol, ethanol, DMF, chloroform) (Riepl et al., 1999a). Most of
the thiols tested did not desorb in aqueous, methanol and ethanol environments,
however, desorption was observed in both DMF and chloroform, and acidic terminated
thiols desorb in aqueous environments. The amount of desorption was accredited to the
solubility of the thiol in the surrounding solution. In addition, Riepl and co-workers
investigated controlled deposition of thiols, based on applied surface potentials (Riepl et
al., 1999b). They have shown that thiol gold binding involves the oxidation of sulphur,
thus it could be a potential controlled redox process. They also demonstrated that thiols
bound to an electrode surface held at -1400 mV are held by physical forces and at the
most stable potential (+300 mV) in basic solution absorption does not occur.
These capacitive devices have been used for monitoring the decrease in monolayer
coverage at a fixed surface pressure (Mirsky et al., 1996, Mirsky et al., 1998). This
method has been used for the detection of phospholipase A2 immobilised to the thiol
monolayer. The product from the interaction between the phospholipase and the
phospholipids, results in a soluble compound which desorbs into the bulk solution,
which in turn results in an increase in the capacitance of the device.
One of the first capacitive MIP sensor (Panasyuk et al., 1999) used a mercaptophenol
monolayer as an anchor for the addition of an electropolymerised MIP layer. However,
neither the mercaptophenol nor the addition of the MIP layer provided the required
insulating layer for capacitive detection. To resolve this problem the authors used the
addition of an octanethiol after the grafting of the MIP layer to ‘fill’ in the defects and
produce a reasonable capacitive device. MIPs have also been grafted to more reliable
Review of capacitive sensors 90
insulating layers of hexadecanethiol using absorbed benzophenone initiator for the
detection of herbicides (Panasyuk-Delaney et al., 2001), creatinine (Panasyuk-Delaney
et al., 2002) and desmetryn (Delaney et al., 2007). This methodology results in a
reproducible high quality insulating layer that is a prerequisite capacitive sensing.
Unlike the aforementioned capacitive sensing techniques, the use of MIPs does not rely
entirely on the absorption or desorption of an analyte to the sensor surface to produce a
change in capacitance. It also relies on the change in dielectric constant within the MIP
due to the expulsion of electrolyte from the MIP’s porous structure, which causes a
change in capacitance, as shown by Delaney and co-workers (Delaney et al., 2007).
5.2.1 Capacitive devices using molecularly imprinted polymers
The first application of molecular imprinting technology in a capacitive device
(Panasyuk et al., 1999) highlighted and addressed four key issues required for capacitive
detection. These are: i) reducing leakage currents to a minimum, ii) providing a low
polymer thickness, iii) ensuring that the capacitive component is significantly greater
than the resistive component and iv) ensuring that the solution resistance is negligible in
comparison to the capacitive impedance. The solution resistance can easily be lowered
by increasing the electrolytes’ ionic concentration and the polymer thickness can be
controlled by electropolymerisation. The leakage current and high capacitance can both
be resolved by ‘blocking’ the surface, usually with an alkanethiol.
The most common procedure for creating a MIP based capacitive sensor is to
electropolymerise o-phenylenediamine (Yin, 2004, Liu et al., 2004, Yin and Xu, 2004)
in the presence of the analyte directly onto a gold electrode surface. However, there are
two main disadvantages with this method: firstly, Polyphenol-gold binding is not
particularly strong and thus the long term stability of these sensors has proven to be
poor; secondly, the insulating properties of the electrodes is insufficient, thus there are
unwanted redox reactions and background currents.
To attain the required insulating properties for a capacitive device, blocking has been
implemented (Cheng et al., 2001, Yang et al., 2005, Gong et al., 2004, Liu et al., 2006,
Panasyuk et al., 1999, Yang et al., 2004). This has been achieved by using long chain
thiols, usually 1-dodecanethiol, after polymerisation to block the electrode areas that
would be otherwise exposed to the electrolyte. To complement blocking and increase

Review of capacitive sensors 91
polymer-electrode binding strength, thiols (Yang et al., 2005) and thiolated monomers
have also been employed to create MIP layers (Gong et al., 2004, Panasyuk et al., 1999,
Yang et al., 2004).
Other approaches without blocking have been investigated by Liao and co-workers
(Liao et al., 2004), who demonstrated that satisfactory insulating properties for a
capacitive device could be achieved by using a slow scan rate during the
electropolymerisation of m-aminophenol onto the electrode surface. Another approach
is to use long chain thiols before polymerisation to form the insulating layer and then to
graft the polymer to the thiol during photo-polymerisation (Delaney et al., 2007,
Panasyuk-Delaney et al., 2002).
The use of a MIP based capacitive device would overcome several of the problems
encountered with sensors based on Faradic processes as seen in Chapter 4. From the
literature summarised in Table 5.1, possibly the simplest and also one of the most
effective ways to produce such a device would be to use an insulating thiol monolayer
to anchor a grafted MIP layer. Using this protocol for a capacitive device also lends
itself towards a universal method of producing a sensor for various analytes, as
theoretically any MIP composition can be polymerised and immobilised onto a sensor
surface for convenient label-free detection of target analytes.
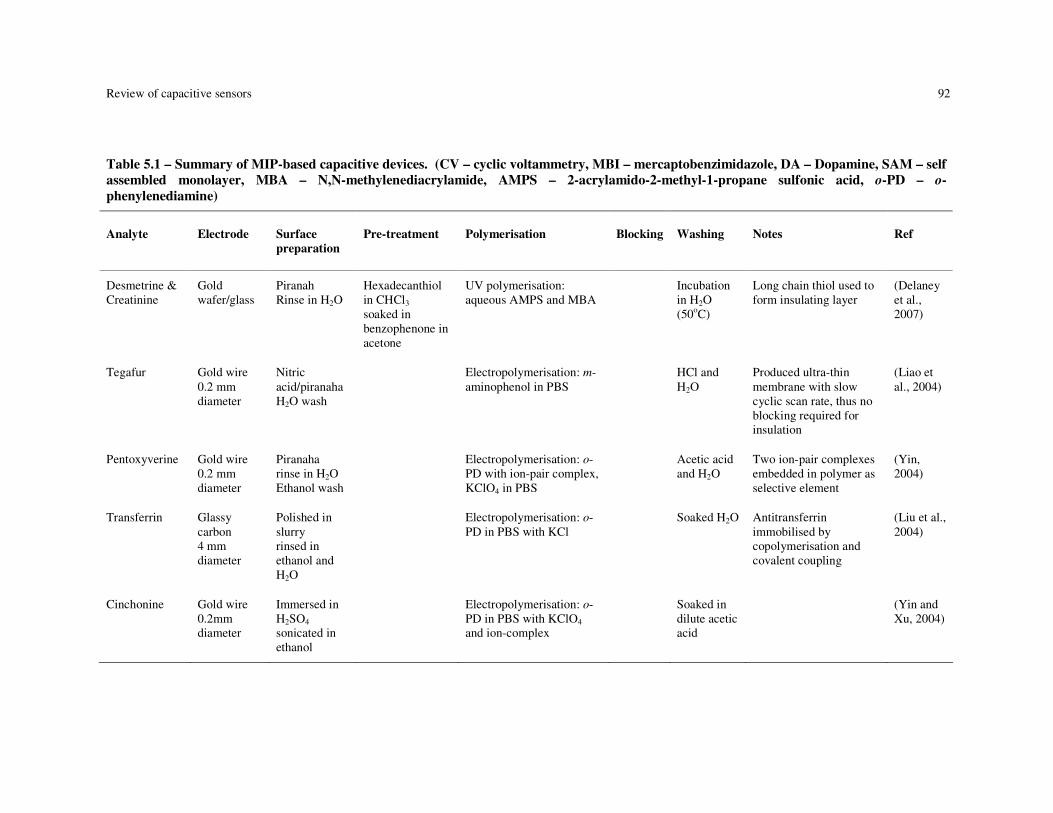
Review of capacitive sensors 92
Table 5.1 – Summary of MIP-based capacitive devices. (CV – cyclic voltammetry, MBI – mercaptobenzimidazole, DA – Dopamine, SAM – self
assembled monolayer, MBA – N,N-methylenediacrylamide, AMPS – 2-acrylamido-2-methyl-1-propane sulfonic acid, o-PD – o-
phenylenediamine)
Analyte Electrode Surface
preparation
Pre-treatment Polymerisation Blocking Washing Notes Ref
Desmetrine & Creatinine
Gold wafer/glass
Piranah Rinse in H2O
Hexadecanthiol in CHCl3 soaked in benzophenone in acetone
UV polymerisation: aqueous AMPS and MBA
Incubation in H2O (50oC)
Long chain thiol used to form insulating layer
(Delaney et al., 2007)
Tegafur Gold wire 0.2 mm diameter
Nitric acid/piranaha H2O wash
Electropolymerisation: m-aminophenol in PBS
HCl and H2O
Produced ultra-thin membrane with slow cyclic scan rate, thus no blocking required for insulation
(Liao et al., 2004)
Pentoxyverine Gold wire 0.2 mm diameter
Piranaha rinse in H2O Ethanol wash
Electropolymerisation: o-PD with ion-pair complex, KClO4 in PBS
Acetic acid and H2O
Two ion-pair complexes embedded in polymer as selective element
(Yin, 2004)
Transferrin Glassy carbon 4 mm diameter
Polished in slurry rinsed in ethanol and H2O
Electropolymerisation: o-PD in PBS with KCl
Soaked H2O Antitransferrin immobilised by copolymerisation and covalent coupling
(Liu et al., 2004)
Cinchonine Gold wire 0.2mm diameter
Immersed in H2SO4 sonicated in ethanol
Electropolymerisation: o-PD in PBS with KClO4 and ion-complex
Soaked in dilute acetic acid
(Yin and Xu, 2004)
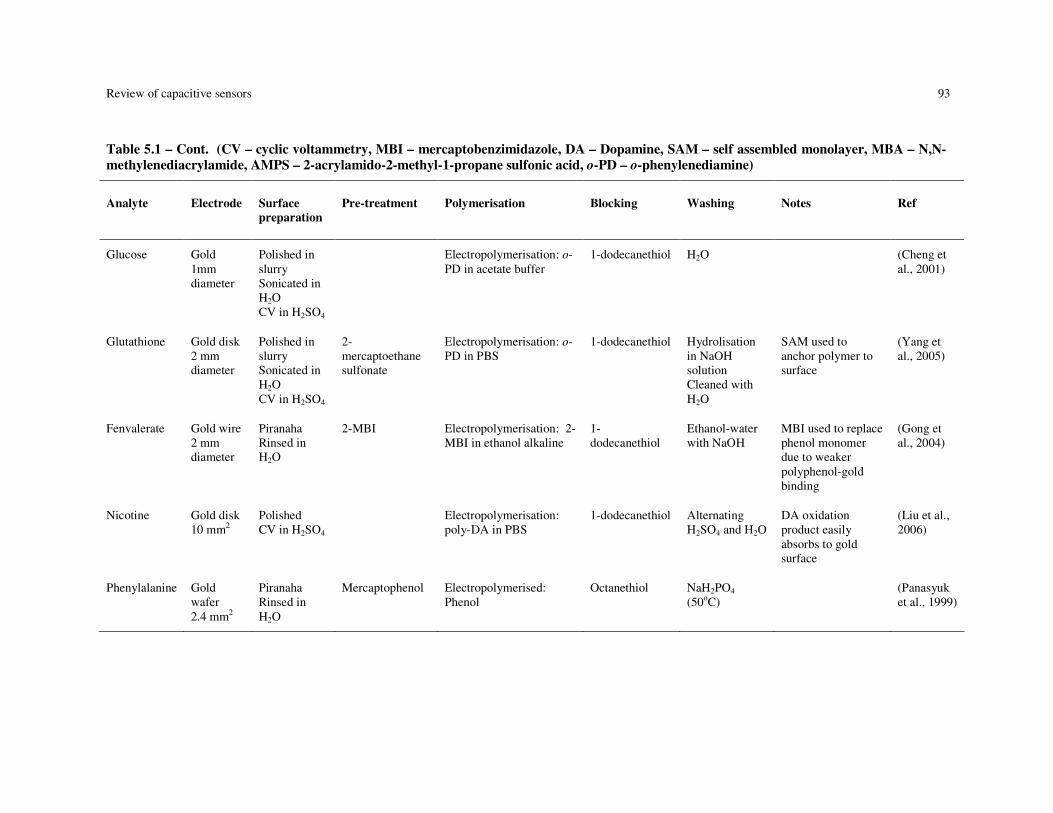
Review of capacitive sensors 93
Table 5.1 – Cont. (CV – cyclic voltammetry, MBI – mercaptobenzimidazole, DA – Dopamine, SAM – self assembled monolayer, MBA – N,N-
methylenediacrylamide, AMPS – 2-acrylamido-2-methyl-1-propane sulfonic acid, o-PD – o-phenylenediamine)
Analyte Electrode Surface
preparation
Pre-treatment Polymerisation Blocking Washing Notes Ref
Glucose Gold 1mm diameter
Polished in slurry Sonicated in H2O CV in H2SO4
Electropolymerisation: o-PD in acetate buffer
1-dodecanethiol H2O (Cheng et al., 2001)
Glutathione Gold disk 2 mm diameter
Polished in slurry Sonicated in H2O CV in H2SO4
2-mercaptoethane sulfonate
Electropolymerisation: o-PD in PBS
1-dodecanethiol Hydrolisation in NaOH solution Cleaned with H2O
SAM used to anchor polymer to surface
(Yang et al., 2005)
Fenvalerate Gold wire 2 mm diameter
Piranaha Rinsed in H2O
2-MBI Electropolymerisation: 2-MBI in ethanol alkaline
1- dodecanethiol
Ethanol-water with NaOH
MBI used to replace phenol monomer due to weaker polyphenol-gold binding
(Gong et al., 2004)
Nicotine Gold disk 10 mm2
Polished CV in H2SO4
Electropolymerisation: poly-DA in PBS
1-dodecanethiol Alternating H2SO4 and H2O
DA oxidation product easily absorbs to gold surface
(Liu et al., 2006)
Phenylalanine Gold wafer 2.4 mm2
Piranaha Rinsed in H2O
Mercaptophenol Electropolymerised: Phenol
Octanethiol NaH2PO4 (50oC)
(Panasyuk et al., 1999)
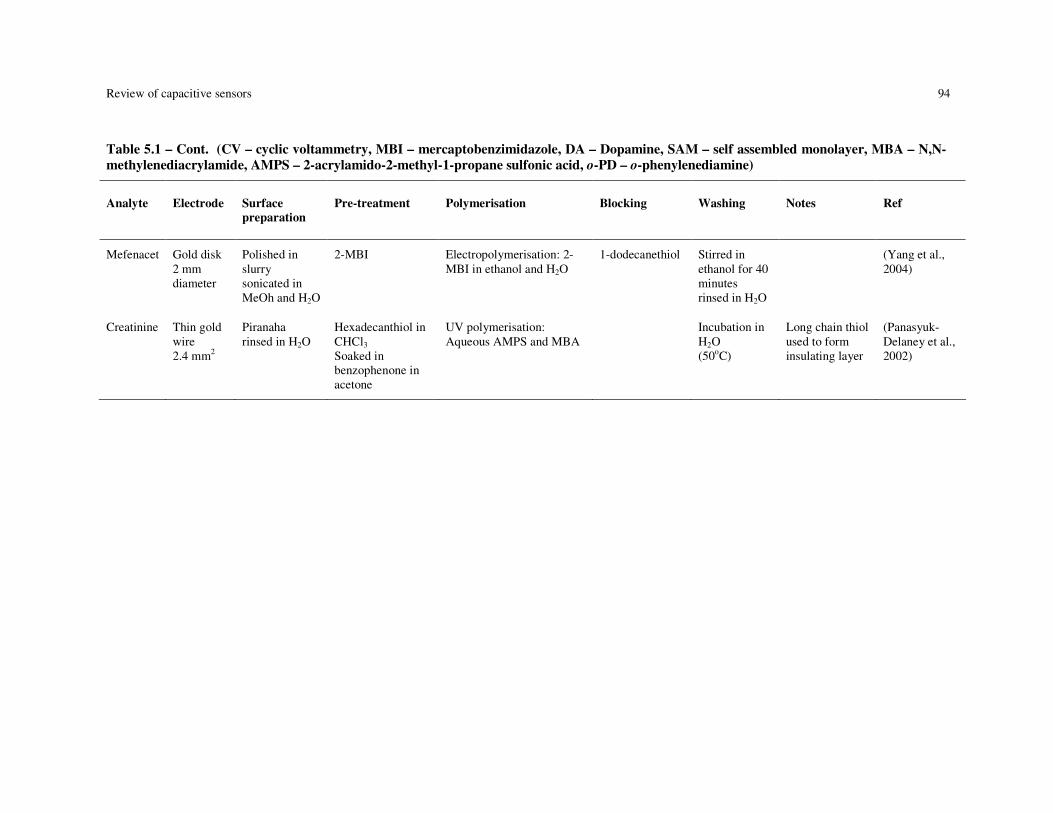
Review of capacitive sensors 94
Table 5.1 – Cont. (CV – cyclic voltammetry, MBI – mercaptobenzimidazole, DA – Dopamine, SAM – self assembled monolayer, MBA – N,N-
methylenediacrylamide, AMPS – 2-acrylamido-2-methyl-1-propane sulfonic acid, o-PD – o-phenylenediamine)
Analyte Electrode Surface
preparation
Pre-treatment Polymerisation Blocking Washing Notes Ref
Mefenacet Gold disk 2 mm diameter
Polished in slurry sonicated in MeOh and H2O
2-MBI Electropolymerisation: 2-MBI in ethanol and H2O
1-dodecanethiol Stirred in ethanol for 40 minutes rinsed in H2O
(Yang et al., 2004)
Creatinine Thin gold wire 2.4 mm2
Piranaha rinsed in H2O
Hexadecanthiol in CHCl3 Soaked in benzophenone in acetone
UV polymerisation: Aqueous AMPS and MBA
Incubation in H2O (50oC)
Long chain thiol used to form insulating layer
(Panasyuk-Delaney et al., 2002)

Reproduction of a capacitive MIP device for the detection of creatinine. 95
5.3 Reproduction of a capacitive MIP device for the detection of
creatinine.
The following investigation is the reproduction of a capacitive MIP based device for the
detection of creatinine as proposed by Delaney (Panasyuk-Delaney et al., 2002). By
reproducing this protocol we gained experience in producing capacitive devices that
utilise an insulating thiol layer for both anchoring a selective polymer film and
providing the necessary insulating properties required for the operation of such a device.
5.3.1 Methodology
All consumables were supplied by Sigma-Aldrich unless stated otherwise.
5.3.1.1 Custom gold electrodes
Custom planar gold electrodes were created by evaporating gold onto borate glass slides
as follows:
The borate glass slides were cut using an CO2 laser (FenixFlyer, Synrad USA) into
18 mm2 working areas and cleaned by soaking them in fresh piranha solution (1:3
mixture of 30% hydrogen peroxide and concentrated sulphuric acid) for 45 minutes.
The clean glass was then thoroughly rinsed in deionised water to remove the pirhana
solution and dried in a stream of nitrogen.
The clean glass was then placed in a vapour depositor (306 vacuum coating system,
Edwards) and 5 nm of chromium was deposited to help bond the following 100 nm of
gold, which was further deposited onto the chromium layer. Both layers were deposited
at 0.5 nm s-1 and the samples were left to cool in air.
5.3.1.2 Polymer immobilisation protocol
5.3.1.2.1 Electrode surface preparation
The gold electrodes’ surfaces were cleaned by immersion in fresh piranha solution (1:3
mixture of 30% hydrogen peroxide and concentrated. sulphuric acid) and then
thoroughly rinsed in deionised water and dried in a stream of nitrogen.
Reproduction of a capacitive MIP device for the detection of creatinine. 96
5.3.1.2.2 Alkanethiol immobilisation
The freshly cleaned gold electrodes were immersed into 5 mM hexadecanethiol in
chloroform for a minimum of 12 hours. After the 12 hour period, the thiolated
electrodes were briefly rinsed in chloroform and dried in a stream of nitrogen.
5.3.1.2.3 Polymer grafting
The initiator was absorbed by immersing the thiolated gold electrodes in 150 mM
benzophenone in acetone for 12 hours. The electrodes were then dried in an oven at
40oC. Following this, 50 µl of de-gassed polymerisation mixture (Table 5.2) was
trapped between the initiated gold electrode and a glass cover slip and irradiated with
UV from an optical lamp (Cermax xenon, PerkinElmer). The NIP electrodes were
prepared in the same fashion, but in the absence of creatinine in the polymerisation
mixture.
Table 5.2 – Composition of creatinine-imprinted polymer
Compound Concentration (mM)
2-Acrylamido-2-methyl-1-propane sulfonic acid 50
N,N-methylenediacrylamide 100
Creatinine 10
5.3.1.2.4 Template removal
The creatinine was removed from the grafted MIP layer by leaving the electrode in a
stirred wash solution (1:1 mixture of deionised water and methanol) at 50oC for 1 hour.
5.3.1.3 Analysis techniques
5.3.1.3.1 Contact angle
The static contact angle measurements were taken using a Cam 100 by KSV
Instruments Ltd. The measurement was performed by placing a drop of deionised water
onto the surface of interest. The contact angle is defined as the angle formed between
the solid/liquid interface and the tangent at the liquid/vapour interface where the three
Reproduction of a capacitive MIP device for the detection of creatinine. 97
phase boundaries intersect. This angle provides information about the relationship
between the cohesive forces of the liquid, and the adhesive forces between the surface
and the liquid. When water is used this relationship is directly related to the
hydrophobicity of solid surface, for example if the angle tends towards 0º (the adhesive
forces are greater than the cohesive forces) then the surface is considered hydrophilic
and if the angle is greater than 90º the surface is considered hydrophobic.
5.3.1.3.2 Atomic force microscopy
The AFM analysis was conducted using a PicoScan (Molecular Imaging, USA) in
contact mode as described in Section 4.5.1.4.
5.3.1.3.3 Impedance spectroscopy
Impedance spectroscopy was conducted using an ACM AutoACpsp impedance
analyser. The impedance was measured over a frequency range of 1 to 1000 Hz with a
32 mV signal amplitude, 0 V offset and an automatic reference resistance in 25 mM
phosphate buffer with 100 mM NaCl.
5.3.1.3.4 Impedance monitoring
The impedance of the electrode was monitored using a two electrode system with a
Ag/AgCl counter/reference electrode in 25 mM phosphate buffer with 100 mM NaCl as
the electrolyte (Figure 5.1). A 10 mV 100 Hz AC potential with a +300 mV offset was
passed through the cell. The change in AC potential and phase was monitored using a
lock-in-amplifier (Stanford instruments, RS830) as the creatinine and creatine were
added to the electrolyte. With the use of a reference resistor and custom software the
resistance, reactance and, consequently, the capacitance were calculated and monitored
over time.
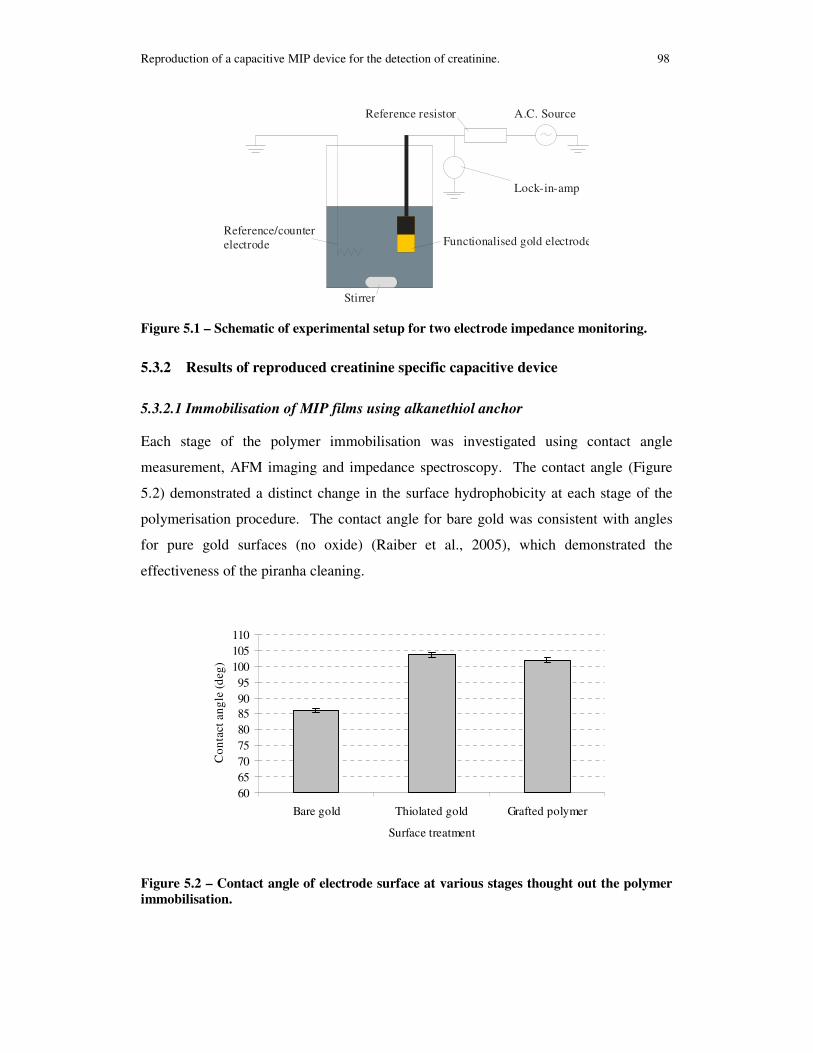
Reproduction of a capacitive MIP device for the detection of creatinine. 98
Lock-in-amp
Reference resistor A.C. Source
Reference/counterelectrode Functionalised gold electrode
Stirrer
Figure 5.1 – Schematic of experimental setup for two electrode impedance monitoring.
5.3.2 Results of reproduced creatinine specific capacitive device
5.3.2.1 Immobilisation of MIP films using alkanethiol anchor
Each stage of the polymer immobilisation was investigated using contact angle
measurement, AFM imaging and impedance spectroscopy. The contact angle (Figure
5.2) demonstrated a distinct change in the surface hydrophobicity at each stage of the
polymerisation procedure. The contact angle for bare gold was consistent with angles
for pure gold surfaces (no oxide) (Raiber et al., 2005), which demonstrated the
effectiveness of the piranha cleaning.
6065707580859095
100105110
Bare gold Thiolated gold Grafted polymer
Surface treatment
Con
tact
ang
le (d
eg)
Figure 5.2 – Contact angle of electrode surface at various stages thought out the polymer
immobilisation.

Reproduction of a capacitive MIP device for the detection of creatinine. 99
The self-assembly of the methyl terminated thiol on the bare gold shows a characteristic
increase in hydrophobicity, which is consistent with the literature for methyl terminated
monolayers (Martins et al., 2003). The addition of the polymer to the surface causes a
slight decrease in the contact angle illustrating that the surface chemistry has once again
changed.
Figure 5.3 – AFM images of A) topography and B) deflection of a bare gold electrode
surface.
The AFM images of the bare gold surface (Figure 5.3) show the characteristic grain
structure of evaporated gold after piranha cleaning (Wang and Yoon, 2008). The
addition of the hexadecanethiol monolayer does not significantly alter the topography of
the gold surface although the monolayer causes a small uniform increase in height.
However, the change in hydrophobicity of the surface affects the AFM tip when
measuring in contact mode and thus reduces the height resolution of the image.
Therefore the grains appear slightly larger and smaller in height, see Figure 5.4.

Reproduction of a capacitive MIP device for the detection of creatinine. 100
Figure 5.4 – AFM images of A) topography and B) deflection of a thiolated gold electrode
surface.
An AFM image of the polymer coating can be seen in Figure 5.5. In this image the gold
grains are no longer clearly visible and the rough surface texture of the polymer is now
present. To assess the thickness of the polymer the AFM tip was used to remove the
polymer from the gold surface (Figure 5.6) and the corresponding profiles demonstrate
a thickness of 15 to 20 nm, which is consistent with the literature (Delaney et al., 2007)
for this grafting procedure.
Figure 5.5 – AFM images of A) topography and B) deflection of a NIP coated gold
electrode surface.
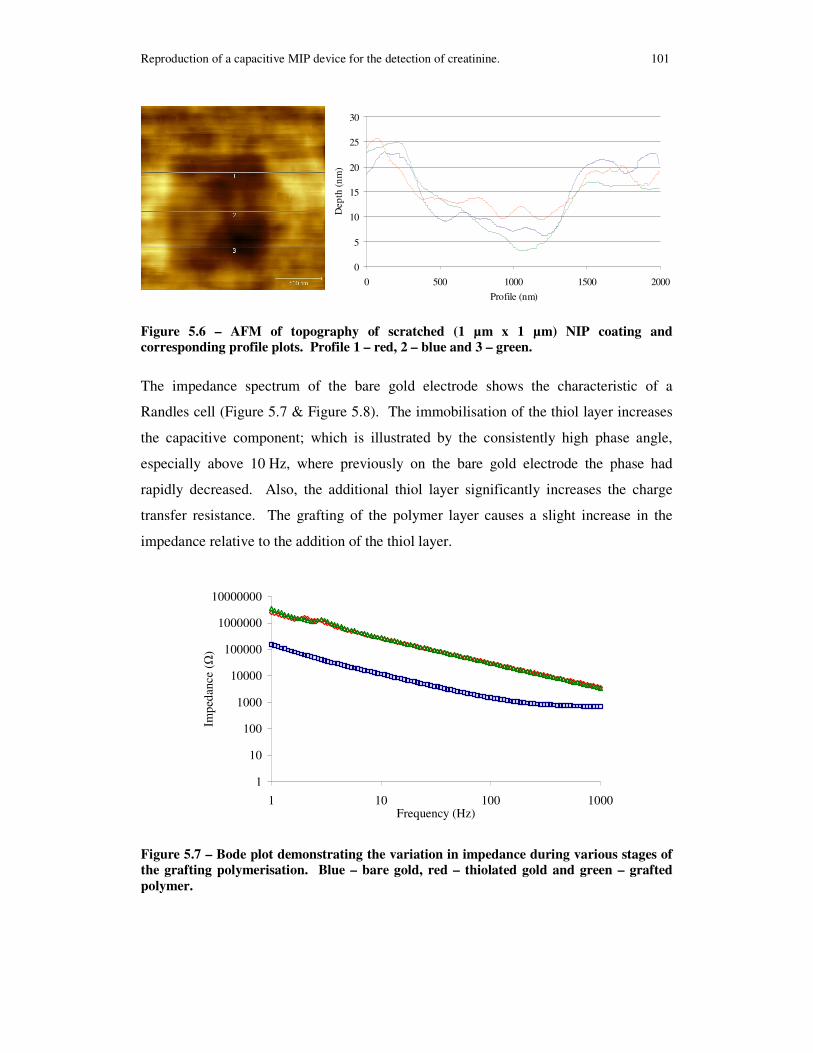
Reproduction of a capacitive MIP device for the detection of creatinine. 101
0
5
10
15
20
25
30
0 500 1000 1500 2000
Profile (nm)
Dep
th(n
m)
Figure 5.6 – AFM of topography of scratched (1 µm x 1 µm) NIP coating and
corresponding profile plots. Profile 1 – red, 2 – blue and 3 – green.
The impedance spectrum of the bare gold electrode shows the characteristic of a
Randles cell (Figure 5.7 & Figure 5.8). The immobilisation of the thiol layer increases
the capacitive component; which is illustrated by the consistently high phase angle,
especially above 10 Hz, where previously on the bare gold electrode the phase had
rapidly decreased. Also, the additional thiol layer significantly increases the charge
transfer resistance. The grafting of the polymer layer causes a slight increase in the
impedance relative to the addition of the thiol layer.
1
10
100
1000
10000
100000
1000000
10000000
1 10 100 1000Frequency (Hz)
Impe
danc
e (Ω
)
Figure 5.7 – Bode plot demonstrating the variation in impedance during various stages of
the grafting polymerisation. Blue – bare gold, red – thiolated gold and green – grafted
polymer.

Reproduction of a capacitive MIP device for the detection of creatinine. 102
0
10
20
30
40
50
60
70
80
90
1 10 100 1000Frequency (Hz)
Phas
e (°
)
Figure 5.8 – Bode plot demonstrating the variation in phase during various stages of the
grafting polymerisation. Blue – bare gold, red – thiolated gold and green – grafted
polymer.
5.3.2.2 Response of creatinine specific capacitive devices
Capacitive changes in the polymer grafted layers were measured and the results were
seen as a decreasing step change in capacitance, an example of which can be seen in
Figure 5.9. Capacitive drift, also visible in Figure 5.9, is probably caused by the
adsorption of material at defects on the electrode’s surface. This causes long delays in
obtaining a steady base line and also limits the sensitivity of the electrode.
418
420
422
424
426
428
430
432
0 500 1000 1500 2000Time (s)
Cap
acit
ance
(nf
)
Figure 5.9 – Example sensor response to alternative injections of creatinine and creatine (3
x 200 µL, 3 x 500 µL and 3 x 1000 µL) in 25 mM phosphate buffer with 100 mM NaCl at
pH 7.5.

Reproduction of a capacitive MIP device for the detection of creatinine. 103
Figure 5.10 and Figure 5.11 show the percentage capacitive change in both NIP and
MIP electrodes to creatinine and creatine, respectfully. These percentage capacitive
changes were calculated as the difference between the capacitance at the point of
injection and the capacitance after the step change divided by the initial capacitance.. It
can be seen that the addition of creatinine to the MIP coated electrode causes a larger
percentage change than its addition to the NIP electrode, therefore demonstrating the
high binding capacity of the MIP to creatinine.
Additionally, the capacitive change to creatinine for the MIP electrode is greater than
the capacitive change due to creatine, which is contrary to the NIP electrode, thus
demonstrating selectivity of the MIP electrode towards creatinine.
0.0%
0.5%
1.0%
1.5%
2.0%
2.5%
3.0%
0 500 1000 1500 2000Concentration (µM)
Cap
acit
ive
chan
ge
Figure 5.10 – Response of NIP sensor to changes in concentration of creatinine (blue) and
creatine (red) from 100 µM to 2000 µM.

Reproduction of a capacitive MIP device for the detection of creatinine. 104
0.0%
0.5%
1.0%
1.5%
2.0%
2.5%
0 500 1000 1500 2000Concentration (µM)
Cap
acit
ive
chan
ge
Figure 5.11 – Response of MIP sensor to changes in concentration of creatinine (blue) and
creatine (red) from 100µM to 2000 µM.
5.3.3 Discussion on the performance of the capacitive creatinine devices
The characterisation of the immobilised polymer film in this work is very consistent
with the published characterisations performed by Delaney and co-workers (Delaney et
al., 2007). The impedance spectroscopy demonstrated Randles cell behaviour with
increasing impedance and decreasing capacitance with each stage of the polymerisation
process. This is expected as the alkanethiol monolayer will block electroactive species
reaching the electrode surface (Hong et al., 1997) and the long chain monolayer has a
very high resistance to electron transfer (Xu and Li, 1995). The AFM images of the
polymer show an increased roughness with a polymer thickness of approximately
15 nm.
The addition of creatinine to a test solution with a MIP electrode gives a fast decrease in
capacitance. Delaney argued that this behaviour was caused by an increase in the
dielectric properties of the polymer layer upon the creatinine binding. The response of
Delaney’s electrodes to the interfering compound creatine was negligible, even for
additions of 1 mM creatine (Panasyuk-Delaney et al., 2002). However, in our case we
found that the electrodes responded to the addition of creatine, although the capacitive
change was smaller than that for the creatinine.
NIP electrodes also responded to additions of both creatinine and creatine although the
capacitive change of the sensor to creatine was higher than that of the creatinine. This
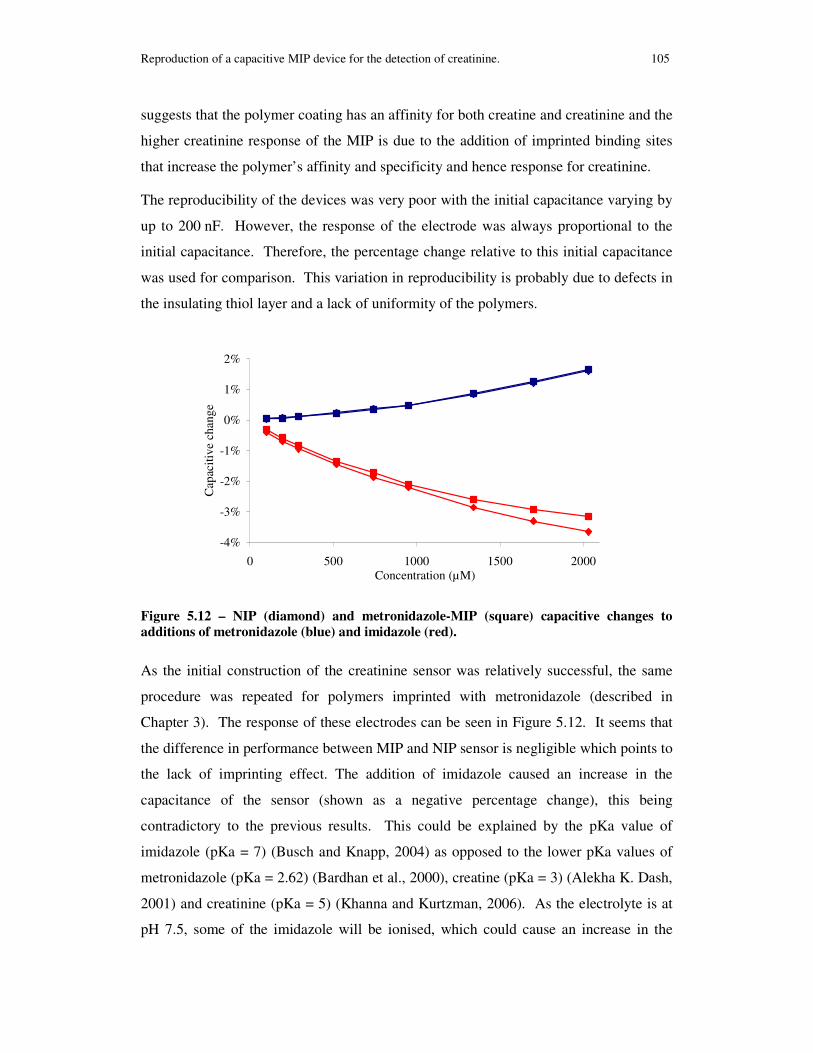
Reproduction of a capacitive MIP device for the detection of creatinine. 105
suggests that the polymer coating has an affinity for both creatine and creatinine and the
higher creatinine response of the MIP is due to the addition of imprinted binding sites
that increase the polymer’s affinity and specificity and hence response for creatinine.
The reproducibility of the devices was very poor with the initial capacitance varying by
up to 200 nF. However, the response of the electrode was always proportional to the
initial capacitance. Therefore, the percentage change relative to this initial capacitance
was used for comparison. This variation in reproducibility is probably due to defects in
the insulating thiol layer and a lack of uniformity of the polymers.
-4%
-3%
-2%
-1%
0%
1%
2%
0 500 1000 1500 2000Concentration (µM)
Cap
aciti
ve c
hang
e
Figure 5.12 – NIP (diamond) and metronidazole-MIP (square) capacitive changes to
additions of metronidazole (blue) and imidazole (red).
As the initial construction of the creatinine sensor was relatively successful, the same
procedure was repeated for polymers imprinted with metronidazole (described in
Chapter 3). The response of these electrodes can be seen in Figure 5.12. It seems that
the difference in performance between MIP and NIP sensor is negligible which points to
the lack of imprinting effect. The addition of imidazole caused an increase in the
capacitance of the sensor (shown as a negative percentage change), this being
contradictory to the previous results. This could be explained by the pKa value of
imidazole (pKa = 7) (Busch and Knapp, 2004) as opposed to the lower pKa values of
metronidazole (pKa = 2.62) (Bardhan et al., 2000), creatine (pKa = 3) (Alekha K. Dash,
2001) and creatinine (pKa = 5) (Khanna and Kurtzman, 2006). As the electrolyte is at
pH 7.5, some of the imidazole will be ionised, which could cause an increase in the

Investigation of an improved creatinine selective device 106
dielectric properties of the polymer. It is also possible that the imidazole can cause the
polymer to swell (due to repulsion forces between chains with adsorbed template)
which would also increase the dielectric properties of the electrode as more electrolyte
would be present at the electrode surface.
5.3.4 Conclusion
The reproduction of Delaney’s capacitive creatinine sensor proved reasonably
successful. Characterisation of the polymer immobilisation was consistent with the
literature and the MIP showed an improved response to creatinine when compared to
the NIP. However, the MIP also responded to creatine, unlike the electrodes in the
literature, and the reproducibility of the devices was poor.
The lack of reproducibility in the devices is most likely due to defects in the insulating
monolayer. As the insulating monolayer is essential for the performance of the device,
its inconsistency can have a detrimental effect on the sensor’s performance. The
improvement in reproducibility and quality of this layer should be a priority in further
development.
5.4 Investigation of an improved creatinine selective device
Considering the lack of reproducibility of the previous capacitive devices (Section 5.3)
and that the quality of the anchoring thiol layer in a capacitive device is essential for
sensor performance, further improvements in the quality of the insulating thiol layer
was the focus of the following investigation.
5.4.1 Surface pre-treatment for thiol self-assembly
It has been shown that various factors affect the quality and reproducibility of self
assembled monolayers (SAM) on gold, these include i) surface contamination (Ron et
al., 1998), ii) surface roughness (Creager et al., 1992) and iii) gold oxide formation
(Ron and Rubinstein, 1994). The most commonly used procedure for cleaning a gold
surface is to immerse the surface in a piranha solution. This highly oxidising solution
cleans organic contamination very effectively and has been shown to cause little oxide
formation (Guo et al., 1994). However, it has also been shown to recrystallise the
surface to a depth of 200 nm (Twardowski and Nuzzo, 2002).

Investigation of an improved creatinine selective device 107
Plasma cleaning for the preparation of a gold surface for self assembly has become a
large area of interest for many companies. In particular, the use of oxygen plasma on
surface pre-treatment can readily oxidise organic contaminants to remove them from the
surface. In addition, etching, for example using piranha solution, has been shown to
reduce pin hole defects (Guo et al., 1994), thus increasing the blocking performance of
alkanethiols due to the smooth topography.
Raiber and co-workers (Raiber et al., 2005) also reviewed various gold surface
treatments to try and attain an optimised method for the removal of SAM layers. They
found that hydrogen plasma was capable of removing the SAM layer and it left the
surface undistinguishable from a bare gold surface. Oxygen plasma was also used, but
it did not remove all the sulphur contaminants and it oxidised the gold surface.
However, there should be no sulphur compounds on freshly deposited gold electrodes
and it is widely known that alcohols will readily reduce gold oxide (Tremiliosi-Filho et
al., 1998).
Therefore, in order to improve the quality of the insulating SAM, an oxygen plasma
surface pre-treatment was used before self assembly. Any gold oxide will be reduced
by soaking the cleaned surfaces in ethanol and the solvent used for immobilisation will
be changed to ethanol as recommended for SAM immobilisation (Schreiber, 2000).
5.4.2 Improved methodology for capacitive detection of creatinine
The following are amendments to the electrode preparation used in Section 5.3.1 to
enhance reproducibility and performance of the capacitive devices.
All consumables were supplied by Sigma-Aldrich unless stated otherwise.
5.4.2.1 Gold surface preparation
The evaporated gold surfaces, prepared as described in Section 5.3.1.1, were cleaned
using exposure to a 40 W oxygen plasma (K1050X, Emitech UK) for 5 minutes and
then immediately immersed in ethanol for 10 minutes to reduce the gold oxide formed
during the plasma cleaning.
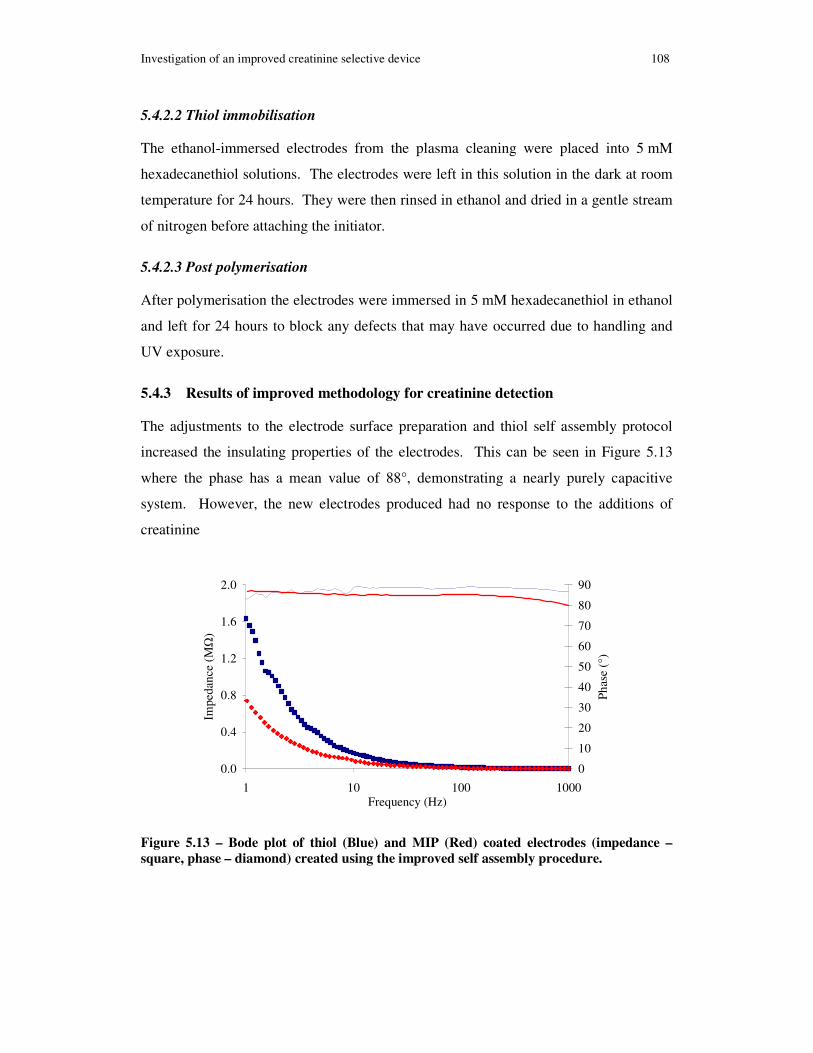
Investigation of an improved creatinine selective device 108
5.4.2.2 Thiol immobilisation
The ethanol-immersed electrodes from the plasma cleaning were placed into 5 mM
hexadecanethiol solutions. The electrodes were left in this solution in the dark at room
temperature for 24 hours. They were then rinsed in ethanol and dried in a gentle stream
of nitrogen before attaching the initiator.
5.4.2.3 Post polymerisation
After polymerisation the electrodes were immersed in 5 mM hexadecanethiol in ethanol
and left for 24 hours to block any defects that may have occurred due to handling and
UV exposure.
5.4.3 Results of improved methodology for creatinine detection
The adjustments to the electrode surface preparation and thiol self assembly protocol
increased the insulating properties of the electrodes. This can be seen in Figure 5.13
where the phase has a mean value of 88°, demonstrating a nearly purely capacitive
system. However, the new electrodes produced had no response to the additions of
creatinine
0.0
0.4
0.8
1.2
1.6
2.0
1 10 100 1000Frequency (Hz)
Impe
danc
e (MΩ
)
0
10
20
30
40
50
60
70
80
90
Phas
e (°
)
Figure 5.13 – Bode plot of thiol (Blue) and MIP (Red) coated electrodes (impedance –
square, phase – diamond) created using the improved self assembly procedure.
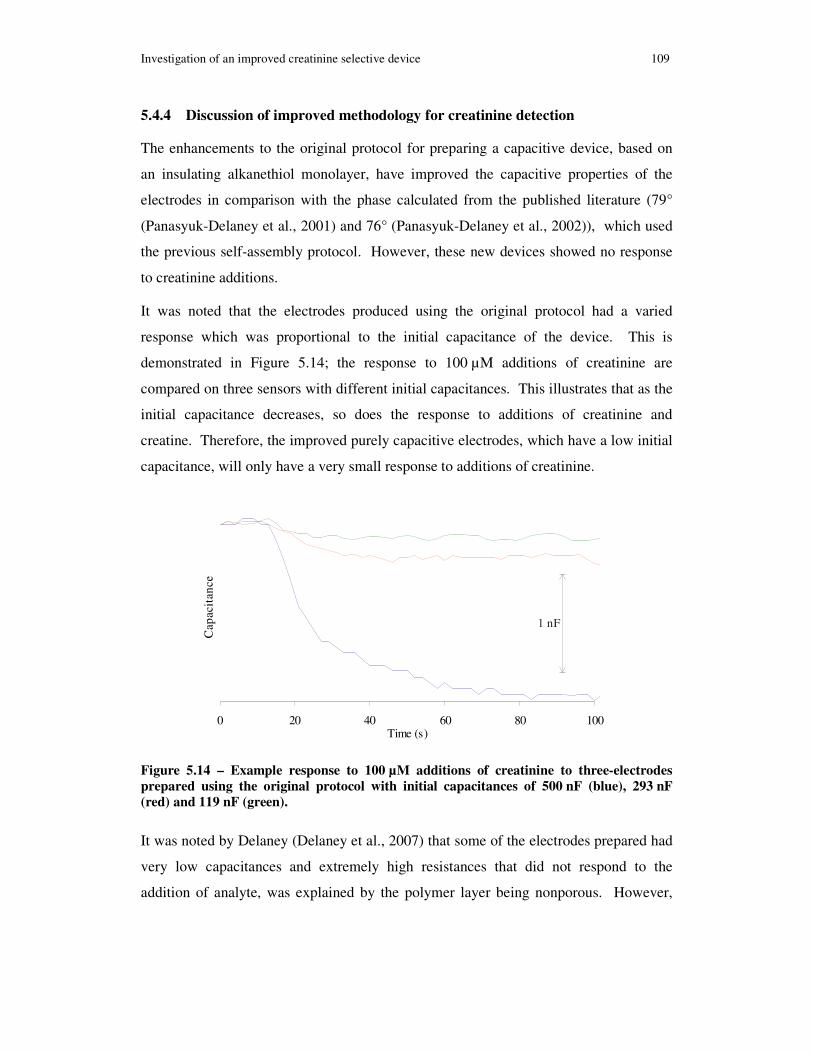
Investigation of an improved creatinine selective device 109
5.4.4 Discussion of improved methodology for creatinine detection
The enhancements to the original protocol for preparing a capacitive device, based on
an insulating alkanethiol monolayer, have improved the capacitive properties of the
electrodes in comparison with the phase calculated from the published literature (79°
(Panasyuk-Delaney et al., 2001) and 76° (Panasyuk-Delaney et al., 2002)), which used
the previous self-assembly protocol. However, these new devices showed no response
to creatinine additions.
It was noted that the electrodes produced using the original protocol had a varied
response which was proportional to the initial capacitance of the device. This is
demonstrated in Figure 5.14; the response to 100 µM additions of creatinine are
compared on three sensors with different initial capacitances. This illustrates that as the
initial capacitance decreases, so does the response to additions of creatinine and
creatine. Therefore, the improved purely capacitive electrodes, which have a low initial
capacitance, will only have a very small response to additions of creatinine.
0 20 40 60 80 100Time (s)
Cap
acit
ance
1 nF
Figure 5.14 – Example response to 100 µM additions of creatinine to three-electrodes
prepared using the original protocol with initial capacitances of 500 nF (blue), 293 nF
(red) and 119 nF (green).
It was noted by Delaney (Delaney et al., 2007) that some of the electrodes prepared had
very low capacitances and extremely high resistances that did not respond to the
addition of analyte, was explained by the polymer layer being nonporous. However,
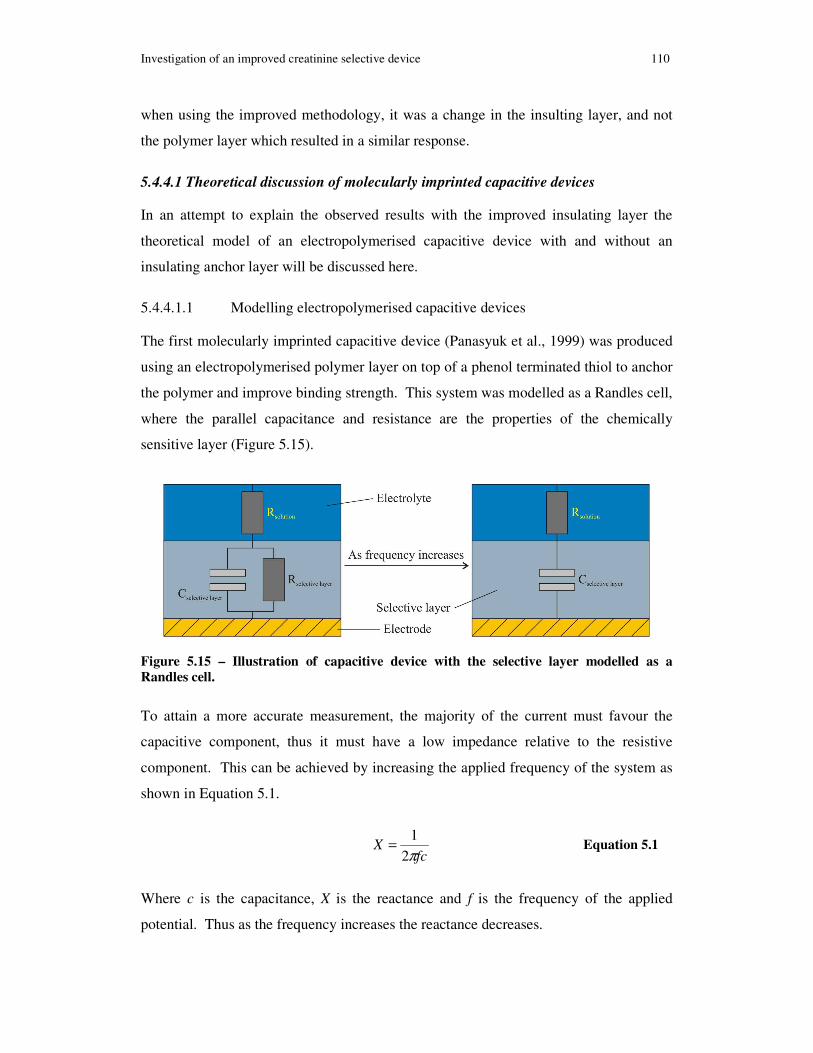
Investigation of an improved creatinine selective device 110
when using the improved methodology, it was a change in the insulting layer, and not
the polymer layer which resulted in a similar response.
5.4.4.1 Theoretical discussion of molecularly imprinted capacitive devices
In an attempt to explain the observed results with the improved insulating layer the
theoretical model of an electropolymerised capacitive device with and without an
insulating anchor layer will be discussed here.
5.4.4.1.1 Modelling electropolymerised capacitive devices
The first molecularly imprinted capacitive device (Panasyuk et al., 1999) was produced
using an electropolymerised polymer layer on top of a phenol terminated thiol to anchor
the polymer and improve binding strength. This system was modelled as a Randles cell,
where the parallel capacitance and resistance are the properties of the chemically
sensitive layer (Figure 5.15).
Figure 5.15 – Illustration of capacitive device with the selective layer modelled as a
Randles cell.
To attain a more accurate measurement, the majority of the current must favour the
capacitive component, thus it must have a low impedance relative to the resistive
component. This can be achieved by increasing the applied frequency of the system as
shown in Equation 5.1.
fc
Xπ2
1= Equation 5.1
Where c is the capacitance, X is the reactance and f is the frequency of the applied
potential. Thus as the frequency increases the reactance decreases.

Investigation of an improved creatinine selective device 111
So, assuming that the selective polymer layer covers the whole of the electrode’s
surface and the electrode’s surface area (A) is constant, then from Equation 5.2 observed
changes in capacitance are dependent on variations in either the polymers thickness (d)
and/or the dielectric (ε).
d
Ac
ε= Equation 5.2
5.4.4.1.2 Modelling capacitive devices with insulating anchoring layers
The use of an insulating anchor can increase the sensitivity of a capacitive device by
reducing the current leakage. One of the simplest ways to achieve this is to create a
SAM.
Assuming, as above, that the operating frequency is chosen so that the device is nearly
purely capacitive and that the insulating layer and selective polymer are in series (Yang
et al., 2005, Liao et al., 2004), then the total capacitance (Ctotal) can be expressed as:
polymerthioltotal CCC
111+= Equation 5.3
Where Cthiol is the capacitance due to the insulating-thiol layer and Cpolymer is the
capacitance due to the polymer layer.
By considering Equation 5.3, if the thiols’ capacitance is large relative to the polymers’
capacitance, then the thiols’ capacitance becomes insignificant, hence, the total
capacitance becomes equivalent to the polymers’ capacitance. Which is equivalent to
the model described in Section 5.4.4.1.1.
Thus, to acquire an insulating layer with a large capacitance, in accordance to Equation
5.3, the thickness of the layer must be small, which assumes a constant surface area (A)
and dielectric (ε). This can be further illustrated (Equation 5.4) by combining Equation
5.2 and 5.3 to give the relationship for the total capacitance of the device.

Investigation of an improved creatinine selective device 112
polymerthiolthiolpolymer
polymerthiol
totaldd
ACεε
εε
+⋅= Equation 5.4
If the polymer coating does not cover the entire surface of the electrode then the
response of the device will deteriorate. A model of this shown in Figure 5.16 with the
device’s total capacitance expressed in Equation 5.5, where θ is the percentage of the
surface covered by the polymer. This model is analogous to the models presented in the
literature for the capacitive detection of analytes causing desorption of the selective
layer (Mirsky et al., 1996, Mirsky et al., 1997).
Figure 5.16 – Illustration of capacitive device produced using a thiol insulating layer to
anchor a thin polymer film. θ is the percentage of the surface (covered with polymer)
which affects the capacitance. This is dependent on polymer coverage and porosity.
( )θθθ
−+
+=
−
111
1
thiol
polymerthiol
total CCC
C Equation 5.5
5.4.4.2 Evaluation of experimental data using the proposed capacitive model
The improved properties of the insulating monolayer are most probably due to a
decrease in the monolayer’s defects and the better packing of the layer. As the packing
of the layer improves, it will become denser and most of the SAM will rearrange itself
into a brush formation, which decreases the effective dielectric and increases the
thickness of the layer. By considering Equation 5.2, both these changes will result in a
lowered capacitance, which possibly explains the decrease in the capacitance of the
device when using the improved method of preparation.

Investigation of an improved creatinine selective device 113
Furthermore, by considering Equation 5.4, the decreased dialectic and increased
thickness of the insulating layer will be detrimental to the detection limit of the device.
This is because, as the effective dialectic decreases so does the effect of any changes in
the polymer layer’s thickness and as the thickness of the insulating layer increases this
is detrimental to any changes in the polymer layer’s dialectic. However, even with
these changes in the insulting layer, variations in both the dielectric, as proposed by
Delaney (Delaney et al., 2007), and thickness, as it is much larger than the monolayer,
of the polymer layer should be seen.
A possible explanation for why no response is seen with the new method is that the
polymer layer does not cover the entire electrode surface, thus, when considering
Equation 5.5, the surface coverage (θ) is less than 1. This implies that as the surface
coverage decreases, thus the capacitance of the insulating layer dominates the
capacitance of the device.
5.4.4.3 Ideal properties of a capacitive device based on the propose theory
To gain a sensitive response when using a thiol to anchor a selective layer to an
electrode, requires the thiol layer to be both insulating and thin, which reduces current
leakage and increases the sensitivity of the device respectively. In addition, the
selective polymer layer must also be uniform; otherwise the capacitance of the
insulating layer will dominate the device.
The other alternative is not to use an insulating anchor as described in Section
5.4.4.1.1., however this will result in high current leakages. Yet, this can be overcome
by blocking the surface.
5.4.5 Conclusion of improved methodology for the detection of creatinine
It has been shown that the quality of the insulating thiol layer can be improved with a
combination of plasma and ethanol surface pre-treatment and with the thiol being
deposited from ethanol solution. However, the capacitive device also requires a
uniform polymer coating, as any holes or defects will result in a decreased sensitivity.

Conclusion of the capacitive detection of creatinine 114
5.5 Conclusion of the capacitive detection of creatinine
To explore alternatives to Faradic detection capacitive devices were investigated. It was
seen in the literature that a capacitive device prepared using an insulating monolayer to
anchor a selectively imprinted polymer provided a simple approach to producing a
capacitive electrode. This approach could be easily applied to other MIPs to form a
universal platform for sensor development.
The reproduction of the creatinine sensitive electrodes described in the literature was the
first goal in investigating these capacitive devices. Variations between MIP and NIP
electrodes showed an increase in the capacitive response for the MIP electrode to
various concentrations of creatinine. This positive result was further reinforced by the
smaller response seen for the interfering compound creatine. However, these results
were not as impressive as those published where there was no response to creatine. In
addition, although the electrodes worked, their reproducibility was unsatisfactory.
Thus to improve the capacitive response as well as the reproducibility of the electrodes
the surface pre-treatment and SAM immobilisation procedure was changed. These
changes showed improvements in the impedance of the insulating monolayer, however,
these improvements were detrimental to the sensitivity of the electrodes, which is
contradictory to the literature.
To explain this unexpected response a model of the capacitive electrodes was derived
based on assumptions within the literature. This model described the relationship
between the properties of the insulating layer and the decrease in sensitivity.
Accordingly, it can be concluded that a uniform polymer layer is as essential as a
perfect insulting layer for the performance of a capacitive device.

115
Chapter 6 - Detection of propofol with the controlled growth
of MIP onto a conducting polymer anchor
“That which we persist in doing becomes easier, not that the task itself has become
easier, but that our ability to perform it has improved”, Ralph Waldo Emerson (1803 –
1882)
6.1 Introduction
From the work presented in the previous chapters two main issues with regards to MIP-
based sensors keep arising; firstly, the lack of control over the polymerisation process
and secondly, the electrical insulation caused by the polymer layer when using a faradic
detection technique. Two new compounds were introduced to address the problems that
incurred during polymer grafting. To increase the level of control over the
polymerisation, iniferters were used to initiate and control the polymerisation, and a
poly(aniline) anchor was used to increase the connectivity between the electrode and
polymer binding sites.
The ploy(aniline) anchor was recently developed at Cranfield University (Lakshmi et
al., 2009b), thus the following chapter is an initial investigation into the possibility of
both an impedance and amperometric sensor, for propofol and creatinine as the target
analytes.
6.2 Review of relevant compounds and their chemistry
The following is a review of the new compounds being introduced into the grafting
procedure.
6.2.1 Iniferters
Iniferters were created by Otsu (Otsu and Kuriyama, 1984) and are similar to initiators
but they are used in ‘living’ radical polymerisations because they can initiate
polymerisation, but also act like chain transfer agents and free radical terminators.

Review of relevant compounds and their chemistry 116
Dithiocarbamate-based iniferters form a carbon radical and a dithiocarbamate radical
(Figure 6.1). The dithiolcarbamate radical is stable and un-reactive, and only the carbon
radical is capable of initiating polymerisation as it acts as an active centre for
propagation. Termination of the polymerisation can occur by either two carbon radicals
reacting or a dithiocarbamate radical reacting with a carbon radical. In the second case,
the dithiocarbamate radical can be re-initiated and propagation can continue. It is this
property of ‘re-initiation’ that gives iniferters their ‘living’ nature when compared to
free radical initiators.
Iniferters are attractive alternatives to free radical initiators because they undergo a
more controlled polymerisation (Luo et al., 2002). The increased control comes from
the polymerisation being slower, compared to free radical initiators. It has been shown
that the initial polymerisation rate can be twelve times slower (Kannurpatti et al., 1996)
and polymer growth is linear relative to polymerisation time (de Boer et al., 2000). This
can be explained by the termination and re-initiation of the dithiocarbamate radical as
opposed to the constant propagation of a carbon radical and the instant termination of a
carbon-carbon radial interaction.
Figure 6.1 – Schematic of dithiocarbamate polymerisation.

Review of relevant compounds and their chemistry 117
6.2.1.1 Polymer grafting
A surface can be functionalised by immobilising iniferters and growing various
polymers from the surface. The slower polymerisation, as a consequence of using an
iniferter, provides a more controlled polymerisation and ensures accurate variation in
the polymer thickness. As the iniferter can be re-initiated, multiple layers consisting of
differing constituents can be grown (de Boer et al., 2000). Surface grafting with
iniferters has been used to create “thermo responsive phase transition” layers (Matsuda
and Ohya, 2005). This was achieved by growing polymer chains of a consistent length
from a silane immobilised iniferter. Iniferters have also been successfully used in the
preparation of MIPs on silica supports (Ruckert et al., 2002) where their main advantage
over immobilised azoinitiators is the lack of bulk polymerisation.
6.2.2 N-phenylethylene diamine methacrylamide (NPEDMA)
N-phenylethylene diamine methacrylamide (NPEDMA) is a monomer designed at
Cranfield University, specifically to provide a conductive anchor to which polymer can
be grafted from the resulting functional surface. NPEDMA consists of two
polymerisable groups, an aniline and a methyacrylamide group which can be
independently polymerised. The electropolymerisation of NPEDMA results in a
poly(aniline) anchor being immobilised on the electrode’s surface with a functional
surface group capable of further polymerisation.
The poly(NPEDMA) anchor is conductive: as an anchor it provides a low resistive path
for the electrochemical study of analytes immobilised in subsequent polymer layers
grown on top of the poly(NPEDMA) layer. This is not being possible with most
anchors which have a high electrical resistance, for example long chain thiol
monolayers.
6.2.2.1 NPEDMA electropolymerisation
The electrochemistry of NPEDMA (Figure 6.2) is presumed to be analogous to that of
aniline, where the secondary amine bonded to the benzene ring is oxidised resulting in a
radical cation, which has three different structural forms. These various cations are
presumed to be unstable, thus further chemical reactions may occur resulting in an
autocatalytic reaction (Cui et al., 1993) when the radical cation reacts with NPEDMA.

Review of relevant compounds and their chemistry 118
This is shown in Equation 6.1 and Equation 6.2, where N is NPEDMA, PN is
poly(NPEDMA), PNox is oxidised poly(NPEDMA) and PN
oli is oligo(NPEDMA).
ox
nn PNnePN →− − Equation 6.1
PNn
ox + nN → PNn−1ox( )PN2
oli Equation 6.2
The unstable radical cations can also form dimers which can be electrochemically
oxidised and reduced (Stuart and Foulkes, 1988), an example of which is shown in
Figure 6.2. This electrochemical activity will presumably result in redox peaks at lower
potentials than the initial NPEDMA oxidation. Poly(NPEDMA) is formed during
chemical reactions between the radical cations and/or their dimers.
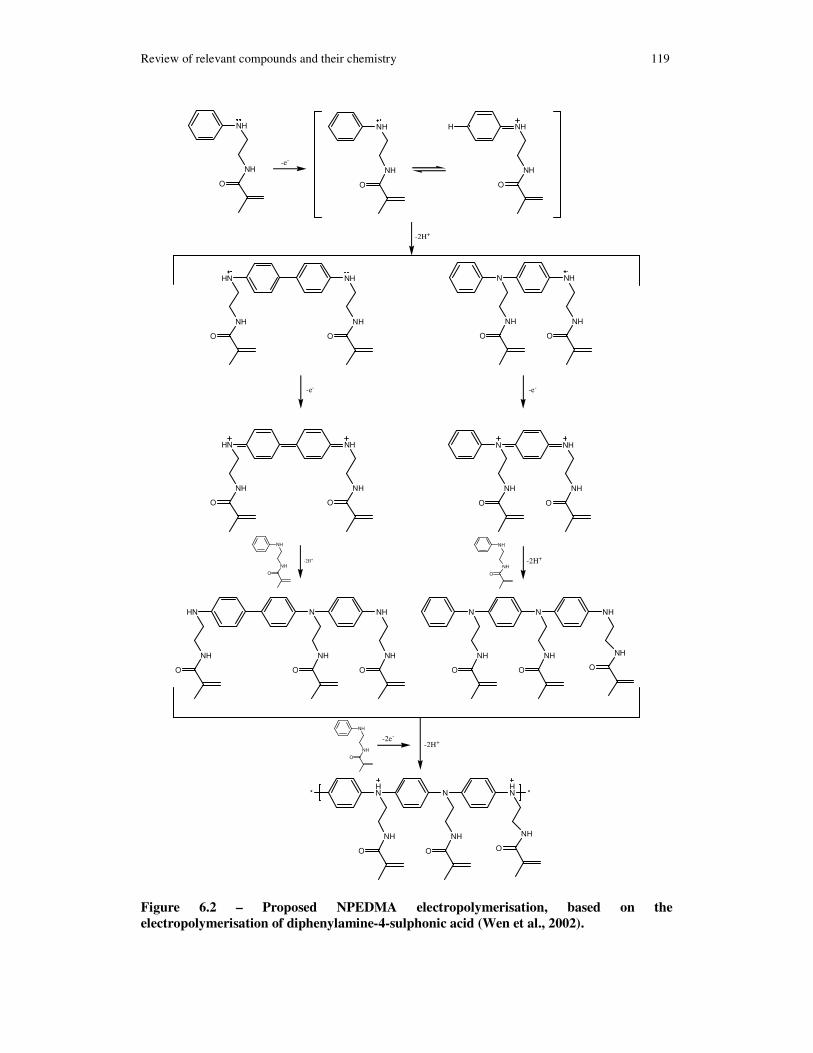
Review of relevant compounds and their chemistry 119
NH
NH
O
NH
NH
O
H NH
NH
O
-e-
HN
NH
O
NH
NH
O
N NH
NH NH
O O
-2H+
HN
NH
O
NH
NH
O
-e--e-
N NH
NH NH
O O
-2H+ -2H+
HN
NH
O
N
NH
O
NH
NH
O
N N
NH NH
O O
NH
NH
O
HN N
NH NH
O O
HN
NH
O
-2H+
* *
NH
NH
O
-2e-
NH
NH
O
NH
NH
O
Figure 6.2 – Proposed NPEDMA electropolymerisation, based on the
electropolymerisation of diphenylamine-4-sulphonic acid (Wen et al., 2002).

Growing polymer from an electropolymerised NPEDMA layer 120
6.3 Growing polymer from an electropolymerised NPEDMA layer
The following section describes an investigation into the electropolymerisation of
NPEDMA onto an electrode surface. NPEDMA was used as a conductive anchor from
which polymer can be grown. The polymerisation was initiated using iniferter attached
to the immobilised NPEDMA coating that will allow a controlled polymerisation.
Thus, by varying the UV intensity and exposure time, control over the polymerisation
can be gained.
6.3.1 Methodology of polymer immobilisation with a NPEDMA anchor
All consumables were supplied by Sigma-Aldrich unless stated otherwise.
6.3.1.1 NPEDMA immobilisation
NPEDMA was synthesised at Cranfield University and dissolved in 50 mM HClO4 with
10% methanol to a concentration of 2.44 mM. The electropolymerisation was
performed using cyclic voltammetry in a three-electrode configuration with a gold
working electrode (BASi, UK), a platinum wire counter electrode and a Ag/AgCl
reference electrode (BASi, UK) using a microAutoLabII (Eco Chemie, Netherlands)
potentiostat. The potential varied between 0 V to 1.1 V at a rate of 50 mV s-1 for 15
scans. The working electrode was mechanically cleaned using aluminium slurry and
rinsed in deionised water before each electropolymerisation. After the polymerisation
the electrode was rinsed in ethanol and dried in a stream of nitrogen ready for the
attachment of the iniferter.
6.3.1.2 Iniferter attachment and polymer growth
The attachment of the iniferter to the NPEDMA coated electrode and the growth of the
polymer using the immobilised iniferter for initiation followed the same procedure, the
only difference was the solution in which the electrode was submerged.
6.3.1.2.1 Iniferter attachment and polymerisation procedure
The working electrode was submerged into a beaker containing either the iniferter or
polymer solution with a glass pipette for degassing. The beaker was sealed with
parafilm and the solution was flushed for ten minutes with argon before irradiation with

Growing polymer from an electropolymerised NPEDMA layer 121
the UV lamp (Cermax xenon, PerkinElmer). After the UV exposure the electrodes were
rinsed in ethanol and dried in a stream of nitrogen.
Argon
Working electrode
Optical UV source
Polymer/iniferter solution
Seal
UV light
Figure 6.3 – Experimental setup for iniferter attachment and polymer grafting.
6.3.1.2.2 Iniferter solution
The iniferter (N,N’diethyldithiocarbamic acid benzyl ester) was purchased from TCI
(Oxford, UK) and dissolved in ethanol at 50 mM concentration for the attachment.
6.3.1.2.3 Polymer solution and cleaning
The composition of imprinted polymer used for the selective binding of propofol can be
found in Table 6.1. It was designed and tested in a previous study by Cranfield
University on behalf of Sphere Medical and was also used in the work described in
Chapter 3 for an initial investigation into electrochemical MIP sensors.
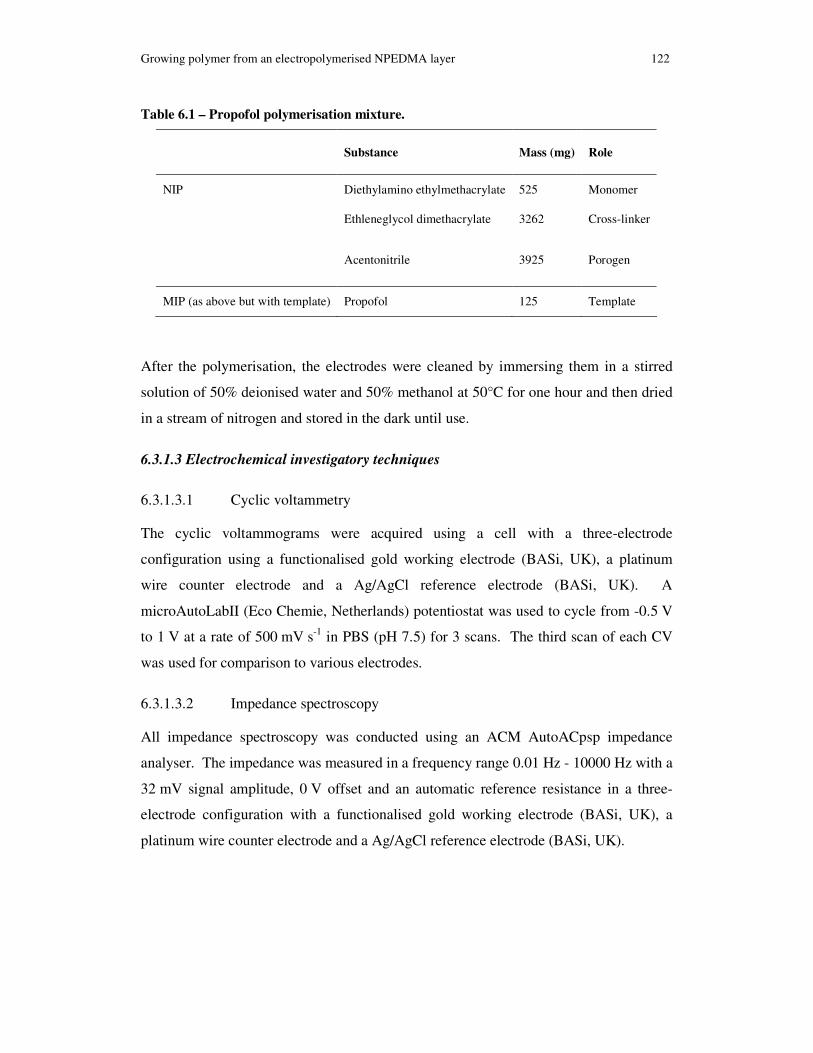
Growing polymer from an electropolymerised NPEDMA layer 122
Table 6.1 – Propofol polymerisation mixture.
Substance Mass (mg) Role
NIP Diethylamino ethylmethacrylate 525 Monomer
Ethleneglycol dimethacrylate 3262 Cross-linker
Acentonitrile 3925 Porogen
MIP (as above but with template) Propofol 125 Template
After the polymerisation, the electrodes were cleaned by immersing them in a stirred
solution of 50% deionised water and 50% methanol at 50°C for one hour and then dried
in a stream of nitrogen and stored in the dark until use.
6.3.1.3 Electrochemical investigatory techniques
6.3.1.3.1 Cyclic voltammetry
The cyclic voltammograms were acquired using a cell with a three-electrode
configuration using a functionalised gold working electrode (BASi, UK), a platinum
wire counter electrode and a Ag/AgCl reference electrode (BASi, UK). A
microAutoLabII (Eco Chemie, Netherlands) potentiostat was used to cycle from -0.5 V
to 1 V at a rate of 500 mV s-1 in PBS (pH 7.5) for 3 scans. The third scan of each CV
was used for comparison to various electrodes.
6.3.1.3.2 Impedance spectroscopy
All impedance spectroscopy was conducted using an ACM AutoACpsp impedance
analyser. The impedance was measured in a frequency range 0.01 Hz - 10000 Hz with a
32 mV signal amplitude, 0 V offset and an automatic reference resistance in a three-
electrode configuration with a functionalised gold working electrode (BASi, UK), a
platinum wire counter electrode and a Ag/AgCl reference electrode (BASi, UK).

Growing polymer from an electropolymerised NPEDMA layer 123
6.3.2 Results of polymer immobilisation with a NPEDMA anchor
6.3.2.1 NPEDMA immobilisation
The cyclic voltammograms of NPEDMA (Figure 6.4) demonstrate its oxidation at a
potential around 850 mV, which is similar to the oxidation of aniline (Zhang et al.,
2008, Lin et al., 2005). The first scan (blue line) shows the characteristic oxidation
peak (I) of the amino oxidation, this peak initially decreases and moves to higher
potentials as the scans progress. This change in peak was characteristic of the
electropolymerised layers getting thicker and interfering with the oxidation.
-20
0
20
40
60
80
100
0 0.2 0.4 0.6 0.8 1 1.2E (V) vs Ag/AgCl
i(µ
A)
I
II
Figure 6.4 – Cyclic voltammetric scans of NPEDMA being electropolymerised (50 mV s-1
).
Consecutive cyclic scans 1 (blue), 2 (red), 3 (green) and 15 (purple).
The redox couple which occurred during the electropolymerisation (II) was due to
dimers of NPEDMA electrochemically reacting, which is typical behaviour of an ECE
(electrochemical-chemical-electrochemical) system. This has also been observed by Jin
and co-workers during the electropolymerisation of aniline (Jin et al., 2006).
6.3.2.2 Polymer growth
Initially the polymer layer was grown on top of the iniferter for 30 minutes with the UV
lamp at a distance of 1 cm, however no response could be gained from these devices.
With a reduction in polymerisation time, current could be measured through the
immobilised layers, this can be seen in Figure 6.5 where the decrease in polymerisation
time leads to increasing current in a cyclic voltammogram.

Growing polymer from an electropolymerised NPEDMA layer 124
-6
-4
-2
0
2
4
6
8
-0.5 -0.3 -0.1 0.1 0.3 0.5 0.7 0.9 1.1
E (V) vs Ag/AgCl
i (µ
A)
Figure 6.5 – CV of MIP coated electrodes polymerised at a distance of 1 cm from light
source for 5 minutes (blue), 10 minutes (green) and 30 minutes (red).
Impedance spectrums (Figure 6.6 and Figure 6.7) of the bare gold electrode conform to
Warburg’s model of a diffusion related system. With the addition of the NPEDMA
layer the overall impedance of the device increases but the Nyquist peak of a
characteristic model Randles cell shifts to a lower frequency which shows a decrease in
the charge transfer resistance. The growth of the MIP layer on top of the iniferter
doubles the impedance of the system compared to a bare gold electrode and the device’s
response becomes diffusion dependent.
0
50
100
150
200
250
300
350
400
450
500
0.01 0.1 1 10 100 1000 10000Frequency (Hz)
Impe
danc
e (KΩ
)
0
10
20
30
40
50
60
70
80
90
Pha
se (
°)
Figure 6.6 – Bode plot of MIP (blue) polymerised for 10 minutes at a distance of 1 cm,
NPEDMA (green) and bare (red) gold electrodes in PBS (pH 7.5).

Growing polymer from an electropolymerised NPEDMA layer 125
0
20
40
60
80
100
120
140
160
180
200
0 20 40 60 80 100 120
Resistance (Ω)
Rea
ctan
ce (Ω
)
Figure 6.7 – Nyquist plot of MIP (blue) polymerised for 10 minutes at a distance of 1 cm,
NPEDMA (green) and bare (red) gold electrodes in PBS (pH 7.5).
The relationships between polymerisation distance (Figure 6.8) and polymerisation time
(Figure 6.9) against the resulting current in a cyclic voltammogram show that increasing
the polymerisation distance and decreasing the polymerisation time result in a larger
current passing through the immobilised layers. This implies that a thicker polymer
film would insulate the electrode surface and therefore hinder diffusion.
-4
-2
0
2
4
6
8
-0.5 -0.3 -0.1 0.1 0.3 0.5 0.7 0.9 1.1E (V) vs Ag/AgCl
i (µ
A)
Figure 6.8 – CV of MIP coated electrodes polymerised for a period of 10 minutes at a
distance of 3 cm (blue), 2 cm (green) and 1 cm (red).
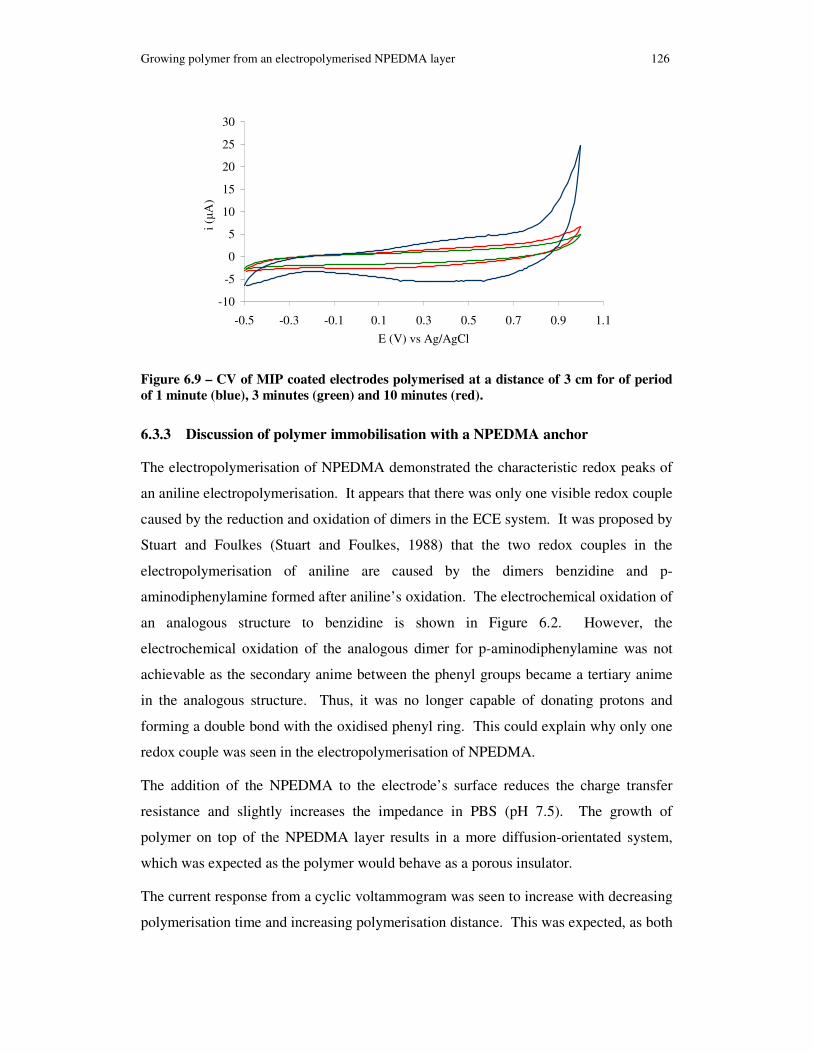
Growing polymer from an electropolymerised NPEDMA layer 126
-10
-5
0
5
10
15
20
25
30
-0.5 -0.3 -0.1 0.1 0.3 0.5 0.7 0.9 1.1
E (V) vs Ag/AgCl
i (µ
A)
Figure 6.9 – CV of MIP coated electrodes polymerised at a distance of 3 cm for of period
of 1 minute (blue), 3 minutes (green) and 10 minutes (red).
6.3.3 Discussion of polymer immobilisation with a NPEDMA anchor
The electropolymerisation of NPEDMA demonstrated the characteristic redox peaks of
an aniline electropolymerisation. It appears that there was only one visible redox couple
caused by the reduction and oxidation of dimers in the ECE system. It was proposed by
Stuart and Foulkes (Stuart and Foulkes, 1988) that the two redox couples in the
electropolymerisation of aniline are caused by the dimers benzidine and p-
aminodiphenylamine formed after aniline’s oxidation. The electrochemical oxidation of
an analogous structure to benzidine is shown in Figure 6.2. However, the
electrochemical oxidation of the analogous dimer for p-aminodiphenylamine was not
achievable as the secondary anime between the phenyl groups became a tertiary anime
in the analogous structure. Thus, it was no longer capable of donating protons and
forming a double bond with the oxidised phenyl ring. This could explain why only one
redox couple was seen in the electropolymerisation of NPEDMA.
The addition of the NPEDMA to the electrode’s surface reduces the charge transfer
resistance and slightly increases the impedance in PBS (pH 7.5). The growth of
polymer on top of the NPEDMA layer results in a more diffusion-orientated system,
which was expected as the polymer would behave as a porous insulator.
The current response from a cyclic voltammogram was seen to increase with decreasing
polymerisation time and increasing polymerisation distance. This was expected, as both

Impedance detection of creatinine and propofol with NPEDMA anchored MIP 127
these changes in polymerisation conditions will result in a decrease in the UV radiation
that was incident on the device over some period of time. The polymer’s thickness
varies proportionally to UV intensity and the exposure time will determine the length of
the polymerisation process. The polymer can be viewed as a porous insulating layer,
thus the thicker it was, the more the thicker the diffusion layer would become, hence the
current would decrease for a constant scan rate.
6.3.4 Conclusion of polymer immobilisation with NPEDMA anchor
Coating an electrode surface with NPEDMA using electropolymerisation has proven to
be successful. The electropolymerisation showed similar characteristics to that of an
aniline electropolymerisation. The attachment of the iniferter and growth of polymer
was also successful and control over the polymerisation by varying the UV exposure
time and UV intensity was achieved.
6.4 Impedance detection of creatinine and propofol with NPEDMA
anchored MIP
The following section looks at the impedance detection of creatinine and propofol using
NPEDMA as a conductive anchor.
6.4.1 Methodology for the impedance detection of creatinine and propofol
All consumables were supplied by Sigma-Aldrich unless stated otherwise.
6.4.1.1 Coating of electrodes with polymers
The various electrode coatings were prepared using the procedure from Section 6.3.1.
6.4.1.2 Impedance detection
The impedance monitoring was achieved by setting up a two-electrode cell with the
functionalised working electrode and a Ag/AgCl reference/counter electrode in PBS
(pH 7.5) with 10% ACN. A lock-in-amplifier (Stanford instruments, RS830) was used
to measure the potential across the cell and the current and impedance were calculated
with the aid of a reference resistor (50 kΩ). Propofol dissolved in PBS (pH 7.5)
containing 10% ACN was injected into the stirred cell. The same impedance setup was
used as previously described in Chapter 5.

Impedance detection of creatinine and propofol with NPEDMA anchored MIP 128
6.4.2 Results of the impedance detection of creatinine and NPEDMA
The addition of both creatinine and propofol to the electrolyte caused a negative step
change in the capacitance of the electrode as seen in Figure 6.10 and Figure 6.11. The
magnitudes of these decreases in capacitance were proportional to the resulting
concentrations of analytes in the test solutions. With the addition of polymer, both NIP
and MIP onto the NPEDMA surface, the overall change in capacitive response
decreased.
287
288
289
290
291
292
293
294
295
0 200 400 600 800 1000 1200Time (s)
Cap
acita
nce
(nF)
Figure 6.10 – Capacitive step response of a NIP electrode, polymerised for 10 minutes at a
distance of 3 cm to additions of creatinine (3 x 200 µL, 3 x 500 µL and 3 x 1000 µL). The
resulting calibration curve is shown in Figure 6.12.
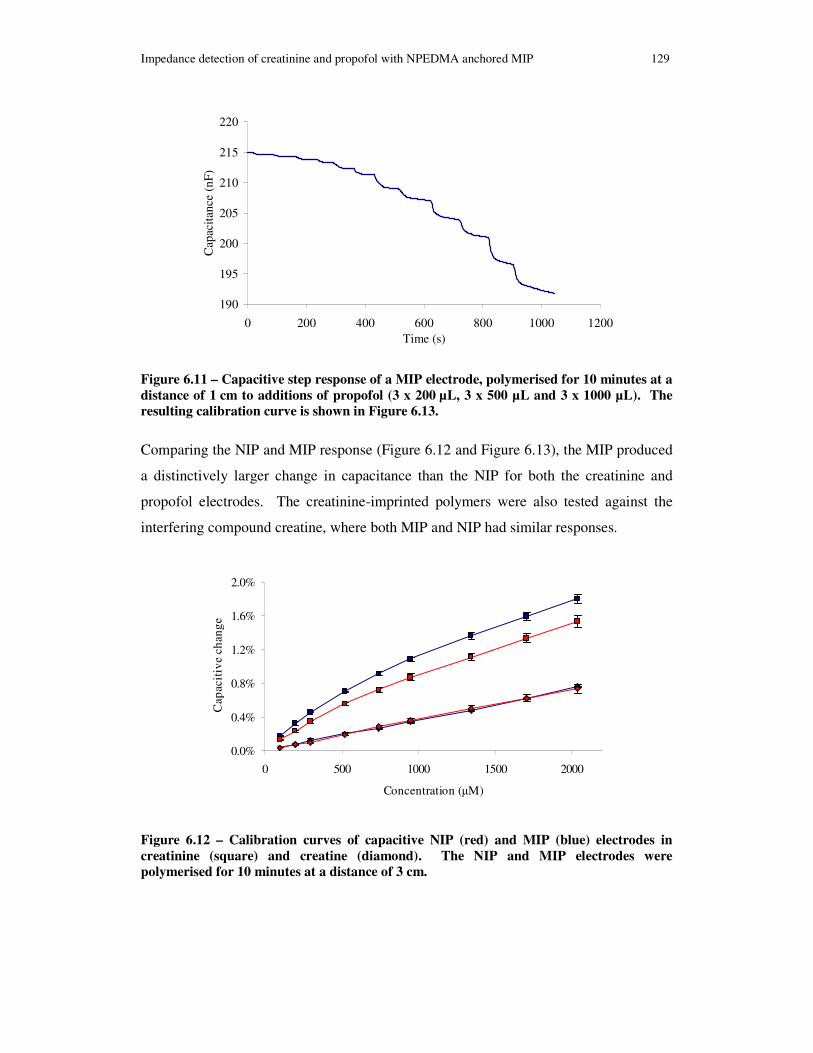
Impedance detection of creatinine and propofol with NPEDMA anchored MIP 129
190
195
200
205
210
215
220
0 200 400 600 800 1000 1200Time (s)
Cap
acita
nce
(nF)
Figure 6.11 – Capacitive step response of a MIP electrode, polymerised for 10 minutes at a
distance of 1 cm to additions of propofol (3 x 200 µL, 3 x 500 µL and 3 x 1000 µL). The
resulting calibration curve is shown in Figure 6.13.
Comparing the NIP and MIP response (Figure 6.12 and Figure 6.13), the MIP produced
a distinctively larger change in capacitance than the NIP for both the creatinine and
propofol electrodes. The creatinine-imprinted polymers were also tested against the
interfering compound creatine, where both MIP and NIP had similar responses.
0.0%
0.4%
0.8%
1.2%
1.6%
2.0%
0 500 1000 1500 2000
Concentration (µM)
Cap
acit
ive
chan
ge
Figure 6.12 – Calibration curves of capacitive NIP (red) and MIP (blue) electrodes in
creatinine (square) and creatine (diamond). The NIP and MIP electrodes were
polymerised for 10 minutes at a distance of 3 cm.

Impedance detection of creatinine and propofol with NPEDMA anchored MIP 130
0%
4%
8%
12%
16%
20%
0 2 4 6 8 10 12 14Concentration (µM)
Cap
acit
ive
chan
ge
Figure 6.13 – Calibration curves of capacitive NPEDMA (green), NIP (red) and MIP
(blue) electrodes. The NIP and MIP electrodes were polymerised for 10 minutes at a
distance of 1 cm.
6.4.3 Discussion on the impedance detection of creatinine and propofol
The difference between the MIP and NIP coatings for the detection of creatinine and
propofol in the impedance monitoring suggests that the MIP has a larger conformational
and/or dielectric change induced by the interaction with the template. This could be due
to the greater selectivity of the MIP coating. This hypothesis is also supported by the
similarity in response to additions of creatine by the creatinine MIP and NIP.
The NPEDMA coating gives a larger response, nearly three times that of the MIP. This
suggests that the NPEDMA coating interacts with propofol; however, there was no
reason for this interaction to have any specificity. Thus, any phenol compound or
protein may readily interact with the NPEDMA surface.
6.4.4 Conclusion on the impedance detection of creatinine and propofol
The additions of creatinine and propofol were detected by the impedance monitoring
system and there was a distinct difference between the NIP and MIP functionalised
electrodes for both of the analytes. This was in accordance with the proposed model of
impedance monitoring in Section 5.4.4.1. This approach shows great promise for the
detection method for propofol, although it was lacking in sensitivity possible due to
current leakage.
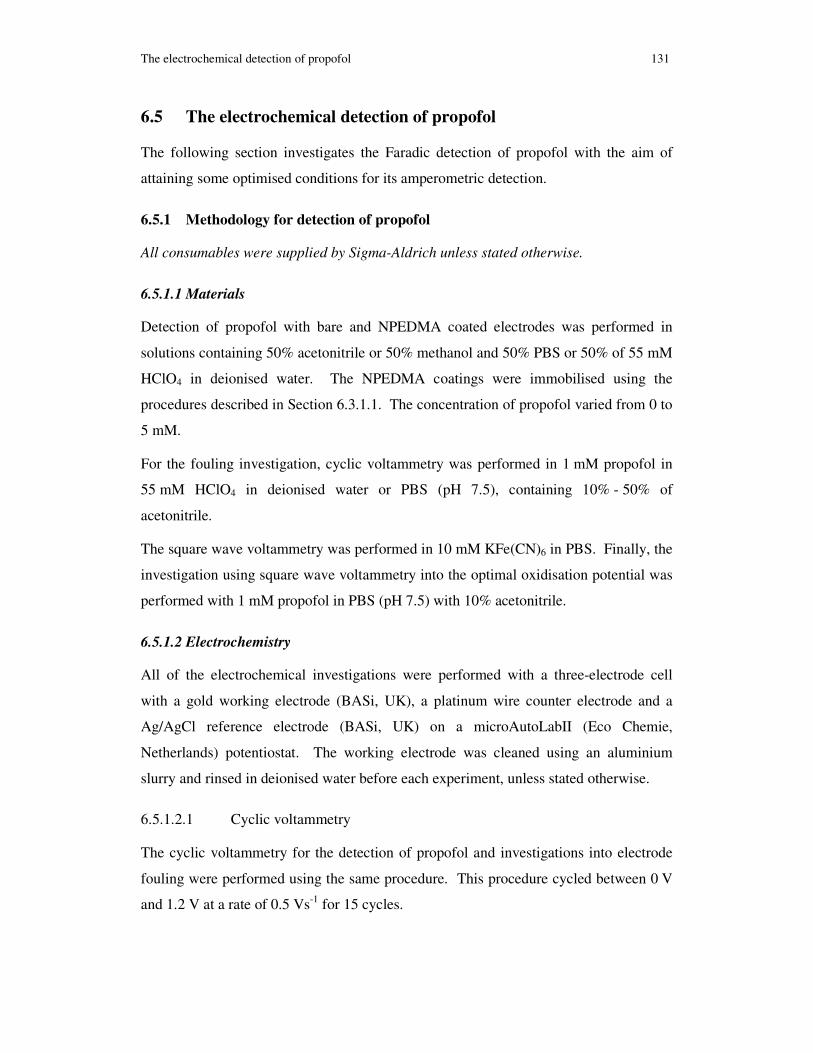
The electrochemical detection of propofol 131
6.5 The electrochemical detection of propofol
The following section investigates the Faradic detection of propofol with the aim of
attaining some optimised conditions for its amperometric detection.
6.5.1 Methodology for detection of propofol
All consumables were supplied by Sigma-Aldrich unless stated otherwise.
6.5.1.1 Materials
Detection of propofol with bare and NPEDMA coated electrodes was performed in
solutions containing 50% acetonitrile or 50% methanol and 50% PBS or 50% of 55 mM
HClO4 in deionised water. The NPEDMA coatings were immobilised using the
procedures described in Section 6.3.1.1. The concentration of propofol varied from 0 to
5 mM.
For the fouling investigation, cyclic voltammetry was performed in 1 mM propofol in
55 mM HClO4 in deionised water or PBS (pH 7.5), containing 10% - 50% of
acetonitrile.
The square wave voltammetry was performed in 10 mM KFe(CN)6 in PBS. Finally, the
investigation using square wave voltammetry into the optimal oxidisation potential was
performed with 1 mM propofol in PBS (pH 7.5) with 10% acetonitrile.
6.5.1.2 Electrochemistry
All of the electrochemical investigations were performed with a three-electrode cell
with a gold working electrode (BASi, UK), a platinum wire counter electrode and a
Ag/AgCl reference electrode (BASi, UK) on a microAutoLabII (Eco Chemie,
Netherlands) potentiostat. The working electrode was cleaned using an aluminium
slurry and rinsed in deionised water before each experiment, unless stated otherwise.
6.5.1.2.1 Cyclic voltammetry
The cyclic voltammetry for the detection of propofol and investigations into electrode
fouling were performed using the same procedure. This procedure cycled between 0 V
and 1.2 V at a rate of 0.5 Vs-1 for 15 cycles.

The electrochemical detection of propofol 132
6.5.1.2.2 Square wave voltammetry
The settings for the square wave voltammetry investigations into the propofol
concentration dependence of the sensor signal and the electrode fouling was to scan
between 0 V and 1.2 V with an amplitude of 50 mV and a frequency of 100 Hz
(approximately 0.5 Vs-1).
6.5.2 Results of the investigation into the detection of propofol
6.5.2.1 Electrochemical detection of propofol and optimisation of the detection
conditions
6.5.2.1.1 Detection of propofol on bare gold electrode
The peak response of propofol was investigated using cyclic voltammetry, an example
of which can be seen in Figure 6.14. By comparing the voltammograms in the presence
of propofol (Figure 6.14, blue lines) to the voltammogram of the supporting electrolyte
(Figure 6.14, red line) a definite peak, at 966 mV, can be seen when 5 mM of propofol
present. There was also a reduction peak in the voltammogram of PBS at 450 mV,
which was lowered in the presence of propofol.
-100
-50
0
50
100
150
200
250
0 0.2 0.4 0.6 0.8 1 1.2E (V) vs Ag/AgCl
i (µ
A)
Figure 6.14 – Cyclic voltammogram performed in 50% PBS (pH 7.5) and 50% methanol
(blue) and with 5 mM propofol, scans 1 (red), 5 (green), 10 (blue) and 15 (purple).
The oxidation peak potential (Figure 6.15) and current (Figure 6.16) were compared for
various electrolytes with a propofol concentration of 5 mM. In all electrolytes tested a

The electrochemical detection of propofol 133
distinct oxidation peak can be seen. When the electrolyte contained methanol, the
potential increased from the first to the fifteenth scan. Acetonitrile, on other hand,
decreased the potential. The peak oxidation currents for the electrolytes tested were
around 60 nA with the highest currents achieved in an electrolyte containing acetonitrile
and in PBS (pH of 7.5).
0
200
400
600
800
1000
1200
Perchloric acid PBS (pH 7.5)
Supporting electrolyte
Oxi
dati
on p
eak
(mV
) .
Figure 6.15 – Chart showing the peak oxidation potential of propofol (5 mM) with
background subtraction. The potential from the first (red and blue) and fifteen scan
(yellow and green) is shown for different electrolytic conditions (HClO4 or PBS)
containing 50% methanol (red and yellow) or 50% acetonitrile (blue and green).
0
10
20
30
40
50
60
70
80
90
Perchloric acid PBS (pH 7.5)Supporting electrolyte
Peak
oxi
datio
n cu
rren
t (µ
A)
Figure 6.16 – Chart showing the oxidation current of propofol (5 mM) at the peak
oxidation current with background subtraction. The current from the first scan is shown
for different electrolytic conditions (HClO4 or PBS) containing either 50% methanol
(yellow) or 50% acetonitrile (red).
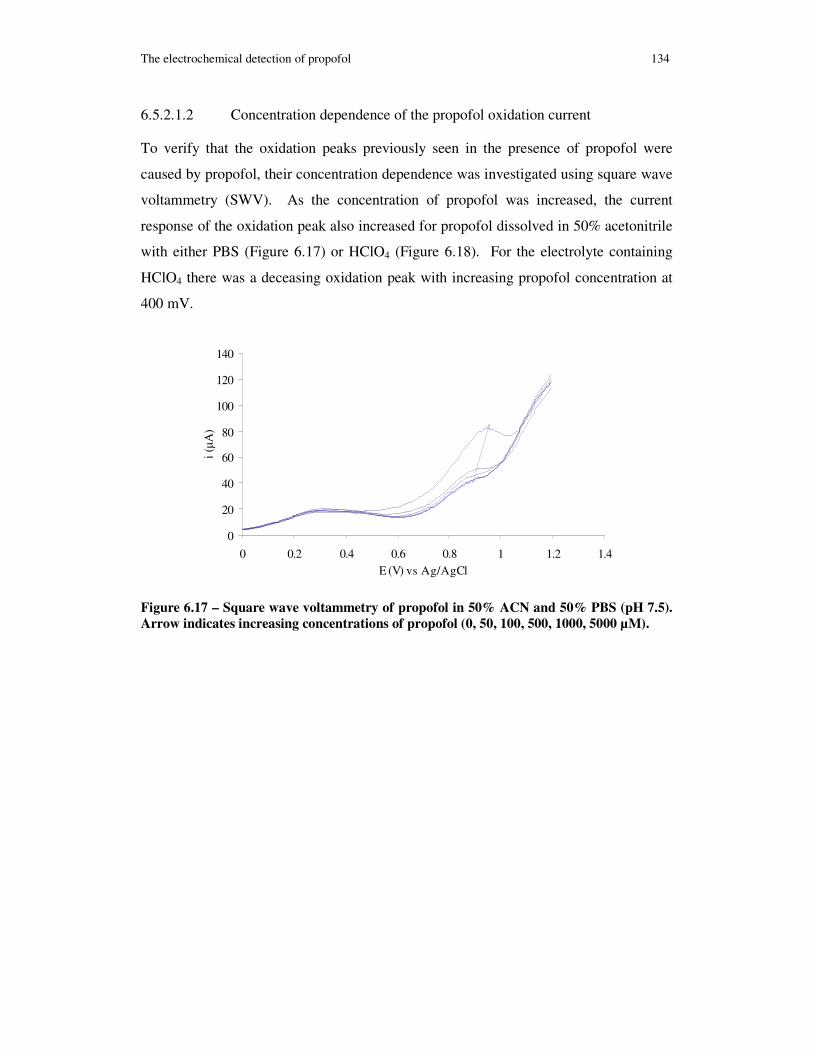
The electrochemical detection of propofol 134
6.5.2.1.2 Concentration dependence of the propofol oxidation current
To verify that the oxidation peaks previously seen in the presence of propofol were
caused by propofol, their concentration dependence was investigated using square wave
voltammetry (SWV). As the concentration of propofol was increased, the current
response of the oxidation peak also increased for propofol dissolved in 50% acetonitrile
with either PBS (Figure 6.17) or HClO4 (Figure 6.18). For the electrolyte containing
HClO4 there was a deceasing oxidation peak with increasing propofol concentration at
400 mV.
0
20
40
60
80
100
120
140
0 0.2 0.4 0.6 0.8 1 1.2 1.4E (V) vs Ag/AgCl
i(µ
A)
Figure 6.17 – Square wave voltammetry of propofol in 50% ACN and 50% PBS (pH 7.5).
Arrow indicates increasing concentrations of propofol (0, 50, 100, 500, 1000, 5000 µM).
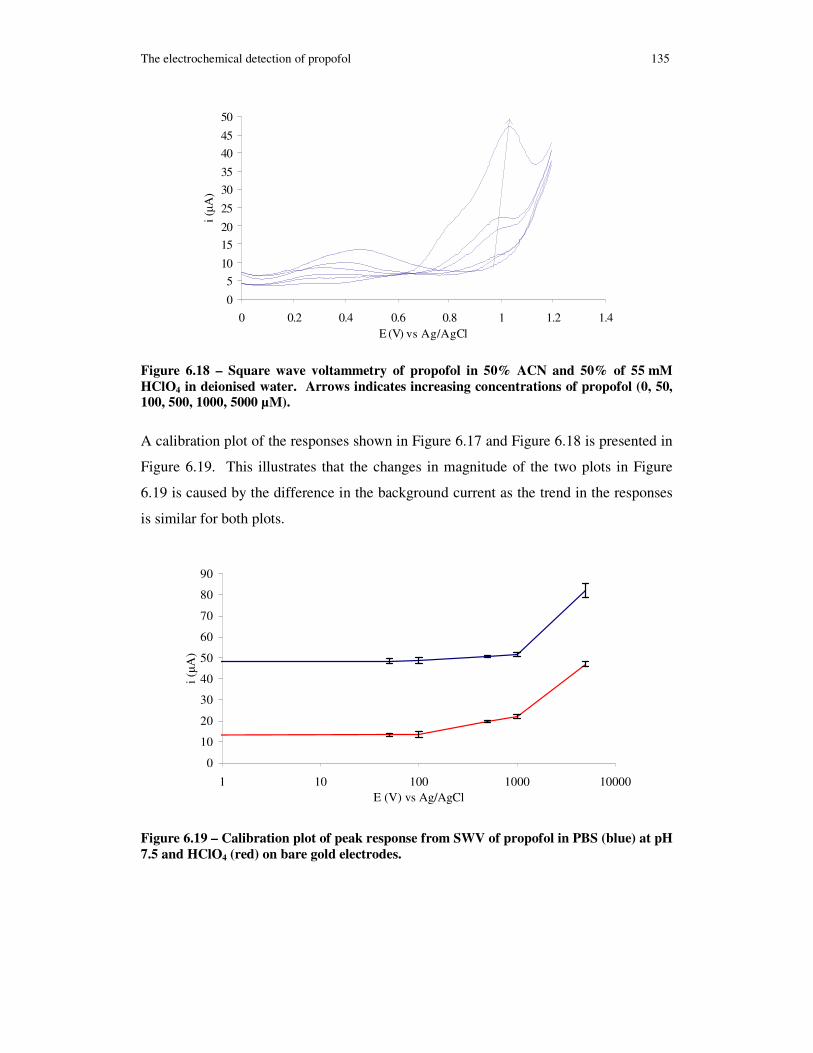
The electrochemical detection of propofol 135
0
5
10
15
20
25
30
35
40
45
50
0 0.2 0.4 0.6 0.8 1 1.2 1.4E (V) vs Ag/AgCl
i(µ
A)
Figure 6.18 – Square wave voltammetry of propofol in 50% ACN and 50% of 55 mM
HClO4 in deionised water. Arrows indicates increasing concentrations of propofol (0, 50,
100, 500, 1000, 5000 µM).
A calibration plot of the responses shown in Figure 6.17 and Figure 6.18 is presented in
Figure 6.19. This illustrates that the changes in magnitude of the two plots in Figure
6.19 is caused by the difference in the background current as the trend in the responses
is similar for both plots.
0
10
20
30
40
50
60
70
80
90
1 10 100 1000 10000E (V) vs Ag/AgCl
i (µ
A)
Figure 6.19 – Calibration plot of peak response from SWV of propofol in PBS (blue) at pH
7.5 and HClO4 (red) on bare gold electrodes.
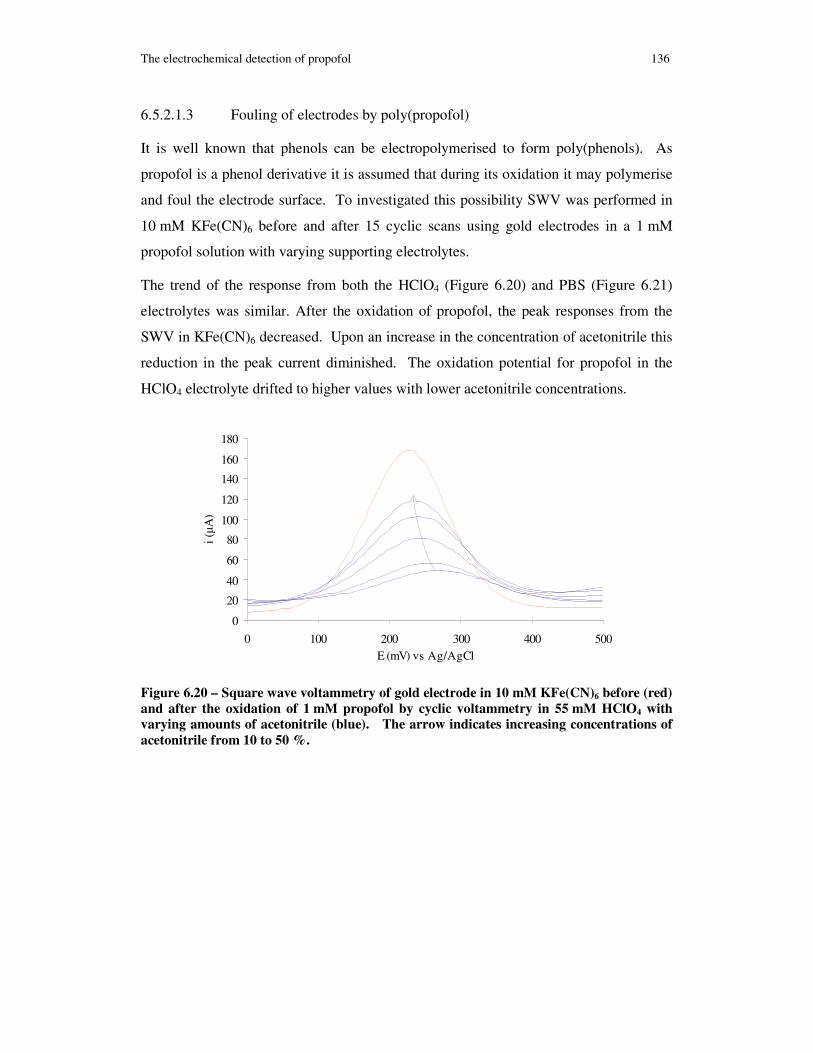
The electrochemical detection of propofol 136
6.5.2.1.3 Fouling of electrodes by poly(propofol)
It is well known that phenols can be electropolymerised to form poly(phenols). As
propofol is a phenol derivative it is assumed that during its oxidation it may polymerise
and foul the electrode surface. To investigated this possibility SWV was performed in
10 mM KFe(CN)6 before and after 15 cyclic scans using gold electrodes in a 1 mM
propofol solution with varying supporting electrolytes.
The trend of the response from both the HClO4 (Figure 6.20) and PBS (Figure 6.21)
electrolytes was similar. After the oxidation of propofol, the peak responses from the
SWV in KFe(CN)6 decreased. Upon an increase in the concentration of acetonitrile this
reduction in the peak current diminished. The oxidation potential for propofol in the
HClO4 electrolyte drifted to higher values with lower acetonitrile concentrations.
0
20
40
60
80
100
120
140
160
180
0 100 200 300 400 500E (mV) vs Ag/AgCl
i(µ
A)
Figure 6.20 – Square wave voltammetry of gold electrode in 10 mM KFe(CN)6 before (red)
and after the oxidation of 1 mM propofol by cyclic voltammetry in 55 mM HClO4 with
varying amounts of acetonitrile (blue). The arrow indicates increasing concentrations of
acetonitrile from 10 to 50 %.
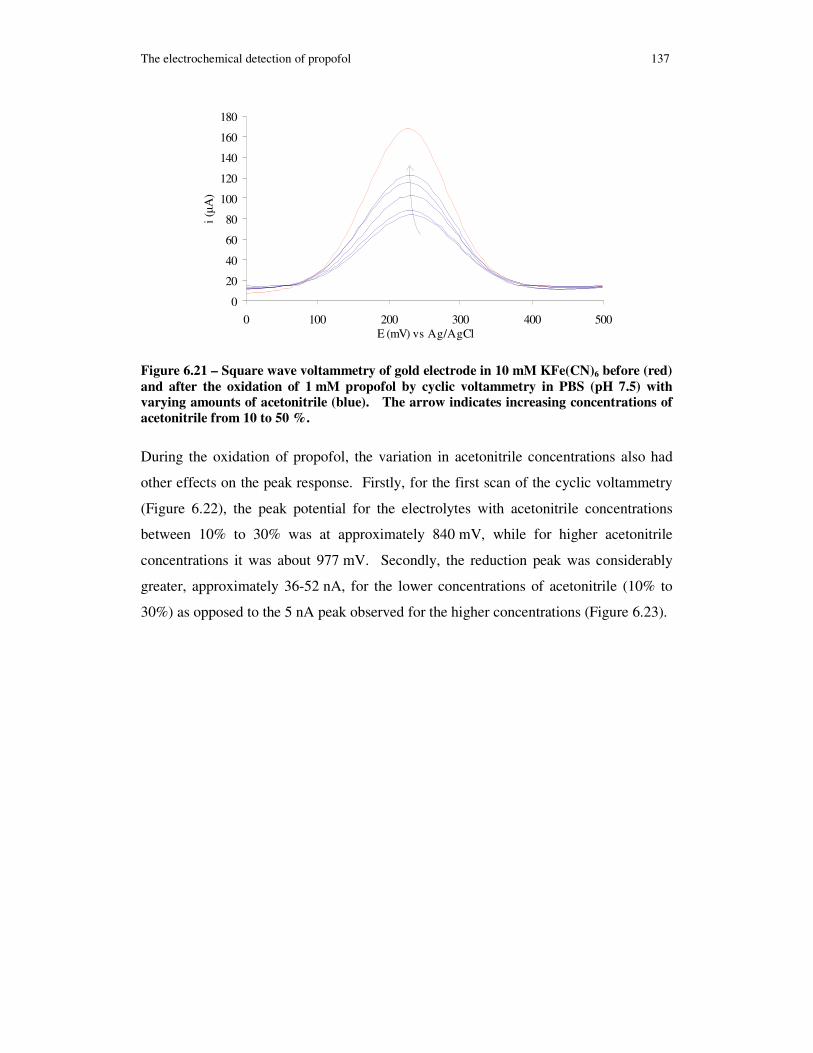
The electrochemical detection of propofol 137
0
20
40
60
80
100
120
140
160
180
0 100 200 300 400 500E (mV) vs Ag/AgCl
i(µ
A)
Figure 6.21 – Square wave voltammetry of gold electrode in 10 mM KFe(CN)6 before (red)
and after the oxidation of 1 mM propofol by cyclic voltammetry in PBS (pH 7.5) with
varying amounts of acetonitrile (blue). The arrow indicates increasing concentrations of
acetonitrile from 10 to 50 %.
During the oxidation of propofol, the variation in acetonitrile concentrations also had
other effects on the peak response. Firstly, for the first scan of the cyclic voltammetry
(Figure 6.22), the peak potential for the electrolytes with acetonitrile concentrations
between 10% to 30% was at approximately 840 mV, while for higher acetonitrile
concentrations it was about 977 mV. Secondly, the reduction peak was considerably
greater, approximately 36-52 nA, for the lower concentrations of acetonitrile (10% to
30%) as opposed to the 5 nA peak observed for the higher concentrations (Figure 6.23).

The electrochemical detection of propofol 138
-10
-5
0
5
10
15
20
25
30
35
40
0 200 400 600 800 1000 1200 1400
E (mV) vs Ag/AgCl
i (µ
A)
Figure 6.22 – Cyclic voltammetry (scan no. 1 of 15) of 1 mM propofol in 55 mM HClO4
with 10% (blue), 20% (red), 30% (green), 40% (purple) and 50% (light blue) acetonitrile.
-60
-40
-20
0
20
40
60
0 200 400 600 800 1000 1200 1400E (mV) vs Ag/AgCl
i (µ
A)
Figure 6.23 – Cyclic voltammetry (scan no. 15) of 1 mM propofol in 55 mM HClO4 with
10% (blue), 20% (red), 30% (green), 40% (purple) and 50% (light blue) acetonitrile.
6.5.2.2 Detection of propofol on NPEDMA coated electrodes
As the electrodes are coated with the conductive NPEDMA anchor, the electrochemical
reactions between propofol and the new electrode surface may have altered. To see if
this is the case the detection of propofol was repeated on NPEDMA coated electrodes.
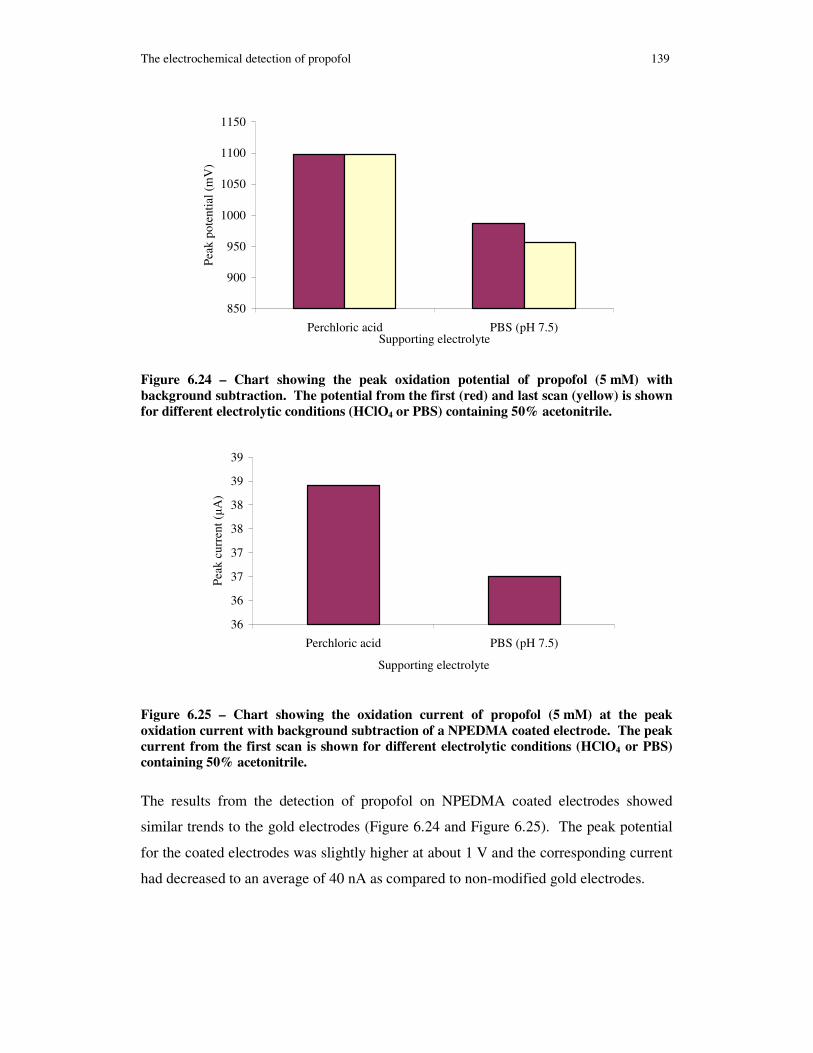
The electrochemical detection of propofol 139
850
900
950
1000
1050
1100
1150
Perchloric acid PBS (pH 7.5)Supporting electrolyte
Peak
pot
entia
l (m
V)
Figure 6.24 – Chart showing the peak oxidation potential of propofol (5 mM) with
background subtraction. The potential from the first (red) and last scan (yellow) is shown
for different electrolytic conditions (HClO4 or PBS) containing 50% acetonitrile.
36
36
37
37
38
38
39
39
Perchloric acid PBS (pH 7.5)
Supporting electrolyte
Peak
cur
rent
(µ
A)
Figure 6.25 – Chart showing the oxidation current of propofol (5 mM) at the peak
oxidation current with background subtraction of a NPEDMA coated electrode. The peak
current from the first scan is shown for different electrolytic conditions (HClO4 or PBS)
containing 50% acetonitrile.
The results from the detection of propofol on NPEDMA coated electrodes showed
similar trends to the gold electrodes (Figure 6.24 and Figure 6.25). The peak potential
for the coated electrodes was slightly higher at about 1 V and the corresponding current
had decreased to an average of 40 nA as compared to non-modified gold electrodes.
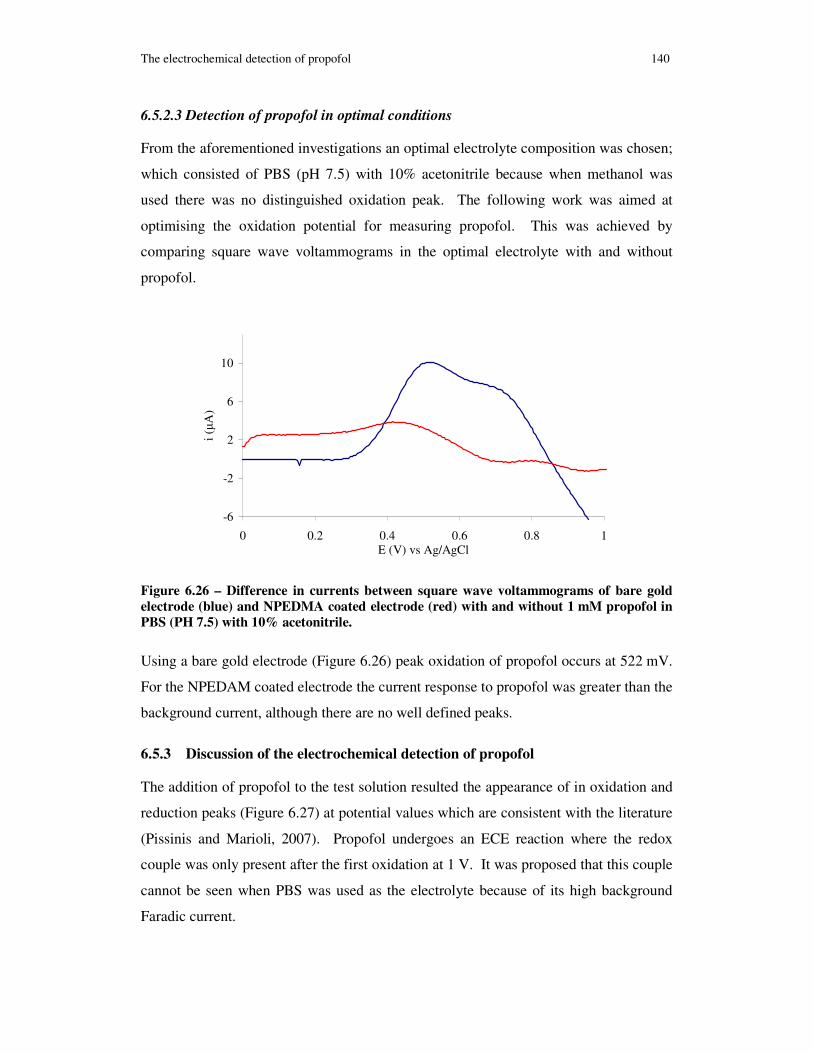
The electrochemical detection of propofol 140
6.5.2.3 Detection of propofol in optimal conditions
From the aforementioned investigations an optimal electrolyte composition was chosen;
which consisted of PBS (pH 7.5) with 10% acetonitrile because when methanol was
used there was no distinguished oxidation peak. The following work was aimed at
optimising the oxidation potential for measuring propofol. This was achieved by
comparing square wave voltammograms in the optimal electrolyte with and without
propofol.
-6
-2
2
6
10
0 0.2 0.4 0.6 0.8 1E (V) vs Ag/AgCl
i (µ
A)
Figure 6.26 – Difference in currents between square wave voltammograms of bare gold
electrode (blue) and NPEDMA coated electrode (red) with and without 1 mM propofol in
PBS (PH 7.5) with 10% acetonitrile.
Using a bare gold electrode (Figure 6.26) peak oxidation of propofol occurs at 522 mV.
For the NPEDAM coated electrode the current response to propofol was greater than the
background current, although there are no well defined peaks.
6.5.3 Discussion of the electrochemical detection of propofol
The addition of propofol to the test solution resulted the appearance of in oxidation and
reduction peaks (Figure 6.27) at potential values which are consistent with the literature
(Pissinis and Marioli, 2007). Propofol undergoes an ECE reaction where the redox
couple was only present after the first oxidation at 1 V. It was proposed that this couple
cannot be seen when PBS was used as the electrolyte because of its high background
Faradic current.

The electrochemical detection of propofol 141
-20
-10
0
10
20
30
40
50
60
70
0 0.2 0.4 0.6 0.8 1 1.2 1.4E (V) vs Ag/AgCl
i (µ
A)
Figure 6.27 – Cyclic voltammetry of 5 mM propofol in 50% acetonitrile and 50%
deionised water with 25 mM HClO4. The first scan is shown in red.
The potential of the propofol oxidation peak was slightly greater than the potentials
quoted in the literature (Pissinis and Marioli, 2007, Dowrie et al., 1996), but this
variation can be expected as most reported electrochemical investigations regarding
propofol have been conducted on graphite electrodes.
The study on the concentration dependence of the propofol oxidation current suggests
that the peak response seen in the cyclic voltammetry was due to the presence of
propofol and that the difference in current between the HClO4 and PBS (pH 7.5)
electrolyte was due to the difference in the background Faradic currents.
As propofol oxidises, like other phenols, it polymerises to poly(propofol). This polymer
can precipitate at the electrode and physically adsorb to the surface. It is suspected that
this adsorbed poly(propofol) causes the fouling. The decrease in the peak current from
the bare electrode to those electrodes which have oxidised propofol indicated a decrease
in electron transfer and demonstrates that fouling has occurred. In addition, the
cathodic shift in the peak potential shows a possible decrease in the diffusion flux which
can also be related to electrode fouling. Both of these effects are visible in the cyclic
voltammograms of propofol and in the SWV in KFe(CN)6.
As the acetonitrile concentration increases the poly(propofol) will be less inclined to
precipitate, hence less fouling will occur. This is a possible explanation for the decease
in fouling observed with increasing acetonitrile concentrations. At low acetonitrile

Investigation into the amperometric detection of propofol with a MIP covered electrode 142
concentrations there was an increase in the oxidation and reduction peaks associated
with propofol dimers. As suggested above, this increase could be explained by the
decrease in the solubility of poly(propofol) due to the lower acetonitrile concentrations.
Hence, there was a higher concentration of the dimer on the electrode surface and this
concentration of dimer increased as more propofol was oxidised.
For a solution with 50% acetonitrile the NPEDMA coated electrodes behaved similar to
the bare gold electrodes. However, in methanol there was no distinguished oxidation
peak. It is known that methanol will oxidise at relatively low potentials. This fact has
been previously used to reduce fouling of propofol on platinum electrodes, via the
reaction of the oxidised-methanol and oxidised-phenol, which produces compounds that
do not readily adsorb onto the electrode surface (Andreescu et al., 2003). In our case,
the oxidised methanol could have reacted with the NPEDMA layer or the resulting
compounds from the oxidised components could prevent the detection of propofol.
The increased current at 522 mV was possibly due to the oxidation of propofol. It was
previously seen that decreasing the acetonitrile concentration causes the oxidation peak
to become more negative.
6.5.4 Conclusion on the electrochemical detection of propofol
Propofol has been successfully oxidised at a gold electrode, and a propofol
concentration dependent current for this oxidisation has been observed. The oxidation
of propofol does cause fouling on the electrode surface and the amount of fouling seems
to be dependent on the organic solvent (acetonitrile) concentration within the
electrolyte. The addition of a NPEDMA coating it does changes the oxidation potential.
The optimal conditions for detecting propofol on a NPEDMA coated electrode were
selected as follows; PBS (pH 7.5) with 10% acetonitrile and an oxidation potential at
522 mV.
6.6 Investigation into the amperometric detection of propofol with a
MIP covered electrode
The following section will consider the amperometric detection of propofol using the
optimal conditions derived in the study of its electrochemistry.

Investigation into the amperometric detection of propofol with a MIP covered electrode 143
6.6.1 Methodology for the amperometric detection of propofol
All consumables were supplied by Sigma-Aldrich unless stated otherwise.
6.6.1.1 Polymerising electrodes
The various electrode coatings were prepared using the procedure described in Section
6.3.1.
6.6.1.2 Amperometry
In both experimental setups (see Section 6.3.1.2.1 and 6.3.1.2.2) amperometry was
conducted using a three-electrode cell with a gold working electrode (BASi, UK), a
platinum wire counter electrode and a Ag/AgCl reference electrode (BASi, UK) on a
microAutoLabII (Eco Chemie, Netherlands) at a fixed potential of 522 mV.
6.6.1.2.1 Initial study
The initial amperometric investigation was conducted using in a beaker with a
peristaltic pump to circulate and agitate the test solution pumped from a reservoir.
Various volumes of propofol were injected into the reservoir and propofol was oxidised
at the electrode surface.
6.6.1.2.2 Flow cell
The amperometric detection of propofol was achieved by injecting specific
concentrations of propofol into a custom flow cell system. The background electrolyte,
PBS (pH 7.5) with 10% acetonitrile, was pumped through the cell using a peristaltic
pump (Miniplus3, Gilson, USA) and the propofol was injected using a Valve V-7 (GE
Healthcare) injector with a 200 µL sample loop. See Figure 6.28.
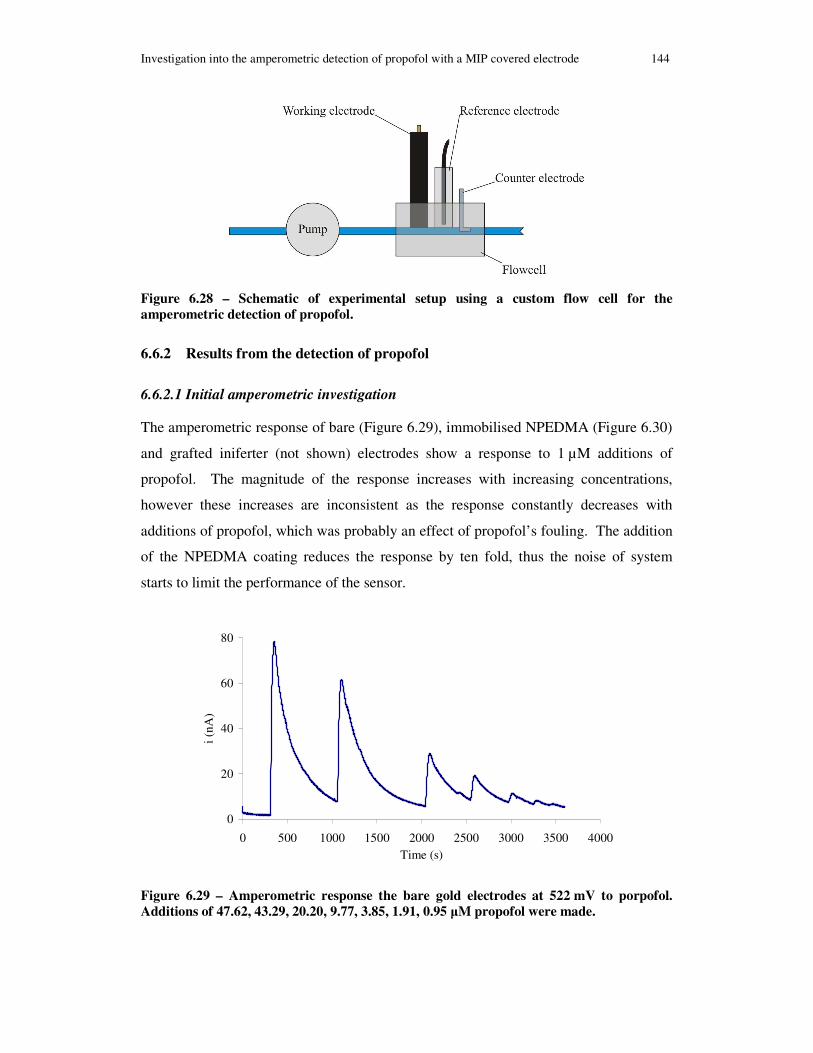
Investigation into the amperometric detection of propofol with a MIP covered electrode 144
Figure 6.28 – Schematic of experimental setup using a custom flow cell for the
amperometric detection of propofol.
6.6.2 Results from the detection of propofol
6.6.2.1 Initial amperometric investigation
The amperometric response of bare (Figure 6.29), immobilised NPEDMA (Figure 6.30)
and grafted iniferter (not shown) electrodes show a response to 1 µM additions of
propofol. The magnitude of the response increases with increasing concentrations,
however these increases are inconsistent as the response constantly decreases with
additions of propofol, which was probably an effect of propofol’s fouling. The addition
of the NPEDMA coating reduces the response by ten fold, thus the noise of system
starts to limit the performance of the sensor.
0
20
40
60
80
0 500 1000 1500 2000 2500 3000 3500 4000Time (s)
i (nA
)
Figure 6.29 – Amperometric response the bare gold electrodes at 522 mV to porpofol.
Additions of 47.62, 43.29, 20.20, 9.77, 3.85, 1.91, 0.95 µM propofol were made.

Investigation into the amperometric detection of propofol with a MIP covered electrode 145
6
7
8
9
10
0 500 1000 1500 2000 2500 3000 3500 4000
Time (s)
i (nA
)
Figure 6.30 – Amperometric response of NPEDMA coated electrodes at 522 mV to
porpofol. Additions of 1.25, 1.25, 2.48, 2.48, 4.90, 4.85, 11.93, 11.64, 22.46, 21.44, 40.06 µM
propofol were made.
A fixed polymerisation distance of 1 cm (Figure 6.5) and a polymerisation time of
30 minutes resulted in electrodes with a very small current response; this was also seen
for the amperometric response to propofol. However, with decreasing polymerisation
times the current response increases. This was also seen in the amperometric response
of these electrodes to propofol (Figure 6.31).
0
1
2
3
4
0 1000 2000 3000 4000 5000Time (s)
i (nA
)
Figure 6.31 – Amperometric response of MIP coated electrodes to various additions of
propofol with resulting concentrations of 1.25, 1.25, 2.48, 2.48, 4.90, 4.85, 11.93, 11.64,
22.46, 21.44, 40.06, 36.70 µM. The MIP layers were polymerised at a distance of 1 cm for
10 (blue), 5 (red) and 3 (green) minutes.

Investigation into the amperometric detection of propofol with a MIP covered electrode 146
0
2
4
6
8
10
12
14
16
18
0 500 1000 1500 2000 2500
Time (s)
i (nA
)
Figure 6.32 – Amperometric response of MIP coated electrodes, polymerised for 1 minute
at a distance of 1 cm, to various additions of propofol resulting in a concentration of 1.25,
1.25, 2.48, 2.48, 4.90, 4.85, 11.93, 11.64, 22.46, 21.44, 40.06, 36.70 µM.
Although a response to 1.25 µM of propofol can be seen (Figure 6.31), the addition of
the MIP on top of the NPEDMA further reduces the magnitude of the response to
propofol. Therefore, further variations in the polymerisation distance (Figure 6.8) and
polymerisation time (Figure 6.9) were investigated. From the amperometric response to
propofol observed for the different electrodes, an optimum of the polymerisation
condition was found to be a polymerisation distance of 3 cm and a polymerisation time
of 1 minute (Figure 6.32).
6.6.2.2 Amperometry with a flow cell
6.6.2.2.1 Selective detection of propofol
The responses of the polymer coated electrodes to injections of propofol are shown as
calibration curves (Figure 6.33) for polymerisation times from 1 to 3 minutes. This
illustrates that the NIP electrode has a similar linear response which was practically
independent of the polymerisation time. However, the MIP electrodes show a decrease
in peak current with increasing polymerisation times.
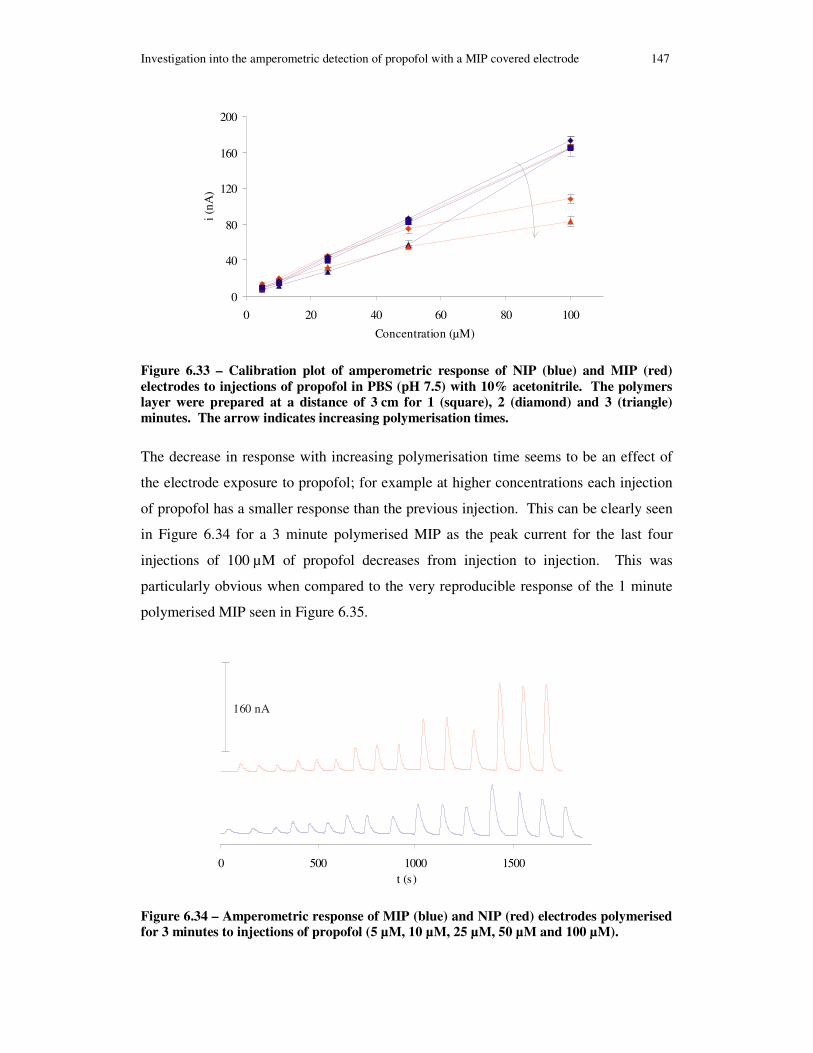
Investigation into the amperometric detection of propofol with a MIP covered electrode 147
0
40
80
120
160
200
0 20 40 60 80 100
Concentration (µM)
i(nA
)
Figure 6.33 – Calibration plot of amperometric response of NIP (blue) and MIP (red)
electrodes to injections of propofol in PBS (pH 7.5) with 10% acetonitrile. The polymers
layer were prepared at a distance of 3 cm for 1 (square), 2 (diamond) and 3 (triangle)
minutes. The arrow indicates increasing polymerisation times.
The decrease in response with increasing polymerisation time seems to be an effect of
the electrode exposure to propofol; for example at higher concentrations each injection
of propofol has a smaller response than the previous injection. This can be clearly seen
in Figure 6.34 for a 3 minute polymerised MIP as the peak current for the last four
injections of 100 µM of propofol decreases from injection to injection. This was
particularly obvious when compared to the very reproducible response of the 1 minute
polymerised MIP seen in Figure 6.35.
0 500 1000 1500t (s)
160 nA
Figure 6.34 – Amperometric response of MIP (blue) and NIP (red) electrodes polymerised
for 3 minutes to injections of propofol (5 µM, 10 µM, 25 µM, 50 µM and 100 µM).

Investigation into the amperometric detection of propofol with a MIP covered electrode 148
0 200 400 600 800 1000 1200 1400 1600t (s)
160 nA
Figure 6.35 – Amperometric response of MIP (blue) and NIP (red) electrodes polymerised
for 1 minute to injections of propofol (5 µM, 10 µM, 25 µM, 50 µM and 100 µM).
6.6.2.2.2 Reduction in flow rate
The response of the electrode will be dependent on the diffusion of propofol through the
polymer to the electrode surface. To analyse the impact of the diffusion process the
flow rate was decreased to 7 µLs-1 from 26 µLs-1. The following calibration plots result
from these investigations at this slower flow rate.
0
50
100
150
200
250
0 20 40 60 80 100 120
Concentration (µM)
i (nA
)
Figure 6.36 – Calibration plot of amperometric response to NIP coated electrodes with a
flow rate of 7 µLs-1
. Polymerised for 1 minute (blue) and 3 minutes (red) at a distance of
3 cm (square), 5 cm (diamond) and 10 cm (triangle).

Investigation into the amperometric detection of propofol with a MIP covered electrode 149
0
40
80
120
160
200
0 20 40 60 80 100 120Concentration (µM)
i(nA
)
Figure 6.37 – Calibration plot of amperometric response to MIP coated electrodes with a
flow rate of 7 µLs-1
. Polymerised for 1 minute (green), 2 minutes (red) and 3 minutes
(blue) at a distance of 3 cm (square), 5 cm (diamond) and 10 cm (triangle). The arrow
shows increasing UV exposure.
For all the NIP electrodes, including those tested at the faster flow rate, the
amperometric response to injections of propofol was very similar (Figure 6.33 and
Figure 6.36). However, the amperometric response of the MIP electrodes was
dependent on polymerisation time and distance (Figure 6.37). With decreasing
polymerisation time and increasing polymerisation distance, the magnitude for the peak
current tends towards the NIP response, even at a slower flow rate.
6.6.2.2.3 Interfering substances
It was observed in the previous results that with the right polymerisation conditions,
there was a large difference between the responses from the MIP and the NIP
electrodes. To see if the MIP coated electrodes have any selectivity, and to assess if
other electrochemical interfering compounds will be rejected, the amperometric
response to ascorbic acid was investigated.
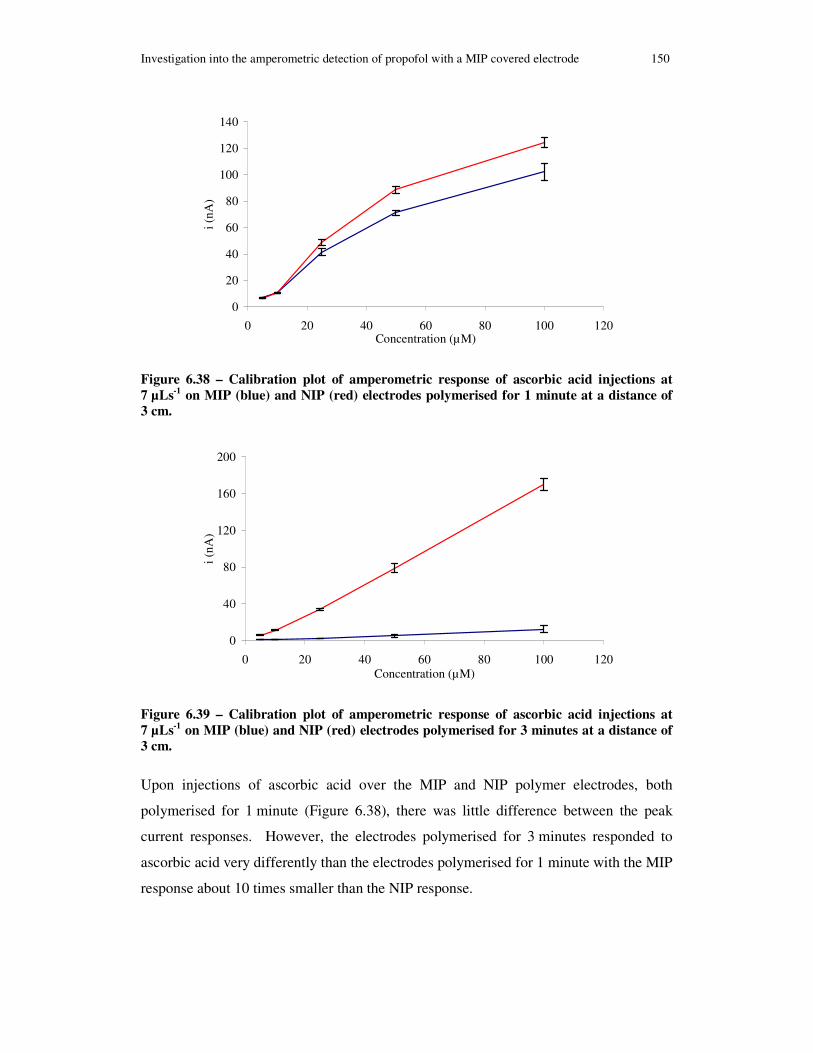
Investigation into the amperometric detection of propofol with a MIP covered electrode 150
0
20
40
60
80
100
120
140
0 20 40 60 80 100 120Concentration (µM)
i (nA
)
Figure 6.38 – Calibration plot of amperometric response of ascorbic acid injections at
7 µLs-1
on MIP (blue) and NIP (red) electrodes polymerised for 1 minute at a distance of
3 cm.
0
40
80
120
160
200
0 20 40 60 80 100 120Concentration (µM)
i (nA
)
Figure 6.39 – Calibration plot of amperometric response of ascorbic acid injections at
7 µLs-1
on MIP (blue) and NIP (red) electrodes polymerised for 3 minutes at a distance of
3 cm.
Upon injections of ascorbic acid over the MIP and NIP polymer electrodes, both
polymerised for 1 minute (Figure 6.38), there was little difference between the peak
current responses. However, the electrodes polymerised for 3 minutes responded to
ascorbic acid very differently than the electrodes polymerised for 1 minute with the MIP
response about 10 times smaller than the NIP response.

Investigation into the amperometric detection of propofol with a MIP covered electrode 151
6.6.3 Discussion of the selective detection of propofol
6.6.3.1 Initial amperometric investigation
The amperometric response of the bare and immobilised NPEDMA and iniferter
electrodes to 1 µM of propofol demonstrates that propofol can be detected at 522 mV in
PBS (pH 7.5) with 10% acetonitrile. However, these additional coatings when
compared to a bare gold electrode decrease the magnitude of the current by
approximately ten fold.
From the 30 minute MIP polymerisation there was no response. As the UV exposure
was lowered either by decreasing polymerisation time or by increasing the
polymerisation distance, the sensor response increased. This suggests that increased
UV exposure leads to a lower response.
The amount of UV can be directly related to the amount of polymer formed. Hence,
less polymer ensures a greater response. This was expected as the polymer has no
foreseable conducting properties, thus it insulates the electrode surface.
The amperometric response did demonstrate the effects of fouling, as the sensor
response to an injection of propofol was not consistent. This is less important for the
final product where the electrodes are in a flow cell and not permanently exposed to
propofol. Also, it should be noted that this also implies that the amperometric response
was a step change as the concentration of propofol permanently increases.
6.6.3.2 Flow cell amperometry
The NIP electrodes, irrespective of the polymerisation time, showed a similar response.
This implies increasing thickness of NIP polymer does not affect the diffusion of
propofol to the surface of the electrode where it is oxidised. There was only a slight
decrease in the baseline of the NIP electrode which could possibly be attributed to
propofol fouling. However, the decrease in the MIP response was probably due to
strong propofol binding onto the surface of polymer preventing more propofol reaching
the electrode. Further washing was performed on the MIP electrodes exposed to
propofol but no change was seen.
Investigation into the amperometric detection of propofol with a MIP covered electrode 152
As there was little difference in response for the electrodes polymerised for 1 minute at
different flow rates this suggests that the response was not diffusion controlled.
However, a decrease in the MIP sensor response was seen when using the slower flow
rate with the MIP electrodes polymerised for 3 minutes, which suggests that the
response was diffusion related for the thicker polymer. It is supposed that the slower
flow rate in this case gave more time for the propofol to diffuse through the MIP and
strongly bind to the imprinted cavities. This in turn hinders further diffusion of
propofol and reduces the amount of oxidation at the electrode surface, hence reducing
the signal from the electrode. Another explanation could be that at slower flow rates the
boundary layer between the fluid and the polymer is larger, therefore less propofol
diffuses across the boundary layer.
Ascorbic acid is considered to be one of the main electrochemically interfering
compounds in blood. Thus, an investigation into the response of the electrodes to
injections of ascorbic allowed an assessment of the sensor’s specificity. As the sensor
responded to ascorbic acid injections in a similar manner as to propofol injections it can
be concluded that ascorbic acid will interfere with the propofol detection using these
electrodes.
As a consequence of the aforementioned results, the large variation in MIP response for
the 3 minute polymerised electrode cannot be considered a sole property of an injection
of propofol. This would imply that the presence of propofol during the 3 minute
polymer coating significantly changes the conformation of the resulting polymer. As
this change affects both ascorbic acid and propofol it was likely that the porosity of the
polymer was lacking, so both compounds cannot diffuse to the electrodes surface. This
could be due to propofol getting polymerised into the cross-linked matrix, thus resulting
in a polymer coating with a higher density than the NIP.
6.6.4 Conclusion on detection of propofol
The magnitude of the amperometric response to propofol was related to the variations in
the test solutions’ concentration. However, increasing the polymer layer thickness on
the electrode surface decreased the magnitude of the response to an extent where the
noise of the system dominated the sensor response.
Chapter conclusion 153
The use of a flow cell increased the sensitivity of propofol detection with the response
to 5 µM concentrations being easily seen, thus it should be possible to detect lower
concentrations using their approach.
The limited exposure of the electrode to propofol has decreased the fouling effects
previously seen, although the long-term lifetime of such a device is still unclear.
The strong binding of propofol to the thicker MIP layers implies that for the longer term
operation of such an amperometric system, a thin MIP layer is required or a washing
procedure would be needed that can remove the bound propofol.
The polymerised electrodes respond to injections of ascorbic acid in a similar manner to
injections of propofol. Hence, ascorbic acid will be an interferant to the detection of
propofol.
6.7 Chapter conclusion
The goal of this chapter was to address two key issues, i) the lack of control over the
polymerisation process and ii) the electrical insulation of the polymer anchor. The
proposed solution to these issues was to introduce two new compounds, an iniferter to
give controlled initiation of the polymerisation and NPEDMA to form a conductive
poly(aniline-based) anchor.
The electropolymerisation and adsorption of NPEDMA proved to be a very repeatable
process and the characterisation of this immobilised layer demonstrated that
poly(NPEDMA) had a high conductivity. Further characterisation of the iniferter and
polymer layers showed significant changes in the electrodes response, this confirming
their immobilisation. The growth of the polymer from the iniferter, which was
immobilised onto the NPEDMA layer, would be controlled by both the UV exposure
time and the distance of UV source from the electrode surface.
Propofol detection on bare gold and on NPEDMA coated electrodes was possible. It
was seen to undergo an ECE reaction and the poly(propofol) formed could adsorb onto
and foul the electrode surface. However, this fouling was dependent on the acetonitrile
concentration in the supporting electrolyte and was less apparent on the NPEDMA
electrodes.
Chapter conclusion 154
The initial investigations into the detection of propofol, both amperometric and
impedance, proved successful. Using amperometry, there was a concentration
dependent response, however, the noise from the experimental setup limited the
detection. The impedance response demonstrated a clear concentration dependence and
there was a significant difference between the NIP and MIP.
Using a custom-made flow cell improved the amperometric response of the polymer
coated electrodes. This resulted in a reproducible response with a detection limit of less
than 5 µM. By altering the polymerisation conditions, the MIP coated electrodes could
be optimised. However, the MIP and NIP electrodes were also both found to respond to
ascorbic acid. This suggests that the difference in peak currents is possibly due to
polymer barrier properties.
155
Chapter 7 - General conclusion and further work
“The rule is perfect: in all matters of opinion our adversaries are insane.” Mark Twain
(1835 - 1910)
7.1 General conclusion
The ability to improve the monitoring of clinical parameters within a critical care
environment would assist healthcare professionals as well as improve patient outcomes.
This thesis addressed this challenge by incorporating MIP-based technology with
electrochemical transducers to selectively monitor the concentration of clinically
relevant parameters. Three different target analytes were investigated, which were; i)
metronidazole, a 5-nitroimidazole drug with antibiotic properties, ii) creatinine, which is
used to evaluate muscle disorders and renal dysfunction, and iii) propofol, an anesthetic
agent used worldwide in both medical and veterinary practices.
For each of these three analytes, a different imprinted polymer composition was used.
For creatinine, the MIP composition was based on a previously developed protocol
proposed by Delaney and co-workers (Panasyuk-Delaney et al., 2002), while for
propofol and metronidazole MIPs were computationally designed at Cranfield
University. All of the MIP tests demonstrated an increased binding capacity to their
imprinted target when compared to the NIP.
The MIP for metronidazole was computationally designed using SybylTM (Tripos, US)
and tested by SPE techniques with UV detection. The immobilisation of the MIP onto
transducers’ surfaces using UV initiation proved relatively inefficient and provided
inconsistent results. However, by using thermal initiation the polymer could be
successfully grafted to the surface. The detection of metronidazole was not as
successful as other analytes, although a concentration dependent current could be seen,
the required sensitivity was not reached. This lack of sensitivity was mainly due to the
General conclusion 156
large cathodic potential at which metronidazole reduces, which pushed the limits of the
application for platinum transducers.
An investigation into the capacitive detection of creatinine was undertaken following
the method described by Delaney (Delaney et al., 2007) and co-workers. The proposed
procedure was simple with the pre-polymerisation complex formed in water, allowing
this approach to be used as a universal method for producing sensing devices for
therapeutic substances. Although precise reproduction of previously described results
proved to be difficult due to lack of consistency and control over the grafting procedure,
the developed sensors did possess the ability to detect creatinine. We managed to
successfully demonstrate that MIP electrodes had a greater response to creatinine as
compared to NIP coated electrodes and that the response to a compound with a similar
structure, such as creatine, was greatly decreased.
In an attempt to improve the reproducibility of the published procedure, the electrode
pre-treatment was modified to increase the density of the intermediate thiol layer. These
alterations improved the insulating properties of thiol monolayer and also improved the
reproducibility of the devices. Contrary to the proposed theory, these changes
decreased the sensitivity of the detection. Taking these results into account, a model for
capacitive electrodes with an anchored selective polymer was derived to explain this
response.
Subsequently, based on the previous results, it was apparent that three key issues needed
to be addressed in order to develop a high performance sensor: i) detection via Faradic
currents and impedance is best served with a conductive polymer anchor, ii) the
reproducibility and control of the grafted polymer needs to be improved to enhance
reproducibility of the results, and iii) the analyte needs to be detectable within the
potential window of the system for Faradic detection. In the following set of
experiments we began to address these key issues. The first key issue was fulfilled using
an innovative dual-polymerisable monomer (NPEDMA) designed and synthesised at
Cranfield University. Using iniferters to initiate and control the polymerisation
addressed the second issue. To address the third issue we changed the target compound
to propofol, which can be easily detected at a relatively low potential.

Suggestions for further work 157
The MIP for propofol was computationally designed and tested earlier at Cranfield
University. In this work MIP was grafted in a controlled environment using an iniferter,
which was anchored to a conductive NPEDMA layer. The successful detection of
propofol, both capacitively and amperometrically was achieved with a MIP sensor.
Using the NPEDMA-iniferter combination, capacitive detection of propofol and
creatinine was demonstrated successfully.
The amperometric detection of propofol had a low detection limit (< 5 µM) and with the
controlled polymerisation, the electrode responses were reproducible. Differences were
observed between the MIP and NIP responses. However, the same differences were
also seen for the interfering substance ascorbic acid, suggesting that the differences
between the MIP and NIP are due to non-specific binding.
Following on from the results of this thesis, it is possible to conclude that a universal
methodology for the production of MIP sensors will be difficult to achieve.
Nonetheless, several key aspects for the construction of MIP sensors can, however, be
proposed: firstly, the choice of detection method for a given analyte is intrinsically
linked to the analyte and the detection system, and thus no matter how well a MIP
functions, if the bound analyte is not detectable, the device will not function. Secondly,
a low impedance path between the transducer and bound analyte is required for Faradic
detection. Finally, in order to attain reproducible devices, control over the polymer
grafting is essential.
7.2 Suggestions for further work
The proposed future work should be focused on improving understanding of the
NPEDMA-iniferter anchor and on developing more effective capacitive and
amperometric detection methodologies.
The development of the NPEDMA-iniferter-based anchor should be continued to ensure
better control over the immobilisation of iniferter. It is expected that developments in
Cranfield Health would produce different aniline derivative with a covalently attached
iniferter. This will dramatically simplify the grafting procedure and also increase the
density of surface radicals needed for initiation of polymerisation process.

Suggestions for further work 158
Monitoring the concentration of an analyte using the capacitive scheme proved
successful and a selective MIP was demonstrated. However, the sensitivity achieved
with this technique was not within the required clinical range, and the electrodes were
not tested in a flow cell, which is more characteristic for the final product. Therefore, to
improve the sensitivity, an investigation into the optimal MIP and polymerisation
conditions should be carried out.
The amperometric detection of propofol proved very successful with a good sensitivity
and reproducibility, yet it lacked in selectivity. Therefore, further improvement of
polymer composition, possibly adding PEG layers or other coatings impenetrable to
ascorbic and uric acids would be necessary.

159
Reference
ABDEL-HAMID, I., IVNITSKI, D., ATANASOV, P. & WILKINS, E. (1998) Fast Amperometric Assay for E. coli O157:H7 Using Partially Immersed Immunoelectrodes. Electroanalysis, 10, 758-763.
ADAMS, E., ROELANTS, W., DE PAEPE, R., ROETS, E. & HOOGMARTENS, J. (1998) Analysis of gentamicin by liquid chromatography with pulsed electrochemical detection. Journal of Pharmaceutical and Biomedical Analysis, 18, 689-698.
AL-GHAMDI, A. H., AL-SHADOKHY, M. A. & AL-WARTHAN, A. A. (2004) Electrochemical determination of Cephalothin antibiotic by adsorptive stripping voltammetric technique. Journal of Pharmaceutical and Biomedical Analysis, 35, 1001-1009.
ALEKHA K. DASH, D. W. M., HAN HUAI-YAN, JOE CARNAZZO, JEFFREY R. STOUT, (2001) Evaluation of creatine transport using Caco-2 monolayers as an in vitro model for intestinal absorption. Journal of Pharmaceutical Sciences, 90, 1593-1598.
ANDREA, P., MIROSLAV, S., SILVIA, S. & STANISLAV, M. (2001) A solid binding matrix/molecularly imprinted polymer-based sensor system for the determination of clenbuterol in bovine liver using differential-pulse voltammetry. Sensors and Actuators, B: Chemical, 76, 286-294.
ANDREESCU, S., ANDREESCU, D. & SADIK, O. A. (2003) A new electrocatalytic mechanism for the oxidation of phenols at platinum electrodes. Electrochemistry
Communications, 5, 681-688.
BAJPAI, L., VARSHNEY, M., SEUBERT, C. N. & DENNIS, D. M. (2004) A new method for the quantitation of propofol in human plasma: efficient solid-phase extraction and liquid chromatography/APCI-triple quadrupole mass spectrometry detection. Molecularly Imprinted Polymers in Separation Science, 810, 291-296.
BANKS, C. E. & COMPTON, R. G. (2006) New electrodes for old: From carbon nanotubes to edge plane pyrolytic graphite. Analyst, 131, 15-21.
BARDHAN, K. D., BAYERDORFFER, E., VAN ZANTEN, S. J. O. V., LIND, T., MEGRAUD, F., DELCHIER, J. C., HELLBLOM, M., STUBBEROD, A., BURMAN, C. F., GROMARK, P.-O. & ZEIJLON, L. (2000) The HOMER Study: The Effect of Increasing the Dose of Metronidazole When Given with Omeprazole and Amoxicillin to Cure Helicobacter pylori Infection. Helicobacter, 5, 196-201.
BARTLETT, P. N., GHONEIM, E., EL-HEFNAWY, G. & EL-HALLAG, I. (2005) Voltammetry and determination of metronidazole at a carbon fiber microdisk electrode. 66, 869.
BATRA, D. & SHEA, K. J. (2003) Combinatorial methods in molecular imprinting. Current Opinion in Chemical Biology, 7, 434-442.

160
BELTAGI, A. M. (2003) Determination of the antibiotic drug pefloxacin in bulk form, tablets and human serum using square wave cathodic adsorptive stripping voltammetry. Journal of Pharmaceutical and Biomedical Analysis, 31, 1079-1088.
BENONI, G., CUZZOLIN, L., GILLI, E., SCHINELIA, M., MAZZI, G., BARTOLONI, A. & PASETTO, A. (1990) Pharmacokinetics of propofol: influence of fentanyl administration. European Journal of Pharmacology, 183, 1457-1458.
BERBERICH, J. A., CHAN, A., BODEN, M. & RUSSELL, A. J. (2005) A stable three-enzyme creatinine biosensor. 3. Immobilization of creatinine amidohydrolase and sensor development. Acta Biomaterialia, 1, 193-199.
BERGER, A. J., ITZKAN, I. & FELD, M. S. (1997) Feasibility of measuring blood glucose concentration by near-infrared Raman spectroscopy. Spectrochimica Acta Part
A: Molecular and Biomolecular Spectroscopy, 53, 287-292.
BOUBRIAK, O. A., SOLDATKIN, A. P., STARODUB, N. F., SANDROVSKY, A. K. & EL'SKAYA, A. K. (1995) Determination of urea in blood serum by a urease biosensor based on an ion-sensitive field-effect transistor. Sensors and Actuators
B: Chemical, 27, 429-431.
BROWN, D. V. & MEYERHOFF, M. E. (1991) Potentiometric enzyme channeling immunosensor for proteins. Biosensors and Bioelectronics, 6, 615-622.
BUSCH, M. S. A. & KNAPP, E.-W. (2004) Accurate pKa Determination for a Heterogeneous Group of Organic Molecules. ChemPhysChem, 5, 1513-1522.
CADUFF, A., HIRT, E., FELDMAN, Y., ALI, Z. & HEINEMANN, L. (2003) First human experiments with a novel non-invasive, non-optical continuous glucose monitoring system. Biosensors and Bioelectronics, 19, 209-217.
CHENG, Z., WANG, E. & YANG, X. (2001) Capacitive detection of glucose using molecularly imprinted polymers. Biosensors and Bioelectronics, 16, 179-185.
CHIANELLA, I., KARIM, K., PILETSKA, E. V., PRESTON, C. & PILETSKY, S. A. (2006) Computational design and synthesis of molecularly imprinted polymers with high binding capacity for pharmaceutical applications-model case: Adsorbent for abacavir. Analytica Chimica Acta, 559, 73-78.
CODMAN. (2001) Neurotrend: Cerebral tissue monitoring system. http://www.jnjgateway.com.
COONEY, C. G. & TOWE, B. C. (1997) Intravascular carbon dioxide monitoring using micro-flow colorimetry. Biosensors and Bioelectronics, 12, 11-17.
COONEY, C. G. & TOWE, B. C. (2000) A miniaturized pH and pCO2 intravascular catheter using optical monitoring and a dual concentric-flow microdialysis approach. Sensors and Actuators B: Chemical, 62, 177-181.
CORTINA, M., ESPLANDIU, M. J., ALEGRET, S. & DEL VALLE, M. (2006) Urea impedimetric biosensor based on polymer degradation onto interdigitated electrodes. Sensors and Actuators B: Chemical, 118, 84-89.
CREAGER, S. E., HOCKETT, L. A. & ROWE, G. K. (1992) Consequences of microscopic surface roughness for molecular self-assembly. Langmuir, 8, 854-861.
161
CUI, C. Q., ONG, L. H., TAN, T. C. & LEE, J. Y. (1993) Extent of incorporation of hydrolysis products in polyaniline films deposited by cyclic potential sweep. Electrochimica Acta, 38, 1395-1404.
DARAIN, F., PARK, S. U. & SHIM, Y. B. (2003) Disposable amperometric immunosensor system for rabbit IgG using a conducting polymer modified screen-printed electrode. Biosensors and Bioelectronics, 18, 773-780.
DAVIES, M. P., DE BIASI, V. & PERRETT, D. (2004) Approaches to the rational design of molecularly imprinted polymers. Analytica Chimica Acta, 504, 7-14.
DE BOER, B., SIMON, H. K., WERTS, M. P. L., VAN DER VEGTE, E. W. & HADZIIOANNOU, G. (2000) "Living" Free Radical Photopolymerization Initiated from Surface-Grafted Iniferter Monolayers. Macromolecules, 33, 349-356.
DELANEY, T. L., ZIMIN, D., RAHM, M., WEISS, D., WOLFBEIS, O. S. & MIRSKY, V. M. (2007) Capacitive Detection in Ultrathin Chemosensors Prepared by Molecularly Imprinted Grafting Photopolymerization. Anal. Chem., 79, 3220-3225.
DOBAY, R., HARSANYI, G. & VISY, C. (1999) Detection of uric acid with a new type of conducting polymer-based enzymatic sensor by bipotentiostatic technique. Analytica Chimica Acta, 385, 187-194.
DONG, W., YAN, M., ZHANG, M., LIU, Z. & LI, Y. (2005) A computational and experimental investigation of the interaction between the template molecule and the functional monomer used in the molecularly imprinted polymer. Analytica
Chimica Acta, 542, 186-192.
DOWRIE, R. H., EBLING, W. F., MANDEMA, J. W. & STANSKI, D. R. (1996) High-performance liquid chromatographic assay of propofol in human and rat plasma and fourteen rat tissues using electrochemical detection. J Chromatogr B
Biomed Appl, 678, 279-88.
EGGENSTEIN, C., BORCHARDT, M., DIEKMANN, C., BERND, G., DUMSCHAT, C., CAMMANN, K., KNOLL, M. & FRIEDRICH, S. (1999) A disposable biosensor for urea determination in blood based on an ammonium-sensitive transducer. Biosensors and Bioelectronics, 14, 33-41.
ELLMERER, M., SCHAUPP, L., TRAJANOSKI, Z., JOBST, G., MOSER, I., URBAN, G., SKRABAL, F. & WACH, P. (1998) Continuous measurement of subcutaneous lactate concentration during exercise by combining open-flow microperfusion and thin-film lactate sensors. Biosensors and Bioelectronics, 13, 1007-1013.
ESPADAS-TORRE, C., OKLEJAS, V., MOWERY, K. & MEYERHOFF, M. E. (1997) Thromboresistant Chemical Sensors Using Combined Nitric Oxide Release/Ion Sensing Polymeric Films. J. Am. Chem. Soc., 119, 2321-2322.
EUBEL, R. A., WIUM, C. A., HAWTREY, A. O. & COETZEE, J. (1990) Electrochemical determination of 2,6-diisopropylphenol after high-performance liquid chromatography of extracts from serum. Journal of Chromatography B:
Biomedical Sciences and Applications, 526, 293-295.

162
FARRINGTON, K. & REGAN, F. (2007) Investigation of the nature of MIP recognition: The development and characterisation of a MIP for Ibuprofen. Biosensors and
Bioelectronics, 22, 1138-1146.
FERANCOVA, A., KORGOVA, E., BUZINKAIOVA, T., KUTNER, W., STEPANEK, I. & LABUDA, J. (2001) Electrochemical sensors using screen-printed carbon electrode assemblies modified with the [beta]-cyclodextrin or carboxymethylated [beta]-cyclodextrin polymer films for determination of tricyclic antidepressive drugs. Analytica Chimica Acta, 447, 47-54.
FERREIRA, V. S., ZANONI, M. V. B. & FOGG, A. G. (1997) Cathodic Stripping Voltammetric Determination of Ceftazidime in Urine at a Hanging Mercury Drop Electrode. Microchemical Journal, 57, 115-122.
FROST, M. C. & MEYERHOFF, M. E. (2002) Implantable chemical sensors for real-time clinical monitoring: progress and challenges. 6, 633-641.
GANTER, M. T., HOFER, C. K., ZOLLINGER, A., SPAHR, T., PASCH, T. & ZALUNARDO, M. P. (2004) Accuracy and performance of a modified continuous intravascular blood gas monitoring device during thoracoscopic surgery. Journal of
Cardiothoracic and Vascular Anesthesia, 18, 587-591.
GERRITSEN, M., JANSEN, J. A. & LUTTERMAN, J. A. (1999) Performance of subcutaneously implanted glucose sensors for continuous monitoring. The
Netherlands Journal of Medicine, 54, 167-179.
GFRERER, R. J., BRUNNER, G. A., TRAJANOSKI, Z., SCHAUPP, L., SENDLHOFER, G., SKRABAL, F., JOBST, G., MOSER, I., URBAN, G., PIEBER, T. R. & WACH, P. (1998) Novel system for real-time ex vivo lactate monitoring in human whole blood. Biosensors and Bioelectronics, 13, 1271-1278.
GHINAMI, C., GIULIANI, V., MENARINI, A., ABBALLE, F., TRAVAINI, S. & LADISA, T. (2007) Electrochemical detection of tobramycin or gentamicin according to the European Pharmacopoeia analytical method. Journal of Chromatography A, 1139, 53-56.
GONG, F. C., ZHANG, X. B., GUO, C. C., SHEN, G. L. & YU, R. Q. (2003) Amperometric metronidazole sensor based on the supermolecular recognition by metalloporphyrin incorporated in carbon paste electrode. Sensors, 3, 91.
GONG, J.-L., GONG, F.-C., KUANG, Y., ZENG, G.-M., SHEN, G.-L. & YU, R.-Q. (2004) Capacitive chemical sensor for fenvalerate assay based on electropolymerized molecularly imprinted polymer as the sensitive layer. Analytical and
Bioanalytical Chemistry, 379, 302-307.
GUMBRECHT, W., SCHELTER, W., MONTAG, B., RASINSKI, M. & PFEIFFER, U. (1990) Online blood electrolyte monitoring with a ChemFET microcell system. Sensors
and Actuators B: Chemical, 1, 477-480.
GUO, L.-H., FACCI, J. S., MCLENDON, G. & MOSHER, R. (1994) Effect of Gold Topography and Surface Pretreatment on the Self-Assembly of Alkanethiol Monolayers. Langmuir, 10, 4588-4593.
163
GUTIERREZ, M., ALEGRET, S. & DEL VALLE, M. (2007) Potentiometric bioelectronic tongue for the analysis of urea and alkaline ions in clinical samples. Biosensors
and Bioelectronics, 22, 2171-2178.
HARWOOD, G. W. J. & POUTON, C. W. (1996) Amperometric enzyme biosensors for the analysis of drugs and metabolites. Advanced Drug Delivery Reviews, 18, 163-191.
HAUPT, K. & MOSBACH, K. (2000) Molecularly Imprinted Polymers and Their Use in Biomimetic Sensors. Chem. Rev., 100, 2495-2504.
HEINZE, J. (1993) Ultramicroelectrodes in electrochemistry. Angewandte Chemie
(International Edition in English), 32, 1268-1288.
HENG, L. Y. & HALL, E. A. H. (2001) Assessing a photocured self-plasticised acrylic membrane recipe for Na+ and K+ ion selective electrodes. 443, 25-40.
HENZE, D., BOMPLITZ, M., RADKE, J. & CLAUSEN, T. (2004) Reliability of the NeuroTrend sensor system under hyperbaric conditions. 132, 45-56.
HERNANDEZ, L., ZAPARDIEL, A., PEREZ LOPEZ, J. A. & BERMEJO, E. (1988) Measurement of nanomolar levels of psychoactive drugs in urine by adsorptive stripping voltammetry. Talanta, 35, 287-292.
HERREJON, A., INCHAURRAGA, I., PALOP, J., PONCE, S., PERIS, R., TERRADEZ, M. & BLANQUER, R. (2006) Usefulness of Transcutaneous Carbon Dioxide Pressure Monitoring to Measure Blood Gases in Adults Hospitalized for Respiratory Disease. Archivos de Bronconeumologia, 42, 225-229.
HIANIK, T., SNEJDARKOVA, M., SOKOLIKOVA, L., MESZAR, E., KRIVANEK, R., TVAROZEK, V., NOVOTNY, I. & WANG, J. (1999) Immunosensors based on supported lipid membranes, protein films and liposomes modified by antibodies. Sensors and Actuators, B: Chemical, 57, 201-212.
HILLBERG, A. L., BRAIN, K. R. & ALLENDER, C. J. (2005) Molecular imprinted polymer sensors: Implications for therapeutics. Molecularly Imprinted Polymers:
Technology and Applications, 57, 1875-1889.
HONG, S., JAMES, E. M., CARL, J. S., HARRY, B. M., JR. & WILLIAM, R. H. (1997) Blocking behavior of self-assembled monolayers on gold electrodes. Journal of
Solid State Electrochemistry, V1, 148.
HU, S. Q., WU, Z. Y., ZHOU, Y. M., CAO, Z. X., SHEN, G. L. & YU, R. Q. (2002) Capacitive immunosensor for transferrin based on an o-aminobenzenthiol oligomer layer. Analytica Chimica Acta, 458, 297-304.
HUANG, K.-J., LUO, D.-F., XIE, W.-Z. & YU, Y.-S. Sensitive voltammetric determination of tyrosine using multi-walled carbon nanotubes/4-aminobenzeresulfonic acid film-coated glassy carbon electrode. Colloids and
Surfaces B: Biointerfaces, In Press, Corrected Proof.
HWANG, E., PAPPAS, D., MATHEW, G., JEEVARAJAN, A. S. & ANDERSON, M. M. (2005) Paratrend Sensor Evaluation.

164
IGUCHI, S., MITSUBAYASHI, K., UEHARA, T. & OGAWA, M. (2005) A wearable oxygen sensor for transcutaneous blood gas monitoring at the conjunctiva. Sensors and
Actuators B: Chemical, 108, 733-737.
JIN, M., YU, Z. & XIA, Y. (2006) Electrochemical and spectroelectrochemical studies on aniline in organic medium and its antiknock mechanism. Russian Journal of
Electrochemistry, 42, 964-968.
KAIMORI, S., KITAMURA, T., ICHINO, M., HOSOYA, T., KURUSU, F., ISHIKAWA, T., NAKAMURA, H., GOTOH, M. & KARUBE, I. (2006) Structural development of a minimally invasive sensor chip for blood glucose monitoring. Analytica Chimica
Acta, 573-574, 104-109.
KAINE, L. A. & WOLNIK, K. A. (1994) Forensic investigation of gentamicin sulfates by anion-exchange ion chromatography with pulsed electrochemical detection. Journal of Chromatography A, 674, 255-261.
KANNURPATTI, A. R., LU, S., BUNKER, G. M. & BOWMAN, C. N. (1996) Kinetic and Mechanistic Studies of Iniferter Photopolymerizations. Macromolecules, 29, 7310-7315.
KAPETANOVIC, V., DIMITROVSKA, A. & ZIVANOV-STAKIC, D. (1992) Differential pulse polarographic determination of cefoxitin. Farmaco, 47, 1429-1435.
KELLY, S., COMPAGNONE, D. & GUILBAULT, G. (1998) Amperometric immunosensor for lactate dehydrogenase LD-1. Biosensors and Bioelectronics, 13, 173-179.
KHANNA, A. & KURTZMAN, N. A. (2006) Metabolic alkalosis. Journal of Nephrology, 19, 10.
KIM, N., PARK, I.-S. & KIM, D.-K. (2004) Characteristics of a label-free piezoelectric immunosensor detecting Pseudomonas aeruginosa. Sensors and Actuators B:
Chemical, 100, 432-438.
KNICHEL, M., HEIDUSCHKA, P., BECK, W., JUNG, G. & GOEPEL, W. (1995) Utilization of a self-assembled peptide monolayer for an impedimetric immunosensor. Sensors
and Actuators, B: Chemical, B28, 85-94.
KOBOS, R. K. (1987) ENZYME-BASED ELECTROCHEMICAL BIOSENSORS. TrAC
- Trends in Analytical Chemistry, 6, 6-9.
KRAUSE, C., MIRSKY, V. M. & HECKMANN, K. D. (1996) Capacitive detection of surfactant adsorption on hydrophobized gold electrodes. Langmuir, 12, 6059-6064.
KRIZ, D. & MOSBACH, K. (1995) Competitive amperometric morphine sensor based on an agarose immobilised molecularly imprinted polymer. Analytica Chimica
Acta, 300, 71-75.
KULAPINA, E. G., BARAGUZINA, V. V. & KULAPINA, O. I. (2004) Ionometric determination of gentamicin and kanamycin in biological fluids and ready-to-use medicinal forms. Pharmaceutical Chemistry Journal, 38, 513-516.
LA-SCALEA, M. A., SERRANO, S. H. P. & GUTZ, I. G. R. (1999) Voltammetric Behaviour of Metronidazole at Mercury Electrodes. J. Braz. Chem. Soc. [online]. 10, 127 - 135.

165
LAKSHMI, D., BOSSI, A., WHITCOMBE, M., CHIANELLA, I., FOWLER, S., SUBRAHMANYAM, S., PILETSKA, E. & PILETSKY, S. (2009a) An Electrochemical Sensor for Catechol and Dopamine Based on a Catalytic Molecularly Imprinted Polymer-Conducting Polymer Hybrid Recognition Element. Analytical
Chemistry, In Press.
LAKSHMI, D., WHITCOMBE, M. J., DAVIS, F., CHIANELLA, I., PILETSKA, E. V., GUERREIRO, A., SUBRAHMANYAM, S., BRITO, P. S., FOWLER, S. A. & PILETSKY, S. A. (2009b) Chimeric Polymers Formed from a Monomer Capable of Free-Radical, Oxidative and Electrochemical Polymerisation. Chemical
Communications, In Press.
LAM, Y.-Z. & ATKINSON, J. K. (2007) Biomedical sensor using thick film technology for transcutaneous oxygen measurement. Medical Engineering & Physics, 29, 291-297.
LE NOIR, M., PLIEVA, F., HEY, T., GUIEYSSE, B. & MATTIASSON, B. (2007) Macroporous molecularly imprinted polymer/cryogel composite systems for the removal of endocrine disrupting trace contaminants. Journal of Chromatography
A, 1154, 158-164.
LEE, Y.-C., CHO, B.-W., KIM, C.-S., KOH, K.-N. & SOHN, B.-K. (2000) A ISFET cartridge for electrolyte measurement by micromachinery. Sensors and
Actuators B: Chemical, 65, 336-339.
LI, C., WANG, C., WANG, C. & HU, S. (2005) Construction of a novel molecularly imprinted sensor for the determination of O,O-dimethyl-(2,4-dichlorophenoxyacetoxyl)(3'-nitrophenyl)methinephosphonate. Analytica
Chimica Acta, 545, 122-128.
LIAO, H., ZHANG, Z., LI, H., NIE, L. & YAO, S. (2004) Preparation of the molecularly imprinted polymers-based capacitive sensor specific for tegafur and its characterization by electrochemical impedance and piezoelectric quartz crystal microbalance. Electrochimica Acta, 49, 4101-4107.
LIN, C. Y., HUNG, Y. C., LIU, C. M., LO, C. F., LIN, Y. C. & LIN, C. L. (2005) Synthesis, electrochemistry, absorption and electro-polymerization of aniline-ethynyl metalloporphyrins. Dalton Transactions, 396-401.
LIU, K., WEI, W.-Z., ZENG, J.-X., LIU, X.-Y. & GAO, Y.-P. (2006) Application of a novel electrosynthesized polydopamine-imprinted film to the capacitive sensing of nicotine. Analytical and Bioanalytical Chemistry, 385, 724-729.
LIU, Y., WANG, F., TAN, T. & LEI, M. (2007) Study of the properties of molecularly imprinted polymers by computational and conformational analysis. Analytica
Chimica Acta, 581, 137-146.
LIU, Z., HUANG, S., JIANG, D., LIU, B. & KONG, J. (2004) A Novel Capacitive Immunosensor Using Electropolymerized Insulating Poly (o-phenylenediamine) Film on a Glass Carbon Electrode for Probing Transferrin. Analytical Letters, 37, 2283 - 2301.
166
LIYONG ZHANG, G. C., CONG FU, (2002) Molecular selectivity of tyrosine-imprinted polymers prepared by seed swelling and suspension polymerization. Polymer
International, 51, 687-692.
LOWINSOHN, D. & BERTOTTI, M. (2007) Flow injection analysis of blood l-lactate by using a Prussian Blue-based biosensor as amperometric detector. Analytical
Biochemistry, 365, 260-265.
LU, S., WU, K., DANG, X. & HU, S. (2004) Electrochemical reduction and voltammetric determination of metronidazole at a nanomaterial thin film coated glassy carbon electrode. 63, 653.
LUO, N., BRIAN HUTCHISON, J., ANSETH, K. S. & BOWMAN, C. N. (2002) Synthesis of a novel methacrylic monomer iniferter and its application in surface photografting on crosslinked polymer substrates. Journal of Polymer Science, Part A: Polymer
Chemistry, 40, 1885-1891.
LUTGERS, H. L., HULLEGIE, L. M., HOOGENBERG, K., SLUITER, W. J., DULLAART, R. P. F., WIENTJES, K. J. & SCHOONEN, A. J. M. (2000) Microdialysis measurement of glucose in subcutaneous adipose tissue up to three weeks in Type 1 diabetic patients. The Netherlands Journal of Medicine, 57, 7-12.
LY, S. Y. & KIM, Y. K. (2006) Assay of glucose in urine and drinking water with voltammetric working sensors of infrared photo diode electrode. Sensors and
Actuators A: Physical, 127, 41-48.
MAHONY, J. O., NOLAN, K., SMYTH, M. R. & MIZAIKOFF, B. (2005) Molecularly imprinted polymers--potential and challenges in analytical chemistry. Analytica
Chimica Acta, 534, 31-39.
MANDAL, P. C. (2004) Reactions of the nitro radical anion of metronidazole in aqueous and mixed solvent: a cyclic voltammetric study. 570, 55.
MANYANGA, V., KREFT, K., DIVJAK, B., HOOGMARTENS, J. & ADAMS, E. (2008) Improved liquid chromatographic method with pulsed electrochemical detection for the analysis of gentamicin. Journal of Chromatography A, 1189, 347-354.
MARTINS, M. C. L., FONSECA, C., BARBOSA, M. A. & RATNER, B. D. (2003) Albumin adsorption on alkanethiols self-assembled monolayers on gold electrodes studied by chronopotentiometry. Biomaterials, 24, 3697-3706.
MATSUDA, T. & OHYA, S. (2005) Photoiniferter-Based Thermoresponsive Graft Architecture with Albumin Covalently Fixed at Growing Graft Chain End. Langmuir, 21, 9660-9665.
MEYERHOFF, M. E. (1993) In vivo blood-gas and electrolyte sensors: Progress and challenges. TrAC Trends in Analytical Chemistry, 12, 257-266.
MIRSKY, V. M., KRAUSE, C. & HECKMANN, K. D. (1996) Capacitive sensor for lipolytic enzymes. Thin Solid Films, 284-285, 939-941.
MIRSKY, V. M., MASS, M., KRAUSE, C. & WOLFBEIS, O. S. (1998) Capacitive Approach to Determine Phospholipase A2 Activity toward Artificial and Natural Substrates. Analytical Chemistry, 70, 3674-3678.

167
MIRSKY, V. M., RIEPL, M. & WOLFBEIS, O. S. (1997) Capacitive monitoring of protein immobilization and antigen-antibody reactions on monomolecular alkylthiol films on gold electrodes. Biosensors and Bioelectronics, 12, 977-989.
MIYAHARA, Y., TSUKADA, K., MIYAGI, H. & SIMON, W. (1991) Urea sensor based on an ammonium-ion-sensitive field-effect transistor. Sensors and Actuators B:
Chemical, 3, 287-293.
MOHAMED, R., MOTTIER, P., TREGUIER, L., RICHOZ-PAYOT, J., YILMAZ, E., TABET, J. C. & GUY, P. A. (2008) Use of molecularly imprinted solid-phase extraction sorbent for the determination of four 5-nitroimidazoles and three of their metabolites from egg-based samples before tandem LC-ESIMS/MS analysis. Journal of Agricultural and Food Chemistry, 56, 3500-3508.
MYLES, P. S., BUCKLAND, M. R., WEEKS, A. M., BUJOR, M. & MOLONEY, J. (1999) Continuous arterial blood gas monitoring during bilateral sequential lung transplantation. Journal of Cardiothoracic and Vascular Anesthesia, 13, 253-257.
NAVARRO-VILLOSLADA, F., ORELLANA, G., MORENO-BONDI, M. C., VICK, T., DRIVER, M., HILDEBRAND, G. & LIEFEITH, K. (2001) Fiber-Optic Luminescent Sensors with Composite Oxygen-Sensitive Layers and Anti-Biofouling Coatings. Anal.
Chem., 73, 5150-5156.
NICHOLLS, I. A. (1998) Towards the rational design of molecularly imprinted polymers. Journal of Molecular Recognition, 11, 79-82.
O'MAHONY, J., MOLINELLI, A., NOLAN, K., SMYTH, M. R. & MIZAIKOFF, B. (2005) Towards the rational development of molecularly imprinted polymers: 1H NMR studies on hydrophobicity and ion-pair interactions as driving forces for selectivity. Biosensors and Bioelectronics, 20, 1884-1893.
O'MAHONY, J., MOLINELLI, A., NOLAN, K., SMYTH, M. R. & MIZAIKOFF, B. (2006) Anatomy of a successful imprint: Analysing the recognition mechanisms of a molecularly imprinted polymer for quercetin. Biosensors and Bioelectronics, 21, 1383-1392.
OGOREVC, B. & GOMISCEK, S. (1991) Electrochemical analysis of cephalosporin antibiotics. Journal of Pharmaceutical and Biomedical Analysis, 9, 225-236.
OGOREVC, B., KRASNA, A., HUDNIK, V. & GOMISCEK, S. (1991) Adsorptive stripping voltammetry of selected cephalosporin antibiotics and their direct determination in urine. Mikrochimica Acta, 103, 131-144.
OLIVEIRA BRETT, A. M., SERRANO, S. H. P., GUTZ, I. & LA-SCALEA, M. A. (1997a) Electrochemical reduction of metronidazole at a DNA-modified glassy carbon electrode. 13th International Symposium on Bioelectrochemistry and
Bioenergetics, 42, 175-178.
OLIVEIRA BRETT, A. M., SERRANO, S. H. P., GUTZ, I. G. R. & LA-SCALEA, M. A. (1997b) Comparison of the Voltammetric Behavior of Metronidazole at a DNA-Modified Glassy Carbon Electrode, a Mercury Thin Film Electrode and a Glassy Carbon Electrode. Electroanalysis, 9, 110.

168
OTSU, T. & KURIYAMA, A. (1984) Living mono- and biradical polymerizations in homogeneous system synthesis of AB and ABA type block copolymers. Polymer Bulletin, 11, 135-142.
OZKAN, S. A., OZKAN, Y. & ŞENTÜRK, Z. (1998) Electrochemical reduction of metronidazole at activated glassy carbon electrode and its determination in pharmaceutical dosage forms. Journal of Pharmaceutical and Biomedical
Analysis, 17, 299-305.
PANASYUK-DELANEY, T., MIRSKY, V. M., ULBRICHT, M. & WOLFBEIS, O. S. (2001) Impedometric herbicide chemosensors based on molecularly imprinted polymers. Analytica Chimica Acta, 435, 157-162.
PANASYUK-DELANEY, T., MIRSKY, V. M. & WOLFBEIS, O. S. (2002) Capacitive creatinine sensor based on a photografted molecularly imprinted polymer. Electroanalysis, 14, 221-224.
PANASYUK, T. L., MIRSKY, V. M., PILETSKY, S. A. & WOLFBEIS, O. S. (1999) Electropolymerized Molecularly Imprinted Polymers as Receptor Layers in Capacitive Chemical Sensors. Anal. Chem., 71, 4609-4613.
PFEIFFER, D., MOLLER, B., KLIMES, N., SZEPONIK, J. & FISCHER, S. (1997) Amperometric lactate oxidase catheter for real-time lactate monitoring based on thin film technology. Biosensors and Bioelectronics, 12, 539-550.
PILETSKY, S. A., KARIM, K., PILETSKA, E. V., DAY, C. J., FREEBAIRN, K. W., LEGGE, C. & TURNER, A. P. F. (2001) Recognition of ephedrine enantiomers by molecularly imprinted polymers designed using a computational approach. Analyst, 126, 1826-1830.
PILETSKY, S. A., PILETSKA, E. V., CHEN, B., KARIM, K., WESTON, D., BARRETT, G., LOWE, P. & TURNER, A. P. F. (2000) Chemical grafting of molecularly imprinted homopolymers to the surface of microplates. Application of artificial adrenergic receptor in enzyme-linked assay for β-agonists determination. Analytical
Chemistry, 72, 4381-4385.
PILETSKY, S. A., PILETSKAYA, E. V., PANASYUK, T. L., EL'SKAYA, A. V., LEVI, R., KARUBE, I. & WULFF, G. (1998) Imprinted membranes for sensor technology: opposite behavior of covalently and noncovalently imprinted membranes. Macromolecules, 31, 2137-2140.
PILETSKY, S. A., PILETSKAYA, E. V., SERGEYEVA, T. A., PANASYUK, T. L. & EL'SKAYA, A. V. (1999) Molecularly imprinted self-assembled films with specificity to cholesterol. Sensors and Actuators, B: Chemical, 60, 216-220.
PILETSKY, S. A., TURNER, N. W. & LAITENBERGER, P. (2006) Molecularly imprinted polymers in clinical diagnostics-Future potential and existing problems. Medical
Engineering and Physics, 28, 971-977.
PISSINIS, D. E. & MARIOLI, J. M. (2007) Electrochemical detection of 2,6-diisopropylphenol (propofol) in reversed phase HPLC at high pH. Journal of
Liquid Chromatography and Related Technologies, 30, 1787-1795.
169
PLUMMER, G. F. (1987) Improved method for the determination of propofol in blood by high-performance liquid chromatography with fluorescence detection. Journal
of Chromatography: Biomedical Applications, 421, 171-176.
RAIBER, K., TERFORT, A., BENNDORF, C., KRINGS, N. & STREHBLOW, H.-H. (2005) Removal of self-assembled monolayers of alkanethiolates on gold by plasma cleaning. Surface Science, 595, 56-63.
RHEMREV-BOOM, M. M., KORF, J., VENEMA, K., URBAN, G. & VADGAMA, P. (2001) A versatile biosensor device for continuous biomedical monitoring. Biosensors and
Bioelectronics, 16, 839-847.
RICKERT, J., GOPEL, W., BECK, W., JUNG, G. & HEIDUSCHKA, P. (1996) A 'mixed' self-assembled monolayer for an impedimetric immunosensor. Biosensors and
Bioelectronics, 11, 757-768.
RIEPL, M., MIRSKY, V. M., NOVOTNY, I., TVAROZEK, V., REHACEK, V. & WOLFBEIS, O. S. (1999a) Optimization of capacitive affinity sensors: Drift suppression and signal amplification. Analytica Chimica Acta, 392, 77-84.
RIEPL, M., MIRSKY, V. M. & WOLFBEIS, O. S. (1999b) Electrical control of alkanethiols self-assembly on a gold surface as an approach for preparation of microelectrode arrays. Mikrochimica Acta, 131, 29-34.
ROLFE, P. (1988) Review of chemical sensors for physiological measurement. Journal
of Biomedical Engineering, 10, 138-145.
RON, H., MATLIS, S. & RUBINSTEIN, I. (1998) Self-Assembled Monolayers on Oxidized Metals. 2. Gold Surface Oxidative Pretreatment, Monolayer Properties, and Depression Formation. Langmuir, 14, 1116-1121.
RON, H. & RUBINSTEIN, I. (1994) Alkanethiol Monolayers on Preoxidized Gold. Encapsulation of Gold Oxide under an Organic Monolayer. Langmuir, 10, 4566-4573.
RUCKERT, B., HALL, A. J. & SELLERGREN, B. (2002) Molecularly imprinted composite materials via iniferter-modified supports. Journal of Materials Chemistry, 12, 2275-2280.
SALVADOR, J. P., ESTEVEZ, M. C., MARCO, M. P. & SANCHEZ-BAEZA, F. (2007) A new methodology for the rational design of molecularly imprinted polymers. Analytical Letters, 40, 1294-1306.
SANT, W., POURCIEL-GOUZY, M. L., LAUNAY, J., DO CONTO, T., COLIN, R., MARTINEZ, A. & TEMPLE-BOYER, P. (2004) Development of a creatinine-sensitive sensor for medical analysis. Sensors and Actuators B: Chemical, 103, 260-264.
SCHEIPERS, A., WAMUS, O., SUNDERMEIER, C., ESHOLD, J., WEI, T., GITTER, M., RO, B. & KNOLL, M. (2001) Potentiometric ion-selective silicon sensors for the on-line monitoring of blood electrolytes. 439, 29.
SCHNAKENBERG, U., LISEC, T., HINTSCHE, R., KUNA, I., UHLIG, A. & WAGNER, B. (1996) Novel potentiometric silicon sensor for medical devices. Sensors and
Actuators B: Chemical, 34, 476-480.

170
SCHOENFISCH, M. H., MOWERY, K. A., RADER, M. V., BALIGA, N., WAHR, J. A. & MEYERHOFF, M. E. (2000) Improving the Thromboresistivity of Chemical Sensors via Nitric Oxide Release: Fabrication and in Vivo Evaluation of NO-Releasing Oxygen-Sensing Catheters. Anal. Chem., 72, 1119-1126.
SCHREIBER, F. (2000) Structure and growth of self-assembling monolayers. Progress in
Surface Science, 65, 151-256.
SHAHROKHIAN, S., KARIMI, M. & KHAJEHSHARIFI, H. (2005) Carbon-paste electrode modified with cobalt-5-nitrolsalophen as a sensitive voltammetric sensor for detection of captopril. Sensors and Actuators B: Chemical, 109, 278-284.
SHEPPARD, N. F., MEARS, D. J. & GUISEPPI-ELIE, A. (1996) Model of an immobilized enzyme conductimetric urea biosensor. Biosensors and Bioelectronics, 11, 967-979.
SHERVEDANI, R. K., MEHRJARDI, A. H. & ZAMIRI, N. (2006) A novel method for glucose determination based on electrochemical impedance spectroscopy using glucose oxidase self-assembled biosensor. Bioelectrochemistry, 69, 201-208.
SINGH, N., CUI, X., BOLAND, T. & HUSSON, S. M. (2007) The role of independently variable grafting density and layer thickness of polymer nanolayers on peptide adsorption and cell adhesion. 28, 763-771.
SKOOG, D. A. (2000) Analytical chemistry: an introduction, Saunders College.
SMITH, I., WHITE, P. F., NATHANSON, M. & GOULDSON, R. (1994) Propofol: An update on its clinical use. Anesthesiology, 81, 1005-1043.
SOLE, S., ALEGRET, S., CESPEDES, F., FABREGAS, E. & DIEZ-CABALLERO, T. (1998) Flow Injection Immunoanalysis Based on a Magnetoimmunosensor System. Analytical Chemistry, 70, 1462-1467.
SPURLOCK, L. D., JARAMILLO, A., PRASERTHDAM, A., LEWIS, J. & BRAJTER-TOTH, A. (1996) Selectivity and sensitivity of ultrathin purine-templated overoxidized polypyrrole film electrodes. Analytica Chimica Acta, 336, 37-46.
STUART, A. & FOULKES, F. (1988) Study of ECE reactions with multiple parallel chemical steps using linear scan voltammetry. Electrochimica Acta, 33, 1411-1424.
SUBRAHMANYAM, S., PILETSKY, S. A., PILETSKA, E. V., CHEN, B., KARIM, K. & TURNER, A. P. F. (2001) `Bite-and-Switch' approach using computationally designed molecularly imprinted polymers for sensing of creatinine. Biosensors
and Bioelectronics, 16, 631-637.
SULEIMAN, A. A. & XU, Y. (1998) An Amperometric Immunosensor for Cocaine. Electroanalysis, 10, 240-243.
SUZUKI, H., ARAKAWA, H. & KARUBE, I. (2001) Fabrication of a sensing module using micromachined biosensors. Biosensors and Bioelectronics, 16, 725-733.
TREMILIOSI-FILHO, G., GONZALEZ, E. R., MOTHEO, A. J., BELGSIR, E. M., LÉGER, J. M. & LAMY, C. (1998) Electro-oxidation of ethanol on gold: analysis of the reaction products and mechanism. Journal of Electroanalytical Chemistry, 444, 31-39.
171
TURA, A., SBRIGNADELLO, S., BARISON, S., CONTI, S. & PACINI, G. (2007) Impedance spectroscopy of solutions at physiological glucose concentrations. Biophysical
Chemistry, 129, 235-241.
TURKEWITSCH, P., WANDELT, B., DARLING, G. D. & POWELL, W. S. (1998) Fluorescent Functional Recognition Sites through Molecular Imprinting. A Polymer-Based Fluorescent Chemosensor for Aqueous cAMP. Analytical Chemistry, 70, 2025-2030.
TWARDOWSKI, M. & NUZZO, R. G. (2002) Chemically Mediated Grain Growth in Nanotextured Au, Au/Cu Thin Films: Novel Substrates for the Formation of Self-Assembled Monolayers. Langmuir, 18, 5529-5538.
VAN ES, R. M., SETFORD, S. J., BLANKWATER, Y. J. & MEIJER, D. (2001) Detection of gentamicin in milk by immunoassay and flow injection analysis with electrochemical measurement. Analytica Chimica Acta, 429, 37-47.
VEL KRAWCZYK, T. K., TROJANOWICZ, M. & LEWENSTAM, A. (1994) Enzymatic flow-injection determination of urea in blood serum using potentiometric gas sensor with internal nonactin based ISE. Talanta, 41, 1229-1236.
VERRELLI, G., FRANCIOSO, L., PAOLESSE, R., SICILIANO, P., DI NATALE, C., D'AMICO, A. & LOGRIECO, A. (2007) Development of silicon-based potentiometric sensors: Towards a miniaturized electronic tongue. Sensors and Actuators B:
Chemical, 123, 191-197.
VOSTIAR, I., TKAC, J., STURDIK, E. & GEMEINER, P. (2002) Amperometric urea biosensor based on urease and electropolymerized toluidine blue dye as a pH-sensitive redox probe. Bioelectrochemistry, 56, 113-115.
WANG, J. (1999) Amperometric biosensors for clinical and therapeutic drug monitoring: a review. Journal of Pharmaceutical and Biomedical Analysis, 19, 47-53.
WANG, J. (2000) Analytical Electrochemistry, Wiley-VCH.
WANG, J. (2006) Analytical electrochemistry, John Wiley & Sons, Inc.
WANG, J. & YOON, R.-H. (2008) AFM Forces Measured between Gold Surfaces Coated with Self-Assembled Monolayers of 1-Hexadecanethiol. Langmuir, 24, 7889-7896.
WANG, W., GAO, S. & WANG, B. (1999) Building fluorescent sensors by template polymerization: The preparation of a fluorescent sensor for d-Fructose. Organic
Letters, 1, 1209-1212.
WANG, Z., ZHOU, H. & ZHOU, S. (1993) Study on the determination of metronidazole in human serum by adsorptive stripping voltammetry. 40, 1073.
WEI, S., JAKUSCH, M. & MIZAIKOFF, B. (2006) Capturing molecules with templated materials-Analysis and rational design of molecularly imprinted polymers. Analytica Chimica Acta, 578, 50-58.
WEN, T. C., SIVAKUMAR, C. & GOPALAN, A. (2002) In-situ spectroelectrochemical evidences for the copolymerization of o-toluidine with diphenylamine-4-sulphonic acid by UV-visible spectroscopy. Spectrochimica Acta - Part A
Molecular and Biomolecular Spectroscopy, 58, 167-177.

172
WIENTJES, K. J., VONK, P., VONK-VAN KLEI, Y., SCHOONEN, A. J. M. & KOSSEN, N. W. (1998) Microdialysis of glucose in subcutaneous adipose tissue up to 3 weeks in healthy volunteers. Diabetes Care, 21, 1481-1488.
WILLIAMS, R. A. & BLANCH, H. W. (1994) Covalent immobilization of protein monolayers for biosensor applications. Biosensors and Bioelectronics, 9, 159-167.
WISNIEWSKI, N. & REICHERT, M. (2000) Methods for reducing biosensor membrane biofouling. Colloids and Surfaces B: Biointerfaces, 18, 197-219.
WODERER, S., HENNINGER, N., GARTHE, C.-D., KLOETZER, H. M., HAJNSEK, M., KAMECKE, U., GRETZ, N., KRAENZLIN, B. & PILL, J. (2007) Continuous glucose monitoring in interstitial fluid using glucose oxidase-based sensor compared to established blood glucose measurement in rats. Analytica Chimica Acta, 581, 7-12.
WU, L. & LI, Y. (2004) Study on the recognition of templates and their analogues on molecularly imprinted polymer using computational and conformational analysis approaches. Journal of Molecular Recognition, 17, 567-574.
WU, Y., ROJAS, A. P., GRIFFITH, G. W., SKRZYPCHAK, A. M., LAFAYETTE, N., BARTLETT, R. H. & MEYERHOFF, M. E. (2007) Improving blood compatibility of intravascular oxygen sensors via catalytic decomposition of S-nitrosothiols to generate nitric oxide in situ. Sensors and Actuators B: Chemical, 121, 36-46.
XU, J. & LI, H. (1995) The Chemistry of Self-Assembled Long-Chain Alkanethiol Monolayers on Gold. Journal of Colloid and Interface Science, 176, 138-149.
YANG, L., WEI, W., XIA, J. & TAO, H. (2004) Artificial Receptor Layer for Herbicide Detection Based on Electrosynthesized Molecular Imprinting Technique and Capacitive Transduction. Analytical Letters, 37, 2303 - 2319.
YANG, L., WEI, W., XIA, J., TAO, H. & YANG, P. (2005) Capacitive Biosensor for Glutathione Detection Based on Electropolymerized Molecularly Imprinted Polymer and Kinetic Investigation of the Recognition Process. Electroanalysis, 17, 969-977.
YANG, Y., ZHANG, S. F., KINGSTON, M. A., JONES, G., WRIGHT, G. & SPENCER, S. A. (2000) Glucose sensor with improved haemocompatibilty. Biosensors and
Bioelectronics, 15, 221-227.
YAO, J., LI, X. & QIN, W. (2008) Computational design and synthesis of molecular imprinted polymers with high selectivity for removal of aniline from contaminated water. Analytica Chimica Acta, 610, 282-288.
YIN, F. (2004) Capacitive sensors using electropolymerized o-phenylenediamine film doped with ion-pair complex as selective elements for the determination of pentoxyverine. Talanta, 63, 641-646.
YIN, F. & XU, X. (2004) Construction and Analytical Application of a Novel Ion-Selective Capacitive Sensor for Determination of Cinchonine. Analytical
Letters, 37, 3129-3147.

173
YOON, H. J., SHIN, J. H., LEE, S. D., NAM, H., CHA, G. S., STRONG, T. D. & BROWN, R. B. (2000) Solid-state ion sensors with a liquid junction-free polymer membrane-based reference electrode for blood analysis. 64, 8.
ZHANG, H., ANNICH, G. M., MISKULIN, J., OSTERHOLZER, K., MERZ, S. I., BARTLETT, R. H. & MEYERHOFF, M. E. (2002) Nitric oxide releasing silicone rubbers with improved blood compatibility: preparation, characterization, and in vivo evaluation. Biomaterials, 23, 1485-1494.
ZHANG, L., ZHANG, C. & LIAN, J. (2008) Electrochemical synthesis of polyaniline nano-networks on p-aminobenzene sulfonic acid functionalized glassy carbon electrode. Its use for the simultaneous determination of ascorbic acid and uric acid. Biosensors and Bioelectronics, 24, 690-695.
ZHI, Y., HU, J., WU, Z. & LI, Q. (1998) Study on the voltammetric behavior of metronidazole and its determination at a Co/GC modified electrode. Analytical
Letters, 31, 429.
ZUMAN, P., KAPETANOVIC, V. & ALEKSIC, M. (2000) Recent developments in electroanalytical chemistry of cephalosporins and cefamycins. Analytical
Letters, 33, 2821.

174
Publications
LAKSHMI, D., BOSSI, A., WHITCOMBE, M., CHIANELLA, I., FOWLER, S., SUBRAHMANYAM, S., PILETSKA, E. & PILETSKY, S. (2009a) An Electrochemical Sensor for Catechol and Dopamine Based on a Catalytic Molecularly Imprinted Polymer-Conducting Polymer Hybrid Recognition Element. Analytical
Chemistry, In Press.
LAKSHMI, D., WHITCOMBE, M. J., DAVIS, F., CHIANELLA, I., PILETSKA, E. V., GUERREIRO, A., SUBRAHMANYAM, S., BRITO, P. S., FOWLER, S. A. & PILETSKY, S. A. (2009b) Chimeric Polymers Formed from a Monomer Capable of Free-Radical, Oxidative and Electrochemical Polymerisation. Chemical
Communications, In Press.
KYPRIANOU, D., GUERREIRO, A. R., CHIANELLA, I., PILETSKA, E. V., FOWLER, S. A., KARIM, K., WHITCOMBE, M. J., TURNER, A. P. F. & PILETSKY, S. A. (2009) New reactive polymer for protein immobilisation on sensor surfaces. Biosensors and
Bioelectronics, 24, 1365-1371.