CRANFIELD UNIVERSITY DEXIN XU ANALYSIS AND · PDF fileiv 4.2.2 Survey Result Analysis..... 39...
135
CRANFIELD UNIVERSITY DEXIN XU ANALYSIS AND MODELLING OF COST OF QUALITY IN AIRCRAFT TAILPLANE ASSEMBLY SCHOOL OF AEROSPACE, TRANSPORT AND MANUFACTURING MSc by Research Thesis Academic Year: 2014 - 2015 Supervisor: Salonitis, Konstantinos August 2015
Transcript of CRANFIELD UNIVERSITY DEXIN XU ANALYSIS AND · PDF fileiv 4.2.2 Survey Result Analysis..... 39...

CRANFIELD UNIVERSITY
DEXIN XU
ANALYSIS AND MODELLING OF COST OF QUALITY IN
AIRCRAFT TAILPLANE ASSEMBLY
SCHOOL OF AEROSPACE, TRANSPORT AND
MANUFACTURING
MSc by Research Thesis
Academic Year: 2014 - 2015
Supervisor: Salonitis, Konstantinos
August 2015
CRANFIELD UNIVERSITY
SCHOOL OF AEROSPACE, TRANSPORT AND
MANUFACTURING
MSc by Research Thesis
Academic Year 2014 - 2015
DEXIN XU
Analysis and Modelling of Cost of Quality in Aircraft Tailplane
Assembly
Supervisor: Salonitis, Konstantinos
August 2015
© Cranfield University 2015. All rights reserved. No part of this
publication may be reproduced without the written permission of the
copyright owner.


i
ABSTRACT
With production quality playing a more and more important role in keeping the
competitive power of company, Cost of Quality (CoQ) are paid more and more
attention in manufacturing industries. Especially in aircraft manufacturing
industry, due to the more stringent requirements on quality, the CoQ has been a
serious issue for manager. However, due to the specificity of the industry, such
as high-tech, low-volume, low degree of automation, the traditional generic CoQ
models are not applied directly which make most of the aircraft manufacturing
companies are lack of systematic method and efficient tool to analysis and
manage CoQ. it is essential to develop a CoQ model which can be used to
analyse and estimate the CoQ in the aircraft manufacturing industry.
This research aims at developing a CoQ model for tailplane assembly which
can help the quality manager to collect and store the quality issue and cost
information, and estimate the CoQ and analyse the benefit of cost spent on
quality. The CoQ elements are identified and defined based on the comparing
results of the literature and actual operation data. Prevention-Appraisal-Failure
(P-A-F)/ Activity-Based-Costing (ABC) system is applied to develop the CoQ
estimation system. And Cost-Benefit-Analysis (CBA) is applied to analyse the
benefit brought by the cost spend on quality. In order to collect enough
professional data for the model, an industry survey is designed. Moreover,
some GUIs are designed using VBA in MS Excel to improve the operability and
practicability. Furthermore, two different cases and expert judgements are used
to validate the developed CoQ model.
The validation result illustrates that the developed model can help the user to
estimate and analyse the CoQ in tailplane assembly, and supply a method to
analyse quality issues quantitatively. And the overall performance of the model
is approved by the experts in aircraft industry. The model is suit for aircraft
industry and worth popularizing in this field.
Keywords:
Cost of Quality, CoQ Model, Cost Benefit Analysis, Tailplane Assembly

ii
ACKNOWLEDGEMENTS
Firstly, I would like to thank my supervisor, Dr. Konstantinos Salonitis, for his
continuous support and encouragement to my thesis. The patience exhibited by
him have truly noteworthy.
I would also like to acknowledge to Prof. Mark Jolly, my second supervisor. His
advice always inspired and guided me during the research.
I own my gratitude to my subject advisor, Dr. Essam Shehab and my chairman,
Dr. Alex, Skordos. Their valuable comments and generous help me a lot when I
needed it.
There are a number of people who went beyond their duty in order to help me
with this research. I would like to express my appreciation to Mr. Qingming
Song, Mr. Yu Lu, Mr. Chaoqun Chen, Mr. Jian Zhang, Ms. Lijuan Sun, Ms.
Wenjing Wang, Mr. Tao Feng, Mr. Xin Sun, Mr. Qiyu Chen, Mr. Mingming Zhu,
for their generous help either on study and living during the research.
My gratitude goes to the experts involved in my research, whose names are not
shown here as required. The same gratitude also goes to the participators who
attended the industry survey of my research. I really appreciated for their
professional opinions and time.
Special thanks to COMAC (Commercial Aircraft Corporation of China) for
providing me with the opportunity to undertake this research, as well as the
continuous support and encouragement. Special thanks also to Cranfield
University, for giving me the chance to better improve myself.
Finally, I deeply appreciate my family and friends for having supported me at all
the times.

iii
TABLE OF CONTENTS
ABSTRACT ......................................................................................................... i
ACKNOWLEDGEMENTS.................................................................................... ii
LIST OF FIGURES ............................................................................................. v
LIST OF TABLES .............................................................................................. vii
LIST OF EQUATIONS ...................................................................................... viii
LIST OF ABBREVIATIONS ................................................................................ ix
LIST OF NOMENCLATURE ............................................................................... x
1 INTRODUCTION ............................................................................................. 1
1.1 Background ............................................................................................... 1
1.2 Problem Statement ................................................................................... 2
1.3 Aim and Objective ..................................................................................... 3
1.4 Thesis Structure ........................................................................................ 3
1.5 Summary .................................................................................................. 4
2 LITERATURE REVIEW ................................................................................... 5
2.1 Introduction ............................................................................................... 5
2.2 Cost of Quality .......................................................................................... 6
2.2.1 Definition of Cost of Quality ................................................................ 6
2.2.2 Usage of Quality Costing .................................................................... 7
2.2.3 CoQ Model ......................................................................................... 8
2.3 Cost Estimation ....................................................................................... 15
2.3.1 Cost Estimation Techniques ............................................................. 15
2.3.2 Activity-Based Costing System ........................................................ 17
2.3.3 CoQ/ABC System............................................................................. 18
2.3.4 Cost Modelling in Aerospace Industry .............................................. 19
2.4 Cost Benefit Analysis .............................................................................. 21
2.4.1 Definition of Cost Benefit Analysis ................................................... 21
2.4.2 Application of Cost Benefit Analysis ................................................. 22
2.5 Aircraft Assembly .................................................................................... 23
2.5.1 Characteristic of Aircraft Assembly .................................................. 24
2.5.2 Tailplane Assembly .......................................................................... 25
2.6 Research Gap Analysis .......................................................................... 29
2.7 Summary ................................................................................................ 30
3 RESEARCH METHODOLOGY ..................................................................... 31
3.1 Introduction ............................................................................................. 31
3.2 Adopted Research Methodology ............................................................. 32
3.3 Summary ................................................................................................ 34
4 DEVELOPMENT OF COST OF QUALITY MODEL ...................................... 36
4.1 Introduction ............................................................................................. 36
4.2 Industry Survey ....................................................................................... 36
4.2.1 Questionnaire Design ....................................................................... 37

iv
4.2.2 Survey Result Analysis ..................................................................... 39
4.3 CoQ Elements Identification and Definition ............................................. 49
4.3.1 Breakdown Structure of CoQ ........................................................... 49
4.3.2 Definition of Prevention Costs .......................................................... 50
4.3.3 Definition of Appraisal Costs ............................................................ 51
4.3.4 Definition of Internal Failure Costs ................................................... 52
4.3.5 Definition of External Failure Costs .................................................. 52
4.4 Activities Identification and Cost Drivers Analysis ................................... 53
4.4.1 Activity Identification ......................................................................... 53
4.4.2 Cost Drivers Analysis ....................................................................... 54
4.5 Development of the CoQ Model .............................................................. 56
4.5.1 Overall Structure of the CoQ Model ................................................. 56
4.5.2 Cost of Quality Estimation System (CoQES) .................................... 58
4.5.3 CBA Module ..................................................................................... 75
4.6 Summary ................................................................................................ 78
5 VALIDATION OF THE COQ MODEL ............................................................ 81
5.1 Introduction ............................................................................................. 81
5.2 Case Study for CoQES Validation .......................................................... 81
5.2.1 Introduction ...................................................................................... 81
5.2.2 Result Analysis ................................................................................. 83
5.3 Case Study for Application of CBA ......................................................... 86
5.3.1 Introduction ...................................................................................... 86
5.3.2 Result Analysis ................................................................................. 87
5.4 Expert Judgment ..................................................................................... 89
5.5 Summary ................................................................................................ 94
6 DISCUSSION AND CONCLUSIONS ............................................................ 95
6.1 Introduction ............................................................................................. 95
6.2 Discussion .............................................................................................. 95
6.2.1 Fulfilment of the Objectives .............................................................. 95
6.2.2 Application of the CoQ Model ........................................................... 97
6.3 Conclusions ............................................................................................ 98
6.4 Research Contributions .......................................................................... 99
6.5 Research Limitations .............................................................................. 99
6.6 Future Work .......................................................................................... 100
6.7 Summary .............................................................................................. 101
REFERENCES ............................................................................................... 102
APPENDICES ................................................................................................ 111

v
LIST OF FIGURES
Figure 1-1 Thesis Structure ................................................................................ 4
Figure 2-1 Literature Review Structure ............................................................... 5
Figure 2-2 Process Cost Model Structure (Hwang & Aspinwall, 1996) ............. 13
Figure 2-3 Taguchi Loss Function (Hwang & Aspinwall, 1996) ........................ 15
Figure 2-4 P-A-F/ABC Framework (Özkan & Karaibrahimoğlu, 2013) ............. 19
Figure 2-5 Common Cost Estimation Methods for Main Steps in the Life Cycle of an Aerospace System (Banazadeh & Jafari, 2012) ............................... 20
Figure 2-6 Aircraft Assembly (Michael, 2009)................................................... 23
Figure 2-7 Overview of Structural Assembly of Aircraft (Encyclopaedia, 2006) 24
Figure 2-8 Position of Tailplane in an Aircraft (Brady, 2014) ............................ 26
Figure 2-9 Tailplane ......................................................................................... 26
Figure 2-10 Central Section.............................................................................. 27
Figure 2-11 Overhanging Section ..................................................................... 27
Figure 2-12 Schematic Diagram of Tailplane Assembly ................................... 28
Figure 2-13 Process Map of Tailplane Assembly ............................................. 28
Figure 3-1 Research Methodology ................................................................... 35
Figure 4-1 Phase with Most Quality Issues in Tailplane Assembly ................... 42
Figure 4-2 Main Quality Issues in Tailplane Assembly ..................................... 43
Figure 4-3 Main Cause for Quality Issues ........................................................ 44
Figure 4-4 Processes with Most Significant Influence on Cost ......................... 45
Figure 4-5 Inspections and Tests with Most Significant Influence on Cost ....... 46
Figure 4-6 Main Cost Drivers for Activities in Tailplane Assembly .................... 47
Figure 4-7 Method to Represent Short-term Benefit ......................................... 48
Figure 4-8 Method to Represent Long-term Benefit ......................................... 49
Figure 4-9 Breakdown Structure of CoQ in Tailplane Assembly....................... 50
Figure 4-10 Overall Structure of the CoQ Model .............................................. 57
Figure 4-11 Equipment Database ..................................................................... 59
Figure 4-12 Internal Failure Database .............................................................. 59

vi
Figure 4-13 Login Interface .............................................................................. 60
Figure 4-14 Main Menu Interface ..................................................................... 61
Figure 4-15 Cost Information Input Menu Interface .......................................... 61
Figure 4-16 Prevention Cost Information Input Interface .................................. 62
Figure 4-17 Appraisal Cost Information Input Interface .................................... 62
Figure 4-18 Internal Failure Cost Information Input Interface ........................... 63
Figure 4-19 External Failure Cost Information Input Interface .......................... 63
Figure 4-20 Annual CoQ Estimation Information Input Interface ...................... 64
Figure 4-21 Cost of Quality Report Interface .................................................... 64
Figure 4-22 Flow Chart of CBA Module on Quality Management ..................... 80
Figure 5-1 Flow Map of Final Assembly Phase in Tailplane Assembly ............ 82
Figure 5-2 Proportion of Different Kind of CoQ in Total CoQ ........................... 84
Figure 5-3 Proportion of Different Kind of CoQ in Appraisal Cost..................... 84
Figure 5-4 Proportion of CoQ in Sales ............................................................. 86
Figure 5-5 Flow Map of Case 2 ........................................................................ 86
Figure 5-6 Pareto Analysis on Quality Issue Number ....................................... 87
Figure 5-7 Pareto Analysis on Cost of Quality Issue ........................................ 87
Figure 5-8 CBA Result of Investment on Equipment Maintenance ................... 89
Figure 5-9 CBA Result of Investment on New Equipment ................................ 89
Figure 5-10 Result of the Grading for the CoQ Model ...................................... 92

vii
LIST OF TABLES
Table 2-1 Generic Cost Models and Categories (Mohamed & Sharmeeni, 2014) .................................................................................................................... 8
Table 2-2 General P-A-F Model for Categorization (Srivastava, 2008) ............ 10
Table 2-3 Cost of Quality in Manufacturing (Assembly) (Yang, 2008) .............. 11
Table 2-4 Advantages, Limitations for Cost Modelling Technique (Niazi et al., 2006) ......................................................................................................... 16
Table 2-5 Main Technologies in Tailplane Assembly (Wang, 2012) ................ 29
Table 2-6 Main Quality Issues in Tailplane Assembly (Yang, 2014) ................ 29
Table 4-1 General Information of Participants ................................................. 41
Table 4-2 Weighted Value of Questions ........................................................... 41
Table 4-3 Cost Drivers of Activities .................................................................. 54
Table 5-1 Main Production Factors Used in Case 1 ......................................... 83
Table 5-2 General Information of Experts ........................................................ 90
Table 5-3 Expert Opinion for CoQ Model ......................................................... 93

viii
LIST OF EQUATIONS
(2-1) .................................................................................................................. 14
(4-1) .................................................................................................................. 50
(4-2) .................................................................................................................. 51
(4-3) .................................................................................................................. 52
(4-4) .................................................................................................................. 53
(4-5) .................................................................................................................. 55
(4-6) .................................................................................................................. 65
(4-7) .................................................................................................................. 65
(4-8) .................................................................................................................. 66
(4-9) .................................................................................................................. 66
(4-10) ................................................................................................................ 66
(4-11) ................................................................................................................ 67
(4-12) ................................................................................................................ 67
(4-13) ................................................................................................................ 68
(4-14) ................................................................................................................ 68
(4-15) ................................................................................................................ 69
(4-16) ................................................................................................................ 70
(4-17) ................................................................................................................ 71
(4-18) ................................................................................................................ 71
(4-19) ................................................................................................................ 71
(4-20) ................................................................................................................ 72
(4-21) ................................................................................................................ 73
(4-22) ................................................................................................................ 74
(4-23) ................................................................................................................ 74
(4-24) ................................................................................................................ 74
(4-25) ................................................................................................................ 74
(4-26) ................................................................................................................ 77

ix
LIST OF ABBREVIATIONS
ABC
CBA
CoQ
CoQES
FIRR
FRR
FOD
GUI
NPV
P-A-F
VBA
Activity Based Costing
Cost Benefit Analysis
Cost of Quality
Cost of Quality Estimation System
Financial Internal Rate of Return
Failure and Rejection Report
Foreign Object Damage
Graphical User Interface
Net Present Value
Prevention-Appraisal-Failure
Visual Basic for Application

x
LIST OF NOMENCLATURE
Cpre Prevention Cost
Cqdm Quality Design and Management Cost
Ceat Education and Training Cost
Cetu Equipment and Tool Update Cost
Capp
Citd
Cito
Ceva
Cinf
Cscr
Crew
Crep
Cdel
Cexf
Cffr
Cddc
Cqm
Cthe
Cpra
Cnep
Chau
Csou
Citse
Citeq
Citto
Citla
Appraisal Cost
Inspection and Test Design and Management Cost
Inspection and Test Operation
Evaluation Cost
Internal Failure Cost
Scrap Cost
Rework Cost
Repair Cost
Delay Cost
External Failure Cost
FRR Compensation Cost
Delivery Delay Cost
Quality Management Cost
Theory Education and Training Cost
Practice Education and Training Cost
New Equipment and Tool Purchasing Cost
Hardware Updating Cost
Software Updating Cost
Set up Cost
Inspection and Test Equipment Cost
Inspection and Test Tool Cost
Inspection and Test Labour Cost

xi
Ciev
Ceev
Cscr_mat
Cscr_com
Cscr_act
Ccoq
Cucoq
Internal Evaluation Cost
External Evaluation Cost
Material Cost of Scrap
Component Cost of Scrap
Activities Cost of Scrap
Total Cost of Quality
Unit Cost of Quality

1
1 INTRODUCTION
1.1 Background
Quality is generally thought as one of the core factors for achieving
competitiveness in manufacturing or service industries. Any serious attempt to
improve quality must take into account the costs associated with achieving
quality, and generally quality costs are reported to be between 5% and 30% of
sales (Giakatis et al., 2001). The significant influence on profit makes reducing
Cost of Quality (CoQ) to be a serious issue for manufacturing industries.
Aircraft manufacturers have to pay more attention and spend more money on
product quality than any other manufacturing industries due to the special
requirements of airworthiness which is inevitable to bring amount of CoQ.
However, not all the aircraft manufacturers attach importance to the CoQ,
especially those start-up companies as most of them are generally lack of
systematic methods for the CoQ management and benefit analysis.
CoQ modelling is researched and reported as an effective method to analysis
and estimate CoQ. And many researchers have made great contribution in this
field (Juran, 1952; Crosby, 1979; Feigenbaum, 2001; Curran, 2006). However,
the generic CoQ models were researched to analyse the CoQ in the whole
lifecycle of product, especially in design phase, and most of generic models
developed based on the high-volume and low-technology progress. These
models could hardly to use directly in the high-technology and low volume
manufacturing process, such as aircraft manufacturing, due to the specificity of
these industries. Additionally, though spend millions of money on quality, most
of companies do not know how many benefits the investment will bring and
have on idea about whether the investment on quality is right due to the lack of
effective method.
Hence, it is clear that a CoQ model which can be used to analyse and estimate
the CoQ in manufacturing progress for aircraft manufacturing industry is
necessary, and effective method to simulate benefit of investment on quality
should be researched, either.

2
1.2 Problem Statement
Aircraft manufacturing is a very complex process, involving approximately more
than ten thousands components, dozens of processes, inspections and tests.
So it will be a very big project to research the whole manufacturing process in
such a short period. Tailplane assembly is a typical assembly process in the
aircraft manufacturing. The assembly process is very similar to the wing
assembly and connection, therefore it will be easy to transfer the application of
the method and models from tailplane to wing, and even the whole aircraft. So
for this research, the tailplane assembly was chosen as the breakthrough point
of C model in aircraft manufacturing.
CoQ identification and definition are the basic of the framework development of
CoQ model. Though many generic models have been developed, the detail
categories of CoQ are still based on the actual application background. Hence,
finding out the specificity of CoQ in tailplane assembly is the premise of CoQ
development.
The difficult point of CoQ estimation is that many kinds of CoQ are difficult to
quantify as they are sometimes too abstract. And the influence of the production
factors on CoQ is generally complex which make it difficult to calculate at times.
Hence, identify and if possibly quantify the drivers of CoQ in the tailplane
assembly is the key of the CoQ estimation.
A widely used method on benefit analysis is Cost Benefit Analysis (CBA), but it
is scarcely used on quality analysis as it is difficult to estimate the benefit in
financial. It is really a challenge to simulate the benefit and represent the
relationship between cost and benefit in a manufacturing system as there are
too many influencing factors for the results. However, as most of CoQ are
caused by quality issues and most of investments focuses on solving them,
CBA can be used to evaluate the investment of quality improvement as it will be
simply to identify and estimate the benefit for single quality issue. And It may be
very important and useful for quality managers in decision-making of quality
issues management and quality improvement.

3
1.3 Aim and Objective
This research aims at developing a CoQ model which suits for the low-volume
and high-technology manufacturing industry such as aircraft industry. The
model can be used as a tool to estimate and analyze the CoQ in an
aircraft tailplane assembly process, and a tool to simulate and analyze the
benefit of investment on quality improvement. It will be very useful for quality
manager to collect and analyze data.
To achieve the aim, a number of research objectives were set for this research
which are shown as follow:
a) To identify the CoQ elements in a high value added assembling process
such as the tailplane assembly.
b) To identify and if possibly quantify the drivers of quality cost for such
assembling processes.
c) To identify and quantify the benefit of investing in the modelling of the
cost of quality.
d) To develop a CoQ model to quantify and estimate the cost of quality in
tailplane assembly process.
e) To apply CBA on quality issue improvement.
f) To validate the developed CoQ model through case studies and expert
judgement.
1.4 Thesis Structure
The structure of the thesis is illustrated in Figure 1-1. Except this chapter, there
are other five chapters in the thesis. In Chapter 2, the related researches on
CoQ, Cost Estimation and CBA are reviewed to identify the research gap.
Chapter 3 discusses the methodology and its procedure for this research. The
process of developing CoQ Model is stated in Chapter 4, and Graphical User
Interface (GUI) based on Visual Basic Application (VBA) is introduced at the
same time. Chapter 5 focuses on the validation of the developed model. Two

4
kinds of case studies based on tailplane assembly are conducted to validate the
CoQ model, and the suggestions from expert judgment are used for the
improvement of the model. In the final chapter, the achievements and limitations
of present model, key findings and future work are discussed and concluded.
Chapter1
Introduction
Chapter2
Literature
Review
Chapter3
Research
Methodology
Chapter 4
Development of
CoQ Model
Chapter 5
Validation of the
CoQ Model
Chapter 6
Discussion &
Conclusions
Figure 1-1 Thesis Structure
1.5 Summary
This chapter firstly introduced importance and necessity of CoQ management in
manufacturing industries, and the CoQ current situation in aircraft
manufacturing industries. Then the problems of CoQ model used in aircraft
manufacturing were stated. And challenges for CoQ modelling and benefit
analysis in aircraft manufacturing industries were discussed. Then the research
aim and objectives were proposed. Developing a CoQ model for tailplane
assembly is the target of the research and many objectives need to achieve for
the target. In the end, the thesis structure was summarized.

5
2 LITERATURE REVIEW
2.1 Introduction
In order to understand the context and gain the fundamental knowledge for the
research, the literature which is associated with major topics and research field
are studied. A brief review of these literature will be presented in this chapter.
As illustrated in Figure 2-1, the related literature includes four main parts: Cost
of Quality, Cost Estimation, Cost Benefit Analysis and Aircraft Manufacturing.
Definition of CoQ
Cost of Quality Cost EstimationCost Benefit
Analysis
Usage of CoQ
CoQ Model
Cost Estimation
Methods
Activity Based
Costing System
CoQ/ABC System
Definition of CBA
Application of
CBA
Aircraft
Assembly
Characteristic of
Aircraft Assembly
Tailplane
Assembly
Gap Analysis
Cost Modelling in
Aircraft Industry
Figure 2-1 Literature Review Structure
6
In order to identify the CoQ precisely, the knowledge on CoQ were studied first.
In Section 2.2, definition and usage of CoQ were introduced first, then the
classical CoQ models were discussed, and the advantages and limitations of
three main kinds of models were compared and discussed. According to the
review results, the definitions and classifications of the CoQ model were
determined. After identifying the CoQ, the methods for quantifying and
calculating these CoQ were researched. In Section 2.3, various methods for
cost estimation were illustrated and compared. Then activity based costing
(ABC) system were introduced. After that, CoQ/ABC system which is an
effective method to estimate CoQ was presented. As a consequence,
estimation method for CoQ was selected. Then CBA method was stated in next
section as it was necessary to understand this method well before using it on
quality. The characteristics and application of CBA were summarized. And the
advantages and limitations were discussed either. Based on the results, the
method to identify and quantify the benefit of investing in the modelling of CoQ
were decided. As the CoQ model was designed for using in aircraft
manufacturing industry, especially in tailplane assembly, so the relevant
literature was focused on in Section 2.5. Aircraft manufacturing industry were
introduced and its characteristics were summarized through the comparison
with other industries, then tailplane assembly was presented in brief. After the
review of the literature, research gaps in this field were discussed in Section 2.6.
And the final section was the summary of the literature review.
2.2 Cost of Quality
2.2.1 Definition of Cost of Quality
Cost of Quality(CoQ), sometimes called quality costs, which first appeared in
Juran’s Quality Control Handbook (Juran & Gryna, 1951) in the early 1950s,
has been extensively researched by many quality experts in order to improve
product quality and reduce costs (Lim et al., 2015). But there is no general
agreement on a single broad definition of the CoQ. So various definitions for the
CoQ were found in literature (Yang, 2008).
Campanella (1999) defined quality costs as the difference between ‘ideal’

7
situation (no failures occur) costs and actual situation costs. Krishnan et al.
(2000) and Giakatis et al. (2001) defined CoQ as the costs to prevent a failure
and ensure the products meet the requirements. However, some quality
researchers called quality cost as ‘cost of poor quality’. Chen & Tang (1992)
thought that cost of poor quality includes cost spend on inspection, prevention
and cost incurred by corrective actions and imperfect quality. Bland et al. (1998)
defined the cost of poor quality as the difference between the actual operating
cost and the operating cost with no failures or mistakes in systems and staffs.
The different terminology and descriptions being different may result in the
difference of identification and classification of CoQ. However, it is apparent that
the term ‘cost of quality’, ’quality cost’ and ‘cost of poor quality’ are similar when
calculate the total CoQ. In other words, the cost spend on the activities which
are different from the ‘ideal situation’ to meet requirements are CoQ or
contribution to the cost of poor quality. So these various definitions are
essentially synonymous (Chiadamrong, 2003). The American Society for
Quality Control (ASQC, 1970) and the British Standard Institute (BS 6143, 1990)
defined CoQ as the costs incurred in ensuring quality, together with the loss
incurred when quality is not achieved. This definition is widely accepted and
used in many fields. So it can be used to discuss and identify CoQ in this thesis.
2.2.2 Usage of Quality Costing
CoQ is used as a progress indicator in measuring the overall performance of
the organization, and organization can gain competitive advantage is that the
CoQ is adequately measured and controlled (Omurgonulsen, 2009). Juran
(1952) characterized the poor quality and its related costs as ‘gold in mine’. The
importance of the quality costs has been realized by more and more companies
in recent years as the quality costs represent a considerable proportion of a
company’s total costs and sales (Giakatis et al, 2001). Many researchers
(Wheelright and Hayes, 1985; Albright and Roth, 1992; Feigenbaum, 2001;
Kent, 2005) reported the CoQ they estimated in different companies. Generally,
quality costs are between 5 and 30% of sales (Yang, 2008). Reducing 10% of
quality cost, the company may get hundreds of millions profit. That is why more

8
and more experts and companies focus on the research of CoQ.
Quality costing not only can be used to reflect the profit, but also can be a
useful method to help the top leader to manage the company (Hwang &
Aspinwall, 1996). First, quality costing can be the first step to set up a quality
system for many start-up companies. Secondly, quality costing can be the
power for the top management to determine improvement project because the
monetary data will be easier to arouse manager’s feelings. At last, quality
costing will establish a channel between the production line and top manager as
quality costs integrate all the separate quality activities into a total quality
system (Yang, 2008).
2.2.3 CoQ Model
Many experts analyzed the CoQ and set up CoQ models. Schiffauerova and
Thomson (2006) summarized the main models in use, and Mohamed &
Sharmeeni (2014) updated the information as detailed in Table 2-1. In all these
models, P-A-F model, Process model and Taguchi Loss Function are the three
main kinds of models which are wildly used in many fields.
Table 2-1 Generic Cost Models and Categories (Mohamed & Sharmeeni, 2014)
Genetic Model Cost/Activity Categories
P-A-F Model Prevention + Appraisal + Failure
Crosby's Model Conformance + Non-conformance
Opportunity or Intangible
Cost Models
Prevention + Appraisal + Failure + Opportunity
Conformance + Non-conformance + Opportunity
Tangibles + Intangibles
P-A-F (Failure Cost includes Opportunity Cost)
Process Cost Models Conformance + Non-conformance
Taguchi Loss Function
Model
Loss of sales revenue due to poor quality +
Process inefficiencies + Losses when a quality
characteristic deviates from a target

9
2.2.3.1 P-A-F Model
The P-A-F model is the oldest CoQ model, which is one of the best known and
widely accepted models among quality practitioners and has been used in both
manufacturing and service industries. Feigenbaum’s and Juran’s P-A-F scheme
has been adopted by the American Society for Quality Control (ASQC, 1970),
and the British Standard Institute (BS6143, 1990).
Prevention cost: the costs of all activities specifically designed to prevent
poor quality in products and services.
Appraisal cost: the costs associated with measuring, evaluating, or
auditing products or services to assure conformance to quality standards
and performance requirements.
Internal failure cost: the costs resulting from products or services not
conforming to requirements or customer/user needs occur prior to delivery
or shipment to the customer.
External failure cost: the costs resulting from products or services not
conforming to requirements or customer/user needs occur after delivery or
shipment of the product, and during or after furnishing of a service to the
customer.
Table 2-2 shows the general categorization and examples of CoQ in P-A-F
model. Yang (2008) summarized the results of former researchers, and
analysed the detailed cost of quality in the manufacturing (assembling) process
(see Table 2-3). The categories of CoQ from Yang were based on P-A-F model,
but additional extra resultant costs and estimation hidden costs were identified.
P-A-F models are widely used in many industries. The United Technologies
Corporation, Essex Telecommunication Products Division, established CoQ
measurement based on a P-A-F model, and Fruin (1986) examined the costs
elements calculation and their relationship to financial performance in detail.
Thompson and Nakamura (1987) proposed a plan based on P-A-F quality
costing structure, which is currently being used at AT&T Bell Laboratories,

10
Transmission Systems Division. Denzer (1978) presented a description of a P-
A-F CoQ system used in an electronics manufacturing facility.
The traditional P-A-F model held that there was an optimum economic level of
quality at which the cost of securing higher quality would exceed the benefits of
the improved quality (BS4778, 1987). However, the concept is challenged by
many researchers (Fox, 1989; Marcellus & Dada, 1991), and some empirical
evidence was found to support the idea about no economic level of quality. So
there may be some limitations in using P-A-F model to discuss the quality level.
Table 2-2 General P-A-F Model for Categorization (Srivastava, 2008)
CoQ Categories Examples
Prevention Costs
New product review
Quality Planning
Supplier capability surveys
Process capability evaluations
Quality improvement team meetings
Quality improvement projects
Quality education and training
Appraisal Costs
Incoming and source inspection/test of purchased material
In-process and final inspection/test
Product, process or service audits
Calibration of measuring and test equipment
Associated supplies and materials
Internal Failure
Costs
Scrap
Rework
Re-inspection
Re-testing
Material review
Downgrading
External Failure
Costs
Processing customer complaints
Customer returns
Warranty claims
Product recalls

11
Table 2-3 Cost of Quality in Manufacturing (Assembly) (Yang, 2008)
CoQ Categories Examples
Prevention Costs
Operations process validation
Operations quality planning
Design and development of quality measurement and
control equipment
Operations support quality planning
Operator quality education and training
Operator SPC/process control
Salaries of quality administrators
Administrative expenses for quality planning and control
Quality program planning
Quality performance reporting and analysis
Quality education
Quality improvement
Quality system audits
Investment in tools and equipment of quality control
Appraisal Costs
Planned operations inspections, tests and audits
Salaries of checking labours
Miscellaneous quality evaluations
Inspection and test materials
Set-up inspections and tests
Process control measurements
Laboratory support
Investments and maintenance expenses of measurement
(inspection and test) equipment
Salaries of maintenance and calibration labours
External appraisal costs
Field performance evaluation
Review of test and inspection data
Internal Failure
Costs
Material review and corrective action costs
Disposition costs for defects in the process
Troubleshooting or failure analysis costs (operations)
Costs of operations corrective actions

12
Operations rework costs
Operations repair costs
Investigation support costs
Re-inspection/retest costs
Costs in labour hours associated with scraps in process
Costs in materials associated with scraps in process
External Failure
Costs
Costs of complaint handling
Costs of handling and repair of returned goods
Costs of scraps of returned goods
Warranty claims
Liability costs
Extra Resultant
Costs
Waste of labour hours and scrap of other parts destroyed,
which were caused by failure operations in the process
The increase costs of downtime, additional inventory due to
the poor quality in process
The resultant costs of the defect bypass the quality control
system
Freight and insurance premium costs
The resultant costs by inadequate quality, delivery and
reliability
The increase costs caused by the delayed order delivery
Penalties of customer damage caused by defective goods
Estimated Hidden Costs
The lost sales owing to poor quality in the past
Loss-of-reputation costs
The opportunity cost of lost customer loyalty
The delay launch of new product due to the poor quality in
process
Brand image damage
2.2.3.2 Process Cost Model
The concept of the process cost model was originally developed by Crosby
(1979) who defined the CoQ as the sum of the price of conformance (POC) and
the price of non-conformance (PONC). BS6143 (1990) accepted the concept,
but replaced the world ‘price’ with ‘cost ’.
The process cost model was first used for quality costing by Marsh (1989)

13
which represents quality cost systems that focus on process rather than
products or services. Process cost is the total cost of conformance and non-
conformance for a particular process. The structure of the model is shown in
Figure 2-2. The cost of conformance is the actual process cost of producing
products or services first time to the required standards by a given specified
process, and cost of non-conformance is the failure cost associated with the
process not being executed to the required standard. These costs can be
measured at any step of the process. Accordingly, it can be determined whether
high non-conformance costs show the requirement for further expenditure on
failure prevention activities or whether excessive conformance costs indicate
the need for a process redesign (Porter and Rayner, 1992).
ActivityInput data
(Needed to
perform activity)
Output data
(When activity
performed)
Processor or mechanism
(Person / equipment
undertaking activity)
Control data
(Governing activity)
Figure 2-2 Process Cost Model Structure (Hwang & Aspinwall, 1996)
A successful example in using process cost model is design and implement in
the power systems division of GEC Alsthom Engineering Systems. Goulden and
Rawlins (1995) describe this hybrid process model by using flowcharts.
The process modeling method called IDEF (the computer-aided manufacturing
integrated program definition methodology) developed by Ross (1977) is useful
for experts in system modeling; nevertheless, for common use by managers or
staff it is too complex. Though some researchers (Crossfield & Dale, 1990;
Goulden & Rawlins, 1995) tried to develop simpler methods to overcome this
limitation, the process cost model is not in widespread use.

14
2.2.3.3 Taguchi Loss Function Model
Traditionally, it has been accepted that quality losses are not incurred within
specification limits but outside them. Therefore, products or services whose
characteristics are within specifications should not produce any external failure
costs. The reality, however, is different. These products can incur opportunity
costs associated with lost sales, or customer dissatisfaction after delivery.
Taguchi (1987) formulated these external quality losses into a loss function
based on his own industrial experience. The function is parabolic, with the loss
increasing continuously as the characteristic moves away from the nominal
point; there is no discontinuity at the specification limits. The loss function curve
(see Figure 2-3) is
(2-1)
Where L = loss (£), C= cost coefficient, X = quality characteristic and T = target.
The Taguchi loss function is considered a breakthrough in describing quality,
and helped fuel the continuous improvement movement that since has become
known as lean manufacturing. And it can help engineers better understand the
importance of designing for variation. But it does not include avoidable costs
and quality costs incurred within the manufacturing plant, reflecting only the
impact of the finished product. At the same time, it does not directly show
relationships between prevention and quality improvement in-house. In addition,
the model is difficult to apply because of the problems associated with correctly
identifying the probability distribution of the product defects which influence the
loss after delivering to the customer.
From the literature summarized above, it can be found that CoQ which has
significant influence on profits need to be paid more attention. Though there are
various definitions for the CoQ, most of them are essentially synonymous.
Though there may be some limitations in discussing quality level, the P-A-F
classification is still the widely accepted and may be suit for the CoQ model in
this research.

15
Loss
incurred
Quality loss
function
Target
value
Lower
specification
limit
Upper
specification
limit
Figure 2-3 Taguchi Loss Function (Hwang & Aspinwall, 1996)
2.3 Cost Estimation
The importance and potential benefits of the measurement of CoQ has been
emphasized by many researchers (Giakatis et al., 2001; Prickett & Rapley,
2001; Chen & Yang, 2002). However, the quantification of CoQ has been
neglected by most organizations (Harry & Schroeder, 2000). Cost estimation is
an effective method to quantify the CoQ within a defined scope.
2.3.1 Cost Estimation Techniques
Liebers (1998) recommended three sub layers to effectively estimate and
control cost in manufacturing environments, which are “production monitoring”,
“cost calculation and evaluation” and “cost modelling” respectively. Cost
modelling which has been applied to support cost estimation, business analysis
and planning, project management, profitability analysis is a significant useful
method to get support data for business decisions (Curran et al. 2004). Many
researchers and industrialists (Roy and Palacio 2000, Rush and Roy 2000,
Agyapong-Kodua 2009) have proposed and experimented with different cost-
modelling techniques and suggested it was necessary to develop structured
enterprise models to scientifically support cost estimation and control.
Boehm (1984) classified and described seven cost-modelling techniques in his
research on the economics of software engineering, which are Parametric,

16
Expert judgment, Analogy, Parkinson, Price to win, Top down, Bottom-up
respectively. Shehab and Abdalla (2001) showed another categorization:
intuitive, parametric, variant-based and generative. Some researchers (Layer et
al. 2002, Foussier 2006) suggested cost-modelling techniques may be
classified as qualitative and quantitative from a methodological point of view.
And quantitative cost-modelling methods were further classified into statistical,
analogous, generative or analytical and feature based (Layer et.al, 2002;
Caputo and Pelagagge, 2008). The widely reported cost-modelling techniques
were summarized (Niazi et al., 2006), and the key advantages, limitations for
each cost modelling technique can be found in Table 2-4.
Table 2-4 Advantages, Limitations for Cost Modelling Technique (Niazi et al.,
2006)
Product Cost Estimation Techniques Key Advantages Limitations
Qualita
tive
Cost
Estima
tion
Techni
ques
Intuitive
Cost
Estimation
Techniques
Case-Based
Systems
Innovative design
approach
Dependence on past
cases
Deci
sion
Supp
ort
Syst
ems
Rule-Based
Systems
Can provide optimized
results Time-consuming
Fuzzy Logic
Systems
Handles uncertainty,
reliable estimates
Estimating complex
features costs is
tedious
Expert
Systems
Quicker, more
consistent and more
accurate results
Complex
programming
required
Analogical
Cost
Estimation
Techniques
Regression Analysis
Model Simpler method
Limited to resolve
linearity issues
Back Propagation
neural network
model
Deal with uncertain
and non-linear
problems
Completely data-
dependence, Higher
establishment cost
Quanti
tative
Cost
Estima
tion
Techni
ques
Parametric Cost Estimation
Techniques
Utilize cost drivers
effectively
Ineffective when cost
drivers hard to define
Analytical
Cost
Estimation
Techniques
Operation-based
cost models
Alternative process
plans can be evaluated
to get optimized results
Time-consuming,
required detailed
design and process
planning data
Break-down cost
models Easier method
Detailed cost
information required
17
Cost tolerance
models
Cost effective design
tolerances can be
identified
Require detailed
design information
Feature-based cost
models
Features with higher
costs can be identified
Difficult to identify
costs for small and
complex features
Activity-based cost
models
Easy and effective
method using unit
activity costs
Require lead-times in
the early design
stages
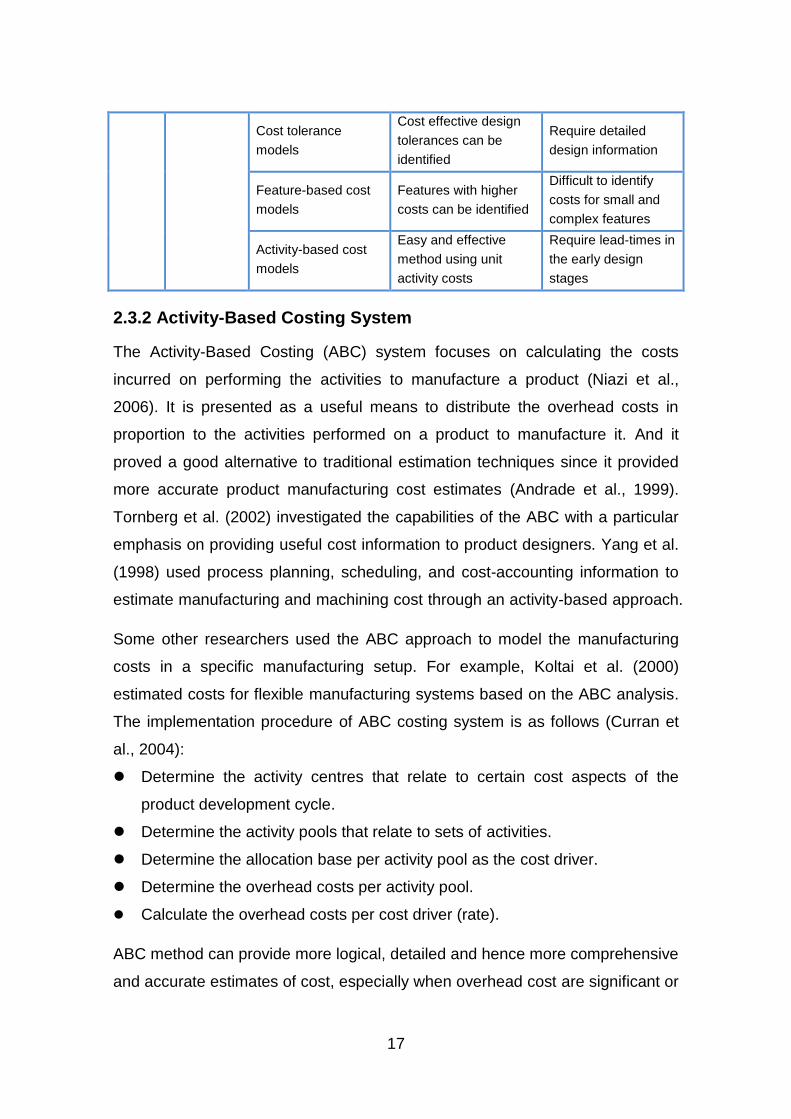
2.3.2 Activity-Based Costing System
The Activity-Based Costing (ABC) system focuses on calculating the costs
incurred on performing the activities to manufacture a product (Niazi et al.,
2006). It is presented as a useful means to distribute the overhead costs in
proportion to the activities performed on a product to manufacture it. And it
proved a good alternative to traditional estimation techniques since it provided
more accurate product manufacturing cost estimates (Andrade et al., 1999).
Tornberg et al. (2002) investigated the capabilities of the ABC with a particular
emphasis on providing useful cost information to product designers. Yang et al.
(1998) used process planning, scheduling, and cost-accounting information to
estimate manufacturing and machining cost through an activity-based approach.
Some other researchers used the ABC approach to model the manufacturing
costs in a specific manufacturing setup. For example, Koltai et al. (2000)
estimated costs for flexible manufacturing systems based on the ABC analysis.
The implementation procedure of ABC costing system is as follows (Curran et
al., 2004):
Determine the activity centres that relate to certain cost aspects of the
product development cycle.
Determine the activity pools that relate to sets of activities.
Determine the allocation base per activity pool as the cost driver.
Determine the overhead costs per activity pool.
Calculate the overhead costs per cost driver (rate).
ABC method can provide more logical, detailed and hence more comprehensive
and accurate estimates of cost, especially when overhead cost are significant or

18
when the product range is very diverse (Qian & Ben-Arieh, 2008). It is easy to
understand the cause and effect of every activity, which allows the identification
of valued-added and non-value-add manufacturing operations and how
resources are consumed.
But ABC method requires amounts of specific and accurate data (Curran et al.,
2004), which means that a detailed design definition is needed. Developing and
implementing such an accounting system is also time consuming, expert
knowledge may be required.
2.3.3 CoQ/ABC System
ABC is an alternative approach that can be used to identify, quantify and
allocate quality costs among products, and therefore, helps to manage CoQ
more effectively. Tsai (1998) proposes an integrated CoQ-ABC framework, in
which ABC and CoQ systems are merged and share a common database in
order to supply various cost and non-financial information for related
management techniques. The long-term goal of ABC system is to eliminate
non-value added activities and to continuously improve processes, activities
and quality so that no defects are produced (Özkan & Karaibrahimoğlu, 2013).
CoQ/ABC, as an alternative costing method overcomes the deficiencies of
traditional cost accounting, by analysing the activities of the production process,
determining the costs of the resources consumed by each activity and allocating
activity costs using an appropriate cost driver for each quality-related (according
to PAF scheme) and quality unrelated cost.
Figure 2-4 shows a P-A-F/ABC system framework. The first step in CoQ
measurement under ABC is the activity analysis and categorization of activities
as value-added or non-value-added. In the second step, each activity of ABC is
categorized as quality-related or quality-unrelated activities using the PAF. In
the third step, resource costs (including overheads) are traced to quality-related
and quality-unrelated activities. Where the resources are used in a single
quality-related activity, they are traced directly, and where used in several
activities, they are assigned among the activities using a resource driver. CoQ
is measured as the sum of the costs of quality-related activities. After activity

19
costs are calculated, they are traced to cost objects using activity drivers.
Figure 2-4 P-A-F/ABC Framework (Özkan & Karaibrahimoğlu, 2013)
2.3.4 Cost Modelling in Aerospace Industry
Cost modelling is nevertheless largely based on experience rather than science,
because it lacks a consolidating theory (Curran et al., 2006). Cost estimation
requires knowledge capture from various disciplines and it is affected by
unpredictable factors, so it is ‘information sensitive’ (Langmaak et al., 2013).
The aerospace industry is a typical example of high-tech but low-volume
manufacturing, where it is very challenging to obtain well documented and
comprehensible costing information (Curran et al., 2004). The sparse and
inaccurate data often increases the challenge of creating objective cost
estimates and validating these (Collopy & Curran, 2005). Therefore, many
researchers tried to use various methods to estimate cost in aerospace industry.
Banazadeh and Jafari (2012) summarized the common cost estimation
methods for main steps in the life cycle of an aerospace system in their
research (see Figure 2-5). And complexity index theory is utilized to develop a
heuristic complexity-based method to estimate various costs of aerospace
systems. The model shows a better R2 value, as a statistical measure of
regression quality, than an already existing successful model by Technomics
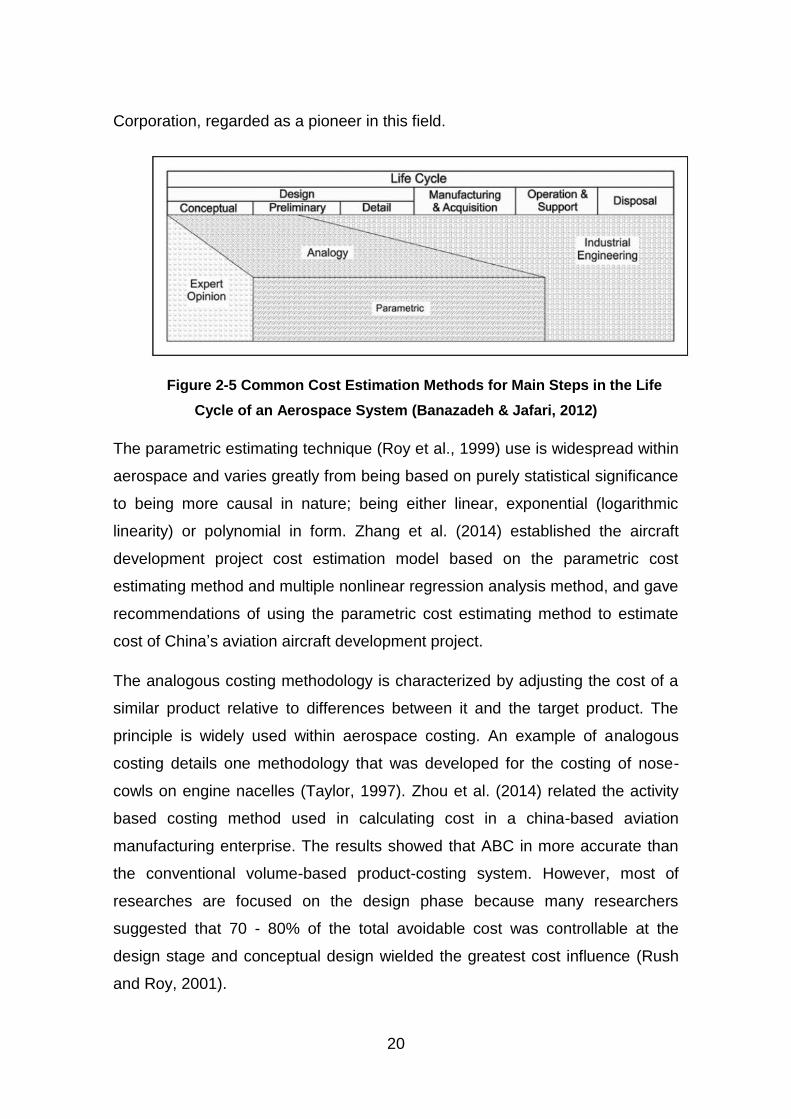
20
Corporation, regarded as a pioneer in this field.
Figure 2-5 Common Cost Estimation Methods for Main Steps in the Life
Cycle of an Aerospace System (Banazadeh & Jafari, 2012)
The parametric estimating technique (Roy et al., 1999) use is widespread within
aerospace and varies greatly from being based on purely statistical significance
to being more causal in nature; being either linear, exponential (logarithmic
linearity) or polynomial in form. Zhang et al. (2014) established the aircraft
development project cost estimation model based on the parametric cost
estimating method and multiple nonlinear regression analysis method, and gave
recommendations of using the parametric cost estimating method to estimate
cost of China’s aviation aircraft development project.
The analogous costing methodology is characterized by adjusting the cost of a
similar product relative to differences between it and the target product. The
principle is widely used within aerospace costing. An example of analogous
costing details one methodology that was developed for the costing of nose-
cowls on engine nacelles (Taylor, 1997). Zhou et al. (2014) related the activity
based costing method used in calculating cost in a china-based aviation
manufacturing enterprise. The results showed that ABC in more accurate than
the conventional volume-based product-costing system. However, most of
researches are focused on the design phase because many researchers
suggested that 70 - 80% of the total avoidable cost was controllable at the
design stage and conceptual design wielded the greatest cost influence (Rush
and Roy, 2001).

21
From the above, cost estimation is a predicting process to quantify the CoQ in
defined scope. Various methods are applied in cost modelling, and ABC method
which can provide more logical and detailed accurate estimation of cost.
Moreover PAF/ABC system is an effective method to estimate the CoQ in
manufacturing industry. Furthermore, though various cost estimation techniques
are used to estimate the cost in aerospace industry, ABC are rarely used. So
the PAF/ABC system used to estimate the CoQ in aircraft manufacturing
industry may be a beneficial research.
2.4 Cost Benefit Analysis
2.4.1 Definition of Cost Benefit Analysis
Cost Benefit Analysis (CBA) which sometimes called benefit–cost
analysis (BCA) is a systematic approach to estimating the strengths and
weaknesses of alternatives that satisfy transactions, activities or functional
requirements for a business. It is a technique that is used to determine options
that provide the best approach for the adoption and practice in terms of benefits
in labour, time and cost savings etc.
CBA is an analysis of the expected balance of benefits and costs, it can help
predict whether the benefits of a policy outweigh its costs, and by how much
relative to other alternatives. CBA usually tries to put all relevant costs and
benefits on a common temporal footing using time value of money calculations.
Generic CBA includes 9 steps (Boardman, 2006):
List alternative projects/programs.
List stakeholders.
Select measurement(s) and measure all cost/benefit elements.
Predict outcome of cost and benefits over relevant time period.
Convert all costs and benefits into a common currency.
Apply discount rate.
Calculate net present value of project options.
Perform sensitivity analysis.
Adopt recommended choice.

22
2.4.2 Application of Cost Benefit Analysis
CBA is a method to identify the risk mitigation strategies which supply an
optimal trade-off between the cost estimation and risk reduction. It can be
widely used in many different fields such as engineering, health management,
and policy making (Špačková & Straub, 2015). One of the typical application of
CBA is economic assessment of natural hazard mitigation projects (Rose et al.,
2007; Defra, 2009; Hochrainer-Stigler, 2011). Additionally, CBA can be used in
risk-based optimization of climate change and the management of man-made
risks (Paltrinieri, 2012). Another important application of CBA is to evaluate the
effect of policies and regulations in many field such as terrorist prevention
estimation (Stewart & Mueller, 2013), earthquakes resistance improvement
through retrofitting of buildings (Li et al., 2009), air pollution control (Fann et al.,
2011) and medicine test (Meckley et al., 2010).
Quality management is a field which need amounts of investments. However,
the CBA is rarely used in this filed as it is difficult to estimation the benefit in the
complex manufacturing process. Only few experts tried to apply CBA in quality
management. Porter and Rayner (1992) suggested a simple cost benefit model
to monitor the effect of a TQM program without reflecting the dynamics of the
quality activities. Bajpai (1989) developed a simulation model over time with
system dynamics techniques, which enumerated different elements of costs and
benefits relating to preventative activities in a manufacturing company. Merino
(1988) also developed a detailed cost benefit model related to technology,
which considered the types of quality problems encountered and their possible
solution using engineering economics. But the model did not explain the
interacting effect between different activities or departments because of dealing
with them independently.
The CBA can supply support to the manager in the decision-making phase
before investment. And the main limitations for its application are benefit
identification and estimation. Though some of experts had tried to apply CBA on
quality, quantitative estimation in benefit was still a difficult issue and the
application in aircraft manufacturing industry had not been reported. So it may
be a beneficial and necessary attempt to apply CBA on the quality management

23
in aircraft manufacturing industry in this research.
2.5 Aircraft Assembly
Aircraft assembly (see Figure 2-6) is the final phase of aircraft manufacturing.
Generally, aircraft assembly includes subassembly and final assembly. Figure
2-7 show the overview of structural assembly of aircraft. In the subassembly
phase, all the sub-assembly components used in final assembly will be
assembled, the part of work generally finished by different suppliers all over the
world. In the final assembly phase, these sub-assembly components will be
assembled together through some special process such as riveting and welding,
this part of work generally finished by aircraft manufacturing companies such as
Boing and Airbus.
Figure 2-6 Aircraft Assembly (Michael, 2009)

24
Figure 2-7 Overview of Structural Assembly of Aircraft (Encyclopaedia, 2006)
2.5.1 Characteristic of Aircraft Assembly
Aircraft assembly is a very complex set of process and it is different from other
manufacturing industry in many aspects. This tremendous amount of drilling
and fastening, along with demanding tolerances makes aerospace assembly
one of the most challenging but at the same time exciting fields in aircraft
manufacturing. Compared with other manufacturing or assembly industry, the
characteristic of aircraft assembly can be summarized as ‘3-high, 1-low’.
2.5.1.1 High Complexity
Aircraft may be the most complex product in the world. Generally a typical
automobile is composed of approximately 20,000 components, while a 150 seat
airplane is composed of approximately 2 million components, and in some large
plane such as A380, the amount of components may exceed 4 million (Ekinci,
2013). It is well known that the more components are used, the more difficulty of
coordination and tolerance distribution are brought. And the increasing trends
are generally not linear, sometime it will increase exponentially. And the more
components are used, the more process are required. The manufacturing
process of Airbus wings requires the drilling of over 40 million holes in aircraft
structures per annum (Ekinci, 2013). Even that the error rate for equipment and
operator is very low, facing to such large base, the quality problem could hardly
be controlled in a low level. So the possibility of occurring quality issue will be
much higher than other manufacturing industry.
2.5.1.2 High Precision
Aircraft is a complex product, but the precision requirement of the assembly
process is much higher than other manufacturing process which can reduce the
possibility of problem occurred in the operation. The more complex it is, the
more precision it needs. In general, a spot weld gun in car assembly is
positioned within +/- 1.2 mm; while a drilling machine in aircraft assembly
requires positioning within +/- 0.2 mm and sometimes with higher tolerance

25
(Ekinci, 2013). High precision requirement means low error-tolerant rate which
result in the increase of possibility of quality issue in the assembly process.
2.5.1.3 High Cost
Aircraft may be the most expensive product in the world. The average price of
one A320 is approximately 40 million pounds while one BMW X5 is only 50
thousand pounds. The high price reflects the high cost of aircraft manufacturing.
One reason is the components, equipment, tools and labour used in aircraft
manufacturing are high cost. Only the cost of one of engine is approximately 4
million pounds. Another reason is the CoQ. Due to the high cost of these main
factors, the failure cost and investment on quality certainly will be high.
Assembly can take up to as much as 40% of the total cost of manufacturing an
aircraft. So aircraft assembly is really a high cost process. And the cost of
quality certainly will be very high in this process either.
2.5.1.4 Low Degree of Automation
Aircraft assembly is not a high-volume process. Compared with automobile, the
yield of aircraft is too low. Even in Boing which may be the biggest aircraft
manufacturing company, the annual yield can hardly be more than 5000, while
annual yield of Ford automobile is more than 5 million. One of the reasons is the
degree of automation. Though some automation equipment such as automatic
assembling line have been used in the aircraft assembly, but due to the
complexity of the assembly process and the input-output ratio, much of the work
in aircraft assembly is still depend on the manual. The 40 million holes which
are on the Airbus wings, approximately 80% of total, were drilled manually
(Ekinci, 2013). There are too many influence factors in the manual operation
which may result in quality issue in different ways. So low degree of automation
may affect the improvement of quality assurance.
2.5.2 Tailplane Assembly
Tailplane, also known as horizontal stabiliser, is a small lifting surface located
on the tail behind the main lifting surfaces of a fixed-wing aircraft as well as
other non-fixed-wing aircraft such as helicopters and gyroplanes (see Figure 2-

26
8). The structure of tailplane is similar as wing, the difference is that tailplane is
smaller and the internal structure of tailplane is simpler.
Tailplane is generally composed of one central section and two symmetrical
overhanging sections (Figure 2-9). Central section is composed of spindle joint
of front girder and back girder, side rib, 3 upper siding, 3 under siding, mast
section of actuator joint (Figure 2-10). Overhanging section is composed of front
girder, back girder, upper siding, lower siding, wing rib, leading edge, trailing
edge cabin, wing end fairing, wing root fairing, hinge brackets of elevators (See
Figure 2-11).
Figure 2-8 Position of Tailplane in an Aircraft (Brady, 2014)
Figure 2-9 Tailplane

27
Figure 2-10 Central Section
Figure 2-11 Overhanging Section
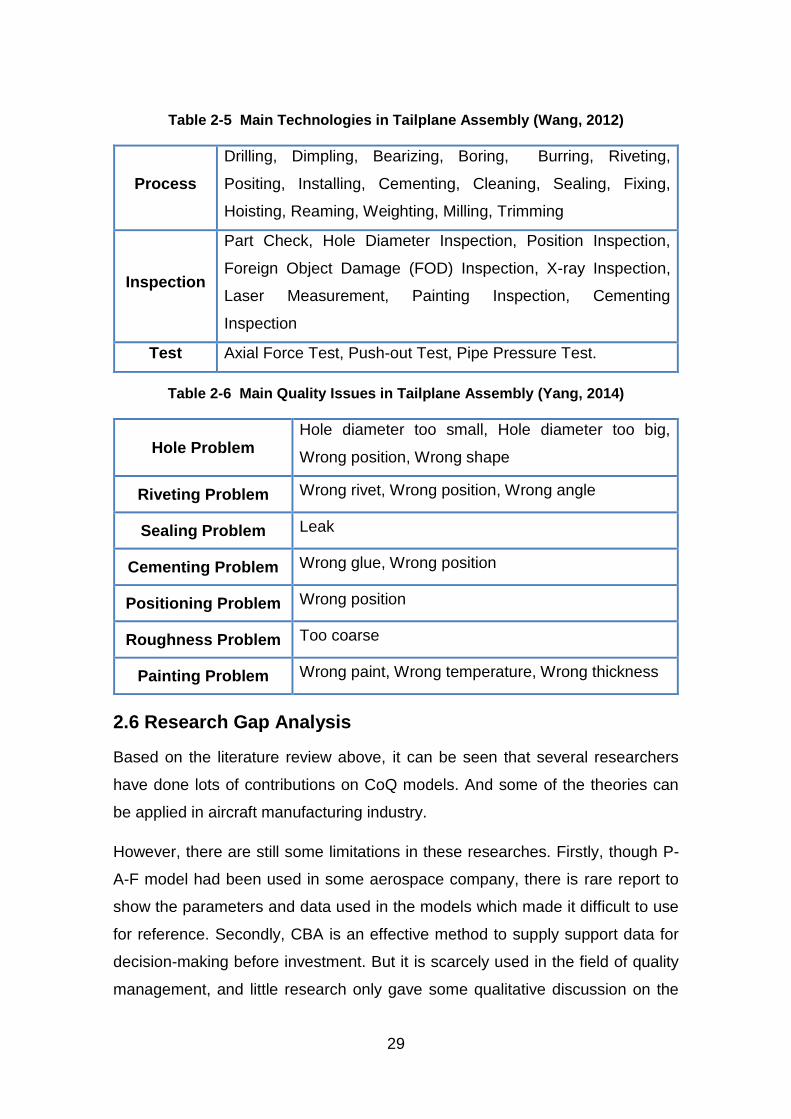
Tailplane assembly process includes five main phases: left overhanging section
assembly, right overhanging section assembly, centre section assembly,
elevator assembly and final assembly. Each phase consists of a series of sub-
assembly process. The schematic diagram and process map of the tailplane
assembly process are shown in Figure 2-12 and Figure 2-13 respectively. The
process involves thousands of components, tens of technologies (Wang, 2012).
The main technologies are summarized in Table 2-5. Additionally, quality issues
are normal in such a complex process (Yang, 2014), and the main quality
issues are summarized in Table 2-6.

28
Figure 2-12 Schematic Diagram of Tailplane Assembly
Back Girder
Component
Assembly
Front Girder
Component
Assembly
Upper/Under
Siding Assembly
RIb and
Connection Corner
Slice between Rib
and Siding Stringer
System Parts
Trailing Edge
Cabin Assembly
Overhanging Box
Sections Assembly
Fixed Leading
Edge Component
Assembly
Overhanging
Sections Milling
and Drilling
Dismountable
Leading Edge
Component
Assembly
Wing End Fairing
Assembly
Central Box
Section
Assembly
Hole Drilling for
Connection of
Leading Edge and
Wind End Fairing
Hinges of
Overhanging
Sections Installing
Horizontal Stabilizer
Butt Joint,
Elevator Butt Joint,
System Parts
Installing
Figure 2-13 Process Map of Tailplane Assembly
29
Table 2-5 Main Technologies in Tailplane Assembly (Wang, 2012)
Process
Drilling, Dimpling, Bearizing, Boring, Burring, Riveting,
Positing, Installing, Cementing, Cleaning, Sealing, Fixing,
Hoisting, Reaming, Weighting, Milling, Trimming
Inspection
Part Check, Hole Diameter Inspection, Position Inspection,
Foreign Object Damage (FOD) Inspection, X-ray Inspection,
Laser Measurement, Painting Inspection, Cementing
Inspection
Test Axial Force Test, Push-out Test, Pipe Pressure Test.
Table 2-6 Main Quality Issues in Tailplane Assembly (Yang, 2014)
Hole Problem Hole diameter too small, Hole diameter too big,
Wrong position, Wrong shape
Riveting Problem Wrong rivet, Wrong position, Wrong angle
Sealing Problem Leak
Cementing Problem Wrong glue, Wrong position
Positioning Problem Wrong position
Roughness Problem Too coarse
Painting Problem Wrong paint, Wrong temperature, Wrong thickness
2.6 Research Gap Analysis
Based on the literature review above, it can be seen that several researchers
have done lots of contributions on CoQ models. And some of the theories can
be applied in aircraft manufacturing industry.
However, there are still some limitations in these researches. Firstly, though P-
A-F model had been used in some aerospace company, there is rare report to
show the parameters and data used in the models which made it difficult to use
for reference. Secondly, CBA is an effective method to supply support data for
decision-making before investment. But it is scarcely used in the field of quality
management, and little research only gave some qualitative discussion on the

30
relationship between cost and benefit, but how to quantitatively represent and
analyze the benefit were not mentioned and the application of CBA on quality
management in aircraft manufacturing industry had not been reported.
In general, it is hardly to find a ready-made CoQ model to estimate and analyze
the CoQ in aircraft assembly process. So it is necessary to develop a CoQ
model which suits for the actual aircraft assembly and includes the quantitative
cost benefit analysis which is the target area of this research.
2.7 Summary
In this chapter, the literature, which is associated with the major topics and
research field are studied and reviewed. The literature review indicates that
many researches have been done on cost of quality model, cost estimation and
cost benefit analysis. And some of studies have been conducted on the topic of
cost of quality model used in aircraft industry. Though some of these results can
be used for reference, it is difficult to find a CoQ model which can be used in
aircraft assembly directly and can analyse the benefit of investment of quality.
So based on the research gap, this research will focus on developing a CoQ
model which suit for tailplane which is an exploration for the CoQ model for the
whole aircraft assembly process.

31
3 RESEARCH METHODOLOGY
3.1 Introduction
Prior to conducting research, it is essential for the researcher to develop a CoQ
model which can be used to estimate and analyse the CoQ and simulate the
benefit of cost on quality in aircraft manufacturing industry. It is imperative to
select the correct methods for fulfilling the research. Firstly, in order to obtain a
comprehensive body of knowledge on the research and reduce bias due to the
researcher’s personal interest or preferences, literature which is related to the
topic need to be studied. Literature review can help the researcher to
comprehensive the context better. Secondly, the reported models and
parameters are the important references for the development of the CoQ model,
the theory data can be collected through literature review. Meanwhile, actual
parameters and records in aircraft manufacturing industry are the guideline of
the model development, the actual data can be collected from aircraft
companies. However, data from one company may not reflect the characteristic
exactly in this industry, industry survey is an effective method for data collection
as it is simple and convenient to collect data from amount of sources. Thirdly,
there may be some difference between the data collected from literature and
industry survey, so contrastive analysis is very important in determining the
parameters and calculation method which can improve the applicability of the
model. Fourthly, the CoQ model is designed to be a tool for quality
management, so it is necessary to be used simply and conveniently. As MS
Excel is the most commonly used statistics and calculation software in office,
the model is set up base on it. Moreover, in order to improve the operability of
the model, Graphical User Interface (GUI) which can supply user friendly
interfaces are designed using the VBA in MS Excel. Finally, validation is the
indispensable progress for the model development. Real system measurement
can test the applicability of the model directly, so case studies based on the
actual assembly progress are used for the validation. Additionally, expert
intuition is an accepted method which can judge the advantage and limitation of
the model according to the experience of the experts which is very important in

32
aircraft manufacturing industry. So the expert judgment is selected as another
method for validation.
3.2 Adopted Research Methodology
As shown in Figure 3-1, the research methodology adopted for CoQ modelling
includes four main phases: understanding the context, data collection and
analysis, development of CoQ model and validation. The activities and outputs
in each phase are elaborated as follow:
Phase 1: Understanding the Context
This phase involved gaining a contextual understanding of the research topic
and related knowledge. Industry requirement were analyzed based on the
quality reports and operation condition from the data supplied by a tailplane
assembly company, then the CoQ issues in tailplane assembly were stated.
Then a detailed literature review was conducted, starting with a classification of
papers according to research objectives. The literature on CoQ was firstly
conducted from journals, books and thesis. A literature review on cost
estimation was followed to introduce the generic cost modelling technologies
and the cost estimation method used in aerospace industry. Then the
applications of CBA were summarize. The last main part literature review was
on aircraft assembly. The characteristic and specificity of aircraft assembly were
stated and the tailplane assembly was introduced in this part. After the review,
research gap was discussed and the research contents of this project were
determined. The output of this phase was a literature review report, which was
incorporated into Chapter 2.
Phase 2: Data Collection and Analysis
This phase aims to collect the necessary data for CoQ modelling and validation.
The data involved materials, parts, processes, equipment, tools and labor which
were used in tailplane assembly. The data can be divided into two parts: theory
data and practice data. The theory data were mainly gathered from literature
and database which was reported. And the practice data mainly came from
actual manufacturing. An industry survey was designed to collect the practice

33
data from five aircraft design and manufacturing companies in China. After data
collection, theory data and practice data was compared to determine the
parameter used in the model, then the structure of CoQ model were developed
based on the P-A-F/ABC system. The output of this phase was the analysis
result of the questionnaires, parameter list and model structure.
Phase 3: Development of CoQ Model
Phase 3 is the core of this research. The CoQ model was developed based on
the MS Excel as it was the main calculated software applied in quality
management. It involved three main modules. Cost of Quality Estimation
System (CoQES), Quality Issues Analysis module and CBA module. The
CoQES focused on the calculation of the CoQ, which included GUI, data
collection module, CoQ estimation module and CoQ reporting module. The GUI
was designed based on the VBA in MS Excel, and the production factors
databases (material, equipment, tool and labor), the CoQ databases (prevention,
appraisal, internal failure and external failure) and the calculator in other
modules were developed based on the store and calculation function in MS
Excel. The Quality Issues Analysis module was designed to analyze the quality
issues based on Pareto Analysis. However, it was not the main work of this
research. The reason for developing it was that the analysis results quality
issues were the necessary support data of CBA. This module included data
collection module and quality issues analysis module, and the developing
method was the same as CoQES. CBA module was designed to evaluate the
investment on quality management. And the benefit of investment on quality
management was mainly simulated based on the analysis results of history data
which was estimated through CoQES. Contrastive analysis was the main
method applied in CBA. After the development of the CoQ model, debugging
were carried out to check the operation of the system.
Phase 4: Validation
In this phase, a validation of the CoQ model was fulfilled through case studies
and expert judgements. Two case studies were used to test the model. One
was used to validate the reliability of the CoQES and the other was used to

34
validate the application of CBA on quality management. Otherwise, some
industry experts were invited to use and analysis the CoQ model, and
assessments to this model were gathered. Based on the results of case studies
and expert judgement, the capacity and the reliability of the CoQ model were
validated. And the model would be reviewed, revised and improved in the future
work.
3.3 Summary
This chapter introduced the research methodology used in the CoQ model
development in tailplane assembly. Literature review was conducted to obtain
the basic knowledge and theory data, and industry survey was used to collect
practice data from the aircraft manufacturing industry. Case studies and expert
judgements were the methods to validate the CoQ model. Main methods and
output in every phase were summarized.

35
Phase 1
Understanding
the Context
Literature
Review Report
Phase Activity Output
Phase 2
Data Collection
and Analysis
Questionnaire
Parameter List
Model
Structure
Phase 3
Development of
CoQ Model
CoQ Model
Database
Phase 4
Validation
Case Study
Report
Validated
Model
Industry
Requirement
Analysis
Report
Operation
Analysis
Literature
Review
Journal
Book
TesisProblem
Statement
Research
Gap
Research
Content
Industry
SurveyLiterature
Industry
Data
Theory
Data
Data
Analysis
CoQ Model
Development
CoQES
Development
Quality Issue
Analysis Module
Development
CBA Module
Development
Modelling System
Creation and Debugging
Data
Collection
Case Study
Expert
Judgment
Database
Built
Calculator
DesignGUI Design
VBA
Figure 3-1 Research Methodology

36
4 DEVELOPMENT OF COST OF QUALITY MODEL
4.1 Introduction
The development approach of the CoQ model was introduced in this chapter.
Firstly, industry survey was designed to collect the necessary data for the model.
Then, based on analysis results of the survey and literature, CoQ in tailplane
assembly were identified and defined according to P-A-F classification.
Moreover, cost drivers for each activity involved in the model were analysed.
Then the CoQ model was developed based on the parameters determined
above. Finally, the main modules in the CoQ model were introduced and
analysed.
4.2 Industry Survey
The questionnaire aims at collecting necessary data which used in the CoQ
model and cases. As the reported data is limited, the support of actual data is
necessary for this research. However, data only from one company may not
reflect the real condition of this industry, so collect data from as many
companies as possible in this field can reduce the risk resulted from company
bias. And industry survey is widely accepted and used method for data
collection in wide-range. The collected data can provide support for identifying
the quality issues and cost drivers, and collect industrial data for analyzing and
calculating the CoQ and the potential benefit in tailplane assembly.
The survey was made among five aircraft design or manufacturing companies
in China as these companies all involved tailplane assembly for civil or military
aircraft and they were the leaders in this field in China. They could be
considered as the representatives of tailplane assembly as they owned the
most advanced technology and richest experience in this field. The participants
who took part in the survey are all from the departments related to quality
issues or CoQ in their companies, including structure design, process design,
quality management, project management, manufacturing department. The
questionnaire and results were sent and collected by a questionnaire tool in a
Chinese public website which named “Wen Juan”. For confidential reasons, the

37
names the companies were not shown in this thesis, and the code names would
be used in necessary places.
4.2.1 Questionnaire Design
The questionnaire was designed as a closed questionnaire. Compared with
open questionnaire, closed questionnaire have many advantages. Firstly, in a
close questionnaire, all the answers are designed which make it is easy to
answer. Moreover, it obliges the respondent to answer particular questions,
providing a high level of control to the questioner. Furthermore, it can save the
answer time. Finally, it can provide better information than open-ended
questions, particularly where respondents are not highly motivated (Rossi, et al.,
2013). So closed questionnaire is the better selection. However, there are still
some limitations for closed questionnaire. For example, closed questions are
appropriate only when the set of possible answers are known and clear-cut, and
the answer list cannot involve all the possible answers for the questions. In
order to solve the issue, two quality management experts with more than 10
years working experience were invited to audit the questionnaires in the design
phase and the questionnaire was improved based on their suggestions before
sending out. Otherwise, as the answer list of some questions may be not
integrated, option which named ‘Other’ was put into the answer list to collect the
special answers and suggestions for the questions.
There are four main sections in the questionnaire (see Appendix A). The first
section focuses on gathering the general information of the participants and
their companies. Section two is designed to find out the quality issues and the
root causes in tailplane assembly. The third section is set to collect the CoQ
estimation parameters and cost drivers in the tailplane assembly. The last
section is to get ideas on benefit simulation. There are total twenty-two
questions in this questionnaire and it may be completed within an hour.
There are four questions in Section 1. These questions all focus on the general
information of participants, including company, department, responsibility and
working experience. This information is the basis for the classification of
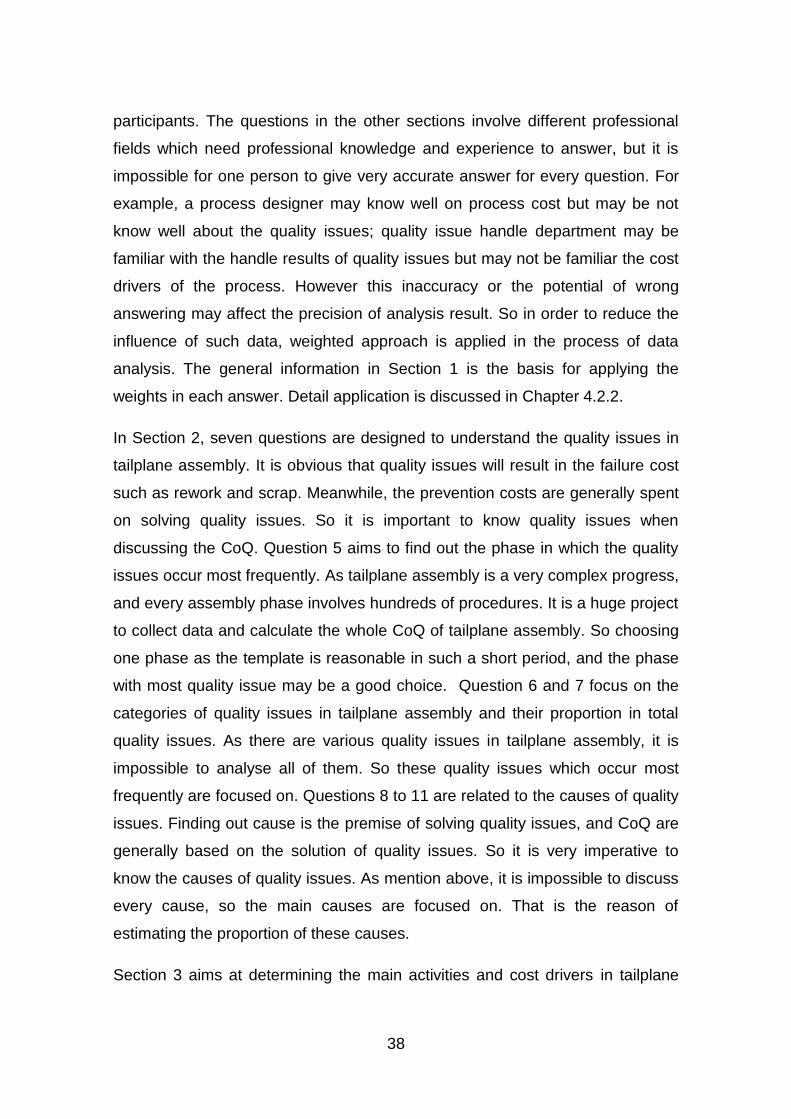
38
participants. The questions in the other sections involve different professional
fields which need professional knowledge and experience to answer, but it is
impossible for one person to give very accurate answer for every question. For
example, a process designer may know well on process cost but may be not
know well about the quality issues; quality issue handle department may be
familiar with the handle results of quality issues but may not be familiar the cost
drivers of the process. However this inaccuracy or the potential of wrong
answering may affect the precision of analysis result. So in order to reduce the
influence of such data, weighted approach is applied in the process of data
analysis. The general information in Section 1 is the basis for applying the
weights in each answer. Detail application is discussed in Chapter 4.2.2.
In Section 2, seven questions are designed to understand the quality issues in
tailplane assembly. It is obvious that quality issues will result in the failure cost
such as rework and scrap. Meanwhile, the prevention costs are generally spent
on solving quality issues. So it is important to know quality issues when
discussing the CoQ. Question 5 aims to find out the phase in which the quality
issues occur most frequently. As tailplane assembly is a very complex progress,
and every assembly phase involves hundreds of procedures. It is a huge project
to collect data and calculate the whole CoQ of tailplane assembly. So choosing
one phase as the template is reasonable in such a short period, and the phase
with most quality issue may be a good choice. Question 6 and 7 focus on the
categories of quality issues in tailplane assembly and their proportion in total
quality issues. As there are various quality issues in tailplane assembly, it is
impossible to analyse all of them. So these quality issues which occur most
frequently are focused on. Questions 8 to 11 are related to the causes of quality
issues. Finding out cause is the premise of solving quality issues, and CoQ are
generally based on the solution of quality issues. So it is very imperative to
know the causes of quality issues. As mention above, it is impossible to discuss
every cause, so the main causes are focused on. That is the reason of
estimating the proportion of these causes.
Section 3 aims at determining the main activities and cost drivers in tailplane
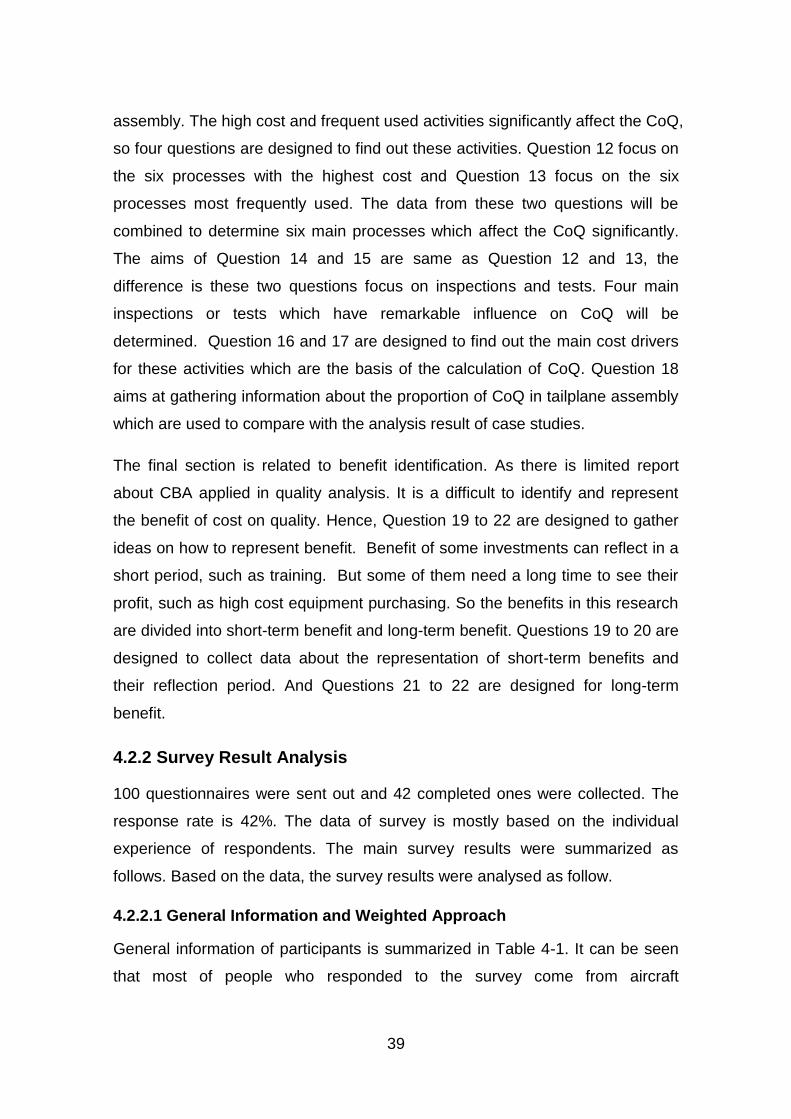
39
assembly. The high cost and frequent used activities significantly affect the CoQ,
so four questions are designed to find out these activities. Question 12 focus on
the six processes with the highest cost and Question 13 focus on the six
processes most frequently used. The data from these two questions will be
combined to determine six main processes which affect the CoQ significantly.
The aims of Question 14 and 15 are same as Question 12 and 13, the
difference is these two questions focus on inspections and tests. Four main
inspections or tests which have remarkable influence on CoQ will be
determined. Question 16 and 17 are designed to find out the main cost drivers
for these activities which are the basis of the calculation of CoQ. Question 18
aims at gathering information about the proportion of CoQ in tailplane assembly
which are used to compare with the analysis result of case studies.
The final section is related to benefit identification. As there is limited report
about CBA applied in quality analysis. It is a difficult to identify and represent
the benefit of cost on quality. Hence, Question 19 to 22 are designed to gather
ideas on how to represent benefit. Benefit of some investments can reflect in a
short period, such as training. But some of them need a long time to see their
profit, such as high cost equipment purchasing. So the benefits in this research
are divided into short-term benefit and long-term benefit. Questions 19 to 20 are
designed to collect data about the representation of short-term benefits and
their reflection period. And Questions 21 to 22 are designed for long-term
benefit.
4.2.2 Survey Result Analysis
100 questionnaires were sent out and 42 completed ones were collected. The
response rate is 42%. The data of survey is mostly based on the individual
experience of respondents. The main survey results were summarized as
follows. Based on the data, the survey results were analysed as follow.
4.2.2.1 General Information and Weighted Approach
General information of participants is summarized in Table 4-1. It can be seen
that most of people who responded to the survey come from aircraft

40
manufacturing companies. And more than 80% of them work in the department
related to assembly process. Moreover 75% of respondents are operators.
Furthermore, approximate 67% of them have worked more than 3 years.
Based on this information, weighted approach is used to distinguish answers
from different participants. Company, department, responsibility and working
experience are the four factors for judging the reliability of the answers. The
reliability of the answer are evaluated by the author based on the working
experience and the comments from the quality experts who audited the
questionnaire. The more the reliability is, the higher the weighted value of
answer is. For example, questions 12 to 18 focus on cost estimation in tailplane
assembly, and the participants from aircraft manufacturing company may be
more familiar with activities costs than the one from aircraft designing company,
so the answer from the former will be more credible than the latter’s. Hence, the
basic weighted value to the answers on question 12 to 18 which given by
participants from aircraft manufacturing company is higher than the one which
given by participants from aircraft designing company. Similarly, the participants
from quality management may be more familiar with quality issues than the
ones from project management; and the answer from supervisor may be more
credible than the one from operator; and the more working experience
participant has, the higher reliability answer he can supply.
Every question can be given a basic weighted value according to each of the
factors, and the final weighted value is the product of the four basic weighted
values. The weighted value for each question was shown in Table 4-2. The
basic value for each questions were determined by the experience of the
authors and the quality experts who attended the audition of the questionnaire.
In order to make the calculation more simply and convenient, all weighted
values were the multiple of 0.5. The calculation process of the final weighted
value was shown as follow. For example, a structure design supervisor from
aircraft designing company with 3 to 5 years working experience who
responded to this survey, according to the company factor, the basic weighted
value of answers to question 5 to 11 is 1; based on the department factor, the
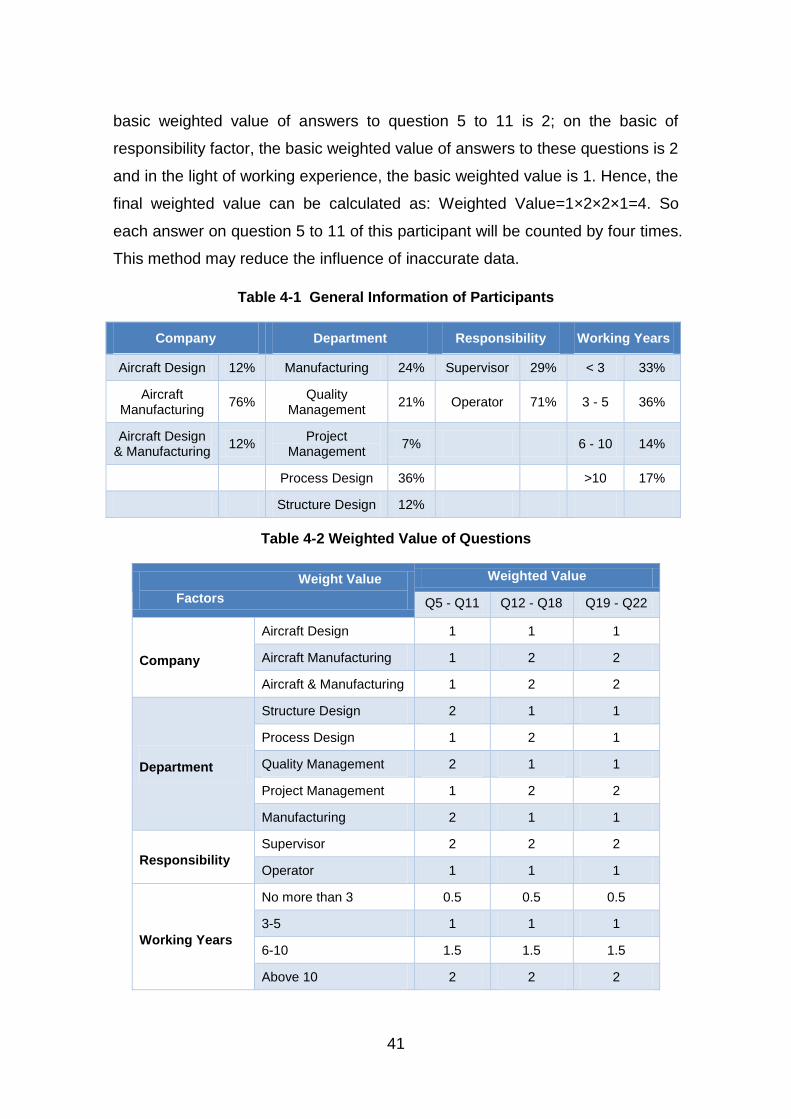
41
basic weighted value of answers to question 5 to 11 is 2; on the basic of
responsibility factor, the basic weighted value of answers to these questions is 2
and in the light of working experience, the basic weighted value is 1. Hence, the
final weighted value can be calculated as: Weighted Value=1×2×2×1=4. So
each answer on question 5 to 11 of this participant will be counted by four times.
This method may reduce the influence of inaccurate data.
Table 4-1 General Information of Participants
Company Department Responsibility Working Years
Aircraft Design 12% Manufacturing 24% Supervisor 29% < 3 33%
Aircraft Manufacturing
76% Quality
Management 21% Operator 71% 3 - 5 36%
Aircraft Design & Manufacturing
12% Project
Management 7% 6 - 10 14%
Process Design 36% >10 17%
Structure Design 12%
Table 4-2 Weighted Value of Questions
Weight Value
Factors
Weighted Value
Q5 - Q11 Q12 - Q18 Q19 - Q22
Company
Aircraft Design 1 1 1
Aircraft Manufacturing 1 2 2
Aircraft & Manufacturing 1 2 2
Department
Structure Design 2 1 1
Process Design 1 2 1
Quality Management 2 1 1
Project Management 1 2 2
Manufacturing 2 1 1
Responsibility
Supervisor 2 2 2
Operator 1 1 1
Working Years
No more than 3 0.5 0.5 0.5
3-5 1 1 1
6-10 1.5 1.5 1.5
Above 10 2 2 2

42
4.2.2.2 Quality Issue Analysis
The phase with the most quality issues in tailplane assembly is Final Assembly
Phase which can be seen in Figure 4-1. Approximately 41% of the participants
support this statement. In the final assembly phase, there is not enough
tolerance to distribute in the assembly process generally. So there will be many
matching problems which may result in amount of rework and repair, even
scrap. That is why most quality issues occur in the final assembly phase. Hence,
the CoQ and the case used in this research will be on the basis of this phase.
Figure 4-1 Phase with Most Quality Issues in Tailplane Assembly
Figure 4-2 shows the results of quality issues in the tailplane assembly. Graph a)
is about the main quality issue in the tailplane assembly, and it reflects the
number of different answers. It can be seen that the most frequently occurred
quality issues are hole problem, position problem and riveting problem. It
reflects the number of different answers. Graph b) reflects the proportion of
these quality issues in total quality issues. The proportions of the three main
quality issues are totally above 50%. Drilling and Riveting are two main
processes in assembly process, and there may be more than ten thousand
holes and rivet in an aircraft. Moreover, as mentioned in Chapter 2, aircraft
assembly significant relies on manual work. Approximately 80% of drilling and
riveting are finished manually. Hence, it is not difficult to explain why hole
problem and riveting problem are the most frequent ones. Otherwise, matching
is very important in assembly process. The more components are used, the

43
more difficult to put these components in right place. Especially in final
assembly phase, positioning problem may be the most frequently and most
difficult quality issues to handle. Therefore, hole problems, riveting and
positioning problems are the main quality issues discussed in this research.
Figure 4-2 Main Quality Issues in Tailplane Assembly
The causes for these quality issues are analyzed based on the results which
are shown in Figure 4-3. Graph a) illustrates the proportion of three main
immediate causes in total immediate causes. Similarly, graph b) shows the
results on root causes. It is clear that misoperation is the main immediate cause
for quality issues in tailplane assembly. And the main root cause is identified to
be the lack of professional skill. Due to the low degree of automation, too much
work in tailplane assembly is finished manually, so quality issues will occur
a)
b)

44
unavoidably. Moreover, using too much young workers in designing and
manufacturing is another reason. Lack of skill and experience may result in the
high error rate in manufacturing.
Figure 4-3 Main Cause for Quality Issues
4.2.2.3 Cost Estimation
Figure 4-4 reflects the processes with most significant influence on cost in
tailplane assembly. Graph a) shows the main processes with highest cost and
graph b) shows the main processes which are used most frequently. It can be
seen that the highest cost processes are riveting, reaming, drilling, sealing,
dimpling and installing and the most frequently used processes are drilling,
position, riveting, dimpling, sealing and cleaning. In order to identity the
processes which can affect cost significantly, the influence proportion on cost of
one process are calculated using the proportion of this process in graph a)
a)
b)
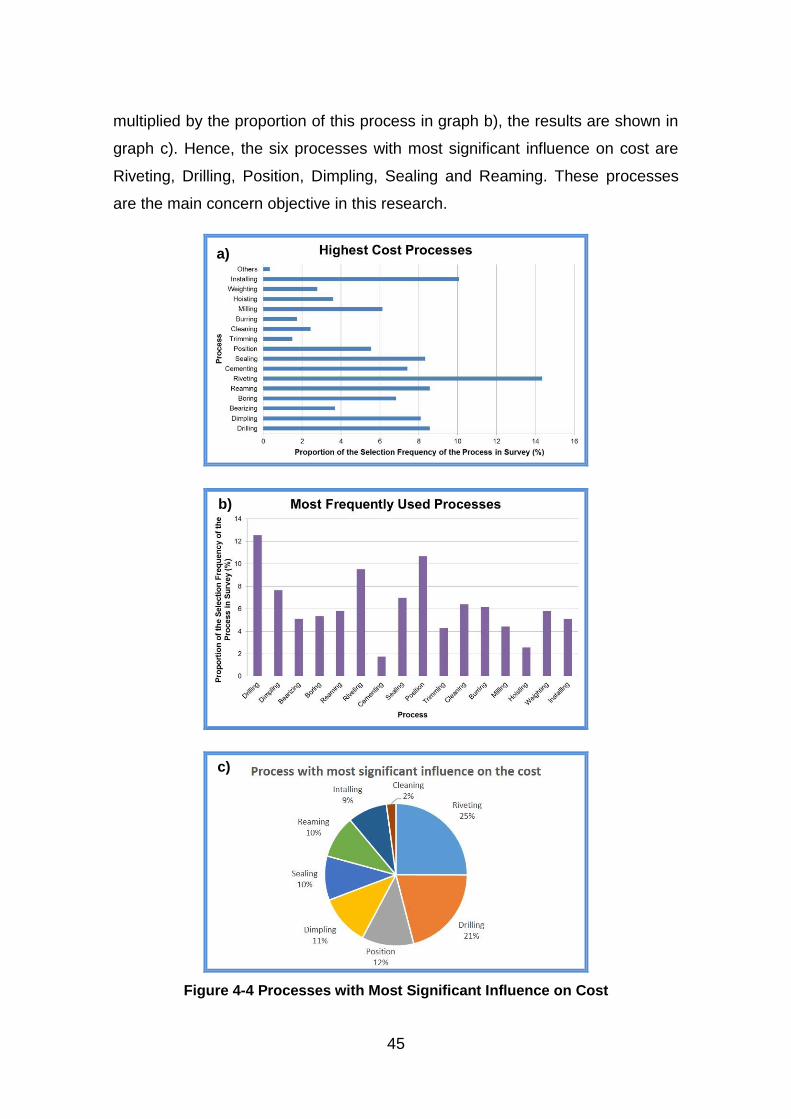
45
multiplied by the proportion of this process in graph b), the results are shown in
graph c). Hence, the six processes with most significant influence on cost are
Riveting, Drilling, Position, Dimpling, Sealing and Reaming. These processes
are the main concern objective in this research.
Figure 4-4 Processes with Most Significant Influence on Cost
a)
b)
c)
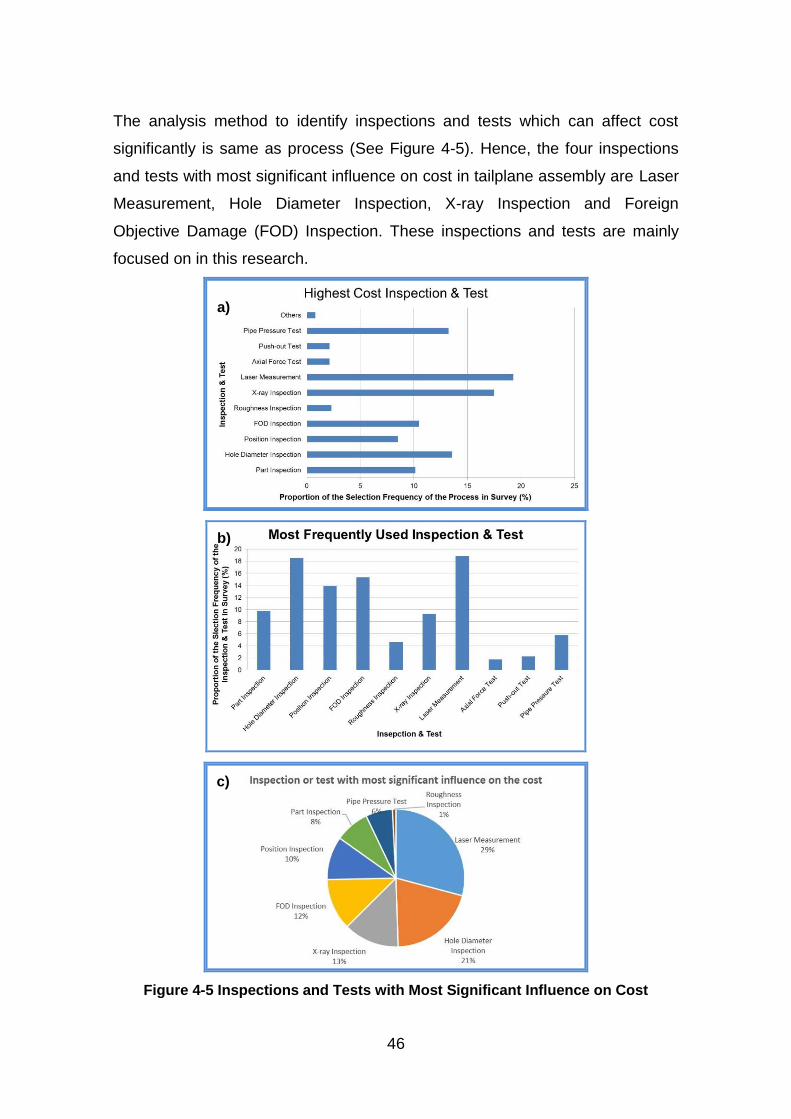
46
The analysis method to identify inspections and tests which can affect cost
significantly is same as process (See Figure 4-5). Hence, the four inspections
and tests with most significant influence on cost in tailplane assembly are Laser
Measurement, Hole Diameter Inspection, X-ray Inspection and Foreign
Objective Damage (FOD) Inspection. These inspections and tests are mainly
focused on in this research.
Figure 4-5 Inspections and Tests with Most Significant Influence on Cost
a)
b)
c)
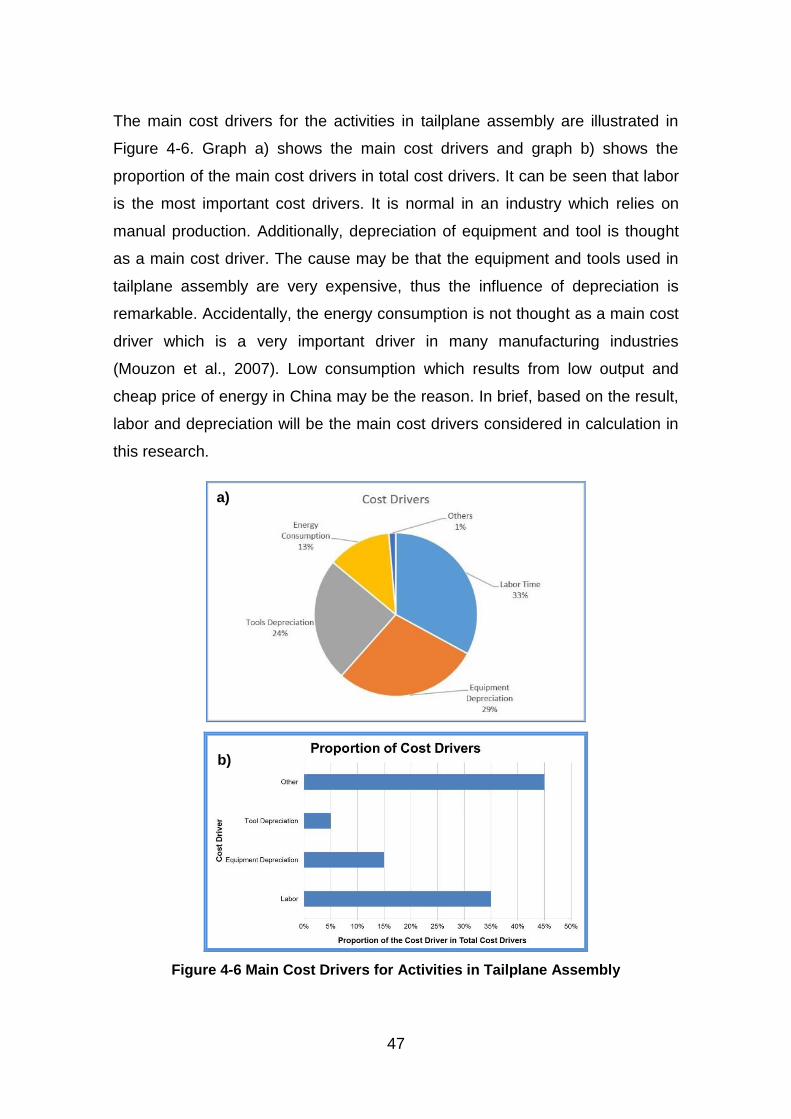
47
The main cost drivers for the activities in tailplane assembly are illustrated in
Figure 4-6. Graph a) shows the main cost drivers and graph b) shows the
proportion of the main cost drivers in total cost drivers. It can be seen that labor
is the most important cost drivers. It is normal in an industry which relies on
manual production. Additionally, depreciation of equipment and tool is thought
as a main cost driver. The cause may be that the equipment and tools used in
tailplane assembly are very expensive, thus the influence of depreciation is
remarkable. Accidentally, the energy consumption is not thought as a main cost
driver which is a very important driver in many manufacturing industries
(Mouzon et al., 2007). Low consumption which results from low output and
cheap price of energy in China may be the reason. In brief, based on the result,
labor and depreciation will be the main cost drivers considered in calculation in
this research.
Figure 4-6 Main Cost Drivers for Activities in Tailplane Assembly
a)
b)

48
Survey result shows that the proportion of CoQ in total cost is most thought as
21% to 30% which is in accord with some reported results (Sower et al., 2007).
It will be the reference parameter to analyze the result of cases.
4.2.2.4 Benefit Identification
Based on the survey result, shown in Figure 4-7 and 4-8, reducing number of
quality issues is thought as the main way to represent the short-term benefit of
the cost on quality, and the period for the benefit to reflect is about 7 to 12
months. Meanwhile, improving customer satisfaction is thought as the main way
to represent the long-term benefit of the cost on quality, and the period for the
benefit to reflect is about 3 to 4 years. These ways to represent benefit are all
abstract, how to using quantitative method to represent these parameters will
be discussed in chapter 4.6. The period of the benefit reflection may be the
reference when collecting the necessary data in CBA and case study.
Figure 4-7 Method to Represent Short-term Benefit
a)
b)

49
Figure 4-8 Method to Represent Long-term Benefit
4.3 CoQ Elements Identification and Definition
4.3.1 Breakdown Structure of CoQ
In order to reduce CoQ, the most important thing is to set priorities for the
effective use of resources and this can be done by the identification of those
factors which contribute a lot in CoQ (Ali et al., 2012). In this research,
classification of CoQ is based on the traditional P-A-F model, which means that
the total CoQ includes prevention cost, appraisal cost, internal failure cost and
external failure cost. As summarized in Chapter 2, it has been some examples
for different kind of CoQ. However, it is difficult to use these examples directly
as not all of these are suit for tailplane assembly. For example, new product
review and supplier capability surveys are two kinds of previous cost of a
product. But they may not be considered when calculating the CoQ in the
a)
b)

50
assembly process. Moreover, in this research, CoQ in tailplane assembly need
to be quantified and calculated, so the examples which is impossible to quantify
will not be considered, such as laboratory support. Furthermore, the research
focus on the assembly phase which is only part of the lift cycle of the production.
So only part of CoQ which is related to the assembly phase will be considered,
most of external failure such as costs of complaint handling will not be involved.
In conclusion, comparing the reported examples of CoQ with the actual data
collected through the industry survey and supplied by a tailplane assembly
company in China. The CoQ in this research can be identified and defined, as
illustrated in Figure 4-9. The detailed definitions are discussed as follow.
Cost of Quality
Prevention Cost Appraisal CostInternal Failure
Cost
External Failure
Cost
Quality Design
and Management
Cost
Education and
Training Cost
Equipment and
Tool Update Cost
Inspection and
Test Design and
Management Cost
Inspection and
Test Operation
Cost
Evaluation Cost
Scrap Cost
Rework Cost
Repair Cost
Failure
Compensation
Delay Cost
Delay
Compensation
Figure 4-9 Breakdown Structure of CoQ in Tailplane Assembly
4.3.2 Definition of Prevention Costs
Prevention costs are the costs of all activities specifically designed to prevent
poor quality in products or services. Prevention costs in tailplane assembly
includes Quality Design and Management Cost (Cqdm), Education and Training
Cost (Ceat), Equipment and Tool Update Cost (Cetu), as shown in Equation (4-1).
(4-1)

51
Quality Design and Management Cost is the cost which is spent on quality
design and management before or during the assembly process, including:
Operations quality planning cost, Operations support quality planning cost,
Operator SPC/ process control cost, Quality program planning cost, Quality
performance report and analysis cost, etc.
Education and Training Cost is the cost which is spent on quality education and
training in order to ensure the people get the necessary skills and knowledge,
including: Quality education cost, Quality training cost, Assembly basic
knowledge education cost, Professional skills training cost, etc.
Equipment and Tool Update Cost is the cost which is spent on new equipment
or tool purchasing, manufacturing or old equipment updating in order to keep or
improve the product quality, including: Equipment or tool purchasing cost,
Hardware updating cost, Software updating cost, etc.
4.3.3 Definition of Appraisal Costs
Appraisal costs are the costs associated with measuring, evaluating or auditing
products or services to assure conformance to quality standards and
performance requirements. Appraisal costs in tailplane assembly process
includes Inspection and Test Design and Management Cost (Citd), Inspection
and Test Operation Cost (Cito), Evaluation Cost (Ceva), as shown in Equation (4-
2).
(4-2)
Inspection and Test Design and Management Cost is the cost which is spent on
the inspection and test design, research and management, including: Planned
operations inspections, tests and audits cost, Review of inspection and test data
cost, etc.
Inspection and Test Operation Cost is the cost which is spent on operating
inspection and test, including Part acceptance inspection cost, In-process
inspection cost, Final inspection cost, Function test cost, etc.

52
Evaluation Cost is the cost which is spent on quality evaluations in order to
check whether the quality system operation is well enough to ensure product
quality, including: Internal evaluation, External evaluation, etc.
4.3.4 Definition of Internal Failure Costs
Internal failure costs occur prior to delivery or shipment of the product, or the
furnishing of a service, to the customer. Internal failure costs in tailplane
assembly process includes Scrap Cost (Cscr), Rework Cost (Crew), Repair Cost
(Crep), and Delay Cost (Cdel), as shown in Equation (4-3).
(4-3)
Scrap Cost is the cost which is spent on the scraped components, including:
Materials cost, Component cost, Equipment cost, Tool cost, Labour cost, etc.
Rework Cost is the cost which is spent on working which can ensure the failed
part meet the design requirement, including: Materials cost, Part cost,
Equipment cost, Tool cost, Labour cost, etc.
Repair Cost is the cost which is spent on the working which can ensure the
failed part be used again though not meet the design requirement, including:
Materials cost, Part cost, Equipment cost, Labour cost, etc.
Delay Cost is the additional cost to finish the planned work due to the delay
which may result from quality issues or other reasons. The main delay cost in
tailplane assembly is waiting cost.
4.3.5 Definition of External Failure Costs
External failure costs occur after delivery or shipment of the product, and during
or after finishing of a service to customer, including: Cost of complaint handling,
Warranty claims, Cost of handling and repair of returned goods, Costs of scraps
of returned goods, etc. However, these kinds of external failure cost are not be
involved in the tailplane assembly progress. So some unreported external
failure cost need to be considered in this model. The repaired components used
on tailplane are not meet the requirements of design drawings, though they

53
were evaluated by the designers before used, the potential risk of occurring
quality issue is more than normal components, and the failure cost for these
quality issue will be undertaken by the customers. So compensation is required
for these components when sell the product to customers. This kind of cost
occurs after delivery of the product, so it can be seen as one of external failure
cost, as all the problems are handled through Failure and Rejection Report
(FRR), this kind of cost can be named FRR compensation. Additionally, quality
issues may result in the delay on delivery which may result in the compensation
due to the breach of contract. This kind of cost can be seen as another external
failure cost in tailplane assembly. So the external failure cost in this model can
be represented as the sum of the FRR compensation (Cfrr) and delivery delay
compensation (Cddc), as shown in Equation (4-4).
(4-4)
4.4 Activities Identification and Cost Drivers Analysis
4.4.1 Activity Identification
Based on P-A-F/ABC framework, after the definition of CoQ, the activities need
to be identified and analysed. And the cost drivers for these activities need to be
determined. According to the results of the literature review and industry survey,
the main activities which result in CoQ in tailplane assembly can be divided into
two groups. One group is the activities which involved in the assembly process
directly. These activities can be called as ‘Productive Activities’, including
inspection, test, rework, repair and scrap. These activities generally refer to one
or more manufacturing processes which require amount of resource to fulfilling.
So there are many cost drivers for these activities such as material, component,
equipment, tool and labour.
The other group is the activities which involves no assembly process. These
activities can be called as ‘Non-productive Activities’, including Quality design
and management, education and training, inspection and test design and
management and evaluation. These activities mainly belong to quality

54
management and quality assurance which do not rely on production factors
such as material, part, equipment, etc. The main cost drivers for these activities
are labour. The cost drivers for activities are illustrated in Table 4-3.
Table 4-3 Cost Drivers of Activities
CoQ Activities Cost Drivers
Quality Design and Management Cost Non-productive Labour
Education and Training Cost Non-productive Labour
Equipment and Tool Purchasing Cost None None
Hardware Updating Cost Non-productive Labour
Software Updating Cost None None
Inspection and Test Design and Management Cost
Non-productive Labour
Inspection and Test Operation Cost Productive Equipment, Tool, Labour
Evaluation Cost Non-productive Labour
Scrap Cost Productive Component, Equipment, Tool, Labour
Rework/Repair Cost Productive Material, Component, Equipment, Tool, Labour
Delay Cost Non-productive Labour
FRR Compensation Cost None None
Delivery Delay Compensation Cost None None
4.4.2 Cost Drivers Analysis
It can be seen from Table 4-3 that the main cost drivers for the activities can be
divided into five groups: material, part, equipment, tool and labour. The
characteristic and influence degree of these cost drivers are discussed and
summarized as follow:
Material is a very important basic production factors in manufacturing industry. It
can be divided into raw material and support material. Generally the influence of
raw material to cost is far more significant than support material due to the
difference of consumption and price. However, in assembly process, the
consumption of raw is too little to ignore. Hence, in this research, material can
be only thought as support material. And the influence of material on cost may
be far less than the other cost drivers.

55
Component is another important basic production factors in manufacturing
industry. It can be divided in subassembly and standard component in assembly.
As the amount of component in tailplane is large and the costs of the
component are very expensive, component costs accord for a high proportion in
total CoQ. Hence, component is one of the main cost drivers for CoQ in
tailplane assembly.
Equipment and tools are used widely in processes, inspection and test. Almost
every activity needs one or more relative equipment and tool. Generally the
main influencing factors to equipment and tool cost are depreciation and energy
consumption. However, based on the result of industry survey, energy
consumption is not thought as the main cost driver. So in this research,
depreciation is thought as the only driver for equipment and tool. There are
various methods to calculate the depreciation, such as Straight Line
Depreciation Method, Declining Balance Depreciation Method and Sum of the
Years Digits. In all these methods, the straight-line depreciation is the simplest
and most often used one (Eisele, 2002). The salvage value is deducted from
the asset and divided by the number of years of the depreciation period. The
only two factors need to consider are cost and period. So the depreciation can
be calculated through Equation (4-5).
(4-5)
Where:
D = Depreciation of Equipment or Tool;
P = Unit Price of Equipment or Tool;
L = Lifetime of Equipment or Tool (Year);
T = Annual Available Working Time of Equipment or Tool.
Labour is one of the most important production factors in the manufacturing
industry which rely on manual work significantly. Generally labour can be

56
classified into direct labour and indirect labour. Direct labour is production or
services labour that is assigned to a specific product. In manufacturing process,
direct labour is considered to be the labour of the production crew that produces
goods, such as machine operators, assembly line operators and inspectors. In
this research direct labour can be thought as all the process operators,
including drilling workers, riveting workers, FOD inspectors, etc. Indirect labour
is the labour who supports the production process, but not directly involved in
the activities to finish products, such as production supervisor and quality
control staff. This part of cost is difficult to calculate for a single activity. The
best method to estimate this kind of cost is to calculate accumulated cost in a
period, such as annual quality management cost. In this research, the indirect
labour can be thought as manufacturing management labour, process design
labour and quality management labour. Based on the literature and industry
survey, labour is thought as a main cost driver in activity in tailplane assembly.
And with the increasing of labour cost these years, the influence of labour to
CoQ is more and more remarkable.
4.5 Development of the CoQ Model
4.5.1 Overall Structure of the CoQ Model
The Developed CoQ model includes three main modules: Cost of Quality
Estimation System (CoQES) module, Quality Issues Analysis module and CBA
module, as shown in Figure 4-10. The CoQES module consists of cost
information collection module, cost estimation module and CoQ reporting
module. The modules in the CoQES are all composed of interfaces and
databases. The cost information collection module consists of five interfaces
and four databases, it is used to collect and store the necessary data for the
CoQES. The cost estimation module consists of one interface and one
calculator and four production factor databases (material, equipment, tool and
labour), when the estimation period and some annual information, such as yield,
annual evaluation cost, is input through the interface, different kind of CoQ will
be calculated based on the information model, then the total CoQ will be the
sum of all these CoQ elements, and unit CoQ will be the ratio of total CoQ to

57
the yield. Finally, the proportion of CoQ in sales will be estimated by the ratio of
unit CoQ to product price. All the estimation will be stored into the database of
CoQ report in the CoQ reporting module, the interface in that module will show
all these results to the user.
User
Prevention
Cost
Database
Appraisal
Cost
Database
Internal
Failure Cost
Database
External
Failure Cost
Database
Preventi
on Cost
Appraisa
l Cost
Internal
Failure
Cost
External
Failure
Cost
Total
CoQ
Unit
CoQ
Proportio
n of CoQ
Quality Issue
Database
CoQ Report
Tailplane
AssemblyCost Information
Cost Information
Collection ModuleCost Estimation Module
GUI
Estimation Period Selection
Quality
Information Cost
Estimation
Number
Counting
Perato
Analysis
CBA Report
Quality Issues
Analysis Module
Cost
Estimation
Benefit
Simulation
CBA
Quality Issues Report
CBA Module
CoQ Model
CoQES
Figure 4-10 Overall Structure of the CoQ Model
The Quality Issue Analysis module includes two interfaces (quality problem
information input and quality problem analysis) and one database (quality issue).
In this module, quality issues information are collected and input into the
database, and the number of different quality issues can be counted in the
selected year. And the failure cost of these quality issues can be estimated
based on the CoQES. Pareto Analysis will be used to determine the main
58
quality issue from these two aspects. And a quality issue report can be
summarized after the analysis. However, as this part is not the main work of this
research, so it will not be discussed in- depth in this thesis and it may be
improved in the future work.
The CBA module is mainly an analysis process of the cost and benefit. So the
operation environment is not based on the interfaces. But the results of cost and
benefit used in CBA are all calculated through CoQES. The CBA generally
focuses on the main quality issues as most of investment on quality aims at
solving them. They can be found through the quality issues analysis module.
When the quality issues are determined, the cost and benefit can be estimated
based on the CoQES. Then the ratio of cost and benefit will be analysed and a
CBA report will be generated finally.
4.5.2 Cost of Quality Estimation System (CoQES)
The CoQES is a digital tool to estimate the cost of quality which can improve
the operability of the CoQ model. It consists of GUIs, databases and algorithmic.
4.5.2.1 GUI Design
The GUIs are designed using VBA based on MS Excel to improve the
operability of the model. The GUIs in the model involves eleven interfaces:
Login Interface, Main Menu, Cost Information Input Menu, Prevention Cost
Input, Appraisal Cost Input, Internal Failure Cost Input and External Failure Cost
Input, Annual CoQ Estimation, CoQ Report, Quality Problem Information Input
and Quality Problem Analysis.
4.5.2.2 Database
There are two kinds of databases in this model. One is basic information
database (see Figure 4-11), which is used to store the basic production
information in the tailplane assembly process, including material database,
component database, equipment database, tool database and labour database.
The information stored in these databases, such as unit component price,
equipment depreciation and unit labour salary, should be collected based on the

59
actual production condition before the CoQES used for estimation. And it is
necessary in the calculation process.
The other kind of database is CoQ information database (see Figure 4-12),
which is used to store the cost of quality information in the tailplane assembly
process, including prevention cost database, appraisal cost database, internal
failure cost database, external failure cost database and total cost of quality
database. The information stored in these databases, such as training cost,
inspection and test cost, scrap cost and FRR compensation cost, will be input
and estimated when the CoQES used for estimation. And it is the basis of the
CoQ report.
Figure 4-11 Equipment Database
Figure 4-12 Internal Failure Database
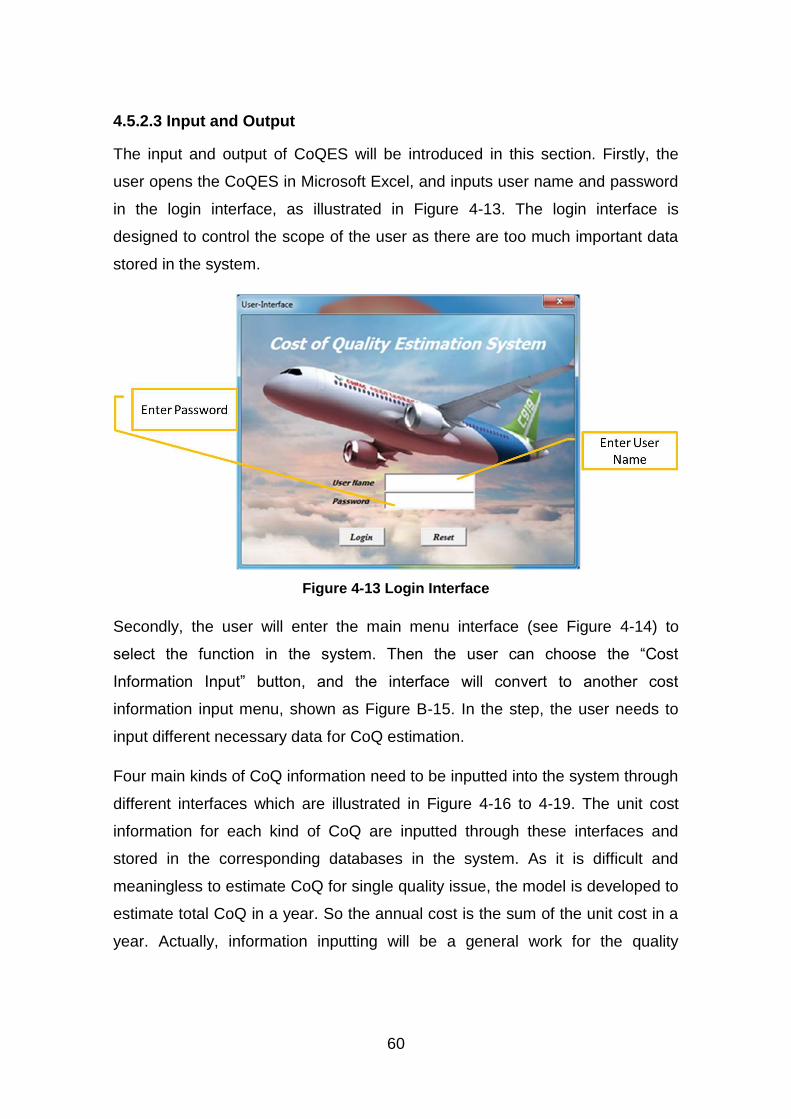
60
4.5.2.3 Input and Output
The input and output of CoQES will be introduced in this section. Firstly, the
user opens the CoQES in Microsoft Excel, and inputs user name and password
in the login interface, as illustrated in Figure 4-13. The login interface is
designed to control the scope of the user as there are too much important data
stored in the system.
Figure 4-13 Login Interface
Secondly, the user will enter the main menu interface (see Figure 4-14) to
select the function in the system. Then the user can choose the “Cost
Information Input” button, and the interface will convert to another cost
information input menu, shown as Figure B-15. In the step, the user needs to
input different necessary data for CoQ estimation.
Four main kinds of CoQ information need to be inputted into the system through
different interfaces which are illustrated in Figure 4-16 to 4-19. The unit cost
information for each kind of CoQ are inputted through these interfaces and
stored in the corresponding databases in the system. As it is difficult and
meaningless to estimate CoQ for single quality issue, the model is developed to
estimate total CoQ in a year. So the annual cost is the sum of the unit cost in a
year. Actually, information inputting will be a general work for the quality
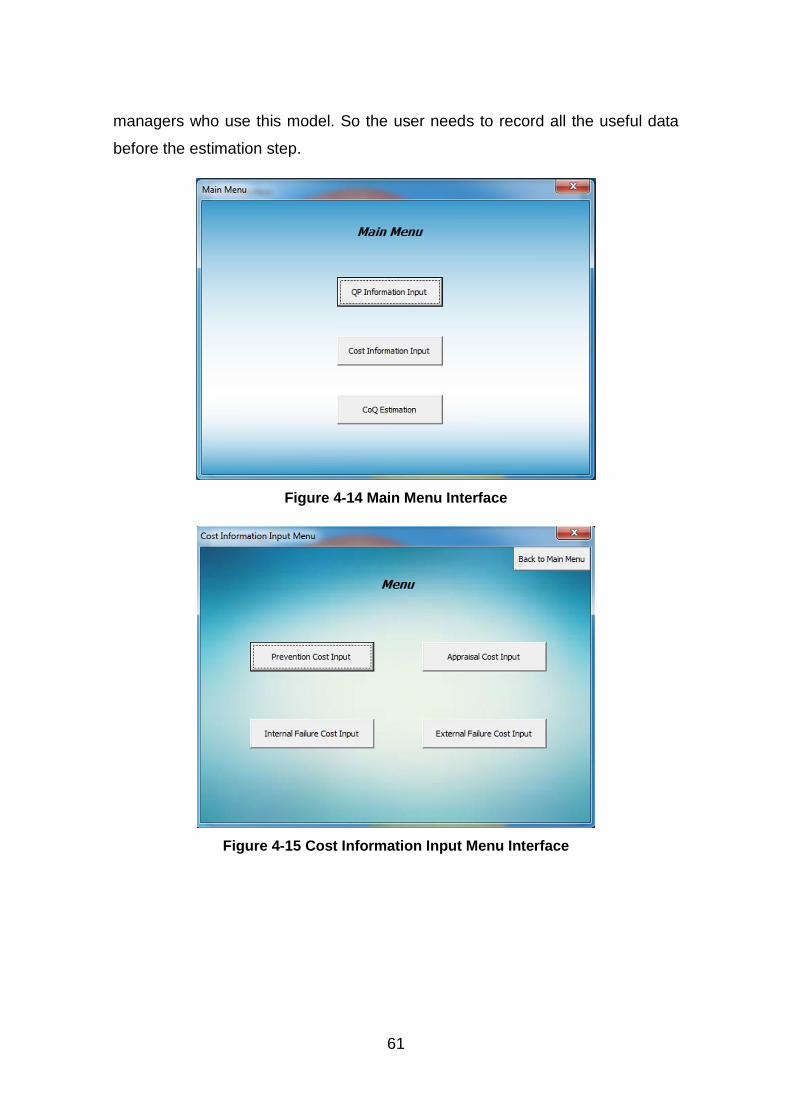
61
managers who use this model. So the user needs to record all the useful data
before the estimation step.
Figure 4-14 Main Menu Interface
Figure 4-15 Cost Information Input Menu Interface

62
Figure 4-16 Prevention Cost Information Input Interface
Figure 4-17 Appraisal Cost Information Input Interface
Fourthly, when the necessary data is collected and input into the system, the
user can go to the estimation interface (See Figure 4-20) through the “CoQ
Estimation” button in Main Menu interface. In estimation phase, the estimation
year need to be selected. Then some necessary data in this year which is
generally collected by year need to be inputted. Finally, the estimation process
will start through the “Estimation” button. The estimation result will be illustrated
in Cost of Quality Estimation Report (See Figure 4-21). The total CoQ, unit
CoQ and every main kind of CoQ will be shown in the report.

63
Figure 4-18 Internal Failure Cost Information Input Interface
Figure 4-19 External Failure Cost Information Input Interface

64
Figure 4-20 Annual CoQ Estimation Information Input Interface
Figure 4-21 Cost of Quality Report Interface
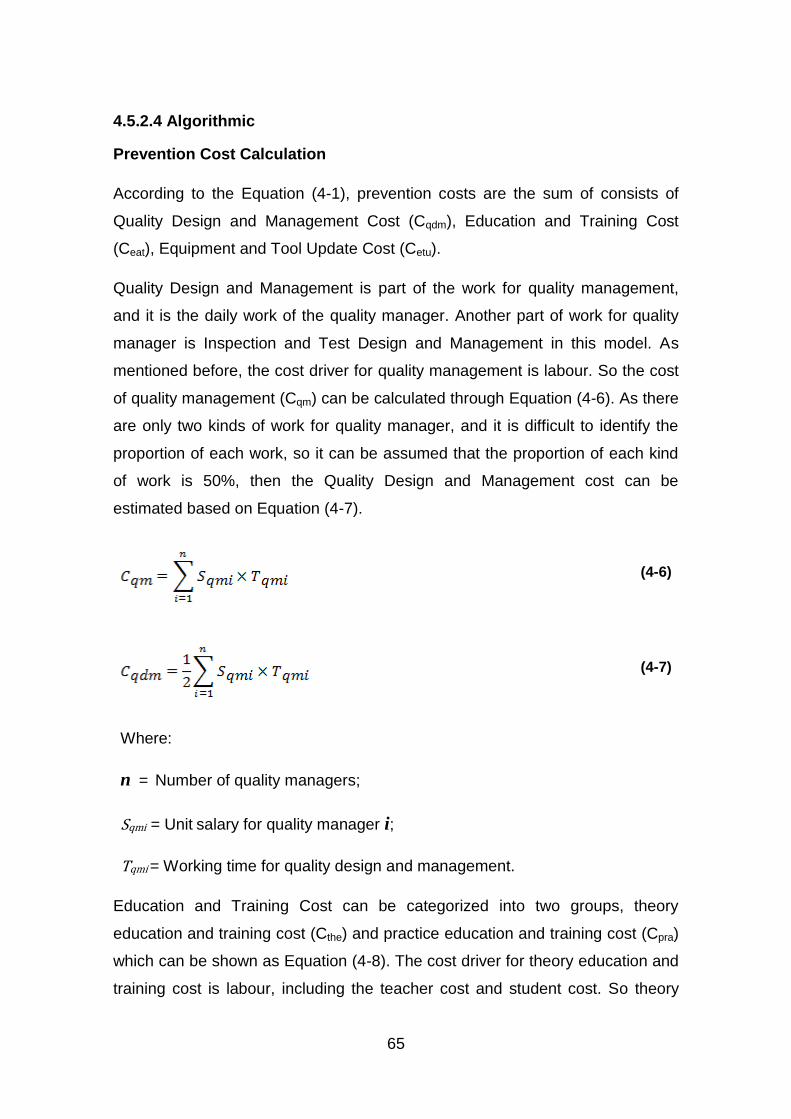
65
4.5.2.4 Algorithmic
Prevention Cost Calculation
According to the Equation (4-1), prevention costs are the sum of consists of
Quality Design and Management Cost (Cqdm), Education and Training Cost
(Ceat), Equipment and Tool Update Cost (Cetu).
Quality Design and Management is part of the work for quality management,
and it is the daily work of the quality manager. Another part of work for quality
manager is Inspection and Test Design and Management in this model. As
mentioned before, the cost driver for quality management is labour. So the cost
of quality management (Cqm) can be calculated through Equation (4-6). As there
are only two kinds of work for quality manager, and it is difficult to identify the
proportion of each work, so it can be assumed that the proportion of each kind
of work is 50%, then the Quality Design and Management cost can be
estimated based on Equation (4-7).
(4-6)
(4-7)
Where:
n = Number of quality managers;
Sqmi = Unit salary for quality manager i;
Tqmi = Working time for quality design and management.
Education and Training Cost can be categorized into two groups, theory
education and training cost (Cthe) and practice education and training cost (Cpra)
which can be shown as Equation (4-8). The cost driver for theory education and
training cost is labour, including the teacher cost and student cost. So theory

66
cost can be calculated through Equation (4-9). Practice education and training
is similar as ‘Productive Activity’, the cost driver for it will involve material,
component, equipment and tool. Considering the materials and component for
practice are scrapped which are value-less, so these parts of costs can be
ignored. So it only needs to calculate equipment cost and tool cost. Hence, the
practice education and tool cost can be represented as Equation (4-10).
(4-8)
(4-9)
Where:
m = Number of teachers in theory education and training;
n = Number of students in theory education and training;
Steai = Unit Salary of teacher i;
Tthei = Training time of teacher i;
Sstuj = Unit Salary of student j;
Tthej = Training time of student j.
(4-10)
Where:
m = Number of equipment used in practice education and training;
n = Number of tools used in practice education and training;

67
Dpra_equi = Deprecation cost of the equipment i;
Tpra_equi = Working time of equipment i;
Dpra_tooj = Deprecation cost of the tool j;
Tpra_tooj = Working time of tool j.
Equipment and Tool Update Cost can be categorized into three groups, new
equipment and tool purchasing cost (Cnep), Hardware updating cost (Chau) and
Software updating cost (Csou) as shown by Equation (4-11).
(4-11)
The main cost driver of new equipment and tool purchasing is the price of
equipment and tool, though purchasing planning, supplier selection,
investigation and invitation for bids will also result in cost, these costs are far
less than the selling price of equipment and tool, and this kind of work is not a
general work which happens frequently, so these parts of costs are ignored. So
new equipment and tool purchasing cost can be represented by Equation (4-12)
(4-12)
Where:
m = Categories of purchased new equipment;
n = Categories of purchased new tools;
Pnep_equi = Unit price of equipment i;
Nnep_equi = Number of equipment i;
Pnep_tooj = Unit price of tool j;

68
Nnep_tooj = Number of tool j.
The hardware updating cost is the cost spent on maintaining structure and
appearance of equipment and tool. It generally includes component cost, tool
cost and labor cost. Maintenance is a period work, and there are no error for
equipment and tool at most of the time, so the component cost and tool cost are
general far less than the labor cost, these parts of costs can be ignored. So the
hardware cost can be represented by the maintenance labor cost which is
shown as Equation (4-13). The software updating cost is the cost spend on
updating edition of software and adjusting software function in equipment. It
generally includes software purchasing cost and labor cost which shown as
Equation (4-14).
(4-13)
Where:
n = Number of update operators;
Shau_labi = Unit salary of hardware updating operator i;
Thau_labi = Working time of hardware updating operator i.
(4-14)
Where:
m = Categories of software;
n = Number of software updating operators
Psou_sofi = Price of software i purchased for updating;

69
Nsou_sofi = Number of software i;
Ssou_labj = Salary of software updating operator j;
Tsou_labj = Working time of software updating operator j;
Appraisal Cost Calculation
According to the Equation (4-2), Appraisal costs are the sum of Inspection and
Test Design and Management Cost (Citd), Inspection and Test Operation Cost
(Cito), Evaluation Cost (Ceva).
As discussed before, the Inspection and Test Design and Management Cost in
this model is equal to Quality Design and Management Cost.
Inspection and Test Operation Cost consists of Set up Cost (Citse), Inspection
and Test Equipment Cost (Citeq), Inspection and Test Tool Cost (Citto) and
Inspection and Test Labor Cost (Citla).
Set up Cost can be estimated by the ratio of set up cost to total process cost.
The ratio is generally based on the industrial experience. Inspection and Test
Equipment Cost is mainly equipment deprecation cost. The main driver of
Inspection and Test Tool is tool deprecation. Inspection and Test Labor Cost
can be calculated using unit cost of Inspector multiplies by working time. So the
Inspection and Test Operation Cost can be represented by Equation (4-15).
(4-15)
Where:
m = Number of inspection and test;
n = Number of equipment used in inspection and test i;
r = Number of tools used in inspection and test i;

70
s = Number of labours in inspection and test i;
Rito_seti = Ratio of set up in inspection or test i;
Diej = Deprecation of equipment j in inspection and test i;
Tiej = Working time of equipment j in inspection and test i;
Ditk = Deprecation of tool k in inspection and test i;
Titk = Working time of tool k in inspection and test i;
Silh = Unit salary of operator h in inspection and test i;
Tilh = Working time of operator h in inspection and test i.
Evaluation Cost can be generally categorized into two major groups, Internal
Evaluation Cost (Ciev) and External Evaluation Cost (Ceev). The main driver of
Internal Evaluation Cost is labor, so Internal Evaluation Cost can be calculated
using unit labor cost multiplies by working time. External Evaluation Cost
generally comes from the third-party evaluation which to verify the Quality
Management System in the company. It will be consist of supply fee, evaluation
fee, meeting fee, report fee, etc. But all these fees are the expenditure to third-
party evaluation organization. So the External Evaluation Cost can be
represented by expenditure to third-party. So the Evaluation Cost can be
represented by Equation (4-16).
(4-16)
Where:
m = Number of internal evaluators;
n = Number of external evaluation;

71
Siei = Unit salary of internal evaluator i;
Tiei = Working time of internal evaluator i;
Eeej = Expenditure of external evaluation j;
Internal Failure Cost Calculation
Based on the Equation (4-3), internal failure costs are the sum of Scrap Cost
(Cscr), Rework Cost (Crew), Repair Cost (Crep) and Delay Cost (Cdel).
Scrap Cost is the cost spent on the component or material which need to be
scrapped due to quality issues. It is the cost of the resource which had been
used in the scrapped component or material. So scrap cost consists of the
material cost (Cscr_mat), component cost (Cscr_com) and activities cost (Sscr_act)
which includes processes, inspection and test used. It can be represented by
Equation (4-17). And the way to calculate these three kinds of cost are
illustrated in Equation (4-18) to (4-20).
(4-17
)
(4-18
)
Where:
n = Categories of material used;
Pscr_mati = Price of material i ;
Qscr_mati = Used quantity of material i.
(4-19
)
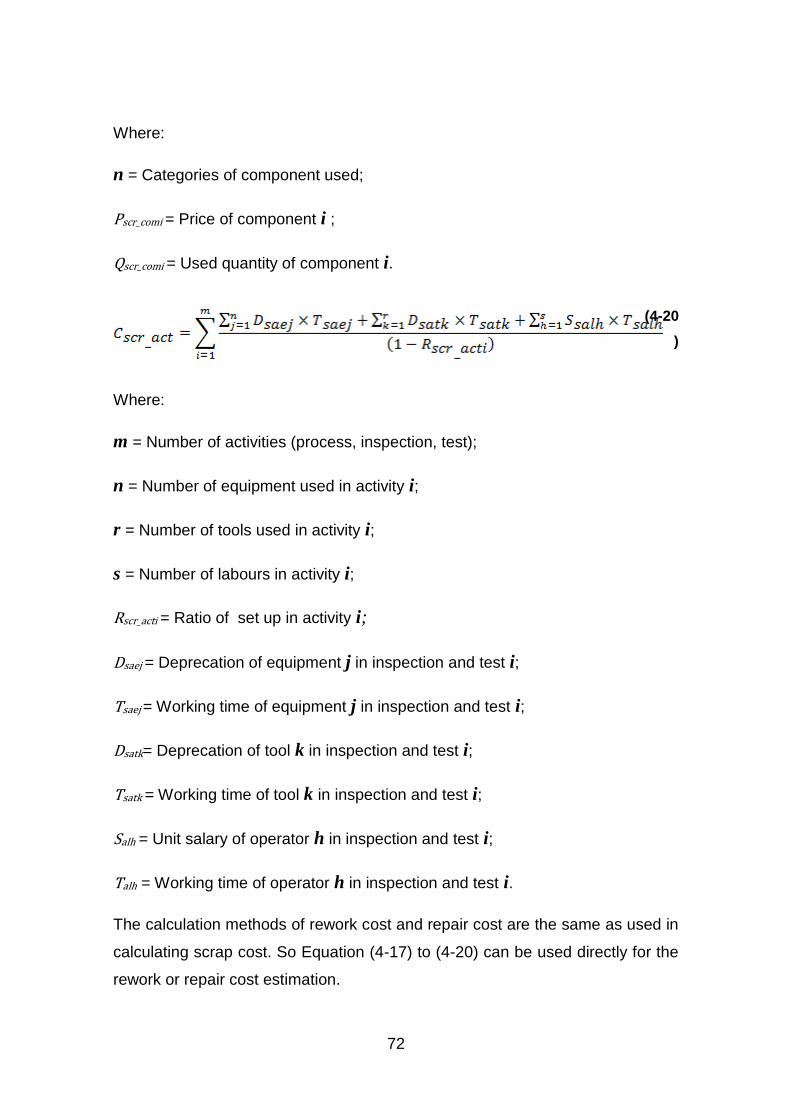
72
Where:
n = Categories of component used;
Pscr_comi = Price of component i ;
Qscr_comi = Used quantity of component i.
(4-20
)
Where:
m = Number of activities (process, inspection, test);
n = Number of equipment used in activity i;
r = Number of tools used in activity i;
s = Number of labours in activity i;
Rscr_acti = Ratio of set up in activity i;
Dsaej = Deprecation of equipment j in inspection and test i;
Tsaej = Working time of equipment j in inspection and test i;
Dsatk= Deprecation of tool k in inspection and test i;
Tsatk = Working time of tool k in inspection and test i;
Salh = Unit salary of operator h in inspection and test i;
Talh = Working time of operator h in inspection and test i.
The calculation methods of rework cost and repair cost are the same as used in
calculating scrap cost. So Equation (4-17) to (4-20) can be used directly for the
rework or repair cost estimation.

73
Delay Cost is the additional cost resulted from schedule delay. The main reason
for schedule delay is the occurrence of quality issues. Generally when quality
issues happen, the procedure with quality issue will lead to schedule delay, and
the latter step will be postponed at the same time. However, it is difficult to
judge which time quantum belong to waiting time in normal working hours, so
there will be a hypothesis when estimate the schedule delay cost. The
hypothesis is “there will be no schedule delay in normal assembly condition,
and all the delay will be handled in overworking time”. It means that overtime
working is the only thing to be considered when estimated the schedule delay
cost. The schedule delay costs are not the total overtime working, because the
main cost of waiting is labor cost, material, part, equipment and tool are not
used during this time. Hence, the schedule delay cost can be represented by
overtime labor working cost. So the Delay Cost can be expressed by Equation
(4-21).
(4-21)
Where:
n = Number of overtime working labour (operator, inspectors and
testers);
Sdel_acti = Unit salary of overtime working labour i;
Tdel_acti = Working time of overtime working operator i;
External Failure Cost Calculation
Based on the Equation (4-4), the external failure costs are the sum of FRR
compensation (Cfrr) and delivery delay compensation (Cddc). These two kinds of
cost are not related to production factors such as material, component and
activities. They are only associated with the value and quantity of the
compensation. So the External Failure Cost can be represented by Equation (4-
22).

74
(4-22)
Where:
m = Number of FRR compensation;
n = Number of delivery delay compensation;
Cfrci = Unit cost of FRR compensation i;
Cddcj = Unit cost of delivery delay compensation j;
Total, Unit and Proportion of CoQ Calculation
Based on the definition, CoQ consists of four main parts, prevention cost,
appraisal cost, internal failure cost and external failure cost. Hence, the total
CoQ can be shown as Equation (4-23). Unit CoQ is the average CoQ in each
product, so it can be calculated through Equation (4-24). The proportion of CoQ
in total sales is generally used to reflect the influence of CoQ the condition of
quality management. And it can be calculated by the ratio of unit CoQ to the
average price of unit product in this model, as shown in Equation (4-25).
(4-23)
(4-24)
(4-25)
Where:
Ccoq = Total CoQ in estimation period;

75
Cucoq = Unit CoQ for each product in estimation period;
N = Yield of product in estimation period.
Pcoq = Proportion of CoQ in sales;
Paup = Average price of unit product.
4.5.3 CBA Module
CBA is generally used as a decision-making process for comparing costs and
benefits of activities. The objective of CBA is to make decision-making more
reasonable and the distribution of resources more efficient. Most of CBA are
used in evaluating whether a project is worth doing. However, in this model,
CBA is used to support quality management.
Quantitative analysis is very important and useful for quality management.
However, due to the lack of effective method to analyse and calculate the
quality related data, quantitative analysis is generally hardly in use. Hence,
most of investments on quality are based on experience, which may be blind
sometimes due to the lack of the support of data. Therefore CBA may be a
good selection for solving this problem as it can support necessary data for
decision-making. Moreover, the support from CoQES may improve the limitation
of CBA in cost and benefit estimation.
The steps of CBA have been introduced in Chapter 2. And it can be simplified
into three main steps: cost identification and calculation, benefit identification
and calculation and comparative analysis. In this module, CBA focuses on
evaluating the investment on solving quality issues as reducing the number and
cost of quality issues is the main method of quality improvement. So the cost
and benefit involved are all related to quality issues.
4.5.3.1 Cost Elements Identification
The cost in CBA means the investment which can bring benefit for the activity or
project. It is normally considered that prevention and appraisal cost are value-
added which can reduce the unnecessary cost. Meanwhile, internal failure and

76
external failure cost are non-value-added which only increase the total CoQ
(Özkan & Karaibrahimoğlu, 2013). The cost benefit analysis is used to
represent the relationship between the cost and the benefit which is brought
through the cost, and those non-valued-added cost can hardly to find out the
relationship as it is difficult to estimate the benefit. Hence, prevention and
appraisal cost are the cost which considered and discussed in CBA.
However, In order to convenient to analyse the relationship between cost and
benefit, some special limits are necessary in cost and benefit identification.
Firstly, the cost can be assigned a financial value as it is impossible to apply
CBA with a non-quantified parameter. Moreover, there is a relatively clear
relationship between the cost and the benefit which can ensure the benefit can
be identified precisely. Based on these limits, the education and training cost,
and equipment and tool update cost will be the main objectives focused on in
this module.
4.5.3.2 Benefit Elements Identification
The benefit in CBA means the profit which is resulting from the investment. It
can be divided into two parts: profit improvement and cost saving. Profit
improvement is the difference between current profit and former profit which
mainly came from the improvement of sales. Cost saving is the difference
between current cost and former cost which mainly came from the reduction of
unnecessary cost. In aircraft manufacturing industry, the sales volume of
product relies on the orders which are placed by the customers a long period
before manufacturing, and the sales volume of every year had been planned.
So it is impossible to improve the sales volume directly due to investment on
quality. Otherwise, the prices of the product are generally constant except for
special requirements from customers. So it is impossible to increase the profit
by improving the sale price of product. Hence, it will be very difficult to represent
benefit by profit improvement. Therefore, cost saving the most suitable and only
way to represent benefit.
Cost saving generally means the reduction of the unnecessary cost in the
manufacturing process. And failure costs which sometimes are generally

77
thought as the unnecessary cost. As the aim of most of investment on quality is
reducing failure cost. So reduced failure cost will be considered the benefit in
this model. Additionally, according to the industry survey, some ideas to
represent the benefit, such as quality problem reduced and customer
satisfaction improvement, are collected. However, these parameters are hardly
to quantify or compare with cost, so they will not be considered in this model.
Based on the literature and industry survey, the action time of investment are
not same. Some investments may reflect the benefit immediately or in a short
period, while others may need a long time to reflect the total benefit. So benefits
are generally divided into short-term benefit and long-term benefit. Based on
industry survey, the period for short-term benefit reflection is thought to be half
or one year, while the period for long-term benefit is more than three years. So
it is important to determine the category of the benefit before CBA for it may
affect the parameter selection.
4.5.3.3 Cost Benefit Analysis
There are various methods can be used in CBA, including Net-Present Value
(NPV), Internal Rate of Return (FIRR) and Benefit- Cost Ratios (B/C). (B/C) is
the most intuitive and simply one in all these methods (Stenstrom, et al., 2015).
It can be used to analyse the benefit of the investment which have been carried
out, while it can also be used to simulate the prospective (B/C) before
investment, either. In this model, it can be represented by Equation (4-26). In
order to describe simply, β is defined to denote (B/C).
(4-26)
Where:
n = Prospective benefit reflection period;
∆Cinfi = Reduced internal failure cost due to the cost in year i;
∆Cexfi = Reduced external failure cost due to the cost in year i;

78
∆Ceati = Additional education and training cost in year i;
∆Cetui = Additional equipment and tool updating cost in year i.
If β >1, it means that the investment on quality is (will be) profitable in n years; if
β =1, it means there is (will be) no loss of the investment in n years; if β <1, it
means there is (will be) loss of the investment in n years.
There is an important hypothesis in CBA in this model. It is that the influence of
all the production factors is constant to the manufacturing system. For example,
if the investments on quality are the same in two years, then the whole condition
of the manufacturing system in the two years are same. That means that if this
year do not add investment on quality, the category and number of quality
issues, the failure cost which caused by quality issue are same. The hypothesis
is to simplify the calculation and analysis used in CBA.
The flow chart of CBA on quality management is illustrated in Figure 4-22.
Firstly, quality issues are analysed using Pareto Analysis both in number and
cost to determine the main quality issues which will be the main targets of
quality improvement. And the data for Pareto Analysis will be obtained from
CoQES and Quality Issues Analysis module. Secondly, the method to solving
quality issue will be determined and the prospective target and period need to
be set. Thirdly, the cost of the solution in the period will be calculated in CoQES.
Fourthly, the CBA is applied to analyse the same investment before based on
the history data in CoQES. And the maximum β in one year, the minimum β in
one year and the average β in one year will be estimated. Then the maximum
benefit, the minimum benefit and the predicted benefit will be simulated
according to Equation (4-26). Then the benefit will be compared with the
excepted target. If the results meet the requirement, the investment will be
carried out. Otherwise, method and period will be adjusted.
4.6 Summary
In this chapter, the developing process of the CoQ estimation system and CBA
model are illustrated. The industry survey results supplied data and ideas for

79
the development of the model. The CoQ in tailplane assembly are identified and
defined based on the P-A-F classification, then the cost drivers of the activities
used in tailplane assembly are identified and analysed. The main cost drivers in
tailplane assembly are component and labours. Furthermore, CoQ estimation
system development is based on MS Excel. The GUIs are designed by using
VBA. The databases and equations are built in the worksheets. Otherwise, a
CBA module are developed which can analyse the benefit of the cost on quality
relying on the calculation result in CoQES.

80
Quality Issues
Pareto Analysis on
Number of Quality Issue
Pareto Analysis on cost
of Quality Issue
Finding out main
quality issue
Determining method
of investment
Determining CBA
period
Cost
CalculationHistorical β
calculation
Maximum β Minimum β Average β
Benefit
Simulation
Meet
Requirement?
Investment
Yes
No
Figure 4-22 Flow Chart of CBA Module on Quality Management
81
5 VALIDATION OF THE COQ MODEL
5.1 Introduction
This chapter presents the validation process of the developed CoQ model.
Case studies and expert judgements are used for the validation. As the tailplane
assembly process is too complex to collect enough data for all the production
factors, two small cases studies are used. One of the cases is used to discuss
the CoQES based on the Final Assembly Phase in tailplane assembly. The
other one is to illustrate the application of CBA on quality management.
Otherwise, some experts with engineering experiences of quality management
in aircraft manufacturing industry are invited to evaluate and grade the CoQ
model. Based on the results of case studies and experts’ suggestions, the
advantage and disadvantage of CoQ model were discussed.
5.2 Case Study for CoQES Validation
5.2.1 Introduction
The CoQES is designed to be an effective tool to analyse and estimate the CoQ
in assembly process, and a support tool for quality manager to manage and
improve the quality based on the quantitative data. Based on the quality-related
information which is input and stored in the system, the user can obtain the
CoQ information in different years. The estimation result can reflect the CoQ
value, the ratio of different kinds of CoQ in total CoQ and the proportion of CoQ
in sales, all of which will be very useful in planning quality improvement.
The case for CoQES validation is based on the final assembly phase in
tailplane assembly. The flow map of this phase is illustrated in Figure 5-1. All
the data in this case are from the actual production record. As it is difficult to
collect and calculate too much data in such a short period, only one year data is
used in this case. Additionally, the activities involved in this case are those
activities which affect the CoQ most significantly based on the findings of
industry survey. Furthermore, only the labours which are related to these
activities closely will be focused on, such as operator and inspector. Thus, the
production factors used in this case are summarized in Table 5-1.

82
Elevator
Actuator
Installing (Left
Overhanging)
Elevator
Actuator
Installing (Right
Overhanging)
Part Check
Drilling
Actuator
Installing
Identification
Electric Bonding
Part Check
Drilling
Actuator
Installing
Identification
FOD Inspection
LVDT Installing
(Left
Overhanging)
Part Check
LVDT Installing
Identification
FOD Inspection
FOD Inspection
Electric Bonding
Electric Bonding
LVDT Installing
(Right
Overhanging)
Part Check
LVDT Installing
Identification
Electric Bonding
FOD Inspection
Hydraulic Pipe
Installing(Central
Box)
Pipe Installing
FOD Inspection
Hydraulic Pipe
Installing(Left
Overhanging)
Pipe Installing
FOD Inspection
Hydraulic Pipe
Installing(Right
Overhanging)
Pipe Installing
Part Check Part Check Part Check
FOD Inspection
Docking
Prepare(Left
Overhanging)
Part Check
Cementing
Painting
Drilling
Deburring
FOD Inspection
Hole Diameter
Inspection
Docking
Prepare(Right
Overhanging)
Part Check
Cementing
Painting
Drilling
Deburring
FOD Inspection
Docking (Central
Box and Left
Overhanging)
Part Check
Docking
Bearizing
Reaming
Hole Diameter
Inspection
Hole Diameter
Inspection
Fastener
Installing
Drilling
Dimpling
Hole Diameter
Inspection
Painting
Sealing
Fastener
Installing
FOD Inspection
Docking (Central
Box and Right
Overhanging)
Part Check
Docking
Bearizing
Reaming
Hole Diameter
Inspection
Fastener
Installing
Drilling
Dimpling
Hole Diameter
Inspection
Painting
Sealing
Fastener
Installing
FOD Inspection
Angle, Door and
Bracket
Installing (Left)
Part Check
Position
Drilling
Deburring
Hole Diameter
Inspection
Angle Installing
Bearizing
Hole Diameter
Inspection
Bracket
Installing
Door Installing
FOD Inspection
Angle, Door and
Bracket
Installing (Right)
Part Check
Position
Drilling
Deburring
Hole Diameter
Inspection
Angle Installing
Bearizing
Hole Diameter
Inspection
Bracket
Installing
Door Installing
FOD Inspection
Preservative
Painting (Left
Overhanging)
Cleaning
Painting
Drying
FOD Inspection
Preservative
Painting (Right
Overhanging)
Cleaning
Painting
Drying
FOD Inspection
Removable and Fixed
Leading Edge
Subassembly Installing
(Left )
Part Check
Fixed Leading Edge
Subassembly Installing
Removable Leading
Edge Subassembly
Installing
FOD Inspection
Removable and Fixed
Leading Edge
Subassembly Installing
(Right)
Part Check
Fixed Leading Edge
Subassembly Installing
Removable Leading
Edge Subassembly
Installing
FOD Inspection
Trailing Edge
Compartment Skin
Installing(Left)
Part Check
Drilling
Deburring
Hole Diameter
Inspection
Upper Skin
Installing
Down Skin
Installing
FOD Inspection
Trailing Edge
Compartment Skin
Installing(Right)
Part Check
Drilling
Deburring
Hole Diameter
Inspection
Upper Skin
Installing
Down Skin
Installing
FOD Inspection
Tip Cover
Installing (Left
Overhanging)
Part Check
Tip Cover
Installing
FOD Inspection
Tip Cover
Installing (Right
Overhanging)
Part Check
Tip Cover
Installing
FOD Inspection
Door Installing
and Stealing
(Left)
Part Check
Dimpling
Cementing
Door Installing
Sealing
Identification
FOD Inspection
Door Installing
and Stealing
(Right)
Part Check
Dimpling
Cementing
Door Installing
Sealing
Identification
FOD Inspection
X-ray
Inspection and
Weighting
Hoisting
Position
X-ray Inspection
Weighting
FOD Inspection
Horizontal
Measurement
Position
Laser
Measurement
FOD Inspection
Figure 5-1 Flow Map of Final Assembly Phase in Tailplane Assembly

83
Table 5-1 Main Production Factors Used in Case 1
Production Factor Detail
Material Primer, Preservative, Sealant, Coolant, Lubricant
Component
Removable Leading Edge Subassembly, Fixed Leading
Edge Subassembly, Tip Cover Assembly, Central Section,
Elevator, Overhanging Section, Elevator Actuator, Surface
Position LVDT, Angle Stock, Pipe, Joint, Bolt, Nail, Washer,
Screw, Nut, Rivet, Skin, Fuse
Process Riveting, Drilling, Position, Dimpling, Sealing, Reaming.
Inspection and Test Part Check, FOD Inspection, X-ray Inspection, Laser
Measurement
Equipment Self-Feeding Drill, Riveter, Laser Measuring Device, X-ray
Detector
Tool Gauge, Drill, Countersink, Reamer, Docking Pin, Lift Car,
Sling, Docking Car
Labour Operator, Inspector, Quality Manager, Process Designer,
Manufacturing Manager.
5.2.2 Result Analysis
As a consequence, the CoQ estimation results of Case 1 are summarized in
Figure 5-2. From the result, it can be seen that “Internal Failure Cost” is the
main cost in the final assembly phase in tailplane assembly, which accords for
approximately 37.1% in total CoQ. “Appraisal Cost” and “Prevention Cost”
follows with the proportion of 29.2% and 28.3%, respectively. “External Failure
Cost” is the lowest one which is only about 5.4% in proportion. Moreover, the
top three kinds of CoQ are very close that nearly each of them accords for one
third of total CoQ. Furthermore, the sum of the prevention cost and appraisal
cost are close to 60% of the total CoQ, which are far more than the failure cost.
According to the result, the quality condition in this case can be analysed. Firstly,
high internal failure cost means that the quality issues in this process are still
serious and the influence of quality issues to the product cost is remarkable.
Moreover, the appraisal cost takes a great proportion in the total CoQ. From
Figure 5-3, it is clear to see that the inspection and test operation is main one in

84
appraisal cost. In aircraft manufacturing industry, due to the strict requirement
on quality, most of the work has to be 100% inspected. Almost all the processes
need to be inspected when they are finished by the operators. And as
mentioned before, aircraft assembly is a complex progress, which involves tens
of thousands of components and hundreds of processes. 100% inspection used
in such a complex process result in the significant increase of the appraisal cost.
Furthermore, the sum of prevention and appraisal cost exceed the sum of
failure cost means that many investments on quality had been spent in tailplane
assembly to ensure the quality. However, more investments on quality are still
needed to reduce the failure cost, as those costs which cannot add value for the
assembly process are hoped to be as low as possible.
Figure 5-2 Proportion of Different Kind of CoQ in Total CoQ
Figure 5-3 Proportion of Different Kind of CoQ in Appraisal Cost

85
The proportion of CoQ in sales is generally used to reflect the influence of CoQ
to product (Giakatis et al., 2001). As mentioned before, the proportion can be
calculated using the ratio of unit CoQ to price of unit product. However, as the
data used in this case is not the integrated data in the assembly process, the
ratio may be lower than the actual value. Hence, some amendments are
needed to the CoQ value before calculating the proportion.
In order to evaluate the influence of the missing data, a hypothesis is set to
amend the value of CoQ. The hypothesis is: “Cost of the activities which are not
considered in the calculation own the liner relationship with the cost of activities
used in the calculation”. For example, there may be fifteen processes used in
tailplane assembly, but only six of them are considered in the calculation. The
cost of other nine processes can be estimated using the product of the
proportionality coefficient and cost of the six used processes. According to
industry survey, the activities used in the estimation process are 10 activities
with most significant influence on cost. The proportionality coefficients for these
activities are less than 1 base on the experience of a quality engineer with more
than 10 years working experience. Hence, the coefficient is set to be 1 which
means that the costs of missing activities are equal to the used activities.
Additionally, the estimation is based on the final assembly phase, and the CoQ
in other phases are not considered. More amendment is needed to the CoQ
value. An experience rate was obtained from a quality engineer with more than
10 years working experience. He thought the CoQ in final assembly phase is
approximately 30% of the total CoQ. So the CoQ values are amended based on
the hypothesis and the experience rate. Figure 5-4 shows the comparison of the
ratio using original CoQ value and amended value. It can be seen that the
proportion CoQ in sales using amended CoQ value is approximately 17.5%. It is
close to the theory value: 21% to 30%, which is the result of industry survey.
Though the amended CoQ which based on hypothesis and experience rate
cannot represent the actual value, it still prove that the CoQES can be used to
estimate the CoQ in tailplane assembly with an acceptable tolerance if there is

86
enough necessary data. However, verification process and improvement are
still necessary before the CoQES is used to actual manufacturing condition.
Figure 5-4 Proportion of CoQ in Sales
5.3 Case Study for Application of CBA
5.3.1 Introduction
In this case, a simplified process is selected to validate the application of CBA
in order to make the results simply to analyse and discuss. The flow map of the
process is illustrated in Figure 5-5.
Figure 5-5 Flow Map of Case 2
According to the flow chart shown in Figure 4-9, the quality issues are analysed
to determine the investment object and method. Figure 5-6 and 5-7 shows the
results of Pareto Analysis on quality issues. It can been seen that the Hole
problems which are caused by equipment failure are the main quality issue both

87
in the number and the cost. So CBA is used to evaluate the investment on the
solution of hole problem caused by equipment failure. The excepted target is
that failure costs caused by this kind of quality issue are reduced 30% in three
years and the investment can be one of the solution is to add 50% maintenance
time every year, the other solution is to purchase 5 new equipment. Both of
solutions are applied CBA and the results are analysed and compared as follow.
Figure 5-6 Pareto Analysis on Quality Issue Number
Figure 5-7 Pareto Analysis on Cost of Quality Issue
5.3.2 Result Analysis
Figure 5-8 illustrates the CBA result of solution 1. The maximum β in one year
for equipment maintenance in history data is 0.35, the minimum β in one year is

88
0.24, and the average β in one year is 0.3. Hence, in three years, the maximum
benefit can be 1.05 times of the cost on equipment maintenance in the first year,
the minimum benefit can be 72% of the cost, and the predicted benefit is 90% of
the cost. Additionally, according to the cost on additional equipment
maintenance and the predicted β, the predicted benefit in the three years was
estimated, and it was only 12% of the current failure costs which were caused
by equipment failure. So based on the result, the solution 1 can almost meet the
excepted target about the return of investment, but cannot meet the excepted
target about the benefit value.
Figure 5-9 shows the CBA result of solution 2. The maximum β in one year for
new drilling equipment in history data is 0.21, the minimum β in one year is 0.15,
and the average β in one year is 0.18. So in three years, the maximum benefit
can be 63% of the cost of purchasing new equipment in the first year, the
minimum benefit can be 45% of the cost, and the predicted benefit is 54% of the
cost. Additionally, according to the cost on new equipment and the predicted β,
the predicted benefit in the three years was estimated, and it was 33% of the
current failure costs which were caused by equipment failure. So based on the
result, the solution 2 can meet the excepted target about the benefit value but
cannot meet the excepted target about the return of investment.
Comparing the two results, it can be found that both of the solutions cannot
meet all the excepted targets. So some new method may be analysed if the
excepted targets are not changed. However, focusing on one target may be a
good way. If the return of investment is thought to be more important, solution 1
is the better choice. In contrast, solution 2 should be selected.
From the results, it is clear that the CBA module can supply useful reference
information for the user in decision-making on quality investment. And it is
simply to obtain more feasibility analysis results through changing the
parameters used in solutions which can help the user to analyse the solution
systematically. However, due to the simulated value relying on the history data
significantly, there may be limitations when apply this method in a process with
no enough history data. Moreover, the average β may be suit for the long-term
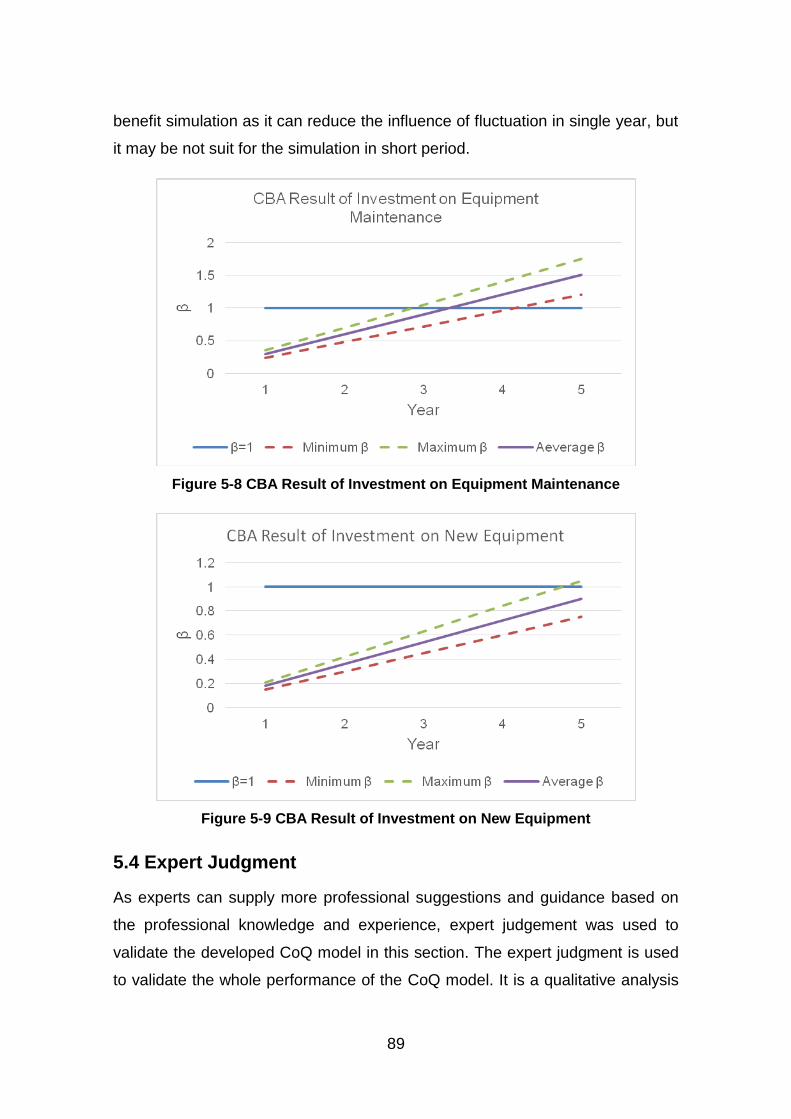
89
benefit simulation as it can reduce the influence of fluctuation in single year, but
it may be not suit for the simulation in short period.
Figure 5-8 CBA Result of Investment on Equipment Maintenance
Figure 5-9 CBA Result of Investment on New Equipment
5.4 Expert Judgment
As experts can supply more professional suggestions and guidance based on
the professional knowledge and experience, expert judgement was used to
validate the developed CoQ model in this section. The expert judgment is used
to validate the whole performance of the CoQ model. It is a qualitative analysis

90
result based on the working experience of these experts. The main aim of the
expert judgment is to validate whether this model is suit for the aircraft
manufacturing industry. In order to collect opinions widely, six experts from
three different companies in aircraft manufacturing industry in China were
invited for evaluation. The general information of these experts was illustrated in
Table 5-2. In accordance with the requirements of experts, the names of their
companies are not mentioned in the thesis.
Table 5-2 General Information of Experts
Expert Company Type Responsibility Working
Experience
A Aircraft Design Overall Design Senior Engineer 8 years
B Aircraft Design Project Management Engineer 6 years
C Aircraft Manufacturing Quality Management Senior Engineer 12 years
D Aircraft Manufacturing Project Management Engineer 7 years
E Aircraft Manufacturing Quality Management Engineer 8 years
F Aircraft Manufacturing Process Design Engineer 10 years
As all the experts are abroad, it is impossible to arrange a face to face
validation session. Hence, the CoQ model is sent to these experts through E-
mail, and the results of case studies are submitted to them at the same time. In
order to ensure the experts can use the CoQES conveniently, an instruction
was attached to the model together.
Otherwise, a grading form (see Appendix B) is designed to collect the
suggestions and comments from the experts. The form includes two parts
content. One part is the grading for the CoQ model. The experts who attend this
validation will grade the CoQ model based on their own application results and
the case studies results which supplied them before. Five scores are designed
to represent different level of the CoQ model: score 1 means very bad; score 2
means bad; score 3 means not bad; score 4 means good and score 5 means

91
very good. The average value of the six scores from experts will be used to
represent the level of performance of CoQ model in different aspects. The
experts will grade the CoQ model from six aspects, which are overall
performance, convenience, operability, reliability, applicability and
generalizability, respectively. The result of grade will be collected to analyse the
level of the CoQ model. The other part is opinions and suggestions collection.
The experts will give theirs opinions on the advantage and limitation of the CoQ
model, and make suggestions for the improvement in the form. The information
is very important and useful for the improvement of model and the
determination of the future work.
The results of the grading for CoQ model are illustrated in Figure 5-10. It can
be found from the result that the CoQ model had been approved by the experts
as all the average score value are not lower than 3 which means that all the
aspects of the CoQ model are not bad in experts mind. In all these
characteristics, convenience and operability are thought as good. It may be due
to the application of the GUI which can supply user-friendly interface to the
users. The performance of applicability and generalizability are regarded
between not bad and good. It may be due to the combination of theory practice.
The identification and definition of CoQ are based on the actual manufacturing
progress, so the parameters and calculation methods may be suit for the aircraft
industry. Moreover, many aircraft manufacturing company are lack of the
systematic CoQ management methods, so this CoQ model can be a template
for these companies. That may be why the experts considered it is worth to
promotion. The score of reliability is the lowest. Though score 3 means not bad,
as a core index, it is still not meet the anticipated effect. The reason for this may
be the over simplification of the actual manufacturing process and the overlook
of some kinds of CoQ which are hidden or difficult to quantify in the phase of
identification and definition. One of the experts gave explanation for the issue in
his feedback. He said that it needs too much data to validate the reliability for
this model, and it is impossible to collect enough data in a short period by one
person. So most of the judgements on this characteristic are based on the case
results supplied to him. As it is not his own practice result, so he could only give
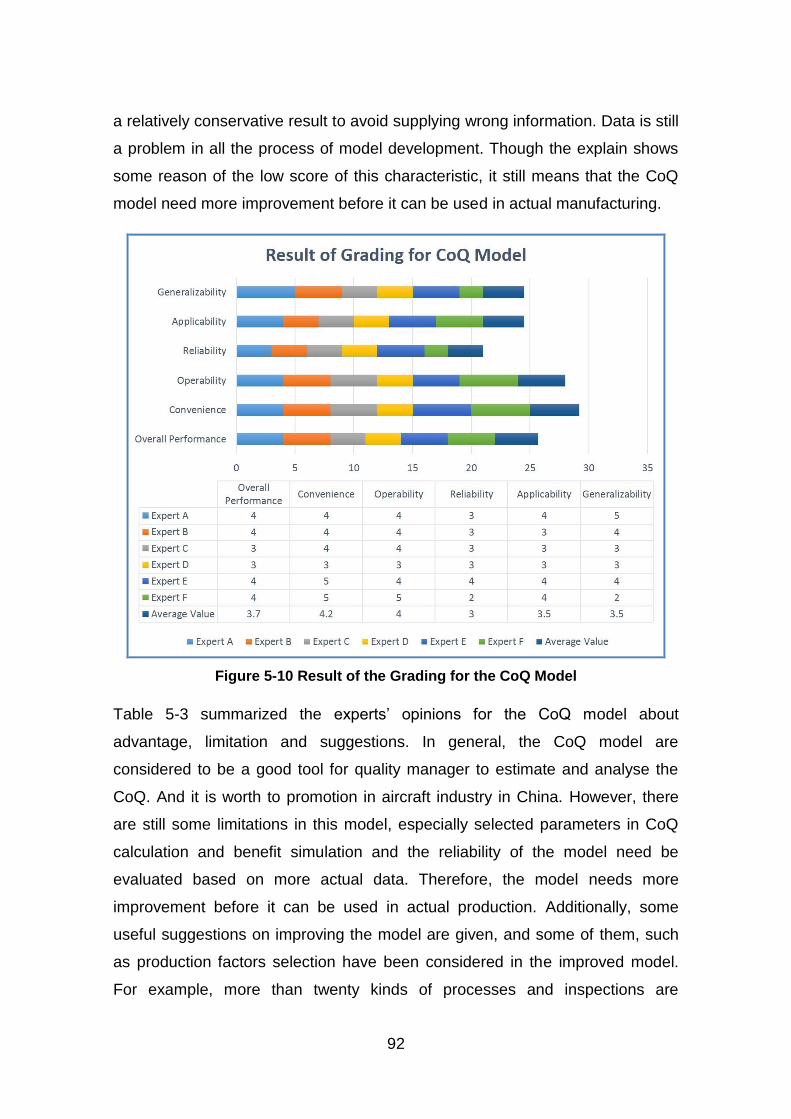
92
a relatively conservative result to avoid supplying wrong information. Data is still
a problem in all the process of model development. Though the explain shows
some reason of the low score of this characteristic, it still means that the CoQ
model need more improvement before it can be used in actual manufacturing.
Figure 5-10 Result of the Grading for the CoQ Model
Table 5-3 summarized the experts’ opinions for the CoQ model about
advantage, limitation and suggestions. In general, the CoQ model are
considered to be a good tool for quality manager to estimate and analyse the
CoQ. And it is worth to promotion in aircraft industry in China. However, there
are still some limitations in this model, especially selected parameters in CoQ
calculation and benefit simulation and the reliability of the model need be
evaluated based on more actual data. Therefore, the model needs more
improvement before it can be used in actual production. Additionally, some
useful suggestions on improving the model are given, and some of them, such
as production factors selection have been considered in the improved model.
For example, more than twenty kinds of processes and inspections are
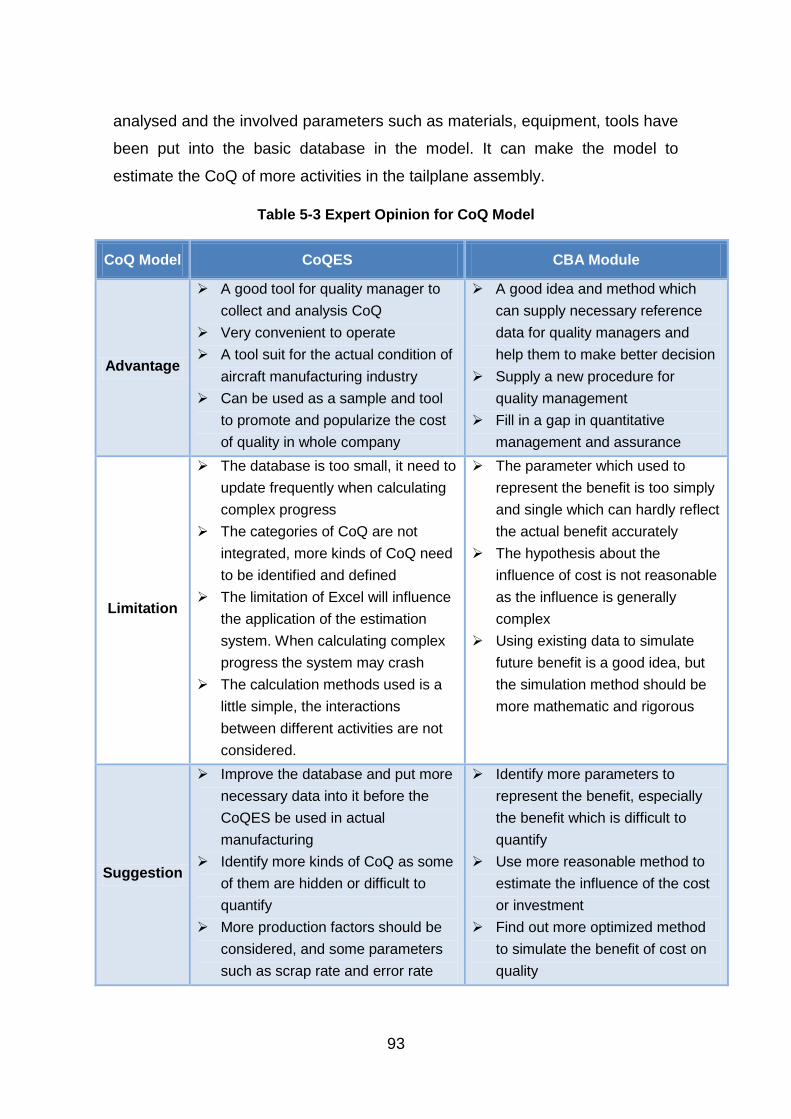
93
analysed and the involved parameters such as materials, equipment, tools have
been put into the basic database in the model. It can make the model to
estimate the CoQ of more activities in the tailplane assembly.
Table 5-3 Expert Opinion for CoQ Model
CoQ Model CoQES CBA Module
Advantage
A good tool for quality manager to
collect and analysis CoQ
Very convenient to operate
A tool suit for the actual condition of
aircraft manufacturing industry
Can be used as a sample and tool
to promote and popularize the cost
of quality in whole company
A good idea and method which
can supply necessary reference
data for quality managers and
help them to make better decision
Supply a new procedure for
quality management
Fill in a gap in quantitative
management and assurance
Limitation
The database is too small, it need to
update frequently when calculating
complex progress
The categories of CoQ are not
integrated, more kinds of CoQ need
to be identified and defined
The limitation of Excel will influence
the application of the estimation
system. When calculating complex
progress the system may crash
The calculation methods used is a
little simple, the interactions
between different activities are not
considered.
The parameter which used to
represent the benefit is too simply
and single which can hardly reflect
the actual benefit accurately
The hypothesis about the
influence of cost is not reasonable
as the influence is generally
complex
Using existing data to simulate
future benefit is a good idea, but
the simulation method should be
more mathematic and rigorous
Suggestion
Improve the database and put more
necessary data into it before the
CoQES be used in actual
manufacturing
Identify more kinds of CoQ as some
of them are hidden or difficult to
quantify
More production factors should be
considered, and some parameters
such as scrap rate and error rate
Identify more parameters to
represent the benefit, especially
the benefit which is difficult to
quantify
Use more reasonable method to
estimate the influence of the cost
or investment
Find out more optimized method
to simulate the benefit of cost on
quality

94
can be used in calculation
Advanced software may to select if
the CoQES is planned to calculate
more complex progress such as
aircraft general assembly
5.5 Summary
In this Chapter, case studies and experts judgements are used to validate the
developed CoQ model. The result of Case 1 which is used to analyse the
capacity and reliability of the CoQES showed that the CoQES can be used to
estimate the CoQ in the aircraft manufacturing industry, but the reliability need
to be validated through more verification process based on integrated data.
Case 2 demonstrated the application of the CBA on investment analysis and
quality management. Finally, some experts from aircraft industry graded for the
CoQ model, the result of which showed that the CoQ model is not bad in all
aspects, and good in convenience and operability. And future work need to
done to improve the model before it was used in actual production.

95
6 DISCUSSION AND CONCLUSIONS
6.1 Introduction
A CoQ model for tailpane assembly which consists of CoQES and CBA module
was developed in Chpter 4, and case studies and expert judgements were used
to validate the overall performance of the CoQ model from different aspects in
Chapter 5. In this chapter, the fulfillment of the aim and objectives of this
research will be discussed. Moreover, the main findings will be summarized and
conclusions will be stated. Furthermore, achievement and limitation of the
research will be presented, and future work will be proposed.
6.2 Discussion
At the beginning of the research, the aim had been represent to develop a CoQ
model which can be used to analyse and estimate the CoQ in tailplane
assembly. In order to achieve the target, several objectives were set in Chapter
1. Based on the finished work, the fulfilment of each objective will be discussed
in this section.
6.2.1 Fulfilment of the Objectives
The first three objectives are the identification and definition of the necessary
parameters which applied in the CoQ model, including: CoQ in tailplane
assembly, cost drivers and benefit. They were the preparation of the CoQ
model development, and were mainly achieved through literature review, actual
operation analysis and industry survey. The theory definition and categories of
the CoQ, cost drivers and benefit were mainly be found through the literature,
includes thesis, books, papers and reports which are related to the topic. The
actual data were collected through the analysis of the operation report and
quality report in an aircraft company in China and the industry survey in the
aircraft manufacturing industry in China. As stated in Chapter 4, the CoQ in
tailplane assembly can be divided into prevention cost, appraisal cost, internal
failure cost and external failure cost according to the classical P-A-F model.
96
The production factors and activities for the CoQ were identified and defined
based on the ABC approach. The cost drivers for the CoQ in tailplane assembly
can be divided into five groups, materials, component, equipment, tool and
labour, and component and labour are the two main cost drivers. Benefit in
tailplane is difficult to identify and represent quantitatively. Based on literature
and industry survey, the cost saving is the best way to reflect the benefit of cost
on quality, and time will be an important factor which effect the value of benefit.
The fourth and fifth objectives are CoQ model development. The CoQ model
developed in this research consists of two main parts: CoQES and CBA modul.
Based on the identification and definition of CoQ elements, the equations for
calculating every element were designed and developed. Then the framework
of the CoQES was set up. In order to make the estimation system more
convenient to use for the user, GUI was developed with VBA in the MS Excel
based on the framework. The GUI consists of Login interface, Main Menu,
Quality Information Input Interface, Cost Information Input Interface, Estimation
Interface and Report Interface. These interfaces are used to collect, store,
calculate and output the CoQ. It can make the CoQES simple to operate for
different users, and it make the CoQES to be a real tool for the user. Database
is a very important part for the system. Some basic database is built according
to the data supplied by an aircraft manufacturing company and collected
through industry survey. Based on the data in the database and inputted by the
user, the CoQ can be calculated through the equations designed before in the
system. Finally, the calculation result will be summarized in a CoQ estimation
report and spread to the user for analysis.
CBA application in the CoQ model is an attempt as it is scarcely used in quality
improvement. In order to analyse the cost and benefit quantitatively, the cost
and benefit used in the CBA are redefined. And a classical method for CBA is
used to analyse the relationship between cost and benefit. Two main possible
application of the CBA module were introduced.
The final objective is to validate the CoQ model. A case study based on the final
assembly phase in tailplane assembly is used to validate the performance of the

97
CoQES. Moreover, another case study based on simple assembly process are
used to demonstrate the application of the CBA module. Finally, expert
judgements is used to validate the integrated model. The experts graded the
CoQ model and gave suggestions for the future improvement.
6.2.2 Application of the CoQ Model
It has been proposed that the aim of the research is to develop a CoQ model
which can be used to analyse and estimate the CoQ in tailplane assembly. The
CoQ model was developed and validated through the work illustrated in Chapter
4 and Chapter 5. This section will focus on the characteristic of the CoQ model
and the application of the CoQ model.
Firstly, according to the identification and definition of the CoQ, the categories
of CoQ in this model are based on traditional P-A-F classification which is
accepted widely in many fields. So the model will be suit for the company which
used P-A-F classification in quality cost management. Moreover, the cost
elements selected in the model were the analysis results through comparing the
theory categories and actual operation of tailplane assembly. Some of the cost
elements may be the characteristics of the aircraft industry, such as FRR
compensation. So the CoQ model will be suit for the aircraft manufacturing
industry, especially for the tailplane assembly. Furthermore, ABC is used for the
estimation of CoQ of this model, so the parameters and calculation methods are
based on the ABC methods, it means that the CoQ model will be suit for the
company which adopts the ABC in costing management. Finally, the CoQ
model only focus on the manufacturing phase of the production, other phases
such as design and sell are not considered. So it may be only can be used in
the manufacturing phase. In conclusion, the CoQ model is best for estimating
the CoQ in manufacturing in the tailplane assembly company which uses P-A-F
classification in quality management and uses ABC in costing management.
However, it is only the most suitable application environment. Actually, the
influence of the methods used in quality and cost management on the CoQ
model is not remarkable, some modification on the original methods may solve
the issue. And for some company which is lack of the systematic management

98
on CoQ, the CoQ model can be applied directly, it can be seen as the basic of
the new CoQ management. So the CoQ model may be widely used in aircraft
manufacturing industry.
Otherwise, the purpose of the CoQ model is to analyse and estimate the CoQ.
As the duty on CoQ management mainly belong to quality manager in many
manufacturing industries. So quality manager may be the main user of the
model. The quality information collected and stored in the system and the
estimation result may help the quality manager to decide the direction of quality
improvement and the result of CBA may supply necessary data for the decision-
making of the detail method to solve quality issue. Moreover, as quality
manager is not the only person when handle quality issue, the participants with
other responsibility, such as process design and structure design, may be the
user of the CoQ model.
6.3 Conclusions
In conclusion, the process for developing and validating a CoQ model which is
suit for the CoQ analysis and estimation in tailplane assembly are stated in this
thesis. The CoQ model enables the user to estimate and analyse the CoQ in
the manufacturing progress, and it also own the capacity to analyse the
relationship between the cost spend on quality and the benefit it brings. It may
help quality manager to make better decision on handling quality issues and
perfecting quality management system.
The research results could be summarized as follows:
Component and Labour are the two main influence factors in the CoQ
estimation process in tailplane assembly.
The estimation results of CoQ in tailplane assembly are different from
many other industries. Though Internal Failure Cost is still the main cost,
the Appraisal Cost is very high which is close to the Internal Failure Cost.
And the sum of Prevention Cost and Appraisal Cost are far more than
Failure Cost in tailplane assembly.

99
Cost Benefit Analysis may be an efficient method to help the quality
manager to make better decision on quality improvement.
The overall performance of the developed CoQ model is approved by the
experts in aircraft industry. The model is suit for aircraft manufacturing
industry and worth popularizing in this field.
6.4 Research Contributions
To sum up, amounts of work have been done in this research, and the
contributions of these works can be summarized as follow:
Firstly, the research illustrates an integrated process of CoQ modelling based
on an actual application background. From the requirement analysis to the data
collection, from the framework developing to the model validating, all the ideas
and approaches of developing the CoQ model can be seen as a sample to
develop CoQ model in other fields.
Moreover, it supplies a method to analyse and handle quality issues
quantitatively. CoQES can be used to estimate the CoQ which result from
quality issue, and CBA module can be applied in the analysis the benefit of the
cost on quality, all these information may help the quality manager to make the
right decision in quality issue handling and quality improvement.
Furthermore, the CoQ model can be popularized readily as a quality
management tool in the aircraft manufacturing industry due to its good
performance and high operability. It can be used as the basic of CoQ
management in the companies which is lack of systematic method in CoQ
management.
6.5 Research Limitations
Though the CoQ model can be used in CoQ analysis and estimation in tailplane
assembly, there are still some limitations for the model which may affect the
application of the model.

100
Firstly, the application scope of the CoQ model is limited. Based on the analysis
above, the CoQ model was developed based on the actual manufacturing
background, and the CoQ definition and equations are suit for the tailplane
assembly. Though some small modification can make it suit for other aircraft
manufacturing phase, it is difficult to be applied in other manufacturing field,
such as textile.
Secondly, the basic database in the CoQES is too simple which may affect the
application of the model, and the parameters selected in calculation equations
are based on the activities with most significant influence on cost, they may be
not enough to some complex activities. So the improvement of CoQES is
necessary.
Thirdly, the validation for the CoQ model is not enough. According to the result
in Chapter 5, there is only one year data used in Case 1, and the data may be
not integrated in such short period, so the result may be not reflect the actual
condition of CoQ in tailplane assembly. And as mentioned in the expert
judgement, amount of data is necessary to evaluate the reliability of the CoQ
model which need to be collected in a long time, so more validation for the CoQ
model is necessary.
Finally, the method used in CBA is the simplest one, and some financial
relationship could not be reflected and considered in this method. It may affect
the result simulation result. Otherwise, the method to simulate the future benefit
is a little simple as it is impossible to vary by the same proportion in different
year. So more coefficients which are used to represent the trend of change
need to be considered.
6.6 Future Work
As presented previously, there are still some limitations for the developed CoQ
model, so future work need to done for the improvement of the CoQ model. And
the recommended future work can be summarized as follows:
Firstly, CoQES needs to be improved. More basic data which belongs to the
activities which not considered in the system need to be put into the system.

101
And the calculation method of complex activities will be analysed and more
parameters will be introduced into the calculation system. Based on the
improvement work, the CoQES is planned to be used in CoQ estimation in
whole airplane assembly.
Moreover, more validation will be designed and tried. More estimation results of
CoQ in different years will be collected and analysed together. The composition
of CoQ and the proportion of CoQ in total cost will be discussed again based on
the results.
Furthermore, other methods of CBA will be considered to be used in CBA
module, such as NPV and FIRR. More parameters will be introduced into the
benefit simulation, and actual data will be collected to analyse the influence of
the cost to benefit. And the application based on actual process and data will be
summarized and discussed.
6.7 Summary
In this chapter, the achievement of the objectives was discussed firstly, and all
the objectives were fulfilled in the process of developing CoQ model. Then the
application of the CoQ model was discussed, and the CoQ model may be
popularized in aircraft manufacturing industry and quality managers may be the
main user of the model. Moreover, the conclusions for the research were
summarized. Furthermore, the contributions and limitations of the research
were discussed. Finally, future work for the improvement of the CoQ model was
proposed.

102
REFERENCES
Agyapong-Kodua, K. (2009). Multi-product cost and value stream modelling in
support of business process analysis. Thesis (PhD). Wolfson School of
Mechanical and Manufacturing Engineering, Loughborough University, UK.
Albright, T.L. & Roth, H.P. (1992). The measurement of quality costs: on
alternative paradigm. Accounting Horizons. 6(2), 15–27.
Ali, H., Arif, W., Pirzada, S.D., Khan, A.A. & Hussain, J. (2012). Classical model
based analysis of cost of poor quality in a manufacturing organization. African
Journal of Business Management. 6(2), 670-680.
Andrade, M. C., Filho, R. C. P., Espozel, A. M., Maia, L. O. A., and Qassim, R.
Y. (1999). Activity-Based Costing for Production Learning. Int. J. Prod. Econ.
62(3), 175–180.
ASQC. (1970). Quality Costs – What and How, American Society for Quality
Control. New York, NY, p. 54.
Bajpai, A.K. (1989). Cost and Benefit of Quality: Computer Simulation. PhD
thesis. Nottingham University.
Banazadeh, A. & Jafari, M.H. (2012). A heuristic complexity-based method for
cost estimation of aerospace systems. Journal of Aerospace Engineering.
227(11), 1685–1700.
Besterfield, D.H. (1994). Quality control (4th edit.). New Jersey: Prentice-Hall
International.
Bland, F.M., Maynard, J., & Herbery, D.W. (1998). Quality costing of an
administrative process. The TQM Magazine. 10(5), 367–377.
Boardman, N. E. (2006). Cost-benefit Analysis: Concepts and Practice (3rd
edit.). Upper Saddle River, NJ: Prentice Hall. ISBN 0-13-143583-3.
Boehm, B. (1984). Software engineering economics. IEEE Transactions of
Software Engineering. 10 (1), 7–19.

103
Brady, C. (2014). The Boeing 737 Technical Guide. Available at:
https://books.google.co.uk/books?hl=en&lr=&id=rqskCQAAQBAJ&oi=fnd&pg=P
R1&dq=boeing+737&ots=FQjse6-ziP&sig=clGXNTh-M3Hbk7pxsQ1o-
GF8Flc#v=onepage&q=boeing%20737&f=false, p: 21.
BS4778. (1987). Quality Vocabulary. British Standards Institute. London.
BS6143. (1990). Guide to Determination and Use of Quality Related Costs.
British Standards Institute. London, p: 16.
Campanella, J. (1999). Principles of quality costs (3rd edit.). Milwaukee, WI:
American Society for Quality.
Caputo, A.C. & Pelagagge, P.M. (2008). Parametric and neural methods for
cost estimation of process vessels. International Journal of Production
Economics. 112(2), 934–954.
Chen, C.C. & Yang, C.C. (2002). Cost-effectiveness based performance
evaluation for suppliers and operations. Quality Management Journal. 9(4), 59–
73.
Chen, Y.S. &Tang, K. (1992). A pictorial approach to poor-quality. IEEE
Transactions on Engineering Management. 39 (2), 149-157.
Chiadamrong, N. (2003). The development of an economic quality cost model.
Total Quality Management and Business Excellence. 14 (9), 999-1014.
Collopy, P. & Curran, R. (2005). The challenge of modeling cost: the problem.
In: Proceedings of the 1st International Conference on Innovation and
Integration in Aerospace Sciences, Belfast, United Kingdom.
Crossfield, R. T. & Dale, B. G. (1990). Mapping quality assurance systems: A
methodology. Quality and Reliability Engineering International. 6 (3), 167–178.
Curran, R., Raghunathan, S. & Price, M. (2004). Review of aerospace cost
modelling: The genetic causal approach. Progress in Aerospace Sciences. 40
(8), 487–534.
Curran, R., Kundu, A.K., Wright, J.M., Crosby, S., Price, M., Raghunathan, S. &

104
Benard, E. (2006). Modelling of aircraft manufacturing cost at the concept stage.
International Journal of Advanced Manufacturing Technology. 31 (3&4), 407–
420.
Defra.(2009). Appraisal of Flood and Coastal Erosion Risk Management: A
Defra Policy Statement. Bristol, UK: Environment Agency. Available at:
http://www.defra.gov.uk/publications/2011/03/30/pb13278-erosion-management
Denzer, H.O. (1978). Quality cost system in electronics. Proceedings of the 5th
Annual National Conference on Nuclear Power. p. B3/1.
Eisele, W. (2002). Technology of accounting: Financial Accounting, Cost and
Performance accounting, special balance sheets (7, completely. Überarb. And
exp. Ed). Vahlens manuals of economic and social sciences. Munich: Vahlen.
Ekinci, C. (2013). Trends in Aerospace Assembly: Measurement Assisted
Assembly- Measurement Devices Providing Guidance for Assembly. Available
at: http://www.builditsoftware.com/2013/09/measurement-assisted-assembly-
guidance/
Encyclopaedia Britannica. (2006). Boeing 737: Cross Sections. Available at:
http://www.britannica.com/technology/airplane/images-videos.
Fann, N., Roman, H.A., Fulcher, C.M., Gentile, M.A., Hubbell, B.J., Wesson, K.
& Levy, J. (2011). Maximizing health benefits and minimizing inequality:
Incorporating local-scale data in the design and evaluation of air quality policies.
Risk Analysis. 31(6), 908–922.
Feigenbaum, A. (2001). How to manage for quality in today’s economy. Quality
Progress. May, 26-7.
Foussier, P.M.M. (2006). From product description to cost: A practical approach.
Vol. 1: The parametric approach. Berlin: Springer.
Fox, M.J. (1989). The great economic quality hoax. Quality Assurance. 15(2),
72.
Fruin, R.E. (1986). Productivity gains from company-wide quality achievements.
105
IEEE International Conference on Communications 86: Integrating the World
through Communications. Conference Record. 86, 163.
Giakatis, G., Enkawa, T., & Washitani, K. (2001). Hidden quality costs and the
distinction between quality cost and quality loss. Total Quality Management.
12(2), 179–190.
Goulden, C. & Rawlins, L. (1995). A hybrid model for process quality costing.
International Journal of Quality & Reliability Management. 12 (8), 32 – 47.
Harry, M.J. & Schroeder, R. (2000). Six Sigma: The breakthrough management
strategy revolutionizing the world’s top corporations. New York: Doubleday,
Random House.
Hochrainer-Stigler, S., Kunreuther, H., Linnerooth-Bayer, J., Mechler, R.,
Michel-Kerjan, E., Muir-Wood, R., Ranger, N., Vaziri, P. & Young, M. (2011).
The Costs and Benefits of Reducing Risk from Natural Hazards to Residential
Structures in Developing Countries. Philadelphia: Risk Management and
Decision Processes Center, University of Pennsylvania.
Hwang, G.H. & Aspinwall, E. M. (1996). Quality cost models and their
application: A review. Total Quality Management. 7(3), 267-282.
Juran, J. M. (1952). Quality Control Handbook. 1st Edn (New York, McGraw-Hill).
Juran, J.M. & Gryna, F.M. (1951). Juran’s Quality Control Handbook. New York:
McGraw-Hill.
Kent, R. (2005). Manufacturing strategy for window fabricators 14 – the cost of
quality. Tanagram Technology. Available at: www.tanagram.co.uk.
Koltai, T., Lozano, S., Guerrero, F., and Onieva, L. (2000). A Flexible Costing
System for Flexible Manufacturing Systems Using Activity-Based Costing. Int. J.
Prod. Res. 38(7), 1615–1630.
Krishnan, S.K., Agus A., & Husain, N. (2000). Cost of quality: The hidden costs.
Total Quality Management. 11(4, 5 & 6), 844–848.
Layer, A., Brinke, T.E., Houten, V.F., Kals, H. & Haasis, S. (2002). Recent and

106
future trends in cost estimation. International Journal of Computer Integrated
Manufacturing. 15 (5), 499–510.
Li, J., Pollard, S., Kendall, G., Soane, E. & Davies G. (2009). Optimising risk
reduction: An expected utility approach for marginal risk reduction during
regulatory decision making. Reliability Engineering and System Safety. 94(11),
1729–1734.
Liebers, A. (1998). An architecture for cost control, the use of cost information in
order-related decisions. Thesis (PhD). University of Twente. Enschede, the
Netherlands.
Lim, C., Sherali, D.H. & Glickman, S.T. (2015). Cost-of-Quality Optimization via
Zero-One Polynomial Programming. IIE Transactions. 47 (3), 1–16.
Marcellus, R.L. & Dada, M. (1991). Interactive process quality improvement.
Management Science. 37(11), 1367.
Marsh, J. (1989). Process modeling for quality improvement. Proceedings of the
Second International Conference on Total Quality Management. p. 111.
Meckley, L.M., Gudgeon, J.M., Anderson, J.L., Williams, M.S. & Veenstra,
APDL. (2010). A policy model to evaluate the benefits, risks and costs of
warfarin pharmacogenomic testing. Pharmacoeconomics. 28(1), 61–74.
Merino, D.N. (1988). Economics of quality: choosing among prevention
alternatives. International Journal of Quality Reliability Management. 7, 13± 23.
Michael. (2009). Boeing 787 Dreamliner for Flight Test Enters Final Assembly.
Available at: http://blog.flightstory.net/1129/boeing-787-dreamliner-for-flight-test-
enters-final-assembly.
Mouzon, G., Yildirim, Y.B. & Twomey, J. (2007). Operational methods for
minimization of energy consumption of manufacturing equipment. International
Journal of Production Research. 45 (18&19), 4247-4271.
Niazi, A., Dai, S.J., Balabani, S. & Seneviratne, L. (2006). Product Cost
Estimation: Technique Classification and Methodology Review. Journal of

107
Manufacturing Science and Engineering. 128 (2), 563-575.
Omurgonulsen, M. (2009). A research on the measurement of quality costs in
the Turkish food manufacturing industry. Total Quality Management & Business
Excellence. 20 (5), 547–562.
Özkan, Z. & Karaibrahimoğlu, Z.Y. (2013). Activity-based costing approach in
the measurement of cost of quality in SMEs: a case study. Total Quality
Management & Business Excellence. 24 (3&4), 420-431.
Paltrinieri, N., Bonvicini, S., Spadoni, G. & Cozzani, V. (2012). Cost-benefit
analysis of passive fire protections in road LPG Transportation. Risk Analysis.
32(2), 200–219.
Porter, L.J. & Rayner, P. (1992). Quality costing for total quality management.
International Journal of Production Economics. 27(1), 69-81.
Prickett, T.W. & Rapley, C.W. (2001). Quality costing: A study of manufacturing
organizations. Part 2: Main survey. Total Quality Management. 12 (2), 211–222.
Qian, L., Ben-Arieh, D. (2008). Parametric cost estimation based on activity-
based costing: a case study for design and development of rotational parts.
International Journal of Production Economics. 113 (2), 805–818.
Rose, A., Porter, K., Dash, N., Bouabid, J., Huyck, C., Whitehead, J., Shaw, D.,
Eguchi, R., Taylor, C., McLane, T., Tobin, L.T., Ganderton, P.T., Godschalk, D.,
Kiremidjian, A.S., Tierney, K., West, C.T. (2007). Benefit-cost analysis of FEMA
hazard mitigation grants. Natural Hazards Review. 8 (4), 97–111.
Rossi, P.H., Wright, J.D. & Anderson, A.B. (2013). Handbook of survey
research. Available at :
https://books.google.co.uk/books?hl=en&lr=&id=8EW0BQAAQBAJ&oi=fnd&pg=
PP1&dq=handbook+of+survey+research&ots=eKTQ4s2fWL&sig=XHIaXlmINk-
FuxO6REKl4fLpcxQ#v=onepage&q=handbook%20of%20survey%20research&f
=false. p, 196.
Roy, R., Bendall, D., Taylor, J.P., Jones, P., Madariaga, A.P., Crossland, J. &
108
Hamel, J. (1999). Taylor IM. Development of airframe engineering CERs for
military aero structures. In: Durham, UK Second world manufacturing congress
(WMC’99); 27–30 September.
Roy, R. & Palacio, A. (2000). Cost estimating and risk analysis in manufacturing
processes. Proceedings of MATADOR 2000 conference, 13–14 July,
Manchester, UMIST. 177–182.
Rush, C. & Roy, R. (2000). Analysis of cost estimating processes used within a
concurrent engineering environment throughout a product life cycle. 7th ISPE
international conference on concurrent engineering: Research and applications,
17–20 July, Lyon, France. Pennsylvania, USA: Technomic. 58–67.
Rush C, Roy R. (2001). Expert judgement in cost estimating: modelling the
reasoning process. Concurrent Engineering. 9(4), 271-284.
Schiffauerova, A. & Thomson, V. (2006). A review of research on cost of quality
models and best practices. International Journal of Quality & Reliability
Management. 23 (6), 647 - 669.
Shehab, E.M. & Abdalla, H.S. (2001). Manufacturing cost modelling for
concurrent product development. Robotics and Computer Integrated
Manufacturing. 17 (4), 341–353.
Sower, V.E., Quarles, R., Broussard, E. (2007). Cost of quality usage and its
relationship to quality system maturity. International Journal of Quality &
Reliability Management. 24 (2), 121 – 140.
Špačková, O., & Straub, D. (2015) Cost-Benefit Analysis for Optimization of
Risk Protection under Budget Constraints. Risk Analysis. 35 (5), 941–959.
Srivastava, K.S. (2008). Towards estimating Cost of Quality in supply chains.
Total Quality Management & Business Excellence. 19 (3), 193-208.
Stenstrom, C., Norrbin, P., Parida, A. & Kumar, U. (2015). Preventive and
corrective maintenance-cost comparison and cost-benefit analysis. Structure
and Infrastructure Engineering. ISSN: 1573-2479.

109
Stewart, M.G. & Mueller, J. (2013). Terrorism risks and cost-benefit analysis of
aviation security. Risk Analysis. 33 (5), 893–908.
Taguchi, G. (1987). System of Experimental Design (White Plains, NY,
Unipub/Kraus International Publications).
Taylor, I.M. (1997). Cost engineering—a feature based approach. 85th Meeting
of the AGARD Structures and Material Panel, Aalborg, Denmark, October 13–
14.14, 1–9.
Tsai, W.H. (1998). Quality cost measurement under activity-based costing.
International Journal of Quality & Reliability Management. 15 (7), 719.
Thompson, W.G. Jr & Nakamura, S. (1987). Measuring cost of quality in the
development process. IEEE International Conference on Communications ’87:
Communications-Sound to Light, Proceedings, p. 1770.
Tornberg, K., Jamsen, M., and Paranko, J. (2002). Activity-Based Costing and
Process Modeling for Cost-Conscious Product Design: A Case Study in a
Manufacturing Company. International Journal of Production Economics. 79 (1),
75–82.
Wang, H.Y. (2012) .Aircraft assembly technology. 1st Edn (Xian, Northwestern
Polytechnical University).
Wheelright, S.C. & Hayes, R.H. (1985). Competing through manufacturing.
Harvard Business Review. Jan/Feb, pp. 99± 109.
Yang, B. (2014). Error analysis and solution in aircraft riveting assembly. China
High-Tech Enterprises. (7), 43.
Yang, C.C. (2008). Improving the definition and quantification of quality costs.
Total Quality Management & Business Excellence. 19 (3), 175-191.
Yang, Y. N., Parsaei, H. R., Hamid, R., Leep, H. R., and Wong, J. P. (1998).
Manufacturing Cost Estimating System Using Activity-Based Costing. Int. J.Flex.
Autom. Integr. Manuf. 6 (3), 223–243.
110
Zhang H. F., Jiang H. Y., Xin N. N., Wang F. L. (2014). Research on the cost
estimating of China’s aviation aircraft development project based on the
parametric method. 7th International Joint Conference on Computational
Sciences and Optimization, CSO 2014; Beijing; China; 4 July 2014 - 6 July
2014. pp. 334-338.
Zhou, N., Ma, J., Luo, J., Wang, C. (2014). Activity optimization in aircraft
manufacturing cost control. Journal of Beijing University of Aeronautics and
Astronautics. 40 (11), 1481-1486.

111
APPENDICES
Appendix A Questionnaire
QUESTIONNAIRE
Analysis and modelling of the quality
cost in aircraft tailplane assembly

112
This questionnaire aims to gather the quality problem and process data of
tailplane assembly which will be the resource of the database for the
researcher’s quality cost model. The model can help quality managers and
designers with quality cost estimating, statistics and analysis.
Thanks for take part in the research. The analysis results of quality problem and
process data of tailplane assembly will benefit you and your company. The
result can be sent to you if required.
The gathered data will be processed under the confidential protection. The
original records will be destroyed when the thesis is completed and not be
spread to any other organization or person.
Contact E-mail: [email protected]

113
Section 1: General Information
Q1. What is the type of your company?
A) Aircraft Design
B) Aircraft Manufacturing
C) Aircraft Design & Manufacturing
D) Others
Q2. What is your department in your company?
e.g. 'Structure Design'; 'Process Design'; 'Quality Management'
Q3. What is your responsibility in your department?
e.g. 'Process Supervisor'; 'Quality Inspector'; Design Department Director'.
Q4. How many years are you working in your current field?
A) No more than 3 years
B) 3 - 5 years
C) 6 - 10 years
D) More than

114
Section 2: Quality Problems
Q5. For tailplane assembly, in which phase the quality problems occur
most frequently?
A) Overhanging Section Assembly Phase
B) Central Box Section Assembly Phase
C) Elevator Assembly Phase
D) Tailplane Final Assembly Phase
Q6. What kind of quality problems occur most frequently in the phase
(choose in Q5)? (Multiple-choice, No more than 3)
A) Hole Problems
B) Riveting Problems
C) Sealing Problems
D) Cementing Problems
E) Position Problems
F) Roughness Problems
G) Painting Problems
H) Others
Q7. From your experience, what percentage of the most general quality
problems (choose in Q6) account for, respectively, in all quality problems
in the phase (choose in Q5)? (Please ensure the sequence of the answers
is in keeping with Q6)
0 - 10% 11% - 20% 21% - 30% 31% - 40% 41% - 50% Above50%
Quality
Problem 1
Quality
Problem 2
Quality
Problem 3

115
Q8. What is the main immediate causes for these most general quality
problems (choose in Q6)? (Multiple-choice, No more than 3)
A) Defective Design
B) Non-Conforming Materials
C) Non-Conforming Parts
D) Defective Equipment
E) Defective Tools
F) Misoperation
G) Unsuitable Environment
H) Others
Q9. From your experience, what percentage of the main immediate
causes (choose in Q8) account for, respectively, in all immediate causes
for the most general quality problems(choose in Q6)? (Please ensure the
sequence of the answers is the same as Q8)
0 - 10% 11% - 20% 21% - 30% 31% - 40% 41% - 50% Above50%
Immediate
Cause 1
Immediate
Cause 2
Immediate
Cause 3
Q10. What is the main root causes for these most general quality problem
in the phase (choose in Q6? (Multiple-choice, No more than 3)
A) Lack of Professional Skill
B) Materials Inspection Failure
C) Parts Inspection Failure
D) Equipment Periodical Inspection Failure
E) Tools Periodical Inspection Failure
F) Environment Management Failure

116
G) Others
Q11. From your experience, what percentage of the main root causes
(choose in Q10) account for, respectively, in all root causes for the most
general quality problems (choose in Q6)? (Please ensure the sequence of
the answers is the same as Q8)
0 - 10% 11% - 20% 21% - 30% 31% - 40% 41% - 50% Above50%
Root
Cause 1
Root
Cause 2
Root
Cause 3
Section 3: Cost Estimation
Q12. For tailplane assembly, in all the processes, which 6 are the highest
cost? ('Equipment Price', 'Tool Price' are not included in the cost; 'Energy
Consumption', 'Depreciation', 'Labour' are included in the cost)
A) Drilling
B) Dimpling
C) Bearizing
D) Boring
E) Riveting
F) Installing
G) Burring
H) Cementing
I) Cleaning
J) Sealing
K) Fixing
L) Hoisting

117
M) Trimming
N) Reaming
O) Weighting
P) Milling
Q) Others
Q13. From your experience, in all processes, which 6 are most frequently
used?
A) Drilling
B) Dimpling
C) Bearizing
D) Boring
E) Riveting
F) Installing
G) Burring
H) Cementing
I) Cleaning
J) Sealing
K) Fixing
L) Hoisting
M) Trimming
N) Reaming
O) Weighting
P) Milling
Q) Others
Q14. For tailplane assembly, in all the inspections and tests, which 4 are
the highest cost? ('Equipment Price', 'Tool Price' are not included in the
cost; 'Energy Consumption', 'Depreciation', 'Labour' are included in the
cost)
A) Part Inspection
B) Hole Diameter Inspection
C) Position Inspection

118
D) FOD Inspection
E) Roughness Inspection
F) X-ray Inspection
G) Laser Measurement
H) Axial Force tests
I) Push-out tests
J) Pipe Pressure tests
K) Others
Q15. From your experience, in all inspections and tests, which 4 are most
frequently used?
A) Part Inspection
B) Hole Diameter Inspection
C) Position Inspection
D) FOD Inspection
E) Roughness Inspection
F) X-ray Inspection
G) Laser Measurement
H) Axial Force tests
I) Push-out tests
J) Pipe Pressure tests
K) Others
Q16. For tailplane assembly, in all the processes, inspections and tests,
which factors have the most significant influence on the cost? (Multiple-
choice, No more than 3)
A) Labour
B) Equipment Depreciation
C) Tools Depreciation
D) Energy Consumption
E) Others

119
Q17. From your experience, what percentage of the factors (choose in
Q16) account for, respectively, in total factors which influence the cost of
processes, inspections and tests? (Please ensure the sequence of the
answers is the same as Q16)
0 - 10% 11% - 20% 21% - 30% 31% - 40% 41% - 50% Above50%
Factor 1
Factor 2
Factor 3
Q18. From your experience, what percentage of the cost of quality cost
(prevention cost, appraisal cost, failure cost, etc.) account for in total cost
of the tailplane assembly?
A) 0 - 10%
B) 11% - 20%
C) 21% - 30%
D) 31% - 40%
E) 41% - 50%
F) Above 50%
Section4: Benefit Simulation
Q19. From your experience, what can significant reflect the benefit of the
cost on quality (e.g. Using machine with higher accuracy, planning more
training) in short-term? (Multiple-choice, no more than 3)
A) Number of Quality Problems Reduced
B) Qualification Ratio under First Acceptance Improved
C) Scrap Rate Reduced
D) Less Program Delay
E) Others

120
Q20. From your experience, what can significant reflect the benefit of the
cost on quality (e.g. Using machine with higher accuracy, planning more
training) in long-term? (Multiple-choice, no more than 3)
A) Total Cost Reduced
B) Customer Satisfaction Improved
C) Production Capacity Improved
D) Profit Improved
E) Others
Q21. From your experience, how long will the benefit reflect in short-term
after the investment on quality?
A) 3 - 6 Months
B) 7 - 12 Months
C) 13 - 18 Months
D) 19 - 24 Months
E) Others
Q22. From your experience, how long will the benefit reflect in long-term
after the investment on quality?
A) 1 - 2 Years
B) 3 - 4 Years
C) 5 - 6 Years
D) 7 - 8 Years
E) Others

121
Appendix B Grading Form for CoQ Model
Performance of CoQ
Model
Grade
1 2 3 4 5
Overall Performance
Convenience
Operability
Reliability
Applicability
Generalizability
Advantage
Limitation
Suggestion