Crane Monopile Foundation Analysis - Bentley
6
6 Plaxis Bulletin l Spring issue 2009 l www.plaxis.nl derived in the first instance from data in a comprehensive geotechnical investigation interpretative report. In summary, the site is underlain by: 2m of made ground, 4m of weathered London Clay, 14.5m of London clay, 19.5m of Lambeth Clay and 3.5m of Thanet Sands founded on Upper Chalk. Given the transitory nature of the crane loading a short-term undrained response of the ground was considered appropriate; consequently an undrained analysis was performed using undrained soil parameters. A range of soil parameters were considered for the detailed analysis and because of the extreme nature of the problem in terms of the close proximity of the surrounding structures and uncertainties with regard to soil strength and stiffness due to construction stage effects; the final analyses assumed a single London clay layer with very conservative values for the undrained Young’s modulus and undrained shear strength of: 30MPa and 150kPa respectively. Given the transitory nature of the loading and the characteristics of the surrounding soils the pile/soil interaction was analysed as an undrained load case. Therefore the London clay has been modelled as an undrained, cohesive linear elastic-perfectly plastic (Tresca) material. The Plaxis Mohr-Coulomb strength model was used with the friction and dilatancy angles equal to zero, cohesion equal to the undrained strength and the Plaxis default (zero tensile strength) tension cut-off criterion in place which restricts the development of tensile stresses in the soil. 0 z } = = ^ h c su = ^ h The monopile is a composite structure as shown in Figure 3 which comprises a 16.825m length of steel pipe (Outer diameter 2.2m with a wall thickness of 40mm) surrounded by a 6.825m length of concrete caisson (Inner diameter of 3m with a wall thickness of 160mm) in the upper portion of the pile where it is known that the high lateral loads will develop. The infill between the concrete and steel is a cement-bentonite grout mixture and the infill in the steel pipe is a 20:1 sand-cement mixture. The basement structure comprises three floors and a contiguous piled wall composed of 28.825m length; 900mm diameter piles at 1050mm centres. The horizontal distance between the bored pile wall and crane monopile centrelines is 3.2m. The top of the crane monopile is connected to the top of the basement structure by a 500 thick reinforced concrete slab as shown in Figure 1. The material properties used for this problem are summarised in Table 1. Interface elements have been used along the outside surfaces of the monopile for all the finite element models in this study. These elements are used to improve the results by allowing for slip between the monopile and the soil and to model a possibly reduced strength along the sides of the monopile to account for reduced soil strengths due to the effects of pile installation. s s ,int int u u $ = a Crane Monopile Foundation Analysis » PLAXIS 3D Foundation results on simplified representations of the pile foundation were compared with Coffey in-house developed analytical tools. The crane monopile is a composite structure composed of concentric elements and the effect of using the pile designer in developing such a configuration was explored. The monopile is a composite structure of concentric elements and this was modelled using a combination of volume elements defined using the pile designer in PLAXIS 3D Foundation. The pile cross-section for each concentric component was modelled as a circular tube with the appropriate diameter and wall thickness. Description of the Problem Considered The proposed foundation is a monopile situated very close to an existing two-level basement as illustrated in Figure 1. As well as ensuring that the proposed design of the monopile is structurally capable of carrying the applied loads from the tower crane, the close proximity of the foundation to the basement warrants investigation of the loads and deformations induced in these neighboring structures by the activities of the tower crane. Such predictions would not be possible via simplistic calculations hence the recourse to finite element modelling to gain insight into this three-dimensional soil-structure interaction problem. The base of the crane platform grillage (500mm thick) is elevated at 9.5m above the top of concrete capping and tie slab. The tower crane is 24.4m high with a 60m long jib as shown in Figure 2. The soil parameters used in the analyses were This article describes the use of PLAXIS 3D Foundation v2.1 (Plaxis, 2008) to analyse the deformation and stability of a crane monopile foundation supporting a tower crane in close proximity to an existing two-level basement structure. Coffey Geotechnics were engaged to carry out a Category 3 check of the crane monopile foundation. As part of our quality assurance procedures a number of comparisons were made to assess the performance of PLAXIS 3D Foundation for analyzing this particular problem. Author: Dr Andrew Mar, Coffey Geotechnics Limited, Atlantic House, Atlas Business Park, Simonsway, Manchester, M22 5PR, United Kingdom, [email protected] continue on page 7
Transcript of Crane Monopile Foundation Analysis - Bentley
6 Plaxis Bulletin l Spring issue 2009 l www.plaxis.nl
derived in the first instance from data in a comprehensive geotechnical investigation interpretative report. In summary, the site is underlain by: 2m of made ground, 4m of weathered London Clay, 14.5m of London clay, 19.5m of Lambeth Clay and 3.5m of Thanet Sands founded on Upper Chalk.
Given the transitory nature of the crane loading a short-term undrained response of the ground was considered appropriate; consequently an undrained analysis was performed using undrained soil parameters. A range of soil parameters were considered for the detailed analysis and because of the extreme nature of the problem in terms of the close proximity of the surrounding structures and uncertainties with regard to soil strength and stiffness due to construction stage effects; the final analyses assumed a single London clay layer with very conservative values for the undrained Young’s modulus and undrained shear strength of: 30MPa and 150kPa respectively. Given the transitory nature of the loading and the characteristics of the surrounding soils the pile/soil interaction was analysed as an undrained load case. Therefore the London clay has been modelled as an undrained, cohesive linear elastic-perfectly plastic (Tresca) material. The Plaxis Mohr-Coulomb strength model was used with the friction and dilatancy angles equal to zero, cohesion equal to the undrained strength and the Plaxis default (zero tensile strength) tension cut-off criterion in place which restricts the development of tensile stresses in the soil.
0z }= =^ hc su=^ h
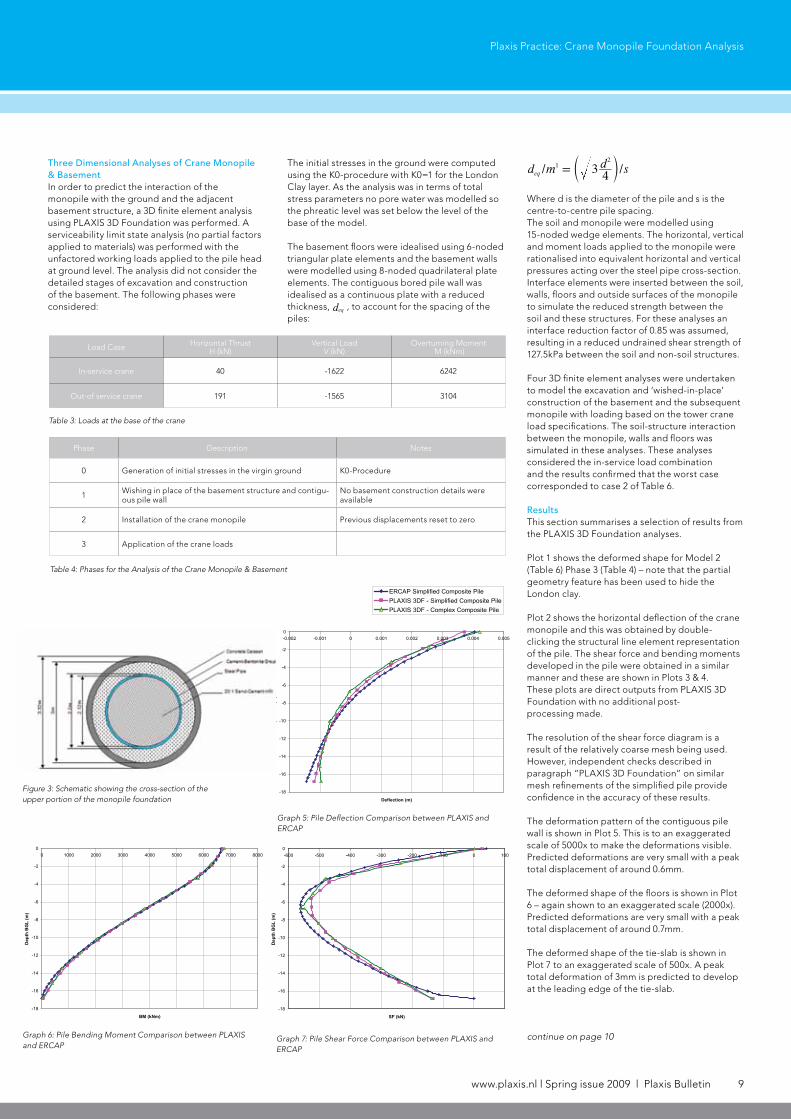
The monopile is a composite structure as shown in Figure 3 which comprises a 16.825m length of steel pipe (Outer diameter 2.2m with a wall thickness of 40mm) surrounded by a 6.825m length of concrete caisson (Inner diameter of 3m with a wall thickness of 160mm) in the upper portion of the pile where it is known that the high lateral loads will develop. The infill between the concrete and steel is a cement-bentonite grout mixture and the infill in the steel pipe is a 20:1 sand-cement mixture. The basement structure comprises three floors and a contiguous piled wall composed of 28.825m length; 900mm diameter piles at 1050mm centres. The horizontal distance between the bored pile wall and crane monopile centrelines is 3.2m. The top of the crane monopile is connected to the top of the basement structure by a 500 thick reinforced concrete slab as shown in Figure 1.
The material properties used for this problem are summarised in Table 1.
Interface elements have been used along the outside surfaces of the monopile for all the finite element models in this study. These elements are used to improve the results by allowing for slip between the monopile and the soil and to model a possibly reduced strength along the sides of the monopile to account for reduced soil strengths due to the effects of pile installation.
s s,int intu u$= a
Crane Monopile Foundation Analysis
»PLAXIS 3D Foundation results on simplified representations of the pile foundation
were compared with Coffey in-house developed analytical tools. The crane monopile is a composite structure composed of concentric elements and the effect of using the pile designer in developing such a configuration was explored.The monopile is a composite structure of concentric elements and this was modelled using a combination of volume elements defined using the pile designer in PLAXIS 3D Foundation. The pile cross-section for each concentric component was modelled as a circular tube with the appropriate diameter and wall thickness.
Description of the Problem ConsideredThe proposed foundation is a monopile situated very close to an existing two-level basement as illustrated in Figure 1. As well as ensuring that the proposed design of the monopile is structurally capable of carrying the applied loads from the tower crane, the close proximity of the foundation to the basement warrants investigation of the loads and deformations induced in these neighboring structures by the activities of the tower crane. Such predictions would not be possible via simplistic calculations hence the recourse to finite element modelling to gain insight into this three-dimensional soil-structure interaction problem.
The base of the crane platform grillage (500mm thick) is elevated at 9.5m above the top of concrete capping and tie slab. The tower crane is 24.4m high with a 60m long jib as shown in Figure 2.The soil parameters used in the analyses were
This article describes the use of PLAXIS 3D Foundation v2.1 (Plaxis, 2008) to analyse the deformation and stability of a
crane monopile foundation supporting a tower crane in close proximity to an existing two-level basement structure. Coffey
Geotechnics were engaged to carry out a Category 3 check of the crane monopile foundation. As part of our quality assurance
procedures a number of comparisons were made to assess the performance of PLAXIS 3D Foundation for analyzing this
particular problem.
Author: Dr Andrew Mar, Coffey Geotechnics Limited, Atlantic House, Atlas Business Park, Simonsway, Manchester, M22 5PR, United Kingdom, [email protected]
continue on page 7
www.plaxis.nl l Spring issue 2009 l Plaxis Bulletin 7
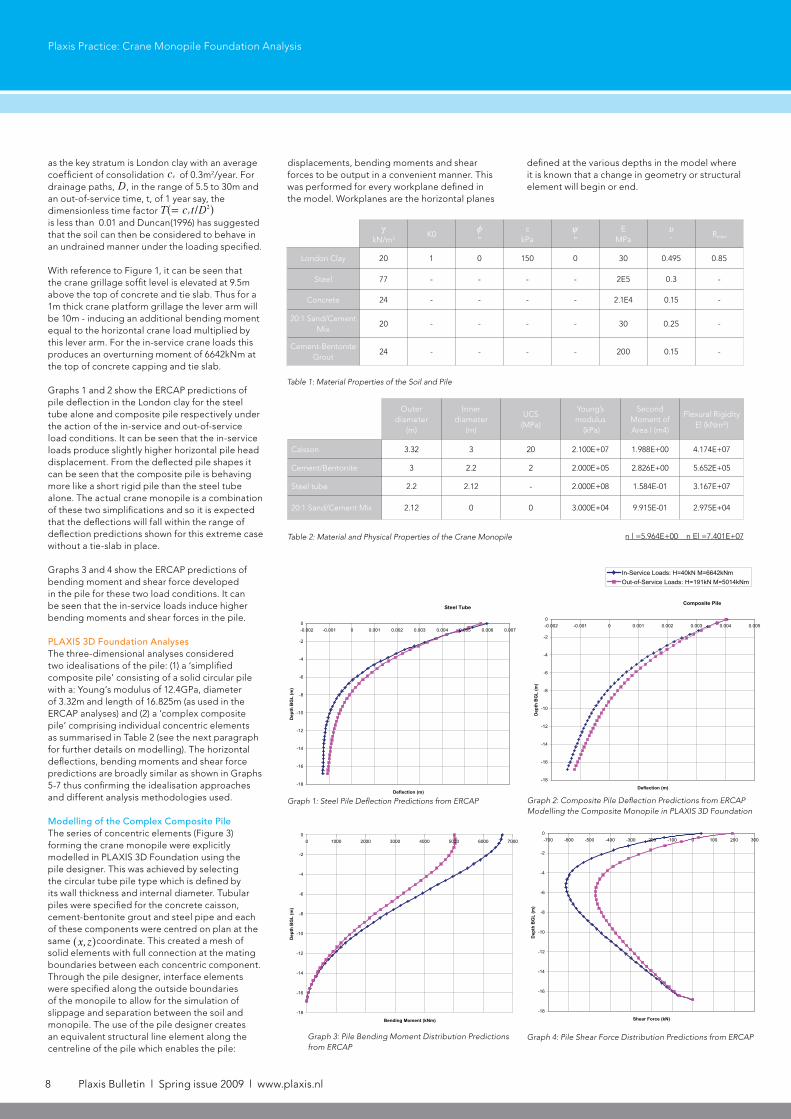
Preliminary Analyses ERCAP AnalysesThe monopile was first analysed using the boundary element program ERCAP. The program implements the method described by Poulos & Davis (1980). This program can analyse a pile subjected to lateral loading and/or lateral soil movements. ERCAP (Earth Retention CAPacity of piles) can analyse the effects of the proximity of a pile to a slope or cutting in an approximate manner. It has the facility to enable the assessment of the stabilising force which a pile or row of piles can develop in a potentially unstable soil mass. In this problem it was used to model the lateral interaction of the monopile with the surrounding soil when subjected to the horizontal load and overturning moment at the pile head. The objective of the preliminary analyses was to compare results from Plaxis 3D Foundation with ERCAP. The ERCAP program restricts the user to a single uniform pile geometry. For this reason, two separate analyses were performed with uniform cross-sectional representations of the actual crane monopile. To bound the predictions of lateral pile deflection in the London clay; the performance of the steel pipe alone and the composite pile were considered. The first analysis modelled the steel tubular section whereas the second analysis modelled the composite pile; each over the full 16.825m length of pile. For the latter, a composite Young’s modulus of 12.4GPa for a solid circular pile of 3.32m diameter was calculated on the basis of
(see Table 2).
Both the in-service and out-of-service crane loads were considered (Table 3) to identify the worst case combination which would develop the highest deflections, shear forces and bending moments in the monopile. This was for the situation without any horizontal restraint offered by the tie-slab.
Both the in-service and out-of-service load cases were performed undrained and this is applicable
/nEI nI
Figure 2: Schematic of the Tower Crane Structure
Figure 1: Cross-section and plan showing the crane monopile and adjacent basement structure
8 Plaxis Bulletin l Spring issue 2009 l www.plaxis.nl
Plaxis Practice: Crane Monopile Foundation Analysis
as the key stratum is London clay with an average coefficient of consolidation of 0.3m2/year. For drainage paths, , in the range of 5.5 to 30m and an out-of-service time, t, of 1 year say, the dimensionless time factor is less than 0.01 and Duncan(1996) has suggested that the soil can then be considered to behave in an undrained manner under the loading specified.
With reference to Figure 1, it can be seen that the crane grillage soffit level is elevated at 9.5m above the top of concrete and tie slab. Thus for a 1m thick crane platform grillage the lever arm will be 10m - inducing an additional bending moment equal to the horizontal crane load multiplied by this lever arm. For the in-service crane loads this produces an overturning moment of 6642kNm at the top of concrete capping and tie slab.
Graphs 1 and 2 show the ERCAP predictions of pile deflection in the London clay for the steel tube alone and composite pile respectively under the action of the in-service and out-of-service load conditions. It can be seen that the in-service loads produce slightly higher horizontal pile head displacement. From the deflected pile shapes it can be seen that the composite pile is behaving more like a short rigid pile than the steel tube alone. The actual crane monopile is a combination of these two simplifications and so it is expected that the deflections will fall within the range of deflection predictions shown for this extreme case without a tie-slab in place.
Graphs 3 and 4 show the ERCAP predictions of bending moment and shear force developed in the pile for these two load conditions. It can be seen that the in-service loads induce higher bending moments and shear forces in the pile.
PLAXIS 3D Foundation AnalysesThe three-dimensional analyses considered two idealisations of the pile: (1) a ‘simplified composite pile’ consisting of a solid circular pile with a: Young’s modulus of 12.4GPa, diameter of 3.32m and length of 16.825m (as used in the ERCAP analyses) and (2) a ‘complex composite pile’ comprising individual concentric elements as summarised in Table 2 (see the next paragraph for further details on modelling). The horizontal deflections, bending moments and shear force predictions are broadly similar as shown in Graphs 5-7 thus confirming the idealisation approaches and different analysis methodologies used.
Modelling of the Complex Composite PileThe series of concentric elements (Figure 3) forming the crane monopile were explicitly modelled in PLAXIS 3D Foundation using the pile designer. This was achieved by selecting the circular tube pile type which is defined by its wall thickness and internal diameter. Tubular piles were specified for the concrete caisson, cement-bentonite grout and steel pipe and each of these components were centred on plan at the same x,z^ hcoordinate. This created a mesh of solid elements with full connection at the mating boundaries between each concentric component. Through the pile designer, interface elements were specified along the outside boundaries of the monopile to allow for the simulation of slippage and separation between the soil and monopile. The use of the pile designer creates an equivalent structural line element along the centreline of the pile which enables the pile:
cv
/T c t Dv2
=^ h
displacements, bending moments and shear forces to be output in a convenient manner. This was performed for every workplane defined in the model. Workplanes are the horizontal planes
n l =5.964E+00 n El =7.401E+07
Outer diameter
(m)
Inner diameter
(m)
UCS(MPa)
Young’s modulus
(kPa)
Second Moment of Area l (m4)
Flexural RigidityEl (kNm2))
Caisson 3.32 3 20 2.100E+07 1.988E+00 4.174E+07
Cement/Bentonite 3 2.2 2 2.000E+05 2.826E+00 5.652E+05
Steel tube 2.2 2.12 - 2.000E+08 1.584E-01 3.167E+07
20:1 Sand/Cement Mix 2.12 0 0 3.000E+04 9.915E-01 2.975E+04
Table 2: Material and Physical Properties of the Crane Monopile
defined at the various depths in the model where it is known that a change in geometry or structural element will begin or end.
Steel Tube
-18
-16
-14
-12
-10
-8
-6
-4
-2
0-0.002 -0.001 0 0.001 0.002 0.003 0.004 0.005 0.006 0.007
Deflection (m)
Dep
th B
GL
(m)
In-Service Loads: H=40kN M=6642kNmOut-of-Service Loads: H=191kN, M=5014kNm
-18
-16
-14
-12
-10
-8
-6
-4
-2
00 1000 2000 3000 4000 5000 6000 7000
Bending Moment (kNm)
Dep
th B
GL
(m)
In-Service Loads: H=40kN M=6642kNmOut-of-Service Loads: H=191kN M=5014kNm
-18
-16
-14
-12
-10
-8
-6
-4
-2
00 1000 2000 3000 4000 5000 6000 7000
Bending Moment (kNm)
Dep
th B
GL
(m)
In-Service Loads: H=40kN M=6642kNmOut-of-Service Loads: H=191kN M=5014kNm
Composite Pile
-18
-16
-14
-12
-10
-8
-6
-4
-2
0-0.002 -0.001 0 0.001 0.002 0.003 0.004 0.005
Deflection (m)
Dep
th B
GL
(m)
In-Service Loads: H=40kN M=6642kNmOut-of-Service Loads: H=191kN, M=5014kNm
-18
-16
-14
-12
-10
-8
-6
-4
-2
0-700 -600 -500 -400 -300 -200 -100 0 100 200 300
Shear Force (kN)
Dep
th B
GL
(m)
In-Service Loads: H=40kN M=6642kNmOut-of-Service Loads: H=191kN M=5014kNm
Graph 1: Steel Pile Deflection Predictions from ERCAP Graph 2: Composite Pile Deflection Predictions from ERCAPModelling the Composite Monopile in PLAXIS 3D Foundation
Graph 3: Pile Bending Moment Distribution Predictions from ERCAP
Graph 4: Pile Shear Force Distribution Predictions from ERCAP
D
ckN/m3
K0zo
ckPa
}o
EMPa
y- Rinter
London Clay 20 1 0 150 0 30 0.495 0.85
Steel 77 - - - - 2E5 0.3 -
Concrete 24 - - - - 2.1E4 0.15 -
20:1 Sand/Cement Mix
20 - - - - 30 0.25 -
Cement-Bentonite Grout
24 - - - - 200 0.15 -
Table 1: Material Properties of the Soil and Pile
www.plaxis.nl l Spring issue 2009 l Plaxis Bulletin 9
Plaxis Practice: Crane Monopile Foundation Analysis
Where d is the diameter of the pile and s is the centre-to-centre pile spacing.The soil and monopile were modelled using 15-noded wedge elements. The horizontal, vertical and moment loads applied to the monopile were rationalised into equivalent horizontal and vertical pressures acting over the steel pipe cross-section. Interface elements were inserted between the soil, walls, floors and outside surfaces of the monopile to simulate the reduced strength between the soil and these structures. For these analyses an interface reduction factor of 0.85 was assumed, resulting in a reduced undrained shear strength of 127.5kPa between the soil and non-soil structures.
Four 3D finite element analyses were undertaken to model the excavation and ‘wished-in-place’ construction of the basement and the subsequent monopile with loading based on the tower crane load specifications. The soil-structure interaction between the monopile, walls and floors was simulated in these analyses. These analyses considered the in-service load combination and the results confirmed that the worst case corresponded to case 2 of Table 6.
ResultsThis section summarises a selection of results from the PLAXIS 3D Foundation analyses.
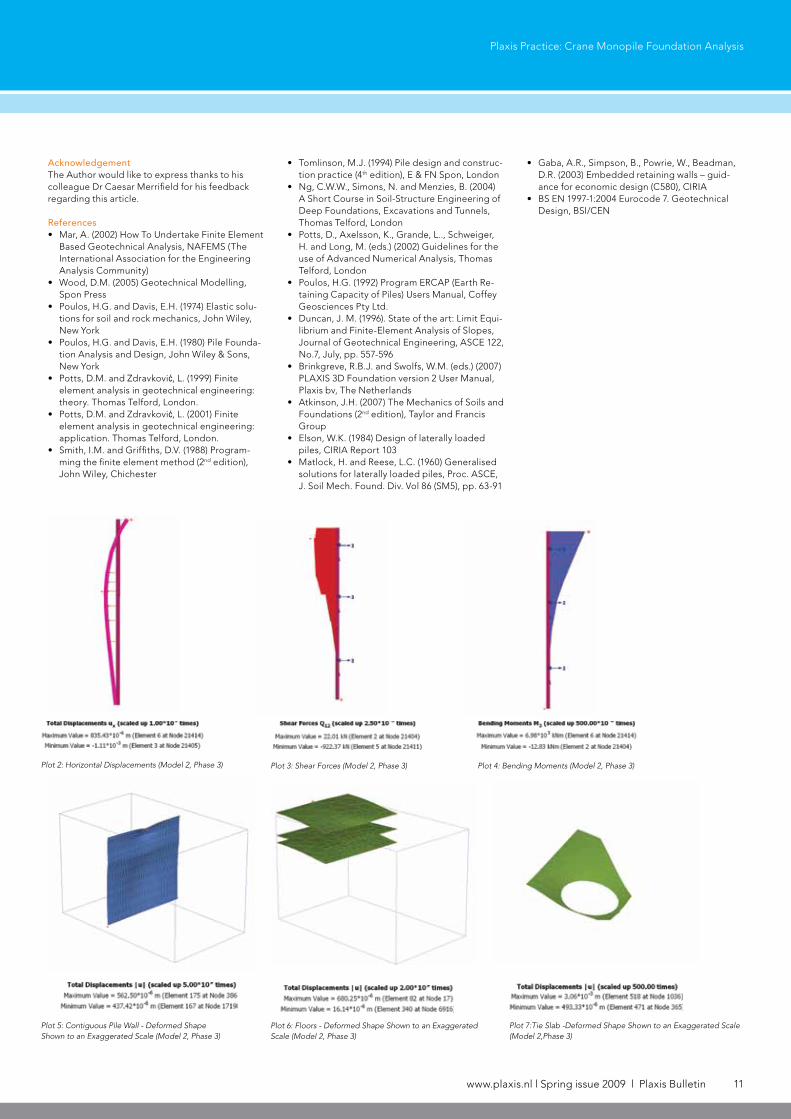
Plot 1 shows the deformed shape for Model 2 (Table 6) Phase 3 (Table 4) – note that the partial geometry feature has been used to hide the London clay.
Plot 2 shows the horizontal deflection of the crane monopile and this was obtained by double-clicking the structural line element representation of the pile. The shear force and bending moments developed in the pile were obtained in a similar manner and these are shown in Plots 3 & 4. These plots are direct outputs from PLAXIS 3D Foundation with no additional post-processing made.
The resolution of the shear force diagram is a result of the relatively coarse mesh being used. However, independent checks described in paragraph “PLAXIS 3D Foundation” on similar mesh refinements of the simplified pile provide confidence in the accuracy of these results.
The deformation pattern of the contiguous pile wall is shown in Plot 5. This is to an exaggerated scale of 5000x to make the deformations visible. Predicted deformations are very small with a peak total displacement of around 0.6mm.
The deformed shape of the floors is shown in Plot 6 – again shown to an exaggerated scale (2000x). Predicted deformations are very small with a peak total displacement of around 0.7mm.
The deformed shape of the tie-slab is shown in Plot 7 to an exaggerated scale of 500x. A peak total deformation of 3mm is predicted to develop at the leading edge of the tie-slab.
Three Dimensional Analyses of Crane Monopile & BasementIn order to predict the interaction of the monopile with the ground and the adjacent basement structure, a 3D finite element analysis using PLAXIS 3D Foundation was performed. A serviceability limit state analysis (no partial factors applied to materials) was performed with the unfactored working loads applied to the pile head at ground level. The analysis did not consider the detailed stages of excavation and construction of the basement. The following phases were considered:
The initial stresses in the ground were computed using the K0-procedure with K0=1 for the London Clay layer. As the analysis was in terms of total stress parameters no pore water was modelled so the phreatic level was set below the level of the base of the model.
The basement floors were idealised using 6-noded triangular plate elements and the basement walls were modelled using 8-noded quadrilateral plate elements. The contiguous bored pile wall was idealised as a continuous plate with a reduced thickness, deq , to account for the spacing of the piles:
/ /d m d s34eq
12
= d n
Load Case Horizontal Thrust H (kN)
Vertical Load V (kN)
Overturning Moment M (kNm)
In-service crane 40 -1622 6242
Out-of service crane 191 -1565 3104
Table 3: Loads at the base of the crane
In-Service Loads: H=40kN M=6642kNm
-18
-16
-14
-12
-10
-8
-6
-4
-2
0-0.002 -0.001 0 0.001 0.002 0.003 0.004 0.005
Deflection (m)
Dep
th B
GL
(m)
ERCAP Simplified Composite PilePLAXIS 3DF - Simplified Composite PilePLAXIS 3DF - Complex Composite Pile In-Service Loads: H=40kN M=6642kNm
-18
-16
-14
-12
-10
-8
-6
-4
-2
0-0.002 -0.001 0 0.001 0.002 0.003 0.004 0.005
Deflection (m)
Dep
th B
GL
(m)
ERCAP Simplified Composite PilePLAXIS 3DF - Simplified Composite PilePLAXIS 3DF - Complex Composite Pile
Graph 5: Pile Deflection Comparison between PLAXIS and ERCAP
Graph 7: Pile Shear Force Comparison between PLAXIS and ERCAP
In-Service Loads: H=40kN M=6642kNm
-18
-16
-14
-12
-10
-8
-6
-4
-2
0-600 -500 -400 -300 -200 -100 0 100
SF (kN)
Dep
th B
GL
(m)
ERCAP Simplified Composite PilePLAXIS 3DF - Simplified Composite PileComplex Composite Pile
In-Service Loads: H=40kN M=6642kNm
-18
-16
-14
-12
-10
-8
-6
-4
-2
00 1000 2000 3000 4000 5000 6000 7000 8000
BM (kNm)
Dep
th B
GL
(m)
ERCAP Simplified Composite PilePLAXIS 3DF - Simplified Composite PilePLAXIS 3DF - Complex Composite Pile
Graph 6: Pile Bending Moment Comparison between PLAXIS and ERCAP
Table 4: Phases for the Analysis of the Crane Monopile & Basement
Phase Description Notes
0 Generation of initial stresses in the virgin ground K0-Procedure
1 Wishing in place of the basement structure and contigu-ous pile wall
No basement construction details were available
2 Installation of the crane monopile Previous displacements reset to zero
3 Application of the crane loads
continue on page 10
Figure 3: Schematic showing the cross-section of the upper portion of the monopile foundation
10 Plaxis Bulletin l Spring issue 2009 l www.plaxis.nl
Plaxis Practice: Crane Monopile Foundation Analysis
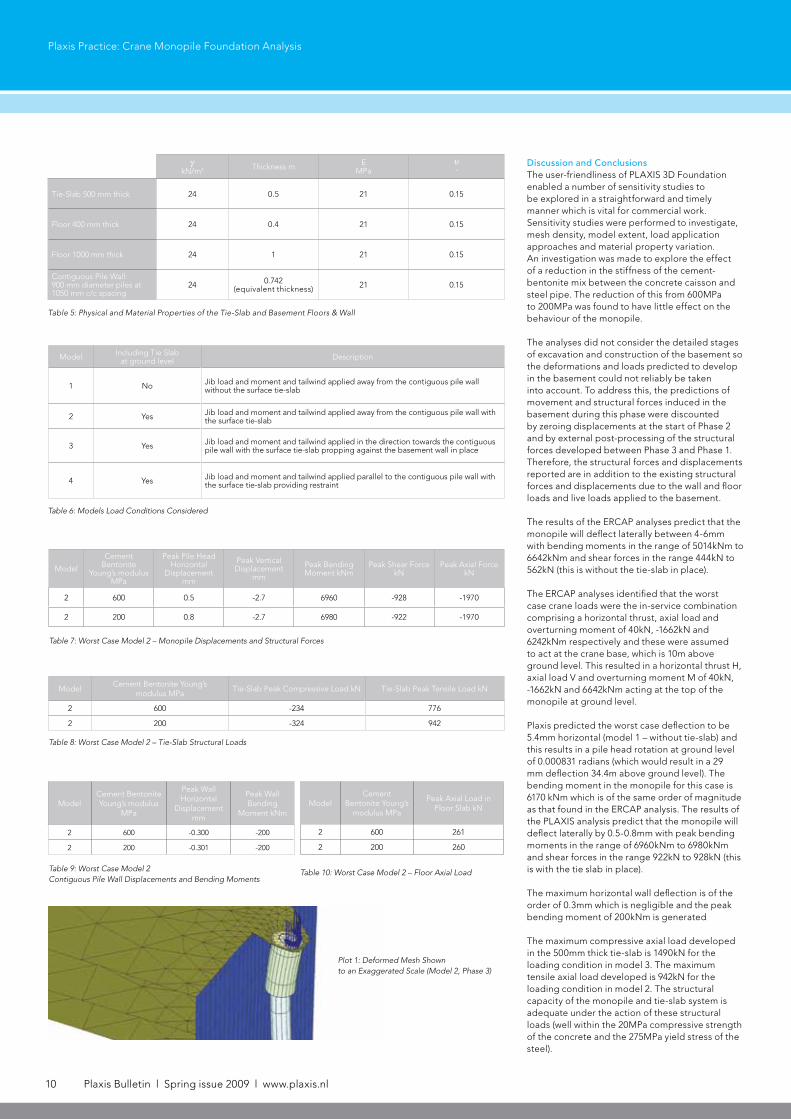
Discussion and ConclusionsThe user-friendliness of PLAXIS 3D Foundation enabled a number of sensitivity studies to be explored in a straightforward and timely manner which is vital for commercial work. Sensitivity studies were performed to investigate, mesh density, model extent, load application approaches and material property variation. An investigation was made to explore the effect of a reduction in the stiffness of the cement-bentonite mix between the concrete caisson and steel pipe. The reduction of this from 600MPa to 200MPa was found to have little effect on the behaviour of the monopile.
The analyses did not consider the detailed stages of excavation and construction of the basement so the deformations and loads predicted to develop in the basement could not reliably be taken into account. To address this, the predictions of movement and structural forces induced in the basement during this phase were discounted by zeroing displacements at the start of Phase 2 and by external post-processing of the structural forces developed between Phase 3 and Phase 1. Therefore, the structural forces and displacements reported are in addition to the existing structural forces and displacements due to the wall and floor loads and live loads applied to the basement.
The results of the ERCAP analyses predict that the monopile will deflect laterally between 4-6mm with bending moments in the range of 5014kNm to 6642kNm and shear forces in the range 444kN to 562kN (this is without the tie-slab in place). The ERCAP analyses identified that the worst case crane loads were the in-service combination comprising a horizontal thrust, axial load and overturning moment of 40kN, -1662kN and 6242kNm respectively and these were assumed to act at the crane base, which is 10m above ground level. This resulted in a horizontal thrust H, axial load V and overturning moment M of 40kN, -1662kN and 6642kNm acting at the top of the monopile at ground level.
Plaxis predicted the worst case deflection to be 5.4mm horizontal (model 1 – without tie-slab) and this results in a pile head rotation at ground level of 0.000831 radians (which would result in a 29 mm deflection 34.4m above ground level). The bending moment in the monopile for this case is 6170 kNm which is of the same order of magnitude as that found in the ERCAP analysis. The results of the PLAXIS analysis predict that the monopile will deflect laterally by 0.5-0.8mm with peak bending moments in the range of 6960kNm to 6980kNm and shear forces in the range 922kN to 928kN (this is with the tie slab in place).
The maximum horizontal wall deflection is of the order of 0.3mm which is negligible and the peak bending moment of 200kNm is generated
The maximum compressive axial load developed in the 500mm thick tie-slab is 1490kN for the loading condition in model 3. The maximum tensile axial load developed is 942kN for the loading condition in model 2. The structural capacity of the monopile and tie-slab system is adequate under the action of these structural loads (well within the 20MPa compressive strength of the concrete and the 275MPa yield stress of the steel).
Model Including Tie Slab at ground level Description
1 No Jib load and moment and tailwind applied away from the contiguous pile wall without the surface tie-slab
2 Yes Jib load and moment and tailwind applied away from the contiguous pile wall with the surface tie-slab
3 Yes Jib load and moment and tailwind applied in the direction towards the contiguous pile wall with the surface tie-slab propping against the basement wall in place
4 Yes Jib load and moment and tailwind applied parallel to the contiguous pile wall with the surface tie-slab providing restraint
Table 6: Models Load Conditions Considered
ckN/m3 Thickness m E
MPay-
Tie-Slab 500 mm thick 24 0.5 21 0.15
Floor 400 mm thick 24 0.4 21 0.15
Floor 1000 mm thick 24 1 21 0.15
Contiguous Pile Wall:900 mm diameter piles at 1050 mm c/c spacing
24 0.742 (equivalent thickness) 21 0.15
Table 5: Physical and Material Properties of the Tie-Slab and Basement Floors & Wall
Model
Cement Bentonite
Young’s modulus MPa
Peak Pile Head Horizontal
Displacement mm
Peak Vertical Displacement
mm
Peak Bending Moment kNm
Peak Shear Force kN
Peak Axial Force kN
2 600 0.5 -2.7 6960 -928 -1970
2 200 0.8 -2.7 6980 -922 -1970
Table 7: Worst Case Model 2 – Monopile Displacements and Structural Forces
ModelCement Bentonite Young’s
modulus MPaTie-Slab Peak Compressive Load kN Tie-Slab Peak Tensile Load kN
2 600 -234 776
2 200 -324 942
Table 8: Worst Case Model 2 – Tie-Slab Structural Loads
ModelCement Bentonite Young’s modulus
MPa
Peak Wall Horizontal
Displacement mm
Peak Wall Bending
Moment kNm
2 600 -0.300 -200
2 200 -0.301 -200
Table 9: Worst Case Model 2 Contiguous Pile Wall Displacements and Bending Moments
Table 10: Worst Case Model 2 – Floor Axial Load
ModelCement
Bentonite Young’s modulus MPa
Peak Axial Load in Floor Slab kN
2 600 261
2 200 260
Plot 1: Deformed Mesh Shown to an Exaggerated Scale (Model 2, Phase 3)
www.plaxis.nl l Spring issue 2009 l Plaxis Bulletin 11
Plaxis Practice: Crane Monopile Foundation Analysis
AcknowledgementThe Author would like to express thanks to his colleague Dr Caesar Merrifield for his feedback regarding this article.
References• Mar, A. (2002) How To Undertake Finite Element
Based Geotechnical Analysis, NAFEMS (The International Association for the Engineering Analysis Community)
• Wood, D.M. (2005) Geotechnical Modelling, Spon Press
• Poulos, H.G. and Davis, E.H. (1974) Elastic solu-tions for soil and rock mechanics, John Wiley, New York
• Poulos, H.G. and Davis, E.H. (1980) Pile Founda-tion Analysis and Design, John Wiley & Sons, New York
• Potts, D.M. and Zdravković, L. (1999) Finite element analysis in geotechnical engineering: theory. Thomas Telford, London.
• Potts, D.M. and Zdravković, L. (2001) Finite element analysis in geotechnical engineering: application. Thomas Telford, London.
• Smith, I.M. and Griffiths, D.V. (1988) Program-ming the finite element method (2nd edition), John Wiley, Chichester
• Tomlinson, M.J. (1994) Pile design and construc-tion practice (4th edition), E & FN Spon, London
• Ng, C.W.W., Simons, N. and Menzies, B. (2004) A Short Course in Soil-Structure Engineering of Deep Foundations, Excavations and Tunnels, Thomas Telford, London
• Potts, D., Axelsson, K., Grande, L.., Schweiger, H. and Long, M. (eds.) (2002) Guidelines for the use of Advanced Numerical Analysis, Thomas Telford, London
• Poulos, H.G. (1992) Program ERCAP (Earth Re-taining Capacity of Piles) Users Manual, Coffey Geosciences Pty Ltd.
• Duncan, J. M. (1996). State of the art: Limit Equi-librium and Finite-Element Analysis of Slopes, Journal of Geotechnical Engineering, ASCE 122, No.7, July, pp. 557-596
• Brinkgreve, R.B.J. and Swolfs, W.M. (eds.) (2007) PLAXIS 3D Foundation version 2 User Manual, Plaxis bv, The Netherlands
• Atkinson, J.H. (2007) The Mechanics of Soils and Foundations (2nd edition), Taylor and Francis Group
• Elson, W.K. (1984) Design of laterally loaded piles, CIRIA Report 103
• Matlock, H. and Reese, L.C. (1960) Generalised solutions for laterally loaded piles, Proc. ASCE, J. Soil Mech. Found. Div. Vol 86 (SM5), pp. 63-91
• Gaba, A.R., Simpson, B., Powrie, W., Beadman, D.R. (2003) Embedded retaining walls – guid-ance for economic design (C580), CIRIA
• BS EN 1997-1:2004 Eurocode 7. Geotechnical Design, BSI/CEN
Plot 2: Horizontal Displacements (Model 2, Phase 3) Plot 3: Shear Forces (Model 2, Phase 3)
Plot 6: Floors - Deformed Shape Shown to an Exaggerated Scale (Model 2, Phase 3)
Plot 4: Bending Moments (Model 2, Phase 3)
Plot 5: Contiguous Pile Wall - Deformed ShapeShown to an Exaggerated Scale (Model 2, Phase 3)
Plot 7:Tie Slab -Deformed Shape Shown to an Exaggerated Scale (Model 2,Phase 3)