Craft Beverage Industry Annual Report
14
Craft Beverage Industry Annual Report 2014-15 SONOMA COUNTY EDB ECONOMIC DEVELOPMENT BOARD SONOMA COUNTY Released July 2015
Transcript of Craft Beverage Industry Annual Report

Craft Beverage IndustryAnnual Report
2014-15S O N O M AC O U N T Y
EDBECONOMIC DEVELOPMENT BOARD
SONOMA COUNTY
Released July 2015

Table of Contents
1 Executive Summary
2 Industry Overview
Industry Briefing | Beer, Cider & Spirits
3 Growth Outlook4 Employment Statistics5 Production, Supply, and Distribution6 Community Impact
Economic Impact | Craft Brewing
7 Economic Impact - Craft Breweries
Case Study | Wastewater
8 Infrastructure Development9 Brewery Development
Appendicies
10 Appendix A | Methodology10 Appendix B | Sources11 Appendix C | Acknowledgements
www.sonomaedb.org
i
Executive Summary
www.sonomaedb.org
1
July 2015
The Sonoma County Economic Development Board (EDB) is pleased to present the Sonoma County Craft Beverage Industry - Annual Report. This report offers economic insight on Sonoma County’s craft brewery, distillery, and cidery businesses and identifies opportunities for growth.
The craft goods industry is typified by a national shift in consumer preferences towards small production, local-ingredients, and high-quality, labor-intensive goods. This means that more American consumers are sampling artisanal, hand-crafted beverages while moving away from mass-produced beers, ciders, and spirits. In Sonoma County, these nationwide trends are reflected by the growing concentration of local craft beer, cider, and spirits producers. Sonoma County’s award-winning craft breweries are experiencing rapid growth and leveraging their reputation to attract tourists from around the nation. Meanwhile, local distilleries and cideries continue to seek opportunities to increase output and employment despite the unique challeng-es they face.
Some highlights and concerns for Sonoma County beer, cider, and spirits businesses include:
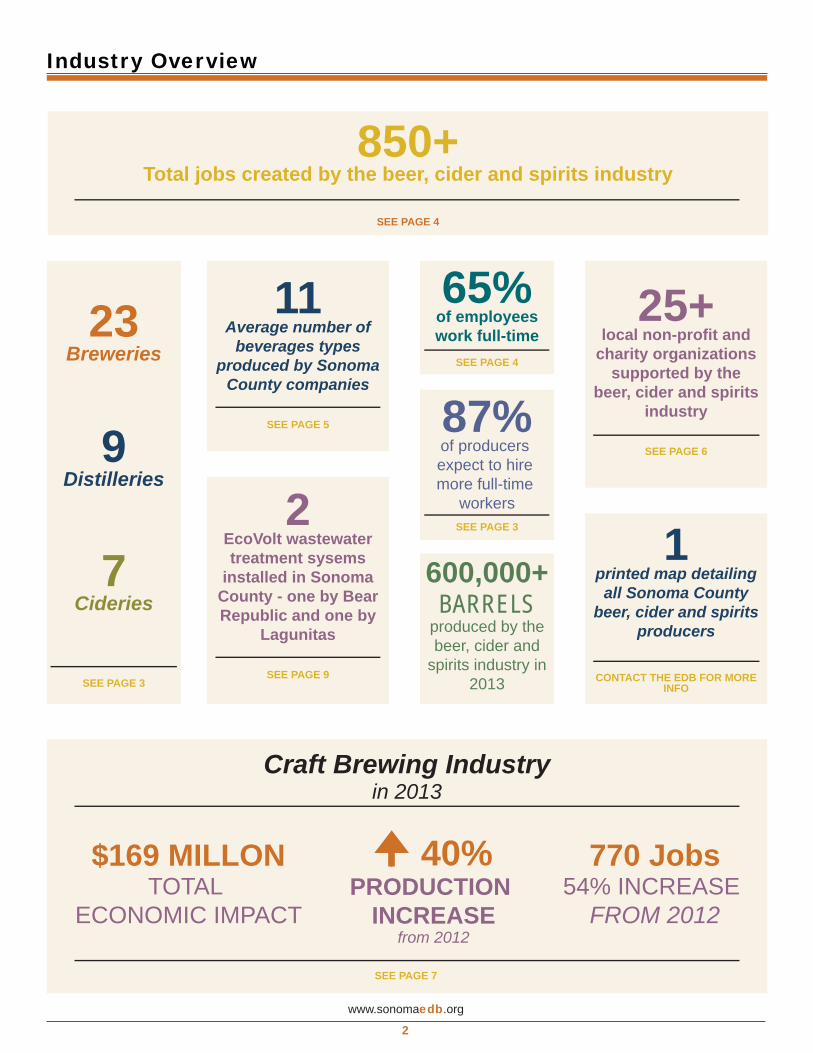
• As of 2014, there were 23 craft breweries, 11 craft distilleries, and 7 craft cideries in Sonoma County.
• The Sonoma County craft brewing industry’s total economic impact was estimated to be $169,000,000 in 2013 (most current data available), a 37.4% increase from 2012.
• Raw materials represents the largest overall supply cost to Sonoma County craft producers. Many craft producers utilize local ingredients in their products, including apples and grains, helping to support local agriculture. As breweries, cideries, and distilleries continue to grow in Sonoma County, so too has their demand for local supplies and ingredients.
• State regulation has grown to become the number one issue affecting growth for beer, cider, and spirits producers in Sonoma County. Changes in the regulatory environment have been varied, with some progress being made in specific areas. However, as reported by local producers, significant barriers still remain at the state level.
Through reports such as this, the EDB gathers essential data so that businesses and policy makers can identify problems, engage in discussion, and partner to resolve issues that stand in the way of economic success for our region. The EDB is committed to working with our partners to take the actions necessary to build on our strengths and to address our deficiencies – to improve economic opportunities for all Sonoma County residents.
Pamela Chanter Chair Economic Development Board
Ben Stone Executive Director Economic Development Board
Industry Overview
www.sonomaedb.org
2
Total jobs created by the beer850+
, cider and spirits industry
SEE PAGE 4
Breweries23
Distilleries9
Cideries7
SEE PAGE 3
Average number of 11
beverages types produced by Sonoma
County companies
SEE PAGE 5
of employees 65%
work full-timeSEE PAGE 4
of producers 87%
expect to hire more full-time
workersSEE PAGE 3
600,000+ BARRELS
produced by the beer, cider and
spirits industry in 2013
local non-profit and 25+
charity organizations supported by the
beer, cider and spirits industry
SEE PAGE 6
EcoVolt wastewater 2
treatment sysems installed in Sonoma
County - one by Bear Republic and one by
Lagunitas
SEE PAGE 9
printed map detailing 1
all Sonoma County beer, cider and spirits
producers
CONTACT THE EDB FOR MORE INFO
Craft Brewing Industryin 2013
$169 MILLONTOTAL
ECONOMIC IMPACT
40%PRODUCTION
INCREASEfrom 2012
770 Jobs54% INCREASE
FROM 2012
SEE PAGE 7

Growth Outlook | Beer, Cider & Spirits
Current Growth in Sonoma County
Sonoma County’s craft beverage industry continues to expand rapidly. Since 2000, the number of craft breweries in Sonoma County has almost quadrupled, with 23 breweries open as of 2014. The number of cideries and distilleries has also grown considerably, reflecting the growth potential in these sub-industries. As of 2014, there were 7 cideries and 9 distilleries open in Sonoma County.
It is likely that this strong upwards trend will continue into the future. Of the companies surveyed, 97% expect to expand production in 2015, 79% expect to invest in equipment, and 87% expect to hire more full-time workers.
Impediments to Growth
Even with the significant growth in Sonoma County’s craft beverage industry, there are still several key impediments challenging local breweries, cideries and distilleries.
The top reported impediment facing breweries is water and wastewater management. A constant local supply of water is necessary to ensure long term growth of Sonoma County’s brewing industry. Coupled with wastewater constraints and sewer line capacity, water management can be viewed as a current and future impediment to growth.
For distilleries, the number one concern was state/federal regulation prohibiting direct sales to consumers. Over 25% of respondents indicated this as their top impediment to growth.
The most concerning issue reported by cideries was state and federal regulations. Specifically, taxation as the most readily identified challenge. The current definition of hard cider only allows for up to 7% alcohol by volume before it is taxed at the more expensive rate for wine, and only a certain level of carbonation before it is subject to the extremely expensive champagne tax ($3.30 or $3.40/gallon).
Growth Outlook Over the Next Year in Breweries, Cideries, and Distilleries
Per
cent
of R
espo
nden
ts
0%
20%
40%
60%
80%
100%
No ChangeDecreaseIncrease
Investment inLocation
Investment inEquipment
Level ofProduction
0
5
10
15
20
25BreweriesDistilleriesCideries
2014
2013
2012
2011
2010
2009
2008
2007
2006
2005
Number of Breweries, Cideries and Distilleriesin Sonoma County
23
79
www.sonomaedb.org
3
State/Federal RegulationPermits/Local RegulationWater/Wastewater ManagementAccess to CapitalMarketingTaxesAvailability/Price of InputsSupply Chain Issues20%
40%
60%
80%
100%
Per
cent
of R
espo
nden
ts
2ndReported Issue
3rdReported Issue
4thReported Issue
5thReported Issue
1stReported Issue
Top Issues as Reported by Sonoma County Breweries, Cideries, and Distilleries

Employment Statistics | Beer, Cider & Spirits
As craft beverage production has grown in Sonoma County, so too has labor employment in the industry, both in part-time and full-time jobs.This section details labor employment in beer, cider, and spirits companies in 2013.
Employment
Sonoma County directly employs more than 850 employees through craft beer, cider, and spirits manufacturing. Out of the total number of employees, over a third are employed part-time. Full-time employees comprise about 65% of total employment in the craft beverage industry (avg. 40 hours/wk).
Demand for Labor
Almost all respondents indicated that they intended to hire more full-time employees in the future. Compared with previ-ous years, this upwards pressure on full-time employment suggests that existing businesses are experiencing contin-ued economic growth. It is also likely that new businesses that have entered the production stage are increasingly able to support additional employees.
Part-Time Workforce
Approximately 40% of companies surveyed indicated that they employed part-time workers (defined as working less than 40 hours/week). Of these companies, nearly 23% indicated that their part-time employees worked an average of 21-30 hours per week. Conversely, 33% indicated that they had no part-time employees. This suggests that while there exists a substantial opportunity for part-time employ-ment in the craft beverage industry, a majority of companies rely on full-time employment alone.
www.sonomaedb.org
4
Employment in Sonoma County Breweries, Cideriesand Distilleries, 2013
Full-Time Part-Time
65%
35%
Does your company plan on hiring more full-time workers in the future?
91%
65%
0
20
40
60
80
100
No
Yes
10.3%
89.7%
0
5
10
15
20
25 30+21-3016-2011-156-100-5
Average Number of Hours Worked per Week (Part-Time Employees)
6% 6%
16%13%
23%
3%
Production, Supply and Distribution | Beer, Cider & Spirits
Product Distribution
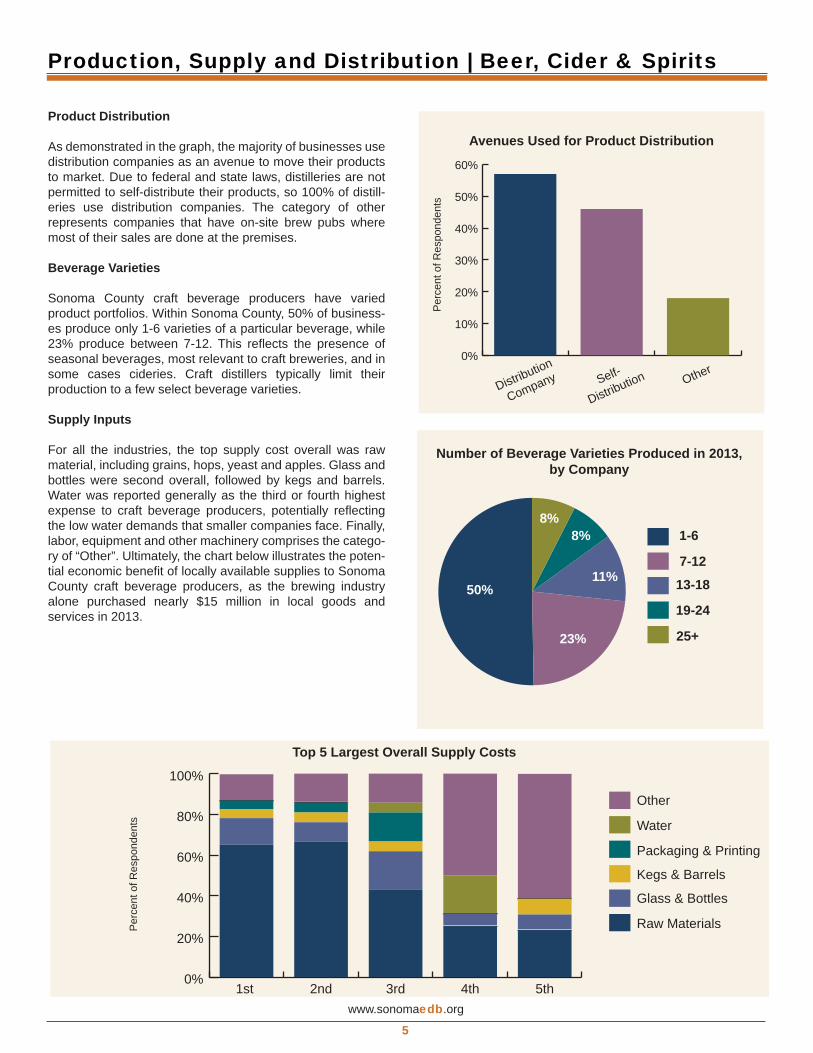
As demonstrated in the graph, the majority of businesses use distribution companies as an avenue to move their products to market. Due to federal and state laws, distilleries are not permitted to self-distribute their products, so 100% of distill-eries use distribution companies. The category of other represents companies that have on-site brew pubs where most of their sales are done at the premises.
Beverage Varieties
Sonoma County craft beverage producers have varied product portfolios. Within Sonoma County, 50% of business-es produce only 1-6 varieties of a particular beverage, while 23% produce between 7-12. This reflects the presence of seasonal beverages, most relevant to craft breweries, and in some cases cideries. Craft distillers typically limit their production to a few select beverage varieties.
Supply Inputs
For all the industries, the top supply cost overall was raw material, including grains, hops, yeast and apples. Glass and bottles were second overall, followed by kegs and barrels. Water was reported generally as the third or fourth highest expense to craft beverage producers, potentially reflecting the low water demands that smaller companies face. Finally, labor, equipment and other machinery comprises the catego-ry of “Other”. Ultimately, the chart below illustrates the poten-tial economic benefit of locally available supplies to Sonoma County craft beverage producers, as the brewing industry alone purchased nearly $15 million in local goods and services in 2013.
www.sonomaedb.org
5
0%
10%
20%
30%
40%
50%
60%
OtherSelf-
DistributionDistribution
Company
Avenues Used for Product Distribution
Per
cent
of R
espo
nden
tsNumber of Beverage Varieties Produced in 2013,
by Company
25+
19-24
13-18
7-12
1-68%8%
11%
23%
50%
Top 5 Largest Overall Supply Costs
0%
20%
40%
60%
80%
100%
Other
Water
Packaging & Printing
Kegs & Barrels
Glass & Bottles
Raw Materials
5th4th3rd2nd1st
Per
cent
of R
espo
nden
ts

Community Impact | Beer, Cider & Spirits
Involvement in community philanthropy is an important aspect for Sonoma County’s breweries, cideries, and distill-eries. The majority of the businesses are invested in creat-ing a positive community impact.
Fundraising and Charity
Almost 90% of respondents indicated that their business participated in either fundraising events, volunteering, or giving to charity organizations. The majority of Sonoma County breweries, cideries, and distilleries participate in events and organizations that raise money for local chari-ties.
It is estimated that in 2013 Sonoma County breweries, cideries, and distilleries donated over $300,000 (both in-kind and in cash) to charities both locally and nationally.
Furthermore, local craft beverage producers fundraise for a wide scope and a number of different causes. Russian River Brewing Company holds a month-long fundraiser in October to raise money for breast cancer research, and reports raising over $100,000 each year. Other companies listed their participation in donations to non-profit organiza-tions, in-kind donations for auctions, and other community efforts.
Below is a detailed list of the charities, events, and commu-nity organizations supported by Sonoma County craft beer, cider, and spirits producers.
www.sonomaedb.org
6
in charitable donations were made by
$300,000Sonoma County breweries, cideries, and
distilleries in 2013
0%
20%
40%
60%
80%
100%
Participate inFundraising Events
VolunteerGive to CharityOrganizations
Community Services
Organizations Supported by Sonoma County Breweries, Cideries, and Distilleries1% for the PlanetAles for ALSAles for AutismAmerican Cancer SocietyAnnadel State ParkBig Brothers Big Sisters of the North BayBoys & Girls ClubCatholic CharitiesCinnabar Theatre
Committee on the ShelterlessEaster SealsFace to FaceHealdsburg Performing ArtsHumane Society Wags, Whiskers, & WineGravenstein Apple FairKiwanis ClubRose Parade
And many more!
Rotary ClubSchool Garden NetworkSchoolsPlusSonoma County Farm TrailsSRJC Shone FarmSurfrider FoundationSutter Pacific Medical FoundationThe Children’s Village

Economic Impact Analysis | Craft Breweries
Craft breweries in Sonoma County continue to hold a signifi-cant impact on the local economy. The most current data avail-able at the time of this analysis was for 2013. The economic impact is expected to increase significantly as more recent data becomes available.
Employment
As of 2013, Sonoma County’s breweries directly employed over 770 individuals with total sales of $117 million. Compari-son of the percentage of brewery employment relative to the labor force shows that employment in the brewery industry is 11 times more concentrated in Sonoma County compared to the US.
Economic Analysis
The economic impact of Sonoma County’s brewery industry in 2013 is estimated to be $168,640,012. This figure includes both the direct output of the breweries themselves as well as the indirect economic multiplier effects associated with their output. The indirect effect measures the additional income to industries linked to the brewery supply chain that in turn use the income to support additional jobs and output. The figure also includes the economic effects of employee spending in the local economy using income earned from the brewery’s output. By aggregating all of these effects, the estimated total impact reflects the overall contribution of the craft brewing industry applied to Sonoma County’s regional economy as a whole. In order to calculate the multiplier effects, the EDB utilized IMPLAN (Impact Analysis for Planning), a modeling software widely used by organizations for economic impact analysis. A detailed methodology of the analysis can be found in Appendix A.
Tax Revenue from Craft Brewing
In addition to the economic impact of craft brewing in Sonoma County that extends to the local economy, the industry gener-ates an estimated total tax revenue of approximately $43,393,412. Of this value, local and state tax comprised $25,467,508, while federal tax comprised $17,925,904. These revenues come from multiple sources of taxation, including employee income taxes, sales taxes, taxes on production and imports, and indirect business taxes. The bulk of federal tax revenue generated from craft brewing comes from excise and consumption taxes.
While it is unknown how much overall tax revenue is retained at the local level, it is a common practice for economic reports to include tax figures into their impact analyses. Thus, if tax revenue is attributed to craft brewing in Sonoma County as an additional component of the industry’s full economic impact, the combined total value is estimated to exceed $212,000,000. Of this figure, this report can assume with relative confidence that at least $169,000,000 is retained within Sonoma County.
Sonoma County Craft Brewing in 2013
jobs directly created by craft 770brewing
economic impact of Sonoma County’$169 Million
s craft brewing industry, pre-tax
40%increase in production since 2012
local and state tax revenue generated $25,500,000
from craft brewing in Sonoma County
Top Industries Affected by Craft Brewing
Total Output Industry %Attributed to Breweries
Wholesale trade businesses $4,009,464 27.6
Real estate establishments $3,025,025 20.9
Food services and drinking $2,666,291 18.4placesManagement of companies $2,134,327 14.7and enterprises
Transport by truck $1,128,060 7.8
Retail Stores - Food and $788,590 5.4beverageManagement, scientific, and $755,240 5.2technical consulting services
www.sonomaedb.org
7

Wastewater | Infrastructure Development
Overview
Both the City of Santa Rosa as well as the City of Petaluma have begun implementing plans to improve their existing wastewater treatment facilities. As the two largest municipal treatment plants in the county, Santa Rosa and Petaluma handle a significant portion of waste sent in from craft brewer-ies, cideries, and distilleries. As these businesses have grown, along with other local businesses in the county, there has been increased need for expanded wastewater treatment capacity.
Separately, Lagunitas and Bear Republic have both invested in new wastewater treatment technology that will allow them to reuse a larger percentage of their wastewater for production purposes, while simultaneously reducing their discharge loads to municipal plants.
City of Santa Rosa Development Update
The City of Santa Rosa has recently opened bids for its planned High Strength Waste Receiving Facility that will be added to the Laguna Treatment Plant.
As outlined, a receiving facility will be constructed to receive up to 40,000 gallons per day of high strength liquid waste. The system will leverage existing infrastructure at the Laguna Treatment Plant, increase disposal service alternatives for existing and future local businesses, offset power costs, and help to reduce the need to truck waste outside of Sonoma County. The project is expected to be completed in the summer of 2015.
City of Petaluma Development Update
The City of Petaluma is working to add several new compo-nents to its existing wastewater treatment plant.
Petaluma has invested in new equipment along with designs for a new digestor that is expected to be completed in 2017. The City is working to increase the plant’s tertiary water capac-ity that will allow for increased treatment and storage of water gathered during the winter and spring for use in the summer. The project is awaiting grant funding and is targeted for completion by 2017. Additionally, Petaluma is seeking funding to expand the facility’s ability to receive high strength waste solids, which is of particular relevance to the local beer, cider, and spirits industry.
Wastewater Treatment Overview
5 million gallons Total amount of water currently treated per day at Ellis
Creek Water Recycling Facility in Petaluma
21 million gallons Total amount of water currently treated per day at the
Laguna Treatment Plant in Santa Rosa
40,000 gallons per day Anticipated capacity of Santa Rosa’s new High Strength
Waste Receiving Facility
Development Timeline
2015Expected completion date for new high strength wastewa-
ter receiving facility at the Laguna Treatment Plant in Santa Rosa.
2017Target completion date for new digestor technology and
expanded tertiary water capacity at the City of Petaluma’s municipal treatment plant.
2018Proposed date for high strength waste capacity expansion
at Petaluma municipal plant.
www.sonomaedb.org
8

Wastewater | Brewery Development
www.sonomaedb.org
9
Lagunitas Brewing Company
Since expanding its Petaluma brewery in 2011, wastewater management has become a significant challenge for the Lagu-nitas Brewing Company. Having outgrown the capabilities of Petaluma’s municipal wastewater treatment facility, Lagunitas currently trucks its high-density wastewater to the East Bay Municipal Utility District in Oakland. Lagunitas estimates that wastewater represents a total cost of about $2.2 million to the company, with approximately $1.3 million attributed to trucking alone.
Lagunitas Anticipated Project Impact
75%total wastewater reduction for Lagunitas
4 to 1 barrels (bbls) of water/ bbl of beercurrent water-to-beer use ratio reported by Lagunitas
2.5 to 1 bbls of water/ bbl of beerexpected water-to-beer use ratio once EcoVolt system becomes operational
50%reduction in total water usage
22%combined percentage of total power and natural gas
demand offset by EcoVolt system
Bear Republic Brewing Company
In 2013, motivated to reduce wastewater impact fees and ensure a stable water supply for the future, the City of Clover-dale and Bear Republic Brewing Company invested in a public-private partnership to construct two new wells for the City, with the ability to produce 600 to 1,000 gallons of water per minute. Even with the opportunity to grow production with increased access to water, Bear Republic is committed to reducing their water usage, currently achieving a 3.5 to 1 water-to-beer use ratio, far below the 7 to 1 industry average.
Bear Republic Anticipated Project Impact
100%of total wastewater will run through the system
3.5 to 1 barrels (bbls) of water/ bbl of beercurrent water-to-beer use ratio reported by Bear Republic
50%of the brewery’s power can be produced by the system
25%return on investment by reduction of water
impact fees and operational costs
®
Investment in New Technology
Recently, Lagunitas and Bear Republic initiated projects to install their own wastewater treatment systems after purchasing new technology from Cambrian Innovation, a biotechnology firm based in Boston, MA. Known as the EcoVolt, the system is used to remove suspended solids and organic matter from wastewater, as well as offset power costs, through the production of biogas that can be used on-site to generate both heat and electricity.
Cambrian has also partnered with Lagunitas to develop an advanced treatment train that will further clean the brewery’s water using membrane bioreactors (MBR) and reverse osmosis (RO). This will enable Lagunitas to clean its wastewater down enough to be re-used on site for applications that do not come in contact with beer, such as cleaning.
Overview of the EcoVolt System
The EcoVolt system utilizes electrically active organisms that produce a measurable electric current as well as a small amount of methane gas as they digest organic matter in wastewater (such as yeast, grain and hop residuals). This process is known as electromethanogenesis. Though the electric current emitted by the microbes is not enough to be a primary power source, it enables technicians to assess the performance of the system in real-time. Electrodes used to monitor the system will also afford greater stability and higher methane fraction, resulting in a simpler, more economically efficient process. These factors are hugely valuable in terms of ensuring consistent, reliable operation. Most important, the system is designed to scale to the needs of the brewery. As Lagunitas reports, their company will be able to deploy capital prudently to manage operation of the system while accounting for the brewery’s continued growth.

Appendix A | Economic Impact Methodology Premise
The EDB surveyed Sonoma County breweries, distilleries, and cideries in order to assess their impact on the county and identify impediments to growth. This survey was partially motivated by recent economic reports on the brewery industry for Larimer County, Colorado (The Economic Impacts of Brew-eries on Larimer County, Colorado State University, 2011), Colorado State (Craft Brewers Industry Overview and Economic Impact, University of Colorado, 2012), and Califor-nia State (California Craft Brewing Industry: An Economic Impact Study, University of California, Berkley, 2012). The major similarity between all three reports is the use of the IMPLAN modeling software to perform the economic impact analysis. In producing an economic impact analysis for Sonoma County, the EDB used these reports as a model to develop its own survey.
While distilleries and cideries were surveyed, and their responses show up throughout the report, the EDB was unable to perform an economic analysis in the same way as it did with breweries. Due to a small sample size, the EDB could not report their impact without compromising their anonymity. Suppressing sensitive business data because of this circum-stance is a common practice among data providers such as the BLS and California EDD.
Survey
The survey was deployed in late 2014. An effort was made to include input from all Sonoma County breweries, distilleries, and cideries. A list of Sonoma County businesses that were classified as a manufacturer of beer, spirits, or cider was creat-ed using information from the California EDD, InfoGroup, press articles, and the California Craft Brewers Association. The survey data informed the analysis presented on growth outlook, employment, production, supply, distribution, commu-nity impact, and economic impact. Responses were received from 30 companies, accounting for more than 80% of the businesses surveyed.
Analysis
The IMPLAN software models the impact of an event on a given economy which is referred to as input-output analysis. An extensive database of industry-specific economic data allows IMPLAN to generate a Social Accountability Matrix. This matrix is used to track the interactions between different sectors of the target economy, and in doing so, provides the basis for calculating an event multiplier.
Survey recipients were asked to indicate their number of full-time and part-time employees in 2013, along with their total sales in 2013. The aggregate brewery sales and employment were allocated to IMPLAN sector 71 to run the analysis. Since all beer production takes place within Sonoma County, the
Appendix B | Sources
www.sonomaedb.org
10
Bear Republic Brewing Company, (www.bearrepublic.com)
Beer Institute, (www.beerinstitute.org)
Brewers Association, (www.brewersassociation.org)
Bureau of Economic Analysis, (www.bea.gov)
Bureau of Labor Statistics, (www.bls.gov)
Distilled Spirits Council of the United States, (www.discus.org)
Frank, Rimerman + Co. LLP, (www.frankrimerman.com)Craft Beer & Wine at a Crossroads
Lagunitas Brewing Company, (www.lagunitas.com)
NACS, (www.nacsonline.com)
Sustainable Brands, (www.sustainablebrands.com/news_and_views/cleantech/jennifer_elks/bear_republic_brewery_unveils_energy-postitive_wastewater_trea)
Sonoma County Economic Development Board, (edb.sonoma-county.org/pdf/2013/craft_beverage_report_2013.pdf)
Sonoma West Times & News, (www.sonomawest.com/cloverdale_reveille/news/unique-wastewater-treatment-system-debuts-at-bear-republic/article_0ba19c28-aa27-11e3-8fcd-0019bb2963f4.html)
The EDB believes all data contained within this report to be accurate and the most current available, but does not guarantee its accuracy or completeness. Use of data from an outside source does not represent an endorsement of any product or service by the EDB, its members or affiliates.
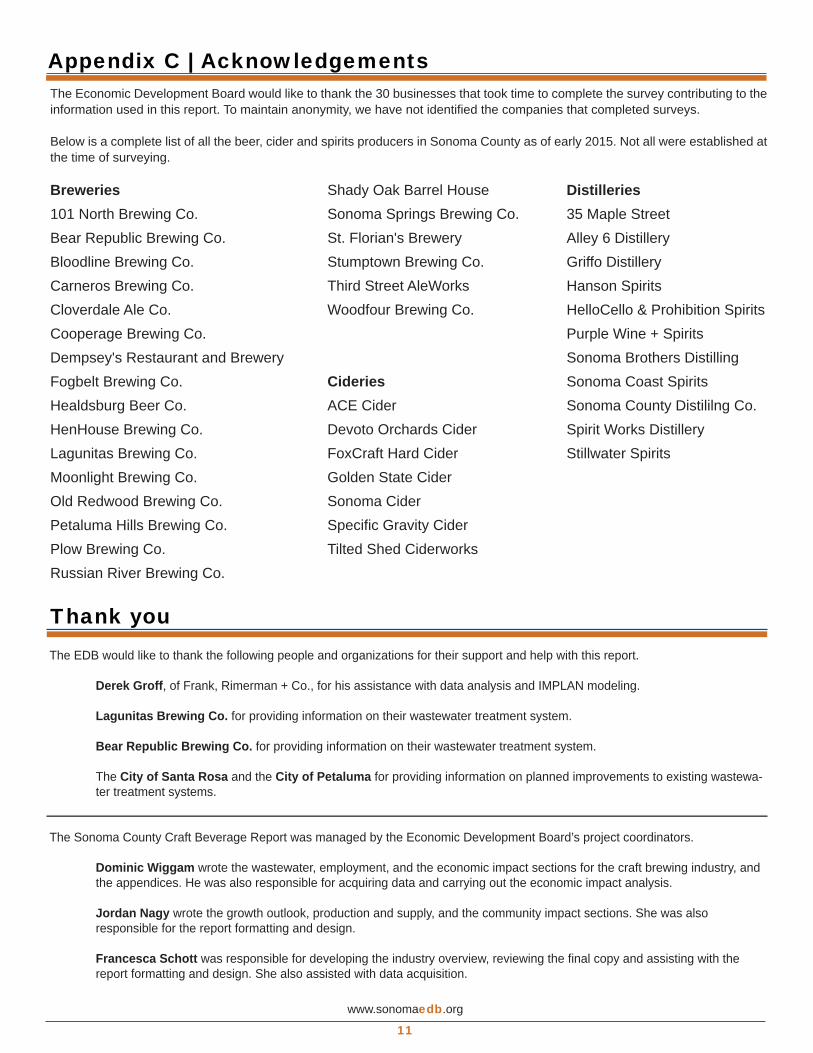
Appendix C | AcknowledgementsThe Economic Development Board would like to thank the 30 businesses that took time to complete the survey contributing to the information used in this report. To maintain anonymity, we have not identified the companies that completed surveys.
Below is a complete list of all the beer, cider and spirits producers in Sonoma County as of early 2015. Not all were established at the time of surveying.
www.sonomaedb.org
11
Breweries101 North Brewing Co.Bear Republic Brewing Co.Bloodline Brewing Co.Carneros Brewing Co.Cloverdale Ale Co.Cooperage Brewing Co.Dempsey's Restaurant and BreweryFogbelt Brewing Co.Healdsburg Beer Co.HenHouse Brewing Co.Lagunitas Brewing Co.Moonlight Brewing Co.Old Redwood Brewing Co.Petaluma Hills Brewing Co.Plow Brewing Co.Russian River Brewing Co.
Shady Oak Barrel HouseSonoma Springs Brewing Co.St. Florian's BreweryStumptown Brewing Co.Third Street AleWorksWoodfour Brewing Co.
CideriesACE CiderDevoto Orchards CiderFoxCraft Hard CiderGolden State CiderSonoma CiderSpecific Gravity CiderTilted Shed Ciderworks
Distilleries35 Maple StreetAlley 6 DistilleryGriffo DistilleryHanson SpiritsHelloCello & Prohibition SpiritsPurple Wine + SpiritsSonoma Brothers DistillingSonoma Coast SpiritsSonoma County Distililng Co.Spirit Works DistilleryStillwater Spirits
Thank youThe EDB would like to thank the following people and organizations for their support and help with this report.
Derek Groff, of Frank, Rimerman + Co., for his assistance with data analysis and IMPLAN modeling.
Lagunitas Brewing Co. for providing information on their wastewater treatment system. Bear Republic Brewing Co. for providing information on their wastewater treatment system.
The City of Santa Rosa and the City of Petaluma for providing information on planned improvements to existing wastewa- ter treatment systems.
The Sonoma County Craft Beverage Report was managed by the Economic Development Board’s project coordinators.
Dominic Wiggam wrote the wastewater, employment, and the economic impact sections for the craft brewing industry, and the appendices. He was also responsible for acquiring data and carrying out the economic impact analysis.
Jordan Nagy wrote the growth outlook, production and supply, and the community impact sections. She was also responsible for the report formatting and design.
Francesca Schott was responsible for developing the industry overview, reviewing the final copy and assisting with the report formatting and design. She also assisted with data acquisition.

The EDB is pleased to thank the following Signature Sponsors for their support of our important programs.
Economic Development Board141 Stony Circle, Ste. 110Santa Rosa, CA 95401(707)565-7170www.SonomaEDB.org
PRESENTING LEVEL
FOUNDATION LEVEL
PREMIER LEVEL
EXECUTIVE LEVEL
MEDIA LEVEL
Sonoma County Board of Supervisors
EDBECONOMIC DEVELOPMENT BOARD
SONOMA COUNTY
AmericanAgCreditAmerican River BankCity of Santa RosaComcast
NorBARSonoma County AllianceVantreo InsuranceZainer Rinehart Clarke