Crack Growth Behavior of Pipeline Steels under … · iv Preface Part of this thesis involved...
286
Crack Growth Behavior of Pipeline Steels under Variable Pressure Fluctuations in a Near-Neutral pH Environment by Mengshan Yu A thesis submitted in partial fulfillment of the requirements for the degree of Doctor of Philosophy in Materials Engineering Department of Chemical and Materials Engineering University of Alberta © Mengshan Yu, 2015
Transcript of Crack Growth Behavior of Pipeline Steels under … · iv Preface Part of this thesis involved...
Crack Growth Behavior of Pipeline Steels under Variable Pressure Fluctuations in
a Near-Neutral pH Environment
by
Mengshan Yu
A thesis submitted in partial fulfillment of the requirements for the degree of
Doctor of Philosophy
in
Materials Engineering
Department of Chemical and Materials Engineering
University of Alberta
© Mengshan Yu, 2015

ii
Abstract
This research aims at understanding the crack propagation behavior of pipeline steels
under variable pressure fluctuations in a near-neutral pH environment. Although pressure
fluctuations have been recognized as the driving force for crack growth for more than two
decades, the mechanisms governing their effects on crack growth have yet to be
determined. Existing crack growth models that consider the effect of pressure fluctuations
are established primarily by assuming a fatigue loading with constant stress amplitudes.
This often yields a predicted life that well exceeds the service lifetime observed in the
field. We believe that the significant discrepancies between laboratory findings and field
observations could be bridged by modeling crack growth through a consideration of
variable amplitude fatigue loadings, which are the conditions in the field.
This investigation has focused on the evaluation of a variable amplitude fatigue
waveform consisting of cycles with higher R ratios (minimum stress/maximum stress),
termed as minor cycles, and periodic underload cycles with lower R ratios. Such a
waveform is typical for the pressure fluctuations in pipeline discharge sections, which
was performed both in air and in near-neutral pH solution. Compared with the
corresponding constant amplitude loadings, the variable amplitude waveform
significantly enhanced fatigue crack growth. The waveform was varied to study the
effects of various contributing factors, including loading frequency, maximum stress
intensity factor, number of minor cycles, and amplitudes of underload and minor cycles.
iii
By comparing results in near-neutral pH solution with that in air, the role of hydrogen
and corrosion in crack growth was characterized and clearly defined.
The obtained results agree with various failure scenarios found in the field, including the
high frequency of failures found at the discharge sections of pipelines, and the different
crack growth characteristics between oil pipelines and gas pipelines. Based on these
findings, practical strategies were proposed for avoiding accelerated crack growth.

iv
Preface
Part of this thesis involved research collaboration: Section 3.4.2.2 - Theoretical
prediction of critical frequency for hydrogen embrittlement in Chapter 3 and Appendix A
were performed by Xiao Xing and Dr. Hao Zhang. Dr. Hao Zhang is the supervisor of
Xiao Xing who is a PhD Candidate in Department of Chemical and Materials
Engineering, University of Alberta. All other parts of this thesis are the original work of
Mengshan Yu.
v
Acknowledgments
First of all, my sincerest appreciation goes to my supervisor, Prof. Weixing Chen, for his
extraordinary tolerance and patience, systematical guidance and continuous
encouragement throughout my studies. I would also like to express many thanks to Dr.
Reg Eadie and Dr. Hao Zhang for their valuable discussions. I acknowledge the members
of the examining committee, Dr. Thomas R. Jack, Dr. Douglas Ivey, Dr. Jingli Luo, and
Dr. Hao Zhang. Special thanks to examining committee chair Dr. Leijun Li.
I’m grateful for the in-time department supports from Lily Laser, Walter Boddez, James
McKinnon, Herb Green, Kevin Heidebrecht, Nathan Gerein and George Braybrook. I
appreciate my colleagues, Dr. Abdoulmajid Eslami, Dr. Tianfei Wang, Dr. Ziqiang Dong,
Dr. Jiaxi Zhao, Dr. Hao Li, Mr. Brett Conrad, Miss Karina Chevil, Miss Zeynab Shirband,
Mr. Xiao Xing, Mr. Devin Engel and many others for their kind help during this research.
I would especially like to thank Dr. Yongwang Kang, who was a postdoctoral faculty
member in the department, for his patient mentoring at the beginning of my studies.
I would like to thank the Natural Science and Engineering Research Council (NSERC),
TransCanada Pipeline Limited, Spectra Energy, and the Pipeline Research Council
International (PRCI) for financial support.
Last but not the least, special thanks go to my parents, Guangxia Yu and Chunhuan
Wang, and brother, Mengyun Yu, for all that they have done and continue to do for me.
vi
Table of Contents
Chapter 1 Introduction.................................................................................................. 1
1.1 Oil and Gas Transmission Pipelines ...................................................................... 2
1.2 Stress Corrosion Cracking (SCC) ......................................................................... 3
1.2.1 High pH SCC ..................................................................................................... 6
1.2.2 Near-neutral pH stress corrosion cracking (NNpHSCC) ................................... 6
1.2.2.1 Study of corrosion ....................................................................................... 7
1.2.2.2 Study of mitigating external corrosion ....................................................... 7
1.2.2.3 Study of materials ....................................................................................... 9
1.2.2.4 Study of crack initiation ............................................................................ 10
1.2.2.5 Study of crack propagation ....................................................................... 10
1.3 Corrosion Fatigue in Near-Neutral pH Environments ...................................... 13
1.3.1 Parameters affecting crack propagation ........................................................... 14
1.3.1.1 Stress intensity factor range ΔK ............................................................... 14
1.3.1.2 Maximum stress intensity factor Kmax ...................................................... 18
1.3.1.3 Loading frequency .................................................................................... 20
1.3.1.4 Hydrogen embrittlement ........................................................................... 21
1.3.2 Available corrosion fatigue models in near-neutral pH environments ............ 22
1.3.2.1 Paris Law .................................................................................................. 22
1.3.2.2 Crack tip strain rate model ........................................................................ 22
1.3.2.3 Superposition model ................................................................................. 23
1.3.2.4 Combined factor ....................................................................................... 24
vii
1.4 Variable Amplitude (VA) Fatigue ....................................................................... 27
1.4.1 Overload cyclic loadings - retardation effect ................................................... 31
1.4.2 Underload cyclic loadings – acceleration effect .............................................. 33
1.4.2.1 Number of minor cycles ........................................................................... 34
1.4.2.2 Maximum stress ........................................................................................ 36
1.4.2.3 Amplitudes of large (underload) and minor cycles .................................. 37
1.4.2.4 Environments ............................................................................................ 38
1.5 Mechanisms of Load Interactions ....................................................................... 39
1.5.1 Crack closure ................................................................................................... 39
1.5.2 Residual stress .................................................................................................. 41
1.5.3 Strain hardening/softening ............................................................................... 42
1.5.4 Dislocation substructure changes ..................................................................... 42
1.6 Challenges in Crack Growth Study of Pipeline Steels Exposed to NNpH
Environments .............................................................................................................. 43
1.7 Research Objectives and Thesis Structure ......................................................... 46
References .................................................................................................................... 47
Chapter 2 Depressurization-Induced Crack Growth Enhancement for Pipeline
Steel Exposed to a Near-Neutral pH Environment ...................................................... 62
2.1. Introduction .......................................................................................................... 62
2.2 Experimental ......................................................................................................... 66
2.2.1 Specimen and near-neutral pH solution ........................................................... 66
2.2.2 Loading conditions........................................................................................... 69
2.2.2.1 Constant amplitude cyclic loading. ........................................................... 69
viii
2.2.2.2 Variable amplitude cyclic loading. ........................................................... 70
2.3 Results and Discussion .......................................................................................... 72
2.3.1 The role of minor cycles .................................................................................. 72
2.3.3 Crack growth behavior at different frequencies ............................................... 75
2.3.3.2 Variable amplitude cyclic loading ............................................................ 77
2.4 Practical Strategies for Avoiding Enhanced Crack Growth............................. 80
2.5 Conclusions ............................................................................................................ 81
References .................................................................................................................... 82
Chapter 3 Crack Growth Behavior of Pipeline Steel Exposed to a Near-Neutral
pH Environment under Variable Pressure Fluctuations: Effects of Loading
Frequency ..................................................................................................................... 86
3.1 Introduction ........................................................................................................... 86
3.2 Experimental ......................................................................................................... 92
3.2.1 Materials and environment .............................................................................. 92
3.2.2 Mechanical loading conditions ........................................................................ 93
3.2.2.1 Effect of loading frequency ...................................................................... 94
3.2.2.2 Effect of maximum stress ......................................................................... 96
3.2.3 Determination of crack growth rate ................................................................. 96
3.3 Results .................................................................................................................... 97
3.3.1 Frequency dependence of crack growth rate under constant amplitude cyclic
loading....................................................................................................................... 97
3.3.2 Frequency dependence of crack growth rate under variable amplitude cyclic
loading..................................................................................................................... 101

ix
3.3.3 Kmax dependence of crack growth rate ........................................................... 102
3.4 Discussion............................................................................................................. 103
3.4.1 Acceleration effect caused by underload ....................................................... 103
3.4.2 Role of corrosive near-neutral pH environments ........................................... 107
3.4.2.1 Observation of critical frequency ........................................................... 108
3.4.2.2 Theoretical prediction of critical frequency for hydrogen embrittlement
............................................................................................................................ 110
3.4.2.3 Understanding the effect of frequency on crack growth behavior .......... 114
3.4.2.4 Understanding the effect of maximum stress on crack growth behavior 118
3.4.3 Study results applied to real cracking in the field .......................................... 118
3.5 Conclusions .......................................................................................................... 122
References .................................................................................................................. 123
Chapter 4 Crack Growth Behavior of Pipeline Steel Exposed to a Near-Neutral
pH Environment under Variable Pressure Fluctuations: Effects of Number of
Minor Cycles.................................................................................................................. 127
4.1 Introduction ......................................................................................................... 127
4.2 Experimental ....................................................................................................... 131
4.2.1 Materials and preparation of specimen .......................................................... 131
4.2.2 Tests in near-neutral pH solution ................................................................... 132
4.2.3 Tests in air ...................................................................................................... 135
4.2.4 Determination of crack growth rate and acceleration factor .......................... 136
4.3 Results .................................................................................................................. 137
4.3.1 Tests in air ...................................................................................................... 137

x
4.3.1.1 Constant amplitude test ........................................................................... 138
4.3.1.2 Periodic underload test ............................................................................ 140
4.3.2 Periodic underload test in C2 solution ........................................................... 143
4.4 Discussion............................................................................................................. 148
4.4.1 The role of minor cycles in fatigue crack propagation .................................. 149
4.4.2 The role of environments in fatigue crack propagation ................................. 151
4.4.3 Mechanisms of acceleration effect induced by underloads ........................... 153
4.4.4 Understanding the field crack behaviors in NNpHSCC ................................ 156
4.5 Conclusions .......................................................................................................... 158
References .................................................................................................................. 159
Chapter 5 Crack Growth Behavior of a Pipeline Steel Exposed to a Near-Neutral
pH Environment under Variable Pressure Fluctuations: Effects of Amplitudes ... 163
5.1 Introduction ......................................................................................................... 163
5.2 Experimental ....................................................................................................... 168
5.2.1 Materials and environment ............................................................................ 168
5.2.2 Determination of crack growth rate and acceleration factor .......................... 170
5.2.3 Mechanical loading conditions ...................................................................... 171
5.3 Results .................................................................................................................. 173
5.3.1 Dependence of crack growth rate on R ratio of underload ............................ 173
5.3.2 Dependence of crack growth rate on R ratio of minor cycles ........................ 175
5.3.3 Dependence of acceleration factor on amplitude ratio .................................. 180
5.4 Discussion............................................................................................................. 182
5.4.1 Enhanced crack growth rate by underload ..................................................... 182

xi
5.4.2 Reduced corrosion fatigue threshold by underload ....................................... 184
5.4.3 Effects of environments on crack growth behaviors...................................... 186
5.4.4 Understanding NNpHSCC crack growth ....................................................... 191
5.5 Conclusions .......................................................................................................... 192
References .................................................................................................................. 193
Chapter 6 Crack Growth Behavior of a Pipeline Steel Exposed to a Near-Neutral
pH Environment under Variable Pressure Fluctuations: the Role of Hydrogen ... 198
6.1 Introduction ......................................................................................................... 198
6.2 Experimental ....................................................................................................... 202
6.2.1 Environment ................................................................................................... 202
6.2.2 Specimen ........................................................................................................ 203
6.2.3 Mechanical loading conditions ...................................................................... 205
6.2.4 Observation of crack growth, widening and fracture surface ........................ 206
6.3 Results and Discussion ........................................................................................ 207
6.3.1 Determination of crack growth rate ............................................................... 207
6.3.2 Characterization of crack width ..................................................................... 211
6.3.3 Fracture surface observation .......................................................................... 216
6.3.4 Process of crack propagation in near-neutral pH environments .................... 222
6.4 Conclusions ....................................................................................................... 226
References .................................................................................................................. 227
Chapter 7 Conclusions, research impact and recommendations .......................... 232
7.1 Conclusions .......................................................................................................... 232
7.1.1 Observation of acceleration effect ................................................................. 233
xii
7.1.2 Effects of number of minor cycles on crack growth ...................................... 233
7.1.3 Effects of frequency and maximum stress on crack growth .......................... 234
7.1.4 Effects of amplitudes of underload and minor cycles on crack growth ......... 235
7.1.5 The role of hydrogen in crack growth in near-neutral pH environments ...... 235
7.1.6 Practical strategies for avoiding enhanced crack growth ............................... 236
7.2 Research Impact.................................................................................................. 237
7.3 Recommendations ............................................................................................... 238
Appendix A ................................................................................................................... 240
References .................................................................................................................. 243
References ................................................................................................................... 245
xiii
List of figures
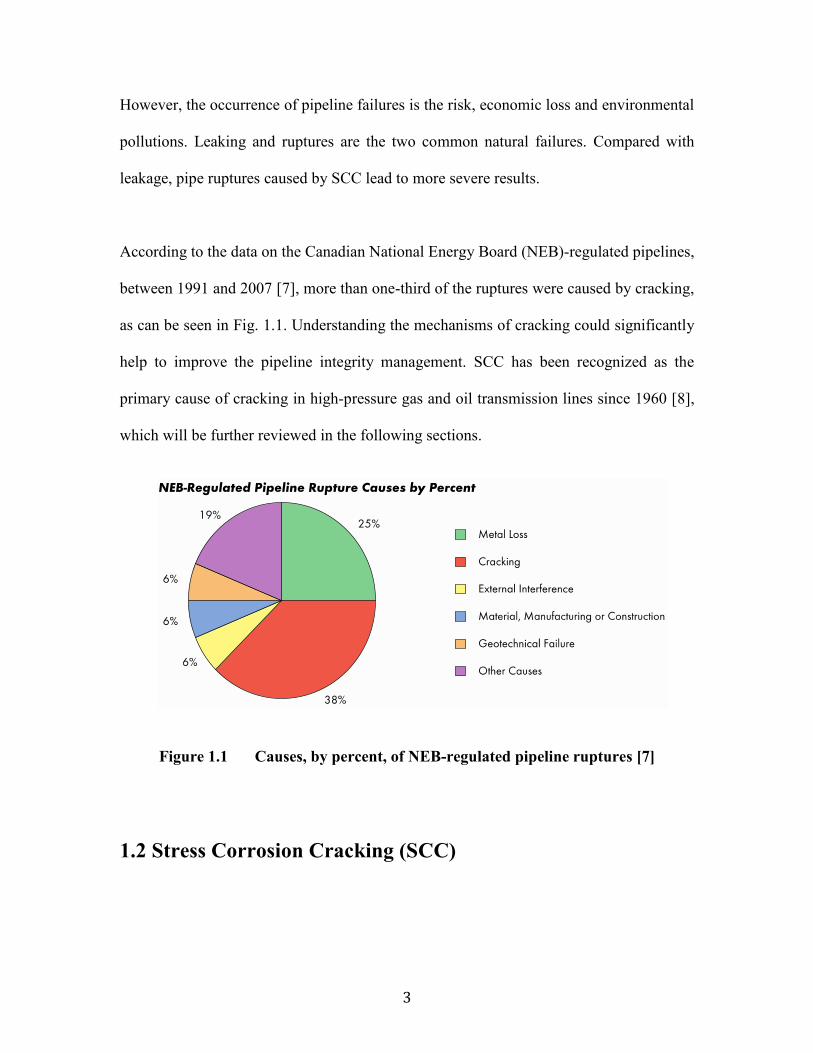
Figure 1.1 Causes, by percent, of NEB-regulated pipeline ruptures [7] ......................... 3
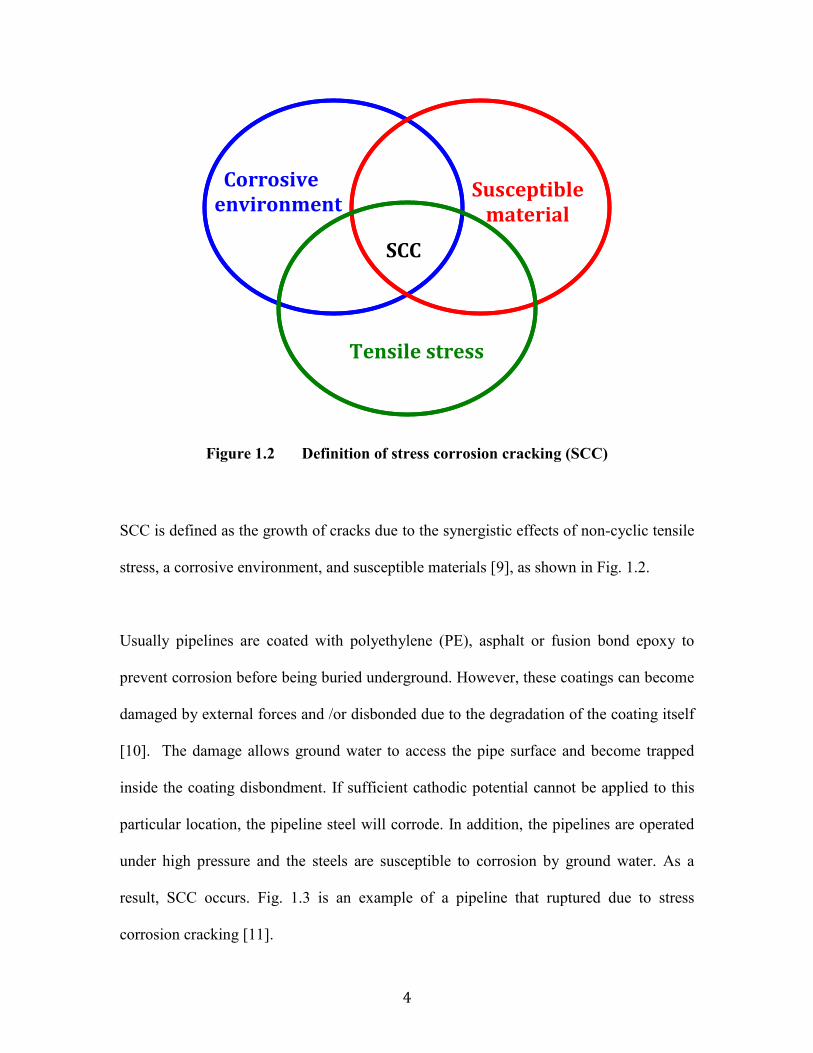
Figure 1.2 Definition of stress corrosion cracking (SCC)............................................... 4
Figure 1.3 Failure of an oil pipeline 800 m downstream of a pump station [11] ........... 5
Figure 1.4 Schematic showing disbonded coating on pipe surface and reduced cathodic
protection toward the bottom of a disbonded holiday [5] .............................. 9
Figure 1.5 Typical morphology of a dormant crack found in a buried pipeline steel
exposed to a near-neutral pH soil-water solution in the field [5] ................ 11
Figure 1.6 Typical stages of crack growth of pipeline steels exposed to near-neutral pH
environments—Bathtub Model. .................................................................. 12
Figure 1.7 Pressure fluctuations recorded for a high-pressure gas transmission pipeline
..................................................................................................................... 13
Figure 1.8 Diagram showing three regimes of fatigue crack growth response ............. 15
Figure 1.9 Crack growth rate as a function of ΔK in near-neutral pH solutions (other
conditions may vary) ................................................................................... 17
Figure 1.10 Crack growth rate as a function of Kmax in near-neutral pH solutions (other
conditions may vary) ................................................................................... 19
Figure 1.11 Crack growth rate as a function of loading frequency in near-neutral pH
solutions (other conditions may vary) ......................................................... 19
Figure 1.12 Correlation of combined factor with crack growth rate in near-neutral pH
solutions [4] ................................................................................................. 27
xiv
Figure 1.13 Basic loading waveforms in variable amplitude fatigue test (a) overload, (b)
underload ..................................................................................................... 28
Figure 1.14 Schematic of delayed retardation of crack growth following a single
overload ....................................................................................................... 30
Figure 1.15 Variables in underload waveform ............................................................. 33
Figure 1.16 Effect of the number of minor cycles per block on the acceleration factor
(other conditions may vary) ....................................................................... 35
Figure 1.17 Effect of maximum stress on acceleration factor (other conditions may
vary) ........................................................................................................... 36
Figure 1.18 Effect of amplitude ratio on the acceleration factor (other conditions may
vary) ........................................................................................................... 37
Figure 1.19 Effects of environments on acceleration factor [88] ................................. 39
Figure 1.20 Changes in crack opening stress level after a) overload [91]; and b)
underload [77]............................................................................................ 40
Figure 1.21 Spectra of an oil pipeline: OA discharge part; and OB suction part ......... 45
Figure 2.1 Pressure fluctuations recorded for a high-pressure gas transmission pipeline
..................................................................................................................... 64
Figure 2.2 Basic loading waveforms in variable amplitude fatigue test ....................... 65
Figure 2.3 SEM image (secondary electron SE) of pipeline steel microstructures in the
transverse section ......................................................................................... 67
Figure 2.4 Dimension of compact tension (CT) specimen used in the testing ............. 67
Figure 2.5 Loading waveform applied in the variable amplitude cyclic loading in C2
solution .......................................................................................................... 69
xv
Figure 2.6 Crack propagation response under different loading waveforms in C2
solution .......................................................................................................... 71
Figure 2.7 SEM images (SE) of fractured surface of specimens in C2 solution, crack
propagating from left to right: a) constant amplitude test; and b) variable
amplitude test ................................................................................................ 74
Figure 2.8 Crack growth behavior at different frequency for both constant and variable
amplitude cyclic loadings in C2 solution ...................................................... 76
Figure 2.9 The crack tip morphology (backscatter electron detector BSD) on the middle
plane in the thickness direction on the samples of variable amplitude tests at
different frequencies. The arrow marks the position of the pre-cracking tip
before test (by comparing with the images taken before test)....................... 80
Figure 3.1 Pressure fluctuations recorded for a high-pressure gas transmission pipeline
(SCADA data) ............................................................................................... 92
Figure 3.2 Variable amplitude fatigue waveform designed to simulate the pressure
fluctuations in Figure 3.1 .............................................................................. 94
Figure 3.3 Frequency dependence of constant amplitude crack growth rate in C2 solution
and in air ...................................................................................................... 100
Figure 3.4 Frequency dependence of variable amplitude crack growth rate in C2
solution and in air ........................................................................................ 100
Figure 3.5 Kmax dependence of variable amplitude crack growth rate in C2 solution and
in air............................................................................................................. 102
Figure 3.6 SEM images showing the striations observed on the specimens after testing
in C2 solution: a) under constant amplitude loading; and b) under variable

xvi
amplitude loading with 300 minor cycles (crack propagation from left to
right) [23] .................................................................................................... 105
Figure 3.7 Crack growth rate under different loading frequency of underload: a) in air;
and b) in C2 solution ................................................................................... 106
Figure 3.8 Crack growth rate under different Kmax: a) in air; and b) in C2 solution ... 107
Figure 3.9 A schematic showing hydrogen diffusion from the annulus region with an
outer radius Req to a circular region with the radius rp (rp is the plastic zone
size) ............................................................................................................ 111
Figure 3.10 Understanding crack growth behavior of gas and oil pipelines exposed to
near-neutral pH environments. n is the number of minor cycles per block.
................................................................................................................. 121
Figure 4.1 (a) Pressure fluctuations recorded for a high-pressure gas transmission
pipeline; (b) designed test waveform ......................................................... 130
Figure 4.2 Comparison of crack growth rate under different waveforms to demonstrate
the importance of minor cycles in the crack growth in C2 solution [18] .. 131
Figure 4.3 Variation of crack growth rate with variable R ratios in air. The tests were
performed at Kmax = 33 and frequency = 0.5 Hz ......................................... 139
Figure 4.4 Results of periodic underload tests in air: (a) measured and predicted crack
growth rates; and (b) variation of acceleration factor with the number of
minor cycles per block ............................................................................... 142
Figure 4.5 Results of periodic underload tests in C2 solution: (a) measured and
predicted crack growth rates; and (b) variation of acceleration factor with
the number of minor cycles per block ....................................................... 144
xvii
Figure 4.6 SEM images (SE) showing the striations observed on the fractured surface
of the specimens tested under different numbers of minor cycles per block
in solution (crack propagated from left to right) ....................................... 147
Figure 4.7 Crack tip morphology on the middle plane in the thickness direction for
specimens tested at a different number of minor cycles per block (n) in C2
solution ...................................................................................................... 148
Figure 4.8 Growth rate of minor cycles in C2 solution and in air .............................. 150
Figure 4.9 Ratio of data in C2 solution over that in air for measured growth rate and
calculated minor cycle growth rate ............................................................ 152
Figure 5.1 Normalized pressure fluctuations recorded for a high-pressure gas
transmission pipeline (SCADA data) ........................................................ 166
Figure 5.2 Crack propagation response under different loading waveforms in C2
solution [24] ............................................................................................... 167
Figure 5.3 Variable amplitude fatigue waveform designed to simulate the pressure
fluctuations in Figure 1 .............................................................................. 172
Figure 5.4 Crack growth behaviors of test of R ratio of underload in air: a) crack
growth rate; and b) acceleration factor ...................................................... 174
Figure 5.5 Crack growth behaviors of test of R ratio of underload in C2 solution: a)
crack growth rate; and b) acceleration factor ............................................ 177
Figure 5.6 Crack growth behaviors of test of R ratio of minor cycles in air: a) crack
growth rate; and b) acceleration factor - R ratio of minor cycles; and c)
acceleration factor – amplitude ratio ......................................................... 179
xviii
Figure 5.7 Crack growth behaviors of test of R ratio of minor cycles in C2 solution: a)
crack growth rate; and b) acceleration factor – R ratio of minor cycles; and
c) acceleration factor – amplitude ratio ..................................................... 182
Figure 5.8 Comparison of crack growth in solution and in air: a) R ratio of underload;
and b) R ratio of minor cycles ................................................................... 188
Figure 5.9 Ratio of crack growth rate in C2 solution over that in air: a) R ratio of
underload; and b) R ratio of minor cycles ................................................. 189
Figure 5.10 A schematic showing the mechanism of crack propagation in pipeline steels
exposed to near-neutral pH environments under pressure fluctuations ..... 191
Figure 6.1 Experimental (a) surface treated compact tension specimen; and (b) variable
amplitude waveform: Kmax = 33 MPa√m, R ratio of minor cycles = 0.9, R
ratio of underload =0.5, frequency of minor cycles = 0.00538 Hz, frequency
of underload =0.0000278 Hz (10 h/cycle), number of minor cycles per block
n = 1000 ..................................................................................................... 204
Figure 6.2 SEM images (BSD) of crack morphologies of specimens after tests (crack
propagation from left to right): a) on surface (the arrow marks the pre-
cracking tip before loading); and b) in the middle .................................... 208
Figure 6.3 (a) Measured crack growth rate; and (b) effects of number of minor cycles
on crack growth rate in C2 solution and in air [42]. The data in the current
investigation were shown as colored dots. ................................................ 209
Figure 6.4 Fracture surface images (SE) in the middle (crack propagation). The marked
zone is the crack growth (from left to right) during the test. Eleven blocks
xix
were applied to the coated specimen in solution at n = 2000, while 17 blocks
were performed for others. ........................................................................ 210
Figure 6.5 Measured crack width behind pre-cracking tip ......................................... 214
Figure 6.6 Comparison of stress-strain curves of an X70 pipeline steel with and without
hydrogen charging [45] .............................................................................. 215
Figure 6.7 Fracture surface images near the crack tip after tests (crack propagation
from left to right). The insert is a magnified view of the fracture surface.
Quasi-cleavage can be seen in the coated specimens. ............................... 218
Figure 6.8 Observation of fractured surface in Figure 6 (d) at different orientations
(SE) The blue square is the reference (the same area) at difference
orientations. ............................................................................................... 220
Figure 6.9 Illustration showing the “fish ladder” formation during crack propagation
(from left to right) ...................................................................................... 221
Figure 6.10 Illustration showing the crack widening behind the pre-cracking tip due to
mechanical loading, HELP and corrosion during the corrosion fatigue test
224
Figure 6.11 Comparison of the crack growth rate and corrosion rate in near-neutral pH
solutions under variety of loading conditions ............................................ 226

xx
List of tables
Table 2.1 Summary of tests performed with constant and variable amplitude loading 68
Table 3.1 Crack growth rate obtained at different frequencies and maximum stress in
this investigation ........................................................................................... 99
Table 4.1 Chemical compositions of C2 solution ....................................................... 133
Table 4.2 Results of periodic underload tests in air .................................................... 141
Table 4.3 Results of periodic underload tests in C2 solution ...................................... 145

1
Chapter 1 Introduction
Near-neutral pH stress corrosion cracking (NNpHSCC) was first identified in 1985
through the examination of failed pipe sections [1]. Despite decades of research, its
mechanisms are still not fully understood and it continues to be a major threat to oil and
gas transmission pipelines worldwide. The pipeline failures cause significant economic
loss, environmental pollution and/or casualties.
The characteristics of NNpHSCC are very different from the classic high pH stress
corrosion cracking (SCC) that has been extensively studied since the 1960s. NNpHSCC
is characterized by wide transgranular cracking in a dilute carbonate-bicarbonate
electrolyte with a pH value in the range of 5.5 to 8.5 [2]. The extensive investigations in
such simulated near-neutral pH environments show that the crack growth rate under the
static tensile stress is too low to be a concern, and thereafter the pressure fluctuations
during pipeline routine operations are recognized as the driving force for crack
propagation [2, 3 ]. It has been proven that NNpHSCC cracking occurs through
mechanisms of corrosion fatigue [4,5].
However, dilemmas still exist between the established corrosion fatigue models and field
findings. For example, the lifetime predicted by these models is much longer than the
actual service life of the pipelines with SCC, and there is a wide range of service lives
found in the field, which varies significantly from section to section. This might be

2
caused on one hand by the complex field conditions, and on the other hand by insufficient
understanding/consideration of the key factors affecting crack growth. One of the key
discrepancies is that constant amplitude cyclic loadings have been applied in laboratory
tests, while random pressure fluctuations occur in the field. It is well established that the
crack growth behavior under variable amplitude fatigue is very different from that under
constant amplitude fatigue. This could be one of the key reasons why the lifetime of a
pipeline steel experiencing NNpHSCC is shorter than that predicted by those established
models.
The following sections will provide a comprehensive review of literature pertinent to this
area of research, especially those areas related to the crack growth behavior of pipeline
steels in near-neutral pH environments under constant and variable amplitude cyclic
loading conditions.
1.1 Oil and Gas Transmission Pipelines
Alberta, Canada, is one of the major producers of oil and gas in the world. In 2012,
Alberta produced 3.7 trillion cubic feet of natural gas, 705 million barrels of crude
bitumen, and 203 million barrels of crude oil, most of which was transported through
pipelines [6]. Of the more than 450,000 kilometers of buried oil and gas transmission
pipelines crisscrossing the province in 2012, about 86% of which were constructed of
steels [6].
3
However, the occurrence of pipeline failures is the risk, economic loss and environmental
pollutions. Leaking and ruptures are the two common natural failures. Compared with
leakage, pipe ruptures caused by SCC lead to more severe results.
According to the data on the Canadian National Energy Board (NEB)-regulated pipelines,
between 1991 and 2007 [7], more than one-third of the ruptures were caused by cracking,
as can be seen in Fig. 1.1. Understanding the mechanisms of cracking could significantly
help to improve the pipeline integrity management. SCC has been recognized as the
primary cause of cracking in high-pressure gas and oil transmission lines since 1960 [8],
which will be further reviewed in the following sections.
Figure 1.1 Causes, by percent, of NEB-regulated pipeline ruptures [7]
1.2 Stress Corrosion Cracking (SCC)
4
Figure 1.2 Definition of stress corrosion cracking (SCC)
SCC is defined as the growth of cracks due to the synergistic effects of non-cyclic tensile
stress, a corrosive environment, and susceptible materials [9], as shown in Fig. 1.2.
Usually pipelines are coated with polyethylene (PE), asphalt or fusion bond epoxy to
prevent corrosion before being buried underground. However, these coatings can become
damaged by external forces and /or disbonded due to the degradation of the coating itself
[10]. The damage allows ground water to access the pipe surface and become trapped
inside the coating disbondment. If sufficient cathodic potential cannot be applied to this
particular location, the pipeline steel will corrode. In addition, the pipelines are operated
under high pressure and the steels are susceptible to corrosion by ground water. As a
result, SCC occurs. Fig. 1.3 is an example of a pipeline that ruptured due to stress
corrosion cracking [11].
Corrosive environment
Susceptible material
Tensile stress
SCC

5
Figure 1.3 Failure of an oil pipeline 800 m downstream of a pump station
[11]
Based on the range of pH values of the electrolytes at the pipeline surface, SCC of
pipeline steels can be categorized as high pH SCC (classical SCC or Intergranular SCC),
and near-neutral pH SCC (low pH SCC or Transgranular SCC). Detailed comparisons of
these two kinds of SCC was made by R. N. Parkins [2] and John A. Beavers [12].
Concise introduction of the characteristics of the two kinds of SCC will be illustrated
below.
6
1.2.1 High pH SCC
The high pH SCC was first reported in the 1960s [8]. It is characterized as intergranular
cracking in concentrated carbonate-bicarbonate soil solutions with pH values above 8.5
[1,8]. In such environments, the cracks propagate in a repeated process of film formation
and rupture along the grain boundaries due to the galvanic effect (different potentials
between grain boundaries and grain material [13]) under stress, and the passive film is
also formed along the crack walls to protect the crack crevice from corrosion [2]. As a
result, a sharp and deep SCC crack is seen. It can be reproduced in the laboratory testing
environments and thus it is thought to be well understood. This kind of SCC can be
controlled by reducing the pipe temperature and controlling the pipe electrochemical
potential range [2].
1.2.2 Near-neutral pH stress corrosion cracking (NNpHSCC)
NNpHSCC was first reported in 1985 after an examination of the failed pipe sections [1].
The main characteristics of NNpHSCC is transgranular cracking in a dilute carbonate-
bicarbonate soil solution with a pH value in the range of 5.5 to 8.5 [1,2]. As the passive
film is not observed in such near-neutral pH solutions, an initially sharp crack will
gradually turn into a wide and dormant crack or pitting, as observed in the oil or gas field
pipelines [14,15]. Despite decades of research, the mechanisms of NNpHSCC are still
open to debate. The work on NNpHSCC will be the focus of this investigation and it will
7
be further reviewed below in terms of near-neutral pH corrosion, crack initiation and
crack propagation.
1.2.2.1 Study of corrosion
The corrosion of pipeline steels occurs when ground water gains access to the pipeline
surface after coating disbondment/damage, especially at locations where a sufficient
cathodic potential is not reached. The corrosion rate of pipeline steels exposed to near-
neutral pH environments is relatively low and could be affected by a number of factors.
Flat coupon tests have shown that the general corrosion rate of pipeline steels is about
1.6×10⁻⁹ mm/s (0.05 mm/year) in a near-neutral pH solution bubbled with 5% CO2
balanced with N2 gas [16]. The general corrosion rate could be affected by the CO2 level
[1], temperature [1], soil condition [1], cathodic protection [17], disbondment size [16],
position relative to the disbondment open mouth [16], and coating type [1,2,18]. The tape
coating disbondment size was well correlated to the corrosion rate of the field data [18].
Although the general corrosion rate, typically 0.05 mm/year, is so low that it may not be
an engineering concern, corrosion plays an important role in crack initiation when
combined with stress and also in crack propagation through the effects of hydrogen, the
by-product of corrosion, which will be described in Section 1.3.1.4.
1.2.2.2 Study of mitigating external corrosion
8
a) Coating: For the buried pipeline, the protective coating is the first line of defense
against external corrosion. However, the coating protection efficiency may be reduced by
poor adhesion, mechanical damage, or the aging process, resulting in coating
disbondment and thus SCC [19]. Different types of coating affect the magnitude of SCC
damage. It was found that even when the epoxy coating and coal tar coating are damaged,
cathodic protential (which will be introduced in the following section) can still reach the
pipe surface and protect the pipe from corrosion and SCC [20]. On the other hand, near-
neutral pH SCC usually occurs under PE and asphalt tape-coated disbondments where
cathodic potential (CP) protection is not effective due to the fact that CP cannot reach the
bottom of the disbondment (because of the electrolyte conductivity) to protect steel from
corrosion due to the geometrical limitation [1,10,21]. The corrosion under PE and asphalt
types of coatings in the field was discussed and well correlated to the disbondment size
and position relative to the open mouth in laboratory testing [18].
b) Cathodic protection: To mitigate the external corrosion of pipeline steels exposed to
ground water solutions after coating disbondment, the pipe can be hooked up to a rectifier
and a CP can be applied to prevent corrosion. Applying CP could also lead to an increase
in the pH of the electrolyte inside the disbondment and passivate the steel in an alkaline
environment [22,23]. The effectiveness of CP depends on several variables, such as steel
surface condition and the potential at the coating disbondment [24], alternating current
(AC) [25], and coating crevice length [21]. If sufficient CP is not able to reach the bottom
of disbondment as shown in Fig. 1.4 [5], NNpHSCC is believed to occur at the pipe

9
surface. In 2013, the Canadian Gas Association recommended the appropriate practice to
control external corrosion [26].
1.2.2.3 Study of materials
Pipe steel of all grades are found to be susceptible to NNpHSCC [10]. These steels
include American Petroleum Institute (API) X52 [27], X60 [28], X65 [4,5], X70 [29],
X80 [30], and X100 [31] (Strong grades have the designation X followed by the specified
minimum yield strength, SMYS, measured in ksi), and they vary in strength and
microstructure. It is hard to determine which pipe grades are more susceptible to
NNpHSCC [32].
Figure 1.4 Schematic showing disbonded coating on pipe surface and reduced
cathodic protection toward the bottom of a disbonded holiday [5]
10
1.2.2.4 Study of crack initiation
Corrosion at selected locations on the pipe surface can lead to the formation of corrosion
pits. The pits could act as stress raisers and cause the formation of micro-cracks at the
bottom of the pits. Various mechanisms of crack initiation for NNpHSCC were proposed
and summarized in Ref. [5]. Recently, a novel testing setup capable of simulating the
synergistic effects of coating disbondment, cathodic protection and cyclic loading on
NNpHSCC crack initiation was designed and systematically implemented [33]. Stress,
time and the level of CP were found to be the three important factors for increasing the
possibility of near-neutral pH SCC crack initiation: old pipes with high levels of stress
fluctuations and insufficient (but not totally lacking) CP were more prone to SCC
initiation.
1.2.2.5 Study of crack propagation
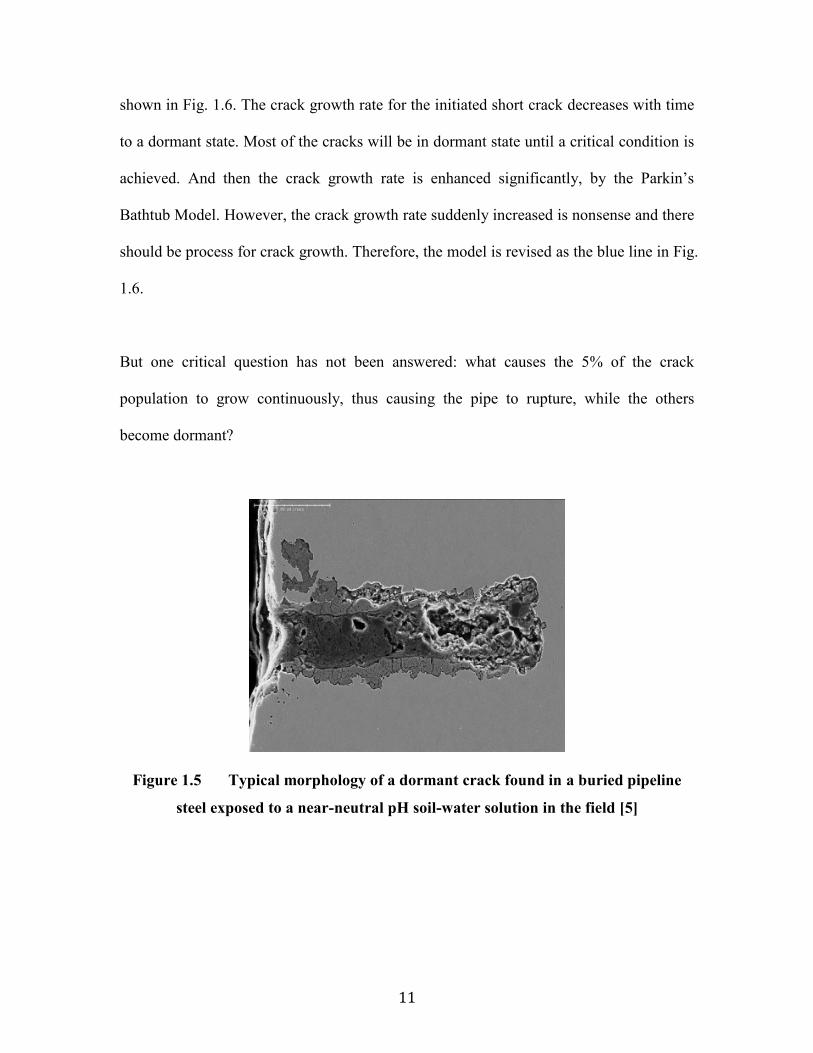
From the statistical analysis of thousands of crack colonies, it has been found that 95% of
the initiated cracks have a blunt tip, as shown in Fig. 1.5 [5]. Cracks with such a crack tip
morphology are considered to be dormant. They are usually less than 1 mm deep and
have very small depth/length aspect ratios, around 0.1-0.2. The reason the initiated cracks
become dormant is because dissolution at the crack tip and crack wall occurs
simultaneously (no passive film formed in NNpH environments as stated before).
However, the remaining 5% of cracks can grow continuously or repeatedly, leading to
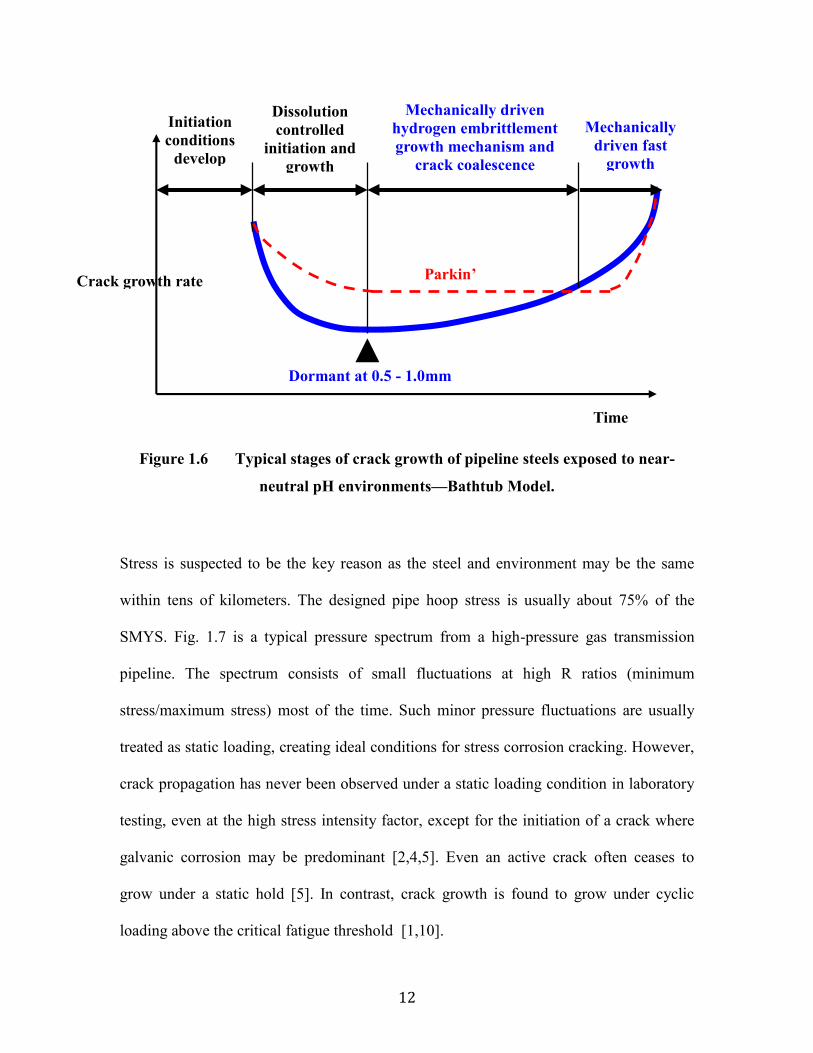
pipeline rupture [5]. Such a process could be described by a modified Bathtub Model
11
shown in Fig. 1.6. The crack growth rate for the initiated short crack decreases with time
to a dormant state. Most of the cracks will be in dormant state until a critical condition is
achieved. And then the crack growth rate is enhanced significantly, by the Parkin’s
Bathtub Model. However, the crack growth rate suddenly increased is nonsense and there
should be process for crack growth. Therefore, the model is revised as the blue line in Fig.
1.6.
But one critical question has not been answered: what causes the 5% of the crack
population to grow continuously, thus causing the pipe to rupture, while the others
become dormant?
Figure 1.5 Typical morphology of a dormant crack found in a buried pipeline
steel exposed to a near-neutral pH soil-water solution in the field [5]
12
Figure 1.6 Typical stages of crack growth of pipeline steels exposed to near-
neutral pH environments—Bathtub Model.
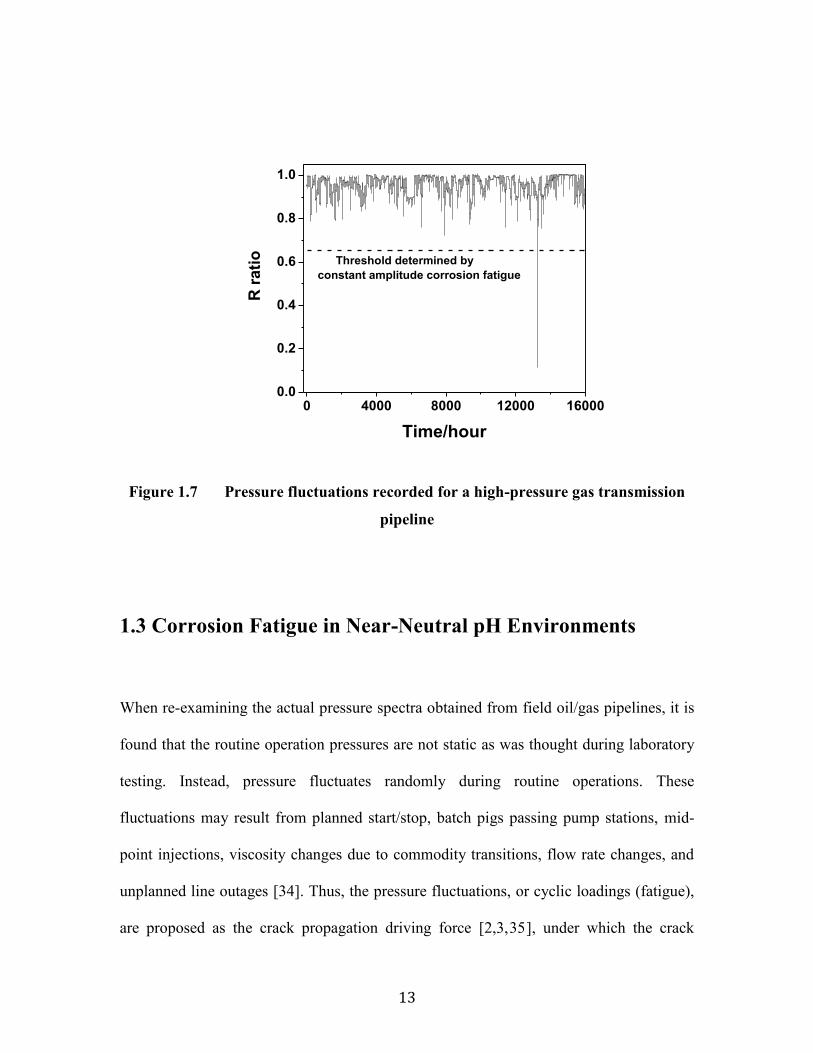
Stress is suspected to be the key reason as the steel and environment may be the same
within tens of kilometers. The designed pipe hoop stress is usually about 75% of the
SMYS. Fig. 1.7 is a typical pressure spectrum from a high-pressure gas transmission
pipeline. The spectrum consists of small fluctuations at high R ratios (minimum
stress/maximum stress) most of the time. Such minor pressure fluctuations are usually
treated as static loading, creating ideal conditions for stress corrosion cracking. However,
crack propagation has never been observed under a static loading condition in laboratory
testing, even at the high stress intensity factor, except for the initiation of a crack where
galvanic corrosion may be predominant [2,4,5]. Even an active crack often ceases to
grow under a static hold [5]. In contrast, crack growth is found to grow under cyclic
loading above the critical fatigue threshold [1,10].
Parkin’
s
Initiation
conditions
develop
Dissolution
controlled
initiation and
growth
Mechanically driven
hydrogen embrittlement
growth mechanism and
crack coalescence
Mechanically
driven fast
growth
Dormant at 0.5 - 1.0mm
Time
Crack growth rate
13
Figure 1.7 Pressure fluctuations recorded for a high-pressure gas transmission
pipeline
1.3 Corrosion Fatigue in Near-Neutral pH Environments
When re-examining the actual pressure spectra obtained from field oil/gas pipelines, it is
found that the routine operation pressures are not static as was thought during laboratory
testing. Instead, pressure fluctuates randomly during routine operations. These
fluctuations may result from planned start/stop, batch pigs passing pump stations, mid-
point injections, viscosity changes due to commodity transitions, flow rate changes, and
unplanned line outages [34]. Thus, the pressure fluctuations, or cyclic loadings (fatigue),
are proposed as the crack propagation driving force [2,3,35], under which the crack
0 4000 8000 12000 160000.0
0.2
0.4
0.6
0.8
1.0
R r
ati
o
Time/hour
Threshold determined by
constant amplitude corrosion fatigue
14
propagation threshold is reduced significantly from non-cyclic SCC [ 36 ]. The
combination of the corrosive near-neutral pH environment and fatigue, a scenario of
corrosion fatigue instead of SCC, is responsible for crack growth. It has been determined
that the NNpHSCC crack growth behavior is consistent with corrosion fatigue
mechanisms, even though it was initially termed SCC [4,5]. Corrosion fatigue in the near-
neutral pH environment is the main focus in this investigation and therefore the current
understanding of corrosion fatigue mechanisms in near-neutral pH environments will be
reviewed in the following sections.
Since pressure fluctuations are recognized as the crack propagation driving force,
constant amplitude cyclic loading tests have been performed in corrosive near-neutral pH
solutions to elucidate the mechanisms of cracking. The effects of fluctuation amplitude
(related to stress intensity factor range ΔK, or R ratio when Kmax is constant), maximum
stress intensity factor Kmax, loading frequency, and hydrogen effects on crack propagation
have been studied. Several models have been also proposed to attempt to incorporate the
laboratory testing observations and field findings.
1.3.1 Parameters affecting crack propagation
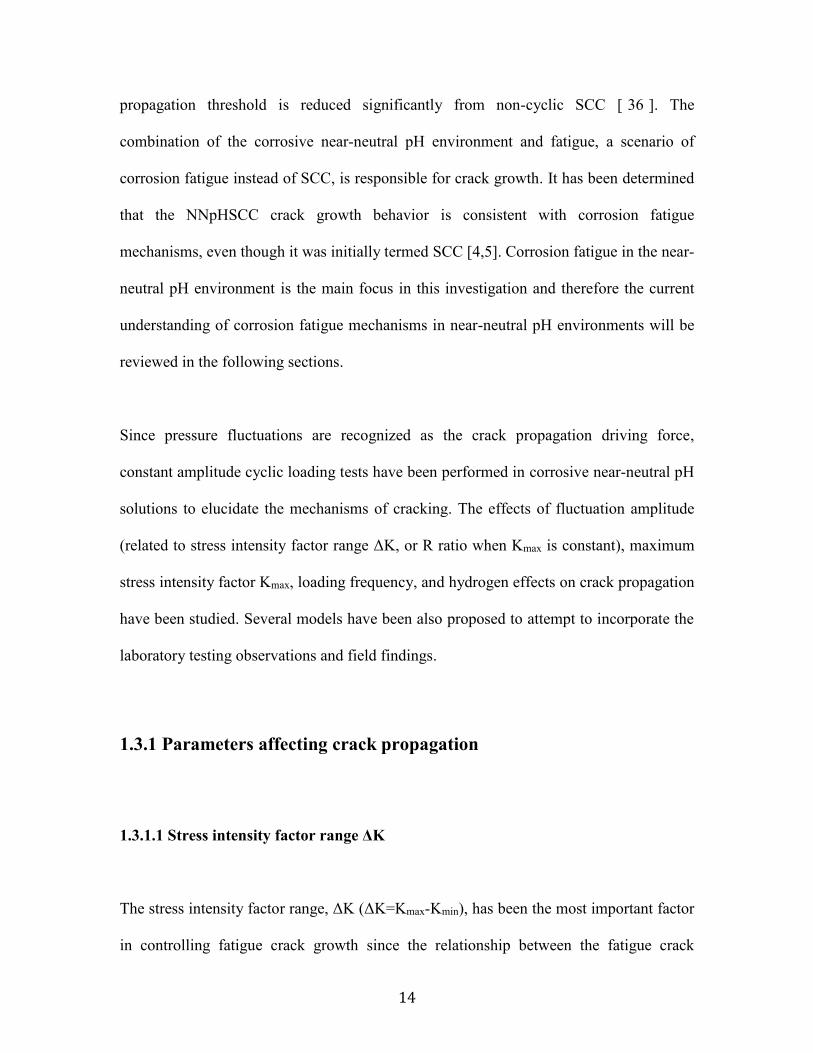
1.3.1.1 Stress intensity factor range ΔK
The stress intensity factor range, ΔK (ΔK=Kmax-Kmin), has been the most important factor
in controlling fatigue crack growth since the relationship between the fatigue crack

15
growth rate and stress intensity factor range was identified in fracture mechanics [37].
There are three regimes of fatigue crack growth rate that are commonly found when
testing in both the inert and corrosive environments, as shown in Fig. 1.8. In Region I, the
fatigue crack growth rate decreases rapidly with decreasing ΔK until a threshold, ΔKth, is
reached, below which the fatigue crack growth rate becomes negligibly low. The ΔKth
threshold is useful in the design of engineering structures that experience cyclic loadings.
The linear region of the log-log plot of Fig. 1.8 is the so-called Paris law [38], expressed
as
𝑑𝑎
𝑑𝑁= 𝐶∆𝐾𝑚 (1 − 1)
where da/dN is the fatigue crack growth rate, ΔK is the stress intensity factor range, and
C and m are material constants that are determined experimentally.
Figure 1.8 Diagram showing three regimes of fatigue crack growth response
𝑙𝑜𝑔𝑑𝑎
𝑑𝑁
𝑙𝑜𝑔Δ𝐾
II I III
ΔKth

16
The Law prevails in Region II, which can be applied to predict the remaining life of
engineering components and to determine the inspection interval when periodic
inspections are required. In Region III, the crack growth rate increases rapidly with ΔK,
which corresponds to the situation where Kmax approaches the toughness of the material,
Kc. Most of the laboratory tests are performed to obtain the crack growth behavior in
Region II and/or to determine ΔKth in Region I.
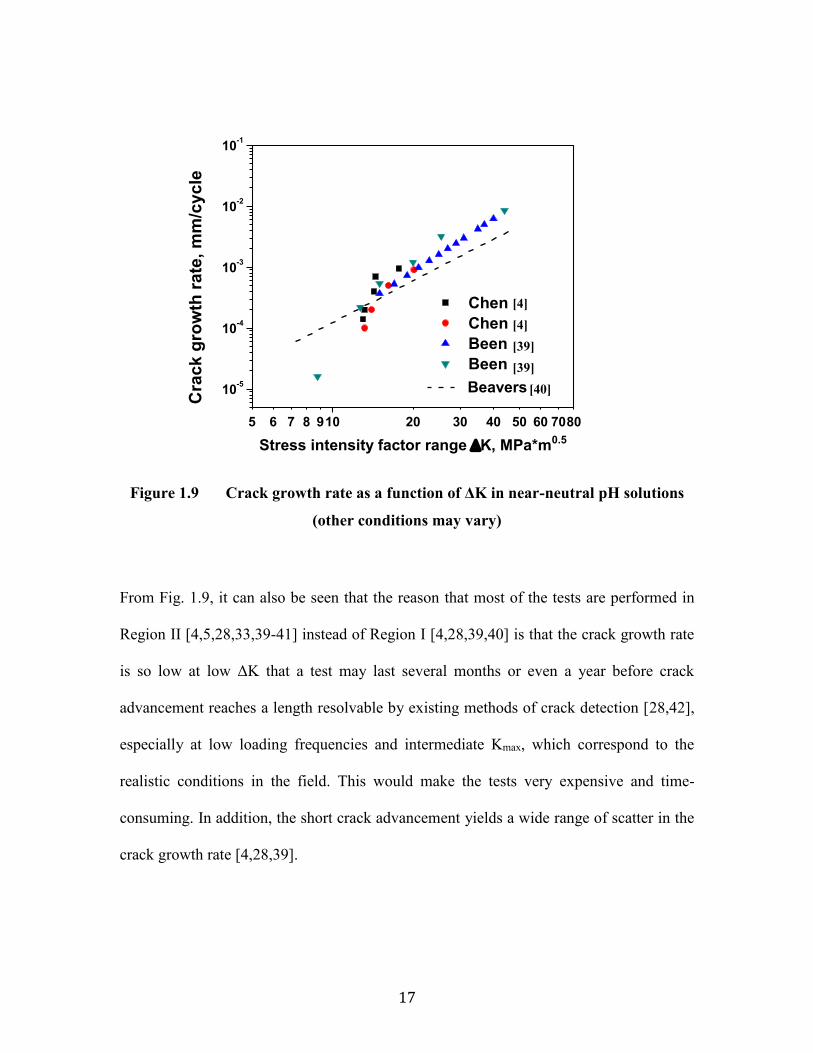
The crack growth behavior in Region II has been specially studied to determine the
mechanisms of NNpHSCC. As drawn from different published resources [4,39,40], the
representative testing results of crack growth rate as a function of ΔK are shown in Fig.
1.9. It can be seen that the linear region of the log-log plot in Fig. 1.9 is primarily
governed by the Paris Law. The Paris Law is still valid under high ΔK in near-neutral pH
environments when all other variables are kept the same. The threshold determined by
Been et al. is lower simply because of the higher applied Kmax. Therefore, Paris Law is
not sufficient to incorporate the effects of other factors, such as Kmax, loading frequency,
environments and cathodic protection.
17
Figure 1.9 Crack growth rate as a function of ΔK in near-neutral pH solutions
(other conditions may vary)
From Fig. 1.9, it can also be seen that the reason that most of the tests are performed in
Region II [4,5,28,33,39-41] instead of Region I [4,28,39,40] is that the crack growth rate
is so low at low ΔK that a test may last several months or even a year before crack
advancement reaches a length resolvable by existing methods of crack detection [28,42],
especially at low loading frequencies and intermediate Kmax, which correspond to the
realistic conditions in the field. This would make the tests very expensive and time-
consuming. In addition, the short crack advancement yields a wide range of scatter in the
crack growth rate [4,28,39].
5 6 7 8 910 20 30 40 50 60 7080
10-5
10-4
10-3
10-2
10-1
Chen
Chen
Been
Been
Cra
ck
gro
wth
rate
, m
m/c
ycle
Stress intensity factor range K, MPa*m0.5
Beavers
[4]
[4]
[39]
[39]
[40]

18
The pressure fluctuations with cyclic amplitude below ΔKth are often considered as near-
static loading and non-propagating. However, these minor pressure fluctuations, for
example, with R≥0.9, were reported to cause a 72% reduction in the SCC threshold [43].
These minor pressure fluctuations in pipeline operations are usually termed as ripple
loads, and are referred to as minor cycles in this investigation. The effect of minor cycles
on the crack growth of pipeline steels in near-neutral pH environments has thus far been
ignored.
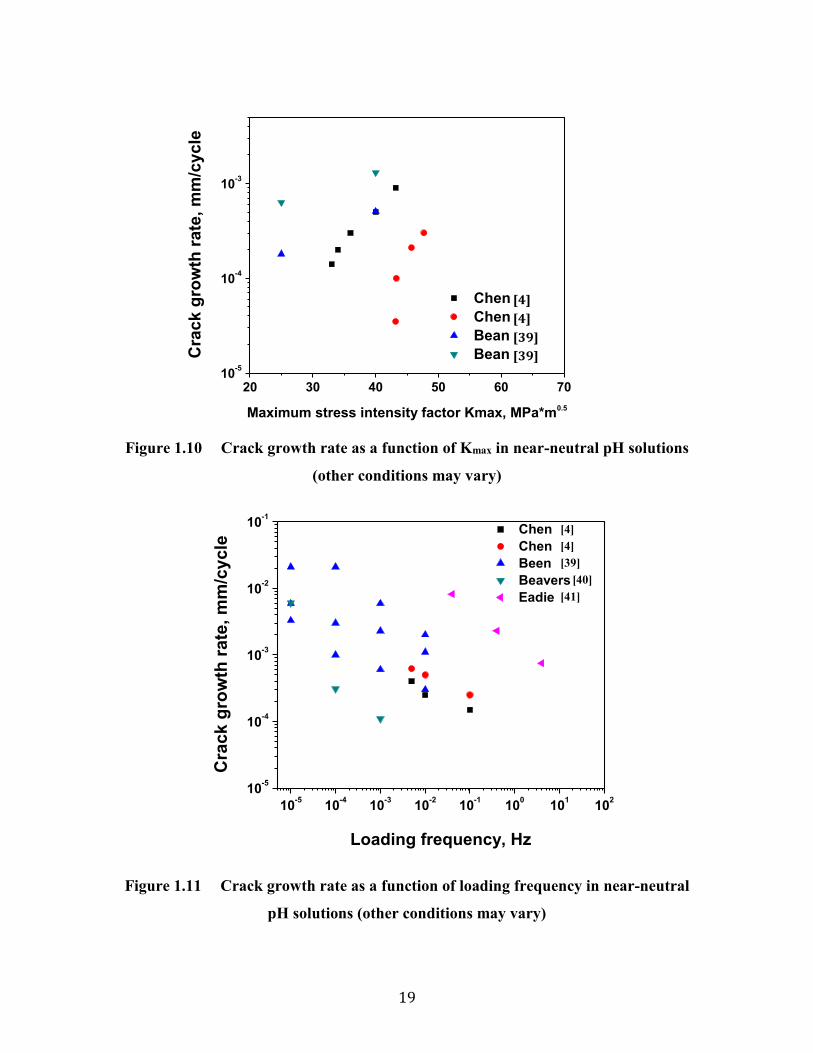
1.3.1.2 Maximum stress intensity factor Kmax
Fig. 1.10 shows some representative results reported on the effect of maximum stress
intensity factor Kmax on the crack growth rate in near-neutral pH environments [4,39]. It
can be seen that the crack growth rate generally increases with increasing Kmax, although
the data are scattered over several orders of magnitude because of the different ΔK.
Higher growth rate with increasing Kmax may result from the synergistic interaction of
enhanced plastic deformation [44] and the corrosive aqueous environments [45], or from
effects of hydrogen embrittlement (HE, will be introduced in Section 1.3.1.4) [5,45]. Fig.
1.10 also suggests that a direct application of the Paris Law would be deficient without
considering the effect of Kmax.
19
Figure 1.10 Crack growth rate as a function of Kmax in near-neutral pH solutions
(other conditions may vary)
Figure 1.11 Crack growth rate as a function of loading frequency in near-neutral
pH solutions (other conditions may vary)
20 30 40 50 60 7010
-5
10-4
10-3
Chen
Chen
Bean
BeanCra
ck
gro
wth
rate
, m
m/c
ycle
Maximum stress intensity factor Kmax, MPa*m0.5
[4]
[4]
[39]
[39]
[4]
[4]
[39]
[40]
[41]
10-5
10-4
10-3
10-2
10-1
100
101
102
10-5
10-4
10-3
10-2
10-1
Chen
Chen
Been
Beavers
Eadie
Cra
ck
gro
wth
ra
te,
mm
/cy
cle
Loading frequency, Hz

20
1.3.1.3 Loading frequency
The effect of loading frequency on crack growth in near-neutral pH environments
[4,39,40,41] is shown in Fig. 1.11. It can be seen that when the frequency is higher than
10-3 Hz, the crack growth rate increases as the frequency decreases, as generally believed
in corrosion fatigue [45]. This trend can be explained by the increased time for corrosion,
or hydrogen diffusion to the crack tip (related to hydrogen embrittlement) with the
decrease in the loading frequency [4]. The crack growth rate determined by Eadie et al.
[41] is apparently higher than the others because H2S was added to the test environments.
Many laboratory tests [4,39,41] have been performed at frequencies at or higher than 10-3
Hz to reduce the duration of the experiments.
However, the conclusion that the fatigue crack growth rate increases as the loading
frequency decreases could not be extended to the frequency range lower than 10-3 Hz,
because the growth data reported were not complete [39,28] and had not excluded the
effect of the maximum stress intensity factor [40,46]. Even for the data shown in Fig.
1.11, the growth rate determined by Been [39] scatters over one order of magnitude at a
given loading frequency, despite the fact that such a low loading frequency used in the
laboratory simulations is consistent with those found in field. Thus, the crack growth
behavior in the frequency range lower than 10-3 Hz should be further studied.
21
1.3.1.4 Hydrogen embrittlement
Hydrogen embrittlement occurs when atomic hydrogen is introduced into the metal
matrix; when this happens, the material toughness and ductility can be reduced
dramatically, and subcritical crack growth can occur [47]. Hydrogen embrittlement is
well recognized as one of the important failure mechanisms for many engineering
components in water vapor [48], aqueous [45,47,49] and hydrogen gaseous [50-52]
environments. The magnitude of hydrogen embrittlement is affected by several variables
[47], including loading rate, loading history, metal strength, amount of available
hydrogen, and system temperature.
Hydrogen embrittlement has been suspected of playing an important role in the crack
propagation of pipeline steels [2,12,15,53] exposed to near-neutral pH environments ever
since NNpHSCC was identified in 1985 [1]. It is found that hydrogen itself, the by-
production of corrosion, may not be an issue for pipeline steels exposed to near-neutral
pH environments since the hydrogen content in the pipeline steel matrix is almost one
order of magnitude lower than the minimum hydrogen content for forming hydrogen
blistering, which is an instant cracking of steels due to the buildup of H2 pressure at
hydrogen traps [54,55].
However, hydrogen embrittlement can occur in the presence of tensile stress and a crack.
To lower the chemical potential, hydrogen diffuses and segregates in the high stress zone
ahead of the crack tip. Indeed, the role of hydrogen in NNpHSCC was confirmed [5,56],
22
re-sharpening the dormant cracks under cyclic loadings in near-neutral pH environments
[4].
On the other hand, hydrogen in pipeline steels can be generated from the sour gas present
in the fluids inside of pipelines [41] or when cathodic potential is applied [4,33,56]. As a
result of these additional hydrogen sources, the amount of hydrogen in the steel matrix
and thus the degree of hydrogen embrittlement are enhanced [57].
1.3.2 Available corrosion fatigue models in near-neutral pH
environments
1.3.2.1 Paris Law
As expressed by Eq. (1-1), the Paris Law only considers one of the three basic parameters
of fatigue, i.e., the stress intensity factor range ΔK. It could well model the crack growth
behavior in inert environments where Kmax and loading frequency have insignificant
influence. As can be seen in Figs. 1.10 and 1.11, Kmax and loading frequency do play an
important role in the crack growth rate in the near-neutral pH environments and their
effects can not be ignored.
1.3.2.2 Crack tip strain rate model

23
The crack tip strain rate was proposed for several corrosion systems under monotonic
loading where the crack propagates through the mechanism involving repeated film
formation-rupture [58]. The crack tip strain rate for near-neutral pH environments was
expressed as [59]:
𝜀̇ ≈ 4𝑓(1 − 𝑅) (1 − 2)
where 𝜀̇ is the crack tip strain rate, f is the loading frequency, and R is the stress ratio.
However, no passive film is observed in near-neutral pH environments [1,2] and models
based on the crack tip strain rate showed poor correlation with NNpHSCC crack growth
rate data [4]. This may suggest that the crack growth rate is not influenced solely by the
strain rate. Other factors should also be considered.
1.3.2.3 Superposition model
The superposition model applied in near-neutral pH environments is given as [60,61]:
(𝑑𝑎
𝑑𝑁)
𝑡𝑜𝑡𝑎𝑙= (
𝑑𝑎
𝑑𝑁)
𝑓𝑎𝑡𝑖𝑔𝑢𝑒+
1
𝑓(
𝑑𝑎
𝑑𝑡)
𝑆𝐶𝐶
(1 − 3)
where (da/dN)total is the total crack growth per cycle in a near-neutral pH solution,
(da/dN)fatigue is the crack growth per cycle in air (inert environment), f is the loading

24
frequency, and (da/dt)SCC is the crack growth in terms of time in a near-neutral pH
solution by SCC.
However, the crack growth of pipeline steels under static loading in near-neutral pH
environments (NNpHSCC) has never been observed, except for the crack initiation
resulting from galvanic corrosion [5]. On the other hand, the loading frequency in the
field is very low, for example, typically about 10-5 Hz for high pressure gas transmission
pipelines [62,63]. As a result, 1/f would be very large and could be even larger than the
fatigue term. And, as shown in Fig. 1.11, the inverse relationship between the crack
growth rate and loading frequency at frequencies lower than 10-3 Hz overestimates the
crack growth rate. The contribution of the SCC term to the total growth rate in Eq. (1-3)
was numerically assumed and had not been experimentally proven.
1.3.2.4 Combined factor
Based on long-term and extensive laboratory crack growth simulations under constant
amplitude cyclic loading in near-neutral pH environments, it is found that the crack
growth rate can be correlated to a combined factor that incorporates both the mechanical
and the environmental driving forces [4] as:
𝑑𝑎
𝑑𝑁= 𝑎 (
∆𝐾𝛼𝐾𝑚𝑎𝑥𝛽
𝑓𝛾)
𝑛
+ 𝑏 (1 − 4)
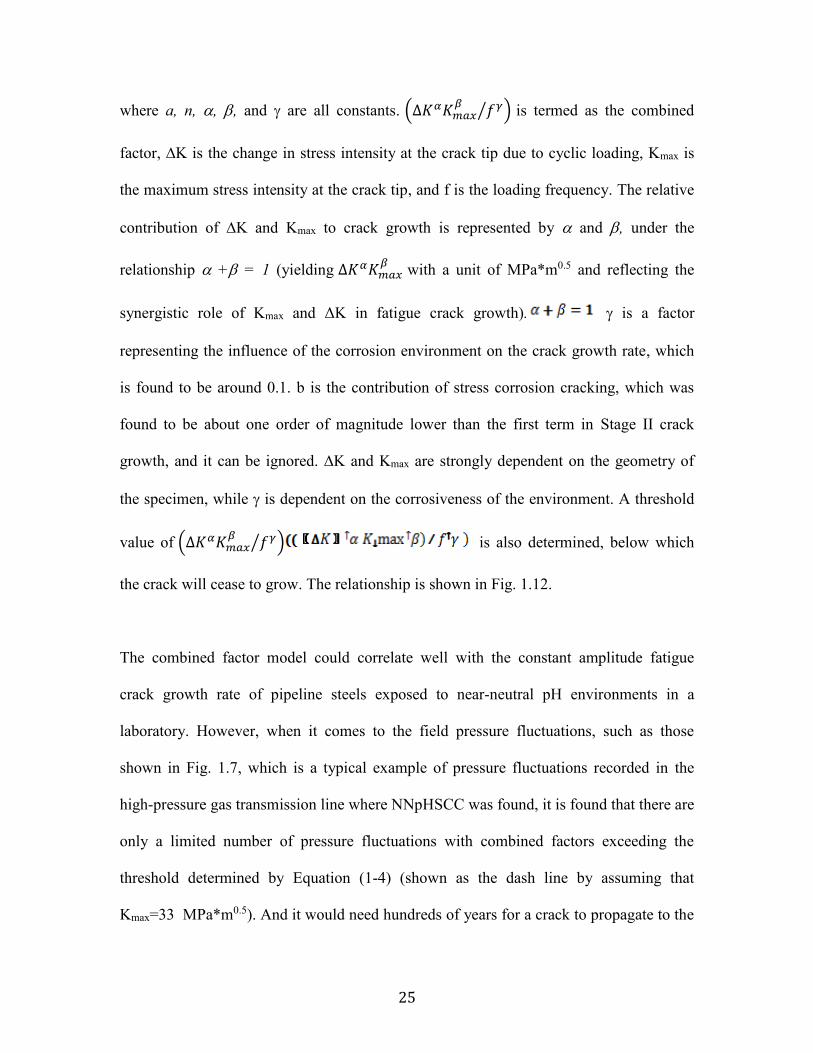
25
where a, n, , , and are all constants. (∆𝐾𝛼𝐾𝑚𝑎𝑥𝛽
𝑓𝛾⁄ ) is termed as the combined
factor, ∆K is the change in stress intensity at the crack tip due to cyclic loading, Kmax is
the maximum stress intensity at the crack tip, and f is the loading frequency. The relative
contribution of ∆K and Kmax to crack growth is represented by and , under the
relationship + = 1 (yielding ∆𝐾𝛼𝐾𝑚𝑎𝑥𝛽
with a unit of MPa*m0.5 and reflecting the
synergistic role of Kmax and ΔK in fatigue crack growth). is a factor
representing the influence of the corrosion environment on the crack growth rate, which
is found to be around 0.1. b is the contribution of stress corrosion cracking, which was
found to be about one order of magnitude lower than the first term in Stage II crack
growth, and it can be ignored. ∆K and Kmax are strongly dependent on the geometry of
the specimen, while is dependent on the corrosiveness of the environment. A threshold
value of (∆𝐾𝛼𝐾𝑚𝑎𝑥𝛽
𝑓𝛾⁄ ) is also determined, below which
the crack will cease to grow. The relationship is shown in Fig. 1.12.
The combined factor model could correlate well with the constant amplitude fatigue
crack growth rate of pipeline steels exposed to near-neutral pH environments in a
laboratory. However, when it comes to the field pressure fluctuations, such as those
shown in Fig. 1.7, which is a typical example of pressure fluctuations recorded in the
high-pressure gas transmission line where NNpHSCC was found, it is found that there are
only a limited number of pressure fluctuations with combined factors exceeding the
threshold determined by Equation (1-4) (shown as the dash line by assuming that
Kmax=33 MPa*m0.5). And it would need hundreds of years for a crack to propagate to the
26
critical dimension at which instant failure would occur. This contradicts the fact that
failure of pipelines by cracking in the field can occur as soon as a few years after the
surface of pipeline steels is in direct contact with near-neutral pH environments. This
contradiction is also found in the other models.
As shown in Fig. 1.7, pressure fluctuates randomly during routine operations, which is a
typical situation of variable amplitude (VA) cyclic loadings, not the constant amplitude
(CA) fatigue testing performed in laboratories. To convert the random stress spectra into
meaningful fatigue cycles, a number of methods have been developed. They include
rainflow counting by the American Society for Testing and Materials (ASTM) Standard
E1049-85 [64], level cross counting, peak counting, simple-range counting, range-pair
counting and simple range counting. These methods have been applied to model the crack
growth in near-neutral pH environments [65]. However, the contradiction as stated above
still exists.
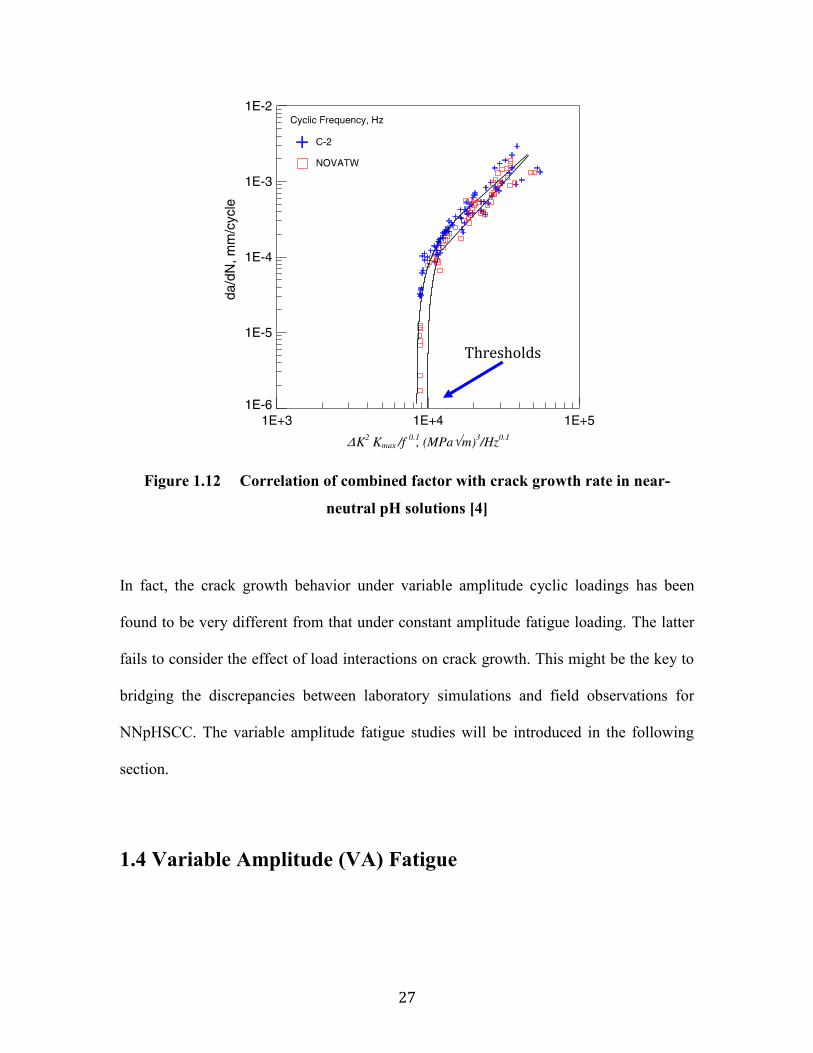
27
Figure 1.12 Correlation of combined factor with crack growth rate in near-
neutral pH solutions [4]
In fact, the crack growth behavior under variable amplitude cyclic loadings has been
found to be very different from that under constant amplitude fatigue loading. The latter
fails to consider the effect of load interactions on crack growth. This might be the key to
bridging the discrepancies between laboratory simulations and field observations for
NNpHSCC. The variable amplitude fatigue studies will be introduced in the following
section.
1.4 Variable Amplitude (VA) Fatigue
Thresholds
28
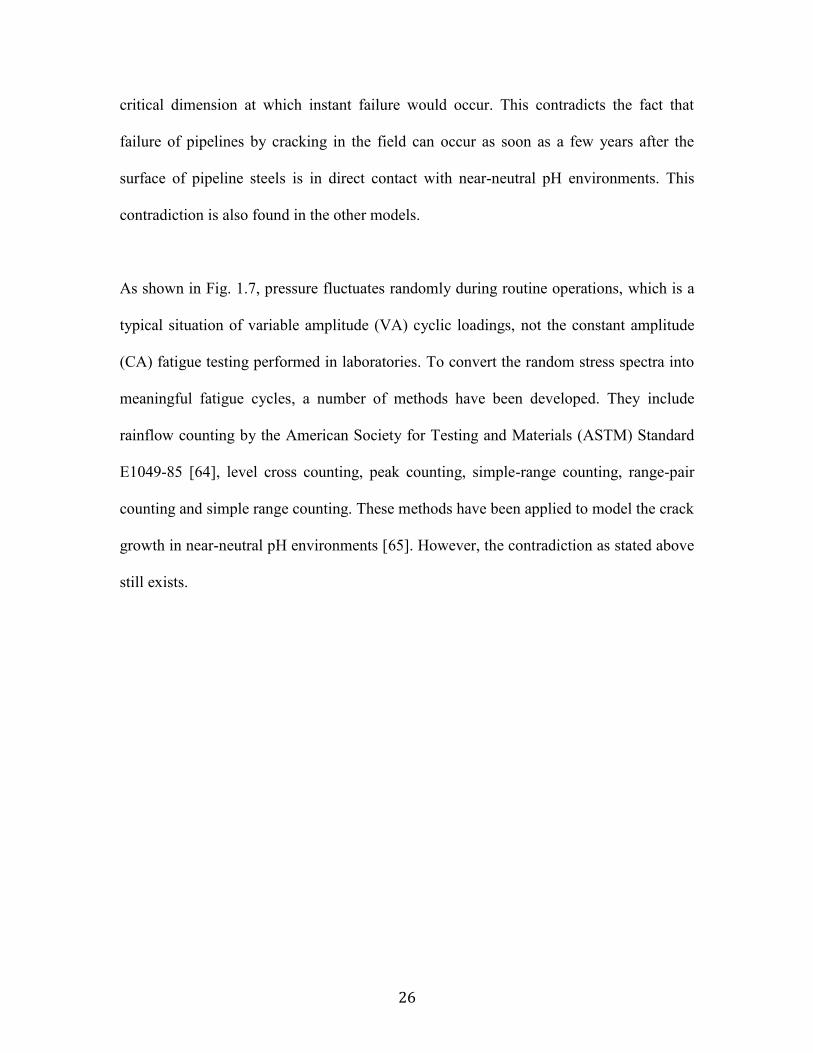
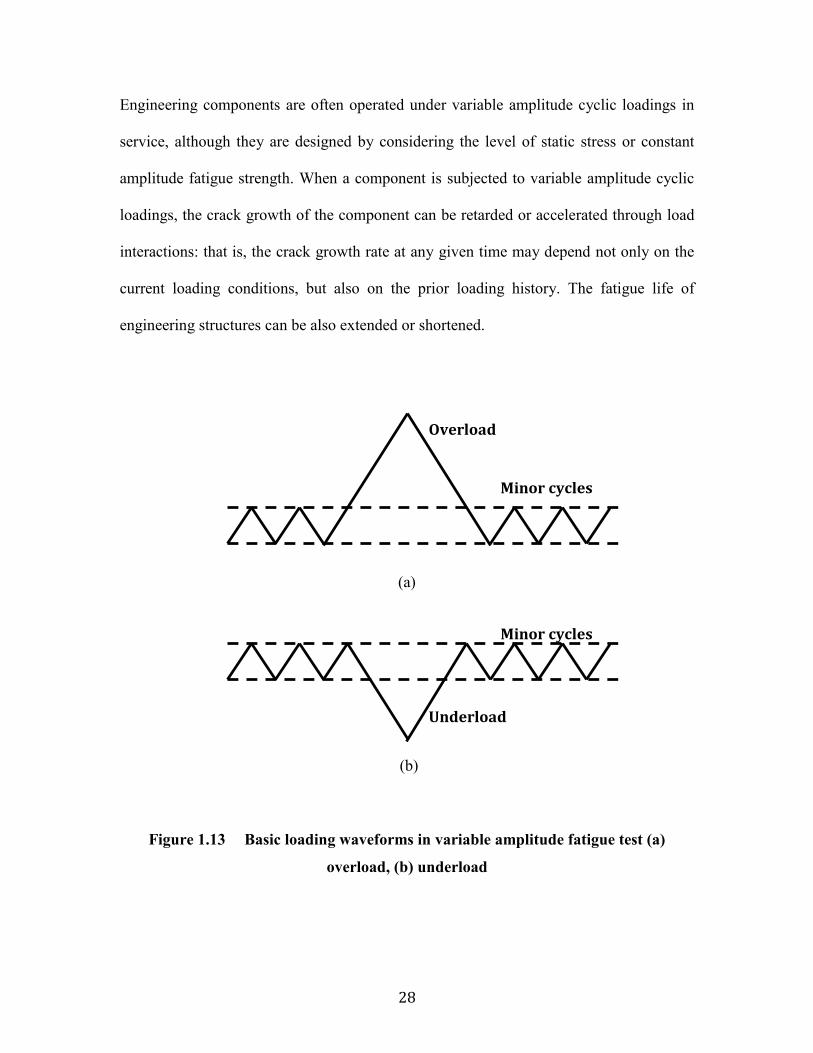
Engineering components are often operated under variable amplitude cyclic loadings in
service, although they are designed by considering the level of static stress or constant
amplitude fatigue strength. When a component is subjected to variable amplitude cyclic
loadings, the crack growth of the component can be retarded or accelerated through load
interactions: that is, the crack growth rate at any given time may depend not only on the
current loading conditions, but also on the prior loading history. The fatigue life of
engineering structures can be also extended or shortened.
(a)
(b)
Figure 1.13 Basic loading waveforms in variable amplitude fatigue test (a)
overload, (b) underload
Minor cycles
Overload
Minor cycles
Underload
29
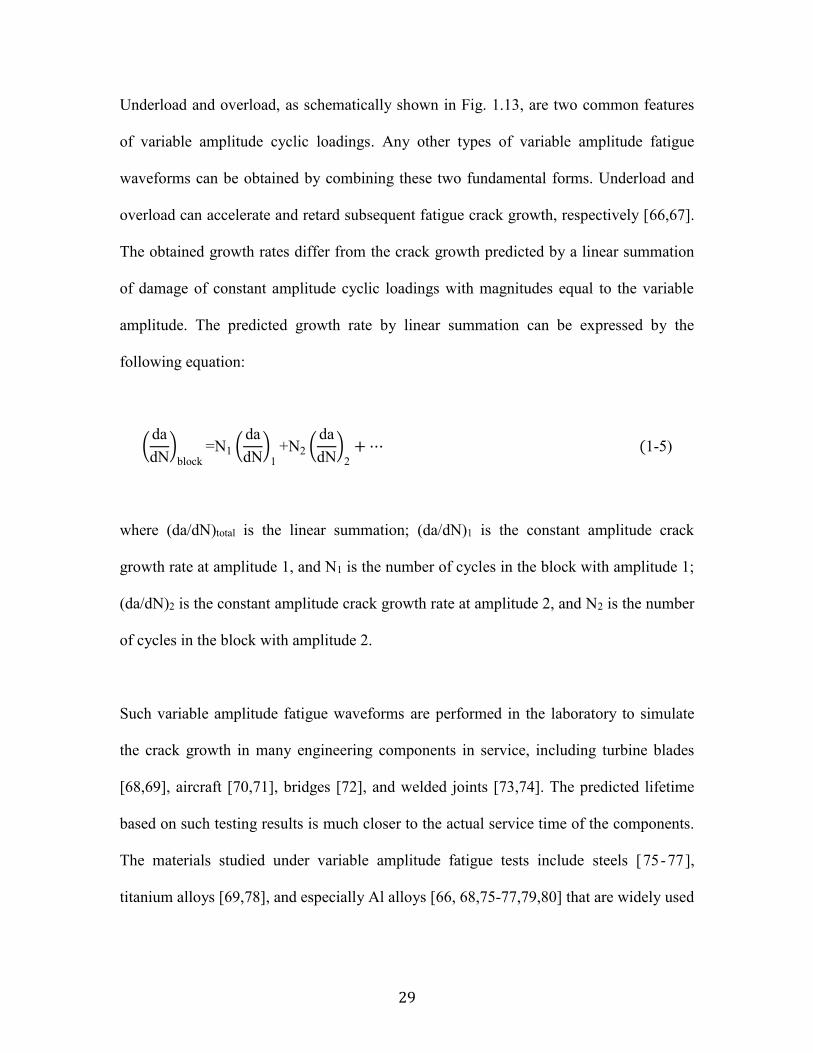
Underload and overload, as schematically shown in Fig. 1.13, are two common features
of variable amplitude cyclic loadings. Any other types of variable amplitude fatigue
waveforms can be obtained by combining these two fundamental forms. Underload and
overload can accelerate and retard subsequent fatigue crack growth, respectively [66,67].
The obtained growth rates differ from the crack growth predicted by a linear summation
of damage of constant amplitude cyclic loadings with magnitudes equal to the variable
amplitude. The predicted growth rate by linear summation can be expressed by the
following equation:
(da
dN)
block
=N1 (da
dN)
1
+N2 (da
dN)
2
+ ⋯ (1-5)
where (da/dN)total is the linear summation; (da/dN)1 is the constant amplitude crack
growth rate at amplitude 1, and N1 is the number of cycles in the block with amplitude 1;
(da/dN)2 is the constant amplitude crack growth rate at amplitude 2, and N2 is the number
of cycles in the block with amplitude 2.
Such variable amplitude fatigue waveforms are performed in the laboratory to simulate
the crack growth in many engineering components in service, including turbine blades
[68,69], aircraft [70,71], bridges [72], and welded joints [73,74]. The predicted lifetime
based on such testing results is much closer to the actual service time of the components.
The materials studied under variable amplitude fatigue tests include steels [75-77],
titanium alloys [69,78], and especially Al alloys [66, 68,75-77,79,80] that are widely used
30
in the aircraft industry. The effects of the two basic waveforms, overload and underload,
will be introduced in detail in the following section.
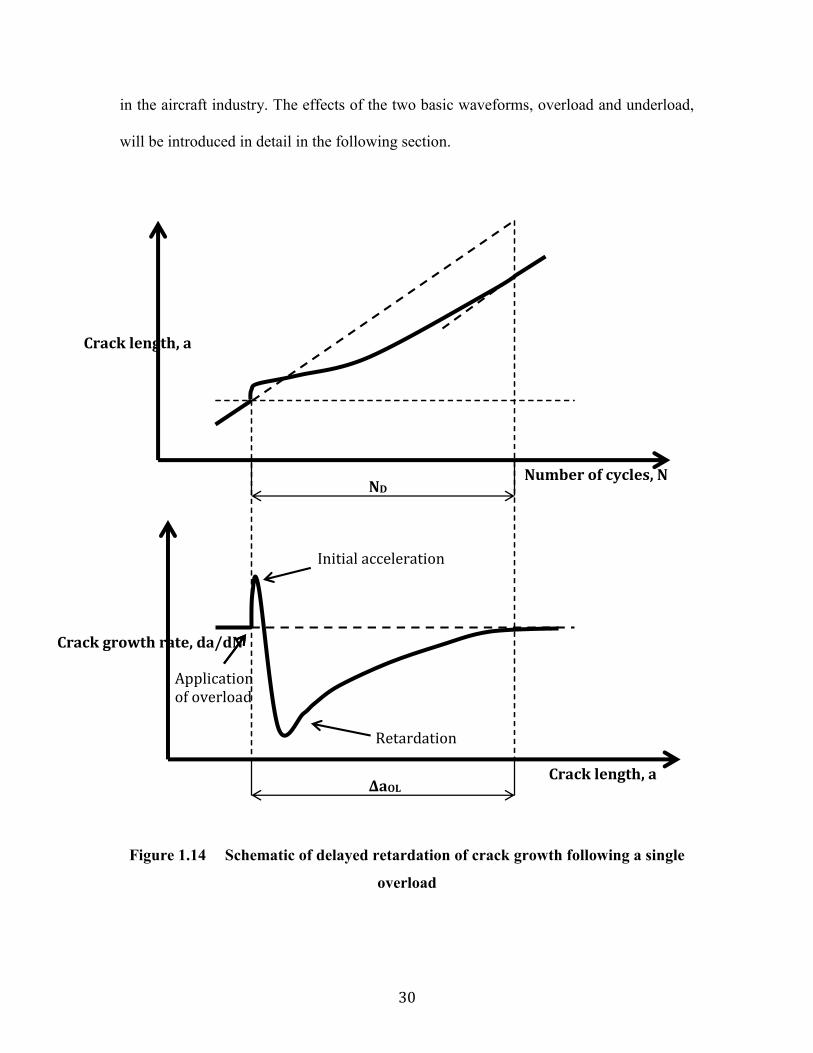
Figure 1.14 Schematic of delayed retardation of crack growth following a single
overload
Crack growth rate, da/dN
Crack length, a
Crack length, a
Number of cycles, N ND
ΔaOL
Application of overload
Initial acceleration
Retardation
31
1.4.1 Overload cyclic loadings - retardation effect
The superposition of a single-peak tensile overload during the constant amplitude cyclic
loadings, as shown in Fig. 1.13 (a), can cause the so-called retardation effect. As
illustrated in Fig. 1.14, the crack growth rate of the subsequent minor cycles increases
initially over a short period of time, but drops by an order of magnitude or more [66,72]
afterwards, before gradually increasing to the growth rate prior to the application of the
overload cycle. The occurrence of initial acceleration is found to depend on the type of
materials [66]. The crack advancement and the applied number of cycles during this
retardation effect are defined as the overload-affected crack growth increment (ΔaOL) and
the number of delay cycles (ND), respectively, as shown in Fig. 1.14 [66]. The extent of
the retardation effect depends on the type of materials [66,72,81,82], specimen thickness
[81], and the loading parameters, such as the ratio of overload amplitude over minor
cycle amplitude [66,81,82], the stress intensity factor range of minor cycles [81] and the
number of minor cycles between two neighboring overloads [82]. The effect of the ratio
of overload amplitude over minor cycle amplitude has been extensively studied: the
higher the ratio, the higher the magnitude of the retardation effect will be.
The retardation effect caused by applied overload has been observed and applied in
industries. An aircraft that occasionally traveled through high gust winds in bad weather
possessed a longer service time than a plane with a more steady flight weather history
32
[83]. For the application, the service life of bridge components can be extended by
applying overload [82].
The hydrostatic tests are often applied to buried pipelines to check whether the pipelines
contain the critical dimension cracks. The pipelines are pressurized up to 110% Specific
Minimum Yield Strength (SMYS) or even higher using water. In case the pipeline failure
occurs, water has limited influence on environment. In fact, the hydrostatic test is of
overload loading. Overload can cause an active crack to grow at a reduced rate or to
become dormant [1, 84 ]. However, a hydrostatic test has its own drawback. If the
monotonic loading rate during the hydrostatic test is not properly controlled, significant
crack advancement can be caused by the hydrostatic test itself [ 85 ] through the
mechanism of hydrogen embrittlement as stated in Section 1.3.1.4 [86]. In addition, the
investigation of plastic zones near SCC tips in a pipeline showed that SCC continued to
propagate during pipeline routine operations after hydrostatic testing [87].
To perform a hydrostatic test, the pipeline has to be shut down twice: for pumping water
into and out of the pipeline. This involves the process of depressurization in addition to
the overload cycle. The process of depressurization itself is a large amplitude underload
cycle from the point view of fatigue, which could lead to an enhancement in crack growth
during subsequent cyclic loading [27]. Fig. 1.13(b) shows the waveform formed by
combining an underload cycle with minor pressure fluctuations, which is also seen during
routine operation of pipelines in Fig. 1.7. Contrary to the retardation effect caused by
overload, acceleration in crack growth is induced by underload, which will be illustrated
33
in the following section. On the other hand, if the underload is applied right before or
after an overload, the magnitude of the retardation effect introduced by overload can be
reduced [66,67]. Hydrostatic testing is a typical case of overloading followed by
underloading. This type of waveform would limit the benefit of the retardation effect
associated with the overloading. It was reported that the retardation effect vanished
within four months of the introduction of a hydrostatic test [27].
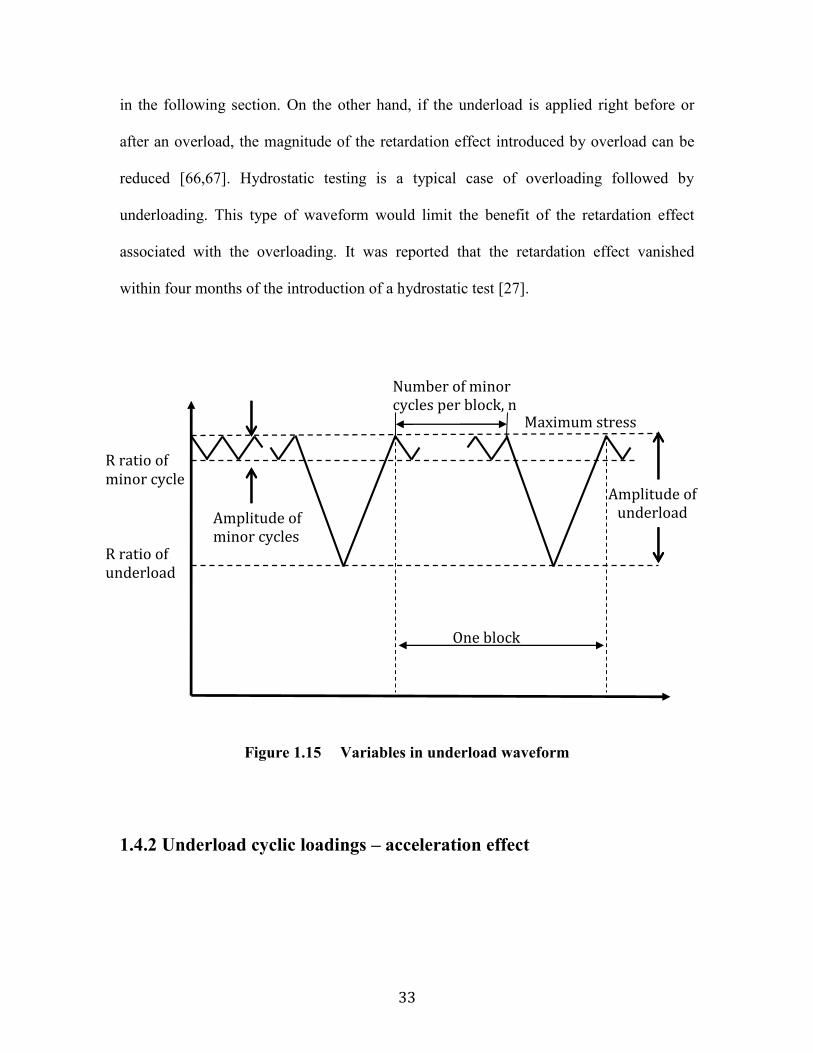
Figure 1.15 Variables in underload waveform
1.4.2 Underload cyclic loadings – acceleration effect
Amplitude of minor cycles
Number of minor cycles per block, n
R ratio of minor cycle
R ratio of underload
One block
Amplitude of underload
Maximum stress
34
Although there are comparatively fewer publications on the effects of underload than on
those of overload [66,67], the acceleration of crack growth associated with the underload
plays an important role in predicting the remaining lifetime of engineering structures. As
stated previously, the combination of depressurization (due to shut-down or routine
operations) and re-loading back to normal pressure is actually an underload-type variable
amplitude fatigue, as schematically show in Fig. 1.15. The underload cycle could not
only cause crack advancement by itself [27], but also accelerate the crack growth rate of
the subsequent minor cycles [66,67,75]. A factor termed as acceleration factor, γ, is often
used to determine the magnitude of the crack growth rate enhancement, which is defined
as the ratio of measured growth rate per block over the predicted growth rate per block by
a linear summation of the constant amplitude crack growth response [75], that is,
𝛾 =𝑚𝑒𝑎𝑠𝑢𝑟𝑒𝑑 𝑔𝑟𝑜𝑤𝑡ℎ 𝑟𝑎𝑡𝑒 𝑝𝑒𝑟 𝑏𝑙𝑜𝑐𝑘
𝑝𝑟𝑒𝑑𝑖𝑐𝑡𝑒𝑑 𝑔𝑟𝑜𝑤𝑡ℎ 𝑟𝑎𝑡𝑒 𝑝𝑒𝑟 𝑏𝑙𝑜𝑐𝑘 𝑏𝑦 𝑎 𝑙𝑖𝑛𝑒𝑎𝑟 𝑠𝑢𝑚𝑚𝑎𝑡𝑖𝑜𝑛 𝑜𝑓 𝑡ℎ𝑒 𝑐𝑜𝑛𝑠𝑡𝑎𝑛𝑡 𝑎𝑚𝑝𝑙𝑖𝑡𝑢𝑑𝑒 𝑐𝑟𝑎𝑐𝑘 𝑔𝑟𝑜𝑤𝑡ℎ 𝑟𝑒𝑠𝑝𝑜𝑛𝑠𝑒
(1-6)
The predicted growth rate can be expressed by Equation (1-5). The acceleration factor is
affected by several variables, as shown in Fig. 1.15, such as the number of minor cycles
per block, maximum stress, amplitudes of minor and underload cycles, and environments.
The effects of these variables on crack growth are further reviewed in the sections below.
1.4.2.1 Number of minor cycles
From Fig. 1.16, it can be seen that the acceleration factor increases with the number of
minor cycles per block, n, until n = 10 for different materials (other conditions may vary).
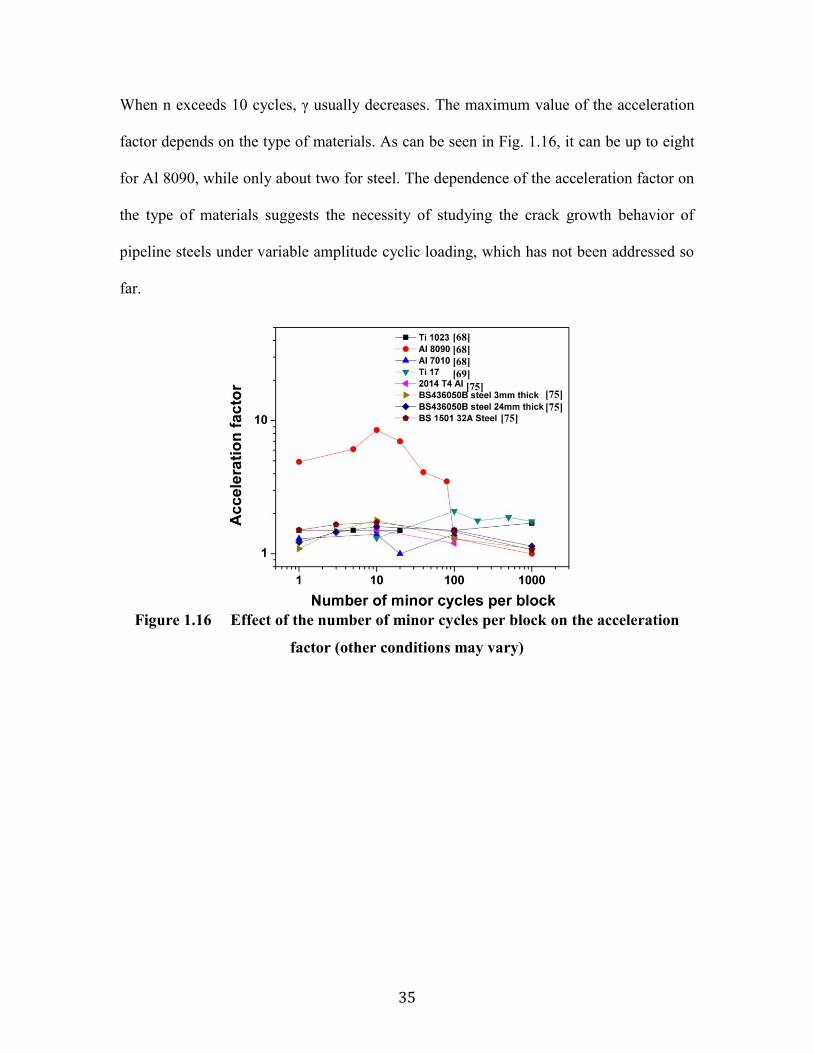
35
When n exceeds 10 cycles, γ usually decreases. The maximum value of the acceleration
factor depends on the type of materials. As can be seen in Fig. 1.16, it can be up to eight
for Al 8090, while only about two for steel. The dependence of the acceleration factor on
the type of materials suggests the necessity of studying the crack growth behavior of
pipeline steels under variable amplitude cyclic loading, which has not been addressed so
far.
Figure 1.16 Effect of the number of minor cycles per block on the acceleration
factor (other conditions may vary)
[68]
[68]
[68]
[69]
[75] [75]
[75] [75]
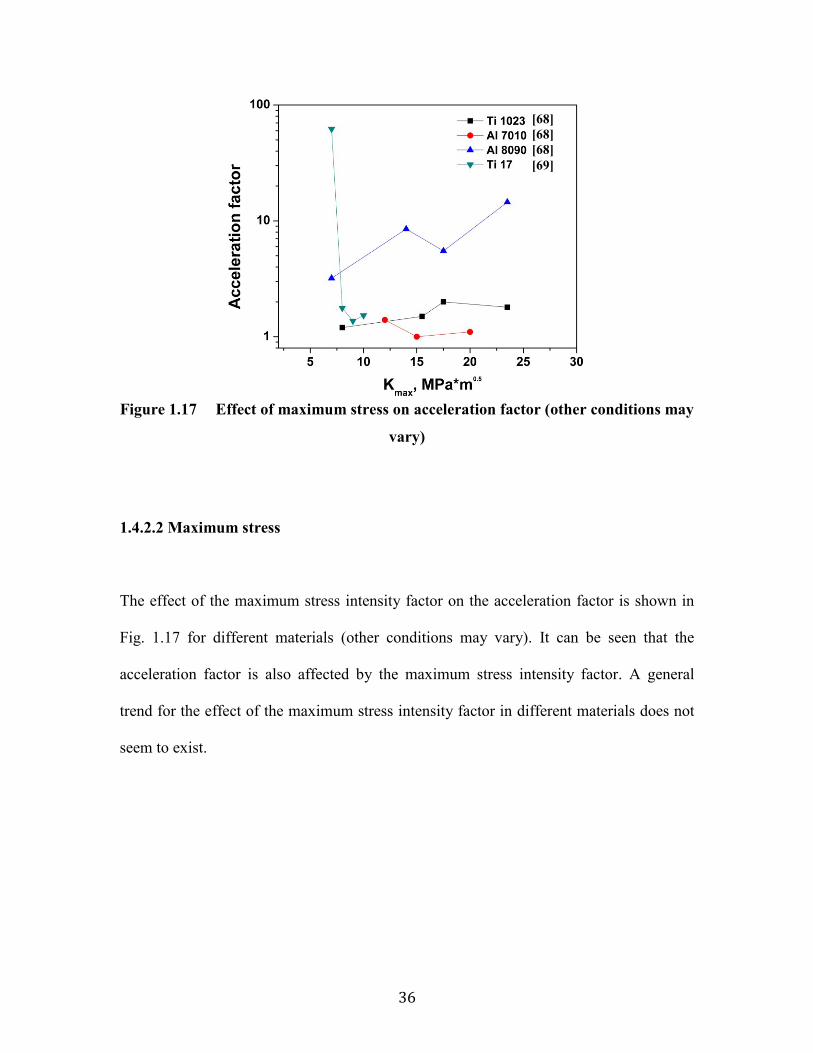
36
Figure 1.17 Effect of maximum stress on acceleration factor (other conditions may
vary)
1.4.2.2 Maximum stress
The effect of the maximum stress intensity factor on the acceleration factor is shown in
Fig. 1.17 for different materials (other conditions may vary). It can be seen that the
acceleration factor is also affected by the maximum stress intensity factor. A general
trend for the effect of the maximum stress intensity factor in different materials does not
seem to exist.
[68]
[68]
[68]
[69]
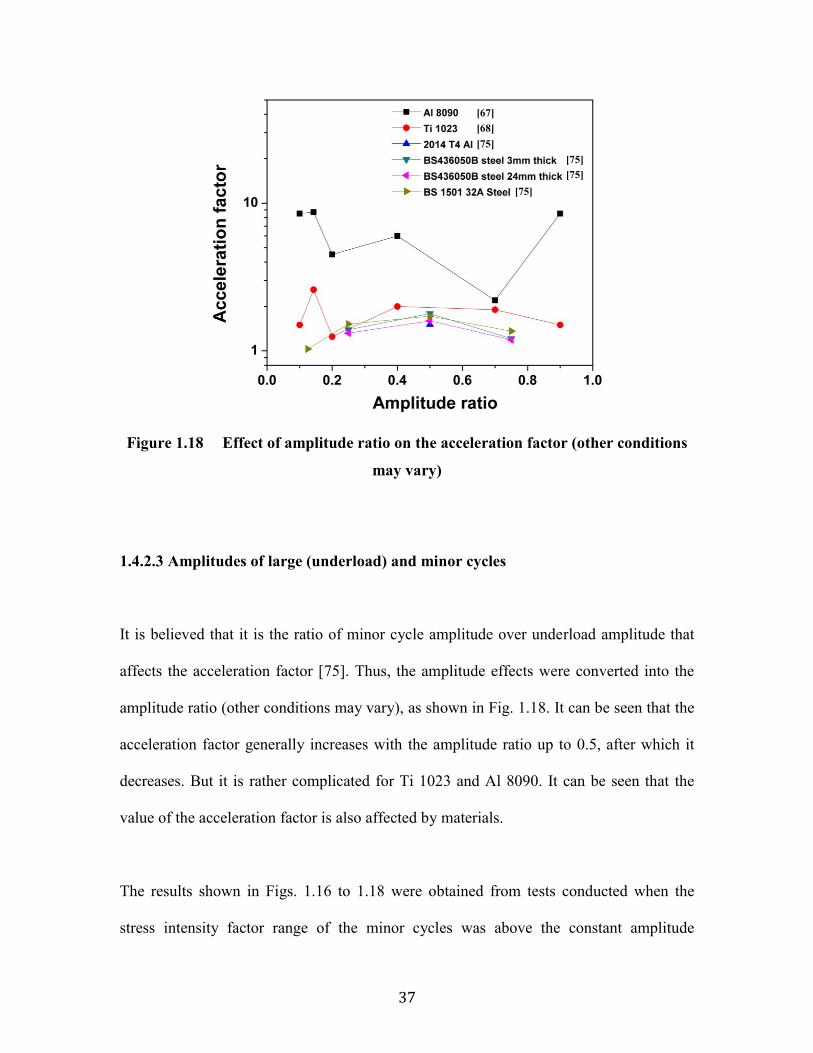
37
Figure 1.18 Effect of amplitude ratio on the acceleration factor (other conditions
may vary)
1.4.2.3 Amplitudes of large (underload) and minor cycles
It is believed that it is the ratio of minor cycle amplitude over underload amplitude that
affects the acceleration factor [75]. Thus, the amplitude effects were converted into the
amplitude ratio (other conditions may vary), as shown in Fig. 1.18. It can be seen that the
acceleration factor generally increases with the amplitude ratio up to 0.5, after which it
decreases. But it is rather complicated for Ti 1023 and Al 8090. It can be seen that the
value of the acceleration factor is also affected by materials.
The results shown in Figs. 1.16 to 1.18 were obtained from tests conducted when the
stress intensity factor range of the minor cycles was above the constant amplitude
[67]
[68]
[75]
[75]
[75]
[75]
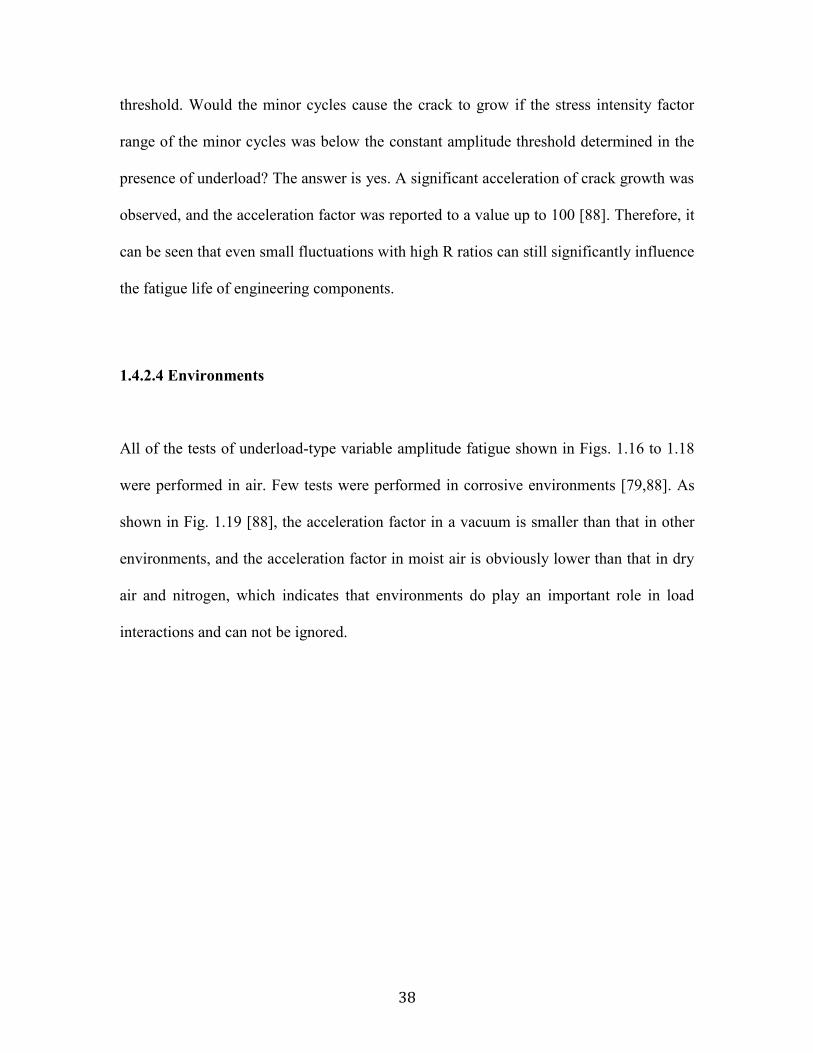
38
threshold. Would the minor cycles cause the crack to grow if the stress intensity factor
range of the minor cycles was below the constant amplitude threshold determined in the
presence of underload? The answer is yes. A significant acceleration of crack growth was
observed, and the acceleration factor was reported to a value up to 100 [88]. Therefore, it
can be seen that even small fluctuations with high R ratios can still significantly influence
the fatigue life of engineering components.
1.4.2.4 Environments
All of the tests of underload-type variable amplitude fatigue shown in Figs. 1.16 to 1.18
were performed in air. Few tests were performed in corrosive environments [79,88]. As
shown in Fig. 1.19 [88], the acceleration factor in a vacuum is smaller than that in other
environments, and the acceleration factor in moist air is obviously lower than that in dry
air and nitrogen, which indicates that environments do play an important role in load
interactions and can not be ignored.

39
Figure 1.19 Effects of environments on acceleration factor [88]
1.5 Mechanisms of Load Interactions
Many mechanisms [67,75] have been proposed to explain the observed phenomena of
load interactions. Some, including crack closure, residual stress, dislocation substructure
changes and strain hardening/softening, will be introduced in the sections below.
1.5.1 Crack closure
Acceleration factor
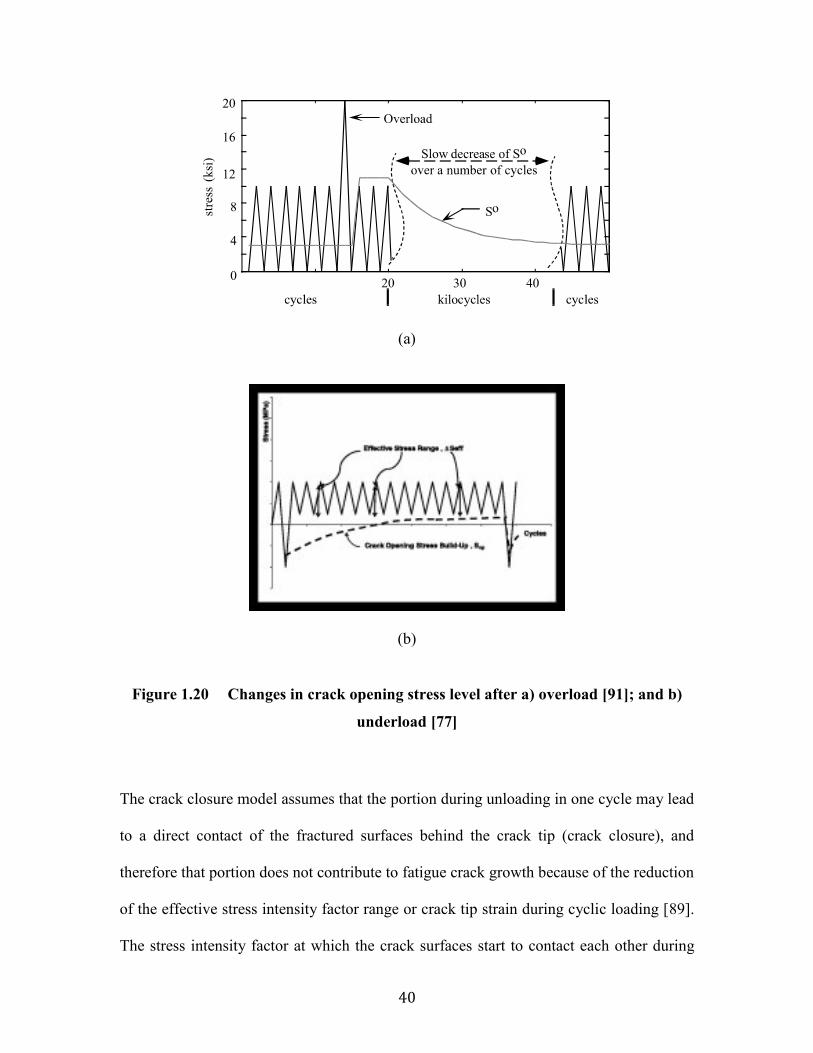
40
(a)
(b)
Figure 1.20 Changes in crack opening stress level after a) overload [91]; and b)
underload [77]
The crack closure model assumes that the portion during unloading in one cycle may lead
to a direct contact of the fractured surfaces behind the crack tip (crack closure), and
therefore that portion does not contribute to fatigue crack growth because of the reduction
of the effective stress intensity factor range or crack tip strain during cyclic loading [89].
The stress intensity factor at which the crack surfaces start to contact each other during
41
unloading or the crack surfaces become separated during loading is termed as the opening
stress intensity factor, Kop. The effective stress intensity factor range, ΔKeff = Kmax - Kop,
which contributes to fatigue damage, is lower than the applied ΔK. The crack closure
model is often applied to explain acceleration and retardation effects induced by
underloads and overloads, respectively, through the change of Kop [66-69,76,77,87,90,91].
As shown in Fig. 1.20, the opening stress is increased after overload, and thus the
effective stress intensity factor range is decreased, resulting in the crack growth
retardation effect, while underload can decrease the opening stress of minor cycles,
leading to crack growth acceleration.
1.5.2 Residual stress
After overload, a plastic zone, one that is larger than the one generated by previous minor
cycles, forms [92]. During the subsequent minor cyclic loadings, the surrounding elastic
material forces the material at the crack tip to conform to its original shape. This results
in compressive residual stresses in the plastic zone. The stress at the crack tip is the result
of the applied tensile stress subtracting residual compressive stress. Thus, retardation in
crack growth occurs. Opposite to this, tensile residual stress can be formed ahead of the
crack tip upon the application of compressive underload (negative R ratio) [92]. The
residual compressive stress caused by overload and residual tensile stress caused by
underload were observed and measured in [93]. However, it is still questionable whether
the above explaination can be applied to the situation of a tensile underload (positive R
ratio) [68].

42
1.5.3 Strain hardening/softening
Strain hardening of the material at the crack tip was believed to be one of the mechanisms
of the load interactions, as fatigue crack growth can be accelerated by pre-straining
[75,94]. Although it is generally accepted that overload can lead to strain hardening, the
strain hardening occurring upon underload is inexplicable, as the maximum stress is kept
constant. Opposite to the strain hardening, the strain softening could be a reason for the
acceleration caused by underload. In fact, the strain increment during the minor cyclic
loading (R ratio 0.7) after underload (R ratio 0.1) was predicted by a finite element
analysis in a Ti alloy [69]. However, experimental validation was not provided.
1.5.4 Dislocation substructure changes
It is well established that the material damage due to fatigue fundamentally results from
the localized irreversibility of a dislocation slip through various mechanisms as
summarized in [95]. These mechanisms include a cross slip of screw dislocations, and
different paths for the forward and reverse gliding during one complete fatigue cycle.
Therefore, it is believed that the retarded and accelerated fatigue growth rate caused by
overload and underload, respectively, could be associated with the change of dislocation
structures. The development of a radial dislocation structure near the crack tip after
43
overloads was indeed observed [96]. However, there has been very limited work on the
dislocation substructure changes caused by underload.
1.6 Challenges in Crack Growth Study of Pipeline Steels
Exposed to NNpH Environments
Although NNpHSCC has been studied for more than two decades since it was identified
in the 1980s, the majority of work was performed by applying constant stress loading, or
by slow strain rate testing, or under constant amplitude cyclic loadings. However, all of
these loading conditions could not represent the variable amplitude loading conditions in
the field. Until now, the obtained results and conclusions from available publications
could not fully answer the following questions:
1). Why do more than 70% of all in-service and hydrostatic-test failures attributed to
SCC often occur in the discharge section (downstream of the pump station), but much
less in the suction part even though there are more pressure fluctuations in the suction
part [1,62]?
2). More than 70% of failures are located within 30 km downstream of a pump station.
Why does such a correlation exist [1,2,11]?
3). What is the crack growth behavior under the variable amplitude loading conditions
seen in the field?
4). Is the shutdown or the depressurization of a pipeline harmless?
44
5). How can the pressure fluctuations be controlled to minimize crack growth?
Questions 1 and 2 are often answered by considering the factors such as temperature [1],
CO2 level [1], mean stress level [1], coating disbondment [97], and loading rate [98]. We
believe that the above considerations are contradictory and are not the root causes of the
dilemma.
The correlation between temperature and the number of SCC colonies was not observed
[1]. The fluid temperatures are often controlled and fall to soil temperature within 5 km
of the pump station. Thus temperature may not be a critical attribute of NNpHSCC. The
CO2 level in the ground may vary with temperature, the type of soils and seasonal
conditions, but should bear little connection to the distance from a pump station while the
pipe failures do. The mean stress indeed decreases with the distance from the pump
station, but its effect is secondary compared with the effect of fatigue amplitude, as
discussed in Section 1.3.1. Coating disbondment was proposed and attributed to higher
temperature, more stress fluctuations, and higher stress levels [97]. As described above,
the temperature and stress level are not the critical issues. In terms of stress fluctuations,
there are more large fluctuations close to the suction sites than there are close to
discharge sites; however, the least number of failures are reported at the suction sites [62].
The loading rate is similar from the discharge part of the pump station down to the next
suctions. These suggest that the existing explanations are very speculative.

45
One important factor that has been ignored is the effect of load interactions. As shown in
Fig. 1.21, the discharge site shows underload-type variable amplitude fatigue, while the
suction site exhibits overload-type variable amplitude fatigue. It is anticipated that
systematically studying crack growth behavior under variable amplitude cyclic loadings
will provide answers to the questions raised above. However, to date, few tests have been
conducted under variable amplitude cyclic loadings for pipeline steels exposed to near-
neutral pH environments. Although the acceleration effect caused by underloads in
pipeline steels was indeed observed in near-neutral pH environments in [99], the R ratios
of underload and minor cycles were too low, 0.1 and 0.5, respectively. These are not
typical of the pressure fluctuations seen in the field, as shown in Fig. 1.7 as an example;
and the growth rates determined were scattered nearly one order of magnitude.
Figure 1.21 Spectra of an oil pipeline: OA discharge part; and OB suction part
46
1.7 Research Objectives and Thesis Structure
The objective of this thesis study is to investigate and understand the crack propagation
behavior of pipeline steels under underload-type variable amplitude cyclic loadings. The
tests will be performed both in air and in near-neutral pH environments to determine the
key environmental factors responsible for the crack growth behavior. In this regard,
specific goals, as outlined below, are to study and determine:
The effect of different loading waveforms on the crack growth rate, especially to
determine the acceleration effect caused by underload in a near-neutral pH
environment
The effects of loading frequency and maximum stress intensity factor of
underload on the crack growth rate of a pipeline steel both in air and in a near-
neutral pH solution
The effects of the number of minor cycles between two neighboring underloads
on crack growth rate of a pipeline steel both in air and in near-neutral pH solution
The effects of amplitudes of underload and minor cycles on the crack growth rate
of a pipeline steel both in air and in near-neutral pH solution
The role of hydrogen in crack growth
The structure of this dissertation, which is meant to cover the mentioned objectives, is as
follows:

47
Chapter 2 will report the depressurization-induced crack growth enhancement for
a pipeline steel exposed to a near-neutral pH environment. This chapter will
provide new insights about the role of minor cycles with high R ratios in crack
growth in the presence of large cycles.
Chapter 3 will investigate the accelerated crack propagation of a pipeline steel
exposed to a near-neutral pH solution in underload testing, specifically the effect
of loading frequency and Kmax.
Chapter 4 will look into the accelerated crack propagation of a pipeline steel
exposed to a near-neutral pH solution in underload testing, specifically the effect
of number of minor cycles.
Chapter 5 will study the acceleration of crack propagation of a pipeline steel
exposed to a near-neutral pH solution in underload testing, specifically the effect
of amplitudes of underload and minor cycles.
Chapter 6 will investigate the role of hydrogen in crack propagation of a pipeline
steel exposed to a near-neutral pH solution.
References
[1] B. S. Delanty, J. O’Beirne. Major Field Study Compares Pipeline SCC with
Coatings. Oil & Gas Journal 15 (1992) 39-44.
[2] Parkins RN. A review of stress corrosion cracking of high pressure gas pipelines
proceedings of corrosion 2000. Paper 00363. Houston, Texas: NACE International; 2000.
48
[3] J. A. Beavers and C. E. Jaske. Near-neutral pH SCC in Pipelines: Effects of
Pressure Fluctuations on Crack Propagation. Corrosion: 1999, NACE International, Paper
No.: 98257.
[4] Weixing Chen and Robert L. Sutherby. Crack Growth Behavior of Pipeline Steel
in Near-Neutral pH Soil Environments. Metallurgical and Materials Transactions A 2007;
38A; pp.1260-1268.
[5] W. Chen, Richard Kania, Robert Worthingham, Gregory Van Boven.
Transgranular crack growth in the pipeline steel exposed to near-neutral pH soil aqueous
solutions: The role of hydrogen. Acta Materialia 57 (2009) 6200-6214.
[6] Alberta Energy Regulator. Report 2013-B: Pipeline Performance in Alberta,
1990-2012.
[7] National Energy Board (NEB), Focus on Safety and Environment a Comparative
Analysis of Pipeline Performance 2000-2007, July 2009.
[8] R.L. Wenk. Field Investigations of Stress Corrosion Cracking, 5th Symposium on
Line Pipe Research, American Gas Association, 1974.
[9] K. Sieradzki and R.C. Newman. Stress-Corrosion Cracking, J. Physics and
Chemistry of Solids, Vol. 48, No.11, pp. 1101-1113, 1987.
[10] National Energy Board (NEB), Report of the Inquiry-Stress Corrosion Cracking
on Canadian Oil and Gas Pipelines, 1996.
[11] C. Manfredi, and J.L. Otegui. Failures by SCC in buried pipelines. Engineering
Failure Analysis 9 (2002) 495-509.
49
[12] John A. Beavers, and Brent A. Harle. Journal of Offshore Mechanics and Arctic
Engineering. 123 (2001). pp.147-151.
[13] Jones DA. Principles and prevention of corrosion. 2nd ed. Upper Saddle River
(NJ): Prentice Hall; 1996. pp.291.
[14] W. Chen, F. King, and E. Vokes. Characteristics of Near-Neutral pH Stress
Corrosion Cracks in an X-65 Pipeline. Corrosion 2002, Vol. 58, No. 3, pp. 267-275.
[15] W. Bouaeshi, S. Ironside, and R. Eadie. Research and Cracking Implications from
an Assessment of Two Variants of Near-Neutral pH Crack Colonies in Liquid Pipelines.
Corrosion: July 2007, Vol. 63, No. 7, pp. 648-660.
[16] Karina Chevil, Abdoulmajid Eslami, Weixing Chen, Reg Eadie, Richard Kania,
Robert Worthingham, and Greg Van Boven. Developing Cathodic Protection Based on
Disbondment Geometry. Proceedings of 2012 9th International Pipeline Conference,
Calgary, Alberta, Canada, Sept. 24-28, 2012. Vol. 2, paper No. IPC2012-90675, pp. 583-
590.
[17] Eslami, A., B. Fang, R. Kania, B. Worthingham, J. Been, R. Eadie, and W. Chen.
Stress corrosion cracking initiation under the disbanded coating of pipeline steel in near-
neutral pH environment. Corrosion Science, Vol. 52, Issue 11, November 2010. pp.3750-
3756.
[18] Karina Chevil, Weixing Chen, Reg Eadie, Richard Kania, Greg Van Boven, and
Jenny Been. Correlating Corrosion Field Data with Experimental Findings for the
Development of Pipeline Mitigation Strategies. Proceedings of IPC2014, 10th
50
International Pipeline conference, Calgary, Alberta, Canada, Sept. 29- Oct. 3, 2014.
Paper No. IPC2014-33678.
[19] Abdoulmajid Eslami, Trevor Place, Shamus McDonnell, Chijikoe Ukiwe and Qin
You. Landscape Investigation on External Corrosion and SCC of a Tape Coated Enbridge
Pipeline. Proceedings of the 2012 9th International Pipeline Conferece, IPC2012, Sept.
24-28, 2012, Calgary, Alberta, Canada. Paper No. IPC2012-90598.
[20] F. King, Tom Jack, Miroslav Kolar and Robert Worthingham. A Permeable
Coating Model for Predicting the Environment at the Pipe Surface under CP-Compatible
Coatings. Corrosion 2004, New Orleans, USA, 2004, Paper No. 04158.
[21] X. Chen, X.G. Li, C.W. Du, and Y.F. Cheng. Effect of cathodic protection on
corrosion of pipeline steel under disbanded coating. Corrosion Science, Vol. 51, Issue 9,
Sept. 2009, pp. 2242-2245.
[22] Barlo T.J. and Berry W.E.. An assessment of the current criteria for cathodic
protection of buried steel pipelines. Materials Performance. Vol. 23:9, 1984,
[23] F. Gan, Z.-W. Sun, G. Sabde, and D.-T. Chin. Cathodic Protection to Mitigate
External Corrosion of Underground Steel Pipe Beneath Disbonded Coating. Corrosion:
October 1994, Vol. 50, No. 10, pp. 804-816.
[24] R. R. Fessler, A. J. Markworth, and R. N. Parkins. Cathodic Protection Levels
under Disbonded Coatings. Corrosion: January 1983, Vol. 39, No.1, pp. 20-25.
[25] Robert G. Wakelin, Robert A. Gummow, and Sorin Marius Segall. AC Corrosion
– Case Histories, Test Procedures, & Mitigation. Corrosion 1998, 22-27 March, San
Diego, California. Paper No. NACE-98565.
51
[26] Canadian Gas Assocaition OCC-1 Task Force. Recommended Practice OCC-1-
2013, Control of External Corrosion on Buried or Submerged Metallic Piping Systems,
June 2013.
[27] O. Vosikovsky, and R.J. Coole. An Analysis of Crack Extension by Corrosion
Fatigue in a Crude Oil Pipeline. International Journal of Pressure Vessels and Piping,
Vol. 6, Issue 2, March 1978, pp. 113-129.
[28] T.M. Ahmed, S. B. Sutherby, and A. Plumtree. Cyclic Crack Growth rates of X-
60 Pipeline Steel in a Neutral Dilute Solution. Corrosion: July 1997, Vol. 53, No. 7,
pp.581-590.
[29] Baotong Lu, Jingli Luo and Brian McCrady. Near-Neutral pH SCC Initiation and
Early Propagation of X70 Pipeline Steel. Proceedings of IPC2002, 4th International
Pipeline Conference, Sept. 29-Oct. 3, 2002, Calgary, Alberta, Canada. Paper No.
IPC2002-27234.
[30] Weimin Zhao, Yongxing Wang, Timing Zhang, and Tong Wang. Study on the
mechanism of high-cycle corrosion fatigue crack initiation in X80 steel. Corrosion
Science 57 (2012) 99-103.
[31] A. Mustapha, E.A. Charles, and D. Hardie. Evaluation of environment-assisted
cracking susceptibility of a grade X100 pipeline steel. Corrosion Science 54 (2012) 5-9.
[32] Frand Cheng. Stress Corrosion Cracking of Pipelines. A John Wiley & Sons, Inc.,
Publication, New Jersey, 2013, pp. 73-111.
[33] Abdoulmajid Eslami. PhD thesis, Near-neutral pH Stress Corrosion Crack
Initiation under Simulated Coating Disbondment. University of Alberta, Fall 2012.
52
[34] Syed J. Haider, Steven Textor, Aaron Sutton and Yvan Hubert. Managing a New
Pressure Cycling Reality in Liquid Pipelines. Proceedings of IPC2014, 10th International
Pipeline Conference, Sept. 29-Oct. 3, 2014, Calgary, Alberta, Canada. Paper No.
IPC2014-33485.
[35] O. Vosikovsky, and R. J. Cooke. An analysis of crack extension by corrosion
fatigue in a crude oil pipeline. International Journal of Pressure Vessels and Piping, Vol.
6, Issue 2, March 1978, pp. 113-129.
[36] R. N. Parkins and B. S. Greenwell. The interface between corrosion fatigue and
stress-corrosion cracking. Metal Science, Vol. 11, Issue 8-9 (01 August 1977), pp. 405-
413.
[37] Richard W. Hertzber. Deformation and Fracture Mechanics of Engineering
Materials, Fourth Edition, John Wiley and Sons, Inc., New York, NY, 1989, pp. 591-604.
[38] P. C. Paris, and F. Erdogan. A Critical Analysis of Crack Propagation Laws.
Journal of Basic Engineering, Vol. 85, 1960, pp. 528-534.
[39] J. Been, R. Eadie, and R. Sutherby. Prediction of Environmentally Assisted
Cracking on Gas and Liquid Pipelines. Proceedings of IPC2006, 6th International Pipeline
Conference, Sept. 25-29, 2006, Calgary, Alberta, Canada. Paper No. IPC2006-10345.
[40] J.A. Beavers, and C.E. Jaske. Effects of Pressure Fluctuations on SCC
Propagation”. PRCI Report on Contract PR-186-9706, Arlington, Virginia 2004.
[41] R. L. Eadie, K.E. Szklarz, and R. L. Suthery. Corrosion Fatigue and Near-Neutral
pH Stress Corrosion Cracking of Pipeline Steel and the Effect of Hydrogen Sulfide.
Corrosion: February 2005, Vol. 61, No. 2, pp.167-173.

53
[42] Afolabi Egbewande, Weixing Chen, Reg Eadie, Richard Kania, Greg Van Boven,
Robert Worthingham and Jenny Been. Transgranular crack growth in the pipeline steel
exposed to near-neutrla pH soil aqueous solutions: Discontinuous crack growth
mechanism. Corrosion Science, Vol. 83, June 2014, pp. 343-354.
[43] P.S. Pao and R.A. Bayles. Effect of Ripple Loads on Stress-Corrosion Cracking in
Structural Steel. Technical Report, Report No. NRL ser 6310/003, May 30, 1995.
[44] T.L. Anderson. Fracture Mechanics, Fundermentals and Applications, Third
Edition. Taylors & Francis Group, 2005. pp: 464-473.
[45] S. Srivatsan, and T.S. Sudarshan. Mechanisms of fatigue crack initiation in
metals: role of aqueous environments. Journal of Materials Science, May 1988, Vol. 23,
Issue 5, pp. 1521-1533.
[46] Weixing Chen, and Robert Sutherby. Laboratory Simulation of Hydrostatic Test
in Near-Neutral pH Soil Environments. Proceedings of IPC2006, 6th International
Pipeline Conference, Sept. 25- 29, 2006, Calgary, Alberta, Canada. Paper No. IPC2006-
10477.
[47] T.L. Anderson. Fracture Mechanics, Fundermentals and Applications, Third
Edition. Taylors & Francis Group, 2005. pp: 529-537.
[48] R. E. Ricker, and D. J. Duquette. The role of hydrogen in corrosion fatigue of
high purity Al-Zn-Mg exposed to water vapor. Metallurgical Transactions A, Vol. 19A,
July 1988, pp. 1775-1783.
[49] Roy Johnsen, Bård Nyhus and Stig Wästberg. Hydrogen Induced Stress Cracking
(HISC) of Stainless Steel under Cathodic Protection in Seawater: Presentation of a New
54
Test Method. Proceedings of the ASME 2009 28th International Conference on Ocean,
Offshore and Arctic Engineering, OMAE2009, May 31- June 5, 2009, Honolulu, Hawaii,
USA.
[50] N. Nanninga, A. Slifka, Y. Levy, and C. White. A Review of Fatigue Crack
Growth for Pipeline Steel Exposed to Hydrogen. Journal of Research of the National
Institute of Standards and Technology, Vol. 115, No. 6, Nov. - Dec. 2010, pp. 437-452.
[51] Arnaud Macadre, Maxim Artamonov, Saburo Matsuoka, and Jader Furtado.
Effects of hydrogen pressure and test frequency on fatigue crack growth properties of Ni-
Cr-Mo steel candidate for a storage cylinder of a 70 MPa hydrogen filling station.
Engineering Facture Mechanics 78 (2011) 3196-3211.
[52] Z. Sun, C. Moriconi, G. Benoit, D. Halm, and G. Henaff. Fatigue Crack Growth
under High Pressure of Gaseous Hydrogen in a 15-5PH Martensitic Stainless Steel:
Influence of Pressure and Loading Frequency. Metallurgical and Materials Transactons
A, March 2013, Vol. 44, No. 3, pp. 1320-1330.
[53] D. X. He, W.X. Chen, and J.L. Luo. Effect of cathodic potential on hydrogen
content in a pipeline steel exposed to NS4 near-neutral pH soil solution. Corrosion
2004;60(8):778-786.
[54] W. Chen, S.-H Wang, F. King, T. R. Jack, M. J. Wilmott. Hydrogen Permeation
Behavior of X-70 Pipeline Steel in a Near-Neutral pH Soil Environment. Proceedings of
IPC2000, 3rd International Pipeline Conference, Vol. 2, New York, NY: ASME
International, 2000, pp. 953-960.
55
[55] D.X. He, W. Chen, and J.L. Luo. Effect of Cathodic Potential on Hydrogen
Content in a Pipeline Steel Exposed to NS4 Near-Neutrla pH Soil Solution. Corrosion
2004;60(8):778-786.
[56] Y.F. Cheng. Fundamentals of hydrogen evolution reaction and its implications on
near-neutral pH stress corrosion cracking of pipeline. Electrochimica Acta 52 (2007)
2661-2667.
[57] Z.Y. Liu, X.G. Li, Y.F. Cheng. Mechanistic aspect of near-neutral pH stress
corrosion cracking of pipelines under cathodic polarization. Corrosion Science 55 (2012)
54-60.
[58] Lisa M. Young, Peter L. Andresen, and Thomas M. Angeliu. Crack tip Strain
Rate: Estimates Based on Contunuum Theory and Experimental Measurement. Corrosion
2001, March 11-16, 2001, NACE, Houston, TX, 2001, paper No. 01131.
[59] R.N. Parkins and J.A. Beavers. Some Effects of Strain Rate on the Transgranular
Stress Corrosion Cracking of Ferritic Steel in Dilute Near-Neutral pH Solutions.
Corrosion: March 2003, Vol. 59, No. 3, pp. 258-273.
[60] T. L. Anderson. Fracture Mechanics, Fundermentals and Applications, Third
Edition. Taylors & Francis Group, 2005. pp: 538-545.
[61] Shyyuan-Fang Chen, Robert P Wei. Environmentally assisted crack growth in a
Ni-18Cr-18Fe ternary alloy at elevated temperatures. Materials Science and Engineering
A, Vol. 256, Issue 1-2, 1998, pp. 197-207.
[62] G. Van Boven, R. Sutherby, and F. King. Characterizing Pressure Fluctuations on
Buried Pipelines in Terms Relevant to Stress Corrosion Cracking. Proceedings of
56
IPC2002, 4th International Pipeline Conference, Sept. 29- Oct. 3, 2002, Calgary, Alberta,
Canada. Paper No. IPC2002-27149.
[63] Jenny Been, Raymond R. Fessler, Sean Keane, and Walter Kresic. History of
Pressure Fluctuations Related to Severity of Near-Neutral pH SCC. Proceedings of
IPC2006, 6th International Pipeline Conference, Sept. 25- 29, 2006, Calgary, Alberta,
Canada. Paper No. IPC2006-10412.
[64] ASTM E1049 – 85 (reapproved 2011)E1. Standard Practices for Cycle Counting in
Fatigue Analysis. American Society for Testing and Materials, West Conshohocken, PA,
2011.
[65] G. Van Boven, R. Sutherby, and F. King. Characterizing Pressure Fluctuations on
Buried Pipelines in Terms Relevant to Stress Corrosion Cracking. Proceedings of
IPC2002, 4th International Pipeline Conference, Sept. 29- Oct. 3, 2002, Calgary, Alberta,
Canada. Paper No. IPC2002-27149.
[66] M. Skorupa. Load Interaction Effects During Fatigue Crack Growth under
Variable Amplitude loading- a Literature Review. Part I: Empirical Trends. Fatigue &
Fracture of Engineering Materials & Structures 1998; 21: 987-1006.
[67] M. Skorupa. Load Interaction Effects During Fatigue Crack Growth under
Variable Amplitude loading- a Literature Review. Part II: Qualitative explaination.
Fatigue & Fracture of Engineering Materials & Structures 1999; 22: 905-926.
[68] Vasilios Zitounis. Fatigue Crack Growth Rates under Variable Amplitude Load
Spectra Containing Tensile Underloads. PhD thesis, Cranfield University, 28 October
2003.
57
[69] Stephan M. Russ. Effect of Underloads on Fatigue Crack Growth of Ti-17. PhD
thesis, Georgia Institute of Technology, October 2003.
[70] Fowler, K.R. and Watanabe, R.T.. Development of Jet Transport Airframe
Fatigue Test Spectra, Development of Fatigue Loading Spectra, ASTM STP 1006, J. M.
Potter and R. T. Watanabe, Eds., American Society for Testing and Materials,
Philadelphia, 1989, pp. 36-64.
[71] Sunder, R. Contribution of Individual Load Cycles to Crack Growth under
Aircraft Spectrum Loading, Advances in Fatigue Lifetime Predictive Techniques, ASTM
STP 1122, M. R. Mitchell and R. W. Landgraf, Eds., American Society for Testing and
Materials, Philadelphia, 1992, pp. 176-190.
[72] T. L. Anderson. Fracture Mechanics, Fundermentals and Applications, Third
Edition. Taylors & Francis Group, 2005. pp: 473-488.
[73] Henning Agerskov. The Fatigue Behavior of Steel Structures under Random
Loading. Key Engineering Materials, Vols. 378-379 (2008) pp.3-16.
[74] Yan-Hui Zhang, and S.J. Maddox. Investigation of fatigue damage to welded
joints under variable amplitude loading spectra. International Journal of Fatigue 31
(2009) 138-152.
[75] N.A. Fleck. Fatigue Crack Growth due to Periodic Underloads and Overloads.
Acta Metallurgica, Vol. 33, No. 7, July 1985, pp. 1339-1354.
[76] Colin MacDougall, and T.H. Topper. The influence of variable amplitude loading
on crack closure and notch fatigue behavior. International Journal of Fatigue, Vol. 19,
No. 5, pp. 389-400, 1997.
58
[77] M. El-Zeghayar, T.H. Topper, F.A. Conle, and J.J. F. Bonnen. Modeling crack
closure and damage in variable amplitude fatigue using smooth specimen fatigue test
data. International Journal of Fatigue, Vol. 33, No. 2, Feb. 2011, pp. 223-231.
[78] J. C. Newman, Jr. and E.P. Phillips. Prediction of Crack Growth Under Variable-
Amplitude and Spectrum Loading in a Titanium Alloy. Fatigue Testing and Analysis
under Variable Amplitude Loading Conditions, ASTM STP 1439, Peter C. McKeighan,
and Narayanaswami Ranganathan, American Society for Testing and Materials,
Philadelphia, 2005, pp. 232-250.
[79] N. Ohrloff, A. Gysler and G. Lütjering. Journal DE Physique, Colloque C3,
supplement au n°9, Tome 48, Sept. 1987, C3-801.
[80] M. Krkoska, S.A. Barter, R.C. Alderliesten, P. White, R. Benedictus. Fatigue
crack paths in AA2024-T3 when loaded with constant amplitude and simple underload
spectra. Engineering Fracture Mechanics, Vol. 77, No. 11, July 2010, pp. 1857-1865.
[81] Richard W. Hertzberg. Deformation and Fracture Mechanics of Engineering
Materials, Fourth Edition, John Wiley & Sons, Inc., 1996, pp. 634-641.
[82] Kentaro Yamada, Qiuliang Cao, Yuji Okuhara and Xiaohua Cheng. Fatigue Crack
Growth Behavior of Various Structural Steel after Single and Periodic Overloads.
Structural Eng./Earthquake Eng., JSCE, Vol. 15, No. 2, 191s-200s, 1998 July. pp. 37-46.
[83] J. Schijve, F. A. Jacobs, and P. J. Tromp. Crack propagation in 2024-T3Al cald
under flight-simulation loading effect of truncating high gust loads. National Aerospace
Laboratory, NLR, The Netherlands, NLR TR-69050-U, June 1969.
59
[84] Raymond R. Fessler and Steve Rapp. Method for Establishing Hydrostatic Re-
Test Intervals for Pipelines with Stress-Corrosion Cracking. Proceedings of IPC2006, 6th
International Pipeline Conference, Sept. 25- 29, 2006, Calgary, Alberta, Canada. Paper
No. IPC2006-10163, pp. 259-263.
[85] Weixing Chen, Yongwang Kang, Reg Eadie, Richard Kania, Greg Van Boven,
and Robert Worthingham. Proceedings of the 2012 9th International Pipeline Conference,
IPC2012, Sept. 24- 28, 2012, Calgary, Alberta, Canada. Paper No. IPC2012-90635.
[86] Yongwang Kang, Weixing Chen, Richard Kania, Gregory Van Boven, Robert
Worthingham. Simulation of crack growth during hydrostatic testing of pipeline steel in
near-neutral pH environment. Corrosion Science 53 (2011) 968-975.
[87] Jian Li, M. Elboujdaini, M. Gao, R. W. Revie. Investigation of plastic zones near
SCC tips in a pipeline after hydrostatic testing. Materials Science and Engineering A 486
(2008) 496-502.
[88] Ryoichi Koterazawa, and Takayoshi Nosho. Acceleraion of Crack Growth under
Intermittent Overstressing in Different Environments. Fatigue & Fracture of Engineering
Materials & Structures. Vol. 15, No. 1, pp. 103-113, 1992.
[89] T. L. Anderson. Fracture Mechanics, Fundermentals and Applications, Third
Edition. Taylors & Francis Group, 2005. pp: 457-464.
[90] Eric F. J. von Euw. Effect of Overload Cycle(s) on Subsequent Fatigue Crack
Propagation in 2024-T3 Aluminum Alloy. PhD Dissertation, Lehigh University, 1971.
60
[91] Asok Ray, and Ravindra Patankar. Fatigue crack growth under variable-amplitude
loading: Part I – Model formulation in state-space setting. Applied Mathematical
Modelling 25 (2001) 979-994.
[92] T. L. Anderson. Fracture Mechanics, Fundermentals and Applications, Third
Edition. Taylors & Francis Group, 2005. pp: 473-488.
[93] Soo Yeol Lee. Effects of Overload and Underload on Internal Strains/Stresses and
Crack Closure during Fatigue-Crack Propagation. Doctoral Dissertations, University of
Tennessee - Knoxville, December, 2009.
[94] J. Schijve. The Effect of Pre-strain on Fatigue Crack Growth and Crack Closure.
Engineering Fracture Mechanics, 1976, Vol. 8, pp. 575-581.
[95] S. Suresh. Fatigue of Materials. Cambridge University Press, Cambridge, New
York Port Chester, Melbourne Sydney, 1991, pp:113.
[96] K. Katagiri, R. Koterazawa, T. Yamada, and T. Tsuboi. Changes in dislocation
structures adjacent to fatigue crack tips induced by intermittent overstressing. Metal
Science, Vol. 17, November 1983, pp:556-562.
[97] Canadian Energy Pipeline Association (CEPA). Stress Corrosion Cracking
Recommended Practices, 2nd Edition, An industry leading document detailing the
management of transgranular SCC, December 2007,pp.5-5.
[98] TransCanada Pipeline (1996) Response to National Energy Board Information
Request 2 of Proceeding MH-2-5, TCP, Calgary, Alberta, Canada, pp.3.

61
[99] B. W. Williams, S. B. Lamber, R. Sutherby, A. Plumtree. Environmental Crack
Growth under Variable Amplitude Loading of Pipeline Steel. Corrosion: January 2004,
Vol. 60, No.1, pp. 95-103.
62
Chapter 2 Depressurization-Induced Crack Growth
Enhancement for Pipeline Steel Exposed to a Near-
Neutral pH Environment1
2.1. Introduction
Although near-neutral pH stress corrosion cracking (NNpHSCC) has been studied since
1985, it is still not fully understood [ 1 - 3 ]. Crack propagation in near-neutral pH
environments has never been observed under static tensile loading conditions, by the
definition of SCC, except for the initiation of a crack where galvanic corrosion may be
predominant [1]. Also, it has been determined that crack growth in near-neutral pH SCC
is driven by mechanisms consistent with corrosion fatigue [1,4,5].
Based on long-term and extensive laboratory crack growth simulations, under constant
amplitude cyclic loading in near-neutral pH environments, it was found that the crack
growth rate could be correlated to a combined factor that incorporated both the
mechanical and the environmental driving forces [6] as:
1 A version of this chapter has been published: M. Yu, W. Chen, R. Kania, G. V. Boven,
J. Been. In: proceedings of the 10th International Pipeline Conference 2014, IPC2014,
Sept. 29 – Oct. 3, 2014, Calgary, Alberta, Canada. Paper No.: IPC2014-33282.

63
𝑑𝑎
𝑑𝑁= 𝑎 (
∆𝐾𝛼𝐾𝑚𝑎𝑥𝛽
𝑓𝛾)
𝑛
+ 𝑏 (2 − 1)
where a, n, , , and are all constants, + = 1, and b is the contribution of stress
corrosion cracking, which was found to be about one order of magnitude lower than the
first term in Stage II crack growth and can be ignored. (∆𝐾𝛼𝐾𝑚𝑎𝑥𝛽
) 𝑓𝛾⁄ is termed as the
combined factor, ∆K is the change in stress intensity at the crack tip due to cyclic
loading, Kmax is the maximum stress intensity at the crack tip, and is a factor
representing the influence of the corrosion environment on the crack growth rate which is
found to be around 0.1. ∆K and Kmax are strongly dependent on the geometry of the
specimen, while is dependent on the corrosiveness of environment. A threshold value of
(∆𝐾𝛼𝐾𝑚𝑎𝑥𝛽
) 𝑓𝛾⁄ is also determined, below which crack will cease to grow.
However, there are two main unsolved issues with this model: first, this empirical
correlation is based on the laboratory tests done in a frequency range of 1×10⁻¹ to
1.25×10⁻³ Hz, which is above the actual frequencies of pressure fluctuations in the field,
especially during the operation of high-pressure gas transmission pipelines where loading
frequencies are about 1×10⁻⁵ Hz (one cycle per day) [7]. Although the crack growth at
such a low frequency has been studied in near-neutral pH environments [8,9], it cannot be
concluded that the crack growth would increase with lowering frequency due to
insufficient data [8,10]. Thus, crack growth at frequencies lower than 1×10⁻³ Hz remains
to be studied.
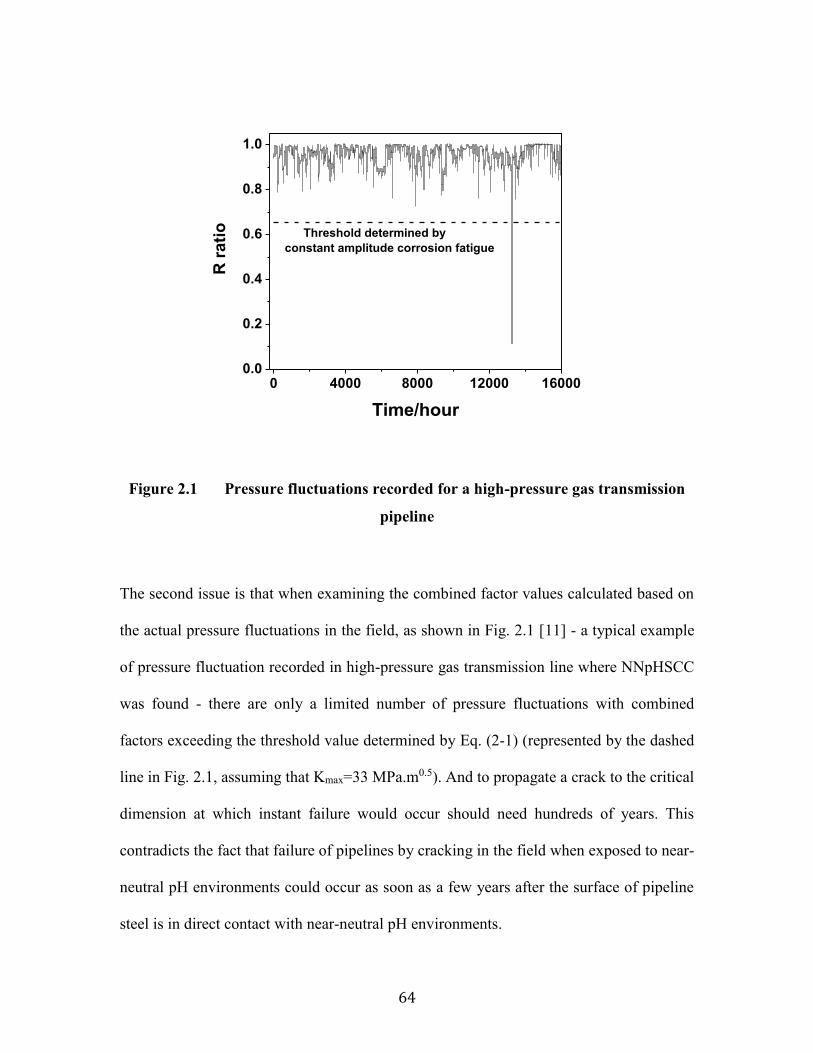
64
0 4000 8000 12000 160000.0
0.2
0.4
0.6
0.8
1.0
R r
ati
o
Time/hour
Threshold determined by
constant amplitude corrosion fatigue
Figure 2.1 Pressure fluctuations recorded for a high-pressure gas transmission
pipeline
The second issue is that when examining the combined factor values calculated based on
the actual pressure fluctuations in the field, as shown in Fig. 2.1 [11] - a typical example
of pressure fluctuation recorded in high-pressure gas transmission line where NNpHSCC
was found - there are only a limited number of pressure fluctuations with combined
factors exceeding the threshold value determined by Eq. (2-1) (represented by the dashed
line in Fig. 2.1, assuming that Kmax=33 MPa.m0.5). And to propagate a crack to the critical
dimension at which instant failure would occur should need hundreds of years. This
contradicts the fact that failure of pipelines by cracking in the field when exposed to near-
neutral pH environments could occur as soon as a few years after the surface of pipeline
steel is in direct contact with near-neutral pH environments.
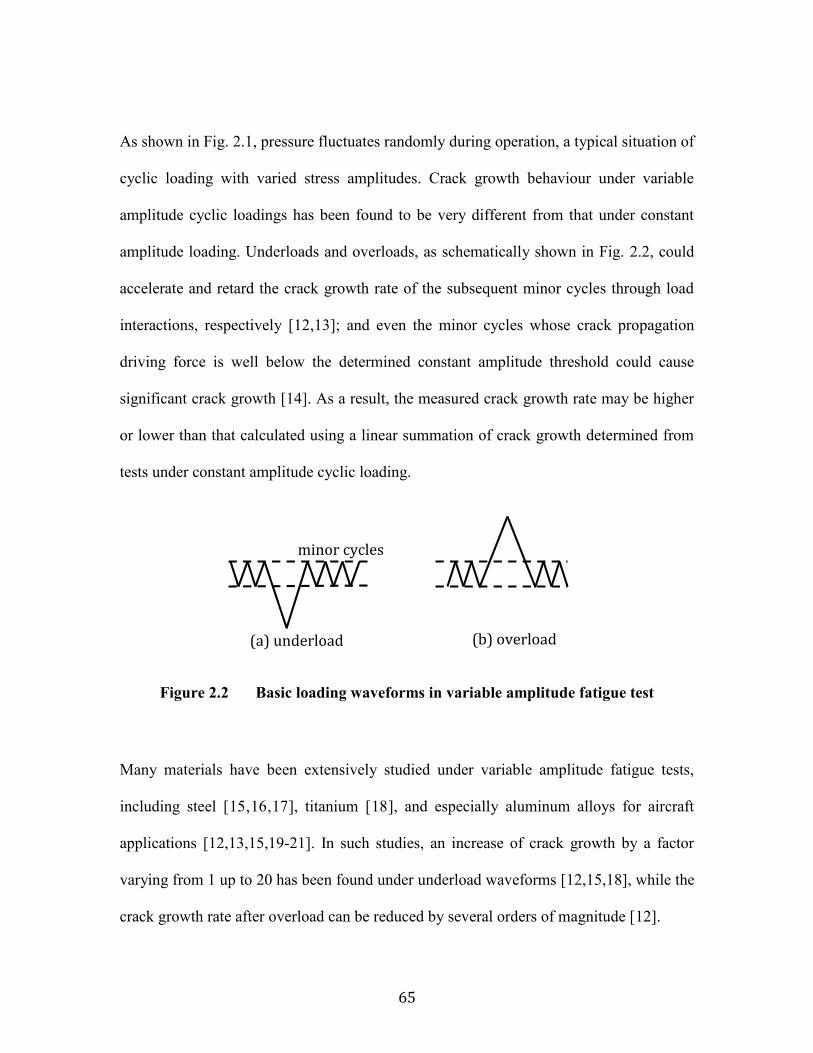
65
As shown in Fig. 2.1, pressure fluctuates randomly during operation, a typical situation of
cyclic loading with varied stress amplitudes. Crack growth behaviour under variable
amplitude cyclic loadings has been found to be very different from that under constant
amplitude loading. Underloads and overloads, as schematically shown in Fig. 2.2, could
accelerate and retard the crack growth rate of the subsequent minor cycles through load
interactions, respectively [12,13]; and even the minor cycles whose crack propagation
driving force is well below the determined constant amplitude threshold could cause
significant crack growth [14]. As a result, the measured crack growth rate may be higher
or lower than that calculated using a linear summation of crack growth determined from
tests under constant amplitude cyclic loading.
Figure 2.2 Basic loading waveforms in variable amplitude fatigue test
Many materials have been extensively studied under variable amplitude fatigue tests,
including steel [15,16,17], titanium [18], and especially aluminum alloys for aircraft
applications [12,13,15,19-21]. In such studies, an increase of crack growth by a factor
varying from 1 up to 20 has been found under underload waveforms [12,15,18], while the
crack growth rate after overload can be reduced by several orders of magnitude [12].
(a) underload
minor cycles
(b) overload

66
The accelerated crack growth of the minor cycles with R ratio 0.5 caused by underload
with R ratio of 0.1 was observed in pipeline steel exposed to near-neutral pH
environments [22]. However, the minor cycles in the study had very low R ratios and
could cause direct crack growth as predicted by the constant amplitude crack growth
model and therefore were not typical of pressure fluctuations seen in the field. This
investigation was initiated to consider the effect of minor cycles with R-ratios typically
seen in the field.
2.2 Experimental
2.2.1 Specimen and near-neutral pH solution
The X60 pipeline steel used in this study was received from Spectra Energy Transmission
after being in service for 19 years, with a thickness of 10.4 mm and outer diameter of 913
mm. The chemical composition (wt.%) of the steel is as follows: C: 0.15, Mn: 1.27, P:
0.019, S: 0.005, Si: 0.37, Ni: 0.045, Cr: 0.2, Cu: 0.27, Al: 0.023, Fe: Balance. The
microstructures (ferrite and pearlite) of the steel are shown in Fig. 2.3; the grain size was
approximately 7 μm. Compact tension (CT) specimens machined from the pipeline steel
were used in this study, the dimension of which was shown in Fig. 2.4. The machined
notch was perpendicular to the pipe hoop direction. Pre-fatigue cracking was conducted
to initiate a sharp crack tip from the machined notch according to the procedures
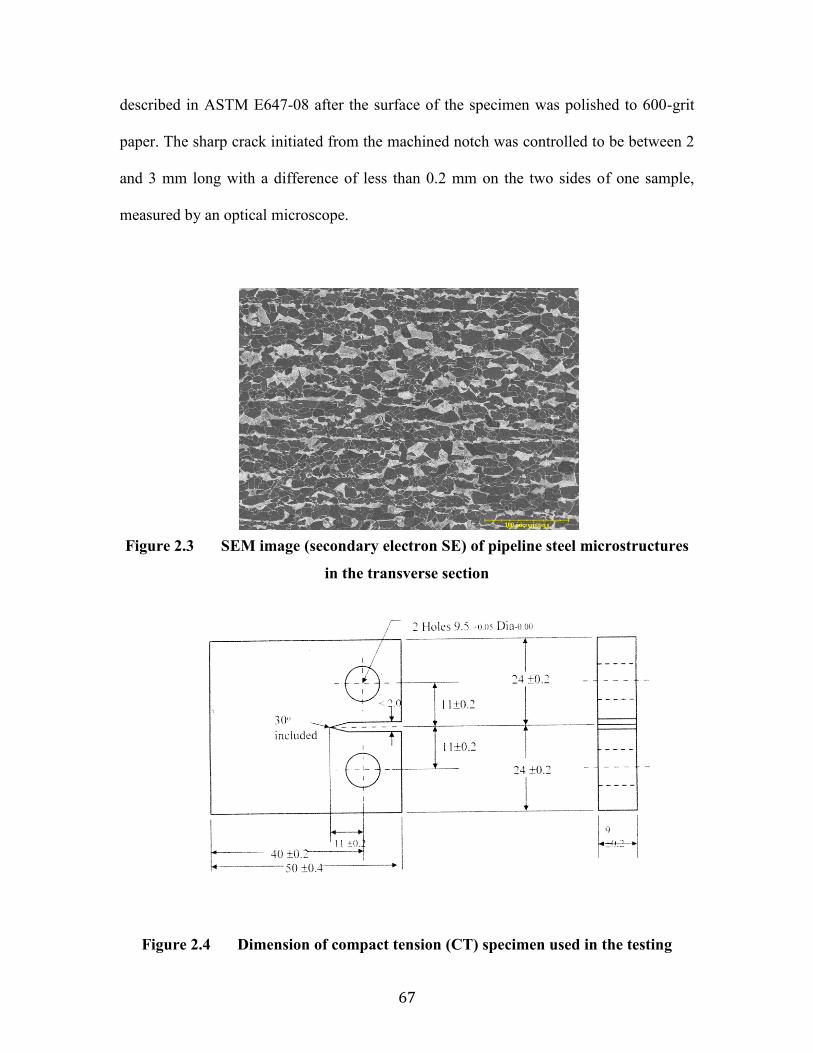
67
described in ASTM E647-08 after the surface of the specimen was polished to 600-grit
paper. The sharp crack initiated from the machined notch was controlled to be between 2
and 3 mm long with a difference of less than 0.2 mm on the two sides of one sample,
measured by an optical microscope.
Figure 2.3 SEM image (secondary electron SE) of pipeline steel microstructures
in the transverse section
Figure 2.4 Dimension of compact tension (CT) specimen used in the testing
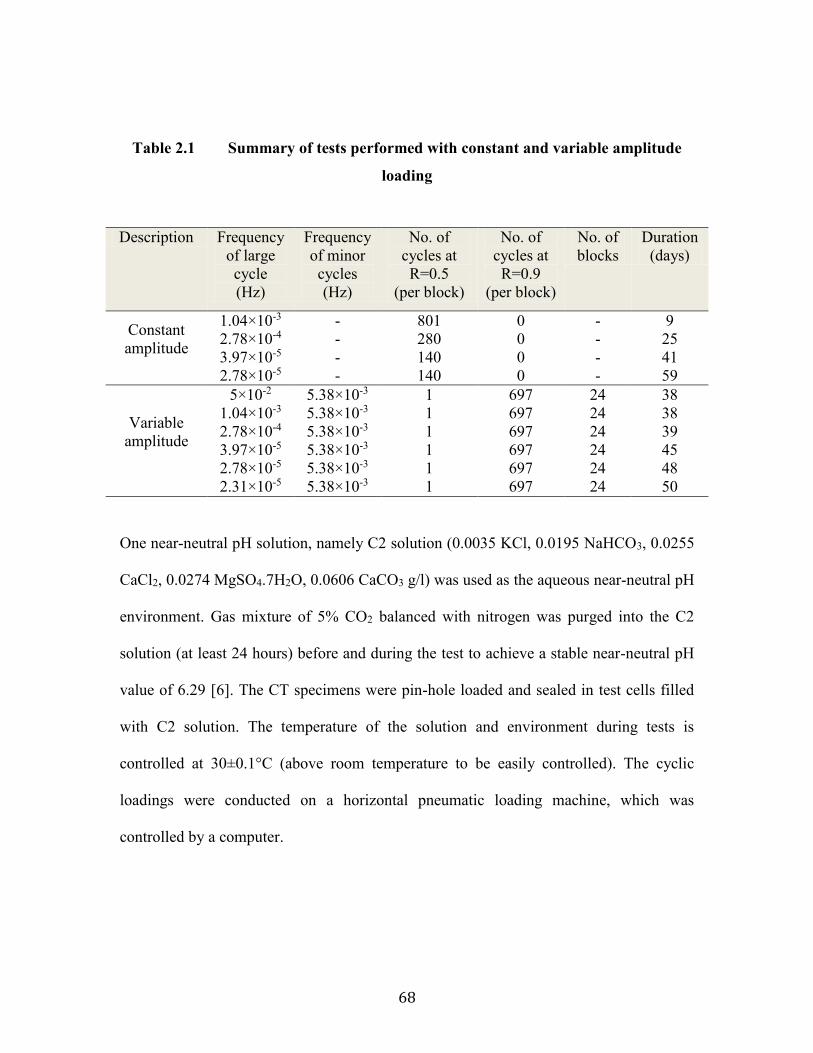
68
Table 2.1 Summary of tests performed with constant and variable amplitude
loading
One near-neutral pH solution, namely C2 solution (0.0035 KCl, 0.0195 NaHCO3, 0.0255
CaCl2, 0.0274 MgSO4.7H2O, 0.0606 CaCO3 g/l) was used as the aqueous near-neutral pH
environment. Gas mixture of 5% CO2 balanced with nitrogen was purged into the C2
solution (at least 24 hours) before and during the test to achieve a stable near-neutral pH
value of 6.29 [6]. The CT specimens were pin-hole loaded and sealed in test cells filled
with C2 solution. The temperature of the solution and environment during tests is
controlled at 30±0.1°C (above room temperature to be easily controlled). The cyclic
loadings were conducted on a horizontal pneumatic loading machine, which was
controlled by a computer.
Description Frequency
of large
cycle
(Hz)
Frequency
of minor
cycles
(Hz)
No. of
cycles at
R=0.5
(per block)
No. of
cycles at
R=0.9
(per block)
No. of
blocks
Duration
(days)
Constant
amplitude
1.04×10⁻³ - 801 0 - 9
2.78×10⁻⁴ - 280 0 - 25
3.97×10⁻⁵ - 140 0 - 41
2.78×10⁻⁵ - 140 0 - 59
Variable
amplitude
5×10⁻² 5.38×10⁻³ 1 697 24 38
1.04×10⁻³ 5.38×10⁻³ 1 697 24 38
2.78×10⁻⁴ 5.38×10⁻³ 1 697 24 39
3.97×10⁻⁵ 5.38×10⁻³ 1 697 24 45
2.78×10⁻⁵ 5.38×10⁻³ 1 697 24 48
2.31×10⁻⁵ 5.38×10⁻³ 1 697 24 50
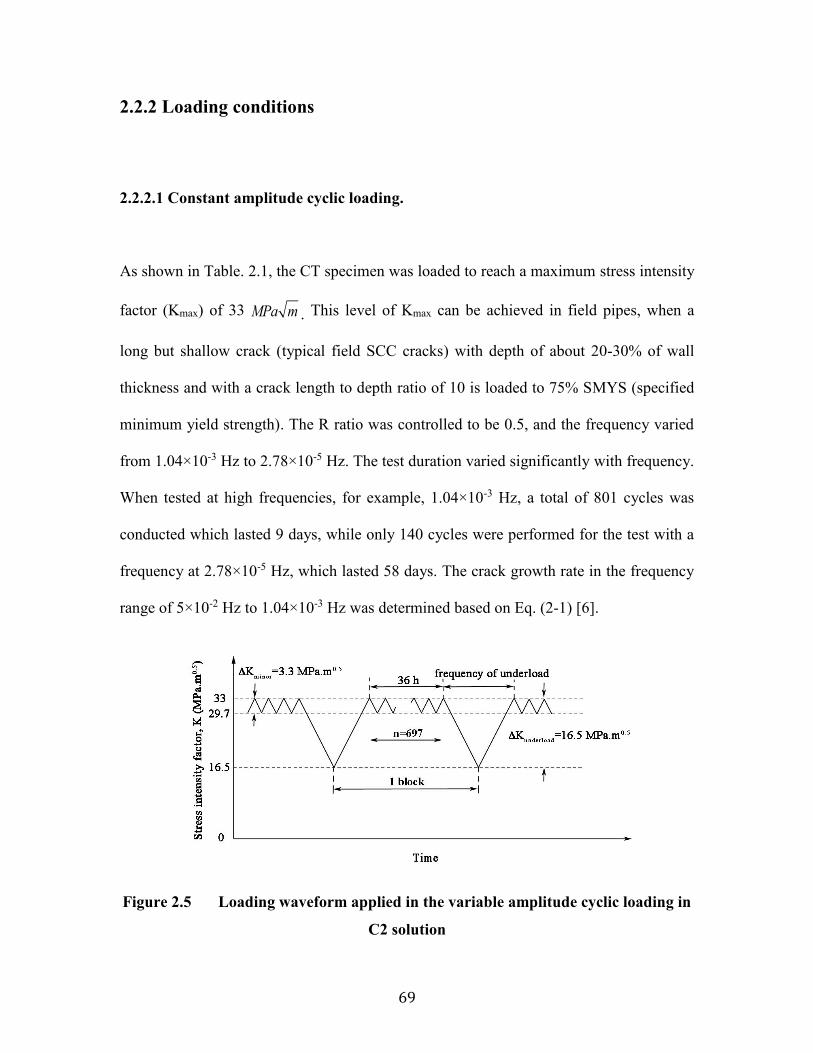
69
2.2.2 Loading conditions
2.2.2.1 Constant amplitude cyclic loading.
As shown in Table. 2.1, the CT specimen was loaded to reach a maximum stress intensity
factor (Kmax) of 33 MPa m . This level of Kmax can be achieved in field pipes, when a
long but shallow crack (typical field SCC cracks) with depth of about 20-30% of wall
thickness and with a crack length to depth ratio of 10 is loaded to 75% SMYS (specified
minimum yield strength). The R ratio was controlled to be 0.5, and the frequency varied
from 1.04×10⁻³ Hz to 2.78×10⁻⁵ Hz. The test duration varied significantly with frequency.
When tested at high frequencies, for example, 1.04×10⁻³ Hz, a total of 801 cycles was
conducted which lasted 9 days, while only 140 cycles were performed for the test with a
frequency at 2.78×10⁻⁵ Hz, which lasted 58 days. The crack growth rate in the frequency
range of 5×10⁻² Hz to 1.04×10⁻³ Hz was determined based on Eq. (2-1) [6].
Figure 2.5 Loading waveform applied in the variable amplitude cyclic loading in
C2 solution

70
2.2.2.2 Variable amplitude cyclic loading.
The waveform shown in Table. 2.1 and Fig. 2.5 was designed to simulate the actual
spectrum of pressure fluctuations of pipelines. The Kmax was also kept at 33 MPa√m. The
R ratios of minor cycles and underload were 0.9 and 0.5, respectively. The frequency of
underload varied from 5×10⁻² Hz (20 s/cycle) to 1×10⁻⁵ Hz (27.8 hours/cycle), while that
of minor cycles in the waveform was kept constant at 5.38×10⁻³ Hz. The number of minor
cycles per block (as defined in the waveform, Fig. 2.5) was set at 697, which lasted 36
hours. 24 blocks (24 underloads) as seen in Fig. 2.5 were applied; the first and last event
in the waveform were the minor cycles so that all the load interactions could be included.
To further confirm the role of minor cycles with R ratio as high as 0.9 in crack
propagation, static hold was applied to replace the minor cycles in the waveform shown
in Fig. 2.5. The static hold period was exactly the same as that of minor cycles, 36 hours.
The other conditions were the same.
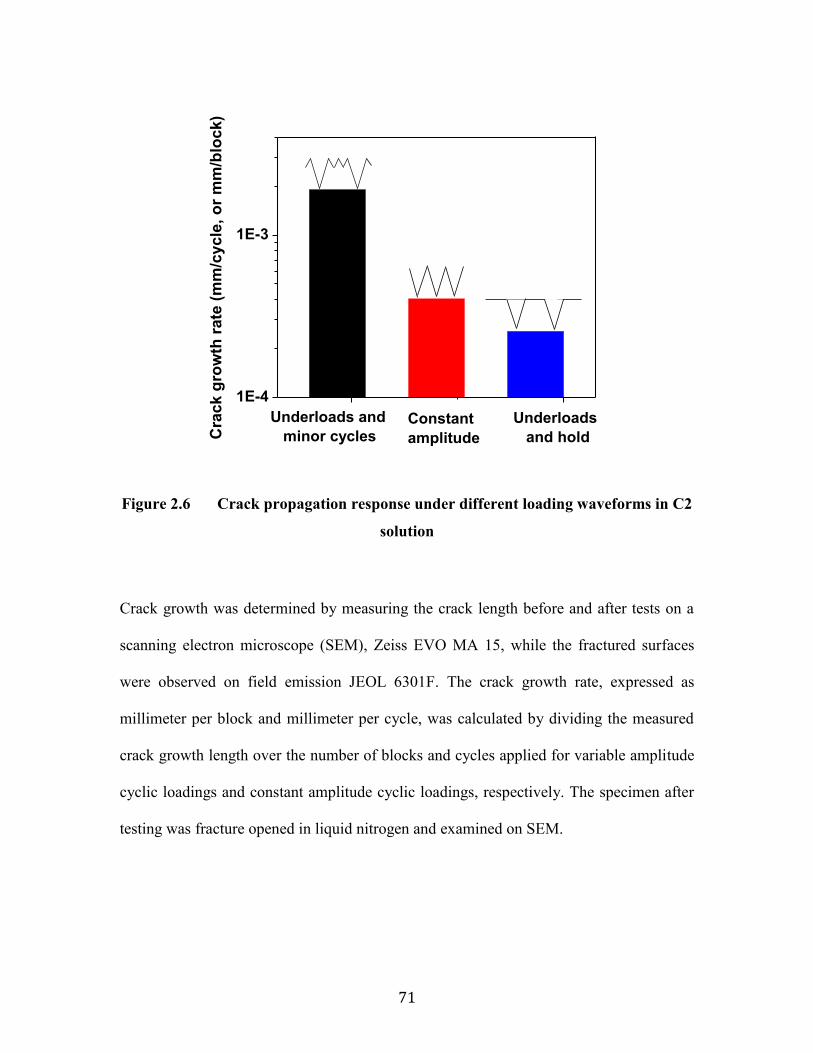
71
1E-4
1E-3
Underloads
and hold
Underloads and
minor cycles
Cra
ck g
row
th r
ate
(m
m/c
ycle
, o
r m
m/b
lock)
Constant
amplitude
Figure 2.6 Crack propagation response under different loading waveforms in C2
solution
Crack growth was determined by measuring the crack length before and after tests on a
scanning electron microscope (SEM), Zeiss EVO MA 15, while the fractured surfaces
were observed on field emission JEOL 6301F. The crack growth rate, expressed as
millimeter per block and millimeter per cycle, was calculated by dividing the measured
crack growth length over the number of blocks and cycles applied for variable amplitude
cyclic loadings and constant amplitude cyclic loadings, respectively. The specimen after
testing was fracture opened in liquid nitrogen and examined on SEM.

72
2.3 Results and Discussion
2.3.1 The role of minor cycles
A comparison of the crack growth rate under three different kinds of waveforms in C2
solution is shown in Fig. 2.6. The frequency of large cycles in the three loading
waveforms was the same, 1.04×10⁻³ Hz. The growth rate of constant amplitude test is
4.07×10⁻⁴ mm/cycle, while that of underload plus minor cycles is 1.92×10⁻³ mm/block,
4.7 times higher because of the introduction of minor cycles. The minor cycles in this test
have a combined factor calculated using Eq. (2-1) well below the crack growth threshold
determined from constant amplitude loading.
2.3.2 Fracture surface examination
The specimens tested in C2 solution were fracture opened in liquid nitrogen to observe
the striations, which are direct physical evidence of crack growth by fatigue. Only large
striations were observed on the fracture surface of the specimen tested under constant
amplitude loading, as shown in Fig. 2.7 (a), while mini-striations were also found on the
fractured surface in the variable amplitude test, as shown in the inserted image in Fig. 2.7
(b). The striation spacing of constant amplitude test was measured to be about 1.29×10⁻³
mm on average, much higher than that of obtained surface crack growth rate of 4.07×10⁻⁴
mm/cycle. Similarly from Fig. 2.7 (b), the large striation spacing of the variable
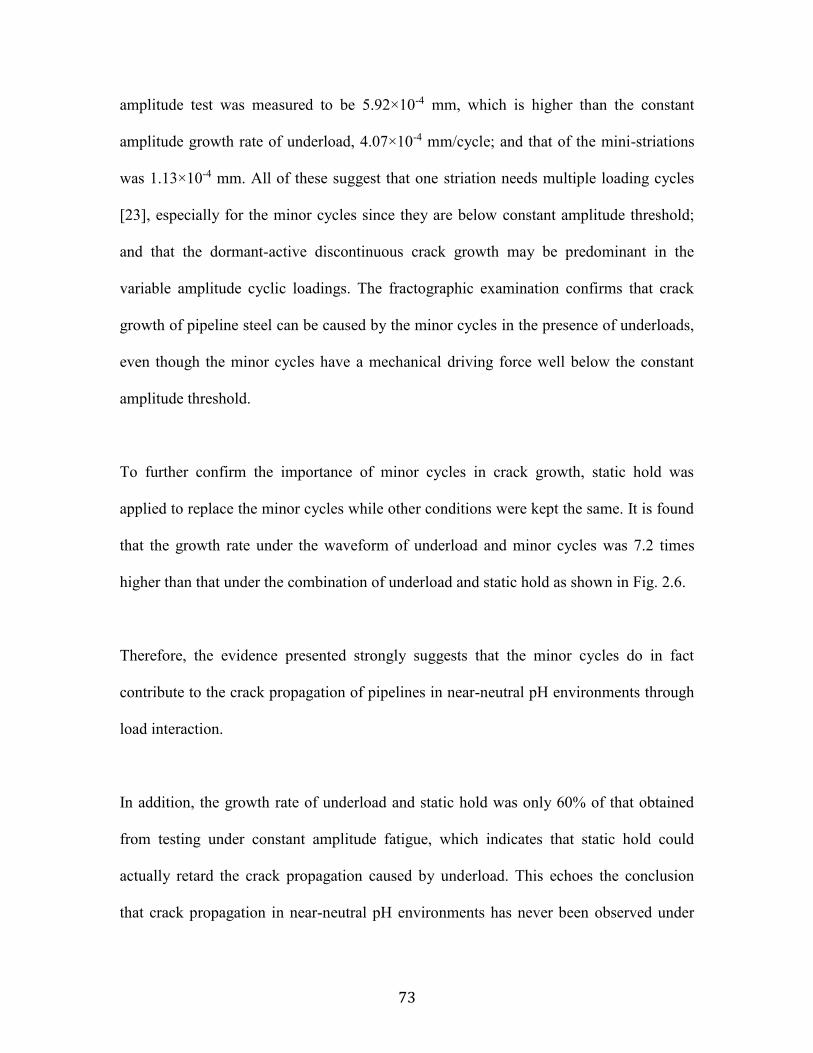
73
amplitude test was measured to be 5.92×10⁻⁴ mm, which is higher than the constant
amplitude growth rate of underload, 4.07×10⁻⁴ mm/cycle; and that of the mini-striations
was 1.13×10⁻⁴ mm. All of these suggest that one striation needs multiple loading cycles
[23], especially for the minor cycles since they are below constant amplitude threshold;
and that the dormant-active discontinuous crack growth may be predominant in the
variable amplitude cyclic loadings. The fractographic examination confirms that crack
growth of pipeline steel can be caused by the minor cycles in the presence of underloads,
even though the minor cycles have a mechanical driving force well below the constant
amplitude threshold.
To further confirm the importance of minor cycles in crack growth, static hold was
applied to replace the minor cycles while other conditions were kept the same. It is found
that the growth rate under the waveform of underload and minor cycles was 7.2 times
higher than that under the combination of underload and static hold as shown in Fig. 2.6.
Therefore, the evidence presented strongly suggests that the minor cycles do in fact
contribute to the crack propagation of pipelines in near-neutral pH environments through
load interaction.
In addition, the growth rate of underload and static hold was only 60% of that obtained
from testing under constant amplitude fatigue, which indicates that static hold could
actually retard the crack propagation caused by underload. This echoes the conclusion
that crack propagation in near-neutral pH environments has never been observed under
74
static tensile loading conditions except for the initiation of a crack where galvanic
corrosion may be predominant [5,6].
Figure 2.7 SEM images (SE) of fractured surface of specimens in C2 solution,
crack propagating from left to right: a) constant amplitude test; and b) variable
amplitude test
(a) LARGE STRIATIONS
(b) LARGE AND MINI- STRIATIONS

75
These findings contradict a number of general beliefs on crack growth in near-neutral pH
environments. First, reducing the maximum pressure to a very low value (one large
underload generated) would not produce any benefit to crack growth since the pipeline
would be in a lower stress state, as generally believed. Second, one unload cycle would
yield crack growth far larger than that predicted by models based on tests under constant
amplitude cycles, which has not been adequately considered. Third, the small fluctuations
with R ratios as high as 0.9 - which are often considered to be near static and therefore
negligible in terms of crack growth - can actually play a role in crack growth. These
findings should be implemented into guidelines for daily operation for the purpose of
minimizing crack growth.
2.3.3 Crack growth behavior at different frequencies
All the tests at different frequencies were conducted at the same maximum stress
intensity factor and R ratio of the underload cycles of the comparative tests shown in Fig.
2.6. Only the frequencies of the large cycles varied for both the constant and variable
amplitude fatigue in C2 solution. The test results are shown in Fig. 2.8 for both constant
and variable amplitude cyclic loadings.
2.3.3.1 Constant amplitude cyclic loading
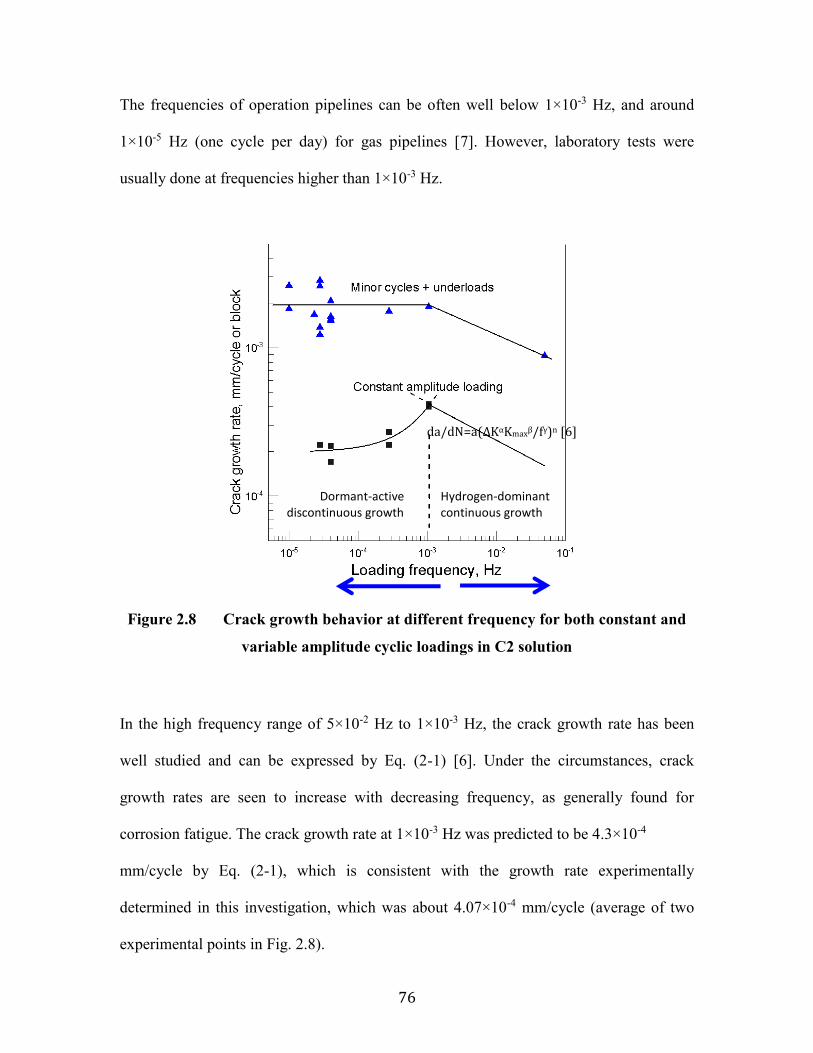
76
The frequencies of operation pipelines can be often well below 1×10⁻³ Hz, and around
1×10⁻⁵ Hz (one cycle per day) for gas pipelines [7]. However, laboratory tests were
usually done at frequencies higher than 1×10⁻³ Hz.
Figure 2.8 Crack growth behavior at different frequency for both constant and
variable amplitude cyclic loadings in C2 solution
In the high frequency range of 5×10⁻² Hz to 1×10⁻³ Hz, the crack growth rate has been
well studied and can be expressed by Eq. (2-1) [6]. Under the circumstances, crack
growth rates are seen to increase with decreasing frequency, as generally found for
corrosion fatigue. The crack growth rate at 1×10⁻³ Hz was predicted to be 4.3×10⁻⁴
mm/cycle by Eq. (2-1), which is consistent with the growth rate experimentally
determined in this investigation, which was about 4.07×10⁻⁴ mm/cycle (average of two
experimental points in Fig. 2.8).
Dormant-active discontinuous growth
Hydrogen-dominant continuous growth
da/dN=a(ΔKαKmaxβ/fγ)n [6]
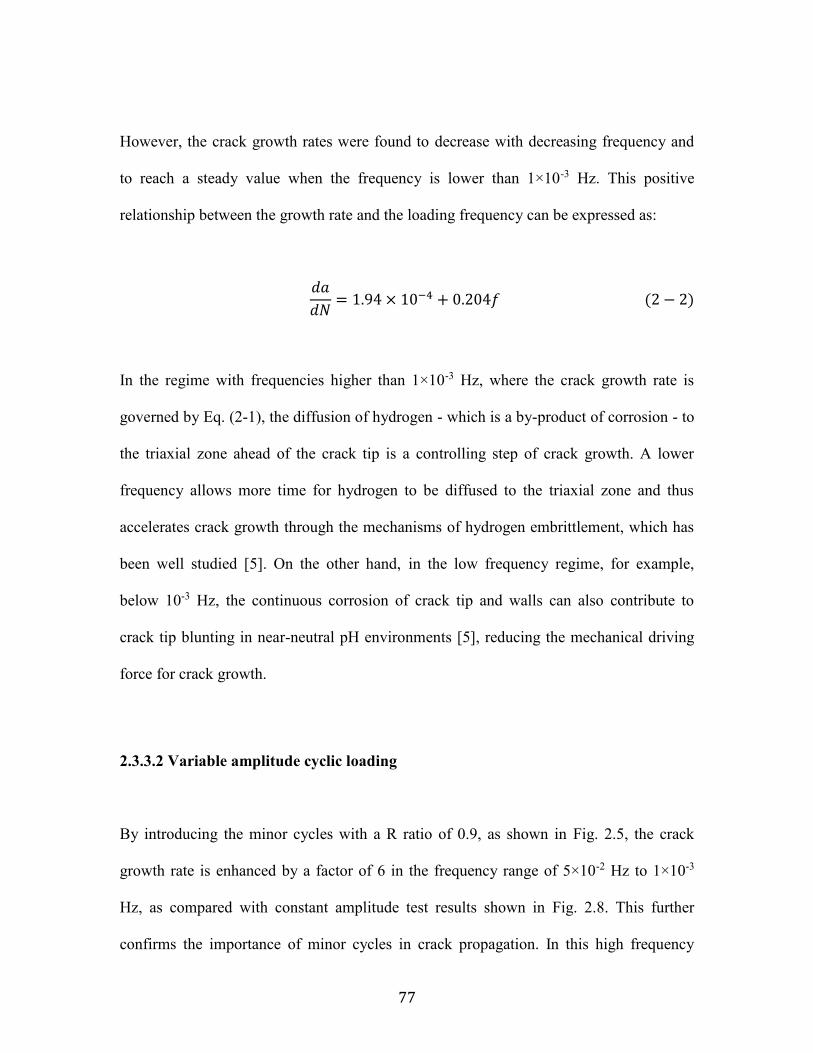
77
However, the crack growth rates were found to decrease with decreasing frequency and
to reach a steady value when the frequency is lower than 1×10⁻³ Hz. This positive
relationship between the growth rate and the loading frequency can be expressed as:
𝑑𝑎
𝑑𝑁= 1.94 × 10⁻⁴ + 0.204𝑓 (2 − 2)
In the regime with frequencies higher than 1×10⁻³ Hz, where the crack growth rate is
governed by Eq. (2-1), the diffusion of hydrogen - which is a by-product of corrosion - to
the triaxial zone ahead of the crack tip is a controlling step of crack growth. A lower
frequency allows more time for hydrogen to be diffused to the triaxial zone and thus
accelerates crack growth through the mechanisms of hydrogen embrittlement, which has
been well studied [5]. On the other hand, in the low frequency regime, for example,
below 10-3 Hz, the continuous corrosion of crack tip and walls can also contribute to
crack tip blunting in near-neutral pH environments [5], reducing the mechanical driving
force for crack growth.
2.3.3.2 Variable amplitude cyclic loading
By introducing the minor cycles with a R ratio of 0.9, as shown in Fig. 2.5, the crack
growth rate is enhanced by a factor of 6 in the frequency range of 5×10⁻² Hz to 1×10⁻³
Hz, as compared with constant amplitude test results shown in Fig. 2.8. This further
confirms the importance of minor cycles in crack propagation. In this high frequency

78
regime, the crack growth rate-frequency dependence is found to be similar to that under
constant amplitude cyclic loadings; that is, increasing frequency leads to a lower crack
growth rate. The crack growth rate was enhanced by a factor of 2.13 with decreasing
frequency from 5×10⁻² Hz to 1×10⁻³ Hz. It is believed that the crack growth under the
current variable loading condition was also governed by the hydrogen-dominant crack
growth mechanisms.
With further decreases of the frequency of underload to 1×10⁻⁵ Hz (27.8 hours per cycle):
the crack growth rate neither increases with decreasing frequency, as generally believed
in corrosion fatigue, nor decreases with decreasing frequency, as observed in the constant
amplitude tests; however, it instead approaches a steady value of about 2×10⁻³ mm/block.
Several tests were repeated in this low frequency range to confirm the trend. It can be
seen that the crack growth rate is increased 10 times of that of constant amplitude fatigue
in C2 solution at the frequency 1×10⁻⁵ Hz. This enhanced crack growth rate in variable
amplitude tests results from the load interaction of variable amplitude loading [12-15].
When accelerated crack growth due to load interaction is considered, the remaining life
of high-pressure gas transmission pipelines with SCC can be predicted to yield a value
consistent with the field experiences.
The crack tip morphology on the middle plane in the thickness direction is shown in Fig.
2.9 - note that a single specimen was etched to show that the etchant may affect the crack
tip sharpness. The arrow marks the position of pre-cracking tip before corrosion fatigue
tests. It can be seen that the crack tip after tests in the high frequency range of 5×10⁻² Hz
79
to 1×10⁻³ Hz remains sharp. However, with further lowering frequency, the crack tip
becomes blunter. It is believed that the near constant crack growth rate at frequencies
lower than 1×10⁻³ Hz is a result of competition between increased mechanical driving
force induced by the interaction between the underload and the minor cycles, and the
crack tip blunting resulting from corrosion. Further research is needed to elucidate the
physical process of crack tip blunting and re-sharpening for the discontinuous growth.
The variable loading spectrum shown in Fig. 2.5 is much closer to the pressure
fluctuations of pipelines in daily operation than the constant amplitude loading scenarios.
The remaining life prediction made based on crack growth rate of variable loading is also
consistent with the field experiences [24].
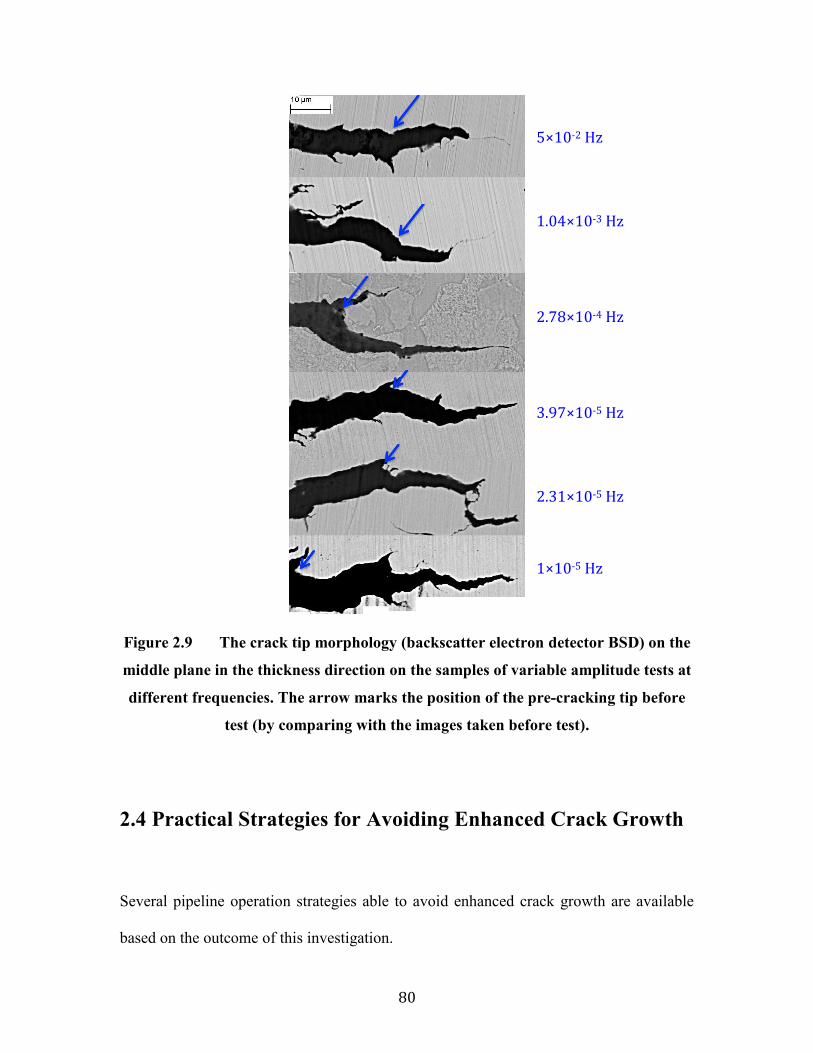
80
Figure 2.9 The crack tip morphology (backscatter electron detector BSD) on the
middle plane in the thickness direction on the samples of variable amplitude tests at
different frequencies. The arrow marks the position of the pre-cracking tip before
test (by comparing with the images taken before test).
2.4 Practical Strategies for Avoiding Enhanced Crack Growth
Several pipeline operation strategies able to avoid enhanced crack growth are available
based on the outcome of this investigation.
5×10⁻² Hz
1.04×10⁻³ Hz
2.78×10⁻⁴ Hz
3.97×10⁻⁵ Hz
2.31×10⁻⁵ Hz
1×10⁻⁵ Hz

81
1) The minimum normal operation pressure should be controlled to as high as possible
to reduce the amplitude of large cycle (reducing acceleration effect).
2) It is recommended that the pipeline be operated with a control of mean pressure,
rather than the current maximum pressure. This would allow for a certain level of
overloading, which on one hand could minimize the enhanced crack growth by
underload, and on the other hand achieve retarded growth by overloading.
3) If underloads, for example, due to shutdown or hydrotests, are not avoidable, a static
hold for a period of at least 24 hours following each underload is recommended to
achieve crack tip blunting and thus to reduce load interaction for an enhanced crack
growth in the subsequent load cycles. A similar recommendation has been proposed
[25,26], which was made based on the results of hydrostatic simulations.
4) If possible, an overloading could be applied following each underload or after a
period of operation.
2.5 Conclusions
A comparative study has been made of X60 pipeline steel to investigate the crack
propagation in near-neutral pH solution under both constant and variable amplitude
loadings in a wide frequency range of 5×10⁻² Hz to 1×10⁻⁵ Hz. Variable amplitude cyclic
loading was designed to consist of an underload with a relatively low R ratio of 0.5 and
minor cycles having a R ratio of 0.9. This loading spectrum simulates pressure

82
fluctuations experienced by high-pressure gas transmission pipelines. It has been found
from this investigation that:
(1) The minor cycles with very high R-ratios that have been previously considered to be
non-propagating based on constant amplitude crack growth model can cause
significant crack advance in the presence of underload. Its growth rate is about 5
times of that of constant amplitude testing, and 7 times of that of static hold and
underload.
(2) Two different crack growth rate-frequency dependences were observed. When the
loading frequency is above 1×10⁻³ Hz, crack growth rate was found to increase with
decreasing frequency, which confirms the findings reported previously. In the
loading frequency lower than 1×10⁻³ Hz, the crack growth rate was found to decrease
with decreasing loading frequency and then to reach a constant at around 1×10⁻⁴ Hz,
which has not been reported before.
(3) Crack growth rate under the loading spectrum consisting of underloads and minor
cycles was found to increase by a factor of up to 10 when compared with constant
amplitude underloading without the inclusion of minor cycles in the low frequency
range.
(4) Four pipeline operation recommendations were made based on the outcomes of this
investigation, which could substantially avoid the impact of underloads and the load
interactions during pipeline operation.
References
83
[1] Parkins RN. Paper 00363. Houston, Texas: NACE International; 2000.
[2] W. Chen, F. King, and E. Vokes. Corrosion 2002, Vol. 58, No. 3, pp.267-275.
[3] W. Bouaeshi, S. Ironside, and R. Eadie. Corrosion 2007, Vol. 63, No. 7, pp.648-
660.
[4] J. A. Beavers and C. E. Jaske. NACE International, ISBN: 98257 1998 CP.
[5] W. Chen, Richard Kania, Robert Worthingham, Gregory Van Boven. Acta
Materialia 57 (2009) 6200-6214.
[6] Weixing Chen and Robert L. Sutherby. Metallurgical and Materials Transactions
A, Vol. 38A, June 2007, pp.1260-1268.
[7] G. Van Boven, R. Sutherby, F. King. Proceedings of IPC 2002, 4th International
Pipeline conference, Sept. 29-Oct. 3, 2002, Calgary, Alberta, Canada. Paper No.:
IPC2002-27149, pp: 1-12.
[8] T.M. Ahmed, et al. Corrosion, Vol. 53, No.7, 1997, pp.581-590.
[9] J. A. Beavers, C. J. Maier, and C. E. Jaske. NACE International, Corrosion 2007
Conference & Expo, Paper No. 07128.
[10] Weixing Chen, and Robert Sutherby. IPC06-10477, Sept. 25-29, 2006, Calgary,
Alberta, Canada.
[11] Brett Conrad, et al. Proceedings of IPC 2012, 9th International Pipeline
conference, Sept. 24-28, 2012, Calgary, Alberta, Canada. Paper No.: IPC2012-90629, pp:
559-567
[12] M. Skorupa. Fatigue & Fracture of Engineering Materials & Structures, 1998, 21,
pp. 987-1006.
84
[13] M. Skorupa. Fatigue & Fracture of Engineering Materials &Structures, 1999, 22,
pp. 905-926.
[14] Ryoichi Koterazawa, and Takayoshi Nosho. Fatigue & Fracture of Engineering
Materials & Structures, Vol. 15, No.1, pp.103-113, 1992.
[15] N. A. Fleck. Acta metall. Vol. 33, No.7, pp. 1339-1354, 1985.
[16] Colin MacDougall and T.H. Topper. International Journal of Fatigue, Vol. 19, No.
5, pp.387-400, 1997.
[17] M. EI-Zeghayar, T.H. Topper, F.A. Conle, J.J.F. Bonnen. International Journal of
Fatigue 33 (2011) 223-231.
[18] Stephan M. Russ. Effect of Underloads on Fatigue crack Growth of Ti-17. PhD
thesis, Georgia Institute of Technology, October 2003.
[19] N. Ohrloff, A. Gysler and G. Lütjering. Journal DE Physique, Colloque C3,
supplément au n°9, Tome 48, Septembre 1987. C3-801-C3-807.
[20] V. Zitounis and P. E. Irving. International Journal of Fatigue 29 (2007) 108-118.
[21] M. Krkoska, et al. Engineering Fracture Mechanics 77 (2010) 1857-1865.
[22] B.W. Williams, et al. Corrosion, Vol. 60, No. 1, Jan. 2004. pp. 95-103.
[23] D. L. Davidson and J. Lankford. International Materials Reviews. Vol. 37, No. 2,
1992, pp. 45-74.
[24] Jiaxi Zhao, et al. Full paper submitted to the 10th International Pipeline
Conference (IPC 2014), Sept. 29- Oct. 3, 2014, Calgary, Alberta, Canada. Paper No.
IPC2014-33325.
85
[25] Weixing Chen, Achieving Maximum Crack Remediation Effect from Optimized
Hydrotesting, Final Report Prepared for US Department of Transportation PHMSA,
Client Contract Number: DTPH56-08-T-000008-WP#355, June 15, 2011, total pages: 93.
[26] Chen, W., et al. Proceedings of IPC2012, the 9th International Pipeline
Conference, Sept. 24-28, 2012, Calgary, Alberta, Canada. Paper No.: IPC2012-90635,
pp: 267-276.
86
Chapter 3 Crack Growth Behavior of Pipeline Steel
Exposed to a Near-Neutral pH Environment under
Variable Pressure Fluctuations: Effects of Loading
Frequency1
3.1 Introduction
This investigation gives an explanation for the various corrosion fatigue (SCC) failure
scenarios found during pipeline operations. In particular, it will focus on the crack
growth behavior over a wide range of loading frequency found in service considering
both gas and liquids pipelines. The corrosion fatigue failure of pipeline steel in near-
neutral pH environments was described as stress corrosion cracking when first reported in
1985 [1]. Although three decades have passed, the models governing the crack growth
still cannot predict failure time accurately, and pipeline failures caused by corrosion
fatigue continue imposing a significant threat to the safety of the operation of the pipeline
network [2, 3].
1 A version of this chapter has been submitted to Acta Materialia for publication after first revision.

87
Corrosion fatigue is often classified into three categories: cyclic dependent, time
dependent, and time and cycle dependent [4]. Crack growth in the first category of
corrosion fatigue is not loading frequency dependent, while the latter two are frequency
dependent. The frequency-dependent growth in essence is attributed to time-dependent
processes that contribute either directly or indirectly to the crack growth, which may
include:
i. The time-dependent process of surface passivation or oxide film formation,
which usually yields an inverse dependence of crack growth rate on loading
frequency [4, 5]. But this is not the case for the near-neutral pH corrosion system
as no passivation or oxide films are observed in near-neutral pH environments
[1].
ii. The time-dependent process of corrosion where lower loading frequencies give
rise to a higher crack growth rate per cycle.
iii. Both time- and cycle-dependent processes, for example, may correspond to a
maximum segregation of hydrogen to the crack tip that is both time and stress
dependent [6, 7, 8].
iv. Time-dependent mechanical property attributes, such as room temperature creep
[9-11] and high temperature creep [12], both of which could lead to crack tip
blunting and mechanical damage to the crack tip materials. Although blunting
can be beneficial as it reduces stress enhancement at the crack tip, it can cause

88
mechanical damage such as void formation (either the ductile dimples or the
creep voids), which accelerates crack growth.
v. Many other specific conditions that could enhance or reduce the time-dependent
crack growth, such as temperature [12], chemistry of materials and electrolytes
[6, 13], mechanical characteristics [3, 6, 14], and electrolyte dynamics [6].
Corrosion fatigue of pipeline steel in near-neutral pH environments is very complicated
because it involves 4 (that is, ii-v) of the 5 aspects of time-dependent processes defined
above. For the physical mechanisms of crack growth, it is generally believed that crack
growth proceeds by either or all of the following processes: 1) by dissolution at the crack
tip only, which is primarily a process of major influence in the earliest stage of crack
growth when the crack is shallow, for example, up to 1 mm in depth, and during the
growth of these small cracks on the pipe surface; 2) by direct cracking of the crack tip
through hydrogen embrittlement mechanisms, which is primarily the mechanism of crack
growth following the dissolution mechanism in the initial stage; 3) by direct cracking
caused by cyclic loading which results from the pressure fluctuations during normal
pipeline operation.
In addition to the above considerations, the complexity of corrosion fatigue of pipeline
steel in near-neutral pH environments also arises from the following unique situations:
89
a) The range of loading frequency is very large, typically in the range from 10-1 to
10-6 Hz [15]. Crack growth behavior in the low range (lower than 10-3 Hz) of
loading frequencies has not been well studied [6,16].
b) The pressure fluctuations are dictated by unpredictable supply and consumption
of fluid media and the location relative to the pumps or pumps which are used to
transport the fluids. This variability of loading and the cycle interactions can lead
to large variations in crack growth as will be shown. However existing life
prediction models of either fatigue or corrosion fatigue [6, 16, 17 ] do not
adequately account for these effects.
Both of the above two unique conditions will be dealt with in this investigation. The
crack growth rate in the frequency range higher than 10-3 Hz under constant amplitude
fatigue loading has been well studied. It is generally believed that the fatigue crack
growth rate increases with lowering frequency, because of the increased time either for
the interaction of corrosive chemicals with the metal or for hydrogen diffusion [6, 7].
However, such a conclusion could not be extended to the frequency range lower than 10-3
Hz, within which there is always sufficient time for hydrogen to diffuse to the weakest
link in the material ahead of the crack tip, in accordance with the change of stress. For
these lower frequencies, the effect of room temperature creep may also become
significant. However, only a few investigations have been reported for the corrosion
fatigue crack growth at loading frequencies lower than 10-3 Hz [16,18].

90
Pipelines are operated under variable pressure fluctuations. All existing crack growth
models were developed based on results obtained from tests either under constant load for
the case of SCC or under constant stress amplitude loading for the case of fatigue or
corrosion fatigue. These models generally yield a prediction that fails to accurately predict
real crack growth because they fail to consider the effect of both the stress-dependent and
the time-dependent load interactions on crack growth during variable pressure fluctuations.
Such predictions may under predict or over predict depending on the loading. These load
interaction situations are essential to the nature of stress-cracking of pipeline steel in
near-neutral pH environments and may be summarized as follows:
1) Scenario 1: A previous cyclic loading with an R-ratio different from the current
cyclic loading may condition the crack tip mechanically to either increase or
decrease the crack growth rate of the current cycle and/or the future cycles, which
is the so-called stress-dependent load interaction [19, 20].
2) Scenario 2: The rate of pressure fluctuations, often referred as loading frequency,
produces variable pressure fluctuations, which may yield different time-dependent
contributions to the crack growth. These time-dependent contributions may
include: the rate of corrosion, the rate of hydrogen segregation by diffusion to the
crack tip [7], and the degree of crack tip blunting caused by room temperature
creep [7, 9-11] and hydrogen facilitated local plasticity (HELP) [21, 22].
3) Scenarios 1) and 2) can also mutually interact, for example, crack tip blunting
caused by the situations described in Scenario 2 which may lead to different stress
states at the crack tip and therefore yield different stress-dependent load
91
interactions considered in Scenario 1.
The pressure fluctuations in the field could be roughly categorized into the following three
types: Type I - underload pressure fluctuations, Type II – load fluctuations above and
below the mean, and Type III - overload fluctuations. Type I is typically seen within 30 km
downstream of a pump station and is the harshest pressure fluctuations in terms of crack
growth rate because the maximum pressure of the variable pressure fluctuations is
generally highest and often controlled to be at or close to the design limit. It, however, is
reduced as the fluids move away from the discharge site of a pump station because of the
friction between the fluids inside the pipeline and the pipeline internal surface. Type III
exits at the suction section of a pipeline and is usually associated with a reduced potential
of crack growth. Type II is very typical for pipeline sections located between Type I and
Type III sections and has a moderate potential for inducing crack growth.
This investigation was initiated to address crack growth behavior corresponding to Type I
pressure fluctuations because these may be life-limiting for the pipeline. A typical
example of Type I pressure fluctuations is illustrated in Fig. 3.1, which is featured with a
combination of occasional underloads with the majority of time periods with stress cycles
with R-ratios (minimum stress/maximum stress) above 0.9. The high R ratio cycles are
often considered to be near-static and non-propagating. In a recent preliminary
investigation, it was found that the minor cycles with an R ratio as high as 0.9 could
cause significant crack propagation in the presence of an underload cycle with lower R-
ratios [23, 24]. This study will focus on the effect of loading frequencies on corrosion

92
fatigue crack growth in near-neutral pH environments, especially when the loading
frequencies are lower than 10-3 Hz and the loading waveforms consisting of occasional
underloads with many minor cycles with high R ratios.
0 4000 8000 12000 16000
0.0
0.2
0.4
0.6
0.8
1.0
R r
atio
Time/hour
Threshold determined by
constant amplitude corrosion fatigue
Figure 3.1 Pressure fluctuations recorded for a high-pressure gas transmission
pipeline (SCADA data)
3.2 Experimental
3.2.1 Materials and environment
93
An X60 pipeline steel with a wall thickness of 10.4 mm and outer diameter of 913 mm
was used in this study, which was received from Spectra Energy Transmission. Near-
neutral pH corrosion fatigue (NNpHCF) was found in the pipeline, which had 19 years of
operation. Pipeline sections that were cut from the joint where cracking had been found
were used in this investigation. Compact tension (CT) specimens with a thickness of 9 ±
0.2 mm were machined from the pipeline regions that were free of crack colonies. The
chemical composition (wt.%) of the steel studied was as follows: C: 0.15, Mn: 1.27, P:
0.019, S: 0.005, Si: 0.37, Ni: 0.045, Cr: 0.2, Cu: 0.27, Al: 0.023, Fe: Balance. The notch
in the CT specimens was orientated in a direction parallel to the pipe longitudinal
direction so that the path of crack growth in the specimen is the same as that of the
longitudinal cracks found in the field. The CT specimens were polished to 600 grit finish
and then pre-cracked by fatigue in air to produce a sharp crack tip from the machined
notch according to ASTM E647-08. The sharp crack initiated from the machined notch
was controlled to be between 2 and 3 mm long and the difference in crack length on
either side of the specimen was less than 0.2 mm.
The corrosion fatigue tests were performed in a near-neutral pH solution, namely C2
solution (0.0035 KCl, 0.0195 NaHCO3, 0.0255 CaCl2, 0.0274 MgSO4.7H2O, 0.0606
CaCO3 g/l). A gas mixture of 5% CO2 balanced with nitrogen was purged through the C2
solution before and during the test to achieve a stable pH value in the solution of 6.29 [6].
3.2.2 Mechanical loading conditions
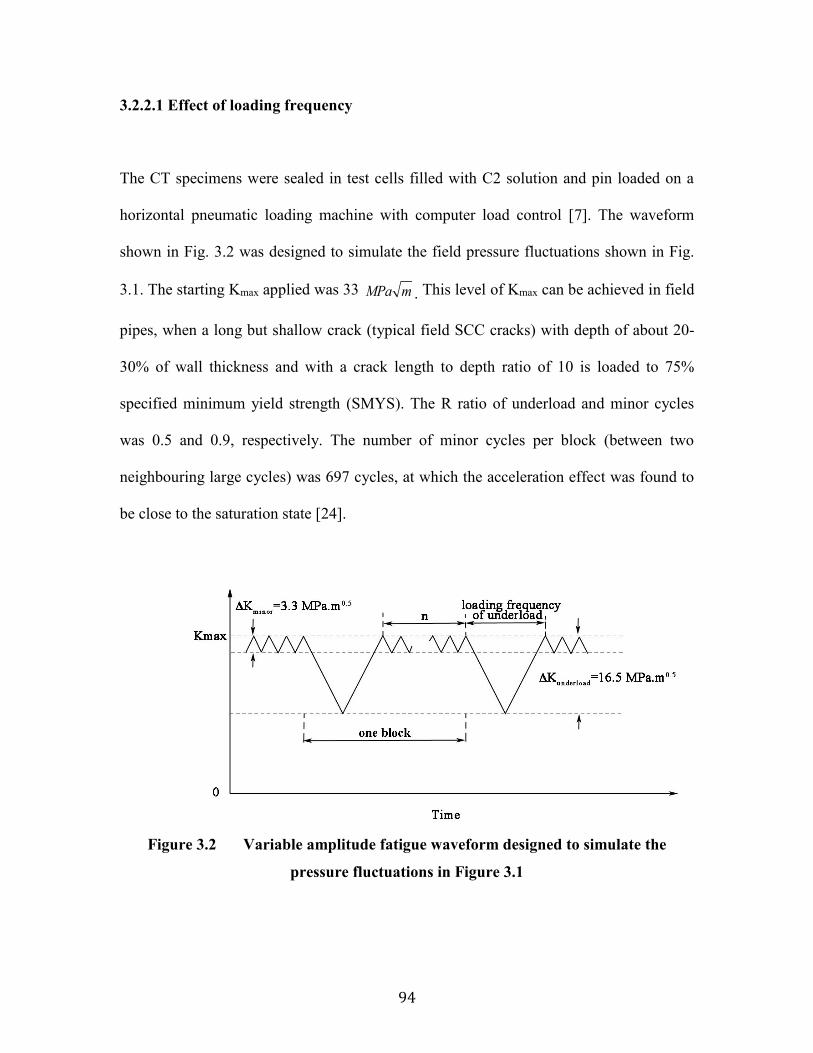
94
3.2.2.1 Effect of loading frequency
The CT specimens were sealed in test cells filled with C2 solution and pin loaded on a
horizontal pneumatic loading machine with computer load control [7]. The waveform
shown in Fig. 3.2 was designed to simulate the field pressure fluctuations shown in Fig.
3.1. The starting Kmax applied was 33 . This level of Kmax can be achieved in field
pipes, when a long but shallow crack (typical field SCC cracks) with depth of about 20-
30% of wall thickness and with a crack length to depth ratio of 10 is loaded to 75%
specified minimum yield strength (SMYS). The R ratio of underload and minor cycles
was 0.5 and 0.9, respectively. The number of minor cycles per block (between two
neighbouring large cycles) was 697 cycles, at which the acceleration effect was found to
be close to the saturation state [24].
Figure 3.2 Variable amplitude fatigue waveform designed to simulate the
pressure fluctuations in Figure 3.1
MPa m
95
The number 697 was found in the following way. The average time interval between two
neighboring cycles with R-ratios lower than 0.9 in the spectra shown in Fig. 3.1 was
found to be 36 hours. The loading frequency of minor cycles was set to be at 5.0×10⁻³ Hz,
which is often used in laboratory simulations [6, 7, 16]. The loading frequency actually
measured during testing on a pneumatic loading frame was 5.4 × 10⁻³ Hz due to some
execution errors in the test system, which yielded a total of 697 cycles for a 36-hour
loading interval of the minor cycles.
The loading frequency range of underload cycle was varied from 1.0×10⁻⁵ Hz (27.8
h/cycle) to 5.0×10⁻¹ Hz (2 s/cycle) in C2 solution. This frequency range was selected
based on the statistics of a total of 18 pressure spectra (14 gas pipelines and 4 oil
pipelines), which were originated from discharge sections of pipeline segments. The
statistical analysis was performed by one self-developed computer program that was built
by the in-house code utilizing MATLAB software. It was found that the statistical
distribution of the loading frequency was within the range of 10-5 to 10-6 Hz and 10-2 to
10-5 Hz, respectively, for the gas pipeline and the oil pipeline. The detailed analyses of
pressure spectra are to be published [25].
To understand the effect of environment, fatigue tests with a similar range of loading
frequency were also performed in air. The tests in air were conducted on a closed loop
hydraulic Instron machine (8516) at room temperature, around 22C. The waveform
shown in Fig. 3.2 was also executed using computer control with Instron Wavemaker-
Runtime software [11]. The loading frequency of underload varied from 2.8×10⁻⁴ Hz (1

96
s/cycle) to 5.0×10⁻¹ Hz (2 s/cycle), while the other loading conditions were the same as
those used for the tests in C2 solution.
3.2.2.2 Effect of maximum stress
The maximum stress intensity factor of the waveform shown in Fig. 3.2 was selected at
27, 33 and 43 , while the amplitude of underload and minor cycles was kept the
same as for the loading frequency tests, which was 16.5 and 3.3 respectively.
Correspondingly, the R ratios of underload and minor cycles would be different. The
loading frequency of underload and minor cycles was 1.0×10⁻³ Hz and 5.4×10⁻³ Hz,
respectively. The number of minor cycles, n, was 300 cycles (more blocks could be
performed compared with n=697 in the same period). 61 blocks were applied for the
three tests in solution, the duration of which was 41 days. For comparison, tests with the
same test conditions were also performed in air on the Instron machine at room
temperature. The net crack growth length for loading frequency and maximum stress tests
was less than 0.5 mm and can be considered as under K control.
3.2.3 Determination of crack growth rate
Crack growth was determined by measuring the crack length before and after tests on
scanning electron microscopy (SEM) on the fracture surface. The crack growth rate,
expressed in millimeter per block, was calculated by dividing the measured crack growth
length by the number of cyclic blocks applied. For this investigation, the crack
MPa m
MPa m
97
propagation caused by underload cycles could not be separated from that caused by the
minor cycles.
3.3 Results
To observe the acceleration effect caused by variable amplitude fatigue through load
interaction, constant amplitude crack growth rate was either determined in this
investigation or obtained from publications [6, 24] for tests in air and in C2 solution.
Using these cracking rates, the predicted crack growth rate of variable amplitude fatigue
could be calculated through linear summation (i.e. ignoring the effects of load
interaction). All the experimental results obtained are listed in Table 3.1.
3.3.1 Frequency dependence of crack growth rate under constant
amplitude cyclic loading
The constant amplitude crack growth rate at different frequencies tested in air and in
near-neutral pH solution (C2) is shown Fig. 3.3. It can be seen that the fatigue crack
growth rate in air was insensitive to the change of loading frequencies in the range of 10-3
to 10-1 Hz under ΔK = 15.3 MPa*m0.5 (using the same material and maximum stress).
And thus the fatigue crack growth rate in air was also believed insensitive to loading
frequency under ΔK = 16.5 MPa*m0.5, which was determined to be 4.2×10⁻⁵ mm/cycle.
For tests in C2 solution, the crack propagation at frequencies higher than 10-3 Hz has

98
been well studied and can be expressed as a function of the combined factor of maximum
stress intensity factor Kmax, stress intensity factor range ΔK and frequency f (for details,
refer to Ref. [6]). The representative crack growth rate data (open diamond) were shown
in Fig. 3.3. In such a frequency range, the crack growth rate increases with lowering
frequency until 10-3 Hz. However, crack growth rate decreases with further decreasing
loading frequency [23], rather than increases as generally believed [6, 7, 26]. ]. A linear
relationship can be obtained between the growth rate, da/dN, and the loading frequency,
f, through curve fitting [23]:
𝑑𝑎
𝑑𝑁(𝑚𝑚 𝑐𝑦𝑐𝑙𝑒⁄ ) = 1.94 × 10⁻⁴ + 0.204𝑓 (3 − 1)
The standard error in Eq. (3-1) was 1.3×10⁻⁵ mm/cycle. Although crack growth rate
decreases linearly with lowering f, the reduction of crack growth rate at very low
frequencies (the small absolute value of frequency) is so small that crack growth rate
appeared constant in logarithm scale shown in Fig. 3.3, about 1.9×10⁻⁴ mm/cycle, which
is about one order of magnitude higher than the standard error.
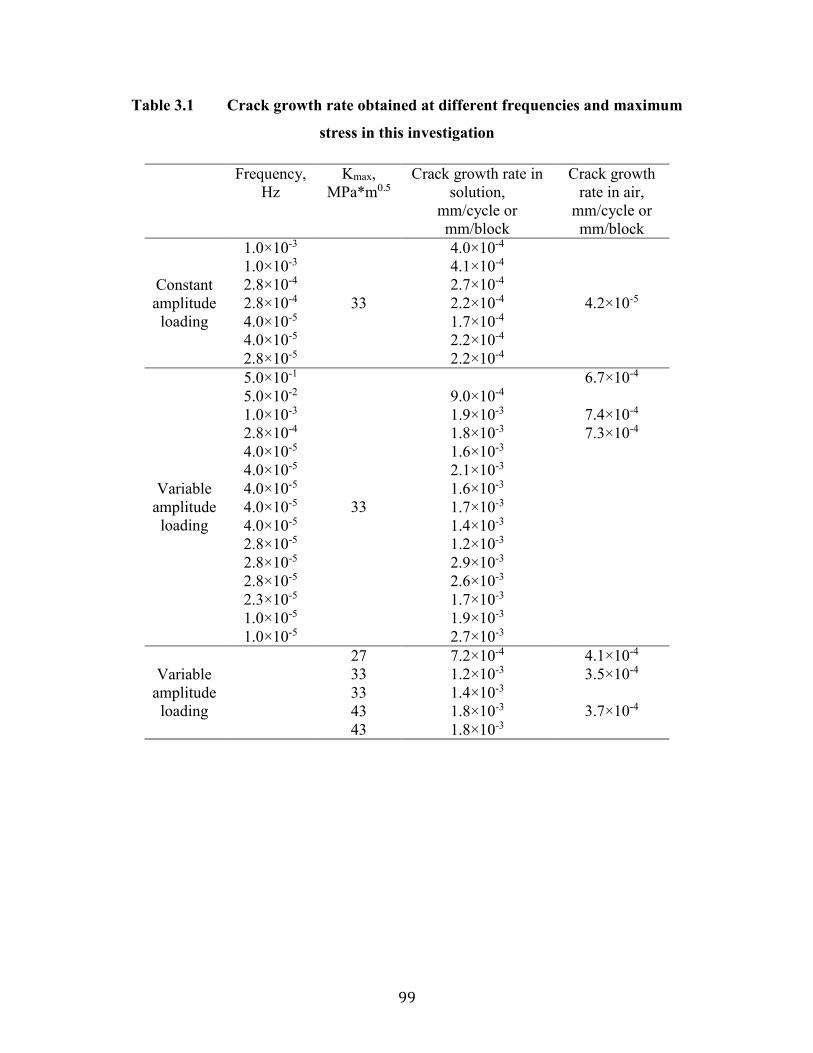
99
Table 3.1 Crack growth rate obtained at different frequencies and maximum
stress in this investigation
Frequency,
Hz
Kmax,
MPa*m0.5
Crack growth rate in
solution,
mm/cycle or
mm/block
Crack growth
rate in air,
mm/cycle or
mm/block
Constant
amplitude
loading
1.0×10⁻³
33
4.0×10⁻⁴
4.2×10⁻⁵
1.0×10⁻³ 4.1×10⁻⁴
2.8×10⁻⁴ 2.7×10⁻⁴
2.8×10⁻⁴ 2.2×10⁻⁴
4.0×10⁻⁵ 1.7×10⁻⁴
4.0×10⁻⁵ 2.2×10⁻⁴
2.8×10⁻⁵ 2.2×10⁻⁴
Variable
amplitude
loading
5.0×10⁻¹
33
6.7×10⁻⁴
5.0×10⁻² 9.0×10⁻⁴
1.0×10⁻³ 1.9×10⁻³ 7.4×10⁻⁴
2.8×10⁻⁴ 1.8×10⁻³ 7.3×10⁻⁴
4.0×10⁻⁵ 1.6×10⁻³
4.0×10⁻⁵ 2.1×10⁻³
4.0×10⁻⁵ 1.6×10⁻³
4.0×10⁻⁵ 1.7×10⁻³
4.0×10⁻⁵ 1.4×10⁻³
2.8×10⁻⁵ 1.2×10⁻³
2.8×10⁻⁵ 2.9×10⁻³
2.8×10⁻⁵ 2.6×10⁻³
2.3×10⁻⁵ 1.7×10⁻³
1.0×10⁻⁵ 1.9×10⁻³
1.0×10⁻⁵ 2.7×10⁻³
Variable
amplitude
loading
27 7.2×10⁻⁴ 4.1×10⁻⁴
33 1.2×10⁻³ 3.5×10⁻⁴
33 1.4×10⁻³
43 1.8×10⁻³ 3.7×10⁻⁴
43 1.8×10⁻³

100
Figure 3.3 Frequency dependence of constant amplitude crack growth rate in C2
solution and in air
Figure 3.4 Frequency dependence of variable amplitude crack growth rate in C2
solution and in air
da/dN=A(ΔKαKmaxβ/fγ)n [6]
101
3.3.2 Frequency dependence of crack growth rate under variable
amplitude cyclic loading
As shown in Fig. 3.4, the crack growth rate measured from tests in air was also found to
be insensitive to loading frequencies, about 7.1×10⁻⁴ mm/block in the frequency range of
5.0×10⁻¹ to 2.8×10⁻⁴ Hz. Therefore the repeated tests were not performed.
For tests with frequencies higher than 10-3 Hz, the variable amplitude growth rate in C2
solution exhibited the same trend as that under constant amplitude fatigue, i.e., increasing
with lowering frequency from 9.0×10⁻⁴ mm/block at 5.0×10⁻² Hz to 1.9×10⁻³ mm/block at
10-3 Hz. Numerous corrosion fatigue tests either reported in literature [3, 4, 16], or from
our investigations using the same grade of pipeline steel [6, 7] have been performed in
the frequency range above 10-3 Hz, and the conclusion that corrosion fatigue crack
growth rate increases with lowering frequency is well accepted. As a result, extensive
crack growth tests in this higher frequency range were not performed. However, when
the frequency was lower than 10-3 Hz, the crack growth rate neither increased with
decreasing frequency, as generally believed in the case of corrosion fatigue, nor
decreased as observed during tests under the constant amplitude loading, but maintained
constant at about 2.0×10⁻³ mm/block, which is about 3 times more than the rate in air.
Because of time-consuming of each test, the tests at selected frequencies in the very low
frequency range were repeated, the growth rates at which are critical to understand the
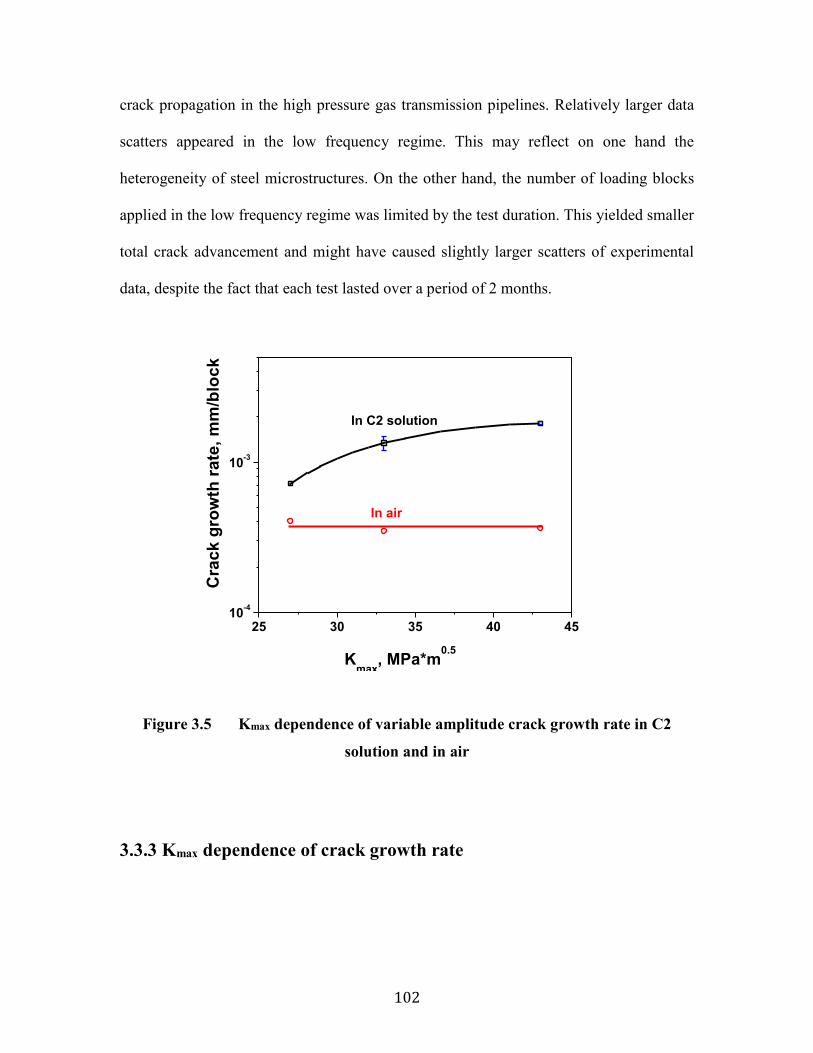
102
crack propagation in the high pressure gas transmission pipelines. Relatively larger data
scatters appeared in the low frequency regime. This may reflect on one hand the
heterogeneity of steel microstructures. On the other hand, the number of loading blocks
applied in the low frequency regime was limited by the test duration. This yielded smaller
total crack advancement and might have caused slightly larger scatters of experimental
data, despite the fact that each test lasted over a period of 2 months.
25 30 35 40 4510
-4
10-3
Kmax
, MPa*m0.5
Cra
ck g
row
th r
ate
, m
m/b
lock
In C2 solution
In air
Figure 3.5 Kmax dependence of variable amplitude crack growth rate in C2
solution and in air
3.3.3 Kmax dependence of crack growth rate

103
As shown in Fig. 3.5, the measured crack growth rate under variable amplitude cyclic
loading in air was not sensitive to the variation of Kmax and was at about 3.8×10⁻⁴
mm/block in the Kmax range of 27 to 43 . However, the measured growth rate in
C2 solution increased with Kmax, from 7.2×10⁻⁴ mm/block at 27 to about 1.8×10⁻³
mm/block at 43 (average of the two values). The crack growth rates in C2
solution were different from those in air by a factor up to about 5.
3.4 Discussion
3.4.1 Acceleration effect caused by underload
It has been well demonstrated that the crack growth rate can be significantly accelerated
by the minor cycles with high R ratios in the presence of underloads through load
interaction [23, 24]. Such crack growth caused by minor cycles was verified by
examining the fracture surface after the tests. Fig. 3.6 [23] is a comparison of the fracture
surface of the specimens tested in C2 solution under the constant amplitude loading and
the variable amplitude loading. As shown in Fig. 3.6, large regularly spaced striations
were observed on the specimen of the constant amplitude test, while mini-striations were
additionally observed, which were generally located between two large regular striations
for the variable amplitude cyclic tests with 300 minor cycles per block. The observation
of mini-striations is direct evidence of crack propagation caused by the applied minor
MPa m
MPa m
MPa m
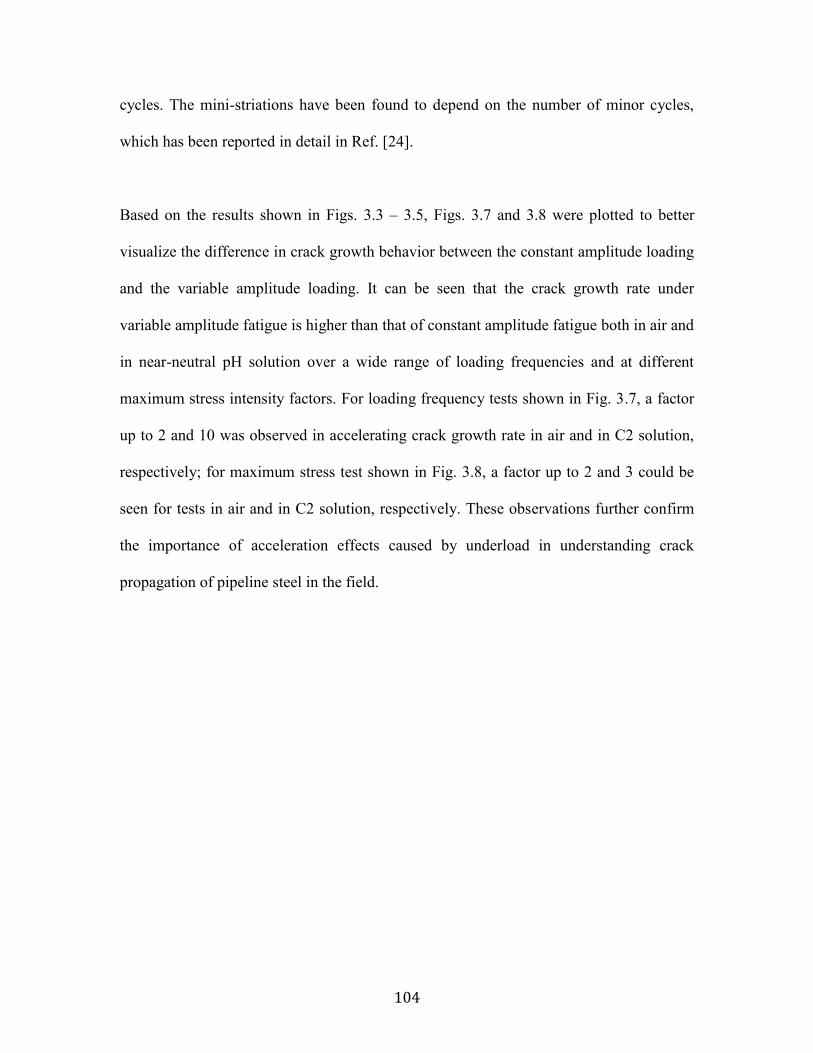
104
cycles. The mini-striations have been found to depend on the number of minor cycles,
which has been reported in detail in Ref. [24].
Based on the results shown in Figs. 3.3 – 3.5, Figs. 3.7 and 3.8 were plotted to better
visualize the difference in crack growth behavior between the constant amplitude loading
and the variable amplitude loading. It can be seen that the crack growth rate under
variable amplitude fatigue is higher than that of constant amplitude fatigue both in air and
in near-neutral pH solution over a wide range of loading frequencies and at different
maximum stress intensity factors. For loading frequency tests shown in Fig. 3.7, a factor
up to 2 and 10 was observed in accelerating crack growth rate in air and in C2 solution,
respectively; for maximum stress test shown in Fig. 3.8, a factor up to 2 and 3 could be
seen for tests in air and in C2 solution, respectively. These observations further confirm
the importance of acceleration effects caused by underload in understanding crack
propagation of pipeline steel in the field.
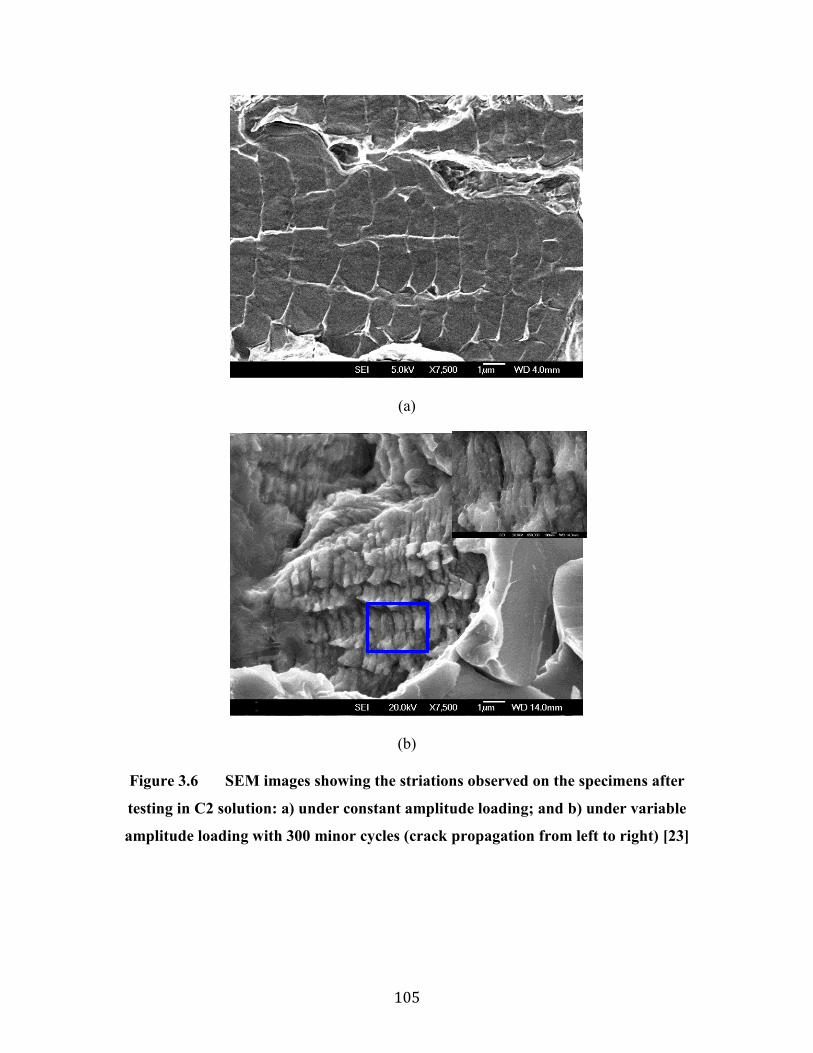
105
(a)
(b)
Figure 3.6 SEM images showing the striations observed on the specimens after
testing in C2 solution: a) under constant amplitude loading; and b) under variable
amplitude loading with 300 minor cycles (crack propagation from left to right) [23]
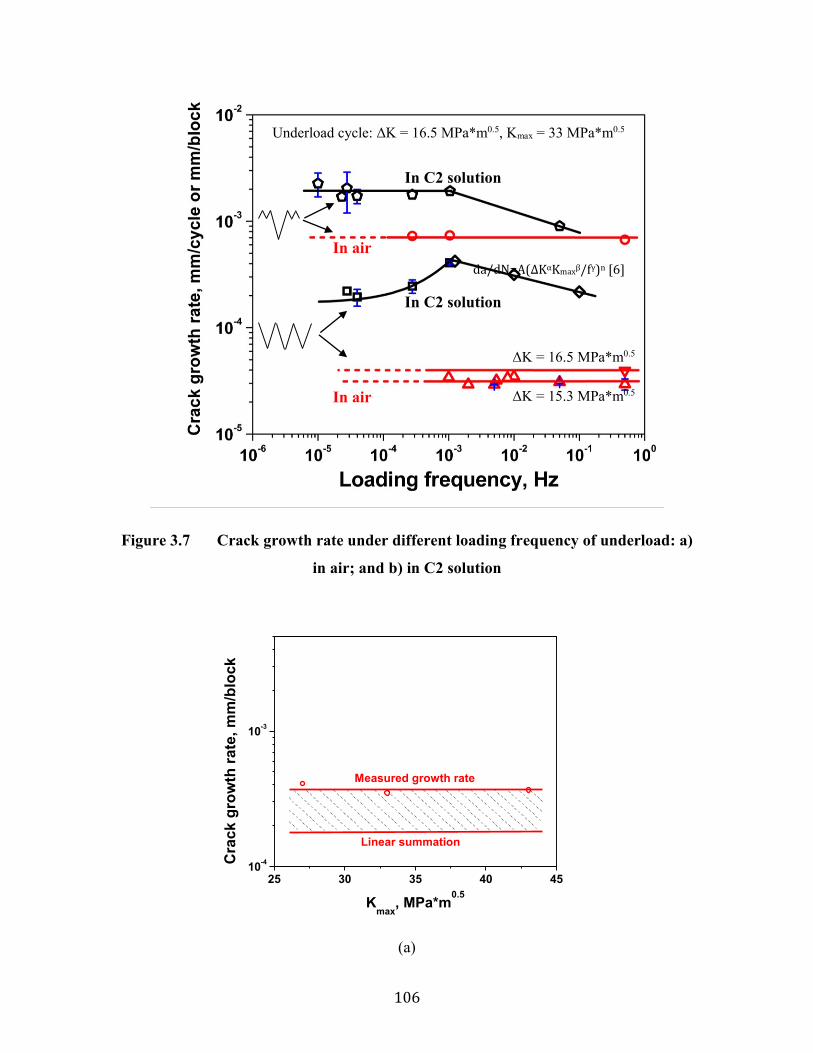
106
Figure 3.7 Crack growth rate under different loading frequency of underload: a)
in air; and b) in C2 solution
25 30 35 40 4510
-4
10-3
Kmax
, MPa*m0.5
Cra
ck
gro
wth
ra
te,
mm
/blo
ck
Linear summation
Measured growth rate
(a)
da/dN=A(ΔKαKmaxβ/fγ)n [6]
Underload cycle: ΔK = 16.5 MPa*m0.5, Kmax = 33 MPa*m0.5
In C2 solution
In C2 solution
In air
In air
ΔK = 16.5 MPa*m0.5
ΔK = 15.3 MPa*m0.5
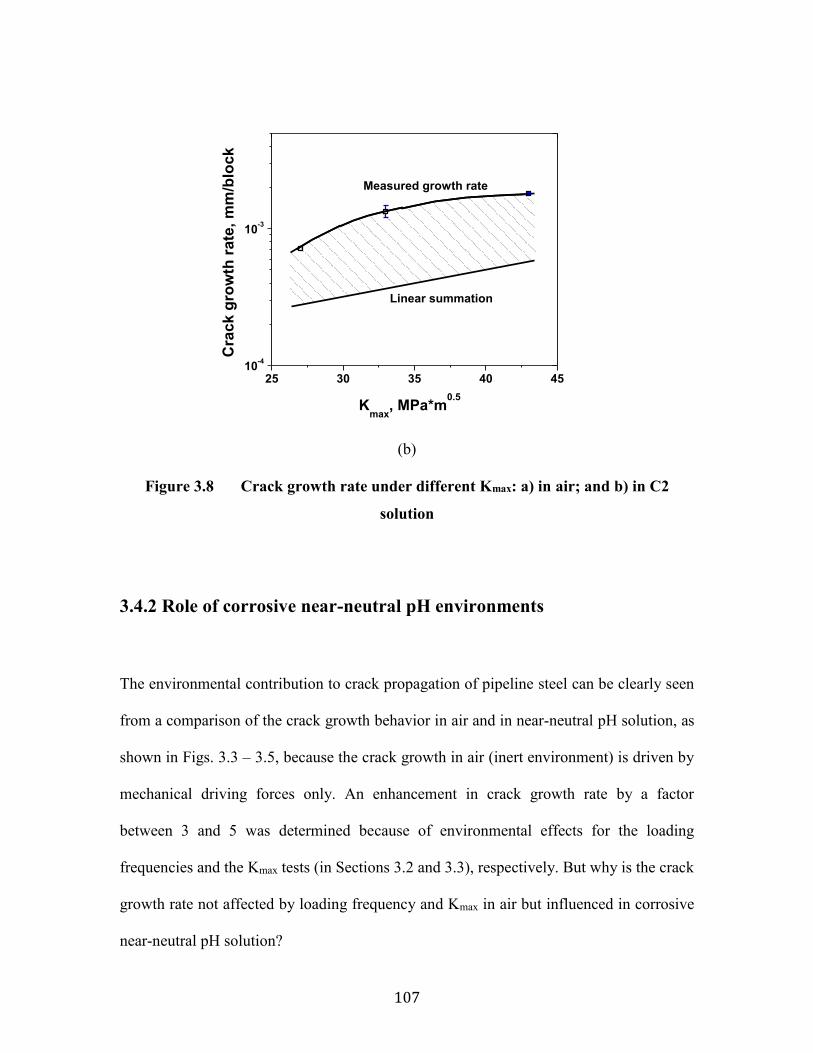
107
25 30 35 40 4510
-4
10-3
Kmax
, MPa*m0.5
Cra
ck
gro
wth
ra
te,
mm
/blo
ck
Measured growth rate
Linear summation
(b)
Figure 3.8 Crack growth rate under different Kmax: a) in air; and b) in C2
solution
3.4.2 Role of corrosive near-neutral pH environments
The environmental contribution to crack propagation of pipeline steel can be clearly seen
from a comparison of the crack growth behavior in air and in near-neutral pH solution, as
shown in Figs. 3.3 – 3.5, because the crack growth in air (inert environment) is driven by
mechanical driving forces only. An enhancement in crack growth rate by a factor
between 3 and 5 was determined because of environmental effects for the loading
frequencies and the Kmax tests (in Sections 3.2 and 3.3), respectively. But why is the crack
growth rate not affected by loading frequency and Kmax in air but influenced in corrosive
near-neutral pH solution?
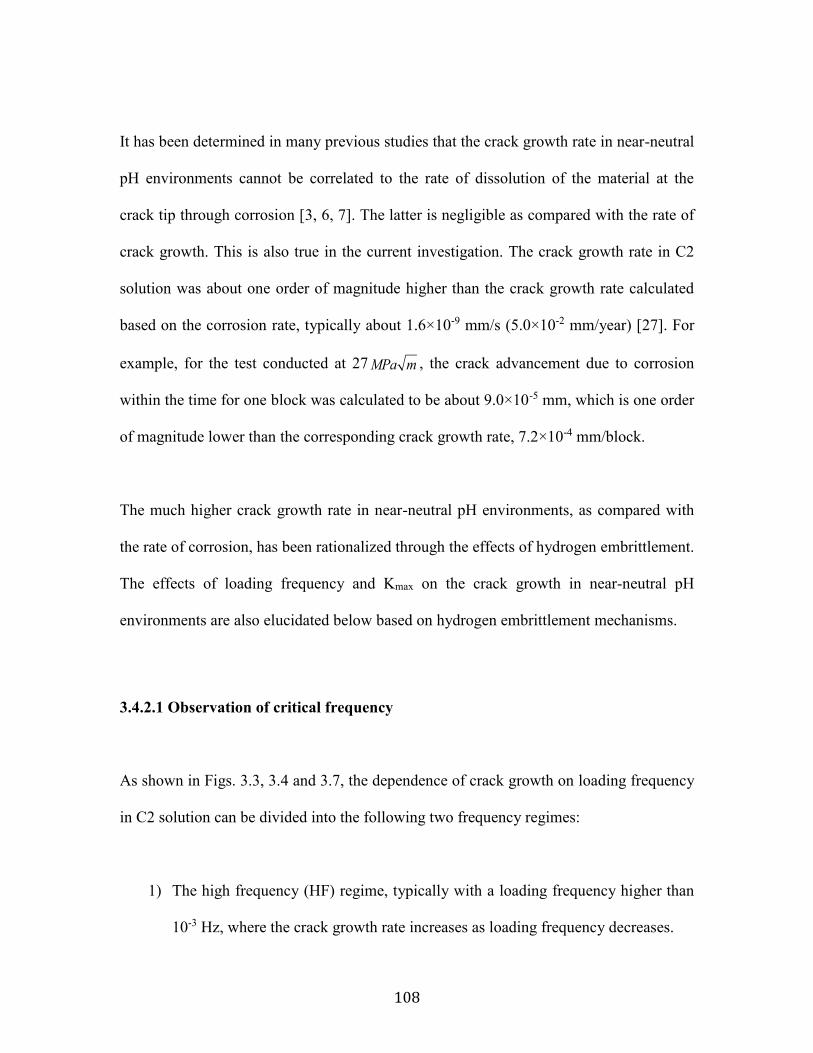
108
It has been determined in many previous studies that the crack growth rate in near-neutral
pH environments cannot be correlated to the rate of dissolution of the material at the
crack tip through corrosion [3, 6, 7]. The latter is negligible as compared with the rate of
crack growth. This is also true in the current investigation. The crack growth rate in C2
solution was about one order of magnitude higher than the crack growth rate calculated
based on the corrosion rate, typically about 1.6×10⁻⁹ mm/s (5.0×10⁻² mm/year) [27]. For
example, for the test conducted at 27 , the crack advancement due to corrosion
within the time for one block was calculated to be about 9.0×10⁻⁵ mm, which is one order
of magnitude lower than the corresponding crack growth rate, 7.2×10⁻⁴ mm/block.
The much higher crack growth rate in near-neutral pH environments, as compared with
the rate of corrosion, has been rationalized through the effects of hydrogen embrittlement.
The effects of loading frequency and Kmax on the crack growth in near-neutral pH
environments are also elucidated below based on hydrogen embrittlement mechanisms.
3.4.2.1 Observation of critical frequency
As shown in Figs. 3.3, 3.4 and 3.7, the dependence of crack growth on loading frequency
in C2 solution can be divided into the following two frequency regimes:
1) The high frequency (HF) regime, typically with a loading frequency higher than
10-3 Hz, where the crack growth rate increases as loading frequency decreases.
MPa m
109
2) The low frequency (LF) regime where the loading frequency is lower than 10-3
Hz and the crack growth rate is insensitive to the loading frequency under
variable amplitude fatigue; whereas, there is a slight decrease of crack growth
rate down to a plateau at lower loading frequencies under constant amplitude
fatigue loading.
Although the corrosion of the metal at the crack tip makes negligible contribution to the
crack growth, as indicated previously, the influence of the corrosion environment on
crack growth is primarily achieved through hydrogen embrittlement mechanisms with
hydrogen being generated by the corrosion in near-neutral pH solution [6, 7]. Therefore,
the transition of crack growth behavior from the HF regime to the LF regime is believed
to be related to the saturation of hydrogen segregation in the crack processing
zone/plastic zone ahead of the crack tip at the peak stress of cyclic loading. Interestingly,
such transition with frequency has also been observed in an aluminum alloy charged with
hydrogen, but happened at a higher critical frequency due to the higher diffusivity of
hydrogen in aluminum [28].
However, the level of hydrogen generated in near-neutral pH aqueous-steel system has
been characterized to be less than 0.1 ppm at the steel surface, of which only a small
fraction of hydrogen atoms being generated can diffuse into the lattice of steel [29]. It has
been further determined that the minimum level of hydrogen at the surface to produce
hydrogen induced cracking is 0.4 ppm or above [29]. Therefore, an elevation of hydrogen
concentration is necessary to produce crack growth through a hydrogen embrittlement
110
mechanism. This is possible in the plastic zone ahead of crack tip where hydrogen
content would be elevated by hydrostatic stress.
To lower the chemical potential, it is generally believed that hydrogen segregates to the
hydrostatic zone ahead of the crack tip as stress increases, which is determined as [30]:
𝑐𝑒𝑞 = 𝑐0 𝑒𝑥𝑝 (𝜎ℎ𝑦𝑑𝛺
𝑘𝐵𝑇) (3 − 2)
where 𝑐0 is the lattice concentration of hydrogen in the absence of stress, 𝑐𝑒𝑞 is the
steady-state lattice concentration of hydrogen under hydrostatic stress, Ω is the partial
molar volume of hydrogen atom, 𝜎ℎ𝑦𝑑 is the hydrostatic stress, kB is the Boltzmann
constant, and T is the absolute temperature of the system. The temperature was controlled
at 30°C for all the tests in near-neutral pH solution in this investigation.
Once equilibrium of hydrogen concentration in the plastic zone is achieved with peak
loading, the hydrogen embrittlement effect would be at its maximum. To further confirm
this discussion, theoretical calculations are made in the following section.
3.4.2.2 Theoretical prediction of critical frequency for hydrogen embrittlement2
2 This section was performed by Xiao Xing and Dr. Hao Zhang.

111
Assumptions. To simplify calculations, the irregular plastic zone shape (i.e., plane strain
condition) is assumed to be a circular region with radius rp, as shown in Fig. 3.9, which is
a reasonable geometric approximation because if the hydrogen concentration within the
circular region with radius rp reaches equilibrium, the hydrogen concentration in the
plastic zone will be saturated too. The hydrogen concentration outside of the plastic zone
is estimated to be 𝑐0. To reach the equilibrium of hydrogen concentration in the plastic
zone during cyclic loading, an annulus region with the inner radius rp and the outer radius
Req is needed to supply hydrogen atoms. The time, tcritical, for hydrogen diffusion into/out
of the peak hydrogen region during cyclic loading is related to critical frequency through
fcritical=1/2tcritical.
Figure 3.9 A schematic showing hydrogen diffusion from the annulus region with
an outer radius Req to a circular region with the radius rp (rp is the plastic zone size)
Determination of critical frequency. By introducing σhyd [ 31 ] into Eq. (3-2) the
equation of ceq can be expressed as:
𝑐𝑒𝑞 = 𝑐0 𝑒𝑥𝑝 (2(1 + 𝑣)𝐾𝐼𝛺
3𝑘𝐵𝑇√2𝜋𝑟𝑐𝑜𝑠
𝜃
2) (3 − 3)

112
where KI is the stress intensity near crack tip, r is the distance to crack tip, ν is the
Poisson’s ratio, and θ is the angle between the crack front and the line from specific
position to the crack tip. The number of hydrogen atoms in an infinitesimal region within
plastic zone is expressed as:
𝑑𝑁 =𝑐𝑒𝑞2𝜋𝑟𝑙𝑧
𝑎03
2⁄
𝑑𝑟 (3 − 4)
where a0 is lattice parameter, lz is the thickness of specimens. Substitute Eq. (3-3) into Eq.
(3-4) and integrate over distance:
𝑁(𝐾𝐼) = ∫
𝑐0 𝑒𝑥𝑝 (4(1 + 𝑣)𝐾𝐼𝛺
3𝜋𝑘𝐵𝑇√2𝜋𝑟) 2𝜋𝑟𝑙𝑧
𝑎03
2⁄
𝑟𝑝
0
𝑑𝑟 (3 − 5)
It is found that N is only function of stress intensity factor KI. rp can be calculated as
follows:
𝑟𝑝 =1
6𝜋(
𝐾𝑚𝑎𝑥
𝜎𝑦𝑠)
2
(3 − 6)
where Kmax is the maximum stress intensity in one cycle and σys is the yield strength.
Substituting Eq. (3-6) into Eq. (3-5), the number of hydrogen atoms needed to saturate a
circular region as the K varies from Kmin to Kmax is:

113
𝑁(𝐾𝑚𝑎𝑥) − 𝑁(𝐾𝑚𝑖𝑛) =2𝜋𝑐0𝑙𝑧
𝑎03 (𝑅𝑒𝑞 − 𝑟𝑝)
2 (3 − 7)
Details of the calculations can be found in the Appendix A. The term (Req-rp) is the
hydrogen atom diffusion distance. The minimum time, tcritical, needed to achieve
equilibrium hydrogen concentration can be approximated with diffusion distance divided
by H velocity, which is related to H diffusivity and driving force (see Appendix A for
details):
𝑡𝑐𝑟𝑖𝑡𝑖𝑐𝑎𝑙 =𝑅𝑒𝑞 − 𝑟𝑝
�̅�𝑟
(3 − 8)
Finally, the critical frequency can be obtained by substituting the test conditions in the
current investigation (please refer to Appendix A) into these equations. Req and rp were
determined to be about 0.47 mm and 0.34 mm, respectively; and thus hydrogen atom
diffusion distance (Req-rp) was determined to be about 0.13 mm, which covers multiple
grains of the pipeline steel with a ferrite plus pearlite structure (grain size about 0.01 mm
[23]. The predicted critical frequency is found in a range of 9.2×10⁻⁴ to 1.2×10⁻³ Hz (the
range is from the variation of H diffusivity [ 32]). The result agrees well with the
experimental critical frequency in Fig. 3.7, 1.04×10⁻³ Hz, which further confirms the
importance of HE in crack propagation in corrosive near-neutral pH environments.
Despite the fact that the model only accounted for the input and boundary conditions for
constant amplitude fatigue, the output results are still quite consistent with the test
114
observations. The reason that the model did not consider the detailed mechanisms of
crack propagation under the synergistic interactions of hydrogen and fatigue, such as the
role of accumulated cycles (that is, one cycle may not generate one striation shown in
Fig. 3.6) is due to the debatable observations and theories [33, 34, 35]. The model could
be further modified once the role of hydrogen in NNpH corrosion fatigue is determined in
detail, such as the interactions between hydrogen and fatigue, and thus material damage,
which is currently under investigation.
3.4.2.3 Understanding the effect of frequency on crack growth behavior
Based on this critical frequency, further discussion of the effect of frequency on crack
growth behavior is made based on the type of cyclic loading used in the current
investigation.
Under constant amplitude cyclic loading. Under constant amplitude cyclic loading, 𝑐𝑒𝑞
would be largest when the applied cyclic stress reaches the peak value. The actual level
of 𝑐𝑒𝑞 at the peak stress is dependent on the loading frequency because of the diffusion of
hydrogen as demonstrated in the former sections.
In the HF range, the crack growth rate under constant amplitude fatigue loading in C2
solution can be rationalized by the following equation [6]:
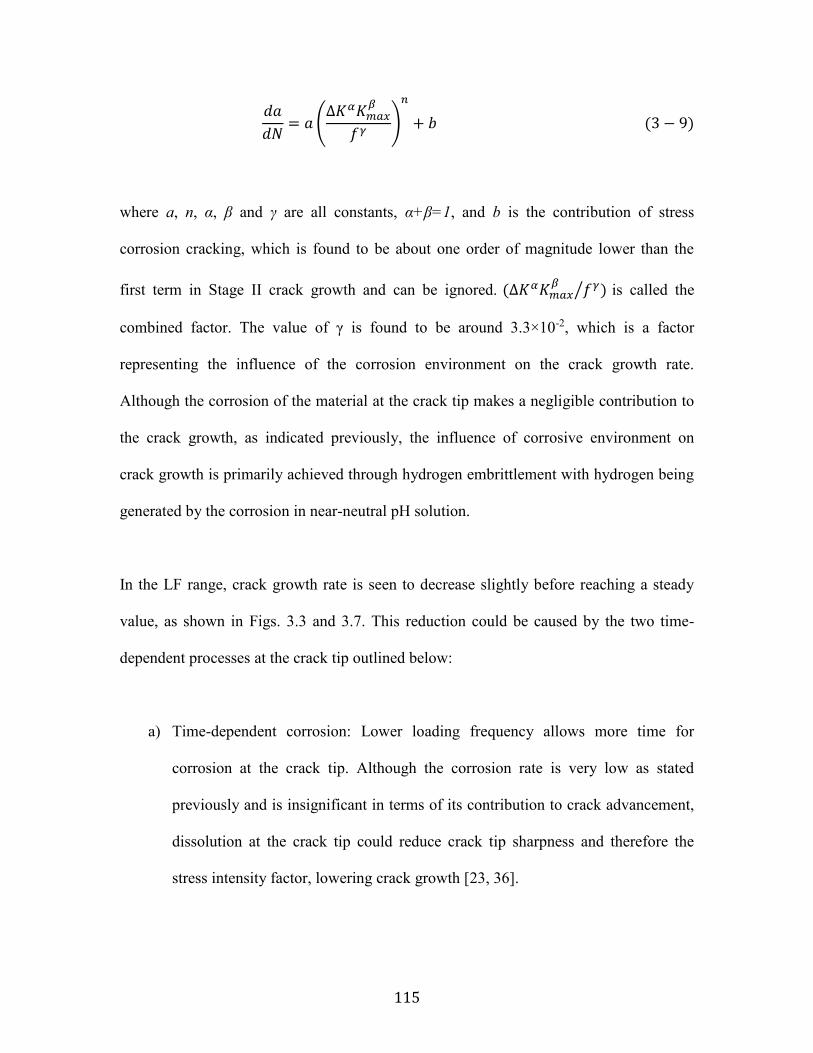
115
𝑑𝑎
𝑑𝑁= 𝑎 (
∆𝐾𝛼𝐾𝑚𝑎𝑥𝛽
𝑓𝛾)
𝑛
+ 𝑏 (3 − 9)
where a, n, α, β and γ are all constants, α+β=1, and b is the contribution of stress
corrosion cracking, which is found to be about one order of magnitude lower than the
first term in Stage II crack growth and can be ignored. (∆𝐾𝛼𝐾𝑚𝑎𝑥𝛽
𝑓𝛾)⁄ is called the
combined factor. The value of γ is found to be around 3.3×10⁻², which is a factor
representing the influence of the corrosion environment on the crack growth rate.
Although the corrosion of the material at the crack tip makes a negligible contribution to
the crack growth, as indicated previously, the influence of corrosive environment on
crack growth is primarily achieved through hydrogen embrittlement with hydrogen being
generated by the corrosion in near-neutral pH solution.
In the LF range, crack growth rate is seen to decrease slightly before reaching a steady
value, as shown in Figs. 3.3 and 3.7. This reduction could be caused by the two time-
dependent processes at the crack tip outlined below:
a) Time-dependent corrosion: Lower loading frequency allows more time for
corrosion at the crack tip. Although the corrosion rate is very low as stated
previously and is insignificant in terms of its contribution to crack advancement,
dissolution at the crack tip could reduce crack tip sharpness and therefore the
stress intensity factor, lowering crack growth [23, 36].
116
b) Time-dependent room temperature creep. Lower loading frequency allows more
time to produce room-temperature creep deformation that can also blunt the
crack tip, leading to a reduced crack growth [7, 9, 11]. The fact that the crack
growth rate in air is insensitive to loading frequency suggests that crack tip
blunting caused by room temperature creep could be insignificant. However, this
cannot rule out the possible effect of room temperature creep in C2 solution. The
segregation of hydrogen to the crack tip could facilitate the plastic deformation
through HELP (hydrogen enhanced localized plasticity) [21, 22].
Both the above factors would yield the same effect, that is, to blunt the crack tip,
therefore leading to a lower crack growth rate in the LF regime. It is not clear, however,
from this investigation which of the above factors is predominant. Investigations are
underway to delineate clearly their relative contribution to crack growth.
A steady state crack growth rate at very low loading frequency was observed. This
reflects the fact that crack tip blunting could reduce the stress intensity factor at the crack
tip but could not eliminate the risk of hydrogen embrittlement. As the crack tip becomes
blunter, the region with the highest hydrogen segregation may move with the hydrostatic
zone gradually away from the crack tip. This would allow more volume of materials at
the crack tip to be sampled by hydrogen segregation. Hydrogen embrittlment would
occur at the weakest links where micro-cracking could be initiated due to the reduced
cohesion strength of materials caused by hydrogen segregation.
117
Underload plus static hold loading. As compared with constant amplitude loading, the
static hold could further enhance crack tip blunting caused by the two time-dependent
factors discussed above, and, therefore, a lower crack growth rate can be expected as
compared with the constant amplitude loading [23]. This argument seems consistent with
the experimental observations. It further confirms that crack growth would not have
occurred during static hold although the hold could maximize the segregation of
hydrogen.
Under the combination of underload and minor cyclic loading. When the static hold
in the loading is replaced by minor cycles, the following similarities between the two
loading scenarios can be identified:
a) Crack tip morphology or degree of the crack tip blunting should be similar
because the R-ratio of minor cycles is very high (near-static) [23].
b) Hydrogen segregation and the location of maximum hydrogen segregation should
be similar since the minor cycles have little effect.
c) The mechanical conditioning to the crack tip caused by the underload should be
similar.
Therefore, the enhanced crack growth should be attributed first to the fatigue nature of
the minor cycles. Regardless of whether hydrogen segregation at the crack tip is present
or not, that is, whether in C2 solution or in air, crack growth enhancement is realized
118
through cyclic loading even at very high ratios (the minor cycles), as shown in Figs. 7
and 8.
The above discussion provides some insights of the loading interactions between the
underload and the minor cyclic loading. It is clear that the underload is a prerequisite for
the crack growth enhancement as the minor cycles alone are non-propagating without the
underload, while the minor cycles are the necessary condition as a static hold is also non-
propagating. The presence of hydrogen could yield the following effects: a) making the
prerequisite condition sufficient, and b) making the necessary condition less critical.
3.4.2.4 Understanding the effect of maximum stress on crack growth behavior
As shown in Fig. 3.5, the crack growth rate increased with Kmax in C2 solution while it
remained constant in air could be explained by considering Eq. (3-3). The hydrogen
concentration in the plastic zone ahead of crack tip increases with the hydrostatic stress,
resulting in a higher magnitude of hydrogen embrittlement and higher crack growth rate.
On the other hand, the increase of crack growth rate with increasing Kmax becomes
weaker at higher Kmax. This could be attributed either to the time-dependent effects on
crack tip blunting discussed in Section 4.2.3.3 or to the transition of the linear elastic
behavior to the elastic-plastic behavior of the materials at the crack tip at higher Kmax.
3.4.3 Study results applied to real cracking in the field
119
Field experience has shown that more than 70% of all-service and hydrostatic-test
failures attribute to CF have occurred within 30 km downstream (pressure discharge) of a
pump station [1]. This finding is consistent with the experimental results obtained in this
investigation.
The maximum pressure of the variable pressure scheme is highest (at the design limit) at
the discharge site of a pump station but decreases with distance from the pump station
due to the friction between the fluid media inside of the pipeline and the pipeline internal
surface. As demonstrated in Fig. 3.5, the measured crack growth rate decreases with
lower maximum stress. Therefore, there is a higher risk of pipeline failure within 30 km
downstream of a pump station. Near the suction inlet (upstream from the pump), the
overload-type of variable amplitude fatigue prevails, which reduces the fatigue crack
growth rate through the well-established concept of overload induced retardation effect
[19, 20]. This makes the relative risk of failure at the discharge section of a pipeline
higher, although more and larger amplitude of pressure fluctuations may occur in suction
sections [17].
Even though much higher maximum pressure exists at the discharge section, the pressure
fluctuations, especially for gas pipelines, are not sufficient to cause pipeline steel to fail
by a fatigue mechanism without a consideration of the load interaction effects identified
in this investigation. For example, a rainflow counting method usually predicts an
operating life of the pipeline of several hundred years, inconsistent with an operating life
of less than 50 years found in pipelines with CF cracking. Many other attempts have also

120
been made unsuccessfully to rationalize the premature failures, including pipeline
temperature, CO2 level, mean stress level, coating disbondment, operating stress, and
loading rate [1, 3, 14, 37-39].
The findings in the current investigation could be applied to both gas and liquid pipelines,
as they have similar underload-type of loading conditions at the discharge sections, which
has been discussed in [24]. Because of the different compressibility of liquids and gases,
gas pipelines often experience much lower loading frequency and smaller amplitude
pressure fluctuations than oil pipelines [15, 17].
For the convenience of life prediction, the crack growth per cycle in C2 solution, as
shown in Fig. 3.7, was converted to crack growth per unit time, as shown in Fig. 3.10.
The typical range of loading frequency and the number of minor cycles are also shown in
Fig. 3.10 for both the gas pipelines and oil pipelines. The crack growth behavior under
constant amplitude loading is also included in the figure. Several key conclusions can be
drawn:
a) The constant amplitude growth behavior would over-estimate the crack growth of
oil pipeline in the high frequency range but significantly under-estimate the crack
growth of gas pipelines typically operated in a low loading frequency regime.
b) Crack growth rate in oil pipeline is generally higher than in gas pipelines because
of larger amplitude and more frequent of pressure fluctuations in oil pipelines.
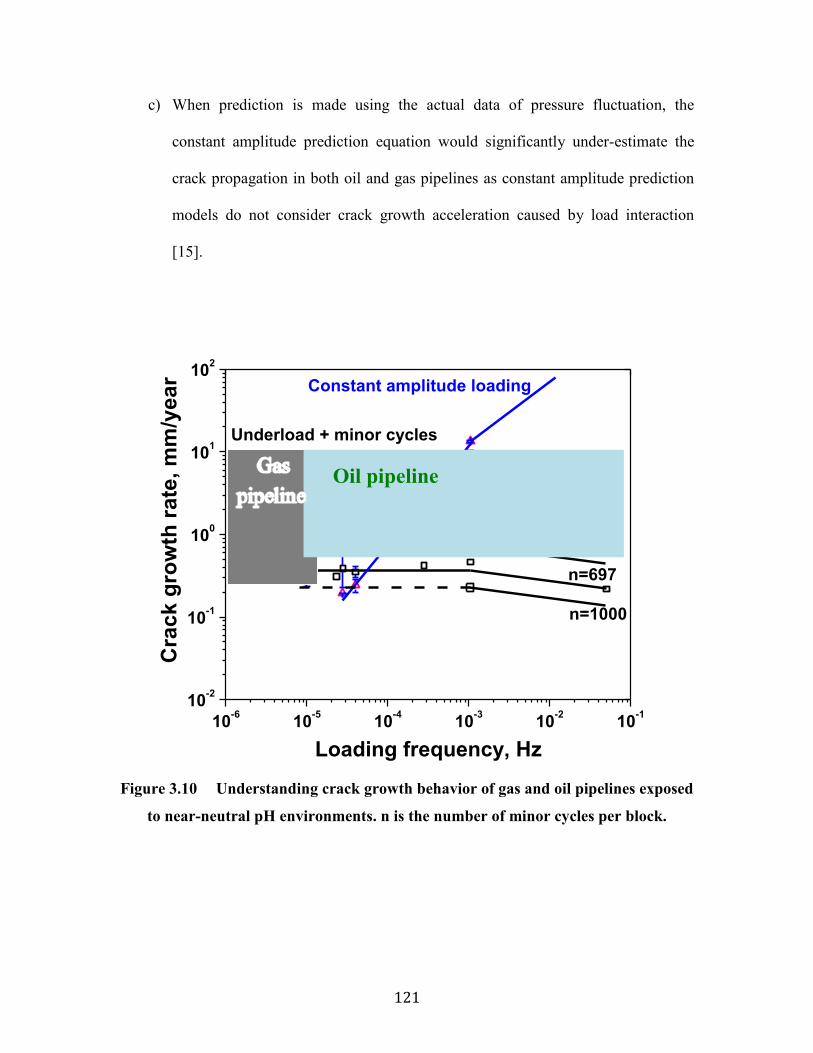
121
c) When prediction is made using the actual data of pressure fluctuation, the
constant amplitude prediction equation would significantly under-estimate the
crack propagation in both oil and gas pipelines as constant amplitude prediction
models do not consider crack growth acceleration caused by load interaction
[15].
10-6
10-5
10-4
10-3
10-2
10-1
10-2
10-1
100
101
102
n=1000
n=697
n=300
n=100
n=10
Cra
ck g
row
th r
ate
, m
m/y
ear
Loading frequency, Hz
Constant amplitude loading
Underload + minor cycles
n=1
Figure 3.10 Understanding crack growth behavior of gas and oil pipelines exposed
to near-neutral pH environments. n is the number of minor cycles per block.
Oil pipeline

122
3.5 Conclusions
The underload-type variable amplitude cyclic loading schemes represent the most risky
pressure fluctuations during pipeline operations. In this study underload type scenarios
were designed and used for crack growth measurements in pipeline steel in a near-neutral
pH environment over a wide loading frequency range, from 5.0×10⁻¹ Hz to 10-5 Hz, and
at different Kmax. Comparative tests were also performed under constant amplitude cyclic
loading and in air to elucidate the crack growth mechanisms. Major findings are as
follows:
1) Crack growth enhancement by a factor of up to 10 was found with the underload-type
variable amplitude cyclic loading, as compared with the constant amplitude cyclic
loading.
2) Crack growth rates measured in air were found to be insensitive to the variation of
loading frequency and Kmax, while these two parameters significantly affected crack
growth rate in near-neutral pH solution.
3) There exist two distinct regimes of crack growth behavior over the range of loading
frequency studied. Crack growth rate was found to increase with decreasing loading
frequency until 10-3 Hz, while it either remained constant for the underload-type
variable amplitude cyclic loadings, or decreased slightly for the constant amplitude
loading when the loading frequency was lower than 10-3 Hz. The transition of crack

123
growth behavior at about 10-3 Hz was successfully predicted by a mechanistic model
established based on the hydrogen assisted crack growth mechanisms identified.
4) The results obtained from this investigation agree well with various failure scenarios
found in the field, including the high frequency of failure at the discharge sections of
pipelines and different crack growth characteristics between oil pipelines and gas
pipelines.
References
[1] Delanty BS, Beirne JO. Major Field Study Compares Pipeline SCC with
Coatings. Oil & Gas Journal 1992;15;39.
[2] National Energy Board (NEB), Focus on Safety and Environment a Comparative
Analysis of Pipeline Performace 2000-2007, July 2009.
[3] Parkins RN. A review of stress corrosion cracking of high pressure gas pipelines
In: Proceedings of corrosion 2000. In: Proceedings of corrosion 2000. Houston, Texas:
NACE International; 2000. Paper No. 00363.
[4] Anderson TL. Fracture Mechanics, Fundermentals and Applications, 3rd ed. Boca
Raton (FL): CRC Press; 2005. p. 538.
[5] Staehle RW, Staehle RW, et al., editors. Stress corrosion cracking and hydrogen
embrittlement of iron base alloys, NACE-5. Houston (TX): NACE; 1977. p. 193.
[6] Chen W, Sutherby RL. Met Mater Trans A 2007; 38A:1260.
[7] Chen W, Kania R, Worthingham R, Boven GV. Acta Mater 2009;57:6200-6214.
[8] Srivatsan TS, Sudarshan TS. J Mater Sci 1988;23:1521-1533.

124
[9] Wang S, Chen W. Mater Sci Eng 2002;A325:144.
[10] Wang S, Zhang YG, Chen W. J Mater Sci 2001;36;1931(8).
[11] Wang S, Chen W. Mater Sci Eng A 2001;A301:147.
[12] Makhlouf K, Jones JW. Int J Fatigue 1993;15(3):163-171.
[13] Chen W, King F, Jack TR, Wilmott MJ. Met Mater Trans A 2002;33(5):1429-
1436.
[14] Lambert SB, Beavers JA, Delanty B, Sutherby R, Plumtree A. Mechanical factors
affecting stress corrosion cracking growth rates in buried pipelines. In: Proceedings of
3rd International Pipeline Conference; 2000, Calgary. p.961-965.
[15] Zhao J, Chen W, Boven GV, Keane S, Been J. Development and Validation of
Load-Interaction Based Models for Crack Growth Prediction. In: Proceedings of 10th
International Pipeline Conference; 2014, Calgary. Paper No.: IPC2014-33325.
[16] Been J, Eadie R, Sutherby R. Prediction of Environmentally Assisted Cracking on
Gas and Liquid Pipelines. In: Proceedings of 6th International Pipeline Conference; 2006,
Calgary. Paper No. IPC2006-10345.
[17] Boven GV, Sutherby R, King F. Characterizing Pressure Fluctuations on Buried
Pipelines in Terms Relevant to Stress Corrosion Cracking. In: Proceedings of 4th
International Pipeline Conference; 2002, Calgary. Paper No. IPC2002-27149.
[18] Ahmed TM, Lambert SB, Sutherby R, Plumtree A. Corrosion 1997;53(7):581-
590.
[19] Skorupa M. Fatigue Fract Eng Mater Struct 1998(21):987-1006.
[20] Skorupa M. Fatigue Fract Eng Mater Struct 1999(22):905-926.
125
[21] Beachem CD. Met Trans 1972;3(2):437-451.
[22] Ferreira PJ, Robertson IM, Birnbaum HK. Acta Mater 1999;47(10):2991-2998.
[23] Yu M, Chen W, Kania R, Boven GV, Been J. Depressurization-Induced Crack
Growth Enhancement for Pipeline Steel Exposed to Near-Neutral pH Environments. In:
Proceedings of 10th International Pipeline conference; 2014, Calgary. Paper No.
IPC2014-33282.
[24] Yu M, Chen W, Kania R, Boven GV, Been J. Fatigue Fract Eng Mater Struct
(DOI: 10.1111/ffe.12274)
[25] Zhao J et al. Statistical analysis on pipeline spectra, in preparation.
[26] Davidson DL, Lankford J. Int Mater Reviews 1992;37(2):45-74.
[27] Chevil K, Chen W, Eadie R, Kania R, Boven GV, Been J. Correlating Corrosion
Field Data with Experimental Findings for the Development of Pipeline Mitigation
Strategies. In: Proceedings of 10th International Pipeline Conference; 2014, Calgary.
Paper No. IPC2014-33678.
[28] Zuhair Mattoug Gasem. Frequency dependent environmental fatigue crack
propagation in the 7XXX alloy/aqueous chloride system. PhD thesis, University of
Virginia, May 1999.
[29] Chen W, King F, Jack TR, Wilmott MJ. Hydrogen Permeation Behavior of X-70
Pipeline Steel in a Near-neutral pH Soil Environment. In: Proceedings of International
Pipeline Conference; 2000, Calgary. ASME, New York. p. 953-960
[30] Matsumoto R, Taketomi S, Matsumoto S, Miyazaki N. Int J Hydrogen Energy
2009;34(23):9576–9584.
126
[31] Anderson TL. Fracture Mechanics, Fundermentals and Applications, 3rd ed. Boca
Raton (FL): CRC Press; 2005. p.44-45.
[32] Liu X, Xie W, Chen W, Zhang H. J Mater Res 2011;26(21):2735–2743.
[33] Troiano A. Trans ASM 52 (1960) 147-157.
[34] Birnbaum H, Sofronis P. Mater Sci Eng A 176 (1994) 191–202.
[35] Doshida T, Nakamura M, Saito H, Sawada T, Takai K. Acta Mater 61 (2013)
7755-7766.
[36] Egbewande A, Chen W, Eadie R, Kania R, Boven GV, Worthingham R, Been J.
Corrosion Science 2014;83:343-354.
[37] Manfredi C, Otegui JL. Eng Failure Analysis 2002;9:495-509.
[38] Canadian Energy Pipeline Association (CEPA). Stress Corrosion Cracking
Recommended Practices, 2nd Edition, An industry leading document detailing the
management of transgranular SCC, December 2007, p.5.
[39] TransCanada Pipeline (1996) Response to National Energy Board Information
Request 2 of Proceeding MH-2-5, TCP, Calgary, Alberta, Canada, p.3.
127
Chapter 4 Crack Growth Behavior of Pipeline Steel
Exposed to a Near-Neutral pH Environment under
Variable Pressure Fluctuations: Effects of Number of
Minor Cycles1
4.1 Introduction
Engineering components are often operated under variable amplitude cyclic loadings.
Underload and overload are two common features of variable amplitude cyclic loading,
which could accelerate and retard subsequent fatigue crack growth, respectively [1,2].
These effects are seen when compared with the crack growth predicted by a linear
summation of damage of constant amplitude cyclic loading, with magnitudes equal to the
variable amplitude load history.
Many materials have been extensively studied to determine their crack growth behavior
under variable amplitude fatigue tests, including: steel [3-5], titanium alloys [6], and
especially Al alloys [1,3-10] that are widely used in aircraft industry. In such studies, an
increase of crack growth rate by a factor ranging from 1 to 20 has been found during
1 A version of this chapter has been published. M. Yu, W. Chen, R. Kania, G. Van Boven
and J. Been. Fatigue & Fracture of Engineering Materials & Structures. Vol. 38, Issue 6,
June 2015, pp. 681-692.
128
variable amplitude loading with underload cycles included [1,3,6,9], while the crack
growth rate of subsequent minor cycles was reduced by several orders of magnitude [1].
It has also been observed that when the minor cycles are well below the constant
amplitude threshold, significant crack propagation may occur in the presence of
overstress, by a factor of 100 in crack growth rate [11]. It has been found that the
magnitude of the acceleration effect in crack growth under underload-type variable
amplitude fatigue follows a parabolic relationship with the number of minor cycles (n),
reaching a maximum value at n = 10 for several materials; the maximum magnitude of
acceleration was also found to be material dependent, ranging from 1.4 to 8.5 being
reported for materials, such as steel, and Ti and Al alloys [3,6,9].
Laboratory studies on crack growth behavior of pipeline steel in near-neutral pH
environments have been primarily conducted under constant amplitude cyclic loading
since the discovery of near-neutral pH stress corrosion cracking (NNpHSCC) in 1985
[ 12 ], although the variable pressure fluctuations have been recognized as a crack
propagation driving force [13-15]. Despite decades of research, the exact mechanisms of
NNpHSCC are still not fully understood and NNpHSCC continuously remains as a major
threat to pipeline integrity [16]. One of the dilemmas is that constant amplitude cyclic
loadings are applied in laboratory tests, while random pressure fluctuations occur in the
field.
The acceleration of crack growth by applying underloads with an R ratio of 0 was
observed for pipeline steel in near-neutral pH solution [17]. In the study, however, the
129
minor cycles had an R ratio of 0.5 and could cause crack propagation in the absence of
underloads. Such a loading scheme is not typical of pressure spectra recorded during
pipeline operation. Occasional underload cycles and overwhelming periods of minor
cycles at very high R-ratios are main features of the pressure fluctuations experienced by
steel pipelines for high-pressure gas transmission as shown in Fig. 4.1(a). The crack
growth behavior of pipeline steel under realistic loading spectra is still not determined.
The minor cycles typically observed in the field usually have R-ratios at which the
corresponding mechanical driving forces are well below the threshold determined by tests
under constant amplitude loading.
The present investigators have recently demonstrated that the minor cycles, even with an
R-ratio as high as 0.9, could contribute to crack growth following an underload cycle in a
preliminary investigation, as shown in Fig. 4.2 [18]. The mechanical driving force
corresponding to such minor cycles was well below the determined threshold based on
constant amplitude tests [19]. In addition, previous studies of the crack growth behavior
under similar loading spectra in other materials were performed either in air or moist air,
which is irrelevant to the crack growth of pipeline steel exposed to near-neutral pH
environments, where both corrosion and hydrogen embrittlement [15] should be
considered simultaneously. This investigation was initiated in order to understand the role
of minor cycles in the crack propagation of pipeline steel. In particular, attention will be
given to the dependence of crack growth rate on the number of minor cycles in between
two neighboring underload cycles. Comparatively tests were performed in air and near-

130
neutral pH solution to demarcate the contribution of corrosion, mechanical driving force
and their synergistic interactions to crack growth rate.
(a)
Figure 4.1 (a) Pressure fluctuations recorded for a high-pressure gas
transmission pipeline; (b) designed test waveform
0 4000 8000 12000 160000.0
0.2
0.4
0.6
0.8
1.0R
ra
tio
Time/hour
Threshold determined by
constant amplitude corrosion fatigue
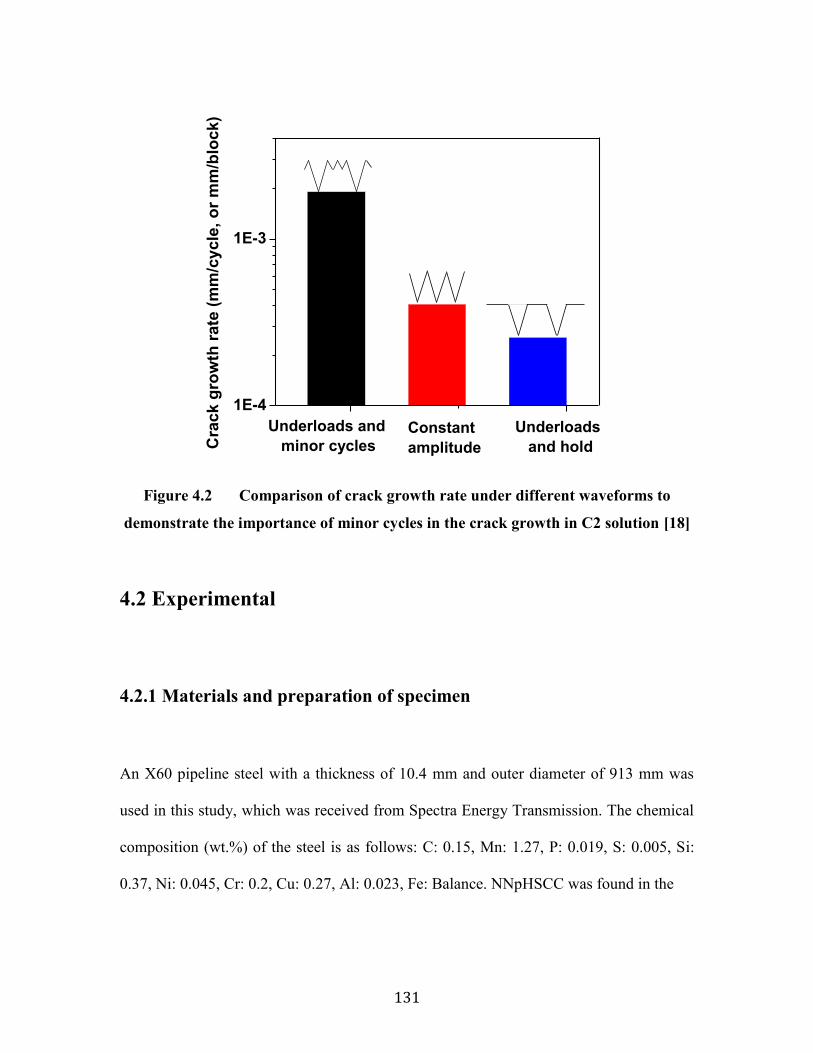
131
Figure 4.2 Comparison of crack growth rate under different waveforms to
demonstrate the importance of minor cycles in the crack growth in C2 solution [18]
4.2 Experimental
4.2.1 Materials and preparation of specimen
An X60 pipeline steel with a thickness of 10.4 mm and outer diameter of 913 mm was
used in this study, which was received from Spectra Energy Transmission. The chemical
composition (wt.%) of the steel is as follows: C: 0.15, Mn: 1.27, P: 0.019, S: 0.005, Si:
0.37, Ni: 0.045, Cr: 0.2, Cu: 0.27, Al: 0.023, Fe: Balance. NNpHSCC was found in the
1E-4
1E-3
Underloads
and hold
Underloads and
minor cycles
Cra
ck g
row
th r
ate
(m
m/c
ycle
, o
r m
m/b
lock)
Constant
amplitude
132
pipeline after being in field service for 19 years. Pipeline sections cut from the location
where SCC was found were used in current investigation. Compact tension (CT)
specimens with a thickness of 9±0.2 mm were machined from the pipeline sections free
of SCC colonies, which were inspected in the field prior to the shipping. The notch in the
CT specimens was orientated in a direction parallel to the pipe longitudinal direction so
that the path of crack growth in the specimen is the same as that of the longitudinal
cracks found in the field. The CT specimens were ground to a 600 grit paper finish and
then pre-cracked by fatigue to produce a sharp crack tip from the machined notch
according to ASTM E647-08. The sharp crack initiated from the machined notch was
controlled to be between 2 and 3 mm long and the difference in crack length on both
sides of the specimen was less than 0.2 mm.
4.2.2 Tests in near-neutral pH solution
The corrosion fatigue tests were performed in a near-neutral pH solution, namely C2
solution, and its composition is listed in Table 4.1. A gas mixture of 5% CO2 balanced
with nitrogen was purged through C2 solution prior to- and during the test to achieve a
stable pH value of 6.29 [19]. These tests were conducted on a horizontal pneumatic
loading frame and the CT specimens were pin-hole loaded and sealed in test cells filled
with the C2 solution. The temperature of the solution and the environment during tests
was controlled at 30±0.1°C (above room temperature to achieve a better control of
temperature).
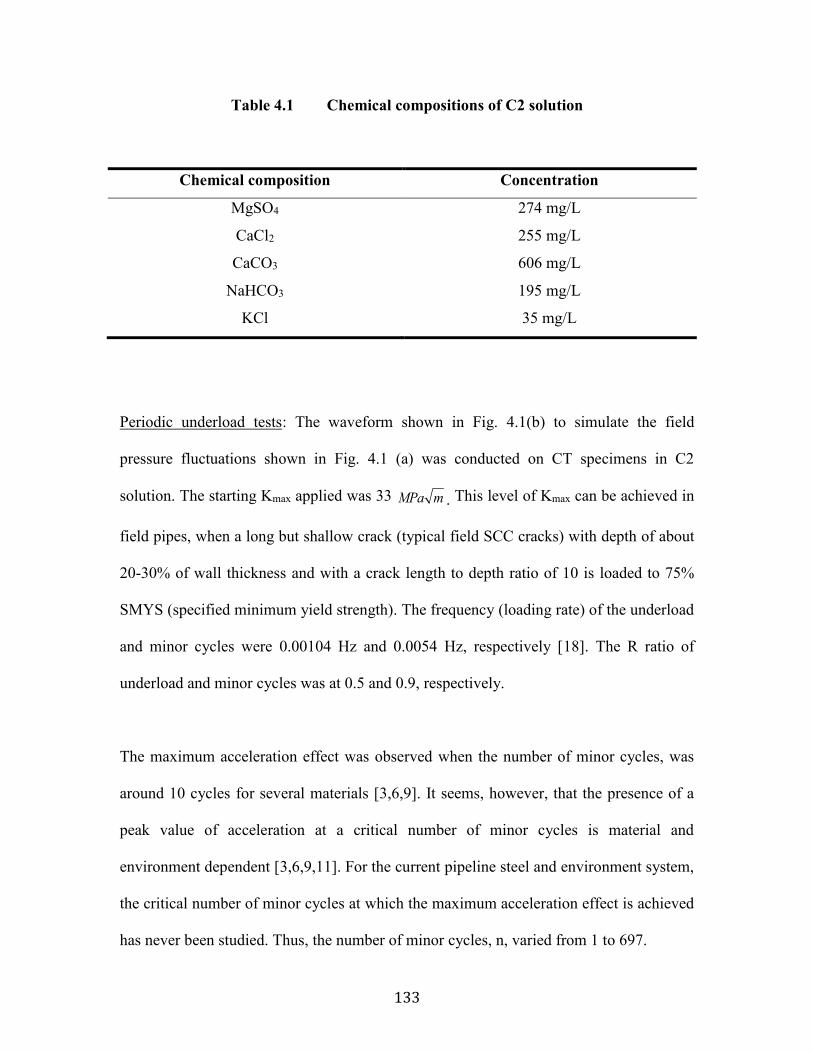
133
Table 4.1 Chemical compositions of C2 solution
Periodic underload tests: The waveform shown in Fig. 4.1(b) to simulate the field
pressure fluctuations shown in Fig. 4.1 (a) was conducted on CT specimens in C2
solution. The starting Kmax applied was 33 . This level of Kmax can be achieved in
field pipes, when a long but shallow crack (typical field SCC cracks) with depth of about
20-30% of wall thickness and with a crack length to depth ratio of 10 is loaded to 75%
SMYS (specified minimum yield strength). The frequency (loading rate) of the underload
and minor cycles were 0.00104 Hz and 0.0054 Hz, respectively [18]. The R ratio of
underload and minor cycles was at 0.5 and 0.9, respectively.
The maximum acceleration effect was observed when the number of minor cycles, was
around 10 cycles for several materials [3,6,9]. It seems, however, that the presence of a
peak value of acceleration at a critical number of minor cycles is material and
environment dependent [3,6,9,11]. For the current pipeline steel and environment system,
the critical number of minor cycles at which the maximum acceleration effect is achieved
has never been studied. Thus, the number of minor cycles, n, varied from 1 to 697.
MPa m
Chemical composition Concentration
MgSO4 274 mg/L
CaCl2 255 mg/L
CaCO3 606 mg/L
NaHCO3 195 mg/L
KCl 35 mg/L

134
The maximum value for the number of minor cycles, 697, was determined in the
following way: The average time intervals between two neighboring cycles with R-ratios
lower than 0.9 in the spectra shown in Fig. 4.1a) was found to be 36 hours. The loading
frequency of minor cycles was set to be at 5×10⁻³ Hz, which is often used in laboratory
simulations [15,19- 21 ] and is consistent with the loading frequency of pressure
fluctuations during field operation. The loading frequency actually measured during
testing on a pneumatic loading frame was 5.38 × 10⁻³ Hz due to some execution errors in
the test system, which yielded a total of 697 cycles for a 36-hour loading interval of the
minor cycles.
To ensure that the maximum acceleration effect was achieved at 697, the number of
minor cycles was further increased to 1000 for tests in C2 solution. The test duration in
solution varied from 12 to 57 days depending on the number of blocks applied. A limited
number of blocks were carried out in each test to avoid significant increment of stress
intensity factor due to crack growth. It was 920 blocks for the loading waveform with n =
1, corresponding to a test duration of 12 days, and only 24 blocks for the test with n =
1000, which lasted over 57 days.
All the tests in this investigation were performed under a constant maximum load or
maximum stress intensity factor to simulate the pressure fluctuations at the discharge
sites where the maximum pressure is strictly controlled. Therefore, the plastic zone size
produced by previous underload cycle was always equal or slightly smaller than that
135
produced by the subsequent underload cycle. The plastic zone size at Kmax = 33
was estimated to be about 1 mm and 0.33 mm in plane stress and plane strain,
respectively. It is impossible to grow the crack by increasing the number of minor cycles
to a length longer than the above calculated plastic zone size because minor cycles do not
contribute to crack growth after a critical number is reached (acceleration effect
disappeared).
Following the tests in C2 solution, the specimens were cut along the middle plane in the
thickness direction. Then, one segment was polished to observe the crack tip morphology
(in the middle plane) via scanning electron microscopy (SEM), while the other half was
sectioned in liquid nitrogen for fractographic examination.
4.2.3 Tests in air
Constant amplitude tests: The CT specimen was pin-hole loaded on a closed loop
hydraulic Instron 8516 loading frame at about 22oC, in laboratory air. The initial Kmax
was also 33 . A loading frequency of 0.5 Hz was used all tests conducted in air. It
has been determined that the crack growth rate of the current steel is insensitive to the
loading frequency when testing in air within the frequency range of 0.5 to 10-4 Hz. The R
ratio – the only variable for the constant amplitude tests in air – was varied from 0.1 to
0.9. Each test was conducted for a period to achieve a crack growth less than 0.4 mm,
which only yields an increase of Kmax for about 0.9 in current investigation.
MPa m
MPa m
MPa m
136
Periodic underload tests: For comparison with tests in solution, the waveform shown in
Fig. 4.1(b) was also executed using a computer running Instron’s Wavemaker-Runtime
software. Here, the initial Kmax was also 33 . The R ratio of underloads and minor
cycles was at 0.5 and 0.9, respectively, corresponding to a ΔK value of 16.5 and 3.3
. The frequency (loading rate) of underloads and minor cycles were 0.00105 Hz
(954 s/cycle) and 0.5 Hz, respectively. The number of minor cycles per block, n, was
ranged from 1 to 697 cycles. The first and last event of the variable amplitude waveform
was the minor cyclic loading.
4.2.4 Determination of crack growth rate and acceleration factor
Crack growth was determined by measuring the crack length before and after tests via
SEM. The crack growth rate, expressed as millimeter per block, was calculated by
dividing the measured crack growth length by the total number of cyclic blocks applied.
In the current investigation, the crack propagation correlated to the individual underload
and minor cycles could not be differentiated from each other, and thereby the explicit
contribution of underloads to the total crack growth could not be defined. After testing in
solution, the specimen was fractured open along the notch direction in liquid nitrogen and
examined on SEM.
A variable γ, termed as the acceleration factor, is often used to determine the degree of
crack growth acceleration, which is defined as the ratio of measured growth rate per
MPa m
MPa m
137
block to the predicted growth rate per block by a linear summation of the constant
amplitude crack growth response [3], that is,
𝛾 = measured growth rate per block
predicted growth rate per block by a linear summation
of the constant amplitude crack growth respone
(4 − 1)
The predicted growth rate per block can be expressed by the following equation:
(da
dN)
block
= N1 (da
dN)
underload
+N2 (da
dN)
minor cycle
(4 − 2)
where, (da/dN)underload is the constant amplitude crack growth rate at the same loading
conditions of underload (large cycle) during variable amplitude fatigue, and N1 is the
number of underload cycles in one block – for the current study, N1 = 1. (da/dN)minor cycle
is the constant amplitude crack growth rate at the same loading conditions of minor
cycles during variable amplitude fatigue, and N2 is the number of minor cycles in one
block, which is N2 = n for current study.
4.3 Results
4.3.1 Tests in air
138
4.3.1.1 Constant amplitude test
Paris’ Law, as expressed below, is often used to correlate the crack growth data with the
stress intensity factor range for fatigue crack growth under constant amplitude loading.
𝑑𝑎
𝑑𝑁= 𝐶∆𝐾𝑚 (4 − 3)
Where K is the stress intensity factor range, and C and m are constants.
Since the maximum stress intensity factor Kmax at the beginning of each test was kept the
same, at 33 , and the growth of the crack was limited to about 0.3 mm, the value
of Kmax can be considered to be constant during the tests. Since ∆𝐾 = 𝐾𝑚𝑎𝑥(1 − 𝑅), the
Paris’ Law can be re-expressed as a function of R ratio,
𝑑𝑎
𝑑𝑁= 𝐶𝐾𝑚𝑎𝑥
𝑚 (1 − 𝑅)𝑚 (4 − 4)
The crack growth rates obtained from the tests under constant amplitude load with
different R-ratios are presented in Fig. 4.3. The results obtained were fitted using Eq. (4-
4), which yields the following relation between da/dN and R.
(𝑑𝑎
𝑑𝑁) = 2.93𝐸 − 4 ∗ (1 − 𝑅)2.79 (4 − 5)
MPa m
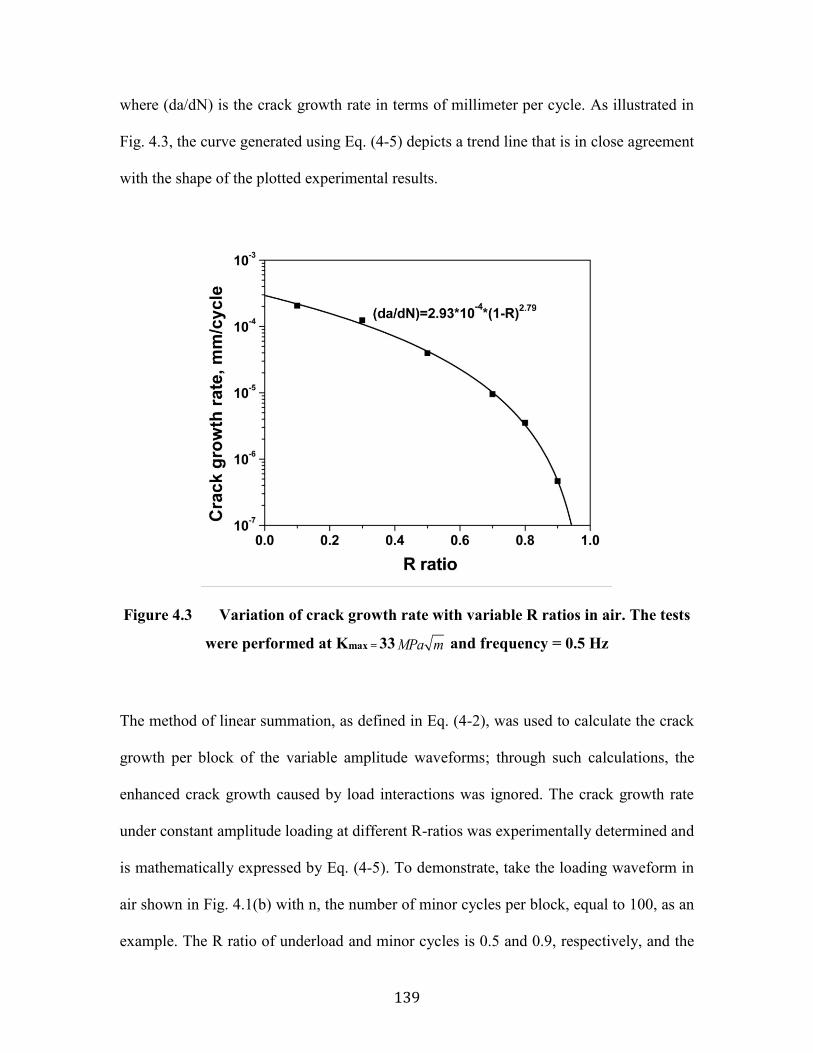
139
where (da/dN) is the crack growth rate in terms of millimeter per cycle. As illustrated in
Fig. 4.3, the curve generated using Eq. (4-5) depicts a trend line that is in close agreement
with the shape of the plotted experimental results.
Figure 4.3 Variation of crack growth rate with variable R ratios in air. The tests
were performed at Kmax = 33 and frequency = 0.5 Hz
The method of linear summation, as defined in Eq. (4-2), was used to calculate the crack
growth per block of the variable amplitude waveforms; through such calculations, the
enhanced crack growth caused by load interactions was ignored. The crack growth rate
under constant amplitude loading at different R-ratios was experimentally determined and
is mathematically expressed by Eq. (4-5). To demonstrate, take the loading waveform in
air shown in Fig. 4.1(b) with n, the number of minor cycles per block, equal to 100, as an
example. The R ratio of underload and minor cycles is 0.5 and 0.9, respectively, and the
MPa m
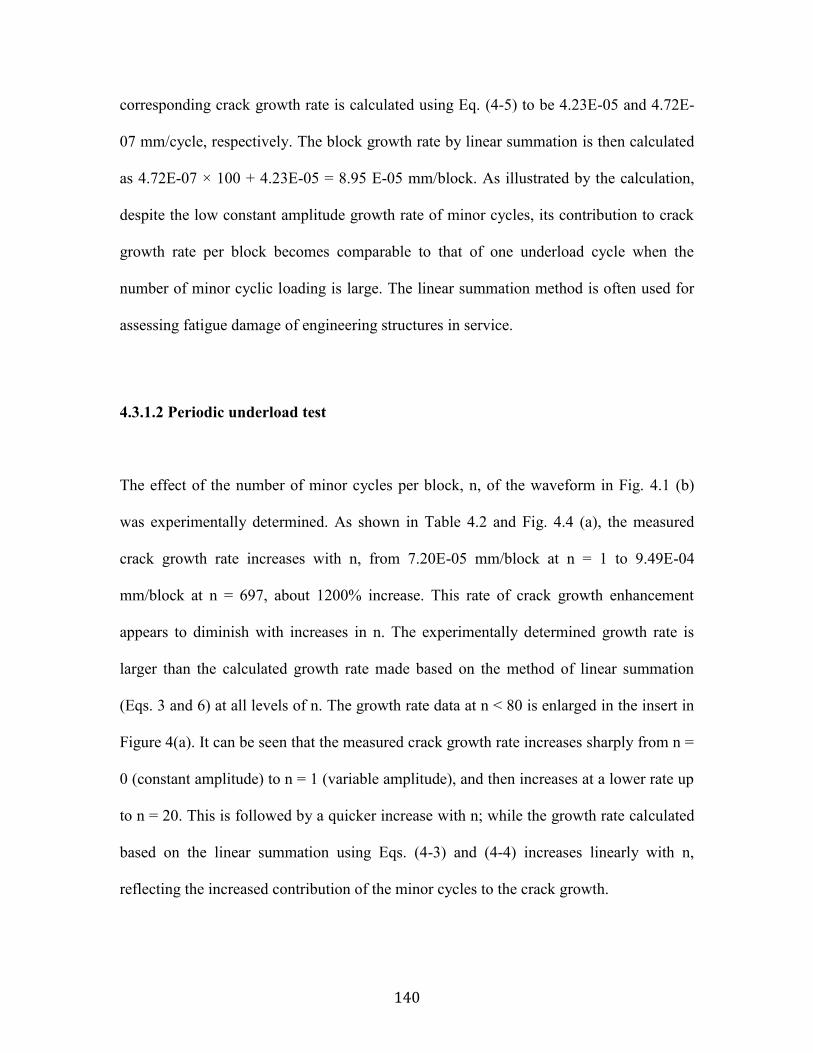
140
corresponding crack growth rate is calculated using Eq. (4-5) to be 4.23E-05 and 4.72E-
07 mm/cycle, respectively. The block growth rate by linear summation is then calculated
as 4.72E-07 × 100 + 4.23E-05 = 8.95 E-05 mm/block. As illustrated by the calculation,
despite the low constant amplitude growth rate of minor cycles, its contribution to crack
growth rate per block becomes comparable to that of one underload cycle when the
number of minor cyclic loading is large. The linear summation method is often used for
assessing fatigue damage of engineering structures in service.
4.3.1.2 Periodic underload test
The effect of the number of minor cycles per block, n, of the waveform in Fig. 4.1 (b)
was experimentally determined. As shown in Table 4.2 and Fig. 4.4 (a), the measured
crack growth rate increases with n, from 7.20E-05 mm/block at n = 1 to 9.49E-04
mm/block at n = 697, about 1200% increase. This rate of crack growth enhancement
appears to diminish with increases in n. The experimentally determined growth rate is
larger than the calculated growth rate made based on the method of linear summation
(Eqs. 3 and 6) at all levels of n. The growth rate data at n < 80 is enlarged in the insert in
Figure 4(a). It can be seen that the measured crack growth rate increases sharply from n =
0 (constant amplitude) to n = 1 (variable amplitude), and then increases at a lower rate up
to n = 20. This is followed by a quicker increase with n; while the growth rate calculated
based on the linear summation using Eqs. (4-3) and (4-4) increases linearly with n,
reflecting the increased contribution of the minor cycles to the crack growth.

141
Table 4.2 Results of periodic underload tests in air
Number of
minor cycles
per block, n
Measured crack
growth rate
(mm/block)
Predicted crack
growth rate*
(mm/block)
Accelerati
on factor,
γ
1 7.20E-05 4.28E-05 1.68
10 7.58E-05 4.70E-05 1.61
20 7.98E-05 5.17E-05 1.54
80 1.97E-04 8.01E-05 2.46
300 5.54E-04 1.84E-04 3.02
697 9.49E-04 3.71E-04 2.56
*Predicted crack growth rate in air was calculated by linear summation of crack growth
due to minor cycles and underloads, that is, 4.72E-07 × n + 4.23E-05, in terms of
mm/block.
The deviation between the measured growth rate and the values calculated using Eqs. (4-
3) and (4-4), illustrated by the shaded area in Fig 4.5(a), is attributed to the acceleration
effect caused by the underloads and can be quantified by the acceleration factor, γ,
defined in Eq. (4-1). As shown in Fig. 4.4 (b), γ increases sharply from 1 (constant
amplitude at n = 0) to 1.7 (n = 1) then decreases with increasing n until n = 20 cycles, as
shown by the inserted close-up of the plot from n = 0 to n = 20 in Fig. 4.4 (b) (the trend
of which was confirmed by the fractured surface observations in the following section).
Beyond n = 20, γ increases with n up to 300 cycles, achieving a peak value of γ = 3.
Further increases in n to a value exceeding 300 result in a reduction in the acceleration
factor. This varied dependence of the acceleration factor with n was also observed during
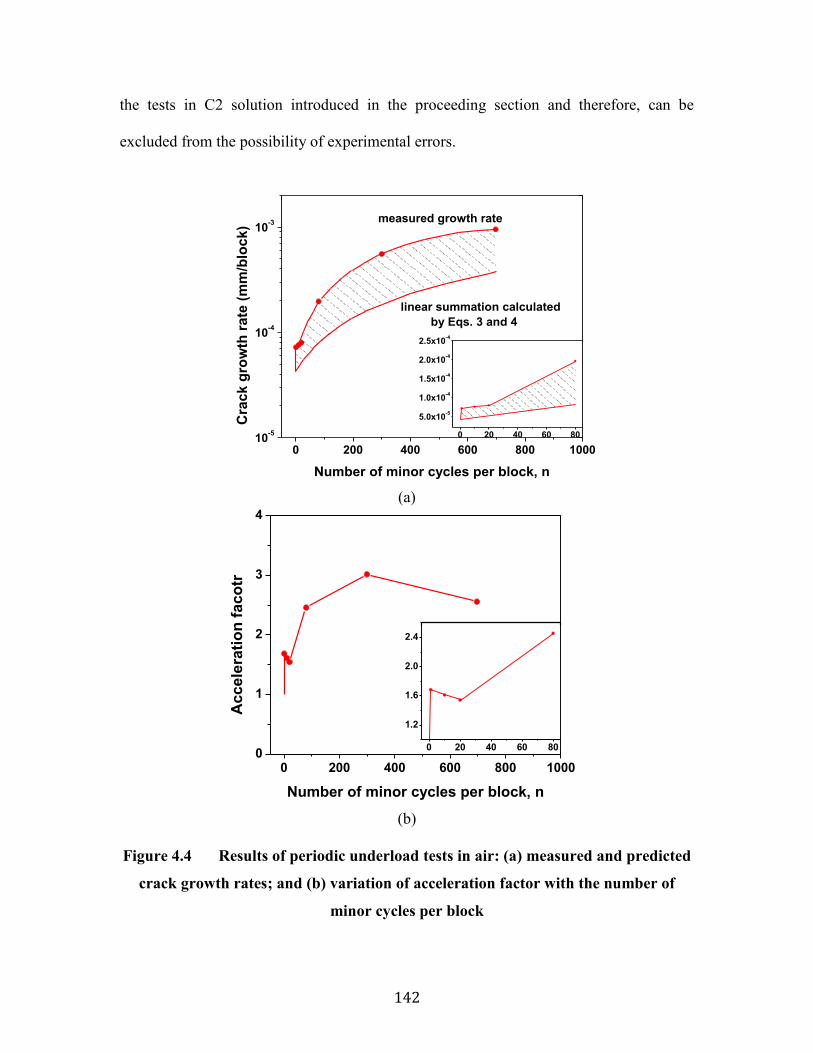
142
the tests in C2 solution introduced in the proceeding section and therefore, can be
excluded from the possibility of experimental errors.
(a)
(b)
Figure 4.4 Results of periodic underload tests in air: (a) measured and predicted
crack growth rates; and (b) variation of acceleration factor with the number of
minor cycles per block
0 200 400 600 800 100010
-5
10-4
10-3
Cra
ck
gro
wth
rate
(m
m/b
lock)
Number of minor cycles per block, n
measured growth rate
linear summation calculated
by Eqs. 3 and 4
0 20 40 60 80
5.0x10⁻⁵
1.0x10⁻⁴
1.5x10⁻⁴
2.0x10⁻⁴
2.5x10⁻⁴
0 200 400 600 800 10000
1
2
3
4
Accele
rati
on
fa
co
tr
Number of minor cycles per block, n
0 20 40 60 80
1.2
1.6
2.0
2.4
143
4.3.2 Periodic underload test in C2 solution
The crack propagation driving force of the minor cycles in the current waveform are well
below the determined threshold in C2 solution as far as the constant amplitude corrosion
fatigue model is considered [19]. Therefore, the predicted growth rate per block of the
variable amplitude waveform in Fig. 4.1(b) is actually the constant amplitude growth rate
of large underload cycles in the waveform (4.07E-04 mm/cycle, in C2 solution) and is
represented by the horizontal line in Fig. 4.5 (a).
Crack growth behavior: As shown in Table 4.3 and Fig. 4.5 (a), the general trend of the
measured crack growth rate in C2 solution is similar to that found in air, that is,
increasing crack growth rate with n until a maximum is reached. The measured crack
growth rate in C2 solution was approximately 3.32E-04 mm/block at n = 1 and 2E-03
mm/block at n = 1000, or about 500% increase, which is significantly less than the
increase observed in air (1200% increase). It is surprising that the measured growth rate
is seen to remain constant with a value below the constant amplitude growth rate from n
= 0 (constant amplitude) to 10; however, for n>10, an increase of crack growth rate
occurs, as shown in the insert in Fig. 4.5(a). This varied dependence of crack growth rate
enhancement with increasing n is quite similar to that found in air.
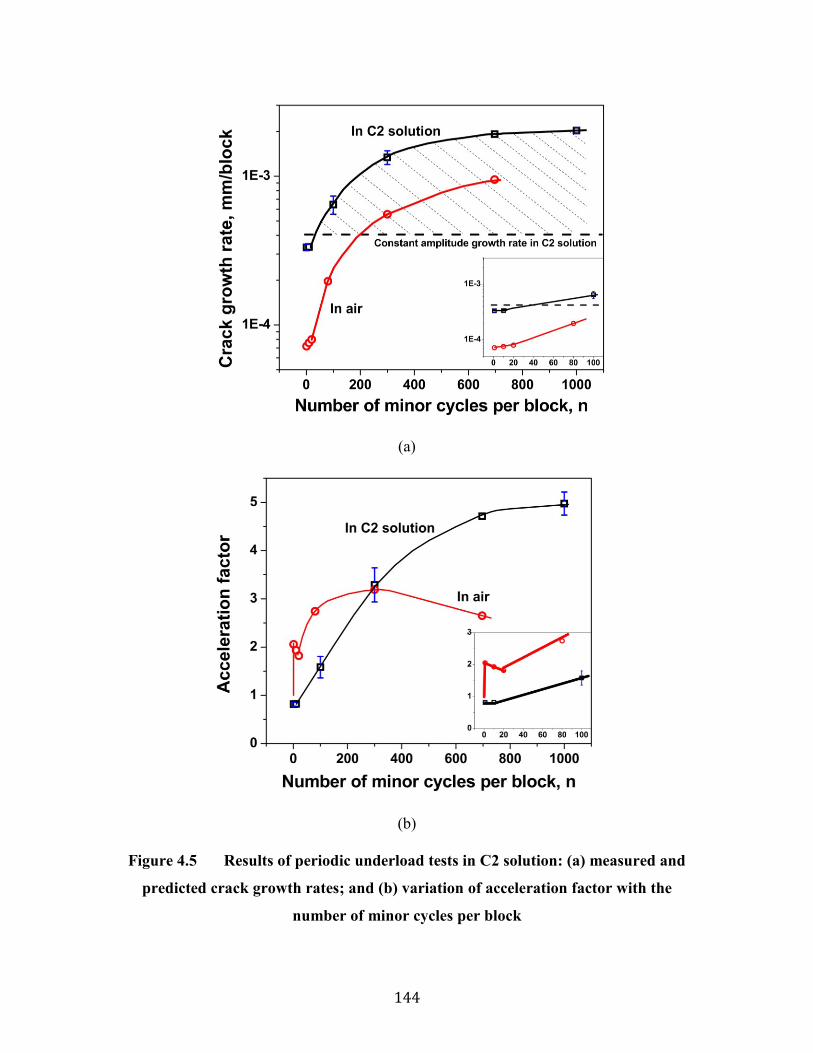
144
(a)
(b)
Figure 4.5 Results of periodic underload tests in C2 solution: (a) measured and
predicted crack growth rates; and (b) variation of acceleration factor with the
number of minor cycles per block

145
Table 4.3 Results of periodic underload tests in C2 solution
Number of
minor cycles
per block, n
Measured crack
growth rate
(mm/block)
Predicted crack
growth rate*
(mm/block)
Acceleration factor, γ
1
1
10
3.44E-04
4.07E-04
0.84
3.20E-04 0.79
3.35E-04 0.82
100
100
7.09E-04 1.74
5.81E-04 1.43
300
300
1.24E-03 3.04
1.44E-03 3.54
697 1.92E-03 4.71
1000
1000
2.10E-03 5.14
1.96E-03 4.81
*Because the minor cycles are below constant amplitude threshold, the predicted crack
growth rate is actually the underload growth rate obtained in constant amplitude cyclic
loading in C2 solution.
The difference between the measured crack growth rate and that predicted by the constant
amplitude test (horizontal line), marked by the shaded area in Fig. 4.5(a), is due to the
acceleration effect caused by underloads. The acceleration factor (γ) was calculated via
Eq. (4-1) and is shown in Fig. 4.5(b). It can be seen that γ generally increases with n, and
can be up to 5 times higher at n = 1000, beyond which it remains constant, while γ in air
peaks out at n = 300 and then decreases with further increases in n. The acceleration
factor in C2 solution is less than that in air when n is less than 300, but higher when n is
larger than 300. The acceleration factor in C2 solution maintained a constant value that
was less than 1 in the first few minor cycles, as shown in the insert in Fig. 4.5(b), while
the decreasing trend was also found from tests in air.

146
Fracture surface observation: The fracture surface of the specimens tested in C2 solution
at different number of minor cycles was examined via SEM after the tests. As shown in
Fig. 4.6, large regularly spaced striations are observed on the specimen of constant
amplitude test (n = 0). For the variable amplitude cyclic tests, striations with a
interspacing similar to those seen at n = 0 were also found for tests with n = 1 and 10.
However, when n ≥ 100 cycles, the mini-striations were also observed, which are
generally located between two large regular striations. The observation of mini-striations
is believed to be a direct evidence of crack propagation caused by the applied minor
cycles. The mini-striations at n = 1000 seemingly appear to be blurred, which was likely
due to long-term corrosion exposure.
The striation interspacing was measured using an intercept method and the average value
was compared with the measured surface crack growth rate. For the specimen of constant
amplitude fatigue testing (n = 0), the large regular striation interspacing was about 1.42E-
3 mm, which is much higher than the measured surface crack growth rate 4.07E-4
mm/cycle [18]. For n = 1 and 10 of the variable amplitude fatigue tests, the striation
interspacing was 1.56E-3 and 1.44E-3 mm, respectively, which are close to that of
constant amplitude testing, 1.42E-3 mm, but were also much larger than the measured
surface growth rate, 3.32E-4 (average value in Table 4.2) and 3.35E-4 mm, respectively.
This echoes the previous observation that the acceleration due to the introduction of
minor cycles was small when n is small. However, when n was increased past 10, for
example, at n = 300, both the large and mini- striations were observed. It is found that the
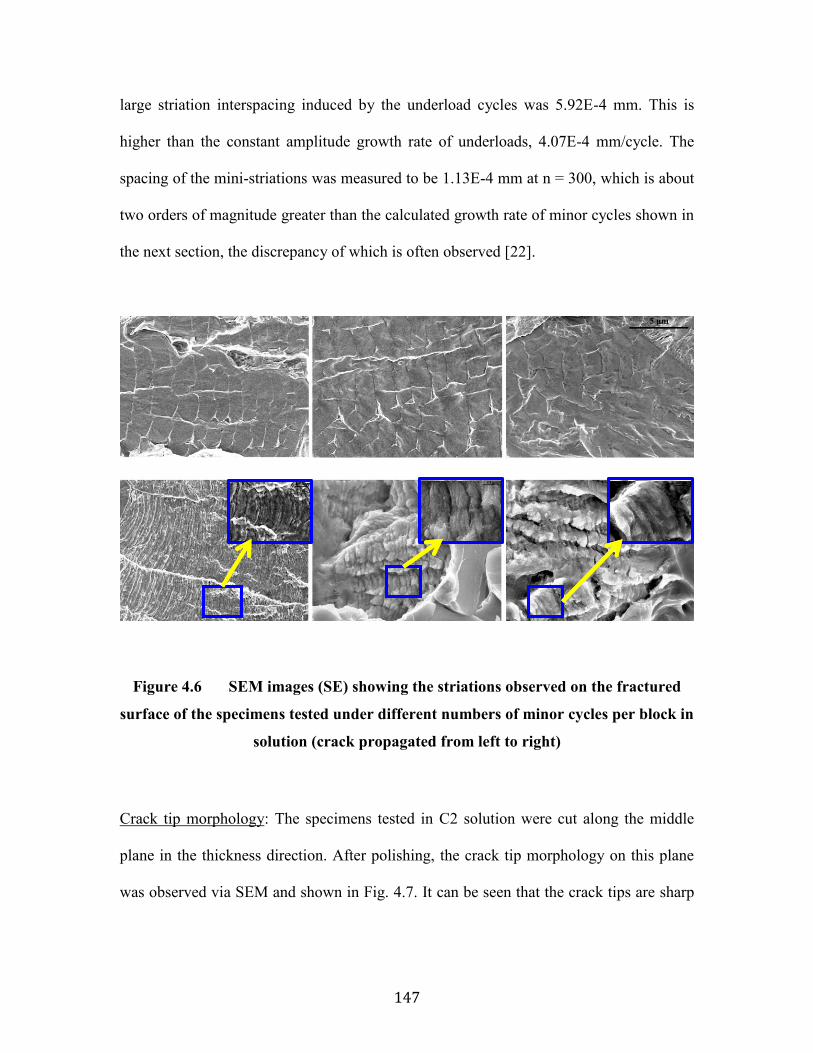
147
large striation interspacing induced by the underload cycles was 5.92E-4 mm. This is
higher than the constant amplitude growth rate of underloads, 4.07E-4 mm/cycle. The
spacing of the mini-striations was measured to be 1.13E-4 mm at n = 300, which is about
two orders of magnitude greater than the calculated growth rate of minor cycles shown in
the next section, the discrepancy of which is often observed [22].
Figure 4.6 SEM images (SE) showing the striations observed on the fractured
surface of the specimens tested under different numbers of minor cycles per block in
solution (crack propagated from left to right)
Crack tip morphology: The specimens tested in C2 solution were cut along the middle
plane in the thickness direction. After polishing, the crack tip morphology on this plane
was observed via SEM and shown in Fig. 4.7. It can be seen that the crack tips are sharp

148
when n < 1000 cycles, but become blunt at n = 1000. A wedge-shaped crack crevice
behind the crack tip was observed.
4.4 Discussion
Variable amplitude cyclic loading waveforms were designed to simulate the actual
pressure fluctuations during pipeline routine operations. It has been demonstrated that the
minor cycles even with a very high R ratio could make a significant contribution to the
crack growth in the presence of underloads with a relatively lower R ratio as shown in
Fig. 4.2 [18]. This type of pressure fluctuations is very typical for high pressure gas
pipelines, especially at the discharge sections of the pump station, where more than 70%
of in-service and hydrostatic-test failures in connection to SCC have been found [12].
Figure 4.7 Crack tip morphology on the middle plane in the thickness direction
for specimens tested at a different number of minor cycles per block (n) in C2
solution
149
4.4.1 The role of minor cycles in fatigue crack propagation
It can be seen from Fig. 4.4 and 4.5 that the measured crack growth rate in air and in C2
solution increases with n and is generally higher than that obtained from linear
summation. This implies that the fatigue damage is enhanced by variable amplitude
cyclic loadings.
The contribution of minor cycles to crack growth can be quantified by the method
introduced in [3]. The crack growth increment for a loading block consisting of one
underload and n number of minor cycles is registered as Δan. The average crack growth
rate between the 2nd and the 10th minor cycle is calculated as (Δa10 - Δa1)/(10-1), while
the mid-point of the 1st and the 10th minor cycles, i.e., (1+10)/2, is taken as the value for
x-axis corresponding to the average crack growth rate. Fig. 4.8 shows the variation of
average crack growth rate with the average minor cycles as determined using the above
method.
As seen in Fig. 4.8, the crack growth during minor cycle loading after the introduction of
an underload cycle can be divided into three stages.
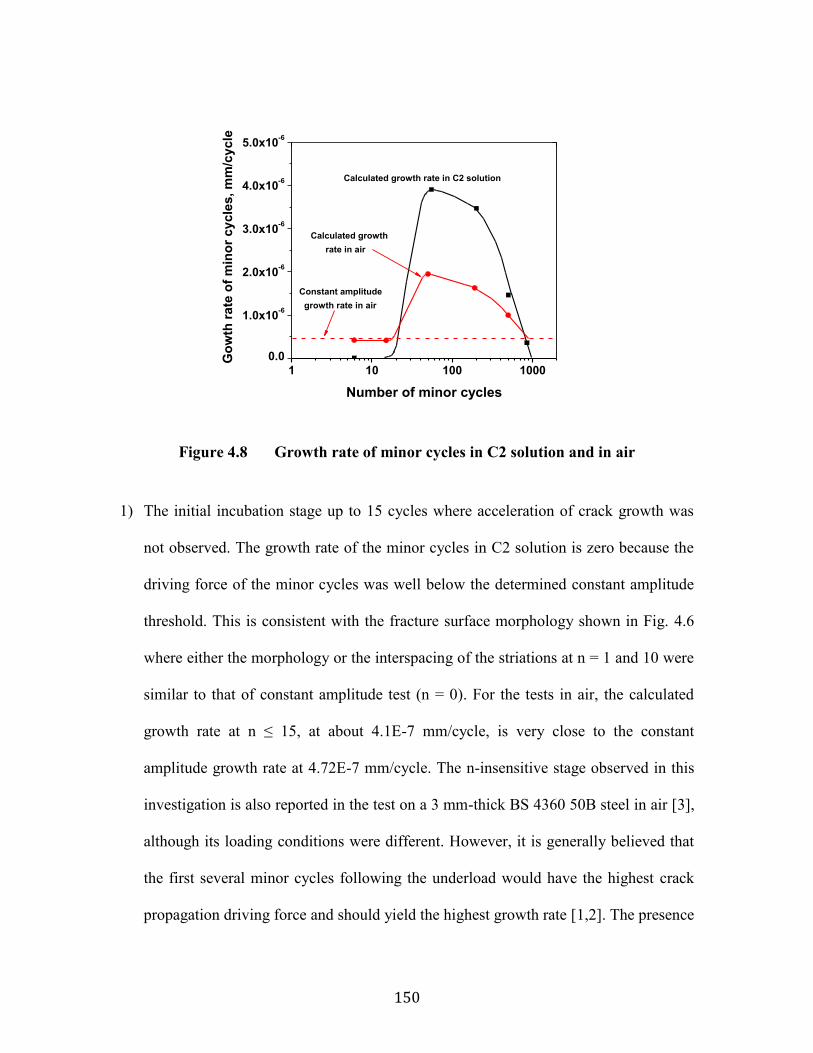
150
Figure 4.8 Growth rate of minor cycles in C2 solution and in air
1) The initial incubation stage up to 15 cycles where acceleration of crack growth was
not observed. The growth rate of the minor cycles in C2 solution is zero because the
driving force of the minor cycles was well below the determined constant amplitude
threshold. This is consistent with the fracture surface morphology shown in Fig. 4.6
where either the morphology or the interspacing of the striations at n = 1 and 10 were
similar to that of constant amplitude test (n = 0). For the tests in air, the calculated
growth rate at n ≤ 15, at about 4.1E-7 mm/cycle, is very close to the constant
amplitude growth rate at 4.72E-7 mm/cycle. The n-insensitive stage observed in this
investigation is also reported in the test on a 3 mm-thick BS 4360 50B steel in air [3],
although its loading conditions were different. However, it is generally believed that
the first several minor cycles following the underload would have the highest crack
propagation driving force and should yield the highest growth rate [1,2]. The presence
1 10 100 1000
0.0
1.0x10⁻⁶
2.0x10⁻⁶
3.0x10⁻⁶
4.0x10⁻⁶
5.0x10⁻⁶
Calculated growth
rate in air
Go
wth
rate
of
min
or
cycle
s, m
m/c
ycle
Number of minor cycles
Calculated growth rate in C2 solution
Constant amplitude
growth rate in air
151
of a period of incubation prior to the onset of acceleration effects is further discussed
in Section 4.4 on the mechanisms of acceleration by underloads.
2) The subsequent stage up to 55 cycles, where the crack growth rate increases by
increasing n, The mini-striations observed in current pipeline steel were a direct
evidence of crack propagation caused by the minor cycles, as shown in Fig. 4.6. This
local acceleration behavior, however, was not reported in [10] and [3].
3) The final stage up to 960 cycles depending on the test environments, where crack
growth rate decreases as n increases to a level at which crack growth enhancement
due to underload effects disappears.
4.4.2 The role of environments in fatigue crack propagation
Crack growth behavior: The effect of environments could be assessed by comparing the
results obtained from tests in C2 solution and in air. Fig. 4.9 shows the ratio of growth
rate in C2 solution to that in air. Linear interpolation was applied if there was not a
corresponding point in air. It can be seen in Fig. 4.9 that the ratio of the measured growth
rate of underload-minor cyclic loadings decreases sharply when n is increased from 1 to
100 cycles, but slowly there afterwards. The ratio of growth rate of the minor cycles is
less sensitive to n when n < 600, beyond which it decreases quickly. This suggests that
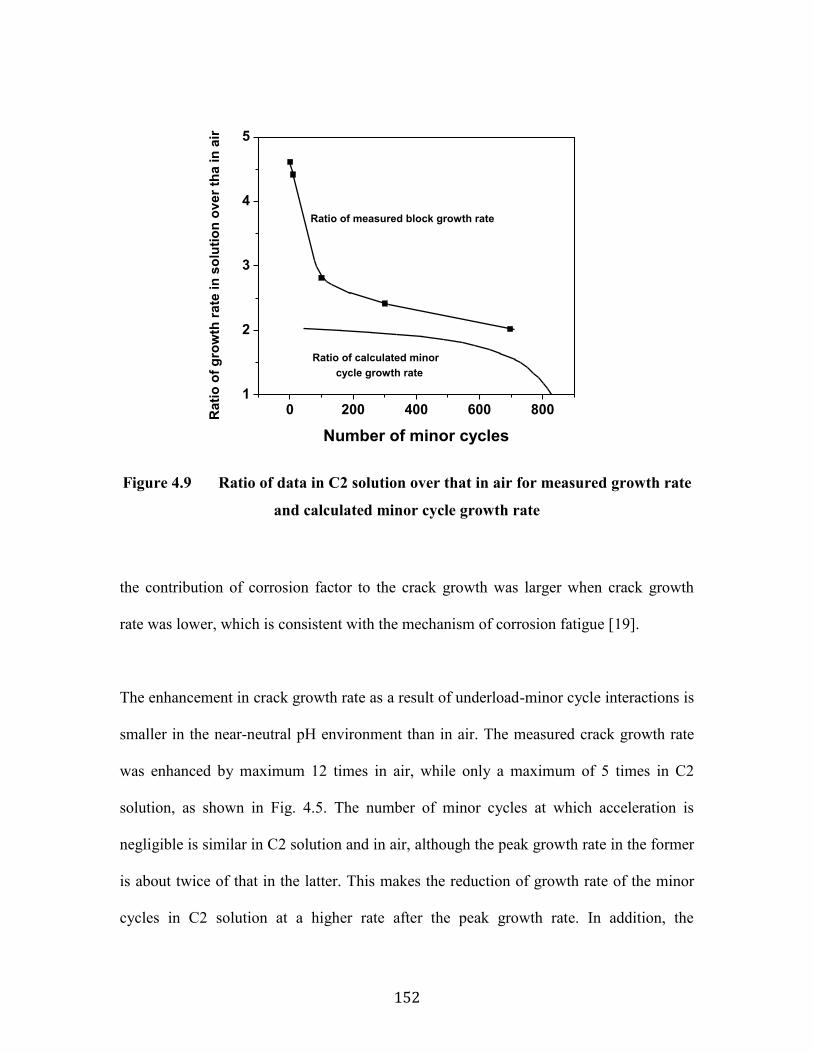
152
Figure 4.9 Ratio of data in C2 solution over that in air for measured growth rate
and calculated minor cycle growth rate
the contribution of corrosion factor to the crack growth was larger when crack growth
rate was lower, which is consistent with the mechanism of corrosion fatigue [19].
The enhancement in crack growth rate as a result of underload-minor cycle interactions is
smaller in the near-neutral pH environment than in air. The measured crack growth rate
was enhanced by maximum 12 times in air, while only a maximum of 5 times in C2
solution, as shown in Fig. 4.5. The number of minor cycles at which acceleration is
negligible is similar in C2 solution and in air, although the peak growth rate in the former
is about twice of that in the latter. This makes the reduction of growth rate of the minor
cycles in C2 solution at a higher rate after the peak growth rate. In addition, the
0 200 400 600 8001
2
3
4
5
Ra
tio
of
gro
wth
ra
te in
so
luti
on
ov
er
tha
in
air
Number of minor cycles
Ratio of measured block growth rate
Ratio of calculated minor
cycle growth rate
153
acceleration factor in air was higher than that in C2 solution when n is below 300 cycles,
as shown in Fig. 4.5 (b). The lower acceleration factor had also been observed for low
carbon steel in moist air compared with that in dry air [11].
The above comparison has clearly demonstrated the different growth behavior of the
minor cycles in air and in the near-neutral pH environment. The environmentally
enhanced crack growth rate is attributed to the effect of hydrogen embrittlement [15],
while a quick diminishment of the acceleration effect in C2 solution could be caused
either by a faster crack growth in C2 solution or by blunting of the crack tip due to
corrosion as indicated in Fig. 4.7 [15]. In the former consideration, a faster crack growth
rate would need fewer minor cycles to achieve a given length of crack growth within
which the underload effect is present; in the latter case, the mechanical driving force
would decrease as crack tip becomes blunter.
4.4.3 Mechanisms of acceleration effect induced by underloads
A number of mechanisms that account for the acceleration effect induced by underloads
have been proposed and discussed in [3], which include crack closure, residual stress,
strain hardening, and change in dislocation structures. These proposed mechanisms are
re-examined based on the experimental findings from this investigation, especially the
results from tests in the near-neutral pH environment. However, all the existing
mechanisms cannot be directly applied to NNpHSCC because they were all proposed
based on the results of tests in air.
154
Crack closure: The crack closure model assumes that a portion of one cyclic cycle that is
after the fractured surface behind the crack tip contact each other (crack closure) does not
contribute to fatigue crack growth because there is no change in crack-tip strain during
cyclic loading of a closed crack [23]. The crack closure model is often applied to explain
the acceleration and retardation induced by underloads and overloads, respectively [2].
The acceleration effect caused by compressive underloads (loading with an R ratio below
zero) was modeled and explained through crack closure [5]. The crack closure, however,
is usually observed during cyclic loading with small R ratios, for example, lower than
0.5~0.6 for steel. In addition, the crack closure model is unable to explain the accelerated
crack growth by the minor cycles with an R ratio as high as 0.9 in air. Furthermore, the
crack closure model would predict the fastest crack growth in the very first minor cycle
following the underload, which is contrary to the current experimental results obtained
from tests in air and in C2 solution, as shown in Fig. 4.8. Similar observations were also
made during the crack growth of BS 4360 50B steel [3]. Thus, crack closure model could
not explain the current acceleration effect caused by underloads.
Residual tensile stress ahead of crack tip: Residual tensile stress was proposed to explain
the crack growth acceleration after compressive underloads [24]. Residual tensile stress
would be generated ahead of the crack tip by the plastic deformation of the fractured
surfaces during the compressive loading, adding to the applied tensile stress, resulting in
acceleration in crack growth. Since tension-tension cyclic loading was applied, the
residual tensile stress mechanism might not be applicable to this study. In addition,
155
similar to the dilemma of the crack closure model, the residual tensile stress could not
explain why the fastest growth rate did not occur during the initial cycles of minor cycle
loading following the underload.
Strain hardening: Strain hardening of the material at the crack tip [3] was believed to be
one of the mechanisms of the load interactions, including acceleration and retardation
caused by underloads and overloads, respectively, because fatigue crack growth could be
accelerated by pre-straining. Although it is generally accepted that overload could lead to
strain hardening, the strain hardening occurring upon an underload cycle is not justified
because the maximum stress was kept constant in the current investigation. Opposite to
strain hardening, strain softening could be a reason for the acceleration. The strain
increment during the minor cyclic loading (R ratio 0.7) after underload (R ratio 0.1) was
predicted by finite element analysis in Ti alloy [6], although experimental validation was
not provided.
Change in dislocation structure: It is well established that the material damage due to
fatigue fundamentally results from the localized irreversibility of dislocation slip through
various mechanisms as summarized in [25], such as cross slip of screw dislocations and
different paths for their forward and reverse gliding during the complete fatigue cycle.
Therefore, it is believed that the accelerated and retarded fatigue growth rate caused by
underload and overload, respectively, could be associated with the change of dislocation
structures. The development of a radial dislocation structure near the crack tip was
observed due to the overloads [26], which could be a result of strain hardening caused by
156
overloads. There has been very limited work, however, on the dislocation substructure
changes caused by underloads and the mechanisms for the delayed acceleration remain to
be determined.
Room temperature creep: It is also suspected that room temperature creep, which is time-
dependent plastic deformation, could play a role in crack propagation of pipeline steel
[15]. The effect of room temperature creep at the crack tip on crack growth could be
determined if the loading frequency is varied. Although it is beyond the scope of the
current investigation, the effect of loading frequency is currently under investigation.
4.4.4 Understanding the field crack behaviors in NNpHSCC
The high-pressure gas transmission pipelines are operated with limited number of large
cycles (underloads with R ratio less than 0.5), fewer than 10 in one year [27]. For the
majority time in operation the pipelines are under minor pressure fluctuations, which are
insufficient to drive a crack to grow under fatigue or corrosion-fatigue if underload
effects are not considered. The crack tip is usually at a blunt state because of corrosion of
steel in non-passivating environments (near-neutral pH environments) and the hydrogen
facilitated plastic deformation [28]. In the case of a pressure cycle with lower R-ratios,
the blunt crack tip may not necessarily be reactivated for growth on the basis of fatigue or
corrosion fatigue mechanisms without considering the load interactions.
157
The current investigation that is focused on the load interaction between the underload
and the minor cycles can rationalize the field observation that 70% of all-service and
hydrostatic-test failures attributed to SCC have occurred within 30 km downstream
(pressure discharge) of a pumping station [12]. At these sections, the maximum pressure
is controlled to be the design limit, which allows the occurrence of underload cycles but,
consequently, prevents overload cycles, and the minor cycles are predominant, as shown
in Fig. 4.1a). This creates a perfect underload-plus-minor-cycle-scenario and substantial
enhancement to crack growth rate can be achieved, especially by those minor cycles that
are often considered to be non-propagating.
In comparison, the downstream sections beyond the first 30 km are featured with a much
lower operation pressure, resulting in a reduced mechanical driving force. At the same
time the overloading cycles become possible, which could further retard the crack
growth.
For liquid transmission pipelines, the pressure fluctuates more rapidly and over larger
amplitudes due to the incompressibility of the liquid fluids. More than 2500 large cycles
with R ratio lower than 0.5 could occur per year [27]. The overall crack growth rate of oil
pipelines could be larger due to the substantially increased contribution of large
(underload) cycles. The number of minor cycles between two neighboring large cycles is
limited and thus, the contribution of minor cycles to crack growth, as shown in Fig.
4.5(a). This would also rationalize the observations of sharp crack morphology [29] and a
shorter life span [27] in the discharge section of the pump station of oil pipelines.
158
4.5 Conclusions
Variable amplitude cyclic loading waveforms were applied to X60 pipeline steel to
observe the crack growth response both in air and in a near-neutral pH environment. The
underloads with an R ratio of 0.5 were periodically introduced into the minor cycles with
an R ratio of 0.9. Such waveforms were designed to simulate the pressure fluctuations
during pipeline operation, particularly the high-pressure gas transmission pipelines that
are normally operated with a near-static pressure condition, except for occasional
underloads. This investigation focused primarily on the effect of minor cycles, with
special attention paid to the number of minor cycles after an underload, on crack growth.
(1) The introduction of an underload cycle could lead to a substantial level of crack
growth during the subsequent minor cycle loadings even with very high R-ratios.
These minor cycles are well below the threshold of growth under constant amplitude
loading. The crack growth of the underload-minor cycle loading combination could
be increased by a factor of 3 and 5, respectively, in air and in C2 solution, when
compared to that of constant amplitude underload cycles alone.
(2) The crack growth during minor cycle loading after the introduction of an underload
cycle can be divided into three stages: 1) The initial incubation stage up to 15 cycles
where acceleration of crack growth was not observed; 2) the subsequent stage up to
55 cycles, where crack growth rate increases by increasing the number of minor
cycles; and 3) the final stage up to 960 cycles depending on the test environments,
159
where crack growth rate decreases with increasing number of minor cycles to a level
at which underload effects disappear.
(3) Crack growth produced by minor cycles after an underload was illustrated by a direct
observation of well-defined mini-striations different from those produced by
underloads.
(4) Under the same underload-minor cycle loading conditions, the crack growth rate of
pipeline steel in near-neutral pH environments was about 4 times higher than that in
air.
(5) The enhanced crack growth as a result of underload-minor cycle interaction could
rationalize the premature failure of high pressure gas transmission pipelines that are
operated most of time under a near-static loading condition but only occasionally
experience relatively larger pressure fluctuations (underloads).
References
[1] M. Skorupa (1998). Fatigue Fract. Engng. Mater. Struct. 21, 987-1006.
[2] M. Skorupa (1999). Fatigue Fract. Engng. Mater. Struct. 22, 905-926.
[3] N. A. Fleck (1985). Acta Metall. 33, 1339-1354.
[4] Colin MacDougall and T.H. Topper (1997). Int. J. Fatigue 19, 387-400.
[5] M. El-Zeghayar, T.H. Topper, F.A. Conle, and J.J.F. Bonnen (2011). Int. J.
Fatigue 33, 223-231.
[6] Stephan M. Russ (2003). Effect of Underloads on Fatigue Crack Growth of Ti-17.
PhD Thesis, Georgia Institute of Technology.

160
[7] M. Baker Jr. (2004), Stress Corrosion Cracking Studies, Integrity Management
Program DTRS56-02-D-70036, Department of Transportation, Office and Pipeline
Safety.
[8] N. Ohrloff, A. Gysler and G. Lütjering (1987). Journal DE Physique, Colloque
C3, supplément au n°9, Tome 48, C3-801-C3-807.
[9] V. Zitounis (2004). Fatigue Crack Growth Rates Under Variable Amplitude Load
Spectrum Contamining Tensile Underloads. PhD Thesis, Cranfield University.
[10] M. Krkoska, S.A. Barter, R.C. Alderliesten, P. White, and R. Benedictus (2010).
Engng. Fract. Mech. 77, 1857-1865.
[11] Ryoichi Koterazawa and Takayoshi Nosho (1992). Fatigue Fract. Engng. Mater.
Struct. 15, 103-113.
[12] B. S. Delanty, J. O’Beirne (1992). Major Field Study Compares Pipeline SCC
with Coatings. Oil & Gas Journal, 15, 39-44.
[13] Parkins RN (2000). In: Proceedings of Corrosion 2000. Houston, Texas: NACE
2000, Paper 00363.
[14] J. A. Beavers and C. E. Jaske (1998). In: Proceedings of Corrosion 1998.
Houston, Texas: NACE 1998, Paper 98257.
[15] W. Chen, Richard Kania, Robert Worthingham, and Gregory Van Boven (2009).
Acta Mater. 57, 6200-6214.
[16] National Energy Board (NEB) (1996). Report of the Inquiry – Stress Corrosion
Cracking on Canadian Oil and Gas Pipelines.

161
[17] B. W. Williams, S. B. Lambert, R. Sutherby, and A. Plumtree (2004). Corrosion,
60, 95-103.
[18] Mengshan Yu, Weixing Chen, Richard Kania, Greg Van Boven, and Jenny Been
(2014). In: Proceedings of IPC 2014, 10th International Pipeline conference, Sept. 29-
Oct. 3, Calgary, Alberta, Canada. Paper No.: IPC2014-33282.
[19] Weixing Chen and Robert L. Sutherby (2007). Metall. and Mater. Trans. A, 38A,
1260-1268.
[20] Weixing Chen and Robert Sutherby (2004). In: Proceedings of IPC 2004, 5th
International Pipeline Conference, Oct. 4-8, 2004, Calgary, Alberta, Canada. Paper No.:
IPC2004-449.
[21] J. Been, R. Eadie and R. Sutherby (2006). In: Proceedings of IPC 2006, 6th
International Pipeline Conference, Sept. 25-29, 2006, Calgary, Alberta, Canada. Paper
No.: IPC2006-10345.
[22] D. L. Davidson and J. Lankford (1992). Int. Mater. Reviews, 37, 45-74.
[23] T.L. Anderson (2005). Fracture Mechanics, Fundermentals and Applications,
Third Edition. Taylors & Francis Group, 457-464.
[24] T.L. Anderson (2005). Fracture Mechanics, Fundermentals and Applications,
Third Edition. Taylors & Francis Group, 482.
[25] S. Suresh (1991). Fatigue of Materials. Cambridge University Press, Cambridge,
New York Port Chester, Melbourne Sydney, 113.
162
[26] R. Koterazawa (1981). In: Proc. Fatigue ’81, SEE Fatigue Group Conf. Warwick
Univ. England (edited by F. Sherratt and J. B. Sturgeon), 318-327. Westbury House,
Guildford, England.
[27] G. Van Boven, R. Sutherby, and F. King (2002). In: Proceedings of IPC 2002, 4th
International Pipeline Conference, Sept. 29-Oct. 3, Calgary, Alberta, Canada. Paper No.:
IPC2002-27149.
[28] W. Chen, F. King, and E. D. Vokes (2002). Corrosion, 58, 267-275.
[29] W. Bouaeshi, S. Ironside, R. Eadie (2007). Corrosion, 63, 648-660.

163
Chapter 5 Crack Growth Behavior of a Pipeline
Steel Exposed to a Near-Neutral pH Environment
under Variable Pressure Fluctuations: Effects of
Amplitudes1
5.1 Introduction
Although fatigue has been studied for more than 100 years [1], the mechanisms of
structure failures caused by fatigue are still not fully understood, especially when other
failure mechanisms, such as corrosion [2], erosion [3], and high temperature [4], are
present simultaneously. Fatigue failures can occur through a three-stage process: crack
initiation (Stage I), propagation (Stage II) and final rupture (Stage III). This investigation
is aimed at understanding the crack growth behavior of pipeline steels exposed to
corrosive near-neutral pH environments, within the scenario of corrosion fatigue.
It has been well studied that the corrosion fatigue crack growth rate in Stage II is affected
by the following four factors:
1 A version of this chapter has been submitted to International Journal of Fatigue for publication (under review)
164
1) Stress intensity factor range ΔK, the primary driving force for crack growth, which is
exponentially correlated to the crack growth rate [5].
2) Maximum stress intensity factor, Kmax, which usually yields a higher crack growth
rate at higher Kmax [2,6].
3) Loading frequency, f, which is an environmentally sensitive factor. Crack growth rate
is often found to be insensitive to f in inert environments [7], but increases with
decreasing f in corrosive environments because of time-dependent processes, such as
corrosion [2], hydrogen embrittlement [8] and creep [9].
4) Environments, which synergistically interact with mechanical driving forces and thus
enhance crack growth in a way that is sensitive to the loading frequency [2].
Based on the understanding of the crack growth behavior affected by these four factors,
several models have been proposed in an attempt to rationalize fatigue crack growth rates.
These include the Paris Law [5], superposition model [2], crack closure model [10], two-
driving force model [11] and combined factor model [12].
The above models usually yield a predicted service life very different from that obtained
by field observations. For example, oil and gas pipelines have been estimated to possess a
service life over several hundred years when predictive methods developed from the Paris
Law [13] are used, while pipelines experiencing corrosion fatigue often fail after being in
service for 20 – 30 years [14].

165
We believe that the above inconsistency is largely caused by the randomness of pressure
fluctuations in the field. The random pressure fluctuations are the typical case of variable
amplitude cyclic loadings. Such variable amplitude loadings create strong load
interactions: that is, fatigue crack growth rate depends on not only the current loading
conditions but also the loading history. It has been well demonstrated that underload-type
variable amplitude fatigue accelerates the crack growth rate of subsequent cycles, while
overload-type variable amplitude fatigue retards crack growth [15,16,17].
The random pressure fluctuations of pipeline steel can be categorized into three types,
based on the analysis of pressure spectra from more than 20 oil and gas pipelines. Type I
- underload pressure fluctuations, are typically seen downstream of pump or pump
stations. The maximum pressure of Type I spectra is often controlled to be at or close to
the design limit, only allowing pressure to fluctuate to a level lower than the design limit.
Fig. 5.1 is one typical Type I spectrum normalized by R ratio (minimum stress/maximum
stress), which consists of the underload cycles (the large fluctuation cycles) and the minor
cycles (also called ripple loads). Type II – mean load pressure fluctuations, are usually
observed further down from the pump station. The pressure fluctuates higher or lower than
the average. Such a spectrum is the combination of Type I and Type III. Type III –
overload pressure fluctuations, are typically observed at or close to the suction segment of
pump stations. Such a spectrum suggests that the pressure is controlled at the minimum
for most of the time period, while there are many pressure spikes (overloads) that are
obviously above the average.
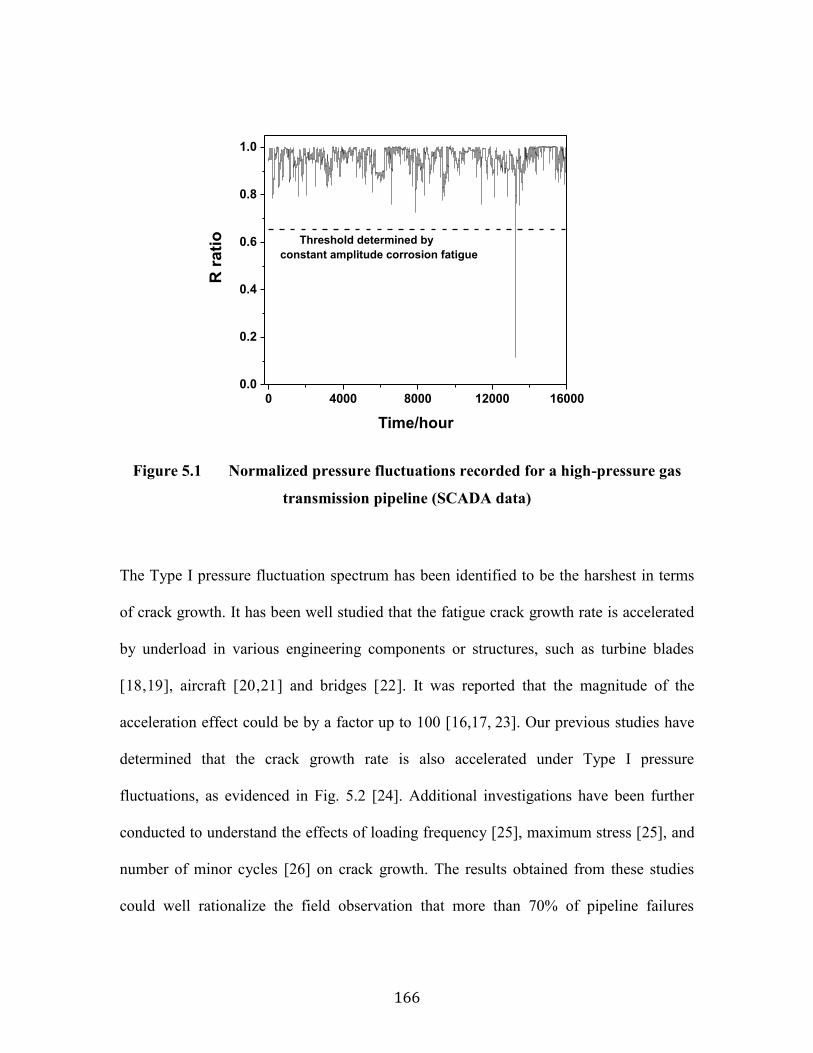
166
0 4000 8000 12000 160000.0
0.2
0.4
0.6
0.8
1.0
R r
ati
o
Time/hour
Threshold determined by
constant amplitude corrosion fatigue
Figure 5.1 Normalized pressure fluctuations recorded for a high-pressure gas
transmission pipeline (SCADA data)
The Type I pressure fluctuation spectrum has been identified to be the harshest in terms
of crack growth. It has been well studied that the fatigue crack growth rate is accelerated
by underload in various engineering components or structures, such as turbine blades
[18,19], aircraft [20,21] and bridges [22]. It was reported that the magnitude of the
acceleration effect could be by a factor up to 100 [16,17, 23]. Our previous studies have
determined that the crack growth rate is also accelerated under Type I pressure
fluctuations, as evidenced in Fig. 5.2 [24]. Additional investigations have been further
conducted to understand the effects of loading frequency [25], maximum stress [25], and
number of minor cycles [26] on crack growth. The results obtained from these studies
could well rationalize the field observation that more than 70% of pipeline failures
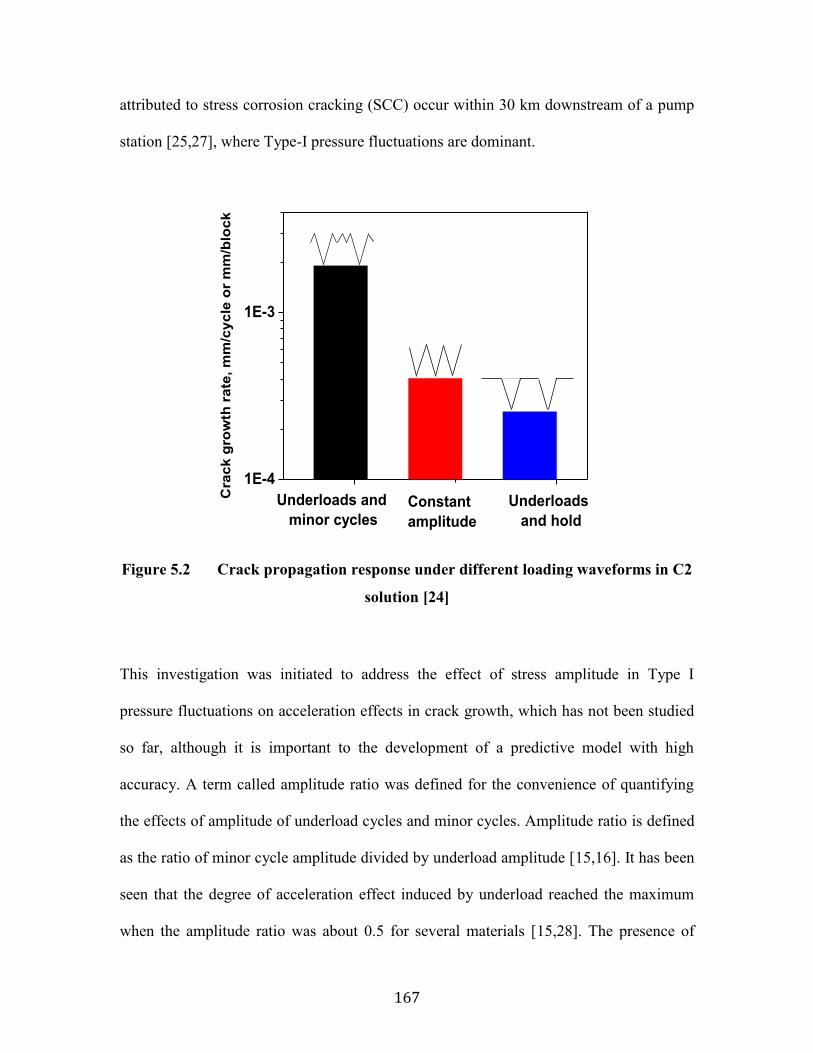
167
attributed to stress corrosion cracking (SCC) occur within 30 km downstream of a pump
station [25,27], where Type-I pressure fluctuations are dominant.
1E-4
1E-3
Underloads
and hold
Underloads and
minor cycles
C
rac
k g
row
th r
ate
, m
m/c
yc
le o
r m
m/b
loc
k
Constant
amplitude
Figure 5.2 Crack propagation response under different loading waveforms in C2
solution [24]
This investigation was initiated to address the effect of stress amplitude in Type I
pressure fluctuations on acceleration effects in crack growth, which has not been studied
so far, although it is important to the development of a predictive model with high
accuracy. A term called amplitude ratio was defined for the convenience of quantifying
the effects of amplitude of underload cycles and minor cycles. Amplitude ratio is defined
as the ratio of minor cycle amplitude divided by underload amplitude [15,16]. It has been
seen that the degree of acceleration effect induced by underload reached the maximum
when the amplitude ratio was about 0.5 for several materials [15,28]. The presence of
168
such a peak value has also been found to be material- [15,28] and environment- [23]
dependent.
The environment involved in the current investigation is a near-neutral pH aqueous soil
solution. The corrosion cracking associated with this environment was initially termed
near-neutral pH stress corrosion cracking (NNpHSCC). It was first reported in 1985 [27],
but remains a major threat to pipeline integrity worldwide today [29] as its mechanisms
are still open to debate. It has been demonstrated that its mechanism is consistent with
corrosion fatigue, rather than SCC, as no crack growth could be detected under static
loading (by definition of SCC), even if the stress intensity factor was high [6,30,31]. The
corrosion fatigue crack growth behavior of the pipeline steel exposed to near-neutral pH
environments under Type I pressure fluctuations forms the topic of this study, the results
of which could shed light on understanding its mechanism.
5.2 Experimental
5.2.1 Materials and environment
An X60 pipeline steel with a wall thickness of 10.4 mm and outer diameter of 913 mm
was used in this study. The steel came from Spectra Energy Transmission. The pipeline
steel had been in operation for 19 years, and showed near-neutral pH stress corrosion
cracking. Pipeline sections that were cut from locations where cracking had been found

169
were used in this investigation. The chemical composition (wt.%) of the steel studied was
as follows: C: 0.15, Mn: 1.27, P: 0.019, S: 0.005, Si: 0.37, Ni: 0.045, Cr: 0.2, Cu: 0.27,
Al: 0.023, Fe: Balance. Compact tension (CT) specimens with a thickness of 9 ± 0.2 mm
were machined from pipeline sections that were free of crack colonies. The notch in the
CT specimens was orientated in a direction parallel to the pipe longitudinal direction so
that the path of crack growth in the specimen was the same as that of the longitudinal
cracks found in the field. The CT specimens were polished to a 600 grit finish and then
pre-cracked by fatigue in air to produce a sharp crack tip from the machined notch,
according to ASTM E647-08. The sharp crack initiated from the machined notch was
controlled to be between two and three mm long, and the difference in crack length on
either side of the specimen was less than 0.2 mm.
The corrosion fatigue tests were performed in a near-neutral pH solution, namely C2
solution (0.0035 KCl, 0.0195 NaHCO3, 0.0255 CaCl2, 0.0274 MgSO4.7H2O, 0.0606
CaCO3 g/l). A gas mixture of 5% CO2 balanced with nitrogen was purged through the C2
solution before and during the test to achieve a stable pH value of 6.29 [6]. The CT
specimens were sealed in test cells filled with the C2 solution and pin-hole loaded on a
horizontal pneumatic loading frame with computer load control [30]. The temperature of
the solution and the environment during the tests was controlled at 30±0.1°C so that a
better control could be achieved when the temperature was above room temperature, as
heating is required to maintain the temperature.
170
5.2.2 Determination of crack growth rate and acceleration factor
Crack growth was determined by using scanning electron microscopy (SEM) to measure
the crack length before and after tests. The crack growth rate, expressed as millimeter per
block, was calculated by dividing the measured crack growth length by the number of
cyclic blocks applied. The crack advancement in each test was less than 0.5 mm, which
only yields an increase of Kmax for about 1 in current investigations. Thus, the
tests can be considered under K control. As the maximum stress intensity factor can be
considered constant, the amplitudes will be expressed as R ratio in the following sections.
A factor, γ, termed as the acceleration factor, is often used to describe the degree of crack
growth acceleration, which is defined as the ratio of measured growth rate per block over
the predicted growth rate per block by a linear summation of the constant amplitude crack
growth response [15], that is,
𝛾 =measured growth rate per block
predicted growth rate per block by a linear summation
of the constant amplitude crack growth respone
(5 − 1)
The linear summation (predicted growth rate) can be expressed by the following
equation:
(da
dN)
block
=N1 (da
dN)
underload
+N2 (da
dN)
minor cycles
(5 − 2)
MPa m
171
where (da/dN)underload is the constant amplitude crack growth rate at the same loading
conditions of underload (large cycle) during variable amplitude fatigue, and N1 is the
number of underload cycles in one block, which is N1=1 for the current study;
(da/dN)minor cycles is the constant amplitude crack growth rate at the same loading
conditions of minor cycles during variable amplitude fatigue, and N2 is the number of
minor cycles in the block, which is N2=n=300 (as indicated in the following section) for
the current study. The constant amplitude crack growth rates in the current investigation
can be obtained from Ref. [12,24,25,26].
5.2.3 Mechanical loading conditions
Effect of R ratio of underload cycles: The variable amplitude cyclic loading waveform
shown in Fig. 5.3 was designed to simulate the field pressure fluctuations shown in Fig.
5.1. The starting Kmax applied was at 33 . This level of Kmax can be achieved in
field pipes, when a long but shallow crack (typical field SCC cracks) with depth of about
20-30% of wall thickness and with a crack length to depth ratio of 10 is loaded to 75%
SMYS (specified minimum yield strength). The R ratio of minor cycles was kept at 0.9,
corresponding to 3.3 , while that of underload cycles varied from 0.1, 0.3, 0.5,
0.7 until 0.8. The loading rate of the underload cycles was kept the same, while the
loading frequency of underload cycles varied with R ratios (amplitude) of the underload
cycle accordingly, ranging from 5.79×10⁻⁴ to 2.6×10⁻³ Hz. The frequency of minor cycles
was selected at 5.38×10⁻³ Hz, and the number of minor cycles per block (between two
neighboring underload cycles), n, was at 300 cycles [26]. The first and last event of the
MPa m
MPa m

172
variable amplitude waveform in Fig. 5.3 was the minor cyclic loading. To obtain a certain
amount of crack advancement, 92 blocks were performed for R ratio 0.8, while 61 blocks
were performed for other R ratios.
Figure 5.3 Variable amplitude fatigue waveform designed to simulate the
pressure fluctuations in Figure 1
For comparison, the same waveform was also performed on a closed loop hydraulic
Instron machine (8516) in air at room temperature, around 22C, which was executed by
a computer with Instron Wavemaker-Runtime software. The tests in air were performed
at a higher loading frequency with 0.5 Hz for the minor cycles, as it is found that the
fatigue crack growth rate of the current pipeline steel was insensitive to the loading
frequency in air [25]; and a greater number of blocks was applied for the tests in air
because the crack growth rate in air is lower than that in the C2 solution. All the other
loading conditions for the tests in air were kept the same as in the C2 solution.

173
Effect of R ratio of minor cycles: The same Kmax, 33 , was also applied. The R
ratio of minor cycles was varied from 0.8, 0.9, 0.95 to 1 (static hold), while the frequency
of minor cycles was kept the same, 5.38×10⁻³ Hz. The number of minor cycles per block
and the number of blocks applied were 300 cycles and 61 blocks, respectively. The static
hold duration at R = 1 was the same as the duration of minor cycles in each loading
block: 15.5 hours.
For comparison, similar tests were also conducted in air. The only difference in loading
conditions from those in solution was that the number of blocks was in a range of 30 for
R ratio 0.7, to 1500 for R ratio 1 to achieve a certain amount of crack advancement; and
that the R ratio of minor cycles was selected to be at 0.7, 0.8, 0.9, 0.94, 0.97 and 1.
5.3 Results
5.3.1 Dependence of crack growth rate on R ratio of underload
Tests in air: As shown in Fig. 5.4(a), both the crack growth rate measured and the linear
summation values calculated by Eq. (5-2) decrease with the R ratio of underload, and the
measured crack growth rates were higher than the linear summation values at all R ratios.
The measured crack growth rate varied from 6.99×10⁻⁴ mm/block at underload R = 0.1 to
1.40×10⁻⁴ mm/block at underload R = 0.9. At the later condition, the variable amplitude
MPa m

174
fatigue waveform becomes the constant amplitude fatigue, and thus the measured
variable amplitude crack growth rate is merged with the value of linear summation.
0.0 0.2 0.4 0.6 0.8 1.0
2.0x10⁻⁴
4.0x10⁻⁴
6.0x10⁻⁴
8.0x10⁻⁴
1.0x10⁻³
Cra
ck
gro
wth
rate
, m
m/b
lock
R ratio of underload
Measured crack growth rate
Linear summation
(a)
(b)
Figure 5.4 Crack growth behaviors of test of R ratio of underload in air: a) crack
growth rate; and b) acceleration factor
175
The effect of the underload R ratio on the acceleration factor is shown in Fig. 5.4(b). It
can be seen that the acceleration factor increased from about 2.0 at underload R = 0.1 to a
maximum value of 2.7 at R = 0.5, and it then dropped to 1.5 at R = 0.8.
Tests in C2 solution: Similar to the results obtained from tests in air, both linear
summation and the measured crack growth rate in the C2 solution decreased with
increasing underload R ratios, as seen in Fig. 5.5(a). However, the linear summation
curve intercepted the variable amplitude curve at around R = 0.2, below which the linear
summation value was higher than the variable amplitude crack growth rates. Unlike the
case in air, the two curves did not approach to a merging point at higher R-ratios in C2
solution.
The acceleration factor in C2 solution is shown in Fig. 5.5(b). It can be seen that the
acceleration factor increased with the underload R ratio, from 0.52 (deceleration) at R =
0.1 to 3.29 at R = 0.5. When R is about 0.6, the mechanical driving forces for constant
amplitude fatigue are reduced to the threshold in the C2 solution [6], and thus the
acceleration factor increased sharply with increasing R ratios (dash line).
5.3.2 Dependence of crack growth rate on R ratio of minor cycles
Tests in air: As seen in Fig. 5.6(a), both the measured crack growth rate and the linear
summation decreased with the R ratio of minor cycles. The measured variable amplitude
crack growth rate varied from 3.43×10⁻³ mm/block at R ratio 0.7 to 3.56×10⁻⁵ mm/block

176
at R ratio 1 (static hold). At R = 1, the variable amplitude fatigue waveform becomes
underload + static hold. At R ratio 1, the difference in crack growth rate between the
measured and the linear summation is small, about 16%, and the measured value appears
lower than the calculated value. This difference, on one hand, could be attributed to
experimental scatters. On the other hand, the difference could be related to the effect of
hold, a non-cyclic condition, which is further discussed later.
The acceleration factor is shown in Fig. 5.6(b). It can be seen that the acceleration factor
reaches a maximum value, about 2, at the R ratio of minor cycles 0.9.
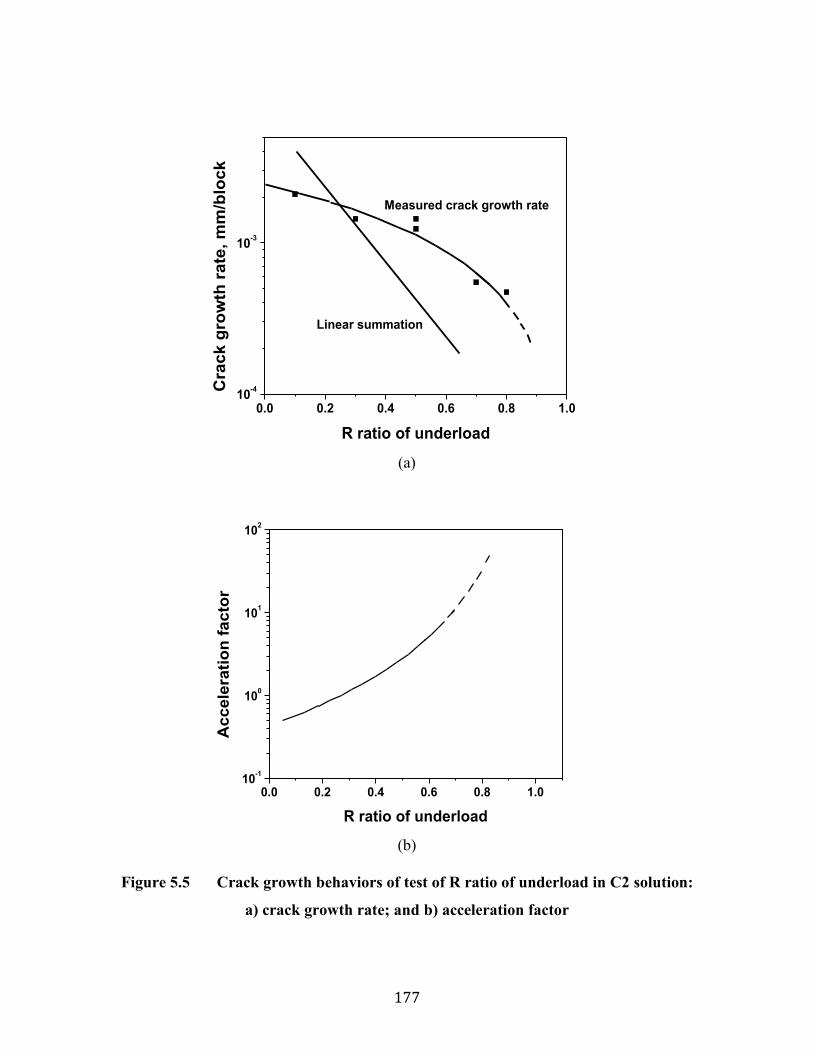
177
0.0 0.2 0.4 0.6 0.8 1.010
-4
10-3
Cra
ck
gro
wth
rate
, m
m/b
lock
R ratio of underload
Measured crack growth rate
Linear summation
(a)
0.0 0.2 0.4 0.6 0.8 1.010
-1
100
101
102
Ac
ce
lera
tio
n f
ac
tor
R ratio of underload
(b)
Figure 5.5 Crack growth behaviors of test of R ratio of underload in C2 solution:
a) crack growth rate; and b) acceleration factor
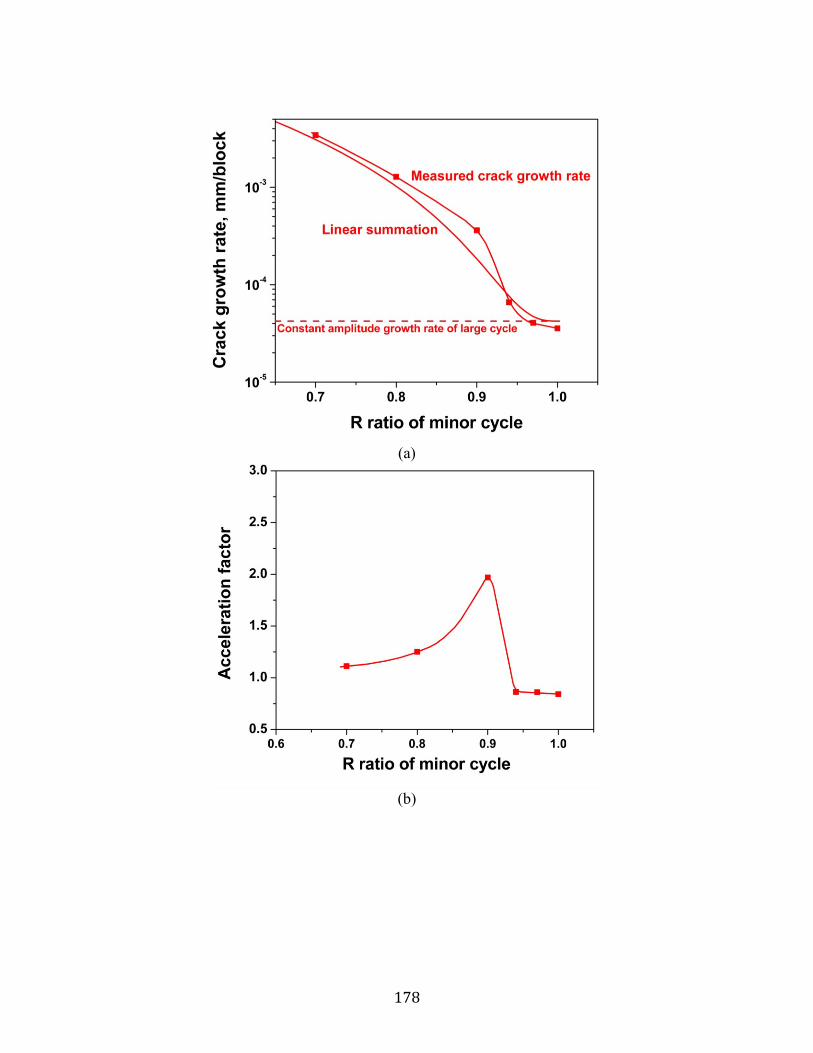
178
(a)
(b)
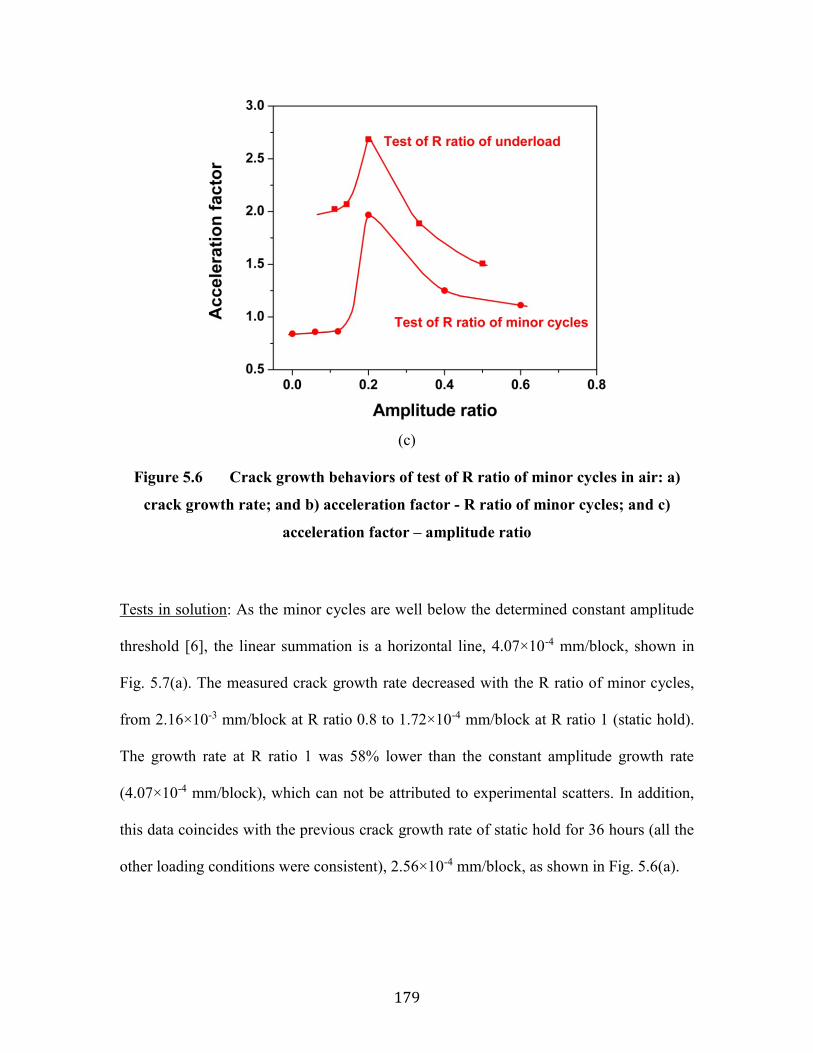
179
(c)
Figure 5.6 Crack growth behaviors of test of R ratio of minor cycles in air: a)
crack growth rate; and b) acceleration factor - R ratio of minor cycles; and c)
acceleration factor – amplitude ratio
Tests in solution: As the minor cycles are well below the determined constant amplitude
threshold [6], the linear summation is a horizontal line, 4.07×10⁻⁴ mm/block, shown in
Fig. 5.7(a). The measured crack growth rate decreased with the R ratio of minor cycles,
from 2.16×10⁻³ mm/block at R ratio 0.8 to 1.72×10⁻⁴ mm/block at R ratio 1 (static hold).
The growth rate at R ratio 1 was 58% lower than the constant amplitude growth rate
(4.07×10⁻⁴ mm/block), which can not be attributed to experimental scatters. In addition,
this data coincides with the previous crack growth rate of static hold for 36 hours (all the
other loading conditions were consistent), 2.56×10⁻⁴ mm/block, as shown in Fig. 5.6(a).

180
The acceleration factor, as can be seen in Fig. 5.7(b), had the same trend as the measured
crack growth rate, decreasing with the R ratio of minor cycles, from 5.3 at R ratio 0.8 to
0.42 (retardation in fact) at R ratio 1.
5.3.3 Dependence of acceleration factor on amplitude ratio
The amplitude ratio, as defined as the ratio of minor cycle amplitude over underload
amplitude, is used to rationalize the acceleration factor. The amplitude ratio was
calculated for amplitude tests of underload and minor cycles, as shown in Figs. 5.6(c) and
5.7(c). For tests in air in Fig. 5.6(c), it can be seen that the acceleration factor reached a
peak value at amplitude ratio 0.2 for both underload and minor cycle amplitude tests,
instead of at amplitude ratio 0.5 found in other materials in Ref. [15,16,28]. For tests in
the near-neutral pH solution, the acceleration factor increased with the amplitude ratio,
and no peak value appeared, as shown in Fig. 5.7(c).
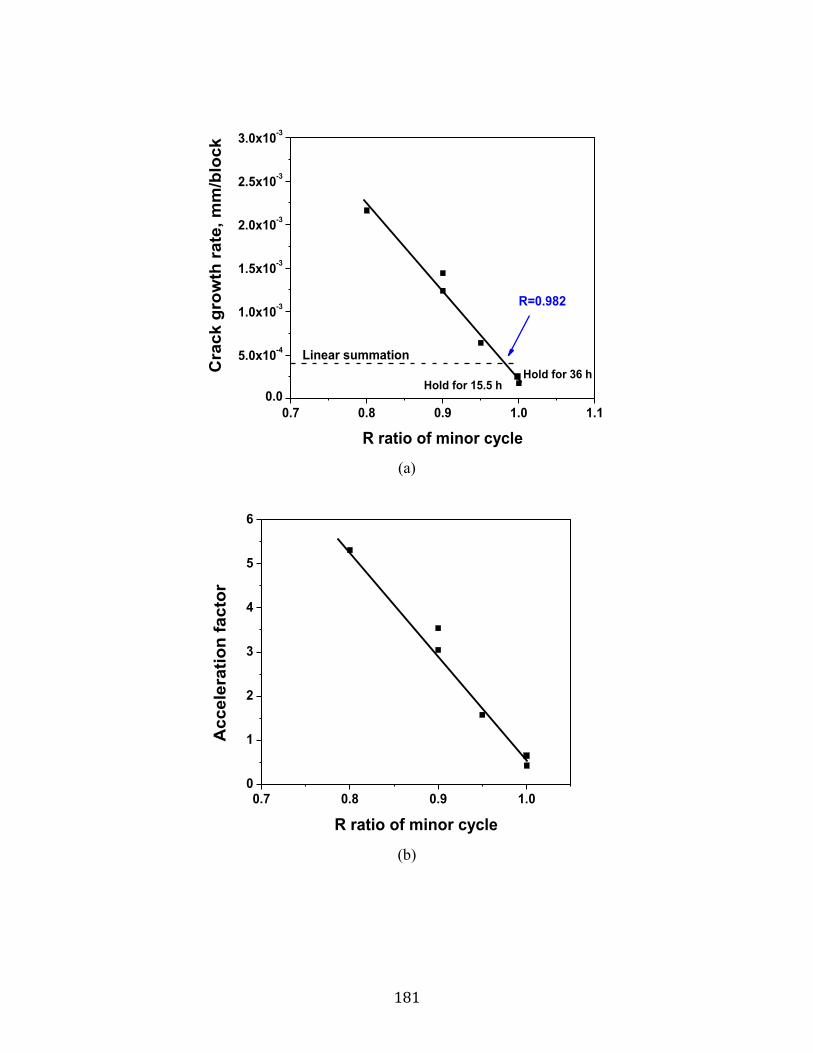
181
0.7 0.8 0.9 1.0 1.1
0.0
5.0x10⁻⁴
1.0x10⁻³
1.5x10⁻³
2.0x10⁻³
2.5x10⁻³
3.0x10⁻³
Cra
ck
gro
wth
rate
, m
m/b
lock
R ratio of minor cycle
R=0.982
Linear summation
Hold for 36 hHold for 15.5 h
(a)
0.7 0.8 0.9 1.00
1
2
3
4
5
6
Ac
ce
lera
tio
n f
ac
tor
R ratio of minor cycle
(b)
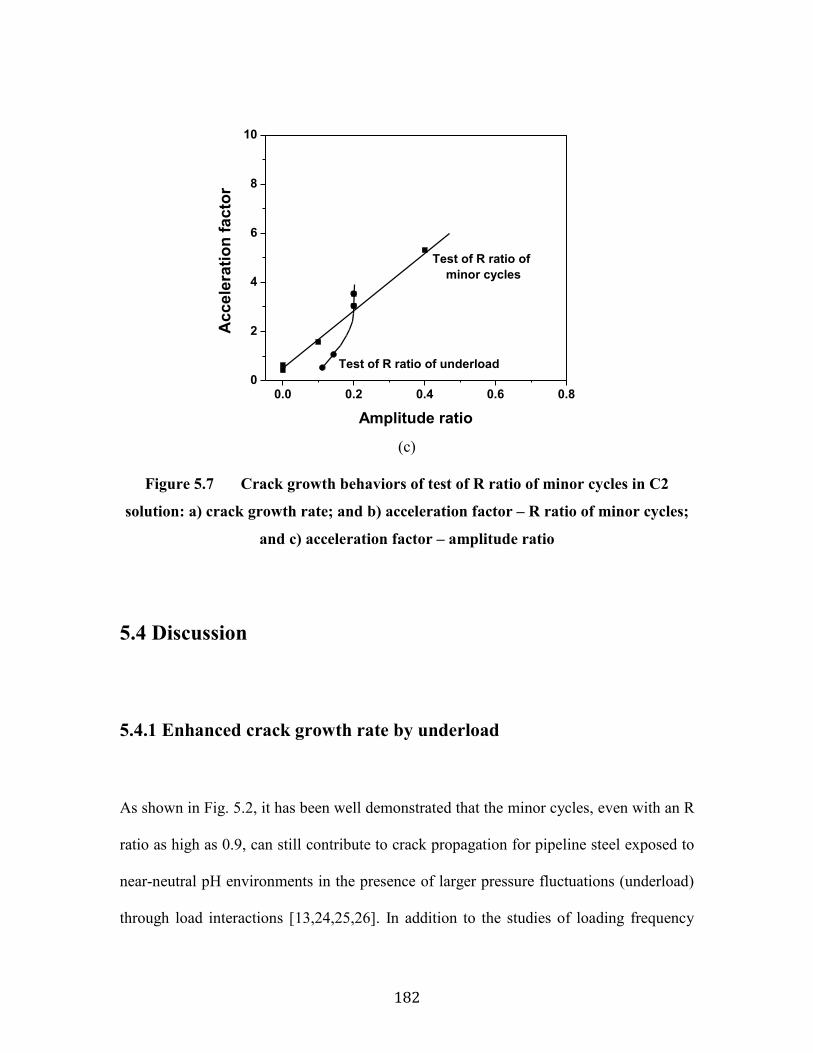
182
0.0 0.2 0.4 0.6 0.80
2
4
6
8
10
Test of R ratio of underload
Accele
rati
on
facto
r
Amplitude ratio
Test of R ratio of
minor cycles
(c)
Figure 5.7 Crack growth behaviors of test of R ratio of minor cycles in C2
solution: a) crack growth rate; and b) acceleration factor – R ratio of minor cycles;
and c) acceleration factor – amplitude ratio
5.4 Discussion
5.4.1 Enhanced crack growth rate by underload
As shown in Fig. 5.2, it has been well demonstrated that the minor cycles, even with an R
ratio as high as 0.9, can still contribute to crack propagation for pipeline steel exposed to
near-neutral pH environments in the presence of larger pressure fluctuations (underload)
through load interactions [13,24,25,26]. In addition to the studies of loading frequency

183
[25], maximum stress [25] and number of minor cycles [26] on crack growth rate, the
amplitude effects in the current investigation have also confirmed the accelerated crack
growth effects both in air and in the near-neutral pH environments, as shown in Figs. 4-7.
It can be seen that the established models based on constant amplitude fatigue, such as
the Paris Law [5], superposition model [2], crack closure [10], two driving force [11] and
combined factor [6], significantly underestimate the crack growth of pipeline steel under
random pressure fluctuations. The observations of load interaction could well bridge the
large discrepancy between predicted service life and field observations [13,24,25].
This investigation has also found some unique crack growth behavior characteristics of
pipeline steels under the underload-type variable amplitude fatigue. The acceleration
factor reached the maximum at amplitude ratio 0.2 in air, and no peak value was
observed for tests in the near-neutral pH environments, while a peak value of the
acceleration factor was reported at amplitude ratio 0.5 for several other materials
[15,16,28]. This further confirms that the crack growth acceleration under variable
loading is both material- and environment-sensitive [15,23,28].
The mechanisms of the acceleration effect induced by underloads, such as crack closure,
residual stress, strain hardening and change in dislocation structures, have been discussed
in Ref. [26]. Although strain softening and the change in dislocation structures were
suspected to be the mechanisms, further research should be conducted.

184
5.4.2 Reduced corrosion fatigue threshold by underload
As shown in Fig. 5.7(a), when the minor cycles were replaced by static hold while
keeping other conditions constant, the block crack growth rate was reduced by 58%. Thus
the static hold could actually retard crack propagation caused by underload. A similar
result was also found when the period of static hold was increased to 36 hours, while the
other conditions were kept the same as those in the current investigations [24]. This
observation echoes the conclusion made in many previous studies that crack growth in
near-neutral pH environments does not occur under static tensile stress (a condition of
SCC), with an exception of crack formation in the stage of initiation, where a crack forms
through galvanic corrosion [3,30].
Based on the above observations, it is possible to define the critical R ratio of minor
cycles below which minor cycles make a contribution to crack growth through load
interaction. The relationship between the growth rate, (da/dN)block in terms of millimeter
per block, and the R ratio of minor cycles (including static hold for 15.5 hours) can be
expressed as:
(𝑑𝑎
𝑑𝑁)
𝑏𝑙𝑜𝑐𝑘= 0.010 − 0.010 × 𝑅𝑚𝑖𝑛𝑜𝑟 (5 − 3)
The critical R ratio of minor cycles is the intercept between the linear relation defined in
Eq. (5-3) with a horizontal line, that is, 0.982, as shown in Fig. 5.7(a). It corresponds to a
stress intensity factor range of 0.594MPa m .

185
The determination of the critical R ratio of minor cycles makes it possible to clearly
demarcate the true boundary between SCC and corrosion fatigue. This boundary is
usually defined based on the constant amplitude fatigue threshold, which is about 10
MPa m for pipeline steel in NNpHSCC [6] and about 3MPa m for most engineering
materials in air [32]. These defined boundaries are obviously much higher than the
critical amplitude of minor cycles determined with a consideration of load interactions,
which is found to be as low as 0.594 MPa m in the current investigation.
Another application of this critical R ratio is to filter the raw data of stress fluctuations.
To analyze the loading history data of structures in service, a data filter is usually set to
remove the intermediate points and small stress cycles that are thought to be too small to
cause any fatigue damage [17]. However, such filters are often set arbitrarily. Based on
the current investigation, this filter could be as low as 0.594 MPa m .
The effect of load interactions should also be incorporated into fatigue design for
engineering structures or components with routine stress fluctuations and/or frequent
shutdown-restart cycles. Traditionally, engineering structures are designed either based
on the stress-number of cycles to failure (S-N) curve [33] or fracture mechanics criteria
[32]. However, based on Ref. [34] and the current investigation, the traditional fatigue
design approaches would significantly underestimate the fatigue damage, even if the
safety factor is selected at 10 [24].

186
5.4.3 Effects of environments on crack growth behaviors
The role of environments in the crack propagation of pipeline steels can be determined by
comparing the crack growth rates in the near-neutral pH solution with those in air under
the same loading conditions. This is shown in Fig. 5.8. It can be seen that the crack
growth rate in C2 solution is higher than that in air.
An environmental factor is used to determine the role of environments on crack growth.
The environmental factor is defined as the ratio of crack growth rate in solution divided
by that in air. As seen in Fig. 5.9, the environmental factor decreased with the R ratio of
underload, from three at underload R = 0.1 to about two at underload R = 0.8, while it
increased to a peak value of 10.7 at the R ratio of minor cycles 0.95, and then decreased
to 4.8 at the R ratio of minor cycles 1 (static hold). (As no test was performed at the R
ratio of minor cycles 0.95 in air, the crack growth rate at R ratio 0.95 was obtained from
linear interception.)
As well documented in previous studies, the contribution of near-neutral pH
environments to crack propagation was attributed to hydrogen embrittlement (HE)
[12,25]. However, HE alone was not sufficient to rationalize the observed crack growth
behavior [25]. The synergistic interaction between HE and the underload cycles must be
considered. Based on the current investigation and those reported previously
[1,6,13,17,24,25,26,27,30], crack propagation behavior in the current corrosion fatigue
system is believed to be governed by the following four factors:
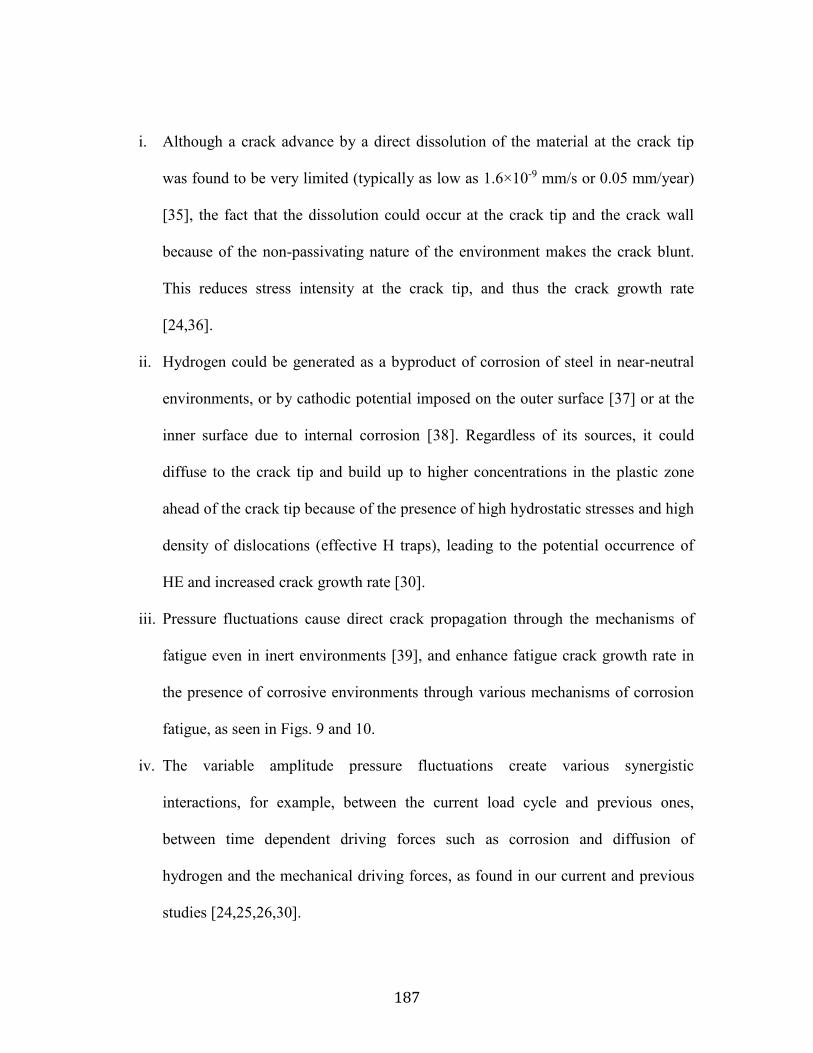
187
i. Although a crack advance by a direct dissolution of the material at the crack tip
was found to be very limited (typically as low as 1.6×10⁻⁹ mm/s or 0.05 mm/year)
[35], the fact that the dissolution could occur at the crack tip and the crack wall
because of the non-passivating nature of the environment makes the crack blunt.
This reduces stress intensity at the crack tip, and thus the crack growth rate
[24,36].
ii. Hydrogen could be generated as a byproduct of corrosion of steel in near-neutral
environments, or by cathodic potential imposed on the outer surface [37] or at the
inner surface due to internal corrosion [38]. Regardless of its sources, it could
diffuse to the crack tip and build up to higher concentrations in the plastic zone
ahead of the crack tip because of the presence of high hydrostatic stresses and high
density of dislocations (effective H traps), leading to the potential occurrence of
HE and increased crack growth rate [30].
iii. Pressure fluctuations cause direct crack propagation through the mechanisms of
fatigue even in inert environments [39], and enhance fatigue crack growth rate in
the presence of corrosive environments through various mechanisms of corrosion
fatigue, as seen in Figs. 9 and 10.
iv. The variable amplitude pressure fluctuations create various synergistic
interactions, for example, between the current load cycle and previous ones,
between time dependent driving forces such as corrosion and diffusion of
hydrogen and the mechanical driving forces, as found in our current and previous
studies [24,25,26,30].
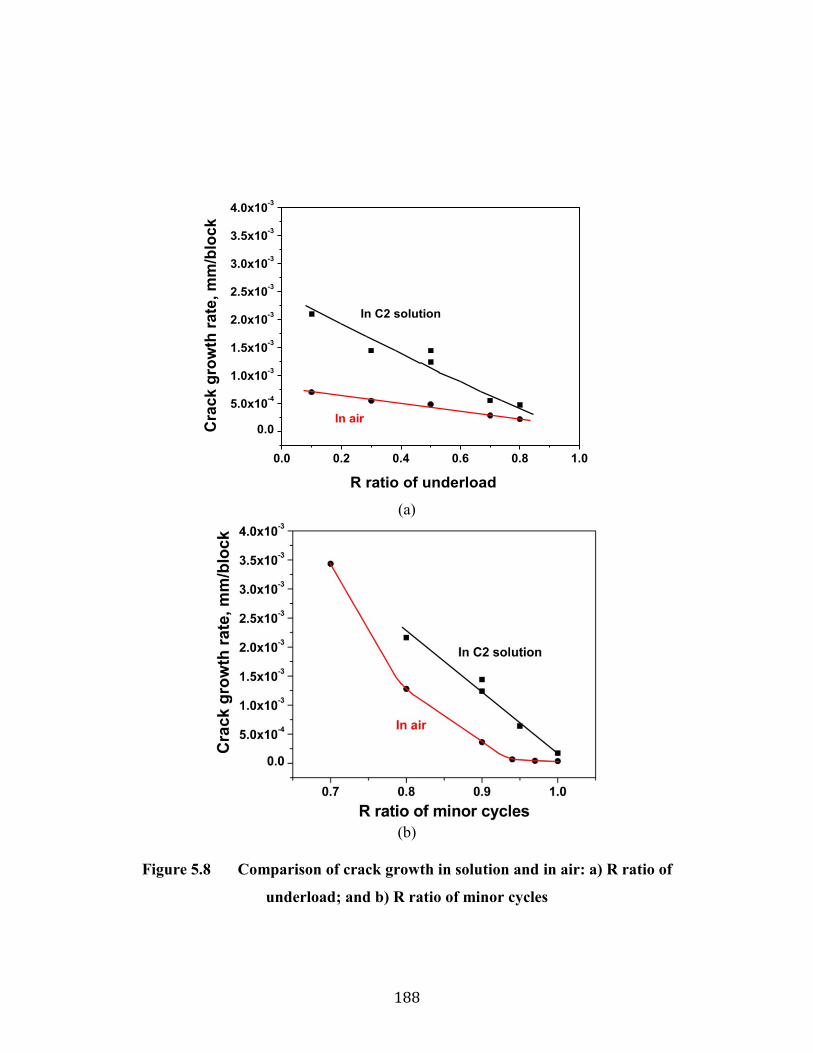
188
0.0 0.2 0.4 0.6 0.8 1.0
0.0
5.0x10⁻⁴
1.0x10⁻³
1.5x10⁻³
2.0x10⁻³
2.5x10⁻³
3.0x10⁻³
3.5x10⁻³
4.0x10⁻³
Cra
ck
gro
wth
rate
, m
m/b
lock
R ratio of underload
In air
In C2 solution
(a)
(b)
Figure 5.8 Comparison of crack growth in solution and in air: a) R ratio of
underload; and b) R ratio of minor cycles
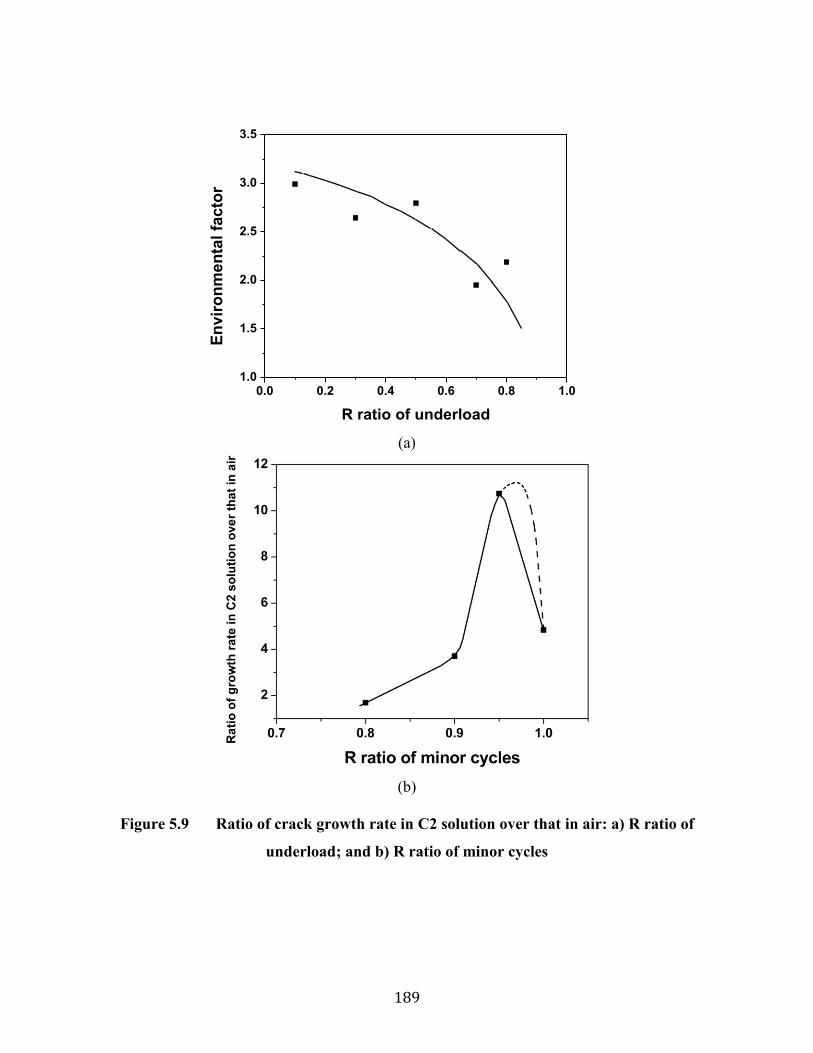
189
0.0 0.2 0.4 0.6 0.8 1.01.0
1.5
2.0
2.5
3.0
3.5
En
vir
on
me
nta
l fa
cto
r
R ratio of underload
(a)
(b)
Figure 5.9 Ratio of crack growth rate in C2 solution over that in air: a) R ratio of
underload; and b) R ratio of minor cycles
190
The results shown in Figs. 5.8 and 5.9 are a good reflection of the above four factors.
With the increasing R ratio of the underload cycle, the fact that both the crack growth rate
and the environmental factor decrease indicates that the underload component (and thus
the acceleration effect) is dominant in crack propagation in the current corrosion fatigue
system, which echoes the importance of fatigue (pressure fluctuations) in NNpHSCC [3-
30].
With the increasing R ratio of minor cycles, the environmental factor increases to a peak
value and hereafter drops, as can be seen in Fig. 5.9(b). This is believed to be the result of
from the following two opposite effects of the R of minor cycles on crack growth:
Higher R ratios of minor cycles favor hydrogen segregation to the crack tip that drives
crack growth through HE mechanisms,
Higher R ratios of minor cycles lower the mechanical driving force for fatigue crack
growth, and favor crack tip blunting through corrosion [36].
When these two opposite effects reach balance, a peak value of the environmental factor
is obtained, which should correlate to the critical R ratio of minor cycles in Section 4.2
where the minor cycles do not contribute to crack growth. Although the peak value in Fig.
5.9 (b) is shown at 0.95, it is supposed to be the critical R ratio of minor cycles, 0.982
(dash line), because no actual test was performed at the R ratio of minor cycles 0.95 in air
and the crack growth rate at R ratio 0.95 was obtained from linear interception.
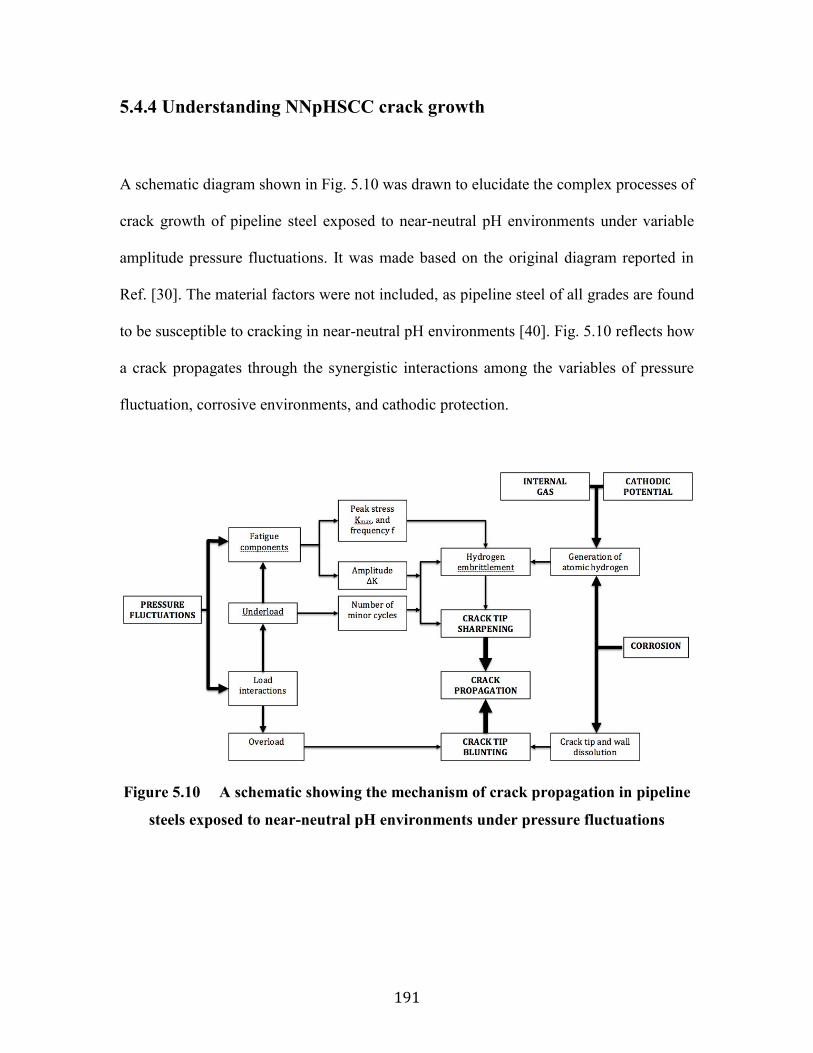
191
5.4.4 Understanding NNpHSCC crack growth
A schematic diagram shown in Fig. 5.10 was drawn to elucidate the complex processes of
crack growth of pipeline steel exposed to near-neutral pH environments under variable
amplitude pressure fluctuations. It was made based on the original diagram reported in
Ref. [30]. The material factors were not included, as pipeline steel of all grades are found
to be susceptible to cracking in near-neutral pH environments [40]. Fig. 5.10 reflects how
a crack propagates through the synergistic interactions among the variables of pressure
fluctuation, corrosive environments, and cathodic protection.
Figure 5.10 A schematic showing the mechanism of crack propagation in pipeline
steels exposed to near-neutral pH environments under pressure fluctuations
192
5.5 Conclusions
A comparative study of X60 pipeline steel was performed in air and in a near-neutral pH
environments under variable amplitude fatigue. The underload waveform was designed
based on the pressure fluctuations during pipeline routine operations. The effects of
amplitudes (R ratios) of underload and minor cycles have been investigated. It has been
found from this investigation that:
1) The crack growth rate was enhanced significantly through load interaction of the
variable amplitude fatigue. The acceleration factor could be up to 2.7 and 5.3 for tests
in air and in the near-neutral pH solution, respectively.
2) The crack growth rate decreased with R ratios of underload and minor cycles for tests
for both in air and in the C2 solution.
3) The corrosive C2 solution could contribute to crack propagation by a factor up to 11
by comparing the crack growth rate in C2 solution and in air, which was attributed to
the synergistic interaction of mechanical loading and hydrogen embrittlement.
4) The critical R ratio of minor cycles at which the minor cycles do not contribute to
crack propagation through load interaction was determined to be as high as 0.982,
corresponding to 0.594 MPa m of the stress intensity factor range, which is much
lower than the threshold determined by constant amplitude fatigue. This critical R
ratio could be utilized to demarcate stress corrosion cracking and corrosion fatigue,
and should be incorporated as one of the design principles for components/structures
subjected to variable amplitude cyclic loading.
193
References
[1] S. Suresh. Fatigue of Materials, Second Edition, Cambridge University Press,
Cambrdge, UK, 1998 (Chapter 1).
[2] T. L. Anderson. Fracture Mechanics, Fundermentals and Applications, Third
Edition. Taylors & Francis Group, 2005. pp. 538-547.
[3] V. M. Pleskach and P. A. Averchenko. Effect of gaseous erosion on a decrease of
the fatigue strength of specimens of titanium alloy VT8. Plenum Publishing Corporation,
1976, No. 8, pp.118-119.
[4] H-J Christ, A Jung, H J Maier and R Teteruk. Sādhanā, Vol. 28, Parts 1 & 2,
February/April 2003, pp. 147–165.
[5] P. C. Paris. Fatigue—An Interdisciplinary Approach, Proceedings, 10th Sagamore
Conference, Syracuse University Press, Syracuse, NY, 1964, pp. 107.
[6] B.L. Boyce and R.O. Ritchie. Engineering Fracture Mechanics 68 (2001) 129-
147.
[7] M. O. Speidel, S. Stanzl and E. Tschegg: Z. Werkstofftech., 1980, 11, 305-308.
[8] Arnaud Macadre, Maxim Artamonov, Saburo Matsuoka, Jader Furtado.
Engineering Fracture Mechanics 78 (2011) 3196-3211.
[9] Kamel Makhlouf and J.W. Jones. International Journal of Fatigue. Vol. 15, No. 3,
pp.163-171.
[10] Elber, Wolf. Engineering Fracture Mechanics, Vol. 2, No. 1, 1970, pp.37-44.
[11] A.K. Vasudevan, K. Sadananda, G. Glinka. Vol. 23, 2001, pp. 39-53.
194
[12] Weixing Chen and Robert L. Sutherby. Metallurgical and Materials Transactions
A 2007; 38A; pp. 1260-1268.
[13] Jiaxi Zhao, Weixing Chen, Richard Kania, Sean Keane, and Jenny Been.
Proceedings of IPC 2014, 10th International Pipeline conference, Sept. 29-Oct. 3, 2014,
Calgary, Alberta, Canada. Paper No. IPC2014-33325.
[14] C. Manfredi and J.L. Otegui. Engineering Failure Analysis, Vol. 9, 2002, pp. 495-
509.
[15] N. A. Fleck. Acta Metall. Vol. 33, No. 7, pp. 1339-1354, 1985.
[16] M. Skorupa. Fatigue & Fracture of Engineering Materials & Structures, 1998, 21:
987-1006.
[17] M. Skorupa. Fatigue & Fracture of Engineering Materials & Structures, 1999, 22:
905-926.
[18] Vasilios Zitounis. Fatigue Crack Growth Rates under Variable Amplitude Load
Spectra Containing Tensile Underloads. PhD thesis, Cranfield University, 28 October
2003.
[19] Stephan M. Russ. Effect of Underloads on Fatigue Crack Growth of Ti-17. PhD
thesis, Georgia Institute of Technology, October 2003.
[20] Fowler, K.R. and Watanabe, R.T.. Development of Jet Transport Airframe
Fatigue Test Spectra, Development of Fatigue Loading Spectra, ASTM STP 1006, J. M.
Potter and R. T. Watanabe, Eds., American Society for Testing and Materials,
Philadelphia, 1989, pp. 36-64.
195
[21] Sunder, R. Contribution of Individual Load Cycles to Crack Growth under
Aircraft Spectrum Loading, Advances in Fatigue Lifetime Predictive Techniques, ASTM
STP 1122, M. R. Mitchell and R. W. Landgraf, Eds., American Society for Testing and
Materials, Philadelphia, 1992, pp. 176-190.
[22] T. L. Anderson. Fracture Mechanics, Fundermentals and Applications, Third
Edition. Taylors & Francis Group, 2005. pp: 473-488.
[23] Ryoichi Koterazawa and Takayoshi Nosho. Fatigue & Fracture of Engineering
Materials & Structures, Vol. 15, No. 1, pp. 103-113, 1992.
[24] Mengshan Yu, Weixing Chen, Richard Kania, Greg Van Boven, and Jenny Been.
Proceedings of IPC 2014, 10th International Pipeline conference, Sept. 29-Oct. 3, 2014,
Calgary, Alberta, Canada. Paper No. IPC2014-33282.
[25] Mengshan Yu, Xiao Xing, Hao Zhang, Jiaxi Zhao, Reg Eadie, Weixing Chen,
Jenny Been, Greg Van Boven, Richard Kania. Corrosion fatigue crack growth of pipeline
steel under underload-type variable amplitude loading schemes. Submitted to Acta
Materialia (under review).
[26] Mengshan Yu, Weixing Chen, Richard Kania, Greg Van Boven, and Jenny Been.
Full paper submitted to Fatigue & Fracture of Engineering Materials & Structures (In
press, DOI: 10.1111/ffe.12274.).
[27] B. S. Delanty, J. O’Beirne. Major Field Study Compares Pipeline SCC with
Coatings. Oil & Gas Journal 15 (1992) 39-44.
196
[28] Vasilios Zitounis. Fatigue Crack Growth Rates under Variable Amplitude Load
Spectra Containing Tensile Underloads. PhD thesis, Cranfield University, 28 October
2003.
[29] National Energy Board (NEB), Focus on Safety and Environment a Comparative
Analysis of Pipeline Performace 2000-2007, July 2009.
[30] W. Chen, Richard Kania, Robert Worthingham, and Gregory Van Boven. Acta
Materialia 57 (2009) 6200-6214.
[31] Parkins RN. A review of stress corrosion cracking of high pressure gas pipelines
proceedings of corrosion 2000. Paper 00363. Houston, Texas: NACE International; 2000.
[32] T.L. Anderson. Fracture Mechanics, Fundermentals and Applications, Third
Edition. Taylors & Francis Group, 2005. pp: 451-500.
[33] Richard W. Hertzber. Deformation and Fracture Mechanics of Engineering
Materials, Fourth Edition, John Wiley and Sons, Inc., New York, NY, 1989, pp. 521-586.
[34] Yan-Hui Zhang, and S.J. Maddox. International Journal of Fatigue 31 (2009) 138-
152.
[35] Karina Chevil, Weixing Chen, Reg Eadie, Richard Kania, Greg Van Boven, and
Jenny Been. Proceedings of IPC 2014, 10th International Pipeline conference, Sept. 29-
Oct. 3, 2014, Calgary, Alberta, Canada. Paper No. IPC2014-33678.
[36] Afolabi Egbewande, Weixing Chen, Reg Eadie, Richard Kania, Greg Van Boven,
Robert Worthingham, Jenny Been. Corrosion Science, Vol. 83, June 2014: 343-354.
[37] C.F. Dong, Z.Y. Liu, X.G. Li and Y.F. Cheng. International Journal of Hydrogen
Energy 34 (2009) 9879-9884.
197
[38] R.L. Eadie, K.E. Szklarz and R.L. Sutherby. Corrosion, Vol. 61, No. 2, 2005, pp.
167-173
[39] R. Sunder, W. J. Porter and N. E. Ashbaugh. Fatigue Fract. Engng. Mater. Struct.,
Vol. 26, Issue 1, Jan. 2003: 1-16.
[40] National Energy Board (NEB), Report of the Inquiry-Stress Corrosion Cracking
on Canadian Oil and Gas Pipelines, 1996.
198
Chapter 6 Crack Growth Behavior of a Pipeline
Steel Exposed to a Near-Neutral pH Environment
under Variable Pressure Fluctuations: the Role of
Hydrogen
6.1 Introduction
Premature failures of many engineering components in the presence of hydrogen have
been extensively studied [1]. Understanding the role of hydrogen in these failures could
yield benefits to many industries, like material production [1], electroplating [2], oil/gas
transmission [3,4] and hydrogen energy [5]. However, the related mechanisms, especially
in steel, are still not fully understood, despite extensive researches for more than 100
years [6,7,8,9,10].
The shortened service lifetime or failures caused by hydrogen-assisted cracking have
been macroscopically attributed to the degradation of mechanical properties, such as
decreased ductility and fracture toughness (commonly known as hydrogen embrittlement,
or HE). The occurrence of HE could be affected by many factors, including material
factors such as chemical composition [11,12], phases [13], grain size [14], inclusions [15]
and surface conditions [16]; mechanical loading conditions such as loading rate [17], pre-
strain [17,18], and fatigue [11,19]; aggressive environments such as gaseous hydrogen
199
environments [11, 20 ], corrosive electrolytes [ 21 ], and cathodic potentials [ 22 ].
Contradictory results are often obtained by using different materials, or even using the
same material but under different testing conditions. These contradictory observations
result in debatable theories or micro-mechanisms.
Except for cracking caused by hydride formation [23], many micro-mechanisms have
been proposed [24], and each is supported by some experimental observations. But none
of the micro-mechanisms can explain all the experiment results [9]. Despite this, two of
them seem widely accepted: the hydrogen enhanced decohesion (HEDE) micro-
mechanism and the hydrogen enhanced localized plasticity (HELP) micro-mechanism.
The HEDE mechanism [25] assumes that lattice hydrogen reduces the bond strength of
host atoms and may cause brittle fracture through the cleavage of crystallographic planes,
especially at locations with high hydrogen concentrations. According to the micro-
mechanism of HELP [26], the macroscopic observation of HE is a result of the highly
localized deformation through ductile processes since the flow stress is reduced by the
high concentration of hydrogen in the plastic zone ahead of the crack tip [27,28]. The
enhanced dislocation mobility in the presence of hydrogen was supported by the in situ
TEM (transmission electron microscope) examinations [9,29,30].
Understanding the micro-mechanisms of hydrogen in the cracking of pipeline steel
externally exposed to near-neutral pH environments could yield benefits to the oil/gas
transmission industry [4,22,31,32,33,34,35 36,37]. Atomic hydrogen is generated on a

200
pipe surface as a by-product of corrosion or as a result of cathodic reactions. Only a small
fraction of the generated atomic hydrogen can enter into the lattice steel [35]. Once
entered, the hydrogen may first get trapped in a variety of locations, such as dislocations,
phase interfaces, grain boundaries, and stress raisers including corrosion pits and cracks.
The other hydrogen atoms which remain in the lattice and are diffusible are often
proposed to be responsible for the increased crack growth rate [1].
However, a clear physical process of HE in enhancing the crack growth of pipeline steels
exposed to near-neutral pH environments remains to be determined. It is challenging to
achieve a clear understanding of the process because of
1) The concurrent occurrence of corrosion and HE. Corrosion generates the hydrogen
required for HE to occur; however, corrosion also destroys or covers up the evidence
of HE on the fractured surface.
2) The uncertainty of the exact mechanism governing the HE between HELP and
HEDE. HELP is related to the enhanced plasticity, which can yield two different
effects: increased crack tip blunting caused by the enhanced plasticity and facilitated
formation of microvoids, which can cause micro-failures through the ductile failure
mechanism at the crack tip [38] or a quasi-cleavage process based on hydrogen-
dislocation interaction. On the other hand, HEDE is related to the occurrence of
micro-cleavage in the plastic zone, which is affected by 1) the level of hydrostatic
stress (in case of plane strain) and 2) the level of hydrogen segregation at the weakest
links located in the plastic zone, such as inclusions, grain boundaries, and phase
201
interfaces. Both of these two factors can also be explained by HELP micro-
mechnism.
3) The influence of the stress state, that is, plane stress vs. plane strain. The direct
evidence of HELP was identified in an in-situ transmission electron microscope
(TEM) examination using extremely thin film samples with a plane stress state, while
cracks in the bulk materials are primarily loaded in a plane strain state. The plane
strain condition was found to be the most severe micromechanical condition for HE
by studying single crystal materials [ 39 ]. But HE is microstructure sensitive
[13,14,15].
4) The effect of loading conditions. The above mechanisms are usually established
based on the experimental observations under static loading. In contrast, the cyclic
loadings, typically variable amplitude cyclic loadings, are often encountered for
structures in service. When cyclic loading (fatigue) is applied, which is itself a failure
mechanism, micro-mechanisms governing HE become even more complicated. A
lowered fatigue limit and enhanced fatigue crack growth rate have been observed in
many steel that are either serviced in gaseous hydrogen environments or are in
contact with aqueous electrolytes where atomic hydrogen is generated [11,19]. They
have been explained on the basis of HELP, as morphological features of the fracture
surface or dislocation slip bands on the surface are often altered in the presence of
atomic hydrogen [26]. However, the correlation of such changes with enhanced
fatigue crack growth or shortened fatigue life is often ambiguous.
202
Through an innovative experimental setup, this investigation was initiated to address all
of the above challenges. Compact tension specimens were utilized and comparatively
loaded in air and in corrosive near-neutral pH environments. For the latter environment,
the specimen was pre-immersed in the environment for sufficient periods of time,
allowing hydrogen equilibrium to be reached throughout the specimen with or without a
direct exposure of the cracks to the test environments, so that the effects of hydrogen
could be separated from those of corrosion. Variable amplitude cyclic loadings were
applied to simulate the stress states of pipelines in service. It is believed that
understanding the role of hydrogen in the cracking behavior in the current investigation
will shed light on other materials suffering hydrogen effects.
6.2 Experimental
6.2.1 Environment
Samples were charged with hydrogen (open circuit potential) in a near-neutral pH
solution, namely the C2 solution (0.0035 KCl, 0.0195 NaHCO3, 0.0255 CaCl2, 0.0274
MgSO4.7H2O, 0.0606 CaCO3 g/l), to simulate one type of the electrolytes trapped within
the coating disbondment on pipelines in the field, where stress cracking is observed. A
gas mixture of 5% CO2 balanced with nitrogen was purged through the C2 solution
before and during the test to achieve a stable pH value of 6.29 [31]. The temperature of
the solution and the environment during tests was controlled at a constant 30 ± 0.1°C
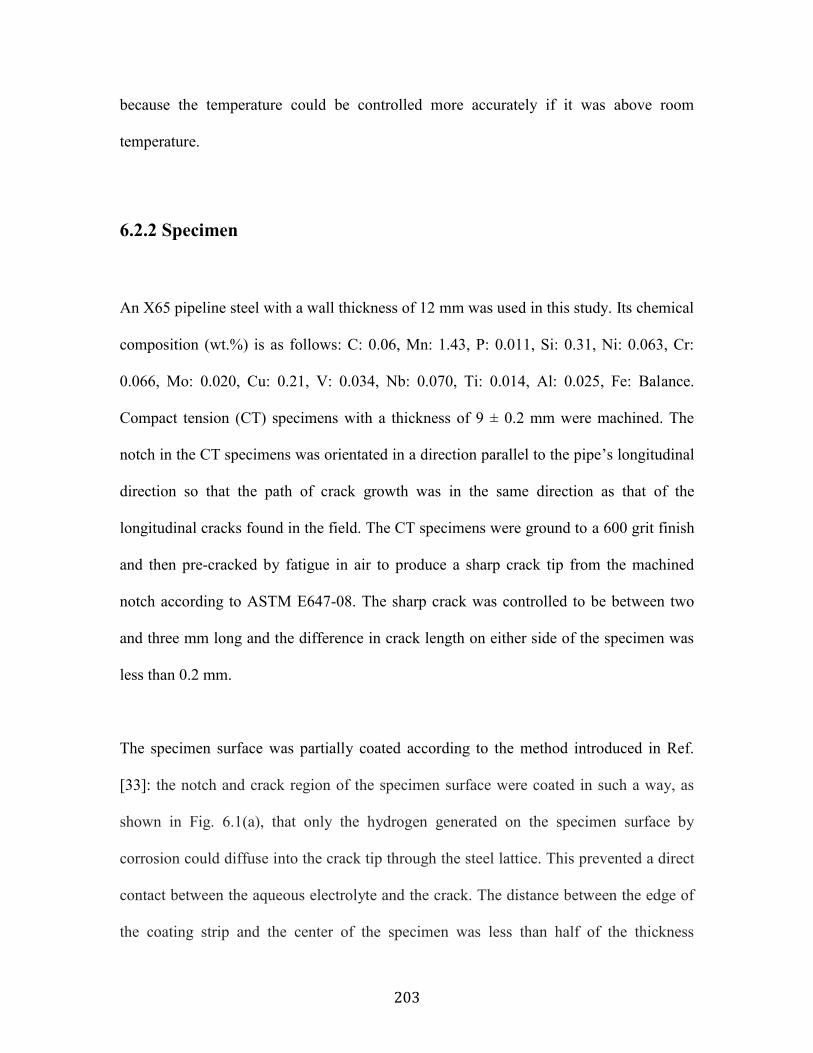
203
because the temperature could be controlled more accurately if it was above room
temperature.
6.2.2 Specimen
An X65 pipeline steel with a wall thickness of 12 mm was used in this study. Its chemical
composition (wt.%) is as follows: C: 0.06, Mn: 1.43, P: 0.011, Si: 0.31, Ni: 0.063, Cr:
0.066, Mo: 0.020, Cu: 0.21, V: 0.034, Nb: 0.070, Ti: 0.014, Al: 0.025, Fe: Balance.
Compact tension (CT) specimens with a thickness of 9 ± 0.2 mm were machined. The
notch in the CT specimens was orientated in a direction parallel to the pipe’s longitudinal
direction so that the path of crack growth was in the same direction as that of the
longitudinal cracks found in the field. The CT specimens were ground to a 600 grit finish
and then pre-cracked by fatigue in air to produce a sharp crack tip from the machined
notch according to ASTM E647-08. The sharp crack was controlled to be between two
and three mm long and the difference in crack length on either side of the specimen was
less than 0.2 mm.
The specimen surface was partially coated according to the method introduced in Ref.
[33]: the notch and crack region of the specimen surface were coated in such a way, as
shown in Fig. 6.1(a), that only the hydrogen generated on the specimen surface by
corrosion could diffuse into the crack tip through the steel lattice. This prevented a direct
contact between the aqueous electrolyte and the crack. The distance between the edge of
the coating strip and the center of the specimen was less than half of the thickness

204
(4.5 mm) of the specimen. These specimens were sealed in test cells and pre-exposed to
C2 solution under a very low load (0.5 kN) for about 300 h, the time during which
hydrogen equilibrium is believed to be achieved throughout the specimen (hydrogen
diffusivity in steel of 2 × 10⁻⁷ cm2/s [40]).
(a)
(b)
Figure 6.1 Experimental (a) surface treated compact tension specimen; and (b)
variable amplitude waveform: Kmax = 33 MPa√m, R ratio of minor cycles = 0.9, R
ratio of underload =0.5, frequency of minor cycles = 0.00538 Hz, frequency of
underload =0.0000278 Hz (10 h/cycle), number of minor cycles per block n = 1000
Time
Stress
Rminor=0.9
Runderload=0.5
n=1000
10 h One block
Epoxy coated
<4.5 mm
Minor cycles
Underload
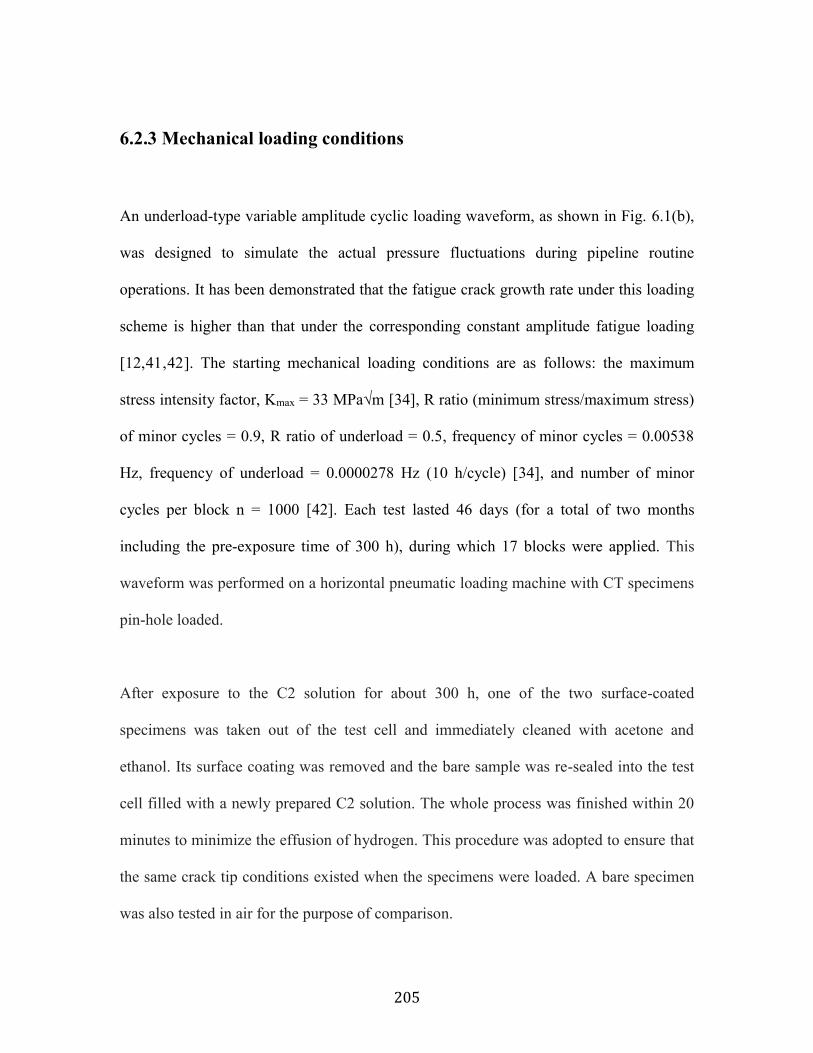
205
6.2.3 Mechanical loading conditions
An underload-type variable amplitude cyclic loading waveform, as shown in Fig. 6.1(b),
was designed to simulate the actual pressure fluctuations during pipeline routine
operations. It has been demonstrated that the fatigue crack growth rate under this loading
scheme is higher than that under the corresponding constant amplitude fatigue loading
[12,41,42]. The starting mechanical loading conditions are as follows: the maximum
stress intensity factor, Kmax = 33 MPa√m [34], R ratio (minimum stress/maximum stress)
of minor cycles = 0.9, R ratio of underload = 0.5, frequency of minor cycles = 0.00538
Hz, frequency of underload = 0.0000278 Hz (10 h/cycle) [34], and number of minor
cycles per block n = 1000 [42]. Each test lasted 46 days (for a total of two months
including the pre-exposure time of 300 h), during which 17 blocks were applied. This
waveform was performed on a horizontal pneumatic loading machine with CT specimens
pin-hole loaded.
After exposure to the C2 solution for about 300 h, one of the two surface-coated
specimens was taken out of the test cell and immediately cleaned with acetone and
ethanol. Its surface coating was removed and the bare sample was re-sealed into the test
cell filled with a newly prepared C2 solution. The whole process was finished within 20
minutes to minimize the effusion of hydrogen. This procedure was adopted to ensure that
the same crack tip conditions existed when the specimens were loaded. A bare specimen
was also tested in air for the purpose of comparison.
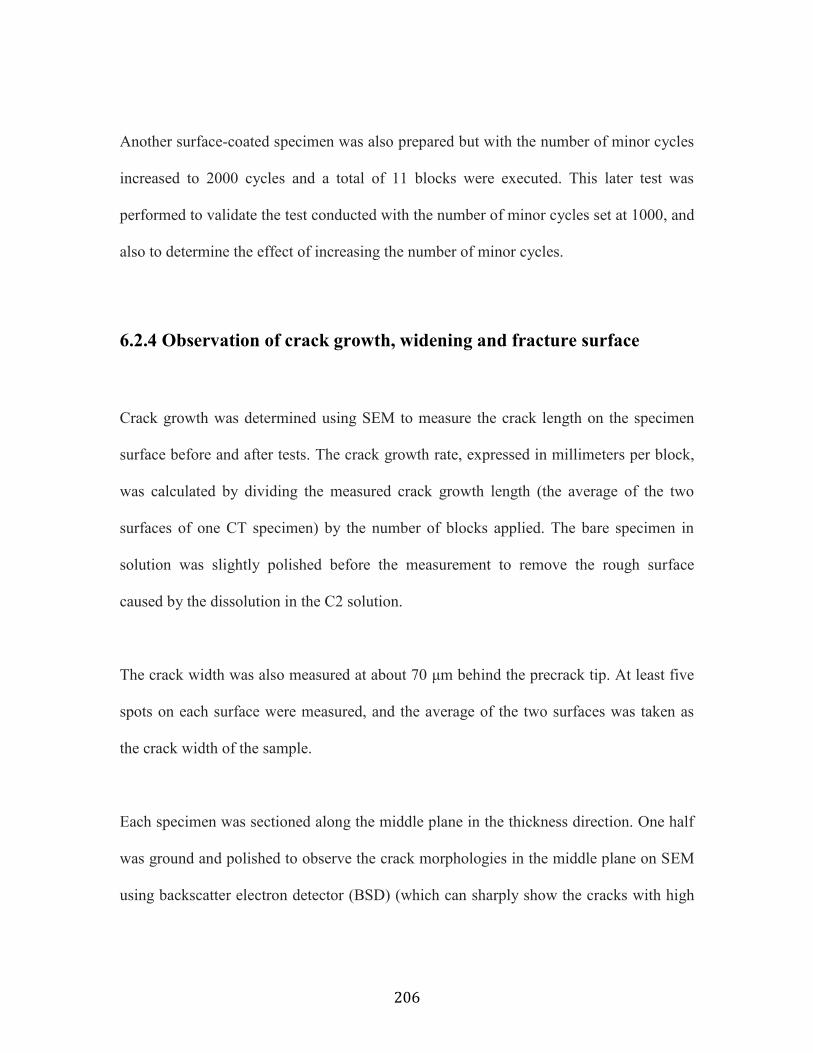
206
Another surface-coated specimen was also prepared but with the number of minor cycles
increased to 2000 cycles and a total of 11 blocks were executed. This later test was
performed to validate the test conducted with the number of minor cycles set at 1000, and
also to determine the effect of increasing the number of minor cycles.
6.2.4 Observation of crack growth, widening and fracture surface
Crack growth was determined using SEM to measure the crack length on the specimen
surface before and after tests. The crack growth rate, expressed in millimeters per block,
was calculated by dividing the measured crack growth length (the average of the two
surfaces of one CT specimen) by the number of blocks applied. The bare specimen in
solution was slightly polished before the measurement to remove the rough surface
caused by the dissolution in the C2 solution.
The crack width was also measured at about 70 μm behind the precrack tip. At least five
spots on each surface were measured, and the average of the two surfaces was taken as
the crack width of the sample.
Each specimen was sectioned along the middle plane in the thickness direction. One half
was ground and polished to observe the crack morphologies in the middle plane on SEM
using backscatter electron detector (BSD) (which can sharply show the cracks with high
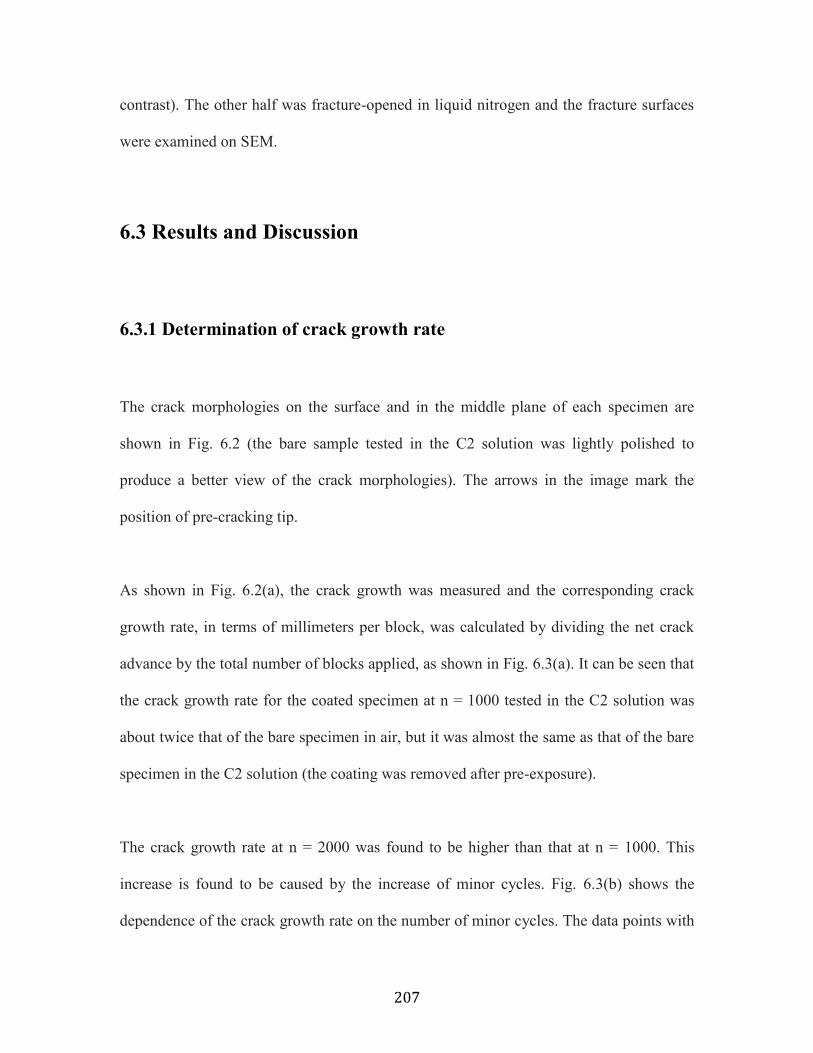
207
contrast). The other half was fracture-opened in liquid nitrogen and the fracture surfaces
were examined on SEM.
6.3 Results and Discussion
6.3.1 Determination of crack growth rate
The crack morphologies on the surface and in the middle plane of each specimen are
shown in Fig. 6.2 (the bare sample tested in the C2 solution was lightly polished to
produce a better view of the crack morphologies). The arrows in the image mark the
position of pre-cracking tip.
As shown in Fig. 6.2(a), the crack growth was measured and the corresponding crack
growth rate, in terms of millimeters per block, was calculated by dividing the net crack
advance by the total number of blocks applied, as shown in Fig. 6.3(a). It can be seen that
the crack growth rate for the coated specimen at n = 1000 tested in the C2 solution was
about twice that of the bare specimen in air, but it was almost the same as that of the bare
specimen in the C2 solution (the coating was removed after pre-exposure).
The crack growth rate at n = 2000 was found to be higher than that at n = 1000. This
increase is found to be caused by the increase of minor cycles. Fig. 6.3(b) shows the
dependence of the crack growth rate on the number of minor cycles. The data points with
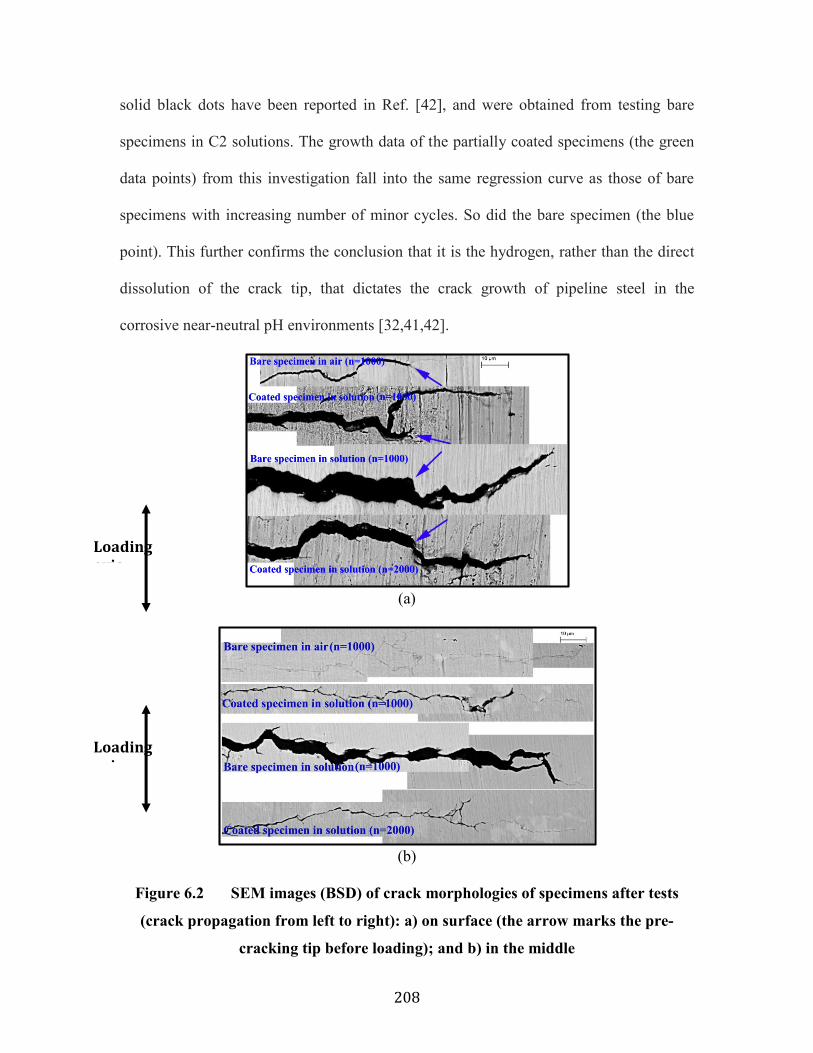
208
solid black dots have been reported in Ref. [42], and were obtained from testing bare
specimens in C2 solutions. The growth data of the partially coated specimens (the green
data points) from this investigation fall into the same regression curve as those of bare
specimens with increasing number of minor cycles. So did the bare specimen (the blue
point). This further confirms the conclusion that it is the hydrogen, rather than the direct
dissolution of the crack tip, that dictates the crack growth of pipeline steel in the
corrosive near-neutral pH environments [32,41,42].
(a)
(b)
Figure 6.2 SEM images (BSD) of crack morphologies of specimens after tests
(crack propagation from left to right): a) on surface (the arrow marks the pre-
cracking tip before loading); and b) in the middle
Loading axis
Loading axis

209
(a)
(b)
Figure 6.3 (a) Measured crack growth rate; and (b) effects of number of minor
cycles on crack growth rate in C2 solution and in air [42]. The data in the current
investigation were shown as colored dots.

210
Figure 6.4 Fracture surface images (SE) in the middle (crack propagation). The
marked zone is the crack growth (from left to right) during the test. Eleven blocks
were applied to the coated specimen in solution at n = 2000, while 17 blocks were
performed for others.
Since the position of the pre-cracking tip in the middle plane of the specimen is unknown
in Fig. 6.2(b), the crack growth rate in the middle plane was determined based on the
(a) Bare specimen in air, n=1000 (b) Coated specimen in solution, n=1000
(c) Bare specimen in solution, n=1000 (d) Coated specimen in solution, n=2000

211
morphologies on the fractured surface opened in liquid nitrogen. As shown in Fig. 6.4,
the crack advancement (the marked zone) was found to be consistent with that measured
from the surface, which suggests that the crack growth was not affected by the stress
state: that is, plane stress on the surface and plane strain in the middle. This seems
inconsistent with the conclusion drawn in Ref. [39] on the study of a Fe-Si single crystal.
It should be noted that the surface surrounding the pre-cracking tip of the partially coated
specimen tested at the n = 1000 cycle was slightly corroded as shown in Fig. 6.2(a).
However, no corrosion was observed on the surface for the partially coated specimen
tested at n = 2000 cycles. Corrosion products were observed on the fracture surface for
the partially coated specimens as shown in Fig. 6.4. These products were probably caused
by moistures trapped in the crack crevice. However, the fact that there is a much
narrower crack crevice in the middle plane in Fig. 6.2(b) suggests the negligible influence
of the corrosion. The implication of different crack crevices observed is further discussed
in the following section.
6.3.2 Characterization of crack width
Significant variations in the width of the crack crevice are found, as shown in Fig. 6.2.
Major observations are summarized as follows:

212
1) The bare specimen exposed in the C2 solution shows the largest crack crevice
compared with that of other specimens. The crack crevice in the middle plane is much
narrower than the corresponding surface crack width.
2) It is surprising that the crack crevice at the surface of the partially coated specimens
in solution is wider than that in air. It is even more surprising that the crack crevice in
the middle plane of these two specimens is very narrow, although it is slightly wider
than that of specimen tested in air. The possible reason, due to corrosion, has been
excluded, as stated above.
3) The specimen tested in air has a much narrower crack crevice at the surface than
other specimens, but its crevice on surface is slightly wider than that in its own
middle plane.
To further understand the mechanisms governing the widening of the crack crevice, the
crack width at the position about 70 μm behind the pre-cracking tip was measured and
compared in Fig. 6.5. It is obvious that the width of the crack crevice can be related to the
following factors:
1) Direct corrosion: This explains the wider crack crevice of the bare specimen tested in
solution, as compared with the partially coated specimens. The crack crevice in the
middle plane, which is narrower than that on the surface, is related to the reduced
corrosion rate inside the crack crevice, which is a unique phenomenon for the
corrosion of pipeline steel in near-neutral pH environments [ 43 ] and is also

213
responsible for the occurrence of crack dormancy in crack depth direction commonly
found in crack colonies in the field [37].
2) Stress state (plane stress vs. plane strain)-dependent mechanical blunting: It is well
accepted that the crack tip at the surface is in plane stress, while that in the middle
plane is in plane stain. This can explain why a slightly wider crack crevice is found at
the surface than that in the middle for the specimen tested in air (without hydrogen or
corrosion). However, as shown in Fig. 6.2, the very narrow crack crevice tested in air,
compared with that tested in solution, indicates that blunting due to mechanical
loading alone is very limited.
3) Crack closure [44]: It might occur and contribute to crack widening in the presence of
corrosion products within the crack crevice. However, it is usually observed during
cyclic loading with small R ratios, for example, lower than 0.5-0.6 for steel. In the
current investigation, the overwhelming periods of time are minor cycles with an R
ratio of 0.9. In addition, the crack closure model could not explain some cracking
behaviors observed in Ref. [42]. Even if crack closure occurs, its extent should be
larger than that tested in air, resulting in the lower effective stress intensity factor
range and thus lower crack growth rate, which contradicts to the observations in Fig.
6.3 (a).
4) The effect of hydrogen: Because of the lack of corrosion and the same stress intensity
factor applied as in air, the above attributing factors cannot explain the wider crack
crevice at the surface in the partially coated specimens. Therefore, the wider crack
crevice on the surface of the partially coated specimens can only be attributed to the
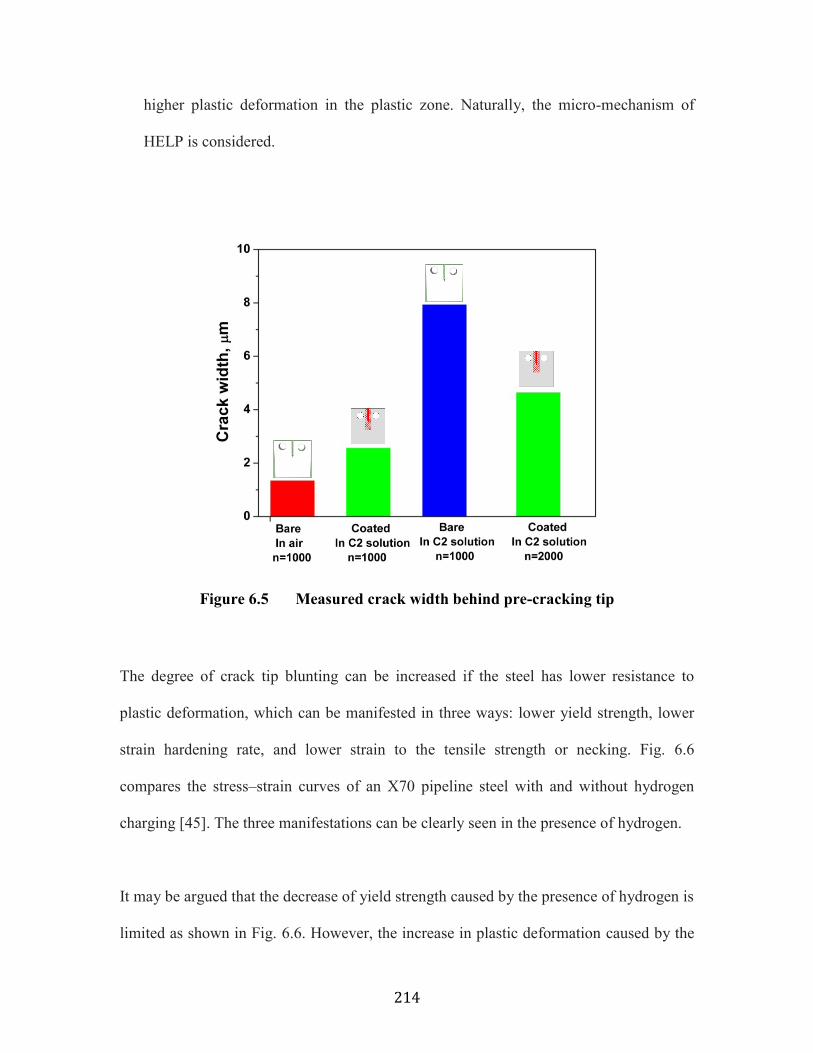
214
higher plastic deformation in the plastic zone. Naturally, the micro-mechanism of
HELP is considered.
Figure 6.5 Measured crack width behind pre-cracking tip
The degree of crack tip blunting can be increased if the steel has lower resistance to
plastic deformation, which can be manifested in three ways: lower yield strength, lower
strain hardening rate, and lower strain to the tensile strength or necking. Fig. 6.6
compares the stress–strain curves of an X70 pipeline steel with and without hydrogen
charging [45]. The three manifestations can be clearly seen in the presence of hydrogen.
It may be argued that the decrease of yield strength caused by the presence of hydrogen is
limited as shown in Fig. 6.6. However, the increase in plastic deformation caused by the
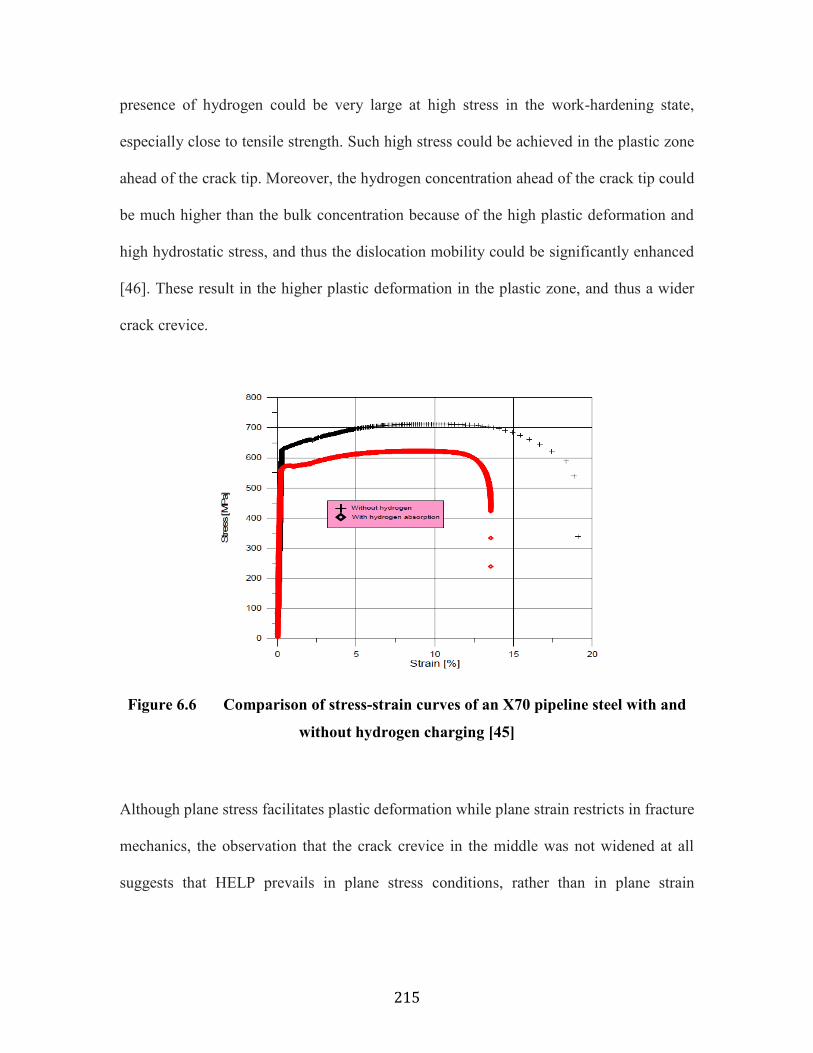
215
presence of hydrogen could be very large at high stress in the work-hardening state,
especially close to tensile strength. Such high stress could be achieved in the plastic zone
ahead of the crack tip. Moreover, the hydrogen concentration ahead of the crack tip could
be much higher than the bulk concentration because of the high plastic deformation and
high hydrostatic stress, and thus the dislocation mobility could be significantly enhanced
[46]. These result in the higher plastic deformation in the plastic zone, and thus a wider
crack crevice.
Figure 6.6 Comparison of stress-strain curves of an X70 pipeline steel with and
without hydrogen charging [45]
Although plane stress facilitates plastic deformation while plane strain restricts in fracture
mechanics, the observation that the crack crevice in the middle was not widened at all
suggests that HELP prevails in plane stress conditions, rather than in plane strain
216
conditions. This is also consistent with many other HELP observations, especially
observations made regarding the in-situ TEM film sample [29].
This could also explain the wider crack crevice at n = 2000 than at n = 1000: the higher
concentration of hydrogen could segregate in the plastic zone at n = 2000, and thus cause
the higher magnitude of plastic deformation and the wider crack crevice.
On the other hand, the observation that the crack was widened by the presence of
hydrogen does not support HEDE mechanism since the reduced bond strength can not be
related to the larger plastic deformation in the presence of hydrogen. But from point view
of crack propagation, both mechanisms can be explained, however, from the point of
view of crack propagation, as will be discussed in the next section.
6.3.3 Fracture surface observation
The fractured surface in the middle section of specimens shown in Fig. 6.4 was further
examined and is shown in Fig. 6.7. It can be seen that striations were observed on the
entire surface for the bare specimen tested in air as shown in Fig. 6.7(a), which confirms
that the crack advancement is caused by the mechanism of fatigue alone. On the other
hand, the fractured surface of the partially coated specimen exhibits a combination of
quasi-cleavage (flat parts) and striations that are alternatively arranged. This progressive
advancement is seen on both the partially coated specimens tested at n = 1000 and n =
2000, respectively, as shown in Fig. 6.7(b) and 6.7(d). For the bare specimen in solution,
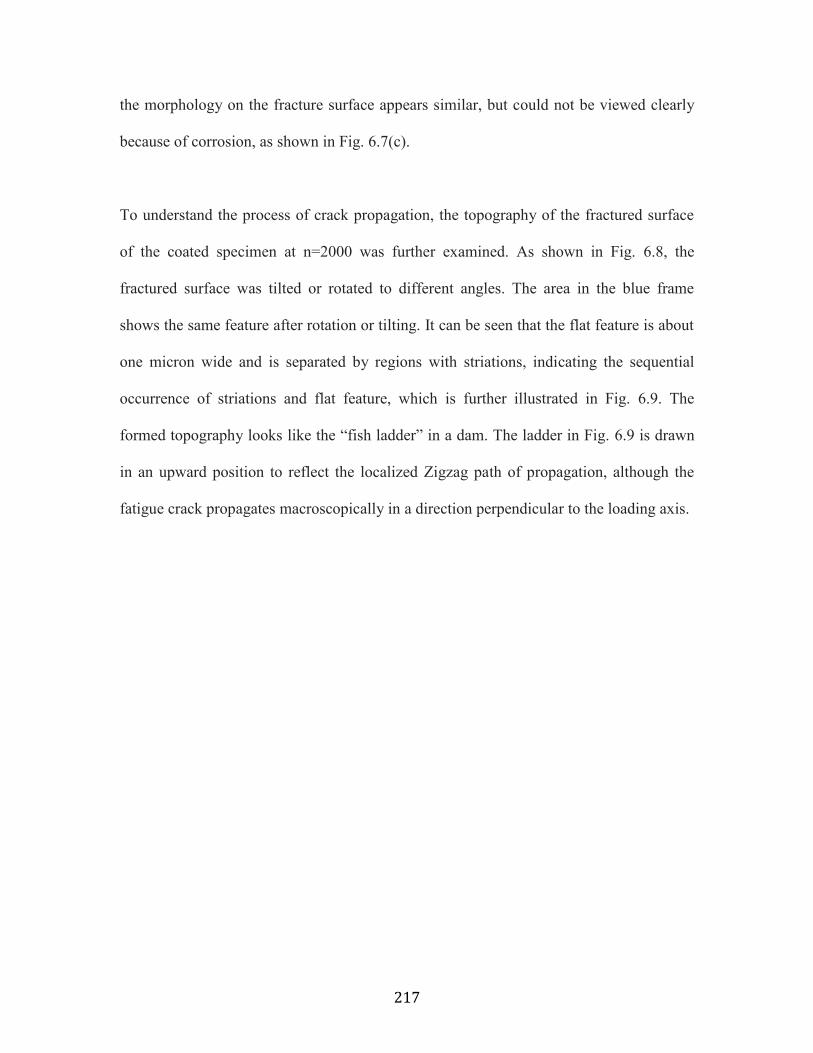
217
the morphology on the fracture surface appears similar, but could not be viewed clearly
because of corrosion, as shown in Fig. 6.7(c).
To understand the process of crack propagation, the topography of the fractured surface
of the coated specimen at n=2000 was further examined. As shown in Fig. 6.8, the
fractured surface was tilted or rotated to different angles. The area in the blue frame
shows the same feature after rotation or tilting. It can be seen that the flat feature is about
one micron wide and is separated by regions with striations, indicating the sequential
occurrence of striations and flat feature, which is further illustrated in Fig. 6.9. The
formed topography looks like the “fish ladder” in a dam. The ladder in Fig. 6.9 is drawn
in an upward position to reflect the localized Zigzag path of propagation, although the
fatigue crack propagates macroscopically in a direction perpendicular to the loading axis.
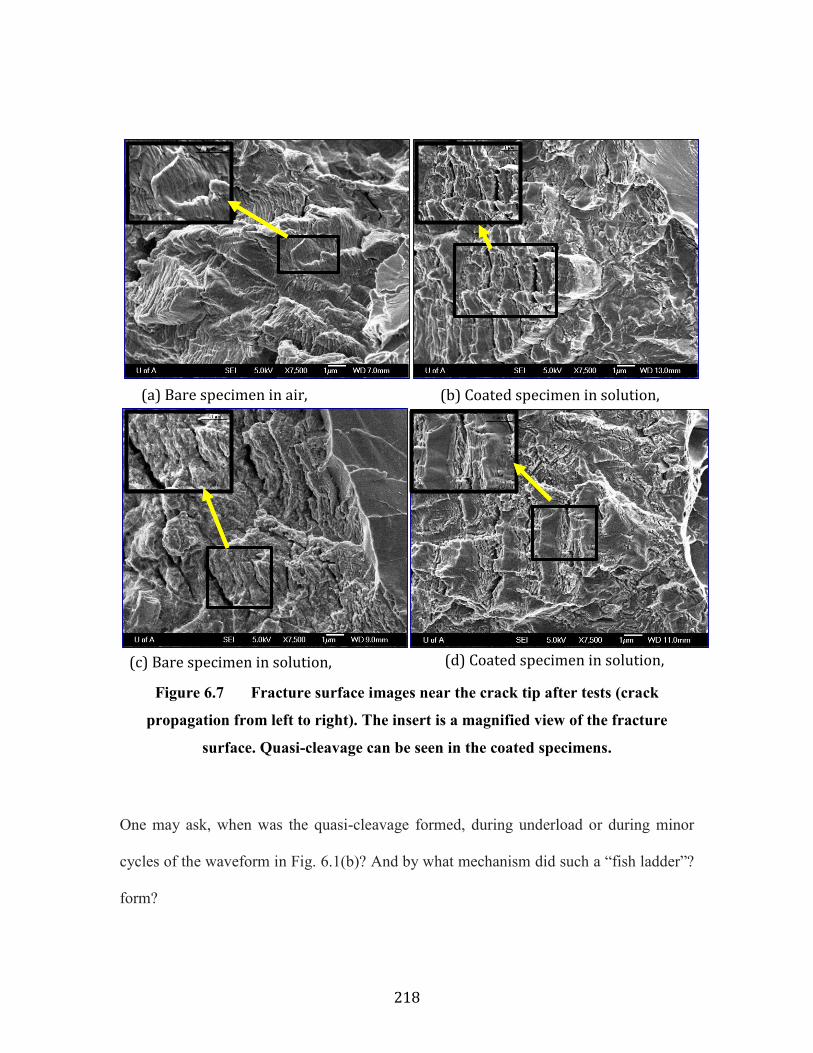
218
Figure 6.7 Fracture surface images near the crack tip after tests (crack
propagation from left to right). The insert is a magnified view of the fracture
surface. Quasi-cleavage can be seen in the coated specimens.
One may ask, when was the quasi-cleavage formed, during underload or during minor
cycles of the waveform in Fig. 6.1(b)? And by what mechanism did such a “fish ladder”?
form?
(a) Bare specimen in air, n=1000
(b) Coated specimen in solution, n=1000
(c) Bare specimen in solution, n=1000
(d) Coated specimen in solution, n=2000
219
For the first question, it has been demonstrated that underload could not only cause crack
propagation by itself, but it could also accelerate/initiate the crack growth of the
following minor cycles. Increasing the number of minor cycles, n, caused the crack
growth rate to increase and the crack advanced through the synergistic interactions of
hydrogen and fatigue; with further increasing n, the crack growth rate reached a
saturation state as shown in Fig. 6.3(b), and the corresponding growth rate of minor
cycles decreased to close to zero [42]. On the other hand, hydrogen could continuously
segregate in the plastic zone ahead of the crack tip under such high R ratio cyclic
loadings. This suggests that a limited crack growth rate and continuous hydrogen
segregation favor the occurrence of quasi-cleavage during the minor cyclic loadings. This
could also explain why the quasi-cleavage for n = 2000 is wider than that for n = 1000:
the more cycles, the more time for hydrogen segregation.
220
Figure 6.8 Observation of fractured surface in Figure 6 (d) at different
orientations (SE) The blue square is the reference (the same area) at difference
orientations.
Cleavage
Electron beam
Cleavage
Cleavage 45o
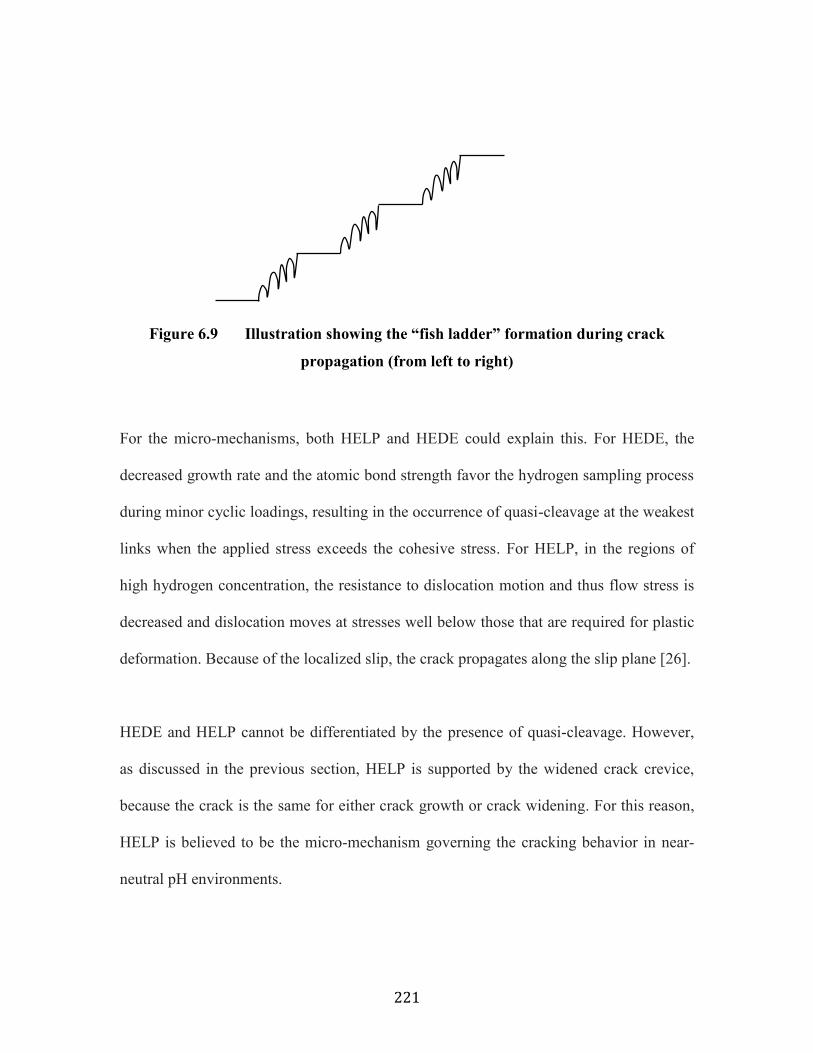
221
Figure 6.9 Illustration showing the “fish ladder” formation during crack
propagation (from left to right)
For the micro-mechanisms, both HELP and HEDE could explain this. For HEDE, the
decreased growth rate and the atomic bond strength favor the hydrogen sampling process
during minor cyclic loadings, resulting in the occurrence of quasi-cleavage at the weakest
links when the applied stress exceeds the cohesive stress. For HELP, in the regions of
high hydrogen concentration, the resistance to dislocation motion and thus flow stress is
decreased and dislocation moves at stresses well below those that are required for plastic
deformation. Because of the localized slip, the crack propagates along the slip plane [26].
HEDE and HELP cannot be differentiated by the presence of quasi-cleavage. However,
as discussed in the previous section, HELP is supported by the widened crack crevice,
because the crack is the same for either crack growth or crack widening. For this reason,
HELP is believed to be the micro-mechanism governing the cracking behavior in near-
neutral pH environments.

222
In addition, HELP also echoes the synergistic interactions of hydrogen and cyclic
loadings [11,19,34]. As has been well demonstrated, fatigue fundamentally results from
the localized dislocation irreversible slip [47]. The enhanced dislocation mobility and/or
lowered flow stress caused by the presence of hydrogen (HELP) can facilitate the
dislocation irreversible slips during cyclic loadings, resulting in more point defects [17]
and thus an enhanced fatigue crack growth rate.
6.3.4 Process of crack propagation in near-neutral pH environments
Based on the understanding of the role of hydrogen on the cracking behaviors under
cyclic loading, the crack propagation process can be schematically illustrated by Fig.
6.10.
1) The sharp crack tip generated from the pre-cracking can be blunted due to the
plastic deformation in the plastic zone ahead of the crack tip by applying
mechanical loads. This plastic deformation might be further increased due to
room temperature creep [32]. But the blunting extent was not high, as shown in
Figs. 6.2 and 6.5. And the crack tip sharpness in the middle of the specimen under
plane strain condition is not affected at all, as shown in Fig. 6.2. In addition, the
fact that the crack growth rate is not affected by the stress states also indicates that
the mechanical loads alone have a limited effect on blunting.
2) The hydrogen generated on the pipe surface would enter the steel lattice and
diffuse into the high stress zone ahead of the crack tip to lower the chemical
potential. Because of HELP, the localized flow stress is reduced and dislocation
223
mobility is enhanced by the presence of hydrogen, resulting in more plastic
deformation in the plastic zone, which contributes to blunting the crack tip.
3) Once the crack walls are opened by mechanical loading and/or HELP, the crack
walls and tip will be exposed to the corrosive near-neutral pH solution, as no
passive film is formed [36]. Dissolution to crack tip and crack walls further blunts
the crack tip.
4) When the tip is blunted, the location of highest hydrostatic stress is lowered and
shifted away from the crack tip, which favors the hydrogen sampling process.
Through HELP, a micro-crack may be formed ahead of the main crack tip.
5) Once the micro-crack joints back to the main crack, a crack propagates. The
newly formed sharp crack tip will repeat the whole process again. The stress
ahead of the sharp crack tip is enhanced.
6) The crack propagation rate is the same under plane stress and plane strain
conditions as the crack advancement (the marked zone) in Fig. 6.4 was found to
be consistent with that measured from the surface.

224
Figure 6.10 Illustration showing the crack widening behind the pre-cracking tip
due to mechanical loading, HELP and corrosion during the corrosion fatigue test
Based on this, the corrosion rate can be calculated by measuring the crack width, which
can be expressed as:
After crack propagation
After pre-cracking
Mechanical loading HELP
Corrosion
Before crack propagation
Corrosion
HELP Mechanical loading
Distance from crack tip
Stress
Initiated crack
Mechanical loading
Just after being loaded

225
𝐶𝑜𝑟𝑟𝑜𝑠𝑖𝑜𝑛 𝑟𝑎𝑡𝑒 =1
2×
𝑐𝑟𝑎𝑐𝑘 𝑤𝑖𝑑𝑡ℎ 𝑖𝑛 𝑠𝑜𝑙𝑢𝑡𝑖𝑜𝑛 − 𝑐𝑟𝑎𝑐𝑘 𝑤𝑖𝑑𝑡ℎ 𝑖𝑛 𝑎𝑖𝑟 − 𝐻𝐸𝐿𝑃
𝑡𝑒𝑠𝑡 𝑑𝑢𝑟𝑎𝑡𝑖𝑜𝑛 (6 − 1)
The subtraction is intended to remove the crack widening by mechanical loading and
HELP. Since both sides of the crack walls were corroded simultaneously, a factor of 1/2
was applied to Eq. (6-1). This calculation should give the accurate corrosion rate inside of
crack crevice. However, because the magnitude of the HELP effect and the
corresponding crack width in air are not known for many previous tests, it is still possible
to estimate the corrosion rate from the crack width in the middle, which is caused only by
dissolution, as demonstrated in Fig. 6.2:
𝐶𝑜𝑟𝑟𝑜𝑠𝑖𝑜𝑛 𝑟𝑎𝑡𝑒 =1
2×
𝑐𝑟𝑎𝑐𝑘 𝑤𝑖𝑑𝑡ℎ 𝑖𝑛 𝑠𝑜𝑙𝑢𝑡𝑖𝑜𝑛
𝑡𝑒𝑠𝑡 𝑑𝑢𝑟𝑎𝑡𝑖𝑜𝑛 (6 − 2)
From previous related tests with periods longer than 30 days [34,41,42], the corrosion
rate was shown in Fig. 6.11. It can be seen that the corrosion rate is much lower than the
field crack growth rate data [ 48 ], which also confirms that in near-neutral pH
environments, it is the hydrogen effect, rather than corrosion, that contributes to crack
growth.
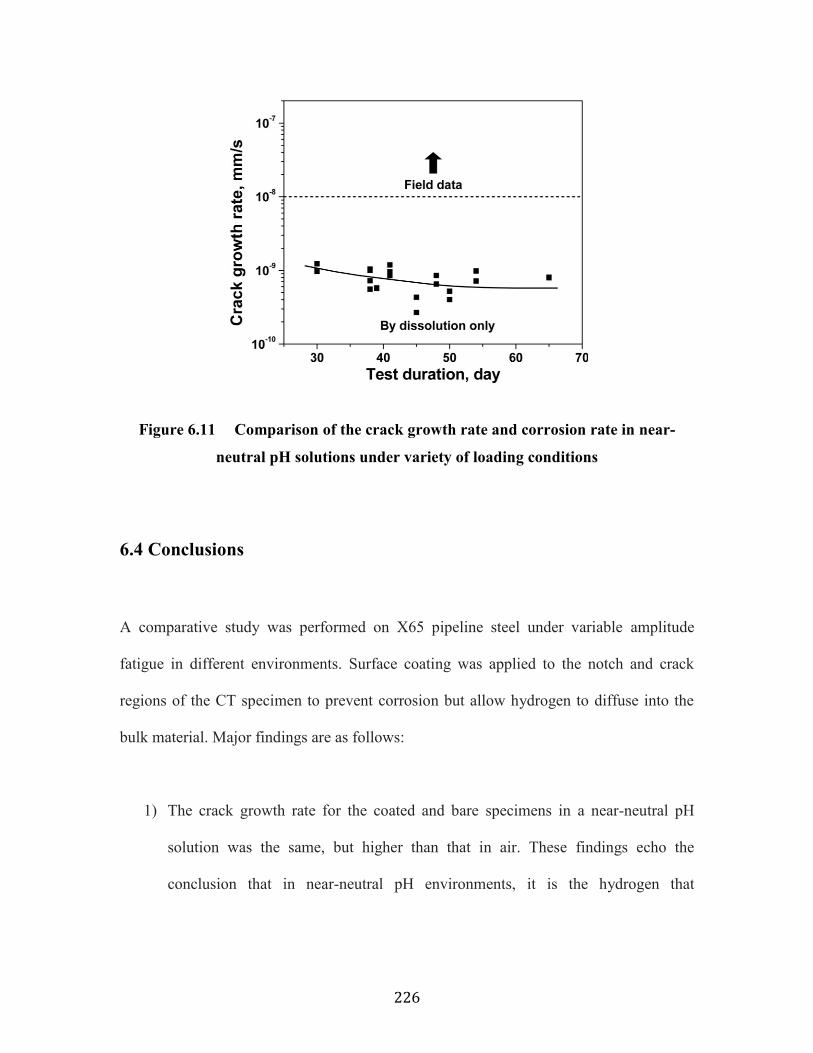
226
Figure 6.11 Comparison of the crack growth rate and corrosion rate in near-
neutral pH solutions under variety of loading conditions
6.4 Conclusions
A comparative study was performed on X65 pipeline steel under variable amplitude
fatigue in different environments. Surface coating was applied to the notch and crack
regions of the CT specimen to prevent corrosion but allow hydrogen to diffuse into the
bulk material. Major findings are as follows:
1) The crack growth rate for the coated and bare specimens in a near-neutral pH
solution was the same, but higher than that in air. These findings echo the
conclusion that in near-neutral pH environments, it is the hydrogen that

227
contributes to crack growth, rather than the direct dissolution of the crack tip. This
is further confirmed by the calculated corrosion rate.
2) The fractured surface was featured with striations and the quasi-cleavage fracture
alternatively arranged, and the crack growth rate was not affected by stress states,
which could be explained by both HELP and HEDE.
3) The crack width on the surface was found to be widened by the presence of
hydrogen, which can only be explained by HELP. Thus it is believed that HELP
governs the cracking behavior of pipeline steels in near-neutral pH environments.
The fact that the crack width was not widened under the plane strain state
suggests that HELP prevails in the plane stress state.
4) Based on the understanding of the micro-mechanisms of hydrogen in cracking
behavior, the process of crack propagation in near-neutral pH environments was
illustrated.
References
[1] L. Raymond. Hydrogen Embrittlement: Prevention and Control, ASTM STP 962,
L. Raymond, Ed., American Society for Testing and Materials, Philadelphia, 1988, pp.
10-16.
[2] M.A.V. Devanathan, Z. Stachurski, W. J. Beck. Electrochem. Soc. 1963 Vol. 110,
Issue 8, 886-890.
[3] D. Hardie, E.A. Charles, A.H. Lopez. Corrosion Sci. 48 (2006) 4378-4385.
[4] R. L. Eadie, K.E. Szklarz, R. L. Suthery. Corrosion 61 (2) (2005) 167-173.

228
[5] J.L. Gillette, R.L. Kolpa. ANL/EVS/TM/08-2, November 2007.
[6] W.H. Johnson. Proc. R. Soc. London. 23 (1875) 168–179.
[7] R.P. Gangloff, R.P. Wei. Met. Trans. A 8 (1977) 1043-1053.
[8] R. A. Oriani. Ann. Rev. Mater. Sci. 1978.8:327-357.
[9] J.P. Hirth, R.F. Mehl Medalist. Met. Trans. A 11A (1980) 861-890.
[10] A. Nagao, C.D. Smith, M. Dadfarnia, P. Sofronis, I.M. Robertson. Acta Mater. 60
(2012) 5182-5189.
[11] S. Ohmiya, H. Fujii. ISIJ Int. 52 (2) (2012) 247-254.
[12] J. Zhao, Z. Jiang, C.S. Lee. Corrosion Sci. 82 (2014) 380-391.
[13] V. Venegas, F. Caleyo, T. Baudin, J.H. Espina-Hernández, J.M. Hallen. Corrosion
Sci. 53 (2011) 4204-4212.
[14] S. Chen, M. Zhao, L. Rong. Mater. Sci. Eng. A 594 (2014) 98-102.
[15] O.M.I. Todoshchenko, Y. Yagodzinskyy, T. Saukkonen, H. Hänninen. Metall.
Mater. Trans. A 45 (11) (2014) 4742-4747.
[16] O. Takakuwa, T. Ohmi, M. Nishikawa, A. Toshimitsu Yokobori Jr. and H.
Soyama. Strength, Fract. Compexity 7 (2011) 79-85.
[17] T. Doshida, M. Nakamura, H. Saito, T. Sawada, K. Takai. Acta Mater. 61 (2013)
7755-7766.
[18] K. Takai, H. Shoda, H. Suzuki, M. Nagumo. Acta Mater. 56 (2008) 5158-5167.
[19] Y. Murakami. Advances in Fracture Research. 2006, p.167-195.
[20] Z. Sun, C. Moriconi, G. Benoit, D. Halm, G. Henaff. Metall. Mater. Trans. A
44(3)(2013) 1320-1330.

229
[21] J.J. DeLuccia. Hydrogen Embrittlement: Prevention and Control, ASTM STP
962, L. Raymond, Ed., American Society for Testing and Materials, Philadelphia, 1988,
pp. 17-34.
[22] C. Dong, Z. Liu, X. Li, Y. Cheng. Int. J. Hydrogen Energy 34 (2009) 9879-9884.
[23] H.D. Fleming, R. G. Ide. Analytica Chimica Acta. 83 (1976) 67-82.
[24] M.R. Louthan Jr. J. Fail. Anal. And Preven. (2008) 8:289-307.
[25] A. Troiano, Trans. ASM 52 (1960) 147-157.
[26] H. Birnbaum, P. Sofronis. Mater. Sci. Eng. A 176 (1994) 191–202.
[27] R.A. Vennett, G.S. Ansell. Trans. Am. Soc. Met. 60 (1967) 242-251.
[28] Z.T. Liu, X.G. Li, Y.F. Cheng. Corrosion Science 55 (2012) 54-60.
[29] I.M. Robertson, H.K. Birnbaum, P. Sofronis. Dislocations in Solids,
J.P. Hirth and L. Kubin Ed. 15 (2009) 249–293.
[30] S. Wang, M.L. Martin, P. Sofronis, S. Ohnuki, N. Hashimoto, I.M. Robertson.
Acta Mater. 69 (2014) 275-282.
[31] W. Chen, R.L. Sutherby. Met. Mater. Trans. A 38A(2007) 1260-1268.
[32] W. Chen, R. Kania, R. Worthingham, G. Boven. Acta Mater. 57 (2009) 6200-
6214.
[33] Y. Kang, W. Chen, R. Kania, G. Boven, R. Worthingham. Corrosion Sci. 53 (3)
(2011) 968-975.
[34] M. Yu, X. Xing, H. Zhang, J. Zhao, R. Eadie, W. Chen, J. Been, G.V. Boven, R.
Kania. Acta Materialia (under review).
[35] W. Chen, F. King, T.R. Jack, M.J. Wilmott. Hydrogen permeation behavior of X-
230
70 pipeline steel in a near-neutral pH soil environment. In: Proc. of the International
Pipeline Conference, pp. 953-960. 2000.
[36] B.S. Delanty, J.O. Beirne. Major Field Study Compares Pipeline SCC with
Coatings. Oil & Gas Journal 1992;15;39.
[37] W. Chen, F. King, and E. Vokes. Corrosion 2002;58(3):267-275 .
[38] T. Neeraj, R. Srinivasan, Ju Li. Acta Materialia 60 (2012) 5160–5171.
[39] X. Chen, T. Foecke, M. Lii, Y. Katz, W.W. Gerberich. Engineering Fracture
Mechnics. Vol. 35, No. 6, pp. 997-1017, 1990.
[40] E. Hörnlund, J.K.T. Fossen, S. Hauger, C. Haugen, T. Havn, T. Hemmingsen. Int.
J. Electrolchem. Sci. 2 (1) (2007) 82-92.
[41] M. Yu, W. Chen, R. Kania, G.V. Boven, J. Been. In: Proc. of the 10th International
Pipeline Conference (IPC2014), Sept. 29- Oct. 3, 2014, Calgary, Canada. Paper No. IPC2014-
33282.
[42] M. Yu, W. Chen, R. Kania, G.V. Boven, J. Been. Fatigue. Fract. Eng. Mater.
Struct.; in press. DOI: 10.1111/ffe.12274.
[43] K. Chevil, W. Chen, G.V. Boven, R. Kania, J. Been. In: proceedings of IPC 2014,
10th International Pipeline conference, Sept. 29 – Oct. 3, 2014, Calgary, Alberta, Canada.
Paper No.: IPC2014-33678.
[44] W. Elber. ASTM STP-486, ASTM, PA, 1970, p.230.
[45] T. Bellahcene, J. Capelle, M. Aberkane, Z. Azari. Effect of hydrogen on
mechanical properties of pipeline API 5L X70 steel. Applied Mechanics and Materials,
Vol. 146 (2012) pp. 213-225.
231
[46] Afolabi Taiwo Egbewande. Growth behaviour of surface cracks in pipeline steel
exposed to near-neutral pH environments. PhD thesis, Fall 2013, University of Alberta.
Chapter 6.
[47] S. Suresh. Fatigue of Materials. Cambridge University Press: Cambridge, New
York Port Chester, Melbourne Sydney, 1991; 113.
[48] K. Chevil, et al. In: proceedings of IPC 2012, 9th International Pipeline
conference, Sept. 24-28, 2012, Calgary, Alberta, Canada. Paper No.: IPC2012-90675, pp:
583-590.
232
Chapter 7 Conclusions, research impact and
recommendations
7.1 Conclusions
The objective of this thesis was to shed light on understanding the crack propagation of
pipeline steels exposed to a near-neutral pH environments under pressure fluctuations. In
this regard, a novel waveform, the underload-type variable amplitude cyclic loadings,
was designed to simulate the actual pressure fluctuations during routine pipeline
operations. By comparatively performing this waveform both in air and in the near-
neutral pH environment, different aspects of near-neutral pH crack propagation were
investigated. The acceleration effect caused by this variable amplitude waveform was
first demonstrated in Chapter 2, by comparing the crack growth rate under different kinds
of waveforms. Based on the results, several parameters of this waveform were studied
systematically both in air and in near-neutral pH environments, including the effect of the
number of minor cycles, loading frequency, the maximum stress and amplitudes, which
were covered in Chapters 3-5. It is found that the contribution of near-neutral pH
environments to crack growth was mainly through the hydrogen effect. Therefore, the
effects of hydrogen on the cracking behavior were investigated in detail in Chapter 6. The
main conclusions obtained from these studies are summarized below.
233
7.1.1 Observation of acceleration effect
The minor cycles with a very high R-ratio of 0.9, which have previously been considered
to be non-propagating based on a constant amplitude crack growth model, can cause a
significant crack advance in the presence of an underload with an R-ratio of 0.5 in a near-
neutral pH solution. Such variable amplitude growth rate in terms of millimeters per
block is about five times higher of that of the corresponding constant amplitude testing,
and seven times of that of the static hold and underload. The mini-striations observed on
the fractured surface are the direct evidence of the crack growth induced by the minor
cycles.
7.1.2 Effects of number of minor cycles on crack growth
1. Compared to the crack growth rate at constant amplitude, the crack growth rate at
the variable amplitude waveform can be increased by a factor of three and five,
respectively, in air and in the C2 solution.
2. Under the same loading conditions, the crack growth rate in the C2 solution was
up to four times higher than that in air.
3. The crack growth during minor cycles loading after the introduction of an
underload cycle can be divided into three stages: (1) the initial incubation stage up
to 15 cycles, where acceleration of crack growth is not observed; (2) the
subsequent stage up to 55 cycles, where the crack growth rate increases by
increasing the number of minor cycles; and (3) the final stage up to 960 cycles

234
depending on the test environments, where crack growth rate of minor cycles
decreases with further increasing number of minor cycles to a level at which
acceleration effects disappear.
7.1.3 Effects of frequency and maximum stress on crack growth
1. Compared with the crack growth rate under constant amplitude cyclic loading, the
underload-type variable amplitude cyclic loading accelerates the crack growth
rate by a factor of up to 10 at variety of loading frequencies.
2. Crack growth rates measured in air were found to be insensitive to the variation of
loading frequency and Kmax, while these two parameters significantly affected the
crack growth rate in the near-neutral pH solution.
3. Two distinct regimes of crack growth behavior exist over the range of loading
frequency studied. The crack growth rate was found to increase with decreasing
loading frequency up to 10-3 Hz, while it either remained constant for underload-
type variable amplitude cyclic loadings, or decreased slightly for constant
amplitude loading when the loading frequency was lower than 10-3 Hz. A
mechanistic model established based on the hydrogen-assisted crack growth
mechanisms successfully predicted the transition of crack growth behavior at
about 10-3 Hz.
235
7.1.4 Effects of amplitudes of underload and minor cycles on crack
growth
1. The acceleration factor was up to 2.7 and 5.3 for tests in air and in the C2
solution, respectively.
2. The crack growth rate decreased with R ratios of underload and minor cycles for
tests both in air and in the C2 solution.
3. A comparison of the crack growth rate in the corrosive C2 solution and in air
showed that the corrosive environments could contribute to crack propagation by
a factor of up to 11. This was attributed to the synergistic interaction of
mechanical loading and hydrogen embrittlement.
4. The R ratio of minor cycles at which the minor cycles do not contribute to crack
propagation through load interaction was determined to be 0.982, corresponding
to 0.594 MPa m of tress intensity factor range, which is much lower than the
threshold determined by constant amplitude fatigue. This critical R ratio could be
utilized to demarcate stress corrosion cracking and corrosion fatigue, and improve
component/structure design.
7.1.5 The role of hydrogen in crack growth in near-neutral pH
environments

236
1. The crack growth rate for the coated and bare specimens in the near-neutral pH
solution was the same, but higher than that in air. These echo the conclusion that
it is hydrogen, not corrosion, that contributes to crack growth in near-neutral pH
environments. The calculated corrosion rate from crack width in the specimen
middle further confirms this conclusion.
2. The fractured surface showed the alternative appearance of striations and quasi-
cleavage, and the crack growth rate was found not affected by stress states, which
could be explained by both HELP and HEDE.
3. The crack width on the surface was found to be widened by the presence of
hydrogen, which can only be explained by HELP. Thus it is believed that HELP
governs the cracking behavior of pipeline steel in near-neutral pH environments.
The fact that the crack width was not widened under the plane strain state
suggests that HELP prevailed in the plane stress state.
4. The process of crack propagation in near-neutral pH environments was illustrated
based on the understanding of the HE micro-mechanisms.
7.1.6 Practical strategies for avoiding enhanced crack growth
1. The minimum normal operation pressure should be controlled to as high a level as
possible to reduce the amplitude of large cycles (reducing acceleration effect).
2. The pipeline should be operated with a control of mean pressure, rather than the
current maximum pressure. This will allow for a certain level of overloading,
237
which can both minimize the enhanced crack growth by underload, and on the
other hand achieve retarded growth by overload.
3. If shutdown or hydro-tests make underloads unavoidable, the recommendation is
to impose a static hold for a period of at least 24 hours following each underload.
This will lead to crack tip blunting and thus reduce the magnitude of load
interaction and thus the crack growth.
4. If possible, an overloading can be applied following each underload or after a
period of operation.
7.2 Research Impact
1. One of the most important accomplishments in this thesis is the identification and
determination of enhanced crack growth caused by underload cycles
(depressurization). This finding enables the understanding of crack growth in high
pressure gas transmission pipelines, for which pressure fluctuations are often
considered to be too benign to cause a significant crack growth through
mechanisms of corrosion fatigue.
2. The results obtained from this thesis corroborate various failure scenarios found
in the field, including the high frequency of failures at the discharge sections of
pipelines and different crack growth characteristics between oil pipelines and gas
pipelines, further confirming the importance of the findings.
238
3. Based on these results, the research group in the process of developing crack
growth software. The software is expected to be a key tool for risk assessment and
to ensure that daily operations achieve maximized pipeline service life.
7.3 Recommendations
1. The mechanisms of acceleration effects caused by underload could be studied
through the observations of dislocation microstructures in the transmission
electron microscope (TEM).
2. Unlike underload, overload can cause a retardation effect in crack growth, which
needs to be studied systematically.
3. As well documented, overload can retard the crack growth rate while an
underload can accelerate it for many other materials. The crack growth behaviors
under the combination of overload and underload for pipeline steels exposed to
near-neutral pH environments should be studied: the results can be very useful for
pipeline integrity management. In fact, the combined waveform is being
performed by a graduate student.
4. Up to now, all the waveforms are performed under symmetric loading cycles. The
effects of asymmetric loading, such as quick unloading and slow loading and vice
versa, could contribute to a deep understanding of the crack growth behavior
under cyclic loadings.
5. As environmental contribution to crack growth is attributed to hydrogen, cathodic
potential is another source of hydrogen. A study should be conducted on the effect
239
of cathodic potential on the crack growth rate under the variable amplitude
waveforms.
6. The results obtained are all from the compact tension (CT) specimen, which is
characterized by a thickness-through crack. The actual cracks on pipelines are
surface cracks. Therefore, specimens with surface cracks should be used to
confirm the conclusions from CT specimen. In fact, the testing using surface
specimens is being performed by one graduate student in the group.
7. Since crack growth under variable amplitude waveform is significantly different
from that under constant amplitude fatigue, further studies should be done to
determine whether crack initiation is also affected by the waveform.
8. The above discussions are all based on the observations of laboratory tests, which
can be further validated by running on a full-dimension pipe exposed to near-
neutral pH environments.
9. The aggressive underload-type of pressure fluctuations may also contribute to
crack initiation and propagation for high pH stress corrosion cracking through
enhancing film ruptures. This should be studied in detail, in addition to the current
understanding of the high pH SCC mechanisms.
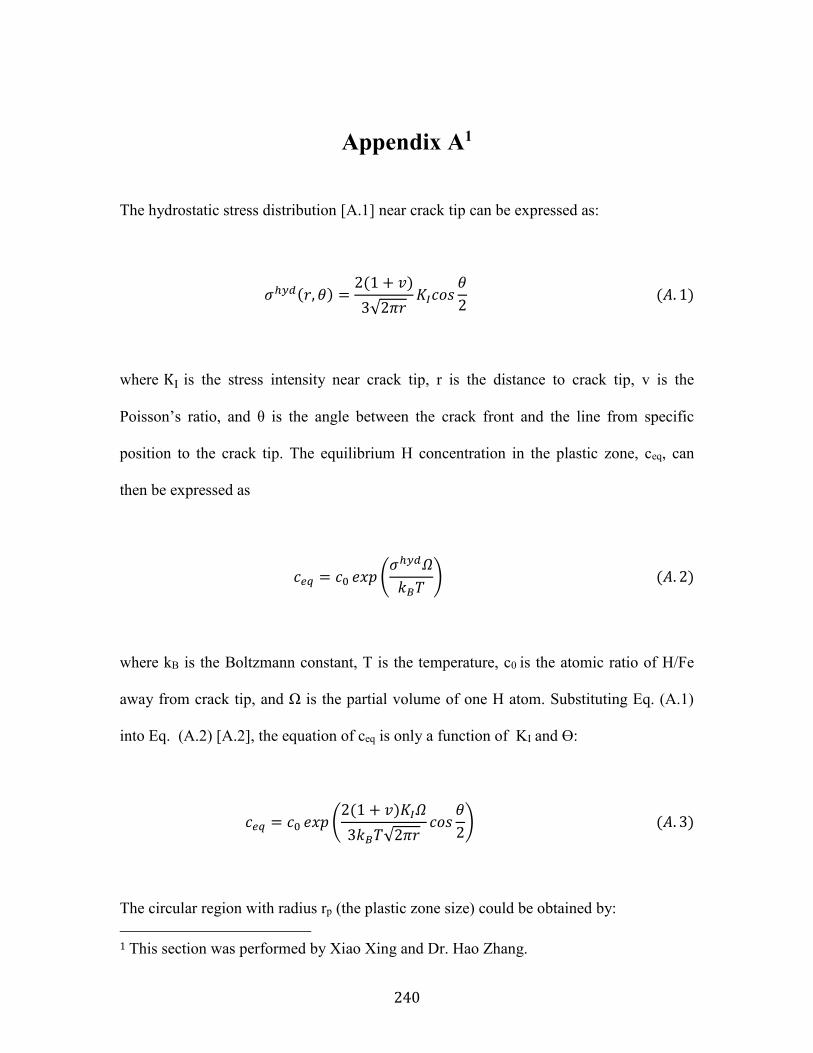
240
Appendix A1
The hydrostatic stress distribution [A.1] near crack tip can be expressed as:
𝜎ℎ𝑦𝑑(𝑟, 𝜃) =2(1 + 𝑣)
3√2𝜋𝑟𝐾𝐼𝑐𝑜𝑠
𝜃
2 (𝐴. 1)
where KI is the stress intensity near crack tip, r is the distance to crack tip, v is the
Poisson’s ratio, and θ is the angle between the crack front and the line from specific
position to the crack tip. The equilibrium H concentration in the plastic zone, ceq, can
then be expressed as
𝑐𝑒𝑞 = 𝑐0 𝑒𝑥𝑝 (𝜎ℎ𝑦𝑑𝛺
𝑘𝐵𝑇) (𝐴. 2)
where kB is the Boltzmann constant, T is the temperature, c0 is the atomic ratio of H/Fe
away from crack tip, and Ω is the partial volume of one H atom. Substituting Eq. (A.1)
into Eq. (A.2) [A.2], the equation of ceq is only a function of KI and Ө:
𝑐𝑒𝑞 = 𝑐0 𝑒𝑥𝑝 (2(1 + 𝑣)𝐾𝐼𝛺
3𝑘𝐵𝑇√2𝜋𝑟𝑐𝑜𝑠
𝜃
2) (𝐴. 3)
The circular region with radius rp (the plastic zone size) could be obtained by:
1 This section was performed by Xiao Xing and Dr. Hao Zhang.

241
𝑟𝑝 =1
6𝜋(
𝐾𝑚𝑎𝑥
𝜎𝑦𝑠)
2
(𝐴. 4)
where Kmax is the maximum stress intensity in one cycle and σys is the yield strength. The
number of hydrogen atoms in an infinitesimal annulus region can be expressed as
𝑑𝑁 =𝑐𝑒𝑞2𝜋𝑟𝑙𝑧
𝑎03
2⁄
𝑑𝑟 (𝐴. 5)
where a0 is lattice parameter, and lz is the thickness of material. Substitute Eqs. (A.3) and
(A.4) into Eq. (A.5) and integrate over distance to obtain
𝑁(𝐾𝐼) = ∫
𝑐0 𝑒𝑥𝑝 (4(1 + 𝑣)𝐾𝐼𝛺
3𝜋𝑘𝐵𝑇√2𝜋𝑟) 2𝜋𝑟𝑙𝑧
𝑎03
2⁄
𝑟𝑝
0
𝑑𝑟 (𝐴. 6)
Expand Eq. (A.6),
N(KI) =C
12[KI
3B3√rpe
KIB
√rp + KI2B2rpe
KIB
√rp + 2KIBrp
32⁄
e
KIB
√rp + 6rp2e
KIB
√rp
− KI4B4Ei (
KIB
√rp
)] + constant (𝐴. 7)

242
where B = 4(1 + v)Ω 3πkBT√2π⁄ , 𝐶 = 4𝜋𝑙𝑧𝑐0 𝑎03⁄ , and Ei is the exponential integral
whose value is close 0 as r= rp. As r =0, ceq would reach the maximum and keep at constant
1 [A.3]. Thus, the lower limit of integral in Eq. (A.6) has been included in the constant in
Eq. (A.7). The number of hydrogen atoms needed to saturate circular region with stress can
be calculated from Kmin to Kmax as Eq. (A.7), which is supplied by the annulus region with
inner radius rp and the outer radius Req, therefore,
𝑁(𝐾𝑚𝑎𝑥) − 𝑁(𝐾𝑚𝑖𝑛) =2𝜋𝑐0𝑙𝑧
𝑎03 (𝑅𝑒𝑞 − 𝑟𝑝)
2=
𝐶
2(𝑅𝑒𝑞 − 𝑟𝑝)
2 (𝐴. 8)
Chemical potential driven hydrogen atom diffusion is expressed by Eq. (A.9) [A.4]
𝜇 = 𝜇0 + 𝑘𝐵𝑇𝑙𝑛𝑐
1−𝑐+ 𝜎ℎ𝑦𝑑𝛺 (𝐴. 9)
where μ is the chemical potential and μ0 is constant. Since the H concentration, c, far
away from the crack tip has been assumed as a constant value, c0, the driving force is
only related to the hydrostatic stress σhyd. The axial velocity of H atom from chemical
potential (driving force) and motivation is expressed as [A.3,A.5]
𝑉𝑟 =(1 + 𝑣)𝛺
𝑘𝐵𝑇3√2𝜋
𝐷𝐾𝐼 𝑐𝑜𝑠𝜃2
𝑟3
2⁄ (𝐴. 10)
where Vr is H atom velocity under specific KI and specific position in specimen. The
average velocity, 𝑉�̅�, over θ, loading and position can be shown as
243
�̅�𝑟 =∫ ∫ ∫ 𝑉𝑟𝑑𝐾𝐼
𝐾𝑚𝑎𝑥
𝐾𝑚𝑖𝑛
𝜋
0
𝑅𝑒𝑞
𝑟𝑝𝑑𝜃𝑑𝑟
𝜋(𝑅𝑒𝑞 − 𝑟𝑝)(𝐾𝑚𝑎𝑥 − 𝐾𝑚𝑖𝑛)=
2(1 + 𝑣)𝛺𝐷(𝐾𝑚𝑎𝑥 + 𝐾𝑚𝑖𝑛) (1
√𝑟𝑝
−1
√𝑅𝑒𝑞
)
𝜋(𝑅𝑒𝑞 − 𝑟𝑝)𝑘𝐵𝑇3√2𝜋 (𝐴. 11)
Hence the minimum time, tcritical, needed to achieve equilibrium hydrogen concentration
with Kmin to Kmax can be approximated with diffusion distance divided by velocity:
𝑡critical =𝑅𝑒𝑞 − 𝑟𝑝
�̅�𝑟
(𝐴. 12)
Therefore, the critical value of frequency could be expressed
𝑓𝑐𝑟𝑖𝑡𝑖𝑐𝑎𝑙 =
(1 + 𝑣)𝛺𝐷(𝐾𝑚𝑎𝑥 + 𝐾𝑚𝑖𝑛) (1
√𝑟𝑝
−1
√𝑅𝑒𝑞
)
𝜋(𝑅𝑒𝑞 − 𝑟𝑝)2
𝑘𝐵𝑇3√2𝜋 (𝐴. 13)
According to the testing conditions in current investigation, Kmax=33 MPa√m, Kmin=16.5
MPa√m , yield strength of X60 steel is 414 MPa, T=303 K, v=0.31 for steel, and
Ω=1.99*10-30 m3. Diffusivity of H can range from 1.5×10⁻⁹ to 2×10⁻⁹ m2/s with varying
stress/strain [A.6]. Then the critical frequency, fcritical , is calculated between 9.2×10⁻⁴ to
1.22×10⁻³ Hz.
References

244
[A.1] T.L. Anderson. Fracture Mechanics, Fundamentals and Applications, Third
Edition. Taylors & Francis Group, 2005. pp: 44-45.
[A.2] R. Matsumoto, S. Taketomi, S. Matsumoto, and N. Miyazaki, “Atomistic
simulations of hydrogen embrittlement,” Int. J. Hydrogen Energy, vol. 34, no. 23, pp.
9576–9584, Dec. 2009.
[A.3] Song J, Curtin WA. Acta Mater 2011;59(4):1557–1569.
[A.4] Haftbaradaran H, Song J, Curtin WA, Gao H. J. Power Sources 2011;196(1):361–
370.
[A.5] Song J, Curtin WA. Nat Mater 2013;12(2):145–51.
[A.6] Liu, W. Xie, W. Chen, and H. Zhang, “Effects of grain boundary and boundary
inclination on hydrogen diffusion in α-iron,” J. Mater. Res., vol. 26, no. 21, pp. 2735–
2743, Sep. 2011.
245
References
[1] B. S. Delanty, J. O’Beirne. Major Field Study Compares Pipeline SCC with
Coatings. Oil & Gas Journal 15 (1992) 39-44.
[2] Parkins RN. A review of stress corrosion cracking of high pressure gas pipelines
proceedings of corrosion 2000. Paper 00363. Houston, Texas: NACE International; 2000.
[3] J. A. Beavers and C. E. Jaske. Near-neutral pH SCC in Pipelines: Effects of
Pressure Fluctuations on Crack Propagation. Corrosion: 1999, NACE International, Paper
No.: 98257.
[4] Weixing Chen and Robert L. Sutherby. Crack Growth Behavior of Pipeline Steel
in Near-Neutral pH Soil Environments. Metallurgical and Materials Transactions A 2007;
38A; pp.1260-1268.
[5] W. Chen, Richard Kania, Robert Worthingham, Gregory Van Boven.
Transgranular crack growth in the pipeline steel exposed to near-neutral pH soil aqueous
solutions: The role of hydrogen. Acta Materialia 57 (2009) 6200-6214.
[6] Alberta Energy Regulator. Report 2013-B: Pipeline Performance in Alberta,
1990-2012.
[7] National Energy Board (NEB), Focus on Safety and Environment a Comparative
Analysis of Pipeline Performance 2000-2007, July 2009.
[8] R.L. Wenk. Field Investigations of Stress Corrosion Cracking, 5th Symposium on
Line Pipe Research, American Gas Association, 1974.

246
[9] K. Sieradzki and R.C. Newman. Stress-Corrosion Cracking, J. Physics and
Chemistry of Solids, Vol. 48, No.11, pp. 1101-1113, 1987.
[10] National Energy Board (NEB), Report of the Inquiry-Stress Corrosion Cracking
on Canadian Oil and Gas Pipelines, 1996.
[11] C. Manfredi, and J.L. Otegui. Failures by SCC in buried pipelines. Engineering
Failure Analysis 9 (2002) 495-509.
[12] John A. Beavers, and Brent A. Harle. Journal of Offshore Mechanics and Arctic
Engineering. 123 (2001). pp.147-151.
[13] Jones DA. Principles and prevention of corrosion. 2nd ed. Upper Saddle River
(NJ): Prentice Hall; 1996. pp.291.
[14] W. Chen, F. King, and E. Vokes. Characteristics of Near-Neutral pH Stress
Corrosion Cracks in an X-65 Pipeline. Corrosion 2002, Vol. 58, No. 3, pp. 267-275.
[15] W. Bouaeshi, S. Ironside, and R. Eadie. Research and Cracking Implications from
an Assessment of Two Variants of Near-Neutral pH Crack Colonies in Liquid Pipelines.
Corrosion: July 2007, Vol. 63, No. 7, pp. 648-660.
[16] Karina Chevil, Abdoulmajid Eslami, Weixing Chen, Reg Eadie, Richard Kania,
Robert Worthingham, and Greg Van Boven. Developing Cathodic Protection Based on
Disbondment Geometry. Proceedings of 2012 9th International Pipeline Conference,
Calgary, Alberta, Canada, Sept. 24-28, 2012. Vol. 2, paper No. IPC2012-90675, pp. 583-
590.
[17] Eslami, A., B. Fang, R. Kania, B. Worthingham, J. Been, R. Eadie, and W. Chen.
Stress corrosion cracking initiation under the disbanded coating of pipeline steel in near-
247
neutral pH environment. Corrosion Science, Vol. 52, Issue 11, November 2010. pp.3750-
3756.
[18] Karina Chevil, Weixing Chen, Reg Eadie, Richard Kania, Greg Van Boven, and
Jenny Been. Correlating Corrosion Field Data with Experimental Findings for the
Development of Pipeline Mitigation Strategies. Proceedings of IPC2014, 10th
International Pipeline conference, Calgary, Alberta, Canada, Sept. 29- Oct. 3, 2014.
Paper No. IPC2014-33678.
[19] Abdoulmajid Eslami, Trevor Place, Shamus McDonnell, Chijikoe Ukiwe and Qin
You. Landscape Investigation on External Corrosion and SCC of a Tape Coated Enbridge
Pipeline. Proceedings of the 2012 9th International Pipeline Conferece, IPC2012, Sept.
24-28, 2012, Calgary, Alberta, Canada. Paper No. IPC2012-90598.
[20] F. King, Tom Jack, Miroslav Kolar and Robert Worthingham. A Permeable
Coating Model for Predicting the Environment at the Pipe Surface under CP-Compatible
Coatings. Corrosion 2004, New Orleans, USA, 2004, Paper No. 04158.
[21] Barlo T.J. and Berry W.E.. An assessment of the current criteria for cathodic
protection of buried steel pipelines. Materials Performance. Vol. 23:9, 1984,
[22] F. Gan, Z.-W. Sun, G. Sabde, and D.-T. Chin. Cathodic Protection to Mitigate
External Corrosion of Underground Steel Pipe Beneath Disbonded Coating. Corrosion:
October 1994, Vol. 50, No. 10, pp. 804-816.
[23] R. R. Fessler, A. J. Markworth, and R. N. Parkins. Cathodic Protection Levels
under Disbonded Coatings. Corrosion: January 1983, Vol. 39, No.1, pp. 20-25.
248
[24] Robert G. Wakelin, Robert A. Gummow, and Sorin Marius Segall. AC Corrosion
– Case Histories, Test Procedures, & Mitigation. Corrosion 1998, 22-27 March, San
Diego, California. Paper No. NACE-98565.
[25] X. Chen, X.G. Li, C.W. Du, and Y.F. Cheng. Effect of cathodic protection on
corrosion of pipeline steel under disbanded coating. Corrosion Science, Vol. 51, Issue 9,
Sept. 2009, pp. 2242-2245.
[26] Canadian Gas Assocaition OCC-1 Task Force. Recommended Practice OCC-1-
2013, Control of External Corrosion on Buried or Submerged Metallic Piping Systems,
June 2013.
[27] O. Vosikovsky, and R.J. Coole. An Analysis of Crack Extension by Corrosion
Fatigue in a Crude Oil Pipeline. International Journal of Pressure Vessels and Piping,
Vol. 6, Issue 2, March 1978, pp. 113-129.
[28] T.M. Ahmed, S. B. Sutherby, and A. Plumtree. Cyclic Crack Growth rates of X-
60 Pipeline Steel in a Neutral Dilute Solution. Corrosion: July 1997, Vol. 53, No. 7,
pp.581-590.
[29] Baotong Lu, Jingli Luo and Brian McCrady. Near-Neutral pH SCC Initiation and
Early Propagation of X70 Pipeline Steel. Proceedings of IPC2002, 4th International
Pipeline Conference, Sept. 29-Oct. 3, 2002, Calgary, Alberta, Canada. Paper No.
IPC2002-27234.
[30] Weimin Zhao, Yongxing Wang, Timing Zhang, and Tong Wang. Study on the
mechanism of high-cycle corrosion fatigue crack initiation in X80 steel. Corrosion
Science 57 (2012) 99-103.
249
[31] A. Mustapha, E.A. Charles, and D. Hardie. Evaluation of environment-assisted
cracking susceptibility of a grade X100 pipeline steel. Corrosion Science 54 (2012) 5-9.
[32] Frand Cheng. Stress Corrosion Cracking of Pipelines. A John Wiley & Sons, Inc.,
Publication, New Jersey, 2013, pp. 73-111.
[33] Abdoulmajid Eslami. PhD thesis, Near-neutral pH Stress Corrosion Crack
Initiation under Simulated Coating Disbondment. University of Alberta, Fall 2012.
[34] Syed J. Haider, Steven Textor, Aaron Sutton and Yvan Hubert. Managing a New
Pressure Cycling Reality in Liquid Pipelines. Proceedings of IPC2014, 10th International
Pipeline Conference, Sept. 29-Oct. 3, 2014, Calgary, Alberta, Canada. Paper No.
IPC2014-33485.
[35] O. Vosikovsky, and R. J. Cooke. An analysis of crack extension by corrosion
fatigue in a crude oil pipeline. International Journal of Pressure Vessels and Piping, Vol.
6, Issue 2, March 1978, pp. 113-129.
[36] R. N. Parkins and B. S. Greenwell. The interface between corrosion fatigue and
stress-corrosion cracking. Metal Science, Vol. 11, Issue 8-9 (01 August 1977), pp. 405-
413.
[37] Richard W. Hertzber. Deformation and Fracture Mechanics of Engineering
Materials, Fourth Edition, John Wiley and Sons, Inc., New York, NY, 1989, pp. 591-604.
[38] P. C. Paris, and F. Erdogan. A Critical Analysis of Crack Propagation Laws.
Journal of Basic Engineering, Vol. 85, 1960, pp. 528-534.
[39] J. Been, R. Eadie, and R. Sutherby. Prediction of Environmentally Assisted
Cracking on Gas and Liquid Pipelines. Proceedings of IPC2006, 6th International Pipeline
Conference, Sept. 25-29, 2006, Calgary, Alberta, Canada. Paper No. IPC2006-10345.
250
[40] J.A. Beavers, and C.E. Jaske. Effects of Pressure Fluctuations on SCC
Propagation”. PRCI Report on Contract PR-186-9706, Arlington, Virginia 2004.
[41] R. L. Eadie, K.E. Szklarz, and R. L. Suthery. Corrosion Fatigue and Near-Neutral
pH Stress Corrosion Cracking of Pipeline Steel and the Effect of Hydrogen Sulfide.
Corrosion: February 2005, Vol. 61, No. 2, pp.167-173.
[42] Afolabi Egbewande, Weixing Chen, Reg Eadie, Richard Kania, Greg Van Boven,
Robert Worthingham and Jenny Been. Transgranular crack growth in the pipeline steel
exposed to near-neutrla pH soil aqueous solutions: Discontinuous crack growth
mechanism. Corrosion Science, Vol. 83, June 2014, pp. 343-354.
[43] P.S. Pao and R.A. Bayles. Effect of Ripple Loads on Stress-Corrosion Cracking in
Structural Steel. Technical Report, Report No. NRL ser 6310/003, May 30, 1995.
[44] T.L. Anderson. Fracture Mechanics, Fundermentals and Applications, Third
Edition. Taylors & Francis Group, 2005. pp: 464-473.
[45] S. Srivatsan, and T.S. Sudarshan. Mechanisms of fatigue crack initiation in
metals: role of aqueous environments. Journal of Materials Science, May 1988, Vol. 23,
Issue 5, pp. 1521-1533.
[46] Weixing Chen, and Robert Sutherby. Laboratory Simulation of Hydrostatic Test
in Near-Neutral pH Soil Environments. Proceedings of IPC2006, 6th International
Pipeline Conference, Sept. 25- 29, 2006, Calgary, Alberta, Canada. Paper No. IPC2006-
10477.
[47] T.L. Anderson. Fracture Mechanics, Fundermentals and Applications, Third
Edition. Taylors & Francis Group, 2005. pp: 529-537.

251
[48] R. E. Ricker, and D. J. Duquette. The role of hydrogen in corrosion fatigue of
high purity Al-Zn-Mg exposed to water vapor. Metallurgical Transactions A, Vol. 19A,
July 1988, pp. 1775-1783.
[49] Roy Johnsen, Bård Nyhus and Stig Wästberg. Hydrogen Induced Stress Cracking
(HISC) of Stainless Steel under Cathodic Protection in Seawater: Presentation of a New
Test Method. Proceedings of the ASME 2009 28th International Conference on Ocean,
Offshore and Arctic Engineering, OMAE2009, May 31- June 5, 2009, Honolulu, Hawaii,
USA.
[50] N. Nanninga, A. Slifka, Y. Levy, and C. White. A Review of Fatigue Crack
Growth for Pipeline Steel Exposed to Hydrogen. Journal of Research of the National
Institute of Standards and Technology, Vol. 115, No. 6, Nov. - Dec. 2010, pp. 437-452.
[51] Arnaud Macadre, Maxim Artamonov, Saburo Matsuoka, and Jader Furtado.
Effects of hydrogen pressure and test frequency on fatigue crack growth properties of Ni-
Cr-Mo steel candidate for a storage cylinder of a 70 MPa hydrogen filling station.
Engineering Facture Mechanics 78 (2011) 3196-3211.
[52] Z. Sun, C. Moriconi, G. Benoit, D. Halm, and G. Henaff. Fatigue Crack Growth
under High Pressure of Gaseous Hydrogen in a 15-5PH Martensitic Stainless Steel:
Influence of Pressure and Loading Frequency. Metallurgical and Materials Transactons
A, March 2013, Vol. 44, No. 3, pp. 1320-1330.
[53] D. X. He, W.X. Chen, and J.L. Luo. Effect of cathodic potential on hydrogen
content in a pipeline steel exposed to NS4 near-neutral pH soil solution. Corrosion
2004;60(8):778-786.
252
[54] W. Chen, S.-H Wang, F. King, T. R. Jack, M. J. Wilmott. Hydrogen Permeation
Behavior of X-70 Pipeline Steel in a Near-Neutral pH Soil Environment. Proceedings of
IPC2000, 3rd International Pipeline Conference, Vol. 2, New York, NY: ASME
International, 2000, pp. 953-960.
[55] D.X. He, W. Chen, and J.L. Luo. Effect of Cathodic Potential on Hydrogen
Content in a Pipeline Steel Exposed to NS4 Near-Neutrla pH Soil Solution. Corrosion
2004;60(8):778-786.
[56] Y.F. Cheng. Fundamentals of hydrogen evolution reaction and its implications on
near-neutral pH stress corrosion cracking of pipeline. Electrochimica Acta 52 (2007)
2661-2667.
[57] Z.Y. Liu, X.G. Li, Y.F. Cheng. Mechanistic aspect of near-neutral pH stress
corrosion cracking of pipelines under cathodic polarization. Corrosion Science 55 (2012)
54-60.
[58] Lisa M. Young, Peter L. Andresen, and Thomas M. Angeliu. Crack tip Strain
Rate: Estimates Based on Contunuum Theory and Experimental Measurement. Corrosion
2001, March 11-16, 2001, NACE, Houston, TX, 2001, paper No. 01131.
[59] R.N. Parkins and J.A. Beavers. Some Effects of Strain Rate on the Transgranular
Stress Corrosion Cracking of Ferritic Steel in Dilute Near-Neutral pH Solutions.
Corrosion: March 2003, Vol. 59, No. 3, pp. 258-273.
[60] T. L. Anderson. Fracture Mechanics, Fundermentals and Applications, Third
Edition. Taylors & Francis Group, 2005. pp: 538-545.
[61] S. B. Lambert, J.A. Beavers, B. Delanty, R. Sutherby, and A. Plumtree.
Mechanical factors affecting stress corrosion cracking growth rates in buried pipelines.
253
Proceedings of International Pipeline conference, IPC2000, ASME, Calgary, Canada, pp.
961-966.
[62] G. Van Boven, R. Sutherby, and F. King. Characterizing Pressure Fluctuations on
Buried Pipelines in Terms Relevant to Stress Corrosion Cracking. Proceedings of
IPC2002, 4th International Pipeline Conference, Sept. 29- Oct. 3, 2002, Calgary, Alberta,
Canada. Paper No. IPC2002-27149.
[63] Jenny Been, Raymond R. Fessler, Sean Keane, and Walter Kresic. History of
Pressure Fluctuations Related to Severity of Near-Neutral pH SCC. Proceedings of
IPC2006, 6th International Pipeline Conference, Sept. 25- 29, 2006, Calgary, Alberta,
Canada. Paper No. IPC2006-10412.
[64] ASTM E1049 – 85 (reapproved 2011)E1. Standard Practices for Cycle Counting in
Fatigue Analysis. American Society for Testing and Materials, West Conshohocken, PA,
2011.
[65] G. Van Boven, R. Sutherby, and F. King. Characterizing Pressure Fluctuations on
Buried Pipelines in Terms Relevant to Stress Corrosion Cracking. Proceedings of
IPC2002, 4th International Pipeline Conference, Sept. 29- Oct. 3, 2002, Calgary, Alberta,
Canada. Paper No. IPC2002-27149.
[66] M. Skorupa. Load Interaction Effects During Fatigue Crack Growth under
Variable Amplitude loading- a Literature Review. Part I: Empirical Trends. Fatigue &
Fracture of Engineering Materials & Structures 1998; 21: 987-1006.
[67] M. Skorupa. Load Interaction Effects During Fatigue Crack Growth under
Variable Amplitude loading- a Literature Review. Part II: Qualitative explaination.
Fatigue & Fracture of Engineering Materials & Structures 1999; 22: 905-926.
254
[68] Vasilios Zitounis. Fatigue Crack Growth Rates under Variable Amplitude Load
Spectra Containing Tensile Underloads. PhD thesis, Cranfield University, 28 October
2003.
[69] Stephan M. Russ. Effect of Underloads on Fatigue Crack Growth of Ti-17. PhD
thesis, Georgia Institute of Technology, October 2003.
[70] Fowler, K.R. and Watanabe, R.T.. Development of Jet Transport Airframe
Fatigue Test Spectra, Development of Fatigue Loading Spectra, ASTM STP 1006, J. M.
Potter and R. T. Watanabe, Eds., American Society for Testing and Materials,
Philadelphia, 1989, pp. 36-64.
[71] Sunder, R. Contribution of Individual Load Cycles to Crack Growth under
Aircraft Spectrum Loading, Advances in Fatigue Lifetime Predictive Techniques, ASTM
STP 1122, M. R. Mitchell and R. W. Landgraf, Eds., American Society for Testing and
Materials, Philadelphia, 1992, pp. 176-190.
[72] T. L. Anderson. Fracture Mechanics, Fundermentals and Applications, Third
Edition. Taylors & Francis Group, 2005. pp: 473-488.
[73] Henning Agerskov. The Fatigue Behavior of Steel Structures under Random
Loading. Key Engineering Materials, Vols. 378-379 (2008) pp.3-16.
[74] Yan-Hui Zhang, and S.J. Maddox. Investigation of fatigue damage to welded
joints under variable amplitude loading spectra. International Journal of Fatigue 31
(2009) 138-152.
[75] N.A. Fleck. Fatigue Crack Growth due to Periodic Underloads and Overloads.
Acta Metallurgica, Vol. 33, No. 7, July 1985, pp. 1339-1354.
255
[76] Colin MacDougall, and T.H. Topper. The influence of variable amplitude loading
on crack closure and notch fatigue behavior. International Journal of Fatigue, Vol. 19,
No. 5, pp. 389-400, 1997.
[77] M. El-Zeghayar, T.H. Topper, F.A. Conle, and J.J. F. Bonnen. Modeling crack
closure and damage in variable amplitude fatigue using smooth specimen fatigue test
data. International Journal of Fatigue, Vol. 33, No. 2, Feb. 2011, pp. 223-231.
[78] J. C. Newman, Jr. and E.P. Phillips. Prediction of Crack Growth Under Variable-
Amplitude and Spectrum Loading in a Titanium Alloy. Fatigue Testing and Analysis
under Variable Amplitude Loading Conditions, ASTM STP 1439, Peter C. McKeighan,
and Narayanaswami Ranganathan, American Society for Testing and Materials,
Philadelphia, 2005, pp. 232-250.
[79] N. Ohrloff, A. Gysler and G. Lütjering. Journal DE Physique, Colloque C3,
supplement au n°9, Tome 48, Sept. 1987, C3-801.
[80] M. Krkoska, S.A. Barter, R.C. Alderliesten, P. White, R. Benedictus. Fatigue
crack paths in AA2024-T3 when loaded with constant amplitude and simple underload
spectra. Engineering Fracture Mechanics, Vol. 77, No. 11, July 2010, pp. 1857-1865.
[81] Richard W. Hertzberg. Deformation and Fracture Mechanics of Engineering
Materials, Fourth Edition, John Wiley & Sons, Inc., 1996, pp. 634-641.
[82] Kentaro Yamada, Qiuliang Cao, Yuji Okuhara and Xiaohua Cheng. Fatigue Crack
Growth Behavior of Various Structural Steel after Single and Periodic Overloads.
Structural Eng./Earthquake Eng., JSCE, Vol. 15, No. 2, 191s-200s, 1998 July. pp. 37-46.
256
[83] J. Schijve, F. A. Jacobs, and P. J. Tromp. Crack propagation in 2024-T3Al cald
under flight-simulation loading effect of truncating high gust loads. National Aerospace
Laboratory, NLR, The Netherlands, NLR TR-69050-U, June 1969.
[84] Raymond R. Fessler and Steve Rapp. Method for Establishing Hydrostatic Re-
Test Intervals for Pipelines with Stress-Corrosion Cracking. Proceedings of IPC2006, 6th
International Pipeline Conference, Sept. 25- 29, 2006, Calgary, Alberta, Canada. Paper
No. IPC2006-10163, pp. 259-263.
[85] Weixing Chen, Yongwang Kang, Reg Eadie, Richard Kania, Greg Van Boven,
and Robert Worthingham. Proceedings of the 2012 9th International Pipeline Conference,
IPC2012, Sept. 24- 28, 2012, Calgary, Alberta, Canada. Paper No. IPC2012-90635.
[86] Yongwang Kang, Weixing Chen, Richard Kania, Gregory Van Boven, Robert
Worthingham. Simulation of crack growth during hydrostatic testing of pipeline steel in
near-neutral pH environment. Corrosion Science 53 (2011) 968-975.
[87] Jian Li, M. Elboujdaini, M. Gao, R. W. Revie. Investigation of plastic zones near
SCC tips in a pipeline after hydrostatic testing. Materials Science and Engineering A 486
(2008) 496-502.
[88] Ryoichi Koterazawa, and Takayoshi Nosho. Acceleraion of Crack Growth under
Intermittent Overstressing in Different Environments. Fatigue & Fracture of Engineering
Materials & Structures. Vol. 15, No. 1, pp. 103-113, 1992.
[89] T. L. Anderson. Fracture Mechanics, Fundermentals and Applications, Third
Edition. Taylors & Francis Group, 2005. pp: 457-464.
[90] Eric F. J. von Euw. Effect of Overload Cycle(s) on Subsequent Fatigue Crack
Propagation in 2024-T3 Aluminum Alloy. PhD Dissertation, Lehigh University, 1971.
257
[91] Asok Ray, and Ravindra Patankar. Fatigue crack growth under variable-amplitude
loading: Part I – Model formulation in state-space setting. Applied Mathematical
Modelling 25 (2001) 979-994.
[92] T. L. Anderson. Fracture Mechanics, Fundermentals and Applications, Third
Edition. Taylors & Francis Group, 2005. pp: 473-488.
[93] Soo Yeol Lee. Effects of Overload and Underload on Internal Strains/Stresses and
Crack Closure during Fatigue-Crack Propagation. Doctoral Dissertations, University of
Tennessee - Knoxville, December, 2009.
[94] J. Schijve. The Effect of Pre-strain on Fatigue Crack Growth and Crack Closure.
Engineering Fracture Mechanics, 1976, Vol. 8, pp. 575-581.
[95] S. Suresh. Fatigue of Materials. Cambridge University Press, Cambridge, New
York Port Chester, Melbourne Sydney, 1991, pp:113.
[96] K. Katagiri, R. Koterazawa, T. Yamada, and T. Tsuboi. Changes in dislocation
structures adjacent to fatigue crack tips induced by intermittent overstressing. Metal
Science, Vol. 17, November 1983, pp:556-562.
[97] Canadian Energy Pipeline Association (CEPA). Stress Corrosion Cracking
Recommended Practices, 2nd Edition, An industry leading document detailing the
management of transgranular SCC, December 2007,pp.5-5.
[98] TransCanada Pipeline (1996) Response to National Energy Board Information
Request 2 of Proceeding MH-2-5, TCP, Calgary, Alberta, Canada, pp.3.
[99] B. W. Williams, S. B. Lamber, R. Sutherby, A. Plumtree. Environmental Crack
Growth under Variable Amplitude Loading of Pipeline Steel. Corrosion: January 2004,
Vol. 60, No.1, pp. 95-103.
258
[100] J. A. Beavers, C. J. Maier, and C. E. Jaske. Methodology for Ranking SCC
Susceptibility of Pipeline Segments Based on the Pressure Cycle history. Corrosion 2007,
Paper No. 07128.
[101] Brett Conrad, Weixing Chen, Reg Eadie, Richad Kania, Greg Van Boven, Robert
Worthingham. Developing a Predictive Model of Near Neutral pH Stress Corrosion
Cracking of Underground Pipelines. Proceedings of IPC 2012, 9th International Pipeline
conference, Sept. 24-28, 2012, Calgary, Alberta, Canada. Paper No.: IPC2012-90629, pp:
559-567.
[102] Weixing Chen, Achieving Maximum Crack Remediation Effect from Optimized
Hydrotesting, Final Report Prepared for US Department of Transportation PHMSA,
Client Contract Number: DTPH56-08-T-000008-WP#355, June 15, 2011, total pages: 93.
[103] R.W. Staehle. R.W. Staehle, et al., editors. Stress corrosion cracking and
hydrogen embrittlement of iron base alloys, NACE-5. Houston (TX): NACE; 1977. p.
193.
[104] S. Srivatsan, T.S. Sudarshan. Mechanisms of fatigue crack initiation in metals:
role of aqueous environments. Journal of Materials Science, 1988;23:1521-1533.
[105] Sheng-Hui Wang, Weixing Chen. A Study on the pre-cyclic load-induced burst of
creep deformation of a pipeline steel under subsequent static load. Materials Science and
Engineering A, 2002;A325:144-151.
[106] Sheng-Hui Wang,Yonggang Zhang, Weixing Chen. Room temperature creep and
strain-rate-dependent stress-strain behavior of pipeline steel. Journal of Materials
Science, 2001;36;1931-1938.
259
[107] Sheng-Hui Wang, Weixing Chen. Room temperature creep deformation and its
effect on yielding behavior of a line pipe steel with discontinuous yielding. Materials
Science and Engineering A 2001;301:147-153.
[108] Kamel Makhlouf, J.W. Jones. Effects of temperature and frequency on fatigue
crack growth in 18% Cr ferritic stainless steel. International Jounal of Fatigue,
1993;15(3):163-171.
[109] Lambert SB, Beavers JA, Delanty B, Sutherby R, Plumtree A. Mechanical factors
affecting stress corrosion cracking growth rates in buried pipelines. In: Proceedings of
3rd International Pipeline Conference; 2000, Calgary. p.961-965.
[110] Zhao J, Chen W, Boven GV, Keane S, Been J. Development and Validation of
Load-Interaction Based Models for Crack Growth Prediction. In: Proceedings of 10th
International Pipeline Conference; 2014, Calgary. Paper No.: IPC2014-33325.
[111] T.M. Ahmed, S.B. Lambert, R. Sutherby, A. Plumtree. Cyclic crack growth rates
of X-60 pipeline steel in a neutral dilute solution. Corrosion 1997;53(7):581-590.
[112] C.D. Beachem. A new model fro hydrogen-assisted cracking (hydrogen
“embrittlement”). Metallurgical Transactions, 1972;3(2):437-451.
[113] P.J. Ferreira, I.M. Robertson, H.K. Birnbaum. Hydrogen effects on the character
of dislocations in high-purity aluminum. Acta Mater 1999;47(10):2991-2998.
[114] Zhao J et al. Statistical analysis on pipeline spectra, in preparation.
[115] D.L. Davidson, J. Lankford. Fatigue crack growth in metals and alloys:
mechanisms and micromechanics. International Materials Reviews, 1992;37(2):45-74.
260
[116] Ryosuke Matsumoto, Shinya Taketomi, Sohei Matsumoto, Noriyuki Miyazaki.
Atomistic simulations of hydrogne embrittlement. International Journal of Hydrogen
Energy, 2009;34(23):9576–9584.
[117] Xiaoyang Liu, Wenbo Xie, Weixing Chen, Hao Zhang. Effects of grain boundary
inclination on hydrogen diffusion in α–iron.Journal of Materials Research,
2011;26(21):2735–2743.
[118] Alexander Troiano. The role of hydrogen and other interstitials in the mechanical
behavior of metals. Trans. ASM 52.1 (1960):54-80.
[119] H.K.Birnbaum, P. Sofronis. Hydrogen-enhanced localized plasticity-a mechanism
fro hydrogen related fracture. Materials Science and Engineering A 176 (1994) 191–202.
[120] T. Doshida, M. Nakamura, H. Saito, T. Sawada, K. Takai. Hydrogen-enhanced
lattice defect formation and hydrogen embrittlement of cyclically prestressed tempered
martensitic steel. Acta Mater 61 (2013) 7755-7766.
[121] Afolabi Egbewande, Weixing Chen, Reg Eadie, Richard Kania, Greg Van Boven,
Robert Worthingham, Jenny Been. Transgranular crack growth in the pipeline steel
exposed to near-neutral pH soil aqueous solutions: discontinuous crack growth
mechanism. Corrosion Science 2014;83:343-354.
[122] M. Baker Jr. (2004), Stress Corrosion Cracking Studies, Integrity Management
Program DTRS56-02-D-70036, Department of Transportation, Office and Pipeline
Safety.
[123] R. Koterazawa (1981). Fatigue crack propagation under periodic overstressing. In:
Proc. Fatigue ’81, SEE Fatigue Group Conf. Warwick Univ. England (edited by F.
Sherratt and J. B. Sturgeon), 318-327. Westbury House, Guildford, England.
261
[124] V. M. Pleskach and P. A. Averchenko. Effect of gaseous erosion on a decrease of
the fatigue strength of specimens of titanium alloy VT8. Plenum Publishing Corporation,
1976, No. 8, pp.118-119.
[125] H.-J. Christ, A. Jung, H.J. Maier and R. Teteruk. Thermomechanical fatigue-
damage mechanisms and mechanism-based life prediction methods. Sadhana, Vol. 28,
Parts 1 & 2, February-April 2003, pp. 147–165.
[126] B.L. Boyce and R.O. Ritchie. Effects of load ratio and maximum stress intensity
on the fatigue threshold in Ti-6Al-4V. Engineering Fracture Mechanics, Vo.68, Issue 2,
2001:129-147.
[127] M. O. Speidel, S.E. Stanzl and E. Tschegg. Fatigue crack growth in a 13% Cr
steel at frequencies from 10-3 Hz to 104 Hz determination of the threshold stress intensity
ΔK0 by ultrasonic fatigue. Materials Science and Engineering Technology. 1980, 11, 305-
308.
[128] Kamel Makhlouf and J.W. Jones. Effects of temperature and frequency on fatigue
crack growth in 18% Cr ferritic stainless steel. International Journal of Fatigue. Vol. 15,
No. 3,1993, pp.163-171.
[129] Elber, Wolf. Fatigue crack closure under cyclic tension. Engineering Fracture
Mechanics, Vol. 2, No. 1, 1970, pp.37-44.
[130] A.K. Vasudevan, K. Sadananda, G. Glinka. Critical parameters for fatigue
damage. Vol. 23, 2001, pp. 39-53.
[131] C. Manfredi and J.L. Otegui. Failures by SCC in buried pipelines. Engineering
Failure Analysis, Vol. 9, 2002, pp. 495-509.
262
[132] Fowler, K.R. and Watanabe, R.T.. Development of Jet Transport Airframe
Fatigue Test Spectra, Development of Fatigue Loading Spectra, ASTM STP 1006, J. M.
Potter and R. T. Watanabe, Eds., American Society for Testing and Materials,
Philadelphia, 1989, pp. 36-64.
[134] Richard W. Hertzber. Deformation and Fracture Mechanics of Engineering
Materials, Fourth Edition, John Wiley and Sons, Inc., New York, NY, 1989, pp. 521-586.
[135] Yan-Hui Zhang, and S.J. Maddox. Fatigue life prediction for toe ground welded
joints. International Journal of Fatigue, 31 (2009):138-152.
[136] C.F. Dong, Z.Y. Liu, X.G. Li and Y.F. Cheng. Effects of hydrogen-charging on
the susceptibility of X100 pipeline steel to hydrogen-induced cracking. International
Journal of Hydrogen Energy, 34 (2009): 9879-9884.
[137] R. Sunder, W. J. Porter and N. E. Ashbaugh. The role of air in fatigue load
interaction. Fatigue & Fracture of Engineering Materials & Structures, Vol. 26, Issue 1,
Jan. 2003: 1-16.
[138] L. Raymond. Hydrogen Embrittlement: Prevention and Control, ASTM STP 962,
L. Raymond, Ed., American Society for Testing and Materials, Philadelphia, 1988, pp.
10-16.
[139] M.A.V. Devanathan, Z. Stachurski, W. J. Beck. A technique for the evaluation of
hydrogen embrittlement characteristics of electroplating baths. Journal of the
Electrochemical Society, 1963 Vol. 110, Issue 8, 886-890.
[140] D. Hardie, E.A. Charles, A.H. Lopez. Hydrogen embrittlement of high strength
pipeline steel. Corrosion Science, 48 (2006) 4378-4385.

263
[141] J.L. Gillette, R.L. Kolpa. Overview of interstate hydrogen pipeline systems.
Report No. : ANL/EVS/TM/08-2, TRN: US0802253, Feb. 2008.
[142] W.H. Johnson. On some remarkable changes produced in iron and steel by the
action of hydrogen and acids. Nature, Vo. 11, Issue 281, 1875: 393.
[143] R.P. Gangloff, R.P. Wei. Gaseous hydrogen embrittlement of high strength steel.
Metallurgical Transactions A, Vol.8, Issue 7, 1977, 1043-1053.
[144] R. A. Oriani. Hydrogen embrittlement of steel. Annual Review of Materials
Science, 1978.8:327-357.
[145] John P. Hirth. Effects of hydrogen on the properties of iron and steel.
Metallurgical Transactions A, Vol. 11, Issue 6, 1980: 861-890.
[146] A. Nagao, C.D. Smith, M. Dadfarnia, P. Sofronis, I.M. Robertson. The role of
hydrogen in hydrogen embrittlement fracture of lath martensitic steel. Acta Mater. 60
(2012) 5182-5189.
[147] S. Ohmiya, H. Fujii. Effects of Ni and Cr contents on fatigue crack growth
properties of SUS316-based stainless steel in high-pressure gaseous hydrogen. The Iron
and Steel Institute of Japan (ISIJ) International, 52 (2) (2012) 247-254.
[148] J. Zhao, Z. Jiang, C.S. Lee. Effects of tungsten on the hydrogen embrittlement
behavior of microalloyed steel. Corrosion Science, 82 (2014) 380-391.
[149] V. Venegas, F. Caleyo, T. Baudin, J.H. Espina-Hernández, J.M. Hallen. On the
role of crystallographic texture in mitigating hydrogen-induced cracking in pipeline steel.
Corrosion Science, 53 (2011) 4204-4212.

264
[150] S. Chen, M. Zhao, L. Rong. Effect of grain size on the hydrogen embrittlement
sensitivity of a precipitation strengthened Fe-Ni based alloy. Materials Science and
Engineering A, 594 (2014) 98-102.
[151] O.M.I. Todoshchenko, Y. Yagodzinskyy, T. Saukkonen, H. Hänninen. Role of
nonmetallic inclusions in hydrogen embrittlement of high-strength carbon steel with
different microalloying. Metallurgical and Materials Transactions A, 45 (11) (2014)
4742-4747.
[152] O. Takakuwa, T. Ohmi, M. Nishikawa, A. Toshimitsu Yokobori Jr. and H.
Soyama. Suppression of fatigue crack propagation with hydrogen embrittlement in
stainless steel by cavitation peening. Strength, Fracture and Compexity, 7 (2011) 79-85.
[153] K. Takai, H. Shoda, H. Suzuki, M. Nagumo. Lattice defects dominating
hydrogen-related failure of metals. Acta Mater. 56 (2008) 5158-5167.
[154] Y. Murakami. The effect of hydrogen on fatigue properties of metals used for fuel
cell system. Advances in Fracture Research, 2006, p.167-195.
[155] J.J. DeLuccia. Hydrogen Embrittlement: Prevention and Control, ASTM STP
962, L. Raymond, Ed., American Society for Testing and Materials, Philadelphia, 1988,
pp. 17-34.
[156] M.R. Louthan. Hydrogen embrittlement of metals: a primer for the failure analyst.
Journal of Failure Analysis and Prevention, (2008) 8:289-307.
[157] H.D. Fleming, R. G. Ide. Determination of volatile hydride-forming metals in
steel by atomic absorption spectrometry. Analytica Chimica Acta. 83 (1976) 67-82.
[158] A. Troiano. The role of hydrogen and other interstitials in the mechanical
behavior of metals. Trans. ASM 52 (1960) 147-157.
265
[159] R.A. Vennett, G.S. Ansell. The effect of high-pressure hydrogen upon the tensile
properties and fracture behavior of 304 L stainless steel. Transactions of American
Society for Metals, 60 (1967) 242-251.
[160] Z.T. Liu, X.G. Li, Y.F. Cheng. Mechanistic aspect of near-neutral pH stress
corrosion cracking of pipelines under cathodic polarization. Corrosion Science 55 (2012)
54-60.
[161] I.M. Robertson, H.K. Birnbaum. Chapter 91 Hydrogen effects on palsticity.
Dislocations in Solids, 15 (2009) 249–293.
[162] S. Wang, M.L. Martin, P. Sofronis, S. Ohnuki, N. Hashimoto, I.M. Robertson.
Hydrogen-induced intergranular failure of iron. Acta Mater. 69 (2014) 275-282.
[163] T. Neeraj, R. Srinivasan, Ju Li. Hydrogen embrittlement of ferritic steel:
observations on deformation microstructure, nanoscale dimples and failure by
nanovoiding. Acta Materialia 60 (2012) 5160–5171.
[164] X. Chen, T. Foecke, M. Lii, Y. Katz, W.W. Gerberich. The role of stress state on
hydrogen cracking in Fe-Si single crystals. Engineering Fracture Mechnics. Vol. 35, No.
6, pp. 997-1017, 1990.
[165] E. Hörnlund, J.K.T. Fossen, S. Hauger, C. Haugen, T. Havn, T. Hemmingsen.
Hydrogen diffusivities and concentrations in 520M carbon steel under cathodic protection
in 0.5 M NaCl and the effect of added sulphite, dithionite, thiosulphate, and sulphide.
International Journal of Electrolchemical Science, 2 (1) (2007) 82-92.
[166] J. Song, W.A. Curtin. A nanoscale mechanism of hydrogen embrittlement in
metals. Acta Mater 2011;59(4):1557–1569.

266
[167] Haftbaradaran H, Song J, Curtin WA, Gao H. J. Continuum and atomistic models
of strongly coupled diffusion, stress, and solute concentration. Journal of Power Sources,
2011;196(1):361–370.
[168] J. Song, W.A. Curtin. Atomic mechanism and prediciton of hydrogen
embrittlement in iron. Nature Materials, 2013;12(2):145–51.
[169] Shyyuan-Fang Chen, Robert P Wei. Environmentally assisted crack growth in a
Ni-18Cr-18Fe ternary alloy at elevated temperatures. Materials Science and Engineering
A, Vol. 256, Issue 1-2, 1998, pp. 197-207.
[170] T. Bellahcene, J. Capelle, M. Aberkane, Z. Azari. Effect of hydrogen on
mechanical properties of pipeline API 5L X70 steel. Applied Mechanics and Materials,
Vol. 146 (2012) pp. 213-225.
[171] Zuhair Mattoug Gasem. Frequency dependent environmental fatigue crack
propagation in the 7XXX alloy/aqueous chloride system. PhD thesis, University of
Virginia, May 1999.