CRA STRATEGIC PLAN 2018 – 2020 - federalreserve.gov · the Plan to its regulatory agency (along...
37
dba Bonneville Bank and GoBank Provo, Utah CRA STRATEGIC PLAN 2018 – 2020 1
Transcript of CRA STRATEGIC PLAN 2018 – 2020 - federalreserve.gov · the Plan to its regulatory agency (along...

dba Bonneville Bank and GoBank Provo, Utah
CRA STRATEGIC PLAN 2018 – 2020
1

2
SECTION 1 INTRODUCTION A. General Information B. The Bank’s Specialized Business Model C. Financial Information
SECTION 2 COMMUNITY REINVESTMENT ACT A. CRA Requirements B. Strategic Plan - Overall Focus, Effective Date and Term C. The Bank’s Commitment to CRA D. Current and Historical CRA Program E. Program Oversight and Resources F. Development of the Bank’s CRA Strategic Plan
SECTION 3 THE BANK’S ASSESSMENT AREA
A. Definition B. Assessment Area Description C. Demographic Characteristics D. Economic Characteristics
SECTION 4 PERFORMANCE CONTEXT
A. The Bank’s Business Model B. Competitive Environment C. Bank Capacity
SECTION 5 STRATEGIC PLAN MEASURABLE GOALS
A. Methodology B. Measurable Goals over the Three-Year Plan
SECTION 6 OTHER INFORMATION
A. Input to the Development of the Strategic Plan B. Public Comments on the Strategic Plan C. Changes to the Strategic Plan D. Monitoring Strategic Plan Performance
APPENDIX A. Assessment Area Maps and Census Tracts B. Evidence of Public Notice of Green Dot Bank’s Draft Strategic Plan C. Bank Balance Sheet as of June 30, 2017

GREEN DOT BANK
COMMUNITY REINVESTMENT ACT STRATEGIC PLAN
INTRODUCTION
A. General Information
Green Dot Bank (“the Bank”) is organized as a commercial bank in the State of Utah
headquartered in Provo, Utah. The Bank is a State Chartered member bank with its primary
regulator as the Federal Reserve Bank of San Francisco. On December 8, 2011, Green Dot
Corporation became a bank holding company through its acquisition of Bonneville Bancorp and
its subsidiary, Bonneville Bank. On January 19, 2012, the Bank was approved to convert its
charter from non-member to member in the Federal Reserve. The Bank completed the charter
conversion on February 6, 2012.
Prior to its acquisition by the Bank, Bonneville Bank had served the Provo and Utah County
community for over 30 years. In order to minimize disruption to its current customers, the Bank
retained the Bonneville Bank name (as a licensed dba) for the purposes of conducting its on-going
community banking operations in Utah. The Bank continues to offer traditional consumer and
small business deposit and loan products similar to those acquired as part of the Bonneville Bank
acquisition from its single office in Provo, Utah. The Bank is not intending to expand its branch
presence for deposit taking at this time.
B. The Bank’s Specialized Business Model
Within the Provo community, Green Dot Bank dba Bonneville Bank has a traditional community
bank footprint, offering individuals and small businesses an array of products and services –
including loans and deposit products – to meet the community’s needs.
Beyond the Provo community, Green Dot Bank has a specialized business model that differs in
important ways from traditional community banks. This model is designed to achieve the
fundamental purposes of the Community Reinvestment Act on a nationwide basis – ensuring that
communities from which a bank draws its deposits are served by that Bank, including with lending
products – while providing a suite of products and consumer touchpoints that more effectively
meet the needs of LMI individuals in the modern world.
3

1 Deposits associated with Green Dot Bank-issued prepaid cards are accounted for as a pooled deposit. The Bank and Green Dot Corporation are required by the Federal Reserve Bank of San Francisco to maintain cash and cash equivalent equal to or greater than total prepaid deposits. This requirement limited the Bank’s ability to lend and invest funds, since the funds must be held in cash or qualified investments with durations of 90 days or shorter. The Bank has requested relief from this commitment. 2 The Bank’s checking account is a demand deposit account (DDA) product designed for individual consumers and small businesses and is offered commercially under the name “GoBank”. Green Dot Bank has licensed the “GoBank” name as a “doing business as” (dba) with the State of Utah. Deposits associated with these DDA accounts are accounted for as individual deposits. 3 Green Dot Bank expects to continue to offer innovative, consumer friendly products and services over time. Under commitments made to the Federal Reserve Bank and the State of Utah, Green Dot Bank must obtain prior approval for any material change to its business plan.
The Bank offers two primary consumer deposit and payment products: a general purpose
reloadable debit card (“GPR card” or “prepaid card”)1 and a mobile checking account.2 Both
products are distributed nationwide through more than 100,000 retailers and other distribution
partners and through on-line and other direct-to-consumer channels, not through traditional
bank branches. Additionally, the GoBank and Walmart MoneyCard card products include an
attached savings feature, which encourages consumers to better manage their finances by
setting aside funds to meet future needs. Green Dot’s mission is to reinvent banking for the
masses, and it designs its products to serve consumers in a fair and transparent way.
In addition to its prepaid cards and checking accounts, the Bank serves as the issuing bank for gift
cards designed to meet consumers’ one-time payment needs.
More recently, in the third quarter of 2016, the Bank launched a secured credit card – the
Green Dot Platinum Visa Credit Card. Thus far, this product appears to be meeting consumers’
needs, as evidenced by meaningful early consumer demand for this card. Our objective is to
offer secured credit as an “on-ramp” for consumers who are new to banking/credit and are
looking to establish a credit file, as well as for consumers who are seeking to enhance an
existing credit file.3
C. Financial Information
As of June 30, 2017, the Bank held total deposits of $764.8 million and assets of $878.7 million.
The Tier 1 Capital Leverage ratio of 10.3% and the Tier 1 Risk Based Capital ratio of 48.0% reflect
a high level of ongoing capitalization. The Bank’s $9.1 million loan portfolio is composed
principally of real estate loans of $3.9 million, commercial loans of $1.3 million, secured credit
card loans of $3.4 million, and individual loans of $0.5 million. The Bank’s loan to deposit ratio is
1.2%.
4

4 The regulations for a strategic plan state:
Any Institution is permitted to develop, and submit for approval by its primary supervisory agency, a strategic plan
(the “Plan”) for addressing its responsibilities with respect to CRA. The Plan option was developed to provide
institutions with more flexibility and certainty regarding what aspects of their performance will be evaluated and
what quantitative and qualitative measures will be applied. To exercise this option, an institution must informally
seek suggestions from the public while developing its Plan, solicit formal public comment on its Plan and submit
the Plan to its regulatory agency (along with any written comments received from the public and an explanation
of any changes made to the Plan in response to those public comments).
To be approved by an agency, the Plan must have measurable goals and address how the institution plans to meet
the credit needs of its assessment area, in particular, low- and moderate-income geographies and individuals,
through lending, investments and services, as appropriate. Although a Plan should generally emphasize lending
goals, the rule allows institutions the flexibility to choose a different emphasis, as necessary, given their business
strategy and the needs of their community. A Plan must contain goals that, if met, would constitute “satisfactory”
performance.
In July 2017, the Bank agreed to purchase a small secured credit card portfolio from a regional
third-party bank, with the transaction expected to close later in 2017. This acquisition will
increase the Bank’s overall secured credit card loan balance to approximately $11.0 million, as
well as increase the loan to deposit ratio to approximately 2.2%.
The Bank’s summary balance sheet and a link to the Consolidated Reports of Condition and
Income (Call Report) as of June 30, 2017 are included in Appendix C.
THE COMMUNITY REINVESTMENT ACT
A. Community Reinvestment Act Requirements
The Bank is subject to various regulatory requirements administered by the Federal banking
agencies, one of which is the Community Reinvestment Act (“CRA”). The CRA encourages banks
to help meet the credit needs of the communities in their assessment areas, which include the
communities in which they operate deposit-taking full-service branches. Although the Bank
issues GPR cards, GoBank accounts, and secured credit cards nationwide, the Bank’s only full
service branch is located in Provo, Utah.
The CRA regulations allow banks to elect to be assessed under a CRA Strategic Plan. Compliance
with CRA through a strategic plan allows a bank an opportunity to design a program that is
appropriate to its own capabilities, business strategies, and organizational framework, as well as
to the communities it serves.4
5

B. Strategic Plan – Overall Focus, Effective Date and Term
Consistent with its balance sheet and business model, the Bank’s CRA Strategic Plan (“the Plan”)
will be focused on supporting the credit needs of its defined assessment area primarily through
direct community development lending, small business lending, investments and services in its
designated Metropolitan Statistical Area (MSA) of Utah and Juab Counties and the state of Utah.
In addition, the Bank will fund qualified grants to community development organizations, and
officers and employees will participate with organizations serving low-and-moderate income
households and communities in its assessment area.
In addition, consistent with the Bank’s nationwide business model and focus on meeting the
needs of LMI populations across the country, the Bank will actively participate with national
organizations that align with Green Dot’s mission to serve the unbanked/underserved
population, many of which also fall into the low- and moderate-income population. The Bank
will work with local, regional, or national organizations to provide direct services related to
financial education and literacy and/or to promote educational, policy, product development, or
other initiatives designed to promote access by underbanked/unbanked populations and LMI
individuals to financial services and/or the financial literacy and economic security of LMI
individuals and communities. Services will be provided by Green Dot Bank employees or
employees of Green Dot Bank’s affiliates located in offices across the country.
The effective date of the Bank’s CRA Plan is anticipated to be January 1, 2018, or 90 days after
the submission of the Plan to the Federal Reserve Bank of San Francisco. The Plan will have a
three-year term. If current CRA requirements are amended during this three-year term, the Bank
may choose to amend its Plan.
C. The Bank’s Commitment to CRA
The Bank acknowledges its important obligation to serve the needs of the communities from
which it draws its deposits and in which it operates. Consistent with this obligation and safe and
sound banking practices, the Bank is committed to a robust CRA program which includes
community development and small business lending, community development investment and
service activity to assist in meeting the related needs of its defined assessment area, the State of
Utah, and the broader region in which the Bank’s products are marketed. The Bank strives to
maintain contact with community leaders, non-profit organizations, and other interested parties
to determine critical needs in the community and for assistance in implementation of its CRA
program and this Plan.
6

D. Current and Historical CRA Program
Prior to Green Dot Corporation’s acquisition of Bonneville Bank, the Bank administered a CRA
program focused on the credit needs of its single branch market in Provo, Utah, and the
immediate surrounding regions. The Bank pursued a strategy to meet its CRA obligations
primarily through direct small business lending within the community. In addition, the Bank
provided additional community support though investments and service activity. The Bank was
responsive to local credit needs primarily through commercial lending to small businesses with
gross annual revenues of less than $1 million, a practice still in place at Bonneville Bank’s single
branch in Provo today. In addition, the Bank originates a substantial majority of its loans in the
amount of $100 thousand or less. Additional loan products offered by the Bank at its Provo
branch include personal lines of credit, automobile loans, consumer purpose loans, and small
construction loans. The Bank also offers a full range of deposit products, including interest-
bearing checking accounts, savings accounts, certificates of deposit, and money market accounts
in the assessment area.
For the period beginning in January 2012, the Bank has operated under two successive three-
year CRA Strategic Plans. The Bank’s Plans included the components listed above as well as the
additional focus on community development lending, specific real estate investments,
participation with community affordable housing oriented and educational groups, Small
Business Investment Corporations (SBIC) and nationwide educational program participations.
Although the Bank has not yet been evaluated for its performance under the 2015-2017 CRA
Strategic Plan, an evaluation rating of “Outstanding” was received in August 2015 for
performance under the 2012-2014 Plan, and the Bank has always maintained at least an overall
“Satisfactory” CRA rating.
E. Program Oversight and Resources
To lead its CRA program, the Bank has appointed its Chief Executive Officer (CEO), and its Utah
resident Director, Lending & Operations as its Joint CRA Officers. The Bank’s CRA program is
supported by employees at its single branch office in Provo, UT, a second non-deposit accepting
administrative office in Sandy, UT, and administrative staff based out of Pasadena, CA. The
Bank’s parent, Green Dot Corporation, also supports the outreach efforts to help identify
community development investment, financial education, and service opportunities within the
Bank’s assessment area, in the broader local region, and nationwide.
7

The Bank’s CRA program requires an annual operating plan consistent with the goals established
in this Plan and the achievement of the Bank’s performance objectives. The CEO and the Director,
Lending & Operations routinely update the Bank’s Board of Directors on CRA performance and
efforts made to achieve the Bank’s Plan objectives.
The Bank’s Board of Directors actively participates in supporting community and educational
outreach efforts as well. This includes several directors speaking at and attending financial
educational conferences on behalf of the Bank, and providing educational information through
our social media channels. For example, the Bank has identified women’s empowerment as an
important and effective entry point to provide financial education due to that fact that many
women control the household budgeting and spending. One of our directors brings a strong
knowledge and background to uniquely support these efforts.
F. Development of the Bank’s CRA Strategic Plan
The Bank’s management took the following steps to develop the 2018-2020 CRA Strategic Plan:
• Evaluated the current business model, relevant financial information, business
strategy, products, performance context and competitive environment.
• Considered demographic information and current economic conditions within the
Bank’s assessment area.
• Assessed the community development, affordable housing, credit, and financial
education needs of the communities in our assessment area as well as the broader
community the Bank serves. During this phase of development, we evaluated various
resource materials and communicated with various representatives of local and
nationwide community development organizations to informally seek suggestions on
the Plan.
• Developed goals for lending, investment, and service activities that are responsive to
the needs of our assessment area, and are appropriate in light of the Bank’s historical
performance context.
This document describes the Bank’s Plan for the three-year period for calendar years 2018 to
2020. The Bank has established a goal of meeting or exceeding the metrics described in the Plan
for satisfactory and outstanding performance in community development lending, investment
and service levels in each of the three years covered in the Plan. Based on the Bank’s business
8

5 Utah Department of Workforce Services, Major Employers 2015, Utah County
model, the Bank would not elect to be evaluated under an alternative assessment method if it
fails to achieve a Satisfactory rating under this strategic plan. It is the intent and expectation of
management that the Bank will meet or exceed all goals established in this plan.
The Bank’s Assessment Area
A. Definition
Pursuant to 12 C.F.R. § 228.41, the Bank designates as its assessment area for purposes of
evaluation under the CRA the Provo-Orem Metropolitan Statistical Area (MSA) 39340, though it
may also conduct service and investment activities that benefit a larger geographic area which
includes the assessment area, up to and including the state of Utah as described below. The
Bank’s MSA and primary CRA assessment area is made up of two contiguous counties, Utah and
Juab. The Bank’s single branch is centrally located in the city of Provo, within Utah County.
Appendix A contains a map of the Bank’s primary assessment area and a listing of the census
tracts located within it.
Because of the high concentration of similarly situated financial institutions within Utah, there is
often significant competition for the relatively limited CRA-qualified service and investment
opportunities within the Bank’s primary assessment area. In order to ensure the Bank can meet
its CRA goals, the Bank may from time to time engage in CRA-qualified activities outside its
primary assessment area, but within the state of Utah. In addition, as noted above, the Bank
may engage in CRA-qualified service activities on a nation-wide basis, consistent with its unique
business model. The criteria governing CRA-qualified activities outside the Bank’s primary
assessment area are described below.
B. Assessment Area Description
The Bank’s primary assessment area, the Provo-Orem MSA, is nestled at the base of the Wasatch
Range of the Rocky Mountains just 25 miles south of Salt Lake City. As of July 2016, 98% of the
MSA’s population resides in Utah County, which is known regionally as Utah Valley. The Provo-
Orem MSA is home to many of the largest employers in the state, including Brigham Young
University, Utah Valley Regional Medical Center, Vivint, and Adobe.5 The region also includes
two large universities, Brigham Young University and Utah Valley University, as well as two
9

6 U.S. Census Bureau, 2016 QuickFacts, Utah and Juab Counties
regional campuses of Utah State University, which assist with maintaining a talented and
educated local workforce.
C. Demographic Characteristics
The estimated 2016 total population of the Bank’s primary assessment area according to the U.S.
Census Bureau was 603,309.6 This represents a 14.5% increase in population since the 2010 U.S.
Census, indicating the rapid growth of the MSA and surrounding areas of the state.
The table below shows the median income and annual income range for low-, moderate-, middle-
, and upper-income populations within the Bank’s primary assessment area.
Income Classification for Assessment Area
Assessment
Area
2015
Median
Income
Low-
Income
Moderate-
Income
Middle-
Income
Upper-
Income
Provo-Orem
MSA $65,092
$32,546
and Below
$32,547 to
$52,074
$52,075 to
$78,110
$78,111
and Up
The table below shows the Bank’s primary assessment area by geographic income level.
Distribution of Census Tracts within the Assessment Area
Census Tract Type Number of Census Tracts % of Total Census Tracts
Low-Income 10 8%
Moderate-Income 17 13%
Middle-Income 62 47%
Upper-Income 41 31%
Income Not Reported 1 1%
Totals 131 100.0%
Source: 2017 FFIEC Census Reports – Summary Census Demographic Information
10

7 U.S. Census Bureau, American FactFinder, Selected Housing Characteristics: 2015 American Community Survey 1-Year Estimates, Provo-Orem MSA
8 Governor’s Office of Management & Budget, Economic Indicators, May 2017 9 U.S. Census Bureau, American FactFinder, Selected Housing Characteristics: 2015 American Community Survey 1-
Year Estimates, Provo-Orem MSA 10 Governor’s Office of Management & Budget, Economic Indicators, May 2017 11 State of Utah Revenue Assumptions Working Group, Moody’s Economy.Com, and IHS Global Insight, Economic Indicators for Utah and The United States: May 2017
Overall, there are 165,983 housing units in the Bank’s primary assessment area, according to the
2015 American Community Survey. Of the total housing units, 67.4% are owner-occupied units
and 32.6% are non-owner-occupied rental units. Of the total housing units, 75.5% are single-
family units, 22.5% are multi-family units and 1.9% are mobile homes.7
In 2015, the median owner-occupied home value was $251,600. 8 According to the U.S. Census
Bureau, in 2015, the median monthly housing cost was $1,470 for home owners with mortgages,
$397 for owners without mortgages, and $956 for renters. 23.4% of owners with mortgages,
9.3% of owners without mortgages, and 46.1% of renters in Utah County spent 30 percent or
more of household income on housing. 9
D. Economic Characteristics
Unemployment - According to the Utah Governor’s Office of Management & Budget, the State’s
unemployment rate was 3.1 percent as of March 2017. This compares to a national
unemployment rate of 4.5 percent for the same period. Utah gained 45,700 jobs between March
2016 and March 2017, an increase in job growth of 3.2 percent, a rate which led the nation for
that period. Utah also had the eighth lowest unemployment rate in the country at the end of
March 2017.10
Total Personal Income - Utah's total personal income reached $124.3 billion in 2016, an
annualized increase of 5.6 percent over 2015, continuing the steady upward trend experienced
over the past two years. National change in personal income over the same period was 3.6
percent. Looking ahead, Utah’s total personal income is forecast to increase 6.5 percent in 2017,
and 5.6 percent in 2018.11
Average Annual Pay - Utah’s average annual pay grew 2.2 percent to reach $44,454 in 2016.
Annual pay in 2017 is forecast to increase 5.0 percent in 2017 and 3.1 percent in 2018. Average
11

12 Governor’s Office of Management & Budget, Economic Indicators, May 2017 13 Governor’s Office of Management & Budget, Economic Indicators, May 2017
annual pay for the nation in 2016 was $56,749 and is forecast to increase 3.1 percent in 2017 and
3.9 percent in 2018. 12
Home Prices – Utah’s Home Price Index (FHFA) increased 7.5 percent in 2016 and is expected to
increase another 7.9 percent in 2017. This compares with national Home Price Index (FHFA)
increases of 6.1 percent in 2016 and 4.5 percent in 2017. 13
As evidenced above, the economic outlook for both the state and the Bank’s MSA is stable with
long-term economic health remaining strong. Migration into the Bank’s MSA is also expected
to be strong in the coming decade due in large part to the strength of the economy and the
availability of high quality jobs. The Bank’s MSA is known nationally as a rapidly growing high-
tech hub, featuring high education levels and a strong entrepreneurial culture, which is
expected to promote job growth locally in both new businesses and established firms.
Available business development initiatives of the Utah Valley University Small Business
Development Center, the many new business incubators in the area, and the Utah
Manufacturing Extension Partnership are expected to further support economic expansion in
the Bank’s MSA in the years ahead.
PERFORMANCE CONTEXT
A. The Bank’s Business Model
As noted above, the Bank is primarily focused on building a nationwide offering of basic banking
services for low- and moderate-income consumers through our core products, the GPR Card and
our GoBank mobile checking account. Both may be acquired online or at select retailers
nationwide. The Bank also recently added the secured Green Dot Platinum Visa Credit Card, with
the intent of providing consumers a tool to build or establish their credit history if the card is
properly managed.
In addition to this, the Bank continues to operate its single community bank branch in Provo, UT
under the name Bonneville Bank. Within the branch, the Bank offers traditional banking services
such as small business and consumer checking and savings accounts, certificates of deposit,
commercial and consumer lending products, and safe deposit box rentals.
12

14 Federal Deposit Insurance Corporation, 2015 FDIC National Survey of Unbanked and Underbanked Households, October 2016. In the study, “unbanked” is defined as no one in the household has a checking or savings account. “Underbanked” is defined as the household had an account at an insured institution but also obtained financial services and products outside of the banking system (Examples include money orders, check cashing, payday loans, pawn shops, rent-to-own services, etc.).
B. Competitive Environment
Within the Provo community, Green Dot Bank operates in a competitive environment. As of June
30, 2016, FDIC Summary of Deposit data shows that there were 85 competing branch offices of
14 commercial banks, thrifts and US branches of foreign banks with just under $7.0 billion in
deposits operating in the Bank’s primary assessment area. As of that date, the Bank represented
approximately 8.2 percent average market share of deposits in FDIC-insured institutions in the
Provo-Orem MSA.
With respect to community development activities, many of the Bank’s competing financial
institutions have long track records of support for affordable housing and economic development
in the Bank’s primary assessment area and the broader region. In pursuing its CRA program, the
Bank competes in a mature community development marketplace.
Across the country overall – the geography across which Green Dot Bank gathers most of its
deposits – we see a continuing and pervasive need for high quality financial products and
services. According to and FDIC study undertaken in 2015, 7.0 percent of national households
are “unbanked”, totalling 15.6 million adults and 7.6 million children. Furthermore, 19.9 percent
are underbanked, totalling 51.1 million adults and 16.3 million children.14
C. Bank Capacity
As of June 30, 2017, the Bank was well-capitalized and earnings are positive and stable. The Bank
has immediate capacity to support the performance goals of this Plan. The goals stated within
this Plan are designed to adjust proportionately with the Bank’s size over the three-year term.
STRATEGIC PLAN MEASURABLE GOALS
A. Methodology
As discussed previously, the Bank met with various representatives within the Bank’s primary
assessment area and at a state-wide level. This included community development organizations
and other interested parties to discuss the credit needs within the Bank’s primary assessment
13

15 Data taken from the respective institution’s Strategic Plans and/or Performance Evaluations available on the FFIEC website http://www.ffiec.gov/craratings/default.aspx
area, especially the unmet needs of low- and moderate-income individuals. These needs were
reviewed and compared to the Bank’s products, overall business goals and objectives. CRA
measurable goals were then established to address the identified credit and community
development needs.
The Bank’s measurable goals were developed considering commitments outlined in other
financial institutions’ approved CRA strategic plans for financial institutions established in Utah.
Banks operating under approved CRA Strategic Plans included commitments for combined
community development loans and investments as follows:15
Target % of Assets
• Sallie Mae Bank
Satisfactory Outstanding Asset Size (9/30/17)
1.20 1.40 $20.86B
• BMW Bank of North America 1.25 1.75 $9.93B
• Merrick Bank 1.05 1.15 $3.28B
• Medallion Bank 1.30 1.75 $1.3B
The Bank selected the above four institutions as comparable peers due both to their being non-
traditional Utah-based banks operating under approved strategic plans who will be primary
competitors for qualified CRA credit within the Bank’s primary assessment area and the State of
Utah, and due to the broad cross-section they represent from an asset size and product offerings
point of view when comparing against all banks operating under an approved plan state-wide.
Finding any perfect match in a peer study comparison is a challenge in light of the Bank’s unique
business model. All four of these peer institutions establish goals in the range of 1.05% to 1.30%
of outstanding qualified loans and investments to assets for a “Satisfactory” rating, and 1.15% to
1.75% of outstanding qualified loans and investments to assets for an “Outstanding” rating.
The goals for small business loans, community development loans and Investments outlined in
the Plan are equal to the top end of the goals established by these banks operating under
approved CRA Strategic Plans. Management believes the goals included herein are appropriately
configured to have a positive impact within the Bank’s local community and across Utah.
B. Measurable Goals over the Three-Year Plan
The CRA strategic plan regulations provide flexibility regarding a bank’s measurable goals, both
in how the goals are expressed and regarding the three performance categories. For example,
14

although the regulations provide that a bank should address in its plan all three performance
categories and “emphasize lending and lending-related activities,” they also provide that:
“Nevertheless, a different emphasis, including a focus on one or more performance
categories, may be appropriate if responsive to the characteristics and credit needs of its
assessment area(s), considering public comment and the bank’s capacity and constraints,
product offerings, and business strategy.”
In light of the regulatory flexibility for both measurable goals, the Bank requests that the FRB’s
evaluation of the Bank’s CRA lending and investment performance be measured in terms of
combined cumulative small business and community development lending and investment
amounts as a percentage of the Bank’s average assets for each of the three years included in the
Bank’s Plan.
A combined cumulative lending/investment measurable goal would enable the Bank to better
respond to evolving opportunities within its assessment area, which would be highly desirable in
light of the anticipated size of the Bank’s CRA Program and the Bank’s need to have an innovative
and flexible approach to its CRA activities.
Accordingly, as in its previously approved strategic plans, the Bank’s measurable goals are
expressed in terms of combined cumulative small business and community development
loans/investment amounts, for which the Bank contemplates FRB approval as part of the
approval of this Plan.
The Bank’s measurable goals for combined cumulative lending and investments are set forth
below. These measurable goals consist of combined cumulative small business and community
development loans and investments expressed as a percentage of the Bank’s average assets for
each plan year, as opposed to percentages of the Bank’s total assets at the end of each plan year.
The “cumulative” amount for any plan year period will include the total of the Bank’s small
business and community development loans and investments extended or made during that plan
year. The Bank has developed three measurable goals to assess its CRA performance over the life
of this Plan. The goals are:
• Direct small business lending within the Bank’s assessment area, including loans with
a primary business purpose collateralized by residential real estate
• Community development lending and qualified investments, including grants to non-
profit organizations
15
The Bank’s measurable goals are set at a level that should be sustainable, depending on the
relevant economic conditions at that time. Management feels the measurable goals compare
favorably with other similarly situated institutions goals that were reviewed during the creation
of this plan, including those previously outlined.
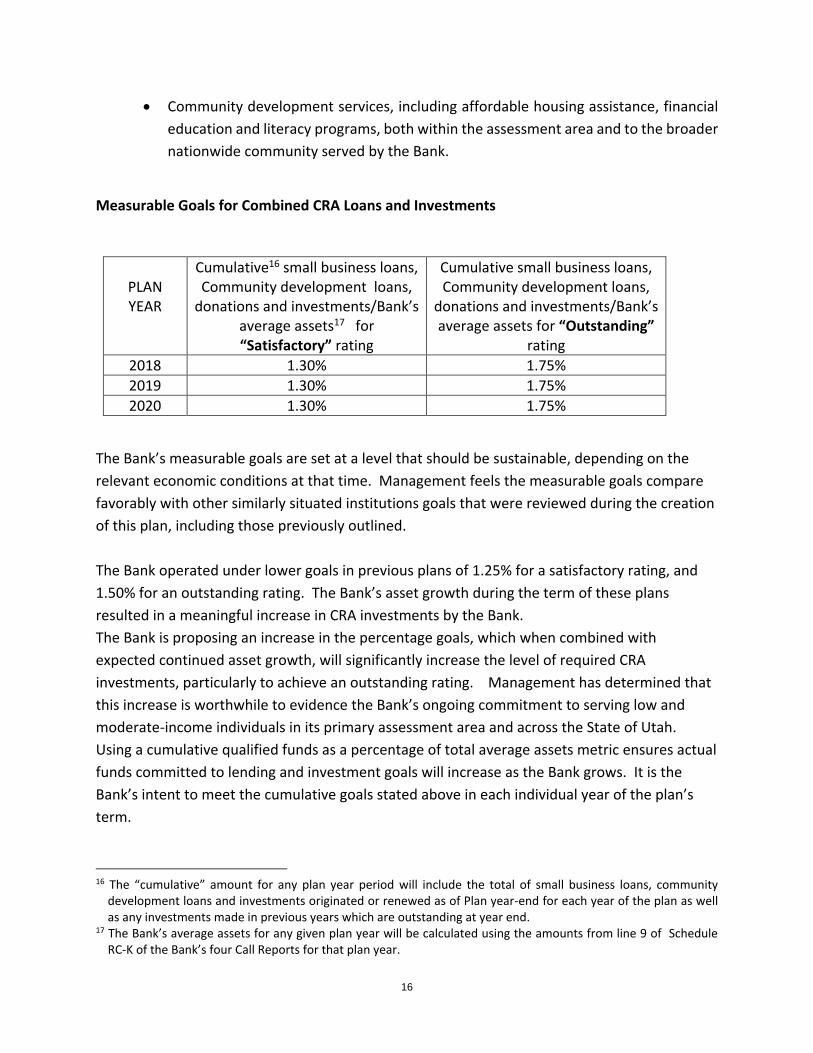
16 The “cumulative” amount for any plan year period will include the total of small business loans, community development loans and investments originated or renewed as of Plan year-end for each year of the plan as well as any investments made in previous years which are outstanding at year end.
17 The Bank’s average assets for any given plan year will be calculated using the amounts from line 9 of Schedule RC-K of the Bank’s four Call Reports for that plan year.
• Community development services, including affordable housing assistance, financial
education and literacy programs, both within the assessment area and to the broader
nationwide community served by the Bank.
Measurable Goals for Combined CRA Loans and Investments
PLAN YEAR
Cumulative16 small business loans, Community development loans,
donations and investments/Bank’s average assets17 for “Satisfactory” rating
Cumulative small business loans, Community development loans,
donations and investments/Bank’s average assets for “Outstanding”
rating
2018 1.30% 1.75%
2019 1.30% 1.75%
2020 1.30% 1.75%
The Bank operated under lower goals in previous plans of 1.25% for a satisfactory rating, and
1.50% for an outstanding rating. The Bank’s asset growth during the term of these plans
resulted in a meaningful increase in CRA investments by the Bank.
The Bank is proposing an increase in the percentage goals, which when combined with
expected continued asset growth, will significantly increase the level of required CRA
investments, particularly to achieve an outstanding rating. Management has determined that
this increase is worthwhile to evidence the Bank’s ongoing commitment to serving low and
moderate-income individuals in its primary assessment area and across the State of Utah.
Using a cumulative qualified funds as a percentage of total average assets metric ensures actual
funds committed to lending and investment goals will increase as the Bank grows. It is the
Bank’s intent to meet the cumulative goals stated above in each individual year of the plan’s
term.
16

The Bank anticipates that a significant majority of the annual cumulative funds committed to
the goals established herein will be comprised of qualified CRA investments rather than small
business or community development lending. This is due primarily to the Bank having a single
branch within the assessment area with a small loan portfolio consisting of an assortment of
small business and consumer installment loans averaging approximately $6MM. The Bank’s
primary reliance on CRA-qualified investments, rather than loans, is consistent with previous
strategic plans the Bank has operated under since 2012.
The Bank’s qualified CRA investments should focus on the primary assessment area, or must
benefit a broader region, up to statewide, that includes the primary assessment area. The Bank
plans to continue seeking out new investment vehicles, such as early-stage venture equity
funds that will make investments to CRA qualified small businesses throughout the state of
Utah. Additionally, the Bank expects to continue purchasing eligible mortgage backed
securities wherein the underlying loans are made predominantly or entirely to low- and
moderate-income individuals located within the primary assessment area, and if needed, to a
broader surrounding geographic region.
Grants and charitable contributions made by the Bank that meet the primary purpose of
community development will be considered qualified for CRA credit if they meet the needs of
the Bank’s assessment area, including grants and charitable contributions specifically focused
on the Bank’s primary assessment area as well as grants and charitable contributions that
benefit a broader region that includes the Bank’s primary assessment area.
Measurable Goals for Community Development Services
The Bank’s measurable goals for community development services are set forth below. These
levels reflect an increase of 20 percent in total service hours for this Plan over the approved levels
in the Bank’s previous plan and reflect an average service hour goal per Bank employee of 10 to
14 hours annually per Bank employee, which is meaningfully higher than other banks operating
under a strategic plan (which require from 3 to 8 hours per employee). Management believes
the goals established herein are material for a Bank with far fewer employees than other peer
institutions reviewed, which have reported employee totals ranging from 28 to 250. The Bank
believes the goals set forth are realistically reachable and maintainable with the current
resources available, and with expected natural growth in Bank staffing levels over the next three
years of the plan. The Bank’s goals are expressed in terms of the number of hours spent
17

18 Qualified service hours performed within the primary assessment area will be equal to or greater than total number of service hours multiplied by the percentage of total Bank employees based in the primary assessment area (calculated as the number of full-time equivalent employees based in the primary assessment area as of January 1st each year divided by the number of full-time equivalent employees listed on the December 31st
previous year-end Call Report, Schedule RI Memoranda, line 5). Service hours are not cumulative from year to year, but rather reflect the number of service hours to be performed during that plan year.
performing qualifying community development services, both within the Bank’s assessment area
and on a national basis. 18
PLAN
YEAR
Bank’s CD Service Hours for
“Satisfactory” rating
Bank’s CD Service Hours for
“Outstanding” rating
2018 190 hours 240 hours
2019 205 hours 255 hours
2020 220 hours 270 hours
It is the Bank’s intent to meet the cumulative goals stated above in each individual year of the
plan’s term.
The Bank’s service hours commitment reflects the Bank’s total number of employees, both within
and outside the assessment area. As of June 30, 2017, the Bank has 19 full-time equivalent
employees, of these, six are based within the Bank’s assessment area at the Provo branch.
Personnel available for community development service hours do not grow proportionately with
asset size, particularly within the Bank’s assessment area. Because of these constraints, it is
prudent for the Bank to set goals that can be realistically performed by the Bank’s relatively small
staff and to provide for an appropriate mix of CRA service hours within and beyond the Bank’s
assessment area. As in its previous Plans, service and financial education assistance service hours
will be considered when performed by Green Dot Bank employees or employees of an affiliated
entity, including Green Dot Corporation. Qualified services will include direct services performed
by employees in their respective communities; education and training, policy, product, or similar
initiatives services designed to promote financial education and literacy, access to financial
services, financial security, financial inclusion, or other needs of low- and moderate-income
consumers across the country; and board or committee involvement in CRA qualifying
community development organizations.
18

Overall, the Bank believes its CRA goals are appropriate and significant considering the size of the
Bank, the size of the Bank’s staff, and are comparable to or exceed other regulated institutions
in the state operating under a strategic plan.
Additional Considerations
GPR Cards, GoBank Accounts and secured credit cards to Consumers in Low- and Moderate-
Income Geographies
As previously noted, the Bank’s main product, the GPR card, is designed to serve the
underbanked and underserved market and generally has a large cross-over to low- and
moderate-income consumers. The GPR card provides valuable benefits and financial access
including:
• Access to the electronic payment systems and ATMs; and
• Regulation E transaction dispute protections; and
• Safe and secure FDIC insured deposits.
The Bank believes that the GPR card product provides an important bridge to banking services
for consumers across the country as well as the local assessment area. The Banks’ GPR card is
not a credit card and purposely does not include a consumer lending element.
In August 2016 the Bank, in partnership with Walmart and Commonwealth, launched a Prize
Savings feature on the Bank-issued Walmart Prepaid MoneyCard. Commonwealth is a national
organization devoted to creating a stronger and more prosperous society where everyone has
financial opportunity and security. Prize Savings encourages cardholders to increase the savings
they have set aside for life’s emergencies, as research shows 90 percent of American households
have less than two percent of their disposable income saved. Cardholders are given entr ies to a
cash prize drawing by moving some of their card balance to their “MoneyCard Vault.” The
sweepstakes awards 500 cash prizes every month, including a $1,000 grand prize, with the funds
deposited directly onto their cards.
The product has been well received by the Bank’s customers, and has proven successful at its
core mission of enticing them to increase their savings. Within a few months of launch,
MoneyCard holder’s average savings increased by 38 percent, and the number of MoneyCard
Vault users increased by 130 percent.
19

Since the GPR card, the GoBank account or Prize Savings are not loan products, they are
technically not eligible for credit consideration under the current CRA regulations. Therefore,
they are not considered measurable components in this three-year Plan.
As noted above, the Bank began offering the Green Dot Platinum Visa secured credit card
nationwide in September 2016. The cards are fully secured by a deposit held by the Bank that is
refunded to the customer if the account is paid off and closed. The maximum credit limits are
intentionally kept small and manageable, and a cardholder’s first late payment fee is waived. By
their very nature, these cards are valuable to low- and moderate-income consumers as a way to
learn to manage and build credit responsibly.
While these cards may be eligible for consideration as credit to low- to moderate-income
individuals, the anticipated volume of accounts in low- to moderate-income census tracts within
the assessment area in the next three years is expected to be minimal due to the nationwide
nature of the product. Additionally, due to this product being relatively new to the Bank,
management is not currently able to accurately forecast its potential size or the distribution of
loans made to qualifying individuals in low- to moderate-income census tracts at this time,
making the establishment of measurable goals related to the product difficult. Therefore, the
Bank does not anticipate considering them a measurable component in this three-year Plan,
though it may include them in a future plan when the program has grown, and data sufficient to
promote an accurate forecast is available.
OTHER INFORMATION
A. Input to the Development of the Strategic Plan
The Bank has informally sought suggestions from the public on credit or investment needs within
its assessment area and service activities that would be responsive to those needs. Employees
of the Bank performed interviews in the assessment area of individuals involved in the affordable
housing, community development and small business sectors. In addition, input on the plan was
solicited from advocates and organizations specializing in nationwide financial literacy and
education initiatives. In discussion with local CRA advocates, we found the following needs:
Within the Primary Assessment Area
Financial Education – As the overall economy continues to improve, the need for financial
education and literacy has remained in extremely high demand. However, the focus has shifted
from foreclosure counselling to teaching such skills as repairing poor credit, successful debt
20

19 NeighborWorks Provo, Community Education Program Factsheet
management, understanding all aspects of a mortgage loan, and choosing the right home to fit
physical and financial requirements. Educated homebuyers are better equipped to keep their
finances balanced and avoid the possibility of foreclosure, as noted by NeighborWorks Provo
which provides such educational programs in Utah County and the surrounding region. It was
also noted that as reverse mortgages become more prevalent with many of the “Baby Boomer”
generation beginning to reach retirement age, it is imperative and actually required to complete
a training course before eligible seniors can close their loans. Since the general economy and the
housing market have seen significant continuous improvement over the past 6 years, it is
important to refocus the counselling and educational efforts to help consumers build toward
homeownership, proper personal budget management, improving their overall financial health
and offering quality reverse mortgage training for seniors.
For example, the reported need for foreclosure counselling education in Utah County has
changed dramatically from the recessionary period and high foreclosure rates experienced
between 2008 to 2014. While NeighborWorks Provo previously counselled 363 homeowners in
foreclosure avoidance in 2011, they counselled only 64 in 2016. However, the rate of counselling
related to reverse mortgages and homebuyer education workshops has drastically increased in
recent years, increasing 20 percent and 148 percent respectively in 2016.19 While the local
economy is strong, it will be important that the Bank participate and continue to support the
counselling and educational efforts in the local community regarding budget planning for
homebuyer education and home equity conversion mortgage (reverse mortgage) training for
seniors. The Bank makes regular contributions to NeighborWorks Provo to aid in the continuance
of these important counselling programs, and a member of Bank management serves on the
Resource Development Committee of the organization, which is tasked with finding new and
innovative ways to fund planned and existing counselling programs in the community.
Additionally, the need for financial education for our community’s students also remains strong
based on the Bank’s discussions. Unfortunately, there are many public schools in the Bank’s
primary assessment area with a majority of students qualifying for the free and reduced school
lunch program. There is a need for students to learn at a young age about skills they need to
own their economic success, plan for their future, and make smart academic and economic
choices. It is proven that these students benefit from participation in in-class programs, related
field trips, or special events where these skills are taught in fun, original and meaningful ways.
Organizations such as Junior Achievement and others provide core content areas of work
readiness, entrepreneurship and financial literacy to low- and moderate-income school children
within the assessment area. The Bank partners with Junior Achievement each year to provide in-
21

20 U.S. Census Bureau, American FactFinder, Selected Housing Characteristics: 2015 American Communities Survey 1-Year Estimates, Provo-Orem MSA
class lessons to the students of a local elementary school, leading classes in the basic concepts of
business, economics, and how education is relevant to the workplace. Employees are also able
to volunteer for the JA Biz Town program at the JA City facility in Salt Lake City, which provides a
more hands-on experience through a day-long visit by 5th grade students. During their day at JA
Biz Town, students work as employees in various businesses facilitated by volunteer educators
and business professionals. They are paid for their labour, and they learn to manage personal
and business checking accounts. Throughout the day students also learn first-hand about time
and money management as they work, bank and shop as consumers. The JA Biz Town program
is a great resource to aid students in developing competitive skills and confidence.
Affordable Housing and Rentals – The need for safe and energy efficient affordable housing,
including Section 8 multifamily rental assistance, and the ability for low- to moderate-income
borrowers to obtain home financing continues to increase. Due to many years of price increases
ranging from 5.6-7.9% in the Utah Home Price Index, many families are being priced out of homes
or must take on mortgages that require more than 30 percent of their available income. 23.4
percent of homeowners with a mortgage in the Provo-Orem MSA faced a housing cost burden of
paying more than 30 percent of income for housing. Similarly, 46.1 percent of rental housing
occupants pay 30 percent or more of their income for housing.20 Average rents in the area have
continued to increase in recent years, making it harder for individuals and families to afford to
stay in their home and reducing their ability to set money aside for a future home purchase.
Several advocates work with the City of Provo, Utah County and surrounding regions in providing
low-to-moderate income households an opportunity to find safe and affordable homes for
purchase or lease. The Bank has provided several innovative funding packages for the purchase
and rehabilitation of dilapidated homes which are then rented out to low- to-moderate income
families by NeighborWorks Provo. As noted above, a member of Bank management participates
on the Resource Development Committee, which seeks funding options for additional affordable
housing projects. Among these is Central Park Station, a new 59-unit development built
specifically for qualified low- to moderate-income families in the Provo community.
Community Service Projects – Over the past few years many more properties, especially those
inhabited by low- to moderate-income households have fallen into disrepair. In order to help
maintain safe housing and stable property values in low- to moderate-income neighbourhoods,
it will be important for employees to participate in service projects that support such efforts.
Quality Job Growth and Small Business Investment – There is also a major need to promote job
growth in the assessment area and surrounding regions by providing debt and seed or early stage
22

21 https://www.forbes.com/sites/amyfeldman/2017/04/03/silicon-slopes-vs-silicon-valley-four-tech-unicorns-thousands-of-startups-no-frenzy/#37ed7a633922 22 https://www.princetonreview.com/college-rankings?rankings=top-25-entrepreneurship-ugrad
venture capital equity funding to local entrepreneurs. Utah’s reputation as a hub for
entrepreneurial activity, and as a top location for major companies to expand, continues to grow
exponentially. The Bank’s assessment area includes much of the rapidly growing “Silicon Slopes”
area, which is home to the offices of major new and established companies, including Adobe,
Oracle, Vivint Solar, Ancestry.com and IM Flash. The region reportedly received $2.5 billion in
venture capital deals in the last three years, compared to $1.1 billion the three years prior.21 The
multiple major universities in the area contribute to a highly skilled workforce, as well as provide
the foundation for many technology innovations. For example, Brigham Young University, which
is located in the Bank’s assessment area, is consistently ranked in the very top of the nation for
“Best Undergraduate Entrepreneurship Program” by the Princeton Review.22 This
entrepreneurial activity creates a large consistent demand for venture capital funding and related
services.
To respond to this growing need, the Bank has partnered with a Utah-based SBIC, which provides
critical funding to these early stage companies, and also provides excellent educational and
internship learning opportunities for students across all financial and ethnic backgrounds. The
University Growth Fund is the largest education-based private equity fund in the country, and is
managed primarily by students from nearby universities. The program provides students with
scholarships, exceptional training, and networking with elite businesses in the finance and
technology markets. Salaries of students who participate in the Fund are on average 55% higher
than other graduates.
The Bank has also partnered with The Kickstart Seed Fund, which is dedicated to building Utah’s
entrepreneurial and small-business ecosystem by providing support at the earliest stages of a
business when it is needed most. Launched in 2008 as the only source of local seed capital in the
state, its three established funds have all achieved successful returns and assisted many well-
known local companies from their earliest stages. They have been rated as the most active firm
in the technology sector in the state from Q1 2011 to Q3 2016. Because Kickstart targets
businesses at their earliest stages of life, when funding is scarce, 40 percent of their investments
are located in LMI census tracts, and an average of 70 percent of their companies had a majority
of employees who were low-to moderate-income at the time of their investment. Their
investments also lead to rapid growth in the companies, which so far have provided employment
for over 3,000 people. Further, though the fund targets companies throughout the state and
cannot focus on only one county or MSA, they report that over half of their investments thus far
23

Outside the Primary Assessment Area
23 Kickstart Seed Fund, Kickstart CRA Impact Presentation, March 15, 2017 24 Federal Deposit Insurance Corporation, 2015 FDIC National Survey of Unbanked and Underbanked Households, October 2016.
have been made in Utah County due to the strong entrepreneurial atmosphere and educated
workforce mentioned above.23 It is important to note there is no guarantee this trend can
continue, given the potential for changing economic circumstances both in the assessment area
and at a greater state-wide and national level.
Summary - Through the Bank’s planned and continued employee participation on boards and key
committees of several organizations and through discussions conducted with representatives of
the following community development organizations, the Bank has made an effort to assess the
needs of the local community. The Bank will continue to contact key community groups within
the assessment area, and on a rotating basis, select several informal alliance partners.
• NeighborWorks of Provo
• Utah Housing Coalition
• Junior Achievement of Utah
• University Growth Fund (SBIC)
• The Kickstart Fund (Seed and Early VC Fund)
• Self-Help Homes
• Habitat for Humanity
• Now I Can Foundation
• American Cancer Association
• Wasatch Mental Health
• Various Trade Association Foundations and Committees
• CRA Officers of other financial institutions within the Bank’s assessment area
Financial Education - On a nationwide basis, Green Dot regularly participates with numerous
consumer advocacy groups in identifying the needs of the underserved and underbanked
populations. Based on the latest FDIC Study of the Unbanked and Underbanked released in
2015,24 there are still 33.5 million households who fall into these categories. Many of these
households would also be considered low- and moderate-income households.
Consistently, advocacy groups cite the need for financial education and inclusion, including
educating consumers on safe money management practices, such as how to utilize direct
deposits and budgeting tools while avoiding overdrafts and predatory products. The Bank does
not allow customers to intentionally overdraw on its core GPR products, and has always had a
24

policy of no penalty fees. In addition, the Bank spends a significant number of service hours on
educational efforts regarding identity theft and tax fraud prevention as well as how consumers
and seniors can protect themselves from scams, social engineering and victim-assisted fraud
schemes. The Bank continually works with advocates and government agencies to better inform
consumers. Similar to its findings related to financial education within its primary assessment
area, the Bank will make considerable efforts to engage employees around the country to provide
financial education and literacy assistance in their local communities.
In addition, the Bank has seen that partnering with women’s education and empowerment
forums is extremely beneficial. One of the Bank’s directors is a nationally recognized personal
finance expert, and continues to identify and work on meaningful partnerships on behalf of the
Bank. By focusing on broadening financial education within this area, the Bank plays an
important role in furthering financial education among not only women, but also their
spouses/partners, their children, and by extension, their communities.
Because the Bank’s core business activities include the generation of deposits (through GPR and
GoBank cards issued nationwide), it will be important to continue to support and actively
participate with consumer advocacy groups in providing leadership and educational training on
a nationwide basis.
Summary - Bank Management will continue to conduct outreach with national community
advocacy groups (not limited to the groups noted below) to continually inform the
implementation of this Plan and identify new opportunities to meet the Bank’s CRA objectives.
These organizations include, but are not limited to:
• Center for Financial Service Innovation (CFSI)
• Consumer Federation of America (CFA)
• National Consumer Law Center
• Pew Foundation
• Operation Hope
• Women’s Empowerment Organizations
• Various Community Reinvestment Associations, Coalitions and Corporations
The input stated above, along with other independent research, forms the basis of the
identification of community development credit and service needs addressed in this Plan.
25

B. Public Comments on the Strategic Plan
Public Comment Period
The Bank published notice of the availability of its proposed draft Plan on August 25, 2017 in the
Daily Herald, the most widely distributed newspaper within the Bank’s established assessment
area.
The Bank will amend the draft Plan to address any concerns identified, where permissible under
current CRA rules and regulations. All comments received are taken seriously when finalizing the
Plan. All comment letters will be provided to the Federal Reserve Bank of San Francisco as a part
of the draft submission. The letters will become part of the Bank’s Public file and can be obtained
upon request. Evidence of Public Notice is attached as Appendix B.
Summary of Public Comment Letters Received
No public comments were received.
Green Dot Bank Response to the Public Comment Letters
No public commen
ts were received.
C. Changes to the Strategic Plan
The Bank will request the Federal Reserve Bank of San Francisco’s approval to modify or amend
the Plan if there is a material change in its underlying assumptions or in the Bank’s mission,
objectives or operations. In such an event, the Bank would administer the modified or amended
Plan in accordance with the Federal Reserve Bank of San Francisco’s requirements, timeframes,
and guidelines for approval of a CRA strategic plan.
D. Monitoring Strategic Plan Performance
The Bank’s Board of Directors and senior management will ensure adequate resources are dedicated to implementing the Plan, and will oversee the Bank’s progress in meeting the measurable goals outlined in the Plan. The Bank recognizes that the lending, investment and service goals outlined in this strategic plan are based on general assumptions about the Bank’s
26

business model and industry as well as general economic conditions. These assumptions and conditions may change. As a result, the Bank’s Board of Directors or a committee thereof will monitor the Bank’s performance on a periodic basis.
27

APPENDIX A: ASSESSMENT AREA MAPS (UTAH AND JUAB COUNTIES)
28

29

Appendix A cont.:
Assessment Area Census – Tract Income Levels Utah County
County Code Tract Code
Tract
Income
Level
2010
MSA/MD
Statewide
non-
MSA/MD
Median
Family
Income
2017 FFIEC
Est.
MSA/MD
non-
MSA/MD
Median
Family
Income
% Below
Poverty Line
Tract
Median
Family
Income %
2010 Tract
Median
Family
Income
2017 Est.
Tract
Median
Family
Income
2010 Tract
Median
Household
Income
30
49 16.01 Low $67,248 $69,200 72.55 23.04 $15,500 $15,944 $14,570
49 16.02 Low $67,248 $69,200 83.25 22.3 $15,000 $15,432 $24,000
49 16.03 Low $67,248 $69,200 55.72 32.09 $21,580 $22,206 $21,681
49 18.01 Low $67,248 $69,200 67.23 25 $16,818 $17,300 $21,652
49 18.02 Low $67,248 $69,200 60.53 29.19 $19,635 $20,199 $21,965
49 18.03 Low $67,248 $69,200 43.04 33.85 $22,768 $23,424 $24,226
49 19 Low $67,248 $69,200 40.02 35.55 $23,913 $24,601 $24,328
49 24 Low $67,248 $69,200 32.27 47.13 $31,696 $32,614 $31,438
49 25 Low $67,248 $69,200 32.6 45.5 $30,601 $31,486 $30,013
49 28.01 Low $67,248 $69,200 49.47 34.79 $23,398 $24,075 $23,322
49 1.02 Middle $67,248 $69,200 13.14 92.93 $62,500 $64,308 $57,964
49 1.03 Middle $67,248 $69,200 4.74 100.28 $67,439 $69,394 $66,577
49 1.05 Middle $67,248 $69,200 3.11 118.03 $79,375 $81,677 $80,648
49 2.03 Middle $67,248 $69,200 20.52 95.54 $64,250 $66,114 $50,391
49 2.04 Middle $67,248 $69,200 12.08 102.06 $68,636 $70,626 $60,159
49 4 Middle $67,248 $69,200 20.94 82.31 $55,352 $56,959 $51,844
49 5.04 Middle $67,248 $69,200 15.06 98.44 $66,201 $68,120 $63,646
49 5.06 Middle $67,248 $69,200 13.04 105.37 $70,865 $72,916 $60,227
49 5.08 Middle $67,248 $69,200 8.66 80.7 $54,271 $55,844 $55,417
49 6.01 Middle $67,248 $69,200 10.11 116.44 $78,304 $80,576 $75,804
49 7.06 Middle $67,248 $69,200 10.6 94.52 $63,563 $65,408 $58,889
49 7.07 Middle $67,248 $69,200 17.43 100.32 $67,466 $69,421 $66,351
49 9.03 Middle $67,248 $69,200 9.49 118.51 $79,696 $82,009 $78,750
49 10.01 Middle $67,248 $69,200 7.67 99.44 $66,875 $68,812 $60,500
49 10.02 Middle $67,248 $69,200 16.88 93.68 $63,000 $64,827 $57,600
49 11.03 Middle $67,248 $69,200 27.89 84.3 $56,691 $58,336 $44,750
49 11.05 Middle $67,248 $69,200 17.48 85.34 $57,394 $59,055 $56,197
49 11.06 Middle $67,248 $69,200 13.19 89.59 $60,250 $61,996 $53,088
49 11.07 Middle $67,248 $69,200 9.62 98.39 $66,170 $68,086 $57,639
49 12.01 Middle $67,248 $69,200 25.3 100.47 $67,566 $69,525 $52,014
49 21.01 Middle $67,248 $69,200 17.58 107.16 $72,065 $74,155 $61,875

County Code Tract Code
Tract
Income
Level
2010
MSA/MD
Statewide
non-
MSA/MD
Median
Family
Income
2017 FFIEC
Est.
MSA/MD
non-
MSA/MD
Median
Family
Income
% Below
Poverty Line
Tract
Median
Family
Income %
2010 Tract
Median
Family
Income
2017 Est.
Tract
Median
Family
Income
2010 Tract
Median
Household
Income
31
49 21.02 Middle $67,248 $69,200 16.42 86.59 $58,235 $59,920 $52,614
49 22.01 Middle $67,248 $69,200 19.06 111.52 $75,000 $77,172 $67,686
49 22.04 Middle $67,248 $69,200 8.44 113.47 $76,313 $78,521 $72,065
49 22.05 Middle $67,248 $69,200 8.71 83.32 $56,037 $57,657 $55,996
49 22.06 Middle $67,248 $69,200 14.91 98.18 $66,029 $67,941 $63,542
49 22.07 Middle $67,248 $69,200 10.24 82.77 $55,664 $57,277 $52,462
49 27.01 Middle $67,248 $69,200 15.6 81.06 $54,514 $56,094 $51,779
49 27.02 Middle $67,248 $69,200 19.89 97.79 $65,766 $67,671 $65,951
49 29.01 Middle $67,248 $69,200 4.3 93.41 $62,818 $64,640 $63,768
49 29.02 Middle $67,248 $69,200 11.43 80.29 $54,000 $55,561 $50,587
49 30.01 Middle $67,248 $69,200 8.82 102.71 $69,076 $71,075 $62,059
49 30.02 Middle $67,248 $69,200 11.56 91.41 $61,477 $63,256 $52,318
49 31.03 Middle $67,248 $69,200 3.08 117.84 $79,250 $81,545 $70,446
49 32.04 Middle $67,248 $69,200 11.71 93.68 $63,000 $64,827 $50,417
49 32.05 Middle $67,248 $69,200 6.14 91.93 $61,827 $63,616 $58,500
49 33 Middle $67,248 $69,200 5.84 98.29 $66,103 $68,017 $60,625
49 34.01 Middle $67,248 $69,200 11.64 95.28 $64,079 $65,934 $58,846
49 34.02 Middle $67,248 $69,200 11.28 107.12 $72,042 $74,127 $63,243
49 34.03 Middle $67,248 $69,200 12.06 85.54 $57,530 $59,194 $57,683
49 101.03 Middle $67,248 $69,200 8.75 97.91 $65,843 $67,754 $65,487
49 101.04 Middle $67,248 $69,200 5.76 107.05 $71,992 $74,079 $72,879
49 101.05 Middle $67,248 $69,200 2.34 114.4 $76,932 $79,165 $73,913
49 101.08 Middle $67,248 $69,200 10.87 104.74 $70,436 $72,480 $74,779
49 101.09 Middle $67,248 $69,200 1.72 109.03 $73,325 $75,449 $72,813
49 101.1 Middle $67,248 $69,200 0.27 117.94 $79,318 $81,614 $79,375
49 101.11 Middle $67,248 $69,200 2.87 107.18 $72,077 $74,169 $70,602
49 101.12 Middle $67,248 $69,200 4 117.52 $79,031 $81,324 $78,063
49 101.13 Middle $67,248 $69,200 1.05 109.35 $73,542 $75,670 $74,137
49 103.04 Middle $67,248 $69,200 7.95 115.72 $77,821 $80,078 $69,145
49 104.05 Middle $67,248 $69,200 3.16 99.02 $66,592 $68,522 $66,712
49 104.07 Middle $67,248 $69,200 9.25 114.92 $77,284 $79,525 $75,667
49 104.08 Middle $67,248 $69,200 9.77 114.31 $76,875 $79,103 $73,309
49 104.09 Middle $67,248 $69,200 6.18 112.82 $75,875 $78,071 $76,500
49 104.1 Middle $67,248 $69,200 8.7 99.94 $67,214 $69,158 $66,797
49 105.03 Middle $67,248 $69,200 6.67 92.31 $62,083 $63,879 $59,338
49 105.04 Middle $67,248 $69,200 12.39 101.89 $68,523 $70,508 $65,036

County Code Tract Code
Tract
Income
Level
2010
MSA/MD
Statewide
non-
MSA/MD
Median
Family
Income
2017 FFIEC
Est.
MSA/MD
non-
MSA/MD
Median
Family
Income
% Below
Poverty Line
Tract
Median
Family
Income %
2010 Tract
Median
Family
Income
2017 Est.
Tract
Median
Family
Income
2010 Tract
Median
Household
Income
32
49 105.05 Middle $67,248 $69,200 9.7 92.08 $61,928 $63,719 $62,344
49 106 Middle $67,248 $69,200 9.32 101.4 $68,194 $70,169 $63,292
49 5.09 Moderate $67,248 $69,200 18.73 72.75 $48,924 $50,343 $46,257
49 7.03 Moderate $67,248 $69,200 22.73 75.62 $50,859 $52,329 $48,441
49 8.01 Moderate $67,248 $69,200 22.83 73.97 $49,744 $51,187 $47,514
49 8.02 Moderate $67,248 $69,200 24.88 78.06 $52,500 $54,018 $48,405
49 9.01 Moderate $67,248 $69,200 29.03 60.94 $40,985 $42,170 $38,170
49 11.08 Moderate $67,248 $69,200 11.58 51.63 $34,722 $35,728 $35,194
49 12.02 Moderate $67,248 $69,200 19.27 66.65 $44,826 $46,122 $43,077
49 13 Moderate $67,248 $69,200 18.27 76.75 $51,618 $53,111 $59,228
49 14.02 Moderate $67,248 $69,200 36.14 56.56 $38,042 $39,140 $41,194
49 17.02 Moderate $67,248 $69,200 40.07 64.8 $43,583 $44,842 $38,861
49 20 Moderate $67,248 $69,200 20.23 66.63 $44,808 $46,108 $46,278
49 23 Moderate $67,248 $69,200 26 64.18 $43,165 $44,413 $38,318
49 28.02 Moderate $67,248 $69,200 30.48 52.41 $35,250 $36,268 $37,857
49 31.05 Moderate $67,248 $69,200 15.13 67.27 $45,238 $46,551 $42,308
49 31.06 Moderate $67,248 $69,200 11.8 76.63 $51,538 $53,028 $52,961
49 32.01 Moderate $67,248 $69,200 9.38 75.64 $50,870 $52,343 $45,208
49 105.06 Moderate $67,248 $69,200 16.89 78.44 $52,750 $54,280 $48,370
49 9801 Unknown $67,248 $69,200 0 0 $0 $0 $0
49 1.04 Upper $67,248 $69,200 7.24 127.66 $85,855 $88,341 $79,009
49 2.05 Upper $67,248 $69,200 6.88 131.97 $88,750 $91,323 $83,125
49 2.06 Upper $67,248 $69,200 2.22 134.99 $90,781 $93,413 $85,729
49 5.05 Upper $67,248 $69,200 3.63 132.57 $89,156 $91,738 $84,970
49 5.07 Upper $67,248 $69,200 3.62 124.38 $83,646 $86,071 $75,288
49 6.03 Upper $67,248 $69,200 9.63 130.81 $87,969 $90,521 $80,588
49 6.04 Upper $67,248 $69,200 3.3 163.88 $110,208 $113,405 $109,006
49 7.08 Upper $67,248 $69,200 13.14 122.03 $82,069 $84,445 $80,431
49 7.09 Upper $67,248 $69,200 6.86 135.47 $91,103 $93,745 $81,442
49 7.1 Upper $67,248 $69,200 3.15 149.63 $100,625 $103,544 $96,786
49 7.11 Upper $67,248 $69,200 6.59 150.29 $101,071 $104,001 $94,044
49 9.04 Upper $67,248 $69,200 5.46 121.61 $81,781 $84,154 $78,750
49 14.01 Upper $67,248 $69,200 21.7 133.16 $89,550 $92,147 $82,045
49 15.01 Upper $67,248 $69,200 4.95 146.52 $98,537 $101,392 $94,250
49 15.03 Upper $67,248 $69,200 8.37 120.87 $81,287 $83,642 $70,000

County Code Tract Code
Tract
Income
Level
2010
MSA/MD
Statewide
non-
MSA/MD
Median
Family
Income
2017 FFIEC
Est.
MSA/MD
non-
MSA/MD
Median
Family
Income
% Below
Poverty Line
Tract
Median
Family
Income %
2010 Tract
Median
Family
Income
2017 Est.
Tract
Median
Family
Income
2010 Tract
Median
Household
Income
33
49 15.04 Upper $67,248 $69,200 18.9 129.67 $87,206 $89,732 $65,000
49 17.01 Upper $67,248 $69,200 13.76 126.46 $85,046 $87,510 $60,508
49 31.04 Upper $67,248 $69,200 3.15 156.18 $105,028 $108,077 $104,148
49 32.03 Upper $67,248 $69,200 6.54 127.93 $86,034 $88,528 $82,031
49 101.06 Upper $67,248 $69,200 1.85 150.84 $101,442 $104,381 $97,083
49 101.07 Upper $67,248 $69,200 6.07 132.93 $89,398 $91,988 $83,125
49 102.08 Upper $67,248 $69,200 2.75 158.88 $106,845 $109,945 $105,774
49 102.09 Upper $67,248 $69,200 7.63 152.05 $102,254 $105,219 $93,452
49 102.1 Upper $67,248 $69,200 5.97 149.77 $100,722 $103,641 $79,659
49 102.11 Upper $67,248 $69,200 8.58 161.34 $108,500 $111,647 $99,509
49 102.12 Upper $67,248 $69,200 0 165.97 $111,615 $114,851 $110,417
49 102.13 Upper $67,248 $69,200 8.23 171.19 $115,125 $118,463 $111,375
49 102.14 Upper $67,248 $69,200 7.6 125.55 $84,433 $86,881 $82,936
49 102.15 Upper $67,248 $69,200 7.8 132.9 $89,375 $91,967 $81,968
49 102.16 Upper $67,248 $69,200 1.6 152.68 $102,679 $105,655 $99,018
49 102.17 Upper $67,248 $69,200 1.62 183.07 $123,116 $126,684 $120,568
49 102.18 Upper $67,248 $69,200 3.44 214.12 $143,994 $148,171 $142,805
49 102.19 Upper $67,248 $69,200 5.27 156.91 $105,524 $108,582 $102,847
49 102.2 Upper $67,248 $69,200 4.8 140.57 $94,531 $97,274 $94,115
49 103.03 Upper $67,248 $69,200 5.1 153.11 $102,969 $105,952 $103,177
49 103.05 Upper $67,248 $69,200 4.83 134.27 $90,294 $92,915 $84,464
49 104.04 Upper $67,248 $69,200 7.02 126.66 $85,183 $87,649 $85,244
49 104.06 Upper $67,248 $69,200 8.54 131.61 $88,508 $91,074 $82,228
49 104.11 Upper $67,248 $69,200 5.74 145.91 $98,125 $100,970 $94,485
49 107 Upper $67,248 $69,200 10.74 127.51 $85,750 $88,237 $83,424
49 109 Upper $67,248 $69,200 2.82 128.04 $86,111 $88,604 $78,438

Appendix A: Assessment Area Census – Tract Income Levels
Juab County
34
2010
MSA/MD
Statewide
non-
MSA/MD
Median
Family
Income
2017 FFIEC
Est.
MSA/MD
non-
MSA/MD
Median
Family
Income
2017 Est.
Tract
Median
Family
Income
Tract
Income
Level
Tract
Median
Family
Income %
2010 Tract
Median
Family
Income
2010 Tract
Median
Household
Income
County Code Tract Code% Below
Poverty Line
23 101 Middle $67,248 $69,200 12.18 85.51 $57,510 $59,173 $53,256
23 102 Middle $67,248 $69,200 16.72 90.56 $60,906 $62,668 $58,367
23 9999.99 Middle $67,248 $69,200 14.31 86.82 $58,389 $60,079 $54,761

APPENDIX B: EVIDENCE OF PUBLIC NOTICE OF GREEN DOT BANK’S DRAFT STRATEGIC
PLAN
Below is a copy of the notice published in the Daily Herald on August 25, 2017.
Green Dot Bank
Community Reinvestment Act (CRA) Strategic Plan
The CRA regulations require a bank that has developed a Strategic Plan to publish Notice of the
plan and solicit formal written public comment for at least a 30-day period. In conformance with
this requirement, Green Dot Bank (the “Bank”) hereby provides notice to the public of its plan to
submit a three (3) year CRA Strategic Plan to the Federal Reserve Bank (FRB).
Written comments from the public concerning the Strategic Plan are encouraged. To obtain a
copy of the Bank’s Strategic Plan at no charge to the requesting party, individuals may request a
copy by mail or phone by contacting Michael Christensen, Director, Lending & Operations and
CRA Officer, 1675 N. Freedom Blvd., Building #1, Provo, UT 84604, (801) 344-7006.
All written comments regarding the plan should be directed to Michael Christensen, CRA Officer,
at the address listed above or via e-mail at [email protected].
Comments and suggestions will be accepted until September 25, 2017, following which time the
plan will be submitted for approval to the Federal Reserve Bank. Green Dot Bank will review all
comments and incorporate suggestions to the plan at its discretion. Green Dot Bank received an
outstanding evaluation from its last CRA performance evaluation under a strategic plan, as of
August 3, 2015, copies of same are also available upon request.
35

36

APPENDIX C: BANK BALANCE SHEET AS OF JUNE 30, 2017
The Green Dot Bank summary Balance Sheet as of June 30, 2017 is displayed below. The
following link provides access to the full Green Dot Bank consolidated Call Report which
includes detailed information on the Bank’s financial reports. Amounts shown below are in
thousands.
https://cdr.ffiec.gov/public/ManageFacsimiles.aspx
GREEN DOT BANK dba BONNEVILLE BANK June 30, 2017
Cash & investments $778,585
Loans receivable, net 8,822
Other assets 91,308
Total assets $878,715
Deposits $764,778
Other liabilities 15,606
Total liabilities $780,384
Equity $98,331
Total liabilities & equity $878,715
37