CPU Workload Analysis In Real-Time Operating Systems
49
CPU Workload Analysis In Real-Time Operating Systems Authors Mikael Johansson Martin Saegebrecht Department of Computer Science and Electronics (IDE), Mälardalen University, Sweden Supervisor Thomas Nolte and Johan Kraft, Mälardalen University Anders Östmark, Bombardier Transportation Sweden AB 2007-06-11
Transcript of CPU Workload Analysis In Real-Time Operating Systems
CPU Workload Analysis In Real-Time Operating Systems
Authors Mikael Johansson
Martin Saegebrecht
Department of Computer Science and Electronics (IDE), Mälardalen University, Sweden
Supervisor Thomas Nolte and Johan Kraft, Mälardalen University
Anders Östmark, Bombardier Transportation Sweden AB
2007-06-11

Abstract Bombardier Transportation Sweden AB is a leading manufacturer of train systems. The trains contain a lot of computers. Most of them run real‐time operating systems (RTOS), such as VxWorks, however this thesis is delimited to only consider VxWorks. Bombardier’s problem is that it is difficult to monitor the systems and analyze them offline. Being able to analyze the systems offline is especially desirable if computers crash or if they behave unexpectedly. This thesis presents theory related to the mentioned problems as well as a solution consisting of two tools, Bombardier Trace Recorder and Bombardier System Analyzer. Bombar‐dier Trace Recorder monitors the RTOS and saves the information in a log file. The file can then be analyzed in offline mode with Bombardier System Analyzer.
Keywords: Real‐time system, task, probe, probe effect, context switch, temporal behaviour, temporal requirements, offline analyze, VxWorks.

Sammanfattning Bombardier Transportation Sweden AB är en ledande tillverkare av tågsystem. Tågen innehåller väldigt många datorer. De flesta av dem kör realtidsoperativsystem (RTOS) såsom VxWorks, och därför är rapporten begränsad till enbart VxWorks. Bombardiers problem är att det är svårt att övervaka systemen och analysera dem offline. Möjlighe‐ten att kunna analysera systemen offline är speciellt önskvärt om datorer kraschar eller beter sig på ett oväntat sätt. Den här avhandlingen presen‐terar en teori till problemet samt en lösning bestående av två verktyg, Bombardier Trace Recorder och Bombardier System Analyzer. Bombar‐dier Trace Recorder övervakar RTOS:et och sparar informationen till fil. Filen kan därefter analyseras i offline‐läge med Bombardier System Analyzer.
Nyckelord: Realtidssystem, task, prob, probeffekt, context switch, tidsmässigt beteende, tidsmässiga krav, offline‐analys, VxWorks.

Preface We would like to thank Anders Östmark, supervisor for the PPC/ETS department at Bombardier Transportation AB, who made it possible for us to take this thesis. We also want to thank Claes Lundholm and Christer Olsson, both software developers at ETS, for helping us during this thesis. Finally, we want to thank Johan Kraft, our thesis supervisor, for his support during this instructive and interesting thesis project.
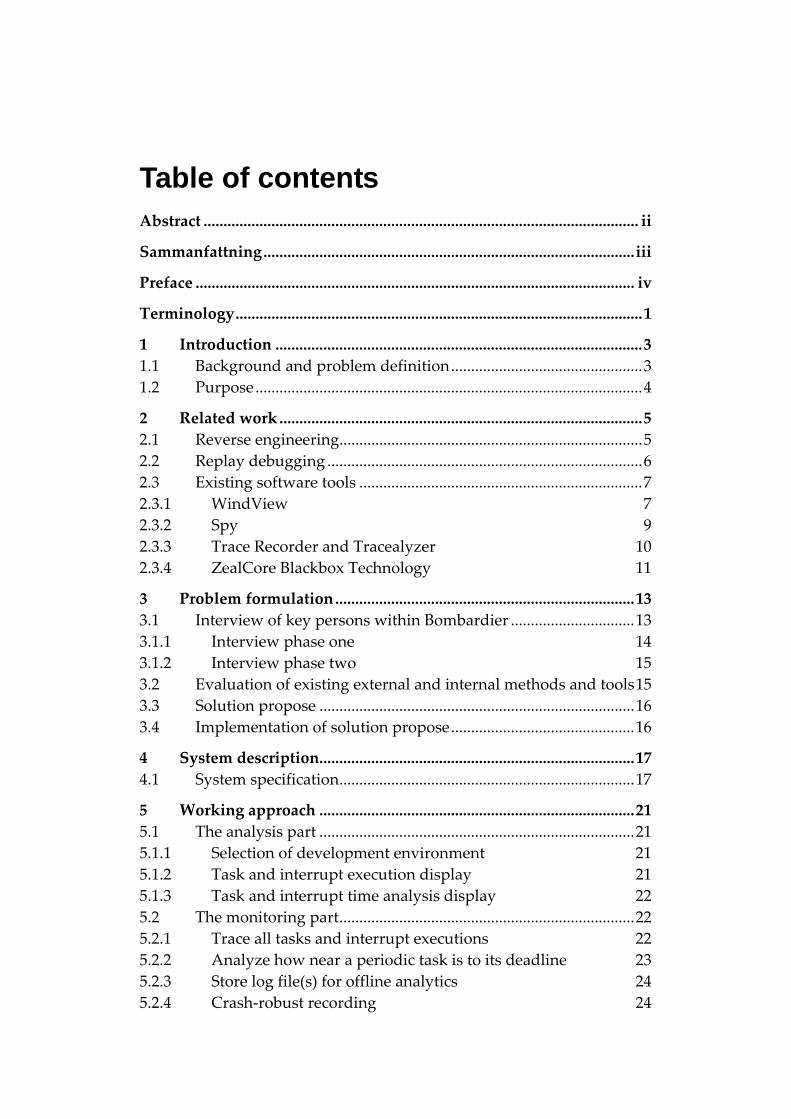
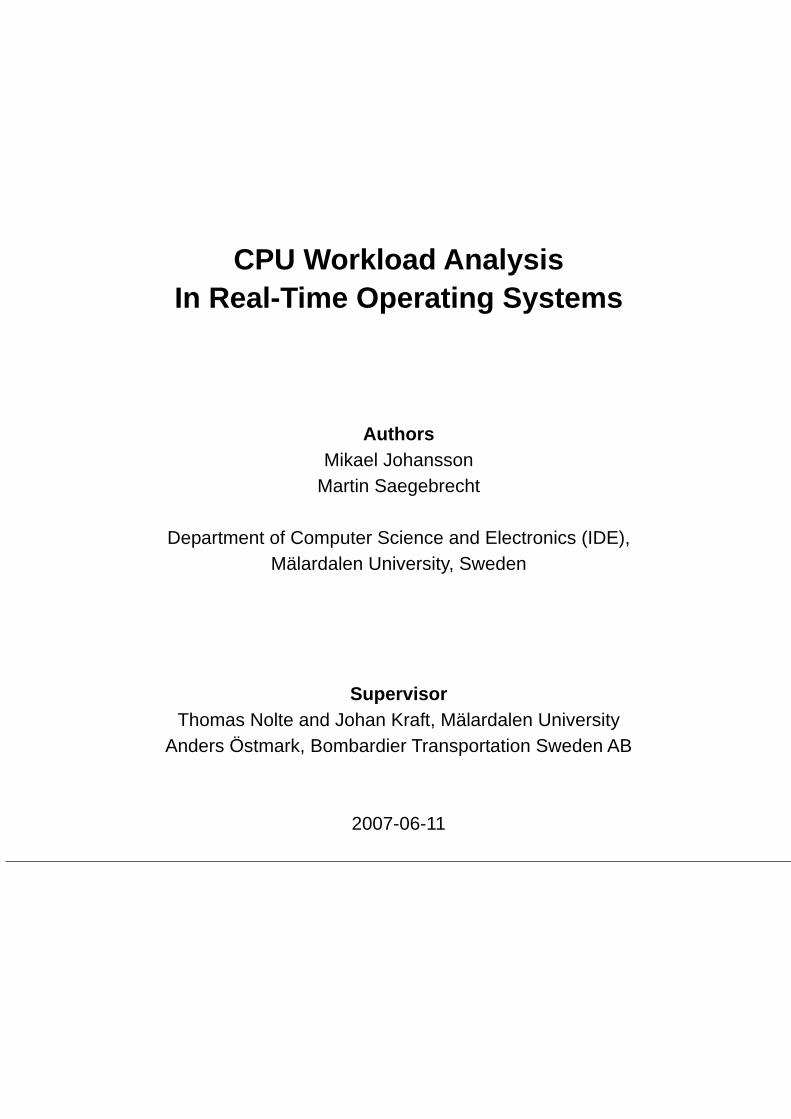
Table of contents Abstract ............................................................................................................. ii
Sammanfattning.............................................................................................iii
Preface .............................................................................................................. iv
Terminology......................................................................................................1
1 Introduction ............................................................................................3 1.1 Background and problem definition................................................3 1.2 Purpose.................................................................................................4
2 Related work...........................................................................................5 2.1 Reverse engineering............................................................................5 2.2 Replay debugging ...............................................................................6 2.3 Existing software tools .......................................................................7 2.3.1 WindView 7 2.3.2 Spy 9 2.3.3 Trace Recorder and Tracealyzer 10 2.3.4 ZealCore Blackbox Technology 11
3 Problem formulation...........................................................................13 3.1 Interview of key persons within Bombardier ...............................13 3.1.1 Interview phase one 14 3.1.2 Interview phase two 15 3.2 Evaluation of existing external and internal methods and tools15 3.3 Solution propose ...............................................................................16 3.4 Implementation of solution propose..............................................16
4 System description...............................................................................17 4.1 System specification..........................................................................17
5 Working approach ...............................................................................21 5.1 The analysis part ...............................................................................21 5.1.1 Selection of development environment 21 5.1.2 Task and interrupt execution display 21 5.1.3 Task and interrupt time analysis display 22 5.2 The monitoring part..........................................................................22 5.2.1 Trace all tasks and interrupt executions 22 5.2.2 Analyze how near a periodic task is to its deadline 23 5.2.3 Store log file(s) for offline analytics 24 5.2.4 Crash‐robust recording 24

5.2.5 CPU statistic over long time periods 25 5.3 Conclusions........................................................................................25
6 Solution..................................................................................................27 6.1 The log file formats ...........................................................................27 6.1.1 Detailed event log file format 27 6.1.2 Long time CPU usage log file format 28 6.2 Bombardier System Analyzer ‐ The analysis part........................30 6.2.1 Task and interrupt time analysis 30 6.2.2 Detailed log file events view 31 6.2.3 Simple log view 32 6.2.4 CPU workload analysis 34 6.3 Bombardier Trace Recorder ‐ The monitoring part .....................34 6.3.1 Collecting system information 35 6.3.2 Backup 36
7 Future work...........................................................................................39
8 Summary and conclusions .................................................................41
9 References..............................................................................................42

1
Terminology
Abbreviation/phrase Description
API Application Programming Interface.
CSS Common Software Structure.
DCU 2 Drive Control Unit.
IEC611131‐3 IEC611131‐3 is a standard block program‐ming language. IEC stands for International Electrotechnical Commission. See block programming.
ISR Interrupt Service Routine.
RTOS Real‐Time Operating System.
VCU‐C Vehicle Computer Unit – Compact.
VT100 A Video Terminal de facto standard.
Expressions Description
Big‐endian Endianness is the byte order used to repre‐sent data types. Big‐endian writes the byte with the biggest significance first. Example: The hex value for the 4‐byte integer number 3460 is 0xD84. This means that a processor using big‐endian writes 0xD84 in the order 00‐00‐0D‐84. For example, Intel’s x86 proces‐sors uses big‐endian. See also little‐endian.
Block programming Programming with code blocks. The devel‐opment environment is often graphical. Each block contains underlying code that is hidden to the developer.
2
Little‐endian Endianness is the byte order used to repre‐sent data types. Little‐endian writes the byte with the smallest significance first. Example: The hex value for the 4‐byte integer number 3460 is 0xD84. This means that a processor using little‐endian writes 0xD84 in the order 84‐0D‐00‐00. For example, Motorola’s PowerPC processors uses little‐endian. See also Big‐endian.
Periodic task A task that runs periodically with a fixed time interval between instances, according to its time period. See also task.
Probe effect The variation in execution behaviour that appears when inserting or removing meas‐urement code into an existing application.
Remaining time The time between the current time and the deadline (cycle time) for a cyclic task. Re‐maining time is equivalent to the term slack.
Task A sequence of instructions treated as a basic unit of work [12] (equivalent to process in non‐RTOS).
Temporal behaviour The system behaviour as a function of time.
Temporal requirement A requirement that has to be performed within a certain time.
Off‐the‐shelf A product that has already been designed and can be used in general and not only for a specific purpose.

3
1 Introduction It is often desirable to monitor the behaviour of embedded real‐time systems because they have temporal requirements, which typically means that the system or a part of the system must be able to respond before a certain time limit. Monitoring a system should not be confused with debugging a system. The main purpose of monitoring a system is to provide statistics and help the developer in making improvements, while debugging is about finding potential bugs in the system which otherwise could lead to failures in runtime. For example, if a task in a real‐time system consumes a lot of CPU time it would be desirable to know how often the task executes and why. There are already existing commercial tools for monitoring and logging information from real‐time systems, for example Windriver’s WindView [13] and Spy [14], Lauter‐bach’s Trace32 [15] and Zealcore’s BlackBox [16]. Unfortunately, it is not always possible to adapt these tools to all systems and some of these tools can only be used during the development phase.
This thesis presents two tools. One tool for recording information from real‐time systems based on the real‐time operating system (RTOS) VxWorks. The other tool is a graphical application for analyzing and viewing the recorded information.
1.1 Background and problem definition Bombardier is a Canadian group with approximately 64 600 employees all over the world and a leading actor in manufacturing trains and aircrafts. The group is divided into three companies: Transportation, Aerospace and Capital. One department for development of control systems for Bombardier’s trains is located in Västerås. This is where this thesis project takes place.
Bombardier is in need for a tool that could be used to monitor their real‐time systems. They especially need the ability to find out the CPU workload for each task and the entire system. Bombardier wants to find a solution that stores, analyzes and displays necessary information from their systems in a proper way.
To be able to record the relevant data, a lot of help comes from the research project Remodel, described in [1]. Remodel presents two tools. One tool is called Trace Recorder which can be manually adapted to any system that uses the VxWorks platform. The Trace Recorder has the
4
ability to store system behaviour information at task level, e.g., which tasks that executes and when. Remodel also provides a tool called Tracealyzer. This tool loads the stored information from the Trace Recorder, analyzes it and displays it in a graphical environment. Some ideas can be reused from this tool but since Bombardier has other requirements, evaluation of other commercial tools and the possibility of creating a new one have to be taken into consideration.
1.2 Purpose The purpose with this thesis is to provide tools to help the software engineers at Bombardier monitor their system behaviour, both during and after development phase. The focus lies on the CPU usage for each task so the engineers can see if a task consumes more CPU cycles than expected. Knowledge about the CPU workload will probably speed up the development phase.

5
2 Related work Since computer systems are getting more and more complex, the need for analysing and debugging system code, component cohesion, etc. is getting bigger. This tends to get even more complex when dealing with multitasking real‐time systems. There are already existing commercial tools for recording information from these systems, each with its own capabilities. This chapter will first present some relevant research areas and then analyse some relevant tools.
2.1 Reverse engineering Reverse engineering is about extracting relevant information from a specific object through analysis of its structure or observable behaviour. The level of detailed information that is extracted depends on usage. One area is documentation. If the documentation for an implementation is missing, reverse engineering could be used to extract UML – dia‐grams from the source code to find out the code structure. Binary reverse engineering analysis is about extracting source code from an implementation and is not relevant in this thesis since this information is not of interest.
Behavioural analysis is to find out how a system behaves. This is strongly related to this thesis because of the importance of determining the behaviour of a real‐time system, due to the temporal requirements. There are two main types of tools that analyse the system behaviour, those who use static analysis (analyse the source code without running the program) and dynamic analysis (record system information during runtime). Most static analysis programs transform the source code to an abstract modelling language. From this language it is possible to find out paths in the execution. Microsoft Research has developed a toolkit called SLAM [1]. This toolkit transforms the source code to a boolean program (variables with only boolean values). The abstraction is made with respect to the properties that are supposed to be analysed. From this information SLAM traces the execution in order to find paths that do not fulfil the safety properties.
Tools that use dynamic analysis are of importance especially when time is an issue. Unfortunately, not much effort has been spent on research of reverse engineering tools for real‐time systems. One approach was made by Jensen [10] who developed a tool for creating behaviour models from real‐time implementations. The model contains external

6
and observable events, timing constraints, task periods, mean arrival times, average execution times and the scheduling algorithm. This model could then be checked by the model verification tool UPPAAL [17] to verify the model according to the implementation requirements. This is of great help when verifying if a real‐time system is schedulable or not, otherwise these complicated calculations has to be done offline.
2.2 Replay debugging Cyclic debugging is essential for finding potential bugs in a system that could lead to run time failures. The program is repeatedly re‐executed to track down errors when failures occur. Since the behaviour of a real‐time system can depend on external events it is not adequate to apply classic debugging methods like breakpoints, etc. because that will only freeze the internal clock and the external synchronization between the involving components will be lost and the failure will be almost impos‐sible to reproduce.
Replay debugging is about recording significant system events online and replay them offline [2]. Technically, the recording can be done in three ways using non‐intrusive recorders, software recorders and hybrid recorders. A Non‐intrusive hardware recorder is an in‐circuit emulator (or on‐circuit debugger, OCD) that can be plugged into the CPU target socket and interface with the rest of the system. This technique does not consume any CPU time and is therefore non‐intrusive. When using software recorders, the history is stored in local memory buffers. This technique is intrusive because it consumes CPU time for recording and memory for storage. The third method, hybrid recorder, is a combina‐tion of the two. Several projects have been done for applying this technique and this thesis will look into one of them.
At Mälardalen University in Sweden, 2003, Thane et al [3] presented a method for deterministic replay of real‐time systems that is compiler and RTOS independent. Previous solutions have been based on non‐standard components (hardware, RTOS, compiler, etc.). The method contains the following basic elements:
• The Recorder. A software recorder that collects the necessary information regarding interrupts, task switches, state variables, etc.
• The Historian. Contains a chronological timeline where it corre‐lates events and data, and composes these with breakpoints.

7
• The Time Traveller. Interacts with an off‐the‐shelf compiler and recreates the program state (i.e., state variables, global variables, program counters, etc.) for any given time in the scope of the Historian.
In this way it is possible for the user to debug a multitasking real‐time system like any other sequential program using regular breakpoints. For a more detailed description about the functionality of the Time Travel‐ler, see [3].
2.3 Existing software tools There are several existing commercial tools for logging information from systems and showing the result either graphically or textually. These tools look a little bit different depending on the level of abstrac‐tion and usage area. Some tools just sample the CPU usage while others provide a range of functionality for logging more details about the system behaviour. One problem is that these tools can not be applied everywhere. Some tools are dependent on a specific operating system while others are dependent on a specific hardware platform. Another important issue is weather these tools affect the behaviour of the target system. Four such tools will be described in the subsections below.
2.3.1 WindView WindView from WindRiver is a graphical tool integrated in the Tornado development environment. It keeps track of different events during the execution of tasks, memory usage and more. The tool has a graphical trace view which displays task execution, context switches, semaphores, interrupts, etc.
In the program, the user can press the GO button to start the recording of the target system and stop it by simply pressing the STOP button. The user can select what to be logged. It is also possible to log user‐defined events. This can be achieved by using the VxWorks C‐library wvLib. This library provides a function (wvEvent) that can be called to store a buffer with the desired information [14].
Once the data is collected with WindView and saved into a file it can be analyzed in WindView’s graphical interface.
8
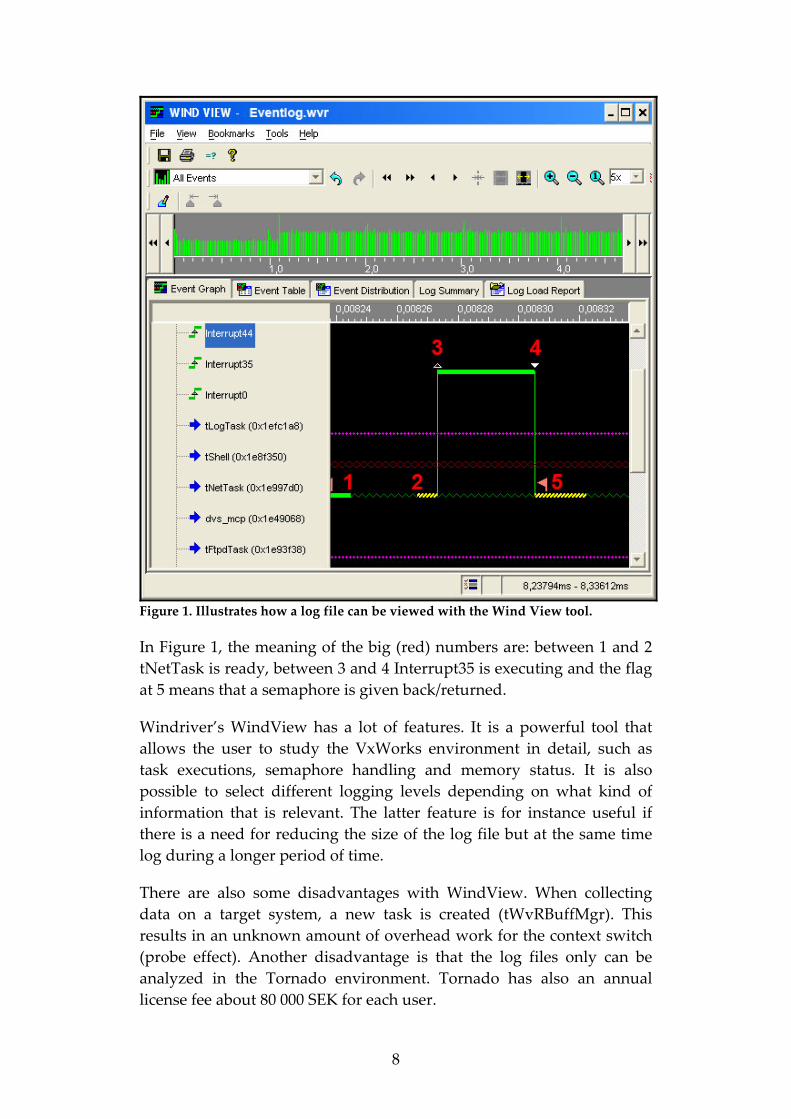
Figure 1. Illustrates how a log file can be viewed with the Wind View tool.
In Figure 1, the meaning of the big (red) numbers are: between 1 and 2 tNetTask is ready, between 3 and 4 Interrupt35 is executing and the flag at 5 means that a semaphore is given back/returned.
Windriver’s WindView has a lot of features. It is a powerful tool that allows the user to study the VxWorks environment in detail, such as task executions, semaphore handling and memory status. It is also possible to select different logging levels depending on what kind of information that is relevant. The latter feature is for instance useful if there is a need for reducing the size of the log file but at the same time log during a longer period of time.
There are also some disadvantages with WindView. When collecting data on a target system, a new task is created (tWvRBuffMgr). This results in an unknown amount of overhead work for the context switch (probe effect). Another disadvantage is that the log files only can be analyzed in the Tornado environment. Tornado has also an annual license fee about 80 000 SEK for each user.
9
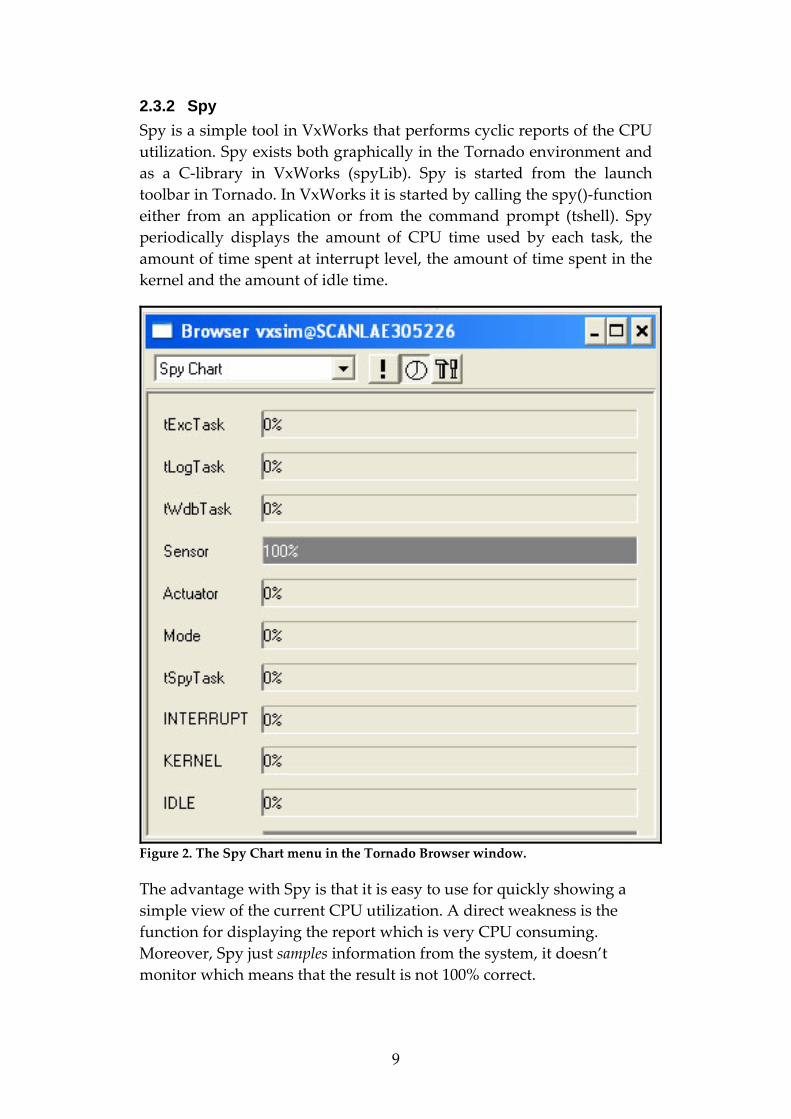
2.3.2 Spy Spy is a simple tool in VxWorks that performs cyclic reports of the CPU utilization. Spy exists both graphically in the Tornado environment and as a C‐library in VxWorks (spyLib). Spy is started from the launch toolbar in Tornado. In VxWorks it is started by calling the spy()‐function either from an application or from the command prompt (tshell). Spy periodically displays the amount of CPU time used by each task, the amount of time spent at interrupt level, the amount of time spent in the kernel and the amount of idle time.
Figure 2. The Spy Chart menu in the Tornado Browser window.
The advantage with Spy is that it is easy to use for quickly showing a simple view of the current CPU utilization. A direct weakness is the function for displaying the report which is very CPU consuming. Moreover, Spy just samples information from the system, it doesn’t monitor which means that the result is not 100% correct.

10
2.3.3 Trace Recorder and Tracealyzer The Trace Recorder can monitor interrupts and task switches, user defined probes and user defined virtual tasks depending of configura‐tion. Virtual tasks are used to measure the time of how long a certain amount of code takes to execute. For instance how long time it takes to wait for a method call to return. When a log file has been created it can be analyzed with the offline tool called Tracealyzer (see Figure 3).
Figure 3. The Tracealyzer with a task execution view.

11
The user‐defined probes make it possible to store the necessary information into a log which can be analyzed offline. The Tracealyzer reads the logged files from the Trace Recorder, analyses the data and shows the result graphically. It is possible to zoom in the trace, overview the CPU usage, search for specific tasks or events and generate statistical reports (containing CPU usage, maximum execution time for each task, etc.) in HTML format. The source code for both Trace Recorder and Tracealyzer is available for Bombardier to use and modify due to cooperation between Bombardier Transportation and Mälardalen University.
2.3.4 ZealCore Blackbox Technology ZealCore’s BlackBox Technology [16] consists of four tools; BlackBox Recorder, BlackBox Architect, BlackBox System Explorer and BlackBox Replicator. These tools allow monitoring a real‐time system, save the information to log files to analyze it offline and replicate a system from a log file.
The BlackBox Recorder is a tool for monitoring of a target system’s context switch and applications internal states. It has a very low impact of the monitored system during the monitoring. All monitored data is saved to log files that can be used by the BlackBox System Explorer and the BlackBox Replicator.
BlackBox Architect is a tool that simplifies the configuration of the BlackBox Recorder.
The BlackBox System Explorer is a graphical offline analysis tool that reads log files created by the BlackBox Recorder. Within the BlackBox System Recorder it is possible to view, debug, processing log files from a monitored system and more. The BlackBox System Explorer has also a public log file format support which makes it possible to use other recorders that uses the file format. The graphical user interface has a well developed design with a lot of functionalities, such as:
• Time analysis information, such as execution times and response times
• Basic and advanced search functionalities for specific data in dif‐ferent ways, for example with Python scripting
• Assertions, that is used to check that specific assertions are ful‐filled, for example that a tasks execution time does not exceed a defined value
12
• View the execution history in a graph
• Modeling system states
With the BlackBox Replicator it is possible to re‐execute system from a log file created by the BlackBox Recorder. It allows running the system both forward and backward, in order to easier find errors that occurred during the recording.
This technology is very powerful and can surely, with some modifica‐tions, be used to meet the needs of Bombardier, although it also comes with some drawbacks. The first is that the main purpose with Blackbox technology is to provide a very detailed image of the system state before a computer crash to find the bug that lead to failure, which is not necessary in this thesis. It is unknown if the BlackBox Architect can configure the BlackBox Recorder in order to only log the requirements that Bombardier have. Second, System Explorer displays more informa‐tion and functionalities to Bombardier’s application engineers that they want to. The third and last drawback is that the source code for Black‐Box System Explorer is not available to modify.
13
3 Problem formulation Bombardier Transportation Sweden AB has systems running on the operating system WindRiver VxWorks 5.5.1. As a layer on top of VxWorks Bombardier has implemented a Common Software Structure (CSS) which has function wrappers to the OS API and some extra features such as a periodic scheduler. With the periodic scheduler it is among other things possible to set a cycle time to a task.
The current state at Bombardier is that it is difficult to analyze a sys‐tem’s behaviour. One problematic situation is if a computer crashes and no one knows what really happened. Which task was last run? Did a periodic task miss its deadline (ran over its cycle time)? Another prob‐lematic situation is when a system behaves unexpected or when one wants to optimize the system. Does any task or interrupt run too often? Do tasks run in incorrect order? A lot of questions can be stated but there are no easy ways to answer these if the system is not monitored. Bombardier is aware of this and that is why this thesis project is speci‐fied.
The thesis is divided into four main parts:
• Perform interviews of key persons within Bombardier to collect their desires and requirements of both data collecting and data analysis. Evaluate the results.
• Evaluate existing external and internal methods and tools for CPU workload measurements in their real‐time systems, such as WindRiver’s WindView, WindRiver’s Spy, Trace Recorder with Tracealyzer and ZealCore [6] BlackBox Technology.
• Propose a solution how Bombardier can meet their CPU work‐load measurement and analysis requirements.
• Make a complete or partial implementation of the proposed solu‐tion, depending on available time.
3.1 Interview of key persons within Bombardier The interviews are divided into two phases. The first interview phase is performed with inputs from several meetings with Anders Östmark (manager), Claes Lundholm (software engineer) and Christer Olsson (software engineer). The purpose with the meetings is to state some
14
fundamental requirements which are necessary for the evaluation of existing methods and tools. These persons are very familiar with real‐time systems and real‐time operating system programming.
The second phase involves IEC611131‐3 application engineers that uses block programming by wiring system components together in a graphi‐cal editor and from that, generates C code. The purpose is to investigate what information these developers need in order to debug and analyze their application’s behaviour in real systems.
3.1.1 Interview phase one The most important issues that have to be taken into consideration, based on the first interview phase, are:
• What information is of interest from the system?
• How much information can be stored and how will it be stored?
• How will the collecting of information affect the system?
• How much will the performance bee decreased during the re‐cording?
• Will the recorder always be activated?
• Analyze how to achieve minimum probe effect (in what way the inserted measurement code affects the system behaviour).
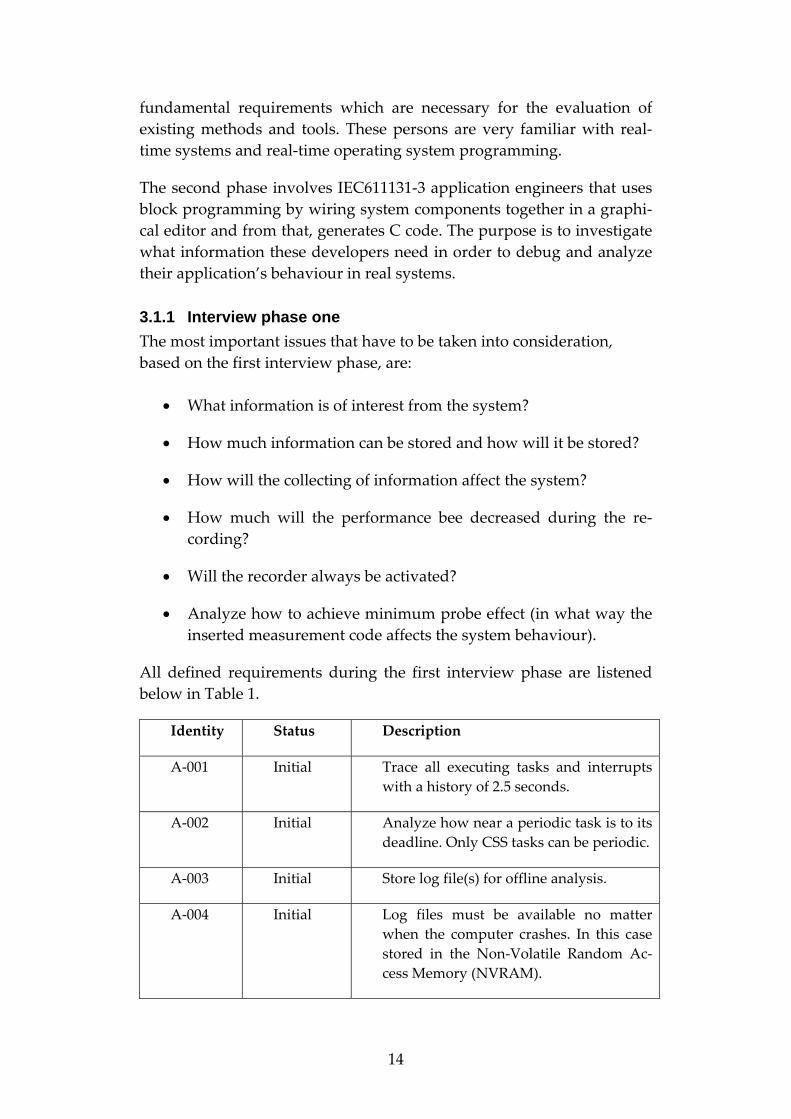
All defined requirements during the first interview phase are listened below in Table 1.
Identity Status Description
A‐001 Initial Trace all executing tasks and interrupts with a history of 2.5 seconds.
A‐002 Initial Analyze how near a periodic task is to its deadline. Only CSS tasks can be periodic.
A‐003 Initial Store log file(s) for offline analysis.
A‐004 Initial Log files must be available no matter when the computer crashes. In this case stored in the Non‐Volatile Random Ac‐cess Memory (NVRAM).
15
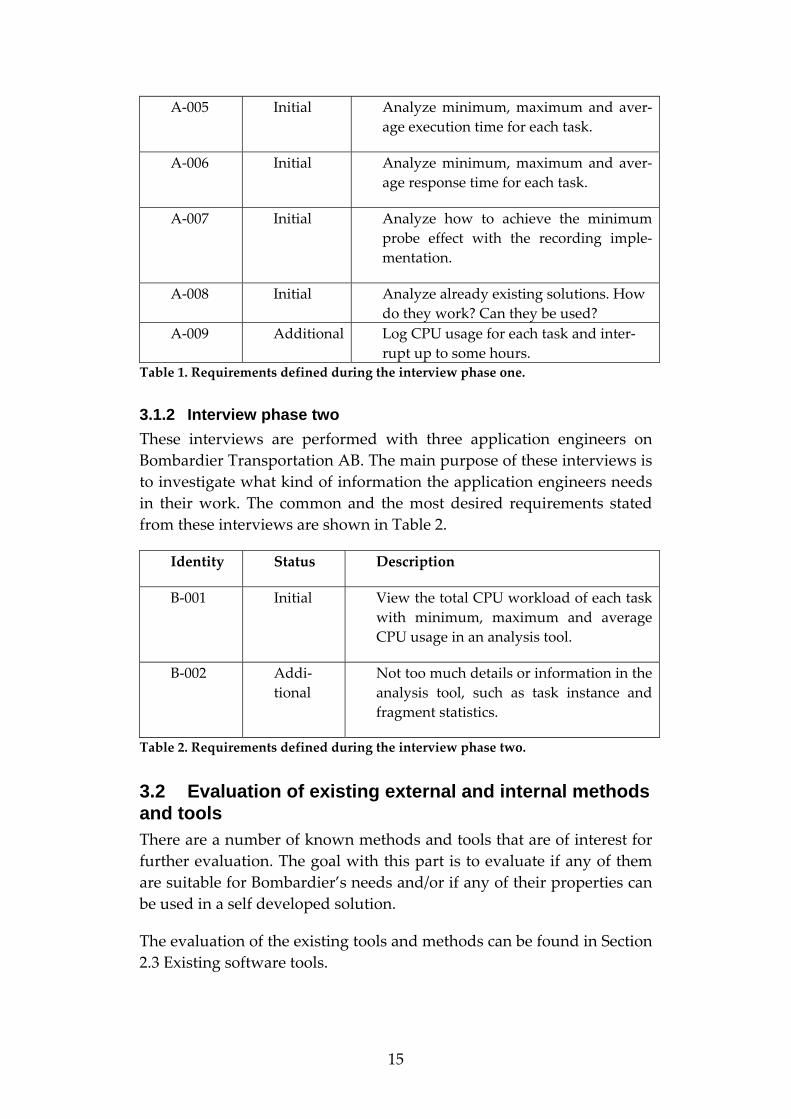
A‐005 Initial Analyze minimum, maximum and aver‐age execution time for each task.
A‐006 Initial Analyze minimum, maximum and aver‐age response time for each task.
A‐007 Initial Analyze how to achieve the minimum probe effect with the recording imple‐mentation.
A‐008 Initial Analyze already existing solutions. How do they work? Can they be used?
A‐009 Additional Log CPU usage for each task and inter‐rupt up to some hours.
Table 1. Requirements defined during the interview phase one.
3.1.2 Interview phase two These interviews are performed with three application engineers on Bombardier Transportation AB. The main purpose of these interviews is to investigate what kind of information the application engineers needs in their work. The common and the most desired requirements stated from these interviews are shown in Table 2.
Identity Status Description
B‐001 Initial View the total CPU workload of each task with minimum, maximum and average CPU usage in an analysis tool.
B‐002 Addi‐tional
Not too much details or information in the analysis tool, such as task instance and fragment statistics.
Table 2. Requirements defined during the interview phase two.
3.2 Evaluation of existing external and internal methods and tools There are a number of known methods and tools that are of interest for further evaluation. The goal with this part is to evaluate if any of them are suitable for Bombardier’s needs and/or if any of their properties can be used in a self developed solution.
The evaluation of the existing tools and methods can be found in Section 2.3 Existing software tools.
16
3.3 Solution propose Find a way to fulfil all the requirements in the requirement table (Table 1). It is of importance that the solution minimizes the memory consump‐tion and the affect of the system behaviour (the probe effect).
3.4 Implementation of solution propose Depending on the time effort, a full or partial implementation of the solution purpose is desired.
17
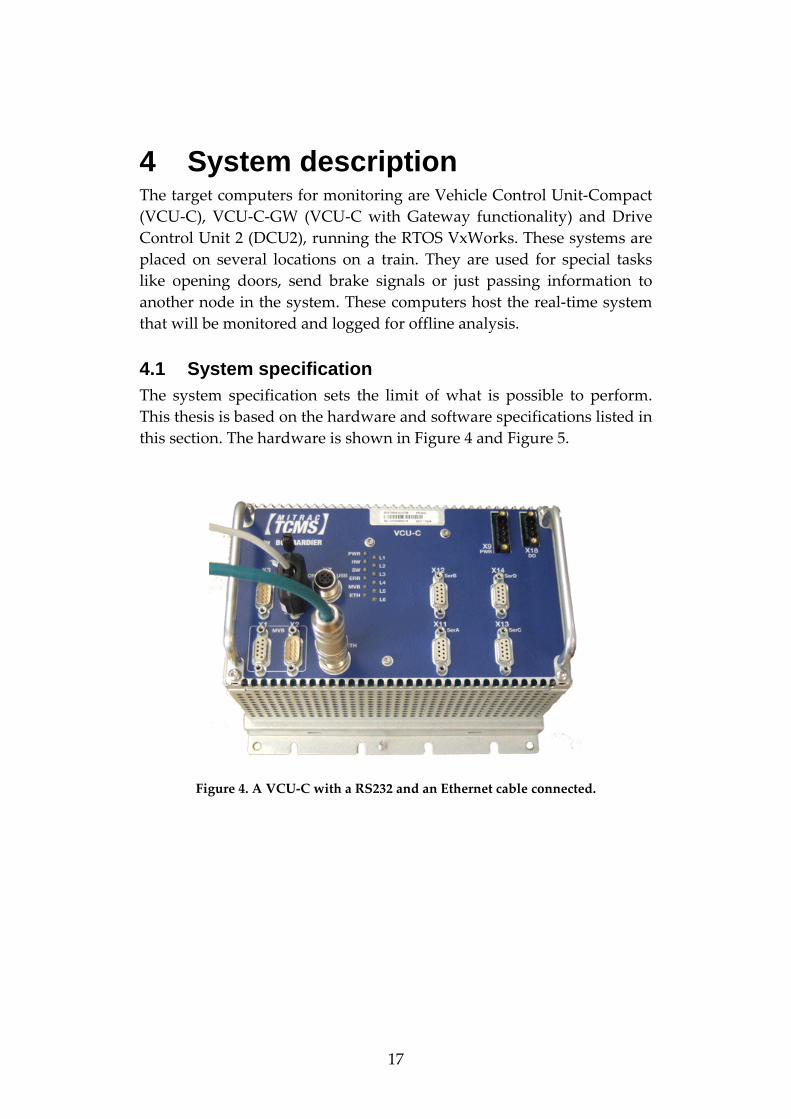
4 System description The target computers for monitoring are Vehicle Control Unit‐Compact (VCU‐C), VCU‐C‐GW (VCU‐C with Gateway functionality) and Drive Control Unit 2 (DCU2), running the RTOS VxWorks. These systems are placed on several locations on a train. They are used for special tasks like opening doors, send brake signals or just passing information to another node in the system. These computers host the real‐time system that will be monitored and logged for offline analysis.
4.1 System specification The system specification sets the limit of what is possible to perform. This thesis is based on the hardware and software specifications listed in this section. The hardware is shown in Figure 4 and Figure 5.
Figure 4. A VCU‐C with a RS232 and an Ethernet cable connected.

18
Figure 5. A DCU2 with a RS232 cable, Ethernet and power cable.
Hardware specifications:
• CPU: Motorola Power PC 603
Important to know about the Power PC architecture is that it uses little‐endian, in opposite to Intel architecture which use big‐endian. This difference is important to know when saving data types bigger than one byte into binary files, if the files are read by architectures with a different endianess.
• 32 MB – 128 MB RAM
There is a big difference in RAM memory size. The VCU‐C has 128 MB RAM and the DCU2 only 32 MB RAM. How much it af‐fects the system performance during a monitoring of the system is unknown, but it is of course possible to store more information in the RAM within a VCU‐C compared with the RAM within a DCU2.
• 32 MB flash memory
The flash memory is a non volatile memory where the OS and applications are stored, and it is a good candidate for storing log files. Both the VCU‐C and the DCU2 has 32 MB flash memory. The disadvantage of this memory is its low write speed.
• 0.5 ‐ 4 MB NVRAM
The NVRAM memory is a non volatile RAM where the memory remains even if the computer restarts. The VCU‐C has 4 MB NVRAM and the DCU2 has 0.5 MB NVRAM. NVRAM is fast as an ordinary RAM (faster than flash memory) and it is also non‐volatile. The disadvantage is the size of the memory. For instance,

19
of the 4 MB in the VCU‐C only ~250 KB can be spared for storing a log file.
• Interfaces: RS232 for monitor, Ethernet and more
The RS232 interface is used to connect to and control the system from a VT100 terminal client with a baud rate at 19 200 bps. As default, all settings in the systems are done through this interface.
The Ethernet interface is used for communication between other computers. The VCU‐C has for instance a built‐in DHCP client, FTP client and FTP server.
The DCU2 has some other interfaces since its main purpose is to control actuators. These interfaces are not of importance in this thesis.
Software specification:
• Universal Bootloader (U‐Boot) [7] as boot loader
U‐Boot is an open source project that provides firmware for many CPU architectures and boards. At Bombardier it is used as boot loader for VxWorks. All boot settings for VxWorks and CSS is done in U‐Boot. The settings are made through the RS232 inter‐face.
• WindRiver VxWorks 5.5.1 as RTOS
VxWorks is the RTOS where all applications execute. An impor‐tant feature relevant to this thesis is the scheduling. It allows pre‐emptive and round‐robin scheduling. Unfortunately VxWorks does not have a periodic scheduler.
• Common Software Structure (CSS) as a basic software layer on top of the RTOS
Bombardier has developed a software layer (CSS) on top of the operating system, which allows for a separating between the ap‐plication code and the operating system. Developing programs on top of the CSS API makes it easier to switch operating system without the need for extensive modification of the application code (in the best case there will not be any modifications). CSS al‐so has a feature missing in VxWorks, videlicet a periodic sched‐uler. The scheduler keeps track of the periodic tasks cycle times (and deadlines).

20

21
5 Working approach There are several methods to solve the earlier stated problems (identi‐fied in Section 3.1.1 Interview phase one). Some methods are easier to implement than others but maybe less effective and vice versa. This chapter discuss different possible methods to solve the problems. The chapter is divided into the two main parts; the analysis part and the monitoring part.
5.1 The analysis part The analysis tool has to be easy to use and informative. It will be used by both real‐time system professionals and users with low knowledge about real‐time systems. Therefore the tool is designed with a graphical user interface (GUI). This analysis tool is below divided into logical sub‐sections.
5.1.1 Selection of development environment Nowadays, there are a lot of programming languages that have good support of GUI development, for example Visual Basic, Java, C++ and C#. Since Tracealyzer is written in C# and the source code became available for use within Bombardier in mars 2007, C# is a very strong candidate. If the analysis tool is developed with C# it will be easy to integrate new features in the existing Tracealyzer. Integration between the new analysis tool and Tracealyzer is desired by Johan Kraft, the author of Tracealyzer. It will of course also be easy to integrate Tracea‐lyzer features into the new analysis tool. C# is also a part of the .NET family and supported in Microsoft Visual Studio 2005 which is a very powerful development environment for graphical user interface (GUI) applications.
For this thesis, there are, without doubt, most benefits with C# as programming language. Apart from the great integration benefits from Tracealyzer, all .NET applications are also platform independent [8].
5.1.2 Task and interrupt execution display A trace of how tasks and interrupts has executed in a system is rather complex and contains a lot of information. It is important to find a method to display it in a way that gives a good overview of the trace. One method to achieve this is with a scrollable table with colours and good description of the lines. Another method is with a scrollable graph

22
with zoom functionality. The latter is probably more time consuming to develop.
5.1.3 Task and interrupt time analysis display There are several ways to analyse and display the task and interrupt time but the most interesting are:
• Execution time. The execution time is the time a task has exe‐cuted in the CPU. This time does not include the time when the task has been interrupted by other tasks. The execution time is the measurement of how much time it takes to perform a task’s instructions.
• Response time. Response time is the time between when a task gets in its ready state until it has finished its execution.
• Remaining time. The time left until deadline (cycle time).
For these time concepts it is desirable to view the minimum, maximum and average times.
5.2 The monitoring part The first challenge in this part is to choose a proper tool or library for recording information. Section 2.3 Existing software tools include three candidates (WindView, Spy and Trace Recorder), and to be able to choose one of them it is necessary to look at the requirements again.
5.2.1 Trace all tasks and interrupt executions The task executions can be recorded in two ways: sampling or event triggered recording. When sampling, a time interval is specified and data is only collected each time period. The result is only approximated and not accurate, if the sample frequency is not the double of most frequently event. When using event triggered recording the monitoring tool is notified each time an event occur (like a context switch) and all the data are collected. This gives accurate information of the execution times in the system.
To be able to trace the execution of tasks and interrupts, information must exist when a new task starts to execute and when it stops to execute. In VxWorks a task can be in three relevant states:
• Ready. Task A is ready to execute. If A has the highest priority among all tasks that are in the ready state, and no other higher
23
priority task is executing, A is the one that will be moved to the executing state.
• Executing. Task A is up and running. A either runs until it is fin‐ished and will then be moved to the waiting state or if a task B in the ready state has higher priority, A will be moved to the ready state and B will be moved to the executing state.
• Waiting. Task A is not ready to execute. When it is, it will be moved to the ready state.
The principle for switching tasks between these states is called the task state transition. In VxWorks it is possible to add a callback‐function to the context switch. The context switch can perform the following transitions: ready ‐ executing, executing – ready and executing – waiting. Switching between other states is not handled by the context switch. Every time the context switch is switching between two tasks, the callback function will be called with specific parameters including which task that is moving from the executing state and which task that is moving in to the executing state. Both the Trace Recorder and WindView have the ability to record this, which is not possible when using Spy.
From this information it is possible to build up a trace of the tasks executions from which other valuable information like execution time and response time for each task can be calculated offline.
5.2.2 Analyze how near a periodic task is to its deadline Bombardier wants to know the time length between the time at which a task finishes its execution and its corresponding relative deadline. This is illustrated in Figure 6.

24
Figure 6. A task with a remaining time of 2 milliseconds after execution.
In Figure 6 task A takes 2 milliseconds to finish and has a period equal to 5 milliseconds. In this case it finishes its execution at time 3 which means that the margin, to the relative deadline, is 2 milliseconds.
The remaining time value is automatically calculated by the periodic scheduler in CSS. Neither one of the three tools (WindView, Spy and Trace Recorder) has the ability of storing this information because it is only reachable from CSS, which is a software layer executing on top of VxWorks. Therefore it is necessary to make modifications in the source code of CSS to get access to this information. Since the WindView source code is not available, Trace Recorder is the best option.
5.2.3 Store log file(s) for offline analytics When the recording is completed the information must be logged for offline analytics. Since modifications have to be made in the Trace Recorder a new version of the files has to be considered. This means that the old offline tool Tracealyzer has to be modified in order to read the new log file format.
5.2.4 Crash-robust recording If a task deadline is missed or if the power gets cut it can lead to unde‐sirable reboots. If the information is not stored permanently it will be lost and none knows what has happened the seconds before crash.
The target machines have NVRAM. Data that is written to NVRAM will not be lost if the system restarts due to persistent storage.
25
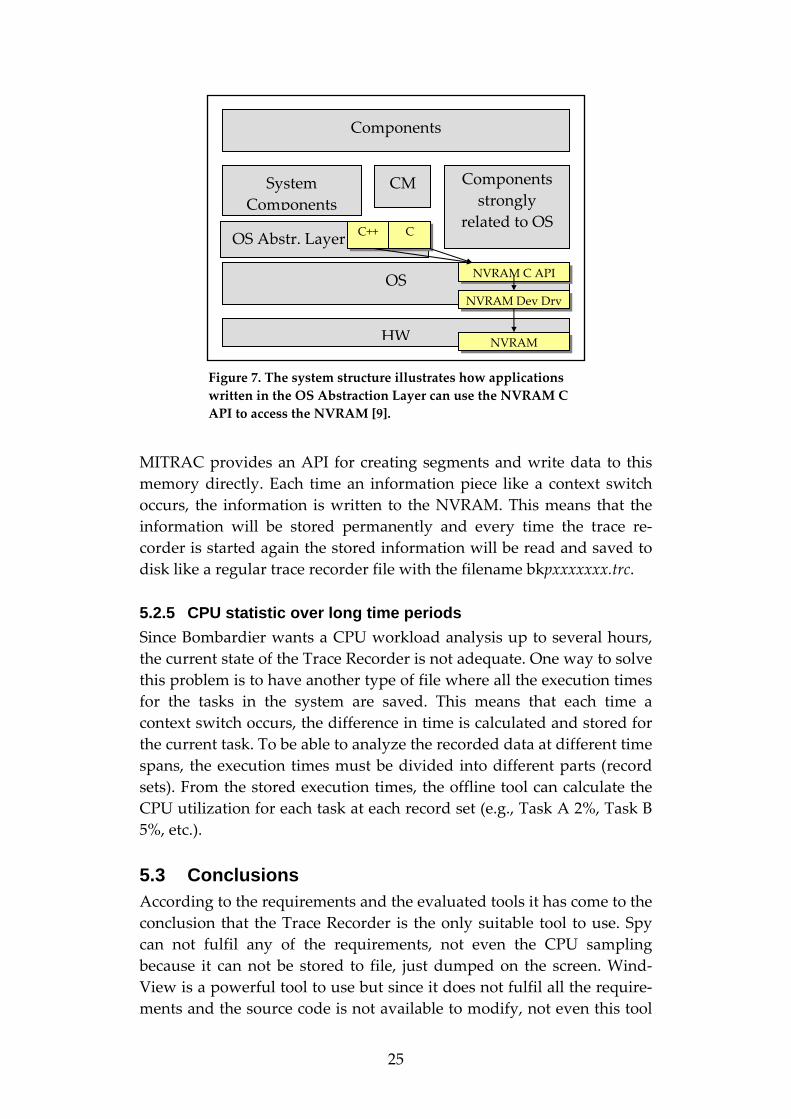
MITRAC provides an API for creating segments and write data to this memory directly. Each time an information piece like a context switch occurs, the information is written to the NVRAM. This means that the information will be stored permanently and every time the trace re‐corder is started again the stored information will be read and saved to disk like a regular trace recorder file with the filename bkpxxxxxxx.trc.
5.2.5 CPU statistic over long time periods Since Bombardier wants a CPU workload analysis up to several hours, the current state of the Trace Recorder is not adequate. One way to solve this problem is to have another type of file where all the execution times for the tasks in the system are saved. This means that each time a context switch occurs, the difference in time is calculated and stored for the current task. To be able to analyze the recorded data at different time spans, the execution times must be divided into different parts (record sets). From the stored execution times, the offline tool can calculate the CPU utilization for each task at each record set (e.g., Task A 2%, Task B 5%, etc.).
5.3 Conclusions According to the requirements and the evaluated tools it has come to the conclusion that the Trace Recorder is the only suitable tool to use. Spy can not fulfil any of the requirements, not even the CPU sampling because it can not be stored to file, just dumped on the screen. Wind‐View is a powerful tool to use but since it does not fulfil all the require‐ments and the source code is not available to modify, not even this tool
OS Abstr. Layer
OS
HW
CM Components strongly
related to OS
Components
System Components
NVRAM Dev Drv
C++ C
NVRAM
NVRAM C API
Figure 7. The system structure illustrates how applications written in the OS Abstraction Layer can use the NVRAM C API to access the NVRAM [9].

26
can be used. The Trace Recorder stores context switch events and the source code is available to modify which makes it a natural choice.

27
6 Solution The solution consists of two parts: the analysis part as the log file analysis tool Bombardier System Analyzer v1.0 and the monitoring part which is Bombardier Trace Recorder v1.0. To make these parts compatible with each other, two common log file formats are defined. Bombardier System Analyzer is a total new tool with no correlation to the Tracealyzer. Bombardier Trace Recorder is a further development of Trace Recorder v1.6.
6.1 The log file formats The solution contains two log file formats, one with detailed system information and one for long time CPU usage logging. The both file formats are described in the subsections below.
6.1.1 Detailed event log file format The format of this solution is based on Trace Recorder version 1.6 with file format version 3. This detailed event log file format is saved with the file extension .trc and further called trc‐file. The trc‐file is binary.
Since this thesis requires more information from the monitored system than before, the file format has to be changed, but the file structure is still preserved with two exceptions – probes and virtual tasks. Probes allow logging an integer value and associating it to a probe. Virtual tasks provide services to monitor code snippets within a task. Both probes and virtual tasks were not useful in the recorder and are there‐fore removed.
Apart from the probe and virtual task removal, the most significant difference with the file format is the size. Since more information is needed the file size has increased. In file version 3 a log file with 100 tasks (70 interrupts and 30 tasks) and 20 000 events had a file size of ~144 KB (144 019 bytes). With the same amount of tasks and events in file format version 8 (the new file format) the file size is ~223 KB (222 619 bytes). The file format is not size optimized due to this thesis scope. A suggestion of an improved file format is discussed in Chapter 7.
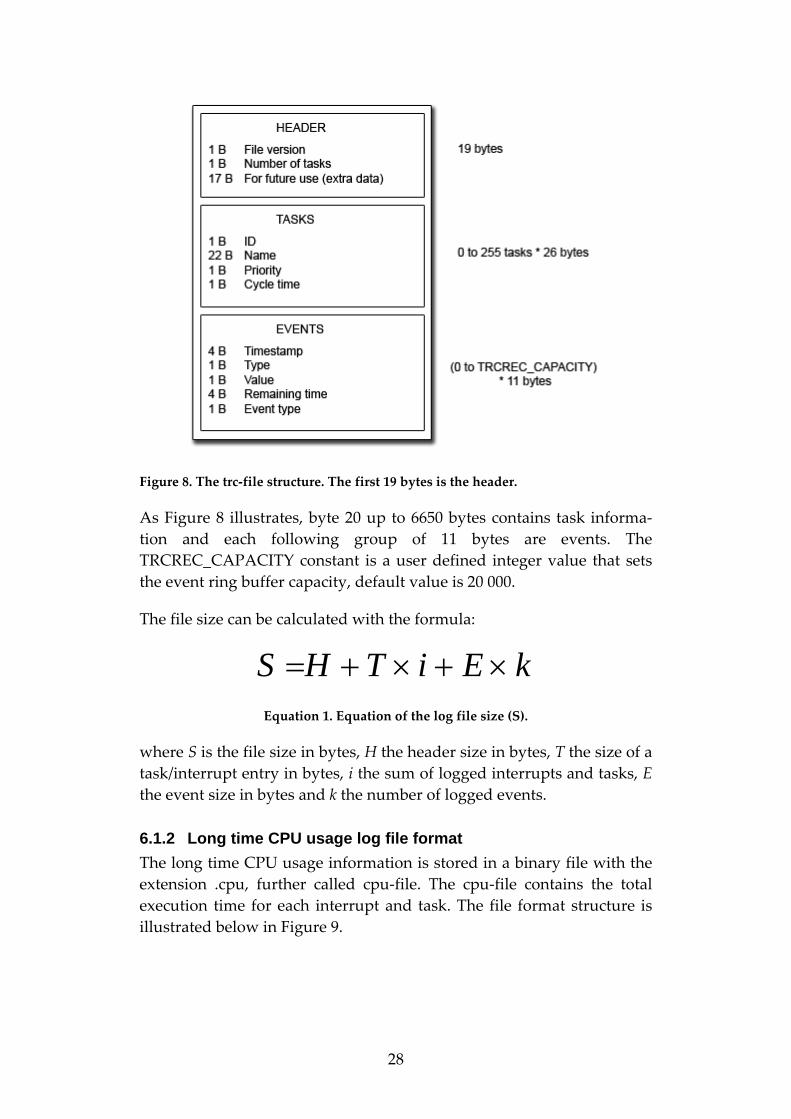
The file format structure for version 8 is illustrated below in Figure 8.
28
Figure 8. The trc‐file structure. The first 19 bytes is the header.
As Figure 8 illustrates, byte 20 up to 6650 bytes contains task informa‐tion and each following group of 11 bytes are events. The TRCREC_CAPACITY constant is a user defined integer value that sets the event ring buffer capacity, default value is 20 000.
The file size can be calculated with the formula:
kEiTHS ×+×+=
Equation 1. Equation of the log file size (S).
where S is the file size in bytes, H the header size in bytes, T the size of a task/interrupt entry in bytes, i the sum of logged interrupts and tasks, E the event size in bytes and k the number of logged events.
6.1.2 Long time CPU usage log file format The long time CPU usage information is stored in a binary file with the extension .cpu, further called cpu‐file. The cpu‐file contains the total execution time for each interrupt and task. The file format structure is illustrated below in Figure 9.

29
Figure 9. The cpu‐file structure.
As Figure 9 shows, all tasks that have executed during the logging are stored after each other, after the header information. The task informa‐tion is used as a lookup table which map task IDs with task names. Following the tasks come the record sets. A record set is a time span (the record set length) of tasks total execution times. In a record set it is possible to see how long time each task has executed. A record set only stores tasks that has executed during the record set. Each record set has one byte that indicates how many tasks it contains. The record sets are stored after each other.
The cpu‐file size can be calculated with the formula:
))(1(0∑=
×++×+=n
rrtEiTHS
Equation 2. Equation of the log file size (S).
where S is the file size in bytes, H the header size in bytes, T the task size in bytes, i the total number of tasks, n the number of record sets, r the current record set, 1 the number of tasks byte, E the size in bytes of a logged task execution time and t the number of executed tasks in the current record set (r).
30
6.2 Bombardier System Analyzer - The analysis part Bombardier System Analyzer is a graphical tool that reads trc‐ and cpu‐files. The program analyzes the files and displays the information in a pedagogic way for the user. The structure of Bombardier System Ana‐lyzer is described in the following subsections.
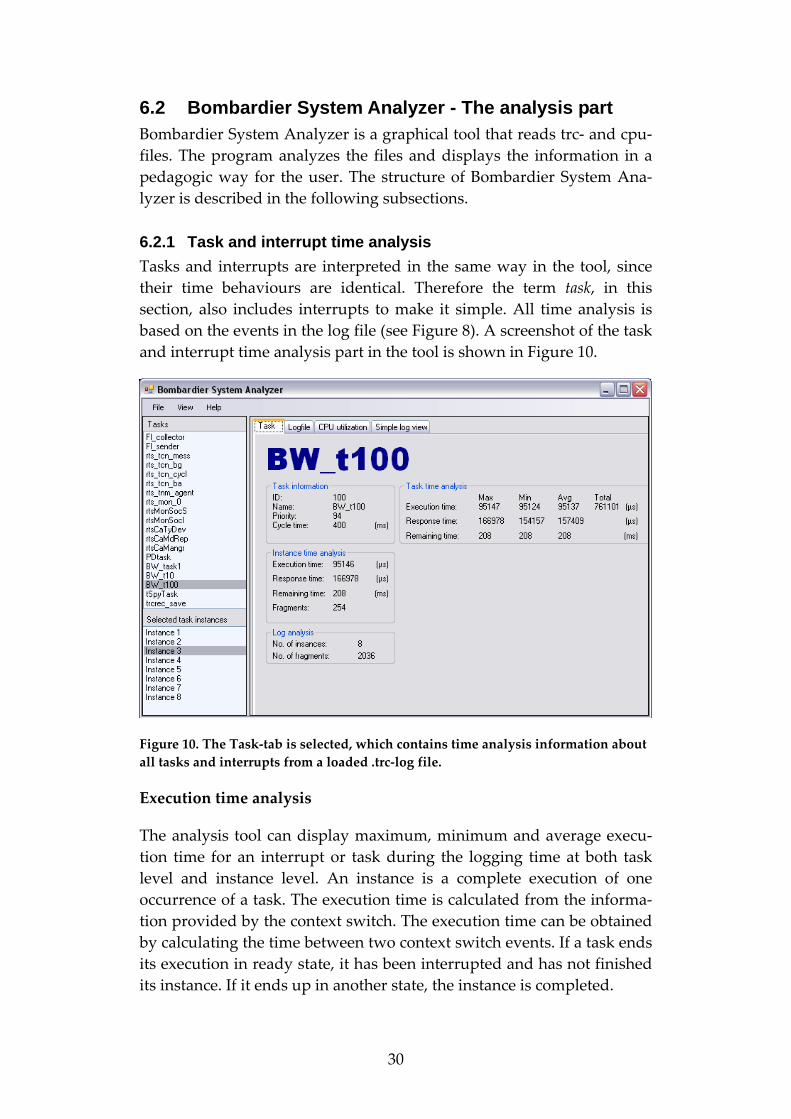
6.2.1 Task and interrupt time analysis Tasks and interrupts are interpreted in the same way in the tool, since their time behaviours are identical. Therefore the term task, in this section, also includes interrupts to make it simple. All time analysis is based on the events in the log file (see Figure 8). A screenshot of the task and interrupt time analysis part in the tool is shown in Figure 10.
Figure 10. The Task‐tab is selected, which contains time analysis information about all tasks and interrupts from a loaded .trc‐log file.
Execution time analysis
The analysis tool can display maximum, minimum and average execu‐tion time for an interrupt or task during the logging time at both task level and instance level. An instance is a complete execution of one occurrence of a task. The execution time is calculated from the informa‐tion provided by the context switch. The execution time can be obtained by calculating the time between two context switch events. If a task ends its execution in ready state, it has been interrupted and has not finished its instance. If it ends up in another state, the instance is completed.
31
Response time analysis
The response time can only be calculated for periodic tasks, since it is possible to monitor when these tasks get into ready state. Other task’s and interrupt’s response time can not be analyzed.
Minimum, maximum and average response time is shown at both task level and instance level.
Remaining time analysis
With remaining time means the time until deadline. This only affects periodic tasks, scheduled by CSS periodic scheduler. The remaining time is measured in milliseconds since the scheduler has 1 ms resolution (activates each millisecond).
Minimum, maximum and average remaining time is shown at both task level and instance level.
6.2.2 Detailed log file events view The 2.5 seconds recorded events can be viewed in two ways. One is the detailed log view and the other one is a simple log view. The detailed view is intended for the software engineers who want to see more information about each event. See Figure 11.

32
Figure 11. The detailed log view. In this example the periodic task (Fl_sender) has run and had remaining time 136 ms.
The view consists of five columns. The first one, Time (μs), represents the timestamp in microseconds for the event (relative to the first event). Name represents the name of the task that is moving into the executing state. The State column represents the last state the previous executing task (from the previous row) had before this switch. If the task state in the current row is ready it means that the previous task was interrupted by the task in the current row. If the task at the current row has the states suspend, pending or delayed, the previous task has finished its execution. Remaining time represents the time left until the task deadline. Only periodic tasks created from CSS has a remaining since they are the only tasks with a period time. Finally the Event Type column represents the type of the event, i.e., if it has occurred by an IRQ, switchhook, etc. It is possible to filter events by the event type or by the task name. An event view can also be saved to a text file.
6.2.3 Simple log view The simple log view is abstracted to satisfy a user who is not familiar with real‐time operating systems, the internal system states and the event types. In the detailed log view the user must look at the previous row to see which task that is moving to the state that is stated in the present row. This is not the case for the simple log view, see Figure 12.

33
Figure 12. The simple log view. Each row tells the user when a task starts, stops and if it is finished or interrupted.
Start and End tells the user the timestamps at which a task starts to execute and when it ends. The event column tells weather the task started, finished or was interrupted.

34
6.2.4 CPU workload analysis The CPU workload can be analysed in two ways: The total and task individual CPU utilization for the latest 2.5 seconds from the trc‐file and the CPU utilization with a larger time span from the cpu‐file. The CPU utilization from the cpu‐file is divided into record sets, each with a length specified by the user in the Trace Recorder.
Figure 13. The CPU utilization view with two tables. The left one shows the utilization for the last 2.5 seconds and the right one represent the long time CPU utilization divided into record sets.
As Figure 13 illustrates the user can select which record set to display by clicking on the list box in the lower right corner. The user can also choose a summary of all the record sets. The rts_tcn_bg task in the tables is the background/idle task. The total CPU usage is calculated by subtracting the background task’s CPU usage from 100.
6.3 Bombardier Trace Recorder - The monitoring part The solution of monitoring the system is the Bombardier Trace Re‐corder, a modified version of Trace Recorder v1.6 in combination with some small modifications of the CSS periodic scheduler code. Bombar‐dier Trace Recorder is a monitoring tool that saves the system behaviour to log files.
35
6.3.1 Collecting system information Bombardier Trace Recorder is based on event triggered information collecting, in opposite to sampling. The reason for having event trig‐gered information is that it is the only way to get an exact recording of the system behaviour. With “all events” means all interrupt and task executions.
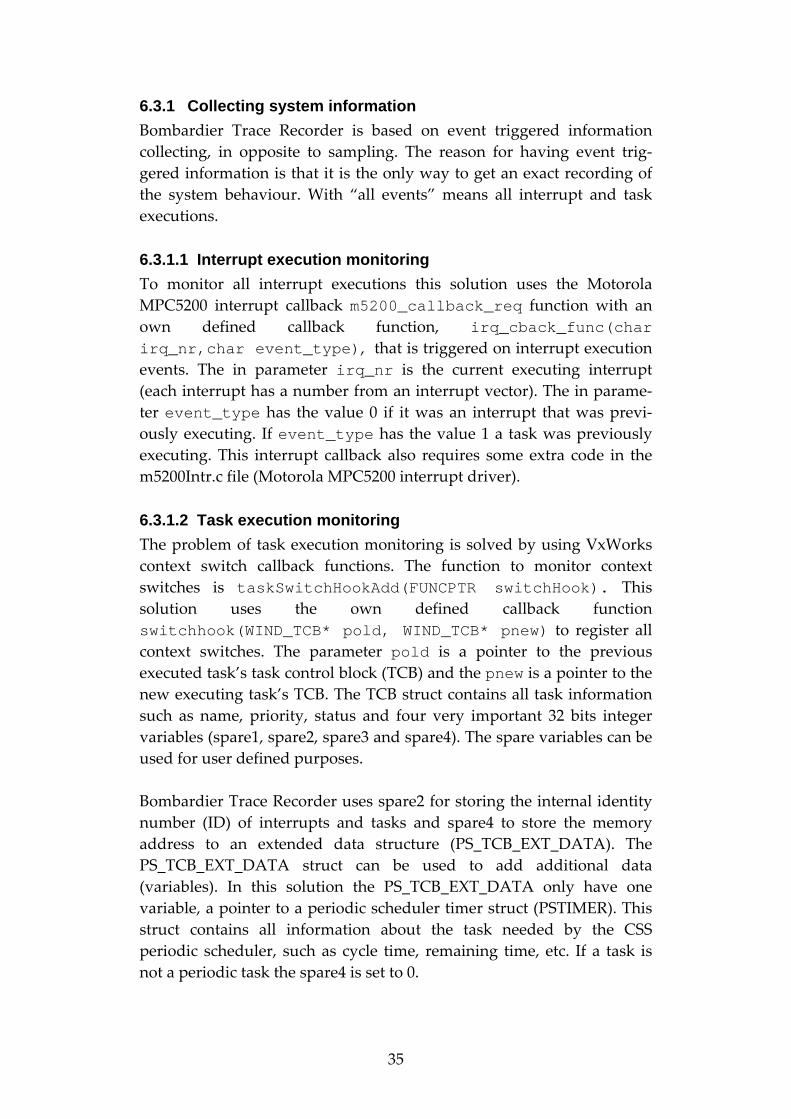
6.3.1.1 Interrupt execution monitoring To monitor all interrupt executions this solution uses the Motorola MPC5200 interrupt callback m5200_callback_req function with an own defined callback function, irq_cback_func(char irq_nr,char event_type), that is triggered on interrupt execution events. The in parameter irq_nr is the current executing interrupt (each interrupt has a number from an interrupt vector). The in parame‐ter event_type has the value 0 if it was an interrupt that was previ‐ously executing. If event_type has the value 1 a task was previously executing. This interrupt callback also requires some extra code in the m5200Intr.c file (Motorola MPC5200 interrupt driver).
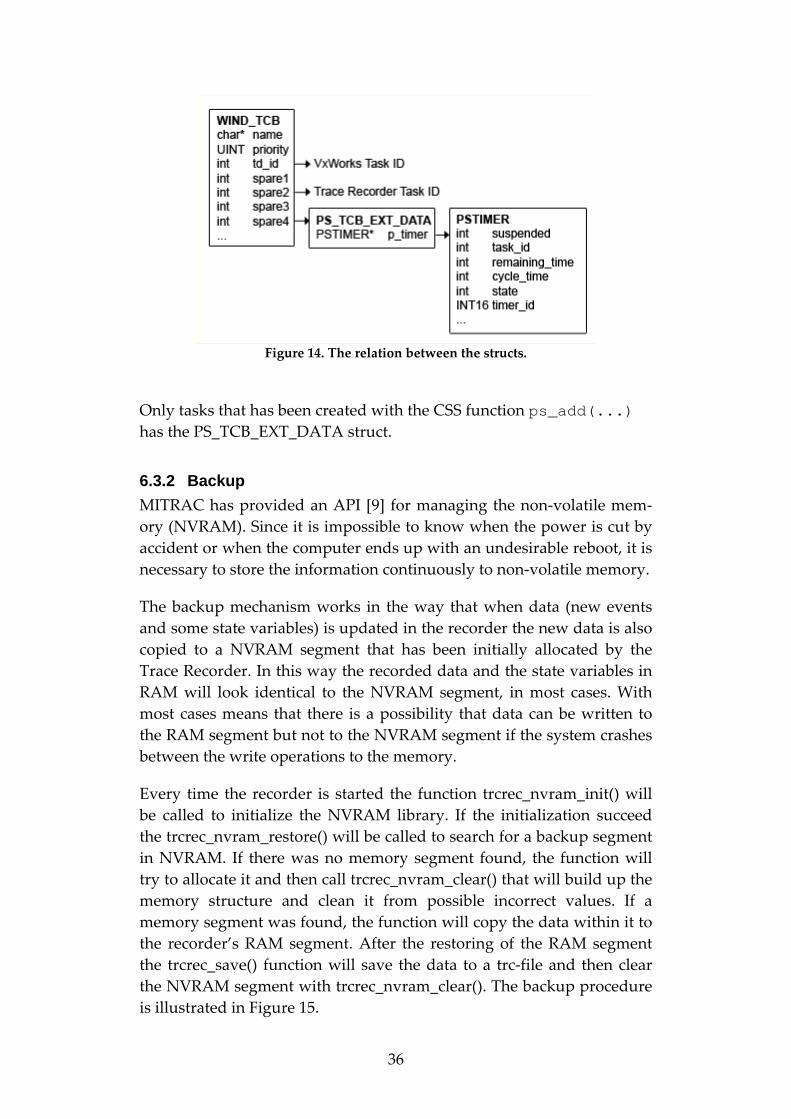
6.3.1.2 Task execution monitoring The problem of task execution monitoring is solved by using VxWorks context switch callback functions. The function to monitor context switches is taskSwitchHookAdd(FUNCPTR switchHook). This solution uses the own defined callback function switchhook(WIND_TCB* pold, WIND_TCB* pnew) to register all context switches. The parameter pold is a pointer to the previous executed task’s task control block (TCB) and the pnew is a pointer to the new executing task’s TCB. The TCB struct contains all task information such as name, priority, status and four very important 32 bits integer variables (spare1, spare2, spare3 and spare4). The spare variables can be used for user defined purposes. Bombardier Trace Recorder uses spare2 for storing the internal identity number (ID) of interrupts and tasks and spare4 to store the memory address to an extended data structure (PS_TCB_EXT_DATA). The PS_TCB_EXT_DATA struct can be used to add additional data (variables). In this solution the PS_TCB_EXT_DATA only have one variable, a pointer to a periodic scheduler timer struct (PSTIMER). This struct contains all information about the task needed by the CSS periodic scheduler, such as cycle time, remaining time, etc. If a task is not a periodic task the spare4 is set to 0.
36
Figure 14. The relation between the structs.
Only tasks that has been created with the CSS function ps_add(...) has the PS_TCB_EXT_DATA struct.
6.3.2 Backup MITRAC has provided an API [9] for managing the non‐volatile mem‐ory (NVRAM). Since it is impossible to know when the power is cut by accident or when the computer ends up with an undesirable reboot, it is necessary to store the information continuously to non‐volatile memory.
The backup mechanism works in the way that when data (new events and some state variables) is updated in the recorder the new data is also copied to a NVRAM segment that has been initially allocated by the Trace Recorder. In this way the recorded data and the state variables in RAM will look identical to the NVRAM segment, in most cases. With most cases means that there is a possibility that data can be written to the RAM segment but not to the NVRAM segment if the system crashes between the write operations to the memory.
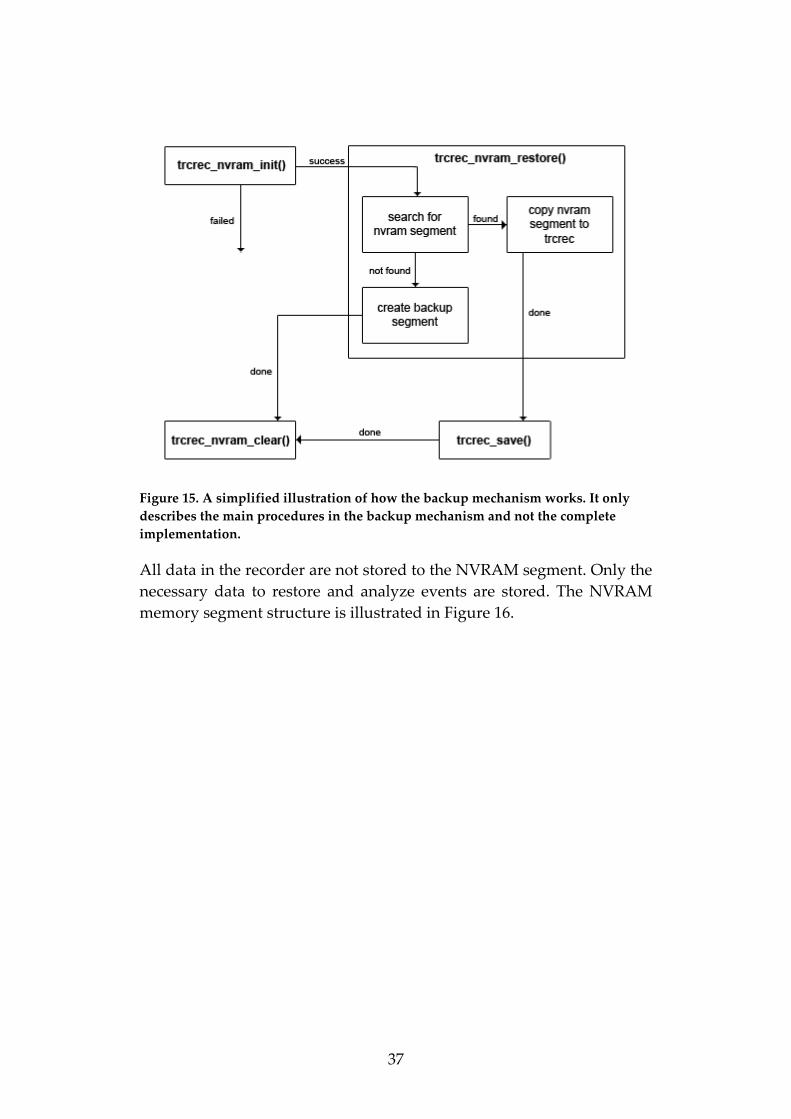
Every time the recorder is started the function trcrec_nvram_init() will be called to initialize the NVRAM library. If the initialization succeed the trcrec_nvram_restore() will be called to search for a backup segment in NVRAM. If there was no memory segment found, the function will try to allocate it and then call trcrec_nvram_clear() that will build up the memory structure and clean it from possible incorrect values. If a memory segment was found, the function will copy the data within it to the recorder’s RAM segment. After the restoring of the RAM segment the trcrec_save() function will save the data to a trc‐file and then clear the NVRAM segment with trcrec_nvram_clear(). The backup procedure is illustrated in Figure 15.
37
Figure 15. A simplified illustration of how the backup mechanism works. It only describes the main procedures in the backup mechanism and not the complete implementation.
All data in the recorder are not stored to the NVRAM segment. Only the necessary data to restore and analyze events are stored. The NVRAM memory segment structure is illustrated in Figure 16.

38
Figure 16. The structure of the NVRAM segment. The data is accessed by pointers or the nvram_read(…) and nvram_write(…) functions.
A very important thing to know when using the NVRAM API is that the API functions nvram_read(…) and nvram_write(…) are much slower method compared with accessing the desired data with pointers. It is specially recommended to direct access the NVRAM with memory pointers in interrupt contexts. Using the NVRAM API functions when logging events and state variables will increase the probe effect a lot, therefore, this solution uses the NVRAM API as little as possible. Also the NVRAM API can not be used in interrupt service routines since it uses semaphores for synchronizing.
39
7 Future work Even if this thesis fulfils its aim, a lot of improvements can be done in the future, especially code improvements in the tools. Things to do in future work are listed categorized below with a short description.
Bombardier System Recorder
• Both spare2 and spare4 variables in the WIND_TCB struct are used by the recorder. A better solution would be to only use one, for instance, spare4 and add an additional variable into that struct of the same kind that was needed in the spare2 variable.
• Some data types are not used in an optimal way, such as the re‐maining time variable in events. The variable is unnecessary for events that belong to non periodic interrupts and tasks. The so‐lution of this is to introduce one byte in the beginning of each event that describes the event (periodic or non periodic event). If the event is a non periodic event, the event does not have a re‐maining time data. This solution will save 3 bytes at each non periodic event.
• The recorder does not limit the number in log files produced by the backup mechanism, which can result that the disk is filled. A future solution should have a limitation of possible backup files that can be saved to disk.
• The present solution is focusing on CPU usage but it could also be of interest to know the memory usage for each task. This could for instance help the software engineers to keep track of the difference between the memory usage and the upper bound for the allocated memory segment.
Bombardier System Analyzer
• The loading of all events into the tables (DataGridView con‐trol) is very time consuming. It is possible to optimize this process. More information about DataGridView optimization is found at Microsoft’s MSDN website [11].
40
• If several CPU log files have been created it could be useful to add them all together and make a CPU usage for several sys‐tem runs.

41
8 Summary and conclusions The final result from the thesis is the offline analysis tool Bombardier System Analyzer and the online recording tool Bombardier Trace Recorder. These tools make it easier for software engineers at Bombardier to improve and supervise their systems. The CPU workload feature provides good statistics over the CPU usage for each task in the system.
Bombardier System Analyzer speeds up the development process since the software engineers can see directly which task that consumes the most CPU cycles during simulation. Bombardier Trace Recorder is also very useful after the development phase. Suppose that a train has one or more computers that end up with undesirable reboots. In this case it is of interest to know exactly what happened the seconds before reboot, which task was last run? Did any task miss its deadline and why? If this information could be maintained it would provide a lot of help for the developers to find the error that led to failure.
Several tools exists for monitoring the behaviour of real‐time systems like WindView, Spy and BlackBox but the only suitable tool for Bom‐bardier‘s requirements is the Trace Recorder developed by Johan Andersson. This is because the trace recorder has the ability to store context switch events and the source code is available to modify. Most requirements can be solved based only on information that comes from the context switch (which task finished, timestamp at the event, etc.) but for the other requirements, extra implementation is needed. The re‐quirement “Log files must be available no matter when the computer crashes” can be solved by continuously save the information to the NVRAM which is connected to an external battery. This means that the information will be saved even if the power is cut or if the computer is rebooted. For the “Analyze how near a periodic task is to its deadline” requirement the task period must be known. This has been solved by modification of the code in the periodic scheduler to be able to map the periodic scheduler timer info to the task control block (TCB).
The performed interviews show that these tools are exactly what Bombardier needs, which was the aim of this thesis.

42
9 References [1] Johan Andersson. Modeling the Temporal Behavior of Complex
Embedded Systems. Mälardalen University, 91‐88834‐71‐9, 2005.
[2] H. Thane, H. Hansson. Using Deterministic Replay for Debug‐ging of Distributed Real Time Systems. 12th EUROMICRO CONFERENCE ON REAL‐TIME SYSTEMS, page 265‐272, Stock‐holm, Sweden, 2000. IEEE Computer Society.
[3] H. Thane, D. Sundmark, J. Huselius and A. Pettersson. Replay Debugging of Real‐Time Systems Using Time Machines. In Pro‐ceedings of the International Parallel and Distributed Processing Symposium (IPDPSʹ03), page 288‐295, Nice, France, 2003. ACM.
[4] The Remodel Project, Homepage, http://www.idt.mdh.se/~jxn01/projects/remodel/, last viewed 2007‐04‐04.
[5] WindRiver, Home, http://www.windriver.com/, last viewed 2007‐04‐04.
[6] ZealCore Embedded Solutions AB, Homepage, http://www.zealcore.se/, last viewed 2007‐04‐04.
[7] Das U‐Boot, Homepage, http://sourceforge.net/projects/u‐boot, last viewed 2007‐04‐12.
[8] The Mono Project, Main Page, http://www.mono‐project.com/, last viewed 2007‐04‐17.
[9] MICTRAC CC NRTOS, NVRAM Handler User’s Manual, 3EGM080950D0002.
[10] P.K. Jensen. Automated Modeling of Real‐Time Implementation. Technical Report BRICS RS‐98‐51, University of Aalborg, De‐cember 1998.
[11] Microsoft, Best Practices for Scaling the Windows Forms Data‐GridView Control, http://msdn2.microsoft.com/en‐us/library/ha5xt0d9.aspx, last viewed 2007‐04‐20.

43
[12] Google, define: task – Google‐sökning, http://www.google.se/search?hl=sv&q=define%3A+task&meta=, last viewed 2007‐05‐09.
[13] WindRiver. WindView User’s Guide 2.2. Part #: DOC‐14200‐ZD‐01, 2002.
[14] WindRiver. VxWorks OS Libraries API Reference, 5.5. Part #: DOC‐14604‐ND‐00, 2002.
[15] Lauterbach, TRACE 32 Basic Concepts, http://www.lauterbach.com/main.html, last viewed 2007‐05‐09.
[16] ZealCore, The BlackBox Technology, http://www.zealcore.se/blackbox/index.html, last viewed 2007‐05‐09.
[17] UPPAAL, UPPAAL Home, http://www.uppaal.com/, last viewed 2007‐05‐21.