CPR Report, 2-2013 - SBA Servicing Asset Valuation ...glsolutions.us/files/Feb 2013 CPR...
27
Coleman Bob Judge, Government Loan Solutions, Editor Bob Judge is a partner at Government Loan Solutions. Government Loan Solutions is a provider of valuation services, pre- payment analytics and operational support for the SBA marketplace. Bob has 25 years of experience in the fixed income markets. He holds a B.A. in Economics from Vassar College and an M.B.A. in Finance from NYU Stern School of Busi- ness. Government Loan Solutions’ CPR Report Providing the most detailed monthly SBA 7(a) and 504 prepayment, default and market information In January, prepays rose signif- icantly as we began 2013. The primary culprit of this increase is the fact that voluntary pre- payments have begun to re- cover from the lows of 2011 and 2012. As for the detail, overall pre- payments rose 46% to 7.84% from 5.39% in December. In comparing prepayment speeds for the first month of 2013 to the same period in 2012, we see an increase of 26%, 7.84% versus 6.20%. As for the largest sector of the market, 20+ years to ma- turity, prepayment speeds rose by 51% to 6.64% from 4.41% in December. Turning to the CPR break- down, the default CPR rose by 73% to 2.76% from 1.60% in December. This reading is the highest one since last May. Regarding voluntary prepay- ments, they continue to rise, increasing 34% to 5.08% from 3.79%. This represents the Article continued on page 3, graphs on page 2 and data on pages 16-17. Volume 7, Issue #2 P REPAYS J UMP 46% IN J ANUARY February, 2013 Special points of interest: • CPRs: Big Jump in January • 7a Defaults Increase • Debentures: 20s Higher • SBI: Positive Returns in February INSIDE THIS ISSUE: 7a Prepayment Speeds 1-3, 16-17 SBI Indexes 1 & 4-5 SMA 7 504 Debenture Speeds 1, 8-10 Default Rate 14 Default Curtailment Ratios 14 & 20 Value Indices 15-17 Sale & Settlement Tip 13 SBI: P OSITIVE R ETURNS IN F EBRUARY Looking at this month’s results, we saw positive returns for both the pool and IO strip in- dexes. The pool index that has all eligible pools between 10 and 25 years, returned .14% (versus .26% in January) for equal weighting and .15% (versus .28% in January) for actual weighting. Continued strong pricing in the 7a loan D EBENTURE S PEEDS : 20 S U P D UE TO V OLUNTARY P REPAYS This month, 20 year debenture speeds rose by 3% to 8.00% from 7.79% in January. Much like the 7a market, we are seeing a rotation from defaults to vol- untary prepayments as the driv- ers of overall prepayments in the 504 debenture space. Last month, voluntary prepay- ments rose by 17% from CRR 5.61% to CRR 6.59%, while defaults fell by 35% to 1.42% from 2.18%. This reading is the lowest one since April, 2008. Continued on page 8 © 2013 Coleman and Government Loan Solutions. All Rights Reserved. Just around 10% of new firms say they’re looking to create their own technology or other innovations. Small Business Fact of the Month Continued on page 4 A S W OODY A LLEN ONCE FAMOUSLY SAID , 90% OF LIFE IS JUST SHOWING UP . F OR THE OTHER 10%, SHOULDN ’ T YOU ... C OME P REPARED ? SBLA. C OME P REPARED .
Transcript of CPR Report, 2-2013 - SBA Servicing Asset Valuation ...glsolutions.us/files/Feb 2013 CPR...

Coleman
Bob Judge, Government LoanSolutions, Editor
Bob Judge is a partner atGovernment Loan Solutions.
Government Loan Solutions is aprovider of valuation services, pre-payment analytics and operationalsupport for the SBA marketplace.
Bob has 25 years of experience inthe fixed income markets. He holdsa B.A. in Economics from VassarCollege and an M.B.A. in Financefrom NYU Stern School of Busi-ness.
Government Loan Solutions’ CPR ReportProviding the most detailed monthly SBA 7(a) and 504 prepayment, default and market information
In January, prepays rose signif-icantly as we began 2013. Theprimary culprit of this increaseis the fact that voluntary pre-payments have begun to re-cover from the lows of 2011and 2012.
As for the detail, overall pre-payments rose 46% to 7.84%from 5.39% in December.
In comparing prepaymentspeeds for the first month of2013 to the same period in2012, we see an increase of26%, 7.84% versus 6.20%.
As for the largest sector ofthe market, 20+ years to ma-turity, prepayment speeds roseby 51% to 6.64% from 4.41%in December.
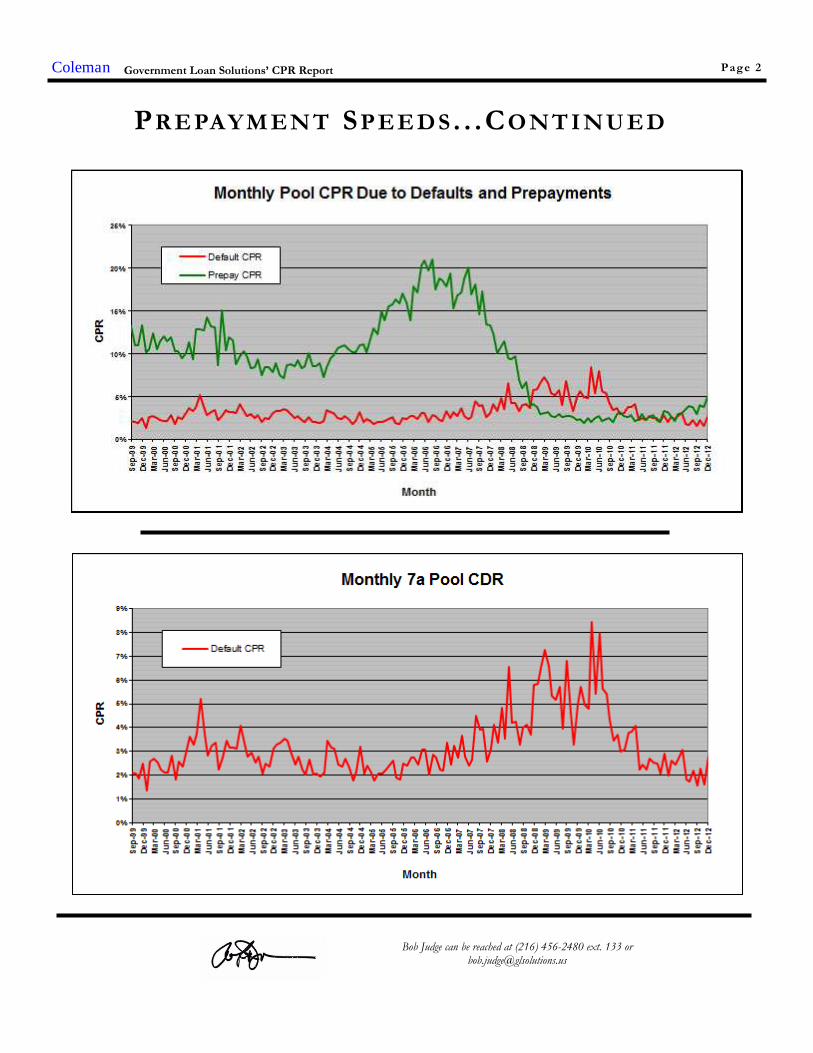
Turning to the CPR break-down, the default CPR roseby 73% to 2.76% from 1.60%in December. This reading isthe highest one since last May.
Regarding voluntary prepay-ments, they continue to rise,increasing 34% to 5.08% from3.79%. This represents the
Article continued on page 3, graphs onpage 2 and data on pages 16-17.
Volume 7, Issue #2
P R E PA Y S J U M P 46% I N J A N UA RY
February, 2013
Special points of interest:
• CPRs: Big Jump in January
• 7a Defaults Increase
• Debentures: 20s Higher
• SBI: Positive Returns in February
I N S I D E T H I S I S S U E :
7a Prepayment Speeds 1-3, 16-17
SBI Indexes 1 & 4-5
SMA 7
504 Debenture Speeds 1, 8-10
Default Rate 14
Default Curtailment Ratios 14 & 20
Value Indices 15-17
Sale & Settlement Tip 13
S B I : P O S I T I V E R E T U R N S I N F E B R UA R Y
Looking at this month’s results,we saw positive returns forboth the pool and IO strip in-dexes. The pool index that has
all eligible pools between 10and 25 years, returned .14%(versus .26% in January) forequal weighting and .15%
(versus .28% in January) foractual weighting. Continuedstrong pricing in the 7a loan
D E B E N T U R E S P E E D S : 2 0 S U P D U E T O
V O L U N TA R Y P R E PA Y S
This month, 20 year debenturespeeds rose by 3% to 8.00%from 7.79% in January. Muchlike the 7a market, we are seeinga rotation from defaults to vol-untary prepayments as the driv-
ers of overall prepayments inthe 504 debenture space.
Last month, voluntary prepay-ments rose by 17% from CRR5.61% to CRR 6.59%, while
defaults fell by 35% to 1.42%from 2.18%. This reading isthe lowest one since April,2008.
Continued on page 8
© 2013 Coleman and Government Loan Solutions. All Rights Reserved.
Just around 10% of new firms say they’re looking to create their own technology or other innovations.
Small Business Fact of the Month
Continued on page 4
A S W O O D Y A L L E N O N C E F A M O U S L Y S A I D , 9 0 % O F L I F E I S J U S T
S H O W I N G U P . F O R T H E O T H E R 1 0 % , S H O U L D N ’ T Y O U . . . C O M E
P R E P A R E D ?
SBLA. COME PREPARED .
Coleman Government Loan Solutions’ CPR Report Page 2
PR E PAYM EN T SP EE DS . . .CO NT I NU ED
Bob Judge can be reached at (216) 456-2480 ext. 133 [email protected]

magnitude, in the 16-20 sector(+353% to CPR 10.45%), 8-10(+63% to CPR 11.19%), <8(+53% to CPR 53%), 20+(+51% to CPR 6.64%), 10-13(+19% to CPR 9.82%) and 13-16 (+13% to CPR 6.56%).
As we begin 2013, prepare forhigher CPRs, driven by in-creased voluntary prepay-ments.
For further information on theterminology and concepts used in thisarticle, please refer to the “Glossaryand Definitions” at the end of thereport.
Coleman
“This month
provides yet more
evidence that the
lows in voluntary
prepayments are a
thing of the past.”
Data on page 16-19
Government Loan Solutions’ CPR Report
highest reading since October,2008.
This month provides yet moreevidence that the lows in volun-tary prepayments are a thing ofthe past.
As previously stated, overallspeeds came in at 7.84%, a46% increase from December.This month ends an unbrokenstreak of 27 consecutivemonths of sub-7% prepayspeeds.
As for next month, preliminarydata from Colson suggests an-other result in the 7% range aswe begin 2013 with two read-ings above 7%., the first timethis has happened in quite awhile.
With the start of 2013 showing7%+ prepayment speeds, it
looks like the days of 5%speeds have come to an end.While we might see the occa-sional sub-6% reading, thetrend suggests 2-3% defaultspeeds combined with 4-5%voluntary prepay speeds,equating to 7%+ overall CPRsin the months to come.
Turning to the default/voluntary prepayment break-down, the Voluntary PrepayCPR (green line) rose to 5.08%from 3.79%, a 34% increase.While the VCPR rose above5%, the Default CPR (red line)moved higher by 73% to 2.76%from 1.60% the previousmonth. While this seems like asignificant increase, it comesoff a low reading in December.
Prepayment speeds rose in allsix maturity categories. In-creases were seen, by order of
Page 3
PR E PAYM EN T SP EE DS . . .CO NT I NU ED
Increase your premium dollars by eliminating brokeragefees. Sell your USDA B&I and CF Loans “Investor Direct” to
Thomas USAF, America’s largest direct investor.
Contact Mike (404) 365-2040 or Vasu at (404) 365-2030
Page 4Coleman Government Loan Solutions’ CPR Report
S M A L L B U S I N E S S I N D E X E S . . . C O N T I N U E D
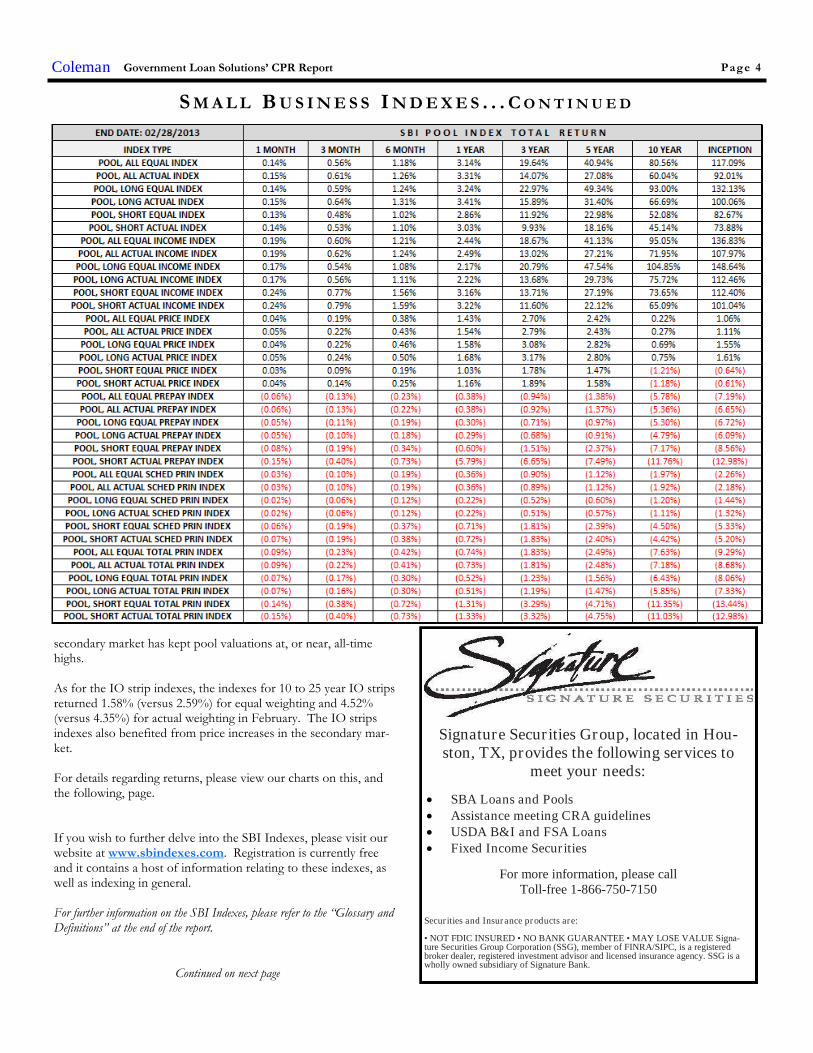
secondary market has kept pool valuations at, or near, all-timehighs.
As for the IO strip indexes, the indexes for 10 to 25 year IO stripsreturned 1.58% (versus 2.59%) for equal weighting and 4.52%(versus 4.35%) for actual weighting in February. The IO stripsindexes also benefited from price increases in the secondary mar-ket.
For details regarding returns, please view our charts on this, andthe following, page.
If you wish to further delve into the SBI Indexes, please visit ourwebsite at www.sbindexes.com. Registration is currently freeand it contains a host of information relating to these indexes, aswell as indexing in general.
For further information on the SBI Indexes, please refer to the “Glossary andDefinitions” at the end of the report.
Signature Securities Group, located in Hou-ston, TX, provides the following services to
meet your needs:
SBA Loans and Pools Assistance meeting CRA guidelines USDA B&I and FSA Loans Fixed Income Securities
For more information, please callToll-free 1-866-750-7150
Securities and Insurance products are:
• NOT FDIC INSURED • NO BANK GUARANTEE • MAY LOSE VALUE Signa-ture Securities Group Corporation (SSG), member of FINRA/SIPC, is a registeredbroker dealer, registered investment advisor and licensed insurance agency. SSG is awholly owned subsidiary of Signature Bank.
Continued on next page

Page 5Coleman Government Loan Solutions’ CPR Report
S M A L L B U S I N E S S I N D E X E S . . . C O N T I N U E D
Through the joint venture of Ryan ALM, Inc. and GLS, bothcompanies have brought their unique capabilities together tocreate the first Total Return Indexes for SBA 7(a) Pools and SBA7(a) Interest-Only Strips, with a history going back to January1st, 2000.
Using the “Ryan Rules” for index creation, the SBI indexesrepresent best practices in both structure and transparency.
For more information, please visit our website:
www.SBIndexes.comPrincipals:
Ronald J. Ryan, CFA, Founder and CEO of Ryan ALM, Inc. Ron has a long history of designing bond indexes, starting at Lehman Broth-ers, where he designed most of the popular Lehman bond indexes. Over his distinguished career, Ron and his team have designedhundreds of bond indexes and ETFs.
Bob Judge, Partner, GLS. Bob, a recognized expert in the valuation of SBA-related assets as well as the SBA Secondary Market and isthe editor of The CPR Report, a widely-read monthly publication that tracks SBA loan defaults, prepayment and secondary marketactivity.

Page 6Coleman Government Loan Solutions’ CPR Report

Page 7Coleman Government Loan Solutions’ CPR Report
S E C O N DA R Y M A R K E T A C C E S S . . . FMLP U P DA T E
FMLP Update
After a high prepay print in January, the FMLP returned to a 0%CPR in February. This zero print pushed the program CPR to1.59% since inception, a very attractive speed over the first 21/2 years of the Program’s existence.
Secondary Market Access
Secondary Market Access (SMA) is an Ohio-based corporationwhose main goal is to provide secondary market solutions for504 first mortgage lenders.
For more information about SMA, please contact JordanBlanchard at [email protected] or Tim Turrittin [email protected].
“Before anything else, preparation is
the key to success.”
Alexander Graham Bell
SBLA. Come Prepared.
www.SBLA.us
MO /WAM
BUCKET
<192Mos.
192-263Mos.
264-288Mos.
289+Mos.
Total byMonth
RESETTYPE
FIXEDRATE
FHLBVARIOUS
PRIMERATE
5 YRLIBORSWAP
3 MOLIBOR
5 YRCMT
Total byMonth
Jan-11 0.00% 0.00% 0.12% 0.00% 0.09% Jan-11 0.16% 0.00% 0.00% 0.13% 0.00% 0.00% 0.09%
Feb-11 0.00% 0.00% 0.00% 0.00% 0.00% Feb-11 0.00% 0.00% 0.00% 0.00% 0.00% 0.00% 0.00%
Mar-11 0.00% 0.00% 0.00% 0.00% 0.00% Mar-11 0.00% 0.00% 0.00% 0.00% 0.00% 0.00% 0.00%
Apr-11 0.00% 0.00% 0.00% 0.00% 0.00% Apr-11 0.00% 0.00% 0.00% 0.00% 0.00% 0.00% 0.00%
May-11 0.00% 0.00% 11.49% 3.49% 9.28% May-11 34.52% 0.00% 0.00% 1.88% 0.00% 0.00% 9.28%
Jun-11 1.04% 0.00% 0.00% 0.00% 0.06% Jun-11 0.00% 0.00% 0.15% 0.00% 0.00% 0.00% 0.06%
Jul-11 0.00% 0.00% 0.00% 0.00% 0.00% Jul-11 0.00% 0.00% 0.00% 0.00% 0.00% 0.00% 0.00%
Aug-11 0.00% 0.00% 0.00% 0.13% 0.03% Aug-11 0.00% 0.00% 0.06% 0.00% 0.00% 0.00% 0.03%
Sep-11 0.00% 0.00% 0.00% 0.00% 0.00% Sep-11 0.00% 0.00% 0.00% 0.00% 0.00% 0.00% 0.00%
Oct-11 0.00% 0.00% 0.00% 0.09% 0.02% Oct-11 0.00% 0.00% 0.00% 0.06% 0.00% 0.00% 0.02%
Nov-11 0.00% 0.00% 15.67% 0.00% 9.78% Nov-11 0.00% 0.00% 0.00% 27.92% 0.00% 0.00% 9.78%
Dec-11 0.00% 0.00% 0.00% 0.00% 0.00% Dec-11 0.00% 0.00% 0.00% 0.00% 0.00% 0.00% 0.00%
Jan-12 0.00% 0.00% 23.69% 0.00% 11.66% Jan-12 0.00% 1.24% 21.92% 0.00% 0.00% 0.00% 11.66%
Feb-12 0.00% 0.00% 0.00% 0.00% 0.00% Feb-12 0.00% 0.00% 0.00% 0.00% 0.03% 0.00% 0.00%
Mar-12 0.00% 0.00% 0.00% 0.00% 0.00% Mar-12 0.00% 0.00% 0.00% 0.00% 0.03% 0.00% 0.00%
Apr-12 0.00% 0.00% 0.00% 0.00% 0.00% Apr-12 0.00% 0.00% 0.00% 0.00% 0.02% 0.00% 0.00%
May-12 0.00% 0.00% 0.00% 0.00% 0.00% May-12 0.00% 0.00% 0.00% 0.00% 0.00% 0.00% 0.00%
Jun-12 0.00% 0.00% 0.01% 0.00% 0.00% Jun-12 0.00% 0.00% 0.00% 0.00% 0.00% 0.00% 0.00%
Jul-12 0.00% 0.00% 0.00% 0.00% 0.00% Jul-12 0.00% 0.00% 0.00% 0.00% 0.00% 0.00% 0.00%
Aug-12 0.00% 0.00% 0.17% 0.00% 0.04% Aug-12 0.43% 0.00% 0.00% 0.00% 0.00% 0.00% 0.04%
Sep-12 0.00% 0.05% 0.00% 0.00% 0.01% Sep-12 0.00% 0.00% 0.00% 0.02% 0.00% 0.00% 0.01%
Oct-12 0.00% 0.00% 0.00% 0.00% 0.00% Oct-12 0.00% 0.00% 0.00% 0.00% 0.00% 0.00% 0.00%
Nov-12 0.13% 0.00% 0.00% 0.00% 0.03% Nov-12 0.00% 0.00% 0.00% 0.07% 0.00% 0.00% 0.03%
Dec-12 0.00% 0.00% 0.00% 2.86% 1.03% Dec-12 0.00% 0.00% 0.00% 2.85% 0.00% 0.00% 1.03%
Jan-13 0.00% 6.04% 12.31% 12.61% 9.08% Jan-13 0.00% 0.00% 10.35% 12.55% 0.00% 0.00% 9.08%
Feb-13 0.00% 0.00% 0.00% 0.00% 0.00% Feb-13 0.00% 0.00% 0.00% 0.00% 0.00% 0.00% 0.00%
Total 0.02% 0.63% 2.68% 1.52% 1.59% Total 1.03% 0.06% 1.71% 2.07% 0.00% 0.00% 1.59%

Page 8Coleman Government Loan Solutions’ CPR Report
For the data and charts, please refer to the following 2 pages of theReport.
For further information on the terminology and concepts used in this article,please refer to the “Glossary and Definitions” at the end of the report.
As for the 10 year sector, this is an “off” month for payment re-porting, so we will have to wait until next month to see how theyhave performed.
Returning to the 20 year sector for a moment, it will be interestingto see how overall prepayments perform this year. With defaults atfive-year lows and voluntary prepayments closing in on five-yearhighs, a break-out in voluntaries could push overall prepaymentspeeds toward 9% this year.
Fortunately, the prepayment penalties on the underlying loans doescreate a disincentive to prepay the loans inside the first ten years,offering protection to investors and keeping the CRR down.
D E B E N T U R E S P E E D S : 20 S D OW N , 10 S U P
A Breakthrough Tool for Underwriters and SBA Investors
Finally a Web-based Loan Analytics Portal for 7(a) and504 loan performance, accessible through a user
friendly, searchable database.
7(a) default and prepayment data going back to 2000
504 default data going back to 1959.
UPDATE: DATA THROUGH 2012 WILL BE AVAILABLE ON 2/10!!!!!!
Monthly subscribers will have access to customized searches using criteria such as:
Structural: Reset Frequency, Guarantee Percentage, Interest Rate, Gross Margin,
Maturity, Cohort Year, and Loan Size
Industry: NAICS or SIC codes, SIC Major Groups, or SIC Division
Franchise: Franchise Code or Franchise Name
Geography: State, County, MSA and Urban versus Rural area.
Demographics: County income as a Percentage of State or National income levels,
Woman or Veteran owned business.
SBLA. Come Prepared.
For more information, please call Bob Judge at 216-456-2480 x133 or visit the website at: www.sbla.us
Subscribe at the website: www.sbla.us
Data and Charts on the following pages

Page 9Coleman Government Loan Solutions’ CPR Report
504 D C PC P R E PA Y S P E E D S - L A S T 5 Y E A R S
504 DCPC Prepayment Speeds by 10 year, 20 year and All. Source: BONY
DATE 20 YR. CPR 20 YR. CRR 20 YR. CDR 10 YR. CPR 10 YR. CRR 10 YR. CDR ALL CPR ALL CRR ALL CDR
3/1/2008 7.90% 6.50% 1.40% 6.43% 4.48% 1.95% 7.86% 6.44% 1.42%
4/1/2008 7.15% 6.10% 1.05% NA NA NA 7.15% 6.10% 1.05%
5/1/2008 7.66% 5.51% 2.15% 10.57% 6.20% 4.37% 7.75% 5.53% 2.22%
6/1/2008 8.53% 6.65% 1.87% NA NA NA 8.53% 6.65% 1.87%
7/1/2008 8.48% 6.52% 1.96% 9.55% 6.20% 3.35% 8.52% 6.50% 2.01%
8/1/2008 8.20% 6.52% 1.68% NA NA NA 8.20% 6.52% 1.68%
9/1/2008 8.32% 6.23% 2.08% 5.43% 4.11% 1.32% 8.21% 6.16% 2.06%
10/1/2008 8.39% 6.03% 2.37% NA NA NA 8.39% 6.03% 2.37%
11/1/2008 7.58% 5.26% 2.32% 6.31% 3.51% 2.80% 7.54% 5.20% 2.33%
12/1/2008 6.76% 4.15% 2.61% NA NA NA 6.76% 4.15% 2.61%
1/1/2009 6.41% 3.72% 2.69% 8.08% 2.57% 5.50% 6.47% 3.68% 2.79%
2/1/2009 6.84% 3.35% 3.49% NA NA NA 6.84% 3.35% 3.49%
3/1/2009 6.96% 3.15% 3.81% 7.80% 4.12% 3.68% 6.99% 3.18% 3.81%
4/1/2009 7.18% 2.93% 4.25% NA NA NA 7.18% 2.93% 4.25%
5/1/2009 6.12% 2.24% 3.87% 5.07% 1.34% 3.73% 6.08% 2.21% 3.87%
6/1/2009 6.83% 2.73% 4.11% NA NA NA 6.83% 2.73% 4.11%
7/1/2009 7.09% 2.62% 4.47% 7.71% 0.45% 7.26% 7.11% 2.54% 4.57%
8/1/2009 7.24% 2.37% 4.87% NA NA NA 7.24% 2.37% 4.87%
9/1/2009 7.59% 2.34% 5.25% 10.52% 1.46% 9.07% 7.70% 2.31% 5.40%
10/1/2009 7.48% 2.21% 5.28% NA NA NA 7.48% 2.21% 5.28%
11/1/2009 7.49% 2.16% 5.33% 5.41% 1.74% 3.67% 7.42% 2.15% 5.27%
12/1/2009 7.46% 1.99% 5.47% NA NA NA 7.46% 1.99% 5.47%
1/1/2010 8.72% 2.09% 6.63% 12.44% 2.37% 10.07% 8.85% 2.10% 6.76%
2/1/2010 8.86% 2.05% 6.81% NA NA NA 8.86% 2.05% 6.81%
3/1/2010 8.28% 2.24% 6.03% 7.24% 2.90% 4.35% 8.24% 2.27% 5.97%
4/1/2010 9.76% 2.15% 7.61% NA NA NA 9.76% 2.15% 7.61%
5/1/2010 8.83% 1.56% 7.26% 4.98% 0.85% 4.12% 8.69% 1.54% 7.15%
6/1/2010 9.41% 1.84% 7.57% NA NA NA 9.41% 1.84% 7.57%
7/1/2010 8.30% 1.58% 6.71% 9.73% 2.86% 6.87% 8.35% 1.63% 6.72%
8/1/2010 8.08% 1.42% 6.66% NA NA NA 8.08% 1.42% 6.66%
9/1/2010 8.38% 2.22% 6.16% 10.61% 3.38% 7.23% 8.46% 2.27% 6.20%
10/1/2010 7.76% 1.95% 5.81% NA NA NA 7.76% 1.95% 5.81%
11/1/2010 8.65% 2.43% 6.22% 13.45% 6.11% 7.34% 8.82% 2.56% 6.26%
12/1/2010 8.54% 2.61% 5.93% NA NA NA 8.54% 2.61% 5.93%
1/1/2011 9.68% 3.10% 6.58% 8.76% 3.75% 5.02% 9.65% 3.12% 6.52%
2/1/2011 8.03% 3.14% 4.89% NA NA NA 8.03% 3.14% 4.89%
3/1/2011 8.71% 2.77% 5.94% 10.61% 5.49% 5.13% 8.79% 2.88% 5.91%
4/1/2011 8.67% 2.87% 5.80% NA NA NA 8.67% 2.87% 5.80%
5/1/2011 9.53% 3.37% 6.16% 17.64% 10.06% 7.58% 9.84% 3.63% 6.21%
6/1/2011 8.78% 3.65% 5.13% NA NA NA 8.78% 3.65% 5.13%
7/1/2011 7.92% 2.87% 5.05% 9.69% 3.01% 6.68% 7.99% 2.87% 5.12%
8/1/2011 7.49% 3.31% 4.18% NA NA NA 7.49% 3.31% 4.18%
9/1/2011 6.83% 2.76% 4.07% 12.27% 4.53% 7.74% 7.06% 2.83% 4.23%
10/1/2011 7.87% 3.50% 4.36% NA NA NA 7.87% 3.50% 4.36%
11/1/2011 7.81% 3.52% 4.29% 3.07% 1.88% 1.19% 7.62% 3.46% 4.17%
12/1/2011 7.43% 3.50% 3.94% NA NA NA 7.43% 3.50% 3.94%
1/1/2012 7.76% 3.48% 4.27% 8.39% 4.13% 4.25% 7.78% 3.51% 4.27%
2/1/2012 7.17% 3.95% 3.22% NA NA NA 7.17% 3.95% 3.22%
3/1/2012 8.17% 4.23% 3.94% 10.74% 7.05% 3.69% 8.28% 4.35% 3.93%
4/1/2012 7.96% 4.17% 3.79% NA NA NA 7.96% 4.17% 3.79%
5/1/2012 8.43% 4.95% 3.48% 4.96% 4.02% 0.94% 8.29% 4.91% 3.37%
6/1/2012 8.15% 4.13% 4.02% NA NA NA 8.15% 4.13% 4.02%
7/1/2012 7.77% 4.82% 2.95% 14.04% 11.15% 2.89% 8.04% 5.09% 2.95%
8/1/2012 8.31% 5.18% 3.13% NA NA NA 8.31% 5.18% 3.13%
9/1/2012 6.94% 4.61% 2.34% 7.35% 5.18% 2.17% 6.96% 4.63% 2.33%
10/1/2012 8.63% 5.89% 2.74% NA NA NA 8.63% 5.89% 2.74%
11/1/2012 8.45% 5.49% 2.95% 7.80% 6.22% 1.58% 8.42% 5.53% 2.89%
12/1/2012 8.59% 5.53% 3.06% NA NA NA 8.59% 5.53% 3.06%
1/1/2013 7.79% 5.61% 2.18% 9.85% 8.72% 1.13% 7.88% 5.75% 2.14%
2/1/2013 8.00% 6.59% 1.42% NA NA NA 8.00% 6.59% 1.42%

Page 10Coleman Government Loan Solutions’ CPR Report

Page 11Coleman Government Loan Solutions’ CPR Report

Page 12Coleman Government Loan Solutions’ CPR Report

Page 13Coleman Government Loan Solutions’ CPR Report
GLS 7(a) Settlement & Sales Strategies Tip #53 – A penny saved is a penny earned...
While we all know this to be true, this proverb is overlooked far too often by lenders who sell their gov-ernment guaranteed loans. This is particularly true when high premiums “hide” some of the economicgive up resulting from high broker fees and lender service provider costs. Because cost also influencesthe economics of any given transaction, they should be scrutinized to ensure that not only is your sale
execution great, but that you truly recognize the full economics of the transaction.
Scott Evans is a partner at GLS. Mr. Evans has over 20 years of trading experience and has been involved in the SBA secondary markets for the last eightof those years. Mr. Evans has bought, sold, settled, and securitized nearly 20,000 SBA loans and now brings some of that expertise to the CPR Report ina recurring article called Sale and Settlement Tip of the Month. The article will focus on pragmatic tips aimed at helping lenders develop a more con-
sistent sale and settlement process and ultimately deliver them the best execution possible.
Government Loan Solutions’ CPR ReportColeman
D E FA U L T - C U R TA I L M E N T R A T I O S
In our Default-Curtailment Ratios (DCR)we witnessed an increase in the 7a ratiocoupled with a decrease in the 504 one lastmonth.
Please note that an increase in the DCRdoes not necessarily mean that the defaultrate is rising, only that the percentage ofearly curtailments attributable to defaultshas increased.
SBA 7(a) Default Ratios
Last month, the 7(a) DCR rose back above30% after one month below that bench-mark. All told, the ratio rose by 18% to35.21% from 29.71% in December.
This month, both defaults and voluntaryprepayments rose. Since defaults in-creased by a greater degree than voluntar-
ies, the ratio moved higher.
Turning to actual dollar amounts, defaultsincreased by 63% to $90 million from $55million. As for voluntary prepayments,they rose by 27% to $165 million versus$130 million.
SBA 504 Default Ratios
The 504 DCR fell by double digits, goingbelow 30% for the first time since Octo-ber, 2008. With defaults falling to a great-er degree than voluntaries, the ratio de-creased.
Specifically, the dollar amount of defaultsdecreased by $22 million to $45 million(-33%). As for voluntary prepayments,they fell by $.3 million to $128.5 million(-.23%).
Graph on page 20
D E FA U L T R A T E R I S E S T O 5 . 9 6 %
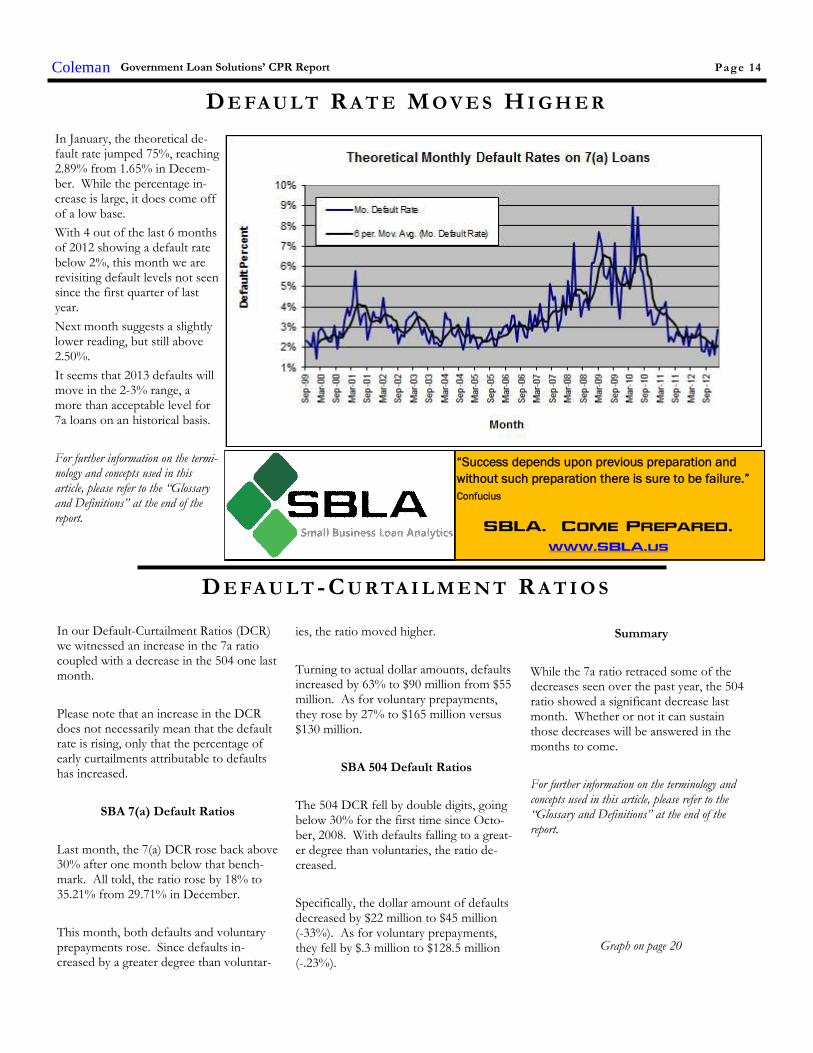
In January, the theoretical de-fault rate jumped 75%, reaching2.89% from 1.65% in Decem-ber. While the percentage in-crease is large, it does come offof a low base.
With 4 out of the last 6 monthsof 2012 showing a default ratebelow 2%, this month we arerevisiting default levels not seensince the first quarter of lastyear.
Next month suggests a slightlylower reading, but still above2.50%.
It seems that 2013 defaults willmove in the 2-3% range, amore than acceptable level for7a loans on an historical basis.
For further information on the termi-nology and concepts used in thisarticle, please refer to the “Glossaryand Definitions” at the end of thereport.
Page 14
D E FA U L T R A T E M O V E S H I G H E R
Summary
While the 7a ratio retraced some of thedecreases seen over the past year, the 504ratio showed a significant decrease lastmonth. Whether or not it can sustainthose decreases will be answered in themonths to come.
For further information on the terminology andconcepts used in this article, please refer to the“Glossary and Definitions” at the end of thereport.
“Success depends upon previous preparation and
without such preparation there is sure to be failure.”
Confucius
SBLA. Come Prepared.
www.SBLA.us

GLS V A L U E I N D I C E S M O S T LY L O W E R
In December, the GLS Value Indicescame in mostly lower, with four out of sixsub-indices decreasing.
The Base Rate / Libor spread movedhigher by 1 basis point to +2.96%. As forthe prepayment element, CPRs wereslightly lower in five out of six sub-indices.
By the end of December, the secondarymarket moved higher by another .25% to.50% as we neared 119 for fully priced,long loans.The only question that remains is how
soon we crest 120 for long, fully-pricedpaper.
Turning to the specifics, the largest de-crease was seen in the GLS VI-5, whichfell by 10% to 131 basis points. The otherdecreases, by order of magnitude, were:VI-1 (-8% to 55), VI-3 (-8% to 55) andVI-6 (-1% to 168).
Increases were seen, also by order of mag-nitude, in VI-4 (+12% to 126) and VI-2(+9% to 58).
With premiums rising almost on a dailybasis, expect lower readings in the monthsto come.
For further information on the terminology andconcepts used in this article, please refer to the“Glossary and Definitions” at the end of thereport.
Data on pages 16-17, Graph below
Coleman Government Loan Solutions’ CPR Report Page 15
MaturityGrossMargin
NetMargin
ServicingThis Month
Price1-Yr. Ago
Price
10 yrs. 2.75% 1.075% 1.00% 114.875 110.00
15 yrs. 2.75% 1.075% 1.00% 115.75 110.50
20 yrs. 2.75% 1.075% 1.00% 118.125 112.75
25 yrs. 2.75% 1.075% 1.00% 118.95 113.75
Last MonthPrice
114.95
115.50
117.875
118.35
3-Mos. AgoPrice
114.25
114.875
117.25
117.875
6-Mos. AgoPrice
113.125
113.25
114.85
115.50
7(a) Secondary Market Pricing Grid: December 2012
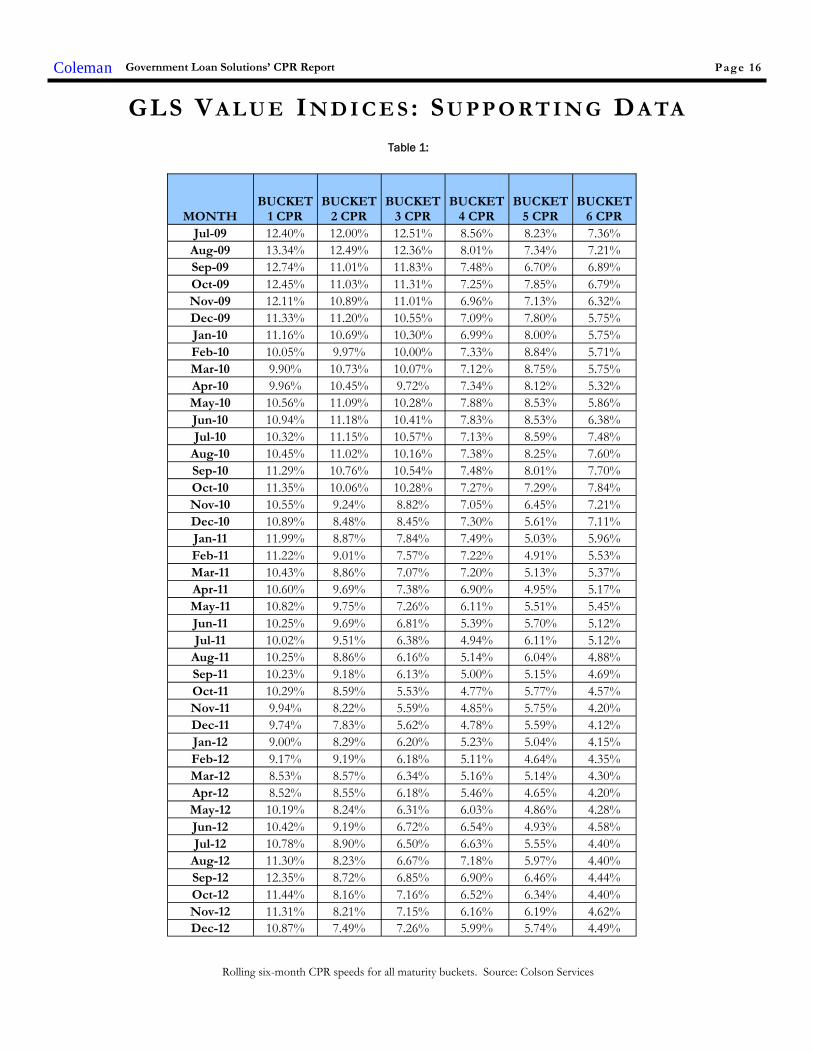
Table 1:
Rolling six-month CPR speeds for all maturity buckets. Source: Colson Services
GLS VA L U E I N D I C E S : SU P P O RT I N G DA TA
Government Loan Solutions’ CPR ReportColeman Page 16
MONTHBUCKET
1 CPRBUCKET
2 CPRBUCKET
3 CPRBUCKET
4 CPRBUCKET
5 CPRBUCKET
6 CPR
Jul-09 12.40% 12.00% 12.51% 8.56% 8.23% 7.36%
Aug-09 13.34% 12.49% 12.36% 8.01% 7.34% 7.21%
Sep-09 12.74% 11.01% 11.83% 7.48% 6.70% 6.89%
Oct-09 12.45% 11.03% 11.31% 7.25% 7.85% 6.79%
Nov-09 12.11% 10.89% 11.01% 6.96% 7.13% 6.32%
Dec-09 11.33% 11.20% 10.55% 7.09% 7.80% 5.75%
Jan-10 11.16% 10.69% 10.30% 6.99% 8.00% 5.75%
Feb-10 10.05% 9.97% 10.00% 7.33% 8.84% 5.71%
Mar-10 9.90% 10.73% 10.07% 7.12% 8.75% 5.75%
Apr-10 9.96% 10.45% 9.72% 7.34% 8.12% 5.32%
May-10 10.56% 11.09% 10.28% 7.88% 8.53% 5.86%
Jun-10 10.94% 11.18% 10.41% 7.83% 8.53% 6.38%
Jul-10 10.32% 11.15% 10.57% 7.13% 8.59% 7.48%
Aug-10 10.45% 11.02% 10.16% 7.38% 8.25% 7.60%
Sep-10 11.29% 10.76% 10.54% 7.48% 8.01% 7.70%
Oct-10 11.35% 10.06% 10.28% 7.27% 7.29% 7.84%
Nov-10 10.55% 9.24% 8.82% 7.05% 6.45% 7.21%
Dec-10 10.89% 8.48% 8.45% 7.30% 5.61% 7.11%
Jan-11 11.99% 8.87% 7.84% 7.49% 5.03% 5.96%
Feb-11 11.22% 9.01% 7.57% 7.22% 4.91% 5.53%
Mar-11 10.43% 8.86% 7.07% 7.20% 5.13% 5.37%
Apr-11 10.60% 9.69% 7.38% 6.90% 4.95% 5.17%
May-11 10.82% 9.75% 7.26% 6.11% 5.51% 5.45%
Jun-11 10.25% 9.69% 6.81% 5.39% 5.70% 5.12%
Jul-11 10.02% 9.51% 6.38% 4.94% 6.11% 5.12%
Aug-11 10.25% 8.86% 6.16% 5.14% 6.04% 4.88%
Sep-11 10.23% 9.18% 6.13% 5.00% 5.15% 4.69%
Oct-11 10.29% 8.59% 5.53% 4.77% 5.77% 4.57%
Nov-11 9.94% 8.22% 5.59% 4.85% 5.75% 4.20%
Dec-11 9.74% 7.83% 5.62% 4.78% 5.59% 4.12%
Jan-12 9.00% 8.29% 6.20% 5.23% 5.04% 4.15%
Feb-12 9.17% 9.19% 6.18% 5.11% 4.64% 4.35%
Mar-12 8.53% 8.57% 6.34% 5.16% 5.14% 4.30%
Apr-12 8.52% 8.55% 6.18% 5.46% 4.65% 4.20%
May-12 10.19% 8.24% 6.31% 6.03% 4.86% 4.28%
Jun-12 10.42% 9.19% 6.72% 6.54% 4.93% 4.58%
Jul-12 10.78% 8.90% 6.50% 6.63% 5.55% 4.40%
Aug-12 11.30% 8.23% 6.67% 7.18% 5.97% 4.40%
Sep-12 12.35% 8.72% 6.85% 6.90% 6.46% 4.44%
Oct-12 11.44% 8.16% 7.16% 6.52% 6.34% 4.40%
Nov-12 11.31% 8.21% 7.15% 6.16% 6.19% 4.62%
Dec-12 10.87% 7.49% 7.26% 5.99% 5.74% 4.49%

Page 17
Table 2:
GLS VI values for all maturity buckets for last 42 months.
GLS VA L U E I N D I C E S : H I S TO R I C A L VA L U E S
INDICES LEGEND
HIGHEST READING
LOWEST READING
Government Loan Solutions’ CPR ReportColeman
MONTHWAVGLIBOR
WAVGBASE
BASELIBOR
SPDGLSVI-1
GLSVI-2
GLSVI-3
GLSVI-4
GLSVI-5
GLSVI-6
Jul-09 0.48% 3.25% 2.77% 150.9 143.8 129.1 191.9 192.4 217.4
Aug-09 0.39% 3.25% 2.86% 129.7 127.4 125.7 201.7 197.3 222.8
Sep-09 0.29% 3.25% 2.96% 122.0 126.5 128.3 205.5 225.3 229.6
Oct-09 0.26% 3.25% 2.99% 128.2 131.3 133.9 216.0 191.2 228.8
Nov-09 0.26% 3.25% 2.99% 115.3 150.9 138.0 219.2 210.8 234.2
Dec-09 0.25% 3.25% 3.00% 136.1 153.4 162.0 226.3 218.0 259.6
Jan-10 0.25% 3.24% 2.99% 153.9 186.5 157.2 201.0 240.6 250.7
Feb-10 0.25% 3.23% 2.99% 150.8 155.1 150.4 192.3 193.0 250.7
Mar-10 0.26% 3.25% 2.99% 133.1 126.0 155.8 206.4 209.5 249.2
Apr-10 0.29% 3.25% 2.96% 142.1 147.5 149.3 213.6 205.1 250.0
May-10 0.41% 3.25% 2.84% 107.5 112.1 117.5 184.4 187.2 218.1
Jun-10 0.52% 3.25% 2.73% 85.9 90.9 90.1 147.5 168.7 200.4
Jul-10 0.46% 3.26% 2.80% 102.7 81.0 106.7 167.0 159.5 193.5
Aug-10 0.33% 3.26% 2.93% 85.6 91.6 95.4 161.6 186.6 193.2
Sep-10 0.28% 3.25% 2.97% 74.1 95.3 94.0 135.6 190.8 187.2
Oct-10 0.28% 3.25% 2.97% 79.8 89.7 91.3 159.8 207.2 179.5
Nov-10 0.27% 3.25% 2.98% 70.5 117.2 113.5 202.0 223.5 195.4
Dec-10 0.29% 3.25% 2.96% 79.7 121.8 113.3 175.5 178.1 191.3
Jan-11 0.29% 3.25% 2.96% 77.0 119.8 117.3 175.2 232.3 203.7
Feb-11 0.29% 3.25% 2.96% 88.9 112.9 129.8 190.4 222.9 207.6
Mar-11 0.30% 3.25% 2.95% 96.8 113.5 132.3 167.8 203.4 216.0
Apr-11 0.27% 3.25% 2.98% 92.5 95.9 137.6 186.2 192.5 218.8
May-11 0.24% 3.25% 3.01% 104.3 116.1 134.3 219.2 235.1 220.2
Jun-11 0.23% 3.24% 3.01% 123.1 123.0 141.8 178.1 243.7 218.4
Jul-11 0.24% 3.25% 3.01% 96.8 98.4 121.7 167.9 175.4 206.5
Aug-11 0.27% 3.24% 2.97% 118.6 101.5 122.8 165.8 186.4 205.3
Sep-11 0.32% 3.25% 2.93% 101.6 98.0 132.7 176.2 234.9 200.5
Oct-11 0.34% 3.24% 2.90% 85.5 80.8 141.1 197.4 183.4 216.3
Nov-11 0.41% 3.25% 2.84% 79.1 106.3 134.9 195.8 175.2 204.9
Dec-11 0.50% 3.25% 2.75% 79.6 103.0 143.8 182.6 193.6 198.5
Jan-12 0.44% 3.25% 2.81% 112.1 141.1 130.7 151.0 201.1 208.5
Feb-12 0.41% 3.25% 2.84% 113.5 65.0 130.5 148.1 214.0 177.6
Mar-12 0.44% 3.25% 2.81% 71.5 93.3 78.5 164.3 160.2 179.3
Apr-12 0.42% 3.25% 2.83% 78.7 109.6 114.6 161.0 160.2 200.8
May-12 0.43% 3.24% 2.81% 81.3 113.4 76.4 132.5 128.0 169.8
Jun-12 0.41% 3.23% 2.83% 87.1 44.0 83.7 145.5 172.0 179.8
Jul-12 0.39% 3.25% 2.86% 98.4 59.0 65.0 109.0 169.6 196.7
Aug-12 0.36% 3.25% 2.89% 85.4 56.2 65.8 130.4 152.5 182.2
Sep-12 0.33% 3.25% 2.91% 93.9 40.0 68.1 140.7 155.1 169.7
Oct-12 0.30% 3.25% 2.95% 37.4 46.0 64.8 102.8 166.5 177.2
Nov-12 0.29% 3.25% 2.95% 59.8 53.4 59.1 112.8 146.0 168.4
Dec-12 0.29% 3.25% 2.96% 55.0 58.2 54.5 126.4 131.2 167.6

Table 3:
2013 monthly prepayment speeds broken out by maturity sector. Source: Colson Services
Table 4:
2013 pool age broken out by maturity sector. Source: Colson Services
YTD P R E PA Y M E N T S P E E D S
Coleman Government Loan Solutions’ CPR Report Page 18
CPR/MO. <8 8 - 10 10 - 13 13 - 16 16 - 20 20+ ALL
Jan-13 10.53% 11.19% 9.82% 6.56% 10.45% 6.64% 7.84%
Grand Total 10.53% 11.19% 9.82% 6.56% 10.45% 6.64% 7.84%
POOL AGE <8 8 - 10 10 - 13 13 - 16 16 - 20 20+ ALL
Jan-13 27 Mos. 37 Mos. 36 Mos. 70 Mos. 51 Mos. 48 Mos. 46 Mos.

Page 19
2013 YTD CPR by maturity and age bucket. Source: Colson Services
Table 5:
Y E A R -T O -DA T E CPR DA TA
Government Loan Solutions’ CPR ReportColeman
< 8 BY AGE 0-12 Mos. 13-24 Mos. 25-36 Mos. 37-48 Mos. 48+ Mos.Jan-13 4.23% 10.46% 21.01% 5.03% 7.88%
Grand Total 4.23% 10.46% 21.01% 5.03% 7.88%
10-13 BY AGE 0-12 Mos. 13-24 Mos. 25-36 Mos. 37-48 Mos. 48+ Mos.Jan-13 5.19% 12.57% 19.73% 12.31% 6.09%
Grand Total 5.19% 12.57% 19.73% 12.31% 6.09%
16-20 BY AGE 0-12 Mos. 13-24 Mos. 25-36 Mos. 37-48 Mos. 48+ Mos.Jan-13 0.00% 28.18% 23.26% 8.62% 2.87%
Grand Total 0.00% 28.18% 23.26% 8.62% 2.87%
8-10 BY AGE 0-12 Mos. 13-24 Mos. 25-36 Mos. 37-48 Mos. 48+ Mos.Jan-13 12.95% 16.91% 20.38% 3.82% 7.33%
Grand Total 12.95% 16.91% 20.38% 3.82% 7.33%
13-16 BY AGE 0-12 Mos. 13-24 Mos. 25-36 Mos. 37-48 Mos. 48+ Mos.Jan-13 0.00% 4.32% 1.34% 2.31% 8.68%
Grand Total 0.00% 4.32% 1.34% 2.31% 8.68%
20+ BY AGE 0-12 Mos. 13-24 Mos. 25-36 Mos. 37-48 Mos. 48+ Mos.Jan-13 0.79% 8.14% 11.73% 8.28% 7.05%
Grand Total 0.79% 8.14% 11.73% 8.28% 7.05%

Coleman Government Loan Solutions’ CPR Report Page 20
GLS provides valuations for:
SBA 7(a), 504 1st mortgage and
USDA servicing rights SBA 7(a) and 504 1st mortgage
pools Guaranteed and non-guaranteed
7(a) loan portions Interest-only
portions of SBA and USDA loans
Government Loan Solutions
The nationwide leader in the valuation of SBA and USDA assets.
In these times of marketuncertainty, let GLS help you indetermining the value of your
SBA and USDA related-assets.
For further information, please contact BobJudge at (216) 456-2480 ext. 133 or at

Coleman Government Loan Solutions’ CPR Report Page 21
GLOSSARY AND DEFINITIONS: PAGE 1Default-Curtailment Ratio
The Default-Curtailment Ratio (DCR), or the percentage of secondary loan curtailments that are attributable to defaults, can be considered a meas-urement of the health of small business in the U.S. GLS, with default and borrower prepayment data supplied by Colson Services, has calculatedDCRs for both SBA 7(a) and 504 loans since January, 2000.
The default ratio is calculated using the following formula:
Defaults / (Defaults + Prepayments)
By definition, when the DCR is increasing, defaults are increasing faster than borrower prepayments, suggesting a difficult business environment forsmall business, perhaps even recessionary conditions. On the flip side, when the DCR is decreasing, either defaults are falling or borrower prepay-ments are outpacing defaults, each suggesting improving business conditions for small business.
Our research suggests that a reading of 20% or greater on 7(a) DCRs and 15% or greater on 504 DCRs suggest economic weakness in these smallbusiness borrower groups.
Theoretical Default RateDue to a lack of up-to-date default data, we attempt to estimate the current default rate utilizing two datasets that we track:
1. Total prepayment data on all SBA pools going back to 2003. This is the basis for our monthly prepayment information.
Total prepayment data on all secondary market 7(a) loans going back to 1999, broken down by defaults and voluntary prepayments. This is the basisfor our monthly default ratio analysis.
With these two datasets, it is possible to derive a theoretical default rate on SBA 7(a) loans. We say “theoretical” because the reader has to accept thefollowing assumptions as true:
1. The ratio of defaults to total prepayments is approximately the same for SBA 7(a) pools and secondary market 7(a) loans.
Fact: 60% to 70% of all secondary market 7(a) loans are inside SBA pools.
2. The default rate for secondary market 7(a) loans closely approximates the default rate for all outstanding 7(a) loans.
Fact: 25% to 35% of all outstanding 7(a) loans have been sold into the secondary market.
While the above assumptions seem valid, there exists some unknown margin for error in the resulting analysis. However, that does not invalidate thepotential value of the information to the SBA lender community.
The Process
To begin, we calculated total SBA pool prepayments, as a percentage of total secondary loan prepayments, using the following formula:
Pool Prepay Percentage = Pool Prepayments / Secondary Loan Prepayments
This tells us the percentage of prepayments that are coming from loans that have been pooled. Next, we calculated the theoretical default rate usingthe following equation:
((Secondary Loan Defaults * Pool Prepay Percentage) / Pool Opening Balance) * 12
This provides us with the theoretical default rate for SBA 7(a) loans, expressed as an annualized percentage.
GLS Long Value Indices
Utilizing the same maturity buckets as in our CPR analysis, we calculate 6 separate indexes, denoted as GLS VI-1 to VI-6. The num-bers equate to our maturity buckets in increasing order, with VI-1 as <8 years, VI-2 as 8-10 years, VI-3 as 10-13 years, VI-4 as 13-16years, VI-5 as 16-20 years and ending with VI-6 as 20+ years.
The new Indices are basically weighted-average spreads to Libor, using the rolling six-month CPR for pools in the same maturitybucket, at the time of the transaction. While lifetime prepayment speeds would likely be lower for new loans entering the secondarymarket, utilizing six-month rolling pool speeds allowed us to make relative value judgments across different time periods.
We compare the bond-equivalent yields to the relevant Libor rate at the time of the transaction. We then break the transactions intothe six different maturity buckets and calculate the average Libor spread, weighting them by the loan size.
For these indices, the value can be viewed as the average spread to Libor, with a higher number equating to greater value in the tradinglevels of SBA 7(a) loans.

GLOSSARY AND DEFINITIONS: PAGE 2Prepayment Calculations
SBA Pool prepayment speeds are calculated using the industry convention of Conditional Prepayment Rate, or CPR. CPR is the annualized percent-age of the outstanding balance of a pool that is expected to prepay in a given period. For example, a 10% CPR suggests that 10% of the currentbalance of a pool will prepay each year.
When reporting prepayment data, we break it into seven different original maturity categories: <8 years, 8-10 years, 10-13 years, 13-16 years, 16-20years and 20+ years. Within these categories we provide monthly CPR and YTD values.
In order to get a sense as to timing of prepayments during a pool’s life, we provide CPR for maturity categories broken down by five different agecategories: 0-12 months, 13-24 months, 25-36 months, 37-48 months and 48+ months.
As to the causes of prepayments, we provide a graph which shows prepayment speeds broken down by voluntary borrower prepayment speeds, de-noted VCPR and default prepayment speeds, denoted as DCPR. The formula for Total CPR is as follows:
Total Pool CPR = VCPR + DCPR
SBA Libor Base Rate
The SBA Libor Base Rate is set on the first business day of the month utilizing one-month LIBOR, as published in a national financial newspaper orwebsite, plus 3% (300 basis points). The rate will be rounded to two digits with .004 being rounded down and .005 being rounded up.
Please note that the SBA’s maximum 7(a) interest rates continue to apply to SBA base rates: Lenders may charge up to 2.25% above the base rate formaturities under seven years and up to 2.75% above the base rate for maturities of seven years or more, with rates 2% higher for loans of $25,000 orless and 1% higher for loans between $25,000 and $50,000. (Allowable interest rates are slightly higher for SBAExpress loans.)
Risk TypesThe various risk types that impact SBA pools are the following:
Basis Risk: The risk of unexpected movements between two indices. The impact of this type of risk was shown in the decrease in the Prime/Liborspread experienced in 2007 and 2008.
Prepayment Risk: The risk of principal prepayments due to borrower voluntary curtailments and defaults. Overall prepayments are expressed inCPR, or Conditional Prepayment Rate.
Interest Rate Risk: The risk of changes in the value of an interest-bearing asset due to movements in interest rates. For pools with monthly orquarterly adjustments, this risk is low.
Credit Risk: Losses experienced due to the default of collateral underlying a security. Since SBA loans and pools are guaranteed by the US govern-ment, this risk is very small.
Secondary Market First Lien Position 504 Loan Pool Guarantee Program
As part of the American Recovery and Reinvestment Act (AKA the Stimulus Bill), Congress authorized the SBA to create a temporary program thatprovides a guarantee on an eligible pool of SBA 504 first liens. The program was authorized for a period of two years from the date of bill passage –February, 2009. The eligibility of each loan is dependent on the date of the SBA Debenture funding. To be eligible, the Debenture must have beenfunded on or after February 17, 2009. The total guarantee allocation is $3 Billion. HR 5297 provides for a two-year extension from the first poolingmonth, so that the end date of the program is now September, 2012.
The SBA announced that they will begin issuing the first pool guarantees in September, 2010 for early October settlement.
For the purposes of the program, a pool is defined as 2 or more loans. A pool must be either fixed (for life) or adjustable (any period adjustmentincluding 5 or 10 years). If the pool is comprised of adjustable rate loans, all loans must have the same base rate (e.g. Prime, LIBOR, LIBOR Swaps,FHLB, etc.). Finally, each loan must be current for the lesser of 6 months or from the time of loan funding. Congress mandated that this be a zerosubsidy program to the SBA (and the US taxpayer). The SBA has determined the program cost (management and expected losses) can be coveredby an ongoing subsidy fee of .744% for fiscal year 2012.
Coleman Government Loan Solutions’ CPR Report Page 22

GLOSSARY AND DEFINITIONS: PAGE 3SBA 504 Program and Debenture Funding
To support small businesses and to strengthen the economy Congress created the U.S. Small Business Administration (SBA) in 1953 to provide arange of services to small businesses including financing. In 1958 Congress passed the Small Business Investment Act which established what isknown today as the SBA 504 loan program.
The 504 loan program provides financing for major fixed assets, such as owner-occupied real estate and long-term machinery and equipment. A 504project is funded by a loan from a bank secured with a first lien typically covering 50% of the project’s cost, a loan from a CDC secured with a sec-ond lien (backed by a 100% SBA-guaranteed debenture) covering a maximum of 40% of the cost, and a contribution of at least 10% of the projectcost from the small business being financed. The SBA promotes the 504 program as an economic development tool because it is a small-businessfinancing product that generates jobs.
Each debenture is packaged with other CDC debentures into a national pool and is sold on a monthly basis to underwriters. Investors purchase inter-ests in debenture pools and receive certificates representing ownership of all or part of a debenture pool. SBA uses various agents to facilitate the saleand service of the certificates and the orderly flow of funds among the parties involved. The debenture sales are broken into monthly sales of 20 yeardebentures and bi-monthly sales of 10 year debentures.
It is the performance of these debenture pools that we track in the CPR Report on a monthly basis.
Cloud Computing and the Banking Industry
What is Cloud Computing?
For many people and organizations, the term “cloud computing” is new and unfamiliar. However, it is a technology that has been used consistentlysince the 1950s. Many of us use cloud computing every day without even realizing it. Whenever we login to Facebook, send an email from a Gmailaccount, or use an enterprise planning systems, such as Oracle and Salesforce.com, we are accessing the cloud.In simple terms, cloud computing means using hardware and software resources delivered as a service over a network. Most frequently, the networkused is the Internet. Cloud-based applications are accessed through a web browser such as Microsoft’s Internet Explorer and Google’s Chrome,while data is stored on secure servers in custom designed data centers located throughout the United States and around the world. Businesses thatuse cloud computing enjoy many advantages, including an ability to get services and employees up and running faster because there is no softwarethat needs to be downloaded and installed. Maintenance of cloud computing applications is easier, because the software does not need to be installedon each user's computer and can be accessed from multiple computers and devices. Proper cloud deployment can also provide the benefits of costsavings, better IT services, less maintenance, and higher levels of reliability.
Cloud Banking
As the banking industry evolves and adapts to changes in the competitive environment, banks will find it advantageous to move their data into thecloud. In fact, many banks are already in the cloud and just don’t realize it, with data stored on Jack Henry and FIS systems.The combination of the cloud’s low cost and high scalability will help improve customer service, day-to-day operations, regulatory compliance, andthe speed at which banks can operate, while reducing technology equipment and management costs.Quite simply, cloud banking allows financial institutions to provide a more affordable and customized dialogue with their customers, regulators, em-ployees and business partners.
SBI Pool and IO Strip Indexes
Through a joint venture called Small Business Indexes, Inc. or SBI, GLS and Ryan ALM introduced a group of total return indexes for SBA 7a poolsand I/O strips with history going back to 1/1/2000.
Why did we do this?
Indexes have been around since 1896 when the Dow Jones Industrial Average was introduced. They have grown in importance to the financial mar-kets, whereby today $6 trillion are invested in Index Funds throughout the world.
Continued on the following pages.
Coleman Government Loan Solutions’ CPR Report Page 23

GLOSSARY AND DEFINITIONS: PAGE 4SBI Pool and IO Strip Indexes...Continued
The reasons for having investment indexes are fivefold:
1. Asset Allocation Models: Asset Allocation usually accounts for over 90% of a client’s total return and becomes the most critical asset deci-sion. Such models use 100% index data to calculate their asset allocations. Bond index funds are the best representation of the intended risk/reward of fixed income asset classes.
2. Transparency: Most bond index benchmarks publish daily returns unlike active managers who publish monthly or even quarterly returns usu-ally with a few days of delinquency. Such transparency should provide clients with more information on the risk/reward behavior of their assetsso there are no surprises at quarterly asset management review meetings.
3. Performance Measurement: Creates a benchmark for professional money managers to track their relative performance.4. Dictates Risk/Reward Behavior: By analyzing historical returns of an index, an investor can better understand how an asset class will per-
form over long periods of time, as well as during certain economic cycles.5. Hedging: An investment index can provide a means for hedging the risk of a portfolio that is comprised of assets tracked by the index. An
example would be hedging a 7a servicing portfolio using the SBI I/O Strip Index.
By creating investment indexes for SBA 7a pool and IO strips, these investments can become a recognized asset class by pension funds and otherlarge investors who won’t consider any asset class in their asset allocation models that does not have a benchmark index.
An additional use for the I/O index could be to allow 7a lenders to hedge servicing portfolios that are getting large due to production and the lowprepayment environment. This increase in exposure to 7a IO Strips would be welcome by IO investors who are constrained by the amount of loansthat are stripped prior to being pooled.
How are the indexes calculated?
The rules for choosing which outstanding pools are eligible for both the pool and IO indexes are the following:
Pool Size:
$5 million minimum through 1/1/2005.
$10 million minimum after 1/1/2005.
Pool Structure:
Minimum of 5 loans inside the pool.
Minimum average loan size of $250,000.
Pool Maturity:
Minimum of 10 years of original maturity.
Sub indices for 10-15 years and 15-25 year maturities.The rules for remaining in the indices are the following:
Pool Size:
Minimum pool factor of .25
Factor Updates in the Indices are on the first of the month, based on the Colson Factor Report that is released in the middle of the previousmonth.
Pool Structure:
Minimum of 5 loans inside the pool.
We have produced two weightings for each pool in the various indexes, “Actual” and “Equal”:
“Actual” weighted Indices:
The actual original balance of each pool is used to weight the pool in the index.
An index for all eligible pools, as well as one for 10-15 years and one for 15-25 years of original maturity.
A total of 3 actual weighted sub-indices.
“Equal” weighted Indices:
An original balance of $10 million is assigned to each pool, regardless of its true size.
An index for all eligible pools, as well as one for 10-15 years and one for 15-25 years of original maturity
A total of 3 equal weighted sub-indices.
Coleman Government Loan Solutions’ CPR Report Page 24

GLOSSARY AND DEFINITIONS: PAGE 5SBI Pool and IO Strip Indexes...Continued
This equates to a total of (6 ) Pool sub-indices. We will refer to them on a go-forward basis as the following:
Actual Weighting:
All 10-25 year in original maturity pools “All Actual”
10-15 year in original maturity pools “Short Actual”
15-25 year in original maturity pools “Long Actual”
Equal Weighting:
All 10-25 year in original maturity pools “All Equal”
10-15 year in original maturity pools “Short Equal”
15-25 year in original maturity pools “Long Equal”
Return Calculations
Each index is tracked by its value on a daily basis, as well as the components of return.
Income Component
Daily return is calculated for the contribution of interest earned.
Mark-to-Market Component
Daily return is calculated for the contribution of Mark-To-Market changes.
Scheduled Principal Component
Daily return is calculated for the contribution of normal principal payments. Only impacts the first of the month.
Prepayed Principal Component
Daily return is calculated for the contribution of prepayed principal payments. Only impacts the first of the month.
Total Principal Component
Daily return is calculated for the contribution of all principal payments. Only impacts the first of the month.
The formula for Total Daily Return is as follows:
Total Daily Return = Income Return + MTM Return + Principal Return
The Principal Return is generated using the following formula:
Principal Return = Prepayed Principal Return + Scheduled Principal Return
The I/O Strip Indexes are a bit more involved, since we have to calculate the pricing multiple, as well as the breakdown between income earned andreturn of capital from interest accruals and payments. Here are the specific rules for the I/O Strip Indexes:
The I/O Strip Indices utilize the same pools as the Pool Indices.
Each pool is synthetically “stripped” upon entering the I/O Indices.
For the equal and actual weighted indices and the maturity sub-indices (10-15 and 15-25), the pools are split into two even buckets utilizing thepool reset margins. The bucket with the higher margins we refer to as the “Upper Bucket” and the lower margin pools are in the “Lower Buck-et”.
The weighted average reset margin and pool MTM is calculated for each bucket. The MTM is the same one utilized in the pool indices.
The weighted average price of the Lower Bucket is subtracted from the Upper Bucket. The same thing is done for the weighted average resetmargin.
The MTM difference is divided by the reset margin difference, giving us the pricing multiple by maturity and weighting.
The end result is a pricing multiple for equal and actual weighting for 10-15 year pools and 15-25 year pools, totaling (4 ) distinct multiples.
Not all interest received is considered earned income, therefore interest received by the stripped pools is divided into earnings and return ofcapital, utilizing OID accounting rules.
Coleman Government Loan Solutions’ CPR Report Page 25

GLOSSARY AND DEFINITIONS: PAGE 6SBI Pool and IO Strip Indexes...Continued
The OID accounting rule create a straight-line return of capital upon entry into the index and the difference between the return of capital andinterest received is earned income.
Fundamentally, high prepayments can push more received interest into return of capital, thus limiting earned income. Excellent prepaymentperformance can generate large amounts of earned income over time.
Once the return percentages are determined for each day, it is then applied to the previous day’s index level, in order to calculate the index levels forthat day.
Supporting Calculations
To aid in the analysis of the indexes, we track (22) distinct calculations for each of the (6) sub-indices:
Size
Pool count and total outstanding balance
Structure
Weighted average issue date, maturity date, reset date, maturity months, remaining months, age, coupon, reset margin, strip percent (strip index-es only).
Price and Yield
Weighted average pool price, bond-equivalent yield, strip discount rate, multiple and strip pricing (strip indexes only)
Other Calculations
CPR assumption, weighted average life, modified duration, index duration, strip duration and strip return of capital average life.
Coleman Government Loan Solutions’ CPR Report Page 26

Powered By:
www.glsolutions.us
Government Loan Solutions’CPR Report is a monthly elec-tronic newsletter published by
Coleman Publishing.
The opinions, unless otherwisestated, are exclusively those of
the editorial staff.
This newsletter is not to bereproduced or distributed inany form or fashion, withoutthe express written consent ofColeman or Government Loan
Solutions.
Government Loan Solutions’CPR Report is distributed in
pdf format via e-mail. Spread-sheets relating to the presenteddata are available to paid sub-
scribers upon request.
The subscription to the Gov-ernment Loan Solutions’ “CPRReport” is free to all members
of the SBA Community.
To subscribe, please contactTim Turrittin at (216) 456-2480
ext. 144 or via email at:[email protected]
Our Staff
Bob Judge, Editor
Jordan Blanchard
Scott Evans
Tim Turrittin
Coleman Government Loan Solutions’ CPR Report Page 27
812 Huron RoadCleveland, OH 44115
Government Loan Solut ions
Phone: (216) 456-2480Fax: (216) 456-2481Web Site: www.glsolutions.usE-mail: [email protected]
Government Loan Solutions, Inc. (GLS) was founded by three former Bond Traders in
Cleveland, OH. Our current partners possess a combined 50 years experience in the institutional
fixed income markets, 30 of which are in the loan securitization business. GLS formally began
operations in January, 2007. Our mission is as follows:
“The purpose of Government Loan Solutions is to bring greater efficiency, productivity
and transparency to the financial markets. Through the use of proprietary technology, we
intend to aid lenders in all aspects of their small business lending, help loan securitizers be
more productive in their operational procedures and provide quality research to the investor
community .”
Services available include:
Lenders:
Manage loan sales to the secondary market
Process loan settlements via our electronic platform, E-Settle
Third-Party servicing and non-guaranteed asset valuation
Model Validation
Specialized research projects
Mortgage Servicing Valuation
Loan Securitizers:
Manage loan settlements and pool formation
Loan and IO accounting
Loan, Pool and IO Mark-To-Market
Specialized research projects
Institutional Investors:
Loan, Pool, and IO Mark-To-Market
Specialized research projects
Portfolio consulting
For additional information regarding our products and capabilities, please contact us at:
Phone: (216)456-2480 E-mail at: [email protected] web: www.glsolutions.us
EDITORIAL DISCLAIMER
DISCLAIMER OF WARRANTIES – GOVERNMENT LOAN SOLUTIONS (GLS) MAKES NO REPRESENTATIONS OR WARRANTIES REGARD-ING THE ACCURACY, RELIABILITY OR COMPLETENESS OF THE CONTENT OF THIS REPORT. TO THE EXTENT PERMISSIBLE BY LAW,GLS DISCLAIMS ALL WARRANTIES, EXPRESS OR IMPLIED, INCLUDING BUT NOT LIMITED TO IMPLIED WARRANTIES OF MERCHANT-ABILITY AND FITNESS FOR A PARTICULAR PURPOSE.
Limitation of Liability - GLS shall not be liable for damages of any kind, including without limitation special or consequential damages, arising outof your use of, or reliance upon, this publication or the content hereof.
This Report may contain advice, opinions, and statements of various information providers and content providers. GLS does not represent orendorse the accuracy or reliability of any advice, opinion, statement or other information provided by any information provider or content provider,or any user of this Report or other person or entity. Reliance upon any such opinion, advice, statement, or other information shall also be at yourown risk.
Prior to the execution of a purchase or sale or any security or investment, you are advised to consult with investment professionals, as appropri-ate, to verify pricing and other information. Neither GLS, its information providers or content providers shall have any liability for investmentdecisions based upon, or the results obtained from, the information provided. Neither GLS, its information providers or content providers guaran-tee or warrant the timeliness, sequence, accuracy, or completeness of any such information. Nothing contained in this Report is intended to be,nor shall it be construed as, investment advice.
CPR Report Staff:
Robert E. Judge II, Production Assistant