CPR Report, 11-2010 - glsolutions.usglsolutions.us/files/Nov 2010 CPR Report.pdf · Coleman...
22
Coleman Bob Judge, Government Loan Solutions, Editor Bob Judge is a partner at Govern- ment Loan Solutions. Government Loan Solutions is a provider of valuation services, pre- payment analytics and operational support for the SBA marketplace. Bob has 25 years of experience in the fixed income markets. He holds a B.A. in Economics from Vassar College and an M.B.A. in Finance from NYU Stern School of Busi- ness. Government Loan Solutions’ CPR Report Providing the most detailed monthly SBA 7(a) and 504 prepayment, default and market information © 2010 Coleman and Government Loan Solutions. All Rights Reserved. SMA U PDATE : T HE 504 P OOLING P ROGRAM B EGINS TO T AKE S HAPE By Jordan Blanchard and Bob Judge The First Mortgage Pool (FMP) program is beginning to be- come more predictable and efficient. Two pools settled in September, one pool settled in October, and numerous pools are scheduled to close in No- vember and December. There were approximately 14 Pool Originators approved at the start of the program, and at least 13 more companies have applied to participate. Prepayments speeds for October hit a YTD low of 6.83%, the first read- ing below 7% since March of this year. October represents the third month in a row of prepayment decreases since the elevated 10.65% result from July. Another decrease in the default CPR, combined with sub-3% voluntary prepays were the cause for yet another decrease in overall speeds. Specifically, defaults fell by 20% from the previ- ous month and have de- creased by 49% since May. Voluntary prepay- ments rose a modest 5% in October, reflecting continued difficulty in refinancing SBA loans in this economy. As for next month, pre- liminary data from Col- son suggests another like- ly decrease in both de- faults and overall prepay- ments. Continued on page 2 Colson Services, the CSA, re- cently hosted an open house to review past pool settlements and take input on how to make the process smoother for Pool Originators. SBA personnel were gracious enough to attend and take sug- gestions on revisions to the final regulations. No major changes are expected, but some changes will result in fewer steps, less ambiguity, and easier settlement for all parties. This in turn will make it easier for first mortgage lenders to sell individual loans, or pools of loans if they happen to also be the pool originator. Continued on page 3 Volume 4, Issue #11 O CTOBER CPR: P REPAYMENT S PEEDS H IT YTD L OW November, 2010 Special points of interest: • Prepayments Hit YTD Low • SMA Update: Taking Shape • Default Rate Below 5% • Value Indices Mostly Lower INSIDE THIS ISSUE: Prepayment Speeds 1-2, 16-18 SMA 1, 3-6 Sale & Settle Tip 9 Value Indices 11, 13-15 Default Rate 12 Default Curtailment Ratios 12 & 21 www.sma504.com
Transcript of CPR Report, 11-2010 - glsolutions.usglsolutions.us/files/Nov 2010 CPR Report.pdf · Coleman...

Coleman
Bob Judge, Government Loan Solutions, Editor
Bob Judge is a partner at Govern-ment Loan Solutions.
Government Loan Solutions is aprovider of valuation services, pre-payment analytics and operationalsupport for the SBA marketplace.
Bob has 25 years of experience inthe fixed income markets. He holdsa B.A. in Economics from VassarCollege and an M.B.A. in Financefrom NYU Stern School of Busi-ness.
Government Loan Solutions’ CPR ReportProviding the most detailed monthly SBA 7(a) and 504 prepayment, default and market information
© 2010 Coleman and Government Loan Solutions. All Rights Reserved.
S MA U P D A T E : T H E 504 P O O L I N G
P R O G R A M B E G I N S T O T A K E S H A P E
By Jordan Blanchard and Bob Judge
The First Mortgage Pool (FMP)program is beginning to be-come more predictable andefficient. Two pools settled inSeptember, one pool settled inOctober, and numerous poolsare scheduled to close in No-vember and December.
There were approximately 14Pool Originators approved atthe start of the program, and atleast 13 more companies haveapplied to participate.
Prepayments speeds for
October hit a YTD low
of 6.83%, the first read-
ing below 7% since
March of this year.
October represents the
third month in a row of
prepayment decreases
since the elevated 10.65%
result from July.
Another decrease in the
default CPR, combined
with sub-3% voluntary
prepays were the cause
for yet another decrease
in overall speeds.
Specifically, defaults fell
by 20% from the previ-
ous month and have de-
creased by 49% since
May. Voluntary prepay-
ments rose a modest 5%
in October, reflecting
continued difficulty in
refinancing SBA loans in
this economy.
As for next month, pre-
liminary data from Col-
son suggests another like-
ly decrease in both de-
faults and overall prepay-
ments.
Continued on page 2
Colson Services, the CSA, re-cently hosted an open house toreview past pool settlementsand take input on how to makethe process smoother for PoolOriginators.
SBA personnel were graciousenough to attend and take sug-gestions on revisions to thefinal regulations. No majorchanges are expected, but somechanges will result in fewersteps, less ambiguity, and easiersettlement for all parties. Thisin turn will make it easier forfirst mortgage lenders to sell
individual loans, or pools ofloans if they happen to also bethe pool originator.
Continued on page 3
Volume 4, Issue #11
O C TO B E R CPR: P R E PA Y M E N T
S P E E D S H I T YTD L OW
November , 2010
Special points of interest:
• Prepayments Hit YTD Low
• SMA Update: Taking Shape
• Default Rate Below 5%
• Value Indices Mostly Lower
I N S I D E T H I S I S S U E :
Prepayment Speeds 1-2, 16-18
SMA 1, 3-6
Sale & Settle Tip 9
Value Indices 11, 13-15
Default Rate 12
Default Curtailment Ratios 12 & 21 www.sma504.com

Increases were seen in the 13-
16 sector (+32% to CPR
7.66%) and the 20+ bucket
(+1% to CPR 6.44%).
With defaults continuing to
decrease to pre-recession lev-
els and voluntary prepayments
low due to limited access to
capital, expect prepayment
speeds to remain low well into
next year.
For further information on the
terminology and concepts used in this
article, please refer to the “Glossary
and Definitions” at the end of the
report.
Coleman
Bob Judge can be reached at
(216) 456-2480 ext. 133 [email protected]
“With defaults
continuing to
decrease to pre-
recession levels
and voluntary pre-
payments low due
to limited access
to capital, expect
prepayment
speeds to remain
low well into next
year.“Data on pages 16-18
Government Loan Solutions’ CPR Report
Turning to the specifics, the
prepayment speed for October
came in at CPR 6.83% a 12%
drop from September.
YTD for 2010 fell CPR .20% to
CPR 8.11%, a favorable com-
parison to YTD 2009 of CPR
9.00%.
Turning to the default/
voluntary prepayment break-
down, the Voluntary Prepay
CPR (green line) rose from
2.37% in September to 2.48%
in October. This result contin-
ues a 17-month trend of sub-
3% VCPR readings.
While the VCPR remained sub-
3%, the Default CPR (red line)
went below 5%, reaching
4.35%, a 20% decrease from
September’s reading of 5.43%.
For 2010, the average DCPR
fell below 6% for the first time
this year, reaching 5.86%,
slightly higher than the YTD
for 2009 of 5.91%.
Specifically, prepayment
speeds fell in four out of the six
maturity categories. The largest
decrease was seen in the 10-13
maturity bucket, which fell by
30% to CPR 7.51%. Other
decreases were seen in 16-20
sector, which fell 29% to CPR
5.13%, the <8 sector (-28% to
CPR 10.76%) and 8-10 bucket
(-19% to CPR 6.76%).
Page 2
PR E PAYM EN T SP EE DS . . .CO NT I NU ED

Page 3Coleman Government Loan Solutions’ CPR Report
issue the underlying pool. If, for example, a bank funds a 6% fixedrate note and expects to sell 85% of that loan for 5 points, the finalpremium would decline by 4 points with a 1% increase in marketrates. A 1% increase in rates during a 90-120 day period is rare, butnot unheard of.
The solution to interest rate risk is a premium lock from the timeof first mortgage funding (or possibly earlier) through loan sale.Certain Pool Originators are finalizing programs whereby they willlock the premium for a period of time that will be sufficient toallow the Debenture to fund and loan sale to occur. This wouldnecessarily require the bank to sell under the participation sale op-tion.
A premium lock will be incredibly valuable to sellers, but is itworth selling under the participation model? Put another way, isthe participation model more risky to the selling bank?
No, it isn’t. If the bank holds the asset on its balance sheet untilsettlement date, it has the same risk than if the lender sells with aput-back clause. If a loan becomes 30 days or more past due whileon the lender’s balance sheet, that loan becomes un-poolable thesame as if it was on the Pool Originator’s balance sheet – the risk isthe same for the lender. The same goes for the accounting treat-ment. The bank realizes a true sale on the same date regardless ofwhose balance sheet it resides on at the time of pool settlement.
The one negative of selling to a Pool Originator prior to pool set-tlement is the lack of interest carry income, but this loss of incomeshould be minor since pools will typically settle within weeks of thepurchase of the loan. The loss of interest carry income is no differ-ent than if the lender sells the whole loan to a secondary lendershortly after funding.
Interest rate risk is likely to be a higher concern than any of theother perceived negatives associated with executing a participationagreement. So, it is likely that banks will gravitate to that model –but not until they see a rise in interest rates.
FMP tips…
Payment Date: SBA and Colson have clarified the paymentdate confusion. The payment date on the note should alwaysbe set for the first of the month, but Colson will not auto-debit the account until the second of each month.
Auto Debit: Colson will auto-debit the borrower on amonthly basis, not the lending bank. However, Colson’s auto-debitwill not begin until pool settlement, so each bank must make pay-ment arrangements until that time. The bank can collect its month-
While there are still kinks to be ironed out, the overall process hasproven successful and the volume of monthly pool settlement isexpected to increase substantially as lenders feel confident in mak-ing first mortgage loans.
Selling to Pool Originators - Participation Sale Versus Simul-taneous Pool Settlement
Participation Sale Model
In the Participation Sale Model, a Pool Originator purchases 85%of the first mortgage after the Debenture funds, but prior to poolsettlement.
The selling bank signs a participation agreement and servicingagreement at the time of sale. The participation agreement includesa put-back provision that requires the selling bank to buy back theparticipation if the loan becomes un-poolable.
So what events cause a loan to become un-poolable? A 30 day latepayment by the borrower is probably the most common reason.This put-back provision negates true sales treatment for the bankdue to FAS 166 guidance. The participation agreement provisionsand the put-back clause expire upon pool settlement, at which timethe bank is able to recognize a loan sale.
Simultaneous Pool Settlement Model
Because of the lack of true-sales accounting treatment, most bankshave opted for the Simultaneous Pool Settlement Model. Simulta-neous pool settlement allows the selling bank to retain the 85%loan interest on its books until the day of settlement. There is noparticipation agreement required. The bank submits the loan pack-age to the Pool Originator, who issues a commitment to purchasethe loan after credit approval. The Pool Originator then organizeseach loan sale off balance sheet into potential pools. All loans settleon the same day and the selling bank recognizes a loan sale imme-diately.
Both options require the selling bank to sign a servicing agreementwith the Pool Originator that is in place for the life of the loan.The servicing agreement is a contract between the two parties onthe duties of the seller as the servicing entity on behalf of the PoolOriginator.
So why would a bank ever want to consider selling prior to poolsettlement? Interest rate risk. Rates have remained low and stablefor most of 2010. But rates will inevitably increase, and as rates risethe value of a fixed rate loan tends to decline. The delay betweenfirst mortgage funding and pool settlement is normally between 90and 120 days due to the time it takes to fund the Debenture and
Continued on next page
S E C O N DA R Y M A R K E T A C C E S S . . . C O N T I N U E D

Page 4Coleman Government Loan Solutions’ CPR Report
S E C O N DA R Y M A R K E T A C C E S S . . . C O N T I N U E D
Secondary Market Access
Secondary Market Access (SMA) is a network of CDC’s and finan-cial companies whose main goal is to provide secondary marketsolutions for 504 first mortgage lenders.
Our website can be found at www.SMA504.com.
Our Role
SMA has a solution for every lender need related to the new pro-gram, including:
Sale of the 85% participation interest for premium andservicing income.
Sale of the 80% participation interest for those banks whodesire to be the Seller and the Pool Originator.
Sale of the whole loan in situations where the lender is una-ble to retain any long term portion.
Who we Are
GLS is a leading consulting, outsourcing and financial asset valua-tion company to the small business lending community. GLS is anationwide leader in the valuation of small business loans, servicingrights and securities. For more information about our services,please contact us at (216) 456-2480, or at [email protected].
ly payment during the interim period by check, wire, or auto debit.
Concurrent Signing: It is highly recommended that banksask their participating CDC’s for concurrent signing of the SBAloan docs with the bank’s loan documents. This will shorten theDebenture funding time frame to roughly 60 days, which will becritically important to the timing of the premium lock agreement.Concurrent signing will also reduce the possibility of an adversechange in financial condition interfering with SBA funding of theDebenture.
Pricing Indices: While any index is allowable under theFMP program, banks are encouraged to stay with the commonindices and adjustment terms such as Prime, 90 Day LIBOR,(quarterly adjustable), 5 Year LIBOR Swap (5 year fixed), 10 yearLIBOR Swap (10 year fixed) and fully fixed rate notes. If a bankissues a loan based on an odd index such as CMT, the pool origi-nator has to wait for another loan with that same index to form apool. This increases the length of time until pool settlement, andreduces the premium because of a small loan pool size.
Rate Sheet: Please see the attached SMA rate sheet for fur-ther pricing levels. This rate sheet is for guidance only as allbids will be formalized upon commitment by a Pool Origina-tor. Please contact SMA or Jordan Blanchard of CDC DirectCapital, for questions regarding pricing or custom quotes forloan terms not noted on the guidance sheet.
Non-Traditional 504 Loan Referral Program
If you have a 504-eligible transaction that you are unable to fund for whatever reason, GLS canmatch you with another, non-competing lender looking to fund non-traditional 504 loans. This
allows you to earn referral fees, while preserving the business relationship with the borrower.
Program Overview:
An outlet for those transactions that you typically would not fund.
All commercial property types are eligible.
Can accommodate projected income and inferior credit.
Loan amounts up to $10 million with 30-year loan terms.
Rate terms are quarterly adjustable, with a 5-year fixed rate option available.
A referral fee for you on the first mortgage portion.
For more information, please contact Bob Judge, GLS, at (216) 456-2480 ext. 133 or at [email protected].

Page 5Coleman Government Loan Solutions’ CPR Report
Secondary Market AccessSecondary Market AccessSecondary Market Access
Providing expertise in all areas of the new SBA 504 First Lien PoolProviding expertise in all areas of the new SBA 504 First Lien PoolProviding expertise in all areas of the new SBA 504 First Lien Pool
Guaranty program, including:Guaranty program, including:Guaranty program, including:
Pricing bids for existing loans
Pricing strategies for new loans
Accepting loan tapes for bid on 85% of eligible loans
Whole loan sale option
Assistance with becoming a Pool Originator
If you are 504 lender and wish to discuss how we can help youIf you are 504 lender and wish to discuss how we can help youIf you are 504 lender and wish to discuss how we can help you
access the 504 secondary market, please contact:access the 504 secondary market, please contact:access the 504 secondary market, please contact:
Bob Judge, GLS, at (216) 456-2480 ext. 133 or via e-mail at
“The source for accessing the SBA 504 Secondary
Market Pooling Program.”
www.SMA504.com

Page 6Coleman Government Loan Solutions’ CPR Report
SECONDARY MARKET ACCESS
504 FMLP Rate Guidance - 85% Loan Interest Sale�ƉƉůŝĞƐ�dŽ�E Ğǁ �>ŽĂŶƐ�KŶůLJ͘��džŝƐƟŶŐ�>ŽĂŶƐ��ƵƐƚŽŵ�Y ƵŽƚĞĚ
NEWLOANSONLY
90 Day Adjustable (LIBOR) Quarterly Adjustable (Prime) 5 Yr Fixed
PAR RATE = 3 Mo LIBOR + PAR RATE = WSJ Prime + PAR RATE = 5-yr Swap + Spread
spread calculated below spread calculated below Resets: Q at 3-Mo. Libor + Spread
Credit D ƵůƟ Hosp Other SP D ƵůƟ Hosp Other SP D ƵůƟ Hosp Other SP
Base + 3.25% + 4.00% + 4.00% + 0.50% + 1.25% + 1.25% + 3.25% + 3.75% + 3.75%
LTV > 55% + 0.25% + 0.50% + 0.75% + 0.25% + 0.50% + 0.75% + 0.25% + 0.50% + 0.75%
DCR < 1.2 + 0.25% + 0.50% + 0.75% + 0.25% + 0.50% + 0.75% + 0.25% + 0.50% + 0.75%
DCR < 1.0 + 0.50% + 0.75% + 1.00% + 0.50% + 0.75% + 1.00% + 0.50% + 0.75% + 1.00%
FICO < 680 + 0.25% + 0.50% + 0.75% + 0.25% + 0.50% + 0.75% + 0.25% + 0.50% + 0.75%
FICO < 620 + 0.75% + 1.00% + 1.25% + 0.75% + 1.00% + 1.25% + 0.75% + 1.00% + 1.25%
Biz < 1 Yr + 0.25% + 0.50% + 0.75% + 0.25% + 0.50% + 0.75% + 0.25% + 0.50% + 0.75%
Rate Floor 5.75% 5.75% 5.75% 5.75% 5.75% 5.75% 6.25% 6.25% 6.25%
Reset Mgn n/a n/a n/a n/a n/a n/a ŝŶŝƟĂů ŝŶŝƟĂů ŝŶŝƟĂů
NEWLOANSONLY
7 Year Fixed 10 Year Fixed Each +0.25% added to Note Rate provides1.00% in YSP. Max 6% premium.PAR RATE = 5-yr Swap + Spread PAR RATE = 10-yr Swap + Spread
Resets: Q at 3-Mo. Libor + Spread Resets: Q at 3-Mo. Libor + Spread Prepay Penalty Premium Calc
Credit D ƵůƟ Hosp Other SP D ƵůƟ Hosp Other SPAdjustable
No Prepay Penalty -1.00%
Base + 3.50% + 4.00% + 4.00% + 3.75% + 4.25% + 4.25%5,4,3,2,1 + 0.00%
5,5,5,5,5 + 1.00%
LTV > 55% + 0.25% + 0.50% + 0.75% + 0.25% + 0.50% + 0.75%7,6,5,4,3,2,1 + 1.50%
10,9,8,7,6,5,4,3,2,1 + 2.00%
DCR < 1.2 + 0.25% + 0.50% + 0.75% + 0.25% + 0.50% + 0.75%5-yr Fixed
No Prepay Penalty -1.00%
DCR < 1.0 + 0.50% + 0.75% + 1.00% + 0.50% + 0.75% + 1.00%5,4,3,2,1 + 0.00%
5,5,5,5,5 + 1.00%
FICO < 680 + 0.25% + 0.50% + 0.75% + 0.25% + 0.50% + 0.75%7,6,5,4,3,2,1 + 1.50%
10,9,8,7,6,5,4,3,2,1 + 2.00%
FICO < 620 + 0.75% + 1.00% + 1.25% + 0.75% + 1.00% + 1.25%7-yr Fixed
No Prepay Penalty -1.50%
Biz < 1 Yr + 0.25% + 0.50% + 0.75% + 0.25% + 0.50% + 0.75%5,4,3,2,1 + 0.00%
5,5,5,5,5 + 1.00%
Rate Floor + 6.50% + 6.50% + 6.50% + 7.00% + 7.00% + 7.00%7,6,5,4,3,2,1 + 1.50%
10,9,8,7,6,5,4,3,2,1 + 2.00%
Reset Mgn ŝŶŝƟĂů ŝŶŝƟĂů ŝŶŝƟĂů ŝŶŝƟĂů ŝŶŝƟĂů ŝŶŝƟĂů10-yr Fixed
No Prepay Penalty -2.00%
Maximum Loan Balance ($MM) Other Pricing Notes 5,4,3,2,1 -+ 1.00%
Credit D ƵůƟ Hosp Other SP Pricing assumes 365/360. 5,5,5,5,5 + 0.00%
LTV > 55% $5 MM $4 MM $3 MM Servicing assumed at 50 bps. 7,6,5,4,3,2,1 + 1.00%
DCR < 1.2 -$1 MM -$1 MM -$1 MM Excess servicing possible on 85%. 10,9,8,7,6,5,4,3,2,1 + 2.00%
DCR < 1.0 -$2 MM -$2 MM -$2 MME ŽƚĞ͗ ��dŚŝƐ�ƉƌŝĐŝŶŐ�ŝƐ�ĨŽƌ�ϴϱй �ƉŽƌƟŽŶƐ�ŽĨ�ϱϬϰ�&D >W�ĂŶĚ�ŝƐ�ĨŽƌ�ŝŶĚŝĐĂƟǀ Ğ�ƉƵƌƉŽƐĞƐ�only. For more info, please call SMA.
Up to 20% of principal paid per year with-ŽƵƚ�ƉĞŶĂůƚLJ�ŝƐ�ƐƵďũĞĐƚ�ƚŽ�Ă�͘ϱϬй �ƌĞĚƵĐƟŽŶ�
in premium.
FICO < 680 -$1 MM -$1 MM -$1 MM
FICO < 620 -$2 MM -$2 MM -$2 MM
Biz < 1 Yr -$1 MM $0 MM $0 MM

Page 7Coleman Government Loan Solutions’ CPR Report
THE LEGAL BEATS OP 5 0 -53: T H E S OP Y O U N E E D T O
K N O W
By Ethan W. Smith
As most of our readers know by now, the SBA has released theupdated SOP 50 10 5(C), which became effective on October1, 2010. Less well known is the fact that the SBA has also re-leased a brand new SOP which also became effective on Octo-ber 1, 2010. The SOP 50 53 http://www.sba.gov/idc/groups/public/documents/sba_homepage/serv_sops_5053.pdf
is the newest member of the SOP family and covers LenderSupervision and Enforcement by the SBA Office of CreditRisk Management (“OCRM”). This SOP provides guidance onthe types of supervision that OCRM may conduct over SBALender participants and sets forth the disciplinary and enforce-ment actions that SBA may employ in response to “violationsof law, rules, regulations, final agency notices and/or unsafeand unsound practices or conditions.” Although this SOPexpressly states that it “is not intended to, does not, and maynot be relied upon to, create rights, substantive or proceduralfor Lending Partners or any other party enforceable at law or inany administrative proceeding against SBA,” an understandingof this SOP is still critical for SBA Lenders to understand theapproach that SBA may take in conducting its lender oversightactivities.
The SOP 50 53 is supplemented by the SOP 51 00“On-Site Lender Reviews and Examinations” and provides fordifferent levels of monitoring by the agency depending on thesize of Lenders SBA portfolios. The 50 53 also provides guid-ance on the different types of lender monitoring and reviews,including off-site and on-site reviews and circumstances thatwarrant increased levels of supervision by the SBA, and coversthe enforcement actions the SBA may take against lender par-ticipants that are determined to be non-compliant with applica-ble law and SBA regulations. Additionally, the SOP sets forthten general grounds for enforcement actions. These tengrounds are:
(1) Failure to maintain eligibility requirements for specific SBAprogram and delegated authorities;
(2) Failure to comply materially with any requirement imposedby SBA Loan Program Requirements, e.g., program fee require-ments, program reporting requirements, maintenance;
(3) Making a material false statement or failure to disclose amaterial fact to SBA;
(4) Not performing underwriting, closing, disbursing, servicing,liquidation, litigation or other actions in a commercially reason-able and prudent manner;
(5) Failure within the time period specified to correct an underwrit-ing, closing, disbursing, servicing, liquidation, litigation or reportingdeficiency or failure in a material respect to take corrective actionafter receiving notice from SBA of deficiency and need to take cor-rective action. SBA will consider failure to take corrective action anexample of a willful violation of the regulations/Act;
(6) Engaging in a pattern of uncooperative behavior or taking an ac-tion that SBA determines is detrimental to an SBA program, thatundermines management or administration of a program, or that isnot consistent with standards of good conduct (See 13 CFR 120.1400(c)(6) for additional guidance specific to this ground);
Continued on next page

Page 8Coleman Government Loan Solutions’ CPR Report
THE LEGAL BEAT . . .C O N T I N U E D
(7) Repeated failure to correct continuing deficiencies;
(8) Unauthorized disclosure of Reports, Risk Rating, or otherConfidential Information, e.g., SBA Supervisory Information;including but not limited to, SBPS loan scores; loan level per-formance data; and review, examination and systematic off-sitemonitoring assessments;
(9) Any other reason that SBA determines in its discretion thatmay increase SBA’s financial risk, e.g., repeated Less Than Ac-ceptable Risk Rating (generally in conjunction with other indi-cators of increased financial risk), Less Than Acceptable on-sitereview results, operating or other deficiencies that increaseSBA’s potential risk, or possible fraud; or
(10) As otherwise authorized by law.
It is important to note that SBA has broad discretion to impose anenforcement action. Accordingly, a thorough understanding andconsistent application of all applicable SBA related laws and regula-tions is critical for lenders, not just to preserve and protect the SBAguaranty, but also to maintain a lender’s good standing with the SBA.
For more information on the SOP 50 53, or other SBA regulatory related mat-ters, contact Ethan at [email protected], or 215-542-7070.
GLS provides valuations for:
SBA 7(a), 504 1st mortgage and
USDA servicing rights SBA 7(a) and 504 1st mortgage
pools Guaranteed and non-guaranteed
7(a) loan portions Interest-only
portions of SBA and USDA loans
Government Loan Solutions
The nationwide leader in the valuation of SBA and USDA assets.
In these times of marketuncertainty, let GLS help you indetermining the value of your
SBA and USDA related-assets.
For further information, please contact RobHerrick at (216) 456-2480 ext. 144 or at

Page 9Coleman Government Loan Solutions’ CPR Report
GLS 7(a) Sale & Settlement Tip of the Month
Settlement & Sales Strategies Tip #28 – Only 40 shopping days left!!!
Not until Christmas but until year end. Much like Christmas, you don’t find the best giftsif you wait until the last minute and you aren’t likely to find the best prices if you takethat approach with your loan sales. I certainly do not want to imply you won’t be able tosell as we near year end, but the closer we get, the tougher it can sometimes become.The reasons can be varied (be it dealer balance sheet constraints, investor demand, ordesk staffing) but the outcome is typically the same…prices and liquidity tend to fall thecloser we get to year end. There’s plenty of time left so sell early and let someone else
be this year’s “last minute shopper”.
Scott Evans is a partner at GLS. Mr. Evans has over 18 years of trading experience and has been involved in the SBA secondary markets for the last eightof those years. Mr. Evans has bought, sold, settled, and securitized nearly 20,000 SBA loans and now brings some of that expertise to the CPR Report ina recurring article called Sale and Settlement Tip of the Month. The article will focus on pragmatic tips aimed at helping lenders develop a more con-
sistent sale and settlement process and ultimately deliver them the best execution possible.
Increase your premium dollars by eliminating brokerage feesand selling your SBA and USDA Loans “Investor Direct” to
Thomas USAF, America’s largest direct investor.
Contact Mike or Vasu at 404-365-2040

Page 10Coleman Government Loan Solutions’ CPR Report

GLS V A L U E I N D I C E S M I X E D
For September, The GLS Value Indicesfell in four out of six maturity categoriesversus August levels.
The Base Rate / Libor spread increased by4 basis points, which benefited the indices,while the prepayment element was essen-tially unchanged. Unfortunately, both ofthese elements were overshadowed by theacross-the-board increases in the second-ary market in September (see below).
With loan prices rising another 1/8 to a5/8 of a point, the indices continue asteady march toward pre-credit crisis lev-els.
With demand high for US government-guaranteed floating rate assets, these levelsseem well supported by the fundamentalsof the market.
Turning to the specifics, the largest de-crease was seen in the GLS VI-4, whichfell by 16% to 136 basis points. The otherdecreases were, by order of magnitude, VI-1 (-13% to 74), VI-6 (-3% to 187) and VI-3 (-1% to 94). Increases, by order of mag-nitude, were seen in VI-2 (+4% to 95) andVI-5 (+2% to 191).
With the secondary market having come along way in relatively short period of time,
we expect pricing to remain close to cur-rent levels through the end of the year.
For further information on the terminology and
concepts used in this article, please refer to the
“Glossary and Definitions” at the end of the
report.
Data on pages 13-14, Graph on page 15
Coleman Government Loan Solutions’ CPR Report Page 11
MaturityGrossMargin
NetMargin
ServicingThis Month
Price1-Yr. Ago
Price
10 yrs. 2.75% 1.075% 1.00% 111.25 109.65
15 yrs. 2.75% 1.075% 1.00% 112.25 109.80
20 yrs. 2.75% 1.075% 1.00% 113.25 110.00
25 yrs. 2.75% 1.075% 1.00% 114.125 110.00
Last MonthPrice
111.125
111.75
113.00
113.50
3-Mos. AgoPrice
110.55
110.875
112.125
112.50
6-Mos. AgoPrice
109.25
109.40
110.05
110.25
7(a) Secondary Market Pricing Grid: September 2010
Signature Securities Group, located inHouston, TX, provides the following
services to meet your needs:
SBA Loans and Pools Assistance meeting CRA guidelines USDA B&I and FSA Loans Fixed Income Securities
For more information, please callToll-free 1-866-750-7150
Securities and Insurance products are:
• NOT FDIC INSURED • NO BANK GUARANTEE • MAY LOSE VALUE SignatureSecurities Group Corporation (SSG), member of FINRA/SIPC, is a registered brokerdealer, registered investment advisor and licensed insurance agency. SSG is a whollyowned subsidiary of Signature Bank.

Government Loan Solutions’ CPR ReportColeman
D E FA U L T - C U R TA I L M E N T R A T I O S
In our Default-Curtailment Ratios (DCR)we witnessed a decrease in 7a and an in-crease in 504 last month.
Please note that an increase in the DCRdoes not necessarily mean that the defaultrate is rising, only that the percentage ofearly curtailments attributable to defaultshas increased.
As has been the case for the past twoyears, both ratios continued the trend ofrecession-level readings of 30%+ for 7(a)and 20%+ for 504 loans.
SBA 7(a) Default Ratios
For the 29th month in a row, the 7(a)DCR exceeded 30%, coming in at 63.68%,a decrease of 9% from the previous read-ing of 69.59%.
A significant decrease in defaults, com-bined with a stable, yet low, voluntary pre-payment component, led to the decrease inthe 7a DCR.
Turning to actual dollar amounts, defaultsfell by 22% to $123 million from $157million. As for voluntary prepayments,they rose slightly, reaching $70 million
versus $69 million.
SBA 504 Default Ratios
Also for the 29th month in a row, the 504DCR came in above 20%, rising 2% to74.17%. Both voluntary prepayments anddefaults fell by double-digits, essentiallyoffsetting each other.
Specifically, the dollar amount of defaultsfell by $22 million to $112 million (-16%).As for voluntary prepayments, they de-creased by $12 million to $39 million(-23%).
Summary
While defaults in both sectors are in de-cline, the low level of voluntary prepay-ments continue to keep both DCRs elevat-ed. Until we see an increase in voluntaryprepayments or a significant decrease indefaults, the DCRs will continue to remainelevated.
Graph on page 20
D E FA U L T R A T E R I S E S T O 5 . 9 6 %
The trend toward lower defaultscontinued last month, as the theo-retical default rate fell 20%, reach-ing 4.35%. This represents thefirst sub-5% reading since Marchof this year.
Based on preliminary data fromColson, we believe that defaultscould fall below 4% next month,which would represent the 4thconsecutive month of declines,something we haven’t seen sinceApril to July 2004.
On a three-month rolling basis,the default rate fell below 6%,reaching 5.36%, a decline of 20%from the previous month.
For 2010, the average default ratecame in at 6.14% versus 6.22% forthe first nine months of 2009.
With the datashowing the de-fault rate on thedecline, the exten-sive damage to thesmall business sec-tor from the reces-sion seems to beon the mend.
However, while weare hopeful forcontinued declinesin defaults, weremain cautious.
If we have learnednothing else overthe past two years,it is that calling the end to weakeconomic conditions can befraught with peril.
For further information on the terminology and concepts used in this
article, please refer to the “Glossary and Definitions” at the end of the
report.
Page 12
D E FA U L T R A T E G O E S B E L O W 5%
For further information on the terminology and
concepts used in this article, please refer to the
“Glossary and Definitions” at the end of the
report.
www.sma504.com
“The Informational Source
for 504 Pooling”

Table 1:
Rolling six-month CPR speeds for all maturity buckets. Source: Colson Services
GLS VA L U E I N D I C E S : SU P P O RT I N G DA TA
Government Loan Solutions’ CPR ReportColeman Page 13
MONTHBUCKET
1 CPRBUCKET
2 CPRBUCKET
3 CPRBUCKET
4 CPRBUCKET
5 CPRBUCKET
6 CPR
Apr-07 0.00% 0.00% 0.00% 0.00% 0.00% 0.00%
May-07 18.09% 17.35% 13.47% 18.38% 19.68% 22.95%
Jun-07 18.39% 17.03% 13.89% 18.96% 20.60% 22.97%
Jul-07 18.52% 17.35% 14.00% 19.55% 20.25% 23.25%
Aug-07 17.72% 17.15% 13.56% 19.48% 18.01% 23.10%
Sep-07 19.18% 17.10% 14.19% 19.85% 18.61% 23.98%
Oct-07 18.14% 17.04% 14.59% 19.16% 18.57% 23.85%
Nov-07 17.68% 16.02% 14.82% 18.87% 18.32% 24.16%
Dec-07 17.14% 15.38% 14.42% 17.22% 17.99% 23.23%
Jan-08 15.70% 14.68% 13.96% 16.44% 17.45% 22.00%
Feb-08 15.91% 13.98% 14.19% 16.20% 17.53% 21.19%
Mar-08 15.58% 13.42% 13.27% 15.08% 15.41% 19.34%
Apr-08 16.16% 13.40% 13.05% 14.59% 15.19% 18.74%
May-08 15.49% 12.93% 12.65% 13.77% 14.33% 17.33%
Jun-08 15.29% 13.36% 12.96% 14.75% 13.62% 17.14%
Jul-08 15.70% 13.03% 12.78% 14.40% 12.49% 16.59%
Aug-08 15.45% 13.28% 12.87% 13.73% 12.24% 15.89%
Sep-08 14.03% 12.49% 12.77% 13.28% 12.36% 15.20%
Oct-08 12.98% 11.67% 12.16% 12.13% 11.97% 14.06%
Nov-08 12.08% 12.36% 11.45% 11.49% 11.49% 13.22%
Dec-08 12.37% 11.81% 10.46% 9.79% 11.08% 11.41%
Jan-09 12.86% 11.55% 10.45% 9.29% 10.61% 10.40%
Feb-09 12.30% 11.30% 10.36% 8.39% 9.99% 9.30%
Mar-09 12.96% 11.97% 10.58% 8.57% 10.47% 8.79%
Apr-09 13.23% 12.34% 11.23% 8.75% 9.81% 8.55%
May-09 13.12% 11.89% 11.80% 8.68% 9.92% 7.98%
Jun-09 13.18% 11.85% 12.36% 8.57% 8.73% 8.02%
Jul-09 12.40% 12.00% 12.51% 8.56% 8.23% 7.36%
Aug-09 13.38% 12.49% 12.36% 8.01% 7.34% 7.21%
Sep-09 12.79% 11.01% 11.83% 7.48% 6.70% 6.89%
Oct-09 12.50% 11.03% 11.35% 7.25% 7.85% 6.79%
Nov-09 12.16% 10.89% 11.05% 6.96% 7.13% 6.32%
Dec-09 11.38% 11.20% 10.59% 7.09% 7.80% 5.75%
Jan-10 11.20% 10.69% 10.34% 6.99% 8.00% 5.75%
Feb-10 10.06% 9.97% 10.05% 7.33% 8.84% 5.71%
Mar-10 9.92% 10.73% 10.11% 7.12% 8.75% 5.75%
Apr-10 9.97% 10.45% 9.73% 7.34% 8.12% 5.32%
May-10 10.58% 11.09% 10.29% 7.88% 8.53% 5.86%
Jun-10 10.95% 11.18% 10.42% 7.83% 8.53% 6.38%
Jul-10 10.33% 11.15% 10.57% 7.13% 8.59% 7.48%
Aug-10 10.45% 11.02% 10.16% 7.38% 8.25% 7.60%
Sep-10 11.29% 10.76% 10.54% 7.48% 8.01% 7.70%

Page 14
Table 2:
GLS VI values for all maturity buckets for last 42 months.
GLS VA L U E I N D I C E S : H I S TO R I C A L VA L U E S
INDICES LEGEND
HIGHEST READING
LOWEST READING
Government Loan Solutions’ CPR ReportColeman
MONTHWAVGLIBOR
WAVGBASE
BASELIBOR
SPDGLSVI-1
GLSVI-2
GLSVI-3
GLSVI-4
GLSVI-5
GLSVI-6
Apr-07 5.35% 8.25% 2.90% 18.8 19.4 43.4 -2.9 -12.5 -53.0
May-07 5.35% 8.25% 2.90% 24.5 8.5 37.6 18.9 -1.4 -50.0
Jun-07 5.36% 8.25% 2.89% 16.3 25.2 40.6 18.6 7.0 -22.1
Jul-07 5.35% 8.25% 2.90% 6.8 20.9 38.1 22.2 30.1 -29.9
Aug-07 5.48% 8.25% 2.77% 12.9 33.5 59.8 43.6 57.8 7.0
Sep-07 5.70% 8.21% 2.51% -7.3 32.2 38.1 36.3 33.3 -14.1
Oct-07 5.05% 7.74% 2.69% 70.2 61.9 75.6 52.2 61.9 14.6
Nov-07 4.96% 7.50% 2.54% 42.6 46.7 50.5 57.8 48.7 -4.3
Dec-07 5.02% 7.35% 2.33% 30.4 55.2 54.4 57.0 46.7 7.9
Jan-08 3.77% 6.86% 3.09% 105.1 118.6 124.7 121.4 140.1 96.8
Feb-08 3.10% 6.00% 2.90% 94.4 98.7 98.6 93.3 118.0 69.9
Mar-08 2.90% 5.95% 3.05% 118.1 120.5 116.2 112.0 128.8 107.4
Apr-08 2.81% 5.25% 2.44% 69.9 79.5 77.4 90.6 100.8 77.4
May-08 2.78% 5.15% 2.37% 61.2 66.7 64.1 82.9 60.5 65.1
Jun-08 2.67% 5.00% 2.33% 44.1 47.4 59.8 74.6 66.9 47.2
Jul-08 2.75% 5.00% 2.25% 41.7 43.4 55.3 60.8 89.1 61.6
Aug-08 2.74% 5.02% 2.27% 44.0 52.5 70.1 47.4 95.8 83.1
Sep-08 3.00% 5.00% 2.00% 73.3 91.2 88.5 111.3 85.2 94.2
Oct-08 4.43% 4.56% 0.12% 2.3 -3.1 -38.6 30.5 -51.0 -12.9
Nov-08 2.06% 4.00% 1.94% 203.9 187.0 143.2 161.1 236.0 196.6
Dec-08 1.64% 3.89% 2.25% 162.2 144.9 170.3 151.0 212.5 238.6
Jan-09 1.11% 3.25% 2.14% 164.8 185.5 181.7 233.2 218.3 204.4
Feb-09 1.15% 3.25% 2.10% 203.6 179.5 157.4 162.9 201.5 171.3
Mar-09 1.06% 3.25% 2.19% 135.3 150.3 151.6 220.4 138.0 169.7
Apr-09 0.96% 3.28% 2.32% 149.4 134.8 144.3 182.0 198.3 184.5
May-09 0.70% 3.26% 2.57% 182.1 138.7 149.6 200.3 192.4 200.8
Jun-09 0.55% 3.25% 2.70% 144.8 130.3 137.3 200.2 183.8 212.8
Jul-09 0.48% 3.25% 2.77% 150.9 143.8 129.1 191.9 192.4 217.4
Aug-09 0.39% 3.25% 2.86% 129.7 127.4 125.7 201.7 197.3 222.8
Sep-09 0.29% 3.25% 2.96% 122.0 126.5 128.3 205.5 225.3 229.6
Oct-09 0.26% 3.25% 2.99% 128.2 131.3 133.9 216.0 191.2 228.8
Nov-09 0.26% 3.25% 2.99% 115.3 150.9 138.0 219.2 210.8 234.2
Dec-09 0.25% 3.25% 3.00% 136.1 153.4 162.0 226.3 218.0 259.6
Jan-10 0.25% 3.24% 2.99% 153.9 186.5 157.2 201.0 240.6 250.7
Feb-10 0.25% 3.23% 2.99% 150.8 155.1 150.4 192.3 193.0 250.7
Mar-10 0.26% 3.25% 2.99% 133.1 126.0 155.8 206.4 209.5 249.2
Apr-10 0.29% 3.25% 2.96% 142.1 147.5 149.3 213.6 205.1 250.0
May-10 0.41% 3.25% 2.84% 107.5 112.1 117.5 184.4 187.2 218.1
Jun-10 0.52% 3.25% 2.73% 85.9 90.9 90.1 147.5 168.7 200.4
Jul-10 0.46% 3.26% 2.80% 102.7 81.0 106.7 167.0 159.5 193.5
Aug-10 0.33% 3.26% 2.93% 85.6 91.6 95.4 161.6 186.6 193.2
Sep-10 0.28% 3.25% 2.97% 74.1 95.3 94.0 135.6 190.8 187.2

Coleman Government Loan Solutions’ CPR Report Page 15
Let GLS Value your Mortgage Servicing Rights
Government Loan Solutions, the national leader in SBA servicing
portfolio valuation, now offers it’s market-based valuation
methodology to the mortgage servicing industry.
If your firm provides mortgage servicing, we can provide you with thesame loan-by-loan detail and stress testing that we provide to our
SBA servicing clients.
For more information, please contact Rob Herrick at 216-456-2480 ext. 144 or by e-mail at [email protected]

Table 3:
2010 monthly prepayment speeds broken out by maturity sector. Source: Colson Services
Table 4:
2010 pool age broken out by maturity sector. Source: Colson Services
YTD P R E PA Y M E N T S P E E D S
Coleman Government Loan Solutions’ CPR Report Page 16
CPR/MO. <8 8 - 10 10 - 13 13 - 16 16 - 20 20+ ALL
Jan-10 11.09% 7.10% 9.64% 10.02% 6.92% 5.69% 7.22%
Feb-10 9.89% 10.00% 10.52% 5.73% 8.62% 6.88% 8.06%
Mar-10 10.13% 10.05% 8.43% 5.37% 8.69% 5.75% 6.93%
Apr-10 10.37% 11.13% 9.06% 8.81% 9.44% 5.50% 7.26%
May-10 13.03% 15.79% 14.85% 9.97% 8.15% 8.07% 10.45%
Jun-10 10.99% 12.88% 9.78% 7.02% 9.37% 6.36% 7.91%
Jul-10 7.44% 6.71% 10.59% 5.79% 7.28% 12.01% 10.65%
Aug-10 10.67% 9.15% 8.01% 7.23% 6.53% 7.66% 7.82%
Sep-10 14.98% 8.34% 10.76% 5.82% 7.22% 6.38% 7.80%
Oct-10 10.76% 6.76% 7.51% 7.66% 5.13% 6.44% 6.83%
Grand Total 10.98% 9.87% 9.94% 7.37% 7.75% 7.11% 8.11%
POOL AGE <8 8 - 10 10 - 13 13 - 16 16 - 20 20+ ALL
Jan-10 23 Mos. 27 Mos. 29 Mos. 64 Mos. 46 Mos. 49 Mos. 43 Mos.
Feb-10 23 Mos. 27 Mos. 30 Mos. 63 Mos. 46 Mos. 49 Mos. 43 Mos.
Mar-10 23 Mos. 27 Mos. 30 Mos. 63 Mos. 46 Mos. 49 Mos. 43 Mos.
Apr-10 22 Mos. 27 Mos. 30 Mos. 63 Mos. 47 Mos. 49 Mos. 43 Mos.
May-10 21 Mos. 28 Mos. 30 Mos. 64 Mos. 47 Mos. 49 Mos. 43 Mos.
Jun-10 21 Mos. 28 Mos. 31 Mos. 65 Mos. 47 Mos. 49 Mos. 44 Mos.
Jul-10 22 Mos. 29 Mos. 31 Mos. 65 Mos. 47 Mos. 49 Mos. 44 Mos.
Aug-10 21 Mos. 29 Mos. 32 Mos. 65 Mos. 48 Mos. 49 Mos. 44 Mos.
Sep-10 22 Mos. 30 Mos. 32 Mos. 65 Mos. 49 Mos. 49 Mos. 44 Mos.
Oct-10 22 Mos. 30 Mos. 31 Mos. 66 Mos. 48 Mos. 50 Mos. 44 Mos.

Page 17
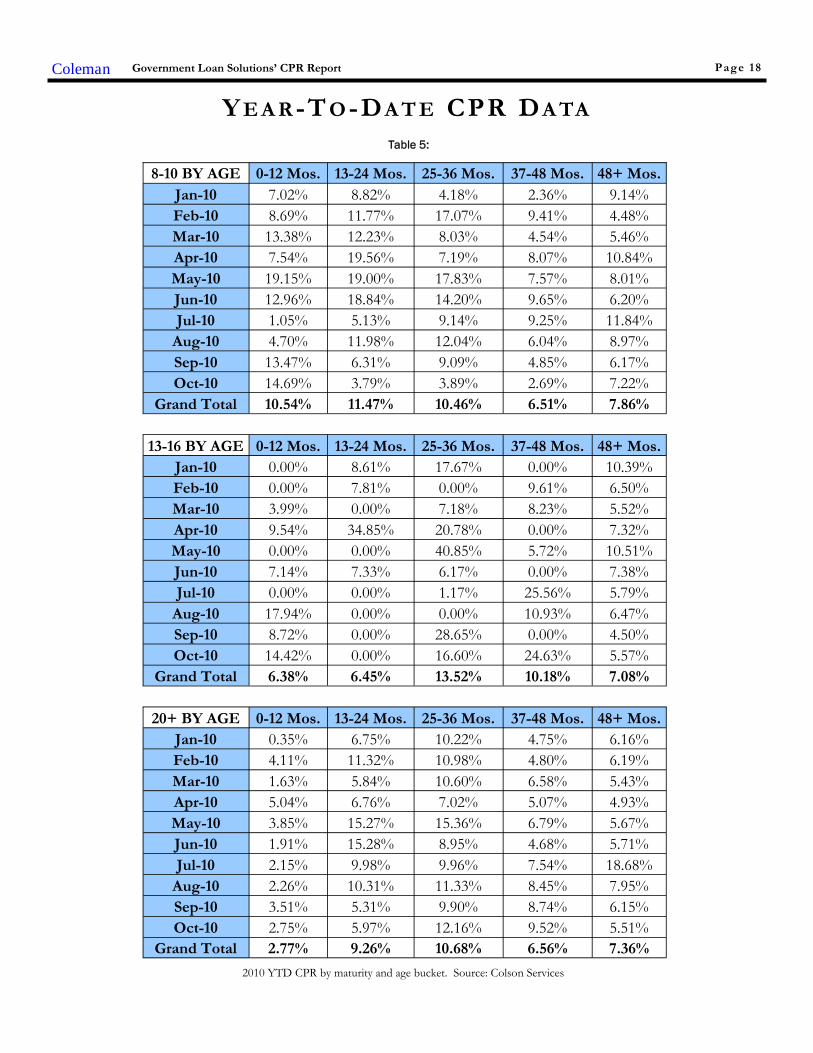
2010 YTD CPR by maturity and age bucket. Source: Colson Services
Table 5:
Y E A R -T O -DA T E CPR DA TA
Government Loan Solutions’ CPR ReportColeman
< 8 BY AGE 0-12 Mos. 13-24 Mos. 25-36 Mos. 37-48 Mos. 48+ Mos.
Jan-10 7.89% 14.51% 11.18% 11.74% 11.13%
Feb-10 11.68% 10.80% 12.71% 3.42% 3.84%
Mar-10 5.02% 13.90% 11.15% 16.45% 4.27%
Apr-10 6.20% 14.99% 10.87% 10.88% 13.92%
May-10 12.39% 17.01% 15.16% 6.56% 11.57%
Jun-10 8.07% 20.25% 14.24% 4.13% 8.02%
Jul-10 6.57% 10.42% 2.10% 16.79% 4.29%
Aug-10 9.51% 12.91% 13.52% 12.00% 3.46%
Sep-10 17.76% 11.25% 13.18% 17.78% 7.94%
Oct-10 14.38% 3.65% 9.14% 3.71% 17.84%
Grand Total 10.29% 13.16% 11.30% 10.55% 8.85%
10-13 BY AGE 0-12 Mos. 13-24 Mos. 25-36 Mos. 37-48 Mos. 48+ Mos.
Jan-10 7.65% 13.02% 10.39% 6.83% 7.40%
Feb-10 6.43% 13.46% 15.61% 4.65% 6.75%
Mar-10 4.40% 13.33% 9.29% 8.42% 4.18%
Apr-10 4.32% 13.93% 10.20% 6.87% 9.22%
May-10 6.04% 21.50% 19.99% 11.41% 13.25%
Jun-10 5.48% 15.92% 12.96% 5.45% 8.44%
Jul-10 6.53% 14.92% 14.70% 10.05% 5.72%
Aug-10 7.07% 7.61% 10.38% 8.38% 5.59%
Sep-10 6.40% 18.18% 13.49% 9.83% 8.17%
Oct-10 6.55% 8.21% 11.40% 6.92% 3.83%
Grand Total 6.11% 14.22% 12.87% 7.95% 7.18%
16-20 BY AGE 0-12 Mos. 13-24 Mos. 25-36 Mos. 37-48 Mos. 48+ Mos.
Jan-10 0.00% 22.97% 4.97% 4.83% 2.78%
Feb-10 2.63% 10.96% 11.70% 15.55% 5.80%
Mar-10 6.12% 11.16% 12.46% 14.22% 4.07%
Apr-10 3.64% 0.00% 17.22% 12.88% 8.66%
May-10 16.91% 19.75% 0.00% 3.31% 5.92%
Jun-10 15.77% 0.00% 7.93% 11.00% 9.90%
Jul-10 1.84% 2.95% 12.37% 9.54% 6.56%
Aug-10 11.55% 0.00% 5.95% 3.30% 8.09%
Sep-10 0.00% 4.98% 2.52% 9.43% 12.92%
Oct-10 0.00% 5.36% 12.30% 3.17% 2.85%
Grand Total 6.15% 9.18% 8.80% 8.63% 6.83%
Page 18
2010 YTD CPR by maturity and age bucket. Source: Colson Services
Table 5:
Y E A R -T O -DA T E CPR DA TA
Government Loan Solutions’ CPR ReportColeman
8-10 BY AGE 0-12 Mos. 13-24 Mos. 25-36 Mos. 37-48 Mos. 48+ Mos.
Jan-10 7.02% 8.82% 4.18% 2.36% 9.14%
Feb-10 8.69% 11.77% 17.07% 9.41% 4.48%
Mar-10 13.38% 12.23% 8.03% 4.54% 5.46%
Apr-10 7.54% 19.56% 7.19% 8.07% 10.84%
May-10 19.15% 19.00% 17.83% 7.57% 8.01%
Jun-10 12.96% 18.84% 14.20% 9.65% 6.20%
Jul-10 1.05% 5.13% 9.14% 9.25% 11.84%
Aug-10 4.70% 11.98% 12.04% 6.04% 8.97%
Sep-10 13.47% 6.31% 9.09% 4.85% 6.17%
Oct-10 14.69% 3.79% 3.89% 2.69% 7.22%
Grand Total 10.54% 11.47% 10.46% 6.51% 7.86%
13-16 BY AGE 0-12 Mos. 13-24 Mos. 25-36 Mos. 37-48 Mos. 48+ Mos.
Jan-10 0.00% 8.61% 17.67% 0.00% 10.39%
Feb-10 0.00% 7.81% 0.00% 9.61% 6.50%
Mar-10 3.99% 0.00% 7.18% 8.23% 5.52%
Apr-10 9.54% 34.85% 20.78% 0.00% 7.32%
May-10 0.00% 0.00% 40.85% 5.72% 10.51%
Jun-10 7.14% 7.33% 6.17% 0.00% 7.38%
Jul-10 0.00% 0.00% 1.17% 25.56% 5.79%
Aug-10 17.94% 0.00% 0.00% 10.93% 6.47%
Sep-10 8.72% 0.00% 28.65% 0.00% 4.50%
Oct-10 14.42% 0.00% 16.60% 24.63% 5.57%
Grand Total 6.38% 6.45% 13.52% 10.18% 7.08%
20+ BY AGE 0-12 Mos. 13-24 Mos. 25-36 Mos. 37-48 Mos. 48+ Mos.
Jan-10 0.35% 6.75% 10.22% 4.75% 6.16%
Feb-10 4.11% 11.32% 10.98% 4.80% 6.19%
Mar-10 1.63% 5.84% 10.60% 6.58% 5.43%
Apr-10 5.04% 6.76% 7.02% 5.07% 4.93%
May-10 3.85% 15.27% 15.36% 6.79% 5.67%
Jun-10 1.91% 15.28% 8.95% 4.68% 5.71%
Jul-10 2.15% 9.98% 9.96% 7.54% 18.68%
Aug-10 2.26% 10.31% 11.33% 8.45% 7.95%
Sep-10 3.51% 5.31% 9.90% 8.74% 6.15%
Oct-10 2.75% 5.97% 12.16% 9.52% 5.51%
Grand Total 2.77% 9.26% 10.68% 6.56% 7.36%

Coleman Government Loan Solutions’ CPR Report Page 19
GLOSSARY AND DEFINITIONS: PART 1Default-Curtailment Ratio
The Default-Curtailment Ratio (DCR), or the percentage of secondary loan curtailments that are attributable to defaults, can be considered a meas-urement of the health of small business in the U.S. GLS, with default and borrower prepayment data supplied by Colson Services, has calculatedDCRs for both SBA 7(a) and 504 loans since January, 2000.
The default ratio is calculated using the following formula:
Defaults / (Defaults + Prepayments)
By definition, when the DCR is increasing, defaults are increasing faster than borrower prepayments, suggesting a difficult business environment forsmall business, perhaps even recessionary conditions. On the flip side, when the DCR is decreasing, either defaults are falling or borrower prepay-ments are outpacing defaults, each suggesting improving business conditions for small business.
Our research suggests that a reading of 20% or greater on 7(a) DCRs and 15% or greater on 504 DCRs suggest economic weakness in these smallbusiness borrower groups.
Theoretical Default RateDue to a lack of up-to-date default data, we attempt to estimate the current default rate utilizing two datasets that we track:
1. Total prepayment data on all SBA pools going back to 2003. This is the basis for our monthly prepayment information.
Total prepayment data on all secondary market 7(a) loans going back to 1999, broken down by defaults and voluntary prepayments. This is the basisfor our monthly default ratio analysis.
With these two datasets, it is possible to derive a theoretical default rate on SBA 7(a) loans. We say “theoretical” because the reader has to accept thefollowing assumptions as true:
1. The ratio of defaults to total prepayments is approximately the same for SBA 7(a) pools and secondary market 7(a) loans.
Fact: 60% to 70% of all secondary market 7(a) loans are inside SBA pools.
2. The default rate for secondary market 7(a) loans closely approximates the default rate for all outstanding 7(a) loans.
Fact: 25% to 35% of all outstanding 7(a) loans have been sold into the secondary market.
While the above assumptions seem valid, there exists some unknown margin for error in the resulting analysis. However, that does not invalidate thepotential value of the information to the SBA lender community.
The Process
To begin, we calculated total SBA pool prepayments, as a percentage of total secondary loan prepayments, using the following formula:
Pool Prepay Percentage = Pool Prepayments / Secondary Loan Prepayments
This tells us the percentage of prepayments that are coming from loans that have been pooled. Next, we calculated the theoretical default rate usingthe following equation:
((Secondary Loan Defaults * Pool Prepay Percentage) / Pool Opening Balance) * 12
This provides us with the theoretical default rate for SBA 7(a) loans, expressed as an annualized percentage.
GLS Long Value Indices
Utilizing the same maturity buckets as in our CPR analysis, we calculate 6 separate indexes, denoted as GLS VI-1 to VI-6. The num-bers equate to our maturity buckets in increasing order, with VI-1 as <8 years, VI-2 as 8-10 years, VI-3 as 10-13 years, VI-4 as 13-16years, VI-5 as 16-20 years and ending with VI-6 as 20+ years.
The new Indices are basically weighted-average spreads to Libor, using the rolling six-month CPR for pools in the same maturitybucket, at the time of the transaction. While lifetime prepayment speeds would likely be lower for new loans entering the secondarymarket, utilizing six-month rolling pool speeds allowed us to make relative value judgments across different time periods.
We compare the bond-equivalent yields to the relevant Libor rate at the time of the transaction. We then break the transactions intothe six different maturity buckets and calculate the average Libor spread, weighting them by the loan size.
For these indices, the value can be viewed as the average spread to Libor, with a higher number equating to greater value in the tradinglevels of SBA 7(a) loans.

GLOSSARY AND DEFINITIONS: PART 2Prepayment Calculations
SBA Pool prepayment speeds are calculated using the industry convention of Conditional Prepayment Rate, or CPR. CPR is the an-nualized percentage of the outstanding balance of a pool that is expected to prepay in a given period. For example, a 10% CPR sug-gests that 10% of the current balance of a pool will prepay each year.
When reporting prepayment data, we break it into seven different original maturity categories: <8 years, 8-10 years, 10-13 years, 13-16years, 16-20 years and 20+ years. Within these categories we provide monthly CPR and YTD values.
In order to get a sense as to timing of prepayments during a pool’s life, we provide CPR for maturity categories broken down by fivedifferent age categories: 0-12 months, 13-24 months, 25-36 months, 37-48 months and 48+ months.
As to the causes of prepayments, we provide a graph which shows prepayment speeds broken down by voluntary borrower prepay-ment speeds, denoted VCPR and default prepayment speeds, denoted as DCPR. The formula for Total CPR is as follows:
Total Pool CPR = VCPR + DCPR
SBA Libor Base RateThe SBA Libor Base Rate is set on the first business day of the month utilizing one-month LIBOR, as published in a national financialnewspaper or website, plus 3% (300 basis points). The rate will be rounded to two digits with .004 being rounded down and .005 be-ing rounded up.
Please note that the SBA’s maximum 7(a) interest rates continue to apply to SBA base rates: Lenders may charge up to 2.25% abovethe base rate for maturities under seven years and up to 2.75% above the base rate for maturities of seven years or more, with rates2% higher for loans of $25,000 or less and 1% higher for loans between $25,000 and $50,000. (Allowable interest rates are slightlyhigher for SBAExpress loans.)
Risk TypesThe various risk types that impact SBA pools are the following:
Basis Risk: The risk of unexpected movements between two indices. The impact of this type of risk was shown in the decrease inthe Prime/Libor spread experienced in 2007 and 2008.
Prepayment Risk: The risk of principal prepayments due to borrower voluntary curtailments and defaults. Overall prepayments areexpressed in CPR, or Conditional Prepayment Rate.
Interest Rate Risk: The risk of changes in the value of an interest-bearing asset due to movements in interest rates. For pools withmonthly or quarterly adjustments, this risk is low.
Credit Risk: Losses experienced due to the default of collateral underlying a security. Since SBA loans and pools are guaranteed bythe US government, this risk is very small.
Secondary Market First Lien Position 504 Loan Pool Guarantee ProgramAs part of the American Recovery and Reinvestment Act (AKA the Stimulus Bill), Congress authorized the SBA to create a temporaryprogram that provides a guarantee on an eligible pool of SBA 504 first liens. The program was authorized for a period of two yearsfrom the date of bill passage – February, 2009. The eligibility of each loan is dependent on the date of the SBA Debenture funding.To be eligible, the Debenture must have been funded on or after February 17, 2009, and prior to February 16, 2011. The total guar-antee allocation is $3 Billion. HR 5297 provides for a two-year extension from the first pooling month.
The SBA announced that they will begin issuing the first pool guarantees in September, 2010 for early October settlement.
For the purposes of the program, a pool is defined as 2 or more loans. A pool must be either fixed (for life) or adjustable (any periodadjustment including 5 or 10 years). If the pool is comprised of adjustable rate loans, all loans must have the same base rate (e.g.Prime, LIBOR, LIBOR Swaps, FHLB, etc.). Finally, each loan must be current for the lesser of 6 months or from the time of loanfunding. Congress mandated that this be a zero subsidy program to the SBA (and the US taxpayer). The SBA has determined theprogram cost (management and expected losses) can be covered by an ongoing subsidy fee of .167%.
Coleman Government Loan Solutions’ CPR Report Page 20

Coleman Government Loan Solutions’ CPR Report Page 21
GLS provides valuations for:
SBA 7(a), 504 1st mortgage and
USDA servicing rights SBA 7(a) and 504 1st mortgage
pools Guaranteed and non-guaranteed
7(a) loan portions Interest-only
portions of SBA and USDA loans
Government Loan Solutions
The nationwide leader in the valuation of SBA and USDA assets.
In these times of marketuncertainty, let GLS help you indetermining the value of your
SBA and USDA related-assets.
For further information, please contact RobHerrick at (216) 456-2480 ext. 144 or at

Powered By:
www.glsolutions.us
Government Loan Solutions’CPR Report is a monthly elec-tronic newsletter published by
Coleman Publishing.
The opinions, unless otherwisestated, are exclusively those of
the editorial staff.
This newsletter is not to bereproduced or distributed inany form or fashion, withoutthe express written consent ofColeman or Government Loan
Solutions.
Government Loan Solutions’CPR Report is distributed in
pdf format via e-mail. Spread-sheets relating to the presenteddata are available to paid sub-
scribers upon request.
The subscription to the Gov-ernment Loan Solutions’ “CPRReport” is free to all members
of the SBA Community.
To subscribe, please contactColeman at (800) 617-1380 or
via email at:[email protected]
Partners
Scott Evans
Bob Judge
Rob Herrick
Coleman Government Loan Solutions’ CPR Report Page 22
812 Huron RoadCleveland, OH 44115
Government Loan Solut ions
Phone: (216) 456-2480Fax: (216) 456-2481Web Site: www.glsolutions.usE-mail: [email protected]
Government Loan Solutions, Inc. (GLS) was founded by three former Bond Traders in
Cleveland, OH. Scott Evans, Rob Herrick and Bob Judge possess a combined 70 years experi-
ence in the institutional fixed income markets, 40 of which are in the loan securitization business.
GLS formally began operations in January, 2007. Our mission is as follows:
“The purpose of Government Loan Solutions is to bring greater efficiency, productivity
and transparency to the financial markets. Through the use of proprietary technology, we
intend to aid lenders in all aspects of their small business lending, help loan securitizers be
more productive in their operational procedures and provide quality research to the investor
community .”
Services available include:
Lenders:
Manage loan sales to the secondary market
Process loan settlements via our electronic platform, E-Settle
Third-Party servicing and non-guaranteed asset valuation
Model Validation
Specialized research projects
Mortgage Servicing Valuation
Loan Securitizers:
Manage loan settlements and pool formation
Loan and IO accounting
Loan, Pool and IO Mark-To-Market
Specialized research projects
Institutional Investors:
Loan, Pool, and IO Mark-To-Market
Specialized research projects
Portfolio consulting
For additional information regarding our products and capabilities, please contact us at:
Phone: (216)456-2480 E-mail at: [email protected] web: www.glsolutions.us
EDITORIAL DISCLAIMER
DISCLAIMER OF WARRANTIES – GOVERNMENT LOAN SOLUTIONS (GLS) MAKES NO REPRESENTATIONS OR WARRANTIES REGARD-ING THE ACCURACY, RELIABILITY OR COMPLETENESS OF THE CONTENT OF THIS REPORT. TO THE EXTENT PERMISSIBLE BY LAW,GLS DISCLAIMS ALL WARRANTIES, EXPRESS OR IMPLIED, INCLUDING BUT NOT LIMITED TO IMPLIED WARRANTIES OF MERCHANT-ABILITY AND FITNESS FOR A PARTICULAR PURPOSE.
Limitation of Liability - GLS shall not be liable for damages of any kind, including without limitation special or consequential damages, arising outof your use of, or reliance upon, this publication or the content hereof.
This Report may contain advice, opinions, and statements of various information providers and content providers. GLS does not represent orendorse the accuracy or reliability of any advice, opinion, statement or other information provided by any information provider or content provider,or any user of this Report or other person or entity. Reliance upon any such opinion, advice, statement, or other information shall also be at yourown risk.
Prior to the execution of a purchase or sale or any security or investment, you are advised to consult with investment professionals, as appropri-ate, to verify pricing and other information. Neither GLS, its information providers or content providers shall have any liability for investmentdecisions based upon, or the results obtained from, the information provided. Neither GLS, its information providers or content providers guaran-tee or warrant the timeliness, sequence, accuracy, or completeness of any such information. Nothing contained in this Report is intended to be,nor shall it be construed as, investment advice.