CPC Monthly Climate Review Feb 2014 Jin Huang Outline: 1.Global Patterns 2.Extremes and US anomalies...
41
CPC Monthly Climate Review Feb 2014 Jin Huang Outline: 1. Global Patterns 2. Extremes and US anomalies 3. DJF Climate Attributions 4. Forecast Verifications 5. After thoughts on the Monthly Climate Reviews
-
Upload
jeffrey-brown -
Category
Documents
-
view
214 -
download
0
Transcript of CPC Monthly Climate Review Feb 2014 Jin Huang Outline: 1.Global Patterns 2.Extremes and US anomalies...

CPC Monthly Climate Review
Feb 2014Jin Huang
Outline:1. Global Patterns2. Extremes and US anomalies 3. DJF Climate Attributions4. Forecast Verifications5. After thoughts on the Monthly Climate Reviews
2
Global Patterns

Global SST Anomaly (0C) and Anomaly Tendency
- Positive (negative) SSTA persisted in the western (eastern) tropical Pacific.
- Strong positive SSTA presented in the northeastern Pacific and was associated with negative phase of PDO.
- Tripolar SST anomalies presented in the North Atlantic.
- Some large SSTAs existed in the South Ocean.
- Positive (negative) SST tendencies were observed in the central (eastern) equatorial Pacific Ocean.

During May-September 2013, well below-average SSTs were observed over the eastern half of the Pacific.
Since January 2014, SSTs have been below average across the eastern equatorial Pacific, while remaining above-average in the western Pacific.
Recent Evolution of Equatorial Pacific SST Departures (oC)
Longitude
Time

Longitude-Depth Temperature Anomaly and Anomaly Tendency in 2OS-2ON
- Strong positive (weak negative)
ocean temperature anomalies in
the western (eastern) equatorial
Pacific may suggest the potential
development of a warm event in
this year.
- Both positive and negative ocean
temperature anomalies were small
in the Indian and Atlantic Oceans.
- Ocean temperature tendencies
were positive in the central-
eastern Pacific and negative in the
both sides, suggesting an
eastward propagation of the
positive ocean temperature
anomalies along the equatorial
Pacific.

Low-level (850-hPa) Zonal (east-west) Wind Anomalies (m s-1)
Longitude
Westerly wind anomalies (orange/red shading).
Easterly wind anomalies (blue shading).
During the last half of January 2014, a strong westerly wind burst occurred over the western equatorial Pacific. Over the last couple weeks, another strong burst has emerged.
Time

Summary of Oceans focused on ENSO
Pacific Ocean ENSO neutral condition continued in Feb 2014. Positive anomalies of subsurface ocean temperature along
the equator propagated eastward and westerly wind burst-like surface wind anomaly were observed in Feb 2014.
ENSO-neutral is expected to continue in spring 2014, with about a 50% chance of El Niño developing during the summer or fall.
Negative PDO persisted in Feb 2014.
Indian Ocean Small anomalies.
Atlantic Ocean NAO switched into positive phase

- All models predicted a warming tendency and a majority of dynamical models predicted an El Nino in second half of 2014.
- Consensus probabilistic forecasts slightly favor a warm phase of ENSO in 2014.
- NOAA “ENSO Diagnostic Discussion” on 06 March 2014 issued “El Nino Watch” and suggests that “ENSO-neutral is expected to continue through the Northern Hemisphere spring 2014, with about a 50% chance of El Niño developing during the summer or fall”
IRI NINO3.4 Forecast Plum

Individual Model Forecasts: warming tendency or neutralJMA: Nino3, IC=Jan 2014
Australia: Nino3.4, IC=02Mar2014UKMO: Nino3.4, IC=Feb2014

NMME SST Forecasts
MAM 2014
1. Warm SSTAs in the North Pacific strengthen
2. Warm SSTAs in the tropical Atlantic
3. ENSO neutral 4. This pattern has seen
persistent for more than 6 months and it will persist to spring 2014
5. Models are consistent
March 2014

11
AO, NAO, PNA

12
Extremes and US anomalies in February 2014

13

14
Extremes in February 2014 (updated Feb.14)
• Heatwaves in part of Russia and Arctic (+11C above normal), China, Australia• Return of the polar vortex to North America.• Britain has had its wettest winter in 250 years.• Snow in Vietnam

15

U.S. Temperature and Precipitation Departures During the Last 30 and 90 Days
30-day (ending 1 Mar 2014) temperature departures (degree C)
90-day (ending 1 Mar 2014) % of average precipitation
90-day (ending 1 Mar 2014) temperature departures (degree C)
Last 30 Days
Last 90 Days
30-day (ending 1 Mar 2014) % of average precipitation

17

18
The UW multi model Ensemble
EMC Dec 2013Multi model ensemble
EMC/NCEP
Both show improvement of Californiaand west coast droughtWetness over the Dakotas continues
UW FEB
UW JAN
SM percentilesFor Feb 2014NCEP

19
Streamflow Percentiles (USGS)
Dry: Much improved over the west coast, dryness continues over Texas
Jan 2013
Feb 27-Mar 5FEB 2014

20
Drought Monitor
•Similar to the DM last month
•Drought conditions over California and Nevada and Texas
•

21
CPC Spring 2014 Temp and Precip Forecast

Drought Outlooks
22
Seasonal
Monthly
Monthly
23
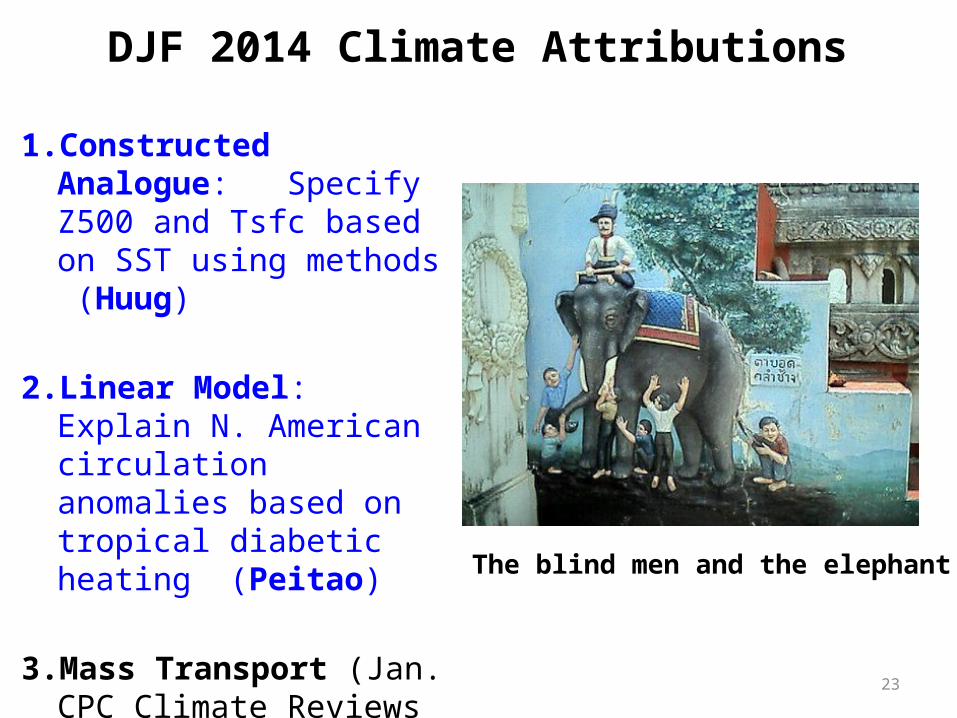
DJF 2014 Climate Attributions
1. Constructed Analogue: Specify Z500 and Tsfc based on SST using methods (Huug)
2. Linear Model: Explain N. American circulation anomalies based on tropical diabetic heating (Peitao)
3. Mass Transport (Jan. CPC Climate Reviews and tomorrow’s seminar) (Ming Cai)
The blind men and the elephant


Global SST

Tropical SST only


Global SST

Tropical SST only

What caused DJF climate anomalies in North America (NA)?(from Peitao Peng)
1. Circulation anomalies over NA region is quite persistent during the period, and so is the warmer SST in northeast Pacific;
2. Is the warmer SST a forcing? maybe, but how to understand the big month-to-month variation of atmospheric circulation over it?

Suggestions from the Relationship between 200mb Stream Function and Precipitation Patterns
1. Though ENSO is neutral, significant precipitation (diabatic heating) anomalies were found in the tropics during the period;
2. Phase relationships between the subtropical stream function and tropical precipitation suggest the tropical diabatic heating anomalies may be responsible for the circulation anomalies to some extent.

What are told by wave flux vectors?
1. Wave flux vectors (Plumb 1995) tell how low-frequency waves propagate and where the waves are started
2. The waves propagating to NA region are from subtropics for the December and January, and higher latitudes for the February

Waves Directly Forced by Tropical Diabatic Heating Anomalies
1. Tropical precipitation rate are converted to 3-D diabatic heating by giving a vertical profile;
2. Use the tropical heating to force a dynamical stationary wave model, which is linearized about monthly climatological flow, the direct global atmospheric response to the heating are obtained;
3. It turns out that for the December and January, the subtropical features from which waves propagating to NA region started are simulated, but little is explained for February.

Peitao’s Conclusions
• For Dec2013 and Jan2014, some subtropical features, from which waves propagating to NA region started, are likely forced by the tropical heating. The forced patterns may tend to modulate transient eddies, and thus generate and maintain the waves to NA region;
• For Feb2014, the circulation anomalies are more likely caused by the internal dynamics of the mid-latitude atmosphere.
• The effect of the warmer SSTs in northeast Pacific is not clear yet.

35
Forecast Verification

36
CPC DJF 2013-14 Forecast VerificationTemp Precip


38
DJF 2013-14 T2m


41
After Thoughts On CPC Monthly Climate Reviews
+ Helpful to get familiar with CPC products, current Climate States, etc.
- Overlap with other briefings
- The Reviews could be more useful, if they are- more “official” (e.g., made by “experts”)- more unique, e.g., including
- Attributions on recent climate events/anomalies- Verification/Attribution of forecast models/tools
- Have external audience, so that- i) external community will turn to CPC for expert
discussions on real-time climate attributions- Ii) get more eyes and brains on the issues