Cowen & Company
18
The global leader in midsize wide-body leasing and operating solutions Joe Hete President & CEO Quint Turner CFO Cowen & Company Global Transportation Conference Boston, Mass. September 7, 2016
Transcript of Cowen & Company

The global leader in midsize wide-body leasing and operating solutions
Joe Hete President & CEO
Quint Turner CFO
Cowen & Company Global Transportation Conference Boston, Mass. September 7, 2016

Safe Harbor Statement
Except for historical information contained herein, the matters discussed in this presentation contain
forward-looking statements that involve risks and uncertainties. There are a number of important
factors that could cause Air Transport Services Group's ("ATSG's") actual results to differ materially
from those indicated by such forward-looking statements. These factors include, but are not limited to,
our operating airlines' ability to maintain on-time service and control costs; the number and timing of
deployments and redeployments of our aircraft to customers; the cost and timing with respect to which
we are able to purchase and modify aircraft to a cargo configuration; the ability and timeliness with
which the Tianjin-based joint venture is able to secure the necessary approvals from the People’s
Republic of China and execute its business plan; the successful implementation and operation of the
new air network for Amazon; changes in market demand for our assets and services, and other factors
that are contained from time to time in ATSG's filings with the U.S. Securities and Exchange
Commission, including its Annual Report on Form 10-K and Quarterly Reports on Form 10-Q. Readers
should carefully review this presentation and should not place undue reliance on ATSG's forward-
looking statements. These forward-looking statements were based on information, plans and estimates
as of the date of this presentation. ATSG undertakes no obligation to update any forward-looking
statements to reflect changes in underlying assumptions or factors, new information, future events or
other changes.
2
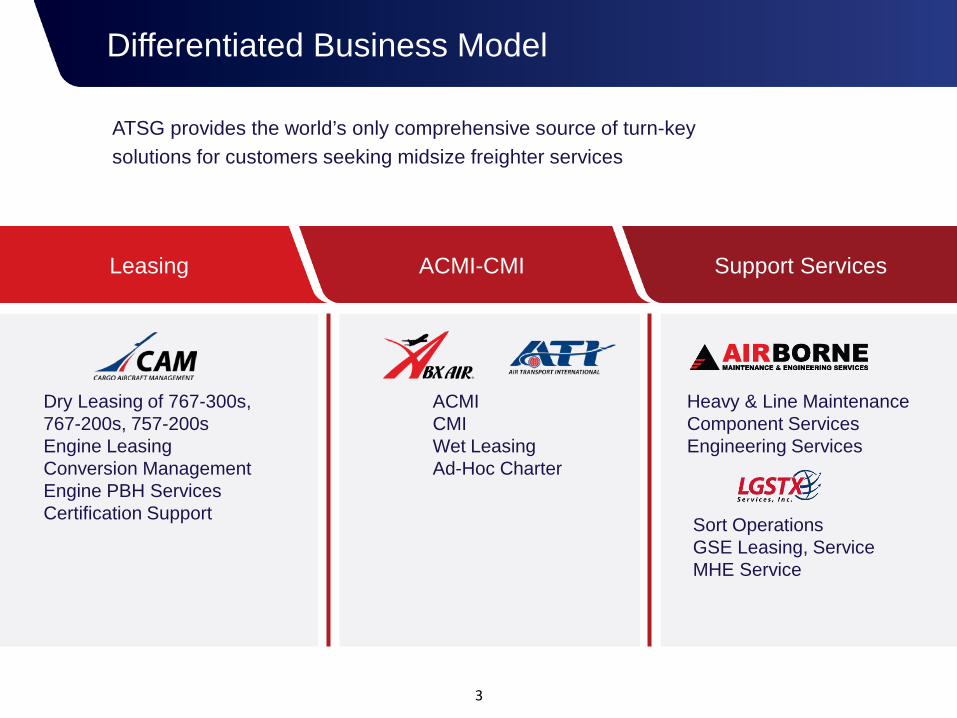
Differentiated Business Model
ATSG provides the world’s only comprehensive source of turn-key solutions for customers seeking midsize freighter services
Dry Leasing of 767-300s, 767-200s, 757-200s Engine Leasing Conversion Management Engine PBH Services Certification Support
Leasing ACMI-CMI Support Services
ACMI CMI Wet Leasing Ad-Hoc Charter
Heavy & Line Maintenance Component Services Engineering Services
3
Sort Operations GSE Leasing, Service MHE Service

Developments Driving Value Creation, Share Gains
DHL relationship amendments effective in April 2015 extended freighter leases and operating agreements through March 2019. Expanded DHL-leased fleet, added more opportunities for ATSG’s solutions within DHL’s global network. Thirteen 767s under multi-year dry lease at April 2015 will grow to seventeen in September 2016; latest three 767-300s for 8-year leases.
International growth & diversification through new customers in Asia and Europe. DHL represented 37% of revenues in 2Q 2016, compared with 48% in 2Q 2016. Amazon 22%, U.S. Military 13%
Fleet expansion from two Boeing 767s added 2Q 2015 to 2Q 2016. Five more due in 2H 2016 as dry leases for Amazon, DHL and Amerijet. At year-end, 767 fleet to be 81% leased, with remaining terms of three to eight years.
Agreements with Amazon following successful holiday trial, ATSG and Amazon in March complete long-term agreements for 20 leased and operated 767 freighters (10 leased to date), plus warrants for 19.9% of ATSG shares
Hangar investment validated through new AMES MRO contract for Delta’s B717 fleet
Pathway into China market through joint venture with Okay Airlines and VIPShop for regional cargo airline; focused on expanding e-commerce opportunity throughout SE Asia. Opportunity for additional ATSG freighter leases Strong operating performance yielded Adjusted EBITDA of $103M million in 1H 2016; projecting $218 million for full year 2016, excluding impact of non-cash pension, affiliate debt issuance, and warrant-related items.
Improved shareholder value thru strong stock price growth and more than $70 million in share repurchases since Board authorization in May 2015, plus increased buyback flexibility under May 2016 credit amendment
4
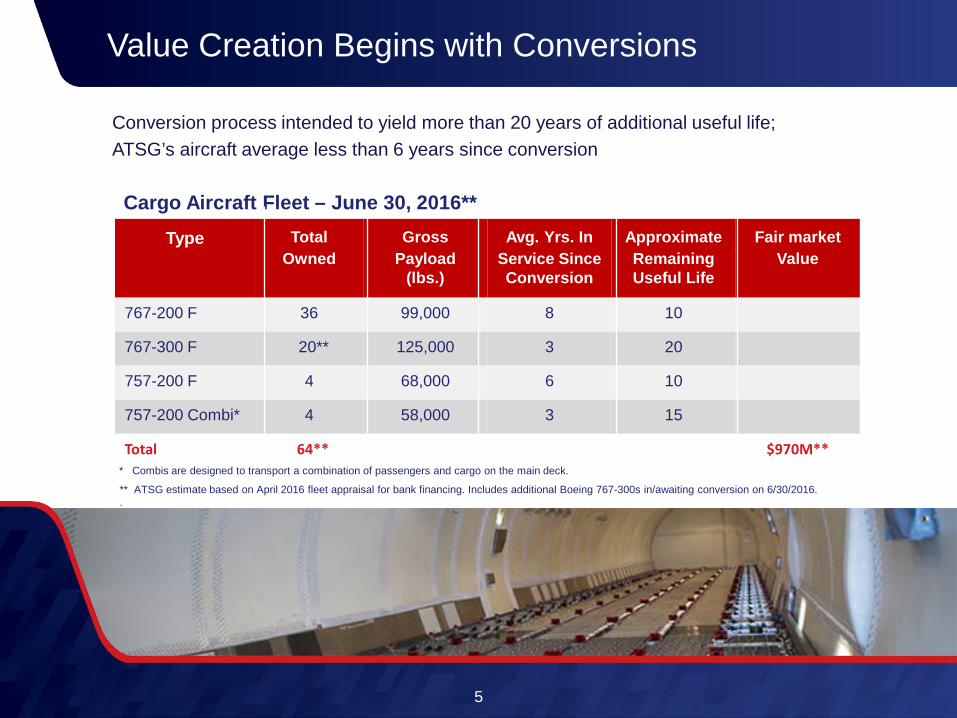
Value Creation Begins with Conversions
Conversion process intended to yield more than 20 years of additional useful life; ATSG’s aircraft average less than 6 years since conversion
Type Total Owned
Gross Payload
(lbs.)
Avg. Yrs. In Service Since Conversion
Approximate Remaining Useful Life
Fair market Value
767-200 F 36 99,000 8 10
767-300 F 20** 125,000 3 20
757-200 F 4 68,000 6 10
757-200 Combi* 4 58,000 3 15
Total 64** $970M**
Cargo Aircraft Fleet – June 30, 2016**
* Combis are designed to transport a combination of passengers and cargo on the main deck. ** ATSG estimate based on April 2016 fleet appraisal for bank financing. Includes additional Boeing 767-300s in/awaiting conversion on 6/30/2016. .
5
17
30
2 20
24
1 10
43
7
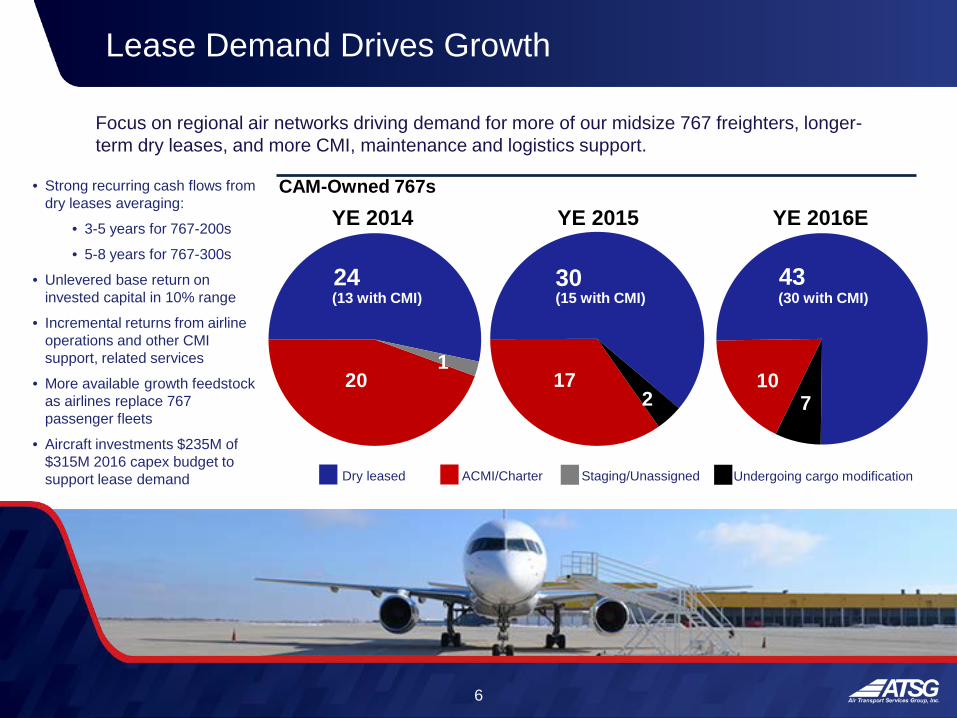
Lease Demand Drives Growth
6
YE 2014 YE 2015 CAM-Owned 767s
YE 2016E
Focus on regional air networks driving demand for more of our midsize 767 freighters, longer-term dry leases, and more CMI, maintenance and logistics support.
Dry leased ACMI/Charter Staging/Unassigned
(13 with CMI) (15 with CMI)
• Strong recurring cash flows from dry leases averaging:
• 3-5 years for 767-200s
• 5-8 years for 767-300s
• Unlevered base return on invested capital in 10% range
• Incremental returns from airline operations and other CMI support, related services
• More available growth feedstock as airlines replace 767 passenger fleets
• Aircraft investments $235M of $315M 2016 capex budget to support lease demand
(30 with CMI)
Undergoing cargo modification

Target Growing Network Demand
E-commerce, distributed manufacturing trends creating demand for new express networks
Abundant ACMI and Dry Lease Opportunities
MIDDLE EAST • Strong double-digit growth in 2015 • Aging network fleets due for replacement • CAM completes two 767 dry leases to DHL-Mideast ASIA • Rapid e-commerce, distributed manufacturing growth • Air express markets growing at similar pace • Air networks operating narrow-body freighters will
require upgrades as payloads increase
AMERICAS • Consistent DHL network growth • Amazon rapid e-commerce growth • Miami airport hub supports Latin America trade lanes • 767 range/payload an ideal fit for north-south routes
EUROPE • Investment in Sweden’s West Atlantic AB yields
additional 767 dry leases • Opportunities with other carriers
7
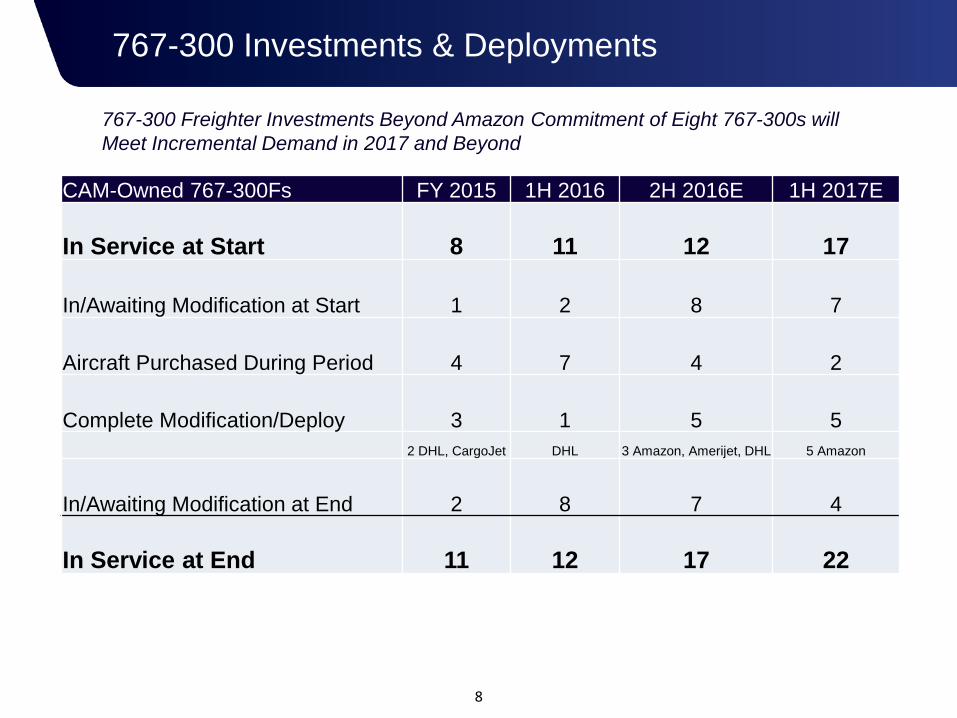
767-300 Investments & Deployments
8
CAM-Owned 767-300Fs FY 2015 1H 2016 2H 2016E 1H 2017E
In Service at Start 8 11 12 17
In/Awaiting Modification at Start 1 2 8 7
Aircraft Purchased During Period 4 7 4 2
Complete Modification/Deploy 3 1 5 5 2 DHL, CargoJet DHL 3 Amazon, Amerijet, DHL 5 Amazon
In/Awaiting Modification at End 2 8 7 4
In Service at End 11 12 17 22
767-300 Freighter Investments Beyond Amazon Commitment of Eight 767-300s will Meet Incremental Demand in 2017 and Beyond
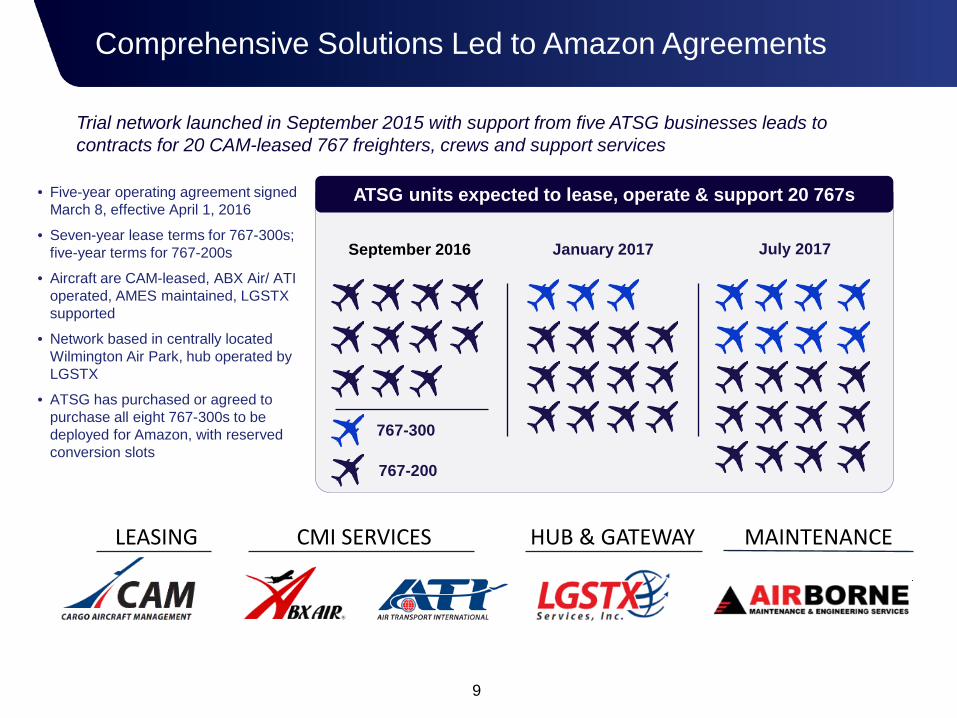
• Five-year operating agreement signed March 8, effective April 1, 2016
• Seven-year lease terms for 767-300s; five-year terms for 767-200s
• Aircraft are CAM-leased, ABX Air/ ATI operated, AMES maintained, LGSTX supported
• Network based in centrally located Wilmington Air Park, hub operated by LGSTX
• ATSG has purchased or agreed to purchase all eight 767-300s to be deployed for Amazon, with reserved conversion slots
Trial network launched in September 2015 with support from five ATSG businesses leads to contracts for 20 CAM-leased 767 freighters, crews and support services
ATSG units expected to lease, operate & support 20 767s
September 2016 January 2017 July 2017
767-300
767-200
Comprehensive Solutions Led to Amazon Agreements
LEASING CMI SERVICES HUB & GATEWAY MAINTENANCE
9

10
Amazon to receive ATSG warrants for purchase of up to 19.9% of ATSG common shares at $9.73 per share through March 2021
Warrant A Warrant B-1 7.7M shares
issued, vested 1.6M shares
to be issued and vest March 2018
Warrant B-2 ~1.6M shares (adjusts to 19.9%)
to be issued and vest September 2020
5.1M shares Pro-rata vesting as eight
767-300Fs are leased through mid-2017
• Investment Agreement for warrants signed March 8, 2016 • ATSG shareholders overwhelmingly approved increase in authorized shares and other enabling measure at annual
meeting on May 12, 2016 • Amazon may appoint a Board observer, and, alternatively, upon acquiring 10% of ATSG shares, nominate one
candidate for election to ATSG’s Board • Number of warrants required to true-up Amazon holdings to 19.9% will be reduced by share repurchases
Amazon Pact Sealed With Investment Agreement
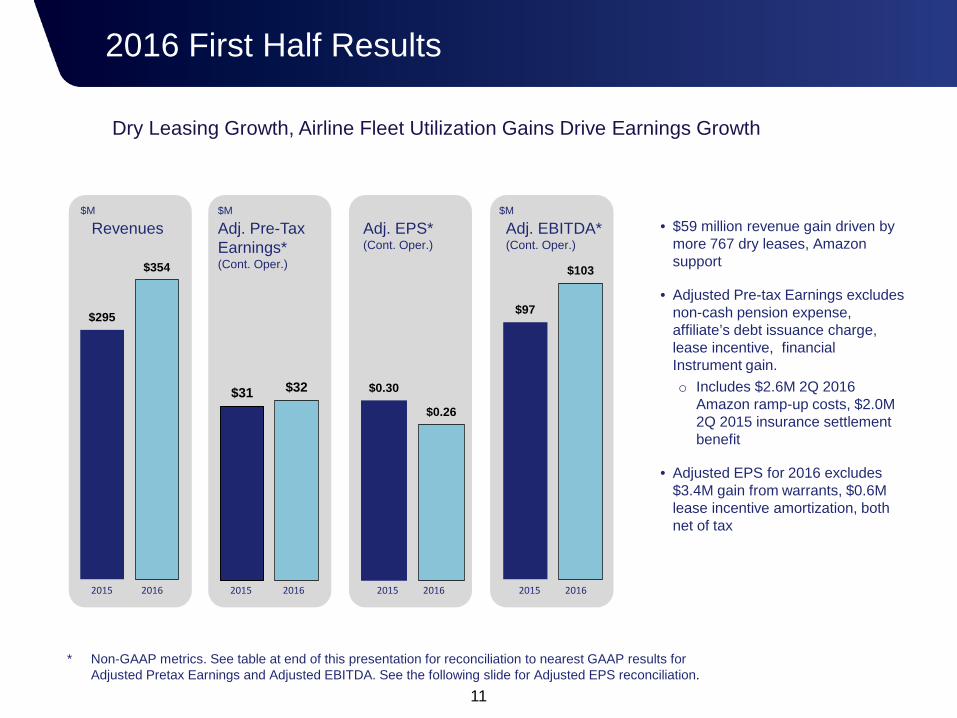
Dry Leasing Growth, Airline Fleet Utilization Gains Drive Earnings Growth
11
• $59 million revenue gain driven by more 767 dry leases, Amazon support
• Adjusted Pre-tax Earnings excludes non-cash pension expense, affiliate’s debt issuance charge, lease incentive, financial Instrument gain. o Includes $2.6M 2Q 2016
Amazon ramp-up costs, $2.0M 2Q 2015 insurance settlement benefit
• Adjusted EPS for 2016 excludes $3.4M gain from warrants, $0.6M lease incentive amortization, both net of tax
$295
$354
$31 $32 $0.30
$0.26
$97
$103
2016 First Half Results
Revenues Adj. Pre-Tax Earnings* (Cont. Oper.)
Adj. EPS* (Cont. Oper.)
Adj. EBITDA* (Cont. Oper.)
2015 2016 2015 2016 2015 2016 2015 2016
* Non-GAAP metrics. See table at end of this presentation for reconciliation to nearest GAAP results for Adjusted Pretax Earnings and Adjusted EBITDA. See the following slide for Adjusted EPS reconciliation.
$M $M $M
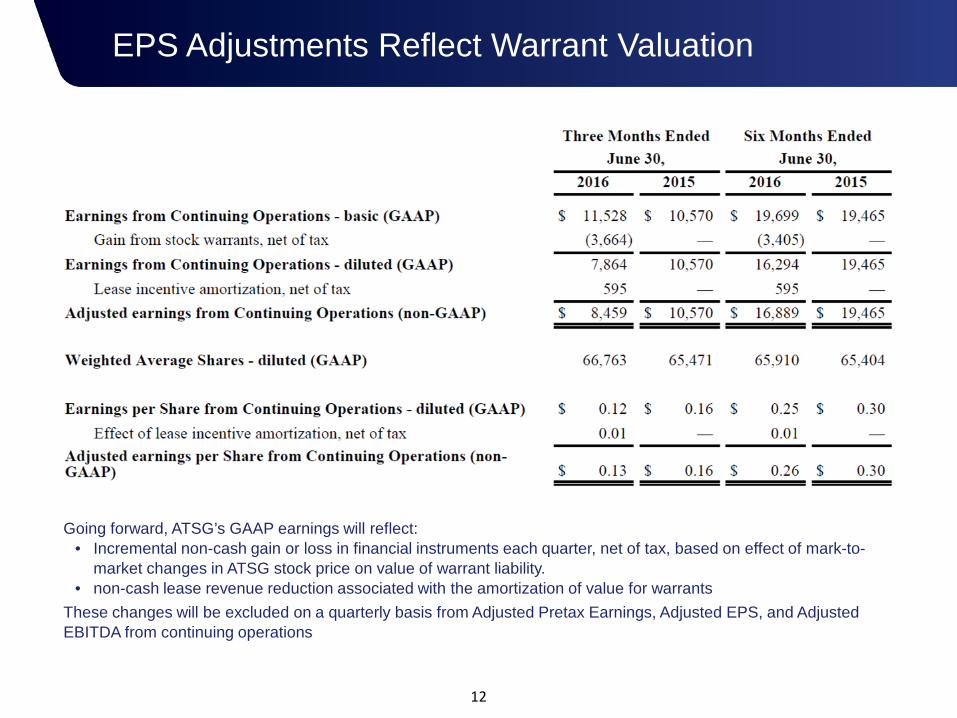
EPS Adjustments Reflect Warrant Valuation
12
Going forward, ATSG’s GAAP earnings will reflect: • Incremental non-cash gain or loss in financial instruments each quarter, net of tax, based on effect of mark-to-
market changes in ATSG stock price on value of warrant liability. • non-cash lease revenue reduction associated with the amortization of value for warrants
These changes will be excluded on a quarterly basis from Adjusted Pretax Earnings, Adjusted EPS, and Adjusted EBITDA from continuing operations

2.2x 2.4x
1.9x 1.6x
1.8x
2012 2013 2014 2015 6/30/2016
Debt Obligations / Adjusted EBITDA*
44
49 53
55 56
Strong Capital Base to Support Fleet Growth
• Adjusted EBITDA is a non-GAAP metric. Debt Obligations, fleet totals are as of end of period. See table at end of this presentation for reconciliation to nearest GAAP results.
13
Strong Adjusted EBITDA generation in 2016 backing expanded capacity under May 2016 credit facility amendments to maintain conservative balance sheet
757 & 767 Owned Freighters
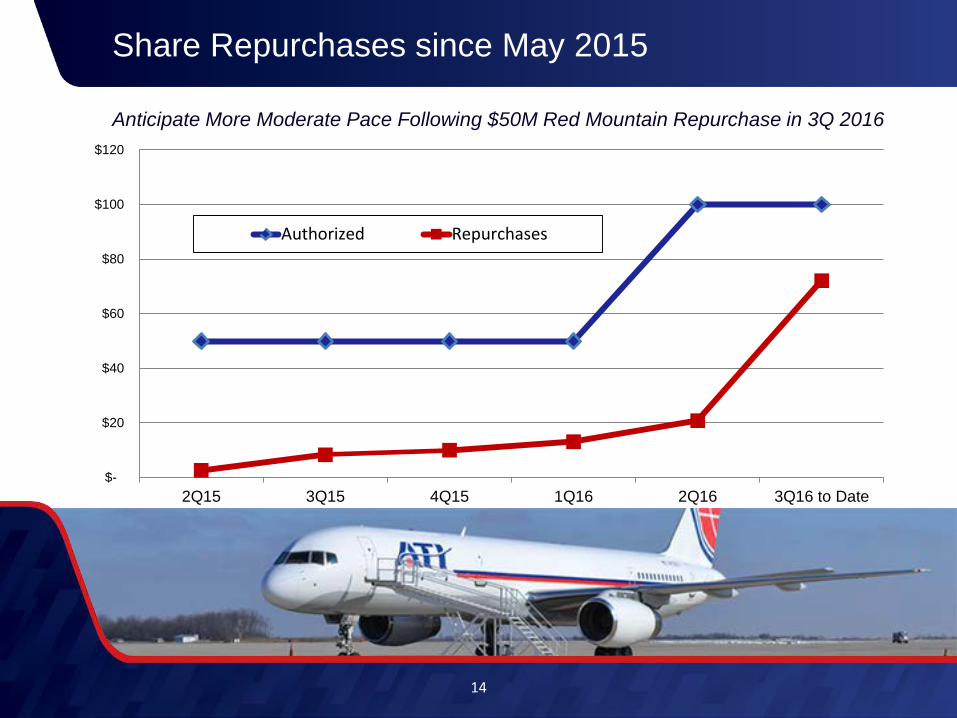
Share Repurchases since May 2015
14
$-
$20
$40
$60
$80
$100
$120
2Q15 3Q15 4Q15 1Q16 2Q16 3Q16 to Date
Authorized Repurchases
Anticipate More Moderate Pace Following $50M Red Mountain Repurchase in 3Q 2016
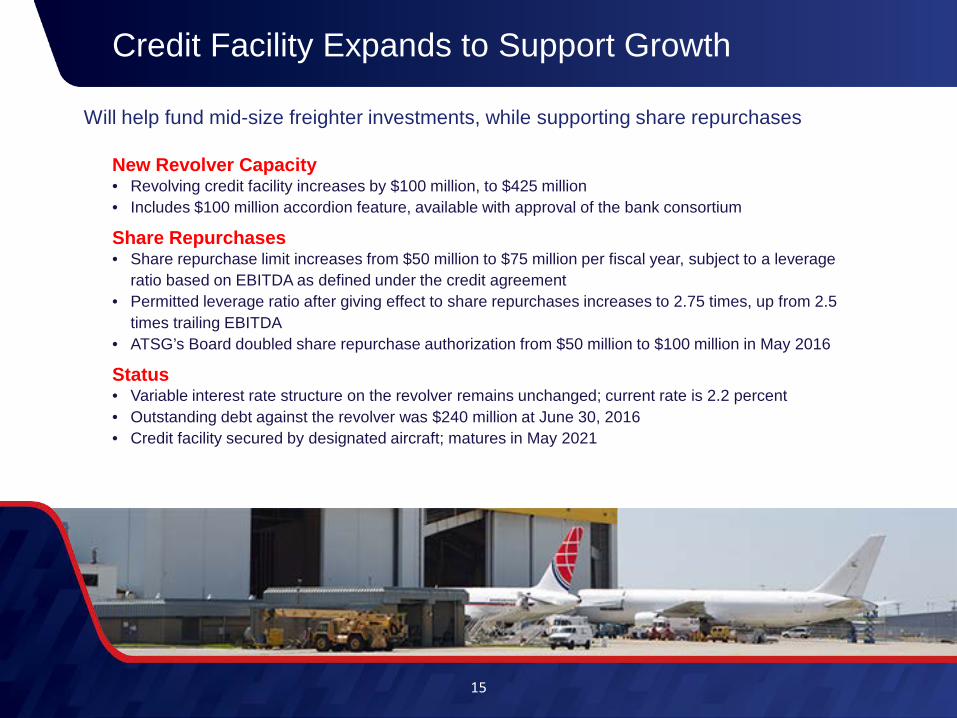
Credit Facility Expands to Support Growth
New Revolver Capacity • Revolving credit facility increases by $100 million, to $425 million • Includes $100 million accordion feature, available with approval of the bank consortium
Share Repurchases • Share repurchase limit increases from $50 million to $75 million per fiscal year, subject to a leverage
ratio based on EBITDA as defined under the credit agreement • Permitted leverage ratio after giving effect to share repurchases increases to 2.75 times, up from 2.5
times trailing EBITDA • ATSG’s Board doubled share repurchase authorization from $50 million to $100 million in May 2016
Status • Variable interest rate structure on the revolver remains unchanged; current rate is 2.2 percent • Outstanding debt against the revolver was $240 million at June 30, 2016 • Credit facility secured by designated aircraft; matures in May 2021
15
Will help fund mid-size freighter investments, while supporting share repurchases
Highlights and Outlook
Strong growth trajectory New and expanding business with new express networks, global network integrators and regional operators attracted to midsize freighter assets, and unique model that offers short-term ACMI flexibility and long-term dry-leasing cost advantages.
Attractive assets World’s largest fleet of 100% owned midsize converted Boeing freighters available on a dedicated basis, with wide range of freighter network applications. P-to-F conversions yield decades of reliable service with lower investment, backed by best-in-class maintenance capabilities.
Lease-driven sustained cash flow Business model emphasizes long-term returns from dry-leasing freighter assets to leading network operators, enhanced by unique combinations of airline, maintenance, logistics and network management services. Not a federal cash taxpayer until 2019 or later.
Strong balance sheet Debt leverage over last two years less than 2X Adjusted EBITDA, not expected to exceed 2.5X in 2016; credit facility amended in May to provide access to more credit at attractive rates to achieve growth objectives, return capital to shareholders.
Delivering shareholder value Fleet investments and share repurchases will continue to generate attractive returns, generating even greater ATSG value.
16
ATSG – a solid growth story with value appeal

The global leader in midsize wide-body leasing and operating solutions
Joe Hete President & CEO
Quint Turner CFO
Cowen & Company Global Transportation Conference Boston, Mass. September 7, 2016
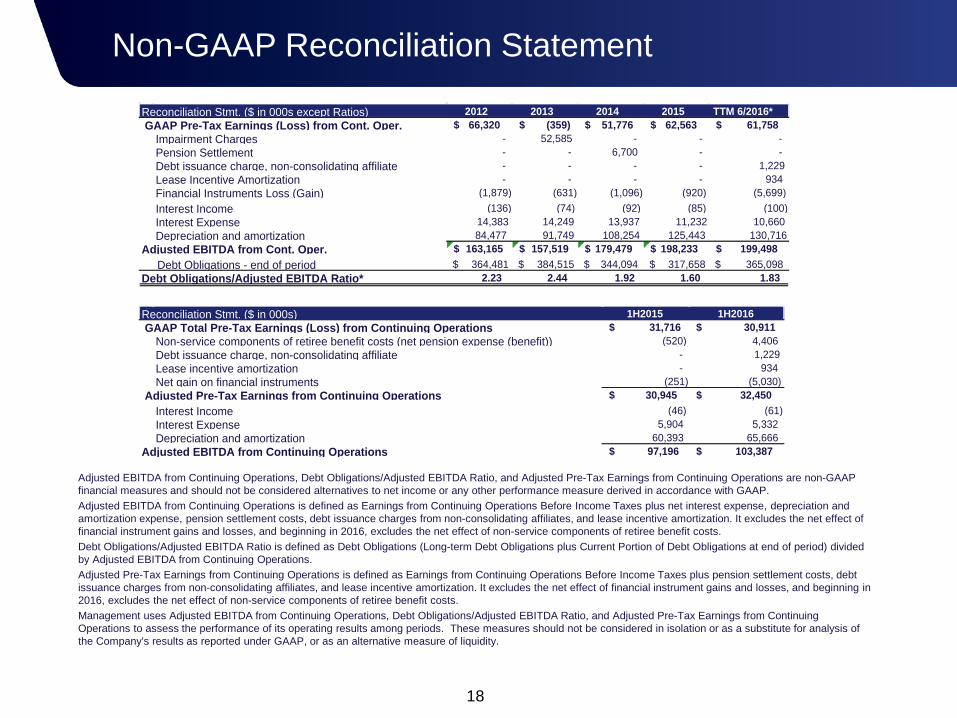
Non-GAAP Reconciliation Statement
18
2012 2013 2014 2015 TTM 6/2016*66,320$ (359)$ 51,776$ 62,563$ 61,758$
Impairment Charges - 52,585 - - - Pension Settlement - - 6,700 - - Debt issuance charge, non-consolidating affiliate - - - - 1,229 Lease Incentive Amortization - - - - 934 Financial Instruments Loss (Gain) (1,879) (631) (1,096) (920) (5,699) Interest Income (136) (74) (92) (85) (100) Interest Expense 14,383 14,249 13,937 11,232 10,660 Depreciation and amortization 84,477 91,749 108,254 125,443 130,716
163,165$ 157,519$ 179,479$ 198,233$ 199,498$ 364,481$ 384,515$ 344,094$ 317,658$ 365,098$
2.23 2.44 1.92 1.60 1.83
Reconciliation Stmt. ($ in 000s except Ratios)
Debt Obligations/Adjusted EBITDA Ratio*
GAAP Pre-Tax Earnings (Loss) from Cont. Oper.
Adjusted EBITDA from Cont. Oper. Debt Obligations - end of period
1H2015 1H201631,716$ 30,911$
Non-service components of retiree benefit costs (net pension expense (benefit)) (520) 4,406 Debt issuance charge, non-consolidating affiliate - 1,229 Lease incentive amortization - 934 Net gain on financial instruments (251) (5,030)
30,945$ 32,450$ Interest Income (46) (61) Interest Expense 5,904 5,332 Depreciation and amortization 60,393 65,666
97,196$ 103,387$
Reconciliation Stmt. ($ in 000s) GAAP Total Pre-Tax Earnings (Loss) from Continuing Operations
Adjusted EBITDA from Continuing Operations
Adjusted Pre-Tax Earnings from Continuing Operations
Adjusted EBITDA from Continuing Operations, Debt Obligations/Adjusted EBITDA Ratio, and Adjusted Pre-Tax Earnings from Continuing Operations are non-GAAP financial measures and should not be considered alternatives to net income or any other performance measure derived in accordance with GAAP. Adjusted EBITDA from Continuing Operations is defined as Earnings from Continuing Operations Before Income Taxes plus net interest expense, depreciation and amortization expense, pension settlement costs, debt issuance charges from non-consolidating affiliates, and lease incentive amortization. It excludes the net effect of financial instrument gains and losses, and beginning in 2016, excludes the net effect of non-service components of retiree benefit costs. Debt Obligations/Adjusted EBITDA Ratio is defined as Debt Obligations (Long-term Debt Obligations plus Current Portion of Debt Obligations at end of period) divided by Adjusted EBITDA from Continuing Operations. Adjusted Pre-Tax Earnings from Continuing Operations is defined as Earnings from Continuing Operations Before Income Taxes plus pension settlement costs, debt issuance charges from non-consolidating affiliates, and lease incentive amortization. It excludes the net effect of financial instrument gains and losses, and beginning in 2016, excludes the net effect of non-service components of retiree benefit costs. Management uses Adjusted EBITDA from Continuing Operations, Debt Obligations/Adjusted EBITDA Ratio, and Adjusted Pre-Tax Earnings from Continuing Operations to assess the performance of its operating results among periods. These measures should not be considered in isolation or as a substitute for analysis of the Company's results as reported under GAAP, or as an alternative measure of liquidity.