Cowen Arena
146
EQUITY RESEARCH INITIATING COVERAGE Biotechnology October 3, 2013 Simos Simeonidis, Ph.D. [email protected] 646.562.1386 Yatin Suneja [email protected] 646.562.1388 Raymond Chang, M.D. [email protected] 646.562.1337 ARENA PHARMACEUTICALS (NASDAQ:ARNA) Initiation: BELVIQ's modest efficacy keeps us on the sidelines Recommendation Rating: Market Perform Price Target (in $): $4.50 Expected Return: (10.0)% Dividend: NA Enterprise Value (MM): $994.0 Earnings Per Share 2012A 2013E 2014E Q1 $(0.18) $(0.09)A $(0.08) Q2 $(0.12) $0.18A $(0.08) Q3 $(0.07) $(0.13) $(0.08) Q4 $(0.10) $(0.13) $(0.04) FY $(0.45) $(0.16) $(0.28) Stock Statistics as of 10/02/2013 (in $) Price: $5.00 52W Range: $11.00-$4.78 Shares Out (MM): 234.8 Market Cap (MM): $1,089.7 Net Debt (MM): 0.0 Net Cash Per Share: 0.76 Fundamentals Revenue (MM) ('12A) 27.6 Revenue (MM) ('13E) 81.1 Revenue (MM) ('14E) 37.5 We are initiating coverage of Arena Pharmaceuticals with a Market Perform rating and $4.50 price target. Despite well- structured partnerships and the potential for an efficacious combination follow-on product, BELVIQ's modest efficacy keeps us on the sidelines on ARNA. BELVIQ has a role in the new obesity landscape, but its efficacy is modest, and its safety profile is not without its issues. We expect BELVIQ (lorcaserin) to find a niche in the obesity space, possibly among female and diabetic obese patients, both large patient groups. However, we view its efficacy as marginal, and we expect this to be a major roadblock to this drug's commercial success. We expect BELVIQ will have a difficult time competing head-to-head with Qsymia and Contrave, should it get approved. In addition, BELVIQ's safety is not pristine either, since it comes with warnings about serotonin syndrome and valvular heart disease. BELVIQ/Phen combo may be the future for Arena, but if it is, that will likely not be for a number of years. Arena and Eisai recently announced plans to test the BELVIQ-plus-phentermine combination. We believe this combination has the potential for significant weight loss, similar to that of Fen- Phen, its predecessor, and theoretically without the disastrous side effects, given lorcaserin's selectivity for the serotonin 2C (vs. the 2B) receptor. However, 1) it could be a number of years until "Bel-Phen" gets to market & 2) the regulatory path, including CVOT requirements, is unclear. Despite that, 3) we have assumed that "Bel-Phen" is approved, have included it in our revenue estimates, and had it account for a significant portion of NPV in ARNA. Close to 52-week low, ARNA still trades on par or at premium to obesity peers. ARNA shares, close to a 52-week low, still trade at EV ~$1B, either on par or even at a premium to obesity peers VVUS ($10.19, Outperform) ($1B), OREX ($6.06 Outperform) ($750M). Our sum-of-the-parts NPV analysis points to a fair value of $4.59/share. Therefore, and despite recent decline in ARNA shares, we consider ARNA fairly valued and as even having some potential room for further downside. Please see addendum of this report for important disclosures. www.cowen.com MEMBER: FINRA/SIPC
-
Upload
phil-murray -
Category
Documents
-
view
58 -
download
0
Transcript of Cowen Arena

EQUITY RESEARCH
INITIATING COVERAGEBiotechnologyOctober 3, 2013Simos Simeonidis, [email protected] 646.562.1386Yatin [email protected] 646.562.1388Raymond Chang, [email protected] 646.562.1337
ARENA PHARMACEUTICALS (NASDAQ:ARNA)
Initiation: BELVIQ's modest efficacykeeps us on the sidelines
RecommendationRating: Market PerformPrice Target (in $): $4.50Expected Return: (10.0)%Dividend: NAEnterprise Value (MM): $994.0
Earnings Per Share2012A 2013E 2014E
Q1 $(0.18) $(0.09)A $(0.08)Q2 $(0.12) $0.18A $(0.08)Q3 $(0.07) $(0.13) $(0.08)Q4 $(0.10) $(0.13) $(0.04)FY $(0.45) $(0.16) $(0.28)
Stock Statistics as of 10/02/2013 (in $)Price: $5.0052W Range: $11.00-$4.78Shares Out (MM): 234.8Market Cap (MM): $1,089.7Net Debt (MM): 0.0Net Cash Per Share: 0.76 FundamentalsRevenue (MM) ('12A) 27.6Revenue (MM) ('13E) 81.1Revenue (MM) ('14E) 37.5
We are initiating coverage of Arena Pharmaceuticals with aMarket Perform rating and $4.50 price target. Despite well-structured partnerships and the potential for an efficaciouscombination follow-on product, BELVIQ's modest efficacykeeps us on the sidelines on ARNA.
BELVIQ has a role in the new obesity landscape, but its efficacy is modest, andits safety profile is not without its issues.We expect BELVIQ (lorcaserin) to find a niche in the obesity space, possibly among femaleand diabetic obese patients, both large patient groups. However, we view its efficacy asmarginal, and we expect this to be a major roadblock to this drug's commercial success. Weexpect BELVIQ will have a difficult time competing head-to-head with Qsymia and Contrave,should it get approved. In addition, BELVIQ's safety is not pristine either, since it comes withwarnings about serotonin syndrome and valvular heart disease.
BELVIQ/Phen combo may be the future for Arena, but if it is, that will likely notbe for a number of years.Arena and Eisai recently announced plans to test the BELVIQ-plus-phentermine combination.We believe this combination has the potential for significant weight loss, similar to that of Fen-Phen, its predecessor, and theoretically without the disastrous side effects, given lorcaserin'sselectivity for the serotonin 2C (vs. the 2B) receptor. However, 1) it could be a number ofyears until "Bel-Phen" gets to market & 2) the regulatory path, including CVOT requirements,is unclear. Despite that, 3) we have assumed that "Bel-Phen" is approved, have included it inour revenue estimates, and had it account for a significant portion of NPV in ARNA.
Close to 52-week low, ARNA still trades on par or at premium to obesity peers.ARNA shares, close to a 52-week low, still trade at EV ~$1B, either on par or even at apremium to obesity peers VVUS ($10.19, Outperform) ($1B), OREX ($6.06 Outperform)($750M). Our sum-of-the-parts NPV analysis points to a fair value of $4.59/share. Therefore,and despite recent decline in ARNA shares, we consider ARNA fairly valued and as evenhaving some potential room for further downside.
Please see addendum of this report for important disclosures.
www.cowen.comMEMBER: FINRA/SIPC

Company Description
Arena’s lead product, BELVIQ (lorcaserin), a selective serotonin (5-HT) 2C receptor agonist,
was approved by the FDA for the treatment of obesity (―chronic weight management‖) in June
2012 and was launched in the U.S. in June 2013. BELVIQ has demonstrated modest weight
loss with a relatively benign safety profile in three Phase III trials. BELVIQ has been classified
by the U.S. Drug Enforcement Administration (DEA) as a Schedule IV drug. Arena has
partnered BELVIQ with Eisai in North and South America. Under this agreement, Arena sells
BELVIQ to Eisai at ―transfer prices‖ (i.e. royalty rates) ranging from 31.5%-36.5% of Eisai’s
annual net sales in the U.S. Additionally, Arena is entitled to receive up to $1.2B in milestones
and ―purchase price adjustments‖ (i.e. sales milestones) from Eisai. Through its G-protein-
coupled receptor (GPCR)-focused drug discovery platform, Arena has internally developed
early stage pipeline candidates, which include: 1) temanogrel, an inverse agonist of the
serotonin 2A receptor, which has completed two Phase I trials and is being developed in
partnership with South Korean biopharma Ildong for treatment of thrombotic diseases; 2)
APD811, an orally available agonist of the prostacyclin (IP) receptor for the treatment of
pulmonary arterial hypertension (PAH), which has recently completed Phase I testing in
healthy volunteers, and will be evaluated in a Phase II trial in 1Q14; 3) APD334, an S1P1
receptor agonist, which is being developed as a potential treatment for autoimmune diseases,
including multiple sclerosis and rheumatoid arthritis, and recently completed Phase I dosing in
healthy volunteers; and 4) APD371, a CB2 receptor agonist, currently in preclinical
development as a potential treatment for pain. Arena was founded in 1997, is based in San
Diego, CA, and currently has approximately 290 employees.
Arena: R&D Pipeline
Candidate name Indication P-C I II III FILING MKT Comments
BELVIQ Obesity • Launched in the US on June 7, 2013 by Eisai
BELVIQ + Phentermine Obesity • Eisai to initiate a 12-week pilot study YE13/1Q14
Temanogrel Thrombotic disease • Partnered with Ildong
APD811 Pulmonary arterial hypertension (PAH) • Phase II in PAH to be initiated 1Q14
APD334 Autoimmune diseases • Completed dosing in a Phase I trial in healthy subjects
APD371 Pain •
Total Drugs in Development 1 4 0 0 0 1
San Diego, CA Investor Relations Contact: Cindy McGee - 858.453.7200 x 1479 Source: Cowen and Company
www.cowen.comMEMBER: FINRA/SIPC 2
EQUITY RESEARCHCowen and Company, LLC

Arena: Expected Milestones
Milestones Timing
Regulatory submission in South Korea YE13/1Q14
Regulatory submission in Brazil YE13/1Q14
Initiate a 12-week pilot study of BELVIQ in combination with Phentermine ( conducted by Eisai ) YE13/1Q14
Phase I PK data for BELVIQ in combination with Phentermine (conducted by Arena ) 2013/14
Decision on Mexican MAA filing 2014
Decision on Canadian MAA filing 2014
Ildong to initiate a Phase I trial of temanogrel YE13
Initiation of a Phase II trial of APD811 in PAH 1Q14
BELVIQ
Other pipeline
Source: Cowen and Company
www.cowen.comMEMBER: FINRA/SIPC 3
EQUITY RESEARCHCowen and Company, LLC

Investment Thesis
We are initiating coverage of Arena Pharmaceuticals (ARNA) with a Market Perform
rating and a 12-month price target of $4.50/share. Our thesis on ARNA is that the
company’s lead asset, BELVIQ (lorcaserin), a novel, twice-a-day agent approved in the U.S.
for the treatment of obesity (―chronic weight management‖), which was launched in the U.S.
market in June 2013, will have a very difficult time garnering significant market share, mainly
due to its modest efficacy. In addition, the compound’s safety is not without its issues, since in
addition to the carcinogenicity and valvulopathy signals that emerged in its preclinical studies,
the BELVIQ label includes warnings about serotonin syndrome (a potentially significant issue,
since many overweight and obese patients present with depression and take SSRIs) and
valvular heart disease (with the Fen-Phen history still very fresh in physicians’ minds). Our
view of BELVIQ’s overall clinical profile is based on A) our own analysis of the BELVIQ clinical
dataset, in conjunction with the datasets from the Qsymia and Contrave clinical trials, and B) a
100-physician survey that we conducted in order to gain an understanding of prescribers’
views of these new anti-obesity agents, which we have included at the end of our initiation.
Qsymia could make things very difficult for BELVIQ in the next 12 months…Our detailed
analysis of the clinical datasets for the three obesity compounds, which is included in the back
of our report, leads us to believe that Qsymia will end up being the leader in the market, given
its strong weight loss efficacy, which comes with once-a-day convenience. Furthermore, and
despite the fact that Vivus’ recently ousted management team and board have faced significant
difficulties in the Qsymia launch thus far, most of which have been self-inflicted by, for
example, not partnering the drug, as Arena management did appropriately, in our view, we
expect that the recent changes at Vivus may serve to relieve some of these issues, for
example, if the new team manages to secure a commercial partner for Qsymia.
Were such a partnership to materialize, especially one in which Qsymia would be partnered
with a big pharma or specialty pharma company with considerable experience in marketing
primary care products in the metabolic space, and one in which a substantial level of
commercial resources would be committed, this could pose an even more daunting
commercial threat to BELVIQ, which until recently was facing a theoretically much easier
opponent: Qsymia was approved with a fairly ominous REMS program, was only available via
mail-order, and was (still is) being detailed by a 180-person salesforce. Right now, the REMS
has been modified, and the drug is available in retail pharmacies; again, should the new
regime at Vivus manage to convert its formidable Rolodex into a strong partnership, BELVIQ,
with its modest-to-underwhelming weight loss, and the shadows (justified or not) of
carcinogenicity and valvulopathy association in some physicians’ minds (again, fair or unfair),
could be in very serious commercial trouble.
…and after that, things could get even tougher, should Contrave make it to the market.
We expect the Qsymia-BELVIQ duopoly to become a three-way fight approximately 12 months
from now, with the U.S. approval of Contrave. Orexigen’s Contrave is a combination of
bupropion, an antidepressant with which U.S. PCPs are very familiar and very comfortable
prescribing (26M scripts annually), and naltrexone, an agent that is approved for the treatment
www.cowen.comMEMBER: FINRA/SIPC 4
EQUITY RESEARCHCowen and Company, LLC
of addiction and the main function of which is to reduce cravings. This combination product is
currently being tested in the LIGHT cardiovascular outcomes trial (CVOT). Interim data from
this trial are expected by early December 2013, and if positive, Orexigen is expecting to
resubmit the Contrave NDA by YE13; this drug could thus be on the market in 2H14. We view
Contrave as a formidable commercial opponent for both BELVIQ and Qsymia in the
obesity/weight loss space, and as one that could quickly garner significant market share and
pose a formidable competitive threat to both Qsymia and BELVIQ for the following reasons:
1) We view Contrave’s mechanism of action, given the combination of the two components
that are present in Contrave, as uniquely positioned to be very effective in the treatment of
obesity, since A) depression is a comorbidity in a large proportion of the obese population
(25-35%, according to a number of sources) and B) helping to deal with cravings and
binge-eating are viewed as especially helpful by the obesity experts with whom we have
consulted,
2) Contrave would be the only anti-obesity agent on the U.S. market that would have been
tested in and received the FDA’s OK to get to the market following (interim) data from a
CVOT study,
3) Contrave has a North American (plus Mexico) partnership with Takeda, which is a
company with a significant diabetes presence in the U.S., given the Actos/alogliptin
franchise, and appears to have committed substantial commercial resources behind this
product in terms of a primary care salesforce first position calling effort,
4) Contrave would be the only one of the three anti-obesity agents that could be sampled,
since both Qsymia and BELVIQ are DEA-scheduled drugs.
We don’t see the upside in ARNA shares…even though we have included
BELVIQ/Phentermine, E.U. BELVIQ revenues, and $1.2B in WW sales. Our Market Perform
rating on ARNA is based on our sum-of-the-parts NPV analysis, which includes revenues from
sales of both BELVIQ and the BELVIQ/Phentermine combination product in the U.S., and from
BELVIQ’s E.U. sales, where we have assumed Arena will be able to secure a partnership with
similar terms as in North America and other territories. We have modeled total peak U.S. sales
of BELVIQ and its combination product with Phentermine of $915M in 2029. We have also
modeled peak E.U. BELVIQ sales of $246M in 2026, and total WW sales of $1.2B in 2026. In
addition, we have assumed revenues from sales of BELVIQ and the BELVIQ/Phentermine
combination product in the other two territories for which Arena has secured partnerships,
namely South Korea and Taiwan.
While one could certainly make the argument that our revenue projections may have left room
for upside in BELVIQ sales, especially when compared to our projections for Qsymia and
Contrave, both of which we consider more efficacious products and thus more commercially
robust for a therapeutic area in which efficacy, in addition to safety, is of paramount
importance, it is also important to acknowledge that in our modeling assumption, we have
included projections for BELVIQ/Phentermine, a potential product for which we don’t know if
www.cowen.comMEMBER: FINRA/SIPC 5
EQUITY RESEARCHCowen and Company, LLC

and when it will get to the market, and, if and when it does, how it will do commercially, given
its inevitable association (fair or unfair, and that’s definitely one argument its competitors will
attempt to make) in physicians’ minds with Fen-Phen. In addition, we have also included in our
NPV calculations revenues from E.U. sales of BELVIQ, while again, we don’t know if and when
BELVIQ will get to the E.U. market. Based on all these modeling assumptions, we have arrived
at our 12-month price target of $4.50/share and our Market Perform rating on ARNA.
www.cowen.comMEMBER: FINRA/SIPC 6
EQUITY RESEARCHCowen and Company, LLC

Arena Partnered With Eisai to Market BELVIQ in North & South America
On July 1, 2010, two months before the first FDA AdCom in September 2010, which voted 9-5
against BELVIQ’s approval, Arena and Eisai announced a partnership agreement to market
BELVIQ in the U.S. The agreement was amended on May 10, 2012, the day of the second
FDA AdCom, which voted 18-4 to recommend BELVIQ’s approval, to include most of North
and South America, including Canada, Mexico, and Brazil. Under the agreement, Arena
received $50M as an upfront payment, $5M for the amendment, a $20M milestone payment for
inclusion in the BELVIQ label of data from the Phase III BLOOM-DM trial in T2D patients, a
$65M milestone upon DEA scheduling and launch, and a $1M milestone for regulatory
submissions in Mexico and Canada, for a total of $141M in milestone payments to date.
Under the terms of the agreement, Arena manufactures BELVIQ at its facility in Switzerland
and sells finished product to Eisai. The ―transfer price‖ (NOTE: this is the term used in the
agreement and one that Arena management has been using in its communications with
investors, and we believe it is equivalent to what most companies and investors commonly
refer as “royalty rate”) starts at 31.5% of Eisai’s annual net product sales and will increase on a
tiered basis, reaching a maximum rate of 36.5% on the portion of annual net product sales
exceeding $750M. Under the agreement, Arena is also entitled to receive up to $53.5M for
regulatory filings and approvals. In total, Arena is eligible to receive up to $1.19B in one-time
―purchase price adjustments‖ (NOTE: again, this is the term used in the agreement and one
that Arena management has been using in its communications with investors, and we believe it
is equivalent to what most companies and investors commonly refer as “sales milestones”).
These one-time purchase price adjustments would be paid in seven payments, and begin to be
triggered at annual net BELVIQ sales of $250M. The caveat here is that, in order for Arena to
receive all the milestones for which it is eligible, BELVIQ must achieve annual sales of $2.5B in
all the territories covered by the agreement.
www.cowen.comMEMBER: FINRA/SIPC 7
EQUITY RESEARCHCowen and Company, LLC

Arena and Eisai Partnership Summary
Partner Eisai
Geographies Eisai owns rights to North and South America (including Canada, Mexico and Brazil)
Partnership date Partnered with Eisai in July 2010; amended May 2012
Upfront payment $50M
US: 31.5%-36.5%
Other territories: 30.75%-35.75%
Amount received thus far
$141M ($50M in upfront; $5M for amending the agreement, and $20M in milestones
for including Phase III BLOOM-DM in the label; $65M received on DEA scheduling
and delivery of launch supply to Eisai; $1M for regulatory filings in Mexico and
Canada )
Regulatory milestones remaining $53.5M for regulatory filings and approvals
$185M in one-time purchase price adjustments for annual net sales in ex-US territories
Total potential purchase price
adjustment payments
up to $1.2B (would have to achieve at least $2.5B in annual sales in all the territorries
covered by the agreement)
Patent life
US patents expire mid-2023; (Arena has guided it believes it can receive up to an additional
three years of patent extension under Hatch-Waxman, extending US patents until mid-
2026)
Post-marketing costsEisai will pay for 90% of CVOT expenses and Arena will pay 10%;
Arena is responsible for 50% of certain pediatric development costs
Purchase price
adjustments/milestones
Transfer price
$330M in one-time purchase price adjustments ($300M) and milestones ($30M) with annual
net sales from $250M-$1B in the US.
Source: Cowen and Company, SEC Filings
Breakdown of Seven Purchase Price Adjustment Payments
Total Eisai Annual
Net Sales
Adjustment Payments to Arena in
Addition to Transfer Price
$250M $25M
$X $X
$X $X
$X $X
$X $X
$X $X
$2.5B $X
Total: $1.16B
Company disclosure
Source: Cowen and Company, SEC filings
Arena Partnered with Ildong for South Korean Rights
In November 2012, Arena and Ildong Pharmaceuticals entered into a collaboration agreement
to market BELVIQ in South Korea. Under the terms of the agreement, Arena received $5M as
an upfront payment and is entitled to receive $3M upon approval. Ildong is responsible for
development, regulatory approval, and ultimately, marketing and distribution of BELVIQ in
South Korea, including all related costs and expenses. Similarly to the agreement between
Arena and Eisai, Arena will sell finished product to Ildong. The purchase price will start at 35%
of Ildong’s annual net product sales, and will increase on a tiered basis up to 45% on the
www.cowen.comMEMBER: FINRA/SIPC 8
EQUITY RESEARCHCowen and Company, LLC

portion of annual net sales exceeding $15M. In its 2Q13 earnings call, Arena announced that
Ildong would file for regulatory approval in South Korea around YE13.
Arena Partnered with CY Biotech for Taiwanese Rights
In July 2013, Arena announced a marketing and supply agreement with CY Biotech Company
(CYB) for BELVIQ in Taiwan. Under the terms of the agreement, Arena received $2M as an
upfront payment and is eligible for a milestone payment upon approval of the first additional
BELVIQ indication in Taiwan. CYB is responsible for development, regulatory approval,
marketing, and distribution of BELVIQ in Taiwan, including all related costs and expenses.
Similarly to the agreement between Arena and Eisai, Arena will sell finished product to CYB.
The purchase price will be 45% of CYB’s annual net product sales, and Arena is eligible for
purchase price adjustment payments (which we understand to be equivalent to sales-based
milestone payments) based on annual net sales by CYB.
www.cowen.comMEMBER: FINRA/SIPC 9
EQUITY RESEARCHCowen and Company, LLC

Valuation
To value ARNA shares, we use a sum-of-the-parts methodology, and estimate the probability-
adjusted NPV of: 1) the BELVIQ royalty stream, 2) the four pipeline compounds, and 3) the
company’s current net cash position.
1) BELVIQ royalties and milestones ($3.62/share)
i) Eisai collaboration: In exchange for North and South American (including Canada, Mexico,
and Brazil) rights for BELVIQ, Arena is entitled to receive up to $1.2B in sales milestones and
purchase price adjustments (i.e sales milestones) from Eisai.
Under the terms of the agreement, Arena will sell finished product to Eisai. The ―transfer price‖
(i.e. royalty rate) will start at 31.5% of Eisai’s annual net product sales and will increase on a
tiered basis up to 36.5% on the portion of annual net product sales exceeding $750M. In June
2013, Arena received a $65M cash milestone from Eisai for DEA scheduling and the U.S.
launch of BELVIQ. In addition, according to the agreement with Eisai, on the year when annual
sales in the North and South American regions reach $250M, Arena will receive $55M as a
cash milestone from Eisai: a milestone payment of $30M, and the first purchase price
adjustment of $25M. In our model, we have assumed this happens in 2018. We have also
assumed that similar purchase price adjustments of $55M, $100M, and $150M will materialize
in 2020, 2022, and 2026, when BELVIQ sales in these regions reach $500M, $750M, and $1B
respectively.
Cowen Revenue Model: Eisai Selling Price Assumptions
1 < $ 2 5 0 M : 3 1 .5 %
2 $ 2 5 0 - $ 7 5 0 M : 3 4 %
3 > $ 7 5 0 : 3 6 .5 %
T ie rs
Source: Cowen and Company
ii) E.U. collaboration: We have assumed that Arena will enter into a collaboration agreement
with a pharmaceutical company for E.U. rights to BELVIQ. We have also assumed that Arena
will be able to secure similar economics for E.U. rights as for North/South American rights with
Eisai. We have assumed that Arena will receive an upfront payment of $100M in 2015 and
$50M in 2016 for commercial launch milestones. Arena will also receive $50M as a first
commercial milestone in 2018, $50M as a second commercial milestone in 2020, $50M as a
third commercial milestone in 2022, and a final commercial milestone of $75M in 2024. Arena
will sell finished product to its E.U. partner at a purchase price of 36% of annual net product
sales.
iii) Ildong collaboration: In exchange for South Korean rights to BELVIQ, Arena received
$5M as an upfront payment and is entitled to receive $3M on approval. Arena will sell finished
product to Eisai at a purchase price that will start at 35% of Ildong’s annual net product sales
www.cowen.comMEMBER: FINRA/SIPC 10
EQUITY RESEARCHCowen and Company, LLC

and will increase on a tiered basis up to 45% of the portion of annual net sales exceeding
$15M. The table below lists the selling price assumptions which we have used in our model for
South Korean sales.
Cowen Revenue Model: Ildong Selling Price Assumptions
1 < $ 5 M : 3 5 %
2 $ 5 - $ 1 5 M : 4 0 %
3 > $ 1 5 M : 4 5 %
Tie rs
Source: Cowen and Company, SEC filings
iv) CY Biotech collaboration: In exchange for Taiwanese rights to BELVIQ, Arena received
$2M as an upfront payment and is eligible for a milestone payment upon approval of an
additional BELVIQ indication in Taiwan. Similar to the agreement between Arena and
Eisai/Ildong, Arena will sell finished product to CYB. The purchase price will be 45% of CYB’s
annual net product sales, and Arena is eligible for purchase price adjustment payments (which
we understand to be equivalent to sales-based milestone payments) based on annual net
sales by CYB.
Patent life assumptions: BELVIQ is covered by issued U.S. and E.U. patents that expire in
mid-2023. Arena has already filed for extension under Hatch-Waxman. In our NPV
calculations, we have assumed that Arena will receive a 3-year patent extension under Hatch-
Waxman, resulting in U.S. patent expiry in mid-2026. Further, we have assumed that the
BELVIQ/Phentermine combination will be introduced to the U.S. in 2018, which will extend the
patent life beyond 2026, because of the longer patent life of BELVIQ/Phentermine. In the E.U.,
BELVIQ will be eligible to receive 10-year exclusivity, which will end in mid-2026, assuming a
2016 launch.
U.S./E.U./South Korea/Taiwan BELVIQ sales: We have modeled that BELVIQ could reach
peak sales of $915M, $246M, $50M, and $24M in the U.S., E.U., South Korea, and Taiwan,
respectively, for total peak sales of $1.2B in 2026.
Discount Rate and Probability of Success (POS): In calculating the net present value of
BELVIQ’s free cash flows, we use a 10% discount rate. We have also probability-adjusted the
E.U., South Korean (SK), and Taiwan royalties to Arena by assigning a 50%, 80%, and 80%
probability of success (POS) that the compound is approved and reaches the market in the
E.U., South Korea, and Taiwan, respectively. Using these assumptions, as shown in the table
below, we arrive at a probability-adjusted NPV for BELVIQ of $3.62/share.
www.cowen.comMEMBER: FINRA/SIPC 11
EQUITY RESEARCHCowen and Company, LLC

BELVIQ NPV analysis – US
($MM) 2013E 2014E 2015E 2016E 2017E 2018E 2019E 2020E 2021E 2022E 2023E 2024E 2025E 2026E 2027E 2028E 2029E
Total US Sales 18 54 88 122 158 290 372 462 634 806 753 797 844 894 901 907 915
Total revenue on US sales to ARNA 6 17 28 39 50 92 120 151 209 269 250 266 283 301 303 305 308
Total US revenues to ARNA 6 17 28 39 50 92 120 151 209 269 250 266 283 301 303 305 308
COGS 2 5 5 7 10 14 19 23 32 40 38 40 42 45 45 45 46
SG&A 33 35 36 36 37 38 19 20 20 21 21 21 22 22 23 23 24
R&D expenses 17 20 20 20 20 20 0 0 0 0 0 0 0 0 0 0 0
Milestone payments - Eisai 65 10 10 10 0 55 0 55 0 100 0 0 0 150 0 0 0
Tax adjusted EBIT 18 (33) (23) (15) (17) 71 76 139 134 247 153 153 164 288 177 178 179
Tax rate 0% 0% 0% 0% 0% 5% 8% 15% 15% 20% 20% 25% 25% 25% 25% 25% 25%
BELVIQ free cash flow 18 (33) (23) (15) (17) 71 76 139 134 247 153 153 164 288 177 178 179% y/y growth -286% -29% -35% 10% -525% 6% 83% -3% 84% -38% 0% 7% 75% -39% 1% 1%
Discount Period 0.24 1.24 2.24 3.24 4.24 5.24 6.24 7.24 8.24 9.24 10.24 11.24 12.24 13.24 14.24 15.24 16.24
Discount Factor 0.98 0.89 0.81 0.73 0.67 0.61 0.55 0.50 0.46 0.41 0.38 0.34 0.31 0.28 0.26 0.23 0.21
PV of BELVIQ Free Cash Flow $17 ($29) ($19) ($11) ($11) $43 $42 $69 $61 $102 $58 $53 $51 $81 $45 $42 $38
Discount Rate 10%
Perpetual Growth Rate 0%
Final year FCF $0
Terminal Value $0
Discount Factor
Present Value of Terminal Value $0
Present Value of Cash Flows $615
Present Value of Total Cash Flows $615
Fully Diluted Shares Outstanding 235
Present Value of Cash Flows Per Share $2.62
Probability of success 100%
BELVIQ NPV $2.62 Source: Cowen and Company
www.cowen.comMEMBER: FINRA/SIPC 12
EQUITY RESEARCHCowen and Company, LLC

BELVIQ NPV analysis – E.U.
($MM) 2013E 2014E 2015E 2016E 2017E 2018E 2019E 2020E 2021E 2022E 2023E 2024E 2025E 2026E 2027E 2028E 2029E
Total EU Sales - 16 35 55 78 101 128 157 176 198 221 246 25 12 12
Royalties on EU sales - - - 6 13 20 28 36 46 56 63 71 79 88 9 4 4
Total EU revenues to ARNA - - - 6 13 20 28 36 46 56 63 71 79 88 9 4 4
COGS 0 0 1 2 3 4 5 6 8 9 10 11 12 1 1 1
Milestone payments - EU 100 50 0 50 0 50 0 50 0 75 0 0 0 0 0
Tax adjusted EBIT - - 100 55 10 64 22 69 34 79 44 102 51 57 6 3 3
Tax rate 0% 0% 0% 0% 0% 5% 8% 15% 15% 20% 20% 25% 25% 25% 25% 25% 25%
BELVIQ free cash flow 0 0 100 55 10 64 22 69 34 79 44 102 51 57 6 3 3% y/y growth -45% -81% 509% -65% 211% -51% 134% -45% 134% -50% 11% -90% -50% 0%
Discount Period 0.24 1.24 2.24 3.24 4.24 5.24 6.24 7.24 8.24 9.24 10.24 11.24 12.24 13.24 14.24 15.24 16.24
Discount Factor 0.98 0.89 0.81 0.73 0.67 0.61 0.55 0.50 0.46 0.41 0.38 0.34 0.31 0.28 0.26 0.23 0.21
PV of BELVIQ Free Cash Flow $0 $0 $81 $40 $7 $39 $12 $35 $15 $33 $16 $35 $16 $16 $1 $1 $1
Discount Rate 10%
Perpetual Growth Rate 0%
Final year FCF $0
Terminal Value $0
Discount Factor
Present Value of Terminal Value $0
Present Value of Cash Flows $348
Present Value of Total Cash Flows $348
Fully Diluted Shares Outstanding 235
Present Value of Cash Flows Per Share $1.48
Probability of success 50%
BELVIQ NPV - EU $0.74 Source: Cowen and Company
www.cowen.comMEMBER: FINRA/SIPC 13
EQUITY RESEARCHCowen and Company, LLC

BELVIQ NPV analysis – South Korea/Taiwan
($MM) 2013E 2014E 2015E 2016E 2017E 2018E 2019E 2020E 2021E 2022E 2023E 2024E 2025E 2026E 2027E 2028E 2029E
Total South Korean Sales - - 2.1 4.6 6.6 8.8 19.9 24.5 33.1 34.8 40.7 42.8 45.0 47.4 49.9 50.0 50.1
Total Taiwan Sales - - 1.0 2.2 3.2 4.2 9.6 11.7 15.9 16.7 19.6 20.6 21.7 22.9 24.1 24.1 24.2
Total South Korea/Taiwan Sales - - 3.1 6.7 9.8 13.1 29.5 36.2 49.0 51.5 60.3 63.4 66.8 70.3 73.9 74.1 74.3
Total revenue on South Korean sales to ARNA - - 0.7 1.6 2.4 3.3 8.0 10.0 13.9 14.7 17.3 18.3 19.3 20.3 21.4 21.5 21.5
Total revenue on Taiwan sales to ARNA - - 0.5 1.0 1.4 1.9 4.3 5.3 7.2 7.5 8.8 9.3 9.8 10.3 10.8 10.9 10.9
Total SK/Taiwan revenues to ARNA - - 1 3 4 5 12 15 21 22 26 28 29 31 32 32 32
COGS 0 0 1 1 1 2 2 3 3 3 3 4 4 4 4
Milestone payments received 3 0 0 0 0 0 0 0 0 0 0 0 0 0 0
Tax adjusted EBIT 4 2 3 4 10 11 16 16 18 18 19 20 21 21 22
Tax rate 0% 0% 0% 5% 8% 15% 15% 20% 20% 25% 25% 25% 25% 25% 25%
BELVIQ free cash flow 0 0 4 2 3 4 10 11 16 16 18 18 19 20 21 21 22% y/y growth -46% 48% 34% 130% 15% 38% -1% 18% -1% 5% 5% 5% 0% 0%
Discount Period 0.24 1.24 2.24 3.24 4.24 5.24 6.24 7.24 8.24 9.24 10.24 11.24 12.24 13.24 14.24 15.24 16.24
Discount Factor 0.98 0.89 0.81 0.73 0.67 0.61 0.55 0.50 0.46 0.41 0.38 0.34 0.31 0.28 0.26 0.23 0.21
PV of BELVIQ Free Cash Flow $0 $0 $3 $2 $2 $3 $5 $6 $7 $7 $7 $6 $6 $6 $6 $5 $5
Discount Rate 10%
Perpetual Growth Rate 0%
Final year FCF $0
Terminal Value $0
Discount Factor
Present Value of Terminal Value $0
Present Value of Cash Flows $75
Present Value of Total Cash Flows $75
Fully Diluted Shares Outstanding 235
Present Value of Cash Flows Per Share $0.32
Probability of success 80%
BELVIQ NPV $0.25 Source: Cowen and Company
2) Arena’s pipeline ($0.21/share)
We believe that the market assigns minimal value to the company’s four pipeline compounds,
given their early stage of development and lack of clinical data: 1) temanogrel, an inverse
agonist of the serotonin 2A receptor, which has completed two Phase I trials and is being
developed in partnership with South Korean biopharma Ildong for treatment of thrombotic
diseases, 2) APD811, being developed for PAH, which has recently completed Phase I testing
in healthy volunteers and will be evaluated in a Phase II trial in 1Q14, 3) APD334, being
developed for autoimmune disease and currently in a Phase I trial in healthy volunteers, and 4)
APD371, which is currently in preclinical development. We believe that the value of this
pipeline: A) is very difficult to accurately quantify, and B) could increase or decrease
significantly, as more data become available. For the purposes of valuing these early stage
assets at this point, we have decided to assign them a total value of $50M.
3) Arena’s current cash position ($0.76/share)
Arena ended 2Q13 with $178.9M or $0.76/fully diluted share in cash.
www.cowen.comMEMBER: FINRA/SIPC 14
EQUITY RESEARCHCowen and Company, LLC

ARNA Sum-of-the-Parts Analysis
BELVIQ NPV - US $2.62
BELVIQ NPV - EU $0.74
BELVIQ NPV - SK/Taiwan $0.25
Pipeline $0.21
Cash $0.76
Sum-of-the-parts value for ARNA $4.59 Source: Cowen and Company
BELVIQ Revenue Model
Obesity is a chronic condition that affects approximately one-third of the United States
population, and its prevalence has doubled over the past two decades. The CDC (―Health,
United States 2012,‖ National Center for Health Statistics 2013) estimates that 35.7% of US
adults are obese (35.5% of men and 35.8% of women). This represents 71.3M adults between
the ages of 18 and 64 (35.4M men and 35.9M women) who can technically be classified as
obese based on their BMI. We have used this group as the starting point in our estimation of
the addressable market for BELVIQ in the U.S.
The prevalence of obesity is slightly lower in the E.U., and according to a number of literature
sources, male and female obesity rates vary from 4% to 28% and 6% to 36%, respectively. In
our revenue model, we have assumed that 20% of adults are obese in the E.U. This
represents 61.9M adults between 18 and 64 years of age (30.7M men and 31.3M women).
Using similar assumptions, we estimate that there are approximately 6.2M obese adults in
South Korea (3.1M men and 3.1M women) and 2.9M obese adults in Taiwan (1.5M men and
1.4M women). We estimate that this is the patient population that would be eligible for
treatment with BELVIQ in the E.U., South Korea, and Taiwan.
Pricing, penetration rates and sales: Eisai has priced BELVIQ at an average monthly cost of
$199.50, and we have estimated that BELVIQ will be launched at a 25% discount to U.S.
pricing in the E.U., and at a 50% discount to U.S. pricing in South Korea and Taiwan. We
estimate that BELVIQ will be launched in 2015 in South Korea and Taiwan, and in mid-2016 in
the E.U. We have also assumed that the BELVIQ/Phentermine combination will be introduced
to the U.S. in 2018, and to South Korea and Taiwan in 2019.
Peak penetration in men between 18 and 64 years of age: We estimate that WW
BELVIQ + BELVIQ/Phentermine sales in men between 18 and 64 years of age could
be ~$70M in 2018, and that at 0.51%, 0.18%, 0.59%, and 0.59% penetrations in the
U.S., E.U., South Korea, and Taiwan, respectively, BELVIQ could reach peak WW
sales of $240M in 2026.
Peak penetration in women between 18 and 64 years of age: We have assumed
that penetration in women will be four times that of men, and we estimate that WW
www.cowen.comMEMBER: FINRA/SIPC 15
EQUITY RESEARCHCowen and Company, LLC

BELVIQ + BELVIQ/Phentermine sales in women between 18 and 64 years of age
could be ~$290M in 2018, and that at 2.04%, 0.72%, 2.36%, and 2.36% penetrations
in the U.S., E.U., South Korea, and Taiwan, respectively, BELVIQ could reach peak
WW sales of $971M in 2026.
BELVIQ + BELVIQ/Phentermine revenue model ($MM) - US
BELVIQ+BELVIQ/Phentermine Revenue Model (US) 2012E 2013E 2014E 2015E 2016E 2017E 2018E 2019E 2020E 2021E 2022E 2023E 2024E 2025E 2026E 2027E 2028E 2029E
US population 318,769,185 321,574,353 324,404,208 327,258,965 330,138,844 333,044,066 335,974,853 338,931,432 341,914,029 344,922,872 347,958,193 351,020,225 354,109,203 357,225,364 360,368,948 363,540,194 366,739,348 369,966,654
Population growth 0.88% 0.88% 0.88% 0.88% 0.88% 0.88% 0.88% 0.88% 0.88% 0.88% 0.88% 0.88% 0.88% 0.88% 0.88% 0.88% 0.88% 0.88%
Total men 155,453,282 156,821,271 158,201,298 159,593,469 160,997,892 162,414,673 163,843,923 165,285,749 166,740,264 168,207,578 169,687,805 171,181,057 172,687,451 174,207,100 175,740,123 177,286,636 178,846,758 180,420,610
# of men between 18 and 64 years old 98,739,136 99,608,040 100,484,591 101,368,855 102,260,901 103,160,797 104,068,612 104,984,416 105,908,279 106,840,272 107,780,466 108,728,934 109,685,749 110,650,984 111,624,712 112,607,010 113,597,951 114,597,613
% of men between 18 and 64 years old 63.5% 63.5% 63.5% 63.5% 63.5% 63.5% 63.5% 63.5% 63.5% 63.5% 63.5% 63.5% 63.5% 63.5% 63.5% 63.5% 63.5% 63.5%
% of men between 18 and 64 years old that are obese 35.5% 35.5% 35.5% 35.5% 35.5% 35.5% 35.5% 35.5% 35.5% 35.5% 35.5% 35.5% 35.5% 35.5% 35.5% 35.5% 35.5% 35.5%
# of men between 18 and 64 years old that are obese 35,052,393 35,360,854 35,672,030 35,985,944 36,302,620 36,622,083 36,944,357 37,269,468 37,597,439 37,928,297 38,262,066 38,598,772 38,938,441 39,281,099 39,626,773 39,975,488 40,327,273 40,682,153
BELVIQ penetration in men 0.025% 0.05% 0.07% 0.09% 0.11% 0.04% 0.03% 0.02% 0.02% 0.02% 0.02% 0.02% 0.02% 0.02% 0.00% 0.00% 0.00%
# of obese men treated with BELVIQ 8,840 17,836 25,190 32,672 40,284 14,778 11,181 7,519 7,586 7,652 7,720 7,788 7,856 7,925 800 403 407
BELVIQ/Phentermine penetration in men 0.15% 0.20% 0.25% 0.33% 0.40% 0.35% 0.35% 0.35% 0.35% 0.35% 0.35% 0.35%
# of obese men treated with BELVIQ/Phentermine 55,417 74,539 93,994 125,163 153,048 135,096 136,285 137,484 138,694 139,914 141,145 142,388
Average # of prescriptions (Rx)/patient 4.5 6 6 6 6 6 6 6 6 6 6 6 6 6 6 6 6
% compliance 70% 70% 70% 70% 70% 70% 70% 70% 70% 70% 70% 70% 70% 70% 70% 70% 70%
Average cost/prescription (Rx) $200 $203 $210 $220 $231 $243 $255 $268 $281 $295 $310 $325 $341 $358 $376 $376 $376
% price increase 2% 3% 5% 5% 5% 5% 5% 5% 5% 5% 5% 5% 5% 5% 0% 0% 0%
Discount offered 35% 30% 22% 20% 20% 20% 20% 20% 20% 20% 20% 20% 20% 20% 20% 20% 20%
BELVIQ - total US Sales in men ($MM) $0 $4 $11 $17 $24 $31 $12 $10 $7 $7 $8 $8 $9 $9 $10 $1 $1 $1
BELVIQ/Phentermine - total US Sales in men ($MM) $0 $0 $0 $0 $0 $0 $45 $64 $84 $118 $152 $141 $149 $158 $167 $177 $179 $180
Total women 160,262,826 161,673,138 163,095,862 164,531,106 165,978,979 167,439,594 168,913,063 170,399,498 171,899,013 173,411,725 174,937,748 176,477,200 178,030,199 179,596,865 181,177,318 182,771,678 184,380,069 186,002,613
# of women between 18 and 64 years old 99,491,200 100,366,722 101,249,949 102,140,949 103,039,789 103,946,539 104,861,269 105,784,048 106,714,948 107,654,039 108,601,395 109,557,087 110,521,189 111,493,776 112,474,921 113,464,700 114,463,190 115,470,466
% of women between 18 and 64 years old 62.1% 62.1% 62.1% 62.1% 62.1% 62.1% 62.1% 62.1% 62.1% 62.1% 62.1% 62.1% 62.1% 62.1% 62.1% 62.1% 62.1% 62.1%
% of women between 18 and 64 years old that are obese 35.8% 35.8% 35.8% 35.8% 35.8% 35.8% 35.8% 35.8% 35.8% 35.8% 35.8% 35.8% 35.8% 35.8% 35.8% 35.8% 35.8% 35.8%
# of women between 18 and 64 years old that are obese 35,617,849 35,931,287 36,247,482 36,566,460 36,888,245 37,212,861 37,540,334 37,870,689 38,203,951 38,540,146 38,879,299 39,221,437 39,566,586 39,914,772 40,266,022 40,620,363 40,977,822 41,338,427
BELVIQ penetration in women 0.1% 0.20% 0.28% 0.36% 0.44% 0.16% 0.12% 0.08% 0.08% 0.08% 0.08% 0.08% 0.08% 0.08% 0.01% 0.00% 0.00%
# of obese women treated with BELVIQ 35,931 72,495 102,386 132,798 163,737 60,065 45,445 30,563 30,832 31,103 31,377 31,653 31,932 32,213 3,250 1,639 1,654
BELVIQ/Phentermine penetration in women 0.60% 0.80% 1.00% 1.32% 1.60% 1.40% 1.40% 1.40% 1.40% 1.40% 1.40% 1.40%
# of obese women treated with BELVIQ/Phentermine 225,242 302,966 382,040 508,730 622,069 549,100 553,932 558,807 563,724 568,685 573,690 578,738
Average # of prescriptions (Rx)/patient 4.5 6 6 6 6 6 6 6 6 6 6 6 6 6 6 6 6
% compliance 70% 70% 70% 70% 70% 70% 70% 70% 70% 70% 70% 70% 70% 70% 70% 70% 70%
Average cost/prescription (Rx) $200 $203 $210 $220 $231 $243 $255 $268 $281 $295 $310 $325 $341 $358 $376 $376 $376
% price increase 2% 3% 5% 5% 5% 5% 5% 5% 5% 5% 5% 5% 5% 5% 0% 0% 0%
Discount offered 35% 30% 22% 20% 20% 20% 20% 20% 20% 20% 20% 20% 20% 20% 20% 20% 20%
BELVIQ - total US Sales in women ($MM) $0 $15 $43 $70 $98 $127 $49 $39 $27 $29 $31 $33 $35 $37 $39 $4 $2 $2
BELVIQ/Phentermine - total US Sales in women ($MM) $0 $0 $0 $0 $0 $0 $184 $259 $343 $480 $616 $571 $605 $641 $679 $719 $726 $732
BELVIQ - total US Sales ($MM) $0 $18 $54 $88 $122 $158 $61 $48 $34 $36 $38 $41 $43 $46 $48 $5 $3 $3
BELVIQ/Phentermine - total US Sales ($MM) $0 $0 $0 $0 $0 $0 $229 $323 $428 $598 $768 $712 $754 $799 $846 $896 $904 $912
BELVIQ + BELVIQ/Phentermine- total US Sales ($MM) $0 $18 $54 $88 $122 $158 $290 $372 $462 $634 $806 $753 $797 $844 $894 $901 $907 $915
Total revenue on US sales to ARNA $0 $6 $17 $28 $39 $50 $92 $120 $151 $209 $269 $250 $266 $283 $301 $303 $305 $308
Source: Cowen and Company
www.cowen.comMEMBER: FINRA/SIPC 16
EQUITY RESEARCHCowen and Company, LLC

BELVIQ revenue model ($MM) – EU
BELVIQ Revenue Model (EU) 2012E 2013E 2014E 2015E 2016E 2017E 2018E 2019E 2020E 2021E 2022E 2023E 2024E 2025E 2026E 2027E 2028E 2029E
EU population 504,832,526 505,337,358 505,842,695 506,348,538 506,854,887 507,361,742 507,869,103 508,376,972 508,885,349 509,394,235 509,903,629 510,413,533 510,923,946 511,434,870 511,946,305 512,458,251 512,970,710 513,483,680
Population growth 0.10% 0.10% 0.10% 0.10% 0.10% 0.10% 0.10% 0.10% 0.10% 0.10% 0.10% 0.10% 0.10% 0.10% 0.10% 0.10% 0.10% 0.10%
Total men 241,263,217 241,504,480 241,745,984 241,987,730 242,229,718 242,471,948 242,714,420 242,957,134 243,200,091 243,443,291 243,686,735 243,930,421 244,174,352 244,418,526 244,662,945 244,907,608 245,152,515 245,397,668
% of men between 18 and 64 years old 63.5% 63.5% 63.5% 63.5% 63.5% 63.5% 63.5% 63.5% 63.5% 63.5% 63.5% 63.5% 63.5% 63.5% 63.5% 63.5% 63.5% 63.5%
# of men between 18 and 64 years old 153,242,963 153,396,206 153,549,602 153,703,152 153,856,855 154,010,712 154,164,722 154,318,887 154,473,206 154,627,679 154,782,307 154,937,089 155,092,026 155,247,118 155,402,366 155,557,768 155,713,326 155,869,039
% of men between 18 and 64 years old that are obese 20.0% 20.0% 20.0% 20.0% 20.0% 20.0% 20.0% 20.0% 20.0% 20.0% 20.0% 20.0% 20.0% 20.0% 20.0% 20.0% 20.0% 20.0%
# of men between 18 and 64 years old that are obese 30,648,593 30,679,241 30,709,920 30,740,630 30,771,371 30,802,142 30,832,944 30,863,777 30,894,641 30,925,536 30,956,461 30,987,418 31,018,405 31,049,424 31,080,473 31,111,554 31,142,665 31,173,808
BELVIQ penetration in men 0.02% 0.04% 0.06% 0.08% 0.10% 0.12% 0.14% 0.15% 0.16% 0.17% 0.18% 0.02% 0.01% 0.01%
# of obese men treated with BELVIQ - - - 6,154 12,321 18,500 25,000 30,895 37,111 43,339 46,481 49,629 52,784 55,945 5,600 2,803 2,806
Average # of prescriptions (Rx)/patient - 6 6 6 6 6 6 6 6 6 6 6 6 6 6
% compliance 70% 70% 70% 70% 70% 70% 70% 70% 70% 70% 70% 70% 70% 70%
Average cost/prescription (Rx) $158 $166 $174 $183 $192 $202 $212 $222 $233 $245 $257 $257 $257 $257
% price increase 5% 5% 5% 5% 5% 5% 5% 5% 5% 5% 0% 0% 0% 0%
Discount offered 25% 20% 20% 20% 20% 20% 20% 20% 20% 20% 20% 20% 20% 20%
BELVIQ - total EU Sales in men ($MM) $0 $0 $0 $0 $3 $7 $11 $15 $20 $25 $31 $35 $39 $43 $48 $5 $2 $2
Total women 251,591,877 251,843,469 252,095,312 252,347,408 252,599,755 252,852,355 253,105,207 253,358,312 253,611,671 253,865,282 254,119,148 254,373,267 254,627,640 254,882,268 255,137,150 255,392,287 255,647,679 255,903,327
% of women between 18 and 64 years old 62.1% 62.1% 62.1% 62.1% 62.1% 62.1% 62.1% 62.1% 62.1% 62.1% 62.1% 62.1% 62.1% 62.1% 62.1% 62.1% 62.1% 62.1%
# of women between 18 and 64 years old 156,188,296 156,344,484 156,500,829 156,657,330 156,813,987 156,970,801 157,127,772 157,284,900 157,442,184 157,599,627 157,757,226 157,914,983 158,072,898 158,230,971 158,389,202 158,547,592 158,706,139 158,864,845
% of women between 18 and 64 years old that are obese 20.0% 20.0% 20.0% 20.0% 20.0% 20.0% 20.0% 20.0% 20.0% 20.0% 20.0% 20.0% 20.0% 20.0% 20.0% 20.0% 20.0% 20.0%
# of women between 18 and 64 years old that are obese 31,237,659 31,268,897 31,300,166 31,331,466 31,362,797 31,394,160 31,425,554 31,456,980 31,488,437 31,519,925 31,551,445 31,582,997 31,614,580 31,646,194 31,677,840 31,709,518 31,741,228 31,772,969
BELVIQ penetration in women 0.08% 0.16% 0.24% 0.32% 0.40% 0.48% 0.56% 0.60% 0.64% 0.68% 0.72% 0.07% 0.04% 0.04%
# of obese women treated with BELVIQ 25,090 50,231 75,421 101,921 125,954 151,296 176,688 189,498 202,333 215,194 228,080 22,831 11,427 11,438
Average # of prescriptions (Rx)/patient 6 6 6 6 6 6 6 6 6 6 6 6 6 6
% compliance 70% 70% 70% 70% 70% 70% 70% 70% 70% 70% 70% 70% 70% 70%
Average cost/prescription (Rx) $158 $166 $174 $183 $192 $202 $212 $222 $233 $245 $257 $257 $257 $257
% price increase 5% 5% 5% 5% 5% 5% 5% 5% 5% 5% 0% 0% 0% 0%
Discount offered 25% 20% 20% 20% 20% 20% 20% 20% 20% 20% 20% 20% 20% 20%
BELVIQ - total EU Sales in women ($MM) $0 $0 $0 $0 $12 $28 $44 $63 $81 $103 $126 $142 $159 $177 $197 $20 $10 $10
BELVIQ - total EU Sales ($MM) $0 $0 $0 $0 $16 $35 $55 $78 $101 $128 $157 $176 $198 $221 $246 $25 $12 $12
Total revenue on EU sales to ARNA $0 $0 $0 $0 $6 $13 $20 $28 $36 $46 $56 $63 $71 $79 $88 $9 $4 $4
Source: Cowen and Company
www.cowen.comMEMBER: FINRA/SIPC 17
EQUITY RESEARCHCowen and Company, LLC
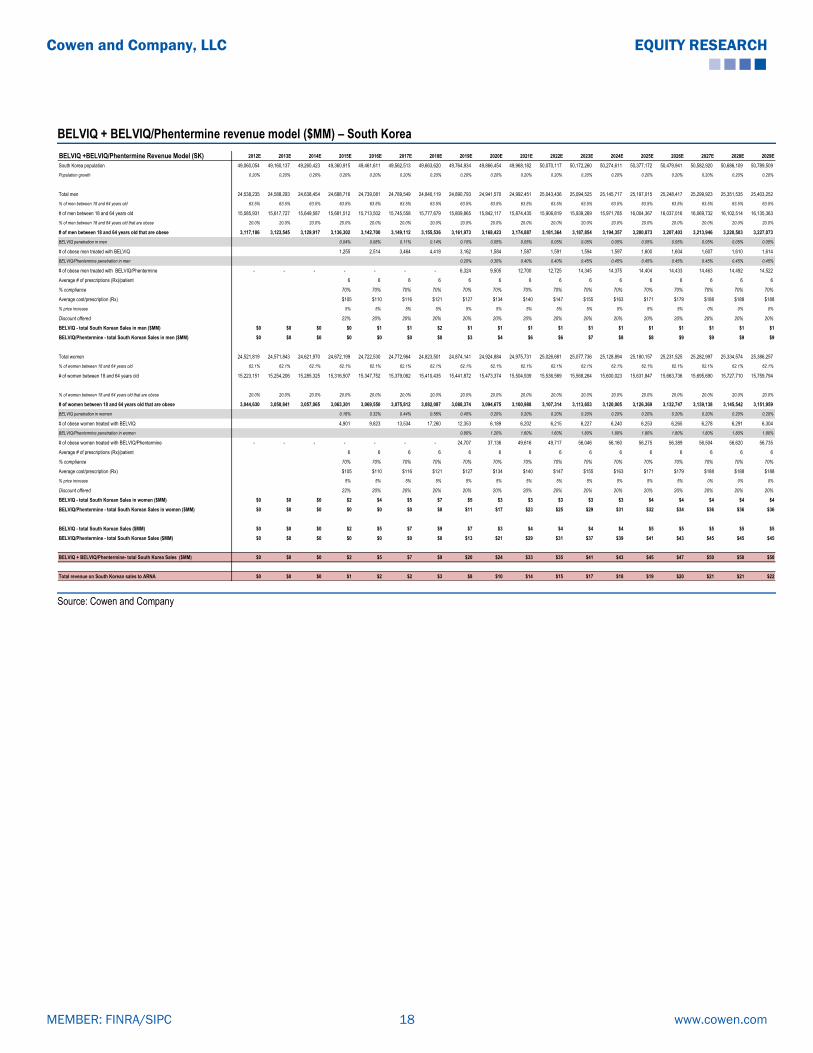
BELVIQ + BELVIQ/Phentermine revenue model ($MM) – South Korea
BELVIQ +BELVIQ/Phentermine Revenue Model (SK) 2012E 2013E 2014E 2015E 2016E 2017E 2018E 2019E 2020E 2021E 2022E 2023E 2024E 2025E 2026E 2027E 2028E 2029E
South Korea population 49,060,054 49,160,137 49,260,423 49,360,915 49,461,611 49,562,513 49,663,620 49,764,934 49,866,454 49,968,182 50,070,117 50,172,260 50,274,611 50,377,172 50,479,941 50,582,920 50,686,109 50,789,509
Population growth 0.20% 0.20% 0.20% 0.20% 0.20% 0.20% 0.20% 0.20% 0.20% 0.20% 0.20% 0.20% 0.20% 0.20% 0.20% 0.20% 0.20% 0.20%
Total men 24,538,235 24,588,293 24,638,454 24,688,716 24,739,081 24,789,549 24,840,119 24,890,793 24,941,570 24,992,451 25,043,436 25,094,525 25,145,717 25,197,015 25,248,417 25,299,923 25,351,535 25,403,252
% of men between 18 and 64 years old 63.5% 63.5% 63.5% 63.5% 63.5% 63.5% 63.5% 63.5% 63.5% 63.5% 63.5% 63.5% 63.5% 63.5% 63.5% 63.5% 63.5% 63.5%
# of men between 18 and 64 years old 15,585,931 15,617,727 15,649,587 15,681,512 15,713,502 15,745,558 15,777,679 15,809,865 15,842,117 15,874,435 15,906,819 15,939,269 15,971,785 16,004,367 16,037,016 16,069,732 16,102,514 16,135,363
% of men between 18 and 64 years old that are obese 20.0% 20.0% 20.0% 20.0% 20.0% 20.0% 20.0% 20.0% 20.0% 20.0% 20.0% 20.0% 20.0% 20.0% 20.0% 20.0% 20.0% 20.0%
# of men between 18 and 64 years old that are obese 3,117,186 3,123,545 3,129,917 3,136,302 3,142,700 3,149,112 3,155,536 3,161,973 3,168,423 3,174,887 3,181,364 3,187,854 3,194,357 3,200,873 3,207,403 3,213,946 3,220,503 3,227,073
BELVIQ penetration in men 0.04% 0.08% 0.11% 0.14% 0.10% 0.05% 0.05% 0.05% 0.05% 0.05% 0.05% 0.05% 0.05% 0.05% 0.05%
# of obese men treated with BELVIQ 1,255 2,514 3,464 4,418 3,162 1,584 1,587 1,591 1,594 1,597 1,600 1,604 1,607 1,610 1,614
BELVIQ/Phentermine penetration in men 0.20% 0.30% 0.40% 0.40% 0.45% 0.45% 0.45% 0.45% 0.45% 0.45% 0.45%
# of obese men treated with BELVIQ/Phentermine - - - - - - - 6,324 9,505 12,700 12,725 14,345 14,375 14,404 14,433 14,463 14,492 14,522
Average # of prescriptions (Rx)/patient 6 6 6 6 6 6 6 6 6 6 6 6 6 6 6
% compliance 70% 70% 70% 70% 70% 70% 70% 70% 70% 70% 70% 70% 70% 70% 70%
Average cost/prescription (Rx) $105 $110 $116 $121 $127 $134 $140 $147 $155 $163 $171 $179 $188 $188 $188
% price increase 5% 5% 5% 5% 5% 5% 5% 5% 5% 5% 5% 5% 0% 0% 0%
Discount offered 22% 20% 20% 20% 20% 20% 20% 20% 20% 20% 20% 20% 20% 20% 20%
BELVIQ - total South Korean Sales in men ($MM) $0 $0 $0 $0 $1 $1 $2 $1 $1 $1 $1 $1 $1 $1 $1 $1 $1 $1
BELVIQ/Phentermine - total South Korean Sales in men ($MM) $0 $0 $0 $0 $0 $0 $0 $3 $4 $6 $6 $7 $8 $8 $9 $9 $9 $9
Total women 24,521,819 24,571,843 24,621,970 24,672,199 24,722,530 24,772,964 24,823,501 24,874,141 24,924,884 24,975,731 25,026,681 25,077,736 25,128,894 25,180,157 25,231,525 25,282,997 25,334,574 25,386,257
% of women between 18 and 64 years old 62.1% 62.1% 62.1% 62.1% 62.1% 62.1% 62.1% 62.1% 62.1% 62.1% 62.1% 62.1% 62.1% 62.1% 62.1% 62.1% 62.1% 62.1%
# of women between 18 and 64 years old 15,223,151 15,254,206 15,285,325 15,316,507 15,347,752 15,379,062 15,410,435 15,441,872 15,473,374 15,504,939 15,536,569 15,568,264 15,600,023 15,631,847 15,663,736 15,695,690 15,727,710 15,759,794
% of women between 18 and 64 years old that are obese 20.0% 20.0% 20.0% 20.0% 20.0% 20.0% 20.0% 20.0% 20.0% 20.0% 20.0% 20.0% 20.0% 20.0% 20.0% 20.0% 20.0% 20.0%
# of women between 18 and 64 years old that are obese 3,044,630 3,050,841 3,057,065 3,063,301 3,069,550 3,075,812 3,082,087 3,088,374 3,094,675 3,100,988 3,107,314 3,113,653 3,120,005 3,126,369 3,132,747 3,139,138 3,145,542 3,151,959
BELVIQ penetration in women 0.16% 0.32% 0.44% 0.56% 0.40% 0.20% 0.20% 0.20% 0.20% 0.20% 0.20% 0.20% 0.20% 0.20% 0.20%
# of obese women treated with BELVIQ 4,901 9,823 13,534 17,260 12,353 6,189 6,202 6,215 6,227 6,240 6,253 6,265 6,278 6,291 6,304
BELVIQ/Phentermine penetration in women 0.80% 1.20% 1.60% 1.60% 1.80% 1.80% 1.80% 1.80% 1.80% 1.80% 1.80%
# of obese women treated with BELVIQ/Phentermine - - - - - - - 24,707 37,136 49,616 49,717 56,046 56,160 56,275 56,389 56,504 56,620 56,735
Average # of prescriptions (Rx)/patient 6 6 6 6 6 6 6 6 6 6 6 6 6 6 6
% compliance 70% 70% 70% 70% 70% 70% 70% 70% 70% 70% 70% 70% 70% 70% 70%
Average cost/prescription (Rx) $105 $110 $116 $121 $127 $134 $140 $147 $155 $163 $171 $179 $188 $188 $188
% price increase 5% 5% 5% 5% 5% 5% 5% 5% 5% 5% 5% 5% 0% 0% 0%
Discount offered 22% 20% 20% 20% 20% 20% 20% 20% 20% 20% 20% 20% 20% 20% 20%
BELVIQ - total South Korean Sales in women ($MM) $0 $0 $0 $2 $4 $5 $7 $5 $3 $3 $3 $3 $3 $4 $4 $4 $4 $4
BELVIQ/Phentermine - total South Korean Sales in women ($MM) $0 $0 $0 $0 $0 $0 $0 $11 $17 $23 $25 $29 $31 $32 $34 $36 $36 $36
BELVIQ - total South Korean Sales ($MM) $0 $0 $0 $2 $5 $7 $9 $7 $3 $4 $4 $4 $4 $5 $5 $5 $5 $5
BELVIQ/Phentermine - total South Korean Sales ($MM) $0 $0 $0 $0 $0 $0 $0 $13 $21 $29 $31 $37 $39 $41 $43 $45 $45 $45
BELVIQ + BELVIQ/Phentermine- total South Korea Sales ($MM) $0 $0 $0 $2 $5 $7 $9 $20 $24 $33 $35 $41 $43 $45 $47 $50 $50 $50
Total revenue on South Korean sales to ARNA $0 $0 $0 $1 $2 $2 $3 $8 $10 $14 $15 $17 $18 $19 $20 $21 $21 $22
Source: Cowen and Company
www.cowen.comMEMBER: FINRA/SIPC 18
EQUITY RESEARCHCowen and Company, LLC

BELVIQ + BELVIQ/Phentermine revenue model ($MM) – Taiwan
BELVIQ +BELVIQ/Phentermine Revenue Model (Taiwan) 2012E 2013E 2014E 2015E 2016E 2017E 2018E 2019E 2020E 2021E 2022E 2023E 2024E 2025E 2026E 2027E 2028E 2029E
Taiwan population 23,299,716 23,362,625 23,425,704 23,488,954 23,552,374 23,615,965 23,679,728 23,743,664 23,807,772 23,872,053 23,936,507 24,001,136 24,065,939 24,130,917 24,196,070 24,261,400 24,326,905 24,392,588
Population growth 0.27% 0.27% 0.27% 0.27% 0.27% 0.27% 0.27% 0.27% 0.27% 0.27% 0.27% 0.27% 0.27% 0.27% 0.27% 0.27% 0.27% 0.27%
Total men 11,699,718 11,731,307 11,762,981 11,794,741 11,826,587 11,858,519 11,890,537 11,922,641 11,954,833 11,987,111 12,019,476 12,051,928 12,084,469 12,117,097 12,149,813 12,182,617 12,215,510 12,248,492
% of men between 18 and 64 years old 63.5% 63.5% 63.5% 63.5% 63.5% 63.5% 63.5% 63.5% 63.5% 63.5% 63.5% 63.5% 63.5% 63.5% 63.5% 63.5% 63.5% 63.5%
# of men between 18 and 64 years old 7,431,300 7,451,365 7,471,483 7,491,656 7,511,884 7,532,166 7,552,503 7,572,895 7,593,341 7,613,843 7,634,401 7,655,014 7,675,682 7,696,406 7,717,187 7,738,023 7,758,916 7,779,865
% of men between 18 and 64 years old that are obese 20.0% 20.0% 20.0% 20.0% 20.0% 20.0% 20.0% 20.0% 20.0% 20.0% 20.0% 20.0% 20.0% 20.0% 20.0% 20.0% 20.0% 20.0%
# of men between 18 and 64 years old that are obese 1,486,260 1,490,273 1,494,297 1,498,331 1,502,377 1,506,433 1,510,501 1,514,579 1,518,668 1,522,769 1,526,880 1,531,003 1,535,136 1,539,281 1,543,437 1,547,605 1,551,783 1,555,973
BELVIQ penetration in men 0.04% 0.08% 0.11% 0.14% 0.10% 0.05% 0.05% 0.05% 0.05% 0.05% 0.05% 0.05% 0.05% 0.05% 0.05%
# of obese men treated with BELVIQ - - 599 1,202 1,657 2,115 1,515 759 761 763 766 768 770 772 774 776 778
BELVIQ/Phentermine penetration in men 0.20% 0.30% 0.40% 0.40% 0.45% 0.45% 0.45% 0.45% 0.45% 0.45% 0.45%
# of obese men treated with BELVIQ/Phentermine - - - - - - - 3,029 4,556 6,091 6,108 6,890 6,908 6,927 6,945 6,964 6,983 7,002
Average # of prescriptions (Rx)/patient - - 6 6 6 6 6 6 6 6 6 6 6 6 6 6 6
% compliance 70% 70% 70% 70% 70% 70% 70% 70% 70% 70% 70% 70% 70% 70% 70%
Average cost/prescription (Rx) $105 $110 $116 $121 $127 $134 $140 $147 $155 $163 $171 $179 $188 $188 $188
% price increase 5% 5% 5% 5% 5% 5% 5% 5% 5% 5% 5% 5% 0% 0% 0%
Discount offered 22% 20% 20% 20% 20% 20% 20% 20% 20% 20% 20% 20% 20% 20% 20%
BELVIQ - total Taiwan Sales in men ($MM) $0 $0 $0 $0 $0 $1 $1 $1 $0 $0 $0 $0 $0 $0 $0 $0 $0 $0
BELVIQ/Phentermine - total Taiwan Sales in men ($MM) $0 $0 $0 $0 $0 $0 $0 $1 $2 $3 $3 $4 $4 $4 $4 $4 $4 $4
Total women 11,725,987 11,757,647 11,789,393 11,821,224 11,853,141 11,885,145 11,917,235 11,949,411 11,981,675 12,014,025 12,046,463 12,078,988 12,111,602 12,144,303 12,177,093 12,209,971 12,242,938 12,275,994
% of women between 18 and 64 years old 62.1% 62.1% 62.1% 62.1% 62.1% 62.1% 62.1% 62.1% 62.1% 62.1% 62.1% 62.1% 62.1% 62.1% 62.1% 62.1% 62.1% 62.1%
# of women between 18 and 64 years old 7,279,495 7,299,150 7,318,858 7,338,619 7,358,433 7,378,301 7,398,222 7,418,197 7,438,226 7,458,310 7,478,447 7,498,639 7,518,885 7,539,186 7,559,542 7,579,953 7,600,419 7,620,940
% of women between 18 and 64 years old that are obese 20.0% 20.0% 20.0% 20.0% 20.0% 20.0% 20.0% 20.0% 20.0% 20.0% 20.0% 20.0% 20.0% 20.0% 20.0% 20.0% 20.0% 20.0%
# of women between 18 and 64 years old that are obese 1,455,899 1,459,830 1,463,772 1,467,724 1,471,687 1,475,660 1,479,644 1,483,639 1,487,645 1,491,662 1,495,689 1,499,728 1,503,777 1,507,837 1,511,908 1,515,991 1,520,084 1,524,188
BELVIQ penetration in women 0.16% 0.32% 0.44% 0.56% 0.40% 0.20% 0.20% 0.20% 0.20% 0.20% 0.20% 0.20% 0.20% 0.20% 0.20%
# of obese women treated with BELVIQ 2,348 4,709 6,493 8,286 5,935 2,975 2,983 2,991 2,999 3,008 3,016 3,024 3,032 3,040 3,048
BELVIQ/Phentermine penetration in women 0.00% 0.80% 1.20% 1.60% 1.60% 1.80% 1.80% 1.80% 1.80% 1.80% 1.80% 1.80%
# of obese women treated with BELVIQ/Phentermine - 11,869 17,852 23,867 23,931 26,995 27,068 27,141 27,214 27,288 27,362 27,435
Average # of prescriptions (Rx)/patient 6 6 6 6 6 6 6 6 6 6 6 6 6 6 6
% compliance 70% 70% 70% 70% 70% 70% 70% 70% 70% 70% 70% 70% 70% 70% 70%
Average cost/prescription (Rx) $105 $110 $116 $121 $127 $134 $140 $147 $155 $163 $171 $179 $188 $188 $188
% price increase 5% 5% 5% 5% 5% 5% 5% 5% 5% 5% 5% 5% 0% 0% 0%
Discount offered 22% 20% 20% 20% 20% 20% 20% 20% 20% 20% 20% 20% 20% 20% 20%
BELVIQ - total Taiwan Sales in women ($MM) $0 $0 $0 $1 $2 $3 $3 $3 $1 $1 $1 $2 $2 $2 $2 $2 $2 $2
BELVIQ/Phentermine - total Taiwan Sales in women ($MM) $0 $0 $0 $0 $0 $0 $0 $5 $8 $11 $12 $14 $15 $16 $16 $17 $17 $17
BELVIQ - total Taiwan Sales ($MM) $0 $0 $0 $1 $2 $3 $4 $3 $2 $2 $2 $2 $2 $2 $2 $2 $2 $2
BELVIQ/Phentermine - total Taiwan Sales ($MM) $0 $0 $0 $0 $0 $0 $0 $6 $10 $14 $15 $18 $19 $20 $21 $22 $22 $22
BELVIQ + BELVIQ/Phentermine- total Taiwan Sales ($MM) $0 $0 $0 $1 $2 $3 $4 $10 $12 $16 $17 $20 $21 $22 $23 $24 $24 $24
% increase 116% 45% 34% 126% 23% 35% 5% 17% 5% 5% 5% 5% 0% 0%
Total revenue on Taiwan sales to ARNA $0 $0 $0 $0 $1 $1 $2 $4 $5 $7 $8 $9 $9 $10 $10 $11 $11 $11
Source: Cowen and Company
www.cowen.comMEMBER: FINRA/SIPC 19
EQUITY RESEARCHCowen and Company, LLC

Arena: P&L and Balance Sheet
Income statement: For 2012, Arena reported a net loss of $88.3M, or ($0.45) per share,
compared to a loss of $111.5M, or ($0.80) per share, in 2011. Total operating expenses in
2012 were $81M, compared to $87.4M in 2011. R&D expenses in 2012 were $54.1M,
compared to $58.7M in 2011, while G&A expenses were $26.2M, compared to $26.2M in
2011.
In 2Q13, the most recently reported quarter, Arena reported a net profit of $40.1M, or $0.18
per share, compared to a net loss of $22.1M, or ($0.12) per share, in 2Q12. The profit was
primarily due to the $65M milestone payment received from Eisai in June 2013 for the delivery
of launch supplies and U.S. launch. Total operating expenses for 2Q13 were $27.4M,
compared to the $19.5M spent in 2Q12. R&D expenses were $18.8M in 2Q13, compared to
the $14.1M spent in 2Q12, while G&A expenses were $8.6M in 2Q13, compared to the $5.2M
spent in 2Q12.
2013 financial guidance: Arena expects 2013 R&D expenses to be in the range of $70-$78M,
including non-cash expenses of approximately $7M. G&A expenses are expected to be in the
range of $28-$34M, including non-cash expenses of approximately $6M.
Balance sheet: Arena ended 2Q13 with $178.9M or $0.76/fully diluted share in cash.
Share count: As of August 2013, the company had 218.2M common shares, 2M warrants,
and 14.6M options outstanding, bringing the fully diluted number of shares to ~234.8M.
Options and Warrants Outstanding (MM)
Warrants OutstandingWeighted
AverageExercise PriceExpiration Date
August 2008 Series B Warrants 2.0 $4.34 8/14/2015
Total Warrants Outstanding 2.0 6.23
Total Options Outstanding 14.6 $4.88
Total Options and Warrants outstanding 16.5
Source: Cowen and Company, SEC Filings
Manufacturing plant in Switzerland provides 10-year tax-break: In 2008, Arena’s Swiss
subsidiary, Arena GmbH, purchased a plant in Switzerland from Siegfried, a company which
provides custom drug development services, including drug substances and drug
manufacturing, for $38.7M ($30.7M in cash and 1.5M shares valued at $8M). Arena plans to
manufacture BELVIQ at this facility and sell it to its partners. This subsidiary has been granted
a conditional incentive tax holiday for its operations in Switzerland, which Arena expects will
exempt it from the majority of potential Swiss income taxes. This tax holiday will continue for a
period of up to 10 years, not to extend beyond December 31, 2022. Arena has guided that, as
www.cowen.comMEMBER: FINRA/SIPC 20
EQUITY RESEARCHCowen and Company, LLC

a result of this tax holiday, it expects to pay lower overall taxes during that period, at a tax rate
in the range of 15-20%.
Arena: Quarterly P&L ($MM)
($MM) 2009A 2010A 2011A Q1:12A Q2:12A Q3:12A Q4:12A 2012A Q1:13A Q2:13A Q3:13E Q4:13E 2013E Q1:14E Q2:14E Q3:14E Q4:14E 2014E 2015E
Total revenue on US sales to ARNA 0.0 0.0 0.0 0.0 0.0 0.0 0.0 0.0 0.0 1.3 1.9 2.6 5.8 3.2 3.8 4.6 5.5 17.0 27.6
Total revenue on EU sales to ARNA - probability-adjusted 0.0 0.0 0.0 0.0 0.0 0.0 0.0 0.0 0.0 0.0 0.0 0.0 0.0 0.0 0.0 0.0 0.0 0.0 0.0
Total revenue on SK sales to ARNA - probability-adjusted 0.0 0.0 0.0 0.0 0.0 0.0 0.0 0.0 0.0 0.0 0.0 0.0 0.0 0.0 0.0 0.0 0.0 0.0 0.6
Total revenue onTaiwan sales to ARNA - probability-adjusted 0.0 0.0 0.0 0.0 0.0 0.0 0.0 0.0 0.0 0.0 0.0 0.0 0.0 0.0 0.0 0.0 0.0 0.0 0.4
Total revenue on sales to ARNA 0.0 0.0 0.0 0.0 0.0 0.0 0.0 0.0 0.0 1.3 1.9 2.6 5.8 3.2 3.8 4.6 5.5 17.0 28.5
Manufacturing services 6.6 7.1 5.3 1.3 1.0 0.6 0.9 3.8 0.8 1.0 0.8 0.8 3.2 0.9 0.9 0.9 0.9 3.6 0.0
Milestones/License Fees - Eisai/Others 3.8 9.6 7.4 0.9 20.9 0.9 0.9 23.6 1.5 66.5 1.5 2.0 71.5 1.5 1.5 1.5 11.5 16.0 16.0
Milestones/License Fees - EU partnership 0.0 0.0 0.0 0.0 0.0 0.0 0.0 0.0 0.0 0.0 0.0 0.0 0.0 0.0 0.0 0.0 0.0 0.0 50.0
Milestones/License Fees - Ildong 0.0 0.0 0.0 0.0 0.0 0.0 0.2 0.2 0.1 0.2 0.2 0.2 0.6 0.2 0.2 0.2 0.2 0.6 3.0
Milestones/License Fees - CYB 0.0 0.0 0.0 0.0 0.0 0.0 0.0 0.0 0.0 0.0 0.0 0.0 0.0 0.0 0.0 0.1 0.1 0.2 0.2
Total Revenues 10.4 16.6 12.7 2.2 22.0 1.5 1.9 27.6 2.4 68.9 4.3 5.5 81.1 5.7 6.3 7.2 18.2 37.5 97.7
Cost of Goods Sold 6.5 7.4 8.1 0.8 0.7 1.4 0.8 3.7 2.1 1.6 1.3 1.5 6.5 1.8 1.9 2.2 2.4 8.3 5.4
Gross Profit 3.9 9.2 4.6 1.4 21.3 0.1 1.1 23.9 0.3 67.3 3.0 4.0 74.5 4.0 4.4 5.1 15.8 29.2 92.3
R&D 110.2 75.5 58.7 14.5 14.1 11.6 13.9 54.1 14.0 18.8 20.0 22.0 74.8 14.0 14.0 14.0 14.0 56.0 57.1
SG&A 25.2 27.9 24.2 6.4 5.2 7.4 7.3 26.2 7.3 8.6 8.7 8.8 33.4 8.7 8.8 8.7 8.8 35.0 35.7
Total Operating Expenses 142.2 105.6 87.4 21.0 19.5 19.2 21.4 81.0 21.3 27.4 28.9 31.0 108.5 22.9 23.0 22.9 23.0 91.7 93.5
% Revenues 1369.4% 635.4% 687.3% 293.7% 133.9% 244.7% 95.7%
Operating Income (138.4) (96.4) (82.8) (19.6) 1.9 (19.1) (20.3) (57.1) (21.0) 39.9 (25.9) (27.0) (34.0) (18.9) (18.6) (17.8) (7.2) (62.5) (1.2)
% Revenues -42.0% -166.8% -1.2%
Total Non-Operating Income (14.8) (28.2) (28.7) (9.8) (24.0) 3.6 (1.0) (31.2) 2.1 0.2 (1.8) (1.8) (1.3) (1.8) (1.8) (1.8) (1.8) (7.2) (7.2)
Pretax Income (153.2) (124.5) (111.5) (29.4) (22.1) (15.5) (21.3) (88.3) (18.9) 40.1 (27.7) (28.8) (35.3) (20.7) (20.4) (19.6) (9.0) (69.7) (8.4)
Income tax expense 0.0 0.0 0.0 0.0 0.0 0.0 0.0 0.0 0.0 0.0 0.0 0.0 0.0 0.0 0.0 0.0 0.0 0.0 0.0
Tax Rate 0.0% 0.0% 0.0% 0.0% 0.0% 0.0% 0.0% 0.0% 0.0% 0.0% 0.0% 0.0% 0.0% 0.0% 0.0% 0.0% 0.0% 0.0% 0.0%
Net Income - Operations (153.2) (124.5) (111.5) (29.4) (22.1) (15.5) (21.3) (88.3) (18.9) 40.1 (27.7) (28.8) (35.3) (20.7) (20.4) (19.6) (9.0) (69.7) (8.4)
Non-Recurring Gains (Losses) 0.0 0.0 0.0 0.0 0.0 0.0 0.0 0.0 0.0 0.0 0.0 0.0 0.0 0.0 0.0 0.0 0.0 0.0 0.0
Net Income - Reported (153.2) (124.5) (111.5) (29.4) (22.1) (15.5) (21.3) (88.3) (18.9) 40.1 (27.7) (28.8) (35.3) (20.7) (20.4) (19.6) (9.0) (69.7) (8.4)
Basic EPS ($1.82) ($1.14) ($0.80) ($0.18) ($0.12) ($0.07) ($0.10) ($0.45) ($0.09) $0.18 ($0.13) ($0.13) ($0.16) ($0.08) ($0.08) ($0.08) ($0.04) ($0.28) ($0.03)
Diluted EPS ($1.82) ($1.14) ($0.80) ($0.18) ($0.12) ($0.07) ($0.10) ($0.45) ($0.09) $0.18 ($0.13) ($0.13) ($0.16) ($0.08) ($0.08) ($0.08) ($0.04) ($0.28) ($0.03)
Shares outstanding (basic) 84.34 109.6 139.2 164.2 190.3 213.9 217.3 196.4 217.5 217.9 219.3 220.4 218.8 246.5 247.8 249.0 250.3 248.4 255.3
Shares outstanding (diluted) 123.52 150.1 181.6 205.0 202.5 233.9 234.7 219.1 236.3 224.5 234.8 235.9 232.9 262.1 263.4 264.7 266.1 264.1 271.4
Source: Cowen and Company, Arena Pharmaceuticals
Arena: Annual P&L ($MM)
($MM) 2009A 2010A 2011A 2012A 2013E 2014E 2015E 2016E 2017E 2018E 2019E 2020E 2021E 2022E 2023E 2024E 2025E 2026E 2027E 2028E 2029E
Total revenue on US sales to ARNA 0.0 0.0 0.0 0.0 5.8 17.0 27.6 38.5 49.9 92.3 120.1 150.9 209.5 269.1 249.7 265.7 282.7 300.7 303.2 305.1 308.0
Total revenue on EU sales to ARNA - probability-adjusted 0.0 0.0 0.0 0.0 0.0 0.0 0.0 2.8 6.3 9.9 14.0 18.2 23.0 28.2 31.7 35.6 39.7 44.2 4.4 2.2 2.2
Total revenue on SK sales to ARNA - probability-adjusted 0.0 0.0 0.0 0.0 0.0 0.0 0.6 1.3 1.9 2.6 6.4 8.0 11.1 11.7 13.8 14.6 15.4 16.3 17.2 17.2 17.2
Total revenue onTaiwan sales to ARNA - probability-adjusted 0.0 0.0 0.0 0.0 0.0 0.0 0.4 0.8 1.1 1.5 3.4 4.2 5.7 6.0 7.1 7.4 7.8 8.2 8.7 8.7 8.7
Total revenue on sales to ARNA 0.0 0.0 0.0 0.0 5.8 17.0 28.5 43.4 59.2 106.3 144.0 181.3 249.3 315.0 302.3 323.3 345.7 369.4 333.5 333.2 336.2
Manufacturing services 6.6 7.1 5.3 3.8 3.2 3.6 0.0 0.0 0.0 0.0 0.0 0.0 0.0 0.0 0.0 0.0 0.0 0.0 0.0 0.0 0.0
Milestones/License Fees - Eisai/Others 3.8 9.6 7.4 23.6 71.5 16.0 16.0 71.0 6.0 55.0 0.0 55.0 0.0 100.0 0.0 0.0 0.0 150.0 0.0 0.0 0.0
Milestones/License Fees - EU partnership 0.0 0.0 0.0 0.0 0.0 0.0 50.0 25.0 0.0 25.0 0.0 25.0 0.0 25.0 0.0 37.5 37.5 0.0 0.0 0.0 0.0
Milestones/License Fees - Ildong 0.0 0.0 0.0 0.2 0.6 0.6 3.0 0.6 0.6 0.0 0.0 0.0 0.0 0.0 0.0 0.0 0.0 0.0 0.0 0.0 0.0
Milestones/License Fees - CYB 0.0 0.0 0.0 0.0 0.0 0.2 0.2 0.2 0.2 0.2 0.2 0.2 0.2 0.2 0.2 0.0 0.0 0.0 0.0 0.0 0.0
Total Revenues 10.4 16.6 12.7 27.6 81.1 37.5 97.7 140.2 66.0 186.5 144.2 261.5 249.5 440.2 302.5 360.8 383.2 519.4 333.5 333.2 336.2
Cost of Goods Sold 6.5 7.4 8.1 3.7 6.5 8.3 5.4 8.1 11.0 16.4 21.7 27.1 36.9 46.3 44.4 47.3 50.4 53.7 48.6 48.6 49.0
Gross Profit 3.9 9.2 4.6 23.9 74.5 29.2 92.3 132.1 55.0 170.1 122.4 234.4 212.6 393.9 258.1 313.5 332.8 465.8 284.8 284.6 287.2
R&D 110.2 75.5 58.7 54.1 74.8 56.0 57.1 58.2 58.6 59.0 59.4 53.8 50.0 47.5 45.8 44.8 44.2 26.5 15.9 9.5 5.7
SG&A 25.2 27.9 24.2 26.2 33.4 35.0 35.7 36.4 37.1 37.9 38.6 39.4 40.2 41.0 41.8 42.7 43.5 44.4 45.3 46.2 47.1
Total Operating Expenses 142.2 105.6 87.4 81.0 108.5 91.7 93.5 95.4 96.5 97.6 98.7 93.9 90.9 89.2 88.3 88.1 88.4 71.6 61.9 55.7 52.8
% Revenues 1369.4% 635.4% 687.3% 293.7% 133.9% 244.7% 95.7% 68.0% 146.1% 52.3% 68.5% 35.9% 36.4% 20.3% 29.2% 24.4% 23.1% 13.8% 18.6% 16.7% 15.7%
Operating Income (138.4) (96.4) (82.8) (57.1) (34.0) (62.5) (1.2) 36.7 (41.5) 72.6 23.7 140.5 121.7 304.8 169.7 225.4 244.4 394.2 222.9 228.9 234.3
% Revenues -42.0% -166.8% -1.2% 26.2% -62.8% 38.9% 16.4% 53.7% 48.8% 69.2% 56.1% 62.5% 63.8% 75.9% 66.9% 68.7% 69.7%
Total Non-Operating Income (14.8) (28.2) (28.7) (31.2) (1.3) (7.2) (7.2) (7.2) (7.2) 0.0 0.0 0.0 0.0 0.0 0.0 0.0 0.0 0.0 0.0 0.0 3.0
Pretax Income (153.2) (124.5) (111.5) (88.3) (35.3) (69.7) (8.4) 29.5 (48.7) 72.6 23.7 140.5 121.7 304.8 169.7 225.4 244.4 394.2 222.9 228.9 237.3
Income tax expense 0.0 0.0 0.0 0.0 0.0 0.0 0.0 0.0 0.0 3.6 1.9 21.1 18.3 61.0 33.9 56.3 61.1 98.5 55.7 57.2 59.3
Tax Rate 0.0% 0.0% 0.0% 0.0% 0.0% 0.0% 0.0% 0.0% 0.0% 5.0% 8.0% 15.0% 15.0% 20.0% 20.0% 25.0% 25.0% 25.0% 25.0% 25.0% 25.0%
Net Income - Operations (153.2) (124.5) (111.5) (88.3) (35.3) (69.7) (8.4) 29.5 (48.7) 68.9 21.8 119.4 103.5 243.8 135.8 169.0 183.3 295.6 167.2 171.7 178.0
Non-Recurring Gains (Losses) 0.0 0.0 0.0 0.0 0.0 0.0 0.0 0.0 0.0 0.0 0.0 0.0 0.0 0.0 0.0 0.0 0.0 1.0 2.0 3.0 4.0
Net Income - Reported (153.2) (124.5) (111.5) (88.3) (35.3) (69.7) (8.4) 29.5 (48.7) 68.9 21.8 119.4 103.5 243.8 135.8 169.0 183.3 296.6 169.2 174.7 182.0
Basic EPS ($1.82) ($1.14) ($0.80) ($0.45) ($0.16) ($0.28) ($0.03) $0.11 ($0.18) $0.25 $0.08 $0.42 $0.36 $0.83 $0.45 $0.55 $0.59 $0.93 $0.52 $0.53 $0.54
Diluted EPS ($1.82) ($1.14) ($0.80) ($0.45) ($0.16) ($0.28) ($0.03) $0.11 ($0.18) $0.24 $0.07 $0.40 $0.34 $0.78 $0.43 $0.52 $0.55 $0.88 $0.49 $0.50 $0.51
Shares outstanding (basic) 84.34 109.6 139.2 196.4 218.8 248.4 255.3 260.4 265.6 270.9 276.3 281.8 287.5 293.2 299.1 305.1 311.2 317.4 323.7 330.2 336.8
Shares outstanding (diluted) 123.52 150.1 181.6 219.1 232.9 264.1 271.4 276.8 282.3 288.0 293.7 299.6 305.6 311.7 318.0 324.3 330.8 337.4 344.2 351.1 358.1
Source: Cowen and Company, Arena Pharmaceuticals
www.cowen.comMEMBER: FINRA/SIPC 21
EQUITY RESEARCHCowen and Company, LLC
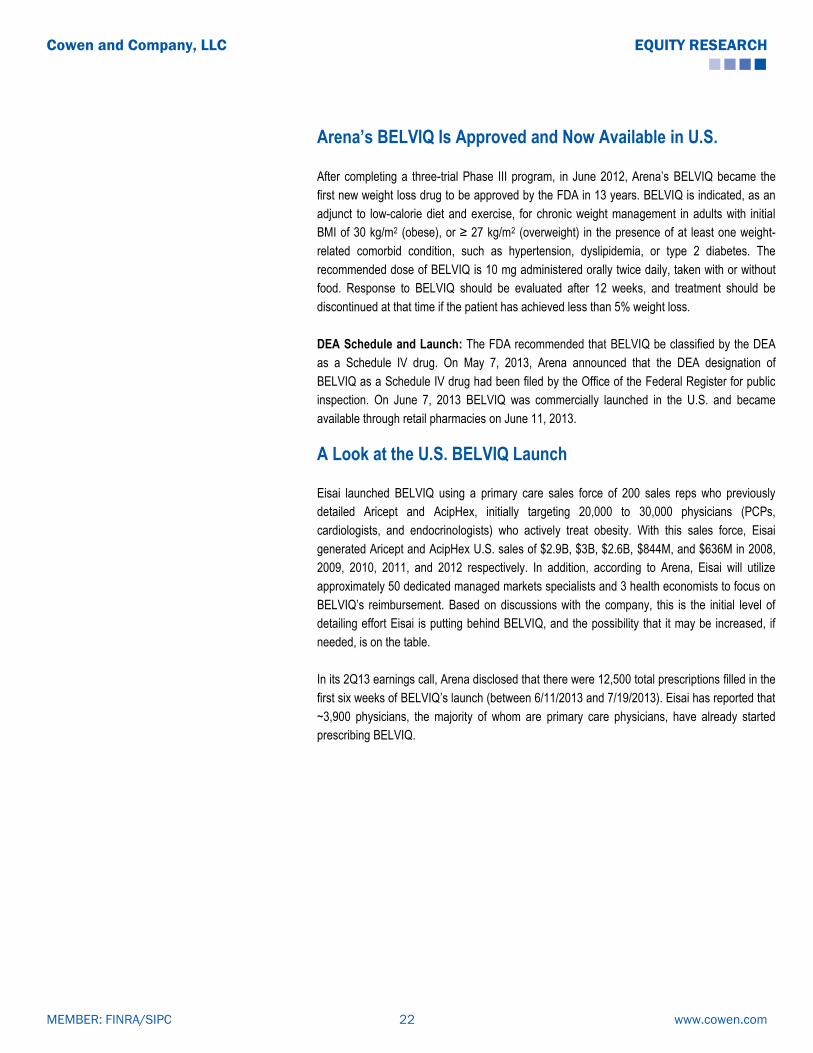
Arena’s BELVIQ Is Approved and Now Available in U.S.
After completing a three-trial Phase III program, in June 2012, Arena’s BELVIQ became the
first new weight loss drug to be approved by the FDA in 13 years. BELVIQ is indicated, as an
adjunct to low-calorie diet and exercise, for chronic weight management in adults with initial
BMI of 30 kg/m2 (obese), or ≥ 27 kg/m2 (overweight) in the presence of at least one weight-
related comorbid condition, such as hypertension, dyslipidemia, or type 2 diabetes. The
recommended dose of BELVIQ is 10 mg administered orally twice daily, taken with or without
food. Response to BELVIQ should be evaluated after 12 weeks, and treatment should be
discontinued at that time if the patient has achieved less than 5% weight loss.
DEA Schedule and Launch: The FDA recommended that BELVIQ be classified by the DEA
as a Schedule IV drug. On May 7, 2013, Arena announced that the DEA designation of
BELVIQ as a Schedule IV drug had been filed by the Office of the Federal Register for public
inspection. On June 7, 2013 BELVIQ was commercially launched in the U.S. and became
available through retail pharmacies on June 11, 2013.
A Look at the U.S. BELVIQ Launch
Eisai launched BELVIQ using a primary care sales force of 200 sales reps who previously
detailed Aricept and AcipHex, initially targeting 20,000 to 30,000 physicians (PCPs,
cardiologists, and endocrinologists) who actively treat obesity. With this sales force, Eisai
generated Aricept and AcipHex U.S. sales of $2.9B, $3B, $2.6B, $844M, and $636M in 2008,
2009, 2010, 2011, and 2012 respectively. In addition, according to Arena, Eisai will utilize
approximately 50 dedicated managed markets specialists and 3 health economists to focus on
BELVIQ’s reimbursement. Based on discussions with the company, this is the initial level of
detailing effort Eisai is putting behind BELVIQ, and the possibility that it may be increased, if
needed, is on the table.
In its 2Q13 earnings call, Arena disclosed that there were 12,500 total prescriptions filled in the
first six weeks of BELVIQ’s launch (between 6/11/2013 and 7/19/2013). Eisai has reported that
~3,900 physicians, the majority of whom are primary care physicians, have already started
prescribing BELVIQ.
www.cowen.comMEMBER: FINRA/SIPC 22
EQUITY RESEARCHCowen and Company, LLC
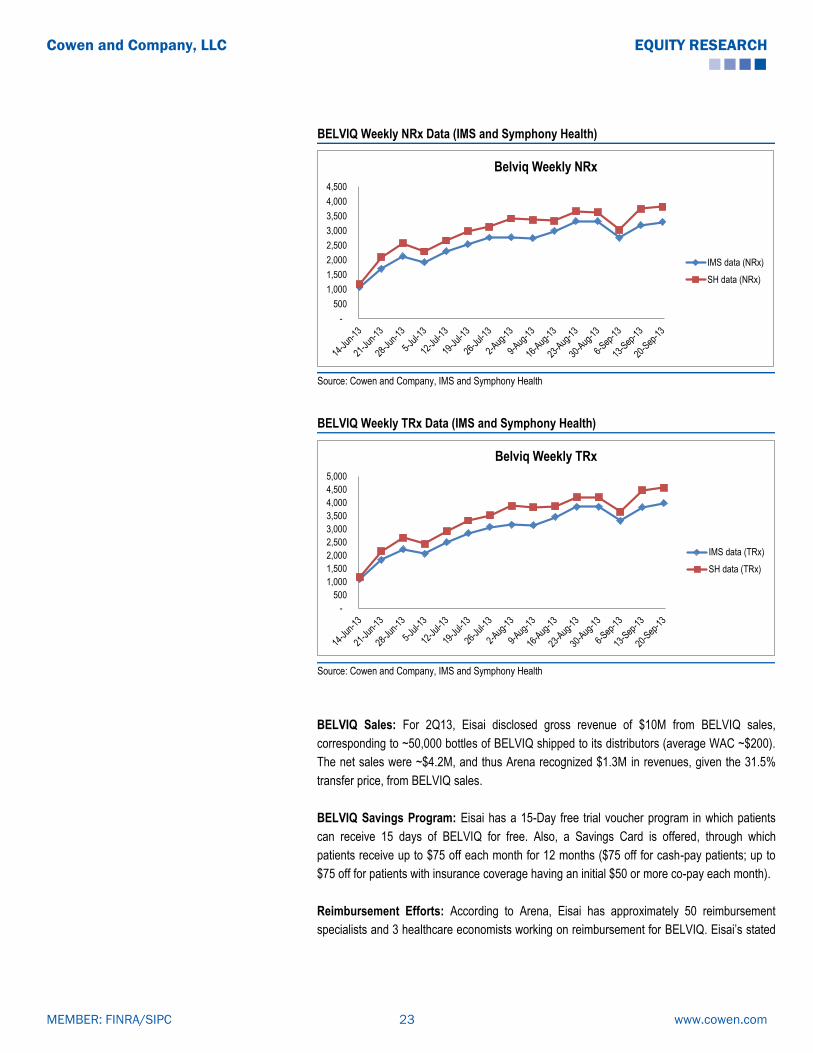
BELVIQ Weekly NRx Data (IMS and Symphony Health)
-
500
1,000
1,500
2,000
2,500
3,000
3,500
4,000
4,500
Belviq Weekly NRx
IMS data (NRx)
SH data (NRx)
Source: Cowen and Company, IMS and Symphony Health
BELVIQ Weekly TRx Data (IMS and Symphony Health)
-
500
1,000
1,500
2,000
2,500
3,000
3,500
4,000
4,500
5,000
Belviq Weekly TRx
IMS data (TRx)
SH data (TRx)
Source: Cowen and Company, IMS and Symphony Health
BELVIQ Sales: For 2Q13, Eisai disclosed gross revenue of $10M from BELVIQ sales,
corresponding to ~50,000 bottles of BELVIQ shipped to its distributors (average WAC ~$200).
The net sales were ~$4.2M, and thus Arena recognized $1.3M in revenues, given the 31.5%
transfer price, from BELVIQ sales.
BELVIQ Savings Program: Eisai has a 15-Day free trial voucher program in which patients
can receive 15 days of BELVIQ for free. Also, a Savings Card is offered, through which
patients receive up to $75 off each month for 12 months ($75 off for cash-pay patients; up to
$75 off for patients with insurance coverage having an initial $50 or more co-pay each month).
Reimbursement Efforts: According to Arena, Eisai has approximately 50 reimbursement
specialists and 3 healthcare economists working on reimbursement for BELVIQ. Eisai’s stated
www.cowen.comMEMBER: FINRA/SIPC 23
EQUITY RESEARCHCowen and Company, LLC

goal is to improve reimbursement from the current ~ 30% to as much as 50% by the end of its
fiscal year (March 2014).
Consumer Launch: In September 2013, Arena reported that Eisai’s US launch campaign for
BELVIQ has entered its consumer phase. Full page announcements were placed in major US
magazines beginning in September, which are intended to educate consumers about BELVIQ
as a weight loss treatment option. Also, Eisai has launched the BELIEVE EVERYDAY
SUPPORT program for BELVIQ, which provides free support and savings, and includes an
online portal. The program includes: a monthly savings card, one-year membership to the
―Lose It!‖ app for calorie- and activity-tracking, nutrition information and meal planning tool, and
motivational tips to help sustain weight loss efforts.
BELVIQ’s (Lorcaserin) Mechanism of Action
BELVIQ (lorcaserin) is a selective serotonin (5-HT) 2C receptor agonist. The 5-HT2C receptor
subtype appears to be involved in the central regulation of satiety, as validated in both animal
models and human studies. It is believed that lorcaserin decreases food consumption and
promotes satiety by selectively activating serotonin 2C receptors in the brain.
Notably, the serotonergic agonist fenfluramine was historically one of the most successful
weight loss drugs ever used, but was withdrawn from the market in 1997 due to cardiac
toxicity, considered to result from the compound’s lack of selectivity. In addition to being an
agonist of the 5-HT2C receptor, the action of fenfluramine on 5-HT2B receptors in the heart led
to valvular disorders.
In contrast, BELVIQ features multi-fold selectivity for the 5-HT2C receptor compared with the
5-HT2B receptor, and also shows relatively low activity at other serotonin receptor subtypes.
High-dose studies in animals over several months have not demonstrated appreciable
cardiovascular changes with lorcaserin treatment.
Lorcaserin Potency (EC50) and Binding Affinity (Ki) to Human 5-HT2A, 5-HT2B, and 5-HT2C Receptor Subtypes
Serotonin Receptor Subtype EC50, nM Ki, nM
5-HT 2C 39 13
5-HT 2B 2380 147
5-HT 2A 553 92
Source: Cowen and Company, BELVIQ Label
www.cowen.comMEMBER: FINRA/SIPC 24
EQUITY RESEARCHCowen and Company, LLC

BELVIQ (Lorcaserin): Clinical Data Summary
BELVIQ Successfully Completed a Three-Trial Phase III Program
BELVIQ’s Phase III pivotal program consisted of two randomized, placebo-controlled trials,
BLOOM and BLOSSOM, which were required for NDA submission. Positive results from
BLOOM and BLOSSOM were reported in March 2009 and September 2009, respectively. A
third, non-pivotal, Phase III trial (BLOOM-DM) in type 2 diabetics had positive results reported
in November 2010. All three trials were conducted in the U.S. BELVIQ has demonstrated
modest weight loss with a benign safety profile in these three Phase III trials.
The co-primary endpoint for all the studies were: the proportion of patients achieving ≥ 5%
weight loss from baseline at one year, mean change in body weight from baseline, and the
proportion of patients achieving ≥ 10% weight loss from baseline at one year. Per FDA
guidelines, subjects enrolled in all three trials (BLOOM, BLOSSOM and BLOOM-DM) received
diet and exercise counseling, in addition to drug or placebo. FDA guidance has delineated the
primary efficacy benchmark for weight management drugs as achievement of either a
statistically significant difference in mean weight loss of at least 5% between therapy and
placebo groups, or a categorical loss > 5% of baseline body weight in at least 35% of patients
on therapy, which proportion should be approximately double that for placebo.
The following tables provide an overview of the BELVIQ Phase III program:
www.cowen.comMEMBER: FINRA/SIPC 25
EQUITY RESEARCHCowen and Company, LLC
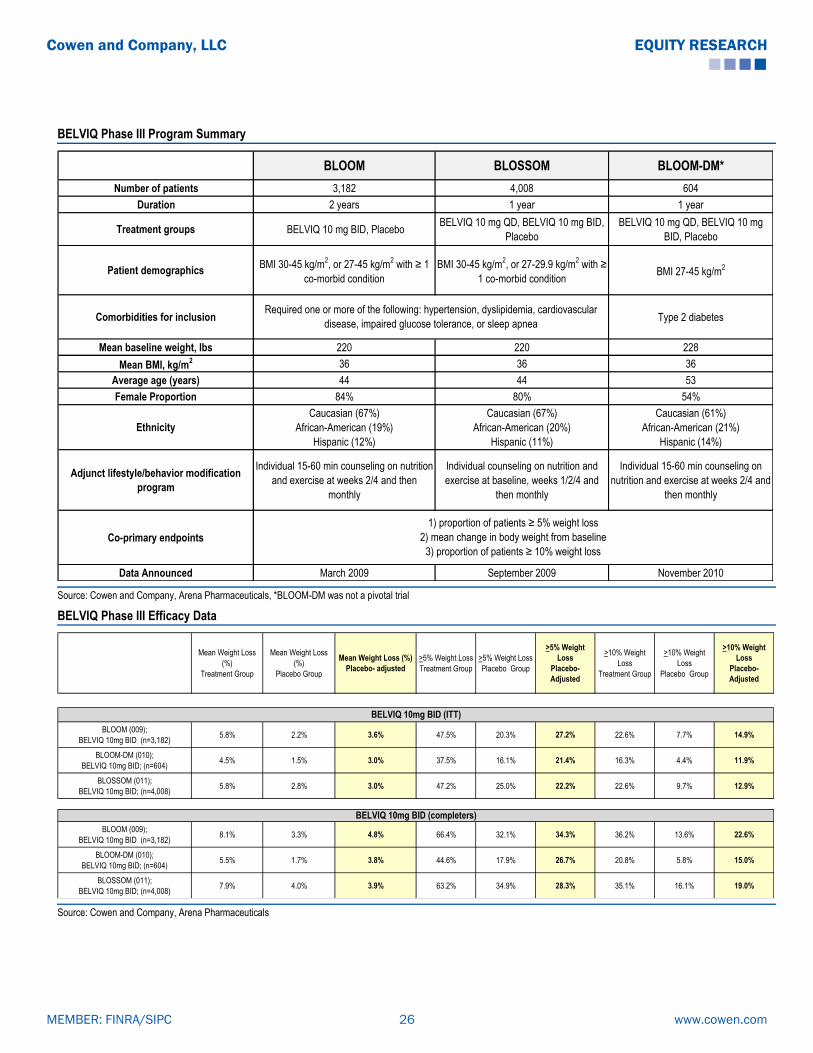
BELVIQ Phase III Program Summary
BLOOM BLOSSOM BLOOM-DM*
Number of patients 3,182 4,008 604
Duration 2 years 1 year 1 year
Treatment groups BELVIQ 10 mg BID, PlaceboBELVIQ 10 mg QD, BELVIQ 10 mg BID,
Placebo
BELVIQ 10 mg QD, BELVIQ 10 mg
BID, Placebo
Patient demographics BMI 30-45 kg/m
2, or 27-45 kg/m
2 with ≥ 1
co-morbid condition
BMI 30-45 kg/m2, or 27-29.9 kg/m
2 with ≥
1 co-morbid conditionBMI 27-45 kg/m
2
Comorbidities for inclusion Type 2 diabetes
Mean baseline weight, lbs 220 220 228
Mean BMI, kg/m2 36 36 36
Average age (years) 44 44 53
Female Proportion 84% 80% 54%
Ethnicity
Caucasian (67%)
African-American (19%)
Hispanic (12%)
Caucasian (67%)
African-American (20%)
Hispanic (11%)
Caucasian (61%)
African-American (21%)
Hispanic (14%)
Adjunct lifestyle/behavior modification
program
Individual 15-60 min counseling on nutrition
and exercise at weeks 2/4 and then
monthly
Individual counseling on nutrition and
exercise at baseline, weeks 1/2/4 and
then monthly
Individual 15-60 min counseling on
nutrition and exercise at weeks 2/4 and
then monthly
Co-primary endpoints
Data Announced March 2009 September 2009 November 2010
1) proportion of patients ≥ 5% weight loss
2) mean change in body weight from baseline
3) proportion of patients ≥ 10% weight loss
Required one or more of the following: hypertension, dyslipidemia, cardiovascular
disease, impaired glucose tolerance, or sleep apnea
Source: Cowen and Company, Arena Pharmaceuticals, *BLOOM-DM was not a pivotal trial
BELVIQ Phase III Efficacy Data
Mean Weight Loss
(%)
Treatment Group
Mean Weight Loss
(%)
Placebo Group
Mean Weight Loss (%)
Placebo- adjusted
>5% Weight Loss
Treatment Group
>5% Weight Loss
Placebo Group
>5% Weight
Loss
Placebo-
Adjusted
>10% Weight
Loss
Treatment Group
>10% Weight
Loss
Placebo Group
>10% Weight
Loss
Placebo-
Adjusted
BLOOM (009);
BELVIQ 10mg BID (n=3,182)5.8% 2.2% 3.6% 47.5% 20.3% 27.2% 22.6% 7.7% 14.9%
BLOOM-DM (010);
BELVIQ 10mg BID; (n=604)4.5% 1.5% 3.0% 37.5% 16.1% 21.4% 16.3% 4.4% 11.9%
BLOSSOM (011);
BELVIQ 10mg BID; (n=4,008)5.8% 2.8% 3.0% 47.2% 25.0% 22.2% 22.6% 9.7% 12.9%
BLOOM (009);
BELVIQ 10mg BID (n=3,182)8.1% 3.3% 4.8% 66.4% 32.1% 34.3% 36.2% 13.6% 22.6%
BLOOM-DM (010);
BELVIQ 10mg BID; (n=604)5.5% 1.7% 3.8% 44.6% 17.9% 26.7% 20.8% 5.8% 15.0%
BLOSSOM (011);
BELVIQ 10mg BID; (n=4,008)7.9% 4.0% 3.9% 63.2% 34.9% 28.3% 35.1% 16.1% 19.0%
BELVIQ 10mg BID (completers)
BELVIQ 10mg BID (ITT)
Source: Cowen and Company, Arena Pharmaceuticals
www.cowen.comMEMBER: FINRA/SIPC 26
EQUITY RESEARCHCowen and Company, LLC
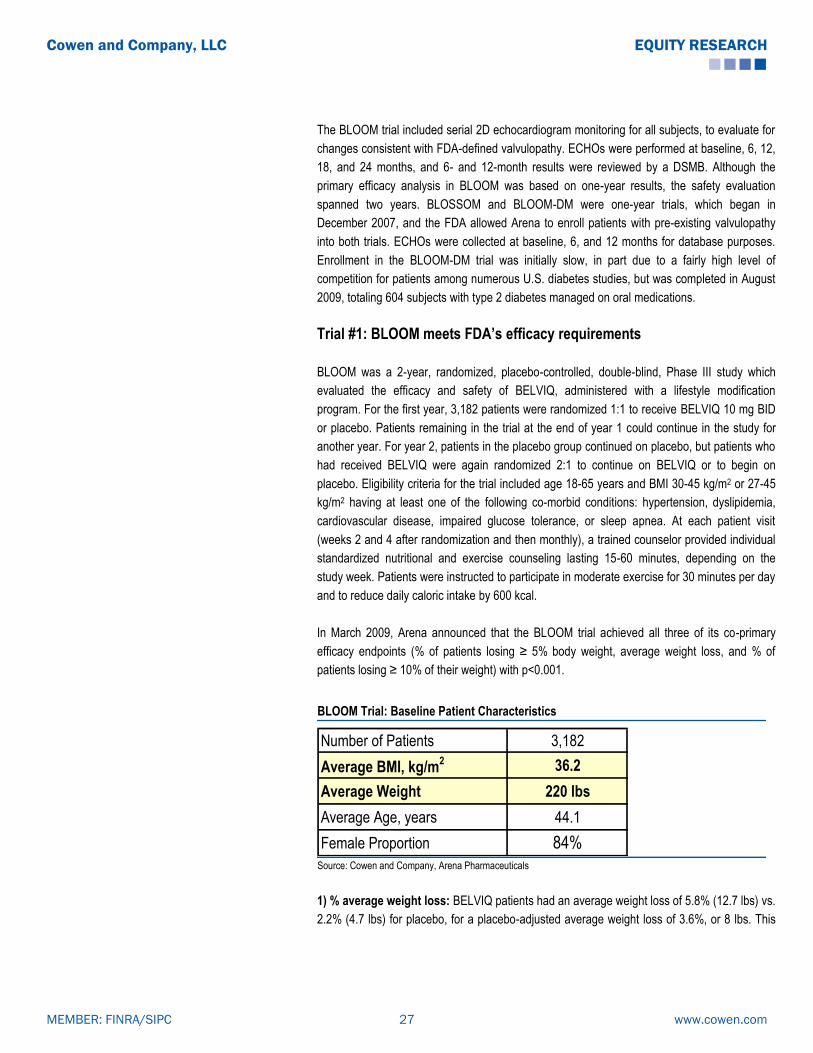
The BLOOM trial included serial 2D echocardiogram monitoring for all subjects, to evaluate for
changes consistent with FDA-defined valvulopathy. ECHOs were performed at baseline, 6, 12,
18, and 24 months, and 6- and 12-month results were reviewed by a DSMB. Although the
primary efficacy analysis in BLOOM was based on one-year results, the safety evaluation
spanned two years. BLOSSOM and BLOOM-DM were one-year trials, which began in
December 2007, and the FDA allowed Arena to enroll patients with pre-existing valvulopathy
into both trials. ECHOs were collected at baseline, 6, and 12 months for database purposes.
Enrollment in the BLOOM-DM trial was initially slow, in part due to a fairly high level of
competition for patients among numerous U.S. diabetes studies, but was completed in August
2009, totaling 604 subjects with type 2 diabetes managed on oral medications.
Trial #1: BLOOM meets FDA’s efficacy requirements
BLOOM was a 2-year, randomized, placebo-controlled, double-blind, Phase III study which
evaluated the efficacy and safety of BELVIQ, administered with a lifestyle modification
program. For the first year, 3,182 patients were randomized 1:1 to receive BELVIQ 10 mg BID
or placebo. Patients remaining in the trial at the end of year 1 could continue in the study for
another year. For year 2, patients in the placebo group continued on placebo, but patients who
had received BELVIQ were again randomized 2:1 to continue on BELVIQ or to begin on
placebo. Eligibility criteria for the trial included age 18-65 years and BMI 30-45 kg/m2 or 27-45
kg/m2 having at least one of the following co-morbid conditions: hypertension, dyslipidemia,
cardiovascular disease, impaired glucose tolerance, or sleep apnea. At each patient visit
(weeks 2 and 4 after randomization and then monthly), a trained counselor provided individual
standardized nutritional and exercise counseling lasting 15-60 minutes, depending on the
study week. Patients were instructed to participate in moderate exercise for 30 minutes per day
and to reduce daily caloric intake by 600 kcal.
In March 2009, Arena announced that the BLOOM trial achieved all three of its co-primary
efficacy endpoints (% of patients losing ≥ 5% body weight, average weight loss, and % of
patients losing ≥ 10% of their weight) with p<0.001.
BLOOM Trial: Baseline Patient Characteristics
Number of Patients 3,182
Average BMI, kg/m2 36.2
Average Weight 220 lbs
Average Age, years 44.1
Female Proportion 84%
Source: Cowen and Company, Arena Pharmaceuticals
1) % average weight loss: BELVIQ patients had an average weight loss of 5.8% (12.7 lbs) vs.
2.2% (4.7 lbs) for placebo, for a placebo-adjusted average weight loss of 3.6%, or 8 lbs. This
www.cowen.comMEMBER: FINRA/SIPC 27
EQUITY RESEARCHCowen and Company, LLC

result was statistically significant; it did not, however, meet FDA’s efficacy benchmark of a 5%
difference in average weight loss between therapy and placebo.
2) % of patients losing at least 5% of their weight: 47.5% of BELVIQ patients lost at least
5% of baseline body weight, compared to 20.3% of placebo patients. With these data, BELVIQ
met the threshold specified in FDA's draft guidance for efficacy of obesity drugs.
3) % of patients losing at least 10% of their weight: 22.6% of BELVIQ patients in the trial
lost at least 10% of body weight, compared to 7.7% of placebo patients.
Arena presented updated data at ADA 2009 from an analysis of those patients who completed
one year of treatment per protocol. In this population, the average weight loss was 18 lbs (8%)
in the drug arm, compared to 7.3 lbs (3.2%) in the placebo group. 66.4% of BELVIQ
completers lost at least 5% of baseline body weight, compared to 32.1% of placebo patients
(p<0.0001), while 36.2% of BELVIQ completers lost at least 10% of body weight, compared to
13.6% for placebo (p<0.0001).
BLOOM Trial: Efficacy Data
Key Endpoints BELVIQ 10mg BID Placebo Difference p-value
n (ITT-LOCF) n=1,538 n=1,499
Mean Weight Loss (%) (ITT-LOCF) 5.8% 2.2% 3.6% <0.001
≥5% weight loss (ITT-LOCF) 47.5% 20.3% 27.2% <0.001
≥10% weight loss (ITT-LOCF) 22.6% 7.7% 14.9% <0.001
n (Completers) n=583 n=737
Mean Weight Loss (%) (Completers) 8.1% 3.3% 4.8% <0.001
≥5% weight loss (Completers) 66.4% 32.1% 34.3% <0.001
≥10% weight loss (Completers) 36.2% 13.6% 22.6% <0.001
Completion rate 38% 49% -
BLOOM (n=3,182)
Source: Cowen and Company, Arena Pharmaceuticals
BELVIQ also improved a number of secondary parameters to a greater extent than placebo
(p<0.001), including waist circumference (-6.8cm vs. -3.9cm), triglycerides (-6.15% vs. -
0.14%), hs-CRP (-1.19mg/L vs. -0.17mg/L), hemoglobin A1C (-0.04% vs. 0.03%) and quality of
life (as measured by the IWQOL-LITE scale, 12.4 for BELVIQ vs. 10.7 for placebo, p<0.001).
With BELVIQ treatment, at 52 weeks, there were also significant reductions from baseline in
systolic and diastolic blood pressures, as well as heart rate, compared with placebo.
www.cowen.comMEMBER: FINRA/SIPC 28
EQUITY RESEARCHCowen and Company, LLC

BLOOM Trial: Secondary Endpoints
BELVIQ (n = 1,538) Placebo (n = 1,499) p-value
Change in waist circumference -6.8cm -3.9cm <0.001
Change in triglycerides -6.15% -0.14% <0.001
Change in hs-CRP -1.19mg/L -0.17mg/L <0.001
Change in IWQOL-LITE 12.4 10.7 <0.001
Change in heart rate -2.0 bpm -1.6 bpm 0.0499
Change Systolic BP (mm Hg) -1.4 mm Hg -0.8 mm Hg 0.04
Change Diastolic BP (mm Hg) -1.1 mm Hg) -0.6 mm Hg 0.01 Source: Cowen and Company, Arena Pharmaceuticals
In BLOOM, the primary endpoint at year 2 was the proportion of patients losing ≥ 5% of
baseline body weight at the end of year 1 who maintained this weight reduction. In BELVIQ
patients who had ≥ 5% weight loss at 52 weeks, more patients who continued to receive
BELVIQ in year 2 maintained this loss, compared to those on placebo (67.9% vs. 50.3%,
p<0.001). The mean body weight was lower in patients treated with BELVIQ for two years
compared with mean body weight in patients on placebo for both years.
Could Safety be BELVIQ’s distinguishing feature?
While generally considering BELVIQ’s efficacy to be “modest,” our consultants were more
positive about its side effect profile. BLOOM produced no serious safety signals. There were
no seizures, and CNS adverse events (depression, anxiety, and suicidal ideation) occurred at
similar rates in both groups. The incidence of depression, depressive symptoms, or depressed
mood was 2.5% in the BELVIQ group and 2.2% in the placebo group at 52 weeks, while the
incidence of suicidal thoughts was 1.3% in each group. The rates of serious adverse events
were similar for placebo and BELVIQ.
In BLOOM, the echocardiographic safety endpoint was the proportion of patients developing
FDA-defined valvulopathy (mild or greater aortic regurgitation and/or moderate or greater mitral
regurgitation) at week 52, and this primarily determined the sample size. A non-inferiority
analysis was used to compare the rates of valvulopathy in BELVIQ patients and in placebo
patients. Based on a non-inferiority margin equating to a relative risk of valvulopathy with
BELVIQ of 1.5, the study was sized to rule out a >50% increase in the incidence of
valvulopathy between the groups at 52 weeks, with statistical power of 80% at the 5%
significance level. At 52 weeks, FDA-defined valvulopathy had occurred in 2.7% of BELVIQ
patients compared with 2.3% of placebo patients (p=0.70, relative risk with BELVIQ: 1.1). At 2
years, the rates for the BELVIQ and placebo groups were 2.6% and 2.7%, respectively.
Our consultants believe that BELVIQ’s clean adverse event profile could be the key driver of its
use. For example, other drugs that produce a similar degree of weight loss are sibutramine and
orlistat. However, BELVIQ appears to be safer than sibutramine (which was removed from the
market for its cardiovascular effects) and better tolerated than orlistat (which can produce
urgent bowel movements, oily spotting, and flatulence).
www.cowen.comMEMBER: FINRA/SIPC 29
EQUITY RESEARCHCowen and Company, LLC

BLOOM Trial: Safety Data
BELVIQ 10 mg BID
(n=1,593)
n(%)
Placebo
(n=1,584)
n(%)
Headache 287 (18.0) 175 (11.0)
Upper respiratory infection 235 (14.8) 189 (11.9)
Nasopharyngitis 213 (13.4) 190 (12.0)
Dizziness 130 (8.2) 60 (3.8)
Nausea 119 (7.5) 85 (5.4)
Sinusitis 114 (7.2) 130 (8.2)
Diarrhea 109 (6.8) 85 (5.4)
Urinary tract infection 106 (6.7) 96 (6.1)
Constipation 106 (6.7) 64 (4.0)
Back pain 99 (6.2) 89 (5.6)
Fatigue 95 (6.0) 48 (3.0)
Dry mouth 83 (5.2) 37 (2.3)
Gastroenteritis (viral cause) 79 (5.0) 64 (4.0)
Influenza 73 (4.6) 69 (4.4)
Arthralgia 70 (4.4) 75 (4.7)
Cough 65 (4.1) 56 (3.5)
Vomiting 59 (3.7) 42 (2.7)
Pharyngolaryngeal pain 57 (3.6) 43 (2.7)
Bronchitis 56 (3.5) 62 (3.9)
Sinus congestion 53 (3.3) 37 (2.3)
Pain in extremity 52 (3.3) 49 (3.1)
Procedural pain 47 (3.0) 41 (2.6)
Insomnia 41 (2.6) 58 (3.7)
Source: Cowen and Company, Arena Pharmaceuticals
Trial #2: BLOSSOM
BLOSSOM was a 1-year, randomized, placebo-controlled, double-blind, Phase III study which
evaluated the efficacy and safety of BELVIQ, administered with a lifestyle modification
program. 4,008 patients were randomized 2:1:2 to receive BELVIQ 10 mg BID, BELVIQ 10 mg
daily, or placebo. Eligibility criteria for the trial included age 18-65 years and BMI 30-45 kg/m2
or 27-29.9 kg/m2 having at least one of the following co-morbid conditions: hypertension,
dyslipidemia, cardiovascular disease, impaired glucose tolerance, or sleep apnea, as well as
ability to participate in a moderate-intensity exercise program. Patients were provided
nutritional and physical exercise counseling at baseline, weeks 1/2/4, and subsequently on a
monthly basis. Patients were encouraged to moderately exercise for 30 minutes per day and
instructed to reduce daily caloric intake by 600 kcal.
In September 2009, Arena released top-line results from BELVIQ's BLOSSOM trial. Full data
were presented in October 2009 at the Obesity Society Meeting.
www.cowen.comMEMBER: FINRA/SIPC 30
EQUITY RESEARCHCowen and Company, LLC

The trial achieved all three of its co-primary efficacy endpoints (% of patients losing ≥ 5% body
weight, average weight loss, and % of patients losing ≥ 10% of their weight) with p<0.0001.
BLOSSOM Trial: Baseline Patient Characteristics
Number Of Patients 4,008
Average BMI, kg/m2 35.9
Average Weight 220 lbs
Average Age, years 44
Female Proportion 80%
Baseline Valvulopathy 4-5% Source: Cowen and Company, Arena Pharmaceuticals
1) % average weight loss: BELVIQ patients (10 mg BID group) had an average weight loss of
5.8% (12.8 lbs) vs. 2.8% (6.4 lbs) for placebo, resulting in a placebo-adjusted average weight
loss of 3.0%, or 6.4 lbs. This result was statistically significant; just as in the BLOOM trial
though, it did not meet FDA’s efficacy benchmark of a 5% difference in average weight loss
between therapy and placebo. The 10mg QD group had weaker efficacy, with just a 1.9%
difference in placebo-adjusted weight loss.
2) % of patients losing at least 5% of their weight: 47.2% of BELVIQ patients (10 mg BID
group) lost at least 5% of baseline body weight, compared to 25% of placebo patients. With
these data, BELVIQ met the threshold specified in FDA's draft guidance for efficacy of obesity
drugs. The 10mg QD group had weaker efficacy here, too, and the difference between it and
placebo was less than the FDA guidance of the active arm being approximately double that of
placebo.
3) % of patients losing at least 10% of their weight: 22.6% of BELVIQ patients (10 mg BID
group) in the trial lost at least 10% of body weight, compared to 9.7% of placebo patients. Not
surprisingly, the 10mg QD group had weaker efficacy here, too.
BLOSSOM Trial: Efficacy Data
Key Endpoints BELVIQ 10mg BID BELVIQ 10mg QD PlaceboDifference from
10mg BIDp-value
Difference from
10mg QDp-value
n (ITT-LOCF) n=1,602 n=801 n=1,601
Mean Weight Loss (%) (ITT-LOCF) 5.8% 4.7% 2.8% 3.0% <0.001 1.9% <0.001
≥5% weight loss (ITT-LOCF) 47.2% 40.2% 25.0% 22.2% <0.001 15.2% <0.001
≥10% weight loss (ITT-LOCF) 22.6% 17.4% 9.7% 12.9% <0.001 7.7% <0.001
n (Completers) n=846 n=418 n=764
Mean Weight Loss (%) (Completers) 7.9% 6.5% 4.0% 3.9% <0.001 2.5% <0.001
≥5% weight loss (Completers) 63.2% 53.1% 34.9% 28.3% <0.001 18.2% <0.001
≥10% weight loss (Completers) 35.1% 26.3% 16.1% 19.0% <0.001 10.2% <0.001
Completion rate 53% 52% 48% - -
BLOSSOM (n=4,008)
Source: Cowen and Company, Arena Pharmaceuticals
www.cowen.comMEMBER: FINRA/SIPC 31
EQUITY RESEARCHCowen and Company, LLC
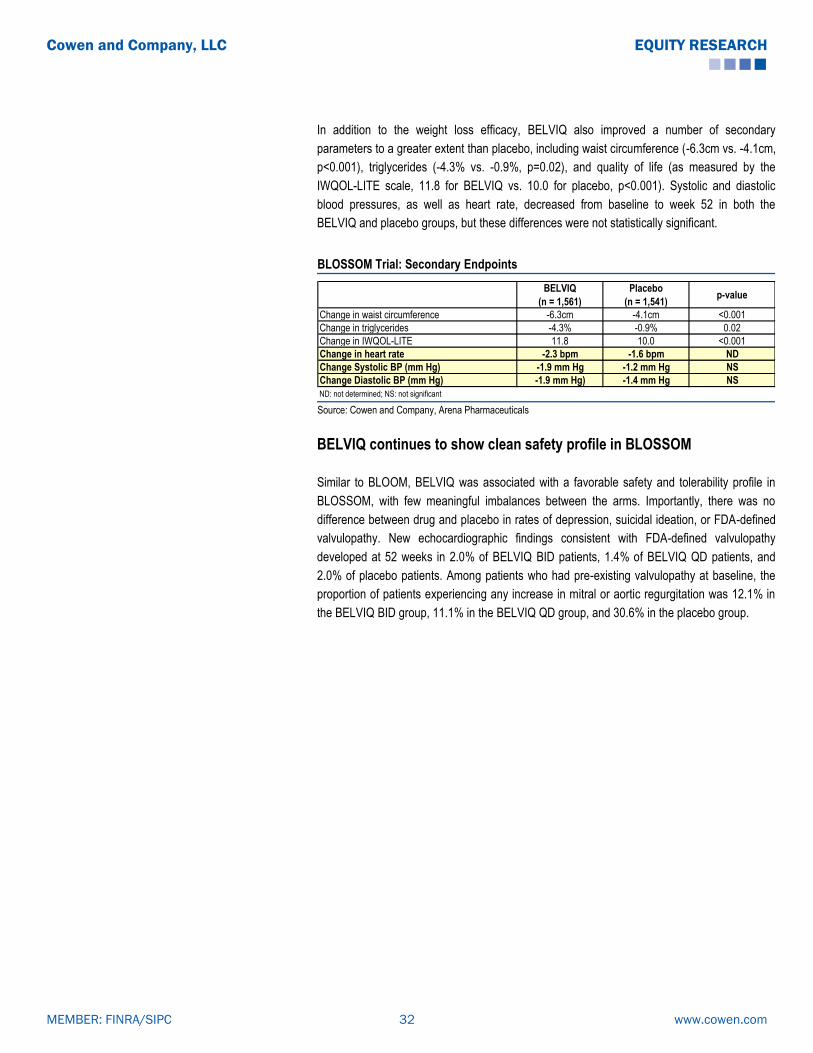
In addition to the weight loss efficacy, BELVIQ also improved a number of secondary
parameters to a greater extent than placebo, including waist circumference (-6.3cm vs. -4.1cm,
p<0.001), triglycerides (-4.3% vs. -0.9%, p=0.02), and quality of life (as measured by the
IWQOL-LITE scale, 11.8 for BELVIQ vs. 10.0 for placebo, p<0.001). Systolic and diastolic
blood pressures, as well as heart rate, decreased from baseline to week 52 in both the
BELVIQ and placebo groups, but these differences were not statistically significant.
BLOSSOM Trial: Secondary Endpoints
BELVIQ
(n = 1,561)
Placebo
(n = 1,541)p-value
Change in waist circumference -6.3cm -4.1cm <0.001
Change in triglycerides -4.3% -0.9% 0.02
Change in IWQOL-LITE 11.8 10.0 <0.001
Change in heart rate -2.3 bpm -1.6 bpm ND
Change Systolic BP (mm Hg) -1.9 mm Hg -1.2 mm Hg NS
Change Diastolic BP (mm Hg) -1.9 mm Hg) -1.4 mm Hg NS
ND: not determined; NS: not significant Source: Cowen and Company, Arena Pharmaceuticals
BELVIQ continues to show clean safety profile in BLOSSOM
Similar to BLOOM, BELVIQ was associated with a favorable safety and tolerability profile in
BLOSSOM, with few meaningful imbalances between the arms. Importantly, there was no
difference between drug and placebo in rates of depression, suicidal ideation, or FDA-defined
valvulopathy. New echocardiographic findings consistent with FDA-defined valvulopathy
developed at 52 weeks in 2.0% of BELVIQ BID patients, 1.4% of BELVIQ QD patients, and
2.0% of placebo patients. Among patients who had pre-existing valvulopathy at baseline, the
proportion of patients experiencing any increase in mitral or aortic regurgitation was 12.1% in
the BELVIQ BID group, 11.1% in the BELVIQ QD group, and 30.6% in the placebo group.
www.cowen.comMEMBER: FINRA/SIPC 32
EQUITY RESEARCHCowen and Company, LLC

BLOSSOM Trial: Safety Data
Adverse EventsBELVIQ 10 mg BID
n(%)
BELVIQ 10 mg QD
n(%)
Placebo
n(%)
Patients with any AE 1,323 (82.6) 653 (81.5) 1,205 (75.3)
Patients with any serious AE 49 (3.1) 27 (3.4) 36 (2.2)
Discontinuation due to AE 115 (7.2) 50 (6.2) 73 (4.6)
FDA-defined valvulopathy 24(2.0) 9 (1.4) 23 (2.0)
AE with incidence >5% in any group
Headache 250 (15.6) 125 (15.6) 147 (9.2)
Upper respiratory tract infection 204 (12.7) 117 (14.6) 202 (12.6)
Nasopharyngitis 201 (12.5) 95 (11.9) 192 (12.0)
Nausea 145 (9.1) 61 (7.6) 85 (5.3)
Dizziness 140 (8.7) 50 (6.2) 62 (3.9)
Fatigue 134 (8.4) 53 (6.6) 66 (4.1)
Sinusitis 122 (7.6) 67 (8.4) 117 (7.3)
Urinary tract infection 107 (6.7) 61 (7.6) 77 (4.8)
Back pain 101 (6.3) 55 (6.9) 91 (5.7)
Diarrhea 98 (6.1) 53 (6.6) 94 (5.9)
Dry mouth 87 (5.4) 27 (3.4) 37 (2.3)
Constipation 80 (5.0) 41 (5.1) 61 (3.8)
Psychiatric AE of interest
Depression 31 (1.9) 9 (1.1) 29 (1.8)
Depressed mood 10 (0.6) 7 (0.9) 14 (0.9)
Suicidal ideation 15 (0.9) 5 (0.6) 11 (0.7)
Source: Cowen and Company, Arena Pharmaceuticals
Trial #3: BLOOM-DM
BLOOM-DM was a 1-year, randomized, placebo-controlled, double-blind, Phase III study which
evaluated the efficacy and safety of BELVIQ, administered with a lifestyle modification
program, in patients with type 2 diabetes treated with metformin and/or a sulfonylurea (SFU).
In the trial, 604 patients were randomized 1:1:1 to receive BELVIQ 10 mg BID, BELVIQ 10 mg
daily (QD), or placebo. After approximately 8 months, the protocol was amended, and
enrollment was discontinued in the BELVIQ 10 mg QD arm because of slow trial recruitment.
Already enrolled patients remained in the study. Eligibility criteria for the trial included age 18-
65 years and BMI 27-45 kg/m2 with type 2 diabetes treated with metformin ± a SFU and HbA1c
level 7-10% at screening, as well as the ability to participate in a moderate-intensity exercise
program. Use of insulin in any form was an exclusion criterion. At each patient visit (weeks 2
and 4 after randomization and then monthly), patients had individual counseling sessions of
15-60 minutes, including advice about exercise, behavior modification, calorie restriction, and
food choices. Patients were instructed to moderately exercise for 30 minutes per day and to
reduce daily caloric intake by 600 kcal.
Arena announced topline results from BLOOM-DM in November 2010. BLOOM-DM met its
three co-primary endpoints (% of patients losing ≥ 5% body weight, average weight loss, and
% of patients losing ≥ 10% of their weight) with p < 0.0001. Efficacy was comparable to that in
the previous two BELVIQ trials.
www.cowen.comMEMBER: FINRA/SIPC 33
EQUITY RESEARCHCowen and Company, LLC

BLOOM-DM Trial: Baseline Patient Characteristics
Number Of Patients 604
Average BMI, kg/m2 36
Average Weight 228 lbs
Average Age, years 53
Average HbA1c Level 8%
Female Proportion 54% Source: Cowen and Company, Arena Pharmaceuticals
1) % average weight loss: BELVIQ patients had an average weight loss of 4.5% vs. 1.5% for
placebo, resulting in a placebo-adjusted average weight loss of 3.0%. This result was
statistically significant; once again, as in BELVIQ’s previous two other Phase III trials, this
result did not meet FDA’s efficacy benchmark of a 5% difference in average weight loss
between therapy and placebo.
2) % of patients losing at least 5% of their weight: 37.5% of BELVIQ patients lost at least
5% of baseline body weight, compared to 16.1% of placebo patients. With these data, BELVIQ
met the threshold specified in FDA's draft guidance for efficacy of obesity drugs.
3) % of patients losing at least 10% of their weight: 16.3% of BELVIQ patients in the trial
lost at least 10% of body weight, compared to 4.4% of placebo patients.
BLOOM-DM Trial: Efficacy Data
Key Endpoints BELVIQ 10mg BID Placebo Difference p-value
n (ITT-LOCF) n=251 n=248
Mean Weight Loss (%) (ITT-LOCF) 4.5% 1.5% 3.0% <0.001
≥5% weight loss (ITT-LOCF) 37.5% 16.1% 21.4% <0.001
≥10% weight loss (ITT-LOCF) 16.3% 4.4% 11.9% <0.001
n (Completers) n=169 n=157
Mean Weight Loss (%) (Completers) 5.5% 1.7% 3.8% <0.001
≥5% weight loss (Completers) 44.6% 17.9% 26.7% <0.001
≥10% weight loss (Completers) 20.8% 5.8% 15.0% <0.001
Completion rate 67% 63% - -
BLOOM-DM (n=604)
Source: Cowen and Company, Arena Pharmaceuticals
Additionally, there were improvements noted in secondary endpoints pertaining to glycemic
control, anthropometric measures, and cardiometabolic parameters. Glycemic control was
evaluated by HbA1c, fasting glucose, fasting insulin, and calculated insulin resistance using
www.cowen.comMEMBER: FINRA/SIPC 34
EQUITY RESEARCHCowen and Company, LLC

homeostatic model assessment-insulin resistance (HOMA-IR). Mean HbA1c, fasting plasma
glucose, and insulin resistance were significantly more decreased in the BELVIQ group
compared with placebo. At 52 weeks, 50.4% of BELVIQ patients had HbA1c level ≤ 7%,
compared with 26.3% of placebo patients. Waist circumference was also reduced significantly
with BELVIQ treatment compared to placebo (-5.5 cm vs. -3.3 cm). Systolic and diastolic blood
pressures decreased from baseline to week 52 in both the BELVIQ and placebo groups, with
no significant differences noted, as was the case with triglyceride levels. Heart rate, however,
did decrease significantly with BELVIQ vs. placebo (-2 bpm vs. -0.4 bpm).
BLOOM-DM Trial: Secondary Endpoints
BELVIQ 10 mg BID
(n = 251)
Placebo
(n = 248)p-value
Change in HbA1C -0.9% -0.4% <0.001
% with HbA1C < 7% 50.4% 26.3% <0.001
Change in fasting glucose -27.4 mg/dL -11.9 mg/dL <0.001
Change in fasting insulin -3 μIU/ml -1.6 μIU/ml 0.12
Change in HOMA-IR -0.5 -0.2 0.022
Change in triglycerides -10.7% -4.8% 0.054
Change in hs-CRP -1.3 g/L -0.6 g/L 0.15
Change in IWQOL-LITE 11.3 10.2 0.221
Change in waist circumference -5.5cm -3.3cm 0.001 Source: Cowen and Company, Arena Pharmaceuticals
Safety OK overall…but valvulopathy signal resurfaces
Safety was similar to that observed in the BLOOM and BLOSSOM trials, with headache being
the most common unbalanced AE. Hypoglycemia was more frequent with BELVIQ treatment
compared with placebo, with 7.4% and 6.3% of patients in each group, respectively, reporting
at least one episode of symptomatic hypoglycemia. There were no reports of severe
hypoglycemia, which was defined as an episode causing confusion, loss of consciousness, or
treatment with intravenous agents, in either group. Also, no patients in either group
discontinued because of hypoglycemia.
www.cowen.comMEMBER: FINRA/SIPC 35
EQUITY RESEARCHCowen and Company, LLC

BLOOM-DM Trial: Safety Data
BELVIQ 10 mg BID
(n=256) n(%)
Placebo
(n=252) n(%)
Headache 37 (14.5) 18 (7.1)
Back pain 30 (11.7) 20 (7.9)
Nasopharyngitis 29 (11.3) 25 (9.9)
Nausea 24 (9.4) 20 (7.9)
Urinary tract infection 23 (9.0) 15 (6.0)
Cough 21 (8.2) 11 (4.4)
Symptomatic hypoglycemia 19 (7.4) 16 (6.3)
Fatigue 19 (7.4) 10 (4.0)
Gastroenteritis, viral 18 (7.0) 11 (4.4)
Dizziness 18 (7.0) 16 (6.3)
Influenza 15 (5.9) 13 (5.2)
Procedural pain 13 (5.1) 5 (2.0)
Hypertension 13 (5.1) 8 (3.2)
Gastroenteritis 8 (3.1) 5 (2.0)
Depression 6 (2.3) 5 (2.0)
FDA-defined valvulopathy 6(2.9) 1 (0.5) Source: Cowen and Company, Arena Pharmaceuticals
With regard to cardiac valvulopathy, there was a trend toward increased new-onset
valvulopathy at 52 weeks in the BELVIQ arm, although the trial was not powered to detect a
statistically significant difference. At 52 weeks, one patient (0.5%) in the placebo group and 6
patients (2.9%) in the BELVIQ BID group had echocardiographic FDA-defined valvulopathy
which was not present at baseline. The difference in incidence rates between the BELVIQ and
placebo groups is higher than differences between the groups in the BLOOM and BLOSSOM
studies, but given the small size of the trial, the differences in this trial did not reach statistical
significance.
Among those with pre-existing FDA-defined valvulopathy at baseline, 11.1% of BELVIQ
patients and 12.5% of placebo patients experienced any increase in mitral regurgitation or
aortic regurgitation score at week 52. This difference was not statistically significant.
Responder Analysis in BLOOM and BLOSSOM Studies
Updated responder data from a pooled, post hoc analysis of the BLOOM and BLOSSOM
studies were presented in June 2013 at the American Diabetes Association meeting. The
BLOOM and BLOSSOM study results were combined, representing patients without type 2
diabetes.
In the combined analysis, 49% (1,251 of 2,537) of patients treated with BELVIQ were
categorized as responders, defined by total body weight loss of at least 5% by week 12.
These patients achieved mean weight loss of 10.6 kg (10.7%) in 52 weeks. This amount of
www.cowen.comMEMBER: FINRA/SIPC 36
EQUITY RESEARCHCowen and Company, LLC

weight loss was similar to the weight loss achieved by responders on placebo of 9.5 kg (9.5%).
The difference was that only 22.6% of placebo patients (541 of 2,393) met the ―at least 5%
weight loss by week 12‖ threshold and were categorized as responders, versus the 49.3% of
BELVIQ patients meeting that definition.
Responder Analysis From the BLOOM and BLOSSOM Studies
RespondersBELVIQ 10mg
BID (n=1,251)
Placebo
(n=541)
Mean baseline weight, kg 99.0 100.3
Mean weight loss, kg 10.6 9.5
Mean weight loss % 10.7% 9.5%
% responders 49.3% 22.6%
Source: Cowen and Company, Arena 2013 ADA Poster
Responder Analysis in BLOOM-DM Study
The June 2013 ADA presentation also had responder analysis from BLOOM-DM, in which
patients had type 2 diabetes. In BLOOM-DM, 35.9% (78/217) of patients treated with BELVIQ
were categorized as responders, defined by total body weight loss of 5% by week 12. These
patients achieved mean weight loss of 9.3 kg (9%) vs. 7.5 kg (7%) for placebo responders.
However, only 11.5% of placebo patients met the 5% weight loss by week 12 threshold and
were categorized as responders, vs. 35.9% for the patients treated with BELVIQ.
Responder Analysis From the BLOOM-DM Study
RespondersBELVIQ 10mg
BID (n=78)
Placebo
(n=25)
Mean baseline weight, kg 102 103
Mean weight loss, kg 9.3 7.5
Mean weight loss % 9.1% 7.3%
% responders 35.9% 11.5%
Source: Cowen and Company, Arena 2013 ADA Poster
Side-Effect Profile Will Carve Out a Niche, But Broader Use Is Likely Only In Combination With Phentermine
Assuming tumorigenesis concerns resulting from preclinical models are viewed by physicians
to have no clinical relevance in humans, and that the same goes for the potential valvulopathy
signal seen in BLOOM-DM, our consultants believe that BELVIQ’s otherwise clean side effect
profile could carve out a niche in mildly obese people who seek medical treatment. They also
suggest that BELVIQ’s ultimate potential will depend on combinability with phentermine.
www.cowen.comMEMBER: FINRA/SIPC 37
EQUITY RESEARCHCowen and Company, LLC

Consultants are unsure about how quickly a BELVIQ/phentermine combination therapy would
be adopted by physicians. Some think that BELVIQ may be combined with phentermine off-
label immediately upon FDA approval. Many others note, however, that most physicians would
be hesitant to combine the two because of their experience with Fen-Phen, and that material
combination therapy will occur only after a large safety and efficacy trial has been conducted.
Future Studies with BELVIQ
Arena has indicated that, in conjunction with partner Eisai, plans and strategy for further
studies of BELVIQ to support additional potential indications are being considered. Discussions
with Eisai will be finalized before proceeding to communication with FDA regarding any new
potential indication. Management has indicated that potential areas of further investigation
include: 1) BELVIQ in combination with phentermine, 2) BELVIQ in combination with
olanzapine to address weight gain associated with antipsychotic use, 3) BELVIQ in
combination with metformin for diabetic patients, and 4) BELVIQ as a single agent for smoking
cessation.
BELVIQ-Phentermine Combination: In May 2013, Arena reported that a development plan
had been finalized with Eisai for the study of BELVIQ in combination with phentermine. A
meeting with the FDA was undertaken in 2Q13 to discuss investigation of this combination.
Management commented that the FDA appeared “to be amenable” to the BELVIQ-
phentermine combination (2Q13 earnings call, 8/1/13).
BELVIQ-Phentermine Combination Studies: In August 2013, Arena reported that a PK study
evaluating the BELVIQ-phentermine combination was completed, with data being analyzed.
This study evaluated BELVIQ 10 mg, phentermine 15 mg, and the BELVIQ-phentermine
combination (10 mg/15 mg). Additionally, Arena announced that Eisai will be initiating a 12-
week pilot study of BELVIQ-phentermine by YE13 or the beginning of 2014. Eisai has not
disclosed the study design. Management indicated that the results of both studies will inform
the future development plan for the combination. Arena is covering costs of the PK study, and
Eisai will cover costs related to the pilot study. The further co-development agreement for the
combination is “under discussion” with Eisai, according to Arena management
www.cowen.comMEMBER: FINRA/SIPC 38
EQUITY RESEARCHCowen and Company, LLC

Summary of BELVIQ’s Regulatory History
NDA Submitted in December 2009; FDA AdCom in September 2010
In December 2009, Arena submitted BELVIQ’s NDA to the FDA. In September 2010, the FDA
AdCom voted 9-5 against recommending approval. The panel concluded that there was too
much uncertainty about BELVIQ's risks, in light of its relatively modest effects on weight loss,
to support approval at that time.
Committee members were generally comfortable that BELVIQ's efficacy, though modest, met
the FDA bar and might be clinically significant. However, the limited efficacy made the panel
more critical of risks. Panelists had two primary concerns: 1) an unexplained preclinical
carcinogenicity signal, and 2) the patient population used in the pivotal trials was not seen as
representative of the presumed real-world patient group. Although they believed Arena made
all reasonable efforts to rule out drug-induced valvulopathy, they suggested that programs to
monitor this issue should be a condition of any approval.
Rat Carcinogenicity Data a Surprise in Briefing Documents, Made Risk/Benefit Unacceptable To AdCom
In FDA briefing documents prepared for the September 2010 BELVIQ AdCom review, it was
revealed that a number of malignant tumors had developed in BELVIQ’s rat carcinogenicity
studies, including tumors of breast, brain, peripheral nerve, skin and subcutis. However, only
mammary tumors were increased to a statistically significant degree in both male and female
rats, and therefore these were the most concerning to committee members. Moreover, the
mammary tumors developed in female rats treated with BELVIQ at doses within sevenfold of
the proposed clinical dose of 10mg BID, which was low enough that the FDA was concerned
about the margin for safety. The FDA’s concerns were further supported by the fact that
preclinical studies had not produced similar tumors in mice. The agency suggested that this
was likely due to lower levels of drug exposure achieved in mice. Moreover, the FDA did not
accept Arena’s studies linking increased tumorigenesis to elevated serum prolactin levels,
which would suggest little clinical significance in humans. The FDA concluded that “given the
lack of a safety margin, an unresolved tumorigenic mechanism of action, and a patient
population already at increased risk of breast cancer, the relevance of these findings in rats to
human risk cannot be dismissed.”
www.cowen.comMEMBER: FINRA/SIPC 39
EQUITY RESEARCHCowen and Company, LLC

Incidence of BELVIQ-Induced Tumors In Two-Year Rat Carcinogenicity Study
Control 10 30 100
Brain astrocytoma 1 0 4 NS 8 SS
adenocarcinoma 0 0 2 2 NS
fibroadenoma 0 1 4 NS 6 NS
combined 0 1 6 SS 8 SS
Skin, subcutis benign fibroma 3 7 NS 11 SS 17 SS
Skin squamous carcinoma 0 0 4 NS 5 SS
Nerve Sheath Schwannoma, all sites 0 0 2 NS 9 SS
hepatocellular carcinoma 1 3 2 4
hepatocellular adenoma 1 1 2 6 SS
combined 2 4 4 NS 10 SS
Thyroid follicular cell adenoma 0 5 4 NS 8 SS
Control 10 30 100
Brain astrocytoma 0 2 0 1
adenocarcinoma 28 34 NS 35 NS 60 SS
fibroadenoma 20 47 SS 53 SS 45 SS
combined 40 56 SS 61 SS 70 SS
SS: Statistically significant, NS: Not statistically significant
Incidence of tumors
Mammary
Male rats BELVIQ dose, mg/kg/day
Incidence of tumors
Mammary
Liver
Female rats BELVIQ dose, mg/kg/day
Source: Cowen and Company, FDA’s BELVIQ briefing documents
CRL Received In October 2010
In October 2010, Arena received a CRL for BELVIQ. The letter requested that Arena complete
and submit BELVIQ's BLOOM-DM trial in obese patients with diabetes, as well as additional
preclinical rat toxicology studies to better understand BELVIQ's association with mammary and
central nervous system (CNS) tumors. Specifically, regarding the rat tumor findings, the FDA
requested additional preclinical data and analyses, including a detailed accounting of the
female rat slides that contributed to the rat mammary tumor incidence data, a re-adjudication of
all mammary and lung tissues from all female rats, a demonstration that the adenocarcinoma
findings have no relevance to humans, and additional data on the distribution of BELVIQ to the
CNS to better estimate the astrocytoma exposure margins.
Report Shows a Shift in Incidence Numbers of BELVIQ-Induced Tumors
To address the rat tumor findings the company convened a Pathology Working Group (PWG)
consisting of 5 pathologists to re-adjudicate the mammary tumors. In August 2011, Arena
announced the results from the PWG re-adjudication. The data showed a shift in the numbers
of both tumor types, benign and malignant, relative to the initial results included in the NDA.
The new analysis showed that the incidences of adenocarcinomas in the BELVIQ low- and
mid-dose groups were no longer numerically higher than those in the control group. However,
the incidence was statistically higher in the BELVIQ high (100mg/kg/day) dose group.
Incidence of fibroadenomas was statistically higher than the control group for all three BELVIQ
dose groups.
www.cowen.comMEMBER: FINRA/SIPC 40
EQUITY RESEARCHCowen and Company, LLC
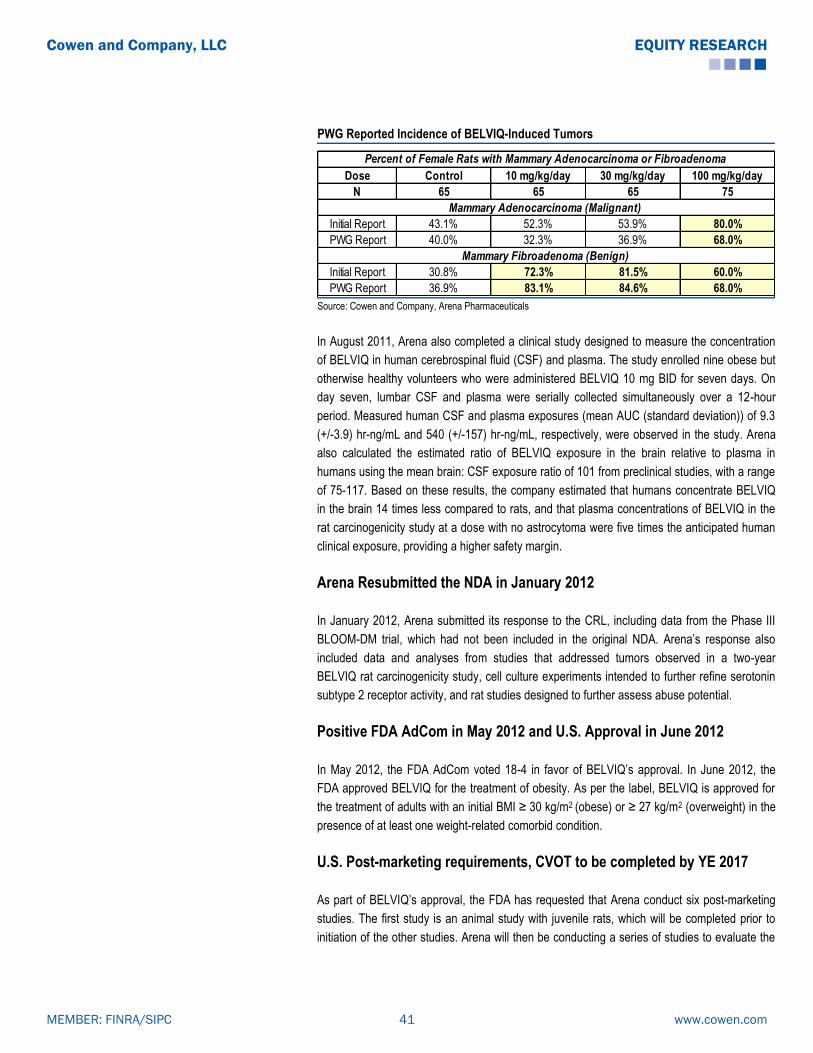
PWG Reported Incidence of BELVIQ-Induced Tumors
Dose Control 10 mg/kg/day 30 mg/kg/day 100 mg/kg/day
N 65 65 65 75
Initial Report 43.1% 52.3% 53.9% 80.0%
PWG Report 40.0% 32.3% 36.9% 68.0%
Initial Report 30.8% 72.3% 81.5% 60.0%
PWG Report 36.9% 83.1% 84.6% 68.0%
Percent of Female Rats with Mammary Adenocarcinoma or Fibroadenoma
Mammary Adenocarcinoma (Malignant)
Mammary Fibroadenoma (Benign)
Source: Cowen and Company, Arena Pharmaceuticals
In August 2011, Arena also completed a clinical study designed to measure the concentration
of BELVIQ in human cerebrospinal fluid (CSF) and plasma. The study enrolled nine obese but
otherwise healthy volunteers who were administered BELVIQ 10 mg BID for seven days. On
day seven, lumbar CSF and plasma were serially collected simultaneously over a 12-hour
period. Measured human CSF and plasma exposures (mean AUC (standard deviation)) of 9.3
(+/-3.9) hr-ng/mL and 540 (+/-157) hr-ng/mL, respectively, were observed in the study. Arena
also calculated the estimated ratio of BELVIQ exposure in the brain relative to plasma in
humans using the mean brain: CSF exposure ratio of 101 from preclinical studies, with a range
of 75-117. Based on these results, the company estimated that humans concentrate BELVIQ
in the brain 14 times less compared to rats, and that plasma concentrations of BELVIQ in the
rat carcinogenicity study at a dose with no astrocytoma were five times the anticipated human
clinical exposure, providing a higher safety margin.
Arena Resubmitted the NDA in January 2012
In January 2012, Arena submitted its response to the CRL, including data from the Phase III
BLOOM-DM trial, which had not been included in the original NDA. Arena’s response also
included data and analyses from studies that addressed tumors observed in a two-year
BELVIQ rat carcinogenicity study, cell culture experiments intended to further refine serotonin
subtype 2 receptor activity, and rat studies designed to further assess abuse potential.
Positive FDA AdCom in May 2012 and U.S. Approval in June 2012
In May 2012, the FDA AdCom voted 18-4 in favor of BELVIQ’s approval. In June 2012, the
FDA approved BELVIQ for the treatment of obesity. As per the label, BELVIQ is approved for
the treatment of adults with an initial BMI ≥ 30 kg/m2 (obese) or ≥ 27 kg/m2 (overweight) in the
presence of at least one weight-related comorbid condition.
U.S. Post-marketing requirements, CVOT to be completed by YE 2017
As part of BELVIQ’s approval, the FDA has requested that Arena conduct six post-marketing
studies. The first study is an animal study with juvenile rats, which will be completed prior to
initiation of the other studies. Arena will then be conducting a series of studies to evaluate the
www.cowen.comMEMBER: FINRA/SIPC 41
EQUITY RESEARCHCowen and Company, LLC

safety and efficacy of BELVIQ in the obese pediatric patient population. In addition, Arena is
also required to conduct a cardiovascular outcomes trial (CVOT) to evaluate the effect of long-
term treatment with BELVIQ on CV safety. Echocardiographic assessments will be included in
this post-marketing CVOT. Arena is currently in discussions with FDA, is finalizing the
protocols for these studies, and expects to initiate these studies sometime in 2013. Arena and
Eisai have agreed on a protocol for the CVOT, and a draft was provided to FDA in February
2013. The company is required to complete the CVOT by December 31, 2017 and to submit
the final report in 2018. As per the agreement with Eisai, Arena will be responsible for 10% of
the CVOT expenses. Furthermore, Arena will be responsible for 50% of certain pediatric
development expenses.
E.U. Regulatory Front: MAA Withdrawn
The BELVIQ MAA was submitted to EMA in March 2012, with the UK as the rapporteur and
Sweden as the co-rapporteur, and in July 2012, Arena also submitted the MAA in Switzerland.
In 4Q12, Arena submitted its response to the CHMP’s 120-day assessment report and list of
questions regarding the MAA. In January 2013, the company received the Day 180 List of
Outstanding Issues from the CHMP. The CHMP requested that the company justify BELVIQ’s
overall benefit-risk profile, taking into account previously raised issues, “including tumors in
rats, valvulopathy, and psychiatric events.” The CHMP requested both oral and written
explanations from the company.
On May 2, 2013, Arena reported that, after the company submitted its written response as well
as oral explanation to the Day 180 List of Outstanding Issues, the CHMP continued to have
―certain major objections‖ which prevented a recommendation to approve the MAA. The
company indicated that the objections were related to results of ―non-clinical studies‖ and that
these could not be resolved before the time of the final CHMP opinion. Therefore, Arena
withdrew the BELVIQ MAA for the E.U. and will ask EMA for scientific advice with regard to
submission at a later time.
Regulatory Update in Other Territories
Mexico: In April 2013, Arena announced that a marketing authorization application had been
submitted in Mexico with the Federal Commission for the Protection Against Sanitary Risk
(COFEPRIS). This submission triggered a $500K milestone from Eisai to Arena.
Canada: In June 2013, Arena announced that a New Drug Submission (NDS) for BELVIQ had
been submitted in Canada, which triggered a $500K milestone from Eisai to Arena.
Brazil: In August 2013, Arena announced that regulatory filings will be submitted for BELVIQ
around YE13.
Switzerland: In August 2013, Arena reported that Swissmedic was “not satisfied” by the
company’s Day 120 response to the agency’s questions and concerns.
www.cowen.comMEMBER: FINRA/SIPC 42
EQUITY RESEARCHCowen and Company, LLC

BELVIQ Has IP Through mid-2023, Possibly Through mid-2026
As of February 15, 2013, Arena owned issued patents that cover compositions of matter for
BELVIQ and related compounds and methods of treatment utilizing BELVIQ and related
compounds in 69 jurisdictions, including the United States, Japan, Germany, France, China,
Italy, Spain, Canada, the United Kingdom, Russia, Australia, India, and South Korea.
Arena holds U.S. Patent # 6,953,787, entitled ―5HT2C Receptor Modulators.‖ As stated in the
patent abstract, ―The present invention relates to novel compounds of Formula (I): which act as
5HT2C receptor modulators. These compounds are useful in pharmaceutical compositions
whose use includes the treatment of obesity.‖ Arena also holds U.S. Patents # 7,514,422;
7,977,329; 8,207,158; and 8,273,734, which are continuations of U.S. Patent # 6,953,787.
These patents cover the composition of matter of lorcaserin for the treatment of obesity,
providing protection through mid-2023. Arena has filed an application with FDA for a patent
extension under Hatch-Waxman, and believes it should be able to receive an additional 3
years of patent life, resulting in patent protection through mid-2026.
BELVIQ Patent Estate
P a t e n t # T it le F ilin g d a t eE a rlie s t p r io r it y
d a t eE x p ira t io n d a t e
6 ,9 5 3 ,7 8 7 4 /1 0 /2 0 0 3 4 /1 2 /2 0 0 2
7 ,5 1 4 ,4 2 2 8 /1 3 /2 0 0 4 4 /1 2 /2 0 0 2
7 ,9 7 7 ,3 2 9 1 1 /1 4 /2 0 0 6 4 /1 2 /2 0 0 2
8 ,2 0 7 ,1 5 8 5 /2 7 /2 0 1 1 4 /1 2 /2 0 0 2
8 ,2 7 3 ,7 3 4 6 /1 4 /2 0 1 2 4 /1 2 /2 0 0 2
8 ,3 6 7 ,6 5 7
T h e p r e se n t in v e n tio n p r o v id e s p r o ce sse s a n d in te r m e d ia te s fo r th e p r e p a r a tio n o f 3 -
b e n za ze p in e s a n d sa lts th e r e o f w h ich ca n b e u se fu l a s se r o to n in ( 5 - H T ) r e ce p to r
a g o n is ts fo r th e tr e a tm e n t o f, fo r e x a m p le , ce n tr a l n e r v o u s sy s te m d iso r d e r s su ch a s
o b e s ity .
6 /1 4 /2 0 0 4 7 /1 7 /2 0 0 3
8 ,1 6 8 ,6 2 4
T h e p r e se n t in v e n tio n is d ir e c te d to c r y s ta llin e fo r m s o f ( R ) - 8 - ch lo r o - 1 - m e th y l- 2 ,3 ,4 ,5 -
te tr a h y d r o - 1 H - 3 - b e n za ze p in e , co m p o s itio n s co n ta in in g th e sa m e , p r e p a r a tio n s , a n d u se s
th e r e o f.
1 2 /2 0 /2 0 0 5 1 2 /2 1 /2 0 0 4
8 ,1 5 3 ,6 2 1
T h e p r e se n t in v e n tio n r e la te s to a co m p o s itio n co m p r is in g p h e n te r m in e a n d a se le c tiv e
5 H T - 2 C r e ce p to r a g o n is t. In a d d itio n , th e in v e n tio n r e la te s to a co m p o s itio n co m p r is in g
p h e n te r m in e a n d a se le c tiv e 5 H T - 2 C r e ce p to r a g o n is t h a v in g F o r m u la ( I) : o r a
p h a r m a ce u tica lly a cce p ta b le sa lt, so lv a te o r h y d r a te th e r e o f. T h e se co m p o s itio n s a r e
u se fu l in p h a r m a ce u tica l co m p o s itio n s w h o se u se in c lu d e s th e tr e a tm e n t o f o b e s ity .
1 2 /2 1 /2 0 0 5 1 2 /2 3 /2 0 0 4
T h e p r e se n t in v e n tio n r e la te s to n o v e l co m p o u n d s o f F o r m u la ( I) : w h ich a c t a s 5 H T 2 C
r e ce p to r m o d u la to r s . T h e se co m p o u n d s a r e u se fu l in p h a r m a ce u tica l co m p o s itio n s w h o se
u se in c lu d e s th e tr e a tm e n t o f o b e s ity
m id - 2 0 2 3
-
Source: Cowen and Company, USPTO
www.cowen.comMEMBER: FINRA/SIPC 43
EQUITY RESEARCHCowen and Company, LLC
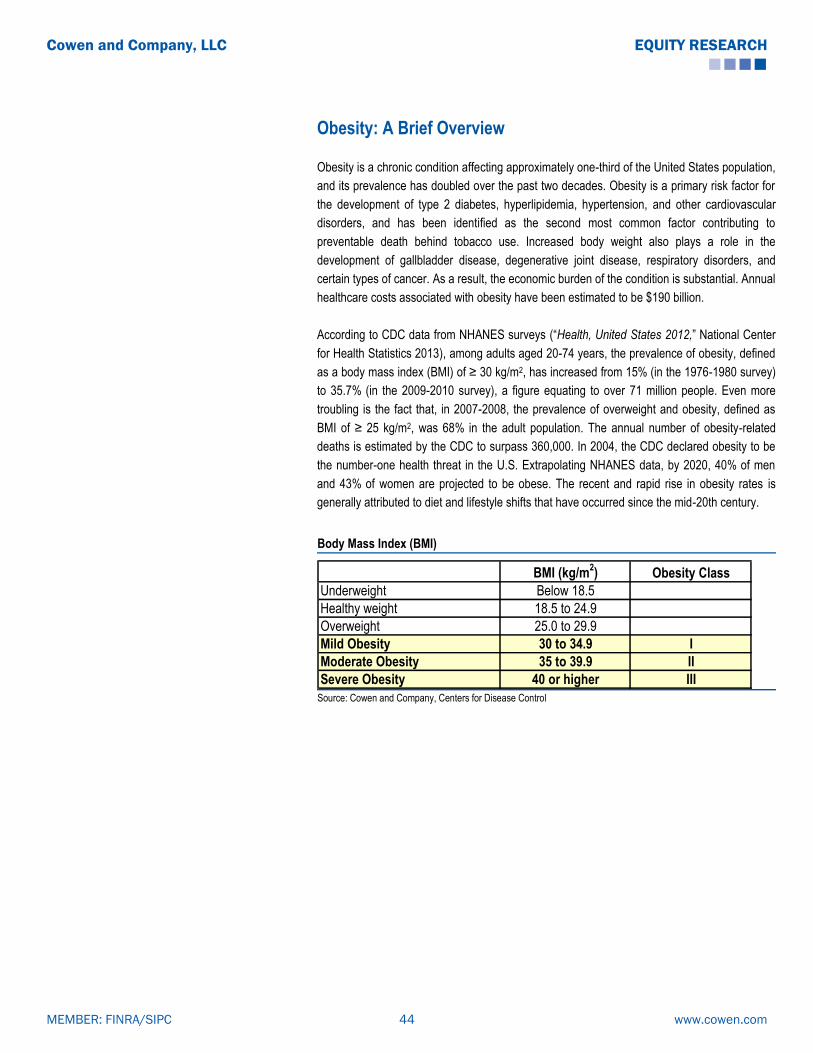
Obesity: A Brief Overview
Obesity is a chronic condition affecting approximately one-third of the United States population,
and its prevalence has doubled over the past two decades. Obesity is a primary risk factor for
the development of type 2 diabetes, hyperlipidemia, hypertension, and other cardiovascular
disorders, and has been identified as the second most common factor contributing to
preventable death behind tobacco use. Increased body weight also plays a role in the
development of gallbladder disease, degenerative joint disease, respiratory disorders, and
certain types of cancer. As a result, the economic burden of the condition is substantial. Annual
healthcare costs associated with obesity have been estimated to be $190 billion.
According to CDC data from NHANES surveys (―Health, United States 2012,‖ National Center
for Health Statistics 2013), among adults aged 20-74 years, the prevalence of obesity, defined
as a body mass index (BMI) of ≥ 30 kg/m2, has increased from 15% (in the 1976-1980 survey)
to 35.7% (in the 2009-2010 survey), a figure equating to over 71 million people. Even more
troubling is the fact that, in 2007-2008, the prevalence of overweight and obesity, defined as
BMI of ≥ 25 kg/m2, was 68% in the adult population. The annual number of obesity-related
deaths is estimated by the CDC to surpass 360,000. In 2004, the CDC declared obesity to be
the number-one health threat in the U.S. Extrapolating NHANES data, by 2020, 40% of men
and 43% of women are projected to be obese. The recent and rapid rise in obesity rates is
generally attributed to diet and lifestyle shifts that have occurred since the mid-20th century.
Body Mass Index (BMI)
BMI (kg/m2) Obesity Class
Underweight Below 18.5
Healthy weight 18.5 to 24.9
Overweight 25.0 to 29.9
Mild Obesity 30 to 34.9 I
Moderate Obesity 35 to 39.9 II
Severe Obesity 40 or higher III Source: Cowen and Company, Centers for Disease Control
www.cowen.comMEMBER: FINRA/SIPC 44
EQUITY RESEARCHCowen and Company, LLC

U.S. Prevalence Of Obesity
Source: Centers for Disease Control
Because of the diverse mechanisms believed to underlie weight control, a broad array of
approaches has been attempted to address this large and growing healthcare issue. Diet,
increased physical activity, and behavioral modification are the mainstay strategies for weight
loss and maintenance of healthy body weight. While such lifestyle changes can be effective in
reducing body fat and increasing lean body mass, and are the typical ―prescription‖ for most
overweight patients, compliance with lower-calorie diets and/or exercise regimens is
challenging for most. According to NIH Guidelines on obesity treatment, pharmacotherapy may
provide a beneficial adjunct to dietary, activity, and behavioral modifications in selected
individuals, including: those with BMI ≥ 30 kg/m2 (obese) and no concomitant risk factors, or
those with BMI ≥ 27 kg/m2 (overweight) and comorbidities such as hypertension, dyslipidemia,
type 2 diabetes, coronary artery disease, and sleep apnea. Per NIH recommendations, the
initial goal of weight loss therapy is an approximately 10% reduction in body weight from
baseline, accomplished within a time frame of 6 months on treatment.
The growing view of obesity as a chronic disease that requires targeted treatment has spurred
industry-wide efforts to develop novel therapeutics. During the 60-year history of obesity drug
marketing, one of the biggest challenges has been to develop a drug that is: (1) effective in
promoting durable weight loss, (2) safe for long-term use, and (3) non habit-forming. Until
1996, all drugs approved for weight-loss indications by the FDA were labeled for short-term
use only (a few weeks). This was partly because obesity was not considered a chronic
condition, so the drugs were viewed as short-term jumpstarts to longer programs of diet and
exercise. Also, most of the early drugs were amphetamine derivatives with significant abuse
potential. As obesity became more prevalent during the 1980’s, the FDA began to recognize it
as a chronic condition requiring longer-term treatment. In 1996, the agency issued a draft
www.cowen.comMEMBER: FINRA/SIPC 45
EQUITY RESEARCHCowen and Company, LLC

guidance requiring extensive safety data for one year or longer for new obesity drug
applications. Long-term safety is an especially crucial issue for contemporary obesity NDAs
since, despite the more stringent 1996 draft guidance, three out of the four obesity drugs
subsequently approved were found to be associated with serious safety issues post approval
and ultimately withdrawn from one or more major markets.
Poor Safety Record of Obesity Drugs
DrugYear
Approved
Approved
Duration Of UseComment
Desoxyn (methamphetamine) 1947 Short-term Black box warning for abuse potential
Preludin (phenmetrazine) 1956 Short-term Banned in Sweden and rarely prescribed elsewhere due to abuse
phentermine 1959 Short-term Label warns against combination use
Tenuate (diethylpropion) 1959 Short-term Label contraindicates combination use
Bontril (phendimetrazine) 1959 Short-term Rarely prescribed due to abuse potential
Didrex (benzphetamine) 1960 Short-term Label warns against combination use
Mazindol 1973 Short-term -
Fenfluramine 1973 Short-term Withdrawn in 1997 on valvulopathy risk
Redux (dexfenfluramine) 1996 Long-term Withdrawn in 1997 on valvulopathy risk
Meridia (sibutramine) 1997 Long-term Withdrawn in 2010 on CV risk
Xenical (orlistat) 1999 Long-term -
Acomplia (rimonabant) 2006 (EU) Long-term Withdrawn from EU in 2009 on suicidality risk Source: Cowen and Company
In 2007, the FDA revised the weight-loss drug draft guidance. The guidance now requires
Phase III placebo-controlled trials, with approximately 1,500 patients on placebo and 3,000
patients on drug for a period of at least one year to assess safety. The 2007 guidance defined
two efficacy endpoints, at least one of which should be met for a new drug candidate to be
considered effective: (1) ―mean efficacy‖ (statistically significant difference in mean weight loss
of at least 5% between therapy and placebo groups), and (2) ―categorical efficacy‖ (the
proportion of subjects losing ≥ 5% of body weight in the active drug group should be greater
than 35%, and at least double the proportion in the placebo group, with the difference between
groups being statistically significant).
Until recently, only a handful of FDA-approved prescription products were marketed, including
generic phentermine and Roche/GlaxoSmithKline’s Xenical (orlistat). Our clinical consultants
use these older medications in about 50% of their obesity patients, primarily because they are
only modestly efficacious (resulting in loss of 8-10 pounds, or approximately 5% of baseline
body weight) while also associated with poor safety and tolerability profiles. Because
phentermine and Xenical have questionable benefit/risk profiles and are not generally
reimbursed by payors, only 6MM of 160MM obese patients worldwide are treated. Of those,
only 50% are thought to be compliant with therapy. Although bariatric surgery and other
invasive procedures have gained wider acceptance and can result in significant weight loss,
these options remain reserved for those patients at the severe end of the obesity spectrum.
Hence, the overwhelming majority of obese patients are inadequately treated for their
www.cowen.comMEMBER: FINRA/SIPC 46
EQUITY RESEARCHCowen and Company, LLC
condition. In this context, and with a difficult market history of weight-loss drugs stymied by
major safety issues, the FDA approved BELVIQ and Qsymia in 2012, after previously rejecting
both.
Current thinking on obesity reflects understanding that the affected population is not
necessarily homogenous. This perspective has been shared in a recent consensus report of
the Obesity Drugs Outcome Measures Dialogue Group, composed of academic and clinical
key opinion leaders, health advocacy leaders, industry representatives, and government (FDA,
CDC, NIH) observers. Beyond characterization based primarily on size (BMI), there is
recognition of an obesity spectrum, accounting for variations in health effects, functional
limitations, and psychosocial impairment. Patient stratification may be considered in three
groups: “Obese and Well,” “Obese with Risk Factors,” and “Obese and Sick.” Obese-Well
individuals have no related risks and no significant impairments. The Obese-Sick have obesity-
related comorbidities, with impairments of function or daily feeling. In the middle are those who
have no current comorbidities but carry specific risk factors for health and symptomatic effects.
Considering disease severity across a spectrum of obesity may help to clarify patient needs,
therapeutic goals, and acceptable risk levels—strategic factors which ultimately impact
treatment decisions.
Recent Developments in Obesity: Recognition and Legislation
In a September 2012 position statement (Mechanick JI et al., Endocrine Practice 2012), the
American Association of Clinical Endocrinologists (AACE) declared obesity to be a disease
“with multiple pathophysiological aspects, including genetic, environmental, physiological, and
psychological factors.” The AACE published a new, comprehensive management algorithm for
diabetes (Garber AJ et al., AACE Comprehensive Diabetes Management Algorithm 2013.
Endocrine Practice 2013) which incorporates obesity, pre-diabetes, and CV risk factor
management in May 2013. In particular, these guidelines specifically incorporate medical
therapy with approved weight loss drugs, including BELVIQ and Qsymia, first-line with lifestyle
modification for treatment of obese and overweight patients with complications such as
diabetes. These therapies are also considered as first-line treatment in the algorithm for pre-
diabetes management. As stated in the AACE Guidelines, “lifestyle optimization is
essential…However, such efforts should not delay pharmacotherapy, which can be initiated
simultaneously.”
In June 2013, the American Medical Association adopted a resolution introduced by the AACE,
and formally recognized obesity as a disease, “with multiple pathophysiological aspects
requiring a range of interventions to advance obesity treatment and prevention.” Also in June
2013, a bipartisan group in the U.S. Congress introduced legislation entitled the Treat and
Reduce Obesity Act of 2013 (H.R. 2415) for consideration in the House of Representatives.
This bill amends title XVIII (Medicare) of the Social Security Act to include information on
coverage of intensive behavioral therapy for obesity in patient handbooks. Furthermore, the
legislation provides reimbursement for this behavioral therapy. Finally, under the bill, there is
coverage with Medicare Part D (voluntary prescription benefit program) for obesity drugs used
to treat overweight individuals with one or more comorbidities.
www.cowen.comMEMBER: FINRA/SIPC 47
EQUITY RESEARCHCowen and Company, LLC

BELVIQ’s Competition, Current and Future
1) The Incumbent: Vivus’ Qsymia
In July 2012, the FDA approved Qsymia, a controlled-release phentermine/ topiramate
combination, as an adjunct to a reduced-calorie diet and increased physical activity for chronic
weight management in adult patients with an initial BMI ≥ 30 kg/m2 (obese), or ≥ 27 kg/m2
(overweight) in the presence of at least one weight-related comorbidity, such as hypertension,
type 2 diabetes mellitus, or dyslipidemia. Per the label, Qsymia treatment is to be started at
low-dose (3.75 mg/23 mg phentermine/topiramate) daily for 14 days and then increased to the
recommended dose of 7.5 mg/46 mg (mid-dose). After 12 weeks on Qsymia mid-dose
treatment, if a patient has not lost at least 3% of baseline body weight, treatment should be
discontinued or escalated to Qsymia top-dose (15mg/92mg). After an additional 12 weeks on
Qsymia top-dose treatment, if a patient has not lost at least 5% of baseline body weight,
treatment should be discontinued.
In September 2012, Qsymia was launched in the U.S. In February 2013, the EMA confirmed its
original decision of 10/18/12 to decline approval for the MAA for Qsiva, the EU proposed
name. EMA indicated that a preapproval CVOT would be necessary to establish Qsiva’s long-
term safety.
Qsymia REMS Requirement
In granting approval for Qsymia, the FDA required a Risk Evaluation and Mitigation Strategy
(REMS) from Vivus, with the goal of informing prescribers and female patients of childbearing
age about potential teratogenic risks of Qsymia and the importance of pregnancy prevention,
as well as need to discontinue Qsymia in the event of pregnancy. The components of the
Qsymia REMS include a Medication Guide with patient-focused labeling, dispensed with every
prescription, as well as Elements to Assure Safe Use (ETASU), with assessments required at
6 months, 12 months, and annually thereafter. The ETASU are comprised by: 1) HCP
education and training, with maintenance of database of trained HCPs by Vivus, and 2)
certified home delivery pharmacy network, with certified pharmacies and pharmacy staff
training on REMS requirements. The ETASU for Qsymia does not include a patient registry,
patient enrollment, patient profile review, or pregnancy test requirement, though a test is
recommended.
REMS amendment approved: In April 2013, Vivus announced the approval by FDA of an
amendment and modification to the REMS program, which made Qsymia available through
certified retail pharmacies. The other components of the original Qsymia REMS program
remain unchanged and in place. Management indicated that the implementation process
includes completing wholesale distribution agreements, enrolling and training each pharmacy
location, and ensuring REMS-compliant database setup, as well as shipping and stocking of
product. On July 1, 2013, Vivus announced the availability of Qsymia in certified retail
pharmacies (approximately 8,000 Walgreens, Costco, and Duane Reade retail locations).
www.cowen.comMEMBER: FINRA/SIPC 48
EQUITY RESEARCHCowen and Company, LLC

Qsymia Achieved Strong Efficacy in Its Phase III Program
The Qsymia Phase III program was comprised by four trials: EQUATE, a 28-week factorial
study conducted to confirm the contributions of phentermine and topiramate to Qsymia
efficacy; EQUIP and CONQUER, two 1-year studies; and SEQUEL, a 1-year extension study
of CONQUER. EQUATE and CONQUER were conducted under SPA with FDA.
Designs of the two pivotal phase III studies, EQUIP and CONQUER, were determined in
consultation with FDA and complied with the FDA Guidance for Industry “Developing Products
for Weight Management” relative to number of participants, enrolled populations, study
duration, and endpoints. The Qsymia Phase III trial program evaluated three dose levels
(phentermine/topiramate): low-dose (3.75 mg/23 mg), mid/recommended-dose (7.5 mg/46
mg), and top-dose (15 mg/92 mg).
Qsymia Phase III Program Summary
EQUATE (OB-301)* EQUIP (OB-302) CONQUER (OB-303) SEQUEL (OB-305)*
Number of patients 756 1,267 2,487 675
Duration 28 weeks 56 weeks 56 weeks 108 weeks (extension study)
Treatment groups
Qsymia 7.5/46 mg, Qsymia 15/92
mg, Topiramate 46 mg, Topiramate
92 mg, Phentermine 7.5 mg,
Phentermine 15 mg, Placebo
Qsymia 3.75/23 mg, Qsymia
15/92 mg, Placebo
Qsymia 7.5/46 mg, Qsymia 15/92
mg, Placebo
Qsymia 7.5/46 mg, Qsymia 15/92
mg, Placebo
Patient demographics
(BMI, kg/m2)
BMI 30-45; baseline weight 223
pounds
BMI ≥ 35, with no upper limit;
baseline weight 256 pounds
BMI 27-45 and ≥ 2 comorbidities
(HTN, dyslipidemia, diabetes,
abdominal obesity; baseline weight
227 pounds
BMI 27-45 and ≥ 2 comorbidities
(HTN, dyslipidemia, diabetes,
abdominal obesity; baseline weight
225 pounds
Mean BMI, kg/m2 36 42 37 36
Average age (years) 46 43 51 51-52
Female Proportion 79% 83% 70% 65%-70%
Ethnicity Caucasian (79%)Caucasian (80%)
African-American (16%-18%)
Caucasian (70%)
African-American (11%-12%)
Caucasian (83%-87%)
African-American (11%-15%)
Adjunct lifestyle/behavior
modification program
Co-primary endpoints
Data Announced December 2008 September 2009 September 2009 September 2010
Qsymia Low-Dose: 3.75/23mg (phentermine/topiramate) ; Qsymia Mid-Dose: 7.5/46mg; Qsymia High-Dose: 15/92mg
1) mean change in body weight from baseline
2) proportion of patients ≥ 5% weight loss
Standardized counseling on nutrition and exercise based on the LEARN weight management program, with monthly progress discussion
Source: Cowen and Company, *EQUATE and SEQUEL were not pivotal studies
www.cowen.comMEMBER: FINRA/SIPC 49
EQUITY RESEARCHCowen and Company, LLC

Qsymia Efficacy Data
M e a n W e ig h t
L o s s (% )
Tre a tm e n t G ro u p
M e a n W e ig h t
L o s s (% )
P la c e b o G ro u p
M e a n W e ig h t
L o s s (% )
P la c e b o -
a d ju s te d
> 5 % W e ig h t L o s s
Tre a tm e n t G ro u p
> 5 % W e ig h t L o s s
P la c e b o G ro u p
> 5 % W e ig h t L o s s
P la c e b o -
A d ju s te d
> 1 0 % W e ig h t
L o s s
Tre a tm e n t G ro u p
> 1 0 % W e ig h t
L o s s
P la c e b o G ro u p
E Q U A TE (O B -3 0 1 ) -
Q s y m ia 1 5 m g p h e n /9 2 m g to p i; (n = 7 5 6 )9 .2 % 1 .7 % 7 .5 % 6 6 .0 % 1 5 .5 % 5 0 .5 % 3 8 .8 % 6 .8 %
E Q U IP (O B -3 0 2 ) -
Q s y m ia 1 5 m g p h e n /9 2 m g to p i; (n = 1 ,2 6 7 )1 0 .9 % 1 .6 % 9 .3 % 6 6 .7 % 1 7 .3 % 4 9 .4 % 4 7 .2 % 7 .4 %
S E Q U E L (O B -3 0 5 )-
Q s y m ia 1 5 m g p h e n /9 2 m g to p i; (n = 2 ,4 8 7 )1 0 .5 % 1 .8 % 8 .7 % 7 9 .3 % 3 0 .0 % 4 9 .3 % 5 3 .9 % 1 1 .5 %
C O N Q U E R (O B -3 0 3 ) -
Q s y m ia 1 5 m g p h e n /9 2 m g to p i; (n = 6 7 5 )1 0 .4 % 1 .8 % 8 .6 % 7 0 .0 % 2 1 .0 % 4 9 .0 % 4 8 .0 % 7 .0 %
E Q U A TE (O B -3 0 1 )-
Q s y m ia 7 .5 m g p h e n /4 6 m g to p ; (n = 7 5 6 )8 .5 % 1 .7 % 6 .8 % 6 2 .1 % 1 5 .5 % 4 6 .6 % 4 0 .8 % 6 .8 %
S E Q U E L (O B -3 0 5 )-
Q s y m ia 7 .5 m g p h e n /4 6 m g to p ; (n = 2 ,4 8 7 )9 .3 % 1 .8 % 7 .5 % 7 5 .2 % 3 0 .0 % 4 5 .2 % 5 0 .3 % 1 1 .5 %
C O N Q U E R (O B -3 0 3 ) -
Q s y m ia 7 .5 m g p h e n /4 6 m g to p ; (n = 6 7 5 )8 .4 % 1 .8 % 6 .6 % 6 2 .0 % 2 1 .0 % 4 1 .0 % 3 7 .0 % 7 .0 %
E Q U IP (O B -3 0 2 ) -
Q s y m ia 1 5 m g p h e n /9 2 m g to p i; (n = 1 ,2 6 7 )1 4 .4 % 2 .1 % 1 2 .2 % 8 3 .5 % 2 5 .5 % 5 8 .0 % 6 7 .7 % 1 3 .0 %
S E Q U E L (O B -3 0 5 )-
Q s y m ia 1 5 m g p h e n /9 2 m g to p i; (n = 2 ,4 8 7 )1 0 .7 % 2 .2 % 8 .5 % 7 9 .3 % 3 0 .0 % 4 9 .3 % 5 3 .9 % 1 1 .5 %
C O N Q U E R (O B -3 0 3 ) -
Q s y m ia 1 5 m g p h e n /9 2 m g to p i; (n = 6 7 5 )1 2 .4 % 1 .6 % 1 0 .8 % 8 5 .1 % 2 6 .2 % 5 8 .9 % 6 4 .3 % 9 .7 %
S E Q U E L (O B -3 0 5 )-
Q s y m ia 1 5 m g p h e n /9 2 m g to p i; (n = 2 ,4 8 7 )9 .3 % 2 .2 % 7 .1 % 7 5 .2 % 3 0 .0 % 4 5 .2 % 5 0 .3 % 1 1 .5 %
C O N Q U E R (O B -3 0 3 ) -
Q s y m ia 1 5 m g p h e n /9 2 m g to p i; (n = 6 7 5 )9 .6 % 1 .6 % 8 .0 % 7 4 .6 % 2 6 .2 % 4 8 .4 % 4 9 .1 % 9 .7 %
Q s ym ia L o w -D o s e : 3 .7 5 / 2 3 m g (p h e n t e rm in e / t o p ira m a t e ) ; Q s ym ia M id -D o s e : 7 .5 / 4 6 m g ; Q s ym ia T o p -D o s e : 15 / 9 2 m g
7 .5 m g p h e n /4 6 m g to p i (c o m p le te rs )
Q s y m ia 1 5 m g p h e n /9 2 m g to p i ( IT T )
Q s y m ia 7 .5 m g p h e n /4 6 m g to p i ( IT T )
Q s y m ia 1 5 m g p h e n /9 2 m g to p i (c o m p le te rs )
Source: Cowen and Company
EQUATE Confirms Efficacy of Qsymia Over Phentermine and Topiramate Alone
EQUATE (OB-301) was a randomized, placebo-controlled, double-blind, multi-center, six-
month, Phase III factorial trial in 756 obese patients comparing weight loss with two doses of
Qsymia (mid-dose, 7.5/46 mg and top-dose, 15/92 mg), single agent phentermine and
topiramate at doses corresponding to those in the Qsymia dose combinations, and placebo.
Eligibility criteria included age ≤ 70 years and BMI 30-45 kg/m2. All participants were provided
standardized counseling based on the LEARN weight management program. LEARN is a 16-
week program incorporating tools for lifestyle, attitude, relationship, nutrition, and exercise
changes.
www.cowen.comMEMBER: FINRA/SIPC 50
EQUITY RESEARCHCowen and Company, LLC
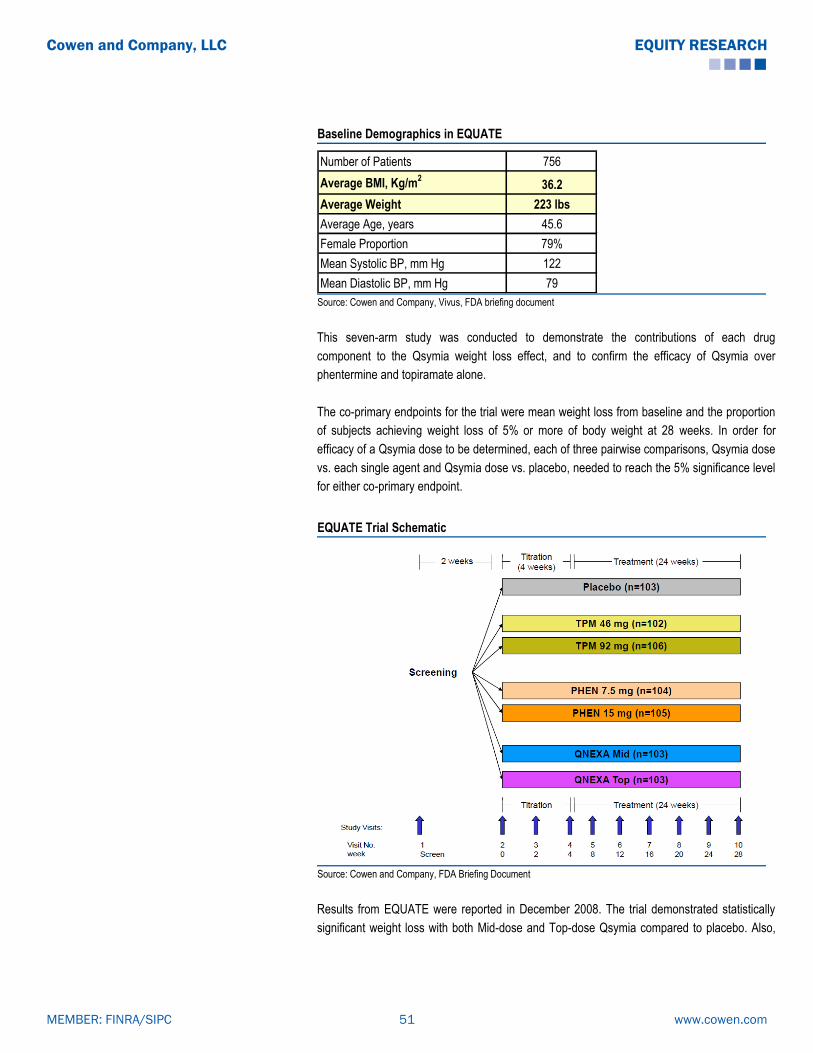
Baseline Demographics in EQUATE
Number of Patients 756
Average BMI, Kg/m2
36.2
Average Weight 223 lbs
Average Age, years 45.6
Female Proportion 79%
Mean Systolic BP, mm Hg 122
Mean Diastolic BP, mm Hg 79 Source: Cowen and Company, Vivus, FDA briefing document
This seven-arm study was conducted to demonstrate the contributions of each drug
component to the Qsymia weight loss effect, and to confirm the efficacy of Qsymia over
phentermine and topiramate alone.
The co-primary endpoints for the trial were mean weight loss from baseline and the proportion
of subjects achieving weight loss of 5% or more of body weight at 28 weeks. In order for
efficacy of a Qsymia dose to be determined, each of three pairwise comparisons, Qsymia dose
vs. each single agent and Qsymia dose vs. placebo, needed to reach the 5% significance level
for either co-primary endpoint.
EQUATE Trial Schematic
Source: Cowen and Company, FDA Briefing Document
Results from EQUATE were reported in December 2008. The trial demonstrated statistically
significant weight loss with both Mid-dose and Top-dose Qsymia compared to placebo. Also,
www.cowen.comMEMBER: FINRA/SIPC 51
EQUITY RESEARCHCowen and Company, LLC
the contributions of phentermine and topiramate individually to Qsymia efficacy were
demonstrated. Furthermore, the efficacy of Qsymia over these components was shown.
1) Qsymia mid-dose vs. placebo: Patients treated with mid-dose Qsymia had mean weight
loss of 8.5% compared to 1.7% for those treated with placebo. This difference was statistically
significant (p<0.0001). 62% of the Qsymia mid-dose group had ≥ 5% weight loss compared
with 15.5% of the placebo group. This difference was also statistically significant (p<0.0001).
For both co-primary endpoints, the benchmark established by the factorial trial design was met
to show efficacy of the Qsymia mid-dose over placebo.
2) Qsymia mid-dose vs. phentermine 7.5 mg: Patients treated with mid-dose Qsymia had
mean weight loss of 8.5%, while those treated with phentermine 7.5 mg lost an average 5.5%
of body weight. This difference was statistically significant (p=0.0003), meeting the significance
level set in the factorial design to determine efficacy of the Qsymia mid-dose over phentermine
alone.
3) Qsymia mid-dose vs. topiramate 46 mg: Patients treated with mid-dose Qsymia had
mean weight loss of 8.5%, while those treated with topiramate 46 mg had average loss of
5.1%. This difference was statistically significant (p<0.0001), also meeting the significance
level set in the factorial design to determine efficacy of the Qsymia mid-dose over topiramate
alone.
4) Qsymia top-dose vs. placebo: Patients treated with top-dose Qsymia had mean weight
loss of 9.2% compared to 1.7% for those treated with placebo. This difference was statistically
significant (p<0.0001). 66% of the Qsymia top-dose group had ≥ 5% weight loss compared
with 15.5% of the placebo group, which was also a statistically significant (p<0.0001)
difference. For both co-primary endpoints, the benchmark established by the factorial trial
design was met to show efficacy of the Qsymia top-dose over placebo.
5) Qsymia top-dose vs. phentermine 15 mg: Patients treated with top-dose Qsymia had
mean weight loss of 9.2%, while those treated with phentermine 15 mg lost 6.1% of body
weight on average. This difference was statistically significant (p=0.0001), meeting the
significance level set in the factorial design to determine efficacy of the Qsymia top-dose over
phentermine alone.
6) Qsymia top-dose vs. topiramate 92 mg: Patients treated with top-dose Qsymia had mean
weight loss of 9.2%, while those treated with topiramate 92 mg had average loss of 6.4%. This
difference was statistically significant (p=0.0009), and again met the significance level set in
the factorial design to determine efficacy of the Qsymia top-dose over topiramate alone.
www.cowen.comMEMBER: FINRA/SIPC 52
EQUITY RESEARCHCowen and Company, LLC

EQUATE: Efficacy Data
Key Endpoints Qsymia mid-
dose
Qsymia top-
dosePlacebo p-value
Phentermine
7.5mg
Phentermine
15mg
Topiramate
46mg
Topiramate
92mg
n (ITT-LOCF) n=103 n=103 n=103 n=104 n=106 n=102 n=105
Mean Weight Loss (%) (ITT-LOCF) 8.5% 9.2% 1.7% p<0.0001 5.5% 6.1% 5.1% 6.4%
≥5% weight loss (ITT-LOCF) 62.1% 66.0% 15.5% p<0.0001
≥10% weight loss (ITT-LOCF) 38.8% 40.8% 6.8% p<0.0001
EQUATE (OB-301) (n=756); (28 weeks)
Source: Cowen and Company, Vivus, FDA briefing document
Safety: Both doses were well tolerated. The most common adverse events were: paresthesia
(mid-dose: 15%, top-dose: 20%, placebo: 3%), dry mouth (mid-dose: 12%, top-dose: 18%,
placebo: 0%), constipation (mid-dose: 6%, top-dose: 11%, placebo: 6%), and altered taste
(mid-dose: 8%, top-dose: 15%, placebo: 0%). There were no significant differences in
depression and altered mood for either Qsymia dose group compared with placebo (mid-dose:
0.9%, top-dose: 1.9%, placebo: 1.8%).
Qsymia’s Pivotal Phase III Trials Successful
In September 2009, Vivus reported results from the two 56-week pivotal Phase III trials of
Qsymia, EQUIP (OB-302) and CONQUER (OB-303). In both trials, treatment with Qsymia met
efficacy benchmarks established by the FDA guidance for weight-loss therapy.
FDA guidance has delineated the primary efficacy benchmark for weight management drugs
as achievement of either a statistically significant difference in mean weight loss of at least 5%
between therapy and placebo groups, or a categorical loss of ≥ 5% of baseline body weight in
at least 35% of patients on therapy, which proportion should be approximately double that for
placebo.
EQUIP: Qsymia Efficacy in Morbidly Obese Patients
EQUIP was a randomized, placebo-controlled, double-blind phase III study evaluating two
doses of Qsymia in morbidly obese patients. Patients were randomized 2:1:2 to Qsymia 15/92
mg (top-dose), Qsymia 3.75/23 mg (low-dose), or placebo. Treatment initiation consisted of a
4-week blinded titration period, typically recommended with clinical topiramate use to minimize
adverse events, starting with the 3.75/23 mg dose and increasing weekly by 3.75/23 mg
increments to the assigned dose. Patients were then maintained at the randomized dose for 52
weeks and evaluated on a monthly basis. Eligibility criteria included: age 18-70 years, BMI ≥
35 kg/m2 with no upper limit, triglycerides ≤ 200 mg/dl on 0–1 lipid lowering medication, BP ≤
140/90 mm Hg on 0–2 antihypertensive medication(s), and fasting serum glucose level ≤ 110
mg/dl. All participants were provided standardized counseling based on the LEARN weight
management program. They were advised to reduce daily dietary intake by 500 kcal, to
increase water consumption, and to increase physical activity.
www.cowen.comMEMBER: FINRA/SIPC 53
EQUITY RESEARCHCowen and Company, LLC

Baseline Demographics in EQUIP
Number of Patients 1,267
Average BMI, Kg/m2
42
Average Weight 255 lbs
Average Age, years 43
Female Proportion 83%
Mean Systolic BP, mm Hg 122
Mean Diastolic BP, mm Hg 77 Source: Cowen and Company, Vivus, FDA Briefing Document
The co-primary endpoints for the trial were mean weight loss from baseline and the proportion
of subjects achieving weight loss ≥ 5% of baseline body weight at 56 weeks.
The trial successfully met its co-primary endpoints at 56 weeks:
1) % average weight loss: Patients treated with Qsymia 15/92 mg had an average weight
loss of 10.9%, compared with 1.6% in the placebo group, for a placebo-adjusted average
weight loss of 9.3%. This result was statistically significant (p<0.0001) and met FDA’s efficacy
benchmark of at least a 5% difference in average weight loss between therapy and placebo.
For the low-dose Qsymia 3.75/23 mg group, patients had mean weight loss of 5.1% and
placebo-adjusted loss of 3.5%. This result was also statistically significant (p<0.0001) but did
not meet FDA’s efficacy benchmark for mean weight loss.
2) % of patients losing at least 5% of their weight: 66.7% of patients in the Qsymia 15/92
mg group lost at least 5% of baseline body weight, compared to 17.3% in the placebo group.
This improvement over placebo was statistically significant (p<0.0001), meeting the categorical
weight loss threshold specified in FDA’s guidance. In the low-dose Qsymia group, 44.9%
achieved ≥ 5% weight loss. This result, which was statistically significant (p<0.0001) compared
to placebo, also met the FDA benchmark for categorical weight loss efficacy.
Analysis of completers demonstrated placebo-adjusted average weight losses of 12.3% and
4.6% in the Qsymia top-dose and low-dose groups, respectively, with these differences from
placebo being statistically significant (p<0.0001). 83.5% and 59% of completers in the Qsymia
top-dose and low-dose groups, respectively, lost ≥ 5% of body weight, compared with 25.5%
of placebo patients.
In EQUIP, the lower limit for baseline BMI was 35 kg/m2, and there was no upper limit. The
BMI spectrum ranged from 35 kg/m2 to 79 kg/m2 in the trial. The ITT-LOCF analysis was
repeated with categorization of patients by BMI to evaluate any influence of baseline BMI on
the efficacy results. There was noted to be no significant interaction (p=0.8056) between BMI
category and efficacy result, meaning that weight-loss results did not vary significantly by
baseline BMI.
www.cowen.comMEMBER: FINRA/SIPC 54
EQUITY RESEARCHCowen and Company, LLC

EQUIP: Efficacy Data
Key Endpoints Qsymia low-
dose
Qsymia top-
dosePlacebo p-value
n (ITT-LOCF) (n=234) (n=498) (n=498)
Mean Weight Loss (%) (ITT-LOCF) 5.1% 10.9% 1.6% p<0.0001
≥5% weight loss (ITT-LOCF) 44.9% 66.7% 17.3% p<0.0001
≥10% weight loss (ITT-LOCF) 18.8% 47.2% 7.4% p<0.0001
n (completers) n=137 n=297 n=239
Mean Weight Loss (%) (Completers) 6.7% 14.4% 2.1% p<0.0001
≥5% weight loss (Completers) 59.1% 83.5% 25.5% p<0.0001
≥10% weight loss (Completers) 27.7% 67.7% 13.0% p<0.0001
Completion rate 59% 57% 47%
EQUIP (OB-302) (n=1267); (56 weeks)
Source: Cowen and Company, Vivus, FDA briefing document
Additionally, weight loss results with Qsymia were associated with general improvements,
compared with placebo, in anthropometric and cardiometabolic parameters, such as waist
circumference, blood pressure, triglycerides, cholesterol, and fasting glucose. The Qsymia top-
dose group had statistically significant improvements, while the Qsymia low-dose group had
numerically greater, but not always statistically significant, changes in these parameters
compared with the placebo group.
Blood pressure and heart rate: Mean systolic and diastolic blood pressures were decreased
from baseline at week 56 in both Qsymia dose groups, while increased in placebo patients.
Mean SBP was reduced by 1.8 mm Hg and 2.9 mm Hg in the Qsymia low-dose and top-dose
groups, respectively, compared to an increase of 0.9 mm Hg in the placebo group. Mean DBP
was lowered by 0.1 mm Hg and 1.5 mm Hg in the Qsymia low-dose and top-dose groups,
respectively, compared to an elevation of 0.4 mm Hg in the placebo group. Heart rate was
elevated in the Qsymia top-dose cohort (+1.2 bpm) at 56 weeks, but decreased in the Qsymia
low-dose (-0.3 bpm) and placebo (-0.2 bpm) groups.
EQUIP: Selected Secondary Endpoints
Qsymia low-
dosep-value
Qsymia top-
dosep-value Placebo
Waist circumference (cm) -5.6 0.0006 -10.9 <0.0001 -3.1
Systolic blood pressure (mm Hg) -1.8 0.0019 -2.9 <0.0001 0.9
Diastolic blood pressure (mm Hg) -0.1 0.4257 -1.5 0.0002 0.4
Change in heart rate (bpm) -0.3 0.9552 +1.2 0.083 -0.2
Total cholesterol (%) -5.4 0.0502 -6.0 0.0014 -3.5
Triglycerides (%) 5.2 0.2639 -5.2 <0.0001 9.1
Fasting glucose (mg/dL) 0.8 0.1209 -0.6 <0.0001 1.9 Source: Cowen and Company, Vivus, FDA briefing document
Safety: The most common adverse events included paresthesia, dry mouth, constipation,
dysgeusia, and insomnia, none of which caused study discontinuation in more than 1% of
www.cowen.comMEMBER: FINRA/SIPC 55
EQUITY RESEARCHCowen and Company, LLC

patients. Assessment of depressive symptoms according to standardized rating scales showed
improvement in symptoms over time in all groups, with no significant differences among the
groups. Qsymia patients did not have increased suicidality compared with placebo patients.
The rates of serious AEs were the same, 2.5%, for all groups. Mood-related AEs, such as
depression, anxiety, and irritability, as well as cognition-related AEs, such as disturbance in
attention, occurred more frequently in the Qsymia top-dose group. Discontinuations related to
AEs were also more common in the Qsymia top-dose group (16%), compared with the low-
dose (11%) or placebo (8%) groups.
Teratogenicity: Out of 15 pregnancies in women treated with Qsymia, there were 3
spontaneous abortions, 3 elective abortions, and 9 healthy live births. There were no birth
defects or congenital malformations in these infants.
www.cowen.comMEMBER: FINRA/SIPC 56
EQUITY RESEARCHCowen and Company, LLC

EQUIP Safety Data: Common Adverse Events
Qsymia Low-dose
n=240, n(%)
Qsymia Top-dose
n=511, n(%)
Placebo
n=513, n(%)
Paresthesia 10 (4.2) 96 (18.8) 10 (1.9)
Dry mouth 16 (6.7) 87 (17.0) 19 (3.7)
Constipation 19 (7.9) 72 (14.1) 35 (6.8)
Upper respiratory tract infection 38 (15.8) 63 (12.3) 56 (10.9)
Headache 25 (10.4) 61 (11.9) 52 (10.1)
Nasopharyngitis 30 (12.5) 46 (9.0) 37 (7.2)
Dysgeusia 3 (1.3) 43 (8.4) 5 (1.0)
Insomnia 12 (5.0) 40 (7.8) 25 (4.9)
Nausea 14 (5.8) 37 (7.2) 24 (4.7)
Sinusitis 18 (7.5) 37 (7.2) 28 (5.5)
Dizziness 7 (2.9) 29 (5.7) 21 (4.1)
Back pain 13 (5.4) 28 (5.5) 26 (5.1)
Bronchitis 16 (6.7) 28 (5.5) 22 (4.3)
Cough 8 (3.3) 26 (5.1) 18 (3.5)
Influenza 18 (7.5) 26 (5.1) 24 (4.7)
Depression 8 (3.3) 24 (4.7) 6 (1.2)
Diarrhea 12 (5.0) 24 (4.7) 23 (4.5)
Fatigue 12 (5.0) 23 (4.5) 17 (3.3)
Irritability 4 (1.7) 23 (4.5) 3 (0.6)
Vision blurred 15 (6.3) 23 (4.5) 16 (3.1)
Alopecia 5 (2.1) 22 (4.3) 5 (1.0)
Anxiety 7 (2.9) 19 (3.7) 6 (1.2)
Disturbance in attention 1 (0.4) 18 (3.5) 3 (0.6)
Hypoesthesia 2 (0.8) 17 (3.3) 4 (0.8)
Dry eye 2 (0.8) 12 (2.3) 4 (0.8)
Paresthesia oral 1 (0.4) 11 (2.2) 2 (0.4)
Dry skin 0 (0.0) 8 (1.6) 1 (0.2)
Anorexia 3 (1.3) 7 (1.4) 0 (0.0)
Serum bicarbonate decreased 0 (0.0) 7 (1.4) 1 (0.2)
Feeling jittery 3 (1.3) 7 (1.4) 1 (0.2)
Amenorrhea 0 (0.0) 6 (1.2) 0 (0.0)
Aphasia 0 (0.0) 6 (1.2) 0 (0.0)
Back injury 3 (1.3) 5 (1.0) 0 (0.0)
Serum potassium decreased 1 (0.4) 5 (1.0) 0 (0.0)
Hypogeusia 1 (0.4) 5 (1.0) 0 (0.0)
Parosmia 1 (0.4) 5 (1.0) 0 (0.0)
Osteoarthritis 4 (1.7) 2 (0.4) 0 (0.0)
Rhinitis 4 (1.7) 1 (0.2) 0 (0.0) Source: Cowen and Company, Vivus, FDA briefing document
www.cowen.comMEMBER: FINRA/SIPC 57
EQUITY RESEARCHCowen and Company, LLC

CONQUER: Qsymia Efficacy in Obese Patients with Comorbidities
CONQUER was a randomized, placebo-controlled, double-blind phase III study evaluating two
doses of Qsymia in obese and overweight patients with co-morbidities. Patients were
randomized 2:1:2 to Qsymia 15/92 mg (top-dose), Qsymia 7.5/46 mg (mid-dose), or placebo.
Treatment initiation consisted of a 4-week blinded titration period, typically recommended with
topiramate use to minimize adverse events, starting with the 3.75/23 mg dose and increasing
weekly by 3.75/23 mg increments to the assigned dose. Patients were then maintained at the
randomized dose for 52 weeks and evaluated on a monthly basis. Eligibility criteria included:
age 18-70 years, BMI 27-45 kg/m2 with two or more comorbidities, including hypertension,
dyslipidemia, pre-diabetes/diabetes, or abdominal obesity (waist circumference ≥ 102 cm in
men and ≥ 88 cm in women). Type 2 diabetes could be managed with metformin monotherapy
or without medication. All participants were provided standardized counseling based on the
LEARN weight management program. They were given the LEARN manual at baseline and
advised to reduce daily dietary intake by 500 kcal, as well as to implement lifestyle changes.
Progress discussions with study staff occurred on monthly visits.
Baseline Demographics in CONQUER
Number of Patients 2,487
Average BMI, Kg/m2
37
Average Weight 227 lbs
Average Age, years 51
Female Proportion 70%
Mean Systolic BP, mm Hg 128
Mean Diastolic BP, mm Hg 81
Proportion with HTN 52%
Mean Triglycerides, mg/dL 162.5
Proportion with dyslipidemia 36%
Mean HbA1c, % 5.9
Proportion with Type 2 diabetes 16%
Proportion with > 3 comorbidities 51% Source: Cowen and Company, Vivus FDA Briefing Document
The co-primary endpoints of the study were mean percent weight loss and the proportion of
subjects achieving weight loss of 5% or more at 56 weeks.
The trial successfully met its co-primary endpoints at 56 weeks:
1) % average weight loss: Patients treated with Qsymia 15/92 mg had an average weight
loss of 9.8%, compared with 1.2% in the placebo group, for a placebo-adjusted average weight
loss of 8.6%. This result was statistically significant (p<0.0001) and met FDA’s efficacy
benchmark of at least a 5% difference in average weight loss between therapy and placebo.
For the mid-dose Qsymia 7.5/46 mg group, patients had mean weight loss of 7.8% and
www.cowen.comMEMBER: FINRA/SIPC 58
EQUITY RESEARCHCowen and Company, LLC
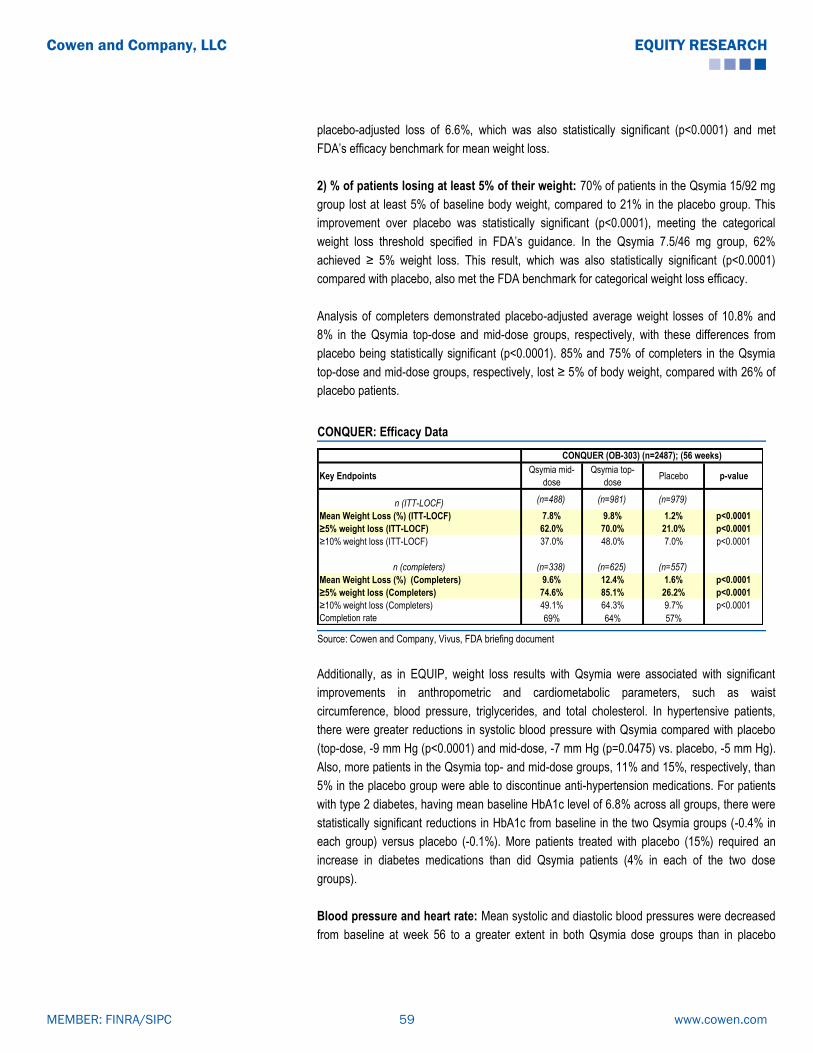
placebo-adjusted loss of 6.6%, which was also statistically significant (p<0.0001) and met
FDA’s efficacy benchmark for mean weight loss.
2) % of patients losing at least 5% of their weight: 70% of patients in the Qsymia 15/92 mg
group lost at least 5% of baseline body weight, compared to 21% in the placebo group. This
improvement over placebo was statistically significant (p<0.0001), meeting the categorical
weight loss threshold specified in FDA’s guidance. In the Qsymia 7.5/46 mg group, 62%
achieved ≥ 5% weight loss. This result, which was also statistically significant (p<0.0001)
compared with placebo, also met the FDA benchmark for categorical weight loss efficacy.
Analysis of completers demonstrated placebo-adjusted average weight losses of 10.8% and
8% in the Qsymia top-dose and mid-dose groups, respectively, with these differences from
placebo being statistically significant (p<0.0001). 85% and 75% of completers in the Qsymia
top-dose and mid-dose groups, respectively, lost ≥ 5% of body weight, compared with 26% of
placebo patients.
CONQUER: Efficacy Data
Key Endpoints Qsymia mid-
dose
Qsymia top-
dose Placebo p-value
n (ITT-LOCF) (n=488) (n=981) (n=979)
Mean Weight Loss (%) (ITT-LOCF) 7.8% 9.8% 1.2% p<0.0001
≥5% weight loss (ITT-LOCF) 62.0% 70.0% 21.0% p<0.0001
≥10% weight loss (ITT-LOCF) 37.0% 48.0% 7.0% p<0.0001
n (completers) (n=338) (n=625) (n=557)
Mean Weight Loss (%) (Completers) 9.6% 12.4% 1.6% p<0.0001
≥5% weight loss (Completers) 74.6% 85.1% 26.2% p<0.0001
≥10% weight loss (Completers) 49.1% 64.3% 9.7% p<0.0001
Completion rate 69% 64% 57%
CONQUER (OB-303) (n=2487); (56 weeks)
Source: Cowen and Company, Vivus, FDA briefing document
Additionally, as in EQUIP, weight loss results with Qsymia were associated with significant
improvements in anthropometric and cardiometabolic parameters, such as waist
circumference, blood pressure, triglycerides, and total cholesterol. In hypertensive patients,
there were greater reductions in systolic blood pressure with Qsymia compared with placebo
(top-dose, -9 mm Hg (p<0.0001) and mid-dose, -7 mm Hg (p=0.0475) vs. placebo, -5 mm Hg).
Also, more patients in the Qsymia top- and mid-dose groups, 11% and 15%, respectively, than
5% in the placebo group were able to discontinue anti-hypertension medications. For patients
with type 2 diabetes, having mean baseline HbA1c level of 6.8% across all groups, there were
statistically significant reductions in HbA1c from baseline in the two Qsymia groups (-0.4% in
each group) versus placebo (-0.1%). More patients treated with placebo (15%) required an
increase in diabetes medications than did Qsymia patients (4% in each of the two dose
groups).
Blood pressure and heart rate: Mean systolic and diastolic blood pressures were decreased
from baseline at week 56 to a greater extent in both Qsymia dose groups than in placebo
www.cowen.comMEMBER: FINRA/SIPC 59
EQUITY RESEARCHCowen and Company, LLC

patients. Mean SBP was reduced by 4.7 mm Hg and 5.6 mm Hg in the Qsymia mid-dose and
top-dose groups, respectively, compared to a decrease of 2.4 mm Hg in the placebo group.
Mean DBP was lower by 3.4 mm Hg and 3.8 mm Hg in the Qsymia mid-dose and top-dose
groups, respectively, compared to a reduction of 2.7 mm Hg in the placebo group. Heart rate
was elevated in the Qsymia top-dose cohort (+1.7 bpm) at 56 weeks, and relatively unchanged
in the Qsymia mid-dose (+0.1 bpm) and placebo (-0.1 bpm) groups.
CONQUER: Selected Secondary Endpoints
Qsymia mid-
dosep-value
Qsymia top-
dosep-value Placebo
Waist circumference (cm) -7.6 <0.0001 -9.2 <0.0001 -2.4
Systolic blood pressure (mm Hg) -4.7 0.0008 -5.6 <0.0001 -2.4
Diastolic blood pressure (mm Hg) -3.4 0.1281 -3.8 0.0031 -2.7
Change in heart rate (bpm) 0.1 0.92 +1.7 <0.0001 -0.1
Total cholesterol (%) -4.9 0.0345 -6.3 <0.0001 -3.3
Triglycerides (%) -8.6 <0.0001 -10.6 <0.0001 4.7
Fasting glucose (mmol/L) -0.01 0.0047 -0.07 <0.0001 0.13
Glycated hemoglobin (%) 0 <0.0001 -0.1 <0.0001 0.1
Change in HbA1c (%) in 388 patients (16%) with
baseline T2D (baseline HbA1c 6.8%, all groups)-0.4 0.0288 -0.4 0.0043 -0.1
Fasting insulin (pmol/L) -24 0.0004 -27.6 <0.0001 5.1
HOMA-IR -0.93 0.0007 -1.07 <0.0001 0.46
hsCRP (mg/L) -2.49 <0.0001 -2.49 <0.0001 -0.79 Source: Cowen and Company, Vivus, FDA briefing document
Safety: As seen in EQUIP, the most common adverse events included paresthesia, dry mouth,
constipation, dysgeusia, and insomnia. Psychiatric AEs, such as depression, anxiety, and
irritability, as well as cognitive AEs, such as disturbance in attention, occurred more frequently
in the Qsymia top-dose group. These AEs were noted earlier in treatment and generally
resolved with discontinuation of therapy. Assessment of depressive symptoms by standardized
rating scales showed no significant differences among the groups. Qsymia patients did not
have increased suicidality compared with placebo patients. The rates of serious AEs were
similar across groups (5% Qsymia top-dose, 3% Qsymia mid-dose, 4% placebo).
Discontinuations related to AEs were more common in the Qsymia top-dose group (19%),
compared with the mid-dose (12%) or placebo (9%) groups.
www.cowen.comMEMBER: FINRA/SIPC 60
EQUITY RESEARCHCowen and Company, LLC

CONQUER Safety Data: Common Adverse Events
Qsymia Mid-dose
n=498, n(%)
Qsymia Top-dose
n=994, n(%)
Placebo
n=993, n(%)
Dry mouth 67 (13%) 207 (21%) 24 (2%)
Paraesthesia 68 (14%) 204 (21%) 20 (2%)
Constipation 75 (15%) 173 (17%) 59 (6%)
Upper respiratory tract infection 61 (12%) 133 (13%) 128 (13%)
Nasopharyngitis 53 (11%) 98 (10%) 86 (9%)
Dysgeusia 37 (7%) 103 (10%) 11 (1%)
Insomnia 29 (6%) 102 (10%) 47 (5%)
Headache 35 (7%) 101 (10%) 90 (9%)
Dizziness 36 (7%) 99 (10%) 31 (3%)
Sinusitis 34 (7%) 85 (9%) 67 (7%)
Back pain 28 (6%) 72 (7%) 49 (5%)
Nausea 18 (4%) 68 (7%) 42 (4%)
Fatigue 22 (4%) 67 (7%) 50 (5%)
Diarrhoea 32 (6%) 58 (6%) 48 (5%)
Blurred vision 20 (4%) 60 (6%) 36 (4%)
Urinary tract infection 26 (5%) 54 (5%) 37 (4%)
Arthralgia 23 (5%) 44 (4%) 54 (5%)
Bronchitis 22 (4%) 52 (5%) 43 (4%)
Depression 14 (3%) 39 (4%) 29 (3%)
Anxiety 9 (2%) 41 (4%) 21 (2%)
Irritability 13 (3%) 34 (3%) 8 (<1%)
Time to onset (days; median, IQR) 36 (8–138) 29 (17–118) 92 (26–164)
Duration (days; median, IQR) 35 (11–81) 29 (12–63) 44 (17–121)
Resolution among patients discontinuing drug 10/10 (100%) 33/37 (89%) 4/5 (80%)
Disturbance in attention 10 (2%) 35 (4%) 7 (<1%)
Time to onset (days; median, IQR) 23 (10–100) 25 (11–51) 22 (8–119)
Duration (days; median, IQR) 51 (8–149) 36 (18–81) 39 (13–76)
Resolution among subjects discontinuing drug 2/2 (100%) 21/21 (100%) 3/3 (100%)
Psychiatric adverse events
Cognitive adverse events
Source: Cowen and Company, Vivus, FDA briefing document
SEQUEL: Qsymia Efficacy Results Maintained in Extension of CONQUER
SEQUEL (OB-305) was a placebo-controlled, double-blind, 52-week extension of the
CONQUER study. In this extension, patients continued in their randomized arms from
CONQUER (2:1:2 Qsymia 15/92 mg, Qsymia 7.5/46 mg, or placebo). Patients were not
permitted to continue in SEQUEL if: 1) their BMI was ≤ 22 kg/m2 at the end of CONQUER, 2)
they were not continuously taking study drug for > 4 weeks at the end of CONQUER, or 3) they
had developed a condition which would interfere with compliance and further participation. All
participants continued to receive standardized counseling based on the LEARN weight
management program. Progress discussions with study staff occurred on monthly visits.
www.cowen.comMEMBER: FINRA/SIPC 61
EQUITY RESEARCHCowen and Company, LLC

Baseline Demographics in SEQUEL
Number of Patients 676
Average BMI, Kg/m2
36
Average Weight 224 lbs
Average Age, years 52
Female Proportion 66%
Mean Systolic BP, mm Hg 128
Mean Diastolic BP, mm Hg 80
Proportion with HTN 50%
Mean Triglycerides, mg/dL 156.6
Proportion with dyslipidemia 34%
Mean HbA1c, % 6
Proportion with Type 2 diabetes 22% Source: Cowen and Company, Vivus, FDA briefing document
The co-primary endpoints of the SEQUEL study, retained from CONQUER, were mean
percentage weight loss and the proportion of subjects achieving weight loss of 5% or more
from baseline (week 0 of CONQUER) to 108 weeks.
The trial successfully met its co-primary endpoints at 108 weeks:
1) % average weight loss: Patients treated with Qsymia 15/92 mg had an average weight
loss of 10.5%, compared with 1.8% in the placebo group, for a placebo-adjusted average
weight loss of 8.7%. This improvement was statistically significant (p<0.0001). For the mid-
dose Qsymia 7.5/46 mg group, patients had mean weight loss of 9.3% and placebo-adjusted
loss of 7.5%, which was also statistically significant (p<0.0001).
2) % of patients losing at least 5% of their weight: 79% of patients in the Qsymia 15/92 mg
group lost at least 5% of baseline body weight, compared to 30% in the placebo group. This
improvement over placebo was statistically significant (p<0.0001). In the Qsymia 7.5/46 mg
group, 75% achieved ≥ 5% weight loss. This result was also statistically significant (p<0.0001).
Analysis of completers demonstrated placebo-adjusted average weight losses of 8.5% and 7%
in the Qsymia top-dose and mid-dose groups, respectively, with these differences from
placebo again being statistically significant (p<0.0001).
www.cowen.comMEMBER: FINRA/SIPC 62
EQUITY RESEARCHCowen and Company, LLC

SEQUEL: Efficacy Data
Key Endpoints Qsymia mid-
dose
Qsymia top-
dose Placebo p-value
n (ITT-LOCF) (n=153) (n=295) (n=227)
Mean Weight Loss (%) (ITT-LOCF) 9.3% 10.5% 1.8% p<0.0001
≥5% weight loss (ITT-LOCF) 75.2% 79.3% 30.0% p<0.0001
≥10% weight loss (ITT-LOCF) 50.3% 53.9% 11.5% p<0.0001
n (completers) (n=127) (n=245) (n=196)
Mean Weight Loss (%) (Completers) 9.3% 10.7% 2.2% p<0.0001
Completion rate 83% 83% 86%
SEQUEL (OB-305) (n=675); (108 weeks)
Source: Cowen and Company, Vivus, FDA briefing document
In SEQUEL, weight loss results with Qsymia continued to be associated with significant
improvements in anthropometric and cardiometabolic parameters, such as waist
circumference, triglycerides, and fasting insulin. For patients with type 2 diabetes, having mean
baseline HbA1c levels of 6.9% in the placebo and Qsymia top-dose groups and 7.3% in the
mid-dose group, there were reductions in HbA1c levels from baseline of 0.2% and 0.4% in the
two Qsymia groups, respectively, versus the placebo group (-0.04%), in which HbA1c was
essentially unchanged.
Blood pressure and heart rate: At week 108, mean systolic and diastolic BPs were
decreased from baseline by 3-5 mm Hg across all groups. The degree of BP reduction did not
differ significantly among the treatment arms. However, more Qsymia patients (16% top-dose
and 13% mid-dose) decreased use of anti-hypertensive medications compared with placebo
patients (8%). Heart rate was elevated in the Qsymia top-dose group (+1.7 bpm) at 108 weeks
to a slightly greater extent than in the Qsymia mid-dose (+1.3 bpm) and placebo (+0.4 bpm)
groups. There were no reported AEs associated with heart rate elevations, and no clinically
significant effects resulting from the elevations were observed.
SEQUEL: Selected Secondary Endpoints
Qsymia mid-
dosep-value
Qsymia top-
dosep-value Placebo
Waist circumference (cm) -9.8 <0.0001 -10.6 <0.0001 -3.6
Systolic blood pressure (mm Hg) -4.7 NS -4.3 NS -3.2
Diastolic blood pressure (mm Hg) -3.7 NS -3.5 NS -3.9
Change in heart rate (bpm) +1.3 - +1.7 - +0.4
Fasting insulin (lIU/mL) -5.3 0.0051 -5.2 0.0012 -2.6
Triglycerides (%) -12.5 <0.01 -13.7 <0.0001 0.4
Change in HbA1c (%) 0.01 0.0042 0 0.0003 0.2
Change in HbA1c (%) in 145 patients (22%) with
baseline T2D (baseline HbA1c 6.9-7.3%)-0.4 NS -0.2 NS -0.04
Source: Cowen and Company, Vivus, FDA briefing document
www.cowen.comMEMBER: FINRA/SIPC 63
EQUITY RESEARCHCowen and Company, LLC

In April 2011, Vivus presented additional data from SEQUEL at the 60th Annual Scientific
Meeting of the American College of Cardiology (ACC). The ACC poster highlighted SEQUEL
data in two subgroups of patients, those with dyslipidemia and hypertension:
1) Hypertensive patients (SBP 140-160 mmHg or DBP 90-100 mmHg in non-diabetic patients,
and SBP 130-160 mmHg or DBP 85-100mmHg in diabetic patients) across all groups had BP
reductions over 108 weeks. Mean SBP decreased by 8.6 mm Hg and 6.9 mm Hg in the
Qsymia top-dose and mid-dose groups, respectively, with reduction of 6.7 mm Hg in placebo
patients. Mean DBP decreased by 5.8 mm Hg, 4.8 mm Hg, and 5.7 mm Hg in the Qsymia top-
dose, Qsymia mid-dose, and placebo groups, respectively. BP reductions in the Qsymia group
were not statistically significant compared to those in the placebo group.
2) Patients with dyslipidemia (triglycerides 200-400mg/dL or patients taking ≥ 2 lipid-lowering
agents) on Qsymia mid-dose and top-dose had reductions in triglyceride levels of 25.9% and
26.3%, respectively, compared with a 14.3% reduction in those on placebo (p=0.055 and
p=0.015, respectively).
3) Patients with dyslipidemia on Qsymia mid-dose and top-Dose had improvements in HDL
cholesterol levels of +11.4% and +16.7%, respectively, compared with a +9.1% increase in
placebo patients (NS and p<0.015, respectively).
Safety: The AEs occurring during the SEQUEL second year extension were similar to those
observed in CONQUER, but the incidence of individual AEs was lower in the second year
compared with the first year. The most common AEs included paresthesia, dry mouth,
constipation, dysgeusia, and upper respiratory tract infection. Rates of depression-related AEs
were comparable in placebo and Qsymia top-dose patients (8% each) and lower in the mid-
dose group (4%). Qsymia patients did not have increased suicidality compared with placebo
patients. The rates of serious AEs were similar across groups (8% Qsymia top-dose, 6%
Qsymia mid-dose, 6% placebo). Discontinuations related to AEs by week 108 were also similar
across the groups: Qsymia top-dose group (4.4%), mid-dose (4.5%), and placebo (3%).
Teratogenicity: During the 108 weeks of CONQUER and SEQUEL, there were 2 pregnancies,
with one pregnancy carried to term by a patient treated with Qsymia 15/92 mg. The infant was
born healthy, with no congenital malformations observed.
www.cowen.comMEMBER: FINRA/SIPC 64
EQUITY RESEARCHCowen and Company, LLC
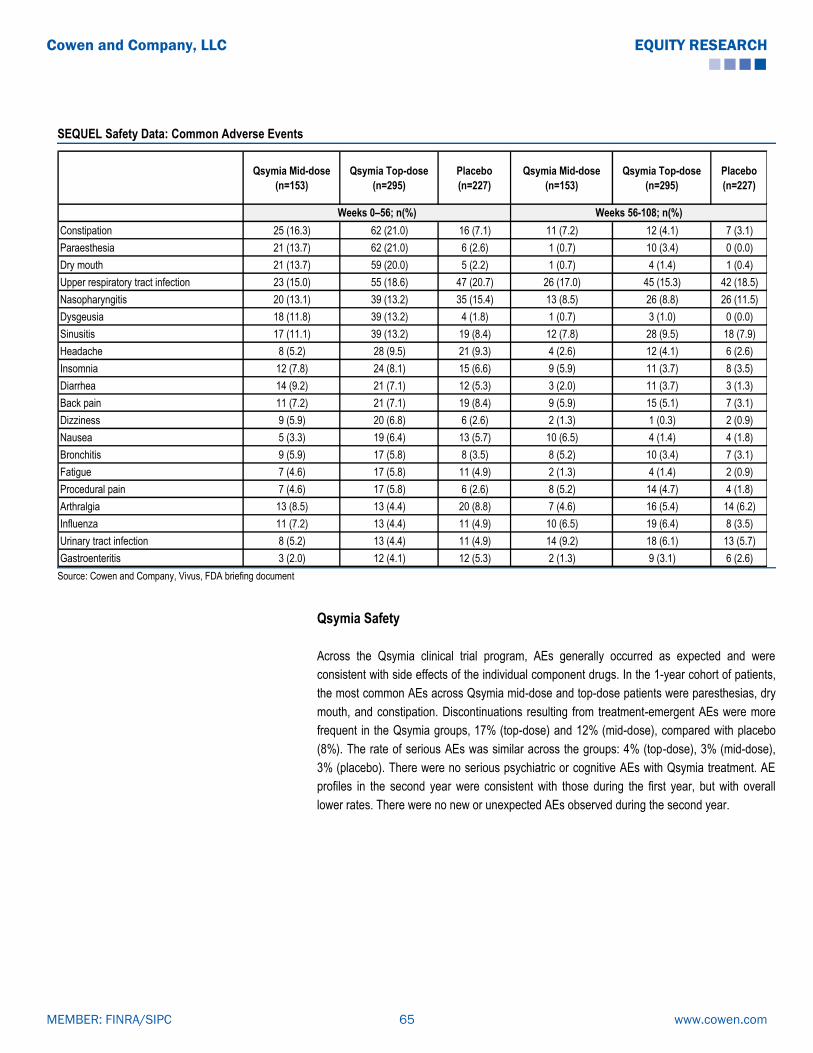
SEQUEL Safety Data: Common Adverse Events
Qsymia Mid-dose
(n=153)
Qsymia Top-dose
(n=295)
Placebo
(n=227)
Qsymia Mid-dose
(n=153)
Qsymia Top-dose
(n=295)
Placebo
(n=227)
Constipation 25 (16.3) 62 (21.0) 16 (7.1) 11 (7.2) 12 (4.1) 7 (3.1)
Paraesthesia 21 (13.7) 62 (21.0) 6 (2.6) 1 (0.7) 10 (3.4) 0 (0.0)
Dry mouth 21 (13.7) 59 (20.0) 5 (2.2) 1 (0.7) 4 (1.4) 1 (0.4)
Upper respiratory tract infection 23 (15.0) 55 (18.6) 47 (20.7) 26 (17.0) 45 (15.3) 42 (18.5)
Nasopharyngitis 20 (13.1) 39 (13.2) 35 (15.4) 13 (8.5) 26 (8.8) 26 (11.5)
Dysgeusia 18 (11.8) 39 (13.2) 4 (1.8) 1 (0.7) 3 (1.0) 0 (0.0)
Sinusitis 17 (11.1) 39 (13.2) 19 (8.4) 12 (7.8) 28 (9.5) 18 (7.9)
Headache 8 (5.2) 28 (9.5) 21 (9.3) 4 (2.6) 12 (4.1) 6 (2.6)
Insomnia 12 (7.8) 24 (8.1) 15 (6.6) 9 (5.9) 11 (3.7) 8 (3.5)
Diarrhea 14 (9.2) 21 (7.1) 12 (5.3) 3 (2.0) 11 (3.7) 3 (1.3)
Back pain 11 (7.2) 21 (7.1) 19 (8.4) 9 (5.9) 15 (5.1) 7 (3.1)
Dizziness 9 (5.9) 20 (6.8) 6 (2.6) 2 (1.3) 1 (0.3) 2 (0.9)
Nausea 5 (3.3) 19 (6.4) 13 (5.7) 10 (6.5) 4 (1.4) 4 (1.8)
Bronchitis 9 (5.9) 17 (5.8) 8 (3.5) 8 (5.2) 10 (3.4) 7 (3.1)
Fatigue 7 (4.6) 17 (5.8) 11 (4.9) 2 (1.3) 4 (1.4) 2 (0.9)
Procedural pain 7 (4.6) 17 (5.8) 6 (2.6) 8 (5.2) 14 (4.7) 4 (1.8)
Arthralgia 13 (8.5) 13 (4.4) 20 (8.8) 7 (4.6) 16 (5.4) 14 (6.2)
Influenza 11 (7.2) 13 (4.4) 11 (4.9) 10 (6.5) 19 (6.4) 8 (3.5)
Urinary tract infection 8 (5.2) 13 (4.4) 11 (4.9) 14 (9.2) 18 (6.1) 13 (5.7)
Gastroenteritis 3 (2.0) 12 (4.1) 12 (5.3) 2 (1.3) 9 (3.1) 6 (2.6)
Weeks 56-108; n(%)Weeks 0–56; n(%)
Source: Cowen and Company, Vivus, FDA briefing document
Qsymia Safety
Across the Qsymia clinical trial program, AEs generally occurred as expected and were
consistent with side effects of the individual component drugs. In the 1-year cohort of patients,
the most common AEs across Qsymia mid-dose and top-dose patients were paresthesias, dry
mouth, and constipation. Discontinuations resulting from treatment-emergent AEs were more
frequent in the Qsymia groups, 17% (top-dose) and 12% (mid-dose), compared with placebo
(8%). The rate of serious AEs was similar across the groups: 4% (top-dose), 3% (mid-dose),
3% (placebo). There were no serious psychiatric or cognitive AEs with Qsymia treatment. AE
profiles in the second year were consistent with those during the first year, but with overall
lower rates. There were no new or unexpected AEs observed during the second year.
www.cowen.comMEMBER: FINRA/SIPC 65
EQUITY RESEARCHCowen and Company, LLC

Qsymia Phase III Safety Data (1-year Cohort)
Placebo
(n=1,561)
Qsymia Low-
dose
(n=240)
Qsymia Mid-
dose
(n=498)
Qsymia Top-
dose
(n=1,580)
Paresthesia 1.9% 4.2% 13.7% 19.9%
Headache 9.3% 10.4% 7.0% 10.6%
Dizziness 3.4% 2.9% 7.2% 8.6%
Dysgeusia 1.1% 1.3% 7.4% 9.4%
Hypoesthesia 1.2% 0.8% 3.6% 3.7%
Disturbance in Attention 0.6% 0.4% 2.0% 3.5%
Insomnia 4.7% 5.0% 5.8% 9.4%
Depression 2.2% 3.3% 2.8% 4.3%
Anxiety 1.9% 2.9% 1.8% 4.1%
Constipation 6.1% 7.9% 15.1% 16.1%
Dry Mouth 2.8% 6.7% 13.5% 19.1%
Nausea 4.4% 5.8% 3.6% 7.2%
Diarrhea 4.9% 5.0% 6.4% 5.6%
Dyspepsia 1.7% 2.1% 2.2% 2.8%
Gastroesophageal Reflux Disease 1.3% 0.8% 3.2% 2.6%
Paresthesia Oral 0.3% 0.4% 0.6% 2.2%
Fatigue 4.3% 5.0% 4.4% 5.9%
Irritability 0.7% 1.7% 2.6% 3.7%
Thirst 0.7% 2.1% 1.8% 2.0%
Chest Discomfort 0.4% 2.1% 0.2% 0.9%
Palpitations 0.8% 0.8% 2.4% 1.7%
Psychiatric Disorders
Gastrointestinal Disorders
General Disorders and Administration Site Conditions
Cardiac Disorders
Nervous System Disorders
Source: Cowen and Company, Vivus, FDA briefing document
Both the Initial Ad Com Panel and the FDA Rejected Qsymia in 2010...
On July 15, 2010, the FDA's Endocrinologic and Metabolic Drugs Advisory Committee voted
10-6 against recommending Qsymia for approval. The advisory committee concluded that
Qsymia’s one-year data did not adequately represent the drug's long-term use, and that
Qsymia had not been sufficiently examined in patients with cardiovascular disease. The FDA
and the advisory committee focused almost exclusively on Qsymia's safety profile, particularly
cardiovascular risk, teratogenicity, cognitive AEs, neuropsychiatric AEs, and metabolic
acidosis. Vivus presented data adequate to assuage the panel on the psychiatric, cognitive,
and metabolic acidosis issues, but the cardiovascular data presented were insufficient to judge
CV outcomes and more teratogenicity data were deemed to be needed.
On October 28, 2010, Vivus announced receipt of a Complete Response Letter from the FDA.
The CRL requested: (1) a comprehensive assessment of topiramate’s and Qsymia’s
www.cowen.comMEMBER: FINRA/SIPC 66
EQUITY RESEARCHCowen and Company, LLC

teratogenic potential, (2) evidence that the elevation in heart rate observed in Qsymia’s trials
does not increase the risk for MACE, and (3) the results of the two-year SEQUEL trial. At a
January 2011 meeting with the FDA, Vivus was asked to perform an analysis of existing
healthcare databases (the FORTRESS study) to determine the incidence of oral clefts in
offspring of women treated with topiramate for migraine prophylaxis.
Qsymia Post Hoc CV Risk Analysis
In November 2010, at the American Heart Association meeting, Vivus presented a poster
entitled “Low-Dose, Controlled-Release Phentermine/Topiramate Significantly Improves
Reynolds 10-Year Risk Score In Obese Women And Men.”
The Reynolds Risk Score is designed as a rough predictive measure of heart attack, stroke, or
major heart disease over the next 10 years. The risk score is calculated by taking into account
gender, age, blood pressure, smoking history, cholesterol levels, high-sensitivity C-reactive
protein (hsCRP) level as a measure of inflammation, and family history. The Reynolds test was
validated in both female and male populations over a 10-year period to evaluate the
development factors for heart attack, stroke, angioplasty, coronary artery bypass surgery, or
mortality due to heart disease.
The AHA presentation highlighted 56-week modified Reynolds Risk Score data pooled from
the Phase III EQUIP and CONQUER studies of Qsymia in a total of 3,652 patients (2,711
women, 941 men). Reynolds Risk Score data were collected for patients at baseline and at the
conclusion of the trials (56 weeks), including gender, age, smoking status, systolic BP, family
history of early CVD, total and HDL cholesterol measurements, hsCRP levels, and diabetic
status (for women only). The Reynolds Risk Score calculator was used to measure the change
in relative risk of a CV event over 10 years between baseline and week 56. In 3,652 patients
analyzed, weight loss with Qsymia in all groups, except for the low-dose Qsymia group in men,
was associated with statistically significant reductions in 10-year Reynolds Risk Score from
baseline to week 56 (p<0.05). Least squares mean percent change analysis showed risk
decline of 5.4%-16.3% in the Qsymia-treated groups, and risk increase by 4.0%-6.1% in the
placebo group. Because the modified Reynolds Risk Score calculator used in this analysis is
driven by systolic BP and total and HDL cholesterol measurements, which improve with weight
loss, this was an expected outcome.
www.cowen.comMEMBER: FINRA/SIPC 67
EQUITY RESEARCHCowen and Company, LLC

Qsymia Reynolds Risk Score (RRS) Data Summary (EQUIP/CONQUER)
RRS Analysis low-dose Qnexa mid-dose Qnexa high-dose Qnexa placebo
n=193 n=341 n=1,084 n=1,093
baseline mean RRS 1.24 3.06 2.51 2.65
mean change RRS (SD) -0.12* (0.64) -0.65* (1.86) -0.55* (2.09) -0.13 (1.76)
least squares mean % change RRS -6.80*,Ŧ
-13.64*,Ŧ
-16.27*,Ŧ
3.97*
RRS Analysis low-dose Qnexa mid-dose Qnexa high-dose Qnexa placebo
n=39 n=147 n=383 n=372
baseline mean RRS 5.12 7.67 6.54 6.70
mean change RRS (SD) -0.36 (1.65) -1.15* (3.01) -1.23* (3.24) -0.20 (3.00)
least squares mean % change RRS -8.88Ŧ
-5.40*,Ŧ
-11.78*,Ŧ
6.06*
*p<0.05 vs baseline; Ŧp<0.05 vs placebo
Women (n=2,711)
Men (n=941)
Source: Cowen and Company, AHA 2010 Company Data Presentation
While the 2010 panel members were satisfied with Qsymia's efficacy profile, they were
concerned about the lack of CV outcomes data and the relatively short safety database (12
months) available for a drug that would be used by high CV risk patients for many years. Even
with the addition of the two-year SEQUEL data, Qsymia’s dataset was considered lacking in
long-term safety data for patients with elevated CV risk.
Pooled Analysis of Blood Pressure and Heart Rate Data
In a pooled analysis of CV data from the Qsymia clinical trial program, mean systolic and
diastolic BPs were decreased from baseline at week 56 in all three Qsymia dose groups as
well as in the placebo group. Mean SBP was reduced by 3.3 mm Hg, 5.2 mm Hg, and 5.2 mm
Hg in the Qsymia low-dose, mid-dose, and top-dose groups, respectively, compared to a
decrease of 2.1 mm Hg in the placebo group. Mean DBP was lower by 0.9 mm Hg, 3.3 mm
Hg, and 2.9 mm Hg in the Qsymia low-dose, mid-dose, and top-dose groups, respectively,
compared to a reduction of 1.9 mm Hg in the placebo group. Heart rate was elevated in all
three Qsymia dose cohorts by an average of +1.3 bpm (low-dose), +0.6 bpm (mid-dose), and
+1.6 bpm (top-dose) at 56 weeks, while there was no overall change in heart rate for the
placebo group.
www.cowen.comMEMBER: FINRA/SIPC 68
EQUITY RESEARCHCowen and Company, LLC
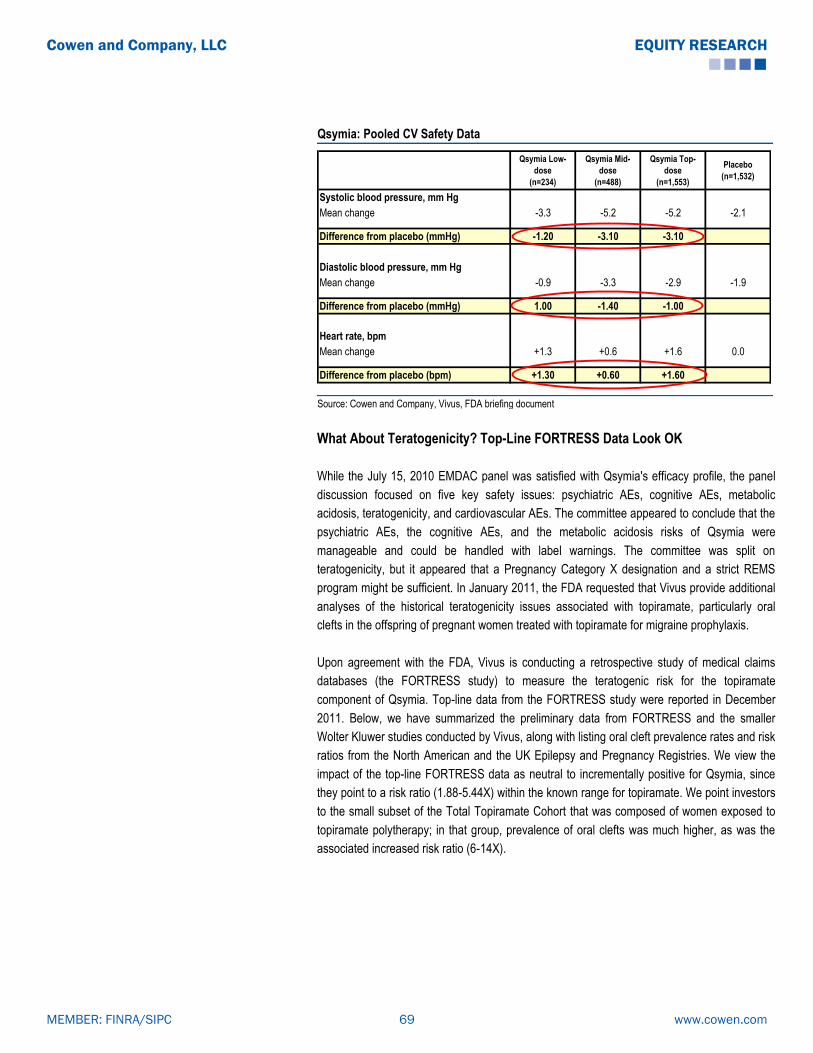
Qsymia: Pooled CV Safety Data
Qsymia Low-
dose
(n=234)
Qsymia Mid-
dose
(n=488)
Qsymia Top-
dose
(n=1,553)
Placebo
(n=1,532)
Systolic blood pressure, mm Hg
Mean change -3.3 -5.2 -5.2 -2.1
Difference from placebo (mmHg) -1.20 -3.10 -3.10
Diastolic blood pressure, mm Hg
Mean change -0.9 -3.3 -2.9 -1.9
Difference from placebo (mmHg) 1.00 -1.40 -1.00
Heart rate, bpm
Mean change +1.3 +0.6 +1.6 0.0
Difference from placebo (bpm) +1.30 +0.60 +1.60
Source: Cowen and Company, Vivus, FDA briefing document
What About Teratogenicity? Top-Line FORTRESS Data Look OK
While the July 15, 2010 EMDAC panel was satisfied with Qsymia's efficacy profile, the panel
discussion focused on five key safety issues: psychiatric AEs, cognitive AEs, metabolic
acidosis, teratogenicity, and cardiovascular AEs. The committee appeared to conclude that the
psychiatric AEs, the cognitive AEs, and the metabolic acidosis risks of Qsymia were
manageable and could be handled with label warnings. The committee was split on
teratogenicity, but it appeared that a Pregnancy Category X designation and a strict REMS
program might be sufficient. In January 2011, the FDA requested that Vivus provide additional
analyses of the historical teratogenicity issues associated with topiramate, particularly oral
clefts in the offspring of pregnant women treated with topiramate for migraine prophylaxis.
Upon agreement with the FDA, Vivus is conducting a retrospective study of medical claims
databases (the FORTRESS study) to measure the teratogenic risk for the topiramate
component of Qsymia. Top-line data from the FORTRESS study were reported in December
2011. Below, we have summarized the preliminary data from FORTRESS and the smaller
Wolter Kluwer studies conducted by Vivus, along with listing oral cleft prevalence rates and risk
ratios from the North American and the UK Epilepsy and Pregnancy Registries. We view the
impact of the top-line FORTRESS data as neutral to incrementally positive for Qsymia, since
they point to a risk ratio (1.88-5.44X) within the known range for topiramate. We point investors
to the small subset of the Total Topiramate Cohort that was composed of women exposed to
topiramate polytherapy; in that group, prevalence of oral clefts was much higher, as was the
associated increased risk ratio (6-14X).
www.cowen.comMEMBER: FINRA/SIPC 69
EQUITY RESEARCHCowen and Company, LLC

February 2012: FDA AdCom Recommends Approval With Post-Approval CVOT
Requirement
At the February 2012 FDA advisory committee, a number of panel members expressed serious
concerns about Qsymia’s CV safety profile. However, given the lack of available treatment
options and the impact of obesity and its comorbidities in patients, the panel recommended
that a post-approval CVOT would be sufficient to rule out CV risk, voting 20-2 in favor of
Qsymia’s approval.
2012 Saw a Change of Heart at the FDA for Obesity Drugs
In July 2012, the FDA approved Qsymia for the treatment of obesity. As part of its post-
marketing commitment, Vivus is required to complete 10 post-marketing requirements,
including a CVOT.
According to the company’s latest guidance, Vivus will conduct a post-approval CVOT, known
as AQCLAIM (A Qsymia CardiovascuLAr morbIdity and Mortality), which will enroll
approximately 11,000 patients with documented CV risk (1/3 high-risk and 2/3 low-risk
patients) at 300 sites worldwide. This randomized, double-blind, placebo-controlled,
multicenter trial will evaluate the effect of long-term Qsymia treatment on incidence of MACE,
and will be designed to show superiority of Qsymia over placebo (16-20% risk reduction).
Approximately 630 events will be needed to complete the trial, and based on a 2% event rate
per year, the company guided that the trial could be completed in approximately 4.5 years. In
September 2013, Vivus indicated that patient enrollment in AQCLAIM is anticipated to begin in
1Q14.
What about Europe?
In December 2010, Vivus filed a MAA with the EMA for Qsiva, the proposed name for Qsymia
in Europe. In May 2011, the company received the EMA’s 120-day list of questions from the
CHMP, which included issues that were similar to those raised by the FDA. Vivus submitted its
response to the 120-day questions in the fourth quarter of 2011. In January 2012, Vivus
received the 180-day List of Outstanding Issues from the CHMP and submitted its response to
these issues in April 2012. In September 2012, Vivus announced that, based on preliminary
feedback from EMA's CHMP, it expects a negative decision on the Qsiva MAA. In October
2012, Vivus announced that it had received the formal opinion from EMA’s CHMP,
recommending against approval of Qsiva. According to the company, the rejection was due to
concerns about potential CV and CNS effects following long-term use, teratogenic potential,
and concerns about inappropriate use of the drug.
In February 2013, Vivus announced that the EMA confirmed its original decision of 10/18/12 to
decline approval for the MAA for Qsiva. EMA indicated that a pre-approval CVOT would be
necessary to establish Qsiva’s long-term safety.
www.cowen.comMEMBER: FINRA/SIPC 70
EQUITY RESEARCHCowen and Company, LLC

EU approval pushed back a minimum of 2-3 years: Management previously indicated that
the most likely scenario would involve proceeding with the CVOT required for the US, and re-
engaging EMA with discussions about possibly re-filing based on interim CVOT data, hoping
for an outcome similar to the Contrave situation (Orexigen) with the LIGHT study in the US. In
September 2013, Vivus announced the submission of a request to EMA for scientific advice
regarding use of a pre-specified interim analysis of AQCLAIM in support of the Qsiva MAA
resubmission. The company indicated that the anticipated 1Q14 date for initiation of enrollment
in AQCLAIM has been chosen “to accommodate advice” from EMA.
Qsymia’s IP Estate Controversial
Qsymia’s intellectual property estate has been the subject of recent controversy. Qsymia is
covered by patents and patent filings in the U.S., Europe, and international markets. The key
U.S. patent (#7,056,890 B2, Najarian patent) covering Qsymia’s use was issued in June 2006.
This patent, along with other patent applications, claims a method-of-use combining a
sympathomimetic agent (i.e., phentermine) and an anticonvulsant (i.e., topiramate) for the
treatment of obesity. This patent also covers phentermine doses of 5-15mg and topiramate
doses of 100-200mg.
Our Consultants Believe That JNJ’s “Shank” Patent Could Be an Issue…But a
Settlement Is the Most Likely Outcome
J&J owns a method-of-use patent for Topamax (topiramate) (U.S. patent #6,071,537, the
―Shank‖ patent), which makes broad claims regarding treatment of obesity ―comprising‖ the
use of topiramate. It also specifically claims therapeutically effective doses of topiramate from
50 to 400mg. The patent claiming composition-of-matter of Topamax expired in September
2008 and thus does not present a commercialization barrier for Qsymia.
According to our consultants, the Qsymia Najarian patent estate could potentially be seen as
infringing on the J&J ―Shank‖ patent, which expires in 2017. Given that J&J is not marketing
topiramate for the treatment of obesity, the company is unlikely to be able to claim irreparable
harm. We see a royalty settlement between Vivus and J&J as the most likely eventual
outcome.
www.cowen.comMEMBER: FINRA/SIPC 71
EQUITY RESEARCHCowen and Company, LLC
2) On Deck: Orexigen’s Contrave
Contrave consists of a fixed-dose combination of sustained-release (SR) bupropion and a
proprietary SR version of naltrexone designed for improved tolerability. These individual drugs
that have been approved separately for non-obesity indications and are sold as generics in the
US.
The arcuate nucleus of the hypothalamus plays a significant role in the regulation of body
weight. In the arcuate nucleus, neurons which produce pro-opiomelanocortin (POMC) release
both α-melanocyte stimulating hormone (α-MSH) and β-endorphin. POMC activation results in
an anorectic effect mediated by α-MSH at melanocortin receptors. A negative autoinhibitory
feedback loop is provided by β-endorphin acting at opioid receptors on POMC neurons.
Bupropion, a chemical aminoketone, is a non-tricyclic antidepressant that is widely used for
depression (approved in the US in 1985) and smoking cessation (approved in the US in 1997).
The primary action of bupropion is considered to be re-uptake inhibition of dopamine and
norepinephrine. Bupropion therapy is known to be associated with modest weight reduction.
Similar to endogenous signals causing weight loss, bupropion appears to increase POMC
firing, ultimately leading to decreased appetite and increase in energy expenditure.
Naltrexone is a non-selective opioid receptor antagonist used in the treatment of opioid
dependence (approved in the US in 1984) and alcohol addiction (approved in the US in 1995).
It is believed that naltrexone inhibits the reinforcement effects of addictive substances by
blocking neural reward pathways. It is possible that β-endorphin may be one compensatory
mechanism limiting long term efficacy of weight loss therapy. By blocking opioid receptors,
naltrexone interferes with the inhibitory action of β-endorphin, which allows POMC firing to be
unchecked. Therefore, naltrexone should augment the effect of bupropion on appetite
suppression.
The synergistic combination of bupropion and naltrexone in Contrave is meant to generate
more robust and durable weight loss. In particular, Orexigen anticipates that, in addition to
causing weight loss, this combination may be especially effective for reduction of food
cravings, which are believed to be governed by central reward systems.
Contrave: Proposed Indication
The proposed indication for Contrave is the management of obesity, including weight loss and
maintenance of weight loss, in conjunction with lifestyle modification. Obese adults with initial
body mass index (BMI) ≥ 30 kg/m2 and overweight adults (BMI ≥ 27 kg/m2) who have one or
more concomitant risk factors, such as diabetes, dyslipidemia, or hypertension, comprise the
target population. The recommended daily dose of Contrave is 32 mg naltrexone/360 mg
bupropion (NB32), administered as 16 mg naltrexone/180 mg bupropion twice daily.
.
www.cowen.comMEMBER: FINRA/SIPC 72
EQUITY RESEARCHCowen and Company, LLC

Contrave: Clinical Data Summary
COR: Contrave’s Successful Phase III Program
In July 2009, Orexigen successfully completed four Phase III trials with Contrave, a
development program termed COR (Contrave Obesity Research). This program met the
requirements detailed in the FDA’s weight management guidance for one-year studies,
adequate patient exposure, efficacy endpoints, and appropriate target populations consisting of
obese and overweight patients with comorbidities, including type 2 diabetes. Four 56-week
trials evaluated a 360 mg daily dose of bupropion SR paired with 16 mg or 32 mg naltrexone
SR doses. The co-primary endpoints of each trial were mean percentage change in body
weight from baseline, and proportion of subjects with categorical ≥ 5% weight loss from
baseline. Secondary endpoints included proportion of subjects with categorical ≥ 10% weight
loss, weight-related cardiometabolic parameters, and impact of weight on QOL. The modified
intent-to-treat (mITT) population, comprised by all randomized patients with at least one post-
baseline measurement while on study drug, was analyzed for primary efficacy.
Contrave’s Phase III Program: COR (Contrave Obesity Research)
COR-BMOD
(formerly NB-302)
COR-I
(formerly NB-301)
COR-II
(formerly NB-303)
COR-Diabetes
(formerly NB-304)
Number of patients 793 1,742 1,496 505
Duration 1 year 1 year 1 year 1 year
Treatment groupsContrave32, Placebo
Contrave32,
Contrave16,
Placebo
Contrave32, PlaceboContrave32, Placebo
Patient demographics BMI 27-45 kg/m2
Comorbidities for inclusion Type 2 diabetes
Mean baseline weight, lbs 232
Mean BMI, kg/m2 36-37 36 36 36
Average age (years) 46 44 44 54
Female Proportion 90% 85% 85% 56%
EthnicityCaucasian (70%)
African-American (24%)
Caucasian (75%)
African-American (19%)
Caucasian (84%)
African-American (14%)
Caucasian (79%)
African-American (16%)
Adjunct lifestyle/behavior modification
program
Intensive 90 min group meetings weekly for 16
weeks, then every other week for 12 weeks,
then monthly (28 total sessions)
Co-primary endpoints
Data Announced January 2009 July 2009 July 2009 July 2009
BMI 30-45 kg/m2 or BMI 27-45 kg/m
2 with at least 1 comorbidity
Required controlled hypertension, dyslipidemia, or both
220
Instruction on diet and advice on lifestyle/behavior modification, including exercise instruction, at baseline and
weeks 12/24/36/48
1) mean weight loss from baseline
2) proportion of patients > 5% weight loss
Source: Cowen and Company, Orexigen Therapeutics
www.cowen.comMEMBER: FINRA/SIPC 73
EQUITY RESEARCHCowen and Company, LLC

Efficacy Data From Contrave's Four Phase III Trials
Mean Weight
Loss (%)
Treatment Group
Mean Weight
Loss (%)
Placebo Group
Mean Weight Loss
(%)
Placebo- adjusted
>5% Weight
Loss
Treatment
Group
>5% Weight
Loss
Placebo Group
>5% Weight Loss
Placebo-
Adjusted
>10% Weight
Loss
Treatment Group
>10% Weight
Loss
Placebo Group
>10% Weight
Loss
Placebo-
Adjusted
COR-BMOD (NB-302);
Contrave 32; (n=793)9.3% 5.1% 4.2% 66.4% 42.5% 23.9% 41.5% 20.2% 21.3%
COR-I (NB-301);
Contrave 32; (n=1,742)6.1% 1.3% 4.8% 48.0% 16.4% 31.6% 24.6% 7.4% 17.2%
COR-II (NB-303);
Contrave 32; (n=1,496)6.5% 1.9% 4.6% 55.6% 17.5% 38.1% 27.3% 7.0% 20.3%
COR-Diabetes (NB-304);
Contrave 32; (n=505)5.0% 1.8% 3.2% 44.5% 18.9% 25.6% 18.5% 5.7% 12.8%
COR-BMOD (NB-302);
Contrave 32; (n=793)11.5% 7.3% 4.2% 80.4% 60.4% 20.0% 55.2% 30.2% 25.0%
COR-I (NB-301);
Contrave 32; (n=1,742)8.1% 1.8% 6.3% 61.8% 23.1% 38.7% 34.5% 10.7% 23.8%
COR-II (NB-303);
Contrave 32; (n=1,496)7.8% 2.4% 5.4% 68.8% 22.3% 46.5% 35.7% 9.4% 26.3%
COR-Diabetes (NB-304);
Contrave 32; (n=505)5.9% 2.2% 3.7% 53.1% 24.0% 29.1% 26.3% 8.0% 18.3%
Contrave 32 mg naltrexone/360 mg bupropion (modified-ITT)
Contrave 32 mg naltrexone/360 mg bupropion (completers)
Source: Cowen and Company, Orexigen Therapeutics
COR-BMOD: First Phase III Trial Meets One of Two FDA Efficacy Benchmarks
In January 2009, Orexigen reported data from the first of four pivotal trials of Contrave, the NB-
302 (COR-BMOD) study. In this 56-week study, both Contrave treatment and placebo were
combined with intensive group behavior modification (BMOD), a program of diet, exercise, and
behavior therapy. Patients were randomized 1:3 to placebo or treatment with 32 mg sustained-
release (SR) naltrexone + 360 mg SR bupropion (Contrave32). The study included a 3-week
dose escalation, starting with one-quarter of the full dose, which was increased weekly until the
full dose was reached by week 4. Eligibility criteria in the trial included: age 18-65 years, and
BMI 30-45 kg/m2 or 27-45 kg/m2 with controlled hypertension and/or dyslipidemia. Exclusion
criteria included diabetes mellitus as well as current smoking, or tobacco/nicotine use within 6
months before screening. The intensive behavior modification program was delivered to
groups of 10-20 participants by registered dieticians, behavioral psychologists, or exercise
specialists. Group meetings of 90 minutes, including a weigh-in, occurred weekly for 16 weeks,
then every other week for 12 weeks, and then monthly, for a total of 28 sessions. Patients were
prescribed a diet of 1,200 kcal/day to 2,000 kcal/day, depending on body weight, and were
encouraged to gradually increase to 180 min/week of moderate physical activity in the first 6
months of the trial.
The trial successfully met its co-primary endpoints:
www.cowen.comMEMBER: FINRA/SIPC 74
EQUITY RESEARCHCowen and Company, LLC
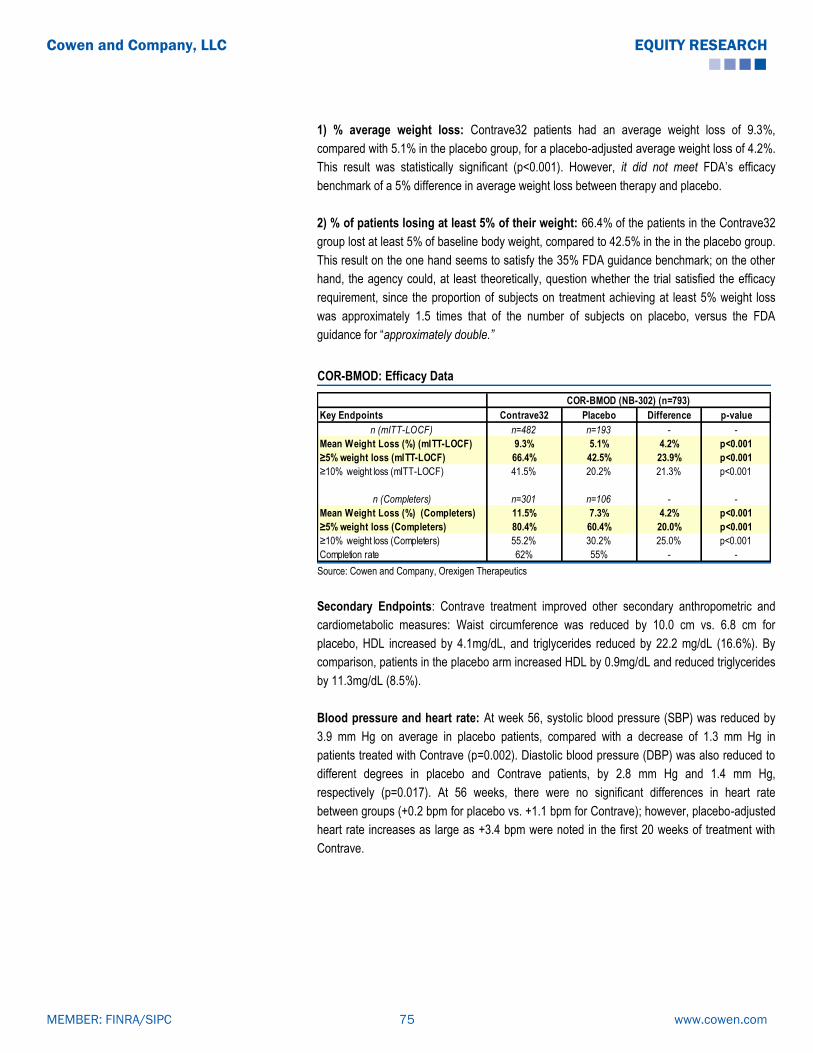
1) % average weight loss: Contrave32 patients had an average weight loss of 9.3%,
compared with 5.1% in the placebo group, for a placebo-adjusted average weight loss of 4.2%.
This result was statistically significant (p<0.001). However, it did not meet FDA’s efficacy
benchmark of a 5% difference in average weight loss between therapy and placebo.
2) % of patients losing at least 5% of their weight: 66.4% of the patients in the Contrave32
group lost at least 5% of baseline body weight, compared to 42.5% in the in the placebo group.
This result on the one hand seems to satisfy the 35% FDA guidance benchmark; on the other
hand, the agency could, at least theoretically, question whether the trial satisfied the efficacy
requirement, since the proportion of subjects on treatment achieving at least 5% weight loss
was approximately 1.5 times that of the number of subjects on placebo, versus the FDA
guidance for ―approximately double.”
COR-BMOD: Efficacy Data
Key Endpoints Contrave32 Placebo Difference p-value
n (mITT-LOCF) n=482 n=193 - -
Mean Weight Loss (%) (mITT-LOCF) 9.3% 5.1% 4.2% p<0.001
≥5% weight loss (mITT-LOCF) 66.4% 42.5% 23.9% p<0.001
≥10% weight loss (mITT-LOCF) 41.5% 20.2% 21.3% p<0.001
n (Completers) n=301 n=106 - -
Mean Weight Loss (%) (Completers) 11.5% 7.3% 4.2% p<0.001
≥5% weight loss (Completers) 80.4% 60.4% 20.0% p<0.001
≥10% weight loss (Completers) 55.2% 30.2% 25.0% p<0.001
Completion rate 62% 55% - -
COR-BMOD (NB-302) (n=793)
Source: Cowen and Company, Orexigen Therapeutics
Secondary Endpoints: Contrave treatment improved other secondary anthropometric and
cardiometabolic measures: Waist circumference was reduced by 10.0 cm vs. 6.8 cm for
placebo, HDL increased by 4.1mg/dL, and triglycerides reduced by 22.2 mg/dL (16.6%). By
comparison, patients in the placebo arm increased HDL by 0.9mg/dL and reduced triglycerides
by 11.3mg/dL (8.5%).
Blood pressure and heart rate: At week 56, systolic blood pressure (SBP) was reduced by
3.9 mm Hg on average in placebo patients, compared with a decrease of 1.3 mm Hg in
patients treated with Contrave (p=0.002). Diastolic blood pressure (DBP) was also reduced to
different degrees in placebo and Contrave patients, by 2.8 mm Hg and 1.4 mm Hg,
respectively (p=0.017). At 56 weeks, there were no significant differences in heart rate
between groups (+0.2 bpm for placebo vs. +1.1 bpm for Contrave); however, placebo-adjusted
heart rate increases as large as +3.4 bpm were noted in the first 20 weeks of treatment with
Contrave.
www.cowen.comMEMBER: FINRA/SIPC 75
EQUITY RESEARCHCowen and Company, LLC

COR-BMOD: Secondary Endpoints
Contrave32 Placebo p-value
Change in blood fasting glucose -1.5% 0.0% 0.185
Change in insulin -28.0% -15.5% 0.003
Change in HOMA-IR -29.9% -16.6% 0.003
Change in triglycerides -16.6% -8.5% 0.004
Change in hs-CRP -25.9% -16.9% 0.165
Change in IWQOL-LITE 13.4 10.3 <0.001
Change in waist circumference -10 cm -6.8cm <0.001
Change in Systolic blood pressure -1.3 mm Hg -3.9 mm Hg 0.002
Change in Diastolic blood pressure -1.4 mm Hg -2.8 mm Hg 0.017
Change in Heart rate (beats per minute) +1.1 +0.2 0.139
Source: Cowen and Company, Orexigen Therapeutics
Safety & Tolerability: Nausea, mostly mild to moderate in intensity, was the most common AE
and more frequently associated with Contrave treatment. Other common AEs included
constipation, dizziness, dry mouth, tremor, upper abdominal pain, and tinnitus. There were no
differences between groups in the most common psychiatric AEs, such as anxiety, sleep
disorder, depressed mood, and insomnia. Depression was more frequent in placebo patients.
www.cowen.comMEMBER: FINRA/SIPC 76
EQUITY RESEARCHCowen and Company, LLC

COR-BMOD: Safety Data
Contrave32
(n=584)
n(%)
Placebo
(n=200)
n(%)
Nausea 199 (34.1) 21 (10.5)
Headache 139 (23.8) 35 (17.5)
Constipation 141 (24.1) 28 (14.0)
Dizziness 85 (14.6) 9 (4.5)
Vomiting 64 (11.0) 13 (6.5)
Insomnia 51 (8.7) 12 (6.0)
Dry mouth 47 (8.0) 6 (3.0)
Anxiety 30 (5.1) 7 (3.5)
Tremor 34 (5.8) 2 (1.0)
Abdominal pain, upper 32 (5.5) 3 (1.5)
Tinnitus 31 (5.3) 1 (0.5)
Insomnia 51 (8.7) 12 (6.0)
Anxiety 30 (5.1) 7 (3.5)
Sleep disorder 14 (2.4) 6 (3.0)
Depressed mood 11 (1.9) 8 (4.0)
Abnormal dreams 8 (1.4) 4 (2.0)
Middle insomnia 6 (1.0) 2 (1.0)
Tension 7 (1.2) 1 (0.5)
Depression 2 (0.3) 5 (2.5)
Stress 3 (0.5) 4 (2.0)
Dissociation 6 (1.0) 0 (0)
Nausea 27 (4.6) 0 (0)
Urticaria 10 (1.7) 1 (0.5)
Anxiety 7 (1.2) 3 (1.5)
Disturbance in attention 6 (1.0) 0 (0)
Headache 5 (0.9) 1 (0.5)
Blood pressure increased 4 (0.7) 0 (0)
Dizziness 4 (0.7) 0 (0)
Vomiting 4 (0.7) 0 (0)
Depressed mood 3 (0.5) 1 (0.5)
Feeling abnormal 3 (0.5) 1 (0.5)
Abdominal pain 3 (0.5) 0 (0)
Abdominal pain upper 3 (0.5) 0 (0)
Disorientation 3 (0.5) 0 (0)
Dissociation 3 (0.5) 0 (0)
Feeling jittery 3 (0.5) 0 (0)
Insomnia 3 (0.5) 0 (0)
Rash 3 (0.5) 0 (0)
Psychiatric AEs
AEs resulting in discontinuation
Source: Cowen and Company, Orexigen Therapeutics
www.cowen.comMEMBER: FINRA/SIPC 77
EQUITY RESEARCHCowen and Company, LLC
Contrave’s Final Three Phase III Trials Meet the Mark
In July 2009, Orexigen announced that Contrave’s three remaining Phase III trials met their co-
primary endpoints, with 48.0%, 50.5%, and 44.5% of patients on Contrave losing ≥ 5% of body
weight after 56 weeks in the NB-301, NB-303, and NB-304 trials, respectively, compared to
16.4%, 17.1%, and 18.9% of placebo patients (p<0.001 for all). These data exceeded the FDA
primary efficacy benchmark for categorical weight loss.
COR-I (NB-301) Trial
This trial was the largest of the four trials in the Phase III Contrave Obesity Research (COR)
program. COR-I was a 56-week trial which evaluated two doses of Contrave in overweight and
obese patients. Patients were randomized 1:1:1 to receive daily 32 mg SR naltrexone + 360
mg SR bupropion (Contrave32), 16 mg SR naltrexone + 360 mg SR bupropion (Contrave16),
or placebo. The study included a 3-week dose escalation, starting with one-quarter of the full
dose, which was increased weekly until the full dose was reached by week 4. Eligibility criteria
in the trial included: age 18-65 years, and BMI 30-45 kg/m2 or 27-45 kg/m2 with controlled
hypertension and/or dyslipidemia. Participants were instructed on diet and provided advice on
lifestyle modification, including exercise instruction, at baseline and weeks 12, 24, 36, and 48.
The trial met both its co-primary endpoints:
1) % average weight loss: Contrave patients had an average weight loss of 6.1% in the
Contrave32 group, 5.0% in the Contrave16 group, and 1.3% in the placebo group, for placebo-
adjusted average weight losses of 4.8% and 3.7% in the Contrave32 group and Contrave16
groups, respectively. These results were statistically significant. However, they did not meet
FDA’s efficacy benchmark of a 5% difference in average weight loss between therapy and
placebo.
2) % of patients losing at least 5% of their weight: 48% of the patients in the Contrave32
group lost at least 5% of baseline body weight, compared to 39% in the Contrave16 group and
16% in the placebo group. With these data, Contrave met the threshold specified in FDA's draft
guidance for efficacy of obesity drugs.
www.cowen.comMEMBER: FINRA/SIPC 78
EQUITY RESEARCHCowen and Company, LLC

COR-I: Primary efficacy endpoints
Key Endpoints Contrave16 Contrave32 PlaceboDifference
(Contrave16)p-value
Difference
(Contrave32)p=value
n (mITT-LOCF) n=471 n=471 n=511 - - - -
Mean Weight Loss (%) (mITT-LOCF) 5.0% 6.1% 1.3% 3.7% p<0.0001 4.8% p=0.0079
≥5% weight loss (mITT-LOCF) 39.5% 48.0% 16.4% 23.1% p<0.0001 31.6% p=0.0099
≥10% weight loss (mITT-LOCF) 20.2% 24.6% 7.4% 12.8% p<0.0001 17.2% p<0.0001
n (Completers) n=284 n=296 n=290 - - - -
Mean Weight Loss (%) (Completers) 6.7% 8.1% 1.8% 4.9% p<0.0001 6.3% p<0.0001
≥5% weight loss (Completers) 54.6% 61.8% 23.1% 31.5% p<0.0001 38.7% p<0.0001
≥10% weight loss (Completers) 29.9% 34.5% 10.7% 19.2% p<0.0001 23.8% p<0.0001
Completion rate 60% 63% 57% - - - -
COR-I (NB-301) (n=1,742)
Source: Cowen and Company, Orexigen Therapeutics
Secondary Endpoints: The Contrave treatment groups also had significant improvements in a
number of secondary anthropometric and cardiometabolic parameters compared with the
placebo group, including (Contrave32/Contrave16/placebo, p value for Contrave 32 vs.
placebo): waist circumference (-6.2 cm vs. -5.0 cm vs. -2.5 cm, p<0.0001); triglycerides (-
12.7% vs. -8% vs. -3.1%, p<0.0001); hs-CRP (-29% vs. -28% vs. -16.7%, p=0.0076); fasting
insulin (-17.1% vs. -11.8% vs. -4.6%, p=0.0007). Patients in the Contrave groups also had
improved quality of life scores, as measured by the IWQOL-LITE scale (12.7 vs. 11.7 vs. 8.6,
p<0.0001).
Blood pressure and heart rate: Mean blood pressure decreased from baseline to 56 weeks
in placebo patients. However, both systolic and diastolic blood pressures were unchanged or
slightly changed in the Contrave groups. SBP decreased by 0.1 mm Hg and increased by 0.3
mm Hg in the Contrave32 and Contrave16 groups, respectively, compared with a reduction of
1.9 mm Hg in the placebo group. DBP did not change from baseline in the Contrave32 group
and increased by 0.1 mm Hg in the Contrave16 group, while placebo patients had a decrease
of 0.9 mm Hg.
Mean systolic and diastolic blood pressures were noted to increase by approximately 1.5 mm
Hg from baseline in the first 8 weeks of Contrave treatment, followed by return to baseline
levels after week 12, with subsequent 1 mm Hg decrease for the remaining time in the study.
These blood pressure changes were less than those experienced by the placebo group, in
which there was a decrease in systolic and diastolic blood pressures of approximately 1.5 mm
Hg from baseline during the first 12 weeks and subsequently continued reductions between 1.5
and 3 mm Hg. Heart rates increased up to 1.5 beats per minute from baseline in Contrave
patients, while placebo patients maintained baseline heart rates.
www.cowen.comMEMBER: FINRA/SIPC 79
EQUITY RESEARCHCowen and Company, LLC

COR-I: Key Secondary Endpoints
Contrave16 Contrave32 Placebo p-value
Contrave16
p-value
Contrave32
Change in blood fasting glucose -1.9% -2.6% -0.7% 0.1584 0.0104
Change in insulin -11.8% -17.1% -4.6% 0.0628 0.0007
Change in HOMA-IR -14.3% -20.2% -5.9% 0.0442 0.0003
Change in triglycerides -8.0% -12.7% -3.1% 0.0461 <0.0001
Change in hs-CRP -28.0% -29.0% -16.7% 0.0159 0.0076
Change in IWQOL-LITE 11.7 12.7 8.6 <0.0001 <0.0001
Change in waist circumference -5.0 cm -6.2 cm -2.5 cm <0.0001 <0.0001
Change in Systolic blood pressure 0.3 mm Hg -0.1 mm Hg -1.9 mm Hg <0.0001 0.0008
Change in Diastolic blood pressure 0.1 mm Hg 0.0 mm Hg -0.9 mm Hg 0.0150 0.0217
Change in Heart rate (beats per minute) +1.5 +1.0 -0.1 <0.05 <0.05 Source: Cowen and Company, Orexigen Therapeutics
Safety and Tolerability: The most common adverse event in the Contrave groups was
nausea. There was no increase in treatment-emergent psychiatric adverse events, such as
depression, suicidality, or other mood-related issues. The rate of serious adverse events did
not differ significantly between groups (1.6% for both Contrave groups and 1.4% for placebo).
There were no seizures or serious hypertension events. There were two serious cardiovascular
adverse events in the Contrave groups, one cardiac failure and one death resulting from MI,
but investigators did not consider these events to be treatment-related.
COR-I: Safety Data
Contrave16
(n=569)
n(%)
Contrave32
(n=573)
n(%)
Placebo
(n=569)
n(%)
Serious adverse events 1.60% 1.60% 1.40%
Participants reporting any adverse event 455 (80·0%) 476 (83·1%) 390 (68·5%)
Nausea 155 (27·2%) 171 (29·8%) 30 (5·3%)
Headache 91 (16·0%) 79 (13·8%) 53 (9·3%)
Constipation 90 (15·8%) 90 (15·7%) 32 (5·6%)
Upper respiratory tract infection 49 (8·6%) 57 (9·9%) 64 (11·2%)
Dizziness 44 (7·7%) 54 (9·4%) 15 (2·6%)
Insomnia 36 (6·3%) 43 (7·5%) 29 (5·1%)
Vomiting 36 (6·3%) 56 (9·8%) 14 (2·5%)
Sinusitis 34 (6·0%) 30 (5·2%) 34 (6·0%)
Dry mouth 42 (7·4%) 43 (7·5%) 11 (1·9%)
Nasopharyngitis 32 (5·6%) 29 (5·1%) 31 (5·4%)
Diarrhoea 31 (5·4%) 26 (4·5%) 28 (4·9%)
Hot fl ush 13 (2·3%) 30 (5·2%) 7 (1·2%)
Participants reporting any psychiatric adverse event 76 (13·4%) 85 (14·8%) 62 (10·9%)
Insomnia 36 (6·3%) 43 (7·5%) 29 (5·1%)
Anxiety 12 (2·1%) 9 (1·6%) 12 (2·1%)
Depression 9 (1·6%) 3 (0·5%) 6 (1·1%)
Source: Cowen and Company, Orexigen Therapeutics
COR-II (NB-303) Trial
This was a 56-week study in obese and overweight patients with co-morbidities. Patients were
randomized 2:1 to daily 32 mg SR naltrexone + 360 mg SR bupropion (Contrave32) or
www.cowen.comMEMBER: FINRA/SIPC 80
EQUITY RESEARCHCowen and Company, LLC

placebo. The Contrave dose was escalated weekly over the first 3-4 weeks, with full dose
reached by the beginning of week 5. To evaluate efficacy and safety of a dose increase in
patients with sub-optimal response, Contrave32 patients with < 5% weight loss between weeks
28 and 44 were randomized again double-blind, 1:1 to continue on Contrave32 or escalate to
48 mg SR naltrexone + 360 mg SR bupropion (Contrave48). The two co-primary endpoints of
the study were mean weight loss at week 28, and proportion of patients with ≥ 5% weight loss
at week 28. Eligibility criteria in the trial included: age 18-65 years, and BMI 30-45 kg/m2 or 27-
45 kg/m2 with controlled hypertension and/or dyslipidemia. Participants were instructed on diet
and provided advice on lifestyle/behavioral modification, including exercise instruction, at
baseline and weeks 12, 24, 36, and 48.
The trial met both its co-primary endpoints:
1) % average weight loss at week 28: At week 28, Contrave32 patients had an average
weight loss of 6.5%, compared with 1.9% in the placebo group. This significant difference was
maintained at 56 weeks, with Contrave patients losing 6.4% of body weight and placebo
patients losing 1.2%, for a placebo-adjusted average weight loss of 5.2%. These results were
statistically significant. The 56-week result did meet FDA’s efficacy benchmark of a 5%
difference in average weight loss between therapy and placebo.
2) % of patients losing at least 5% of their weight: At week 28, 55.6% of the patients in the
Contrave32 group lost at least 5% of baseline body weight, compared to 17.5% in the placebo
group. This significant difference was also maintained at 56 weeks, with 50.5% of Contrave
patients losing ≥ 5% of body weight, compared with 17.1% of placebo patients. With these
data, Contrave met the categorical weight loss threshold specified in FDA's draft guidance for
efficacy of obesity drugs.
COR-II: Efficacy Data
Key Endpoints Contrave32 Placebo Difference p-value Contrave32 Placebo Difference p-value
n (mITT-LOCF) n=825 n=456 - - n=702 n=456 - -
Mean Weight Loss (%) (mITT-LOCF) 6.5% 1.9% 4.6% p<0.001 6.4% 1.2% 5.2% p<0.001
≥5% weight loss (mITT-LOCF) 55.6% 17.5% 38.1% p<0.001 50.5% 17.1% 33.4% p<0.001
≥10% weight loss (mITT-LOCF) 27.3% 7.0% 20.3% p<0.001 28.3% 5.7% 22.6% p<0.001
n (Completers) n=619 n=319 - - n=434 n=267 - -
Mean Weight Loss (%) (Completers) 7.8% 2.4% 5.4% p<0.001 8.2% 1.4% 6.8% p<0.001
≥5% weight loss (Completers) 68.8% 22.3% 46.5% p<0.001 64.9% 21.7% 43.2% p<0.001
≥10% weight loss (Completers) 35.7% 9.4% 26.3% p<0.001 39.4% 7.9% 31.5% p<0.001
Completion rate 75% 70% - - 62% 59% - -
COR-II (NB-303) (n=1,496)
28 weeks (timepoint for primary endpoint analysis) 56 weeks
Source: Cowen and Company, Orexigen Therapeutics
Secondary Endpoints: As in the other trials in the COR program, Contrave treatment also
resulted in improvements of a number of secondary anthropometric and cardiometabolic
parameters, such as waist circumference, triglycerides, fasting insulin, and HOMA-IR. There
www.cowen.comMEMBER: FINRA/SIPC 81
EQUITY RESEARCHCowen and Company, LLC

was similarly also improvement in quality of life with Contrave treatment versus placebo, as
measured by the IWQOL-Lite score, including physical function self-esteem, and sexual life.
Blood pressure and heart rate: At week 56, mean SBP was elevated by 0.6 mm Hg in the
Contrave group, but decreased by 0.5 mm Hg in the placebo group. Mean DBP was elevated
in both groups, by 0.4 mm Hg and 0.3 mm Hg, respectively. Heart rate remained unchanged
with placebo, and a +1 bpm increased rate was noted in the Contrave group.
COR-II: Key Secondary Endpoints
Contrave32 Placebo p-value Contrave32 Placebo p-value
Change in blood fasting glucose -2.1 mg/dL -1.7 mg/dL 0.0544 -2.8 mg/dL -1.3 mg/dL 0.051
Change in insulin -14.1% -0.5% <0.001 -11.4% 3.5% <0.001
Change in HOMA-IR -16.4% -4.2% <0.001 -13.8% 1.2% <0.001
Change in triglycerides -7.3% -1.4% 0.007 -9.8% -0.5% <0.001
Change in hs-CRP -9.4% -1.1% 0.091 -28.8% -8.3% <0.001
Change in IWQOL-LITE 9.9 6.2 <0.001 10.9 6.4 <0.001
Change in waist circumference -6.2 cm -2.7 cm <0.001 -6.7 cm -2.1 cm <0.001
Change in Systolic blood pressure -0.9 (mm Hg) -1.2 (mm Hg) 0.556 +0.6 (mm Hg) -0.5 (mm Hg) 0.039
Change in Diastolic blood pressure +0.2 (mm Hg) -0.7 (mm Hg) 0.017 +0.4 (mm Hg) +0.3 (mm Hg) 0.847
Change in Heart rate (beats per minute) - - - +0.8 -0.3 <0.05
28 weeks 56 weeks
Source: Cowen and Company, Orexigen Therapeutics
Safety and tolerability: Consistent with the other COR trials, the most common treatment-
emergent AEs were nausea, headache, and constipation, which were usually mild to moderate
in intensity. There were no differences between the Contrave and placebo groups in
psychiatric measures, such as sadness, irritability, tension, and suicidality. Contrave was not
associated with increased depression or other mood-related AEs. Serious AE rates were
similar between the Contrave (2.1%) and placebo (1.4%) groups. In the Contrave group, there
was one MI in a patient with CV history and one seizure.
www.cowen.comMEMBER: FINRA/SIPC 82
EQUITY RESEARCHCowen and Company, LLC

COR-II: Safety Data
Contrave32
n=992
Placebo
n=492
Participants (%) reporting any adverse event 85.9% 75.2%
Nausea 29.2% 6.9%
Constipation 19.1% 7.1%
Headache 17.5% 8.7%
Insomnia 9.8% 6.7%
Dry mouth 9.1% 2.6%
Upper respiratory 8.7% 11.2%
Vomiting 8.5% 2.0%
Nasopharyngitis 8.3% 8.1%
Dizziness 6.9% 3.7%
Diarrhea 5.5% 3.7%
Sinusitis 5.1% 7.1%
Arthralgia 3.8% 5.7%
Bronchitis 1.4% 5.1%
Participants (%) reporting any psychiatric AEs 20.7% 15.2%
Insomnia 9.8% 6.7%
Anxiety 4.8% 4.3%
Depression 1.3% 1.6%
Sleep disorder 1.1% 0.8%
Participants (%) reporting any adverse event leading to discontinuation 24.3% 13.8%
Nausea 6.0% 0.2%
Headache 2.6% 0.8%
Depression 0.5% 1.2%
Cardiovascular endpoints
Systolic blood pressure, change from baseline (mm Hg) +0.20 -0.40
Diastolic blood pressure, change from baseline (mm Hg) +00 +0.10
Heart rate, change from baseline to Week 56 (bpm) +0.8 -0.30 Source: Cowen and Company, Orexigen Therapeutics
COR-Diabetes (NB-304) Trial
This was a 56-week trial in obese and overweight patients with type 2 diabetes. Patients were
randomized 2:1 to daily 32 mg SR naltrexone + 360 mg SR bupropion (Contrave32) or
placebo. Eligibility criteria in the trial included: age 18-70 years, and BMI 27-45 kg/m2 with type
2 diabetes mellitus, on no injectable or inhaled insulin for more than 3 months, and with HbA1c
levels between 7%-10%. Patients were permitted to be on oral single or combination diabetes
medications, stable for at least 3 months before randomization, or on no medications.
Participants were instructed on diet and provided advice on lifestyle/behavioral modification,
including exercise instruction, at baseline and weeks 12, 24, 36, and 48.
The trial met both its co-primary endpoints:
1) % average weight loss: At week 56, Contrave patients had an average weight loss of 5%,
compared with 1.8% in the placebo group, for a placebo-adjusted average weight loss of 3.2%.
While statistically significant, this result did not meet FDA’s efficacy benchmark of a 5%
difference in average weight loss between therapy and placebo.
2) % of patients losing at least 5% of their weight: 44.5% of the patients in the Contrave32
group lost at least 5% of baseline body weight, compared to 18.9% in the placebo group. With
www.cowen.comMEMBER: FINRA/SIPC 83
EQUITY RESEARCHCowen and Company, LLC
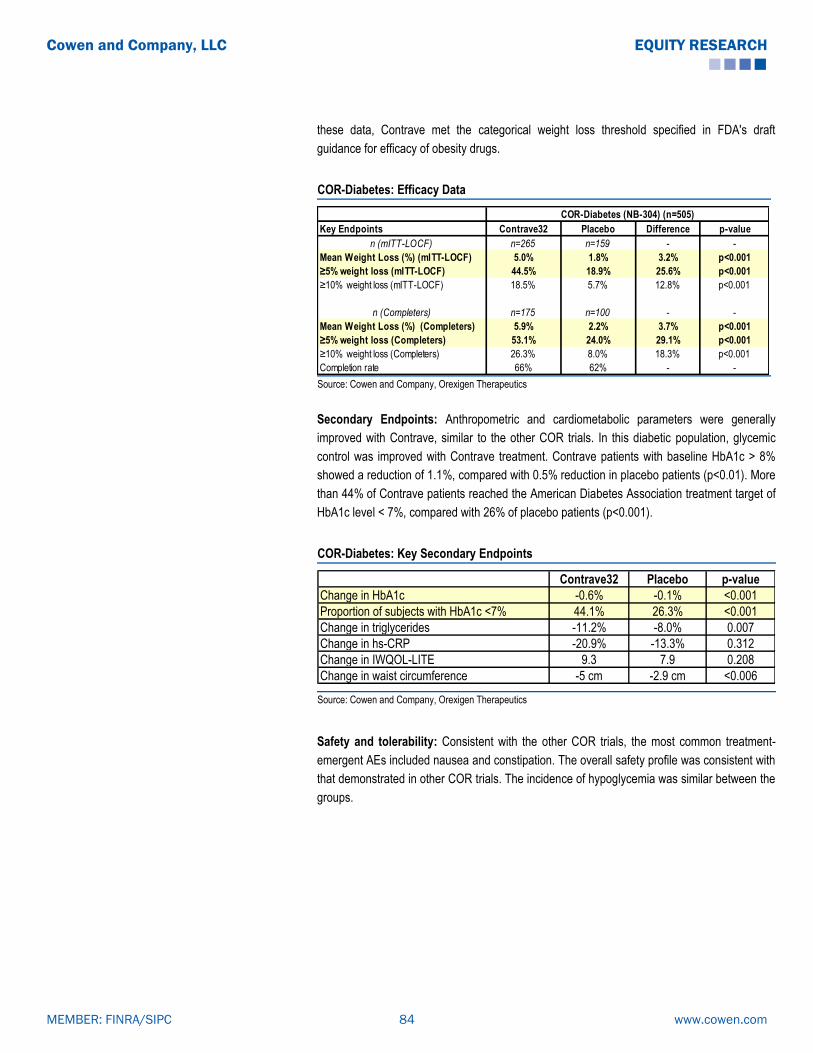
these data, Contrave met the categorical weight loss threshold specified in FDA's draft
guidance for efficacy of obesity drugs.
COR-Diabetes: Efficacy Data
Key Endpoints Contrave32 Placebo Difference p-value
n (mITT-LOCF) n=265 n=159 - -
Mean Weight Loss (%) (mITT-LOCF) 5.0% 1.8% 3.2% p<0.001
≥5% weight loss (mITT-LOCF) 44.5% 18.9% 25.6% p<0.001
≥10% weight loss (mITT-LOCF) 18.5% 5.7% 12.8% p<0.001
n (Completers) n=175 n=100 - -
Mean Weight Loss (%) (Completers) 5.9% 2.2% 3.7% p<0.001
≥5% weight loss (Completers) 53.1% 24.0% 29.1% p<0.001
≥10% weight loss (Completers) 26.3% 8.0% 18.3% p<0.001
Completion rate 66% 62% - -
COR-Diabetes (NB-304) (n=505)
Source: Cowen and Company, Orexigen Therapeutics
Secondary Endpoints: Anthropometric and cardiometabolic parameters were generally
improved with Contrave, similar to the other COR trials. In this diabetic population, glycemic
control was improved with Contrave treatment. Contrave patients with baseline HbA1c > 8%
showed a reduction of 1.1%, compared with 0.5% reduction in placebo patients (p<0.01). More
than 44% of Contrave patients reached the American Diabetes Association treatment target of
HbA1c level < 7%, compared with 26% of placebo patients (p<0.001).
COR-Diabetes: Key Secondary Endpoints
Contrave32 Placebo p-value
Change in HbA1c -0.6% -0.1% <0.001
Proportion of subjects with HbA1c <7% 44.1% 26.3% <0.001
Change in triglycerides -11.2% -8.0% 0.007
Change in hs-CRP -20.9% -13.3% 0.312
Change in IWQOL-LITE 9.3 7.9 0.208
Change in waist circumference -5 cm -2.9 cm <0.006
Source: Cowen and Company, Orexigen Therapeutics
Safety and tolerability: Consistent with the other COR trials, the most common treatment-
emergent AEs included nausea and constipation. The overall safety profile was consistent with
that demonstrated in other COR trials. The incidence of hypoglycemia was similar between the
groups.
www.cowen.comMEMBER: FINRA/SIPC 84
EQUITY RESEARCHCowen and Company, LLC

COR-Diabetes: Safety Data
Contrave 32
n=333
Placebo
n=169
Participants (%) reporting any AEs 90.4% 85.2%
Nausea 42.3% 7.1%
Vomiting 18.3% 3.6%
Constipation 17.7% 7.1%
Diarrhea 15.6% 9.5%
Headache 13.8% 8.9%
Dizziness 11.7% 5.3%
Insomnia 11.1% 5.3%
Hypertension 9.9% 4.1%
Hypoglycemia 7.5% 7.1%
Tremor 6.6% 2.4%
Dry mouth 6.0% 3.0%
Anxiety 5.4% 1.2%
Upper respiratory 5.1% 1.8% Source: Cowen and Company, Orexigen Therapeutics
Responders Maintained Meaningful Weight Loss
Approximately 51% and 67% of the patients in the COR program and COR-BMOD trial,
respectively, met the definition of responder by achieving >5% weight loss at week 16.
Responders achieved meaningful weight losses of 11.3% and 13.4%, respectively, after one
year of treatment. In the COR program, 19% of placebo patients met the definition of
responder, and these patients had an average loss of 8.6% at one year.
COR Program responders
COR Program
(n=1,038)
Placebo Responder
(n=254)
% Meeting responder definition 51.0% 19.0%
% Weight loss at 1 year 11.3% 8.6%
>5% weight loss at 16 weeks
Source: Cowen and Company, Orexigen
Similarly, approximately 62% and 73% of the patients in the COR program and COR-BMOD
trial, respectively, met the responder definition of achieving >3% weight loss at week 12. This
patient population achieved meaningful weight loss of 10.3% and 12.7%, respectively, in the
trials after one year of treatment.
We believe that only responders will continue treatment with Contrave after 16 weeks. The
representative weight loss in the Contrave responder patient population is similar to that
achieved by treatment with either Qsymia or BELVIQ.
www.cowen.comMEMBER: FINRA/SIPC 85
EQUITY RESEARCHCowen and Company, LLC
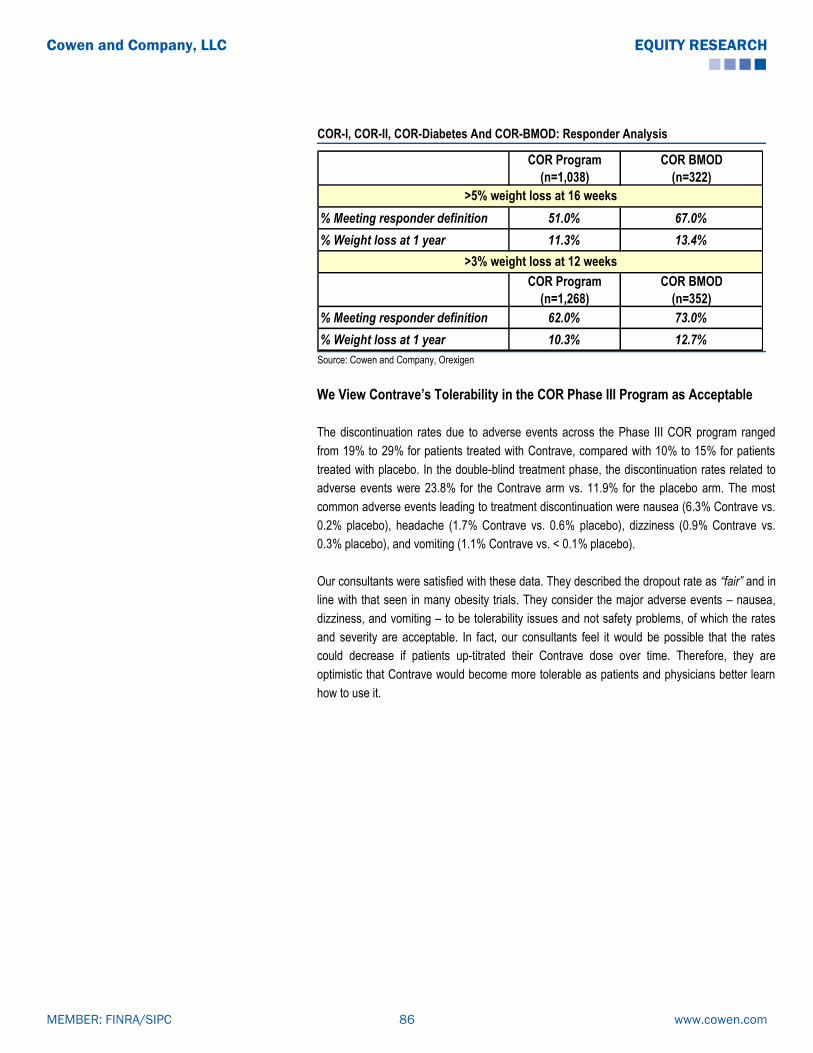
COR-I, COR-II, COR-Diabetes And COR-BMOD: Responder Analysis
COR Program
(n=1,038)
COR BMOD
(n=322)
% Meeting responder definition 51.0% 67.0%
% Weight loss at 1 year 11.3% 13.4%
COR Program
(n=1,268)
COR BMOD
(n=352)
% Meeting responder definition 62.0% 73.0%
% Weight loss at 1 year 10.3% 12.7%
>5% weight loss at 16 weeks
>3% weight loss at 12 weeks
Source: Cowen and Company, Orexigen
We View Contrave’s Tolerability in the COR Phase III Program as Acceptable
The discontinuation rates due to adverse events across the Phase III COR program ranged
from 19% to 29% for patients treated with Contrave, compared with 10% to 15% for patients
treated with placebo. In the double-blind treatment phase, the discontinuation rates related to
adverse events were 23.8% for the Contrave arm vs. 11.9% for the placebo arm. The most
common adverse events leading to treatment discontinuation were nausea (6.3% Contrave vs.
0.2% placebo), headache (1.7% Contrave vs. 0.6% placebo), dizziness (0.9% Contrave vs.
0.3% placebo), and vomiting (1.1% Contrave vs. < 0.1% placebo).
Our consultants were satisfied with these data. They described the dropout rate as “fair” and in
line with that seen in many obesity trials. They consider the major adverse events – nausea,
dizziness, and vomiting – to be tolerability issues and not safety problems, of which the rates
and severity are acceptable. In fact, our consultants feel it would be possible that the rates
could decrease if patients up-titrated their Contrave dose over time. Therefore, they are
optimistic that Contrave would become more tolerable as patients and physicians better learn
how to use it.
www.cowen.comMEMBER: FINRA/SIPC 86
EQUITY RESEARCHCowen and Company, LLC

Safety and Tolerability Data From Contrave's Four Phase III COR Trials
Treatment-Emergent Adverse EventsPlacebo
(N=1,515)
Contrave
(naltrexone 16mg)
(N=633)
Contrave
(naltrexone 32mg)
(N=2,545)
Contrave
(combined 16/32
data)
(N=3,239)
p-value
Discontinue treatment due to any AE 181 (11.9%) 139 (22.0%) 612 (24.0%) 771 (23.8%) <0.001
Nausea 3 (0.2%) 32 (5.1%) 160 (6.3%) 203 (6.3%) <0.001
Headache 9 (0.6%) 10 (1.6%) 43 (1.7%) 55 (1.7%) 0.002
Dizziness 5 (0.3%) 15 (2.4%) 23 (0.9%) 42 (1.3%) 0.001
Vomiting 1 (<0.1%) 4 (0.6%) 28 (1.1%) 35 (1.1%) <0.001
Insomnia 7 (0.5%) 5 (0.8%) 17 (0.7%) 23 (0.7%) 0.290
Anxiety 10 (0.7%) 1 (0.2%) 19 (0.7%) 21 (0.6%) 0.843
Urticaria 4 (0.3%) 3 (0.5%) 16 (0.6%) 19 (0.6%) 0.198
Depression 13 (0.9%) 6 (0.9%) 10 (0.4%) 16 (0.5%) 0.144
Blood pressure increased 3 (0.2%) 3 (0.5%) 10 (0.4%) 13 (0.4%) 0.276
Rash 2 (0.1%) 1 (0.2%) 12 (0.5%) 13 (0.4%) 0.125
Hypertension 0 3 (0.5%) 7 (0.3%) 11 (0.3%) 0.021
Fatigue 3 (0.2%) 3 (0.5%) 7 (0.3%) 10 (0.3%) 0.518
Palpitations 0 5 (0.8%) 4 (0.2%) 10 (0.3%) 0.031
Abdominal pain 1 (<0.1%) 5 (0.8%) 4 (0.2%) 9 (0.3%) 0.157
Tremor 1 (<0.1%) 3 (0.5%) 6 (0.2%) 9 (0.3%) 0.141 Source: Cowen and Company, Orexigen
Summary of Contrave’s Regulatory History
The AdCom gives Contrave a surprise 13-7 positive nod…
The EMDAC (Endocrinologic and Metabolic Drugs Advisory Committee) of the FDA met to
consider the Contrave NDA on December 7, 2010. Given that the AdCom had previously voted
against the approvals of both BELVIQ and Qsymia, there was low investor expectation for a
positive vote. Thus, the 13-7 vote in favor of Contrave approval for treatment of obesity came
as a surprise. While panel members viewed Contrave’s efficacy as modest, they considered it
to meet FDA requirements for weight loss efficacy. In view of the modest benefit, a key issue
was Contrave’s safety, with CV safety being the greatest concern to advisory panel members.
In the COR Phase III program, overall mean elevations in BP and HR were associated with
Contrave treatment relative to placebo. Both the FDA and Orexigen agreed that a
cardiovascular outcomes trial (CVOT) would be required. However, the key question revolved
around the timing requirement of the study, specifically before or after potential approval.
There was debate between panel members considering the CV risk as low and definable in a
quickly conducted trial and those worried about the potential need to withdraw another obesity
drug from the market after approval, with resulting loss of FDA credibility. The panel ultimately
voted 11-8 for CVOT completion post-approval.
www.cowen.comMEMBER: FINRA/SIPC 87
EQUITY RESEARCHCowen and Company, LLC

Contrave’s CV Safety Data
C o n tr a v e ( n a ltr e x o n e 1 6 m g )
( n = 2 7 6 )
C o n tr a v e
( n a ltr e x o n e 3 2 m g )
( n = 1 ,3 1 2 )
C o n tr a v e ( co m b in e d
1 6 /3 2 d a ta ) ( n = 1 ,5 8 8 )
P la ce b o
( n = 7 5 1 )
S y s to l ic b lo o d p re s s u re , m m H g
M e a n c h a n g e -0 .2 4 -0 .9 4 -0 .8 2 -2 .3 3
D i ffe re n c e fro m p la c e b o (m m H g ) + 2 .0 9 + 1 .3 9 + 1 .5 4
D ia s to l ic b lo o d p re s s u re , m m H g
M e a n c h a n g e -0 .3 7 -1 .1 4 -1 .0 1 -1 .5
D i ffe re n c e fro m p la c e b o (m m H g ) + 1 .1 3 + 0 .3 6 + 0 .5 1
H e a rt ra te , b p m
M e a n c h a n g e + 1 .3 + 0 .1 + 0 .3 -0 .9 8
D i ffe re n c e fro m p la c e b o (b p m ) + 2 .2 8 + 1 .0 7 + 1 .3 5
Source: Cowen and Company, Orexigen
…but FDA goes 3-for-3 in rejecting these new obesity drugs
Despite the positive opinion from the AdCom, in February 2011, Orexigen announced that it
had received a Complete Response Letter (CRL) from the FDA, noting "concern about the
cardiovascular safety profile of naltrexone/bupropion when used long term in a population of
overweight and obese subjects." The CRL requested the completion of a pre-approval CV
safety study by Orexigen and specifically stated, "before your application can be approved, you
must conduct a randomized, double-blind placebo-controlled trial of sufficient size and duration
to demonstrate that the risk of major adverse cardiovascular events in overweight and obese
subjects treated with naltrexone/bupropion does not adversely affect the drug's adverse event
profile."
In May 2011, Orexigen met with FDA’s Division of Metabolic and Endocrinologic Products
(DMEP) to gain more clarity on the CRL. Orexigen proposed Contrave approval with a narrow
indication, in patients with lower cardiovascular risk, until data from a proposed CVOT could be
reviewed for label expansion. The DMEP rejected this request and advised Orexigen that its
proposed CVOT would not adequately address cardiovascular issues. The DMEP further
stated that it would not consider approval of Contrave for a narrow indication without first
reviewing CVOT data. Based on this feedback, Orexigen decided to put further clinical
development of Contrave on hold in the United States.
After a dispute resolution process with the FDA, Orexigen announced in September 2011 that
an agreement had been reached on the design requirement for the CVOT, addressing
concerns specified in the CRL. According to the company, the FDA stated that ―if the interim
analysis meets the specified criteria to exclude an unacceptable increased cardiovascular (CV)
risk, the drug could be approved.‖ This signaled a reversal from the previous FDA stance that
CV risk be ruled out, which would have required a much larger trial. In agreeing with the terms,
Orexigen considered the design requirements to be “reasonable and feasible.”
www.cowen.comMEMBER: FINRA/SIPC 88
EQUITY RESEARCHCowen and Company, LLC

Contrave’s CVOT: LIGHT Study
The LIGHT Study is the randomized, double-blind, placebo-controlled cardiovascular outcomes
trial (CVOT) for Contrave. The trial is being conducted under a Special Protocol Assessment
(SPA) with the FDA. FDA requirements for the trial design include powering based on an
intent-to-treat (ITT) analysis. The trial must enroll an overweight and obese population which
has an estimated annual risk of 1% to 1.5% for major adverse cardiovascular events (MACE),
defined as: 1) cardiovascular death, 2) non-fatal myocardial infarction, and 3) non-fatal stroke.
LIGHT Study Statistical Criteria: Specific statistical criteria have been issued for the interim
and final analyses of CV risk in this population:
The upper bound of the 95% confidence interval (CI) should exclude a hazard ratio (HR)
of 2.0 at the interim analysis, and of 1.4 at the final analysis. With this design, there is an
estimate of at least 87 total required MACE events at the interim analysis, and of at least 371
MACE events at the final analysis. The company has previously indicated that, at interim
analysis, in order to exclude a HR of 2.0 from the confidence interval, the observed HR in the
trial must be <1.32, and at final analysis, the observed HR must be <1.14.
LIGHT Study Design: Patients are randomized 1:1 to treatment with Contrave, administered
in conjunction with a comprehensive weight management program, or to placebo administered
with the same program. The dose of Contrave is escalated weekly over 4 weeks up to the full
dose.
Lead-in Period: There is a two-week lead-in period after screening and prior to the treatment
period. For the lead-in, patients are randomized 1:1 to receive either placebo during the first
week and the lowest daily dose of Contrave (8 mg naltrexone/90 mg bupropion) during the
second week, or the lowest Contrave dose during the first week and placebo during the second
week. Patients will be trained on using food diaries, which they are expected to consistently
complete during this time.
Orexigen has guided that the purpose of the lead-in period is two-fold: 1) to provide subjects
with a small dose of Contrave, in order to stimulate nausea and allow patients unable to
tolerate this known side-effect of naltrexone to drop out, and 2) to evaluate subjects’
commitment to a clinical trial by assessing compliance with food diaries. The company has
noted its intention to avoid discontinuations resulting from nausea during LIGHT’s treatment
period, which occurred with a 15-20% incidence and a usual duration of ~2 weeks, in the
Phase III Contrave trial program. Subjects who discontinue during the lead-in period will
not be counted as part of the ITT population.
Evaluation to Continue Treatment: Patients will be evaluated at Week 16 to determine
continuation in the study. Patients who 1) have not lost 2% of body weight by week 16 and/or
2) experience a sustained increase in either systolic or diastolic BP, defined as multiple
observations of at least 10 mm Hg increases in BP on two successive readings, any time
www.cowen.comMEMBER: FINRA/SIPC 89
EQUITY RESEARCHCowen and Company, LLC

during the 16-week period will discontinue treatment. However, as part of the ITT
population, their MACE events, if any, will be included in the final study analysis.
LIGHT Study Design
Source: Orexigen Presentation
Orexigen expects that, after Week 16, approximately 50% of patients in both trial arms will
have discontinued study treatment, either resulting from standard drop-outs or from meeting
criteria for discontinuation at 16 weeks. These patients will be counted in the ITT population.
Primary Endpoint: The primary endpoint of the trial is time from treatment period
randomization to the first confirmed occurrence of MACE events. The time frame extends from
Day 1 to first confirmed occurrence, assessed up to 4 years.
LIGHT Study Population: Inclusion and exclusion criteria for the trial reflect the target
background annual 1%-1.5% CV event risk. Using U.S. population-based data sets, for
example NHANES, Orexigen targeted enrollment of a patient population with a modeled
background annual MACE rate of > 2%, expecting to observe a MACE rate of about 1.5%. The
trial population included females ≥ 50 years old and males ≥ 45 years old, with BMI range 27-
50 kg/m2. Subjects were required to have 1) cardiovascular disease; or 2) diabetes mellitus,
with at least two of four additional risk factors; or 3) both:
CV disease was identified by at least one of the following: history of MI >3 months
prior to screening, history of coronary/carotid/peripheral revascularization
procedures, angina with ischemia, evidence of peripheral vascular disease, or ≥ 50%
arterial stenosis (coronary/carotid/lower extremity vessel) within prior 2 years.
Otherwise, instead of, or in addition to, CV disease, patients had type 2 diabetes
mellitus accompanied by at least two of the following conditions: controlled
hypertension with BP<145/95mmHg, dyslipidemia requiring pharmacotherapy, low
HDL cholesterol (< 50 mg/dL in women or < 40 mg/dL in men), or current smoking
history.
www.cowen.comMEMBER: FINRA/SIPC 90
EQUITY RESEARCHCowen and Company, LLC

Particularly high-risk individuals, such as those with MI within 3 months, unstable angina,
stroke history, tachyarrhythmia history, planned bariatric surgery/cardiac surgery/coronary
angioplasty, or life expectancy < 4 years, were excluded.
The following table illustrates the characteristics of 8,911 patients enrolled in LIGHT.
Patient Characteristics in LIGHT Study
Characteristics TargetRandomized subjects
(n=8,911)
Age 64 61
Younger age group <25% 14%
Gender 50:50 (M:F) 45:55 (M:F)
Minority 15% 22%
CV disease 30% 34%
Diabetes >70% 85%
Smoking status >5% 9% Source: Cowen and Company, Orexigen Presentation August 2013
LIGHT Study Enrollment: The trial began enrolling patients on June 6, 2012. On September
5, 2012, Orexigen announced that the LIGHT study was enrolling patients more quickly than
anticipated, with > 4,500 patients enrolled as of August 31, 2012. On December 18, 2012, the
company announced the completion of screening and enrollment, accomplished within 6.5
months of initiation, indicating that 13,192 patients had been screened for the study, of which
approximately 10,400 patients met eligibility criteria, were enrolled, and entered the lead-in
period. Ultimately 8,911 patients were then randomized to the treatment period. The company
has stated that the final population in the trial is sufficient for and reflective of the targeted 1-
1.5% annual MACE rate.
LIGHT Trial Enrollment Faster Than Expected
Source: Orexigen Presentation
www.cowen.comMEMBER: FINRA/SIPC 91
EQUITY RESEARCHCowen and Company, LLC
Faster Path to Resubmission of the Contrave NDA
On January 7, 2013, Orexigen announced further progress with regard to the potential
resubmission of the Contrave NDA. The FDA will allow Orexigen to resubmit the NDA based
on the Data Monitoring Committee (DMC) summary report of the LIGHT interim analysis, and
to submit the complete clinical study report within 60 days. Interim analysis from the study is
expected by early December 2013, with plan for NDA resubmission by YE13.
2Q13 Earnings Call Update: On August 6, 2013, Orexigen management reiterated guidance
that the LIGHT trial interim analysis and resubmission of the Contrave NDA (Class 2
resubmission, with a 6-month review process expected) were expected in 2H13. According to
management, the LIGHT trial timeline was “on track,” and the 87th MACE event was expected
within the “next few months.” More information on this, with a more specific time frame, was
anticipated after the next DMC meeting, which was expected to occur “pretty soon.” The DMC
would notify Orexigen when the number of events was close to the target, so that the company
could finalize preparations for the interim analysis.
August 2013 Update: On August 27, 2013, Orexigen announced the DMC’s confirmation that
sufficient MACE events for interim analysis in LIGHT are expected to occur within two months,
meaning that the DMC expects the 87th MACE event will occur within 8 weeks. Therefore, the
company expects the interim analysis of the LIGHT study to have been conducted by early
December 2013. Management guided that the Contrave NDA will then be resubmitted by YE13
(recall that the FDA is allowing resubmission based on the DMC summary report of the LIGHT
interim analysis, and will accept the complete clinical study report within 60 days). Additionally,
the company reiterated that the MAA for Contrave will be submitted prior to the interim analysis
of LIGHT, with the expectation that data will be ready for the CHMP Day 120 List of Questions.
Preparing For the Launch
The Ignite Study: In preparation for the launch of Contrave, Orexigen has initiated a
multicenter, randomized, open-label, controlled Phase IIIb method-of-use study designed to
provide additional information regarding the real world weight loss potential of Contrave. This
trial will assess the effects of Contrave used in conjunction with a commercially available,
comprehensive lifestyle intervention (CLI) program versus Usual Care, which is defined as a
self-directed, minimal lifestyle intervention program. The CLI program is a telephone-based,
interactive system with counseling, education, goal setting, and tracking tools. The study is
evaluating Contrave utilization in the manner intended after approval.
In February 2013, the trial completed enrollment (in 3 days) of approximately 240 adult patients
with BMI 30-45 kg/m2 or BMI 27-45 kg/m2 with dyslipidemia and/or controlled hypertension.
Diabetic patients are excluded. At week 26, patients originally assigned to the Usual Care arm
will switch to the Contrave/CLI arm. Those in the Contrave/CLI arm continue on treatment for
the duration of the study, which is 78 weeks. The primary endpoint is change in body weight
after 26 weeks. Secondary endpoints include categorical weight loss and changes in
www.cowen.comMEMBER: FINRA/SIPC 92
EQUITY RESEARCHCowen and Company, LLC

anthropometric and cardiometabolic parameters. Results from the study are anticipated by
YE13.
E.U. Regulatory Front
In 4Q12, Orexigen submitted a MAA Letter of Intent (LOI) with the EMA. Orexigen met with the
EMA in 1H13 for pre-submission discussions. On May 8, 2013, the company reported that the
rapporteurs had been assigned.
Status Update: On August 6, 2013, in its 2Q13 Earnings Call, Orexigen reported that, having
met with the rapporteur (Denmark) and co-rapporteur (U.K.) for discussions about filing, it
planned to submit the MAA for Contrave to the EMA using the centralized procedure in 2H13
(“in the next few months”), before the LIGHT trial interim analysis. The company plans to have
CVOT data from LIGHT available for the CHMP Day 120 List of Questions. According to
management, the rapporteurs are supportive of this plan for MAA submission. The company
noted that the pediatric investigational plan (PIP) has been accepted, and the risk
management plan is currently being refined before submission (as per management, a key part
of this involves LIGHT, but may also include commitments for other components, such as a
registry program). Orexigen anticipates potential E.U. approval in “Fall 2014,” should there be
a positive CHMP opinion.
Orexigen Partnered with Takeda in North America and Mexico
In September 2010, Orexigen and Takeda announced a partnership to commercialize
Contrave in the U.S., Canada, and Mexico. Orexigen received an upfront payment of $50M
and is eligible for up to $1B in additional milestone payments, as well as tiered royalties of
20%-35% on net sales. Orexigen will be responsible for all pre-approval development costs,
the first $60M of post-approval development costs, and 25% of most post-approval
development costs. Takeda will be responsible for all post-approval manufacturing and
commercialization costs, plus 75% of post-approval development costs. Orexigen retains the
right to co-promote Contrave in North America and Mexico and intends to out-license ex-North
American rights for Contrave to a pharma partner.
www.cowen.comMEMBER: FINRA/SIPC 93
EQUITY RESEARCHCowen and Company, LLC

Orexigen/Takeda partnership summary
Partner Takeda
GeographiesTakeda owns rights to U.S., Canada and Mexico;
Orexigen owns rights to rest of the wold
Partnership date Partnered with Takeda in September 2010
Upfront payment $50M
Royalty rate 20-35%
Next expected milestone
$20M on U.S. approval, $10M upon the delivery of
launch supplies to Takeda and $70M on first
commercial sales.
Total potential milestones up to $1B
Patent life US patents expire 2024-2025 Source: Cowen and Company, SEC Filings
Sales and Marketing Efforts
Orexigen has not yet disclosed the exact details of the sales and marketing effort that Takeda
will implement for Contrave. However, according to Orexigen, the companies have a multi-year
contractual commercial commitment, outlining specific agreements on marketing spend, sales
force compensation structure, and the minimum number of prescribers that Takeda will be
targeting. Orexigen has guided that Takeda expects to reach between 50,000+ prescribers. In
December 2012, at an Analyst Day, Orexigen discussed a theoretical scenario in which a sales
force of 500 representatives, having an average frequency of 12 calls a year per physician,
could target a total of 60,000 physicians in any given year. The figure below illustrates a
potential reaching frequency of a representative primary care launch.
We believe Takeda’s marketing strategy with its commitment of a sizeable primary care sales
force provides Contrave with a significant commercial advantage, enabling comprehensive
outreach to potential physician prescribers. The projected sales force for Contrave is
substantial, generating a potential advantage relative to other products in the market.
Orexigen’s IP Estate
Contrave is covered by an intellectual property estate for which Orexigen has exclusive rights.
The compositions of matter for Contrave as well as its use for obesity, will be protected in the
U.S. and abroad until at least 2024-25.
Orexigen holds U.S. Patents # 7,375,111 and 7,462,626, entitled Compositions For Affecting
Weight Loss. As stated in the patent abstracts, “Disclosed are compositions for affecting
weight loss comprising a first compound and a second compound, where the first compound is
an opioid antagonist and the second compound causes increased agonism of a melanocortin 3
receptor (MC3-R) or a melanocortin 4 receptor (MC4-R) compared to normal physiological
conditions. Also disclosed are methods of affecting weight loss, increasing energy expenditure,
increasing satiety in an individual, or suppressing the appetite of an individual, comprising
www.cowen.comMEMBER: FINRA/SIPC 94
EQUITY RESEARCHCowen and Company, LLC

identifying an individual in need thereof and treating that individual to antagonize opioid
receptor activity and to enhance α-MSH activity.”
The company refers to these patents as the ―Weber/Cowley composition patent‖ and the
―Weber/Cowley methods patent,‖ respectively. Collectively, these patents are known as the
―Weber/Cowley patents‖ and cover the current composition of Contrave and methods of
administering Contrave to treat obesity. The composition patent expires in March 2025, and
the methods patent expires in July 2024. The European Patent Office has granted the
European version of the Weber/Cowley patents, published as EP1617832 B1. This patent has
been issued in numerous countries throughout the European Union, providing coverage for
Contrave until at least 2024. Orexigen has also filed a number of international patent
applications in foreign countries.
www.cowen.comMEMBER: FINRA/SIPC 95
EQUITY RESEARCHCowen and Company, LLC

3) Big Pharma: Novo Nordisk’s Victoza (liraglutide)
Novo Nordisk’s Victoza (liraglutide) has been approved by the FDA (with a black box warning
about possible increased risk of thyroid cancer) and by the EMA for the treatment of diabetes
at doses of 1.2 mg and 1.8 mg (and 0.9 mg in Japan) once daily. Liraglutide is a long-acting
analog of glucagon-like peptide-1 (GLP-1), which increases insulin secretion and decreases
glucagon secretion. It also slows gastric emptying. The drug is in Phase III development for the
treatment of obesity in the non-diabetic setting.
Like other GLP-1 analogs, such as Amylin’s Byetta, Victoza has demonstrated an ability to
generate weight loss in its trials. In a 165-subject dose-ranging Phase IIb monotherapy study in
type 2 diabetics, patients at the highest dose of Victoza (1.8 mg) lost approximately 3 kg from
baseline vs. 1.2 kg on placebo after 14 weeks. Data from the 533-patient LEAD-4 trial, part of
Victoza’s Phase III diabetes program, demonstrated that patients treated with a combination of
Victoza, metformin, and Avandia experienced 2.5 kg weight loss at 26 weeks, compared to
patients administered metformin and Avandia.
In 2007, Victoza initiated a 550-patient, dose-finding, Phase II trial in obese subjects without
diabetes. This 20-week, double-blind study randomized participants to either Victoza, placebo,
or an open-label Xenical arm. Baseline BMI was 30-40 kg/m2, and the protocol included a low-
fat diet and exercise program. In November 2007, Novo Nordisk released positive results from
the study, demonstrating that patients who received Victoza at the highest dose had weight
loss from baseline of >7 kg versus weight loss of <3 kg in the placebo group and weight loss of
>4 kg in the Xenical treated group. All doses of Victoza reduced body weight. More than 75%
of the people treated with the highest dose experienced a weight loss greater than 5%, and
more than 25% experienced weight loss greater than 10% relative to their body weight at
randomization. The study revealed a beneficial effect on systolic blood pressure after treatment
with Victoza.
In addition, 30% of the participants showed signs of pre-diabetes at randomization. After 20
weeks of treatment with any dose of Victoza, 80-90% of patients no longer had any signs of
pre-diabetes, compared with approximately 40% in the placebo- and Xenical-treated groups.
Victoza was generally well tolerated. The overall withdrawal rate across the study was around
20%, and no more than 10% of patients treated with Victoza withdrew from the trial due to
adverse events. In a 32-week open label extension study, patients who were treated at the
highest dose experienced mean weight loss from baseline of 7.5-8.0 kg (5.5-6.0 kg as adjusted
for placebo). Approximately 75% of all treated subjects achieved >5% weight loss, and >35%
achieved >10% weight loss after 52 weeks of treatment vs. 25% and 10% of placebo subjects,
respectively.
Novo Nordisk completed enrollment for one of Victoza’s Phase III obesity studies in non-
diabetic patients with a history of hypertension or dyslipidemia. However, in mid-2009, Novo
Nordisk announced that two other Phase III trials would not be initiated until “more clarity on
the U.S. regulatory process for liraglutide for the treatment of type 2 diabetes” was obtained.
www.cowen.comMEMBER: FINRA/SIPC 96
EQUITY RESEARCHCowen and Company, LLC
In June 2010, the company announced that, based on feedback from the FDA, it decided to re-
initiate the global Phase III liraglutide obesity program. The clinical trial program evaluating
safety and efficacy of liraglutide 3 mg for weight management is known as the SCALE (Satiety
and Clinical Adiposity-Liraglutide Evidence in Non-diabetic and Diabetic People) program. It is
comprised by four Phase III trials with approximately 5,000 obese (BMI ≥ 30 kg/m2) and
overweight (BMI ≥ 27 kg/m2) patients with comorbidities, such as hypertension, dyslipidemia,
or type 2 diabetes:
SCALE Maintenance: This was a 56-week, randomized, double-blind, placebo-controlled
evaluating weight loss maintenance with liraglutide 3 mg vs. placebo in 422 obese and
overweight patients after successfully achieving ≥ 5% weight loss during a 12-week run-in
period consisting of a lifestyle modification program with low calorie diet and exercise alone.
After the run-in period, patients were randomized for the 56-week main trial period to daily
liraglutide 3 mg or placebo. Patients then discontinued treatment and were followed for an
additional observation period of 12 weeks. Diabetic patients were excluded from the trial. The 3
co-primary endpoints were: 1) mean change in body weight from baseline; 2) proportion of
patients maintaining full run-in weight loss; and 3) proportion of patients losing ≥ 5% of body
weight from week 0 (i.e., achieving further weight loss after randomization).
SCALE Diabetes: This was a 56-week, randomized, double-blind, placebo-controlled trial in
846 obese and overweight patients with type 2 diabetes, evaluating safety and efficacy of
liraglutide 3 mg vs. liraglutide 1.8 mg and placebo to induce and maintain weight loss in
diabetic patients over 56 weeks, when added to background diabetes treatment, consisting of
metformin, a sulfonylurea, or glitazone as single-agents or in combination. Patients were
randomized 2:1:1 to treatment with daily liraglutide 3 mg, liraglutide 1.8 mg, or placebo.
Treatment was discontinued at 56 weeks, and patients were followed during an additional 12-
week observation period. The co-primary endpoints were: 1) change in mean body weight
from baseline; 2) proportion of patients losing ≥ 5% body weight from baseline; and 3)
proportion of patients losing ≥ 10% body weight from baseline.
SCALE Obesity and Pre-Diabetes: This is a 56-week/160-week randomized, double-blind,
placebo-controlled trial in 3,731 obese and overweight patients with comorbidities, evaluating
safety and efficacy of liraglutide 3 mg vs. placebo to induce and maintain weight loss, as well
as to delay onset of type 2 diabetes in pre-diabetic patients. Patients with known diabetes
(HbA1c ≥ 6.5%) are excluded from the trial. Patients without pre-diabetes are randomized 2:1
to daily liraglutide 3 mg or placebo for 56 weeks. After 56 weeks, patients are re-randomized to
receive liraglutide or placebo for an additional 12 weeks. Pre-diabetic patients are randomized
to liraglutide 3 mg or placebo for 160 weeks. The co-primary endpoints are: 1) change in mean
body weight from baseline to week 56; 2) proportion of patients losing ≥ 5% body weight from
baseline at week 56; 3) proportion of patients losing ≥ 10% body weight from baseline at week
56; and 4) proportion of patients with onset of type 2 diabetes at 160 weeks.
SCALE Sleep Apnea: This is a 32-week randomized, double-blind, placebo-controlled trial in
approximately 340 obese patients with moderate or severe obstructive sleep apnea (OSA),
evaluating efficacy of liraglutide 3 mg in combination with diet and exercise vs. placebo to
www.cowen.comMEMBER: FINRA/SIPC 97
EQUITY RESEARCHCowen and Company, LLC
reduce the severity of OSA. Patients must be unwilling or unable to use continuous positive
airway pressure (CPAP) treatment and must not have had CPAP treatment for at least 4
weeks prior to screening. Diabetic patients (HbA1c ≥ 6.5%) are excluded from the trial.
Patients are randomized to daily liraglutide 3 mg or placebo, both in combination with diet and
exercise, for 32 weeks. The primary endpoint of the trial is change in apnea-hypopnea index
(AHI) from baseline.
SCALE Phase III Trial Program
Study Name SCALE Maintenance SCALE Diabetes SCALE Obesity and Pre-Diabetes SCALE Sleep Apnea
Study Type
Study Duration12-week run-in period, followed by a 56-week treatment
period, followed by 12-week observation period
56-week treatment period followed
by 12-week observation period
Without pre-diabetes: 56-week treatment
period, followed 12-week re-randomization
period
With pre-diabetes: 160-week treatment
period
32-week treatment period
Disease Setting
Obese/overweight patients who have achieved ≥ 5%
weight loss after 12-week run-in period of lifestyle
modification program with low calorie diet and exercise
alone
Obese/overweight patients with
type 2 diabetes
Obese/overweight patients with
comorbidities, including pre-diabetes
Obese patients with moderate or
severe obstructive sleep apnea
(OSA)
DemographicsBMI ≥ 30 kg/m
2 and BMI ≥ 27 kg/m
2 with comorbidities,
such as hypertension or dyslipidemia
BMI ≥ 27 kg/m2 with type 2
diabetes (HbA1c 7.0-10.0%)
BMI ≥ 30 kg/m2 and BMI ≥ 27 kg/m
2 with
comorbidities, such as hypertension or
dyslipidemia
BMI ≥ 30 kg/m2
with diagnosis of
moderate or severe OSA
Estimated Enrollment 422 846 3,731 340
Treatment Regimenliragultide 3.0 mg
vs. placebo
liragultide 3.0 mg vs.
liragultide 1.8 mg vs.
placebo
(2:1:1 randomization)
liragultide 3.0 mg vs.
placebo
liragultide 3.0 mg vs.
placebo
Primary Endpoint
1) Mean change in body weight from baseline
2) Proportion of patients maintaining full run-in weight
loss
3) Proportion of patients losing ≥ 5% of body weight
from week 0 (i.e., achieving further weight loss after
randomization).
1) Mean change in body weight
from baseline
2) Proportion of patients losing ≥
5% body weight
3) Proportion of patients losing ≥
10% body weight
1) Mean change in body weight from
baseline to week 56
2) Proportion of patients losing ≥ 5% body
weight at week 56
3) Proportion of patients losing ≥ 10%
body weight at week 56
4) Proportion of patients with onset of type
2 diabetes at 160 weeks
Change in apnea-hypopnea index
(AHI) from baseline
Study Started October 2008 June 2011 June 2011 June 2012
Data
Announced/Expected2010 March 2013 May 2013 4Q13
Phase III, randomized, double-blind, placebo-controlled
Source: Cowen and Company, www.clinicaltrials.gov
Data from SCALE Maintenance: Results were presented at the ADA and EASD meetings in
2011. Patients in the trial had average age of 46 years and average BMI of 38 kg/m2, with an
average run-in weight loss of 6%. At 56 weeks after randomization, 81% of liraglutide patients
maintained this run-in weight loss, compared with 49% of placebo patients. Liraglutide
treatment also resulted in an additional mean weight loss of 6% after randomization, while
there was minimal additional weight loss (0.1%) in the placebo group. 51% of liraglutide
patients lost ≥ 5% of body weight after randomization, compared with 22% of placebo patients.
The most common adverse event was nausea, which occurred in 48% of patients.
Data from SCALE Diabetes: Topline data were announced in March 2013. Patients had
baseline mean weight of 233 pounds and baseline average BMI of 27 kg/m2. The trial
www.cowen.comMEMBER: FINRA/SIPC 98
EQUITY RESEARCHCowen and Company, LLC
successfully met all three endpoints, with all differences for both liraglutide doses being
statistically significant. At 56 weeks, the mean weight loss in the liraglutide 3 mg and 1.8 mg
groups was 6% and 5%, respectively, compared with 2% in the placebo group. 50% (3 mg)
and 22% (1.8 mg) of liraglutide-treated patients lost ≥ 5% of body weight from baseline,
compared with 13% in the placebo group, while 35% (3 mg) and 13% (1.8 mg) of liraglutide-
treated patients lost ≥ 10% of body weight from baseline, versus 4% for placebo. During the 12
week follow-up period, patients from both liraglutide treatment groups had modest re-gain of
weight. Starting from baseline HbA1c of 8%, more patients in the liraglutide 3 mg and 1.8 mg
groups, 69% and 67%, respectively, achieved HbA1c level ≤ 7% (ADA target
recommendation), compared with 27% of placebo patients. The most common adverse events
were reported as gastrointestinal in nature.
SCALE Diabetes Efficacy Data
liraglutide 3
mg
liraglutide 1.8
mgPlacebo
Mean Weight Loss (%) 6% 5% 2%
>5% Weight Loss 50% 35% 13%
>10% Weight Loss 22% 13% 4%
Completion rate 77% 78% 66%
Patients achieving HbA1c target of ≤ 7% 69% 67% 27% Source: Cowen and Company, Novo Nordisk
Data from SCALE Obesity and Pre-Diabetes: Topline data for all patients at 56 weeks were
announced in May 2013. The trial succeeded in all three co-primary endpoints at 56 weeks.
Patients had mean baseline BMI of 38 kg/m2, and 61% had pre-diabetes at randomization. At
56 weeks, the average weight loss with liraglutide 3 mg was 8% vs. 2.6% on placebo.
Liraglutide patients had greater categorical weight loss of ≥ 5% (64% vs. 27%) and ≥ 10%
(33% vs. 10%) compared to placebo. At 56 weeks, 69% of the pre-diabetes subgroup receiving
liraglutide eliminated signs of pre-diabetes, compared to 33% of the placebo group. Of the 39%
of patients without baseline pre-diabetes, 7% of liraglutide patients and 21% of placebo
patients eventually developed pre-diabetes. The company stated that all differences between
liraglutide and placebo were statistically significant, though specific statistical values were not
provided. The most common AEs were reported to be GI-related and diminishing over time.
What’s next? The Phase III SCALE Sleep Apnea trial was completed in 3Q13. The company
expects to file for approval of liraglutide 3 mg as an obesity treatment in the U.S. and E.U.
around YE13 (“around the turn of the year”).
www.cowen.comMEMBER: FINRA/SIPC 99
EQUITY RESEARCHCowen and Company, LLC

4) Orexigen’s Empatic
Orexigen’s Empatic is a combination of bupropion and zonisamide, for the treatment of obese
patients with high BMI (high 30 kg/m2 range and beyond). Although zonisamide is rarely used
for weight loss, it does have appetite suppressant effects, which may be related to
enhancement of dopamine and serotonin neurotransmission. It is generally well-tolerated,
although headache and somnolence are reported to occur with some frequency. Zonisamide
went generic in the U.S. in 2005. As with naltrexone in Contrave, Orexigen has developed a
proprietary, sustained-release form of zonisamide, which has shown improved tolerability
compared to the generic IR form, with significant reduction in the incidence of spontaneous
adverse events. Empatic has been evaluated in two Phase IIb trials (Study ZB-201 and ZB-
202).
ZB-201: Empatic succeeds in its first Phase IIb trial
In study ZB-201, 623 otherwise healthy subjects with BMI 29-45 kg/m2 (average weight, 220
lbs.) were enrolled at 15 sites in the U.S. Patients were given minimal diet/exercise
interventions. Six different bupropion/zonisamide combinations were tested. Empatic treatment
resulted in 24-week, placebo-adjusted weight loss in the ITT group of up to 8.6%, and up to
10.3% in completers.
Patients who remained in the Phase IIb trial at 24 weeks were allowed to continue through 48
weeks of double-blind treatment. Those failing to achieve 5% weight loss at 24 weeks in any
group were permitted to switch to the open-label Z360/B360 dose during this extension. At 48
weeks, Empatic treatment resulted in placebo-adjusted weight reductions of up to 12.9% in the
ITT group, and of up to 13.9% among completers. We view these levels of weight loss as
promising, and the observation of robust weight loss continuing after six months is a notable
feature of this combination treatment. With evidence of a continued trend of weight loss at the
end of the 48-week period, it is likely that additional reductions may occur with longer-term
therapy. As this extension was conducted under double-blind conditions, the data are likely to
better represent Empatic’s efficacy, compared with typical open-label designs.
ZB-202: Empatic goes 2-for-2 in second successful Phase IIb study
In September 2009, Orexigen released positive data from a 24-week, Phase IIb trial of Empatic
in 729 obese and overweight patients (BMI range 27-45 kg/m2). Patients were randomized to
one of six arms: two Empatic groups (Bup360/Zon360, Bup360/Zon120), three single-
treatment groups (Bup360/placebo, Zon360/placebo, Zon120/placebo), and placebo. Patients
treated with Empatic360 and Empatic120 had significantly greater average weight loss from
baseline, 7.5% and 6.1%, respectively, compared with placebo (1.4%, p≤0.001). Weight loss in
the Empatic groups was also greater than that achieved with zonisamide (3.2% and 5.3%) or
bupropion (2.3%) alone. There was no plateau in weight loss observed at 24 weeks, and this
may indicate the potential for greater weight loss with treatment over a longer period.
www.cowen.comMEMBER: FINRA/SIPC 100
EQUITY RESEARCHCowen and Company, LLC

The most common side effects were nausea, headache, and insomnia. The most common AEs
resulting in discontinuation were insomnia, headache and urticarial (hives). According to
Orexigen, no patients experienced serious AEs related to Empatic, and there were no
statistically or clinically meaningful difference in incidence of depression, anxiety, suicidality,
and impaired cognition with Empatic treatment compared to placebo. Our consultants have
noted these potential CNS effects as causing some hesitation to use zonisamide, and they are
interested to see results in a larger patient population receiving Empatic.
What’s next for Empatic? In March 2013, Orexigen announced that, in a series of
discussions about continued development of Empatic, FDA indicated Phase III data for
Empatic may be sufficient to support a NDA submission without additional data from a CVOT.
Also, the company guided that, should there be no CV signals in the Empatic development
program and if placebo-adjusted body weight, blood pressure, and heart rate changes are
similar to or more favorable than those observed with Contrave, FDA has stated ―reassuring
results of a CVOT with Contrave will be sufficient.‖ Furthermore, Orexigen reported that the
FDA will allow Phase III studies of Empatic to include women of childbearing age, despite
teratogenicity concerns resulting from the zonisamide component.
Orexigen has indicated its thinking at this point that, prior to initiating Phase III development of
Empatic, it seeks a collaboration partner to help fund clinical development and future
commercialization.
www.cowen.comMEMBER: FINRA/SIPC 101
EQUITY RESEARCHCowen and Company, LLC
5) The Novel Mechanism: Zafgen’s Beloranib
The private company Zafgen is developing beloranib, a novel injectable agent that inhibits
methionine aminopeptidase 2 (MetAP2), a key enzyme in the control of the production and
utilization of fatty acids. Beloranib is a highly selective MetAP2 inhibitor, which is being
developed as a twice-weekly, subcutaneous injection for severe obesity. Beloranib has shown
very promising activity in its Phase Ib trials, and is currently in a Phase IIa trial for the treatment
of severely obese patients.
Data from two Phase Ib trials, 2012 Obesity Society meeting: Data from two Phase Ib trials
were presented at the 2012 Obesity Society meeting in San Antonio. Both trials were
randomized, double-blind, placebo-controlled studies, designed to evaluate the safety,
tolerability, and metabolic effects of twice-weekly administered beloranib in severely obese
women. In one trial, beloranib was administered by IV, and in the second trial, beloranib was
administered subcutaneously. Patients were allowed to eat normally and were not counseled
to change their exercise habits.
1) Phase Ib trial, IV administration: The trial enrolled 16 severely obese women (BMI 39.5
kg/m2) who were randomized into three arms: 3.0 mg (n=6), 6.0 mg (n=5), and placebo (n=5).
14 patients (6 patients in 3.0 mg arm, 3 patients in the 6.0 mg arm, and 6 patients in the
placebo arm) completed treatment, and data for these patients were reported.
Efficacy Data: After four weeks, patients in the 3.0 mg arm lost an average of 4.7 kg from
baseline (p=0.0008), and patients in the 6.0 mg arm lost an average of 6.7 kg (p=0.0013),
while patients in the placebo arm gained 0.2 kg. Hunger tended to be reduced on beloranib (-
28% for 3.0 mg arm, -52% for 6.0 mg arm, compared to -2% for placebo). Body composition
measurements were consistent with reduced adipose tissue mass.
Safety Data: The most frequent AEs were mild diarrhea, nausea, headache, dizziness,
infusion site injury, and mild-to-moderate sleep disturbance, which resulted in two drop-outs
from the 6.0 mg arm. There were no clinically significant, abnormal laboratory or ECG findings.
Doses less than 6.0 mg appeared to have clinical utility in balancing effectiveness and
tolerability.
2) Phase Ib trial, Subcutaneous administration: This trial enrolled 25 obese women (BMI,
34 to 36.4 kg/m2) who were randomized into four arms: beloranib (twice-weekly for 4 weeks) at
1.0 mg (n=6), 2.0 mg (n=6), 4.0 mg (n=7), or placebo (n=6). 21 patients (6 patients in the 1.0
mg arm, 5 patients in the 2.0 mg arm, 4 patients in the 4.0 mg arm, and 6 patients on placebo)
completed treatment, and data for these patients were reported.
Efficacy Data: After four weeks, patients in the 1.0 mg arm lost an average of 4.3 kg from
baseline; patients in the 2.0 mg arm lost an average of 4.2 kg, and patients in the 4.0 mg arm
lost an average of 6.1 kg (all p<0.001). Patients receiving placebo lost 1.2 kg from baseline.
Hunger tended to be reduced with beloranib (-42% for the 1.0 mg arm, -45% for the 2.0 mg
arm, -46% for the 4.0 mg arm, compared to -22% for placebo arm).
www.cowen.comMEMBER: FINRA/SIPC 102
EQUITY RESEARCHCowen and Company, LLC
Safety Data: The most frequent AEs were decreased appetite, vivid dreams, and sleep
disturbance, which resulted in two drop-outs from the 4.0 mg arm. There were no severe AEs,
serious AEs, or deaths. There were no clinically significant, abnormal laboratory or ECG
findings. Subcutaneous doses of beloranib less than 4.0 mg appeared to have clinical utility in
balancing effectiveness and tolerability.
Current Status: Based on the activity observed in the two Phase Ib trials, Zafgen advanced
beloranib into Phase II development. In November 2012, a Phase IIa clinical trial testing
beloranib for the treatment of severe obesity was initiated. This is a randomized, double-blind,
placebo-controlled, dose ranging, Phase IIa trial evaluating weight loss, safety, and PK with
beloranib in ~150 obese patients, both with and without type 2 diabetes. Patients will be
randomized to receive either placebo or beloranib as a subcutaneous injection for 12 weeks.
They are allowed to eat normally and are not counseled to change their exercise habits. The
primary endpoints of the trial are safety and change in body weight from baseline.
Phase IIa Trial Interim Data, ADA 2013: Interim data for 19 patients who completed the 12-
week treatment period were presented at the ADA meeting in June 2013. Enrolled patients
have a mean age of 40 years, with an average body weight of 101.2 kg and BMI of 37.9 kg/m2.
There were 148 patients randomized to treatment with beloranib 0.6 mg (n=37), 1.2 mg (n=37),
or 2.4 mg (n=36), or placebo (n=38). The 19 patients for which data were presented had been
randomized as follows: beloranib 0.6 mg (n=5), 1.2 mg (n=6), or 2.4 mg (n=3), and placebo
(n=5). After 12 weeks of treatment, patients treated with 0.6 mg, 1.2 mg, or 2.4 mg of beloranib
had average weight losses of 3.8 kg, 6.1 kg, and 9.9kg, respectively, compared with a weight
gain of 1.8 kg in the placebo group (all p<0.005 vs. placebo). The most common AEs with
beloranib included nausea, vomiting, and sleep disturbance. There were no serious AEs or
deaths. Full data from the trial are expected in 2013.
6) Another Novel Mechanism: Rhythm’s RM-493
Private company Rhythm Pharmaceuticals is developing RM-493, a selective, small-peptide
melanocortin-4 receptor (MC4R) agonist, for the treatment of obesity and diabetes. The MC4
receptor is a G-protein-coupled receptor which is expressed in cells of the hypothalamus, and
is the main melanocortin receptor involved in control of food intake. MC4R modulates both an
agonist signal from the pro-opiomelanocortin (POMC) derivative α-melanocyte stimulating
hormone (α-MSH) which is anorexigenic (appetite suppressing), and an antagonist signal from
Agouti-related peptide (AgRP) which is orexigenic (appetite stimulating). The balance in these
neuropeptide effects on MC4R activation regulates food intake, energy expenditure, and body
weight. It is estimated that MC4R mutations account for up to 6% of severe obesity cases, and
they are the most common cause of monogenic (resulting from mutations in a single gene)
genetic obesity.
In preclinical animal studies, treatment with RM-493 was associated with reduction in food
intake and decreases in body weight. RM-493 is currently in Phase II clinical development.
www.cowen.comMEMBER: FINRA/SIPC 103
EQUITY RESEARCHCowen and Company, LLC

Preclinical Studies: Results from preclinical evaluation of RM-493 in a non-human primate
(monkeys) model of diet-induced obesity were published in 2012 (Kievit P et al., Diabetes
2012). A dose response study, evaluating doses of 0.17, 0.5, and 1.5 mg/kg/day) in lean
animals demonstrated that a RM-493 dose of 0.5 mg/kg/day maximally reduced food intake,
and this dose was used for further study. Twelve adult (age 9-11 years) male rhesus macaque
monkeys, with body weights of 9-19 kg, were studied. The monkeys had been provided a high-
fat diet (32% of calories from fat) and daily calorie-rich treats for 1.5 years. Nine monkeys were
obese, insulin-resistant, and hypertensive; they were classified as ―diet-sensitive.‖ Three
monkeys had normal body weight and blood pressure, and were classified as lean or ―diet-
resistant.‖ The animals were treated with delivery vehicle alone for 4 weeks to obtain baseline
values. Then, they received 0.5 mg/kg/day of RM-493 for a total of 8 weeks.
Efficacy Results in Monkeys: Food intake decreased significantly, by 35%, in the first week
of treatment with RM-493. However, food intake then normalized by weeks 4 through 7 and
increased by 8 weeks, compared to levels during the previous vehicle delivery alone period.
Both the obese and lean monkey groups showed comparable decreases in food intake. The
monkeys lost an average of 1 kg of body weight during the first 4 weeks of treatment. They
also continued to lose weight through the treatment period, with a total average weight loss of
1.5 kg (~10%) at 8 weeks. The average peak weight loss was 13.5% of body weight, with 8/12
of the monkeys continuing to lose weight for 2 weeks after treatment was discontinued.
Daytime activity was noted to increase during the treatment period, nearly doubling by Week 8,
through there was no significant relationship between weight loss amount and activity increase
on statistical analysis. Energy expenditure (measured by carbon dioxide production) was also
increased by 14% at the end of treatment.
CV Safety Results in Monkeys: Potential cardiovascular side effects of increased heart rate
and blood pressure have been associated with MC4R agonist treatment in humans. The
monkeys were implanted with telemetry devices in order to measure blood pressure and heart
rate during the delivery vehicle and treatment periods. Throughout the RM-493 treatment
period, there were no increases in heart rate or blood pressure measured in the animals. Heart
rate significantly decreased in the treatment period, compared to the delivery vehicle period
(average morning HR 128 bpm vs. 141 bpm; average evening HR 98 bpm vs. 111 bpm;
p=0.008 for the course of the treatment). There were also decreases in DBP during treatment
compared to the delivery vehicle period (79-80 mm Hg vs. 83-84 mm Hg), whereas SBP did
not significantly differ (129-130 mm Hg vs. 129-133 mm Hg).
Phase II Trial in Obese Patients: This is a randomized, double-blind, placebo-controlled,
Phase II trial evaluating RM-493 versus placebo in adult (ages 18-65 years) obese patients,
with BMI range of 35-50 kg/m2. Patients must have had stable body weight (± 5 kg) in the prior
6 months, and blood pressure must be < 140/90 mm Hg, with use of up to 2 anti-hypertensive
medications allowed. Patients with uncontrolled hypertension, diabetes (fasting blood glucose
> 140 mg/dL and HbA1c ≥ 6.5%), and psychiatric disorders (including major depression) are
excluded. Treatment will be administered with RM-493 (1 mg/14 hrs via subcutaneous
infusion) for 90 days or placebo (subcutaneous infusion) for 90 days. The primary endpoint of
the trial is mean percentage change in weight loss. Secondary endpoints include the proportion
www.cowen.comMEMBER: FINRA/SIPC 104
EQUITY RESEARCHCowen and Company, LLC

with loss of ≥ 5% baseline body weight, PK, effect on hunger/satiety, quality of life, and safety.
The trial has an estimated enrollment of 70 patients and an estimated completion date in
October 2013.
Phase Ib Trial in Patients with MC4R Gene Deficiency: In September 2013, Rhythm
announced initiation of the first in a series of RM-493 trials for treatment of obesity in patients
with a genetic loss-of-function deficiency in the MC4R pathway. This is a Phase Ib trial which
will evaluate efficacy and safety of RM-493 in obese patients with a loss-of-function mutation in
the MC4R gene. Patients will receive up to 4 weeks of treatment with RM-493. According to
Rhythm, this study expands the ongoing Phase II program.
www.cowen.comMEMBER: FINRA/SIPC 105
EQUITY RESEARCHCowen and Company, LLC

Beyond BELVIQ: Arena’s Four Pipeline Candidates
In addition to BELVIQ, Arena is developing additional product candidates for the treatment of
autoimmune diseases, pulmonary arterial hypertension (PAH), and multiple sclerosis. Arena’s
early stage pipeline includes temanogrel, APD811, APD334, and APD371.
Temanogrel: Temanogrel, an inverse agonist of the serotonin 2A receptor, is being co-
developed by Arena and Ildong Pharmaceutical for the treatment of thrombotic disease.
Platelet activation is an initial event in thrombus formation, with resultant release of factors,
including serotonin, which cause aggregation and adherence. Serotonin promotes platelet
aggregation and also causes vasoconstriction, and these effects are mediated by the 5-HT2A
receptors. Inverse agonists of the 5-HT2A receptor may inhibit these effects. In preventing
serotonin-mediated platelet aggregation and reversing serotonin-mediated vasoconstriction,
temanogrel has a potential dual mechanism of action which may be relevant for treatment or
prevention of thrombotic diseases.
Arena has completed two Phase I trials of temanogrel. Ildong is responsible for funding and
conducting the next two planned clinical trials of temanogrel, which include a Phase I multiple-
dose trial in healthy volunteers and a Phase IIa proof-of-concept trial. According to Arena,
Ildong plans to initiate the Phase I trial by YE13.
Phase Ia trial: The first Phase Ia trial was initiated in July 2007. This was a randomized,
double-blind, placebo-controlled, single-ascending dose trial designed to evaluate temanogrel
in 90 healthy volunteers. Initially the intended doses for this trial ranged from 1 mg to 160 mg,
but the maximum dose was increased to 320 mg because of favorable tolerability. Dose-
dependent inhibition of serotonin-mediated platelet aggregation was demonstrated. The MTD
could not be defined, despite achieving high blood concentrations of the drug.
Phase Ib trial: The Phase Ib trial was initiated in January 2008. This was a randomized,
double-blind, placebo-controlled, multiple-ascending dose trial in 50 healthy volunteers who
received total daily doses ranging from 15 mg to 80 mg. The goal of the study was to evaluate
safety, tolerability, pharmacokinetics and pharmacodynamics of multiple-ascending doses of
temanogrel over a period of one week. Dose-dependent inhibition of serotonin-mediated
platelet aggregation was demonstrated starting at the 15 mg dose. This may permit
identification of exposure ranges producing minimal, moderate and near-complete inhibition of
serotonin-mediated platelet aggregation. The most frequent AE was headache, which was
more common in the placebo group than in any temanogrel group. No adverse events were
dose-related, with the exception of epistaxis, which occurred in two volunteers receiving the 80
mg dose, which is above the anticipated therapeutic range.
APD811: This agent is an orally available agonist of the prostacyclin (IP) receptor, intended for
the treatment of pulmonary arterial hypertension. In October 2012, Arena initiated a
randomized, double-blind, Phase Ib multiple ascending dose titration trial that enrolled 55
healthy volunteers (40 received APD811 and 15 received placebo). The trial evaluated safety,
tolerability, pharmacokinetics, and the optimal titration schedule for APD811.
www.cowen.comMEMBER: FINRA/SIPC 106
EQUITY RESEARCHCowen and Company, LLC

In August 2013, Arena announced the completion of the Phase Ib trial. There were no serious
adverse events observed. The most frequent treatment-emergent AEs were headache,
nausea, and jaw pain. There was one serious AE, transient atrial fibrillation, which occurred in
a single patient and was considered possibly treatment related.
Arena announced that a Phase II trial of APD811 will be initiated in 1Q14.
APD334: This agent is a S1P1 (sphingosine 1-phosphate subtype 1) receptor agonist,
currently in Phase I development for the potential treatment of autoimmune diseases, including
multiple sclerosis and rheumatoid arthritis. S1P1 receptors are involved in the modulation of
several biological responses, including lymphocyte trafficking from lymph nodes to peripheral
blood. Five S1P receptors have been identified. A non-selective oral S1P agonist, fingolomod,
(Novartis’s Gilenya) has demonstrated lowering of lymphocyte counts in blood and is approved
for the treatment of multiple sclerosis. Arena has optimized potent and selective small
molecule S1P1 receptor agonists, such as APD334, that reduce severity of disease in
preclinical autoimmune disease models of multiple sclerosis, such as the experimental
autoimmune encephalomyelitis (EAE) model and the collagen-induced arthritis (CIA) model.
Phase I trial: In April 2013, Arena announced the advancement of APD334 into Phase I
clinical development with the initiation of dosing in a Phase I randomized, double-blind,
placebo-controlled trial, evaluating safety, tolerability and PK of single-ascending doses of
APD334 in up to 64 healthy adult volunteers. In August 2013, Arena reported that dosing was
completed in the trial. Preliminary results demonstrated reduction in blood lymphocyte count
(the desired benefit), but a reduction in heart rate (an AE observed with other S1P1-targeting
drugs). Further data evaluation is ongoing.
APD371: This agent is a CB2 receptor agonist currently in preclinical development for the
treatment of pain. Arena has identified several novel, potent, CB2-selective, orally available
compounds that are intended to retain the analgesic activity of CB receptor agonists while
avoiding psychotropic side effects.
www.cowen.comMEMBER: FINRA/SIPC 107
EQUITY RESEARCHCowen and Company, LLC

So, What Do Physicians Think About All This?
Our Two Obesity Surveys
Obesity remains, and according to most experts and projections, will continue to be a major
public health issue in the United States and a significant portion of the developed world. The
most recent national data from the CDC on obesity prevalence indicate that more than one-
third of U.S. adults (35.7%) are obese, equating to over 71 million people. According to NIH
guidelines (Clinical Guidelines on the Identification, Evaluation, and Treatment of Overweight
and Obesity in Adults: The Evidence Report, NIH Publication 98-4083) on obesity treatment,
pharmacotherapy may provide a beneficial adjunct to dietary, activity, and behavioral
modifications in selected individuals, including: those with BMI ≥ 30 kg/m2 (obese) and no
concomitant risk factors, or those with BMI ≥ 27 kg/m2 (overweight) and comorbidities such as
hypertension, dyslipidemia, type 2 diabetes, coronary artery disease (CAD), and sleep apnea.
There has been a difficult market history for weight-loss drugs, stymied by major safety issues.
After more than a decade without the approval of a new weight-loss drug, and after handing
out an initial round of rejections to each of the three most recent anti-obesity agents under
review, the FDA approved BELVIQ (lorcaserin, Arena Pharmaceuticals) in late June 2012.
Three weeks later, in July 2012, Qsymia (phentermine/topiramate, Vivus) was also approved.
Qsymia became available in the U.S. market first, in mid-September 2012, and BELVIQ was
commercially launched in June 2013. The third agent, Contrave (naltrexone/bupropion,
Orexigen Therapeutics) was also denied approval by the FDA in 2011, based on
cardiovascular safety concerns, with a cited requirement for a cardiovascular outcomes trial
(CVOT). The FDA has notified Orexigen that it supports a faster path to NDA resubmission for
Contrave and provided guidance on design of the LIGHT study, the Contrave CVOT, which
has completed enrollment and is currently ongoing. Interim analysis of the LIGHT Study is
expected by December 2013, and NDA resubmission is anticipated by YE13.
In order to gain further insight into the evolving obesity therapeutics market and to gauge
physician perceptions of these new agents, we have conducted two surveys with a total of 100
U.S. physicians. The first survey polled 50 primary care physicians (PCPs) who, while not
specializing in obesity management, have familiarity with the clinical profiles of the new obesity
drugs and would be open to using these agents in their practices (―The PCP Survey‖). The
second survey polled 50 physicians who specialize in obesity management and currently
prescribe weight-loss medications (―The Obesity Specialist Survey‖).
We report the findings from both of our surveys. Our key conclusions follow:
1) Qsymia is considered to have the strongest weight-loss efficacy and is projected to
be the obesity drug market leader. Despite the majority of PCPs in our survey having no
(62%) or very little (28%) experience using Qsymia so far, more than half considered Qsymia
to be the most efficacious weight-loss agent. Our specialists concurred with this opinion and
were even more positive, with 68% considering Qsymia to produce the best weight loss among
www.cowen.comMEMBER: FINRA/SIPC 108
EQUITY RESEARCHCowen and Company, LLC

obesity therapies. A clear majority (near three fourths) of our specialists projected Qsymia to
have a ≥ 60% market share relative to BELVIQ.
2) All three new obesity drugs will potentially share the obesity drug market. Assuming
approval of Contrave and its availability along with Qsymia and BELVIQ, most PCP
respondents in our survey feel that all three drugs will be used, though with an uneven
allocation in the market. (And here, more expect Qsymia to have the advantage). Our
specialists agree with this outlook. Like PCPs, specialists expect all three drugs to have some
use in patients, while they too think that Qsymia will dominate overall.
3) Safety issues are not likely to stand in the way of obesity drug uptake. While
physicians are familiar with potential safety issues of these new therapies, safety does not
appear to present a major barrier to utilization. PCPs generally expressed moderate concern
about specific risks potentially associated with Qsymia, BELVIQ, or Contrave, such as
teratogenicity, serotonin syndrome, and cardiovascular concerns. However, only 30% viewed
safety and tolerability issues as significant enough to prevent adoption. Specialists tended to
be more even more comfortable, with fewer than 15% of respondents identifying a specific
concern which would present a barrier to uptake of these respective drugs.
4) Cost and reimbursement are the key concerns weighing on physicians’ minds about
these drugs. Both PCPs and specialists most frequently cited drug costs and lack of
reimbursement as the most significant hurdles to wide use of the new anti-obesity agents. Most
physicians in both groups remain relatively pessimistic about insurance coverage for these
agents. Given cost concerns, when possible, both PCPs and specialists appear willing to use
generic substitutions for branded agents. In our surveys, PCPs (76%) seemed more willing in
this regard, but a significant proportion of specialists (58% and 54% regarding Qsymia and
Contrave, respectively) also indicated comfort with prescribing generics.
www.cowen.comMEMBER: FINRA/SIPC 109
EQUITY RESEARCHCowen and Company, LLC

Survey Methodology
1) The Primary Care Physician (PCP) Survey
We surveyed 50 primary care physicians (PCP) across the United States. Given our view that
the commercial success or failure of these new anti-obesity drugs will be determined by how
well received and how widely prescribed they will be by the PCP community, we specifically
wanted to gain insights into these non-specialist physicians’ views on these drugs. Therefore,
in this survey, we sought the opinion of PCPs who did not consider themselves to be
specialists in the treatment of obesity, and we pre-screened respondents using this criterion
(see full questionnaire, including the four screening questions, at the back of this report).
However, we did seek survey participants who were knowledgeable about the therapeutic
area. Therefore, we also required respondents to be familiar with the efficacy and safety data
from the clinical trials of Qsymia and BELVIQ. In addition, physicians needed to be willing to
treat patients with these agents in their clinical practices.
We received a total of 50 responses from PCPs meeting the screening criteria. The physicians
were from diverse regions across the U.S., representing 28 states. The majority of respondents
were either solo practitioners or based in group practices.
2) The Obesity Specialist Survey
For our second survey, we polled 50 physicians who specialize in the management of obesity
across the United States. We sought physicians whose clinical practices primarily focus on the
care of obese patients. Respondents were prescreened according to this criterion. We also
screened for physicians who currently prescribe anti-obesity drugs in their practices.
We collected a total of 50 responses from obesity specialist physicians who met the screening
criteria. These physicians were geographically diverse, representing 22 institutions, in 19
states across the U.S. All respondents were affiliated with either tertiary academic medical
centers or specialized clinical centers dedicated to weight management.
www.cowen.comMEMBER: FINRA/SIPC 110
EQUITY RESEARCHCowen and Company, LLC

#1) The PCP Survey Results
Primary care physicians (PCPs) are the front-line providers of care for obese and overweight
patients. In order to understand the perspective of this physician segment on the new obesity
therapies, we conducted a survey limited to self-identified PCPs who did not consider
themselves specialists in obesity treatment. We selected for PCPs with 1) knowledge of the
efficacy and safety data for Qsymia and BELVIQ, and 2) willingness to treat patients in their
practices with these agents.
PCP experience with Qsymia remains limited in our survey
In the months after the commercial launch of Qsymia in the U.S., clinical experience with the
drug by PCPs remains fairly low. A significant majority of our surveyed physicians (62%)
reported having no experience with Qsymia use in their patients, while 90% of the respondents
had treated only up to 5 patients each. Looking at these numbers in another way, only 10% of
our responding PCPs had treated more than 5 patients using Qsymia, and among that 10%,
about half had treated between 6 and 10 patients, and the other half had treated between 16-
20 patients. No physician among the 50 PCPs we surveyed had treated more than 20 patients.
In our survey, PCP experience with Qsymia to date is limited
62%
28%
6%
0%4%
0% 0% 0%0%
10%
20%
30%
40%
50%
60%
70%
None 1-5 6-10 11-15 16-20 21-30 31-49 >50
How many patients have you treated with Qsymia since it became commercially available in September 2012?
Source: Cowen and Company, Epocrates
We asked the physicians who had not yet treated any patients with Qsymia to elaborate further
and answer the “Why not?” question. A number of them expressed general cautiousness
about the use of new drugs and tendency for slow uptake of medications with which they are
not familiar. Others delineated issues with cost and availability of Qsymia. We have included all
the individual answers we received in response to the ―Why not‖ question in the next figure.
www.cowen.comMEMBER: FINRA/SIPC 111
EQUITY RESEARCHCowen and Company, LLC
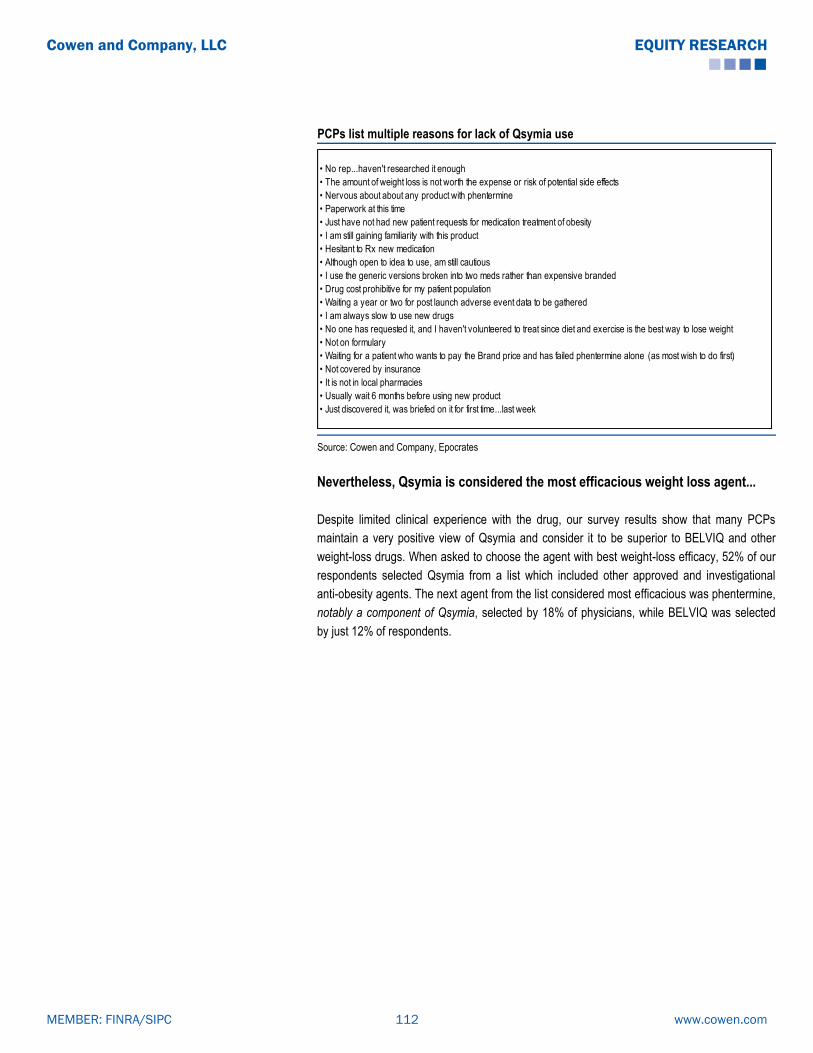
PCPs list multiple reasons for lack of Qsymia use
• No rep...haven't researched it enough
• The amount of weight loss is not worth the expense or risk of potential side effects
• Nervous about about any product with phentermine
• Paperwork at this time
• Just have not had new patient requests for medication treatment of obesity
• I am still gaining familiarity with this product
• Hesitant to Rx new medication
• Although open to idea to use, am still cautious
• I use the generic versions broken into two meds rather than expensive branded
• Drug cost prohibitive for my patient population
• Waiting a year or two for post launch adverse event data to be gathered
• I am always slow to use new drugs
• No one has requested it, and I haven't volunteered to treat since diet and exercise is the best way to lose weight
• Not on formulary
• Waiting for a patient who wants to pay the Brand price and has failed phentermine alone (as most wish to do first)
• Not covered by insurance
• It is not in local pharmacies
• Usually wait 6 months before using new product
• Just discovered it, was briefed on it for first time...last week
Source: Cowen and Company, Epocrates
Nevertheless, Qsymia is considered the most efficacious weight loss agent...
Despite limited clinical experience with the drug, our survey results show that many PCPs
maintain a very positive view of Qsymia and consider it to be superior to BELVIQ and other
weight-loss drugs. When asked to choose the agent with best weight-loss efficacy, 52% of our
respondents selected Qsymia from a list which included other approved and investigational
anti-obesity agents. The next agent from the list considered most efficacious was phentermine,
notably a component of Qsymia, selected by 18% of physicians, while BELVIQ was selected
by just 12% of respondents.
www.cowen.comMEMBER: FINRA/SIPC 112
EQUITY RESEARCHCowen and Company, LLC
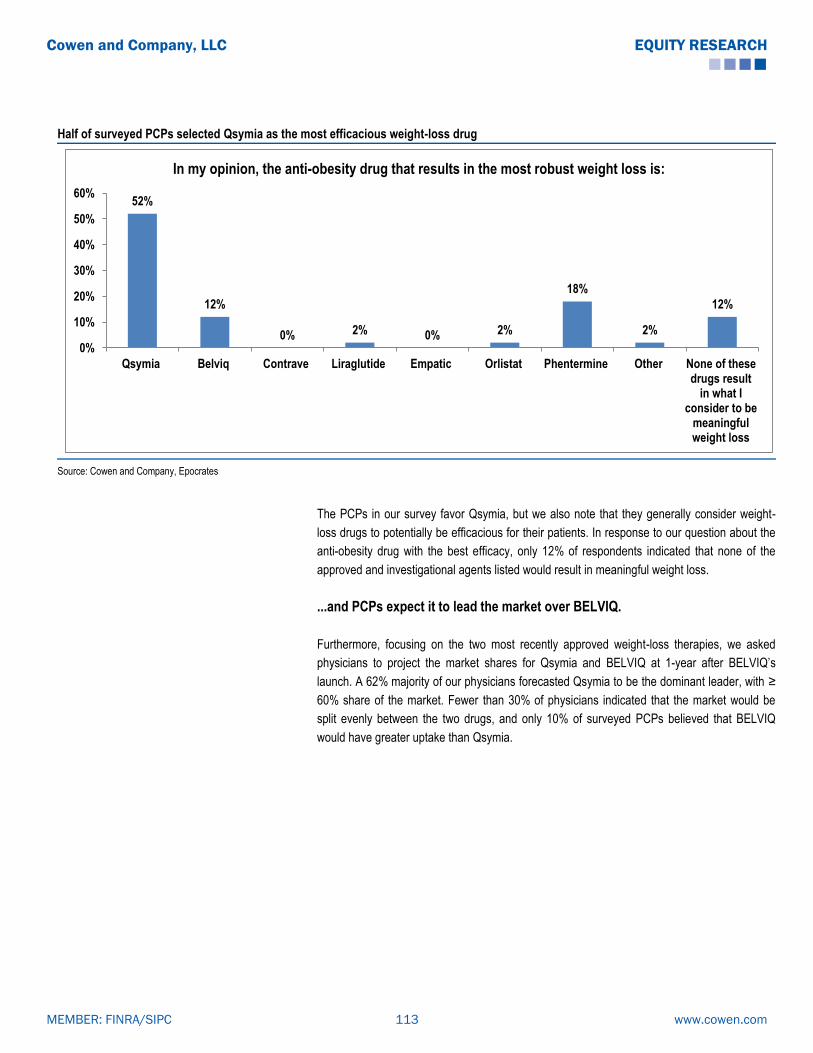
Half of surveyed PCPs selected Qsymia as the most efficacious weight-loss drug
52%
12%
0% 2% 0% 2%
18%
2%
12%
0%
10%
20%
30%
40%
50%
60%
Qsymia Belviq Contrave Liraglutide Empatic Orlistat Phentermine Other None of thesedrugs result
in what Iconsider to be
meaningfulweight loss
In my opinion, the anti-obesity drug that results in the most robust weight loss is:
Source: Cowen and Company, Epocrates
The PCPs in our survey favor Qsymia, but we also note that they generally consider weight-
loss drugs to potentially be efficacious for their patients. In response to our question about the
anti-obesity drug with the best efficacy, only 12% of respondents indicated that none of the
approved and investigational agents listed would result in meaningful weight loss.
...and PCPs expect it to lead the market over BELVIQ.
Furthermore, focusing on the two most recently approved weight-loss therapies, we asked
physicians to project the market shares for Qsymia and BELVIQ at 1-year after BELVIQ’s
launch. A 62% majority of our physicians forecasted Qsymia to be the dominant leader, with ≥
60% share of the market. Fewer than 30% of physicians indicated that the market would be
split evenly between the two drugs, and only 10% of surveyed PCPs believed that BELVIQ
would have greater uptake than Qsymia.
www.cowen.comMEMBER: FINRA/SIPC 113
EQUITY RESEARCHCowen and Company, LLC

Most surveyed PCPs expect Qsymia to lead the market over BELVIQ: 62% for Qsymia lead vs. 10% for BELVIQ lead vs. 28% for a market split
10%
28%
24%
28%
2%
8%
0%
0% 5% 10% 15% 20% 25% 30%
Qsymia 90%, Belviq 10%
Qsymia 75%, Belviq 25%
Qsymia 60%, Belviq 40%
Qsymia 50%, Belviq 50%
Qsymia 40%, Belviq 60%
Qsymia 25%, Belviq 75%
Qsymia 10%, Belviq 90%
One year after Belviq’s launch, I would expect that Qsymia and Belviq will have split the anti-obesity market in the following way:
Source: Cowen and Company, Epocrates
Our PCPs will also use Contrave, if approved; however, Qsymia seems to be the
agent of choice in our group of PCPs
With the potential approval of a third new weight-loss agent, Contrave, on the horizon, possibly
sometime in 2014, we were interested to find out the PCP perspective on use of all three of
these new drugs. We asked physicians to project to a time with full availability of all three drugs
and to consider multiple market-split scenarios.
12% voted for an even split among the three drugs
One-fourth of the PCPs voted for the ―one-drug-really-dominates-the-market‖
scenario, or the 80/10/10 split, and Qsymia dominated the vote there with 18%, vs.
just 4% and 2% for BELVIQ and Contrave, respectively.
Similarly, approximately half of the PCP’s (52%) voted for scenarios of one dominant
drug in the market, i.e. the 60/20/20 or the 80/10/10 splits. Again, Qsymia was the
clear winner here, with 38% vs. 10% and 4% for BELVIQ and Contrave, respectively.
However, a third of our PCPs expect two agents to share the lead position in the
market (40% each). Again, Qsymia was more often the drug included as one of the
two leads (26% of votes). That does show that our physicians believe there is room
for multiple drugs to be used in this space, possibly reflecting the fact that there are
several patient types that may benefit from different characteristics of each agent.
www.cowen.comMEMBER: FINRA/SIPC 114
EQUITY RESEARCHCowen and Company, LLC

Surveyed PCPs view Qsymia as the dominant one, but expect to use of all three new weight-loss agents
18%
4%
2%
20%
6%
2%
16%
8%
10%
12%
2%
0% 5% 10% 15% 20% 25%
Qsymia 80%, Belviq 10%, Contrave 10%
Belviq 80%, Qsymia 10%, Contrave 10%
Contrave 80%, Qsymia 10%, Belviq 10%
Qsymia 60%, Belviq 20%, Contrave 20%
Belviq 60%, Qsymia 20%, Contrave 20%
Contrave 60%, Qsymia 20%, Belviq 20%
Qsymia 40%, Belviq 40%, Contrave 20%
Belviq 40%, Contrave 40%, Qsymia 20%
Contrave 40%, Qsymia 40%, Belviq 20%
Qsymia 33%, Belviq 33%, Contrave 33%
Other market split
Assuming Contrave is approved, 18-24 months from its launch, I believe the obesity drug market will be split in the following way:
Source: Cowen and Company, Epocrates
What about treatment duration? PCPs much more optimistic (out of touch?)
than in recent history
Again focusing on the two newly approved weight-loss drugs, we asked our PCPs to indicate
the anticipated average duration of therapy on either Qsymia or BELVIQ for their patients. 78%
of the physicians expected the treatment duration to be 5 months or longer, including 38% who
expected an average patient would remain on therapy for close to a year (10-12 months) or
longer than a year. This assessment by PCPs may be a too optimistic outlook and expectation
for these drugs, in the context of a therapy category with poor patient adherence in the long-
term historically. In recent investor calls, Vivus management has indicated that Qsymia’s
―persistence rate,‖ which could be a surrogate for treatment duration, was approximately 3.4
months. In our survey, only 22% of the PCPs expected the average treatment duration to be
between 0-4 months.
www.cowen.comMEMBER: FINRA/SIPC 115
EQUITY RESEARCHCowen and Company, LLC

Most surveyed PCPs anticipate significant Qsymia/BELVIQ treatment duration
2%
20%
36%
4%
20%18%
0%0%
5%
10%
15%
20%
25%
30%
35%
40%
45%
50%
0-2 months 3-4 months 5-6 months 7-9 months 10-12 months >12 months Other
How long would you expect the average Qsymia and Belviq patient to remain on therapy?
Source: Cowen and Company, Epocrates
What about safety? They all have their issues, and none of them really stand
out…
Safety issues have caused a troubled history for weight-loss agents and resulted in the
withdrawal of multiple drugs from the U.S. market. Prior to the approvals of BELVIQ and
Qsymia in June and July 2012, respectively, these withdrawals had left orlistat as the only
prescription drug approved for the long-term treatment of obesity. We sought to ascertain how
safety concerns might impact our physicians’ utilization of the new anti-obesity drugs. In our
survey, we asked respondents to choose the drug with the best safety profile from a list which
included approved agents (Qsymia, BELVIQ, orlistat, phentermine) and agents under
investigation (Contrave, Empatic, liraglutide). The answers we received show that no agent
was singled out by physicians with regard to safety, and indeed the responses were fairly
evenly distributed among the approved agents. Interestingly, Contrave and Empatic received
zero votes from our PCPs as the safest choice, while one-fifth of our respondents indicated
that safety and tolerability concerns of the listed weight-loss drugs would prevent clinical use in
patients.
www.cowen.comMEMBER: FINRA/SIPC 116
EQUITY RESEARCHCowen and Company, LLC

PCPs in our survey didn’t differentiate any obesity drug as safer than the others
16% 16%
0%
4%
0%
20%22%
2%
20%
0%
5%
10%
15%
20%
25%
Qsymia Belviq Contrave Liraglutide Empatic Orlistat Phentermine Other I believe thatthe safety and
tolerabilityprofile of
these agentswould likelyprevent mefrom using
them in mostof my patients
The obesity drug with the cleanest safety and tolerability profile is:
Source: Cowen and Company, Epocrates
…but BELVIQ fared better in terms of “comfort” than Qsymia
To investigate in further detail, we focused on some specific safety issues which have been
associated with Qsymia, BELVIQ, and Contrave. These potential concerns were highlighted by
crafting specific patient types for each agent. We then asked our PCPs to rate their comfort
level with prescribing on a scale of 1 (very comfortable) to 5 (not comfortable).
Qsymia: The most highlighted concerns with Qsymia have been teratogenicity and heart rate
elevations. In particular, data have suggested that women exposed to topiramate during
pregnancy have an increased risk of orofacial cleft formation in offspring. Qsymia approval
required a risk evaluation and mitigation strategy (REMS) program, including educational
efforts on teratogenic risk for patients and physicians. With regard to Qsymia, we specified
women of child-bearing age and patients at increased CV risk as patient types to focus on
these concerns.
BELVIQ: Over the course of BELVIQ’s development, identified safety concerns have included
potential tumorigenicity, numerical imbalances in occurrence of cardiac valvulopathy, as well
as risks of psychiatric, cognitive, and serotonergic adverse effects. We therefore specified
patient types with potential risk factors, such as increased malignancy risk, increased CV risk,
and those taking selective serotonin reuptake inhibitors (SSRIs), respectively, and queried
about prescribing of BELVIQ.
Contrave: Contrave is currently being further evaluated in a Cardiovascular Outcomes Trial
(CVOT), the LIGHT study, as a pre-approval requirement. In particular, across its clinical
development program, Contrave therapy has been associated with blood pressure elevations.
We specified patients at increased CV risk in asking about PCP’s comfort level in prescribing
Contrave.
www.cowen.comMEMBER: FINRA/SIPC 117
EQUITY RESEARCHCowen and Company, LLC

The mean comfort level for 5 out of the 6 patient types we asked about ranged from 3.1 to 3.4.
Thus, our PCPs generally had fairly neutral comfort levels (with a trend toward less comfort) for
prescribing the respective agents in the patient types which highlighted specific safety
concerns. The highest level of discomfort was noted for prescribing Qsymia to women of child-
bearing age, with a mean 3.7 comfort level rating. This is not surprising, given that teratogenic
risk is a main focus of the current Qsymia REMS program.
Surveyed PCPs had generally neutral comfort levels with potential safety concerns
3.7
3.44
3.42
3.36
3.36
3.12
0 1 2 3 4 5
Prescribing Qsymia to women of child-bearing age
Prescribing Qsymia to patients at increased CV risk
Prescribing Contrave to patients at increased CV risk
Prescribing Belviq to patients taking SSRIs
Prescribing Belviq to patients at increased CV risk
Prescribing Belviq to patients with increased malignancy risk
Level of comfort around the following factors pertaining to use of anti-obesity agents on a scale of 1-5 (1=very comfortable, 5=not comfortable)
Source: Cowen and Company, Epocrates
While the obesity pharmacotherapy space has had a very difficult history from a safety
standpoint, when looking at these data and in combination with the answer to the previous
question on safety, in which for 80% of our surveyed PCPs, safety and tolerability concerns
would not prevent clinical use of various weight-loss drugs, our conclusion from this specific
survey would have to be that the safety profiles of the new anti-obesity therapies would not
present major barriers to physician uptake among PCPs.
Cost is an issue that has to be dealt with, according to our PCPs
In order to identify the most significant potential barrier to widespread adoption of Qsymia,
BELVIQ, and eventually Contrave, we asked our PCPs to choose one reason from the
following: 1) safety/tolerability concerns; 2) cost/lack of reimbursement; 3) patient
disappointment with lack of efficacy and consequent lack of motivation; 4) competition from off-
label use of generic phentermine/topiramate and bupropion/naltrexone; 5) no major hurdles
preventing widespread prescribing; 6) other issues. The most commonly identified hurdle to
adoption was cost or lack of reimbursement, chosen by 54% of respondents. Not too
surprisingly, the second most commonly identified issue was safety, selected by 30% of the
PCPs in our survey.
Regarding other adoption hurdles, only a minority (10%) indicated patient disappointment from
lack of efficacy; 4% of our physicians felt that there would not be any substantial impediments
to prescribing these therapies, 2% (i.e. one physician) selected competition from off-label use
www.cowen.comMEMBER: FINRA/SIPC 118
EQUITY RESEARCHCowen and Company, LLC

of generic components of the branded products (Qsymia and Contrave), and none of the
physicians in our survey selected reasons other than those listed.
In our survey, PCPs selected cost/lack of reimbursement as most significant hurdle to adoption of new weight-loss drugs
30%
54%
10%
2%
4%
0%
In my view, the biggest hurdle to Qsymia, Belviq, and Contrave’s wide adoption will be:
Concerns over safety and/or tolerability
Cost/lack of reimbursement
Patient disappointment with the small amountof weight loss and the resulting lack ofmotivation to continue treatment
Competition from off-label use of genericphentermine/topiramate andbupropion/naltrexone
I don’t expect any big hurdles; I think Qsymia, Belviq, and Contrave will be widely prescribed
Other hurdles
Source: Cowen and Company, Epocrates
With third-party payers historically reluctant to pay for obesity pharmacotherapy, lack of
reimbursement for obesity drugs has been a common issue, until the progress achieved
recently. We polled our PCPs on their expectations for insurance coverage of the approved
agents Qsymia and BELVIQ in the future, two to three years following their market entries,
asking them to estimate what percentage of insurers will provide prescription coverage. Most
of our physicians were not optimistic about the prospects for coverage of these drugs. Only
20% of the group believed that ≥ 50% of insurers would cover obesity drugs in that time frame.
In fact, a 62% majority of PCPs in our survey forecasted that less than 30% of insurance
companies would reimburse these drugs approximately 2-3 years after their launches.
Majority of surveyed PCPs pessimistic about insurance coverage
24%
20%
18%
16%
2%
14%
0%
2%
0%
4%
0%
0% 5% 10% 15% 20% 25% 30%
Less than 10%
10-19%
20-29%
30-39%
40-49%
50-59%
60-69%
70-79%
80-89%
90-99%
100%
What percentage of insurers do you expect will cover Qsymia and Belviq approximately 2-3 years after their launch:
Source: Cowen and Company, Epocrates
www.cowen.comMEMBER: FINRA/SIPC 119
EQUITY RESEARCHCowen and Company, LLC
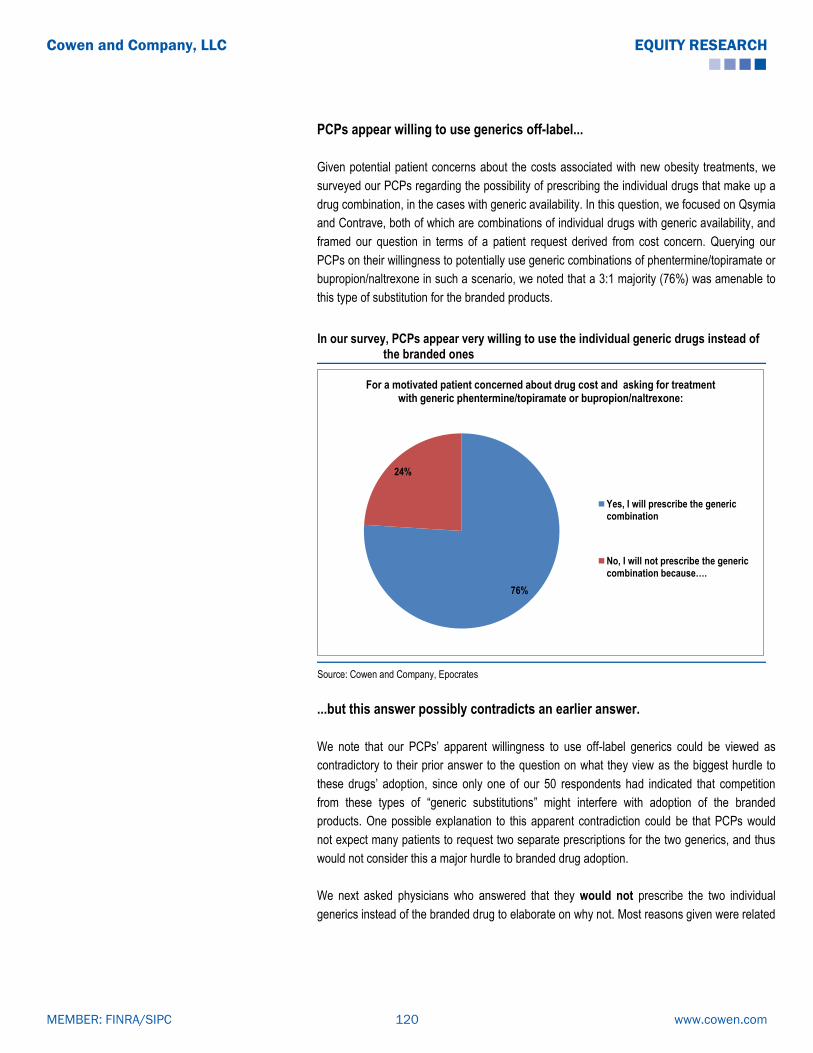
PCPs appear willing to use generics off-label...
Given potential patient concerns about the costs associated with new obesity treatments, we
surveyed our PCPs regarding the possibility of prescribing the individual drugs that make up a
drug combination, in the cases with generic availability. In this question, we focused on Qsymia
and Contrave, both of which are combinations of individual drugs with generic availability, and
framed our question in terms of a patient request derived from cost concern. Querying our
PCPs on their willingness to potentially use generic combinations of phentermine/topiramate or
bupropion/naltrexone in such a scenario, we noted that a 3:1 majority (76%) was amenable to
this type of substitution for the branded products.
In our survey, PCPs appear very willing to use the individual generic drugs instead of the branded ones
76%
24%
For a motivated patient concerned about drug cost and asking for treatment with generic phentermine/topiramate or bupropion/naltrexone:
Yes, I will prescribe the genericcombination
No, I will not prescribe the generic combination because….
Source: Cowen and Company, Epocrates
...but this answer possibly contradicts an earlier answer.
We note that our PCPs’ apparent willingness to use off-label generics could be viewed as
contradictory to their prior answer to the question on what they view as the biggest hurdle to
these drugs’ adoption, since only one of our 50 respondents had indicated that competition
from these types of ―generic substitutions‖ might interfere with adoption of the branded
products. One possible explanation to this apparent contradiction could be that PCPs would
not expect many patients to request two separate prescriptions for the two generics, and thus
would not consider this a major hurdle to branded drug adoption.
We next asked physicians who answered that they would not prescribe the two individual
generics instead of the branded drug to elaborate on why not. Most reasons given were related
www.cowen.comMEMBER: FINRA/SIPC 120
EQUITY RESEARCHCowen and Company, LLC

to concerns about dosing equivalence and off-label prescribing, as we would expect. We have
provided the answers we received to this question in the next table.
Surveyed PCPs unwilling to use generics cite off-label and equivalence concerns
PCP Reasons for Not Using Generics
• I don't prescribe phentermine; I also suspect the 2 meds separate will still be expensive anyway
• It's not approved
• Dosages may be different
• Not FDA approved
• Not clear on the long-term side-effects of these combination products
• To my knowledge, the generic phentermine does not come in the equivalent dose alone
• Dosing/strength
• The studies showing safety and efficacy were done with the combination [branded product]
Source: Cowen and Company, Epocrates
www.cowen.comMEMBER: FINRA/SIPC 121
EQUITY RESEARCHCowen and Company, LLC

#2) The Obesity Specialist Survey Results
In order to gain further perspective on the treatment of obesity using this new generation of
pharmacotherapies from a group of physicians that exclusively treat obesity, we conducted a
second survey and limited participation to physicians who are obesity specialists. All survey
participants were current prescribers of anti-obesity pharmacotherapies in their clinical
practices.
Two thirds of obesity specialists view Qsymia as the most efficacious agent
By a very wide margin, 68% vs. 4% for the next highest drug, our specialists selected Qsymia
as the drug resulting in the greatest weight loss. Notably, none of the obesity specialists we
surveyed selected BELVIQ. All other agents on our list received a very small number of votes,
ranging from 2% to 4%. Thus, it is very clear that among this specialist group of prescribers,
Qsymia is considered to be, by far, the most efficacious agent.
In our survey, most obesity specialists consider Qsymia as the most efficacious agent
68%
0%4% 4% 4% 2%
18%
0%
10%
20%
30%
40%
50%
60%
70%
80%
Qsymia Belviq Contrave Liraglutide Empatic Orlistat None of thesedrugs result inwhat I consider
meaningful weightloss
The obesity drug that results in the most robust weight loss is:
Source: Cowen and Company, SurveyMonkey
We further asked our specialists to predict the relative market share of the two newly approved
weight-loss agents, Qsymia and BELVIQ, in order to further gauge perceptions on relative
efficacy and measure relative potential utilization. When asked to project to 18-24 months after
their launches, 3/4 of our specialists (74%) viewed Qsymia as the dominant drug in the market
over BELVIQ, with 60% or greater share. In addition, only 4% of the respondents in our survey
selected BELVIQ as the market leader over Qsymia, with 60% or higher market share. Finally,
22% of the physicians we surveyed projected a 50-50 split between the two agents.
www.cowen.comMEMBER: FINRA/SIPC 122
EQUITY RESEARCHCowen and Company, LLC

74% of obesity specialists pick Qsymia to be the market leader; only 4% pick BELVIQ
4%
36%
34%
22%
2%
2%
0%
0% 5% 10% 15% 20% 25% 30% 35% 40%
Qsymia 90%, Belviq 10%
Qsymia 75%, Belviq 25%
Qsymia 60%, Belviq 40%
Qsymia 50%, Belviq 50%
Qsymia 40%, Belviq 60%
Qsymia 25%, Belviq 75%
Qsymia 10%, Belviq 90%
18-24 months after their launch, I believe that Qsymia and Belviq will have split the market in the following way:
Source: Cowen and Company, SurveyMonkey
While our specialists were clearly not impressed with the weight-loss efficacy of BELVIQ, it is
worth examining whether they may view it as a safer replacement for fenfluramine. Given the
notorious history of the fenfluramine-phentermine combination, the popular and effective ―Fen-
phen,‖ eventually withdrawn from the market because of cardiac valvulopathy risk, and the
greater serotonin receptor selectivity of BELVIQ, some clinicians may view one potential use of
BELVIQ to be in combination with phentermine. We asked our specialists about their possible
use of this combination. Only one fourth of the obesity specialists in our survey answered that
they would use the BELVIQ-Phentermine combination right now. The remaining three fourths
stated that they would not utilize it, most often (54%) because of lack of clinical trial data,
with the next most common reason (14%) being lack of FDA approval for this combination. It is
therefore clear that, until clinical trial data and/or FDA approval of this combination, the vast
majority of obesity specialists would be unwilling to use this potentially promising combination
off-label.
Majority of specialists in our survey would not use BELVIQ-Phentermine now
26%
6%
54%
14%
0%
10%
20%
30%
40%
50%
60%
Yes No, I don’t believe the addition of phentermine can significantly
add to the weight loss seen with Belviq alone
No, because we have not yetseen clinical trial data with the
Belviq + phenterminecombination
No, because the combination isnot FDA-approved
I would be willing to treat my patients with Belviq in combination with phentermine to help them achieve more robust weight loss:
Source: Cowen and Company, SurveyMonkey
www.cowen.comMEMBER: FINRA/SIPC 123
EQUITY RESEARCHCowen and Company, LLC

Specialists are open to trying multiple agents…but it seems like Qsymia will get
the first script
Not surprisingly, the majority of our obesity specialists believe in the use of pharmacotherapy
for the treatment of obesity. In our earlier question concerning the most efficacious obesity
therapy, only 9 respondents (18%) stated than none of the listed drugs result in meaningful
weight loss. Despite their clear distinction of Qsymia as the most efficacious anti-obesity
therapy, most of our specialists appear willing to embrace multiple options. We asked our
physicians about how they might use Qsymia and BELVIQ in practice. Half of the group
indicated willingness to try both agents in sequence, should a patient lack response to the first
agent, without specifying which agent would be used upfront. Still, Qsymia seems to be the
agent of choice, when a drug is selected by name: 38% expect to use Qsymia first, while only
6% expect to start first with BELVIQ. Finally, a 10% minority of specialists expected to utilize
only one agent, and only 4% indicated that neither drug would be used.
Vast majority of surveyed specialists expect to use both Qsymia and BELVIQ…but Qsymia is the preferred agent when docs do select one
30%
6%
8%
0%
50%
2%
4%
0% 10% 20% 30% 40% 50% 60%
I will try Qsymia first, if the patient doesn’t respond, I will then try Belviq
I will try Belviq first, if the patient doesn’t respond, I will then try Qsymia
I will try Qsymia first, if the patient doesn’t respond, I won’t try Belviq
I will try Belviq first, if the patient doesn’t respond, I won’t try Qsymia
I will try one of the two first, if the patient doesn’t respond, I will then try the other one
I will try one of the two first, if the patient doesn’t respond, I won’t try the other one
I won’t use either of these drugs
The following statement best describes my expectation for my use of Qsymia and Belviq:
Source: Cowen and Company, SurveyMonkey
We further polled our specialists about their views on two drugs under investigation for obesity
treatment, Novo Nordisk’s injectable GLP-1 receptor agonist Victoza (liraglutide), already
approved for the treatment of Type 2 diabetes in the EU and the US, and Orexigen’s Empatic
(bupropion/zonisamide). Concerning both agents, the physicians in our survey tended to have
a fairly positive outlook. The majority of respondents for questions on both agents (76% and
66%, respectively) considered the drugs to be either incremental improvements compared to
currently available therapies, or very promising anti-obesity agents. For both drugs, 20% of
respondents voted that they had low expectations for these agents. In Victoza’s case, a third of
respondents (32%) viewed the drug as very promising, while 44% viewed it as an incremental
improvement over existing therapies.
www.cowen.comMEMBER: FINRA/SIPC 124
EQUITY RESEARCHCowen and Company, LLC
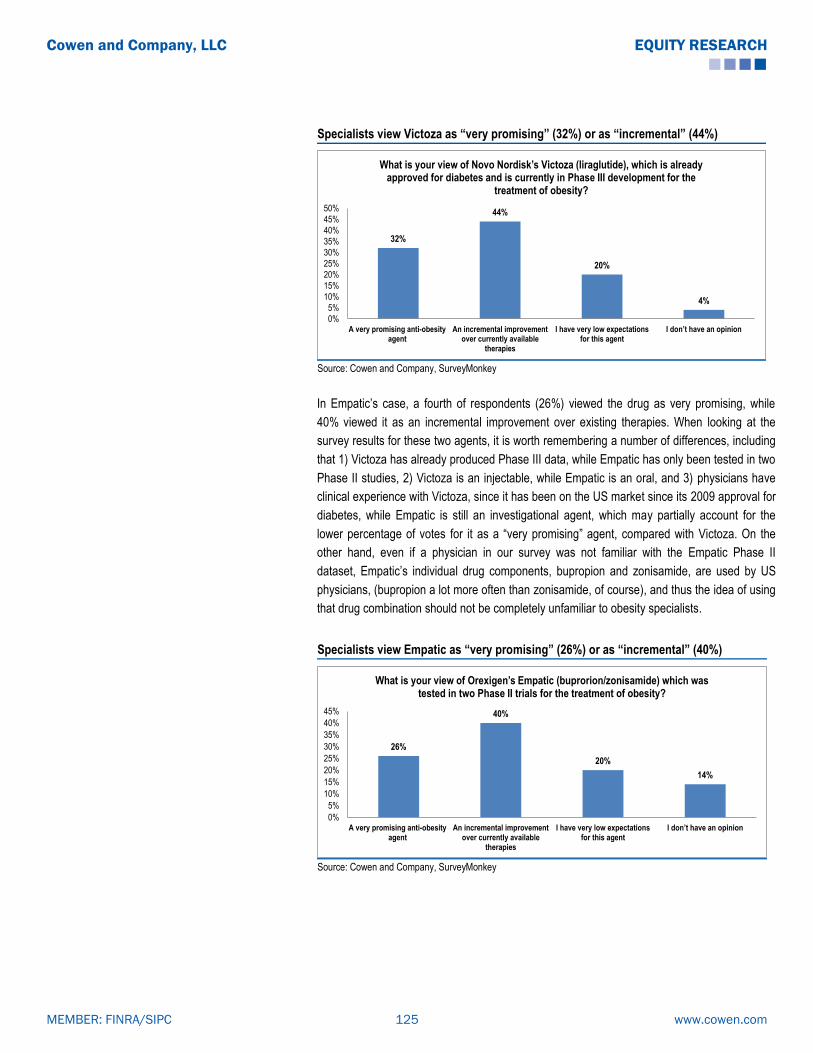
Specialists view Victoza as “very promising” (32%) or as “incremental” (44%)
32%
44%
20%
4%
0%
5%
10%
15%
20%
25%
30%
35%
40%
45%
50%
A very promising anti-obesityagent
An incremental improvementover currently available
therapies
I have very low expectationsfor this agent
I don’t have an opinion
What is your view of Novo Nordisk’s Victoza (liraglutide), which is already approved for diabetes and is currently in Phase III development for the
treatment of obesity?
Source: Cowen and Company, SurveyMonkey
In Empatic’s case, a fourth of respondents (26%) viewed the drug as very promising, while
40% viewed it as an incremental improvement over existing therapies. When looking at the
survey results for these two agents, it is worth remembering a number of differences, including
that 1) Victoza has already produced Phase III data, while Empatic has only been tested in two
Phase II studies, 2) Victoza is an injectable, while Empatic is an oral, and 3) physicians have
clinical experience with Victoza, since it has been on the US market since its 2009 approval for
diabetes, while Empatic is still an investigational agent, which may partially account for the
lower percentage of votes for it as a ―very promising‖ agent, compared with Victoza. On the
other hand, even if a physician in our survey was not familiar with the Empatic Phase II
dataset, Empatic’s individual drug components, bupropion and zonisamide, are used by US
physicians, (bupropion a lot more often than zonisamide, of course), and thus the idea of using
that drug combination should not be completely unfamiliar to obesity specialists.
Specialists view Empatic as “very promising” (26%) or as “incremental” (40%)
26%
40%
20%
14%
0%
5%
10%
15%
20%
25%
30%
35%
40%
45%
A very promising anti-obesityagent
An incremental improvementover currently available
therapies
I have very low expectationsfor this agent
I don’t have an opinion
What is your view of Orexigen’s Empatic (buprorion/zonisamide) which was tested in two Phase II trials for the treatment of obesity?
Source: Cowen and Company, SurveyMonkey
www.cowen.comMEMBER: FINRA/SIPC 125
EQUITY RESEARCHCowen and Company, LLC
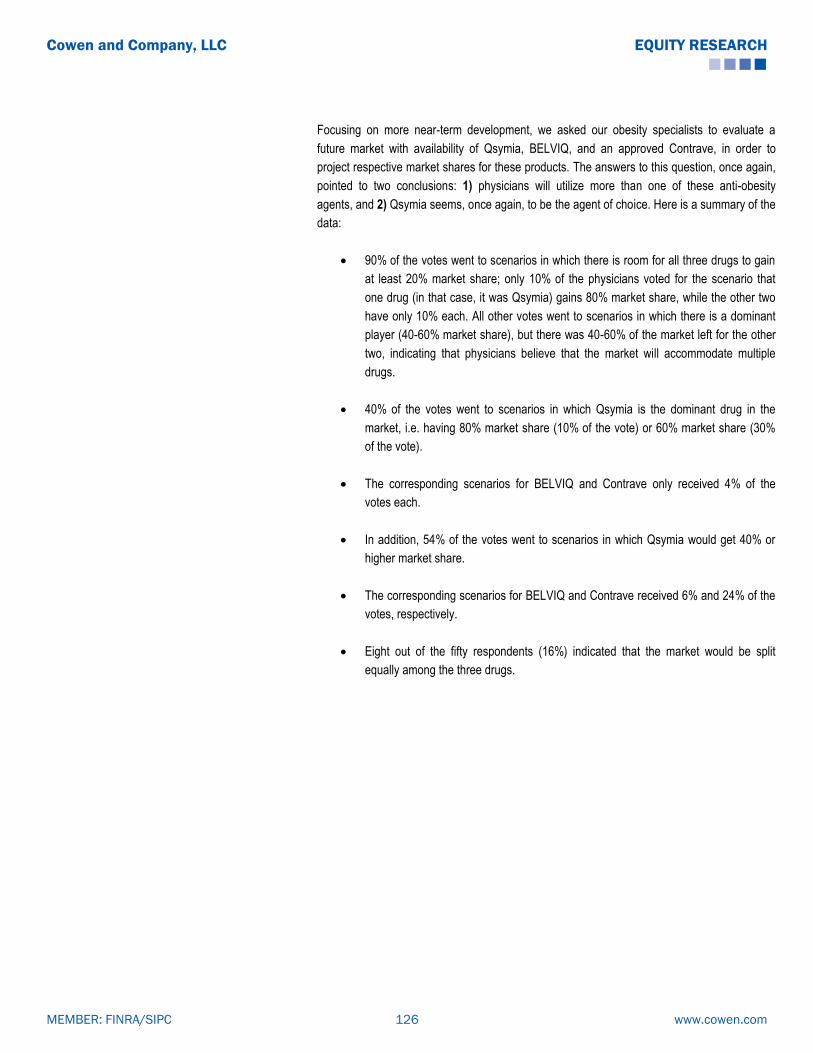
Focusing on more near-term development, we asked our obesity specialists to evaluate a
future market with availability of Qsymia, BELVIQ, and an approved Contrave, in order to
project respective market shares for these products. The answers to this question, once again,
pointed to two conclusions: 1) physicians will utilize more than one of these anti-obesity
agents, and 2) Qsymia seems, once again, to be the agent of choice. Here is a summary of the
data:
90% of the votes went to scenarios in which there is room for all three drugs to gain
at least 20% market share; only 10% of the physicians voted for the scenario that
one drug (in that case, it was Qsymia) gains 80% market share, while the other two
have only 10% each. All other votes went to scenarios in which there is a dominant
player (40-60% market share), but there was 40-60% of the market left for the other
two, indicating that physicians believe that the market will accommodate multiple
drugs.
40% of the votes went to scenarios in which Qsymia is the dominant drug in the
market, i.e. having 80% market share (10% of the vote) or 60% market share (30%
of the vote).
The corresponding scenarios for BELVIQ and Contrave only received 4% of the
votes each.
In addition, 54% of the votes went to scenarios in which Qsymia would get 40% or
higher market share.
The corresponding scenarios for BELVIQ and Contrave received 6% and 24% of the
votes, respectively.
Eight out of the fifty respondents (16%) indicated that the market would be split
equally among the three drugs.
www.cowen.comMEMBER: FINRA/SIPC 126
EQUITY RESEARCHCowen and Company, LLC

Surveyed specialists expect use of Qsymia, BELVIQ, and Contrave in the market
16%
14%
2%
20%
30%
4%
4%
10%
0%
0%
0% 5% 10% 15% 20% 25% 30% 35%
Qsymia 33%, Belviq 33%, Contrave 33%
Qsymia 40%, Belviq 40%, Contrave 20%
Belviq 40%, Contrave 40%, Qsymia 20%
Contrave 40%, Qsymia 40%, Belviq 20%
Qsymia 60%, Belviq 20%, Contrave 20%
Belviq 60%, Qsymia 20%, Contrave 20%
Contrave 60%, Qsymia 20%, Belviq 20%
Qsymia 80%, Belviq 10%, Contrave 10%
Belviq 80%, Qsymia 10%, Contrave 10%
Contrave 80%, Qsymia 10%, Belviq 10%
Assuming Contrave is approved, 18-24 months from its launch, I believe the obesity drug market will be split in the following way:
Source: Cowen and Company, SurveyMonkey
Another way to look at these data is that more than one-third of the respondents forecasted a
market with two agents having equal lead shares of 40% each, most often with Qsymia being
one of the two leaders (34% of votes). Otherwise, the most votes (30%) were allocated to a
scenario with Qsymia holding 60% of the market and the two other agents dividing the
remaining share equally. With these market allocations, physicians in our survey have
accounted for some degree of utilization of all three agents, albeit often disproportionate. We
believe our specialists are recognizing the heterogeneous nature of obesity and considering
the potential variability of therapeutic responses with different drugs in individual patients.
These results reiterate for us that 1) Qsymia seems to be the dominant drug in the space, and
2) there is indeed room for multiple anti-obesity agents in clinical practice.
Specialists seem comfortable dealing with these drugs’ potential safety issues
We asked our specialists to select the obesity agent with the best safety and tolerability profile.
The results did not distinguish any one specific agent as the safest, and votes were almost
evenly distributed among currently approved obesity agents and liraglutide, which is approved
for Type 2 diabetes treatment. We believe this fairly uniform split in votes demonstrates that
our physicians recognize potential safety issues with all the weight-loss therapies which they
may use. Notably, only 3 out of the 50 respondents (6%) indicated that safety concerns
associated with these agents would prevent their clinical use. Clearly, the vast majority of
obesity specialists in our survey seem comfortable with management of any potential safety or
tolerability issues, and have concluded that the benefits provided by these therapies outweigh
possible risks.
www.cowen.comMEMBER: FINRA/SIPC 127
EQUITY RESEARCHCowen and Company, LLC

Specialists in our survey did not distinguish any one weight-loss drug as the safest
20%22%
10%
24%
0%
18%
6%
0%
5%
10%
15%
20%
25%
30%
Qsymia Belviq Contrave Liraglutide Empatic Orlistat I believe that thesafety and tolerability
profile of theseagents is such that Iwould probably notuse them in most of
my patients
The obesity drug with the best safety and tolerability profile is:
Source: Cowen and Company, SurveyMonkey
In our survey, we took the opportunity to gain insight into our obesity specialists’ perspectives
on specific safety concerns that have been associated with the approved agents Qsymia and
BELVIQ. We referred to these concerns and rated comfort with prescribing of a particular
agent in a clinical scenario, according to four levels: 1) very comfortable; 2) comfortable, but
with precautions; 3) somewhat comfortable, limiting prescribing to a small group of patients;
and 4) not comfortable, with no prescribing.
For Qsymia, we asked about prescribing to women of child-bearing age and to patients at
increased cardiovascular risk, in order to elicit reactions to the risks of teratogenicity and
elevated heart rate, respectively. In both Qsymia scenarios, the majority of our respondents
(66% with regard to teratogenic risk and 62% for CV risk) rated themselves in one of the two
highest comfort levels.
Specialists comfortable prescribing Qsymia to younger women
12%
54%
26%
8%
0%
10%
20%
30%
40%
50%
60%
Very comfortable, I trust my patients to not take Qsymia
once they realize they’re pregnant
Comfortable, but I wouldclosely monitor and remind
the patient every month
Somewhat comfortable, Iwould only prescribe it to a
small fraction of these patients
Not comfortable, I would notprescribe Qsymia to women of
child-bearing age
How comfortable would you be prescribing Qsymia to women of child-bearing age?
Source: Cowen and Company, SurveyMonkey
www.cowen.comMEMBER: FINRA/SIPC 128
EQUITY RESEARCHCowen and Company, LLC

Specialists comfortable prescribing Qsymia to CV risk patients
26%
36%
22%
16%
0%5%
10%15%20%25%30%35%40%
Very comfortable Comfortable, but wouldclosely monitor and warn thepatient and would ask them todiscuss with their cardiologist
before or after starting onQsymia
Somewhat comfortable, Iwould only prescribe it in a
small fraction of thesepatients
Not comfortable, I would notprescribe to this group of
patients
How comfortable would you be prescribing Qsymia to patients at increased CV risk?
Source: Cowen and Company, SurveyMonkey
For BELVIQ, we queried on prescribing to patients taking SSRIs and to patients at increased
cardiovascular risk, referring to serotonergic risk/serotonin syndrome and cardiac valvulopathy,
respectively. In the case of patients taking SSRIs, 56% of our specialists indicated the two
lowest comfort levels for prescribing BELVIQ, with approximately one-third signifying intention
to limit prescribing for such patients, and about one-quarter not prescribing in this scenario.
Another approximately one-third of the group was comfortable prescribing BELVIQ to patients
taking SSRIs, with close monitoring and discussion. On the other hand, with regard to CV risk,
most physicians (64%) indicated the two highest comfort levels for prescribing BELVIQ in this
case.
Some discomfort prescribing BELVIQ to patients on SSRIs
12%
32%
32%
24%
0% 5% 10% 15% 20% 25% 30% 35%
Very comfortable, I don’t think this is an issue for Belviq
Comfortable, but I would closely monitor and warn the patient
Somewhat comfortable, I would only prescribe to a small fractionof these patients
Not comfortable, I would not prescribe Belviq to this group ofpatients
How comfortable would you be prescribing Belviq to patients taking SSRIs?
Source: Cowen and Company, SurveyMonkey
www.cowen.comMEMBER: FINRA/SIPC 129
EQUITY RESEARCHCowen and Company, LLC
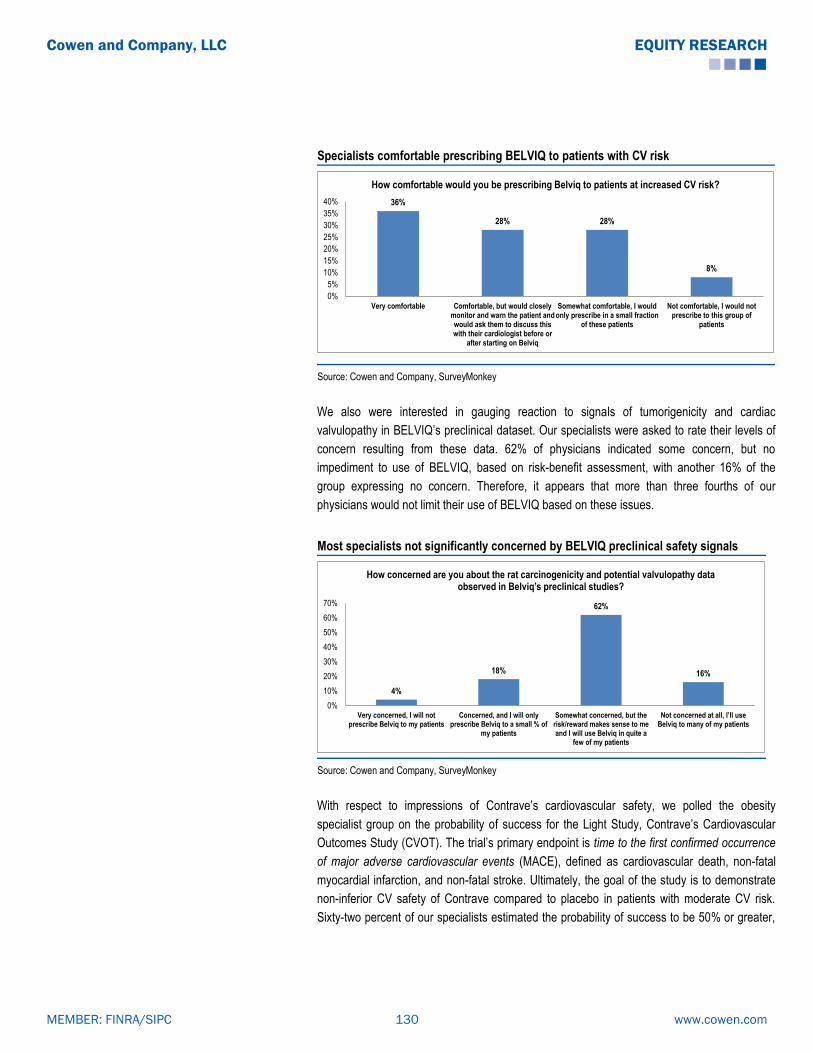
Specialists comfortable prescribing BELVIQ to patients with CV risk
36%
28% 28%
8%
0%
5%
10%
15%
20%
25%
30%
35%
40%
Very comfortable Comfortable, but would closelymonitor and warn the patient andwould ask them to discuss thiswith their cardiologist before or
after starting on Belviq
Somewhat comfortable, I wouldonly prescribe in a small fraction
of these patients
Not comfortable, I would notprescribe to this group of
patients
How comfortable would you be prescribing Belviq to patients at increased CV risk?
Source: Cowen and Company, SurveyMonkey
We also were interested in gauging reaction to signals of tumorigenicity and cardiac
valvulopathy in BELVIQ’s preclinical dataset. Our specialists were asked to rate their levels of
concern resulting from these data. 62% of physicians indicated some concern, but no
impediment to use of BELVIQ, based on risk-benefit assessment, with another 16% of the
group expressing no concern. Therefore, it appears that more than three fourths of our
physicians would not limit their use of BELVIQ based on these issues.
Most specialists not significantly concerned by BELVIQ preclinical safety signals
4%
18%
62%
16%
0%
10%
20%
30%
40%
50%
60%
70%
Very concerned, I will notprescribe Belviq to my patients
Concerned, and I will onlyprescribe Belviq to a small % of
my patients
Somewhat concerned, but therisk/reward makes sense to meand I will use Belviq in quite a
few of my patients
Not concerned at all, I’ll use Belviq to many of my patients
How concerned are you about the rat carcinogenicity and potential valvulopathy data observed in Belviq’s preclinical studies?
Source: Cowen and Company, SurveyMonkey
With respect to impressions of Contrave’s cardiovascular safety, we polled the obesity
specialist group on the probability of success for the Light Study, Contrave’s Cardiovascular
Outcomes Study (CVOT). The trial’s primary endpoint is time to the first confirmed occurrence
of major adverse cardiovascular events (MACE), defined as cardiovascular death, non-fatal
myocardial infarction, and non-fatal stroke. Ultimately, the goal of the study is to demonstrate
non-inferior CV safety of Contrave compared to placebo in patients with moderate CV risk.
Sixty-two percent of our specialists estimated the probability of success to be 50% or greater,
www.cowen.comMEMBER: FINRA/SIPC 130
EQUITY RESEARCHCowen and Company, LLC
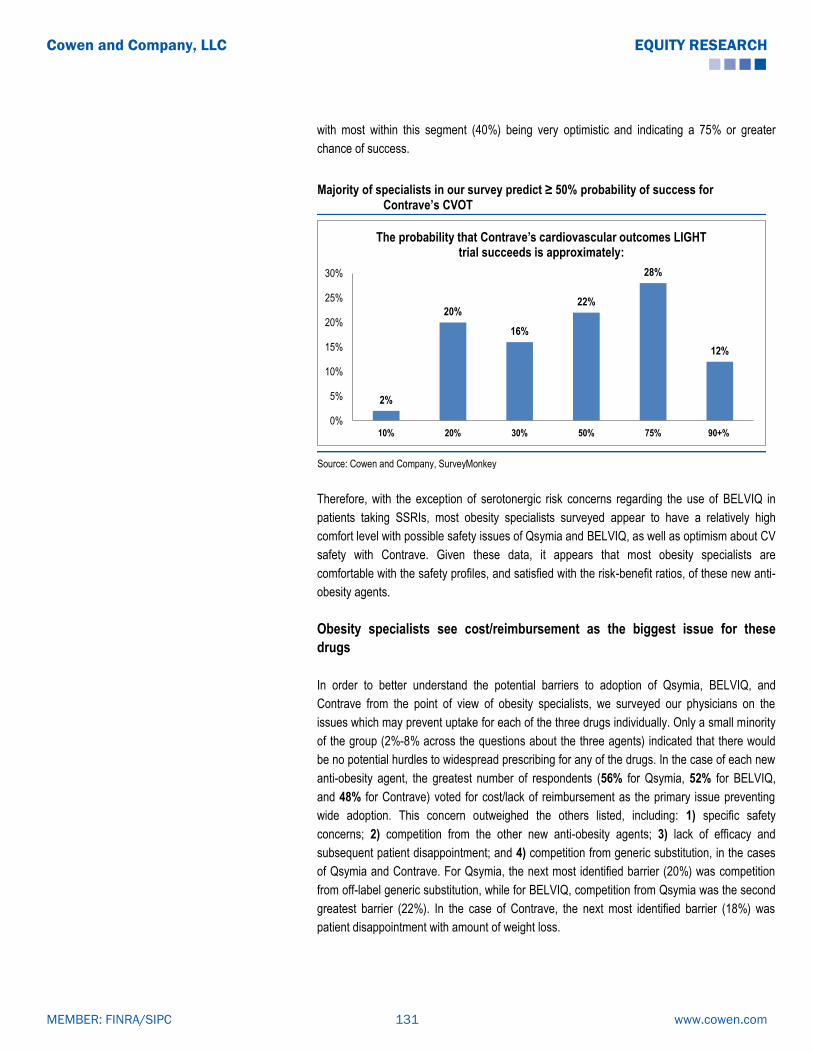
with most within this segment (40%) being very optimistic and indicating a 75% or greater
chance of success.
Majority of specialists in our survey predict ≥ 50% probability of success for Contrave’s CVOT
2%
20%
16%
22%
28%
12%
0%
5%
10%
15%
20%
25%
30%
10% 20% 30% 50% 75% 90+%
The probability that Contrave’s cardiovascular outcomes LIGHT trial succeeds is approximately:
Source: Cowen and Company, SurveyMonkey
Therefore, with the exception of serotonergic risk concerns regarding the use of BELVIQ in
patients taking SSRIs, most obesity specialists surveyed appear to have a relatively high
comfort level with possible safety issues of Qsymia and BELVIQ, as well as optimism about CV
safety with Contrave. Given these data, it appears that most obesity specialists are
comfortable with the safety profiles, and satisfied with the risk-benefit ratios, of these new anti-
obesity agents.
Obesity specialists see cost/reimbursement as the biggest issue for these
drugs
In order to better understand the potential barriers to adoption of Qsymia, BELVIQ, and
Contrave from the point of view of obesity specialists, we surveyed our physicians on the
issues which may prevent uptake for each of the three drugs individually. Only a small minority
of the group (2%-8% across the questions about the three agents) indicated that there would
be no potential hurdles to widespread prescribing for any of the drugs. In the case of each new
anti-obesity agent, the greatest number of respondents (56% for Qsymia, 52% for BELVIQ,
and 48% for Contrave) voted for cost/lack of reimbursement as the primary issue preventing
wide adoption. This concern outweighed the others listed, including: 1) specific safety
concerns; 2) competition from the other new anti-obesity agents; 3) lack of efficacy and
subsequent patient disappointment; and 4) competition from generic substitution, in the cases
of Qsymia and Contrave. For Qsymia, the next most identified barrier (20%) was competition
from off-label generic substitution, while for BELVIQ, competition from Qsymia was the second
greatest barrier (22%). In the case of Contrave, the next most identified barrier (18%) was
patient disappointment with amount of weight loss.
www.cowen.comMEMBER: FINRA/SIPC 131
EQUITY RESEARCHCowen and Company, LLC

56% of specialists identify cost/lack of reimbursement as biggest hurdle to Qsymia’s wide adoption
6%
56%6%0%
2%
20%
10%
In my view, the biggest hurdle to Qsymia’s wide adoption will be:
I don’t expect any big hurdles; I think Qsymia will be very widely prescribed
Cost/lack of reimbursement
Concerns about teratogenicity
Concerns about heart rate increase
Competition from Belviq
Competition from off-label use ofgeneric phentermine/topiramate
Patients won’t lose much weight, will be disappointed and discontinue treatment
Source: Cowen and Company, SurveyMonkey
52% of specialists identify cost/lack of reimbursement as biggest hurdle to BELVIQ’s wide adoption
8%
52%14%
0%
4%
22%
In my view, the biggest hurdle to Belviq’s wide adoption will be:
I don’t expect any big hurdles; I think Belviq will be very widely prescribed
Cost/lack of reimbursement
Concerns about valvulopathy
Concerns about tumorigenicity
Concerns about serotonin syndrome
Competition from Qsymia
Source: Cowen and Company, SurveyMonkey
www.cowen.comMEMBER: FINRA/SIPC 132
EQUITY RESEARCHCowen and Company, LLC

48% of specialists identify cost/lack of reimbursement as biggest hurdle to Contrave’s wide adoption
2%
48%
12%0%
12%
8%
18%
Assuming it is approved, the biggest hurdle to Contrave’s wide adoption will be:
I don’t expect any big hurdles; I think Contrave will be very widely prescribed
Cost/lack of reimbursement
Competition from Qsymia
Competition from Belviq
Competition from off-label use ofbupropion and naltrexone
Safety concerns
Source: Cowen and Company, SurveyMonkey
We also asked our specialists about their expectations for future insurance coverage of
Qsymia and BELVIQ. One-third of the specialists we surveyed predicted that half of all insurers
would provide prescription coverage for these drugs, while another 18% was even more
optimistic, expecting 70% or higher coverage. However, almost 50% of our specialists
expected only one-third or less of insurers to reimburse these drugs.
Our specialists slightly pessimistic about future insurance coverage
16.0%14.0%
18.0%
34.0%
8.0%6.0%
4.0%
0%
5%
10%
15%
20%
25%
30%
35%
40%
10% 20% 33% 50% 70% 85% 100%
I believe that 2-3 years after their launch, _____ of insurers will cover Qsymia and Belviq:
Source: Cowen and Company, SurveyMonkey
www.cowen.comMEMBER: FINRA/SIPC 133
EQUITY RESEARCHCowen and Company, LLC
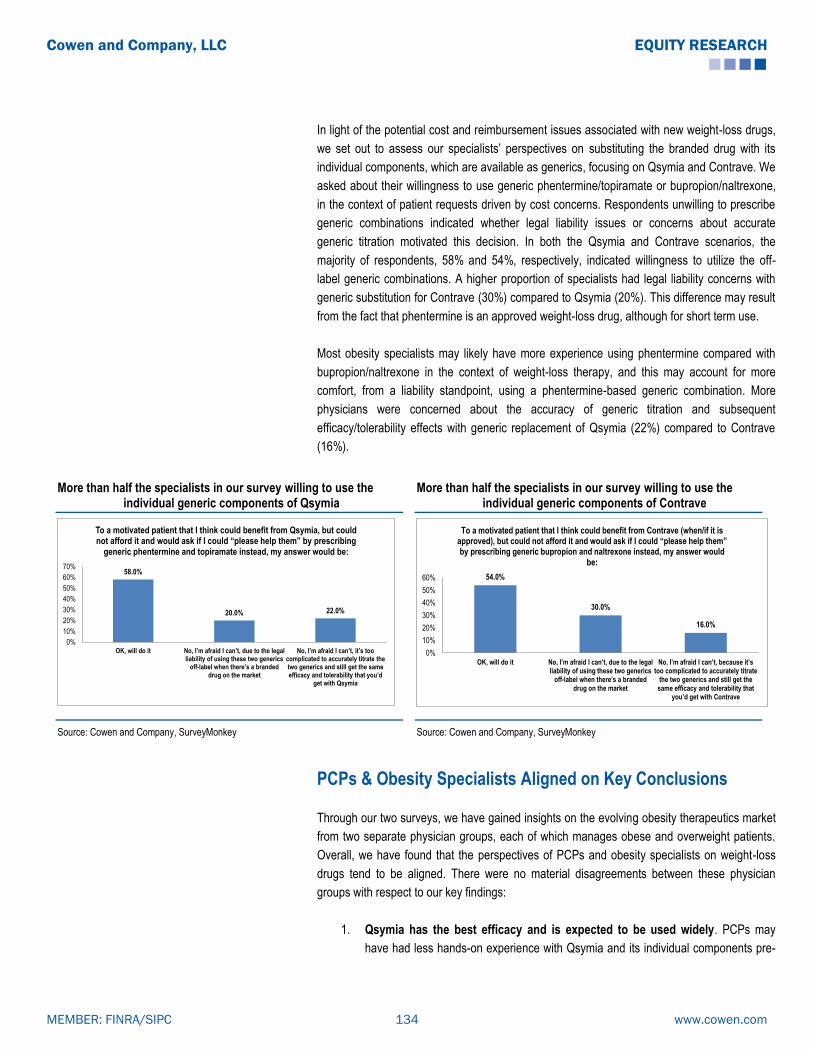
In light of the potential cost and reimbursement issues associated with new weight-loss drugs,
we set out to assess our specialists’ perspectives on substituting the branded drug with its
individual components, which are available as generics, focusing on Qsymia and Contrave. We
asked about their willingness to use generic phentermine/topiramate or bupropion/naltrexone,
in the context of patient requests driven by cost concerns. Respondents unwilling to prescribe
generic combinations indicated whether legal liability issues or concerns about accurate
generic titration motivated this decision. In both the Qsymia and Contrave scenarios, the
majority of respondents, 58% and 54%, respectively, indicated willingness to utilize the off-
label generic combinations. A higher proportion of specialists had legal liability concerns with
generic substitution for Contrave (30%) compared to Qsymia (20%). This difference may result
from the fact that phentermine is an approved weight-loss drug, although for short term use.
Most obesity specialists may likely have more experience using phentermine compared with
bupropion/naltrexone in the context of weight-loss therapy, and this may account for more
comfort, from a liability standpoint, using a phentermine-based generic combination. More
physicians were concerned about the accuracy of generic titration and subsequent
efficacy/tolerability effects with generic replacement of Qsymia (22%) compared to Contrave
(16%).
More than half the specialists in our survey willing to use the individual generic components of Qsymia
More than half the specialists in our survey willing to use the individual generic components of Contrave
58.0%
20.0% 22.0%
0%
10%
20%
30%
40%
50%
60%
70%
OK, will do it No, I’m afraid I can’t, due to the legal liability of using these two generics
off-label when there’s a branded drug on the market
No, I’m afraid I can’t, it’s too complicated to accurately titrate the two generics and still get the same efficacy and tolerability that you’d
get with Qsymia
To a motivated patient that I think could benefit from Qsymia, but could not afford it and would ask if I could “please help them” by prescribing
generic phentermine and topiramate instead, my answer would be:
54.0%
30.0%
16.0%
0%
10%
20%
30%
40%
50%
60%
OK, will do it No, I’m afraid I can’t, due to the legal liability of using these two generics
off-label when there’s a branded drug on the market
No, I’m afraid I can’t, because it’s too complicated to accurately titrate
the two generics and still get the same efficacy and tolerability that
you’d get with Contrave
To a motivated patient that I think could benefit from Contrave (when/if it is approved), but could not afford it and would ask if I could “please help them” by prescribing generic bupropion and naltrexone instead, my answer would
be:
Source: Cowen and Company, SurveyMonkey Source: Cowen and Company, SurveyMonkey
PCPs & Obesity Specialists Aligned on Key Conclusions
Through our two surveys, we have gained insights on the evolving obesity therapeutics market
from two separate physician groups, each of which manages obese and overweight patients.
Overall, we have found that the perspectives of PCPs and obesity specialists on weight-loss
drugs tend to be aligned. There were no material disagreements between these physician
groups with respect to our key findings:
1. Qsymia has the best efficacy and is expected to be used widely. PCPs may
have had less hands-on experience with Qsymia and its individual components pre-
www.cowen.comMEMBER: FINRA/SIPC 134
EQUITY RESEARCHCowen and Company, LLC

approval in clinical practice, but both groups consider Qsymia to produce the most
robust weight loss and project Qsymia to be the obesity pharmacotherapy market
leader. Obesity specialists are even more positive about Qsymia than PCPs.
2. There is room for multiple weight-loss drugs in clinical practice. PCPs and
obesity specialists are very aligned on the fact that one treatment does not fit all
obese patients. Assuming Contrave approval, they agree that Qsymia, BELVIQ, and
Contrave will all be used to some extent for obesity treatment.
3. Safety concerns will not significantly prevent use of anti-obesity agents.
Obesity specialists are generally more comfortable with the specific safety issues
that may be associated with these drugs. However, both groups do not consider
safety to be the major barrier preventing utilization of these therapies.
4. Drug cost and lack of reimbursement are viewed as the major barriers to
adoption. PCPs and obesity specialists identify therapy cost concerns and lack of
insurance coverage as the primary hurdles to widespread uptake of anti-obesity
drugs. Both groups appear relatively willing to use the individual generic components
of branded drugs off-label in order to help patients with cost concerns. Interestingly,
and somewhat surprisingly, PCPs appear even more willing than specialists to
prescribe such generic replacements.
www.cowen.comMEMBER: FINRA/SIPC 135
EQUITY RESEARCHCowen and Company, LLC

Cowen and Company PCP Obesity Survey Questionnaire n=50 for all questions
1. How many patients have you treated with Qsymia since it became commercially available in September 2012?
1. None (62%) 2. 1-5 (28%) 3. 6-10 (6%) 4. 11-15 (0%) 5. 16-20 (4%) 6. 21-30 (0%) 7. 31-49 (0%) 8. >50 (0%)
2. One year after BELVIQ’s launch, I would expect that Qsymia and BELVIQ will have split the anti-obesity market in the
following way: 1. Qsymia 90%, BELVIQ 10% (10%) 2. Qsymia 75%, BELVIQ 25% (28%) 3. Qsymia 60%, BELVIQ 40% (24%) 4. Qsymia 50%, BELVIQ 50% (28%) 5. Qsymia 40%, BELVIQ 60% (2%) 6. Qsymia 25%, BELVIQ 75% (8%) 7. Qsymia 10%, BELVIQ 90% (0%)
3. In my opinion, the anti-obesity drug that results in the most robust weight loss is: 1. Qsymia (52%) 2. BELVIQ (12%) 3. Contrave (0%) 4. Liraglutide (2%) 5. Empatic (0%) 6. Orlistat (2%) 7. Phentermine (18%) 8. Other (2%) 9. None of these drugs result in what I consider to be meaningful weight loss (12%)
4. The obesity drug with the cleanest safety and tolerability profile is:
1. Qsymia (16%) 2. BELVIQ (16%) 3. Contrave (0%) 4. Liraglutide (4%) 5. Empatic (0%) 6. Orlistat (20%) 7. Phentermine (22%) 8. Other (2%) 9. I believe that the safety and tolerability profile of these agents would likely prevent me from using them in most of
my patients (20%)
5. How long would you expect the average Qsymia and BELVIQ patient to remain on therapy?
1. 0-2 months (2%) 2. 3-4 months (20%) 3. 5-6 months (4%) 4. 7-9 months (4%) 5. 10-12 months (20%) 6. >12 months (18%) 7. Other (0%)
www.cowen.comMEMBER: FINRA/SIPC 136
EQUITY RESEARCHCowen and Company, LLC

6. Please rate your level of comfort around the following factors pertaining to your use of anti-obesity agents on a scale of 1-5 (1=very comfortable, 5=not comfortable)
1. Prescribing Qsymia to women of child-bearing age (mean 3.7) 2. Prescribing Qsymia to patients at increased CV risk (mean 3.44) 3. Prescribing BELVIQ to patients taking SSRIs (mean 3.36) 4. Prescribing BELVIQ to patients at increased CV risk (mean 3.36) 5. Prescribing BELVIQ to patients with increased malignancy risk (mean 3.12) 6. Prescribing Contrave to patients at increased CV risk (mean 3.42)
7. For a motivated patient who may benefit from Qsymia or Contrave but is concerned about drug cost and is asking for treatment with generic phentermine/topiramate or bupropion/naltrexone instead, my answer would be:
1. Yes, I will prescribe the generic combination (76%)
2. No, I will not prescribe the generic combination because…. (24%) Please provide your reasoning
8. In my view, the biggest hurdle to Qsymia, BELVIQ, and Contrave’s wide adoption will be:
1. Concerns over safety and/or tolerability (30%) 2. Cost/lack of reimbursement (54%) 3. Patient disappointment with the small amount of weight loss and the resulting lack of motivation to continue
treatment (10%) 4. Competition from off-label use of generic phentermine/topiramate and bupropion/naltrexone (2%) 5. I don’t expect any big hurdles; I think Qsymia, BELVIQ, and Contrave will be widely prescribed (4%) 6. Other hurdles (0%)
9. Assuming Contrave is approved, 18-24 months from its launch, I believe the obesity drug market will be split in the
following way: 1. Qsymia 80%, BELVIQ 10%, Contrave 10% (18%) 2. BELVIQ 80%, Qsymia 10%, Contrave 10% (4%) 3. Contrave 80%, Qsymia 10%, BELVIQ 10% (2%) 4. Qsymia 60%, BELVIQ 20%, Contrave 20% (20%) 5. BELVIQ 60%, Qsymia 20%, Contrave 20% (6%) 6. Contrave 60%, Qsymia 20%, BELVIQ 20% (2%) 7. Qsymia 40%, BELVIQ 40%, Contrave 20% (16%) 8. BELVIQ 40%, Contrave 40%, Qsymia 20% (8%) 9. Contrave 40%, Qsymia 40%, BELVIQ 20% (10%) 10. Qsymia 33%, BELVIQ 33%, Contrave 33% (12%) 11. Other market split (2%)
10. What percentage of insurers do you expect will cover Qsymia and BELVIQ approximately 2-3 years after their
launch:
1. Less than 10% (24%) 2. 10-19% (20%) 3. 20-29% (18%) 4. 30-39% (16%) 5. 40-49% (2%) 6. 50-59% (14%) 7. 60-69% (0%) 8. 70-79% (2%) 9. 80-89% (0%) 10. 90-99% (4%) 11. 100% (0%)
www.cowen.comMEMBER: FINRA/SIPC 137
EQUITY RESEARCHCowen and Company, LLC

Cowen and Company Obesity Specialist Survey Questionnaire n=50 for all questions
1. I believe that 2-3 years after their launch, _____ of insurers will cover Qsymia and BELVIQ:
1. 10% (16%)
2. 20% (14%)
3. 33% (18%)
4. 50% (34%)
5. 70% (8%)
6. 85% (6%)
7. 100% (4%)
2. In my view, the biggest hurdle to Qsymia’s wide adoption will be:
1. I don’t expect any big hurdles; I think Qsymia will be very widely prescribed (6%)
2. Cost/lack of reimbursement (56%)
3. Concerns about teratogenicity (6%)
4. Concerns about heart rate increase (0%)
5. Competition from BELVIQ (2%)
6. Competition from off-label use of generic phentermine/topiramate (20%)
7. Patients won’t lose much weight, will be disappointed and discontinue treatment (10%)
3. How comfortable would you be prescribing Qsymia to women of child-bearing age?
1. Very comfortable, I trust my patients to not take Qsymia once they realize they’re pregnant (12%)
2. Comfortable, but I would closely monitor and remind the patient every month (54%)
3. Somewhat comfortable, I would only prescribe it to a small fraction of these patients (26%)
4. Not comfortable, I would not prescribe Qsymia to women of child-bearing age (8%)
4. How comfortable would you be prescribing Qsymia to patients at increased CV risk?
1. Very comfortable (26%)
2. Comfortable, but would closely monitor and warn the patient and would ask them to discuss with their cardiologist
before or after starting on Qsymia (36%)
3. Somewhat comfortable, I would only prescribe it in a small fraction of these patients (22%)
4. Not comfortable, I would not prescribe to this group of patients (16%)
5. To a motivated patient that I think could benefit from Qsymia, but could not afford it and would ask if I could “please
help them” by prescribing generic phentermine and topiramate instead, my answer would be:
1. OK, will do it (58%)
2. No, I’m afraid I can’t, due to the legal liability of using these two generics off-label when there’s a branded drug on
the market (20%)
3. No, I’m afraid I can’t, it’s too complicated to accurately titrate the two generics and still get the same efficacy and
tolerability that you’d get with Qsymia (22%)
6. In my view, the biggest hurdle to BELVIQ’s wide adoption will be:
1. I don’t expect any big hurdles; I think BELVIQ will be very widely prescribed (8%)
2. Cost/lack of reimbursement (52%)
3. Concerns about valvulopathy (14%)
4. Concerns about tumorigenicity (0%)
5. Concerns about serotonin syndrome (4%)
6. Competition from Qsymia (22%)
7. How comfortable would you be prescribing BELVIQ to patients taking SSRIs?
1. Very comfortable, I don’t think this is an issue for BELVIQ (12%)
www.cowen.comMEMBER: FINRA/SIPC 138
EQUITY RESEARCHCowen and Company, LLC

2. Comfortable, but I would closely monitor and warn the patient (32%)
3. Somewhat comfortable, I would only prescribe to a small fraction of these patients (32%)
4. Not comfortable, I would not prescribe BELVIQ to this group of patients (24%)
8. How comfortable would you be prescribing BELVIQ to patients at increased CV risk?
1. Very comfortable (36%)
2. Comfortable, but would closely monitor and warn the patient and would ask them to discuss this with their
cardiologist before or after starting on BELVIQ (28%)
3. Somewhat comfortable, I would only prescribe in a small fraction of these patients (28%)
4. Not comfortable, I would not prescribe to this group of patients (8%)
9. How concerned are you about the rat carcinogenicity and potential valvulopathy data observed in BELVIQ’s
preclinical studies?
1. Very concerned, I will not prescribe BELVIQ to my patients (4%)
2. Concerned, and I will only prescribe BELVIQ to a small % of my patients (18%)
3. Somewhat concerned, but the risk/reward makes sense to me and I will use BELVIQ in quite a few of my patients
(62%)
4. Not concerned at all, I’ll use BELVIQ to many of my patients (16%)
10. I would be willing to treat my patients with BELVIQ in combination with phentermine to help them achieve more
robust weight loss:
1. Yes (26%)
2. No, I don’t believe the addition of phentermine can significantly add to the weight loss seen with BELVIQ alone (6%)
3. No, because we have not yet seen clinical trial data with the BELVIQ + phentermine combination (54%)
4. No, because the combination is not FDA-approved (14%)
11. The following statement best describes my expectation for my use of Qsymia and BELVIQ:
1. I will try Qsymia first, if the patient doesn’t respond, I will then try BELVIQ (30%)
2. I will try BELVIQ first, if the patient doesn’t respond, I will then try Qsymia (6%)
3. I will try Qsymia first, if the patient doesn’t respond, I won’t try BELVIQ (8%)
4. I will try BELVIQ first, if the patient doesn’t respond, I won’t try Qsymia (0%)
5. I will try one of the two first, if the patient doesn’t respond, I will then try the other one (50%)
6. I will try one of the two first, if the patient doesn’t respond, I won’t try the other one (2%)
7. I won’t use either of these drugs (4%)
12. 18-24 months after their launch, I believe that Qsymia and BELVIQ will have split the market in the following way:
1. Qsymia 90%, BELVIQ 10% (4%)
2. Qsymia 75%, BELVIQ 25% (36%)
3. Qsymia 60%, BELVIQ 40% (34%)
4. Qsymia 50%, BELVIQ 50% (22%)
5. Qsymia 40%, BELVIQ 60% (2%)
6. Qsymia 25%, BELVIQ 75% (2%)
7. Qsymia 10%, BELVIQ 90% (0%)
13. The obesity drug that results in the most robust weight loss is:
1. Qsymia (68%)
2. BELVIQ (0%)
3. Contrave (4%)
4. Liraglutide (4%)
5. Empatic (4%)
6. Orlistat (2%)
7. None of these drugs result in what I consider meaningful weight loss (18%)
www.cowen.comMEMBER: FINRA/SIPC 139
EQUITY RESEARCHCowen and Company, LLC

14. The obesity drug with the best safety and tolerability profile is:
1. Qsymia (20%)
2. BELVIQ (22%)
3. Contrave (10%)
4. Liraglutide (24%)
5. Empatic (0%)
6. Orlistat (18%)
7. I believe that the safety and tolerability profile of these agents is such that I would probably not use them in most of
my patients (6%)
15. The probability that Contrave’s cardiovascular outcomes LIGHT trial succeeds is approximately:
1. 10% (2%)
2. 20% (20%)
3. 30% (16%)
4. 50% (22%)
5. 75% (28%)
6. 90+% (12%)
16. Assuming it is approved, the biggest hurdle to Contrave’s wide adoption will be:
1. I don’t expect any big hurdles; I think Contrave will be very widely prescribed (2%)
2. Cost/lack of reimbursement (48%)
3. Competition from Qsymia (12%)
4. Competition from BELVIQ (0%)
5. Competition from off-label use of bupropion and naltrexone (12%)
6. Safety concerns (8%)
7. Patients won’t lose much weight, will be disappointed and discontinue treatment (18%)
17. To a motivated patient that I think could benefit from Contrave (when/if it is approved), but could not afford it and
would ask if I could “please help them” by prescribing generic bupropion and naltrexone instead, my answer would be:
1. OK, will do it (54%)
2. No, I’m afraid I can’t, due to the legal liability of using these two generics off-label when there’s a branded drug on
the market (30%)
3. No, I’m afraid I can’t, because it’s too complicated to accurately titrate the two generics and still get the same
efficacy and tolerability that you’d get with Contrave (16%)
18. Assuming Contrave is approved, 18-24 months from its launch, I believe the obesity drug market will be split in the
following way:
1. Qsymia 33%, BELVIQ 33%, Contrave 33% (16%)
2. Qsymia 40%, BELVIQ 40%, Contrave 20% (14%)
3. BELVIQ 40%, Contrave 40%, Qsymia 20% (2%)
4. Contrave 40%, Qsymia 40%, BELVIQ 20% (20%)
5. Qsymia 60%, BELVIQ 20%, Contrave 20% (30%)
6. BELVIQ 60%, Qsymia 20%, Contrave 20% (4%)
7. Contrave 60%, Qsymia 20%, BELVIQ 20% (4%)
8. Qsymia 80%, BELVIQ 10%, Contrave 10% (10%)
9. BELVIQ 80%, Qsymia 10%, Contrave 10% (0%)
10. Contrave 80%, Qsymia 10%, BELVIQ 10% (0%)
19. What is your view of Novo Nordisk’s Victoza (liraglutide), which is already approved for diabetes and is currently in
Phase III development for the treatment of obesity?
www.cowen.comMEMBER: FINRA/SIPC 140
EQUITY RESEARCHCowen and Company, LLC

1. A very promising anti-obesity agent (32%)
2. An incremental improvement over currently available therapies (44%)
3. I have very low expectations for this agent (20%)
4. I don’t have an opinion (4%)
20. What is your view of Orexigen’s Empatic (buprorion/zonisamide) which was tested in two Phase II trials for the
treatment of obesity?
1. A very promising anti-obesity agent (26%)
2. An incremental improvement over currently available therapies (40%)
3. I have very low expectations for this agent (20%)
4. I don’t have an opinion (14%)
www.cowen.comMEMBER: FINRA/SIPC 141
EQUITY RESEARCHCowen and Company, LLC

Valuation Methodology & Investment Risks
Valuation MethodologyBiotechnology:
In calculating our 12-month target price, we employ one or more valuation methodologies, which include a discounted earnings analysis, discountedcash flow analysis, net present value analysis and/or a comparable company analysis. These analyses may or may not require the use of objectivemeasures such as price-to-earnings or price-to-sales multiples as well as subjective measures such as discount rates.
We make investment recommendations on early stage (pre-commercial) biotechnology companies based upon an assessment of their technology,the probability of pipeline success, and the potential market opportunity in the event of success. However, because these companies lack traditionalfinancial metrics, we do not believe there are any good methodologies for assigning a specific target price to such stocks.
Investment RisksBiotechnology:
There are multiple risks that are inherent with an investment in the biotechnology sector. Beyond systemic risk, there is also clinical, regulatory, andcommercial risk. Additionally, biotechnology companies require significant amounts of capital in order to develop their clinical programs. The capital-raising environment is always changing and there is risk that necessary capital to complete development may not be readily available.
Company Specific Risks
Risks to our Market Perform rating on ARNA include: 1) significant changes in the uptake in BELVIQ scripts, 2) competitive pressure from Qsymia,3) positive (or negative) data from Orexigen's LIGHT CVOT, 4) change of EU regulatory plans for BELVIQ, and 5) acceleration of development plansand/or regulatory pathway news for combination product with phentermine.
www.cowen.comMEMBER: FINRA/SIPC 142
EQUITY RESEARCHCowen and Company, LLC
AddendumSTOCKS MENTIONED IN IMPORTANT DISCLOSURESTicker Company Name
ARNA Arena PharmaceuticalsOREX Orexigen TherapeuticsVVUS Vivus
Analyst CertificationEach author of this research report hereby certifies that (i) the views expressed in the research report accurately reflect his or her personal views aboutany and all of the subject securities or issuers, and (ii) no part of his or her compensation was, is, or will be related, directly or indirectly, to the specificrecommendations or views expressed in this report.
Important DisclosuresCowen and Company, LLC and or its affiliates make a market in the stock of Arena Pharmaceuticals, Orexigen Therapeutics and Vivus securities.
Cowen and Company, LLC compensates research analysts for activities and services intended to benefit the firm's investor clients. Individualcompensation determinations for research analysts, including the author(s) of this report, are based on a variety of factors, including the overallprofitability of the firm and the total revenue derived from all sources, including revenues from investment banking. Cowen and Company, LLC doesnot compensate research analysts based on specific investment banking transactions.
DisclaimerThis research is for our clients only. Our research is disseminated primarily electronically and, in some cases, in printed form. Research distributedelectronically is available simultaneously to all Cowen and Company, LLC clients. All published research can be obtained on the Firm's client website,https://cowenlibrary.bluematrix.com/client/library.jsp.
Further information on any of the above securities may be obtained from our offices. This report is published solely for information purposes, and is notto be construed as an offer to sell or the solicitation of an offer to buy any security in any state where such an offer or solicitation would be illegal. Otherthan disclosures relating to Cowen and Company, LLC, the information herein is based on sources we believe to be reliable but is not guaranteed byus and does not purport to be a complete statement or summary of the available data. Any opinions expressed herein are statements of our judgmenton this date and are subject to change without notice.
For important disclosures regarding the companies that are the subject of this research report, please contact Compliance Department, Cowen andCompany, LLC, 599 Lexington Avenue, 20th Floor, New York, NY 10022. In addition, the same important disclosures, with the exception of the valuationmethods and risks, are available on the Firm's disclosure website at https://cowen.bluematrix.com/sellside/Disclosures.action.
Price Targets: Cowen and Company, LLC assigns price targets on all covered companies unless noted otherwise. The price target for an issuer'sstock represents the value that the analyst reasonably expects the stock to reach over a performance period of twelve months. The price targets inthis report should be considered in the context of all prior published Cowen and Company, LLC research reports (including the disclosures in any suchreport or on the Firm's disclosure website), which may or may not include price targets, as well as developments relating to the issuer, its industryand the financial markets. For price target valuation methodology and risks associated with the achievement of any given price target, please see theanalyst's research report publishing such targets.
Notice to UK Investors: This publication is produced by Cowen and Company, LLC which is regulated in the United States by FINRA. It is to becommunicated only to persons of a kind described in Articles 19 and 49 of the Financial Services and Markets Act 2000 (Financial Promotion) Order2005. It must not be further transmitted to any other person without our consent.
Copyright, User Agreement and other general information related to this report© 2013 Cowen and Company, LLC. Member NYSE, FINRA and SIPC. All rights reserved. This research report is prepared for the exclusive use ofCowen clients and may not be reproduced, displayed, modified, distributed, transmitted or disclosed, in whole or in part, or in any form or manner,to others outside your organization without the express prior written consent of Cowen. Cowen research reports are distributed simultaneously to allclients eligible to receive such research reports. Any unauthorized use or disclosure is prohibited. Receipt and/or review of this research constitutesyour agreement not to reproduce, display, modify, distribute, transmit, or disclose to others outside your organization the contents, opinions, conclusion,or information contained in this report (including any investment recommendations, estimates or price targets). All Cowen trademarks displayed in thisreport are owned by Cowen and may not be used without its prior written consent.
www.cowen.comMEMBER: FINRA/SIPC 143
EQUITY RESEARCHCowen and Company, LLC

Cowen and Company, LLC. New York (646) 562-1000 Boston (617) 946-3700 San Francisco (415) 646-7200 Chicago (312) 577-2240 Cleveland(440) 331-3531 Atlanta (866) 544-7009 London (affiliate) 44-207-071-7500
COWEN AND COMPANY RATING DEFINITIONSCowen and Company Rating System effective May 25, 2013Outperform (1): The stock is expected to achieve a total positive return of at least 15% over the next 12 monthsMarket Perform (2): The stock is expected to have a total return that falls between the parameters of an Outperform and Underperform over thenext 12 monthsUnderperform (3): Stock is expected to achieve a total negative return of at least 10% over the next 12 monthsAssumption: The expected total return calculation includes anticipated dividend yieldCowen and Company Rating System until May 25, 2013Outperform (1): Stock expected to outperform the S&P 500Neutral (2): Stock expected to perform in line with the S&P 500Underperform (3): Stock expected to underperform the S&P 500Assumptions: Time horizon is 12 months; S&P 500 is flat over forecast periodCowen Securities, formerly known as Dahlman Rose & Company, Rating System until May 25, 2013Buy – The fundamentals/valuations of the subject company are improving and the investment return is expected to be 5 to 15 percentage points higherthan the general market returnSell – The fundamentals/valuations of the subject company are deteriorating and the investment return is expected to be 5 to 15 percentage pointslower than the general market returnHold – The fundamentals/valuations of the subject company are neither improving nor deteriorating and the investment return is expected to be inline with the general market return
COWEN AND COMPANY RATING ALLOCATIONDistribution of Ratings/Investment Banking Services (IB) as of 09/30/13Rating Count Ratings Distribution Count IB Services/Past 12 MonthsBuy (a) 394 58.72% 54 13.71%Hold (b) 255 38.00% 5 1.96%Sell (c) 22 3.28% 1 4.55%
(a) Corresponds to "Outperform" rated stocks as defined in Cowen and Company, LLC's rating definitions. (b) Corresponds to "Market Perform" asdefined in Cowen and Company, LLC's ratings definitions. (c) Corresponds to "Underperform" as defined in Cowen and Company, LLC's ratingsdefinitions.Note: "Buy", "Hold" and "Sell" are not terms that Cowen and Company, LLC uses in its ratings system and should not be construed as investmentoptions. Rather, these ratings terms are used illustratively to comply with FINRA and NYSE regulations.
www.cowen.comMEMBER: FINRA/SIPC 144
EQUITY RESEARCHCowen and Company, LLC

www.cowen.comMEMBER: FINRA/SIPC 145
EQUITY RESEARCHCowen and Company, LLC

Legend for Price Chart:I = Initation | 1 = Outperform | 2 = Market Perform | 3 = Underperform | T = Terminated Coverage | $xx = Price Target | NA = Not Available
www.cowen.comMEMBER: FINRA/SIPC 146
EQUITY RESEARCHCowen and Company, LLC