COVID19 reproduction Number estimation
21
COVID19 reproduction Number estimation P. Abry & Signals, Systems, and Physics (SiSyPh) research team (Physics Lab., ENS Lyon, CNRS) http://www.ens-lyon.fr/PHYSIQUE/teams/signaux-systemes-physique December 12, 2021 Abstract from numbers of daily infected people using nonsmooth convex optimization This work reports the estima- tion of th espace and time evolution of COVID19 reproduction Num- ber for around 200 countries around the world, the 49 continental states of the USA and the 96 MetropplitanFrance counties. Esti- mation is based on the numbers of daily new infections provide by John Hopkins University, and Sant´ e Publique France. Estimation makes uses of nonsmooth convex optimization. Work performed by the Signal, System and Physics team at ENS Lyon and CNRS. Full paper has been published in a major scientific journal PLoSOne : https://journals.plos.org/plosone/article?id=10.1371/journal.pone.0237901 https://journals.plos.org/plosone/article?id=10.1371/journal.pone.0237901 Contents 1 Introduction 1 2 France 3 2.1 Population vs. Hopsital based estimates ............ 3 2.2 Daily estimates for France from two datasources ....... 5 2.3 France D´ epartements ....................... 6 2.4 France : Impacts of outliers ................... 8 3 Worldwide COVID-19 9 3.1 Map of the World ......................... 9 3.2 Maps of the USA ......................... 10 3.3 Europe ............................... 12 3.4 America .............................. 15 3.5 Asia ................................ 17 3.6 Africa ............................... 19 1
Transcript of COVID19 reproduction Number estimation

COVID19 reproduction Number estimation
P. Abry & Signals, Systems, and Physics (SiSyPh) research team(Physics Lab., ENS Lyon, CNRS)
http://www.ens-lyon.fr/PHYSIQUE/teams/signaux-systemes-physique
December 12, 2021
Abstract
from numbers of daily infected peopleusing nonsmooth convex optimization This work reports the estima-tion of th espace and time evolution of COVID19 reproduction Num-ber for around 200 countries around the world, the 49 continentalstates of the USA and the 96 MetropplitanFrance counties. Esti-mation is based on the numbers of daily new infections provide byJohn Hopkins University, and Sante Publique France. Estimationmakes uses of nonsmooth convex optimization. Work performed bythe Signal, System and Physics team at ENS Lyon and CNRS. Fullpaper has been published in a major scientific journal PLoSOne :https://journals.plos.org/plosone/article?id=10.1371/journal.pone.0237901https://journals.plos.org/plosone/article?id=10.1371/journal.pone.0237901
Contents
1 Introduction 1
2 France 32.1 Population vs. Hopsital based estimates . . . . . . . . . . . . 32.2 Daily estimates for France from two datasources . . . . . . . 52.3 France Departements . . . . . . . . . . . . . . . . . . . . . . . 62.4 France : Impacts of outliers . . . . . . . . . . . . . . . . . . . 8
3 Worldwide COVID-19 93.1 Map of the World . . . . . . . . . . . . . . . . . . . . . . . . . 93.2 Maps of the USA . . . . . . . . . . . . . . . . . . . . . . . . . 103.3 Europe . . . . . . . . . . . . . . . . . . . . . . . . . . . . . . . 123.4 America . . . . . . . . . . . . . . . . . . . . . . . . . . . . . . 153.5 Asia . . . . . . . . . . . . . . . . . . . . . . . . . . . . . . . . 173.6 Africa . . . . . . . . . . . . . . . . . . . . . . . . . . . . . . . 19
1
1 Introduction
This work proposes an original estimation of the space and time evolutionof R(t) for the Covid19 pandemic obtained by combining :
- a relevant epidemiological model proposed by an international group ofepidemiologists from the study of several previous pandemics/epidemics[1] ;
- an original functional optimization based non linear filtering of dailynew infections counts to provide piecewise smooth in time and spaceestimates of R(t),
- the daily counts of new infections reported by Sante Publique France(for France) and John Hopkins University for the world.
Estimation is based on non-smooth (proximal-based) optimization, witha Poisson prior for the data fidelity term and a Laplacian penalization tofavor piecewise linear estimate. Estimates are computed daily and reportedautomatically at perso.ens-lyon.fr/patrice.abry in the form of :
- time evolution plots for R(t) per countries https://perso.ens-lyon.fr/patrice.abry/Covid France trendOutlier.png ;
- space maps for R(t) for the French Counties http://perso.ens-lyon.fr/patrice.abry/FranceSPF.png ;
- video along time for R(t) for the French Counties https://perso.ens-lyon.fr/patrice.abry/DeptRegul.mp4 ;
- space maps plots for the world https://perso.ens-lyon.fr/patrice.abry/WorldR.png ;
- space maps plots for the USA http://perso.ens-lyon.fr/patrice.abry/USADeptReg.png ;
- tables of estimates for France http://perso.ens-lyon.fr/patrice.abry/R deptJoinToday.csv ;
- tables of estimates for the World http://perso.ens-lyon.fr/patrice.abry/DataCountriesLastToday ;
- a detailed report for all the countries of the world ttps://perso.ens-lyon.fr/patrice.abry/PlotCovid.pdf.
Further, animated and interactive maps are being developed and prelim-inary version are available at :
- For France http://barthes.enssib.fr/coronavirus/cartes/R-du-jour-France-Dpts.svg ;
- For the World http://barthes.enssib.fr/coronavirus/cartes/R-Covid-19-today-World.svg ;
- For the World http://betternet-rumbi.lhs.loria.fr/website/covid/monde.
2

These reports aim to make available scientific assessment of the pandemicgrowth :
- not only to scientific and experts ;
- but also to the press and to decision makers ;
- and to citizens and to anyone interested in a relevant independentscientific information on the status of the pandemic without mediabias and noise.
Up to Dec. 14th. data were provided by the European center for DiseaseControl https://www.ecdc.europa.eu/.. This was a great website, but dataavailability has been abruptly stoped on Dec. 14th, 2020, with no priornotice and
3

2 France
2.1 Population vs. Hopsital based estimates
Figure 1: Daily Estimates for France from two different sources ofdata. Population daily new infection counts from John Hopkins University.Red (resp., Blue) correspond to rapidly (resp., slowly) varying estimates. βis the derivative of R.
4

Figure 2: Daily Estimates for France from two different sources ofdata. Hospital based counts of daily new infection from Sante-Publique-France (right). Red (resp., Blue) correspond to rapidly (resp., slowly) vary-ing estimates. β is the derivative of R.
5
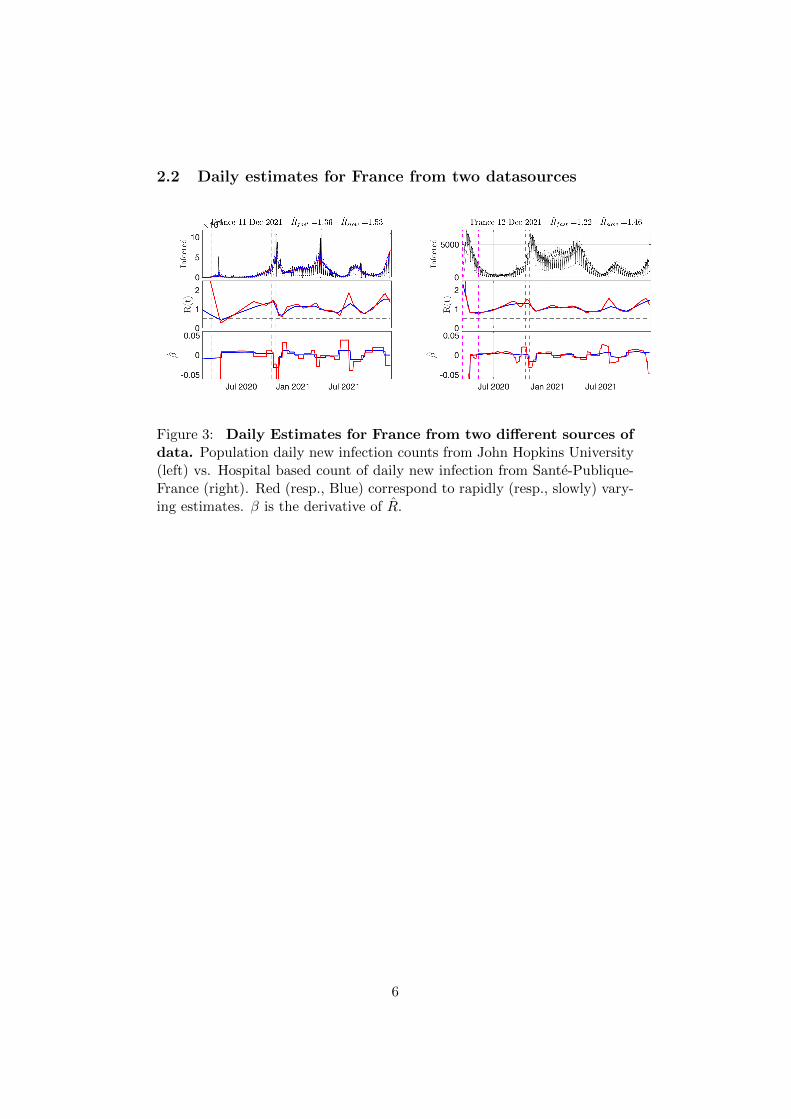
2.2 Daily estimates for France from two datasources
Figure 3: Daily Estimates for France from two different sources ofdata. Population daily new infection counts from John Hopkins University(left) vs. Hospital based count of daily new infection from Sante-Publique-France (right). Red (resp., Blue) correspond to rapidly (resp., slowly) vary-ing estimates. β is the derivative of R.
6

2.3 France Departements
Figure 4: R for the French Departments Independent (per de-partement) estimates (left) vs. graph-based spatially regularized estimates(right). R (top) vs. β (derivative of R) (bottom). Movies for the wholeperiod are made available at perso.ens-lyon.fr/patrice.abry/DeptRegul.mp4and updated on a regular basis.
7

Figure 5: Graph-based spatially regularized estimates of Rfor the 96 Metropolitan France Departments, as a functions ofdays. A Movie for the whole period is made available at perso.ens-lyon.fr/patrice.abry/DeptRegul.mp4 and updated on a regular basis.Hospital-based data from Source3 (SPF).
8

2.4 France : Impacts of outliers
Figure 6: Daily Estimates for France Estimation of R(t) and of theoutliers are performed in single step (left) vs. Outliers are preprocessed firstfollowed by the estimate of R(t). Population daily new infection counts fromthe European Centre for Disease Prevention. Red (resp., Blue) correspondto rapidly (resp., slowly) varying estimates. β is the derivative of R.
9

3 Worldwide COVID-19
3.1 Map of the World
Figure 7: World Map for the current estimate of R(t).
10

3.2 Maps of the USA
q
Figure 8: Current estimate of R(t) for the USA.
11

Figure 9: Continental USA Map for the current estimate of R(t).
12

3.3 Europe
Figure 10: Daily Estimates.
13
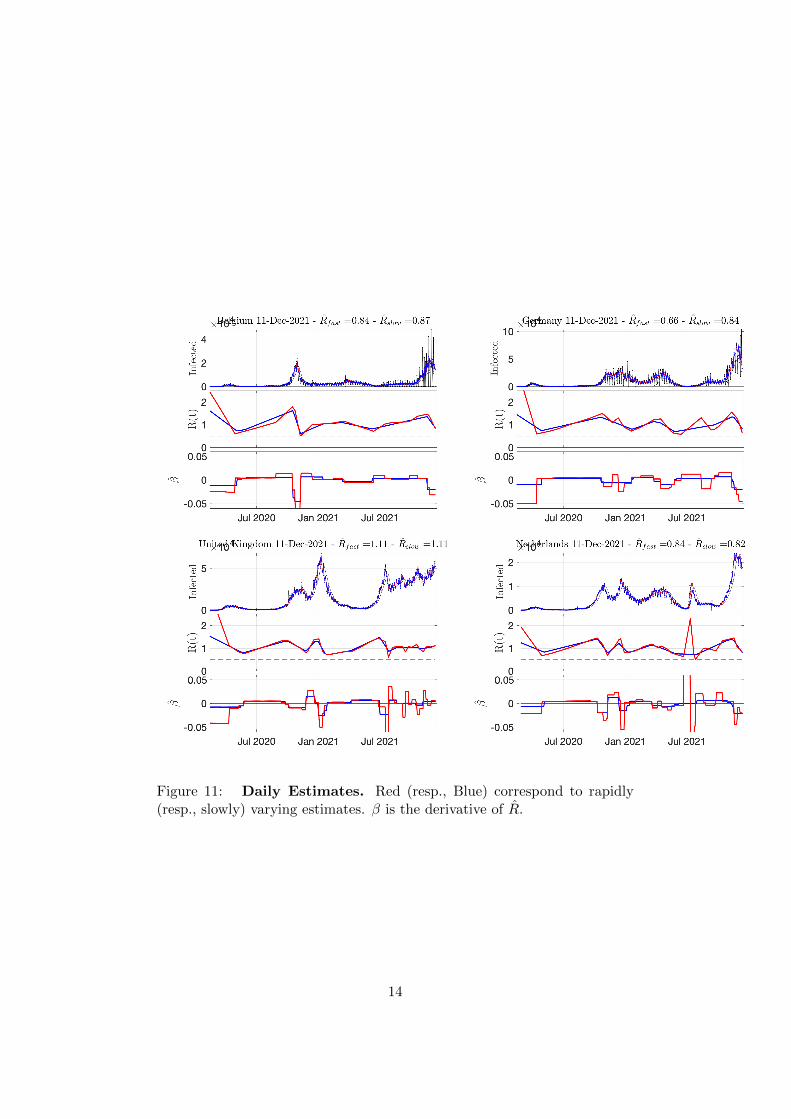
Figure 11: Daily Estimates. Red (resp., Blue) correspond to rapidly(resp., slowly) varying estimates. β is the derivative of R.
14

Figure 12: Daily Estimates.
15
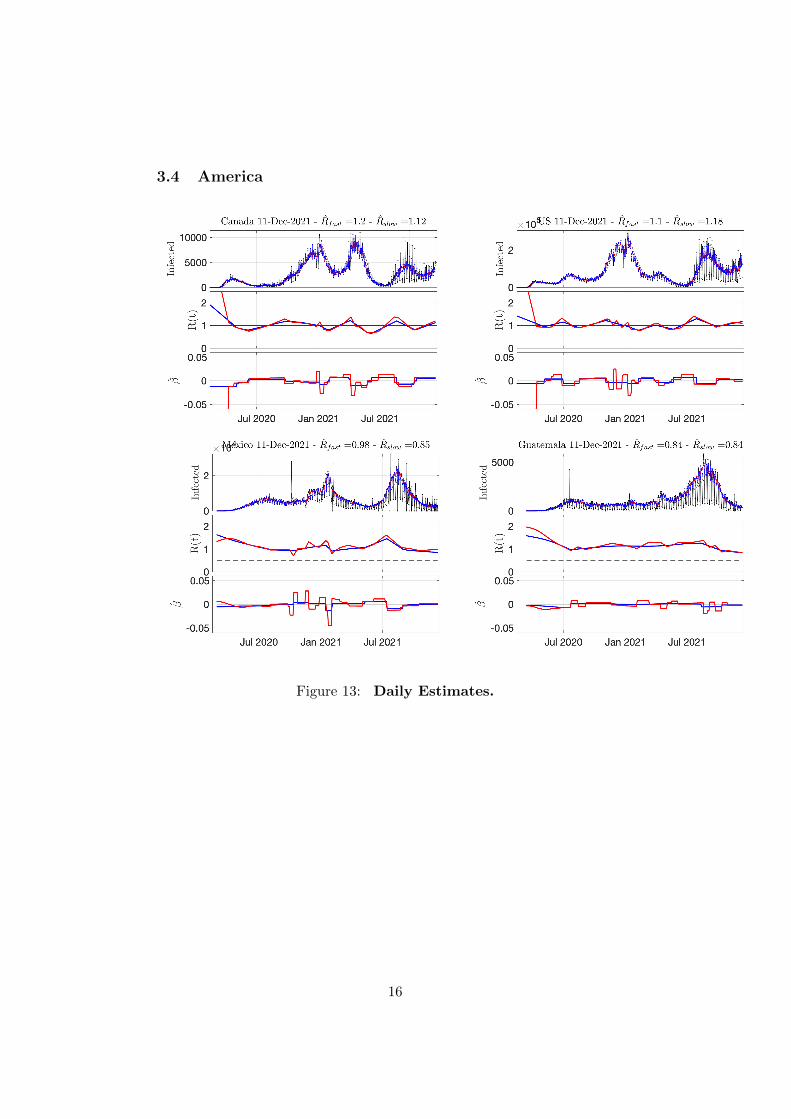
3.4 America
Figure 13: Daily Estimates.
16

Figure 14: Daily Estimates. Red (resp., Blue) correspond to rapidly(resp., slowly) varying estimates. β is the derivative of R.
17

3.5 Asia
Figure 15: Daily Estimates. Red (resp., Blue) correspond to rapidly(resp., slowly) varying estimates. β is the derivative of R.
18

Figure 16: Daily Estimates. Red (resp., Blue) correspond to rapidly(resp., slowly) varying estimates. β is the derivative of R.
19
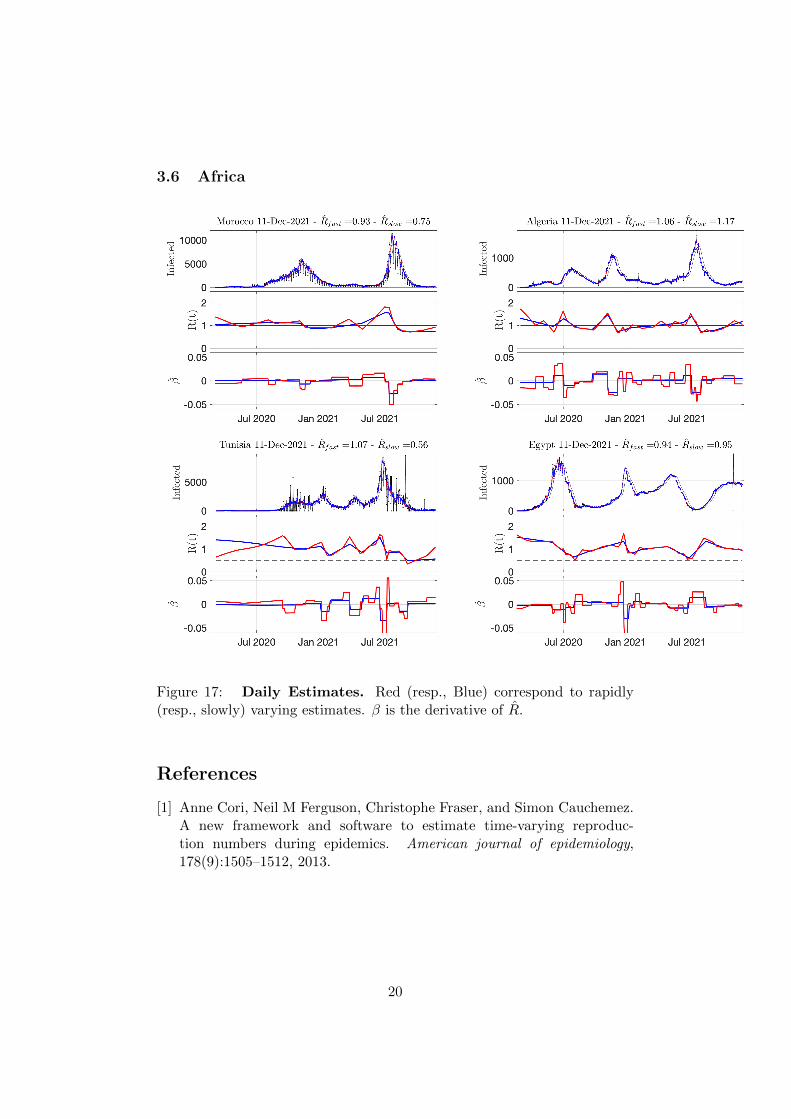
3.6 Africa
Figure 17: Daily Estimates. Red (resp., Blue) correspond to rapidly(resp., slowly) varying estimates. β is the derivative of R.
References
[1] Anne Cori, Neil M Ferguson, Christophe Fraser, and Simon Cauchemez.A new framework and software to estimate time-varying reproduc-tion numbers during epidemics. American journal of epidemiology,178(9):1505–1512, 2013.
20

Figure 18: Daily Estimates. Red (resp., Blue) correspond to rapidly(resp., slowly) varying estimates. β is the derivative of R.
21