COVID-19 in Ontario: January 15, 2020 to April 13, 2021
31
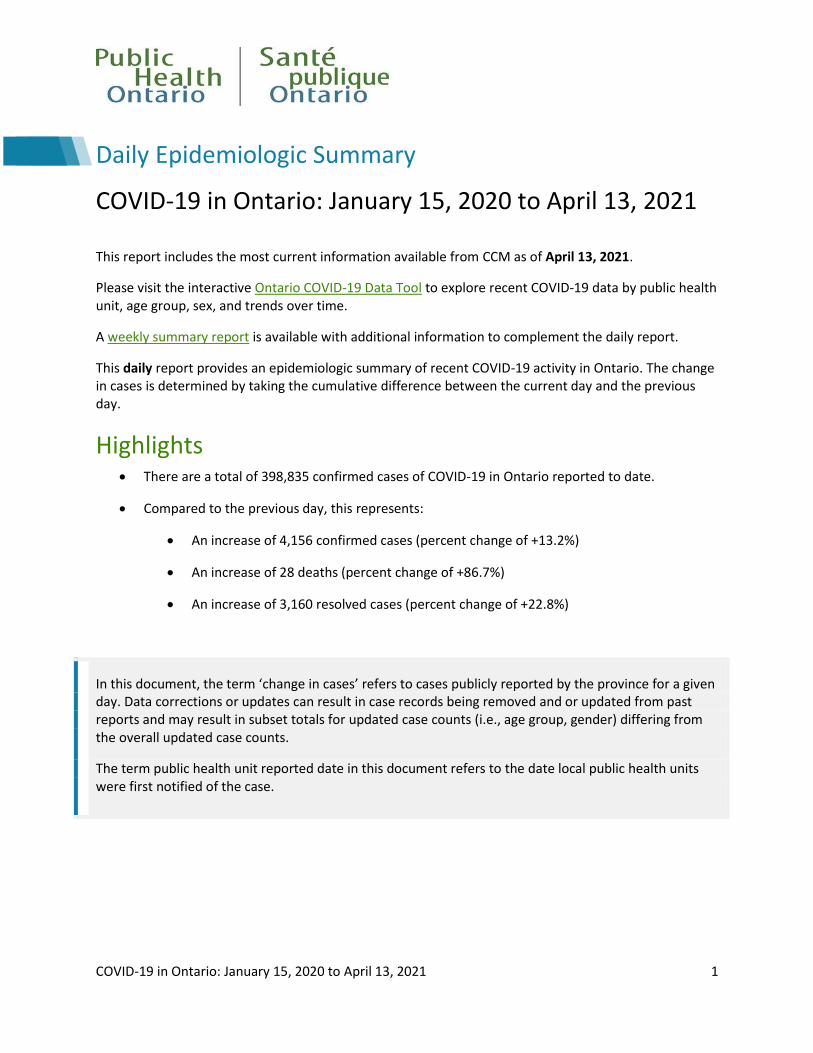
COVID-19 in Ontario: January 15, 2020 to April 13, 2021 1 Daily Epidemiologic Summary COVID-19 in Ontario: January 15, 2020 to April 13, 2021 This report includes the most current information available from CCM as of April 13, 2021. Please visit the interactive Ontario COVID-19 Data Tool to explore recent COVID-19 data by public health unit, age group, sex, and trends over time. A weekly summary report is available with additional information to complement the daily report. This daily report provides an epidemiologic summary of recent COVID-19 activity in Ontario. The change in cases is determined by taking the cumulative difference between the current day and the previous day. Highlights There are a total of 398,835 confirmed cases of COVID-19 in Ontario reported to date. Compared to the previous day, this represents: An increase of 4,156 confirmed cases (percent change of +13.2%) An increase of 28 deaths (percent change of +86.7%) An increase of 3,160 resolved cases (percent change of +22.8%) In this document, the term ‘change in cases’ refers to cases publicly reported by the province for a given day. Data corrections or updates can result in case records being removed and or updated from past reports and may result in subset totals for updated case counts (i.e., age group, gender) differing from the overall updated case counts. The term public health unit reported date in this document refers to the date local public health units were first notified of the case.
Transcript of COVID-19 in Ontario: January 15, 2020 to April 13, 2021
COVID-19 in Ontario: January 15, 2020 to April 13, 2021 1
Daily Epidemiologic Summary
COVID-19 in Ontario: January 15, 2020 to April 13, 2021
This report includes the most current information available from CCM as of April 13, 2021.
Please visit the interactive Ontario COVID-19 Data Tool to explore recent COVID-19 data by public health unit, age group, sex, and trends over time.
A weekly summary report is available with additional information to complement the daily report.
This daily report provides an epidemiologic summary of recent COVID-19 activity in Ontario. The change in cases is determined by taking the cumulative difference between the current day and the previous day.
Highlights There are a total of 398,835 confirmed cases of COVID-19 in Ontario reported to date.
Compared to the previous day, this represents:
An increase of 4,156 confirmed cases (percent change of +13.2%)
An increase of 28 deaths (percent change of +86.7%)
An increase of 3,160 resolved cases (percent change of +22.8%)
In this document, the term ‘change in cases’ refers to cases publicly reported by the province for a given day. Data corrections or updates can result in case records being removed and or updated from past reports and may result in subset totals for updated case counts (i.e., age group, gender) differing from the overall updated case counts.
The term public health unit reported date in this document refers to the date local public health units were first notified of the case.
COVID-19 in Ontario: January 15, 2020 to April 13, 2021 2
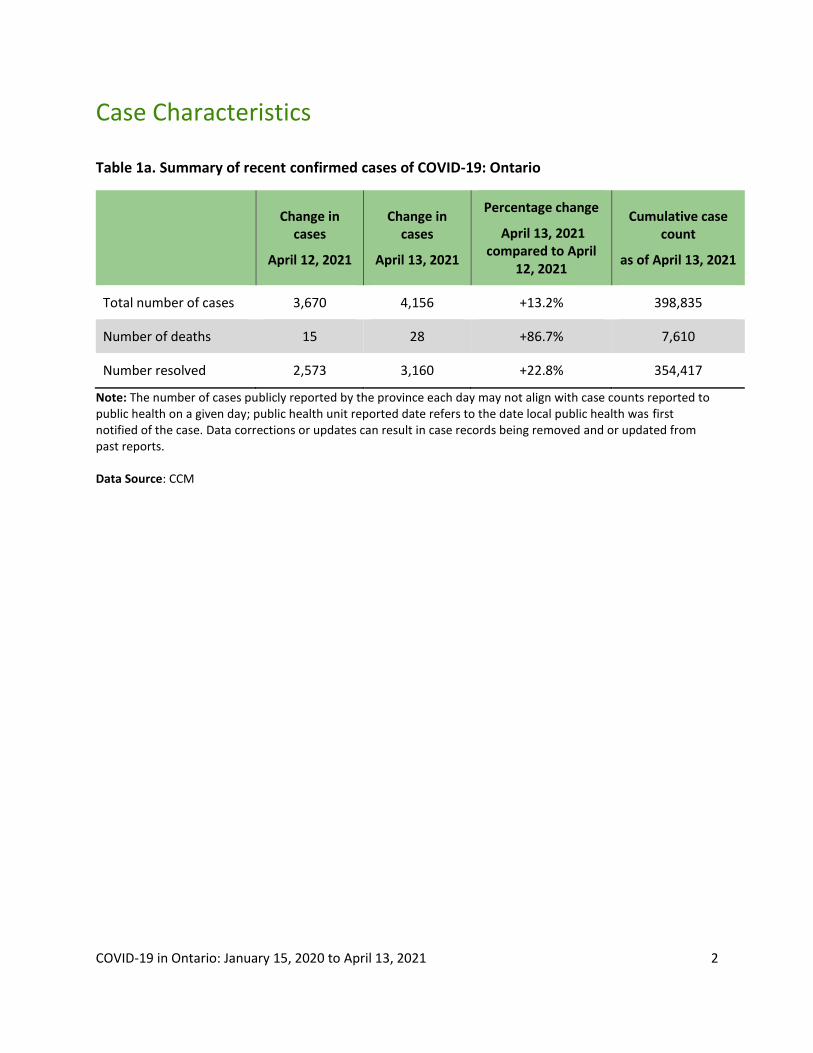
Case Characteristics
Table 1a. Summary of recent confirmed cases of COVID-19: Ontario
Change in cases
April 12, 2021
Change in cases
April 13, 2021
Percentage change
April 13, 2021 compared to April
12, 2021
Cumulative case count
as of April 13, 2021
Total number of cases 3,670 4,156 +13.2% 398,835
Number of deaths 15 28 +86.7% 7,610
Number resolved 2,573 3,160 +22.8% 354,417
Note: The number of cases publicly reported by the province each day may not align with case counts reported to public health on a given day; public health unit reported date refers to the date local public health was first notified of the case. Data corrections or updates can result in case records being removed and or updated from past reports. Data Source: CCM

COVID-19 in Ontario: January 15, 2020 to April 13, 2021 3
Table 1b. Summary of recent confirmed cases of COVID-19 by age group and gender: Ontario
Change in cases
April 12, 2021
Change in cases
April 13, 2021
Cumulative case count
as of April 13, 2021
Gender: Male 1,896 2,135 197,750
Gender: Female 1,754 1,998 198,784
Ages: 19 and under 721 755 59,572
Ages: 20-39 1,344 1,490 146,366
Ages: 40-59 1,075 1,271 114,718
Ages: 60-79 459 560 55,715
Ages: 80 and over 72 76 22,370
Note: Not all cases have a reported age or gender reported. Data corrections or updates can result in case records being removed and or updated from past reports and may result in subset totals (i.e., age group, gender) differing from past publicly reported case counts. Data Source: CCM
Table 2. Summary of recent confirmed cases of COVID-19 in school aged children by age group, August 30, 2020 to April 13, 2021: Ontario
Change in cases
April 12, 2021
Change in cases
April 13, 2021
Cumulative case count from August 30, 2020
to April 13, 2021
Ages: 4 to 8 145 141 10,742
Ages: 9 to 13 193 207 14,033
Ages: 14 to 17 160 194 13,861
Note: Includes all confirmed cases of COVID-19 for specified ages, regardless of school attendance. Data corrections or updates can result in case records being removed and or updated from past reports and may result in subset totals (i.e., age group) differing from past publicly reported case counts. Data Source: CCM
COVID-19 in Ontario: January 15, 2020 to April 13, 2021 4
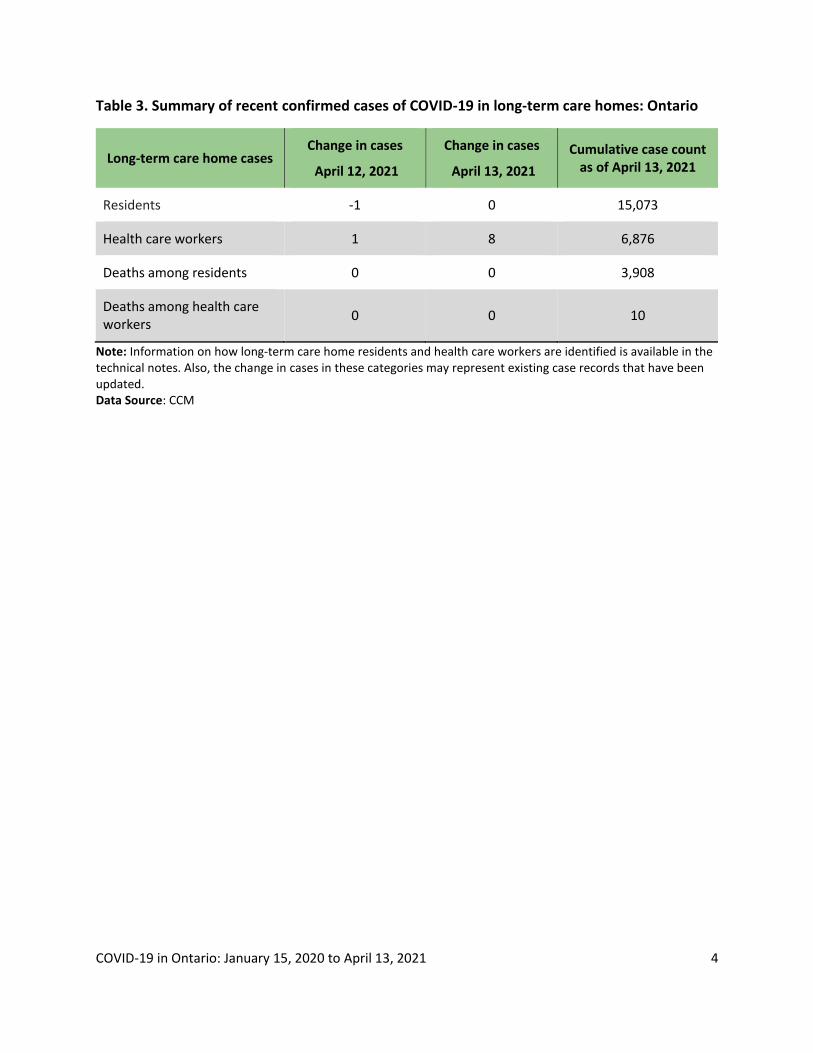
Table 3. Summary of recent confirmed cases of COVID-19 in long-term care homes: Ontario
Long-term care home cases Change in cases
April 12, 2021
Change in cases
April 13, 2021
Cumulative case count as of April 13, 2021
Residents -1 0 15,073
Health care workers 1 8 6,876
Deaths among residents 0 0 3,908
Deaths among health care workers
0 0 10
Note: Information on how long-term care home residents and health care workers are identified is available in the technical notes. Also, the change in cases in these categories may represent existing case records that have been updated. Data Source: CCM
5
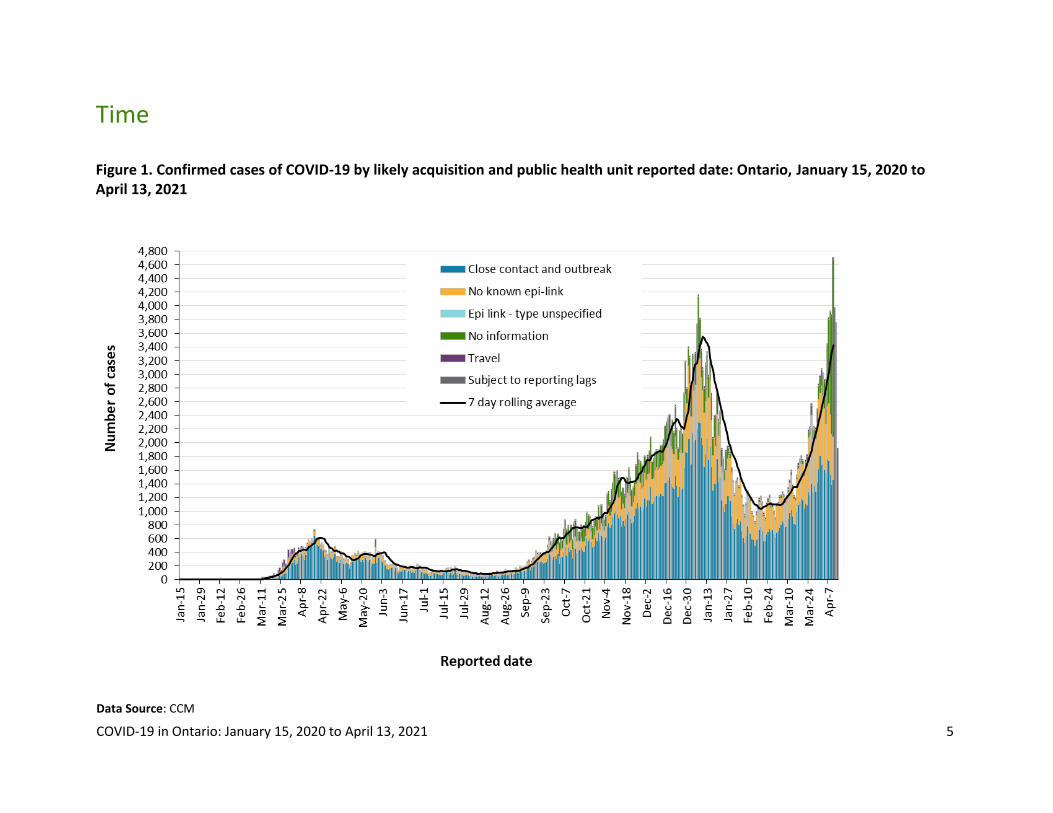
Time
Figure 1. Confirmed cases of COVID-19 by likely acquisition and public health unit reported date: Ontario, January 15, 2020 to April 13, 2021
Data Source: CCM
COVID-19 in Ontario: January 15, 2020 to April 13, 2021
COVID-19 in Ontario: January 15, 2020 to April 13, 2021 6
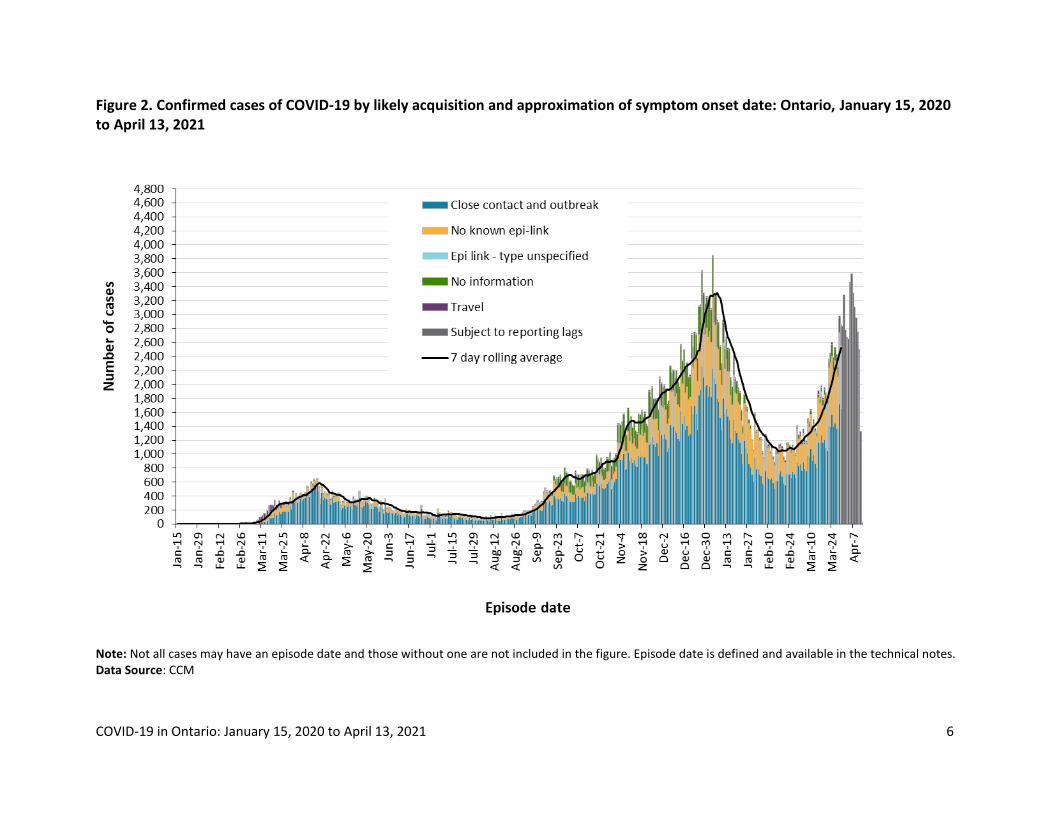
Figure 2. Confirmed cases of COVID-19 by likely acquisition and approximation of symptom onset date: Ontario, January 15, 2020 to April 13, 2021
Note: Not all cases may have an episode date and those without one are not included in the figure. Episode date is defined and available in the technical notes. Data Source: CCM
COVID-19 in Ontario: January 15, 2020 to April 13, 2021 7
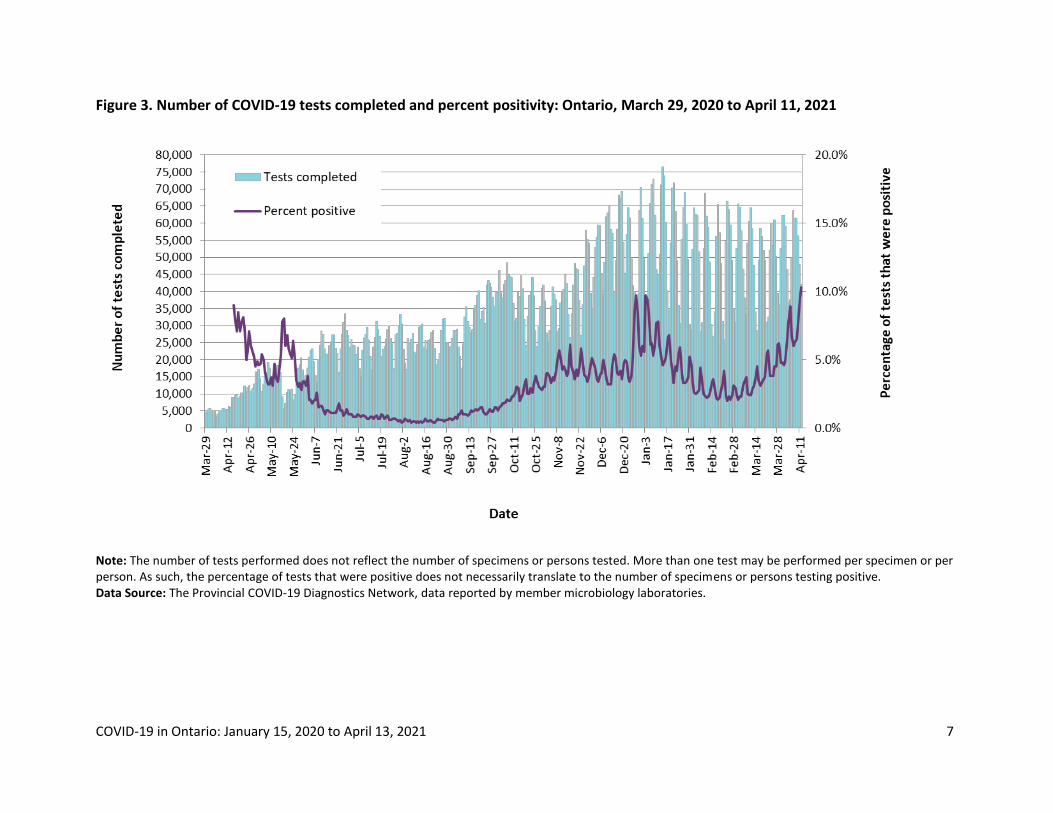
Figure 3. Number of COVID-19 tests completed and percent positivity: Ontario, March 29, 2020 to April 11, 2021
Note: The number of tests performed does not reflect the number of specimens or persons tested. More than one test may be performed per specimen or per person. As such, the percentage of tests that were positive does not necessarily translate to the number of specimens or persons testing positive. Data Source: The Provincial COVID-19 Diagnostics Network, data reported by member microbiology laboratories.
COVID-19 in Ontario: January 15, 2020 to April 13, 2021 8
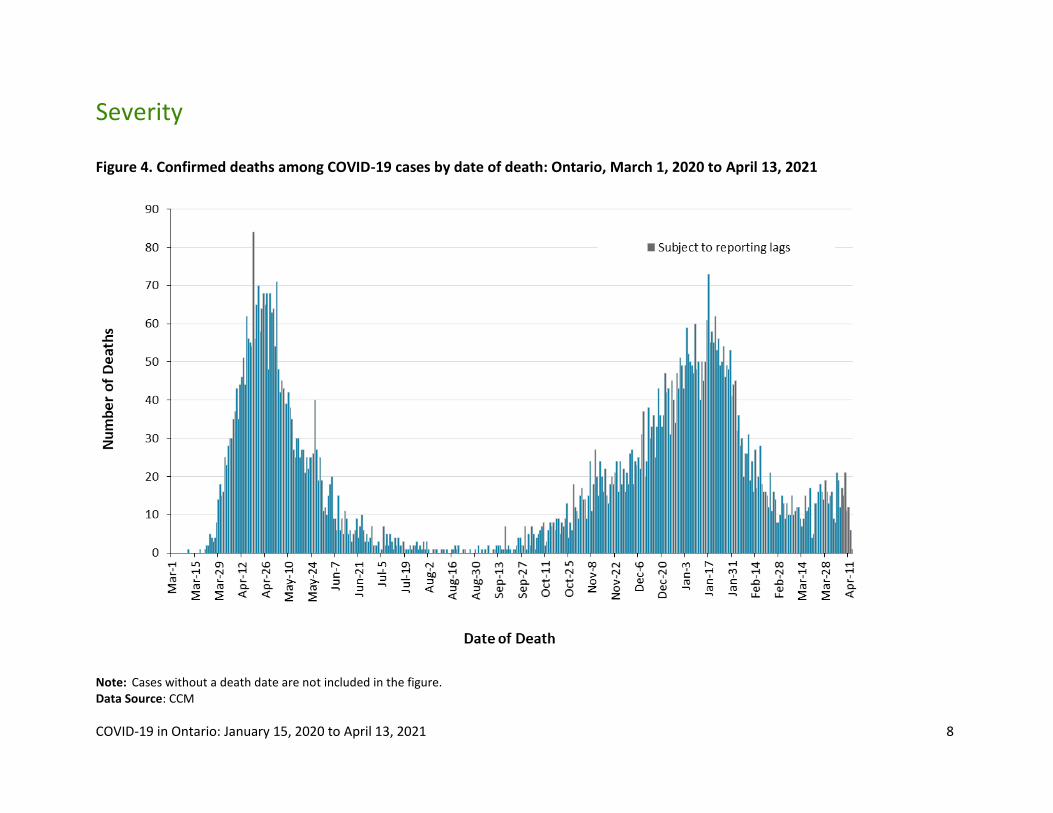
Severity
Figure 4. Confirmed deaths among COVID-19 cases by date of death: Ontario, March 1, 2020 to April 13, 2021
Note: Cases without a death date are not included in the figure. Data Source: CCM

COVID-19 in Ontario: January 15, 2020 to April 13, 2021 9
Table 4. Confirmed cases of COVID-19 by severity: Ontario
Blank cell Cumulative case count
as of April 13, 2021 Percentage of all
cases
Cumulative deaths reported (please note there may be a reporting delay for deaths)
7,610 1.9%
Deaths reported in ages: 19 and under 2 <0.1%
Deaths reported in ages: 20-39 38 <0.1%
Deaths reported in ages: 40-59 331 0.3%
Deaths reported in ages: 60-79 2,188 3.9%
Deaths reported in ages: 80 and over 5,050 22.6%
Ever in ICU 3,338 0.8%
Ever hospitalized 18,868 4.7%
Note: Not all cases have an age reported. Data corrections or updates can result in case records being removed and/or updated and may result in totals differing from past publicly reported case counts. Data Source: CCM
COVID-19 in Ontario: January 15, 2020 to April 13, 2021 10
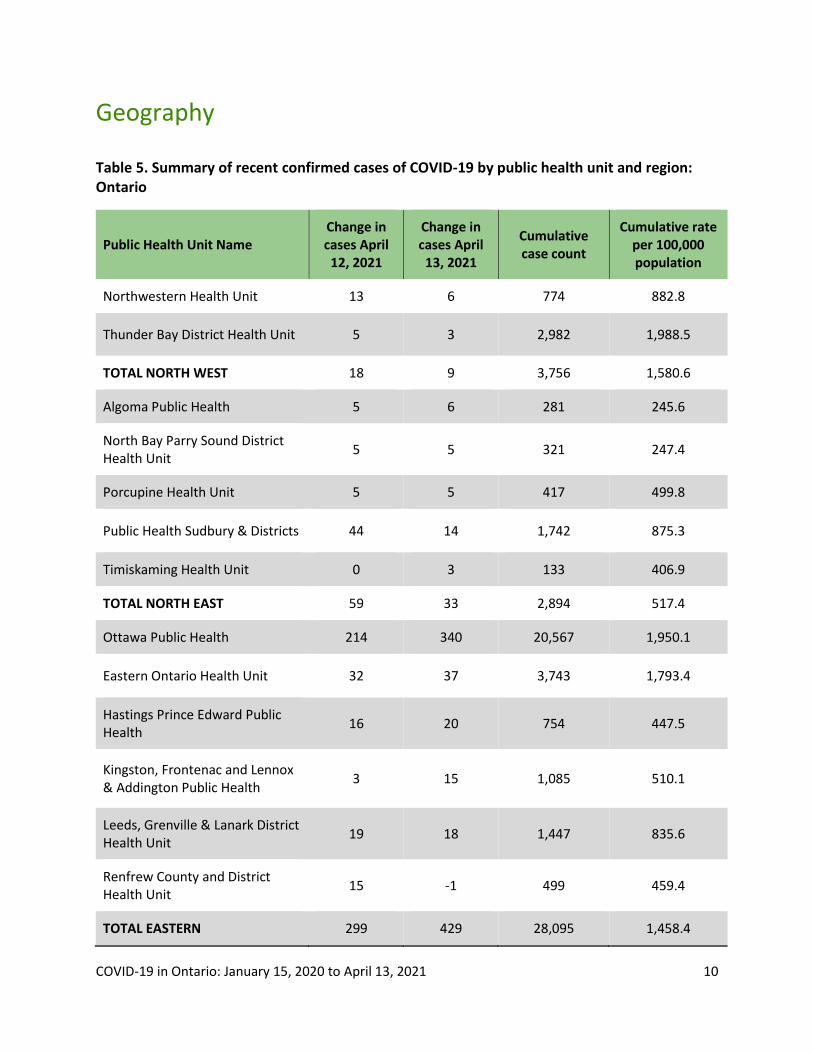
Geography
Table 5. Summary of recent confirmed cases of COVID-19 by public health unit and region: Ontario
Public Health Unit Name Change in cases April
12, 2021
Change in cases April
13, 2021
Cumulative case count
Cumulative rate per 100,000 population
Northwestern Health Unit 13 6 774 882.8
Thunder Bay District Health Unit 5 3 2,982 1,988.5
TOTAL NORTH WEST 18 9 3,756 1,580.6
Algoma Public Health 5 6 281 245.6
North Bay Parry Sound District Health Unit
5 5 321 247.4
Porcupine Health Unit 5 5 417 499.8
Public Health Sudbury & Districts 44 14 1,742 875.3
Timiskaming Health Unit 0 3 133 406.9
TOTAL NORTH EAST 59 33 2,894 517.4
Ottawa Public Health 214 340 20,567 1,950.1
Eastern Ontario Health Unit 32 37 3,743 1,793.4
Hastings Prince Edward Public Health
16 20 754 447.5
Kingston, Frontenac and Lennox & Addington Public Health
3 15 1,085 510.1
Leeds, Grenville & Lanark District Health Unit
19 18 1,447 835.6
Renfrew County and District Health Unit
15 -1 499 459.4
TOTAL EASTERN 299 429 28,095 1,458.4

COVID-19 in Ontario: January 15, 2020 to April 13, 2021 11
Public Health Unit Name Change in cases April
12, 2021
Change in cases April
13, 2021
Cumulative case count
Cumulative rate per 100,000 population
Durham Region Health Department
196 248 16,865 2,367.3
Haliburton, Kawartha, Pine Ridge District Health Unit
8 45 1,393 737.3
Peel Public Health 613 593 78,285 4,874.7
Peterborough Public Health 7 14 1,019 688.6
Simcoe Muskoka District Health Unit
102 70 8,956 1,493.7
York Region Public Health 519 476 39,149 3,193.8
TOTAL CENTRAL EAST 1,445 1,446 145,667 3,251.0
Toronto Public Health 1,016 1,254 123,695 3,964.1
TOTAL TORONTO 1,016 1,254 123,695 3,964.1
Chatham-Kent Public Health 7 0 1,693 1,592.4
Grey Bruce Health Unit 12 11 927 545.7
Huron Perth Public Health 1 5 1,505 1,076.9
Lambton Public Health 5 8 3,060 2,336.5
Middlesex-London Health Unit 83 121 8,690 1,712.2
Southwestern Public Health 30 20 3,078 1,455.3
Windsor-Essex County Health Unit
42 40 14,480 3,408.4
TOTAL SOUTH WEST 180 205 33,433 1,977.4
Brant County Health Unit 27 66 2,584 1,664.9
City of Hamilton Public Health Services
161 189 14,561 2,459.0
COVID-19 in Ontario: January 15, 2020 to April 13, 2021 12
Public Health Unit Name Change in cases April
12, 2021
Change in cases April
13, 2021
Cumulative case count
Cumulative rate per 100,000 population
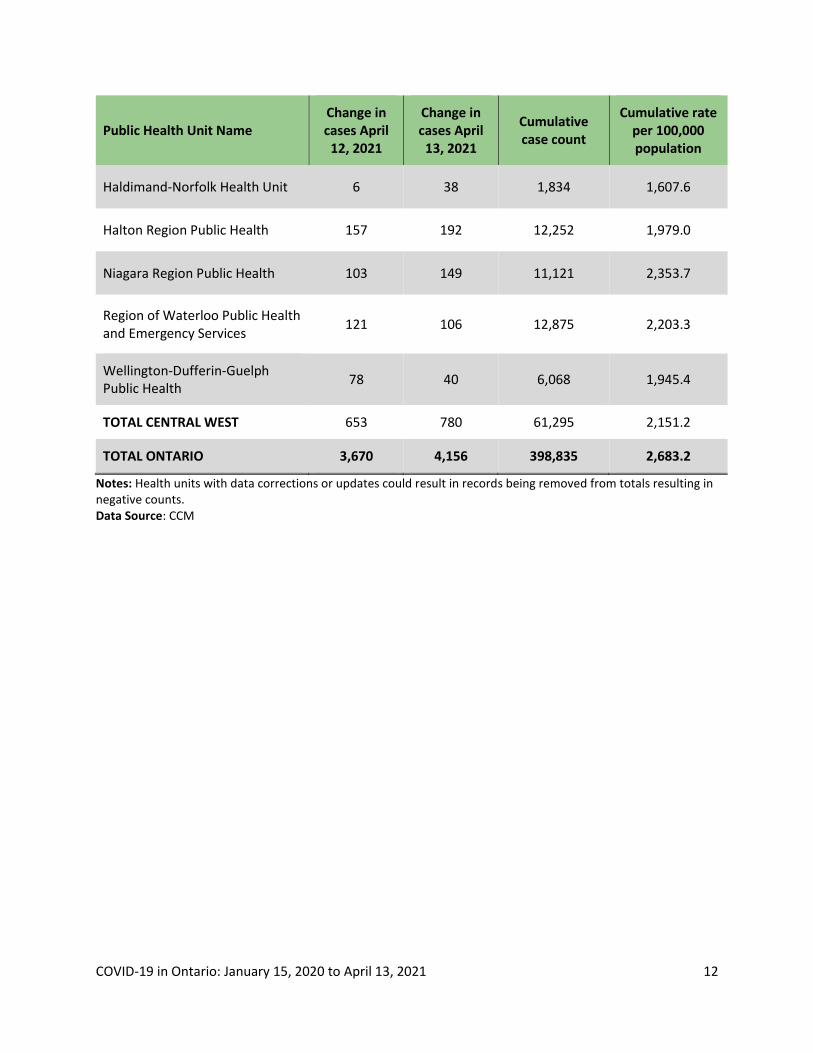
Haldimand-Norfolk Health Unit 6 38 1,834 1,607.6
Halton Region Public Health 157 192 12,252 1,979.0
Niagara Region Public Health 103 149 11,121 2,353.7
Region of Waterloo Public Health and Emergency Services
121 106 12,875 2,203.3
Wellington-Dufferin-Guelph Public Health
78 40 6,068 1,945.4
TOTAL CENTRAL WEST 653 780 61,295 2,151.2
TOTAL ONTARIO 3,670 4,156 398,835 2,683.2
Notes: Health units with data corrections or updates could result in records being removed from totals resulting in negative counts. Data Source: CCM
COVID-19 in Ontario: January 15, 2020 to April 13, 2021 13
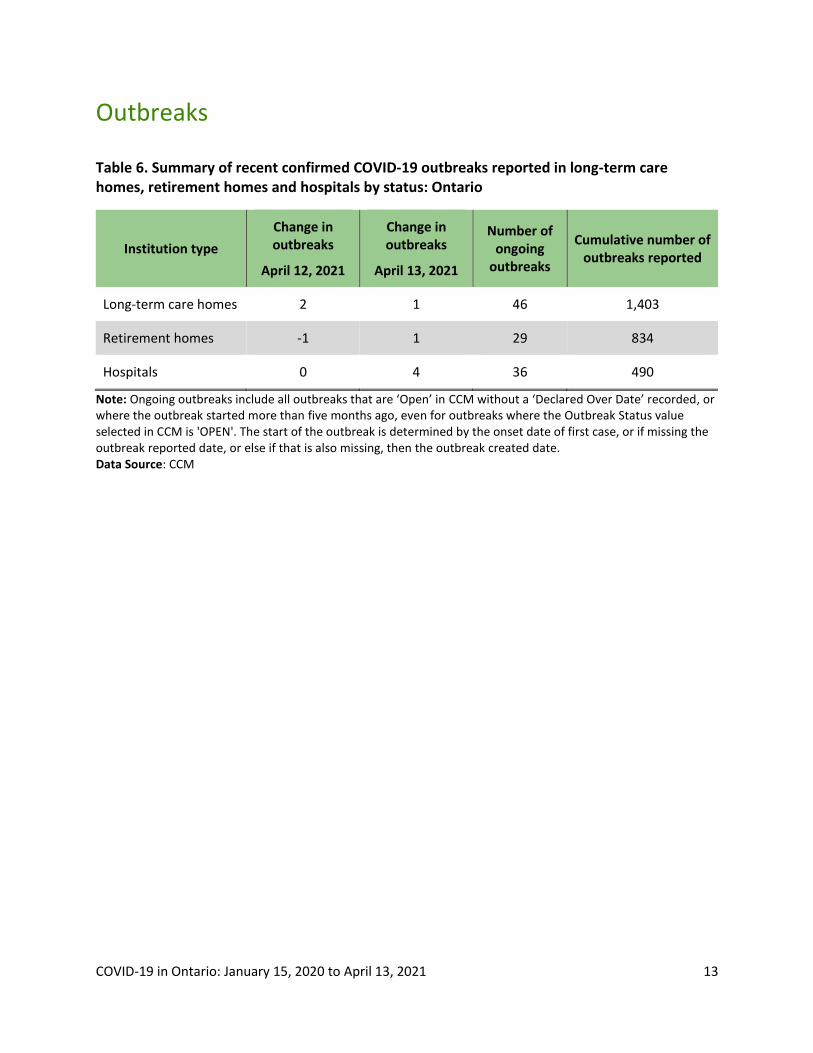
Outbreaks
Table 6. Summary of recent confirmed COVID-19 outbreaks reported in long-term care homes, retirement homes and hospitals by status: Ontario
Institution type
Change in outbreaks
April 12, 2021
Change in outbreaks
April 13, 2021
Number of ongoing
outbreaks
Cumulative number of outbreaks reported
Long-term care homes 2 1 46 1,403
Retirement homes -1 1 29 834
Hospitals 0 4 36 490
Note: Ongoing outbreaks include all outbreaks that are ‘Open’ in CCM without a ‘Declared Over Date’ recorded, or where the outbreak started more than five months ago, even for outbreaks where the Outbreak Status value selected in CCM is 'OPEN'. The start of the outbreak is determined by the onset date of first case, or if missing the outbreak reported date, or else if that is also missing, then the outbreak created date. Data Source: CCM

COVID-19 in Ontario: January 15, 2020 to April 13, 2021 14
Variant COVID-19 Cases The laboratory detection of a variant of concern (VOC) is a multi-step process. Samples that test positive for SARS-CoV-2 and have a cycle threshold (Ct) value ≤ 35 can be tested for mutations common to variants of concern. If positive for the mutation of interest these samples may then undergo genomic analyses to identify the VOC. VOC lineages may still be confirmed using genomic analysis despite specific S gene mutation(s) being documented as ‘unable to complete’ due to poor sequence quality at the genome position.
Figure 5. Number of confirmed COVID-19 cases and percent positive for mutations or VOCs: Ontario, February 7, 2021 to April 13, 2021
Note: Data used to calculate the number of cases tested for mutations common to VOCs or lineages using genomic analyses are obtained using information from the Laboratory object in CCM in addition to the data from the Investigation Subtype field. Therefore, comparisons to counts using only information from the Investigation Subtype field may not align. The percent of cases due to a VOC may be higher than described in this report. While all confirmed COVID-19 cases are included in the denominator, not all cases were able to be tested for VOCs. *VOC not reported category includes cases where mutations common to VOCs or lineages were not detected or where testing results were not available/not completed. Data Source: CCM

COVID-19 in Ontario: January 15, 2020 to April 13, 2021 15
Table 7. Summary of confirmed COVID-19 cases with a mutation or VOC detected: Ontario
Change in cases April 11, 2021
Change in cases April 13, 2021
Cumulative case count up to April 13, 2021
Variant of Concern
Lineage B.1.1.7* 3,947 3,980 24,467
Lineage B.1.351 0 3 84
Lineage P.1 3 33 176
Mutations
N501Y and E484K 192 158 2,514
N501Y (E484K unknown)** 143 395 22,510
E484K (N501Y negative) 66 64 712
E484K (N501Y unknown) 8 7 269
Note: Interpret the VOC and mutation trends with caution due to the varying time required to complete VOC testing and/or genomic analysis following the initial positive test for SARS-CoV-2. Due to the nature of the genomic analysis, test results may be completed in batches. Data corrections or updates can result in case records being removed and/or updated and may result in totals differing from past publicly reported case counts. Data for calculating the change in cases and the cumulative case counts uses data from the Investigation Subtype field only. Changes to the VOC testing algorithm may impact counts and trends. Further details can be found in the data caveats section. *Includes all confirmed COVID-19 cases where lineage B.1.1.7 was identified by genomic analysis and those presumed to be B.1.1.7 based on positive N501Y and negative E484K mutation in the Investigation Subtype field **The category ‘N501Y (E484K unknown)’ mainly consists of results from before the introduction of the E484K test. Counts will shift from this category into a VOC lineage category as E484K tests or genomic analysis are completed. Data Source: CCM

COVID-19 in Ontario: January 15, 2020 to April 13, 2021 16
Figure 6. Confirmed COVID-19 cases with a mutation or VOC detected by public health unit reported date: Ontario, November 29, 2020 to April 13, 2021
Note: Reported date is based on the date the case was reported, not the date that the VOC or mutation was identified. Further details on testing for variants of concern can be found in the technical notes. Interpret the VOC and mutation trends with caution due to the varying time required to complete testing and/or genomic analysis following the initial positive test for SARS-CoV-2. Data for calculating the change in cases and the cumulative case count uses data from the Investigation Subtype field only. Data for cases with a B.1.1.7, B.1.351, and P.1 lineage detected are determined using the Investigation Subtype field only. Changes to the VOC testing algorithm may impact counts and trends. Further details can be found in the data caveats section. *Includes all confirmed COVID-19 cases where lineage B.1.1.7 was identified by genomic analysis and those presumed to be B.1.1.7 based on positive N501Y and negative E484K mutation. Starting March 22, 2021, specimens tested for the both the N501Y and E484K mutation, and if found to be positive for the N501Y mutation only, are not forwarded for further genomic analysis and presumed to be B.1.1.7. **Mutations includes all confirmed COVID-19 cases with the following mutations detected, reported from the Investigation Subtype field: N501Y and E484K, N501Y (E484K unknown), E484K (N501Y negative), E484K (N501Y unknown). Data Source: CCM
COVID-19 in Ontario: January 15, 2020 to April 13, 2021 17
Technical Notes
Data Sources The data for this report were based on information successfully extracted from the Public Health
Case and Contact Management Solution (CCM) for all PHUs by PHO as of April 13, 2021 at 1 p.m.
CCM is a dynamic disease reporting system, which allows ongoing updates to data previously entered. As a result, data extracted from CCM represent a snapshot at the time of extraction and may differ from previous or subsequent reports.
Ontario population projection data for 2020 were sourced from Ministry, IntelliHEALTH Ontario. Data were extracted on November 26, 2019.
COVID-19 test data were based on information from The Provincial COVID-19 Diagnostics Network, reported by member microbiology laboratories.
Data Caveats The data only represent cases reported to public health units and recorded in CCM. As a result,
all counts will be subject to varying degrees of underreporting due to a variety of factors, such as disease awareness and medical care seeking behaviours, which may depend on severity of illness, clinical practice, changes in laboratory testing, and reporting behaviours.
Lags in CCM data entry due to weekend staffing may result in lower case counts than would otherwise be recorded.
Only cases meeting the confirmed case classification as listed in the MOH Case Definition – Coronavirus Disease (COVID-19) document
Cases of confirmed reinfection, as defined in the provincial case definitions, are counted as unique investigations.
Case classification information may be updated for individuals with a positive result issued from a point-of-care assays.
The number of tests performed does not reflect the number of specimens or persons tested. More than one test may be performed per specimen or per person. As such, the percentage of tests that were positive does not necessarily translate to the number of specimens or persons testing positive.
Reported date is the date the case was reported to the public health unit.
Case episode date is based on an estimate of the best date of disease onset. This date is calculated based on either the date of symptom onset, specimen collection/test date, or the date reported to the public health unit.

COVID-19 in Ontario: January 15, 2020 to April 13, 2021 18
Resolved cases are determined only for COVID-19 cases that have not died. Cases that have died are considered fatal and not resolved. The following cases are classified as resolved:
Cases that are reported as ‘recovered’ in CCM
Cases that are not hospitalized and are 14 days past their episode date
Cases that are currently hospitalized (no hospital end date entered) and have a status of ‘closed’ in CCM (indicating public health unit follow-up is complete) and are 14 days past their symptom onset date or specimen collection date
Hospitalization includes all cases for which a hospital admission date was reported at the time of data extraction. It includes cases that have been discharged from hospital as well as cases that are currently hospitalized. Emergency room visits are not included in the number of reported hospitalizations.
ICU admission includes all cases for which an ICU admission date was reported at the time of data extraction. It is a subset of the count of hospitalized cases. It includes cases that have been treated or that are currently being treated in an ICU.
Orientation of case counts by geography is based on the diagnosing health unit (DHU). DHU refers to the case's public health unit of residence at the time of illness onset and not necessarily the location of exposure. Cases for which the DHU was reported as MOH-PHO (to signify a case that is not a resident of Ontario) have been excluded from the analyses.
Likely source of acquisition is determined by examining the epidemiologic link and epidemiologic link status fields in CCM. If no epidemiologic link is identified in those fields the risk factor fields are examined to determine whether a case travelled, was associated with a confirmed outbreak, was a contact of a case, had no known epidemiological link (sporadic community transmission) or was reported to have an unknown source/no information was reported. Some cases may have no information reported if the case is untraceable, was lost to follow-up or referred to FNIHB. Cases with multiple risk factors were assigned to a single likely acquisition source group which was determined hierarchically in the following order:
For cases with an episode date on or after April 1, 2020: Outbreak-associated > close contact of a confirmed case > travel > no known epidemiological link > information missing or unknown
For cases with an episode date before April 1, 2020: Travel > outbreak-associated > close contact of a confirmed case > no known epidemiological link > information missing or unknown
Deaths are determined by using the outcome field in CCM. Any case marked ‘Fatal’ is included in the deaths data. The CCM field Type of Death is not used to further categorize the data.
The date of death is determined using the outcome date field for cases marked as ‘Fatal’ in the outcome field.
COVID-19 cases from CCM for which the Classification and/or Disposition was reported as ENTERED IN ERROR, DOES NOT MEET DEFINITION, IGNORE, DUPLICATE or any variation on these
COVID-19 in Ontario: January 15, 2020 to April 13, 2021 19
values have been excluded. The provincial case count for COVID-19 may include some duplicate records, if these records were not identified and resolved.
Ongoing outbreaks include all outbreaks that are ‘Open’ in CCM without a ‘Declared Over Date’ recorded, or where the outbreak started more than five months ago, even for outbreaks where the Outbreak Status value selected in CCM is 'OPEN'. The start of the outbreak is determined by the onset date of first case, or if missing the outbreak reported date, or else if that is also missing, then the outbreak created date.
‘Long-term care home residents’ includes cases that reported ‘Yes’ to the risk factor ‘Resident of a long-term care home’; or ‘Yes’ to the risk factor ‘Resident of nursing home or other chronic care facility’ and reported to be part of an outbreak assigned as a long-term care home (via the Outbreak number or case comments field); or were reported to be part of an outbreak assigned as a long-term care home (via the outbreak number or case comments field) with an age over 70 years and did not report ‘No’ to the risk factors ‘Resident of long-term care home’ or ‘Resident of nursing home or other chronic care facility’. ‘Long-term care home residents’ excludes cases that reported ‘Yes’ to any of the health care worker occupational risk factors.
The ‘health care workers’ variable includes cases that reported ‘Yes’ to any of the occupation of health care worker, doctor, nurse, dentist, dental hygienist, midwife, other medical technicians, personal support worker, respiratory therapist, first responder.
‘Health care workers associated with long-term care outbreaks’ includes ‘health care workers’ reported to be part of an outbreak assigned as a long-term care home (via the outbreak number or case comments field). Excludes cases that reported ‘Yes’ to risk factors ‘Resident of long-term care home’ or ‘Resident of nursing home or other chronic care facility’ and ‘Yes’ to the calculated ‘health care workers’ variable.
Percent change is calculated by taking the difference between the current period (i.e., daily count or sum of the daily count over a 7-day period) and previous period (i.e., daily count or sum of the daily count over a 7-day period), divided by the previous period.
PANGO lineage B.1.1.7: This lineage was first detected in England in September, 2020. Early evidence suggests that the N501Y mutation may increase SARS-CoV-2 transmissibility. The PANGO lineage B.1.1.7 is assigned to genome sequences with at least 5 of the 17 defining B.1.1.7 SNPs.
PANGO lineage B.1.351 (also known as 501Y.V2): This lineage was first detected October, 2020 in South Africa and has several mutations of concern, including spike (S) gene: N501Y, K417N, and E484K. Early evidence suggests that these mutations may increase SARS-CoV-2 transmissibility and decrease vaccine efficacy. The PANGO lineage B.1.351 will be assigned to genome sequences at least 5 of the 9 defining B.1.351 SNPs.
PANGO lineage P.1 (also known as 501Y.V3): This lineage was first detected January, 2021 in Brazil and has several mutations of concern, including spike (S) gene N501Y, K417T, and E484K. Early evidence suggests that these mutations may increase SARS-CoV-2 transmissibility and decrease vaccine efficacy. The PANGO lineage P.1 is assigned to genome sequences with more than 10 of the 17 defining P.1 SNPs.

COVID-19 in Ontario: January 15, 2020 to April 13, 2021 20
Public Health Ontario conducts testing and genomic analyses for SARS-CoV-2 positive specimens using the criteria outlined here: https://www.publichealthontario.ca/en/laboratory-services/test-information-index/covid-19-voc
Changes to the VOC testing algorithm may occur over time and trends should be interpreted with caution. Since February 3, 2021 all PCR positive SARS-Co-V-2 specimens with CT values ≤ 35 are tested for a N501Y mutation. Starting March 22, 2021, these specimens are tested for the E484K mutation as well. Specimens that are positive for the N501Y mutation only are not being forwarded for further genomic analysis. Specimens that are E484K positive (with or without N501Y) are forwarded for genomic analysis.
The laboratory detection of a variant of concern is a multi-step process. Samples that test positive for SARS-CoV-2 and have a cycle threshold (Ct) value ≤ 35 can be tested for mutations common to variants of concern. If positive for the mutation of interest these samples may then undergo genomic analyses to identify the VOC. VOC lineages may still be confirmed using genomic analysis despite specific S gene mutation(s) being documented as ‘unable to complete’ due to poor sequence quality at the genome position.
VOC testing data are analyzed for cases with a reported date on or after February 07, 2021. VOC testing data are based on CCM information reported within the laboratory object for select Logical Observation Identifiers Names and Codes (LOINC) and supplemented with information from the Investigation Subtype field. A confirmed Case Investigation is assigned a VOC test value (e.g., VOC test detected, VOC test not detected) based on the following hierarchy:
If multiple laboratory results are identified, a VOC test value is assigned based on the following hierarchy: Detected > Not Detected > Unable to complete
If a laboratory result is ‘Not Detected’ or ‘Unable to complete’, but data on the Investigation Subtype field is listed as a lineage or mutation common to a VOC, then the VOC test value is set to ‘Detected’
If a VOC is identified through genomic analysis cases initially classified as a mutation may be updated and moved to the appropriate lineage (B.1.1.7, B.1.351 and P.1)
LOINCs are a set of internationally used result description codes. In the absence of a standard LOINC, Ontario Health can create local result codes, which are identified with an ‘XON’ prefix. LOINCs incorporate details of the result value (e.g. test method, target detected - such as IgG, DNA, isolate etc.) and are unique to each result.
VOC testing data in this report are assigned on a per case basis. Multiple laboratory results may be associated to a single case investigation, but for analysis purposes are only counted once.
The percent of cases that test VOC positive is calculated by taking the number of VOC test positive, divided by the total number of confirmed COVID-19 cases for a given reported date.
The VOC percent positive may be higher than described in this report. While all confirmed COVID-19 cases are included in the denominator, not all cases were able to be tested for VOCs. As testing algorithms change, the VOC percent positivity may not be reflective of the exact number of COVID-19 cases due to VOCs
COVID-19 in Ontario: January 15, 2020 to April 13, 2021 21
Only CCM case investigations with a CONFIRMED classification have their laboratory records with VOC testing information included in the percent positivity calculations

COVID-19 in Ontario: January 15, 2020 to April 13, 2021 22
Appendix A
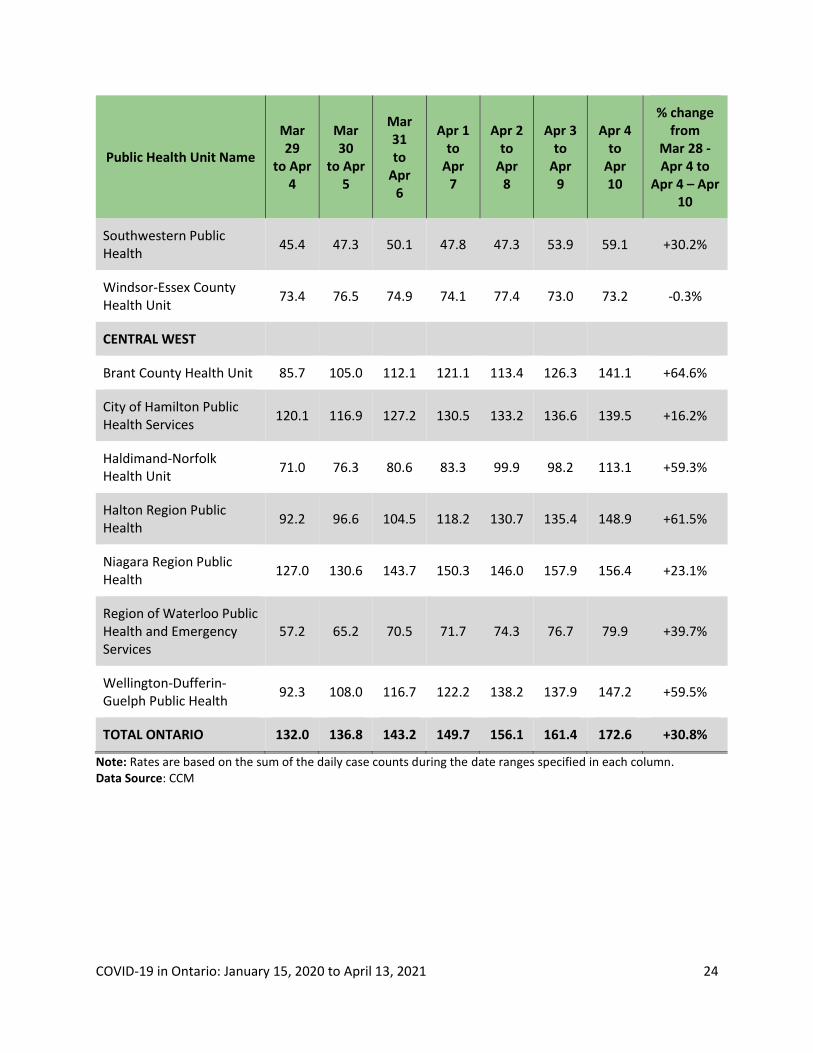
Table A1. Weekly rates of confirmed COVID-19 cases per 100,000 population over recent rolling 7-day periods, by reported date and public health unit: Ontario, March 29 to April 10, 2021
Public Health Unit Name
Mar 29
to Apr 4
Mar 30
to Apr 5
Mar 31 to
Apr 6
Apr 1 to
Apr 7
Apr 2 to
Apr 8
Apr 3 to
Apr 9
Apr 4 to
Apr 10
% change from
Mar 28 - Apr 4 to
Apr 4 – Apr 10
NORTH WEST
Northwestern Health Unit 42.2 43.3 45.6 42.2 39.9 51.3 54.7 +29.6%
Thunder Bay District Health Unit
68.0 52.0 46.7 32.0 34.7 36.7 36.0 -47.1%
NORTH EAST
Algoma Public Health 12.2 16.6 17.5 21.0 21.0 24.5 26.2 +114.8%
North Bay Parry Sound District Health Unit
10.0 9.2 10.0 13.1 13.1 13.1 12.3 +23.0%
Porcupine Health Unit 25.2 28.8 34.8 27.6 30.0 46.7 44.3 +75.8%
Public Health Sudbury & Districts
73.4 73.9 82.9 85.4 76.9 83.4 87.4 +19.1%
Timiskaming Health Unit 12.2 12.2 6.1 6.1 6.1 3.1 3.1 -74.6%
EASTERN
Ottawa Public Health 117.6 124.3 128.5 142.1 148.9 148.3 168.0 +42.9%
Eastern Ontario Health Unit
102.1 103.5 115.0 114.5 114.0 119.8 126.5 +23.9%
Hastings Prince Edward Public Health
70.0 81.9 89.6 84.9 86.1 84.3 80.1 +14.4%
Kingston, Frontenac and Lennox & Addington Public Health
28.2 33.8 38.5 43.7 47.0 54.1 60.6 +114.9%

COVID-19 in Ontario: January 15, 2020 to April 13, 2021 23
Public Health Unit Name
Mar 29
to Apr 4
Mar 30
to Apr 5
Mar 31 to
Apr 6
Apr 1 to
Apr 7
Apr 2 to
Apr 8
Apr 3 to
Apr 9
Apr 4 to
Apr 10
% change from
Mar 28 - Apr 4 to
Apr 4 – Apr 10
Leeds, Grenville & Lanark District Health Unit
37.0 39.3 47.4 53.1 54.9 67.0 72.2 +95.1%
Renfrew County and District Health Unit
23.9 23.0 28.5 30.4 40.5 40.5 33.1 +38.5%
CENTRAL EAST
Durham Region Health Department
145.7 144.7 154.0 159.7 166.1 177.4 214.3 +47.1%
Haliburton, Kawartha, Pine Ridge District Health Unit
39.7 50.3 49.8 58.7 62.5 63.0 64.0 +61.2%
Peel Public Health 230.9 240.4 248.4 257.4 269.3 275.5 294.5 +27.5%
Peterborough Public Health
44.6 44.6 46.6 50.7 52.7 61.5 53.4 +19.7%
Simcoe Muskoka District Health Unit
74.1 81.2 87.7 94.1 98.9 104.4 109.1 +47.2%
York Region Public Health 174.5 181.6 187.8 204.5 216.3 221.7 233.7 +33.9%
TORONTO
Toronto Public Health 193.3 197.2 206.0 209.9 218.1 226.6 242.8 +25.6%
SOUTH WEST
Chatham-Kent Public Health
51.7 49.9 42.3 35.7 44.2 38.6 35.7 -30.9%
Grey Bruce Health Unit 34.1 35.9 33.0 39.4 38.9 37.1 38.3 +12.3%
Huron Perth Public Health 16.5 17.2 17.2 22.9 25.0 30.1 32.9 +99.4%
Lambton Public Health 90.1 88.6 69.5 84.0 79.4 79.4 87.0 -3.4%
Middlesex-London Health Unit
133.6 139.7 144.8 155.5 161.8 164.9 163.7 +22.5%
COVID-19 in Ontario: January 15, 2020 to April 13, 2021 24
Public Health Unit Name
Mar 29
to Apr 4
Mar 30
to Apr 5
Mar 31 to
Apr 6
Apr 1 to
Apr 7
Apr 2 to
Apr 8
Apr 3 to
Apr 9
Apr 4 to
Apr 10
% change from
Mar 28 - Apr 4 to
Apr 4 – Apr 10
Southwestern Public Health
45.4 47.3 50.1 47.8 47.3 53.9 59.1 +30.2%
Windsor-Essex County Health Unit
73.4 76.5 74.9 74.1 77.4 73.0 73.2 -0.3%
CENTRAL WEST
Brant County Health Unit 85.7 105.0 112.1 121.1 113.4 126.3 141.1 +64.6%
City of Hamilton Public Health Services
120.1 116.9 127.2 130.5 133.2 136.6 139.5 +16.2%
Haldimand-Norfolk Health Unit
71.0 76.3 80.6 83.3 99.9 98.2 113.1 +59.3%
Halton Region Public Health
92.2 96.6 104.5 118.2 130.7 135.4 148.9 +61.5%
Niagara Region Public Health
127.0 130.6 143.7 150.3 146.0 157.9 156.4 +23.1%
Region of Waterloo Public Health and Emergency Services
57.2 65.2 70.5 71.7 74.3 76.7 79.9 +39.7%
Wellington-Dufferin-Guelph Public Health
92.3 108.0 116.7 122.2 138.2 137.9 147.2 +59.5%
TOTAL ONTARIO 132.0 136.8 143.2 149.7 156.1 161.4 172.6 +30.8%
Note: Rates are based on the sum of the daily case counts during the date ranges specified in each column. Data Source: CCM

COVID-19 in Ontario: January 15, 2020 to April 13, 2021 25
Table A2. Summary of confirmed COVID-19 cases with a mutation or VOC by public health unit: Ontario as of April 13, 2021
Public Health Unit Name
Cumulative count for Lineage B.1.1.7*
Cumulative count for Lineage B.1.351
Cumulative count for
Lineage P.1
Cumulative count for
mutations**
Algoma Public Health 5 0 0 3
Brant County Health Unit 91 0 4 143
Chatham-Kent Public Health 18 1 0 82
City of Hamilton Public Health Services 619 0 2 832
Durham Region Health Department 2,154 1 8 1,644
Eastern Ontario Health Unit 233 2 0 253
Grey Bruce Health Unit 56 0 0 29
Haldimand-Norfolk Health Unit 17 0 0 82
Haliburton, Kawartha, Pine Ridge District Health Unit
42 0 0 151
Halton Region Public Health 1,174 0 1 551
Hastings Prince Edward Public Health 4 0 0 153
Huron Perth Public Health 8 0 0 33
Kingston, Frontenac and Lennox & Addington Public Health
93 0 0 113
Lambton Public Health 195 0 0 51
Leeds, Grenville & Lanark District Health Unit
119 0 0 31
Middlesex-London Health Unit 701 0 0 185

COVID-19 in Ontario: January 15, 2020 to April 13, 2021 26
Public Health Unit Name
Cumulative count for Lineage B.1.1.7*
Cumulative count for Lineage B.1.351
Cumulative count for
Lineage P.1
Cumulative count for
mutations**
Niagara Region Public Health 347 0 0 491
North Bay Parry Sound District Health Unit
31 27 0 13
Northwestern Health Unit 11 0 0 15
Ottawa Public Health 833 6 0 856
Peel Public Health 6,937 13 39 3,621
Peterborough Public Health 126 0 0 169
Porcupine Health Unit 4 2 0 4
Public Health Sudbury & Districts 56 0 0 523
Region of Waterloo Public Health and Emergency Services
333 1 0 563
Renfrew County and District Health Unit
41 0 0 11
Simcoe Muskoka District Health Unit 968 2 16 694
Southwestern Public Health 167 0 0 30
Thunder Bay District Health Unit 0 0 0 9
Timiskaming Health Unit 22 1 0 0
Toronto Public Health 4,154 25 79 12,121
Wellington-Dufferin-Guelph Public Health
524 0 1 174
Windsor-Essex County Health Unit 278 0 0 75

COVID-19 in Ontario: January 15, 2020 to April 13, 2021 27
Public Health Unit Name
Cumulative count for Lineage B.1.1.7*
Cumulative count for Lineage B.1.351
Cumulative count for
Lineage P.1
Cumulative count for
mutations**
York Region Public Health 4,106 3 26 2,300
TOTAL ONTARIO 24,467 84 176 26,005
Note: Interpret the VOC and mutation trends with caution due to the varying time required to complete VOC testing and/or genomic analysis following the initial positive test for SARS-CoV-2. Due to the nature of the genomic analysis, test results may be completed in batches. Data corrections or updates can result in case records being removed and/or updated and may result in totals differing from past publicly reported case counts. Data for calculating the change in cases and the cumulative case count uses data from the Investigation Subtype field only. Changes to the VOC testing algorithm may impact counts and trends. Further details can be found in the data caveats section. *Includes all confirmed COVID-19 cases where lineage B.1.1.7 was identified by genomic analysis and those presumed to be B.1.1.7 based on positive N501Y and negative E484K mutation. **Mutations includes all confirmed COVID-19 cases with the following mutations detected, reported from the Investigation Subtype field: N501Y and E484K, N501Y (E484K unknown), E484K (N501Y negative), E484K (N501Y unknown). If a VOC is identified through genomic analysis, the change in cases and/or cumulative case counts for mutations will fluctuate as the case is moved to one of the listed lineages. Data Source: CCM
COVID-19 in Ontario: January 15, 2020 to April 13, 2021 28
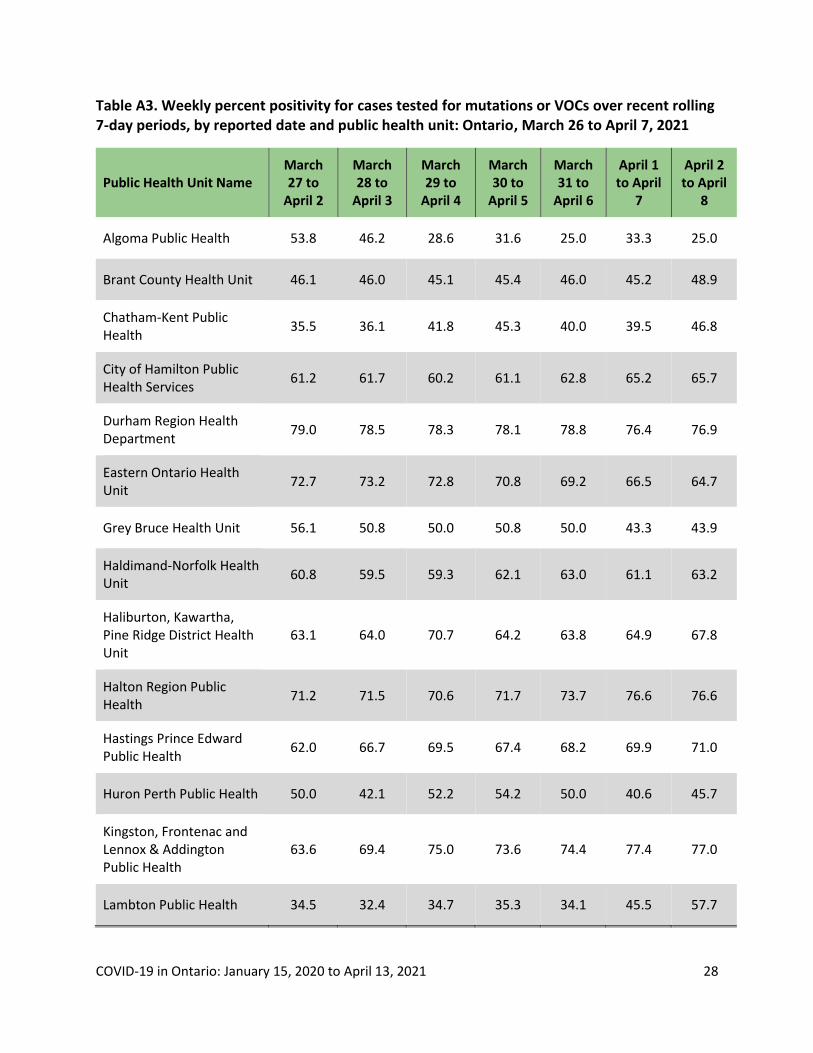
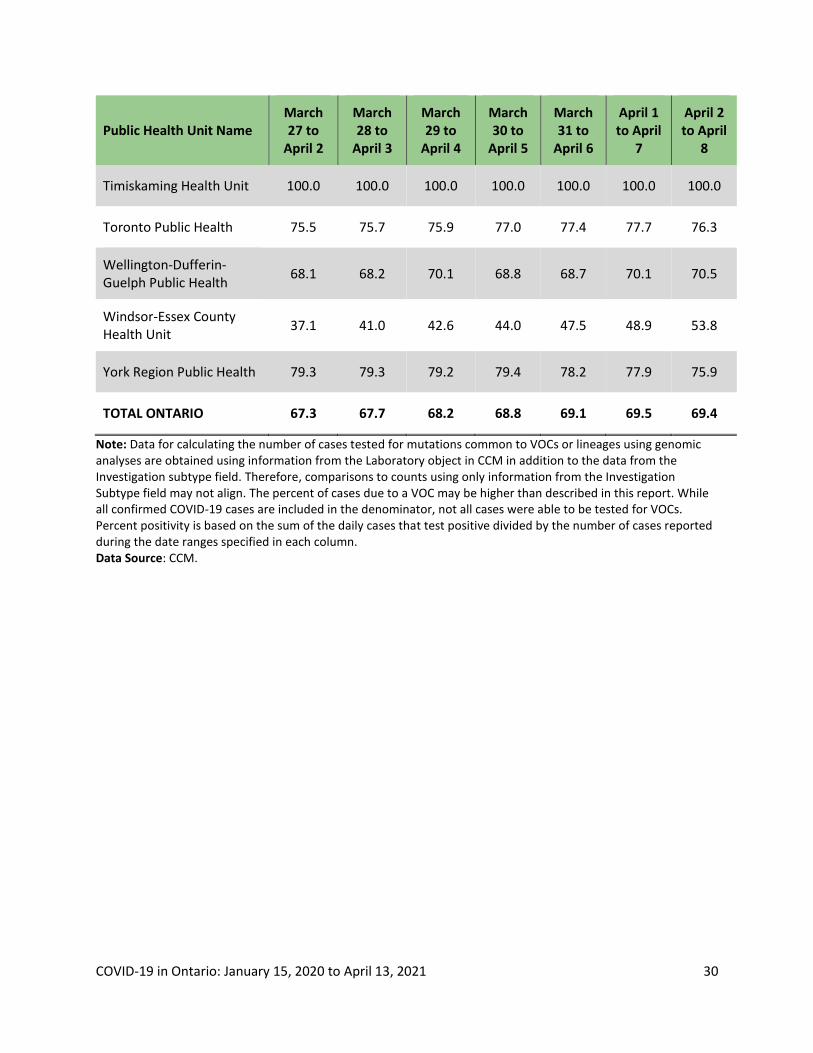
Table A3. Weekly percent positivity for cases tested for mutations or VOCs over recent rolling 7-day periods, by reported date and public health unit: Ontario, March 26 to April 7, 2021
Public Health Unit Name March 27 to
April 2
March 28 to
April 3
March 29 to
April 4
March 30 to
April 5
March 31 to
April 6
April 1 to April
7
April 2 to April
8
Algoma Public Health 53.8 46.2 28.6 31.6 25.0 33.3 25.0
Brant County Health Unit 46.1 46.0 45.1 45.4 46.0 45.2 48.9
Chatham-Kent Public Health
35.5 36.1 41.8 45.3 40.0 39.5 46.8
City of Hamilton Public Health Services
61.2 61.7 60.2 61.1 62.8 65.2 65.7
Durham Region Health Department
79.0 78.5 78.3 78.1 78.8 76.4 76.9
Eastern Ontario Health Unit
72.7 73.2 72.8 70.8 69.2 66.5 64.7
Grey Bruce Health Unit 56.1 50.8 50.0 50.8 50.0 43.3 43.9
Haldimand-Norfolk Health Unit
60.8 59.5 59.3 62.1 63.0 61.1 63.2
Haliburton, Kawartha, Pine Ridge District Health Unit
63.1 64.0 70.7 64.2 63.8 64.9 67.8
Halton Region Public Health
71.2 71.5 70.6 71.7 73.7 76.6 76.6
Hastings Prince Edward Public Health
62.0 66.7 69.5 67.4 68.2 69.9 71.0
Huron Perth Public Health 50.0 42.1 52.2 54.2 50.0 40.6 45.7
Kingston, Frontenac and Lennox & Addington Public Health
63.6 69.4 75.0 73.6 74.4 77.4 77.0
Lambton Public Health 34.5 32.4 34.7 35.3 34.1 45.5 57.7

COVID-19 in Ontario: January 15, 2020 to April 13, 2021 29
Public Health Unit Name March 27 to
April 2
March 28 to
April 3
March 29 to
April 4
March 30 to
April 5
March 31 to
April 6
April 1 to April
7
April 2 to April
8
Leeds, Grenville & Lanark District Health Unit
37.7 41.8 43.8 50.0 52.4 63.0 66.3
Middlesex-London Health Unit
48.4 48.7 49.3 49.2 50.6 52.6 51.8
Niagara Region Public Health
58.1 49.9 49.5 48.6 39.9 33.5 29.7
North Bay Parry Sound District Health Unit
88.9 91.7 84.6 83.3 84.6 70.6 64.7
Northwestern Health Unit 35.9 35.1 21.6 18.4 15.0 18.9 14.3
Ottawa Public Health 49.2 53.0 54.7 55.3 57.0 59.1 61.4
Peel Public Health 68.2 68.2 68.6 69.0 70.0 70.4 70.6
Peterborough Public Health
66.7 79.1 80.3 78.8 81.2 77.3 76.9
Porcupine Health Unit 33.3 40.0 38.1 41.7 41.4 60.9 60.0
Public Health Sudbury & Districts
50.3 54.5 62.3 67.3 68.5 68.2 69.3
Region of Waterloo Public Health and Emergency Services
46.6 46.1 52.1 55.4 57.3 59.2 63.1
Renfrew County and District Health Unit
76.9 85.7 76.9 76.0 77.4 78.8 79.5
Simcoe Muskoka District Health Unit
64.7 63.8 64.0 64.5 64.3 64.0 62.6
Southwestern Public Health
27.4 34.4 37.5 48.0 50.9 55.4 64.0
Thunder Bay District Health Unit
0.0 0.0 0.0 0.0 0.0 0.0 0.0
COVID-19 in Ontario: January 15, 2020 to April 13, 2021 30
Public Health Unit Name March 27 to
April 2
March 28 to
April 3
March 29 to
April 4
March 30 to
April 5
March 31 to
April 6
April 1 to April
7
April 2 to April
8
Timiskaming Health Unit 100.0 100.0 100.0 100.0 100.0 100.0 100.0
Toronto Public Health 75.5 75.7 75.9 77.0 77.4 77.7 76.3
Wellington-Dufferin-Guelph Public Health
68.1 68.2 70.1 68.8 68.7 70.1 70.5
Windsor-Essex County Health Unit
37.1 41.0 42.6 44.0 47.5 48.9 53.8
York Region Public Health 79.3 79.3 79.2 79.4 78.2 77.9 75.9
TOTAL ONTARIO 67.3 67.7 68.2 68.8 69.1 69.5 69.4
Note: Data for calculating the number of cases tested for mutations common to VOCs or lineages using genomic analyses are obtained using information from the Laboratory object in CCM in addition to the data from the Investigation subtype field. Therefore, comparisons to counts using only information from the Investigation Subtype field may not align. The percent of cases due to a VOC may be higher than described in this report. While all confirmed COVID-19 cases are included in the denominator, not all cases were able to be tested for VOCs. Percent positivity is based on the sum of the daily cases that test positive divided by the number of cases reported during the date ranges specified in each column. Data Source: CCM.
COVID-19 in Ontario: January 15, 2020 to April 13, 2021 31
Disclaimer This document was developed by Public Health Ontario (PHO). PHO provides scientific and technical advice to Ontario’s government, public health organizations and health care providers. PHO’s work is guided by the current best available evidence at the time of publication.
The application and use of this document is the responsibility of the user. PHO assumes no liability resulting from any such application or use.
This document may be reproduced without permission for non-commercial purposes only and provided that appropriate credit is given to PHO. No changes and/or modifications may be made to this document without express written permission from PHO.
Citation Ontario Agency for Health Protection and Promotion (Public Health Ontario). Epidemiologic summary: COVID-19 in Ontario – January 15, 2020 to April 13, 2021. Toronto, ON: Queen’s Printer for Ontario; 2021.
For Further Information For more information, email [email protected].
Public Health Ontario Public Health Ontario is an agency of the Government of Ontario dedicated to protecting and promoting the health of all Ontarians and reducing inequities in health. Public Health Ontario links public health practitioners, front-line health workers and researchers to the best scientific intelligence and knowledge from around the world.
For more information about PHO, visit publichealthontario.ca.
©Queen’s Printer for Ontario, 2021