Thailand Car Sales Statistics Subcompact SUV Segment July 2015
Upload
hoangthuanCategory
view
214download
0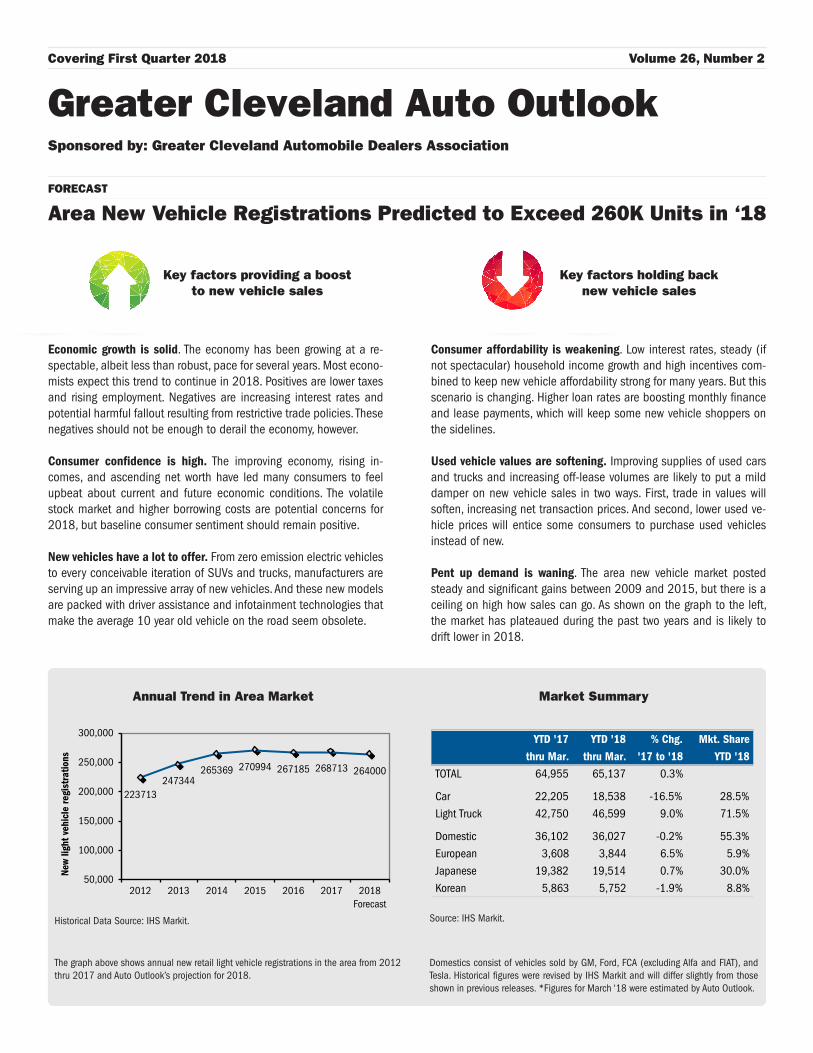
Covering First Quarter 2018 Volume 26, Number 2
Greater Cleveland Auto OutlookSponsored by: Greater Cleveland Automobile Dealers Association
Market Summary
Source: IHS Markit.
Annual Trend in Area Market
Historical Data Source: IHS Markit.
223713247344
265369 270994 267185 268713 264000
50,000
100,000
150,000
200,000
250,000
300,000
2012 2013 2014 2015 2016 2017 2018Forecast
New
ligh
t veh
icle
regi
stra
tions
YTD '17 YTD '18 % Chg. Mkt. Share
thru Mar. thru Mar. '17 to '18 YTD '18
TOTAL 64,955 65,137 0.3%
Car 22,205 18,538 -16.5% 28.5%
Light Truck 42,750 46,599 9.0% 71.5%
Domestic 36,102 36,027 -0.2% 55.3%
European 3,608 3,844 6.5% 5.9%
Japanese 19,382 19,514 0.7% 30.0%
Korean 5,863 5,752 -1.9% 8.8%
FORECAST
Area New Vehicle Registrations Predicted to Exceed 260K Units in ‘18
Economic growth is solid. The economy has been growing at a re-spectable, albeit less than robust, pace for several years. Most econo-mists expect this trend to continue in 2018. Positives are lower taxes and rising employment. Negatives are increasing interest rates and potential harmful fallout resulting from restrictive trade policies. These negatives should not be enough to derail the economy, however.
Consumer confidence is high. The improving economy, rising in-comes, and ascending net worth have led many consumers to feel upbeat about current and future economic conditions. The volatile stock market and higher borrowing costs are potential concerns for 2018, but baseline consumer sentiment should remain positive.
New vehicles have a lot to offer. From zero emission electric vehicles to every conceivable iteration of SUVs and trucks, manufacturers are serving up an impressive array of new vehicles. And these new models are packed with driver assistance and infotainment technologies that make the average 10 year old vehicle on the road seem obsolete.
Key factors providing a boostto new vehicle sales
Consumer affordability is weakening. Low interest rates, steady (if not spectacular) household income growth and high incentives com-bined to keep new vehicle affordability strong for many years. But this scenario is changing. Higher loan rates are boosting monthly finance and lease payments, which will keep some new vehicle shoppers on the sidelines.
Used vehicle values are softening. Improving supplies of used cars and trucks and increasing off-lease volumes are likely to put a mild damper on new vehicle sales in two ways. First, trade in values will soften, increasing net transaction prices. And second, lower used ve-hicle prices will entice some consumers to purchase used vehicles instead of new.
Pent up demand is waning. The area new vehicle market posted steady and significant gains between 2009 and 2015, but there is a ceiling on high how sales can go. As shown on the graph to the left, the market has plateaued during the past two years and is likely to drift lower in 2018.
Key factors holding backnew vehicle sales
Domestics consist of vehicles sold by GM, Ford, FCA (excluding Alfa and FIAT), and Tesla. Historical figures were revised by IHS Markit and will differ slightly from those shown in previous releases. *Figures for March ‘18 were estimated by Auto Outlook.
The graph above shows annual new retail light vehicle registrations in the area from 2012 thru 2017 and Auto Outlook’s projection for 2018.
Page 2 Greater Cleveland Auto Outlook
61,154
65,137
0 10,000 20,000 30,000 40,000 50,000 60,000 70,000
1Q avg.('13 to '17)
1Q '18
Quarterly new retail light vehicle registrations
Q2 '17 Q3 '17 Q4 '17 Q1 '18*
Area 0.8% -0.6% -0.8% 0.3%
U.S. -1.0% -2.8% 0.6% 0.7%
-10.0%
-7.5%
-5.0%
-2.5%
0.0%
2.5%
5.0%
7.5%
10.0%
% c
hang
e ve
rsus
yea
r ear
lier
Greater ClevelandAuto Outlook
First Quarter 2018
Published by:Auto Outlook, Inc.
PO Box 390Exton, PA 19341
Phone: 800-206-0102EMail: [email protected]
Editor: Jeffrey A. Foltz
Reproduction, including photocopying of this publication in whole or in part, is prohibited without the express per-mission of Auto Outlook, Inc. Any material quoted must be attributed to Greater Cleveland Auto Outlook, published by Auto Outlook, Inc. on behalf of the Greater Cleveland Au-tomobile Dealers Association, and must also include the statement: “Data Source: IHS Markit.” Unforeseen events may affect the forecast projections. Consequently, Auto Outlook is not responsible for management decisions based on the content of Greater Cleveland Auto Outlook.
Area Market U.S. Market
Percent change in registrations
YTD '18 thru Mar.* vs. YTD '170.3% 0.7%
Passenger car market share
YTD '18 thru Mar.*28.5% 31.5%
Domestic brand market share
YTD '18 thru Mar.*55.3% 42.5%
Top 10 brands and market share
YTD '18 thru Mar.*
First Chevrolet 15.3% Toyota 13.0%
Second Ford 14.4% Ford 11.8%
Third Jeep 8.7% Chevrolet 11.6%
Fourth Honda 8.1% Honda 9.7%
Fifth Toyota 7.6% Nissan 6.8%
Sixth Nissan 4.9% Jeep 6.3%
Seventh Kia 4.9% Subaru 4.4%
Eighth Subaru 4.5% Kia 3.5%
Ninth GMC 4.4% GMC 3.5%
Tenth Hyundai 3.9% Hyundai 3.3%
*March 2018 figures estimated by Auto Outlook Source: IHS Markit
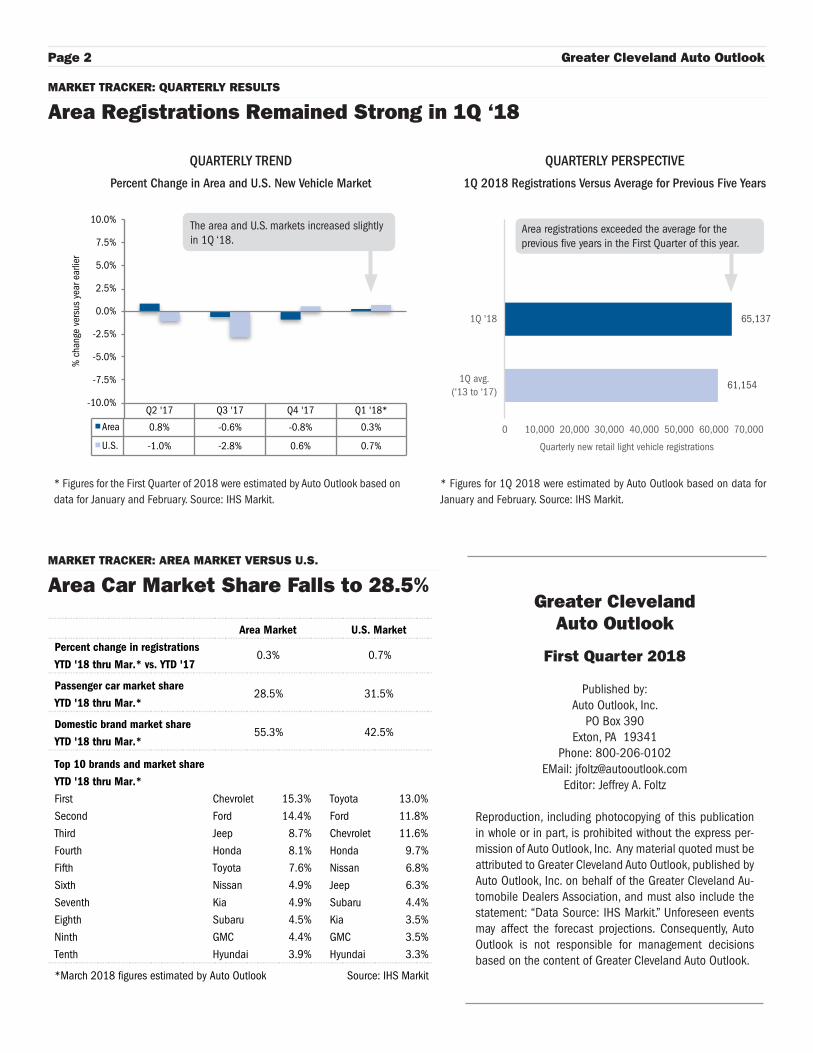
QUARTERLY TREND
Percent Change in Area and U.S. New Vehicle Market
MARKET TRACKER: QUARTERLY RESULTS
Area Registrations Remained Strong in 1Q ‘18
QUARTERLY PERSPECTIVE
1Q 2018 Registrations Versus Average for Previous Five Years
* Figures for the First Quarter of 2018 were estimated by Auto Outlook based on data for January and February. Source: IHS Markit.
MARKET TRACKER: AREA MARKET VERSUS U.S.
Area Car Market Share Falls to 28.5%
* Figures for 1Q 2018 were estimated by Auto Outlook based on data for January and February. Source: IHS Markit.
Area registrations exceeded the average for the previous five years in the First Quarter of this year.
The area and U.S. markets increased slightly in 1Q ‘18.
Covering First Quarter 2018 Page 3
0.0%
0.2%
0.4%
0.6%
0.8%
1.0%
1.2%
1.4%
Q215
Q315
Q415
Q116
Q216
Q316
Q416
Q117
Q217
Q317
Q417
Q118*
Mar
ket S
hare
Hybrid Plug In Hybrid Electric
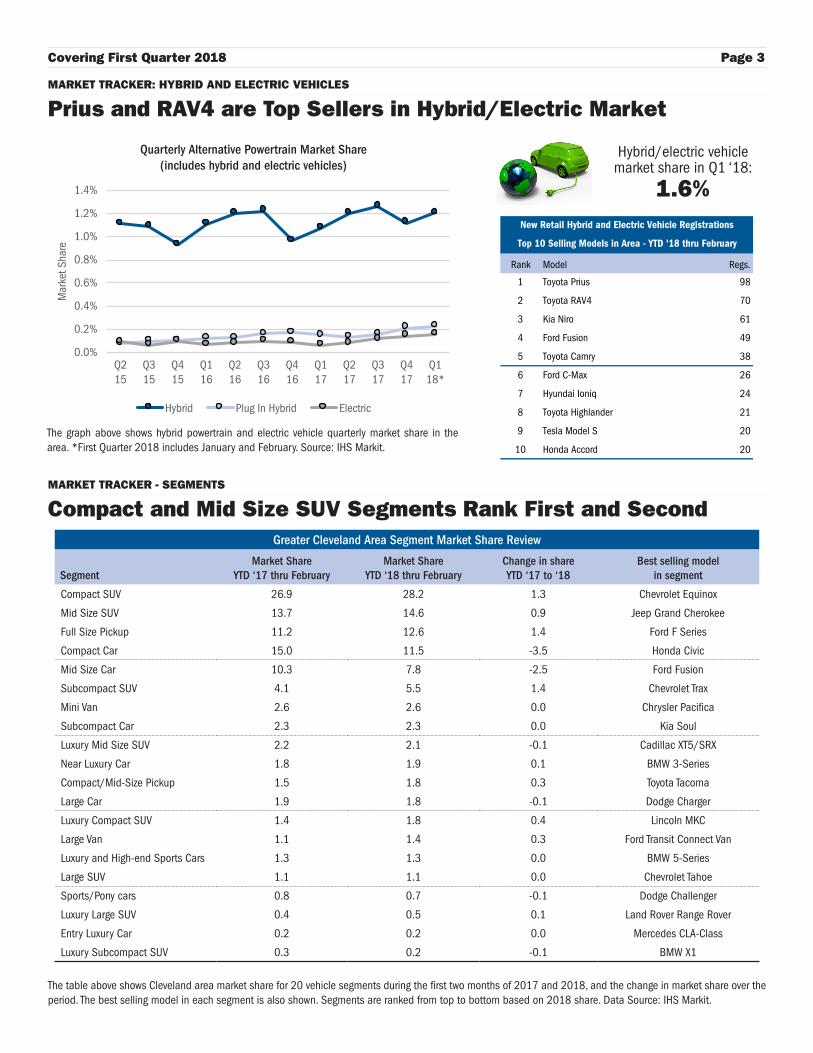
New Retail Hybrid and Electric Vehicle Registrations
Top 10 Selling Models in Area - YTD '18 thru February
Rank Model Regs.
1 Toyota Prius 98
2 Toyota RAV4 70
3 Kia Niro 61
4 Ford Fusion 49
5 Toyota Camry 38
6 Ford C-Max 26
7 Hyundai Ioniq 24
8 Toyota Highlander 21
9 Tesla Model S 20
10 Honda Accord 20
MARKET TRACKER - SEGMENTS
Compact and Mid Size SUV Segments Rank First and Second
The table above shows Cleveland area market share for 20 vehicle segments during the first two months of 2017 and 2018, and the change in market share over the period. The best selling model in each segment is also shown. Segments are ranked from top to bottom based on 2018 share. Data Source: IHS Markit.
The graph above shows hybrid powertrain and electric vehicle quarterly market share in the area. *First Quarter 2018 includes January and February. Source: IHS Markit.
MARKET TRACKER: HYBRID AND ELECTRIC VEHICLES
Prius and RAV4 are Top Sellers in Hybrid/Electric Market
Hybrid/electric vehicle market share in Q1 ‘18:
1.6%
Quarterly Alternative Powertrain Market Share(includes hybrid and electric vehicles)
Greater Cleveland Area Segment Market Share Review
SegmentMarket Share
YTD ‘17 thru FebruaryMarket Share
YTD ‘18 thru FebruaryChange in shareYTD ‘17 to ‘18
Best selling modelin segment
Compact SUV 26.9 28.2 1.3 Chevrolet Equinox
Mid Size SUV 13.7 14.6 0.9 Jeep Grand Cherokee
Full Size Pickup 11.2 12.6 1.4 Ford F Series
Compact Car 15.0 11.5 -3.5 Honda Civic
Mid Size Car 10.3 7.8 -2.5 Ford Fusion
Subcompact SUV 4.1 5.5 1.4 Chevrolet Trax
Mini Van 2.6 2.6 0.0 Chrysler Pacifica
Subcompact Car 2.3 2.3 0.0 Kia Soul
Luxury Mid Size SUV 2.2 2.1 -0.1 Cadillac XT5/SRX
Near Luxury Car 1.8 1.9 0.1 BMW 3-Series
Compact/Mid-Size Pickup 1.5 1.8 0.3 Toyota Tacoma
Large Car 1.9 1.8 -0.1 Dodge Charger
Luxury Compact SUV 1.4 1.8 0.4 Lincoln MKC
Large Van 1.1 1.4 0.3 Ford Transit Connect Van
Luxury and High-end Sports Cars 1.3 1.3 0.0 BMW 5-Series
Large SUV 1.1 1.1 0.0 Chevrolet Tahoe
Sports/Pony cars 0.8 0.7 -0.1 Dodge Challenger
Luxury Large SUV 0.4 0.5 0.1 Land Rover Range Rover
Entry Luxury Car 0.2 0.2 0.0 Mercedes CLA-Class
Luxury Subcompact SUV 0.3 0.2 -0.1 BMW X1

Page 4 Greater Cleveland Auto Outlook
The table above shows new retail light vehicle (car and light truck) registrations in the Greater Cleveland area market. Figures are shown for the First Quarters of 2017 and 2018, and annual totals for 2016 and 2017. The top ten ranked brands in each category are shaded yellow.
Brand Registrations ReportGreater Cleveland Area New Retail Car and Light Truck Registrations
First Quarter* Anuual Totals
Registrations Market Share (%) Registrations Market Share (%)
1Q '17 1Q '18 % change 1Q '17 1Q '18 Change 2016 2017 % change 2016 2017 Change
TOTAL 64,955 65,137 0.3 267,185 268,713 0.6
Cars 22,205 18,538 -16.5 34.2 28.5 -5.7 101,769 90,239 -11.3 38.1 33.6 -4.5
Light Trucks 42,750 46,599 9.0 65.8 71.5 5.7 165,416 178,474 7.9 61.9 66.4 4.5
Domestic Brands 36,102 36,027 -0.2 55.6 55.3 -0.3 143,358 144,567 0.8 53.7 53.8 0.1
European Brands 3,608 3,844 6.5 5.6 5.9 0.3 16,218 16,221 0.0 6.1 6.0 -0.1
Japanese Brands 19,382 19,514 0.7 29.8 30.0 0.2 83,499 83,733 0.3 31.3 31.2 -0.1
Korean Brands 5,863 5,752 -1.9 9.0 8.8 -0.2 24,110 24,192 0.3 9.0 9.0 0.0
Acura 330 378 14.5 0.5 0.6 0.1 1,734 1,742 0.5 0.6 0.6 0.0
Alfa Romeo 7 61 771.4 0.0 0.1 0.1 3 155 5066.7 0.0 0.1 0.1
Audi 374 358 -4.3 0.6 0.5 -0.1 1,800 1,846 2.6 0.7 0.7 0.0
BMW 571 650 13.8 0.9 1.0 0.1 2,926 2,571 -12.1 1.1 1.0 -0.1
Buick 2,017 2,062 2.2 3.1 3.2 0.1 7,183 8,323 15.9 2.7 3.1 0.4
Cadillac 682 748 9.7 1.0 1.1 0.1 3,336 3,278 -1.7 1.2 1.2 0.0
Chevrolet 10,353 9,974 -3.7 15.9 15.3 -0.6 39,542 40,738 3.0 14.8 15.2 0.4
Chrysler 932 972 4.3 1.4 1.5 0.1 5,205 3,750 -28.0 1.9 1.4 -0.5
Dodge 1,789 1,645 -8.0 2.8 2.5 -0.3 6,157 6,371 3.5 2.3 2.4 0.1
FIAT 60 29 -51.7 0.1 0.0 -0.1 361 255 -29.4 0.1 0.1 0.0
Ford 10,213 9,401 -8.0 15.7 14.4 -1.3 41,216 40,638 -1.4 15.4 15.1 -0.3
Genesis 56 57 1.8 0.1 0.1 0.0 50 244 388.0 0.0 0.1 0.1
GMC 2,688 2,877 7.0 4.1 4.4 0.3 9,905 10,467 5.7 3.7 3.9 0.2
Honda 5,559 5,277 -5.1 8.6 8.1 -0.5 24,655 24,872 0.9 9.2 9.3 0.1
Hyundai 2,667 2,526 -5.3 4.1 3.9 -0.2 9,968 10,629 6.6 3.7 4.0 0.3
Infiniti 382 323 -15.4 0.6 0.5 -0.1 1,682 1,585 -5.8 0.6 0.6 0.0
Jaguar 97 65 -33.0 0.1 0.1 0.0 261 318 21.8 0.1 0.1 0.0
Jeep 4,678 5,687 21.6 7.2 8.7 1.5 20,041 19,688 -1.8 7.5 7.3 -0.2
Kia 3,140 3,169 0.9 4.8 4.9 0.1 14,092 13,319 -5.5 5.3 5.0 -0.3
Land Rover 130 186 43.1 0.2 0.3 0.1 552 534 -3.3 0.2 0.2 0.0
Lexus 520 565 8.7 0.8 0.9 0.1 2,709 2,635 -2.7 1.0 1.0 0.0
Lincoln 719 573 -20.3 1.1 0.9 -0.2 2,989 2,959 -1.0 1.1 1.1 0.0
Maserati 20 14 -30.0 0.0 0.0 0.0 64 105 64.1 0.0 0.0 0.0
Mazda 1,248 1,471 17.9 1.9 2.3 0.4 4,803 5,183 7.9 1.8 1.9 0.1
Mercedes 784 738 -5.9 1.2 1.1 -0.1 3,724 3,412 -8.4 1.4 1.3 -0.1
MINI 92 87 -5.4 0.1 0.1 0.0 467 489 4.7 0.2 0.2 0.0
Mitsubishi 327 409 25.1 0.5 0.6 0.1 1,464 1,377 -5.9 0.5 0.5 0.0
Nissan 3,471 3,215 -7.4 5.3 4.9 -0.4 13,627 13,877 1.8 5.1 5.2 0.1
Other 21 15 -28.6 0.0 0.0 0.0 108 91 -15.7 0.0 0.0 0.0
Porsche 107 118 10.3 0.2 0.2 0.0 494 529 7.1 0.2 0.2 0.0
Ram 1,989 2,031 2.1 3.1 3.1 0.0 7,580 8,121 7.1 2.8 3.0 0.2
Subaru 2,772 2,914 5.1 4.3 4.5 0.2 10,742 11,254 4.8 4.0 4.2 0.2
Tesla 38 55 44.7 0.1 0.1 0.0 193 222 15.0 0.1 0.1 0.0
Toyota 4,770 4,959 4.0 7.3 7.6 0.3 22,070 21,191 -4.0 8.3 7.9 -0.4
Volkswagen 1,148 1,281 11.6 1.8 2.0 0.2 4,726 5,126 8.5 1.8 1.9 0.1
Volvo 204 247 21.1 0.3 0.4 0.1 756 819 8.3 0.3 0.3 0.0
*March 2018 figures were estimated by Auto Outlook.Source: IHS Markit
Covering First Quarter 2018 Page 5
-15.4%
-7.4%
-5.3%
-5.1%
0.9%
1.8%
4.0%
5.1%
8.7%
14.5%
17.9%
25.1%
-51.7%
-33.0%
-30.0%
-5.9%
-5.4%
-4.3%
10.3%
11.6%
13.8%
21.1%
43.1%
-20.3%
-8.0%
-8.0%
-3.7%
2.1%
2.2%
4.3%
7.0%
9.7%
21.6%
-60.0% -40.0% -20.0% 0.0% 20.0% 40.0% 60.0%
Infiniti
Nissan
Hyundai
Honda
Kia
Genesis
Toyota
Subaru
Lexus
Acura
Mazda
Mitsubishi
FIAT
Jaguar
Maserati
Mercedes
MINI
Audi
Porsche
Volkswagen
BMW
Volvo
Land Rover
Lincoln
Dodge
Ford
Chevrolet
Ram
Buick
Chrysler
GMC
Cadillac
Jeep
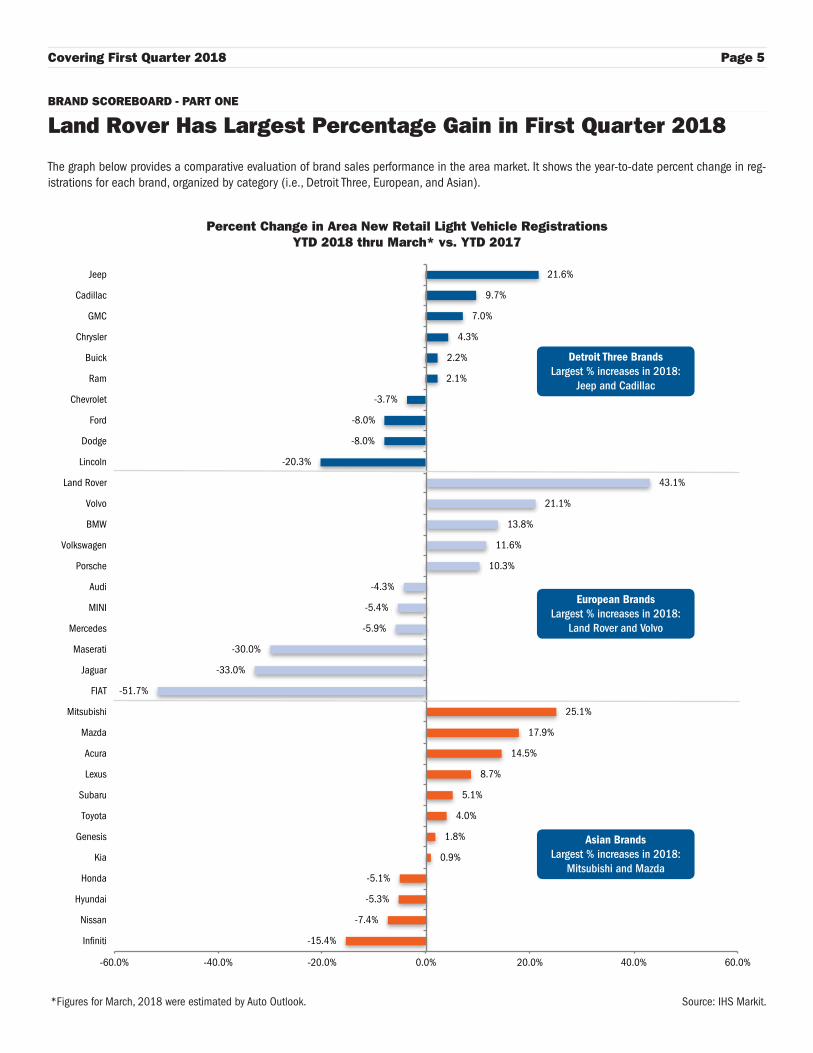
BRAND SCOREBOARD - PART ONE
Land Rover Has Largest Percentage Gain in First Quarter 2018
*Figures for March, 2018 were estimated by Auto Outlook. Source: IHS Markit.
Percent Change in Area New Retail Light Vehicle RegistrationsYTD 2018 thru March* vs. YTD 2017
The graph below provides a comparative evaluation of brand sales performance in the area market. It shows the year-to-date percent change in reg-istrations for each brand, organized by category (i.e., Detroit Three, European, and Asian).
Detroit Three BrandsLargest % increases in 2018:
Jeep and Cadillac
European BrandsLargest % increases in 2018:
Land Rover and Volvo
Asian BrandsLargest % increases in 2018:
Mitsubishi and Mazda
Page 6 Greater Cleveland Auto Outlook
4.6
4.7
5.7
7.3
8.3
9.6
11.6
12.9
13.6
16.4
0.0 5.0 10.0 15.0 20.0
Volvo
Land Rover
Infiniti
Audi
Acura
BMW
Mercedes
Lincoln
Lexus
Cadillac
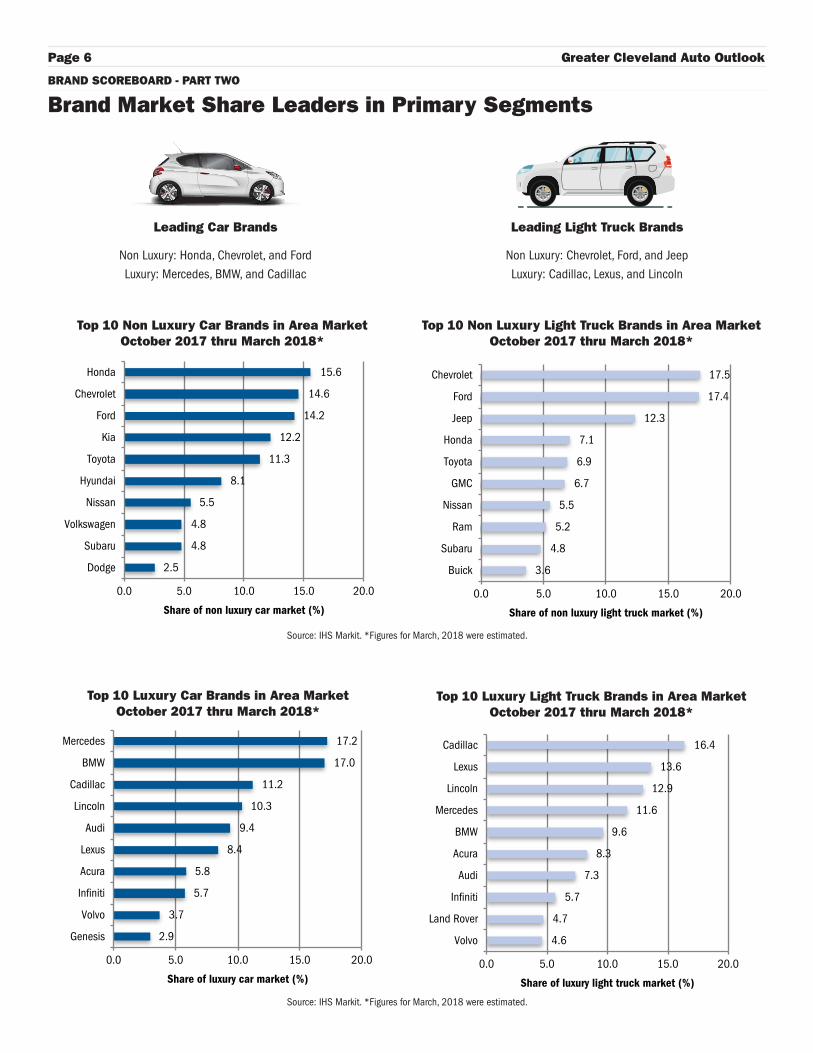
Share of luxury light truck market (%)
2.9
3.7
5.7
5.8
8.4
9.4
10.3
11.2
17.0
17.2
0.0 5.0 10.0 15.0 20.0
Genesis
Volvo
Infiniti
Acura
Lexus
Audi
Lincoln
Cadillac
BMW
Mercedes
Share of luxury car market (%)
3.6
4.8
5.2
5.5
6.7
6.9
7.1
12.3
17.4
17.5
0.0 5.0 10.0 15.0 20.0
Buick
Subaru
Ram
Nissan
GMC
Toyota
Honda
Jeep
Ford
Chevrolet
Share of non luxury light truck market (%)
2.5
4.8
4.8
5.5
8.1
11.3
12.2
14.2
14.6
15.6
0.0 5.0 10.0 15.0 20.0
Dodge
Subaru
Volkswagen
Nissan
Hyundai
Toyota
Kia
Ford
Chevrolet
Honda
Share of non luxury car market (%)
BRAND SCOREBOARD - PART TWO
Brand Market Share Leaders in Primary Segments
Top 10 Non Luxury Car Brands in Area MarketOctober 2017 thru March 2018*
Top 10 Luxury Car Brands in Area MarketOctober 2017 thru March 2018*
Top 10 Non Luxury Light Truck Brands in Area MarketOctober 2017 thru March 2018*
Top 10 Luxury Light Truck Brands in Area MarketOctober 2017 thru March 2018*
Leading Car Brands
Non Luxury: Honda, Chevrolet, and FordLuxury: Mercedes, BMW, and Cadillac
Leading Light Truck Brands
Non Luxury: Chevrolet, Ford, and JeepLuxury: Cadillac, Lexus, and Lincoln
Source: IHS Markit. *Figures for March, 2018 were estimated.
Source: IHS Markit. *Figures for March, 2018 were estimated.
Covering First Quarter 2018 Page 7
0.6%
1.9%
2.1%
0.9%
0.9%
2.3%
2.1%
2.0%
2.8%
1.6%
3.3%
3.5%
4.4%
3.5%
6.8%
13.0%
9.7%
6.3%
11.8%
11.6%
0.9%
1.0%
1.1%
1.1%
1.5%
2.0%
2.3%
2.5%
3.1%
3.2%
3.9%
4.4%
4.5%
4.9%
4.9%
7.6%
8.1%
8.7%
14.4%
15.3%
0.0% 2.0% 4.0% 6.0% 8.0% 10.0% 12.0% 14.0% 16.0% 18.0%
Lincoln
BMW
Mercedes
Cadillac
Chrysler
Volkswagen
Mazda
Dodge
Ram
Buick
Hyundai
GMC
Subaru
Kia
Nissan
Toyota
Honda
Jeep
Ford
Chevrolet
Market Share
Area
U.S.
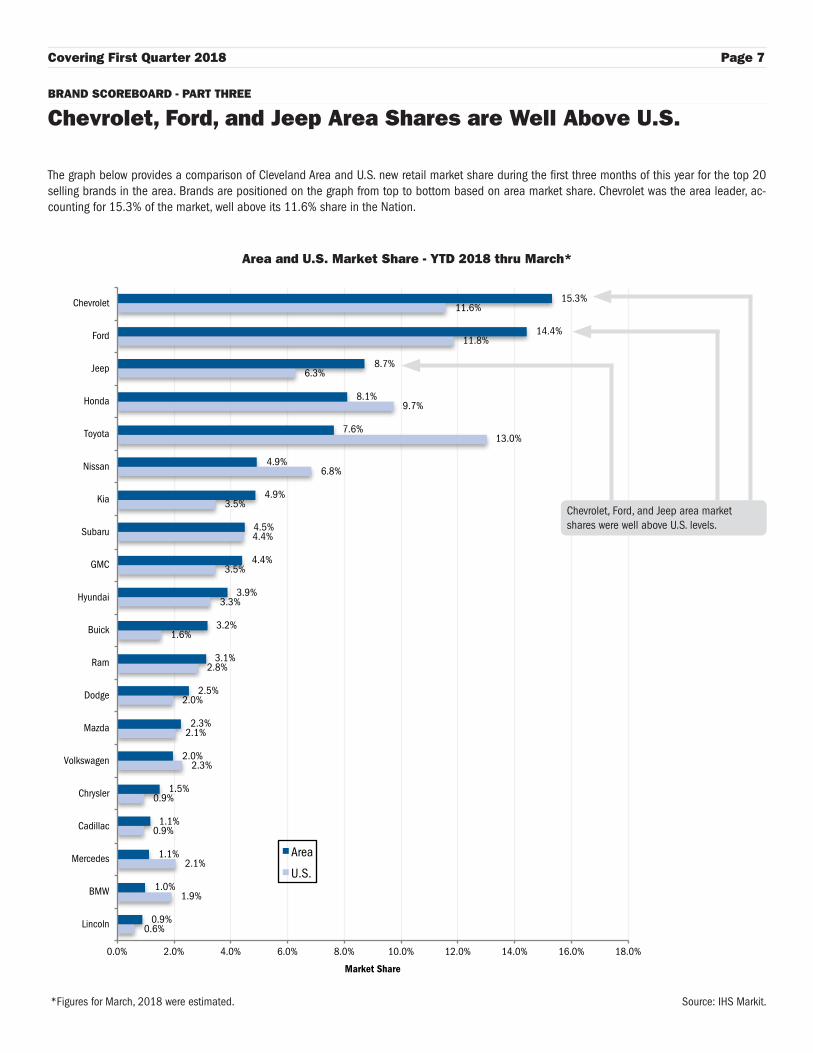
The graph below provides a comparison of Cleveland Area and U.S. new retail market share during the first three months of this year for the top 20 selling brands in the area. Brands are positioned on the graph from top to bottom based on area market share. Chevrolet was the area leader, ac-counting for 15.3% of the market, well above its 11.6% share in the Nation.
BRAND SCOREBOARD - PART THREE
Chevrolet, Ford, and Jeep Area Shares are Well Above U.S.
Area and U.S. Market Share - YTD 2018 thru March*
*Figures for March, 2018 were estimated. Source: IHS Markit.
Chevrolet, Ford, and Jeep area market shares were well above U.S. levels.
Page 8 Greater Cleveland Auto Outlook
-60%
0%
60%
120%
180%
-5000
0
5000
10000
15000
Perc
ent c
hang
e in
regi
stra
tions
-20
12 to
201
7 (b
lue
bars
)
Unit
chan
ge in
regi
stra
tions
-20
12 to
201
7 (o
rang
e ba
rs)
BRAND SCOREBOARD - PART FOUR
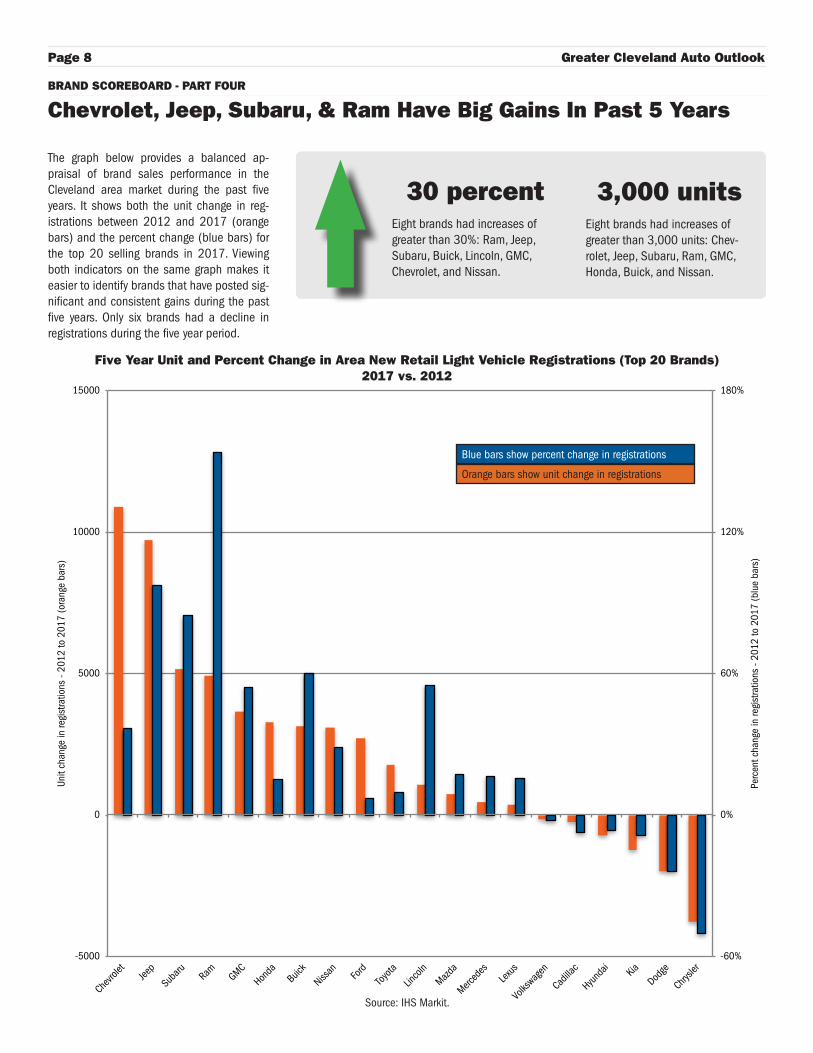
Chevrolet, Jeep, Subaru, & Ram Have Big Gains In Past 5 Years
The graph below provides a balanced ap-praisal of brand sales performance in the Cleveland area market during the past five years. It shows both the unit change in reg-istrations between 2012 and 2017 (orange bars) and the percent change (blue bars) for the top 20 selling brands in 2017. Viewing both indicators on the same graph makes it easier to identify brands that have posted sig-nificant and consistent gains during the past five years. Only six brands had a decline in registrations during the five year period.
30 percentEight brands had increases of greater than 30%: Ram, Jeep, Subaru, Buick, Lincoln, GMC, Chevrolet, and Nissan.
3,000 unitsEight brands had increases of greater than 3,000 units: Chev-rolet, Jeep, Subaru, Ram, GMC, Honda, Buick, and Nissan.
Five Year Unit and Percent Change in Area New Retail Light Vehicle Registrations (Top 20 Brands)2017 vs. 2012
Source: IHS Markit.
Blue bars show percent change in registrations
Orange bars show unit change in registrations
Covering First Quarter 2018 Page 9
Chevrolet Cruze
Ford Fusion
Buick Encore
Ford Escape
Honda CR-V
Honda Civic
Jeep Grand Cherokee
Jeep Cherokee
Chevrolet Equinox
Toyota Camry
GMC Terrain
Subaru Forester
Ford F Series
Chevrolet Silverado
Nissan Rogue
Ram Pickup
Kia Forte
Toyota RAV4
Ford Explorer
Chevrolet Trax
Hyundai Elantra
Jeep Wrangler
Chevrolet Traverse
Jeep Compass
Chrysler Pacifica
-25 -20 -15 -10 -5 0 5 10 15 20 25
MODEL RANKINGS
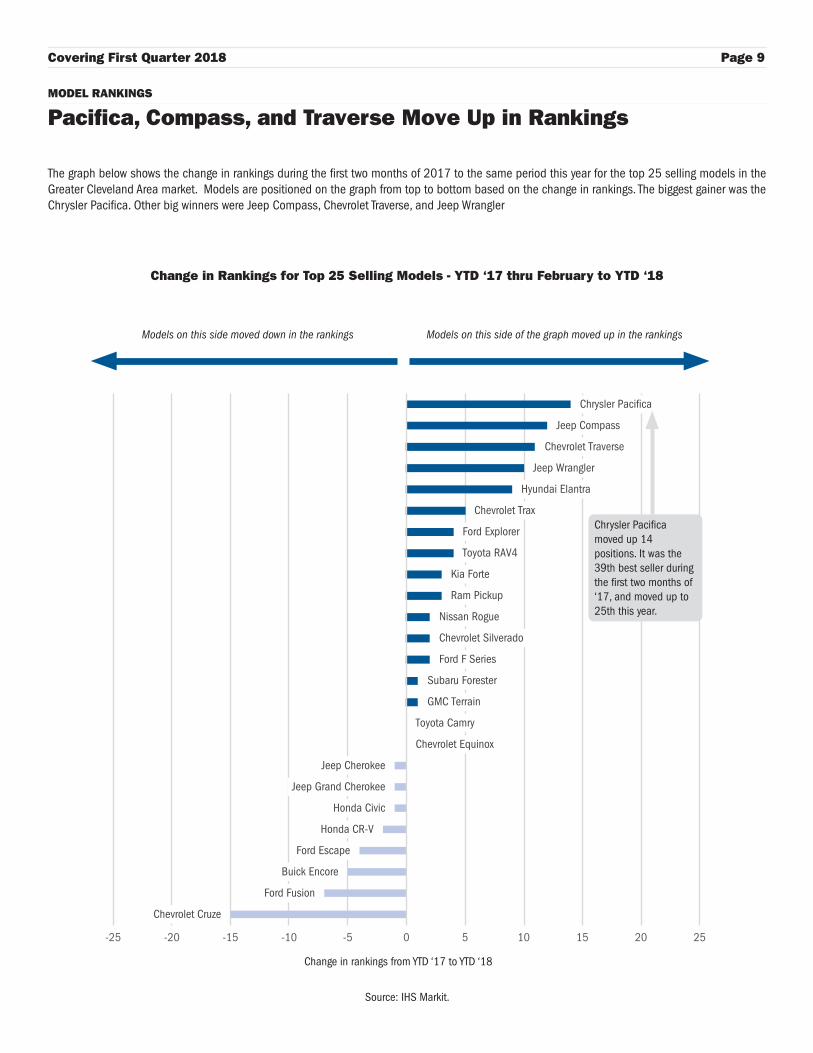
Pacifica, Compass, and Traverse Move Up in Rankings
The graph below shows the change in rankings during the first two months of 2017 to the same period this year for the top 25 selling models in the Greater Cleveland Area market. Models are positioned on the graph from top to bottom based on the change in rankings. The biggest gainer was the Chrysler Pacifica. Other big winners were Jeep Compass, Chevrolet Traverse, and Jeep Wrangler
Source: IHS Markit.
Change in rankings from YTD ‘17 to YTD ‘18
Models on this side moved down in the rankings Models on this side of the graph moved up in the rankings
Chrysler Pacifica moved up 14 positions. It was the 39th best seller during the first two months of ‘17, and moved up to 25th this year.
Change in Rankings for Top 25 Selling Models - YTD ‘17 thru February to YTD ‘18
Page 10 Greater Cleveland Auto Outlook
0
20
40
60
80
100
120
'09 '10 '11 '12 '13 '14 '15 '16 '17 1Q '18
Cons
umer
sen
timen
t
Years
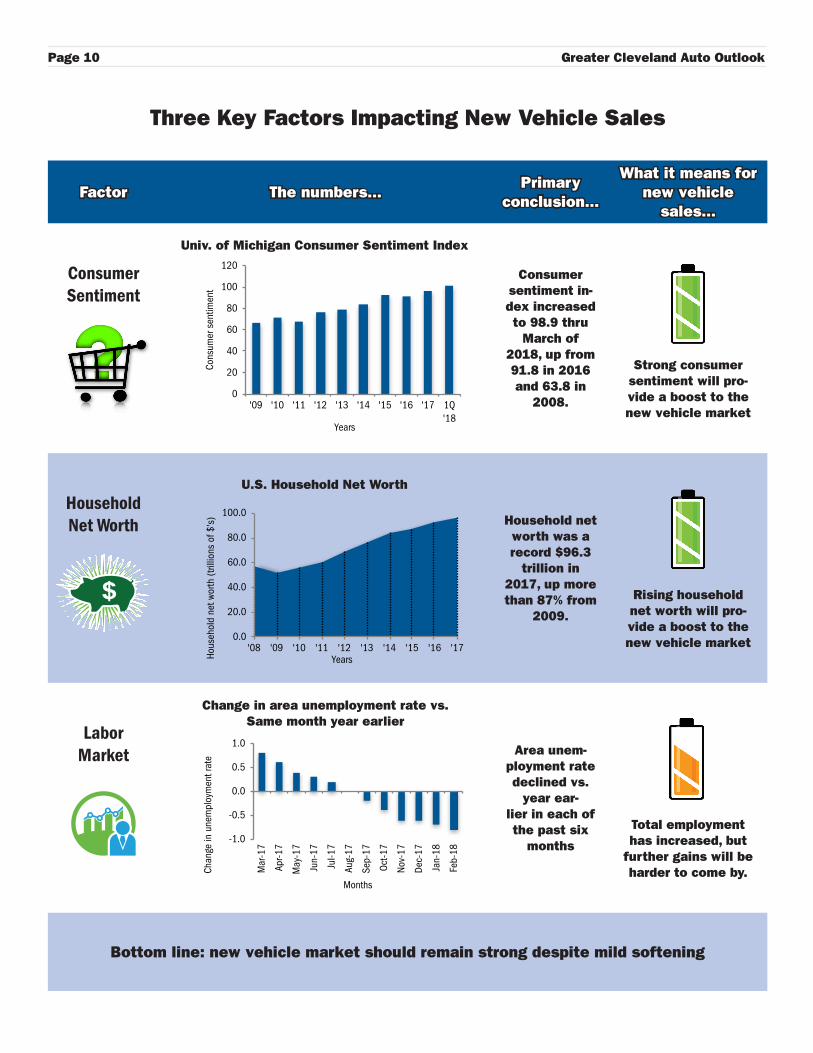
Three Key Factors Impacting New Vehicle Sales
Factor The numbers...Primary
conclusion...
What it means for new vehicle
sales...
Consumer Sentiment
Consumer sentiment in-dex increased to 98.9 thru
March of 2018, up from 91.8 in 2016 and 63.8 in
2008.
Strong consumer sentiment will pro-vide a boost to the new vehicle market
Household Net Worth Household net
worth was a record $96.3
trillion in 2017, up more than 87% from
2009.
Rising household net worth will pro-vide a boost to the new vehicle market
Labor Market Area unem-
ployment rate declined vs.
year ear-lier in each of the past six
months
Total employment has increased, but
further gains will be harder to come by.
Bottom line: new vehicle market should remain strong despite mild softening
Univ. of Michigan Consumer Sentiment Index
U.S. Household Net Worth
Change in area unemployment rate vs. Same month year earlier
0.0
20.0
40.0
60.0
80.0
100.0
'08 '09 '10 '11 '12 '13 '14 '15 '16 '17
Hous
ehol
d ne
t wor
th (t
rillio
ns o
f $'s
)
Years
-1.0
-0.5
0.0
0.5
1.0
Mar
-17
Apr-1
7
May
-17
Jun-
17
Jul-1
7
Aug-
17
Sep-
17
Oct-1
7
Nov-
17
Dec-
17
Jan-
18
Feb-
18
Chan
ge in
une
mpl
oym
ent r
ate
Months
Covering First Quarter 2018 Page 11
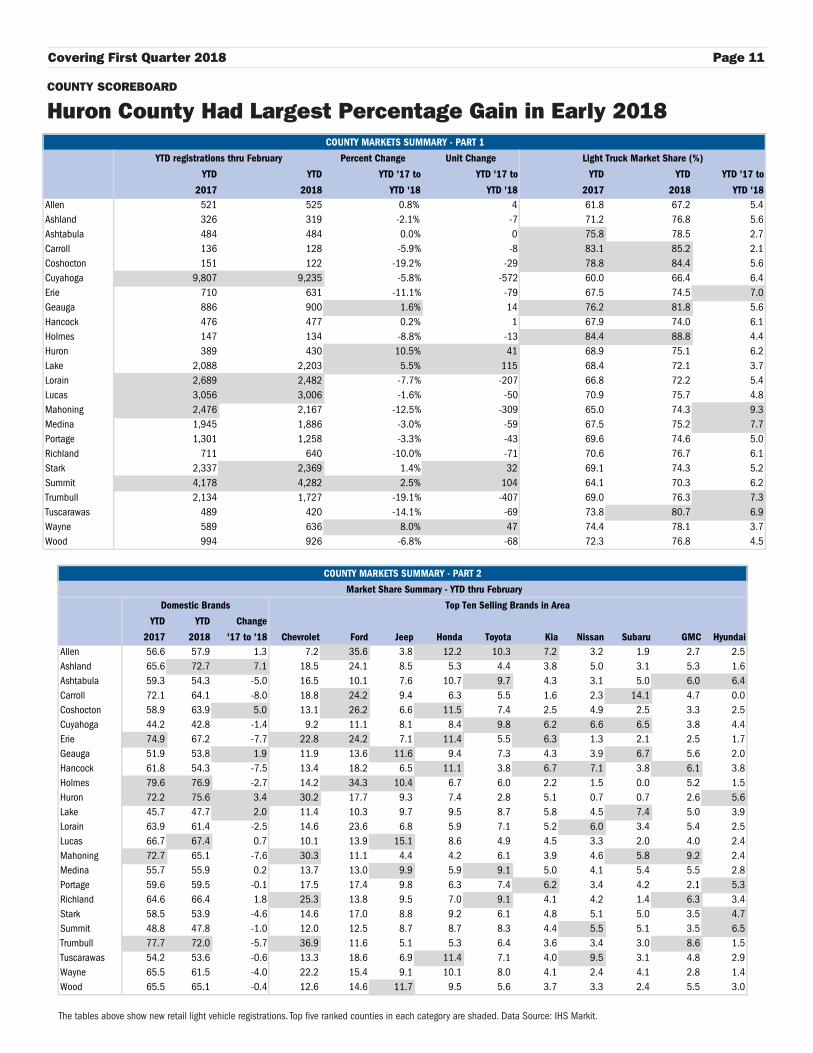
COUNTY SCOREBOARD
Huron County Had Largest Percentage Gain in Early 2018
The tables above show new retail light vehicle registrations. Top five ranked counties in each category are shaded. Data Source: IHS Markit.
COUNTY MARKETS SUMMARY - PART 1
YTD registrations thru February Percent Change Unit Change Light Truck Market Share (%)
YTD
2017
YTD
2018
YTD '17 to
YTD '18
YTD '17 to
YTD '18
YTD
2017
YTD
2018
YTD '17 to
YTD '18Allen 521 525 0.8% 4 61.8 67.2 5.4Ashland 326 319 -2.1% -7 71.2 76.8 5.6Ashtabula 484 484 0.0% 0 75.8 78.5 2.7Carroll 136 128 -5.9% -8 83.1 85.2 2.1Coshocton 151 122 -19.2% -29 78.8 84.4 5.6Cuyahoga 9,807 9,235 -5.8% -572 60.0 66.4 6.4Erie 710 631 -11.1% -79 67.5 74.5 7.0Geauga 886 900 1.6% 14 76.2 81.8 5.6Hancock 476 477 0.2% 1 67.9 74.0 6.1Holmes 147 134 -8.8% -13 84.4 88.8 4.4Huron 389 430 10.5% 41 68.9 75.1 6.2Lake 2,088 2,203 5.5% 115 68.4 72.1 3.7Lorain 2,689 2,482 -7.7% -207 66.8 72.2 5.4Lucas 3,056 3,006 -1.6% -50 70.9 75.7 4.8Mahoning 2,476 2,167 -12.5% -309 65.0 74.3 9.3Medina 1,945 1,886 -3.0% -59 67.5 75.2 7.7Portage 1,301 1,258 -3.3% -43 69.6 74.6 5.0Richland 711 640 -10.0% -71 70.6 76.7 6.1Stark 2,337 2,369 1.4% 32 69.1 74.3 5.2Summit 4,178 4,282 2.5% 104 64.1 70.3 6.2Trumbull 2,134 1,727 -19.1% -407 69.0 76.3 7.3Tuscarawas 489 420 -14.1% -69 73.8 80.7 6.9Wayne 589 636 8.0% 47 74.4 78.1 3.7Wood 994 926 -6.8% -68 72.3 76.8 4.5
COUNTY MARKETS SUMMARY - PART 2
Market Share Summary - YTD thru February
Domestic Brands Top Ten Selling Brands in Area
YTD
2017
YTD
2018
Change
'17 to '18 Chevrolet Ford Jeep Honda Toyota Kia Nissan Subaru GMC HyundaiAllen 56.6 57.9 1.3 7.2 35.6 3.8 12.2 10.3 7.2 3.2 1.9 2.7 2.5Ashland 65.6 72.7 7.1 18.5 24.1 8.5 5.3 4.4 3.8 5.0 3.1 5.3 1.6Ashtabula 59.3 54.3 -5.0 16.5 10.1 7.6 10.7 9.7 4.3 3.1 5.0 6.0 6.4Carroll 72.1 64.1 -8.0 18.8 24.2 9.4 6.3 5.5 1.6 2.3 14.1 4.7 0.0Coshocton 58.9 63.9 5.0 13.1 26.2 6.6 11.5 7.4 2.5 4.9 2.5 3.3 2.5Cuyahoga 44.2 42.8 -1.4 9.2 11.1 8.1 8.4 9.8 6.2 6.6 6.5 3.8 4.4Erie 74.9 67.2 -7.7 22.8 24.2 7.1 11.4 5.5 6.3 1.3 2.1 2.5 1.7Geauga 51.9 53.8 1.9 11.9 13.6 11.6 9.4 7.3 4.3 3.9 6.7 5.6 2.0Hancock 61.8 54.3 -7.5 13.4 18.2 6.5 11.1 3.8 6.7 7.1 3.8 6.1 3.8Holmes 79.6 76.9 -2.7 14.2 34.3 10.4 6.7 6.0 2.2 1.5 0.0 5.2 1.5Huron 72.2 75.6 3.4 30.2 17.7 9.3 7.4 2.8 5.1 0.7 0.7 2.6 5.6Lake 45.7 47.7 2.0 11.4 10.3 9.7 9.5 8.7 5.8 4.5 7.4 5.0 3.9Lorain 63.9 61.4 -2.5 14.6 23.6 6.8 5.9 7.1 5.2 6.0 3.4 5.4 2.5Lucas 66.7 67.4 0.7 10.1 13.9 15.1 8.6 4.9 4.5 3.3 2.0 4.0 2.4Mahoning 72.7 65.1 -7.6 30.3 11.1 4.4 4.2 6.1 3.9 4.6 5.8 9.2 2.4Medina 55.7 55.9 0.2 13.7 13.0 9.9 5.9 9.1 5.0 4.1 5.4 5.5 2.8Portage 59.6 59.5 -0.1 17.5 17.4 9.8 6.3 7.4 6.2 3.4 4.2 2.1 5.3Richland 64.6 66.4 1.8 25.3 13.8 9.5 7.0 9.1 4.1 4.2 1.4 6.3 3.4Stark 58.5 53.9 -4.6 14.6 17.0 8.8 9.2 6.1 4.8 5.1 5.0 3.5 4.7Summit 48.8 47.8 -1.0 12.0 12.5 8.7 8.7 8.3 4.4 5.5 5.1 3.5 6.5Trumbull 77.7 72.0 -5.7 36.9 11.6 5.1 5.3 6.4 3.6 3.4 3.0 8.6 1.5Tuscarawas 54.2 53.6 -0.6 13.3 18.6 6.9 11.4 7.1 4.0 9.5 3.1 4.8 2.9Wayne 65.5 61.5 -4.0 22.2 15.4 9.1 10.1 8.0 4.1 2.4 4.1 2.8 1.4Wood 65.5 65.1 -0.4 12.6 14.6 11.7 9.5 5.6 3.7 3.3 2.4 5.5 3.0
Page 12 Greater Cleveland Auto Outlook
7.9%
2.6%
2.8%
3.0%
4.1%
4.3%
4.4%
4.6%
5.5%
5.8%
6.7%
7.5%
7.6%
9.1%
11.6%
12.5%
0.0% 2.0% 4.0% 6.0% 8.0% 10.0% 12.0% 14.0%
Others
Dodge Durango
Toyota 4 Runner
Buick Envision
Dodge Journey
Buick Enclave
Hyundai Santa Fe Sport
Kia Sorento
Honda Pilot
Toyota Highlander
GMC Acadia
Ford Edge
Subaru Outback
Chevrolet Traverse
Ford Explorer
Jeep Grand Cherokee
Share of Mid Size SUV Segment
Greater Cleveland Auto Outlook
Greater Cleveland Auto Outlook is distributed free of charge to all members of the Greater Cleveland Automobile Deal-ers Association. The publication is sponsored and supported by GCADA.
Greater Cleveland Auto Outlook is published and edited by Auto Outlook, Inc., an independent automotive market research firm. Opinions expressed in Greater Cleveland Auto Outlook are solely those of Auto Outlook, Inc., and are not necessarily shared by GCADA.
Greater Cleveland Automobile Dealers Association
10100 Brecksville RoadBrecksville, OH 44141
440-746-1500www.gcada.org
Copyright Auto Outlook, Inc. April 2018
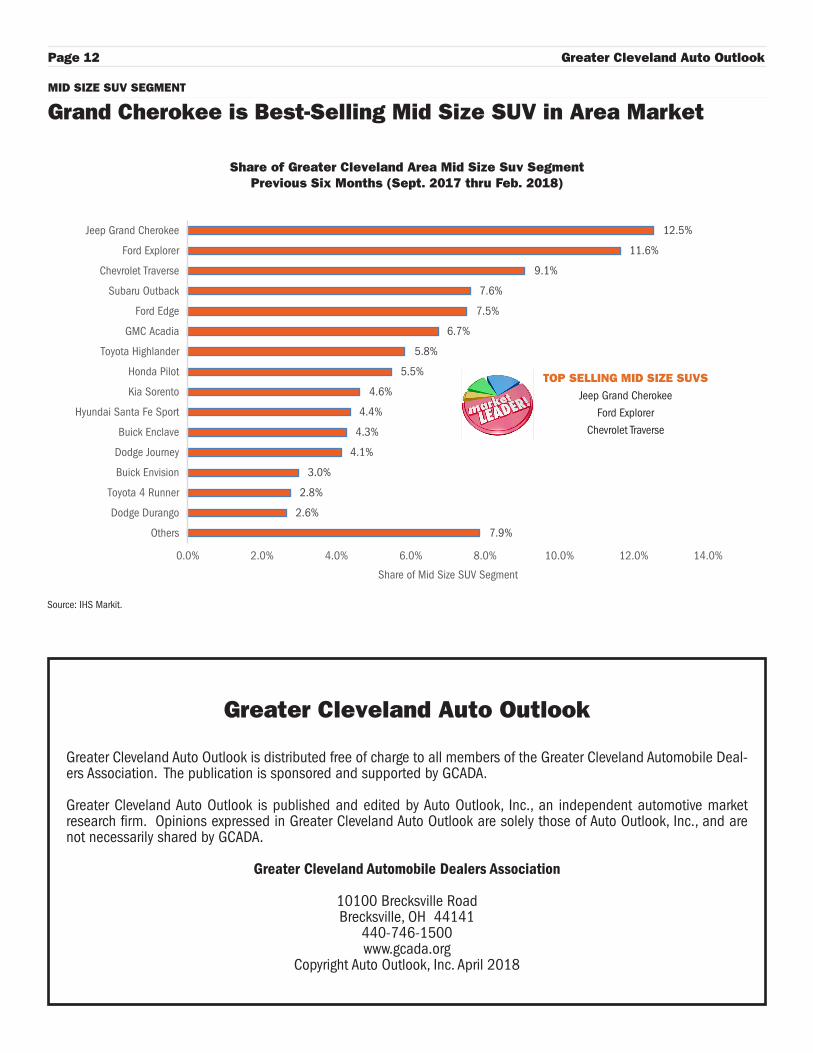
MID SIZE SUV SEGMENT
Grand Cherokee is Best-Selling Mid Size SUV in Area Market
Source: IHS Markit.
Share of Greater Cleveland Area Mid Size Suv SegmentPrevious Six Months (Sept. 2017 thru Feb. 2018)
TOP SELLING MID SIZE SUVSJeep Grand Cherokee
Ford Explorer
Chevrolet Traverse