
COVER PAGE TO BE INSERTED - bcis.co.za
45
COVER PAGE TO BE INSERTED Abridged Financial Report 2015 Think Efficient. Realise potential.
Transcript of COVER PAGE TO BE INSERTED - bcis.co.za

COVER PAGE TO BE INSERTED
Abridged Financial Report 2015
Think Efficient. Realise potential.

Report of the Trustees 3
Funds 4 - 29
Fees and Charges 30 - 34
Distributions 35 - 40
Total Expense Ratio 41 - 44
Contact Information 45
Table of Contents
2

REPORT OF THE TRUSTEE FOR THE EFFICIENT COLLECTIVE INVESTMENTS SCHEME
27 November 2015
Report of the Trustees
We, the Standard Bank of South Africa Limited, in our capacity as Trustee of the Boutique Collective Investment Scheme
(“the Scheme”) have prepared a report in terms of Section 70(1)(f) of the Collective Investment Schemes Control Act, 45 of
2002, as amended (“the Act”), for the financial year ended 31 August 2015.
In support of our report we have adopted certain processes and procedures that allow us to form a reasonable conclusion
on whether the Manager has administered the Scheme in accordance with the Act and the Scheme Deed.
As Trustees of the Scheme we are also obliged to in terms of Section 70(3) of the Act to satisfy ourselves that every
statement of comprehensive income, statement of financial position or other return prepared by the Manager of the
Scheme as required by Section 90 of the Act fairly represents the assets and liabilities, as well as the income and distribution
of income, of every portfolio of the Scheme.
The Manager is responsible for maintaining the accounting records and preparing the annual financial statements of the
Scheme in conformity with International Financial Reporting Standards. This responsibility also includes appointing an
external auditor to the Scheme to ensure that the financial statements are properly drawn up so as to fairly represent the
financial position of every portfolio of its collective investment scheme are in accordance with generally accepted accounting
practice and in the manner required by the Act.
Our enquiry into the administration of the Scheme by the Manager does not cover a review of the annual financial
statements and hence we do not provide an opinion thereon.
Based on our records, internal processes and procedures we report that nothing has come to our attention that causes us to
believe that the accompanying financial statements do not fairly represent the assets and liabilities, as well as the income
and distribution of income, of every portfolio of the Scheme
administered by the Manager.
We confirm that according to the records available to us, no losses were suffered in the portfolios and no investor was
prejudiced as a result thereof.
We conclude our report by stating that we reasonably believe that the Manager has administered the
Scheme in accordance with:
(i) the limitations imposed on the investment and borrowing powers of the manager by this Act;
(ii) and the provisions of this Act and the deed;
3
Melinda Mostert
Head: Trustee Services
Standard Bank of South Africa Limited

4D BCI Aggressive
Flexible Fund of Funds
4D BCI Cautious Fund
of Funds
4D BCI Flexible Fund 4D BCI Moderate Fund
of Funds
ADB BCI Balanced Fund
of Funds
ADB BCI Flexible
Prudential Fund of
Funds
Altre BCI Real Return
Property Fund
Income Statement R R R R R R R
Revenue 827 958 4 969 573 1 834 193 20 061 070 12 555 424 13 155 974 18075242
Operating Expenses 718 500 1 364 466 548 152 8 964 218 5 904 442 6 772 390 4837416
Change in net assets 109 458 3 605 107 1 286 041 11 096 852 6 650 982 6 383 584 13237826
Balance Sheet
Income attributable to unit holders -21 306 -46 469 364 -323 281 -131 282 2 544 -22525
Capital attributable to unit holders 56 934 944 92 841 031 49 438 566 684 020 818 410 902 238 515 361 585 625580114
Capital Employed 56 913 638 92 794 562 49 438 930 683 697 537 410 770 956 515 364 129 625557589
Non-current Assets
Total Assets 57 041 942 93 564 461 50 042 614 688 635 062 414 609 245 518 820 540 627182529
Liabilities 128 304 769 899 603 684 4 937 525 3 838 289 3 456 411 1624940
Net assets 56 913 638 92 794 562 49 438 930 683 697 537 410 770 956 515 364 129 625557589
1 Year Investment Performance % % % % % % %
Fund 6.75 7.35 13.89 7.81 4.80 3.62 22.16
Benchmark 10.22 7.07 4.04 8.12 8.12 9.17 27.50
Asset Allocation % % % % % % %
Domestic Equity 58.20 22.50 71.80 42.60 29.70 41.60 -
Offshore Equity 23.50 13.10 26.40 20.20 14.70 18.10 -
Domestic Property 1.50 4.10 - 4.60 9.30 9.20 76.60
Offshore Property - - - - 4.20 4.20 20.80
Domestic Bonds 1.60 23.20 - 10.10 - - -
Offshore Bonds - - - - 3.40 0.80 -
Domestic Cash / Liquid Assets 15.20 37.20 1.80 22.60 36.50 23.70 2.40
Offshore Cash / Liquid Assets - - - - 2.40 2.40 0.20
Notes
Performance figures sourced from Morningstar
Fund performance shown as n/a do not have
a performance history for this period
Benchmark available on Request
Funds
4

Income Statement
Revenue
Operating Expenses
Change in net assets
Balance Sheet
Income attributable to unit holders
Capital attributable to unit holders
Capital Employed
Non-current Assets
Total Assets
Liabilities
Net assets
1 Year Investment Performance
Fund
Benchmark
Asset Allocation
Domestic Equity
Offshore Equity
Domestic Property
Offshore Property
Domestic Bonds
Offshore Bonds
Domestic Cash / Liquid Assets
Offshore Cash / Liquid Assets
Notes
Performance figures sourced from Morningstar
Fund performance shown as n/a do not have
a performance history for this period
Benchmark available on Request
ABSA Access BCI Stable
Fund
ABSA Access BCI
Cautious Fund
ABSA Access BCI
Balanced Fund
ABSA Access BCI
Growth Fund
ABSA Access BCI
Aggressive Fund
Amity BCI Conserver
Fund of Funds
Amity BCI Flexible
Growth Fund of Funds
R R R R R R R
112 707 308 137 154 031 40 490 562 25 840 346 7 613 445
83 506 388 551 396 506 122 768 40 901 7 954 078 4 206 819
29 201 -80 414 -242 475 -82 278 -40 339 17 886 268 3 406 626
4 350 -80 414 -242 475 -82 278 -40 339 -3 601 -135 670
245 847 287 1 386 886 627 1 415 552 908 391 605 939 77 662 494 639 830 608 313 686 134
245 851 637 1 386 806 213 1 415 310 433 391 523 660 77 622 155 639 827 007 313 550 464
246159146 1 392 181 201 1 415 697 530 391641974 83859506 646532787 315 702 199
307509 5 374 988 387 097 118314 6237351 6705780 2 151 735
245851637 1 386 806 213 1 415 310 433 391523660 77622155 639827007 313 550 464
% % % % % % %
n/a n/a n/a n/a n/a 6.34 1.59
n/a n/a n/a n/a n/a 8.04 12.04
% % % % % % %
26.45 32.41 60.92 76.08 71.06 14.96 48.10
- - - - - 14.04 16.63
3.52 13.38 10.69 11.67 14.80 7.00 7.37
4.63 4.58 4.12 3.71 6.01 3.33 4.09
13.65 12.84 8.32 0.59 0.82 34.73 14.49
- - - - - 2.64 0.15
51.74 36.79 15.95 7.94 7.32 19.42 6.70
- - - - - 3.88 2.47
Funds
5
Income Statement
Revenue
Operating Expenses
Change in net assets
Balance Sheet
Income attributable to unit holders
Capital attributable to unit holders
Capital Employed
Non-current Assets
Total Assets
Liabilities
Net assets
1 Year Investment Performance
Fund
Benchmark
Asset Allocation
Domestic Equity
Offshore Equity
Domestic Property
Offshore Property
Domestic Bonds
Offshore Bonds
Domestic Cash / Liquid Assets
Offshore Cash / Liquid Assets
Notes
Performance figures sourced from Morningstar
Fund performance shown as n/a do not have
a performance history for this period
Benchmark available on Request
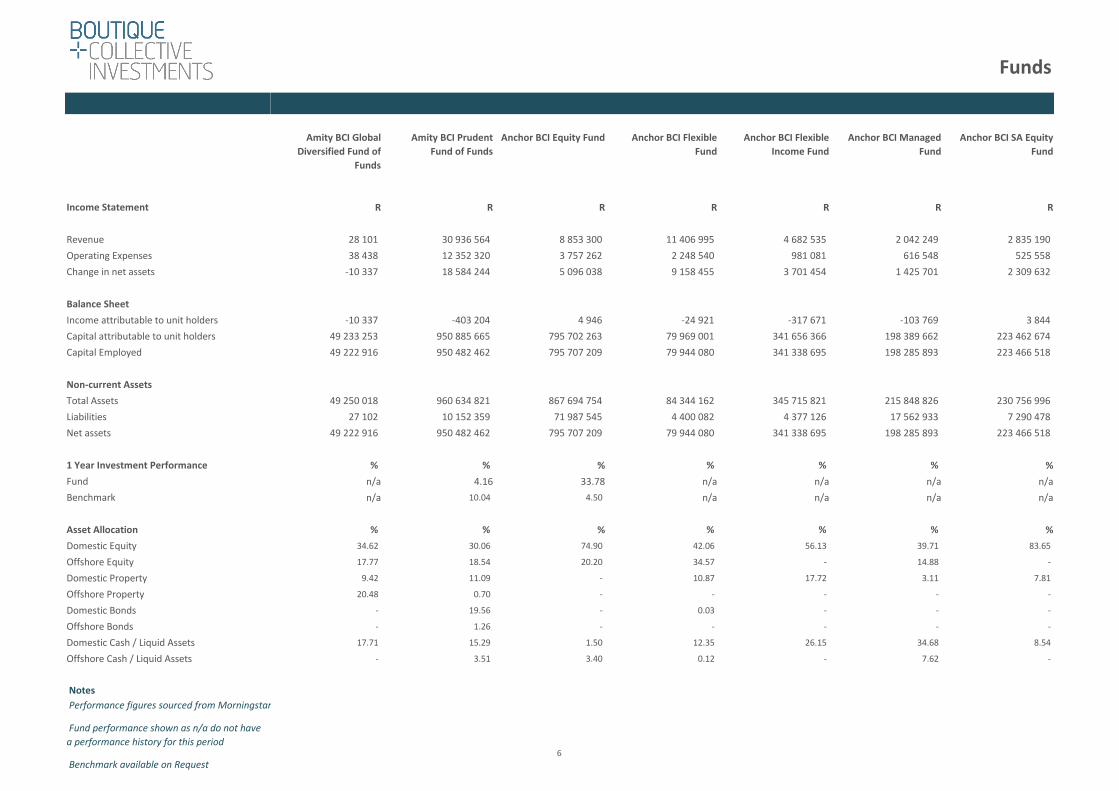
Amity BCI Global
Diversified Fund of
Funds
Amity BCI Prudent
Fund of Funds
Anchor BCI Equity Fund Anchor BCI Flexible
Fund
Anchor BCI Flexible
Income Fund
Anchor BCI Managed
Fund
Anchor BCI SA Equity
Fund
R R R R R R R
28 101 30 936 564 8 853 300 11 406 995 4 682 535 2 042 249 2 835 190
38 438 12 352 320 3 757 262 2 248 540 981 081 616 548 525 558
-10 337 18 584 244 5 096 038 9 158 455 3 701 454 1 425 701 2 309 632
-10 337 -403 204 4 946 -24 921 -317 671 -103 769 3 844
49 233 253 950 885 665 795 702 263 79 969 001 341 656 366 198 389 662 223 462 674
49 222 916 950 482 462 795 707 209 79 944 080 341 338 695 198 285 893 223 466 518
49 250 018 960 634 821 867 694 754 84 344 162 345 715 821 215 848 826 230 756 996
27 102 10 152 359 71 987 545 4 400 082 4 377 126 17 562 933 7 290 478
49 222 916 950 482 462 795 707 209 79 944 080 341 338 695 198 285 893 223 466 518
% % % % % % %
n/a 4.16 33.78 n/a n/a n/a n/a
n/a 10.04 4.50 n/a n/a n/a n/a
% % % % % % %
34.62 30.06 74.90 42.06 56.13 39.71 83.65
17.77 18.54 20.20 34.57 - 14.88 -
9.42 11.09 - 10.87 17.72 3.11 7.81
20.48 0.70 - - - - -
- 19.56 - 0.03 - - -
- 1.26 - - - - -
17.71 15.29 1.50 12.35 26.15 34.68 8.54
- 3.51 3.40 0.12 - 7.62 -
Funds
6

Income Statement
Revenue
Operating Expenses
Change in net assets
Balance Sheet
Income attributable to unit holders
Capital attributable to unit holders
Capital Employed
Non-current Assets
Total Assets
Liabilities
Net assets
1 Year Investment Performance
Fund
Benchmark
Asset Allocation
Domestic Equity
Offshore Equity
Domestic Property
Offshore Property
Domestic Bonds
Offshore Bonds
Domestic Cash / Liquid Assets
Offshore Cash / Liquid Assets
Notes
Performance figures sourced from Morningstar
Fund performance shown as n/a do not have
a performance history for this period
Benchmark available on Request
Anchor BCI Worldwide
Aggressive Flexible Fund
Anchor BCI Worldwide
Flexible Fund
API BCI Managed Fund
of Funds
API BCI Stable Fund of
Funds
API BCI Worldwide
Opportunities Fund of
Funds
Argon BCI Worldwide
Flexible Fund
AS BCI Forum
Aggressive Fund of
Funds
R R R R R R R
2 237 154 3 129 329 -705 200 877 117 346 564 57 610 10 226 477
1 510 112 1 631 014 89 874 124 607 156 436 44 930 6 700 893
727 042 1 498 315 -795 074 752 510 190 128 12 680 3 525 584
6 432 -28 280 -795 074 3 707 685 86 -269 700
126 047 599 201 812 352 50 913 692 102 287 225 74 244 492 5 572 101 453 115 234
126 054 031 201 784 072 50 118 618 102 290 932 74 245 177 5 572 187 452 845 534
127 265 451 202 629 927 50 167 016 103 103 832 74 486 425 6 038 968 453 411 031
1 211 420 845 855 48 398 812 900 241 248 466 781 565 497
126 054 031 201 784 072 50 118 618 102 290 932 74 245 177 5 572 187 452 845 534
% % % % % % %
24.94 23.67 n/a n/a n/a n/a 5.26
10.87 8.97 n/a n/a n/a n/a 12.04
% % % % % % %
74.15 0.33 43.40 9.90 5.50 90.90 42.50
- 54.34 15.80 14.00 45.90 - 18.01
9.68 - 8.50 9.00 6.10 - 9.90
- - 4.20 4.10 15.00 - 5.06
- - - - - - -
- - 1.50 3.20 0.90 - -
12.21 10.05 24.00 57.10 15.90 9.10 19.87
3.96 35.34 2.60 2.70 10.70 - 4.65
Funds
7

Income Statement
Revenue
Operating Expenses
Change in net assets
Balance Sheet
Income attributable to unit holders
Capital attributable to unit holders
Capital Employed
Non-current Assets
Total Assets
Liabilities
Net assets
1 Year Investment Performance
Fund
Benchmark
Asset Allocation
Domestic Equity
Offshore Equity
Domestic Property
Offshore Property
Domestic Bonds
Offshore Bonds
Domestic Cash / Liquid Assets
Offshore Cash / Liquid Assets
Notes
Performance figures sourced from Morningstar
Fund performance shown as n/a do not have
a performance history for this period
Benchmark available on Request
AS BCI Forum Cautious
Fund of Funds
AS BCI Forum
Moderate Fund of
Funds
Autus BCI Balanced
Fund
Autus BCI Equity Fund Autus BCI Global Equity
Fund
Autus BCI Income Plus
Fund
Autus BCI Opportunity
Fund
R R R R R R R
4 782 535 20 478 979 7 507 432 2 477 760 1 535 682 10 154 991 9 714 135
1 777 345 9 921 961 8 062 155 1 603 835 1 788 098 1 747 355 6 286 498
3 005 190 10 557 018 -554 723 873 925 -252 416 8 407 636 3 427 637
-12 941 -68 676 -4 097 770 -853 187 -2 351 850 11 354 -6 049 561
102 702 518 657 104 014 460 785 866 129 261 706 255 818 641 156 173 484 355 686 844
102 689 577 657 035 338 456 688 096 128 408 519 253 466 791 156 184 838 349 637 283
103 490 081 661 458 253 457 362 765 128 933 749 254 189 231 158 299 910 352 541 029
800 504 4 422 915 674 669 525 230 722 440 2 115 072 2 903 746
102 689 577 657 035 338 456 688 096 128 408 519 253 466 791 156 184 838 349 637 283
% % % % % % %
6.68 4.96 15.16 19.65 n/a 4.68 21.28
8.04 10.04 3.78 1.12 n/a 6.55 2.95
% % % % % % %
11.16 29.24 32.10 60.10 1.00 39.90
12.72 14.74 20.90 19.80 77.00 - 9.00
9.74 10.02 8.70 - - 2.70 5.40
4.10 4.06 0.50 - 2.90 - -
- - 0.50 - - 17.70 -
- - - - - - -
55.04 35.76 33.80 20.10 - 78.60 45.80
7.19 6.19 3.40 - 20.10 - -
Funds
8

Income Statement
Revenue
Operating Expenses
Change in net assets
Balance Sheet
Income attributable to unit holders
Capital attributable to unit holders
Capital Employed
Non-current Assets
Total Assets
Liabilities
Net assets
1 Year Investment Performance
Fund
Benchmark
Asset Allocation
Domestic Equity
Offshore Equity
Domestic Property
Offshore Property
Domestic Bonds
Offshore Bonds
Domestic Cash / Liquid Assets
Offshore Cash / Liquid Assets
Notes
Performance figures sourced from Morningstar
Fund performance shown as n/a do not have
a performance history for this period
Benchmark available on Request
Autus BCI Property
Fund
Autus BCI Stable Fund Autus BCI Worldwide
Flexible Fund
Baobab BCI Flexible
Opportunity Fund
Baroque BCI Moderato
Fund of Funds
BCI Best Blend
Balanced Fund
BCI Best Blend Cautious
Fund
R R R R R R R
6 315 095 16 754 724 4 137 756 3 663 287 6 147 859 9 622 608 9 366 567
2 278 851 8 777 350 3 236 444 2 748 460 2 903 026 1 858 940 1 589 671
4 036 244 7 977 374 901 312 914 827 3 244 833 7 763 668 7 776 896
6 175 -4 755 997 -471 004 -1 512 289 -132 667 23 508 6 817
108 751 019 438 696 724 148 011 920 406 578 356 252 240 013 416 373 991 277 475 136
108 757 194 433 940 727 147 540 916 405 066 067 252 107 346 416 397 499 277 481 953
109 247 469 437 240 317 170 105 248 412 424 405 253 190 626 421 336 653 280 495 549
490 275 3 299 590 22 564 332 7 358 338 1 083 280 4 939 154 3 013 596
108 757 194 433 940 727 147 540 916 405 066 067 252 107 346 416 397 499 277 481 953
% % % % % % %
25.31 11.97 10.00 35.94 8.08 8.41 10.12
27.50 5.04 7.85 10.85 9.17 10.22 8.12
% % % % % % %
14.30 30.20 71.50 29.30 44.60 12.30
- 16.80 20.70 22.40 14.80 14.40 15.30
81.70 8.60 5.00 5.60 10.00 8.20 11.00
- 0.40 - - 4.10 5.20 4.90
- 18.80 - - - - -
- - - - 3.30 1.10 1.00
18.30 37.90 44.10 0.50 36.30 23.80 52.80
- 3.00 - 0.10 2.30 2.50 2.70
Funds
9
Income Statement
Revenue
Operating Expenses
Change in net assets
Balance Sheet
Income attributable to unit holders
Capital attributable to unit holders
Capital Employed
Non-current Assets
Total Assets
Liabilities
Net assets
1 Year Investment Performance
Fund
Benchmark
Asset Allocation
Domestic Equity
Offshore Equity
Domestic Property
Offshore Property
Domestic Bonds
Offshore Bonds
Domestic Cash / Liquid Assets
Offshore Cash / Liquid Assets
Notes
Performance figures sourced from Morningstar
Fund performance shown as n/a do not have
a performance history for this period
Benchmark available on Request
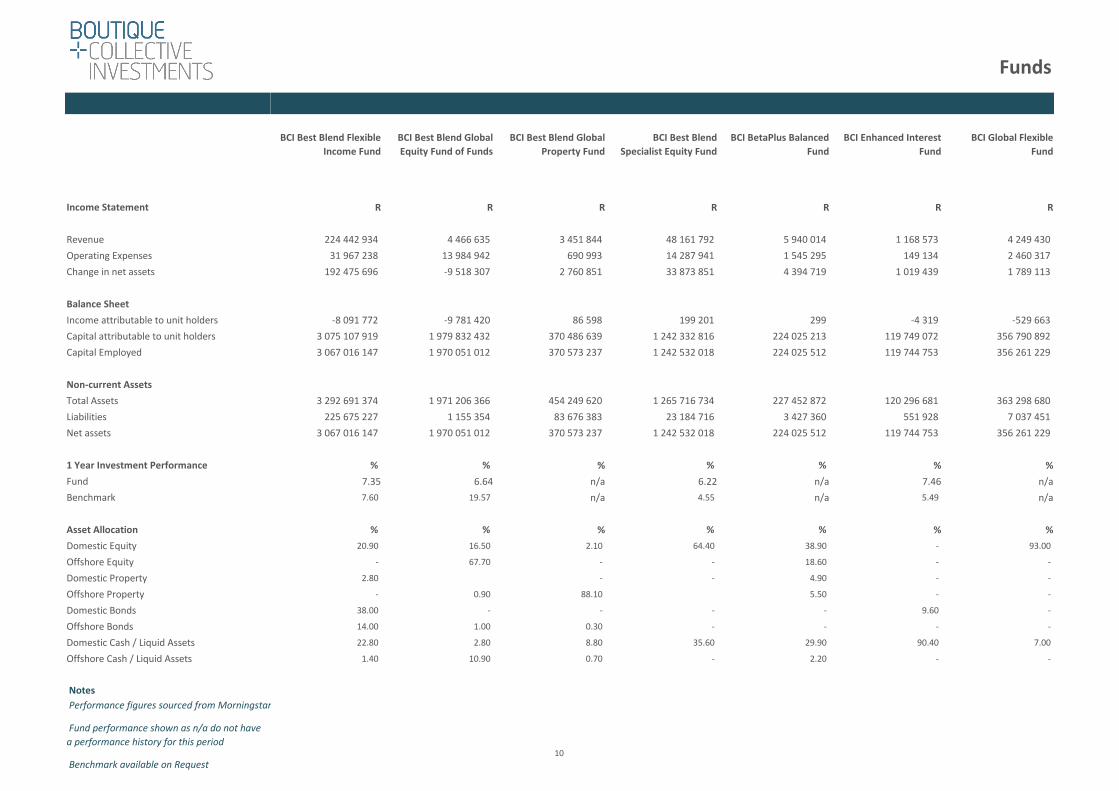
BCI Best Blend Flexible
Income Fund
BCI Best Blend Global
Equity Fund of Funds
BCI Best Blend Global
Property Fund
BCI Best Blend
Specialist Equity Fund
BCI BetaPlus Balanced
Fund
BCI Enhanced Interest
Fund
BCI Global Flexible
Fund
R R R R R R R
224 442 934 4 466 635 3 451 844 48 161 792 5 940 014 1 168 573 4 249 430
31 967 238 13 984 942 690 993 14 287 941 1 545 295 149 134 2 460 317
192 475 696 -9 518 307 2 760 851 33 873 851 4 394 719 1 019 439 1 789 113
-8 091 772 -9 781 420 86 598 199 201 299 -4 319 -529 663
3 075 107 919 1 979 832 432 370 486 639 1 242 332 816 224 025 213 119 749 072 356 790 892
3 067 016 147 1 970 051 012 370 573 237 1 242 532 018 224 025 512 119 744 753 356 261 229
3 292 691 374 1 971 206 366 454 249 620 1 265 716 734 227 452 872 120 296 681 363 298 680
225 675 227 1 155 354 83 676 383 23 184 716 3 427 360 551 928 7 037 451
3 067 016 147 1 970 051 012 370 573 237 1 242 532 018 224 025 512 119 744 753 356 261 229
% % % % % % %
7.35 6.64 n/a 6.22 n/a 7.46 n/a
7.60 19.57 n/a 4.55 n/a 5.49 n/a
% % % % % % %
20.90 16.50 2.10 64.40 38.90 - 93.00
- 67.70 - - 18.60 - -
2.80 - - 4.90 - -
- 0.90 88.10 5.50 - -
38.00 - - - - 9.60 -
14.00 1.00 0.30 - - - -
22.80 2.80 8.80 35.60 29.90 90.40 7.00
1.40 10.90 0.70 - 2.20 - -
Funds
10
Income Statement
Revenue
Operating Expenses
Change in net assets
Balance Sheet
Income attributable to unit holders
Capital attributable to unit holders
Capital Employed
Non-current Assets
Total Assets
Liabilities
Net assets
1 Year Investment Performance
Fund
Benchmark
Asset Allocation
Domestic Equity
Offshore Equity
Domestic Property
Offshore Property
Domestic Bonds
Offshore Bonds
Domestic Cash / Liquid Assets
Offshore Cash / Liquid Assets
Notes
Performance figures sourced from Morningstar
Fund performance shown as n/a do not have
a performance history for this period
Benchmark available on Request
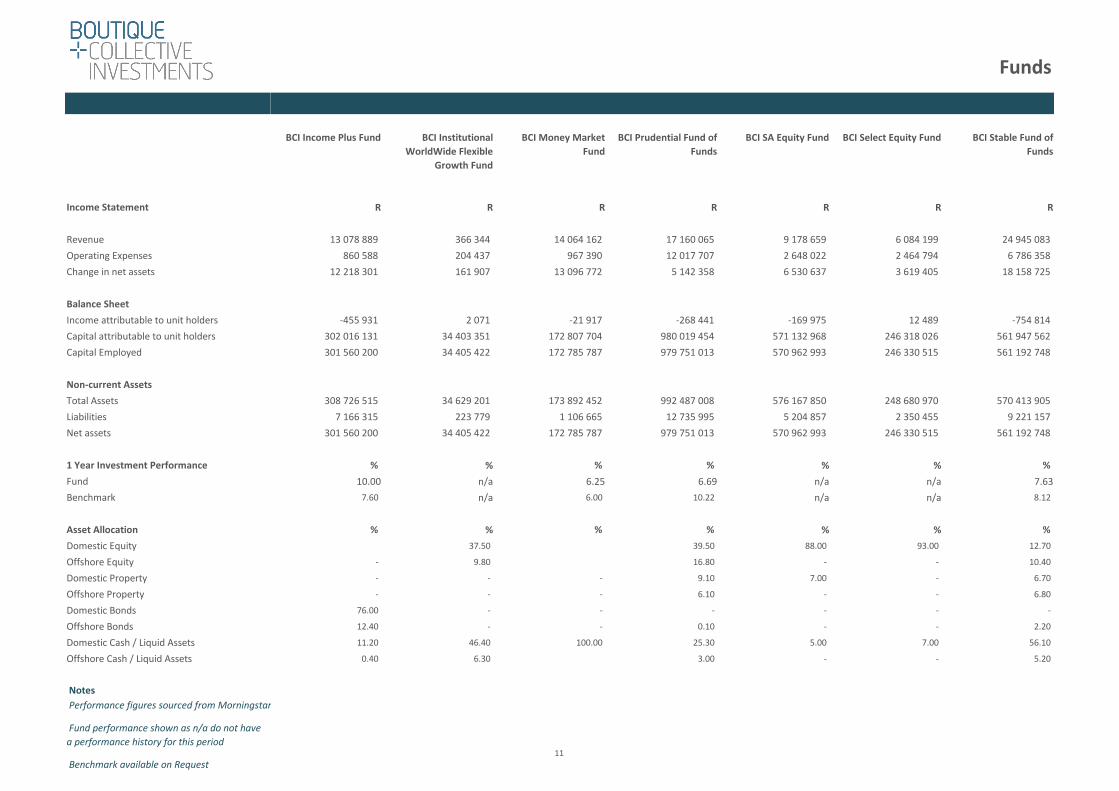
BCI Income Plus Fund BCI Institutional
WorldWide Flexible
Growth Fund
BCI Money Market
Fund
BCI Prudential Fund of
Funds
BCI SA Equity Fund BCI Select Equity Fund BCI Stable Fund of
Funds
R R R R R R R
13 078 889 366 344 14 064 162 17 160 065 9 178 659 6 084 199 24 945 083
860 588 204 437 967 390 12 017 707 2 648 022 2 464 794 6 786 358
12 218 301 161 907 13 096 772 5 142 358 6 530 637 3 619 405 18 158 725
-455 931 2 071 -21 917 -268 441 -169 975 12 489 -754 814
302 016 131 34 403 351 172 807 704 980 019 454 571 132 968 246 318 026 561 947 562
301 560 200 34 405 422 172 785 787 979 751 013 570 962 993 246 330 515 561 192 748
308 726 515 34 629 201 173 892 452 992 487 008 576 167 850 248 680 970 570 413 905
7 166 315 223 779 1 106 665 12 735 995 5 204 857 2 350 455 9 221 157
301 560 200 34 405 422 172 785 787 979 751 013 570 962 993 246 330 515 561 192 748
% % % % % % %
10.00 n/a 6.25 6.69 n/a n/a 7.63
7.60 n/a 6.00 10.22 n/a n/a 8.12
% % % % % % %
37.50 39.50 88.00 93.00 12.70
- 9.80 16.80 - - 10.40
- - - 9.10 7.00 - 6.70
- - - 6.10 - - 6.80
76.00 - - - - - -
12.40 - - 0.10 - - 2.20
11.20 46.40 100.00 25.30 5.00 7.00 56.10
0.40 6.30 3.00 - - 5.20
Funds
11
Income Statement
Revenue
Operating Expenses
Change in net assets
Balance Sheet
Income attributable to unit holders
Capital attributable to unit holders
Capital Employed
Non-current Assets
Total Assets
Liabilities
Net assets
1 Year Investment Performance
Fund
Benchmark
Asset Allocation
Domestic Equity
Offshore Equity
Domestic Property
Offshore Property
Domestic Bonds
Offshore Bonds
Domestic Cash / Liquid Assets
Offshore Cash / Liquid Assets
Notes
Performance figures sourced from Morningstar
Fund performance shown as n/a do not have
a performance history for this period
Benchmark available on Request
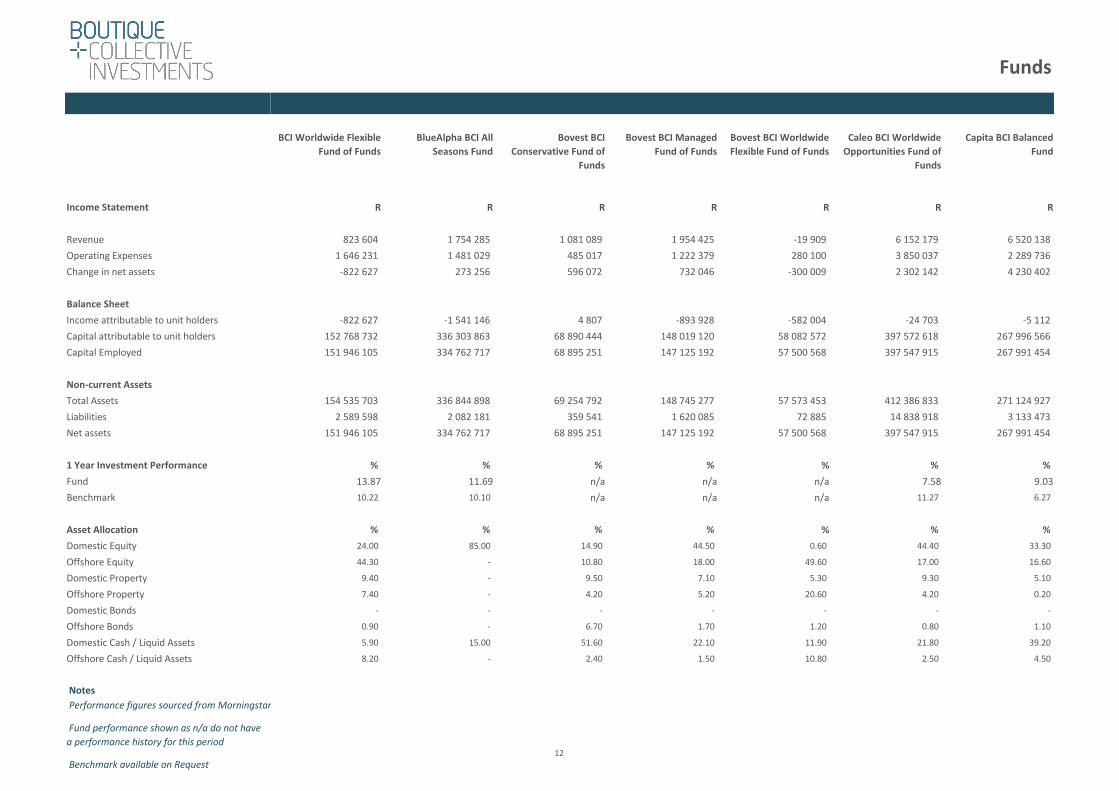
BCI Worldwide Flexible
Fund of Funds
BlueAlpha BCI All
Seasons Fund
Bovest BCI
Conservative Fund of
Funds
Bovest BCI Managed
Fund of Funds
Bovest BCI Worldwide
Flexible Fund of Funds
Caleo BCI Worldwide
Opportunities Fund of
Funds
Capita BCI Balanced
Fund
R R R R R R R
823 604 1 754 285 1 081 089 1 954 425 -19 909 6 152 179 6 520 138
1 646 231 1 481 029 485 017 1 222 379 280 100 3 850 037 2 289 736
-822 627 273 256 596 072 732 046 -300 009 2 302 142 4 230 402
-822 627 -1 541 146 4 807 -893 928 -582 004 -24 703 -5 112
152 768 732 336 303 863 68 890 444 148 019 120 58 082 572 397 572 618 267 996 566
151 946 105 334 762 717 68 895 251 147 125 192 57 500 568 397 547 915 267 991 454
154 535 703 336 844 898 69 254 792 148 745 277 57 573 453 412 386 833 271 124 927
2 589 598 2 082 181 359 541 1 620 085 72 885 14 838 918 3 133 473
151 946 105 334 762 717 68 895 251 147 125 192 57 500 568 397 547 915 267 991 454
% % % % % % %
13.87 11.69 n/a n/a n/a 7.58 9.03
10.22 10.10 n/a n/a n/a 11.27 6.27
% % % % % % %
24.00 85.00 14.90 44.50 0.60 44.40 33.30
44.30 - 10.80 18.00 49.60 17.00 16.60
9.40 - 9.50 7.10 5.30 9.30 5.10
7.40 - 4.20 5.20 20.60 4.20 0.20
- - - - - - -
0.90 - 6.70 1.70 1.20 0.80 1.10
5.90 15.00 51.60 22.10 11.90 21.80 39.20
8.20 - 2.40 1.50 10.80 2.50 4.50
Funds
12

Income Statement
Revenue
Operating Expenses
Change in net assets
Balance Sheet
Income attributable to unit holders
Capital attributable to unit holders
Capital Employed
Non-current Assets
Total Assets
Liabilities
Net assets
1 Year Investment Performance
Fund
Benchmark
Asset Allocation
Domestic Equity
Offshore Equity
Domestic Property
Offshore Property
Domestic Bonds
Offshore Bonds
Domestic Cash / Liquid Assets
Offshore Cash / Liquid Assets
Notes
Performance figures sourced from Morningstar
Fund performance shown as n/a do not have
a performance history for this period
Benchmark available on Request
Capita BCI Cautious
Fund
Capita BCI Real Income
Fund
Capital Incubator BCI
Worldwide Flexible
Fund
Capital Incubator BCI
Worldwide Flexible
Fund of Funds
Capstone BCI Balanced
Fund
Capstone BCI Equity
Fund
Capstone BCI Managed
Fund
R R R R R R R
9 598 100 5 725 897 11 562 904 716 773 217 855 2 299 434 147 393
2 897 715 1 185 093 2 664 470 1 369 935 132 178 1 249 926 119 842
6 700 385 4 540 804 8 898 434 -653 162 85 677 1 049 508 27 551
-68 582 -20 637 -23 587 -653 162 -48 650 1 215 -69 544
337 484 205 70 022 783 703 472 065 537 742 371 100 431 080 42 350 258 79 033 261
337 415 623 70 002 146 703 448 478 537 089 209 100 382 430 42 351 473 78 963 717
340 401 512 71 295 846 706 885 227 537 239 947 103 590 869 43 083 398 81 476 455
2 985 889 1 293 700 3 436 749 150 738 3 208 439 731 925 2 512 738
337 415 623 70 002 146 703 448 478 537 089 209 100 382 430 42 351 473 78 963 717
% % % % % % %
7.99 7.94 9.27 5.00 n/a -5.97 n/a
7.17 6.35 10.22 11.27 n/a 4.55 n/a
% % % % % % %
19.60 2.10 52.30 - 31.40 83.30 41.20
16.20 0.20 30.30 - 14.30 - 18.20
2.80 1.30 - - 9.70 14.70 9.60
0.70 0.30 - - 3.20 - 4.20
- - - - - - -
1.50 11.10 - - 3.40 - 1.90
55.70 84.70 0.60 0.30 34.50 2.10 22.40
3.50 0.30 16.80 99.70 3.60 2.50
Funds
13

Income Statement
Revenue
Operating Expenses
Change in net assets
Balance Sheet
Income attributable to unit holders
Capital attributable to unit holders
Capital Employed
Non-current Assets
Total Assets
Liabilities
Net assets
1 Year Investment Performance
Fund
Benchmark
Asset Allocation
Domestic Equity
Offshore Equity
Domestic Property
Offshore Property
Domestic Bonds
Offshore Bonds
Domestic Cash / Liquid Assets
Offshore Cash / Liquid Assets
Notes
Performance figures sourced from Morningstar
Fund performance shown as n/a do not have
a performance history for this period
Benchmark available on Request
Cartesian Money
Market Fund
Celtis BCI Conservative
Fund of Funds
Celtis BCI Flexible Fund
of Funds
Celtis BCI Managed
Fund of Funds
Centaur BCI Balanced
Fund
Centaur BCI Flexible
Fund
Colourfield BCI Equity
Fund 1
R R R R R R R
2 630 778 17 660 863 5 538 090 1 133 992 16 717 663 27 063 023 26 294
246 446 8 484 276 4 038 140 698 475 5 850 620 10 389 524 3 079
2 384 332 9 176 587 1 499 950 435 517 10 867 043 16 673 499 23 215
- -213 307 -772 218 -24 649 14 659 12 541 3 755
109 228 336 466 783 141 215 115 382 100 798 181 1 103 325 784 1 269 839 048 197 716 085
109 228 336 466 569 834 214 343 163 100 773 532 1 103 340 443 1 269 851 589 197 719 840
109 842 534 469 679 587 214 670 268 100 908 950 1 111 451 932 1 293 368 747 197 742 379
614 198 3 109 753 327 105 135 418 8 111 489 23 517 158 22 539
109 228 336 466 569 834 214 343 163 100 773 532 1 103 340 443 1 269 851 589 197 719 840
% % % % % % %
n/a 7.59 7.21 n/a 11.04 10.20 n/a
n/a 8.12 11.27 n/a 7.59 2.07 n/a
% % % % % % %
- 16.10 42.40 43.40 46.60 50.90 97.62
- 10.10 16.80 16.80 12.70 20.10 -
- 9.60 9.20 9.00 5.20 2.70 1.97
- 4.00 4.40 3.90 0.40 0.30 -
- - - - 12.30 9.50 -
- 6.70 1.30 1.30 0.50 0.30 -
100.00 51.10 23.20 22.90 21.90 16.30 0.41
- 2.40 2.70 2.70 0.40 0.10 -
Funds
14

Income Statement
Revenue
Operating Expenses
Change in net assets
Balance Sheet
Income attributable to unit holders
Capital attributable to unit holders
Capital Employed
Non-current Assets
Total Assets
Liabilities
Net assets
1 Year Investment Performance
Fund
Benchmark
Asset Allocation
Domestic Equity
Offshore Equity
Domestic Property
Offshore Property
Domestic Bonds
Offshore Bonds
Domestic Cash / Liquid Assets
Offshore Cash / Liquid Assets
Notes
Performance figures sourced from Morningstar
Fund performance shown as n/a do not have
a performance history for this period
Benchmark available on Request
Colourfield BCI Fixed
Income Fund 1
Colourfield BCI Fixed
Income Fund 2
Colourfield BCI Money
Market Fund
Consilium BCI Flexible
Fund
Consilium BCI
Worldwide Flexible
Fund
Cratos BCI Equity Fund CS BCI Aggressive
Prudential Fund of
Funds
R R R R R R R
963 746 743 542 18 848 065 5 318 101 3 866 177 -19 308 1 116 686
337 087 252 922 419 405 4 698 007 4 272 097 8 474 2 043 376
626 659 490 620 18 428 660 620 094 -405 920 -27 782 -926 690
5 271 623 -1 -12 534 -406 347 -27 782 -926 690
58 515 540 39 667 490 270 500 246 50 309 488 228 147 337 11 930 124 100 447 485
58 520 811 39 668 113 270 500 245 50 296 954 227 740 990 11 902 342 99 520 795
59 039 469 40 016 710 272 112 475 51 197 197 228 059 325 13 348 811 99 708 633
518 658 348 597 1 612 230 900 243 318 335 1 446 469 187 838
58 520 811 39 668 113 270 500 245 50 296 954 227 740 990 11 902 342 99 520 795
% % % % % % %
5.08 4.43 6.52 15.77 11.87 n/a 10.06
4.47 5.00 6.00 10.22 16.12 n/a 10.22
% % % % % % %
- - - 46.80 2.60 83.20 46.70
- - - 13.90 67.30 - 27.00
- - - 12.20 0.40 - 4.00
- - - 0.10 - - -
97.90 92.10 - 2.80 0.10 - 7.50
- - - 0.20 - - -
2.10 7.90 100.00 19.80 10.60 16.80 14.90
- - - 4.10 19.00 - -
Funds
15

Income Statement
Revenue
Operating Expenses
Change in net assets
Balance Sheet
Income attributable to unit holders
Capital attributable to unit holders
Capital Employed
Non-current Assets
Total Assets
Liabilities
Net assets
1 Year Investment Performance
Fund
Benchmark
Asset Allocation
Domestic Equity
Offshore Equity
Domestic Property
Offshore Property
Domestic Bonds
Offshore Bonds
Domestic Cash / Liquid Assets
Offshore Cash / Liquid Assets
Notes
Performance figures sourced from Morningstar
Fund performance shown as n/a do not have
a performance history for this period
Benchmark available on Request
CS BCI Flexible Fund of
Funds
CS BCI Prudential Fund
of Funds
Dinamika BCI
Conservative Fund of
Funds
Dinamika BCI
Worldwide Flexible
Fund
Dolberg Spencer BCI
Equity Fund
Dolberg Spencer BCI
Flexible Fund
Dolberg Spencer BCI
Flexible Income Fund
R R R R R R R
1 891 123 6 635 334 15 900 636 131 155 875 453 5 480 651 552 867
3 295 673 6 356 667 6 654 675 254 489 428 696 2 744 991
-1 404 550 278 667 9 245 961 -123 334 446 757 2 735 660 552 867
-1 404 550 -304 607 -269 295 -123 334 3 092 -15 414 31 511
170 609 975 291 774 992 433 026 374 94 960 812 50 848 202 162 995 584 607 218 342
169 205 425 291 470 385 432 757 079 94 837 478 50 851 294 162 980 170 607 249 853
169 497 057 294 645 726 435 468 606 95 180 707 51 921 663 163 309 163 607 771 209
291 632 3 175 341 2 711 527 343 229 1 070 369 328 993 521 356
169 205 425 291 470 385 432 757 079 94 837 478 50 851 294 162 980 170 607 249 853
% % % % % % %
10.46 9.74 6.38 n/a n/a 3.65 n/a
11.27 9.17 7.91 n/a n/a 10.87 n/a
% % % % % % %
48.40 40.00 15.90 35.20 83.30 81.00 -
26.60 24.80 - - - - -
3.90 3.80 8.00 16.50 - 4.00 -
- - - - - - -
6.40 6.70 - - - - 92.73
- - - - - - -
14.70 24.70 55.40 11.00 16.70 15.00 7.27
- - 20.60 37.20 - - -
Funds
16

Income Statement
Revenue
Operating Expenses
Change in net assets
Balance Sheet
Income attributable to unit holders
Capital attributable to unit holders
Capital Employed
Non-current Assets
Total Assets
Liabilities
Net assets
1 Year Investment Performance
Fund
Benchmark
Asset Allocation
Domestic Equity
Offshore Equity
Domestic Property
Offshore Property
Domestic Bonds
Offshore Bonds
Domestic Cash / Liquid Assets
Offshore Cash / Liquid Assets
Notes
Performance figures sourced from Morningstar
Fund performance shown as n/a do not have
a performance history for this period
Benchmark available on Request
Dolberg Spencer BCI
Property Fund
Dotport BCI Flexible
Fund of Funds
Dotport BCI Prudential
Fund of Funds
Dotport BCI Cautious
Fund of Funds
Efficient BCI Balanced
Fund
Efficient BCI Cautious
Fund
Efficient BCI Equity
Fund
R R R R R R R
2 511 097 7 506 614 9 245 602 4 259 503 11 342 885 1 774 183 12 095 162
841 374 4 050 821 3 920 521 1 194 366 3 032 039 487 721 4 716 692
1 669 723 3 455 793 5 325 081 3 065 137 8 310 846 1 286 462 7 378 470
1 449 -628 973 -419 459 -102 392 -457 727 -930 -1 733 156
52 409 113 304 991 820 311 198 955 80 786 068 293 517 397 46 392 702 326 153 996
52 410 562 304 362 847 310 779 496 80 683 676 293 059 670 46 391 772 324 420 840
52 635 811 305 135 500 312 338 562 81 405 106 299 126 924 46 979 765 331 405 752
225 249 772 653 1 559 066 721 430 6 067 254 587 993 6 984 912
52 410 562 304 362 847 310 779 496 80 683 676 293 059 670 46 391 772 324 420 840
% % % % % % %
24.30 4.88 4.33 4.24 4.77 5.48 1.94
27.50 8.64 7.07 4.97 2.37 8.12 1.12
% % % % % % %
- 62.40 51.50 29.40 47.00 11.60 83.80
- 20.60 16.60 9.40 20.20 19.50 9.40
74.00 3.00 4.90 8.40 4.90 5.20 6.20
22.00 0.50 0.50 0.40 - - -
- 3.40 10.40 25.40 24.00 54.30 -
- 0.60 - - - - -
4.00 6.40 12.90 25.10 3.90 9.40 0.60
- 3.00 3.10 1.90 - - -
Funds
17

Income Statement
Revenue
Operating Expenses
Change in net assets
Balance Sheet
Income attributable to unit holders
Capital attributable to unit holders
Capital Employed
Non-current Assets
Total Assets
Liabilities
Net assets
1 Year Investment Performance
Fund
Benchmark
Asset Allocation
Domestic Equity
Offshore Equity
Domestic Property
Offshore Property
Domestic Bonds
Offshore Bonds
Domestic Cash / Liquid Assets
Offshore Cash / Liquid Assets
Notes
Performance figures sourced from Morningstar
Fund performance shown as n/a do not have
a performance history for this period
Benchmark available on Request
Efficient BCI Equity
Fund of Funds
Efficient BCI Fixed
Income Fund
Efficient BCI Flexible
Fund of Funds
Efficient BCI Property
Fund
Efficient BCI Prudential
High Fund of Funds
Efficient BCI Prudential
Medium Fund of Funds
Efficient BCI Worldwide
Flexible Fund
R R R R R R R
645 792 15 580 218 3 006 616 2 890 610 2 211 032 10 933 167 4 466 080
570 617 1 767 791 2 435 267 613 919 1 591 036 6 289 885 2 915 687
75 175 13 812 427 571 349 2 276 691 619 996 4 643 282 1 550 393
-774 916 -32 813 -581 748 -76 137 -658 163 -910 803 -6 531 838
19 353 344 217 408 455 127 658 833 29 984 668 70 165 533 315 855 901 266 944 379
18 578 428 217 375 642 127 077 085 29 908 531 69 507 370 314 945 098 260 412 541
18 639 997 227 189 534 127 396 955 30 153 885 69 814 707 317 404 627 332 780 454
61 569 9 813 892 319 870 245 354 307 337 2 459 529 72 367 913
18 578 428 217 375 642 127 077 085 29 908 531 69 507 370 314 945 098 260 412 541
% % % % % % %
4.58 8.98 4.42 24.13 5.39 6.54 13.24
1.32 6.35 6.89 27.50 6.27 6.53 9.17
% % % % % % %
56.40 - 51.00 - 42.90 26.80 6.50
20.00 - 20.00 - 21.00 21.00 81.20
12.20 3.90 9.50 99.80 6.00 4.70 1.80
0.10 - 0.10 - 0.10 - -
- 70.00 - - - - -
1.60 10.30 2.90 - 6.00 7.50 8.40
9.70 15.70 16.60 0.20 24.00 40.00 -
- 0.10 - - - 2.10
Funds
18

Income Statement
Revenue
Operating Expenses
Change in net assets
Balance Sheet
Income attributable to unit holders
Capital attributable to unit holders
Capital Employed
Non-current Assets
Total Assets
Liabilities
Net assets
1 Year Investment Performance
Fund
Benchmark
Asset Allocation
Domestic Equity
Offshore Equity
Domestic Property
Offshore Property
Domestic Bonds
Offshore Bonds
Domestic Cash / Liquid Assets
Offshore Cash / Liquid Assets
Notes
Performance figures sourced from Morningstar
Fund performance shown as n/a do not have
a performance history for this period
Benchmark available on Request
Efficient BCI African
Flexible Income Fund
Evolve BCI Managed
Fund
Evolve BCI
Conservative Fund
Foster BCI Moderate
Fund of Funds
GFA BCI Managed Fund
of Funds
GFA BCI Stable Fund of
Funds
Harvard House BCI
Equity Fund
R R R R R R R
4 221 085 236 880 1 319 430 8 232 424 2 868 685 9 031 945 4 643 529
914 336 109 208 309 252 3 409 746 1 649 515 2 873 968 1 773 342
3 306 749 127 672 1 010 178 4 822 678 1 219 170 6 157 977 2 870 187
-957 936 1 533 5 307 -104 752 -236 796 -132 054 3 521
54 892 660 50 800 134 71 317 640 241 326 560 114 999 522 206 562 000 123 017 760
53 934 724 50 801 667 71 322 947 241 221 808 114 762 726 206 429 946 123 021 281
78 203 174 51 111 372 71 963 253 243 426 119 115 017 923 207 905 279 128 472 215
24 268 450 309 705 640 306 2 204 311 255 197 1 475 333 5 450 934
53 934 724 50 801 667 71 322 947 241 221 808 114 762 726 206 429 946 123 021 281
% % % % % % %
13.12 n/a n/a 6.16 6.14 7.25 7.36
8.47 n/a n/a 10.60 10.22 8.12 1.12
% % % % % % %
- 37.40 6.80 41.40 41.70 12.30 85.60
- 18.30 10.70 15.90 15.10 10.70 -
- 9.50 9.40 3.80 9.20 9.10 4.60
- 5.00 2.70 10.10 5.10 4.60 -
5.55 - - - - - -
69.23 1.40 3.60 1.40 0.70 5.40 -
25.22 26.00 64.70 26.70 24.50 54.20 9.80
- 2.40 2.20 0.70 3.80 3.70 -
Funds
19

Income Statement
Revenue
Operating Expenses
Change in net assets
Balance Sheet
Income attributable to unit holders
Capital attributable to unit holders
Capital Employed
Non-current Assets
Total Assets
Liabilities
Net assets
1 Year Investment Performance
Fund
Benchmark
Asset Allocation
Domestic Equity
Offshore Equity
Domestic Property
Offshore Property
Domestic Bonds
Offshore Bonds
Domestic Cash / Liquid Assets
Offshore Cash / Liquid Assets
Notes
Performance figures sourced from Morningstar
Fund performance shown as n/a do not have
a performance history for this period
Benchmark available on Request
Harvard House BCI
Flexible Income Fund
Kanaan BCI Balanced
Fund of Funds
Kanaan BCI Flexible
Fund of Funds
Maitland Flexible Fund
of Funds
Montrose BCI Cautious
FoF’s
Montrose BCI Flexible
FoF’s
Montrose BCI
Moderate FoF’s
R R R R R R R
9 339 413 1 499 302 426 434 8 564 608 2 628 640 -164 868 2 295 203
1 592 493 1 053 022 720 652 2 784 541 1 565 135 606 449 1 673 138
7 746 920 446 280 -294 218 5 780 067 1 063 505 -771 317 622 065
4 304 -263 267 -731 527 -62 128 -60 458 -1 521 760 -875 620
158 692 922 75 187 738 55 207 192 190 423 324 94 571 288 56 133 362 133 727 907
158 697 226 74 924 471 54 475 665 190 361 196 94 510 830 54 611 602 132 852 287
162 243 051 75 095 940 54 616 721 193 205 376 98 477 285 54 740 995 133 039 502
3 545 825 171 469 141 056 2 844 180 3 966 455 129 393 187 215
158 697 226 74 924 471 54 475 665 190 361 196 94 510 830 54 611 602 132 852 287
% % % % % % %
9.50 10.65 9.31 5.64 6.25 10.09 6.85
6.40 8.12 8.12 8.99 8.12 7.91 10.22
% % % % % % %
7.90 70.53 67.92 50.00 13.60 21.40 31.20
25.00 25.00 - 17.60 62.40 19.40
18.70 1.27 1.96 5.00 0.90 1.80 6.20
- - - - 2.80 5.30 3.30
56.10 3.19 5.10 - - - -
- - - - 1.50 1.10 1.00
17.30 0.01 0.02 45.00 60.60 9.30 37.10
- - - - 3.00 1.70 1.80
Funds
20

Income Statement
Revenue
Operating Expenses
Change in net assets
Balance Sheet
Income attributable to unit holders
Capital attributable to unit holders
Capital Employed
Non-current Assets
Total Assets
Liabilities
Net assets
1 Year Investment Performance
Fund
Benchmark
Asset Allocation
Domestic Equity
Offshore Equity
Domestic Property
Offshore Property
Domestic Bonds
Offshore Bonds
Domestic Cash / Liquid Assets
Offshore Cash / Liquid Assets
Notes
Performance figures sourced from Morningstar
Fund performance shown as n/a do not have
a performance history for this period
Benchmark available on Request
Naviga BCI Balanced
Growth Fund of Funds
Naviga BCI Equity Fund
of Funds
Naviga BCI Income
Planner Fund of Funds
Naviga BCI SA Equity
Fund
Naviga BCI Secure
Growth Fund of Funds
NeFG BCI Equity Fund NeFG BCI Flexible Fund
R R R R R R R
24 738 918 2 283 924 50 721 936 41 318 698 58 584 277 1 872 420 13 314 348
16 652 318 3 017 247 7 331 194 24 758 585 19 136 495 948 293 6 442 631
8 086 600 -733 323 43 390 742 16 560 113 39 447 782 924 127 6 871 717
-3 194 450 -1 964 786 -1 941 112 16 697 -3 743 121 -7 997 -51 980
788 712 263 200 676 123 550 582 547 1 186 578 796 1 236 055 052 44 835 184 354 125 982
785 517 813 198 711 337 548 641 435 1 186 595 493 1 232 311 931 44 827 187 354 074 002
789 406 584 199 604 548 558 345 840 1 206 850 307 1 250 989 873 45 635 066 358 037 524
3 888 771 893 211 9 704 405 19 995 261 18 677 942 807 879 3 963 522
785 517 813 198 711 337 548 641 435 1 186 855 046 1 232 311 931 44 827 187 354 074 002
% % % % % % %
4.20 2.40 7.17 1.33 6.34 -4.16 0.91
8.97 8.44 6.35 4.55 7.97 4.55 11.27
% % % % % % %
40.18 63.98 - 90.69 13.91 87.60 61.50
15.45 1.24 - - 13.27 11.20 20.20
5.98 1.65 2.88 - 7.13 - 3.80
1.49 - 0.26 - 0.84 - 0.30
17.56 - 47.13 - 37.14 - 5.60
3.07 - 9.94 - 7.35 - 0.70
14.72 9.55 38.60 6.06 19.05 1.10 7.60
1.56 1.24 1.18 3.25 1.31 0.10 0.30
Funds
21

Income Statement
Revenue
Operating Expenses
Change in net assets
Balance Sheet
Income attributable to unit holders
Capital attributable to unit holders
Capital Employed
Non-current Assets
Total Assets
Liabilities
Net assets
1 Year Investment Performance
Fund
Benchmark
Asset Allocation
Domestic Equity
Offshore Equity
Domestic Property
Offshore Property
Domestic Bonds
Offshore Bonds
Domestic Cash / Liquid Assets
Offshore Cash / Liquid Assets
Notes
Performance figures sourced from Morningstar
Fund performance shown as n/a do not have
a performance history for this period
Benchmark available on Request
NeFG BCI Income
Provider Fund
Olympiad BCI Managed
Fund of Funds
Olympiad BCI
Worldwide Flex Fund of
Funds
Optimum BCI Balanced
Fund
Optimum BCI Managed
Growth Fund
Optimum BCI Stable
Fund
Ora BCI Worldwide
Flexible Fund
R R R R R R R
6 481 555 1 181 617 1 629 369 6 569 767 3 666 153 4 662 402 3 106 949
3 707 337 543 377 958 093 2 166 971 1 749 103 1 231 191 363 277
2 774 218 638 240 671 276 4 402 796 1 917 050 3 431 211 2 743 672
-224 812 -40 035 -37 846 -27 1 225 -3 065 8 852
191 730 312 28 869 768 72 433 401 256 366 951 204 838 846 125 474 469 106 027 821
191 505 500 28 829 733 72 395 555 256 366 923 204 840 070 125 471 404 106 036 673
192 646 686 29 127 632 72 565 819 260 304 253 206 708 950 126 651 042 108 406 322
1 141 186 297 899 170 264 3 937 330 1 868 880 1 179 638 2 369 649
191 505 500 28 829 733 72 395 555 256 366 923 204 840 070 125 471 404 106 036 673
% % % % % % %
6.34 8.03 8.09 8.05 7.63 8.33 n/a
8.12 8.12 8.12 9.04 11.04 7.04 n/a
% % % % % % %
13.80 24.10 28.40 34.22 46.06 14.40 83.90
30.20 29.50 40.00 14.84 15.56 13.43 -
0.70 19.80 28.70 13.82 13.52 13.39 -
0.20 - - 2.95 3.26 2.95 -
39.30 - - - - - -
0.30 - - 2.25 1.26 4.84 -
14.20 26.50 2.90 29.76 18.29 49.88 16.00
1.40 - - 2.17 2.06 1.11 -
Funds
22

Income Statement
Revenue
Operating Expenses
Change in net assets
Balance Sheet
Income attributable to unit holders
Capital attributable to unit holders
Capital Employed
Non-current Assets
Total Assets
Liabilities
Net assets
1 Year Investment Performance
Fund
Benchmark
Asset Allocation
Domestic Equity
Offshore Equity
Domestic Property
Offshore Property
Domestic Bonds
Offshore Bonds
Domestic Cash / Liquid Assets
Offshore Cash / Liquid Assets
Notes
Performance figures sourced from Morningstar
Fund performance shown as n/a do not have
a performance history for this period
Benchmark available on Request
Plexus Wealth BCI
Balanced Fund
Plexus Wealth BCI
Conservative Fund
Plexus Wealth BCI
Property Fund
PortfolioMetrix BCI
Bond Fund of Funds
PortfolioMetrix BCI
Equity Fund of Funds
PortfolioMetrix BCI
Global Equity Fund of
Funds
PortfolioMetrix BCI
Income Fund of Funds
R R R R R R
8 024 293 12 838 598 16 123 940 95 040 20 954 401 562 297 -2 401
2 566 176 3 645 542 2 945 910 123 396 1 543 783 752 130 84 317
5 458 117 9 193 056 13 178 030 -28 356 19 410 618 -189 833 -86 718
-83 879 -127 857 -10 981 -28 356 46 066 -189 833 -86 718
187 790 106 233 265 986 244 503 144 793 627 830 1 564 025 907 811 761 101 507 885 502
187 706 227 233 138 129 244 492 163 793 599 474 1 564 071 973 811 571 268 507 798 784
192 667 811 235 965 424 247 724 792 794 478 101 1 579 677 467 822 683 177 509 067 847
4 961 584 2 827 295 3 232 629 878 627 15 605 494 11 111 909 1 269 063
187 706 227 233 138 129 244 492 163 793 599 474 1 564 071 973 811 571 268 507 798 784
% % % % % %
15.67 14.78 34.72 n/a 9.83 n/a n/a
10.22 8.12 27.50 n/a 4.55 n/a n/a
% % % % % %
47.70 20.70 0.50 - 88.91 - -
17.70 18.70 - - - 98.36 -
24.40 24.40 94.60 - - - -
- - - - - - -
7.30 30.30 - 100.11 - - 99.90
- - - - - - -
2.70 5.60 4.90 -0.11 11.09 - 0.10
0.20 0.30 - - - 1.64 -
Funds
23

Income Statement
Revenue
Operating Expenses
Change in net assets
Balance Sheet
Income attributable to unit holders
Capital attributable to unit holders
Capital Employed
Non-current Assets
Total Assets
Liabilities
Net assets
1 Year Investment Performance
Fund
Benchmark
Asset Allocation
Domestic Equity
Offshore Equity
Domestic Property
Offshore Property
Domestic Bonds
Offshore Bonds
Domestic Cash / Liquid Assets
Offshore Cash / Liquid Assets
Notes
Performance figures sourced from Morningstar
Fund performance shown as n/a do not have
a performance history for this period
Benchmark available on Request
PortfolioMetrix BCI SA
Property Fund
Quantum BCI Balanced
Fund of Funds
Quantum BCI Capital
Plus Fund of Funds
Quantum BCI Core
Income Fund
Quantum BCI
Worldwide Flexible
Fund of Funds
RCI BCI Flexible Fund Rebalance BCI Inflation
Plus 3 Fund
R R R R R R R
1 694 647 6 971 643 12 970 899 11 408 454 1 131 247 10 993 052 8 978 137
293 070 4 241 691 5 159 064 2 152 078 1 176 244 5 687 720 3 134 030
1 401 577 2 729 952 7 811 835 9 256 376 -44 997 5 305 332 5 844 107
-3 184 -236 088 -281 966 -94 362 -73 465 -17 283 17 893
306 370 581 279 636 451 328 617 164 167 741 770 85 476 203 318 879 651 317 601 657
306 367 397 279 400 363 328 335 198 167 647 408 85 402 736 318 862 368 317 619 550
311 972 851 280 467 486 330 828 608 169 666 128 89 033 372 367 709 846 324 045 547
5 605 454 1 067 123 2 493 410 2 018 720 3 630 634 48 847 478 6 425 997
306 367 397 279 400 363 328 335 198 167 647 408 85 402 738 318 862 368 317 619 550
% % % % % % %
n/a 6.82 7.58 7.12 12.86 12.48 n/a
n/a 10.22 8.12 7.07 11.27 9.17 n/a
% % % % % % %
- 37.90 11.80 0.80 6.60 54.50 30.24
- 16.10 12.90 - 45.70 19.90 -
94.66 9.20 9.70 4.50 5.50 5.40 17.08
- 5.90 4.10 - 18.20 - -
- - - - - - -
- 1.30 3.70 5.60 0.70 - -
5.34 26.70 54.50 86.40 18.80 12.40 9.88
- 3.00 3.30 2.70 4.40 7.80 41.90
Funds
24

Income Statement
Revenue
Operating Expenses
Change in net assets
Balance Sheet
Income attributable to unit holders
Capital attributable to unit holders
Capital Employed
Non-current Assets
Total Assets
Liabilities
Net assets
1 Year Investment Performance
Fund
Benchmark
Asset Allocation
Domestic Equity
Offshore Equity
Domestic Property
Offshore Property
Domestic Bonds
Offshore Bonds
Domestic Cash / Liquid Assets
Offshore Cash / Liquid Assets
Notes
Performance figures sourced from Morningstar
Fund performance shown as n/a do not have
a performance history for this period
Benchmark available on Request
Rebalance BCI Inflation
Plus 5 Fund
Rebalance BCI Inflation
Plus 7 Fund
Reitway BCI Global
Property Fund
Renaissance BCI
Cautious Fund
Renaissance BCI Global
Best Ideas Feeder Fund
Renaissance BCI
Managed Fund
Rudiarius BCI Africa
Equity Fund
R R R R R R R
6 120 276 1 277 287 43 721 461 14 394 309 79 203 8 798 949 45 511 819
2 961 189 1 199 810 14 614 098 6 193 467 168 370 4 506 602 18 565 502
3 159 087 77 477 29 107 363 8 200 842 -89 167 4 292 347 26 946 317
-9 809 -29 639 -155 428 32 894 -89 167 8 241 316 064
299 661 340 106 226 240 998 600 855 362 125 170 166 227 812 276 024 644 1 536 444 407
299 651 531 106 196 601 998 445 427 362 158 064 166 138 645 276 032 885 1 536 760 471
303 194 574 106 466 247 1 035 037 889 364 776 931 166 183 933 279 332 864 1 563 612 539
3 543 043 269 646 36 592 462 2 618 867 45 288 3 299 979 26 852 068
299 651 531 106 196 601 998 445 427 362 158 064 166 138 645 276 032 885 1 536 760 471
% % % % % % %
n/a n/a 21.33 9.26 n/a 9.54 -9.68
n/a n/a 20.99 7.07 n/a 9.17 -10.69
% % % % % % %
63.38 66.01 - 20.90 - 35.10 -
- - - 15.10 93.70 13.80 80.20
15.15 16.97 - 11.30 - 6.60 -
- 100.00 1.30 - 1.20 2.31
- - - - - - -
- - - 1.20 - 1.10 -
6.29 9.22 - 40.80 6.30 33.40 8.67
15.13 8.10 - 9.20 - 8.70 8.82
Funds
25

Income Statement
Revenue
Operating Expenses
Change in net assets
Balance Sheet
Income attributable to unit holders
Capital attributable to unit holders
Capital Employed
Non-current Assets
Total Assets
Liabilities
Net assets
1 Year Investment Performance
Fund
Benchmark
Asset Allocation
Domestic Equity
Offshore Equity
Domestic Property
Offshore Property
Domestic Bonds
Offshore Bonds
Domestic Cash / Liquid Assets
Offshore Cash / Liquid Assets
Notes
Performance figures sourced from Morningstar
Fund performance shown as n/a do not have
a performance history for this period
Benchmark available on Request
SA Asset Management
BCI Cautious Fund
SA Asset Management
BCI Managed Fund
SA Asset Management
BCI Moderate Fund
S-BRO BCI Balanced
Fund of Funds
S-BRO BCI Defensive
Fund of Funds
Simplisiti BCI Flexible
Fund of Funds
Simplisiti BCI Income
Plus Fund of Funds
R R R R R R R
3 922 936 5 073 552 7 315 592 22 950 499 27 925 717 1 649 647 5 520 752
1 221 644 2 036 166 2 418 560 10 052 777 10 922 271 2 056 120 1 117 881
2 701 292 3 037 386 4 897 032 12 897 722 17 003 446 -406 473 4 402 871
541 587 -16 053 894 378 -1 023 806 -202 074 -2 619 844 -209
82 930 658 189 168 646 222 252 488 878 613 256 795 021 906 172 074 425 78 074 453
83 472 245 189 152 593 223 146 866 877 589 450 794 819 832 169 454 581 78 074 244
83 935 402 191 340 617 225 961 963 884 233 060 800 860 621 191 743 542 79 014 018
463 157 2 188 024 2 815 097 6 643 610 6 040 789 22 288 961 939 774
83 472 245 189 152 593 223 146 866 877 589 450 794 819 832 169 454 581 78 074 244
% % % % % % %
7.85 10.20 9.87 6.78 7.00 9.76 7.56
7.07 11.27 9.17 11.27 8.12 11.27 7.07
% % % % % % %
17.80 40.90 33.10 30.00 12.00 9.20 1.60
9.90 15.10 11.40 14.80 11.20 46.10 0.40
3.70 4.40 3.90 9.00 9.40 14.50 1.90
6.00 5.70 6.40 4.10 3.60 10.20 0.60
- - - - - - -
0.70 0.40 0.60 3.60 7.20 0.70 14.00
59.90 32.20 42.80 35.90 54.00 10.80 80.80
1.90 1.30 1.70 2.60 2.60 8.40 0.80
Funds
26

Income Statement
Revenue
Operating Expenses
Change in net assets
Balance Sheet
Income attributable to unit holders
Capital attributable to unit holders
Capital Employed
Non-current Assets
Total Assets
Liabilities
Net assets
1 Year Investment Performance
Fund
Benchmark
Asset Allocation
Domestic Equity
Offshore Equity
Domestic Property
Offshore Property
Domestic Bonds
Offshore Bonds
Domestic Cash / Liquid Assets
Offshore Cash / Liquid Assets
Notes
Performance figures sourced from Morningstar
Fund performance shown as n/a do not have
a performance history for this period
Benchmark available on Request
Simplisiti BCI Managed
Protector Fund of Funds
Skyblue BCI Cumulus
Moderate Fund of
Funds
Skyblue BCI Kimberlite
Cautious Fund of Funds
Skyblue BCI Solar
Flexible Fund of Funds
Southern Charter BCI
Balanced Fund of Funds
Southern Charter BCI
Defensive Fund of
Funds
Southern Charter BCI
Growth Fund of Funds
R R R R R R R
8 945 220 25 317 478 6 742 194 445 896 13 700 873 8 591 599 18 693 133
4 822 332 8 438 011 2 197 324 351 207 5 011 502 2 598 269 8 643 802
4 122 888 16 879 467 4 544 870 94 689 8 689 371 5 993 330 10 049 331
-238 215 -1 904 666 -396 494 -5 979 -280 581 -224 126 -139 005
374 517 909 665 949 218 135 534 505 47 399 600 427 249 691 146 102 795 690 557 098
374 279 694 664 044 552 135 138 011 47 393 621 426 969 110 145 878 669 690 418 093
374 850 880 672 078 764 136 104 531 47 483 182 431 799 608 146 871 138 695 386 107
571 186 8 034 212 966 520 89 561 4 830 498 992 469 4 968 014
374 279 694 664 044 552 135 138 011 47 393 621 426 969 110 145 878 669 690 418 093
% % % % % % %
5.80 8.08 3.88 14.78 8.62 9.39 7.71
9.17 9.54 7.41 11.66 9.10 8.10 8.90
% % % % % % %
41.80 27.80 18.40 - 33.60 17.30 44.10
18.10 23.30 - 29.10 21.90 20.80 24.10
8.50 10.30 7.00 - 7.40 7.90 4.50
4.10 - - - 5.80 6.10 6.20
- - - - 16.20 26.10 9.60
1.40 - - - - - -
23.40 13.40 52.20 2.10 15.10 32.40 8.50
2.60 25.20 22.50 68.80 - - -
Funds
27

Income Statement
Revenue
Operating Expenses
Change in net assets
Balance Sheet
Income attributable to unit holders
Capital attributable to unit holders
Capital Employed
Non-current Assets
Total Assets
Liabilities
Net assets
1 Year Investment Performance
Fund
Benchmark
Asset Allocation
Domestic Equity
Offshore Equity
Domestic Property
Offshore Property
Domestic Bonds
Offshore Bonds
Domestic Cash / Liquid Assets
Offshore Cash / Liquid Assets
Notes
Performance figures sourced from Morningstar
Fund performance shown as n/a do not have
a performance history for this period
Benchmark available on Request
Southern Charter BCI
WW Flexible Fund of
Funds
Stonewood BCI
Worldwide Flexible
Fund
Stringfellow BCI
Flexible Fund of Funds
Stringfellow BCI Stable
Fund of Funds
Tantalum BCI Cautious
Fund
Tantalum BCI Strategic
Income Fund
UAM BCI Balanced
Fund
R R R R R R R
984 932 25 452 998 1 840 119 4 948 777 6 170 220 6 146 722 577 839
757 807 12 720 817 1 556 549 2 069 421 906 663 396 067 329 009
227 125 12 732 181 283 570 2 879 356 5 263 557 5 750 655 248 830
13 332 60 557 -1 684 212 -10 226 11 085 4 237 2 337
64 563 644 888 368 613 120 697 234 126 397 120 130 160 750 160 299 927 67 672 914
64 576 976 888 429 170 119 013 022 126 386 894 130 171 835 160 304 164 67 675 251
64 842 219 898 201 378 119 195 247 127 426 762 132 267 279 163 728 802 67 973 904
265 243 9 772 208 182 225 1 039 868 2 095 444 3 424 638 298 653
64 576 976 888 429 170 119 013 022 126 386 894 130 171 835 160 304 164 67 675 251
% % % % % % %
10.97 4.27 7.28 7.22 n/a n/a -7.01
10.20 12.73 12.32 8.12 n/a n/a 4.92
% % % % % % %
22.80 77.50 56.30 23.20 30.60 - 45.10
41.20 10.40 16.70 10.60 - - 3.90
6.60 1.90 11.90 18.60 9.60 10.20 1.40
7.50 - 3.40 4.60 - - 0.20
3.50 - - - 23.80 33.80 5.60
- - 0.30 4.90 - - 0.70
15.40 10.10 7.90 34.20 36.00 52.60 42.90
3.00 - 3.40 4.10 - - 0.20
Funds
28

Income Statement
Revenue
Operating Expenses
Change in net assets
Balance Sheet
Income attributable to unit holders
Capital attributable to unit holders
Capital Employed
Non-current Assets
Total Assets
Liabilities
Net assets
1 Year Investment Performance
Fund
Benchmark
Asset Allocation
Domestic Equity
Offshore Equity
Domestic Property
Offshore Property
Domestic Bonds
Offshore Bonds
Domestic Cash / Liquid Assets
Offshore Cash / Liquid Assets
Notes
Performance figures sourced from Morningstar
Fund performance shown as n/a do not have
a performance history for this period
Benchmark available on Request
Visio BCI Actinio Fund Visio BCI General
Equity Fund
R R
32 932 087 31 353 645
17 133 744 7 131 798
15 798 343 24 221 847
-9 783 625 63 267
1 250 146 548 1 481 187 678
1 240 362 923 1 481 250 944
1 248 193 394 1 503 229 188
7 830 471 21 978 244
1 240 362 923 1 481 250 944
% %
9.55 6.09
7.60 4.55
% %
82.50 88.70
5.60 -
- 4.10
5.90
- -
- -
2.50 7.20
3.50 -
Funds
29

Fees excluding VAT
Max Rate Cap Cap
4D BCI Aggressive Flexible Fund of Funds A 1.00% 0.00% 0.00% 1.00%
4D BCI Cautious Fund of Funds A 1.00% 0.00% 0.00% 1.00%
4D BCI Flexible Fund A 0.80% 15.00% 2.00% 2.80%
4D BCI Moderate Fund of Funds A 1.00% 0.00% 0.00% 1.00%
ABSA Access BCI Stable Fund A 0.70% 0.00% 0.00% 0.70%
ABSA Access BCI Stable Fund C 1.00% 0.00% 0.00% 1.00%
ABSA Access BCI Stable Fund D 1.25% 0.00% 0.00% 1.25%
ABSA Access BCI Cautious Fund A 0.75% 0.00% 0.00% 0.75%
ABSA Access BCI Cautious Fund C 1.00% 0.00% 0.00% 1.00%
ABSA Access BCI Cautious Fund D 1.25% 0.00% 0.00% 1.25%
ABSA Access BCI Balanced Fund A 0.80% 0.00% 0.00% 0.80%
ABSA Access BCI Balanced Fund C 1.00% 0.00% 0.00% 1.00%
ABSA Access BCI Balanced Fund D 1.25% 0.00% 0.00% 1.25%
ABSA Access BCI Growth Fund A 0.90% 0.00% 0.00% 0.90%
ABSA Access BCI Growth Fund C 1.00% 0.00% 0.00% 1.00%
ABSA Access BCI Growth Fund D 1.25% 0.00% 0.00% 1.25%
ABSA Access BCI Aggressive Fund A 0.95% 0.00% 0.00% 0.95%
ABSA Access BCI Aggressive Fund C 1.00% 0.00% 0.00% 1.00%
ABSA Access BCI Aggressive Fund D 1.25% 0.00% 0.00% 1.25%
ADB BCI Balanced Fund of Funds A 1.00% 0.00% 0.00% 1.00%
ADB BCI Flexible Prudential Fund of Funds A 1.00% 0.00% 0.00% 1.00%
Altre BCI Global Property Fund A 1.25% 15.00% 0.00% 1.25%
Altre BCI Real Return Property Fund A 0.75% 20.00% 2.00% 2.75%
Amity BCI Conserver Fund of Funds A 1.00% 0.00% 0.00% 1.00%
Amity BCI Flexible Growth Fund of Funds A 1.00% 0.00% 0.00% 1.00%
Amity BCI Global Diversified Fund of Funds A 1.00% 0.00% 0.00% 1.00%
Amity BCI Managed Select Fund A 1.50% 0.00% 0.00% 1.50%
Amity BCI Stable Select Fund A 1.50% 0.00% 0.00% 1.50%
Amity BCI Prudent Fund of Funds A 1.00% 0.00% 0.00% 1.00%
Anchor BCI Equity Fund A 1.00% 0.00% 0.00% 1.00%
Anchor BCI Flexible Income Fund A 1.00% 0.00% 0.00% 1.00%
Anchor BCI Flexible Income Fund B 0.75% 0.00% 0.00% 0.75%
Anchor BCI Flexible Income Fund C 0.55% 0.00% 0.00% 0.55%
Anchor BCI Managed Fund A 1.25% 15.00% 0.00% 1.25%
Anchor BCI SA Equity Fund A 1.00% 0.00% 0.00% 1.00%
Anchor BCI SA Equity Fund C 0.65% 0.00% 2.00% 2.65%
Anchor BCI Worldwide Flexible Fund A 1.00% 0.00% 0.00% 1.00%
API BCI Managed Fund of Funds A 0.30% 0.00% 0.00% 0.30%
API BCI Stable Fund of Funds A 0.30% 0.00% 0.00% 0.30%
API BCI Worldwide Opportunities Fund of Funds A 0.30% 0.00% 0.00% 0.30%
Argon BCI Worldwide Flexible Fund A 1.25% 20.00% 1.25% 2.50%
AS BCI Forum Aggressive Fund of Funds A 1.15% 15.00% 1.00% 2.15%
AS BCI Forum Cautious Fund of Funds A 1.15% 15.00% 0.50% 1.65%
AS BCI Forum Moderate Fund of Funds A 1.15% 15.00% 0.75% 1.90%
Fees and Charges
Annual Management FeeClassFund Performance Fee Total Fee
30

Fees excluding VAT
Max Rate Cap Cap
Fees and Charges
Annual Management FeeClassFund Performance Fee Total Fee
Autus BCI Balanced Fund A 1.25% 15.00% 0.75% 2.00%
Autus BCI Equity Fund A 1.25% 15.00% 2.00% 3.25%
Autus BCI Global Equity Fund A 1.50% 15.00% 1.50% 3.00%
Autus BCI Income Plus Fund A 0.60% 0.00% 0.00% 0.60%
Autus BCI Opportunity Fund A 1.25% 15.00% 2.00% 3.25%
Autus BCI Property Fund A 1.25% 15.00% 2.00% 3.25%
Autus BCI Stable Fund A 1.25% 15.00% 0.75% 2.00%
Autus BCI Worldwide Flexible Fund A 1.25% 15.00% 2.00% 3.25%
Baobab BCI Flexible Opportunity Fund A 1.50% 15.00% 0.00% 1.50%
Baroque BCI Moderato Fund of Funds A 1.00% 15.00% 2.00% 3.00%
BCI Best Blend Balanced Fund C 0.50% 15.00% 0.50% 1.00%
BCI Best Blend Cautious Fund C 0.50% 15.00% 0.50% 1.00%
BCI Best Blend Flexible Income Fund C 0.75% 0.00% 0.00% 0.75%
BCI Best Blend Global Equity Fund of Funds A 1.40% 15.00% 1.50% 2.90%
BCI Best Blend Global Property Fund A 1.25% 0.00% 0.00% 1.25%
BCI Best Blend Global Property Fund B 0.95% 0.00% 0.00% 0.95%
BCI Best Blend Specialist Equity Fund C 1.00% 0.00% 0.00% 1.00%
BCI BetaPlus Balanced Fund A 0.75% 0.00% 0.00% 0.75%
BCI Enhanced Interest Fund A 0.50% 0.00% 0.00% 0.50%
BCI Income Plus Fund C 0.50% 0.00% 0.00% 0.50%
BCI Money Market Fund A 0.30% 0.00% 0.00% 0.30%
BCI Prudential Fund of Funds 3B1 0.75% 0.00% 0.00% 0.75%
BCI Prudential Fund of Funds 3B2 1.15% 0.00% 0.00% 1.15%
BCI SA Equity Fund C 0.85% 20.00% 2.00% 2.85%
BCI Stable Fund of Funds 3B1 0.75% 0.00% 0.00% 0.75%
BCI Stable Fund of Funds 3B2 1.15% 0.00% 0.00% 1.15%
BCI Worldwide Flexible Fund of Funds 3B1 0.75% 0.00% 0.00% 0.75%
BCI Worldwide Flexible Fund of Funds 3B2 1.15% 0.00% 0.00% 1.15%
BlueAlpha BCI All Seasons Fund A 1.25% 20.00% 2.00% 3.25%
BlueAlpha BCI Global Equity Fund A 1.25% 15.00% 3.00% 4.25%
BlueAlpha BCI Global Equity Fund C 1.15% 15.00% 3.00% 4.15%
BlueAlpha BCI Select Equity Fund A 1.25% 15.00% 2.00% 3.25%
BlueAlpha BCI Select Equity Fund C 0.85% 15.00% 2.00% 2.85%
Bovest BCI Conservative Fund of Funds A 1.00% 0.00% 0.00% 1.00%
Bovest BCI Conservative Fund of Funds B 1.00% 0.00% 0.00% 1.00%
Bovest BCI Managed Fund of Funds A 1.00% 10.00% 0.00% 1.00%
Bovest BCI Managed Fund of Funds B 1.00% 15.00% 0.00% 1.00%
Bovest BCI Worldwide Flexible Fund of Funds A 1.00% 10.00% 0.00% 1.00%
Caleo BCI Worldwide Opportunities Fund of Funds A 1.00% 15.00% 2.00% 3.00%
Caleo BCI Worldwide Opportunities Fund of Funds C 1.00% 15.00% 2.00% 3.00%
Capita BCI Balanced Fund A 0.85% 0.00% 0.00% 0.85%
Capita BCI Balanced Fund C 0.85% 0.00% 0.00% 0.85%
Capita BCI Cautious Fund A 0.85% 0.00% 0.00% 0.85%
Capita BCI Cautious Fund C 0.85% 0.00% 0.00% 0.85%
Capita BCI Real Income Fund A 0.80% 0.00% 0.00% 0.80%
Capita BCI Real Income Fund C 0.80% 0.00% 0.00% 0.80%
31

Fees excluding VAT
Max Rate Cap Cap
Fees and Charges
Annual Management FeeClassFund Performance Fee Total Fee
Capstone BCI Balanced Fund A 0.70% 0.00% 0.00% 0.70%
Capstone BCI Equity Fund A 1.25% 0.00% 0.00% 1.25%
Capstone BCI Managed Fund A 0.70% 0.00% 0.00% 0.70%
Cartesian Money Market Fund A 0.25% 0.00% 0.00% 0.25%
Celtis BCI Conservative Fund of Funds A 1.00% 15.00% 2.00% 3.00%
Celtis BCI Flexible Fund of Funds A 1.00% 15.00% 2.00% 3.00%
Celtis BCI Managed Fund of Funds A 1.00% 15.00% 0.00% 1.00%
Celtis BCI Managed Fund of Funds C 1.00% 15.00% 0.00% 1.00%
Centaur BCI Balanced Fund A 1.50% 12.50% 1.00% 2.50%
Centaur BCI Flexible Fund A 1.25% 20.00% 2.00% 3.25%
Centaur BCI Flexible Fund C 0.85% 20.00% 2.00% 2.85%
Colourfield BCI Fixed Income Fund 1 A 0.45% 0.00% 0.00% 0.45%
Colourfield BCI Fixed Income Fund 2 A 0.45% 0.00% 0.00% 0.45%
Colourfield BCI Money Market Fund C 0.23% 0.00% 0.00% 0.23%
Consilium BCI Flexible Fund A 1.65% 0.00% 0.00% 1.65%
Consilium BCI Worldwide Flexible Fund A 1.25% 0.00% 0.00% 1.25%
Cratos BCI Equity Fund A 1.25% 0.00% 2.00% 3.25%
CS BCI Aggressive Prudential Fund of Funds A 1.65% 0.00% 0.00% 1.65%
CS BCI Aggressive Prudential Fund of Funds B 1.25% 0.00% 0.00% 1.25%
CS BCI Flexible Fund of Funds A 1.65% 0.00% 0.00% 1.65%
CS BCI Prudential Fund of Funds A 1.65% 0.00% 0.00% 1.65%
CS BCI Prudential Fund of Funds B 1.25% 0.00% 0.00% 1.25%
CS BCI Worldwide Flexible Fund of Funds A 1.65% 0.00% 0.00% 1.65%
CS BCI Worldwide Flexible Fund of Funds B 1.25% 0.00% 0.00% 1.25%
Dinamika BCI Conservative Fund of Funds A 1.25% 15.00% 2.00% 3.25%
Dinamika BCI Worldwide Flexible Fund A 1.25% 15.00% 2.00% 3.25%
Dolberg Spencer BCI Equity Fund A 1.00% 15.00% 2.00% 3.00%
Dolberg Spencer BCI Flexible Fund A 1.00% 15.00% 2.00% 3.00%
Dolberg Spencer BCI Property Fund A 1.00% 15.00% 2.00% 3.00%
Dotport BCI Flexible Fund of Funds A 1.00% 15.00% 2.00% 3.00%
Dotport BCI Prudential Fund of Funds A 1.00% 15.00% 2.00% 3.00%
Dotport BCI Cautious Fund of Funds A 1.00% 7.50% 2.00% 3.00%
Efficient BCI Balanced Fund A 1.00% 10.00% 0.75% 1.75%
Efficient BCI Cautious Fund A 1.00% 15.00% 1.00% 2.00%
Efficient BCI Equity Fund A 1.00% 20.00% 2.00% 3.00%
Efficient BCI Equity Fund of Funds A 1.50% 0.00% 0.00% 1.50%
Efficient BCI Fixed Income Fund A 0.75% 0.00% 0.00% 0.75%
Efficient BCI Flexible Fund of Funds A 1.50% 0.00% 0.00% 1.50%
Efficient BCI Property Fund A 0.85% 15.00% 1.75% 2.60%
Efficient BCI Prudential High Fund of Funds A 1.50% 0.00% 0.00% 1.50%
Efficient BCI Prudential Medium Fund of Funds C 1.50% 0.00% 0.00% 1.50%
Efficient BCI Worldwide Flexible Fund A 1.00% 15.00% 1.75% 2.75%
Efficient BCI African Flexible Income Fund A 0.85% 15.00% 1.00% 1.85%
Evolve BCI Managed Fund A 0.50% 0.18% 2.00% 2.50%
Evolve BCI Conservative Fund A 0.50% 0.18% 2.00% 2.50%
32

Fees excluding VAT
Max Rate Cap Cap
Fees and Charges
Annual Management FeeClassFund Performance Fee Total Fee
Florin BCI Managed Fund A 1.50% 0.00% 0.00% 1.50%
Foster BCI Moderate Fund of Funds A 1.00% 10.00% 1.00% 2.00%
GFA BCI Managed Fund of Funds A 1.00% 15.00% 2.00% 3.00%
GFA BCI Stable Fund of Funds A 1.00% 15.00% 2.00% 3.00%
Harvard House BCI Equity Fund A 0.95% 0.00% 0.00% 0.95%
Harvard House BCI Flexible Income Fund A 0.95% 0.00% 0.00% 0.95%
Harvard House BCI Property Fund A 0.95% 0.00% 0.00% 0.95%
Kanaan BCI Balanced Fund of Funds A 1.00% 15.00% 2.00% 3.00%
Kanaan BCI Flexible Fund of Funds A 1.00% 15.00% 2.00% 3.00%
Maitland Flexible Fund of Funds A 1.00% 0.00% 0.00% 1.00%
Montrose BCI Cautious FoF’s A 1.00% 15.00% 1.00% 2.00%
Montrose BCI Flexible FoF’s A 1.00% 15.00% 2.00% 3.00%
Montrose BCI Moderate FoF’s A 1.00% 15.00% 2.00% 3.00%
Naviga BCI Balanced Growth Fund of Funds A 1.25% 10.00% 0.50% 1.75%
Naviga BCI Equity Fund of Funds A 0.80% 0.00% 0.00% 0.80%
Naviga BCI Income Planner Fund of Funds A 0.60% 0.00% 0.00% 0.60%
Naviga BCI SA Equity Fund A 1.25% 15.00% 1.50% 2.75%
Naviga BCI Secure Growth Fund of Funds A 1.25% 10.00% 0.50% 1.75%
NeFG BCI Equity Fund A 1.25% 15.00% 2.00% 3.25%
NeFG BCI Flexible Fund A 1.25% 15.00% 2.00% 3.25%
NeFG BCI Income Provider Fund A 1.50% 15.00% 2.00% 3.50%
Olympiad BCI Managed Fund of Funds A 1.00% 15.00% 2.00% 3.00%
Olympiad BCI Worldwide Flex Fund of Funds A 1.00% 15.00% 2.00% 3.00%
Optimum BCI Balanced Fund A 1.00% 15.00% 1.00% 2.00%
Optimum BCI Balanced Fund D 1.00% 0.00% 1.00% 2.00%
Optimum BCI Equity Fund A 1.35% 0.00% 1.00% 2.35%
Optimum BCI Managed Growth Fund A 1.00% 15.00% 1.00% 2.00%
Optimum BCI Stable Fund A 1.00% 15.00% 1.00% 2.00%
Optimum BCI Worldwide Flexible Fund of Funds A 1.00% 0.00% 0.00% 1.00%
Plexus Wealth BCI Balanced Fund A 1.30% 0.00% 0.00% 1.30%
Plexus Wealth BCI Conservative Fund A 1.30% 0.00% 0.00% 1.30%
Plexus Wealth BCI Property Fund A 1.00% 0.00% 0.00% 1.00%
Portfoliometrix BCI Bond Fund of Funds A 0.10% 0.00% 0.00% 0.10%
PortfolioMetrix BCI Equity Fund of Funds B2 0.50% 0.00% 0.00% 0.50%
PortfolioMetrix BCI Equity Fund of Funds B1 0.10% 0.00% 0.00% 0.10%
PortfolioMetrix BCI Global Equity Fund of Funds B2 0.50% 0.00% 0.00% 0.50%
PortfolioMetrix BCI Global Equity Fund of Funds B1 0.10% 0.00% 0.00% 0.10%
Portfoliometrix BCI Income Fund of Funds A 0.10% 0.00% 0.00% 0.10%
Portfoliometrix BCI SA Property Fund A 0.75% 0.00% 0.00% 0.75%
Quantum BCI Balanced Fund of Funds A 1.15% 0.00% 0.00% 1.15%
Quantum BCI Capital Plus Fund of Funds A 1.15% 0.00% 0.00% 1.15%
Quantum BCI Core Income Fund A 0.80% 0.00% 0.00% 0.80%
Quantum BCI Worldwide Flexible Fund of Funds A 1.15% 0.00% 0.00% 1.15%
RCI BCI Flexible Fund A 1.33% 10.00% 2.00% 3.33%
33

Fees excluding VAT
Max Rate Cap Cap
Fees and Charges
Annual Management FeeClassFund Performance Fee Total Fee
Rebalance BCI Inflation Plus 3 Fund A 1.05% 0.00% 0.00% 1.05%
Rebalance BCI Inflation Plus 5 Fund A 1.05% 0.00% 0.00% 1.05%
Rebalance BCI Inflation Plus 7 Fund A 1.05% 0.00% 0.00% 1.05%
Reitway BCI Global Property Fund A 1.25% 0.00% 0.00% 1.25%
Reitway BCI Global Property Fund C 0.95% 0.00% 0.00% 0.95%
Renaissance BCI Cautious Fund A 1.50% 0.00% 0.00% 1.50%
Renaissance BCI Global Best Ideas Feeder Fund A 0.15% 0.00% 0.00% 0.15%
Renaissance BCI Managed Fund A 1.50% 0.00% 0.00% 1.50%
Rudiarius BCI Africa Equity Fund C 1.00% 20.00% 0.00% 1.00%
SA Asset Management BCI Cautious Fund A 1.20% 15.00% 1.00% 2.20%
SA Asset Management BCI Managed Fund A 1.10% 15.00% 2.00% 3.10%
SA Asset Management BCI Moderate Fund A 1.15% 15.00% 1.50% 2.65%
S-BRO BCI Balanced Fund of Funds A 1.00% 15.00% 2.50% 3.50%
S-BRO BCI Defensive Fund of Funds A 1.00% 15.00% 1.50% 2.50%
Simplisiti BCI Flexible Fund of Funds A 1.00% 15.00% 2.00% 3.00%
Simplisiti BCI Income Plus Fund of Funds A 0.85% 0.00% 0.50% 1.35%
Simplisiti BCI Managed Protector Fund of Funds A 1.00% 15.00% 1.00% 2.00%
Skyblue BCI Cumulus Moderate Fund of Funds A 1.00% 10.00% 2.00% 3.00%
Skyblue BCI Kimberlite Cautious Fund of Funds A 1.00% 10.00% 2.00% 3.00%
Skyblue BCI Solar Flexible Fund of Funds A 1.00% 10.00% 2.00% 3.00%
Southern Charter BCI Balanced Fund of Funds A 1.00% 15.00% 1.50% 2.50%
Southern Charter BCI Defensive Fund of Funds A 1.00% 15.00% 0.75% 1.75%
Southern Charter BCI Growth Fund of Funds A 1.00% 15.00% 1.50% 2.50%
Southern Charter BCI WW Flexible Fund of Funds A 1.00% 15.00% 1.50% 2.50%
Stonewood BCI Worldwide Flexible Fund B 1.50% 0.00% 0.00% 1.50%
Stringfellow BCI Flexible Fund of Funds A 1.00% 15.00% 2.00% 3.00%
Stringfellow BCI Stable Fund of Funds A 1.00% 15.00% 2.00% 3.00%
Tantalum BCI Cautious Fund A 0.85% 15.00% 1.00% 1.85%
Tantalum BCI Strategic Income Fund A 0.75% 10.00% 0.00% 0.75%
UAM BCI Balanced Fund A 1.50% 0.00% 0.00% 1.50%
Visio BCI Actinio Fund A 1.25% 12.50% 3.50% 4.75%
Visio BCI Actinio Fund B1 1.25% 12.50% 2.00% 3.25%
Visio BCI Actinio Fund C 0.75% 12.50% 2.00% 2.75%
Visio BCI Actinio Fund D 0.85% 12.50% 2.00% 2.85%
Visio BCI General Equity Fund A 1.00% 20.00% 1.00% 2.00%
34

4D BCI Aggressive Flexible Fund of Funds A - 0.27 - 0.10
4D BCI Cautious Fund of Funds A 0.77 1.12 0.68 0.89
4D BCI Flexible Fund A - 1.46 - 1.31
4D BCI Moderate Fund of Funds A - 1.27 - 0.92
ABSA Access BCI Stable Fund A - - - 0.01
ABSA Access BCI Stable Fund C - - - -
ABSA Access BCI Stable Fund D - - - -
ABSA Access BCI Cautious Fund A - - - -
ABSA Access BCI Cautious Fund C - - - -
ABSA Access BCI Cautious Fund D - - - -
ABSA Access BCI Balanced Fund A - - - -
ABSA Access BCI Balanced Fund C - - - -
ABSA Access BCI Balanced Fund D - - - -
ABSA Access BCI Growth Fund A - - - -
ABSA Access BCI Growth Fund C - - - -
ABSA Access BCI Growth Fund D - - - -
ABSA Access BCI Aggressive Fund A - - - -
ABSA Access BCI Aggressive Fund C - - - -
ABSA Access BCI Aggressive Fund D - - - -
ADB BCI Balanced Fund of Funds A - 0.90 - -
ADB BCI Flexible Prudential Fund of Funds A - 0.87 - -
Altre BCI Global Property Fund A - - - -
Altre BCI Real Return Property Fund A 0.97 0.50 1.79 -
Amity BCI Conserver Fund of Funds A 0.25 1.33 0.28 -
Amity BCI Flexible Growth Fund of Funds A - 0.72 - -
Amity BCI Global Diversified Fund of Funds A - - - -
Amity BCI Managed Select Fund A - - - -
Amity BCI Stable Select Fund A - - - -
Amity BCI Prudent Fund of Funds A - 0.96 - -
Anchor BCI Equity Fund A - 0.42 - -
Anchor BCI Flexible Income Fund A - - - -
Anchor BCI Flexible Income Fund B - - - -
Anchor BCI Flexible Income Fund C - - - -
Anchor BCI Managed Fund A - - - -
Anchor BCI SA Equity Fund A - - - -
Anchor BCI SA Equity Fund C - - - -
Anchor BCI Worldwide Flexible Fund A - 0.61 - 0.35
API BCI Managed Fund of Funds A - - - -
API BCI Stable Fund of Funds A - - - 0.74
API BCI Worldwide Opportunities Fund of Funds A - 0.03 - 0.25
Argon BCI Worldwide Flexible Fund A - - - -
Distribution
Fund Class
Income Distribution (cpu)
Nov-14 Feb-15 May-15 Aug-15
35

Distribution
Fund Class
Income Distribution (cpu)
Nov-14 Feb-15 May-15 Aug-15
AS BCI Forum Aggressive Fund of Funds A - - - -
AS BCI Forum Cautious Fund of Funds A 0.93 0.99 0.73 1.01
AS BCI Forum Moderate Fund of Funds A - 0.78 - 1.13
Autus BCI Balanced Fund A - - - -
Autus BCI Equity Fund A - - - -
Autus BCI Global Equity Fund A - - - -
Autus BCI Income Plus Fund A 1.86 1.56 1.54 1.52
Autus BCI Opportunity Fund A - - - -
Autus BCI Property Fund A 1.58 0.22 1.67 0.39
Autus BCI Stable Fund A - 2.07 - 0.81
Autus BCI Worldwide Flexible Fund A - - - -
Baobab BCI Flexible Opportunity Fund A - - - -
Baroque BCI Moderato Fund of Funds A - - - 0.36
BCI Best Blend Balanced Fund C - 0.42 - 1.21
BCI Best Blend Cautious Fund C 0.79 0.75 0.63 0.93
BCI Best Blend Flexible Income Fund C 1.44 1.28 1.47 1.82
BCI Best Blend Global Equity Fund of Funds A - - - -
BCI Best Blend Global Property Fund A - - - 0.52
BCI Best Blend Global Property Fund B - - - 0.65
BCI Best Blend Specialist Equity Fund C - 1.02 - 1.73
BCI BetaPlus Balanced Fund A - - - 1.25
BCI Enhanced Interest Fund A - - 0.34 0.53
BCI Income Plus Fund C 1.78 0.47 1.14 2.31
BCI Money Market Fund A - - - -
BCI Prudential Fund of Funds 3B1 - 0.87 - 0.85
BCI Prudential Fund of Funds 3B2 - 0.32 - 0.40
BCI SA Equity Fund C - 0.02 - 0.06
BCI Stable Fund of Funds 3B1 1.29 0.80 1.71 0.88
BCI Stable Fund of Funds 3B2 1.13 0.64 1.54 0.71
BCI Worldwide Flexible Fund of Funds 3B1 - - - -
BCI Worldwide Flexible Fund of Funds 3B2 - - - -
BlueAlpha BCI All Seasons Fund A - - - -
BlueAlpha BCI Global Equity Fund A - - - -
BlueAlpha BCI Global Equity Fund C - - - -
BlueAlpha BCI Select Equity Fund A - - - 0.25
BlueAlpha BCI Select Equity Fund C - 0.21 - 0.15
Bovest BCI Conservative Fund of Funds A - - - 0.39
Bovest BCI Conservative Fund of Funds B - - - -
Bovest BCI Managed Fund of Funds A - - - -
Bovest BCI Managed Fund of Funds B - - - -
Bovest BCI Worldwide Flexible Fund of Funds A - - - -
Caleo BCI Worldwide Opportunities Fund of Funds A - - - 0.28
Caleo BCI Worldwide Opportunities Fund of Funds C - - - 0.41
36
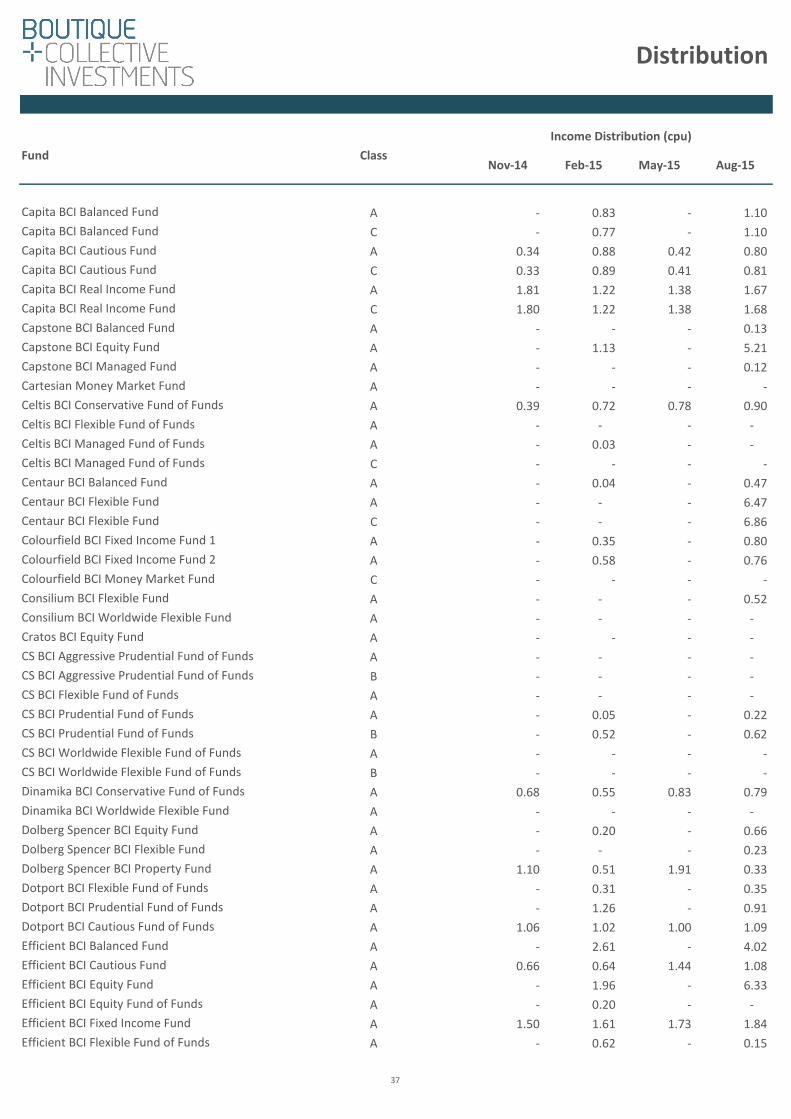
Distribution
Fund Class
Income Distribution (cpu)
Nov-14 Feb-15 May-15 Aug-15
Capita BCI Balanced Fund A - 0.83 - 1.10
Capita BCI Balanced Fund C - 0.77 - 1.10
Capita BCI Cautious Fund A 0.34 0.88 0.42 0.80
Capita BCI Cautious Fund C 0.33 0.89 0.41 0.81
Capita BCI Real Income Fund A 1.81 1.22 1.38 1.67
Capita BCI Real Income Fund C 1.80 1.22 1.38 1.68
Capstone BCI Balanced Fund A - - - 0.13
Capstone BCI Equity Fund A - 1.13 - 5.21
Capstone BCI Managed Fund A - - - 0.12
Cartesian Money Market Fund A - - - -
Celtis BCI Conservative Fund of Funds A 0.39 0.72 0.78 0.90
Celtis BCI Flexible Fund of Funds A - - - -
Celtis BCI Managed Fund of Funds A - 0.03 - -
Celtis BCI Managed Fund of Funds C - - - -
Centaur BCI Balanced Fund A - 0.04 - 0.47
Centaur BCI Flexible Fund A - - - 6.47
Centaur BCI Flexible Fund C - - - 6.86
Colourfield BCI Fixed Income Fund 1 A - 0.35 - 0.80
Colourfield BCI Fixed Income Fund 2 A - 0.58 - 0.76
Colourfield BCI Money Market Fund C - - - -
Consilium BCI Flexible Fund A - - - 0.52
Consilium BCI Worldwide Flexible Fund A - - - -
Cratos BCI Equity Fund A - - - -
CS BCI Aggressive Prudential Fund of Funds A - - - -
CS BCI Aggressive Prudential Fund of Funds B - - - -
CS BCI Flexible Fund of Funds A - - - -
CS BCI Prudential Fund of Funds A - 0.05 - 0.22
CS BCI Prudential Fund of Funds B - 0.52 - 0.62
CS BCI Worldwide Flexible Fund of Funds A - - - -
CS BCI Worldwide Flexible Fund of Funds B - - - -
Dinamika BCI Conservative Fund of Funds A 0.68 0.55 0.83 0.79
Dinamika BCI Worldwide Flexible Fund A - - - -
Dolberg Spencer BCI Equity Fund A - 0.20 - 0.66
Dolberg Spencer BCI Flexible Fund A - - - 0.23
Dolberg Spencer BCI Property Fund A 1.10 0.51 1.91 0.33
Dotport BCI Flexible Fund of Funds A - 0.31 - 0.35
Dotport BCI Prudential Fund of Funds A - 1.26 - 0.91
Dotport BCI Cautious Fund of Funds A 1.06 1.02 1.00 1.09
Efficient BCI Balanced Fund A - 2.61 - 4.02
Efficient BCI Cautious Fund A 0.66 0.64 1.44 1.08
Efficient BCI Equity Fund A - 1.96 - 6.33
Efficient BCI Equity Fund of Funds A - 0.20 - -
Efficient BCI Fixed Income Fund A 1.50 1.61 1.73 1.84
Efficient BCI Flexible Fund of Funds A - 0.62 - 0.15
37
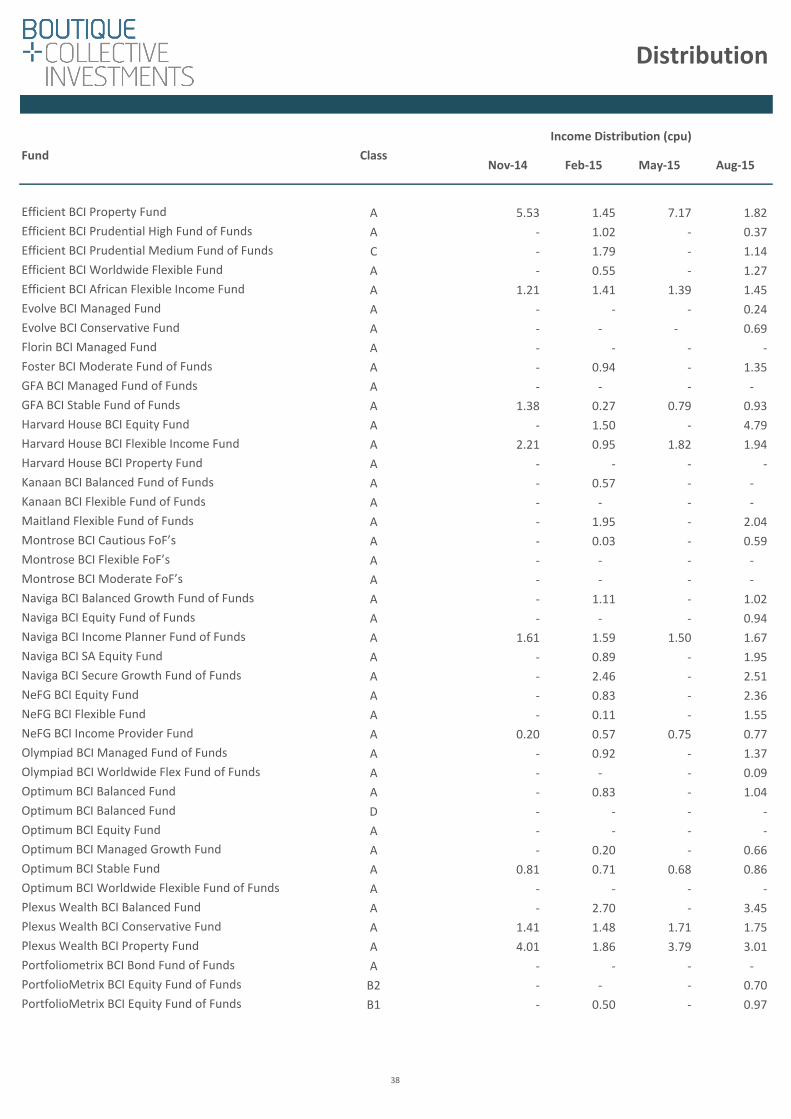
Distribution
Fund Class
Income Distribution (cpu)
Nov-14 Feb-15 May-15 Aug-15
Efficient BCI Property Fund A 5.53 1.45 7.17 1.82
Efficient BCI Prudential High Fund of Funds A - 1.02 - 0.37
Efficient BCI Prudential Medium Fund of Funds C - 1.79 - 1.14
Efficient BCI Worldwide Flexible Fund A - 0.55 - 1.27
Efficient BCI African Flexible Income Fund A 1.21 1.41 1.39 1.45
Evolve BCI Managed Fund A - - - 0.24
Evolve BCI Conservative Fund A - - - 0.69
Florin BCI Managed Fund A - - - -
Foster BCI Moderate Fund of Funds A - 0.94 - 1.35
GFA BCI Managed Fund of Funds A - - - -
GFA BCI Stable Fund of Funds A 1.38 0.27 0.79 0.93
Harvard House BCI Equity Fund A - 1.50 - 4.79
Harvard House BCI Flexible Income Fund A 2.21 0.95 1.82 1.94
Harvard House BCI Property Fund A - - - -
Kanaan BCI Balanced Fund of Funds A - 0.57 - -
Kanaan BCI Flexible Fund of Funds A - - - -
Maitland Flexible Fund of Funds A - 1.95 - 2.04
Montrose BCI Cautious FoF’s A - 0.03 - 0.59
Montrose BCI Flexible FoF’s A - - - -
Montrose BCI Moderate FoF’s A - - - -
Naviga BCI Balanced Growth Fund of Funds A - 1.11 - 1.02
Naviga BCI Equity Fund of Funds A - - - 0.94
Naviga BCI Income Planner Fund of Funds A 1.61 1.59 1.50 1.67
Naviga BCI SA Equity Fund A - 0.89 - 1.95
Naviga BCI Secure Growth Fund of Funds A - 2.46 - 2.51
NeFG BCI Equity Fund A - 0.83 - 2.36
NeFG BCI Flexible Fund A - 0.11 - 1.55
NeFG BCI Income Provider Fund A 0.20 0.57 0.75 0.77
Olympiad BCI Managed Fund of Funds A - 0.92 - 1.37
Olympiad BCI Worldwide Flex Fund of Funds A - - - 0.09
Optimum BCI Balanced Fund A - 0.83 - 1.04
Optimum BCI Balanced Fund D - - - -
Optimum BCI Equity Fund A - - - -
Optimum BCI Managed Growth Fund A - 0.20 - 0.66
Optimum BCI Stable Fund A 0.81 0.71 0.68 0.86
Optimum BCI Worldwide Flexible Fund of Funds A - - - -
Plexus Wealth BCI Balanced Fund A - 2.70 - 3.45
Plexus Wealth BCI Conservative Fund A 1.41 1.48 1.71 1.75
Plexus Wealth BCI Property Fund A 4.01 1.86 3.79 3.01
Portfoliometrix BCI Bond Fund of Funds A - - - -
PortfolioMetrix BCI Equity Fund of Funds B2 - - - 0.70
PortfolioMetrix BCI Equity Fund of Funds B1 - 0.50 - 0.97
38

Distribution
Fund Class
Income Distribution (cpu)
Nov-14 Feb-15 May-15 Aug-15
PortfolioMetrix BCI Global Equity Fund of Funds B2 - - - -
PortfolioMetrix BCI Global Equity Fund of Funds B1 - - - -
Portfoliometrix BCI Income Fund of Funds A - - - -
Portfoliometrix BCI SA Property Fund A - - - 0.46
Quantum BCI Balanced Fund of Funds A 1.20 0.42 0.51 0.71
Quantum BCI Capital Plus Fund of Funds A 0.73 1.41 0.88 1.29
Quantum BCI Core Income Fund A 1.73 0.75 1.51 1.01
Quantum BCI Worldwide Flexible Fund of Funds A - 0.01 - -
RCI BCI Flexible Fund A - 0.58 - 1.58
Rebalance BCI Inflation Plus 3 Fund A - 0.04 - 1.89
Rebalance BCI Inflation Plus 5 Fund A - - - 1.11
Rebalance BCI Inflation Plus 7 Fund A - - - 0.10
Reitway BCI Global Property Fund A 1.29 1.01 1.16 1.02
Reitway BCI Global Property Fund C 1.43 1.18 1.32 1.20
Renaissance BCI Cautious Fund A 0.65 0.32 0.86 0.60
Renaissance BCI Global Best Ideas Feeder Fund A - - - -
Renaissance BCI Managed Fund A - 0.60 - 1.11
Rudiarius BCI Africa Equity Fund C - 0.18 - 1.52
SA Asset Management BCI Cautious Fund A 1.27 0.29 1.12 0.41
SA Asset Management BCI Managed Fund A - 0.97 - 1.11
SA Asset Management BCI Moderate Fund A - 1.04 - 1.21
S-BRO BCI Balanced Fund of Funds A - 0.51 - 1.47
S-BRO BCI Defensive Fund of Funds A 0.48 0.76 0.64 0.97
Simplisiti BCI Flexible Fund of Funds A - - - -
Simplisiti BCI Income Plus Fund of Funds A 1.26 1.31 1.14 1.20
Simplisiti BCI Managed Protector Fund of Funds A - - - -
Skyblue BCI Cumulus Moderate Fund of Funds A - 1.21 - 1.82
Skyblue BCI Kimberlite Cautious Fund of Funds A 0.66 1.09 0.71 0.78
Skyblue BCI Solar Flexible Fund of Funds A - 0.10 - 0.05
Southern Charter BCI Balanced Fund of Funds A - 1.43 - 1.76
Southern Charter BCI Defensive Fund of Funds A 1.17 0.77 0.99 0.88
Southern Charter BCI Growth Fund of Funds A - 1.20 - 1.12
Southern Charter BCI WW Flexible Fund of Funds A - 0.19 - 0.33
Stonewood BCI Worldwide Flexible Fund B - 0.08 - -
Stringfellow BCI Flexible Fund of Funds A - - - -
Stringfellow BCI Stable Fund of Funds A - 0.62 - 1.20
Tantalum BCI Cautious Fund A - 0.11 - -
Tantalum BCI Strategic Income Fund A 0.02 0.79 1.45 1.66
UAM BCI Balanced Fund A - - - 0.34
Visio BCI Actinio Fund A - - - -
Visio BCI Actinio Fund B1 - - - -
Visio BCI Actinio Fund C - 0.10 - 0.84
Visio BCI Actinio Fund D - - - 1.72
Visio BCI General Equity Fund A - 0.62 - 1.59
39

4D BCI Aggressive Flexible Fund of Funds A 2.96
4D BCI Cautious Fund of Funds A 2.35
4D BCI Flexible Fund A 1.33
4D BCI Moderate Fund of Funds A 2.41
ABSA Access BCI Stable Fund A -
ABSA Access BCI Stable Fund C -
ABSA Access BCI Stable Fund D -
ABSA Access BCI Cautious Fund A -
ABSA Access BCI Cautious Fund C -
ABSA Access BCI Cautious Fund D -
ABSA Access BCI Balanced Fund A -
ABSA Access BCI Balanced Fund C -
ABSA Access BCI Balanced Fund D -
ABSA Access BCI Growth Fund A -
ABSA Access BCI Growth Fund C -
ABSA Access BCI Growth Fund D -
ABSA Access BCI Aggressive Fund A -
ABSA Access BCI Aggressive Fund C -
ABSA Access BCI Aggressive Fund D -
ADB BCI Balanced Fund of Funds A 2.28
ADB BCI Flexible Prudential Fund of Funds A 2.31
Altre BCI Global Property Fund A -
Altre BCI Real Return Property Fund A 0.90
Amity BCI Conserver Fund of Funds A 2.33
Amity BCI Flexible Growth Fund of Funds A 1.81
Amity BCI Global Diversified Fund of Funds A -
Amity BCI Managed Select Fund A -
Amity BCI Stable Select Fund A -
Amity BCI Prudent Fund of Funds A 2.27
Anchor BCI Equity Fund A 1.22
Anchor BCI Flexible Income Fund A 1.14
Anchor BCI Flexible Income Fund B -
Anchor BCI Flexible Income Fund C -
Anchor BCI Managed Fund A 1.43
Anchor BCI SA Equity Fund A 1.46
Anchor BCI SA Equity Fund C 1.46
Anchor BCI Worldwide Flexible Fund A 1.25
API BCI Managed Fund of Funds A 0.34
API BCI Stable Fund of Funds A 0.34
API BCI Worldwide Opportunities Fund of Funds A 0.34
Argon BCI Worldwide Flexible Fund A 1.43
Total Expense Ratio
Fund Class TER June 2015
40

Total Expense Ratio
Fund Class TER June 2015
AS BCI Forum Aggressive Fund of Funds A 3.17
AS BCI Forum Cautious Fund of Funds A 2.61
AS BCI Forum Moderate Fund of Funds A 2.93
Autus BCI Balanced Fund A 3.61
Autus BCI Equity Fund A 2.76
Autus BCI Global Equity Fund A 1.71
Autus BCI Income Plus Fund A 1.12
Autus BCI Opportunity Fund A 3.78
Autus BCI Property Fund A 1.50
Autus BCI Stable Fund A 2.92
Autus BCI Worldwide Flexible Fund A 2.49
Baobab BCI Flexible Opportunity Fund A 1.90
Baroque BCI Moderato Fund of Funds A 3.28
BCI Best Blend Balanced Fund C 2.13
BCI Best Blend Cautious Fund C 1.67
BCI Best Blend Flexible Income Fund C 0.96
BCI Best Blend Global Equity Fund of Funds A 2.01
BCI Best Blend Global Property Fund A 1.43
BCI Best Blend Global Property Fund B -
BCI Best Blend Specialist Equity Fund C 1.13
BCI BetaPlus Balanced Fund A 1.15
BCI Enhanced Interest Fund A 1.41
BCI Income Plus Fund C 0.65
BCI Money Market Fund A 0.61
BCI Prudential Fund of Funds 3B1 2.29
BCI Prudential Fund of Funds 3B2 2.73
BCI SA Equity Fund C 1.82
BCI Stable Fund of Funds 3B1 1.90
BCI Stable Fund of Funds 3B2 2.35
BCI Worldwide Flexible Fund of Funds 3B1 2.37
BCI Worldwide Flexible Fund of Funds 3B2 2.84
BlueAlpha BCI All Seasons Fund A 4.42
BlueAlpha BCI Global Equity Fund A 2.20
BlueAlpha BCI Global Equity Fund C -
BlueAlpha BCI Select Equity Fund A 2.48
BlueAlpha BCI Select Equity Fund C 2.08
Bovest BCI Conservative Fund of Funds A 2.81
Bovest BCI Conservative Fund of Funds B 0.84
Bovest BCI Managed Fund of Funds A 3.34
Bovest BCI Managed Fund of Funds B 0.97
Bovest BCI Worldwide Flexible Fund of Funds A 1.14
Caleo BCI Worldwide Opportunities Fund of Funds A 2.56
Caleo BCI Worldwide Opportunities Fund of Funds C 2.46
41

Total Expense Ratio
Fund Class TER June 2015
Capita BCI Balanced Fund A 2.01
Capita BCI Balanced Fund C 2.01
Capita BCI Cautious Fund A 1.93
Capita BCI Cautious Fund C 1.94
Capita BCI Real Income Fund A 1.27
Capita BCI Real Income Fund C 1.30
Capstone BCI Balanced Fund A 0.80
Capstone BCI Equity Fund A 1.51
Capstone BCI Managed Fund A 0.80
Cartesian Money Market Fund A -
Celtis BCI Conservative Fund of Funds A 2.17
Celtis BCI Flexible Fund of Funds A 3.23
Celtis BCI Managed Fund of Funds A 2.89
Celtis BCI Managed Fund of Funds C 2.89
Centaur BCI Balanced Fund A 2.40
Centaur BCI Flexible Fund A 3.21
Centaur BCI Flexible Fund C 1.69
Colourfield BCI Fixed Income Fund 1 A 0.63
Colourfield BCI Fixed Income Fund 2 A 0.68
Colourfield BCI Money Market Fund C 0.14
Consilium BCI Flexible Fund A 2.27
Consilium BCI Worldwide Flexible Fund A 1.55
Cratos BCI Equity Fund A 1.43
CS BCI Aggressive Prudential Fund of Funds A 3.46
CS BCI Aggressive Prudential Fund of Funds B 3.02
CS BCI Flexible Fund of Funds A 3.46
CS BCI Prudential Fund of Funds A 3.22
CS BCI Prudential Fund of Funds B 2.76
CS BCI Worldwide Flexible Fund of Funds A -
CS BCI Worldwide Flexible Fund of Funds B -
Dinamika BCI Conservative Fund of Funds A 2.92
Dinamika BCI Worldwide Flexible Fund A 1.43
Dolberg Spencer BCI Equity Fund A 1.38
Dolberg Spencer BCI Flexible Fund A 2.80
Dolberg Spencer BCI Property Fund A 1.68
Dotport BCI Flexible Fund of Funds A 3.02
Dotport BCI Prudential Fund of Funds A 2.89
Dotport BCI Cautious Fund of Funds A 2.17
Efficient BCI Balanced Fund A 1.31
Efficient BCI Cautious Fund A 2.05
Efficient BCI Equity Fund A 1.16
Efficient BCI Equity Fund of Funds A 2.78
Efficient BCI Fixed Income Fund A 1.13
42

Total Expense Ratio
Fund Class TER June 2015
Efficient BCI Flexible Fund of Funds A 2.76
Efficient BCI Property Fund A 1.06
Efficient BCI Prudential High Fund of Funds A 2.82
Efficient BCI Prudential Medium Fund of Funds C 2.68
Efficient BCI Worldwide Flexible Fund A 2.07
Efficient BCI African Flexible Income Fund A 1.68
Evolve BCI Managed Fund A 0.57
Evolve BCI Conservative Fund A 2.36
Florin BCI Managed Fund A -
Foster BCI Moderate Fund of Funds A 2.45
GFA BCI Managed Fund of Funds A 3.56
GFA BCI Stable Fund of Funds A 2.56
Harvard House BCI Equity Fund A 1.34
Harvard House BCI Flexible Income Fund A 1.17
Harvard House BCI Property Fund A -
Kanaan BCI Balanced Fund of Funds A 3.36
Kanaan BCI Flexible Fund of Funds A 4.28
Maitland Flexible Fund of Funds A 2.26
Montrose BCI Cautious FoF’s A 2.69
Montrose BCI Flexible FoF’s A 4.61
Montrose BCI Moderate FoF’s A 3.48
Naviga BCI Balanced Growth Fund of Funds A 2.65
Naviga BCI Equity Fund of Funds A 2.07
Naviga BCI Income Planner Fund of Funds A 1.30
Naviga BCI SA Equity Fund A 1.67
Naviga BCI Secure Growth Fund of Funds A 2.39
NeFG BCI Equity Fund A 2.03
NeFG BCI Flexible Fund A 2.71
NeFG BCI Income Provider Fund A 2.88
Olympiad BCI Managed Fund of Funds A 2.37
Olympiad BCI Worldwide Flex Fund of Funds A 2.92
Optimum BCI Balanced Fund A 2.39
Optimum BCI Balanced Fund D 2.39
Optimum BCI Equity Fund A -
Optimum BCI Managed Growth Fund A 2.43
Optimum BCI Stable Fund A 2.55
Optimum BCI Worldwide Flexible Fund of Funds A -
Plexus Wealth BCI Balanced Fund A 1.69
Plexus Wealth BCI Conservative Fund A 1.66
Plexus Wealth BCI Property Fund A 1.18
Portfoliometrix BCI Bond Fund of Funds A -
PortfolioMetrix BCI Equity Fund of Funds B2 1.45
PortfolioMetrix BCI Equity Fund of Funds B1 1.00
43

Total Expense Ratio
Fund Class TER June 2015
PortfolioMetrix BCI Global Equity Fund of Funds B2 1.67
PortfolioMetrix BCI Global Equity Fund of Funds B1 1.24
Portfoliometrix BCI Income Fund of Funds A -
Portfoliometrix BCI SA Property Fund A -
Quantum BCI Balanced Fund of Funds A 2.48
Quantum BCI Capital Plus Fund of Funds A 2.58
Quantum BCI Core Income Fund A 1.67
Quantum BCI Worldwide Flexible Fund of Funds A 2.71
RCI BCI Flexible Fund A 2.58
Rebalance BCI Inflation Plus 3 Fund A 2.03
Rebalance BCI Inflation Plus 5 Fund A 2.09
Rebalance BCI Inflation Plus 7 Fund A 2.46
Reitway BCI Global Property Fund A 1.51
Reitway BCI Global Property Fund C 1.13
Renaissance BCI Cautious Fund A 2.10
Renaissance BCI Global Best Ideas Feeder Fund A 0.17
Renaissance BCI Managed Fund A 2.10
Rudiarius BCI Africa Equity Fund C 1.51
SA Asset Management BCI Cautious Fund A 2.11
SA Asset Management BCI Managed Fund A 2.07
SA Asset Management BCI Moderate Fund A 2.11
S-BRO BCI Balanced Fund of Funds A 2.90
S-BRO BCI Defensive Fund of Funds A 2.10
Simplisiti BCI Flexible Fund of Funds A 3.83
Simplisiti BCI Income Plus Fund of Funds A 1.85
Simplisiti BCI Managed Protector Fund of Funds A 3.36
Skyblue BCI Cumulus Moderate Fund of Funds A 2.85
Skyblue BCI Kimberlite Cautious Fund of Funds A 2.12
Skyblue BCI Solar Flexible Fund of Funds A 2.99
Southern Charter BCI Balanced Fund of Funds A 2.35
Southern Charter BCI Defensive Fund of Funds A 2.45
Southern Charter BCI Growth Fund of Funds A 2.39
Southern Charter BCI WW Flexible Fund of Funds A 2.67
Stonewood BCI Worldwide Flexible Fund B 1.83
Stringfellow BCI Flexible Fund of Funds A 4.07
Stringfellow BCI Stable Fund of Funds A 3.15
Tantalum BCI Cautious Fund A 0.83
Tantalum BCI Strategic Income Fund A 0.99
UAM BCI Balanced Fund A 2.08
Visio BCI Actinio Fund A 3.20
Visio BCI Actinio Fund B1 2.97
Visio BCI Actinio Fund C 1.95
Visio BCI Actinio Fund D 1.58
Visio BCI General Equity Fund A 1.25
44

Boutique Collective Investments (RF) (Pty) LtdRegistration Number 2003/024082/07
Cape Town Office
Telephone +27 (0) 21 007 1500 | +72 (0) 21 914 1880
Fax +27 (0) 86 502 5319
Email [email protected]
Physical Address Catnia Building
Bella Rosa Village
Bella Rosa Street
Bellville
7530
Directors Trustees
R Walton The Standard Bank of South Africa Limited
J Meyer PO Box 54
M Geale Cape Town
G Abrahams 8000
Disclaimer
Copies of the audited financial statements for Boutique Collective Investments (RF) (Pty) Limited, together with each of the
Boutique Collective Investments portfolios is available on request, free of charge. You need simply call our offices on (021) 007
1500/(021) 914 1220 or alternatively e-mail us at [email protected] to request a printed or electronic copy.
Boutique Collective Investments (RF) (Pty) Ltd (“BCI”) is a registered Manager of the Boutique Collective Investments Scheme,
approved in terms of the Collective Investments Schemes Control Act, No 45 of 2002 and is a full member of the Association
for Savings and Investment SA.
Collective Investment Schemes in securities are generally medium to long term investments. The value of participatory
interests may go up or down and past performance is not necessarily an indication of future performance. The Manager does
not guarantee the capital or the return of a portfolio. Collective Investments are traded at ruling prices and can engage in
borrowing and scrip lending. A schedule of fees, charges and maximum commissions is available on request. BCI reserves the
right to close and reopen certain portfolios from time to time in order to manage them more efficiently. Additional
information, including application forms, annual or quarterly reports can be obtained from BCI, free of charge. Should a
performance fee be applicable, the performance fees will be calculated and accrued on a daily basis based upon the daily
outperformance, in excess of the benchmark, multiplied by the share rate and paid over to the manager monthly.
Performance figures quoted are from Morningstar, as at the date of this document for a lump sum investment, using NAV-
NAV with income reinvested and do not take any upfront manager’s charge into account. Income distributions are declared
on the ex-dividend date. Actual investment performance will differ based on the initial fees charge applicable, the actual
investment date, the date of reinvestment and dividend withholding tax. A fund of funds is a portfolio that invests in
portfolios of collective investment schemes that levy their own charges, which could result in a higher fee structure.
Contact Information
45