Cover Makalani 9/17/09 2:50 PM Page 1 - ShareData
80
09 ANNUAL REPORT
Transcript of Cover Makalani 9/17/09 2:50 PM Page 1 - ShareData

www.makalani.co.za
09ANNUAL REPORT
MA
KA
LAN
I AN
NU
AL REPO
RT
Cover Makalani 9/17/09 2:50 PM Page 1

G R A P H I C O R 4 0 9 8 0MAKALANI ANNUAL REPORT
Contents
KEY RATIOS 1
COMPANY PROFILE 2
PORTFOLIO REPORT 3
CHAIRMAN’S REPORT 7
CHIEF EXECUTIVE OFFICER’S REPORT 9
FINANCIAL DIRECTOR’S REPORT 11
BOARD PROFILE 15
CORPORATE GOVERNANCE 18
ANNUAL FINANCIAL STATEMENTS 23
UNITHOLDERS’ INFORMATION 67
DEFINITIONS 70
NOTICE OF ANNUAL GENERAL MEETING 71
ADMINISTRATION 74
PROXY FORM 75
Cover Makalani 9/17/09 2:50 PM Page 2

MAKALANI ANNUAL REPORT 1
Key ratios
23%
900cents per
linked unit
6cents loss
Interest and dividend revenue increased by
Distributions increased 10% to
Headline earnings per linked unit (“HEPLU”) decreased to a
2007 2008
Distribution per linked unitand HEPLU (cents)
0
100
200
300
400
500
600
700
800
900
1 000
1 100
Headline earnings per linked unit
Interim distribution
Final distribution
2009Dec2005
June2006
Portfolio and total assets (Rm)
Invested assets Cash
Dec2006
June2007
Dec2007
June2008
0
500
1 000
1 500
2 000
2 500
3 000
21%
79%
2 581
43%
57%
2 5672 371 2 373 2 433
2 629
25%
75%
11%
89%
4%
96%
3%
97%
June2009
Dec2008
2 6557%
93%
2 4277%
93%
Makalani front Final 9/17/09 6:19 PM Page 1

2 MAKALANI ANNUAL REPORT
Company profile
Makalani listed on the JSE on 18 May 2005, after raising R2.5 billion of capital
from institutional and private investors.
Makalani is a mezzanine financing company that provides funding for black
economic empowerment transactions and targeted investments, such as
infrastructure and affordable housing, as defined in the Financial Sector Charter.
The capital structure of Makalani comprises ordinary shares which are linked to
unsecured, variable-rate debentures in the ratio of one ordinary share to one
debenture.
Makalani’s investment focus is predominantly on mezzanine instruments; but
can also invest in senior loans, convertible instruments and, where appropriate,
ordinary shares.
Makalani is managed by Manco.
The Company is fully invested with a well-diversifiedportfolio with no one sector representing more than 15% of the total portfolio.
Makalani front Final 9/17/09 6:19 PM Page 2
MAKALANI ANNUAL REPORT 3
Portfolio report
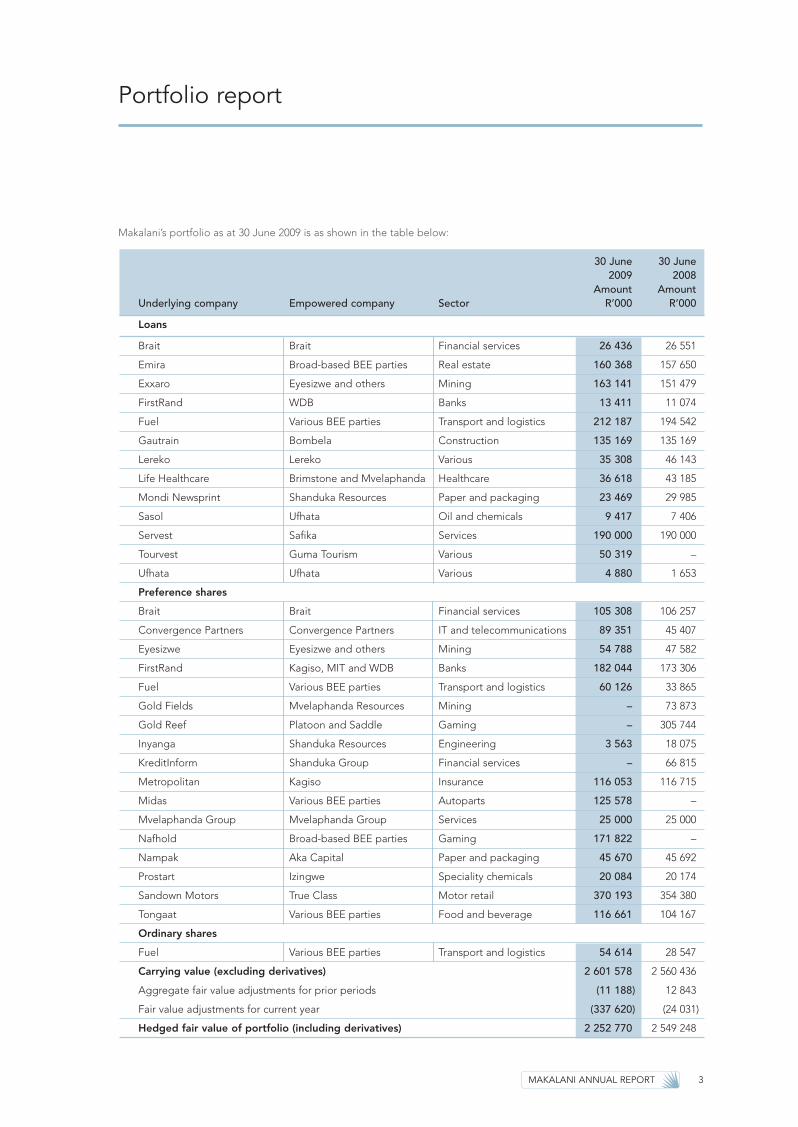
30 June 30 June2009 2008
Amount AmountUnderlying company Empowered company Sector R’000 R’000
Loans
Brait Brait Financial services 26 436 26 551
Emira Broad-based BEE parties Real estate 160 368 157 650
Exxaro Eyesizwe and others Mining 163 141 151 479
FirstRand WDB Banks 13 411 11 074
Fuel Various BEE parties Transport and logistics 212 187 194 542
Gautrain Bombela Construction 135 169 135 169
Lereko Lereko Various 35 308 46 143
Life Healthcare Brimstone and Mvelaphanda Healthcare 36 618 43 185
Mondi Newsprint Shanduka Resources Paper and packaging 23 469 29 985
Sasol Ufhata Oil and chemicals 9 417 7 406
Servest Safika Services 190 000 190 000
Tourvest Guma Tourism Various 50 319 –
Ufhata Ufhata Various 4 880 1 653
Preference shares
Brait Brait Financial services 105 308 106 257
Convergence Partners Convergence Partners IT and telecommunications 89 351 45 407
Eyesizwe Eyesizwe and others Mining 54 788 47 582
FirstRand Kagiso, MIT and WDB Banks 182 044 173 306
Fuel Various BEE parties Transport and logistics 60 126 33 865
Gold Fields Mvelaphanda Resources Mining – 73 873
Gold Reef Platoon and Saddle Gaming – 305 744
Inyanga Shanduka Resources Engineering 3 563 18 075
KreditInform Shanduka Group Financial services – 66 815
Metropolitan Kagiso Insurance 116 053 116 715
Midas Various BEE parties Autoparts 125 578 –
Mvelaphanda Group Mvelaphanda Group Services 25 000 25 000
Nafhold Broad-based BEE parties Gaming 171 822 –
Nampak Aka Capital Paper and packaging 45 670 45 692
Prostart Izingwe Speciality chemicals 20 084 20 174
Sandown Motors True Class Motor retail 370 193 354 380
Tongaat Various BEE parties Food and beverage 116 661 104 167
Ordinary shares
Fuel Various BEE parties Transport and logistics 54 614 28 547
Carrying value (excluding derivatives) 2 601 578 2 560 436
Aggregate fair value adjustments for prior periods (11 188) 12 843
Fair value adjustments for current year (337 620) (24 031)
Hedged fair value of portfolio (including derivatives) 2 252 770 2 549 248
Makalani’s portfolio as at 30 June 2009 is as shown in the table below:
Makalani front Final 9/17/09 6:19 PM Page 3

4 MAKALANI ANNUAL REPORT
Portfolio report CONTINUED
BRAITMakalani initially acquired R103 million of cumulative
redeemable preference shares in Brait South Africa Limited
(“BSAL”) as part of an exercise by Brait Societe Anonyme
(“Brait”) to raise capital to fund its growth. Makalani
subsequently increased its exposure to BSAL by
R25 million through a credit linked note. BSAL is 26%
owned by black economic empowerment entities.
BSAL is a subsidiary of Brait, which is registered in
Luxembourg and listed on the London Stock Exchange,
the Luxembourg Stock Exchange and the JSE. Brait is an
international investment and financial services group
focused on private equity, specialised funds management
and corporate finance. As an international group, Brait
operates and invests in South Africa, sub-Saharan Africa,
Europe and North America. Brait provides a wide range of
investment and specialised financial services to a
substantial client base that includes listed and unlisted
companies, financial and government institutions and high
net-worth individuals.
CONVERGENCE PARTNERSMakalani has provided R79 million as part of a drawdown
facility to Convergence Partners (Proprietary) Limited
(“Convergence Partners”).
Convergence Partners has raised a R300 million drawdown
facility from Makalani and Nedbank. Convergence
Partners is a black economic empowerment company led
by Mr Andile Ngcaba. Convergence Partners’ current
major investments include interests in Telkom SA Limited
and Dimension Data Middle East Africa.
EMIRAEmira Property Fund (“Emira”) concluded a transaction that
resulted in 14.2% of its units in issue being owned by black
economic empowerment (“BEE”) partners. Tiso Group
(Proprietary) Limited (“Tiso”) was the lead BEE partner and
held 9.9% of Emira’s participatory interest. Micawber
410 (Proprietary) Limited (“Micawber”), which is made
up of broad-based BEE entities, held 4.3% of Emira’s
participatory interest. Makalani provided funding to
Micawber. Mr BJ van der Ross, a director of Makalani,
is a shareholder of Micawber.
Emira is a collective investment scheme duly established in
accordance with the Collective Investment Schemes
Control Act No 45 of 2002, as amended, and a participatory
interest means a participatory interest in Emira as provided
for in the trust deed in terms of which Emira was
established. Makalani subsequently provided funding of
R30 million to various BEE parties to acquire additional
units in Emira.
EXXARO
Makalani provided funding of R125 million to Main Street
333 (Proprietary) Limited (“BEE Holdco”), a black-owned
and controlled company, to acquire an interest in the
Exxaro empowerment transaction.
Exxaro is the diversified mining resources company that
resulted from Kumba Resources Limited’s empowerment
transactions. Exxaro has a diverse and world-class
commodity portfolio in coal, mineral sands, base metals
and industrial minerals, with exposure to iron ore through a
20% interest in listed Kumba Iron Ore Limited.
EYESIZWE
Makalani provided preference share funding of
R43 million to Eyesizwe Mining (Proprietary) Limited
(“Eyesizwe”) to acquire an additional indirect interest in
Exxaro Resources Limited.
FIRSTRAND
Makalani participated alongside other financiers in the
FirstRand Limited (“FirstRand”) BEE transaction for
R150 million to fund Kagiso Trust (“Kagiso”), WDB Trust
(“WDB”) and Mine Workers Investment Trust (“MIT”) to
acquire a 6.5% interest in FirstRand.
FirstRand is a multi-branded financial services group. Its
various companies and divisions are involved in financial
services activities, such as retail, corporate, investment
and merchant banking, short-term insurance, life
insurance, employee benefits, health insurance and asset
management. Some of the brands within FirstRand
include Rand Merchant Bank (“RMB”), First National Bank
(“FNB”), Momentum and WesBank.
FUEL
Makalani initially participated in the leveraged buyout of
Fuel Logistics Group (Proprietary) Limited (“Fuel”) by Actis
Africa Fund 2 L.P. (“Actis”), a private equity fund. Makalani
provided funding of approximately R134 million as part
funding to an empowerment company to acquire a 25%
equity interest in Fuel and simultaneously acquired a direct
equity stake in Fuel for approximately R111 million.
Fuel is a logistics services group whose core businesses are
centred on the provision of customised solutions integrating
Makalani front Final 9/17/09 6:19 PM Page 4

MAKALANI ANNUAL REPORT 5
e-commerce and IT with a logistics infrastructure. Fuel is
principally engaged in the distribution of a wide range of
commercial goods, including clothing, high-value items,
pharmaceuticals, spare parts, electronics, etc. In addition,
Fuel also provides related warehousing and other logistical
services.
GAUTRAIN
Makalani provided mezzanine funding of R135 million
to the Gautrain Rapid Rail Link Project.
INYANGA
Makalani subscribed for R26 million of cumulative
redeemable preference shares in Shanduka Engineering
Investments (Proprietary) Limited (“Shanduka Engineering”),
a wholly owned subsidiary of Shanduka Resources
(Proprietary) Limited. Shanduka Engineering utilised the
proceeds to acquire a shareholding in Inyanga Consolidated
Investments (Proprietary) Limited (“Inyanga”), a company
whose principal business is engineering project management
and process plant design. Inyanga’s operating subsidiaries
are Dowding, Reynard and Associates (DRA) and Minopex.
LEREKO
Makalani provided a R60 million drawdown facility to
Lereko Investments (Proprietary) Limited (”Lereko”) for
further investments. Lereko is a BEE investment holding
company led by Dr Popo Molefe, Mr Valli Moosa and
Dr Lulu Gwagwa.
LIFE HEALTHCARE
Makalani has exposure to senior and mezzanine loans
provided to Life Healthcare Group (Proprietary) Limited
(“Life Healthcare“). Life Healthcare was acquired and
delisted from the JSE by a company jointly controlled by
Brimstone Investment Corporation Limited (“Brimstone”)
and Mvelaphanda Strategic Investments (Proprietary)
Limited (“Mvelaphanda”) in March 2005.
Life Healthcare is one of the largest private hospital
operations outside the United States. Life Healthcare’s
business is acute hospital care and comprises one of the
most geographic spreads of acute care hospitals and
same-day-surgical centres in South Africa.
METROPOLITAN
Makalani, in two separate transactions, firstly acquired
R77 million of preference shares and secondly subscribed
alongside other financiers for R59 million of preference
shares in Metropolitan Holdings Limited’s (“Metropolitan”)
second BEE transaction. The preference shares were issued
by a special-purpose vehicle (“SPV”) owned by Kagiso Trust
Investments (Proprietary) Limited (“Kagiso”) and a trust
representing the members of Metropolitan management
to acquire shares in Metropolitan.
Metropolitan, listed on the JSE, provides financial services
to the middle to lower income market. The Metropolitan
Group comprises four independent operating businesses,
each with clearly defined areas of focus, performance and
profit objectives: retail, corporate, health and international.
MIDAS
Makalani provided R117 million funding to a consortium for
the acquisition of an equity stake in Midas Group
(Proprietary) Limited (“Midas”).
Midas sells branded, guaranteed, quality parts at
competitive prices to its nationwide preferred customer base
through a national distribution channel. These products are
distributed to more than 300 franchisees and other
independent spares shops, workshops, fleets, chainstores
and engineering shops.
MONDI NEWSPRINT
Makalani initially provided R35 million of senior loan
funding to Mondi Shanduka Newsprint (Proprietary)
Limited (“Mondi Newsprint”). This investment was
made when Shanduka Resources (Proprietary) Limited
(“Shanduka Resources”) acquired an interest in
the company.
Mondi Newsprint is a leading supplier of newsprint and
telephone directory paper in South Africa and selected
export markets. Mondi Newsprint was formed in 2004
following Shanduka Resources’ acquisition of a 42%
interest in Mondi South Africa Limited’s integrated South
African newsprint business.
MVELAPHANDA GROUP
Makalani subscribed for R25 million of listed convertible,
perpetual, cumulative preference shares issued by
Mvelaphanda Group Limited (“Mvelaphanda Group”).
Mvelaphanda Group, listed on the JSE, is a 53% black-
owned and managed diversified company, which has
interests in a range of companies in the financial services,
property, healthcare and general industrial sectors.
Makalani front Final 9/17/09 6:19 PM Page 5
6 MAKALANI ANNUAL REPORT
Portfolio report CONTINUED
NAFHOLD
Makalani provided funding amounting to R159 million to
Lexpub 53 Investments (Proprietary) Limited which is a
SPV that is 100% owned by Lexpub 56 Investments
(Proprietary) Limited and which in turn is wholly-owned
by the members of Nafcoc.
The funding was for the acquisition of approximately
14 million shares in Nafhold from certain existing
shareholders (ie Nafcoc Regional and Sectoral Trusts)
of Nafhold at a significant discount to market value.
Nafhold is an investment holding company. Its significant
asset is a 25% shareholding in Tsogo Investment Holdings
(“TIH”), which has a 51% shareholding in Tsogo Sun
Holdings (Proprietary) Limited (“Tsogo Sun”). Tsogo Sun’s
other shareholder is SABSA Holdings (Proprietary) Limited
(“SAB”), a subsidiary of SABMiller plc, with a 49%
shareholding.
NAMPAK
Makalani subscribed (alongside other financiers) for
R44 million of subordinated preference shares in Red Coral
Investments (Proprietary) Limited (“Red Coral”) to enable
Red Coral to partly fund its acquisition of a 5% shareholding
in Nampak Limited (“Nampak”). Red Coral’s acquisition was
part of a larger BEE transaction involving an acquisition of
10% of Nampak’s shares. Red Coral is a SPV owned by a
consortium of broad-based BEE shareholders led by Aka
Capital (Proprietary) Limited.
Nampak, listed on the JSE, is Africa’s largest, most
diversified packaging manufacturer, and has operations
in several countries in Europe.
PROSTART
Makalani provided senior preference share funding of
R19 million to Izingwe to acquire a stake in Prostart, a
subsidiary of Free World Coatings (Proprietary) Limited
(formerly Barlow Coatings (Proprietary) Limited).
SANDOWN MOTORS
Makalani provided funding of R320 million to True Class
Consortium 2 (Proprietary) Limited (“True Class”) to
enable it to acquire a 40% equity interest in Sandown
Motor Holdings (Proprietary) Limited (“Sandown Motors”),
a subsidiary of DaimlerChrysler. True Class is a broad-
based black economic empowerment company that is
led by Messrs Lot Ndlovu and Sipho Majombozi.
Sandown Motors owns and operates motor dealerships,
selling passenger and commercial vehicles under the
DaimlerChrysler brands in Gauteng and Western Cape.
The brands include Mercedes-Benz passenger vehicles,
Smart, Chrysler, Jeep, Dodge, Mercedes-Benz commercial
vehicles, Freightliner and Mitsubishi FUSO.
SERVEST
Makalani provided R190 million of debt funding to
Servest Limited (“Servest”) when Servest management
increased its shareholding and introduced a BEE partner,
Safika Investments (Proprietary) Limited (“Safika”). Servest
is an integrated support services group, which provides
support services in South Africa.
TONGAAT
Makalani provided part of the mezzanine preference share
funding to two BEE companies of R101 million to acquire a
stake in the unbundled Tongaat Hulett Limited (“Tongaat”).
Tongaat is an agri-processing business which includes
integrated components of land management, property
development and agriculture.
TOURVEST
Makalani provided funding of R50 million as part of
a syndicated mezzanine debt facility to the Tourism
Investment Corporation Limited (“Tourvest”).
Tourvest was incorporated in South Africa in 1996. Its
wholly-owned operating subsidiary, Tourvest Holdings
(Pty) Limited (“Tourvest Holdings”), owns travel, financial
services and tourism merchandising (retail) businesses
and owns strategic tourism products.
The Tourvest Group is the leading tourism company in
sub-Saharan Africa and has four divisions namely:
• Inbound Tourism Services;
• Outbound Travel Services;
• Financial Services; and
• Retail Merchandising.
Makalani front Final 9/17/09 6:19 PM Page 6

MAKALANI ANNUAL REPORT 7
Chairman’s report
INTRODUCTION
Makalani, like many other companies, faced very
challenging trading conditions in the year under review.
Consequently, while investors continue to receive returns
resulting from redemptions, Makalani’s results reflect the
generally negative state of the local economy over the
reporting period.
However, as outlined in the CEO’s and FD’s reports in
more detail, against these tough markets, the Company
managed to continue generating strong cash flows and
protect its net asset value.
MACRO CONTEXT
After an extended period of turbulence, the global
economic context remains very fluid. The complexity of
the global slump means that a full return to previous
levels of economic activity is likely to take place over an
extended timeframe. At the time of writing, steady,
positive movements were occurring across global stock
markets – an indication that the start of a recovery could
be in sight. However, it remains unclear at what pace key
economies such as the USA and Europe are likely to
recover their vibrancy. Consumer-spend across the world
therefore remains sluggish, and key sectors such as the
automotive and manufacturing sectors remain in a
perilous situation. In addition, the global financial sector
has yet to fully provide reliable access to credit, creating a
significant squeeze on general economic activity.
LOCAL CONTEXT
South Africa, and indeed Southern Africa in general, was
fortunate at the start of the global crisis to have had an
extensive infrastructure development programme in
place. This programme is linked to the forthcoming 2010
Soccer World Cup, although government has explicitly
recommitted itself to its infrastructure programme well
beyond the scope of the World Cup. This programme has
created some buffer for South Africa against the global
crisis. However, recent delays of anything between six to
eight months in the roll-out of the infrastructure
programme have started to impact companies’ results.
It currently remains unclear when government will
reactivate the current bottleneck in terms of certain areas
of crucial spend in the country.
During the year, the country has successfully transitioned
to a new government, which is currently facing significant
service delivery imperatives against these delays.
Related to this is South Africa’s ongoing challenge in
demonstrably shifting from its previous focus on
ownership-centric black economic empowerment (BEE)
to a more inclusive broad-based black economic
empowerment (BBBEE) paradigm, where the benefits
of empowerment deals are spread far wider. Currently,
the BEE sector is in a state of flux, with the negative
market context placing the viability of deals already
concluded under threat. Moving forward, significant BEE
restructuring is likely, and most key players in the sector
are in agreement that new and alternative approaches to
BEE transactions will need to be developed if the country
is to transition successfully and sustainably to true
transformation.
RESPONSE TO MARKET DYNAMICS
As has been communicated to the market, the board
believes that Makalani, as a listed investment vehicle,
has been attracting too large a discount given the quality
assets in the portfolio. The proposal for the winding
down of Makalani was endorsed by unitholders in
December 2008.
Makalani’s strategy moving forward is twofold. Firstly, the
Company will continue with the active management of its
portfolio within the context of current market conditions.
Makalani front Final 9/17/09 6:19 PM Page 7

8 MAKALANI ANNUAL REPORT
Chairman’s report CONTINUED
As is dealt with in more detail in the CEO’s report, the
Company is consulting widely within the industry as to the
optimum path forward with respect to managing asset
disposals in the most judicious manner possible.
Secondly, the Company will continue to focus on its
structural integrity. Significantly, Makalani has successfully
reduced its gearing to below 15%, renegotiated the
management contract of the Makalani Management
Company (Manco) and has put in place an internal
investment committee to guide activity, according to its
previously articulated approach.
PROSPECTSMakalani remains focused on ensuring that it secures the
best possible value for investors in the management of its
portfolio. For the Company, much of the security for loans
issued resides in the underlying shares of its investments,
exposing Makalani to equity prices and general market
volatility. While the Company was impacted by
challenging market conditions, the slump does not
fundamentally throw into question the relevance of
Makalani’s business model. Looking forward, Makalani
remains well placed to deliver value to investors as
markets across the world slowly recover and are
recalibrated according to the new dictates.
APPRECIATIONI would like to take this opportunity to thank everyone
at Makalani for the hard work they have put in over the
year under review. Special thanks must go to members
of the board for their support, as well as to Keshan Pillay,
who has led the Company extremely well in his first year
of tenure as CEO. Despite the negative market context
in which we are operating, I am confident that Makalani
has the leadership and organisational talent in place to
ultimately deliver strong returns to shareholders, and to
make a meaningful contribution to South Africa’s ongoing
empowerment process.
Viv BartlettChairman
16 September 2009
Potential empowerment deals to the extent of about R41 billion were wiped out due to unfavourable tradingconditions, rating agency Empowerdex reported in 2009.
MTN shelved its empowerment deal in 2009, citing theglobal credit crunch.
In 2008 domestic airline Nationwide was forced to closedown – influencing the Company’s failure was the collapseof an empowerment deal under which the African GeneralEquity Group was expected to take a 51% stake in thecompany.
Makalani front Final 9/17/09 6:19 PM Page 8

MAKALANI ANNUAL REPORT 9
Chief executive officer’s report
INTRODUCTION
The period under review was one of the most challenging
the global economy has seen in recent memory. The
nature of Makalani’s business, where the underlying value
of investments is central to Company value, means that
we have been particularly exposed to the downward spiral
of global and local markets.
Against the backdrop of these extremely difficult
conditions, headline earnings per linked unit decreased
to a 6 cents loss. However, this loss was mainly due to
prudent write-downs of a limited number of equity
positions, representing a small portion of the Company’s
investment portfolio. This loss is therefore not reflective of
the operating cash flows of the Company for the 2009
financial year, with R52 million more cash generated than
in 2008. Even after debt-servicing costs of R192 million,
we had a R153 million net cash inflow – something we
believe represents the continued underlying strength of
the business. Furthermore, distributions increased by 10%,
which represents a yield of 14% versus 9% in 2008, and
net asset value per linked unit was marginally down at
R100.43 versus R107.38 in 2008.
STRATEGYExternal environment
Globally, access to credit has tightened significantly. Many
banks are notably reticent to be involved in the mezzanine
financing space, effectively reducing competition levels in
this segment of the market.
Makalani has played an important role within the local
economy as a mezzanine level financier of BEE
transactions, having concluded in excess of R2.3 billion
worth of BEE transactions to date. (See a breakdown of
our full portfolio on page 3).
Therefore, while the impact of the global crisis on
Makalani’s results for this period has been significant,
the mezzanine financing space for us remains attractive,
particularly in the context of South Africa’s evolving
BEE sector.
In the period under review, several broad-based black
economic empowerment (BBBEE) transactions faced
significant challenges and many transactions have been
placed under serious structural pressure. That being said,
the national commitment to BBBEE has not changed.
However, in the near term the global slump is likely to
continue to play a major role in dictating the pace and
intensity of BEE activity. Investors and BEE role players are
likely to be more cautious than in the past in developing
the structural detail of new deals. Given the fluidity and
uncertainty that continues to permeate stock markets,
and given the dip in general economic activity across
the country, South Africa’s BEE environment, while
fundamentally healthy, is likely to be characterised
by caution.
Internal strategic developments
As was communicated in previous announcements, after
careful evaluation and consultation with unitholders,
Makalani has determined that the listed platform may not
be the most appropriate structure for the Company from
a long-term perspective. The proposal for the winding
down of Makalani was endorsed by unitholders in
December 2008.
In light of the wind-down strategy of the Company, it has
been agreed in principle by the board of the Company
Makalani front Final 9/17/09 6:19 PM Page 9

10 MAKALANI ANNUAL REPORT
Chief executive officer’s report CONTINUED
and its management Company, Manco, that the existing
management contract be amended to better cater for the
new strategy. A new fixed-term contract will be entered
into effective from 1 July 2009 and will provide for a lower
ongoing management fee and a performance fee to
encourage the return of cash to unitholders within the
defined period ending 30 June 2012. Salient features of
the new contract are provided on page 18.
In the meantime, the Company continues to actively
pursue all three core options in terms of the wind-down
strategy:
• Disposal of all assets
• Staggered disposal of assets
• Take-over of Makalani by a third party
OUTLOOK
The medium-term outlook for the global economy remains
uncertain. Consequently, the board is of the view that the
Company has made prudent provisions for its portfolio so as
to reflect prevailing market conditions.
Against these uncertain conditions, we continue to
proactively manage all exposures. Makalani has made use of
significantly less long-term debt funding than was previously
anticipated, which has reduced our gearing to below 15%.
This creates a strong buffer to further deteriorations in
market conditions and asset pricing, should they occur.
As outlined above, we will continue to assess the best
route to realise optimal value in the winding-down process.
In the interim, the portfolio is being actively managed to
preserve value in the best interests of unitholders.
APPRECIATION
My appreciation must go to everyone involved with
Makalani for their efforts over what has been a
challenging period for the Company. A special
thanks to our Financial Director, Grant Minnaar, for
his dedication to the Group. Lastly, thank you to the
board for their ongoing support and for their insight
and leadership in defining a sustainable path
forward for the Company.
Keshan Pillay
CEO
16 September 2009
Interest and dividend revenue increased by 23%.
Distributions increased by 10% to 900 cents per linked unit.
Headline earnings per linked unit (“HEPLU”) decreased to asix cents loss.
Makalani front Final 9/17/09 6:19 PM Page 10

MAKALANI ANNUAL REPORT 11
Financial director’s report
FINANCIAL RESULTS
The Company increased interest and dividend revenue
by 23% to R392 million (2008: R317 million). Revenue
comprised interest income of R34 million on cash
(2008: R19 million), interest of R158 million on invested
assets (2008: R115 million) and dividend income of
R200 million on invested assets (2008: R183 million).
Although revenue increased, there was a significant
impact on headline earnings following write-downs in
equity valuations due to market pressure. The result of
these write-downs was a headline loss attributable to
unitholders of R1.3 million, or six cents per linked unit
(2008: profit of R241 million or 1 086 cents per linked unit).
This headline loss per linked unit is almost entirely
attributable to fair value adjustments and not reflective of
the operating cash flows of the Company for the 2009
financial year, which remained strong at R153 million.
The net asset value per linked unit was R100.43 at
30 June 2009 compared to R107.38 at 30 June 2008.
The net asset value per linked unit is calculated as assets
less liabilities (excluding debenture interest payable to
unitholders).
The Company continued to make use of positive gearing,
with interest income for the 2009 financial year up by 23%
on the 2008 financial year.
The annual general meeting in December 2008 approved
the conversion of existing bridging facilities into less
expensive preference share funding in February 2009.
However, with the change of intention to a wind-down
strategy, as announced last year, the Company is
de-gearing itself. A total of R36 million of preference
share funding was therefore repaid in April 2009.
Operating expenses were R29 million (2008: R30 million),
of which R25 million was the management fee relating to
the management agreement between the Company and
Makalani Management Company (Proprietary) Limited
(“Manco”). The balance of the operating expenses of
R4 million relates to audit fees, directors’ fees and other
sundry operating expenses.
Interest on borrowings for the 2008 financial year relating
to the bridging facility was charged at a three-month
JIBAR plus 185 basis points from the date of the first
drawdown on the loan, being 28 March 2008. Interest
on borrowings for the 2009 financial year relates to
preference share term funding priced at 76% of the
prime lending rate. The bridging facility was replaced by
preference share funding of R333 million in February 2009.
The Company’s portfolio continues to be well diversifiedand management remains confident as to the sustainabilityof the performance of the portfolio in light of the currentturbulent markets.
Makalani front Final 9/17/09 6:19 PM Page 11

12 MAKALANI ANNUAL REPORT
Financial director’s report CONTINUED
0
2
4
6
8
10
12
14
16
Yield
Net fair value adjustments
Operating costs
Dividend gross-up
-12009 Current
portfolioannualised
%
10.56%
13.87%
12.18%
(0.6%)
9.24%
8.24%
No EPIsNo fair valueadjustments
2008
The above diagram has been prepared on the following
basis:
• various income and cost items are divided by average
assets;
• average assets are calculated as average of quarterly
balances;
• average assets are also based on the invested
portfolio (including roll-ups), fair valuations and
cash; and
• current portfolio annualised assumes all assets as at
30 June 2009 were on the Company’s books for the
full year.
The positive movement in income tax for the 2009
financial year pertains to deferred tax on assessed tax loss
positions and STC credits, which the Company anticipates
using in forthcoming years.
The diagram below depicts the make-up of the gross
yield of the Company’s portfolio:
-2
0
2
4
6
8
10
12
14
16
2009
%
1.10%
1.34%
2.84%
5.71%
2.75%
Interest received on cash
Interest received on investments
Dividends received on investments
Interest accrued on investments
Dividends accrued on investments
EPIs
0.07%0.98%
5.85%
0.40%
2.39%
1.25%0.66%
2.75%
0.33%
1.75%
1.95%
0.37%
7.14%
2.32%
0.52%
3.72%
(1.10)%(0.41)%
200820072006
The diagram appearing in the next column depicts the
make-up of the gross yield of the Company’s portfolio,
including the impact of dividend gross-ups, excluding
secondary tax on companies.
Makalani front Final 9/17/09 6:19 PM Page 12
MAKALANI ANNUAL REPORT 13
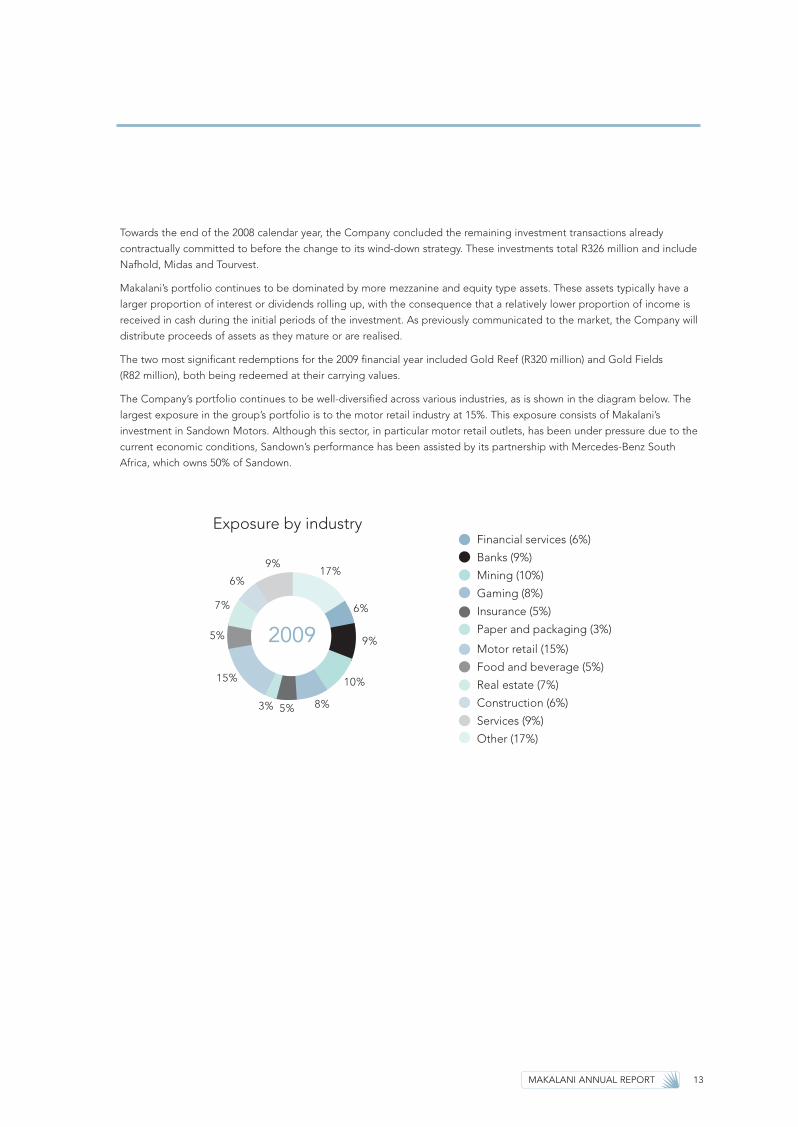
Motor retail (15%)
Food and beverage (5%)
Real estate (7%)
Construction (6%)
Services (9%)
Other (17%)
5%
7%
9%
Exposure by industry
6%
15%
9%
17%
6%
8%5%3%
10%
Financial services (6%)
Banks (9%)
Mining (10%)
Gaming (8%)
Insurance (5%)
Paper and packaging (3%)2009
Towards the end of the 2008 calendar year, the Company concluded the remaining investment transactions already
contractually committed to before the change to its wind-down strategy. These investments total R326 million and include
Nafhold, Midas and Tourvest.
Makalani’s portfolio continues to be dominated by more mezzanine and equity type assets. These assets typically have a
larger proportion of interest or dividends rolling up, with the consequence that a relatively lower proportion of income is
received in cash during the initial periods of the investment. As previously communicated to the market, the Company will
distribute proceeds of assets as they mature or are realised.
The two most significant redemptions for the 2009 financial year included Gold Reef (R320 million) and Gold Fields
(R82 million), both being redeemed at their carrying values.
The Company’s portfolio continues to be well-diversified across various industries, as is shown in the diagram below. The
largest exposure in the group’s portfolio is to the motor retail industry at 15%. This exposure consists of Makalani’s
investment in Sandown Motors. Although this sector, in particular motor retail outlets, has been under pressure due to the
current economic conditions, Sandown’s performance has been assisted by its partnership with Mercedes-Benz South
Africa, which owns 50% of Sandown.
Makalani front Final 9/17/09 6:19 PM Page 13

14 MAKALANI ANNUAL REPORT
Financial director’s report CONTINUED
The Company’s portfolio guideline is to limit counterparty risk to 15% of the Company’s assets and as at 30 June 2009
there was no individual asset and sector that constituted more than 15% of the Company’s total assets.
The Company’s invested assets by exposure to various credit rating buckets is shown in the diagrams below:
Ratings for exposures are determined by reference to FirstRand Bank’s rating methodologies.
During the 2009 financial year, there has been a shift in the weighting of the fair value of the portfolio to B bucket assets
resulting from:
• write-down in certain equity-type positions; and
• credit migrations.
Additional information on the portfolio is disclosed on pages 3 to 6 of this report.
The Company’s invested assets have a maturity profile, as shown in the diagrams below. More than 80% of the Company’s
portfolio will mature within five years of the balance sheet date, up from 50% in 2008.
A number of companies underlying the Company’s investments are operating in sectors of the economy that have been
negatively impacted over the past financial year. Where necessary, the directors have made prudent provision for those
investments. The Company’s portfolio continues to be well-diversified and management remains confident as to the
sustainability of the performance of the portfolio in light of the current turbulent markets.
Grant Minnaar
Financial Director
16 September 2009
EquityB-, B, B+BB-, BB, BB+BBB-, BBB, BBB+
47%
10%
42%
1%
2009
32%
17%
51%
2008
Less than 1 year2 – 4 years4 – 5 yearsOver 5 years
48%
17%
15%2009
20%
50% 30%
10%
2008
10%
Makalani front Final 9/17/09 6:19 PM Page 14

MAKALANI ANNUAL REPORT 15
Board profile
Viv Bartlett started his career with Barclays Bank DCO SouthAfrica, which became First National Bank of South Africa in 1987.After some four years of overseas secondments, he returnedto South Africa in 1972 where he served as general manager andmanaging director in various group companies until beingappointed as group managing director and chief executive officerof First National Bank of South Africa in 1996. In 1998, he wasappointed deputy chief executive officer of FirstRand Bank,a position he held until his retirement in 2004.
DirectorshipsFirstRand LimitedFirstRand Bank Holdings LimitedFirstRand STI Holdings Limited
VIVIAN WADE BARTLETT (66)
Independent Non-Executive ChairmanAMP (Harvard), FIBSAAppointed February 2005
Grant Minnaar joined Makalani Holdings Limited as chieffinancial officer in January 2007 after spending two years withthe Vodacom group. Prior to that, Grant spent three years as ateam leader in the financial institutions unit of the South AfricanRevenue Service, focusing on banking and structured finance.He completed his articles in the banking division ofPricewaterhouseCoopers Inc.
DirectorshipsMakalani Management Company (Proprietary) Limited
GRANT LAWRENCE MINNAAR (33)
Financial DirectorBCompt (Hons), LLB, MCom, CA(SA), CFAAppointed October 2008
Keshan Pillay is a senior transactor with significant experience inthe structuring and financing of BEE transactions. He waspreviously the executive director responsible for finance andstrategy of the Mineworkers Investment Company (“MIC”) wherehe was a driving force in growing MIC’s asset base strongly in the10 years he was there. Significant transactions led by him duringhis tenure at MIC included BP, FirstRand, Metrofile, Tracker andthe successful R15 billion public to private transactions ofPeermont Global and Primedia.
DirectorshipsPrimedia (Proprietary) LimitedTracker Investment Holding (Proprietary) LimitedPeermont Global (Proprietary) LimitedEastvaal Motor Holdings (Proprietary) LimitedFuel Group Holding Company (Proprietary) LimitedMakalani Management Company (Proprietary) Limited
KESHAN PILLAY (41)
Chief Executive OfficerBCom (UDW)Executive Development Programme (WBS)Appointed September 2008
Makalani front Final 9/17/09 6:20 PM Page 15

16 MAKALANI ANNUAL REPORT
Dines Gihwala has practised as an attorney since 1978, exceptfor the periods that he served as a judge of the High Court ofSouth Africa in Bloemfontein and Cape Town. He is currently thechairman and senior partner of DLA Cliffe Dekker Hofmeyr Inc.,with offices in Gauteng and the Western Cape. He was adirector responsible for monitoring of the Independent ElectoralCommission during South Africa’s first democratic election in1994 for which he received a gold merit award. In 1997, hereceived a proclamation from the Office of the Governor of theState of Arizona in the USA for his contribution towards the newSouth Africa. He is the chairman of the Independent RegulatoryBoard for Auditors (“IRBA”).
DirectorshipsDLA Cliffe Dekker Hofmeyr Inc.Santam LimitedRedefine Income Fund Limited
DINES CHANDRA MANILAL GIHWALA (56)
Independent Non-Executive DirectorBProc (UWC), HDip Tax (RAU)Appointed February 2005
BRYAN DOUGLAS HOPKINS (62)
Independent Non-Executive DirectorBCom (Hons), CA(SA)Appointed January 2009
Bryan Hopkins is currently an independent non-executivedirector of Mvelaphanda Group Limited and PangbourneProperties Limited, and Chairman of their respective auditcommittees. He is currently serving a three-year term on theFinancial Services Board’s (“FSB”) Directorate of Market Abuse.He was previously Executive Director and CIO of AbvestAssociates and Old Mutual Asset Managers. Prior to that, he was Professor of Accounting at the University of Cape Town. Heserved on the Accounting Standards Committee of the SouthAfrican Institute of Chartered Accountants and co-authored, withProfessor GK Everingham “Generally Accepted AccountingPractice – A South African Viewpoint”.
DirectorshipsPangbourne Properties LimitedMvelaphanda Group Limited
Len Konar was previously executive director of the IndependentDevelopment Trust where he was, amongst other activities,responsible for the internal audit and investment portfolios. Prior to that, he was a professor and head of the Department ofAccountancy at the University of Durban Westville. He is amember of the King Committee on Corporate Governance, theSecurities Regulation Panel and the Institute of Directors. He wasthe chairperson of the Ministerial Panel for the Review of theRegulation of Accountants and Auditors.
He is the co-chairman of the Implementation Oversight Panel ofthe World Bank in Washington. He has been a member andChairman of the external audit committee of the InternationalMonetary Fund in Washington for three years. He also chairs orserves on the audit committees of a number of listed companiesand public sector corporations.
DirectorshipsIllovo Sugar Limited JD Group Limited Exxaro LimitedMustek Limited Sappi LimitedSouth African Reserve Bank Steinhoff International Holdings Limited
DEENADAYALEN KONAR (55)
Independent Non-Executive DirectorBCom, PG Dip in Acc, MAS (USA), Cert Tax Law,DCom, CA(SA)Appointed April 2005
Board profile CONTINUED
Makalani front Final 9/17/09 6:20 PM Page 16

MAKALANI ANNUAL REPORT 17
Ben van der Ross is a director of companies. He has a diploma inlaw from the University of Cape Town and was admitted to theCape Side Bar as an attorney and conveyancer. He practised on hisown account for 16 years. He became an executive director withthe Urban Foundation for five years until 1990 and thereafter of theIndependent Development Trust where he was deputy chiefexecutive officer from 1995 to 1998. He acted as chief executiveofficer of the South African Rail Commuter Corporation from 2001to 2003 and as chief executive officer of Business South Africa from2003 to 2004. He served on the board of Southern Life Associationfrom 1986 until the formation of FirstRand Limited in 1998.
DirectorshipsFirstRand LimitedFirstRand Bank Holdings LimitedStrategic Real Estate Management (Proprietary) Limited – Chairman(managers of the EMIRA Property Fund)Corridor Infrastructure Developments (Proprietary) LimitedDistell Group LimitedLewis Group LimitedNaspers LimitedPick n Pay Stores Limited
BENEDICT JAMES VAN DER ROSS (62)
Independent Non-Executive DirectorDip Law (UCT)Appointed February 2005
Sonja Sebotsa has almost 12 years’ experience in investmentbanking, corporate finance and advisory work. She is currentlythe Principal Partner of Identity Partners, an investment firm with an SME financing fund. She was previously executivedirector at WDB Investment Holdings and spent six years atDeutsche Bank, including time in its UK and Japan offices. Her experience includes advising on the structuring andfinancing of transactions, BEE fundraising and economic accessfor women and SMEs.
Sonja is a member of the Association of Black Securities andInvestment Professionals and is registered with the Securitiesand Futures Authority in the UK.
DirectorshipsAnglo Platinum LimitedDiscovery Holdings LimitedMr Price Group LimitedRMB Holdings Limited
SONJA EMILIA NCUMISA SEBOTSA (37)
Independent Non-Executive DirectorLLB Hons (LSE, UK), MA Economic PolicyManagement (McGill, Canada), SFA, UKAppointed February 2005
ROBERT JAMES CHILDERSTONE HAMER (41)
Non-Executive DirectorBCom (Hons) (Wits), MCom, CA(SA)Appointed October 2008
Robert Hamer joined Rand Merchant Bank in 1996. He is co-head of Rand Merchant Bank’s Investment Banking division anda member of the Rand Merchant Bank management board. The Investment Banking division participates in and is involvedin arranging, underwriting and distributing senior and mezzaninedebt in a variety of transactions, which include asset-basedfinance, capital markets transactions, leverage finance,management buyouts, BEE transactions and property finance.Prior to joining Rand Merchant Bank, he was employed atPricewaterhouseCoopers Inc. He is a member of the SouthAfrican Institute of Chartered Accountants.
DirectorshipsMakalani Management Company (Proprietary) Limited
Makalani front Final 9/17/09 6:20 PM Page 17

18 MAKALANI ANNUAL REPORT
Corporate governance
GOVERNANCE ETHOS
The directors of Makalani endorse the Code of Corporate
Practices and Conduct (“King II”) contained within the
King Report on Corporate Governance for South Africa
of 2002. They are satisfied that the Company has in all
material respects complied with the provisions and the
spirit of the King II and will be able to meet the
requirements of the King Report on Corporate
Governance in South Africa 2009 (King III).
MANAGEMENT AND ADMINISTRATION
Manco has been mandated in terms of the management
agreement to manage the affairs of Makalani. As at
30 June 2009, RMB owned 100% of the share capital of
Manco. A memorandum of understanding has been
signed for the sell-down of RMB’s 100% stake in Manco to
less than 50%. It is anticipated that final agreements will
be signed in the latter part of the 2009 calendar year.
Responsibilities of Manco
In December 2008, unitholders were advised that after
careful evaluation and consultation, Makalani had
determined that from a long-term perspective the listed
platform might not be the most appropriate structure for
the company. Unitholders at that time endorsed a
proposal for a winding down of Makalani. A number of
alternatives to achieve this have been considered by
Manco during the year.
As a result of this change in strategy, the management
agreement between Makalani and Manco has been
renegotiated. Incentives will be put in place to encourage
Manco to implement the winding-down strategy in a
manner which benefits all unitholders.
It remains Manco’s responsibility to:
• manage the general administrative activities of the
Company, including the accounting functions;
• manage the broader investment functions, making
recommendations on disposals of investments;
• participate in the management of the investee
companies when required;
• manage the financial matters of the Company,
including managing and monitoring the Company’s
gearing and liquidity positions; and
• manage communications with unitholders and other
stakeholders.
The basis of calculation of the management fee in the
past year is included on page 29 of this report.
The existing management agreement may be terminated
at six months’ notice with the prior approval of 75% of
unitholders.
As noted above, a new fixed-term management contract
of three years (“the Contract”) will be entered into,
effective from 1 July 2009 and ending 30 June 2012, in the
absence of any corporate action by 31 March 2010. No
corporate action is under consideration by the Company
at this juncture. The new management contract has the
following salient points:
Base fee
The management fee calculated on invested assets
will be revised from 1% to 0.50% over the period
of the Contract.
Performance fees structure
Manco is now to be incentivised to return funds to
unitholders in the shortest timeframe possible without
selling assets at significant discounts. The timeframes
and incentives based on a NAV of R100.43 and unit
market price of R64.50 as at 30 June 2009 are:
Value returned to unitholders before 31 December 2010
calculated as follows:
Manco’s % participation
Unit value ranges within range
R65 – R75 0%
R75.01 – R85 20%
R85.01 – R100.43 25%
> R100.43 30%
Value returned to unitholders before 31 December 2011
calculated as follows:
Manco’s % participation
Unit value ranges within range
R65 – R75 0%
R75.01 – R85 15%
R85.01 – R100.43 20%
> R100.43 25%
Makalani front Final 9/17/09 6:20 PM Page 18

MAKALANI ANNUAL REPORT 19
Value returned to unitholders before 30 June 2012
calculated as follows:
Manco’s % participation
Unit value ranges within range
R65 – R75 0%
R75.01 – R85 10%
R85.01 – R100.43 15%
> R100.43 20%
Unit value ranges to be adjusted upwards by JIBAR from
1 July 2009 to each determination date.
STAKEHOLDER COMMUNICATION
Makalani actively distributes information to unitholders
and other stakeholders through the Stock Exchange News
Services (SENS), the print media and its website
(www.makalani.co.za) and meets with unitholders as and
when deemed appropriate.
An analysis of unitholders at 30 June 2009 can be found
on page 68 of this report.
The notice to unitholders regarding the annual general
meeting encourages attendance.
THE BOARD OF DIRECTORS AND ITS COMMITTEES
Role and function of the board
The directors have a duty and responsibility to ensure that
the principles outlined in King II are observed. They have
a fiduciary duty to act in good faith, with due diligence
and care in the best interest of the Company and all its
stakeholders. All directors subscribe to the code of ethics
which forms part of the board charter. The code can be
found in the Makalani prospectus.
Although the board is the focal point for governance and
is ultimately accountable and responsible for the
performance and affairs of the Company, certain functions
linked under the management and administration section
of this report have been delegated to Manco.
In overseeing the winding down of the Company, the
directors are required to exercise leadership, enterprise,
integrity and judgement based on transparency, fairness,
accountability and responsibility. The board is responsible
for ensuring compliance with all relevant laws, regulations
and codes.
The board’s responsibility for operational performance
includes identifying risks which impact on the Company
and the monitoring of the management of these risks,
internal controls, corporate governance, business plans,
key performance indicators, both financial and non-
financial, as well as the annual budget. It oversees all
investment decisions.
In exercising control, the directors are empowered to
delegate their authority which they do through various
board committees. Reports from these committees are
reviewed at quarterly board meetings.
Classification of directors
For the purposes of this report the classification of
directors is as follows:
• Executive directors are employed by Manco;
• Non-executive directors are employed within the
FirstRand Limited Group; and
• Independent non-executive directors are not
employed by either Manco or FirstRand Limited.
Directors who are also directors within the FirstRand
Group are classified as independent if they are
classified as independent at FirstRand Group level.
Composition of the board
Makalani has a unitary board structure, with a balance of
power and authority to ensure that no one individual has
unfettered powers of decision-making. Its chairman is an
independent non-executive director. His nearly 50 years’
experience in the financial services industry equips him
ideally to lead the Makalani board. There is a strong
complement of independent non-executive directors who
have during the past year ensured the necessary objectivity
essential for the effective functioning of the board. The roles
of chairman and chief executive officer are separate.
At 30 June 2009, the board of Makalani comprised nine
directors. Two of the directors are executives, one is a
non-executive director and the remainder are
independent non-executive directors in terms of the
classification set out above. The board includes one
woman. Five of the directors are classified as black in
terms of the Financial Sector Charter. Profiles are detailed
on pages 15 to 17 of this report.
Makalani front Final 9/17/09 6:20 PM Page 19

20 MAKALANI ANNUAL REPORT
Corporate governance CONTINUED
18 August 14 November 26 February 11 May
2008 2008 2009 2009
VW Bartlett (Chairman) � � � �
DCM Gihwala � � � A
RJC Hamer1 � � � �
BD Hopkins2 – – � �
D Konar � � � �
GL Minnaar – FD1 � � � �
K Pillay – CEO3 – � � �
SEN Sebotsa � � � �
BJ van der Ross � � A �
MS Moloko4 � � – –
L von Moltke5 � – – –
� Present A Apologies1 Appointed 29 October 20082 Appointed 4 December 20083 Appointed 3 September 20084 Resigned 31 December 20085 Resigned 29 October 2008
Appointment of new directors
The charter of the board details procedures for the
appointment of directors to the board. Appointments are
formal and a matter for the board as a whole. When
appointing directors, the board takes cognisance of its
needs in terms of skills, experience, diversity, size and
demographics. The board has not deemed it necessary to
appoint a nominations committee.
In terms of the Company’s Articles of Association,
one-third of the directors are required to retire each
year. Non-executive directors are appointed for three
years and are subject to the Companies Act provisions
relating to their removal. The reappointment of non-
executive directors is not automatic and is subject to
performance and eligibility. The retirement age is 70.
The directors are encouraged to participate in ongoing
training to familiarise themselves with Makalani’s
operations, its business environment, their fiduciary duties
and responsibilities and unitholder expectations.
Board proceedings
The board meets quarterly, and additional meetings
are convened when deemed necessary.
During the year, the board met quarterly. Additional
meetings were held to address the implementation
of the wind-down strategy and to deliberate on
the new management fee structure. Attendance
at the quarterly meetings was as follows:
Board meetings
Makalani front Final 9/17/09 6:20 PM Page 20

MAKALANI ANNUAL REPORT 21
Directors have full and unrestricted access to Makalani’s
information and property. They are entitled to seek
independent professional advice at the Company’s
expense in pursuance of their duties. Non-executive
directors also have the opportunity to meet separately
without the attendance of the executive directors.
REMUNERATION COMMITTEE
All the non-executive directors are members of the
remuneration committee, which is responsible for
recommending to unitholders the fees payable to
directors for their services. These fees are subject to
unitholder approval at the annual general meeting.
Separate remuneration committee meetings are not held
and remuneration-related matters are dealt with in the
normal course of business at quarterly board meetings.
The remuneration of the executive directors is the
responsibility of and for the account of Manco.
AUDIT AND RISK COMMITTEE
Role
The Makalani audit and risk committee reviews findings
and reports from the internal and external auditors.
The committee assists the board in discharging its
responsibilities on the management of risk, both financial
and non-financial, the safeguarding of assets, financial
control and reporting, internal controls, unitholder
reporting and corporate governance. In doing this, the
committee takes cognisance of the Act and other
applicable laws, the JSE Listings Requirements and
International Financial Reporting Standards.
The committee is responsible for maintaining a
transparent and appropriate relationship with the external
auditors, reviewing the scope, quality and the costs of the
statutory audit as well as questioning their independence
and objectivity. The committee is also responsible for
reviewing the scope and extent of any non-audit services
rendered by the external auditors to ensure that their
independence is not impaired. The chairman is required
to attend the annual general meeting.
In terms of the appropriateness of the financial director of
the Company, the commitee has considered the experience
and expertise of Mr GL Minnaar, and is satisfied with his
competence and performance.
Comprehensive details of the Company’s risk
management processes are disclosed in note 22
of the financial statements.
Composition
The audit and risk committee comprises three
independent non-executive directors. The chief executive
officer and the financial director of the Company attend
the meetings in an ex-officio capacity. The internal and
external auditors are present at all audit and risk
committee meetings by invitation and are able to meet
independently with the chairman of the audit committee
if required.
Attendance at the meetings held during the year was
as follows:
Audit and risk committee meetings
18 August 26 February 11 May
2008 2009 2009
D Konar (Chairman) � � �
DCM Gihwala � � A
SEN Sebotsa � � �
� Present
A Apologies
INVESTMENT AND CREDIT COMMITTEE
Role
The role of the investment and credit committee to date
has been to oversee the management and monitoring of
credit and investment risk, investment approval processes
and governance, investment risk management and
reporting and the general compliance with the Company’s
investment mandate.
Investment process
Manco has managed the current investment process by
identifying suitable FSC-compliant investments consistent
with the investment mandate and the Company’s
objectives. The approval process for an investment
depends on the size of the investment.
A summary of the processes used is set out below:
• investments of less than R30 million are considered
and made on behalf of Makalani, with the support of
two RMB investment professionals;
Makalani front Final 9/17/09 6:20 PM Page 21

22 MAKALANI ANNUAL REPORT
Corporate governance CONTINUED
• investments in excess of R30 million, but less than
R150 million are considered and recommended to the
RMB investment committee for approval; and
• investments in excess of R150 million are considered
and recommended to the RMB investment committee
and the investment and credit committee of the
board of directors for approval.
At the time of the listing of the Company on the JSE, the
level at which approval was required from the investment
and credit committee of the board was set at R250 million.
The board subsequently considered it prudent to amend
this level to R150 million. Investment transactions during the
year have therefore been approved on this basis.
The board has deemed it appropriate that all disposals or
other related transactions forming part of the Company’s
wind-down strategy should be subject to the approval of the
entire board. Directors who are employed by the FirstRand
Group or Manco are required to recuse themselves from any
decisions relating to transactions within the FirstRand Group,
thereby avoiding any conflicts of interest.
Counterparty limit
Limits per counterparty across equity, mezzanine debt and
senior debt are decided by Manco, subject to a maximum
exposure of 15% of the total funds of the Company being
invested in any one counterparty.
Composition
During the past year, the committee comprised four
non-executive directors and the chief executive officer.
The committee, which meets as and when required to
approve transactions in excess of R150 million, or as
deemed necessary by the chairman, has met only once
during the year. All the members of the committee were
present at that meeting. The members of the committee
are Messrs VW Bartlett, RJC Hamer, K Pillay and
BJ van der Ross, as well as Ms SEN Sebotsa.
DONATIONS TO POLITICAL PARTIES
The company does not make donations to political parties.
The making or acceptance of payments, other than
declared remuneration, gifts and entertainment, as
consideration to act or fail to act in a certain way, are
prohibited. Directors are required to disclose any
potential conflicts of interest.
COMPANY SECRETARY
AH Arnott was appointed company secretary on
25 November 2004. He is suitably qualified and
empowered. He has access to the FirstRand Group
secretarial resources. The company secretary provides
support and guidance to the board in matters relating to
governance and ethical practices across the company. He
assists the board as a whole and directors individually with
detailed guidance as to how their responsibilities should
be properly discharged in the best interest of Makalani.
He facilitates, where necessary, induction and training for
directors and assists the chairman in determining the
annual meeting timetable. He also serves as secretary to
the board committees.
AUDITOR INDEPENDENCE
Makalani’s financial statements have been audited by the
independent auditors, PricewaterhouseCoopers Inc.
The board and audit committee believe that they have
observed the highest level of business and professional
ethics and have no reason to believe that they have
not at all times acted with unimpaired independence.
The designated auditor from PricewaterhouseCoopers is
Mr Ranesh Hariparsad who was appointed in 2009 and
replaces Mr Victor Muguto. Rotation rules require that
Mr Hariparsad may only hold this position for five
financial reporting periods.
Details of any non-audit services provided by the external
auditors are disclosed in the financial statements,
together with fees paid.
FINANCIAL SECTOR CHARTER
Non-bank financial institutions’ investment mandates are
highly regulated and in many instances preclude or limit
investment in unlisted securities and below-investment
grade instruments. This reduces the list of instruments
available in making FSC-compliant investments. As a
result, BEE consortia find it difficult to source sufficient
funding for the implementation of BEE transactions and
other targeted investments.
Makalani was established to facilitate the implementation
of the FSC by, on the one hand, providing investors with a
listed instrument (linked unit) earning a commercial return
and qualifying as an FSC-compliant investment earning
FSC scorecard points and, on the other hand, providing
sufficient funding to drive FSC-compliant investments
forward. Makalani’s exclusive mandate has been to fund
BEE transactions and targeted investments as defined in
the charter. It is now required to wind-down its portfolio in
the best interests of all its stakeholders, and, in due
course, to delist the Company.
Makalani front Final 9/17/09 6:20 PM Page 22

MAKALANI ANNUAL REPORT 23
Annual financial statements
DIRECTORS’ RESPONSIBILITY STATEMENT 24
DECLARATION BY THE COMPANY SECRETARY 25
INDEPENDENT AUDITOR’S REPORT 26
DIRECTORS’ REPORT 27
CONSOLIDATED INCOME STATEMENT 32
CONSOLIDATED BALANCE SHEET 33
CONSOLIDATED CASH FLOW STATEMENT 34
CONSOLIDATED STATEMENT OF CHANGES IN EQUITY 35
NOTES TO THE CONSOLIDATED FINANCIAL STATEMENTS 36
Makalani front Final 9/17/09 6:20 PM Page 23

24 MAKALANI ANNUAL REPORT
Directors’ responsibility statement to the members ofMakalani Holdings Limited
for the year ended 30 June 2009
In accordance with the provisions of the Companies Act of 1973 (Act 61 of 1973), as amended, the directors are responsible
for the preparation, integrity and fair representation of this fourth set of consolidated annual financial statements of
Makalani Holdings Limited, which with International Financial Reporting Standards (“IFRS”) and which, in accordance with
those standards, fairly present the state of affairs of the Group at 30 June 2009, and the net income and cash flows for the
12 months then ended.
It is the responsibility of the independent auditors to report on the fair presentation of the financial statements.
The directors are ultimately responsible for the internal controls. The directors discharge these responsibilities through,
inter alia, the management agreement with Manco. In terms of the management agreement, standards and systems of
internal control are designed and implemented to provide reasonable assurance as to the integrity and reliability of the
financial statements in accordance with IFRS and to adequately safeguard, verify and maintain accountability for the
Group’s assets. Systems and controls include the proper delegation of responsibilities within a clearly defined framework,
effective accounting procedures and adequate segregation of duties. Systems, controls and the risk management
processes are monitored in terms of the management agreement.
Based on the information and explanations provided by Manco, and the internal auditors, the directors are of the opinion
that the internal controls are adequate and that the financial records may be relied on in preparing the financial statements
in accordance with IFRS and maintaining accountability for the Group’s assets and liabilities. Nothing has come to the
attention of the directors to indicate that any material breakdown in the functioning of the controls, resulting in material
loss to the Group, has occurred during the 2009 financial year and up to the date of this report.
The directors have a reasonable expectation that the Group has adequate resources to continue operating for the
foreseeable future. For this reason, the annual financial statements have been prepared on a going-concern basis.
These financial statements, which are prepared in accordance with IFRS and presented on pages 32 to 66, were approved
by the board of directors on 16 September 2009 and are signed on its behalf by:
VW Bartlett K PillayChairman CEO
for the year ended 30 June 2009
Makalani fin final 9/17/09 6:29 PM Page 24

MAKALANI ANNUAL REPORT 25
Declaration by the company secretary in respect ofsection 268G (d) of the Companies Act
for the year ended 30 June 2009
I declare that, to the best of my knowledge, the Company has lodged with the Registrar of Companies all such returns as
are required of a public company in terms of the Companies Act and that all such returns are true, correct and up to date.
AH ArnottBCom, CA (SA)
Company Secretary
16 September 2009
Makalani fin final 9/17/09 6:29 PM Page 25

26 MAKALANI ANNUAL REPORT
Independent auditor’s report to the members ofMakalani Holdings Limited
for the year ended 30 June 2009
We have audited the Group annual financial statements of Makalani Holdings Limited, which comprise the consolidatedbalance sheet as at 30 June 2009, the consolidated income statement, the consolidated statement of changes in equityand the consolidated cash flow statement for the year then ended, and a summary of significant accounting policies andother explanatory notes, and the directors’ report, as set out on pages 27 to 66.
DIRECTORS’ RESPONSIBILITY FOR THE FINANCIAL STATEMENTSThe Company’s directors are responsible for the preparation and fair presentation of these financial statements inaccordance with International Financial Reporting Standards and in the manner required by the Companies Act of SouthAfrica. This responsibility includes: designing, implementing and maintaining internal control relevant to the preparationand fair presentation of financial statements that are free from material misstatement, whether due to fraud or error;selecting and applying appropriate accounting policies; and making accounting estimates that are reasonable in thecircumstances.
AUDITOR’S RESPONSIBILITYOur responsibility is to express an opinion on these financial statements based on our audit. We conducted our audit inaccordance with International Standards on Auditing. Those standards require that we comply with ethical requirementsand plan and perform the audit to obtain reasonable assurance whether the financial statements are free from materialmisstatement.
An audit involves performing procedures to obtain audit evidence about the amounts and disclosures in the financialstatements. The procedures selected depend on the auditor’s judgement, including the assessment of the risks of materialmisstatement of the financial statements, whether due to fraud or error. In making those risk assessments, the auditorconsiders internal control relevant to the entity’s preparation and fair presentation of the financial statements in order todesign audit procedures that are appropriate in the circumstances, but not for the purpose of expressing an opinion on theeffectiveness of the entity’s internal control. An audit also includes evaluating the appropriateness of accounting policiesused and the reasonableness of accounting estimates made by management, as well as evaluating the overall presentationof the financial statements.
We believe that the audit evidence we have obtained is sufficient and appropriate to provide a basis for our audit opinion.
OPINIONIn our opinion, the financial statements present fairly, in all material respects, the consolidated financial position ofMakalani Holdings Limited as at 30 June 2009, and its consolidated financial performance and its consolidated cash flowsfor the year then ended in accordance with International Financial Reporting Standards and in the manner required by theCompanies Act of South Africa.
PricewaterhouseCoopers Inc. Director: Ranesh HariparsadRegistered Auditor
Johannesburg16 September 2009
Makalani fin final 9/17/09 6:29 PM Page 26

MAKALANI ANNUAL REPORT 27
Directors’ report
for the year ended 30 June 2009
The directors have pleasure in presenting their fourth report, which forms part of the audited financial statements of the
Group for the year ended 30 June 2009.
NATURE OF BUSINESS
The profile of the Company is set out on page 2 of this report.
GROUP RESULTS AND FINANCIAL STATEMENTS
A general review of the financial results of the Group and the operations of its subsidiary is contained within the financial
director’s report on pages 11 to 14.
The financial statements on pages 32 to 66 set out the financial position at 30 June 2009. The comparative results are for
the year ended 30 June 2008. The financial statements were prepared in terms of IFRS.
SHARE AND DEBENTURE CAPITAL
Authorised
The authorised share capital of the Company comprises 4 250 million ordinary shares of R0.0001 each. Each ordinary share
is linked to one debenture of R75 each.
Each debenture is irrevocably linked to each share. The combined instrument trades as a linked unit on the JSE. Separate
transfer of a share or debenture is not permitted. The debentures are unsecured and carry a variable interest rate as
determined by the directors from time to time. The debentures are repayable on the 99th anniversary of the date of issue,
except if a special resolution by the linked unitholders determines otherwise or in the event of the Company being
wound up.
The authorised preference share capital of the Company comprises 750 million cumulative redeemable preference shares
of R0.0001 each.
Issued
At 30 June 2009, the issued share and debenture capital (before deducting treasury linked units) of the Company was
23 592 568 ordinary shares of R0.0001 each (21 352 568: net of treasury linked units) and 23 592 568 debentures with a
nominal value of R75 per debenture (21 352 568: net of treasury linked units).
During the year, the Company issued 333 million preference shares at a par value of R0.0001 and a premium of
R0.9999 each. In March 2009, the Company redeemed 35.6 million of the issued preference shares, leaving it with
a total of 297 444 037 preference shares in issue at the year-end.
Earnings
Headline losses attributable to linked units for the year ended 30 June 2009 amounted to R1.3 million (2008: headline
earnings of R241 million), which is equivalent to a six cents headline loss per linked unit (2008: 1 086 cents headline
earnings per linked unit).
Makalani fin final 9/17/09 6:29 PM Page 27

28 MAKALANI ANNUAL REPORT
Directors’ report CONTINUED
for the year ended 30 June 2009
SHARE AND DEBENTURE CAPITAL (continued)
Dividend and interest distributions to linked unitholders
The following ordinary dividend and interest distributions were declared by Makalani:
For the year ended 30 June 2009
Cents per linked unit Dividend Interest Total
Interim (declared 3 March 2009) – 180 180
Special (declared 2 April 2009) 200 – 200
Final (declared on 25 August 2009)* 396 124 520
596 304 900
* The last day to trade in Makalani linked units on a cum-distribution basis will be Friday, 25 September 2009. The first day to trade inMakalani linked units on an ex-distribution basis will be Monday, 28 September 2009. The record date for the final distribution is Friday, 2 October 2009 and the date of payment is Monday, 5 October 2009. No dematerialisation or rematerialisation of linked unit certificatescan be done during the period Monday, 28 September 2009 and Friday, 2 October 2009 (both days included).
For the year ended 30 June 2008
Cents per linked unit Dividend Interest Total
Interim (declared 3 March 2008) 243 267 510
Final (declared on 3 September 2008) 207 102 309
450 369 819
DIRECTORATE
Details of the directors appear on pages 15 to 17 of this report. Mr K Pillay joined the Company in the position of CEO
on 3 September 2008 and was appointed to the board of directors as of the same date.
To comply with the JSE Listings Requirements, Mr GL Minnaar was appointed to the board as FD on 29 October 2008.
Mr BD Hopkins was appointed to the board with effect from 4 December 2008. Mr BD Hopkins is an independent
non-executive director who brings considerable investment and asset management experience to the board.
The appointments of Messrs BD Hopkins, K Pillay and GL Minnaar were approved by the unitholders at the annual
general meeting of unitholders in December 2008.
Makalani fin final 9/17/09 6:29 PM Page 28
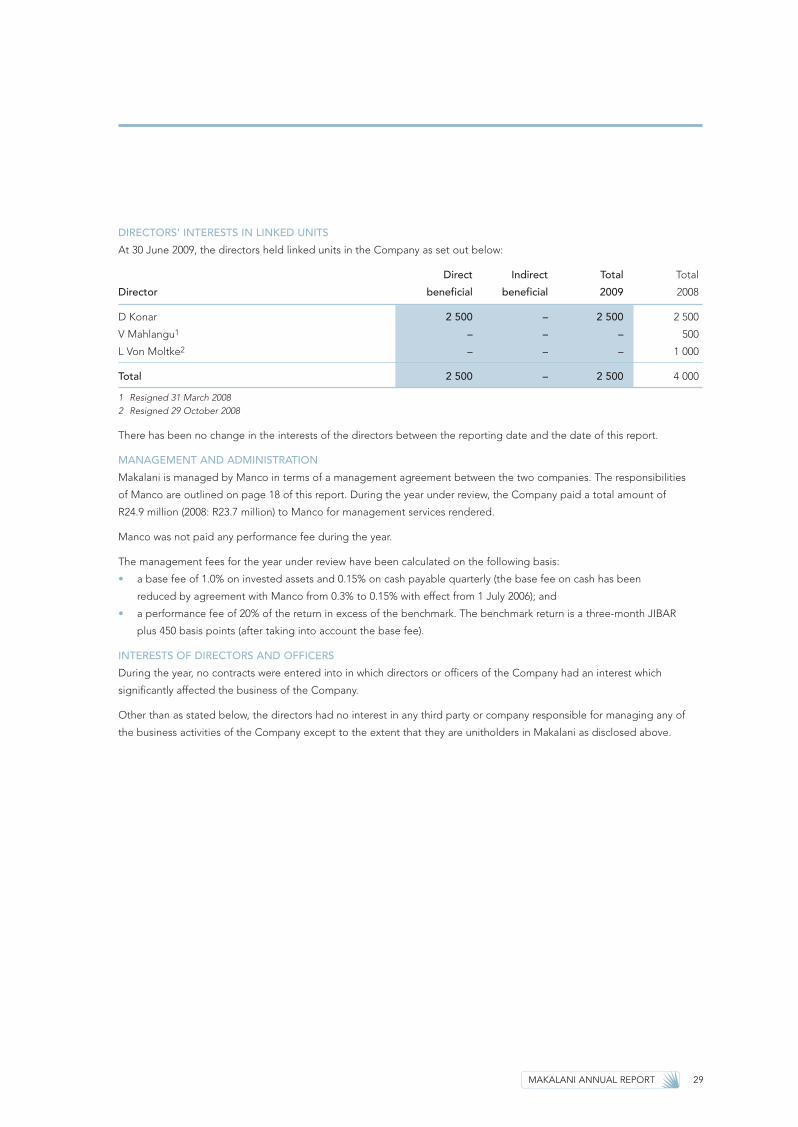
MAKALANI ANNUAL REPORT 29
DIRECTORS’ INTERESTS IN LINKED UNITS
At 30 June 2009, the directors held linked units in the Company as set out below:
Direct Indirect Total Total
Director beneficial beneficial 2009 2008
D Konar 2 500 – 2 500 2 500
V Mahlangu1 – – – 500
L Von Moltke2 – – – 1 000
Total 2 500 – 2 500 4 000
1 Resigned 31 March 20082 Resigned 29 October 2008
There has been no change in the interests of the directors between the reporting date and the date of this report.
MANAGEMENT AND ADMINISTRATION
Makalani is managed by Manco in terms of a management agreement between the two companies. The responsibilities
of Manco are outlined on page 18 of this report. During the year under review, the Company paid a total amount of
R24.9 million (2008: R23.7 million) to Manco for management services rendered.
Manco was not paid any performance fee during the year.
The management fees for the year under review have been calculated on the following basis:
• a base fee of 1.0% on invested assets and 0.15% on cash payable quarterly (the base fee on cash has been
reduced by agreement with Manco from 0.3% to 0.15% with effect from 1 July 2006); and
• a performance fee of 20% of the return in excess of the benchmark. The benchmark return is a three-month JIBAR
plus 450 basis points (after taking into account the base fee).
INTERESTS OF DIRECTORS AND OFFICERS
During the year, no contracts were entered into in which directors or officers of the Company had an interest which
significantly affected the business of the Company.
Other than as stated below, the directors had no interest in any third party or company responsible for managing any of
the business activities of the Company except to the extent that they are unitholders in Makalani as disclosed above.
Makalani fin final 9/17/09 6:29 PM Page 29

30 MAKALANI ANNUAL REPORT
Directors’ report CONTINUED
for the year ended 30 June 2009
The following directors have disclosed their interests in the Company:
Director Interest
RJC Hamer Employee of RMB
K Pillay Employee and shareholder of Manco
GL Minnaar Employee and shareholder of Manco
Mr DCM Gihwala is chairman and senior partner of DLA Cliffe Dekker Hofmeyr Inc. (“Hofmeyr”), which provides
professional services to the Company and Manco. The Company has no exclusive arrangement or contract with Hofmeyr.
Mr BJ van der Ross has also declared his interest in the Emira BEE transaction, which was funded by Makalani as outlined
on page 4 of this report.
Details of related party transactions are disclosed on page 60 of this report.
DIRECTORS’ EMOLUMENTS
The fees and expenses paid to the directors during the period for their services as directors are as follows:
30 June 30 June
2009 2008
Director R’000 R’000
VW Bartlett (Chairman) 229 249
DCM Gihwala 153 142
RJC Hamer1 56 –
BD Hopkins2 80 –
D Konar 217 172
V Mahlangu3 – 114
GL Minnaar1 80 –
MS Moloko4 66 97
K Pillay5 142 –
SEN Sebotsa 171 167
BJ van der Ross 124 142
L von Moltke6 70 103
1 388 1 186
1 Appointed 29 October 20082 Appointed 4 December 20083 Resigned 31 March 20084 Resigned 5 December 20085 Appointed 3 September 20086 Resigned 29 October 2008
Makalani fin final 9/17/09 6:29 PM Page 30

MAKALANI ANNUAL REPORT 31
Mr RJC Hamer is a full-time employee of RMB, while Messrs GL Minnaar and K Pillay are full-time employees of Manco.
The fees received by them per the above table have been waived and ceded to their respective employers and do not
accrue to them in their private capacities. All the above directors, with the exception of Messrs GL Minnaar and K Pillay,
are non-executive directors.
Messrs GL Minnaar and K Pillay are also directors of the Group’s wholly owned subsidiary, but have not earned any
remuneration from that entity.
INSURANCE
Makalani has professional indemnity and protection against crime.
PROPERTY AND EQUIPMENT
Makalani does not own any property or equipment.
SUBSIDIARY
These consolidated financial statements and financial position include Makalani’s only subsidiary being Makalani Treasury
Units (Proprietary) Limited (formerly Business Venture Invest No. 1111 (Proprietary) Limited), a company that was formed
during the 2007 financial year to hold Makalani’s treasury linked units. Makalani Treasury Units is a wholly owned subsidiary
with a loss after tax of R48 million (2008: R2 million).
The Group prepares a separate set of annual financial statements for Makalani Holdings Limited as well as for Makalani
Treasury Units (Proprietary) Limited on a standalone basis. These annual financial statements are available to members of
the Company on request.
Company secretary and registered office
Mr AH Arnott is the company secretary. The address of the Company secretary is 4th Floor, 4 Merchant Place, Corner Fredman
Drive and Rivonia Road, Sandton, 2196. The Company’s registered office is 4th Floor, 4 Merchant Place, Corner Fredman Drive
and Rivonia Road, Sandton, 2196. The Company operates from The Reserve, 52–54 Melville Road, Illovo, Gauteng, 2196.
Trading statements
Makalani will continue using headline earnings per linked unit (HEPLU) as the criteria for trading statement purposes
as per paragraph 3.4(b)(v) of the JSE Listings Requirements.
Events subsequent to the balance sheet date
Subsequent to the reporting date, Makalani has declared a dividend per share of 396 cents as outlined on page 28
of this report.
Makalani fin final 9/17/09 6:29 PM Page 31

Consolidated income statement
for the year ended 30 June 2009
32 MAKALANI ANNUAL REPORT
Audited Audited
12 months 12 months
30 June 2009 30 June 2008
Notes R’000 R’000
Interest income 2 391 677 317 296
Fair value losses 3 (338 725) (25 403)
Fee income 4 5 582 2 378
Operating expenses 5 (29 150) (30 070)
Profit on repurchase of debentures 6 – 4 228
Indirect taxation 7 (3 580) (4 189)
Net operating profit before interest 25 804 264 240
Interest on borrowings 8 (44 660) (10 002)
Net operating (loss)/profit (18 856) 254 238
Debenture interest 9 (65 168) (82 948)
Net (loss)/profit before taxation (84 024) 171 290
Taxation 10 17 576 (8 963)
(Loss)/profit for the year attributable to equity holders (66 448) 162 327
(Loss)/earnings per share (cents) 11 (311) 731
Headline (loss)/earnings per linked unit (cents) (6) 1 086
Makalani fin final 9/17/09 6:29 PM Page 32

Consolidated balance sheet
30 June 2009
MAKALANI ANNUAL REPORT 33
Audited Audited
30 June 2009 30 June 2008
Notes R’000 R’000
ASSETSCash and cash equivalents 12 174 116 79 740
Invested assets at fair value 2 258 604 2 493 944
Loans and advances at fair value 14 2 241 104 2 448 711
Other financial assets at fair value 14 17 500 45 233
Derivative financial instruments 13 204 56 232
Taxation 4 346 –
Deferred tax assets 10.1 22 368 6 738
Total assets 2 459 638 2 636 654
EQUITY AND LIABILITIESShare capital and premium 15 528 037 528 037
Accumulated profit 11 072 164 425
Share capital and reserves 539 109 692 462
Debentures 16 1 578 798 1 578 542
Linked unitholders’ interest 2 117 907 2 271 004
Preference share funding – non-current portion 17 142 860 –
Current borrowings 18 – 315 000
Preference share funding – current portion 17 154 584 –
Taxation – 6 001
Derivative financial instruments 13 6 038 928
Linked unitholders for debenture interest 26 477 21 780
Other liabilities 19 5 903 14 983
Provisions 20 5 869 6 958
Total equity and liabilities 2 459 638 2 636 654
Makalani fin final 9/17/09 6:29 PM Page 33

Audited Audited
12 months 12 months
30 June 2009 30 June 2008
Notes R’000 R’000
Cash generated from operations 21.1 353 254 301 045
Taxation paid (8 401) (7 118)
Interest paid on external borrowings (44 660) (10 002)
Interest and dividend distributions (147 119) (217 975)
Net cash inflow from operating activities 153 074 65 950
Cash flow from investing activitiesInvestment in loans and advances 21.2 (15 075) (449 753)
Investment in other financial assets 21.3 (26 067) –
Net cash outflow from investing activities (41 142) (449 753)
Cash flow from financing activities(Repayment of)/proceeds from bridging loan (315 000) 315 000
Proceeds from issue of preference shares 333 000 –
Redemption of preference shares (35 556) –
Amounts paid for shares as part of linked unit repurchase – (25 133)
Amounts paid for debentures as part of linked unit repurchase – (75 046)
Net cash (outflow)/inflow from financing activities (17 556) 214 821
Net increase/(decrease) in cash and cash equivalents 94 376 (168 982)
Cash and cash equivalents at beginning of year 79 740 248 722
Cash and cash equivalents at end of year 174 116 79 740
Consolidated cash flow statement
for the year ended 30 June 2009
34 MAKALANI ANNUAL REPORT
Makalani fin final 9/17/09 6:29 PM Page 34

Share Share Accumulated TotalR’000 capital premium profit equity
Balance at 30 June 2007 2 553 050 87 290 640 342
Repurchase of shares – (25 015) – (25 015)
Profit for the year attributable to ordinary shareholders – – 162 327 162 327
Dividends paid – – (85 192) (85 192)
Balance at 30 June 2008 2 528 035 164 425 692 462
Loss for the year attributable to ordinary shareholders – – (66 448) (66 448)
Dividends paid – – (86 905) (86 905)
Balance at 30 June 2009 2 528 035 11 072 539 109
Consolidated statement of changes in equity
for the year ended 30 June 2009
MAKALANI ANNUAL REPORT 35
Makalani fin final 9/17/09 6:29 PM Page 35

36 MAKALANI ANNUAL REPORT
Notes to the consolidated financial statements
for the year ended 30 June 2009
1. ACCOUNTING POLICIES1.1 Basis of presentation
The Group’s annual financial statements have been prepared in accordance with those International FinancialReporting Standards (“IFRS”) and International Financial Reporting Interpretations Committee (“IFRIC”)interpretations issued and effective at the time of preparing these results and in the manner required by the Companies Act of South Africa. Standards and interpretations issued but not yet effective and those that the Group will adopt are shown in note 37.
The preparation of annual financial statements in conformity with IFRS requires the use of certain criticalaccounting estimates (refer to note 29). It also requires management to exercise its judgement in the process of applying the Group’s accounting policies.
All monetary information and figures presented in these financial statements are stated in thousands of Rands(R’000), unless otherwise indicated.
The Group prepares its annual financial statements on a going-concern basis using the historical-cost basis,except for certain financial assets and liabilities where it adopts the fair value basis of accounting.
These financial assets and liabilities include:• derivative financial instruments; and• financial instruments designated at fair value through profit and loss.
The annual financial statements have consolidated the results and financial position of the Company’s onlysubsidiary being a Company that holds the Company’s treasury linked units. The results of the subsidiary arepresented in separate standalone annual financial statements.
The comparative financial information as previously published is for the year ended 30 June 2008.
1.2 Basis of consolidationThe consolidated annual financial statements include the assets, liabilities and results of the operations of theholding Company and its subsidiary. A subsidiary is a company in which the Company, directly or indirectly, hasthe power to exercise control over the operations for its own benefit. The Company considers the existence andeffect of potential voting rights that are presently exercisable or convertible in determining control. A subsidiaryis consolidated from the date on which the Company acquires effective control. Consolidation is discontinuedfrom the effective date of disposal or where the Company no longer exercises control.
Intercompany transactions, balances and unrealised gains on transactions between group companies areeliminated. Unrealised losses are also eliminated unless the transaction provides evidence of impairment of theasset transferred. Accounting policies of the subsidiary are consistent with that of the Company.
1.3 Interest income and expenseThe Group recognises fair value gains and losses on financial assets designated as held at fair value throughprofit and loss in the income statement. Interest income on these assets is recognised as interest income at theirrespective effective interest rates.
The Group recognises interest expense in the income statement for debentures (measured at amortised cost)using the effective interest rate method.
The effective interest rate method is a method of calculating the amortised cost of a financial asset or a financial liability and of allocating the interest income or interest expense over the average expected life of the financial instruments or portfolios of financial instruments.
The effective interest rate is the rate that exactly discounts estimated future cash payments or receipts through the expected life of the financial instrument or, when appropriate, a shorter period to the net carryingamount of the financial asset or financial liability. When calculating the effective interest rate, the Group estimatescash flows considering all contractual terms of the financial instrument (for example, prepayment options) butdoes not consider future credit losses. The calculation includes all fees and transaction costs between parties tothe contract that are an integral part of the effective interest rate and all other premiums or discounts.
Dividends received or paid on instruments with characteristics of debt, such as redeemable preference shares,
are included and accrued in interest income or expense.
Makalani fin final 9/17/09 6:29 PM Page 36

MAKALANI ANNUAL REPORT 37
1.4 Dividend income
The Group recognises dividends that are not recognised as interest income when the Group’s right to receive
payment is established. This is on the “last day to trade” for listed shares, and on the “date of declaration” for
unlisted shares.
1.5 Fee income
The Group recognises fee income on an accrual basis when the service is rendered.
1.6 Direct and indirect tax
Direct taxes include South African corporate tax payable, secondary tax on companies, as well as capital
gains tax.
Indirect taxes include various other taxes paid to central and local governments, including value added tax.
Indirect taxes are disclosed separately from direct tax in the income statement.
The charge for current tax is based on the results for the period as adjusted for items which are non-taxable
or disallowed. It is calculated using tax rates that have been enacted or substantively enacted by the balance
sheet date.
Dividends declared by South African companies are subject to STC, but the STC liability is reduced by dividends
received during the dividend cycle. Where the dividends received exceed dividends declared within a cycle, there
is no liability to pay STC. The potential tax benefit related to excess dividends received is carried forward to the
next dividend cycle. Where dividends declared exceed the dividends received during a cycle, STC is payable at
the current STC rate. The STC expense is included in the taxation charge in the income statement in the period
that the dividend is paid. Deferred tax assets are recognised on unutilised STC credits to the extent that it is
probable that the Group will declare future dividends to utilise such STC credits.
1.7 Deferred tax
The Group calculates deferred taxation on the comprehensive basis using the liability method on a balance
sheet-based approach. It calculates deferred tax liabilities or assets by applying corporate tax rates to the
temporary differences existing at each balance sheet date between the tax values of assets and liabilities and
their carrying amount, where such temporary differences are expected to result in taxable or deductible amounts
in determining taxable income for future periods when the carrying amount of the assets or liabilities are
recovered or settled.
The Group recognises deferred tax assets to the extent that the directors consider it probable that future taxable
income will be available, against which the unused tax losses can be utilised. The Group also recognises deferred
tax assets arising from unused credits on STC to the extent that it is probable that the Group will declare
dividends against which the unused STC credits can be utilised.
Temporary differences arise primarily from revaluation of certain financial assets and liabilities including derivative
contracts and tax losses carried forward. However, the deferred income tax is not accounted for if it arises from
initial recognition of an asset or liability in a transaction other than a business combination that at the time of the
transaction affects neither accounting nor taxable profit nor loss.
1.8 Recognition of assets
1.8.1 Assets
The Group recognises assets when it obtains control of a resource as a result of past events, and from which
future economic benefits are expected to flow to the Group.
1.8.2 Contingent assets
The Group discloses a contingent asset where, as a result of past events, it is highly likely that economic benefits
will flow to it, but this will only be confirmed by the occurrence or non-occurrence of one or more uncertain future
events which are not wholly within the Group’s control.
Makalani fin final 9/17/09 6:29 PM Page 37

38 MAKALANI ANNUAL REPORT
Notes to the consolidated financial statements CONTINUED
for the year ended 30 June 2009
1.9 Liabilities, provisions and contingent liabilities1.9.1 Liabilities and provisions
The Group recognises liabilities, including provisions, when:
• it has a present legal or constructive obligation as a result of past events;
• it is probable that an outflow of resources embodying economic benefits will be required to settle the
obligation; and
• a reliable estimate of the amount of the obligation can be made.
Where there are a number of similar obligations, the likelihood that an outflow will be required in settlement is
determined by considering the class of the obligation as a whole. A provision is recognised even if the likelihood
of an outflow with respect to any one item included in the same class of obligations may be small.
1.9.2 Contingent liabilities
The Group discloses a contingent liability where:
• it has a possible obligation arising from past events, the existence of which will be confirmed only by the
occurrence or non-occurrence of one or more uncertain future events not wholly within the control of the
Group; or
• it is not probable that an outflow of resources will be required to settle an obligation; or
• the amount of the obligation cannot be measured with sufficient reliability.
1.10 Cash and cash equivalentsIn the cash flow statement and balance sheet, cash and cash equivalents comprise money at call, instruments
issued by banks and balances with banks. Cash and cash equivalents are short-term, highly liquid investments
that are readily convertible to known amounts of cash and which are subject to an insignificant risk of changes
in value. All balances included in cash and cash equivalents have a maturity date of less than three months.
1.11 Financial instruments1.11.1 General
Financial instruments carried on the balance sheet include all assets and liabilities, including derivative
instruments, but exclude deferred tax and tax payable.
The Group recognises financial assets and financial liabilities on its balance sheet when, and only when, the
Group becomes a party to the contractual provisions of the instrument.
1.11.2 Financial assets
The Group classifies its financial assets in the category of financial assets designated at fair value through
profit or loss.
Financial assets are initially recognised at fair value plus transaction costs for all financial assets not carried at fair
value through profit or loss. Subsequent to initial recognition, gains and losses arising from changes in the fair
value of the financial assets at fair value through profit and loss and derivative financial assets are included in the
income statement in the period in which they arise.
The Group recognises purchases and sales of financial instruments that require delivery within the timeframe
established by regulation or market convention (regular way purchases and sales) at settlement date, which is the
date the asset is delivered to or by it. Otherwise such transactions are treated as derivatives until settlement.
The fair values of quoted investments in active markets are based on current bid prices. If the market for a
financial asset is not active (and for unlisted securities), the Group establishes fair value by using valuation
techniques. These include the use of recent arm’s length transactions, discounted cash flow analyses, option-
pricing models and other valuation techniques commonly used by market participants.
The Group classifies derivative financial instruments as at fair value through profit and loss.
1.11.2.1 Financial assets at fair value through profit or loss
This category has two subcategories – financial assets held for trading, and those designated at fair value through
profit or loss at inception.
Makalani fin final 9/17/09 6:29 PM Page 38

MAKALANI ANNUAL REPORT 39
A financial asset is classified as a trading instrument if acquired principally for the purpose of selling in the short
term or if so designated by management.
Assets are designated on initial recognition as “held at fair value through profit and loss” to the extent that it
produces more relevant information because it either:
• results in the reduction of measurement inconsistency (or accounting mismatch) that would arise as a result of
measuring assets and liabilities and the gains and losses on them on a different basis; or
• a group of financial assets and/or financial liabilities is managed and its performance is evaluated on a fair
value basis, in accordance with a documented risk management or investment strategy, and this is the basis
on which information about the assets and/or liabilities is provided internally to the entity’s key management
personnel; or
• a financial asset or liability containing significant embedded derivatives that clearly require bifurcation.
Financial assets designated at fair value through profit and loss include:
• loans and advances which are non-derivative financial assets with fixed or determinable payments that are
not quoted in an active market;
• purchased loans and advances, where the Group has designated such loans and advances as held at fair
value through profit and loss;
• equity investments; and
• equity participation instruments forming part of lending structures, and are included in loans and advances.
Instruments with characteristics of debt, such as redeemable preference shares, are included in loans and
advances recognised at fair value.
The Group recognises fair value adjustments on financial assets designated as at fair value through profit and loss
in fair value gains or losses. Interest income on these assets is recognised as interest income at the respective
effective rates.
1.11.3 Financial liabilities
Financial liabilities are initially recognised at fair value less transactions costs for all financial liabilities not carried
at fair value through profit and loss. Financial liabilities are subsequently recognised at amortised cost, unless
held for trading or designated at fair value through profit or loss, and interest is recognised over the period of
the borrowing using the effective interest rate method.
The Group designates certain liabilities at fair value through profit and loss to the extent that it produces more
relevant information because it either:
• results in the reduction of measurement inconsistency (or accounting mismatch) that would arise as a result of
measuring assets and liabilities and the gains and losses on them on a different basis; or
• a group of financial assets and/or financial liabilities is managed and its performance is evaluated on a fair value
basis, in accordance with a documented risk management or investment strategy, and this is the basis on which
information about the assets and/or liabilities is provided internally to the entity’s key management personnel; or
• a liability containing significant embedded derivatives that clearly requires bifurcation.
The Group recognises fair value adjustments on financial liabilities classified as at fair value through profit and
loss in fair value gains or losses. Interest expense on these liabilities is included in interest expense to the extent
that it can be calculated separately; otherwise it is included in fair value gains or losses.
1.11.4 Derivative financial instruments
The Group’s policy is to hedge all its fixed interest rate assets into floating interest rates. In all instances where
the Group enters into interest rate swaps, these transactions are solely to economically hedge the Group’s
exposure to interest rates. The Group does, however, not apply hedge accounting and accordingly these
instruments are shown as held for trading.
The Group initially recognises derivative financial instruments (including interest rate swaps) in the balance sheet
at fair value and subsequently remeasures these instruments at their fair value with all movements in fair value
recognised in the income statement.
Makalani fin final 9/17/09 6:29 PM Page 39

40 MAKALANI ANNUAL REPORT
Notes to the consolidated financial statements CONTINUED
for the year ended 30 June 2009
The fair value of non-traded derivatives is based on discounted cash flow models and option-pricing models as
appropriate. The Group recognises derivatives as assets when the fair value is positive and as liabilities when the
fair value is negative.
The best evidence of the fair value of a derivative at initial recognition is the transaction price (ie the fair value
of the consideration given or received) unless the fair value of that instrument is evidenced by comparison with
other observable current market transactions in the same instrument (ie without modification or repackaging) or
based on a valuation technique whose variables include only data from observable markets. When such evidence
exists, the Group recognises profits or losses on day one.
1.11.5 Derecognition of assets and liabilities
The Group derecognises an asset when the contractual rights to the asset expire, where there is a transfer of the
contractual rights that comprise the asset, or the Group retains the contractual rights of the assets but assumes a
corresponding liability to transfer these contractual rights to another party and consequently transfers
substantially all the risks and benefits associated with the asset.
Where the Group retains substantially all the risks and rewards of ownership of the financial asset, the Group
continues to recognise the financial asset.
If a transfer does not result in derecognition because the Group has retained substantially all the risks and
rewards of ownership of the transferred asset, the Group shall continue to recognise the transferred asset in its
entirety and recognises a financial liability for the consideration received. In subsequent periods, the Group
recognises any income on the transferred asset and any expense incurred on the financial liability.
Where the Group neither transfers nor retains substantially all the risks and rewards of ownership of the financial
asset, the Group shall determine whether it has retained control of the financial asset. In this case:
(i) if the Group has not retained control, it shall derecognise the financial asset and recognise separately as
assets or liabilities any rights and obligations created or retained in the transfer; or
(ii) if the Group has retained control, it shall continue to recognise the financial asset to the extent of its
continuing involvement in the financial asset.
The Group derecognises a financial liability, or part of a financial liability, when it is extinguished, ie when the
obligation is discharged or cancelled or expired.
1.11.6 Offsetting financial instruments
The Group offsets financial assets and liabilities and reports the net balance in the balance sheet where:
• there is a legally enforceable right to set off; and
• there is an intention to settle on a net basis or to realise the asset and settle the liability simultaneously.
1.12 Impairments of financial assetsThe Group has designated all its financial assets at their fair value through profit and loss and as such credit
impairments are included in the computation of fair value gains or losses.
1.13 Intangible assetsThe Group expenses the costs incurred on internally generated intangible assets such as trademarks,
concessions, patents and similar rights and assets, to the income statement in the period in which the costs
are incurred. The Group has no intangible assets.
1.14 DebenturesThe Group initially recognises debentures at the fair value of the consideration received. Debentures are
subsequently measured at amortised cost. Transaction costs and discounts or premiums on debentures issued
are amortised on a basis that reflects the effective yield on the debentures over their lifespan.
Interest paid is recognised in the income statement on an effective interest rate basis.
Where the Company purchases its own debentures, the debentures are derecognised from the balance sheet
and any differences between the carrying amount of the liability and the consideration paid is included in income.
Makalani fin final 9/17/09 6:29 PM Page 40

MAKALANI ANNUAL REPORT 41
1.15 Share capital1.15.1 Share issue costs
Incremental costs directly related to the issue of new shares are shown in equity as a deduction from equity.
1.15.2 Dividends paid
Dividends on ordinary shares are recognised against equity in the period in which they are approved by the
Company’s directors. Dividends declared after the balance sheet date are not recognised but disclosed as a
post-balance sheet event.
1.16 Treasury securitiesWhere the Company or its subsidiary company repurchases the Company’s linked units, the consideration paid is
deducted from total linked unitholders’ interest as treasury securities until they are cancelled. Where such
securities are subsequently sold or reissued, any consideration received is included in linked unitholders’ interest.
Further detail as to the accounting treatment of repurchase of linked units is contained in notes 29.3 and 30.
1.17 Segment reportingThe Group defines a segment as a distinguishable component or business that provides either:
• unique products or services (“business segment”); or
• products or services within a particular economic environment (“geographical segment”), subject to risks and
rewards that are different from those of other segments.
The Group’s operations are at this stage considered to be a single business segment. The Company’s operations
relate to provision of funding to BEE transactions and targeted investments, and are all within South Africa.
2009 2008
R’000 R’000
2. INTEREST INCOMEInterest on loans 157 767 115 254 Dividends on redeemable preference shares* 199 954 182 845Interest on cash, cash equivalents and money market instruments 33 956 19 197
391 677 317 296
* Items are classified as financial liabilities under International Financial Reporting Standards when the issuer has a contractual obligation to deliver cash or another financial asset to the holder of the instrument or to issue a variable number of own shares to settle a fixed amount, regardless of its legal form. Accordingly dividends received on redeemable preference shares held by the Group (note 14) are classified as interest received. This classification, however, does not impact the form of dividend and interest distribution to linked unitholders.
3. FAIR VALUE LOSSESFair value losses on invested assets at fair value through profit and loss (277 587) (69 577)Fair value (losses)/gains on derivative instruments held for trading (61 138) 44 174
(338 725) (25 403)
Fair value losses consist of the aggregate fair value movements of assets in the portfolio, including derivativehedging positions. These fair value movements include both positive and negative movements in credit migrationsand on equity investments.
Makalani fin final 9/17/09 6:29 PM Page 41

42 MAKALANI ANNUAL REPORT
Notes to the consolidated financial statements CONTINUED
for the year ended 30 June 2009
2009 2008
R’000 R’000
4. FEE INCOMEFee income 5 582 2 378
5 582 2 378
The Company earns fees in the form of capital raising fees, commitment fees and structuring fees on transactions. In accordance with the Company’saccounting policy, fees, transaction costs, premiums or discounts that are an integral part of the transaction are included in the calculation of effective interest rate and are not recognised separately as fee income.
5. OPERATING EXPENSESOperating expenses comprise:Auditors’ remuneration 583 462
– Audit fees 538 462 – Prior year underprovision 45 –
Business advertising 12 38 Directors’ fees 1 480 1 186JSE fees 282 265 Manco management fees 24 923 23 913Professional fees 1 243 3 386Other 627 820
29 150 30 070
Manco management fees consist of management fees payable to Manco. The description of these fees has been included on page 29 of this report.
6. PROFIT ON REPURCHASE OF DEBENTURESProfit on repurchase of debentures – 4 228
– 4 228
Refer to notes 29.3 and 30 for the accounting treatment.
7. INDIRECT TAXATIONValue added tax 3 491 4 189 Other 89 –
Total indirect taxation 3 580 4 189
8. INTEREST ON BORROWINGSInterest on bridging loan – FirstRand Bank Limited 32 471 10 002Dividends on preference share funding – FirstRand Bank Limited 12 189 –
44 660 10 002
Interest on borrowings pertains to interest and dividends charged on the bridging facility and the preference share funding respectively. Refer to notes 17 and 18.
9. DEBENTURE INTERESTDistribution to linked unitholders 64 912 82 789Amortisation of debenture issue expenses 256 159
65 168 82 948
Makalani fin final 9/17/09 6:29 PM Page 42

MAKALANI ANNUAL REPORT 43
2009 2008
R’000 R’000
10. TAXATIONNormal taxation– Current – (10 487)– Prior year 1 946 –– Deferred 11 324 278 Secondary tax on companies– Current – – – Deferred 4 306 1 246
Total 17 576 (8 963)
10.1 Deferred tax assetsOpening balance 6 738 5 214
STC credit 4 867 3 621 Assessed losses – –Provisions 1 871 1 593
Credit to the income statement 11 324 278STC credit released to the income statement 4 306 1 246
Closing balance 22 368 6 738
STC credit 9 173 4 867Assessed losses 10 000 –Provisions 3 195 1 871
Total debit balance 22 368 6 738
The Group recognises deferred tax assets to the extent that it is considered probable that future taxable income will be available against which the unused tax loss can be utilised. The Group has recognised deferred tax on all deductible temporary differences, unused STC credits and a portion of the assessed loss as at 30 June 2009.
10.2 Taxation rate reconciliation % %Effective rate of taxation 20.9 5.2Total taxation has been affected by:Prior year (2.3) –Secondary tax on companies (5.1) 0.7 Non-taxable income (66.7) 25.7Assessed loss 31.9 –Other permanent differences 49.3 (3.6)
Standard rate of South African taxation 28.0 28.0
Makalani fin final 9/17/09 6:29 PM Page 43

2009 2008
R’000 R’000
11. EARNINGS PER SHARE AND DISTRIBUTION PER LINKED UNITTotal number of linked units in issue (‘000) 23 593 23 593
Treasury linked units (‘000) (2 240) (2 240)
Number of linked units in issue (‘000) 21 353 21 353
Weighted average number of linked units in issue (‘000) 21 353 22 194
(Loss)/earnings per share (cents) (311) 731
Headline (loss)/earnings per share (cents) (311) 731
Headline (loss)/earnings reconciliation(Loss)/profit for the period attributable to equity holders (66 448) 162 327
Adjustments – –
Headline (loss)/earnings (66 448) 162 327
The Group did not calculate diluted earnings per share as there are no instances of a potential dilution. The disclosure of earnings and headline earnings per share set out above, while obligatory in terms of accounting standards and the JSE Listings Requirements, is not considered meaningful to investors as the shares are traded as part of a linked unit and a significant part of the earnings is distributed in the form of debenture interest. The calculation of headline earnings per linked unit, distributable earnings and the distribution per linked unit as shown below are considered more meaningful. It is to be noted that the Group has no minorities and therefore no reconciling items.
Headline (loss)/earnings per linked unit (cents) (6) 1 086
2009 2008Gross Net* Gross Net*
Headline (loss)/earnings attributable to linked unitholdersHeadline (loss)/earnings (66 448) (66 448) 162 327 162 327Debenture interest 65 168 65 168 82 948 82 948Profit on repurchase of debentures – – (4 228) (4 228)
Headline (loss)/earnings attributable to linked unitholders (1 280) (1 280) 241 047 241 047
* Net of tax and minority interest.
2009 2008
R’000 R’000
Calculation of distributable earningsNet operating profit 25 804 264 240Profit on repurchase of debentures – (4 228)Taxation 17 576 (8 963)
43 380 251 049
Distribution to linked unitholdersDebenture interest 64 912 82 789 Dividends 86 905 85 192
Total distribution to linked unitholders 151 817 167 981
Notes to the consolidated financial statements CONTINUED
for the year ended 30 June 2009
44 MAKALANI ANNUAL REPORT
Makalani fin final 9/17/09 6:29 PM Page 44

2009 2008
Cents Cents
11. EARNINGS PER SHARE AND DISTRIBUTION PER LINKED UNIT (continued)
Total distribution per linked unit 900 819
Debenture interest 304 369
Dividends 596 450
Distribution for the period per linked unit 900 819
Interim distribution 380 510
Interest 180 267
Dividend 200 243
Final distribution 520 309
Interest 124 102 Dividend 396 207
12. CASH AND CASH EQUIVALENTSCash on call 174 116 79 740
174 116 79 740
The effective interest rate achieved during the period on the cash and cash equivalents, including interest rate
swaps, was 26.8% (2008: 11.7%). The carrying value of cash and cash equivalents approximates its fair value.
13. DERIVATIVE FINANCIAL INSTRUMENTSDerivative financial instruments consist of interest rate swaps that the Group has entered into to swap fixed interest
rates on its assets into floating interest rates based on the three-month Johannesburg Interbank Agreed Rate
(“JIBAR”). Interest rate swaps are used for the purposes of eliminating the risk of capital losses that the Group faces
due to changes in interest rates. In all instances where the Group enters into interest rate swaps, these transactions
are solely to economically hedge the Group’s exposure to interest rate risk. Further information on the risk
management of the Group is set out in note 22 below.
30 June 2009R’000
Assets Liabilities Net liabilities
Notional Fair value Notional Fair value Fair value
Interest rate swaps 70 670 204 829 266 6 038 5 834
30 June 2008
R’000
Assets Liabilities Net assets
Notional Fair value Notional Fair value Fair value
Interest rate swaps 860 196 56 232 73 873 928 55 304
MAKALANI ANNUAL REPORT 45
Makalani fin final 9/17/09 6:29 PM Page 45

2009 2008
R’000 R’000
14. INVESTED ASSETS DESIGNATED AT FAIR VALUE THROUGH PROFIT AND LOSSUnlistedLoans and advances at nominal value 2 206 969 2 299 504
Interest receivable 314 995 207 383
Fair value revaluation on loans and advances (293 026) (99 175)
Equity participation instruments at nominal value – –
Fair value revaluation on equity participation instruments 12 166 40 999
Ordinary shares at nominal value 54 614 28 547
Fair value revaluation on ordinary shares (54 614) (5 064)
2 241 104 2 472 194
Listed 17 500 21 750
Other financial assets at nominal value 25 000 25 000
Fair value revaluation (7 500) (3 250)
2 258 604 2 493 944
Loans and advances at fair value 2 241 104 2 448 711
Other financial assets at fair value 17 500 45 233
Invested assets at fair value comprise:Loans 846 815 950 727
Preference shares and ordinary shares 1 411 789 1 543 217
2 258 604 2 493 944
Makalani has designated all of its invested assets as held at fair value through profit and loss. Invested assets are
evaluated and measured on a fair value basis in accordance with the investment strategy. This is the basis on
which information about the assets is provided internally. The fair value revaluation takes into account changes in
interest rates and other financial risks.
The above financial assets are analysed by credit exposure to industry sector in note 22.3.
Equity participation instruments (“EPIs”) relate to instances where the Company is entitled to participate in the
growth in the net asset values of the special purpose vehicles (“SPVs”) that it has funded. These instruments,
although providing the benefit of being able to participate in equity upside of the SPVs, do not form direct
investments in the equity of the SPVs but form an integral part of the funding advanced to these SPVs.
In valuing EPIs, a discount for lack of liquidity and lock-in periods is applied in arriving at a fair value for these
instruments. If no discount was applied to these instruments, the financial effect for the current financial period
would be R21 million (2008: R41 million).
The basis for arriving at the valuation of the EPIs and ordinary shares is covered in note 29.1 addressing fair value
of financial assets.
The other financial assets in the listed category above comprise a single investment being a listed convertible
preference share issued by Mvelaphanda Group Limited.
Notes to the consolidated financial statements CONTINUED
for the year ended 30 June 2009
46 MAKALANI ANNUAL REPORT
Makalani fin final 9/17/09 6:29 PM Page 46

2009 2008
R’000 R’000
15. SHARE CAPITAL AND PREMIUMAuthorised
4 250 000 000 ordinary shares of R0.0001 each 425 500
Issued
21 352 568 ordinary shares of R0.0001 each 2 2
Share premium 528 035 528 035
Total equity 528 037 528 037
Number of shares
In issue at the beginning of the year (‘000) 21 353 22 430
Repurchased during the year (‘000) – (1 077)
In issue at the end of year (‘000) 21 353 21 353
16. DEBENTURESIssued
21 352 568 debentures of R75 each 1 601 443 1 601 443
Debenture issue costs (23 645) (23 645)
Debenture issue costs amortised 1 000 744
Total debentures 1 578 798 1 578 542
Number of debentures
In issue at the beginning of year (‘000) 21 353 22 430
Repurchased during the year (‘000) – (1 077)
In issue at the end of year (‘000) 21 353 21 353
Each debenture is irrevocably linked to each share and trades as a linked unit on the JSE. The separate transfer of a
share or a debenture is not permitted. The debentures are unsecured and carry a variable interest rate as determined
by the directors from time to time. The debentures are repayable on the 99th anniversary of the date of issue, except if
a special resolution by the linked unitholders determines otherwise or in the event of the Company being wound up.
The directors determine the debenture interest distribution based on the Group’s distribution policy of
distributing 100% of all after-tax income realised in cash and received as interest, subject to good corporate
governance, sound business principles, going concern and future investment requirements. The effective interest
rate on the debentures for the period was 4.11% (2008: 4.9%). At 30 June 2009, the fair value of each linked unit
was R64.50 (2008: R90), being the closing linked unit price on the JSE at that date.
MAKALANI ANNUAL REPORT 47
Makalani fin final 9/17/09 6:29 PM Page 47

2009 2008
R’000 R’000
17. PREFERENCE SHARE FUNDINGAuthorised
750 000 000 cumulative redeemable preference shares with
a par value of R0.0001 75 –
Issued
297 444 037 cumulative redeemable preference shares with
a par value of R0.0001 30 –
Share premium 297 414 –
Total preference shares 297 444 –
Number of shares
Issued during the year 333 000 –
Redeemed during the year (35 556) –
In issue at the end of year 297 444 –
Less: Current portion repayable within 12 months (154 584) –
Non-current portion of the preference share funding 142 860 –
The preference share funding is unsecured as part of an initial amount of R333 million of which R35.6 million has been repaid. The preference share facility bears interest at 76% of the prime rate, payable semi-annually in arrears and is fully redeemable by no later than February 2014.
The carrying value of the preference shares approximates the fair value.
18. CURRENT BORROWINGSNominal – 315 000
– 315 000
The loan from FirstRand Bank Limited was unsecured as part of a R750 million facility which incurred interest at a three-month JIBAR plus 185 basis points with fixed quarterly interest payments in arrears and was fully redeemed in March 2009.
The carrying value of the prior year current borrowings approximated the fair value.
19. OTHER LIABILITIESOther liabilities comprise:Payables 5 903 14 983
5 903 14 983
The carrying value of the other liabilities approximates the fair value.
Notes to the consolidated financial statements CONTINUED
for the year ended 30 June 2009
48 MAKALANI ANNUAL REPORT
Makalani fin final 9/17/09 6:29 PM Page 48

2009 2008
R’000 R’000
20. PROVISIONSProvision for performance feeOpening balance 5 000 4 800Charge to income statement – 200
Closing balance 5 000 5 000
OtherOpening balance 1 958 694 Charge to income statement (1 089) 1 264
Closing balance 869 1 958
Total provisions 5 869 6 958
The provision for performance fee is expected to be settled over various periods longer than 12 months whilst other provisions, consisting of audit and directors’ fee provisions, are expected to be settled within 12 months. The performance fee will be paid in accordance with the basis outlined on page 29 of this report.
21. NOTES TO THE CASH FLOW STATEMENT21.1 Cash generated from operations
Net operating profit 25 804 264 240 Revaluation of assets at fair value 337 620 24 690 (Decrease)/increase in payables and provisions (10 170) 16 343 Profit on repurchase of debentures – (4 228)
353 254 301 045
21.2 Investment in loans and advancesOpening balance 2 407 714 2 053 885 Fair value revaluation 99 175 3 251
2 506 889 2 057 136 Closing balance (2 521 964) (2 506 889)
Balance including fair value (2 228 938) (2 407 714)Fair value revaluation (293 026) (99 175)
(15 075) (449 753)
21.3 Investment in other financial assetsOpening balance 45 233 59 172
Fair value revaluation 8 314 (5 625)
53 547 53 547
Closing balance (79 614) (53 547)
Balance including fair value (17 500) (45 233)
Fair value revaluation (62 114) (8 314)
(26 067) –
MAKALANI ANNUAL REPORT 49
Makalani fin final 9/17/09 6:29 PM Page 49

22. FINANCIAL RISK MANAGEMENT22.1 General
Makalani is a mezzanine financing Group that provides funding for black economic empowerment (“BEE”)transactions and targeted investments, such as infrastructure and affordable housing, as defined in the FinancialSector Charter. The Group provides funding to a wide variety of FSC-compliant transactions.
Makalani ensures that all significant risks are identified and managed on an ongoing basis. The Group seeks tolimit adverse movements in earnings and equity by managing the balance sheet within agreed levels of riskappetite, which is discussed and reviewed by the audit and risk committee.
Essential elements and capabilities of the Group’s management and control of exposures continue to beenhanced to assist in delivering growth in a controlled environment and help enable management to operatemore effectively in a changing environment.
The funding provided by the Group is usually in the form of debt, although it may sometimes be in the form ofequity. The Group is therefore mainly exposed to credit and interest rate risks. The various risks to which theGroup is exposed and how these risks are managed and mitigated are considered in greater detail below.
22.2 Interest rate riskInterest rate risk is the risk that the fair value or future cash flows of a financial instrument will fluctuate because of changes in market interest rates.
The Group advances money to borrowers either on a fixed-interest rate or floating rate basis. Where the Grouphas advanced money on a fixed-interest rate basis, it will immediately enter into an interest rate swap to convertthe fixed rate receipts into floating rate receipts based on a three-month JIBAR. The cost of the interest rateswap is usually borne by the borrower. By converting all of its assets into a floating-interest rate profile, the Group is able to pay more matched interest and dividends to its unitholders, as well as to avoid capital losseswhen interest rates change subsequent to entering into transactions.
Although the Group is subject to interest rate risk in its floating rate portfolio, this risk is offset by the Group’s owncapital structure which is in the form of debentures and preference share funding which also attract variable rates.The Group is effectively a conduit structure. Changes in interest rates should therefore have a correspondingchange to profit and loss, before distributions to linked unitholders.
The Group’s exposure to assets by interest rate maturity and industry is disclosed under credit risk in 22.3 below.
The Group’s exposure to interest rate movements is shown in the following sensitivity analysis:
2009 Effects of changes in interest ratesInterest rate risk CurrentlyR’000 in AFS +20% -20%
Income statement line itemInterest income 391 677 470 012 313 342Current borrowing interest (44 660) (53 592) (35 728)Debenture interest (64 912) (77 894) (51 930)
Net movementChanges in interest income 78 335 (78 335)Changes in current borrowing interest (8 932) 8 932Changes in debenture interest (12 982) 12 982
Impact on profit or loss after tax 56 421 (56 421)
Notes to the consolidated financial statements CONTINUED
for the year ended 30 June 2009
50 MAKALANI ANNUAL REPORT
Makalani fin final 9/17/09 6:29 PM Page 50

22. FINANCIAL RISK MANAGEMENT (continued)
22.2 Interest rate risk (continued)
2008 Effects of changes in interest ratesInterest rate risk CurrentlyR’000 in AFS +20% -20%
Interest income 317 296 380 755 253 837
Current borrowing interest (10 002) (12 002) (8 002)
Debenture interest (82 789) (99 347) (66 231)
Net movementChanges in interest income 63 459 (63 459)
Changes in current borrowing interest (2 000) 2 000
Changes in debenture interest (16 558) 16 558
Impact on profit or loss after tax 44 901 (44 901)
Due to Makalani’s policy to give its linked unitholders a floating rate exposure to interest rates, interest income
has been increased or decreased accordingly in the sensitivity analysis. Furthermore, due to Makalani’s
distribution policy under note 16, debenture interest has been kept in the same ratio to interest received.
The Company acts as a conduit type of structure, and therefore the impact of tax in the interest rate sensitivity
is assumed to be zero.
22.3 Credit riskCredit risk is the risk that one party to the financial instrument will cause a financial loss to the other party by
failing to discharge an obligation.
The Group manages credit risk by placing limits on acceptable risk exposure to individual borrowers and industry
segments, in addition to the Group’s overall maximum permitted exposure per counterparty of 15% of its capital
in terms of its investment mandate. The credit ratings as determined by reference to FirstRand Bank Limited’s
rating methodologies are used in investing and pricing decisions.
Credit risk exposures are reviewed and approved at different levels of investment and credit committees
depending on the materiality of the exposure. (See Investment Process on page 21 of this report). Despite overall
challenging market conditions, there are no assets in the portfolio where a counterparty has failed to make a
payment when contractually due.
Preference share investments typically make use of underlying shares and related dividend flows for security on
a share cover basis. Loans typically make use of underlying enterprise cash flows under loan commitments.
All loans and advances make use of covenants to minimise credit and settlement risks associated with each
transaction, with certain investments making use of put options and third-party guarantees.
MAKALANI ANNUAL REPORT 51
Makalani fin final 9/17/09 6:29 PM Page 51

52 MAKALANI ANNUAL REPORT
Notes to the consolidated financial statements CONTINUED
for the year ended 30 June 2009
22. FINANCIAL RISK MANAGEMENT (continued)
22.3 Credit risk (continued)
Significant credit and investment exposures are analysed by sector and maturity in the tables below:
Invested assets 2009 fair value Total Revenue TotalSector R’000 % R’000 %
Banks 197 101 8 25 333 6
Construction 135 037 6 22 610 6
Engineering 3 563 – 435 –
Financial services 131 373 5 19 901 5
Food and beverage 125 370 5 17 467 4
Gaming 176 153 7 23 947* 6
Healthcare 37 026 1 6 162 1
Insurance 116 053 5 11 676 3
IT and telecommunications 92 477 4 6 524 2
Mining 220 429 9 38 351* 10
Motor retail 344 172 14 51 813 13
Oil and chemicals 9 417 – 2 015 1
Paper and packaging 70 670 3 7 971 2
Real estate 158 868 7 20 560 5
Services 207 500 9 30 271 8
Speciality chemicals 19 913 1 2 261 1
Transport and logistics – – 38 346 10
Various 213 482 9 32 078 8
Cash and cash equivalents and money market instruments 174 116 7 33 956 9
Total 2 432 720 100 391 677 100
* Includes assets repaid during the year.
Makalani fin final 9/17/09 6:29 PM Page 52

MAKALANI ANNUAL REPORT 53
22. FINANCIAL RISK MANAGEMENT (continued)
22.3 Credit risk (continued)
Invested assets 2008 fair value Total Revenue TotalSector R’000 % R’000 %
Banks 173 387 7 22 468 7
Construction 135 169 5 18 936 6
Engineering 18 075 1 4 346 1
Financial services 199 623 8 26 668 8
Food and beverage 94 831 4 5 947 2
Gaming 303 998 12 38 127* 12
Healthcare 43 396 2 3 352 1
Household goods – – 6 166 2
Insurance 116 715 5 11 590 4
IT and telecommunications 47 678 2 3 531 1
Mining 308 910 11 33 855 11
Motor retail 334 984 12 48 894 15
Oil and chemicals 7 406 – 156 –
Paper and packaging 72 591 3 8 396 4
Real estate 146 095 6 17 295 5
Services 211 750 8 7 804 2
Speciality chemicals 20 173 1 1 955 1
Transport and logistics 211 367 8 36 215* 11
Various 47 796 2 2 398 1
Cash and equivalents and money market instruments 79 740 3 19 197 6
Total 2 573 684 100 317 296 100
* The revenue includes revenue from assets that were repaid during year.
Makalani fin final 9/17/09 6:29 PM Page 53

54 MAKALANI ANNUAL REPORT
Notes to the consolidated financial statements CONTINUED
for the year ended 30 June 2009
22. FINANCIAL RISK MANAGEMENT (continued)
22.3 Credit risk (continued)
The Group’s exposure to the various industry sectors is analysed by maturity in the tables below:
2009Sector Less than Two – four Four – five Over R’000 Fair value one year years years five years
Banks 197 101 181 510 – 15 591 –
Construction 135 037 – 2 862 9 469 122 706
Engineering 3 563 3 563 – – –
Financial services 131 373 5 628 64 926 60 819 –
Food and beverage 125 370 4 971 10 579 109 820 –
Healthcare 37 026 7 616 29 410 – –
Insurance 116 053 116 053 – – –
IT and telecommunications 92 477 – – 92 477 –
Mining 220 429 – – 57 288 163 141
Motor retail 344 172 27 435 79 648 237 089 –
Oil and chemicals 9 417 – – – 9 417
Paper and packaging 70 670 8 863 61 807 – –
Real estate 158 868 9 124 4 747 4 107 140 890
Services 207 500 7 700 52 500 147 300 –
Speciality chemicals 19 913 784 8 271 5 514 5 344
Gaming 176 153 – – 176 153 –
Various 213 482 6 186 29 804 172 612 4 880
Total 2 258 604 379 433 344 554 1 088 239 446 378
The above does not include commitments of R100 million as at 30 June 2009.
Makalani fin final 9/17/09 6:29 PM Page 54

MAKALANI ANNUAL REPORT 55
22. FINANCIAL RISK MANAGEMENT (continued)
22.3 Credit risk (continued)
2008Sector Less than Two – four Four – five Over R’000 Fair value one year years years five years
Banks 173 387 – 160 565 – 12 822
Construction 135 169 – 1 008 1 854 132 307
Engineering 18 075 20 18 055 – –
Financial services 199 623 8 400 69 343 121 880 –
Food and beverage 94 831 4 972 3 700 – 86 159
Healthcare 43 396 6 932 25 113 11 351 –
Insurance 116 715 – 116 715 – –
IT and telecommunications 47 678 – – – 47 678
Mining 308 910 72 871 – – 236 039
Motor retail 334 984 27 633 114 423 29 463 163 465
Oil and chemicals 7 406 – – – 7 406
Paper and packaging 72 591 2 061 40 912 – 29 618
Real estate 146 095 5 851 5 874 1 755 132 615
Services 211 750 – 17 500 37 500 156 750
Speciality chemicals 20 173 873 5 514 2 757 11 029
Transport and logistics 211 367 – – – 211 367
Gaming 303 998 303 998 – – –
Various 47 796 1 972 426 43 745 1 653
Total 2 493 944 435 583 579 148 250 305 1 228 908
Makalani fin final 9/17/09 6:29 PM Page 55

56 MAKALANI ANNUAL REPORT
Notes to the consolidated financial statements CONTINUED
for the year ended 30 June 2009
22. FINANCIAL RISK MANAGEMENT (continued)
22.3 Credit risk (continued)
The maximum exposure to credit risk before taking into account any collateral held:
30 June 30 June% of 2009 % of 2008total R’000 total R’000
Cash and cash equivalents 6 174 116 3 79 740
Invested assets at carrying valueUnlisted
Loans and advances at nominal value 82 2 261 583 88 2 299 504
Interest receivable 11 314 995 8 207 383
2 750 694 2 586 627
Listed
Other financial assets at nominal value 1 25 000 1 25 000
100 2 775 694 100 2 611 627
The Group’s portfolio exposure to credit risk is as follows:
Investedassets
Cash designated 2009 and at fair value By rating cash through R’000 equivalents profit and loss Derivatives Total
BBB 174 116 25 249 204 199 569BB – 1 066 984 – 1 066 984B – 949 501 – 949 501Equity – 216 870 – 216 870
174 116 2 258 604 204 2 432 924
2008By ratingR’000BBB 79 740 – 56 232 135 972BB – 1 276 704 – 1 276 704B – 796 682 – 796 682Equity – 420 558 – 420 558
79 740 2 493 944 56 232 2 629 916
Ratings for exposures are determined by reference to FirstRand Bank Limited’s rating methodologies, which havebeen mapped to an international scale as used by Standard and Poor’s and Moody’s.
Makalani fin final 9/17/09 6:29 PM Page 56

MAKALANI ANNUAL REPORT 57
22. FINANCIAL RISK MANAGEMENT (continued)
22.3 Credit risk (continued)
The Group’s industry exposure to credit risk by sector is as follows:
2009 2008
Financial services BB BB, BBanks BB BB, BMining BB, Equity BB, EquityGaming BB BBInsurance BB BBPaper and packaging BB, B BBMotor retail B BFood and beverage B BReal estate BB, B BBConstruction BB BBServices B, Equity B, EquityTransport and logistics Equity EquityOther BBB, BB, B, Equity BB, B, Equity
Due to the low number of investments in the Group’s portfolio, the Group is able to monitor all exposuresindividually on an ongoing basis, and therefore is able to quantify any specific changes to invested assets at fairvalue through profit and loss or cash and cash equivalents not attributable to changes in market conditions thatgive rise to market risk. There were no moves in the fair values in other assets not designated under unlisted.
Ongoing monitoring is performed by Manco through interaction with counterparties and FirstRand Bank Limited’scredit risk management function including but not limited to:• review of facilities at appropriate intervals; and• collateral and covenant management.
22.4 Currency riskCurrency risk is the risk that the fair value or future cash flows of a financial instrument will fluctuate because of
changes in foreign exchange rates.
The Group did not have balances denominated in foreign currency as at 30 June 2009, and therefore was not
exposed to any changes in exchange rates.
22.5 Liquidity riskLiquidity risk is the risk that an entity will encounter difficulty in meeting obligations associated with financial liabilities.
The efficient management of liquidity risk is essential to the Group to ensure that financial market confidence is
maintained.
The Group is exposed to funding liquidity risk, whereby the Group would be unable to meet its obligations under
external funding arrangements (ie other than debentures forming part of its linked unit capital structure).
The Group is not exposed to opportunity liquidity risk, due to the change to a wind-down strategy as outlined in
the CEO’s report.
The objective of the Group’s cash management policy is, inter alia, to ensure that the Group retains sufficient
liquidity to meet the investment requirements of the Group.
Funding and cash management policies are effected through forecasting models and monitoring of gearing.
The bridging facility of R315 million was refinanced through the issue of a five-year preference share facility as
disclosed under note 17. Debentures are considered part of capital.
The remaining contractual maturities for financial and non-financial assets and liabilities at undiscounted amounts
are disclosed in the table below. The table includes the following non-financial items: deferred tax asset
(presented on an undiscounted expected cash flow basis); provisions (presented on a discounted expected cash
flow basis) and taxation asset/liability (presented on an undiscounted expected cash flow basis).
Makalani fin final 9/17/09 6:29 PM Page 57

58 MAKALANI ANNUAL REPORT
Notes to the consolidated financial statements CONTINUED
for the year ended 30 June 2009
22. FINANCIAL RISK MANAGEMENT (continued)
22.5 Liquidity risk (continued)
Maturity analysis based on contractually undiscounted amounts
Term to maturity2009 Less than Two – four Four – five Over R’000 one year years years five years Total
AssetsCash and cash equivalents 174 116 – – – 174 116 Derivative financial instruments 18 444 – 14 020 10 582 43 046 Invested assets at fair value through
profit and loss 379 433 344 554 1 088 239 446 378 2 258 604 Taxation asset 4 346 – – – 4 346 Deferred tax asset 22 368 – – – 22 368 LiabilitiesDerivative financial instruments – (12 343) – – (12 343)Provisions (869) – (5 000) – (5 869)Debentures – repayable on 99th
anniversary of date of issue – – – (1 578 798) (1 578 798)Taxation liability – – – – –Preference share funding (154 584) (142 860) – – (297 444)Other liability (5 903) – – – (5 903)
Total net surplus/(deficit) 437 351 189 351 1 097 259 (1 121 838) 602 123
2008R’000AssetsCash and cash equivalents 79 740 – – – 79 740
Derivative financial instruments – – 195 376 98 733 294 109
Invested assets at fair value through
profit and loss 435 583 579 149 250 304 1 228 908 2 493 944
Deferred tax asset 6 738 – – – 6 738
LiabilitiesDerivative financial instruments (9 740) (142 441) – – (152 181)
Provisions (1 958) – (5 000) – (6 958)
Debentures – repayable on 99th
anniversary of date of issue – – – (1 578 542) (1 578 542)
Taxation liability (6 001) – – – (6 001)
Short-term borrowings (315 000) – – – (315 000)
Other liability (36 763) – – – (36 763)
Total net surplus/(deficit) 152 599 436 708 440 680 (250 901) 779 086
Makalani fin final 9/17/09 6:29 PM Page 58

MAKALANI ANNUAL REPORT 59
22. FINANCIAL RISK MANAGEMENT (continued)
22.6 Capital riskThe Group needs to manage its capital so as to safeguard the Group’s ability to continue as a going concern in
order to provide returns for the unitholders and benefits to the stakeholders and to maintain an optimal capital
structure to reduce the cost of capital.
For risk management purposes, the Group considers its linked units (consisting of share capital, share premium,
debentures and retained earnings, see under notes 15 and 16) as its capital.
The Group assesses its capital adequacy against estimates of capital requirements so as to be able to absorb
unexpected losses that may arise from the risks facing the Group.
The Group manages capital risk through ongoing monitoring and active management of credit risk and gearing of the
Group. The Group has set a gearing target of 25% of debt to total assets. As at 30 June 2009, the gearing ratio was
12.1% (2008: 12.0%). There have been no significant events that impacted on capital during the period under review.
22.7 Price riskPrice risk is the risk that the fair value or future cash flows of a financial instrument will fluctuate because of
changes in market prices (other than those arising from interest rate risk or currency risk), whether those changes
are caused by factors specific to the individual instrument or its issuer, or factors affecting all similar financial
instruments traded in the market.
The Group holds listed investments which are monitored on an ongoing basis.
Sensitivity analysis of price risk
The effect of changes in market prices on retained earnings is as follows:
2009 – Equity participation instruments R’000 R’000 R’000Price risk 30 June 2009 +10% -10%
Income statement line itemFair value losses (28 834) (9 254) (34 647)
Net movement 19 580 (5 813)
Impact on profit or loss after tax 19 580 (5 813)
2008 – Equity participation instruments R’000 R’000 R’000Price risk 30 June 2008 +10% -10%
Income statement line itemFair value losses (24 031) (14 439) (33 624)
Net movement 9 592 (9 593)
Impact on profit or loss after tax 9 592 (9 593)
In arriving at the increases and decreases in fair value losses in the sensitivity analysis, listed equity prices to which
the Company is exposed were adjusted. Due to the equity nature of the instruments no adjustments were made
for tax purposes.
Makalani fin final 9/17/09 6:29 PM Page 59

60 MAKALANI ANNUAL REPORT
Notes to the consolidated financial statements CONTINUED
for the year ended 30 June 2009
22. FINANCIAL RISK MANAGEMENT (continued)
22.7 Price risk (continued)
As at and around 30 June 2009, the management of the Company would have considered a 10% move in theequity market as significant and is therefore used for the purposes of the sensitivity analysis.
Due to the nature of the equity participation instruments, the Company’s exposure is limited to the upsidepotential of these instruments.
23. SECTOR ANALYSISAs stated in note 1.17 above, the Group’s operations are considered to be a single segment at this stage andsegment reporting is therefore not presented as the business consists of granting funding to BEE transactions andtargeted investments in South Africa. Instead, a sector analysis is presented under the credit risk section. TheGroup’s credit and investment exposures are analysed by sector and maturity in note 22.
24. RELATED PARTY TRANSACTIONSParties are considered to be related if one party has the ability to control the other party or exercise significantinfluence over the other party in making financial or operational decisions. Details of the directors’ remunerationare set out on page 30 of this report. The Group did not have any transactions with key personnel or theirimmediate family members other than as disclosed in this annual report. In view of the fact that Manco is asubsidiary of RMB, the additional disclosure below is given in the interest of greater transparency and goodcorporate governance.
2009 2008R’000 R’000
Transactions for the period endedManagement fee paid to Manco 20 355 22 465Invested assets acquired from RMB 49 636 429 342Invested assets sold to RMB – 229 994Invested assets redeemed via RMB 81 648 –
Balance at end of yearCash and cash equivalents with FirstRand Bank Limited 174 116 79 740Swap contracts entered with RMB– Assets at fair value 478 730 558 143– Liabilities at fair value 484 564 502 839Preference share funding from RMB 297 444 –Bridging facility with RMB – 315 000
Invested assets sold to RMB during the 2008 financial year consist of the Aberdare preference shares at carryingvalue of R23.8 million (cum interest) and the Steinhoff CLN at carrying value of R206.2 million (cum interest).
The invested asset acquired from RMB during 2009 financial year relates to the Tourvest loan asset purchased forR49.6 million.
During the 2009 financial year, the Gold Fields preference shares were redeemed via RMB at the carrying value ofR81.6 million (cum interest).
Details of the bridging loan and preference share funding facilities with RMB are contained within notes 17 and 18.
The Group provided funding on an arm’s length basis to a company which acquired an interest in Emira and Mr BJ van der Ross, a director of Makalani, is a shareholder of that company. This transaction is discussed infurther detail on page 4 of this report.
25. CONTINGENT LIABILITIES The Group is not aware of any contingent liabilities.
26. CAPITAL COMMITMENTSThe Group has no irrevocable commitments to invest funds in potential new transactions. At 30 June 2009,certain transactions amounting to approximately R100 million have been reserved. These commitments are notyet irrevocable as they are still subject to various other conditions before drawdown. All commitments will be met from the Group’s existing cash resources and/or borrowings.
Makalani fin final 9/17/09 6:29 PM Page 60

MAKALANI ANNUAL REPORT 61
27. BORROWING POWERSIn terms of the Company’s Articles of Association, the Company may from time to time borrow such sums as thedirectors deem fit. The board has approved for the Group to incur borrowings of up to R750 million for the purposeof performing repurchases and making new investments. The Company, however, does not intend to incur furtherlong-term borrowings.
28. SHARE-BASED PAYMENTSThe Group did not enter into any linked unit-based transactions or arrangements during the period.
29. CRITICAL ACCOUNTING ESTIMATES AND JUDGEMENTS IN APPLYING ACCOUNTING POLICIESThe Group makes estimates and assumptions that affect the reported amounts of assets and liabilities. Estimatesand judgements are continually evaluated and are based on historical experience and other factors, includingexpectations of future events that are believed to be reasonable under the circumstances.
29.1 Fair value of financial assetsThe fair value of financial instruments that are not quoted in active markets are determined by using valuationtechniques. Where valuation techniques (for example, models) are used to determine fair values, these arevalidated and periodically reviewed by qualified personnel. All models are reviewed before they are used and arecalibrated to ensure that outputs reflect actual data and comparative market prices. To the extent practical,models use only observable market data, however, areas such as credit risk (both own and counterparty),volatilities and correlations require management to make estimates. Changes in assumptions about these factorscould affect the reported fair values of financial instruments.
29.1.1. Loans and advances designated at fair value through profit and loss are valued using a combination of thefollowing:• mapping to international scale ratings from external rating agencies for any credit migration are estimated
and not always necessarily supported by prices from any observable market prices;• discounting future cash flows by reference to published price quotations in an active market for changes in
market prices for fixed-rate assets where applicable; and• discounting estimated future cash flows not necessarily based on available observable market data in
instances of impairment forming part of fair value. The Company uses management forecasts, the CapitalAsset Pricing Model, Relevering Beta’s and peer comparisons in arriving at fair value.
29.1.2. Ordinary shares under fair value through profit and loss (“Ordinary shares”)
Unlisted ordinary shares are valued using a combination of the following, which are supported by bothobservable market prices and management estimations in addition to items under 29.1.1 above:• earnings multiple;• discounted cash flows of the underlying business;• industry valuation benchmarks; and• available market prices.
29.1.3. Preference shares under fair value through profit and loss (“Preference shares”)The value of participating preference shares is calculated as the net asset value of the structure to which the EPI isattached. The asset portion is marked to market to the relevant listed counter or unlisted asset. The liability portion issourced per the relevant funding provided. A discount is then applied to the net asset value as per note 14.
29.2 Income taxesThe current income tax charge is calculated on the basis of the tax laws enacted or substantively enacted at thebalance sheet date in the countries where the Company’s subsidiaries and associates operate and generatetaxable income. Management periodically evaluates positions taken in tax returns with respect to situations inwhich applicable tax regulation is subject to interpretation. It establishes provisions where appropriate on thebasis of amounts expected to be paid to the tax authorities.
The Group has recognised deferred tax on all deductible temporary differences, unused STC credits and aportion of the assessed loss. The Group has not recognised the full value of the assessed loss as a deferred taxasset due to the conduit nature of the Group and the wind-down strategy as communicated to the market.Management therefore does not believe that sufficient future taxable profits will be generated for the forseeablefuture against which the full value of the assessed loss could be utilised.
Makalani fin final 9/17/09 6:29 PM Page 61

62 MAKALANI ANNUAL REPORT
Notes to the consolidated financial statements CONTINUED
for the year ended 30 June 2009
29. CRITICAL ACCOUNTING ESTIMATES AND JUDGEMENTS IN APPLYING ACCOUNTING POLICIES (continued)
29.3 Linked unitsIAS 32 – Financial Instruments: Presentation and Disclosure requires the Group, as an issuer of a non-derivativecompound financial instrument (linked unit), to evaluate the terms of the financial instrument to determinewhether it contains both a liability and an equity component.
The Group’s linked units, as disclosed in notes 15 and 16, contain elements of liability and equity and thereforethe proceeds from the issue of the linked units were split at initial recognition between the liability and equitycomponent. The Group applied judgement in determining the allocation of the proceeds from each linked unitinto liability and equity components. The basis of the split is that the Group intended to invest 75% of its capitalin interest-bearing assets that would provide the required return on the debentures issued and 25% intodividend-bearing assets for dividend income and capital growth from these assets and that would provide aresidual return for the ordinary shares issued.
This significant judgement is applied only when linked units are initially issued, as IAS 32 requires classification ofthe liability and equity components of a compound instrument not to be revised once the liability and equity splithas been completed at initial recognition. Subsequent changes in the investment mix would not have an impacton the initial split of existing linked units, but could have an impact on the liability and equity split of linked unitsissued or repurchased at a later date.
30. LINKED UNITS REPURCHASEDuring April 2008, the Company repurchased 1 077 206 of its issued linked units for a total consideration of
R100.1 million. The repurchased units represented 4.8% of the then issued share and debenture capital. Of the
linked units that have been repurchased, all have been cancelled and delisted from the JSE. Treasury units are
currently held through a 100%-held subsidiary, which has been consolidated in accordance with the basis of
consolidation note above.
In calculating the allocation of the consideration paid and transaction costs to the equity and debenture
components of the linked units, the methodology applied is consistent with that used in the original allocation of
the separate components of the proceeds received by the Company when the linked units were first issued. The
consideration paid was allocated to the debenture and equity component of the linked unit in the ratio of 75%
and 25% respectively.
The consideration paid for the equity component of the treasury and cancelled linked units was deducted fromshare capital and premium. The debenture portion of the repurchase was derecognised from the balance sheetand the difference between the carrying value of the debentures and the consideration included in the incomestatement.
31. PROPERTY AND EQUIPMENTThe Group does not own any property and equipment.
32. LEASESThe Group does not have any leases (either as a lessee or lessor).
33. FOREIGN CURRENCYThe Group does not have any balances or transactions denominated in foreign currency for the year ended
30 June 2009.
34. COMMODITIESThe Group does not have any commodities as at 30 June 2009.
35. EMPLOYEE BENEFITSThe Group does not employ any staff, having contracted its management to Manco.
36. EVENTS SUBSEQUENT TO THE BALANCE SHEET DATESubsequent to the reporting date, Makalani has declared a dividend per share of 396 cents as outlined in the
declaration of final dividend and interest.
Makalani fin final 9/17/09 6:29 PM Page 62

MAKALANI ANNUAL REPORT 63
37. STANDARDS AND INTERPRETATIONS ISSUED BUT NOT YET EFFECTIVEThe Group will comply with the following new standards and interpretations applicable to its business from thestated effective dates:
Effective date
IFRIC 15 Agreements for the Construction of Real Estate Annual periods commencing on or after 1 January 2009
The interpretation clarifies when real estate sales should beIAS 18 – Revenue.
The interpretation is not applicable to the Group.
IFRIC 16 Hedges of a Net Investment in a Foreign Operation Annual periods commencing on or after 1 October 2008
The interpretation clarifies which risks can be hedged under a hedge of the net investment in a foreign operation and by which entities within the Group the hedging instruments can be held in order to qualify as a hedge of a net investment in a foreign operation.
The interpretation is not applicable to the Group.
IFRIC 17 Distribution of Non-cash Assets to Owners Annual periods commencing on or after 1 July 2009
The interpretation clarifies how an entity should measure distribution of assets other than when it pays cash dividends to its owners. At present there is diversity in practice when accounting for these dividends payable. These assets will be measured at their fair value, and the difference between the fair value and the carrying value will be recorded in the profit or loss for the period.
The impact of this interpretation on the Group is not considered to be significant.
IFRIC 18 Transfers of Assets from Customer Annual periods commencing on or after 1 July 2009
The interpretation clarifies how an entity should treat items of property, plant and equipment from its customers that must be used to connect those customers to a network and provide them with ongoing access to a supply of commodities such as electricity, gas or water. An entity could also receive cash from customers for the acquisition or construction of such items of property, plant and equipment. This interpretation applies to the accounting for such transfers.
This amendment is not expected to impact the Group’s results significantly.
Makalani fin final 9/17/09 6:29 PM Page 63

64 MAKALANI ANNUAL REPORT
Notes to the consolidated financial statements CONTINUED
for the year ended 30 June 2009
37. STANDARDS AND INTERPRETATIONS ISSUED BUT NOT YET EFFECTIVE (continued)
Effective date
IFRS 1 Cost of an Investment in a Subsidiary, Jointly Annual periods and Controlled Entity or Associate commencing on or IAS 27 after 1 January 2009(revised)
The amendments to IFRS 1 allow first-time adopters of IFRS 1 to use a deemed cost option for determining the cost of an investment in a subsidiary, jointly controlled entity or associate.
This amendment will not impact the Group as the Group adopted IFRS in full in the financial year ending 30 June 2006. Consequently, IFRS 1 is no longer appropriate.
IFRS 2 Vesting Conditions and Cancellations Annual periods (amended) commencing on or after
1 January 2009
The amendments to IFRS 2 clarify that vesting conditions are performance conditions and service conditions only. The amendment also clarify that cancellations of share options by parties other than the entity are to be accounted for in the same way as cancellations by the entity.
This amendment is not expected to impact the Group’s results significantly.
IFRS 2 Group Cash-settled Share-based Payment Transactions Annual periods (amended) commencing on or after
1 January 2010
The amendments clarify how an individual subsidiary in a groupshould account for some share-based payment arrangements in its own financial statements. In these arrangements, the subsidiary receives goods or services from employees or suppliers but its parent or another entity in the group must pay those suppliers. The amendments make clear that:
An entity that receives goods or services in a share-based payment arrangement must account for those goods or services no matter which entity in the group settles the transaction, and no matter whether the transaction is settled in shares or cash.
This amendment is not expected to impact the Group’s results significantly.
IFRS 3 Revision to IFRS 3 – Business Combinations and IAS 27 – Annual periods and Consolidated and Separate Financial Statements commencing on or IAS 27 after 1 July 2009(revised)
The revised IFRS 3 retains the current basic requirements. The most significant amendments are that the acquisition related costs will nowbe recognised as an expense in the income statement when incurred,rather than including it in goodwill.
The revised IFRS 3 also states that contingent consideration must be recognised and measured at fair value at the acquisition date. Subsequent changes in fair value are recognised in accordance with other IFRSs,usually in the income statement rather than by adjusting goodwill.
The amendment to IAS 27 requires that changes in a parent’s ownership interest in a subsidiary that does not result in a loss of control to be accounted for within equity.
The amendments are expected to affect the Group’s accounting for business combinations that arise after the effective date. The amendment to IAS 27 requires that transactions with minorities be accounted for in equity and will require a prospective change in accounting policy for the Group in line with the amended transitional provisions.
Makalani fin final 9/17/09 6:29 PM Page 64

MAKALANI ANNUAL REPORT 65
37. STANDARDS AND INTERPRETATIONS ISSUED BUT NOT YET EFFECTIVE (continued)
Effective date
IFRS 7 Financial Instruments: Disclosures Annual periodscommencing on or after 1 January 2009
The amendments to IFRS 7 will require enhanced disclosures about fair value measurements and liquidity risk.
The amendment addresses disclosure in the annual financial statements and will not affect recognition and measurement.
IFRS 8 Operating Segments Annual periodscommencing on or after 1 January 2009
IFRS 8 replaces IAS 14 – Segment Reporting. IFRS 8 requires an entity to report financial and descriptive information about its reportable operating segments. Operating segments are components of an entity about which separate financial information is available and that is evaluated regularly by the chief operating decision-maker in deciding how to allocate resources and assessing performance.
The standard addresses disclosure in the annual financial statements and will not affect recognition and measurement. The impact on the revised disclosure is not expected to be significant.
IAS 1 Presentation of Financial Statements Annual periods(revised) commencing on or after
1 January 2009The main change in the revised IAS 1 is the requirement to present all non-owner transactions in the statement of comprehensive income. The amendment also requires two sets of comparative numbers to be provided for the financial position in any year where there has been a restatement or reclassification of balances.
The amendments will not affect the financial position or results of the Group but will introduce some changes to the presentation of the financial position, changes in equity and financial results of the Group.
IAS 23 Borrowing Costs Annual periods(amended) commencing on or after
1 January 2009The amendment removes the option of immediately recognising as an expense borrowing costs that relate to assets that take a substantial period of time to get ready for use or sale. The capitalisation of borrowing costs as part of the cost of such assets is therefore now required.
The Group’s accounting policy is to capitalise borrowing costs on a qualifying asset. The amendment will therefore not have an effect on the Group’s results.
Makalani fin final 9/17/09 6:29 PM Page 65

66 MAKALANI ANNUAL REPORT
Notes to the consolidated financial statements CONTINUED
for the year ended 30 June 2009
37. STANDARDS AND INTERPRETATIONS ISSUED BUT NOT YET EFFECTIVE (continued)
Effective date
IAS 32 Financial Instruments Puttable at Fair Value Annual periods(amended) commencing on or after
1 January 2009The amendment to IAS 32 requires the classification of certain puttable financial instruments and financial instruments that impose on the issuer an obligation to deliver a pro-rata share of the entity only on liquidation as equity. The amendments sets out specific criteria that are to be met to present the instruments as equity together with related disclosure requirements.
This amendment is not expected to have an impact on the Group.
IAS 39 Eligible Hedged Items Annual periods(amended) commencing on or after
1 July 2009The amendment clarifies that inflation may only be hedged in instances where changes in inflation are contractually specified portions of cash flows of a recognised financial instrument. It also clarifies that an entity is permitted to designate purchase or net purchased options as a hedging instrument in a hedge of a financial or non-financial item and to improve effectiveness, an entity is allowed to exclude the time value of money from the hedging instrument.
This amendment is not expected to have a significant impact to the Group.
Annual Annual Improvements Project Annual periodsImprove- commencing on orments after 1 January 2009
As part of its first annual improvements projects, the IASB has issued its edition of annual improvements. The annual improvement project’s aim is to clarify and improve the accounting standards. The improvements include those involving terminology or editorial changes with minimal effect on recognition and measurement.
There are no significant changes in the current year’s improvement that will affect the Group.
Makalani fin final 9/17/09 6:29 PM Page 66

for the year ended 30 June 2009
MAKALANI ANNUAL REPORT 67
ReportingInterims for 2010 31 December 2009
Announcement of results Early March 2010
Final for 2010 30 June 2010
– Announcement of results Mid-September 2010
– Annual report posted End September 2010
– Annual general meeting End October 2010
Dividends and interest distributionsInterims for 2010 31 December 2009
– Declared Early March 2010
– Payable Mid-March 2010
Final for 2010 30 June 2010
– Declared Mid-September 2010
– Payable Early October 2010
Unitholders’ information
Makalani fin final 9/17/09 6:29 PM Page 67

68 MAKALANI ANNUAL REPORT
Unitholders’ information CONTINUED
for the year ended 30 June 2009
Unitholders’ analysis at 30 June 2009*
Linked units
Number of Unitholders Number issued
unitholders % of units %
Range1 – 10 000 326 79.13 595 682 2.52 10 001 – 50 000 48 11.65 1 255 323 5.32 50 001 – 100 000 10 2.43 776 786 3.30 100 001 – 500 000 16 3.88 2 665 900 11.30 500 001 – 1 000 000 3 0.73 2 010 259 8.52 1 000 001 – and more 9 2.18 16 288 618 69.04
412 100.00 23 592 568 100.00
Non-publicDirectors 1 0.24 2 500 0.01 FirstRand Bank Limited 1 0.24 5 480 885 23.23 Makalani Treasury 1 0.24 2 240 000 9.49
3 0.72 7 723 385 32.73
Public categoryNominees and trusts 68 16.50 4 702 093 19.93 Banks 36 8.74 6 128 365 25.98 Pension and provident funds 64 15.53 3 970 946 16.83 Private companies 19 4.61 241 401 1.02 Other corporate bodies 175 42.48 680 870 2.89 Individuals 39 9.47 138 108 0.59 Close corporations 8 1.95 7 400 0.03
409 99.28 15 869 183 67.27
Total public and non-public 412 100.00 23 592 568 100.00
The following unitholders beneficially held directly or indirectly, at 30 June 2009, in excess of 5% of the linked units of theCompany:
Number of Linked unitslinked units %
FirstRand Bank Limited 5 480 885 23.23 RMB Asset Management 4 939 263 20.94 Makalani Treasury 2 240 000 9.49 Public Investment Corporation 1 614 756 6.84 ABSA Stockbrokers 1 437 432 6.09 Liberty Life 1 402 160 5.94 Golden Hind Partnership 1 185 119 5.02
18 299 615 77.55
* Extracted from unitholders’ analysis provided by the Company’s transfer secretaries, Link Market Services South Africa (Proprietary) Limited.
Makalani fin final 9/17/09 6:29 PM Page 68

MAKALANI ANNUAL REPORT 69
Listed below are fund managers managing more than 5% of the linked units of the Company*:
Number Number of Linked units
Manager of funds linked units %
RMBAM 31 4 939 263 20.94
Liberty Life 1 1 402 160 5.94
32 6 341 423 26.88
* Extracted from unitholders’ analysis provided by the Company’s transfer secretaries, Link Market Services South Africa (Proprietary) Limited.
Linked unit performance on the JSEas at 30 June**
2009 2008
Number of units in issue 23 592 568 24 929 774
Unit prices (cents per unit)
– Closing 6 450 9 000
– High 9 000 10 000
– Low 5 051 8 890
Volume of units traded 2 048 442 7 564 021
Value of units traded (R’million) 147 702
Market capitalisation (R’million) 1 522 2 244
** Extracted from I-Net Bridge.
Makalani fin final 9/17/09 6:29 PM Page 69

70 MAKALANI ANNUAL REPORT
Definitions
Throughout this annual report and annexures thereto, unless otherwise stated or the context otherwise indicates, the words inthe first column shall have the corresponding meaning stated opposite them in the second column, words in the singular shallinclude the plural and vice versa, words importing natural persons shall include corporations and associations of persons andany reference to one gender shall include the other genders:
“Act” or “Companies Act” the Companies Act 61 of 1973, as amended;“BEE” Black economic empowerment;“board of directors” the board of directors of Makalani;“CEO” Chief Executive Officer of Makalani Holdings Limited;“certificated linked units” linked units held in certificated form;“CSDP” Central Securities Depository Participant;“debenture” an unsecured variable rate debenture with a nominal value of R75, created
and issued by Makalani subject to the terms and conditions of the debenture trust deed;
“dematerialised linked units” linked units held in dematerialised form;“directors” directors of Makalani;“EPI” Equity participation instrument;“FD” Financial Director of Makalani Holdings Limited;“FirstRand” FirstRand Limited (registration number 1966/010753/06), a public company
duly incorporated in South Africa and listed on the JSE and the Namibian Stock Exchange;
“the FirstRand Group” FirstRand and its subsidiaries;“FSC” Financial Sector Charter adopted by the Association of Black Securities and
Investment Professionals, the Banking Council of South Africa, the Foreign BankersAssociation of South Africa and other persons on 17 October 2003;
“FSC-compliant investments” BEE transaction funding and other targeted investments as contemplated in the FSC;
“FSC scorecard” the scorecard contained in the FSC that outlines the points available for eachcategory of the FSC;
“the Group” Makalani and its subsidiary company, Makalani Treasury;“IFRIC” International Financial Reporting Interpretations Committee;“IFRS” International Financial Reporting Standards;“JIBAR” Johannesburg InterBank Agreed Rate;“JSE” JSE Limited;“King II” the Code of Corporate Practices and Conduct contained within the King Report
on Corporate Governance for South Africa 2002;“linked units” or “Makalani linked a unit comprising one ordinary share of R0.0001 cents, issued at a premium ofunits” R24.9999, and one debenture of R75 each;“Makalani” or “the Company” Makalani Holdings Limited (registration number 2005/000726/06), a public
company duly incorporated in South Africa;“Manco” Makalani Management Company (Proprietary) Limited (registration number
2004/023302/07), a private company duly incorporated in South Africa;“Makalani Treasury” Makalani Treasury Units (Proprietary) Limited (formerly Business Venture
Investments No 111 (Proprietary) Limited), a wholly owned subsidiary of the Company;
“management agreement” the management agreement entered into between Makalani and Manco on 19 April 2005;
“ordinary shares” or “Makalani ordinary shares with a par value of R0.0001 each in the issued share capitalordinary shares” of Makalani;“RMB” or “Rand Merchant Bank” Rand Merchant Bank, a division of FirstRand Bank Limited;“RMBAM” RMB Asset Management (Proprietary) Limited;“SENS” the Securities Exchange News Service of the JSE;“SPV” Special-purpose vehicle; and“transfer secretaries” Link Market Services South Africa (Proprietary) Limited (Registration number
2000/007239/07).
Makalani fin final 9/17/09 6:29 PM Page 70

MAKALANI ANNUAL REPORT 71
Notice of annual general meeting
Makalani Holdings Limited(Incorporated in the Republic of South Africa)(Registration number 2005/000726/06)JSE code: MKLISIN: ZAE000066700(“Makalani or “the Company”)
Notice is hereby given that the fourth annual general meeting of Makalani will be held at Makalani Holdings Limited, The Reserve, 52 – 54 Melville Road, Illovo, Gauteng, on Monday, 26 October 2009 at 09h00, and if approved; pass the following resolutions with or without modifications.
1. Ordinary resolution number 1Approval of annual financial statementsTo accept and approve the audited annual financial statements of the Company and the Group for the year ended30 June 2009.
2. Ordinary resolution number 2Final distributionTo note the final distribution of 520 cents per linked unit declared on 25 August 2009.
3. Ordinary resolution number 3.1 to 3.3Reappointment of directorsTo reappoint the below-mentioned directors by way of seperate resolutions, who retire by rotation in terms of theCompany’s Articles of Association (“the Company’s Articles”) and who, being eligible, offer themselves for re-election:
3.1 VIVIAN WADE BARTLETT (66)Independent Non-executive ChairmanAMP (Harvard), FIBSAAppointed February 2005
DirectorshipsFirstRand LimitedFirstRand Bank Holdings LimitedFirstRand STI Holdings Limited
3.2 DINES CHANDRA MANILAL GIHWALA (56)Independent Non-executive DirectorBProc (UWC), HDip Tax (RAU)Appointed February 2005
DirectorshipsDLA Cliff Dekker Hofmeyr Inc.Santam LimitedRedefine Income Fund Limited
3.3 BENEDICT JAMES VAN DER ROSS (62) Independent Non-executive DirectorDip Law (UCT) Appointed February 2005
DirectorshipsFirstRand LimitedFirstRand Bank Holdings Limited Strategic Real Estate Management (Proprietary) Limited – Chairman (managers of the EMIRA Property Fund) Corridor Infrastructure Developments (Proprietary) Limited Distell Group Limited Lewis Group Limited Naspers Limited Pick n Pay Stores Limited
Makalani fin final 9/17/09 6:29 PM Page 71

72 MAKALANI ANNUAL REPORT
Notice of annual general meeting CONTINUED
4. Ordinary resolution number 4Approval of directors’ remuneration for the year ended 30 June 2009To approve the remuneration of the directors as reflected on page 30 of the financial statements.
5. Ordinary resolution number 5Approval of directors’ fees for the year ending 30 June 2010To approve the fees of the directors for the year to 30 June 2010 as reflected below:
Makalani board ProposedChairman R157 500 per annum
Director R105 000 per annum
Chief Executive Officer R157 500 per annum
Audit committee
Chairman R30 000 per meeting
Member R14 500 per meeting
Ad hoc meetings (in exceptional circumstances) R2 600 per hour
These fees represent an increase of approximately 8% over those paid in the previous year.
6. Ordinary resolution number 6Approval of reappointment of auditors
To reappoint PricewaterhouseCoopers Inc. as auditors of the Company and to appoint Mr Ranesh Hariparsad as
the individual registered auditor of the Company for the ensuing financial year.
7. Ordinary resolution number 7Approval of auditors’ remuneration
To authorise the directors to determine and pay the auditors’ remuneration, on the recommendation of the Audit
Committee, for the period ended 30 June 2009.
To transact any other business that may be transacted at an annual general meeting.
Please note that any unlisted securities, and shares held as treasury shares will not have their votes taken into
account for the purposes of resolutions proposed in terms of the Listings Requirements of the JSE Limited.
By order of the board of directors
AH ArnottBCom, CA (SA)
Company secretary
16 September 2009
Makalani fin final 9/17/09 6:29 PM Page 72

Important notes regarding the attendance at theannual general meeting
MAKALANI ANNUAL REPORT 73
GeneralUnitholders wishing to attend the annual general meeting must ensure beforehand with the Transfer Secretaries of the
Company that their linked units are in fact registered in their name.
Certificated unitholdersUnitholders who have not dematerialised their linked units or who have dematerialised their linked units with “own name”
registration are entitled to attend and vote at the meeting and are entitled to appoint a proxy or proxies to attend, speak
and vote in their stead. The person so appointed need not be a unitholder. Proxy forms must be forwarded to reach the
registered office of the Company’s transfer secretaries, Link Market Services South Africa (Proprietary) Limited, situated
at 11 Diagonal Street, Johannesburg, 2001 (PO Box 4844, Johannesburg, 2000), by no later than 10h00 on Thursday,
22 October 2009.
Dematerialised unitholdersUnitholders who have dematerialised their linked units, other than those unitholders who have dematerialised their linked
units with “own name” registration, should contact their Central Securities Depositary Participant (CSDP) or broker in the
manner and time stipulated in their agreement:
• to furnish them with their voting instructions; and
• in the event that they wish to attend the meeting, to obtain the necessary authority to do so.
On a show of hands, every unitholder of the Company present in person represented by proxy shall have one vote only.
On a poll, every unitholder of the Company shall have one vote for every linked unit held in the Company by such
unitholder.
AH ArnottBCom, CA (SA)
Company secretary
Makalani fin final 9/17/09 6:29 PM Page 73

74 MAKALANI ANNUAL REPORT
Administration
REGISTERED OFFICE4th Floor, 4 Merchant Place, Corner Fredman Drive and Rivonia Road, Sandton, 2196
PO Box 781463, Sandton, 2146
Tel: +27 11 428 0680 Fax: +27 11 447 7389
Email: [email protected] Web: www.makalani.co.za
PHYSICAL OFFICEThe Reserve, 52 – 54 Melville Road, Illovo, Gauteng
DIRECTORSVW Bartlett (Chairman), K Pillay (Chief Executive Officer), DCM Gihwala, RJC Hamer, BD Hopkins, D Konar,
GL Minnaar (Financial Director), SEN Sebotsa and BJ van der Ross
COMPANY SECRETARYAH Arnott, 4th Floor, 4 Merchant Place, Corner Fredman Drive and Rivonia Road, Sandton, 2196
TRANSFER SECRETARYLink Market Services South Africa (Proprietary) Limited
5th Floor, 11 Diagonal Street, Johannesburg, 2001
PO Box 4844, Johannesburg, 2000
SPONSORRand Merchant Bank (A division of FirstRand Bank Limited)
1 Merchant Place, Corner Fredman Drive and Rivonia Road, Sandton, 2196
AUDITORSPricewaterhouseCoopers Inc.
2 Eglin Road, Sunninghill, 2157
Private Bag X36, Sunninghill, 2157
Makalani fin final 9/17/09 6:29 PM Page 74

Proxy form
For use at the annual general meeting – unitholders
Makalani Holdings Limited(Incorporated in the Republic of South Africa)
(Registration number 2005/000726/06)
JSE code: MKL, ISIN: ZAE000066700
(“Makalani” or “the Company”)
This form should only be used by unitholders who hold their linked units in certificated form or unitholders who have dematerialisedtheir linked units with “own name” registration. All other dematerialised unitholders must contact their CSDP or broker to make therelevant arrangements concerning voting and/or attendance at the annual general meeting.
For completion by the aforesaid registered unitholders who hold linked units in the Company and who are unable to attend the 2009 annualgeneral meeting of the Company to be held at Makalani Holdings Limited, The Reserve, 52 – 54 Melville Road, Illovo, Gauteng, on Monday,26 October 2009 at 09h00 (“the annual general meeting”).
I/We, – – – – – – – – – – – – – – – – – – – – – – – – – – – – – – – – – – – – – – – – – – – – – – – – – – – – – – – – – – – – – – – – – – – – – – – – – – – – – –
of (address) – – – – – – – – – – – – – – – – – – – – – – – – – – – – – – – – – – – – – – – – – – – – – – – – – – – – – – – – – – – – – – – – – – – – – – – – – – –
being the holder/s of – – – – – – – – – – – – – – – – – – – – – – – – – – – – – – – – – – – – – – – – – – – linked units in the Company, hereby appoint
1. – – – – – – – – – – – – – – – – – – – – – – – – – – – – – – – – – – – – – – – – – – – – – – – – – – – – – – – – – – – – – – – – – – – – – – or, failing him/her
2. – – – – – – – – – – – – – – – – – – – – – – – – – – – – – – – – – – – – – – – – – – – – – – – – – – – – – – – – – – – – – – – – – – – – – – or, failing him/her
3. the Chairperson of the annual general meeting, as my/our proxy to attend, speak and vote for me/us on my/our behalf or to abstainfrom voting at the annual general meeting of the Company and at any adjournment thereof, as follows (see instruction below):
Insert an “X” or the number of votes exercisable (one vote per share)
In favour of Against Abstain
Ordinary resolution number 1Approval of annual financial statements
Ordinary resolution number 2Final distribution
Ordinary resolution number 3Reappointment of directors3.1 VW Bartlett
3.2 DCM Gihwala
3.3 BJ van der Ross
Ordinary resolution number 4Approval of directors’ remuneration for the year ended 30 June 2009
Ordinary resolution number 5Approval of directors’ fees for the year ending 30 June 2010
Ordinary resolution number 6Approval of reappointment of auditors
Ordinary resolution number 7Approval of auditors’ remuneration
Signed at – – – – – – – – – – – – – – – – – – – – – – – – – – – – – – – on – – – – – – – – – – – – – –day of – – – – – – – – – – – – – – – – – – – – – 2009
Signature/s – – – – – – – – – – – – – – – – – – – – – – – – – – – – – – – – – – – – – – – – – – – – – – – – – – – – – – – – – – – – – – – – – – – – – – – – – – –
Assisted by – – – – – – – – – – – – – – – – – – – – – – – – – – – – – – – – – – – – – – – – – – – – – – – – – – – – – – – – – – – – – – – – – – – – – – – – – – –(where applicable)
MAKALANI ANNUAL REPORT 75
Makalani fin final 9/17/09 6:29 PM Page 75

76 MAKALANI ANNUAL REPORT
Notes
Use of proxiesA unitholder who holds linked units in Makalani (“unitholder”) is entitled to attend and vote at the annual general meeting
and to appoint one or more proxies to attend, speak and vote in his/her stead. A proxy need not be a unitholder of the
Company.
Every unitholder present in person or by proxy and entitled to vote at the annual general meeting of the Company shall,
on a show of hands, have one vote only, irrespective of the number of linked units such unitholder holds, but in the event
of a poll, every linked unit in the Company shall have one vote.
Instructions on signing and lodging the proxy form:1. A unitholder may insert the name of a proxy or names of two alternative proxies of the unitholder’s choice in the
space/s provided overleaf, with or without deleting “the Chairman of the annual general meeting”, but any such
deletion must be initialled by the unitholder. Should this space be left blank, the Chairman of the annual general
meeting will exercise the proxy. The person whose name appears first on the proxy form and who is present at the
annual general meeting will be entitled to act as proxy to the exclusion of those whose names follow.
2. A unitholder’s voting instructions to the proxy must be indicated by the insertion of the number of votes
exercisable by that unitholder in the appropriate spaces provided overleaf. Failure to do so shall be deemed to
authorise the proxy to vote or to abstain from voting at the annual general meeting, as he/she thinks fit in respect
of all the unitholder’s exercisable votes. A unitholder or his/her proxy is not obliged to use all the votes exercisable
by his/her proxy, but the total number of votes cast, or those in respect of which abstention is recorded, may not
exceed the total number of votes exercisable by the unitholder or by his/her proxy.
3. A minor must be assisted by his/her parent or guardian unless the relevant documents establishing his/her legal
capacity are produced or have been registered by the transfer secretaries.
4. To be valid the completed proxy forms must be forwarded to reach the Company’s transfer secretaries by no later
than 22 October 2009 at 10h00. Proxy forms may only be completed by unitholders who have not dematerialised
their linked units or who have dematerialised their linked units with “own name” registration.
5. Documentary evidence establishing the authority of a person signing a proxy form in a representative capacity
must be attached to the proxy form unless previously recorded by the transfer secretaries or waived by the
Chairman of the annual general meeting.
6. The completion and lodging of his proxy form shall not preclude the relevant unitholder from attending the
annual general meeting and speaking and voting in person thereat to the exclusion of any proxy appointed in
terms thereof, should such unitholder wish to do so.
7. The completion of any blank spaces overleaf need not be initialled. Any alteration or corrections to this proxy form
must be initialled by the signatory/ies.
8. The Chairman of the annual general meeting may reject or accept any proxy form which is completed other than
in accordance with these instructions, provided that he is satisfied as to the manner in which a unitholder wishes
to vote.
Makalani fin final 9/17/09 6:29 PM Page 76

G R A P H I C O R 4 0 9 8 0MAKALANI ANNUAL REPORT
Contents
KEY RATIOS 1
COMPANY PROFILE 2
PORTFOLIO REPORT 3
CHAIRMAN’S REPORT 7
CHIEF EXECUTIVE OFFICER’S REPORT 9
FINANCIAL DIRECTOR’S REPORT 11
BOARD PROFILE 15
CORPORATE GOVERNANCE 18
ANNUAL FINANCIAL STATEMENTS 23
UNITHOLDERS’ INFORMATION 67
DEFINITIONS 70
NOTICE OF ANNUAL GENERAL MEETING 71
ADMINISTRATION 74
PROXY FORM 75
Cover Makalani 9/17/09 2:50 PM Page 2

www.makalani.co.za
09ANNUAL REPORT
MA
KA
LAN
I AN
NU
AL REPO
RT
Cover Makalani 9/17/09 2:50 PM Page 1