cover front 11sep21 v1 - AnnualReports.com · 5. Market for Registrant’s Common Equity, Related...
88
Transcript of cover front 11sep21 v1 - AnnualReports.com · 5. Market for Registrant’s Common Equity, Related...

lara
UNITED STATES SECURITIES AND EXCHANGE COMMISSION
WASHINGTON, D.C. 20549
FORM 10-K (Mark One) ANNUAL REPORT PURSUANT TO SECTION 13 OR 15(d) OF THE SECURITIES EXCHANGE ACT OF 1934
For the Fiscal Year Ended June 30, 2011
or TRANSITION REPORT PURSUANT TO SECTION 13 OR 15(d) OF THE SECURITIES EXCHANGE ACT OF 1934
For the transition period from to .
Commission File Number: 0-30260
eGain Communications Corporation (Exact name of registrant as specified in its charter)
Delaware 77-0466366(State or other jurisdiction
of incorporation or organization)(I.R.S. Employer
Identification No.)
345 E. Middlefield Road, Mountain View, California 94043 (650)230-7500(Address of principal executive offices, including zip code) (Registrant’s telephone number, including area code)
Securities registered pursuant to Section 12(b) of the Act: None
Securities registered pursuant to Section 12(g) of the Act:
Common Stock, par value $0.001 per share Indicate by check mark if registrant is a well-known seasoned issuer, as defined in Rule 405 of the Securities Act. Yes No Indicate by check mark if registrant is not required to file reports pursuant to Section 13 or Section 15(d) of the Act. Yes No Indicate by check mark whether the registrant: (1) has filed all reports required to be filed by Section 13 or 15(d) of the Securities
Exchange Act of 1934 during the preceding 12 months (or for such shorter period that the registrant was required to file such reports), and (2) has been subject to such filing requirements for the past 90 days: Yes No
Indicate by check mark whether the registrant has submitted electronically and posted on its corporate Web site, if any, every Interactive Data File required to be submitted and posted pursuant to Rule 405 of Regulation S-T (§232.405 of this chapter) during the preceding 12 months (or for such shorter period that the registrant was required to submit and post such files). Yes No .
Indicate by check mark if disclosure of delinquent filers pursuant to Item 405 of Regulation S-K is not contained herein, and will not be contained, to the best of registrant’s knowledge, in definitive proxy or information statements incorporated by reference in Part III of this Form 10-K or any amendment to this Form 10-K.
Indicate by check mark whether the registrant is a large accelerated filer, an accelerated filer, or non-accelerated filer or a smaller reporting company. See the definitions of “large accelerated filer”, “accelerated filer” and “smaller reporting company”, in Rule 12b-2 of the Exchange Act (check one):
Large accelerated filer Accelerated filer Non-accelerated filer (Do not check if a smaller reporting company) Smaller reporting company Indicate by check mark whether the registrant is a shell company (as defined in Rule 12b-2 of the Exchange Act): Yes No . The aggregate market value of the voting and non-voting common equity held by non-affiliates, on the OTC Bulletin Board on
December 31, 2010 (the last business day of registrant’s second quarter of fiscal 2011), was approximately $4.4 million. For purposes of the foregoing calculation only, the registrant has included in the shares owned by affiliates the beneficial ownership of voting and non-voting common equity of officers and directors, and affiliated entities, of the registrant and members of their families. Such inclusion shall not be construed as an admission that any such person is an affiliate for any other purpose.
Indicate the number of shares outstanding of each of the issuer’s classes of common stock, as of the latest practicable date.
Class Outstanding at
September 22, 2011
Common Stock $0.001 par value ........................................................................................................................... 22,121,511
DOCUMENTS INCORPORATED BY REFERENCE Items 10 (as to directors), 11, 12, 13 and 14 of Part III incorporate by reference information from the registrant’s proxy statement to be
filed with the Securities and Exchange Commission in connection with the solicitation of proxies for the registrant’s 2011 Annual Meeting of Stockholders.

i
eGAIN COMMUNICATIONS CORPORATION TABLE OF CONTENTS
2010 FORM 10-K
Item No.
Page
PART I
1. Business ................................................................................................................................................................................... 1
1A. Risk Factors ............................................................................................................................................................................. 9
1B. Unresolved Staff Comments .................................................................................................................................................... 18
2. Properties ................................................................................................................................................................................. 18
3. Legal Proceedings ................................................................................................................................................................... 19
4. Removed and Reserved ........................................................................................................................................................... 19
PART II
5. Market for Registrant’s Common Equity, Related Stockholder Matters and Issuer Purchases of Equity Securities .............. 20
6. Selected Financial Data ........................................................................................................................................................... 22
7. Management’s Discussion and Analysis of Financial Condition and Results of Operations .................................................. 23
7A. Quantitative and Qualitative Disclosures About Market Risk ................................................................................................. 38
8. Financial Statements and Supplementary Data ....................................................................................................................... 39
9. Changes In and Disagreements With Accountants on Accounting and Financial Disclosure ................................................. 65
9A Controls and Procedures .......................................................................................................................................................... 65
9B. Other Information .................................................................................................................................................................... 65
PART III
10. Directors, Executive Officers and Corporate Governance ...................................................................................................... 66
11. Executive Compensation ......................................................................................................................................................... 66
12. Security Ownership of Certain Beneficial Owners and Management and Related Stockholder Matters ................................ 67
13. Certain Relationships and Related Transactions and Director Independence ......................................................................... 67
14. Principal Accountant Fees and Services .................................................................................................................................. 67
PART IV
15. Exhibits and Financial Statement Schedule ............................................................................................................................. 68
Signatures ................................................................................................................................................................................ 70
1
CAUTIONARY NOTE ON FORWARD-LOOKING STATEMENTS This report on Form 10-K and the documents incorporated herein by reference contain forward-looking statements that involve
risks and uncertainties. These statements may be identified by the use of the words such as “anticipates,” “believes,” “continue,” “could,” “would,” “estimates,” “expects,” “intends,” “may,” “might,” “plans,” “potential,” “should,” or “will” and similar expressions or the negative of those terms. The forward-looking statements include, but are not limited to, risks stemming from: our failure to compete successfully in the markets in which we do business; our history of net losses and our ability to sustain profitability; the adequacy of our capital resources and need for additional financing; continued lengthy and delayed sales cycles; the development and expansion of our strategic and third party distribution partnership and relationships with systems integrators; our ability to improve our current products; our ability to innovate and respond to rapid technological change and competitive challenges; legal and regulatory uncertainties and other risks related to protection of our intellectual property assets; the operational integrity and maintenance of our systems; the uncertainty of demand for our products; the anticipated customer benefits from our products; the actual mix in new business between hosting and license transactions when compared with management’s projections; the anticipated revenue to us from the Cisco OEM agreement; the ability to increase revenue as a result of the increased investment in sales and marketing; our ability to hire additional personnel and retain key personnel; our ability to manage our expenditures and estimate future expenses, revenue, and operational requirements; our ability to manage our business plans, strategies and outlooks and any business-related forecasts or projections; risks from our substantial international operations; our ability to manage future growth and geographical and currency fluctuations. Our actual results could differ materially from those discussed in statements relating to our future plans, product releases, objectives, expectations and intentions, and other assumptions underlying or relating to any of these statements. These forward-looking statements represent our estimates and assumptions and speak only as of the date hereof. We expressly disclaim any obligation or understanding to release publicly any updates or revisions to any forward-looking statements contained herein to reflect any change in our expectations with regard thereto or any change in events, conditions or circumstances on which any such statement is based unless required by law.
All references to “eGain”, the “Company”, “our”, “we” or “us” mean eGain Communications Corporation and its subsidiaries, except where it is clear from the context that such terms mean only this parent company and excludes subsidiaries.
PART I
ITEM 1. BUSINESS Overview
The Company was incorporated in Delaware in September 1997. eGain is one of the premier providers of cloud and on-site customer interaction software for sales and service. For over a decade, eGain solutions have helped improve customer experience, grow sales, and optimize service processes across the web, social, and phone channels. Hundreds of global enterprises rely on eGain to transform fragmented sales engagement and customer service operations into unified Customer Interaction Hubs.
Industry Background As products get commoditized in a digitally connected global economy, business differentiation increasingly depends on brands
built on high-quality customer interactions. For businesses that sell to consumers (B2C), delivering smart customer interactions is vital as customer perceptions based on individual interactions can get magnified through the social megaphone and “always on” mobile connectivity. Consumers, especially the younger generation, expect businesses to serve them conveniently across all touch points, while catering to their social-enabled lifestyle. We have found that making customer interactions easy, seamless, and consistent can be difficult. In our experience, executives across industries are looking for efficient, modular, and scalable solutions to rapidly enable smart customer interactions.
The eGain Solution
Our solution is designed to provide clients with the following benefits: • Build profitable long-term customer relationships. Enabled by an “always on” mobile lifestyle, customers are spending
more time conducting business on the Web and Social channels. Our solution helps businesses design brand-aligned experiences at every touch point. Whether a customer is looking to buy, ask a question, or pay a bill, our solution helps businesses provide customers personalized, consistent responses.
• Increase revenue through improved sales conversion and cross-sell. In addition to strengthening customer relationships, our solution helps businesses convert website visitors into buyers. It also helps agents to contextually up-sell and cross-sell products in the course of customer interactions. A visitor to a website that uses eGain can be proactively offered personalized promotional content or real-time assistance based on configurable business rule informed by visitor behavior and history. Visitors can interact with a customer service representative live over the Web through click to call, chat and cobrowse to inquire about and buy a product. Customers calling into a service center can be offered powerful cross-sell offers by agents using the expert reasoning capability of eGain.
2
• Reduce operating costs through improved agent productivity and self-service automation. Our solution helps companies to provide highly effective customer service while reducing operating costs. Our intelligent routing, auto-response, tracking, and reporting features, complemented with agent-facing knowledge tools, measurably enhance the productivity of service agents. Our robust online self-service tools, with integrated escalation paths and sophisticated artificial intelligence, help resolve customer inquiries without human assistance.
• Reduce total cost of ownership through an open architecture, integration adapters, and scalable design. Our solution is designed to easily integrate with business data and processes residing in legacy systems and other enterprise data sources. By integrating out of the box with leading business applications, our platform allows clients to leverage existing data, content, and communication assets.
• Offer rapid time to value through flexible deployment options. Our solution can be deployed on-site, on-demand, or as a managed service. In addition, we offer eGain Solution-as-a-Service (SLaaS™), a package that enables clients to use our solution without a long-term contract or upfront implementation fee. Moreover, our clients have the flexibility to move from one deployment model to another when their needs change.
3
Products and Services eGain 10 Suite
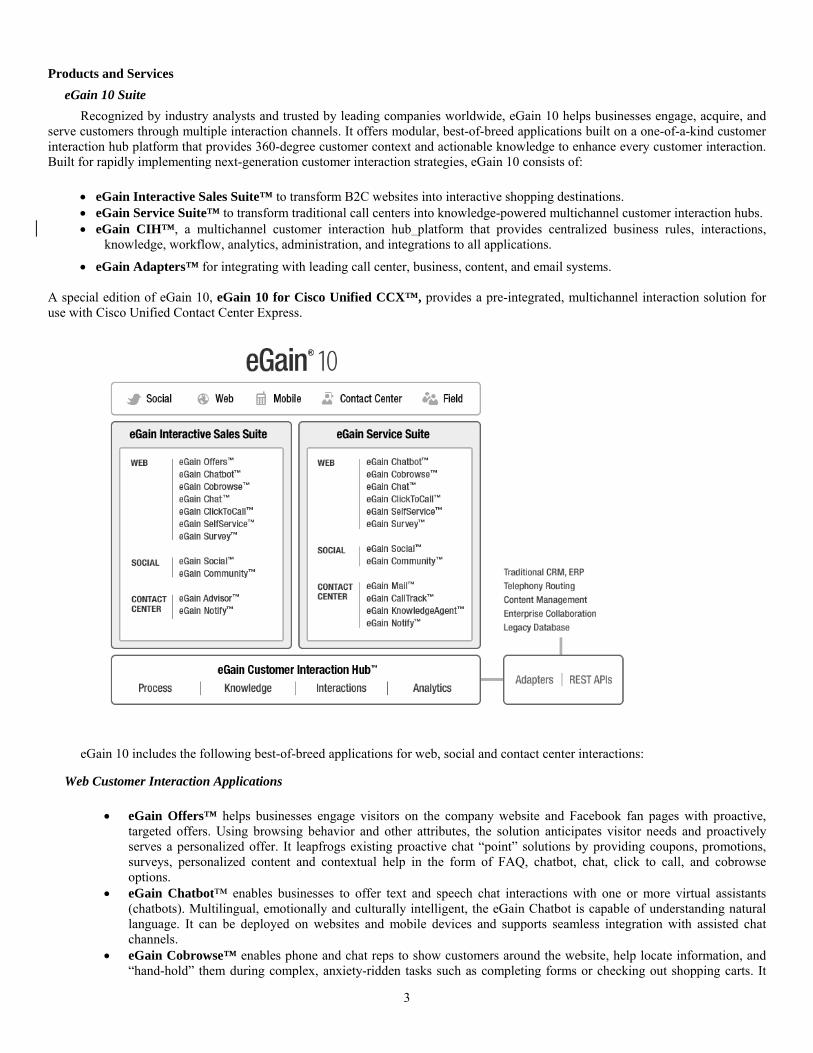
Recognized by industry analysts and trusted by leading companies worldwide, eGain 10 helps businesses engage, acquire, and serve customers through multiple interaction channels. It offers modular, best-of-breed applications built on a one-of-a-kind customer interaction hub platform that provides 360-degree customer context and actionable knowledge to enhance every customer interaction. Built for rapidly implementing next-generation customer interaction strategies, eGain 10 consists of:
eGain Interactive Sales Suite™ to transform B2C websites into interactive shopping destinations. eGain Service Suite™ to transform traditional call centers into knowledge-powered multichannel customer interaction hubs. eGain CIH™, a multichannel customer interaction hub platform that provides centralized business rules, interactions,
knowledge, workflow, analytics, administration, and integrations to all applications.
eGain Adapters™ for integrating with leading call center, business, content, and email systems. A special edition of eGain 10, eGain 10 for Cisco Unified CCX™, provides a pre-integrated, multichannel interaction solution for use with Cisco Unified Contact Center Express.
eGain 10 includes the following best-of-breed applications for web, social and contact center interactions:
Web Customer Interaction Applications
eGain Offers™ helps businesses engage visitors on the company website and Facebook fan pages with proactive, targeted offers. Using browsing behavior and other attributes, the solution anticipates visitor needs and proactively serves a personalized offer. It leapfrogs existing proactive chat “point” solutions by providing coupons, promotions, surveys, personalized content and contextual help in the form of FAQ, chatbot, chat, click to call, and cobrowse options.
eGain Chatbot™ enables businesses to offer text and speech chat interactions with one or more virtual assistants (chatbots). Multilingual, emotionally and culturally intelligent, the eGain Chatbot is capable of understanding natural language. It can be deployed on websites and mobile devices and supports seamless integration with assisted chat channels.
eGain Cobrowse™ enables phone and chat reps to show customers around the website, help locate information, and “hand-hold” them during complex, anxiety-ridden tasks such as completing forms or checking out shopping carts. It
4
offers true collaborative browsing without any customer download requirement. Access to web page views and actions is controlled through user roles and business rules.
eGain Chat™ enables website visitors to conduct text and video chats with agents. It gives representatives a comprehensive set of tools for serving customers in real- time. eGain Chat supports two-way, “follow me” web browsing so that agents and customers can lead each other to specific web pages for faster issue resolution. The system’s powerful, query-specific routing and workflow maximize both agent productivity and interaction quality.
eGain ClickToCall™ provides website visitors the ability to request a callback while browsing. Callbacks can be scheduled according to the customer’s convenience or be established in real-time.
eGain SelfService™ is a comprehensive solution supporting what we believe to be the broadest set of self-service access options in the industry—dynamic FAQs, topic-based browsing, natural language search, guided help, virtual assistant technology, and case tracking. eGain SelfService offers a unique combination of rich, multi-access self-service capabilities built on a collaborative knowledge management framework within eGain OpenCIH™ Platform. This framework makes it easy for organizations to create, maintain, and enhance common content in a distributed manner, as well as leverage existing content from across the enterprise. The key modules of this application are:
o eGain Portals™ enables organizations to provide distinctive, productive and brand-aligned self-service experiences. Powered by eGain Multisearch™ knowledge access technology, it brings together the power of a broad set of knowledge access methods, federated search, process intelligence, multilingual capabilities, and flexible look and feel—all behind a single search box—for distinctive, on-target self-service. Customers can also view frequently asked questions, manage their own accounts, review open tickets, and review their communications with the company within a secure, personalized environment.
o eGain Guided Help™ gives customers interactive access to the company’s knowledge base, allowing them to find answers and troubleshoot problems by themselves at their convenience. It uses patented search and reasoning technology, coupled with natural language and advanced linguistic processing to search, suggest additional questions, and recommend solutions.
o eGain MessageCenter™ enables secure and authenticated messaging between a business and its customers. eGain MessageCenter is a secure web-based portal for customers to read confidential messages, including attachments.
o eGain Widgets™ enable contextual access to knowledge and account information through mobile devices and web pages.
o eGain Survey™ helps contact centers, ecommerce sites, and customer portals connect with their customers in a vital and immediate way by eliciting feedback at various points of contact. It enables them to measure and improve the quality of service across all interaction channels, thereby maximizing customer retention.
Social Customer Interaction Applications
eGain Social™ is a one-of-a-kind application for social customer service knowledge harvesting and single-sourced social publishing, and reputation management. It enables businesses to monitor social networks such as Facebook, Twitter and blogs for customer queries, analyze their content, analyze search results for sentiment, route them intelligently, and post responses privately or back to the social cloud in media appropriate format.
eGain Community™ enables the creation and management of online communities or forums, community knowledge harvesting, and single-sourced publishing. Forum posts are searchable from portals, and can be submitted as content for the Knowledge Base Adapters allow integration with existing forums.
Contact Center Applications
5
eGain Mail™ is an industry-leading application for processing inbound customer emails and providing mission-critical email customer response, incorporating hundreds of best practices developed over years of serving innovative global enterprises. Secure messaging, lifecycle audits, and real-time archival are some of the features that provide our customers a next-generation email management platform for their enterprises. Designed to process very high volumes of email and webform requests, eGain Mail allows companies to deliver consistent, high-quality service through flexible process automation, optimized user interface, and powerful reports. Additional modules include:
o eGain SecureMail™ for authenticated web-based access to confidential emails. It is widely used in financial services sector and other regulated industries.
o eGain EncryptedMail™ for encrypted email payload delivered to the customer’s mailbox (push), complementing eGain SecureMail (invitation to secure website to share payload).
o eGain Fax™ and eGain SMS™ to enable timely responses to faxes (and postal mail) and SMS with the same infrastructure that is used to handle emails. Optical Character Recognition (OCR) technology is used to process faxes and postal mail.
• eGain CallTrack™ is a comprehensive and a flexible phone call logging system. Together with eGain KnowledgeAgent™, it provides an integrated application for phone call logging, tracking and resolution as well as follow-on task management for service fulfillment.
• eGain KnowledgeAgent™ empowers contact center agents with best-practice knowledge management and is designed to make every agent as productive and capable as the enterprise’s best agent. This application delivered fast, consistent, and accurate answers to agents as they use the rich conversational interface while engaging customers over the phone. eGain KnowledgeAgent uses patented search and reasoning technology coupled with natural language and advanced linguistic processing to search, suggest additional questions, and recommend solutions. eGain Multisearch enables simple search-based access to various types of federated content and guided help.
• eGain IVR™ enables superior phone self-service experiences by adding human-like intelligence to interactive voice response, or IVR and unifying it with other interaction channels, including web self-service. Unlike traditional voice self-service applications, it offers intelligent dialogs driven by eGain’s patented case-based reasoning technology and seamless movement across channels.
• eGain Notify™ is a flexible, easy-to-use application for managing and delivering automatic reminders, alerts, and updates at all stages of the customer relationship cycle. It is used to provide proactive customer service by sending alerts to customers via multiple interaction channels such as email, phone and SMS. These alerts could span various stages of a service transaction, a customer’s life event, or a customer’s overall life progression where a business may want to add value by providing contextual customer service.
• eGain SME™ is an enterprise collaboration tool that allows subject matter experts, or SMEs, to participate in the process of resolving customer queries. SMEs, both internal in the contact center and external in other departments or companies, are able to fully participate in both solving ongoing problems and suggesting new solutions for inclusion in the knowledge base.
Flexible Deployment Options eGain’s deployment options, we believe, are unmatched in the industry. eGain customers can choose from multiple options: on-site, cloud, managed, and solution as a service. They can even choose a hybrid model or switch from one deployment type to another. eGain is one of the few vendors that has consistently offered both cloud and on-site deployments for more than a decade.
Customers We serve a worldwide customer base across a wide variety of industry sectors including: telecommunications, financial services,
insurance, outsourced services, retail, technology, utilities, government, manufacturing and consumer electronics. Our product is sold primarily to large enterprises (over $250 million in annual revenue). Recently, we began to build out sales capability to reach medium sized enterprises (companies with up to $250 million in annual revenue). For the fiscal year ended June 30, 2011, international revenue accounted for 53% and domestic revenue for 47% of total revenue, compared to 47% and 53% respectively for fiscal year 2010 and 50% and 50% respectively for fiscal year 2009.
One customer accounted for about 22% of total revenue in fiscal year 2011. One customer accounted for 14% of total revenue in both fiscal years 2010 and 2009.
Competition
We compete with other application software vendors including Avaya, Inc., Consona Corporation, Genesys Telecommunications (a wholly-owned subsidiary of Alcatel), Kana Software, Inc., Live Person, Inc., Moxie Software, Inc. and
6
RightNow Technologies, Inc. In addition, we face actual or potential competition from larger software companies such as Microsoft Corporation, Oracle Corporation, Salesforce.com, Inc. and SAP Inc. that may attempt to sell customer interaction software to their installed base. We also compete with internally developed applications within large enterprises. Finally, we face, or expect to face, competition from software vendors who may develop toolsets and products that allow customers to build new applications that run on the customers’ infrastructure or as hosted services.
We believe the principal competitive factors in our market include the following: • proven track record of customer success; • speed and ease of implementation; • product functionality; • financial stability and viability of the vendor;
• product adoption; • ease of use and rates of user adoption; • low total cost of ownership and demonstrable cost-effective benefits for customers;
• performance, security, scalability, flexibility and reliability of the service;
• ease of integration with existing applications;
• quality of customer support; • availability and quality of implementation, consulting and training services; and
• vendor reputation and brand awareness.
Sales and Marketing Sales Strategy
Our sales strategy is to pursue targeted accounts, mostly Business to Consumer (B2C) enterprises , through a combination of our direct sales force and partners. We target our sales efforts at Enterprise and Mid-market companies. Our North American direct sales organization is based at our corporate headquarters in Mountain View, California, with field sales presence throughout the United States. Internationally, we have field offices in Ireland, Italy, India, the Netherlands, and the United Kingdom.
The direct sales force is organized into teams that include sales representatives and sales consultants. Our direct sales force is made up of two components, field sales and inside sales representatives. It is complemented by lead generation representatives.
We also complement our direct sales force with reseller and sales alliances. We believe we are able to leverage additional sales, marketing and deployment capabilities through these alliances.
Marketing and Partner Strategy Our marketing strategy is to build brand around innovative and robust products trusted by leading enterprises. Our marketing
organization focuses on public relations, analyst relations, marketing communications and demand generation. We employ a wide range of marketing avenues to deliver our message, including print and Internet advertising, targeted electronic and postal mailing, email newsletters, and a variety of trade shows, seminars, webinars, and interest groups.
Our marketing group also produces sales tools, including product collateral, customer case studies, demonstrations, presentations, and competitive analyses. In addition, the group performs market analyses and conducts focus group and customer reviews to identify and develop key partnership opportunities and product capabilities.
We believe that our partners help extend the breadth and depth of our product offerings, drive market penetration, and augment our professional service capabilities. We believe these relationships are important to delivering successful, integrated products and services to our customers, and scaling our business. Our partner portal, EcoNet™, enables us to provide comprehensive sales, support and services information for channel partners, while enabling them to collaborate with one another through an online forum. Partner enablement is a key focus area for our consulting and training teams too.
As of fiscal year ended June 30, 2011, there were approximately 94 employees engaged in worldwide sales and marketing activities.
Consulting and Education Our worldwide professional services organization provides consulting and education services designed to facilitate customer success and build customer loyalty.
• Consulting Services. Our consulting services group offers rapid implementation services, custom solution development, and systems integration services. Consultants work with customers to understand their specific requirements, analyze their
7
business needs, and implement integrated solutions. We provide these services independently or in partnership with system integrators who have developed consulting expertise on our platform.
• Education Services. Our education services group provides a comprehensive set of basic and customized training programs to our customers and partners in addition to online tutorial modules for ongoing refresher courses . Training programs are offered either in-person at the customer site, or at one of our worldwide training centers.
As of fiscal year ended June 30, 2011, we had approximately 56 professionals providing worldwide services for systems installation, solutions development, application management, and education.
Customer Support We offer a comprehensive collection of support services designed to rapidly respond to inquiries. Our technical support services
are available to customers worldwide under maintenance agreements. Our customer support strategy is to provide dedicated customer support account managers for large enterprise customers. The customer support team uses eGain’s own software suite to provide world-class service to all our customers through support centers located in California, the United Kingdom, and India.
As of fiscal year ended June 30, 2011, there were approximately 30 employees engaged in worldwide customer support services.
8
Research and Development The market for our products changes rapidly and is characterized by evolving industry standards, swift changes in customer
requirements, and frequent new product introductions and enhancements. We believe that strong product development capabilities are essential to our strategy of maintaining technology leadership. This includes enhancing current technology, providing excellent quality, performance, and functionality, as well as developing additional applications, and maintaining the competitiveness of our product and service offerings. We have invested significant time and resources to set up a comprehensive software development process that involves several functional groups at all levels within our organization and is designed to provide a framework for defining and addressing the activities required in bringing product concepts and development projects to market successfully.
In addition, we continuously analyze market and customer requirements and evaluate technology that we believe will enhance platform acceptance in the market.
As of fiscal year ended June 30, 2011, there were approximately 82 employees engaged in worldwide product development activities. We spent approximately $5.6 million on research and development in fiscal year 2011, and $5.5 million in fiscal years 2010 and 2009.
Intellectual Property We regard our copyrights, service marks, trademarks and similar intellectual property as critical to our success. We rely on
patent, trademark, copyright, trade secret and other laws, as well as confidentiality procedures and licensing arrangements, to protect the proprietary aspects of our technology and business.
We continually assess the propriety of seeking patent and other intellectual property protection for those aspects of our technology that we believe constitute innovations providing significant competitive advantages. Future applications may or may not receive the issuance of valid patents and trademarks.
We routinely require our employees, customers, and potential business partners to enter into confidentiality and nondisclosure agreements before we will disclose any sensitive aspects of our products, technology, or business plans. In addition, we require employees to agree to surrender to us any proprietary information, inventions or other intellectual property they generate or come to possess while employed by us. Despite our efforts to protect our proprietary rights through confidentiality and license agreements, unauthorized parties may attempt to copy or otherwise obtain and use our products or technology. These precautions may not prevent misappropriation or infringement of our intellectual property. In addition, some of our license agreements with certain customers and partners require us to place the source code for our products into escrow. These agreements typically provide that some party will have a limited, non-exclusive right to access and use this code as authorized by the license agreement if there is a bankruptcy proceeding instituted by or against us, or if we materially breach a contractual commitment to provide support and maintenance to the party.
Third parties may infringe or misappropriate our copyrights, trademarks and similar proprietary rights. In addition, other parties may assert infringement claims against us. Our products may infringe issued patents that may relate to our products. In addition, because patent applications in the United States are not publicly disclosed until the patent is issued, applications may have been filed which relate to our software products. We may be subject to legal proceedings and claims from time to time in the ordinary course of our business, including claims of alleged infringement of the trademarks and other intellectual property rights of third parties. Intellectual property litigation is expensive and time consuming and could divert management’s attention away from running our business. This litigation could also require us to develop non-infringing technology or enter into royalty or license agreements. These royalty or license agreements, if required, may not be available on acceptable terms, if at all, in the event of a successful claim of infringement. Our failure or inability to develop non-infringing technology or license the proprietary rights on a timely basis would harm our business.
Employees As of fiscal year ended June 30, 2011, we had 321 full-time employees, of which 82 were in product development, 109 in
services and support, 94 in sales and marketing, and 36 in finance and administration.
None of our employees are covered by collective bargaining agreements. While we believe our relations with our employees are good, our future performance depends largely upon the continued service of our key technical, sales and marketing, and senior management personnel, none of whom are bound by employment agreements requiring service for a defined period of time. The loss of services of one or more of our key employees could have a material adverse effect on our business.
We may not be successful in attracting, training and retaining qualified personnel, and the failure to do so, particularly in key functional areas such as product development and sales, could materially and adversely affect our business, results of operations and financial condition. Our future success will likely depend largely on our ability to attract and retain experienced sales, technical, marketing and management personnel.
9
ITEM 1A. RISK FACTORS The risks and uncertainties described below are not the only ones facing us. Other events that we do not currently anticipate or that we currently deem immaterial also may affect our results of operations, cash flows and financial condition.
Our business is influenced by a range of factors that are beyond our control and that we have no comparative advantage in forecasting. These include:
• general economic and business conditions; • currency exchange rate fluctuations; • the overall demand for enterprise software and services; • governmental budgetary constraints or shifts in government spending priorities; and • general political developments.
The recent recession and global economic crisis caused a general tightening in the credit markets, lower levels of liquidity, increases in the rates of default and bankruptcy, and extreme volatility in credit, equity and fixed income markets. These macroeconomic developments negatively affected, and could continue to negatively affect, our business, operating results or financial condition which, in turn, could adversely affect our stock price. A general weakening of, and related declining corporate confidence in, the global economy or the curtailment in government or corporate spending could cause current or potential customers to reduce their technology budgets or be unable to fund software or services purchases, which could cause customers to delay, decrease or cancel purchases of our products and services or cause customers not to pay us or to delay paying us for previously purchased products and services.
Our lengthy sales cycles and the difficulty in predicting timing of sales or delays may impair our operating results The long sales cycle for our products may cause license revenue and operating results to vary significantly from period to
period. The sales cycle for our products can be six months or more and varies substantially from customer to customer. Because we sell complex and deeply integrated solutions, it can take many months of customer education to secure sales. While our potential customers are evaluating our products before, if ever, executing definitive agreements, we may incur substantial expenses and spend significant management effort in connection with the potential customer. Our multi-product offering and the increasingly complex needs of our customers contribute to a longer and unpredictable sales cycle. Consequently, we often face difficulty predicting the quarter in which expected sales will actually occur. This contributes to the uncertainty and fluctuations in our future operating results. In particular, the corporate decision-making and approval process of our customers and potential customers has become more complicated. This has caused our average sales cycle to further increase and, in some cases, has prevented the closure of sales that we believed were likely to close. In addition, historically our license sales have comprised a relatively small number of high value transactions; consequently, we may miss our revenue forecasts and may incur expenses that are not offset by corresponding revenue from the delay in even one transaction.
10
Our hybrid revenue model may impact our operating results We have a hybrid delivery model meaning that we offer our solutions on a hosted or license basis to our customers. For license
transactions, the license revenue amount is generally recognized in the quarter delivery and acceptance of our software takes place whereas, for hosting transactions, hosting revenue is recognized ratably over the term of the hosting contract, which is typically one to two years. As a result, our total revenue may increase or decrease in future quarters as a result of the timing and mix of license and hosting transactions.
We must compete successfully in our market segment The market for customer interaction software is intensely competitive. Other than product innovation and existing customer
relationships, there are no substantial barriers to entry in this market, and established or new entities may enter this market in the future. While software internally developed by enterprises represents indirect competition, we also compete directly with packaged application software vendors, including Avaya, Inc., Consona Corporation, Genesys Telecommunications (a wholly-owned subsidiary of Alcatel), Kana Software, Inc, Live Person, Inc., Moxie Software, Inc., and RightNow Technologies, Inc. In addition, we face actual or potential competition from larger software companies such as Microsoft Corporation, Oracle Corporation, Salesforce.com, Inc. and SAP Inc. and similar companies that may attempt to sell customer interaction software to their installed base.
We believe competition will continue to be fierce as current competitors increase the sophistication of their offerings and as new participants enter the market. Many of our current and potential competitors have longer operating histories, larger customer bases, broader brand recognition, and significantly greater financial, marketing and other resources. With more established and better-financed competitors, these companies may be able to undertake more extensive marketing campaigns, adopt more aggressive pricing policies, and make more attractive offers to businesses to induce them to use their products or services. If we fail to expand and improve our sales performance and marketing activities, we may be unable to grow our business, negatively impacting our operating results and financial condition
Expansion and growth of our business is dependent on our ability to expand our sales force and on the ability of our sales force to become more productive. If we are not able to effectively develop and maintain awareness of our products in a cost-effective manner, we may not achieve widespread acceptance of our existing and future products. This may result in a failure to expand and attract new customers and enhance relationships with existing customers. This may impede our efforts to improve operations in other areas of the Company and may result in further decline of the market price of our common stock.
Due to the complexity of our customer interaction hub platform and related products and services, we must utilize highly trained sales personnel to educate prospective customers regarding the use and benefits of our products and services as well as provide effective customer support. If we have turnover in our sales and marketing forces and because we have fewer resources than those of our competitors, we may not be able to successfully compete with those of our competitors.
We have experienced growth in recent periods and expect to continue to grow. If we fail to manage our growth effectively, we may be unable to execute our business plan, maintain high levels of service or adequately address competitive challenges
To achieve our business objectives, we will need to continue to expand our business at an appropriate pace. This expansion has placed, and is expected to continue to place, a significant strain on our managerial, administrative, operational, financial and other resources. We anticipate that expansion will require substantial management effort and additional investment in our infrastructure and headcount. If we are unable to successfully manage our growth, our business, financial condition and results of operations will be adversely affected.
Part of the challenge that we expect to face in the course of our expansion is increased staffing which is being used primarily towards developing new sales strategies and expanding into different markets. We have considerable need to recruit, train, and retain qualified staff and any delays or difficulties we encounter in these staffing efforts could impair our ability to grow.
We intend to continue to expand our distribution channels into international markets and to spend significant financial and managerial resources to do so. If our revenue from international operations does not exceed the expense associated with establishing and maintaining these channels, our business and operating results will suffer.
Our failure to develop and expand strategic and third-party distribution channels would impede our revenue growth Our success and future growth depends in part upon the skills, experience, performance and continued service of our distribution
partners, including software and hardware vendors and resellers. We engage with distribution partners in a number of ways, including assisting us to identify prospective customers, to distribute our products in geographies where we do not have a physical presence and to distribute our products where they are considered complementary to other third party products distributed by the partner. We believe that our future success depends in part upon our ability to develop and expand strategic, long term and profitable partnerships and reseller relationships. If we are unable to do so, or if any existing or future distribution partners fail to successfully market, resell,
11
implement or support our products for their customers, or if distribution partners represent multiple providers and devote greater resources to market, resell, implement and support competing products and services, our future revenue growth could be impeded. Our failure to develop and expand relationships with systems integrators could harm our business.
We sometimes rely on system integrators to recommend our products to their customers and to install and support our products for their customers. We likewise depend on broad market acceptance by these system integrators of our product and service offerings. Our agreements generally do not prohibit competitive offerings and system integrators may develop market or recommend software applications that compete with our products. Moreover, if these firms fail to implement our products successfully for their customers, we may not have the resources to implement our products on the schedule required by their customers. To the extent we devote resources to these relationships and the partnerships do not proceed as anticipated or provide revenue or other results as anticipated, our business may be harmed. Once partnerships are forged, there can be no guarantee that such relationships will be renewed in the future or available on acceptable terms. If we lose strategic third party relationships, fail to renew or develop new relationships, or fail to fully exploit revenue opportunities within such relationships, our results of operations and future growth may suffer.
Our international operations involve various risks
We derived 53% of our revenue from international sales for the fiscal year 2011 compared to 47% for the fiscal year 2010, and 50% for fiscal year 2009. Including those discussed above, our international sales operations are subject to a number of specific risks, such as:
• general economic conditions in each country or region in which we do or plan to do business; • foreign currency fluctuations and imposition of exchange controls; • expenses associated with complying with differing technology standards and language translation issues; • difficulty and costs in staffing and managing our international operations; • difficulties in collecting accounts receivable and longer collection periods; • health or similar issues, such as a pandemic or epidemic; • various trade restrictions and tax consequences; • hostilities in various parts of the world; and • reduced intellectual property protections in some countries.
About 48% of our workforce is employed in India. Of these employees, more than 37% are allocated to research and development. Although the movement of certain operations internationally was principally motivated by cost cutting, the continued management of these remote operations requires significant management attention and financial resources that could adversely affect our operating performance. In addition, with the significant increase in the numbers of foreign businesses that have established operations in India, the competition to attract and retain employees there has increased significantly. As a result of the increased competition for skilled workers, we experienced increased compensation costs and expect these costs to increase in the future. Our reliance on our workforce in India makes us particularly susceptible to disruptions in the business environment in that region. In particular, sophisticated telecommunications links, high speed data communications with other eGain offices and customers, and overall consistency and stability of our business infrastructure are vital to our day-to-day operations, and any impairment of such infrastructure will cause our financial condition and results to suffer. The maintenance of stable political relations between the United States, European Union and India are also of great importance to our operations.
Any of these risks could have a significant impact on our product development, customer support, or professional services. To the extent the benefit of maintaining these operations abroad does not exceed the expense of establishing and maintaining such activities, our operating results and financial condition will suffer.
Our revenue and operating expenses are unpredictable and may fluctuate, which may harm our operating results and financial condition
Due to the emerging nature of the multichannel contact center market and other similar factors, our revenue and operating results may fluctuate from quarter to quarter. Our revenue could fall short of expectations if we experience delays or cancellations of even a small number of orders. It is possible that our operating results in some quarters will be below the expectations of financial analysts or investors. In this event, the market price of our common stock is also likely to decline.
A number of factors are likely to cause fluctuations in our operating results, including, but not limited to, the following: • demand for our software and budget and spending decisions by information technology departments of our customers; • the mix of hosted and license transactions;
12
• seasonal trends in technology purchases; • our ability to attract and retain customers; and • litigation relating to our intellectual proprietary rights.
In addition, we base our expense levels in part on expectations regarding future revenue levels. In the short term, expenses, such as employee compensation and rent, are relatively fixed. If revenue for a particular quarter is below expectations, we may be unable to reduce our operating expenses proportionately for that quarter. Accordingly, such a revenue shortfall would have a disproportionate effect on expected operating results for that quarter. For this reason, period-to-period comparisons of our operating results may also not be a good indication of our future performance.
Changes to current accounting policies could have a significant effect on our reported financial results or the way in which we conduct our business
Generally accepted accounting principles and the related accounting pronouncements, implementation guidelines and interpretations for some of our significant accounting policies are highly complex and require subjective judgments and assumptions. Some of our more significant accounting policies that could be affected by changes in the accounting rules and the related implementation guidelines and interpretations include:
• recognition of revenue; • contingencies and litigation; and • accounting for income taxes.
Changes in these or other rules, or scrutiny of our current accounting practices, could have a significant adverse effect on our
reported operating results or the way in which we conduct our business.
We may need additional capital, and raising such additional capital may be difficult or impossible and will likely significantly dilute existing stockholders
We believe that existing capital resources will enable us to maintain current and planned operations for the next 12 months. However, our working capital requirements in the foreseeable future are subject to numerous risks and will depend on a variety of factors, in particular, whether we maintain or exceed the level of revenue achieved in fiscal year 2011 and that customers continue to pay on a timely basis. We may need to secure additional financing due to unforeseen or unanticipated market conditions. We may try to raise additional funds through public or private financings, strategic relationships, or other arrangements. Such financing may be difficult to obtain on terms acceptable to us, if at all. If we succeed in raising additional funds through the issuance of equity or convertible securities, then the issuance could result in substantial dilution to existing stockholders. If we raise additional funds through the issuance of debt securities or preferred stock, these new securities would have rights, preferences, and privileges senior to those of the holders of our common stock. The terms of these securities could impose restrictions on our operations.
We depend on broad market acceptance of our applications and of our business model We depend on the widespread acceptance and use of our applications as an effective solution for businesses seeking to manage
high volumes of customer interactions across multiple channels, including Web, phone, email, print and in-person. While we believe the potential to be very large, we cannot accurately estimate the size or growth rate of the potential market for such product and service offerings generally, and we do not know whether our products and services in particular will achieve broad market acceptance. The market for customer interaction software is relatively new and rapidly evolving, and concerns over the security and reliability of online transactions, the privacy of users and quality of service or other issues may inhibit the growth of the Internet and commercial online services. If the market for our applications fails to grow or grows more slowly than we currently anticipate, our business will be seriously harmed.
Furthermore, our business model is premised on business assumptions that are still evolving. Our business model assumes that both customers and companies will increasingly elect to communicate via multiple channels, as well as demand integration of the online channels into the traditional telephone-based call center. Our business model also assumes that many companies recognize the benefits of a hosted delivery model and will seek to have their customer interaction software applications hosted by us. If any of these assumptions is incorrect or if customers and companies do not adopt digital technology in a timely manner, our business will be seriously harmed and our stock price will decline. Difficulties in implementing our products could harm our revenue and margins
We generally recognize license revenue from a customer sale when persuasive evidence of an arrangement exists, the product has been delivered, the arrangement does not involve significant customization of the software, the license fee is fixed or determinable and collection of the fee is probable. If an arrangement requires significant customization or implementation services from us, recognition of the associated license and service revenue could be delayed. The timing of the commencement and completion of these

13
services is subject to factors that may be beyond our control, as this process requires access to the customer’s facilities and coordination with the customer’s personnel after delivery of the software. In addition, customers could cancel or delay product implementations. Implementation typically involves working with sophisticated software, computing and communications systems. If we experience difficulties with implementation or do not meet project milestones in a timely manner, we could be obligated to devote more customer support, engineering and other resources to a particular project. Some customers may also require us to develop customized features or capabilities. If new or existing customers cancel or have difficulty deploying our products or require significant amounts of our professional services, support, or customized features, revenue recognition could be cancelled or further delayed and our costs could increase, causing increased variability in our operating results.
We may not be able to respond to the rapid technological change of the customer interaction software industry The customer interaction software industry is characterized by rapid technological change, changes in customer requirements
and preferences, and the emergence of new industry standards and practices that could render our existing services, proprietary technology and systems obsolete. We must continually develop or introduce and improve the performance, features and reliability of our products and services, particularly in response to competitive offerings. Our success depends, in part, on our ability to enhance our existing services and to develop new services, functionality and technology that address the increasingly sophisticated and varied needs of prospective customers. If we do not properly identify the feature preferences of prospective customers, or if we fail to deliver product features that meet the standards of these customers, our ability to market our service and compete successfully and to increase revenue could be impaired. The development of proprietary technology and necessary service enhancements entails significant technical and business risks and requires substantial expenditures and lead-time. We may not be able to keep pace with the latest technological developments. We may also be unable to use new technologies effectively or adapt services to customer requirements or emerging industry standards or regulatory or legal requirements. More generally, if we cannot adapt or respond in a cost-effective and timely manner to changing industry standards, market conditions or customer requirements, our business and operating results will suffer.
Our reserves may be insufficient to cover receivables we are unable to collect We assume a certain level of credit risk with our customers in order to do business. Conditions affecting any of our customers
could cause them to become unable or unwilling to pay us in a timely manner, or at all, for products or services we have already provided them. In the past, we have experienced collection delays from certain customers, and we cannot predict whether we will continue to experience similar or more severe delays in the future. Although we have established reserves to cover losses due to delays or inability to pay, there can be no assurance that such reserves will be sufficient to cover our losses. If losses due to delays or inability to pay are greater than our reserves, it could harm our business, operating results and financial condition.
From time to time, we may become defendants in legal proceedings about which we are unable to assess our exposure and which could become significant liabilities upon judgment.
We may become defendants in legal proceedings from time to time. Companies in our industry have been subject to claims related to patent infringement as well as contract and employment-related claims. We may not be able to accurately assess the risk related to these lawsuits, and we may be unable to accurately assess our level of exposure.
We rely on trademark, copyright, trade secret laws, contractual restrictions and patent rights to protect our intellectual property and proprietary rights and if these rights are impaired our ability to generate revenue will be harmed
If we fail to protect our intellectual property rights adequately, our competitors might gain access to our technology, and our business might be harmed. In addition, defending our intellectual property rights might entail significant expense. Any of our trademarks or other intellectual property rights may be challenged by others or invalidated through administrative process or litigation. While we have some U.S. patents and pending U.S. patent applications, we may be unable to obtain patent protection for the technology covered in our patent applications. In addition, our existing patents and any patents issued in the future may not provide us with competitive advantages, or may be successfully challenged by third parties. Furthermore, legal standards relating to the validity, enforceability and scope of protection of intellectual property rights are uncertain. Effective patent, trademark, copyright and trade secret protection may not be available to us in every country in which our service is available. The laws of some foreign countries may not be as protective of intellectual property rights as those in the U.S., and mechanisms for enforcement of intellectual property rights may be inadequate. Accordingly, despite our efforts, we may be unable to prevent third parties from infringing upon or misappropriating our intellectual property.
We might be required to spend significant resources to monitor and protect our intellectual property rights. We may initiate claims or litigation against third parties for infringement of our proprietary rights or to establish the validity of our proprietary rights. Any litigation, whether or not it is resolved in our favor, could result in significant expense to us and divert the efforts of our technical and management personnel.
14
Unknown software defects could disrupt our products and services and problems arising from our vendors’ products or services could disrupt operations, which could harm our business and reputation
Our product and service offerings depend on complex software, both internally developed and licensed from third parties. Complex software often contains defects or errors in translation or integration, particularly when first introduced or when new versions are released or localized for international markets. We may not discover software defects that affect our new or current services or enhancements until after they are deployed. It is possible that, despite testing by us, defects may occur in the software and we can give no assurance that our products and services will not experience such defects in the future. Furthermore, our customers generally use our products together with products from other companies. As a result, when problems occur in the integration or network, it may be difficult to identify the source of the problem. Even when our products do not cause these problems, these problems may cause us to incur significant warranty and repair costs, divert the attention of our engineering personnel from product development efforts and cause significant customer relations problems. These defects or problems could result in damage to our reputation, lost sales, product liability claims, delays in or loss of market acceptance of our products, product returns and unexpected expenses, and diversion of resources to remedy errors.
We are not listed on a national securities exchange which may affect the price and liquidity of our common stock and impair our ability to obtain future equity financing
Our listing on the OTC Bulletin Board, or declines in our stock price, may greatly impair our ability to raise additional necessary capital through equity or debt financing.
As our common stock is not listed on a principal national exchange, selling our common stock is likely more difficult because of diminished liquidity in smaller quantities of shares likely being bought and sold. In addition, we are subject to Rule 15g-9 under the Securities and Exchange Act of 1934, as amended. That rule imposes additional sales practice requirements on broker-dealers that sell low-priced securities to persons other than established customers and institutional accredited investors. For transactions covered by this rule, a broker-dealer must make a special suitability determination for the purchaser and have received the purchaser’s written consent to the transaction prior to sale. Consequently, the rule may affect the ability of broker-dealers to sell our common stock and affect the ability of holders to sell their shares of our common stock in the secondary market. Moreover, investors may be less interested in purchasing low-priced securities because the brokerage commissions, as a percentage of the total transaction value, tend to be higher for such securities, and some investment funds will not invest in low-priced securities (other than those which focus on small-capitalization companies or low-priced securities).
In addition, the price at which we would issue shares in such transactions is generally based on the market price of our common stock and a decline in the stock price could result in our need to issue a greater number of shares to raise a given amount of funding which could significantly increase the dilution to our current stockholders.
Our stock price has demonstrated volatility and continued market conditions may cause declines or fluctuations The price at which our common stock trades has been and will likely continue to be highly volatile and show wide fluctuations
due to factors such as the following: • the thinly traded nature of our stock on the OTC Bulletin Board; • concerns related to liquidity of our stock; • actual or anticipated fluctuations in our operating results, our ability to meet announced or anticipated profitability goals
and changes in or failure to meet securities analysts’ expectations; • announcements of technological innovations and/or the introduction of new services by us or our competitors; • developments with respect to intellectual property rights and litigation, regulatory scrutiny and new legislation; • conditions and trends in the Internet and other technology industries; and • general market and economic conditions.
Furthermore, the stock market has recently and in the past experienced significant price and volume fluctuations that have affected the market prices for the common stock of technology companies, regardless of the specific operating performance of the affected company. These broad market fluctuations may cause the market price of our common stock to increase or decline.

15
Our insiders who are significant stockholders may control the election of our board and may have interests that conflict with those of other stockholders
Our directors and executive officers, together with members of their immediate families, beneficially owned, in the aggregate, approximately 41.7% of our outstanding capital stock as of our record date, September 22, 2011. As a result, acting together, this group has the ability to exercise significant control over most matters requiring our stockholders’ approval, including the election and removal of directors and significant corporate transactions.
Ability to hire and retain key personnel Our success will also depend in large part on the skills, experience and performance of our senior management, engineering,
sales, marketing and other key personnel. The loss of the services of any of our senior management or other key personnel, including our Chief Executive Officer and co-founder, Ashutosh Roy, could harm our business.
We have embarked upon an aggressive hiring plan to support our growth. Our hiring is focused in the areas of sales and development. We are taking steps to retain our key personnel.
An increase in attrition in the Indian workforce on which we deeply rely for research and development would have significant negative effects on us and our results of operations. Unplanned system interruptions and capacity constraints and failure to effect efficient transmission of customer communications and data over the Internet could harm our business and reputation
Our customers have in the past experienced some interruptions with eGain-hosted operations. We believe that these interruptions will continue to occur from time to time. These interruptions could be due to hardware and operating system failures. As a result, our business will suffer if we experience frequent or long system interruptions that result in the unavailability or reduced performance of our hosted operations or reduce our ability to provide remote management services. We expect to experience occasional temporary capacity constraints due to sharply increased traffic or other Internet-wide disruptions, which may cause unanticipated system disruptions, slower response times, impaired quality, and degradation in levels of customer service. If this were to continue to happen, our business and reputation could be seriously harmed.
The growth in the use of the Internet has caused interruptions and delays in accessing the Internet and transmitting data over the Internet. Interruptions also occur due to systems burdens brought on by unsolicited bulk email or “Spam,” malicious service attacks and hacking into operating systems, viruses, worms and a “Trojan” horse, the proliferation of which is beyond our control and may seriously impact our and our customers’ businesses.
Because we provide Cloud-based software, interruptions or delays in Internet transmissions will harm our customers’ ability to receive and respond to online interactions. Therefore, our market depends on ongoing improvements being made to the entire Internet infrastructure to alleviate overloading and congestion.
Our success largely depends on the efficient and uninterrupted operation of our computer and communications hardware and network systems. A significant amount of our computer and communications systems are located in Mountain View, California. Due to our location, our systems and operations are vulnerable to damage or interruption from fire, earthquake, power loss, telecommunications failure and similar events.
We have entered into service agreements with some of our customers that require minimum performance standards, including standards regarding the availability and response time of our remote management services. If we fail to meet these standards, our customers could terminate their relationships with us, and we could be subject to contractual refunds and service credits to customers. Any unplanned interruption of services may harm our ability to attract and retain customers. If our system security is breached, our business and reputation could suffer and we may face liability associated with disclosure of sensitive customer information
A fundamental requirement for online communications and transactions is the secure transmission of confidential information over public networks. Third parties may attempt to breach our security or that of our customers. We may be liable to our customers for any breach in our security and any breach could harm our business and reputation. Although we have implemented network security measures, our servers are vulnerable to computer viruses, physical or electronic break-ins and similar disruptions, which could lead to interruptions, delays, or loss of data. We may be required to expend significant capital and other resources to license encryption technology and additional technologies to protect against security breaches or to alleviate problems caused by any breach since our applications frequently manage sensitive and personally identifiable customer information. We may also be subject to claims associated with invasion of privacy or inappropriate disclosure, use or loss of this information and fraud and identity theft crimes associated with such use or loss. Any imposition of liability, particularly liability that is not covered by insurance or is in excess of insurance coverage, could harm our reputation and our business and operating results.
16
The regulatory environment for and certain legal uncertainties in the operation of our business and our customer’s business could impair our growth or decrease demand for our services or increase our cost of doing business
The imposition of more stringent protections and/or new regulations and the application of existing laws to our business could burden our company and our business partners and customers. Further, the adoption of additional laws and regulations could limit the growth of our business and that of our business partners and customers. Any decreased generalized demand for our services, or the loss/decrease in business by a key partner or customer due to regulation or the expense of compliance with any regulation, could either increase the costs associated with our business or affect revenue, either of which could harm our financial condition or operating results.
We face increased regulatory scrutiny and potential criminal liability for our executives associated with various accounting and corporate governance rules promulgated under the Sarbanes-Oxley Act of 2002. We review and continue to monitor all of our accounting policies and practices, legal disclosure and corporate governance policies in accordance with the Sarbanes-Oxley Act of 2002, including those related to relationships with our independent accountants, enhanced financial disclosures, internal controls, board and board committee practices, corporate responsibility and loan practices, and intend to fully comply with such laws. Nevertheless, such increased scrutiny and penalties involve risks to both eGain and our executive officers and directors in monitoring and insuring compliance. A failure to properly navigate the legal disclosure environment and implement and enforce appropriate policies and procedures, if needed, could harm our business and prospects.
As Internet commerce continues to evolve, increasing regulation by federal, state or foreign agencies becomes more likely. For example, we believe increased regulation is likely in the area of data privacy. Our customers use our hosting service to store their customer data, which may contain contact and other personal or identifying information regarding their customers and contacts. Laws and regulations applying to the solicitation, collection, processing or use of personal or consumer information could affect our customer’s ability to use and share data and, potentially restrict our ability to store and process data.
The costs of compliance with, and other burdens imposed by, such laws and regulations that are applicable to the businesses of our customers may limit the use and adoption of our service and reduce overall demand for it, or lead to significant fines, penalties or liabilities for any noncompliance with such privacy laws. Furthermore, privacy concerns may cause our customers’ customers to resist providing the personal data necessary to allow our customers to use our service effectively and may reduce demand for our service. Even the perception of privacy concerns, whether or not valid, may inhibit market adoption of our service in certain industries.
Federal, state and foreign government bodies and agencies have adopted or are considering adopting laws and regulations regarding the collection, use and disclosure of personal information obtained from consumers and individuals. For example, in the United States regulations such as the Gramm-Leach-Bliley Act, which protects and restricts the use of consumer credit and financial information, and the Health Insurance Portability and Accountability Act of 1996, which regulates the use and disclosure of personal health information, impose significant requirements and obligations on businesses that may affect the use and adoption of our service. The European Union has also adopted a data privacy directive that requires member states to impose restrictions on the collection and use of personal data that, in some respects, are more stringent, and impose more significant burdens on subject businesses, than current privacy standards in the United States. Many other jurisdictions have similar stringent privacy laws and regulations. Our customers may demand that we incur significant costs to be compliant with all the relevant laws and regulations, which regulate their particular industry.
In addition to government activity, privacy advocacy groups and the technology and other industries are considering various new, additional or different self-regulatory standards that may place additional burdens on us.
We may need to license third-party technologies and may be unable to do so To the extent we need to license third-party technologies, we may be unable to do so on commercially reasonable terms or at all.
In addition, we may fail to successfully integrate any licensed technology into our products or services. Third-party licenses may expose us to increased risks, including risks associated with the integration of new technology, the diversion of resources from the development of our own proprietary technology, and our inability to generate revenue from new technology sufficient to offset associated acquisition and maintenance costs. Our inability to obtain and successfully integrate any of these licenses could delay product and service development until equivalent technology can be identified, licensed and integrated. This in turn would harm our business and operating results.
We may engage in future acquisitions or investments that could dilute our existing stockholders, cause us to incur significant expenses or harm our business
We may review acquisition or investment prospects that might complement our current business or enhance our technological capabilities. Integrating any newly acquired businesses or their technologies or products may be expensive and time-consuming. To finance any acquisitions, it may be necessary for us to raise additional funds through public or private financings. Additional funds may not be available on terms that are favorable to us, if at all, and, in the case of equity financings, may result in dilution to our existing stockholders. We may not be able to operate acquired businesses profitably. If we are unable to integrate newly acquired
17
entities or technologies effectively, our operating results could suffer. Future acquisitions by us could also result in large and immediate write-offs, incurrence of debt and contingent liabilities, or amortization of expenses related to goodwill and other intangibles, any of which could harm our operating results.
ITEM 1B. UNRESOLVED STAFF COMMENTS None.
ITEM 2. PROPERTIES We lease all facilities used in our business. The following table summarizes our principal properties:
Location
Principal Use Approximate
Square Footage Lease
Expiration Date Mountain View, California Corporate Headquarters 16,000 2011 Sunnyvale, California ............................. Corporate Headquarters 20,640 2016 Pune, India .............................................. Corporate Offices 33,262 2016 Noida, India ............................................ Corporate Offices 5,374 2014 Slough, England ...................................... European Headquarters 7,000 2013
Our Mountain View office leased expired in June 2011. We are currently leasing the space until renovation to the Sunnyvale space is complete. We will then move our corporate headquarters to Sunnyvale and will cancel the Mountain View lease.
Our India office leases that expired in fiscal year 2011 were renewed and we were able to obtain new office spaces on acceptable and commercially reasonable terms. Due to our hiring plans and to adequately support our operations we are currently in negotiations to increase our office space in the United Kingdom.
18
ITEM 3. LEGAL PROCEEDINGS Beginning on October 25, 2001, a number of securities class action complaints were filed against us, and certain of our then officers and directors and underwriters connected with our initial public offering of common stock. The class actions were filed in the U.S. District Court for the Southern District of New York. The complaints alleged generally that the prospectus under which such securities were sold contained false and misleading statements with respect to discounts and excess commissions received by the underwriters as well as allegations of “laddering” whereby underwriters required their customers to purchase additional shares in the aftermarket in exchange for an allocation of IPO shares. The complaints sought an unspecified amount in damages on behalf of persons who purchased the common stock between September 23, 1999 and December 6, 2000. Similar complaints were filed against 55 underwriters and more than 300 other companies and other individuals. The over 1,000 actions were consolidated into a single action called In re Initial Public Offering Sec. Litig. In 2003, we and the other issuer defendants (but not the underwriter defendants) reached an agreement with the plaintiffs to resolve the cases as to our liability and that of our officers and directors. The settlement involved no monetary payment or other consideration by us or our officers and directors and no admission of liability. On August 31, 2005, the Court issued an order preliminarily approving the settlement. On April 24, 2006, the Court held a public hearing on the fairness of the proposed settlement. Meanwhile the consolidated case against the underwriters proceeded. In October 2004, the Court certified a class. On December 5, 2006, however, the United States Court of Appeals for the Second Circuit reversed, holding that the class certified by the District Court could not be certified. In re Initial Public Offering Sec. Litig., 471 F.3d 24 (2d Cir. 2006), modified F 3d 70 (2d Cir. 2007). The Second Circuit’s holding, while directly affecting only the underwriters, raised doubt as to whether the settlement class contemplated by the proposed issuer settlement could be approved. On June 25, 2007, the district court entered a stipulated order terminating the proposed issuer settlement. Thereafter pretrial proceedings resumed. In March 2009, all parties agreed on a new global settlement of the litigation; this settlement included underwriters as well as issuers. Under the settlement, the insurers would pay the full amount of settlement share allocated to us, and we would bear no financial liability. We, as well as the officer and director defendants, who were previously dismissed from the action pursuant to a stipulation, would receive complete dismissals from the case. On June 10, 2009, the Court entered an order granting preliminary approval of the settlement. On October 5, 2009, the Court issued an order finally approving the settlement. Starting on or about October 23, 2009, some would-be objectors to the certification of a settlement class (which occurred as part of the October 5, 2009 order) petitioned the Court for permission to appeal from the order certifying the settlement class, and on October 29 and November 2, 2009, several groups of objectors filed notices of appeal seeking to challenge the Court’s approval of the settlement. On November 24, 2009, the Court signed, and on, December 4, 2009, the Court entered final judgment pursuant to the settlement dismissing all claims involving us. The appeals remain pending and briefing on the appeals is set to begin in October 2010 and end in the spring of 2011. On October 7, 2010, lead plaintiffs and all but two of the objectors filed a stipulation pursuant to which these objectors withdrawing their appeals with prejudice. The remaining two objectors, however, are pursuing their appeals and have filed their opening briefs. On December 8, 2010, plaintiffs moved to dismiss the appeals. On March 2, 2011, one of the two appellants, appearing pro se, filed a stipulated dismissal of his appeal with prejudice. On May 17, 2011, the Court of Appeals dismissed the appeals of two of the three remaining appellants, and directed the district court to determine whether the third and final appellant had standing. On August 25, 2011, the district court determined that the final appellant lacked standing. This litigation will be concluded unless that determination is successfully appealed. If the settlement and final judgment were to be overturned on appeal and litigation were to proceed, we believe that we have meritorious defenses to plaintiffs’ claims and intend to defend the action vigorously. We have not accrued any liability in connection with this matter as we do not expect the outcome of this litigation to have a material impact on our financial condition.
In May 2010, Microlog Corporation filed a patent infringement lawsuit in the United States District Court in the Eastern District of Texas, case number 6:10-CV-260 LED against a number of defendants, including several current and past eGain customers. LaQuinta Corporation, a named defendant in the Microlog case and a former eGain customer has subsequently filed a third party claim against us requesting indemnification from us in connection with the Microlog case. We have filed a motion to dismiss this claim, which is currently pending before the court. From time to time, we are involved in legal proceedings in the ordinary course of business. We believe that the resolution of these matters will not have a material effect on our consolidated financial position, results of operations or liquidity.
ITEM 4. REMOVED AND RESERVED
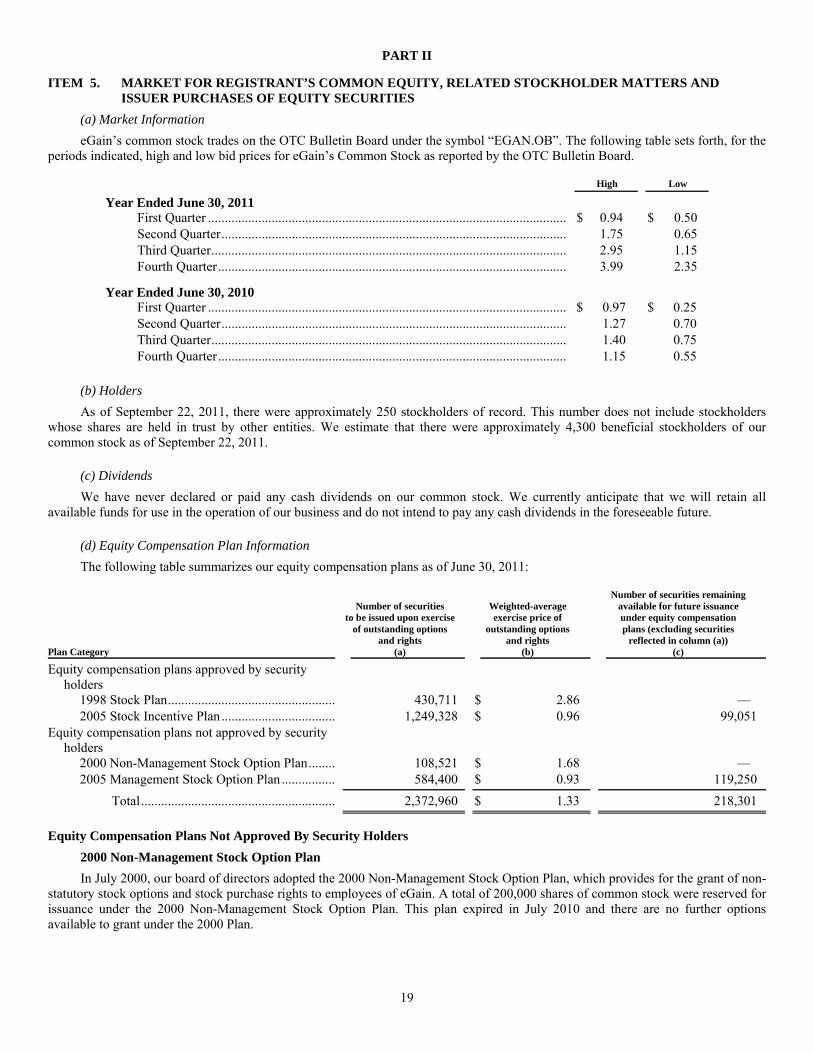
19
PART II
ITEM 5. MARKET FOR REGISTRANT’S COMMON EQUITY, RELATED STOCKHOLDER MATTERS AND ISSUER PURCHASES OF EQUITY SECURITIES
(a) Market Information eGain’s common stock trades on the OTC Bulletin Board under the symbol “EGAN.OB”. The following table sets forth, for the
periods indicated, high and low bid prices for eGain’s Common Stock as reported by the OTC Bulletin Board.
High
Low
Year Ended June 30, 2011
First Quarter ........................................................................................................... $ 0.94 $ 0.50Second Quarter ....................................................................................................... 1.75 0.65Third Quarter .......................................................................................................... 2.95 1.15 Fourth Quarter ........................................................................................................ 3.99 2.35
Year Ended June 30, 2010
First Quarter ........................................................................................................... $ 0.97 $ 0.25 Second Quarter ....................................................................................................... 1.27 0.70 Third Quarter .......................................................................................................... 1.40 0.75 Fourth Quarter ........................................................................................................ 1.15 0.55
(b) Holders As of September 22, 2011, there were approximately 250 stockholders of record. This number does not include stockholders
whose shares are held in trust by other entities. We estimate that there were approximately 4,300 beneficial stockholders of our common stock as of September 22, 2011.
(c) Dividends We have never declared or paid any cash dividends on our common stock. We currently anticipate that we will retain all
available funds for use in the operation of our business and do not intend to pay any cash dividends in the foreseeable future.
(d) Equity Compensation Plan Information The following table summarizes our equity compensation plans as of June 30, 2011:
Plan Category
Number of securities to be issued upon exercise
of outstanding options and rights
(a)
Weighted-average exercise price of
outstanding options and rights
(b)
Number of securities remaining available for future issuance under equity compensation plans (excluding securities
reflected in column (a)) (c)
Equity compensation plans approved by security holders
1998 Stock Plan .................................................. 430,711 $ 2.86 — 2005 Stock Incentive Plan .................................. 1,249,328 $ 0.96 99,051
Equity compensation plans not approved by security holders
2000 Non-Management Stock Option Plan ........ 108,521 $ 1.68 — 2005 Management Stock Option Plan ................ 584,400 $ 0.93 119,250
Total .......................................................... 2,372,960 $ 1.33 218,301
Equity Compensation Plans Not Approved By Security Holders
2000 Non-Management Stock Option Plan In July 2000, our board of directors adopted the 2000 Non-Management Stock Option Plan, which provides for the grant of non-
statutory stock options and stock purchase rights to employees of eGain. A total of 200,000 shares of common stock were reserved for issuance under the 2000 Non-Management Stock Option Plan. This plan expired in July 2010 and there are no further options available to grant under the 2000 Plan.
20
2005 Management Stock Option Plan In May 2005, our board of directors adopted the 2005 Management Stock Option Plan, or the 2005 Management Plan,
pursuant, to which the Compensation Committee may grant non-qualified stock options to purchase up to 962,400 shares of eGain common stock, at an exercise price of not less than 100% of the fair market value of such common stock, to directors, officers and key employees of the Company and its subsidiaries. In November 2007, our board of directors approved an increase of 500,000 shares for issuance under the 2005 Management Plan. Options granted under the 2005 Management Plan are subject to vesting as determined by the Compensation Committee. The options are exercisable for up to ten years from the date of grant.
(e) Issuer Repurchases of Equity Securities On September 14, 2009, we announced that our board of directors has approved a stock repurchase program under which we
may purchase up to 1,000,000 shares of our common stock. Under the program, we can purchase shares of common stock from time to time through the open market and privately negotiated transactions at prices deemed appropriate by our management. The repurchases will be funded by cash on hand and the duration of the repurchase program is open-ended. We had repurchased 321,551 shares and retired 308,361 shares as of June 30, 2011. The remaining 13,190 shares were retired on July 13, 2011.
21
ITEM 6. SELECTED FINANCIAL DATA The selected consolidated financial data should be read in conjunction with “Management’s Discussion and Analysis of
Financial Condition and Results of Operations,” our Consolidated Financial Statements and Notes thereto, and other financial information included elsewhere in this Annual Report on Form 10-K. Historical results are not necessarily indicative of results that may be expected for future periods.
Year ended June 30,
2011 2010 2009
2008 2007
(in thousands, except per share information)
Revenue:
License ........................................................................................ $ 17,371 $ 7,389 $ 8,613 $ 6,570 $ 3,407 Recurring revenue ....................................................................... 20,040 16,617 15,382 15,330 13,188 Professional services ................................................................... 6,654 5,871 9,224 8,207 5,878
Total revenue ..................................................................... 44,065 29,877 33,219 30,107 22,473 Cost of license ............................................................................. 34 168 263 80 99 Cost of recurring revenue ............................................................ 5,273 4,492 4,371 4,395 3,702 Cost of professional services ....................................................... 5,609 5,048 6,112 7,161 5,430
Gross profit ........................................................................ 33,149 20,169 22,473 18,471 13,242
Operating costs and expenses:
Research and development .......................................................... 5,551 5,510 5,481 5,098 3,973 Sales and marketing ..................................................................... 13,932 10,226 10,465 11,747 12,853 General and administrative .......................................................... 3,974 3,211 3,271 4,240 2,884
Total operating costs and expenses .................................... 23,457 18,947 19,217 21,085 19,710
Income / (loss) from operations ............................................................ 9,692 1,222 3,256 (2,614) (6,468)Interest expense, net .............................................................................. (1,230) (1,123) (1,435) (1,659 ) (1,167 )Other income / (expense) ...................................................................... 245 (67) 230 332 72
Income / (loss) before income tax ......................................................... 8,707 32 2,051 (3,941) (7,563 )Income tax benefit / (expense), net ....................................................... (196) (159 ) 129 (206 ) (136 )
Net income / (loss) ................................................................................ $ 8,511 $ (127) $ 2,180 $ (4,147) (7,699 )
Per share information:
Basic net income / (loss) per common share ............................... $ 0.37 $ (0.01) $ 0.11 $ (0.27) $ (0.50)
Diluted net income / (loss) per common share ............................ $ 0.35 $ (0.01) $ 0.11 $ (0.27) $ (0.50)
Weighted average shares used in computing basic net income / (loss) per common share ......................................................... 22,709 22,180 20,611 15,330 15,317
Weighted average shares used in computing diluted net income / (loss) per common share .......................................... 24,289 22,180 20,612 15,330 15,317
Below is a summary of stock-based compensation included in the costs and expenses above: Cost of professional services ....................................................... $ 32 $ 35 $ 29 $ 41 $ 47 Research and development .......................................................... $ 52 $ 78 $ 46 $ 57 $ 39 Sales and marketing ..................................................................... $ 46 $ 49 $ 25 $ 67 $ 127 General and administrative .......................................................... $ 88 $ 82 $ 141 $ 153 $ 60
June 30,
2011 2010 2009
2008 2007
Consolidated Balance Sheet Data:
Cash, cash equivalents and short-term investments .............................. $ 13,057 $ 5,733 $ 7,511 $ 3,790 $ 6,195 Working capital ..................................................................................... $ 3,847 $ (1,055) $ (1,883) $ (2,666) $ (4,111)Total assets ............................................................................................ $ 28,224 $ 15,316 $ 18,636 $ 13,914 $ 15,362 Deferred revenue ................................................................................... $ 5,824 $ 5,103 $ 5,531 $ 5,164 $ 5,541 Long-term debt ..................................................................................... $ 3,333 $ 8,752 $ 7,999 $ 16,553 $ 11,820
22
ITEM 7. MANAGEMENT’S DISCUSSION AND ANALYSIS OF FINANCIAL CONDITION AND RESULTS OF OPERATIONS
The following discussion of eGain’s financial condition and results of operations should be read together with the consolidated financial statements and related notes in this Annual Report on Form 10-K. This discussion may contain forward-looking statements based upon current expectations that involve risks and uncertainties. These risks and uncertainties may cause actual results to differ materially from those discussed in the forward-looking statements.
Overview
The Company was incorporated in Delaware in September 1997. eGain is one of the premier providers of cloud and on-site customer interaction software for sales and service. For over a decade, eGain solutions have helped improve customer experience, grow sales, and optimize service processes across the web, social, and phone channels. Hundreds of global enterprises rely on eGain to transform fragmented sales engagement and customer service operations into unified Customer Interaction Hubs.
In fiscal year 2011, we recorded annual revenue of $44.1 million and income from operations of $9.7 million, compared to an annual revenue of $29.9 million and income from operations of $1.2 million in the prior year. Total revenue growth of 47%, was primarily driven by the license and recurring revenue growth. Cash from operations increased significantly to $6.8 million in fiscal year 2011 from $2.5 million in the prior year.
Based upon the strong increase in the demand for our products and services we continued to increase our investment in sales and marketing and began to expand our distribution capability during fiscal year 2011. If the demand continues for our products and services, we intend to continue to increase our sales and marketing investments and the expansion of distribution capability in fiscal year 2012. In addition, we intend to make further investments in product development and technology to enhance our current products and services, develop new products and services and further advance our solution offerings. We believe that existing capital resources will enable us to maintain current and planned operations for the next 12 months. Due to our limited operating history and fluctuations in business, we believe that period-to-period comparisons of our revenue and operating results may not be meaningful and should not be relied upon as indications of future performance, but we anticipate an increase in revenue in fiscal year 2012.
Critical Accounting Policies and Estimates Management’s Discussion and Analysis of Financial Condition and Results of Operations discusses our consolidated financial
statements, which have been prepared in accordance with accounting principles generally accepted in the United States of America. The preparation of these financial statements requires management to make estimates and assumptions that affect the reported amounts of assets and liabilities and the disclosure of contingent assets and liabilities at the date of the financial statements and the reported amounts of revenue and expenses during the reporting period. On an on-going basis, management evaluates its estimates and judgments, including those related to revenue recognition, allowance for doubtful accounts, valuation allowance and accrued liabilities, long-lived assets and stock-based compensation. Management bases its estimates and judgments on historical experience and on various other factors that are believed to be reasonable under the circumstances, the results of which form the basis for making judgments about the carrying values of assets and liabilities that are not readily apparent from other sources. Actual results may differ from these estimates under different assumptions or conditions.
Revenue Recognition We derive revenue from three sources: license fees, recurring revenue, and professional services. Recurring revenue include
hosting and software maintenance and support. Maintenance and support consists of technical support and software upgrades and enhancements. Professional services primarily consist of consulting and implementation services and training. Significant management judgments and estimates are made and used to determine the revenue recognized in any accounting period. Material differences may result in changes to the amount and timing of our revenue for any period if different conditions were to prevail. We present revenue net of taxes collected from customers and remitted to governmental authorities.
We apply the provisions of Financial Accounting Standards Board, or FASB, Accounting Standards Codification, or ASC, 985-605, Software Revenue Recognition, to all transactions involving the licensing of software products. In the event of a multiple element arrangement for a license transaction, we evaluate the transaction as if each element represents a separate unit of accounting taking into account all factors following the accounting standards. We apply ASC 605, Revenue Recognition, for hosting transactions to determine the accounting treatment for multiple elements. We also apply ASC 605 for fixed fee arrangements in which we use the percentage of completion method to recognize revenue when reliable estimates are available for the costs and efforts necessary to complete the implementation services. When such estimates are not available, the completed contract method is utilized. Under the completed contract method, revenue is recognized only when a contract is completed or substantially complete.
When licenses are sold together with system implementation and consulting services, license fees are recognized upon shipment, provided that (i) payment of the license fees is not dependent upon the performance of the consulting and implementation services, (ii) the services are available from other vendors, (iii) the services qualify for separate accounting as we have sufficient experience in
23
providing such services, have the ability to estimate cost of providing such services, and we have vendor-specific objective evidence of pricing, and (iv) the services are not essential to the functionality of the software.
We use signed software license and services agreements and order forms as evidence of an arrangement for sales of software, hosting, maintenance and support. We use signed engagement letters to evidence an arrangement for professional services.
License Revenue We recognize license revenue when persuasive evidence of an arrangement exists, the product has been delivered, no significant
obligations remain, the fee is fixed or determinable, and collection of the resulting receivable is probable. In software arrangements that include rights to multiple software products and/or services, we use the residual method under which revenue is allocated to the undelivered elements based on vendor-specific objective evidence of the fair value of such undelivered elements. The residual amount of revenue is allocated to the delivered elements and recognized as revenue assuming all other criteria for revenue recognition have been met. Such undelivered elements in these arrangements typically consist of software maintenance and support, implementation and consulting services and in some cases hosting services.
Software is delivered to customers electronically or on a CD-ROM, and license files are delivered electronically. We assess whether the fee is fixed or determinable based on the payment terms associated with the transaction. We have standard payment terms included in our contracts. We assess collectability based on a number of factors, including the customer’s past payment history and its current creditworthiness. If we determine that collection of a fee is not reasonably assured, we defer the revenue and recognize it at the time collection becomes reasonably assured, which is generally upon receipt of cash payment. If an acceptance period is required, revenue is recognized upon the earlier of customer acceptance or the expiration of the acceptance period.
We periodically sell to resellers. License sales to resellers as a percentage of total revenue were approximately 5%, 4% and 11% in fiscal years 2011, 2010 and 2009, respectively. Revenue from sales to resellers is generally recognized upon delivery to the reseller but depends on the facts and circumstances of the transaction, such as our understanding of the reseller’s plans to sell the software, if there are any return provisions, price protection or other allowances, the reseller’s financial status and our past experience with the particular reseller. Historically sales to resellers have not included any return provisions, price protections or other allowances.
Hosting Revenue Included in recurring revenue is revenue derived from our hosted service offerings. We recognize hosting revenue ratably over
the period of the applicable agreement as services are provided. Hosting agreements typically have an initial term of one or two years and automatically renew unless either party cancels the agreement. The majority of the hosting services customers purchase a combination of our hosting service and professional services. In some cases the customer may also acquire a license for our software.
We evaluate whether each of the elements in these arrangements represents a separate unit of accounting, as defined by ASC 605, using all applicable facts and circumstances, including whether (i) we sell or could readily sell the element unaccompanied by the other elements, (ii) the element has stand-alone value to the customer, and (iii) there is a general right of return. We use vendor specific objective evidence of fair value (VSOE) for each of those units, when available. Upon adoption of the new guidance for revenue recognition with multiple-deliverable elements, in certain limited circumstances when VSOE does not exist, we apply the selling price hierarchy to applicable multiple-deliverable arrangements. We consider the applicability of ASC 985-605, Software Revenue Recognition, on a contract-by-contract basis. In hosted term-based agreements, where the customer does not have the contractual right to take possession of the software, the revenue is recognized on a monthly basis over the term of the contract. Invoiced amounts are recorded in accounts receivable and in deferred revenue or revenue, depending on whether the revenue recognition criteria have been met. For professional services that we determine do not have stand-alone value to the customer, we recognize the services revenue ratably over the longer of the remaining contractual period or the remaining estimated life of the customer hosting relationship, once hosting has gone live. We currently estimate the life of the customer hosting relationship to be approximately 26 months, based on the average life of all hosting customer relationships.
We consider a software element to exist when we determine that the customer has the contractual right to take possession of our software at any time during the hosting period without significant penalty and can feasibly run the software on its own hardware or enter into another arrangement with a third party to host the software. Additionally, we have established vendor-specific objective evidence for the hosting and support elements of perpetual license sales, based on the prices charged when sold separately and substantive renewal terms. Accordingly, when a software element exists in a hosting services arrangement, license revenue for the perpetual software license element is determined using the residual method and is recognized upon delivery. Revenue for the hosting and support elements is recognized ratably over the contractual time period. Professional services are recognized as described below under “Professional Services Revenue.” If evidence of fair value cannot be established for the undelivered elements of an agreement, the entire amount of revenue from the arrangement is recognized ratably over the period that these elements are delivered.
24
Maintenance and Support Revenue Included in recurring revenue is revenue derived from maintenance and support. We use vendor-specific objective evidence of
fair value for maintenance and support to account for the arrangement using the residual method, regardless of any separate prices stated within the contract for each element. Maintenance and support revenue is recognized ratably over the term of the maintenance contract, which is typically one year. Maintenance and support is renewable by the customer on an annual basis. Maintenance and support rates, including subsequent renewal rates, are typically established based upon a specified percentage of net license fees as set forth in the arrangement.
Professional Services Revenue Included in professional services revenue is revenue derived from system implementation, consulting and training. For license
transactions, the majority of our consulting and implementation services and accompanying agreements qualify for separate accounting. We use vendor-specific objective evidence of fair value for the services to account for the arrangement using the residual method, regardless of any separate prices stated within the contract for each element. Our consulting and implementation service contracts are bid either on a fixed-fee basis or on a time-and-materials basis. Substantially all of our contracts are on a time-and-materials basis. For time-and-materials contracts, where the services are not essential to the functionality, we recognize revenue as services are performed. If the services are essential to functionality, then both the product license revenue and the service revenue are recognized under the percentage of completion method. For a fixed-fee contract we recognize revenue based upon the costs and efforts to complete the services in accordance with the percentage of completion method, provided we are able to estimate such cost and efforts.
For hosting, consulting, and implementation services that do not qualify for separate accounting, we recognize the services revenue ratably over the estimated life of the customer hosting relationship.
Training revenue that meets the criteria to be accounted for separately is recognized when training is provided or, in the case of hosting, when the customer also has access to the hosting services.
Stock-Based Compensation
We account for stock-based compensation in accordance with ASC 718, Compensation — Stock Compensation. Under the fair value recognition provisions of ASC 718, stock-based compensation cost is measured at the grant date based on the fair value of the award and is recognized as an expense over the vesting period. Determining the fair value of the stock-based awards at the grant date requires significant judgment and the use of estimates, particularly surrounding Black-Scholes valuation assumptions such as stock price volatility and expected option lives. We determine the appropriate measure of expected volatility by reviewing historic volatility in the share price of our common stock, as adjusted for certain events that management deemed to be non-recurring and non-indicative of future events. Prior to October 2009, in developing our estimate of expected life of a stock option, we used a temporary method to develop the estimate of the expected life of a “plain vanilla” employee stock option. Under this approach, the expected life would be presumed to be the mid-point between the vesting date and the end of the contractual term. In October 2009 we changed from using this approach to basing it on the historical exercise behavior, cancellations of all past option grants made by the company during the time period in which its equity shares have been publicly traded the contractual term, the vesting period and the expected remaining term of the option. The change in the estimate did not have a material effect on either the expected life or the valuation of the stock options. Based on our historical experience of option pre-vesting cancellations, we have assumed an annualized 14% forfeiture rate for our options. We record additional expense if the actual forfeiture rate is lower than we estimated, and record a recovery of prior expense if the actual forfeiture is higher than what we estimated.
Valuation of Goodwill In accordance with ASC 350, Goodwill and Other Intangible Assets, we review goodwill annually for impairment (or more
frequently if impairment indicators arise). We perform an annual goodwill impairment review April 1 every year and we have found no impairment in the last three years.
Allowance for Doubtful Accounts We maintain an allowance for doubtful accounts to reserve for potential uncollectible trade receivables. We review our trade
receivables by aging category to identify specific customers with known disputes or collectability issues. We exercise judgment when determining the adequacy of these reserves as we evaluate historical bad debt trends, general economic conditions in the U.S. and internationally, and changes in customer financial conditions. If we make different judgments or utilize different estimates, material differences may result in additional reserves for trade receivables, which would be reflected by charges in general and administrative expenses for any period presented. We write off a receivable after all collection efforts have been exhausted and the amount deemed uncollectible.
25
Leases Lease agreements are evaluated to determine whether they are capital or operating leases in accordance with ASC 840, Leases.
When any one of the four test criteria in ASC 840 is met, the lease then qualifies as a capital lease.
Capital leases are capitalized at the lower of the net present value of the total amount of rent payable under the leasing agreement (excluding finance charges) or the fair market value of the leased asset. Capital lease assets are depreciated on a straight-line basis, over a period consistent with our normal depreciation policy for tangible fixed assets, but not exceeding the lease term. Interest charges are expensed over the period of the lease in relation to the carrying value of the capital lease obligation.
Rent expense for operating leases, which may include free rent or fixed escalation amounts in addition to minimum lease payments, is recognized on a straight-line basis over the duration of each lease term.
Deferred tax valuation allowance When we prepare our consolidated financial statements, we estimate our income tax liability for each of the various jurisdictions
where we conduct business. This requires us to estimate our actual current tax exposure and to assess temporary differences that result from differing treatment of certain items for tax and accounting purposes. The net deferred tax assets are reduced by a valuation allowance if, based upon weighted available evidence, it is more likely than not that some or all of the deferred tax assets will not be realized. We must make significant judgments to determine our provision for income taxes, our deferred tax assets and liabilities and any valuation allowance to be recorded against our net deferred assets. As of June 30, 2011, we had a valuation allowance of approximately $77.3 million of which approximately $76.4 million was attributable to U.S. and state net operating losses and research and development credit carry forwards.
We apply ASC 740, Income Taxes, in determining any uncertain tax positions. The guidance seeks to reduce the diversity in practice associated with certain aspects of measurement and recognition in accounting for income taxes and prescribes a recognition threshold and measurement attribute for the financial statement recognition and measurement of a tax position that an entity takes or expects to take in a tax return. Additionally, ASC 740 provides guidance on de-recognition, classification, interest and penalties, accounting in interim periods, disclosure and transition. Under ASC 740, an entity may only recognize or continue to recognize tax positions that meet a “more likely than not” threshold. In accordance with our accounting policy, we recognize accrued interest and penalties related to unrecognized tax benefits as a component of other income and expense, in the consolidated statements of operations.
Results of Operations The following table sets forth certain items reflected in our consolidated statements of operations expressed as a percent of total
revenue for the periods indicated.
2011
2010 2009
Revenue:
License ................................................................................................................................... 39% 25% 26%Recurring revenue .................................................................................................................. 46% 55% 46%Professional services .............................................................................................................. 15% 20% 28%
Total revenue ................................................................................................................ 100% 100% 100%Cost of license ........................................................................................................................ 0% 1% 1%Cost of recurring revenue ....................................................................................................... 12% 15% 13%Cost of professional services .................................................................................................. 13% 16% 18%
Gross profit ................................................................................................................... 75% 68% 68%Research and development ..................................................................................................... 12% 18% 16%Sales and marketing ................................................................................................................ 32% 34% 32%General and administrative ..................................................................................................... 9% 12% 10%
Total operating costs and expenses ............................................................................... 53% 64% 58%
Income from operations .......................................................................................................... 22% 4% 10%
26
Revenue Total revenue, which consists of license revenue, recurring revenue and professional services revenue, was $44.1 million, $29.9
million, and $33.2 million, in fiscal years 2011, 2010, and 2009, respectively.
In fiscal year 2011, total revenue increased 47%, or $14.2 million, from the prior year. Our international sales accounted for approximately 53% of total revenue in fiscal year 2011, an increase from 47% of total revenue in fiscal year 2010. The impact of the foreign exchange fluctuation between the U.S. dollar and against the Euro and British pound in total revenue was minimal in both fiscal year 2011 and 2010. One customer accounted for about 22% of total revenue in fiscal year 2011. One customer accounted for 14% of total revenue in both fiscal years 2010 and 2009.
We are continuing to see increased interest in our customer interaction solutions but there remains a general unpredictability in the length of our current sales cycles, the timing of revenue recognition on more complex license transactions and seasonal buying patterns. This unpredictability has increased due to the global economic slowdown and the increased volatility of the value of the British pound and Euro in relation to the U.S. dollar. Also, because we offer a hybrid delivery model, the mix of new hosting and license transactions in a quarter could also have an impact on our revenue in a particular quarter. We are continuing to see that the mix of license and hosting business fluctuate from quarter to quarter. The value of new hosting transactions, as a percentage of combined new hosting and license business excluding the Cisco OEM agreement, was approximately 248%, 53% and 34% for the fiscal years 2011, 2010 and 2009, respectively. For license transactions the license revenue amount is generally recognized in the quarter that delivery and acceptance of our software takes place whereas, for hosting transactions, hosting revenue is recognized ratably over the term of the hosting contract, which is typically one to two years. As a result, our total revenue may increase or decrease in future quarters as a result of the timing and mix of license and hosting transactions, but we anticipate total revenue to increase in fiscal year 2012.
License Revenue
Fiscal Year Ended June 30 Year-Over-Year Change
2011
2010 2009 2010 to 2011 2009 to 2010
(in thousands)
Revenue:
License ......................................... $17,371 $ 7,389 $ 8,613 $ 9,982 135% $ (1,224) (14)% Percentage of total revenue .......... 39% 25% 26%
License revenue was $17.4 million, $7.4 million, and $8.6 million in fiscal years 2011, 2010, and 2009, respectively. This represents an increase of 135% or $10.0 million, in fiscal year 2011 from fiscal year 2010, compared to a decrease of 14% or $1.2 million, in fiscal year 2010 from fiscal year 2009. License revenue represented 39%, 25%, and 26% of total revenue for the fiscal years 2011, 2010, and 2009, respectively.
License revenue in fiscal year 2011 included a large transaction of approximately $7.0 million, a total of approximately $5.4 million from four other transactions with average deal size over $1.0 million and $1.2 million from the Cisco OEM agreement. The license revenue in fiscal year 2010 primarily included $2.1 million from the Cisco OEM agreement and one transaction of approximately $1.0 million. License revenue in fiscal year 2011 was negatively impacted by $227,000 due to the strengthening of the U.S. dollar against the Euro in which certain licenses were denominated.
License revenue in fiscal year 2010 included $2.1 million from the amendment to the Cisco OEM agreement. Based upon certain changes, including pricing for support, we no longer estimate the minimum profit and record the associated revenue as professional services for the Cisco OEM agreement from the effective date of the amendment. Instead, we record royalties earned under the Cisco OEM agreement as license revenue. The decrease in fiscal year 2010 was primarily due to the length or unpredictable nature of our sales cycles resulting in the delay in the completion of a number of significant customer transactions until fiscal 2011. The mix of license and hosting business also contributed to the decrease. The value of new license transactions, as a percentage of combined new hosting and license business excluding the Cisco OEM agreement, was approximately 47% in fiscal year 2010 down from 66% in fiscal year 2009. The impact from the foreign currency fluctuations on license revenue was minimal in fiscal year 2010.
Given the general unpredictability in the length of current sales cycles, the mix between hosting and license transactions, the uncertainty in the global economy and the volatility of the value of the British pound and Euro in relation to the U.S. dollar, license revenue may increase or decrease in future periods, but we anticipate total license revenue to increase in fiscal year 2012.
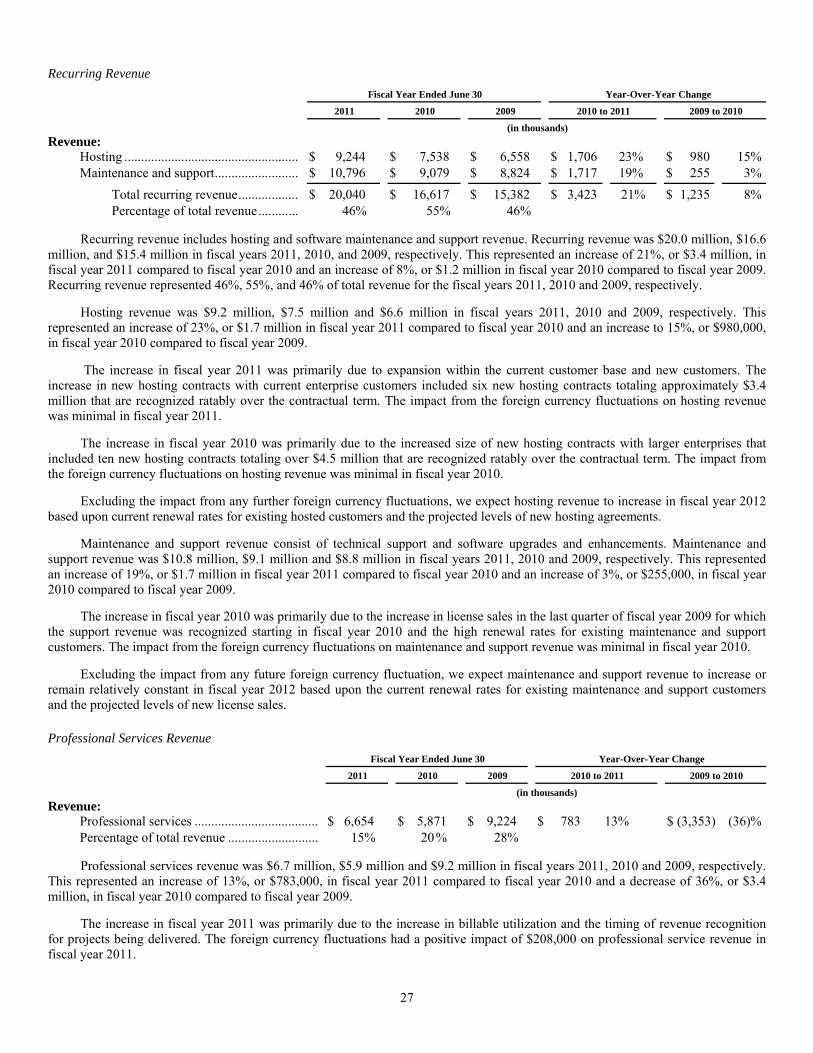
27
Recurring Revenue
Fiscal Year Ended June 30 Year-Over-Year Change
2011 2010 2009 2010 to 2011
2009 to 2010
(in thousands)
Revenue:
Hosting ..................................................... $ 9,244 $ 7,538 $ 6,558 $ 1,706 23% $ 980 15%Maintenance and support .......................... $ 10,796 $ 9,079 $ 8,824 $ 1,717 19% $ 255 3%
Total recurring revenue ................... $ 20,040 $ 16,617 $ 15,382 $ 3,423 21% $ 1,235 8%Percentage of total revenue ............. 46% 55% 46%
Recurring revenue includes hosting and software maintenance and support revenue. Recurring revenue was $20.0 million, $16.6 million, and $15.4 million in fiscal years 2011, 2010, and 2009, respectively. This represented an increase of 21%, or $3.4 million, in fiscal year 2011 compared to fiscal year 2010 and an increase of 8%, or $1.2 million in fiscal year 2010 compared to fiscal year 2009. Recurring revenue represented 46%, 55%, and 46% of total revenue for the fiscal years 2011, 2010 and 2009, respectively.
Hosting revenue was $9.2 million, $7.5 million and $6.6 million in fiscal years 2011, 2010 and 2009, respectively. This represented an increase of 23%, or $1.7 million in fiscal year 2011 compared to fiscal year 2010 and an increase to 15%, or $980,000, in fiscal year 2010 compared to fiscal year 2009.
The increase in fiscal year 2011 was primarily due to expansion within the current customer base and new customers. The increase in new hosting contracts with current enterprise customers included six new hosting contracts totaling approximately $3.4 million that are recognized ratably over the contractual term. The impact from the foreign currency fluctuations on hosting revenue was minimal in fiscal year 2011.
The increase in fiscal year 2010 was primarily due to the increased size of new hosting contracts with larger enterprises that included ten new hosting contracts totaling over $4.5 million that are recognized ratably over the contractual term. The impact from the foreign currency fluctuations on hosting revenue was minimal in fiscal year 2010.
Excluding the impact from any further foreign currency fluctuations, we expect hosting revenue to increase in fiscal year 2012 based upon current renewal rates for existing hosted customers and the projected levels of new hosting agreements.
Maintenance and support revenue consist of technical support and software upgrades and enhancements. Maintenance and support revenue was $10.8 million, $9.1 million and $8.8 million in fiscal years 2011, 2010 and 2009, respectively. This represented an increase of 19%, or $1.7 million in fiscal year 2011 compared to fiscal year 2010 and an increase of 3%, or $255,000, in fiscal year 2010 compared to fiscal year 2009.
The increase in fiscal year 2010 was primarily due to the increase in license sales in the last quarter of fiscal year 2009 for which the support revenue was recognized starting in fiscal year 2010 and the high renewal rates for existing maintenance and support customers. The impact from the foreign currency fluctuations on maintenance and support revenue was minimal in fiscal year 2010.
Excluding the impact from any future foreign currency fluctuation, we expect maintenance and support revenue to increase or remain relatively constant in fiscal year 2012 based upon the current renewal rates for existing maintenance and support customers and the projected levels of new license sales.
Professional Services Revenue
Fiscal Year Ended June 30 Year-Over-Year Change
2011 2010 2009 2010 to 2011
2009 to 2010
(in thousands) Revenue:
Professional services ..................................... $ 6,654 $ 5,871 $ 9,224 $ 783 13% $ (3,353) (36)%Percentage of total revenue ........................... 15% 20 % 28%
Professional services revenue was $6.7 million, $5.9 million and $9.2 million in fiscal years 2011, 2010 and 2009, respectively. This represented an increase of 13%, or $783,000, in fiscal year 2011 compared to fiscal year 2010 and a decrease of 36%, or $3.4 million, in fiscal year 2010 compared to fiscal year 2009.
The increase in fiscal year 2011 was primarily due to the increase in billable utilization and the timing of revenue recognition for projects being delivered. The foreign currency fluctuations had a positive impact of $208,000 on professional service revenue in fiscal year 2011.
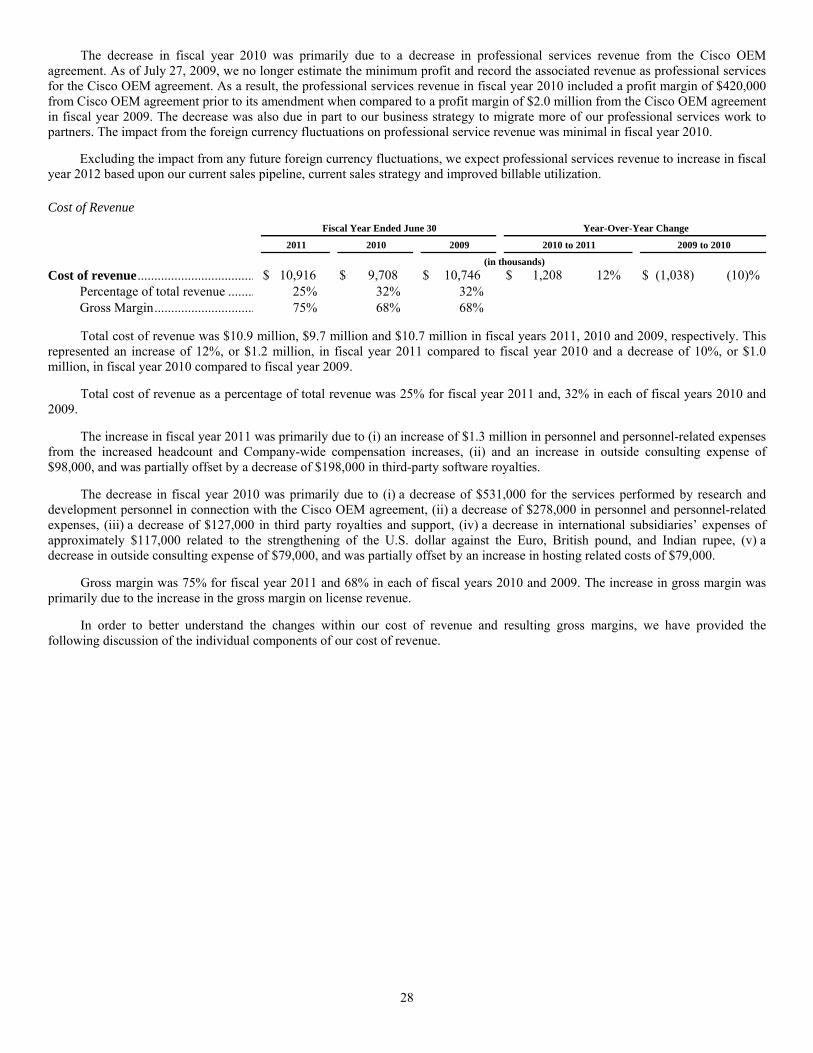
28
The decrease in fiscal year 2010 was primarily due to a decrease in professional services revenue from the Cisco OEM agreement. As of July 27, 2009, we no longer estimate the minimum profit and record the associated revenue as professional services for the Cisco OEM agreement. As a result, the professional services revenue in fiscal year 2010 included a profit margin of $420,000 from Cisco OEM agreement prior to its amendment when compared to a profit margin of $2.0 million from the Cisco OEM agreement in fiscal year 2009. The decrease was also due in part to our business strategy to migrate more of our professional services work to partners. The impact from the foreign currency fluctuations on professional service revenue was minimal in fiscal year 2010. Excluding the impact from any future foreign currency fluctuations, we expect professional services revenue to increase in fiscal year 2012 based upon our current sales pipeline, current sales strategy and improved billable utilization.
Cost of Revenue
Fiscal Year Ended June 30 Year-Over-Year Change
2011
2010 2009 2010 to 2011 2009 to 2010
(in thousands)
Cost of revenue ................................... $ 10,916 $ 9,708 $ 10,746 $ 1,208 12% $ (1,038) (10)%Percentage of total revenue ........ 25% 32% 32%
Gross Margin .............................. 75% 68% 68%
Total cost of revenue was $10.9 million, $9.7 million and $10.7 million in fiscal years 2011, 2010 and 2009, respectively. This represented an increase of 12%, or $1.2 million, in fiscal year 2011 compared to fiscal year 2010 and a decrease of 10%, or $1.0 million, in fiscal year 2010 compared to fiscal year 2009.
Total cost of revenue as a percentage of total revenue was 25% for fiscal year 2011 and, 32% in each of fiscal years 2010 and 2009.
The increase in fiscal year 2011 was primarily due to (i) an increase of $1.3 million in personnel and personnel-related expenses from the increased headcount and Company-wide compensation increases, (ii) and an increase in outside consulting expense of $98,000, and was partially offset by a decrease of $198,000 in third-party software royalties.
The decrease in fiscal year 2010 was primarily due to (i) a decrease of $531,000 for the services performed by research and development personnel in connection with the Cisco OEM agreement, (ii) a decrease of $278,000 in personnel and personnel-related expenses, (iii) a decrease of $127,000 in third party royalties and support, (iv) a decrease in international subsidiaries’ expenses of approximately $117,000 related to the strengthening of the U.S. dollar against the Euro, British pound, and Indian rupee, (v) a decrease in outside consulting expense of $79,000, and was partially offset by an increase in hosting related costs of $79,000.
Gross margin was 75% for fiscal year 2011 and 68% in each of fiscal years 2010 and 2009. The increase in gross margin was primarily due to the increase in the gross margin on license revenue.
In order to better understand the changes within our cost of revenue and resulting gross margins, we have provided the following discussion of the individual components of our cost of revenue.

29
Cost of License
Fiscal Year Ended June 30 Year-Over-Year Change
2011 2010 2009 2010 to 2011
2009 to 2010
(in thousands) Cost of license ..................................................................... $ 34 $ 168 $ 263 $ (134) (80)% $ (95) (36)%
Percentage of license revenue .................................... 0% 2% 1 %
Gross Margin .............................................................. 100% 98% 99 %
Cost of license primarily includes third-party software royalties and delivery costs for shipments to customers. Total cost of license was $34,000, $168,000 and $263,000 in fiscal years 2011, 2010 and 2009, respectively.
This represented a decrease of 80%, or $134,000, in fiscal year 2011 compared to 2010 and a decrease of 36%, or $95,000, in fiscal year 2010 compared to 2009. Total cost of license as a percentage of total license revenue was approximately 0% (a gross margin of 100%) in fiscal year 2011 compared to 2% in fiscal year 2010 (a gross margin of 98%) and to 1% (a gross margin of 99%) in fiscal year 2009. The decrease in both fiscal years 2011 and 2010 was due to a decrease in third party royalties.
We anticipate cost of license to increase slightly as a percentage of total license revenue in future periods.
Cost of Recurring Revenue
Fiscal Year Ended June 30
Year-Over-Year Change
2011 2010 2009 2010 to 2011
2009 to 2010
(in thousands) Cost of recurring revenue ............................................... $ 5,273 $ 4,492 $ 4,371 $ 781 17% $ 121 3%
Percentage of recurring service revenue ................... 26% 27% 28%
Gross Margin ............................................................ 74% 73% 72%
Cost of recurring revenue includes personnel costs for our hosting services and maintenance and support. It also includes depreciation of capital equipment used in our hosted network, cost of support for the third-party software and lease costs paid to remote co-location centers.
Total cost of recurring revenue was $5.3 million, $4.5 million and $4.4 million in fiscal years 2011, 2010 and 2009, respectively. This represented an increase of 17%, or $781,000, in fiscal year 2011 compared to fiscal year 2010 and an increase of 3%, or $121,000, in fiscal year 2010 compared to fiscal year 2009. Total cost of recurring revenue as a percentage of total recurring revenue was 26% (a gross margin of 74%) in fiscal year 2011 compared to 27% (a gross margin of 73%) in fiscal year 2010 and 28% (a gross margin of 72%) in fiscal year 2009.
The increase in cost of recurring revenue in fiscal year 2011 was primarily due to (i) an increase of $747,000 in personnel and personnel-related expenses from the increased headcount and Company-wide compensation increases, (ii) an increase in international subsidiaries’ expenses of approximately $32,000 from the foreign exchange fluctuation between the U.S. dollar, the Euro, British pound and India rupee, (iii) an increase of $31,000 in outside consulting services, and was partially offset by a decrease of $23,000 in support of third party software.
The increase in cost of recurring revenue in fiscal year 2010 primarily consisted of (i) an increase of $99,000 in hosting related costs, (ii) an increase of $75,000 in personnel and personnel-related expenses and was partially offset by (i) a decrease in support of third-party software of $32,000 and (ii) a decrease in our international subsidiaries’ expenses of approximately $32,000 primarily from the strengthening of the U.S. dollar against the Euro, British pound, and Indian rupee.
Excluding the impact from any future foreign currency fluctuations, we anticipate cost of recurring revenue to increase in fiscal year 2012, but for the gross margin to remain relatively constant when compared to fiscal year 2011
Cost of Professional Services
Fiscal Year Ended June 30 Year-Over-Year Change
2011 2010 2009 2010 to 2011
2009 to 2010
(in thousands)
Cost of professional services ............................ $ 5,609 $ 5,048 $ 6,112 $ 561 11% $ (1,064 ) (17)%Percentage of professional service
revenue ................................................. 84% 86 % 66 %
Gross Margin ............................................. 16% 14 % 34 %
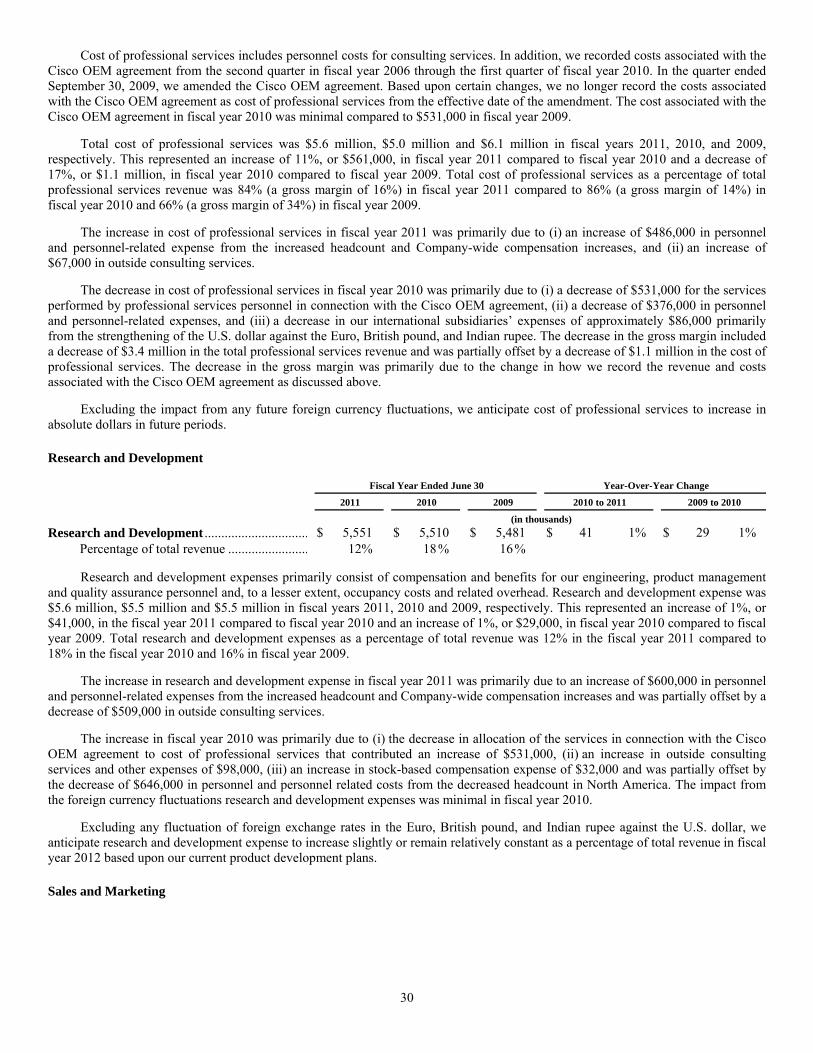
30
Cost of professional services includes personnel costs for consulting services. In addition, we recorded costs associated with the Cisco OEM agreement from the second quarter in fiscal year 2006 through the first quarter of fiscal year 2010. In the quarter ended September 30, 2009, we amended the Cisco OEM agreement. Based upon certain changes, we no longer record the costs associated with the Cisco OEM agreement as cost of professional services from the effective date of the amendment. The cost associated with the Cisco OEM agreement in fiscal year 2010 was minimal compared to $531,000 in fiscal year 2009.
Total cost of professional services was $5.6 million, $5.0 million and $6.1 million in fiscal years 2011, 2010, and 2009, respectively. This represented an increase of 11%, or $561,000, in fiscal year 2011 compared to fiscal year 2010 and a decrease of 17%, or $1.1 million, in fiscal year 2010 compared to fiscal year 2009. Total cost of professional services as a percentage of total professional services revenue was 84% (a gross margin of 16%) in fiscal year 2011 compared to 86% (a gross margin of 14%) in fiscal year 2010 and 66% (a gross margin of 34%) in fiscal year 2009.
The increase in cost of professional services in fiscal year 2011 was primarily due to (i) an increase of $486,000 in personnel and personnel-related expense from the increased headcount and Company-wide compensation increases, and (ii) an increase of $67,000 in outside consulting services.
The decrease in cost of professional services in fiscal year 2010 was primarily due to (i) a decrease of $531,000 for the services performed by professional services personnel in connection with the Cisco OEM agreement, (ii) a decrease of $376,000 in personnel and personnel-related expenses, and (iii) a decrease in our international subsidiaries’ expenses of approximately $86,000 primarily from the strengthening of the U.S. dollar against the Euro, British pound, and Indian rupee. The decrease in the gross margin included a decrease of $3.4 million in the total professional services revenue and was partially offset by a decrease of $1.1 million in the cost of professional services. The decrease in the gross margin was primarily due to the change in how we record the revenue and costs associated with the Cisco OEM agreement as discussed above.
Excluding the impact from any future foreign currency fluctuations, we anticipate cost of professional services to increase in absolute dollars in future periods.
Research and Development
Fiscal Year Ended June 30 Year-Over-Year Change
2011 2010 2009 2010 to 2011
2009 to 2010
(in thousands) Research and Development ............................... $ 5,551 $ 5,510 $ 5,481 $ 41 1% $ 29 1%
Percentage of total revenue ........................ 12% 18 % 16 %
Research and development expenses primarily consist of compensation and benefits for our engineering, product management and quality assurance personnel and, to a lesser extent, occupancy costs and related overhead. Research and development expense was $5.6 million, $5.5 million and $5.5 million in fiscal years 2011, 2010 and 2009, respectively. This represented an increase of 1%, or $41,000, in the fiscal year 2011 compared to fiscal year 2010 and an increase of 1%, or $29,000, in fiscal year 2010 compared to fiscal year 2009. Total research and development expenses as a percentage of total revenue was 12% in the fiscal year 2011 compared to 18% in the fiscal year 2010 and 16% in fiscal year 2009.
The increase in research and development expense in fiscal year 2011 was primarily due to an increase of $600,000 in personnel and personnel-related expenses from the increased headcount and Company-wide compensation increases and was partially offset by a decrease of $509,000 in outside consulting services.
The increase in fiscal year 2010 was primarily due to (i) the decrease in allocation of the services in connection with the Cisco OEM agreement to cost of professional services that contributed an increase of $531,000, (ii) an increase in outside consulting services and other expenses of $98,000, (iii) an increase in stock-based compensation expense of $32,000 and was partially offset by the decrease of $646,000 in personnel and personnel related costs from the decreased headcount in North America. The impact from the foreign currency fluctuations research and development expenses was minimal in fiscal year 2010.
Excluding any fluctuation of foreign exchange rates in the Euro, British pound, and Indian rupee against the U.S. dollar, we anticipate research and development expense to increase slightly or remain relatively constant as a percentage of total revenue in fiscal year 2012 based upon our current product development plans.
Sales and Marketing
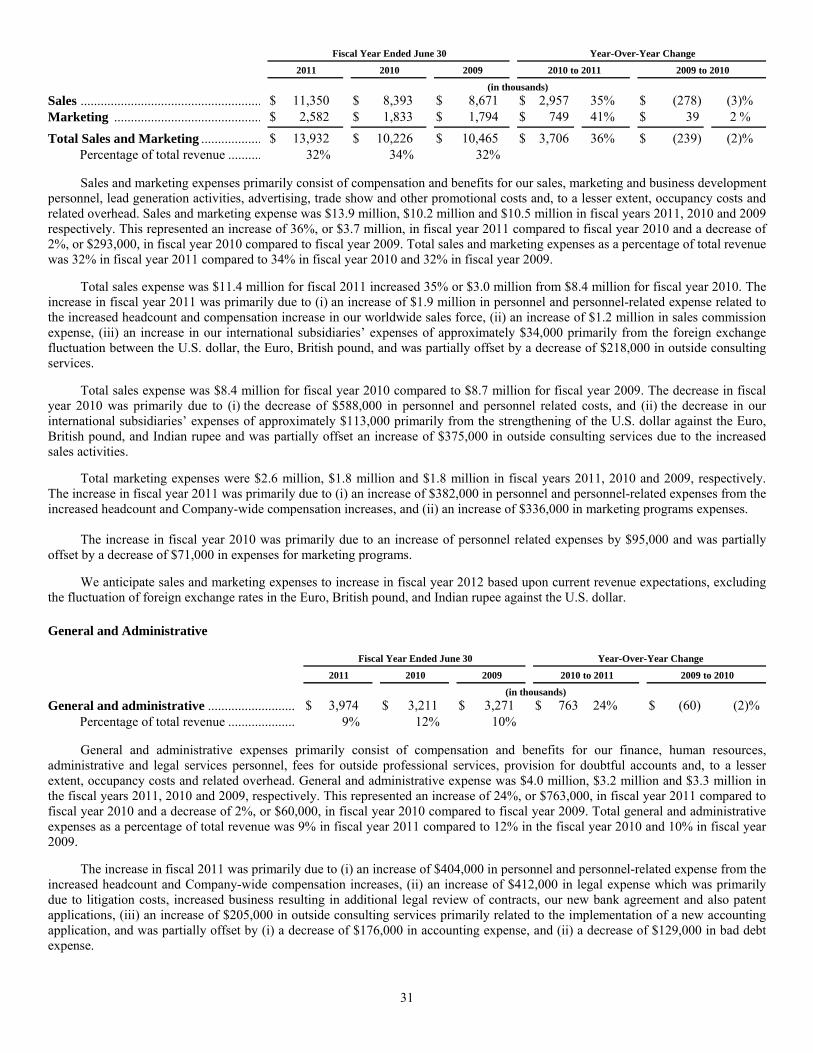
31
Fiscal Year Ended June 30 Year-Over-Year Change
2011
2010 2009 2010 to 2011
2009 to 2010
(in thousands)
Sales ...................................................... $ 11,350 $ 8,393 $ 8,671 $ 2,957 35% $ (278) (3)%Marketing ............................................ $ 2,582 $ 1,833 $ 1,794 $ 749 41% $ 39 2 %
Total Sales and Marketing .................. $ 13,932 $ 10,226 $ 10,465 $ 3,706 36% $ (239) (2)%Percentage of total revenue .......... 32% 34% 32%
Sales and marketing expenses primarily consist of compensation and benefits for our sales, marketing and business development personnel, lead generation activities, advertising, trade show and other promotional costs and, to a lesser extent, occupancy costs and related overhead. Sales and marketing expense was $13.9 million, $10.2 million and $10.5 million in fiscal years 2011, 2010 and 2009 respectively. This represented an increase of 36%, or $3.7 million, in fiscal year 2011 compared to fiscal year 2010 and a decrease of 2%, or $293,000, in fiscal year 2010 compared to fiscal year 2009. Total sales and marketing expenses as a percentage of total revenue was 32% in fiscal year 2011 compared to 34% in fiscal year 2010 and 32% in fiscal year 2009.
Total sales expense was $11.4 million for fiscal 2011 increased 35% or $3.0 million from $8.4 million for fiscal year 2010. The increase in fiscal year 2011 was primarily due to (i) an increase of $1.9 million in personnel and personnel-related expense related to the increased headcount and compensation increase in our worldwide sales force, (ii) an increase of $1.2 million in sales commission expense, (iii) an increase in our international subsidiaries’ expenses of approximately $34,000 primarily from the foreign exchange fluctuation between the U.S. dollar, the Euro, British pound, and was partially offset by a decrease of $218,000 in outside consulting services.
Total sales expense was $8.4 million for fiscal year 2010 compared to $8.7 million for fiscal year 2009. The decrease in fiscal year 2010 was primarily due to (i) the decrease of $588,000 in personnel and personnel related costs, and (ii) the decrease in our international subsidiaries’ expenses of approximately $113,000 primarily from the strengthening of the U.S. dollar against the Euro, British pound, and Indian rupee and was partially offset an increase of $375,000 in outside consulting services due to the increased sales activities.
Total marketing expenses were $2.6 million, $1.8 million and $1.8 million in fiscal years 2011, 2010 and 2009, respectively. The increase in fiscal year 2011 was primarily due to (i) an increase of $382,000 in personnel and personnel-related expenses from the increased headcount and Company-wide compensation increases, and (ii) an increase of $336,000 in marketing programs expenses.
The increase in fiscal year 2010 was primarily due to an increase of personnel related expenses by $95,000 and was partially
offset by a decrease of $71,000 in expenses for marketing programs.
We anticipate sales and marketing expenses to increase in fiscal year 2012 based upon current revenue expectations, excluding the fluctuation of foreign exchange rates in the Euro, British pound, and Indian rupee against the U.S. dollar.
General and Administrative
Fiscal Year Ended June 30 Year-Over-Year Change
2011 2010 2009 2010 to 2011
2009 to 2010
(in thousands)
General and administrative .......................... $ 3,974 $ 3,211 $ 3,271 $ 763 24% $ (60) (2)%Percentage of total revenue .................... 9% 12% 10%
General and administrative expenses primarily consist of compensation and benefits for our finance, human resources, administrative and legal services personnel, fees for outside professional services, provision for doubtful accounts and, to a lesser extent, occupancy costs and related overhead. General and administrative expense was $4.0 million, $3.2 million and $3.3 million in the fiscal years 2011, 2010 and 2009, respectively. This represented an increase of 24%, or $763,000, in fiscal year 2011 compared to fiscal year 2010 and a decrease of 2%, or $60,000, in fiscal year 2010 compared to fiscal year 2009. Total general and administrative expenses as a percentage of total revenue was 9% in fiscal year 2011 compared to 12% in the fiscal year 2010 and 10% in fiscal year 2009.
The increase in fiscal 2011 was primarily due to (i) an increase of $404,000 in personnel and personnel-related expense from the increased headcount and Company-wide compensation increases, (ii) an increase of $412,000 in legal expense which was primarily due to litigation costs, increased business resulting in additional legal review of contracts, our new bank agreement and also patent applications, (iii) an increase of $205,000 in outside consulting services primarily related to the implementation of a new accounting application, and was partially offset by (i) a decrease of $176,000 in accounting expense, and (ii) a decrease of $129,000 in bad debt expense.
32
The decrease in fiscal 2010 was primarily due to (i) a decrease of $177,000 in accounting and outside consulting expenses, (ii) decreased legal expenses of $62,000, (iii) a decrease in our international subsidiaries’ expenses of approximately $34,000 from the strengthening of the U.S. dollar against the Euro, British pound, and Indian rupee and was partially offset by an increase in bad debt expense of $231,000.
We anticipate general and administrative expenses to increase slightly or remain relatively constant as a percentage of total revenue in fiscal year 2012 based upon current revenue expectations excluding the fluctuation of foreign exchange rates in the Euro, British pound, and Indian rupee against the U.S. dollar. Valuation and Amortization of Stock-Based Compensation
Fiscal Year Ended June 30 Year-Over-Year Change
2011 2010 2009 2010 to 2011
2009 to 2010
(in thousands) Cost of support and services ..................................... $ 32 $ 35 $ 29 $ (3) (9)% $ 6 21%Research and development ....................................... 52 78 46 (26) (33)% 32 70%Sales and marketing .................................................. 46 49 25 (3) (6)% 24 96%General and administrative ....................................... 88 82 141 6 7% (59) (42)%
Total Stock-Based Compensation .......................... $ 218 $ 244 $ 241 $ (26) (11)% $ 3 (1)%Percentage of total revenue ............................. 0% 1% 1%
Stock-based compensation expenses include the amortization of the fair value of share-based payments made to employees, members of our Board of Directors and consultants, primarily in the form of stock options. The fair value of stock options granted is recognized as an expense, as the underlying stock options vest.
We value our share-based payments under ASC 718, and record compensation expense for all share-based payments made to employees based on the fair value at the date of the grant.
We expect our stock-based compensation expense to increase in fiscal year 2012 based on our anticipated hiring and also, if the
stock price continues to increase.
Income from Operations
Fiscal Year Ended June 30 Year-Over-Year Change
2011
2010 2009 2010 to 2011
2009 to 2010
(in thousands)
Operating income .................................... $ 9,692 $ 1,222 $ 3,256 $ 8,470 693% $ (2,034 ) (62)%Operating margin .............................. 22% 4% 10%
Income from operations was $9.7 million in fiscal year 2011 compared to the income from operations of $1.2 million in fiscal year 2010 and income from operations of $3.3 million in fiscal year 2009. We recorded an operating margin of 22% in fiscal year 2011 compared to 4% in fiscal year 2010 and 10% in the fiscal year 2009. The change of operating income in fiscal year 2011 included an increase in revenue of $14.2 million and was partially offset by an increase in total costs and operating expenses of $5.7 million. The increase in revenue was primarily due to a large license transactions signed in fiscal year 2011. The impact of any fluctuation of foreign currencies against the U.S. dollar on revenue was minimal. The increase in total costs and operating expenses was primarily due to (i) an increase in personnel-related costs of $5.7 million including an increase of $1.2 million in sales commission, (ii) an increase of $412,000 in legal and other expenses, (iii) an increase of $336,000 in marketing programs, (iv) an increase of $138,000 in international expenses from the foreign exchange fluctuation between the U.S. dollar, the Euro, British pound and India rupee, and was partially offset by (i) a decrease of $416,000 in outside consulting services, (ii) a decrease of $198,000 in third party royalties and support, (iii) a decrease of $176,000 in accounting expenses and (iv) a decrease of $129,000 in bad debt expense.
The change of operating income in fiscal year 2010 primarily included a decrease in revenue of $3.3 million and a decrease in total costs and operating expenses of $1.3 million. The decrease in revenue was primarily due to the length of our sales cycles resulting in the delay in the completion of a number of significant customer transactions until fiscal year 2011. The mix of license and hosting business also contributed to the decrease. The impact of any fluctuation of foreign currencies against the U.S. dollar on revenue was minimal. The decrease in total costs and operating expenses was a net of (i) a decrease in personnel-related costs of $1.3 million, (ii) a decrease of $253,000 in international expenses due to the strengthening of the U.S. dollar against the Euro, British pound, and Indian rupee, (iii) a decrease of $127,000 in third party royalties and support, (iv) a decrease of $115,000 in auditing, legal
33
and other expenses, and (v) a decrease of $71,000 in expense of marketing program and was partially offset by, (i) an increase of $267,000 in outside consulting expense, (ii) an increase of $231,000 in bad debt expense and (iii) an increase of $99,000 in hosting related cost.
Interest Expense, Net and Other Income (Expense) Interest expense, net was $1.2 million, $1.1 million and $1.4 million in fiscal years 2011, 2010 and 2009 respectively. This
represents an increase of 10% or $107,000, in fiscal year 2011 compared to fiscal year 2010 and a decrease of 22%, or $312,000, in fiscal year 2010 compared to fiscal year 2009. Interest income was not significant in any year.
The increase in interest expense in fiscal year 2011 primarily included the additional interest expense of $81,000 due to the prepayment of portion of related party notes.
The decrease in interest expense in fiscal year 2010 was primarily due to the reduction in bank borrowings.
Other income was $245,000 in fiscal year 2011, compared to other expense was $67,000 in fiscal year 2010 and other income of $230,000 in fiscal year 2009. The other income in fiscal year 2011 primarily included the foreign exchange gain on international trade receivables. The other expense in fiscal year 2010 primarily included a foreign exchange loss related to the payments from international trade receivables due to the weakening of British pound against the Euro in which certain sales were denominated. The other income in fiscal year 2009 was primarily from a foreign exchange gain related to the payments from international trade receivables.
Income Tax Benefit (Expense) We recorded an income tax expense of $196,000 for fiscal year 2011 compared to an income tax expense of $159,000 in fiscal
year 2010 and an income tax benefit of $129,000 in fiscal year 2009. The income tax expenses for fiscal years 2011 and 2010 were primarily related to the income tax provision for foreign subsidiaries. The income tax benefit for fiscal year 2009 mainly related to our Indian subsidiary.
Related Party Transactions On December 24, 2002, we entered into a note and warrant purchase agreement, as amended, or the 2002 Agreement, with
Ashutosh Roy, our Chief Executive Officer, pursuant to which Mr. Roy made a loan to us, evidenced by a subordinated secured promissory note and received warrants to purchase shares of our common stock in connection with such loan. The five year subordinated secured promissory note bore interest at an effective annual rate of 12% due and payable upon the term of such note. We had the option to prepay the note at any time subject to the prepayment penalties set forth in such note. On December 31, 2002, Mr. Roy loaned us $2.0 million under the agreement and received warrants that allow him to purchase up to 236,742 shares of our common stock at an exercise price equal to $2.11 per share. These warrants expired in December 2005. In connection with this loan, we recorded $1.83 million in related party notes payable and $173,000 of discount on the note related to the relative value of the warrants issued in the transaction that was amortized to interest expense over the five year life of the note.
On October 31, 2003, we entered into an amendment to the 2002 Agreement with Mr. Roy, pursuant to which he loaned to us an additional $2.0 million evidenced by a subordinated secured promissory note, or the 2003 Note, and received additional warrants to purchase up to 128,766 shares of our common stock at an exercise price of $3.88 per share. These warrants expired in October 2008. In connection with this additional loan we recorded $1.8 million in related party notes payable and $195,000 of discount on the notes related to the relative value of the warrants issued in the transaction that was amortized to interest expense over the five year life of the note. This note was amended and restated on June 29, 2007 and on September 24, 2008.
On March 31, 2004, we entered into notes and warrant purchase agreement with Mr. Roy, Oak Hill Capital Partners L.P., Oak Hill Capital Management Partners L.P., and FW Investors L.P., or the lenders, pursuant to which the lenders loaned to us $2.5 million evidenced by secured promissory notes and received warrants to purchase shares of our common stock in connection with such loan. The secured promissory notes had a term of five years and bore interest at an effective annual rate of 12% due and payable upon the maturity of such notes. The warrants allowed the lenders to purchase up to 312,500 shares at an exercise price of $2.00 per share. These warrants expired in March 2007. We recorded $2.3 million in related party notes payable and $223,000 of discount on the notes related to the relative value of the warrants issued in the transaction that was amortized to interest expense over the five year life of the notes. These notes were amended and restated on September 24, 2008.
34
On June 29, 2007, we amended and restated the 2002 and 2003 notes with Mr. Roy and he loaned to us an additional $2.0 million evidenced by a subordinated secured promissory note, or the 2007 Note, and received additional warrants that allowed him to purchase up to 333,333 shares at $1.20 per share. These warrants expired in June 2010. In connection with this additional loan we recorded $1.8 million in related party notes payable and $187,000 discount on the note related to the relative value of the warrants issued in the transaction that is being amortized to interest expense over the life of the note. In addition, the amendment extended the maturity date of the previous note through March 31, 2009. This note was amended and restated on September 24, 2008. On September 24, 2008, we entered into a Conversion Agreement and Amendment to Subordinated Secured Promissory Notes, as amended, or the Agreement, with the lenders. Immediately prior to the Agreement, the total outstanding indebtedness, including accrued interest, under the prior notes issued to the lenders, including the 2002, 2003 and 2007 Notes, as amended as applicable, equaled $13.8 million. Pursuant to the Agreement and subject to the terms and conditions contained therein, we and the lenders (i) converted a portion of the outstanding indebtedness under the prior notes equal to $6.5 million into shares of our common stock at a price per share equal to $0.95, or at a fair value of $3.4 million, or the Note Conversion, and (ii) extended the maturity date of the remaining outstanding indebtedness of $7.3 million to March 31, 2012, as well as the period for which interest shall accrue, or the Note Extension. In consideration for the Note Extension, the lenders received warrants to purchase an aggregate of 1,525,515 shares of our common stock at a price per share equal to $0.95 and as a result, we recorded $272,000 of discount on the notes related to the relative value of the warrants issued in the transaction that is being amortized to interest expense over the three year life of the note. The fair value of these warrants was determined using the Black-Scholes valuation method with the following assumptions: an expected life of three years, an expected stock price volatility of 80%, a risk free interest rate of 2.26%, and a dividend yield of 0%. In addition, we recorded the $3.1 million gain on the Note Conversion as a deemed contribution to capital since the lenders are related parties. On June 30, 2011, and pursuant to the Agreement, we repaid in full all outstanding indebtedness, including interest, to Oak Hill Capital Partners L.P., Oak Hill Capital Management Partners L.P., and FW Investors L.P. In addition we made a partial payment to Mr. Roy for $2.9 million, including accrued interest, against his notes. Mr. Roy also exercised his warrants to purchase 1,218,493 shares of our common stock in March 2011. As of June 30, 2011 and 2010, the principal, net of discount and interest due on the loans was $5.0 million and $8.7 million, respectively, and warrants to purchase 307,022 and 1,525,515 shares of common stock, respectively, were vested and outstanding. The interest expense on related party notes was $1.2 million, $1.0 million, and $1.2 million for fiscal years 2011, 2010 and 2009, respectively.
New Accounting Pronouncements In June 2011, the FASB issued ASU 2011-05, Presentation of Comprehensive Income, on comprehensive income presentation
to allow an entity the option to present the total of comprehensive income, the components of net income, and the components of other comprehensive income either in a single continuous statement of comprehensive income or in two separate but consecutive statements. In both choices, an entity is required to present each component of net income along with total net income, each component of other comprehensive income along with a total for other comprehensive income, and a total amount for comprehensive income. This update eliminates the option to present the components of other comprehensive income as part of the statement of changes in stockholders' equity. The amendments to the Codification in the ASU do not change the items that must be reported in other comprehensive income or when an item of other comprehensive income must be reclassified to net income. This update should be applied retrospectively. For public entities, the amendments are effective for fiscal years, and interim periods within those years, beginning after December 15, 2011. Early adoption is permitted. We do not anticipate the adoption of this amendment to have a material impact on our consolidated financial statements.
In May 2011, the FASB issued ASU 2011-04, Amendments to Achieve Common Fair Value Measurement and Disclosure Requirements in U.S. GAAP and IFRS, on fair value measurement, which is intended to create consistency between U.S. GAAP and International Financial Reporting Standards. The amendments include clarification on the application of certain existing fair value measurement guidance and expanded disclosures for fair value measurements that are estimated using significant unobservable (Level 3) inputs. The update should be applied prospectively. For public entities, the amendments are effective during interim and annual periods beginning after December 15, 2011. Early application by public entities is not permitted. We are currently evaluating the requirements of this standard, but do not expect it to have a material impact on our Consolidated Financial Statements.
In March 2010, the FASB issued ASU 2010-28, When to Perform Step 2 of the Goodwill Impairment Test for Reporting Units with Zero or Negative Carrying Amounts, on goodwill and other intangible assets. The amendment modifies Step 1 of the goodwill impairment test for reporting units with zero or negative carrying amounts. For those reporting units, an entity is required to perform Step 2 of the goodwill impairment test if there are qualitative factors indicating that it is more likely than not that a goodwill impairment exists. The qualitative factors are consistent with the existing guidance which requires goodwill of a reporting unit to be tested for impairment between annual tests if an event occurs or circumstances change that would more likely than not reduce the fair value of a reporting unit below its carrying amount. This amendment is effective for public entities for fiscal years, and interim periods within those years, beginning after December 15, 2010. We do not anticipate that the adoption of this amendment will have a material impact on our consolidated financial statements.
35
In January 2010, the FASB issued ASU 2010-06, Improving Disclosures about Fair Value Measurements, on fair value measurement and disclosures which amends fair value measurements and disclosures, adding new requirements for disclosures for levels 1 and 2, separate disclosures and purchases, sales, issuances, and settlements relating to Level 3 measurements and clarification of existing fair value disclosures. The update is effective for interim and annual periods beginning after December 15, 2009, except for the requirement to provide Level 3 activity of purchases, sales, issuances, and settlements on a gross basis, which was effective for fiscal years beginning after December 15, 2010 (our fiscal year 2012); early adoption is permitted. We have made additional disclosures in footnote 11, as applicable for level 1.
In October 2009, the FASB issued ASU 2009-13, Multiple-Deliverable Revenue Arrangements, on revenue recognition with multiple deliverable revenue arrangements. The objective of this guidance is to address the accounting for multiple-deliverable arrangements to enable vendors to account for products or services (deliverables) separately rather than as a combined unit as well as eliminate the use of residual method for use in allocating contractual consideration and replace it with the relative selling price method. Vendors often provide multiple products or services to their customers. Those deliverables are provided at different points in time or over different time periods. This update provides amendments for separating consideration in multiple-deliverable arrangements. The amendments in this update establish a selling price hierarchy for determining the selling price of a deliverable. The selling price used for each deliverable is based on vendor-specific objective evidence if available, third-party evidence if vendor-specific objective evidence is not available, or estimated selling price if neither vendor-specific objective evidence nor third-party evidence is available. The amendments in this update also will replace the term fair value in the revenue allocation guidance with selling price to clarify that the allocation of revenue is based on entity-specific assumptions rather than assumptions of a marketplace participant. Additionally, the new guidance is only applicable to non-software related deliverables sold as part of a multiple deliverable arrangement. In the instance an arrangement includes software deliverables as well as non-software related deliverables, the provisions of ASC 985-605, Software Revenue Recognition, would apply to the software deliverables. This update is effective for fiscal years beginning on or after June 15, 2010; however, early adoption is permitted. We adopted this update effective July 1, 2010. The adoption of this update had no material impact on our financial position, results of operations, or cash flow.
Liquidity and Capital Resources Overview
Based upon the increased revenue and income from operations in fiscal years 2006 and 2005 as well as the positive cash flow from operating activities in fiscal year 2006, we made increased investments in our business in fiscal year 2007 including the expansion in our product and sales and marketing teams. This investment was driven in part by the OEM agreement we signed with Cisco Systems in August 2006. Resulting from these investments we recorded annual revenue of $44.1 million, $29.9 million and $33.2 million in fiscal years 2011, 2010 and 2009, respectively. Furthermore we recorded an operating income of $9.7 million, $1.2 million, and $3.3 million in fiscal years 2011, 2010, and 2009, respectively. In addition, net cash from operating activities was $6.8 million, $2.5 million and $3.7 million in fiscal years 2011, 2010 and 2009, respectively. As of June 30, 2011, our cash and cash equivalents and short term investments were $13.1 million compared to $5.7 million on June 30, 2010 and $7.5 million on June 30, 2009. Our working capital was $3.8 million at June 30, 2011, improved from a negative working capital of $1.1 million and $1.9 million at June 30, 2010 and 2009, respectively. As of June 30, 2011, our deferred revenue was $5.8 million, compared to $5.1 million and $5.5 million at June 30, 2010 and 2009, respectively.
Based upon our fiscal year 2012 plan, we believe that existing capital resources will enable us to maintain current and planned operations for at least the next 12 months. From time to time, however, we may consider opportunities for raising additional capital and/or exchanging all or a portion of our existing debt for equity. We can make no assurances that such opportunities will be available to us on economic terms we consider favorable, if at all.
If adequate funds are not available on acceptable terms, our ability to achieve or sustain positive cash flows, maintain current operations, fund any potential expansion, take advantage of unanticipated opportunities, develop or enhance products or services, or otherwise respond to competitive pressures would be significantly limited. Our expectations as to our future cash flows and our future cash balances are subject to a number of assumptions, including assumptions regarding anticipated increases in our revenue, the mix of new hosting and license business, our ability to retain existing customers and customer purchasing and payment patterns, many of which are beyond our control. On September 24, 2008, we entered into a Conversion Agreement and Amendment to Subordinated Secured Promissory Notes, as amended, or the Agreement, with the lenders (See Note 3—“Related Party Notes Payable”). Pursuant to the Agreement we and the lenders (i) converted a portion of the outstanding indebtedness under the prior notes equal to $6.5 million into shares of our common stock, and (ii) extended the maturity date of the remaining outstanding indebtedness to March 31, 2012, as well as the period for which interest shall accrue, or the Note Extension. In consideration for the Note Extension, the lenders received warrants to purchase an aggregate of 1,525,515 shares of our common stock. On June 30, 2011, and pursuant to the Agreement we paid in full all outstanding indebtedness, including interest, to Oak Hill Capital Partners L.P., Oak Hill Capital Management Partners L.P., and FW Investors L.P. In addition we made a partial payment to Mr. Roy for $2.9 million, including accrued interest, against his notes. Mr. Roy also exercised his warrants to purchase 1,218,493 shares of our common stock in March 2011. As of June 30, 2011 and 2010, the

36
principal, net of discount and interest due on the loans was $5.0 million and $8.7 million, respectively, and warrants to purchase 307,022 and 1,525,515 shares of common stock, respectively, were vested and outstanding. As of June 30, 2010 there was no outstanding balance under the revolving credit line. The Bridge Bank Facility also provided up to $300,000 to pay off existing obligation to another bank, or the Bridge Bank Term Loan, and $300,000 to be used to finance equipment purchases, or the Bridge Bank Equipment Line. As of June 30, 2010 the balance outstanding on the Term Loan was $92,000 and the balance outstanding on the Equipment line was $23,000 and the interest rate was 4.75%. On June 27, 2011, we entered into a Loan and Security Agreement, or the Comerica Credit Facility, with Comerica Bank, or Comerica, as may be amended from time to time (See Note 4—“Bank Borrowings”). The Comerica Credit Facility provides for the advance of up to the lesser of $1.5 million under a revolving line of credit, or the sum of (i) 80% of certain qualified receivables, less (ii) the aggregate face amounts of any letter of credit issued and any outstanding obligations to Comerica. The revolving line of credit has a maturity date of June 27, 2012. As of June 30, 2011 there was no outstanding balance under the revolving credit line. The Comerica Credit Facility also provides $5.0 million to pay off existing obligations associated with our related parties, or the Comerica Term Loan, and is payable in 36 equal monthly payments of principal and interest. As of June 30, 2011 the amount outstanding under the Comerica Term Loan was $5.0 million. There are a number of affirmative and negative covenants under the Comerica Credit Facility, with the primary covenants being that we are required to maintain a minimum cash balance of $1.0 million and we must maintain liquidity to debt ratio of at least 1.50 to 1.00. If we fail to comply with our covenants, Comerica can declare any outstanding amounts immediately due and payable and stop extending credit to us. These covenants are effective July 1, 2011.
Cash Flows Net cash provided by operating activities was $6.8 million in fiscal year 2011 compared to the net cash provided by operating
activities of $2.5 million in fiscal year 2010 and the net cash provided by operating activities of $3.7 million in fiscal year 2009. The net cash provided by operating activities consisted primarily of net income or loss, plus non-cash expenses related to depreciation, stock-based compensation, accrued interest and amortization of discount on related party notes, amortization of debt issuance costs, provision for doubtful accounts, and the net change in operating assets and liabilities.
The net change in operating assets and liabilities in fiscal year 2011 primarily consisted of an increase in accounts receivable by $6.4 million, an increase of $1.8 million in deferred revenue and $1.2 million in accrued compensation. The increase in accounts receivable was primarily due to a large license transactions signed at the end of fiscal year 2011. The increase in deferred revenue was primarily related to the increased license transactions. The increase in accrued compensation included primarily the increase in sales commissions and accrued bonuses.
The net change in operating assets and liabilities in fiscal year 2010 primarily consisted of a decrease of $1.1 million in accounts receivable and an increase in accounts payable by $200,000. This was partially offset by decreases including $368,000 in accrued compensation primarily related to the decreased commissions, a decrease of $245,000 in other long term liabilities and a decrease of $95,000 in other accrued liabilities.
The net change is operating assets and liabilities in fiscal year 2009 primarily consisted of an increase of $2.4 million in accounts receivable, increases of $865,000 in accrued compensation, $676,000 in accrued liabilities, $554,000 in deferred revenue and a decrease in accounts payable by $611,000. The increase in accrued compensation was primarily due to the increased commission associated with the increased bookings and the change in the frequency of payment of bonuses to North American employees from three months to six months. The increase in deferred revenue was primarily due to the increase in deferred support and hosting from new contracts.
Net cash used in investing activities was $1.4 million in fiscal year 2011 compared to $521,000 in fiscal year 2010 and $266,000 in fiscal year 2009. Cash used in investing activities in fiscal year 2011 included $725,000 for the purchase of equipment and software to support the increase in our hosting business and for new employees and purchases of short-term investments of $626,000. Cash used in investing activities in fiscal year 2010 was primarily due to the purchase of equipment and software to support the increase in our hosting business and for new employees. Cash used in investing activities in fiscal year 2009 was a net of purchase of equipment and software for increased hosted customers and new employees and proceeds from sales of fixed assets.
Net cash provided by financing activities was $1.4 million in fiscal year 2011 compared to net cash used in financing activities of $3.4 million in fiscal year 2010 and net cash used in financing activities of $99,000 in fiscal year 2009. Net cash used in financing activities in fiscal year 2011 primarily included the proceeds from new bank borrowings of $5.0 million, proceeds from exercise of warrants of $1.2 million and proceeds from exercise of stock options of $771,000, and offset by the repayment of $5.0 million of related party notes, payment of $276,000 for the repurchase of our stock, $159,000 payment of capital leases and $115,000 payment of existing bank borrowings. Net cash used in financing activities in fiscal year 2010 primarily included a repayment of $3.1 million of existing bank borrowings, $181,000 payment of capital leases and $108,000 for the repurchase of our stock. Net cash used in
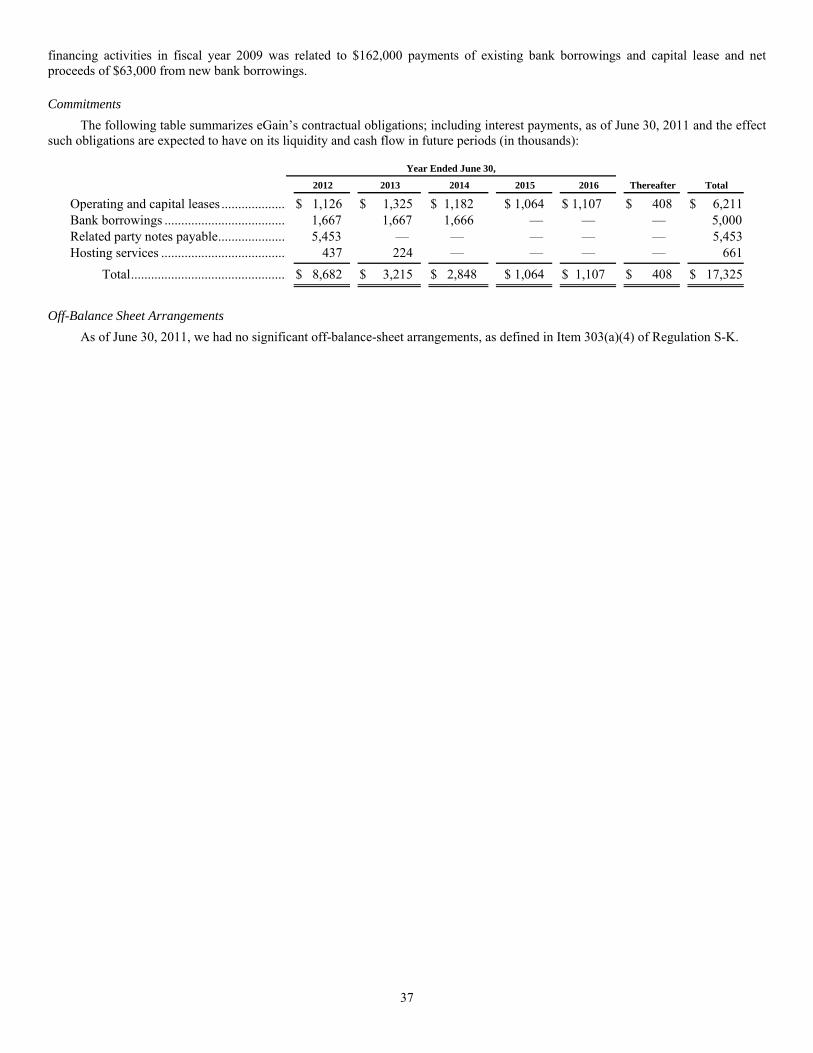
37
financing activities in fiscal year 2009 was related to $162,000 payments of existing bank borrowings and capital lease and net proceeds of $63,000 from new bank borrowings.
Commitments The following table summarizes eGain’s contractual obligations; including interest payments, as of June 30, 2011 and the effect
such obligations are expected to have on its liquidity and cash flow in future periods (in thousands):
Year Ended June 30,
Thereafter
Total 2012
2013 2014 2015 2016
Operating and capital leases .................... $ 1,126 $ 1,325 $ 1,182 $ 1,064 $ 1,107 $ 408 $ 6,211Bank borrowings ..................................... 1,667 1,667 1,666 — — — 5,000Related party notes payable ..................... 5,453 — — — — — 5,453Hosting services ...................................... 437 224 — — — — 661
Total ............................................... $ 8,682 $ 3,215 $ 2,848 $ 1,064 $ 1,107 $ 408 $ 17,325
Off-Balance Sheet Arrangements As of June 30, 2011, we had no significant off-balance-sheet arrangements, as defined in Item 303(a)(4) of Regulation S-K.
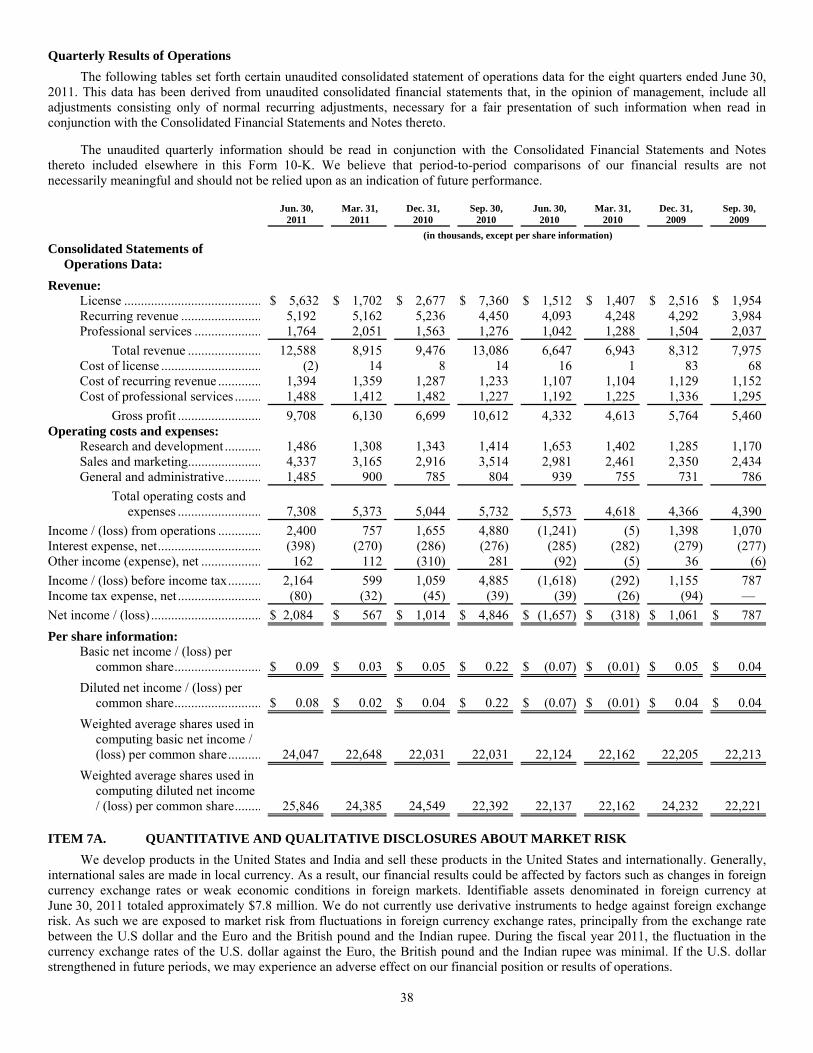
38
Quarterly Results of Operations The following tables set forth certain unaudited consolidated statement of operations data for the eight quarters ended June 30,
2011. This data has been derived from unaudited consolidated financial statements that, in the opinion of management, include all adjustments consisting only of normal recurring adjustments, necessary for a fair presentation of such information when read in conjunction with the Consolidated Financial Statements and Notes thereto.
The unaudited quarterly information should be read in conjunction with the Consolidated Financial Statements and Notes thereto included elsewhere in this Form 10-K. We believe that period-to-period comparisons of our financial results are not necessarily meaningful and should not be relied upon as an indication of future performance.
Jun. 30, 2011
Mar. 31,2011
Dec. 31, 2010
Sep. 30, 2010
Jun. 30, 2010
Mar. 31, 2010
Dec. 31, 2009
Sep. 30, 2009
(in thousands, except per share information) Consolidated Statements of
Operations Data:
Revenue:
License ......................................... $ 5,632 $ 1,702 $ 2,677 $ 7,360 $ 1,512 $ 1,407 $ 2,516 $ 1,954 Recurring revenue ........................ 5,192 5,162 5,236 4,450 4,093 4,248 4,292 3,984 Professional services .................... 1,764 2,051 1,563 1,276 1,042 1,288 1,504 2,037
Total revenue ...................... 12,588 8,915 9,476 13,086 6,647 6,943 8,312 7,975 Cost of license .............................. (2) 14 8 14 16 1 83 68 Cost of recurring revenue ............. 1,394 1,359 1,287 1,233 1,107 1,104 1,129 1,152 Cost of professional services ........ 1,488 1,412 1,482 1,227 1,192 1,225 1,336 1,295
Gross profit ......................... 9,708 6,130 6,699 10,612 4,332 4,613 5,764 5,460 Operating costs and expenses:
Research and development ........... 1,486 1,308 1,343 1,414 1,653 1,402 1,285 1,170 Sales and marketing ...................... 4,337 3,165 2,916 3,514 2,981 2,461 2,350 2,434 General and administrative ........... 1,485 900 785 804 939 755 731 786
Total operating costs and expenses ......................... 7,308 5,373 5,044 5,732 5,573 4,618 4,366 4,390
Income / (loss) from operations ............. 2,400 757 1,655 4,880 (1,241) (5) 1,398 1,070 Interest expense, net ............................... (398) (270) (286) (276) (285) (282) (279) (277)Other income (expense), net .................. 162 112 (310) 281 (92) (5) 36 (6)
Income / (loss) before income tax .......... 2,164 599 1,059 4,885 (1,618) (292) 1,155 787 Income tax expense, net ......................... (80) (32) (45) (39) (39) (26) (94) —
Net income / (loss) ................................. $ 2,084 $ 567 $ 1,014 $ 4,846 $ (1,657) $ (318) $ 1,061 $ 787
Per share information:
Basic net income / (loss) per common share .......................... $ 0.09 $ 0.03 $ 0.05 $ 0.22 $ (0.07) $ (0.01) $ 0.05 $ 0.04
Diluted net income / (loss) per common share .......................... $ 0.08 $ 0.02 $ 0.04 $ 0.22 $ (0.07) $ (0.01) $ 0.04 $ 0.04
Weighted average shares used in computing basic net income / (loss) per common share .......... 24,047 22,648 22,031 22,031 22,124 22,162 22,205 22,213
Weighted average shares used in computing diluted net income / (loss) per common share ........ 25,846 24,385 24,549 22,392 22,137 22,162 24,232 22,221
ITEM 7A. QUANTITATIVE AND QUALITATIVE DISCLOSURES ABOUT MARKET RISK
We develop products in the United States and India and sell these products in the United States and internationally. Generally, international sales are made in local currency. As a result, our financial results could be affected by factors such as changes in foreign currency exchange rates or weak economic conditions in foreign markets. Identifiable assets denominated in foreign currency at June 30, 2011 totaled approximately $7.8 million. We do not currently use derivative instruments to hedge against foreign exchange risk. As such we are exposed to market risk from fluctuations in foreign currency exchange rates, principally from the exchange rate between the U.S dollar and the Euro and the British pound and the Indian rupee. During the fiscal year 2011, the fluctuation in the currency exchange rates of the U.S. dollar against the Euro, the British pound and the Indian rupee was minimal. If the U.S. dollar strengthened in future periods, we may experience an adverse effect on our financial position or results of operations.

39
ITEM 8. FINANCIAL STATEMENTS AND SUPPLEMENTARY DATA
eGain Communications Corporation
Consolidated Financial Statements
As of June 30, 2011 and 2010
And for the years ended June 30, 2011, 2010, and 2009

40
eGain Communications Corporation Index to Consolidated Financial Statements
Page Number
Report of Burr Pilger Mayer, Inc., Independent Registered Public Accounting Firm ............................................................. 41 Consolidated Financial Statements:
Consolidated Balance Sheets, June 30, 2011 and 2010 ................................................................................................... 42 Consolidated Statements of Operations for the years ended June 30, 2011, 2010 and 2009 ........................................... 43 Consolidated Statements of Stockholders’ Equity / (Deficit) and Comprehensive Income / (Loss) for the years ended
June 30, 2011, 2010 and 2009 .................................................................................................................................... 44 Consolidated Statements of Cash Flows for the years ended June 30, 2011, 2010 and 2009 ......................................... 45 Notes to Consolidated Financial Statements ................................................................................................................... 46
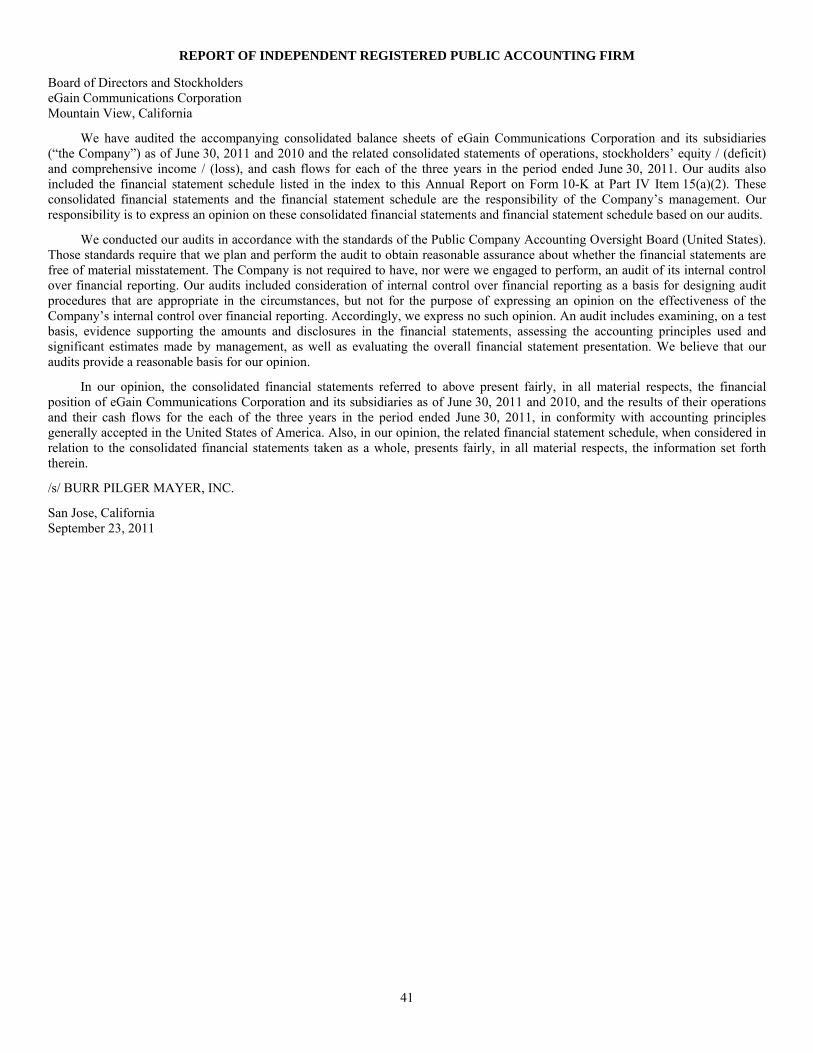
41
REPORT OF INDEPENDENT REGISTERED PUBLIC ACCOUNTING FIRM
Board of Directors and Stockholders eGain Communications Corporation Mountain View, California
We have audited the accompanying consolidated balance sheets of eGain Communications Corporation and its subsidiaries (“the Company”) as of June 30, 2011 and 2010 and the related consolidated statements of operations, stockholders’ equity / (deficit) and comprehensive income / (loss), and cash flows for each of the three years in the period ended June 30, 2011. Our audits also included the financial statement schedule listed in the index to this Annual Report on Form 10-K at Part IV Item 15(a)(2). These consolidated financial statements and the financial statement schedule are the responsibility of the Company’s management. Our responsibility is to express an opinion on these consolidated financial statements and financial statement schedule based on our audits.
We conducted our audits in accordance with the standards of the Public Company Accounting Oversight Board (United States). Those standards require that we plan and perform the audit to obtain reasonable assurance about whether the financial statements are free of material misstatement. The Company is not required to have, nor were we engaged to perform, an audit of its internal control over financial reporting. Our audits included consideration of internal control over financial reporting as a basis for designing audit procedures that are appropriate in the circumstances, but not for the purpose of expressing an opinion on the effectiveness of the Company’s internal control over financial reporting. Accordingly, we express no such opinion. An audit includes examining, on a test basis, evidence supporting the amounts and disclosures in the financial statements, assessing the accounting principles used and significant estimates made by management, as well as evaluating the overall financial statement presentation. We believe that our audits provide a reasonable basis for our opinion.
In our opinion, the consolidated financial statements referred to above present fairly, in all material respects, the financial position of eGain Communications Corporation and its subsidiaries as of June 30, 2011 and 2010, and the results of their operations and their cash flows for the each of the three years in the period ended June 30, 2011, in conformity with accounting principles generally accepted in the United States of America. Also, in our opinion, the related financial statement schedule, when considered in relation to the consolidated financial statements taken as a whole, presents fairly, in all material respects, the information set forth therein.
/s/ BURR PILGER MAYER, INC.
San Jose, California September 23, 2011
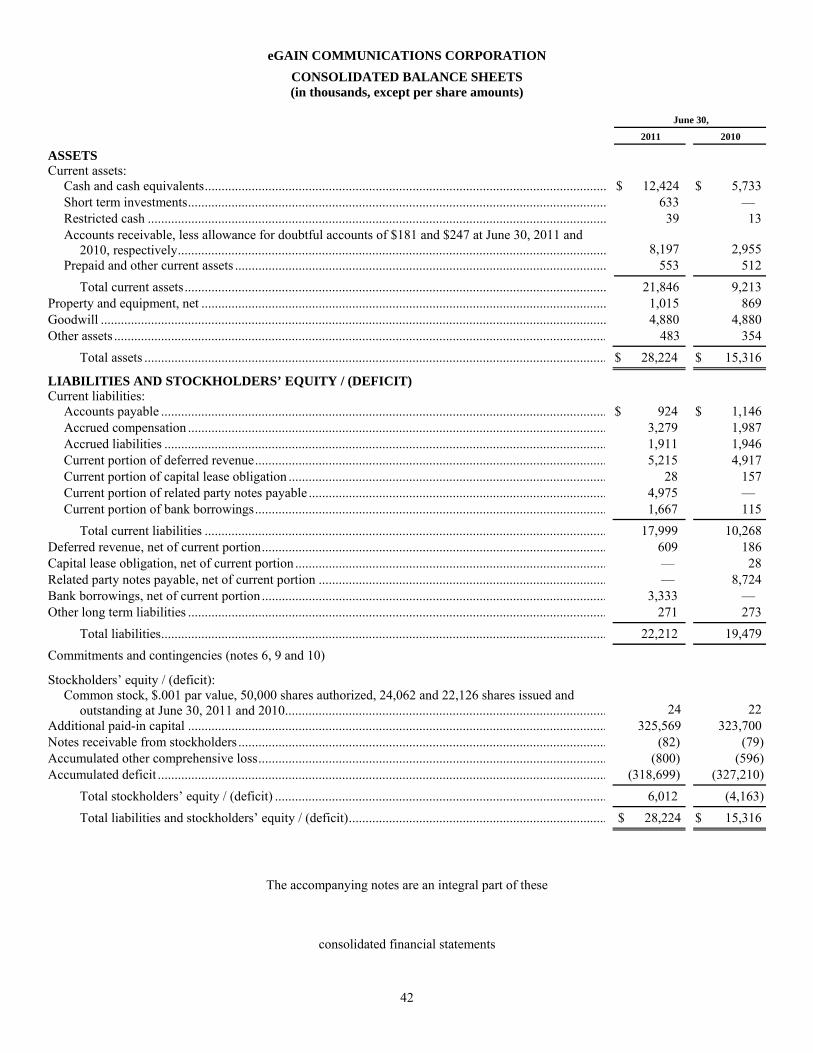
42
eGAIN COMMUNICATIONS CORPORATION CONSOLIDATED BALANCE SHEETS (in thousands, except per share amounts)
June 30,
2011
2010
ASSETS
Current assets:
Cash and cash equivalents ........................................................................................................................ $ 12,424 $ 5,733 Short term investments ............................................................................................................................. 633 — Restricted cash ......................................................................................................................................... 39 13 Accounts receivable, less allowance for doubtful accounts of $181 and $247 at June 30, 2011 and
2010, respectively ................................................................................................................................ 8,197 2,955 Prepaid and other current assets ............................................................................................................... 553 512
Total current assets .............................................................................................................................. 21,846 9,213 Property and equipment, net ......................................................................................................................... 1,015 869 Goodwill ....................................................................................................................................................... 4,880 4,880 Other assets ................................................................................................................................................... 483 354
Total assets .......................................................................................................................................... $ 28,224 $ 15,316
LIABILITIES AND STOCKHOLDERS’ EQUITY / (DEFICIT)
Current liabilities:
Accounts payable ..................................................................................................................................... $ 924 $ 1,146 Accrued compensation ............................................................................................................................. 3,279 1,987 Accrued liabilities .................................................................................................................................... 1,911 1,946 Current portion of deferred revenue ......................................................................................................... 5,215 4,917 Current portion of capital lease obligation ............................................................................................... 28 157 Current portion of related party notes payable ......................................................................................... 4,975 — Current portion of bank borrowings ......................................................................................................... 1,667 115
Total current liabilities ........................................................................................................................ 17,999 10,268 Deferred revenue, net of current portion ....................................................................................................... 609 186 Capital lease obligation, net of current portion ............................................................................................. — 28 Related party notes payable, net of current portion ...................................................................................... — 8,724 Bank borrowings, net of current portion ....................................................................................................... 3,333 — Other long term liabilities ............................................................................................................................. 271 273
Total liabilities ..................................................................................................................................... 22,212 19,479
Commitments and contingencies (notes 6, 9 and 10)
Stockholders’ equity / (deficit):
Common stock, $.001 par value, 50,000 shares authorized, 24,062 and 22,126 shares issued and outstanding at June 30, 2011 and 2010 ................................................................................................ 24 22
Additional paid-in capital ............................................................................................................................. 325,569 323,700 Notes receivable from stockholders .............................................................................................................. (82) (79)Accumulated other comprehensive loss ........................................................................................................ (800) (596)Accumulated deficit ...................................................................................................................................... (318,699) (327,210)
Total stockholders’ equity / (deficit) ................................................................................................... 6,012 (4,163)
Total liabilities and stockholders’ equity / (deficit) ............................................................................. $ 28,224 $ 15,316
The accompanying notes are an integral part of these
consolidated financial statements
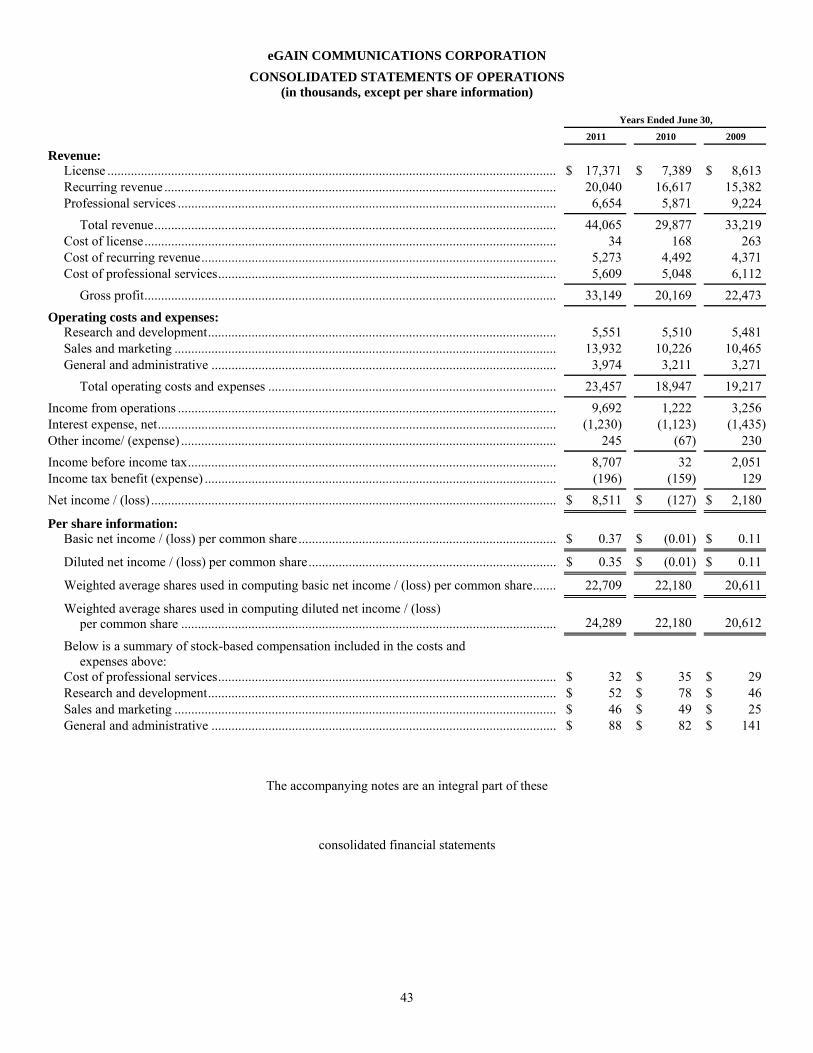
43
eGAIN COMMUNICATIONS CORPORATION CONSOLIDATED STATEMENTS OF OPERATIONS
(in thousands, except per share information)
Years Ended June 30,
2011
2010 2009
Revenue:
License ...................................................................................................................................... $ 17,371 $ 7,389 $ 8,613 Recurring revenue ..................................................................................................................... 20,040 16,617 15,382 Professional services ................................................................................................................. 6,654 5,871 9,224
Total revenue ........................................................................................................................ 44,065 29,877 33,219 Cost of license ........................................................................................................................... 34 168 263 Cost of recurring revenue .......................................................................................................... 5,273 4,492 4,371 Cost of professional services ..................................................................................................... 5,609 5,048 6,112
Gross profit ........................................................................................................................... 33,149 20,169 22,473
Operating costs and expenses:
Research and development ........................................................................................................ 5,551 5,510 5,481 Sales and marketing .................................................................................................................. 13,932 10,226 10,465 General and administrative ....................................................................................................... 3,974 3,211 3,271
Total operating costs and expenses ...................................................................................... 23,457 18,947 19,217
Income from operations ................................................................................................................. 9,692 1,222 3,256 Interest expense, net ....................................................................................................................... (1,230) (1,123) (1,435)Other income/ (expense) ................................................................................................................ 245 (67) 230
Income before income tax .............................................................................................................. 8,707 32 2,051 Income tax benefit (expense) ......................................................................................................... (196) (159) 129
Net income / (loss) ......................................................................................................................... $ 8,511 $ (127) $ 2,180
Per share information:
Basic net income / (loss) per common share ............................................................................. $ 0.37 $ (0.01) $ 0.11
Diluted net income / (loss) per common share .......................................................................... $ 0.35 $ (0.01) $ 0.11
Weighted average shares used in computing basic net income / (loss) per common share ....... 22,709 22,180 20,611
Weighted average shares used in computing diluted net income / (loss) per common share ................................................................................................................ 24,289 22,180 20,612
Below is a summary of stock-based compensation included in the costs and expenses above:
Cost of professional services ..................................................................................................... $ 32 $ 35 $ 29 Research and development ........................................................................................................ $ 52 $ 78 $ 46 Sales and marketing .................................................................................................................. $ 46 $ 49 $ 25 General and administrative ....................................................................................................... $ 88 $ 82 $ 141
The accompanying notes are an integral part of these
consolidated financial statements
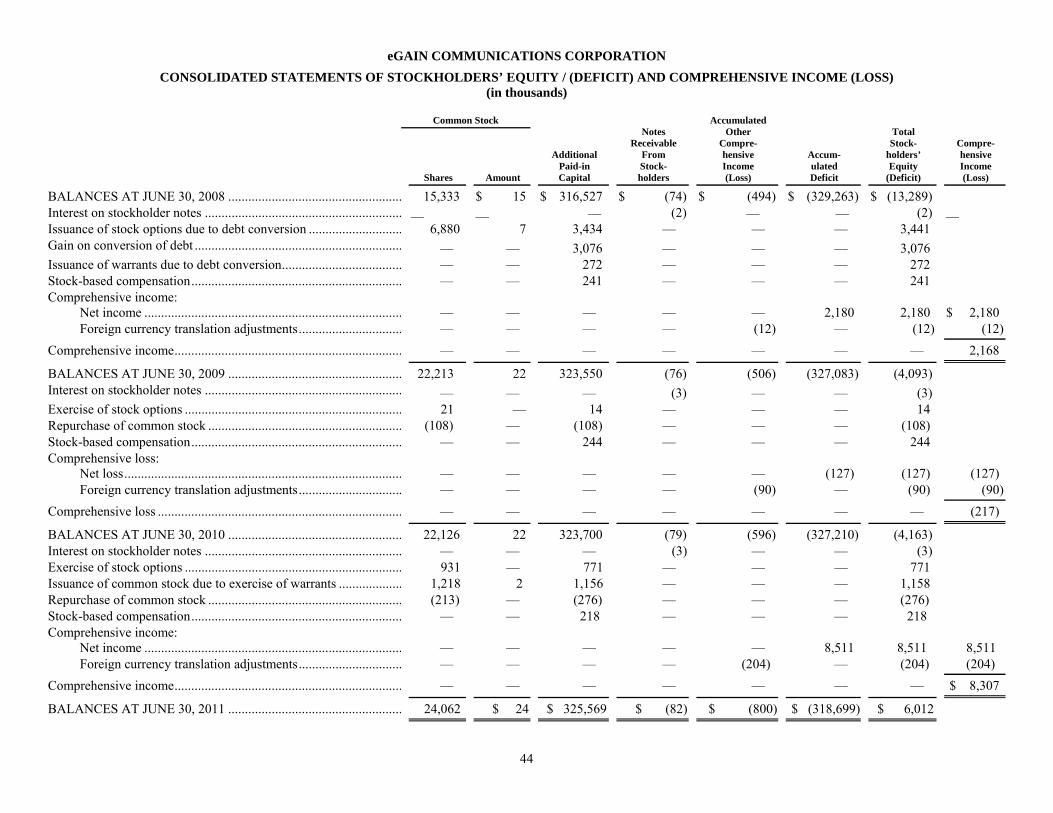
44
eGAIN COMMUNICATIONS CORPORATION CONSOLIDATED STATEMENTS OF STOCKHOLDERS’ EQUITY / (DEFICIT) AND COMPREHENSIVE INCOME (LOSS)
(in thousands)
Common Stock
Additional Paid-in Capital
Notes Receivable
From Stock- holders
Accumulated Other
Compre- hensive Income (Loss)
Accum- ulated Deficit
Total Stock-
holders’ Equity
(Deficit)
Compre- hensive Income (Loss) Shares Amount
BALANCES AT JUNE 30, 2008 .................................................... 15,333 $ 15 $ 316,527 $ (74) $ (494) $ (329,263) $ (13,289)Interest on stockholder notes ........................................................... — — — (2) — — (2) —
Issuance of stock options due to debt conversion ............................ 6,880 7 3,434 — — — 3,441 Gain on conversion of debt .............................................................. — — 3,076 — — — 3,076 Issuance of warrants due to debt conversion .................................... — — 272 — — — 272 Stock-based compensation ............................................................... — — 241 — — — 241 Comprehensive income:
Net income ............................................................................. — — — — — 2,180 2,180 $ 2,180 Foreign currency translation adjustments ............................... — — — — (12) — (12) (12)
Comprehensive income .................................................................... — — — — — — — 2,168
BALANCES AT JUNE 30, 2009 .................................................... 22,213 22 323,550 (76) (506) (327,083) (4,093)Interest on stockholder notes ........................................................... — — — (3) — — (3) Exercise of stock options ................................................................. 21 — 14 — — — 14 Repurchase of common stock .......................................................... (108) — (108) — — — (108) Stock-based compensation ............................................................... — — 244 — — — 244 Comprehensive loss:
Net loss ................................................................................... — — — — — (127) (127) (127) Foreign currency translation adjustments ............................... — — — — (90) — (90) (90)
Comprehensive loss ......................................................................... — — — — — — — (217)
BALANCES AT JUNE 30, 2010 .................................................... 22,126 22 323,700 (79) (596) (327,210) (4,163)Interest on stockholder notes ........................................................... — — — (3) — — (3)Exercise of stock options ................................................................. 931 — 771 — — — 771Issuance of common stock due to exercise of warrants ................... 1,218 2 1,156 — — — 1,158Repurchase of common stock .......................................................... (213) — (276) — — — (276) Stock-based compensation ............................................................... — — 218 — — — 218 Comprehensive income:
Net income ............................................................................. — — — — — 8,511 8,511 8,511 Foreign currency translation adjustments ............................... — — — — (204) — (204) (204)
Comprehensive income .................................................................... — — — — — — — $ 8,307
BALANCES AT JUNE 30, 2011 .................................................... 24,062 $ 24 $ 325,569 $ (82) $ (800) $ (318,699) $ 6,012

45
The accompanying notes are an integral part of these
consolidated financial statements
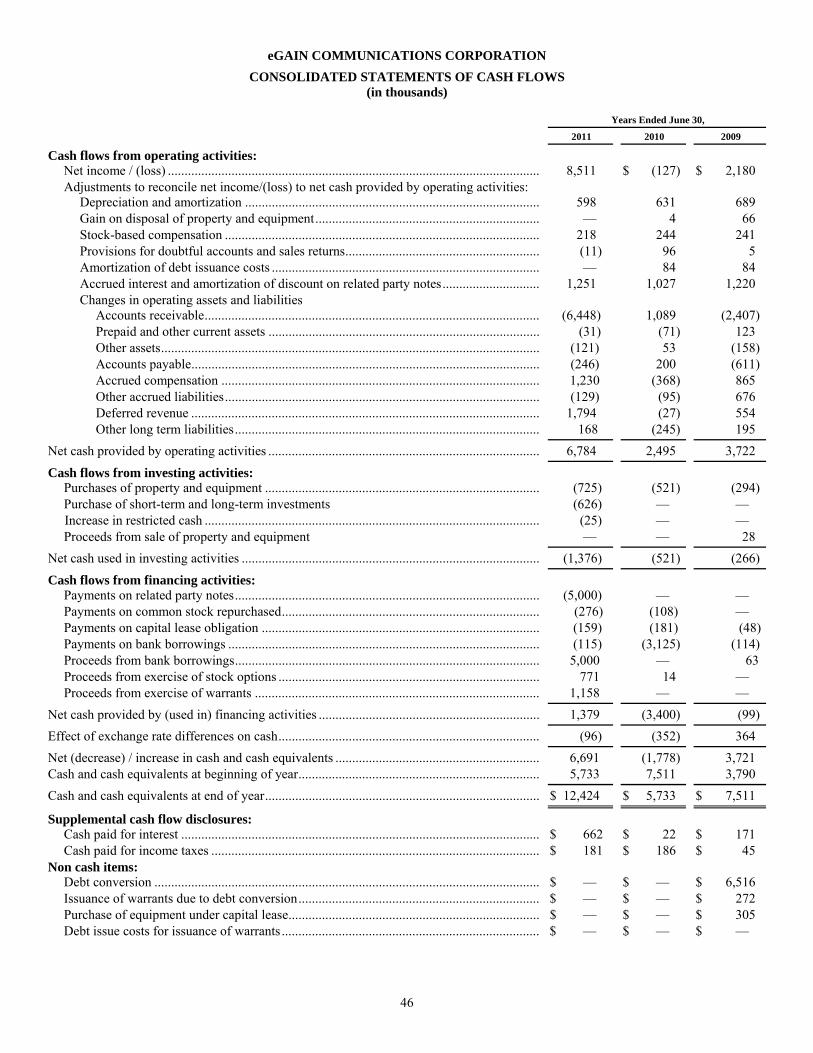
46
eGAIN COMMUNICATIONS CORPORATION CONSOLIDATED STATEMENTS OF CASH FLOWS
(in thousands)
Years Ended June 30,
2011
2010
2009
Cash flows from operating activities:
Net income / (loss) ............................................................................................................... 8,511 $ (127) $ 2,180 Adjustments to reconcile net income/(loss) to net cash provided by operating activities:
Depreciation and amortization ........................................................................................ 598 631 689 Gain on disposal of property and equipment ................................................................... — 4 66 Stock-based compensation .............................................................................................. 218 244 241 Provisions for doubtful accounts and sales returns .......................................................... (11) 96 5 Amortization of debt issuance costs ................................................................................ — 84 84 Accrued interest and amortization of discount on related party notes ............................. 1,251 1,027 1,220 Changes in operating assets and liabilities
Accounts receivable .................................................................................................... (6,448) 1,089 (2,407)Prepaid and other current assets ................................................................................. (31) (71) 123 Other assets ................................................................................................................. (121) 53 (158)Accounts payable ........................................................................................................ (246) 200 (611)Accrued compensation ............................................................................................... 1,230 (368) 865 Other accrued liabilities .............................................................................................. (129) (95) 676 Deferred revenue ........................................................................................................ 1,794 (27) 554 Other long term liabilities ........................................................................................... 168 (245) 195
Net cash provided by operating activities ................................................................................. 6,784 2,495 3,722
Cash flows from investing activities:
Purchases of property and equipment .................................................................................. (725) (521) (294)Purchase of short-term and long-term investments (626) — —
Increase in restricted cash .................................................................................................... (25) — — Proceeds from sale of property and equipment — — 28
Net cash used in investing activities ......................................................................................... (1,376) (521) (266)
Cash flows from financing activities:
Payments on related party notes ........................................................................................... (5,000) — — Payments on common stock repurchased ............................................................................. (276) (108) — Payments on capital lease obligation ................................................................................... (159) (181) (48)Payments on bank borrowings ............................................................................................. (115) (3,125) (114)Proceeds from bank borrowings ........................................................................................... 5,000 — 63 Proceeds from exercise of stock options .............................................................................. 771 14 — Proceeds from exercise of warrants ..................................................................................... 1,158 — —
Net cash provided by (used in) financing activities .................................................................. 1,379 (3,400) (99)
Effect of exchange rate differences on cash .............................................................................. (96) (352) 364
Net (decrease) / increase in cash and cash equivalents ............................................................. 6,691 (1,778) 3,721 Cash and cash equivalents at beginning of year ........................................................................ 5,733 7,511 3,790
Cash and cash equivalents at end of year .................................................................................. $ 12,424 $ 5,733 $ 7,511
Supplemental cash flow disclosures:
Cash paid for interest ........................................................................................................... $ 662 $ 22 $ 171 Cash paid for income taxes .................................................................................................. $ 181 $ 186 $ 45
Non cash items:
Debt conversion ................................................................................................................... $ — $ — $ 6,516 Issuance of warrants due to debt conversion ........................................................................ $ — $ — $ 272 Purchase of equipment under capital lease ........................................................................... $ — $ — $ 305 Debt issue costs for issuance of warrants ............................................................................. $ — $ — $ —

47
The accompanying notes are an integral part of these
consolidated financial statements
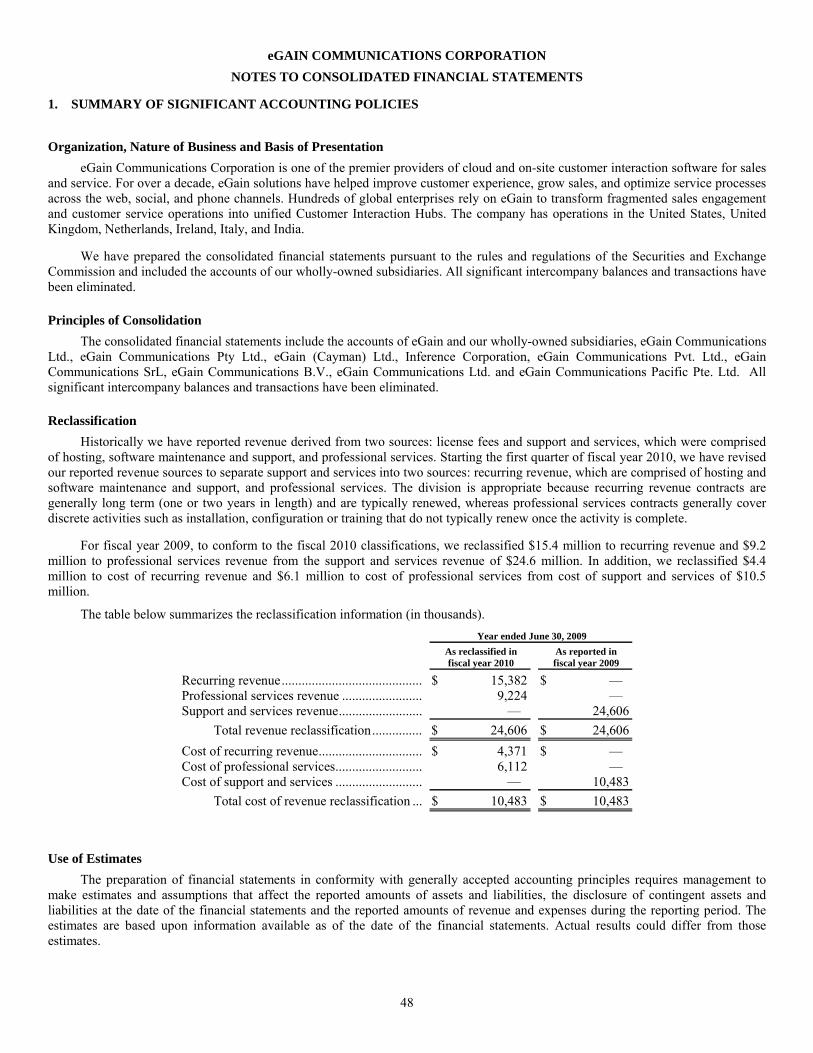
48
eGAIN COMMUNICATIONS CORPORATION NOTES TO CONSOLIDATED FINANCIAL STATEMENTS
1. SUMMARY OF SIGNIFICANT ACCOUNTING POLICIES
Organization, Nature of Business and Basis of Presentation eGain Communications Corporation is one of the premier providers of cloud and on-site customer interaction software for sales
and service. For over a decade, eGain solutions have helped improve customer experience, grow sales, and optimize service processes across the web, social, and phone channels. Hundreds of global enterprises rely on eGain to transform fragmented sales engagement and customer service operations into unified Customer Interaction Hubs. The company has operations in the United States, United Kingdom, Netherlands, Ireland, Italy, and India.
We have prepared the consolidated financial statements pursuant to the rules and regulations of the Securities and Exchange Commission and included the accounts of our wholly-owned subsidiaries. All significant intercompany balances and transactions have been eliminated.
Principles of Consolidation The consolidated financial statements include the accounts of eGain and our wholly-owned subsidiaries, eGain Communications
Ltd., eGain Communications Pty Ltd., eGain (Cayman) Ltd., Inference Corporation, eGain Communications Pvt. Ltd., eGain Communications SrL, eGain Communications B.V., eGain Communications Ltd. and eGain Communications Pacific Pte. Ltd. All significant intercompany balances and transactions have been eliminated.
Reclassification Historically we have reported revenue derived from two sources: license fees and support and services, which were comprised
of hosting, software maintenance and support, and professional services. Starting the first quarter of fiscal year 2010, we have revised our reported revenue sources to separate support and services into two sources: recurring revenue, which are comprised of hosting and software maintenance and support, and professional services. The division is appropriate because recurring revenue contracts are generally long term (one or two years in length) and are typically renewed, whereas professional services contracts generally cover discrete activities such as installation, configuration or training that do not typically renew once the activity is complete.
For fiscal year 2009, to conform to the fiscal 2010 classifications, we reclassified $15.4 million to recurring revenue and $9.2 million to professional services revenue from the support and services revenue of $24.6 million. In addition, we reclassified $4.4 million to cost of recurring revenue and $6.1 million to cost of professional services from cost of support and services of $10.5 million.
The table below summarizes the reclassification information (in thousands).
Year ended June 30, 2009
As reclassified in fiscal year 2010
As reported in fiscal year 2009
Recurring revenue .......................................... $ 15,382 $ — Professional services revenue ........................ 9,224 — Support and services revenue ......................... — 24,606
Total revenue reclassification ............... $ 24,606 $ 24,606
Cost of recurring revenue ............................... $ 4,371 $ — Cost of professional services .......................... 6,112 — Cost of support and services .......................... — 10,483
Total cost of revenue reclassification ... $ 10,483 $ 10,483
Use of Estimates The preparation of financial statements in conformity with generally accepted accounting principles requires management to
make estimates and assumptions that affect the reported amounts of assets and liabilities, the disclosure of contingent assets and liabilities at the date of the financial statements and the reported amounts of revenue and expenses during the reporting period. The estimates are based upon information available as of the date of the financial statements. Actual results could differ from those estimates.

49
We evaluate our significant estimates, including those related to revenue recognition, provision for doubtful accounts, valuation of stock-based compensation, valuation of long-lived assets, valuation of deferred tax assets, and litigation, among others. We base our estimates on historical experience and on various other assumptions that are believed to be reasonable under the circumstances, the results of which form the basis for making judgments about the carrying values of assets and liabilities that are not readily apparent from other sources. We refer to accounting estimates of this type as “critical accounting estimates.”
Foreign Currency The functional currency of each of our international subsidiaries is the local currency of the country in which it operates. Assets
and liabilities of our foreign subsidiaries are translated at month-end exchange rates, and revenue and expenses are translated at the average monthly exchange rates. The resulting cumulative translation adjustments are recorded as a component of accumulated other comprehensive income/ (loss). Foreign currency transaction gains and losses are included in other income/(expense) in the consolidated statements of operations, and resulted in a gain of $218,000, a loss of $47,000, and a gain of $252,000 in fiscal years 2011, 2010 and 2009, respectively. Cash and Cash Equivalents and Investments
We consider all highly liquid investments with an original maturity of three months or less to be cash equivalents. Time deposits held for investments that are not debt securities are included in short-term investments in the consolidated balance sheets. Investments in time deposits with original maturities of more than three months but remaining maturities of less than one year are considered short-term investments. Investments held with the intent to reinvest or hold for longer than a year, or with remaining maturities of one year or more, are considered long-term investments. The Company’s cash equivalents at June 30, 2011 and 2010 consisted of money market funds with original maturities of three months or less, and are therefore classified as cash and cash equivalents in the accompanying consolidated balance sheets. The Company’s short-term investments at June 30, 2011 consisted of time deposits with maturities of less than one year. As of June 30, 2010, the Company did not have any short-term or long-term investments.
Fair Value of Financial Instruments Our financial instruments consist of cash and cash equivalents, investments, accounts receivable, accounts payable and debt. We
do not have any derivative financial instruments. We believe the reported carrying amounts of these financial instruments approximate fair value, based upon their short-term nature and comparable market information available at the respective balance sheet dates.
Concentration of Credit Risk Financial instruments that subject us to concentrations of credit risk consist principally of cash and cash equivalents,
investments, and trade accounts receivable. We are exposed to credit risk in the event of default by these institutions to the extent of the amount recorded on the balance sheet. We invest excess cash primarily in money market funds, which are highly liquid securities that bear minimal risk. Our cash and cash equivalents were $12.4 million as of June 30, 2011 which exceeded the FDIC (Federal Deposit Insurance Corporation) limit. In addition, we have investment policies and procedures that are reviewed periodically to minimize credit risk.
Our customer base extends across many different industries and geographic regions. We perform ongoing credit evaluations of our customers with outstanding receivables and generally do not require collateral. In addition, we established an allowance for doubtful accounts based upon factors surrounding the credit risk of customers, historical trends and other information. One customer accounted for about 22% of total revenue in fiscal year 2011. One customer accounted for 14% of total revenue in both fiscal years 2010 and 2009. Three customers accounted for approximately 23%, 18% and 16%, respectively, of accounts receivables at June 30, 2011, and one customer accounted for approximately 31% of accounts receivables at June 30, 2010.
Sales to customers outside of North America accounted for $23.5 million, $14.2 million and $15.5 million of our total revenue in the fiscal years 2011, 2010 and 2009, respectively.
Property and Equipment Property and equipment are stated at cost, net of accumulated depreciation and amortization. Depreciation is computed using the
straight-line method over the estimated useful life of the respective assets which typically is between three to five years. Leasehold improvements are amortized over the lesser of their corresponding lease term or the estimated useful lives of the improvements which typically is five years. Leased equipment is depreciated on straight-line basis over the useful life of the asset if the lease meets either the transfer of ownership criterion or the bargain purchase option criterion. If the lease does not meet either of the two criterions mentioned, the asset is depreciated over the lease term.
Goodwill and Other Intangible Assets In accordance with Financial Accounting Standards Board, or FASB, Accounting Standards Codification, or ASC 350,
Goodwill and Other Intangible Assets, we review goodwill annually for impairment (or more frequently if impairment indicators
50
arise). In addition, we evaluate our purchased intangible assets to determine that all such assets have determinable lives. We operate under a single reporting unit and accordingly, all of our goodwill is associated with the entire company. We performed annual impairment reviews for fiscal years 2011, 2010 and 2009 and found no impairment.
Impairment of Long-Lived Assets
In accordance with the provisions of ASC 360, Property, Plant and Equipment, we review long-lived assets for impairment, including property and equipment and intangible assets, whenever events or changes in business circumstances indicate that the carrying amounts of the assets may not be fully recoverable. Under ASC 360, an impairment loss is recognized when estimated undiscounted future cash flows expected to result from the use of the asset and its eventual disposition are less than its carrying amount. Impairment, if any, is assessed using discounted cash flows. During fiscal years 2011 and 2010, we did not have any such losses.
Revenue Recognition We derive revenue from three sources: license fees, recurring revenue and professional services. Recurring revenue include
hosting and software maintenance and support. Maintenance and support consists of technical support, software upgrades and enhancements. Professional services primarily consist of consulting, implementation services and training. Significant management judgments and estimates are made and used to determine the revenue recognized in any accounting period. Material differences may result in changes to the amount and timing of our revenue for any period if different conditions were to prevail. We present revenue, net of taxes collected from customers and remitted to governmental authorities.
We apply the provisions of Accounting Standards Codification, or ASC 985-605, Software Revenue Recognition, to all transactions involving the licensing of software products. In the event of a multiple element arrangement for a license transaction, we evaluate the transaction as if each element represents a separate unit of accounting taking into account all factors following the accounting standards. We apply ASC 605, Revenue Recognition, for hosting transactions to determine the accounting treatment for multiple elements. We also apply ASC 605 for fixed fee arrangements in which we use the percentage of completion method to recognize revenue when reliable estimates are available for the costs and efforts necessary to complete the implementation services. When such estimates are not available, the completed contract method is utilized. Under the completed contract method, revenue is recognized only when a contract is completed or substantially complete.
When licenses are sold together with system implementation and consulting services, license fees are recognized upon shipment, provided that (i) payment of the license fees is not dependent upon the performance of the consulting and implementation services, (ii) the services are available from other vendors, (iii) the services qualify for separate accounting as we have sufficient experience in providing such services, have the ability to estimate cost of providing such services, and we have vendor-specific objective evidence of fair value, and (iv) the services are not essential to the functionality of the software.
We use signed software license and services agreements and order forms as evidence of an arrangement for sales of software, hosting, maintenance and support. We use signed engagement letters to evidence an arrangement for professional services.
License Revenue We recognize license revenue when persuasive evidence of an arrangement exists, the product has been delivered, no significant
obligations remain, the fee is fixed or determinable, and collection of the resulting receivable is probable. In software arrangements that include rights to multiple software products and/or services, we use the residual method under which revenue is allocated to the undelivered elements based on vendor- specific objective evidence of the fair value of such undelivered elements. The residual amount of revenue is allocated to the delivered elements and recognized as revenue, assuming all other criteria for revenue recognition have been met. Such undelivered elements in these arrangements typically consist of software maintenance and support, implementation and consulting services and in some cases, hosting services.
Software is delivered to customers electronically or on a CD-ROM, and license files are delivered electronically. We assess whether the fee is fixed or determinable based on the payment terms associated with the transaction. We have standard payment terms included in our contracts. We assess collectability based on a number of factors, including the customer’s past payment history and its current creditworthiness. If we determine that collection of a fee is not reasonably assured, we defer the revenue and recognize it at the time collection becomes reasonably assured, which is generally upon receipt of cash payment. If an acceptance period is required, revenue is recognized upon the earlier of customer acceptance or the expiration of the acceptance period.
51
We periodically sell to resellers. License sales to resellers as a percentage of total revenue were approximately 5%, 4% and 11% in fiscal years 2011, 2010 and 2009, respectively. Revenue from sales to resellers is generally recognized upon delivery to the reseller but depends on the facts and circumstances of the transaction, such as our understanding of the reseller’s plans to sell the software, if there are any return provisions, price protection or other allowances, the reseller’s financial status and our past experience with the particular reseller. Historically sales to resellers have not included any return provisions, price protections or other allowances.
Hosting Revenue Included in recurring revenue is revenue derived from our hosted service offerings. We recognize hosting services revenue
ratably over the period of the applicable agreement as services are provided. Hosting agreements typically have an initial term of one or two years and automatically renew unless either party cancels the agreement. The majority of the hosting services customers purchase a combination of our hosting service and professional services. In some cases the customer may also acquire a license for our software.
We evaluate whether each of the elements in these arrangements represents a separate unit of accounting, as defined by ASC 605, using all applicable facts and circumstances, including whether (i) we sell or could readily sell the element unaccompanied by the other elements, (ii) the element has stand-alone value to the customer, and (iii) there is a general right of return. We use vendor specific objective evidence of fair value (VSOE) for each of those units, when available. Upon adoption of new guidance for revenue recognition with multiple-deliverable elements, in certain limited circumstances when VSOE does not exist, we apply the selling price hierarchy to applicable multiple-deliverable arrangements. We consider the applicability of ASC 985-605, Software Revenue Recognition, on a contract-by-contract basis. In hosted term-based agreements, where the customer does not have the contractual right to take possession of the software, the revenue is recognized on a monthly basis over the term of the contract. Invoiced amounts are recorded in accounts receivable and in deferred revenue or revenue, depending on whether the revenue recognition criteria have been met. For professional services that we determine do not have stand-alone value to the customer, we recognize the services revenue ratably over the longer of the remaining contractual period or the remaining estimated life of the customer hosting relationship, once hosting has gone live. We currently estimate the life of the customer hosting relationship to be approximately 26 months, based on the average life of all hosting customer relationships.
We consider a software element to exist when we determine that the customer has the contractual right to take possession of our software at any time during the hosting period without significant penalty and can feasibly run the software on its own hardware or enter into another arrangement with a third party to host the software. Additionally, we have established vendor-specific objective evidence for the hosting and support elements of perpetual license sales, based on the prices charged when sold separately and substantive renewal terms. Accordingly, when a software element exists in a hosting services arrangement, license revenue for the perpetual software license element is determined using the residual method and is recognized upon delivery. Revenue for the hosting and support elements is recognized ratably over the contractual time period. Professional services are recognized as described below under “Professional Services Revenue.” If vendor-specific evidence of fair value cannot be established for the undelivered elements of an agreement, the entire amount of revenue from the arrangement is recognized ratably over the period that these elements are delivered.
Maintenance and Support Revenue Included in recurring revenue is revenue derived from maintenance and support services. We use vendor-specific objective
evidence of fair value for maintenance and support to account for the arrangement using the residual method, regardless of any separate prices stated within the contract for each element. Maintenance and support revenue is recognized ratably over the term of the maintenance contract, which is typically one year. Maintenance and support is renewable by the customer on an annual basis. Maintenance and support rates, including subsequent renewal rates, are typically established based upon a specified percentage of net license fees as set forth in the arrangement.
Professional Services Revenue Included in professional services revenue is revenue derived from system implementation, consulting and training. For license
transactions, the majority of our consulting and implementation services and accompanying agreements qualify for separate accounting. We use vendor-specific objective evidence of fair value for the services to account for the arrangement using the residual method, regardless of any separate prices stated within the contract for each element. Our consulting and implementation service contracts are bid either on a fixed-fee basis or on a time-and-materials basis. Substantially all of our contracts are on a time-and-materials basis. For time-and-materials contracts, where the services are not essential to the functionality, we recognize revenue as services are performed. If the services are essential to functionality, then both the product license revenue and the service revenue are recognized under the percentage of completion method. For a fixed-fee contract we recognize revenue based upon the costs and efforts to complete the services in accordance with the percentage of completion method, provided we are able to estimate such cost and efforts.
52
For hosting, consulting and implementation services that do not qualify for separate accounting we recognize the services revenue ratably over the estimated life of the customer hosting relationship.
Training revenue that meets the criteria to be accounted for separately is recognized when training is provided or, in the case of hosting, when the customer also has access to the hosting services.
Allowance for Doubtful Accounts We maintain an allowance for doubtful accounts to reserve for potential uncollectible trade receivables. We review our trade
receivables by aging category to identify specific customers with known disputes or collectability issues. We exercise judgment when determining the adequacy of these reserves as we evaluate historical bad debt trends, general economic conditions in the U.S. and internationally, and changes in customer financial conditions. If we made different judgments or utilized different estimates, material differences may result in additional reserves for trade receivables, which would be reflected by charges in general and administrative expenses for any period presented. We write off a receivable after all collection efforts have been exhausted and the amount is deemed uncollectible.
Leases Lease agreements are evaluated to determine whether they are capital or operating leases in accordance with ASC 840,
Accounting for Leases. When any one of the four test criteria in ASC 840 is met, the lease then qualifies as a capital lease.
Capital leases are capitalized at the lower of the net present value of the total amount of rent payable under the leasing agreement (excluding finance charges) or the fair market value of the leased asset. Capital lease assets are depreciated on a straight-line basis, over a period consistent with our normal depreciation policy for tangible fixed assets, but not exceeding the lease term. Interest charges are expensed over the period of the lease in relation to the carrying value of the capital lease obligation.
Rent expense for operating leases, which may include free rent or fixed escalation amounts in addition to minimum lease payments, is recognized on a straight-line basis over the duration of each lease term.
Software Development Costs We account for software development costs in accordance with ASC 985, Software, for costs of the software to be sold, leased
or marketed, whereby costs for the development of new software products and substantial enhancements to existing software products are included in research and development expense as incurred until technological feasibility has been established, at which time any additional costs are capitalized. Technological feasibility is established upon completion of a working model. To date, software development costs incurred in the period between achieving technological feasibility and general availability of software have not been material and have been charged to operations as incurred.
Legal Costs We expense legal costs in connection with loss contingency as incurred.
Advertising Costs We expense advertising costs as incurred. Total advertising expenses for the fiscal years ended June 30, 2011, 2010 and 2009
were $348,000, $289,000 and $215,000, respectively.
Stock-Based Compensation We account for stock-based compensation in accordance with ASC 718, Compensation—Stock Compensation. Under the fair
value recognition provisions of ASC 718, stock-based compensation cost is measured at the grant date based on the fair value of the award and is recognized as expense over the vesting period. Determining the fair value of the stock-based awards at the grant date requires significant judgment and the use of estimates, particularly surrounding Black-Scholes valuation assumptions such as stock price volatility and expected option lives.
Income Taxes Income taxes are accounted for using the asset and liability method in accordance with ASC 740, Income Taxes. Under this
method, deferred tax liabilities and assets are recognized for the estimated future tax consequences attributable to differences between the financial statement carrying amounts of existing assets and liabilities and their respective tax bases. Based upon the weight of available evidence, which includes our historical operating performance and the reported cumulative net losses in all prior years, we have provided a full valuation allowance against our net deferred tax assets except the deferred tax assets related to India as we believe it is more likely than not that those assets will be realized.
53
The FASB clarifies the accounting for uncertainty in income taxes recognized in an entity’s financial statement, and prescribes a recognition threshold and measurement attributes for financial statement disclosure of tax positions taken or expected to be taken on a tax return. Additionally, the FASB provides guidance under ASC 740, Income Taxes on de-recognition, classification, interest and penalties, accounting in interim periods, disclosure and transition. Our provision consists of foreign and state income taxes.
Comprehensive Income / (Loss) We report comprehensive income / (loss) and its components in accordance with ASC 220, Comprehensive Income. Under the
accounting standards, comprehensive income / (loss) includes all changes in equity during a period except those resulting from investments by or distributions to owners. Total comprehensive income / (loss) for each of the three years in the period ended June 30, 2011 is shown in the statement of stockholders’ equity / (deficit). Accumulated other comprehensive income / (loss) presented in the accompanying consolidated balance sheets at June 30, 2011 and 2010 consist solely of accumulated foreign currency translation adjustments.
Net Income / (Loss) Per Common Share Basic net income / (loss) per common share is computed using the weighted-average number of shares of common stock
outstanding. In periods where net income is reported, the weighted–average number of shares is increased by warrants and options in the money to calculate diluted net income per common share.
The following table represents the calculation of basic and diluted net income/ (loss) per common share (in thousands, except per share data):
Years Ended June 30,
2011 2010
2009
Net income/(loss) applicable to common stockholders ........................................... $ 8,511 $ (127 ) $ 2,180
Basic net income/(loss) per common share ............................................................. $ 0.37 $ (0.01 ) $ 0.11
Weighted average common shares used in computing basic net income/(loss) per common share ..................................................................................................... 22,709 22,180 20,611
Effect of dilutive options and warrants outstanding ...................................... 1,580 — 1
Weighted average common shares used in computing diluted net income/(loss) per common share ............................................................................................... 24,289 22,180 20,612
Diluted net income/(loss) per common share .......................................................... $ 0.35 $ (0.01 ) $ 0.11
Weighted average shares of stock options and warrants to purchase 682,926 and 4,208,295 shares of common stock at June 30, 2011 and 2009, respectively, were not included in the computation of diluted net income per common share due to their exercise price exceeding the average market price of the common stock during the period.
Weighted average shares of stock options and warrants to purchase 4,896,247 shares of common stock at June 30, 2010, were not included in the computation of diluted net loss per common share due to their anti-dilutive effect. Such securities could have a dilutive effect in future periods.
Segment Information We operate in one segment, the development, license, implementation and support of our customer service infrastructure
software solutions. Operating segments are identified as components of an enterprise for which discrete financial information is available and regularly reviewed by the company’s chief operating decision-maker in order to make decisions about resources to be allocated to the segment and assess its performance. Our chief operating decision-makers under ASC 280, Segment Reporting, are our executive management team. Our chief operating decision-makers review financial information presented on a consolidated basis for purposes of making operating decisions and assessing financial performance. Information relating to our geographic areas for the fiscal years ended June 30, 2011, 2010 and 2009 is as follows (in thousands):
Total Revenue
Operating Income (Loss)
Identifiable Assets
Year ended June 30, 2011:
North America ................................................................................... $ 20,533 $ 2,590 $ 15,854 EMEA ................................................................................................ 23,396 10,494 5,800 Asia Pacific ........................................................................................ 136 (3,392) 1,690
44,065 9,692 23,344
Year ended June 30, 2010:
North America ................................................................................... $ 15,697 $ 1,179 $ 6,531 EMEA ................................................................................................ 14,027 2,910 3,053 Asia Pacific ........................................................................................ 153 (2,867) 852
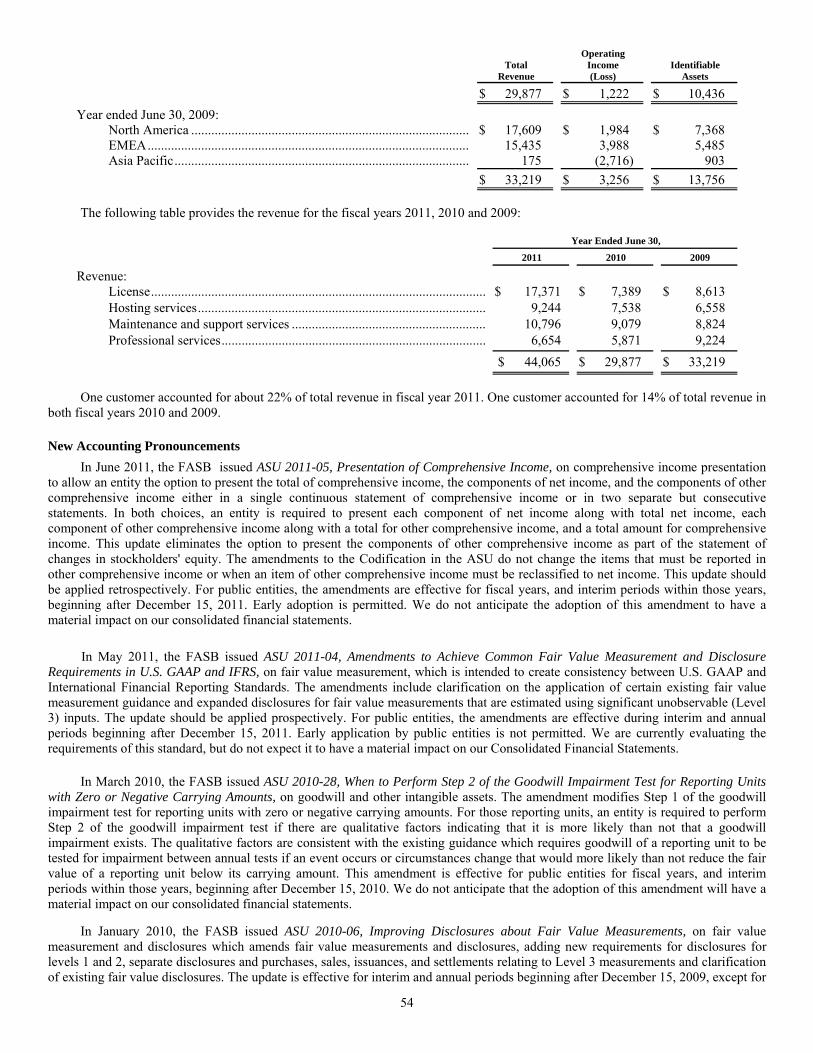
54
Total Revenue
Operating Income (Loss)
Identifiable Assets
$ 29,877 $ 1,222 $ 10,436
Year ended June 30, 2009:
North America ................................................................................... $ 17,609 $ 1,984 $ 7,368 EMEA ................................................................................................ 15,435 3,988 5,485 Asia Pacific ........................................................................................ 175 (2,716) 903
$ 33,219 $ 3,256 $ 13,756
The following table provides the revenue for the fiscal years 2011, 2010 and 2009:
Year Ended June 30,
2011 2010
2009
Revenue:
License .................................................................................................... $ 17,371 $ 7,389 $ 8,613 Hosting services ...................................................................................... 9,244 7,538 6,558 Maintenance and support services .......................................................... 10,796 9,079 8,824 Professional services ............................................................................... 6,654 5,871 9,224
$ 44,065 $ 29,877 $ 33,219
One customer accounted for about 22% of total revenue in fiscal year 2011. One customer accounted for 14% of total revenue in both fiscal years 2010 and 2009.
New Accounting Pronouncements In June 2011, the FASB issued ASU 2011-05, Presentation of Comprehensive Income, on comprehensive income presentation
to allow an entity the option to present the total of comprehensive income, the components of net income, and the components of other comprehensive income either in a single continuous statement of comprehensive income or in two separate but consecutive statements. In both choices, an entity is required to present each component of net income along with total net income, each component of other comprehensive income along with a total for other comprehensive income, and a total amount for comprehensive income. This update eliminates the option to present the components of other comprehensive income as part of the statement of changes in stockholders' equity. The amendments to the Codification in the ASU do not change the items that must be reported in other comprehensive income or when an item of other comprehensive income must be reclassified to net income. This update should be applied retrospectively. For public entities, the amendments are effective for fiscal years, and interim periods within those years, beginning after December 15, 2011. Early adoption is permitted. We do not anticipate the adoption of this amendment to have a material impact on our consolidated financial statements.
In May 2011, the FASB issued ASU 2011-04, Amendments to Achieve Common Fair Value Measurement and Disclosure Requirements in U.S. GAAP and IFRS, on fair value measurement, which is intended to create consistency between U.S. GAAP and International Financial Reporting Standards. The amendments include clarification on the application of certain existing fair value measurement guidance and expanded disclosures for fair value measurements that are estimated using significant unobservable (Level 3) inputs. The update should be applied prospectively. For public entities, the amendments are effective during interim and annual periods beginning after December 15, 2011. Early application by public entities is not permitted. We are currently evaluating the requirements of this standard, but do not expect it to have a material impact on our Consolidated Financial Statements.
In March 2010, the FASB issued ASU 2010-28, When to Perform Step 2 of the Goodwill Impairment Test for Reporting Units with Zero or Negative Carrying Amounts, on goodwill and other intangible assets. The amendment modifies Step 1 of the goodwill impairment test for reporting units with zero or negative carrying amounts. For those reporting units, an entity is required to perform Step 2 of the goodwill impairment test if there are qualitative factors indicating that it is more likely than not that a goodwill impairment exists. The qualitative factors are consistent with the existing guidance which requires goodwill of a reporting unit to be tested for impairment between annual tests if an event occurs or circumstances change that would more likely than not reduce the fair value of a reporting unit below its carrying amount. This amendment is effective for public entities for fiscal years, and interim periods within those years, beginning after December 15, 2010. We do not anticipate that the adoption of this amendment will have a material impact on our consolidated financial statements.
In January 2010, the FASB issued ASU 2010-06, Improving Disclosures about Fair Value Measurements, on fair value measurement and disclosures which amends fair value measurements and disclosures, adding new requirements for disclosures for levels 1 and 2, separate disclosures and purchases, sales, issuances, and settlements relating to Level 3 measurements and clarification of existing fair value disclosures. The update is effective for interim and annual periods beginning after December 15, 2009, except for
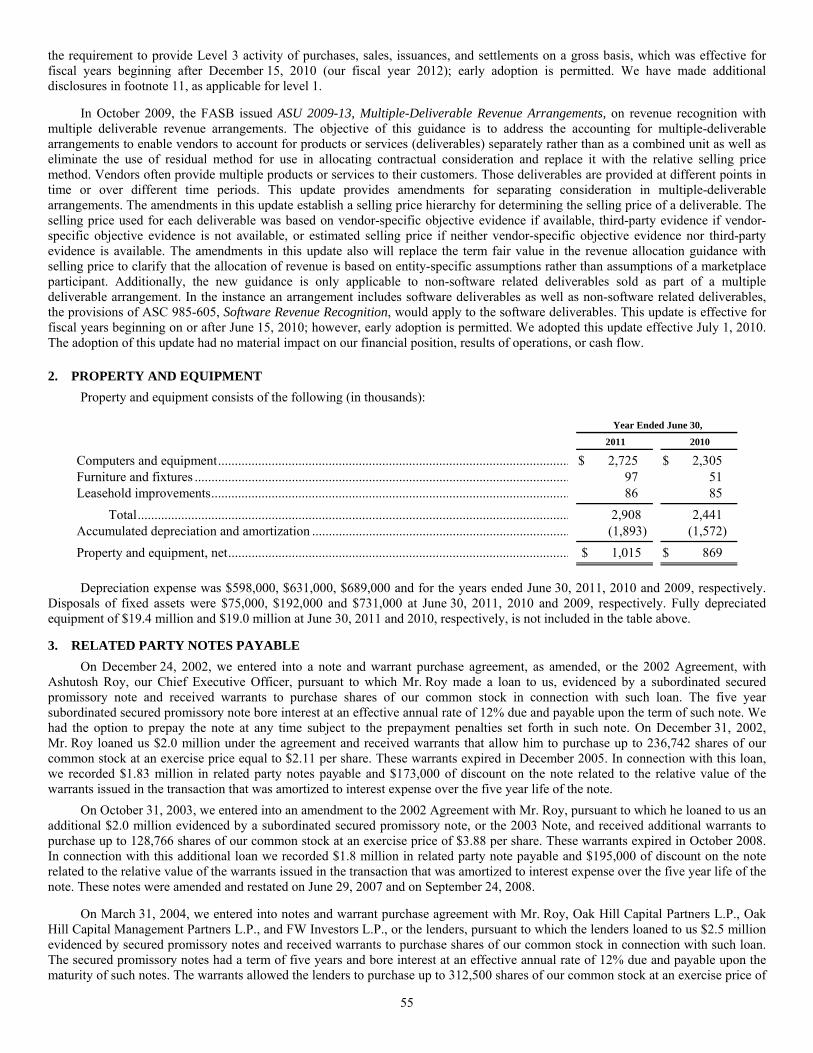
55
the requirement to provide Level 3 activity of purchases, sales, issuances, and settlements on a gross basis, which was effective for fiscal years beginning after December 15, 2010 (our fiscal year 2012); early adoption is permitted. We have made additional disclosures in footnote 11, as applicable for level 1.
In October 2009, the FASB issued ASU 2009-13, Multiple-Deliverable Revenue Arrangements, on revenue recognition with multiple deliverable revenue arrangements. The objective of this guidance is to address the accounting for multiple-deliverable arrangements to enable vendors to account for products or services (deliverables) separately rather than as a combined unit as well as eliminate the use of residual method for use in allocating contractual consideration and replace it with the relative selling price method. Vendors often provide multiple products or services to their customers. Those deliverables are provided at different points in time or over different time periods. This update provides amendments for separating consideration in multiple-deliverable arrangements. The amendments in this update establish a selling price hierarchy for determining the selling price of a deliverable. The selling price used for each deliverable was based on vendor-specific objective evidence if available, third-party evidence if vendor-specific objective evidence is not available, or estimated selling price if neither vendor-specific objective evidence nor third-party evidence is available. The amendments in this update also will replace the term fair value in the revenue allocation guidance with selling price to clarify that the allocation of revenue is based on entity-specific assumptions rather than assumptions of a marketplace participant. Additionally, the new guidance is only applicable to non-software related deliverables sold as part of a multiple deliverable arrangement. In the instance an arrangement includes software deliverables as well as non-software related deliverables, the provisions of ASC 985-605, Software Revenue Recognition, would apply to the software deliverables. This update is effective for fiscal years beginning on or after June 15, 2010; however, early adoption is permitted. We adopted this update effective July 1, 2010. The adoption of this update had no material impact on our financial position, results of operations, or cash flow.
2. PROPERTY AND EQUIPMENT Property and equipment consists of the following (in thousands):
Year Ended June 30,
2011
2010
Computers and equipment ......................................................................................................... $ 2,725 $ 2,305 Furniture and fixtures ................................................................................................................ 97 51 Leasehold improvements ........................................................................................................... 86 85
Total ................................................................................................................................. 2,908 2,441 Accumulated depreciation and amortization ............................................................................. (1,893) (1,572)
Property and equipment, net ...................................................................................................... $ 1,015 $ 869
Depreciation expense was $598,000, $631,000, $689,000 and for the years ended June 30, 2011, 2010 and 2009, respectively. Disposals of fixed assets were $75,000, $192,000 and $731,000 at June 30, 2011, 2010 and 2009, respectively. Fully depreciated equipment of $19.4 million and $19.0 million at June 30, 2011 and 2010, respectively, is not included in the table above. 3. RELATED PARTY NOTES PAYABLE
On December 24, 2002, we entered into a note and warrant purchase agreement, as amended, or the 2002 Agreement, with Ashutosh Roy, our Chief Executive Officer, pursuant to which Mr. Roy made a loan to us, evidenced by a subordinated secured promissory note and received warrants to purchase shares of our common stock in connection with such loan. The five year subordinated secured promissory note bore interest at an effective annual rate of 12% due and payable upon the term of such note. We had the option to prepay the note at any time subject to the prepayment penalties set forth in such note. On December 31, 2002, Mr. Roy loaned us $2.0 million under the agreement and received warrants that allow him to purchase up to 236,742 shares of our common stock at an exercise price equal to $2.11 per share. These warrants expired in December 2005. In connection with this loan, we recorded $1.83 million in related party notes payable and $173,000 of discount on the note related to the relative value of the warrants issued in the transaction that was amortized to interest expense over the five year life of the note.
On October 31, 2003, we entered into an amendment to the 2002 Agreement with Mr. Roy, pursuant to which he loaned to us an additional $2.0 million evidenced by a subordinated secured promissory note, or the 2003 Note, and received additional warrants to purchase up to 128,766 shares of our common stock at an exercise price of $3.88 per share. These warrants expired in October 2008. In connection with this additional loan we recorded $1.8 million in related party note payable and $195,000 of discount on the note related to the relative value of the warrants issued in the transaction that was amortized to interest expense over the five year life of the note. These notes were amended and restated on June 29, 2007 and on September 24, 2008.
On March 31, 2004, we entered into notes and warrant purchase agreement with Mr. Roy, Oak Hill Capital Partners L.P., Oak Hill Capital Management Partners L.P., and FW Investors L.P., or the lenders, pursuant to which the lenders loaned to us $2.5 million evidenced by secured promissory notes and received warrants to purchase shares of our common stock in connection with such loan. The secured promissory notes had a term of five years and bore interest at an effective annual rate of 12% due and payable upon the maturity of such notes. The warrants allowed the lenders to purchase up to 312,500 shares of our common stock at an exercise price of
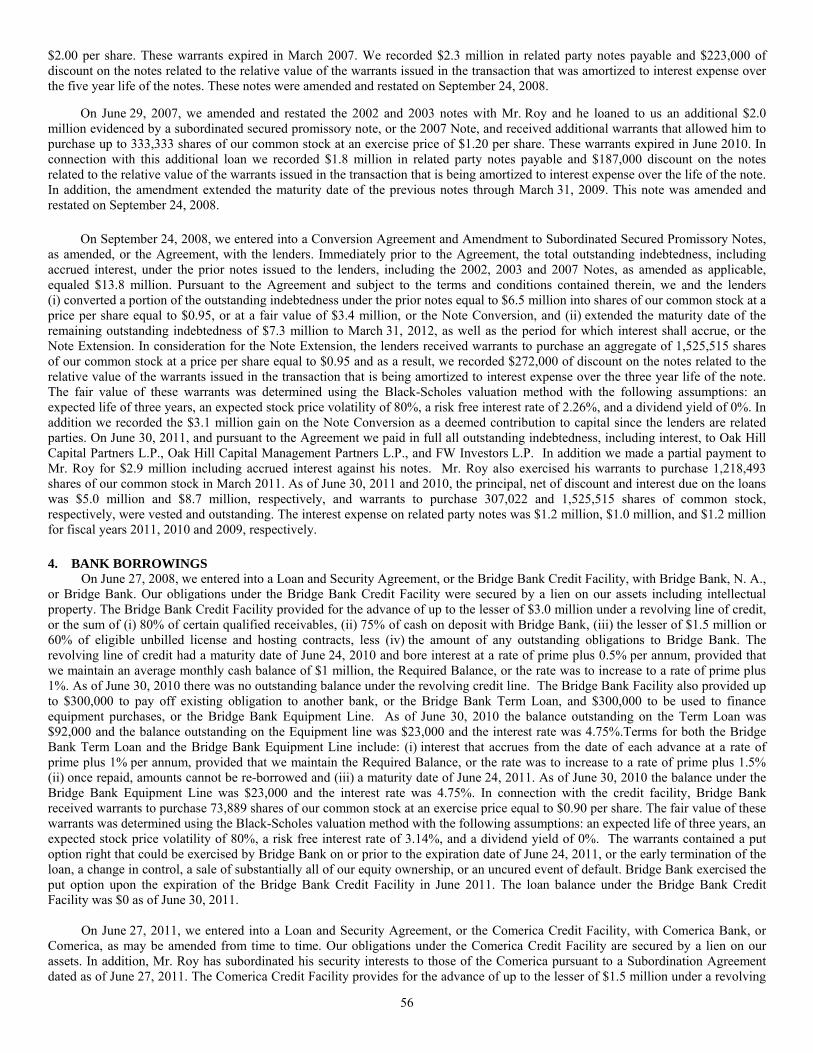
56
$2.00 per share. These warrants expired in March 2007. We recorded $2.3 million in related party notes payable and $223,000 of discount on the notes related to the relative value of the warrants issued in the transaction that was amortized to interest expense over the five year life of the notes. These notes were amended and restated on September 24, 2008.
On June 29, 2007, we amended and restated the 2002 and 2003 notes with Mr. Roy and he loaned to us an additional $2.0 million evidenced by a subordinated secured promissory note, or the 2007 Note, and received additional warrants that allowed him to purchase up to 333,333 shares of our common stock at an exercise price of $1.20 per share. These warrants expired in June 2010. In connection with this additional loan we recorded $1.8 million in related party notes payable and $187,000 discount on the notes related to the relative value of the warrants issued in the transaction that is being amortized to interest expense over the life of the note. In addition, the amendment extended the maturity date of the previous notes through March 31, 2009. This note was amended and restated on September 24, 2008.
On September 24, 2008, we entered into a Conversion Agreement and Amendment to Subordinated Secured Promissory Notes, as amended, or the Agreement, with the lenders. Immediately prior to the Agreement, the total outstanding indebtedness, including accrued interest, under the prior notes issued to the lenders, including the 2002, 2003 and 2007 Notes, as amended as applicable, equaled $13.8 million. Pursuant to the Agreement and subject to the terms and conditions contained therein, we and the lenders (i) converted a portion of the outstanding indebtedness under the prior notes equal to $6.5 million into shares of our common stock at a price per share equal to $0.95, or at a fair value of $3.4 million, or the Note Conversion, and (ii) extended the maturity date of the remaining outstanding indebtedness of $7.3 million to March 31, 2012, as well as the period for which interest shall accrue, or the Note Extension. In consideration for the Note Extension, the lenders received warrants to purchase an aggregate of 1,525,515 shares of our common stock at a price per share equal to $0.95 and as a result, we recorded $272,000 of discount on the notes related to the relative value of the warrants issued in the transaction that is being amortized to interest expense over the three year life of the note. The fair value of these warrants was determined using the Black-Scholes valuation method with the following assumptions: an expected life of three years, an expected stock price volatility of 80%, a risk free interest rate of 2.26%, and a dividend yield of 0%. In addition we recorded the $3.1 million gain on the Note Conversion as a deemed contribution to capital since the lenders are related parties. On June 30, 2011, and pursuant to the Agreement we paid in full all outstanding indebtedness, including interest, to Oak Hill Capital Partners L.P., Oak Hill Capital Management Partners L.P., and FW Investors L.P. In addition we made a partial payment to Mr. Roy for $2.9 million including accrued interest against his notes. Mr. Roy also exercised his warrants to purchase 1,218,493 shares of our common stock in March 2011. As of June 30, 2011 and 2010, the principal, net of discount and interest due on the loans was $5.0 million and $8.7 million, respectively, and warrants to purchase 307,022 and 1,525,515 shares of common stock, respectively, were vested and outstanding. The interest expense on related party notes was $1.2 million, $1.0 million, and $1.2 million for fiscal years 2011, 2010 and 2009, respectively.
4. BANK BORROWINGS On June 27, 2008, we entered into a Loan and Security Agreement, or the Bridge Bank Credit Facility, with Bridge Bank, N. A., or Bridge Bank. Our obligations under the Bridge Bank Credit Facility were secured by a lien on our assets including intellectual property. The Bridge Bank Credit Facility provided for the advance of up to the lesser of $3.0 million under a revolving line of credit, or the sum of (i) 80% of certain qualified receivables, (ii) 75% of cash on deposit with Bridge Bank, (iii) the lesser of $1.5 million or 60% of eligible unbilled license and hosting contracts, less (iv) the amount of any outstanding obligations to Bridge Bank. The revolving line of credit had a maturity date of June 24, 2010 and bore interest at a rate of prime plus 0.5% per annum, provided that we maintain an average monthly cash balance of $1 million, the Required Balance, or the rate was to increase to a rate of prime plus 1%. As of June 30, 2010 there was no outstanding balance under the revolving credit line. The Bridge Bank Facility also provided up to $300,000 to pay off existing obligation to another bank, or the Bridge Bank Term Loan, and $300,000 to be used to finance equipment purchases, or the Bridge Bank Equipment Line. As of June 30, 2010 the balance outstanding on the Term Loan was $92,000 and the balance outstanding on the Equipment line was $23,000 and the interest rate was 4.75%.Terms for both the Bridge Bank Term Loan and the Bridge Bank Equipment Line include: (i) interest that accrues from the date of each advance at a rate of prime plus 1% per annum, provided that we maintain the Required Balance, or the rate was to increase to a rate of prime plus 1.5% (ii) once repaid, amounts cannot be re-borrowed and (iii) a maturity date of June 24, 2011. As of June 30, 2010 the balance under the Bridge Bank Equipment Line was $23,000 and the interest rate was 4.75%. In connection with the credit facility, Bridge Bank received warrants to purchase 73,889 shares of our common stock at an exercise price equal to $0.90 per share. The fair value of these warrants was determined using the Black-Scholes valuation method with the following assumptions: an expected life of three years, an expected stock price volatility of 80%, a risk free interest rate of 3.14%, and a dividend yield of 0%. The warrants contained a put option right that could be exercised by Bridge Bank on or prior to the expiration date of June 24, 2011, or the early termination of the loan, a change in control, a sale of substantially all of our equity ownership, or an uncured event of default. Bridge Bank exercised the put option upon the expiration of the Bridge Bank Credit Facility in June 2011. The loan balance under the Bridge Bank Credit Facility was $0 as of June 30, 2011. On June 27, 2011, we entered into a Loan and Security Agreement, or the Comerica Credit Facility, with Comerica Bank, or Comerica, as may be amended from time to time. Our obligations under the Comerica Credit Facility are secured by a lien on our assets. In addition, Mr. Roy has subordinated his security interests to those of the Comerica pursuant to a Subordination Agreement dated as of June 27, 2011. The Comerica Credit Facility provides for the advance of up to the lesser of $1.5 million under a revolving
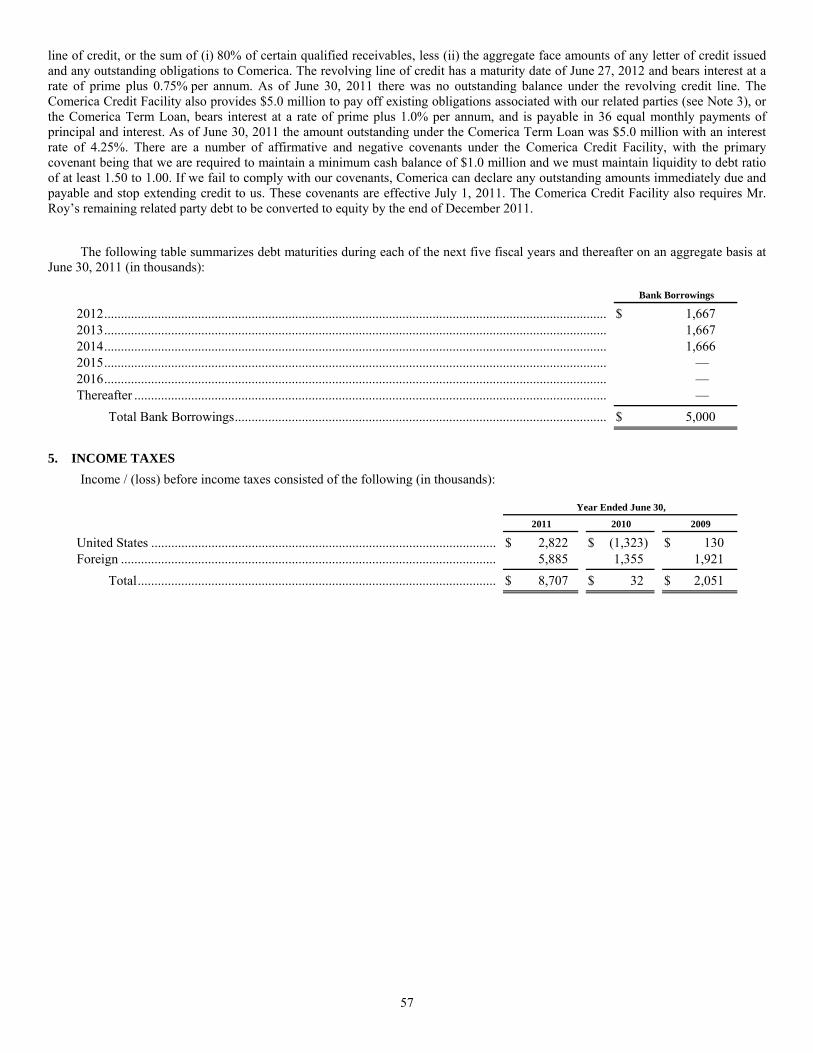
57
line of credit, or the sum of (i) 80% of certain qualified receivables, less (ii) the aggregate face amounts of any letter of credit issued and any outstanding obligations to Comerica. The revolving line of credit has a maturity date of June 27, 2012 and bears interest at a rate of prime plus 0.75% per annum. As of June 30, 2011 there was no outstanding balance under the revolving credit line. The Comerica Credit Facility also provides $5.0 million to pay off existing obligations associated with our related parties (see Note 3), or the Comerica Term Loan, bears interest at a rate of prime plus 1.0% per annum, and is payable in 36 equal monthly payments of principal and interest. As of June 30, 2011 the amount outstanding under the Comerica Term Loan was $5.0 million with an interest rate of 4.25%. There are a number of affirmative and negative covenants under the Comerica Credit Facility, with the primary covenant being that we are required to maintain a minimum cash balance of $1.0 million and we must maintain liquidity to debt ratio of at least 1.50 to 1.00. If we fail to comply with our covenants, Comerica can declare any outstanding amounts immediately due and payable and stop extending credit to us. These covenants are effective July 1, 2011. The Comerica Credit Facility also requires Mr. Roy’s remaining related party debt to be converted to equity by the end of December 2011.
The following table summarizes debt maturities during each of the next five fiscal years and thereafter on an aggregate basis at June 30, 2011 (in thousands):
Bank Borrowings
2012 ...................................................................................................................................................... $ 1,6672013 ...................................................................................................................................................... 1,6672014 ...................................................................................................................................................... 1,6662015 ...................................................................................................................................................... — 2016 ...................................................................................................................................................... — Thereafter ............................................................................................................................................. —
Total Bank Borrowings ............................................................................................................... $ 5,000
5. INCOME TAXES Income / (loss) before income taxes consisted of the following (in thousands):
Year Ended June 30,
2011 2010
2009
United States ....................................................................................................... $ 2,822 $ (1,323) $ 130 Foreign ................................................................................................................ 5,885 1,355 1,921
Total ........................................................................................................... $ 8,707 $ 32 $ 2,051
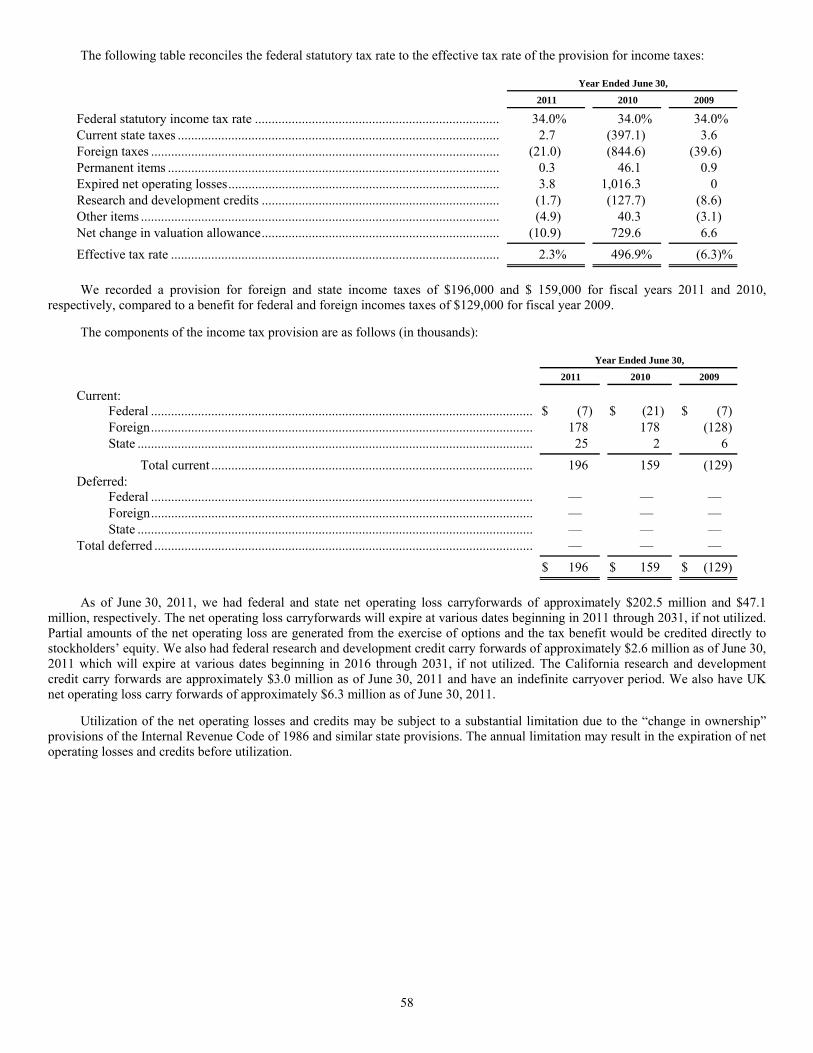
58
The following table reconciles the federal statutory tax rate to the effective tax rate of the provision for income taxes:
Year Ended June 30,
2011 2010
2009
Federal statutory income tax rate ......................................................................... 34.0% 34.0% 34.0%Current state taxes ................................................................................................ 2.7 (397.1) 3.6 Foreign taxes ........................................................................................................ (21.0) (844.6) (39.6)Permanent items ................................................................................................... 0.3 46.1 0.9 Expired net operating losses ................................................................................. 3.8 1,016.3 0 Research and development credits ....................................................................... (1.7) (127.7) (8.6)Other items ........................................................................................................... (4.9) 40.3 (3.1)Net change in valuation allowance ....................................................................... (10.9) 729.6 6.6
Effective tax rate .................................................................................................. 2.3% 496.9% (6.3)%
We recorded a provision for foreign and state income taxes of $196,000 and $ 159,000 for fiscal years 2011 and 2010, respectively, compared to a benefit for federal and foreign incomes taxes of $129,000 for fiscal year 2009.
The components of the income tax provision are as follows (in thousands):
Year Ended June 30,
2011
2010
2009
Current:
Federal .................................................................................................................. $ (7) $ (21) $ (7)Foreign .................................................................................................................. 178 178 (128)State ...................................................................................................................... 25 2 6
Total current ................................................................................................ 196 159 (129)Deferred:
Federal .................................................................................................................. — — — Foreign .................................................................................................................. — — — State ...................................................................................................................... — — —
Total deferred ................................................................................................................. — — —
$ 196 $ 159 $ (129)
As of June 30, 2011, we had federal and state net operating loss carryforwards of approximately $202.5 million and $47.1 million, respectively. The net operating loss carryforwards will expire at various dates beginning in 2011 through 2031, if not utilized. Partial amounts of the net operating loss are generated from the exercise of options and the tax benefit would be credited directly to stockholders’ equity. We also had federal research and development credit carry forwards of approximately $2.6 million as of June 30, 2011 which will expire at various dates beginning in 2016 through 2031, if not utilized. The California research and development credit carry forwards are approximately $3.0 million as of June 30, 2011 and have an indefinite carryover period. We also have UK net operating loss carry forwards of approximately $6.3 million as of June 30, 2011.
Utilization of the net operating losses and credits may be subject to a substantial limitation due to the “change in ownership” provisions of the Internal Revenue Code of 1986 and similar state provisions. The annual limitation may result in the expiration of net operating losses and credits before utilization.
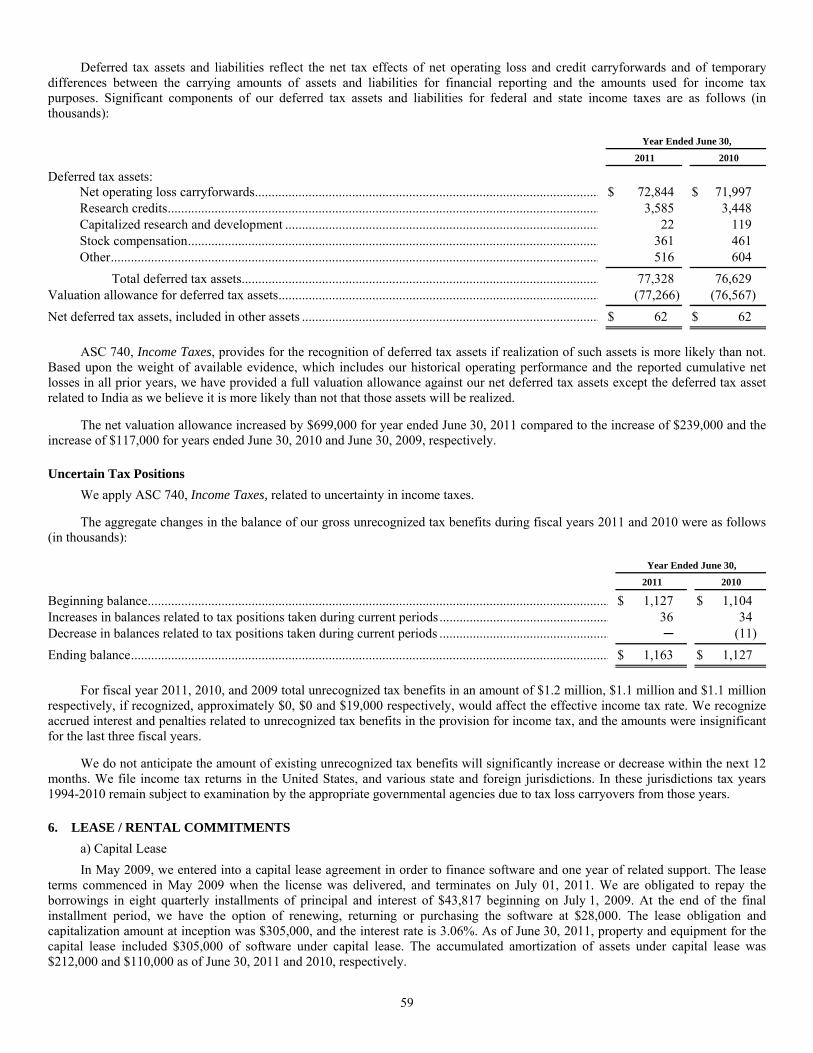
59
Deferred tax assets and liabilities reflect the net tax effects of net operating loss and credit carryforwards and of temporary differences between the carrying amounts of assets and liabilities for financial reporting and the amounts used for income tax purposes. Significant components of our deferred tax assets and liabilities for federal and state income taxes are as follows (in thousands):
Year Ended June 30,
2011
2010
Deferred tax assets:
Net operating loss carryforwards ....................................................................................................... $ 72,844 $ 71,997 Research credits ................................................................................................................................. 3,585 3,448 Capitalized research and development .............................................................................................. 22 119 Stock compensation ........................................................................................................................... 361 461 Other .................................................................................................................................................. 516 604
Total deferred tax assets........................................................................................................... 77,328 76,629 Valuation allowance for deferred tax assets ................................................................................................ (77,266) (76,567)
Net deferred tax assets, included in other assets ......................................................................................... $ 62 $ 62
ASC 740, Income Taxes, provides for the recognition of deferred tax assets if realization of such assets is more likely than not. Based upon the weight of available evidence, which includes our historical operating performance and the reported cumulative net losses in all prior years, we have provided a full valuation allowance against our net deferred tax assets except the deferred tax asset related to India as we believe it is more likely than not that those assets will be realized.
The net valuation allowance increased by $699,000 for year ended June 30, 2011 compared to the increase of $239,000 and the increase of $117,000 for years ended June 30, 2010 and June 30, 2009, respectively.
Uncertain Tax Positions We apply ASC 740, Income Taxes, related to uncertainty in income taxes.
The aggregate changes in the balance of our gross unrecognized tax benefits during fiscal years 2011 and 2010 were as follows (in thousands):
Year Ended June 30,
2011
2010
Beginning balance .......................................................................................................................................... $ 1,127 $ 1,104 Increases in balances related to tax positions taken during current periods ................................................... 36 34 Decrease in balances related to tax positions taken during current periods ................................................... ─ (11)
Ending balance ............................................................................................................................................... $ 1,163 $ 1,127
For fiscal year 2011, 2010, and 2009 total unrecognized tax benefits in an amount of $1.2 million, $1.1 million and $1.1 million respectively, if recognized, approximately $0, $0 and $19,000 respectively, would affect the effective income tax rate. We recognize accrued interest and penalties related to unrecognized tax benefits in the provision for income tax, and the amounts were insignificant for the last three fiscal years.
We do not anticipate the amount of existing unrecognized tax benefits will significantly increase or decrease within the next 12 months. We file income tax returns in the United States, and various state and foreign jurisdictions. In these jurisdictions tax years 1994-2010 remain subject to examination by the appropriate governmental agencies due to tax loss carryovers from those years.
6. LEASE / RENTAL COMMITMENTS a) Capital Lease In May 2009, we entered into a capital lease agreement in order to finance software and one year of related support. The lease
terms commenced in May 2009 when the license was delivered, and terminates on July 01, 2011. We are obligated to repay the borrowings in eight quarterly installments of principal and interest of $43,817 beginning on July 1, 2009. At the end of the final installment period, we have the option of renewing, returning or purchasing the software at $28,000. The lease obligation and capitalization amount at inception was $305,000, and the interest rate is 3.06%. As of June 30, 2011, property and equipment for the capital lease included $305,000 of software under capital lease. The accumulated amortization of assets under capital lease was $212,000 and $110,000 as of June 30, 2011 and 2010, respectively.
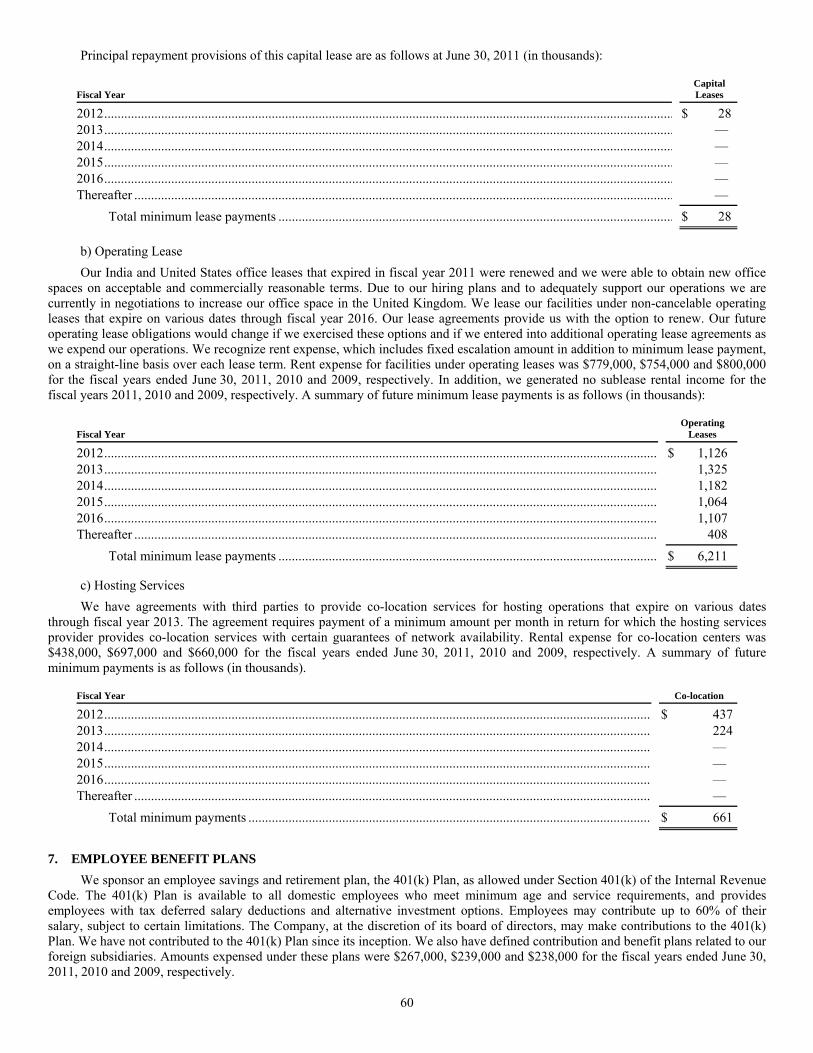
60
Principal repayment provisions of this capital lease are as follows at June 30, 2011 (in thousands):
Fiscal Year CapitalLeases
2012 .......................................................................................................................................................................... $ 28 2013 .......................................................................................................................................................................... — 2014 .......................................................................................................................................................................... — 2015 .......................................................................................................................................................................... — 2016 .......................................................................................................................................................................... — Thereafter ................................................................................................................................................................. —
Total minimum lease payments ...................................................................................................................... $ 28
b) Operating Lease Our India and United States office leases that expired in fiscal year 2011 were renewed and we were able to obtain new office
spaces on acceptable and commercially reasonable terms. Due to our hiring plans and to adequately support our operations we are currently in negotiations to increase our office space in the United Kingdom. We lease our facilities under non-cancelable operating leases that expire on various dates through fiscal year 2016. Our lease agreements provide us with the option to renew. Our future operating lease obligations would change if we exercised these options and if we entered into additional operating lease agreements as we expend our operations. We recognize rent expense, which includes fixed escalation amount in addition to minimum lease payment, on a straight-line basis over each lease term. Rent expense for facilities under operating leases was $779,000, $754,000 and $800,000 for the fiscal years ended June 30, 2011, 2010 and 2009, respectively. In addition, we generated no sublease rental income for the fiscal years 2011, 2010 and 2009, respectively. A summary of future minimum lease payments is as follows (in thousands):
Fiscal Year Operating
Leases 2012 ...................................................................................................................................................................... $ 1,1262013 ...................................................................................................................................................................... 1,3252014 ...................................................................................................................................................................... 1,182 2015 ...................................................................................................................................................................... 1,064 2016 ...................................................................................................................................................................... 1,107 Thereafter ............................................................................................................................................................. 408
Total minimum lease payments .................................................................................................................. $ 6,211
c) Hosting Services We have agreements with third parties to provide co-location services for hosting operations that expire on various dates
through fiscal year 2013. The agreement requires payment of a minimum amount per month in return for which the hosting services provider provides co-location services with certain guarantees of network availability. Rental expense for co-location centers was $438,000, $697,000 and $660,000 for the fiscal years ended June 30, 2011, 2010 and 2009, respectively. A summary of future minimum payments is as follows (in thousands).
Fiscal Year Co-location
2012 .................................................................................................................................................................... $ 437 2013 .................................................................................................................................................................... 224 2014 .................................................................................................................................................................... — 2015 .................................................................................................................................................................... — 2016 .................................................................................................................................................................... — Thereafter ........................................................................................................................................................... —
Total minimum payments ......................................................................................................................... $ 661
7. EMPLOYEE BENEFIT PLANS We sponsor an employee savings and retirement plan, the 401(k) Plan, as allowed under Section 401(k) of the Internal Revenue
Code. The 401(k) Plan is available to all domestic employees who meet minimum age and service requirements, and provides employees with tax deferred salary deductions and alternative investment options. Employees may contribute up to 60% of their salary, subject to certain limitations. The Company, at the discretion of its board of directors, may make contributions to the 401(k) Plan. We have not contributed to the 401(k) Plan since its inception. We also have defined contribution and benefit plans related to our foreign subsidiaries. Amounts expensed under these plans were $267,000, $239,000 and $238,000 for the fiscal years ended June 30, 2011, 2010 and 2009, respectively.
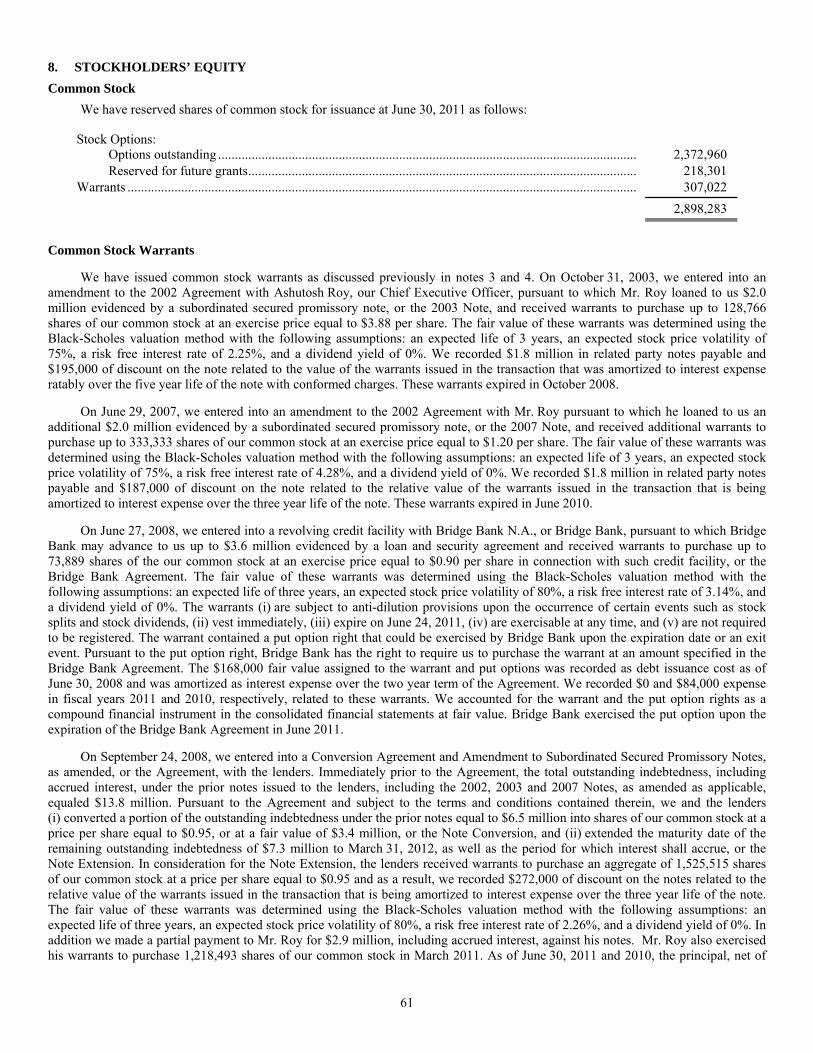
61
8. STOCKHOLDERS’ EQUITY Common Stock
We have reserved shares of common stock for issuance at June 30, 2011 as follows:
Stock Options:
Options outstanding ............................................................................................................................. 2,372,960 Reserved for future grants .................................................................................................................... 218,301
Warrants ........................................................................................................................................................ 307,022
2,898,283
Common Stock Warrants
We have issued common stock warrants as discussed previously in notes 3 and 4. On October 31, 2003, we entered into an amendment to the 2002 Agreement with Ashutosh Roy, our Chief Executive Officer, pursuant to which Mr. Roy loaned to us $2.0 million evidenced by a subordinated secured promissory note, or the 2003 Note, and received warrants to purchase up to 128,766 shares of our common stock at an exercise price equal to $3.88 per share. The fair value of these warrants was determined using the Black-Scholes valuation method with the following assumptions: an expected life of 3 years, an expected stock price volatility of 75%, a risk free interest rate of 2.25%, and a dividend yield of 0%. We recorded $1.8 million in related party notes payable and $195,000 of discount on the note related to the value of the warrants issued in the transaction that was amortized to interest expense ratably over the five year life of the note with conformed charges. These warrants expired in October 2008.
On June 29, 2007, we entered into an amendment to the 2002 Agreement with Mr. Roy pursuant to which he loaned to us an additional $2.0 million evidenced by a subordinated secured promissory note, or the 2007 Note, and received additional warrants to purchase up to 333,333 shares of our common stock at an exercise price equal to $1.20 per share. The fair value of these warrants was determined using the Black-Scholes valuation method with the following assumptions: an expected life of 3 years, an expected stock price volatility of 75%, a risk free interest rate of 4.28%, and a dividend yield of 0%. We recorded $1.8 million in related party notes payable and $187,000 of discount on the note related to the relative value of the warrants issued in the transaction that is being amortized to interest expense over the three year life of the note. These warrants expired in June 2010.
On June 27, 2008, we entered into a revolving credit facility with Bridge Bank N.A., or Bridge Bank, pursuant to which Bridge Bank may advance to us up to $3.6 million evidenced by a loan and security agreement and received warrants to purchase up to 73,889 shares of the our common stock at an exercise price equal to $0.90 per share in connection with such credit facility, or the Bridge Bank Agreement. The fair value of these warrants was determined using the Black-Scholes valuation method with the following assumptions: an expected life of three years, an expected stock price volatility of 80%, a risk free interest rate of 3.14%, and a dividend yield of 0%. The warrants (i) are subject to anti-dilution provisions upon the occurrence of certain events such as stock splits and stock dividends, (ii) vest immediately, (iii) expire on June 24, 2011, (iv) are exercisable at any time, and (v) are not required to be registered. The warrant contained a put option right that could be exercised by Bridge Bank upon the expiration date or an exit event. Pursuant to the put option right, Bridge Bank has the right to require us to purchase the warrant at an amount specified in the Bridge Bank Agreement. The $168,000 fair value assigned to the warrant and put options was recorded as debt issuance cost as of June 30, 2008 and was amortized as interest expense over the two year term of the Agreement. We recorded $0 and $84,000 expense in fiscal years 2011 and 2010, respectively, related to these warrants. We accounted for the warrant and the put option rights as a compound financial instrument in the consolidated financial statements at fair value. Bridge Bank exercised the put option upon the expiration of the Bridge Bank Agreement in June 2011.
On September 24, 2008, we entered into a Conversion Agreement and Amendment to Subordinated Secured Promissory Notes, as amended, or the Agreement, with the lenders. Immediately prior to the Agreement, the total outstanding indebtedness, including accrued interest, under the prior notes issued to the lenders, including the 2002, 2003 and 2007 Notes, as amended as applicable, equaled $13.8 million. Pursuant to the Agreement and subject to the terms and conditions contained therein, we and the lenders (i) converted a portion of the outstanding indebtedness under the prior notes equal to $6.5 million into shares of our common stock at a price per share equal to $0.95, or at a fair value of $3.4 million, or the Note Conversion, and (ii) extended the maturity date of the remaining outstanding indebtedness of $7.3 million to March 31, 2012, as well as the period for which interest shall accrue, or the Note Extension. In consideration for the Note Extension, the lenders received warrants to purchase an aggregate of 1,525,515 shares of our common stock at a price per share equal to $0.95 and as a result, we recorded $272,000 of discount on the notes related to the relative value of the warrants issued in the transaction that is being amortized to interest expense over the three year life of the note. The fair value of these warrants was determined using the Black-Scholes valuation method with the following assumptions: an expected life of three years, an expected stock price volatility of 80%, a risk free interest rate of 2.26%, and a dividend yield of 0%. In addition we made a partial payment to Mr. Roy for $2.9 million, including accrued interest, against his notes. Mr. Roy also exercised his warrants to purchase 1,218,493 shares of our common stock in March 2011. As of June 30, 2011 and 2010, the principal, net of

62
discount and interest due on the loans was $5.0 million and $8.7 million, respectively, and warrants to purchase 307,022 and 1,525,515 shares of common stock, respectively, were vested and outstanding.
The warrants activity is summarized as follows:
Warrants Outstanding
Weighted Average
Exercise Price Warrants outstanding as of June 30, 2008 ......................................................................................... 535,988 $ 1.80
Expiration of warrants assumed in October 2003 .................................................................... (128,766) $ 3.88 Warrants issued per amendment to Note with related parties .................................................. 1,525,515 $ 0.95
Warrants outstanding as of June 30, 2009 ......................................................................................... 1,932,737 $ 0.99 Expiration of warrants assumed in June 2007 .......................................................................... (333,333) $ 1.20
Warrants outstanding as of June 30, 2010 ......................................................................................... 1,599,404 $ 0.95 Expiration of warrants assumed in June 2008 ........................................................................... (73,889) $ 0.90 Warrants exercised from amendment to Notes with related parties .......................................... (1,218,493) $ 0.95
Warrants outstanding as of June 30, 2011 ......................................................................................... 307,022 $ 0.95
2005 Management Stock Option Plan In May 2005, our board of directors adopted the 2005 Management Stock Option Plan, or the 2005 Management Plan, which
provides for the grant of nonstatutory stock options to directors, officers and key employees of eGain and its subsidiaries. The Plan was increased by 500,000 shares in November 2007. Options under the 2005 Management Plan are granted at a price not less than 100% of the fair market value of the common stock on the date of grant. Shares of restricted stock granted under the 2005 Management Plan are subject to eGain’s right of repurchase, whose right shall lapse with respect to one-forty-eighth (1/48th ) of the shares granted to a director or officer for each month of continuous service provided by such director or officer to eGain. The options granted under this plan are exercisable for up to ten years from the date of grant.
The following table represents the activity under the 2005 Management Plan:
Shares Available for Grant
Options Outstanding
Weighted Average
Price Balance at June 30, 2008 .................................................................................................. 325,850 1,132,800 $ 0.77
Options Granted ...................................................................................................... (25,000) 25,000 $ 0.50 Options Forfeited / Expired ..................................................................................... 23,400 (23,400) $ 0.55
Balance at June 30, 2009 .................................................................................................. 324,250 1,134,400 $ 0.77 Options Granted ...................................................................................................... (120,000) 120,000 $ 0.82 Options Forfeited / Expired ..................................................................................... 30,000 (30,000) $ 0.64
Balance at June 30, 2010 .................................................................................................. 234,250 1,224,400 $ 0.78 Options Granted ....................................................................................................... (115,000) 115,000 $ 1.97 Options Exercised .................................................................................................... — (755,000) —
Balance at June 30, 2011 .................................................................................................. 119,250 584,400 $ 0.93
2005 Stock Incentive Plan
In March 2005, our board of directors adopted the 2005 Stock Incentive Plan, the 2005 Incentive Plan, which provides for the grant of stock options to eGain’s employees, officers, directors and consultants. Options granted under the 2005 Incentive Plan are either incentive stock options or non-statutory stock options. Incentive stock options may be granted to employees with exercise prices of no less than the fair value of the common stock on the date of grant. The options generally vest ratably over a period of four years and expire no later than ten (10) years from the date of grant. We received stockholder approval of the 2005 Incentive Plan at its 2005 Annual Meeting of Stockholders. Our board of directors approved an increase in the 2005 Incentive Plan by 1.0 million shares of common stock in February 2009. We received stockholder approval for the increase at our 2009 Annual Meeting of Stockholders.
The following table represents the activity under the 2005 Stock Incentive Plan:
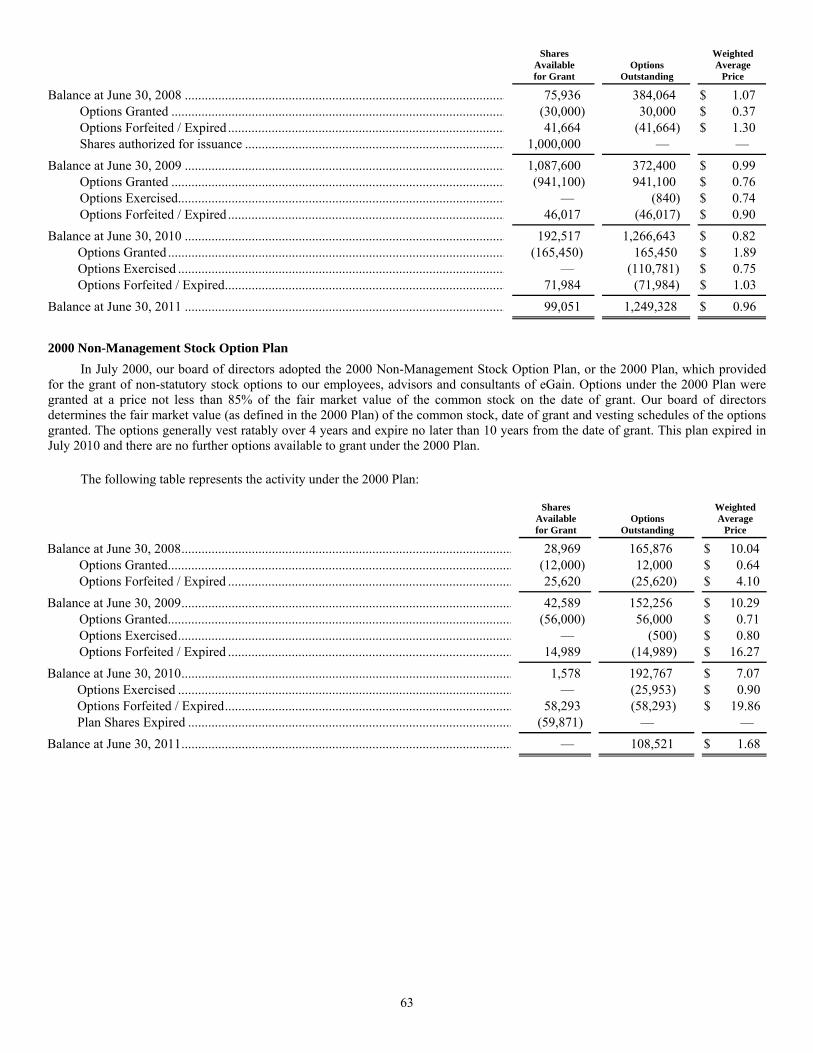
63
Shares Available for Grant
Options Outstanding
Weighted Average
Price Balance at June 30, 2008 ................................................................................................ 75,936 384,064 $ 1.07
Options Granted .................................................................................................... (30,000) 30,000 $ 0.37 Options Forfeited / Expired ................................................................................... 41,664 (41,664) $ 1.30 Shares authorized for issuance .............................................................................. 1,000,000 — —
Balance at June 30, 2009 ................................................................................................ 1,087,600 372,400 $ 0.99 Options Granted .................................................................................................... (941,100) 941,100 $ 0.76 Options Exercised.................................................................................................. — (840) $ 0.74 Options Forfeited / Expired ................................................................................... 46,017 (46,017) $ 0.90
Balance at June 30, 2010 ................................................................................................ 192,517 1,266,643 $ 0.82 Options Granted ..................................................................................................... (165,450) 165,450 $ 1.89 Options Exercised .................................................................................................. — (110,781) $ 0.75 Options Forfeited / Expired .................................................................................... 71,984 (71,984) $ 1.03
Balance at June 30, 2011 ................................................................................................ 99,051 1,249,328 $ 0.96
2000 Non-Management Stock Option Plan In July 2000, our board of directors adopted the 2000 Non-Management Stock Option Plan, or the 2000 Plan, which provided
for the grant of non-statutory stock options to our employees, advisors and consultants of eGain. Options under the 2000 Plan were granted at a price not less than 85% of the fair market value of the common stock on the date of grant. Our board of directors determines the fair market value (as defined in the 2000 Plan) of the common stock, date of grant and vesting schedules of the options granted. The options generally vest ratably over 4 years and expire no later than 10 years from the date of grant. This plan expired in July 2010 and there are no further options available to grant under the 2000 Plan.
The following table represents the activity under the 2000 Plan:
Shares Available for Grant
Options Outstanding
Weighted Average
Price Balance at June 30, 2008 ................................................................................................... 28,969 165,876 $ 10.04
Options Granted ....................................................................................................... (12,000) 12,000 $ 0.64 Options Forfeited / Expired ..................................................................................... 25,620 (25,620) $ 4.10
Balance at June 30, 2009 ................................................................................................... 42,589 152,256 $ 10.29 Options Granted ....................................................................................................... (56,000) 56,000 $ 0.71 Options Exercised .................................................................................................... — (500) $ 0.80 Options Forfeited / Expired ..................................................................................... 14,989 (14,989) $ 16.27
Balance at June 30, 2010 ................................................................................................... 1,578 192,767 $ 7.07 Options Exercised .................................................................................................... — (25,953) $ 0.90 Options Forfeited / Expired ...................................................................................... 58,293 (58,293) $ 19.86 Plan Shares Expired ................................................................................................. (59,871) — —
Balance at June 30, 2011 ................................................................................................... — 108,521 $ 1.68
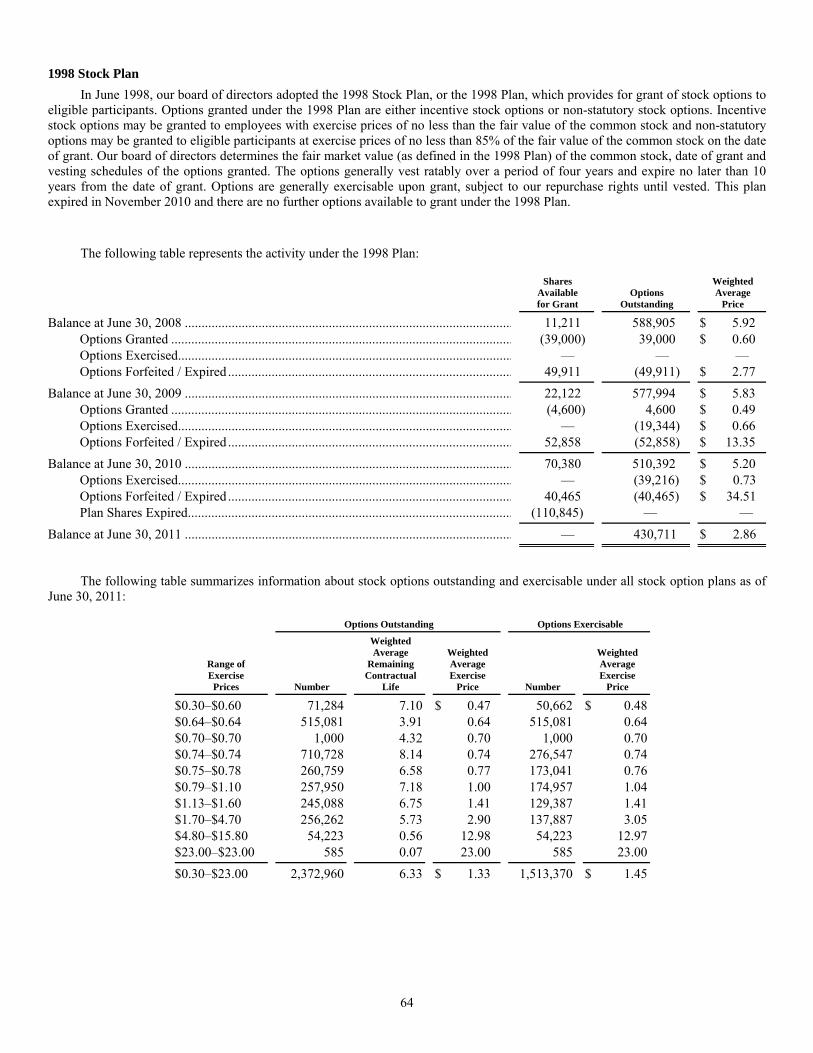
64
1998 Stock Plan In June 1998, our board of directors adopted the 1998 Stock Plan, or the 1998 Plan, which provides for grant of stock options to
eligible participants. Options granted under the 1998 Plan are either incentive stock options or non-statutory stock options. Incentive stock options may be granted to employees with exercise prices of no less than the fair value of the common stock and non-statutory options may be granted to eligible participants at exercise prices of no less than 85% of the fair value of the common stock on the date of grant. Our board of directors determines the fair market value (as defined in the 1998 Plan) of the common stock, date of grant and vesting schedules of the options granted. The options generally vest ratably over a period of four years and expire no later than 10 years from the date of grant. Options are generally exercisable upon grant, subject to our repurchase rights until vested. This plan expired in November 2010 and there are no further options available to grant under the 1998 Plan.
The following table represents the activity under the 1998 Plan:
Shares Available for Grant
Options Outstanding
Weighted Average
Price Balance at June 30, 2008 .................................................................................................. 11,211 588,905 $ 5.92
Options Granted ...................................................................................................... (39,000) 39,000 $ 0.60 Options Exercised.................................................................................................... — — — Options Forfeited / Expired ..................................................................................... 49,911 (49,911) $ 2.77
Balance at June 30, 2009 .................................................................................................. 22,122 577,994 $ 5.83 Options Granted ...................................................................................................... (4,600) 4,600 $ 0.49 Options Exercised.................................................................................................... — (19,344) $ 0.66 Options Forfeited / Expired ..................................................................................... 52,858 (52,858) $ 13.35
Balance at June 30, 2010 .................................................................................................. 70,380 510,392 $ 5.20
Options Exercised.................................................................................................... — (39,216) $ 0.73 Options Forfeited / Expired ..................................................................................... 40,465 (40,465) $ 34.51 Plan Shares Expired ................................................................................................. (110,845) — —
Balance at June 30, 2011 .................................................................................................. — 430,711 $ 2.86
The following table summarizes information about stock options outstanding and exercisable under all stock option plans as of June 30, 2011:
Options Outstanding Options Exercisable
Range of Exercise
Prices
Number
Weighted Average
Remaining Contractual
Life
Weighted Average Exercise
Price Number
Weighted Average Exercise
Price
$0.30–$0.60 71,284 7.10 $ 0.47 50,662 $ 0.48
$0.64–$0.64 515,081 3.91 0.64 515,081 0.64
$0.70–$0.70 1,000 4.32 0.70 1,000 0.70
$0.74–$0.74 710,728 8.14 0.74 276,547 0.74
$0.75–$0.78 260,759 6.58 0.77 173,041 0.76
$0.79–$1.10 257,950 7.18 1.00 174,957 1.04
$1.13–$1.60 245,088 6.75 1.41 129,387 1.41
$1.70–$4.70 256,262 5.73 2.90 137,887 3.05
$4.80–$15.80 54,223 0.56 12.98 54,223 12.97
$23.00–$23.00 585 0.07 23.00 585 23.00
$0.30–$23.00 2,372,960 6.33 $ 1.33 1,513,370 $ 1.45
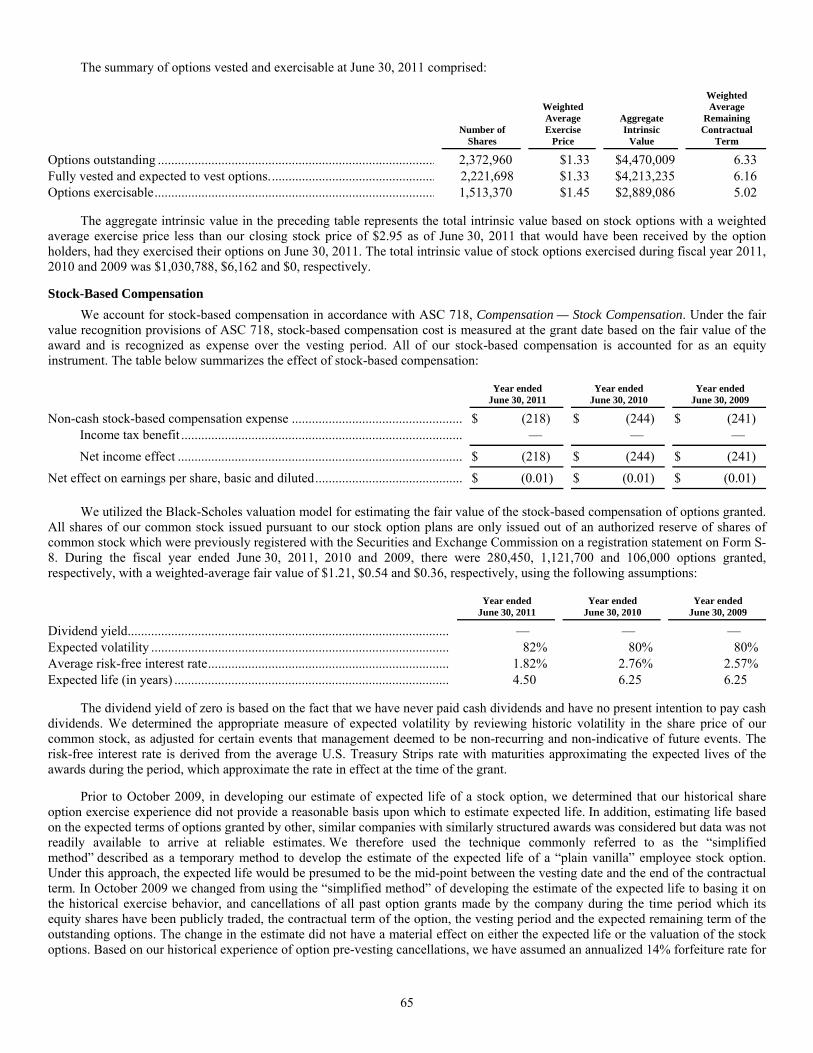
65
The summary of options vested and exercisable at June 30, 2011 comprised:
Number of Shares
Weighted Average Exercise
Price
Aggregate Intrinsic
Value
Weighted Average
Remaining Contractual
Term Options outstanding ................................................................................... 2,372,960 $1.33 $4,470,009 6.33 Fully vested and expected to vest options. ................................................. 2,221,698 $1.33 $4,213,235 6.16 Options exercisable .................................................................................... 1,513,370 $1.45 $2,889,086 5.02
The aggregate intrinsic value in the preceding table represents the total intrinsic value based on stock options with a weighted average exercise price less than our closing stock price of $2.95 as of June 30, 2011 that would have been received by the option holders, had they exercised their options on June 30, 2011. The total intrinsic value of stock options exercised during fiscal year 2011, 2010 and 2009 was $1,030,788, $6,162 and $0, respectively. Stock-Based Compensation
We account for stock-based compensation in accordance with ASC 718, Compensation — Stock Compensation. Under the fair value recognition provisions of ASC 718, stock-based compensation cost is measured at the grant date based on the fair value of the award and is recognized as expense over the vesting period. All of our stock-based compensation is accounted for as an equity instrument. The table below summarizes the effect of stock-based compensation:
Year ended June 30, 2011
Year ended June 30, 2010
Year ended June 30, 2009
Non-cash stock-based compensation expense ................................................... $ (218) $ (244) $ (241)Income tax benefit .................................................................................... — — —
Net income effect ..................................................................................... $ (218) $ (244) $ (241)
Net effect on earnings per share, basic and diluted ............................................ $ (0.01) $ (0.01) $ (0.01)
We utilized the Black-Scholes valuation model for estimating the fair value of the stock-based compensation of options granted. All shares of our common stock issued pursuant to our stock option plans are only issued out of an authorized reserve of shares of common stock which were previously registered with the Securities and Exchange Commission on a registration statement on Form S-8. During the fiscal year ended June 30, 2011, 2010 and 2009, there were 280,450, 1,121,700 and 106,000 options granted, respectively, with a weighted-average fair value of $1.21, $0.54 and $0.36, respectively, using the following assumptions:
Year ended June 30, 2011
Year ended June 30, 2010
Year ended June 30, 2009
Dividend yield ................................................................................................ — — — Expected volatility ......................................................................................... 82% 80% 80%Average risk-free interest rate ........................................................................ 1.82% 2.76% 2.57%Expected life (in years) .................................................................................. 4.50 6.25 6.25
The dividend yield of zero is based on the fact that we have never paid cash dividends and have no present intention to pay cash dividends. We determined the appropriate measure of expected volatility by reviewing historic volatility in the share price of our common stock, as adjusted for certain events that management deemed to be non-recurring and non-indicative of future events. The risk-free interest rate is derived from the average U.S. Treasury Strips rate with maturities approximating the expected lives of the awards during the period, which approximate the rate in effect at the time of the grant.
Prior to October 2009, in developing our estimate of expected life of a stock option, we determined that our historical share option exercise experience did not provide a reasonable basis upon which to estimate expected life. In addition, estimating life based on the expected terms of options granted by other, similar companies with similarly structured awards was considered but data was not readily available to arrive at reliable estimates. We therefore used the technique commonly referred to as the “simplified method” described as a temporary method to develop the estimate of the expected life of a “plain vanilla” employee stock option. Under this approach, the expected life would be presumed to be the mid-point between the vesting date and the end of the contractual term. In October 2009 we changed from using the “simplified method” of developing the estimate of the expected life to basing it on the historical exercise behavior, and cancellations of all past option grants made by the company during the time period which its equity shares have been publicly traded, the contractual term of the option, the vesting period and the expected remaining term of the outstanding options. The change in the estimate did not have a material effect on either the expected life or the valuation of the stock options. Based on our historical experience of option pre-vesting cancellations, we have assumed an annualized 14% forfeiture rate for

66
our options. We will record additional expense if the actual forfeiture rate is lower than we estimated, and record a recovery of prior expense if the actual forfeiture is higher than what we estimated.
Total compensation cost, net of forfeitures of all options granted but not yet vested as of June 30, 2011 was $290,033 which is expected to be recognized over the weighted average period of 1.34 years.
9. COMMITMENTS We generally warrant that the program portion of our software will perform substantially in accordance with certain
specifications for a period up to one year from the date of delivery. Our liability for a breach of this warranty is either a return of the license fee or providing a fix, patch, work-around or replacement of the software. During the fiscal year 2010, we changed the warranty period from a 90 day period to a period of up to one year from the date of delivery in response to industry trends. The effect of this change in estimate was insignificant.
We also provide standard warranties against and indemnification for the potential infringement of third party intellectual property rights to our customers relating to the use of our products, as well as indemnification agreements with certain officers and employees under which we may be required to indemnify such persons for liabilities arising out of their duties to us. The terms of such obligations vary. Generally, the maximum obligation is the amount permitted by law.
Historically, costs related to these warranties have not been significant. However we cannot guarantee that a warranty reserve will not become necessary in the future.
We have also agreed to indemnify our directors and executive officers for costs associated with any fees, expenses, judgments, fines and settlement amounts incurred by any of these persons in any action or proceeding to which any of those persons is, or is threatened to be, made a party by reason of the person’s service as a director or officer, including any action by us, arising out of that person’s services as our director or officer or that person’s services provided to any other company or enterprise at our request.
10. LITIGATION Beginning on October 25, 2001, a number of securities class action complaints were filed against us, and certain of our then officers and directors and underwriters connected with our initial public offering of common stock. The class actions were filed in the U.S. District Court for the Southern District of New York. The complaints alleged generally that the prospectus under which such securities were sold contained false and misleading statements with respect to discounts and excess commissions received by the underwriters as well as allegations of “laddering” whereby underwriters required their customers to purchase additional shares in the aftermarket in exchange for an allocation of IPO shares. The complaints sought an unspecified amount in damages on behalf of persons who purchased the common stock between September 23, 1999 and December 6, 2000. Similar complaints were filed against 55 underwriters and more than 300 other companies and other individuals. The over 1,000 actions were consolidated into a single action called In re Initial Public Offering Sec. Litig. In 2003, we and the other issuer defendants (but not the underwriter defendants) reached an agreement with the plaintiffs to resolve the cases as to our liability and that of our officers and directors. The settlement involved no monetary payment or other consideration by us or our officers and directors and no admission of liability. On August 31, 2005, the Court issued an order preliminarily approving the settlement. On April 24, 2006, the Court held a public hearing on the fairness of the proposed settlement. Meanwhile the consolidated case against the underwriters proceeded. In October 2004, the Court certified a class. On December 5, 2006, however, the United States Court of Appeals for the Second Circuit reversed, holding that the class certified by the District Court could not be certified. In re Initial Public Offering Sec. Litig., 471 F.3d 24 (2d Cir. 2006), modified F 3d 70 (2d Cir. 2007). The Second Circuit’s holding, while directly affecting only the underwriters, raised doubt as to whether the settlement class contemplated by the proposed issuer settlement could be approved. On June 25, 2007, the district court entered a stipulated order terminating the proposed issuer settlement. Thereafter pretrial proceedings resumed. In March 2009, all parties agreed on a new global settlement of the litigation; this settlement included underwriters as well as issuers. Under the settlement, the insurers would pay the full amount of settlement share allocated to us, and we would bear no financial liability. We, as well as the officer and director defendants, who were previously dismissed from the action pursuant to a stipulation, would receive complete dismissals from the case. On June 10, 2009, the Court entered an order granting preliminary approval of the settlement. On October 5, 2009, the Court issued an order finally approving the settlement. Starting on or about October 23, 2009, some would-be objectors to the certification of a settlement class (which occurred as part of the October 5, 2009 order) petitioned the Court for permission to appeal from the order certifying the settlement class, and on October 29 and November 2, 2009, several groups of objectors filed notices of appeal seeking to challenge the Court’s approval of the settlement. On November 24, 2009, the Court signed, and on, December 4, 2009, the Court entered final judgment pursuant to the settlement dismissing all claims involving us. The appeals remain pending and briefing on the appeals is set to begin in October 2010 and end in the spring of 2011. On October 7, 2010, lead plaintiffs and all but two of the objectors filed a stipulation pursuant to which these objectors withdrawing their appeals with prejudice. The remaining two objectors, however, are continuing to pursue their appeals and have filed their opening briefs. On December 8, 2010, plaintiffs moved to discuss the appeals. On March 2, 2011, one of the two appellants, appearing pro se, filed a stipulated dismissal of his appeal with prejudice. On May 17, 2011, the Court of Appeals dismissed the appeals of two of the three remaining appellants, and directed the district court to determine whether the third and final appellant had standing. On August 25, 2011, the district court determined that the final appellant lacked standing. Unless that determination is successfully appealed, the litigation will be at an end. If the settlement and
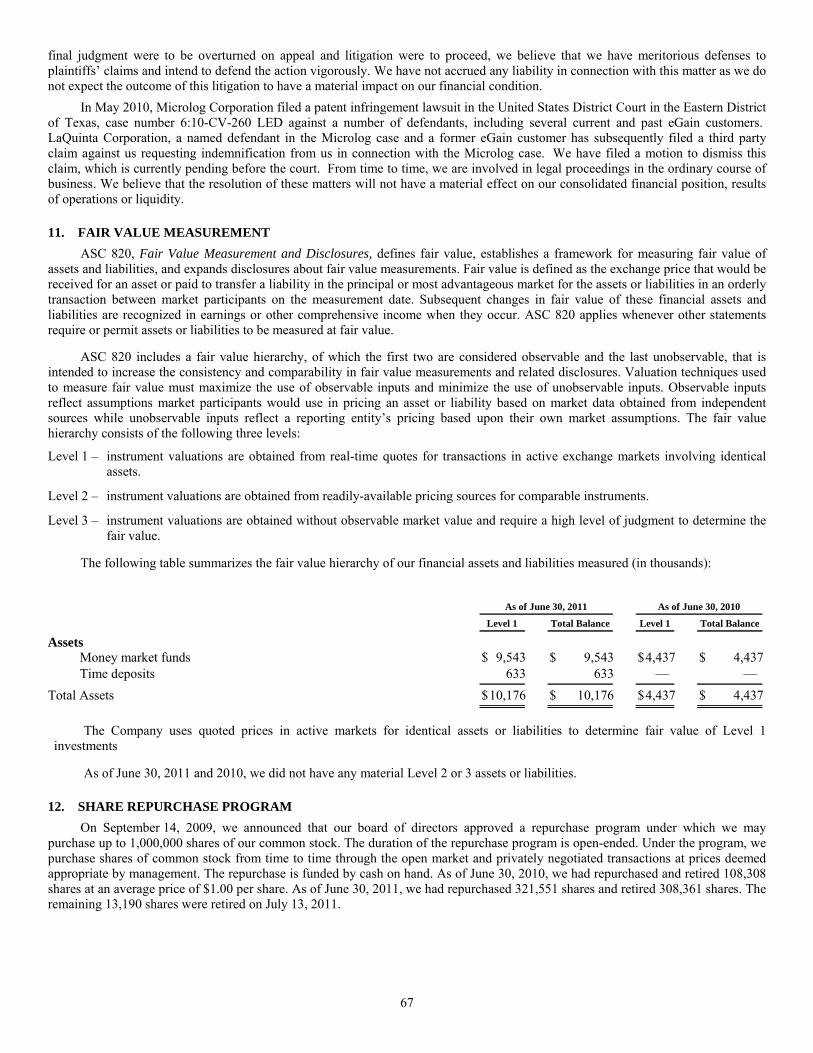
67
final judgment were to be overturned on appeal and litigation were to proceed, we believe that we have meritorious defenses to plaintiffs’ claims and intend to defend the action vigorously. We have not accrued any liability in connection with this matter as we do not expect the outcome of this litigation to have a material impact on our financial condition.
In May 2010, Microlog Corporation filed a patent infringement lawsuit in the United States District Court in the Eastern District of Texas, case number 6:10-CV-260 LED against a number of defendants, including several current and past eGain customers. LaQuinta Corporation, a named defendant in the Microlog case and a former eGain customer has subsequently filed a third party claim against us requesting indemnification from us in connection with the Microlog case. We have filed a motion to dismiss this claim, which is currently pending before the court. From time to time, we are involved in legal proceedings in the ordinary course of business. We believe that the resolution of these matters will not have a material effect on our consolidated financial position, results of operations or liquidity.
11. FAIR VALUE MEASUREMENT ASC 820, Fair Value Measurement and Disclosures, defines fair value, establishes a framework for measuring fair value of
assets and liabilities, and expands disclosures about fair value measurements. Fair value is defined as the exchange price that would be received for an asset or paid to transfer a liability in the principal or most advantageous market for the assets or liabilities in an orderly transaction between market participants on the measurement date. Subsequent changes in fair value of these financial assets and liabilities are recognized in earnings or other comprehensive income when they occur. ASC 820 applies whenever other statements require or permit assets or liabilities to be measured at fair value.
ASC 820 includes a fair value hierarchy, of which the first two are considered observable and the last unobservable, that is intended to increase the consistency and comparability in fair value measurements and related disclosures. Valuation techniques used to measure fair value must maximize the use of observable inputs and minimize the use of unobservable inputs. Observable inputs reflect assumptions market participants would use in pricing an asset or liability based on market data obtained from independent sources while unobservable inputs reflect a reporting entity’s pricing based upon their own market assumptions. The fair value hierarchy consists of the following three levels:
Level 1 – instrument valuations are obtained from real-time quotes for transactions in active exchange markets involving identicalassets.
Level 2 – instrument valuations are obtained from readily-available pricing sources for comparable instruments.
Level 3 – instrument valuations are obtained without observable market value and require a high level of judgment to determine thefair value.
The following table summarizes the fair value hierarchy of our financial assets and liabilities measured (in thousands):
As of June 30, 2011 As of June 30, 2010
Level 1 Total Balance
Level 1 Total Balance
Assets
Money market funds $ 9,543 $ 9,543 $ 4,437 $ 4,437 Time deposits 633 633 — —
Total Assets $ 10,176 $ 10,176 $ 4,437 $ 4,437
The Company uses quoted prices in active markets for identical assets or liabilities to determine fair value of Level 1 investments
As of June 30, 2011 and 2010, we did not have any material Level 2 or 3 assets or liabilities.
12. SHARE REPURCHASE PROGRAM On September 14, 2009, we announced that our board of directors approved a repurchase program under which we may
purchase up to 1,000,000 shares of our common stock. The duration of the repurchase program is open-ended. Under the program, we purchase shares of common stock from time to time through the open market and privately negotiated transactions at prices deemed appropriate by management. The repurchase is funded by cash on hand. As of June 30, 2010, we had repurchased and retired 108,308 shares at an average price of $1.00 per share. As of June 30, 2011, we had repurchased 321,551 shares and retired 308,361 shares. The remaining 13,190 shares were retired on July 13, 2011.

68
13. SUBSEQUENT EVENTS
None.
69
ITEM 9. CHANGES IN AND DISAGREEMENTS WITH ACCOUNTANTS ON ACCOUNTING AND FINANCIAL DISCLOSURE
None.
ITEM 9A. CONTROLS AND PROCEDURES Evaluation of disclosure controls and procedures. We maintain “disclosure controls and procedures,” as such term is defined
in Rule 13a-15(e) under the Securities Exchange Act of 1934, the Exchange Act, that are designed to ensure that information required to be disclosed by us in reports that we file or submit under the Exchange Act is recorded, processed, summarized, and reported within the time periods specified in Securities and Exchange Commission rules and forms, and that such information is accumulated and communicated to our management, including our Chief Executive Officer and Chief Financial Officer, as appropriate, to allow timely decisions regarding required disclosure. In designing and evaluating our disclosure controls and procedures, management recognized that disclosure controls and procedures, no matter how well conceived and operated, can provide only reasonable, not absolute, assurance that the objectives of the disclosure controls and procedures are met. Our disclosure controls and procedures have been designed to meet reasonable assurance standards. Additionally, in designing disclosure controls and procedures, our management necessarily was required to apply its judgment in evaluating the cost-benefit relationship of possible disclosure controls and procedures. The design of any disclosure controls and procedures also is based in part upon certain assumptions about the likelihood of future events, and there can be no assurance that any design will succeed in achieving its stated goals under all potential future conditions.
Based on their evaluation as of the end of the period covered by this Annual Report on Form 10-K, our Chief Executive Officer and Chief Financial Officer have concluded that, as of June 30, 2011, our disclosure controls and procedures were effective at the reasonable assurance level.
Changes in internal controls. There was no change in our internal control over financial reporting (as defined in Rule 13a-15(f) under the Exchange Act) that occurred during our last fiscal quarter that has materially affected, or is reasonably likely to materially affect, our internal control over financial reporting.
Management’s annual report on internal control over financial reporting. Our management is responsible for establishing and maintaining adequate internal control over financial reporting, as such term is defined in Exchange Act Rules 13a-15(f). Because of its inherent limitations, internal control over financial reporting may not prevent or detect misstatements. Projections of any evaluation of the effectiveness to future periods are subject to the risk that controls may become inadequate because of changes in conditions, or that the degree of compliance with the policies or procedures may deteriorate. Our management, with the participation of our Chief Executive Officer and Chief Financial Officer, conducted an evaluation of the effectiveness of our internal control over financial reporting based on the framework in Internal Control—Integrated Framework issued by the Committee of Sponsoring Organizations of the Treadway Commission. Based on our evaluation under the framework in Internal Control—Integrated Framework, our management concluded that our internal control over financial reporting was effective as of June 30, 2011.
This annual report does not include an attestation report of the Company’s registered public accounting firm regarding internal control over financial reporting. Management’s report was not subject to attestation by the Company’s registered public accounting firm pursuant to permanent exemption rules of the Securities and Exchange Commission that permit the Company to provide only management’s report in this annual report as the company meets the definition of a smaller reporting company defined in Rule 12b-2 of the Security and Exchange Act of 1934.
ITEM 9B. OTHER INFORMATION None.
70
PART III
ITEM 10. DIRECTORS, EXECUTIVE OFFICERS AND CORPORATE GOVERNANCE The information required by this item (with respect to our Directors) is incorporated by reference from the information under the
caption “Election of Directors” contained in eGain’s Proxy Statement to be filed with the Securities and Exchange Commission in connection with the solicitation of proxies for the Company’s 2011 Annual Meeting of Stockholders, the Proxy Statement.
The following table sets forth information regarding eGain’s current executive officers as of September 23, 2011:
Name
Age
Position Ashutosh Roy ....................... 45 Chief Executive Officer and ChairmanEric Smit .............................. 49 Chief Financial OfficerPromod Narang .................... 53 Senior Vice President of Products and EngineeringThomas Hresko .................... 61 Senior Vice President of Worldwide SalesCharles Jepson ..................... 65 Senior Vice President of Business Development
Ashutosh Roy co-founded eGain and has served as Chief Executive Officer and a director of eGain since September 1997 and President since October 2003. From May 1995 through April 1997, Mr. Roy served as Chairman of WhoWhere? Inc., an Internet-service company co-founded by Mr. Roy. From June 1994 to April 1995, Mr. Roy co-founded Parsec Technologies, a call center company based in New Delhi, India. From August 1988, to August 1992, Mr. Roy worked as a Software Engineer at Digital Equipment Corp. Mr. Roy holds a B.S. in Computer Science from the Indian Institute of Technology, New Delhi, a Masters degree in Computer Science from Johns Hopkins University and an M.B.A. from Stanford University.
Eric Smit has served as Chief Financial Officer since August 2002. From April 2001 to July 2002, Mr. Smit served as Vice President, Operations of eGain. From June 1999 to April 2001, Mr. Smit served as Vice President, Finance and Administration of eGain. From June 1998 to June 1999, Mr. Smit served as Director of Finance of eGain. From December 1996 to May 1998, Mr. Smit served as Director of Finance for WhoWhere? Inc., an Internet services company. From April 1993 to November 1996, Mr. Smit served as Vice President of Operations and Chief Financial Officer of Velocity Incorporated, a software game developer and publishing company. Mr. Smit holds a Bachelor of Commerce in Accounting from Rhodes University, South Africa.
Promod Narang has served as Sr. Vice President of Engineering of eGain since March 2000. Mr. Narang joined eGain in October 1998, and served as Director of Engineering prior to assuming his current position. Prior to joining eGain, Mr. Narang served as President of VMpro, a system software consulting company from September 1987 to October 1998. Mr. Narang holds a Bachelors of Science in Computer Science from Wayne State University.
Thomas Hresko has served as Sr. Vice President of Worldwide Sales since November of 2005. From July 2004 to October 2005, Mr. Hresko served as Vice President, Worldwide Sales for Corrigo, an enterprise application software company. From April 2002 to October of 2003 Mr. Hresko served as Vice President of Worldwide Sales at Primus Knowledge Solutions, a software company specializing in knowledge management and self service. From January 1990 to January of 2002, he served in sales management positions at Network Associates, enterprise software, security and anti-virus software company. In his most recent position, he served as Vice President Worldwide Sales for the customer relationship management software division. Mr. Hresko holds an M.B.A. from Harvard University and B.B.A from the University of Michigan.
Charles Jepson has served as Sr. Vice President Business Development since June 2010. Prior to eGain, Mr. Jepson worked as an independent consultant specializing in enterprise software from January 2006 to June 2010. He served as President and Chief Executive Officer of Extended Systems from February 2002 to October 2005, President and Chief Executive Officer of Diligent Software from July 2001 to January 2002, Vice President of North American Sales for eGain from June 2000 to July 2001, President and Chief Executive Officer of Inference Corporation from May 1997 to June 2000; and President and Chief Executive Officer of Interlink Computer Sciences from March 1992 to May 1997. Mr. Jepson holds an M.B.A from the University of California, Berkeley and a Bachelor of Arts from San Jose State University.
The information contained under the caption “Section 16(a) Beneficial Ownership Reporting Compliance” in the definitive Proxy Statement for the Company’s 2011 Annual Meeting of Stockholders is incorporated herein by reference.
ITEM 11. EXECUTIVE COMPENSATION The information contained under the heading “Executive Compensation” and under the captions “Director Compensation,” and
“Recent Option Grants” in the definitive Proxy Statement for eGain’s 2011 Annual Meeting of Stockholders is incorporated herein by reference.
71
ITEM 12. SECURITY OWNERSHIP OF CERTAIN BENEFICIAL OWNERS AND MANAGEMENT AND RELATED STOCKHOLDER MATTERS
The information contained under the heading “Security Ownership of Certain Beneficial Owners and Management” in the definitive Proxy Statement for eGain’s 2011 Annual Meeting of Stockholders is incorporated herein by reference.
ITEM 13. CERTAIN RELATIONSHIPS AND RELATED TRANSACTIONS AND DIRECTOR INDEPENDENCE The information contained under the caption “Related Party Transactions” in the definitive Proxy Statement for eGain’s 2011
Annual Meeting of Stockholders is incorporated herein by reference.
ITEM 14. PRINCIPAL ACCOUNTANT FEES AND SERVICES The information contained under the heading “Principal Accounting Fees and Services” in the definitive Proxy Statement for
eGain’s 2011 Annual Meeting of Stockholders is incorporated herein by reference.
72
PART IV
ITEM 15. EXHIBITS AND FINANCIAL STATEMENT SCHEDULES
(a) 1. Financial Statements See Index to Financial Statements in Item 8 of this Report.
2. Financial Statement Schedule Financial statement schedule, which is included at the end of this report: Schedule II—Valuation and Qualifying Accounts.
3. Exhibits See Item 15(b) of this report.
All other schedules have been omitted since they are either not required, not applicable or the information has been included in the consolidated financial statements or notes thereto.
(b) Exhibits The exhibits listed below are filed or incorporated by reference herein.
Exhibit No.
Description of Exhibits
3(i) Amended and Restated Certificate of Incorporation filed as Exhibit 3.1 on eGain’s Quarterly Report on Form 10-Q for the quarter ended September 30, 2008.
3(ii) Amended and Restated Bylaws filed as Exhibit 3.4 to eGain’s Registration Statement on Form S-1, File No. 333-83439, originally filed with the Commission on July 22, 1999, as subsequently amended, and incorporated by reference herein.
4.1 Registration Rights Agreement dated as of August 8, 2000, filed as Exhibit 10.2 to eGain’s Current Report on Form 8-K dated August 15, 2000.
4.2 Form of Warrant to Purchase Common Stock, filed as Exhibit 4.1 to eGain’s Current Report on Form 8-K dated September 24, 2008.
10.1(a) Form of Indemnification Agreement.
10.2(a)# Amended and Restated 1998 Stock Plan and forms of stock option agreements there under.
10.3(a) Golden Gate Commercial Lease Agreement dated as of July 21, 1998 between Registrant and Golden Gate Commercial Company.
10.4(a)# Amendment to Common Stock Purchase Agreement dated as of June 24, 1998 between Registrant and Ashutosh Roy.
10.5(a)# Amendment to Common Stock Purchase Agreement dated as of June 24, 1998 between Registrant and Gunjan Sinha.
10.6# eGain Communications Corporation 2005 Stock Incentive Plan, filed on May 16, 2005 as Exhibit 10.2 on eGain’s Quarterly Report on Form 10-Q for the quarter ended March 31, 2005.
10.7# eGain Communications Corporation 2005 Management Stock Option Plan, filed as Exhibit 10.1 on eGain’s Current Report on Form 8-K on June 2, 2005.
10.8 Loan and Security Agreement between eGain and Bridge Bank, N.A. dated June 24, 2008, filed as Exhibit 10.1 to eGain’s Current Report on Form 8-K on June 27, 2008.
10.9 Subordination Agreement by and among Ashutosh Roy, Oak Hill Capital Partners, L.P., Oak Hill Capital Management Partners, L.P., FW Investors V, L.P. and Bridge Bank National Association dated as of June 24, 2008, filed as Exhibit 10.2 to eGain’s Current Report on Form 8-K on June 27, 2008.
10.10 Conversion Agreement and Amendment to Subordinated Secured Promissory Notes by and among eGain Communications Corporation, Ashutosh Roy, Oak Hill Capital Partners, L.P., Oak Hill Capital Management Partners, L.P. and FW Investors V, L.P, and filed as Exhibit 10.1 to eGain’s Current Report on Form 8-K on September 24, 2008.
10.11 Form of Restated Subordinated Secured Promissory Note by and between eGain Communications and Ashutosh Roy, Oak Hill Capital Partners, L.P., Oak Hill Capital Management Partners, L.P. and FW Investors V, L.P., and filed as Exhibit 10.2 to eGain’s Current Report on Form 8-K on September 24, 2008.
73
Exhibit No.
Description of Exhibits
10.12 Amendment No. 1 to the Conversion Agreement and Amendment to Subordinated Secured Promissory Notes by and among Ashutosh Roy, Oak Hill Capital Partners, L.P., Oak Hill Capital Management Partners, L.P. and FW Investors V, L.P. filed on February 17, 2009 as Exhibit 10.1 on eGain’s Quarterly Report on Form 10-Q for the quarter ended December 31, 2008.
10.13 Loan and Security Agreement between eGain and Comerica Bank dated June 27, 2011, filed as Exhibit 10.1 to eGain’s Current Report on Form 8-K on June 27, 2011.
10.14 Subordination Agreement between Ashutosh Roy and Comerica Bank dated as of June 27, 2011, filed as Exhibit 10.2 to eGain’s Current Report on Form 8K on June 27, 2011.
21.1 Subsidiaries of eGain Communications Corporation.
23.1 Consent of Burr Pilger Mayer, Inc., Independent Registered Public Accounting Firm.
24.1 Power of Attorney (see Signature Page).
31.1 Rule 13a-15(e)/15(d)-15(e) Certification of Chief Executive Officer.
31.2 Rule 13a-15(e) /15(d)-15(e) Certification of Chief Financial Officer.
32.1 Certification pursuant to 18 U.S.C. Section 1350, as adopted pursuant to Section 906 of the Sarbanes Oxley Act of 2002 of Ashutosh Roy, Chief Executive Officer.*
32.2 Certification pursuant to 18 U.S.C. Section 1350, as adopted pursuant to Section 906 of the Sarbanes Oxley Act of 2002 of Eric Smit, Chief Financial Officer.*
(a) Incorporated by reference to eGain’s Registration Statement on Form S-1, File No. 333-83439, originally filed with the
Commission on July 22, 1999, as subsequently amended. # Indicates management contract or compensation plan or arrangement. * The material contained in this exhibit is not deemed “filed” with the Securities and Exchange Commission and is not to be
incorporated by reference into any filing of the company under the Securities Act of 1933 or the Securities Exchange Act of 1934, whether made before or after date hereof and irrespective of any general incorporation language contained in such filing.
74
SIGNATURES
Pursuant to the requirements of Section 13 or 15(d) of the Securities Exchange Act of 1934, the registrant has duly caused this report to be signed on its behalf by the undersigned, thereunto duly authorized.
eGAIN COMMUNICATIONS CORPORATION Date: September 26, 2011 By: /s/ ASHUTOSH ROY
Chief Executive Officer
KNOW ALL MEN BY THESE PRESENT, that each person whose signature appears below constitutes and appoints Ashutosh Roy and Eric Smit, and each of them, his true and lawful attorneys-in-fact and agents, each with full power of substitution and resubstitution, for him and in his name, place, and stead, in any and all capacities, to sign any and all amendments to this annual report, and to file the same, with exhibits thereto and other documents in connection therewith, with the Securities and Exchange Commission, granting unto said attorneys-in-fact and agents, and each of them, full power and authority to do and perform each and every act and thing requisite and necessary to be done, as fully to all intents and purposes as he might or could do in person, hereby ratifying and confirming all that each of said attorneys-in-fact and agents or their substitute or substitutes may lawfully do or cause to be done by virtue hereof.
Pursuant to the requirements of the Securities Exchange Act of 1934, as amended, this report has been signed below by the following persons on behalf of the Registrant and in the capacities and on the dates indicated.
Name
Title Date
/s/ ASHUTOSH ROY
Ashutosh Roy Chief Executive Officer and Director
(Principal Executive Officer) September 26, 2011
/s/ ERIC N. SMIT
Eric N. Smit Chief Financial Officer
(Duly Authorized Officer and Principal Financial and Accounting Officer)
September 26, 2011
/s/ MARK A. WOLFSON
Mark A. Wolfson Director September 26, 2011
/s/ DAVID SCOTT
David Scott Director September 26, 2011
/s/ GUNJAN SINHA
Gunjan Sinha Director September 26, 2011
/s/ PHIROZ P. DARUKHANAVALA
Phiroz P. Darukhanavala Director September 26, 2011

75
SCHEDULE II—VALUATION AND QUALIFYING ACCOUNTS (in thousands)
Balance at Beginning of Period
Additions Charged to
Expense
Amounts Written
Off, Net of Recoveries
Balance at End of Period
Allowance for Doubtful Accounts:
Year ended June 30, 2011 ......................................................... $ 247 $ 62 $ (128) $ 181Year ended June 30, 2010 ......................................................... $ 139 $ 172 $ (64) $ 247 Year ended June 30, 2009 ......................................................... $ 204 $ (54) $ (11) $ 139
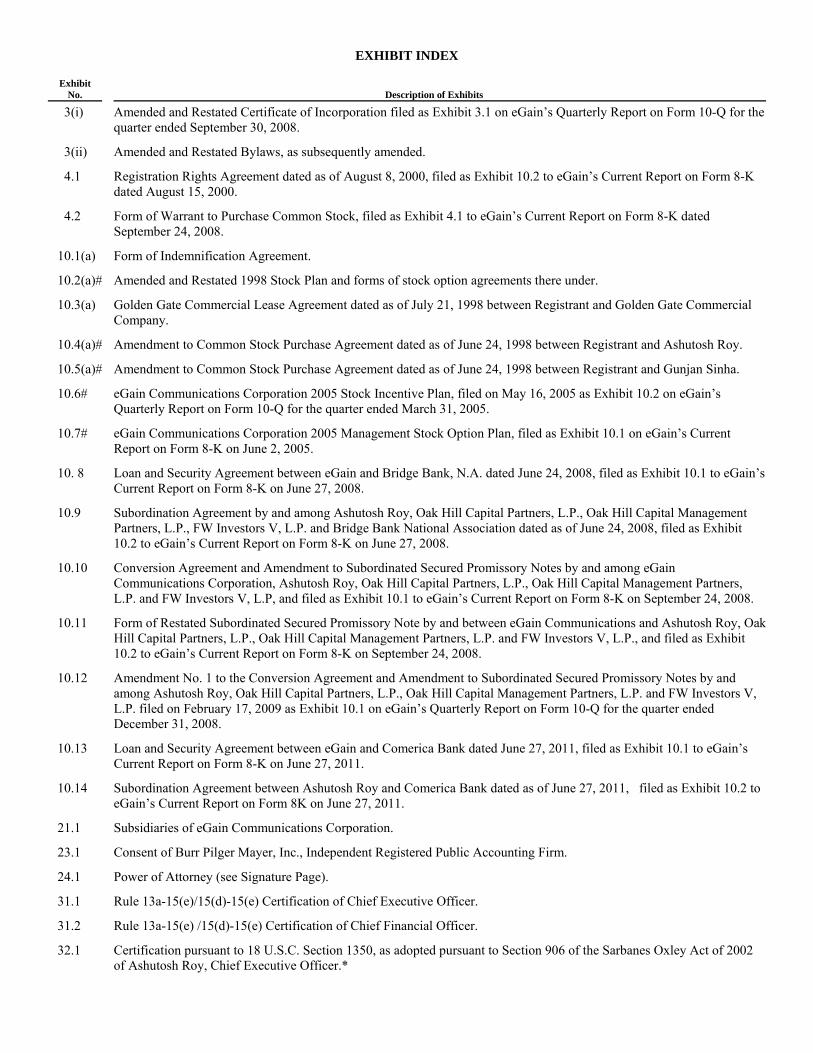
EXHIBIT INDEX
Exhibit No.
Description of Exhibits
3(i) Amended and Restated Certificate of Incorporation filed as Exhibit 3.1 on eGain’s Quarterly Report on Form 10-Q for the quarter ended September 30, 2008.
3(ii) Amended and Restated Bylaws, as subsequently amended.
4.1 Registration Rights Agreement dated as of August 8, 2000, filed as Exhibit 10.2 to eGain’s Current Report on Form 8-K dated August 15, 2000.
4.2 Form of Warrant to Purchase Common Stock, filed as Exhibit 4.1 to eGain’s Current Report on Form 8-K dated September 24, 2008.
10.1(a) Form of Indemnification Agreement.
10.2(a)# Amended and Restated 1998 Stock Plan and forms of stock option agreements there under.
10.3(a) Golden Gate Commercial Lease Agreement dated as of July 21, 1998 between Registrant and Golden Gate Commercial Company.
10.4(a)# Amendment to Common Stock Purchase Agreement dated as of June 24, 1998 between Registrant and Ashutosh Roy.
10.5(a)# Amendment to Common Stock Purchase Agreement dated as of June 24, 1998 between Registrant and Gunjan Sinha.
10.6# eGain Communications Corporation 2005 Stock Incentive Plan, filed on May 16, 2005 as Exhibit 10.2 on eGain’s Quarterly Report on Form 10-Q for the quarter ended March 31, 2005.
10.7# eGain Communications Corporation 2005 Management Stock Option Plan, filed as Exhibit 10.1 on eGain’s Current Report on Form 8-K on June 2, 2005.
10. 8 Loan and Security Agreement between eGain and Bridge Bank, N.A. dated June 24, 2008, filed as Exhibit 10.1 to eGain’s Current Report on Form 8-K on June 27, 2008.
10.9 Subordination Agreement by and among Ashutosh Roy, Oak Hill Capital Partners, L.P., Oak Hill Capital Management Partners, L.P., FW Investors V, L.P. and Bridge Bank National Association dated as of June 24, 2008, filed as Exhibit 10.2 to eGain’s Current Report on Form 8-K on June 27, 2008.
10.10 Conversion Agreement and Amendment to Subordinated Secured Promissory Notes by and among eGain Communications Corporation, Ashutosh Roy, Oak Hill Capital Partners, L.P., Oak Hill Capital Management Partners, L.P. and FW Investors V, L.P, and filed as Exhibit 10.1 to eGain’s Current Report on Form 8-K on September 24, 2008.
10.11 Form of Restated Subordinated Secured Promissory Note by and between eGain Communications and Ashutosh Roy, OakHill Capital Partners, L.P., Oak Hill Capital Management Partners, L.P. and FW Investors V, L.P., and filed as Exhibit 10.2 to eGain’s Current Report on Form 8-K on September 24, 2008.
10.12 Amendment No. 1 to the Conversion Agreement and Amendment to Subordinated Secured Promissory Notes by and among Ashutosh Roy, Oak Hill Capital Partners, L.P., Oak Hill Capital Management Partners, L.P. and FW Investors V, L.P. filed on February 17, 2009 as Exhibit 10.1 on eGain’s Quarterly Report on Form 10-Q for the quarter ended December 31, 2008.
10.13 Loan and Security Agreement between eGain and Comerica Bank dated June 27, 2011, filed as Exhibit 10.1 to eGain’s Current Report on Form 8-K on June 27, 2011.
10.14 Subordination Agreement between Ashutosh Roy and Comerica Bank dated as of June 27, 2011, filed as Exhibit 10.2 to eGain’s Current Report on Form 8K on June 27, 2011.
21.1 Subsidiaries of eGain Communications Corporation.
23.1 Consent of Burr Pilger Mayer, Inc., Independent Registered Public Accounting Firm.
24.1 Power of Attorney (see Signature Page).
31.1 Rule 13a-15(e)/15(d)-15(e) Certification of Chief Executive Officer.
31.2 Rule 13a-15(e) /15(d)-15(e) Certification of Chief Financial Officer.
32.1 Certification pursuant to 18 U.S.C. Section 1350, as adopted pursuant to Section 906 of the Sarbanes Oxley Act of 2002 of Ashutosh Roy, Chief Executive Officer.*

32.2 Certification pursuant to 18 U.S.C. Section 1350, as adopted pursuant to Section 906 of the Sarbanes Oxley Act of 2002 of Eric Smit, Chief Financial Officer.*
(a) Incorporated by reference to eGain’s Registration Statement on Form S-1, File No. 333-83439, originally filed with the
Commission on July 22, 1999, as subsequently amended. # Indicates management contract or compensation plan or arrangement. * The material contained in this exhibit is not deemed “filed” with the Securities and Exchange Commission and is not to be
incorporated by reference into any filing of the company under the Securities Act of 1933 or the Securities Exchange Act of 1934, whether made before or after date hereof and irrespective of any general incorporation language contained in such filing.
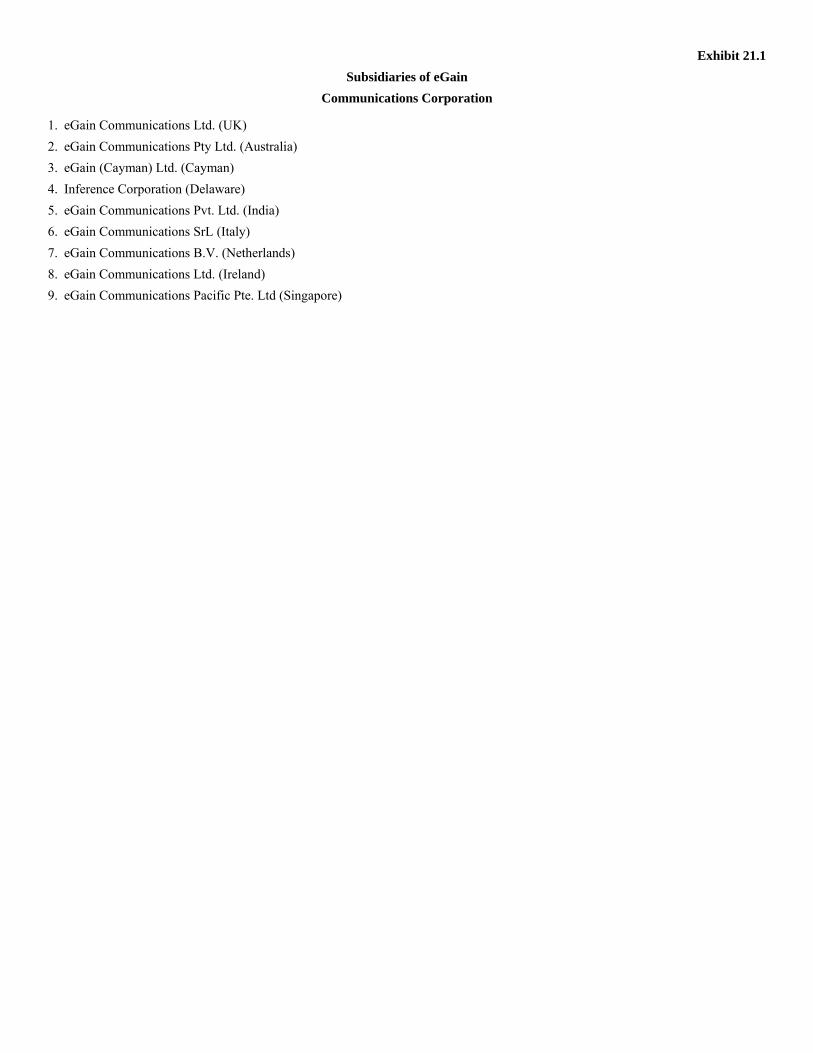
Exhibit 21.1 Subsidiaries of eGain
Communications Corporation
1. eGain Communications Ltd. (UK) 2. eGain Communications Pty Ltd. (Australia) 3. eGain (Cayman) Ltd. (Cayman) 4. Inference Corporation (Delaware) 5. eGain Communications Pvt. Ltd. (India) 6. eGain Communications SrL (Italy) 7. eGain Communications B.V. (Netherlands) 8. eGain Communications Ltd. (Ireland) 9. eGain Communications Pacific Pte. Ltd (Singapore)

Exhibit 23.1 CONSENT OF BURR PILGER MAYER, INC, INDEPENDENT REGISTERED PUBLIC ACCOUNTING FIRM
eGain Communications Corporation Mountain View, California We hereby consent to the incorporation by reference in the Registration Statements on Form S-8 ( Nos. 333-161019, 333-153763, 333-129854, 333-76692, 333-76690, 333-76688, 333-41394, and 333-32854) and Form S-3, as amended, (No. 333-48314) of our report dated September 23, 2011 relating to the consolidated financial statements and financial statement schedule of eGain Communications Corporation, which appears in eGain Communications Corporation’s Annual Report on Form 10-K.
/s/ BURR PILGER MAYER, INC.San Jose, California September 26, 2011

Exhibit 31.1 CERTIFICATIONS
I, Ashutosh Roy, certify that: 1. I have reviewed this annual report on Form 10-K of eGain Communications Corporation; 2. Based on my knowledge, this report does not contain any untrue statement of a material fact or omit to state a material
fact necessary to make the statements made, in light of the circumstances under which such statements were made, not misleading with respect to the period covered by this report;
3. Based on my knowledge, the financial statements, and other financial information included in this report, fairly present in all material respects the financial condition, results of operations and cash flows of the registrant as of, and for, the periods presented in this report;
4. The registrant’s other certifying officer and I are responsible for establishing and maintaining disclosure controls and procedures (as defined in Exchange Act Rules 13a-15(e) and 15d-15(e)) and internal control over financial reporting (as defined in Exchange Act Rules 13a-15(f) and 15d-15(f)) for the registrant and have:
a. Designed such disclosure controls and procedures, or caused such disclosure controls and procedures to be designed under our supervision, to ensure that material information relating to the registrant, including its consolidated subsidiaries, is made known to us by others within those entities, particularly during the period in which this report is being prepared;
b. Designed such internal control over financial reporting, or caused such internal control over financial reporting to be designed under our supervision, to provide reasonable assurance regarding the reliability of financial reporting and the preparation of financial statements for external purposes in accordance with generally accepted accounting principles;
c. Evaluated the effectiveness of the registrant’s disclosure controls and procedures and presented in this report our conclusions about the effectiveness of the disclosure controls and procedures, as of the end of the period covered by this report based on such evaluation; and
d. Disclosed in this report any change in the registrant’s internal control over financial reporting that occurred during the registrant’s most recent fiscal quarter (the registrant’s fourth fiscal quarter in the case of an annual report) that has materially affected, or is reasonably likely to materially affect, the registrant’s internal control over financial reporting; and
5. The registrant’s other certifying officer and I have disclosed, based on our most recent evaluation of internal control over financial reporting, to the registrant’s auditors and the audit committee of the registrant’s board of directors (or persons performing the equivalent functions):
a. All significant deficiencies and material weaknesses in the design or operation of internal control over financial reporting which are reasonably likely to adversely affect the registrant’s ability to record, process, summarize and report financial information; and
b. Any fraud, whether or not material, that involves management or other employees who have a significant role in the registrant’s internal control over financial reporting.
By: /s/ ASHUTOSH ROY
Ashutosh RoyChief Executive Officer
Date: September 26, 2011
Exhibit 31.2
I, Eric Smit, certify that: 1. I have reviewed this annual report on Form 10-K of eGain Communications Corporation; 2. Based on my knowledge, this report does not contain any untrue statement of a material fact or omit to state a material
fact necessary to make the statements made, in light of the circumstances under which such statements were made, not misleading with respect to the period covered by this report;
3. Based on my knowledge, the financial statements, and other financial information included in this report, fairly present in all material respects the financial condition, results of operations and cash flows of the registrant as of, and for, the periods presented in this report;
4. The registrant’s other certifying officer and I are responsible for establishing and maintaining disclosure controls and procedures (as defined in Exchange Act Rules 13a-15(e) and 15d-15(e)) and internal control over financial reporting (as defined in Exchange Act Rules 13a-15(f) and 15d-15(f)) for the registrant and have:
a. Designed such disclosure controls and procedures, or caused such disclosure controls and procedures to be designed under our supervision, to ensure that material information relating to the registrant, including its consolidated subsidiaries, is made known to us by others within those entities, particularly during the period in which this report is being prepared;
b. Designed such internal control over financial reporting, or caused such internal control over financial reporting to be designed under our supervision, to provide reasonable assurance regarding the reliability of financial reporting and the preparation of financial statements for external purposes in accordance with generally accepted accounting principles;
c. Evaluated the effectiveness of the registrant’s disclosure controls and procedures and presented in this report our conclusions about the effectiveness of the disclosure controls and procedures, as of the end of the period covered by this report based on such evaluation; and
d. Disclosed in this report any change in the registrant’s internal control over financial reporting that occurred during the registrant’s most recent fiscal quarter (the registrant’s fourth fiscal quarter in the case of an annual report) that has materially affected, or is reasonably likely to materially affect, the registrant’s internal control over financial reporting; and
5. The registrant’s other certifying officer and I have disclosed, based on our most recent evaluation of internal control over financial reporting, to the registrant’s auditors and the audit committee of the registrant’s board of directors (or persons performing the equivalent functions):
a. All significant deficiencies and material weaknesses in the design or operation of internal control over financial reporting which are reasonably likely to adversely affect the registrant’s ability to record, process, summarize and report financial information; and
b. Any fraud, whether or not material, that involves management or other employees who have a significant role in the registrant’s internal control over financial reporting.
By: /s/ ERIC N. SMIT
Eric N. SmitChief Financial Officer
Date: September 26, 2011
Exhibit 32.1 STATEMENT OF CHIEF EXECUTIVE OFFICER UNDER 18 U.S.C. § 1350
I, Ashutosh Roy, the chief executive officer of eGain Communications Corporation (the “Company”), certify for the purposes of section 1350 of chapter 63 of title 18 of the United States Code that, to my knowledge,
(i) the Annual Report of the Company on Form 10-K for the period ending June 30, 2011 the (“Report”), fully complies with the requirements of section 13(a) of the Securities Exchange Act of 1934, and
(ii) the information contained in the Report fairly presents, in all material respects, the financial condition and results of operations of the Company.
/s/ ASHUTOSH ROY
Ashutosh Roy
September 26 ,2011
A signed original of this written statement required by 18 U.S.C. § 1350 has been provided to eGain Communications Corporation and will be retained by eGain Communications Corporation and furnished to the Securities and Exchange Commission or its staff upon request.

Exhibit 32.2 STATEMENT OF CHIEF FINANCIAL OFFICER UNDER 18 U.S.C. § 1350
I, Eric Smit, the chief financial officer of eGain Communications Corporation (the “Company”), certify for the purposes of section 1350 of chapter 63 of title 18 of the United States Code that, to my knowledge,
(i) the Annual Report of the Company on Form 10-K for the period ending June 30, 2011 (the “Report”), fully complies with the requirements of section 13(a) of the Securities Exchange Act of 1934, and
(ii) the information contained in the Report fairly presents, in all material respects, the financial condition and results of operations of the Company.
/s/ ERIC N. SMIT
Eric N. Smit
September 26, 2011
A signed original of this written statement required by 18 U.S.C. § 1350 has been provided to eGain Communications Corporation and will be retained by eGain Communications Corporation and furnished to the Securities and Exchange Commission or its staff upon request.