Covariation between forelimb muscle anatomy and bone shape ...
16
RESEARCH ARTICLE Covariation between forelimb muscle anatomy and bone shape in an Australian scratch-digging marsupial: Comparison of morphometric methods Meg L. Martin 1 | Kenny J. Travouillon 2 | Emma Sherratt 3 | Patricia A. Fleming 1 | Natalie M. Warburton 4 1 Environmental and Conservation Sciences, Murdoch University, Murdoch, Western Australia, Australia 2 Department of Terrestrial Zoology, Western Australian Museum, Welshpool, Western Australia, Australia 3 School of Biological Sciences, University of Adelaide, North Terrace, Adelaide, South Australia, Australia 4 Medical, Molecular, and Forensic Sciences, Murdoch University, Murdoch, Western Australia, Australia Correspondence Meg L. Martin, Environmental and Conservation Sciences, Murdoch University, Murdoch, WA 6150, Australia. Email: [email protected] Abstract The close association between muscle and bone is broadly intuitive; however, details of the covariation between the two has not been comprehensively studied. Without quan- titative understanding of how muscle anatomy influences bone shape, it is difficult to draw conclusions of the significance of many morphological traits of the skeleton. In this study, we investigated these relationships in the Quenda (Isoodon fusciventer), a scratch- digging marsupial. We quantified the relationships between forelimb muscle anatomy and bone shape for animals representing a range of body masses (124–1,952 g) using two-block partial least square analyses. Muscle anatomy was quantified as muscle mass and physiological cross-sectional area (PCSA), and we used two morphometric methods to characterize bone shape: seven indices of linear bone proportions, and landmarks analysis. Bone shape was significantly correlated with body mass, reflecting allometric bone growth. Of the seven bone indices, only shoulder moment index (SMI) and ulna robustness index (URI) showed a significant covariation with muscle anatomy. Stronger relationships between muscle anatomy and forelimb bone shape were found using the landmark coordinates: muscle mass and PCSA were correlated with the geometric shape of the scapula, humerus, and third metacarpal, but to a lesser extent with shape of the ulna. Overall, our data show that landmark coordinates are more sensitive than bone indices to capturing shape changes evident throughout ontogeny, and is therefore a more appropriate method to investigate covariation with forelimb muscle anatomy. Single-species studies investigating ontogeny require refined methods to accurately develop understanding of the important relationships between muscle force generation and bone shape remodeling. Landmark analyses provide such a method. KEYWORDS Biopedturbation, humerus, scapula, third metacarpal, two-block partial least squares, ulna 1 | INTRODUCTION An animal's musculoskeletal system is shaped and altered as the individ- ual grows in response to mechanical forces associated with movement (Currey, 2013). Differences in the musculoskeletal system between groups and species reflect adaptations to particular movements and behaviors, and thus also represent an animal species' ecological niche. For example, arboreal species demonstrate strong elbow, wrist, and digi- tal flexors to meet the mechanical forces imposed by brachiation (Leischner et al., 2018). In contrast, cursorial species have proximal pelvic limb muscles enlarged and specialized for force generation, proximal tho- racic limb muscles specialized for action over a large range of motion Received: 2 May 2019 Revised: 20 September 2019 Accepted: 7 October 2019 DOI: 10.1002/jmor.21074 Journal of Morphology. 2019;1–16. wileyonlinelibrary.com/journal/jmor © 2019 Wiley Periodicals, Inc. 1
Transcript of Covariation between forelimb muscle anatomy and bone shape ...
R E S E A R CH A R T I C L E
Covariation between forelimb muscle anatomy and boneshape in an Australian scratch-digging marsupial: Comparisonof morphometric methods
Meg L. Martin1 | Kenny J. Travouillon2 | Emma Sherratt3 |
Patricia A. Fleming1 | Natalie M. Warburton4
1Environmental and Conservation Sciences,
Murdoch University, Murdoch, Western
Australia, Australia
2Department of Terrestrial Zoology, Western
Australian Museum, Welshpool, Western
Australia, Australia
3School of Biological Sciences, University of
Adelaide, North Terrace, Adelaide, South
Australia, Australia
4Medical, Molecular, and Forensic Sciences,
Murdoch University, Murdoch, Western
Australia, Australia
Correspondence
Meg L. Martin, Environmental and
Conservation Sciences, Murdoch University,
Murdoch, WA 6150, Australia.
Email: [email protected]
Abstract
The close association between muscle and bone is broadly intuitive; however, details of
the covariation between the two has not been comprehensively studied. Without quan-
titative understanding of how muscle anatomy influences bone shape, it is difficult to
draw conclusions of the significance of manymorphological traits of the skeleton. In this
study, we investigated these relationships in the Quenda (Isoodon fusciventer), a scratch-
digging marsupial. We quantified the relationships between forelimb muscle anatomy
and bone shape for animals representing a range of body masses (124–1,952 g) using
two-block partial least square analyses. Muscle anatomy was quantified as muscle mass
and physiological cross-sectional area (PCSA), and we used two morphometric methods
to characterize bone shape: seven indices of linear bone proportions, and landmarks
analysis. Bone shape was significantly correlated with body mass, reflecting allometric
bone growth. Of the seven bone indices, only shoulder moment index (SMI) and ulna
robustness index (URI) showed a significant covariation with muscle anatomy. Stronger
relationships between muscle anatomy and forelimb bone shape were found using the
landmark coordinates: muscle mass and PCSAwere correlated with the geometric shape
of the scapula, humerus, and third metacarpal, but to a lesser extent with shape of the
ulna. Overall, our data show that landmark coordinates are more sensitive than bone
indices to capturing shape changes evident throughout ontogeny, and is therefore a
more appropriate method to investigate covariation with forelimb muscle anatomy.
Single-species studies investigating ontogeny require refined methods to accurately
develop understanding of the important relationships between muscle force generation
and bone shape remodeling. Landmark analyses provide such amethod.
K E YWORD S
Biopedturbation, humerus, scapula, third metacarpal, two-block partial least squares, ulna
1 | INTRODUCTION
An animal's musculoskeletal system is shaped and altered as the individ-
ual grows in response to mechanical forces associated with movement
(Currey, 2013). Differences in the musculoskeletal system between
groups and species reflect adaptations to particular movements and
behaviors, and thus also represent an animal species' ecological niche.
For example, arboreal species demonstrate strong elbow, wrist, and digi-
tal flexors to meet the mechanical forces imposed by brachiation
(Leischner et al., 2018). In contrast, cursorial species have proximal pelvic
limb muscles enlarged and specialized for force generation, proximal tho-
racic limb muscles specialized for action over a large range of motion
Received: 2 May 2019 Revised: 20 September 2019 Accepted: 7 October 2019
DOI: 10.1002/jmor.21074
Journal of Morphology. 2019;1–16. wileyonlinelibrary.com/journal/jmor © 2019 Wiley Periodicals, Inc. 1
(Williams,Wilson, Rhodes, Andrews, & Payne, 2008). For an individual ani-
mal, such relationships will also vary as the individual increases in body
mass during growth, and/or changes aspects of its behavior over time.
Characteristics of behavior are particularly evident in the bony
and muscular anatomy of digging mammals. In addition to the require-
ments for locomotion, these animals also demonstrate specializations
for digging. Species that are highly specialized for scratch-digging and
burrowing (semi-fossorial and fossorial animals) have enlarged muscles
associated with the power stroke (i.e., humeral retractors, elbow
extensors, and carpal/digital flexors) as they are required to match the
mechanical resistance of the substrate they dig through (Moore,
Budny, Russell, & Butcher, 2013; Warburton, Grégoire, Jacques, &
Flandrin, 2013). These muscular changes are then reflected in their
bony anatomy. For example, the marsupial mole (Marsupialia: Not-
oryctemorphia) shows some of the more extreme specializations for
fossorial behavior; their forelimb bones reflect their highly-specialized
digging motion of “sand-swimming” in which they constantly back-fill
their burrow (Warburton, 2006). All forelimb bones of the marsupial
mole show specializations: the scapula is elongated and narrow, which
reflects a reduction on muscles attaching to the vertebral column to
allow for more posterior rotation, while the humerus and ulna are
short and robust to assist the forelimb in withstanding the large mus-
cular force and reaction forces acting against the bone during the dig-
ging motion. These patterns are observable in extant and extinct
Notoryctes (Beck, Warburton, Archer, Hand, & Aplin, 2016;
Warburton, 2006). Scratch-digging mammals show similar forelimb
adaptions, though in less extreme forms: shortened and robust bones,
enlarged distal epicondyles, and increased bone surface areas provid-
ing increased surface area for enlarged muscle attachment
(Cingulates: Milne, Vizcaíno, & Fernicola, 2009; Mustelidae: Rose,
Moore, Russell, & Butcher, 2014; Tenrecoidea: Salton & Sargis, 2008;
Myrmecophagidae: Sesoko et al., 2015). Such specializations of the
forelimbs provide the mechanical advantage necessary for digging.
The relationship between bone shape and muscle size in verte-
brates reflects the forces acting on the musculoskeletal system as the
body performs motions (Currey, 2013). One measure could therefore
be used to predict the other. Morphometrics and associated multivari-
ate statistical analyses used to quantify biological shape and assess
covariation largely follow two approaches (Adams, Rohlf, & Slice,
2013). First, traditional morphometrics uses linear measurements and
derived ratios/indices, which are useful in assessing bony proportions.
These methods are particularly suited to studying articulated struc-
tures. Second, advances in computing power have allowed rapid
development of geometric morphometrics using coordinate-based
methods (in two- or three-dimensions) to characterise shape; such
methods are increasingly common practice for quantifying individual
bone shapes (Zelditch, Swiderski, & Sheets, 2012). Understanding the
relative value of each approach in the context of quantifying covaria-
tion with muscle anatomy would be helpful in guiding future work.
Unfortunately, muscles and bones are often studied separately,
with quantitative studies that match these tissues being rare; the
exceptions have focused on the skull, investigating bite force and
feeding strategies (e.g., Cornette, Tresset, & Herrel, 2015; Fabre et al.,
2018; Fabre, Andrade, Huyghe, Cornette, & Herrel, 2014; Noback &
Harvati, 2015; Sella-Tunis, Pokhojaev, Sarig, O'Higgins, & May, 2018).
There has been a general lack of postcranial studies, and very few
studies have investigated the quantitative relationship between bones
and muscles for digging mammals (e.g., Böhmer, Fabre, Herbin,
Peigné, & Herrel, 2018; Warburton et al., 2013). Of those studies that
have investigated interactions between muscles and bones, the major-
ity have used linear bone measurements and associated ratios/indices
to make inferences about muscle anatomy (e.g., Böhmer et al., 2018),
while others have used landmark coordinates without clear extrapola-
tion to muscle anatomy (e.g., Carlon, 2014; McCabe, Henderson,
Pantinople, Richards, & Milne, 2017). Also lacking in the literature are
studies that explicitly compare the two methods of assessing bone
shape (indices and landmark coordinates; e.g., Bernal, 2007; Bonnan,
Farlow, & Masters, 2008; Breno, Leirs, & Van Dongen, 2011).
We carried out morphometric analysis of the forelimb of the
Quenda (Isoodon fusciventer) to quantify the relationship between the
shape of forelimb long bone and associated muscle anatomy
(i.e., physiological cross-sectional area; PCSA) to test the extent to
which these two parameters covary. Furthermore, we test indices and
landmark coordinates as methods for quantifying bone shape, to
determine which method provides the better insight into muscle force
production. Specifically, we predict that shape covariation will be
greater between the landmark coordinates and muscle PCSA as this
method captures the precise geometry of bones, and thus conveys
more shape information in comparison with the bone indices.
Quenda employ their forelimbs for scratch-digging to search for
subterranean food items (e.g., invertebrates, bulbs, and fungi fruiting
bodies) as well as to construct short burrows and nests for shelter
(Gordon & Hulbert, 1989; Long, 2009; Warburton & Travouillon,
2016). The species displays adaptations of both muscle and bone
anatomy associated with scratch-digging (Warburton et al., 2013).
This study builds on previous findings that showed Quenda force
generation capacity (PCSA) showed differential growth between
main movers of the recovery stroke and the power stroke of
scratch-digging (Martin, Warburton, Travouillon, & Fleming, 2019).
We therefore predicted that muscles associated with the power-
stroke of digging will have disproportionate influence on shape
change of the long bones. To account for allometric effects, we
repeated analyses on the residuals of linear regressions of muscle
forces (PCSA) and bone shape data against body mass. This study
contributes to our understanding of how forelimb muscle anatomy
influences bone shape, and how these structures functionally covary
in a digging marsupial as a reflection of the mechanical demands of
scratch-digging.
2 | MATERIALS AND METHODS
The Quenda (Isoodon fusciventer), formerly listed as a subspecies of
Southern Brown Bandicoot (I. obesulus fusciventer), has recently
2 MARTIN ET AL.
been raised to species level based on cranio-dental morphology and
molecular data (Travouillon & Phillips, 2018). We sampled
32 Quenda specimens: 19 males (1,041 ± 667 g) and 13 females
(810 ± 356 g). Males can reach larger body mass than females
(males: 500-1800 g, females: 400–1,200 g; Warburton & Trav-
ouillon, 2016), although the difference in body mass in our data set
was not significant (t32 = −1.15, p = .259). The specimens were from
either Kanyana Wildlife Rehabilitation Centre, Lesmurdie, Western
Australia, or opportunistically collected throughout the Perth metro-
politan area (Regulation 17 licence SF010344; accidental deaths
including road collisions, pool drownings, and domestic pet attack).
As some specimens were often injured, forelimb bones were some-
times too badly damaged to be analyzed; consequently, the number
of specimens per bone varied.
Muscles were dissected and measured for mass and PCSA; these
data have been fully analyzed and published separately (Martin et al.,
2019) (Table 1). Muscle mass is a representation of overall muscle
size, while PCSA is a representation of maximum isometric force pro-
duction for individual muscles. PCSA is generally considered a more
appropriate measure of muscle force potential to interpret biological
functions in correlation with skeletal morphology (Myatt et al., 2012;
Thorpe, Crompton, Gunther, Ker, & McNeill, 1999).
2.1 | Morphometric analyses
The scapula, humerus, ulna and third metacarpal for each specimenwere
scanned using a Skyscan 1176 scanner (Bruker microCT; Centre of
Microscopy, Characterization and Analysis, The University of Western
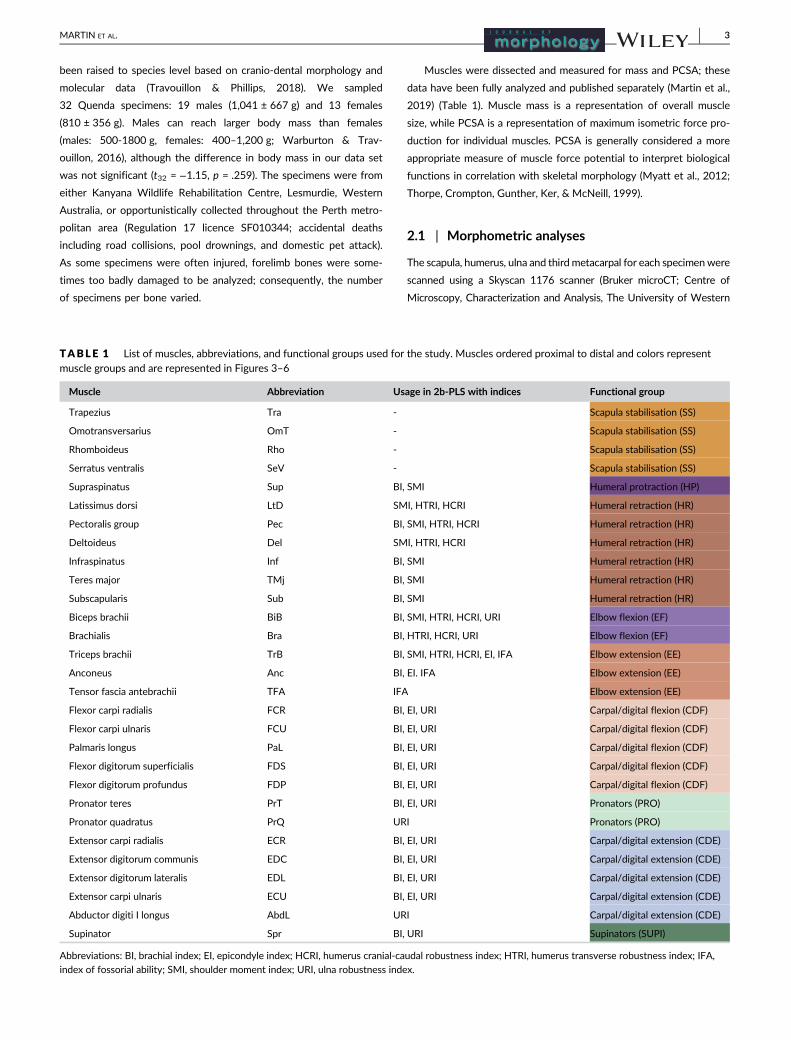
TABLE 1 List of muscles, abbreviations, and functional groups used for the study. Muscles ordered proximal to distal and colors representmuscle groups and are represented in Figures 3–6
Muscle Abbreviation Usage in 2b-PLS with indices Functional group
Trapezius Tra - Scapula stabilisation (SS)
Omotransversarius OmT - Scapula stabilisation (SS)
Rhomboideus Rho - Scapula stabilisation (SS)
Serratus ventralis SeV - Scapula stabilisation (SS)
Supraspinatus Sup BI, SMI Humeral protraction (HP)
Latissimus dorsi LtD SMI, HTRI, HCRI Humeral retraction (HR)
Pectoralis group Pec BI, SMI, HTRI, HCRI Humeral retraction (HR)
Deltoideus Del SMI, HTRI, HCRI Humeral retraction (HR)
Infraspinatus Inf BI, SMI Humeral retraction (HR)
Teres major TMj BI, SMI Humeral retraction (HR)
Subscapularis Sub BI, SMI Humeral retraction (HR)
Biceps brachii BiB BI, SMI, HTRI, HCRI, URI Elbow flexion (EF)
Brachialis Bra BI, HTRI, HCRI, URI Elbow flexion (EF)
Triceps brachii TrB BI, SMI, HTRI, HCRI, EI, IFA Elbow extension (EE)
Anconeus Anc BI, EI. IFA Elbow extension (EE)
Tensor fascia antebrachii TFA IFA Elbow extension (EE)
Flexor carpi radialis FCR BI, EI, URI Carpal/digital flexion (CDF)
Flexor carpi ulnaris FCU BI, EI, URI Carpal/digital flexion (CDF)
Palmaris longus PaL BI, EI, URI Carpal/digital flexion (CDF)
Flexor digitorum superficialis FDS BI, EI, URI Carpal/digital flexion (CDF)
Flexor digitorum profundus FDP BI, EI, URI Carpal/digital flexion (CDF)
Pronator teres PrT BI, EI, URI Pronators (PRO)
Pronator quadratus PrQ URI Pronators (PRO)
Extensor carpi radialis ECR BI, EI, URI Carpal/digital extension (CDE)
Extensor digitorum communis EDC BI, EI, URI Carpal/digital extension (CDE)
Extensor digitorum lateralis EDL BI, EI, URI Carpal/digital extension (CDE)
Extensor carpi ulnaris ECU BI, EI, URI Carpal/digital extension (CDE)
Abductor digiti I longus AbdL URI Carpal/digital extension (CDE)
Supinator Spr BI, URI Supinators (SUPI)
Abbreviations: BI, brachial index; EI, epicondyle index; HCRI, humerus cranial-caudal robustness index; HTRI, humerus transverse robustness index; IFA,
index of fossorial ability; SMI, shoulder moment index; URI, ulna robustness index.
MARTIN ET AL. 3
Australia) at a resolution of 35 μm, with a 0.2-mm aluminium filter, volt-
age 45 kv, and amperage 550 μA. Scans were reconstructed using the
software NRecon (Burker microCT) which produces stacks of images
that were visualized in CTAn (Burker microCT) as a 3D digital volume.
The volumeswere processed via a threshold approach to digitally dissect
the bone, and surfacemodels of the bones were exported as .ply files.
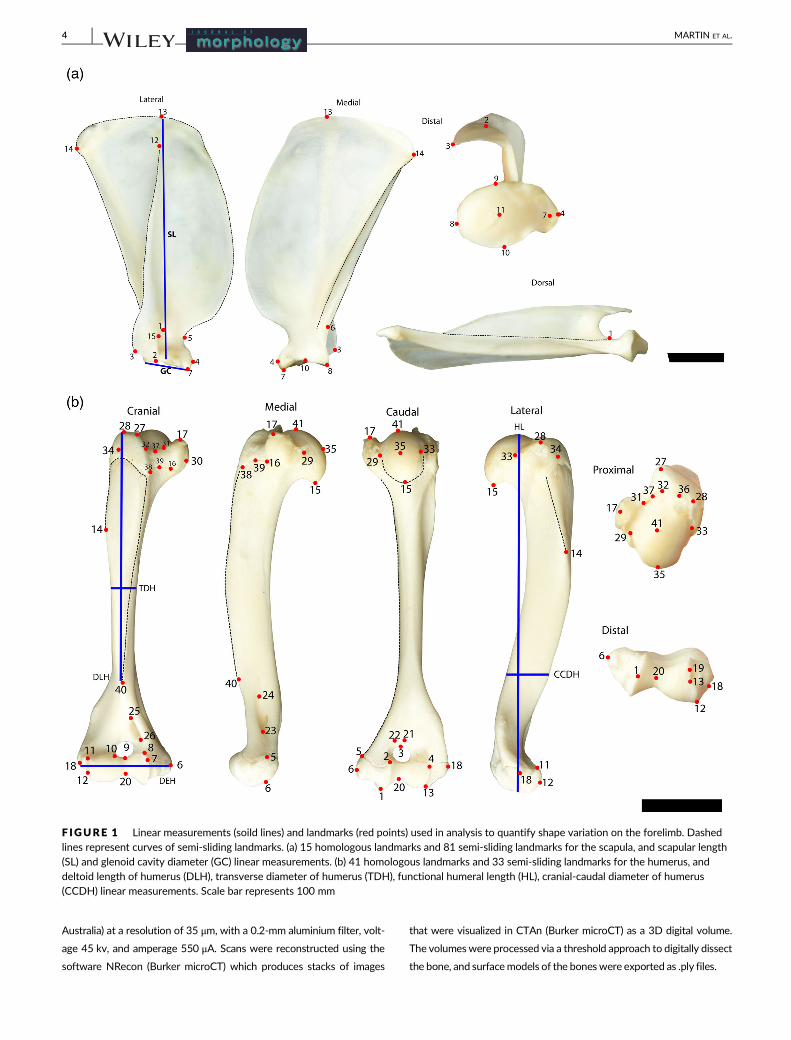
F IGURE 1 Linear measurements (soild lines) and landmarks (red points) used in analysis to quantify shape variation on the forelimb. Dashedlines represent curves of semi-sliding landmarks. (a) 15 homologous landmarks and 81 semi-sliding landmarks for the scapula, and scapular length(SL) and glenoid cavity diameter (GC) linear measurements. (b) 41 homologous landmarks and 33 semi-sliding landmarks for the humerus, anddeltoid length of humerus (DLH), transverse diameter of humerus (TDH), functional humeral length (HL), cranial-caudal diameter of humerus(CCDH) linear measurements. Scale bar represents 100 mm
4 MARTIN ET AL.
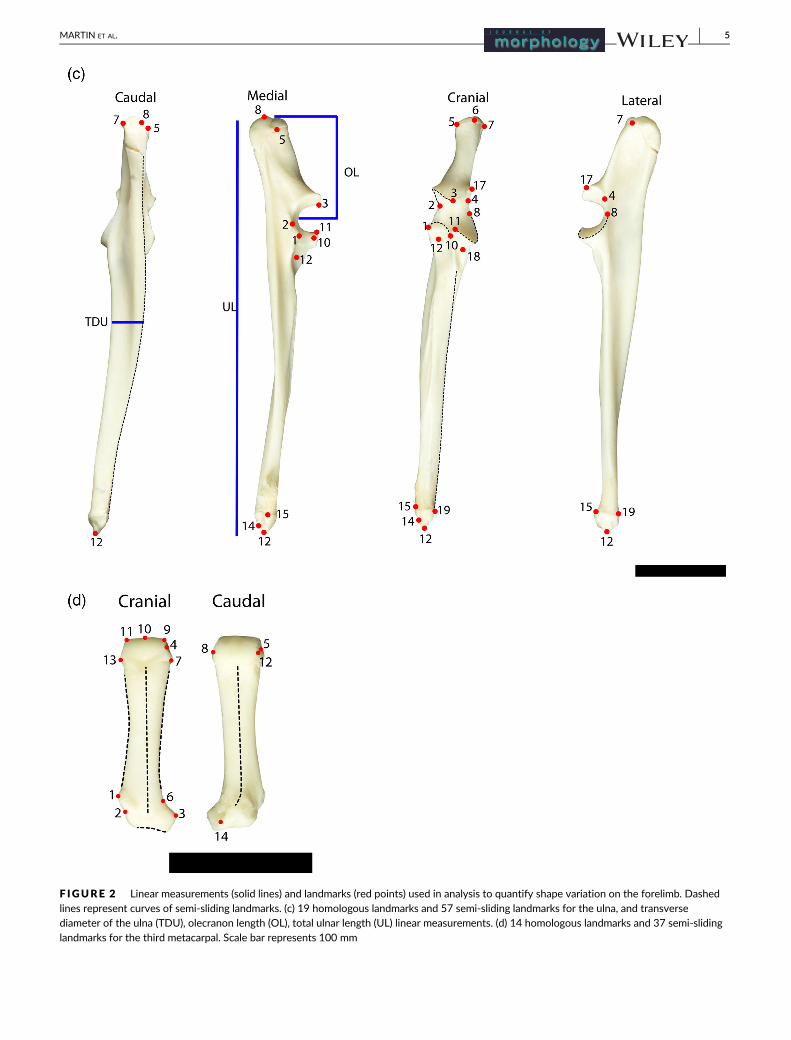
F IGURE 2 Linear measurements (solid lines) and landmarks (red points) used in analysis to quantify shape variation on the forelimb. Dashedlines represent curves of semi-sliding landmarks. (c) 19 homologous landmarks and 57 semi-sliding landmarks for the ulna, and transversediameter of the ulna (TDU), olecranon length (OL), total ulnar length (UL) linear measurements. (d) 14 homologous landmarks and 37 semi-slidinglandmarks for the third metacarpal. Scale bar represents 100 mm
MARTIN ET AL. 5
2.1.1 | Indices
Seventeen linear variables of the scapula, humerus, ulna, and thirdmetacar-
pal were measured on skeletal material to the nearest 0.01 mm using PES
digital callipers (Figure 1 and Figure 2) which were combined to calculate
seven functional indices that represent attributes of the forelimb bones
and the potential mechanical efficiency for digging (Table 2). The indices
have developed in the literature as means of characterizing limb specializa-
tions, primarily used to distinguish between species, and predict different
styles of digging and ecology (i.e., diggers, occasional diggers, generalized,
burrowers, and cursorial; Hopkins & Davis, 2009). Indices are ratios, and
therefore control for size variation in the sample (Klingenberg, 2016).
2.1.2 | Landmark coordinates
The software IDAV Landmark Editor v.3.6 (Wiley et al., 2005) was
used to place homologous landmarks and curves of semi-sliding land-
marks to the bones (Figure 1 and Figure 2; detailed descriptions of
the individual landmarks are listed in the Tables s1–S4). Landmark
coordinates analyses were completed in R (R Development Core
Team, 2018) using the package geomorph v.3.0.4 (Adams, Collyer, &
Sherratt, 2018; Adams & Otárola-Castillo, 2013). Landmarks were
aligned using Generalized Procrustes Superimposition to remove the
effects of size, position, and orientation, leaving only shape variation
(Rohlf & Slice, 1990). During Procrustes superimposition, the semi-
sliding landmarks were permitted to slide along their tangent direc-
tions to minimize the Procrustes distance between specimens.
2.2 | Allometry in bone shape
In order to address potential sex differences and allometric relation-
ships between bone shape and muscles, we used a multivariate
analysis of covariance (MANCOVA) model testing bone shape (indices
and landmark coordinates as dependent variables in two separate ana-
lyses) against log-transformed body mass, with sex as independent
factor (implemented with function procD.lm in geomorph; R Develop-
ment Core Team, 2018). The models were evaluated for statistical sig-
nificance with Goodall's F-test (Goodall, 1991) using a permutation
procedure (1,000 permutations).
2.3 | Covariation between forelimb muscle anatomyand bone shape
To quantify the strength of covariation between forelimb muscle
anatomy (mass and PCSA) and bone shape (indices and landmark
coordinates), we carried out a series of two-block partial least squares
(2b-PLS) analyses (Rohlf & Corti, 2000) implemented using two.b.pls
function in geomorph. This method identifies axes in two multivariate
datasets (“blocks”) that explain the covariance between them, and
quantifies the degree of association between the two blocks by con-
structing pairs of variables that are linear combinations of the vari-
ables within each of the two blocks. The linear combinations
construct new variables that account for as much of the covariation
as possible between the two blocks. The results of the 2b-PLS analysis
are an r-PLS value: the correlation coefficient between the scores of
projected values from the two blocks, and an associated p-value:
empirically calculated from the resampling procedure.
First, 2b-PLS was performed individually for the seven indices
against log-transformed muscle anatomy including only muscles asso-
ciated with the bone or the index (listed in Table 1); and for landmark
coordinates each forelimb bone individually against log-transformed
muscle anatomy. These tests examined the strength of covariation
due to allometry.
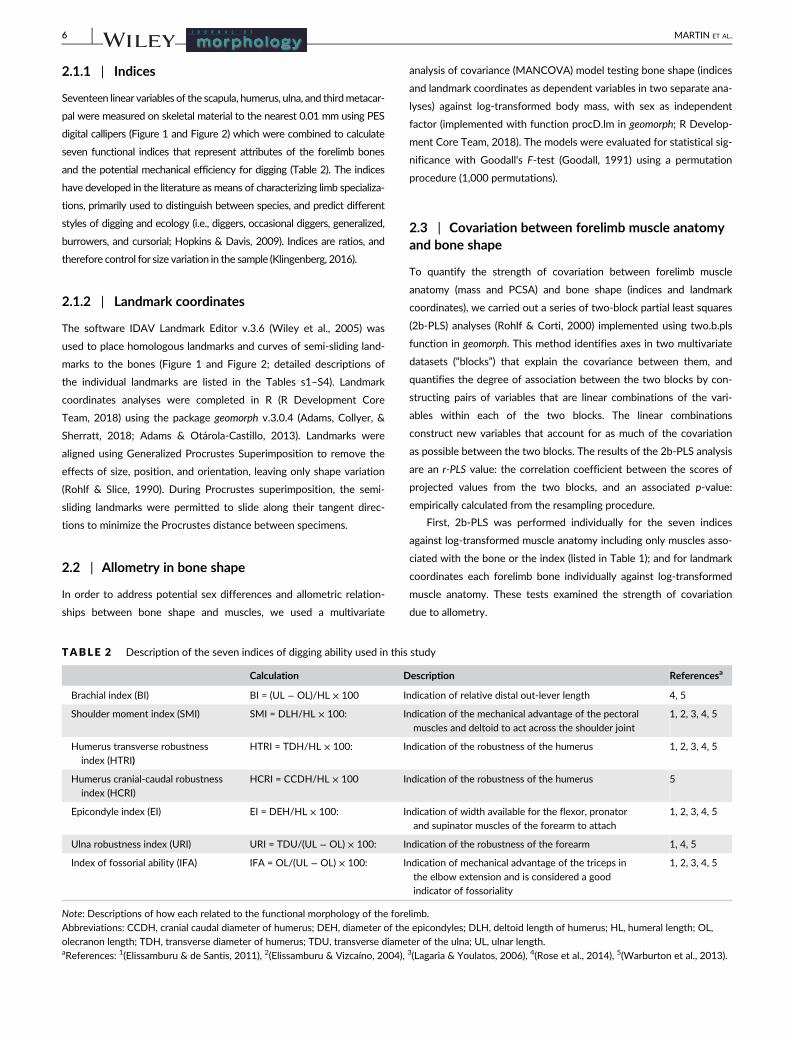
TABLE 2 Description of the seven indices of digging ability used in this study
Calculation Description Referencesa
Brachial index (BI) BI = (UL − OL)/HL × 100 Indication of relative distal out-lever length 4, 5
Shoulder moment index (SMI) SMI = DLH/HL × 100: Indication of the mechanical advantage of the pectoral
muscles and deltoid to act across the shoulder joint
1, 2, 3, 4, 5
Humerus transverse robustness
index (HTRI)HTRI = TDH/HL × 100: Indication of the robustness of the humerus 1, 2, 3, 4, 5
Humerus cranial-caudal robustness
index (HCRI)
HCRI = CCDH/HL × 100 Indication of the robustness of the humerus 5
Epicondyle index (EI) EI = DEH/HL × 100: Indication of width available for the flexor, pronator
and supinator muscles of the forearm to attach
1, 2, 3, 4, 5
Ulna robustness index (URI) URI = TDU/(UL − OL) × 100: Indication of the robustness of the forearm 1, 4, 5
Index of fossorial ability (IFA) IFA = OL/(UL − OL) × 100: Indication of mechanical advantage of the triceps in
the elbow extension and is considered a good
indicator of fossoriality
1, 2, 3, 4, 5
Note: Descriptions of how each related to the functional morphology of the forelimb.
Abbreviations: CCDH, cranial caudal diameter of humerus; DEH, diameter of the epicondyles; DLH, deltoid length of humerus; HL, humeral length; OL,
olecranon length; TDH, transverse diameter of humerus; TDU, transverse diameter of the ulna; UL, ulnar length.aReferences: 1(Elissamburu & de Santis, 2011), 2(Elissamburu & Vizcaíno, 2004), 3(Lagaria & Youlatos, 2006), 4(Rose et al., 2014), 5(Warburton et al., 2013).
6 MARTIN ET AL.
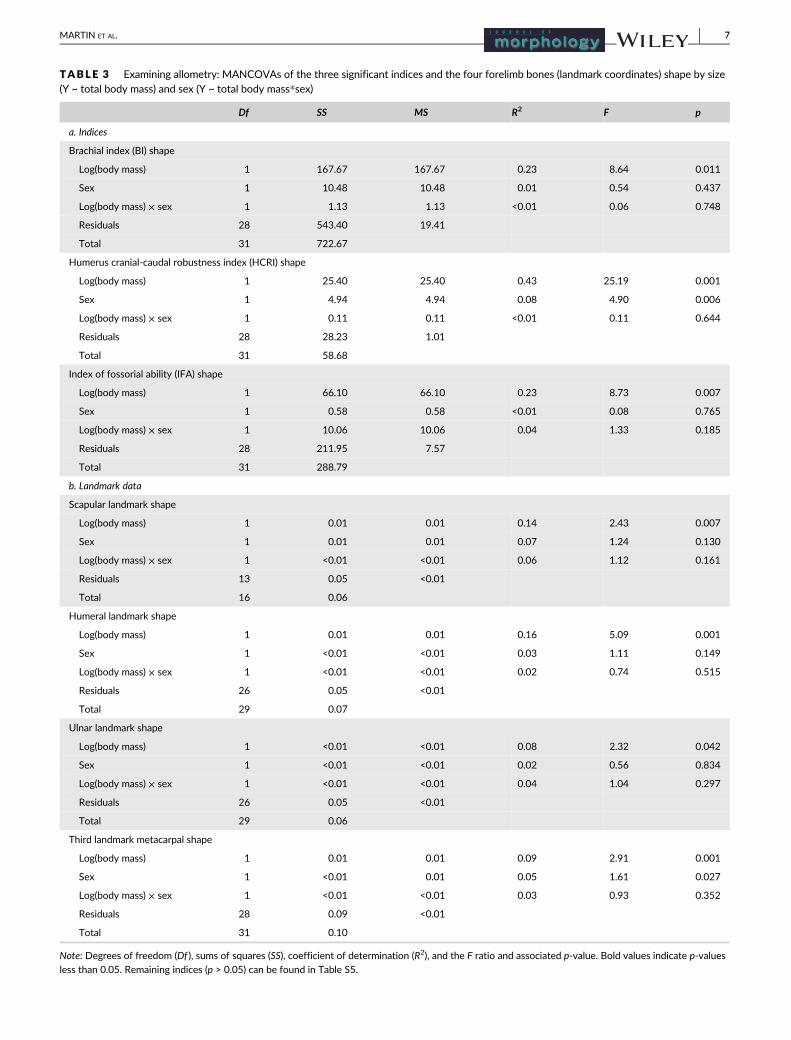
TABLE 3 Examining allometry: MANCOVAs of the three significant indices and the four forelimb bones (landmark coordinates) shape by size(Y ~ total body mass) and sex (Y ~ total body mass*sex)
Df SS MS R2 F p
a. Indices
Brachial index (BI) shape
Log(body mass) 1 167.67 167.67 0.23 8.64 0.011
Sex 1 10.48 10.48 0.01 0.54 0.437
Log(body mass) × sex 1 1.13 1.13 <0.01 0.06 0.748
Residuals 28 543.40 19.41
Total 31 722.67
Humerus cranial-caudal robustness index (HCRI) shape
Log(body mass) 1 25.40 25.40 0.43 25.19 0.001
Sex 1 4.94 4.94 0.08 4.90 0.006
Log(body mass) × sex 1 0.11 0.11 <0.01 0.11 0.644
Residuals 28 28.23 1.01
Total 31 58.68
Index of fossorial ability (IFA) shape
Log(body mass) 1 66.10 66.10 0.23 8.73 0.007
Sex 1 0.58 0.58 <0.01 0.08 0.765
Log(body mass) × sex 1 10.06 10.06 0.04 1.33 0.185
Residuals 28 211.95 7.57
Total 31 288.79
b. Landmark data
Scapular landmark shape
Log(body mass) 1 0.01 0.01 0.14 2.43 0.007
Sex 1 0.01 0.01 0.07 1.24 0.130
Log(body mass) × sex 1 <0.01 <0.01 0.06 1.12 0.161
Residuals 13 0.05 <0.01
Total 16 0.06
Humeral landmark shape
Log(body mass) 1 0.01 0.01 0.16 5.09 0.001
Sex 1 <0.01 <0.01 0.03 1.11 0.149
Log(body mass) × sex 1 <0.01 <0.01 0.02 0.74 0.515
Residuals 26 0.05 <0.01
Total 29 0.07
Ulnar landmark shape
Log(body mass) 1 <0.01 <0.01 0.08 2.32 0.042
Sex 1 <0.01 <0.01 0.02 0.56 0.834
Log(body mass) × sex 1 <0.01 <0.01 0.04 1.04 0.297
Residuals 26 0.05 <0.01
Total 29 0.06
Third landmark metacarpal shape
Log(body mass) 1 0.01 0.01 0.09 2.91 0.001
Sex 1 <0.01 0.01 0.05 1.61 0.027
Log(body mass) × sex 1 <0.01 <0.01 0.03 0.93 0.352
Residuals 28 0.09 <0.01
Total 31 0.10
Note: Degrees of freedom (Df ), sums of squares (SS), coefficient of determination (R2), and the F ratio and associated p-value. Bold values indicate p-values
less than 0.05. Remaining indices (p > 0.05) can be found in Table S5.
MARTIN ET AL. 7
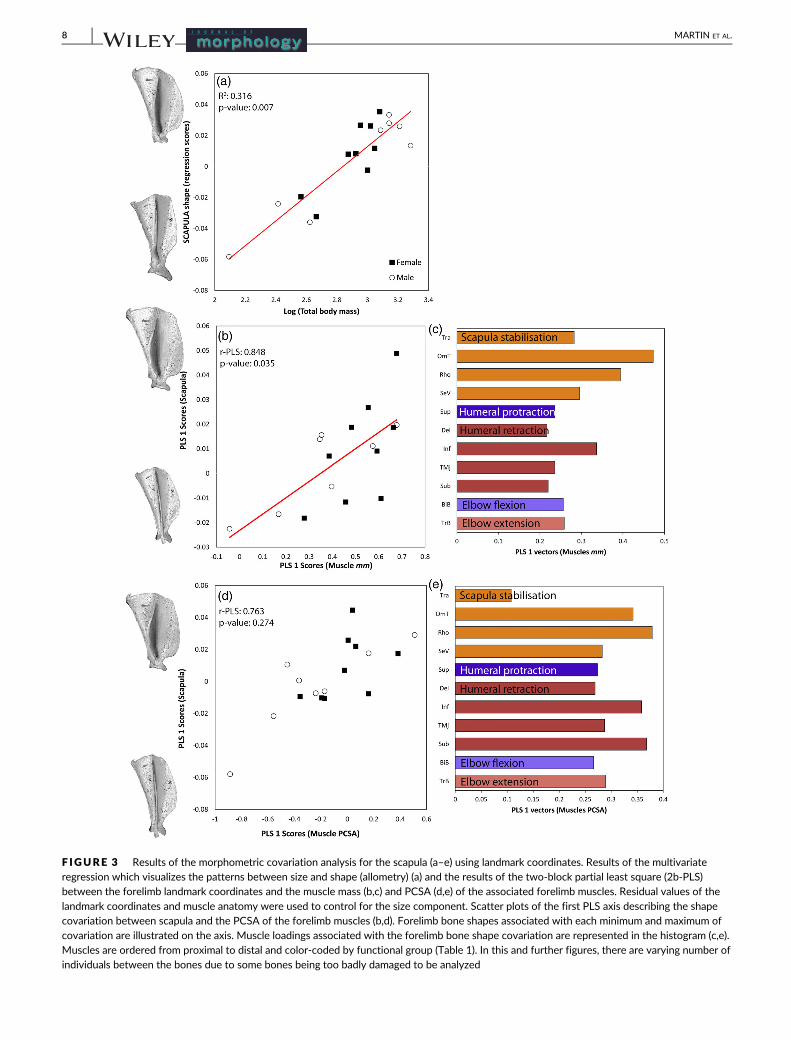
F IGURE 3 Results of the morphometric covariation analysis for the scapula (a–e) using landmark coordinates. Results of the multivariateregression which visualizes the patterns between size and shape (allometry) (a) and the results of the two-block partial least square (2b-PLS)between the forelimb landmark coordinates and the muscle mass (b,c) and PCSA (d,e) of the associated forelimb muscles. Residual values of the
landmark coordinates and muscle anatomy were used to control for the size component. Scatter plots of the first PLS axis describing the shapecovariation between scapula and the PCSA of the forelimb muscles (b,d). Forelimb bone shapes associated with each minimum and maximum ofcovariation are illustrated on the axis. Muscle loadings associated with the forelimb bone shape covariation are represented in the histogram (c,e).Muscles are ordered from proximal to distal and color-coded by functional group (Table 1). In this and further figures, there are varying number ofindividuals between the bones due to some bones being too badly damaged to be analyzed
8 MARTIN ET AL.
Second, to exclude the effects of allometry (Klingenberg, 2016), the
above analyses were repeated using residuals calculated from linear regres-
sions of the bone shapedata (indices, landmarks) andmuscle anatomy (mass
and PCSA) against log-transformed bodymass. Thesewere calculated using
resid(lm) (R Development Core Team, 2018) for each indices and muscle
anatomy, and using procD.lm in geomorph for landmark shape data.
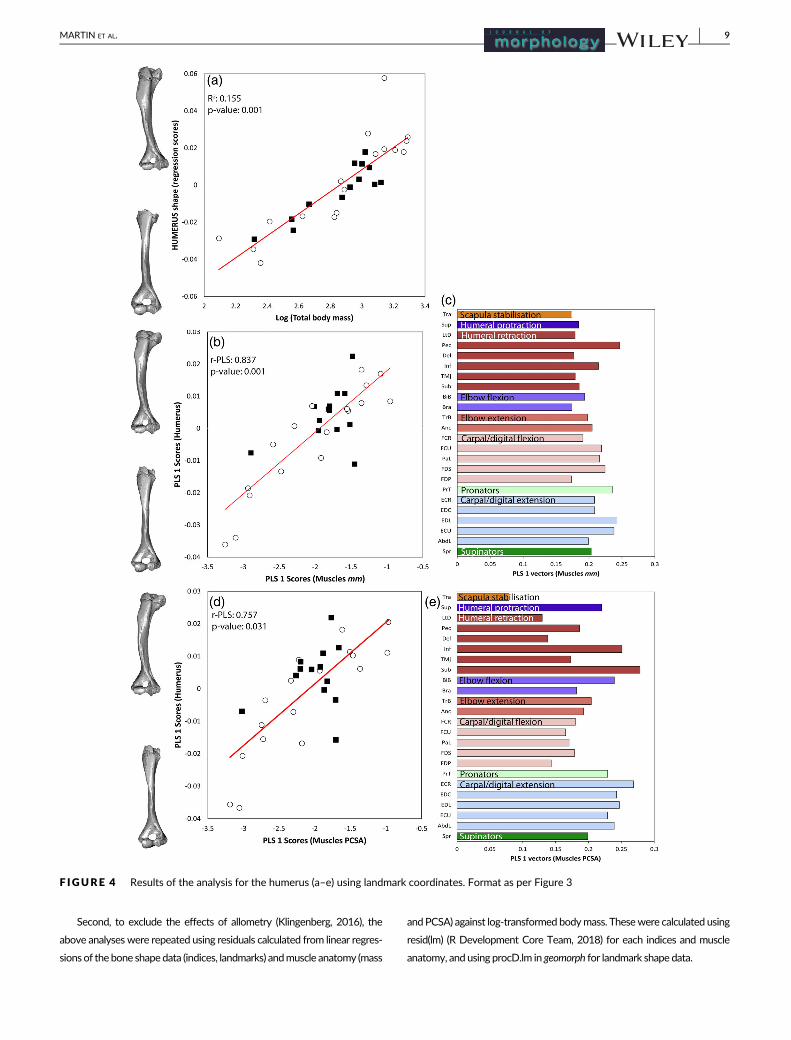
F IGURE 4 Results of the analysis for the humerus (a–e) using landmark coordinates. Format as per Figure 3
MARTIN ET AL. 9
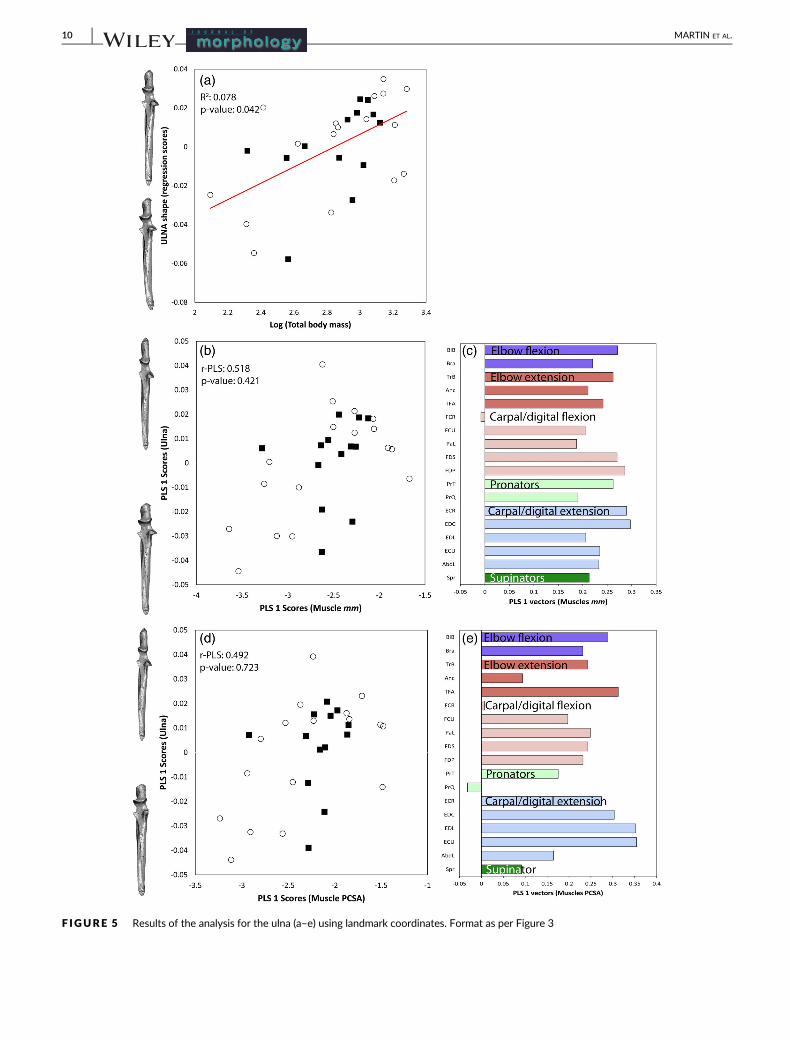
F IGURE 5 Results of the analysis for the ulna (a–e) using landmark coordinates. Format as per Figure 3
10 MARTIN ET AL.
3 | RESULTS
3.1 | Allometry in bone shape
3.1.1 | Indices
Of the seven indices, only three showed significant allometric
associations with body mass (Table 3). The brachial index (BI),
humerus cranial-caudal robustness index (HCRI), and the index of
fossorial ability (IFA) were associated with body mass, while the
remaining four indices showed no significant association. HCRI
was the only index to show an interaction for sex, although there
was no significant interaction term between body mass and sex,
indicating that the allometric slopes between males and females
were the same.
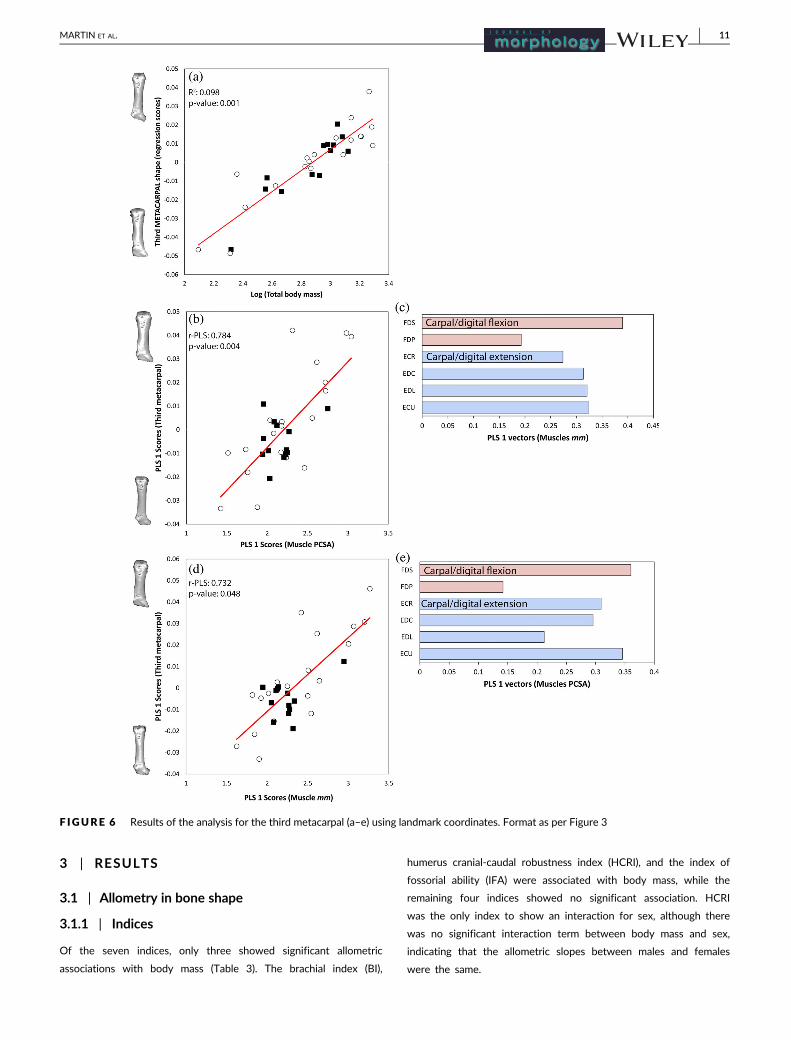
F IGURE 6 Results of the analysis for the third metacarpal (a–e) using landmark coordinates. Format as per Figure 3
MARTIN ET AL. 11
3.1.2 | Landmark coordinates
MANCOVA showed significant allometric associations between body
mass and bone shapes for the landmark coordinates for all four bones
(Table 3). Body mass explained between 8 and 16% of the shape vari-
ation, while sex explained less than 7% of the shape variation
(Figure 3a, 4a, 5a, 6a). Allometry in scapular shape was primarily evi-
dent in the cranial and caudal borders as well as the shape and relative
size of the glenoid cavity and coracoid process. The humerus primarily
changed in the deltopectoral crest and the epicondyles. Shape varia-
tion in the ulna was primarily in the trochlear notch. The third meta-
carpal showed minimal shape change to the proximal end of the bone,
although this shape change was strongly associated with body mass.
Only the third metacarpal showed a significant sex difference the
change of shape (4.8% of variance). The interaction terms between
body mass and sex for all four bones were not significant, which indi-
cates that allometric slopes did not differ between the sexes. Due to
these negligible sex differences, the sexes were pooled for all further
analyses.
3.2 | Covariation between bone shape and forelimbmuscle anatomy
3.2.1 | Indices
Four of the bone shape indices—BI, HTRI (the humerus transverse
robustness index), HCRI and IFA—showed significant covariation asso-
ciated with muscle mass; three of these—BI, HCRI, IFA—were those
indices also correlated with body mass. Two indices covaried with
muscle PCSA: HCRI, SMI (shoulder moment index; Table 4). When
allometric relationships were removed, only two indices retained sig-
nificant covariation: URI (ulna robustness index) covaried with muscle
mass (largely the FCR [flexor carpi radialis], and FDS [flexor digitorum
superficialis]), while SMI covaried with muscle PCSA (largely driven by
the Inf [infraspinatus], and LtD [latissimus dorsi]).
3.2.2 | Landmark coordinates
Covariation between the landmark coordinates and forelimb muscle
anatomy (both mass and PCSA) was evident for the scapula, humerus,
and third metacarpal; no covariation was seen between the ulnar
shape and muscle anatomy. When the influence of body mass was
removed (analysis of residuals), covariance remained significant in all
bones except between scapula shape and muscle PCSA (Table 4).
Variation in muscle anatomy was associated with changes in the
scapular shape at the cranial and caudal borders, as well as the scapu-
lar spine, and therefore change in shape of the infraspinous, sup-
raspinous, and subscapular fossae (Figure 3b,d). Scapular shape varied
with mass of the omotransversarius (OmT), rhomboideus (Rho), and
infraspinatus (Inf) (Figure 3c). Muscle PCSA varied additionally with
the subscapularis (Sub) (Figure 3e) although this association was not
significant when using the residual data. Individuals with more
massive muscles and greater PCSA values had a scapula with a rela-
tively more rounded and wide supraspinous fossa.
For the humerus, variation in muscle anatomy was associated with
changes in the humeral capitulum, lesser tuberosity and the pectoral
ridge, and therefore changes in articulation at the elbow joint, and
muscle origin and insertion points (Figure 4b,d). Humeral shape varied
with mass of the carpal/digital extensors, pectoralis (Pec), and the pro-
nator teres (PrT) (Figure 4c). Humeral shape varied with PCSA of the
subscapularis (Sub), infraspinatus (Inf), and extensor carpi radialis
(ECR) (Figure 4e). Individuals with more massive muscles and greater
PCSA values had a larger lesser tuberosity and a rotated/bowed
humeral shaft.
There was no significant covariation between muscle anatomy
(mass and PCSA) and ulnar shape (Figure 5b,d). The shape change evi-
dent in the ulna was concentrated at the trochlear notch, coronoid
process, and olecranon, and therefore changes in the articulation sur-
face and the insertion for triceps brachii.
For the third metacarpal, variation in muscle anatomy was associ-
ated with changes in the proximal end shape and shaft robustness
(Figure 6b,d), and therefore changes in the articulation surface with
the carpal bones. Shape of the third metacarpal varied with mass of
the flexor digitorum superficialis (FDS), extensor carpi ulnaris (ECU),
and extensor digitorum lateralis (EDL). Shape of the third metacarpal
varied with PCSA (Figure 6e) of flexor digitorum superficialis (FDS)
and extensor carpi radialis (ECR). Individuals with more massive mus-
cles and greater PCSA values had a more robust metacarpal shaft.
4 | DISCUSSION
Few studies in the literature have assessed the relationship between
muscle anatomy and bones, and rarely have quantified the covariation
of the forelimb muscle anatomy with bone shape (Cornette, Baylac,
Souter, & Herrel, 2013; Fabre et al., 2014, 2018). We present the first
study to demonstrate strong quantitative relationships between mus-
cle anatomy and bone shape in limbs of a digging mammal. Indepen-
dent of the allometric relationships with body mass, we identified
strong correlations between muscle anatomy (mass and PCSA) and
forelimb bone shape (quantified using landmark coordinates) in the
Quenda. This study is therefore an important step to understand how
the musculoskeletal system functions, and can be used to formulate
questions concerning the functional significance of morphological
traits in the forelimb.
4.1 | Sex differences in bone shape change
Quenda are sexually dimorphic in body mass (Warburton & Trav-
ouillon, 2016) and we therefore predicted that there may be some sex
differences in forelimb musculature or bone shape. Despite these dif-
ferences, we previously identified that Quenda forelimb muscle anat-
omy (muscle mass, PCSA, and fiber length) showed no significant
difference between the sexes (Martin et al., 2019). Furthermore, there
were only minor sex differences in a single forelimb bone in the
12 MARTIN ET AL.
Quenda in the present study; the third metacarpal showed shape dif-
ferences between the sexes, with males having a smaller, less elon-
gated proximal end. These minor differences in bone shape
development, which were likely to be driven by body mass and associ-
ated forelimb muscle anatomy, were unlikely to result in major func-
tional differences in forelimb mechanics between males and females.
4.2 | Indices associated with body mass and muscleanatomy
The indices are ratios of the forelimb bones and represent relative
proportions that are commonly used to determine locomotion and
digging ability (Lagaria & Youlatos, 2006; Rose et al., 2014). While typ-
ically used to distinguish between species of differing digging,
climbing and running abilities (Hopkins & Davis, 2009), these indices
are rarely used for single-species ontogenetic studies. Since the ratio
of bone proportions within one species likely exhibits less variability
(intraspecific variation) compared with the large variability evident
between species (interspecific variation), it was unsurprising that the
seven bone indices showed little association with muscle anatomy in
this ontogenetic study. However, the BI, HCRI, and IFA all increased
with body mass in the Quenda, suggesting increased mechanical adap-
tation for digging as individuals grow.
The BI reflects the relative distal out-lever length and therefore
mechanical leverage able to be applied across the whole limb.
Throughout the literature, semi-fossorial species often show small
values for the BI (Vizcaíno, Farina, & Mazzetta, 1999; Vizcaíno &
Milne, 2002). BI increased with body mass in the Quenda, which was
unexpected as digging species generally show relatively shorter fore-
arms (Warburton et al., 2013).
Greater values for the two humeral robustness indices (HTRI or
HCRI) is a common finding for digging mammals (Elissamburu & de
Santis, 2011; Lagaria & Youlatos, 2006). Digging mammals that
employ a sprawled and abducted limb during humeral rotation digging,
such as echidnas (Tachyglosidae) and moles (Talpidae) (Barnosky,
1981; Hopkins & Davis, 2009), have an increased robustness in the
transverse axis. By contrast, the HCRI (rather than HTRI) increased
significantly with body mass in Quenda. These animals scratch-dig in
an cranial-caudal plane (parasagittal), and therefore forces are concen-
trated in this axis (Warburton et al., 2013). The HCRI therefore cap-
tures the ability of the humerus to resist the high bending loads in this
plane.
Lastly, of all the indices, IFA is reported to be the best predictor of
fossorial ability (Elissamburu & Vizcaíno, 2004; Lagaria & Youlatos,
2006; Rose et al., 2014; Vizcaíno et al., 1999; Vizcaíno & Milne, 2002;
Warburton et al., 2013). It is likely that IFA increases with body mass
to increase the mechanical advantage of the triceps and elbow exten-
sor muscles.
Few indices also showed covariation with both the residual muscle
masses (URI) and PCSA (SMI). For URI, robustness of the ulna is
potentially driven by antebrachium muscle mass. SMI covaried with
muscle PCSA and showed shape change in the deltoid and pectoral
ridge, which is reasonable as SMI represents the mechanical advan-
tage of the pectoral and deltoid muscles across the shoulder. Few of
the indices showed significant covariation with muscle anatomy, and
indices therefore show limited use for predicting muscle anatomy in
the forelimb.
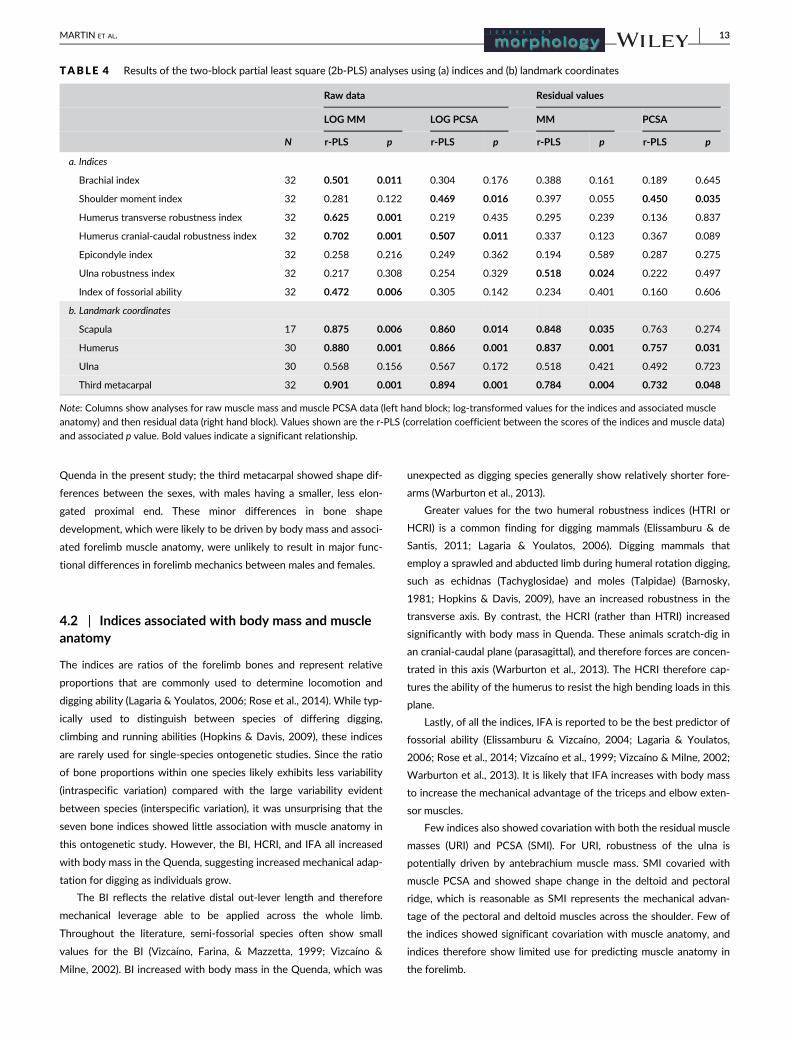
TABLE 4 Results of the two-block partial least square (2b-PLS) analyses using (a) indices and (b) landmark coordinates
Raw data Residual values
LOG MM LOG PCSA MM PCSA
N r-PLS p r-PLS p r-PLS p r-PLS p
a. Indices
Brachial index 32 0.501 0.011 0.304 0.176 0.388 0.161 0.189 0.645
Shoulder moment index 32 0.281 0.122 0.469 0.016 0.397 0.055 0.450 0.035
Humerus transverse robustness index 32 0.625 0.001 0.219 0.435 0.295 0.239 0.136 0.837
Humerus cranial-caudal robustness index 32 0.702 0.001 0.507 0.011 0.337 0.123 0.367 0.089
Epicondyle index 32 0.258 0.216 0.249 0.362 0.194 0.589 0.287 0.275
Ulna robustness index 32 0.217 0.308 0.254 0.329 0.518 0.024 0.222 0.497
Index of fossorial ability 32 0.472 0.006 0.305 0.142 0.234 0.401 0.160 0.606
b. Landmark coordinates
Scapula 17 0.875 0.006 0.860 0.014 0.848 0.035 0.763 0.274
Humerus 30 0.880 0.001 0.866 0.001 0.837 0.001 0.757 0.031
Ulna 30 0.568 0.156 0.567 0.172 0.518 0.421 0.492 0.723
Third metacarpal 32 0.901 0.001 0.894 0.001 0.784 0.004 0.732 0.048
Note: Columns show analyses for raw muscle mass and muscle PCSA data (left hand block; log-transformed values for the indices and associated muscle
anatomy) and then residual data (right hand block). Values shown are the r-PLS (correlation coefficient between the scores of the indices and muscle data)
and associated p value. Bold values indicate a significant relationship.
MARTIN ET AL. 13
4.3 | Landmark coordinates associated with bodymass and muscle anatomy
The shape of all four forelimb bones of the Quenda changed with
allometry and showed strong covariation with forelimb muscle mass
and PCSA. Although the strongest relationships were exhibited for
body mass, even the residual muscle and bone shape data showed sig-
nificant relationships. The minimal difference between the strength of
covariation calculated from log-transformed muscle anatomy and the
residual muscle anatomy suggests that the association of muscle on
bone shape is not just associated with allometry, but other factors
also contribute.
In response to both increasing body mass and increasing muscu-
larity, the scapula became more rounded, showed an increase in sur-
face area (specifically infraspinous and supraspinous fossae), and
widening of the acromion. The infraspinatus and supraspinatus drove
this shape change and their large fleshy origins were likely to be a
stronger influence on scapular shape compared with the influence of
discrete or tendinous insertions shown by other muscles. The broad
scapula seen in the Quenda is commonly seen in digging mammals
(Hildebrand, 1985; Moore et al., 2013; Rose et al., 2014) and assists in
stabilizing the shoulder by increasing surface area for the rotator cuff
muscles, increasing force output while digging (Argot, 2001; Jenkins,
1973; Warburton et al., 2013).
Allometry with body mass and covariation with muscle anatomy
showed the humerus became more robust (wider humeral shaft) with
an increased pectoral ridge and lesser tuberosity, while the capitulum
decreased in relative size. Larger specimens had relatively smaller dis-
tal joints, a pattern that has also been observed for extant and fossil
armadillos (order Cingulata; Milne et al., 2009) and has been attributed
to allometric principles, in that the surface area of bone increases in
proportion to the square of the length increase. Different muscles
covaried with humeral shape for the analyses of muscle mass or PCSA
measures, suggesting that muscle size and force production influence
humeral shape differently. Rotation of the pectoral ridge would be
driven by an increase in the pectoralis muscle mass and by the distal
insertion of the pectoralis, an observation that has been noted previ-
ously (Warburton et al., 2013). Enlarged deltopectoral ridges are asso-
ciated with digging (Milne et al., 2009) as well as a large lesser
tuberosity, which allows for increased surface area for the sub-
scapularis to stabilize the shoulder joint (Argot, 2001).
Shape of the ulna showed the weakest association with body mass
and muscle anatomy, suggesting that there was substantial variation
in ulnar shape, which did not strongly reflect ontogeny. The patterns
that were observed align with previous studies showing that digging
species develop a deeper concave trochlea surface to stabilize the
elbow joint (Rose et al., 2014; Sesoko et al., 2015) and limit rotation in
the elbow (Andersson, 2004; Argot, 2001; Jenkins, 1973). Interest-
ingly, the ulna robustness index (URI) significantly covaried with mus-
cle mass; therefore, the URI may be better than landmark coordinates
in representing muscles around the ulna.
The minimal shape change in proximal end of the third metacarpal
bone was strongly associated with body mass and muscle anatomy.
Digging mammals have relatively short and robust metacarpals with
elongated claws to provide great out-forces for digging (Hildebrand,
1985; Moore et al., 2013; Salton & Sargis, 2008). All the forces gener-
ated throughout the limb are concentrated into the metacarpals and
claws to cut through compact soil (Rose et al., 2014). Therefore, the
metacarpals would be subject to large selective pressures. This may
explain the strong patterns we observed, despite little obvious shape
change.
4.4 | Comparison of indices and landmarkcoordinates reveals the strengths and limitations ofboth methods
Indices were designed to be a proxy of fossorial ability across a wide
variety of taxa (Hopkins & Davis, 2009) using large sample sizes. We
found that indices were largely unable to distinguish small changes in
the forelimb that occur in an ontogenetic series, probably because
many of the changes in the bones are not captured in the linear mea-
surements (Zelditch, Swiderski, & Sheets, 2004). Compared with bone
indices, Quenda bone shape captured as three-dimensional landmarks
more strongly covaried with muscle anatomy. Landmark and semi-
sliding landmarks allow for detailed comparison (Bernal, 2007; Breno
et al., 2011; Maderbacher et al., 2008), and the landmark coordinate
method is therefore the most suitable to represent/act as a proxy for
muscle anatomy in an ontogenetic study. Our data was collected
through 3D digital methods (micro-CT); however, landmarking is also
possible from photographs (2D) which is an inexpensive and time effi-
cient method of landmarking. Arguably, 2D and 3D produce similar
results (e.g., Buser, Sidlauskas, & Summers, 2018; Cardini, 2014).
5 | CONCLUSIONS
We present the first study to show a strong association between mus-
cle anatomy and bone shape irrespective of their inherent allometric
correlations with body mass. Allometry with body mass was a large
driver of bone shape, but we also identify relationships between mus-
cle anatomy (mass and PCSA) that determined bone shape in the
Quenda. Notably, muscles that were drivers on the bone shape were
shoulder stabilisers and humeral retractors (main movers in the power
stroke of digging), vital for generating large out-forces and pulling the
forelimbs horizontally against the resistance of the soil in this digging
species. Our results show that bone shape (3D landmarks) can be a
good proxy for muscle anatomy, and bone shape analysis could there-
fore be used in the future for reconstructions of extinct species.
ACKNOWLEDGMENTS
The authors acknowledge the facilities, and the scientific and technical
assistance of the National Imaging Facility at the Centre for Micros-
copy, Characterisation & Analysis, The University of Western
Australia, a facility funded by the University, State and Common-
wealth Governments. The authors also thank Kanyana Wildlife
14 MARTIN ET AL.
Rehabilitation Centre for access to specimens. This study was carried
out with the technical support at Murdoch University, and we thank
Diana Nottle, Zsa Zsa Wong, and Joe Hong for their assistance. Finan-
cial support was provided by Murdoch University.
CONFLICT OF INTEREST
We have no competing interests to declare.
AUTHOR CONTRIBUTIONS
M.L.M. collect specimens, carried out all scanning and processing of
specimens, landmarked all the specimens, undertook statistical analy-
sis, and drafted the manuscript. K.J.T. drafted the manuscript, ES
assisted in statistical analysis and drafted the manuscript,
P.A.F. assisted in statistical analysis and drafted the manuscript, and
N.M.W. collected specimens and drafted the manuscript. All authors
contributed to the experimental design and gave final approval for
publication.
ORCID
Meg L. Martin https://orcid.org/0000-0003-4924-309X
Kenny J. Travouillon https://orcid.org/0000-0003-1734-4742
Emma Sherratt https://orcid.org/0000-0003-2164-7877
Patricia A. Fleming https://orcid.org/0000-0002-0626-3851
Natalie M. Warburton https://orcid.org/0000-0002-8498-3053
REFERENCES
Adams, D. C., Collyer, M. L., & Sherratt, E. (2018). Geomorph: Software for
Geometric Morphometric Analyses. R Package Version 3.0.4. Retrieved
from http://cran.r-project.org/web/packages/geomorph/index.html.
Adams, D. C., & Otárola-Castillo, E. (2013). Geomorph: An r package for
the collection and analysis of geometric morphometric shape data.
Methods in Ecology and Evolution, 4(4), 393–399. https://doi.org/10.1111/2041-210X.12035
Adams, D. C., Rohlf, F. J., & Slice, D. E. (2013). A field comes of age: Geo-
metric morphometrics in the 21st century. Hystrix, the Italian Journal of
Mammalogy, 24(1), 7–14. https://doi.org/10.4404/hystrix-24.1-6283Andersson, K. I. (2004). Elbow-joint morphology as a guide to forearm
function and foraging behaviour in mammalian carnivores. Zoological
Journal of the Linnean Society, 142(1), 91–104. https://doi.org/10.
1111/j.1096-3642.2004.00129.x
Argot, C. (2001). Functional-adaptive anatomy of the forelimb in the
didelphidae, and the paleobiology of the paleocene marsupials May-
ulestes ferox and Pucadelphys andinus. Journal of Morphology, 247(1),
51–79. https://doi.org/10.1002/1097-4687(200101)247:1<51::AID-
JMOR1003>3.0.CO;2-%23
Barnosky, A. D. (1981). A skeleton of Mesoscalops (Mammalia, Insectivora)
from the Miocene deep river formation, Montana, and a review of the
Proscalopid moles: Evolutionary, functional, and stratigraphic relation-
ships. Journal of Vertebrate Paleontology, 1(3/4), 285–339. https://doi.org/10.1080/02724634.1981.10011904
Beck, R. M. D., Warburton, N. M., Archer, M., Hand, S. J., & Aplin, K. P.
(2016). Going underground: Postcranial morphology of the early Mio-
cene marsupial mole Naraboryctes philcreaseri and the evolution of
fossoriality in notoryctemorphians. Memoirs of Museum Victoria, 74,
151–171. https://doi.org/10.24199/j.mmv.2016.74.14
Bernal, V. (2007). Size and shape analysis of human molars: Comparing tra-
ditional and geometric morphometric techniques. Journal of Compara-
tive Human Biology, 58(4), 279–296. https://doi.org/10.1016/j.jchb.
2006.11.003
Böhmer, C., Fabre, A.-C., Herbin, M., Peigné, S., & Herrel, A. (2018). Ana-
tomical basis of differences in locomotor behaviour in martens: A com-
parison of the forelimb musculature between two sympatric species of
Martes. The Anatomical Record, 301(3), 449–472. https://doi.org/10.1002/ar.23742
Bonnan, M. F., Farlow, J. O., & Masters, S. L. (2008). Using linear and geo-
metric morphometrics to detect intraspecific variability and sexual
dimorphism in femoral shape in Alligator mississippiensis and its impli-
cations for sexing fossil Archosaurs. Journal of Vertebrate Paleontology,
28(2), 422–431. https://doi.org/10.1671/0272-4634(2008)28[422:
ULAGMT]2.0.CO;2
Breno, M., Leirs, H., & Van Dongen, S. (2011). Traditional and geometric
morphometrics for studying skull morphology during growth in
Mastomys natalensis (Rodentia: Muridae). Journal of Mammalogy, 92(6),
1395–1406. https://doi.org/10.1644/10-MAMM-A-331.1
Buser, T. J., Sidlauskas, B. L., & Summers, A. P. (2018). 2D or not 2D? Test-
ing the utility of 2D vs. 3D landmark data in geometric morphometrics
of the sculpin subfamily Oligocottinae (Pisces; Cottoidea). The Anatom-
ical Record, 301(5), 806–818. https://doi.org/10.1002/ar.23752Cardini, A. (2014). Missing the third dimension in geometric morphomet-
rics: How to assess if 2D images really are a good proxy for 3D struc-
tures? Hystrix, the Italian Journal of Mammalogy, 25(2), 73–81.Carlon, B. (2014). Functional limb morphology of extinct carnivores Smilodon
fatalis, Panthera atrox, and Canis dirus based on comparisons with four
extant felids and one extant canid. (Doctor of Philosophy). Northern Illi-
nois University.
Cornette, R., Baylac, M., Souter, T., & Herrel, A. (2013). Does shape co-
variation between the skull and the mandible have functional conse-
quences? A 3D approach for a 3D problem. Journal of Anatomy, 223
(4), 329–336. https://doi.org/10.1111/joa.12086Cornette, R., Tresset, A., & Herrel, A. (2015). The shrew tamed by Wolff's
law: Do functional constraints shape the skull through muscle and
bone covariation? Journal of Morphology, 276(3), 301–309. https://doi.org/10.1002/jmor.20339
Currey, J. D. (2013). Bones: Structure and mechanics. Princeton, New Jer-
sey: Princeton University Press.
Elissamburu, A., & de Santis, L. (2011). Forelimb proportions and fossorial
adaptations in the scratch-digging rodent Ctenomys (Caviomorpha).
Journal of Mammalogy, 92(3), 683–689. https://doi.org/10.1644/09-mamm-a-113.1
Elissamburu, A., & Vizcaíno, S. F. (2004). Limb proportions and adaptations
in caviomorph rodents (Rodentia: Caviomorpha). Journal of Zoology,
262(02), 145–159. https://doi.org/10.1017/S0952836903004485Fabre, A.-C., Andrade, D. V., Huyghe, K., Cornette, R., & Herrel, A. (2014).
Interrelationships between bones, muscles, and performance: Biting in
the lizard Tupinambis merianae. Evolutionary Biology, 41(4), 518–527.https://doi.org/10.1007/s11692-014-9286-3
Fabre, A.-C., Perry, J. M. G., Hartstone-Rose, A., Lowie, A., Boens, A., &
Dumont, M. (2018). Do muscles constrain skull shape evolution in
Strepsirrhines? The Anatomical Record, 301(2), 291–310. https://doi.org/10.1002/ar.23712
Goodall, C. (1991). Procrustes methods in the statistical analysis of shape.
Journal of the Royal Statistical Society: Series B (Methodological), 53(2),
285–321.Gordon, G., & Hulbert, A. J. (1989). Peramelidae. In D. W. Walton &
B. J. Richardson (Eds.), Fauna of Australia. Mammalia (Vol. 1B,
pp. 603–624). Canberra: Australian Government Publishing Service.
Hildebrand, M. (1985). Digging of quadrupeds. In M. Hildebrand,
D. M. Bramble, K. F. Liem, & B. D. Wake (Eds.), Functional vertebrate
MARTIN ET AL. 15
morphology (pp. 89–109). Cambridge, MA: The Blknap Press of Har-
vard Univeristy Press.
Hopkins, S. S. B., & Davis, E. B. (2009). Quantitative morphological proxies
for fossoriality in small mammals. Journal of Mammalogy, 90(6),
1449–1460. https://doi.org/10.1644/08-mamm-a-262r1.1
Jenkins, F. A. (1973). The functional anatomy and evolution of the mam-
malian humero-ulnar articulation. American Journal of Anatomy, 137(3),
281–297. https://doi.org/10.1002/aja.1001370304Klingenberg, C. P. (2016). Size, shape, and form: Concepts of allometry in
geometric morphometrics. Development Genes and Evolution, 226(3),
113–137. https://doi.org/10.1007/s00427-016-0539-2Lagaria, A., & Youlatos, D. (2006). Anatomical correlates to scratch digging
in the forelimb of European ground squirrels (Spermophilus citellus). Jour-
nal of Mammalogy, 87(3), 563–570. https://doi.org/10.2307/4094514Leischner, C. L., Crouch, M., Allen, K. L., Marchi, D., Pastor, F., &
Hartstone-Rose, A. (2018). Scaling of primate forearm muscle architec-
ture as it relates to locomotion and posture. The Anatomical Record,
301(3), 484–495. https://doi.org/10.1002/ar.23747Long, K. (2009). Burrowing bandicoots—An adaptation to life in a fire-
prone environment? Australian Mammalogy, 31(1), 57–59. https://doi.org/10.1071/AM08107
Maderbacher, M., Bauer, C., Herler, J., Postl, L., Makasa, L., &
Sturmbauer, C. (2008). Assessment of traditional versus geometric
morphometrics for discriminating populations of the Tropheus moorii
species complex (Teleostei: Cichlidae), a Lake Tanganyika model for
allopatric speciation. Journal of Zoological Systematics and Evolutionary
Research, 46(2), 153–161. https://doi.org/10.1111/j.1439-0469.2007.00447.x
Martin, M. L., Warburton, N., Travouillon, K. J., & Fleming, P. A. (2019).
Mechanical similarity across ontogeny of digging muscles in an
Australian marsupial (Isoodon fusciventer). Journal of Morphology, 280,
423–435. https://doi.org/10.1002/jmor.20954
McCabe, K., Henderson, K., Pantinople, J., Richards, H. L., & Milne, N.
(2017). Curvature reduces bending strains in the quokka femur. PeerJ,
5, e3100. https://doi.org/10.7717/peerj.3100
Milne, N., Vizcaíno, S. F., & Fernicola, J. C. (2009). A 3D geometric mor-
phometric analysis of digging ability in the extant and fossil cingulate
humerus. Journal of Zoology, 278(1), 48–56. https://doi.org/10.1111/j.1469-7998.2008.00548.x
Moore, A. L., Budny, J. E., Russell, A. P., & Butcher, M. T. (2013). Architec-
tural specialization of the intrinsic thoracic limb musculature of the
American badger (Taxidea taxus). Journal of Morphology, 274(1), 35–48.https://doi.org/10.1002/jmor.20074
Myatt, J. P., Crompton, R. H., Payne-Davis, R. C., Vereecke, E. E., Isler, K.,
Savage, R., … Thorpe, S. K. S. (2012). Functional adaptations in the
forelimb muscles of non-human great apes. Journal of Anatomy, 220(1),
13–28. https://doi.org/10.1111/j.1469-7580.2011.01443.xNoback, M. L., & Harvati, K. (2015). Covariation in the human masticatory
apparatus. The Anatomical Record, 298(1), 64–84. https://doi.org/10.1002/ar.23067
R Development Core Team. (2018). R: A language and environment for sta-
tistical computing. Retrieved from http://www.R-project.org/.
Rohlf, F. J., & Corti, M. (2000). Use of two-block partial least-squares to
study covariation in shape. Systematic Biology, 49(4), 740–753.https://doi.org/10.1080/106351500750049806
Rohlf, F. J., & Slice, D. (1990). Extensions of the procrustes method for the
optimal superimposition of landmarks. Systematic Biology, 39(1),
40–59. https://doi.org/10.2307/2992207Rose, J., Moore, A., Russell, A., & Butcher, M. (2014). Functional osteology
of the forelimb digging apparatus of badgers. Journal of Mammalogy,
95(3), 543–558. https://doi.org/10.1644/13-mamm-a-174
Salton, J. A., & Sargis, E. J. (2008). Evolutionary morphology of the Ten-
recoidea (Mammalia) carpal complex. Biological Journal of the Linnean
Society, 93(2), 267–288. https://doi.org/10.1111/j.1095-8312.2007.
00908.x
Sella-Tunis, T., Pokhojaev, A., Sarig, R., O'Higgins, P., & May, H. (2018). Human
mandibular shape is associated with masticatory muscle force. Scientific
Reports, 8(1), 6042. https://doi.org/10.1038/s41598-018-24293-3
Sesoko, N. F., Rahal, S. C., Bortolini, Z., de Souza, L. P., Vulcano, L. C.,
Monteiro, F. O. B., & Teixeira, C. R. (2015). Skeletal morphology of the
forelimb of Myrmecophaga tridactyla. Journal of Zoo and Wildlife Medi-
cine, 46(4), 713–722. https://doi.org/10.1638/2013-0102.1Thorpe, S. K. S., Crompton, R. H., Gunther, M. M., Ker, R. F., &
McNeill, A. R. (1999). Dimensions and moment arms of the hind- and
forelimb muscles of common chimpanzees (Pan troglodytes). American
Journal of Physical Anthropology, 110(2), 179–199. https://doi.org/10.1002/(SICI)1096-8644(199910)110:2<179::AID-AJPA5>3.0.CO;2-Z
Travouillon, K. J., & Phillips, M. J. (2018). Total evidence analysis of the phyloge-
netic relationships of bandicoots and bilbies (Marsupialia: Peramelemorphia):
Reassessment of two species and description of a new species. Zootaxa,
4378(2), 224–256. https://doi.org/10.11646/zootaxa.4378.2.3Vizcaíno, S., & Milne, N. (2002). Structure and function in armadillo limbs
(Mammalia: Xenarthra: Dasypodidae). Journal of Zoology, 257(1), 117–127.Vizcaíno, S. F., Farina, R. A., & Mazzetta, G. V. (1999). Ulnar dimensions
and fossoriality in armadillos. Acta Theriologica, 44, 309–320.Warburton, N. (2006). Functional morphology of marsupial moles
(Marsupialia: Notoryctidae). Verhandlungen Des Naturwissenschaftlichen
Vereins in Hamburg, 42, 39–149.Warburton, N. M., Grégoire, L., Jacques, S., & Flandrin, C. (2013). Adapta-
tions for digging in the forelimb muscle anatomy of the southern brown
bandicoot (Isoodon obesulus) and bilby (Macrotis lagotis). Australian Jour-
nal of Zoology, 61(5), 402–419. https://doi.org/10.1071/ZO13086
Warburton, N. M., & Travouillon, K. J. (2016). The biology and pal-
aeontology of the Peramelemorphia: A review of current knowledge
and future research directions. Australian Journal of Zoology, 64,
151–182. https://doi.org/10.1071/ZO16003
Wiley, D. F., Amenta, N., Alcantara, D. A., Ghosh, D., Kil, Y. J., Delson, E.,
Harcourt-Smith, W., Rohlf, F. J., St John, K., & Hamann, B. (2005, ).
Evolutionary morphing. Paper presented at the VIS 05. IEEE visualiza-
tion, Minneapolis, MN.
Williams, S. B., Wilson, A. M., Rhodes, L., Andrews, J., & Payne, R. C.
(2008). Functional anatomy and muscle moment arms of the pelvic
limb of an elite sprinting athlete: The racing greyhound (Canis
familiaris). Journal of Anatomy, 213(4), 361–372. https://doi.org/10.1111/j.1469-7580.2008.00961.x
Zelditch, M. L., Swiderski, D. L., & Sheets, H. D. (2004). Geometric morpho-
metrics for biologists: A primer. New York, NY: Academic Press.
Zelditch, M. L., Swiderski, D. L., & Sheets, H. D. (2012). Geometric morpho-
metrics for biologists: A primer (2nd ed.). Amsterdam: Elsevier.
SUPPORTING INFORMATION
Additional supporting information may be found online in the
Supporting Information section at the end of this article.
How to cite this article: Martin ML, Travouillon KJ,
Sherratt E, Fleming PA, Warburton NM. Covariation between
forelimb muscle anatomy and bone shape in an Australian
scratch-digging marsupial: Comparison of morphometric
methods. Journal of Morphology. 2019;1–16. https://doi.org/
10.1002/jmor.21074
16 MARTIN ET AL.