Course-Bank Management Co. Compare- IDLS & Bank Asia
109
ANALYSIS & COMPARISON OF BANK ASIA LIMITED AND IDLC FINANCE LIMITED Course: FIN435 Section: 1 Submitted to: M. Morshed (MDM) Senior Lecturer School of Business Submitted by: Md. Ferdous Khan Samuel 111 0706 030 Page | 1
-
Upload
md-ferdous-khan-samuel -
Category
Documents
-
view
278 -
download
0
Transcript of Course-Bank Management Co. Compare- IDLS & Bank Asia

ANALYSIS & COMPARISON OF BANK ASIA LIMITED AND IDLC FINANCE LIMITED
Course: FIN435Section: 1
Submitted to:
M. Morshed (MDM)
Senior Lecturer
School of Business
Submitted by:
Md. Ferdous Khan Samuel 111 0706 030
Page | 1

TABLE OF CONTENTS
1 EXECUTIVE SUMMARY....................................................................................................3
2 INTRODUCTION..................................................................................................................4
3 OBJECTIVES.........................................................................................................................5
4 METHODOLOGY.................................................................................................................6
5 LIMITATIONS......................................................................................................................7
6 OVERVIEW OF BANK ASIA LTD & IDLC FINANCE LTD.........................................8
7 FINDINGS AND ANALYSIS..............................................................................................11
7.1 EFFICIENCY................................................................................................................11
7.2 PROFITABILITY..........................................................................................................16
7.3 MARKET POSITION....................................................................................................27
7.4 LIQUIDITY....................................................................................................................29
7.5 FINANCIAL RISK.........................................................................................................33
7.6 INVESTORS’ VIEWPOINT.........................................................................................36
8 RECOMMENDATIONS.....................................................................................................42
9 CONCLUSION.....................................................................................................................44
10 BIBLIOGRAPHY................................................................................................................45
APPENDIX…………………………………………………………………………………46
Page | 2

EXECUTIVE SUMMARY
The report compares the performance of Bank Asia Limited, a commercial bank, and
IDLCFinance Limited, a non-bank financial institution, within the time period of 2008 to
2013, making use of financial statements such as balance sheet, profit & loss account, and all
other relevant data required for the purpose of analyzing the financial performances. Both the
bank and the non-bank are enlisted in the Dhaka Stock Exchange (DSE). The overall
performances were analyzed using various financial ratios regarding liquidity, efficiency,
financial risk, and profitability, market ratios. The resulting ratios were used to comparison
purposes in order to come up with the findings from the analysis.
The reportcovers the introduction, objectives, limitation, methodology, the overview of Bank
Asia Limited and IDLC Finance Limited,the findings and analysis with recommendations and
the conclusion. One of the major areas of this report is the findings and analysis section as it
discusses all the resulting information essential for potential investors. The appendix,
provided in the end, includes all the relevant calculations used throughout the report.
Page | 3

INTRODUCTION
Bank Asia Limited and IDLC Finance Limited, which is a non-bank financial institution, are
both enlisted in the Dhaka Stock Exchange (DSE). In this report, we compare the
performances between Bank Asia Limited, which is the assigned commercial bank, and IDLC
Finance Limited, which is the randomly selected non-bank financial institution. We are to
analyze both of their performances based on financial ratios and come up with the findings
and conclusion.
Bank Asia has been launched by a group of successful entrepreneurs with recognized
standing in the society. It set milestone by acquiring the business operations of the Bank of
Nova Scotia in Dhaka, first in the banking history of Bangladesh. It again repeated the
performance by acquiring the Bangladesh operations of Muslim Commercial Bank Ltd.
(MCB), a Pakistani bank. In the year 2003, the Bank again came to the limelight with
oversubscription of the Initial Public Offering of the shares of the Bank, which was a record
(55 times) in our capital market's history and its shares commands respectable premium. The
asset and liability growth has been remarkable. Bank Asia Limited started its service with a
vision to serve people with modern and innovative banking products and services at
affordable charge. Being parallel to the cutting edge technology the Bank is offering online
banking with added delivery channels like ATM, Tele-banking, SMS and Net Banking. And
as part of the bank's commitment to provide all modern and value added banking service in
keeping with the very best standard in a globalize world.
IDLC was initially established in Bangladesh in 1985 through the collaboration of
International Finance Corporation (IFC) of the World Bank, German Investment and
Development Company (DEG), Kookmin Bank and Korean Development Leasing
Corporation of South Korea, the Aga Khan Fund for Economic Development, the City Bank
Limited, IPDC of Bangladesh Limited, and SadharanBima Corporation. As the company
evolved, initial foreign shareholding of 49% was gradually withdrawn and the last foreign
shareholding was bought out by local sponsors in 2009. IDLC has grown to become the
largest multi-product non-bank financial institution of Bangladesh with almost equal focus in
Corporate, Retail and SME sectors. Moreover, IDLC has a significant presence in the Capital
Markets. Its merchant banking arm, IDLC Investments Limited, a wholly-owned subsidiary
of IDLC is a premier brand for investment banking in the country. Its stock brokerage arm,
Page | 4
IDLC Securities Limited, another wholly-owned subsidiary of IDLC is also amongst the top
five brokers in the country.
OBJECTIVES
The objective of the project is to evaluate the performances of Bank Asia Limited and IDLC
Finance Limited. The primary objective of the term paper is to analyze the performance of
Bank Asia Limited and IDLC Finance Limited in terms of their liquidity positions, financial
risk positions, efficiency ratios, profitability ratios, market positions and investors’ view
point. Their performances will be calculated and analyzed over the period between 2008 and
2013 using both time series and cross-sectional analysis. Based on the ratios calculated, the
resulting findings will be discussed.
As a result, the findings or resulting information will be useful to assess the overall
performances of Bank Asia Limited and IDLC Finance Limited which can be used as the
basis for investment decisions by potential investors. Thus, performances are also analyzed
according to investors’ view point. Lastly, some recommendations on policy implementation
are provided which can be used to enhance their performances.
Page | 5

METHODOLOGY
The financial data for all the years between 2008 and 2013 have been collected from the
annual reports of Bank Asia Limited and IDLC Finance Limited available in their respective
websites. Using the financial data provided in the annual reports, all the required ratios were
calculated accordingly. After analyzing the performances of the bank and non-bank financial
institution individually through both time series and cross-sectional analysis, their overall
performances throughout the periods were compared.Then, the resulting findings were
revealed and discusses in the findings and analysis section. Lastly, a list of suggestions and
recommendations were discussed regarding which one would be better to invest as a potential
investor.
Page | 6

LIMITATIONS
In the course of attempting to successfully complete the term paper with effective results,
certain limitations were inevitable. There were several limitationsthat restricted the ability to
disclose some of the information of both Bank Asia Limited and IDLC Finance Limited. The
number of limitations includes the following:
Since the performance analysis has been done based on the financial data of the last
few years only, the results might be limited to a certain extent.
The findings are based only on the outcomes of the financial ratios. The findings and
recommendations do not reflect the future perspectives of the bank and the non-bank
financial institution.
The annual reports may have limitations in terms of data discrepancies which make it
difficult to calculate some ratios and thus affect the quality of the analysis or
comparison to some extent.
During the completion of the term paper, few ratios could not be dealt with due to the
absence of required relevant information in the annual reports of Bank Asia Limited
and IDLC Finance Limited. Thus, some relevant information could not be addressed.
Page | 7

OVERVIEW OF BANK ASIA LIMITED
Bank Asia Limited set milestone by acquiring the business operations of the Bank of Nova
Scotia in Dhaka, first in the banking history of Bangladesh. It again repeated the performance
by acquiring the Bangladesh operations of Muslim Commercial Bank Ltd. (MCB), a
Pakistani bank.
The asset and liability growth has been remarkable. Bank Asia has been actively participating
in the local money market as well as foreign currency market without exposing the Bank to
vulnerable positions.Bank Asia Limited started its service with a vision to serve people with
modern and innovative banking products and services at affordable charge. Being parallel to
the cutting edge technology the Bank is offering online banking with added delivery channels
like ATM, Tele-banking, SMS and Net Banking. And as part of the bank's commitment to
provide all modern and value added banking service in keeping with the very best standard in
a globalize world.
Bank Asia is a third generation public limited commercial bank. It received the Certificate of
Incorporation on September 28, 1999 and came to operation on November 27, 1999. Now
after 12 faithful years of dedicated and reliable services, Bank Asia has created an envious
position for itself among the leading banks of the country with an Asset base of TK. 117
billion, Deposit of TK 95 Billion and 70+ outlets all over the country. But most importantly,
the Bank has an unsurpassed legacy attached with its image.
VISION
Bank Asia's vision is to have a poverty free Bangladesh in course of a generation in the new
millennium, reflecting the national dream. Its vision is to build a society where human dignity
and human rights receive the highest consideration along with reduction of poverty.
MISSION
To assist in bringing high quality service to our customers and to participate in the
growth and expansion of our national economy
To set high standards of integrity and bring total satisfaction to our clients,
shareholders and employees
Page | 8

To become the most sought after bank in the country, rendering technology driven
innovative services by our dedicated team of professionals
CORE VALUES
Place customer interest and satisfaction as first priority and provide customized
banking products and services
Value addition to the stakeholders through attaining excellence in banking operations
Maintain high ethical standard and transparency in dealings
Be a compliant institution through adhering to all regulatory requirements
Contribute significantly for the betterment of the society
Ensure higher degree of motivation and dignified working environment for our human
capital and respect optimal work-life balance
Committed to protect the environment and go green
OVERVIEW OF IDLC FINANCE LIMITED
IDLC was initially established in Bangladesh in 1985 through the collaboration of
International Finance Corporation (IFC) of the World Bank, German Investment and
Development Company (DEG), Kookmin Bank and Korean Development Leasing
Corporation of South Korea, the Aga Khan Fund for Economic Development, the City Bank
Limited, IPDC of Bangladesh Limited, and SadharanBima Corporation. As the company
evolved, initial foreign shareholding of 49% was gradually withdrawn and the last foreign
shareholding was bought out by local sponsors in 2009.
IDLC has grown to become the largest multi-product Non-Bank Financial Institution of
Bangladesh, with almost equal focus in Corporate, Retail and SME sectors. IDLC has a
significant presence in the capital markets.Over the years, IDLC has attained a significant
presence in the corporate sector of Bangladesh. IDLC continues to play a pioneering role in
introducing and popularizing a variety of financial instruments suiting ever-changing
requirements of its fast-growing clients.
IDLC Finance Limited has two subsidiaries:IDLC Securities Limited and IDLC Investments
Limited.IDLC Securities Limited, a fully-owned subsidiary of IDLC, offers full-fledged
international standard brokerage services for both its retail and institutional clients. It has
Page | 9

seats on both Dhaka Stock Exchange Limited and Chittagong Stock Exchange Limited. It is
also a Depository Participant (DP) of Central Depository Bangladesh Limited (CDBL).As per
requirement of the Securities & Exchange Commission (SEC), IDLC formed a separate
subsidiary on May 19, 2010 in the name of ‘IDLC Investments Limited’, in order to transfer
its existing merchant banking activities to the newly formed entity. IDLC applied to SEC to
transfer the existing merchant banking license of IDLC Finance Limited to IDLC Investments
Limited. Accordingly, IDLC Investments Limited has started its operations from August 16,
2011 to offer merchant banking services to both its individual and institutional clients.
VISION
To be the best financial brand in the country.
MISSION
To focus on quality growth, superior customer experience and sustainable business practices.
Strategic Objectives – 2012/2013
Grow and develop our talent pool
Fully leverage new core banking platform
Optimize distribution points
Grow and diversify funding sources
Grow sales and service capabilities in Consumer Division
Aggressively grow SME portfolio
Focus on top-tier clients in Corporate
Consolidate capital market operations and enhance capabilities
Embrace internationally accepted corporate governance and sustainable business
practices
Page | 10

FINDINGS & ANALYSIS
EFFICIENCY RATIOS
Asset Management Efficient/ Asset Utilization
2009 2010 2011 2012 2013Bank Asia 6.01% 6.34% 5.64% 5.58% 5.16%
IDLC 8.43% 11.31% 6.93% 6.36% 5.48%
2009 2010 2011 2012 20130.00%
2.00%
4.00%
6.00%
8.00%
10.00%
12.00%
Bank AsiaIDLC
Bank Asia: For Bank Asia, every 100 TK asset generates TK 6.01in operating revenue in the
year 2009. It indicates how efficiently Bank Asia manages its assets to generate revenue.
From the year 2009 to 2010, asset utilization increased slightly from 6.01% to 6.34%, but
then started decreasing in 2011and it fell to 5.16% in 2013. It means the bank’s assets have
not been managed efficiently enough generate more profit failing to allocate resources to the
right assets.
IDLC: For IDLC, every 100 TK asset generated TK 8.43in operating revenue in the year
2009. From year 2009 to 2010, asset utilization increased fairly from 8.43% to 11.31% but
then started to decrease gradually from 2011 and fell to 5.48% in the year 2013. Thus, IDLC
has not been able to maintain stability in its asset utilization failing to allocate its resources to
the appropriate assets.
Cross-sectional analysis: Over the five year period, the asset utilization position was more
or less same for the both Bank Asia and IDLC. In 2010,both experienced an increase in asset
utilization. From the year 2011, both of them began experiencing a gradual decrease in the
ratio till the year 2013. At the end of the five year period, both of them were almost in the
Page | 11

same position in terms of the efficiency in asset management that is they were almost similar
in utilizing their assets.
Tax Management Efficiency
2009 2010 2011 2012 2013Bank Asia 58.05% 53.91% 56.54% 31.7% 39.1%
IDLC 64.54% 67.84% 41.12% 56.93% 50.52%
2009 2010 2011 2012 20130.00%
10.00%
20.00%
30.00%
40.00%
50.00%
60.00%
70.00%
80.00%
Bank AsiaIDLC
Bank Asia: From 2009 to 2010, tax management efficiency for Bank Asia decreased from
58.05% to 53.91% which indicates that the bank is paying huge taxes and it kept on
decreasing to reach at 39.1% in 2013. Overall, from the year 2009 till 2013, it shows a
decreasing trend of the ratio which is actually indicating poor efficiency of the bank
regarding its taxes.
IDLC: From 2009 to 2010, tax management efficiency for IDLC increased from 64.54% to
67.84% which indicates that it managed to reduce its tax. However, in the year 2011 the ratio
decreased significantly to 41.12% indicating its inability to manage tax efficiently resulting in
high taxes in the year 2011. The ratio again increased in the year 2012 to 56.93% but fell
again in the year 2013 to 50.52%. It shows its inability to maintain stability in tax
management efficiency.
Cross-sectional analysis: Both Bank Asia and IDLC have not been able to successfully
manage its tax expense. Both experienced a slight increase in one particular period but it was
only temporary and the ratio kept on declining till the end of 2013.Both are experiencing a
Page | 12

downward trend. However, IDLC has been able to recover and experience improvements in
some periods. Nevertheless, the ratio had declined for both of them.
Expense Control Efficiency
2009 2010 2011 2012 2013Bank Asia 55.36% 53.66% 54.31% 34% 40%
IDLC 66.58% 64.20% 56.33% 52.10% 47.97%
2009 2010 2011 2012 20130.00%
10.00%
20.00%
30.00%
40.00%
50.00%
60.00%
70.00%
Bank AsiaIDLC
Bank Asia: From 2009 to 2010, Bank Asia’s expense control efficiency declined
from55.36% to 53.66%. It means the bank was unable to efficiently control its operating
expenses in year 2010. In 2011, it increased slightly showing some efficiency in controlling
expenses. It declined again in 2012 to 34%. However, it increased again in 2013 reaching
40%. Overall, it recovered and was able to control its operating expenses in the year 2013.
IDLC: From 2009 to 2010, IDLC’s expense control efficiency decreasedfrom 66.58 % to
64.20%. It means it was also unable to efficiently control its operating expenses in the year
2010. IDLC’s expense control efficiency ratio kept on decreasing reaching at 47.97% in the
year 2013. Thus, it failed to manage and reduce its operating expenses efficiently.
Cross-sectional analysis: Overall, both of them failed to manage their operating expenses
and thus experienced decline in their expense control efficiency ratio. However, Bank Asia
was able to recover in some particular periods and manage its operating expenses. On the
Page | 13

other hand, IDLC followed a downward trend starting from 2009 till 2013 failing to manage
its operating expenses efficiently.
Operating Efficiency
2009 2010 2011 2012 2013Bank Asia 36.62% 36.31% 36.53% 36.46% 37.75%
IDLC 25.59% 31.70% 42.29% 44.03% 45.05%
2009 2010 2011 2012 20130.00%
5.00%
10.00%
15.00%
20.00%
25.00%
30.00%
35.00%
40.00%
45.00%
50.00%
Bank AsiaIDLC
Bank Asia: The operating efficiency of Bank Asia decreasedin slightly in the year 2010
showing some efficiency in managing its operating revenues to cover operating expenses. It
increased slightly in 2011 indicating somewhat inefficiency. However, it declined again to
36.46% in 2012 indicating recovery in efficiency. Lastly, in the year 2013 it increased again
to 37.75% showing that Bank Asia has been inefficient in managing its operating expenses in
relation to its generation of operating revenue.
IDLC: The operating efficiency of IDLC has increased over the five year period from
25.59% in 2009 to 45.05% in 2013. IDLC’s operating efficiency ratio shows a downward
trend and it indicates that it has been less efficient in managing its operating expenses in
relation to its operating revenue.
Cross-sectional analysis: The analysis suggests both of them have not been able to manage
their operating expenses efficiently in relation to their operating revenues. However, Bank
Asia has been somewhat efficient in managing its operating expenses in relation to its
operating revenue in some of the periods between the years 2009 and 2013.
Page | 14

Employee Productivity
2009 2010 2011 2012 2013Bank Asia TK.2,217,451 TK.2,893,711 TK.2,600,044 TK.1,760,349 TK.2,128,346
IDLC TK.5,033,256 TK.5,541,730 TK.2,974,578 TK.2,603,301 TK.2,064,176
2009 2010 2011 2012 20130
1,000,000
2,000,000
3,000,000
4,000,000
5,000,000
6,000,000
Bank AsiaIDLC
Bank Asia: The level of employee productivity increased initially in the year 2010. This
indicated that Bank Asia was able to efficiently utilize its human resources in order to
generate operating income. However, it started to decline in the year 2011 and dropped
further in 2012. In 2013, it recovered again and experienced an increase in employee
productivity compared to the year 2012.
IDLC: IDLC’slevel of employee productivity increased in the year 2010 showing its ability
to utilize its human resources efficiently to generate operating income. However, it started to
decline in the year 2011 and continued to decline till the year 2013 to reach TK.2,064,176.
This downward trend indicates that IDLC has not been able to utilize its human resources
efficiently to generate operating income.
Cross-sectional analysis: Overall, IDLC is following a downward trend and has not been
able to manage its human resources efficiently in generating operating income. Bank Asia
also experienced a decline in the two periods but was able to recover. Thus, compared to
IDLC, Bank Asia has been more efficient in managing its human resources to generate
operating income.
Page | 15

PROFITABILITY RATIOS
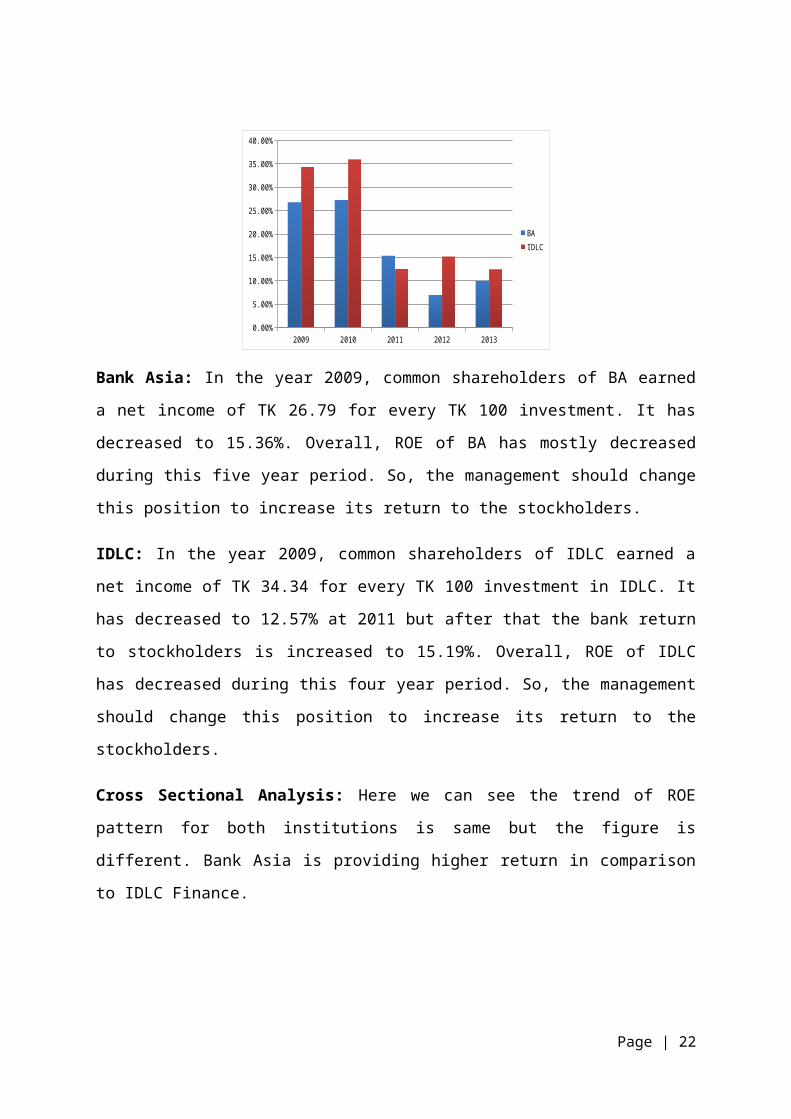
Return on Equity (ROE)
2009 2010 2011 2012 2013Bank Asia 26.79% 27.33% 15.36% 6.96% 9.99%
IDLC 34.34% 35.96% 12.57% 15.19% 12.48%
2009 2010 2011 2012 20130.00%
5.00%
10.00%
15.00%
20.00%
25.00%
30.00%
35.00%
40.00%
BAIDLC
Bank Asia: In the year 2009, common shareholders of BA earned a net income of TK 26.79
for every TK 100 investment. It has decreased to 15.36%. Overall, ROE of BA has mostly
decreased during this five year period. So, the management should change this position to
increase its return to the stockholders.
IDLC: In the year 2009, common shareholders of IDLC earned a net income of TK 34.34 for
every TK 100 investment in IDLC. It has decreased to 12.57% at 2011 but after that the bank
return to stockholders is increased to 15.19%. Overall, ROE of IDLC has decreased during
this four year period. So, the management should change this position to increase its return to
the stockholders.
Cross Sectional Analysis: Here we can see the trend of ROE pattern for both institutions is
same but the figure is different. Bank Asia is providing higher return in comparison to IDLC
Finance.
Page | 16

Return on Asset (ROA)
2009 2010 2011 2012 2013
Bank Asia 1.93% 1.83% 1.63% 0.65% 0.89%
IDLC 3.62% 4.93% 1.61% 1.87% 1.33%
2009 2010 2011 2012 20130.00%
1.00%
2.00%
3.00%
4.00%
5.00%
6.00%
BAIDLC
Bank Asia: In the year 2009, every TK 100 asset earned a net income of TK 1.93 for Bank
Asia. In 2010, it is decreased to 1.83% because relative increase in net income is greater than
relative increase in total assets. It means that managerial efficiency did not improved in 2010.
But in 2011, it decreased to 1.63% and continued till 2013 to 0.89% which means managers
were unsuccessful in increasing the bank’s net income after tax efficiently. Overall, ROA of
BA has decreased during this five year period.
IDLC: In the year 2009, every TK 100 asset earns a net income of TK 3.62 for IDLC
Finance Ltd. In 2010, it is increased to 4.93% because relative increase in net income is
greater than relative increase in total assets. It means that managerial efficiency is improved
in 2010. But in 2011, it decreased to 1.61% and it continued till 2013 and it was 1.33 %which
means managers failed to increase the bank net income after tax efficiently. Overall, ROA of
IDLC has decreased during this five year period.
Cross Sectional Analysis: In ROA, we can see that Bank Asia has less return than IDLC
Finance Ltd. And in 2011, Bank Asia earned more ROA than IDLC though it was declined
from previous two years. Bank Asia earned more return on its total assets.
Page | 17

Net Interest Margin
2009 2010 2011 2012 2013
Bank Asia 2.55% 2.81% 2.29% 2.62% 1.94%
IDLC 3.94% 4.69% 5.06% 4.63% 4.12%
2009 2010 2011 2012 20130.00%
1.00%
2.00%
3.00%
4.00%
5.00%
6.00%
BAIDLC
Bank Asia: From 2009 to 2010, net interest income for Bank Asia (interest income – interest
expense) increases from 2.55% to 2.81% and it continued till 2012 and it was 2.62% because
relative change in interest income is greater than relative increase in interest expense and total
assets. But in 2013 net interest margin decreases to 1.94 % because net interest income
decreased but total interest expense and total assets increased.
IDLC: From 2009 to 2010, net interest margin for IDLC increased from 3.94% to 4.69%
because relative change in net interest income is higher than relative increase in interest
expense and total assets. In 2011, it increased to 5.06% because they could not earn much
from their loan. But again can observe a positive change in NIM in 2013 which is a good sign
for bank.
Cross Sectional Analysis: Though both banks are in the decreasing rate in 2011 compare to
2010, IDLC is in the good position compare to Bank Asia In 2011but competitor bank is
doing well in net interest margin overall . So, in the cross sectional analysis we can see that
Bank Asia is in not in better position than IDLC.
Page | 18

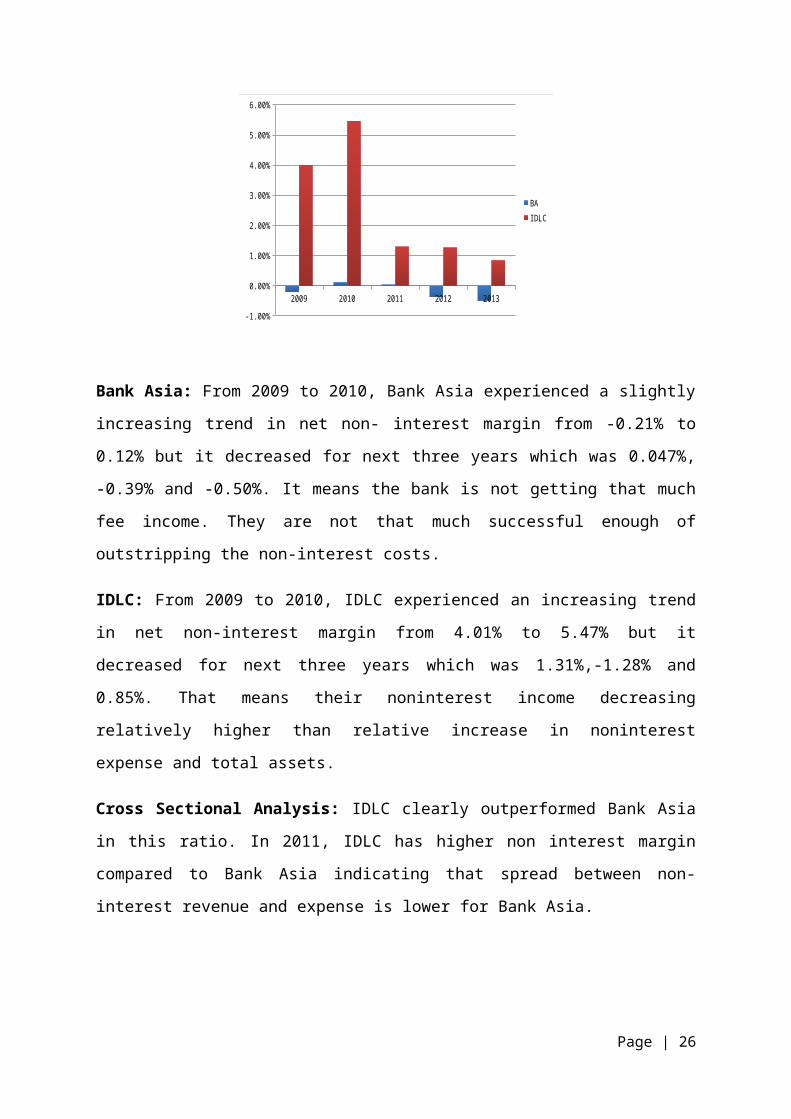
Net Non Interest Margin
2009 2010 2011 2012 2013
Bank Asia -0.21% 0.12% 0.047% -0.39% -0.50%
IDLC 4.01% 5.47% 1.31% 1.28% 0.85%
2009 2010 2011 2012 2013
-1.00%
0.00%
1.00%
2.00%
3.00%
4.00%
5.00%
6.00%
BAIDLC
Bank Asia: From 2009 to 2010, Bank Asia experienced a slightly increasing trend in net
non- interest margin from -0.21% to 0.12% but it decreased for next three years which was
0.047%, -0.39% and -0.50%. It means the bank is not getting that much fee income. They are
not that much successful enough of outstripping the non-interest costs.
IDLC: From 2009 to 2010, IDLC experienced an increasing trend in net non-interest margin
from 4.01% to 5.47% but it decreased for next three years which was 1.31%,-1.28% and
0.85%. That means their noninterest income decreasing relatively higher than relative
increase in noninterest expense and total assets.
Cross Sectional Analysis: IDLC clearly outperformed Bank Asia in this ratio. In 2011,
IDLC has higher non interest margin compared to Bank Asia indicating that spread between
non-interest revenue and expense is lower for Bank Asia.
Page | 19

Net Bank Operating Margin
2009 2010 2011 2012 2013
Bank Asia 2.34% 2.93% 2.34% 2.22% 1.44%
IDLC 6.27% 7.73% 4.00% 3.56% 3.01%
2009 2010 2011 2012 20130.00%
1.00%
2.00%
3.00%
4.00%
5.00%
6.00%
7.00%
8.00%
9.00%
BAIDLC
Bank Asia: From 2009 to 2010, net operating margin for Bank Asia increased from 2.34% to
2.93% but then decreased slowly to 2.22% in 2012 and continued till 2013 and it was 1.44%.
This tells us that in the relative spread in operating revenue and operating expense decreased
by a larger amount than relative decrease in total assets so there is lack of operating revenue
to cover the operating cost compare to 2009 & 2010.
IDLC: From 2009 to 2010, net operating margin for IDLC increased from 6.27% to 7.73%
but then decreases to 3.56% in 2012 and continued this downward trend till 2013 which was
3.01%. This tells us that in 2012 & 2013 the relative spread in operating revenue and
operating expense decreased by a larger amount than relative decrease in total assets so there
is lack of operating revenue to cover the operating cost compare to previous two years 2010
and 2009.
Cross Sectional Analysis: In 2013, operating margin decreased for both banks but over 5
years and also in 2010IDLC has higher operating margin indicating that it is more profitable.
Page | 20

Earnings Per Share (EPS)
2009 2010 2011 2012 2013
Bank Asia 6.19 6.43 3.65 1.44 2.10
IDLC 13.70 13.41 5.05 4.43 4.16
2009 2010 2011 2012 20130
2
4
6
8
10
12
14
16
BA
Bank Asia: There is a significant decrease in EPS over the last five years. It came down from
Tk. 6.19 in 2009 to Tk. 2.10 in 2013. The outcome can be explained by the huge increase in
the total number of common stock outstanding over the years. An EPS of Tk. 2.10 suggests
that BA has earned Tk. 2.10 for every unit of common stock
IDLC: There is a significant decrease in EPS over the last five years. It came down from Tk.
13.7 in 2009 to Tk. 4.16 in 2013. The outcome is such due do the huge increase in the total
number of common stock outstanding as when compared to that of 2009. An EPS of Tk. 4.16
suggests that IDLC has earned Tk. 4.16 for every unit of common stock.
.Cross Sectional Analysis: Although both financial institutions show a decreasing trend in
their values of EPS, the above data suggests that overall BA has a lower EPS than that of
IDLC. This indicates that BA is earning lower income for each unit of share against IDLC.
Dividend Per Share (DPS)
Page | 21
2009 2010 2011 2012 2013
Bank Asia 4 4 2 1 1
IDLC 5.5 6.06 2.5 2.31 3
2009 2010 2011 2012 20130
1
2
3
4
5
6
7
BAIDLC
Bank Asia: There is a significant decrease in DPS over the last five years. It came down
from Tk4 in 2009 to Tk1 in 2013. This can be explained by the huge increase in the total
number of common stock outstanding when compared to that of 2009. The dividend is
distributed among greater number of stockholders so the DPS is less. A DPS of Tk. 1 in 2013
suggests that BA has provided dividend of Tk. 1 for every unit of common stock the
shareholders hold which indicates that they are receiving a lot lower return.
IDLC: There is a marginal decrease in DPS over the last five years. It came down from Tk.
5.5 in 2009 to Tk. 3 in 2013. This can be explained by the huge increase in the total number
of common stock outstanding when compared to that of 2009. A DPS of Tk. 3 in 2013
suggests that IDLC has provided dividend of Tk. 3 for every unit of common stock the
shareholders hold which indicates that they are receiving a lot lower return relative to earlier
periods.
Cross Sectional Analysis: Although both institutions show a decreasing trend in their values
of DPS, the above data suggests that overall BA is providing a lower return in the form of
dividend. Over the last two years, IDLC has been providing almost twice as much DPS than
that of BA which is a very good signal by IDLC to attract investors to purchase its shares.
Dividend Payout Ratio
Page | 22

2009 2010 2011 2012 2013
Bank Asia 64.65% 62.25% 54.85% 69.45% 47.51%
IDLC 40.13% 45.21% 49.47% 52.08% 72.09%
2009 2010 2011 2012 20130.00%
10.00%
20.00%
30.00%
40.00%
50.00%
60.00%
70.00%
80.00%
BAIDLC
Bank Asia: From 2009 to 2013 a fluctuation is visible in dividend payout ratio from 64.65%
to 47.51%. But 2012, Bank Asia’s dividend payout shows a huge increase to 69.45% showing
that it pays investor with more dividends than before in 2012. But in 2013 it became 47.51%.
That means investors did not get higher dividend as given earlier.
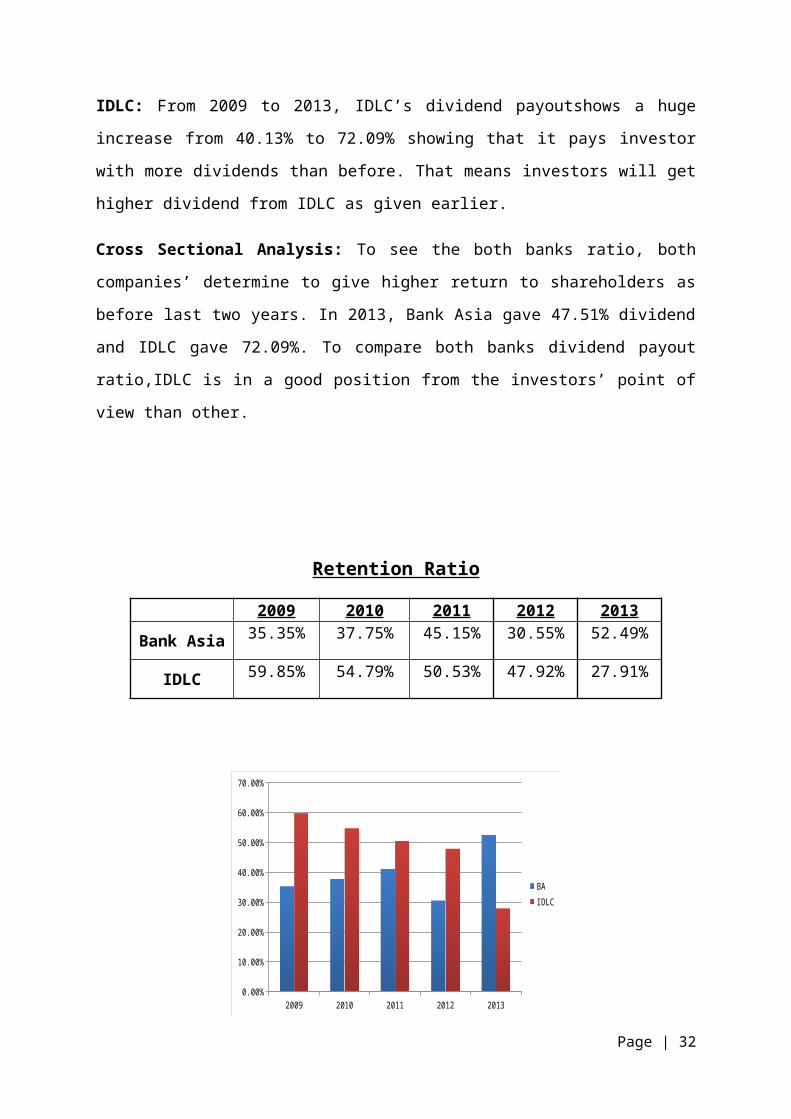
IDLC: From 2009 to 2013, IDLC’s dividend payoutshows a huge increase from 40.13% to
72.09% showing that it pays investor with more dividends than before. That means investors
will get higher dividend from IDLC as given earlier.
Cross Sectional Analysis: To see the both banks ratio, both companies’ determine to give
higher return to shareholders as before last two years. In 2013, Bank Asia gave 47.51%
dividend and IDLC gave 72.09%. To compare both banks dividend payout ratio,IDLC is in a
good position from the investors’ point of view than other.
Retention Ratio
2009 2010 2011 2012 2013
Page | 23

Bank Asia 35.35% 37.75% 45.15% 30.55% 52.49%
IDLC 59.85% 54.79% 50.53% 47.92% 27.91%
2009 2010 2011 2012 20130.00%
10.00%
20.00%
30.00%
40.00%
50.00%
60.00%
70.00%
BAIDLC
Bank Asia: In 2013, Bank has huge amount in the retained earnings. In 2010, the bank
reduced its retention rate and increase dividend. And in 2012 they decreased their retention
rate again and it was more or less stable in 2011. Overall, from bank perspective retention
rate is increased which is good for bank. But from the shareholders perspective reduced rate
of retention is good.
IDLC: In 2009 & 2010 IDLC has huge amount in the retained earnings. In 2012&
2013,IDLC reduced its retention rate and increase dividend. Overall, from the company’s
perspective retention rate is decreased which is not good for bank. But in shareholders
perspective reduced rate of retention is good.
Cross Sectional Analysis: Overall, both banks actually reduced their retention rate
bychanging their policies over the period depending on their financial conditions.
Dividend Yield Ratio
2009 2010 2011 2012 2013
Page | 24

Bank Asia 9.37% 4.66% 5.24% 4.65% 4.35%
IDLC 1.49% 4.14% 1.83% 2.51% 4.77%
2009 2010 2011 2012 20130.00%
1.00%
2.00%
3.00%
4.00%
5.00%
6.00%
7.00%
8.00%
9.00%
10.00%
BAIDLC
Bank Asia: From 2009 to 2010, Bank Asia’s Dividend yield decreases from 9.37% to 4.66%
and then it increased at a marginal rate to 5.24% in 2011. In general, the dividend yield of BA
has fluctuated during the last five years.
IDLC: From 2009 to 2010, IDLC’s dividend yield increases from 1.49% to 4.14% and then it
decreased to 1.83% in 2011 and increased to 4.77% in 2013. After 2010, the dividend yield of
IDLC is following an upward trend.
Cross Sectional Analysis: Both the bank got a downward slope in 2010. But after that they
are trying to increase ratio again. With respect to 2013,IDLC is in a better position.
Net Profit Margin
2009 2010 2011 2012 2013
Page | 25
Bank Asia 17.43% 17.65% 14.39% 5.86% 8.77%
IDLC 42.97% 43.56% 23.16% 29.66% 24.23%
2009 2010 2011 2012 20130.00%
5.00%
10.00%
15.00%
20.00%
25.00%
30.00%
35.00%
40.00%
45.00%
50.00%
BAIDLC
Bank Asia: In the year 2009, out of every TK 100 operating revenues, Bank Asia earns a
profit of TK 17.43. From 2009 to 2010, net profit margin for BankAsia increased slightly
from 17.43% to 17.65%. It means compare to 2009 in 2010 bank is efficiently managed their
operating expenses and tax. But in 2012 NPM went down to 5.86% which means they fail to
manage efficiently operating expenses and tax compare to 2010 and it increased slightly in
2013 to 8.77%.
IDLC:For IDLC from 2009 to 2010, net profit margin increased slightly from 42.97% to
43.56% because relative increase in net profit was more than relative increase in operating
revenue. It means they are successful to manage their operating expense and tax efficiently.
But in 2011, NPM goes down to 23.16% which means they fail to manage their operating
expenses and tax efficiently compare to 2010 and this fall continued in 2013 and NPM
became 24.23%.
Cross Sectional Analysis:From 2009 to 2010 both companies increased their NPM but
IDLC made higher NPM. Form 2010 and 2011, net profit margin for both banks decreased.
From 2011 to 2013, NPM for both companies reduced but Bank Asia had faced a good
portion of reduction.
MARKET POSITION
Price Earnings Ratio
Page | 26

2009 2010 2011 2012 2013
Bank Asia 6.89 times 13.34times 10.47 times 14.93 times 10.95 times
IDLC 27 times 10.91 times 27.07 times 20.74 times 8.1 times
2009 2010 2011 2012 20130
5
10
15
20
25
30
BAIDLC
Bank Asia: In 2009, the shareholders were willing to pay TK 6.89 for every TK 1 of reported
earnings for Bank Asia. P/E ratio for Bank Asia increased gradually from 6.89 in 2009 to
10.47 in 2011. But in 2012 it increased to 14.93/share and in 2013 by reducing a lot it became
10.95 which means they are willing to pay TK 10.95 for every TK 1 of reported earnings
which is not a good sign. In future, it will not give that much return.
IDLC: In 2009, the shareholders were willing to pay TK 27 for every TK 1 of reported
earnings for IDLC. P/E ratio for IDLC decreased a lot from 27 in 2009 to 10.91 in 2010. But
in 2011 it decreased to 27.07/share and in 2012 it was 20.74 which means they are willing to
pay TK 20.74 for every TK 1 of reported earnings which is not a good sign. In future, it will
not give that much return.
Cross Sectional Analysis: A high P/E ratio indicates better position for a particular bank. In
2009, IDLC was in good position in terms of price to earnings ratio compare to Bank Asia
andit continuedfor the nextfour years.
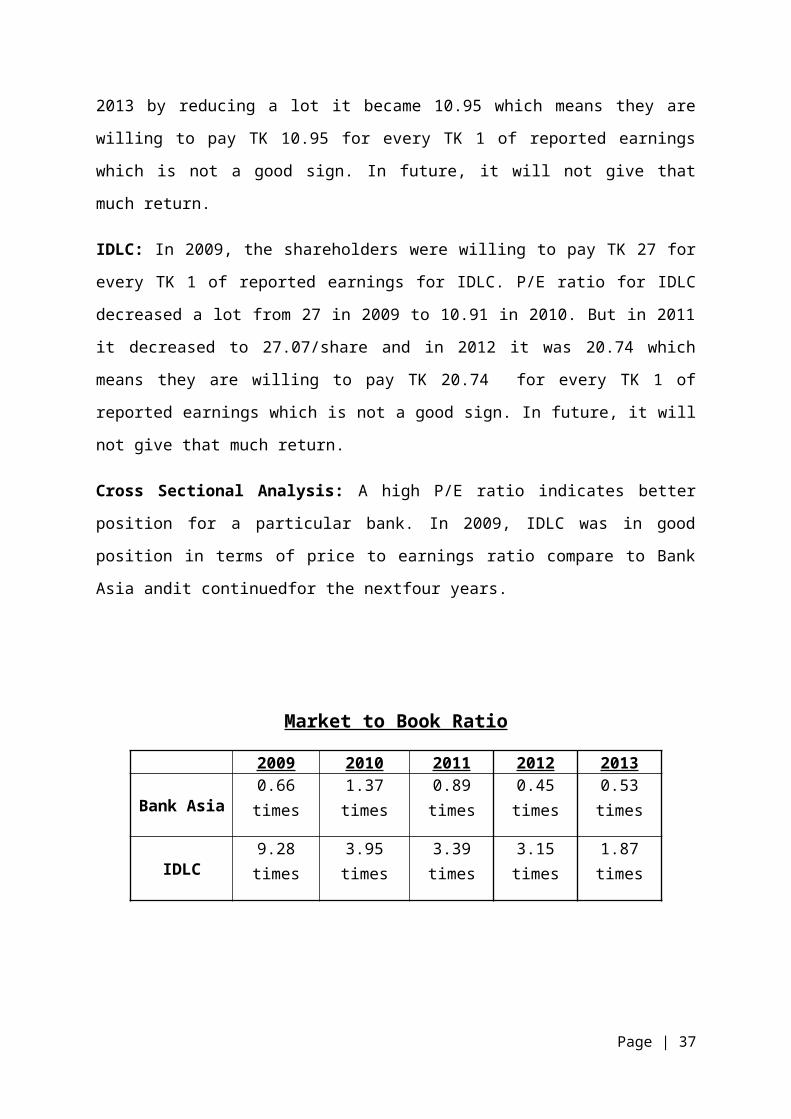
Market to Book Ratio
2009 2010 2011 2012 2013
Bank Asia 0.66 times 1.37 times 0.89 times 0.45 times 0.53 times
Page | 27

IDLC 9.28 times 3.95 times 3.39 times 3.15 times 1.87 times
2009 2010 2011 2012 20130
1
2
3
4
5
6
7
8
9
10
BAIDLC
Bank Asia: From 2009 to 2010, market to book value ratio for Bank Asia decreased
gradually from 0.66/share to 1.37/share. Then in the year 2011, market to book ratio
decreased steadily to 0.89/share and it continued till 2013 to 0.53/share. This is because
market price per share decreases and book value per share increases for which market to book
ratio reduced in 2011 and 2012. It means the share more than its book value that is good but
compare to previous years it is not good though it is overpriced.
IDLC: From 2009 to 2010, market to book value ratio for IDLC decreased rapidly from
9.28/share to 3.95/share. Then in the year 2011, market to book ratio decreased steadily to
3.39/share and 2012 it became 3.15/share and finally in 2013 it came down to 1.87. This is
because market price per share decreases and book value per share increases for which
market to book ratio reduced in 2011 and 2012. It means the share more than its book value
that is good but compare to previous years it is not good though it is overpriced.
Cross Sectional Analysis: The overall position shows that the performance of IDLC is far
better than Bank Asia since investors value IDLC more than its book value.
LIQUIDITY RATIOS
Cash Position Indicator
Page | 28

2009 2010 2011 2012 2013
Bank Asia7.47% 6.61% 7.36% 7.49% 6.76%
IDLC 5.27% 11.05% 8.44% 10.03% 15.19%
2009 2010 2011 2012 20130.00%
2.00%
4.00%
6.00%
8.00%
10.00%
12.00%
14.00%
16.00%
Bank AsiaIDLC Finance
Bank Asia: This ratio indicates the ability of the bank or institution to handle immediate cash
needs. From 2009 to 2012, we can see that cash position indicator for Bank Asia is
fluctuating every year. It simply indicates that bank tries to increase their first line of defense
so that they can fulfill depositors’ withdrawals and customers’ loan demands.
IDLC: From 2009 to 2010 IDLC cash position indicator increases from 5.27% to 15.19%
which means they are strengthening their first line ofdefense to protect them from immediate
cash needs. In 2013 they have highest of their cash position indicator and it was 15.19% that
means it is in greater portion of cash implies the bank is in a stronger position to meet
immediate cash needs.
Cross Sectional Analysis: To see four years, both banks are close to each other in cash
position indicator but IDLC always went through a gradual improvement but, on the other
hand, Bank Asia went through fluctuations.
Capacity Ratio
2009 2010 2011 2012 201373.20% 75.57% 70.34% 65.77% 64.05%
Page | 29

Bank Asia
IDLC90.60% 83.79% 86.52% 86.54% 79.69%
2009 2010 2011 2012 20130.00%
10.00%
20.00%
30.00%
40.00%
50.00%
60.00%
70.00%
80.00%
90.00%
100.00%
Bank AsiaIDLC
Bank Asia: The capacity ratio shows a decreasing trend throughout the year 2009 and 2013
which is a positive signal for Bank Asia as loan is the least liquid asset for a bank. Lower
capacity ratio means liquidity for the bank is going up.
IDLC: IDLC has also a decrease trend in 5-year period from 2009 to 2013 where the
capacity ratio shows a decreasing trend from 90% to 79%, which is a positive signal as loan
is the least liquid asset for a bank. Lower capacity ratio means liquidity for the bank is going
up.
Cross Sectional Analysis: Overall, the capacity ratio of IDLC is larger than that of Bank
Asia which is an indicator of poor liquidity condition for IDLC.
Liquid Securities Indicator
2009 2010 2011 2012 2013
Bank Asia 1.48% 1.11% 1.09% 1.38% 1.86%
Page | 30

IDLC 2.81% 2.14% 1.76% 1.02% 1.56%
2009 2010 2011 2012 20130.00%
0.50%
1.00%
1.50%
2.00%
2.50%
3.00%
BAIDLC
Bank Asia: This shows that from 2009 to 2011, liquidity securities indicators of Bank Asia
were more or less similar and it was around 1%. But in 2013, it increases to 1.86% which is
highest in all five years. That means bank is trying to increase its second line of defense and
also try to get a little bit interest from that securities.
IDLC: This shows that from 2009 to 2010, liquidity securities indicators of IDLC decreases
2.81% to 2.14% which means it reduces its government securities or it is not buying that
much security out of its total assets. And in 2011 it decreases to 1.76% and 1.02% in 2012
which indicates the greater portion of government securities and it also indicates the more
liquid the bank position tends to be.
Cross Sectional Analysis: Here, both institutions have government securities in its total
assets. They actually want to earn some interest and also want to fulfill liquidity requirement.
In 2013, Bank Asia has 1.86% liquid securities and IDLC has 1.56% liquid securities. That
means Bank Asia, in comparison, has a higher second line of defense against customer
demands and withdrawals.
Core Deposit Ratio
2009 2010 2011 2012 2013
Bank Asia 6.76% 6.24% 8.1% 7.44% 7.27%
IDLC 17.19% 20.73% 15.98% 15.24% 11.99%
Page | 31
2009 2010 2011 2012 20130.00%
5.00%
10.00%
15.00%
20.00%
25.00%
BAIDLC
Bank Asia: The core deposit ratio has gone up during the last five years which suggests that
the relative change in core deposits was greater than the relative change in total deposits. An
increase in this ratio indicates that the liquidity requirement of Bank Asia is going down over
the years.
IDLC: The core deposit ratio of IDLC has gone down during 2012 and 2013 which suggests
that the relative change in core deposits was smaller than the relative change in total deposits.
A decrease in this ratio indicates that the liquidity requirement of IDLC is going up.
Cross Sectional Analysis: In general, the core deposit ratio of IDLC is much higher than
that of BA. This suggests that the liquidity requirement of BA is lower than IDLC because it
will have enough cash to meet fulfill its obligations.
FINANCIAL RISK
Equity Multiplier
Page | 32

2009 2010 2011 2012 2013
Bank Asia13.85 14.90 9.43 10.75 11.20
IDLC11.65 9.65 9.16 9.38 10.50
2009 2010 2011 2012 20130
2
4
6
8
10
12
14
16
Bank AsiaIDLC
Bank Asia: From 2009 to 2010, Bank Asia’s equity multiplier increased to from 13.85 to
14.90 times which means they increased their financial leverage. Then again, the ratio
declined in 2011 to 9.43 times. With an increase again in 2012 at 10.75, it experienced a
slight rise in its financial leverage. However, in the end of the period of 2013, Bank Asia’s
financial leverage reduced to 11.20 times.
IDLC : Equity multiplier is declining steadily from for IDLC from 11.75times in 2009 to
9.65 times in 2010 indicating the funding from the equity portion is increasing and the bank
is not relying on borrowed funds to finance its assets. But next two years it increased to 9.16
in 2011 and 9.38 in 2012. In 2013, it increases to 10.50.
Cross Sectional Analysis: It is apparent in the equity multiplier ratio that Bank Asia had a
high financial leverage than that of IDLC and thus can be said that their management was not
successful in minimizing their risk exposure of the shareholders by ensuring more equity
capital in every single unit of assets.
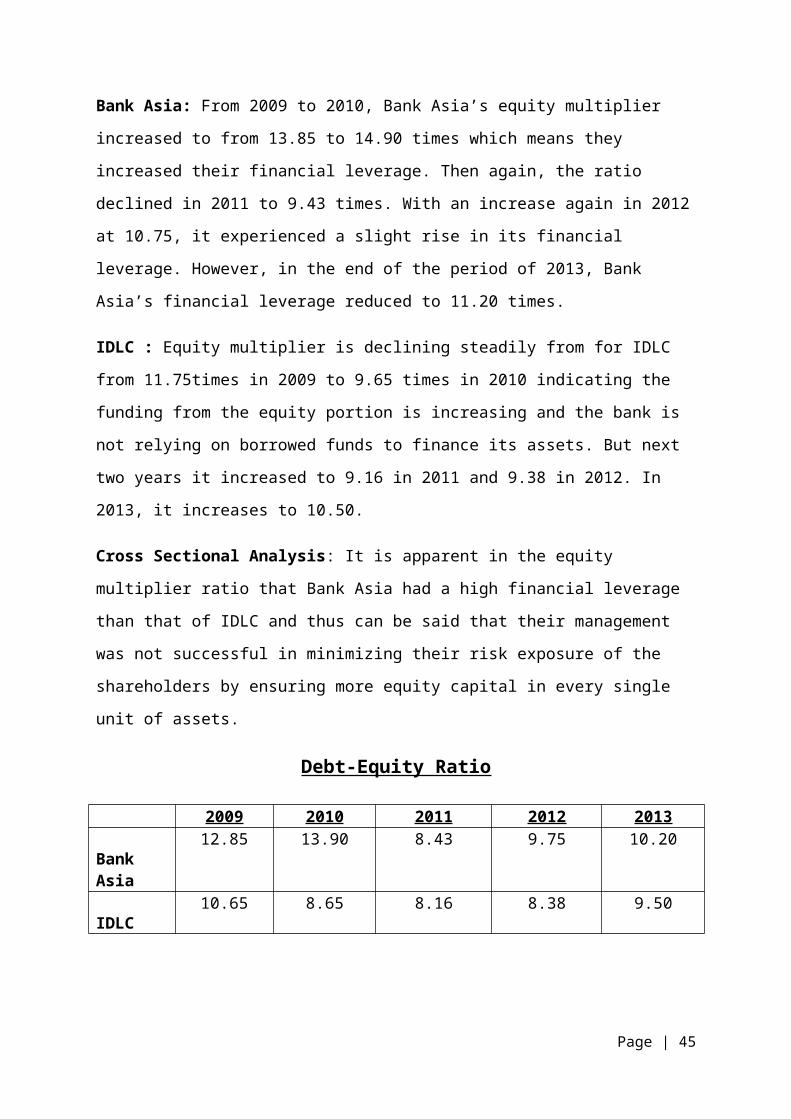
Debt-Equity Ratio
2009 2010 2011 2012 201312.85 13.90 8.43 9.75 10.20
Page | 33

Bank Asia
IDLC10.65 8.65 8.16 8.38 9.50
2009 2010 2011 2012 20130
2
4
6
8
10
12
14
16
Bank AsiaIDLC
Bank Asia: From the year of 2009 to 2010, there was slight increase in the debt to equity
ratio of Bank Asia. In 2009, debt to equity ratio of Bank Asia was 12.85 times which
increased to 13.90 times. Very next year it reduced to 8.43 times and the following it
increased to 9.75 times. It also increased in 2013 to 10.20. It can be said that over the period
it was more or less stable.
IDLC: The debt to equity capital ratio of the IDLC Finance is in a lower pattern from year
2009 to 2011. In 2009, it was 10.65 times but it reduced to 8.16 times in 2011 because of
relative increases in debt lower than its relative increase in equity. But next two years it
gradually increased to 8.38 times in 2012 and 9.50 times in 2013.
Cross Sectional Analysis: Bank Asia debt to equity ratio is higher than that of IDLC Finance
Limited. This tells us that the cost of equity and risk is higher for Bank Asia. So from the risk
perspective IDLC is in a better position.
Interest Coverage Ratio
2009 2010 2011 2012 2013
Bank Asia0.29 times 0.35 times 0.23 times 0.09 times 0.13 times
IDLC0.28 times 0.44 times 0.34 times 0.19 times 0.19 times
Page | 34

2009 2010 2011 2012 20130
0.05
0.1
0.15
0.2
0.25
0.3
0.35
0.4
0.45
0.5
Bank AsiaIDLC
Bank Asia: With the highest ratio in 2010 of0.35 times, the interest coverage ratio of Bank
Asia has overall decreased over this five year period. The jump in 2010 can be explained by
the fact that the relative increase in net profit was larger than the relative increase in interest
expense. A value of 0.13 times indicates that in 2013 the bank has earned a net income which
could cover its interest expense 0.13 times.
IDLC: The interest coverage ratio of IDLC has, overall, decreased over this five year period.
The jump in 2010 can be explained by the fact that the relative increase in net profit was
larger than the relative increase in interest expense. A value of 0.19 times indicates that in
2012 and in 2013 the bank has earned a net income which could cover its interest expense
0.19 times for two years.
Cross Sectional Analysis: Overall IDLC has a higher interest coverage ratio than that of
Bank Asia and the difference is quite prominent. This means that IDLC is more successful in
generating net income to cover the interest expense and is utilizing its resources more
efficiently in covering the interest expenses.
Investors’ View Point
Valuation using Gordon Growth Model:
2009 2010 2011 2012 2013 AverageBank Asia:ROE 1.93% 1.83% 1.63% 0.65% 0.89% 1.39%Retention ratio
35.35% 37.75% 45.15% 30.55% 52.49% 40.26%
Page | 35

IDLC:ROE 3.62% 4.93% 1.61% 1.87% 1.33% 2.67%Retention ratio
59.85% 54.79% 50.53% 47.92% 27.91% 48.2%
Growth Rate (ROE X Retention Ratio)Bank Asia 0.0139 X 0.4026 0.56%IDLC 0.0267 X 0.482 1.29%
Required rate of return:
K = Kf+(Km-Kf)* ß
where - Kf: Risk free rate of Return
Km: Market Return
ß: Beta
Bank Asia Ltd:
The Beta of the stock was found to be 0.74, which implies that for every 1% increase(or
decrease) in Index returns, the returns of Bank Asia Ltd would increase(or decrease) by
0.74%.
-10.00% -5.00% 0.00% 5.00% 10.00% 15.00%
-10.00%
-5.00%
0.00%
5.00%
10.00%
15.00%
f(x) = 0.743615984544353 x − 0.00902945586453816
Market Index
Bank
Asi
a Re
turn
Market return
The monthly average market return is computed to be 0.84%.
Risk Free Rate of Return
Page | 36
According to Bangladesh Bank, the yield of one year Treasury bill is considered to be the
annualized risk free rate of return, which is equal to 10.52%. Therefore, the monthly risk free
return would be 0.88% (10.52/12)
Required rate of return for Bank Asia Ltd:
K = Kf + (Km-Kf) * ß
K = 0.88 + (0.84 -0.88)*0.74
K = 0.91% (monthly)/ 10.92% (annual)
IDLC:
The Beta of the stock was found to be 1.43, which implies that for every 1% increase(or
decrease) in Index returns, the returns of IDLC would increase (or decrease) by 1.43%.
-10.00% -5.00% 0.00% 5.00% 10.00% 15.00%
-40.00%
-30.00%
-20.00%
-10.00%
0.00%
10.00%
20.00%
30.00%
40.00%
f(x) = 1.43524118116374 x − 0.0180745368089185
Market index
IDLC
Ret
urns
Required rate of return for IDLC:
K = Kf + (Km-Kf) * ß
K = 0.88 + (0.84 -0.88)*1.43
K = 0.94% (monthly)/11.28% (annual)
Intrinsic value:
BANK ASIA IDLCCurrent dividend 0.9091 3.00Growth 0.56% 1.29%Next year’s dividend 0.9142 3.0387Required rate of return/Cost of borrowing
10.92% 11.28%
Page | 37

Intrinsic value 8.82 30.42Market value 23.00 62.90
P0 (intrinsic value) = Current dividend(1+g)K−g
After calculating the intrinsic value, both Bank Asia and IDLC seems to be overpriced.
Capital Adequacy Ratio (CAR):
2009 2010 2011 2012 2013 Required(Bangladesh Bank)Bank Asia
12.27% 8.11% 14.88% 13.05% 11.05% 10%
IDLC - - 13.61% 13.88% 15.43% 10%
Currently Bangladesh Bank prescribed Minimum Capital Adequacy Ratio (CAR) is 10%,
whereas as on December 2013 the Capital Adequacy Ratio (CAR) was 11.05%, above the
minimum level. For IDLC, total Risk Weighted Assets (RWA) of the Company is determined
by multiplying the capital charge formarket risk and operational risk by the reciprocal of the
minimum capital adequacy ratio i.e. 10% and adding the resulting figuresto the sum of risk
weighted assets for credit risk. At the end of 2013, IDLC had a Capital Adequacy Ratio
(CAR) of 15.43%, well above the minimum requirement set by Bangladesh Bank. In
comparison, IDLC has been able to maintain better capital adequacy over Bank Asia.
Investors valuation based on Price-Earnings (P/E) ratio:
2009 2010 2011 2012 2013
Bank Asia 6.89 times 13.34times 10.47 times 14.93 times 10.95 times
IDLC 27 times 10.91 times 27.07 times 20.74 times 8.1 times
Among the most common and reliable tools many investors use to decide where to invest
their money is the price to earnings ratio (P/E ratio), also commonly referred to as the price
Page | 38

multiple, earnings multiple, or simply, multiple.Price (market value) is the cost of buying one
share of the company’s common stock. The price is set by investors based on such factors as
their expectations for the company’s future growth, the state of the industry it belongs to,
inflation and the overall market. Actions the company takescan have a positive or negative
effect on price, depending on how such actions are perceived by the market.
By relating share prices to actual profits, the P/E ratio highlights the connection between the
price and recent company performance. If prices get higher and profits get higher, the ratio
stays the same. The ratio only moves as price and profits become disconnected. Both Bank
Asia and IDLC have high price-earnings (P/E) ratio. For Bank Asia, the P/E ratio has
increased from 6.89 to 10.95. Theoretically, a stock's P/E indicates how much investors are
willing to pay per Taka of earnings. For this reason it's also called the "multiple" of a stock.
In other words, a P/E ratio of about 11 of Bank Asia suggests that investors in the stock are
willing to pay about TK. 11 for every TK. 1 of earnings that the bank generates.The P/E ratio
measures the level of confidence investors have in a company. A higher P/E ratio in this
casemeans that the market is more willing to pay for the earnings of the Bank Asia. Higher
price to earnings ratio indicates that the market has high hopes for the future of the stock and
therefore it has bid up the price.
On the other hand, IDLC’s P/E ratio is positive, but it has decreased over the past five year
period. Compared to Bank Asia, in the end of the year of 2013 IDLC has a lower P/E ratio.
The market may not have enough confidence in the future of the stock of IDLC and thus the
P/E may have declined over time. Nevertheless, its P/E ratio is still positive. It is normally
assumed that a low P/E ratio indicates a company is undervalued. It is not always right as this
may be due to the stock market assumes that the company is headed over several issues or the
company itself has warned a low earnings than expected.In other words, there is no strict rule
of thumb when it comes to interpreting the exact relationship between a P/E ratio and the
company’s true value as an investment. Thus, a low P/E ratio might be interpreted as either
the market giving the bank a vote of no confidence or, alternatively, that the bank is
undervalued and therefore a good bargain.
Investors valuation based on Market-to-Book ratio:
2009 2010 2011 2012 2013Bank Asia 0.66 times 1.37 times 0.89 times 0.45 times 0.53 times
Page | 39

IDLC 9.28 times 3.95 times 3.39 times 3.15 times 1.87 times
Investors can also evaluate a company based on the market-to-book ratio. Market-to-book
ratio is a way of measuring the relative value of a company compared to its stock price or
market value. It is an essential figure to potential investors and analysts because it provides a
simple way of judging whether a company is under or overvalued. It offers a more tangible
measure of a company's value than earnings do and hence it is evaluated by most
conservative investors. Book value simply implies the value of the company on its books,
often referred to as accounting value. It's the accounting value once assets and liabilities have
been accounted for by a company's auditors. Whether book value is an accurate assessment of
a company's value is determined by stock market investors who buy and sell the stock.
Market value has a more meaningful implication in the sense that it is the price investors have
to pay to own a part of the business regardless of what book value is stated.
For Bank Asia, the market-to-book ratio is 0.53 indicating that its book value is greater than
the market value. This is suggesting the investors that the bank’s assets may be undervalued
by 47%. Like the price-to-earnings ratio, the lower the market-to-book ratio, the better the
value. Investors would use a low market-to-book to identify potential new investments. A
low market-to-book ratio could suggest a company’s assets are undervalued, or that the
company’s prospects are good and earnings/value should grow. The market values Bank Asia
less than its stated value or net worth. In one sense, it may be because the market has lost
confidence in the ability of the company's assets to generate future profits and cash flows.
Value investors often like to seek out companies in such a position in hopes that the market
perception turns out to be incorrect.
IDLC has a market-to-book ratio of 1.87 in the end of the period of the year 2013. Thus, its
market value is perceived to be higher than its book value. The market assigns a higher value
to IDLC due to the earnings power of its assets. Nearly all consistently profitable companies
will have market values greater than book values. A market-to-book ratio of more than one is
suggesting that the market’s perception is positive towards IDLC and that the market values
IDLC more than its book value. Thus, generally higher ratios are preferred.
Investors valuation based on financial leverage:
Page | 40

2009 2010 2011 2012 2013
Bank Asia13.85 14.90 9.43 10.75 11.20
IDLC11.65 9.65 9.16 9.38 10.50
The equity multiplier is a method of evaluating a company’s ability to use its debt for
financing its assets. The equity multiplier is also referred to as the leverage ratio or the
financial leverage ratio. The higher the equity multiplier, the higher is the financial leverage,
which indicates that the company relies more on debt to finance its assets. It is apparent in the
equity multiplier ratio that Bank Asia had a high financial leverage than that of IDLC and
thus can be said that their management was not successful in minimizing their risk exposure
of the shareholders by ensuring more equity capital in every 1tk worth of assets. The equity
multiplier gives investors an insight into what financing methods a company may be able to
use to finance the purchase of new assets. It's also an indicator of potential threats a company
may face from economic conditions that affect the debt-equity mix.
From the perspective of the investors, IDLC will be considered less risky since has a lower
equity multiplier meaning that, compared to Bank Asia, it is making less use of borrowed
funds to finance its assets. Thus, higher the financial leverage, investors will perceive the
bank as more risky.
CAMELS RATING:
CAMELS rating is used by the Bangladesh Bank as a tool for evaluating the strength and
performance of banks and non-bank financial institutions. The composite rating adjudged by
theBangladesh Bank signifies satisfactory performance of IDLC i.e. it has a B grade. Bank
Asia also has been given a B grade, signifying that it also has an overall satisfactory
performance.
Recommendations
Several recommendations can be made after analyzing the performance of both Bank Asia
and IDLC Finance Limited by assessing all the ratios. Firstly, it must be noted that both Bank
Asia and IDLC Finance Limited are assigned satisfactory (or B grade) performance according
to the CAMELS rating.
Page | 41

Both Bank Asia and IDLC Finance Limited failed to manage their operating expenses and
thus experienced decline in their expense control efficiency ratio. Even though in the end of
the five year period in 2013 IDLC had a better position in terms of expense control
efficiency, both of them struggled to maintain the ratio and failed to manage and reduce their
operating expenses efficiently.Due to these unmanageable expenses, costs are rising up and
net income is going down. They both need to concentrate harder in handling their expenses
more carefully and improve their net income. Consequently, more income will result in more
dividends and retained earnings for them. This will eventually boost investors’ confidence.
Secondly, in terms of employee productivity, both of them experienced negative results in the
year 2013 compared to 2009. Overall, both are following a downward trend and have not
been able to manage human resources efficiently in generating operating income. Both Bank
Asia and IDLC need to consider this problem and implement ways in order to improve
productivity, perhaps through providing improved incentives. More importantly, both Bank
Asia and IDLC have not been able to successfully manage their tax expense. They need to
implement appropriate tax management tools, such as tax swapping tool or portfolio shifting
tool, to enhance their incomes by efficiently controlling taxes.
IDLC uses its limited fund very aggressively and efficiently as a result its net profit margin is
higher than Bank Asia’s. IDLC has higher operating margin indicating that it is more
profitable. In addition, IDLC is paying out more dividends to its shareholders than what Bank
Asia is. Investors in general require more dividends. Thus, Bank Asia needs to give out more
dividends in order to keep its shareholders satisfied because dividends can be a motivational
factor and encourage shareholders to invest in Bank Asia. Bank Asia also needs to strive to
achieve lower financial leverage by making use of more equity to finance its assets since at
present it is making use of more and more borrowed funds for this purpose.
In terms of the market position, Bank Asia has been able to achieve higher price earnings
relative to IDLC Finance Limited. IDLC over the five year period has been experiencing a
downward trend in price earnings. They need to find out ways to improve investors’
confidence and make them believe that their shares have high future potentials. Generally,
investors consider that a bank with lower price earnings is undervalued and therefore a good
bargain.
Page | 42

Conclusion
Overall, the performance analysis of Bank Asia Limited with the non-bank IDLC Finance
Limited shows both have more or less satisfactory level of performance, which is also
indicated by the CAMELS rating. As a whole, according to the findings, it is indicating that
Page | 43

both Bank Asia and IDLC Finance Limited are following close trends in many of the aspects
of the complete analysis. However, from some of the aspects, such as the levels of
profitability, IDLC Finance Limited is outperforming Bank Asia.
Furthermore, in terms of the financial position, IDLC Finance Limited is in a better position
since it comprises of less financial leverage risk, as indicated by the equity multiplier and
debt-equity ratio, relative to Bank Asia. In addition, the investors’ perception is positive
regarding IDLC Finance Limited, as indicated by the market-to-book ratio, as they value it
more than its overall book value.
All in all, it can be concluded that IDLC Finance Limited is in a better financial position and
has been more profitable as a whole. Perhaps, it has more potential to maximize stockholders’
wealth in the future. Even though Bank Asia has also been experiencing improved
performances in various aspects, investors would rather choose IDLC Finance Limited as it is
providing higher return in the form of dividends and it also has been in a better financial
position.
Bibliography
1. Bank Asia website- http://www.bankasia-bd.com/
2. IDLC website- http://www.idlc.com/
Page | 44
3. Bank Management & Financial Services, Eighth edition, by Peter S. Rose and Sylvia
C. Hudgins.
4. Bangladesh Bank website- http://www.bb.org.bd/monetaryactivity/treasury.php
Page | 45

APPENDIX
Effic iency Ratios:
BANK ASIA - 2013
Ratio Formula Calculation
Page | 46

Asset Utilization
Total Operating Revenues/Total Assets
8,515,429,452/165,067,196,178 5.16%
Tax Management Efficiency
Net Income after tax/Net Income before tax
1,330,538,402/3,405,355,188 39.1%
Expense Control Efficiency
Net Income before tax/Total Operating Revenues
3,405,355,188/8,515,429,452 40%
.Operating Efficiency
Total Operating Expense/Total Operating revenue
3,214,731,899/8,515,429,452 37.75%
Employee
productivity ratio
Net operating income / total no. of full-time employees
3,405,355,188 /1600 TK.2,128,346
BANK ASIA - 2012
Ratio Formula Calculation
Asset Utilization
Total Operating Revenues/Total Assets
7,884,761,090/141,235,371,839 5.58%
Tax Management Efficiency
Net Income after tax/Net Income before tax
849,941,367/2,681,011,849 31.7%
Expense Control Efficiency
Net Income before tax/Total Operating Revenues
2,681,011,849/7,884,761,090 34%
.Operating Efficiency
Total Operating Expense/Total
2,874,720,292/7,884,761,090 36.46%
Page | 47

Operating revenue
Employee
productivity ratio
Net operating income / total no. of full-time employees
2,681,011,849/1523 TK.1,760,349
BANK ASIA - 2011
Ratio Formula Calculation
Asset Utilization
Total Operating Revenues/Total Assets
6,654,492,493/118,020,504,822 5.64%
Tax Management Efficiency
Net Income after tax/Net Income before tax
2,043,256,551/3,614,061,828 56.54%
Expense Control Efficiency
Net Income before tax/Total Operating Revenues
3,614,061,828/6,654,492,493 54.31%
.Operating Efficiency
Total Operating Expense/Total Operating revenue
2,430,668,241/6,654,492,493 36.53%
Employee
productivity ratio
Net operating income / total no. of full-time employees
3,614,061,828/1,390 TK.2,600,044
BANK ASIA - 2010
Ratio Formula Calculation
Page | 48

Asset Utilization
Total Operating Revenues/Total Assets
6,670,998,590/105,198,050,148 6.34%
Tax Management Efficiency
Net Income after tax/Net Income before tax
1,929,582,157/3,579,520,742 53.91%
Expense Control Efficiency
Net Income before tax/Total Operating Revenues
3,579,520,742/6,670,998,590 53.66%
.Operating Efficiency
Total Operating Expense/Total Operating revenue
2,422,133,786/6,670,998,590 36.31%
Employee
productivity ratio
Net operating income / total no. of full-time employees
3,579,520,742/1,237 TK.2,893,711
BANK ASIA - 2009
Ratio Formula Calculation
Asset Utilization
Total Operating Revenues/Total Assets
4,129,503,653/68,663,199,976 6.01%
Tax Management Efficiency
Net Income after tax/Net Income before tax
1,327,184,458/2,286,192,468 58.05%
Expense Control Efficiency
Net Income before tax/Total Operating Revenues
2,286,192,468/4,129,503,653 55.36%
.Operating Efficiency
Total Operating Expense/Total
1,512,465,951/4,129,503,653 36.62%
Page | 49

Operating revenue
Employee
productivity ratio
Net operating income / total no. of full-time employees
2,286,192,468/1,031 TK.2,217,451
IDLC - 2013
Ratio Formula Calculation
Asset Utilization
Total Operating Revenues/Total Assets
2,762,513,057/50,429,383,474 5.48%
Tax Management Efficiency
Net Income after tax/Net Income before tax
669,466,122/1,325,201,146 50.52%
Expense Control Efficiency
Net Income before tax/Total Operating Revenues
1,325,201,146/2,762,513,057 47.97%
.Operating Efficiency
Total Operating Expense/Total Operating revenue
1,244,470,721/2,762,513,057 45.05%
Employee
productivity ratio
Net operating income / total no. of full-time employees
1,325,201,146/642 TK.2,064,176
IDLC - 2012
Ratio Formula Calculation
Page | 50

Asset Utilization
Total Operating Revenues/Total Assets
2,403,239,834/37,783,865,737 6.36%
Tax Management Efficiency
Net Income after tax/Net Income before tax
712,821,226/1,252,188,166 56.93%
Expense Control Efficiency
Net Income before tax/Total Operating Revenues
1,252,188,166/2,403,239,834 52.10%
.Operating Efficiency
Total Operating Expense/Total Operating revenue
1,058,105,008/2,403,239,834 44.03%
Employee
productivity ratio
Net operating income / total no. of full-time employees
1,252,188,166/481 TK.2,603,301
IDLC - 2011
Ratio Formula Calculation
Asset Utilization
Total Operating Revenues/Total Assets
2,159,874,824/31,164,540,454 6.93%
Tax Management Efficiency
Net Income after tax/Net Income before tax
500,282,954/1,216,602,518 41.12%
Expense Control Efficiency
Net Income before tax/Total Operating Revenues
1,216,602,518/2,159,874,824 56.33%
.Operating Efficiency
Total Operating Expense/Total
913,460,730/2,159,874,824 42.29%
Page | 51

Operating revenue
Employee
productivity ratio
Net operating income / total no. of full-time employees
1,216,602,518/409 TK.2,974,578
IDLC - 2010
Ratio Formula Calculation
Asset Utilization
Total Operating Revenues/Total Assets
3,046,920,087/26,929,990,229 11.31%
Tax Management Efficiency
Net Income after tax/Net Income before tax
1,327,098,116/1,956,230,807 67.84%
Expense Control Efficiency
Net Income before tax/Total Operating Revenues
1,956,230,807/3,046,920,087 64.20%
.Operating Efficiency
Total Operating Expense/Total Operating revenue
965,919,987/3,046,920,087 31.70%
Employee
productivity ratio
Net operating income / total no. of full-time employees
1,956,230,807/353 TK.5,541,730
IDLC - 2009
Ratio Formula Calculation
Page | 52

Asset Utilization
Total Operating Revenues/Total Assets
1,912,731,103/22,681,287,226 8.43%
Tax Management Efficiency
Net Income after tax/Net Income before tax
821,879,365/1,273,413,841 64.54%
Expense Control Efficiency
Net Income before tax/Total Operating Revenues
1,273,413,841/1,912,731,103 66.58%
.Operating Efficiency
Total Operating Expense/Total Operating revenue
489,504,439/1,912,731,103 25.59%
Employee
productivity ratio
Net operating income / total no. of full-time employees
1,273,413,841/253 TK.5,033,256
Profitability Ratios:Bank Asia Ltd 2013
Page | 53

** Taka values are in millions unless specified
Ratio Formula Calculations Answers1. Return on Equity (ROE)
Net Income after Tax/Total Equity Capital
1459.82/14617.79.99%
2. Return on Asset (ROA)
Net Income after Tax/Total Assets
1459.82/163777.74 0.89%
3. Net Interest Margin
(Interest Income-Interest Expenses)/ Total Assets
(14346.31-11166.02)/163777.74
1.94%
4. Net Non Interest Margin
(Non Interest Income- Non Interest Expenses)/ Total Assets
(2299.04-3117.36) /163777.74 -0.50%
5. Net Bank Operating Margin
(Operating Income-Operating Expenses)/ Total Assets
(16645.35-14283.38)/ 163777.74
1.44%
6. Earnings Per Share (EPS)
Net Income after Tax/# of common shares outstanding
1459.82/693.63 2.10
7. Dividend Per Share (DPS)
Dividend/# of common shares outstanding
693.63/693.63 1
8.Dividend Payout Ratio
Dividend/Net Income
693.63/1459.82 47.51%
9. Retention Ratio
Retained Earnings/Net Income
766.19/1459.82 52.49%
10. Dividend Yield Ratio
DPS/Current Market Price
1/23 4.35%
11. Net Profit Margin
Net Income/Total Operating Revenues
1459.82/16645.35 8.77%
Bank Asia Ltd 2012
Page | 54

**taka values are in millions unless specified
Ratio Formula Calculations Answers1. Return on Equity (ROE)
Net Income after Tax/Total Equity Capital
908/13045.176.96%
2. Return on Asset (ROA)
Net Income after Tax/Total Assets
908/140361.37 0.65%
3. Net Interest Margin
(Interest Income-Interest Expenses)/ Total Assets
(13296.06-9616.35)/140361.37
2.62%
4. Net Non Interest Margin
(Non Interest Income- Non Interest Expenses)/ Total Assets
(2210.32-2768.87) /140361.37 -0.39%
5. Net Bank Operating Margin
(Operating Income-Operating Expenses)/ Total Assets
(15506.38-12385.22)/ 140361.37
2.22%
6. Earnings Per Share (EPS)
Net Income after Tax/# of common shares outstanding
908/630.57 1.44
7. Dividend Per Share (DPS)
Dividend/# of common shares outstanding
630.57/630.57 1
8.Dividend Payout Ratio
Dividend/Net Income
630.57/908 69.45%
9. Retention Ratio
Retained Earnings/Net Income
277.43/908 30.55%
10. Dividend Yield Ratio
DPS/Current Market Price
1/21.5 4.65%
11. Net Profit Margin
Net Income/Total Operating Revenues
908/15506.38 5.86%
Bank Asia Ltd 2011
Page | 55

** taka values are in millions unless specified
Ratio Formula Calculations Answers1. Return on Equity (ROE)
Net Income after Tax/Total Equity Capital
1916.21/12478.9315.36%
2. Return on Asset (ROA)
Net Income after Tax/Total Assets
1916.21/117729.41 1.63%
3. Net Interest Margin
(Interest Income-Interest Expenses)/ Total Assets
(10903.58-8202.66)/117729.41
2.29%
4. Net Non Interest Margin
(Non Interest Income- Non Interest Expenses)/ Total Assets
(2416.97-2361.47) /117729.41 0.047%
5. Net Bank Operating Margin
(Operating Income-Operating Expenses)/ Total Assets
(13320.55-10564.13)/ 117729.41
2.34%
6. Earnings Per Share (EPS)
Net Income after Tax/# of common shares outstanding
1916.21/525.48 3.65
7. Dividend Per Share (DPS)
Dividend/# of common shares outstanding
1050.96/525.48 2
8.Dividend Payout Ratio
Dividend/Net Income
1050.96/1916.21 54.85%
9. Retention Ratio
Retained Earnings/Net Income
865.25/1916.21 45.15%
10. Dividend Yield Ratio
DPS/Current Market Price
2/38.2 5.24%
11. Net Profit Margin
Net Income/Total Operating Revenues
1916.21/13320.55 14.39%
Bank Asia Ltd 2010
Page | 56

** taka values are in millions unless specified
Ratio Formula Calculations Answers1. Return on Equity (ROE)
Net Income after Tax/Total Equity Capital
1929.58/7059.9427.33%
2. Return on Asset (ROA)
Net Income after Tax/Total Assets
1929.58/105198.05 1.83%
3. Net Interest Margin
(Interest Income-Interest Expenses)/ Total Assets
(8381.35-5420.58)/105198.05
2.81%
4. Net Non Interest Margin
(Non Interest Income- Non Interest Expenses)/ Total Assets
(2546.73-2422.13) /105198.05 0.12%
5. Net Bank Operating Margin
(Operating Income-Operating Expenses)/ Total Assets
(10928.08-7842.71)/ 105198.05
2.93%
6. Earnings Per Share (EPS)
Net Income after Tax/# of common shares outstanding
1929.58/300.3 6.43
7. Dividend Per Share (DPS)
Dividend/# of common shares outstanding
1201.2/300.30 4
8.Dividend Payout Ratio
Dividend/Net Income
1201.2/1929.58 62.25%
9. Retention Ratio
Retained Earnings/Net Income
728.38/1929.58 37.75%
10. Dividend Yield Ratio
DPS/Current Market Price
4/85.75 4.66%
Bank Asia Ltd 2009
** taka values are in millions unless specified
Ratio Formula Calculations Answers1. Return on Net Income 26.79%
Page | 57
Equity (ROE)
after Tax/Total Equity Capital
1327.18/4954.14
2. Return on Asset (ROA)
Net Income after Tax/Total Assets
1327.18/68663.2 1.93%
3. Net Interest Margin
(Interest Income-Interest Expenses)/ Total Assets
(6247.49-4498.02)/68663.22.55%
4. Net Non Interest Margin
(Non Interest Income- Non Interest Expenses)/ Total Assets
(1367.03-1512.47) /68663.2 -0.21%
5. Net Bank Operating Margin
(Operating Income-Operating Expenses)/ Total Assets
(7614.52-6010.49)/ 68663.22.34%
6. Earnings Per Share (EPS)
Net Income after Tax/# of common shares outstanding
1327.18/214.5 6.19
7. Dividend Per Share (DPS)
Dividend/# of common shares outstanding
858/214.5 4
8.Dividend Payout Ratio
Dividend/Net Income
858/1327.18 64.65%
9. Retention Ratio
Retained Earnings/Net Income
469.18/1327.18 35.35%
10. Dividend Yield Ratio
DPS/Current Market Price
4/42.68 9.37%
11. Net Profit Margin
Net Income/Total Operating Revenues
1327.18/7614.52 17.43%
IDLC Finance Ltd 2013
** taka values are in millions unless specefied
Ratio Formula Calculations Answers
Page | 58

1. Return on Equity (ROE)
Net Income after Tax/Total Equity Capital
669.47/5362.7612.48%
2. Return on Asset (ROA)
Net Income after Tax/Total Assets
669.47/50429.38 1.33%
3. Net Interest Margin
(Interest Income-Interest Expenses)/ Total Assets
(6215.85-4137.61)/50429.384.12%
4. Net Non Interest Margin
(Non Interest Income- Non Interest Expenses)/ Total Assets
(684.27-257.65) /50429.38 0.85%
5. Net Bank Operating Margin
(Operating Income-Operating Expenses)/ Total Assets
(2762.51-1244.47)/ 50429.383.01%
6. Earnings Per Share (EPS)
Net Income after Tax/# of common shares outstanding
669.47/160.875 4.16
7. Dividend Per Share (DPS)
Dividend/# of common shares outstanding
482.63/160.875 3.00
8.Dividend Payout Ratio
Dividend/Net Income
482.63/669.47 72.09%
9. Retention Ratio
Retained Earnings/Net Income
186.84/669.47 27.91%
10. Dividend Yield Ratio
DPS/Current Market Price
3.00/62.9 4.77%
11. Net Profit Margin
Net Income/Total Operating Revenues
669.47/2762.51 24.23%
IDLC Finance Ltd 2012
**taka values are in millions unless specified
Page | 59

Ratio Formula Calculations Answers1. Return on Equity (ROE)
Net Income after Tax/Total Equity Capital
712.82/4693.2915.19%
2. Return on Asset (ROA)
Net Income after Tax/Total Assets
712.82/37783.87 1.87%
3. Net Interest Margin
(Interest Income-Interest Expenses)/ Total Assets
(4853.77-3102.88)/37783.874.63%
4. Net Non Interest Margin
(Non Interest Income- Non Interest Expenses)/ Total Assets
(652.35-168.51) /37783.87 1.28%
5. Net Bank Operating Margin
(Operating Income-Operating Expenses)/ Total Assets
(2403.24-1058.11)/ 37783.873.56%
6. Earnings Per Share (EPS)
Net Income after Tax/# of common shares outstanding
712.82/160.875 4.43
7. Dividend Per Share (DPS)
Dividend/# of common shares outstanding
371.25/160.875 2.31
8.Dividend Payout Ratio
Dividend/Net Income
371.25/712.82 52.08%
9. Retention Ratio
Retained Earnings/Net Income
341.57/712.82 47.92%
10. Dividend Yield Ratio
DPS/Current Market Price
2.31/91.9 2.51%
11. Net Profit Margin
Net Income/Total Operating Revenues
712.82/2403.24 29.66%
IDLC Finance Ltd 2011
** taka values are in millions unless specified
Page | 60

Ratio Formula Calculations Answers1. Return on Equity (ROE)
Net Income after Tax/Total Equity Capital
500.28/3980.4712.57%
2. Return on Asset (ROA)
Net Income after Tax/Total Assets
500.28/31164.54 1.61%
3. Net Interest Margin
(Interest Income-Interest Expenses)/ Total Assets
(3942.1-2364.39)/31164.545.06%
4. Net Non Interest Margin
(Non Interest Income- Non Interest Expenses)/ Total Assets
(582.16-172.96) /31164.54 1.31%
5. Net Bank Operating Margin
(Operating Income-Operating Expenses)/ Total Assets
(2159.87-913.46)/ 31164.544.00%
6. Earnings Per Share (EPS)
Net Income after Tax/# of common shares outstanding
500.28/99 5.05
7. Dividend Per Share (DPS)
Dividend/# of common shares outstanding
247.5/99 2.5
8.Dividend Payout Ratio
Dividend/Net Income
247.5/ 500.28 49.47%
9. Retention Ratio
Retained Earnings/Net Income
252.78/500.28 50.53%
10. Dividend Yield Ratio
DPS/Current Market Price
2.5/136.7 1.83%
11. Net Profit Margin
Net Income/Total Operating Revenues
500.28/2159.87 23.16%
IDLC Finance Ltd 2010
** taka values are in millions
Page | 61

Ratio Formula Calculations Answers1. Return on Equity (ROE)
Net Income after Tax/Total Equity Capital
1327.1/3690.1935.96%
2. Return on Asset (ROA)
Net Income after Tax/Total Assets
1327.1/26929.99 4.93%
3. Net Interest Margin
(Interest Income-Interest Expenses)/ Total Assets
(3084.69-1822.06)/26929.994.69%
4. Net Non Interest Margin
(Non Interest Income- Non Interest Expenses)/ Total Assets
(1784.29-311.74) /26929.99 5.47%
5. Net Bank Operating Margin
(Operating Income-Operating Expenses)/ Total Assets
(3046.92-965.92)/ 26929.997.73%
6. Earnings Per Share (EPS)
Net Income after Tax/# of common shares outstanding
1327.1/99 13.41
7. Dividend Per Share (DPS)
Dividend/# of common shares outstanding
600/99 6.06
8.Dividend Payout Ratio
Dividend/Net Income
600/ 1327.1 45.21%
9. Retention Ratio
Retained Earnings/Net Income
727.1/1327.1 54.79%
10. Dividend Yield Ratio
DPS/Current Market Price
6.06/146.3 4.14%
11. Net Profit Margin
Net Income/Total Operating Revenues
1327.1/ 3046.92 43.56%
IDLC Finance Ltd 2009
**taka values are in millions unless specified
Page | 62

Ratio Formula Calculations Answers1. Return on Equity (ROE)
Net Income after Tax/Total Equity Capital
821.88/2393.0934.34%
2. Return on Asset (ROA)
Net Income after Tax/Total Assets
821.88/22681.29 3.62%
3. Net Interest Margin
(Interest Income-Interest Expenses)/ Total Assets
(2579.8-1686.83)/22681.293.94%
4. Net Non Interest Margin
(Non Interest Income- Non Interest Expenses)/ Total Assets
(1019.76-108.97) /22681.29 4.01%
5. Net Bank Operating Margin
(Operating Income-Operating Expenses)/ Total Assets
(1912.73-489.5)/ 22681.296.27%
6. Earnings Per Share (EPS)
Net Income after Tax/# of common shares outstanding
821.88/60 13.7
7. Dividend Per Share (DPS)
Dividend/# of common shares outstanding
330/60 5.5
8.Dividend Payout Ratio
Dividend/Net Income
330/821.88 40.15%
9. Retention Ratio
Retained Earnings/Net Income
491.88/821.88 59.85%
10. Dividend Yield Ratio
DPS/Current Market Price
5.5/370.3 1.49%
11. Net Profit Margin
Net Income/Total Operating Revenues
821.88/1912.73 42.97%
Market Position:
Bank Asia Ltd 2013
Page | 63

Bank Asia Ltd 2012
Bank Asia Ltd 2011
Page | 64
Ratio Formula Calculation
1. Price Earnings Ratio
Market Price per share/Earnings per share
23/2.1 10.95 times
2. Market to book ratio
Market price per share/Book Value per share
23/((163777.74-133489.37)/ 693.63) 0.53times
Ratio Formula Calculation
1. Price Earnings Ratio
Market Price per share/Earnings per share
21.5/1.44 14.93 times
2. Market to book ratio
Market price per share/Book Value per share
21.5/((140361.37-110061.78)/630.57) 0.45 times
Ratio Formula Calculation
1. Price Earnings Ratio
Market Price per share/Earnings per share
38.2/3.65 10.47 times
2. Market to book ratio
Market price per share/Book Value per share
38.2/((117729.41-95131.1)/525.48)
0.89times

Bank Asia Ltd 2010
Bank Asia Ltd 2009
IDLC 2013
Page | 65
Ratio Formula Calculation
1. Price Earnings Ratio
Market Price per share/Earnings per share
85.75/6.43 13.34 times
2. Market to book ratio
Market price per share/Book Value per share
85.75/((105198.05-86365.64)/300.3)
1.37 times
Ratio Formula Calculation
1. Price Earnings Ratio
Market Price per share/Earnings per share
42.68/6.19 6.89 times
2. Market to book ratio
Market price per share/Book Value per share
42.68/((68663.2-54832.82)/214.5)
0.66 times
Ratio Formula Calculation
1. Price Earnings Ratio
Market Price per share/Earnings per share
62.9/4.16 8.10 times
2. Market to book ratio
Market price per share/Book Value per share
62.9/((50429.38-45066.62)/ 160.875)
1.87times
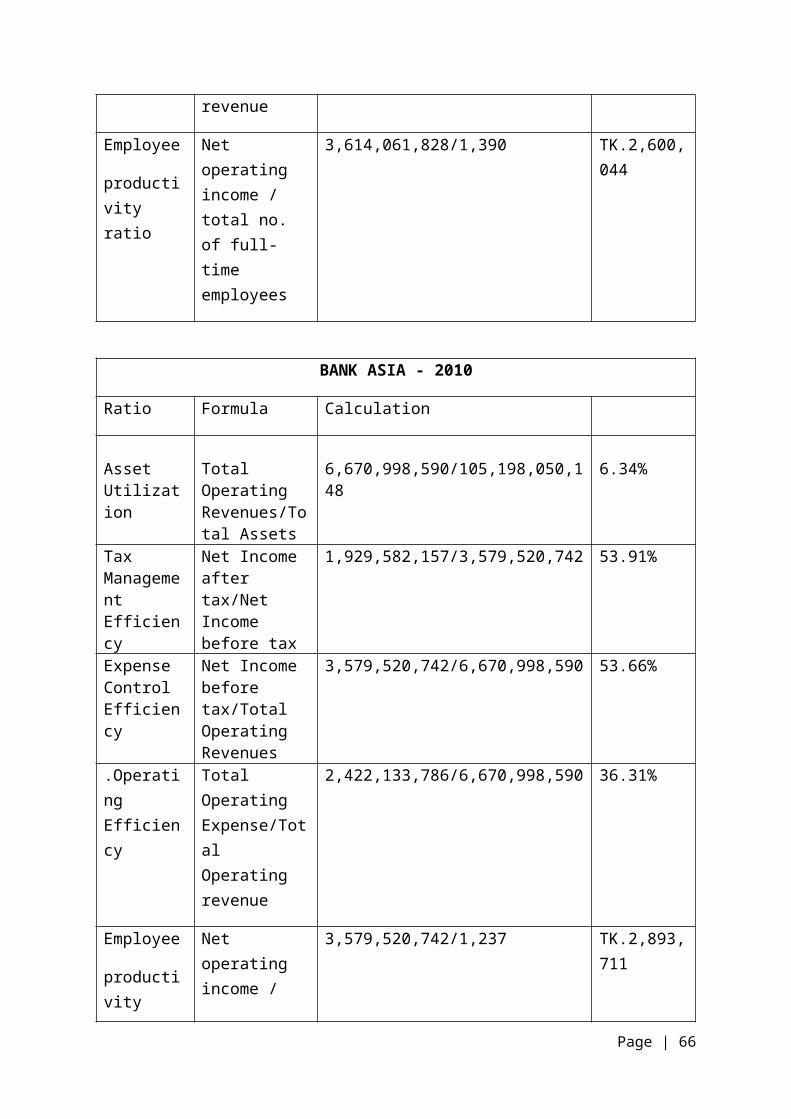
IDLC 2012
IDLC 2011
IDLC 2010
Page | 66
Ratio Formula Calculation
1. Price Earnings Ratio
Market Price per share/Earnings per share
91.9/4.43 20.74 times
2. Market to book ratio
Market price per share/Book Value per share
91.9/((37783.87-33090.57)/ 160.875)
3.15 times
Ratio Formula Calculation
1. Price Earnings Ratio
Market Price per share/Earnings per share
136.7/5.05 27.07 times
2. Market to book ratio
Market price per share/Book Value per share
136.70/((31164.54-27184.07-)/ 99)
3.39times

IDLC 2009
Liquidity Ratios:
Bank Asia 2009
Ratio Formula Calculations
1. Cash position indicator
cash & deposits due from depository institutions / total assets
(3760368749+1346434437)/
68663199976
7.47%
2. Capacity ratio
net loans & leases / total
50267917439/68663199976 73.20%
Page | 67
Ratio Formula Calculation
1. Price Earnings Ratio
Market Price per share/Earnings per share
146.3/13.41 10.91 times
2. Market to book ratio
Market price per share/Book Value per share
146.3/((26929.99-23239.8)/ 99)
3.95 times
Ratio Formula Calculation
1. Price Earnings Ratio
Market Price per share/Earnings per share
370.3/13.7 27 times
2. Market to book ratio
Market price per share/Book Value per share
370.3/((22681.29-20288.2)/ 60)
9.28times

assets
3. Liquid securities indicator
government securities / total assets
1012.99/68663.2 (in millions) 1.48%
4. Core deposit ratio
core deposits / total deposits
4644.4/68663.2 (in millions) 6.76%
Bank Asia 2010
Ratio Formula Calculations
1. Cash position indicator
cash & deposits due from depository institutions / total assets
(5878497950+1080206294)/
1.05198E+11
6.61%
2. Capacity ratio
net loans & leases / total assets
82,819,973,884/1.05198E+11 75.57%
3. Liquid securities indicator
government securities / total assets
1163.49/105198.05 (in millions) 1.11%
4. Core deposit ratio
core deposits / total deposits
6565.16/105198.05 (in millions) 6.24%
Bank Asia 2011
Ratio Formula Calculations
1. Cash position indicator
cash & deposits due from depository institutions / total assets
(7,027,279,041+1,635,850,212)/
117,729,408,006
7.35%
2. Capacity net loans & 82,819,973,884/117,729,408,006 70.34%
Page | 68

ratio leases / total assets
3. Liquid securities indicator
government securities / total assets
1285.55/117729.41 (in millions) 1.09%
4. Core deposit ratio
core deposits / total deposits
9536.33/117729.41 (in millions) 8.1%
Bank Asia 2012
Ratio Formula Calculations
1. Cash position indicator
cash & deposits due from depository institutions / total assets
(6,593,971,845+220,000,000+3,703,560,536)/
140,361,374,568
7.49%
2. Capacity ratio
net loans & leases / total assets
92,328,818,525/140,361,374,568 65.77%
3. Liquid securities indicator
government securities / total assets
1930.64/140361.37 (in millions) 1.38%
4. Core deposit ratio
core deposits / total deposits
10444.33/140361.37 (in millions) 7.44%
Bank Asia 2013
Ratio Formula Calculations
1. Cash position indicator
cash & deposits due from depository institutions /
(9,708,569,284+1,362,883,245)/
163,777,743,402
6.76%
Page | 69

total assets
2. Capacity ratio
net loans & leases / total assets
104,911,261,053/163,777,743,402 65.05%
3. Liquid securities indicator
government securities / total assets
3053.8/163777.74 (in millions) 1.86%
4. Core deposit ratio
core deposits / total deposits
11904.15/163777.74 (in millions) 7.27%
IDLC 2009
Ratio Formula Calculations
1. Cash position indicator
cash & deposits due from depository institutions / total assets
(225,221,458+912,152,616)/
21,565,260,034
5.27%
2. Capacity ratio
net loans & leases / total assets
19,539,159,763/21,565,260,034 90.60%
3. Liquid securities indicator
government securities / total assets
637.95/22681.29 (in millions) 2.81%
4. Core deposit ratio
core deposits / total deposits
3899.25/22681.29 (in millions) 17.19%
Page | 70

IDLC 2010
Ratio Formula Calculations
1. Cash position indicator
cash & deposits due from depository institutions / total assets
(324,039,694+370,000,000+2,106,738,063)/
25,353,009,291
11.04%
2. Capacity ratio
net loans & leases / total assets
21,245,794,636/25,353,009,291 83.79%
3. Liquid securities indicator
government securities / total assets
575.47/26929.99 (in millions) 2.14%
4. Core deposit ratio
core deposits / total deposits
5581.49/26929.99 (in millions) 20.73%
IDLC 2011
Ratio Formula Calculations
1. Cash position indicator
cash & deposits due from depository institutions / total assets
(417,343,356+670,000,000+1,404,989,474)/
29,518,815,302
8.44%
Page | 71

2. Capacity ratio
net loans & leases / total assets
25,540,199,582/29,518,815,302 86.52%
3. Liquid securities indicator
government securities / total assets
549.6/31164.54 (in millions) 1.76%
4. Core deposit ratio
core deposits / total deposits
4979.4/31164.54 (in millions) 15.98%
IDLC 2012
Ratio Formula Calculations
1. Cash position indicator
cash & deposits due from depository institutions / total assets
(565,494,055+40,000,000+2,980,373,758)/
35,748,171,782
10.03%
2. Capacity ratio
net loans & leases / total assets
30,938,682,259/35,748,171,782 86.54%
3. Liquid securities indicator
government securities / total assets
387.54/37783.87 (in millions) 1.02%
4. Core deposit ratio
core deposits / total deposits
5757.85/37783.87 (in millions) 15.24%
Page | 72

IDLC 2013
Ratio Formula Calculations
1. Cash position indicator
cash & deposits due from depository institutions / total assets
(744,390,114+6,629,287,813)/
48,534,842,746
15.19%
2. Capacity ratio
net loans & leases / total assets
38,677,966,492/48,534,842,746 79.69%
3. Liquid securities indicator
government securities / total assets
786.55/50429.38 (in millions) 1.56%
4. Core deposit ratio
core deposits / total deposits
6051.29/50429.38 (in millions) 11.99%
Financial risk:
Bank Asia 2009
Ratio Formula Calculation
1. Equity Multiplier
Total Asset/Total Equity Capital
68663199976/4954144557
13.85
Page | 73

2. Debt-Equity Ratio
Total Debt/Total Equity
63709055419/4954144557
12.85
3. Interest Coverage Ratio
Net Income/Interest Expense
1327184458/4498016814 0.29 times
Bank Asia 2010
Ratio Formula Calculation
1. Equity Multiplier
Total Asset/Total Equity Capital
1.05198E+11/7059943201 14.90
2. Debt-Equity Ratio
Total Debt/Total Equity
98138106947/7059943201
13.90
3. Interest Coverage Ratio
Net Income/Interest Expense
1929582157/5420584211 0.35 times
Bank Asia 2011
Ratio Formula Calculation
1. Equity Multiplier
Total Asset/Total Equity Capital
117,729,408,006/12,478,933,539
9.43
Page | 74

2. Debt-Equity Ratio
Total Debt/Total Equity
105,250,474,466/12,478,933,539
8.43
3. Interest Coverage Ratio
Net Income/Interest Expense
1,916,214,381/8,202,658,439 0.23 times
Bank Asia 2012
Ratio Formula Calculation
1. Equity Multiplier
Total Asset/Total Equity Capital
140,361,374,568/13,045,170,346
10.75
2. Debt-Equity Ratio
Total Debt/Total Equity
127,316,204,222/13,045,170,346
9.75
3. Interest Coverage Ratio
Net Income/Interest Expense
907,996,995/9,616,349,333 0.09 times
Bank Asia 2013
Page | 75

Ratio Formula Calculation
1. Equity Multiplier
Total Asset/Total Equity Capital
163,777,743,402/14,617,704,017
11.20
2. Debt-Equity Ratio
Total Debt/Total Equity
149,160,039,385/14,617,704,017
10.20
3. Interest Coverage Ratio
Net Income/Interest Expense
1,459,817,905/11,166,022,060 0.13 times
IDLC 2009
Ratio Formula Calculation
1. Equity Multiplier
Total Asset/Total Equity Capital
21,565,260,034/1,850,714,614 11.65
2. Debt-Equity Ratio
Total Debt/Total Equity
19,714,545,420/1,850,714,614 10.65
3. Interest Coverage
Net Income/Interes
468,530,425/1,619,153,280 0.28 times
Page | 76

Ratio t Expense
IDLC 2010
Ratio Formula Calculation
1. Equity Multiplier
Total Asset/Total Equity Capital
25,353,009,291/2,626,286,595 9.65
2. Debt-Equity Ratio
Total Debt/Total Equity
22,726,722,696/2,626,286,595 8.65
3. Interest Coverage Ratio
Net Income/Interest Expense
805,571,981/1,817,840,968 0.44 times
IDLC 2011
Ratio Formula Calculation
1. Equity Multiplier
Total Asset/Total Equity Capital
29,518,815,302/3,220,515,574 9.16
2. Debt-Equity Ratio
Total Debt/Total Equity
26,298,299,728/3,220,515,574 8.16
3. Interest Coverage
Net Income/Interes
804,228,979/2,359,226,854 0.44 times
Page | 77

Ratio t Expense
IDLC 2012
Ratio Formula Calculation
1. Equity Multiplier
Total Asset/Total Equity Capital
35,748,171,782/3,809,715,843 9.38
2. Debt-Equity Ratio
Total Debt/Total Equity
31,938,455,939/3,809,715,843 8.38
3. Interest Coverage Ratio
Net Income/Interest Expense
589,200,269/3,087,770,161 0.19 times
IDLC 2013
Ratio Formula Calculation
1. Equity Multiplier
Total Asset/Total Equity Capital
48,534,842,746/4,620,722,835 10.50
2. Debt-Equity Ratio
Total Debt/Total Equity
43,914,119,911/4,620,722,835 9.50
3. Interest Coverage
Net Income/Interes
811,006,992/4,127,315,005 0.19 times
Page | 78
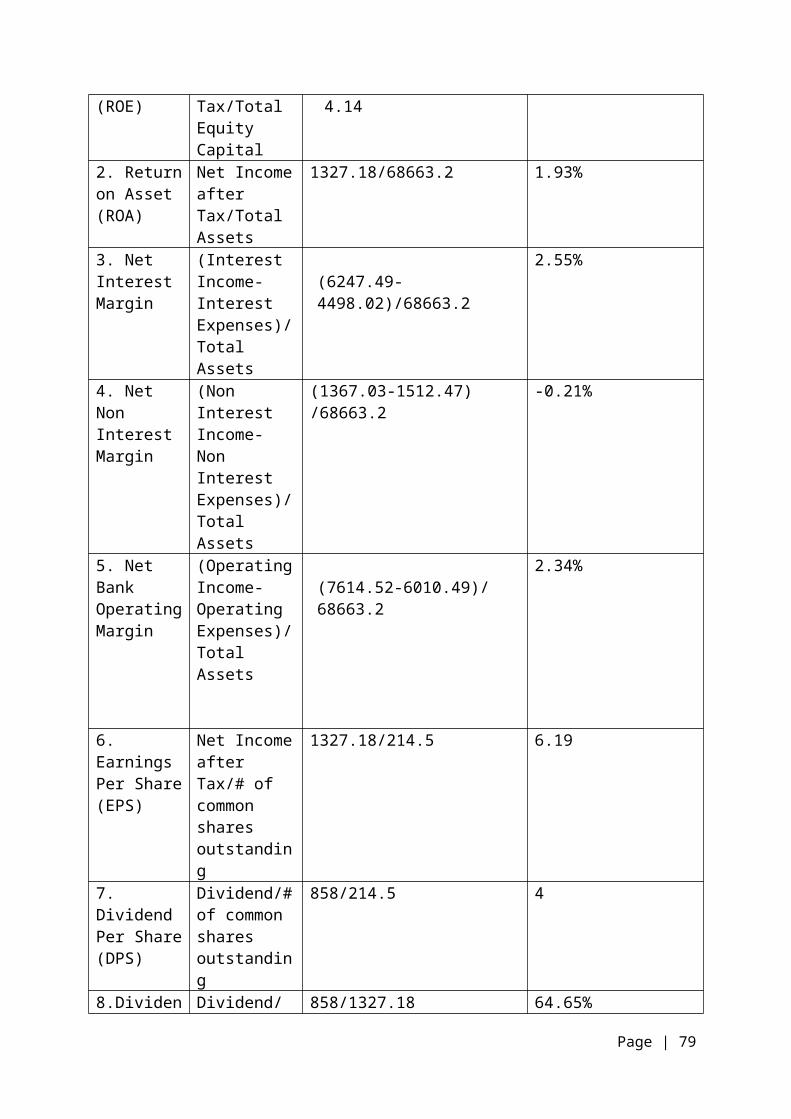
Ratio t Expense
Investors’ Viewpoint:
Bank Asia:
Regression Output (for calculation of Beta)
Regression StatisticsMultiple R 0.777545R Square 0.604576Adjusted R Square 0.565034Standard Error 0.034583Observations 12
ANOVA
df SS MS FSignificance
FRegression 1 0.018286 0.018286 15.289312 0.002913Residual 10 0.01196 0.001196Total 11 0.030245
CoefficientsStandard
Error t Stat P-value Lower 95%Upper 95%
Lower 95.0%
Upper 95.0%
Intercept -0.00903 0.010111 -0.89304 0.3928182 -0.03156 0.013499 -0.03156 0.013499X Variable 1 0.743616 0.190176 3.910155 0.0029125 0.319878 1.167354 0.319878 1.167354
IDLC:
Regression Output (for calculation of Beta)
Regression StatisticsMultiple R 0.567873R Square 0.32248
Page | 79

Adjusted R Square 0.254728Standard Error 0.120234Observations 12
ANOVA
df SS MS FSignificanc
e F
Regression 1 0.0688080.06880
84.75971
6 0.054092
Residual 10 0.1445630.01445
6Total 11 0.213371
Coefficient
sStandard
Error t Stat P-value Lower 95%Upper 95%
Lower 95.0%
Upper 95.0%
Intercept -0.01807 0.035125 -0.514580.61802
7 -0.096340.06018
8 -0.096340.06018
8
X Variable 1 1.435241 0.6578612.18167
70.05409
2 -0.030572.90104
8 -0.030572.90104
8
Page | 80