Coupling finite volume and lattice Boltzmann …nht.xjtu.edu.cn/paper/en/2015211.pdfinvestigation on...
10
Coupling finite volume and lattice Boltzmann methods for pore scale investigation on volatile organic compounds emission process Yu-Tong Mu, Li Chen, Ya-Ling He, Wen-QuanTao * Key Laboratory of Thermo-Fluid Engineering and Science of MOE, School of Energy and Power Engineering, Xi'an Jiaotong University, Xi'an, Shaanxi 710049, China article info Article history: Received 6 September 2014 Received in revised form 23 January 2015 Accepted 24 January 2015 Available online 27 March 2015 Keywords: VOCs emission LBM Multiscale simulation Pore-scale Adsorption/desorption abstract A coupled numerical model is employed to investigate the emission process of volatile organic com- pounds (VOCs) in the building material and chamber. In this model, for the first time the Langmuir- isotherm sink model is introduced by taking into account of the adsorption/desorption process be- tween the absorbed VOCs on the material surfaces and the gas phase VOCs in pores. The porous material adopted in the model is reconstructed with a random generation-growth algorithm for 3D microstruc- tures fibers. This model is numerically implemented by a multiscale strategy with the lattice Boltzmann method (LBM) being used to simulate pore-scale diffusion and finite volume method (FVM) for macroscopic transport. Information transferring from the macro scalar obtained from FVM zone to the distribution functions in LBM zone is executed with a reconstruction operator. The model is validated with the well-mixed diffusion model, and then applied to predict the VOCs emission process. A comprehensively investigation of the effects of sorption parameters, including adsorption/desorption rate constants, partition coefficient, Schmidt number and Reynolds number on the VOCs adsorption/ desorption process in building material and emission process in chamber is conducted. The simulation results reveal that the equilibrium VOCs concentration in the building material pores could be numer- ically estimated with our proposed model; the equilibrium concentration of VOCs in a closed chamber depends on the initial emitted VOCs concentration and partition coefficient; Reynolds number can promote the emission process in a ventilated chamber. © 2015 Elsevier Ltd. All rights reserved. 1. Introduction Volatile organic compounds (VOCs) constitute important classes of indoor air contaminants, which are always interacted with almost all the indoor material surfaces. Building material and decorative material have been considered as the main sources of VOCs. Study [1] has shown that the sorption of VOCs and their subsequent desorption contribute substantially to the degradation of indoor air quality (IAQ). Unfortunately, people are unavoidably exposed to building materials in the modern life, and may easily suffer from sick building syndrome [2]. Therefore, predicting the VOCs emissions from building materials is of great importance for risk assessment. Compared with emission chamber tests, emission simulations by numerical models can provide a more cost effective way to examine the emission behaviors of VOCs. Regarding the whole physicochemical phenomena, the VOCs emission process from the building material to environment is a typical multi-scale process [3], which involves adsorption/desorption process occurring on the microstructure surfaces due to the adsorbability of VOCs, pore- scale diffusion within building material pores at the mesoscopic scale and diffusion/convection in chamber at the macroscopic scale. Most of the existing and commonly used mechanistic models including first order sorption models [1,4,5], single-phase diffusion model [6,7], porous diffusion model [8] and integrated emission and sink model [9,10] are all single scale model, and they have been successfully employed to predict the VOCs emission in the past decades. Langmuir-isotherm model has been widely adopted as one of the first order sorption models. It assumes that a monolayer of molecules exists on a solid surface and all sorption sites are inde- pendent and identical [5]. The sorption rate constants for Langmuir-isotherm model, such as the adsorption/desorption rate constants are obtained by fitting the model constants to * Corresponding author. E-mail address: [email protected] (W.-Q. Tao). Contents lists available at ScienceDirect Building and Environment journal homepage: www.elsevier.com/locate/buildenv http://dx.doi.org/10.1016/j.buildenv.2015.01.038 0360-1323/© 2015 Elsevier Ltd. All rights reserved. Building and Environment 92 (2015) 236e245
Transcript of Coupling finite volume and lattice Boltzmann …nht.xjtu.edu.cn/paper/en/2015211.pdfinvestigation on...

lable at ScienceDirect
Building and Environment 92 (2015) 236e245
Contents lists avai
Building and Environment
journal homepage: www.elsevier .com/locate/bui ldenv
Coupling finite volume and lattice Boltzmann methods for pore scaleinvestigation on volatile organic compounds emission process
Yu-Tong Mu, Li Chen, Ya-Ling He, Wen-Quan Tao*
Key Laboratory of Thermo-Fluid Engineering and Science of MOE, School of Energy and Power Engineering, Xi'an Jiaotong University, Xi'an, Shaanxi 710049,China
a r t i c l e i n f o
Article history:Received 6 September 2014Received in revised form23 January 2015Accepted 24 January 2015Available online 27 March 2015
Keywords:VOCs emissionLBMMultiscale simulationPore-scaleAdsorption/desorption
* Corresponding author.E-mail address: [email protected] (W.-Q. Ta
http://dx.doi.org/10.1016/j.buildenv.2015.01.0380360-1323/© 2015 Elsevier Ltd. All rights reserved.
a b s t r a c t
A coupled numerical model is employed to investigate the emission process of volatile organic com-pounds (VOCs) in the building material and chamber. In this model, for the first time the Langmuir-isotherm sink model is introduced by taking into account of the adsorption/desorption process be-tween the absorbed VOCs on the material surfaces and the gas phase VOCs in pores. The porous materialadopted in the model is reconstructed with a random generation-growth algorithm for 3D microstruc-tures fibers. This model is numerically implemented by a multiscale strategy with the lattice Boltzmannmethod (LBM) being used to simulate pore-scale diffusion and finite volume method (FVM) formacroscopic transport. Information transferring from the macro scalar obtained from FVM zone to thedistribution functions in LBM zone is executed with a reconstruction operator. The model is validatedwith the well-mixed diffusion model, and then applied to predict the VOCs emission process. Acomprehensively investigation of the effects of sorption parameters, including adsorption/desorptionrate constants, partition coefficient, Schmidt number and Reynolds number on the VOCs adsorption/desorption process in building material and emission process in chamber is conducted. The simulationresults reveal that the equilibrium VOCs concentration in the building material pores could be numer-ically estimated with our proposed model; the equilibrium concentration of VOCs in a closed chamberdepends on the initial emitted VOCs concentration and partition coefficient; Reynolds number canpromote the emission process in a ventilated chamber.
© 2015 Elsevier Ltd. All rights reserved.
1. Introduction
Volatile organic compounds (VOCs) constitute important classesof indoor air contaminants, which are always interacted withalmost all the indoor material surfaces. Building material anddecorative material have been considered as the main sources ofVOCs. Study [1] has shown that the sorption of VOCs and theirsubsequent desorption contribute substantially to the degradationof indoor air quality (IAQ). Unfortunately, people are unavoidablyexposed to building materials in the modern life, and may easilysuffer from sick building syndrome [2]. Therefore, predicting theVOCs emissions from building materials is of great importance forrisk assessment.
Compared with emission chamber tests, emission simulationsby numerical models can provide a more cost effective way to
o).
examine the emission behaviors of VOCs. Regarding the wholephysicochemical phenomena, the VOCs emission process from thebuilding material to environment is a typical multi-scale process[3], which involves adsorption/desorption process occurring on themicrostructure surfaces due to the adsorbability of VOCs, pore-scale diffusion within building material pores at the mesoscopicscale and diffusion/convection in chamber at themacroscopic scale.Most of the existing and commonly used mechanistic modelsincluding first order sorption models [1,4,5], single-phase diffusionmodel [6,7], porous diffusion model [8] and integrated emissionand sink model [9,10] are all single scale model, and they have beensuccessfully employed to predict the VOCs emission in the pastdecades.
Langmuir-isotherm model has been widely adopted as one ofthe first order sorption models. It assumes that a monolayer ofmolecules exists on a solid surface and all sorption sites are inde-pendent and identical [5]. The sorption rate constants forLangmuir-isotherm model, such as the adsorption/desorption rateconstants are obtained by fitting the model constants to

Y.-T. Mu et al. / Building and Environment 92 (2015) 236e245 237
experimental data, which indicates that their accuracy is highlydepended on the multiple solutions with different initial estima-tions [11]. Besides, the model is designed to consider the adsorp-tion/desorption process at the microstructure surface. Therefore,the diffusion process inside the pore space and the chamber cannotbe considered in the Langmuir-isotherm model.
The single-phase diffusion model considers the VOCs diffusionin building material and assumes that the VOCs are well-mixed inchamber [6]. Therefore, unlike the Langmuir-isotherm model, themodel is computationally intensive but more accurate. In thismodel, the key parameters, such as effective diffusivity, convectivemass transfer coefficient and partition coefficient at the material-phase interface and the initial material-phase compound concen-tration can highly influence the accuracy of the model [2]. So far, allthe parameters are usually obtained with empirical equations orexperimental tests and the model does not consider the adsorp-tion/desorption on the material surfaces between absorbed VOCsand gas phase VOCs in the building material.
The porous diffusion model describes the VOCs transport in aporous material, which involves the pores space and solid regions[8]. The adsorption/desorption process is assumed to take place inthe whole solid regions, and which is merely handled with thepartition coefficient in porousmedia [2]. This is not proper since theadsorption/desorption process only takes place at the microstruc-ture surfaces. This model is based on the representative elementaryvolume (REV) scale and seems to be more appropriate in describingthe diffusion process in the material since the influence of micro-structure on the effective diffusion coefficient is considered [12].However, as a whole this model is still a macroscopic model innature, and the results cannot reveal the complex transport processin the material at the pore-scale.
The integrated emission and sink model is a combination ofdiffusion and sorption model [9,10]. Like the porous diffusionmodel, this model is also based on REV scale and handles theadsorption/desorption of VOCs as sink/source in the diffusionmodel.
The information obtained from all the above-mentionedmodelsfor VOCs emission transport can predict, in a certain degree, theVOCs emission process correctly. However, in the aforementionedmodels following two basic questions are not resolved properly andmay affect the reliability and applicability of these models.
1. All the models do not consider the influence of real micro-structures of the porous material on the VOCs adsorption/
Fig. 1. Microstructure and 3D reconstructed images of a M
desorption process at the pore-scale. The heterogeneous mi-crostructures not only affect the effective diffusion coefficient,but also significantly influence the VOCs adsorption/desorptionprocess. Studies have revealed that VOCs are mainly adsorbed inthe micro and meso pore space, and only a small amount ofVOCs exists in the macro pore space, which indicate that themicrostructure can influence the adsorption/desorption processin building material. According to Xiong et al. [12], for a mediumdensity board (MDB) widely used in China, the pores whichoccupy the indispensable cumulative pore volume are microand meso pores, and the pore size diameter is typically below oraround 1 mm.
2. All the models above can only partially consider the real VOCsemission process from the buildingmaterial to the chamber. Thefirst order sorption model ignores the diffusion process in thematerial pores and chamber, while the single-phase model,porous diffusion model and integrated model ignore or simplifythe adsorption/desorption process on the microstructuressurfaces.
On the whole, the real emission process is a pore-scale process,which cannot be fully described by the aforementioned modelsfrom macroscopic point of view. Besides, some assumptions areusually adopted in these models, such as the VOCs concentrationis well-mixed in the room and mass transfer coefficient is usuallytaken as constant, and does not depend on the air flow rate or theposition. Therefore, to understand the VOCs mass transport pro-cess in depth, a more fundamental model is highly required whichcan fully consider the actual structures of building material, theVOCs diffusion in the material pores and the adsorption/desorp-tion process on the material surfaces. The structures of manybuilding material are actually of porous type with pores ofdifferent sizes and shapes (see Figs. 1 and 2). The transport processin porous materials can be well simulated by the LBM because ofits simplicity and flexibility in dealing with complex boundaryconditions [13,14].
Xuan et al. [13] investigated the effective diffusivity of VOCs in aregular and random porous media with LBM. Ma et al. [14]considered the transient desorption process on the material sur-face, and adopted the Henry law to describe the desorption processbetween the VOCs and the material. However, the model neglectedthe adsorption process, thus no equilibrium state can be reachedand the VOCs adsorbed on the material and the material pores canbe emitted thoroughly, which is not reasonable. However, relatively
DB: (a) SEM image [12] (b) 3D reconstructed image.

Fig. 2. Pore size distribution of the reconstructed microstructures.
Y.-T. Mu et al. / Building and Environment 92 (2015) 236e245238
speaking LBM is time-consuming and should be used when themacroscale numerical method fails to work such as the simulationof pore-scale transport phenomena. For macroscale phenomena,the FVM based on the continuum hypothesis is a powerful andeconomical tool to simulate the mass transport process. Then at theinterface of the two regions information from the two regionsshould be exchanged to keep solution consistency in the entirecomputational domain. Therefore, in the present study, LBM isadopted to simulate the VOCs emission in building materials atmesoscopic level, while FVM is chosen to simulate the VOCsdiffusion and convection in the chamber. As for the interface in-formation exchanging, recently, the author's group has successfullydeveloped reconstruction operators functions to exchange the in-formation from the FVM solution to LBM solution [15].
The focus of the present paper is to present the coupled nu-merical method which has not been adopted in the previousreference for the study of VOC emission. In this model, adsorption/desorption process on the microstructure surfaces is implementedwith the Langmuir-isotherm sink model, which can simulate theequilibrium state in the material; the diffusion in the materialpores is simulated with the mass transport LB model while thediffusion and convection in the chamber is predicted with FVM;solid regions is supposed to be impermeable, thus the diffusion insolid regions is neglected.
Compared with the previous VOCs model, the coupled model isa little sophisticated and time-consuming due to its grid resolutionto capture the microstructure of the building material. However,detailed VOCs emission process from the building material to thechamber can be captured. Besides, the model is less parameterdependent since the effective diffusion coefficient and masstransfer coefficient are determined numerically with this model.Moreover, with the proposed model described in Section 3.2, theinitial VOCs concentration in building material could be numeri-cally obtained when the total amount of VOCs and adsorption/desorption rate constants are known.
In the remainder of the paper, we firstly describe the masstransport LB model and FVM, followed by a brief introduction ofreconstruction operator for the density concentration distributionfunction. Secondly, the porous microstructures of building materialare reconstructed, which is used for computational domain. Theadsorption/desorption process in the material surface as boundaryconditions is also explained. Then, the simulated results and dis-cussion are presented. Finally some conclusions are drawn.
2. Simulation methodology
2.1. Mass transport LB model
Toquantitatively investigate the effect ofmicrostructuresonVOCsemission process in building material, it is necessary to account forthe diffusion process at the pore-scale. The LBM is a promising nu-merical method in computational fluid dynamics for exploring pore-scale phenomena in porous media [13e18]. The LB simulationmethod employed is based on the Bhatnagar-Gross-Krook (BGK)model, which simulates the mass transport phenomena by trackingthe time evolution of concentration distribution functions, and eachevolution process contains streaming and collision steps.
The evolution equation of the distribution function is written as
fiðx þ eiDt; t þ DtÞ � fiðx; tÞ ¼ �1t
�fiðx; tÞ � f eqi ðx; tÞ
�(1)
where fi(x,t) is the concentration distribution function with latticevelocity ei at the site x and time t. t is the collision time which isrelated to the mass transfer diffusivity. The equilibrium concentra-tion function is commonly chosen as shown in Eq. (2) [17].
f eqi ðx; tÞ ¼ X�Ji þ
12ei$u
�(2)
where X is the concentration, and Ji is a specially chosen constantgiven by Ref. [15]. With the Chapmann-Enskog expansion for Eqs.(1) and (2), the advection-diffusion equation can be recovered. Wechoose a reduced D2Q5 lattice model instead of the original D2Q9lattice model without loss the accuracy [18].
The discrete velocities are given by
ei ¼8<:
0 i ¼ 0�cos
�ði� 1Þp2
�; sin
�ði� 1Þp2
��i ¼ 1;2;3;4
(3)
Species concentration X is obtained by
X ¼X4i¼0
fi (4)
Ji is expressed as
Ji ¼�J0 i ¼ 0ð1� J0Þ=4 i ¼ 1;2;3;4 (5)
with the rest fraction J0 can be chosen from 0 to 1.The diffusivity corresponding to the collision time is written as
D ¼ 12ð1� J0Þðt� 0:5ÞDx
2
Dt(6)
where D, Dx and Dt are the diffusivity, lattice step and time incre-ment, respectively.
2.2. Finite volume method
The general governing equation is written as follows:
vðrfÞvt
þ V$ðrufÞ ¼ VGfVf
þ Sf (7)
where the terms from left side to the right side in Eq. (7) representthe unsteady term, convective term, diffusion term and sourceterm, respectively. f is a scalar dependent variable, Gf is a general

Fig. 3. Comparison of the effective diffusivity between the analytical result and thepresent model.
Y.-T. Mu et al. / Building and Environment 92 (2015) 236e245 239
diffusion coefficient. When the variable f equals 1, u and X, Eq. (7)represents the continuity equation, momentum equation and massdiffusion equation, respectively. The general governing equation isdiscretized by FVM. A fully implicit algorithm called IDEAL algo-rithm is used in this paper to solve the coupling of pressure and thevelocity, which overcomes two main assumptions in the SIMPLEalgorithm completely [19]. A new stability-guaranteed second-or-der difference scheme (SGSD) is adopted for the convective termdiscretion in Eq. (7) [20].
2.3. Concentration coupling distribution functions
In LBM zone, the fluid flow is ignored and only the mass diffu-sion process is considered in the building materials. In FVM zone,both themass diffusion and fluid floware considered in chamber. Inthe coupled zone, the information derived from the FVM and LBMshould be exchanged. It's worth noting that in the coupled regionthe solutions of FVM are still of convection-diffusion type. The in-formation calculated from the LBM zone can be easily transformedto FVM zones with Eq. (4). However, the distribution functionsrequired by LBM cannot be obtained directly from the resultscalculated with FVM. Here the reconstruction operators developedby our group are adopted [15]. For brevity, we only list the recon-struction operator for concentration distribution functions from themacro variables.
fi ¼ f eqi
h1� tDtX�1ðUiavxaX � DvxavxaXÞ
i
� 0:5tDtXcib�Uiavxaub þ nvxavxaub þ r�1nSabvxar
�
þ 0:5tDtr�1Xcibc�2s vxar
(8)
where n and cs are the viscosity and lattice sound speed, respec-tively. Uia, Sab can be calculated as
Uia ¼ cia � ua; Sab ¼ vxbua þ vxaub (9)
For details of the derivation, readers are recommended to referto [15].
3. Computational domain and boundary conditions
3.1. Computational domain
The complex porousmicrostructure of aMDB is illustrated in thescanning electron microscope (SEM) image (Fig. 1(a)) [12]. The poresize is around a few or tens of microns, thus the Fick diffusion law isstill satisfied. The fibers in the building material are randomlydistributed, and the diameter of the fiber can be estimated with theresolution. The present study uses the easily acquired porosity andfiber diameter as the main characters to reconstruct the micro-structure randomly. Although this method has a room for furtherimprovement, it can basically represent the physical process inporous media. Similar reconstruction methods have been widelyadopted in the study of other physical process in porousmedia [15].In the 3D reconstructed image (see Fig. 1(b)), we assume that thediameter of the fiber is 5, 10 and 15 mm which are determinedrandomly during the reconstruction process, and the porosity is thesame as a real MDB. The whole reconstruction process of randomgeneration-growth algorithm may be described by the followingthree steps: Step 1, with an initial point which is randomly located,radial and axial angles are also randomly chosen, thus the axis offiber is determined; Step 2, the fiber diameter is randomly ob-tained, and the fiber can be generated through the entire domain;Step 3, the porosity is calculated, and such steps is repeated untilthe designed porosity is reached.
In the present study, five microstructures are reconstructed andthe porous size distribution (PSD) is statistically determined by the13 direction averaging method [21]. PSD comparisons of thereconstructed microstructures and the experimental result [12] areillustrated in Fig. 2. It is worth noting that those pore diametersbelow 1 mm or over 60 mm in Ref. [12] are not included due to thegrid resolution. As can be seen in this figure, even though somequantitative differences exist, all the PSDs of the reconstructedmicrostructures show the same distribution trend. The majority ofthe pore diameters with the reconstruction method is between 15and 20 mm, while those in Ref. [12] is around 10 mm. To the authors'knowledge such an agreement is acceptable for a stochasticreconstruction method.
Bruggeman equation has been widely adopted to calculate theeffective diffusivity Deff
Deff
.D ¼ ε
ttor(10)
where ttor is the tortuosity, defined as the ratio between the actualflow path length and the straight length of a porous medium. It canbe calculated with [22].
ttor ¼ ð1þ 0:63$lnð1=εÞÞ2 (11)
The predicted variations of Deff/D with the porosity by theanalytical model and Ma's work [14] are also compared with thepresent study, as shown in Fig. 3. It shows a satisfying accordanceamong the three methods.
A cross-section of the 3D reconstructed model is chosen andpresented in Fig. 4. The length and height of the building materialare L1 ¼ 1.0 � 10�2 m and H1 ¼ 1.1 � 10�3 m, respectively; and thelength and height of the chamber are L2 ¼ 1.0 � 10�2 m andH2 ¼ 1.01 � 10�2 m, respectively. The grid resolution in LBM zone is1.0 � 10�5 m, therefore the grid adopted is 1000 � 110; while thegrid resolution in FVM zone is 1.0� 10�4 m, and the grid adopted is100 � 101. The chamber is a closed one as Re ¼ 0, while it is aventilated one as Re s 0. Details of the physical and operationparameters for basic case are listed in Table 1. Note that Schmidtnumber (Sc ¼ n/D) defines the ratio of momentum diffusivity andmass diffusivity. The initially absorbed VOCs on the building ma-terial surfaces is denoted as Mintial.

Fig. 4. Cross-section of computation domain of building materials and chamber.
Y.-T. Mu et al. / Building and Environment 92 (2015) 236e245240
3.2. Initial conditions and boundary conditions
In order to study the transport process of VOCs from buildingmaterial to the chamber space, an initial equilibrium state of theVOCs in the building material pores is needed. We proposed anumerical method to predict the initial VOC concentration, which isstimulated from the physical process described in Ref. [23]. Themodel supposes that at the beginning VOC components exist onlyon the microstructure surfaces, and then they desorbs to thebuilding material pores until a dynamic equilibrium state isreached. The initially adsorbed VOCs on microstructure surfacesMintial is assumed to be the total amount of VOCs in building ma-terial, and the adsorption/desorption rate constants are constantduring the whole emission process. The evolution boundary con-ditions on the microstructure surfaces can be derived based on theLangmuir-isotherm model (see Eqs. (17)e(21)). Thus, the initialVOCs concentration is numerically obtained. Then this equilibriumstate is taken as the initial condition for the simulation of VOCsemission from building material surface to the chamber space. Inthe present study, to obtain the initial equilibrium state, only LBM isused for the region of building material; while for the emissionprocess, both LBM and FVM are adopted.
The following lists the detailed initial conditions and boundaryconditions of the two computations.
For obtaining the equilibrium state, the initial condition is thatthe adsorbed VOCs concentration on the material surfaces isMinitial,and the VOCs concentration in the building material pores is 0. Theboundary condition is that all the walls of LBM zone are no-fluxduring this process. The computation ends when an equilibriumstate is reached.
For the emission simulation coupled by LBM and FVM, theboundary conditions are as follows.
In FVM zone, no-slip condition and no-flux condition areimplemented for all velocities and concentration at the walls. Forthe inlet as shown in Fig. 4 following conditions are adopted:
X ¼ 0; u ¼ ReLref.n; v ¼ 0 (12)
Table 1Physical parameters and basic case.
Parameters Kpart Mintial (mg m�2) ka (m h�1) kd (h�1)
Value 1000 1.423 0.25 2.81Parameters n (m2 s�1) Sc ReValue 5.9e-4 50 0
where Lref is the characteristic length which equals 2 � 10�3 m inthe present study, and for the outlet,
vX=vx ¼ 0; vu=vx ¼ 0; vv=vx ¼ 0 (13)
In the coupled zone, the VOCs concentration at the bottomwallof FVM is calculated with [6,7,24].
XFVM ¼ XLBM�Kpart (14)
where Kpart is the material/air partition coefficient.The VOCs concentration at the upper wall of LBM used in Eq. (8)
is obtained with
XLBM ¼ XFVM$Kpart (15)
In LBM zone, bounce back condition of the concentration dis-tribution function is applied on the walls. At the surface of thebuilding material and the pores, Langmuir-Isotherm sink model isused to describe the variation of VOCs concentration and adsorbedVOCs on the material surfaces. The Langmuir-isotherm sink modelcan be discretized as follows:
dXðx; tÞdt
¼ Rð � kaXðx; tÞ þ kdMðx; tÞÞ;dMðx; tÞ
dt¼ kaXðx; tÞ � kdMðx; tÞ; ke ¼ ka
kd¼ Meqðx; tÞ
Xeqðx; tÞ(16)
where X (x,t) and M (x,t) are the VOCs concentration in the poreand the VOCs adsorbed on the material surfaces, respectively. R isthe loading ratio in the MDB and ke is the equilibrium constant.The rate constants ka and kd are obtained from Ref. [1]. Fig. 5schematically shows the VOCs phases in the building material.There are two types of VOCs in the domain, namely, absorbedVOCs and gas phase VOCs. Adsorption/desorption process is takenplaces in the nodes named 1 and 2. For the nodes named 2 thereare two adsorption/desorption surfaces while those nodes named1 there is only one adsorption/desorption surface. For brevity, thefollowing equations implicitly present the evolution of theadsorbed VOCs and their nearest VOCs concentration in pores onthe basis of Eq. (16):
Fig. 5. VOCs phases states in building materials.

Y.-T. Mu et al. / Building and Environment 92 (2015) 236e245 241
For those nodes named 1
M1ðx; t þ DtÞ ¼ ð1=Dt þ kaRÞM1ðx; tÞ þ kaX1;1ðx; tÞ1=Dt þ kaRþ kd
(17)
X1ðx; t þ DtÞ ¼ X1ðx; tÞ þ RðM1ðx; tÞ �M1ðx; t þ DtÞÞ (18)
For those nodes named 2
X2;2ðx; t þ DtÞ ¼2X2;2ðx; tÞ þ DtR
�kdM2ðx;tÞ1þkdDt
þ�ka � Rkakd
1þkdDt
�X2;2ðx; tÞ � X2;1ðx; tÞ
�
2þ 2kaDtR� 2kakdDt2R�ð1þ kdDtÞ
(19)
X2;1ðx; t þ DtÞ ¼ X2;2ðx; t þ DtÞ þ X2;1ðx; tÞ � X2;2ðx; tÞ (20)
M2ðx; t þ DtÞ ¼ �M2ðx; tÞ þ Dt
kaX2;1ðx; tÞ
þ kdX2;2ðx; tÞ �ð1þ kdDtÞ
(21)
3.3. Validation of the model
In order to verify our proposed coupled model, a well-mixeddiffusion model developed by Xu et al. [7] is used to estimate theemission process of VOCs in a closed chamber. For brevity, thedetails of Xu's model is omitted here. Based upon the basic caselisted in Table 1, the model parameters needed in Xu's model arenumerically predicted by our proposed model, and the results arelisted in Table 2.
The comparison of the VOCs concentration in chamber is shownin Fig. 6. The result obtained with our proposed model accords wellwith that of Xu's model, showing the reliability of the proposedmodel.
4. Results and discussion
In the following section, the results of the two computations(obtaining the equilibrium state and emission process) are pre-sented together. The effects of adsorption/desorption rate con-stants, partition coefficient and Schmidt number are firstlyinvestigated, and then the operation parameters are studied. Theinfluence of each parameter is investigated while keeping the otherparameters constant, and the values of the parameters of the basiccase are listed in Table 1.
4.1. Influence of adsorption rate constant
Fig. 7 presents the VOCs adsorption/desorption process in thebuilding material and emission process in a chamber with differentadsorption rate constant ka, where the abscissa is Fourier numberwhich is the dimensionless time defined by Fo ¼ Dt/L12. As can be
Table 2Model parameters in Xu's model.
Parameters hm (m s�1) C0 (mg m�3) Deff (m2 s�1)
Value 1.17e-3 1.02e-2 3.78e-6
seen in Fig. 7(a), a higher VOCs concentration in the material couldbe obtained with a decrease in ka and starting from the same initialstage, different equilibrium concentration state in the pores can bereached at different adsorption rate constant. Besides, the timeneeded to reach the equilibrium state increases dramatically with alower ka. These can be explained as follows. At the beginning of theadsorption/desorption process, the VOCs are all adsorbed on thesurfaces of the material and the VOCs concentration in the pores is
zero. Therefore, at the beginning desorption process is dominant onthe basis of Eq. (16), and the variations of VOCs concentration inpores are nearly the same. When the VOCs concentration is higher,adsorption process becomes more significant. Thus, a higheradsorption rate constant could lead to an equilibrium state earlier.The equilibrium VOCs concentration decreases with a higher ka dueto a higher equilibrium constant (see Eq. (16)). The adsorbed VOCson material surfaces during the adsorption/desorption processdepicted in Fig. 7(b) shows an opposite variation trend comparedwith Fig. 7(a). This is mainly because the total amount of VOCs is aconstant.
Fig. 7(c) presents the VOCs emission process in a chamber. TheVOCs concentration increases significantly at the beginning andthen tends to be gentle. The equilibrium concentration increaseswith a decrease in ka, which is consistent with the results shown inFig. 7(a). Based on Fig. 7(c), a conclusion can be drawn that theequilibrium VOCs concentration in the material building dependson ka, and a higher ka leads to a lower equilibrium VOCsconcentration.
4.2. Influence of desorption rate constant
The influence of desorption rate constant kd on the adsorption/desorption process in the building material and emission process inthe chamber is investigated and the results are presented in Fig. 8.Fig. 8(a) shows VOCs concentration in material pores during the
Fig. 6. Comparison of the present model and the well-mixed model.
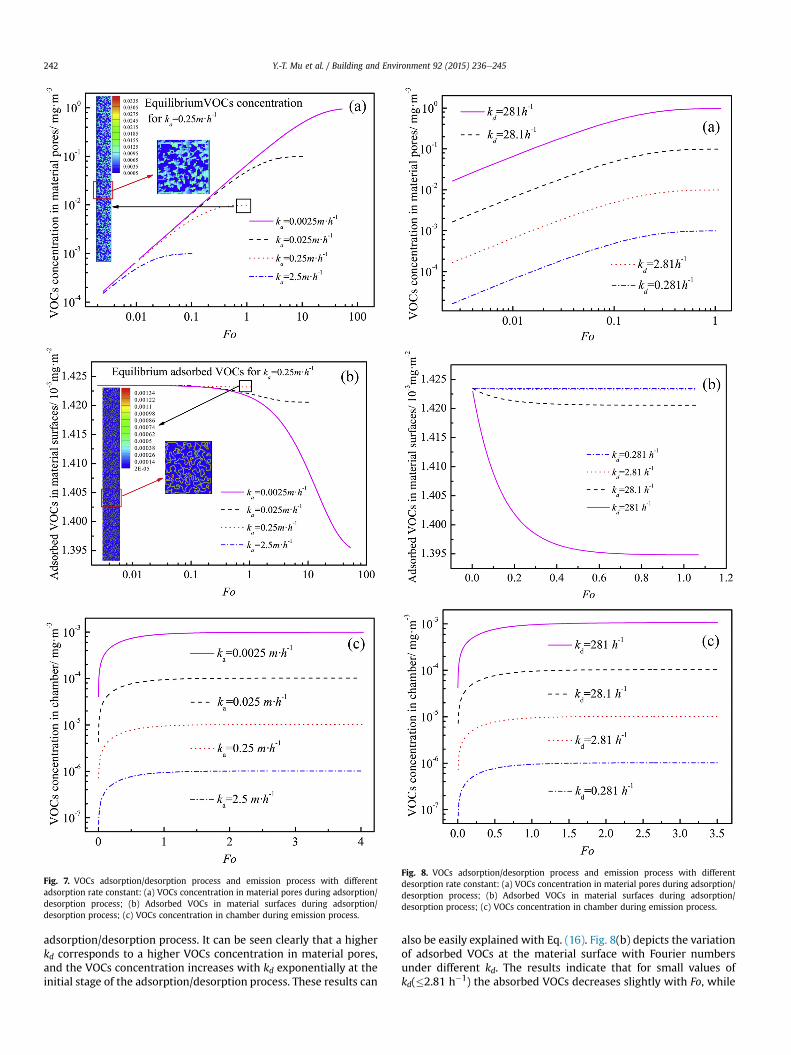
Fig. 7. VOCs adsorption/desorption process and emission process with differentadsorption rate constant: (a) VOCs concentration in material pores during adsorption/desorption process; (b) Adsorbed VOCs in material surfaces during adsorption/desorption process; (c) VOCs concentration in chamber during emission process.
Fig. 8. VOCs adsorption/desorption process and emission process with differentdesorption rate constant: (a) VOCs concentration in material pores during adsorption/desorption process; (b) Adsorbed VOCs in material surfaces during adsorption/desorption process; (c) VOCs concentration in chamber during emission process.
Y.-T. Mu et al. / Building and Environment 92 (2015) 236e245242
adsorption/desorption process. It can be seen clearly that a higherkd corresponds to a higher VOCs concentration in material pores,and the VOCs concentration increases with kd exponentially at theinitial stage of the adsorption/desorption process. These results can
also be easily explained with Eq. (16). Fig. 8(b) depicts the variationof adsorbed VOCs at the material surface with Fourier numbersunder different kd. The results indicate that for small values ofkd(�2.81 h�1) the absorbed VOCs decreases slightly with Fo, while

Y.-T. Mu et al. / Building and Environment 92 (2015) 236e245 243
for large values of kd (�28.1 h�1) the absorbed VOCs decreasessignificantly at initial stage and then keeps constant with Fo.
Fig. 8(c) presents the VOCs emission process in the chamberunder different kd. The result is similar to Fig. 7(c) that the variationof VOCs concentration increases significantly at the beginning andthen tends to be gentle. The equilibrium concentration increaseswith kd due to a lower equilibrium constant ke. Besides, like theadsorption rate constant, desorption rate constant shows no effecton the time for the chamber to reach an equilibrium state. It ismainly because that the VOCs concentration in the building ma-terial has already in an equilibrium state at the beginning of theVOCs emission in chamber, and the amount of VOCs emitted in thechamber is quiet small compared with the total amount of VOCs.Therefore, it is always in a quasi-equilibrium state in buildingmaterial with different desorption rate constants. Based onFigs. 8(a) and (c), conclusions can also be drawn that the initialemitted VOCs concentration in thematerial building depends on kd,and the equilibrium VOCs concentration in chamber depends onthe initial emitted VOCs concentration in building material.
4.3. Influence of partition coefficient
Partition coefficient is usually used to describe the concentra-tion relationship at the interface between building materials andchamber (see Eq. (14)). Fig. 9 presents the VOCs emission process inchamber with different partition coefficients. It can be seen that theequilibrium VOCs concentration in chamber is almost inverselyvaried with the partition coefficient. This is mainly because theVOCs concentration at the interface decreases with partition coef-ficient. Combining the aforementioned results of partition coeffi-cient and adsorption/desorption rate constants, the followingconclusions can be drawn. With the constant absorbed VOCs, theinitial emitted VOCs concentration in the building materials de-pends on the adsorption/desorption rate constants, and the VOCsconcentration in the chamber depends on the initial emitted VOCsconcentration and partition coefficient.
Fig. 10. VOCs adsorption/desorption process and emission process with differentSchmidt numbers: (a) VOCs concentration in material pores during adsorption/desorption process; (b) VOCs concentration in chamber during emission process.
4.4. Influence of Schmidt number
The influence of Schmidt number on the effect of VOCsadsorption/desorption process in building material and emissionprocess in chamber has been investigated. Fig. 10(a) illustrates thevariation of VOCs concentration in material pores with Fo under
Fig. 9. VOCs emission process with different partition coefficient.
different Schmidt numbers. It can be seen that at the initial stageVOCs concentration in the material pores is strongly dependent onSchmidt number, and the higher the Schmidt number the higherthe concentration, even though their variation speeds with time arealmost the same. However, finally all cases with different Schmidtnumbers approach the same equilibrium state. These can beexplained as follows. The amount of VOCs desorbed from themicrostructure surfaces can be considered as source term SX in Eq.(7). The governing equation for mass diffusion in building materialcan be simplified as:
vðrXÞvFo
¼ L2refVðVXÞ þ L2ref ScSX.n (22)
As can be seen in Eq. (22), a lower Schmidt number correspondsto a lower source term. Therefore, the variation of VOCs concen-tration in the building material increases with Schmidt number.The equilibrium VOCs concentration only depends on the adsorp-tion/desorption rate constants, therefore, all cases reach the sameequilibrium state in the end.
Fig. 10(b) depicts the VOCs concentration in the chamber duringemission process. It can be seen that Schmidt number has no

Fig. 11. VOCs emission process with different Reynolds numbers.
Fig. 12. VOCs concentration and steam li
Y.-T. Mu et al. / Building and Environment 92 (2015) 236e245244
influence on the variation of concentration in chamber (seen in Eq.(22)), which accords well with the results of [24].
4.5. Influence of Reynolds number
The influence of inlet Reynolds number on the VOCs emissionprocess in chamber is investigated and Fig. 11 presents the results.The equilibrium state can be reached earlier with a higher Reynoldsnumber. Besides, the equilibrium concentration in chamber de-creases with an increase in Reynolds dramatically. This is mainlybecause VOCs flows out of the chamber, and the mass transfercoefficient at the interface between chamber and building mate-rials increases with Re. Fig. 12 shows the VOCs concentration andstream line with different Reynolds numbers. It can also be foundthat VOCs distributes unevenly in chamber. Combing the influencesof Schmidt number and Reynolds number on VOCs concentration inthe chamber, it can be concluded that VOCs concentrationwould bechanged greatly with operation conditions (such as inlet Reynoldsnumber) in an open chamber. However, in a closed chamber,equilibrium concentration would not be influenced by Schmidtnumber, and the parameters influencing the emission source termwould influence emission rate (such as Schmidt number).
ne with different Reynolds numbers.

Y.-T. Mu et al. / Building and Environment 92 (2015) 236e245 245
5. Conclusions
In the present study, a new VOCs emission model is proposed,which considers adsorption/desorption on the material surface andthe diffusion in the material pores and chamber. A multiscaleprocess approach is adopted inwhich LBM is used to simulate pore-scale diffusion in the building material and FVM is used to inves-tigate the macroscopic transfer in the chamber. A numericalmethod is proposed to estimate the initial equilibrium VOCs con-centration in building material. The main conclusions are asfollows:
1. According to the proposed numerical method the initial equi-librium VOCs concentration in building material increases withdesorption rate constant and decreases with adsorption rateconstant;
2. VOCs concentration in chamber is inversely varied with thepartition coefficient;
3. Variation of material pores increases with Schmidt number, andSchmidt number has no influence on the variation of concen-tration in chamber;
4. Equilibrium state can also be reached earlier with a higherReynolds number, and the equilibrium concentration in cham-ber decreases with the increase in Reynolds dramatically.
Acknowledgment
This work is supported by the 12th Five-Year National KeyTechnology R & D Program (2012BAJ02B03) and the Key Project ofthe National Natural Science Foundation of China (51136004).
References
[1] Popa J, Haghighat F. The impact of VOC mixture, film thickness and substrateon adsorption/desorption characteristics of some building materials. BuildEnviron 2003;38:959e64.
[2] Liu Z, Ye W, Little JC. Predicting emissions of volatile and semivolatile organiccompounds from building materials: a review. Build Environ 2013;64:7e25.
[3] He YL, Tao WQ. Multiscale simulations of heat transfer and fluid flow prob-lems. ASME J Heat Transfer 2012;134:031018-1e031018-13.
[4] Liu X, Guo Z, Sparks LE, Roache NF. VOC sink behaviour on building materials -model evaluation. Indoor Built Environ 2011;20:661e76.
[5] Tichenor BA, Guo Z, Dunn JE, Sparks LE, Mason MA. The interaction of vaporphase organic compound with indoor sink. Indoor Air 1991;1:23e35.
[6] Little JC, Hodgson AT, Gadgil AJ. Modeling emissions of volatile organiccompounds from new carpets. Atmos Environ 1994;28:227e34.
[7] Xu Y, Zhang Y. A general model for analyzing single surface VOC emissioncharacteristics from building materials and its application. Atmos Environ2004;38:113e9.
[8] Blondeau P, Tiffonnet AL, Allard F, Haghighat F. Physically based modelling ofthe material and gaseous contaminant interactions in buildings: models,experimental data and future developments. Adv Build Energy Res 2008;2:57e93.
[9] Tefera DT, Jahandar Lashaki M, Fayaz M, Hashisho Z, Philips JH, Anderson JE,et al. Two-dimensional modeling of volatile organic compounds adsorptiononto beaded activated carbon. Environ Sci Technol 2013;47:11700e10.
[10] Yang X, Chen Q. A coupled air flow and source sink model for simulatingindoor VOC exposures A coupled airflow and source sink model for simulatingindoor VOC exposures. Indoor Air 2001;11:257e69.
[11] Zhang J, Chen Q, Zhang JS, Chen QY, Yang XD. A critical review on studies ofvolatile organic compound (VOC) sorption by building materials. ASHRAETrans 2002;108:162e74.
[12] Xiong J, Zhang Y, Wang X, Chang D. Macroemeso two-scale model for pre-dicting the VOC diffusion coefficients and emission characteristics of porousbuilding materials. Atmos Environ 2008;42:5278e90.
[13] Xuan YM, Zhao K, Li Q. Investigation on mass diffusion process in porousmedia based on lattice Boltzmann method. Int J Heat Mass Trans 2010;46:1039e51.
[14] Ma Q, Chen Z, Shi J, Li D. Lattice Boltzmann modeling of VOC desorption anddiffusion in porous materials. Build Environ 2014;72:145e53.
[15] Chen L, Luan H, Feng Y, Song C, He Y-L, Tao W-Q. Coupling between finitevolume method and lattice Boltzmann method and its application to fluidflow and mass transport in proton exchange membrane fuel cell. Int J HeatMass Trans 2012;55:3834e48.
[16] Chen L, Kang Q, Mu Y, He Y-L, Tao W-Q. A critical review of the pseudopo-tential multiphase lattice Boltzmann model: methods and applications. Int JHeat Mass Trans 2014;76:210e36.
[17] Sullivan SP, Sani FM, Johns ML, Gladden LF. Simulation of packed bed reactorsusing lattice Boltzmann methods. Chem Eng Sci 2005;60:3405e18.
[18] Dawson SP, Chen SY, Doolen GD. Lattice Boltzmann computations forreaction-diffusion equations. J Chem Phys 1993;98:1514e23.
[19] Sun DL, Qu ZG, He YL, Tao WQ. An efficient segregated algorithm for incom-pressible fluid flow and heat transfer problemsdIDEAL (inner doubly iterativeefficient algorithm for linked equations) Part I: mathematical formulation andsolution procedure. Numer Heat Tr B-Fund 2008;53:1e17.
[20] Li ZY, Tao WQ. A new stability-guaranteed second-order difference scheme.Numer Heat Tr B-Fund 2002;42:349e65.
[21] Chen L, Zhang L, Kang Q, Viswanathan HS, Yao J, Tao WQ. Nanoscale simu-lation of shale transport properties using the lattice Boltzmann method:permeability and diffusivity. Sci Rep 2015;5:8089. http://dx.doi.org/10.1038/srep08089.
[22] Tang X-W, Sun Z-F, Cheng G-C. Simulation of the relationship betweenporosity and tortuosity in porous media with cubic particles. Chin Phys B2012;21:100201.
[23] Seiichi K, Tatsuo I, Abe I. Adsorption science. 2nd ed. Beijing Chemical IndustryPress; 2010.
[24] Xu Y, Little JC. Predicting emissions of SVOCs from polymeric materials andtheir interaction with airborne particles. Environ Sci Technol 2006;40:456e61.