COUNTY OF OTTAWA GRAND HAVEN, MICHIGAN
202
COUNTY OF OTTAWA GRAND HAVEN, MICHIGAN 2020 COMPREHENSIVE ANNUAL FINANCIAL REPORT YEAR ENDED SEPTEMBER 30, 2020 Prepared by Fiscal Services Department
Transcript of COUNTY OF OTTAWA GRAND HAVEN, MICHIGAN
COUNTY OF OTTAWA GRAND HAVEN, MICHIGAN
2020 COMPREHENSIVE ANNUAL FINANCIAL REPORT YEAR ENDED SEPTEMBER 30, 2020
Prepared by Fiscal Services Department
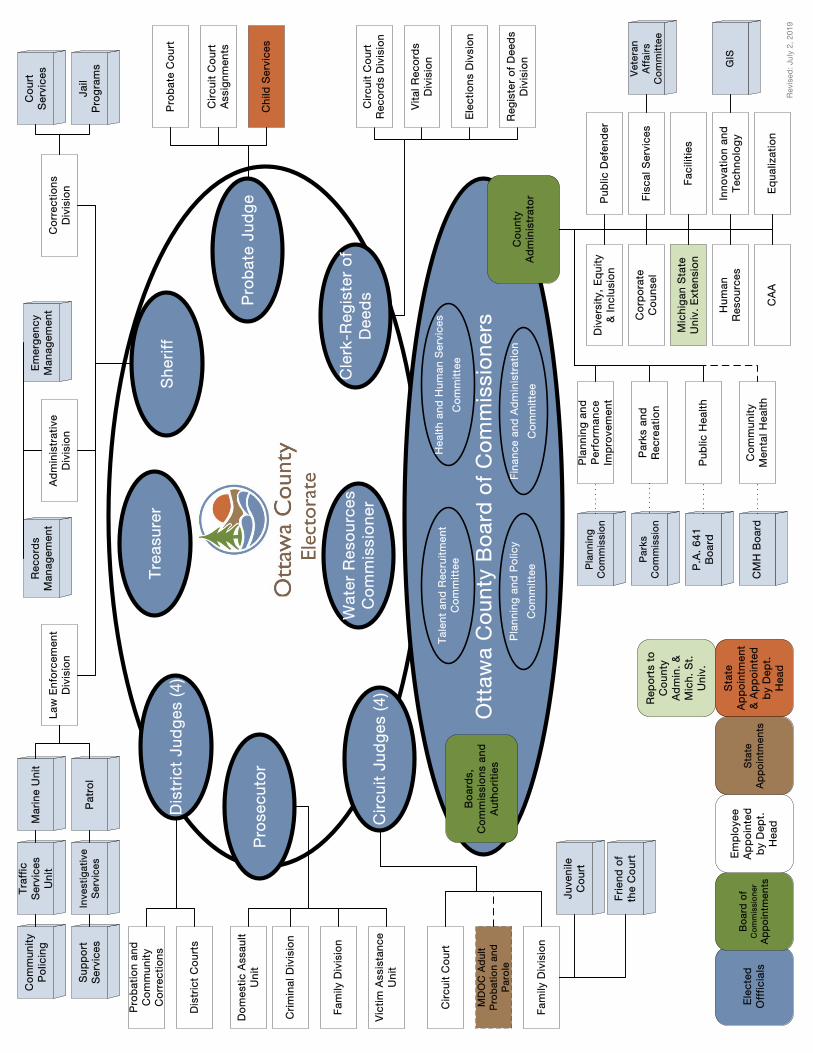
INTRODUCTORY PAGELetter of Transmittal i-iiiGFOA Certificate of Achievement ivOrganizational Chart vListing of Principal Officials vi
INDEPENDENT AUDITORS' REPORTIndependent Auditors’ Report 1-2
MANAGEMENT'S DISCUSSION AND ANALYSISManagement’s Discussion and Analysis 3-12
BASIC FINANCIAL STATEMENTSThe accompanying notes are an integral part of these financial statements.
Government-wide Financial Statements:Statement of Net Position 13Statement of Activities 14-15
Fund Financial Statements:Balance Sheet - Governmental Funds 16Reconciliation of Fund Balances on the Balance Sheet for
Governmental Funds to the Net Position of Governmental Activities on the Statement of Net Position 17
Statement of Revenue, Expenditures, and Changes in Fund Balances -Governmental Funds 18
Reconciliation of the Statement of Revenues, Expenditures, and Changesin Fund Balances of Governmental Funds to the Statement of Activities 19
Statement of Net Position - Proprietary Funds 20Statement of Revenue, Expenses, and Changes in Fund Net Position -
Proprietary Funds 21Statement of Cash Flows - Proprietary Funds 22-23Statement of Net Position - Fiduciary Funds 24Statement of Changes in Net Position - Other Post Employment Benefits Plan 25Statement of Net Position - Component Units 26Statement of Activities - Component Units 27-28
NOTES TO THE FINANCIAL STATEMENTSNotes to the Financial Statements 29-95
SUPPLEMENTARYRequired Supplementary Information:
Schedule of Revenues, Expenditures, and Changes in Fund Balance -Budget and Actual - General Fund 96
Notes to Required Supplementary Information 97Schedule of Revenues, Expenditures, and Changes in Fund Balance -
Budget and Actual - Community Mental Health Fund 98Schedule of Revenues, Expenditures, and Changes in Fund Balance -
Budget and Actual - Sustance Use Disorder Fund 99Defined Benefit Pension Plans - Schedule of Changes in Employers Net Position
Liability and Related Ratios 100Defined Benefit Pension Plans - Schedule of Employer Contributions 101Other Post Employment Benefit Plans - Schedule of Changes in Employers
Liability and Related Ratios 102(Continued)
FOR THE YEAR ENDED SEPTEMBER 30, 2020
TABLE OF CONTENTS
COUNTY OF OTTAWA
COMPREHENSIVE ANNUAL FINANCIAL REPORT
SUPPLEMENTARY (continued) PAGEOther Post Employment Benefit Plans - Scheduled of Employer Contributions 103Other Supplementary Information:
General Fund - Sub-funds Combining Balance Sheet Schedule 104-105General Fund - Sub-funds Combining Schedule of Revenues,
Expenditures, and Changes in Fund Balances 106-107General Fund - Schedule of Expenditures Budget and Actual 108Fund Descriptions 109-112Schedules of Revenues, Expenditures, and Changes in Fund Balance -
Budget and Actual - All Sub-funds 113-116Combining Balance Sheet - Nonmajor Governmental Funds 117-120Combining Statement of Revenues, Expenditures, and Changes in
Fund Balances - Nonmajor Governmental Funds 121-124Schedules of Revenues, Expenditures, and Changes in Fund Balance -
Budget and Actual - All Nonmajor Governmental Funds 125-142Combining Statement of Net Position - Internal Service Funds 143-145Combining Statement of Revenues, Expenses, and Changes in Fund
Net Position - Internal Service Funds 146-148Combining Statement of Cash Flows - Internal Service Funds 149-150Combining Balance Sheet - Agency Funds 151Combining Statement of Changes in Assets and Liabilities -
Agency Funds 152-154
STATISTICALNet Position by Component 155Changes in Net Position 156-157Fund Balances - Governmental Funds 158Changes in Fund Balances - Governmental Funds 159-160Assessed Value and Estimated Value of Taxable Property 161Direct and Overlapping Property Tax Rates 162Principal Taxpayers 163Property Tax Levies and Collections 164Ratios of Outstanding Debt 165Computation of Direct and Overlapping Debt 166Ratio of Net General Obligation Debt Outstanding and Legal Debt Margin 167Demographic and Economic Statistics 168Principal Employers 169Full-time Equivalents 170Operating Indicators 171-172Capital Asset Statistics 173Labor Force Statistics 174
SINGLE AUDITIndependent Auditors’ Report on Internal Control over Financial Reporting and
on Compliance and Other Matters Based on an Audit of Financial StatementsPerformed in Accordance with Government Auditing Standards 175-176
Independent Auditors’ Report on Compliance for Each Major Program and onInternal Control over Compliance Required by The Uniform Guidance 177-178
Schedule of Expenditures of Federal Awards 179-180Notes to Schedule of Expenditures of Federal Awards 181-183Schedule of Findings and Questioned Costs 184
(Concluded)
TABLE OF CONTENTS
COUNTY OF OTTAWA
COMPREHENSIVE ANNUAL FINANCIAL REPORTFOR THE YEAR ENDED SEPTEMBER 30, 2020

INTRODUCTORY
mclaren
Text Box
March 31, 2021
mclaren
Typewritten Text
i
mclaren
Typewritten Text
ii
mclaren
Typewritten Text
iii

Page 1 of 1ExportStreamingHandler.ashx
1/11/2021https://lf.gfoa.org/laserfiche/Viewer/Pdf/PrintPdfViewer.html?file=ExportStreamingHandler.ashx%3Frepo%3D...
mclaren
Line
mclaren
Line
mclaren
Typewritten Text
iv
Ott
awa
Co
unty
Bo
ard
of
Co
mm
issi
one
rs
Dis
tric
t Ju
dg
es (
4)
Sh
eriff
Cle
rk-R
egis
ter
of
Dee
ds
Wat
er R
eso
urce
s C
om
mis
sio
ner
Cir
cuit
Ju
dg
es (
4)
Pro
bat
e Ju
dg
eP
rose
cuto
r
Law
En
forc
emen
t D
ivis
ion
Ad
min
istr
ativ
e D
ivis
ion
Co
rrec
tio
ns
Div
isio
n
Co
unt
y A
dm
inis
trat
or
Co
rpo
rate
C
ou
nsel
Pla
nn
ing
an
d
Per
form
ance
Im
pro
vem
ent
Hu
man
R
eso
urce
s
Fis
cal S
ervi
ces
Fac
iliti
es
Inn
ova
tio
n a
nd
Tec
hno
log
y
CA
A
Par
ks a
nd
R
ecre
atio
n
Pla
nn
ing
C
om
mis
sio
n
Par
ks
Co
mm
issi
on
Mic
hig
an S
tate
U
niv
. E
xten
sio
n
Eq
ualiz
atio
n
Pu
blic
Hea
lth
Co
mm
unit
y M
enta
l Hea
lth
CM
H B
oar
d
P.A
. 6
41
Bo
ard
Ele
cted
O
fffic
ials
Bo
ard
of
Co
mm
issi
on
er
Ap
po
intm
ents
Em
plo
yee
Ap
po
inte
d
by
Dep
t.
Hea
d
Sta
te
Ap
po
intm
ent
& A
pp
oin
ted
b
y D
ept.
H
ead
Sta
te
Ap
po
intm
ents
Hea
lth
and
Hu
man
Ser
vice
s
Co
mm
itte
e
Pla
nn
ing
an
d P
olic
y
Co
mm
itte
e
Tal
ent
and
Rec
ruit
men
t C
om
mit
tee
Fin
ance
an
d A
dm
inis
trat
ion
Co
mm
itte
e
Rep
ort
s to
C
ou
nty
Ad
min
. &
M
ich
. S
t.
Un
iv.
Cri
min
al D
ivis
ion
Vic
tim
Ass
ista
nce
U
nit
Fam
ily D
ivis
ion
Do
mes
tic
Ass
ault
U
nit
Su
pp
ort
S
ervi
ces
Jail
Pro
gra
ms
Co
urt
S
ervi
ces
Rec
ord
s M
anag
emen
tE
mer
gen
cy
Man
agem
ent
Mar
ine
Uni
tT
raff
ic
Ser
vice
s U
nit
Co
mm
unit
y P
olic
ing
Pat
rol
Inve
stig
ativ
e S
ervi
ces
Bo
ard
s,
Co
mm
issi
on
s an
d
Au
tho
riti
es
Tre
asu
rer
Rev
ised
: Jul
y 2,
201
9
Ch
ild S
ervi
ces
Cir
cuit
Co
urt
A
ssig
nm
ents
Pro
bat
e C
ou
rt
Fam
ily D
ivis
ion
MD
OC
Ad
ult
Pro
bat
ion
and
P
aro
le
Cir
cuit
Co
urt
Pro
bat
ion
and
C
om
mun
ity
Co
rrec
tio
ns
Dis
tric
t C
ou
rts
Cir
cuit
Co
urt
R
eco
rds
Div
isio
n
Reg
iste
r o
f D
eed
s D
ivis
ion
Ele
ctio
ns D
ivsi
on
Vit
al R
eco
rds
Div
isio
n
Juve
nile
C
ou
rt
Fri
end
of
the
Co
urt
Vet
eran
A
ffai
rs
Co
mm
itte
e
GIS
Electorate
Pu
blic
Def
end
erD
iver
sity
, E
qu
ity
& I
ncl
usio
n
mclaren
Typewritten Text
v

COMPREHENSIVE ANNUAL FINANCIAL REPORT
of
COUNTY OF OTTAWA GRAND HAVEN, MICHIGAN
FOR THE YEAR ENDED SEPTEMBER 30, 2020
BOARD OF COMMISSIONERS
2020
ROGER BERGMAN, CHAIRMAN MATTHEW FENSKE, VICE-CHAIRMAN
JOSEPH BAUMANN PHILIP KUYERS ALLEN DANNENBERG RANDALL MEPPELINK GREGORY DEJONG KYLE TERPSTRA FRANCISCO GARCIA DOUG ZYLSTRA JAMES HOLTVLUWER
ADMINISTRATOR ALAN G. VANDERBERG
FISCAL SERVICES DIRECTOR
KAREN KARASINSKI, CPA
mclaren
Typewritten Text
vi
INDEPENDENT AUDITORS’ REPORT
Vredeveld Haefner LLC CPAs and Consultants Douglas J. Vredeveld, CPA
10302 20th Avenue (616) 446-7474Grand Rapids, MI 49534 Peter S. Haefner, CPA
Fax (616) 828-0307 (616) 460-9388
Specializing in services to governmental and nonprofit entities
INDEPENDENT AUDITORS’ REPORT
March 31, 2021 County of Ottawa Board of County Commissioners West Olive, Michigan
Report on the Financial Statements
We have audited the accompanying financial statements of the governmental activities, the business-type activities, the aggregate discretely presented component units, each major fund, and the aggregate remaining fund information of the County of Ottawa, Michigan, as of and for the year ended September 30, 2020, and the related notes to the financial statements, which collectively comprise the County’s basic financial statements as listed in the table of contents.
Management’s Responsibility for the Financial Statements
Management is responsible for the preparation and fair presentation of these financial statements in accordance with accounting principles generally accepted in the United States of America; this includes the design, implementation, and maintenance of internal control relevant to the preparation and fair presentation of financial statements that are free from material misstatement, whether due to fraud or error.
Auditor’s Responsibility
Our responsibility is to express opinions on these financial statements based on our audit. We conducted our audit in accordance with auditing standards generally accepted in the United States of America and the standards applicable to financial audits contained in Government Auditing Standards, issued by the Comptroller General of the United States. Those standards require that we plan and perform the audit to obtain reasonable assurance about whether the financial statements are free from material misstatement.
An audit involves performing procedures to obtain audit evidence about the amounts and disclosures in the financial statements. The procedures selected depend on the auditor’s judgment, including the assessment of the risks of material misstatement of the financial statements, whether due to fraud or error. In making those risk assessments, the auditor considers internal control relevant to the entity’s preparation and fair presentation of the financial statements in order to design audit procedures that are appropriate in the circumstances, but not for the purpose of expressing an opinion on the effectiveness of the entity’s internal control. Accordingly, we express no such opinion. An audit also includes evaluating the appropriateness of accounting policies used and the reasonableness of significant accounting estimates made by management, as well as evaluating the overall presentation of the financial statements.
We believe that the audit evidence we have obtained is sufficient and appropriate to provide a basis for our audit opinions.
Opinions
In our opinion, the financial statements referred to above present fairly, in all material respects, the respective financial position of the governmental activities, the business-type activities, the aggregate discretely presented component units, each major fund, and the aggregate remaining fund information of the Ottawa County, Michigan, as of September 30, 2020, and the respective changes in financial position and, where applicable, cash flows thereof for the year then ended in accordance with accounting principles generally accepted in the United States of America.
1
Other Matters
Required Supplementary Information
Accounting principles generally accepted in the United States of America require that the management’s discussion and analysis on pages 3 through 12 and the Required Supplementary Information section be presented to supplement the basic financial statements. Such information, although not a part of the basic financial statements, is required by the Governmental Accounting Standards Board, who considers it to be an essential part of financial reporting for placing the basic financial statements in an appropriate operational, economic, or historical context. We have applied certain limited procedures to the required supplementary information in accordance with auditing standards generally accepted in the United States of America, which consisted of inquiries of management about the methods of preparing the information and comparing the information for consistency with management’s responses to our inquiries, the basic financial statements, and other knowledge we obtained during our audit of the basic financial statements. We do not express an opinion or provide any assurance on the information because the limited procedures do not provide us with sufficient evidence to express an opinion or provide any assurance.
Other Information
Our audit was conducted for the purpose of forming opinions on the financial statements that collectively comprise the County of Ottawa’s basic financial statements. The introductory section, combining and individual nonmajor fund financial statements, and statistical section are presented for purposes of additional analysis and are not a required part of the basic financial statements. The schedule of expenditures of federal awards is presented for purposes of additional analysis as required by Title 2 U.S. Code of Federal Regulations Part 200, Uniform Administrative Requirements, Cost Principles, and Audit Requirements for Federal Awards, and is also not a required part of the basic financial statements.
The combining and individual nonmajor fund financial statements and the schedule of expenditures of federal awards are the responsibility of management and were derived from and relate directly to the underlying accounting and other records used to prepare the basic financial statements. Such information has been subjected to the auditing procedures applied in the audit of the basic financial statements and certain additional procedures, including comparing and reconciling such information directly to the underlying accounting and other records used to prepare the basic financial statements or to the basic financial statements themselves, and other additional procedures in accordance with auditing standards generally accepted in the United States of America. In our opinion, the combining and individual nonmajor fund financial statements and the schedule of expenditures of federal awards are fairly stated in all material respects in relation to the basic financial statements as a whole.
The introductory and statistical sections have not been subjected to the auditing procedures applied in the audit of the basic financial statements and, accordingly, we do not express an opinion or provide any assurance on them.
Other Reporting Required by Government Auditing Standards
In accordance with Government Auditing Standards, we have also issued our report dated March 31, 2021, on our consideration of the County of Ottawa’s control over financial reporting and on our tests of its compliance with certain provisions of laws, regulations, contracts, and grant agreements and other matters. The purpose of that report is solely to describe the scope of our testing of internal control over financial reporting and compliance and the results of that testing, and not to provide an opinion on the effectiveness of the County’s internal control over financial reporting or on compliance. That report is an integral part of an audit performed in accordance with Government Auditing Standards in considering the County of Ottawa’s internal control over financial reporting and compliance.
2

MANAGEMENT’S DISCUSSION AND ANALYSIS

COUNTY OF OTTAWA
MANAGEMENT’S DISCUSSION AND ANALYSIS
As management of the County of Ottawa, we offer readers of the County’s financial statements this narrative discussion and analysis of the financial activities of the County for the fiscal year ended September 30, 2020. We encourage readers to consider the information presented here in conjunction with additional information that we have furnished in our letter of transmittal, which can be found on pages i-v of the introductory section.
FINANCIAL HIGHLIGHTS
The County’s net position, which is the excess of assets and deferred outflows over liabilities and deferred inflows, at the close of the fiscal year was $180,828,132, of which $27,322,732 is unrestricted and may be used to meet the government’s ongoing obligations to citizens and creditors. Total net position increased by $5,707,949 as a result of operations of the current fiscal year.
At the end of the current fiscal year, the County’s governmental funds reported combined ending
fund balances of $60,650,310, an increase of $5,455,814 as a result of operations of the current fiscal year. Of the ending fund balance total, $40,387,704 (65%) is Nonspendable or subject to the underlying restrictions, commitments, or assignments of the particular general, special revenue, debt service or capital project funds, while $20,262,606 (33%) is unassigned and available for spending at the County’s discretion.
At the end of the current fiscal year, total fund balance for the General Fund was $43,015,427, an
increase of $2,551,103 from current operations.
The County’s total bonded debt decreased by $2,345,000 during the current fiscal year. OVERVIEW OF THE FINANCIAL STATEMENTS This discussion and analysis is intended to serve as introduction to the County’s basic financial statements, which are comprised of three components:
Government-wide financial statements Fund financial statements Notes to the financial statements
The report also contains other supplementary information in addition to the basic financial statements. Government-wide financial statements
Government-wide financial statements are designed to provide readers a broad overview of the County’s finances in a manner similar to a private-sector business. These two statements distinguish between the governmental activities of the County, which include legislative, judicial, general government, public safely, public works, health and welfare, community and economic development, and culture and recreation, that are principally supported by taxes and intergovernmental revenues and the business-type activities of the County, which include the administration of the delinquent property tax collection system, that are intended to recover all, or a significant portion, of their costs through user fees and charges.
Included in these statements are the primary government, which includes the County and two blended component units (Ottawa County Building Authority and the Ottawa County, Michigan Insurance Authority) which are legally separate entities but function as departments of the County, as well as seven legally separate entities, known as discretely presented component units, which are:
3
COUNTY OF OTTAWA
MANAGEMENT’S DISCUSSION AND ANALYSIS
Ottawa County Road Commission Ottawa County Central Dispatch Authority (“OCCDA”) Ottawa County Public Utilities System (“the System”) Ottawa County Land Bank Authority Ottawa County Office of the Water Resources Commissioner (“WR Commissioner”) Ottawa County Brownfield Redevelopment Authority (“BRA”) Ottawa County Economic Development Corporation (“EDC”)
The statement of net position presents information of all of the County’s assets and liabilities, with the difference between the two reported as net position. Over time, increases or decreases in net position may serve as a useful indicator of whether the financial position of the County is improving or deteriorating.
The statement of activities presents information of how the government’s net position changed during the current period. All changes in net position are reported as soon as the underlying event causing the change occurs, regardless of the timing of related cash flows, which means some revenues and expenses are reported in this statement for items that will only result in cash flows in future fiscal periods.
Fund financial statements A fund is a group of related accounts used to track resources separated for a specific activity or purpose. Like other state and local governments, the County uses fund accounting to ensure and demonstrate compliance with finance-related legal requirements. The funds of the County can be divided into three categories: governmental funds, proprietary funds, and fiduciary funds.
Governmental funds Governmental funds are similar to governmental activities in the government-wide financial statements, but the governmental fund financial statements focus on near-term inflows and outflows of spendable resources, as well as on balances of spendable resources available at the end of the period. Both the governmental fund balance sheet and the governmental fund statement of revenues, expenditures, and changes in fund balances provide a reconciliation to the government-wide financial statements which allows for comparison between governmental funds and governmental activities so readers may better understand the long-term impact of the government’s near-term financing decisions.
The County has 21 governmental funds, three of them (General, Community Mental Health, and Substance Use Disorder) are considered major funds and are presented separately in the governmental fund balance sheet and in the governmental fund statement of revenues, expenditures, and changes in fund balances. The other 18 funds are considered nonmajor funds and are combined into a single, aggregated presentation. Information for each of the nonmajor funds is provided in both individual and combined statements later in the report. There are 4 funds that do not meet the requirements of special revenue funds according to GASB Statement No.54 and are consolidated into the General Fund. These funds include Solid Waste Clean-Up, Infrastructure, Stabilization and DB/DC.
The County adopts an annual appropriated budget for its general, special revenue, debt service and capital projects funds. Budgetary comparison statements or schedules have been provided herein to demonstrate compliance with those budgets. Proprietary funds The County has two types of proprietary funds: enterprise and internal service funds. The County has one enterprise fund for the Delinquent Tax Revolving Fund, which is presented as business-type activities in the government-wide financial statements. The County has eleven internal service funds
4
COUNTY OF OTTAWA
MANAGEMENT’S DISCUSSION AND ANALYSIS
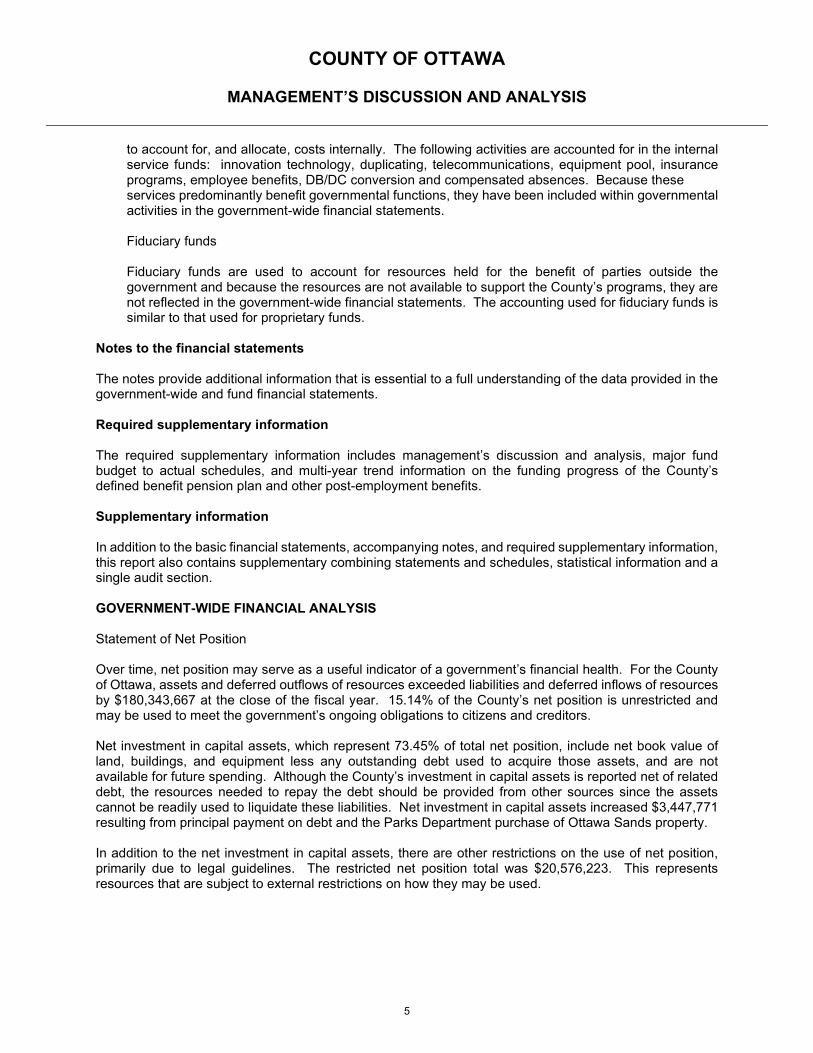
to account for, and allocate, costs internally. The following activities are accounted for in the internal service funds: innovation technology, duplicating, telecommunications, equipment pool, insurance programs, employee benefits, DB/DC conversion and compensated absences. Because these services predominantly benefit governmental functions, they have been included within governmental activities in the government-wide financial statements. Fiduciary funds Fiduciary funds are used to account for resources held for the benefit of parties outside the government and because the resources are not available to support the County’s programs, they are not reflected in the government-wide financial statements. The accounting used for fiduciary funds is similar to that used for proprietary funds.
Notes to the financial statements The notes provide additional information that is essential to a full understanding of the data provided in the government-wide and fund financial statements. Required supplementary information The required supplementary information includes management’s discussion and analysis, major fund budget to actual schedules, and multi-year trend information on the funding progress of the County’s defined benefit pension plan and other post-employment benefits. Supplementary information In addition to the basic financial statements, accompanying notes, and required supplementary information, this report also contains supplementary combining statements and schedules, statistical information and a single audit section. GOVERNMENT-WIDE FINANCIAL ANALYSIS
Statement of Net Position Over time, net position may serve as a useful indicator of a government’s financial health. For the County of Ottawa, assets and deferred outflows of resources exceeded liabilities and deferred inflows of resources by $180,343,667 at the close of the fiscal year. 15.14% of the County’s net position is unrestricted and may be used to meet the government’s ongoing obligations to citizens and creditors. Net investment in capital assets, which represent 73.45% of total net position, include net book value of land, buildings, and equipment less any outstanding debt used to acquire those assets, and are not available for future spending. Although the County’s investment in capital assets is reported net of related debt, the resources needed to repay the debt should be provided from other sources since the assets cannot be readily used to liquidate these liabilities. Net investment in capital assets increased $3,447,771 resulting from principal payment on debt and the Parks Department purchase of Ottawa Sands property. In addition to the net investment in capital assets, there are other restrictions on the use of net position, primarily due to legal guidelines. The restricted net position total was $20,576,223. This represents resources that are subject to external restrictions on how they may be used.
5
COUNTY OF OTTAWA
MANAGEMENT’S DISCUSSION AND ANALYSIS
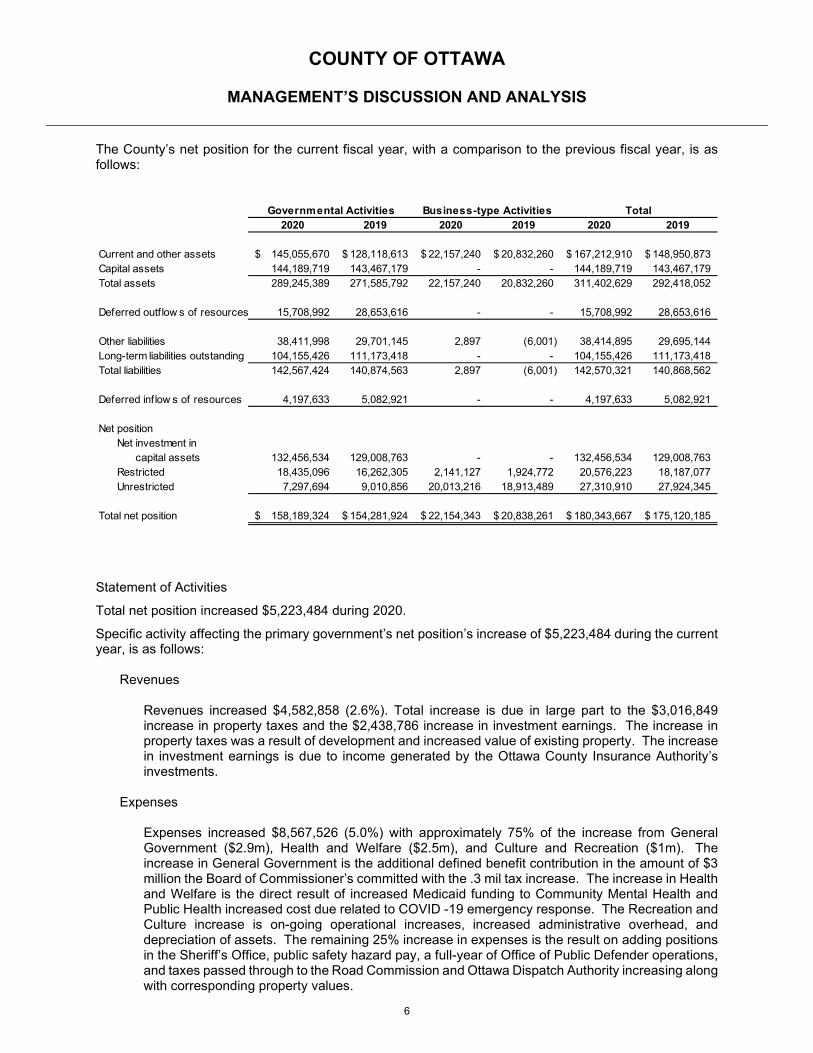
The County’s net position for the current fiscal year, with a comparison to the previous fiscal year, is as follows:
Statement of Activities
Total net position increased $5,223,484 during 2020.
Specific activity affecting the primary government’s net position’s increase of $5,223,484 during the current year, is as follows: Revenues
Revenues increased $4,582,858 (2.6%). Total increase is due in large part to the $3,016,849 increase in property taxes and the $2,438,786 increase in investment earnings. The increase in property taxes was a result of development and increased value of existing property. The increase in investment earnings is due to income generated by the Ottawa County Insurance Authority’s investments.
Expenses Expenses increased $8,567,526 (5.0%) with approximately 75% of the increase from General Government ($2.9m), Health and Welfare ($2.5m), and Culture and Recreation ($1m). The increase in General Government is the additional defined benefit contribution in the amount of $3 million the Board of Commissioner’s committed with the .3 mil tax increase. The increase in Health and Welfare is the direct result of increased Medicaid funding to Community Mental Health and Public Health increased cost due related to COVID -19 emergency response. The Recreation and Culture increase is on-going operational increases, increased administrative overhead, and depreciation of assets. The remaining 25% increase in expenses is the result on adding positions in the Sheriff’s Office, public safety hazard pay, a full-year of Office of Public Defender operations, and taxes passed through to the Road Commission and Ottawa Dispatch Authority increasing along with corresponding property values.
2020 2019 2020 2019 2020 2019
Current and other assets 145,055,670$ 128,118,613$ 22,157,240$ 20,832,260$ 167,212,910$ 148,950,873$ Capital assets 144,189,719 143,467,179 - - 144,189,719 143,467,179 Total assets 289,245,389 271,585,792 22,157,240 20,832,260 311,402,629 292,418,052
Deferred outf low s of resources 15,708,992 28,653,616 - - 15,708,992 28,653,616
Other liabilities 38,411,998 29,701,145 2,897 (6,001) 38,414,895 29,695,144 Long-term liabilities outstanding 104,155,426 111,173,418 - - 104,155,426 111,173,418 Total liabilities 142,567,424 140,874,563 2,897 (6,001) 142,570,321 140,868,562
Deferred inflow s of resources 4,197,633 5,082,921 - - 4,197,633 5,082,921
Net positionNet investment in
capital assets 132,456,534 129,008,763 - - 132,456,534 129,008,763 Restricted 18,435,096 16,262,305 2,141,127 1,924,772 20,576,223 18,187,077 Unrestricted 7,297,694 9,010,856 20,013,216 18,913,489 27,310,910 27,924,345
Total net position 158,189,324$ 154,281,924$ 22,154,343$ 20,838,261$ 180,343,667$ 175,120,185$
Governmental Activities Business-type Activities Total
6

COUNTY OF OTTAWA
MANAGEMENT’S DISCUSSION AND ANALYSIS
The County’s changes in net position for the current fiscal year, with a comparison to the previous fiscal
year, is as follows:
2020 2019 2020 2019 2020 2019
RevenuesProgram revenues:
Charges for services 17,434,370$ 27,175,231$ 1,162,746$ 908,033$ 18,597,116$ 28,083,264$ Operating grants and contributions 82,688,482 73,019,233 - - 82,688,482 73,019,233 Capital grants and contributions - - - - - -
General revenues:Property taxes 66,285,148 63,268,299 - - 66,285,148 63,268,299 Grants and contributions not
3,754,650 4,803,626 - - 3,754,650 4,803,626 Investment earnings 5,259,314 3,202,576 1,039,433 657,385 6,298,747 3,859,961 Miscellaneous 8,588 15,490 - - 8,588 15,490
Total revenues 175,430,552 171,484,455 2,202,179 1,565,418 177,632,731 173,049,873
ExpensesLegislative 540,006 548,540 - - 540,006 548,540 Judicial 22,422,730 21,779,336 - - 22,422,730 21,779,336 General government 19,916,065 17,002,751 - - 19,916,065 17,002,751 Public safety 42,075,389 41,312,780 - - 42,075,389 41,312,780 Public w orks 7,915,476 7,101,848 - - 7,915,476 7,101,848 Health and w elfare 71,429,258 68,887,815 - - 71,429,258 68,887,815 Community and economic development 1,143,007 1,206,248 - - 1,143,007 1,206,248 Culture and recreation 5,661,175 4,620,440 - - 5,661,175 4,620,440 Interest on long-term debt 1,094,794 1,186,589 - - 1,094,794 1,186,589 Business-type activities 211,347 195,374 211,347 195,374
Total expenses 172,197,900 163,646,347 211,347 195,374 172,409,247 163,841,721
Increase in net position beforetransfers to other funds 3,232,652 7,838,108 1,990,832 1,370,044 5,223,484 9,208,152
Transfers 674,750 1,668,575 (674,750) (1,668,575) - - Increase (decrease) in net position 3,907,402 9,506,683 1,316,082 (298,531) 5,223,484 9,208,152 Net position, beginning of year 154,281,922 144,775,241 20,838,261 21,136,792 175,120,183 165,912,033 Net position, end of year 158,189,324$ 154,281,924$ 22,154,343$ 20,838,261$ 180,343,667$ 175,120,185$
Governmental Activities Business-type Activities Total
Restricted to specif ic programs
7
COUNTY OF OTTAWA
MANAGEMENT’S DISCUSSION AND ANALYSIS
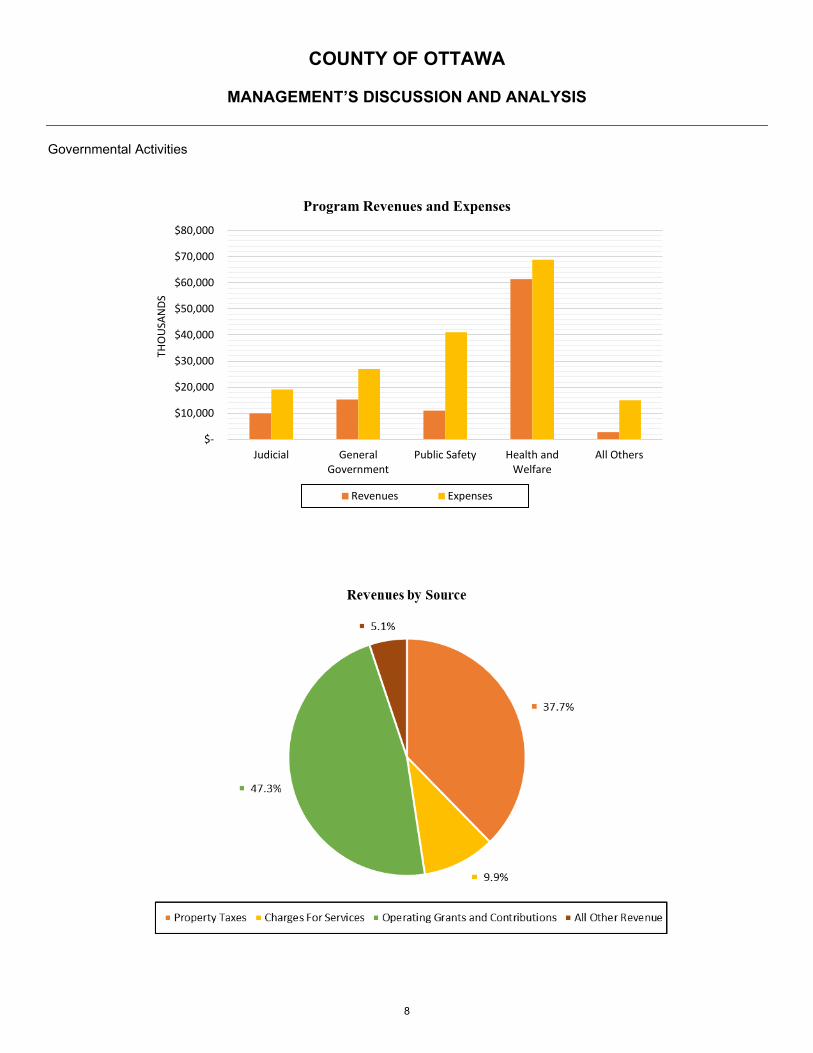
Governmental Activities
$-
$10,000
$20,000
$30,000
$40,000
$50,000
$60,000
$70,000
$80,000
Judicial GeneralGovernment
Public Safety Health andWelfare
All Others
THO
USA
NDS
Program Revenues and Expenses
Revenues Expenses
8
COUNTY OF OTTAWA
MANAGEMENT’S DISCUSSION AND ANALYSIS
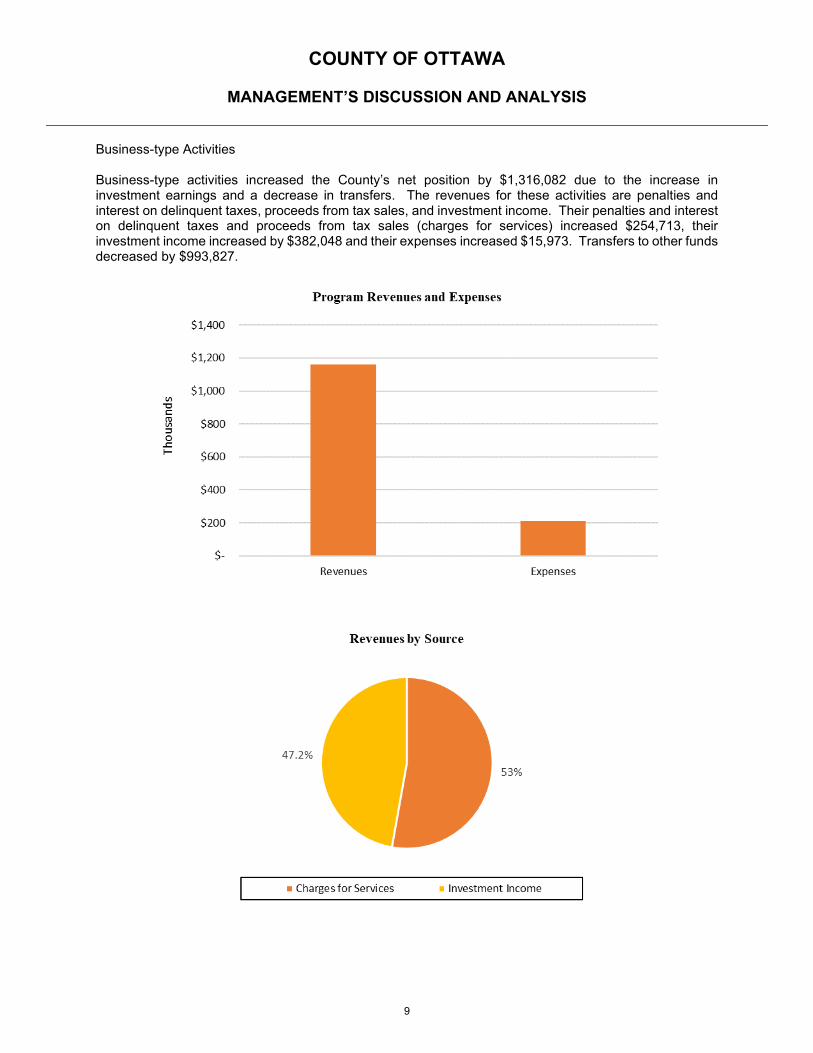
Business-type Activities Business-type activities increased the County’s net position by $1,316,082 due to the increase in investment earnings and a decrease in transfers. The revenues for these activities are penalties and interest on delinquent taxes, proceeds from tax sales, and investment income. Their penalties and interest on delinquent taxes and proceeds from tax sales (charges for services) increased $254,713, their investment income increased by $382,048 and their expenses increased $15,973. Transfers to other funds decreased by $993,827.
9

COUNTY OF OTTAWA
MANAGEMENT’S DISCUSSION AND ANALYSIS
FUND STATEMENT FINANCIAL ANALYSIS Governmental Funds Of the $60,650,310 combined governmental fund balances as of the end of the current fiscal year, $19,362,350 (32%) is considered non-spendable or restricted because it is either in a non-spendable form (inventory or prepaid expenses), or is unavailable because it is a long-term advance to component units and other funds or due to legal restrictions. Those amounts are $927,254 and $18,435,096, respectively. The remaining $41,287,960 (67%) is considered spendable fund balance, of which $14,597,405 has been committed by the Board for specific purposes, $6,427,949 has been assigned by the County Administrator for specific purposes, and $20,262,606 is unassigned fund balance and is available for spending at the County’s discretion. Unassigned fund balance represents 24.3% percent of total General Fund expenditures and transfers out, which may be a useful measurement of the General Fund’s liquidity. The County’s fund balance is still higher than the normal 10-15% range.
The General Fund is the chief operating fund of the County and at September 30, 2020 had a total fund balance of $43,015,427. In accordance with GASB 54, the County consolidates 4 sub-funds with the General Fund. The sub-funds represent resources designated for specific purposes and, during the year, added to reserves in the amount of $237,897. The sub-funds additions to reserves combined with the increase of $2,313,206 from on-going operations resulted in the net increase of $2,551,103 from the previous year.
The Community Mental Health Fund (2220) had an increase to fund balance of $391,535. There was a increase in the Substance Use Disorder Fund (2225) fund balance of $90,811 from the prior fiscal year due to transfers from other funds. General Fund Budgetary Highlights The original revenue and expenditure budgets (including transfers in/out) for the General Fund (1010) were $81,348,242 and $82,727,078, respectively. The amended revenue budget was $82,560,930, and the amended expenditure budget was $85,321,950. The revenue budget (including transfers in) increased overall by $1,212,688, spread throughout the County in various departments with no area having a material increase. Revenues and transfers in as a whole were $412,950 under budget. The budget for General Fund expenditures (including transfers out) increased $2,594,872 in total. Expenditures and transfers out as a whole were $5,413,632 under budget. Which is normal, departments usually underspend by approximately 3% each year.
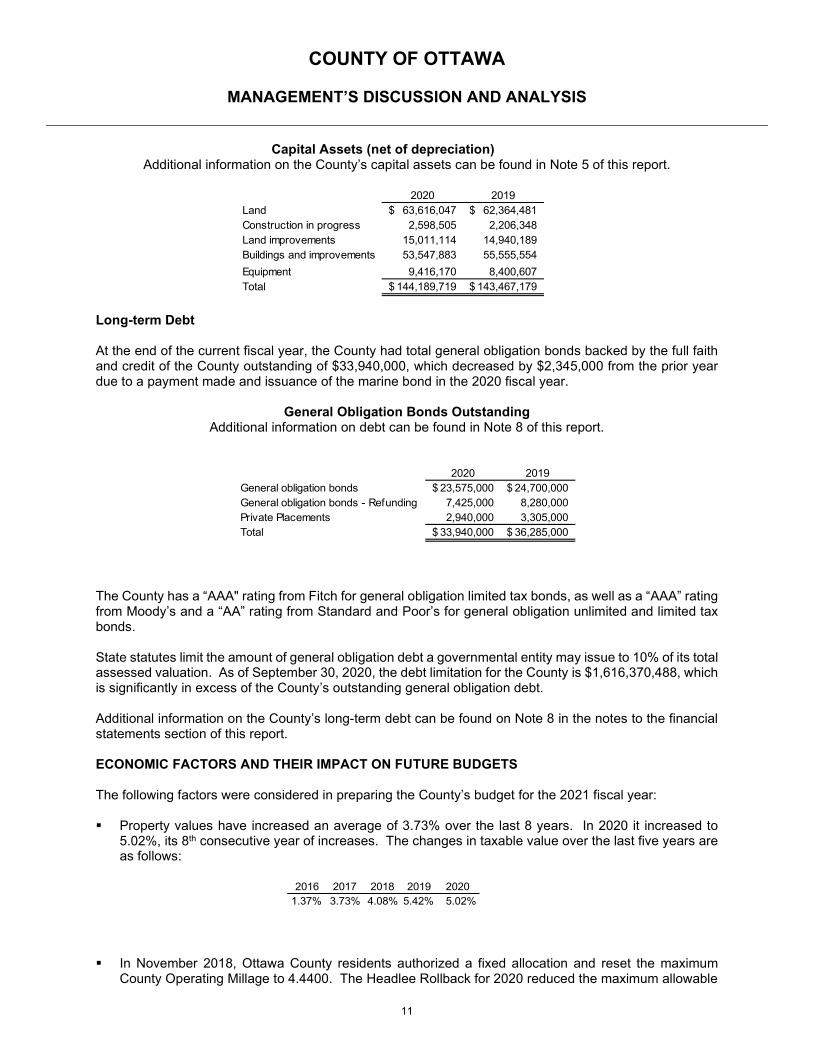
Capital Asset and Debt Administration Capital Assets
The County’s investment in capital assets net of accumulated depreciation was $144,189,719 as of September 30, 2020. This investment in capital assets includes land and land improvements, buildings and improvements, and equipment. The County’s total investment in capital assets for the current year remained essentially steady as additions approximated depreciation. Major capital asset events during the current fiscal year included the following:
Approximately $1,251,000 was spent on the Bend Area Expansion and Easement.
Approximately $1,000,000 was spent on various acquisitions such as a Mobile Dental Van, remodel of the James St ding C, completion of the EHR software, Courtroom Tools software and fitness equipment.
10
COUNTY OF OTTAWA
MANAGEMENT’S DISCUSSION AND ANALYSIS
Capital Assets (net of depreciation)
Additional information on the County’s capital assets can be found in Note 5 of this report.
Long-term Debt At the end of the current fiscal year, the County had total general obligation bonds backed by the full faith and credit of the County outstanding of $33,940,000, which decreased by $2,345,000 from the prior year due to a payment made and issuance of the marine bond in the 2020 fiscal year.
General Obligation Bonds Outstanding
Additional information on debt can be found in Note 8 of this report.
The County has a “AAA" rating from Fitch for general obligation limited tax bonds, as well as a “AAA” rating from Moody’s and a “AA” rating from Standard and Poor’s for general obligation unlimited and limited tax bonds. State statutes limit the amount of general obligation debt a governmental entity may issue to 10% of its total assessed valuation. As of September 30, 2020, the debt limitation for the County is $1,616,370,488, which is significantly in excess of the County’s outstanding general obligation debt. Additional information on the County’s long-term debt can be found on Note 8 in the notes to the financial statements section of this report.
ECONOMIC FACTORS AND THEIR IMPACT ON FUTURE BUDGETS The following factors were considered in preparing the County’s budget for the 2021 fiscal year: Property values have increased an average of 3.73% over the last 8 years. In 2020 it increased to
5.02%, its 8th consecutive year of increases. The changes in taxable value over the last five years are as follows:
In November 2018, Ottawa County residents authorized a fixed allocation and reset the maximum County Operating Millage to 4.4400. The Headlee Rollback for 2020 reduced the maximum allowable
2020 2019Land 63,616,047$ 62,364,481$ Construction in progress 2,598,505 2,206,348 Land improvements 15,011,114 14,940,189 Buildings and improvements 53,547,883 55,555,554 Equipment 9,416,170 8,400,607 Total 144,189,719$ 143,467,179$
2020 2019General obligation bonds 23,575,000$ 24,700,000$ General obligation bonds - Refunding 7,425,000 8,280,000 Private Placements 2,940,000 3,305,000 Total 33,940,000$ 36,285,000$
2016 2017 2018 2019 20201.37% 3.73% 4.08% 5.42% 5.02%
11
COUNTY OF OTTAWA
MANAGEMENT’S DISCUSSION AND ANALYSIS
millage to 4.3814. The FY2021 budget is based on the same millage rate, .3 mill still committed to pay down the unfunded liability from the closed defined benefit plan.
The unemployment rate for the County was 3.7% in December 2020, which is the 3rd lowest in the state. Industry initiatives discussed in the transmittal letter have continued to improve the employment outlook for the County.
The County continues to see sustained population growth, as it has the last five years.
REQUESTS FOR INFORMATION This financial report is designed to provide a general overview of the County’s finances for all those who are interested. Questions concerning any of the information provided in this report, or requests for additional financial information, should be addressed to:
Fiscal Services Director 12220 Fillmore Street, Room 331 West Olive, Michigan 49460
12

BASIC FINANCIAL STATEMENTS
Governmental Business-type ComponentActivities Activities Total Units
AssetsCurrent assets
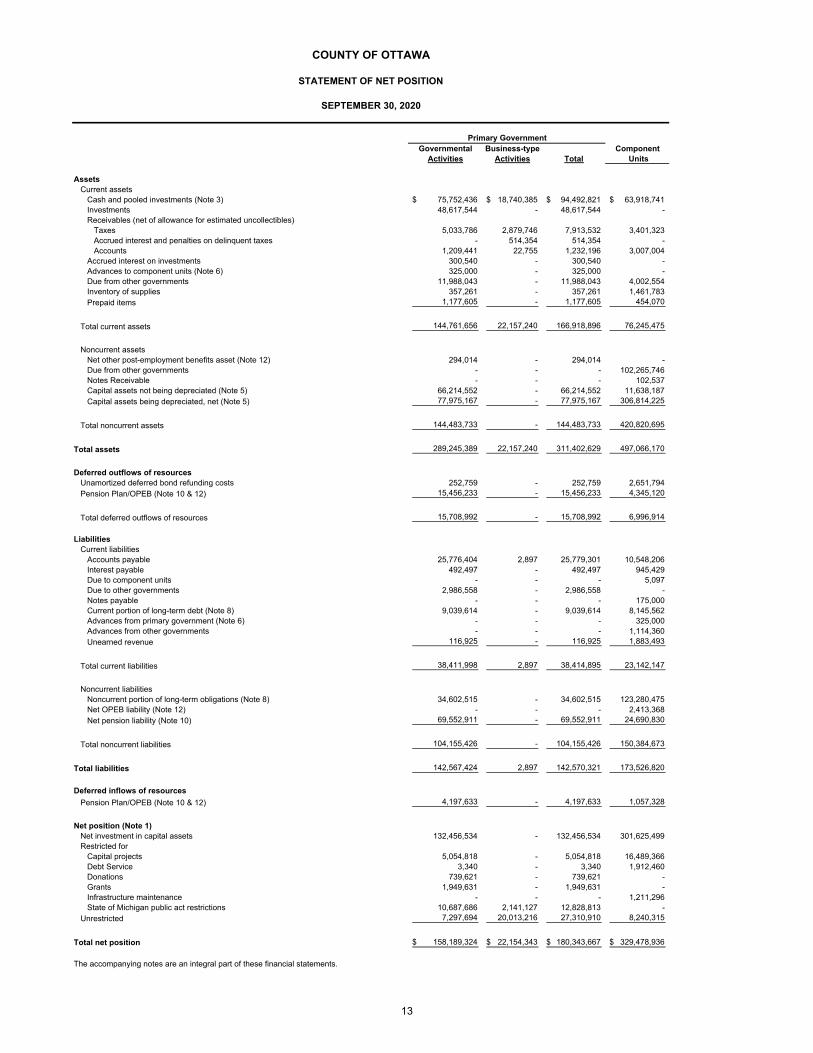
Cash and pooled investments (Note 3) 75,752,436$ 18,740,385$ 94,492,821$ 63,918,741$ Investments 48,617,544 - 48,617,544 - Receivables (net of allowance for estimated uncollectibles)
Taxes 5,033,786 2,879,746 7,913,532 3,401,323 Accrued interest and penalties on delinquent taxes - 514,354 514,354 - Accounts 1,209,441 22,755 1,232,196 3,007,004
Accrued interest on investments 300,540 - 300,540 - Advances to component units (Note 6) 325,000 - 325,000 - Due from other governments 11,988,043 - 11,988,043 4,002,554 Inventory of supplies 357,261 - 357,261 1,461,783 Prepaid items 1,177,605 - 1,177,605 454,070
Total current assets 144,761,656 22,157,240 166,918,896 76,245,475
Noncurrent assetsNet other post-employment benefits asset (Note 12) 294,014 - 294,014 - Due from other governments - - - 102,265,746 Notes Receivable - - - 102,537 Capital assets not being depreciated (Note 5) 66,214,552 - 66,214,552 11,638,187 Capital assets being depreciated, net (Note 5) 77,975,167 - 77,975,167 306,814,225
Total noncurrent assets 144,483,733 - 144,483,733 420,820,695
Total assets 289,245,389 22,157,240 311,402,629 497,066,170
Deferred outflows of resourcesUnamortized deferred bond refunding costs 252,759 - 252,759 2,651,794 Pension Plan/OPEB (Note 10 & 12) 15,456,233 - 15,456,233 4,345,120
Total deferred outflows of resources 15,708,992 - 15,708,992 6,996,914
LiabilitiesCurrent liabilities
Accounts payable 25,776,404 2,897 25,779,301 10,548,206 Interest payable 492,497 - 492,497 945,429 Due to component units - - - 5,097 Due to other governments 2,986,558 - 2,986,558 - Notes payable - - - 175,000 Current portion of long-term debt (Note 8) 9,039,614 - 9,039,614 8,145,562 Advances from primary government (Note 6) - - - 325,000 Advances from other governments - - - 1,114,360 Unearned revenue 116,925 - 116,925 1,883,493
Total current liabilities 38,411,998 2,897 38,414,895 23,142,147
Noncurrent liabilitiesNoncurrent portion of long-term obligations (Note 8) 34,602,515 - 34,602,515 123,280,475 Net OPEB liability (Note 12) - - - 2,413,368 Net pension liability (Note 10) 69,552,911 - 69,552,911 24,690,830
Total noncurrent liabilities 104,155,426 - 104,155,426 150,384,673
Total liabilities 142,567,424 2,897 142,570,321 173,526,820
Deferred inflows of resources
Pension Plan/OPEB (Note 10 & 12) 4,197,633 - 4,197,633 1,057,328
Net position (Note 1)Net investment in capital assets 132,456,534 - 132,456,534 301,625,499 Restricted for
Capital projects 5,054,818 - 5,054,818 16,489,366 Debt Service 3,340 - 3,340 1,912,460 Donations 739,621 - 739,621 - Grants 1,949,631 - 1,949,631 - Infrastructure maintenance - - - 1,211,296 State of Michigan public act restrictions 10,687,686 2,141,127 12,828,813 -
Unrestricted 7,297,694 20,013,216 27,310,910 8,240,315
Total net position 158,189,324$ 22,154,343$ 180,343,667$ 329,478,936$
The accompanying notes are an integral part of these financial statements.
COUNTY OF OTTAWA
Primary Government
STATEMENT OF NET POSITION
SEPTEMBER 30, 2020
13
Program RevenuesIndirect Operating Capital
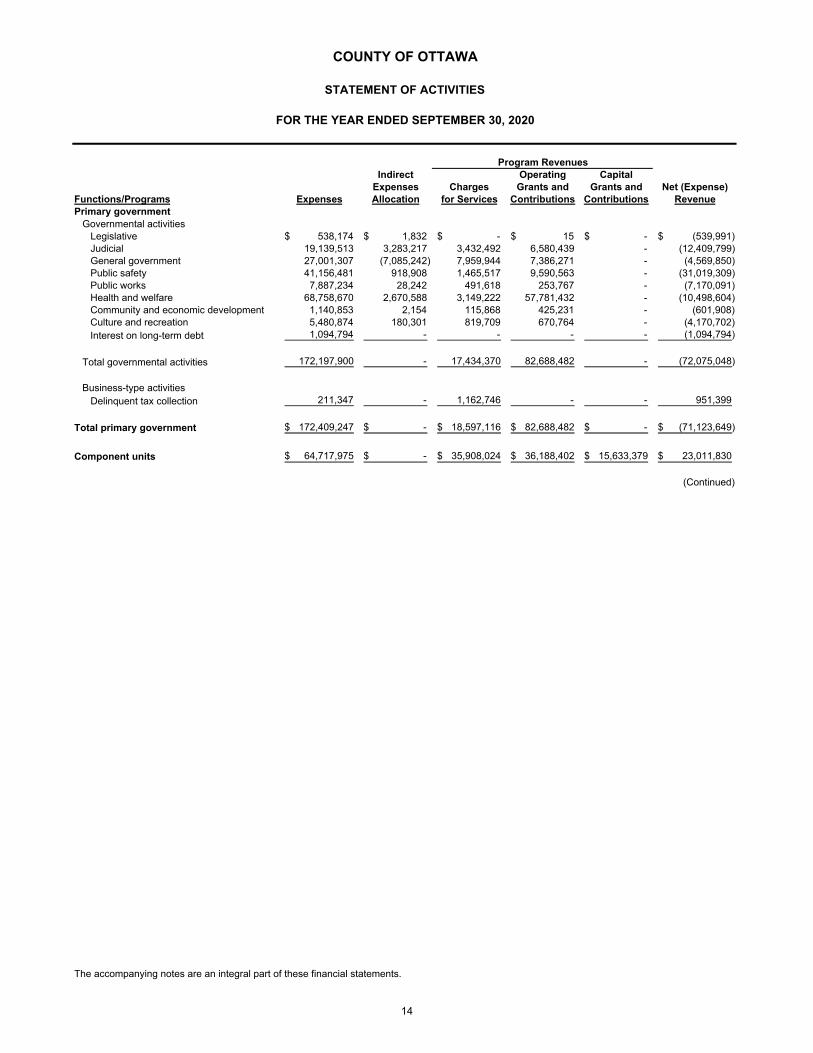
Expenses Charges Grants and Grants and Net (Expense)Functions/Programs Expenses Allocation for Services Contributions Contributions RevenuePrimary government
Governmental activitiesLegislative 538,174$ 1,832$ -$ 15$ -$ (539,991)$ Judicial 19,139,513 3,283,217 3,432,492 6,580,439 - (12,409,799) General government 27,001,307 (7,085,242) 7,959,944 7,386,271 - (4,569,850) Public safety 41,156,481 918,908 1,465,517 9,590,563 - (31,019,309) Public works 7,887,234 28,242 491,618 253,767 - (7,170,091) Health and welfare 68,758,670 2,670,588 3,149,222 57,781,432 - (10,498,604) Community and economic development 1,140,853 2,154 115,868 425,231 - (601,908) Culture and recreation 5,480,874 180,301 819,709 670,764 - (4,170,702) Interest on long-term debt 1,094,794 - - - - (1,094,794)
Total governmental activities 172,197,900 - 17,434,370 82,688,482 - (72,075,048)
Business-type activitiesDelinquent tax collection 211,347 - 1,162,746 - - 951,399
Total primary government 172,409,247$ -$ 18,597,116$ 82,688,482$ -$ (71,123,649)$
Component units 64,717,975$ -$ 35,908,024$ 36,188,402$ 15,633,379$ 23,011,830$
(Continued)
The accompanying notes are an integral part of these financial statements.
COUNTY OF OTTAWA
STATEMENT OF ACTIVITIES
FOR THE YEAR ENDED SEPTEMBER 30, 2020
14
Governmental Business-type ComponentActivities Activities Total Units
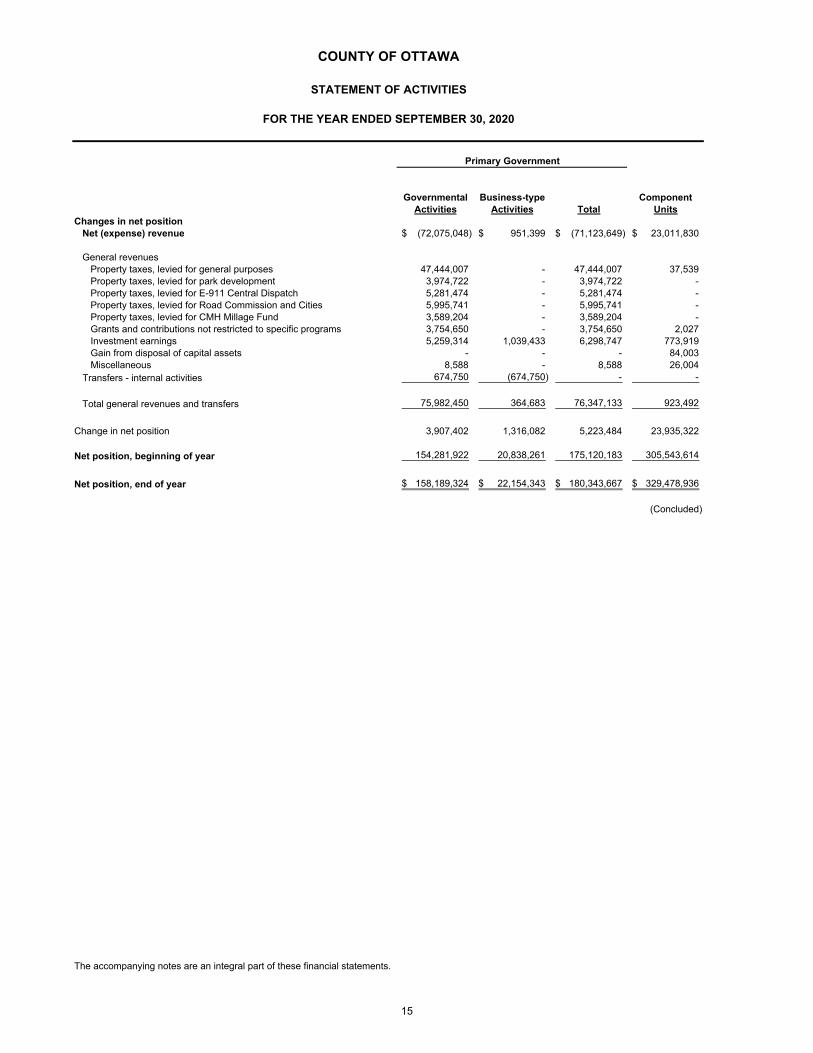
Changes in net positionNet (expense) revenue (72,075,048)$ 951,399$ (71,123,649)$ 23,011,830$
General revenuesProperty taxes, levied for general purposes 47,444,007 - 47,444,007 37,539 Property taxes, levied for park development 3,974,722 - 3,974,722 - Property taxes, levied for E-911 Central Dispatch 5,281,474 - 5,281,474 - Property taxes, levied for Road Commission and Cities 5,995,741 - 5,995,741 - Property taxes, levied for CMH Millage Fund 3,589,204 - 3,589,204 - Grants and contributions not restricted to specific programs 3,754,650 - 3,754,650 2,027 Investment earnings 5,259,314 1,039,433 6,298,747 773,919 Gain from disposal of capital assets - - - 84,003 Miscellaneous 8,588 - 8,588 26,004
Transfers - internal activities 674,750 (674,750) - -
Total general revenues and transfers 75,982,450 364,683 76,347,133 923,492
Change in net position 3,907,402 1,316,082 5,223,484 23,935,322
Net position, beginning of year 154,281,922 20,838,261 175,120,183 305,543,614
Net position, end of year 158,189,324$ 22,154,343$ 180,343,667$ 329,478,936$
(Concluded)
The accompanying notes are an integral part of these financial statements.
Primary Government
STATEMENT OF ACTIVITIES
FOR THE YEAR ENDED SEPTEMBER 30, 2020
COUNTY OF OTTAWA
15
Community Substance NonmajorMental Use Governmental
General Health Disorder Funds 2020 2019Assets
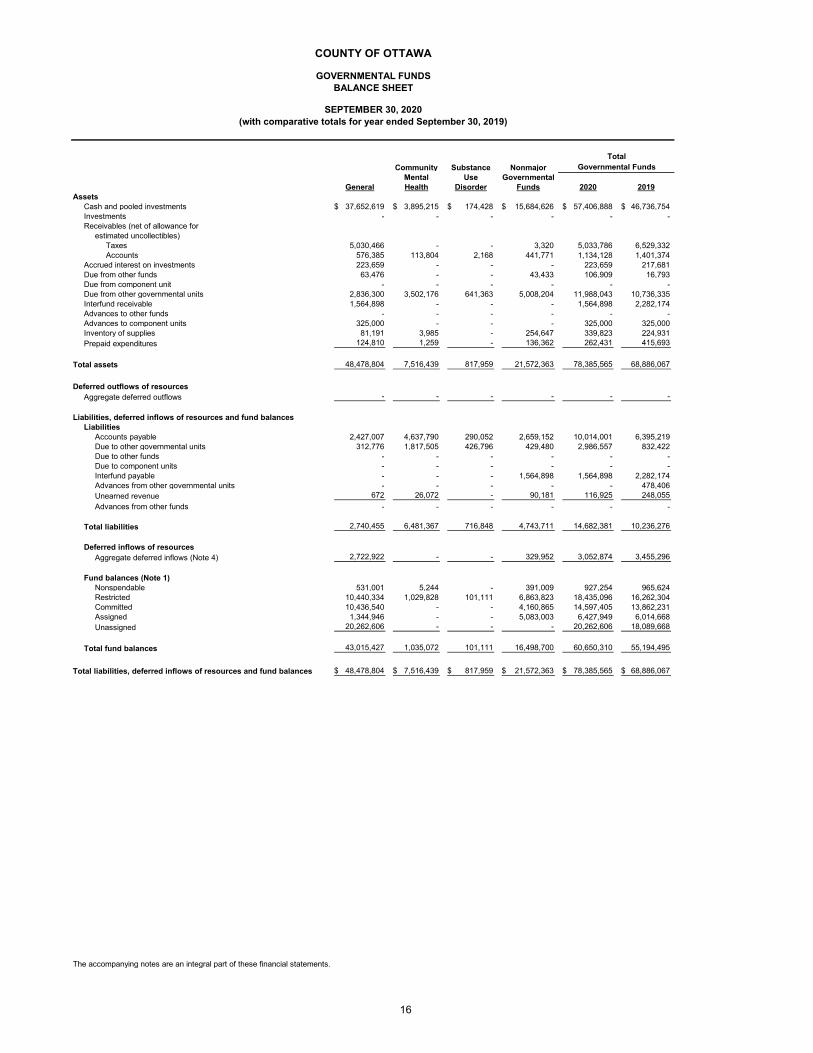
Cash and pooled investments 37,652,619$ 3,895,215$ 174,428$ 15,684,626$ 57,406,888$ 46,736,754$ Investments - - - - - - Receivables (net of allowance for
estimated uncollectibles)Taxes 5,030,466 - - 3,320 5,033,786 6,529,332 Accounts 576,385 113,804 2,168 441,771 1,134,128 1,401,374
Accrued interest on investments 223,659 - - - 223,659 217,681 Due from other funds 63,476 - - 43,433 106,909 16,793 Due from component unit - - - - - - Due from other governmental units 2,836,300 3,502,176 641,363 5,008,204 11,988,043 10,736,335 Interfund receivable 1,564,898 - - - 1,564,898 2,282,174 Advances to other funds - - - - - - Advances to component units 325,000 - - - 325,000 325,000 Inventory of supplies 81,191 3,985 - 254,647 339,823 224,931 Prepaid expenditures 124,810 1,259 - 136,362 262,431 415,693
Total assets 48,478,804 7,516,439 817,959 21,572,363 78,385,565 68,886,067
Deferred outflows of resourcesAggregate deferred outflows - - - - - -
Liabilities, deferred inflows of resources and fund balancesLiabilities
Accounts payable 2,427,007 4,637,790 290,052 2,659,152 10,014,001 6,395,219 Due to other governmental units 312,776 1,817,505 426,796 429,480 2,986,557 832,422 Due to other funds - - - - - - Due to component units - - - - - - Interfund payable - - - 1,564,898 1,564,898 2,282,174 Advances from other governmental units - - - - - 478,406 Unearned revenue 672 26,072 - 90,181 116,925 248,055 Advances from other funds - - - - - -
Total liabilities 2,740,455 6,481,367 716,848 4,743,711 14,682,381 10,236,276
Deferred inflows of resourcesAggregate deferred inflows (Note 4) 2,722,922 - - 329,952 3,052,874 3,455,296
Fund balances (Note 1)Nonspendable 531,001 5,244 - 391,009 927,254 965,624 Restricted 10,440,334 1,029,828 101,111 6,863,823 18,435,096 16,262,304 Committed 10,436,540 - - 4,160,865 14,597,405 13,862,231 Assigned 1,344,946 - - 5,083,003 6,427,949 6,014,668 Unassigned 20,262,606 - - - 20,262,606 18,089,668
Total fund balances 43,015,427 1,035,072 101,111 16,498,700 60,650,310 55,194,495
Total liabilities, deferred inflows of resources and fund balances 48,478,804$ 7,516,439$ 817,959$ 21,572,363$ 78,385,565$ 68,886,067$
The accompanying notes are an integral part of these financial statements.
COUNTY OF OTTAWA
(with comparative totals for year ended September 30, 2019)
Governmental FundsTotal
SEPTEMBER 30, 2020
BALANCE SHEETGOVERNMENTAL FUNDS
16

Total Fund Balances - Governmental Funds 60,650,310$
Amounts reported for governmental activities in the statement of net positionare different because:
Capital assets used in governmental activities are not current financial resourcesand therefore are not reported in the funds.
Capital assets not being depreciated - land 66,214,552 Capital assets being depreciated, net of accumulated depreciation 71,986,091
Certain assets are not current financial resources and are not reported in the funds.
Net other post-employment benefits asset 294,014
Internal service funds are used by management to charge the costs of centralizedservices, to individual funds. The assets and liabilities of the internal service fundsare included in the governmental activities.
Total net position of internal service funds 54,351,758
Certain deferred inflows reported in the funds are not available but are recognizedin the governmental activities.
Unavailable deferred inflows 3,052,874
Certain liabilities are not due and payable in the current period and therefore arenot reported in the funds.
Bonds and notes payable (33,998,640) Landfill reclamation liability (5,006,640) Accrued interest payable (492,499) Unamortized bond premium (820,944) Unamortized deferred bond refunding loss 252,759 Deferred Inflows OPEB (4,197,633) Net pension liability (69,552,911) Deferred outflows for pension and OPEB plans 15,456,233
Net Position of Governmental Activities 158,189,324$
The accompanying notes are an integral part of these financial statements.
SEPTEMBER 30, 2020
COUNTY OF OTTAWA
RECONCILIATION OF FUND BALANCE ON THE BALANCE SHEETFOR GOVERNMENTAL FUNDS TO NET POSITION OF
GOVERNMENTAL ACTIVITIES ON THE STATEMENT OF NET POSITION
17
Community Substance NonmajorMental Use Governmental
General Health Disorder Funds 2020 2019Revenues
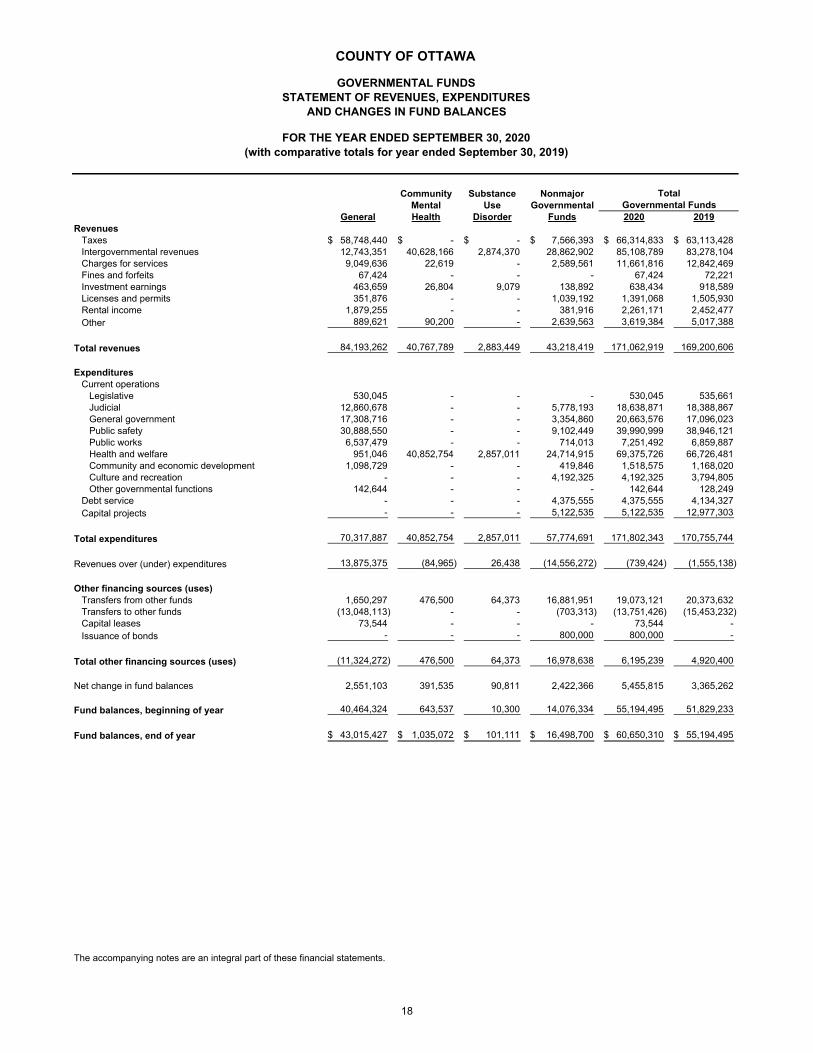
Taxes 58,748,440$ -$ -$ 7,566,393$ 66,314,833$ 63,113,428$ Intergovernmental revenues 12,743,351 40,628,166 2,874,370 28,862,902 85,108,789 83,278,104 Charges for services 9,049,636 22,619 - 2,589,561 11,661,816 12,842,469 Fines and forfeits 67,424 - - - 67,424 72,221 Investment earnings 463,659 26,804 9,079 138,892 638,434 918,589 Licenses and permits 351,876 - - 1,039,192 1,391,068 1,505,930 Rental income 1,879,255 - - 381,916 2,261,171 2,452,477 Other 889,621 90,200 - 2,639,563 3,619,384 5,017,388
Total revenues 84,193,262 40,767,789 2,883,449 43,218,419 171,062,919 169,200,606
ExpendituresCurrent operations
Legislative 530,045 - - - 530,045 535,661 Judicial 12,860,678 - - 5,778,193 18,638,871 18,388,867 General government 17,308,716 - - 3,354,860 20,663,576 17,096,023 Public safety 30,888,550 - - 9,102,449 39,990,999 38,946,121 Public works 6,537,479 - - 714,013 7,251,492 6,859,887 Health and welfare 951,046 40,852,754 2,857,011 24,714,915 69,375,726 66,726,481 Community and economic development 1,098,729 - - 419,846 1,518,575 1,168,020 Culture and recreation - - - 4,192,325 4,192,325 3,794,805 Other governmental functions 142,644 - - - 142,644 128,249
Debt service - - - 4,375,555 4,375,555 4,134,327 Capital projects - - - 5,122,535 5,122,535 12,977,303
Total expenditures 70,317,887 40,852,754 2,857,011 57,774,691 171,802,343 170,755,744
Revenues over (under) expenditures 13,875,375 (84,965) 26,438 (14,556,272) (739,424) (1,555,138)
Other financing sources (uses)Transfers from other funds 1,650,297 476,500 64,373 16,881,951 19,073,121 20,373,632 Transfers to other funds (13,048,113) - - (703,313) (13,751,426) (15,453,232) Capital leases 73,544 - - - 73,544 - Issuance of bonds - - - 800,000 800,000 -
Total other financing sources (uses) (11,324,272) 476,500 64,373 16,978,638 6,195,239 4,920,400
Net change in fund balances 2,551,103 391,535 90,811 2,422,366 5,455,815 3,365,262
Fund balances, beginning of year 40,464,324 643,537 10,300 14,076,334 55,194,495 51,829,233
Fund balances, end of year 43,015,427$ 1,035,072$ 101,111$ 16,498,700$ 60,650,310$ 55,194,495$
The accompanying notes are an integral part of these financial statements.
Governmental FundsTotal
COUNTY OF OTTAWA
GOVERNMENTAL FUNDSSTATEMENT OF REVENUES, EXPENDITURES
AND CHANGES IN FUND BALANCES
FOR THE YEAR ENDED SEPTEMBER 30, 2020(with comparative totals for year ended September 30, 2019)
18
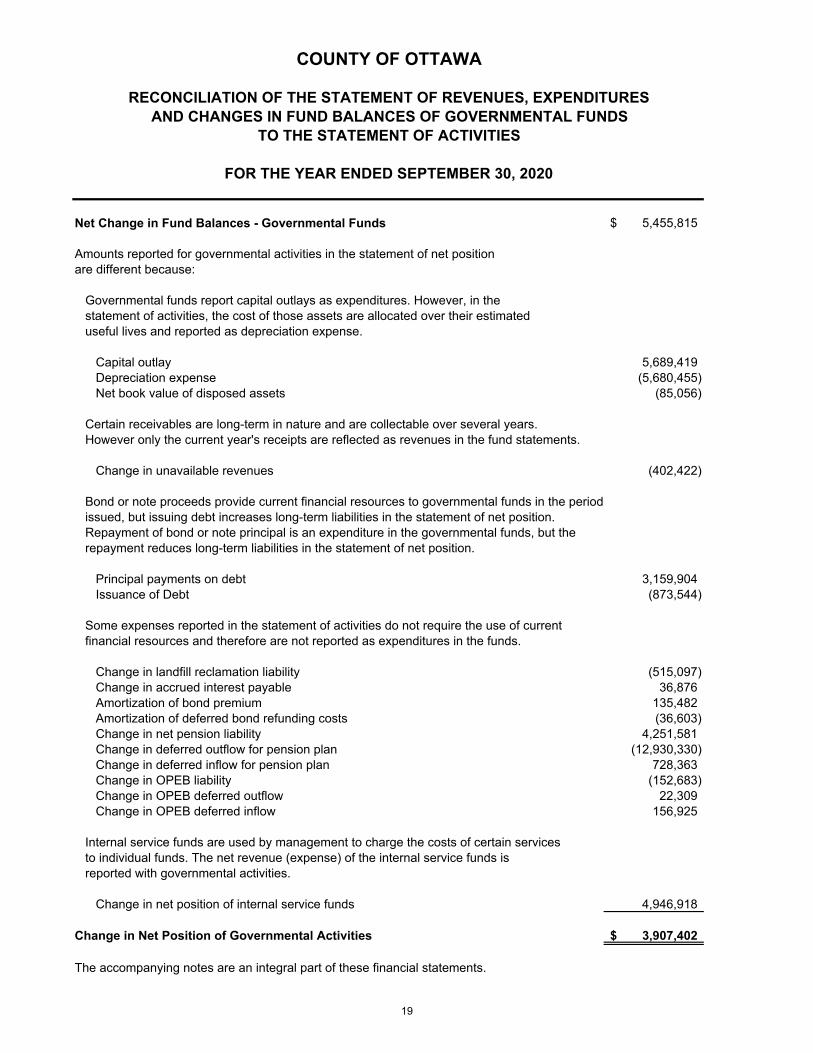
Net Change in Fund Balances - Governmental Funds 5,455,815$
Amounts reported for governmental activities in the statement of net positionare different because:
Governmental funds report capital outlays as expenditures. However, in thestatement of activities, the cost of those assets are allocated over their estimateduseful lives and reported as depreciation expense.
Capital outlay 5,689,419 Depreciation expense (5,680,455) Net book value of disposed assets (85,056)
Certain receivables are long-term in nature and are collectable over several years.However only the current year's receipts are reflected as revenues in the fund statements.
Change in unavailable revenues (402,422)
Bond or note proceeds provide current financial resources to governmental funds in the periodissued, but issuing debt increases long-term liabilities in the statement of net position.Repayment of bond or note principal is an expenditure in the governmental funds, but therepayment reduces long-term liabilities in the statement of net position.
Principal payments on debt 3,159,904 Issuance of Debt (873,544)
Some expenses reported in the statement of activities do not require the use of currentfinancial resources and therefore are not reported as expenditures in the funds.
Change in landfill reclamation liability (515,097) Change in accrued interest payable 36,876 Amortization of bond premium 135,482 Amortization of deferred bond refunding costs (36,603) Change in net pension liability 4,251,581 Change in deferred outflow for pension plan (12,930,330) Change in deferred inflow for pension plan 728,363 Change in OPEB liability (152,683) Change in OPEB deferred outflow 22,309 Change in OPEB deferred inflow 156,925
Internal service funds are used by management to charge the costs of certain servicesto individual funds. The net revenue (expense) of the internal service funds isreported with governmental activities.
Change in net position of internal service funds 4,946,918
Change in Net Position of Governmental Activities 3,907,402$
The accompanying notes are an integral part of these financial statements.
FOR THE YEAR ENDED SEPTEMBER 30, 2020
COUNTY OF OTTAWA
RECONCILIATION OF THE STATEMENT OF REVENUES, EXPENDITURESAND CHANGES IN FUND BALANCES OF GOVERNMENTAL FUNDS
TO THE STATEMENT OF ACTIVITIES
19
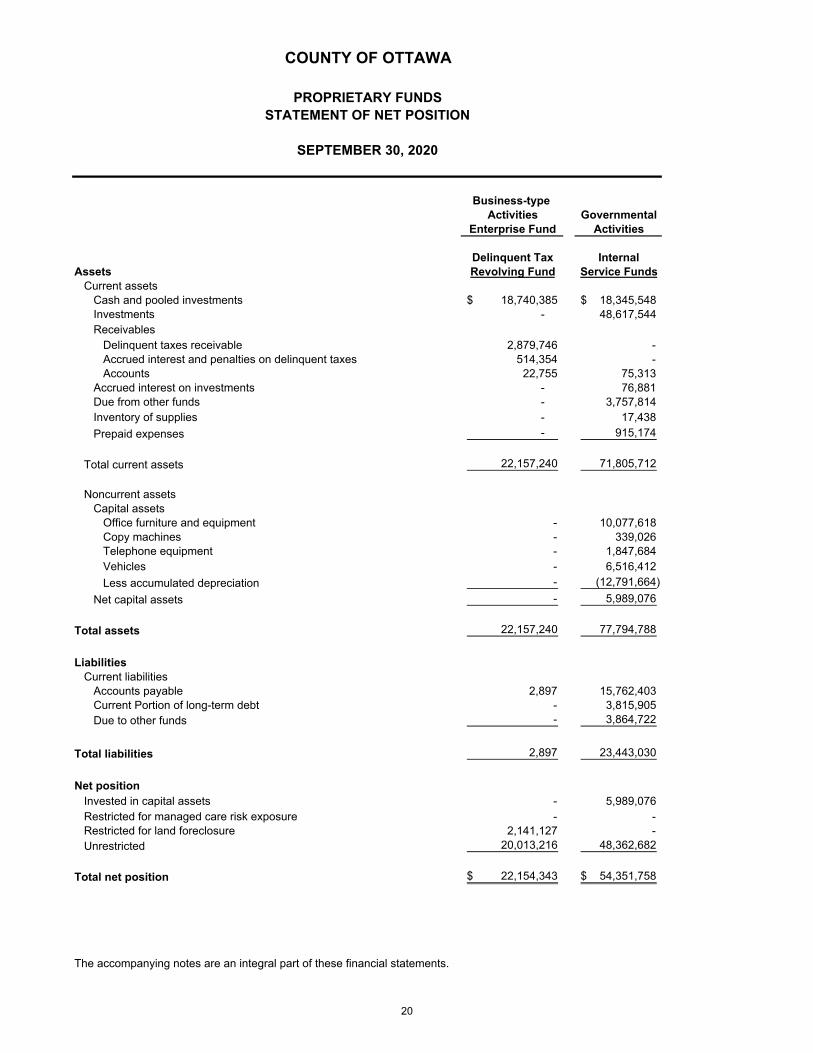
Business-type Activities Governmental
Enterprise Fund Activities
Delinquent Tax InternalAssets Revolving Fund Service Funds
Current assetsCash and pooled investments 18,740,385$ 18,345,548$ Investments - 48,617,544 Receivables
Delinquent taxes receivable 2,879,746 - Accrued interest and penalties on delinquent taxes 514,354 - Accounts 22,755 75,313
Accrued interest on investments - 76,881 Due from other funds - 3,757,814 Inventory of supplies - 17,438
Prepaid expenses - 915,174
Total current assets 22,157,240 71,805,712
Noncurrent assetsCapital assets
Office furniture and equipment - 10,077,618 Copy machines - 339,026 Telephone equipment - 1,847,684 Vehicles - 6,516,412
Less accumulated depreciation - (12,791,664)
Net capital assets - 5,989,076
Total assets 22,157,240 77,794,788
LiabilitiesCurrent liabilities
Accounts payable 2,897 15,762,403 Current Portion of long-term debt - 3,815,905 Due to other funds - 3,864,722
Total liabilities 2,897 23,443,030
Net positionInvested in capital assets - 5,989,076 Restricted for managed care risk exposure - - Restricted for land foreclosure 2,141,127 - Unrestricted 20,013,216 48,362,682
Total net position 22,154,343$ 54,351,758$
The accompanying notes are an integral part of these financial statements.
COUNTY OF OTTAWA
PROPRIETARY FUNDSSTATEMENT OF NET POSITION
SEPTEMBER 30, 2020
20
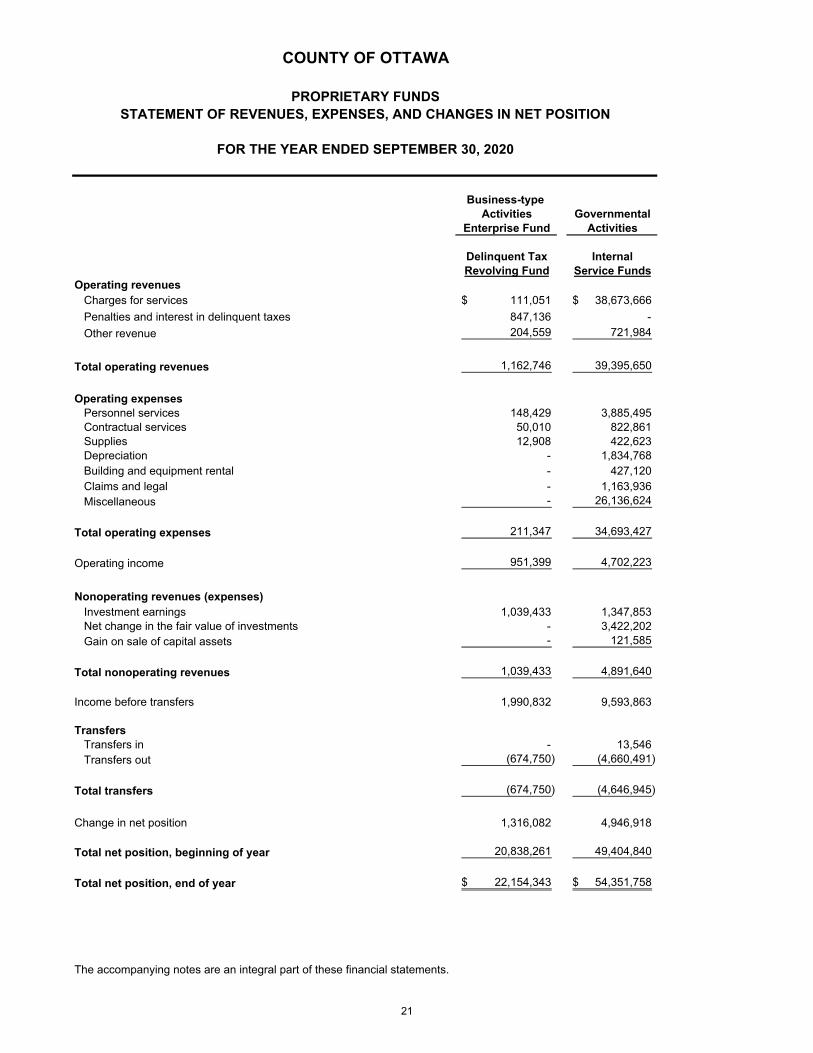
Business-type Activities Governmental
Enterprise Fund Activities
Delinquent Tax InternalRevolving Fund Service Funds
Operating revenuesCharges for services 111,051$ 38,673,666$
Penalties and interest in delinquent taxes 847,136 -
Other revenue 204,559 721,984
Total operating revenues 1,162,746 39,395,650
Operating expensesPersonnel services 148,429 3,885,495 Contractual services 50,010 822,861 Supplies 12,908 422,623 Depreciation - 1,834,768 Building and equipment rental - 427,120 Claims and legal - 1,163,936 Miscellaneous - 26,136,624
Total operating expenses 211,347 34,693,427
Operating income 951,399 4,702,223
Nonoperating revenues (expenses)Investment earnings 1,039,433 1,347,853 Net change in the fair value of investments - 3,422,202 Gain on sale of capital assets - 121,585
Total nonoperating revenues 1,039,433 4,891,640
Income before transfers 1,990,832 9,593,863
TransfersTransfers in - 13,546 Transfers out (674,750) (4,660,491)
Total transfers (674,750) (4,646,945)
Change in net position 1,316,082 4,946,918
Total net position, beginning of year 20,838,261 49,404,840
Total net position, end of year 22,154,343$ 54,351,758$
The accompanying notes are an integral part of these financial statements.
PROPRIETARY FUNDS
COUNTY OF OTTAWA
STATEMENT OF REVENUES, EXPENSES, AND CHANGES IN NET POSITION
FOR THE YEAR ENDED SEPTEMBER 30, 2020
21
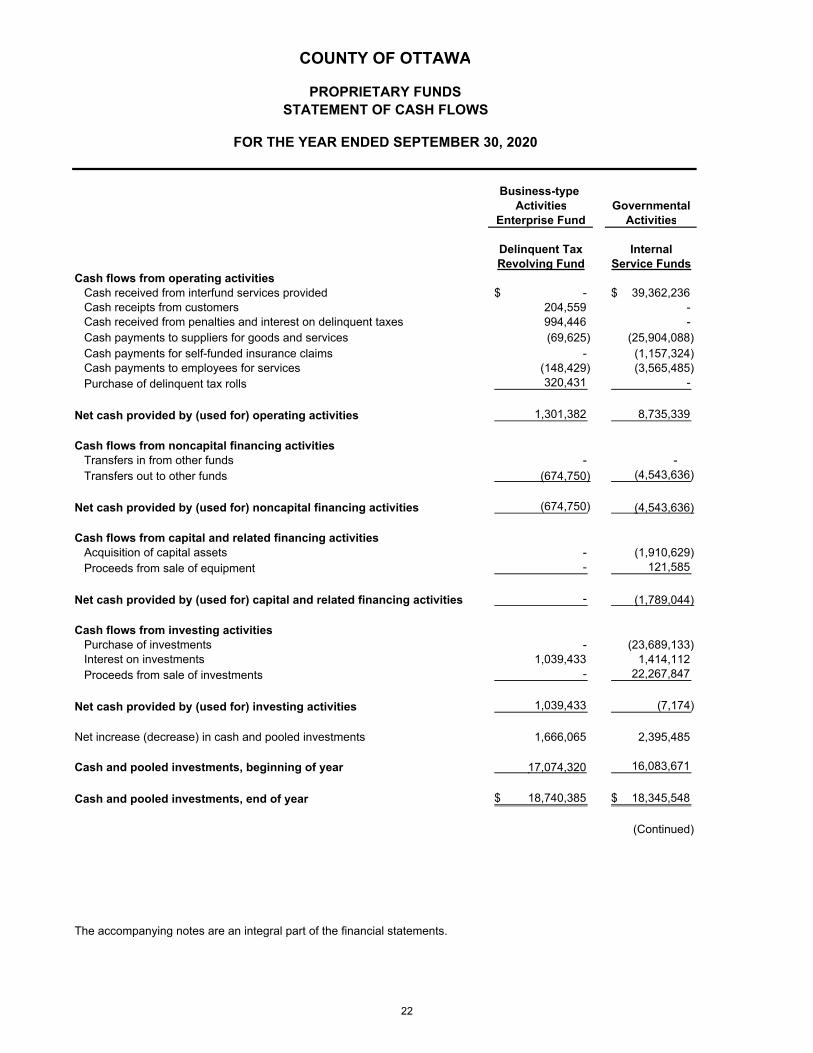
Business-type Activities Governmental
Enterprise Fund Activities
Delinquent Tax InternalRevolving Fund Service Funds
Cash flows from operating activitiesCash received from interfund services provided -$ 39,362,236$ Cash receipts from customers 204,559 - Cash received from penalties and interest on delinquent taxes 994,446 - Cash payments to suppliers for goods and services (69,625) (25,904,088) Cash payments for self-funded insurance claims - (1,157,324) Cash payments to employees for services (148,429) (3,565,485) Purchase of delinquent tax rolls 320,431 -
Net cash provided by (used for) operating activities 1,301,382 8,735,339
Cash flows from noncapital financing activities
Transfers in from other funds - - Transfers out to other funds (674,750) (4,543,636)
Net cash provided by (used for) noncapital financing activities (674,750) (4,543,636) Cash flows from capital and related financing activities
Acquisition of capital assets - (1,910,629) Proceeds from sale of equipment - 121,585
Net cash provided by (used for) capital and related financing activities - (1,789,044) Cash flows from investing activities
Purchase of investments - (23,689,133) Interest on investments 1,039,433 1,414,112 Proceeds from sale of investments - 22,267,847
Net cash provided by (used for) investing activities 1,039,433 (7,174)
Net increase (decrease) in cash and pooled investments 1,666,065 2,395,485
Cash and pooled investments, beginning of year 17,074,320 16,083,671
Cash and pooled investments, end of year 18,740,385$ 18,345,548$
(Continued)
The accompanying notes are an integral part of the financial statements.
COUNTY OF OTTAWA
PROPRIETARY FUNDSSTATEMENT OF CASH FLOWS
FOR THE YEAR ENDED SEPTEMBER 30, 2020
22

Reconciliation of operating income (loss) to net cashprovided by (used for) operating activities
Operating income (loss) 951,399$ 4,702,223$ Adjustments to reconcile operating income (loss) to net
cash provided by (used for) operating activitiesDepreciation - 1,834,768
Change in assets and liabilities not affecting cashprovided by (used for) operating activities
(Increase) decrease in receivables 357,499 (33,414) (Increase) decrease in prepaid expenses - 161,394Increase (decrease) in unpaid claims liability - 302,199Increase (decrease) in accounts payable (7,276) 1,007,081Increase (decrease) in current portion of long-term debt - 785,708Increase (decrease) in due to other funds - 68,457Increase (decrease) in due to other governmental units (240) -Increase (decrease) in total noncurrent liabilities - (93,077)
Net cash provided by (used for) operating activities 1,301,382$ 8,735,339$
Noncash investing activitiesThe change in fair value of investments for the internal service funds was $3,422,202.
(Concluded)
The accompanying notes are an integral part of the financial statements.
COUNTY OF OTTAWA
PROPRIETARY FUNDSSTATEMENT OF CASH FLOWS
FOR THE YEAR ENDED SEPTEMBER 30, 2020
23

2020 2019 2020 2019Assets
Cash and pooled investments 210,272$ 114,143$ 46,097,263$ 40,481,908$ Certificates of deposit - - - - U.S. Government securities 855,000 805,491 - - U.S. Government agencies - - - - Corporate bonds 897,680 848,410 - - Mutual funds Money market mutual funds 238,999 294,642 - - Fixed income 135,264 130,798 - - Domestic equity 1,352,105 1,254,351 - - Exchange traded 2,898,311 299,500 - - International equity 160,045 2,352,526 - - Receivables
Accounts - - 19,666 5,404
Due from other governmental units - - 280,591 395,564
Total assets 6,747,676 6,099,861 46,397,520 40,882,876
LiabilitiesDue to other governmental units
Due to State of Michigan - - 44,637,867 39,773,182 Fines and fees due to local libraries - - 236,602 222,891
Agency deposits 5,400 - 1,523,051 886,803
Total liabilities 5,400 - 46,397,520$ 40,882,876$
Net position restricted for
other post-employement benefits 6,742,278$ 6,099,862$
The accompanying notes are an integral part of these financial statements.
Benefit Plan Agency Funds
COUNTY OF OTTAWA
FIDUCIARY FUNDSSTATEMENT OF NET POSITION/BALANCE SHEET
SEPTEMBER 30, 2020
Other Post-Employment
(with comparative totals at September 30, 2019)
24
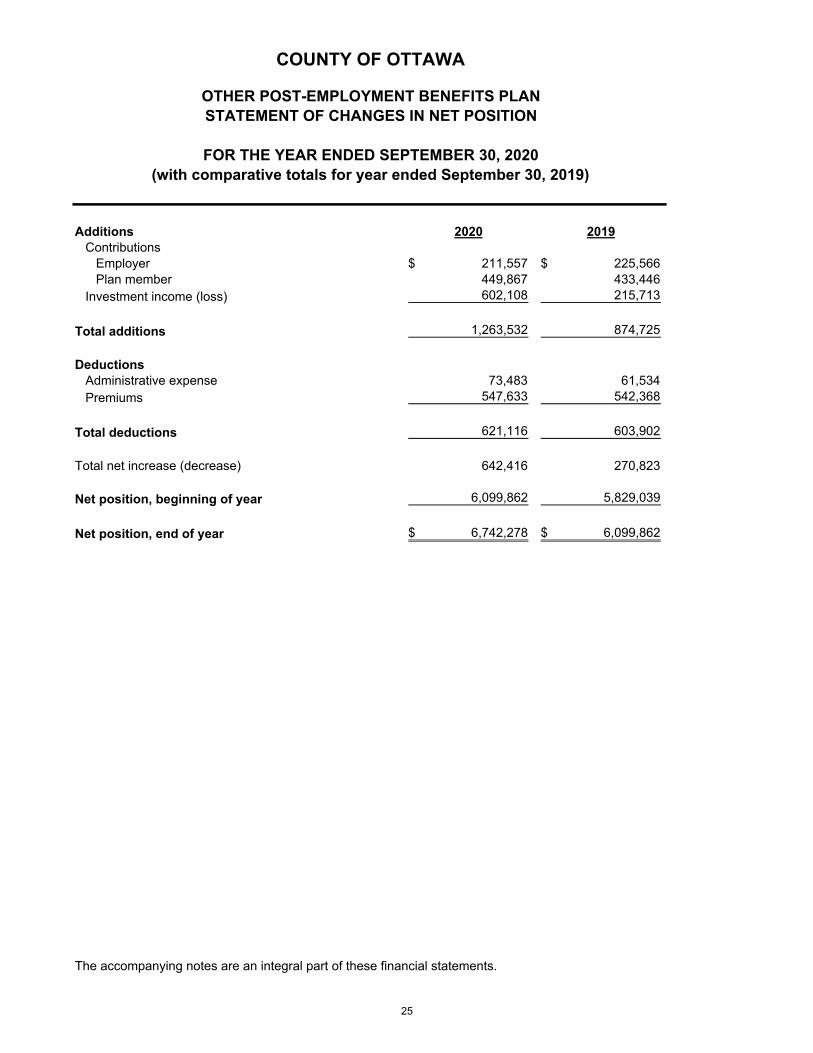
Additions 2020 2019Contributions
Employer 211,557$ 225,566$ Plan member 449,867 433,446
Investment income (loss) 602,108 215,713
Total additions 1,263,532 874,725
DeductionsAdministrative expense 73,483 61,534 Premiums 547,633 542,368
Total deductions 621,116 603,902
Total net increase (decrease) 642,416 270,823
Net position, beginning of year 6,099,862 5,829,039
Net position, end of year 6,742,278$ 6,099,862$
The accompanying notes are an integral part of these financial statements.
COUNTY OF OTTAWA
STATEMENT OF CHANGES IN NET POSITIONOTHER POST-EMPLOYMENT BENEFITS PLAN
FOR THE YEAR ENDED SEPTEMBER 30, 2020(with comparative totals for year ended September 30, 2019)
25

Ottawa Ottawa Ottawa Ottawa Ottawa OttawaOttawa County County County County County CountyCounty Central Public Land Office of the Brownfield EconomicRoad Dispatch Utilities Bank Water Resources Redevelopment Development
Commission Authority System Authority Commissioner Authority Corporation TotalAssets
Current assetsCash and pooled investments 38,983,231$ 6,214,364$ 15,745,255$ 49,181$ 2,823,904$ 92,924$ 9,882$ 63,918,741$
Taxes 3,401,323 - - - - - - 3,401,323 Accounts 122,519 - 2,884,485 - - - - 3,007,004
Due from other governments 2,360,979 670,487 - - 971,088 - - 4,002,554 Inventory of supplies 1,443,083 - 18,700 - - - 1,461,783 Prepaid items 276,728 177,342 - - - - - 454,070
Total current assets 46,587,863 7,062,193 18,648,440 49,181 3,794,992 92,924 9,882 76,245,475
Noncurrent assetsDue from other governments - - 99,732,502 - 2,533,244 - - 102,265,746 Notes receivable - - - - - 102,537 - 102,537 Capital assets not being depreciated 10,926,140 712,047 - - - - - 11,638,187 Capital assets being depreciated, net 250,116,300 14,824,502 - - 41,873,423 - - 306,814,225
Total noncurrent assets 261,042,440 15,536,549 99,732,502 - 44,406,667 102,537 - 420,820,695
Total assets 307,630,303 22,598,742 118,380,942 49,181 48,201,659 195,461 9,882 497,066,170
Deferred outflows of resourcesUnamortized bond refunding costs - - 2,651,794 - - - - 2,651,794 Deferred for pension/opeb plans 4,089,540 255,580 - - - - - 4,345,120
4,089,540 255,580 2,651,794 - - - - 6,996,914 Liabilities
Current liabilitiesAccounts payable 5,376,064 372,792 3,951,012 - 830,608 17,730 - 10,548,206 Interest payable - - 909,060 - 36,369 - - 945,429 Due to component units - - 5,097 - - - - 5,097 Notes payable - - - - 175,000 - - 175,000 Current portion of long-term debt 1,290,516 619,775 5,747,087 - 488,184 - - 8,145,562 Advances from primary government - - 150,000 - 175,000 - - 325,000 Advances from other governments 1,114,360 - - - - - - 1,114,360 Unearned revenue - - 1,584,873 - 298,620 - - 1,883,493
Total current liabilities 7,780,940 992,567 12,347,129 - 2,003,781 17,730 - 23,142,147
Noncurrent liabilitiesNoncurrent portion of long-term obligations 5,271,747 7,444,341 107,254,313 - 3,207,537 102,537 - 123,280,475 Net OPEB liability 2,413,368 - - - - - - 2,413,368 Net pension liability 24,305,367 385,463 - - - - - 24,690,830
Total noncurrent liabilities 31,990,482 7,829,804 107,254,313 - 3,207,537 102,537 - 150,384,673
Total liabilities 39,771,422 8,822,371 119,601,442 - 5,211,318 120,267 - 173,526,820
Deferred inflows of resources
Deferred for pension/opeb plans 1,057,328 - - - - - - 1,057,328
Net positionNet investment in capital assets 256,150,364 7,472,433 - - 38,002,702 - - 301,625,499 Restricted for
Debt service - - - - 1,912,460 - - 1,912,460 Capital projects 14,740,729 - - - 1,748,637 - - 16,489,366 Infrastructure maintenance - - 1,154,824 - 56,472 - - 1,211,296
Unrestricted - 6,559,518 276,470 49,181 1,270,070 75,194 9,882 8,240,315
Total net position 270,891,093$ 14,031,951$ 1,431,294$ 49,181$ 42,990,341$ 75,194$ 9,882$ 329,478,936$
The accompanying notes are an integral part of these financial statements.
COUNTY OF OTTAWA
COMPONENT UNITSCOMBINING STATEMENT OF NET POSITION
SEPTEMBER 30, 2020
26
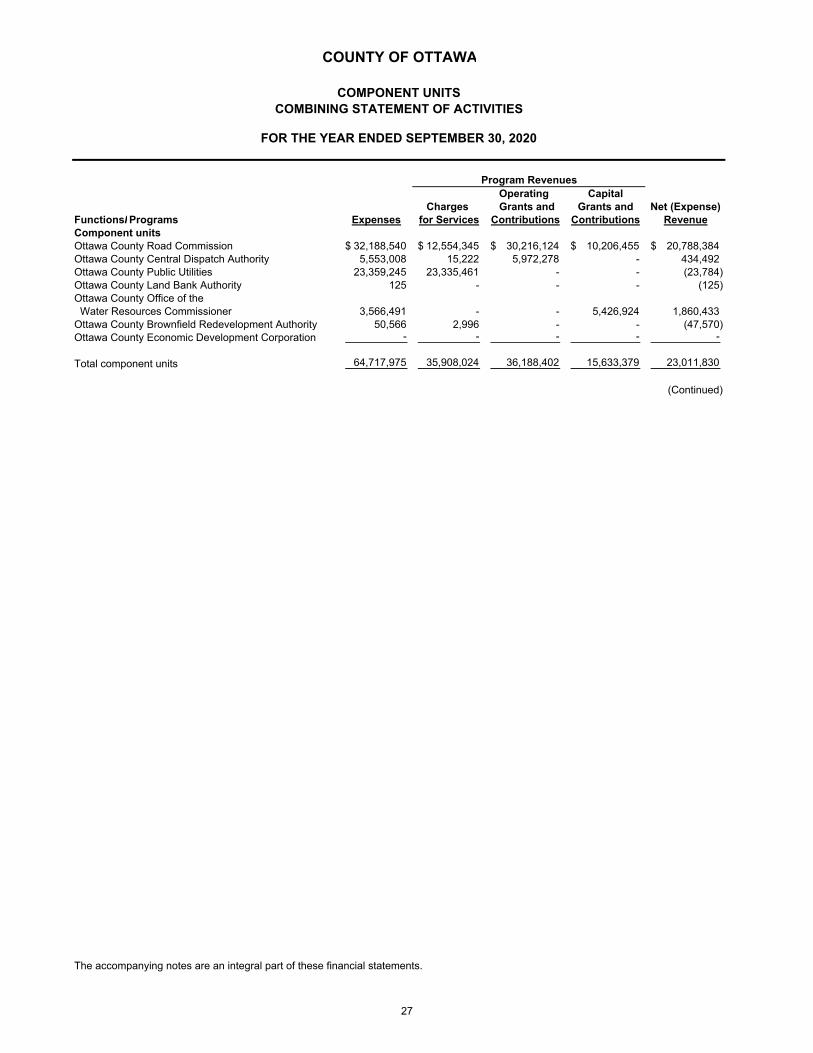
Operating CapitalCharges Grants and Grants and Net (Expense)
FunctionsI Programs Expenses for Services Contributions Contributions RevenueComponent unitsOttawa County Road Commission 32,188,540$ 12,554,345$ 30,216,124$ 10,206,455$ 20,788,384$ Ottawa County Central Dispatch Authority 5,553,008 15,222 5,972,278 - 434,492 Ottawa County Public Utilities 23,359,245 23,335,461 - - (23,784) Ottawa County Land Bank Authority 125 - - - (125) Ottawa County Office of the Water Resources Commissioner 3,566,491 - - 5,426,924 1,860,433 Ottawa County Brownfield Redevelopment Authority 50,566 2,996 - - (47,570) Ottawa County Economic Development Corporation - - - - -
Total component units 64,717,975 35,908,024 36,188,402 15,633,379 23,011,830
(Continued)
The accompanying notes are an integral part of these financial statements.
COUNTY OF OTTAWA
COMBINING STATEMENT OF ACTIVITIES
FOR THE YEAR ENDED SEPTEMBER 30, 2020
Program Revenues
COMPONENT UNITS
27

OttawaOttawa Ottawa Ottawa County Ottawa Ottawa
Ottawa County County County Office of the County CountyCounty Central Public Land Water Brownfield EconomicRoad Dispatch Utilities Bank Resources Redevelopment Development
Commission Authority System Authority Commissioner Authority Corporation TotalChanges in net position
Net (expense) revenue 20,788,384$ 434,492$ (23,784)$ (125)$ 1,860,433$ (47,570)$ -$ 23,011,830$
General revenuesProperty taxes, levied for general purposes - - - - - 37,539 - 37,539 Grants and contributions not restricted to specific programs - - - - - 2,027 - 2,027 Investment earnings 364,223 244,136 126,356 - 39,204 - - 773,919 Gain from disposal of capital assets 84,003 - - - - - - 84,003 Miscellaneous 25,406 598 - - - - - 26,004
Total general revenues 473,632 244,734 126,356 - 39,204 39,566 - 923,492
Change in net position 21,262,016 679,226 102,572 (125) 1,899,637 (8,004) - 23,935,322
Net position, beginning of year 249,629,077 13,352,725 1,328,722 49,306 41,090,704 83,198 9,882 305,543,614
Net position, end of year 270,891,093$ 14,031,951$ 1,431,294$ 49,181$ 42,990,341$ 75,194$ 9,882$ 329,478,936$
(Concluded)
The accompanying notes are an integral part of these financial statements.
Component Units
COUNTY OF OTTAWA
COMPONENT UNITSCOMBINING STATEMENT OF ACTIVITIES
FOR THE YEAR ENDED SEPTEMBER 30, 2020
28

NOTES TO THE FINANCIAL STATEMENTS
COUNTY OF OTTAWA, MICHIGAN
NOTES TO THE FINANCIAL STATEMENTS
FOR THE YEAR ENDED SEPTEMBER 30, 2020
1. SUMMARY OF SIGNIFICANT ACCOUNTING POLICIES
The County of Ottawa, Michigan (the "County") was incorporated in 1837 and covers an area of approximately 565 square miles with the County seat located in the City of Grand Haven. The County operates under an 11 member-elected Board of Commissioners (the “Board”) and provides services to its estimated 291,830 residents in many areas including law enforcement, administration of justice, community enrichment and development and human services. The financial statements of the County have been prepared in conformity with U.S. generally accepted accounting principles (GAAP) as applied to governmental units. The Governmental Accounting Standards Board (GASB) is the accepted standard-setting body for establishing governmental accounting and financial reporting principles. The more significant of the County's accounting policies are described below. Reporting entity
The accompanying financial statements present the County (the primary government) and its component units, entities for which the government is considered to be financially accountable. Blended component units, although legally separate entities, are, in substance, part of the County's operations, so data from these units are combined with data of the primary government. Discretely presented component units, on the other hand, are reported in a separate column in the government-wide financial statements to emphasize they are legally separate from the County. Blended and discretely presented component units are shown based on their year-end indicated below. Blended component units
The Building Authority is governed by a three-member board appointed by the Ottawa County Board of Commissioners. Its sole purpose is to finance and construct the County's public buildings. It is reported in the appropriate fund categories of debt service and capital projects and has a September 30 year-end.
The Ottawa County, Michigan Insurance Authority (“OCIA”) is a separate legal entity organized for the purpose of providing insurance coverage and risk management and related services to public entities in the County of Ottawa, Michigan pursuant to State of Michigan Act No. 36 of the Public Acts of 1988. The governing board consists of one appointed and four elected officials of the County and one appointed official from each other participating public entity. The County and the Building Authority are currently the only participating entities. The OCIA is reported in an internal service fund and has a September 30 year-end.
A separate report for the Building Authority and complete financial statements for the OCIA can be obtained from:
Fiscal Services Director, Ottawa County
12220 Fillmore Street West Olive, MI 49460
29
COUNTY OF OTTAWA, MICHIGAN
NOTES TO THE FINANCIAL STATEMENTS
FOR THE YEAR ENDED SEPTEMBER 30, 2020
1. SUMMARY OF SIGNIFICANT ACCOUNTING POLICIES (continued)
Reporting entity (continued)
Discretely presented component units
The Ottawa County Road Commission (“Road Commission”) was established pursuant to the County Road Law (MCL 224.1). The governing board is appointed by the Ottawa County Board of Commissioners. It may not issue debt or levy a tax without the approval of the County Board of Commission. Road Commission property taxes are levied under the taxing authority of the County, as approved by the County electors, and are included as part of the County's total tax levy. The Road Commission has a September 30 year-end.
Complete financial statements for the Road Commission can be obtained from:
Finance Director, Ottawa County Road Commission P.O. Box 7392 Grand Haven, MI 49417
The Ottawa County Central Dispatch Authority (“OCCDA”) is governed by an eight-member board with two members appointed by the Ottawa County Board of Commissioners. The OCCDA is fiscally dependent upon the County because it cannot levy taxes or issue bonded debt without approval of the Board. OCCDA property taxes are levied under the taxing authority of the County, as approved by the County electors, and are included as part of the County's total tax levy. Additionally, the economic resources of the OCCDA are almost entirely for the benefit of the Ottawa County residents and it would be misleading to exclude the activity. The OCCDA has a December 31 year-end.
Complete financial statements for the OCCDA can be obtained from:
Director, Ottawa County Central Dispatch Authority
12101 Stanton Street West Olive, MI 49460
The Ottawa County Public Utilities System (“System”) is governed by a board appointed by the Ottawa County Board of Commissioners. The System deposits receipts with and invests through the County. It is fiscally dependent upon the County because the Board must approve debt issuances of Public Act 342 bonds. The System has a December 31 year-end.
Complete financial statements for the System can be obtained from:
Finance Director, Ottawa County Road Commission P.O. Box 7392 Grand Haven, MI 49417
30

COUNTY OF OTTAWA, MICHIGAN
NOTES TO THE FINANCIAL STATEMENTS
FOR THE YEAR ENDED SEPTEMBER 30, 2020
1. SUMMARY OF SIGNIFICANT ACCOUNTING POLICIES (continued)
Reporting entity (continued) Discretely presented component units (continued)
The Ottawa County Land Bank Authority (“Authority”) was established pursuant to the Michigan Land Bank Fast Track Act, 2003 P.A. 258, 124.751 and the intergovernmental agreement by and between the Michigan Land Bank Fast Track Authority and the Treasurer of the County of Ottawa. The governing board consists of the Treasurer of the County of Ottawa and eight additional members appointed by the Ottawa County Board of Commissioners. The Authority has the power to contract, to sue and be sued, to hold, manage and dispose of property, etc. Although funding for the Authority is designed to come from the eventual sale of properties, the County Board of Commission has enabled the Authority to borrow up to $50,000 from the County’s Delinquent Tax Revolving fund as needed, interest free. The Authority has a September 30 year-end. Complete financial statements for the Authority can be obtained from: Fiscal Services Director, Ottawa County 12220 Fillmore Street West Olive, MI 49460
The Ottawa County Office of the Water Resources Commissioner (“WR Commissioner”) drainage districts established pursuant to the Drain Code of 1956 are separate legal entities, with the power to contract, to sue and be sued, to hold, manage and dispose of real and personal property, etc. The WR Commissioner is considered to be a component unit of the County because the County has the ability to significantly influence operations and has accountability for fiscal matters, by formally approving the WR Commissioner’s budget and performing all financial management functions. The statutory drainage board of Chapter 20 drainage districts consists of the Water Resources Commissioner, the Chair of the County Board of Commissioners and one other member of the Board of Commissioners. The statutory drainage board of Chapter 6 and 21 drainage districts consists of the State Director of Agriculture and the Water Resources Commissioner of each county involved in the project. The Water Resources Commissioner has sole responsibility to administer the drainage districts established pursuant to Chapter 4 and 8 of the Drain Code. The drainage board or Water Resources Commissioner, on behalf of the drainage district, may issue debt and levy special assessments authorized by the Drain Code without the prior approval of the Board. The full faith and credit of the County may be pledged for the debt of the drainage district. The Office of the Water Resources Commissioner has a September 30 year-end. Complete financial statements for the WR Commissioner can be obtained from: Fiscal Services Director, Ottawa County 12220 Fillmore Street West Olive, MI 49460
31
COUNTY OF OTTAWA, MICHIGAN
NOTES TO THE FINANCIAL STATEMENTS
FOR THE YEAR ENDED SEPTEMBER 30, 2020
1. SUMMARY OF SIGNIFICANT ACCOUNTING POLICIES (continued)
Reporting entity (continued)
Discretely presented component units (continued) The Economic Development Corporation of the County of Ottawa (“EDC”) was established pursuant to the Economic Development Corporations Act (Act 338, Public Acts of 1974, as amended) and is a separate legal entity. The EDC’s governing board is appointed by the Ottawa County Board of Commissioners. The County was required to hold a public hearing and approve the bonds issued in 2011 in compliance with the Internal Revenue Code. Neither the EDC nor the County is obligated in any way for the payment of these bonds. The EDC has a September 30 year-end. Complete financial statements for the EDC can be obtained from: Fiscal Services Director, Ottawa County 12220 Fillmore Street West Olive, MI 49460
The Ottawa County Brownfield Redevelopment Authority (the “BRA”) was established pursuant to the Brownfield Redevelopment Financing Act (Act 381, Public Acts of 1996, as amended) and is separate legal entity. The BRA’s governing board is appointed by the Ottawa County Board of Commissioners. The primary government appoints the voting majority and imposes its will through the approval of all BRA projects. The BRA has a September 30 year-end. Complete financial statements for the BRA can be obtained from: Fiscal Services Director, Ottawa County 12220 Fillmore Street West Olive, MI 49460
Government-wide and fund financial statements
The government-wide financial statements (i.e., the statement of net position and the statement of activities) report information on all of the nonfiduciary activities of the primary government and its component units. For the most part, the effect of interfund activity has been removed from these statements. However, exceptions to this general rule are charges between enterprise functions and other various functions of the government. Elimination of these charges would distort costs and program revenues for the various functions concerned. Governmental activities, which normally are supported by taxes and intergovernmental revenues, are reported separately from business-type activities, which rely to a significant extent on fees and charges for support.
32
COUNTY OF OTTAWA, MICHIGAN
NOTES TO THE FINANCIAL STATEMENTS
FOR THE YEAR ENDED SEPTEMBER 30, 2020
1. SUMMARY OF SIGNIFICANT ACCOUNTING POLICIES (continued)
Government-wide and fund financial statements
Likewise, the primary government is reported separately from certain legally separate component units for which the primary government is financially accountable. The statement of activities demonstrates the degree to which the direct expenses of a given function or segment are offset by program revenues. Direct expenses are those that are clearly identifiable with a specific function or segment. Indirect expenses are charged based upon a County-wide cost allocation plan which allocates costs based upon the number of full time equivalents, number of transactions, and other pertinent information. Program revenues include (1) charges to customers or applicants who purchase, use, or directly benefit from goods, services, or privileges provided by a given function or segment and (2) grants and contributions that are restricted to meeting the operational or capital requirements of a particular function or segment. Taxes and other items not properly included among program revenues are reported instead as general revenues. Separate financial statements are provided for governmental funds, proprietary funds, and fiduciary funds, even though the latter are excluded from the government-wide financial statements. Major individual governmental funds and major individual enterprise funds are reported as separate columns in the fund financial statements. The government-wide financial statements are reported using the economic resources measurement focus and the accrual basis of accounting, as are the proprietary fund statements. The fiduciary fund financial statements are reported using the accrual basis of accounting and the economic resources measurement focus (agency funds do not utilize a measurement focus). Revenues are recorded when earned and expenses are recorded when liability is incurred, regardless of the timing of related cash flows. Property taxes are recognized as revenues in the year for which they are levied. After March 1 of the following year, the Delinquent Tax Revolving Fund pays the County for any real outstanding taxes as of that date. Grants and similar items are recognized as revenue as soon as all eligibility requirements imposed by the provider have been met. Measurement focus, basis of accounting, and financial statement presentation Governmental fund financial statements are reported using the current financial resources measurement focus and the modified accrual basis of accounting. Revenues are recognized as soon as they are both measurable and available. Revenues are considered to be available when they are collectible within the current period or soon enough thereafter to pay liabilities of the current period. For this purpose, the government considers property tax revenues to be available if they are collected within 60 days of the end of the current fiscal period. Expenditures generally are recorded when a liability is incurred, as under accrual accounting. However, debt service expenditures, landfill closure costs and compensated absences are recorded only when payment is due. Intergovernmental revenue, charges for services, grants and interest associated with the current fiscal period are all considered to be susceptible to accrual and so have been recognized as revenues of the current fiscal period. The County considers these to be available if received within 180 days of year-end. Only the portion of special assessments receivable due within the current fiscal period is considered to be susceptible to accrual as revenue of the current period. All other revenue items are considered to be measurable and available only when cash is received by the County.
33

COUNTY OF OTTAWA, MICHIGAN
NOTES TO THE FINANCIAL STATEMENTS
FOR THE YEAR ENDED SEPTEMBER 30, 2020
1. SUMMARY OF SIGNIFICANT ACCOUNTING POLICIES (continued)
Measurement focus, basis of accounting, and financial statement presentation (continued)
The County reports the following major governmental funds: General Fund is the County’s primary operating fund. It accounts for all financial resources of the general government, except those required to be accounted for in another fund. With the implementation of GASB Statement No.54, Fund Balance Reporting and Governmental Fund Type Definitions, certain funds which had been special revenue funds have been combined with the general fund. These funds include:
Solid Waste Clean-Up Fund (2271) – This fund was established to account for monies received from settlement of a claim. The monies are mainly used for the clean-up of the Southwest Ottawa Landfill.
Infrastructure Fund (2444) – This fund was established by the County Board to provide financial assistance to local units of government for water, sewer, road and bridge projects that are especially unique, non-routine, and out-of-the ordinary.
Stabilization Fund (2570) – This fund was established to assure the continued solid financial condition of the County in case of emergency. DBDC Fund (2970) – This fund is used to account for the property tax revenue committed by the Board of Commissioners to pay the unfunded liability for the Municipal Employees Defined Benefit Retirement Plan.
Community Mental Health Fund (2220) – This fund is used to account for monies to provide mental health services within the County. Monies are provided by federal, state and county appropriations, contributions and charges for services. Substance Use Disorder Fund (2225) – This fund is used to account for monies to provide substance disorder health services within the County. Monies are provided by federal and state appropriations, contributions and charges for services. The County reports the following major proprietary fund: Delinquent Tax Revolving Fund (5160) – This Enterprise Fund is used to pay each local governmental unit, including the County general fund, the respective amount of delinquent taxes not collected as of March 1 of each year. Financing is provided by subsequent collection of delinquent property taxes by the County Treasurer. The County also reports the following fund types: Special Revenue Funds account for revenue from specific revenue sources (other than fiduciary or major capital projects) and related expenditures which are restricted for specific purposes by administrative action or law. The Debt Service Fund accounts for the resources accumulated and payments made for principal and interest on long-term general obligation debt of governmental funds. Capital Projects Funds accounts for construction projects performed on existing County facilities, the purchase of capital equipment and for the construction of County buildings.
34
COUNTY OF OTTAWA, MICHIGAN
NOTES TO THE FINANCIAL STATEMENTS
FOR THE YEAR ENDED SEPTEMBER 30, 2020
1. SUMMARY OF SIGNIFICANT ACCOUNTING POLICIES (continued)
Measurement focus, basis of accounting, and financial statement presentation (continued) Internal Service Funds account for data processing, equipment purchases, and insurance coverage provided to County departments on a cost reimbursement basis. The OPEB Trust Fund is used to account for the activity of the County’s other post-employment benefit program. Agency Funds account for assets held on behalf of outside parties, including other governments. The majority of the balances in the agency funds represent payments collected on behalf of the State of Michigan and other governmental agencies. Proprietary funds distinguish operating revenues and expenses from nonoperating items. Operating revenues and expenses generally result from providing services and producing and delivering goods in connection with a proprietary fund’s principal ongoing operations. The principal operating revenues of the delinquent tax revolving enterprise fund are interest and penalties on delinquent taxes. The principal operating revenues of the County’s internal service funds are charges to County departments for equipment amortization, employee benefit programs and insurance coverage. Operating expenses for the enterprise fund include costs associated with the collection of delinquent taxes and rent payments for certain County facilities designed to pay the debt obligations of the related bond issue. Operating expenses for the internal service funds include the cost of services (including premiums and claims), administrative expenses, and depreciation on capital assets. All revenues and expenses not meeting this definition are reported as nonoperating revenues and expenses. Assets, liabilities, and net position or equity Cash and pooled investments For purposes of the statement of cash flows, the County considers all assets held in the cash and investment pool to be cash equivalents because the investments are not identifiable to specific funds and the assets can be withdrawn at any time, similar to a demand deposit account. The investments of the County investment pool consist primarily of U.S. treasuries, U.S. government agency securities, commercial paper, certificates of deposit, local government investment pools, and mutual funds. Investments of the Insurance Authority and other post-employment benefit plan trust also consist of government and corporate debt and equity securities. All investments are recorded at fair value. Receivables, payables, and due from other governments During the course of operations, numerous transactions occur between individual funds and/or between the primary government and component units for goods provided or services rendered. These receivables and payables are classified as "due from other funds/component units" or "due to other funds/
35
COUNTY OF OTTAWA, MICHIGAN
NOTES TO THE FINANCIAL STATEMENTS
FOR THE YEAR ENDED SEPTEMBER 30, 2020
1. SUMMARY OF SIGNIFICANT ACCOUNTING POLICIES (continued)
Assets, liabilities, and net position or equity (continued) Receivables, payables, and due from other governments (continued) component units" on the balance sheet. Short-term interfund loans are classified as "interfund receivables/payables". Any residual balances outstanding between the governmental activities and business-type activities are reported in the government-wide financial statements as “internal balances.” Other accounts receivable is shown net of the allowance for estimated uncollectible. For the mental health fund receivables, an allowance of $67,181 has been established. For the jail and inmate housing receivable and various other receivables an allowance of $267,024 has been established. The health fund receivables also has an allowance of $23,175. Property taxes Property taxes for general County operations are levied as of July 1 (lien date) on property values assessed as of the same date. Property taxes for Parks and Recreation, Community Mental Health, the OCCDA, the Road Commission and Cities are levied December 1 (lien date) on property values assessed as of the same date. The taxes levied July 1 are due on September 14 and taxes levied December 1 are due on February 14 of the following year. After the due dates, the applicable property is subject to penalties and interest. Advances to other funds Noncurrent portions of long-term interfund loans receivable in governmental funds are reported as advances and are offset by non-spendable fund balance reserve account which indicates that they do not constitute expendable available financial resources and therefore are not available for appropriation. Inventories and prepaids Inventories are valued at cost on the first-in / first-out (FIFO) method. Inventories are recorded as expenditures when consumed rather than when purchased. Payments made to vendors for services that will benefit periods beyond a fund's fiscal year-end are recorded as prepaid in both government-wide and fund financial statements. Prepaid items are recorded as expenditures when consumed rather than when purchased.
Capital assets Capital assets, which include property, plant, equipment, and infrastructure assets (e.g., roads, bridges, sidewalks, and similar items), are reported in the governmental activities column in the government-wide financial statements. For the County, infrastructure exists in the Road Commission and the Office of the Water Resources Commissioner component units. The capitalization threshold ranges from $1,000 - $25,000. Capital assets are defined by the primary government as assets with an initial, individual cost of more than $5,000 (amount not rounded) and an estimated useful life in excess of two years. Such assets are valued at cost where historical records are available and at an estimated historical cost where no historical records exists. Donated capital assets are valued at acquisition value (the amount that would
36
COUNTY OF OTTAWA, MICHIGAN
NOTES TO THE FINANCIAL STATEMENTS
FOR THE YEAR ENDED SEPTEMBER 30, 2020
1. SUMMARY OF SIGNIFICANT ACCOUNTING POLICIES (continued)
Assets, liabilities, and net position or equity (continued) Capital assets (continued) be paid to acquire an asset with an equivalent potential in an ordinary market transaction) on the date received. The amount reported for infrastructure includes assets acquired or constructed since 1980. The costs of normal maintenance and repairs that do not add to the value of the asset or materially extend asset lives are not capitalized. Improvements are capitalized and depreciated over the remaining useful lives of the related capital assets, as applicable. No interest expense has been incurred or capitalized on capital assets reported in proprietary funds. Depreciation of the capital assets (including infrastructure) of the primary government, as well as the component units, is computed using the straight-line method over the estimated useful lives.
Years Land improvements 25 Buildings and improvements 25 - 50 Office furniture and equipment 3 - 20 Vehicles 3 - 10 Infrastructure 30
Self-insurance claims incurred but not reported
At September 30, 2020 the County had several Internal Service funds which account for various uninsured risks. The County is self-insured up to certain limits, which vary by type of risk, and purchases reinsurance to cover claims in excess of those limits. The County records estimates of self-insurance claims incurred but not reported as of September 30 and the Road Commission based on historical trend information, claims reported subsequent to year-end, actuarial valuations and/or professional judgment. Such estimates are included in accounts payable. Compensated absences Substantially all County employees are granted vacation and sick leave in varying amounts based on length of service. Vacation pay is fully vested when earned and accrued in the government-wide financial statements. Employees are granted varying amounts of sick days annually and may accumulate up to various maximums. Unused sick leave accumulated under the current plan is forfeited upon termination or retirement. Therefore, no liability for unpaid accumulated sick leave is recorded. All employees except judges and elected officials are covered under short and long-term disability benefits if an illness lasts longer than 10 working days or six months, respectively. Employees who accumulated sick days under the County's prior sick leave policy before moving into the current plan have been allowed to bank up to 120 hours of their sick days accumulated under the prior plan in a holding account at the pay rate in effect when they entered the current plan. Employees' accounts earn interest annually at the average rate earned by the County Treasurer. Eligible employees with at least ten years of continuous service are paid for banked sick days in full upon death or retirement and at the rate of 50% of accumulated benefits upon termination for reasons other than death or retirement.
37
COUNTY OF OTTAWA, MICHIGAN
NOTES TO THE FINANCIAL STATEMENTS
FOR THE YEAR ENDED SEPTEMBER 30, 2020
1. SUMMARY OF SIGNIFICANT ACCOUNTING POLICIES (continued)
Assets, liabilities, and net position or equity (continued)
Compensated absences (continued) A liability for this amount is accrued and reported in the government-wide financial statements. The County estimates that the maximum liability for unpaid and unused sick leave would be $57,080 at September 30, 2020 if all employees who accumulated sick leave under the prior plan retired. Only the portion of this liability that has matured is recognized as a current liability. The liability for this balance is recorded in the internal service funds. The County has fully funded its vacation pay liability. The vacation pay expenditure/expense was recorded in each fund, and this amount was recorded in the compensated absence internal service fund. An adjustment was made at September 30, 2020 to reflect the change in the accumulated balance reported in the internal service fund previously included only at the government level of $3,815,905. Under the Road Commission’s personnel policy and contracts negotiated with employee groups, individual employees have a vested right to receive payments for unused vacation and sick leave under formulas and conditions specified in the policy and contracts. Accumulated leave of the General Fund is recorded on the statement of net position and not on the General Fund balance sheet because it is not expected to be liquidated with expendable available financial resources. The OCCDA’s personnel policy and employment agreements provide employees a vested right to receive payments for unused vacation leave under formulas and conditions specified in the policy and agreements. Accumulated leave of the General Fund is recorded on the statement of net position and not on the General Fund balance sheet because it is not expected to be liquidated with expendable available financial resources. Employee retirement plans For purposes of measuring the net pension liability, deferred outflows of resources and deferred inflows of resources related to pensions, and pension expense, information about the fiduciary net position of the Municipal Employees Retirement System (MERS) of Michigan and additions to/deductions from MERS’ fiduciary net position have been determined on the same basis as they are reported by MERS. For this purpose, benefit payments (including refunds of employee contributions) are recognized when due and payable in accordance with the benefit terms. Investments are reported at fair value.
Long-term obligations In the government-wide financial statements and proprietary fund types in the fund financial statements, the long-term debt and other long-term obligations are reported as liabilities in the governmental activities, business-type activities, or proprietary fund type statement of net position. Bonds payable are reported including bond premiums or net of discounts. In the fund financial statements, governmental fund types recognize bond premiums and discounts, as well as bond issuance costs, during the current period. The face amount of debt issued is reported as other financing sources. Premiums received on debt issuances are reported as other financing sources while discounts on debt issuances are reported as other financing uses. Issuance costs, whether or not withheld from the actual debt proceeds received, are reported as debt service expense regardless of fund or activity.
38
COUNTY OF OTTAWA, MICHIGAN
NOTES TO THE FINANCIAL STATEMENTS
FOR THE YEAR ENDED SEPTEMBER 30, 2020
1. SUMMARY OF SIGNIFICANT ACCOUNTING POLICIES (continued)
Assets, liabilities, and net position or equity (continued) Restricted net position Under Act 30, Public Acts of 1978, the use of the fund balance of the Stabilization Fund (consolidated with the General Fund) is restricted to 1) cover a deficit, 2) prevent a reduction in the level of public services or number of employees in the current or next fiscal year, or 3) cover expenses arising from a natural disaster. Fund equity The County implemented the provisions of GASB Statement No.54, Fund Balance Reporting and Governmental Fund Type Definitions, in the 2011 financial statements. GASB 54 establishes fund balance classifications that comprise a hierarchy based primarily on the extent to which a government is bound to observe constraints imposed upon the use of the resources reported in governmental funds. In the fund financial statements, governmental funds report fund balance in five categories:
1. Nonspendable fund balance cannot be spent because it is either a) not in spendable form or b) legally or contractually required to be maintained intact.
2. Restricted fund balance can only be spent for specific purposes due to a) externally
imposed by grantors, creditors, and contributors, of laws or regulations of other governments or b) imposed by law through constitutional provisions or enabling legislation.
3. Committed fund balance can only be spent for specific purposes pursuant to constraints
imposed by formal action of the government’s highest level of decision–making authority. The Board is the highest level of decision-making authority for the government that can, by adoption of a resolution prior to the end of the fiscal year, commit fund balance. Once adopted, the limitation imposed by the resolution remains in place until a similar action is taken (the adoption of another resolution) to remove or revise the limitation.
4. Assigned fund balance is constrained by the government’s intent to be used for specific
purposes but has not been formally committed by Board action or restricted in any way. Through the County’s fund balance policy, the Board has delegated the authority to assign fund balance to the County Administrator.
5. Unassigned fund balance is the residual classification for the General Fund. Except for
funds with negative fund balance, only the General Fund has unassigned fund balance.
When an expenditure is incurred for purposes for which both restricted and unrestricted (committed, assigned, or unassigned) amounts are available, it is the County’s policy to consider restricted amounts to have been reduced first. When an expenditure is incurred for purposes for which amounts in any of the unrestricted fund balance classifications could be used, it is the County’s policy that committed amounts would be reduced first, followed by assigned amounts and then unassigned amounts. In addition, it is the County’s policy to maintain a fund balance in the General Fund of not less than 10% and not more than 15% of the most recently audited General Fund expenditures and transfers out for cash flow and flexibility purposes. Such assignments cannot exceed the available (spendable, unrestricted, uncommitted) fund balance in any particular fund.
39
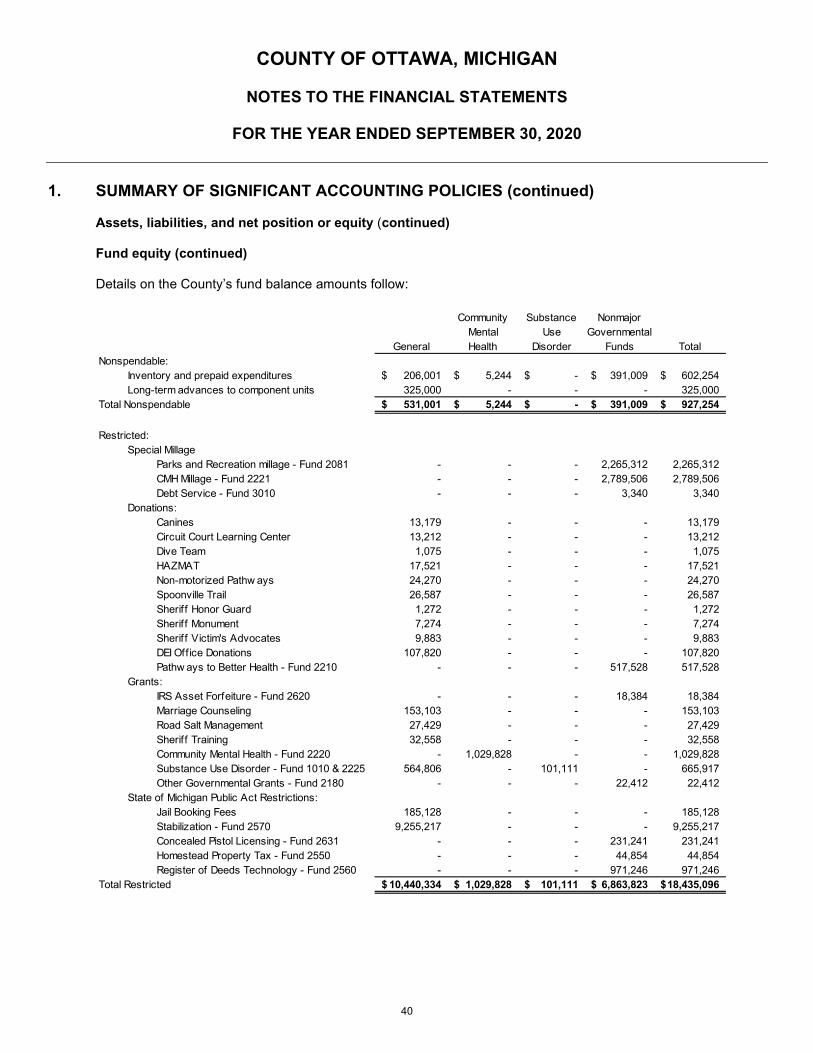
COUNTY OF OTTAWA, MICHIGAN
NOTES TO THE FINANCIAL STATEMENTS
FOR THE YEAR ENDED SEPTEMBER 30, 2020
1. SUMMARY OF SIGNIFICANT ACCOUNTING POLICIES (continued)
Assets, liabilities, and net position or equity (continued) Fund equity (continued) Details on the County’s fund balance amounts follow:
Community Substance NonmajorMental Use Governmental
General Health Disorder Funds TotalNonspendable:
Inventory and prepaid expenditures 206,001$ 5,244$ -$ 391,009$ 602,254$ Long-term advances to component units 325,000 - - - 325,000
Total Nonspendable 531,001$ 5,244$ -$ 391,009$ 927,254$
Restricted:Special Millage
Parks and Recreation millage - Fund 2081 - - - 2,265,312 2,265,312 CMH Millage - Fund 2221 - - - 2,789,506 2,789,506 Debt Service - Fund 3010 - - - 3,340 3,340
Donations:Canines 13,179 - - - 13,179 Circuit Court Learning Center 13,212 - - - 13,212 Dive Team 1,075 - - - 1,075 HAZMAT 17,521 - - - 17,521 Non-motorized Pathw ays 24,270 - - - 24,270 Spoonville Trail 26,587 - - - 26,587 Sheriff Honor Guard 1,272 - - - 1,272 Sheriff Monument 7,274 - - - 7,274 Sheriff Victim's Advocates 9,883 - - - 9,883 DEI Office Donations 107,820 - - - 107,820 Pathw ays to Better Health - Fund 2210 - - - 517,528 517,528
Grants:IRS Asset Forfeiture - Fund 2620 - - - 18,384 18,384 Marriage Counseling 153,103 - - - 153,103 Road Salt Management 27,429 - - - 27,429 Sheriff Training 32,558 - - - 32,558 Community Mental Health - Fund 2220 - 1,029,828 - - 1,029,828 Substance Use Disorder - Fund 1010 & 2225 564,806 - 101,111 - 665,917 Other Governmental Grants - Fund 2180 - - - 22,412 22,412
State of Michigan Public Act Restrictions:Jail Booking Fees 185,128 - - - 185,128 Stabilization - Fund 2570 9,255,217 - - - 9,255,217 Concealed Pistol Licensing - Fund 2631 - - - 231,241 231,241 Homestead Property Tax - Fund 2550 - - - 44,854 44,854 Register of Deeds Technology - Fund 2560 - - - 971,246 971,246
Total Restricted 10,440,334$ 1,029,828$ 101,111$ 6,863,823$ 18,435,096$
40
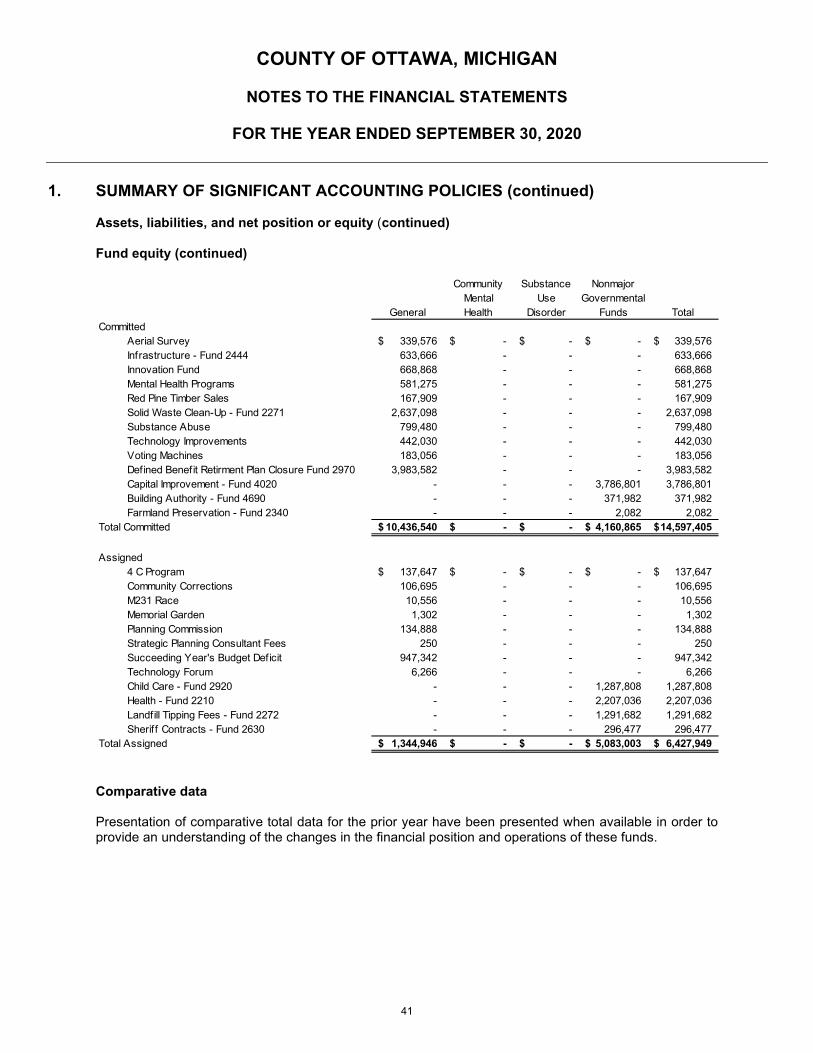
COUNTY OF OTTAWA, MICHIGAN
NOTES TO THE FINANCIAL STATEMENTS
FOR THE YEAR ENDED SEPTEMBER 30, 2020
1. SUMMARY OF SIGNIFICANT ACCOUNTING POLICIES (continued)
Assets, liabilities, and net position or equity (continued)
Fund equity (continued)
Comparative data Presentation of comparative total data for the prior year have been presented when available in order to provide an understanding of the changes in the financial position and operations of these funds.
Community Substance NonmajorMental Use Governmental
General Health Disorder Funds TotalCommitted
Aerial Survey 339,576$ -$ -$ -$ 339,576$ Infrastructure - Fund 2444 633,666 - - - 633,666 Innovation Fund 668,868 - - - 668,868 Mental Health Programs 581,275 - - - 581,275 Red Pine Timber Sales 167,909 - - - 167,909 Solid Waste Clean-Up - Fund 2271 2,637,098 - - - 2,637,098 Substance Abuse 799,480 - - - 799,480 Technology Improvements 442,030 - - - 442,030 Voting Machines 183,056 - - - 183,056 Defined Benefit Retirment Plan Closure Fund 2970 3,983,582 - - - 3,983,582 Capital Improvement - Fund 4020 - - - 3,786,801 3,786,801 Building Authority - Fund 4690 - - - 371,982 371,982 Farmland Preservation - Fund 2340 - - - 2,082 2,082
Total Committed 10,436,540$ -$ -$ 4,160,865$ 14,597,405$
Assigned4 C Program 137,647$ -$ -$ -$ 137,647$ Community Corrections 106,695 - - - 106,695 M231 Race 10,556 - - - 10,556 Memorial Garden 1,302 - - - 1,302 Planning Commission 134,888 - - - 134,888 Strategic Planning Consultant Fees 250 - - - 250 Succeeding Year's Budget Deficit 947,342 - - - 947,342 Technology Forum 6,266 - - - 6,266 Child Care - Fund 2920 - - - 1,287,808 1,287,808 Health - Fund 2210 - - - 2,207,036 2,207,036 Landfill Tipping Fees - Fund 2272 - - - 1,291,682 1,291,682 Sheriff Contracts - Fund 2630 - - - 296,477 296,477
Total Assigned 1,344,946$ -$ -$ 5,083,003$ 6,427,949$
41
COUNTY OF OTTAWA, MICHIGAN
NOTES TO THE FINANCIAL STATEMENTS
FOR THE YEAR ENDED SEPTEMBER 30, 2020
2. STEWARDSHIP, COMPLIANCE, AND ACCOUNTABILITY Budgetary information
The General, Special Revenue, Debt Service, Capital Projects, and Permanent funds are under formal budgetary control. Formal budgetary integration is used as a management control device during the year for governmental funds. While formal budget integration is not used for other funds, informational summaries are prepared and presented to the Board for consideration for internal service and proprietary fund types. The County adopts its budget in accordance with Public Act 621, the Uniform Budgeting and Accounting Act, which mandates an annual budget process and an annual appropriation act to implement the budget. Budgets, as presented for these funds in the accompanying financial statements, were prepared on the modified accrual basis of accounting. The Fiscal Services Director presents the budget requests for the succeeding fiscal year to the County Administrator in July. The County Administrator, Fiscal Services Director and Assistant Fiscal Services Director meet with department heads and elected officials during July to review and discuss the requested revenue and expenditures levels. A proposed budget with balancing options for all funds is presented to the Finance Committee in August, then made available to the public to review. A public hearing and formal budget presentation is held at the first board meeting in September to provide any county resident with the opportunity to discuss the budget with the Board prior to approval. The budget, and an appropriation ordinance implementing it, is approved by the Finance Committee and forwarded to the Board for approval at the last Board meeting in September. Budgetary control over expenditures is maintained on a departmental basis, which is the legal level of control. Expenditures may not legally exceed budgeted amounts and certain Special Revenue fund expenditures must be in accordance with the respective agreements with Federal and State grantor agencies. All budget appropriations lapse at the end of each fiscal year unless specific Board action is taken. Budgets for the current year are continually reviewed for any required revisions of original estimates. Proposed increases or reductions in appropriations may not be made without review by the Finance Committee and approval by the Board, with certain exceptions. The Board has delegated authority to the County Administrator to approve budget transfers between departments within a fund if the amount to be transferred does not exceed $50,000. The Board amends the general appropriation act as soon as it becomes apparent this action is necessary. The budgetary information as presented herein has been amended by official actions of the Board.
42
COUNTY OF OTTAWA, MICHIGAN
NOTES TO THE FINANCIAL STATEMENTS
FOR THE YEAR ENDED SEPTEMBER 30, 2020
3. DEPOSITS AND INVESTMENTS
Primary government Deposit and investment balances at year-end are as follows:
Primary Component Fiduciary Government Units Funds Total Statement of net position Cash and pooled investments $ 94,492,821 $ 63,918,741 $ 46,307,535 $204,719,097 Investments 48,617,544 - 6,537,404 55,154,948 Total 143,110,365 63,918,741 52,844,939 259,874,045 Separate disclosure Ottawa County Road Commission -
(38,983,231)
(38,983,231)
Ottawa County Central Dispatch Authority - (6,214,364)
- (6,214,364)
Ottawa County Other Post-Employment Benefit Plan - -
(6,537,404) (6,537,404)
Ottawa County Insurance Authority
(48,763,643) -
- (48,763,643)
Ottawa County Public Utilities System - (15,745,255)
- (15,745,255)
Balance $ 94,346,722 $ 2,975,891 $ 46,307,535 $143,630,148 Cash on hand $ 17,575 Deposits 98,686,759 Investments 44,925,814 Total $ 143,630,148
Deposits Custodial Credit Risk – Deposits. Custodial credit risk is the risk that, in the event of bank failure, the County’s deposits may not be returned. It is County policy to review and verify a bank’s credit worthiness through a system of ratio analysis and from information provided by several third party sources. The County policy also places maximum limits on percent of portfolio, per issuer and duration. The County places concentration limits on banks based on bank size and credit worthiness analysis. As of September 30, 2020, the County’s bank balance (including certificates of deposit) was $86,719,110 and of that $83,966,930 was uninsured and uncollateralized.
43
COUNTY OF OTTAWA, MICHIGAN
NOTES TO THE FINANCIAL STATEMENTS
FOR THE YEAR ENDED SEPTEMBER 30, 2020
3. DEPOSITS AND INVESTMENTS (continued)
Investments The County categorizes its fair value measurements of investments within the fair value hierarchy established by generally accepted accounting principles. The hierarchy is based on the valuation inputs used to measure the fair value of the asset. Level 1 inputs are quoted prices in active markets for identical assets; Level 2 inputs are significant other observable inputs; Level 3 inputs are significant unobservable inputs. The County has the following recurring fair value measurements as of September 30, 2020:
• The Ottawa County Investment Pool investments are valued using either quoted market prices (Level 1 inputs) or a pricing model utilizing observable fair value measures of fund/pool investments and other observable inputs to determine the fair value of the securities making up the investment fund/pool (Level 2 inputs).
• The County does not have any investments which are valued based on significant unobservable
inputs (Level 3 inputs).
Michigan statutes authorize the County to invest in bonds, other direct obligations and repurchase agreements of the United States, certificates of deposit, savings accounts, deposit accounts or receipts of a bank which is a member of the FDIC, commercial paper, bankers’ acceptances of United States banks, obligations of the State of Michigan and its political subdivisions, external investment pools, and certain mutual funds. The County’s investment policy, last amended in January of 2014, allows for all of these types of investments. The County chooses to disclose its investments by weighted average maturity. As of September 30, 2020, the County had the following investments:
Moody's or Weighted AvgInvestment Type Fair Value S&P Rating Maturity (year) Level
MiClass 3,426,523$ AAAm N/A 2Agency - FFCB 2,039,490 AA+ 2.674 2Agency - FHLB 5,100,290 AA+ 2.6493 2
Agency - FHLMC 4,417,404 AAA & AA+ 3.6438 2Agency - FNMA 1,556,205 AA+ 2.8219 2Municipal Bond 9,150,652 AA+, AA, AA1, AA2, A 2.3973 2Treasury Notes 19,024,979 AAA 2.5425 2
44,715,542$
As of September 30, 2020 the County had the following investments:
44
COUNTY OF OTTAWA, MICHIGAN
NOTES TO THE FINANCIAL STATEMENTS
FOR THE YEAR ENDED SEPTEMBER 30, 2020
3. DEPOSITS AND INVESTMENTS (continued)
Primary Government (continued) Custodial Credit Risk – Investments. For an investment, custodial credit risk is the risk that, in the event of the failure of the counterparty, the County will not be able to recover the value of its investments or collateral securities that are in the possession of an outside party. The County’s investment policy requires that investment securities be held in third-party safekeeping by an institution designated as primary agent. To reduce custodial risk further, the County’s investment policy requires that all trades of marketable securities be executed by delivery versus payment to ensure that securities are deposited in an eligible financial institution prior to the release of funds. As of September 30, 2020, the County’s investments in treasuries, U.S. government agency securities, marketable CDs and municipal bonds were held in third-party safekeeping in the County’s name. The $3,426,523 MiClass investment listed in the Ottawa County Investments as of September 30, 2020 is a pooled account similar to a mutual fund for which the County’s custodial credit risk exposure cannot be determined because the investment does not consist of specifically identifiable securities.
Credit Risk. State law limits investments in commercial paper to the top two ratings issued by nationally recognized statistical rating organizations with a maximum maturity of 270 days. The County’s investment policy further limits its investment choices by limiting the maturity to A-1 270 days. The County’s investment policy is silent on the use of rated vs. unrated money market funds. In addition, there is no rating level requirement for those money market funds that are rated. Investment ratings are identified in the chart on the previous page. Concentration of Credit Risk. The County’s investment policy specifies a plan to diversify and set concentration limits to further manage credit risk. The policy sets maximum percentages of the pooled portfolio by investment type with additional maximums by issuer. A minimum of 15% is to be invested in U.S. Treasuries. The policy sets a maximum of 50% in U.S. agencies with a maximum of 20% in any one issuer. Certificates of deposit have a 50% maximum with concentration limits set at 5% of the issuer’s net worth. Investment balances by investment type are identified in the chart on the previous page. Interest Rate Risk. The County does have a formal investment policy that limits investment maturities as a means of managing its exposure to fair value losses arising from increasing interest rates. The policy sets the maximum maturity by specific type of security and by specific issuer with the maximum of 10 years. The weighted average maturity of each type of investment are identified in the chart on the previous page. Foreign Currency Risk. The County’s investment policy is silent regarding foreign currency risk. Management believes the County’s exposure to foreign currency risk is immaterial.
Ottawa County Other Post-Employment Benefit Plan (“OPEB Plan”) The Ottawa County Other Post-Employment Benefit Plan can utilize all investment options allowed for the County as well as equity, corporate securities, and foreign investment. The OPEB Plan held the following investments as of September 30, 2020:
45

COUNTY OF OTTAWA, MICHIGAN
NOTES TO THE FINANCIAL STATEMENTS
FOR THE YEAR ENDED SEPTEMBER 30, 2020
3. DEPOSITS AND INVESTMENTS (continued)
Ottawa County Other Post-Employment Benefit Plan (“OPEB Plan”) OPEB PLAN HOLDINGS AS OF:
Market Value(Fair Value) Less than 1 1-5 6-10 over 10
US Gov't Notes & Bonds 855,000$ -$ 476,858$ 378,141$ -$ Corporate Bonds 897,680$ 126,192$ 636,581$ 134,907$ -$ Total Gov't Notes & Bonds 1,752,680$ 126,192$ 1,113,439$ 513,048$ -$
Mutual FundsMM Funds-Taxable 238,999$ MF-Fixed Income 135,264$ MF-Equity 1,352,105$ MF-Intl 160,045$ Exchange Traded Fds-Equity 2,898,312$
Total Mutual Funds 4,784,725$
Total held by OPEB 6,537,404$
Outstanding DepositTOTAL 6,537,404$
Investment Maturities (fair value by years)September 30, 2020
Custodial Credit Risk - Investments. For an investment, custodial credit risk is the risk that, in the event of the failure of the counterparty, the County will not be able to recover the value of its investments or collateral securities that are in the possession of an outside party. Of the $6,537,403 of investments, the County has custodial credit risk of $1,752,680 because the related securities are uninsured, unregistered and held by the government’s brokerage firm which is also the counterparty for these particular securities. Of the above investments, $4,784,724 is invested in mutual funds for which the County’s custodial credit risk exposure cannot be determined because the mutual funds do not consist of specifically identifiable securities.
Credit Risk. At September 30, 2020, U.S. Government Notes & Bonds, Corporate Bonds and Mutual Fund-Fixed Income were rated by Standard & Poors as follows:
46

COUNTY OF OTTAWA, MICHIGAN
NOTES TO THE FINANCIAL STATEMENTS
FOR THE YEAR ENDED SEPTEMBER 30, 2020
3. DEPOSITS AND INVESTMENTS (continued)
Ottawa County Other Post-Employment Benefit Plan (OPEB Plan) (continued)
Concentration of Credit Risk. The County’s investment policy for the OPEB Plan provides for no more than 50% fixed income securities, 70% equities, 20% international securities, 15% commodities and 50% cash and equivalents. Investments at year-end comply with policy. Foreign Currency Risk. The County’s investment policy is silent regarding foreign currency risk. The OPEB Plan has mutual funds with a fair value of $160,045 containing international equities involving numerous currencies. Management believes the County’s exposure to foreign currency risk from these equities is immaterial. The OPEB Plan categorizes its fair value measurements of investments within the fair value hierarchy established by generally accepted accounting principles. The hierarchy is based on the valuation inputs used to measure the fair value of the asset. Level 1 inputs are quoted prices in active markets for identical assets; Level 2 inputs are significant other observable inputs; Level 3 inputs are significant unobservable inputs.
The OPEB Plan has the following recurring fair value measurements as of September 30, 2020:
• The money market accounts, fixed income, domestic equity, exchange traded, and equity mutual funds are valued using quoted market prices (Level 1 inputs).
• The US Government Notes & Bonds and Corporate Bonds are valued based on significant other observable inputs (Level 2 inputs).
• The OPEB Plan had no investments which are valued based on significant unobservable inputs
(Level 3 inputs). Blended Component Units
Ottawa County Insurance Authority (“OCIA”) The OCIA’s investments, including its cash and cash equivalents, are held in a trust account at local banks. Public Act 218 of 1956 (the Insurance Code of 1956) establishes asset requirements for domestic insurers. Qualified assets as defined thereunder include investments in domestic and foreign stocks, bonds, and
Market ValueS&P Rating (Fair Value)AAA 25,124$ AA, AA-, AA+ 1,096,920$ A, A-, A+ 373,476$ BBB, BBB-, BBB+ 392,424$ Total Rated Inv 1,887,944$
47
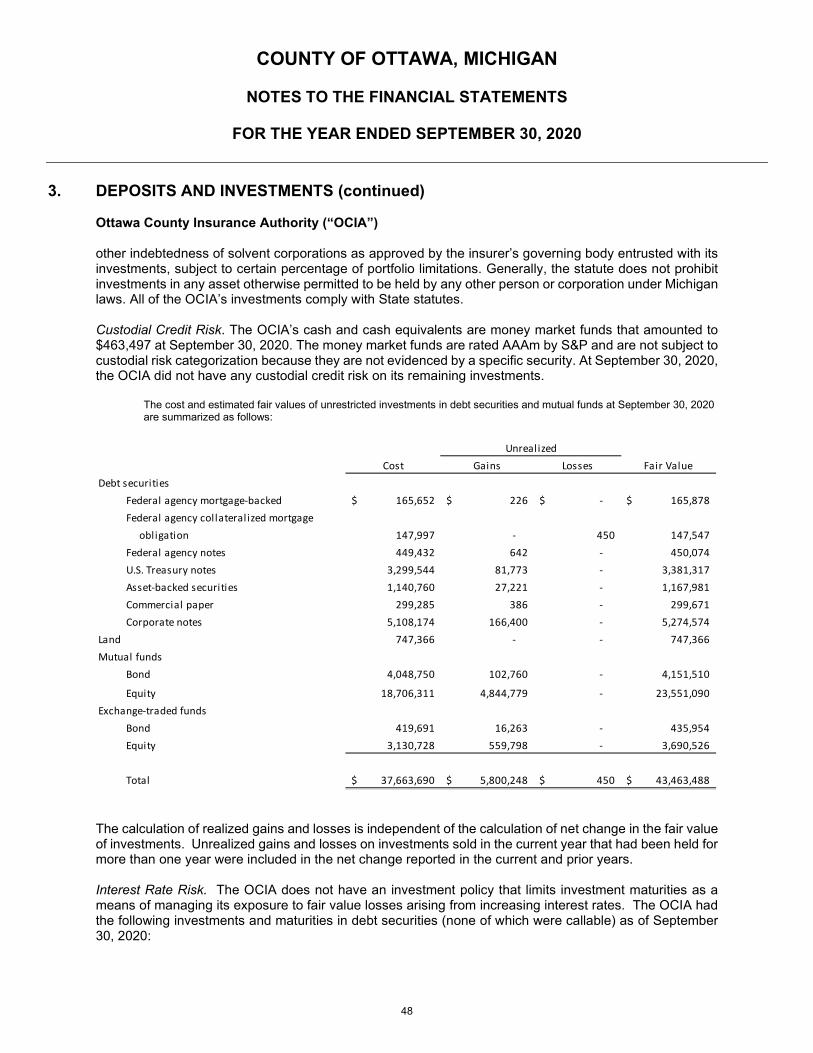
COUNTY OF OTTAWA, MICHIGAN
NOTES TO THE FINANCIAL STATEMENTS
FOR THE YEAR ENDED SEPTEMBER 30, 2020
3. DEPOSITS AND INVESTMENTS (continued)
Ottawa County Insurance Authority (“OCIA”) other indebtedness of solvent corporations as approved by the insurer’s governing body entrusted with its investments, subject to certain percentage of portfolio limitations. Generally, the statute does not prohibit investments in any asset otherwise permitted to be held by any other person or corporation under Michigan laws. All of the OCIA’s investments comply with State statutes. Custodial Credit Risk. The OCIA’s cash and cash equivalents are money market funds that amounted to $463,497 at September 30, 2020. The money market funds are rated AAAm by S&P and are not subject to custodial risk categorization because they are not evidenced by a specific security. At September 30, 2020, the OCIA did not have any custodial credit risk on its remaining investments.
The cost and estimated fair values of unrestricted investments in debt securities and mutual funds at September 30, 2020 are summarized as follows:
The calculation of realized gains and losses is independent of the calculation of net change in the fair value of investments. Unrealized gains and losses on investments sold in the current year that had been held for more than one year were included in the net change reported in the current and prior years. Interest Rate Risk. The OCIA does not have an investment policy that limits investment maturities as a means of managing its exposure to fair value losses arising from increasing interest rates. The OCIA had the following investments and maturities in debt securities (none of which were callable) as of September 30, 2020:
Cost Gains Losses Fair ValueDebt securities
Federal agency mortgage-backed 165,652$ 226$ -$ 165,878$ Federal agency collateralized mortgage obligation 147,997 - 450 147,547 Federal agency notes 449,432 642 - 450,074 U.S. Treasury notes 3,299,544 81,773 - 3,381,317 Asset-backed securities 1,140,760 27,221 - 1,167,981 Commercial paper 299,285 386 - 299,671 Corporate notes 5,108,174 166,400 - 5,274,574
Land 747,366 - - 747,366 Mutual funds
Bond 4,048,750 102,760 - 4,151,510
Equity 18,706,311 4,844,779 - 23,551,090 Exchange-traded funds
Bond 419,691 16,263 - 435,954 Equity 3,130,728 559,798 - 3,690,526
Total 37,663,690$ 5,800,248$ 450$ 43,463,488$
Unrealized
48
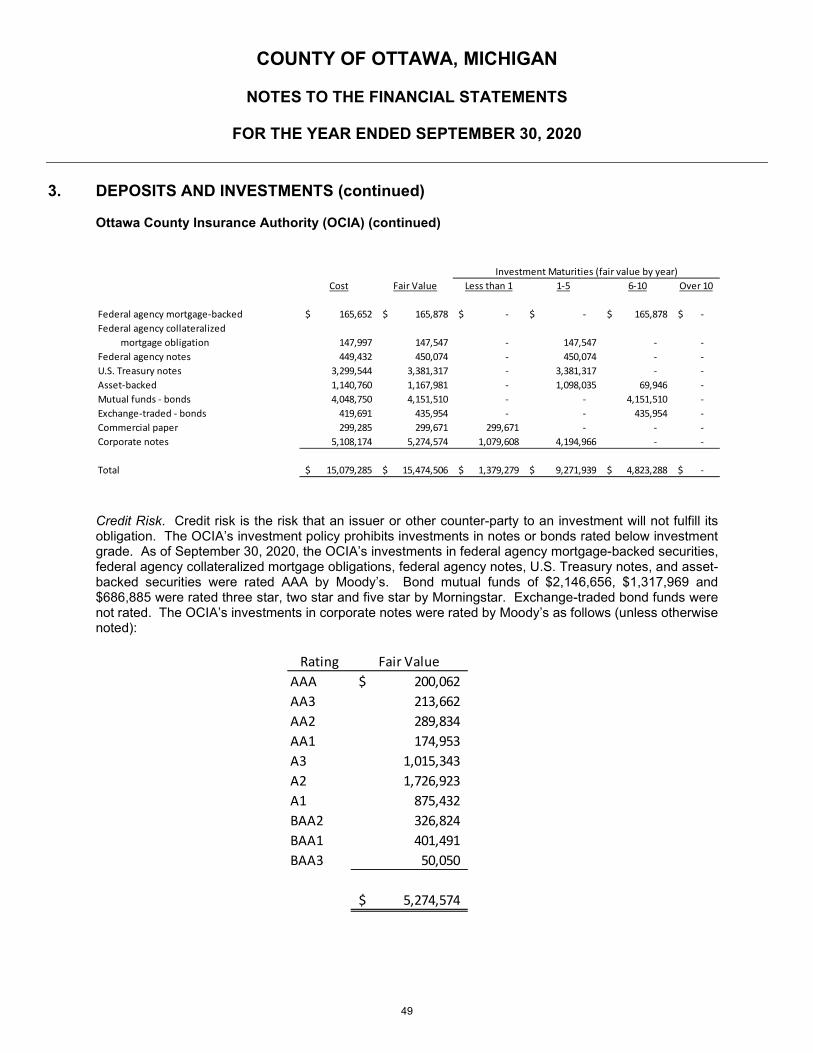
COUNTY OF OTTAWA, MICHIGAN
NOTES TO THE FINANCIAL STATEMENTS
FOR THE YEAR ENDED SEPTEMBER 30, 2020
3. DEPOSITS AND INVESTMENTS (continued)
Ottawa County Insurance Authority (OCIA) (continued)
Credit Risk. Credit risk is the risk that an issuer or other counter-party to an investment will not fulfill its obligation. The OCIA’s investment policy prohibits investments in notes or bonds rated below investment grade. As of September 30, 2020, the OCIA’s investments in federal agency mortgage-backed securities, federal agency collateralized mortgage obligations, federal agency notes, U.S. Treasury notes, and asset-backed securities were rated AAA by Moody’s. Bond mutual funds of $2,146,656, $1,317,969 and $686,885 were rated three star, two star and five star by Morningstar. Exchange-traded bond funds were not rated. The OCIA’s investments in corporate notes were rated by Moody’s as follows (unless otherwise noted):
Cost Fair Value Less than 1 1-5 6-10 Over 10
Federal agency mortgage-backed 165,652$ 165,878$ -$ -$ 165,878$ -$ Federal agency collateralized
mortgage obligation 147,997 147,547 - 147,547 - - Federal agency notes 449,432 450,074 - 450,074 - - U.S. Treasury notes 3,299,544 3,381,317 - 3,381,317 - - Asset-backed 1,140,760 1,167,981 - 1,098,035 69,946 - Mutual funds - bonds 4,048,750 4,151,510 - - 4,151,510 - Exchange-traded - bonds 419,691 435,954 - - 435,954 - Commercial paper 299,285 299,671 299,671 - - - Corporate notes 5,108,174 5,274,574 1,079,608 4,194,966 - -
Total 15,079,285$ 15,474,506$ 1,379,279$ 9,271,939$ 4,823,288$ -$
Investment Maturities (fair value by year)
Rating Fair ValueAAA 200,062$ AA3 213,662 AA2 289,834 AA1 174,953 A3 1,015,343 A2 1,726,923 A1 875,432 BAA2 326,824 BAA1 401,491 BAA3 50,050
5,274,574$
49
COUNTY OF OTTAWA, MICHIGAN
NOTES TO THE FINANCIAL STATEMENTS
FOR THE YEAR ENDED SEPTEMBER 30, 2020
3. DEPOSITS AND INVESTMENTS (continued)
Ottawa County Insurance Authority (OCIA) (continued) Concentration of Credit Risk. Concentration of credit risk is the risk of loss attributed to the magnitude of the OCIA’s investment in a single issuer. The OCIA’s investment policy stipulates that investment managers may not invest more than 5% of the domestic equity, international equity or fixed income portfolio assets in the securities of one issuer at time of purchase, nor in more than 5% of the outstanding securities of one issuer. Excluding U.S. government guaranteed investments, mutual funds, and pooled investments, the OCIA had no investment in a single issuer that exceeded 5% of total investments at September 30, 2020.
Foreign Currency Risk. Foreign currency risk is the risk that changes in the exchange rates will adversely affect the fair value of an investment or deposit. The OCIA’s investment policy permits investing in foreign publicly held stocks, mutual funds, ETFs and other pooled investments. At September 30, 2020, the OCIA had International Equity mutual funds with a total fair market value of $8,477,596. The OCIA categorizes its fair value measurements of investments within the fair value hierarchy established by generally accepted accounting principles. The hierarchy is based on the valuation inputs used to measure the fair value of the asset. Level 1 inputs are quoted prices in active markets for identical assets; Level 2 inputs are significant other observable inputs; Level 3 inputs are significant unobservable inputs.
The OCIA has the following recurring fair value measurements as of September 30, 2020:
• The money market accounts, bond mutual funds, and equity mutual funds are valued using quoted market prices (Level 1 inputs).
• The debt securities are valued using a pricing model utilizing observable fair value measures of fund/pool investments and other observable inputs to determine the fair value of the securities making up the investments fund/pool (Level 2 inputs).
• The OCIA investments in real estate are valued based on significant unobservable inputs (Level 3
inputs).
Restricted Investments In 1998, to comply with Michigan Insurance Bureau regulations, the OCIA transferred certain investments – i.e., U.S. Treasury Notes – to the Michigan Department of Treasury as security for the benefit of the OCIA’s policyholders. As these investments mature, they are replaced with comparable investments to maintain a face value balance of $5.0 million. Such investments held by the State Treasurer as of September 30, 2020, are as summarized below:
50
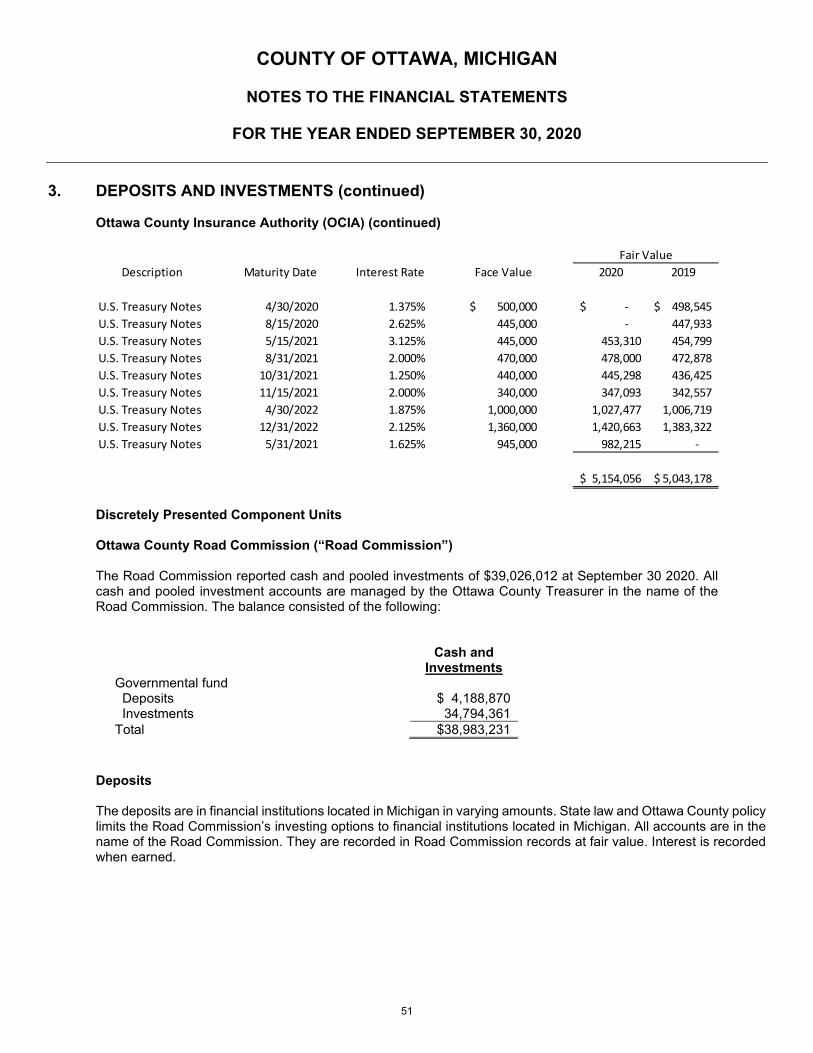
COUNTY OF OTTAWA, MICHIGAN
NOTES TO THE FINANCIAL STATEMENTS
FOR THE YEAR ENDED SEPTEMBER 30, 2020
3. DEPOSITS AND INVESTMENTS (continued)
Ottawa County Insurance Authority (OCIA) (continued)
Discretely Presented Component Units Ottawa County Road Commission (“Road Commission”) The Road Commission reported cash and pooled investments of $39,026,012 at September 30 2020. All cash and pooled investment accounts are managed by the Ottawa County Treasurer in the name of the Road Commission. The balance consisted of the following:
Cash and
Investments Governmental fund Deposits $ 4,188,870 Investments 34,794,361 Total $38,983,231
Deposits The deposits are in financial institutions located in Michigan in varying amounts. State law and Ottawa County policy limits the Road Commission’s investing options to financial institutions located in Michigan. All accounts are in the name of the Road Commission. They are recorded in Road Commission records at fair value. Interest is recorded when earned.
Description Maturity Date Interest Rate Face Value 2020 2019
U.S. Treasury Notes 4/30/2020 1.375% 500,000$ -$ 498,545$ U.S. Treasury Notes 8/15/2020 2.625% 445,000 - 447,933 U.S. Treasury Notes 5/15/2021 3.125% 445,000 453,310 454,799 U.S. Treasury Notes 8/31/2021 2.000% 470,000 478,000 472,878 U.S. Treasury Notes 10/31/2021 1.250% 440,000 445,298 436,425 U.S. Treasury Notes 11/15/2021 2.000% 340,000 347,093 342,557 U.S. Treasury Notes 4/30/2022 1.875% 1,000,000 1,027,477 1,006,719 U.S. Treasury Notes 12/31/2022 2.125% 1,360,000 1,420,663 1,383,322 U.S. Treasury Notes 5/31/2021 1.625% 945,000 982,215 -
5,154,056$ 5,043,178$
Fair Value
51

COUNTY OF OTTAWA, MICHIGAN
NOTES TO THE FINANCIAL STATEMENTS
FOR THE YEAR ENDED SEPTEMBER 30, 2020
3. DEPOSITS AND INVESTMENTS (continued)
Ottawa County Road Commission (“Road Commission”) (continued) Deposit risk Custodial Credit Risk - Deposits. Custodial credit risk is the risk that in the event of a bank failure, the Commission’s deposits may not be returned. State law does not require, and Ottawa County does not have, a policy for deposit custodial credit risk. As of year-end, $5,308,334 of the Road Commission’s bank balance of $5,562,048 was exposed to custodial credit risk because the balance was uninsured and uncollateralized. Investments The Road Commission chooses to disclose its investments by specifically identifying each. As of year-end, the Commission had the following investment:
Maturity Fair Value Rating Source MBIA Michigan Class
N/A
$34,794,361
AAAm
S&P
Investment risk
Interest Rate Risk. State law and Ottawa County policy limit the allowable investments and the maturities of some of the allowable investments as identified in Note 1, the summary of significant accounting policies. Ottawa County’s investment policy does not have specific limits in excess of state law on investment maturities as a means of managing its exposure to fair value losses arising from increasing interest rates. The maturity date for each investment is identified above for investments held at year-end. There is no stated maturity date for the Road Commission’s investment in MBIA Michigan Class identified above.
Credit Risk. State law limits investments to specific government securities, certificates of deposits and bank accounts with qualified financial institutions, commercial paper with specific maximum maturities and ratings when purchased, bankers acceptances of specific financial institutions, qualified mutual funds and qualified external investment pools as identified in Note 1, the summary of significant accounting policies. Ottawa County’s investment policy does not have specific limits in excess of state law on investment credit risk. The rating for each investment is identified above for investments held at year-end.
Custodial Credit Risk - Investments. For an investment, custodial credit risk is the risk that, in the event of the failure of the counterparty, the Road Commission will not be able to recover the value of its investments or collateral securities that are in the possession of an outside party. State law does not require, and Ottawa County does not have, a policy for investment custodial credit risk. Of the above investments in MBIA Michigan Class, the Road Commission’s custodial credit risk exposure cannot be determined because the investment fund does not consist of specifically identifiable securities.
Concentration of Credit Risk. State law limits allowable investments but does not limit concentration of credit risk as identified in Note 1, the summary of significant accounting policies. Ottawa County’s investment policy does not have specific limits in excess of state law on concentration of credit risk. All investments held at year-end are reported above.
52
COUNTY OF OTTAWA, MICHIGAN
NOTES TO THE FINANCIAL STATEMENTS
FOR THE YEAR ENDED SEPTEMBER 30, 2020
3. DEPOSITS AND INVESTMENTS (continued)
Ottawa County Road Commission (“Road Commission”) (continued)
The Road Commission categorizes its fair value measurements of investments within the fair value hierarchy established by generally accepted accounting principles. The hierarchy is based on the valuation inputs used to measure the fair value of the asset. Level 1 inputs are quoted prices in active markets for identical assets; Level 2 inputs are significant other observable inputs; Level 3 inputs are significant unobservable inputs. The Road Commission has the following recurring fair value measurements as of year-end.
• The Road Commission does not have any investments valued using quoted market prices (Level 1 inputs).
• The MBIA Michigan Class investment is valued using a pricing model utilizing observable fair value measures of fund investments and other observable inputs to determining the fair value of the securities making up the investment fund (Level 2 inputs).
• The Road Commission does not have any investments that report fair value based on significant unobservable inputs (Level 3 inputs).
Ottawa County Central Dispatch Authority (“OCCDA”) OCCDA reported cash and pooled investments of $6,214,364 at December 31 2019. The balance consisted of the following:
Deposits $1,325,157 Investments 4,889,107 Petty cash 100 Total $6,214,364
Deposits The deposits are in financial institutions located in Michigan. State policy limits the OCCDA’s investing options to financial institutions located in Michigan. All accounts are in the name of the OCCDA. They are recorded in OCCDA records at fair value. Interest is recorded when earned.
Custodial Credit Risk - Deposits. Custodial credit risk is the risk that in the event of a bank failure, the OCCDA’s deposits may not be returned. State law does not require, and the OCCDA does not have, a policy for deposit custodial credit risk. As of year-end, $74,588 of the OCCDA’s bank balance of $1,324,588 was uninsured and uncollateralized.
Investments The OCCDA chooses to disclose its investments by specifically identifying each. As of year-end, the OCCDA had the following investments:
53
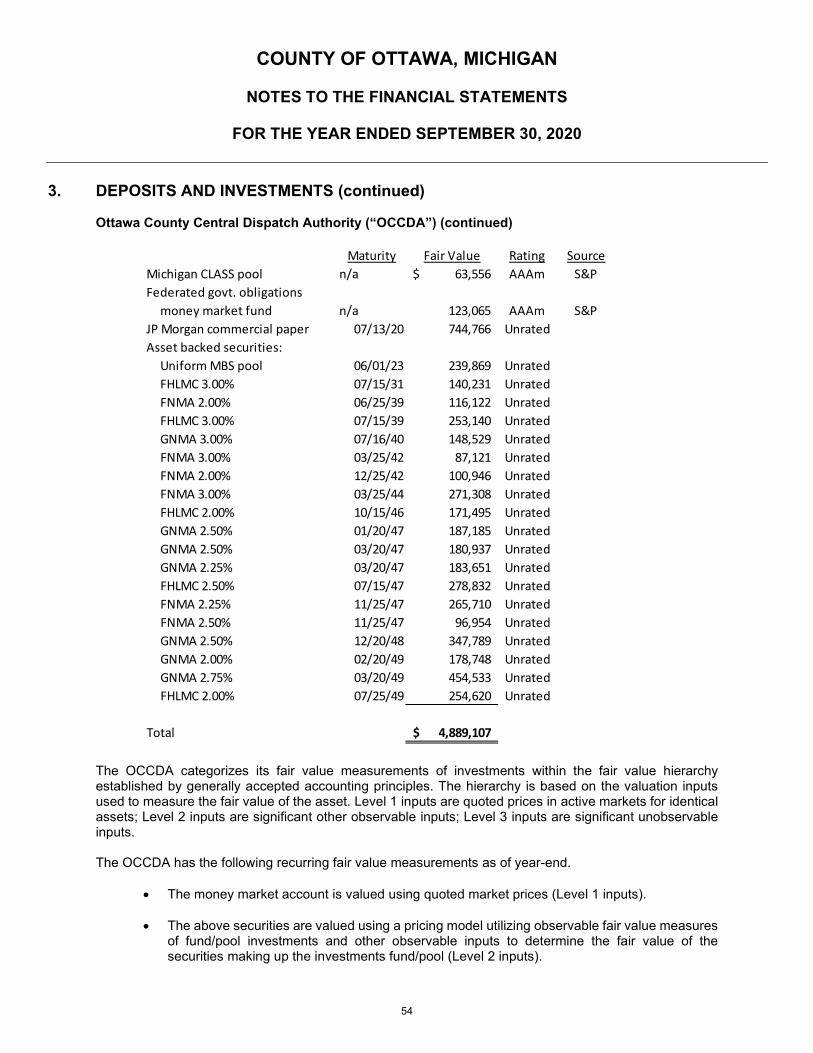
COUNTY OF OTTAWA, MICHIGAN
NOTES TO THE FINANCIAL STATEMENTS
FOR THE YEAR ENDED SEPTEMBER 30, 2020
3. DEPOSITS AND INVESTMENTS (continued)
Ottawa County Central Dispatch Authority (“OCCDA”) (continued)
The OCCDA categorizes its fair value measurements of investments within the fair value hierarchy established by generally accepted accounting principles. The hierarchy is based on the valuation inputs used to measure the fair value of the asset. Level 1 inputs are quoted prices in active markets for identical assets; Level 2 inputs are significant other observable inputs; Level 3 inputs are significant unobservable inputs.
The OCCDA has the following recurring fair value measurements as of year-end.
• The money market account is valued using quoted market prices (Level 1 inputs).
• The above securities are valued using a pricing model utilizing observable fair value measures
of fund/pool investments and other observable inputs to determine the fair value of the securities making up the investments fund/pool (Level 2 inputs).
Maturity Fair Value Rating SourceMichigan CLASS pool n/a 63,556$ AAAm S&PFederated govt. obligations
money market fund n/a 123,065 AAAm S&PJP Morgan commercial paper 07/13/20 744,766 UnratedAsset backed securities:
Uniform MBS pool 06/01/23 239,869 UnratedFHLMC 3.00% 07/15/31 140,231 UnratedFNMA 2.00% 06/25/39 116,122 UnratedFHLMC 3.00% 07/15/39 253,140 UnratedGNMA 3.00% 07/16/40 148,529 UnratedFNMA 3.00% 03/25/42 87,121 UnratedFNMA 2.00% 12/25/42 100,946 UnratedFNMA 3.00% 03/25/44 271,308 UnratedFHLMC 2.00% 10/15/46 171,495 UnratedGNMA 2.50% 01/20/47 187,185 UnratedGNMA 2.50% 03/20/47 180,937 UnratedGNMA 2.25% 03/20/47 183,651 UnratedFHLMC 2.50% 07/15/47 278,832 UnratedFNMA 2.25% 11/25/47 265,710 UnratedFNMA 2.50% 11/25/47 96,954 UnratedGNMA 2.50% 12/20/48 347,789 UnratedGNMA 2.00% 02/20/49 178,748 UnratedGNMA 2.75% 03/20/49 454,533 UnratedFHLMC 2.00% 07/25/49 254,620 Unrated
Total 4,889,107$
54
COUNTY OF OTTAWA, MICHIGAN
NOTES TO THE FINANCIAL STATEMENTS
FOR THE YEAR ENDED SEPTEMBER 30, 2020
3. DEPOSITS AND INVESTMENTS (continued)
Ottawa County Central Dispatch Authority (“OCCDA”) (continued)
• The OCCDA has no investments that report fair value based on significant unobservable inputs (Level 3 inputs).
The aforementioned investments do not include certificates of deposit which are classified as deposits for risk identification purposes.
Investment risk
Interest Rate Risk. State law and OCCDA policy limit the allowable investments and the maturities of some of the allowable investments as identified in Note 1, the summary of significant accounting policies.
The OCCDA’s investment policy does not have specific limits in excess of state law on investment maturities as a means of managing its exposure to fair value losses arising from increasing interest rates. The maturity date for each investment is identified above for investments held at year-end.
Credit Risk. State law limits investments to specific securities as identified in Note 1 of the summary of significant accounting policies. The investment policy does not have specific limits in excess of state law on investment credit risk. The rating for each investment is identified above for investments held at year-end.
Custodial Credit Risk - Investments. For an investment, custodial credit risk is the risk that, in the event of the failure of the counterparty, the OCCDA will not be able to recover the value of its investments or collateral securities that are in the possession of an outside party. State law does not require and the OCCDA does not have a policy for investment custodial credit risk. The OCCDA had custodial credit risk totaling $4,462,617 at year-end because the related securities were held by the government’s brokerage firm which is also the counterparty. At year-end, the OCCDA had $426,490 invested in money market mutual funds for which custodial credit risk exposure could not be determined because the mutual funds did no consist of specifically identifiable securities.
Concentration of Credit Risk. State law limits allowable investments but does not limit concentration of credit risk as identified in Note 1, the summary of significant accounting policies. The OCCDA’s investment policy does not have specific limits in excess of state law on concentration of credit risk. All investments held at year-end are reported above. Ottawa County Public Utilities System (“System”) All cash and temporary investment accounts are managed by the Ottawa County Treasurer. Balances reported on the financial statements consist of the following at year-end:
Cash and Investments
Deposits 7,273,978$ Certificates of deposit 200,000 Temporary investments 8,271,277
Total cash and temporary investments 15,745,255$
55

COUNTY OF OTTAWA, MICHIGAN
NOTES TO THE FINANCIAL STATEMENTS
FOR THE YEAR ENDED SEPTEMBER 30, 2020
3. DEPOSITS AND INVESTMENTS (continued)
Ottawa County Public Utilities System (“System”) (continued) Deposits The deposits are in financial institutions located in Michigan in varying amounts. State law and Ottawa County policy limits the System’s investing options to financial institutions located in Michigan. All accounts are in the name of the System and are recorded in the System’s records at fair value. Interest is recorded when earned. Deposit risk Custodial Credit Risk – Deposits. Custodial credit risk is the risk that in the event of a bank failure, the System’s deposits may not be returned. State law does not require, and Ottawa County does not have, a policy for deposit custodial credit risk. As of year-end, $7,026,450 of the System’s bank balance of $7,476,450 was exposed to custodial credit risk because the balance was uninsured and uncollateralized. Investments The System chooses to disclose its investments by specifically identifying each. As of year-end, the System had the following investment:
Investments do not include certificates of deposit which are classified as deposits for risk identification purposes. Investment risk Interest Rate Risk. State law and Ottawa County policy limit the allowable investments and the maturities of some of the allowable investments as identified in Note 1, the summary of significant accounting policies. Ottawa County’s investment policy does not have specific limits in excess of state law on investment maturities as a means of managing its exposure to fair value losses arising from increasing interest rates. The maturity rate for each investment is identified above for investments held at year-end. There is no stated maturity date for the System’s investment in MBIA Michigan Class identified above. Credit Risk. State law limits investments to specific government securities, certificates of deposits and bank accounts with qualified financial institutions, commercial paper with specific maximum maturities and ratings when purchased, bankers acceptances of specific financial institutions, qualified mutual funds and qualified external investment pools as identified in Note 1, the summary of significant accounting policies. Ottawa County’s investment policy does not have specific limits in excess of state law on investment credit risk. The rating for each investment is identified above for investments held at year-end. Custodial Credit Risk – Investments. For an investment, custodial credit risk is the risk that, in the event of the failure of the counterparty, the System will not be able to recover the value of its investments or collateral securities that are in the possession of an outside party. State law does not require, and Ottawa County does not have, a policy for investment custodial credit risk. Of the above investments in MBIA Michigan Class, the System’s custodial credit risk exposure cannot be determined because the investment fund does not consist of specifically identifiable securities.
Maturity Fair Value Rating SourceMBIA Michigan Class N/A $8,271,277 AAAm S&P
56

COUNTY OF OTTAWA, MICHIGAN
NOTES TO THE FINANCIAL STATEMENTS
FOR THE YEAR ENDED SEPTEMBER 30, 2020
3. DEPOSITS AND INVESTMENTS (continued)
Ottawa County Public Utilities System (“System”) (continued) Concentration of Credit Risk. State law limits allowable investments but does not limit concentration of credit risk as identified in Note 1, the summary of significant accounting policies. Ottawa County’s investment policy does not have specific limits in excess of state law on concentration of credit risk. All investments held at year-end are reported above. The System categorizes its fair value measurements of investments within the fair value hierarchy established by generally accepted accounting principles. The hierarchy is based on the valuation inputs used to measure the fair value of the asset. Level 1 inputs are quoted prices in active markets for identical assets; Level 2 inputs are significant other observable inputs; Level 3 inputs are significant unobservable inputs. The System has the following recurring fair value measurements as of year-end.
• The System does not have any investments valued using quoted market prices (Level 1 inputs). • The MBIA Michigan Class investment is valued using a pricing model utilizing observable fair value
measures of fund investments and other observable inputs to determining the fair value of the securities making up the investment fund (Level 2 inputs).
• The System does not have any investments that report fair value based on significant unobservable inputs (Level 3 inputs).
Remaining Discretely Presented Component Units The remaining component units reported cash and pooled investments of $2,975,891 at their year-ends. All cash and pooled investment accounts are in the name of the Ottawa County Treasurer and a specific fund or common account at component unit year-ends. Cash and pooled investments are recorded in component unit records at fair value. Reported balances of cash and pooled investments were as follows:
Component unit Amount Ottawa County Land Bank Authority – 9/30/20 $ 49,181 Ottawa County Office of the Water Resources Commissioner – 9/30/20 2,823,904 Ottawa County Brownfield Redevelopment Authority – 9/30/20 92,924 Ottawa County Economic Development Corporation – 9/30/20 9,882 Total $2,975,891
The remaining component units categorize their fair value measurements of cash and pooled investments with the Ottawa County Treasurer within the fair value hierarchy established by generally accepted accounting principles. The hierarchy is based on the valuation inputs used to measure the fair value of the asset. Level 1 inputs are quoted prices in active markets for identical assets; Level 2 inputs are significant other observable inputs; Level 3 inputs are significant unobservable inputs.
57

COUNTY OF OTTAWA, MICHIGAN
NOTES TO THE FINANCIAL STATEMENTS
FOR THE YEAR ENDED SEPTEMBER 30, 2020
3. DEPOSITS AND INVESTMENTS (continued)
Discretely Presented Component Units (continued) The remaining component units have the following recurring fair value measurements for their participation in the Ottawa County cash and pooled investments as of their year-ends:
• The Ottawa County cash and pooled investments are valued using either quoted market prices
(Level 1 inputs) or a pricing model utilizing observable fair value measures of fund/pool investments and other observable inputs to determine the fair value of the securities making up the investment fund/pool (Level 2 inputs).
• The Ottawa County cash and pooled investments does not consist of any investments which are
valued based on significant unobservable inputs (Level 3 inputs). Deposit and Investment Risk. For remaining component unit cash and pooled investments held by Ottawa County, the deposit and investment risks can be determined for Ottawa County as a whole, but cannot be separately identified for the remaining component units. The Ottawa County investment pool is unrated. Specific disclosure regarding Ottawa County deposits and investments is provided above.
58
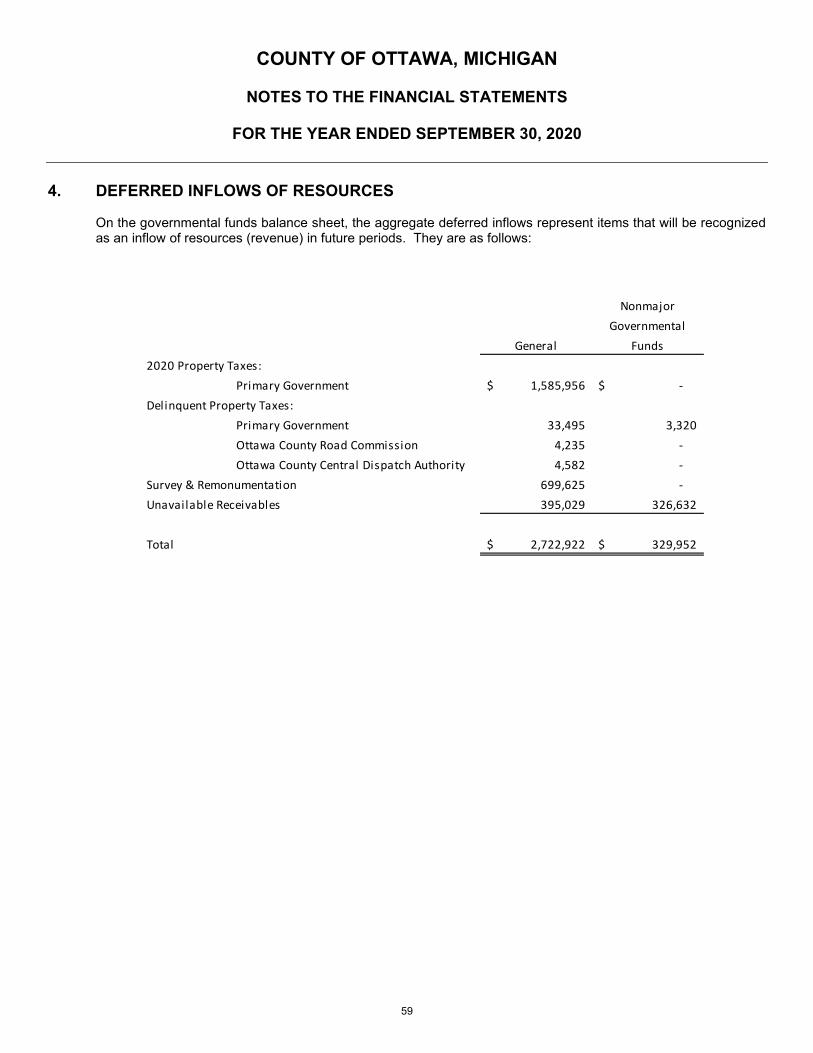
COUNTY OF OTTAWA, MICHIGAN
NOTES TO THE FINANCIAL STATEMENTS
FOR THE YEAR ENDED SEPTEMBER 30, 2020
4. DEFERRED INFLOWS OF RESOURCES
On the governmental funds balance sheet, the aggregate deferred inflows represent items that will be recognized as an inflow of resources (revenue) in future periods. They are as follows:
NonmajorGovernmental
General Funds2020 Property Taxes:
Primary Government 1,585,956$ -$ Delinquent Property Taxes:
Primary Government 33,495 3,320 Ottawa County Road Commission 4,235 - Ottawa County Central Dispatch Authority 4,582 -
Survey & Remonumentation 699,625 - Unavailable Receivables 395,029 326,632
Total 2,722,922$ 329,952$
59
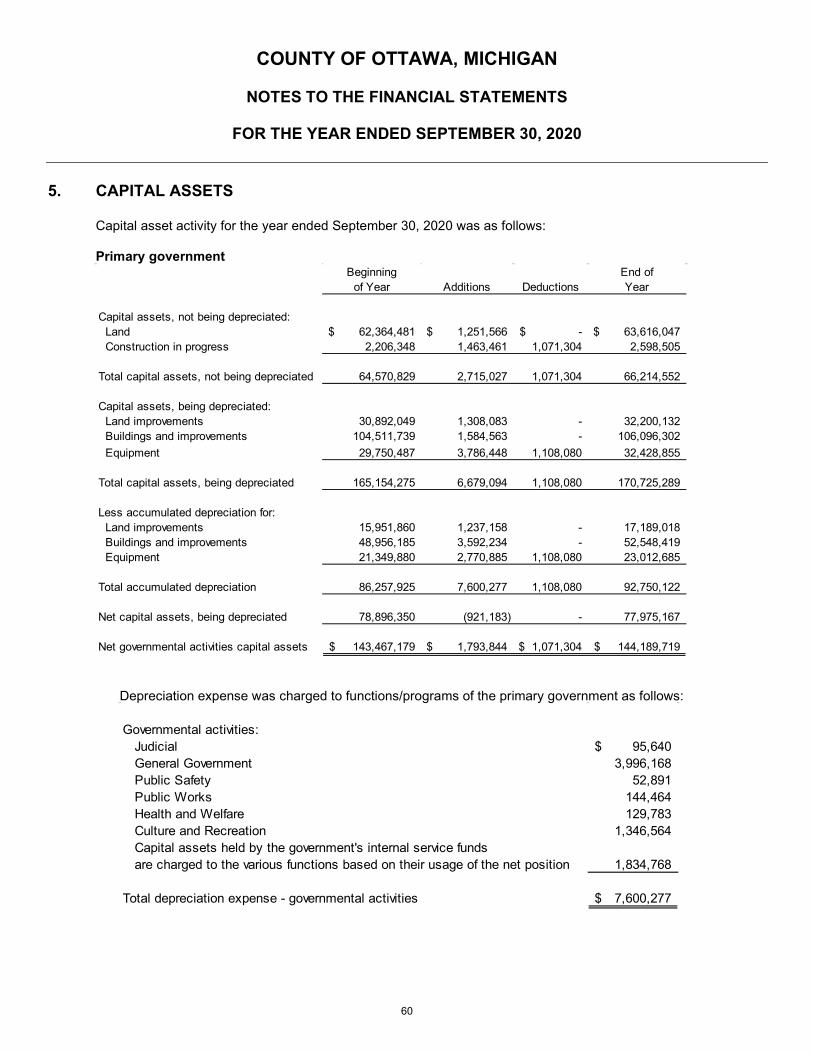
COUNTY OF OTTAWA, MICHIGAN
NOTES TO THE FINANCIAL STATEMENTS
FOR THE YEAR ENDED SEPTEMBER 30, 2020
5. CAPITAL ASSETS Capital asset activity for the year ended September 30, 2020 was as follows: Primary government
Depreciation expense was charged to functions/programs of the primary government as follows:
Beginning End ofof Year Additions Deductions Year
Capital assets, not being depreciated: Land 62,364,481$ 1,251,566$ -$ 63,616,047$ Construction in progress 2,206,348 1,463,461 1,071,304 2,598,505
Total capital assets, not being depreciated 64,570,829 2,715,027 1,071,304 66,214,552
Capital assets, being depreciated: Land improvements 30,892,049 1,308,083 - 32,200,132 Buildings and improvements 104,511,739 1,584,563 - 106,096,302 Equipment 29,750,487 3,786,448 1,108,080 32,428,855
Total capital assets, being depreciated 165,154,275 6,679,094 1,108,080 170,725,289
Less accumulated depreciation for: Land improvements 15,951,860 1,237,158 - 17,189,018 Buildings and improvements 48,956,185 3,592,234 - 52,548,419 Equipment 21,349,880 2,770,885 1,108,080 23,012,685
Total accumulated depreciation 86,257,925 7,600,277 1,108,080 92,750,122
Net capital assets, being depreciated 78,896,350 (921,183) - 77,975,167
Net governmental activities capital assets 143,467,179$ 1,793,844$ 1,071,304$ 144,189,719$
Governmental activities: Judicial 95,640$ General Government 3,996,168 Public Safety 52,891 Public Works 144,464 Health and Welfare 129,783 Culture and Recreation 1,346,564 Capital assets held by the government's internal service funds are charged to the various functions based on their usage of the net position 1,834,768
Total depreciation expense - governmental activities 7,600,277$
60
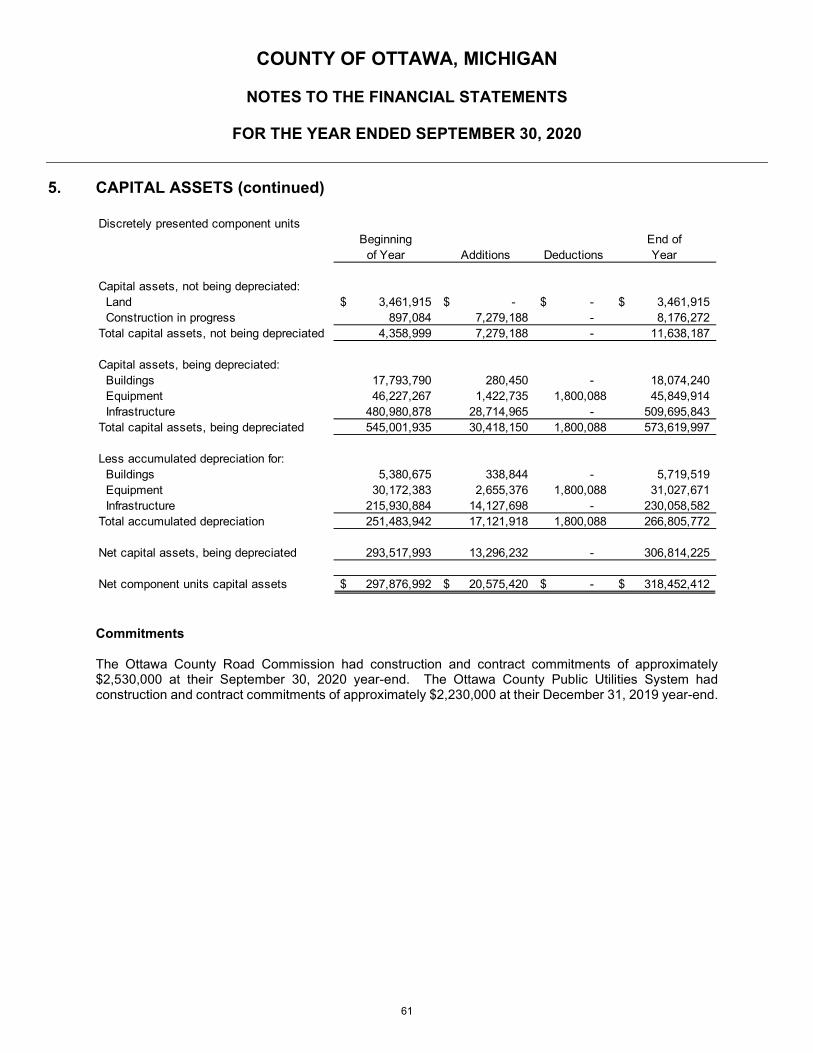
COUNTY OF OTTAWA, MICHIGAN
NOTES TO THE FINANCIAL STATEMENTS
FOR THE YEAR ENDED SEPTEMBER 30, 2020
5. CAPITAL ASSETS (continued)
Commitments
The Ottawa County Road Commission had construction and contract commitments of approximately $2,530,000 at their September 30, 2020 year-end. The Ottawa County Public Utilities System had construction and contract commitments of approximately $2,230,000 at their December 31, 2019 year-end.
Discretely presented component unitsBeginning End of
of Year Additions Deductions Year
Capital assets, not being depreciated: Land 3,461,915$ -$ -$ 3,461,915$ Construction in progress 897,084 7,279,188 - 8,176,272 Total capital assets, not being depreciated 4,358,999 7,279,188 - 11,638,187
Capital assets, being depreciated: Buildings 17,793,790 280,450 - 18,074,240 Equipment 46,227,267 1,422,735 1,800,088 45,849,914 Infrastructure 480,980,878 28,714,965 - 509,695,843 Total capital assets, being depreciated 545,001,935 30,418,150 1,800,088 573,619,997
Less accumulated depreciation for: Buildings 5,380,675 338,844 - 5,719,519 Equipment 30,172,383 2,655,376 1,800,088 31,027,671 Infrastructure 215,930,884 14,127,698 - 230,058,582 Total accumulated depreciation 251,483,942 17,121,918 1,800,088 266,805,772
Net capital assets, being depreciated 293,517,993 13,296,232 - 306,814,225
Net component units capital assets 297,876,992$ 20,575,420$ -$ 318,452,412$
61

COUNTY OF OTTAWA, MICHIGAN
NOTES TO THE FINANCIAL STATEMENTS
FOR THE YEAR ENDED SEPTEMBER 30, 2020
6. INTERFUND, RECEIVABLES, PAYABLES, AND TRANSFERS
Interfund balances as of September 30, 2020 are as follows: Amounts due to and from other funds
Included in the Internal Service funds is $3,864,723 which represents funds from the worker’s compensation program that are invested by the Ottawa County Insurance Authority. Receivable and Payable As of September 30, 2020, certain funds that are a part of the County’s pooled cash report negative cash balances. Accordingly, an interfund payable is established in the amount of the negative cash balance and a corresponding interfund receivable is established in the General Fund.
Due from Due toOther Funds Other Funds
Primary GovernmentGeneral Fund 63,476$ -$ Nonmajor Governmental 43,433 - Internal Service Funds 3,757,814 3,864,723
3,864,723$ 3,864,723$
Interfund Receivable
Interfund Payable
General Fund 1,564,898$ -$ Nonmajor Governmental Funds - 1,564,898
1,564,898$ 1,564,898$
62
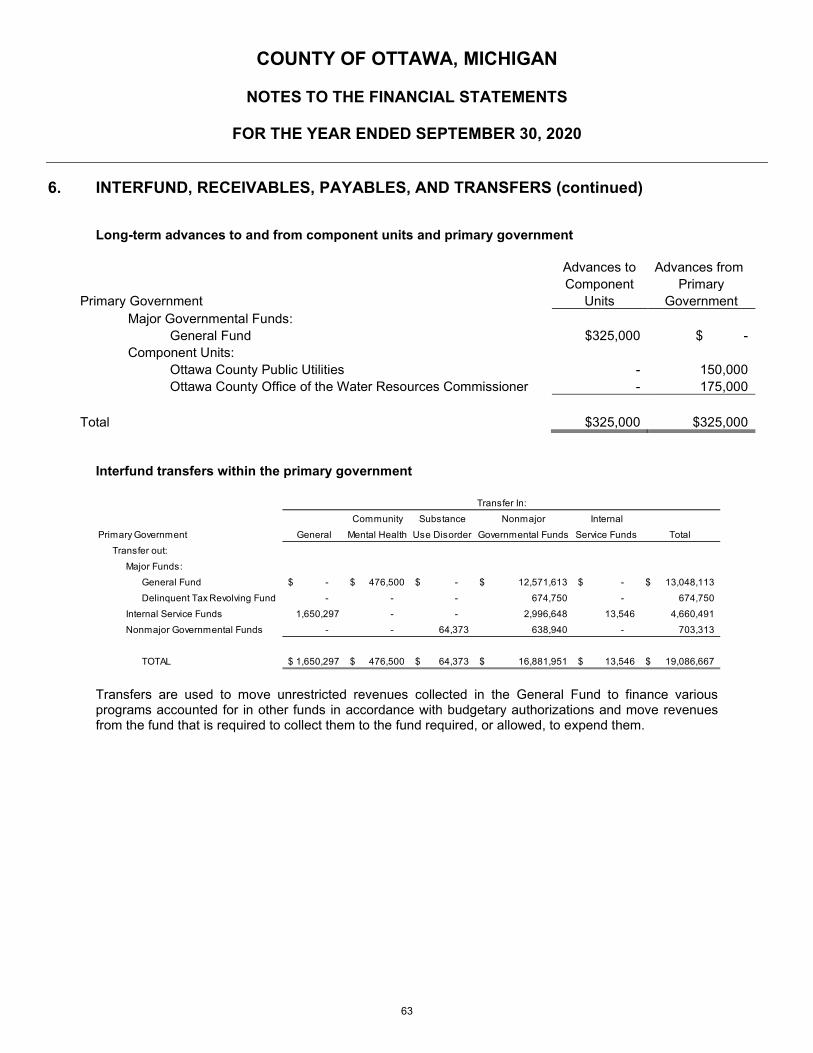
COUNTY OF OTTAWA, MICHIGAN
NOTES TO THE FINANCIAL STATEMENTS
FOR THE YEAR ENDED SEPTEMBER 30, 2020
6. INTERFUND, RECEIVABLES, PAYABLES, AND TRANSFERS (continued)
Long-term advances to and from component units and primary government
Advances to Advances from Component Primary Primary Government Units Government
Major Governmental Funds: General Fund $325,000 $ - Component Units: Ottawa County Public Utilities - 150,000 Ottawa County Office of the Water Resources Commissioner - 175,000 Total $325,000 $325,000
Interfund transfers within the primary government
Transfers are used to move unrestricted revenues collected in the General Fund to finance various programs accounted for in other funds in accordance with budgetary authorizations and move revenues from the fund that is required to collect them to the fund required, or allowed, to expend them.
Community Substance Nonmajor InternalPrimary Government General Mental Health Use Disorder Governmental Funds Service Funds Total
Transfer out:Major Funds:
General Fund -$ 476,500$ -$ 12,571,613$ -$ 13,048,113$ Delinquent Tax Revolving Fund - - - 674,750 - 674,750
Internal Service Funds 1,650,297 - - 2,996,648 13,546 4,660,491 Nonmajor Governmental Funds - - 64,373 638,940 - 703,313
TOTAL 1,650,297$ 476,500$ 64,373$ 16,881,951$ 13,546$ 19,086,667$
Transfer In:
63

COUNTY OF OTTAWA, MICHIGAN
NOTES TO THE FINANCIAL STATEMENTS
FOR THE YEAR ENDED SEPTEMBER 30, 2020
7. LEASES
Operating leases
The County is a lessee under various operating leases for building and office space. Lease expenditures for the year ended September 30, 2020 amounted to $39,256. Future minimum lease payments for these leases are as follows:
The County is also a lessor under various operating lease agreements for office space and marinas. At September 30, 2020 the original cost of these assets was $7,769,738 and the accumulated depreciation totals $3,447,926 leaving a carrying value of $4,321,813. Lease revenue for the year ended September 30, 2020 was $601,559. Future lease revenues for these leases are as follows:
Year EndingSeptember 30 Amount
2021 $33,5382022 4,9482023 4,948
$43,433
Year EndingSeptember 30 Amount
2021 625,719$ 2022 583,450 2023 557,429 2024 537,302 2025 598,340
2026 - 2030 2,550,000
5,452,240$
64

COUNTY OF OTTAWA, MICHIGAN
NOTES TO THE FINANCIAL STATEMENTS
FOR THE YEAR ENDED SEPTEMBER 30, 2020
8. LONG-TERM DEBT
The County issues and guarantees bonds for governmental activities and component units to provide funds for the construction of water and sewage disposal systems, drains and buildings, and to refund previously issued bonds. The Primary Government bonds are repaid through designated general funding sources. The private placement bonds for the primary government are secured by the limited tax, full faith and credit pledge of the County. The bonds issued for the component units are generally being repaid from funds received from local municipalities in the County, from drain assessments levied and gas and weight tax. Under the terms of the bond agreements with local municipalities, the local municipalities have pledged their full faith and credit to pay the amounts sufficient to make principal and interest payments on the bonds each year. The County has also pledged its full faith and credit for payment on the bonds, but has not established a reserve or sinking fund to cover defaults by property owners or local units. These bonds generally are issued as 20-year serial bonds with varying amounts of principal maturing each year. The original issue amount of the primary government’s bonds is $47,535,000. Bonds outstanding for which the County has pledged its full faith and credit are as follows: Component Units Ottawa County Ottawa County Office of the Total
Primary Public Utilities Water Resources Ottawa Purpose Government System Commissioner County
Governmental activities $23,575,000 $ 59,269,055 $ 1,541,530 $ 84,385,585 Governmental activities-refunding 7,425,000 47,720,000 - 55,145,000 Private placements 2,940,000 - - 2,940,000
Total $33,940,000 $106,989,055 $ 1,541,530 $142,470,585 Interest is payable on all bond obligations semi-annually, and principal payments are made annually. The annual debt service requirements to maturity for the bonds outstanding (including component unit notes and capital leases) at year-end are as follows:
Current YearPlus Principal Interest Principal Interest Principal Interest
one year 3,205,000$ 1,023,858$ 365,000$ 111,720$ 7,550,046$ 4,729,537$ two years 3,680,000 917,668 365,000 97,850 7,791,130 4,446,514 three years 4,370,000 785,526 365,000 83,980 8,044,782 4,151,227 four years 3,880,000 643,994 365,000 70,110 8,194,214 3,844,151 five years 3,525,000 508,654 370,000 56,240 8,224,373 3,535,734 years 6-10 11,905,000 840,337 1,110,000 84,360 39,706,035 13,152,499 years 11-15 205,000 40,652 - - 31,809,349 5,749,676 years 16-20 230,000 17,030 - - 10,551,500 1,316,992 years 21-25 - - - - 1,290,000 28,219 Total 31,000,000$ 4,777,719$ 2,940,000$ 504,260$ 123,161,429$ 40,954,549$
Bond Private Placement BondComponent Units
Governmental ActivitiesPrimary Government
65
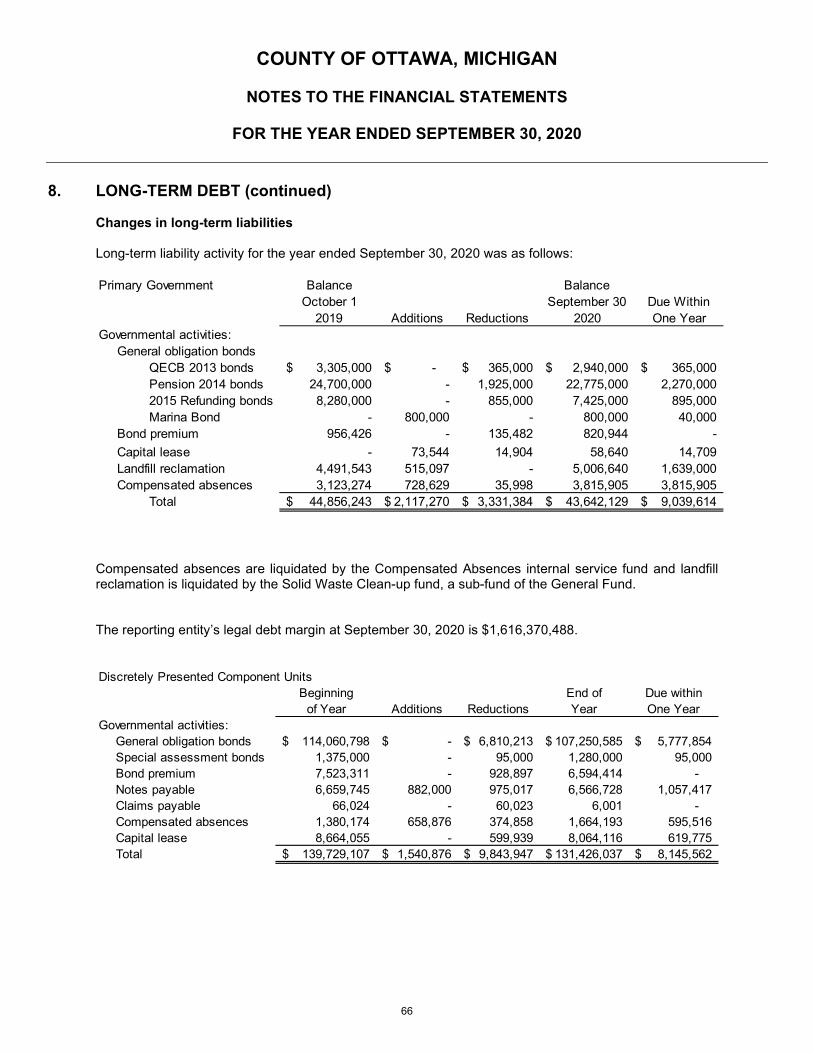
COUNTY OF OTTAWA, MICHIGAN
NOTES TO THE FINANCIAL STATEMENTS
FOR THE YEAR ENDED SEPTEMBER 30, 2020
8. LONG-TERM DEBT (continued)
Changes in long-term liabilities
Long-term liability activity for the year ended September 30, 2020 was as follows:
Compensated absences are liquidated by the Compensated Absences internal service fund and landfill reclamation is liquidated by the Solid Waste Clean-up fund, a sub-fund of the General Fund. The reporting entity’s legal debt margin at September 30, 2020 is $1,616,370,488.
Primary Government Balance BalanceOctober 1 September 30 Due Within
2019 Additions Reductions 2020 One YearGovernmental activities:
General obligation bondsQECB 2013 bonds 3,305,000$ -$ 365,000$ 2,940,000$ 365,000$ Pension 2014 bonds 24,700,000 - 1,925,000 22,775,000 2,270,000 2015 Refunding bonds 8,280,000 - 855,000 7,425,000 895,000 Marina Bond - 800,000 - 800,000 40,000
Bond premium 956,426 - 135,482 820,944 - Capital lease - 73,544 14,904 58,640 14,709 Landfill reclamation 4,491,543 515,097 - 5,006,640 1,639,000 Compensated absences 3,123,274 728,629 35,998 3,815,905 3,815,905
Total 44,856,243$ 2,117,270$ 3,331,384$ 43,642,129$ 9,039,614$
Discretely Presented Component UnitsBeginning End of Due within
of Year Additions Reductions Year One YearGovernmental activities:
General obligation bonds 114,060,798$ -$ 6,810,213$ 107,250,585$ 5,777,854$ Special assessment bonds 1,375,000 - 95,000 1,280,000 95,000 Bond premium 7,523,311 - 928,897 6,594,414 - Notes payable 6,659,745 882,000 975,017 6,566,728 1,057,417 Claims payable 66,024 - 60,023 6,001 - Compensated absences 1,380,174 658,876 374,858 1,664,193 595,516 Capital lease 8,664,055 - 599,939 8,064,116 619,775 Total 139,729,107$ 1,540,876$ 9,843,947$ 131,426,037$ 8,145,562$
66
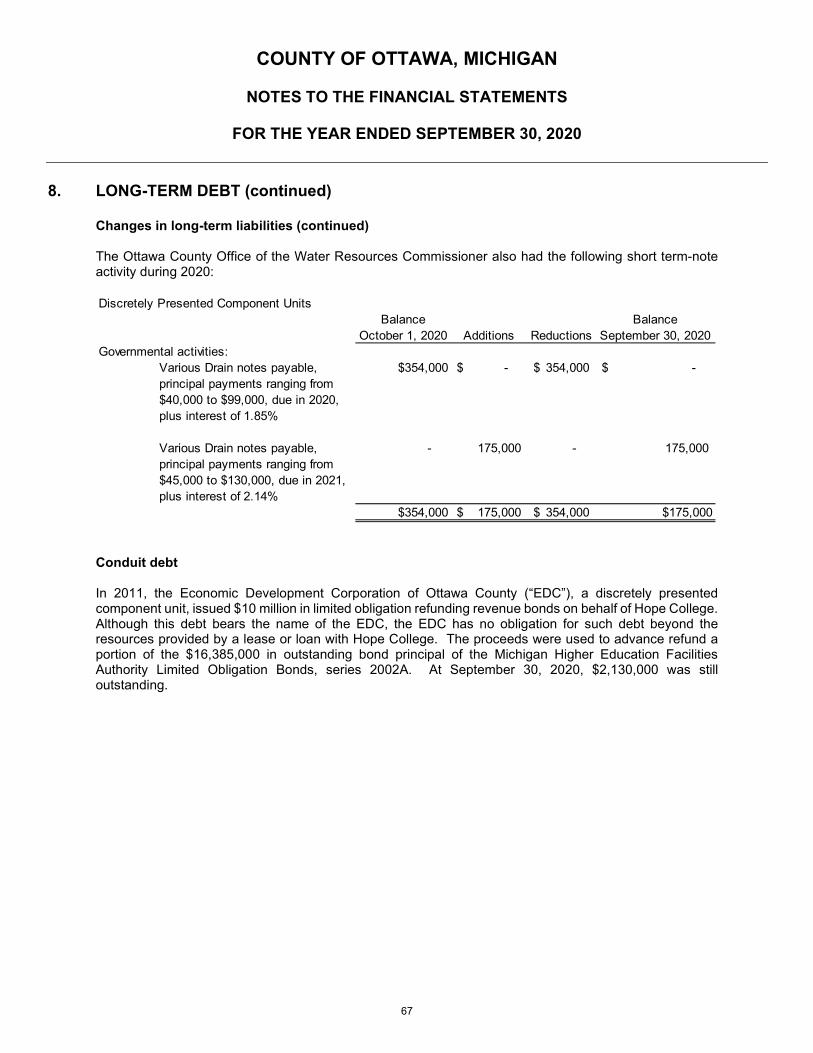
COUNTY OF OTTAWA, MICHIGAN
NOTES TO THE FINANCIAL STATEMENTS
FOR THE YEAR ENDED SEPTEMBER 30, 2020
8. LONG-TERM DEBT (continued)
Changes in long-term liabilities (continued)
The Ottawa County Office of the Water Resources Commissioner also had the following short term-note activity during 2020:
Conduit debt In 2011, the Economic Development Corporation of Ottawa County (“EDC”), a discretely presented component unit, issued $10 million in limited obligation refunding revenue bonds on behalf of Hope College. Although this debt bears the name of the EDC, the EDC has no obligation for such debt beyond the resources provided by a lease or loan with Hope College. The proceeds were used to advance refund a portion of the $16,385,000 in outstanding bond principal of the Michigan Higher Education Facilities Authority Limited Obligation Bonds, series 2002A. At September 30, 2020, $2,130,000 was still outstanding.
Discretely Presented Component UnitsBalance Balance
October 1, 2020 Additions Reductions September 30, 2020Governmental activities:
Various Drain notes payable, $354,000 -$ 354,000$ -$ principal payments ranging from$40,000 to $99,000, due in 2020,plus interest of 1.85%
Various Drain notes payable, - 175,000 - 175,000 principal payments ranging from$45,000 to $130,000, due in 2021,plus interest of 2.14%
$354,000 175,000$ 354,000$ $175,000
67

COUNTY OF OTTAWA, MICHIGAN
NOTES TO THE FINANCIAL STATEMENTS
FOR THE YEAR ENDED SEPTEMBER 30, 2020
9. LANDFILL RECLAMATION
The County owns the Southwest Ottawa County Refuse Disposal Center ("SOCRDC") otherwise known as the Southwest Ottawa County Landfill. Waste Management operated the landfill from the early 1970’s until it was closed in 1981. The landfill was closed per the terms of the “1981 closure agreement” between the County and the Department of Natural Resources (“DNR”). The agreement outlined a plan to cap the landfill and install a pump and carbon filtration system. Waste Management installed the cap in the mid 1980's; the pump and carbon filtration system was built by the County in 1987, as per the terms of the closure agreement. The County has been operating the pump and filter system 24 hours a day, 7 days a week since beginning operation in 1987. The pump and filter system were not effective in containing the plume of contaminants in the groundwater down gradient from the landfill. As a result, contaminants have escaped past the outer purge wells and are migrating southwest towards Lake Michigan. Even though the contaminated water meets drinking water standards, the County provided municipal water infrastructure to property owners in the path of the plume, and is working with the local unit of government to place institutional controls on future users moving into the area. The County has completed negotiations with the Michigan Department of Environmental Quality (“MDEQ”), formerly known as the DNR, with a revised plan to contain the contamination. The County recapped the landfill and enhanced the water filtration system with a project started in 2006. The County is reviewing the feasibility of a soil/bentonite onsite slurry wall and treatment system improvements to minimize additional contamination. Landfill post closure cost estimates are subject to change based on inflation, deflation, technology or changes to applicable laws or regulations. The County's estimate of the costs of operating, maintaining and improvements to the landfill containment and treatment system are as follows:
Year Ending Present Value of
September 30 Estimated Cost
2021 $1,639,000 2022 334,723 2023 343,950 2024 353,439 2025 363,197
2026-2030 1,972,331
Total $5,006,640
68
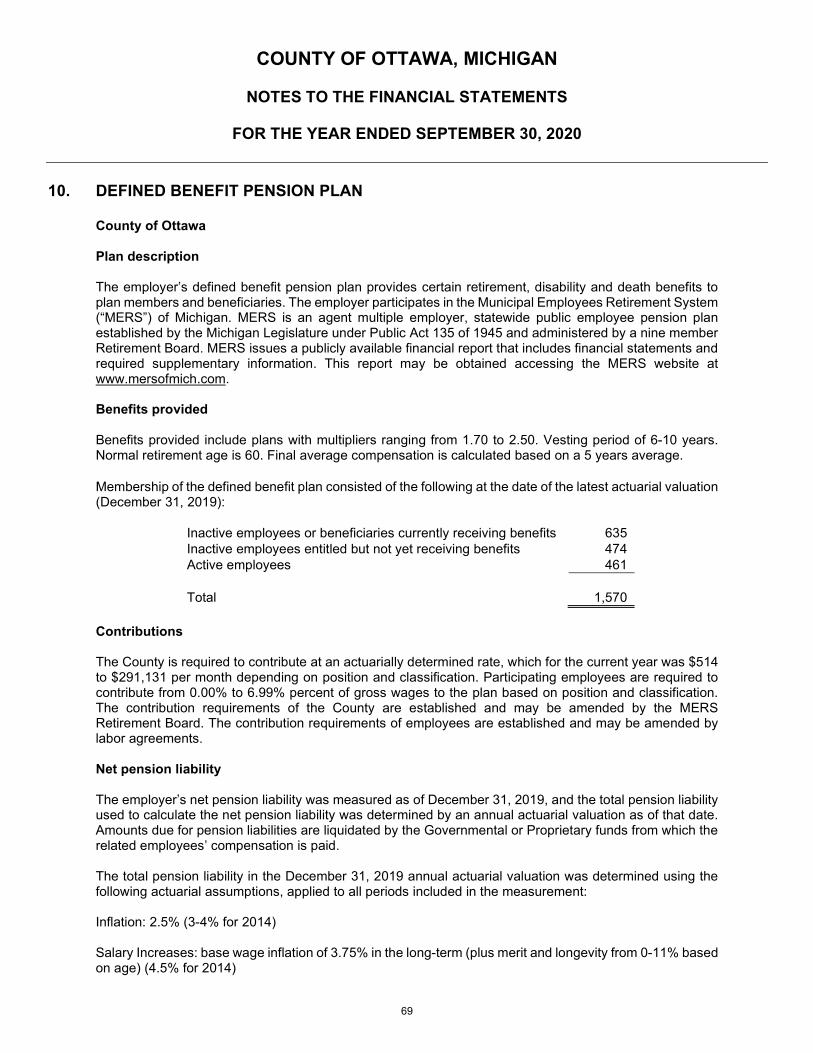
COUNTY OF OTTAWA, MICHIGAN
NOTES TO THE FINANCIAL STATEMENTS
FOR THE YEAR ENDED SEPTEMBER 30, 2020
10. DEFINED BENEFIT PENSION PLAN
County of Ottawa Plan description The employer’s defined benefit pension plan provides certain retirement, disability and death benefits to plan members and beneficiaries. The employer participates in the Municipal Employees Retirement System (“MERS”) of Michigan. MERS is an agent multiple employer, statewide public employee pension plan established by the Michigan Legislature under Public Act 135 of 1945 and administered by a nine member Retirement Board. MERS issues a publicly available financial report that includes financial statements and required supplementary information. This report may be obtained accessing the MERS website at www.mersofmich.com. Benefits provided Benefits provided include plans with multipliers ranging from 1.70 to 2.50. Vesting period of 6-10 years. Normal retirement age is 60. Final average compensation is calculated based on a 5 years average. Membership of the defined benefit plan consisted of the following at the date of the latest actuarial valuation (December 31, 2019):
Inactive employees or beneficiaries currently receiving benefits 635 Inactive employees entitled but not yet receiving benefits 474 Active employees 461
Total 1,570
Contributions The County is required to contribute at an actuarially determined rate, which for the current year was $514 to $291,131 per month depending on position and classification. Participating employees are required to contribute from 0.00% to 6.99% percent of gross wages to the plan based on position and classification. The contribution requirements of the County are established and may be amended by the MERS Retirement Board. The contribution requirements of employees are established and may be amended by labor agreements. Net pension liability The employer’s net pension liability was measured as of December 31, 2019, and the total pension liability used to calculate the net pension liability was determined by an annual actuarial valuation as of that date. Amounts due for pension liabilities are liquidated by the Governmental or Proprietary funds from which the related employees’ compensation is paid. The total pension liability in the December 31, 2019 annual actuarial valuation was determined using the following actuarial assumptions, applied to all periods included in the measurement: Inflation: 2.5% (3-4% for 2014) Salary Increases: base wage inflation of 3.75% in the long-term (plus merit and longevity from 0-11% based on age) (4.5% for 2014)
69

COUNTY OF OTTAWA, MICHIGAN
NOTES TO THE FINANCIAL STATEMENTS
FOR THE YEAR ENDED SEPTEMBER 30, 2020
10. DEFINED BENEFIT PENSION PLAN (continued)
County of Ottawa (continued)
Net pension liability (continued) Investment rate of return: 7.35%, net of investment expense, including inflation
Mortality rates used for non-disabled plan member were based on a weighted blend of RP-2014 mortality tables of a 50% male and 50% female blend. Mortality rates for disabled plan member were based on a blend of RP-2014 disabled retire mortality tables of a 50% male and 50% female blend. The actuarial assumptions used in the valuation were based on the results of the most recent actuarial experience study. The long-term expected rate of return on pension plan investments was determined using a model method in which the best-estimate ranges of expected future real rates of return (expected returns, net of investment and administrative expenses and inflation) are developed for each major asset class. These ranges are combined to produce the long-term expected rate of return by weighting the expected future real rates of return by the target asset allocation percentage and by adding expected inflation. The target allocation and best estimates of arithmetic real rates of return for each major asset class are summarized in the following table:
Target Long-Term Expected Expected Money Asset Class Allocation Real Rate of Return Weighted Rate of Return
Global Equity 60.00% 7.75% 3.15% Global Fixed Income 20.00% 3.75% 0.25% Private Investments 20.00% 9.75% 1.45% Inflation 2.50% Administrative fee 0.25%
7.60%
Discount rate. The discount rate used to measure the total pension liability is 7.60%, which did not change from the prior year. The projection of cash flows used to determine the discount rate assumes that employer and employee contributions will be made at the rates agreed upon for employees and the actuarially determined rates for employers. Based on these assumptions, the pension plan’s fiduciary net position was projected to be available to pay all projected future benefit payments of current active and inactive employees. Therefore, the long-term expected rate of return on pension plan investments was applied to all periods of projected benefit payments to determine the total pension liability.
70

COUNTY OF OTTAWA, MICHIGAN
NOTES TO THE FINANCIAL STATEMENTS
FOR THE YEAR ENDED SEPTEMBER 30, 2020
10. DEFINED BENEFIT PENSION PLAN (continued)
County of Ottawa (continued)
Changes in the net pension liability
Increase (Decrease) Total Plan Net Pension Fiduciary Pension Liability Net Position Liability (a) (b) (a)-(b)
Balance at 12/31/18 $295,112,543 $221,308,051 $73,804,492 Changes for the year:
Service cost 3,911,248 - 3,911,248 Interest 23,176,263 - 23,176,263 Change in benefits - - - Differences between expected and actual experience (599,287) - (599,287) Change in assumptions 10,554,788 - 10,554,788 Employer contributions - 10,604,402 (10,604,402) Employee contributions - 1,283,336 (1,283,336) Net investment income - 29,922,304 (29,922,304) Benefit payments, including refunds (14,729,757) (14,729,757) - Administrative expense - (515,451) 515,451 Other changes (2) - (2) Net changes 22,313,253 26,564,834 (4,251,581)
Balance at 12/31/19 $317,425,796 $247,872,885 $69,552,911 Sensitivity of the net pension liability to changes in the discount rate The following presents the net pension liability of the employer, calculated using the discount rate of 7.60%, as well as what the employer’s net pension liability would be using a discount rate that is 1.00% lower (6.60%) or 1.00% higher (8.60%) than the current rate.
Current
1% Decrease Discount rate 1% Increase Total Pension Liability $355,632,394 $317,425,796 $285,302,170 Fiduciary Net Position 247,872,885 247,872,885 247,872,885 Net Pension Liability $107,759,509 $ 69,552,911 $ 37,429,285
71
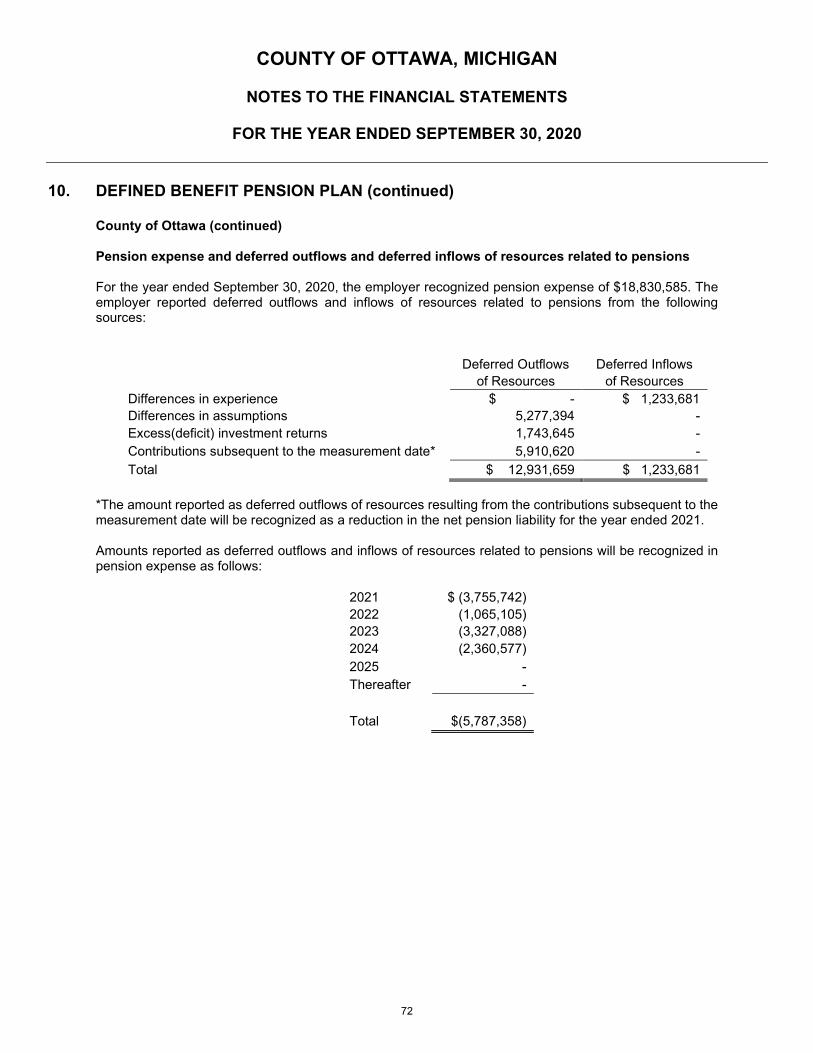
COUNTY OF OTTAWA, MICHIGAN
NOTES TO THE FINANCIAL STATEMENTS
FOR THE YEAR ENDED SEPTEMBER 30, 2020
10. DEFINED BENEFIT PENSION PLAN (continued)
County of Ottawa (continued) Pension expense and deferred outflows and deferred inflows of resources related to pensions For the year ended September 30, 2020, the employer recognized pension expense of $18,830,585. The employer reported deferred outflows and inflows of resources related to pensions from the following sources:
Deferred Outflows Deferred Inflows of Resources of Resources
Differences in experience $ - $ 1,233,681 Differences in assumptions 5,277,394 - Excess(deficit) investment returns 1,743,645 - Contributions subsequent to the measurement date* 5,910,620 - Total $ 12,931,659 $ 1,233,681
*The amount reported as deferred outflows of resources resulting from the contributions subsequent to the measurement date will be recognized as a reduction in the net pension liability for the year ended 2021. Amounts reported as deferred outflows and inflows of resources related to pensions will be recognized in pension expense as follows:
2021 $ (3,755,742) 2022 (1,065,105) 2023 (3,327,088) 2024 (2,360,577) 2025 - Thereafter -
Total $(5,787,358)
72

COUNTY OF OTTAWA, MICHIGAN
NOTES TO THE FINANCIAL STATEMENTS
FOR THE YEAR ENDED SEPTEMBER 30, 2020
10. DEFINED BENEFIT PENSION PLAN (continued)
Ottawa County Road Commission Plan description
The employer’s defined benefit pension plan provides certain retirement, disability and death benefits to plan members and beneficiaries. The employer participates in the Municipal Employees Retirement System (“MERS”) of Michigan. MERS is an agent multiple employer, statewide public employee pension plan established by the Michigan Legislature under Public Act 135 of 1945 and administered by a nine member Retirement Board. MERS issues a publicly available financial report that includes financial statements and required supplementary information. This report may be obtained accessing the MERS website at www.mersofmich.com.
Benefits provided Benefits provided include plans with multipliers ranging from 1.7 to 2.50. Vesting period of 6-10 years. Normal retirement age is 60. Final average compensation is calculated based on a 3 years average.
Membership of the defined benefit plan consisted of the following at the date of the latest actuarial valuation (December 31, 2019):
Inactive employees or beneficiaries currently receiving benefits 141 Inactive employees entitled but not yet receiving benefits 20 Active employees 71
Total 232
Contributions The Commission is required to contribute a fixed monthly amount of $184,999 for some employee groups and at an actuarially determined rate of 70.32% of annual covered payroll for other groups depending on position and classification. Participating employees are required to contribute from 3% to 5% percent of gross wages to the plan based on position and classification. The contribution requirements of the Commission are established and may be amended by the MERS Retirement Board. The contribution requirements of employees are established and may be amended by labor agreements. Net pension liability The employer’s net pension liability was measured as of December 31, 2019, and the total pension liability used to calculate the Net Pension Liability was determined by an annual actuarial valuation as of that date. The total pension liability in the December 31, 2019 annual actuarial valuation was determined using the following actuarial assumptions, applied to all periods included in the measurement: Inflation: 2.5% Salary Increases: base wage inflation of 3.00% in the long-term (plus merit and longevity from 0-11% based on age) Investment rate of return: 7.35%, net of investment expense, including inflation
73
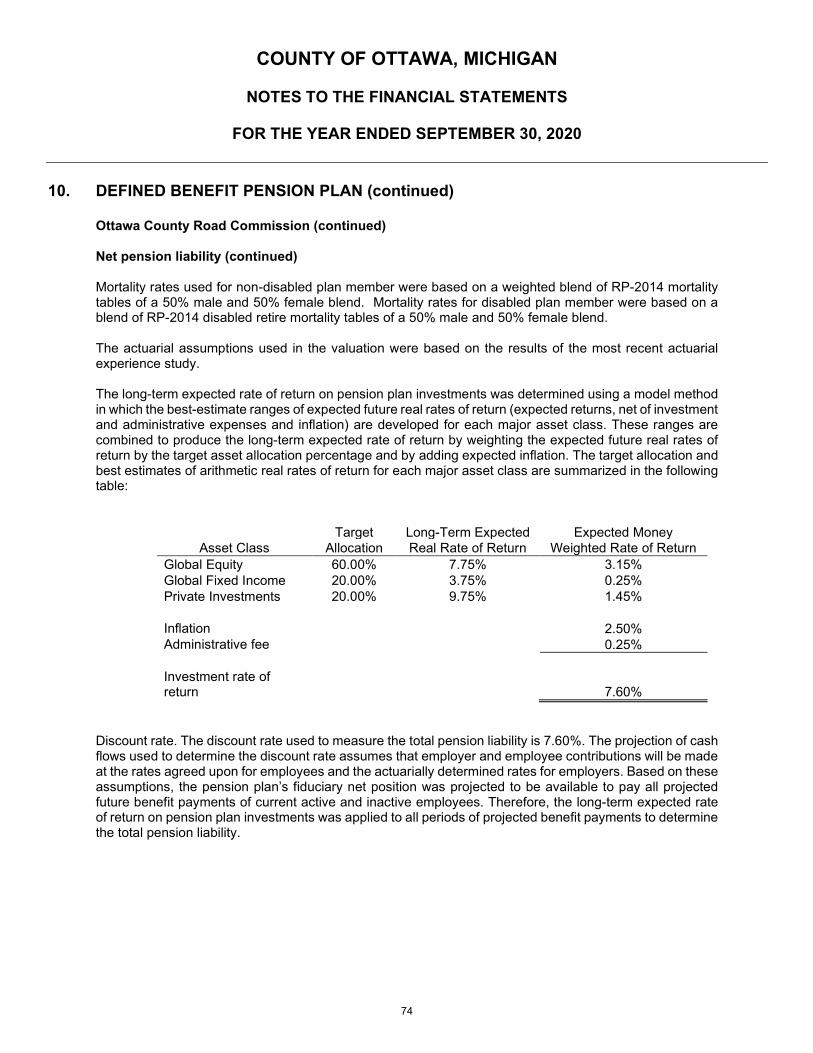
COUNTY OF OTTAWA, MICHIGAN
NOTES TO THE FINANCIAL STATEMENTS
FOR THE YEAR ENDED SEPTEMBER 30, 2020
10. DEFINED BENEFIT PENSION PLAN (continued)
Ottawa County Road Commission (continued) Net pension liability (continued) Mortality rates used for non-disabled plan member were based on a weighted blend of RP-2014 mortality tables of a 50% male and 50% female blend. Mortality rates for disabled plan member were based on a blend of RP-2014 disabled retire mortality tables of a 50% male and 50% female blend. The actuarial assumptions used in the valuation were based on the results of the most recent actuarial experience study. The long-term expected rate of return on pension plan investments was determined using a model method in which the best-estimate ranges of expected future real rates of return (expected returns, net of investment and administrative expenses and inflation) are developed for each major asset class. These ranges are combined to produce the long-term expected rate of return by weighting the expected future real rates of return by the target asset allocation percentage and by adding expected inflation. The target allocation and best estimates of arithmetic real rates of return for each major asset class are summarized in the following table:
Target Long-Term Expected Expected Money Asset Class Allocation Real Rate of Return Weighted Rate of Return
Global Equity 60.00% 7.75% 3.15% Global Fixed Income 20.00% 3.75% 0.25% Private Investments 20.00% 9.75% 1.45%
Inflation 2.50% Administrative fee 0.25%
Investment rate of return 7.60%
Discount rate. The discount rate used to measure the total pension liability is 7.60%. The projection of cash flows used to determine the discount rate assumes that employer and employee contributions will be made at the rates agreed upon for employees and the actuarially determined rates for employers. Based on these assumptions, the pension plan’s fiduciary net position was projected to be available to pay all projected future benefit payments of current active and inactive employees. Therefore, the long-term expected rate of return on pension plan investments was applied to all periods of projected benefit payments to determine the total pension liability.
74
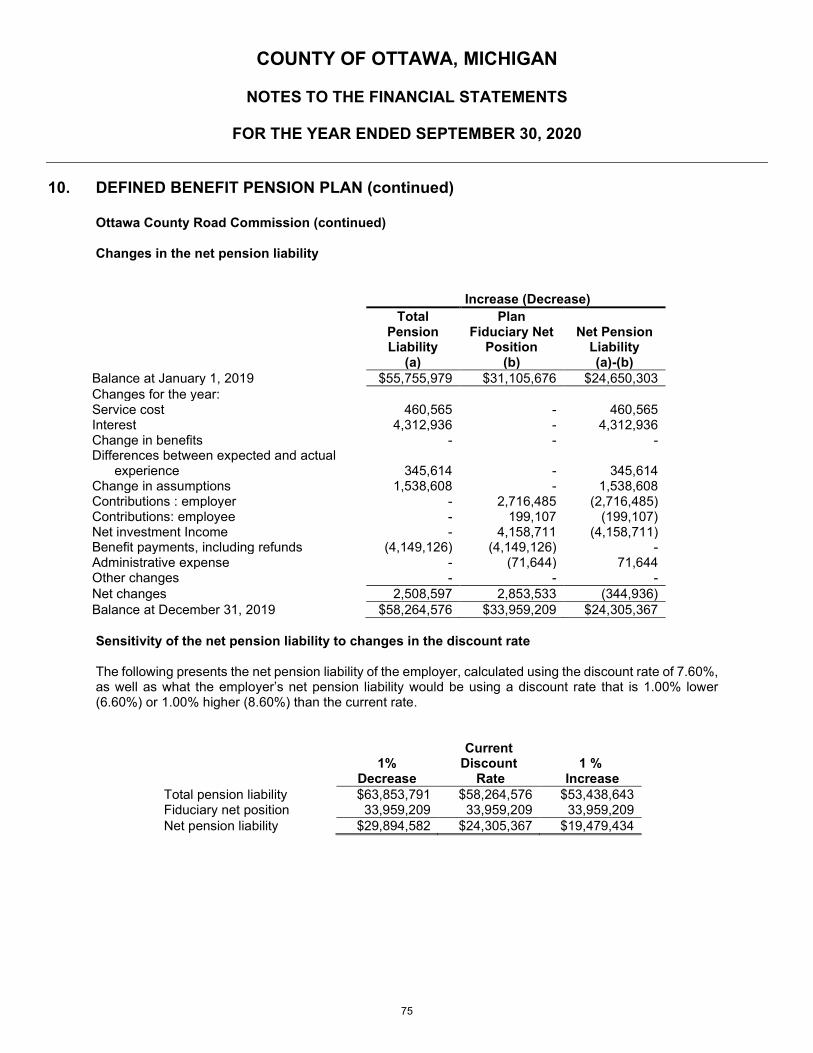
COUNTY OF OTTAWA, MICHIGAN
NOTES TO THE FINANCIAL STATEMENTS
FOR THE YEAR ENDED SEPTEMBER 30, 2020
10. DEFINED BENEFIT PENSION PLAN (continued)
Ottawa County Road Commission (continued)
Changes in the net pension liability
Increase (Decrease) Total
Pension Liability
(a)
Plan Fiduciary Net
Position (b)
Net Pension
Liability (a)-(b)
Balance at January 1, 2019 $55,755,979 $31,105,676 $24,650,303 Changes for the year: Service cost 460,565 - 460,565 Interest 4,312,936 - 4,312,936 Change in benefits - - - Differences between expected and actual
experience
345,614
-
345,614 Change in assumptions 1,538,608 - 1,538,608 Contributions : employer - 2,716,485 (2,716,485) Contributions: employee - 199,107 (199,107) Net investment Income - 4,158,711 (4,158,711) Benefit payments, including refunds (4,149,126) (4,149,126) - Administrative expense - (71,644) 71,644 Other changes - - - Net changes 2,508,597 2,853,533 (344,936) Balance at December 31, 2019 $58,264,576 $33,959,209 $24,305,367 Sensitivity of the net pension liability to changes in the discount rate The following presents the net pension liability of the employer, calculated using the discount rate of 7.60%, as well as what the employer’s net pension liability would be using a discount rate that is 1.00% lower (6.60%) or 1.00% higher (8.60%) than the current rate.
1%
Decrease
Current Discount
Rate
1 %
Increase Total pension liability $63,853,791 $58,264,576 $53,438,643 Fiduciary net position 33,959,209 33,959,209 33,959,209 Net pension liability $29,894,582 $24,305,367 $19,479,434
75
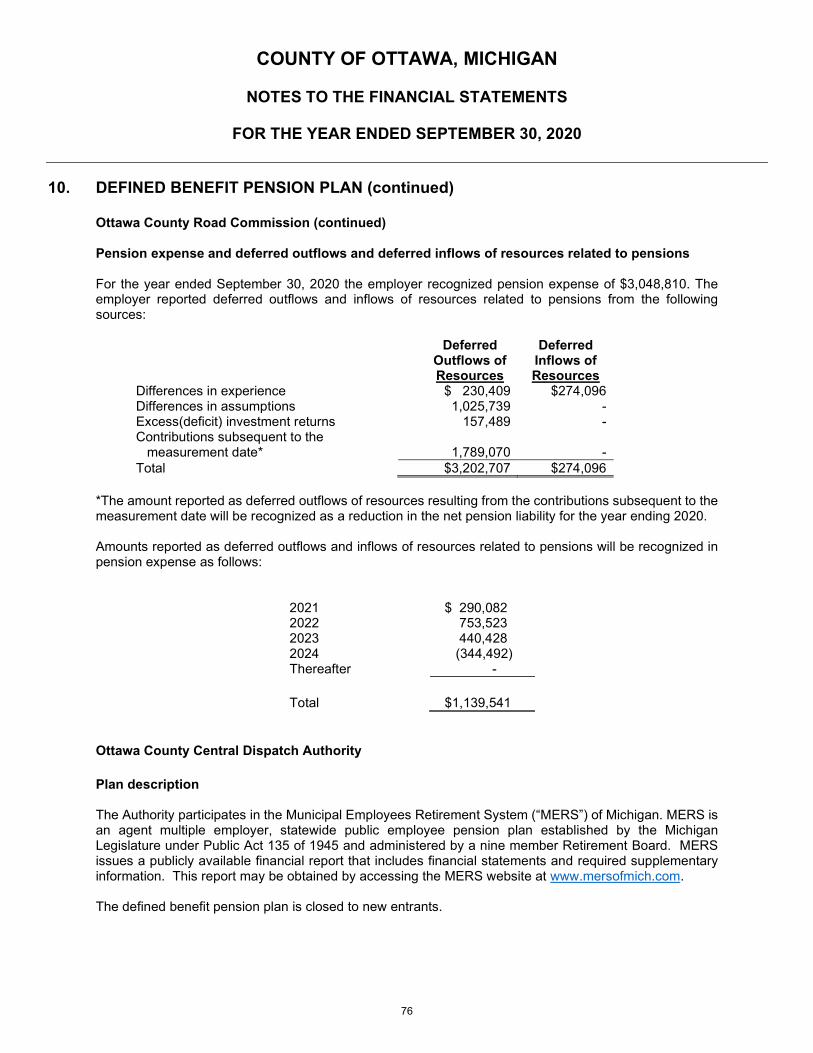
COUNTY OF OTTAWA, MICHIGAN
NOTES TO THE FINANCIAL STATEMENTS
FOR THE YEAR ENDED SEPTEMBER 30, 2020
10. DEFINED BENEFIT PENSION PLAN (continued)
Ottawa County Road Commission (continued)
Pension expense and deferred outflows and deferred inflows of resources related to pensions For the year ended September 30, 2020 the employer recognized pension expense of $3,048,810. The employer reported deferred outflows and inflows of resources related to pensions from the following sources:
Deferred Outflows of Resources
Deferred Inflows of Resources
Differences in experience $ 230,409 $274,096 Differences in assumptions 1,025,739 - Excess(deficit) investment returns 157,489 - Contributions subsequent to the measurement date*
1,789,070
-
Total $3,202,707 $274,096 *The amount reported as deferred outflows of resources resulting from the contributions subsequent to the measurement date will be recognized as a reduction in the net pension liability for the year ending 2020. Amounts reported as deferred outflows and inflows of resources related to pensions will be recognized in pension expense as follows:
2021 $ 290,082 2022 753,523 2023 440,428 2024 (344,492) Thereafter - Total $1,139,541
Ottawa County Central Dispatch Authority
Plan description The Authority participates in the Municipal Employees Retirement System (“MERS”) of Michigan. MERS is an agent multiple employer, statewide public employee pension plan established by the Michigan Legislature under Public Act 135 of 1945 and administered by a nine member Retirement Board. MERS issues a publicly available financial report that includes financial statements and required supplementary information. This report may be obtained by accessing the MERS website at www.mersofmich.com. The defined benefit pension plan is closed to new entrants.
76
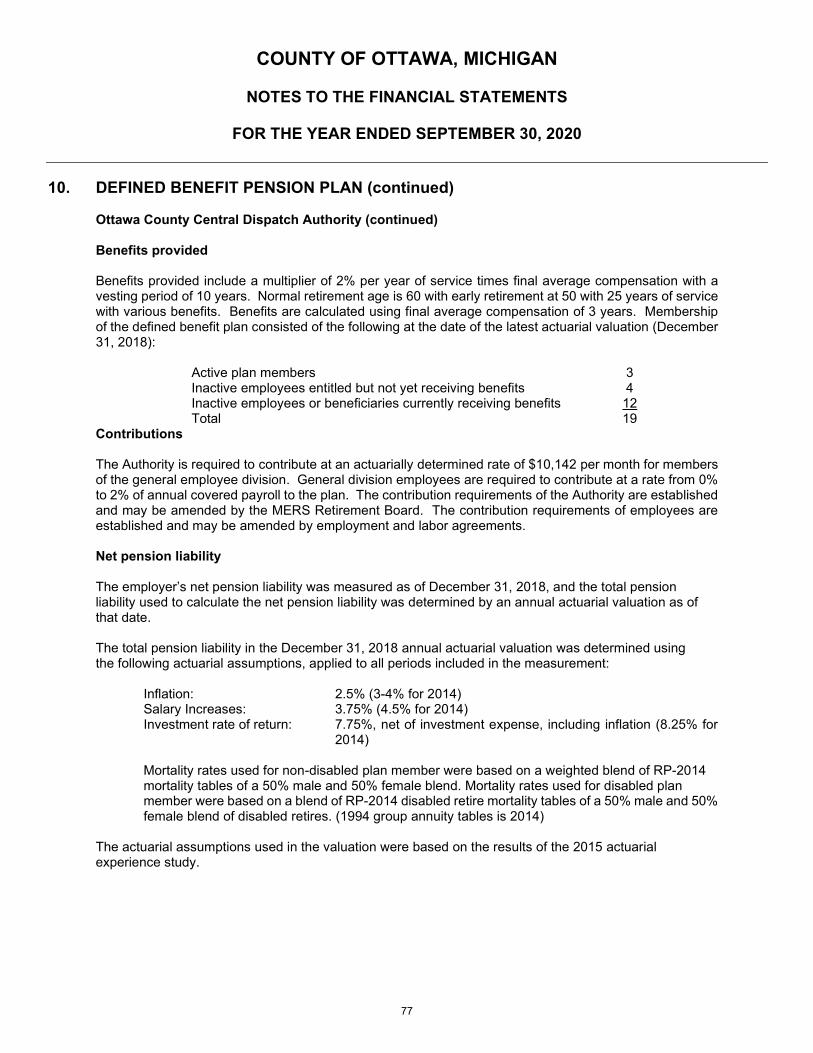
COUNTY OF OTTAWA, MICHIGAN
NOTES TO THE FINANCIAL STATEMENTS
FOR THE YEAR ENDED SEPTEMBER 30, 2020
10. DEFINED BENEFIT PENSION PLAN (continued)
Ottawa County Central Dispatch Authority (continued) Benefits provided Benefits provided include a multiplier of 2% per year of service times final average compensation with a vesting period of 10 years. Normal retirement age is 60 with early retirement at 50 with 25 years of service with various benefits. Benefits are calculated using final average compensation of 3 years. Membership of the defined benefit plan consisted of the following at the date of the latest actuarial valuation (December 31, 2018):
Active plan members 3 Inactive employees entitled but not yet receiving benefits 4 Inactive employees or beneficiaries currently receiving benefits 12 Total 19
Contributions The Authority is required to contribute at an actuarially determined rate of $10,142 per month for members of the general employee division. General division employees are required to contribute at a rate from 0% to 2% of annual covered payroll to the plan. The contribution requirements of the Authority are established and may be amended by the MERS Retirement Board. The contribution requirements of employees are established and may be amended by employment and labor agreements. Net pension liability The employer’s net pension liability was measured as of December 31, 2018, and the total pension liability used to calculate the net pension liability was determined by an annual actuarial valuation as of that date. The total pension liability in the December 31, 2018 annual actuarial valuation was determined using the following actuarial assumptions, applied to all periods included in the measurement:
Inflation: 2.5% (3-4% for 2014) Salary Increases: 3.75% (4.5% for 2014) Investment rate of return: 7.75%, net of investment expense, including inflation (8.25% for
2014) Mortality rates used for non-disabled plan member were based on a weighted blend of RP-2014 mortality tables of a 50% male and 50% female blend. Mortality rates used for disabled plan member were based on a blend of RP-2014 disabled retire mortality tables of a 50% male and 50% female blend of disabled retires. (1994 group annuity tables is 2014)
The actuarial assumptions used in the valuation were based on the results of the 2015 actuarial experience study.
77

COUNTY OF OTTAWA, MICHIGAN
NOTES TO THE FINANCIAL STATEMENTS
FOR THE YEAR ENDED SEPTEMBER 30, 2020
10. DEFINED BENEFIT PENSION PLAN (continued)
Ottawa County Central Dispatch Authority (continued) The long-term expected rate of return on pension plan investments was determined using a model method in which the best-estimate ranges of expected future real rates of return (expected returns, net of investment and administrative expenses and inflation) are developed for each major asset class. These ranges are combined to produce the long-term expected rate of return by weighting the expected future real rates of return by the target asset allocation percentage and by expected inflation. The target allocation and best estimates of arithmetic real rates of return for each major asset class are summarized in the following table:
Discount rate. The discount rate used to measure the total pension liability is 8.00% which remained the same as the prior year. The projection of cash flows used to determine the discount rate assumes that employer and employee contributions will be made at the rates agreed upon for employees and the actuarially determined rates for employers. Based on these assumptions, the pension plan’s fiduciary net position was projected to be available to pay all projected future benefit payments of current active and inactive employees. Therefore, the long-term expected rate of return on pension plan investments was applied to all periods of projected benefit payments to determine the total pension liability.
Asset Class Target AllocationLong-Term Expected Real Rate of Return
Expected Money Weighted Rate of Return*
Global Equity 57.50% 6.27% 3.60%Global Fixed Income 20.00% 3.43% 0.68%Real Assets 12.50% 5.48% 0.69%Diversifying Strategies 10.00% 7.81% 0.78%
Inflation 2.00%Administrative Fee 0.25%
Investment rate of return 8.00%
78

COUNTY OF OTTAWA, MICHIGAN
NOTES TO THE FINANCIAL STATEMENTS
FOR THE YEAR ENDED SEPTEMBER 30, 2020
10. DEFINED BENEFIT PENSION PLAN (continued)
Ottawa County Central Dispatch Authority (continued)
Sensitivity of the net pension liability to changes in the discount rate The following presents the net pension liability of the employer, calculated using the discount rate of 8.00%, as well as what the employer’s net pension liability would be using a discount rate that is 1% lower (7.00%) or 1% higher (9.00%) than the current rate.
Pension expense and deferred outflows of resources related to pensions For the year ended December 31, 2019 the employer recognized pension expense of $(32,710). The employer reported deferred outflows and inflows of resources related to pensions from the following sources:
Total Pension Liability
Plan Fiduciary Net Position
Net Pension Liability
(a) (b) (a) - (b)Balance at 12/31/17 $2,433,259 $2,109,587 $323,672Changes for the Year:
Service Cost 14,945 - 14,945 Interest 188,436 - 188,436 Change in benefits - - - Differences between expected and actual experience (129,216) - (129,216) Change in assumptions - - - Contributions: employer - 93,216 (93,216) Contributions: employee - 4,165 (4,165) Net Investment income - (80,956) 80,956 Benefit payments, incl refunds (170,552) (170,552) - Administrative expense - (4,050) 4,050 Other Changes 1 - 1
Net Changes (96,386) (158,177) 61,791 Balance at 12/31/18 $2,336,873 $1,951,410 $385,463
Changes in the Net Pension Liability
1% DecreaseCurrent
Discount Rate 1% IncreaseTotal Pension Liability 2,543,216$ 2,336,873$ 2,156,897$ Fiduciary Net Position 1,951,410 1,951,410 1,951,410 Net Pension Liability 591,806$ 385,463$ 205,487$
79
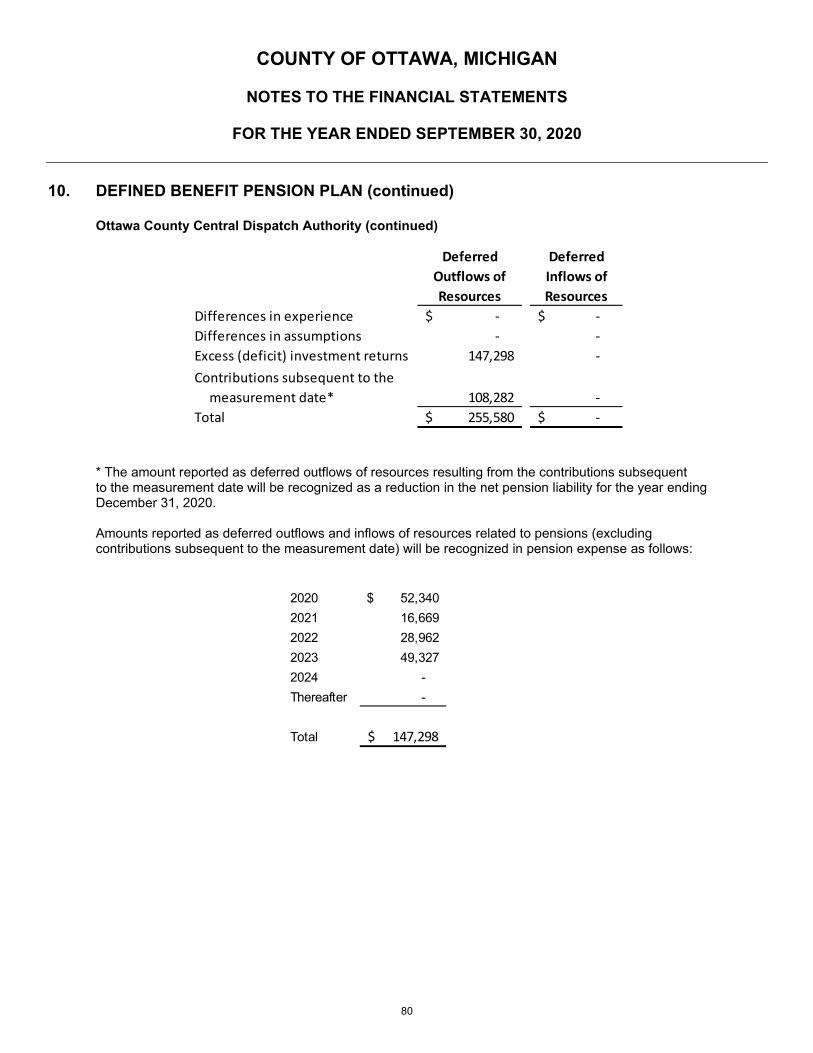
COUNTY OF OTTAWA, MICHIGAN
NOTES TO THE FINANCIAL STATEMENTS
FOR THE YEAR ENDED SEPTEMBER 30, 2020
10. DEFINED BENEFIT PENSION PLAN (continued)
Ottawa County Central Dispatch Authority (continued)
* The amount reported as deferred outflows of resources resulting from the contributions subsequent to the measurement date will be recognized as a reduction in the net pension liability for the year ending December 31, 2020. Amounts reported as deferred outflows and inflows of resources related to pensions (excluding contributions subsequent to the measurement date) will be recognized in pension expense as follows:
Deferred Outflows of Resources
Deferred Inflows of Resources
Differences in experience -$ -$ Differences in assumptions - - Excess (deficit) investment returns 147,298 - Contributions subsequent to the measurement date* 108,282 - Total 255,580$ -$
2020 52,340$ 2021 16,669 2022 28,962 2023 49,327 2024 - Thereafter -
Total 147,298$
80
COUNTY OF OTTAWA, MICHIGAN
NOTES TO THE FINANCIAL STATEMENTS
FOR THE YEAR ENDED SEPTEMBER 30, 2020
11. DEFINED CONTRIBUTION PENSION PLAN
Primary government The County’s defined contribution pension plans provide pension benefits for certain employee groups hired after January 1, 2012 who are eligible for MERS membership and those hired before January 1, 2012 electing participation in the defined contribution plan. In a defined contribution plan, benefits depend solely on amounts contributed to the plan plus investment earnings. Employer and plan member contributions are recognized in the period that the contributions are due. Plan investments are excluded from this report as the fiduciary responsibility for this plan rests with MERS.
Participation in the defined contribution plan is mandatory for all eligible employees. The County contributes 3% of each participant’s base salary to the plan. Employees are required to contribute a minimum of 3% of base pay to the plan. The County also matches employee contributions another 3% for a maximum County contribution of 6%. Participating employees are vested 50% after 3 years of service, 75% after 4 years of service, and 100% after 5 years of service. The plan provisions and contribution amounts were established by the Board and may be amended by the Board. The plan is administered by MERS. The County and member contributions were $1,395,569 and $1,339,620, respectively, for the current year. Deferred compensation plan The County offers to their employees several different deferred compensation plans created in accordance with Internal Revenue Code Section 457. The plans are available to County employees with various options and employer contribution requirements depending on which bargaining unit the employee is a member. All plans permit employees to defer a portion of their salary until future years. Participation in the plans is optional. The deferred compensation is not available to employees until termination, retirement, death or unforeseeable emergency. The County employee contributions for the year ended September 30, 2020 were $2,287,492 and the County match was $385,892.
Discretely presented component units The Ottawa County Central Dispatch Authority’s (“OCCDA”) defined contribution pension plan provides pension benefits for employees hired after January 1, 2000 who work 30 or more hours per week and those hired before January 1, 2000 electing participation in the defined contribution plan. In a defined contribution plan, benefits depend solely on amounts contributed to the plan plus investment earnings. Employees are eligible to participate immediately upon employment. The OCCDA contributes 2% of each participant’s base salary to the plan. The Authority also matches employee contributions up to a total OCCDA contribution of 5%. Employees are required to contribute a minimum of 2% of base pay to the plan. Participating employees are immediately 100% vested in the member’s accumulated balance. The plan provisions and contribution amounts were established by the OCCDA Board and may be amended by the OCCDA Board. The plan is administered by MERS. The OCCDA and member contributions were $89,258 and $89,258 respectively, for the current year. The Ottawa County Road Commission (“Commission”) provides a defined contribution pension plan for eligible employees excluded from the defined benefit pension plan (externally managed), which provides pension benefits to qualified employees. In a defined contribution plan, benefits depend solely on amounts contributed to the plan plus investment earnings. The Commission’s contribution for employees eligible to participate in the plans vests immediately. The Commission and employees contribute 4% of participant coverage wages. Commission contributions were $100,526 and participant contributions were $100,526 to the plan during the year. The plan provisions and contribution amounts were established and may be amended by the Commission.
81
COUNTY OF OTTAWA, MICHIGAN
NOTES TO THE FINANCIAL STATEMENTS
FOR THE YEAR ENDED SEPTEMBER 30, 2020
11. DEFINED CONTRIBUTION PENSION PLAN
Deferred compensation plan The OCCDA offers to their employees several different deferred compensation plans created in accordance with Internal Revenue Code Section 457. The plans are available to OCCDA employees with various options and employer contribution requirements depending on which bargaining unit the employee is a member. All plans permit employees to defer a portion of their salary until future years. Participation in the plans is optional. The deferred compensation is not available to employees until termination, retirement, death or unforeseeable emergency. The OCCDA employee contributions were $88,200 and OCCDA match was $18,372 for the current year. All amounts of compensation deferred under the plans, all property and rights purchased with those amounts, and all income attributable to those amounts, property or rights are held in trust for the exclusive benefit of participants and their beneficiaries. Investments are managed by the plans' trustees, under one of several investment options, or combination thereof. The choice of the investment option(s) is made by the participants or the investment manager at the option of the employee. As the assets of the trust are managed by the plans trustees, and the County does not have fiduciary responsibility. The plan assets are not recorded in the financial statements of the County. The Commission offers its employees a deferred compensation plan created in accordance with IRS section 457. The plan, available to all Commission employees, permits them to defer a portion of their current salary until future years. A trust has been established for the plan assets and the related assets and liability are not included in the Commission’s financial statements.
82
COUNTY OF OTTAWA, MICHIGAN
NOTES TO THE FINANCIAL STATEMENTS
FOR THE YEAR ENDED SEPTEMBER 30, 2020
12. OTHER POST-EMPLOYMENT BENEFITS
County of Ottawa Plan description The County of Ottawa Retiree Medical Plan (The “Plan”) is a single-employer plan established and administered by the County of Ottawa and can be amended at its discretion. The Plan is included as an Other Post-Employment Benefits (“OPEB”) trust fund in the County’s financial statements; a stand-alone financial report has not been issued, but a legal trust has been established for the plan. Benefits provided Benefit provisions are established through negotiations between the County and bargaining units and employee groups. Retirees under age 65 hired before January 1, 2008 contribute an amount equal to the Priority Health insured premium rate (which is a combined rate for active and pre-65 retirees). Retirees under 65, hired after January 1, 2008 pay the actuarially determined cost of medical and prescription drug benefits for retirees under age 65. All retirees over 65 pay the insured premium rate applicable to retirees over 65. In addition, retirees under age 65 in certain benefit groups receive a monthly credit that is used to reduce the amount of their contribution. The credit amount for the years of service range from $4 - $10 for each year of service with a maximum of $100 - $250 per month. Summary of participants Membership of the Plan consisted of the following as October 1, 2019:
Retired Plan Members 65 Active Plan Members 837 Total Participants 902
Contributions The Plan was established and is being funded under the authority of the County Board of Commissioners and under agreements with the unions representing various classes of employees. The Plan’s funding policy is that the employer will contribute any required amounts as determined by an annual actuarial valuation. There are no long-term contracts for contributions to The Plan. The Plan has no legally required reserves. Net OPEB liability The employer’s net OPEB liability was measured as of September 30, 2020. The total OPEB liability was determined by an actuarial valuation as of October 1, 2019 and projected to September 30, 2020 and rolled forward to September 30, 2019. The following actuarial assumptions applied to all periods included in the measurement:
Inflation Included in rate of return Salary increases 2.0% Investment rate of return 5.00% including inflation Mortality Pub-2010 Headcount weighted mortality table for General and Public
Safety, annuitant and non-annuitant, sex distinct with improvement scale MP-2018
83

COUNTY OF OTTAWA, MICHIGAN
NOTES TO THE FINANCIAL STATEMENTS
FOR THE YEAR ENDED SEPTEMBER 30, 2020
12. OTHER POST-EMPLOYMENT BENEFITS (continued)
Net OPEB Liability (continued) The long-term expected rate of return on retirement plan investments was determined using a building-block method in which best-estimate ranges of expected future real rates of return (expected returns, net of retirement plan investment expense and inflation) are developed for each major asset class. These ranges are combined to produce the long-term expected rate of return by weighting the expected future real rates of return by the target asset allocation percentage and by adding expected inflation. Best estimates of arithmetic real rates of return for each major asset class included in the retirement plan’s target asset allocations of September 30, 2020 are summarized in the following table:
Asset Class Target
Allocation
Expected Rate of Return
US stocks 56% 6.3% International developed stocks 4% 7.0% Emerging market stocks 5% 8.6% Bonds 30% 3.0% Cash 5% 1.4%
The sum of each target allocation times its long-term expected rate is 5.00%.
Discount rate The discount rate used to measure the total OPEB liability was 5.00%. The projection of cash flows used to determine the discount rate assumed that County contributions will be made at rates equal to the most recent recommend contribution expressed as a percentage of covered payroll. Based on those assumptions, the retirement plan’s fiduciary net position was projected to be sufficient to make all projected future benefit payments of current plan members. For projected benefits that are covered by projected assets, the long-term expected rate was used to discount the projected benefits. From the year that the benefit payments were not projected to be covered by the projected assets (the “depletion date”), projected benefits were discounted at a discount rate reflecting a 20-year AA/Aa tax-exempt municipal bond yield. A single equivalent discount rate that yields the same present value of benefits is calculated. This discount rate is used to determine the total OPEB liability. The discount rate used for September 30, 2019 actuarial liability was 5.28%.
84

COUNTY OF OTTAWA, MICHIGAN
NOTES TO THE FINANCIAL STATEMENTS
FOR THE YEAR ENDED SEPTEMBER 30, 2020
12. OTHER POST-EMPLOYMENT BENEFITS (continued)
Changes in the Net OPEB Liability
Total OPEB
Liability (a)
Plan Fiduciary
Net Position (b)
Net OPEB Liability (a) - (b)
Balance at September 30, 2019 $5,652,909 $6,099,606 $(446,697)
Changes during the year Service cost 46,742 - 46,742 Interest 298,361 - 298,361
Experience (gains)/losses (144,260) - (144,260)
Change in actuarial assumptions 487,403 - 487,103 Contributions-employer, including receivable to OPEB trust - 1,539 (1,539) Contributions-employee - - - Contribution to OPEB trust - - - Contributions/expenses paid from general operating funds - - - Contributions/benefit paid from general operating funds - - - Net investment income - 602,108 (602,108) Benefit payments; including refunds of employee contributions (97,766) (97,766) - Administrative expenses - (68,084) 68,084 Other changes - - - Total changes 590,480 437,797 152,683
Balance at September 30, 2020 $6,243,389 $6,537,403 $(294,014)
Sensitivity of the net OPEB liability to changes in the discount rate The following presents the net OPEB liability of the County, calculated using the discount rate of 5.28%, as well as using a discount rate that is 1% higher and lower than base assumptions.
Current
1% Decrease Discount
Rate 1% Increase 4.28% 5.28% 6.28%
Discount Total OPEB Liability $6,866,606 $ 6,243,389 $ 5,707,829 Plan Fiduciary Net Position 6,537,403 6,537,403 6,537,403 Net OPEB Liability $ 329,203 $ (294,014) $ (829,574)
85
COUNTY OF OTTAWA, MICHIGAN
NOTES TO THE FINANCIAL STATEMENTS
FOR THE YEAR ENDED SEPTEMBER 30, 2020
12. OTHER POST-EMPLOYMENT BENEFITS (continued)
Sensitivity of the net OPEB liability to changes in the health cost trend rate The following presents the net OPEB liability of the County, calculated using the trend rate, as well using a trend rate that is 1% higher and lower than base assumptions.
1% Decrease Current Trend 1% Increase Trend Total OPEB Liability $ 5,601,303 $ 6,243,389 $ 7,051,335 Plan Fiduciary Net Position 6,537,403 6,537,403 6,537,403 Net OPEB Liability $ (936,100) $ (294,014) $ 513,932
Pension expense and deferred outflows of resources and deferred inflows of resources related to pensions For the year ended September 30, 2020 the County recognized OPEB expense of $(25,012). The County reported deferred outflows and inflows of resources related to OPEB from the following sources:
Deferred Outflows of Resources
Deferred Inflows of Resources
Differences in experience $ 2,108,325 $ 1,082,576 Differences in assumptions 416,249 1,549,633 Excess (deficit) invest returns - 331,743 Total $ 2,524,574 $ 2,963,952
Amounts reported as deferred outflows and inflows of resources related to OPEB will be recognized in OPEB expense as follows:
Year Ended Amount
Sept 30 Recognized 2021 $ (120,475) 2022 (50,735) 2023 (4,946) 2024 (23,975) 2025 32,903
Thereafter (272,150) $ (439,378)
86
COUNTY OF OTTAWA, MICHIGAN
NOTES TO THE FINANCIAL STATEMENTS
FOR THE YEAR ENDED SEPTEMBER 30, 2020
12. OTHER POST EMPLOYMENT BENEFITS (continued) Ottawa County Road Commission Plan Description and Benefits Provided The Commission administers a single-employer defined benefit healthcare plan (the Retiree Health Plan). The plan provides of health insurance premiums for retirees until age 65 (Medicare eligible). The plan was closed to non-bargaining employees hired after September 12, 2013 and bargaining employees hired after May 31, 2016. Benefit provisions are established through negotiations between the Commission and bargaining units and employee groups. The Commission makes 80% of the premium payment to the plan. The Retiree Health Plan does not issue a publicly available financial report but a legal trust has not been established for the plan. The retiree contribution was 20% and a benefit freeze was put in place for bargaining employees hired after May 31, 2016 and non-bargaining employees hired after September 12, 2013.
Membership of the Retiree Health plan consisted of the following at the date of the latest actuarial valuation (September 30, 2020):
Inactive employees or beneficiaries currently receiving benefits 72 Active plan members 17
Total 89
Contributions
The contribution requirements of Plan members and the Commission are established and may be amended by the Commission. The actuarially determined contributions are based on the actuarial valuation of the plan. The actual contributions to the plan include benefit costs (80% and 20% made by the Commission and employees respectively) and a contribution to the trust which is made at the discretion of Commission.
Net OPEB Liability
The employer’s net OPEB liability was measured as of September 30, 2020 using a method of rolling forward the September 30, 2019 valuation. The total OPEB liability used to calculate the net OPEB liability was determined by an annual actuarial valuation as of that date.
The total OPEB liability in the October 1, 2019 annual actuarial valuation was determined using the following actuarial assumptions, applied to all periods included in the measurement:
Inflation: 2.5%
Salary Increases: 0.0%
Discount rate: 7.03%
Healthcare cost trend rates: 8.0 initially going down 0.5% per year, reaching a long-term rate of 5.0%
Mortality rates were based on the 2018 IRS Annuitant and Non-Annuitant tables
The actuarial assumptions used in valuation were based on the results of the 2018 actuarial experience study.
87
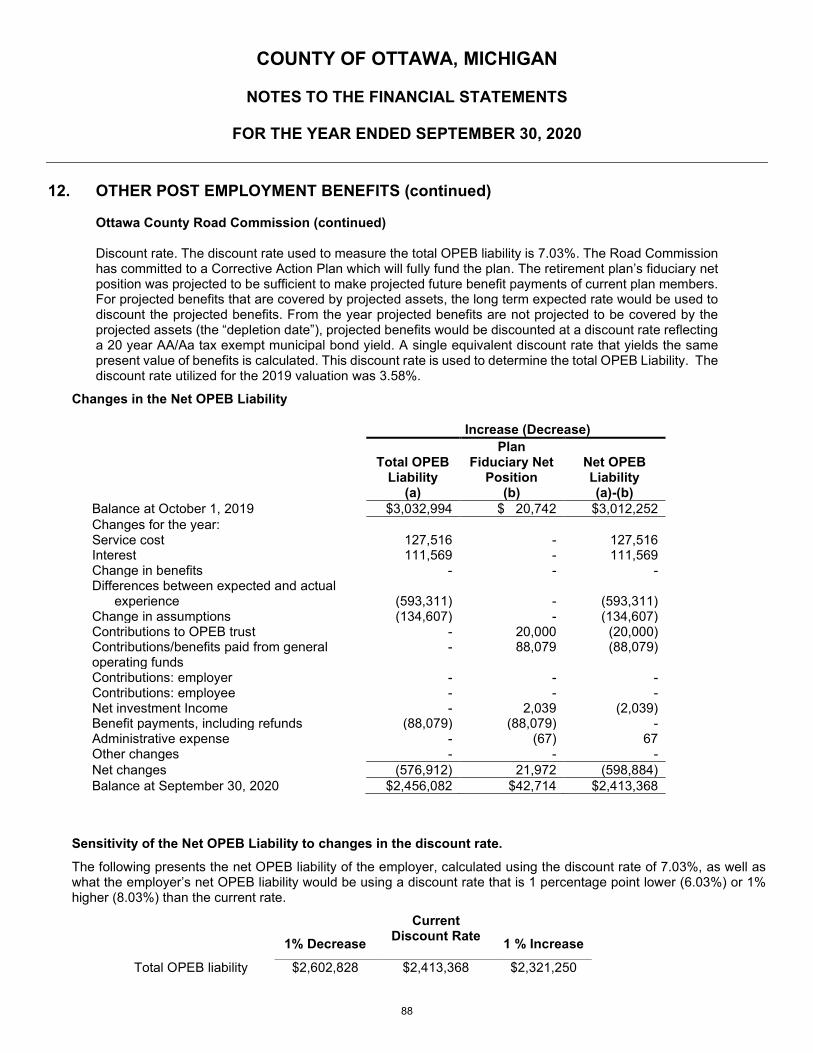
COUNTY OF OTTAWA, MICHIGAN
NOTES TO THE FINANCIAL STATEMENTS
FOR THE YEAR ENDED SEPTEMBER 30, 2020
12. OTHER POST EMPLOYMENT BENEFITS (continued) Ottawa County Road Commission (continued) Discount rate. The discount rate used to measure the total OPEB liability is 7.03%. The Road Commission has committed to a Corrective Action Plan which will fully fund the plan. The retirement plan’s fiduciary net position was projected to be sufficient to make projected future benefit payments of current plan members. For projected benefits that are covered by projected assets, the long term expected rate would be used to discount the projected benefits. From the year projected benefits are not projected to be covered by the projected assets (the “depletion date”), projected benefits would be discounted at a discount rate reflecting a 20 year AA/Aa tax exempt municipal bond yield. A single equivalent discount rate that yields the same present value of benefits is calculated. This discount rate is used to determine the total OPEB Liability. The discount rate utilized for the 2019 valuation was 3.58%.
Changes in the Net OPEB Liability
Increase (Decrease)
Total OPEB Liability
(a)
Plan Fiduciary Net
Position (b)
Net OPEB Liability (a)-(b)
Balance at October 1, 2019 $3,032,994 $ 20,742 $3,012,252 Changes for the year: Service cost 127,516 - 127,516 Interest 111,569 - 111,569 Change in benefits - - - Differences between expected and actual
experience
(593,311)
-
(593,311) Change in assumptions (134,607) - (134,607) Contributions to OPEB trust - 20,000 (20,000) Contributions/benefits paid from general operating funds
- 88,079 (88,079)
Contributions: employer - - - Contributions: employee - - - Net investment Income - 2,039 (2,039) Benefit payments, including refunds (88,079) (88,079) - Administrative expense - (67) 67 Other changes - - - Net changes (576,912) 21,972 (598,884) Balance at September 30, 2020 $2,456,082 $42,714 $2,413,368
Sensitivity of the Net OPEB Liability to changes in the discount rate. The following presents the net OPEB liability of the employer, calculated using the discount rate of 7.03%, as well as what the employer’s net OPEB liability would be using a discount rate that is 1 percentage point lower (6.03%) or 1% higher (8.03%) than the current rate.
1% Decrease
Current Discount Rate
1 % Increase
Total OPEB liability $2,602,828 $2,413,368 $2,321,250
88

COUNTY OF OTTAWA, MICHIGAN
NOTES TO THE FINANCIAL STATEMENTS
FOR THE YEAR ENDED SEPTEMBER 30, 2020
12. OTHER POST EMPLOYMENT BENEFITS (continued) Ottawa County Road Commission (continued) Sensitivity of the Net OPEB Liability to changes in the healthcare cost trend rates. The following presents the net OPEB liability of the employer, calculated using the healthcare cost trend rate, as well as what the employer’s net OPEB liability would be using a rate that is 1 percentage point lower or 1% higher than the current rate.
1% Decrease
Current Healthcare Rate
1 % Increase
Total OPEB liability $2,268,067 $2,413,368 $2,670,331
For the year ended September 30, 2020 the employer recognized OPEB expense of $280,360. Deferred outflows of resources and deferred inflows of resources related to OPEB For the year ended September 30, 2020 the employer reported deferred outflows and inflows of resources related to OPEB from the following sources:
Deferred Outflows of Resources
Deferred Inflows of Resources
Differences in experience $ - $600,108 Differences in assumptions 886,129 183,124 Excess(deficit) investment returns 704 - Total $886,833 $783,232
Amounts reported as deferred outflows and inflows of resources related to OPEB will be recognized in OPEB expense as follows:
2021 $44,152 2022 44,152 2023 44,150 2024 44,158 2025 45,383 Thereafter (118,394) Total $103,601
89
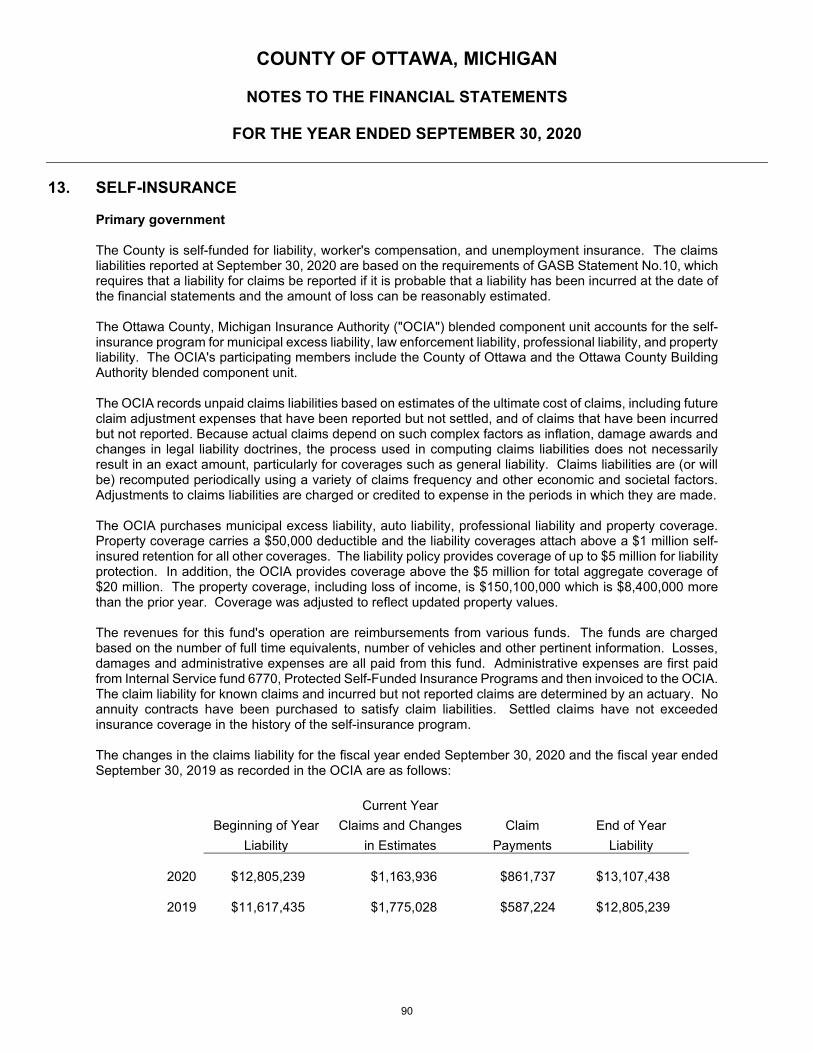
COUNTY OF OTTAWA, MICHIGAN
NOTES TO THE FINANCIAL STATEMENTS
FOR THE YEAR ENDED SEPTEMBER 30, 2020
13. SELF-INSURANCE
Primary government The County is self-funded for liability, worker's compensation, and unemployment insurance. The claims liabilities reported at September 30, 2020 are based on the requirements of GASB Statement No.10, which requires that a liability for claims be reported if it is probable that a liability has been incurred at the date of the financial statements and the amount of loss can be reasonably estimated. The Ottawa County, Michigan Insurance Authority ("OCIA") blended component unit accounts for the self-insurance program for municipal excess liability, law enforcement liability, professional liability, and property liability. The OCIA's participating members include the County of Ottawa and the Ottawa County Building Authority blended component unit. The OCIA records unpaid claims liabilities based on estimates of the ultimate cost of claims, including future claim adjustment expenses that have been reported but not settled, and of claims that have been incurred but not reported. Because actual claims depend on such complex factors as inflation, damage awards and changes in legal liability doctrines, the process used in computing claims liabilities does not necessarily result in an exact amount, particularly for coverages such as general liability. Claims liabilities are (or will be) recomputed periodically using a variety of claims frequency and other economic and societal factors. Adjustments to claims liabilities are charged or credited to expense in the periods in which they are made. The OCIA purchases municipal excess liability, auto liability, professional liability and property coverage. Property coverage carries a $50,000 deductible and the liability coverages attach above a $1 million self-insured retention for all other coverages. The liability policy provides coverage of up to $5 million for liability protection. In addition, the OCIA provides coverage above the $5 million for total aggregate coverage of $20 million. The property coverage, including loss of income, is $150,100,000 which is $8,400,000 more than the prior year. Coverage was adjusted to reflect updated property values. The revenues for this fund's operation are reimbursements from various funds. The funds are charged based on the number of full time equivalents, number of vehicles and other pertinent information. Losses, damages and administrative expenses are all paid from this fund. Administrative expenses are first paid from Internal Service fund 6770, Protected Self-Funded Insurance Programs and then invoiced to the OCIA. The claim liability for known claims and incurred but not reported claims are determined by an actuary. No annuity contracts have been purchased to satisfy claim liabilities. Settled claims have not exceeded insurance coverage in the history of the self-insurance program. The changes in the claims liability for the fiscal year ended September 30, 2020 and the fiscal year ended September 30, 2019 as recorded in the OCIA are as follows:
Current Year Beginning of Year Claims and Changes Claim End of Year
Liability in Estimates Payments Liability
2020 $12,805,239 $1,163,936 $861,737 $13,107,438
2019 $11,617,435 $1,775,028 $587,224 $12,805,239
90
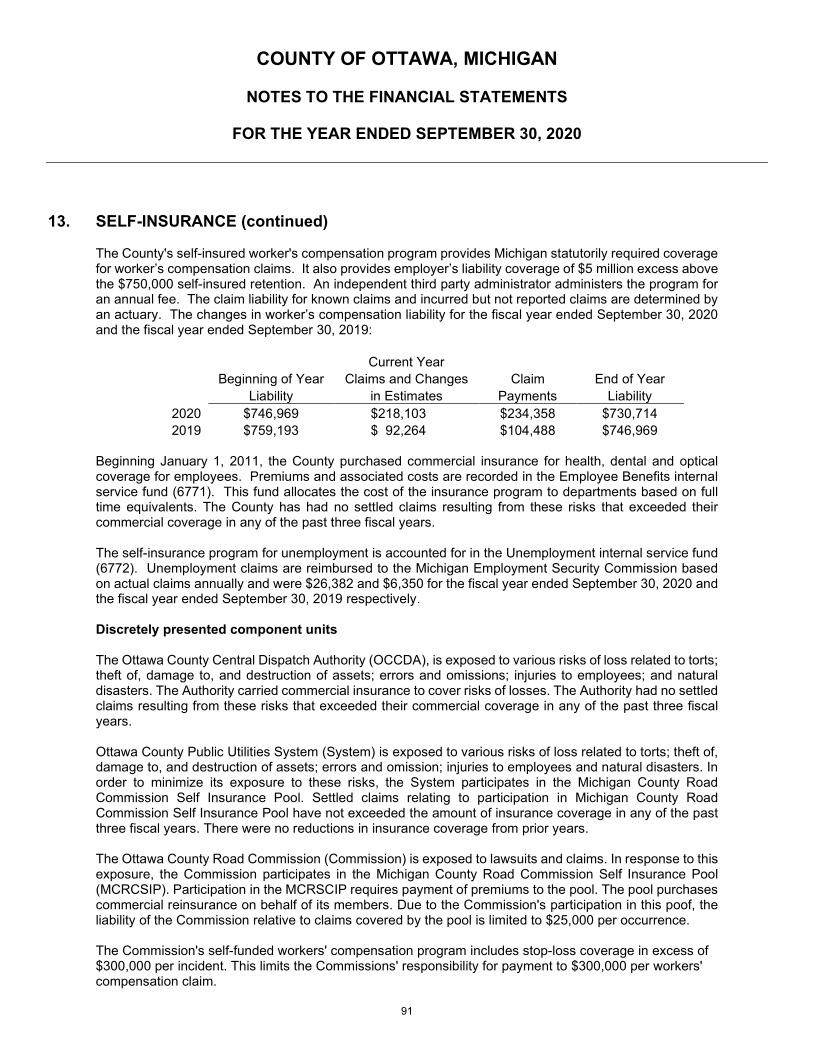
COUNTY OF OTTAWA, MICHIGAN
NOTES TO THE FINANCIAL STATEMENTS
FOR THE YEAR ENDED SEPTEMBER 30, 2020
13. SELF-INSURANCE (continued)
The County's self-insured worker's compensation program provides Michigan statutorily required coverage for worker’s compensation claims. It also provides employer’s liability coverage of $5 million excess above the $750,000 self-insured retention. An independent third party administrator administers the program for an annual fee. The claim liability for known claims and incurred but not reported claims are determined by an actuary. The changes in worker’s compensation liability for the fiscal year ended September 30, 2020 and the fiscal year ended September 30, 2019:
Current Year Beginning of Year Claims and Changes Claim End of Year Liability in Estimates Payments Liability
2020 $746,969 $218,103 $234,358 $730,714 2019 $759,193 $ 92,264 $104,488 $746,969
Beginning January 1, 2011, the County purchased commercial insurance for health, dental and optical coverage for employees. Premiums and associated costs are recorded in the Employee Benefits internal service fund (6771). This fund allocates the cost of the insurance program to departments based on full time equivalents. The County has had no settled claims resulting from these risks that exceeded their commercial coverage in any of the past three fiscal years. The self-insurance program for unemployment is accounted for in the Unemployment internal service fund (6772). Unemployment claims are reimbursed to the Michigan Employment Security Commission based on actual claims annually and were $26,382 and $6,350 for the fiscal year ended September 30, 2020 and the fiscal year ended September 30, 2019 respectively. Discretely presented component units The Ottawa County Central Dispatch Authority (OCCDA), is exposed to various risks of loss related to torts; theft of, damage to, and destruction of assets; errors and omissions; injuries to employees; and natural disasters. The Authority carried commercial insurance to cover risks of losses. The Authority had no settled claims resulting from these risks that exceeded their commercial coverage in any of the past three fiscal years. Ottawa County Public Utilities System (System) is exposed to various risks of loss related to torts; theft of, damage to, and destruction of assets; errors and omission; injuries to employees and natural disasters. In order to minimize its exposure to these risks, the System participates in the Michigan County Road Commission Self Insurance Pool. Settled claims relating to participation in Michigan County Road Commission Self Insurance Pool have not exceeded the amount of insurance coverage in any of the past three fiscal years. There were no reductions in insurance coverage from prior years. The Ottawa County Road Commission (Commission) is exposed to lawsuits and claims. In response to this exposure, the Commission participates in the Michigan County Road Commission Self Insurance Pool (MCRCSIP). Participation in the MCRSCIP requires payment of premiums to the pool. The pool purchases commercial reinsurance on behalf of its members. Due to the Commission's participation in this poof, the liability of the Commission relative to claims covered by the pool is limited to $25,000 per occurrence. The Commission's self-funded workers' compensation program includes stop-loss coverage in excess of $300,000 per incident. This limits the Commissions' responsibility for payment to $300,000 per workers' compensation claim.
91
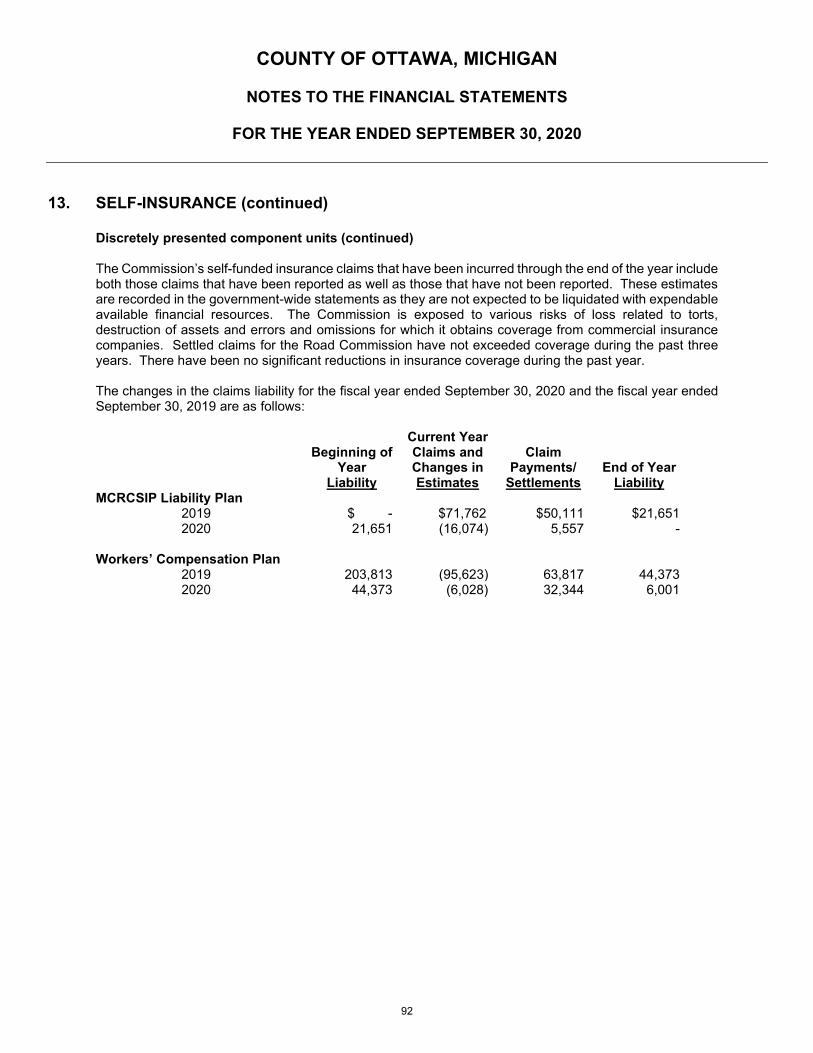
COUNTY OF OTTAWA, MICHIGAN
NOTES TO THE FINANCIAL STATEMENTS
FOR THE YEAR ENDED SEPTEMBER 30, 2020
13. SELF-INSURANCE (continued)
Discretely presented component units (continued) The Commission’s self-funded insurance claims that have been incurred through the end of the year include both those claims that have been reported as well as those that have not been reported. These estimates are recorded in the government-wide statements as they are not expected to be liquidated with expendable available financial resources. The Commission is exposed to various risks of loss related to torts, destruction of assets and errors and omissions for which it obtains coverage from commercial insurance companies. Settled claims for the Road Commission have not exceeded coverage during the past three years. There have been no significant reductions in insurance coverage during the past year. The changes in the claims liability for the fiscal year ended September 30, 2020 and the fiscal year ended September 30, 2019 are as follows:
Beginning of Year
Liability
Current Year Claims and Changes in Estimates
Claim
Payments/ Settlements
End of Year Liability
MCRCSIP Liability Plan 2019 $ - $71,762 $50,111 $21,651 2020 21,651 (16,074) 5,557 -
Workers’ Compensation Plan
2019 203,813 (95,623) 63,817 44,373 2020 44,373 (6,028) 32,344 6,001
92
COUNTY OF OTTAWA, MICHIGAN
NOTES TO THE FINANCIAL STATEMENTS
FOR THE YEAR ENDED SEPTEMBER 30, 2020
14. LITIGATION
In the normal course of its activities, the County is a party to various legal actions and subject to certain asserted and unasserted claims. The County refers these actions and claims to the Ottawa County, Michigan Insurance Authority which has sufficient expertise, reserves, excess insurance coverage and available surplus to defend against or, if necessary, satisfy any of these claims and mitigate any negative effects on the County’s financial condition.
93
COUNTY OF OTTAWA, MICHIGAN
NOTES TO THE FINANCIAL STATEMENTS
FOR THE YEAR ENDED SEPTEMBER 30, 2020
15. RELATED PARTY TRANSACTIONS
During the year ended September 30, 2020, the County provided OCCDA operating grants of $5,274,303 from the 2019 levy. During the year ended September 30, 2020, the County provided OCRC operating grants of $4,619,041 from the 2019 levy. Ottawa County Public Utilities System (“System”) incurred expenses of approximately $1,140,000 for wages and equipment provided by the Ottawa County Road Commission, which also provides fiscal and managerial services to the System. At their year-end, the System owed the Ottawa County Road Commission $5,097 for these goods and services.
94
COUNTY OF OTTAWA, MICHIGAN
NOTES TO THE FINANCIAL STATEMENTS
FOR THE YEAR ENDED SEPTEMBER 30, 2020
16. TAX ABATEMENTS
The County receives reduced property tax revenues as a result of Industrial Facilities Tax exemptions. Industrial Facilities Tax Exemptions (IFT), entered into under the Plant Rehabilitation and Industrial Development Districts Act PA 198 of 1974, as amended, provide a tax incentive to manufacturers to enable renovation and expansion of aging facilities, assist in the building of new facilities, and to promote the establishment of high tech facilities. An IFT certificate entitles the facility to exemption from ad valorem real and/or personal property taxes for a term of 1-12 years as determined by the local unit of government and is computed at half the local property tax millage rate, amounting to a reduction in property taxes of approximately 50%. The amount of IFT Exemptions for the year ended September 30, 2020 was approximately $829,000. Of the $829,000 abated, approximately $416,000 of the abatements were initiated by various townships in the County and $413,000 were initiated by various cities in the County.
95

SUPPLEMENTARY
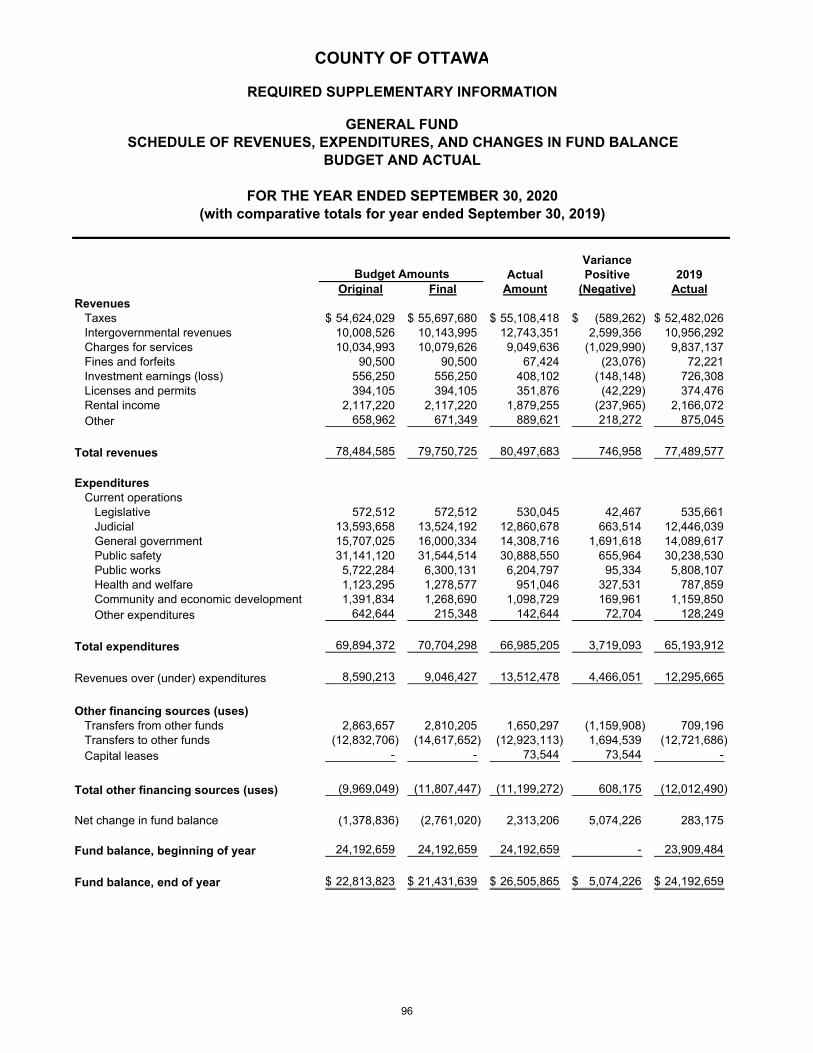
VarianceActual Positive 2019
Original Final Amount (Negative) ActualRevenues
Taxes 54,624,029$ 55,697,680$ 55,108,418$ (589,262)$ 52,482,026$ Intergovernmental revenues 10,008,526 10,143,995 12,743,351 2,599,356 10,956,292 Charges for services 10,034,993 10,079,626 9,049,636 (1,029,990) 9,837,137 Fines and forfeits 90,500 90,500 67,424 (23,076) 72,221 Investment earnings (loss) 556,250 556,250 408,102 (148,148) 726,308 Licenses and permits 394,105 394,105 351,876 (42,229) 374,476 Rental income 2,117,220 2,117,220 1,879,255 (237,965) 2,166,072 Other 658,962 671,349 889,621 218,272 875,045
Total revenues 78,484,585 79,750,725 80,497,683 746,958 77,489,577
ExpendituresCurrent operations
Legislative 572,512 572,512 530,045 42,467 535,661 Judicial 13,593,658 13,524,192 12,860,678 663,514 12,446,039 General government 15,707,025 16,000,334 14,308,716 1,691,618 14,089,617 Public safety 31,141,120 31,544,514 30,888,550 655,964 30,238,530 Public works 5,722,284 6,300,131 6,204,797 95,334 5,808,107 Health and welfare 1,123,295 1,278,577 951,046 327,531 787,859 Community and economic development 1,391,834 1,268,690 1,098,729 169,961 1,159,850 Other expenditures 642,644 215,348 142,644 72,704 128,249
Total expenditures 69,894,372 70,704,298 66,985,205 3,719,093 65,193,912
Revenues over (under) expenditures 8,590,213 9,046,427 13,512,478 4,466,051 12,295,665
Other financing sources (uses)
Transfers from other funds 2,863,657 2,810,205 1,650,297 (1,159,908) 709,196 Transfers to other funds (12,832,706) (14,617,652) (12,923,113) 1,694,539 (12,721,686) Capital leases - - 73,544 73,544 -
Total other financing sources (uses) (9,969,049) (11,807,447) (11,199,272) 608,175 (12,012,490)
Net change in fund balance (1,378,836) (2,761,020) 2,313,206 5,074,226 283,175
Fund balance, beginning of year 24,192,659 24,192,659 24,192,659 - 23,909,484
Fund balance, end of year 22,813,823$ 21,431,639$ 26,505,865$ 5,074,226$ 24,192,659$
SCHEDULE OF REVENUES, EXPENDITURES, AND CHANGES IN FUND BALANCEGENERAL FUND
COUNTY OF OTTAWA
Budget Amounts
(with comparative totals for year ended September 30, 2019)FOR THE YEAR ENDED SEPTEMBER 30, 2020
BUDGET AND ACTUAL
REQUIRED SUPPLEMENTARY INFORMATION
96
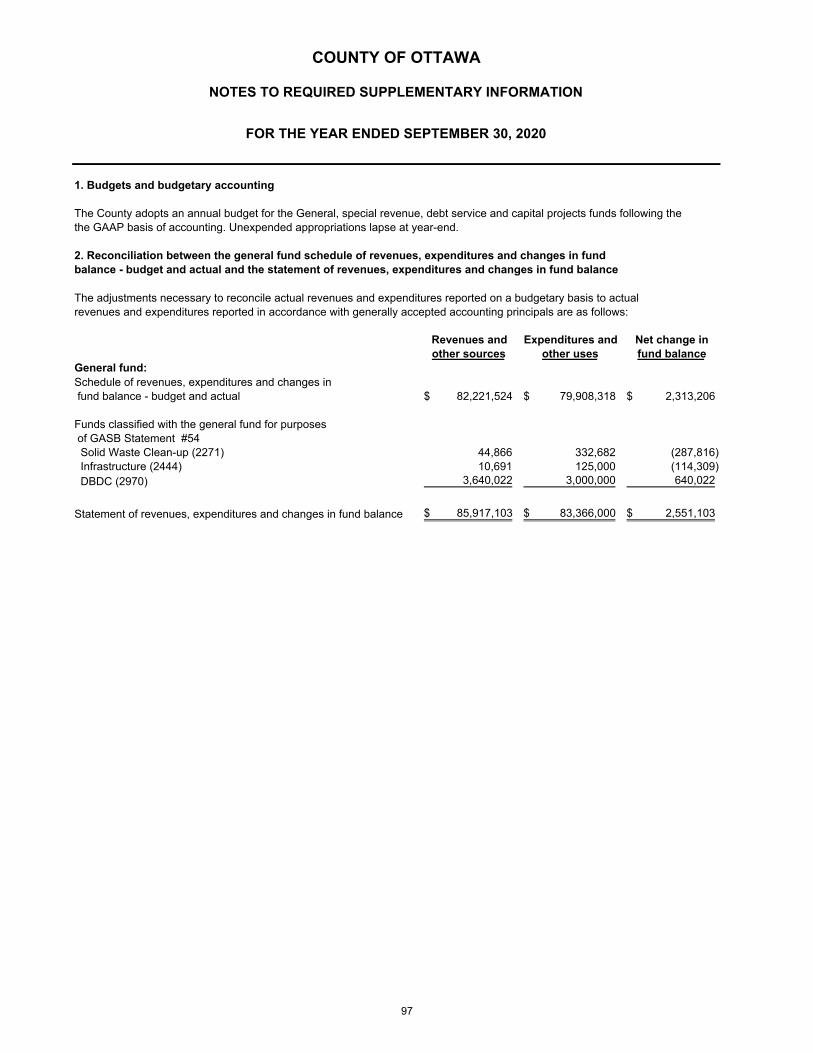
1. Budgets and budgetary accounting
2. Reconciliation between the general fund schedule of revenues, expenditures and changes in fundbalance - budget and actual and the statement of revenues, expenditures and changes in fund balance
The adjustments necessary to reconcile actual revenues and expenditures reported on a budgetary basis to actual revenues and expenditures reported in accordance with generally accepted accounting principals are as follows:
Revenues and Expenditures and Net change inother sources other uses fund balance
General fund:Schedule of revenues, expenditures and changes in fund balance - budget and actual 82,221,524$ 79,908,318$ 2,313,206$
Funds classified with the general fund for purposes of GASB Statement #54 Solid Waste Clean-up (2271) 44,866 332,682 (287,816) Infrastructure (2444) 10,691 125,000 (114,309) DBDC (2970) 3,640,022 3,000,000 640,022
Statement of revenues, expenditures and changes in fund balance 85,917,103$ 83,366,000$ 2,551,103$
The County adopts an annual budget for the General, special revenue, debt service and capital projects funds following thethe GAAP basis of accounting. Unexpended appropriations lapse at year-end.
COUNTY OF OTTAWA
NOTES TO REQUIRED SUPPLEMENTARY INFORMATION
FOR THE YEAR ENDED SEPTEMBER 30, 2020
97

VarianceActual Positive 2019
Original Final Amount (Negative) ActualRevenues
Intergovernmental revenues 38,474,355$ 39,244,057$ 40,628,166$ 1,384,109$ 36,618,920$ Charges for services 188,353 188,353 22,619 (165,734) 241,392 Investment earnings (loss) - - 26,804 26,804 (27,890) Other 48,452 48,667 90,200 41,533 107,545
Total revenues 38,711,160 39,481,077 40,767,789 1,286,712 36,939,967
ExpendituresCurrent operations
Personnel services 9,885,521 10,119,345 9,604,158 515,187 9,022,543 Supplies 354,386 450,312 329,972 120,340 825,897 Other services and charges 29,897,753 30,337,920 30,918,624 (580,704) 28,909,694
Total expenditures 40,137,660 40,907,577 40,852,754 54,823 38,758,134
Revenues over (under) expenditures (1,426,500) (1,426,500) (84,965) 1,341,535 (1,818,167)
Other financing sources (uses)Transfers from other funds 1,426,500 1,426,500 476,500 950,000 1,818,167
Total other financing sources (uses) 1,426,500 1,426,500 476,500 950,000 1,818,167
Net change in fund balance - - 391,535 2,291,535 -
Fund balance, beginning of year 643,537 643,537 643,537 - 643,537
Fund balance, end of year 643,537$ 643,537$ 1,035,072$ 2,291,535$ 643,537$
Budget Amounts
COUNTY OF OTTAWA
COMMUNITY MENTAL HEALTH (2220)SCHEDULE OF REVENUES, EXPENDITURES, AND CHANGES IN FUND BALANCE
BUDGET AND ACTUAL
FOR THE YEAR ENDED SEPTEMBER 30, 2020(with comparative totals for year ended September 30, 2019)
REQUIRED SUPPLEMENTARY INFORMATION
98

VarianceActual Positive 2019
Original Final Amount (Negative) ActualRevenues
Intergovernmental revenues 3,034,121$ 3,617,976$ 2,874,370$ (743,606)$ 2,927,254$ Investment earnings - - 9,079 9,079 39,137 Other - - - - 2,017
Total revenues 3,034,121 3,617,976 2,883,449 (734,527) 2,968,408
ExpendituresCurrent operations
Personnel services 251,970 507,809 456,887 50,922 335,789 Supplies 4,507 21,117 7,936 13,181 4,495 Other services and charges 2,777,644 3,164,050 2,392,188 771,862 2,667,419
Total expenditures 3,034,121 3,692,976 2,857,011 835,965 3,007,703
Revenues over (under) expenditures - (75,000) 26,438 (101,438) (39,295)
Other financing sources (uses)Transfers from other funds - 75,000 64,373 (10,627) -
Total other financing sources (uses) - 75,000 64,373 (10,627) -
Net change in fund balance - - 90,811 (112,065) (39,295)
Fund balance, beginning of year 21,720 21,720 10,300 - 49,595
Fund balance, end of year 21,720$ 21,720$ 101,111$ (112,065)$ 10,300$
Budget Amounts
COUNTY OF OTTAWA
SUBSTANCE USE DISORDER (2225)SCHEDULE OF REVENUES, EXPENDITURES, AND CHANGES IN FUND BALANCE
BUDGET AND ACTUAL
FOR THE YEAR ENDED SEPTEMBER 30, 2020(with comparative totals for year ended September 30, 2019)
REQUIRED SUPPLEMENTARY INFORMATION
99
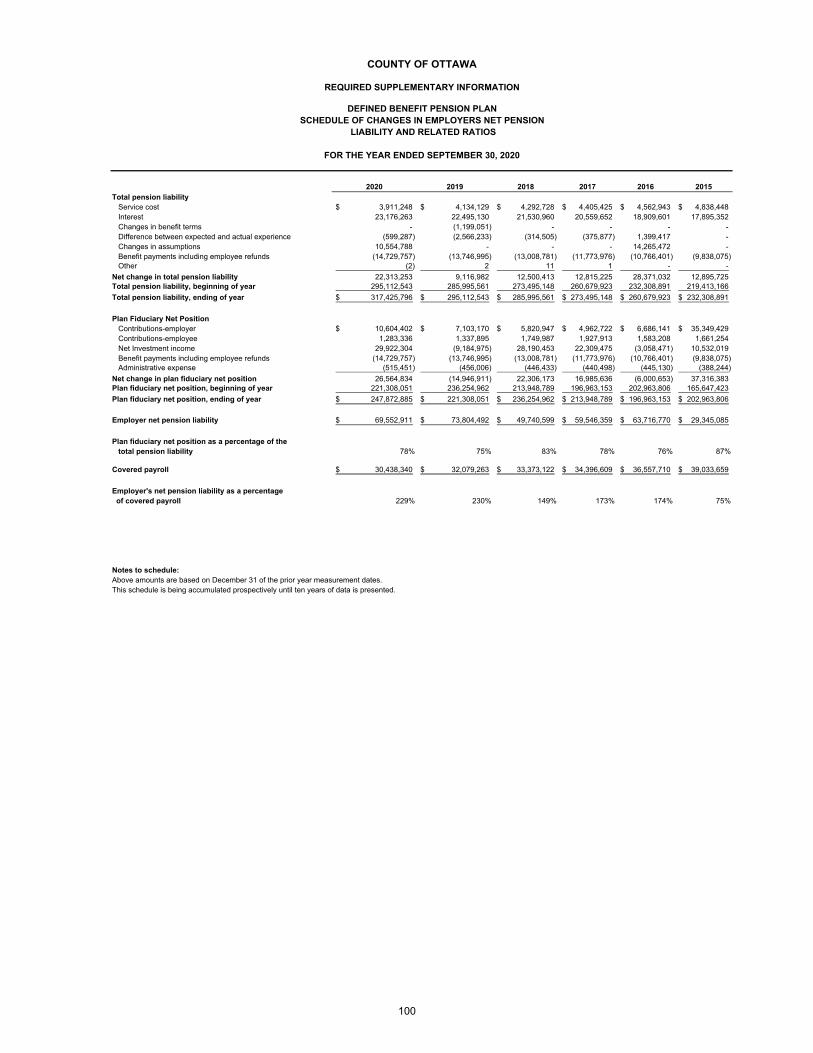
2020 2019 2018 2017 2016 2015Total pension liability
Service cost 3,911,248$ 4,134,129$ 4,292,728$ 4,405,425$ 4,562,943$ 4,838,448$ Interest 23,176,263 22,495,130 21,530,960 20,559,652 18,909,601 17,895,352 Changes in benefit terms - (1,199,051) - - - - Difference between expected and actual experience (599,287) (2,566,233) (314,505) (375,877) 1,399,417 - Changes in assumptions 10,554,788 - - - 14,265,472 - Benefit payments including employee refunds (14,729,757) (13,746,995) (13,008,781) (11,773,976) (10,766,401) (9,838,075) Other (2) 2 11 1 - -
Net change in total pension liability 22,313,253 9,116,982 12,500,413 12,815,225 28,371,032 12,895,725 Total pension liability, beginning of year 295,112,543 285,995,561 273,495,148 260,679,923 232,308,891 219,413,166
Total pension liability, ending of year 317,425,796$ 295,112,543$ 285,995,561$ 273,495,148$ 260,679,923$ 232,308,891$
Plan Fiduciary Net PositionContributions-employer 10,604,402$ 7,103,170$ 5,820,947$ 4,962,722$ 6,686,141$ 35,349,429$ Contributions-employee 1,283,336 1,337,895 1,749,987 1,927,913 1,583,208 1,661,254 Net Investment income 29,922,304 (9,184,975) 28,190,453 22,309,475 (3,058,471) 10,532,019 Benefit payments including employee refunds (14,729,757) (13,746,995) (13,008,781) (11,773,976) (10,766,401) (9,838,075) Administrative expense (515,451) (456,006) (446,433) (440,498) (445,130) (388,244)
Net change in plan fiduciary net position 26,564,834 (14,946,911) 22,306,173 16,985,636 (6,000,653) 37,316,383 Plan fiduciary net position, beginning of year 221,308,051 236,254,962 213,948,789 196,963,153 202,963,806 165,647,423
Plan fiduciary net position, ending of year 247,872,885$ 221,308,051$ 236,254,962$ 213,948,789$ 196,963,153$ 202,963,806$
Employer net pension liability 69,552,911$ 73,804,492$ 49,740,599$ 59,546,359$ 63,716,770$ 29,345,085$
Plan fiduciary net position as a percentage of the total pension liability 78% 75% 83% 78% 76% 87%
Covered payroll 30,438,340$ 32,079,263$ 33,373,122$ 34,396,609$ 36,557,710$ 39,033,659$
Employer's net pension liability as a percentage of covered payroll 229% 230% 149% 173% 174% 75%
Notes to schedule:Above amounts are based on December 31 of the prior year measurement dates.This schedule is being accumulated prospectively until ten years of data is presented.
COUNTY OF OTTAWA
REQUIRED SUPPLEMENTARY INFORMATION
DEFINED BENEFIT PENSION PLANSCHEDULE OF CHANGES IN EMPLOYERS NET PENSION
LIABILITY AND RELATED RATIOS
FOR THE YEAR ENDED SEPTEMBER 30, 2020
100

2020 2019 2018 2017 2016 2015
Actuarial determined contributions 7,880,199$ 7,296,615$ 6,685,320$ 5,606,562$ 3,717,504$ 6,664,452$ Contributions in relation to the actuarially
determined contribution 10,880,199 7,296,615 6,685,320 5,606,562 3,717,504 6,664,452
Contribution deficiency (excess) (3,000,000)$ -$ -$ -$ -$ -$
Covered payroll 30,554,828$ 32,292,727$ 33,302,626$ 34,764,334$ 27,462,087$ 39,033,659$
Contributions as a percentage of covered payroll 36% 23% 20% 16% 14% 17%
Notes to scheduleActuarial cost method Entry AgeAmortization method Level percentage of payroll, closedRemaining amortization period 20-24 yearsAsset valuation method 5 year smoothed (10 year smoothed for 2014)Inflation 2.5% (3-4% for 2014)Salary increases 3.75% (4.50% for 2014)Investment rate of return 7.75% (8.00% for 2014)Retirement age Varies depending on plan adoptionMortality 50% female/ 50% male RP-2014
mortality table
This schedule is being accumulated prospectively until ten years of data is presented.
COUNTY OF OTTAWA
DEFINED BENEFIT PENSION PLANSCHEDULE OF EMPLOYER CONTRIBUTIONS
FOR THE YEAR ENDED SEPTEMBER 30, 2020
REQUIRED SUPPLEMENTARY INFORMATION
101
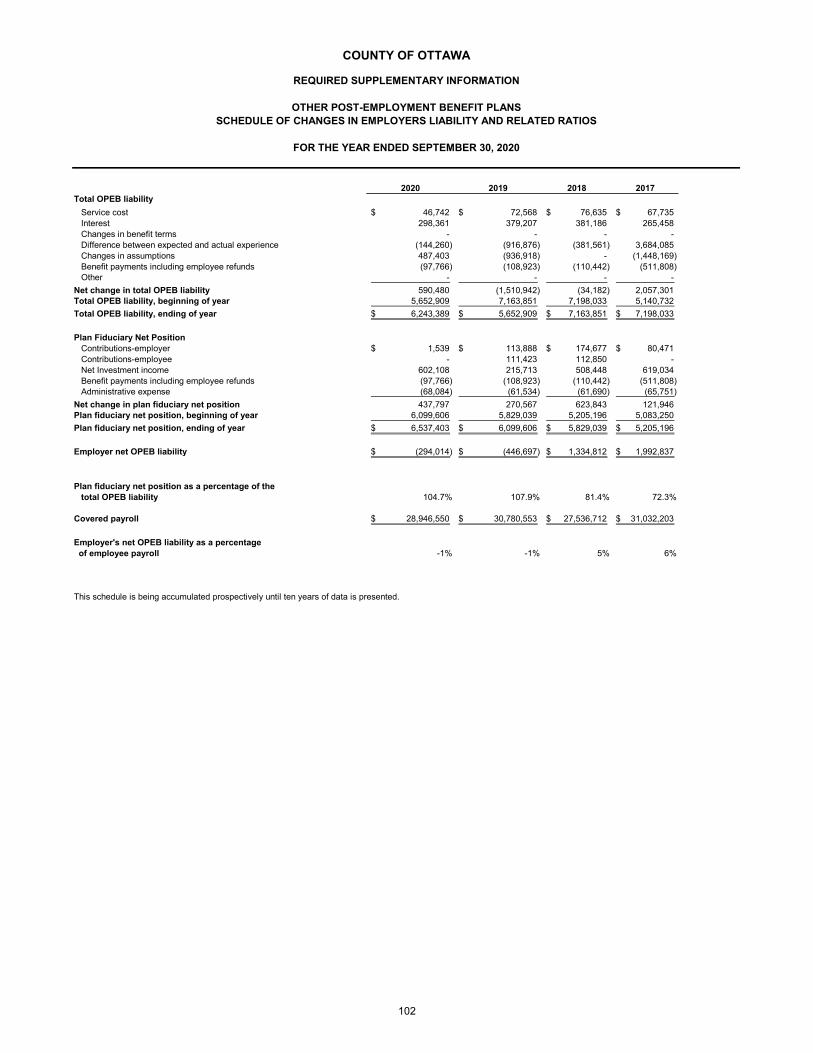
2020 2019 2018 2017Total OPEB liability
Service cost 46,742$ 72,568$ 76,635$ 67,735$ Interest 298,361 379,207 381,186 265,458 Changes in benefit terms - - - - Difference between expected and actual experience (144,260) (916,876) (381,561) 3,684,085 Changes in assumptions 487,403 (936,918) - (1,448,169) Benefit payments including employee refunds (97,766) (108,923) (110,442) (511,808) Other - - - -
Net change in total OPEB liability 590,480 (1,510,942) (34,182) 2,057,301 Total OPEB liability, beginning of year 5,652,909 7,163,851 7,198,033 5,140,732
Total OPEB liability, ending of year 6,243,389$ 5,652,909$ 7,163,851$ 7,198,033$
Plan Fiduciary Net PositionContributions-employer 1,539$ 113,888$ 174,677$ 80,471$ Contributions-employee - 111,423 112,850 - Net Investment income 602,108 215,713 508,448 619,034 Benefit payments including employee refunds (97,766) (108,923) (110,442) (511,808) Administrative expense (68,084) (61,534) (61,690) (65,751)
Net change in plan fiduciary net position 437,797 270,567 623,843 121,946 Plan fiduciary net position, beginning of year 6,099,606 5,829,039 5,205,196 5,083,250
Plan fiduciary net position, ending of year 6,537,403$ 6,099,606$ 5,829,039$ 5,205,196$
Employer net OPEB liability (294,014)$ (446,697)$ 1,334,812$ 1,992,837$
Plan fiduciary net position as a percentage of the total OPEB liability 104.7% 107.9% 81.4% 72.3%
Covered payroll 28,946,550$ 30,780,553$ 27,536,712$ 31,032,203$
Employer's net OPEB liability as a percentage of employee payroll -1% -1% 5% 6%
This schedule is being accumulated prospectively until ten years of data is presented.
COUNTY OF OTTAWA
REQUIRED SUPPLEMENTARY INFORMATION
OTHER POST-EMPLOYMENT BENEFIT PLANSSCHEDULE OF CHANGES IN EMPLOYERS LIABILITY AND RELATED RATIOS
FOR THE YEAR ENDED SEPTEMBER 30, 2020
102

2020 2019 2018 2017
Actuarially determined contributions 1,539$ 225,311$ 287,527$ 80,471$ Contributions in relation to the actuarially
determined contribution 1,539 225,311 287,527 80,471
Contribution deficiency (excess) -$ -$ -$ -$
Covered payroll 28,946,550$ 30,780,553$ 27,536,712$ 31,032,203$
Contributions as a percentage of covered payroll 0.01% 0.73% 1.04% 0.26%
Notes to scheduleActuarial cost method Entry AgeAmortization method Level percentage of compensationRemaining amortization period 12 year level percentage of payrollAsset valuation method Equal to market value of assetsInflation Included in rate of returnSalary increases 2.00%Investment rate of return 5.28% (including inflation)Retirement age Varies depending on plan adoptionMortality 50% female/ 50% male RP-2014
mortality table
Annual money-weighted rate of return net of investment expense 9.37% 3.62% 9.24% 26.07%
This schedule is being accumulated prospectively until ten years of data is presented.
COUNTY OF OTTAWA
REQUIRED SUPPLEMENTARY INFORMATION
OTHER POST-EMPLOYMENT BENEFIT PLANSSCHEDULE OF EMPLOYER CONTRIBUTIONS
FOR THE YEAR ENDED SEPTEMBER 30, 2020
103

SolidGeneral Waste
Fund Clean-Up Infrastructure(1010) (2271) (2444)
AssetsCash and pooled investments 21,057,085$ 2,723,070$ 633,666$ Receivables (net of allowance for estimated uncollectibles)
Taxes 5,030,466 - - Accounts 576,385 - -
Accrued interest on investments 223,659 - - Due from other funds 63,476 - - Interfund receivable 1,564,898 - - Advances to component units 325,000 - - Due from other governmental units 2,836,300 - - Inventory of supplies 81,191 - - Prepaid expenditures 124,810 - -
Total assets 31,883,270 2,723,070 633,666
Liabilities, deferred inflows of resourcesand fund balances
LiabilitiesAccounts payable 2,341,035 85,972 - Due to other governmental units 312,776 - - Unearned revenue 672 - -
Total liabilities 2,654,483 85,972 -
Deferred inflows of resourcesAggregate deferred inflows 2,722,922 - -
Fund balances
Nonspendable 531,001 - - Restricted 1,185,117 - - Committed 3,182,195 2,637,098 633,666 Assigned 1,344,946 - - Unassigned 20,262,606 - -
Total fund balances 26,505,865 2,637,098 633,666
Total liabilities, deferred inflows ofresources and fund balances 31,883,270$ 2,723,070$ 633,666$
(Continued)
COUNTY OF OTTAWA
GENERAL FUND - SUBFUNDSCOMBINING BALANCE SHEET SCHEDULE
SEPTEMBER 30, 2020
104
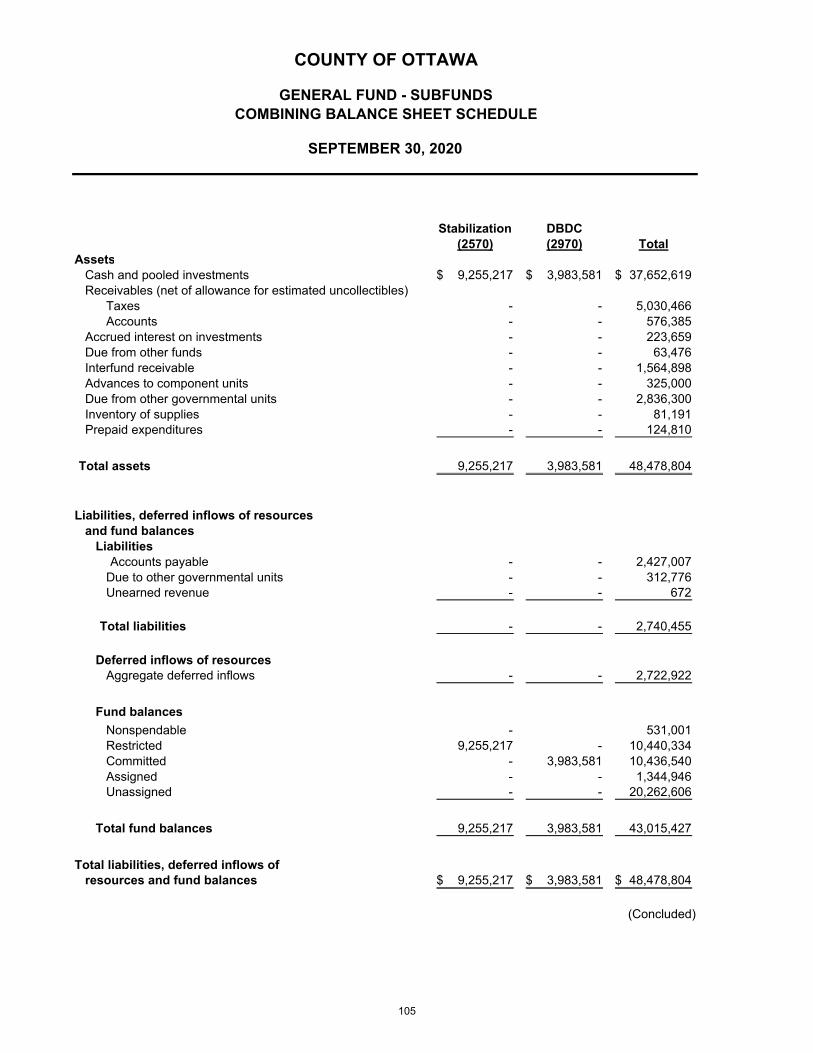
Stabilization DBDC(2570) (2970) Total
AssetsCash and pooled investments 9,255,217$ 3,983,581$ 37,652,619$ Receivables (net of allowance for estimated uncollectibles)
Taxes - - 5,030,466 Accounts - - 576,385
Accrued interest on investments - - 223,659 Due from other funds - - 63,476 Interfund receivable - - 1,564,898 Advances to component units - - 325,000 Due from other governmental units - - 2,836,300 Inventory of supplies - - 81,191 Prepaid expenditures - - 124,810
Total assets 9,255,217 3,983,581 48,478,804
Liabilities, deferred inflows of resourcesand fund balances
LiabilitiesAccounts payable - - 2,427,007
Due to other governmental units - - 312,776 Unearned revenue - - 672
Total liabilities - - 2,740,455
Deferred inflows of resourcesAggregate deferred inflows - - 2,722,922
Fund balances
Nonspendable - 531,001 Restricted 9,255,217 - 10,440,334 Committed - 3,983,581 10,436,540 Assigned - - 1,344,946 Unassigned - - 20,262,606
Total fund balances 9,255,217 3,983,581 43,015,427
Total liabilities, deferred inflows ofresources and fund balances 9,255,217$ 3,983,581$ 48,478,804$
(Concluded)
SEPTEMBER 30, 2020
COUNTY OF OTTAWA
GENERAL FUND - SUBFUNDSCOMBINING BALANCE SHEET SCHEDULE
105
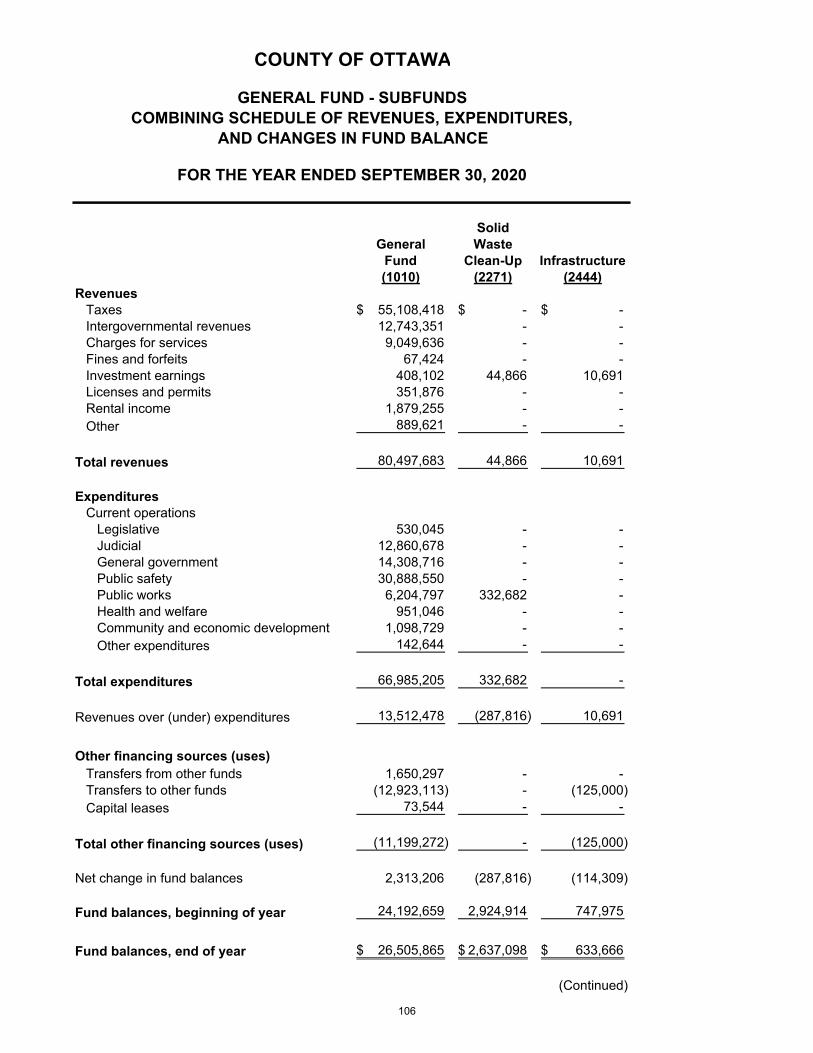
SolidGeneral Waste
Fund Clean-Up Infrastructure(1010) (2271) (2444)
RevenuesTaxes 55,108,418$ -$ -$ Intergovernmental revenues 12,743,351 - - Charges for services 9,049,636 - - Fines and forfeits 67,424 - - Investment earnings 408,102 44,866 10,691 Licenses and permits 351,876 - - Rental income 1,879,255 - - Other 889,621 - -
Total revenues 80,497,683 44,866 10,691
ExpendituresCurrent operations
Legislative 530,045 - - Judicial 12,860,678 - - General government 14,308,716 - - Public safety 30,888,550 - - Public works 6,204,797 332,682 - Health and welfare 951,046 - - Community and economic development 1,098,729 - - Other expenditures 142,644 - -
Total expenditures 66,985,205 332,682 -
Revenues over (under) expenditures 13,512,478 (287,816) 10,691
Other financing sources (uses)Transfers from other funds 1,650,297 - - Transfers to other funds (12,923,113) - (125,000) Capital leases 73,544 - -
Total other financing sources (uses) (11,199,272) - (125,000)
Net change in fund balances 2,313,206 (287,816) (114,309)
Fund balances, beginning of year 24,192,659 2,924,914 747,975
Fund balances, end of year 26,505,865$ 2,637,098$ 633,666$
(Continued)
COUNTY OF OTTAWA
GENERAL FUND - SUBFUNDSCOMBINING SCHEDULE OF REVENUES, EXPENDITURES,
AND CHANGES IN FUND BALANCE
FOR THE YEAR ENDED SEPTEMBER 30, 2020
106

Stabilization DB/DC(2570) (2970) Total
RevenuesTaxes -$ 3,640,022$ 58,748,440$ Intergovernmental revenues - - 12,743,351 Charges for services - - 9,049,636 Fines and forfeits - - 67,424 Investment earnings - - 463,659 Licenses and permits - - 351,876 Rental income - - 1,879,255 Other - - 889,621
Total revenues - 3,640,022 84,193,262
ExpendituresCurrent operations
Legislative - - 530,045 Judicial - - 12,860,678 General government - 3,000,000 17,308,716 Public safety - - 30,888,550 Public works - - 6,537,479 Health and welfare - - 951,046 Community and economic development - - 1,098,729 Other expenditures - - 142,644
Total expenditures - 3,000,000 70,317,887
Revenues over (under) expenditures - 640,022 13,875,375
Other financing sources (uses)Transfers from other funds - - 1,650,297 Transfers to other funds - - (13,048,113) Capital leases - - 73,544
Total other financing sources (uses) - - (11,324,272)
Net change in fund balances - 640,022 2,551,103
Fund balances, beginning of year 9,255,217 3,343,559 40,464,324
Fund balances, end of year 9,255,217$ 3,983,581$ 43,015,427$
(Concluded)
COUNTY OF OTTAWA
GENERAL FUND - SUBFUNDSCOMBINING SCHEDULE OF REVENUES, EXPENDITURES,
AND CHANGES IN FUND BALANCE
FOR THE YEAR ENDED SEPTEMBER 30, 2020
107
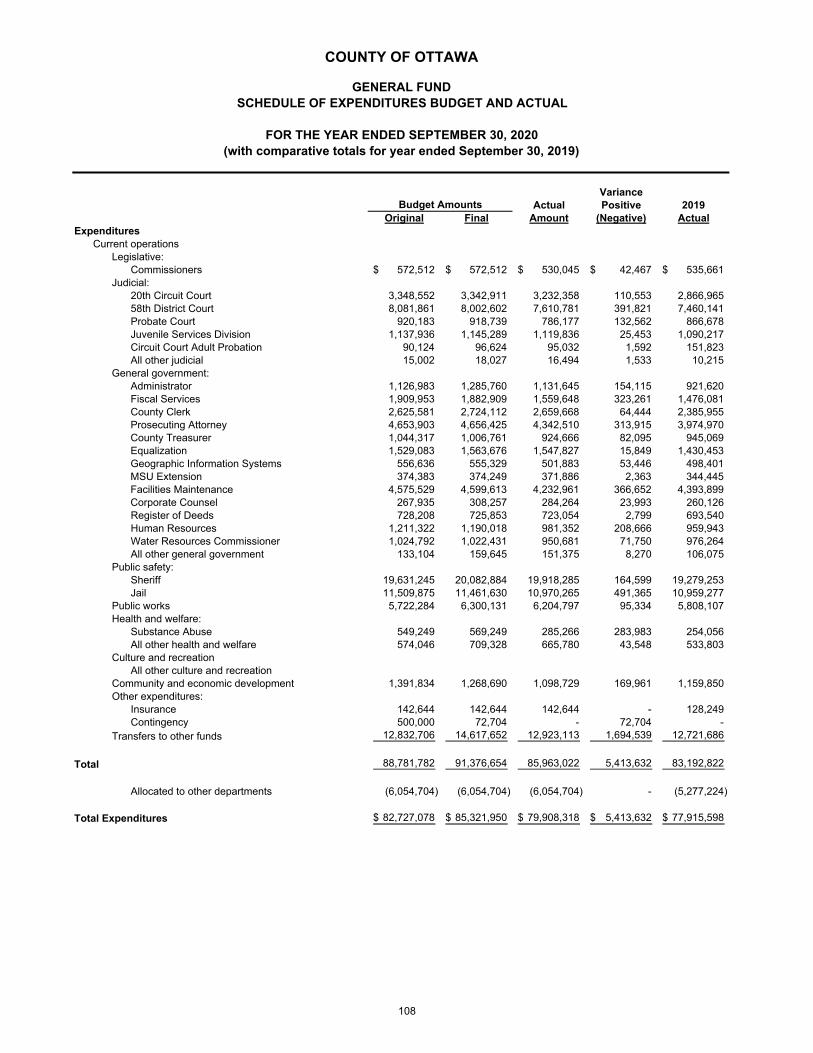
VarianceActual Positive 2019
Original Final Amount (Negative) ActualExpenditures
Current operationsLegislative:
Commissioners 572,512$ 572,512$ 530,045$ 42,467$ 535,661$ Judicial:
20th Circuit Court 3,348,552 3,342,911 3,232,358 110,553 2,866,965 58th District Court 8,081,861 8,002,602 7,610,781 391,821 7,460,141 Probate Court 920,183 918,739 786,177 132,562 866,678 Juvenile Services Division 1,137,936 1,145,289 1,119,836 25,453 1,090,217 Circuit Court Adult Probation 90,124 96,624 95,032 1,592 151,823 All other judicial 15,002 18,027 16,494 1,533 10,215
General government:Administrator 1,126,983 1,285,760 1,131,645 154,115 921,620 Fiscal Services 1,909,953 1,882,909 1,559,648 323,261 1,476,081 County Clerk 2,625,581 2,724,112 2,659,668 64,444 2,385,955 Prosecuting Attorney 4,653,903 4,656,425 4,342,510 313,915 3,974,970 County Treasurer 1,044,317 1,006,761 924,666 82,095 945,069 Equalization 1,529,083 1,563,676 1,547,827 15,849 1,430,453 Geographic Information Systems 556,636 555,329 501,883 53,446 498,401 MSU Extension 374,383 374,249 371,886 2,363 344,445 Facilities Maintenance 4,575,529 4,599,613 4,232,961 366,652 4,393,899 Corporate Counsel 267,935 308,257 284,264 23,993 260,126 Register of Deeds 728,208 725,853 723,054 2,799 693,540 Human Resources 1,211,322 1,190,018 981,352 208,666 959,943 Water Resources Commissioner 1,024,792 1,022,431 950,681 71,750 976,264 All other general government 133,104 159,645 151,375 8,270 106,075
Public safety:Sheriff 19,631,245 20,082,884 19,918,285 164,599 19,279,253 Jail 11,509,875 11,461,630 10,970,265 491,365 10,959,277
Public works 5,722,284 6,300,131 6,204,797 95,334 5,808,107 Health and welfare:
Substance Abuse 549,249 569,249 285,266 283,983 254,056 All other health and welfare 574,046 709,328 665,780 43,548 533,803
Culture and recreationAll other culture and recreation
Community and economic development 1,391,834 1,268,690 1,098,729 169,961 1,159,850 Other expenditures:
Insurance 142,644 142,644 142,644 - 128,249 Contingency 500,000 72,704 - 72,704 -
Transfers to other funds 12,832,706 14,617,652 12,923,113 1,694,539 12,721,686
Total 88,781,782 91,376,654 85,963,022 5,413,632 83,192,822
Allocated to other departments (6,054,704) (6,054,704) (6,054,704) - (5,277,224)
Total Expenditures 82,727,078$ 85,321,950$ 79,908,318$ 5,413,632$ 77,915,598$
Budget Amounts
COUNTY OF OTTAWA
GENERAL FUNDSCHEDULE OF EXPENDITURES BUDGET AND ACTUAL
FOR THE YEAR ENDED SEPTEMBER 30, 2020(with comparative totals for year ended September 30, 2019)
108
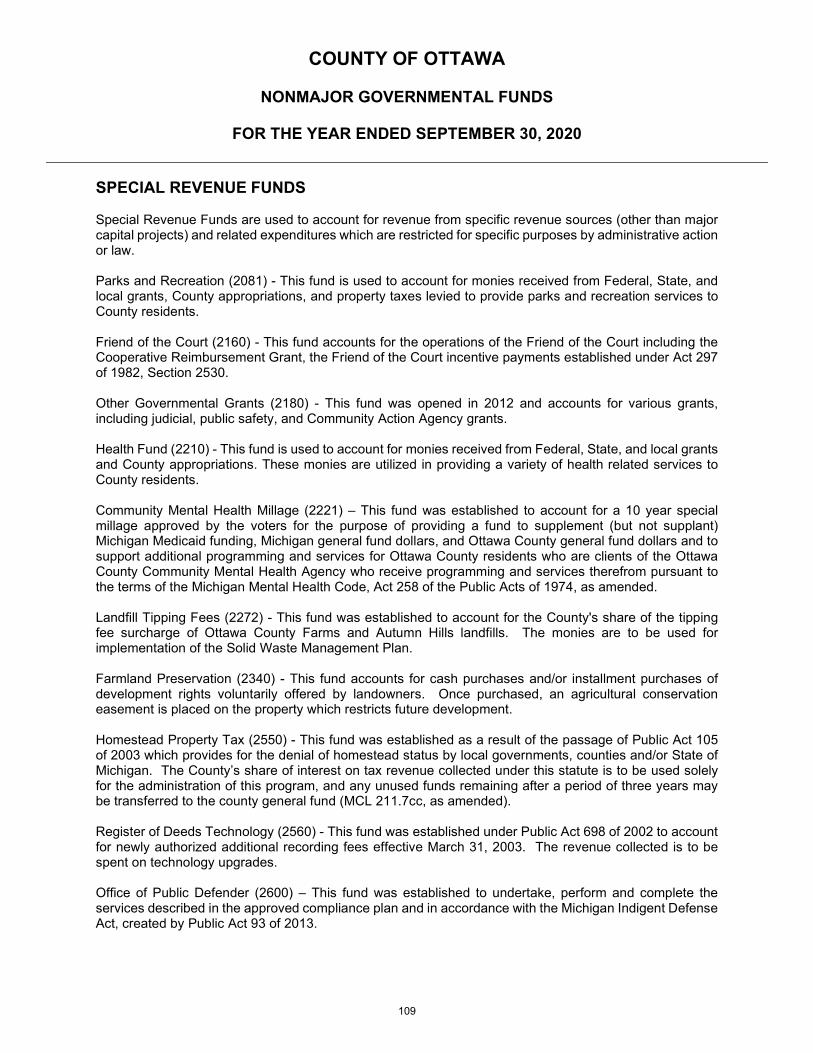
COUNTY OF OTTAWA
NONMAJOR GOVERNMENTAL FUNDS
FOR THE YEAR ENDED SEPTEMBER 30, 2020
SPECIAL REVENUE FUNDS Special Revenue Funds are used to account for revenue from specific revenue sources (other than major capital projects) and related expenditures which are restricted for specific purposes by administrative action or law. Parks and Recreation (2081) - This fund is used to account for monies received from Federal, State, and local grants, County appropriations, and property taxes levied to provide parks and recreation services to County residents. Friend of the Court (2160) - This fund accounts for the operations of the Friend of the Court including the Cooperative Reimbursement Grant, the Friend of the Court incentive payments established under Act 297 of 1982, Section 2530. Other Governmental Grants (2180) - This fund was opened in 2012 and accounts for various grants, including judicial, public safety, and Community Action Agency grants. Health Fund (2210) - This fund is used to account for monies received from Federal, State, and local grants and County appropriations. These monies are utilized in providing a variety of health related services to County residents. Community Mental Health Millage (2221) – This fund was established to account for a 10 year special millage approved by the voters for the purpose of providing a fund to supplement (but not supplant) Michigan Medicaid funding, Michigan general fund dollars, and Ottawa County general fund dollars and to support additional programming and services for Ottawa County residents who are clients of the Ottawa County Community Mental Health Agency who receive programming and services therefrom pursuant to the terms of the Michigan Mental Health Code, Act 258 of the Public Acts of 1974, as amended. Landfill Tipping Fees (2272) - This fund was established to account for the County's share of the tipping fee surcharge of Ottawa County Farms and Autumn Hills landfills. The monies are to be used for implementation of the Solid Waste Management Plan. Farmland Preservation (2340) - This fund accounts for cash purchases and/or installment purchases of development rights voluntarily offered by landowners. Once purchased, an agricultural conservation easement is placed on the property which restricts future development. Homestead Property Tax (2550) - This fund was established as a result of the passage of Public Act 105 of 2003 which provides for the denial of homestead status by local governments, counties and/or State of Michigan. The County’s share of interest on tax revenue collected under this statute is to be used solely for the administration of this program, and any unused funds remaining after a period of three years may be transferred to the county general fund (MCL 211.7cc, as amended). Register of Deeds Technology (2560) - This fund was established under Public Act 698 of 2002 to account for newly authorized additional recording fees effective March 31, 2003. The revenue collected is to be spent on technology upgrades. Office of Public Defender (2600) – This fund was established to undertake, perform and complete the services described in the approved compliance plan and in accordance with the Michigan Indigent Defense Act, created by Public Act 93 of 2013.
109
COUNTY OF OTTAWA
NONMAJOR GOVERNMENTAL FUNDS
FOR THE YEAR ENDED SEPTEMBER 30, 2020
SPECIAL REVENUE FUNDS (continued) Federal Forfeiture (2620) – This fund was established under Public Act 20 of 1943 to account for deposit of fees and expenses of costs for those local units participating in the Justice Department Equitable Sharing Program. Sheriff Grants & Contracts (2630) - This fund accounts for various public safety grants and contracts for policing services with County municipalities. Concealed Pistol Licensing (2631) - This fund was established under Public Act 3 of 2015 to account for the deposit of fees, and expense of costs, of administering the act. Department of Health and Human Services (2901) - This fund accounts for County appropriations to assist with the welfare program which offers aid to disadvantaged individuals of Ottawa County. Child Care Funds (2920) - This fund is used to account for foster child care in the County, including the operating costs of the Ottawa County Detention Center, which is a facility that houses juveniles on a short-term basis and is funded by both the State and a County appropriation.
DEBT SERVICE FUND Building Authority (3517) and Debt Service (3010, 3600) - These funds were established to account for the accumulation of resources for payment of principal and interest on bonds issued to finance building projects for the County of Ottawa. Financing is provided by cash rental payments pursuant to lease agreements with the County of Ottawa. CAPITAL PROJECTS FUND Capital Improvement (4020) - This fund was established to account for the receipt of funds Under Act 136, Public Acts of 1956 (Sections 141.261-141.263, Compiled Laws of 1979), which are restricted for statutory Public Improvement. Building Authority Capital Improvement (4690) – This fund was established to record receipts and expenditures for capital projects financed by the Building Authority. INTERNAL SERVICE FUNDS Internal Service Funds are established to account for the financing of goods or services provided by one department to other departments of the governmental unit on a cost-reimbursement basis. Innovation and Technology (6360) - This fund is used to account for revenues collected from user departments for service charges to cover the costs incurred in the operation of the department including computer processing time and programming time. Duplicating (6450) - This fund is used to account for revenues received from user departments and expenses incurred in providing copier services. Telecommunications (6550) - This fund is used to account for revenues received from user departments and expenses incurred in providing telephone service.
110
COUNTY OF OTTAWA
NONMAJOR GOVERNMENTAL FUNDS
FOR THE YEAR ENDED SEPTEMBER 30, 2020
INTERNAL SERVICE FUNDS (continued) Equipment Pool (6641) - This fund is used to account for revenues collected from user departments for the equipment rental charges to cover the costs incurred to administer the equipment pool fund and depreciation of the equipment.
Protected Self-Funded Insurance Programs (6770) - This fund is used to account for the administrative costs associated with managing the self-insured portion of the vehicle protection program, the workers' compensation program, the liability protection program and the property and fire protection program. Employee Benefits (6771) - This fund is used to account for revenues collected from user departments for the payment of costs incurred to administer the employee insurance programs, third party administrative expenses and actual premiums paid. Protected Self-Funded Unemployment (6772) - This fund is used to account for revenues collected from user departments for the payment of costs incurred to administer the self-funded unemployment insurance program, third party administrative expenses and actual unemployment claims paid. Long-Term Disability Insurance (6775) - This fund is used to account for revenues collected from user departments for the payment of costs incurred to administer the long-term disability insurance program and insurance premiums paid. Ottawa County, Michigan Insurance Authority (6780) - This fund is used to account for insurance coverage and risk management related services to participating public entities pursuant to State of Michigan Act No. 36 of the Public Acts of 1988. DB/DC Conversion (6810) – this fund was established by the County Board to set aside funds needed for startup costs associated with moving new hires to a defined contribution retirement system. Compensated Absences (6800) – This fund is used to account for the future payments of accumulated sick pay of County employees under the sick days/short and long-term disability plan. This fund is also used to accrue vacation pay.
FIDUCIARY FUNDS Fiduciary Funds are used to account for assets held by a governmental unit in a trustee capacity or as an agent for individuals, private organizations, other governmental units and/or other funds. Agency Funds Trust and Agency (7010) - This fund was established to account for monies received by the County for later distribution to other agencies or persons. Primarily the fund accounts for revenue received and later remitted to the State of Michigan. Juvenile Court (7015) – This fund was established to account for monies received by the Juvenile Court for later distribution to other agencies or persons. Library Penal Fine (7210) - This fund was established under Act 236, Section 4351 to account for monies received from District Court fines which are allocated annually for operations of libraries in the County. Imprest Payroll Fund (7040) - This fund was established to account for the salaries and fringes of the County employees payroll. Money is disbursed from this fund after being reimbursed by the benefiting funds.
111
COUNTY OF OTTAWA
NONMAJOR GOVERNMENTAL FUNDS
FOR THE YEAR ENDED SEPTEMBER 30, 2020
FIDUCIARY FUNDS (continued) Inland Lake Improvement (8725) - The Water Resource Commissioner serves as the treasurer for various inland lake boards that do not meet the requirements of a component unit, so the financial activity is recorded in this fund.
112
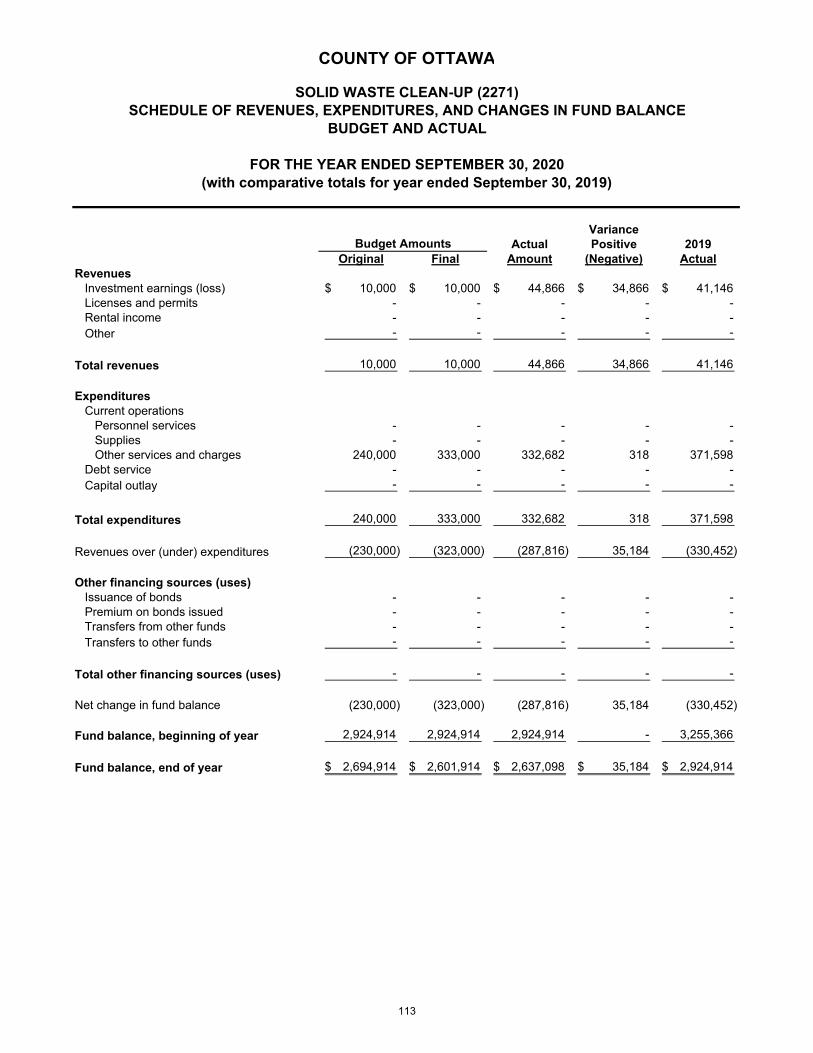
VarianceActual Positive 2019
Original Final Amount (Negative) ActualRevenues
Investment earnings (loss) 10,000$ 10,000$ 44,866$ 34,866$ 41,146$ Licenses and permits - - - - - Rental income - - - - - Other - - - - -
Total revenues 10,000 10,000 44,866 34,866 41,146
ExpendituresCurrent operations
Personnel services - - - - - Supplies - - - - - Other services and charges 240,000 333,000 332,682 318 371,598
Debt service - - - - - Capital outlay - - - - -
Total expenditures 240,000 333,000 332,682 318 371,598
Revenues over (under) expenditures (230,000) (323,000) (287,816) 35,184 (330,452)
Other financing sources (uses)Issuance of bonds - - - - - Premium on bonds issued - - - - - Transfers from other funds - - - - - Transfers to other funds - - - - -
Total other financing sources (uses) - - - - -
Net change in fund balance (230,000) (323,000) (287,816) 35,184 (330,452)
Fund balance, beginning of year 2,924,914 2,924,914 2,924,914 - 3,255,366
Fund balance, end of year 2,694,914$ 2,601,914$ 2,637,098$ 35,184$ 2,924,914$
Budget Amounts
COUNTY OF OTTAWA
SOLID WASTE CLEAN-UP (2271)SCHEDULE OF REVENUES, EXPENDITURES, AND CHANGES IN FUND BALANCE
BUDGET AND ACTUAL
FOR THE YEAR ENDED SEPTEMBER 30, 2020(with comparative totals for year ended September 30, 2019)
113

VarianceActual Positive 2019
Original Final Amount (Negative) ActualRevenues
Investment earnings (loss) 10,000$ 10,000$ 10,691$ 691$ 17,231$ Licenses and permits - - - - - Rental income - - - - - Other - - - - -
Total revenues 10,000 10,000 10,691 691 17,231
ExpendituresCurrent operations
Personnel services - - - - - Supplies - - - - - Other services and charges - - - - -
Debt service - - - - - Capital outlay - - - - -
Total expenditures - - - - -
Revenues over (under) expenditures 10,000 10,000 10,691 691 17,231
Other financing sources (uses)Issuance of bonds - - - - - Premium on bonds issued - - - - - Transfers from other funds - - - - - Transfers to other funds (125,000) (125,000) (125,000) - (625,000)
Total other financing sources (uses) (125,000) (125,000) (125,000) - (625,000)
Net change in fund balance (115,000) (115,000) (114,309) 691 (607,769)
Fund balance, beginning of year 747,975 747,975 747,975 - 1,355,744
Fund balance, end of year 632,975$ 632,975$ 633,666$ 691$ 747,975$
Budget Amounts
COUNTY OF OTTAWA
INFRASTRUCTURE (2444)SCHEDULE OF REVENUES, EXPENDITURES, AND CHANGES IN FUND BALANCE
BUDGET AND ACTUAL
FOR THE YEAR ENDED SEPTEMBER 30, 2020(with comparative totals for year ended September 30, 2019)
114
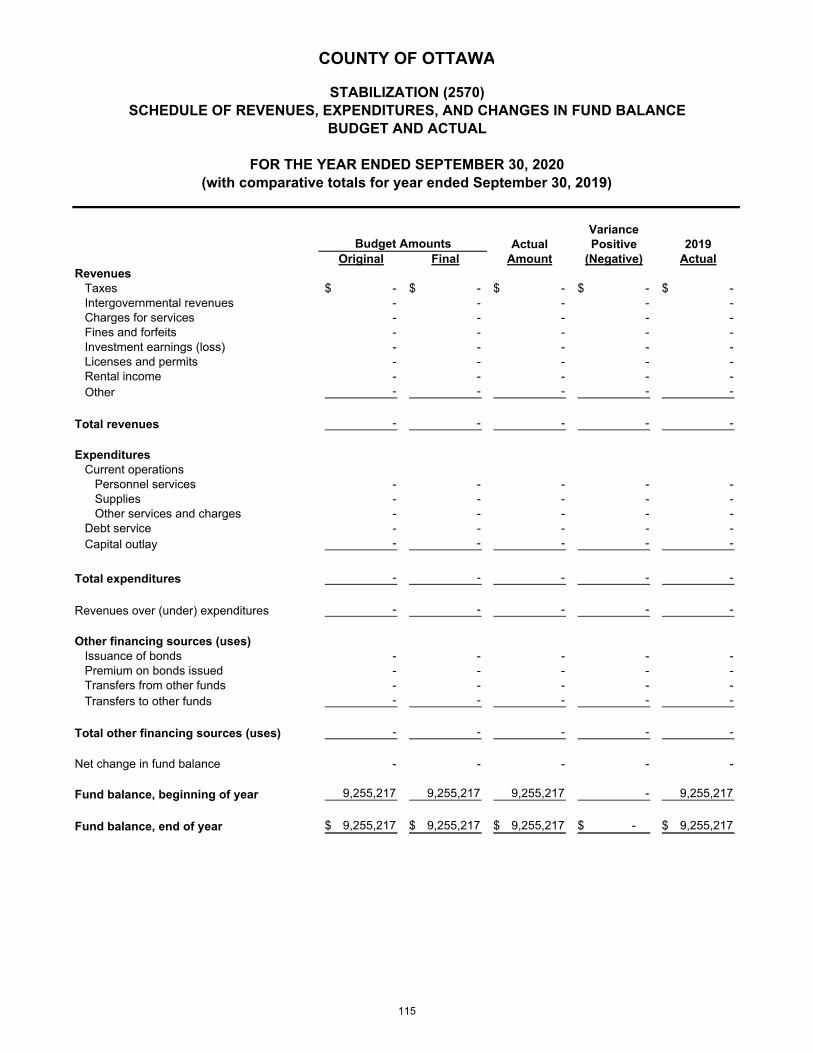
VarianceActual Positive 2019
Original Final Amount (Negative) ActualRevenues
Taxes -$ -$ -$ -$ -$ Intergovernmental revenues - - - - - Charges for services - - - - - Fines and forfeits - - - - - Investment earnings (loss) - - - - - Licenses and permits - - - - - Rental income - - - - - Other - - - - -
Total revenues - - - - -
ExpendituresCurrent operations
Personnel services - - - - - Supplies - - - - - Other services and charges - - - - -
Debt service - - - - - Capital outlay - - - - -
Total expenditures - - - - -
Revenues over (under) expenditures - - - - -
Other financing sources (uses)Issuance of bonds - - - - - Premium on bonds issued - - - - - Transfers from other funds - - - - - Transfers to other funds - - - - -
Total other financing sources (uses) - - - - -
Net change in fund balance - - - - -
Fund balance, beginning of year 9,255,217 9,255,217 9,255,217 - 9,255,217
Fund balance, end of year 9,255,217$ 9,255,217$ 9,255,217$ -$ 9,255,217$
Budget Amounts
COUNTY OF OTTAWA
STABILIZATION (2570)SCHEDULE OF REVENUES, EXPENDITURES, AND CHANGES IN FUND BALANCE
BUDGET AND ACTUAL
FOR THE YEAR ENDED SEPTEMBER 30, 2020(with comparative totals for year ended September 30, 2019)
115
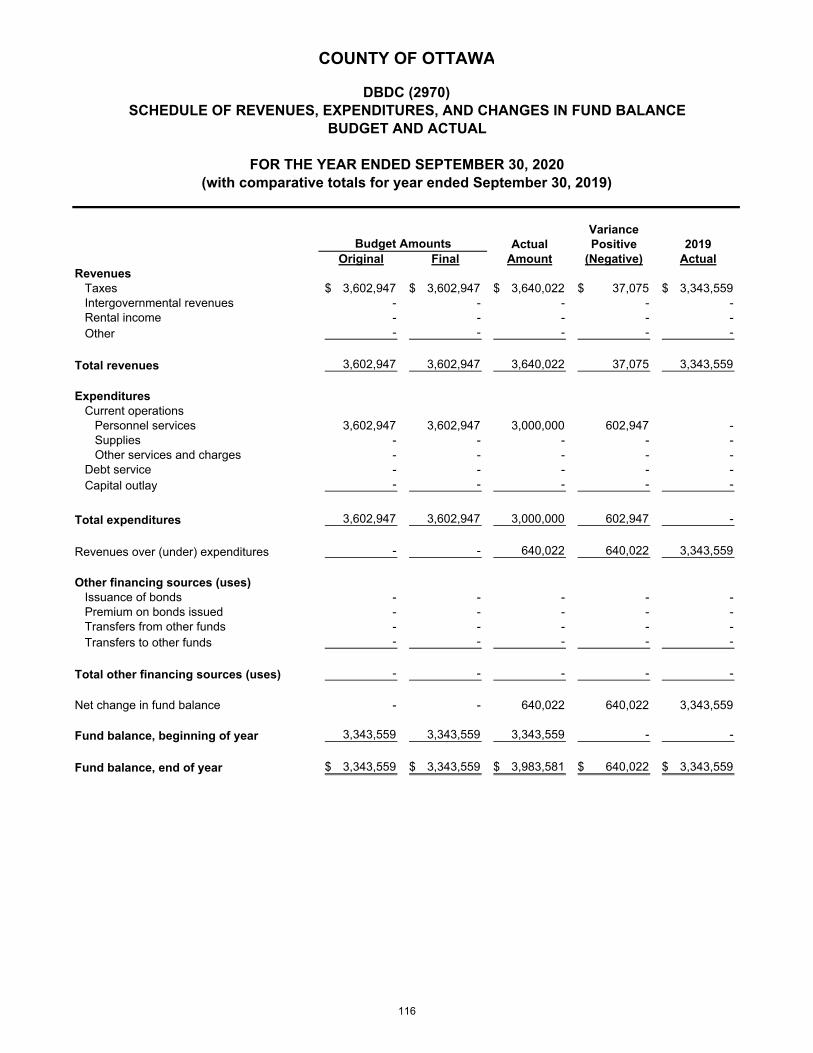
VarianceActual Positive 2019
Original Final Amount (Negative) ActualRevenues
Taxes 3,602,947$ 3,602,947$ 3,640,022$ 37,075$ 3,343,559$ Intergovernmental revenues - - - - - Rental income - - - - - Other - - - - -
Total revenues 3,602,947 3,602,947 3,640,022 37,075 3,343,559
ExpendituresCurrent operations
Personnel services 3,602,947 3,602,947 3,000,000 602,947 - Supplies - - - - - Other services and charges - - - - -
Debt service - - - - - Capital outlay - - - - -
Total expenditures 3,602,947 3,602,947 3,000,000 602,947 -
Revenues over (under) expenditures - - 640,022 640,022 3,343,559
Other financing sources (uses)Issuance of bonds - - - - - Premium on bonds issued - - - - - Transfers from other funds - - - - - Transfers to other funds - - - - -
Total other financing sources (uses) - - - - -
Net change in fund balance - - 640,022 640,022 3,343,559
Fund balance, beginning of year 3,343,559 3,343,559 3,343,559 - -
Fund balance, end of year 3,343,559$ 3,343,559$ 3,983,581$ 640,022$ 3,343,559$
Budget Amounts
COUNTY OF OTTAWA
DBDC (2970)SCHEDULE OF REVENUES, EXPENDITURES, AND CHANGES IN FUND BALANCE
BUDGET AND ACTUAL
FOR THE YEAR ENDED SEPTEMBER 30, 2020(with comparative totals for year ended September 30, 2019)
116

Other CommunityParks and Friend of Governmental Mental HealthRecreation the Court Grants Health Millage
(2081) (2160) (2180) (2210) (2221)Assets
Cash and pooled investments 2,894,219$ 250$ -$ 2,356,335$ 2,690,173$ Receivables (net of allowance for
estimated uncollectibles)Taxes 3,320 - - - - Accounts (5,913) - 71 219,331 2,220
Due from other funds 3,600 - - - - Due from other governmental units 48,444 556,839 952,600 818,994 148,315 Inventory of supplies 13,249 - 44,190 197,208 - Prepaid expenditures - - 5,523 89,471 41,368
Total assets 2,956,919 557,089 1,002,384 3,681,339 2,882,076
Liabilities, deferred inflows of resources and fund balancesLiabilities
Accounts payable 598,843 91,870 512,332 321,583 48,982 Due to other governmental units - - 2,397 206,601 - Interfund payable - 465,219 403,602 - - Advances from other governmental units - - - - - Unearned revenue 75,653 - 11,928 380 2,220
Total liabilities 674,496 557,089 930,259 528,564 51,202
Deferred inflows of resourcesAggregate deferred inflows 3,862 - - 141,532 -
Fund balancesNonspendable 13,249 - 49,713 286,679 41,368 Restricted 2,265,312 - 22,412 517,528 2,789,506 Committed - - - - - Assigned - - - 2,207,036 -
Total fund balances 2,278,561 - 72,125 3,011,243 2,830,874
Total liabilities, deferred inflows of resources and fund balances 2,956,919$ 557,089$ 1,002,384$ 3,681,339$ 2,882,076$
(Continued)
Special Revenue
COUNTY OF OTTAWA
NONMAJOR GOVERNMENTAL FUNDSCOMBINING BALANCE SHEET
SEPTEMBER 30, 2020
117

Landfill Homestead RegisterTipping Farmland Property of Deeds
Fees Preservation Tax Technology(2272) (2340) (2550) (2560)
AssetsCash and pooled investments 1,307,626$ 1,452$ 44,854$ 971,998$ Receivables (net of allowance for
estimated uncollectibles)Taxes - - - - Accounts 40,844 660 - -
Due from other funds - - - - Due from other governmental units - - - - Inventory of supplies - - - - Prepaid expenditures - - - -
Total assets 1,348,470 2,112 44,854 971,998
Liabilities, deferred inflows of resources and fund balancesLiabilities
Accounts payable 56,788 30 - 752 Due to other governmental units - - - - Interfund payable - - - -
Advances from other governmental units - - - - Unearned revenue - - - -
Total liabilities 56,788 30 - 752
Deferred inflows of resourcesAggregate deferred inflows - - - -
Fund balancesNonspendable - - - - Restricted - - 44,854 971,246 Committed - 2,082 - - Assigned 1,291,682 - - -
Total fund balances 1,291,682 2,082 44,854 971,246
Total liabilities, deferred inflows of resources and fund balances 1,348,470$ 2,112$ 44,854$ 971,998$
(Continued)
COUNTY OF OTTAWA
NONMAJOR GOVERNMENTAL FUNDSCOMBINING BALANCE SHEET
SEPTEMBER 30, 2020
Special Revenue
118
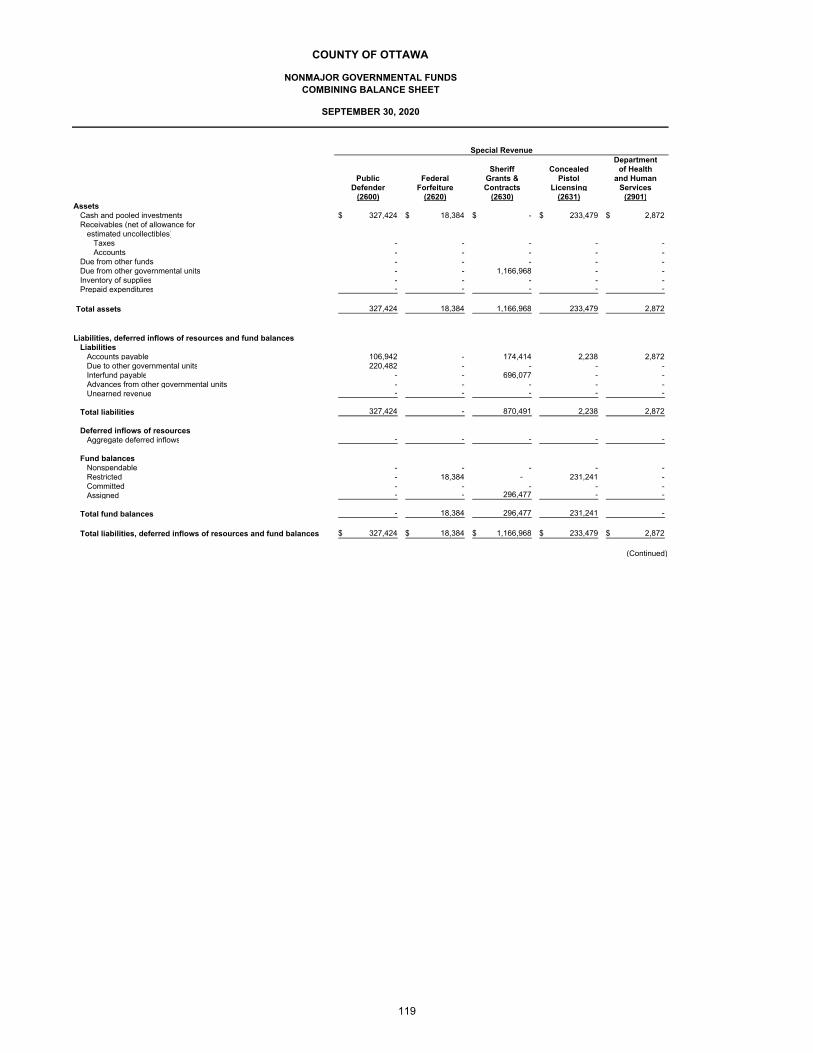
DepartmentSheriff Concealed of Health
Public Federal Grants & Pistol and HumanDefender Forfeiture Contracts Licensing Services
(2600) (2620) (2630) (2631) (2901)Assets
Cash and pooled investments 327,424$ 18,384$ -$ 233,479$ 2,872$ Receivables (net of allowance for
estimated uncollectibles)Taxes - - - - - Accounts - - - - -
Due from other funds - - - - - Due from other governmental units - - 1,166,968 - - Inventory of supplies - - - - - Prepaid expenditures - - - - -
Total assets 327,424 18,384 1,166,968 233,479 2,872
Liabilities, deferred inflows of resources and fund balancesLiabilities
Accounts payable 106,942 - 174,414 2,238 2,872 Due to other governmental units 220,482 - - - - Interfund payable - - 696,077 - - Advances from other governmental units - - - - - Unearned revenue - - - - -
Total liabilities 327,424 - 870,491 2,238 2,872
Deferred inflows of resourcesAggregate deferred inflows - - - - -
Fund balancesNonspendable - - - - - Restricted - 18,384 - 231,241 - Committed - - - - - Assigned - - 296,477 - -
Total fund balances - 18,384 296,477 231,241 -
Total liabilities, deferred inflows of resources and fund balances 327,424$ 18,384$ 1,166,968$ 233,479$ 2,872$
(Continued)
COUNTY OF OTTAWA
NONMAJOR GOVERNMENTAL FUNDSCOMBINING BALANCE SHEET
SEPTEMBER 30, 2020
Special Revenue
119
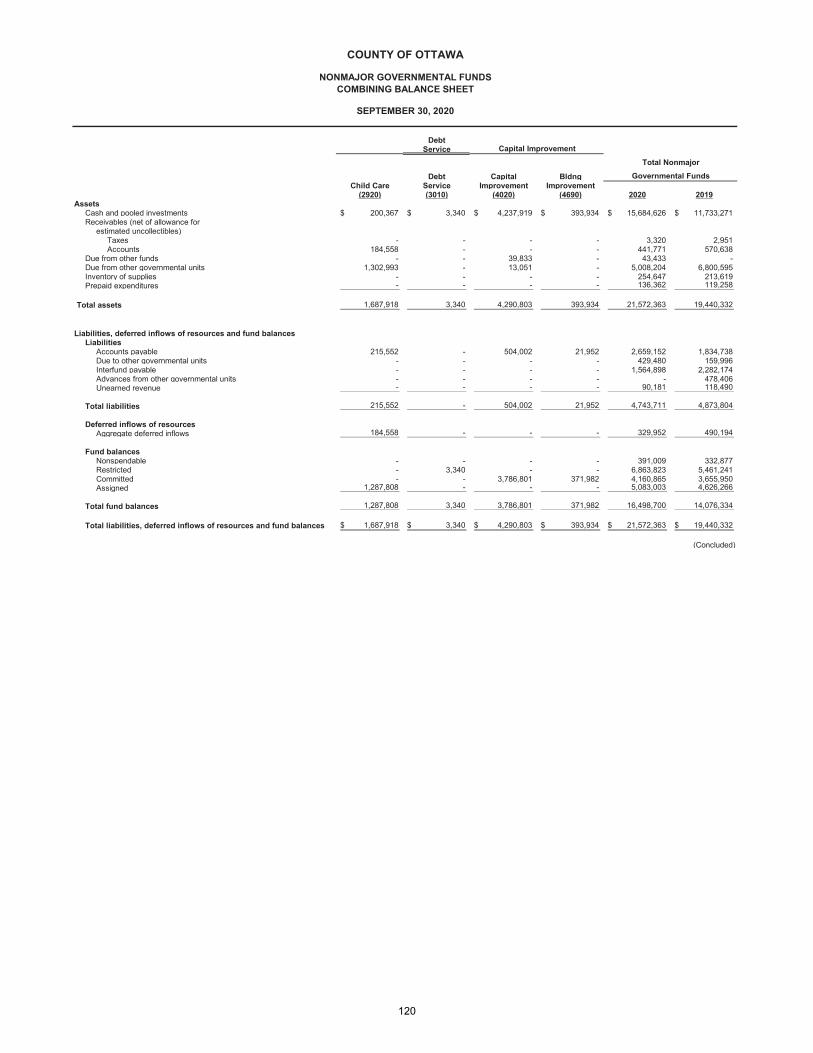
DebtService
Debt Capital BldngChild Care Service Improvement Improvement
(2920) (3010) (4020) (4690) 2020 2019Assets
Cash and pooled investments 200,367$ 3,340$ 4,237,919$ 393,934$ 15,684,626$ 11,733,271$ Receivables (net of allowance for
estimated uncollectibles)Taxes - - - - 3,320 2,951 Accounts 184,558 - - - 441,771 570,638
Due from other funds - - 39,833 - 43,433 - Due from other governmental units 1,302,993 - 13,051 - 5,008,204 6,800,595 Inventory of supplies - - - - 254,647 213,619 Prepaid expenditures - - - - 136,362 119,258
Total assets 1,687,918 3,340 4,290,803 393,934 21,572,363 19,440,332
Liabilities, deferred inflows of resources and fund balancesLiabilities
Accounts payable 215,552 - 504,002 21,952 2,659,152 1,834,738 Due to other governmental units - - - - 429,480 159,996 Interfund payable - - - - 1,564,898 2,282,174 Advances from other governmental units - - - - - 478,406Unearned revenue - - - - 90,181 118,490
Total liabilities 215,552 - 504,002 21,952 4,743,711 4,873,804
Deferred inflows of resourcesAggregate deferred inflows 184,558 - - - 329,952 490,194
Fund balancesNonspendable - - - - 391,009 332,877 Restricted - 3,340 - - 6,863,823 5,461,241 Committed - - 3,786,801 371,982 4,160,865 3,655,950 Assigned 1,287,808 - - - 5,083,003 4,626,266
Total fund balances 1,287,808 3,340 3,786,801 371,982 16,498,700 14,076,334
Total liabilities, deferred inflows of resources and fund balances 1,687,918$ 3,340$ 4,290,803$ 393,934$ 21,572,363$ 19,440,332$
(Concluded)
Capital ImprovementTotal Nonmajor
Governmental Funds
COUNTY OF OTTAWA
NONMAJOR GOVERNMENTAL FUNDSCOMBINING BALANCE SHEET
SEPTEMBER 30, 2020
120
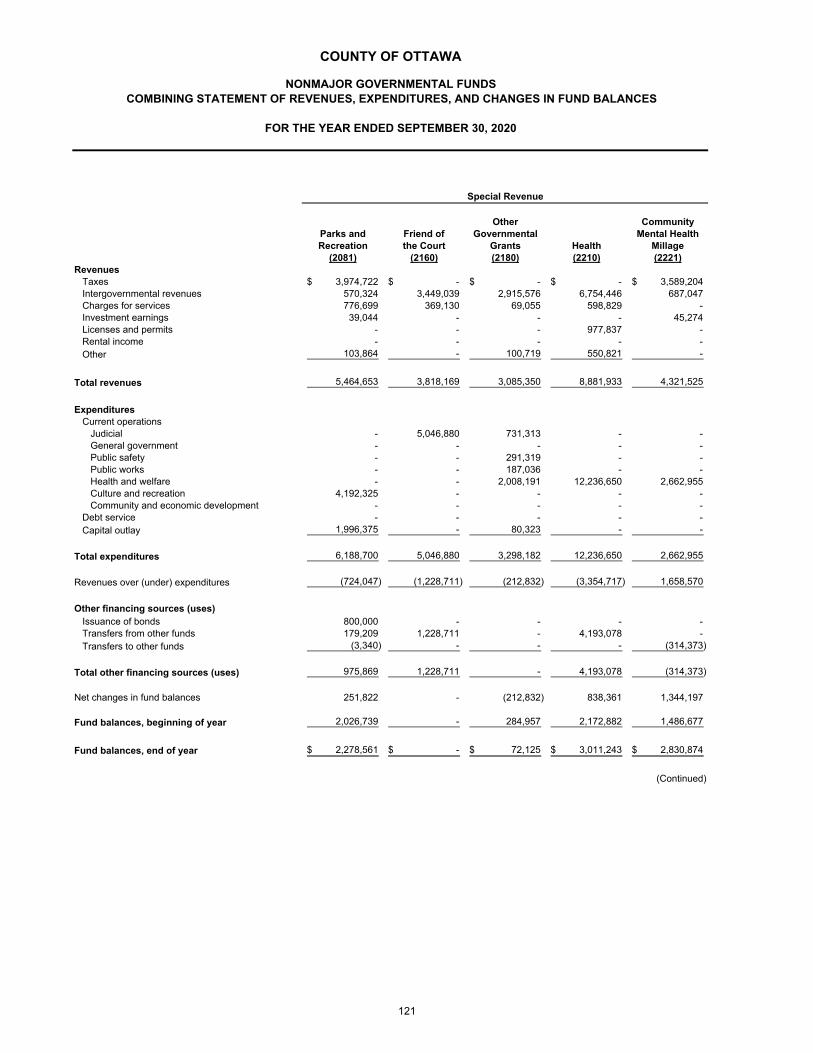
Other CommunityParks and Friend of Governmental Mental HealthRecreation the Court Grants Health Millage
(2081) (2160) (2180) (2210) (2221)Revenues
Taxes 3,974,722$ -$ -$ -$ 3,589,204$ Intergovernmental revenues 570,324 3,449,039 2,915,576 6,754,446 687,047 Charges for services 776,699 369,130 69,055 598,829 - Investment earnings 39,044 - - - 45,274 Licenses and permits - - - 977,837 - Rental income - - - - - Other 103,864 - 100,719 550,821 -
Total revenues 5,464,653 3,818,169 3,085,350 8,881,933 4,321,525
ExpendituresCurrent operations
Judicial - 5,046,880 731,313 - - General government - - - - - Public safety - - 291,319 - - Public works - - 187,036 - - Health and welfare - - 2,008,191 12,236,650 2,662,955 Culture and recreation 4,192,325 - - - - Community and economic development - - - - -
Debt service - - - - - Capital outlay 1,996,375 - 80,323 - -
Total expenditures 6,188,700 5,046,880 3,298,182 12,236,650 2,662,955
Revenues over (under) expenditures (724,047) (1,228,711) (212,832) (3,354,717) 1,658,570
Other financing sources (uses)Issuance of bonds 800,000 - - - - Transfers from other funds 179,209 1,228,711 - 4,193,078 - Transfers to other funds (3,340) - - - (314,373)
Total other financing sources (uses) 975,869 1,228,711 - 4,193,078 (314,373)
Net changes in fund balances 251,822 - (212,832) 838,361 1,344,197
Fund balances, beginning of year 2,026,739 - 284,957 2,172,882 1,486,677
Fund balances, end of year 2,278,561$ -$ 72,125$ 3,011,243$ 2,830,874$
(Continued)
COUNTY OF OTTAWA
NONMAJOR GOVERNMENTAL FUNDSCOMBINING STATEMENT OF REVENUES, EXPENDITURES, AND CHANGES IN FUND BALANCES
FOR THE YEAR ENDED SEPTEMBER 30, 2020
Special Revenue
121
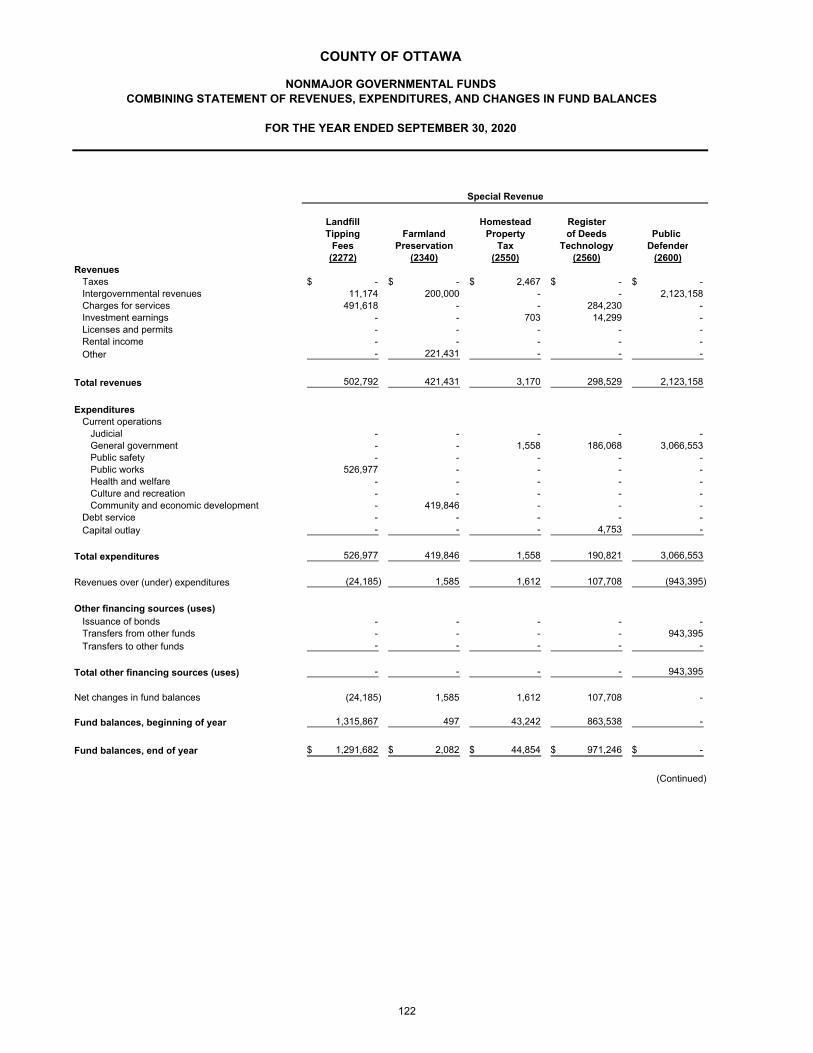
Landfill Homestead RegisterTipping Farmland Property of Deeds Public
Fees Preservation Tax Technology Defender(2272) (2340) (2550) (2560) (2600)
RevenuesTaxes -$ -$ 2,467$ -$ -$ Intergovernmental revenues 11,174 200,000 - - 2,123,158 Charges for services 491,618 - - 284,230 - Investment earnings - - 703 14,299 - Licenses and permits - - - - - Rental income - - - - - Other - 221,431 - - -
Total revenues 502,792 421,431 3,170 298,529 2,123,158
ExpendituresCurrent operations
Judicial - - - - - General government - - 1,558 186,068 3,066,553 Public safety - - - - - Public works 526,977 - - - - Health and welfare - - - - - Culture and recreation - - - - - Community and economic development - 419,846 - - -
Debt service - - - - - Capital outlay - - - 4,753 -
Total expenditures 526,977 419,846 1,558 190,821 3,066,553
Revenues over (under) expenditures (24,185) 1,585 1,612 107,708 (943,395)
Other financing sources (uses)Issuance of bonds - - - - - Transfers from other funds - - - - 943,395 Transfers to other funds - - - - -
Total other financing sources (uses) - - - - 943,395
Net changes in fund balances (24,185) 1,585 1,612 107,708 -
Fund balances, beginning of year 1,315,867 497 43,242 863,538 -
Fund balances, end of year 1,291,682$ 2,082$ 44,854$ 971,246$ -$
(Continued)
Special Revenue
COUNTY OF OTTAWA
NONMAJOR GOVERNMENTAL FUNDSCOMBINING STATEMENT OF REVENUES, EXPENDITURES, AND CHANGES IN FUND BALANCES
FOR THE YEAR ENDED SEPTEMBER 30, 2020
122
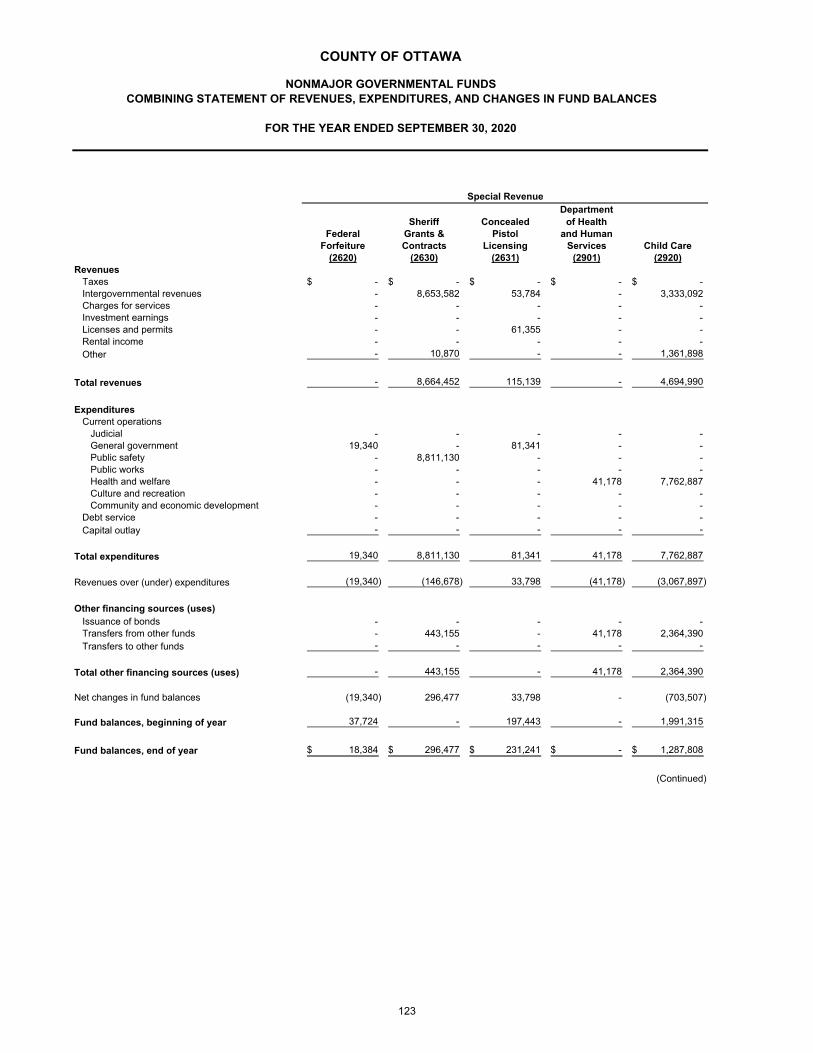
DepartmentSheriff Concealed of Health
Federal Grants & Pistol and HumanForfeiture Contracts Licensing Services Child Care
(2620) (2630) (2631) (2901) (2920)Revenues
Taxes -$ -$ -$ -$ -$ Intergovernmental revenues - 8,653,582 53,784 - 3,333,092 Charges for services - - - - - Investment earnings - - - - - Licenses and permits - - 61,355 - - Rental income - - - - - Other - 10,870 - - 1,361,898
Total revenues - 8,664,452 115,139 - 4,694,990
ExpendituresCurrent operations
Judicial - - - - - General government 19,340 - 81,341 - - Public safety - 8,811,130 - - - Public works - - - - - Health and welfare - - - 41,178 7,762,887 Culture and recreation - - - - - Community and economic development - - - - -
Debt service - - - - - Capital outlay - - - - -
Total expenditures 19,340 8,811,130 81,341 41,178 7,762,887
Revenues over (under) expenditures (19,340) (146,678) 33,798 (41,178) (3,067,897)
Other financing sources (uses)Issuance of bonds - - - - - Transfers from other funds - 443,155 - 41,178 2,364,390 Transfers to other funds - - - - -
Total other financing sources (uses) - 443,155 - 41,178 2,364,390
Net changes in fund balances (19,340) 296,477 33,798 - (703,507)
Fund balances, beginning of year 37,724 - 197,443 - 1,991,315
Fund balances, end of year 18,384$ 296,477$ 231,241$ -$ 1,287,808$
(Continued)
Special Revenue
COUNTY OF OTTAWA
NONMAJOR GOVERNMENTAL FUNDSCOMBINING STATEMENT OF REVENUES, EXPENDITURES, AND CHANGES IN FUND BALANCES
FOR THE YEAR ENDED SEPTEMBER 30, 2020
123
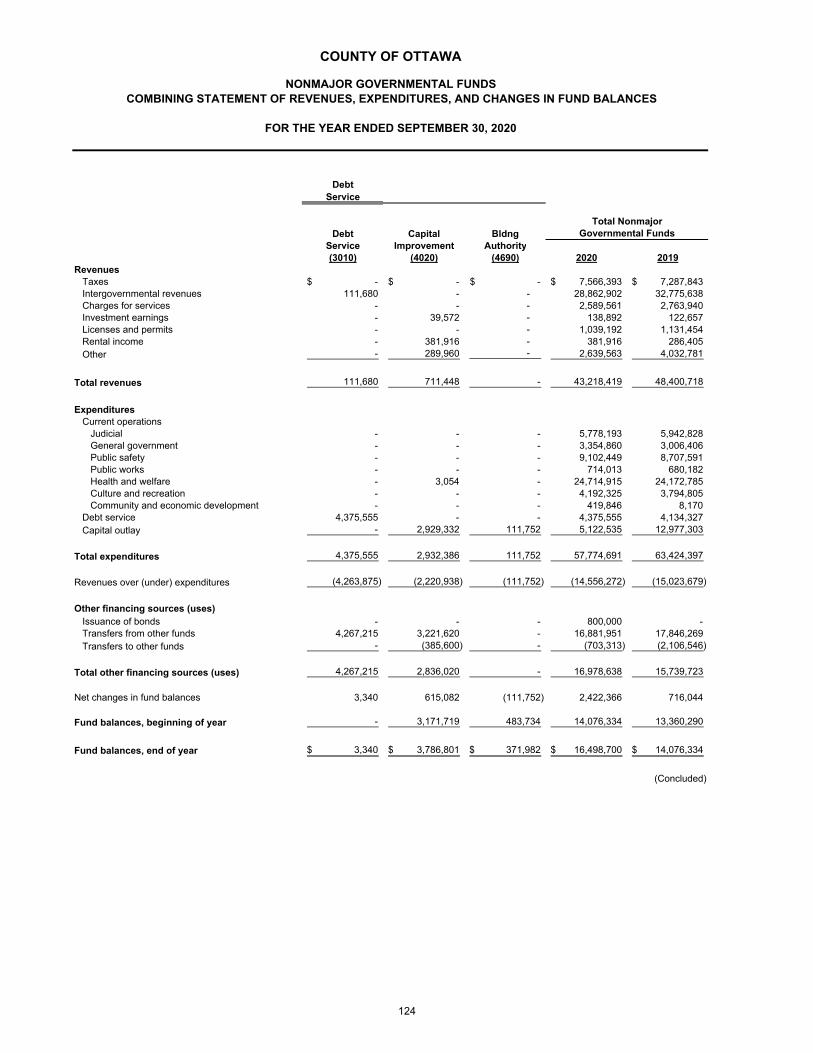
DebtService
Debt Capital BldngService Improvement Authority (3010) (4020) (4690) 2020 2019
RevenuesTaxes -$ -$ -$ 7,566,393$ 7,287,843$ Intergovernmental revenues 111,680 - - 28,862,902 32,775,638 Charges for services - - - 2,589,561 2,763,940 Investment earnings - 39,572 - 138,892 122,657 Licenses and permits - - - 1,039,192 1,131,454 Rental income - 381,916 - 381,916 286,405 Other - 289,960 - 2,639,563 4,032,781
Total revenues 111,680 711,448 - 43,218,419 48,400,718
ExpendituresCurrent operations
Judicial - - - 5,778,193 5,942,828 General government - - - 3,354,860 3,006,406 Public safety - - - 9,102,449 8,707,591 Public works - - - 714,013 680,182 Health and welfare - 3,054 - 24,714,915 24,172,785 Culture and recreation - - - 4,192,325 3,794,805 Community and economic development - - - 419,846 8,170
Debt service 4,375,555 - - 4,375,555 4,134,327 Capital outlay - 2,929,332 111,752 5,122,535 12,977,303
Total expenditures 4,375,555 2,932,386 111,752 57,774,691 63,424,397
Revenues over (under) expenditures (4,263,875) (2,220,938) (111,752) (14,556,272) (15,023,679)
Other financing sources (uses)Issuance of bonds - - - 800,000 - Transfers from other funds 4,267,215 3,221,620 - 16,881,951 17,846,269 Transfers to other funds - (385,600) - (703,313) (2,106,546)
Total other financing sources (uses) 4,267,215 2,836,020 - 16,978,638 15,739,723
Net changes in fund balances 3,340 615,082 (111,752) 2,422,366 716,044
Fund balances, beginning of year - 3,171,719 483,734 14,076,334 13,360,290
Fund balances, end of year 3,340$ 3,786,801$ 371,982$ 16,498,700$ 14,076,334$
(Concluded)
COUNTY OF OTTAWA
NONMAJOR GOVERNMENTAL FUNDSCOMBINING STATEMENT OF REVENUES, EXPENDITURES, AND CHANGES IN FUND BALANCES
FOR THE YEAR ENDED SEPTEMBER 30, 2020
Governmental FundsTotal Nonmajor
124
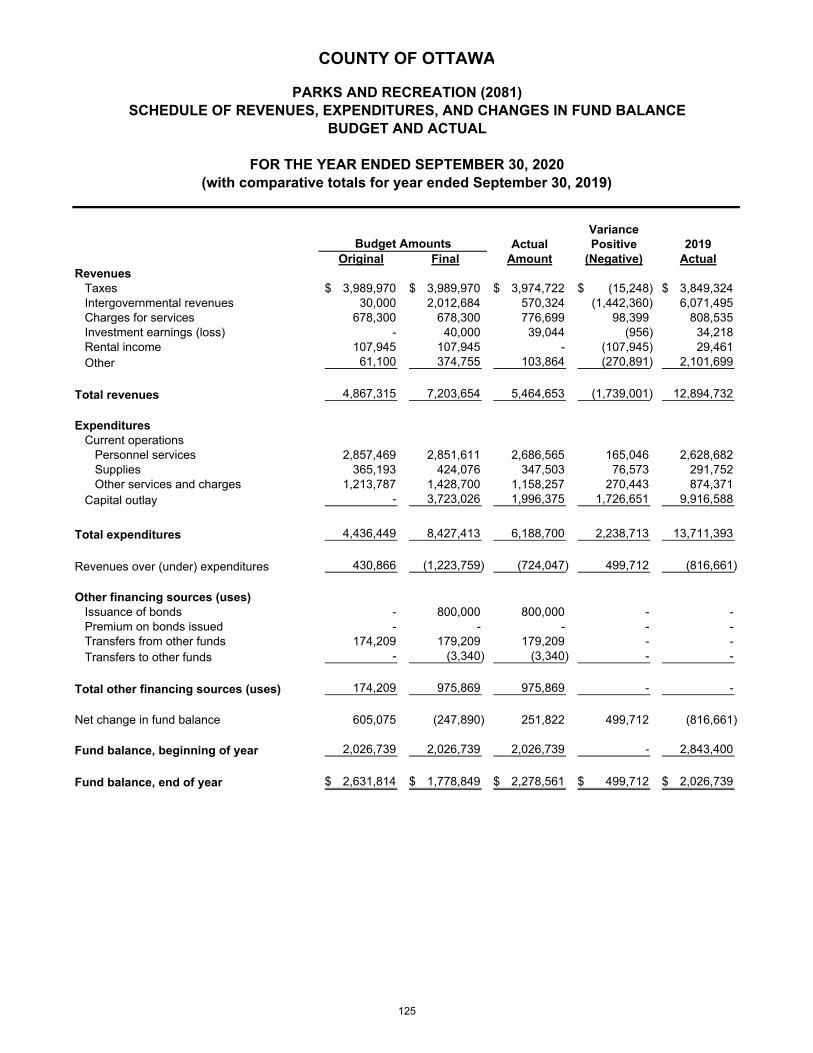
VarianceActual Positive 2019
Original Final Amount (Negative) ActualRevenues
Taxes 3,989,970$ 3,989,970$ 3,974,722$ (15,248)$ 3,849,324$ Intergovernmental revenues 30,000 2,012,684 570,324 (1,442,360) 6,071,495 Charges for services 678,300 678,300 776,699 98,399 808,535 Investment earnings (loss) - 40,000 39,044 (956) 34,218 Rental income 107,945 107,945 - (107,945) 29,461 Other 61,100 374,755 103,864 (270,891) 2,101,699
Total revenues 4,867,315 7,203,654 5,464,653 (1,739,001) 12,894,732
ExpendituresCurrent operations
Personnel services 2,857,469 2,851,611 2,686,565 165,046 2,628,682 Supplies 365,193 424,076 347,503 76,573 291,752 Other services and charges 1,213,787 1,428,700 1,158,257 270,443 874,371
Capital outlay - 3,723,026 1,996,375 1,726,651 9,916,588
Total expenditures 4,436,449 8,427,413 6,188,700 2,238,713 13,711,393
Revenues over (under) expenditures 430,866 (1,223,759) (724,047) 499,712 (816,661)
Other financing sources (uses)Issuance of bonds - 800,000 800,000 - - Premium on bonds issued - - - - - Transfers from other funds 174,209 179,209 179,209 - - Transfers to other funds - (3,340) (3,340) - -
Total other financing sources (uses) 174,209 975,869 975,869 - -
Net change in fund balance 605,075 (247,890) 251,822 499,712 (816,661)
Fund balance, beginning of year 2,026,739 2,026,739 2,026,739 - 2,843,400
Fund balance, end of year 2,631,814$ 1,778,849$ 2,278,561$ 499,712$ 2,026,739$
Budget Amounts
COUNTY OF OTTAWA
PARKS AND RECREATION (2081)SCHEDULE OF REVENUES, EXPENDITURES, AND CHANGES IN FUND BALANCE
BUDGET AND ACTUAL
FOR THE YEAR ENDED SEPTEMBER 30, 2020(with comparative totals for year ended September 30, 2019)
125
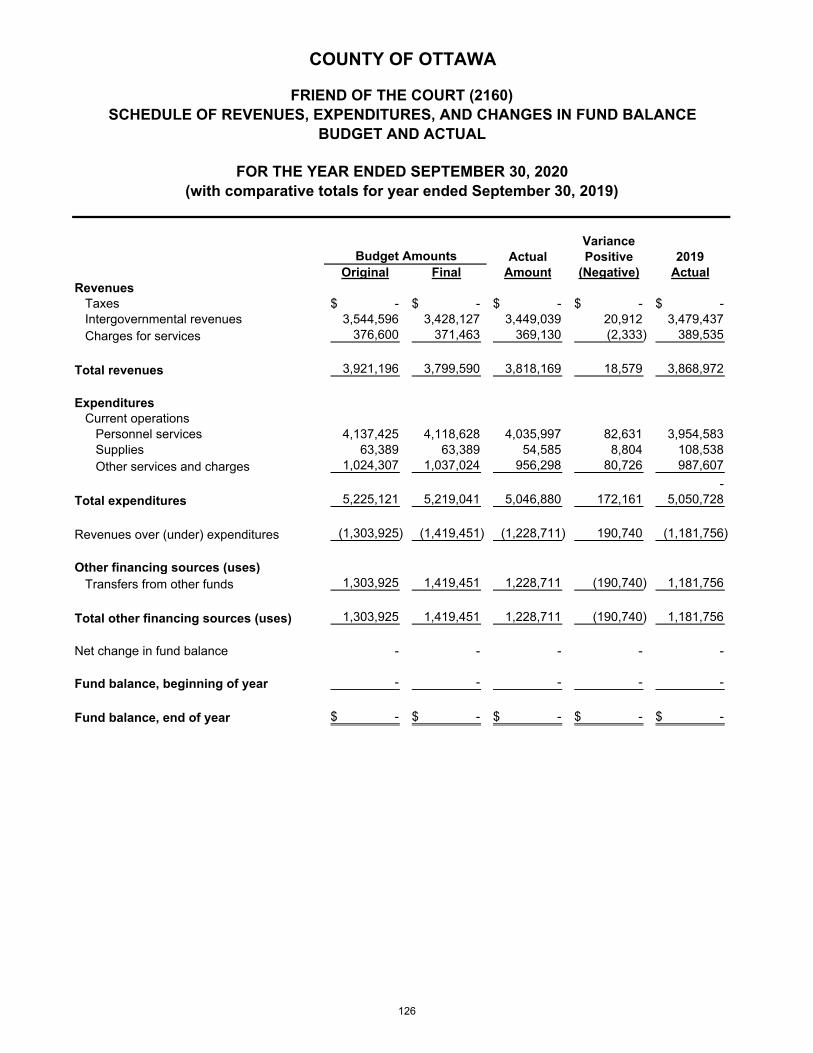
VarianceActual Positive 2019
Original Final Amount (Negative) ActualRevenues
Taxes -$ -$ -$ -$ -$ Intergovernmental revenues 3,544,596 3,428,127 3,449,039 20,912 3,479,437 Charges for services 376,600 371,463 369,130 (2,333) 389,535
Total revenues 3,921,196 3,799,590 3,818,169 18,579 3,868,972
ExpendituresCurrent operations
Personnel services 4,137,425 4,118,628 4,035,997 82,631 3,954,583 Supplies 63,389 63,389 54,585 8,804 108,538 Other services and charges 1,024,307 1,037,024 956,298 80,726 987,607
- Total expenditures 5,225,121 5,219,041 5,046,880 172,161 5,050,728
Revenues over (under) expenditures (1,303,925) (1,419,451) (1,228,711) 190,740 (1,181,756)
Other financing sources (uses)Transfers from other funds 1,303,925 1,419,451 1,228,711 (190,740) 1,181,756
Total other financing sources (uses) 1,303,925 1,419,451 1,228,711 (190,740) 1,181,756
Net change in fund balance - - - - -
Fund balance, beginning of year - - - - -
Fund balance, end of year -$ -$ -$ -$ -$
Budget Amounts
COUNTY OF OTTAWA
FRIEND OF THE COURT (2160)SCHEDULE OF REVENUES, EXPENDITURES, AND CHANGES IN FUND BALANCE
BUDGET AND ACTUAL
FOR THE YEAR ENDED SEPTEMBER 30, 2020(with comparative totals for year ended September 30, 2019)
126
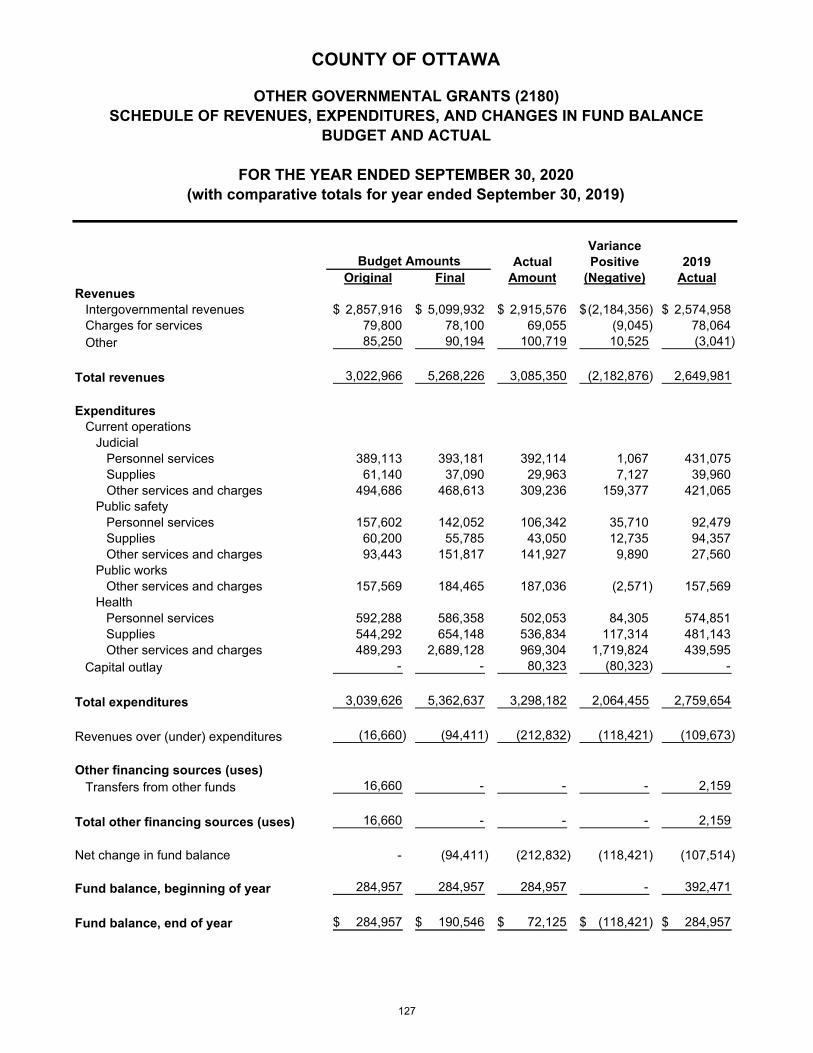
VarianceActual Positive 2019
Original Final Amount (Negative) ActualRevenues
Intergovernmental revenues 2,857,916$ 5,099,932$ 2,915,576$ (2,184,356)$ 2,574,958$ Charges for services 79,800 78,100 69,055 (9,045) 78,064 Other 85,250 90,194 100,719 10,525 (3,041)
Total revenues 3,022,966 5,268,226 3,085,350 (2,182,876) 2,649,981
ExpendituresCurrent operations
JudicialPersonnel services 389,113 393,181 392,114 1,067 431,075 Supplies 61,140 37,090 29,963 7,127 39,960 Other services and charges 494,686 468,613 309,236 159,377 421,065
Public safetyPersonnel services 157,602 142,052 106,342 35,710 92,479 Supplies 60,200 55,785 43,050 12,735 94,357 Other services and charges 93,443 151,817 141,927 9,890 27,560
Public worksOther services and charges 157,569 184,465 187,036 (2,571) 157,569
HealthPersonnel services 592,288 586,358 502,053 84,305 574,851 Supplies 544,292 654,148 536,834 117,314 481,143 Other services and charges 489,293 2,689,128 969,304 1,719,824 439,595
Capital outlay - - 80,323 (80,323) -
Total expenditures 3,039,626 5,362,637 3,298,182 2,064,455 2,759,654
Revenues over (under) expenditures (16,660) (94,411) (212,832) (118,421) (109,673)
Other financing sources (uses)Transfers from other funds 16,660 - - - 2,159
Total other financing sources (uses) 16,660 - - - 2,159
Net change in fund balance - (94,411) (212,832) (118,421) (107,514)
Fund balance, beginning of year 284,957 284,957 284,957 - 392,471
Fund balance, end of year 284,957$ 190,546$ 72,125$ (118,421)$ 284,957$
Budget Amounts
COUNTY OF OTTAWA
OTHER GOVERNMENTAL GRANTS (2180)SCHEDULE OF REVENUES, EXPENDITURES, AND CHANGES IN FUND BALANCE
BUDGET AND ACTUAL
FOR THE YEAR ENDED SEPTEMBER 30, 2020(with comparative totals for year ended September 30, 2019)
127

VarianceActual Positive 2019
Original Final Amount (Negative) ActualRevenues
Intergovernmental revenues 6,042,448$ 6,039,694$ 6,754,446$ 714,752$ 5,946,990$ Charges for services 797,180 806,610 598,829 (207,781) 705,830 Licenses and permits 1,020,635 1,020,635 977,837 (42,798) 1,052,855 Other 10,800 520,304 550,821 30,517 135,976
Total revenues 7,871,063 8,387,243 8,881,933 494,690 7,841,651
ExpendituresCurrent operations
Personnel services 9,103,928 9,968,145 8,917,698 1,050,447 7,868,542 Supplies 821,524 1,132,052 940,917 191,135 1,072,513 Other services and charges 2,670,219 2,941,624 2,378,035 563,589 2,224,040
Total expenditures 12,595,671 14,041,822 12,236,650 1,805,172 11,165,095
Revenues over (under) expenditures (4,724,608) (5,654,578) (3,354,717) (2,299,861) (3,323,444)
Other financing sources (uses)Transfers from other funds 3,988,408 4,193,078 4,193,078 - 4,610,713
Total other financing sources (uses) 3,988,408 4,193,078 4,193,078 - 4,610,713
Net change in fund balance (736,200) (1,461,500) 838,361 (2,299,861) 1,287,269
Fund balance, beginning of year 2,172,882 2,172,882 2,172,882 - 885,613
Fund balance, end of year 1,436,682$ 711,382$ 3,011,243$ (2,299,861)$ 2,172,882$
Budget Amounts
COUNTY OF OTTAWA
HEALTH (2210)SCHEDULE OF REVENUES, EXPENDITURES, AND CHANGES IN FUND BALANCE
BUDGET AND ACTUAL
FOR THE YEAR ENDED SEPTEMBER 30, 2020(with comparative totals for year ended September 30, 2019)
128
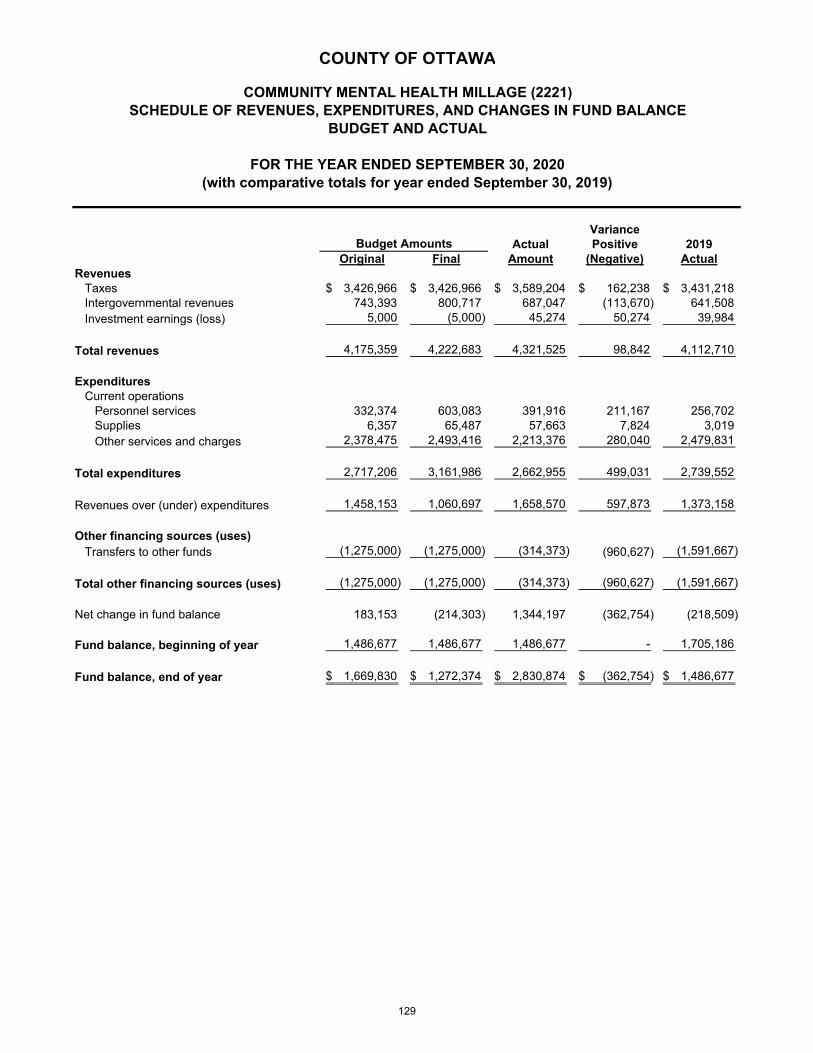
VarianceActual Positive 2019
Original Final Amount (Negative) ActualRevenues
Taxes 3,426,966$ 3,426,966$ 3,589,204$ 162,238$ 3,431,218$ Intergovernmental revenues 743,393 800,717 687,047 (113,670) 641,508 Investment earnings (loss) 5,000 (5,000) 45,274 50,274 39,984
Total revenues 4,175,359 4,222,683 4,321,525 98,842 4,112,710
ExpendituresCurrent operations
Personnel services 332,374 603,083 391,916 211,167 256,702 Supplies 6,357 65,487 57,663 7,824 3,019 Other services and charges 2,378,475 2,493,416 2,213,376 280,040 2,479,831
Total expenditures 2,717,206 3,161,986 2,662,955 499,031 2,739,552
Revenues over (under) expenditures 1,458,153 1,060,697 1,658,570 597,873 1,373,158
Other financing sources (uses)Transfers to other funds (1,275,000) (1,275,000) (314,373) (960,627) (1,591,667)
Total other financing sources (uses) (1,275,000) (1,275,000) (314,373) (960,627) (1,591,667)
Net change in fund balance 183,153 (214,303) 1,344,197 (362,754) (218,509)
Fund balance, beginning of year 1,486,677 1,486,677 1,486,677 - 1,705,186
Fund balance, end of year 1,669,830$ 1,272,374$ 2,830,874$ (362,754)$ 1,486,677$
(with comparative totals for year ended September 30, 2019)
Budget Amounts
COUNTY OF OTTAWA
COMMUNITY MENTAL HEALTH MILLAGE (2221)SCHEDULE OF REVENUES, EXPENDITURES, AND CHANGES IN FUND BALANCE
BUDGET AND ACTUAL
FOR THE YEAR ENDED SEPTEMBER 30, 2020
129
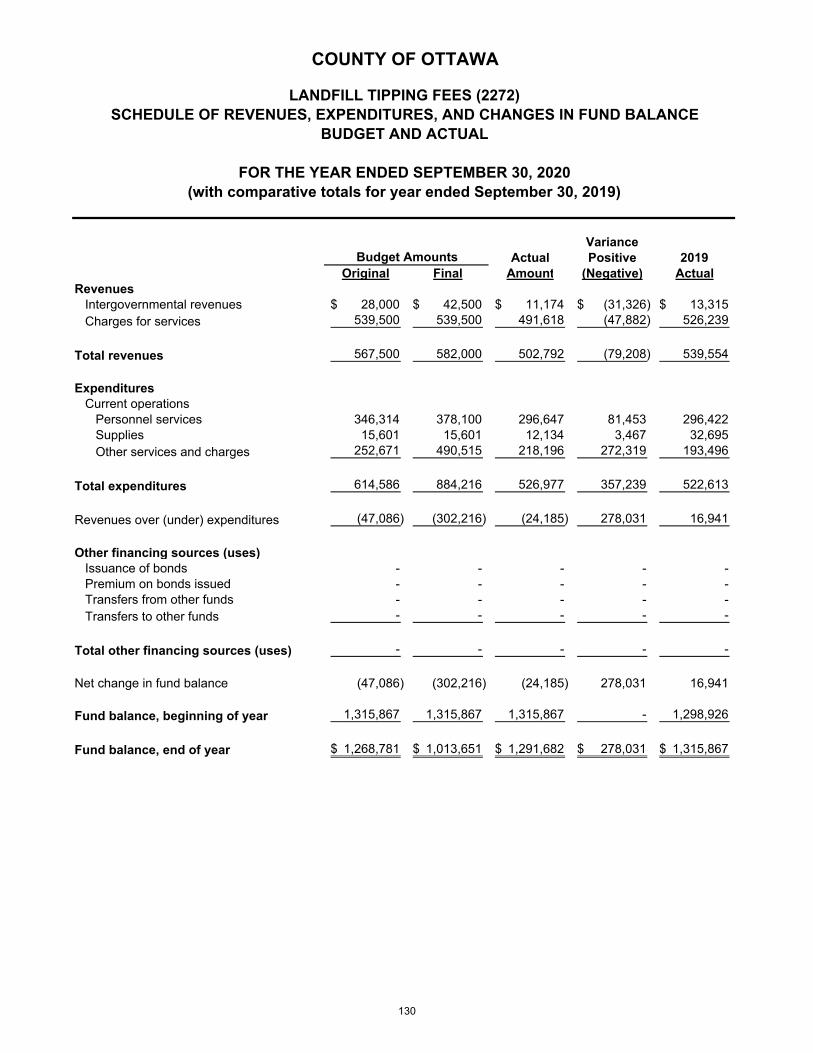
VarianceActual Positive 2019
Original Final Amount (Negative) ActualRevenues
Intergovernmental revenues 28,000$ 42,500$ 11,174$ (31,326)$ 13,315$ Charges for services 539,500 539,500 491,618 (47,882) 526,239
Total revenues 567,500 582,000 502,792 (79,208) 539,554
ExpendituresCurrent operations
Personnel services 346,314 378,100 296,647 81,453 296,422 Supplies 15,601 15,601 12,134 3,467 32,695 Other services and charges 252,671 490,515 218,196 272,319 193,496
Total expenditures 614,586 884,216 526,977 357,239 522,613
Revenues over (under) expenditures (47,086) (302,216) (24,185) 278,031 16,941
Other financing sources (uses)Issuance of bonds - - - - - Premium on bonds issued - - - - - Transfers from other funds - - - - - Transfers to other funds - - - - -
Total other financing sources (uses) - - - - -
Net change in fund balance (47,086) (302,216) (24,185) 278,031 16,941
Fund balance, beginning of year 1,315,867 1,315,867 1,315,867 - 1,298,926
Fund balance, end of year 1,268,781$ 1,013,651$ 1,291,682$ 278,031$ 1,315,867$
Budget Amounts
COUNTY OF OTTAWA
LANDFILL TIPPING FEES (2272)SCHEDULE OF REVENUES, EXPENDITURES, AND CHANGES IN FUND BALANCE
BUDGET AND ACTUAL
(with comparative totals for year ended September 30, 2019)FOR THE YEAR ENDED SEPTEMBER 30, 2020
130

VarianceActual Positive 2019
Original Final Amount (Negative) ActualRevenues
Intergovernmental revenues 200,000$ 200,000$ 200,000$ -$ -$ Other 119,607 221,119 221,431 312 8,217
Total revenues 319,607 421,119 421,431 312 8,217
ExpendituresCurrent operations
Personnel services - - - - - Supplies 2,401 3,913 3,184 729 2,320 Other services and charges 317,206 417,206 416,662 544 5,850
Capital outlay - - - - -
Total expenditures 319,607 421,119 419,846 1,273 8,170
Revenues over (under) expenditures - - 1,585 1,585 47
Other financing sources (uses)Transfers from other funds - - - - - Transfers to other funds - - - - -
Total other financing sources (uses) - - - - -
Net change in fund balance - - 1,585 1,585 47
Fund balance, beginning of year 497 497 497 - 450
Fund balance, end of year 497$ 497$ 2,082$ 1,585$ 497$
Budget Amounts
COUNTY OF OTTAWA
FARMLAND PRESERVATION (2340)SCHEDULE OF REVENUES, EXPENDITURES, AND CHANGES IN FUND BALANCE
BUDGET AND ACTUAL
FOR THE YEAR ENDED SEPTEMBER 30, 2020(with comparative totals for year ended September 30, 2019)
131

VarianceActual Positive 2019
Original Final Amount (Negative) ActualRevenues
Taxes 5,000$ 5,000$ 2,467$ (2,533)$ 7,301$ Investment earnings 150 150 703 553 542 Other - - - - -
Total revenues 5,150 5,150 3,170 (1,980) 7,843
ExpendituresCurrent operations
Personnel services - - - - - Supplies 100 100 - 100 - Other services and charges 1,567 1,567 1,558 9 1,529
Capital outlay - - - - -
Total expenditures 1,667 1,667 1,558 109 1,529
Revenues over (under) expenditures 3,483 3,483 1,612 (1,871) 6,314
Other financing sources (uses)Transfers from other funds - - - - - Transfers to other funds - - - - -
Total other financing sources (uses) - - - - -
Net change in fund balance 3,483 3,483 1,612 (1,871) 6,314
Fund balance, beginning of year 43,242 43,242 43,242 - 36,928
Fund balance, end of year 46,725$ 46,725$ 44,854$ (1,871)$ 43,242$
Budget Amounts
COUNTY OF OTTAWA
HOMESTEAD PROPERTY TAX (2550)SCHEDULE OF REVENUES, EXPENDITURES, AND CHANGES IN FUND BALANCE
BUDGET AND ACTUAL
FOR THE YEAR ENDED SEPTEMBER 30, 2020(with comparative totals for year ended September 30, 2019)
132

VarianceActual Positive 2019
Original Final Amount (Negative) ActualRevenues
Charges for services 200,000$ 200,000$ 284,230$ 84,230$ 231,940$ Fines and forfeits - - - - - Investment earnings - - 14,299 14,299 11,025 Other - - - - -
Total revenues 200,000 200,000 298,529 98,529 242,965
ExpendituresCurrent operations
Personnel services 28,368 28,368 28,202 166 28,166 Supplies 4,090 4,585 3,727 858 33,456 Other services and charges 189,604 189,604 154,139 35,465 126,312
Capital outlay 37,000 36,505 4,753 31,752 232
Total expenditures 259,062 259,062 190,821 68,241 188,166
Revenues over (under) expenditures (59,062) (59,062) 107,708 166,770 54,799
Other financing sources (uses)Transfers from other funds - - - - - Transfers to other funds - - - - -
Total other financing sources (uses) - - - - -
Net change in fund balance (59,062) (59,062) 107,708 166,770 54,799
Fund balance, beginning of year 863,538 863,538 863,538 - 808,739
Fund balance, end of year 804,476$ 804,476$ 971,246$ 166,770$ 863,538$
Budget Amounts
COUNTY OF OTTAWA
REGISTER OF DEEDS TECHNOLOGY (2560)SCHEDULE OF REVENUES, EXPENDITURES, AND CHANGES IN FUND BALANCE
BUDGET AND ACTUAL
FOR THE YEAR ENDED SEPTEMBER 30, 2020(with comparative totals for year ended September 30, 2019)
133
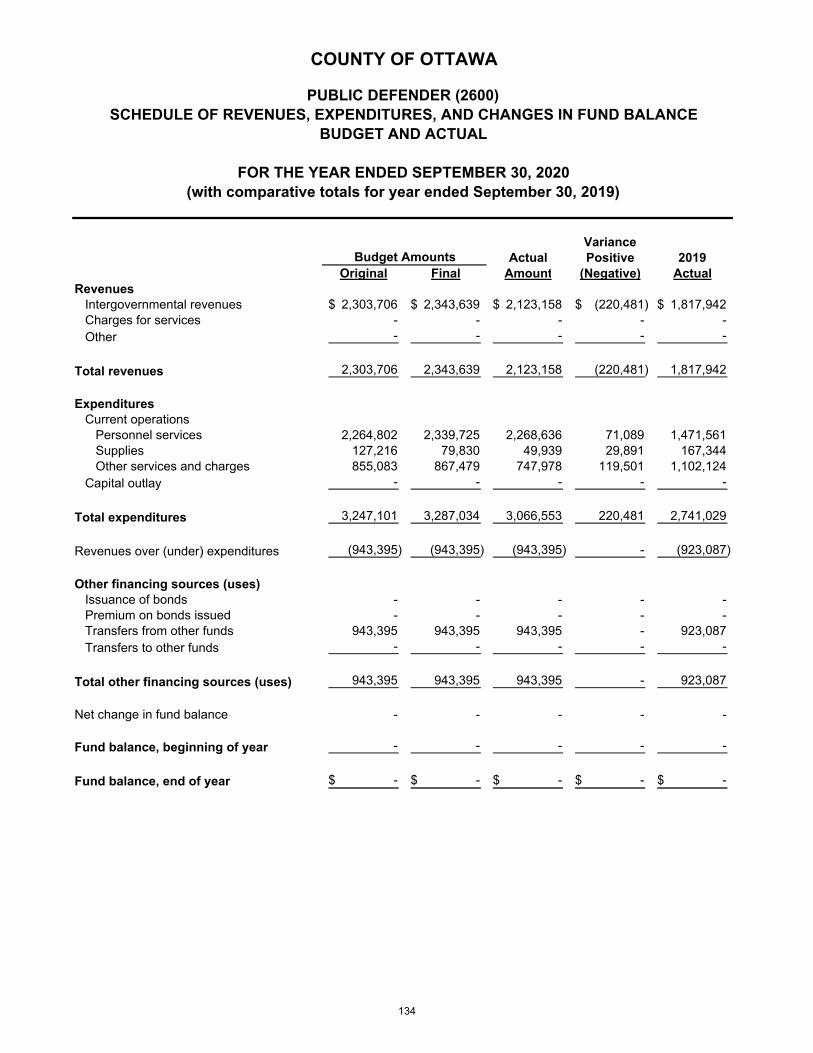
VarianceActual Positive 2019
Original Final Amount (Negative) ActualRevenues
Intergovernmental revenues 2,303,706$ 2,343,639$ 2,123,158$ (220,481)$ 1,817,942$ Charges for services - - - - - Other - - - - -
Total revenues 2,303,706 2,343,639 2,123,158 (220,481) 1,817,942
ExpendituresCurrent operations
Personnel services 2,264,802 2,339,725 2,268,636 71,089 1,471,561 Supplies 127,216 79,830 49,939 29,891 167,344 Other services and charges 855,083 867,479 747,978 119,501 1,102,124
Capital outlay - - - - -
Total expenditures 3,247,101 3,287,034 3,066,553 220,481 2,741,029
Revenues over (under) expenditures (943,395) (943,395) (943,395) - (923,087)
Other financing sources (uses)Issuance of bonds - - - - - Premium on bonds issued - - - - - Transfers from other funds 943,395 943,395 943,395 - 923,087 Transfers to other funds - - - - -
Total other financing sources (uses) 943,395 943,395 943,395 - 923,087
Net change in fund balance - - - - -
Fund balance, beginning of year - - - - -
Fund balance, end of year -$ -$ -$ -$ -$
Budget Amounts
COUNTY OF OTTAWA
PUBLIC DEFENDER (2600)SCHEDULE OF REVENUES, EXPENDITURES, AND CHANGES IN FUND BALANCE
BUDGET AND ACTUAL
FOR THE YEAR ENDED SEPTEMBER 30, 2020(with comparative totals for year ended September 30, 2019)
134
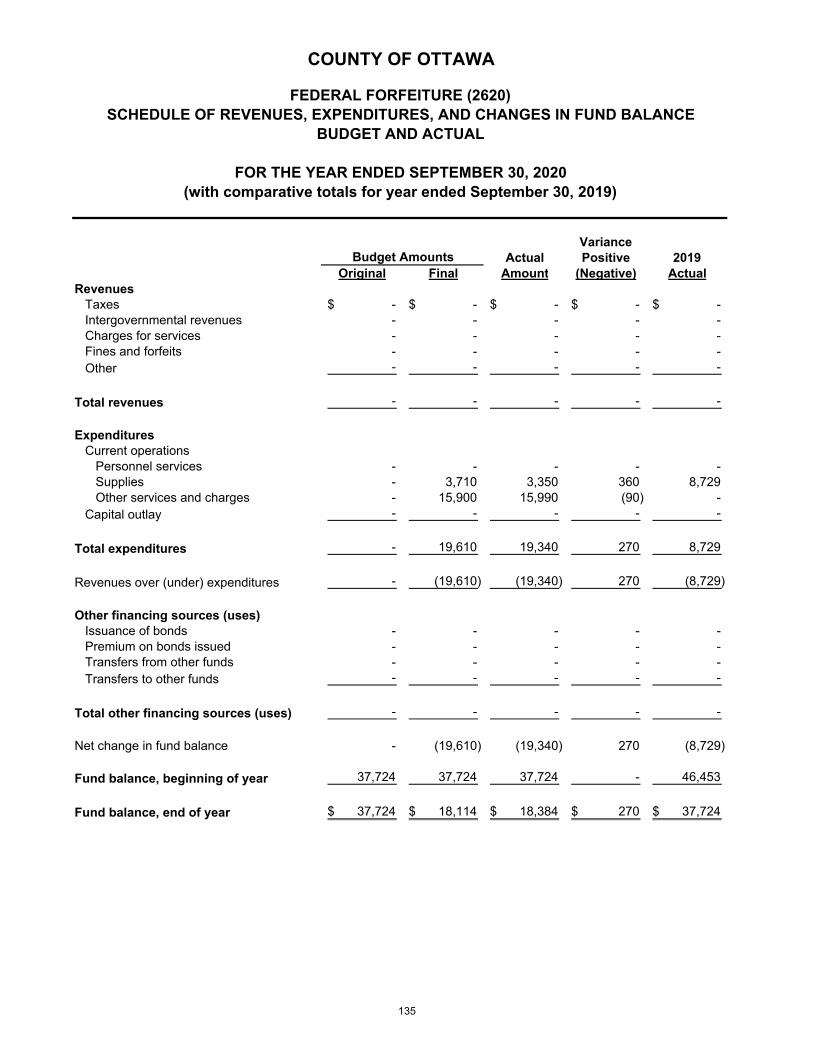
VarianceActual Positive 2019
Original Final Amount (Negative) ActualRevenues
Taxes -$ -$ -$ -$ -$ Intergovernmental revenues - - - - - Charges for services - - - - - Fines and forfeits - - - - - Other - - - - -
Total revenues - - - - -
ExpendituresCurrent operations
Personnel services - - - - - Supplies - 3,710 3,350 360 8,729 Other services and charges - 15,900 15,990 (90) -
Capital outlay - - - - -
Total expenditures - 19,610 19,340 270 8,729
Revenues over (under) expenditures - (19,610) (19,340) 270 (8,729)
Other financing sources (uses)Issuance of bonds - - - - - Premium on bonds issued - - - - - Transfers from other funds - - - - - Transfers to other funds - - - - -
Total other financing sources (uses) - - - - -
Net change in fund balance - (19,610) (19,340) 270 (8,729)
Fund balance, beginning of year 37,724 37,724 37,724 - 46,453
Fund balance, end of year 37,724$ 18,114$ 18,384$ 270$ 37,724$
Budget Amounts
COUNTY OF OTTAWA
FEDERAL FORFEITURE (2620)SCHEDULE OF REVENUES, EXPENDITURES, AND CHANGES IN FUND BALANCE
BUDGET AND ACTUAL
FOR THE YEAR ENDED SEPTEMBER 30, 2020(with comparative totals for year ended September 30, 2019)
135

VarianceActual Positive 2019
Original Final Amount (Negative) ActualRevenues
Intergovernmental revenues 8,684,026$ 8,808,711$ 8,653,582$ (155,129)$ 8,004,048$ Charges for services - - - - - Other - - 10,870 10,870 47,606
Total revenues 8,684,026 8,808,711 8,664,452 (144,259) 8,051,654
ExpendituresCurrent operations
Personnel services 8,228,879 8,069,610 7,943,896 125,714 7,601,828 Supplies 231,129 204,564 145,222 59,342 157,925 Other services and charges 667,173 777,692 722,012 55,680 733,442
Capital outlay - - - - -
Total expenditures 9,127,181 9,051,866 8,811,130 240,736 8,493,195
Revenues over (under) expenditures (443,155) (243,155) (146,678) 96,477 (441,541)
Other financing sources (uses)Transfers from other funds 443,155 443,155 443,155 - 441,540 Transfers to other funds - - - - -
Total other financing sources (uses) 443,155 443,155 443,155 - 441,540
Net change in fund balance - 200,000 296,477 96,477 (1)
Fund balance, beginning of year - - - - 1
Fund balance, end of year -$ 200,000$ 296,477$ 96,477$ -$
COUNTY OF OTTAWA
Budget Amounts
SCHEDULE OF REVENUES, EXPENDITURES, AND CHANGES IN FUND BALANCESHERIFF GRANTS & CONTRACTS (2630)
BUDGET AND ACTUAL
FOR THE YEAR ENDED SEPTEMBER 30, 2020(with comparative totals for year ended September 30, 2019)
136
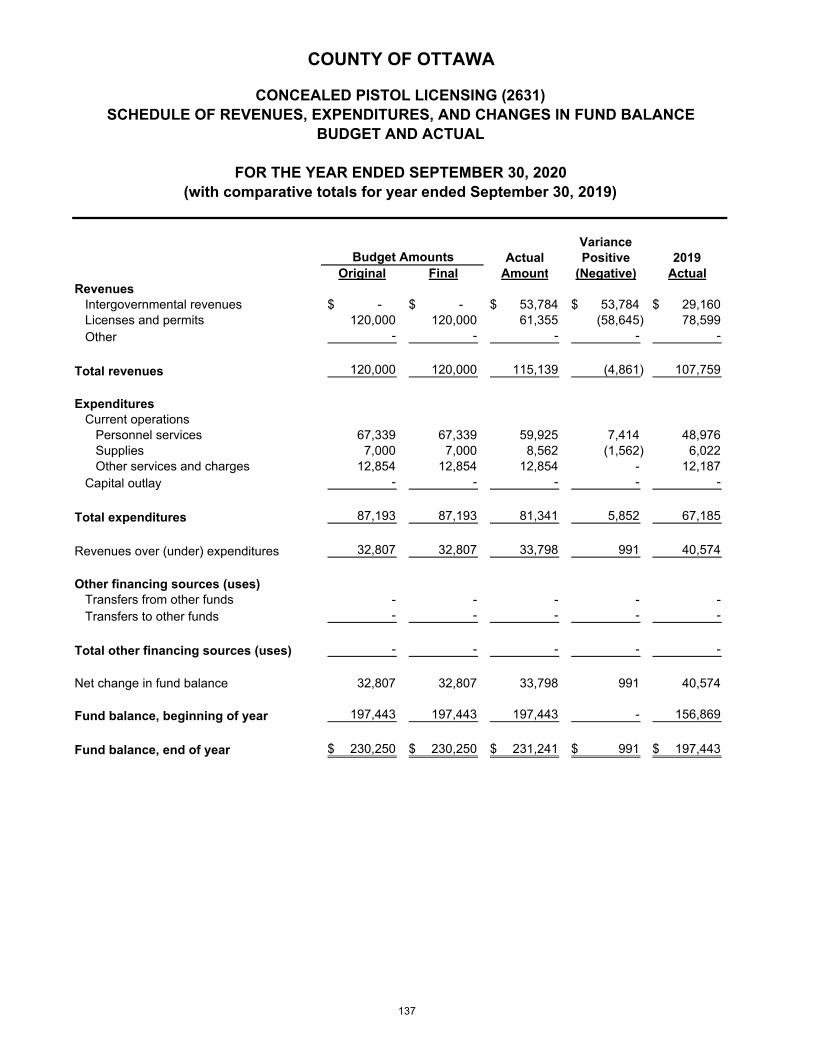
VarianceActual Positive 2019
Original Final Amount (Negative) ActualRevenues
Intergovernmental revenues -$ -$ 53,784$ 53,784$ 29,160$ Licenses and permits 120,000 120,000 61,355 (58,645) 78,599 Other - - - - -
Total revenues 120,000 120,000 115,139 (4,861) 107,759
ExpendituresCurrent operations
Personnel services 67,339 67,339 59,925 7,414 48,976 Supplies 7,000 7,000 8,562 (1,562) 6,022 Other services and charges 12,854 12,854 12,854 - 12,187
Capital outlay - - - - -
Total expenditures 87,193 87,193 81,341 5,852 67,185
Revenues over (under) expenditures 32,807 32,807 33,798 991 40,574
Other financing sources (uses)Transfers from other funds - - - - - Transfers to other funds - - - - -
Total other financing sources (uses) - - - - -
Net change in fund balance 32,807 32,807 33,798 991 40,574
Fund balance, beginning of year 197,443 197,443 197,443 - 156,869
Fund balance, end of year 230,250$ 230,250$ 231,241$ 991$ 197,443$
Budget Amounts
COUNTY OF OTTAWA
CONCEALED PISTOL LICENSING (2631)SCHEDULE OF REVENUES, EXPENDITURES, AND CHANGES IN FUND BALANCE
BUDGET AND ACTUAL
FOR THE YEAR ENDED SEPTEMBER 30, 2020(with comparative totals for year ended September 30, 2019)
137
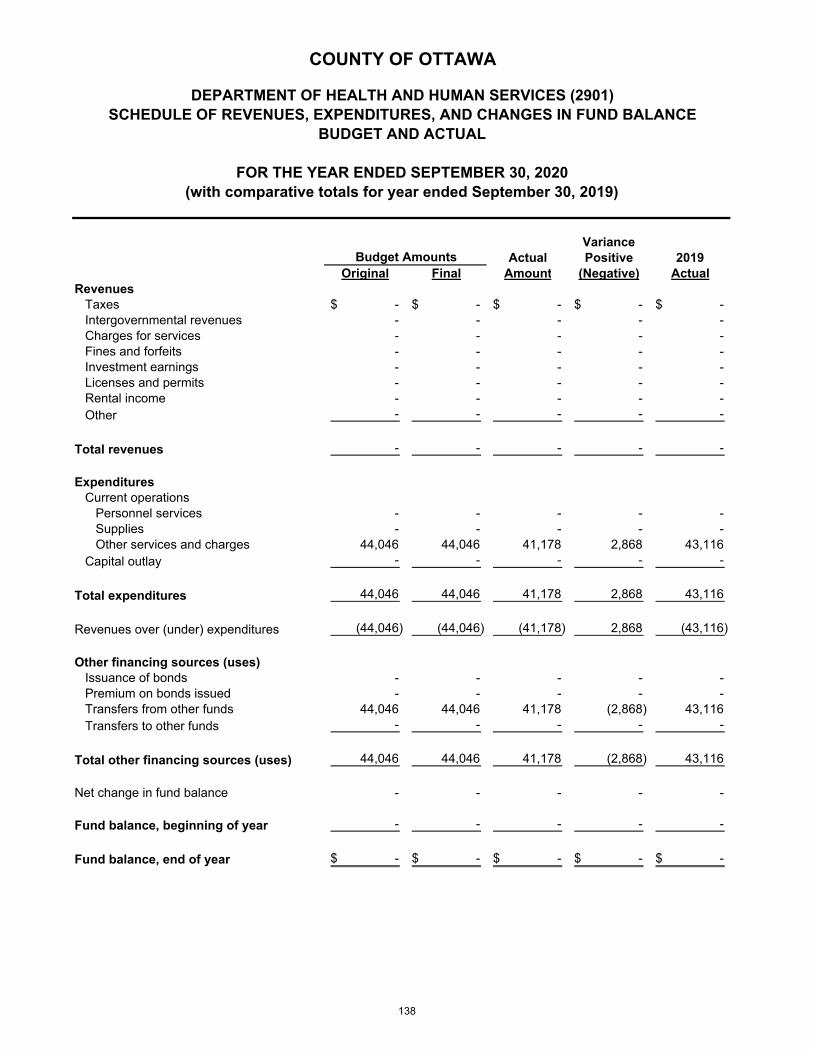
VarianceActual Positive 2019
Original Final Amount (Negative) ActualRevenues
Taxes -$ -$ -$ -$ -$ Intergovernmental revenues - - - - - Charges for services - - - - - Fines and forfeits - - - - - Investment earnings - - - - - Licenses and permits - - - - - Rental income - - - - - Other - - - - -
Total revenues - - - - -
ExpendituresCurrent operations
Personnel services - - - - - Supplies - - - - - Other services and charges 44,046 44,046 41,178 2,868 43,116
Capital outlay - - - - -
Total expenditures 44,046 44,046 41,178 2,868 43,116
Revenues over (under) expenditures (44,046) (44,046) (41,178) 2,868 (43,116)
Other financing sources (uses)Issuance of bonds - - - - - Premium on bonds issued - - - - - Transfers from other funds 44,046 44,046 41,178 (2,868) 43,116 Transfers to other funds - - - - -
Total other financing sources (uses) 44,046 44,046 41,178 (2,868) 43,116
Net change in fund balance - - - - -
Fund balance, beginning of year - - - - -
Fund balance, end of year -$ -$ -$ -$ -$
Budget Amounts
COUNTY OF OTTAWA
DEPARTMENT OF HEALTH AND HUMAN SERVICES (2901)SCHEDULE OF REVENUES, EXPENDITURES, AND CHANGES IN FUND BALANCE
BUDGET AND ACTUAL
FOR THE YEAR ENDED SEPTEMBER 30, 2020(with comparative totals for year ended September 30, 2019)
138

VarianceActual Positive 2019
Original Final Amount (Negative) ActualRevenues
Intergovernmental revenues 3,366,796$ 3,380,680$ 3,333,092$ (47,588)$ 4,074,130$ Rental income - - - - - Other 1,782,800 1,782,800 1,361,898 (420,902) 1,742,324
Total revenues 5,149,596 5,163,480 4,694,990 (468,490) 5,816,454
ExpendituresCurrent operations
Personnel services 5,439,050 5,371,818 4,810,555 561,263 4,958,878 Supplies 325,819 326,649 218,027 108,622 242,893 Other services and charges 3,659,642 3,753,812 2,734,305 1,019,507 3,527,662
Capital outlay - - - - -
Total expenditures 9,424,511 9,452,279 7,762,887 1,689,392 8,729,433
Revenues over (under) expenditures (4,274,915) (4,288,799) (3,067,897) 1,220,902 (2,912,979)
Other financing sources (uses)Premium on bonds issued - - - - - Transfers from other funds 3,850,506 3,864,390 2,364,390 (1,500,000) 3,979,295 Transfers to other funds - - - - -
Total other financing sources (uses) 3,850,506 3,864,390 2,364,390 (1,500,000) 3,979,295
Net change in fund balance (424,409) (424,409) (703,507) (279,098) 1,066,316
Fund balance, beginning of year 1,991,315 1,991,315 1,991,315 - 924,999
Fund balance, end of year 1,566,906$ 1,566,906$ 1,287,808$ (279,098)$ 1,991,315$
Budget Amounts
COUNTY OF OTTAWA
CHILD CARE (2920)SCHEDULE OF REVENUES, EXPENDITURES, AND CHANGES IN FUND BALANCE
BUDGET AND ACTUAL
FOR THE YEAR ENDED SEPTEMBER 30, 2020(with comparative totals for year ended September 30, 2019)
139
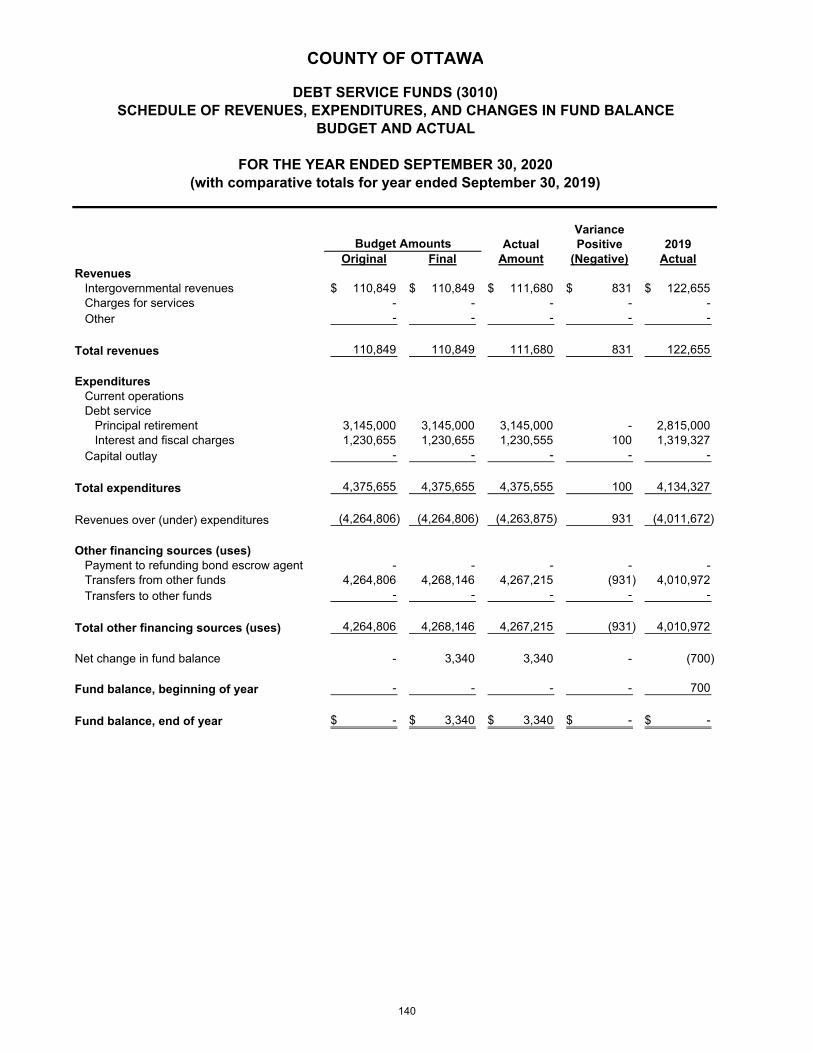
VarianceActual Positive 2019
Original Final Amount (Negative) ActualRevenues
Intergovernmental revenues 110,849$ 110,849$ 111,680$ 831$ 122,655$ Charges for services - - - - - Other - - - - -
Total revenues 110,849 110,849 111,680 831 122,655
ExpendituresCurrent operationsDebt service
Principal retirement 3,145,000 3,145,000 3,145,000 - 2,815,000 Interest and fiscal charges 1,230,655 1,230,655 1,230,555 100 1,319,327
Capital outlay - - - - -
Total expenditures 4,375,655 4,375,655 4,375,555 100 4,134,327
Revenues over (under) expenditures (4,264,806) (4,264,806) (4,263,875) 931 (4,011,672)
Other financing sources (uses)Payment to refunding bond escrow agent - - - - - Transfers from other funds 4,264,806 4,268,146 4,267,215 (931) 4,010,972 Transfers to other funds - - - - -
Total other financing sources (uses) 4,264,806 4,268,146 4,267,215 (931) 4,010,972
Net change in fund balance - 3,340 3,340 - (700)
Fund balance, beginning of year - - - - 700
Fund balance, end of year -$ 3,340$ 3,340$ -$ -$
Budget Amounts
COUNTY OF OTTAWA
DEBT SERVICE FUNDS (3010)SCHEDULE OF REVENUES, EXPENDITURES, AND CHANGES IN FUND BALANCE
BUDGET AND ACTUAL
FOR THE YEAR ENDED SEPTEMBER 30, 2020(with comparative totals for year ended September 30, 2019)
140
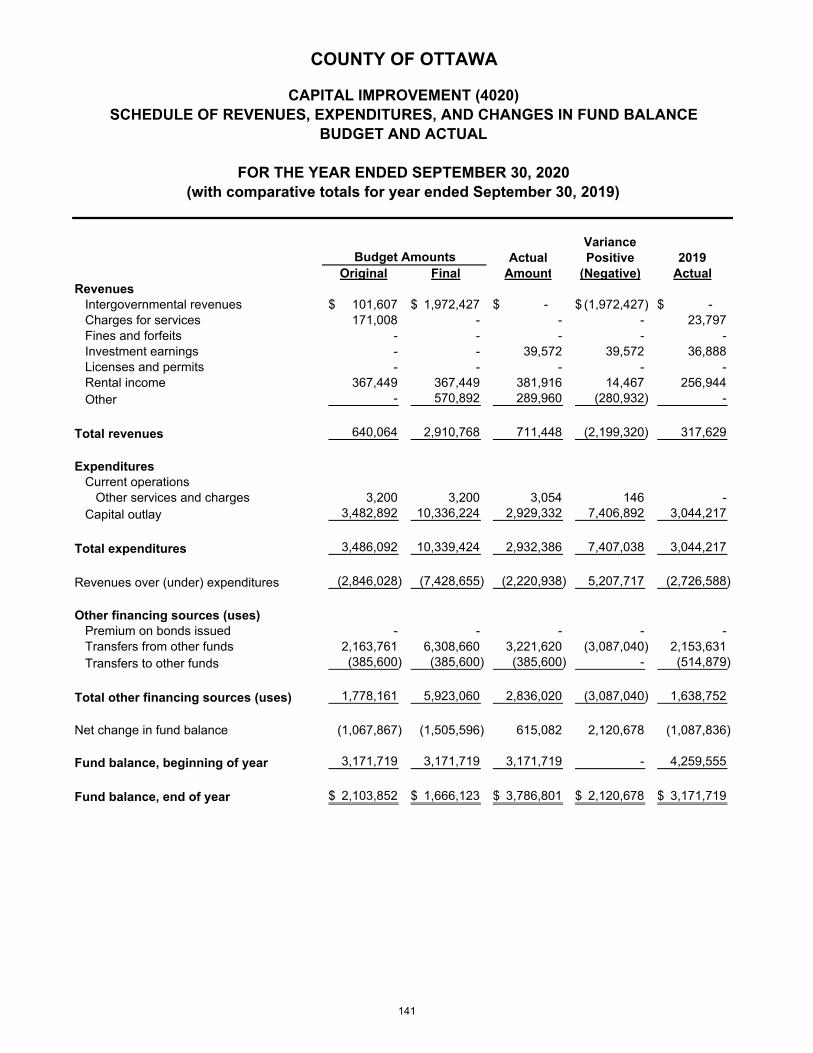
VarianceActual Positive 2019
Original Final Amount (Negative) ActualRevenues
Intergovernmental revenues 101,607$ 1,972,427$ -$ (1,972,427)$ -$ Charges for services 171,008 - - - 23,797 Fines and forfeits - - - - - Investment earnings - - 39,572 39,572 36,888 Licenses and permits - - - - - Rental income 367,449 367,449 381,916 14,467 256,944 Other - 570,892 289,960 (280,932) -
Total revenues 640,064 2,910,768 711,448 (2,199,320) 317,629
ExpendituresCurrent operations
Other services and charges 3,200 3,200 3,054 146 - Capital outlay 3,482,892 10,336,224 2,929,332 7,406,892 3,044,217
Total expenditures 3,486,092 10,339,424 2,932,386 7,407,038 3,044,217
Revenues over (under) expenditures (2,846,028) (7,428,655) (2,220,938) 5,207,717 (2,726,588)
Other financing sources (uses)Premium on bonds issued - - - - - Transfers from other funds 2,163,761 6,308,660 3,221,620 (3,087,040) 2,153,631 Transfers to other funds (385,600) (385,600) (385,600) - (514,879)
Total other financing sources (uses) 1,778,161 5,923,060 2,836,020 (3,087,040) 1,638,752
Net change in fund balance (1,067,867) (1,505,596) 615,082 2,120,678 (1,087,836)
Fund balance, beginning of year 3,171,719 3,171,719 3,171,719 - 4,259,555
Fund balance, end of year 2,103,852$ 1,666,123$ 3,786,801$ 2,120,678$ 3,171,719$
(with comparative totals for year ended September 30, 2019)
Budget Amounts
COUNTY OF OTTAWA
CAPITAL IMPROVEMENT (4020)SCHEDULE OF REVENUES, EXPENDITURES, AND CHANGES IN FUND BALANCE
BUDGET AND ACTUAL
FOR THE YEAR ENDED SEPTEMBER 30, 2020
141

VarianceActual Positive 2019
Original Final Amount (Negative) ActualRevenues
Taxes -$ -$ -$ -$ -$ Intergovernmental revenues - - - - - Rental income - - - - - Other - - - - -
Total revenues - - - - -
ExpendituresCurrent operations
Principal retirement - - - - - Interest and fiscal charges - - - - -
Capital outlay - 483,734 111,752 371,982 16,266
Total expenditures - 483,734 111,752 371,982 16,266
Revenues over (under) expenditures - (483,734) (111,752) 371,982 (16,266)
Other financing sources (uses)Issuance of bonds - - - - - Premium on bonds issued - - - - - Transfers from other funds - - - - 500,000 Transfers to other funds - - - - -
Total other financing sources (uses) - - - - 500,000
Net change in fund balance - (483,734) (111,752) 371,982 483,734
Fund balance, beginning of year 483,734 483,734 483,734 - -
Fund balance, end of year 483,734$ -$ 371,982$ 371,982$ 483,734$
Budget Amounts
COUNTY OF OTTAWA
BUILDING AUTHORITY (4690)SCHEDULE OF REVENUES, EXPENDITURES, AND CHANGES IN FUND BALANCE
BUDGET AND ACTUAL
FOR THE YEAR ENDED SEPTEMBER 30, 2020(with comparative totals for year ended September 30, 2019)
142
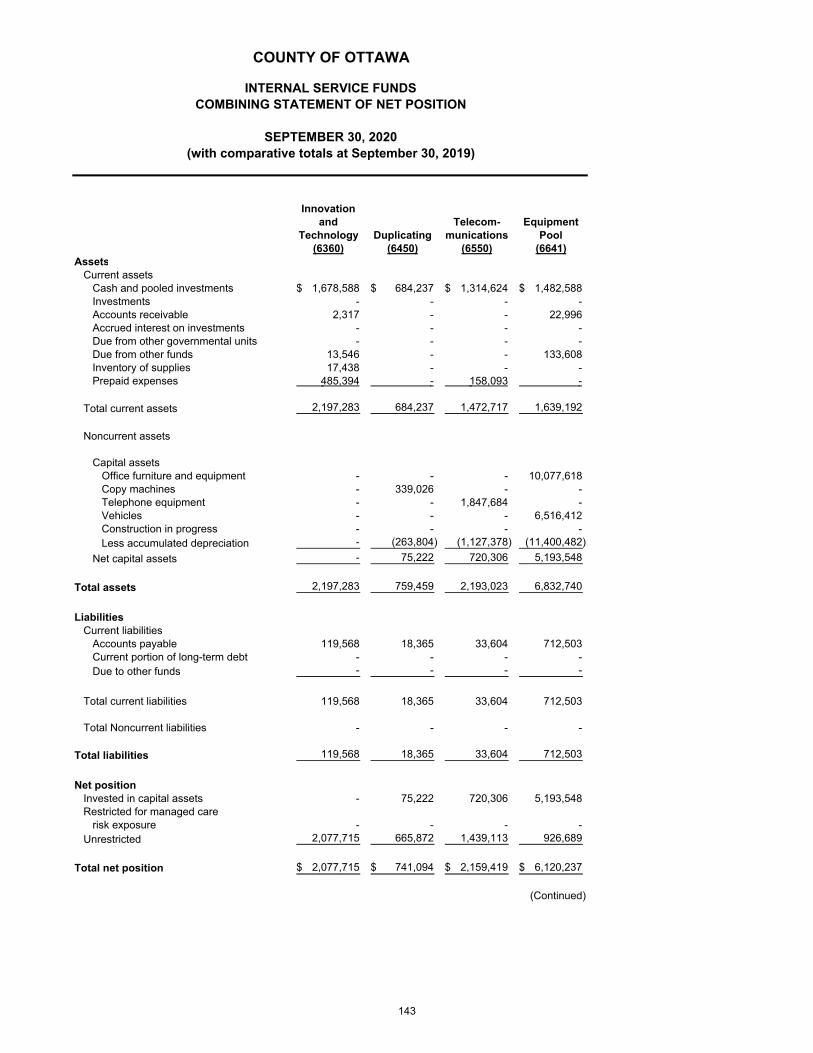
Innovationand Telecom- Equipment
Technology Duplicating munications Pool(6360) (6450) (6550) (6641)
AssetsCurrent assets
Cash and pooled investments 1,678,588$ 684,237$ 1,314,624$ 1,482,588$ Investments - - - - Accounts receivable 2,317 - - 22,996 Accrued interest on investments - - - - Due from other governmental units - - - - Due from other funds 13,546 - - 133,608 Inventory of supplies 17,438 - - - Prepaid expenses 485,394 - 158,093 -
Total current assets 2,197,283 684,237 1,472,717 1,639,192
Noncurrent assets
Capital assetsOffice furniture and equipment - - - 10,077,618 Copy machines - 339,026 - - Telephone equipment - - 1,847,684 - Vehicles - - - 6,516,412 Construction in progress - - - - Less accumulated depreciation - (263,804) (1,127,378) (11,400,482)
Net capital assets - 75,222 720,306 5,193,548
Total assets 2,197,283 759,459 2,193,023 6,832,740
LiabilitiesCurrent liabilities
Accounts payable 119,568 18,365 33,604 712,503 Current portion of long-term debt - - - - Due to other funds - - - -
Total current liabilities 119,568 18,365 33,604 712,503
Total Noncurrent liabilities - - - -
Total liabilities 119,568 18,365 33,604 712,503
Net positionInvested in capital assets - 75,222 720,306 5,193,548 Restricted for managed care
risk exposure - - - - Unrestricted 2,077,715 665,872 1,439,113 926,689
Total net position 2,077,715$ 741,094$ 2,159,419$ 6,120,237$
(Continued)
COUNTY OF OTTAWA
INTERNAL SERVICE FUNDSCOMBINING STATEMENT OF NET POSITION
SEPTEMBER 30, 2020(with comparative totals at September 30, 2019)
143
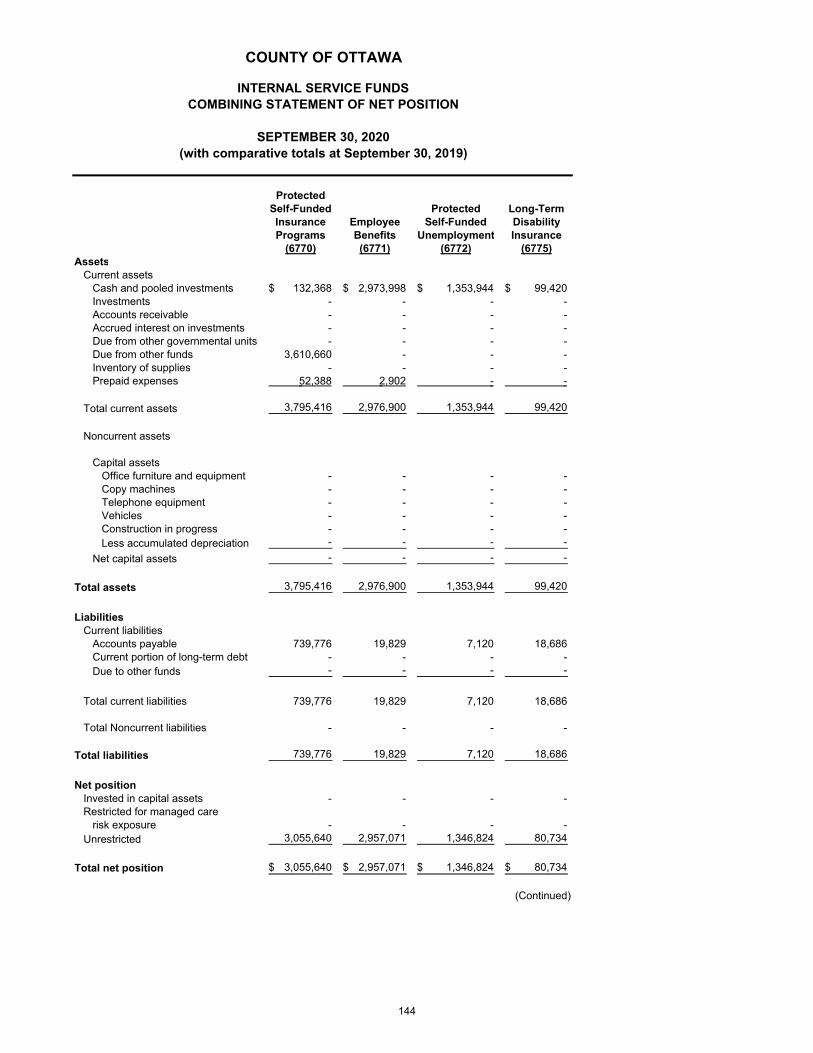
ProtectedSelf-Funded Protected Long-TermInsurance Employee Self-Funded DisabilityPrograms Benefits Unemployment Insurance
(6770) (6771) (6772) (6775)Assets
Current assetsCash and pooled investments 132,368$ 2,973,998$ 1,353,944$ 99,420$ Investments - - - - Accounts receivable - - - - Accrued interest on investments - - - - Due from other governmental units - - - - Due from other funds 3,610,660 - - - Inventory of supplies - - - - Prepaid expenses 52,388 2,902 - -
Total current assets 3,795,416 2,976,900 1,353,944 99,420
Noncurrent assets
Capital assetsOffice furniture and equipment - - - - Copy machines - - - - Telephone equipment - - - - Vehicles - - - - Construction in progress - - - - Less accumulated depreciation - - - -
Net capital assets - - - -
Total assets 3,795,416 2,976,900 1,353,944 99,420
LiabilitiesCurrent liabilities
Accounts payable 739,776 19,829 7,120 18,686 Current portion of long-term debt - - - - Due to other funds - - - -
Total current liabilities 739,776 19,829 7,120 18,686
Total Noncurrent liabilities - - - -
Total liabilities 739,776 19,829 7,120 18,686
Net positionInvested in capital assets - - - - Restricted for managed care
risk exposure - - - - Unrestricted 3,055,640 2,957,071 1,346,824 80,734
Total net position 3,055,640$ 2,957,071$ 1,346,824$ 80,734$
(Continued)
COUNTY OF OTTAWA
INTERNAL SERVICE FUNDSCOMBINING STATEMENT OF NET POSITION
SEPTEMBER 30, 2020(with comparative totals at September 30, 2019)
144
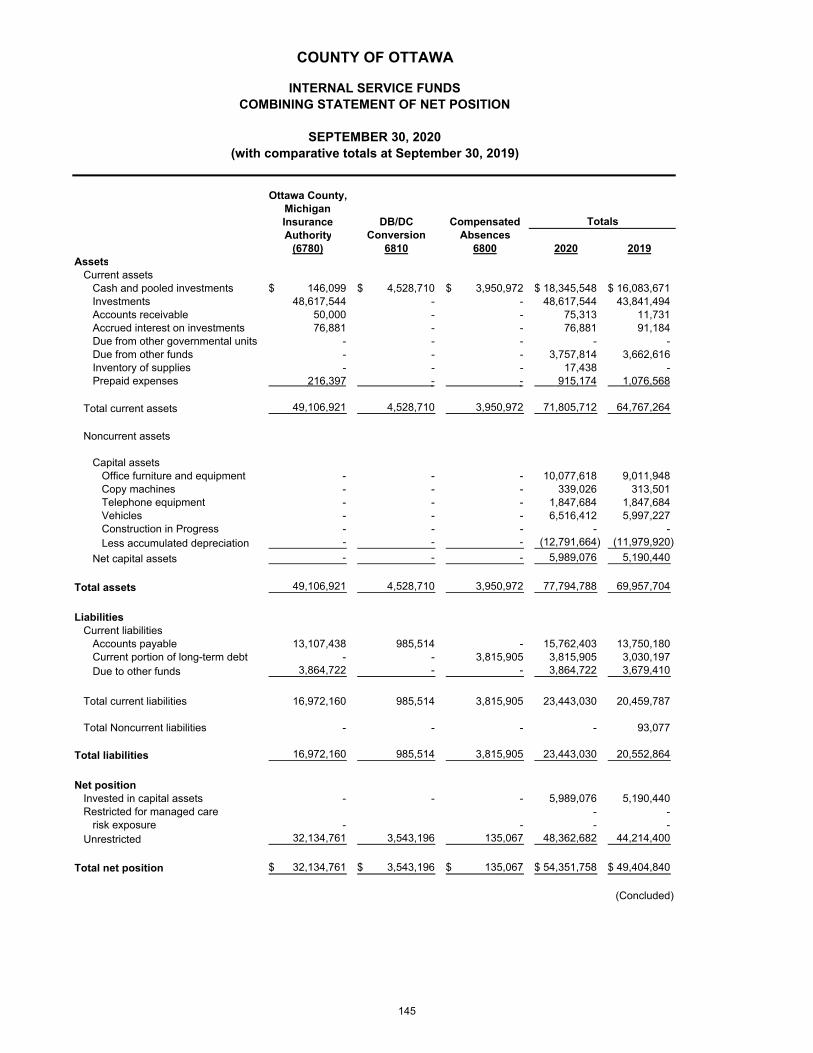
Ottawa County,MichiganInsurance DB/DC CompensatedAuthority Conversion Absences
(6780) 6810 6800 2020 2019Assets
Current assetsCash and pooled investments 146,099$ 4,528,710$ 3,950,972$ 18,345,548$ 16,083,671$ Investments 48,617,544 - - 48,617,544 43,841,494 Accounts receivable 50,000 - - 75,313 11,731 Accrued interest on investments 76,881 - - 76,881 91,184 Due from other governmental units - - - - - Due from other funds - - - 3,757,814 3,662,616 Inventory of supplies - - - 17,438 - Prepaid expenses 216,397 - - 915,174 1,076,568
Total current assets 49,106,921 4,528,710 3,950,972 71,805,712 64,767,264
Noncurrent assets
Capital assetsOffice furniture and equipment - - - 10,077,618 9,011,948 Copy machines - - - 339,026 313,501 Telephone equipment - - - 1,847,684 1,847,684 Vehicles - - - 6,516,412 5,997,227 Construction in Progress - - - - - Less accumulated depreciation - - - (12,791,664) (11,979,920)
Net capital assets - - - 5,989,076 5,190,440
Total assets 49,106,921 4,528,710 3,950,972 77,794,788 69,957,704
LiabilitiesCurrent liabilities
Accounts payable 13,107,438 985,514 - 15,762,403 13,750,180 Current portion of long-term debt - - 3,815,905 3,815,905 3,030,197 Due to other funds 3,864,722 - - 3,864,722 3,679,410
Total current liabilities 16,972,160 985,514 3,815,905 23,443,030 20,459,787
Total Noncurrent liabilities - - - - 93,077
Total liabilities 16,972,160 985,514 3,815,905 23,443,030 20,552,864
Net positionInvested in capital assets - - - 5,989,076 5,190,440 Restricted for managed care - -
risk exposure - - - - Unrestricted 32,134,761 3,543,196 135,067 48,362,682 44,214,400
Total net position 32,134,761$ 3,543,196$ 135,067$ 54,351,758$ 49,404,840$
(Concluded)
Totals
COUNTY OF OTTAWA
INTERNAL SERVICE FUNDSCOMBINING STATEMENT OF NET POSITION
SEPTEMBER 30, 2020(with comparative totals at September 30, 2019)
145
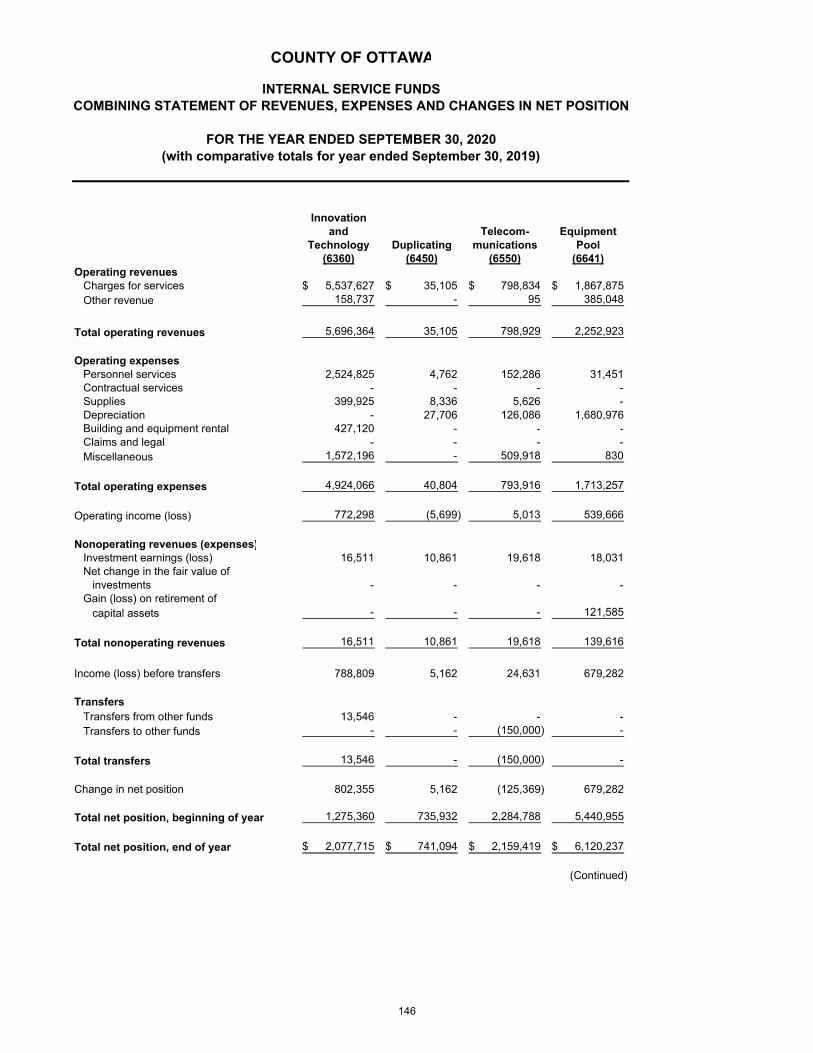
Innovationand Telecom- Equipment
Technology Duplicating munications Pool(6360) (6450) (6550) (6641)
Operating revenuesCharges for services 5,537,627$ 35,105$ 798,834$ 1,867,875$ Other revenue 158,737 - 95 385,048
Total operating revenues 5,696,364 35,105 798,929 2,252,923
Operating expensesPersonnel services 2,524,825 4,762 152,286 31,451 Contractual services - - - - Supplies 399,925 8,336 5,626 - Depreciation - 27,706 126,086 1,680,976 Building and equipment rental 427,120 - - - Claims and legal - - - - Miscellaneous 1,572,196 - 509,918 830
Total operating expenses 4,924,066 40,804 793,916 1,713,257
Operating income (loss) 772,298 (5,699) 5,013 539,666
Nonoperating revenues (expenses)Investment earnings (loss) 16,511 10,861 19,618 18,031 Net change in the fair value of
investments - - - - Gain (loss) on retirement of
capital assets - - - 121,585
Total nonoperating revenues 16,511 10,861 19,618 139,616
Income (loss) before transfers 788,809 5,162 24,631 679,282
TransfersTransfers from other funds 13,546 - - - Transfers to other funds - - (150,000) -
Total transfers 13,546 - (150,000) -
Change in net position 802,355 5,162 (125,369) 679,282
Total net position, beginning of year 1,275,360 735,932 2,284,788 5,440,955
Total net position, end of year 2,077,715$ 741,094$ 2,159,419$ 6,120,237$
(Continued)
COUNTY OF OTTAWA
INTERNAL SERVICE FUNDSCOMBINING STATEMENT OF REVENUES, EXPENSES AND CHANGES IN NET POSITION
FOR THE YEAR ENDED SEPTEMBER 30, 2020(with comparative totals for year ended September 30, 2019)
146
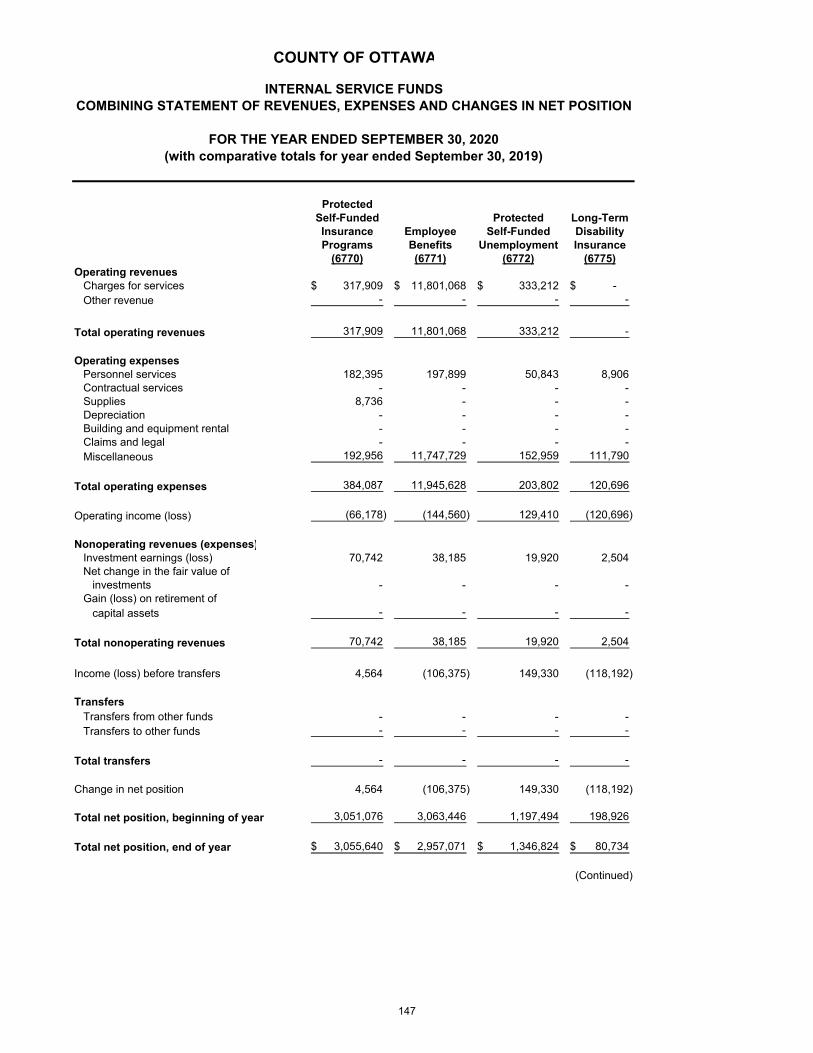
ProtectedSelf-Funded Protected Long-TermInsurance Employee Self-Funded DisabilityPrograms Benefits Unemployment Insurance
(6770) (6771) (6772) (6775)Operating revenues
Charges for services 317,909$ 11,801,068$ 333,212$ -$ Other revenue - - - -
Total operating revenues 317,909 11,801,068 333,212 -
Operating expensesPersonnel services 182,395 197,899 50,843 8,906 Contractual services - - - - Supplies 8,736 - - - Depreciation - - - - Building and equipment rental - - - - Claims and legal - - - - Miscellaneous 192,956 11,747,729 152,959 111,790
Total operating expenses 384,087 11,945,628 203,802 120,696
Operating income (loss) (66,178) (144,560) 129,410 (120,696)
Nonoperating revenues (expenses)Investment earnings (loss) 70,742 38,185 19,920 2,504 Net change in the fair value of
investments - - - - Gain (loss) on retirement of
capital assets - - - -
Total nonoperating revenues 70,742 38,185 19,920 2,504
Income (loss) before transfers 4,564 (106,375) 149,330 (118,192)
TransfersTransfers from other funds - - - - Transfers to other funds - - - -
Total transfers - - - -
Change in net position 4,564 (106,375) 149,330 (118,192)
Total net position, beginning of year 3,051,076 3,063,446 1,197,494 198,926
Total net position, end of year 3,055,640$ 2,957,071$ 1,346,824$ 80,734$
(Continued)
FOR THE YEAR ENDED SEPTEMBER 30, 2020(with comparative totals for year ended September 30, 2019)
COUNTY OF OTTAWA
INTERNAL SERVICE FUNDSCOMBINING STATEMENT OF REVENUES, EXPENSES AND CHANGES IN NET POSITION
147
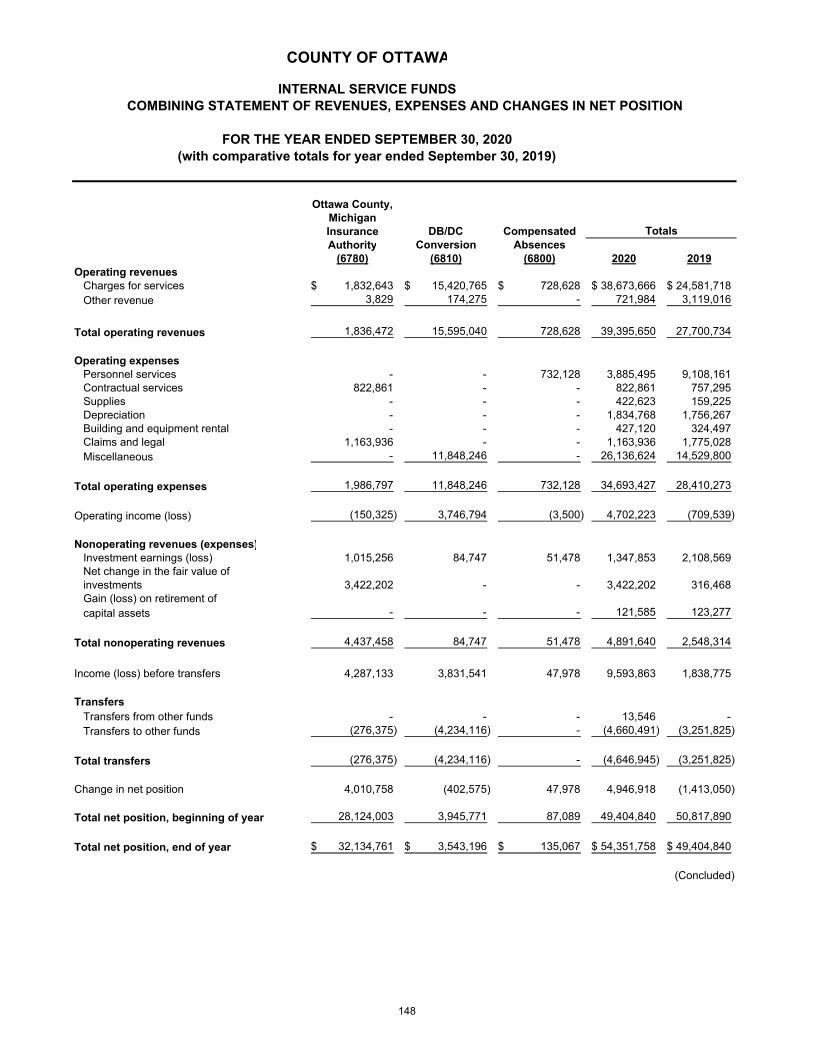
Ottawa County,MichiganInsurance DB/DC CompensatedAuthority Conversion Absences
(6780) (6810) (6800) 2020 2019Operating revenues
Charges for services 1,832,643$ 15,420,765$ 728,628$ 38,673,666$ 24,581,718$ Other revenue 3,829 174,275 - 721,984 3,119,016
Total operating revenues 1,836,472 15,595,040 728,628 39,395,650 27,700,734
Operating expensesPersonnel services - - 732,128 3,885,495 9,108,161 Contractual services 822,861 - - 822,861 757,295 Supplies - - - 422,623 159,225 Depreciation - - - 1,834,768 1,756,267 Building and equipment rental - - - 427,120 324,497 Claims and legal 1,163,936 - - 1,163,936 1,775,028 Miscellaneous - 11,848,246 - 26,136,624 14,529,800
Total operating expenses 1,986,797 11,848,246 732,128 34,693,427 28,410,273
Operating income (loss) (150,325) 3,746,794 (3,500) 4,702,223 (709,539)
Nonoperating revenues (expenses)Investment earnings (loss) 1,015,256 84,747 51,478 1,347,853 2,108,569 Net change in the fair value ofinvestments 3,422,202 - - 3,422,202 316,468 Gain (loss) on retirement of capital assets - - - 121,585 123,277
Total nonoperating revenues 4,437,458 84,747 51,478 4,891,640 2,548,314
Income (loss) before transfers 4,287,133 3,831,541 47,978 9,593,863 1,838,775
TransfersTransfers from other funds - - - 13,546 - Transfers to other funds (276,375) (4,234,116) - (4,660,491) (3,251,825)
Total transfers (276,375) (4,234,116) - (4,646,945) (3,251,825)
Change in net position 4,010,758 (402,575) 47,978 4,946,918 (1,413,050)
Total net position, beginning of year 28,124,003 3,945,771 87,089 49,404,840 50,817,890
Total net position, end of year 32,134,761$ 3,543,196$ 135,067$ 54,351,758$ 49,404,840$
(Concluded)
Totals
COUNTY OF OTTAWA
INTERNAL SERVICE FUNDSCOMBINING STATEMENT OF REVENUES, EXPENSES AND CHANGES IN NET POSITION
FOR THE YEAR ENDED SEPTEMBER 30, 2020(with comparative totals for year ended September 30, 2019)
148
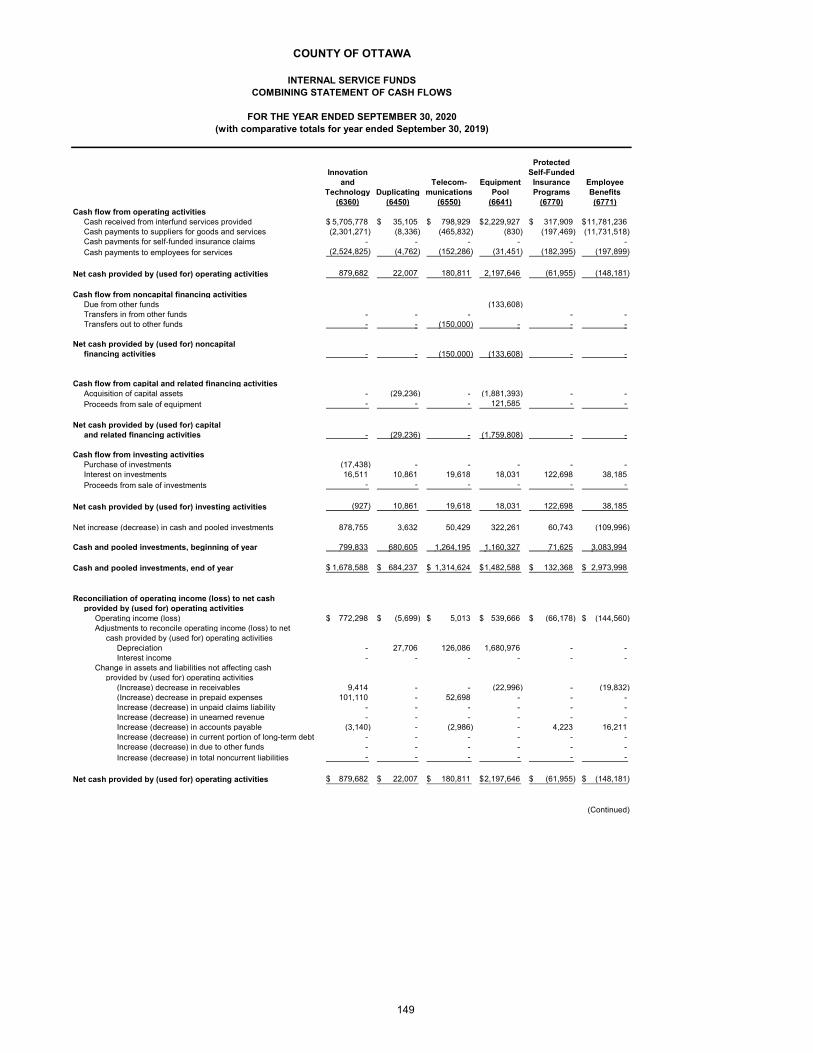
ProtectedInnovation Self-Funded
and Telecom- Equipment Insurance EmployeeTechnology Duplicating munications Pool Programs Benefits
(6360) (6450) (6550) (6641) (6770) (6771)Cash flow from operating activities
Cash received from interfund services provided 5,705,778$ 35,105$ 798,929$ 2,229,927$ 317,909$ 11,781,236$ Cash payments to suppliers for goods and services (2,301,271) (8,336) (465,832) (830) (197,469) (11,731,518) Cash payments for self-funded insurance claims - - - - - - Cash payments to employees for services (2,524,825) (4,762) (152,286) (31,451) (182,395) (197,899)
Net cash provided by (used for) operating activities 879,682 22,007 180,811 2,197,646 (61,955) (148,181) Cash flow from noncapital financing activities
Due from other funds (133,608) Transfers in from other funds - - - - - Transfers out to other funds - - (150,000) - - -
Net cash provided by (used for) noncapitalfinancing activities - - (150,000) (133,608) - -
Cash flow from capital and related financing activitiesAcquisition of capital assets - (29,236) - (1,881,393) - - Proceeds from sale of equipment - - - 121,585 - -
Net cash provided by (used for) capitaland related financing activities - (29,236) - (1,759,808) - -
Cash flow from investing activities
Purchase of investments (17,438) - - - - - Interest on investments 16,511 10,861 19,618 18,031 122,698 38,185 Proceeds from sale of investments - - - - - -
Net cash provided by (used for) investing activities (927) 10,861 19,618 18,031 122,698 38,185
Net increase (decrease) in cash and pooled investments 878,755 3,632 50,429 322,261 60,743 (109,996)
Cash and pooled investments, beginning of year 799,833 680,605 1,264,195 1,160,327 71,625 3,083,994
Cash and pooled investments, end of year 1,678,588$ 684,237$ 1,314,624$ 1,482,588$ 132,368$ 2,973,998$
Reconciliation of operating income (loss) to net cashprovided by (used for) operating activities
Operating income (loss) 772,298$ (5,699)$ 5,013$ 539,666$ (66,178)$ (144,560)$ Adjustments to reconcile operating income (loss) to net
cash provided by (used for) operating activitiesDepreciation - 27,706 126,086 1,680,976 - - Interest income - - - - - -
Change in assets and liabilities not affecting cashprovided by (used for) operating activities
(Increase) decrease in receivables 9,414 - - (22,996) - (19,832) (Increase) decrease in prepaid expenses 101,110 - 52,698 - - - Increase (decrease) in unpaid claims liability - - - - - - Increase (decrease) in unearned revenue - - - - - - Increase (decrease) in accounts payable (3,140) - (2,986) - 4,223 16,211 Increase (decrease) in current portion of long-term debt - - - - - - Increase (decrease) in due to other funds - - - - - - Increase (decrease) in total noncurrent liabilities - - - - - -
Net cash provided by (used for) operating activities 879,682$ 22,007$ 180,811$ 2,197,646$ (61,955)$ (148,181)$
(Continued)
COUNTY OF OTTAWA
INTERNAL SERVICE FUNDSCOMBINING STATEMENT OF CASH FLOWS
FOR THE YEAR ENDED SEPTEMBER 30, 2020(with comparative totals for year ended September 30, 2019)
149
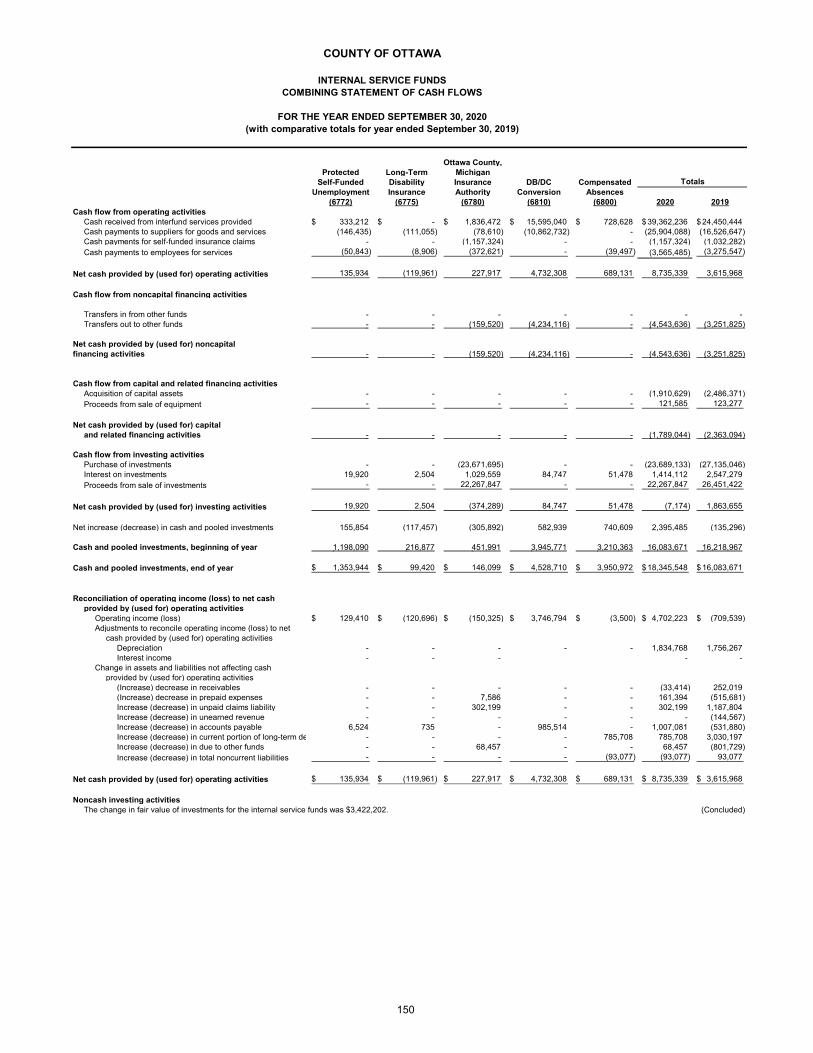
Ottawa County,Protected Long-Term Michigan
Self-Funded Disability Insurance DB/DC CompensatedUnemployment Insurance Authority Conversion Absences
(6772) (6775) (6780) (6810) (6800) 2020 2019Cash flow from operating activities
Cash received from interfund services provided 333,212$ -$ 1,836,472$ 15,595,040$ 728,628$ 39,362,236$ 24,450,444$ Cash payments to suppliers for goods and services (146,435) (111,055) (78,610) (10,862,732) - (25,904,088) (16,526,647) Cash payments for self-funded insurance claims - - (1,157,324) - - (1,157,324) (1,032,282) Cash payments to employees for services (50,843) (8,906) (372,621) - (39,497) (3,565,485) (3,275,547)
Net cash provided by (used for) operating activities 135,934 (119,961) 227,917 4,732,308 689,131 8,735,339 3,615,968 Cash flow from noncapital financing activities
Transfers in from other funds - - - - - - - Transfers out to other funds - - (159,520) (4,234,116) - (4,543,636) (3,251,825)
Net cash provided by (used for) noncapitalfinancing activities - - (159,520) (4,234,116) - (4,543,636) (3,251,825)
Cash flow from capital and related financing activitiesAcquisition of capital assets - - - - - (1,910,629) (2,486,371) Proceeds from sale of equipment - - - - - 121,585 123,277
Net cash provided by (used for) capitaland related financing activities - - - - - (1,789,044) (2,363,094)
Cash flow from investing activities
Purchase of investments - - (23,671,695) - - (23,689,133) (27,135,046) Interest on investments 19,920 2,504 1,029,559 84,747 51,478 1,414,112 2,547,279 Proceeds from sale of investments - - 22,267,847 - - 22,267,847 26,451,422
Net cash provided by (used for) investing activities 19,920 2,504 (374,289) 84,747 51,478 (7,174) 1,863,655
Net increase (decrease) in cash and pooled investments 155,854 (117,457) (305,892) 582,939 740,609 2,395,485 (135,296)
Cash and pooled investments, beginning of year 1,198,090 216,877 451,991 3,945,771 3,210,363 16,083,671 16,218,967
Cash and pooled investments, end of year 1,353,944$ 99,420$ 146,099$ 4,528,710$ 3,950,972$ 18,345,548$ 16,083,671$
Reconciliation of operating income (loss) to net cashprovided by (used for) operating activities
Operating income (loss) 129,410$ (120,696)$ (150,325)$ 3,746,794$ (3,500)$ 4,702,223$ (709,539)$ Adjustments to reconcile operating income (loss) to net
cash provided by (used for) operating activitiesDepreciation - - - - - 1,834,768 1,756,267 Interest income - - - - -
Change in assets and liabilities not affecting cashprovided by (used for) operating activities
(Increase) decrease in receivables - - - - - (33,414) 252,019 (Increase) decrease in prepaid expenses - - 7,586 - - 161,394 (515,681) Increase (decrease) in unpaid claims liability - - 302,199 - - 302,199 1,187,804 Increase (decrease) in unearned revenue - - - - - - (144,567) Increase (decrease) in accounts payable 6,524 735 - 985,514 - 1,007,081 (531,880) Increase (decrease) in current portion of long-term de - - - - 785,708 785,708 3,030,197 Increase (decrease) in due to other funds - - 68,457 - - 68,457 (801,729) Increase (decrease) in total noncurrent liabilities - - - - (93,077) (93,077) 93,077
Net cash provided by (used for) operating activities 135,934$ (119,961)$ 227,917$ 4,732,308$ 689,131$ 8,735,339$ 3,615,968$
Noncash investing activitiesThe change in fair value of investments for the internal service funds was $3,422,202. (Concluded)
Totals
COUNTY OF OTTAWA
INTERNAL SERVICE FUNDSCOMBINING STATEMENT OF CASH FLOWS
FOR THE YEAR ENDED SEPTEMBER 30, 2020(with comparative totals for year ended September 30, 2019)
150

Trust and Juvenile Library Imprest Inland LakeAgency Court Penal Fine Payroll Improvement
7010 7015 7210 7040 8725 2020 2019
Assets
Cash and pooled investments 45,561,872$ 1,770$ 236,602$ 209,069$ 87,950$ 46,097,263$ 40,481,908$ Accounts receivable 2,799 - - 16,867 - 19,666 5,404 Due from other governmental units 280,591 - - - - 280,591 395,564
Total assets 45,845,262$ 1,770$ 236,602$ 225,936$ 87,950$ 46,397,520$ 40,882,876$
Liabilities
Due to other governmental units:Due to State of Michigan 44,474,820$ -$ -$ 163,047$ -$ 44,637,867$ 39,773,182$ Fines and fees due to local libraries - - 236,602 - - 236,602 222,891
Agency deposits 1,370,442 1,770 - 62,889 87,950 1,523,051 886,803
Total liabilities 45,845,262$ 1,770$ 236,602$ 225,936$ 87,950$ 46,397,520$ 40,882,876$
Totals
COUNTY OF OTTAWA
AGENCY FUNDSCOMBINING BALANCE SHEET
SEPTEMBER 30, 2020(with comparative totals at September 30, 2019)
151

Balance Balance
October 1, September 30,
2019 Additions Deductions 2020Assets
Cash and pooled investments 38,773,322$ 96,881,900$ 90,093,350$ 45,561,872$ Accounts receivable 3,866 243,421 244,488 2,799 Due from other governmental units 395,564 731,191 846,164 280,591
Total assets 39,172,752$ 97,856,512$ 91,184,002$ 45,845,262$
LiabilitiesDue to other governmental units
Due to State of Michigan 38,523,952$ 134,630,137$ 128,679,269$ 44,474,820$ Agency deposits 648,800 8,559,681 7,838,039 1,370,442
Total liabilities 39,172,752$ 143,189,818$ 136,517,308$ 45,845,262$
AssetsCash and pooled investments 2,421$ 36,296$ 36,947.00$ 1,770$
Total assets 2,421$ 36,296$ 36,947.00$ 1,770$
LiabilitiesAgency deposits 2,481$ 78,169$ 78,880$ 1,770$
Total liabilities 2,481$ 78,169$ 78,880$ 1,770$
(Continued)
COUNTY OF OTTAWA
AGENCY FUNDSCOMBINING STATEMENT OF CHANGES IN ASSETS AND LIABILITIES
FOR THE YEAR ENDED SEPTEMBER 30, 2020
Trust and agency fund (7010)
Juvenile Court fund (7015)
152
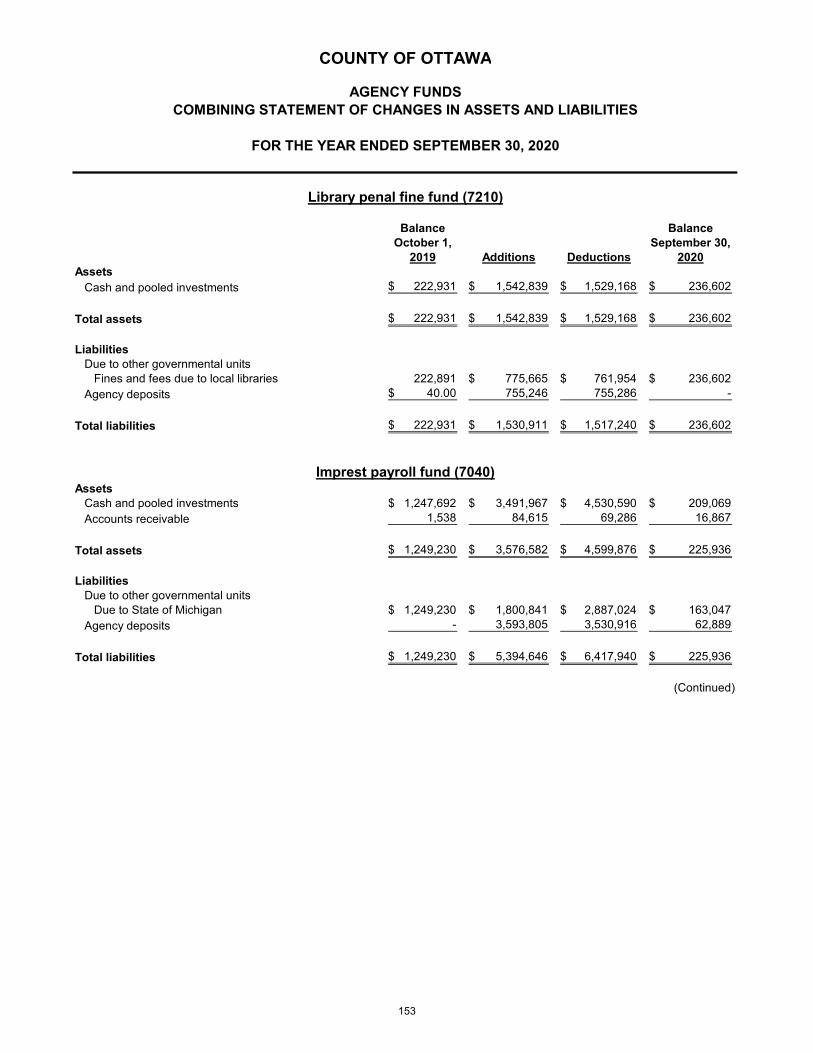
COUNTY OF OTTAWA
AGENCY FUNDSCOMBINING STATEMENT OF CHANGES IN ASSETS AND LIABILITIES
FOR THE YEAR ENDED SEPTEMBER 30, 2020
Balance BalanceOctober 1, September 30,
2019 Additions Deductions 2020Assets
Cash and pooled investments 222,931$ 1,542,839$ 1,529,168$ 236,602$
Total assets 222,931$ 1,542,839$ 1,529,168$ 236,602$
LiabilitiesDue to other governmental units
Fines and fees due to local libraries 222,891 775,665$ 761,954$ 236,602$ Agency deposits 40.00$ 755,246 755,286 -
Total liabilities 222,931$ 1,530,911$ 1,517,240$ 236,602$
AssetsCash and pooled investments 1,247,692$ 3,491,967$ 4,530,590$ 209,069$ Accounts receivable 1,538 84,615 69,286 16,867
Total assets 1,249,230$ 3,576,582$ 4,599,876$ 225,936$
LiabilitiesDue to other governmental units
Due to State of Michigan 1,249,230$ 1,800,841$ 2,887,024$ 163,047$ Agency deposits - 3,593,805 3,530,916 62,889
Total liabilities 1,249,230$ 5,394,646$ 6,417,940$ 225,936$
(Continued)
Library penal fine fund (7210)
Imprest payroll fund (7040)
153
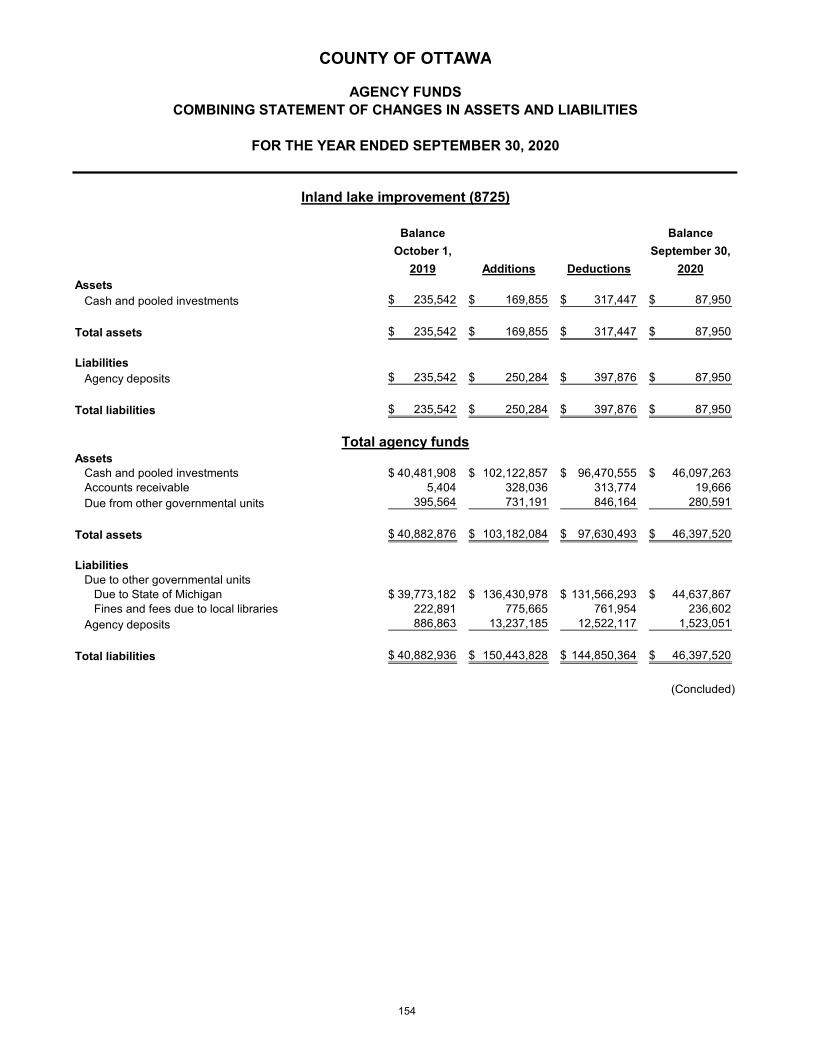
COUNTY OF OTTAWA
AGENCY FUNDSCOMBINING STATEMENT OF CHANGES IN ASSETS AND LIABILITIES
FOR THE YEAR ENDED SEPTEMBER 30, 2020
Balance Balance
October 1, September 30,
2019 Additions Deductions 2020
AssetsCash and pooled investments 235,542$ 169,855$ 317,447$ 87,950$
Total assets 235,542$ 169,855$ 317,447$ 87,950$
LiabilitiesAgency deposits 235,542$ 250,284$ 397,876$ 87,950$
Total liabilities 235,542$ 250,284$ 397,876$ 87,950$
AssetsCash and pooled investments 40,481,908$ 102,122,857$ 96,470,555$ 46,097,263$ Accounts receivable 5,404 328,036 313,774 19,666 Due from other governmental units 395,564 731,191 846,164 280,591
Total assets 40,882,876$ 103,182,084$ 97,630,493$ 46,397,520$
LiabilitiesDue to other governmental units
Due to State of Michigan 39,773,182$ 136,430,978$ 131,566,293$ 44,637,867$ Fines and fees due to local libraries 222,891 775,665 761,954 236,602
Agency deposits 886,863 13,237,185 12,522,117 1,523,051
Total liabilities 40,882,936$ 150,443,828$ 144,850,364$ 46,397,520$
(Concluded)
Total agency funds
Inland lake improvement (8725)
154
STATISTICAL
Contents Page
Financial TrendsThese schedules contain trend information to help the readerunderstand how the County's financial performance and well-beinghave changed over time. 155
Revenue CapacityThese schedules contain information to help the reader assess theCounty's most significant local revenue source, the property tax. 161
Debt CapacityThese schedules present information to help the reader assess the affordability of the County's current levels of outstanding debt and theCounty's ability to issue additional debt in the future. 165
Demographic and Economic InformationThese schedules offer demographic and economic indicators to helpthe reader understand the environment within which the County's financial activities take place. 168
Operating InformationThese schedules contain service and infrastructure data to help the reader understand how the information in the County's financial reportrelates to the services the County provides and the activities it performs. 171
Source: Unless otherwise noted, the information in these schedules is derivedfrom the comprehensive annual financial reports for the relevant year.
overall financial health.
COUNTY OF OTTAWA
STATISTICAL SECTION
This part of the County of Ottawa's comprehensive annual financial report presents detailedinformation as a context for understanding what the information in the financial statements,note disclosures, and required supplementary information says about the government's
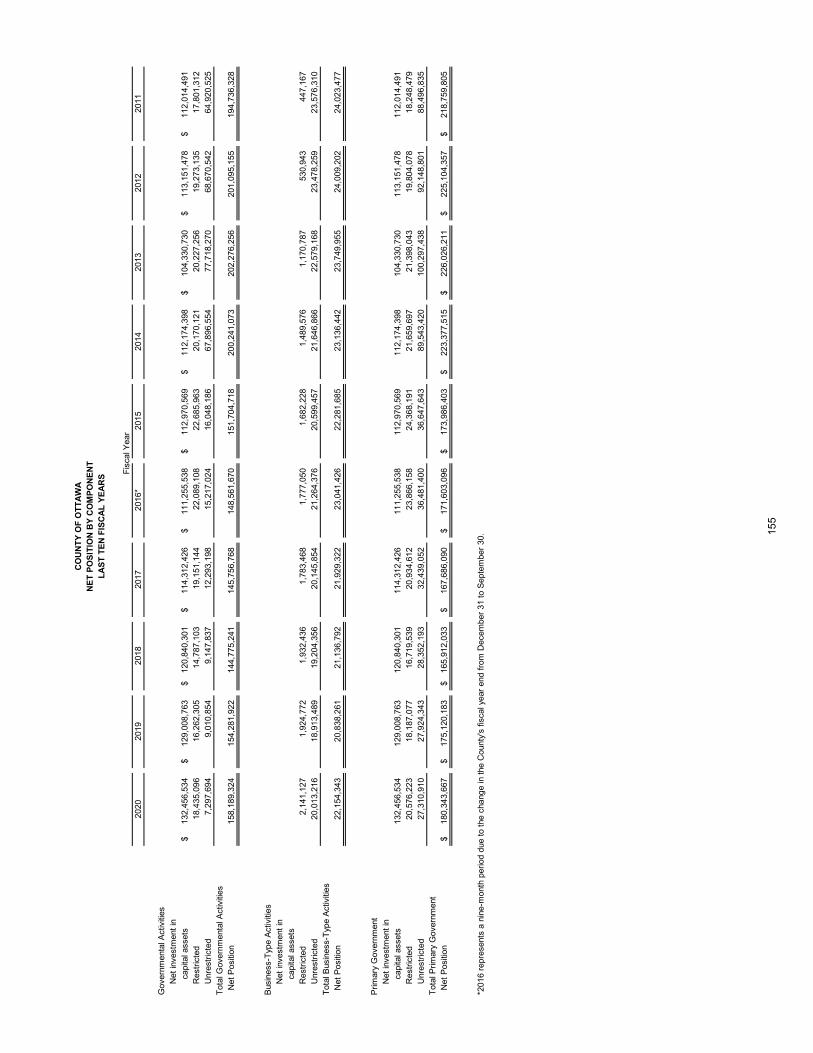
2020
2019
2018
2017
2016
*20
1520
1420
1320
1220
11
Gov
ernm
enta
l Act
iviti
esN
et in
vest
men
t in
ca
pita
l ass
ets
132,
456,
534
$
129,
008,
763
$
120,
840,
301
$
11
4,31
2,42
6$
11
1,25
5,53
8$
11
2,97
0,56
9$
11
2,17
4,39
8$
10
4,33
0,73
0$
11
3,15
1,47
8$
11
2,01
4,49
1$
R
estr
icte
d18
,435
,096
16
,262
,305
14
,787
,103
19,1
51,1
44
22,0
89,1
08
22,6
85,9
63
20,1
70,1
21
20,2
27,2
56
19,2
73,1
35
17,8
01,3
12
Unr
estr
icte
d7,
297,
694
9,01
0,85
4
9,
147,
837
12
,293
,198
15
,217
,024
16
,048
,186
67
,896
,554
77
,718
,270
68
,670
,542
64
,920
,525
T
otal
Gov
ernm
enta
l Act
iviti
es
Net
Pos
ition
158,
189,
324
154,
281,
922
144,
775,
241
14
5,75
6,76
8
14
8,56
1,67
0
15
1,70
4,71
8
20
0,24
1,07
3
20
2,27
6,25
6
20
1,09
5,15
5
19
4,73
6,32
8
Bus
ines
s-T
ype
Act
iviti
esN
et in
vest
men
t in
ca
pita
l ass
ets
Res
tric
ted
2,14
1,12
7
1,
924,
772
1,93
2,43
6
1,78
3,46
8
1,
777,
050
1,68
2,22
8
1,
489,
576
1,17
0,78
7
53
0,94
3
44
7,16
7
U
nres
tric
ted
20,0
13,2
16
18,9
13,4
89
19,2
04,3
56
20
,145
,854
21
,264
,376
20
,599
,457
21
,646
,866
22
,579
,168
23
,478
,259
23
,576
,310
T
otal
Bus
ines
s-T
ype
Act
iviti
es
N
et P
ositi
on22
,154
,343
20
,838
,261
21
,136
,792
21,9
29,3
22
23,0
41,4
26
22,2
81,6
85
23,1
36,4
42
23,7
49,9
55
24,0
09,2
02
24,0
23,4
77
Prim
ary
Gov
ernm
ent
Net
inve
stm
ent
in
capi
tal a
sset
s13
2,45
6,53
4
12
9,00
8,76
3
12
0,84
0,30
1
114,
312,
426
111,
255,
538
112,
970,
569
112,
174,
398
104,
330,
730
113,
151,
478
112,
014,
491
Res
tric
ted
20,5
76,2
23
18,1
87,0
77
16,7
19,5
39
20
,934
,612
23
,866
,158
24
,368
,191
21
,659
,697
21
,398
,043
19
,804
,078
18
,248
,479
U
nres
tric
ted
27,3
10,9
10
27,9
24,3
43
28,3
52,1
93
32
,439
,052
36
,481
,400
36
,647
,643
89
,543
,420
10
0,29
7,43
8
92
,148
,801
88
,496
,835
T
otal
Prim
ary
Gov
ernm
ent
N
et P
ositi
on18
0,34
3,66
7$
17
5,12
0,18
3$
16
5,91
2,03
3$
167,
686,
090
$
171,
603,
096
$
173,
986,
403
$
223,
377,
515
$
226,
026,
211
$
225,
104,
357
$
218,
759,
805
$
*201
6 re
pres
ents
a n
ine-
mon
th p
erio
d du
e to
the
cha
nge
in t
he C
ount
y's
fisca
l yea
r en
d fr
om D
ecem
ber
31 t
o S
epte
mbe
r 30
.
Fis
cal Y
ear
CO
UN
TY
OF
OT
TA
WA
NE
T P
OS
ITIO
N B
Y C
OM
PO
NE
NT
LA
ST
TE
N F
ISC
AL
YE
AR
S
155
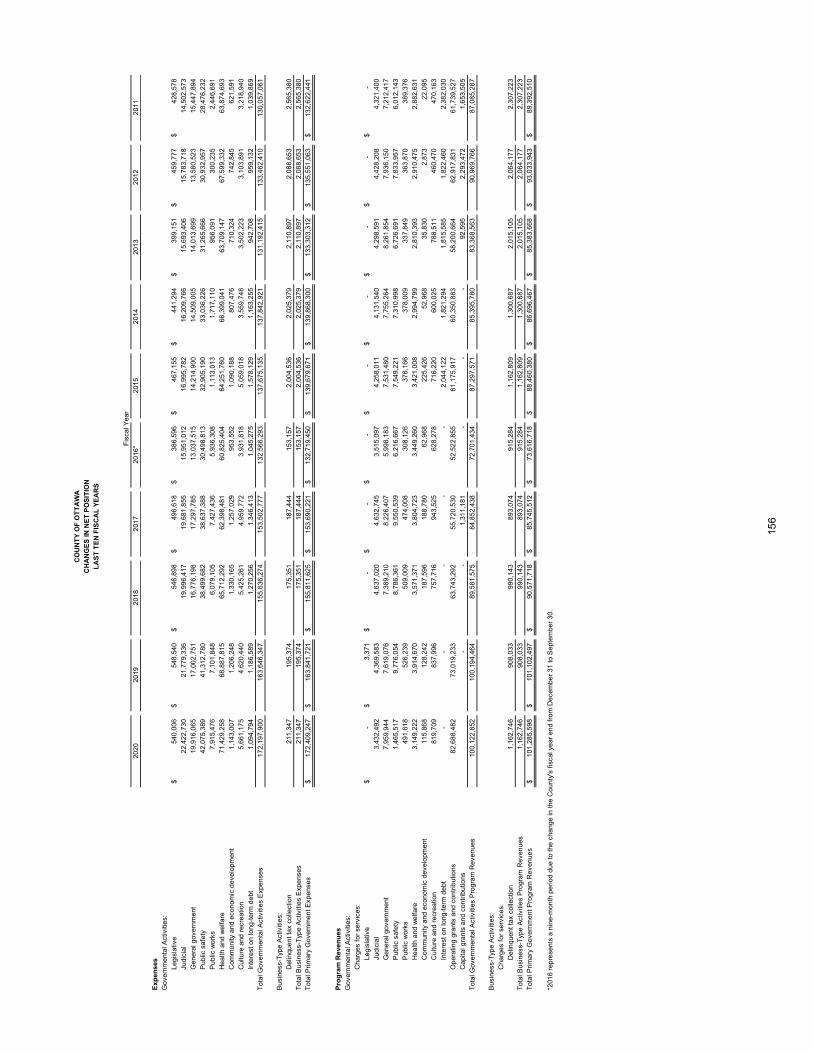
2020
2019
2018
2017
2016
*20
1520
1420
1320
1220
11
Exp
ense
s
Gov
ernm
enta
l Act
iviti
es:
Legi
slat
ive
540,
006
$
548,
540
$
546,
898
$
49
6,61
8$
386,
596
$
46
7,15
5$
441,
294
$
39
9,15
1$
459,
777
$
42
8,57
8$
Judi
cial
22,4
22,7
30
21
,779
,336
19,9
96,4
17
19,6
81,8
55
15,9
51,0
12
16,9
95,7
82
16,2
09,7
66
15,6
93,4
06
15,7
83,7
18
14,5
02,5
73
Gen
eral
gov
ernm
ent
19,9
16,0
65
17
,002
,751
16,7
76,1
98
17,2
97,7
85
13,0
37,5
15
14,2
14,9
00
14,5
09,0
05
14,0
13,6
99
13,5
80,5
23
15,4
47,8
94
Pub
lic s
afet
y42
,075
,389
41,3
12,7
80
38
,499
,682
38
,637
,388
30
,498
,813
32
,905
,190
33
,036
,226
31
,265
,666
30
,932
,957
28
,476
,232
Pub
lic w
orks
7,91
5,47
6
7,10
1,84
8
6,07
9,10
5
7,
427,
436
5,93
6,30
8
1,
113,
013
1,71
7,11
0
95
6,09
1
300,
235
2,
446,
691
Hea
lth a
nd w
elfa
re71
,429
,258
68,8
87,8
15
65
,712
,292
62
,398
,481
60
,825
,404
64
,251
,760
66
,399
,041
63
,709
,147
67
,599
,332
63
,874
,693
Com
mun
ity a
nd e
cono
mic
dev
elop
men
t1,
143,
007
1,
206,
248
1,
330,
165
1,25
7,02
9
95
3,55
2
1,09
0,18
8
80
7,47
6
710,
324
74
2,84
5
621,
591
Cul
ture
and
rec
reat
ion
5,66
1,17
5
4,62
0,44
0
5,42
5,26
1
4,
959,
772
3,93
1,81
8
5,
059,
018
3,55
9,74
8
3,
502,
223
3,10
3,89
1
3,
218,
940
Inte
rest
on
long
-ter
m d
ebt
1,09
4,79
4
1,18
6,58
9
1,27
0,25
6
1,
346,
413
1,04
5,27
5
1,
578,
129
1,16
3,25
5
94
2,70
8
959,
132
1,
039,
869
Tot
al G
over
nmen
tal A
ctiv
ities
Exp
ense
s17
2,19
7,90
0
163,
646,
347
15
5,63
6,27
4
15
3,50
2,77
7
13
2,56
6,29
3
13
7,67
5,13
5
13
7,84
2,92
1
13
1,19
2,41
5
13
3,46
2,41
0
13
0,05
7,06
1
Bus
ines
s-T
ype
Act
iviti
es:
Del
inqu
ent
tax
colle
ctio
n21
1,34
7
195,
374
17
5,35
1
18
7,44
4
153,
157
2,
004,
536
2,02
5,37
9
2,
110,
897
2,08
8,65
3
2,
565,
380
Tot
al B
usin
ess-
Typ
e A
ctiv
ities
Exp
ense
s21
1,34
7
195,
374
17
5,35
1
18
7,44
4
153,
157
2,
004,
536
2,02
5,37
9
2,
110,
897
2,08
8,65
3
2,
565,
380
Tot
al P
rimar
y G
over
nmen
t E
xpen
ses
172,
409,
247
$
16
3,84
1,72
1$
155,
811,
625
$
153,
690,
221
$
13
2,71
9,45
0$
139,
679,
671
$
13
9,86
8,30
0$
133,
303,
312
$
13
5,55
1,06
3$
132,
622,
441
$
Pro
gra
m R
even
ues
Gov
ernm
enta
l Act
iviti
es:
Cha
rges
for
ser
vice
s:
Leg
isla
tive
-$
3,
371
$
-$
-$
-$
-$
-$
-$
-$
-$
Jud
icia
l3,
432,
492
4,
369,
583
4,
637,
020
4,63
2,74
5
3,
515,
097
4,25
8,01
1
4,
131,
540
4,29
8,59
1
4,
428,
208
4,32
1,40
0
Gen
eral
gov
ernm
ent
7,95
9,94
4
7,61
9,07
6
7,38
9,21
0
8,
226,
407
5,99
8,18
3
7,
531,
480
7,75
5,26
4
8,
261,
854
7,93
6,15
0
7,
212,
417
Pub
lic s
afet
y1,
465,
517
9,
776,
054
8,
786,
361
9,55
0,53
9
6,
216,
667
7,54
9,22
1
7,
310,
998
6,72
6,69
1
7,
833,
957
6,01
2,14
3
Pub
lic w
orks
491,
618
52
6,23
9
509,
009
474,
008
30
8,12
6
376,
166
37
8,00
9
337,
849
36
3,87
0
389,
376
Hea
l th a
nd w
elfa
re3,
149,
222
3,
914,
670
3,
571,
371
3,80
4,72
3
3,
449,
260
3,42
1,00
8
2,
994,
799
2,81
0,39
3
2,
910,
475
2,88
2,63
1
Com
mun
ity a
nd e
cono
mic
dev
elop
men
t11
5,86
8
128,
242
18
7,59
6
18
8,78
0
62,9
68
22
5,42
6
52,9
68
35
,830
2,87
3
22,0
95
Cul
ture
and
rec
reat
ion
819,
709
83
7,99
6
757,
716
943,
525
62
8,27
8
716,
220
60
0,02
5
788,
511
46
0,47
0
470,
163
Int
eres
t on
long
-ter
m d
ebt
-
-
-
-
-
2,
044,
122
1,82
1,29
4
1,
815,
585
1,82
2,46
0
2,
382,
030
Ope
ratin
g gr
ants
and
con
trib
utio
ns82
,688
,482
73,0
19,2
33
63
,743
,292
55
,720
,530
52
,522
,855
61
,175
,917
60
,350
,883
58
,200
,664
62
,917
,831
61
,739
,527
Cap
ital g
rant
s an
d co
ntrib
utio
ns-
-
1,31
1,18
1
-
-
-
92
,595
2,29
3,47
2
1,
653,
505
Tot
al G
over
nmen
tal A
ctiv
ities
Pro
gram
Rev
enue
s10
0,12
2,85
2
100,
194,
464
89
,581
,575
84
,852
,438
72
,701
,434
87
,297
,571
85
,395
,780
83
,368
,563
90
,969
,766
87
,085
,287
Bus
ines
s-T
ype
Act
iviti
es:
Cha
rges
for
ser
vice
s:
Del
inqu
ent
tax
colle
ctio
n1,
162,
746
90
8,03
3
990,
143
893,
074
91
5,28
4
1,16
2,80
9
1,
300,
687
2,01
5,10
5
2,
064,
177
2,30
7,22
3
Tot
al B
usin
ess-
Typ
e A
ctiv
ities
Pro
gram
Rev
enue
s1,
162,
746
90
8,03
3
990,
143
893,
074
91
5,28
4
1,16
2,80
9
1,
300,
687
2,01
5,10
5
2,
064,
177
2,30
7,22
3
T
otal
Prim
ary
Gov
ernm
ent
Pro
gram
Rev
enue
s10
1,28
5,59
8$
101,
102,
497
$
90
,571
,718
$
85
,745
,512
$
73,6
16,7
18$
88
,460
,380
$
86,6
96,4
67$
85
,383
,668
$
93,0
33,9
43$
89
,392
,510
$
*201
6 re
pres
ents
a n
ine-
mon
th p
erio
d du
e to
the
cha
nge
in t
he C
ount
y's
fisca
l yea
r en
d fr
om D
ecem
ber
31 t
o S
epte
mbe
r 30
.
CO
UN
TY
OF
OT
TA
WA
CH
AN
GE
S IN
NE
T P
OS
ITIO
N
LA
ST
TE
N F
ISC
AL
YE
AR
S
Fis
cal Y
ear
156

2020
2019
2018
2017
2016
*20
1520
1420
1320
1220
11
CO
UN
TY
OF
OT
TA
WA
CH
AN
GE
S IN
NE
T P
OS
ITIO
N
LA
ST
TE
N F
ISC
AL
YE
AR
S
Fis
cal Y
ear
Net
(E
xpen
se)/
Rev
enu
e
Gov
ernm
enta
l act
iviti
es(7
2,07
5,04
8)$
(63,
451,
883)
$
(6
6,05
4,69
9)$
(6
8,65
0,33
9)$
(5
9,86
4,85
9)$
(5
0,37
7,56
4)$
(5
2,44
7,14
1)$
(4
7,82
3,85
2)$
(4
2,49
2,64
4)$
(4
2,97
1,77
4)$
Bus
ines
s-ty
pe a
ctiv
ities
951,
399
71
2,65
9
814,
792
705,
630
76
2,12
7
(841
,727
)
(724
,692
)
(95,
792)
(24,
476)
(258
,157
)
Tot
al P
rimar
y G
over
nmen
t N
et E
xpen
se(7
1,12
3,64
9)$
(62,
739,
224)
$
(6
5,23
9,90
7)$
(6
7,94
4,70
9)$
(5
9,10
2,73
2)$
(5
1,21
9,29
1)$
(5
3,17
1,83
3)$
(4
7,91
9,64
4)$
(4
2,51
7,12
0)$
(4
3,22
9,93
1)$
Gen
eral
Rev
enu
es a
nd
Oth
er C
han
ges
in
Net
Po
siti
on
Gov
ernm
enta
l Act
iviti
es:
Tax
es
Pro
pert
y ta
xes
66,2
85,1
48$
63
,268
,299
$
54,8
27,3
35$
54,6
96,2
31$
49
,877
,687
$
44,5
83,7
27$
42
,185
,402
$
41,1
02,6
95$
40
,693
,219
$
41,2
20,2
81$
Unr
estr
icte
d gr
ants
and
con
trib
utio
ns3,
754,
650
4,
803,
626
5,
639,
410
6,03
6,96
5
4,
462,
913
4,72
9,72
2
4,
124,
536
3,18
0,24
5
3,
659,
304
6,00
3,39
3
Inve
stm
ent
earn
ings
5,25
9,31
4
3,20
2,57
6
2,79
0,12
7
3,
785,
952
2,13
5,19
2
1,
090,
878
2,71
7,49
0
3,
509,
045
3,23
3,15
5
1,
362,
564
Mis
cella
neou
s8,
588
15
,490
-
11
,986
21,7
27
47
2,03
3
1,23
4,53
0
1,
448,
322
1,11
3,63
3
70
1,58
7
Tra
nsfe
rs67
4,75
0
1,66
8,57
5
1,81
6,30
0
1,
814,
150
226,
145
15
0,00
0
150,
000
15
2,44
0
152,
160
16
3,44
8
Tot
al G
over
nmen
tal A
ctiv
ities
75,9
82,4
50$
72
,958
,566
$
65,0
73,1
72$
66,3
45,2
84$
56
,723
,664
$
51,0
26,3
60$
50
,411
,958
$
49,3
92,7
47$
48
,851
,471
$
49,4
51,2
73$
Bus
ines
s-T
ype
Act
iviti
es:
Unr
estr
icte
d gr
ants
-$
-
$
-$
-$
-$
-$
-$
89$
-$
-$
Inve
stm
ent
earn
ings
1,03
9,43
3
657,
385
20
8,97
8
(3
,584
)
223,
759
13
6,97
0
261,
179
(1
3,54
4)
16
0,20
1
159,
838
Mis
cella
neou
s-
-
-
-
-
-
-
-
-
-
Tra
nsfe
rs(6
74,7
50)
(1,6
68,5
75)
(1
,816
,300
)
(1
,814
,150
)
(226
,145
)
(150
,000
)
(150
,000
)
(150
,000
)
(150
,000
)
(150
,000
)
Tot
al B
usin
ess-
Typ
e A
ctiv
ities
364,
683
(1
,011
,190
)
(1,6
07,3
22)
(1,8
17,7
34)
(2
,386
)
(13,
030)
111,
179
(1
63,4
55)
10
,201
9,83
8
Tot
al P
rimar
y G
over
nmen
t76
,347
,133
$
71,9
47,3
76$
63
,465
,850
$
64
,527
,550
$
56,7
21,2
78$
51
,013
,330
$
50,5
23,1
37$
49
,229
,292
$
48,8
61,6
72$
49
,461
,111
$
Ch
ang
es i
n N
et P
osi
tio
n
Gov
ernm
enta
l act
iviti
es3,
907,
402
$
9,
506,
683
$
(9
81,5
27)
$
(2
,305
,055
)$
(3,1
41,1
95)
$
64
8,79
6$
(2,0
35,1
83)
$
1,
568,
895
$
6,
358,
827
$
6,
479,
499
$
Bus
ines
s-ty
pe a
ctiv
ities
1,31
6,08
2
(298
,531
)
(7
92,5
30)
(1
,112
,104
)
759,
741
(8
54,7
57)
(6
13,5
13)
(2
59,2
47)
(1
4,27
5)
(2
48,3
19)
T
otal
Prim
ary
Gov
ernm
ent
5,22
3,48
4$
9,20
8,15
2$
(1,7
74,0
57)
$
(3
,417
,159
)$
(2,3
81,4
54)
$
(2
05,9
61)
$
(2,6
48,6
96)
$
1,
309,
648
$
6,
344,
552
$
6,
231,
180
$
*201
6 r e
pres
ents
a n
ine-
mon
th p
erio
d du
e to
the
cha
nge
in t
he C
ount
y's
fisca
l yea
r en
d fr
om D
ecem
ber
31 t
o S
epte
mbe
r 30
.
157
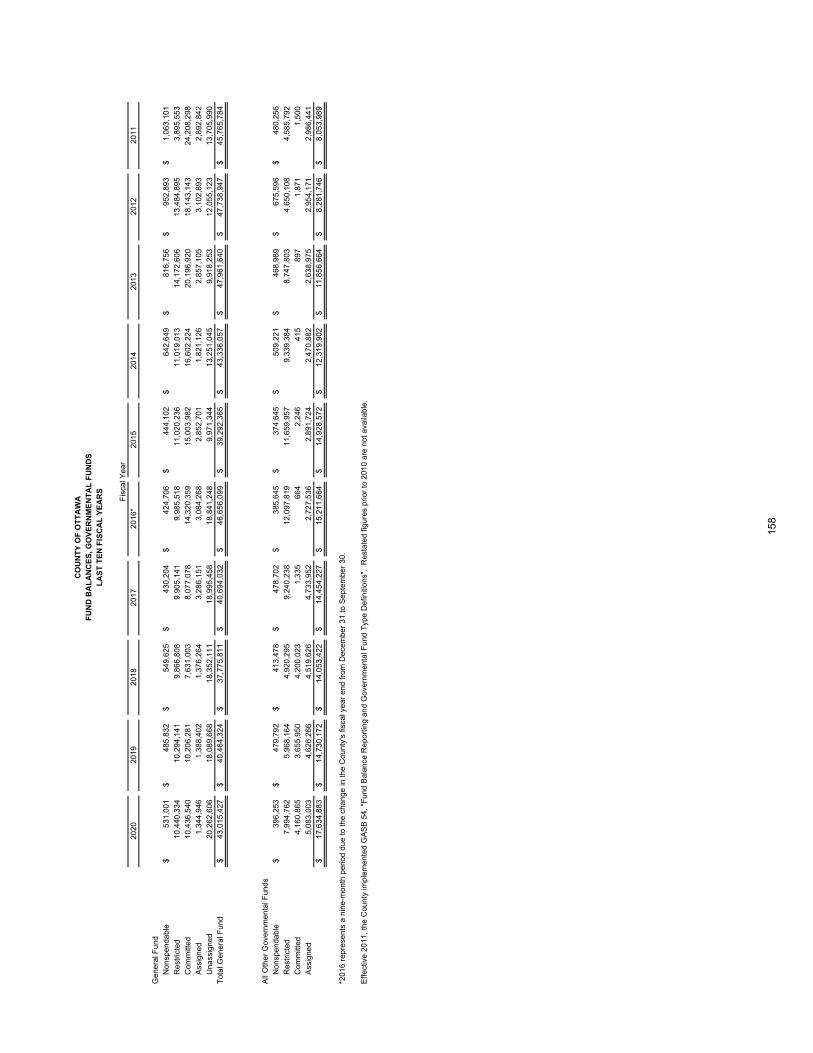
2020
2019
2018
2017
2016
*20
1520
1420
1320
1220
11
Gen
eral
Fun
dN
onsp
enda
ble
531,
001
$
485,
832
$
549,
625
$
43
0,20
4$
424,
706
$
44
4,10
2$
642,
649
$
81
6,75
6$
952,
893
$
1,
063,
101
$
Res
tric
ted
10,4
40,3
34
10
,294
,141
9,86
6,80
8
9,
905,
141
9,98
5,51
8
11
,020
,236
11
,019
,013
14
,172
,606
13
,484
,895
3,89
5,55
3
C
omm
itted
10,4
36,5
40
10
,206
,281
7,63
1,00
3
8,
077,
078
14,3
20,3
59
15,0
03,9
82
16,6
02,2
24
20,1
96,9
20
18,1
43,1
43
24
,208
,298
Ass
igne
d1,
344,
946
1,
388,
402
1,
376,
264
3,28
6,15
1
3,
084,
268
2,85
2,70
1
1,
821,
126
2,85
7,10
5
3,
102,
893
2,89
2,84
2
U
nass
igne
d20
,262
,606
18,0
89,6
68
18
,352
,111
18
,995
,458
18
,841
,248
9,
971,
344
13,2
51,0
45
9,91
8,25
3
12
,055
,123
13,7
05,9
90
T
otal
Gen
eral
Fun
d43
,015
,427
$
40,4
64,3
24$
37
,775
,811
$
40
,694
,032
$
46
,656
,099
$
39
,292
,365
$
43
,336
,057
$
47
,961
,640
$
47
,738
,947
$
45,7
65,7
84$
All
Oth
er G
over
nmen
tal F
unds
Non
spen
dabl
e39
6,25
3$
47
9,79
2$
41
3,47
8$
478,
702
$
38
5,64
5$
374,
645
$
50
9,22
1$
468,
989
$
67
5,59
6$
480,
256
$
R
estr
icte
d7,
994,
762
5,
968,
164
4,
920,
295
9,24
0,23
8
12
,097
,819
11
,659
,957
9,
339,
384
8,74
7,80
3
4,
650,
108
4,58
5,79
2
C
omm
itted
4,16
0,86
5
3,65
5,95
0
4,20
0,02
3
1,
335
664
2,
246
415
89
7
1,87
1
1,50
0
Ass
igne
d5,
083,
003
4,
626,
266
4,
519,
626
4,73
3,95
2
2,
727,
536
2,89
1,72
4
2,
470,
882
2,63
8,97
5
2,
954,
171
2,98
6,44
1
17
,634
,883
$
14,7
30,1
72$
14
,053
,422
$
14
,454
,227
$
15
,211
,664
$
14
,928
,572
$
12
,319
,902
$
11
,856
,664
$
8,
281,
746
$
8,05
3,98
9$
*201
6 re
pres
ents
a n
ine-
mon
th p
erio
d du
e to
the
chan
ge in
the
Cou
nty'
s fis
cal y
ear
end
from
Dec
embe
r 31
to S
epte
mbe
r 30
.
Effe
ctiv
e 20
11, t
he C
ount
y im
plem
ente
d G
AS
B 5
4, "
Fun
d B
alan
ce R
epor
ting
and
Gov
ernm
enta
l Fun
d T
ype
Def
initi
ons"
. R
esta
ted
figu
res
prio
r to
201
0 ar
e no
t ava
ilabl
e.
CO
UN
TY
OF
OT
TA
WA
FU
ND
BA
LA
NC
ES
, GO
VE
RN
ME
NT
AL
FU
ND
SL
AS
T T
EN
FIS
CA
L Y
EA
RS
Fis
cal Y
ear
158
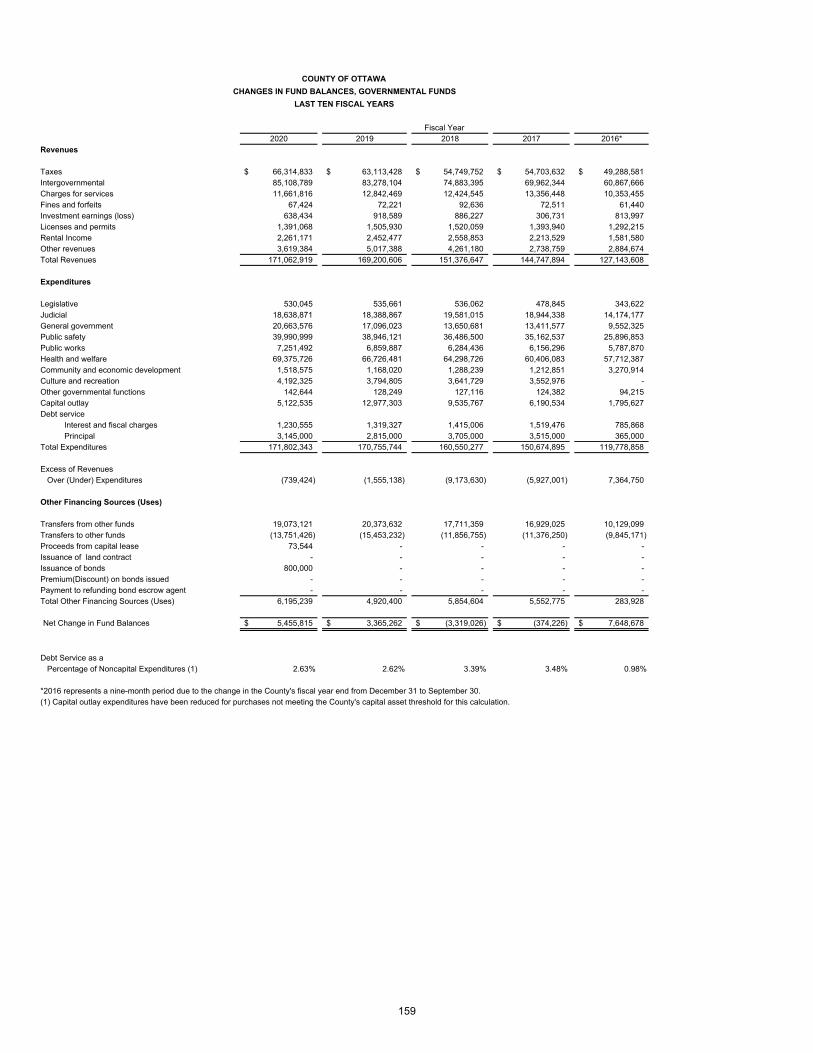
2020 2019 2018 2017 2016*Revenues
Taxes 66,314,833$ 63,113,428$ 54,749,752$ 54,703,632$ 49,288,581$ Intergovernmental 85,108,789 83,278,104 74,883,395 69,962,344 60,867,666 Charges for services 11,661,816 12,842,469 12,424,545 13,356,448 10,353,455 Fines and forfeits 67,424 72,221 92,636 72,511 61,440 Investment earnings (loss) 638,434 918,589 886,227 306,731 813,997 Licenses and permits 1,391,068 1,505,930 1,520,059 1,393,940 1,292,215 Rental Income 2,261,171 2,452,477 2,558,853 2,213,529 1,581,580 Other revenues 3,619,384 5,017,388 4,261,180 2,738,759 2,884,674 Total Revenues 171,062,919 169,200,606 151,376,647 144,747,894 127,143,608
Expenditures
Legislative 530,045 535,661 536,062 478,845 343,622 Judicial 18,638,871 18,388,867 19,581,015 18,944,338 14,174,177 General government 20,663,576 17,096,023 13,650,681 13,411,577 9,552,325 Public safety 39,990,999 38,946,121 36,486,500 35,162,537 25,896,853 Public works 7,251,492 6,859,887 6,284,436 6,156,296 5,787,870 Health and welfare 69,375,726 66,726,481 64,298,726 60,406,083 57,712,387 Community and economic development 1,518,575 1,168,020 1,288,239 1,212,851 3,270,914 Culture and recreation 4,192,325 3,794,805 3,641,729 3,552,976 - Other governmental functions 142,644 128,249 127,116 124,382 94,215 Capital outlay 5,122,535 12,977,303 9,535,767 6,190,534 1,795,627 Debt service
Interest and fiscal charges 1,230,555 1,319,327 1,415,006 1,519,476 785,868 Principal 3,145,000 2,815,000 3,705,000 3,515,000 365,000
Total Expenditures 171,802,343 170,755,744 160,550,277 150,674,895 119,778,858
Excess of Revenues Over (Under) Expenditures (739,424) (1,555,138) (9,173,630) (5,927,001) 7,364,750
Other Financing Sources (Uses)
Transfers from other funds 19,073,121 20,373,632 17,711,359 16,929,025 10,129,099 Transfers to other funds (13,751,426) (15,453,232) (11,856,755) (11,376,250) (9,845,171) Proceeds from capital lease 73,544 - - - - Issuance of land contract - - - - - Issuance of bonds 800,000 - - - - Premium(Discount) on bonds issued - - - - - Payment to refunding bond escrow agent - - - - - Total Other Financing Sources (Uses) 6,195,239 4,920,400 5,854,604 5,552,775 283,928
Net Change in Fund Balances 5,455,815$ 3,365,262$ (3,319,026)$ (374,226)$ 7,648,678$
Debt Service as a Percentage of Noncapital Expenditures (1) 2.63% 2.62% 3.39% 3.48% 0.98%
*2016 represents a nine-month period due to the change in the County's fiscal year end from December 31 to September 30.(1) Capital outlay expenditures have been reduced for purchases not meeting the County's capital asset threshold for this calculation.
Fiscal Year
COUNTY OF OTTAWA
CHANGES IN FUND BALANCES, GOVERNMENTAL FUNDS
LAST TEN FISCAL YEARS
159
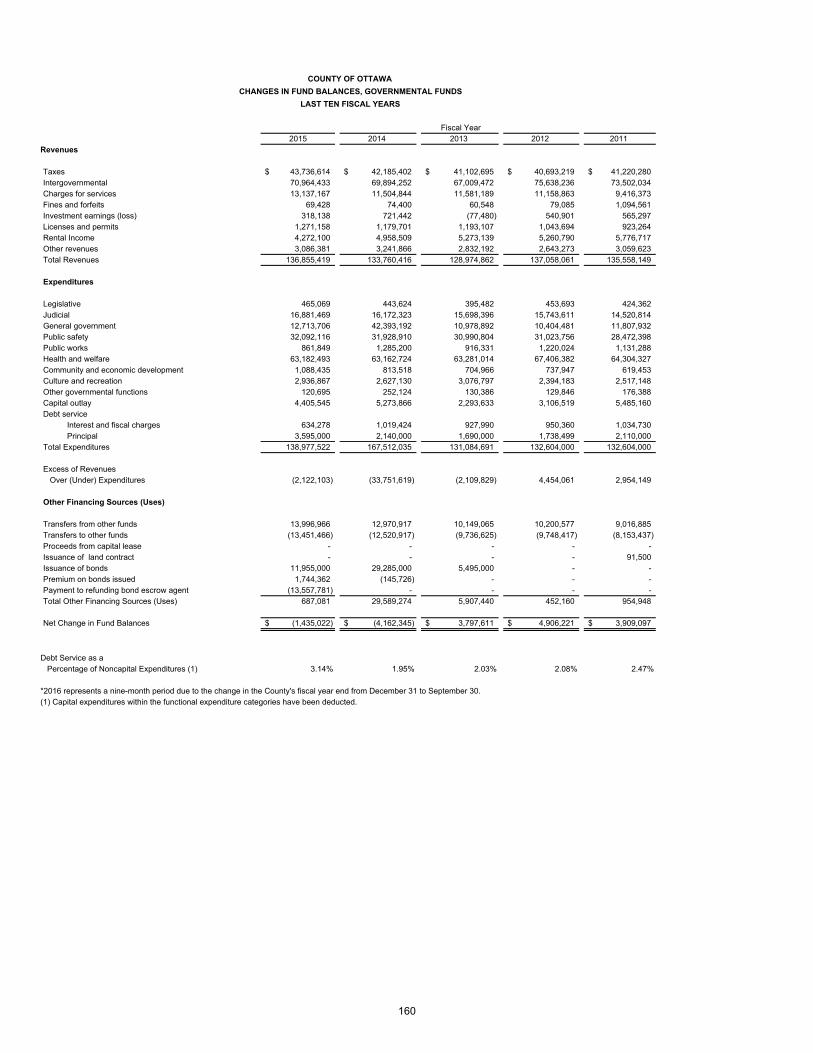
2015 2014 2013 2012 2011Revenues
Taxes 43,736,614$ 42,185,402$ 41,102,695$ 40,693,219$ 41,220,280$ Intergovernmental 70,964,433 69,894,252 67,009,472 75,638,236 73,502,034 Charges for services 13,137,167 11,504,844 11,581,189 11,158,863 9,416,373 Fines and forfeits 69,428 74,400 60,548 79,085 1,094,561 Investment earnings (loss) 318,138 721,442 (77,480) 540,901 565,297 Licenses and permits 1,271,158 1,179,701 1,193,107 1,043,694 923,264 Rental Income 4,272,100 4,958,509 5,273,139 5,260,790 5,776,717 Other revenues 3,086,381 3,241,866 2,832,192 2,643,273 3,059,623 Total Revenues 136,855,419 133,760,416 128,974,862 137,058,061 135,558,149
Expenditures
Legislative 465,069 443,624 395,482 453,693 424,362 Judicial 16,881,469 16,172,323 15,698,396 15,743,611 14,520,814 General government 12,713,706 42,393,192 10,978,892 10,404,481 11,807,932 Public safety 32,092,116 31,928,910 30,990,804 31,023,756 28,472,398 Public works 861,849 1,285,200 916,331 1,220,024 1,131,288 Health and welfare 63,182,493 63,162,724 63,281,014 67,406,382 64,304,327 Community and economic development 1,088,435 813,518 704,966 737,947 619,453 Culture and recreation 2,936,867 2,627,130 3,076,797 2,394,183 2,517,148 Other governmental functions 120,695 252,124 130,386 129,846 176,388 Capital outlay 4,405,545 5,273,866 2,293,633 3,106,519 5,485,160 Debt service
Interest and fiscal charges 634,278 1,019,424 927,990 950,360 1,034,730 Principal 3,595,000 2,140,000 1,690,000 1,738,499 2,110,000
Total Expenditures 138,977,522 167,512,035 131,084,691 132,604,000 132,604,000
Excess of Revenues Over (Under) Expenditures (2,122,103) (33,751,619) (2,109,829) 4,454,061 2,954,149
Other Financing Sources (Uses)
Transfers from other funds 13,996,966 12,970,917 10,149,065 10,200,577 9,016,885 Transfers to other funds (13,451,466) (12,520,917) (9,736,625) (9,748,417) (8,153,437) Proceeds from capital lease - - - - - Issuance of land contract - - - - 91,500 Issuance of bonds 11,955,000 29,285,000 5,495,000 - - Premium on bonds issued 1,744,362 (145,726) - - - Payment to refunding bond escrow agent (13,557,781) - - - - Total Other Financing Sources (Uses) 687,081 29,589,274 5,907,440 452,160 954,948
Net Change in Fund Balances (1,435,022)$ (4,162,345)$ 3,797,611$ 4,906,221$ 3,909,097$
Debt Service as a Percentage of Noncapital Expenditures (1) 3.14% 1.95% 2.03% 2.08% 2.47%
*2016 represents a nine-month period due to the change in the County's fiscal year end from December 31 to September 30.(1) Capital expenditures within the functional expenditure categories have been deducted.
COUNTY OF OTTAWA
CHANGES IN FUND BALANCES, GOVERNMENTAL FUNDS
LAST TEN FISCAL YEARS
Fiscal Year
160
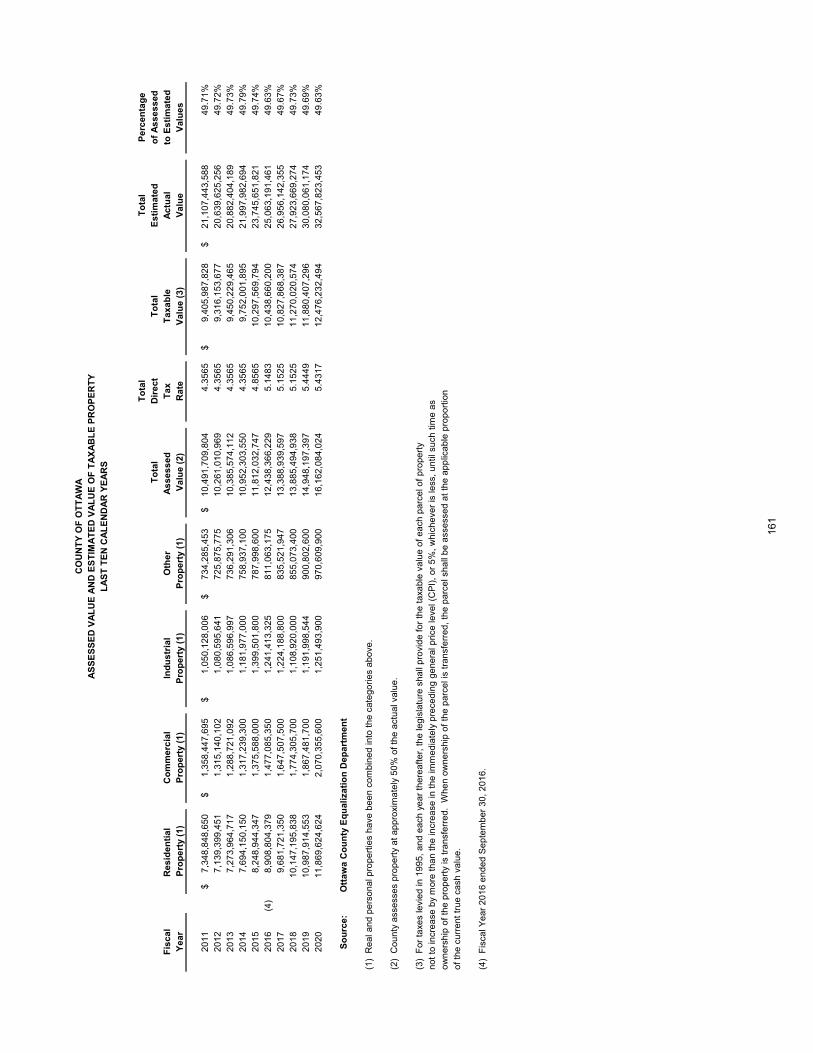
To
tal
To
tal
Pe
rce
nta
ge
To
tal
Dir
ec
tT
ota
lE
sti
ma
ted
of
As
se
ss
ed
Fis
ca
lR
es
ide
nti
al
Co
mm
erc
ial
Ind
us
tria
lO
the
rA
ss
es
se
d
Ta
xT
ax
ab
leA
ctu
al
to E
sti
ma
ted
Ye
ar
Pro
pe
rty
(1)
Pro
pe
rty
(1)
Pro
pe
rty
(1)
Pro
pe
rty
(1)
Va
lue
(2
)R
ate
Va
lue
(3
)V
alu
eV
alu
es
20
11
7,3
48
,84
8,6
50
$
1,3
58
,44
7,6
95
$
1
,05
0,1
28
,00
6$
7
34
,28
5,4
53
$
10
,49
1,7
09
,80
4$
4
.35
65
9,4
05
,98
7,8
28
$
21
,10
7,4
43
,58
8$
4
9.7
1%
20
12
7,1
39
,39
9,4
51
1,3
15
,14
0,1
02
1
,08
0,5
95
,64
1
7
25
,87
5,7
75
10
,26
1,0
10
,96
9
4
.35
65
9,3
16
,15
3,6
77
20
,63
9,6
25
,25
6
4
9.7
2%
20
13
7,2
73
,96
4,7
17
1,2
88
,72
1,0
92
1
,08
6,5
96
,99
7
7
36
,29
1,3
06
10
,38
5,5
74
,11
2
4
.35
65
9,4
50
,22
9,4
65
20
,88
2,4
04
,18
9
4
9.7
3%
20
14
7,6
94
,15
0,1
50
1,3
17
,23
9,3
00
1
,18
1,9
77
,00
0
7
58
,93
7,1
00
10
,95
2,3
03
,55
0
4
.35
65
9,7
52
,00
1,8
95
21
,99
7,9
82
,69
4
4
9.7
9%
20
15
8,2
48
,94
4,3
47
1,3
75
,58
8,0
00
1
,39
9,5
01
,80
0
7
87
,99
8,6
00
11
,81
2,0
32
,74
7
4
.85
65
10
,29
7,5
69
,79
4
23
,74
5,6
51
,82
1
4
9.7
4%
20
16
(4)
8,9
08
,80
4,3
79
1,4
77
,08
5,3
50
1
,24
1,4
13
,32
5
8
11
,06
3,1
75
12
,43
8,3
66
,22
9
5
.14
83
10
,43
8,6
60
,20
0
25
,06
3,1
91
,46
1
4
9.6
3%
20
17
9,6
81
,72
1,3
50
1,6
47
,50
7,5
00
1
,22
4,1
88
,80
0
8
35
,52
1,9
47
13
,38
8,9
39
,59
7
5
.15
25
10
,82
7,8
68
,38
7
26
,95
6,1
42
,35
5
4
9.6
7%
20
18
10
,14
7,1
95
,83
8
1,7
74
,30
5,7
00
1
,10
8,9
20
,00
0
8
55
,07
3,4
00
13
,88
5,4
94
,93
8
5
.15
25
11
,27
0,0
20
,57
4
27
,92
3,6
69
,27
4
4
9.7
3%
20
19
10
,98
7,9
14
,55
3
1,8
67
,48
1,7
00
1
,19
1,9
98
,54
4
9
00
,80
2,6
00
14
,94
8,1
97
,39
7
5
.44
49
11
,88
0,4
07
,29
6
30
,08
0,0
61
,17
4
4
9.6
9%
20
20
11
,86
9,6
24
,62
4
2,0
70
,35
5,6
00
1
,25
1,4
93
,90
0
9
70
,60
9,9
00
16
,16
2,0
84
,02
4
5
.43
17
12
,47
6,2
32
,49
4
32
,56
7,8
23
,45
3
4
9.6
3%
So
urc
e:
Ott
aw
a C
ou
nty
Eq
ua
liza
tio
n D
ep
art
me
nt
(1)
Re
al a
nd
pe
rso
na
l pro
pe
rtie
s h
ave
be
en
co
mb
ine
d in
to t
he
ca
teg
ori
es
ab
ove
.
(2)
Co
un
ty a
sse
sse
s p
rop
ert
y a
t a
pp
roxi
ma
tely
50
% o
f th
e a
ctu
al v
alu
e.
(3)
Fo
r ta
xes
levi
ed
in 1
99
5,
an
d e
ach
ye
ar
the
rea
fte
r, t
he
leg
isla
ture
sh
all
pro
vid
e f
or
the
ta
xab
le v
alu
e o
f e
ach
pa
rce
l of
pro
pe
rty
no
t to
incr
ea
se b
y m
ore
th
an
th
e in
cre
ase
in t
he
imm
ed
iate
ly p
rece
din
g g
en
era
l pri
ce le
vel (
CP
I),
or
5%
, w
hic
he
ver
is le
ss,
un
til s
uch
tim
e a
so
wn
ers
hip
of
the
pro
pe
rty
is t
ran
sfe
rre
d.
Wh
en
ow
ne
rsh
ip o
f th
e p
arc
el i
s tr
an
sfe
rre
d,
the
pa
rce
l sh
all
be
ass
ess
ed
at
the
ap
plic
ab
le p
rop
ort
ion
of
the
cu
rre
nt
tru
e c
ash
va
lue
.
(4)
Fis
cal Y
ea
r 2
01
6 e
nd
ed
Se
pte
mb
er
30
, 2
01
6.
CO
UN
TY
OF
OT
TA
WA
AS
SE
SS
ED
VA
LU
E A
ND
ES
TIM
AT
ED
VA
LU
E O
F T
AX
AB
LE
PR
OP
ER
TY
LA
ST
TE
N C
AL
EN
DA
R Y
EA
RS
161
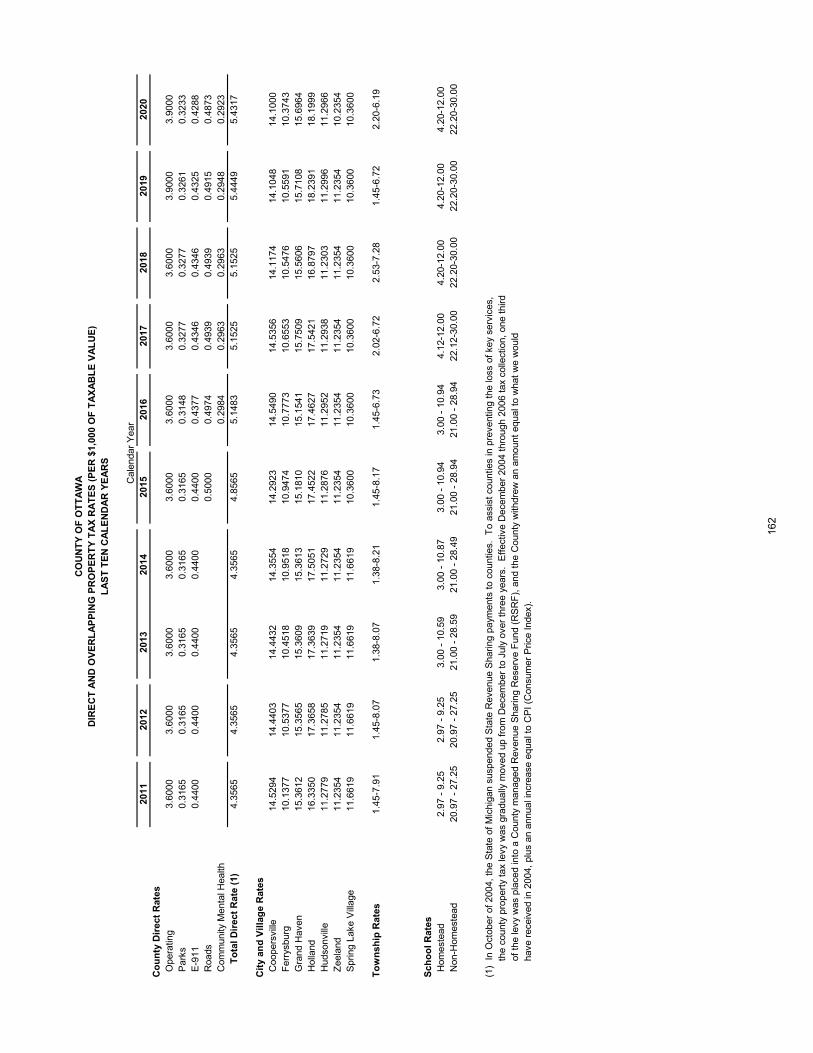
2011
2012
2013
2014
2015
2016
2017
2018
2019
2020
Co
un
ty D
irec
t R
ates
O
pera
ting
3.60
003.
6000
3.60
003.
6000
3.60
003.
6000
3.60
003.
6000
3.90
003.
9000
P
arks
0.31
650.
3165
0.31
650.
3165
0.31
650.
3148
0.32
770.
3277
0.32
610.
3233
E
-911
0.44
000.
4400
0.44
000.
4400
0.44
000.
4377
0.43
460.
4346
0.43
250.
4288
R
oads
0.50
000.
4974
0.49
390.
4939
0.49
150.
4873
C
omm
unity
Men
tal H
ealth
0.29
840.
2963
0.29
630.
2948
0.29
23
T
ota
l D
irec
t R
ate
(1)
4.35
654.
3565
4.35
654.
3565
4.85
655.
1483
5.15
255.
1525
5.44
495.
4317
Cit
y an
d V
illa
ge
Rat
es
Coo
pers
ville
14.5
294
14.4
403
14.4
432
14.3
554
14.2
923
14.5
490
14.5
356
14.1
174
14.1
048
14.1
000
F
erry
sbur
g10
.137
710
.537
710
.451
810
.951
810
.947
410
.777
310
.655
310
.547
610
.559
110
.374
3
Gra
nd H
aven
15.3
612
15.3
565
15.3
609
15.3
613
15.1
810
15.1
541
15.7
509
15.5
606
15.7
108
15.6
964
H
olla
nd16
.335
017
.365
817
.363
917
.505
117
.452
217
.462
717
.542
116
.879
718
.239
118
.199
9
Hud
sonv
ille
11.2
779
11.2
785
11.2
719
11.2
729
11.2
876
11.2
952
11.2
938
11.2
303
11.2
996
11.2
966
Z
eela
nd11
.235
411
.235
411
.235
411
.235
411
.235
411
.235
411
.235
411
.235
411
.235
410
.235
4
Spr
ing
Lake
Vill
age
11.6
619
11.6
619
11.6
619
11.6
619
10.3
600
10.3
600
10.3
600
10.3
600
10.3
600
10.3
600
To
wn
ship
Rat
es1.
45-7
.91
1.45
-8.0
71.
38-8
.07
1.38
-8.2
11.
45-8
.17
1.45
-6.7
32.
02-6
.72
2.53
-7.2
81.
45-6
.72
2.20
-6.1
9
Sch
oo
l R
ates
H
omes
tead
2.97
- 9
.25
2.97
- 9
.25
3.00
- 1
0.59
3.00
- 1
0.87
3.00
- 1
0.94
3.00
- 1
0.94
4.12
-12.
004.
20-1
2.00
4.20
-12.
004.
20-1
2.00
N
on-H
omes
tead
20.9
7 -
27.2
520
.97
- 27
.25
21.0
0 -
28.5
921
.00
- 28
.49
21.0
0 -
28.9
421
.00
- 28
.94
22.1
2-30
.00
22.2
0-30
.00
22.2
0-30
.00
22.2
0-30
.00
(1)
In O
ctob
er o
f 20
04,
the
Sta
te o
f M
ichi
gan
susp
ende
d S
tate
Rev
enue
Sha
ring
paym
ents
to
coun
ties.
T
o as
sist
cou
ntie
s in
pre
vent
ing
the
loss
of
key
serv
ices
,
the
coun
ty p
rope
rty
tax
levy
was
gra
dual
ly m
oved
up
from
Dec
embe
r to
Jul
y ov
er t
hree
yea
rs.
Eff
ectiv
e D
ecem
ber
2004
thr
ough
200
6 ta
x co
llect
ion,
one
thi
rd
of t
he le
vy w
as p
lace
d in
to a
Cou
nty
man
aged
Rev
enue
Sha
ring
Res
erve
Fun
d (R
SR
F),
and
the
Cou
nty
with
drew
an
amou
nt e
qual
to
wha
t w
e w
ould
ha
ve r
ecei
ved
in 2
004,
plu
s an
ann
ual i
ncre
ase
equa
l to
CP
I (C
onsu
mer
Pric
e In
dex)
.
Cal
enda
r Y
ear
LA
ST
TE
N C
AL
EN
DA
R Y
EA
RS
DIR
EC
T A
ND
OV
ER
LA
PP
ING
PR
OP
ER
TY
TA
X R
AT
ES
(P
ER
$1,
000
OF
TA
XA
BL
E V
AL
UE
)C
OU
NT
Y O
F O
TT
AW
A
162
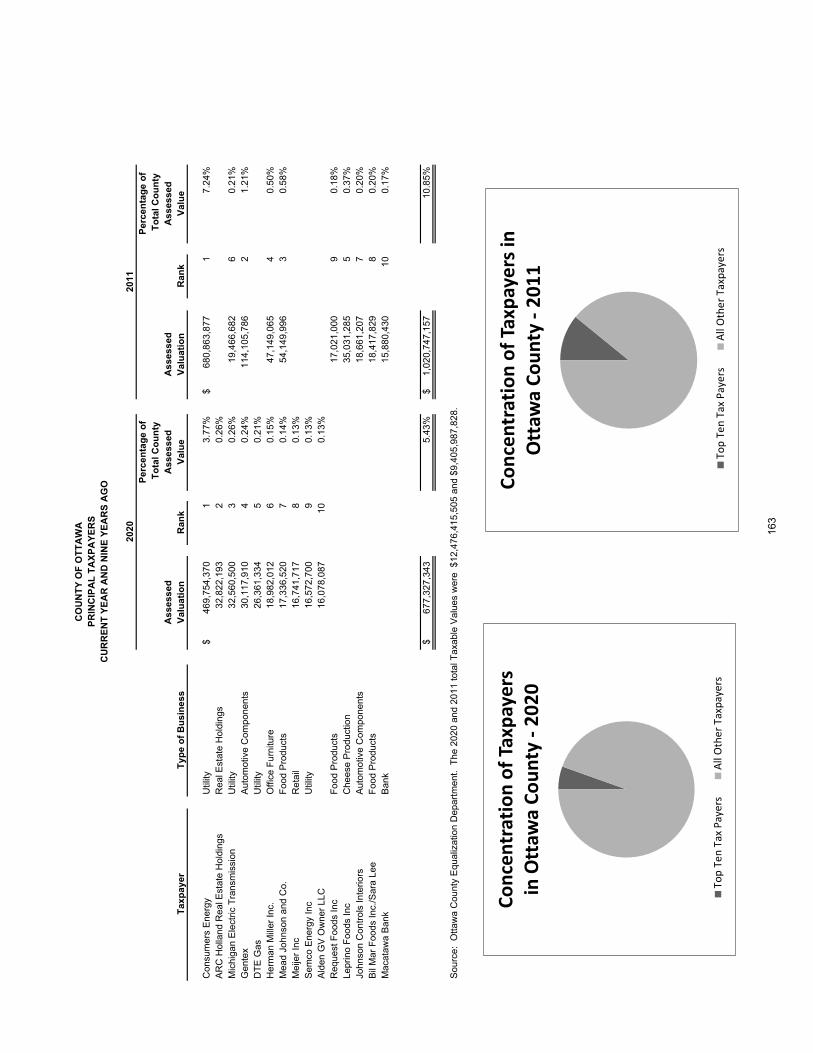
Per
cen
tag
e o
fP
erce
nta
ge
of
To
tal C
ou
nty
To
tal C
ou
nty
A
sses
sed
Ass
esse
dA
sses
sed
Ass
esse
dT
axp
ayer
Typ
e o
f B
usi
nes
sV
alu
atio
nR
ank
Val
ue
Val
uat
ion
Ran
kV
alu
e
Con
sum
ers
Ene
rgy
Util
ity46
9,75
4,37
0$
13.
77%
680,
863,
877
$
17.
24%
AR
C H
olla
nd R
eal E
stat
e H
oldi
ngs
Rea
l Est
ate
Hol
ding
s32
,822
,193
2
0.26
%M
ichi
gan
Ele
ctric
Tra
nsm
issi
onU
tility
32,5
60,5
00
30.
26%
19,4
66,6
82
60.
21%
Gen
tex
Aut
omot
ive
Com
pone
nts
30,1
17,9
10
40.
24%
114,
105,
786
21.
21%
DT
E G
asU
tility
26,3
61,3
34
50.
21%
Her
man
Mill
er In
c.O
ffice
Fur
nitu
re18
,982
,012
6
0.15
%47
,149
,065
4
0.50
%M
ead
John
son
and
Co.
Foo
d P
rodu
cts
17,3
36,5
20
70.
14%
54,1
49,9
96
30.
58%
Mei
jer
Inc
Ret
ail
16,7
41,7
17
80.
13%
Sem
co E
nerg
y In
cU
tility
16,5
72,7
00
90.
13%
Ald
en G
V O
wne
r LL
C16
,078
,087
10
0.13
%R
eque
st F
oods
Inc
Foo
d P
rodu
cts
17,0
21,0
00
90.
18%
Lepr
ino
Foo
ds In
cC
hees
e P
rodu
ctio
n35
,031
,285
5
0.37
%Jo
hnso
n C
ontr
ols
Inte
riors
Aut
omot
ive
Com
pone
nts
18,6
61,2
07
70.
20%
Bil
Mar
Foo
ds In
c./S
ara
Lee
Foo
d P
rodu
cts
18,4
17,8
29
80.
20%
Mac
ataw
a B
ank
Ban
k15
,880
,430
10
0.17
%
677,
327,
343
$
5.
43%
1,02
0,74
7,15
7$
10.8
5%
Sou
rce:
Otta
wa
Cou
nty
Equ
aliz
atio
n D
epar
tmen
t. T
he 2
020
and
2011
tota
l Tax
able
Val
ues
wer
e $
12,4
76,4
15,5
05 a
nd $
9,40
5,98
7,82
8.
CO
UN
TY
OF
OT
TA
WA
PR
INC
IPA
L T
AX
PA
YE
RS
CU
RR
EN
T Y
EA
R A
ND
NIN
E Y
EA
RS
AG
O
2020
2011
Concen
tration of Taxpa
yers
in Ottaw
a Co
unty ‐20
20
Top Ten Tax Payers
All O
ther Taxpayers
Concen
tration of Taxpa
yers in
Ottaw
a Co
unty ‐20
11
Top Ten Tax Payers
All O
ther Taxpayers
163

Fis
cal
Tax
es L
evie
dC
oll
ecti
on
sY
ear
in t
he
Per
cen
tag
ein
Su
bse
qu
ent
Per
cen
tag
eE
nd
edF
isca
l Y
ear
Am
ou
nt
of
Lev
yY
ears
Am
ou
nt
of
Lev
y
12/3
1/20
1140
,967
,095
$
39
,933
,281
$
97
.48%
605,
193
$
40
,538
,474
$
98
.95%
12/3
1/20
1240
,575
,521
39,7
39,8
95
97
.94%
665,
147
40
,405
,042
99.5
8%12
/31/
2013
41,1
41,0
33
40
,348
,866
98.0
7%53
1,50
3
40,8
80,3
69
99
.37%
12/3
1/20
1441
,589
,916
40,8
64,8
66
98
.26%
519,
299
41
,384
,165
99.5
1%12
/31/
2015
(1)
49,5
51,1
11
48
,826
,061
98.5
4%27
0,25
5
49,0
96,3
16
99
.08%
9/30
/201
6(2
)36
,812
,648
35,5
62,5
68
96
.60%
924,
535
36
,487
,103
99.1
2%9/
30/2
017
53,9
42,3
06
53
,784
,953
99.7
1%15
7,35
3
53,9
42,3
06
10
0.00
%9/
30/2
018
56,0
33,3
10
55
,871
,645
99.7
1%16
1,66
5
56,0
33,3
10
10
0.00
%9/
30/2
019
(3)
62,1
17,8
35
61
,948
,004
99.7
3%16
9,83
1
62,1
17,8
35
10
0.00
%9/
30/2
020
65,1
81,9
28
65
,171
,347
99.9
8%10
,581
65,1
81,9
28
10
0.00
%
(1)
The
Cou
nty
levi
ed a
new
roa
ds m
illag
e in
201
5, o
n be
half
of t
he O
ttaw
a C
ount
y R
oad
Com
mis
sion
and
City
gov
ernm
ents
.
(2)
Onl
y th
e C
ount
y m
illag
e is
sho
wn
beca
use
the
Cou
nty'
s fis
cal y
ear
ende
d S
epte
mbe
r 30
, 20
16.
(3)
The
Cou
nty
Ope
ratin
g m
ilage
was
incr
ease
d .3
mill
s.
Co
llec
ted
wit
hin
th
e F
isca
l Y
ear
of
the
Lev
yT
ota
l C
oll
ecti
on
s to
Dat
e
CO
UN
TY
OF
OT
TA
WA
PR
OP
ER
TY
TA
X L
EV
IES
AN
D C
OL
LE
CT
ION
SL
AS
T T
EN
FIS
CA
L Y
EA
RS
164
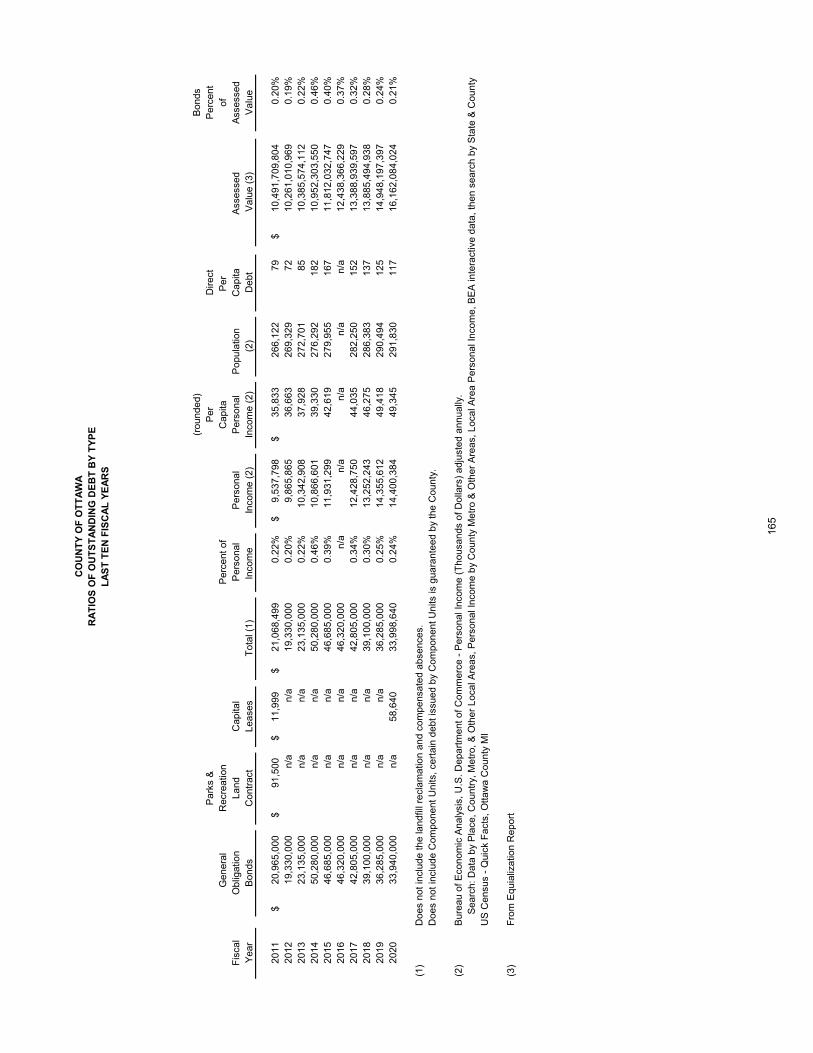
(rou
nded
)B
onds
Par
ks &
Per
Dire
ctP
erce
nt G
ener
alR
ecre
atio
nP
erce
nt o
f
Cap
itaP
er
ofF
isca
lO
blig
atio
nLa
ndC
apita
lP
erso
nal
Per
sona
lP
erso
nal
Pop
ulat
ion
Cap
itaA
sses
sed
Ass
esse
dY
ear
Bon
dsC
ontr
act
Leas
esT
otal
(1)
Inco
me
Inco
me
(2)
Inco
me
(2)
(2)
Deb
tV
alue
(3)
Val
ue
2011
20,9
65,0
00$
91
,500
$
11,9
99$
21,0
68,4
99$
0.22
%9,
537,
798
$
35
,833
$
266,
122
79
10,4
91,7
09,8
04$
0.
20%
2012
19,3
30,0
00
n/
an/
a19
,330
,000
0.
20%
9,86
5,86
5
36,6
63
26
9,32
9
72
10
,261
,010
,969
0.19
%20
1323
,135
,000
n/a
n/a
23,1
35,0
00
0.22
%10
,342
,908
37,9
28
27
2,70
1
85
10
,385
,574
,112
0.22
%20
1450
,280
,000
n/a
n/a
50,2
80,0
00
0.46
%10
,866
,601
39,3
30
27
6,29
2
18
2
10
,952
,303
,550
0.46
%20
1546
,685
,000
n/a
n/a
46,6
85,0
00
0.39
%11
,931
,299
42,6
19
27
9,95
5
16
7
11
,812
,032
,747
0.40
%20
1646
,320
,000
n/a
n/a
46,3
20,0
00
n/a
n/a
n/a
n/a
n/a
12,4
38,3
66,2
29
0.
37%
2017
42,8
05,0
00
n/
an/
a42
,805
,000
0.
34%
12,4
28,7
50
44
,035
282,
250
152
13,3
88,9
39,5
97
0.
32%
2018
39,1
00,0
00
n/
an/
a39
,100
,000
0.
30%
13,2
52,2
43
46
,275
286,
383
137
13,8
85,4
94,9
38
0.
28%
2019
36,2
85,0
00
n/
an/
a36
,285
,000
0.
25%
14,3
55,6
12
49
,418
290,
494
125
14,9
48,1
97,3
97
0.
24%
2020
33,9
40,0
00
n/
a58
,640
33
,998
,640
0.
24%
14,4
00,3
84
49
,345
291,
830
117
16,1
62,0
84,0
24
0.
21%
(1)
Do
es
no
t in
clu
de
th
e la
nd
fill r
ecl
am
atio
n a
nd
co
mpe
nsat
ed a
bse
nce
s.D
oes
not
incl
ude
Com
pone
nt U
nits
, cer
tain
deb
t is
sued
by
Com
pone
nt U
nits
is g
uara
ntee
d by
the
Cou
nty.
(2)
Bur
eau
of E
cono
mic
Ana
lysi
s, U
.S.
Dep
artm
ent
of C
omm
erce
- P
erso
nal I
ncom
e (T
hous
ands
of
Dol
lars
) ad
just
ed a
nnua
lly.
Sea
rch:
Dat
a by
Pla
ce,
Cou
ntry
, M
etro
, &
Oth
er L
ocal
Are
as,
Per
sona
l Inc
ome
by C
ount
y M
etro
& O
ther
Are
as,
Loca
l Are
a P
erso
nal I
nco
me
, B
EA
inte
ract
ive
da
ta,
the
n s
ea
rch
by
Sta
te &
Co
un
tyU
S C
ensu
s -
Qui
ck F
acts
, Ott
awa
Cou
nty
MI
(3)
Fro
m E
quia
lizat
ion
Rep
ort
CO
UN
TY
OF
OT
TA
WA
RA
TIO
S O
F O
UT
ST
AN
DIN
G D
EB
T B
Y T
YP
EL
AS
T T
EN
FIS
CA
L Y
EA
RS
165
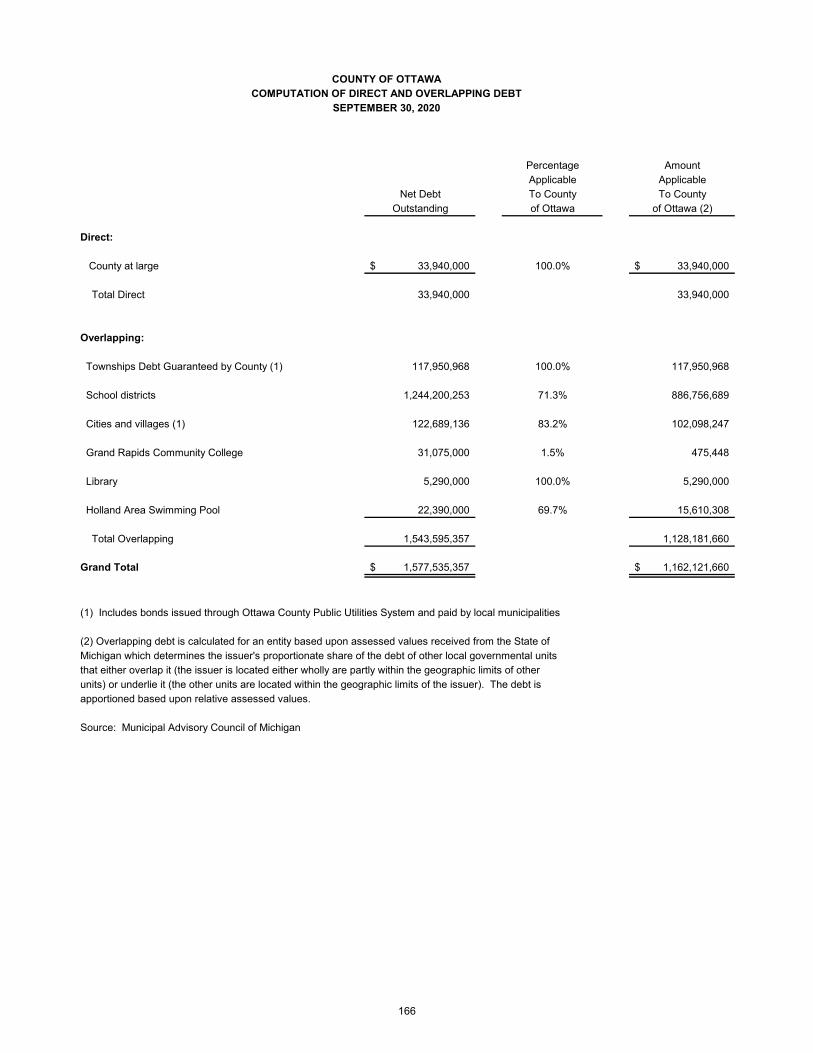
COUNTY OF OTTAWACOMPUTATION OF DIRECT AND OVERLAPPING DEBT
Percentage Amount Applicable Applicable
Net Debt To County To CountyOutstanding of Ottawa of Ottawa (2)
Direct:
County at large 33,940,000$ 100.0% 33,940,000$
Total Direct 33,940,000 33,940,000
Overlapping:
Townships Debt Guaranteed by County (1) 117,950,968 100.0% 117,950,968
School districts 1,244,200,253 71.3% 886,756,689
Cities and villages (1) 122,689,136 83.2% 102,098,247
Grand Rapids Community College 31,075,000 1.5% 475,448
Library 5,290,000 100.0% 5,290,000
Holland Area Swimming Pool 22,390,000 69.7% 15,610,308 Total Overlapping 1,543,595,357 1,128,181,660
Grand Total 1,577,535,357$ 1,162,121,660$
(1) Includes bonds issued through Ottawa County Public Utilities System and paid by local municipalities
(2) Overlapping debt is calculated for an entity based upon assessed values received from the State ofMichigan which determines the issuer's proportionate share of the debt of other local governmental units that either overlap it (the issuer is located either wholly are partly within the geographic limits of otherunits) or underlie it (the other units are located within the geographic limits of the issuer). The debt is apportioned based upon relative assessed values.
Source: Municipal Advisory Council of Michigan
SEPTEMBER 30, 2020
166
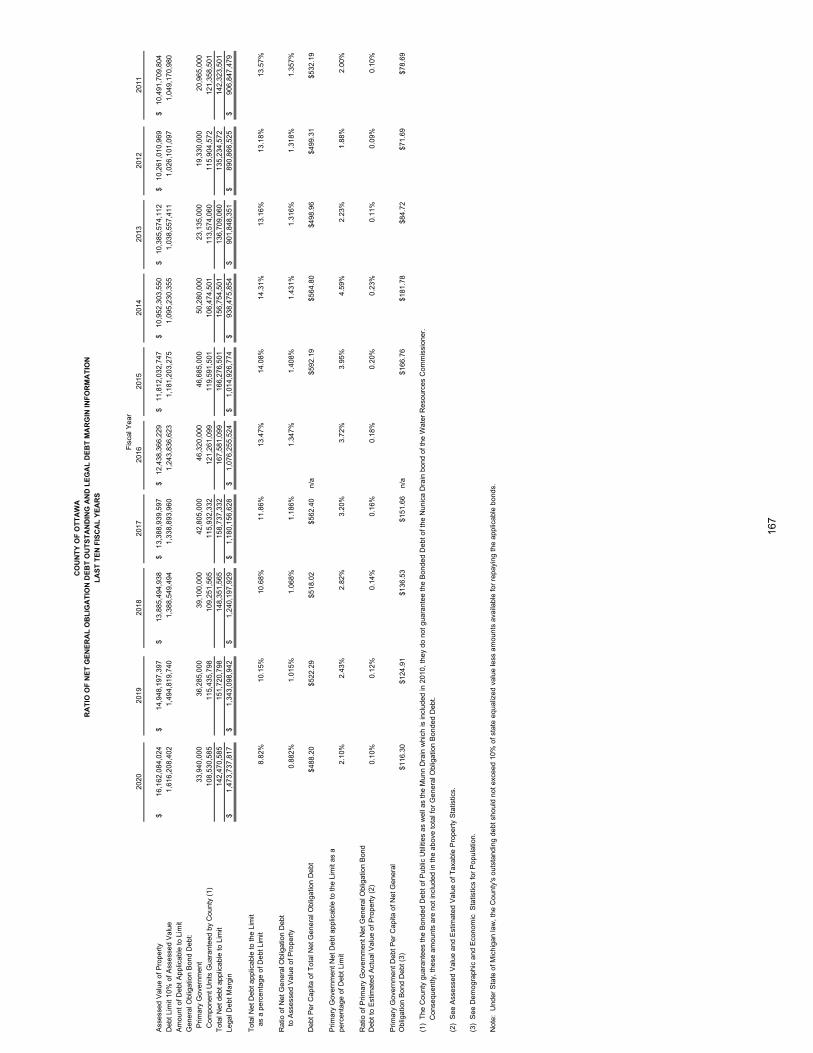
2020
2019
2018
2017
2016
2015
2014
2013
2012
2011
Ass
esse
d V
alue
of P
rope
rty
16,1
62,0
84,0
24$
14
,948
,197
,397
$
13,8
85,4
94,9
38$
13
,388
,939
,597
$
12
,438
,366
,229
$
11
,812
,032
,747
$
10
,952
,303
,550
$
10
,385
,574
,112
$
10
,261
,010
,969
$
10
,491
,709
,804
$
Deb
t Lim
it 10
% o
f Ass
esse
d V
alue
1,61
6,20
8,40
2
1,49
4,81
9,74
0
1,38
8,54
9,49
4
1,33
8,89
3,96
0
1,24
3,83
6,62
3
1,18
1,20
3,27
5
1,09
5,23
0,35
5
1,03
8,55
7,41
1
1,02
6,10
1,09
7
1,04
9,17
0,98
0
Am
ount
of D
ebt A
pplic
able
to L
imit
Gen
eral
Obl
igat
ion
Bon
d D
ebt:
Prim
ary
Gov
ernm
ent
33,9
40,0
00
36,2
85,0
00
39,1
00,0
00
42,8
05,0
00
46,3
20,0
00
46,6
85,0
00
50,2
80,0
00
23,1
35,0
00
19,3
30,0
00
20,9
65,0
00
Com
pone
nt U
nits
Gua
rant
eed
by C
ount
y (1
)10
8,53
0,58
5
11
5,43
5,79
8
10
9,25
1,56
5
11
5,93
2,33
2
12
1,26
1,09
9
11
9,59
1,50
1
10
6,47
4,50
1
11
3,57
4,06
0
11
5,90
4,57
2
12
1,35
8,50
1
Tot
al N
et d
ebt a
pplic
able
to L
imit
142,
470,
585
151,
720,
798
148,
351,
565
158,
737,
332
167,
581,
099
166,
276,
501
156,
754,
501
136,
709,
060
135,
234,
572
142,
323,
501
Lega
l Deb
t Mar
gin
1,47
3,73
7,81
7$
1,34
3,09
8,94
2$
1,24
0,19
7,92
9$
1,18
0,15
6,62
8$
1,07
6,25
5,52
4$
1,01
4,92
6,77
4$
938,
475,
854
$
901,
848,
351
$
890,
866,
525
$
906,
847,
479
$
Tot
al N
et D
ebt a
pplic
able
to th
e Li
mit
as
a p
erce
ntag
e of
Deb
t Lim
it8.
82%
10.1
5%10
.68%
11.8
6%13
.47%
14.0
8%14
.31%
13.1
6%13
.18%
13.5
7%
Rat
io o
f Net
Gen
eral
Obl
igat
ion
Deb
t
to A
sses
sed
Val
ue o
f Pro
pert
y 0.
882%
1.01
5%1.
068%
1.18
6%1.
347%
1.40
8%1.
431%
1.31
6%1.
318%
1.35
7%
Deb
t Per
Cap
ita o
f Tot
al N
et G
ener
al O
blig
atio
n D
ebt
$488
.20
$522
.29
$518
.02
$562
.40
n/a
$592
.19
$564
.80
$498
.96
$499
.31
$532
.19
Prim
ary
Gov
ernm
ent N
et D
ebt a
pplic
able
to th
e Li
mit
as a
pe
rcen
tage
of D
ebt L
imit
2.10
%2.
43%
2.82
%3.
20%
3.72
%3.
95%
4.59
%2.
23%
1.88
%2.
00%
Rat
io o
f Prim
ary
Gov
ernm
ent N
et G
ener
al O
blig
atio
n B
ond
Deb
t to
Est
imat
ed A
ctua
l Val
ue o
f Pro
pert
y (2
)0.
10%
0.12
%0.
14%
0.16
%0.
18%
0.20
%0.
23%
0.11
%0.
09%
0.10
%
Prim
ary
Gov
ernm
ent D
ebt P
er C
apita
of N
et G
ener
al
Obl
igat
ion
Bon
d D
ebt (
3)$1
16.3
0$1
24.9
1$1
36.5
3$1
51.6
6n/
a$1
66.7
6$1
81.7
8$8
4.72
$71.
69$7
8.69
(1)
The
Cou
nty
guar
ante
es th
e B
onde
d D
ebt o
f Pub
lic U
tiliti
es a
s w
ell a
s th
e M
unn
Dra
in w
hich
is in
clud
ed in
201
0, th
ey d
o no
t gu
aran
tee
the
Bon
ded
Deb
t of t
he N
unic
a D
rain
bon
d of
the
Wat
er R
esou
rces
Com
mis
sion
er.
Con
sequ
ently
, the
se a
mou
nts
are
not i
nclu
ded
in th
e ab
ove
tota
l for
Gen
eral
Obl
igat
ion
Bon
ded
Deb
t.
(2)
See
Ass
esse
d V
alue
and
Est
imat
ed V
alue
of T
axab
le P
rope
rty
Sta
tistic
s.
(3)
See
Dem
ogra
phic
and
Eco
nom
ic S
tatis
tics
for
Pop
ulat
ion.
Not
e: U
nder
Sta
te o
f Mic
higa
n la
w, t
he C
ount
y's
outs
tand
ing
debt
sho
uld
not e
xcee
d 10
% o
f sta
te e
qual
ized
val
ue le
ss a
mou
nts
ava
ilabl
e fo
r re
payi
ng th
e ap
plic
able
bon
ds.
RA
TIO
OF
NE
T G
EN
ER
AL
OB
LIG
AT
ION
DE
BT
OU
TS
TA
ND
ING
AN
D L
EG
AL
DE
BT
MA
RG
IN IN
FO
RM
AT
ION
CO
UN
TY
OF
OT
TA
WA
LA
ST
TE
N F
ISC
AL
YE
AR
S
Fis
cal Y
ear
167
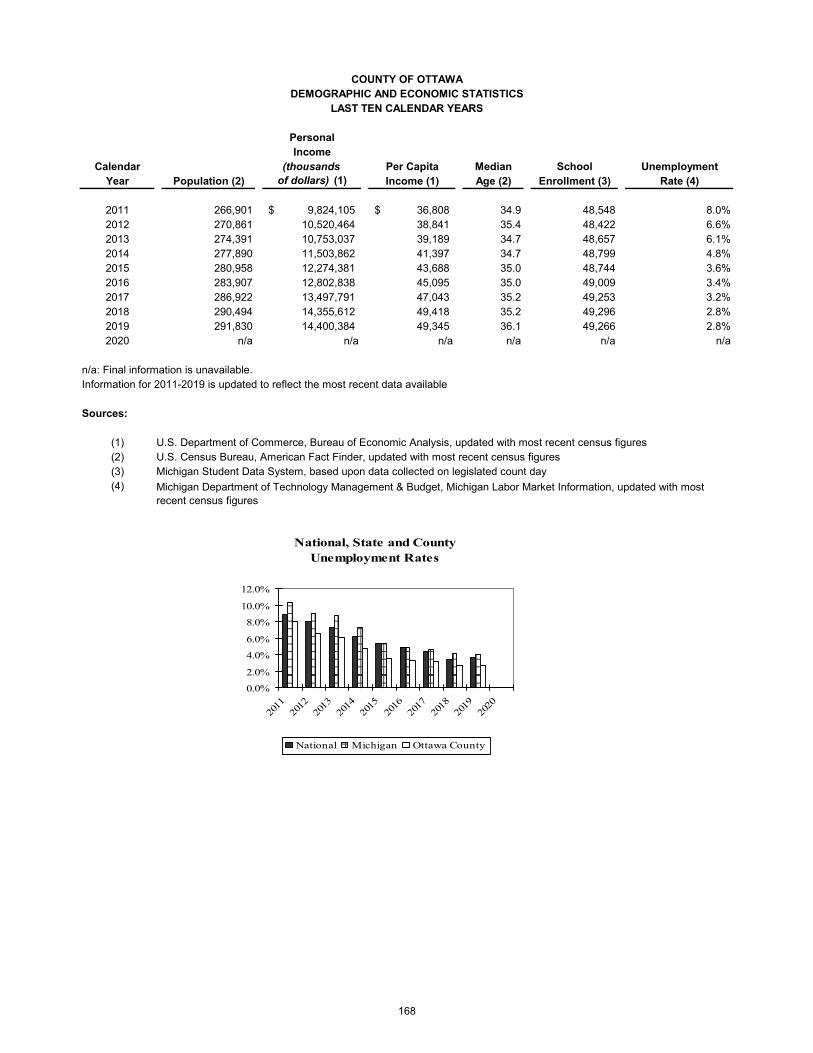
Personal Income
Calendar (thousands Per Capita Median School UnemploymentYear Population (2) of dollars) (1) Income (1) Age (2) Enrollment (3) Rate (4)
2011 266,901 9,824,105$ 36,808$ 34.9 48,548 8.0%2012 270,861 10,520,464 38,841 35.4 48,422 6.6%2013 274,391 10,753,037 39,189 34.7 48,657 6.1%2014 277,890 11,503,862 41,397 34.7 48,799 4.8%2015 280,958 12,274,381 43,688 35.0 48,744 3.6%2016 283,907 12,802,838 45,095 35.0 49,009 3.4%2017 286,922 13,497,791 47,043 35.2 49,253 3.2%2018 290,494 14,355,612 49,418 35.2 49,296 2.8%2019 291,830 14,400,384 49,345 36.1 49,266 2.8%2020 n/a n/a n/a n/a n/a n/a
n/a: Final information is unavailable.Information for 2011-2019 is updated to reflect the most recent data available
Sources:
(1) U.S. Department of Commerce, Bureau of Economic Analysis, updated with most recent census figures(2) U.S. Census Bureau, American Fact Finder, updated with most recent census figures(3) Michigan Student Data System, based upon data collected on legislated count day(4)
COUNTY OF OTTAWADEMOGRAPHIC AND ECONOMIC STATISTICS
LAST TEN CALENDAR YEARS
Michigan Department of Technology Management & Budget, Michigan Labor Market Information, updated with most recent census figures
National, State and County Unemployment Rates
0.0%
2.0%
4.0%
6.0%
8.0%
10.0%
12.0%
2011
2012
2013
2014
2015
2016
2017
2018
2019
2020
National Michigan Ottawa County
168
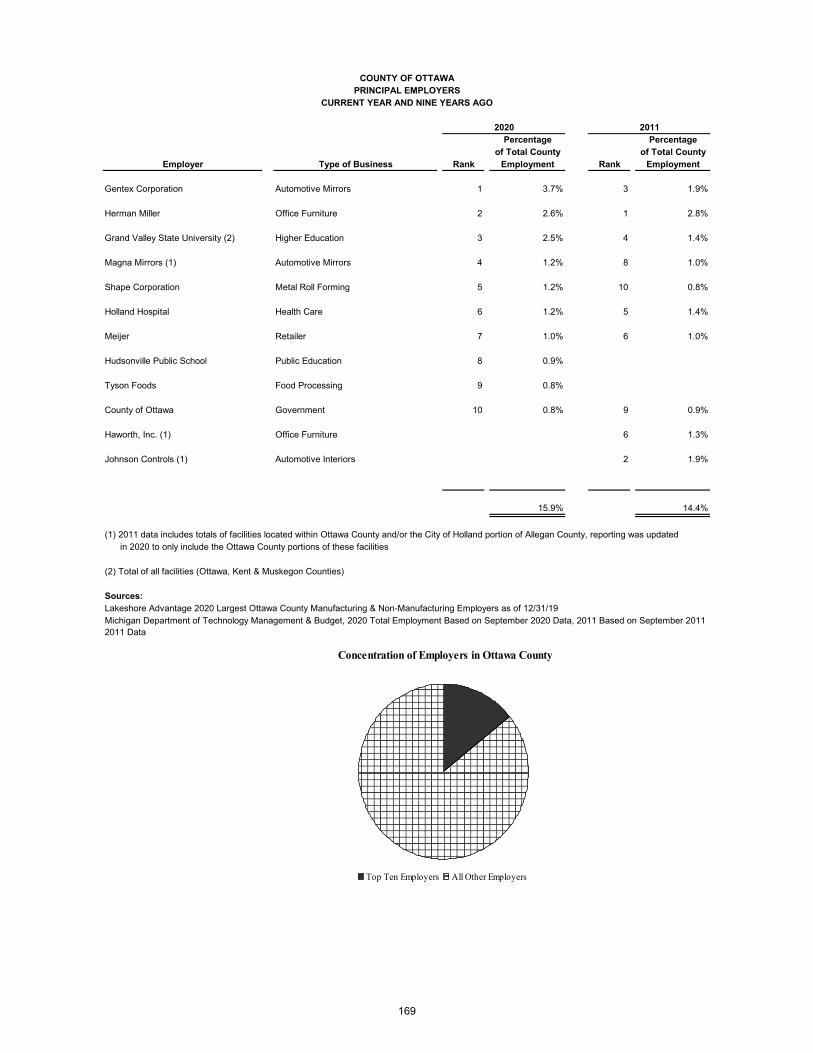
Percentage Percentage of Total County of Total County
Employer Type of Business Rank Employment Rank Employment
Gentex Corporation Automotive Mirrors 1 3.7% 3 1.9%
Herman Miller Office Furniture 2 2.6% 1 2.8%
Grand Valley State University (2) Higher Education 3 2.5% 4 1.4%
Magna Mirrors (1) Automotive Mirrors 4 1.2% 8 1.0%
Shape Corporation Metal Roll Forming 5 1.2% 10 0.8%
Holland Hospital Health Care 6 1.2% 5 1.4%
Meijer Retailer 7 1.0% 6 1.0%
Hudsonville Public School Public Education 8 0.9%
Tyson Foods Food Processing 9 0.8%
County of Ottawa Government 10 0.8% 9 0.9%
Haworth, Inc. (1) Office Furniture 6 1.3%
Johnson Controls (1) Automotive Interiors 2 1.9%
15.9% 14.4%
(1) 2011 data includes totals of facilities located within Ottawa County and/or the City of Holland portion of Allegan County, reporting was updated in 2020 to only include the Ottawa County portions of these facilities
(2) Total of all facilities (Ottawa, Kent & Muskegon Counties)
Sources:Lakeshore Advantage 2020 Largest Ottawa County Manufacturing & Non-Manufacturing Employers as of 12/31/19
2011 Data
COUNTY OF OTTAWAPRINCIPAL EMPLOYERS
CURRENT YEAR AND NINE YEARS AGO
Michigan Department of Technology Management & Budget, 2020 Total Employment Based on September 2020 Data, 2011 Based on September 2011
2020 2011
Concentration of Employers in Ottawa County
Top Ten Employers All Other Employers
169
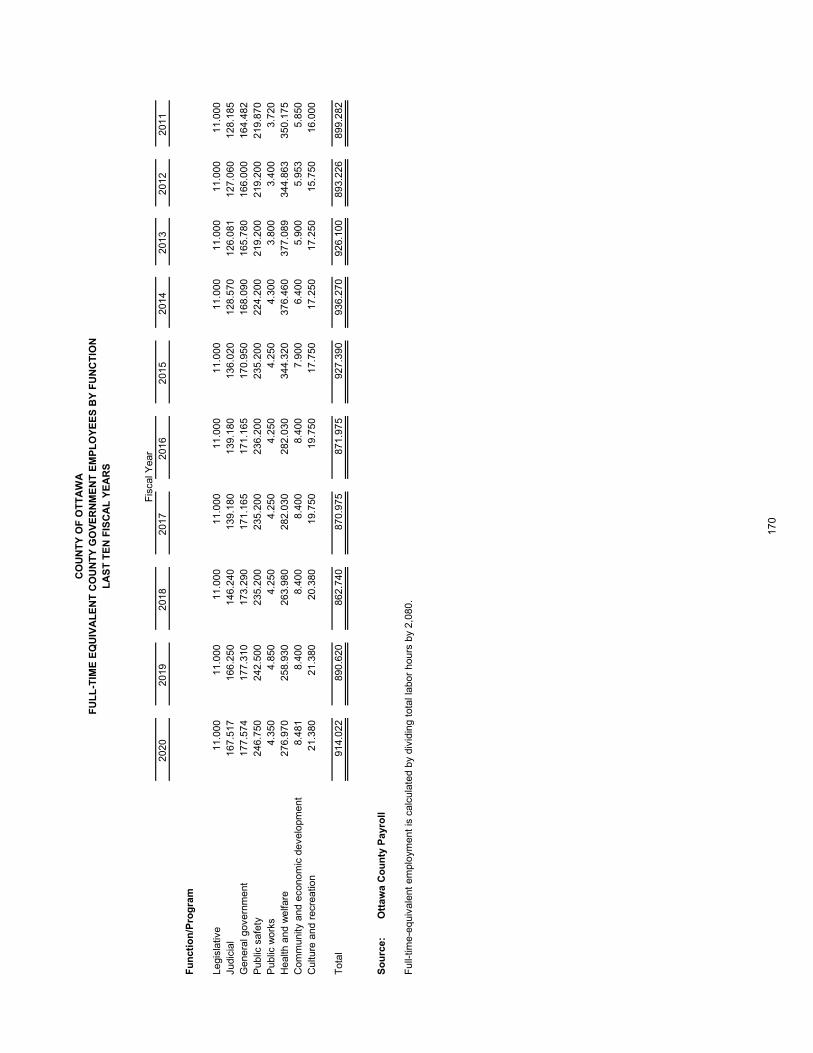
2020
2019
2018
2017
2016
2015
2014
2013
2012
2011
Fu
nct
ion
/Pro
gra
m
Legi
slat
ive
11.0
0011
.000
11.0
0011
.000
11.0
0011
.000
11.0
0011
.000
11.0
0011
.000
Judi
cial
167.
517
166.
250
146.
240
139.
180
139.
180
136.
020
128.
570
126.
081
127.
060
128.
185
Gen
eral
gov
ernm
ent
177.
574
177.
310
173.
290
171.
165
171.
165
170.
950
168.
090
165.
780
166.
000
164.
482
Pub
lic s
afet
y24
6.75
024
2.50
023
5.20
023
5.20
023
6.20
023
5.20
022
4.20
021
9.20
021
9.20
021
9.87
0P
ublic
wor
ks4.
350
4.85
04.
250
4.25
04.
250
4.25
04.
300
3.80
03.
400
3.72
0H
ealth
and
wel
fare
276.
970
258.
930
263.
980
282.
030
282.
030
344.
320
376.
460
377.
089
344.
863
350.
175
Com
mun
ity a
nd e
cono
mic
dev
elop
men
t8.
481
8.40
08.
400
8.40
08.
400
7.90
06.
400
5.90
05.
953
5.85
0C
ultu
re a
nd r
ecre
atio
n21
.380
21.3
8020
.380
19.7
5019
.750
17.7
5017
.250
17.2
5015
.750
16.0
00
Tot
al
914.
022
890.
620
862.
740
870.
975
871.
975
927.
390
936.
270
926.
100
893.
226
899.
282
So
urc
e:O
ttaw
a C
ou
nty
Pay
roll
Ful
l-tim
e-eq
uiva
lent
em
ploy
men
t is
cal
cula
ted
by d
ivid
ing
tota
l lab
or h
ours
by
2,08
0.
CO
UN
TY
OF
OT
TA
WA
FU
LL
-TIM
E E
QU
IVA
LE
NT
CO
UN
TY
GO
VE
RN
ME
NT
EM
PL
OY
EE
S B
Y F
UN
CT
ION
LA
ST
TE
N F
ISC
AL
YE
AR
S
F
isca
l Yea
r
170

20
20
20
19
20
18
20
17
20
16
20
15
20
14
20
13
20
12
20
11
Fu
nc
tio
n/P
rog
ram
Jud
icia
l Cir
cuit
Co
urt
To
tal C
ivil
Fili
ng
sn
/a3
61
35
03
66
31
83
28
41
13
63
44
34
23
To
tal C
rim
ina
l Fili
ng
sn
/a8
57
99
61
,01
38
49
93
09
22
88
49
28
91
8T
ota
l Ap
pe
als
Fili
ng
sn
/a4
25
44
85
95
67
06
05
85
3D
om
est
ic R
ela
tion
s F
ilin
gs
n/a
1,6
13
1,6
23
1,6
75
1,7
42
1,5
93
1,4
68
1,5
87
1,5
56
1,5
24
Pe
rso
na
l Pro
tect
ion
Fili
ng
sn
/a6
47
65
96
65
62
85
50
58
05
98
74
77
83
Juve
nile
Co
de
Fili
ng
sn
/a8
18
86
01
,00
79
21
1,0
55
1,0
23
1,2
09
1,3
37
1,4
13
Ad
op
tion
Fili
ng
sn
/a1
18
14
81
06
14
31
18
11
21
39
12
01
42
Mis
c. F
am
ily F
ilin
gs
n/a
12
51
03
88
90
81
71
76
71
67
Dis
tric
t C
ou
rtF
elo
ny
Ca
ses
n/a
1,3
23
1,5
11
1,4
71
1,3
09
1,3
85
1,3
90
1,2
81
1,4
11
1,3
78
Mis
de
me
an
or
Ca
ses
n/a
6,2
72
7,3
30
8,0
53
7,7
15
7,2
16
8,1
36
8,6
69
9,0
87
8,6
30
Ge
ne
ral C
ivil
Ca
ses
n/a
6,0
53
5,5
92
4,8
45
4,5
56
4,6
33
4,2
10
4,8
06
6,2
25
5,6
72
Pro
ba
te C
ou
rtE
sta
tes,
Tru
sts
Fili
ng
sn
/a4
02
44
13
85
39
14
17
42
53
71
40
43
73
Civ
il, O
the
r F
ilin
gs
n/a
17
17
11
19
16
23
11
15
10
Gu
ard
ian
ship
s,C
on
serv
ato
rs e
t a
ln
/a6
47
69
55
91
58
96
11
61
25
45
51
65
48
Pu
blic
Sa
fety
Ja
il:
Su
bje
cts
Ad
mitt
ed
4,1
03
6,0
80
6,8
98
6,5
25
6,3
65
5,8
99
6,7
76
7,0
15
7,4
53
7,1
36
A
vera
ge
da
ily p
op
ula
tion
22
83
15
.03
38
.02
97
.02
86
.03
01
.03
17
.03
38
.03
52
.03
27
.8
P
olic
e:
C
alls
fo
r S
erv
ice
n/a
73
,40
27
2,8
79
73
,37
57
0,5
55
69
,83
06
7,3
34
65
,17
96
6,6
83
65
,59
6
Cri
min
al A
rre
sts
n/a
6,4
24
7,7
37
8,2
98
6,7
60
6,4
03
6,8
93
6,3
07
6,9
43
6,9
89
Tra
ffic
Vio
latio
ns
n/a
17
,74
31
8,4
24
18
,34
71
7,0
34
19
,63
01
9,9
84
21
,49
42
2,8
67
21
,42
3
He
alth
an
d w
elfa
re
P
ub
lic H
ea
lth # o
f F
ixe
d F
oo
d S
erv
ice
Insp
ect
ion
s2
,08
12
,09
81
,88
51
,72
11
,61
71
,18
81
,20
11
,18
39
68
1,0
47
% o
f n
ew
en
tra
nts
en
rolle
d in
sc
ho
ol i
mm
un
ize
d9
6%
95
%9
6%
96
%9
6%
96
%9
9%
99
%9
9%
99
%M
ate
rna
l/In
fan
t H
ea
lth S
erv
ice
s
#
of
Vis
its1
,28
81
,36
51
,89
62
,18
32
,04
72
,02
62
,58
73
,06
52
,80
43
,21
6#
of
De
nta
l Se
rvic
es
with
Mile
s
of
Sm
iles
an
d S
ea
lan
t P
rog
ram
4,8
29
7,5
53
8,0
07
8,4
82
8,7
54
8,9
89
8,7
76
10
,16
31
0,4
76
9,6
30
Me
nta
l He
alth
# o
f P
ers
on
s S
erv
ed
4,2
53
3,9
55
4,0
96
3,7
50
3,4
43
2,8
48
2,7
98
2,7
84
3,5
13
3,2
76
Cu
lture
an
d r
ecr
ea
tion
Pa
rks:
# o
f O
pe
ratin
g D
ays
10
89
69
89
59
91
03
96
98
97
10
1D
aily
Pe
rmits
39
,13
94
4,7
49
43
,68
84
2,9
24
42
,21
14
1,2
14
32
,69
33
3,0
04
36
,51
13
3,2
67
An
nu
al P
erm
its9
,70
48
,26
09
,61
99
,40
68
,73
46
,93
47
,01
75
,98
16
,51
65
,84
5
CO
UN
TY
OF
OT
TA
WA
OP
ER
AT
ING
IN
DIC
AT
OR
S B
Y F
UN
CT
ION
/PR
OG
RA
ML
AS
T T
EN
FIS
CA
L Y
EA
RS
Fis
cal Y
ea
r
171
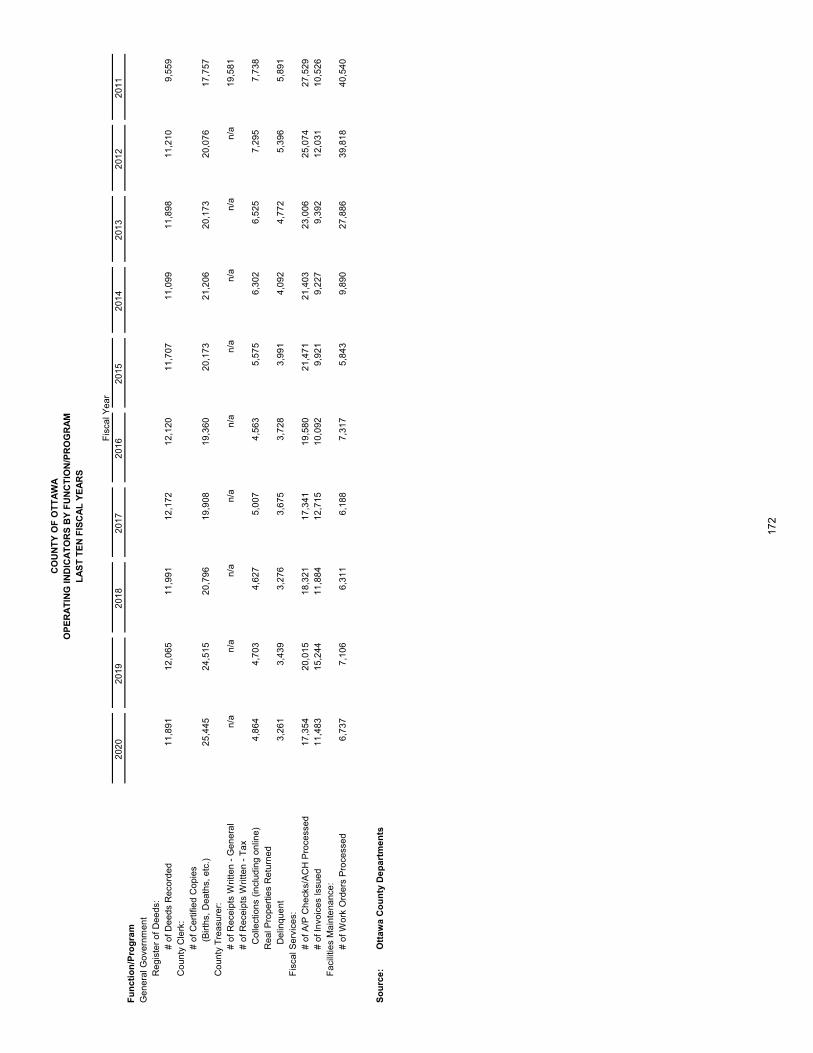
20
20
20
19
20
18
20
17
20
16
20
15
20
14
20
13
20
12
20
11
Fu
nc
tio
n/P
rog
ram
CO
UN
TY
OF
OT
TA
WA
OP
ER
AT
ING
IN
DIC
AT
OR
S B
Y F
UN
CT
ION
/PR
OG
RA
ML
AS
T T
EN
FIS
CA
L Y
EA
RS
Fis
cal Y
ea
r
Ge
ne
ral G
ove
rnm
en
tR
eg
iste
r o
f D
ee
ds:
# o
f D
ee
ds
Re
cord
ed
11
,89
11
2,0
65
11
,99
11
2,1
72
12
,12
01
1,7
07
11
,09
91
1,8
98
11
,21
09
,55
9C
ou
nty
Cle
rk:
# o
f C
ert
ifie
d C
op
ies
(
Bir
ths,
De
ath
s, e
tc.)
25
,44
52
4,5
15
20
,79
61
9,9
08
19
,36
02
0,1
73
21
,20
62
0,1
73
20
,07
61
7,7
57
Co
un
ty T
rea
sure
r:#
of
Re
ceip
ts W
ritt
en
- G
en
era
ln
/an
/an
/an
/an
/an
/an
/an
/an
/a1
9,5
81
# o
f R
ece
ipts
Wri
tte
n -
Ta
x
Co
llect
ion
s (i
ncl
ud
ing
on
line
)4
,86
44
,70
34
,62
75
,00
74
,56
35
,57
56
,30
26
,52
57
,29
57
,73
8R
ea
l Pro
pe
rtie
s R
etu
rne
d
D
elin
qu
en
t3
,26
13
,43
93
,27
63
,67
53
,72
83
,99
14
,09
24
,77
25
,39
65
,89
1F
isca
l Se
rvic
es:
# o
f A
/P C
he
cks/
AC
H P
roce
sse
d1
7,3
54
20
,01
51
8,3
21
17
,34
11
9,5
80
21
,47
12
1,4
03
23
,00
62
5,0
74
27
,52
9#
of
Invo
ice
s Is
sue
d1
1,4
83
15
,24
41
1,8
84
12
,71
51
0,0
92
9,9
21
9,2
27
9,3
92
12
,03
11
0,5
26
Fa
cilit
ies
Ma
inte
na
nce
:#
of
Wo
rk O
rde
rs P
roce
sse
d6
,73
77
,10
66
,31
16
,18
87
,31
75
,84
39
,89
02
7,8
86
39
,81
84
0,5
40
So
urc
e:
Ott
aw
a C
ou
nty
De
pa
rtm
en
ts
172
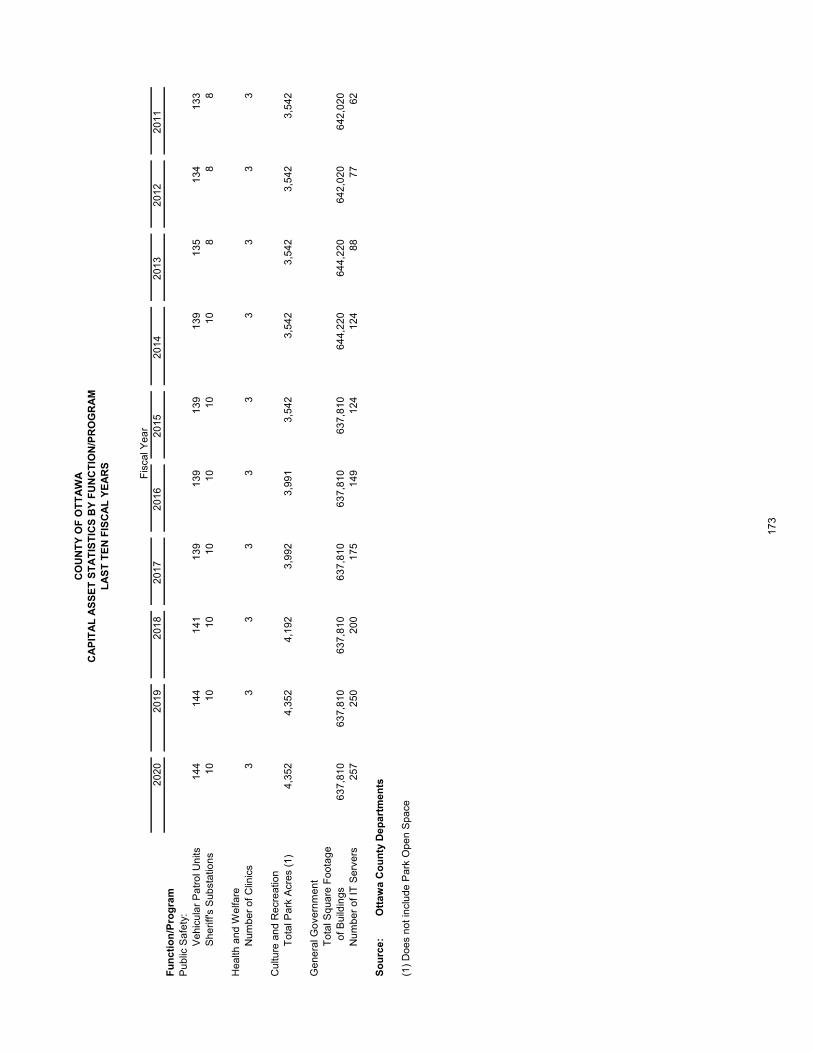
20
20
20
19
20
18
20
17
20
16
20
15
20
14
20
13
20
12
20
11
Fu
nc
tio
n/P
rog
ram
Pu
blic
Sa
fety
:V
eh
icu
lar
Pa
tro
l Un
its1
44
14
41
41
13
91
39
13
91
39
13
51
34
13
3
Sh
erif
f's S
ub
sta
tion
s1
01
01
01
01
01
01
08
88
He
alth
an
d W
elfa
reN
um
be
r o
f C
linic
s3
33
33
33
33
3
Cu
lture
an
d R
ecr
ea
tion
To
tal P
ark
Acr
es
(1)
4,3
52
4,3
52
4,1
92
3,9
92
3,9
91
3,5
42
3,5
42
3,5
42
3,5
42
3,5
42
Ge
ne
ral G
ove
rnm
en
tT
ota
l Sq
ua
re F
oo
tag
e
of
Bu
ildin
gs
63
7,8
10
63
7,8
10
63
7,8
10
63
7,8
10
63
7,8
10
63
7,8
10
64
4,2
20
64
4,2
20
64
2,0
20
64
2,0
20
Nu
mb
er
of
IT S
erv
ers
25
72
50
20
01
75
14
91
24
12
48
87
76
2
So
urc
e:
Ott
aw
a C
ou
nty
De
pa
rtm
en
ts
(1)
Do
es
no
t in
clu
de
Pa
rk O
pe
n S
pa
ce
CO
UN
TY
OF
OT
TA
WA
CA
PIT
AL
AS
SE
T S
TA
TIS
TIC
S B
Y F
UN
CT
ION
/PR
OG
RA
ML
AS
T T
EN
FIS
CA
L Y
EA
RS
Fis
cal Y
ea
r
173
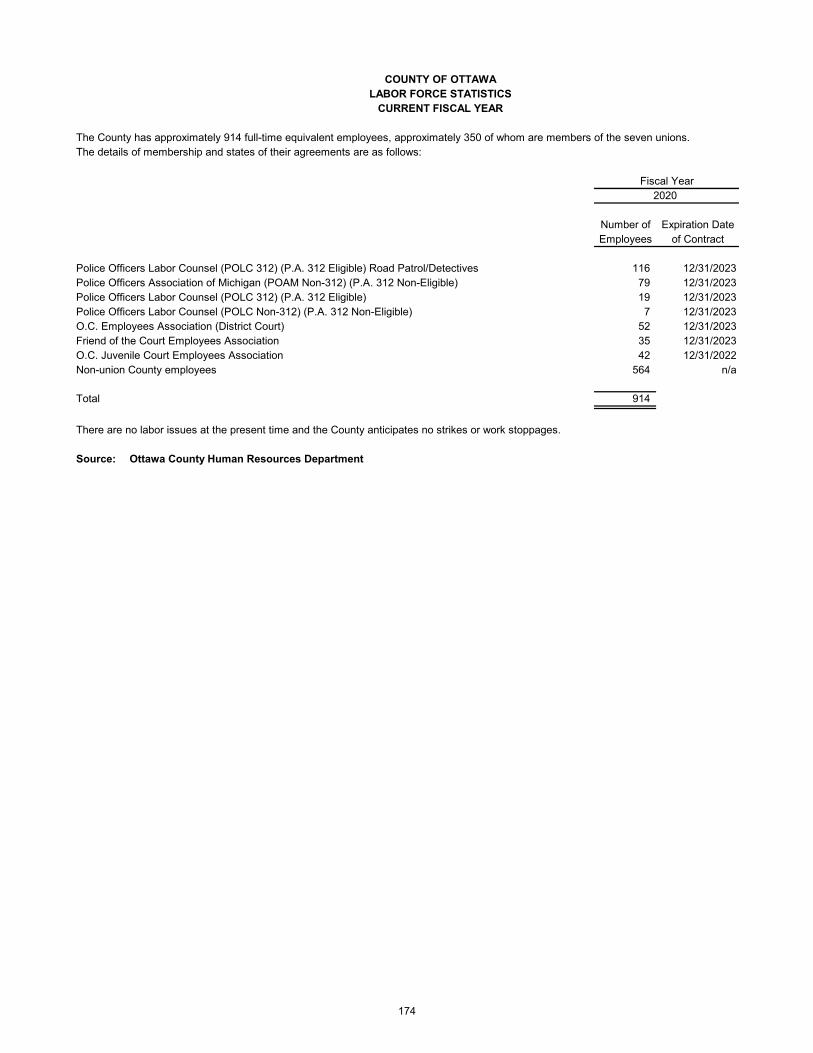
The County has approximately 914 full-time equivalent employees, approximately 350 of whom are members of the seven unions.The details of membership and states of their agreements are as follows:
Number of Expiration DateEmployees of Contract
Police Officers Labor Counsel (POLC 312) (P.A. 312 Eligible) Road Patrol/Detectives 116 12/31/2023Police Officers Association of Michigan (POAM Non-312) (P.A. 312 Non-Eligible) 79 12/31/2023Police Officers Labor Counsel (POLC 312) (P.A. 312 Eligible) 19 12/31/2023Police Officers Labor Counsel (POLC Non-312) (P.A. 312 Non-Eligible) 7 12/31/2023O.C. Employees Association (District Court) 52 12/31/2023Friend of the Court Employees Association 35 12/31/2023O.C. Juvenile Court Employees Association 42 12/31/2022Non-union County employees 564 n/a
Total 914
There are no labor issues at the present time and the County anticipates no strikes or work stoppages.
Source: Ottawa County Human Resources Department
COUNTY OF OTTAWALABOR FORCE STATISTICS
CURRENT FISCAL YEAR
Fiscal Year2020
174

SINGLE AUDIT
Vredeveld Haefner LLC CPAs and Consultants Douglas J. Vredeveld, CPA 10302 20th Avenue (616) 446-7474 Grand Rapids, MI 49534 Peter S. Haefner, CPA Fax (616) 828-0307 (616) 460-9388
Specializing in services to governmental and nonprofit entities
INDEPENDENT AUDITORS’ REPORT ON INTERNAL CONTROL OVER FINANCIAL REPORTING AND ON COMPLIANCE AND OTHER MATTERS BASED ON AN AUDIT OF
FINANCIAL STATEMENTS PERFORMED IN ACCORDANCE WITH GOVERNMENT AUDITING STANDARDS
March 31, 2021
Board of County Commissioners County of Ottawa West Olive, Michigan
We have audited, in accordance with the auditing standards generally accepted in the United States of America and the standards applicable to financial audits contained in Government Auditing Standards issued by the Comptroller General of the United States, the financial statements of the governmental activities, the business-type activities, the aggregate discretely presented component units, each major fund and the aggregate remaining fund information of the County of Ottawa, Michigan (the County) as of and for the year ended September 30, 2020, and the related notes to the financial statements, which collectively comprise the County’s basic financial statements, and have issued our report thereon dated March 31, 2021.
Internal Control Over Financial Reporting
In planning and performing our audit of the financial statements, we considered the County's internal control over financial reporting (internal control) to determine the audit procedures that are appropriate in the circumstances for the purpose of expressing our opinions on the financial statements, but not for the purpose of expressing an opinion on the effectiveness of the County’s internal control. Accordingly, we do not express an opinion on the effectiveness of the County’s internal control.
A deficiency in internal control exists when the design or operation of a control does not allow management or employees, in the normal course of performing their assigned functions, to prevent, or detect and correct, misstatements on a timely basis. A material weakness is a deficiency, or a combination of deficiencies, in internal control, such that there is a reasonable possibility that a material misstatement of the entity’s financial statements will not be prevented, or detected and corrected, on a timely basis. A significant deficiency is a deficiency, or a combination of deficiencies, in internal control that is less severe than a material weakness, yet important enough to merit attention by those charged with governance.
Our consideration of internal control was for the limited purpose described in the first paragraph of this section and was not designed to identify all deficiencies in internal control that might be material weaknesses or significant deficiencies. Given these limitations, during our audit we did not identify any deficiencies in internal control that we consider to be material weaknesses. However, material weaknesses may exist that have not been identified.
Compliance and Other Matters
As part of obtaining reasonable assurance about whether the County's financial statements are free from material misstatement, we performed tests of its compliance with certain provisions of laws, regulations, contracts, and grant agreements, noncompliance with which could have a direct and material effect on the determination of financial statement amounts. However, providing an opinion on compliance with those provisions was not an objective of our audit, and accordingly, we do not express such an opinion. The results of our tests disclosed no instances of noncompliance or other matters that are required to be reported under Government Auditing Standards.
175

Purpose of this Report
The purpose of this report is solely to describe the scope of our testing of internal control and compliance and the results of that testing, and not to provide an opinion on the effectiveness of the County’s internal control or on compliance. This report is an integral part of an audit performed in accordance with Government Auditing Standards in considering the County’s internal control and compliance. Accordingly, this communication is not suitable for any other purpose.
176
Vredeveld Haefner LLC CPAs and Consultants Douglas J. Vredeveld, CPA 10302 20th Avenue (616) 446-7474 Grand Rapids, MI 49534 Peter S. Haefner, CPA Fax (616) 828-0307 (616) 460-9388
Specializing in services to governmental and nonprofit entities
INDEPENDENT AUDITOR’S REPORT ON COMPLIANCE FOR EACH
MAJOR PROGRAM AND ON INTERNAL CONTROL OVER COMPLIANCE REQUIRED BY THE UNIFORM GUIDANCE
March 31, 2021
Board of County Commissioners County of Ottawa West Olive, Michigan
Report on Compliance for Each Major Federal Program
We have audited the County of Ottawa, Michigan’s (the County) compliance with the types of compliance requirements described in the OMB Compliance Supplement that could have a direct and material effect on each of the County’s major federal programs for the year ended September 30, 2020. The County’s major federal programs are identified in the summary of auditors’ results section of the accompanying schedule of findings and questioned costs.
Management’s Responsibility
Management is responsible for compliance with federal statutes, regulations and the terms and conditions of its federal awards applicable to its federal programs.
Auditor’s Responsibility
Our responsibility is to express an opinion on compliance for each of the County’s major federal programs based on our audit of the types of compliance requirements referred to above. We conducted our audit of compliance in accordance with auditing standards generally accepted in the United States of America; the standards applicable to financial audits contained in Government Auditing Standards, issued by the Comptroller General of the United States; and the audit requirements of Title 2 U.S. Code of Federal Regulations Part 200, Uniform Administrative Requirements, Cost Principles, and Audit Requirements for Federal Awards (Uniform Guidance). Those standards and the Uniform Guidance require that we plan and perform the audit to obtain reasonable assurance about whether noncompliance with the types of compliance requirements referred to above that could have a direct and material effect on a major federal program occurred. An audit includes examining, on a test basis, evidence about the County’s compliance with those requirements and performing such other procedures as we considered necessary in the circumstances.
We believe that our audit provides a reasonable basis for our opinion on compliance for each major federal program. However, our audit does not provide a legal determination of the County’s compliance.
Opinion on Each Major Federal Program
In our opinion, the County complied, in all material respects, with the types of compliance requirements referred to above that could have a direct and material effect on each of its major federal programs for the year ended September 30, 2020.
177
Report on Internal Control Over Compliance
Management of the County is responsible for establishing and maintaining effective internal control over compliance with the types of compliance requirements referred to above. In planning and performing our audit of compliance, we considered the County’s internal control over compliance with the types of requirements that could have a direct and material effect on each major federal program to determine the auditing procedures that are appropriate in the circumstances for the purpose of expressing an opinion on compliance for each major federal program and to test and report on internal control over compliance in accordance with the Uniform Guidance, but not for the purpose of expressing an opinion on the effectiveness of internal control over compliance. Accordingly, we do not express an opinion on the effectiveness of the County’s internal control over compliance.
A deficiency in internal control over compliance exists when the design or operation of a control over compliance does not allow management or employees, in the normal course of performing their assigned functions, to prevent, or detect and correct, noncompliance with a type of compliance requirement of a federal program on a timely basis. A material weakness in internal control over compliance is a deficiency, or a combination of deficiencies, in internal control over compliance, such that there is a reasonable possibility that material noncompliance with a type of compliance requirement of a federal program will not be prevented, or detected and corrected, on a timely basis. A significant deficiency in internal control over compliance is a deficiency, or a combination of deficiencies, in internal control over compliance with a type of compliance requirement of a federal program that is less severe than a material weakness in internal control over compliance, yet important enough to merit attention by those charged with governance.
Our consideration of internal control over compliance was for the limited purpose described in the first paragraph of this section and was not designed to identify all deficiencies in internal control over compliance that might be material weaknesses or significant deficiencies. We did not identify any deficiencies in internal control over compliance that we consider to be material weaknesses. However, material weaknesses may exist that have not been identified.
The purpose of this report on internal control over compliance is solely to describe the scope of our testing of internal control over compliance and the results of that testing based on the requirements of the Uniform Guidance. Accordingly, this report is not suitable for any other purpose.
178

Federal Agency/Cluster/Program TitleCFDA
Number Pass Through Agency Cluster Pass Through Number Expenditures
U.S. Department of Agriculture:
Trade Mitigation Program 10.178 MDE 200990 16,409 Trade Mitigation Program (Food Commodities) 10.178 MDE 200990 87,479
103,888
School Breakfast Program 10.553 MDE Child Nutrition 201970 20,208
National School Lunch Program 10.555 MDE Child Nutrition 201960 31,616 National School Lunch Program 10.555 MDE Child Nutrition 201980 8,542
40,157
Total Child Nutrition Cluster 60,365
Commodity Supplemental Food Program 10.565 MDE Food Distribution 200930 32,549 Commodity Supplemental Food Program - Commodities 10.565 MDE Food Distribution 200930 112,012
144,561
Emergency Food Assistance Program (Administrative Costs) 10.568 MDE Food Distribution 200990 56,387 Families First Coronavirus Recovery Act (TEFAP) 10.568 MDE Food Distribution 200990 7,036 The Coronavirus Aid, Relief, and Economic Security Act 10.568 MDE Food Distribution 200990 3,895 Emergency Food Assistance Program (Food Commodities) 10.569 MDE Food Distribution 200990 107,897
175,215
Total Food Distribution Cluster 319,776
Agriculture Conservation Easement Program 10.913 Direct 200,000
Total U.S. Department of Agriculture 684,030
U.S. Department of Commerce:
Costal Zone Management Administration 11.419 EGLE 20-CHab-001 26,590 Total U.S. Department of Commerce 26,590
U.S. Department of Housing and Urban Development:
Community Development Block Grant 14.228 MEDC MSC 22047-CV1 289,256
Emergency Solutions Grant 14.231 MSHDA HML-2019-Ottawa C-2526-ESF 262,679 Emergency Solutions Cares Act Funding Grant 14.231 MSHDA HML-2020-Ottawa C-5826-C19 66,923
329,602
Continuum of Care Program - HUD 1 14.267 Direct 505,496 Continuum of Care Program - HUD 4 14.267 Direct 17,016
522,512
Total U.S. Department of Housing and Urban Development 1,141,370
U.S. Department of the Interior
Sustain our Great Lakes 15.662 NFWF FCR366 66,124 Sustain our Great Lakes 15.662 National Audubon Society None issued 10,000
76,124
Total U.S. Department of the Interior 76,124
U.S. Department of Justice:
BJA Coronavirus 16.034 Direct 48,713
Drug Court Discretionary Grant Program 16.585 Direct 63,103
State Criminal Alien Assistance Program 16.606 Direct 26,452
Edward Byrne Memorial Justice Assistance Grant Program (2018) 16.738 Direct 30,380 Edward Byrne Memorial Justice Assistance Grant Program (2017) 16.738 Direct 35,941
66,321
Total U.S. Department of Justice 204,588
U.S. Department of Treasury:
Equitable Sharing Program - Asset Forfeiture 21.016 Direct 19,340
Coronavirus Relief Fund 21.019 MDHHS E20204048-001 41,238 Quarantine Box Coronavirus Aid Relief 21.019 MDHHS E20204500-00 448 Coronavirus Relief Fund Water and Plumbing 21.019 MDHHS E20204585-00 609 Eviction Diversion Program 21.019 MSHDA HML-2020-Ottawa C-5826-CRF 301,243 Coronavirus Relief Fund Migrant Worker 21.019 MDHHS E20204448-00 2,126 CRF LHD Contact Tracing 21.019 MDHHS E20204707-00 291,667 LHD COVID-19 Homeless Match 21.019 MDHHS E20204477-00 919 Coronavirus Relief Local Government Grants 21.019 Mi Dept of Treasury 70-0000-CRLGG 1,783,462 First Responder Hazard Pay Premiums Program - CARES Act 21.019 Mi Dept of Treasury SLT0040/SLT0247 206,000 Public Safety and Public Health Payroll Reimbursement Program - CARES Act 21.019 Mi Dept of Treasury SLT0040/SLT0247 3,344,410
5,972,121
Total U.S. Department of Treasury 5,991,461
U.S. Department of Transportation:
State and Community Highway Safety 20.600 MSP Highway Safety PT-21-08 23,940
Alcohol Traffic Safety and Drunk Driving Prevention 20.601 SCAO Highway Safety 17518 113,090
Drug Recognition Expert 20.616 MSP Highway Safety None issued 1,863 Total Highway Safety Cluster 138,892
Total U.S. Department of Transportation 138,892
U.S. Environmental Protection Agency:
Capitalization Grants for Drinking Water State Revolving Funds - A2 66.468 EGLE Drinking Water State Revolving Funds FS975487-18 4,977 Total Drinking Water State Revolving Funds Cluster 4,977
Beach Monitoring and Notification Program Implementation Grants 66.472 EGLE CU-00E99310 3,220
Total U.S. Environmental Protection Agency 8,197
U.S. Department of Energy:
Weatherization Assistance for Low-Income Persons 81.042 MDHHS E20203334-00/E20204188-00 226,965 Total U.S. Department of Energy 226,965
U.S. Election Assistance Commission:
2020 Help America Vote Act CARES Act Grant 90.404 Michigan Department of State None issued 92,163
Total U.S. Election Assistance Commission 92,163
COUNTY OF OTTAWA
SCHEDULE OF EXPENDITURES OF FEDERAL AWARDS
FOR THE FISCAL YEAR ENDED SEPTEMBER 30, 2020
179
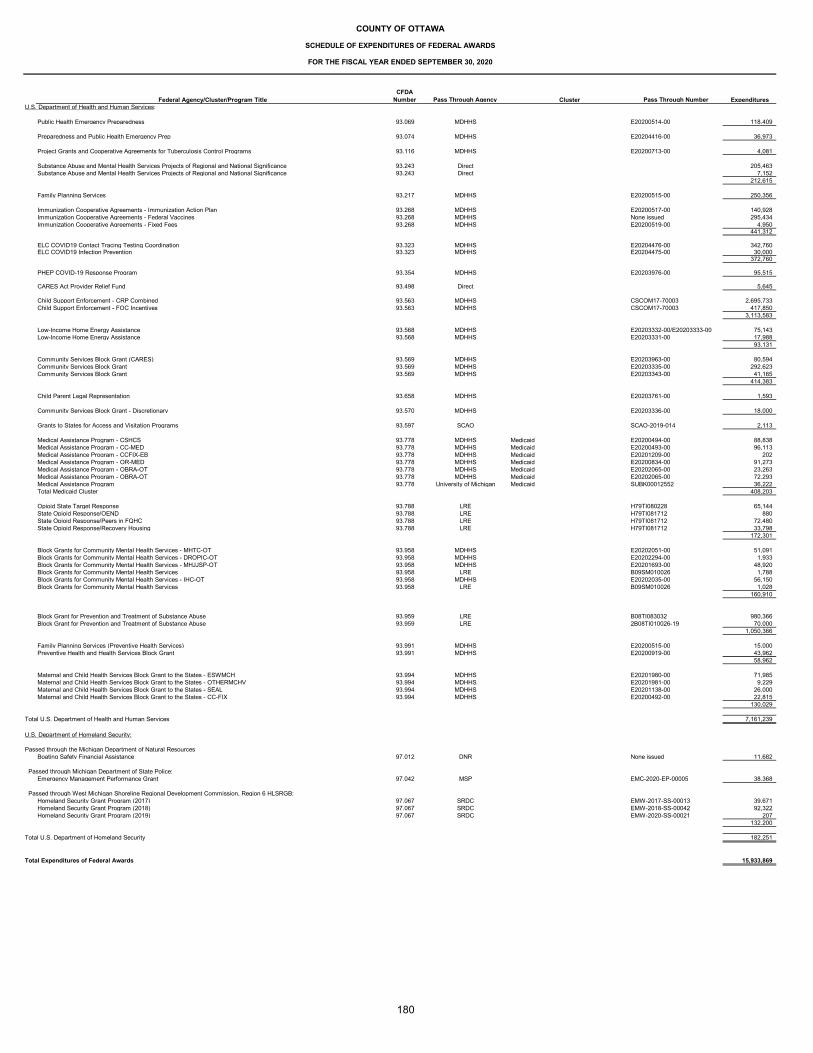
Federal Agency/Cluster/Program TitleCFDA
Number Pass Through Agency Cluster Pass Through Number Expenditures
COUNTY OF OTTAWA
SCHEDULE OF EXPENDITURES OF FEDERAL AWARDS
FOR THE FISCAL YEAR ENDED SEPTEMBER 30, 2020
U.S. Department of Health and Human Services:
Public Health Emergency Preparedness 93.069 MDHHS E20200514-00 118,409
Preparedness and Public Health Emergency Prep 93.074 MDHHS E20204416-00 36,973
Project Grants and Cooperative Agreements for Tuberculosis Control Programs 93.116 MDHHS E20200713-00 4,081
Substance Abuse and Mental Health Services Projects of Regional and National Significance 93.243 Direct 205,463 Substance Abuse and Mental Health Services Projects of Regional and National Significance 93.243 Direct 7,152
212,615
Family Planning Services 93.217 MDHHS E20200515-00 250,356
Immunization Cooperative Agreements - Immunization Action Plan 93.268 MDHHS E20200517-00 140,928 Immunization Cooperative Agreements - Federal Vaccines 93.268 MDHHS None issued 295,434 Immunization Cooperative Agreements - Fixed Fees 93.268 MDHHS E20200519-00 4,950
441,312
ELC COVID19 Contact Tracing Testing Coordination 93.323 MDHHS E20204476-00 342,760 ELC COVID19 Infection Prevention 93.323 MDHHS E20204475-00 30,000
372,760
PHEP COVID-19 Response Program 93.354 MDHHS E20203976-00 95,515
CARES Act Provider Relief Fund 93.498 Direct 5,645
Child Support Enforcement - CRP Combined 93.563 MDHHS CSCOM17-70003 2,695,733 Child Support Enforcement - FOC Incentives 93.563 MDHHS CSCOM17-70003 417,850
3,113,583
Low-Income Home Energy Assistance 93.568 MDHHS E20203332-00/E20203333-00 75,143 Low-Income Home Energy Assistance 93.568 MDHHS E20203331-00 17,988
93,131
Community Services Block Grant (CARES) 93.569 MDHHS E20203963-00 80,594 Community Services Block Grant 93.569 MDHHS E20203335-00 292,623 Community Services Block Grant 93.569 MDHHS E20203343-00 41,165
414,383
Child Parent Legal Representation 93.658 MDHHS E20203761-00 1,593
Community Services Block Grant - Discretionary 93.570 MDHHS E20203336-00 18,000
Grants to States for Access and Visitation Programs 93.597 SCAO SCAO-2019-014 2,113
Medical Assistance Program - CSHCS 93.778 MDHHS Medicaid E20200494-00 88,838 Medical Assistance Program - CC-MED 93.778 MDHHS Medicaid E20200493-00 96,113 Medical Assistance Program - CCFIX-EB 93.778 MDHHS Medicaid E20201209-00 202 Medical Assistance Program - OR-MED 93.778 MDHHS Medicaid E20200834-00 91,273 Medical Assistance Program - OBRA-OT 93.778 MDHHS Medicaid E20202065-00 23,263 Medical Assistance Program - OBRA-OT 93.778 MDHHS Medicaid E20202065-00 72,293 Medical Assistance Program 93.778 University of Michigan Medicaid SUBK00012552 36,222 Total Medicaid Cluster 408,203
Opioid State Target Response 93.788 LRE H79TI080228 65,144 State Opioid Response/OEND 93.788 LRE H79TI081712 880 State Opioid Response/Peers in FQHC 93.788 LRE H79TI081712 72,480 State Opioid Response/Recovery Housing 93.788 LRE H79TI081712 33,798
172,301
Block Grants for Community Mental Health Services - MHTC-OT 93.958 MDHHS E20202051-00 51,091 Block Grants for Community Mental Health Services - DROPIC-OT 93.958 MDHHS E20202294-00 1,933 Block Grants for Community Mental Health Services - MHJJSP-OT 93.958 MDHHS E20201693-00 48,920 Block Grants for Community Mental Health Services 93.958 LRE B09SM010026 1,788 Block Grants for Community Mental Health Services - IHC-OT 93.958 MDHHS E20202035-00 56,150 Block Grants for Community Mental Health Services 93.958 LRE B09SM010026 1,028
160,910
Block Grant for Prevention and Treatment of Substance Abuse 93.959 LRE B08TI083032 980,366 Block Grant for Prevention and Treatment of Substance Abuse 93.959 LRE 2B08TI010026-19 70,000
1,050,366
Family Planning Services (Preventive Health Services) 93.991 MDHHS E20200515-00 15,000 Preventive Health and Health Services Block Grant 93.991 MDHHS E20200919-00 43,962
58,962
Maternal and Child Health Services Block Grant to the States - ESWMCH 93.994 MDHHS E20201980-00 71,985 Maternal and Child Health Services Block Grant to the States - OTHERMCHV 93.994 MDHHS E20201981-00 9,229 Maternal and Child Health Services Block Grant to the States - SEAL 93.994 MDHHS E20201138-00 26,000 Maternal and Child Health Services Block Grant to the States - CC-FIX 93.994 MDHHS E20200492-00 22,815
130,029
Total U.S. Department of Health and Human Services 7,161,239
U.S. Department of Homeland Security:
Passed through the Michigan Department of Natural ResourcesBoating Safety Financial Assistance 97.012 DNR None issued 11,682
Passed through Michigan Department of State Police:Emergency Management Performance Grant 97.042 MSP EMC-2020-EP-00005 38,368
Passed through West Michigan Shoreline Regional Development Commission, Region 6 HLSRGB:Homeland Security Grant Program (2017) 97.067 SRDC EMW-2017-SS-00013 39,671 Homeland Security Grant Program (2018) 97.067 SRDC EMW-2018-SS-00042 92,322 Homeland Security Grant Program (2019) 97.067 SRDC EMW-2020-SS-00021 207
132,200
Total U.S. Department of Homeland Security 182,251
Total Expenditures of Federal Awards 15,933,869
180
COUNTY OF OTTAWA
NOTES TO SCHEDULE OF EXPENDITURES OF FEDERAL AWARDS
FOR THE PERIOD ENDED SEPTEMBER 30, 2020
(Continued)
1. BASIS OF PRESENTATION The accompanying schedule of expenditures of federal awards includes the federal grant activity of the County of Ottawa, Michigan and is presented in accordance with the requirements of Title 2 U.S. Code of Federal Regulations (CFR) Part 200, Uniform Administrative Requirements, Cost Principles, and Audit Requirements for Federal Awards (Uniform Guidance). Therefore, some amounts presented in this schedule may differ from amounts presented in the financial statements.
2. ACCOUNTING PERIOD The County’s fiscal year end is September 30.
3. INDIRECT COSTS The County did not elect to use the 10% de minimis cost rate as covered in Uniform Guidance section 2 CFR 200.141 indirect costs.
4. ABBREVIATIONS The abbreviations used on the schedule of expenditures of federal awards are as follows:
Pass Through Agency Name Pass Through Agency Abbreviation
Direct Funding from Federal Agency Direct Michigan Department of Environmental, Great Lakes, & Energy EGLE Michigan Economic Development Corporation MEDC Michigan State Housing Development Authority MSHDA Michigan Department of Education MDE Michigan Department of Health and Human Services MDHHS Lakeshore Regional Entity LRE Michigan Department of State Police MSP Michigan Department of Natural Resources DNR Shoreline Regional Development Commission SRDC National Fish and Wildlife Foundation NFWF State Court Administrative Office SCAO Michigan Supreme Court MSC
181
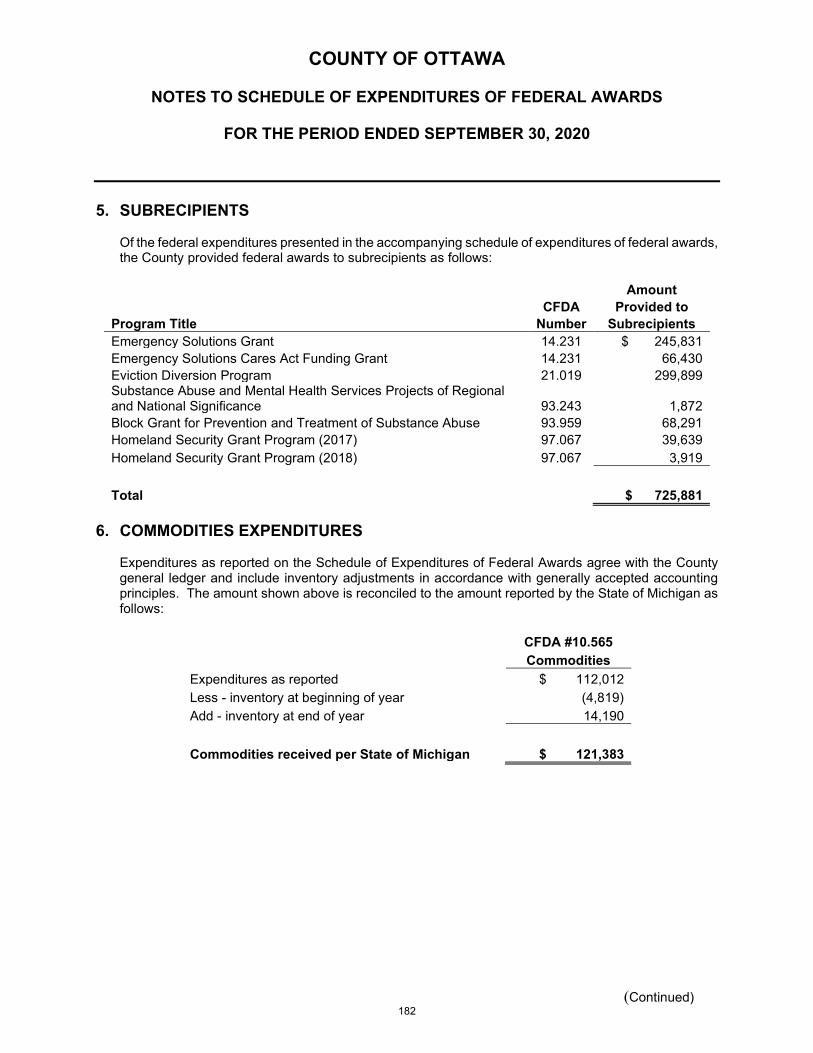
COUNTY OF OTTAWA
NOTES TO SCHEDULE OF EXPENDITURES OF FEDERAL AWARDS
FOR THE PERIOD ENDED SEPTEMBER 30, 2020
(Continued)
5. SUBRECIPIENTS Of the federal expenditures presented in the accompanying schedule of expenditures of federal awards, the County provided federal awards to subrecipients as follows:
Amount CFDA Provided to
Program Title Number Subrecipients Emergency Solutions Grant 14.231 $ 245,831 Emergency Solutions Cares Act Funding Grant 14.231 66,430 Eviction Diversion Program 21.019 299,899 Substance Abuse and Mental Health Services Projects of Regional and National Significance 93.243 1,872 Block Grant for Prevention and Treatment of Substance Abuse 93.959 68,291 Homeland Security Grant Program (2017) 97.067 39,639 Homeland Security Grant Program (2018) 97.067 3,919 Total $ 725,881
6. COMMODITIES EXPENDITURES
Expenditures as reported on the Schedule of Expenditures of Federal Awards agree with the County general ledger and include inventory adjustments in accordance with generally accepted accounting principles. The amount shown above is reconciled to the amount reported by the State of Michigan as follows:
CFDA #10.565 Commodities
Expenditures as reported $ 112,012 Less - inventory at beginning of year (4,819) Add - inventory at end of year 14,190 Commodities received per State of Michigan $ 121,383
182
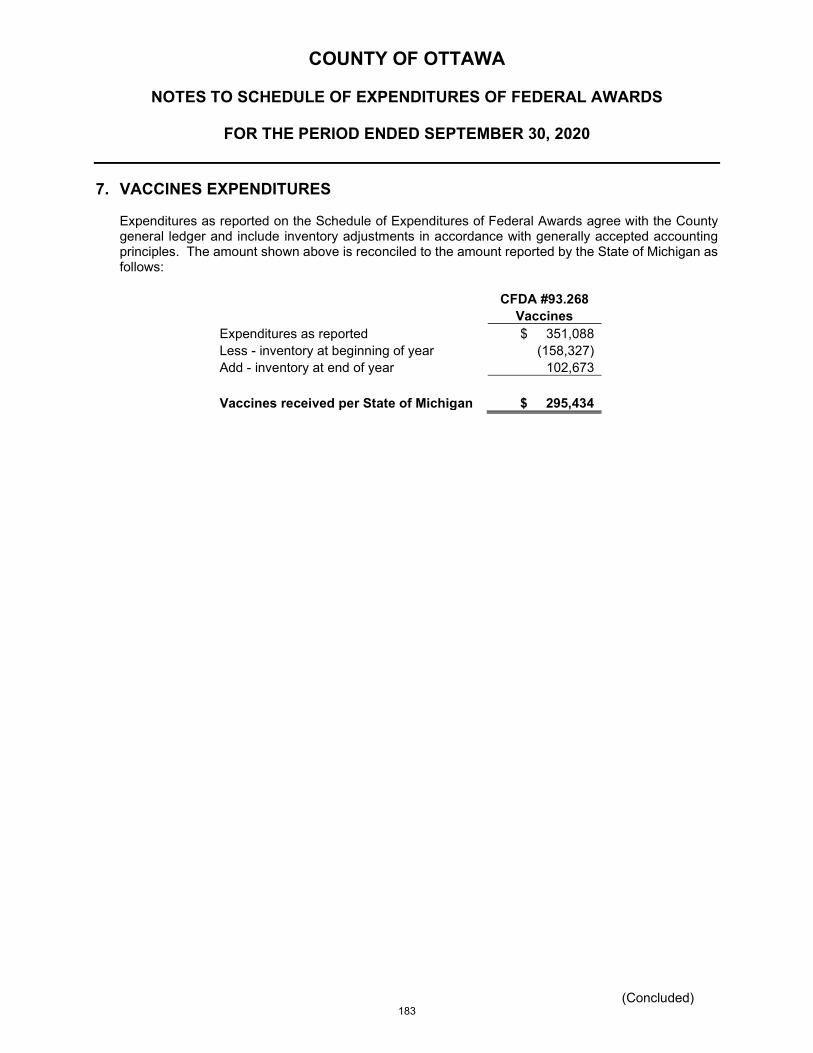
COUNTY OF OTTAWA
NOTES TO SCHEDULE OF EXPENDITURES OF FEDERAL AWARDS
FOR THE PERIOD ENDED SEPTEMBER 30, 2020
(Concluded)
7. VACCINES EXPENDITURES
Expenditures as reported on the Schedule of Expenditures of Federal Awards agree with the County general ledger and include inventory adjustments in accordance with generally accepted accounting principles. The amount shown above is reconciled to the amount reported by the State of Michigan as follows:
CFDA #93.268
Vaccines Expenditures as reported $ 351,088 Less - inventory at beginning of year (158,327) Add - inventory at end of year 102,673 Vaccines received per State of Michigan $ 295,434
183
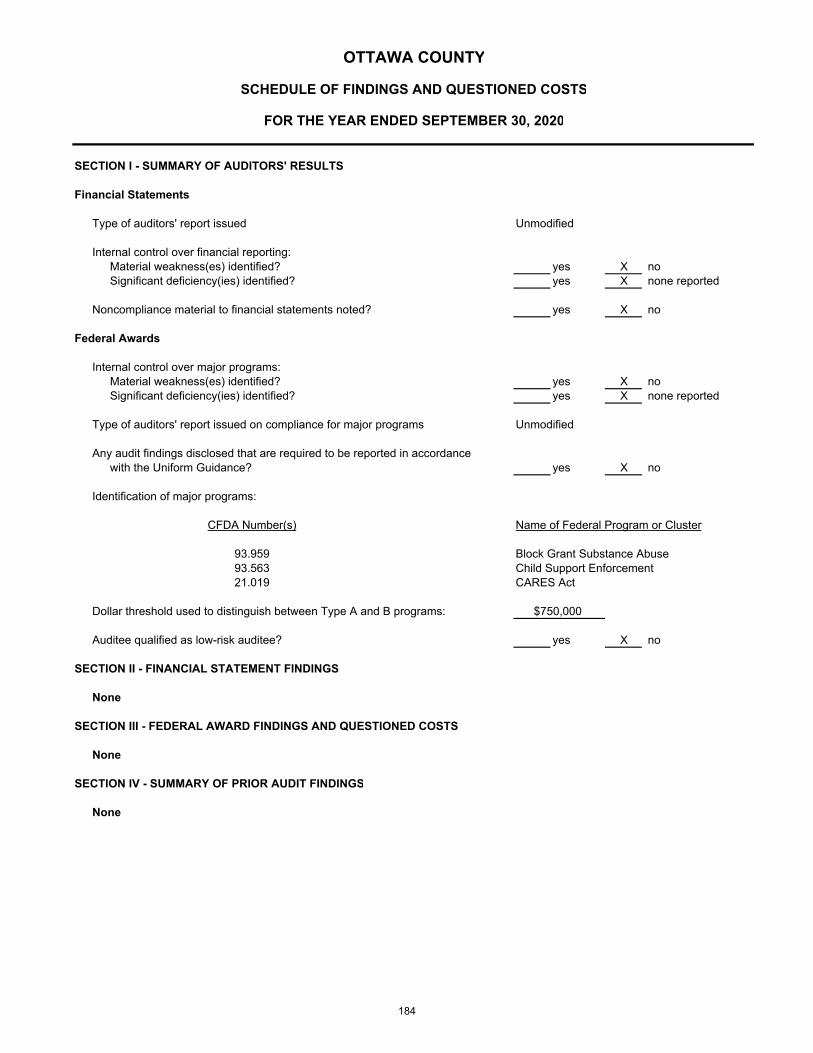
SECTION I - SUMMARY OF AUDITORS' RESULTS
Financial Statements
Type of auditors' report issued Unmodified
Internal control over financial reporting:Material weakness(es) identified? yes X noSignificant deficiency(ies) identified? yes X none reported
Noncompliance material to financial statements noted? yes X no
Federal Awards
Internal control over major programs:Material weakness(es) identified? yes X noSignificant deficiency(ies) identified? yes X none reported
Type of auditors' report issued on compliance for major programs Unmodified
Any audit findings disclosed that are required to be reported in accordancewith the Uniform Guidance? yes X no
Identification of major programs:
CFDA Number(s)
93.959 Block Grant Substance Abuse93.563 Child Support Enforcement21.019 CARES Act
Dollar threshold used to distinguish between Type A and B programs:
Auditee qualified as low-risk auditee? yes X no
SECTION II - FINANCIAL STATEMENT FINDINGS
None
SECTION III - FEDERAL AWARD FINDINGS AND QUESTIONED COSTS
None
SECTION IV - SUMMARY OF PRIOR AUDIT FINDINGS
None
OTTAWA COUNTY
SCHEDULE OF FINDINGS AND QUESTIONED COSTS
FOR THE YEAR ENDED SEPTEMBER 30, 2020
Name of Federal Program or Cluster
$750,000
184