County of Monterey Workshop - State of the Salinas River ...
42
Workshop - State of the Salinas River Groundwater Basin Report County of Monterey 26 May 2015
Transcript of County of Monterey Workshop - State of the Salinas River ...

Workshop - State of the Salinas River Groundwater Basin Report
County of Monterey
26 May 2015

Project Goals
Provide a snapshot of the current conditions within Zone 2C. The Report also addresses the ramifications of prolonged drought by considering potential changes in:
• groundwater storage,• groundwater head elevations, and• seawater intrusion
The Report provided technical options that could help alleviate the consequences of continued drought conditions

Project Background
The study was conducted in response to the Monterey County Board of Supervisors Referral No. 2014.01.
The work was carried out with oversight provided by the Monterey County Water Resources Agency (MCWRA).

Report Organization• Introduction – Project
Background• Study Area Background• Basin Hydrogeology• Groundwater Balance• Groundwater Quality• State of the Basin
• Report Message• The Five-year Study• Hydrogeology• Water Balance• Seawater Intrusion• State of the Basin• Technical Options• Next Steps
Workshop Topics

Report Significance(Current Conditions)
• Loss of about 550,000 af of storage since 1944, mostly in the Pressure and East Side Subareas
• The Basin is currently out of balance – usage exceeds yield by approximately 17,000 to 24,000 afy.
• However, the estimated volume of groundwater in reserve (i.e. storage) in Zone 2C is about 16.4 million acre-feet.
• Seawater intrusion has reached about 8 miles into the Pressure Subarea– No change has been observed in the location of the
500 mg/L chloride contour since 2011

Report Significance(Future Conditions)
• Storage may decline by about 50,000 to 85,000 afy in Zone 2C under continued drought conditions, or about 165,000 to 215,000 afy if reservoir releases are heavily curtailed
• Seawater intrusion can be expected to increase and accelerate in future years in response to current and continued drought conditions

Report Significance(Technical Options)
• Shift pumping out of the Pressure and East Side Subareas into the Forebay and Upper Valley Subareas
• Shift pumping from the Pressure 180-Foot and 400-Foot Aquifers into the Pressure Deep Aquifer
• These options would require additional, in-depth technical investigations and stakeholder buy-in

How the Report Contributes to the 5-Year Study and Modeling Efforts
• Establishes a baseline characterization of the hydrogeologic conditions in the SRGB
• This Report contributes to the model configuration and calibration to be conducted as part of the 5-Year Study

Basin Hydrogeology

Study Area:Zone 2C
Subareas:Pressure; East Side; Forebay; and Upper
Valley
MNB6

Geologic Model2.5 million years ago to recent
Depositional Environment

Hydrostratigraphic SectionPresent Day
Pressure Subarea

Geologic Sections - Conceptual Model
13
2015 Salinas River GW Basin Study
2004 Hydrostratigraphic Study (Kennedy/Jenks for MCWRA)
2014 SVIGSM Update(LSCE for Geoscience)
A A’2015 Cross-Sections(Brown and Caldwell)

2015 Geodatabase
Brown and Caldwell 14
Basin Model Cross-sections (Brown and Caldwell)
A-A’
M-M’
N-N’
O-O’
P-P’
Q-Q’ R-R’
S-S’
Pacific Ocean

Cross-section A-A’
Brown and Caldwell 15
2015 State of the Basin Report (Brown and Caldwell)

180-Foot and 400-Foot AquifersInterpretation of Water Well Data
Gabilan Range Santa Lucia Range
Pressure Subarea

180-Foot and 400-Foot AquifersInterpretation of Water Well Data
Gabilan Range Santa Lucia Range
Pressure Subarea
P-180 Bottom
P-180 Groundwater Head Surface
P-400 Top
P-400 Bottom
20
0’
15
0’
East SidePumping Trough

180-Foot and 400-Foot AquifersInterpretation of Water Well Data
Pressure Subarea
Gabilan Range Santa Lucia Range

Groundwater Flow Direction(Fall 2013)
Basin-wide
MNB7

Groundwater Flow Direction
(Fall 2013)
Pressure & East Side Subareas

Water Balance

Current Conditions
• The Basin is currently out of balance – usage exceeds yield by approximately 17,000 to 24,000 afy.
• However, the estimated volume of groundwater in reserve (i.e. storage) in Zone 2C is about 16.4 million acre-feet.
• Significant groundwater reserve – as compared to the current estimated storage loss of 17,000 to 24,000 afy –could be used to offset temporary overdraft conditions in the future.
• Consequences of extended use of this reserve include water level and water quality declines; along with continued seawater advancements – will be the primary topics of investigation and numerical modeling.


Groundwater Storage
Subarea
Storage Coefficient
(ft3/ft3)1
Land Area
(acres)2
Storage Capacity
(acre-feet)1
Groundwater in Storage
(acre-feet)1
Available Storage
(acre-feet)
Pressure 0.036 126,000 7,240,000 6,860,000 380,000
East Side 0.08 75,000 3,690,000 2,560,000 1,130,000
Forebay 0.12 87,000 5,720,000 4,530,000 1,190,000
Upper Valley 0.10 92,000 3,100,000 2,460,000 640,000
Total 380,000 19,750,000 16,410,000 3,340,000
Note 1: From DWR (2003).Note 2: From the Salinas Valley Integrated Ground and Surface Water Model (SVIGSM).
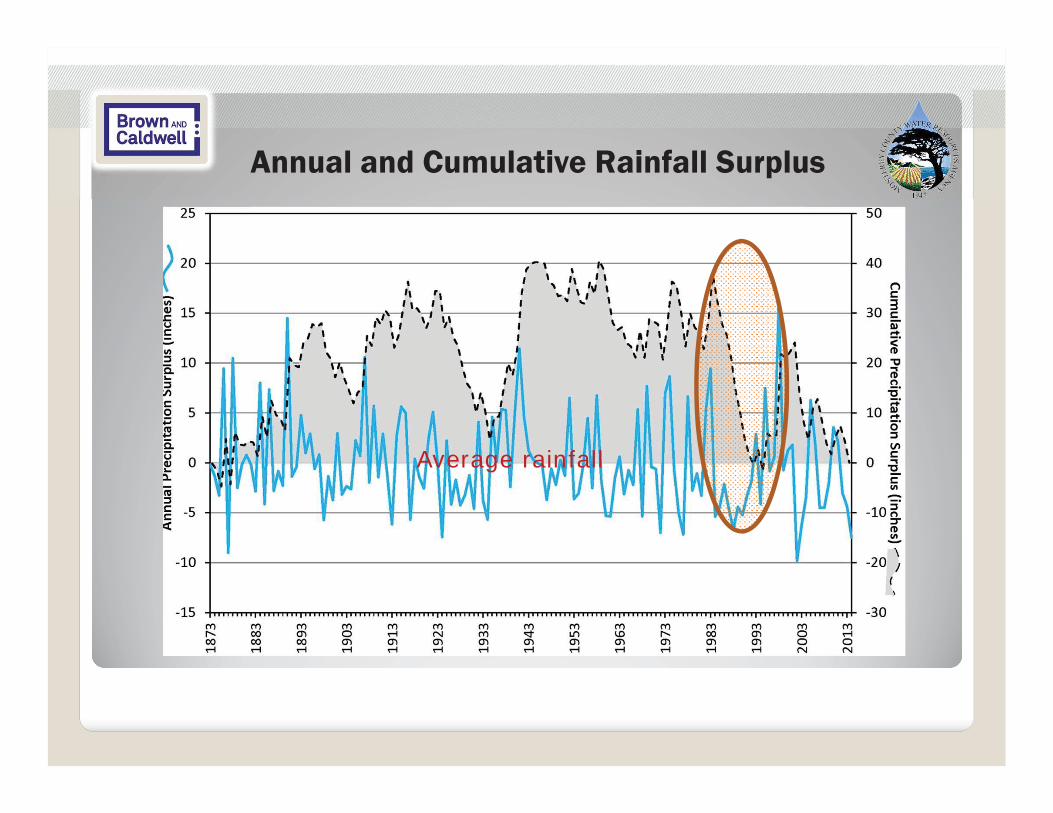
Annual and Cumulative Rainfall Surplus
Average rainfall

Cumulative Storage by Subarea

Storage Change by Subarea, 1944 to 2013
SubareaAnnualAverage
(afy)
2013Cumulative
(af)
Predicted Change If DroughtContinues (afy)
Normal Reservoir Operations
Curtailed Reservoir Operations
Pressure -1,6001 -110,000 -10,000 to -20,000 -10,000 to -20,000
East Side -4,500 -333,000 -25,000 to -35,000 -25,000 to -35,000
Forebay -2,000 -105,000 -10,000 to -15,000 -80,000 to -90,000
Upper Valley -200 -12,000 -5,000 to -15,000 -50,000 to -70,000
Zone 2C -8,000 -559,000 -50,000 to -85,000 -165,000 to -215,0001Plus -11,000 to -18,000 afy due to seawater intrusion
MNB8

Expected Range of Groundwater Head Elevation Changes
Based on statistical correlations and comparison with the extended drought from WY 1984 to WY 1991, representative head changes at the Subarea scale are expected to range from:
• -5.3 to -1.1 feet per year in the Pressure Subarea(for all three aquifers),
• -9.6 to -3.0 feet per year in the East Side Subarea,• -5.6 to -1.8 feet per year in the Forebay Subarea, and• -2.0 to +0.2 feet per year in the Upper Valley Subarea.

No Seawater Intrusion (Coastward groundwater head gradient)
Conceptualized seawater intrusion due to storage depletion (Landward groundwater head gradient)
Aquifer intruded by seawater(Annually occupying ~11,000 to 18,000 af of aquifer storage)
1944
2013
Decline in piezometric surface represents loss of 1,600 afy of storage (110,000 af cumulative)
From http://pubs.usgs.gov/fs/2002/fs030-02/

State of the Basin - Seawater Intrusion

Current Conditions
• The extent of seawater intrusion into the Pressure 180-Foot and Pressure 400-Foot Aquifers in 2013 was not different from the extents mapped in 2011.
The first two years of current drought did not have an apparent effect on the seawater intrusion front.
• Seawater intrusion accounts for between 11,000 and 18,000 afy of the 17,000 to 24,000 afy annual exceedance of groundwater usage.
• A possible latent response to the current drought means that seawater intrusion will likely advance in the next few years –similar to the delayed response to the extended drought that began in WY1984.

2013 Seawater Intrusion Fronts
Pressure 180-Foot Aquifer Pressure 400-Foot Aquifer

180-Foot and 400-Foot Aquifers2013 Seawater Intrusion Fronts
Gabilan RangeSanta Lucia Range
P-180 SeawaterIntrusion Acreage
Pressure Subarea
P-400 SeawaterIntrusion Acreage
East SidePumping Trough

0
50
100
150
200
250
300
350
400
450
500
-140
-120
-100
-80
-60
-40
-20
0
20
40
Oct-43 Oct-53 Oct-63 Oct-73 Oct-83 Oct-93 Oct-03 Oct-13
Cl C
oncen
tration (m
g/
L)G
rou
nd
wat
er H
ead
Ele
vati
on (
ft m
sl)
AcceleratedSeawaterIntrusion
Historical Groundwater Elevations and Chloride Changes
Dry years
MNB9

0
50
100
150
200
250
300
350
400
450
500
-50
-40
-30
-20
-10
0
10
20
Oct-43 Oct-53 Oct-63 Oct-73 Oct-83 Oct-93 Oct-03 Oct-13
Cl C
oncen
tration (m
g/
L)G
rou
nd
wat
er H
ead
Ele
vati
on (
ft m
sl)
AcceleratedSeawaterIntrusion
Historical Groundwater Elevations and Chloride Changes
Dry years

Options to Address Water Supply under Continued Drought Conditions

Technical Options
1. Reduction of pumping in the Pressure and East Side Subareas could mitigate the anticipated effects of extended drought on groundwater storage and water quality in the study area.
2. Shifting of pumping to areas farther away from the coast and south of the pumping trough in the East Side Subarea.
3. While not currently consistent with County Policy, shifting of pumping to areas hydraulically connected to the Salinas River could help address seawater intrusion.
4. Shifting of some pumping from the Pressure 180-Foot and Pressure 400-Foot Aquifers to the Pressure Deep Aquifer would reduce the storage deficit in the shallower aquifers.

The Pressure Deep Aquifer
The installation of deeper wells may not be feasible in some areas because of lower groundwater yield and water quality (older water) in the Pressure Deep Aquifer.
It is uncertain if the Pressure Deep Aquifer is hydraulically connected to the ocean in Monterey Bay, so it is not known whether this pumping shift would lead to the onset of seawater intrusion.
Also uncertain is the likelihood of localized interaquifer seawater mixing between the Pressure 400-Foot Aquifer and the Pressure Deep Aquifer.
Hence, this mitigation option requires more investigation to determine its feasibility.

Important Next Step: Technical Evaluation
The numerical groundwater modeling analysis (Project 2) will support various management decisions on the water supply and water quality in the study area.
The primary questions to be answered using the model are:
1. What will be the rate of groundwater head changes?
2. What will be the rate of movement of the seawater intrusion front?
We can then determine the economic effects of 1) and 2) due to water supply wells becoming inoperable and the further loss of aquifer storage due to the advancement of seawater intrusion.

Evaluation of Solutions forSustainable Groundwater Management
The numerical model should be used to predict groundwater head changes under different management scenarios, including:
1. Implementing prescribed pumping rates and optimizing the distribution of pumping;
2. Establishing “trigger (groundwater) head levels” that can be used as measures of safe yield and an early alert system as part of the Basin Management Objectives;
3. Conducting uncertainty analysis for model areas that are considered priority, determining data gaps, and enhancing monitoring; and
4. Conducting model parameter sensitivity analysis for the entire model area to improve the accuracy of model calculations in support of engineering decisions.

State of the Salinas River Groundwater BasinSUMMARY
1. Although groundwater heads are generally lower, heads near the coast saw little change (2011 – 2013)…
… as is evident in that the first two years of current drought did not have an apparent effect on the seawater intrusion front (2011 – 2013);
2. Although the estimated volume of groundwater in reserve (i.e. storage) is about 16.4 million acre-feet…
… the Basin is out of balance by approximately 17,000 –24,000 acre-feet per year (based on long term groundwater head trends 1944 - 2013);

State of the Salinas River Groundwater BasinSUMMARY (continued)
3. A preliminary review of groundwater head and water quality data for 2014 indicate lower groundwater heads near the coast and advancement of the seawater intrusion front.
4. If the drought continues…….
A. Groundwater heads will continue to decline…B. The seawater intrusion front will continue to move inland…C. Storage depletion will accelerate.