
COUNTY OF BROOME, NEW YORK COMPREHENSIVE ANNUAL …
232
COMPREHENSIVE ANNUAL FINANCIAL REPORT FOR THE YEAR ENDED DECEMBER 31, 2020 COUNTY OF BROOME, NEW YORK
Transcript of COUNTY OF BROOME, NEW YORK COMPREHENSIVE ANNUAL …
COMPREHENSIVEANNUAL
FINANCIALREPORT
FOR THE YEAR ENDED DECEMBER 31, 2020
COUNTY OF BROOME, NEW YORK
County of Broome, New York
Comprehensive Annual Financial Report
For the Year Ended December 31, 2020
Jerome Z. Knebel Director
Office of Management and Budget (OMB)
Gino M. Bucciarelli, Deputy Director of OMB
Krista L. Soltis, Treasury Manager
Tracy L. Ryan, Senior Financial Analyst
County of Broome
Comprehensive Annual Financial Report
For the Year Ended December 31, 2020
(Continued)
Table of Contents
I. Introductory Section Page
Letter of Transmittal ................................................................................................................ 3-13
County of Broome Government Organizational Chart ............................................................... 14
County of Broome Officials ....................................................................................................... 15
County of Broome Chairs of Legislative Committees................................................................ 16
County of Broome Department Heads ....................................................................................... 17
County of Broome Office of Management and Budget (OMB) ................................................. 18
II. Financial Section
Independent Auditors’ Report ............................................................................................... 23-25
Management’s Discussion and Analysis (Unaudited) .......................................................... 27-46
Basic Financial Statements:
Statement of Net Position ................................................................................................. 49
Statement of Activities ................................................................................................. 50-51
Balance Sheet – Governmental Funds .............................................................................. 52
Reconciliation of the Governmental Funds Balance Sheet to the Statement of
Net Position of Governmental Activities ....................................................................... 53
Statement of Revenues, Expenditures, and Changes in Fund Balances (Deficits) –
Governmental Funds ...................................................................................................... 54
Reconciliation of the Statement of Revenues, Expenditures, and Changes in Fund
Balances (Deficits) of Governmental Funds to the Statement of Activities .................. 55
Statement of Revenues, Expenditures, and Changes in the Fund Balances – Budget
and Actual – General Fund ............................................................................................ 57
Statement of Net Position – Proprietary Funds ................................................................. 58
Statement of Revenues, Expenses, and Changes in Net Position – Proprietary
Funds ............................................................................................................................. 59
Statement of Cash Flows – Proprietary Funds ............................................................. 60-61
Statement of Fiduciary Net Position ................................................................................. 62
Statement of Changes in Fiduciary Net Position .............................................................. 63
Combining Statement of Net Position – Discretely Presented Component Units ............ 64
Combining Statement of Activities – Discretely Presented Component Units ................. 65

(Continued)
Notes to the Basic Financial Statements .................................................................... 67-138
1. Summary of Significant Accounting Policies ....................................................... 67-92
2. Cash, Cash Equivalents, and Investments ............................................................. 93-96
3. Allowance for Uncollectible Amounts ....................................................................... 96
4. Restricted Assets ........................................................................................................ 97
5. Sales Tax .................................................................................................................... 98
6. Capital Assets ...................................................................................................... 99-102
7. Short-Term Liabilities .............................................................................................. 103
8. Long-Term Liabilities ....................................................................................... 103-113
9. Fund Balance ..................................................................................................... 114-115
10. Employee Retirement Systems and Pensions Plans .......................................... 116-120 11. Other Postemployment Benefits ........................................................................ 120-123
12. Self-Insurance .................................................................................................... 123-126
13. Lease Obligations .............................................................................................. 127-128
14. Interfund Activity .............................................................................................. 129-130
15. Tax Abatements ................................................................................................. 130-132
16. Commitments and Contingencies ...................................................................... 133-134
17. Solid Waste Management .................................................................................. 135-136
18. Deficit Fund Balances / Net Position ................................................................ 136-137
19. Other Restricted Net Position ................................................................................... 137
20. Subsequent Events .................................................................................................... 138
21. Related Party Transactions ....................................................................................... 138 22. Accounting Pronouncements Issues Not Yet Implemented ..................................... 138
Required Supplementary Information:
Schedule of Proportionate Share of Net Position Liability ............................................. 141
Schedule of Contributions............................................................................................... 142
Schedule of Changes in the County’s Total OPEB Liability and Related Ratios .... 143-144
Note to the Required Supplementary Information .......................................................... 145
Supplementary Information:
Combining Individual Fund Financial Statements and Schedules:
Combining Balance Sheet – Nonmajor Governmental Funds ........................................ 155
Combining Statement of Revenues, Expenditures, and Changes Fund Balances
(Deficit) – Nonmajor Governmental Funds ................................................................. 156
Schedule of Revenues, Expenditures, and Changes in Fund Balances – Total
Budgetary Authority and Actual – County Road Fund ............................................... 157
Schedule of Revenues, Expenditures, and Changes in Fund Balances – Total
Budgetary Authority and Actual – County Road Machinery Fund ............................. 158
Schedule of Revenues, Expenditures, and Changes in Fund Balances – Total
Budgetary Authority and Actual – Library Fund......................................................... 159
(Continued)
Schedule of Revenues, Expenditures, and Changes in Fund Balance (Deficit) –
Total Budgetary Authority and Actual – Arena Fund ................................................. 160
Schedule of Revenues, Expenditures, and Changes in Fund Balances (Deficit) –
Total Budgetary Authority and Actual – En Joie Golf Course Fund ........................... 161
Combining Statement of Net Position – Nonmajor Business-type Activities ................ 167
Combining Statement of Revenues, Expenses, and Changes in Net
Position – Nonmajor Business-type Activities ............................................................ 168
Combining Statement of Cash Flows – Nonmajor Business-type Activities ................. 169
Combining Statement of Net Position – Internal Service Funds .................................... 175
Combining Statement of Revenues, Expenses, and Changes in Net
Position – Internal Service Funds ................................................................................ 176
Combining Statement of Cash Flows – Internal Service Funds ..................................... 177
Other Information:
Comparative Schedule of Actual Expenditures vs Total Budgetary Authority
– General Fund .................................................................................................... 185-189
III. Statistical and Economic Data Section (Unaudited)
Tables:
1. Net Position by Components – Last Ten Fiscal Years ................................................ 193
2. Change in Net Position – Last Ten Fiscal Years .................................................. 194-195
3. Program Revenues by Function – Last Ten Fiscal Years ............................................ 196
4. Governmental Fund Balances – Last Ten Fiscal Years ............................................... 197
5. Changes in Fund Balance, Governmental Funds – Last Ten Fiscal Years .................. 198
6. Assessed Value and Actual Value of Taxable Property – Last Ten Fiscal Years ....... 199
7. Property Tax Rates – Direct and All Overlapping Governments
– Last Ten Fiscal Years ..................................................................................... 200-201
8. Principal Taxpayers – Last Ten Fiscal Years ....................................................... 202-205
9. Property Tax Levies and Collections – Last Ten Fiscal Years .................................... 206
10. Taxable Sales by Category – Last Ten Fiscal Years ................................................... 207
11. Ratio of Outstanding Debt by Type – Last Ten Fiscal Years ...................................... 208
12. Ratio of Net General Bonded Debt Outstanding – Last Ten Fiscal Years .................. 209
(Concluded)
13. Direct and Overlapping Governmental Activities Debt ....................................... 210-211
14. Legal Debt Margin – Last Ten Fiscal Years ................................................................ 212
15. Demographic Statistics – Last Ten Fiscal Years ......................................................... 213
16. Principal Employers – Last Ten Fiscal Years ....................................................... 214-217
17. Construction and Bank Deposits – Last Ten Fiscal Years ........................................... 218
18. Total Population by Age .............................................................................................. 219
19. Employees by Function – Last Ten Fiscal Years ................................................. 220-221
20. Operating Indicators by Function – Last Ten Fiscal Years .................................. 222-223
21. Capital Indicators by Function – Last Ten Fiscal Years ....................................... 224-225
Introductory Section
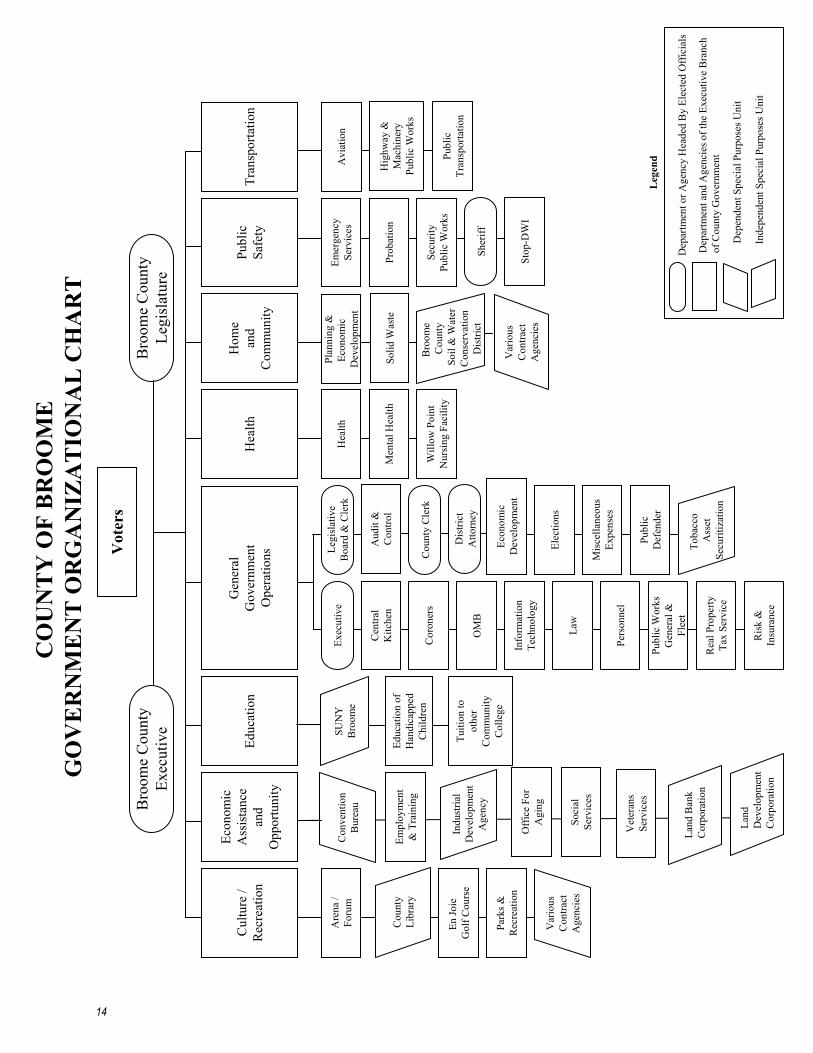
The following section contains the Letter of Transmittal, the County of Broome Government Organizational
Chart, County of Broome Officials, County of Broome Chairs of Legislative Committees, County of
Broome Department Heads, and the County of Broome Office of Management and Budget.
1

This page left blank intentionally.
2

July 7, 2021
Honorable Jason T Garnar, County Executive
Honorable Daniel J. Reynolds, Chairman of the Legislature
Honorable County Legislators
County of Broome
Binghamton, NY 13902
Ladies and Gentlemen:
I submit to you the Comprehensive Annual Financial Report of the County of Broome, New York (the
"County"), for the year ended December 31, 2020 in accordance with the requirements of Article V, §C502
(c) of the Broome County Charter.
This report presents comprehensive financial information summarizing the County's activities during the
year ended December 31, 2020 and contains information useful for managers in the Executive and
Legislative Branches of County government, taxpayers, interested citizens, and the financial markets in
which the County issues its debt obligations. The financial statements included in this report have been
prepared in conformity with generally accepted accounting principles (“U.S. GAAP”) as applicable to
governments in the United States of America.
This report presents the financial position and results of operations of the County and its component units
that are properly included in conformity with U.S. GAAP. The data presented can be compared to the prior
basic financial statements, and to other counties' reports to identify relevant trends.
Responsibility for material accuracy, completeness, and fairness of the information presented, including all
disclosures, rests with management of the County and its component units. The presentation fairly discloses
the financial position and results of operation of the County and its component units as measured by the
financial activity of the various funds. Disclosures considered necessary to enable readers to fully
understand the County's financial activities have been included.
To provide a reasonable basis for making its’ representation, the County has established and maintains a
comprehensive internal control framework that is designed to both protect the County’s assets from loss,
theft or misuse and to ensure that sufficient accounting data is compiled to allow for the preparation of the
County’s financial statements in accordance with U.S. GAAP. The comprehensive internal control
framework is to provide reasonable, but not absolute, assurance that these objectives are met. Reasonable
assurance recognizes both that the cost of internal controls should not outweigh their benefits and the
evaluation of costs and benefits require estimates and judgments by management.
The Office of the Comptroller is responsible for auditing expenditures. Additionally, audits of selected
departments and financial activity are performed by the Comptroller's staff.
Internal controls are reviewed by the internal audit staff throughout the year.
3

Independent Audit
The County has an annual independent audit of its basic financial statements. The certified public
accounting firm of Drescher & Malecki, LLP has audited the accompanying basic financial statements and
their independent auditor’s report is included in the financial section.
The goal of the independent audit was to provide reasonable assurance that the financial statements of the
County as of and for the year ended December 31, 2020 are free from material misstatement. The
independent audit involved examining on a test basis, evidence supporting the amounts and disclosures in
the financial statements, assessing the accounting principles used and significant estimates made by
management, and evaluating the overall financial statement presentation. The auditors concluded based
upon the audit, that there was a reasonable basis for rendering an unmodified opinion that the County’s
financial statements for the year ended December 31, 2020 are fairly presented in conformity with U.S.
GAAP. The independent auditor’s report is presented first in the financial section of this report.
Additionally, the audit was designed to meet the requirements of the Single Audit Act Amendments of 1996
and Title 2 U.S. Code of Federal Regulations (CFR) Part 200, Uniform Administrative Requirements, Cost
Principals, and Audit Requirements for Federal Awards (Uniform Guidance). The Act requires the
independent auditors not only report on the fair presentation of the financial statements, but also on the
County’s compliance with requirements that could have a direct and material effect on each of its major
federal programs and internal control over program compliance. The Single Audit Report is not included
in this report but may be obtained upon request to the County Comptroller’s Office.
U.S. GAAP requires that management provide a narrative introduction, overview, and analysis to
accompany the basic financial statements in the form of Management's Discussion and Analysis (MD&A).
This letter of transmittal is designed to complement the MD&A and should be read in conjunction with it.
The County's MD&A can be found immediately following the report of the independent auditors.
Report Structure
The 2020 Comprehensive Annual Financial Report is comprised of the following three basic sections in
conformance with recommendations of the Government Finance Officers Association:
A. The Introductory Section is intended to familiarize the reader with the organizational structure of
the County, the nature and scope of the services that it provides, and the specifics of its legal
operating environment.
B. The Financial Section includes the independent auditor’s report, the MD&A, the audited basic
financial statements, notes disclosures, and supporting statements and schedules to provide the
reader with a comprehensive understanding of the County’s financial activities for the past fiscal
year.
C. The Statistical and Economic Data Section presents comprehensive demographic and economic
information regarding the financial condition of the County.
4
Profile of the County
Government Structure
The County is a municipal corporation established in New York State. The County was incorporated in
1806, and is governed by the Charter of the County of Broome, New York State County Law, and other
general laws of the State of New York. The fifteen-member County Legislature is the legislative body
responsible for the overall operation of the County, enacting County law and approving the County budget.
It consists of elected officials from each of the fifteen legislative districts in the County serving two year
terms. The County Executive, elected to a four-year term, serves as Chief Executive Officer and is
responsible for County operations and developing the County budget. The Director of the Office of
Management and Budget, appointed by the County Executive and confirmed by the County Legislature,
serves as the Chief Fiscal Officer of the County.
The County provides a variety of services to its residents. Public health is promoted through the programs
provided by the County’s Health and Mental Health departments. These include the health clinics, food
subsidies provided to women and children through the Women, Infants, and Children Program (WIC) as
well as the inspections of public water supplies. Sheriff’s Office, District Attorney’s Office, and Office of
Emergency Services provide for the public safety through patrols, arrests and prosecution of criminals as
well as emergency planning. Public welfare is enhanced through the programs of Social Services and the
Office for Aging including temporary assistance to needy families, social services administration, home
emergency assistance, and Meals on Wheels. The Department of Public Works builds, repairs, and
maintains the County’s roads and public facilities.
The County, with a land area of approximately 710 square miles, is situated in the central southern portion
of upstate New York commonly referred to as the Southern Tier. The City of Binghamton is the County
seat and is situated in the southern portion of the County. The City of Syracuse is 75 miles to the north and
the Pennsylvania border is seven miles to the south. Binghamton is part of a metropolitan area running
along the Susquehanna River Valley including the incorporated villages of Johnson City and Endicott, and
the unincorporated area of Vestal. According to the U. S. Census Bureau in 2019, the County’s population
was estimated to be 190,488. Broome County is classified as an urban county.
Reporting Entity
The financial reporting entity for the County includes all organizations, functions and activities for which
elected and appointed officials have financial accountability, or without the inclusion of, would render the
County's financial statements incomplete or misleading. Oversight responsibility is based on financial
interdependency, selection of governing authority, designation of management, ability to significantly
influence operations, and accountability for fiscal matters.
The reporting entity has been defined to include all chartered departments of the County by which the
following basic services are supplied: law enforcement, economic assistance, health and mental health
services, maintenance of County roads, economic development, general administration, recreation, culture,
transportation, solid waste disposal, and long-term care.
Also, included in the reporting entity are SUNY Broome (College), the Broome County Industrial
Development Agency (IDA), the Broome County Soil & Water Conservation District (District), the Broome
Tobacco Asset Securitization Corporation (BTASC), the Broome County Land Bank Corporation (LBC),
and the Broome County Local Development Corporation (LDC). Information on all six of these legally
separate entities can be found in Note 1, Section A, to the financial statements.
5
Budget Process and Controls
The County budget is the foundation for the County’s financial planning and control. County departments
and the Director of the Office of Management and Budget develop the County Executive’s proposal to be
sent to the County Legislature. On or before September 15th, the County Executive submits the proposed
operating budget and a six-year Capital Improvement Program to the Legislature for approval. Public
hearings are conducted by the Legislature and County Executive to obtain public comment on the proposed
budget. The County Executive has the power to veto any modification made by the Legislature. An
Executive veto can be overridden by a two-thirds vote of the Legislature. On or before November 25th, the
annual budget is completed by adoption of an appropriation resolution; the legal authority for enactment of
the budget.
After the budget is adopted, appropriations and estimated revenues are posted into an automated accounting
system. An electronic review for available appropriations is performed prior to expenditures being
incurred.
The legal level of budgetary control is at the character level within department level. A character is a
grouping of similar appropriation/expenditure accounts. The County Charter prohibits expenditures for
which there is no legal appropriation.
Monthly information detailing expenditures, revenues, and encumbrance activity is produced. A
comparison of budget to actual information is included. Budget transfers from one appropriation account
to another are made when needed. The transfer must be approved by formal Legislative resolution if the
total of an administrative unit's budget is changed or salary appropriations are impacted, otherwise, the
transfer is approved by the Director of the Office of Management and Budget.
Additional information on the County budget controls can be found in Note 1, Section F of the financial
statements.
6
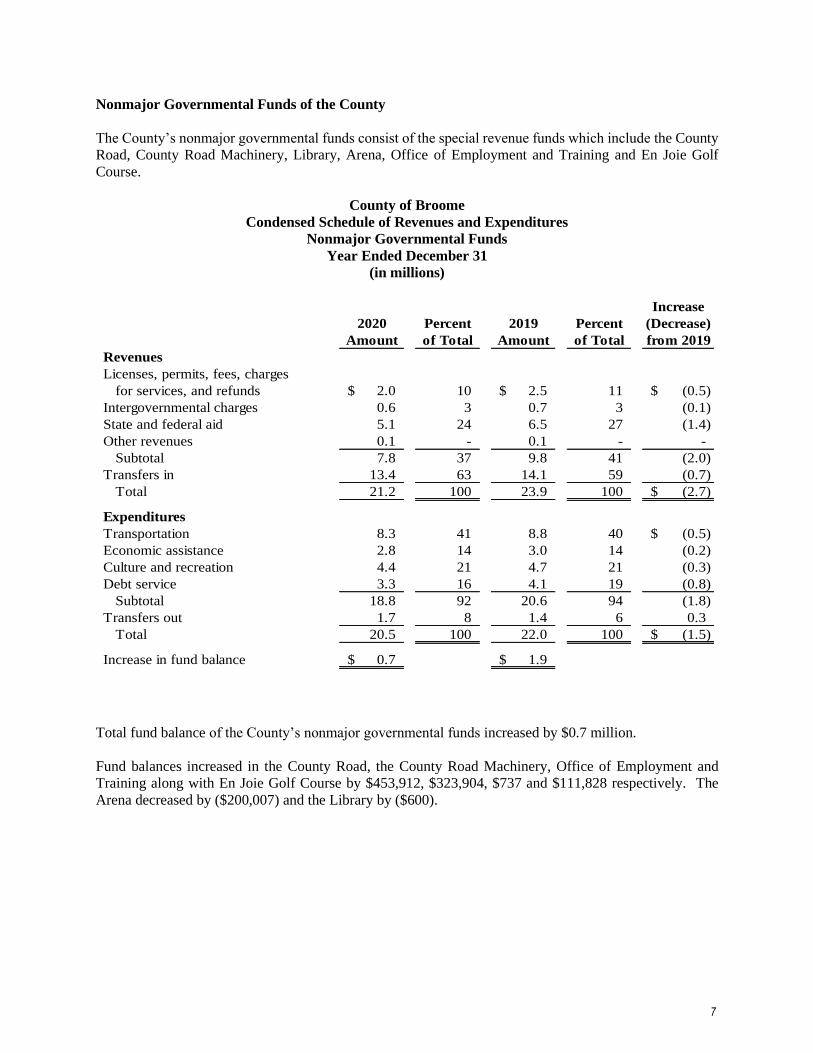
Nonmajor Governmental Funds of the County
The County’s nonmajor governmental funds consist of the special revenue funds which include the County
Road, County Road Machinery, Library, Arena, Office of Employment and Training and En Joie Golf
Course.
County of Broome
Condensed Schedule of Revenues and Expenditures
Nonmajor Governmental Funds
Year Ended December 31
(in millions)
Increase
2020 Percent 2019 Percent (Decrease)
Amount of Total Amount of Total from 2019
Revenues
Licenses, permits, fees, charges
for services, and refunds 2.0$ 10 2.5$ 11 (0.5)$
Intergovernmental charges 0.6 3 0.7 3 (0.1)
State and federal aid 5.1 24 6.5 27 (1.4)
Other revenues 0.1 - 0.1 - -
Subtotal 7.8 37 9.8 41 (2.0)
Transfers in 13.4 63 14.1 59 (0.7)
Total 21.2 100 23.9 100 (2.7)$
Expenditures
Transportation 8.3 41 8.8 40 (0.5)$
Economic assistance 2.8 14 3.0 14 (0.2)
Culture and recreation 4.4 21 4.7 21 (0.3)
Debt service 3.3 16 4.1 19 (0.8)
Subtotal 18.8 92 20.6 94 (1.8)
Transfers out 1.7 8 1.4 6 0.3
Total 20.5 100 22.0 100 (1.5)$
Increase in fund balance 0.7$ 1.9$
Total fund balance of the County’s nonmajor governmental funds increased by $0.7 million.
Fund balances increased in the County Road, the County Road Machinery, Office of Employment and
Training along with En Joie Golf Course by $453,912, $323,904, $737 and $111,828 respectively. The
Arena decreased by ($200,007) and the Library by ($600).
7

Internal Service Funds of the County
The County’s internal service funds consist of Fleet Management, Central Foods, Health Insurance,
Workers’ Compensation, Insurance Reserve, and Unemployment Insurance.
County of Broome
Condensed Schedule of Revenues and Expenses
Internal Service Funds
Year Ended December 31
(in millions)
Increase
2020 Percent 2019 Percent (Decrease)
Amount of Total Amount of Total from 2019
Revenues
Operating revenues
External charges for services 11.3$ 17 11.0$ 16 0.3$
Internal charges for services 40.5 59 39.0 58 1.5
Other operating revenue 7.8 11 7.3 11 0.5
Non-operating revenues
State and federal aid 1.5 2 1.0 2 0.5
Interest revenue - - 0.2 - (0.2)
Other non-operating 7.9 11 8.6 13 (0.7)
Total 69.0 100 67.0 100 2.0$
Expenses
Personal services 0.5 1 0.5 1 -$
Contractual expenses 7.5 12 8.2 13 (0.7)
Insurance claims and expenses 52.4 86 55.5 86 (3.1)
Employee benefits 0.3 1 (0.1) - 0.4
Depreciation 0.2 - 0.2 - -
Total 60.8 100 64.3 100 (3.5)$
Increase in net position 8.2$ 2.7$
Net position increased by $8.2 million.
All the internal service funds increased: Fleet Management $233,056; Central Foods $61,732; Health
Insurance $6,032,424; Worker’s Compensation $1,747,890; Insurance Reserve $122,114; and
Unemployment Insurance $397.
8

Factors Affecting Financial Condition
Local Economy
Broome County’s economic development resources provide various financing and tax abatement programs
to new, expanding and relocating businesses as well as a variety of technology related research and
development opportunities.
The IDA assists businesses in planning new facilities or the expansion of an existing one. The IDA assists
with financing and facilitates Payment In Lieu of Tax (PILOT) agreements with local municipalities. Under
a PILOT agreement, municipalities abate a certain percentage of a company’s taxes for a specific period.
The IDA owns the Broome Corporate Park, a 600-acre mixed-use business park located in the southern
portion of the County. The park is immediately adjacent to Interstate Route 81 and rail service is available
(Canadian/Pacific and Delaware & Hudson).
Several joint initiatives between local industry and Binghamton University’s Watson School of Engineering
have contributed to the advancement of local industrial development. The Integrated Electronics
Engineering Center (IEEC), a New York State Center for Advanced Technology, works in conjunction with
Universal Instruments Corporation, IBM Microelectronics and Lockheed Martin to provide leading-edge
research in the electronics industry.
The Strategic Partnership for Industrial Resurgence (SPIR) assists small manufacturers in developing new
products and defense manufacturers in diversifying their product lines.
Broome County continues to foster a diverse base of high technology, manufacturing, and institutional
employers. The local unemployment rate falls between the federal and state rate.
Broome County has an active Workforce Development program that provides training and education for
people in need of skill upgrades to obtain employment, and those who are currently employed and need
additional training to enhance their skill level. The Broome-Tioga Workforce Development Program has
consolidated many of the services job seekers use to search for employment and develop the skills necessary
to re-train for new career opportunities.
On January 31, 2020, the United States Secretary of Health and Human Services (“HHS”) declared a public
health emergency related to the global spread of coronavirus COVID-19. In February 2020, a pandemic
was declared by the World Health Organization. Efforts to fight the widespread disease included limiting
or closing many businesses and resulted in a severe disruption of operations for organizations. During this
time, recreational and leisure activities were not available to the County residents.
Broome County is the home to the Binghamton Devils American Hockey League team during the fall and
winter months. Affiliated with the New Jersey Devils, the Binghamton Devils play home in the Floyd L.
Maines Veterans’ Memorial Arena. During the spring and summer months, the County is also home to the
Binghamton Rumble Ponies, an Eastern League professional baseball franchise affiliated with the New
York Mets. The Rumble Ponies play at NYSEG Stadium located in the heart of downtown Binghamton.
9
The Spiedie Fest & Balloon Rally and Broome County Parks Triathlon are a few of the special events
postponed in 2020 usually held at the Broome County Parks. Otsiningo Park is the site for over 20 run/walks
for various awareness and local groups in the County. Nature trails at five county parks participates in the
Wegman's "Passport to Family Wellness" program. Softball fields, soccer fields, and sand volleyball courts
are available for organized teams and public use.
Although the Dick’s Sporting Goods Open, a PGA Champion’s Tour Stop was not held during 2020, the
event has traditionally been held at the En Joie Golf Course in Endicott, New York.
The Levene, Gouldin & Thompson Tennis Challenger Tournament features players ranked in the top 20 in
the world. The event was postponed to 2021. This event is held at Recreation Park in the historic west side
neighborhood of Binghamton.
The County has six restored carousels in local parks throughout the area. Donated by local entrepreneurs
in the 1920’s and 30’s, the carousels have been carefully restored to their original grandeur. They are a
popular attraction for local and national organizations interested in their preservation and history.
A variety of other cultural centers and attractions exist in Broome County, including several performing
arts centers, the country’s fifth oldest zoo, a space observatory and several museums. All of which have
been affected by the 2020 pandemic.
Debt Administration and Long-term Financial Planning
Under New York State law, the County’s bonded debt issuances are subject to a constitutional tax limit
based on 7% of the average full valuation of real property for the last five years. The County’s net
outstanding indebtedness on December 31, 2020 was 19.7% of its constitutional debt limit. This represents
a decrease from the County’s outstanding indebtedness of 20.0% at the end of 2019.
In December 2013, the Moody’s Rating Report upgraded the County’s outstanding general obligation bond
rating from an A2- rating to an A2 rating with no outlook. In April 2014, Standard & Poor’s upgraded the
County’s outstanding general obligation bond rating to A+ stable from a previous “A” rating. Both ratings
were re-affirmed in January 2019 and April 2017, respectively. In April 2019, Standard & Poor’s changed
the County’s rating from A+ to AA. Additionally, in April 2020, the Moody’s Investors Service has
assigned a MIG 1 rating to Broome County which reflects the long-term credit of Broome County in the
A2 long-term rating.
The County Executive has proposed and the Legislature has approved future funding of capital projects for
maintaining, improving, and modernizing the County’s infrastructure as well as the purchase of vehicles
and equipment. Work planned to begin in 2021 includes the following projects of $1.0 million or greater:
• $3.4M Aviation Taxiway Rehabilitation & Extension.
• $2.5M Highway Reconstruction & Rehabilitation.
• $1.4M North Sanford Road Bridge Construction.
• $1.0M Computer Equipment Replacement/Upgrade.
• $3.1M Transit 5 Bus Replacements.
• $2.5M Solid Waste Management Section V Phase 1 Relocation Closure Construction.
New capital projects beginning in 2021 total an estimated $21.0 million. The County anticipates funding
$9.3 million through the issuance of general obligation debt. It is expected that federal, state, and fees/other
sources will fund the remaining balance.
10

Cash Management and Investments
Cash is accounted for based on fund ownership. Most County cash is maintained in a pooled bank account.
The County also maintains several other special purpose bank accounts, from which funds are transferred
into the pooled account by the Treasury Manager on a regular basis. The bank accounts are interest bearing.
The Treasury Manager uses bank reports daily to monitor cash balances. Idle cash balances are kept at a
minimum with any excess funds being invested. Projections of major cash flows are made to determine the
investment of funds not immediately required to pay County debts. The Director of the Office of
Management and Budget has ultimate responsibility for investing idle funds. County investments include
certificates of deposit, money market accounts and treasury bills. Deposits in excess of FDIC insurance are
collateralized by securities purchased in the County’s name and held by third party custodians. The
custodians adjust the collateral maintained and notify the County of the changes based upon a monthly
review. The Office of Management and Budget maintains records verifying collateral balances are
sufficient.
Comparison of Cash, Cash Equivalents Balances (including Restricted Cash), and Investment
Balances (in millions of dollars)
12/31/2020 12/31/2019
$113.7 $106.0
8/31/2020 8/31/2019 12/31/2020 12/31/2019 12/31/2020 12/31/2019
$58.8 $59.2 $8.4 $8.6 $0.4 $0.4
Broome County Soil
& Water
Conservation DistrictSUNY Broome
Broome County
Industrial
Development Agency
County of Broome
Cash, Cash Equivalents Balances (including Restricted Cash) and Investment Balances by Fund,
charted by percentages, as of December 31, 2020 (in millions of dollars)
Fund Balance
General Fund 24.8$
Enterprise Funds 29.9
Debt Service Fund 1.9
BTASC Fund 3.0
Nonmajor Funds 1.8
Fiduciary Fund 15.3
Capital Projects Fund 10.5
Internal Service Funds 26.5
113.7$
Additional information on the County’s cash management can be found in Note 2 to the financial
statements.
General
21.8%
Enterprise 26.3%
Debt
Service
1.7%BTASC
2.6%
Nonmajor
1.6%
Fiduciary
13.5%
Capital
Projects 9.2%
Internal
Service
23.3%
11

Risk Financing
The County is self-insured for general liability and property loss. Commercial insurance is purchased for
losses more than $50,000. Payment of claims is provided by annual appropriations based on claim payment
experience and recognition of liability amounts.
The County administers a workers' compensation pool. Pool costs are distributed to the fifteen participant
municipalities, including the County. Cost allocation is based on the participant’s assessed property
valuation and claim experience.
The County maintains self-insured health insurance. Health care benefits are financed by County and
employee contributions to the plan. The County's contribution, which amounted to approximately $30.0
million for the year, is determined by rates approved by the County Legislature and based upon advice from
plan consultants and the Risk Manager. Rates incorporate experience, fund liabilities and projected reserve
level.
The County participates in a self-insured unemployment insurance plan. The New York Department of
Labor acts as the third-party administrator.
Additional information on the County’s risk management activities can be found in Note 12 to the financial
statements.
Pension and Other Postemployment Benefits
Substantially all full-time employees of the County are members of the New York State and Local
Retirement System (the "System"). The System is a cost-sharing multiple employer public employee
retirement plan. The System is non-contributory with respect to employees hired prior to July 27, 1976.
Employees hired after July 27, 1976 must contribute 3% of gross annual salary toward the cost of the
retirement program until they attain ten years in the retirement system, at such time the employee
contribution ceases.
On December 10, 2009, the Governor signed into law a new Tier 5. The law is effective for new ERS
employees hired on or after January 1, 2010. New employees will now contribute 3% of their salaries with
no provision for these contributions to cease after a certain period of service. In addition, a new Tier 6
group has also been created. Any employee hired after April 1, 2012 will have scaling contribution rates
based on annual salary. From April 1, 2012 until March 31, 2013 all Tier 5 employees contributed 3% of
their reportable salaries. Starting April 1, 2013, the Tier 6 contribution rate became dependent upon
employee’s annual wage. More details are available in Note 10 of this financial statement.
In addition, certain employees of SUNY Broome are members of either the New York State Employees
Retirement System or the New York State Teachers Retirement System.
Postemployment health benefits are provided to qualifying retired County employees with at least ten years
of service or those on disability retirement if hired prior to January 1, 2012. Both the County and the College
recognizes and funds such expenditures as incurred. During 2020 expenditures were approximately $14.6
million for County retirees.
Any employee, former employee or elected official first hired or taking office on or after January 1, 2012
would require a cumulative 20 years of full time equivalent employment or service and must have been
12

enrolled in the County’s health insurance plan for a cumulative minimum of 10 years with 2 of those years
of enrollment immediately preceding their retirement. For purposes of determining eligibility any
employee, former employee or elected official who was employed or took office prior to January 1, 2012
and is rehired or takes office after a break in employment or service on or after January 1, 2012 shall not
be considered as first hired or taking office after January 1, 2012.
Additional information on the County’s pension arrangements and postemployment benefits can be found
in Notes 10 and 11 to the financial statements.
Acknowledgments
Preparation of the Comprehensive Annual Financial Report and its timely issuance is the result of a
concentrated, dedicated, and coordinated effort by the Office of Management and Budget staff and financial
staff located throughout the County's departments. The preparation of this report would not be possible
without each of their efforts.
Respectfully submitted,
Jerome Z. Knebel
Director
Office of Management and Budget
13
Vot
ers
CO
UN
TY
OF
BR
OO
ME
GO
VE
RN
ME
NT
OR
GA
NIZ
AT
ION
AL
CH
AR
T
Bro
ome
Cou
nty
Exec
utiv
eB
room
e C
ount
yLe
gisl
atur
e
Avi
atio
n
Publ
icTr
ansp
orta
tion
Hig
hway
&M
achi
nery
Publ
ic W
orks
Educ
atio
n of
Han
dica
pped
Chi
ldre
n
Emer
genc
ySe
rvic
esSU
NY
Bro
ome
Tuiti
on to
othe
rC
omm
unity
Col
lege
Prob
atio
n
Secu
rity
Publ
ic W
orks
Sher
iff
Stop
-DW
I
Men
tal H
ealth
Will
ow P
oint
Nur
sing
Fac
ility
Hea
lth
Leg
end
Dep
artm
ent o
r Age
ncy
Hea
ded
By
Elec
ted
Off
icia
ls
Dep
artm
ent a
nd A
genc
ies o
f the
Exe
cutiv
e B
ranc
hof
Cou
nty
Gov
ernm
ent
Dep
ende
nt S
peci
al P
urpo
ses U
nit
Inde
pend
ent S
peci
al P
urpo
ses U
nit
Off
ice
For
Agi
ng
Soci
alSe
rvic
es
Vet
eran
sSe
rvic
es
Empl
oym
ent
& T
rain
ing
Indu
stria
lD
evel
opm
ent
Age
ncy
Con
vent
ion
Bur
eau
Publ
icSa
fety
Educ
atio
nH
ealth
Hom
ean
dC
omm
unity
Plan
ning
&Ec
onom
ic
Dev
elop
men
t
Var
ious
Con
tract
Age
ncie
s
Park
s &R
ecre
atio
n
Are
na /
Foru
m
Cou
nty
Libr
ary
Var
ious
Con
tract
Age
ncie
s
Cul
ture
/R
ecre
atio
nTr
ansp
orta
tion
Econ
omic
Ass
ista
nce
and
Opp
ortu
nity
Gen
eral
Gov
ernm
ent
Ope
ratio
ns
Exec
utiv
e
Cen
tral
Kitc
hen
Info
rmat
ion
Tech
nolo
gy
Publ
ic W
orks
Gen
eral
&Fl
eet
Pers
onne
l
Cor
oner
s
OM
B
Ris
k &
Insu
ranc
e
Rea
l Pro
perty
Tax
Serv
ice
Law
Legi
slat
ive
Boa
rd &
Cle
rk
Cou
nty
Cle
rk
Dis
trict
Atto
rney
Aud
it &
Con
trol
Mis
cella
neou
sEx
pens
es
Publ
icD
efen
der
Elec
tions
Toba
cco
Ass
etSe
curit
izat
ion
Econ
omic
Dev
elop
men
t
Bro
ome
Cou
nty
Soil
& W
ater
Con
serv
atio
nD
istri
ct
En Jo
ie
Gol
f Cou
rse
Land
Ban
k C
orpo
ratio
n
Land
Dev
elop
men
tC
orpo
ratio
n
Solid
Was
te
14

County of Broome
Officials
2020
Executive
Jason T. Garnar .................................................................................................................County Executive*
Kevin M. McManus .............................................................................................. Deputy County Executive
Legislature *
Steven J. Flagg ........................................................................................................... First District Legislator
Scott D. Baker ....................................................................................................... Second District Legislator
Kelly F. Wildoner ................................................................................................... Third District Legislator
Kim A. Myers ....................................................................................................... Fourth District Legislator
Daniel J. Reynolds, Chairman .................................................................................. Fifth District Legislator
Greg W. Baldwin ...................................................................................................... Sixth District Legislator
Matthew J. Pasquale ............................................................................................ Seventh District Legislator
Jason E. Shaw. ..................................................................................................... . Eighth District Legislator
Matthew J. Hilderbrant ........................................................................................... Ninth District Legislator
Cindy L. O’Brien ..................................................................................................... Tenth District Legislator
Susan V. Ryan .................................................................................................... Eleventh District Legislator
Richard P. Balles ................................................................................................. Twelfth District Legislator
Bob Weslar ...................................................................................................... Thirteenth District Legislator
Mary A. Kaminsky ........................................................................................... Fourteenth District Legislator
Mark R. Whalen ................................................................................................. Fifteenth District Legislator
Law
Robert G. Behnke ................................................................................................................ County Attorney
Michael A. Korchak .......................................................................................................... District Attorney *
David E. Harder ................................................................................................................................ Sheriff *
Joseph A. Mihalko ................................................................................................................ .County Clerk *
Office of Management and Budget
Jerome Z. Knebel ............................................................................................................................... Director
Department of Audit and Control
Alex J. McLaughlin .................................................................................................................... Comptroller
*Elected
15

County of Broome
Chairs of Legislative Committees
2020
Clerk of the Legislature ....................................................................................................... Aaron M. Martin
County Administration ............................................................................... Cindy L. O’Brien, Tenth District
Economic Development, Education and Culture ..................................... Richard P. Balles, Twelfth District
Finance ........................................................................................................... Stephen J. Flagg, First District
Health and Human Services ........................................................................... Jason E. Shaw, Eighth District
Personnel .................................................................................................... Kelly F. Wildoner, Third District
Public Safety and Emergency Services ......................................................... Scott D. Baker, Second District
Public Works and Transportation .......................................................Matthew J. Pasquale, Seventh District
16
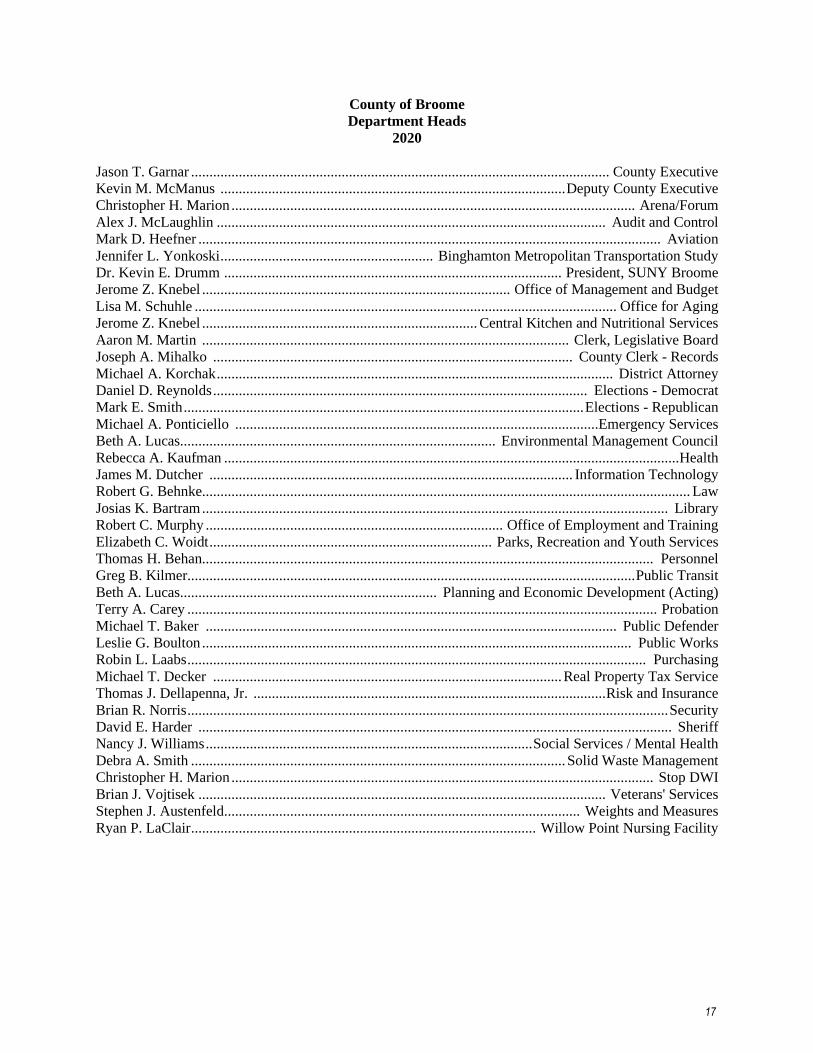
County of Broome
Department Heads
2020
Jason T. Garnar .................................................................................................................. County Executive
Kevin M. McManus .............................................................................................. Deputy County Executive
Christopher H. Marion .............................................................................................................. Arena/Forum
Alex J. McLaughlin .......................................................................................................... Audit and Control
Mark D. Heefner .............................................................................................................................. Aviation
Jennifer L. Yonkoski .......................................................... Binghamton Metropolitan Transportation Study
Dr. Kevin E. Drumm ............................................................................................ President, SUNY Broome
Jerome Z. Knebel .................................................................................... Office of Management and Budget
Lisa M. Schuhle ................................................................................................................... Office for Aging
Jerome Z. Knebel ........................................................................... Central Kitchen and Nutritional Services
Aaron M. Martin .................................................................................................... Clerk, Legislative Board
Joseph A. Mihalko .................................................................................................. County Clerk - Records
Michael A. Korchak ............................................................................................................ District Attorney
Daniel D. Reynolds ...................................................................................................... Elections - Democrat
Mark E. Smith ............................................................................................................. Elections - Republican
Michael A. Ponticiello ...................................................................................................Emergency Services
Beth A. Lucas...................................................................................... Environmental Management Council
Rebecca A. Kaufman ............................................................................................................................ Health
James M. Dutcher ................................................................................................... Information Technology
Robert G. Behnke. .................................................................................................................................... Law
Josias K. Bartram ............................................................................................................................... Library
Robert C. Murphy ................................................................................. Office of Employment and Training
Elizabeth C. Woidt ............................................................................. Parks, Recreation and Youth Services
Thomas H. Behan........................................................................................................................... Personnel
Greg B. Kilmer.......................................................................................................................... Public Transit
Beth A. Lucas...................................................................... Planning and Economic Development (Acting)
Terry A. Carey ................................................................................................................................ Probation
Michael T. Baker ................................................................................................................ Public Defender
Leslie G. Boulton ..................................................................................................................... Public Works
Robin L. Laabs ............................................................................................................................. Purchasing
Michael T. Decker ............................................................................................... Real Property Tax Service
Thomas J. Dellapenna, Jr. ................................................................................................ Risk and Insurance
Brian R. Norris ................................................................................................................................... Security
David E. Harder ................................................................................................................................. Sheriff
Nancy J. Williams ......................................................................................... Social Services / Mental Health
Debra A. Smith ...................................................................................................... Solid Waste Management
Christopher H. Marion ................................................................................................................... Stop DWI
Brian J. Vojtisek ............................................................................................................... Veterans' Services
Stephen J. Austenfeld ................................................................................................. Weights and Measures
Ryan P. LaClair .............................................................................................. Willow Point Nursing Facility
17
County of Broome
Office of Management and Budget (OMB)
2020
Jerome Z. Knebel .................................................................................................................Director of OMB
Gino M. Bucciarelli ............................................................................................... Deputy Director of OMB
Krista L. Soltis .................................................................................................................. Treasury Manager
Tracy L. Ryan ……………………………………………………………………...Senior Financial Analyst
Megan S. Brown ............................................................................................................... Payroll Supervisor
Katelyn N. Turner .............................................................................................................Treasury Associate
Kevin A. Manley………………………………………………………………………….Financial Analyst
Peter D. Hans..…………………………………………………………………………….Financial Analyst
Vacant………….………………………………………………………………………….Financial Analyst
Sharon L. Tucker….…………………………………………………………………………Treasury Clerk
Kathleen M. Clancy ................................................................................................................ Treasury Clerk
Steven T. Maximowicz ........................................................................................................... Treasury Clerk
Karen M. Veruto ...................................................................................................... Principal Account Clerk
18

Financial Section
19

This page left blank intentionally.
20

Financial Section
The Financial Section which follows includes the Independent Auditors’ Report, the Management’s
Discussion and Analysis, the Basic Financial Statements and related Footnotes.
21

This page left blank intentionally.
22

Certified Public Accountants
Drescher & Malecki LLP 3083 William Street, Suite 5 Buffalo, New York 14227 Telephone: 716.565.2299 Fax: 716.565.2201
23
INDEPENDENT AUDITORS’ REPORT
Honorable Broome County Executive Honorable Members of the County Legislature County Comptroller County of Broome, New York: Report on the Financial Statements We have audited the accompanying financial statements of the governmental activities, the business-type activities, the aggregate discretely presented component units, each major fund, and the aggregate remaining fund information of the County of Broome, New York (the “County”), as of and for the year ended December 31, 2020 (with the Broome Community College for the year ended August 31, 2020), and the related notes to the financial statements, which collectively comprise the County’s basic financial statements as listed in the table of contents. Management’s Responsibility for the Financial Statements The County’s management is responsible for the preparation and fair presentation of these financial statements in accordance with accounting principles generally accepted in the United States of America; this includes the design, implementation, and maintenance of internal control relevant to the preparation and fair presentation of financial statements that are free from material misstatement, whether due to fraud or error. Auditor’s Responsibility Our responsibility is to express opinions on these financial statements based on our audit. We did not audit the financial statements of the Broome County Local Development Corporation (“LDC”) and the Broome County Land Bank Corporation (“LBC”), which represents 0.3% and 0.6% of the assets, respectively, and 0.6% and 0.7% of revenues, respectively, of the business-type activities. We did not audit the financial statements of SUNY Broome (the “College”) and Broome County Industrial Development Agency (“IDA”), which are considered to be discretely presented component units and represent 84.9% and 14.9%, respectively, of the assets, and 98.0% and 1.5%, respectively, of the revenues of the aggregate discretely presented component units. Those financial statements were audited by other auditors whose reports thereon have been furnished to us, and our opinion, insofar as it relates to the amounts included for the LDC, LBC, College, and IDA, is based solely on the reports of such other auditors. We conducted our audit in accordance with auditing standards generally accepted in the United States of America. Those standards require that we plan and perform the audit to obtain reasonable assurance about whether the financial statements are free from material misstatement.
24
An audit involves performing procedures to obtain audit evidence about the amounts and disclosures in the financial statements. The procedures selected depend on the auditor’s judgment, including the assessment of the risks of material misstatement of the financial statements, whether due to fraud or error. In making those risk assessments, the auditor considers internal control relevant to the entity’s preparation and fair presentation of the financial statements in order to design audit procedures that are appropriate in the circumstances, but not for the purpose of expressing an opinion on the effectiveness of the entity’s internal control. Accordingly, we express no such opinion. An audit also includes evaluating the appropriateness of accounting policies used and the reasonableness of significant accounting estimates made by management, as well as evaluating the overall presentation of the financial statements. We believe that the audit evidence we have obtained is sufficient and appropriate to provide a basis for our audit opinions. Opinions In our opinion, based on our audit and the reports of the other auditors, the financial statements referred to above present fairly, in all material respects, the respective financial position of the governmental activities, the business-type activities, the aggregate discretely presented component units, each major fund, and the aggregate remaining fund information of the County, as of December 31, 2020, and the respective changes in financial position and, where applicable, cash flows thereof and the respective budgetary comparison of the General Fund for the year then ended in accordance with accounting principles generally accepted in the United States of America. Other Matters Required Supplementary Information Accounting principles generally accepted in the United States of America require that the Management’s Discussion and Analysis and other Required Supplementary Information, as listed in the table of contents, be presented to supplement the basic financial statements. Such information, although not a part of the basic financial statements, is required by the Governmental Accounting Standards Board, who considers it to be an essential part of financial reporting for placing the basic financial statements in an appropriate operational, economic, or historical context. We have applied certain limited procedures to the required supplementary information in accordance with auditing standards generally accepted in the United States of America, which consisted of inquiries of management about the methods of preparing the information and comparing the information for consistency with management’s responses to our inquiries, the basic financial statements, and other knowledge we obtained during our audit of the basic financial statements. We do not express an opinion or provide any assurance on the information because the limited procedures do not provide us with sufficient evidence to express an opinion or provide any assurance. Other Information Our audit was conducted for the purpose of forming opinions on the financial statements that collectively comprise the County’s basic financial statements. The Introductory Section, Supplementary Information, Other Information and Statistical and Economic Data Section, as listed in the table of contents, are presented for the purpose of additional analysis and are not a required part of the basic financial statements. The Supplementary Information, as listed in the table of contents, are the responsibility of management and were derived from and relate directly to the underlying accounting and other records used to prepare the basic financial statements. Such information has been subjected to the auditing procedures applied in

25
the audit of the basic financial statements and certain additional procedures, including comparing and reconciling such information directly to the underlying accounting and other records used to prepare the basic financial statements or to the basic financial statements themselves, and other additional procedures in accordance with auditing standards generally accepted in the United States of America by us and the other auditors. In our opinion, the Supplementary Information, as listed in the table of contents, are fairly stated in all material respects in relation to the basic financial statements as a whole. The Introductory Section, Other Information and Statistical and Economic Data Section, as listed in the table of contents, have not been subjected to the auditing procedures applied in the audit of the basic financial statements and, accordingly, we do not express an opinion or provide any assurance on them.
July 7, 2021

26

County of Broome
Management’s Discussion and Analysis (Unaudited)
For the Year Ended December 31, 2020
The County of Broome’s (the “County”) Financial Section presents Management’s Discussion and Analysis
(MD&A) on the County’s financial performance during the 2020 fiscal year. It is intended to be an easily
readable analysis of the financial activities of the County, focusing on the current activities, known facts,
and their impact. The results, both positive and negative, are discussed. To properly evaluate the County’s
position, the MD&A should be read in conjunction with additional information that we have furnished in
the County’s financial statements.
Financial Highlights
The County’s primary government liabilities and deferred inflows of resources exceeded its assets and
deferred outflows of resources at the close of fiscal year 2020 by $238,517,110 (net position). This
amount includes $16,617,181 that is restricted for specific purposes (restricted net position),
$163,404,398 net investment in capital assets and an unrestricted net deficit of ($418,538,689).
The County’s primary government total net position increased during 2020 by $13,472,961. The
increase was the result of an increase in governmental activities of $7,414,567 and an increase in
business-type activities of $6,058,394.
As of December 31, 2020, the County’s governmental funds had combined fund balances of
($9,148,782), a decrease of $240,652 from 2019.
The combined assigned and unassigned fund balances for the County’s General Fund was $18,221,437
at the end of 2020. This is approximately 5.2% of the total 2020 expenditures and transfers out for the
general fund.
Overview of the Financial Statements
The County’s basic financial statements are comprised of three components: (1) government-wide financial
statements, (2) fund financial statements, and (3) the accompanying notes to the basic financial statements.
The notes further explain and support the basic financial statements. The County presents two types of
financial statements with different views of the County.
Government-wide financial statements are the first two statements. These statements are designed to
provide readers with a broad overview of the County’s finances, in a manner like a private-sector business.
These statements present a long-term view of the County's finances. Government-wide presentations use
the accrual basis of accounting. Under the accrual basis, revenues are recorded at the time they are earned,
and expenses are recorded at the time liabilities are incurred.
27
Management’s Discussion and Analysis (Unaudited) (Continued)
Both statements differentiate functions of the County that are principally supported by taxes and
intergovernmental revenues (governmental activities) from functions that are intended to recover part or all
their costs through user fees and charges (business-type activities). Governmental activities include general
government, education, public safety, health, transportation, economic assistance, culture and recreation,
and home and community services. The business-type activities include public transportation, the nursing
home, solid waste management, the airport, and economic assistance.
The government-wide statements not only include Broome County itself, known as the primary
government, but also the legally separate SUNY Broome, the Broome County Industrial Development
Agency, and Broome County Soil & Water Conservation District, which the County is financially
accountable. Financial information for the College, the IDA and the District is reported separately
(discretely) from the primary government itself. Additionally, the Broome County Land Bank Corporation
and the Broome County Local Development Corporation are reported as component units within the
business-type activities within the primary government. The Broome Tobacco Asset Securitization
Corporation, although also legally separate functions for all practical purposes is reported as a County
department and therefore has been included as an integral part (blended) of the primary government.
The statement of net position presents information on all the County assets, liabilities and deferred inflows
and outflows of resources, with the difference reported as net position. Net position signifies the financial
position of the County and over time, increases or decreases may serve as a useful indicator whether the
financial position of the County is improving or deteriorating. To assess the overall financial health of the
County, it is also necessary to consider non-financial factors such as changes in the property tax base.
The statement of activities presents information showing how the County’s net position changed during the
most recent fiscal year. All changes in net position are reported as soon as the underlying event giving rise
to the change occurs, regardless of the timing of related cash flows. Thus, revenues and expenses are
reported in this statement for some items that will only result in future period cash flows (e.g. uncollected
taxes and earned but unused vacation and sick leave).
The government-wide financial statements can be found on pages 49-51 of this report.
Fund financial statements focus on the major funds of the County in more detail than the government-
wide financial statements. A fund is a grouping of related accounts that is used to maintain control over
resources that are segregated for specific activities or objectives. The County, like other state and local
governments, uses fund accounting to ensure and demonstrate compliance with finance-related
requirements. The County’s funds can be divided into three types: governmental funds, proprietary funds,
and fiduciary funds.
Governmental funds are used to account for the functions reported as governmental activities in the
government-wide statements. However, unlike the government-wide financial statements, governmental
funds financial statements focus on near-term inflows and outflows of expendable resources as well as what
expendable resources remain to fund future activities. Such information may be useful in evaluating the
County’s near-term financial requirements.
28
Management’s Discussion and Analysis (Unaudited) (Continued)
Because the focus of the governmental funds is narrower than that of the government-wide statements, it is
useful to compare the information presented for governmental funds with similar information presented for
governmental activities in the government-wide statements. By doing so, readers may better understand the
long-term impact of the County’s near-term financing decisions. Both the governmental fund balance sheet
and the governmental fund statement of revenues, expenditures, and changes in fund balance provide a
reconciliation to facilitate this comparison.
The County maintains ten individual governmental funds. Information is presented separately in the
governmental fund balance sheet and the governmental fund statement of revenues, expenditures, and
changes in fund balances for the General Fund, Capital Projects Fund, Debt Service Fund and BTASC fund.
Data for the other six funds is combined into a single aggregated presentation. Individual fund data for each
of these nonmajor governmental funds is provided in the form of combining statements, which are included
in the Combining Individual Fund Financial Statements and Schedules section.
The governmental fund financial statements can be found on pages 52-57 of this report.
Proprietary funds consist of enterprise and internal service funds. The enterprise funds are used to report
the same functions presented as business-type activities in the government-wide statements. The
Department of Transportation, Willow Point Nursing Home, Solid Waste Management, and Aviation are
considered major funds. Data for the other two enterprise funds are combined into a single aggregated
presentation and are considered nonmajor enterprise funds. All the enterprise funds are presented on the
full accrual basis of accounting.
Although a type of proprietary fund, the internal service funds provide services primarily to other County
departments. They are allocated on the government-wide statements between governmental and business-
type activities. They are presented as nonmajor funds in a single aggregated presentation on the proprietary
fund statements. Individual fund data for each of the internal service funds is provided in the form of
combining statements, which are included in the Combining Individual Fund Financial Statements and
Schedules.
Because the internal service funds are allocated between the governmental and business-type activities on
the government-wide statements, both the proprietary fund statement of net position and statement of
revenues, expenses, and changes in net position provide a reconciliation to facilitate comparison with
similar information presented for business-type activities in the government-wide statements.
Proprietary funds statements provide the same type of information as the government-wide statements, only
in more detail.
The proprietary fund financial statements can be found on pages 58-61 of this report.
Fiduciary funds are used to account for those resources the County maintains only as a trustee, or fiduciary,
for the benefit of others, to whom those resources belong. All the fiduciary funds held by the County are
Custodial funds. Custodial funds are held on behalf of others and involve the receipt, temporary investment,
and remittance of the resources to individuals, private organizations, or other governments. Fiduciary funds
held by the County are not reflected in the government-wide statements because the resources of those
funds are not available to support the County’s own programs.
29
Management’s Discussion and Analysis (Unaudited) (Continued)
The statement of fiduciary net position and statement of changes in fiduciary net position can be found on
pages 62-63 of this report.
Notes to the basic financial statements provide additional information that is essential to a full
understanding of the data provided in the government-wide and fund financial statements.
The notes to the basic financial statements can be found starting on page 67 of this report.
Other Information, in addition to the basic financial statements and accompanying notes presents required
supplementary information concerning the County’s net pension liability and the County’s other
postemployment benefits (“OPEB”) obligation.
Required Supplementary Information and related notes can be found on pages 141-145 of this report.
Combining statements, referred to earlier, are presented as supplementary information and provide
information on nonmajor governmental, business-type and internal service funds, and are presented
immediately following the notes to the basic financial statements.
Combining and individual fund statements and schedules can be found starting on page 155 of this report.
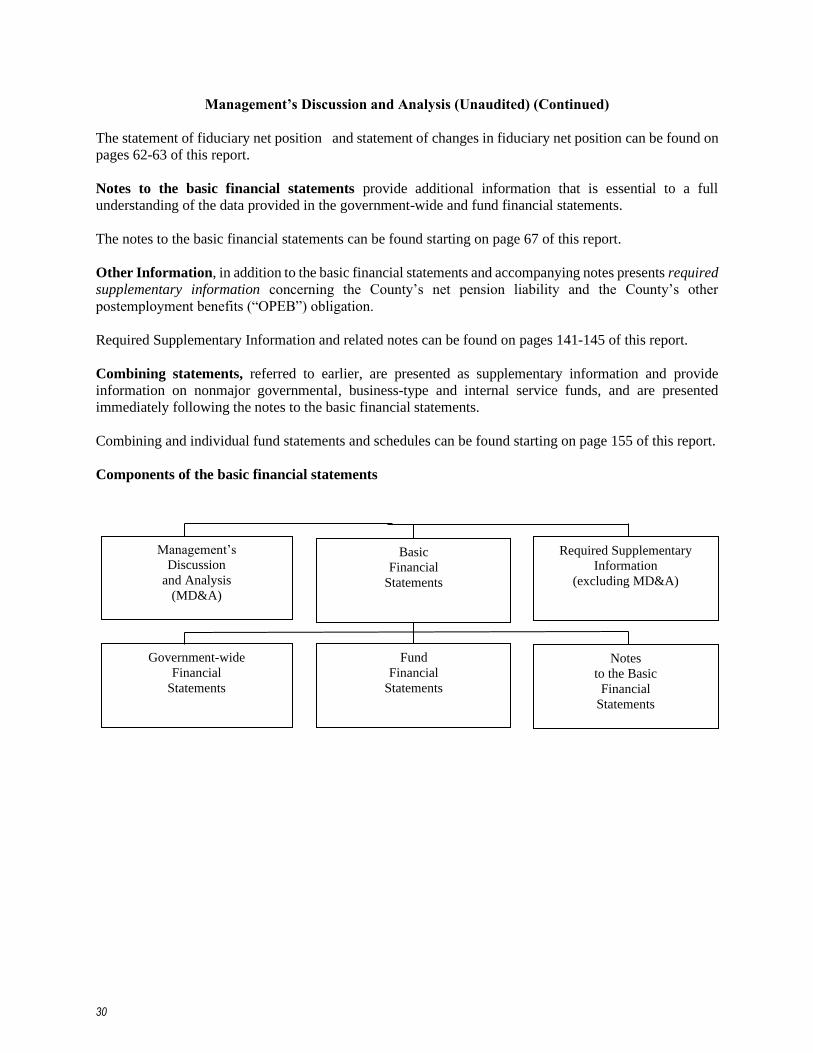
Components of the basic financial statements
Management’s
Discussion
and Analysis
(MD&A)
Government-wide
Financial
Statements
Basic
Financial
Statements
Notes
to the Basic
Financial
Statements
Fund
Financial
Statements
Required Supplementary
Information
(excluding MD&A)
30
Ma
nagem
ent’
s D
iscu
ssio
n a
nd
An
aly
sis
(Un
au
dit
ed)
(Con
tin
ued
)
Ma
jor
Fea
ture
s o
f B
roo
me
Co
un
ty’s
Ba
sic
Fin
an
cia
l S
tate
men
ts
Fu
nd
Fin
anci
al S
tate
men
ts
G
ov
ern
men
t-w
ide
Sta
tem
ents
Go
ver
nm
enta
l F
un
ds
Pro
pri
eta
ry F
un
ds
Fid
uci
ary
Fu
nd
s
Sco
pe
En
tire
C
ou
nty
g
ov
ern
men
t
(ex
cep
t fi
du
ciar
y
fund
s)
and
com
po
nen
t un
its.
Co
unty
ac
tiv
itie
s fu
nd
ed
pri
mar
ily
th
rou
gh
ta
xes
an
d
inte
rgo
ver
nm
enta
l re
ven
ues
su
ch
as
Sh
erif
f,
Par
ks,
an
d
Pub
lic
Hea
lth
.
Co
unty
ac
tiv
itie
s o
per
ated
li
ke
pri
vat
e b
usi
nes
ses
such
as
Tra
nsi
t.
Act
ivit
ies
wh
ere
the
Co
un
ty a
cts
as a
tru
stee
or
cust
odia
n f
or
non
-
cou
nty
re
sou
rces
, su
ch
as
mo
rtg
age
tax h
eld
fo
r dis
trib
uti
on
to m
un
icip
alit
ies.
Req
uir
ed f
inan
cial
sta
tem
ents
S
tate
men
t o
f N
et P
osi
tio
n
Sta
tem
ent
of
Act
ivit
ies
Bal
ance
Sh
eet
Sta
tem
ent
of
Rev
enu
es,
Ex
pen
dit
ure
s,
and
C
han
ges
in
Fu
nd
Bal
ance
Sta
tem
ent
of
Net
Po
siti
on
Sta
tem
ent
of
Rev
enu
es,
Ex
pen
ses,
an
d
Ch
ang
es
in
Net
Po
siti
on
Sta
tem
ent
of
Cas
h F
low
s
Sta
tem
ent
of
Fid
uci
ary
N
et
Po
siti
on
Sta
tem
ent
of
Ch
ang
es
in
Fid
uci
ary
Net
Po
siti
on
Acc
ou
nti
ng
bas
is
Acc
rual
M
od
ifie
d A
ccru
al
Acc
rual
A
ccru
al
Mea
sure
men
t fo
cus
Eco
no
mic
res
ou
rces
C
urr
ent
fin
anci
al r
esou
rces
E
con
om
ic r
esou
rces
E
con
om
ic r
esou
rces
Ass
et/l
iab
ilit
y i
nfo
rmat
ion
A
ll a
sset
s, lia
bil
itie
s, a
nd d
efer
red
infl
ow
s/o
utf
low
s o
f re
sou
rces
,
bo
th
fin
anci
al
and
cap
ital
, an
d
sho
rt-t
erm
and
lon
g-t
erm
.
Incl
ud
es s
ho
rt-t
erm
ass
ets,
sh
ort
term
li
abil
itie
s,
and
def
erre
d
infl
ow
s/o
utf
low
s o
r re
sou
rces
,
on
ly.
Lon
g-t
erm
ca
pit
al
asse
ts
and
lon
g-t
erm
li
abil
itie
s ar
e no
t
incl
ud
ed.
All
as
sets
an
d
liab
ilit
ies,
an
d
def
erre
d
infl
ow
s/ou
tflo
ws
of
reso
urc
es,
bo
th
fin
anci
al
and
cap
ital
, an
d s
ho
rt-t
erm
and
lo
ng
-
term
.
All
as
sets
an
d
liab
ilit
ies,
b
oth
sho
rt-t
erm
and
lon
g-t
erm
.
Infl
ow
/ou
tflo
w i
nfo
rmat
ion
A
ll r
even
ues
and
exp
ense
s du
rin
g
the
yea
r, r
egar
dle
ss o
f w
hen
cas
h
is r
ecei
ved
or
dis
bu
rsed
.
Rev
enu
es
for
wh
ich
cash
is
rece
ived
du
ring
th
e y
ear
or
soo
n
afte
r th
e en
d
of
the
yea
r.
Ex
pen
dit
ure
s w
hen
g
oo
ds
or
serv
ices
hav
e b
een
rec
eiv
ed a
nd
pay
men
t is
du
e d
uri
ng
th
e y
ear
or
soo
n
ther
eaft
er
exce
pt
for
deb
t
serv
ice.
All
rev
enu
es a
nd
exp
ense
s du
rin
g
the
yea
r, r
egar
dle
ss o
f w
hen
cas
h
is r
ecei
ved
or
dis
bu
rsed
.
All
ad
dit
ion
s an
d
ded
uct
ion
s
du
rin
g
the
yea
r,
reg
ard
less
o
f
wh
en
cash
is
re
ceiv
ed
or
dis
bu
rsed
.
31

Management’s Discussion and Analysis (Unaudited) (Continued)
Government-wide Financial Analysis
County of Broome
Condensed Statement of Net Position
Years Ended December 31
(in millions)
2020 2019 2020 2019 2020 2019
Assets and deferred outflows
of resources
Current assets 190.1$ 167.0$ 41.6$ 49.4$ 231.6$ 216.4$
Noncurrent assets 115.1 112.9 123.6 124.3 238.7 237.2
Deferred outflows of resources 88.7 17.7 19.4 4.2 108.1 21.9
Total assets and deferred outflow
of resources 393.9 297.6 184.5 177.9 578.5 475.5
Liabilities and deferred inflows
of resources
Current liabilities 155.5 141.8 17.0 32.5 172.5 174.3
Noncurrent liabilities 424.9 346.2 108.1 89.7 533.0 435.9
Deferred inflows of resources 88.0 91.5 23.4 25.8 111.4 117.3
Total liabilities and deferred
inflows of resources 668.4 579.5 148.6 147.9 816.9 727.5
Net position
Net investment in capital assets 69.3 67.0 94.1 92.7 163.4 159.7
Restricted 16.6 25.6 - - 16.6 25.6
Unrestricted (360.5) (374.6) (58.1) (62.8) (418.5) (437.4)
Total net position (274.5)$ (281.9)$ 36.0$ 29.9$ (238.5)$ (252.0)$
Government
Governmental Business-type
Activities Activities
Total Primary
The largest portion of the County’s total primary government net position reflects its $163.4 million
investment in capital assets (land, buildings, infrastructure, and equipment), less the outstanding debt used
to acquire these assets. The County uses these assets to provide services to citizens, consequently these
assets are not available for future spending. Although the County’s investment in capital assets are reported
net of related debt, it should be noted that the resources needed to repay this debt must be provided from
other sources, since the capital assets cannot be used to liquidate these liabilities.
An additional portion of the County’s total primary government net position, $16.6 million, represents
resources that are subject to restrictions on how they may be used either by external entities or by enabling
legislation of the County. More detailed information about the County’s restricted net position is presented
in Note 19 to the financial statements.
The remaining portion of the primary government net position, ($418.5) million, is unrestricted. This deficit
does not mean that the County dos not have resources available to meet its obligations in the ensuing year.
Rather, it reflects liabilities not related to the County’s capital assets and are not expected to be repaid from
current resources. These long-term liabilities, presented in Note 8, are funded annually within the funds.
32

Management’s Discussion and Analysis (Unaudited) (Continued)
County of Broome
Condensed Statement of Activities
Years Ended December 31
(in millions)
2020 2019 2020 2019 2020 2019
Revenues
Program revenues
Charges for services 47.4$ 41.2$ 45.2$ 45.6$ 92.6$ 86.8$
Operating grants 100.3 111.3 19.2 22.3 119.4 133.6
Capital grants 7.4 16.7 - - 7.4 16.7
General
Property taxes 76.7 77.6 - - 76.7 77.6
Sales taxes 137.4 141.3 - - 137.4 141.3
Hotel / motel occupancy tax 1.0 2.1 - - 1.0 2.1
Tobacco settlement 3.3 2.7 - - 3.3 2.7
Investments earnings 0.3 0.8 0.1 0.3 0.3 1.1
Other 14.2 12.7 0.3 0.7 14.6 13.4
Total revenues 387.9 406.5 64.8 69.0 452.7 475.5
Expenses
General government 106.5 105.2 - - 106.5 105.2
Education 19.1 25.8 - - 19.1 25.8
Public safety 50.2 56.5 - - 50.2 56.5
Health 23.3 24.8 - - 23.3 24.8
Transportation 20.7 15.2 - - 20.7 15.2
Economic assistance 141.2 142.1 0.3 0.5 141.5 142.6
Culture and recreation 10.3 8.6 - - 10.3 8.6
Home and community services 3.0 2.3 - - 3.0 2.3
Interest on long-term debt 4.7 5.4 - - 4.7 5.4
Department of transportation - - 14.4 13.1 14.4 13.1
Nursing home - - 31.5 30.6 31.5 30.6
Solid waste management - - 6.5 8.5 6.5 8.5
Airport - - 7.3 8.0 7.3 8.0
Total expenses 379.1 385.9 60.1 60.7 439.2 446.6
Surplus before transfer 8.8 20.7 4.7 8.3 13.5 29.0
Transfers (1.4) (3.3) 1.4 3.3 - -
Changes in net position 7.4 17.4 6.1 11.6 13.5 29.0
Net position - beginning (281.9) (299.3) 29.9 18.3 (252.0) (281.0)
Net position - ending (274.5)$ (281.9)$ 36.0$ 29.9$ (238.5)$ (252.0)$
GovernmentActivitiesActivities
Governmental Business-type Total Primary
33
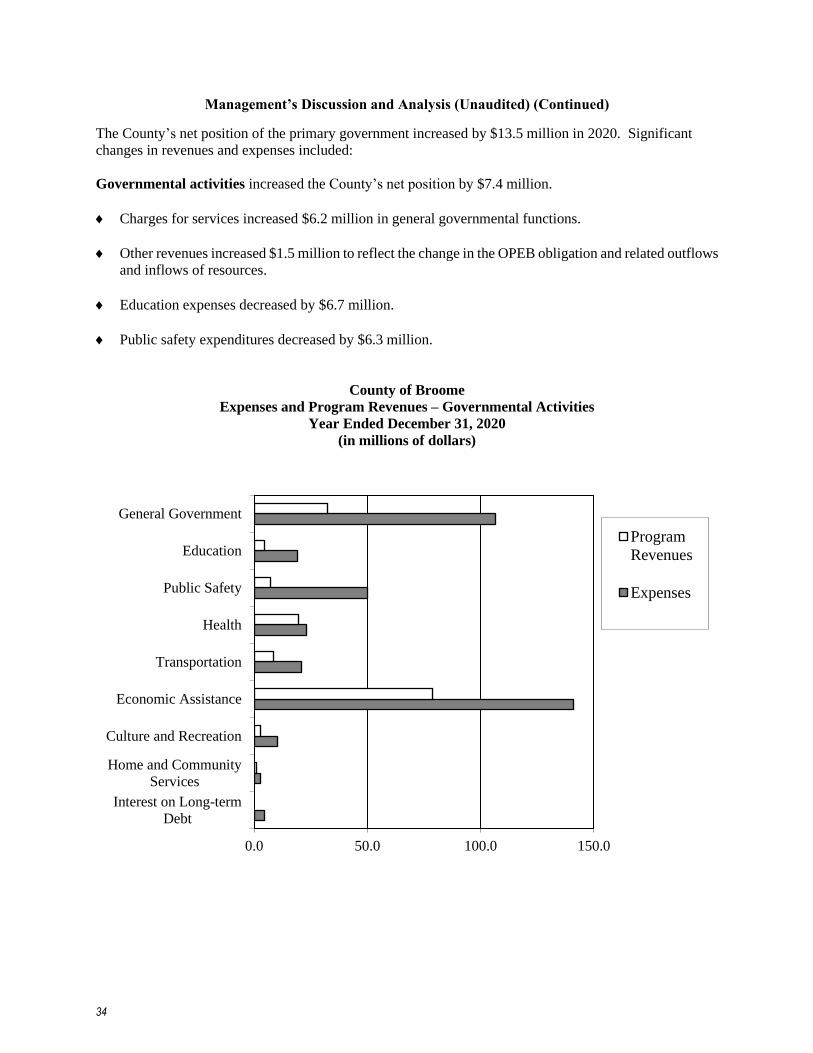
Management’s Discussion and Analysis (Unaudited) (Continued)
The County’s net position of the primary government increased by $13.5 million in 2020. Significant
changes in revenues and expenses included:
Governmental activities increased the County’s net position by $7.4 million.
Charges for services increased $6.2 million in general governmental functions.
Other revenues increased $1.5 million to reflect the change in the OPEB obligation and related outflows
and inflows of resources.
Education expenses decreased by $6.7 million.
Public safety expenditures decreased by $6.3 million.
County of Broome
Expenses and Program Revenues – Governmental Activities
Year Ended December 31, 2020
(in millions of dollars)
0.0 50.0 100.0 150.0
Interest on Long-term
Debt
Home and Community
Services
Culture and Recreation
Economic Assistance
Transportation
Health
Public Safety
Education
General Government
Program
Revenues
Expenses
34
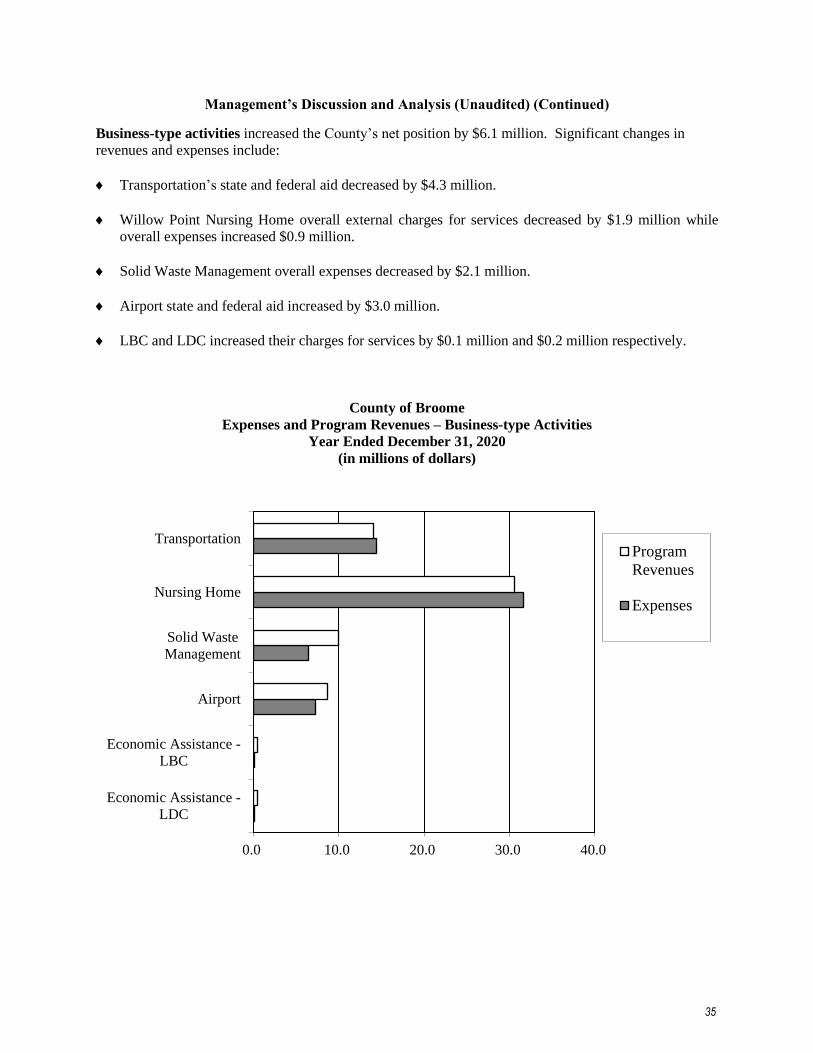
Management’s Discussion and Analysis (Unaudited) (Continued)
Business-type activities increased the County’s net position by $6.1 million. Significant changes in
revenues and expenses include:
Transportation’s state and federal aid decreased by $4.3 million.
Willow Point Nursing Home overall external charges for services decreased by $1.9 million while
overall expenses increased $0.9 million.
Solid Waste Management overall expenses decreased by $2.1 million.
Airport state and federal aid increased by $3.0 million.
LBC and LDC increased their charges for services by $0.1 million and $0.2 million respectively.
County of Broome
Expenses and Program Revenues – Business-type Activities
Year Ended December 31, 2020
(in millions of dollars)
0.0 10.0 20.0 30.0 40.0
Economic Assistance -
LDC
Economic Assistance -
LBC
Airport
Solid Waste
Management
Nursing Home
TransportationProgram
Revenues
Expenses
35

Management’s Discussion and Analysis (Unaudited) (Continued)
Financial Analysis of the County’s Funds
As noted earlier the County uses fund accounting to ensure and demonstrate compliance with finance-
related legal requirements.
Governmental funds focus on providing information on near-term inflows and outflows of expendable
resources as well as what expendable resources remain to fund future activities. Such information may be
useful in evaluating the County’s near-term financial requirements. Unassigned fund balance may serve as
a useful measure of the County’s net resources available for spending at the end of the fiscal year.
At the end of fiscal year 2020 the County’s major governmental funds reported combined fund balances of
($13.2) million, a decrease of $0.9 million from the prior year. Excluding the effects on the capital projects
fund deficit, $18.2 million constitutes assigned and unassigned fund balance, which is available for
spending at the County’s discretion. The remainder of the fund balance is not available for spending because
it is nonspendable, $2.9 million, or restricted, $12.0 million.
36
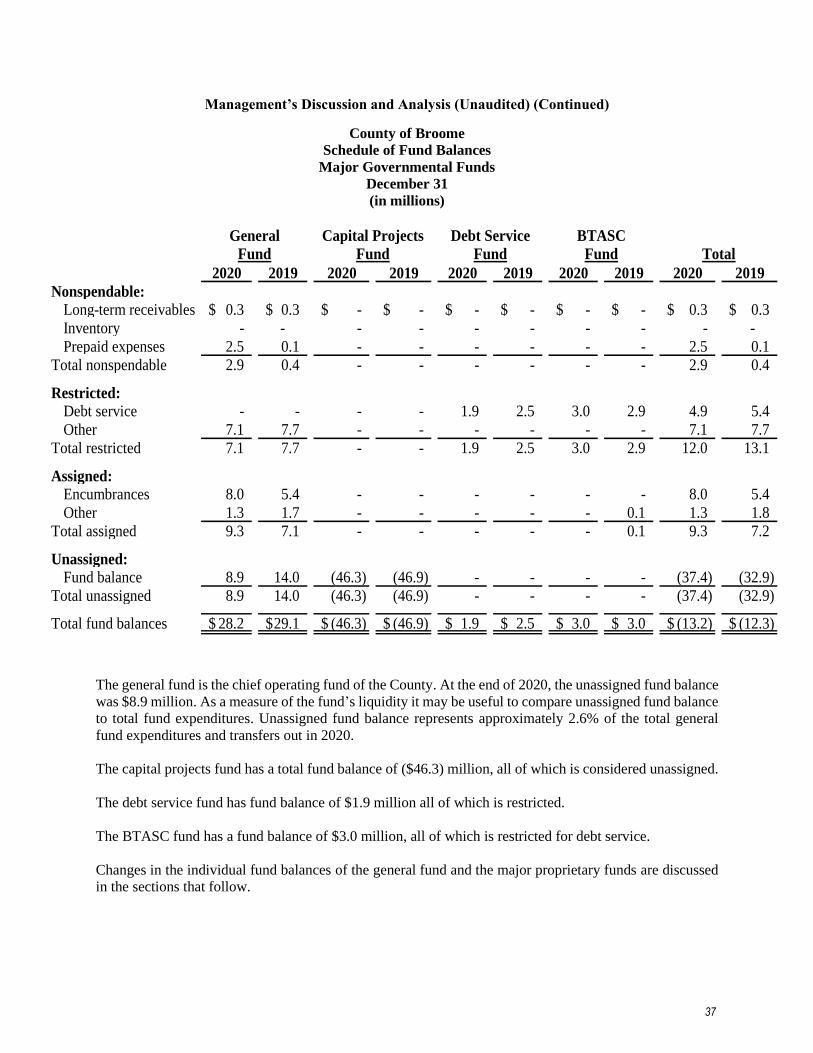
Management’s Discussion and Analysis (Unaudited) (Continued)
County of Broome
Schedule of Fund Balances
Major Governmental Funds
December 31
(in millions)
2020 2019 2020 2019 2020 2019 2020 2019 2020 2019
Nonspendable:
Long-term receivables 0.3$ 0.3$ -$ -$ -$ -$ -$ -$ 0.3$ 0.3$
Inventory - - - - - - - - - -
Prepaid expenses 2.5 0.1 - - - - - - 2.5 0.1
Total nonspendable 2.9 0.4 - - - - - - 2.9 0.4
Restricted:
Debt service - - - - 1.9 2.5 3.0 2.9 4.9 5.4
Other 7.1 7.7 - - - - - - 7.1 7.7
Total restricted 7.1 7.7 - - 1.9 2.5 3.0 2.9 12.0 13.1
Assigned:
Encumbrances 8.0 5.4 - - - - - - 8.0 5.4
Other 1.3 1.7 - - - - - 0.1 1.3 1.8
Total assigned 9.3 7.1 - - - - - 0.1 9.3 7.2
Unassigned:
Fund balance 8.9 14.0 (46.3) (46.9) - - - - (37.4) (32.9)
Total unassigned 8.9 14.0 (46.3) (46.9) - - - - (37.4) (32.9)
Total fund balances 28.2$ 29.1$ (46.3)$ (46.9)$ 1.9$ 2.5$ 3.0$ 3.0$ (13.2)$ (12.3)$
General Capital Projects
TotalFund Fund
Debt Service
Fund
BTASC
Fund
The general fund is the chief operating fund of the County. At the end of 2020, the unassigned fund balance
was $8.9 million. As a measure of the fund’s liquidity it may be useful to compare unassigned fund balance
to total fund expenditures. Unassigned fund balance represents approximately 2.6% of the total general
fund expenditures and transfers out in 2020.
The capital projects fund has a total fund balance of ($46.3) million, all of which is considered unassigned.
The debt service fund has fund balance of $1.9 million all of which is restricted.
The BTASC fund has a fund balance of $3.0 million, all of which is restricted for debt service.
Changes in the individual fund balances of the general fund and the major proprietary funds are discussed
in the sections that follow.
37
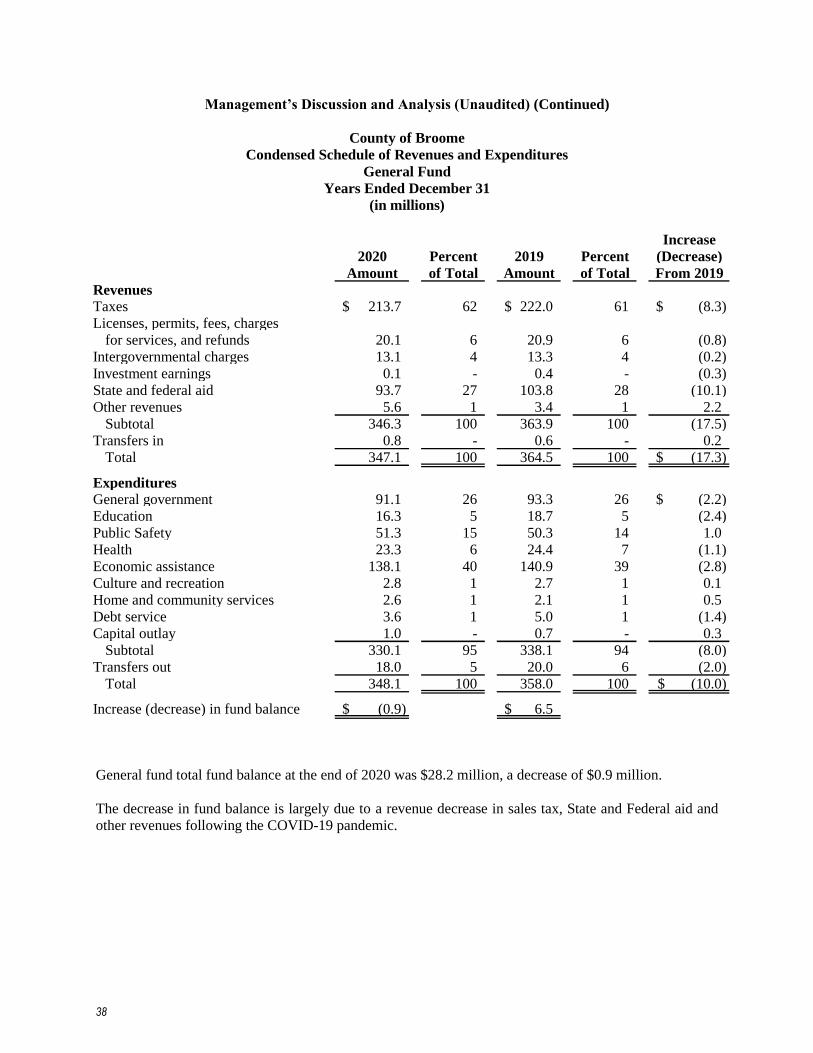
Management’s Discussion and Analysis (Unaudited) (Continued)
County of Broome
Condensed Schedule of Revenues and Expenditures
General Fund
Years Ended December 31
(in millions)
Increase
2020 Percent 2019 Percent (Decrease)
Amount of Total Amount of Total From 2019
Revenues
Taxes 213.7$ 62 222.0$ 61 (8.3)$
Licenses, permits, fees, charges
for services, and refunds 20.1 6 20.9 6 (0.8)
Intergovernmental charges 13.1 4 13.3 4 (0.2)
Investment earnings 0.1 - 0.4 - (0.3)
State and federal aid 93.7 27 103.8 28 (10.1)
Other revenues 5.6 1 3.4 1 2.2
Subtotal 346.3 100 363.9 100 (17.5)
Transfers in 0.8 - 0.6 - 0.2
Total 347.1 100 364.5 100 (17.3)$
Expenditures
General government 91.1 26 93.3 26 (2.2)$
Education 16.3 5 18.7 5 (2.4)
Public Safety 51.3 15 50.3 14 1.0
Health 23.3 6 24.4 7 (1.1)
Economic assistance 138.1 40 140.9 39 (2.8)
Culture and recreation 2.8 1 2.7 1 0.1
Home and community services 2.6 1 2.1 1 0.5
Debt service 3.6 1 5.0 1 (1.4)
Capital outlay 1.0 - 0.7 - 0.3
Subtotal 330.1 95 338.1 94 (8.0)
Transfers out 18.0 5 20.0 6 (2.0)
Total 348.1 100 358.0 100 (10.0)$
Increase (decrease) in fund balance (0.9)$ 6.5$
General fund total fund balance at the end of 2020 was $28.2 million, a decrease of $0.9 million.
The decrease in fund balance is largely due to a revenue decrease in sales tax, State and Federal aid and
other revenues following the COVID-19 pandemic.
38
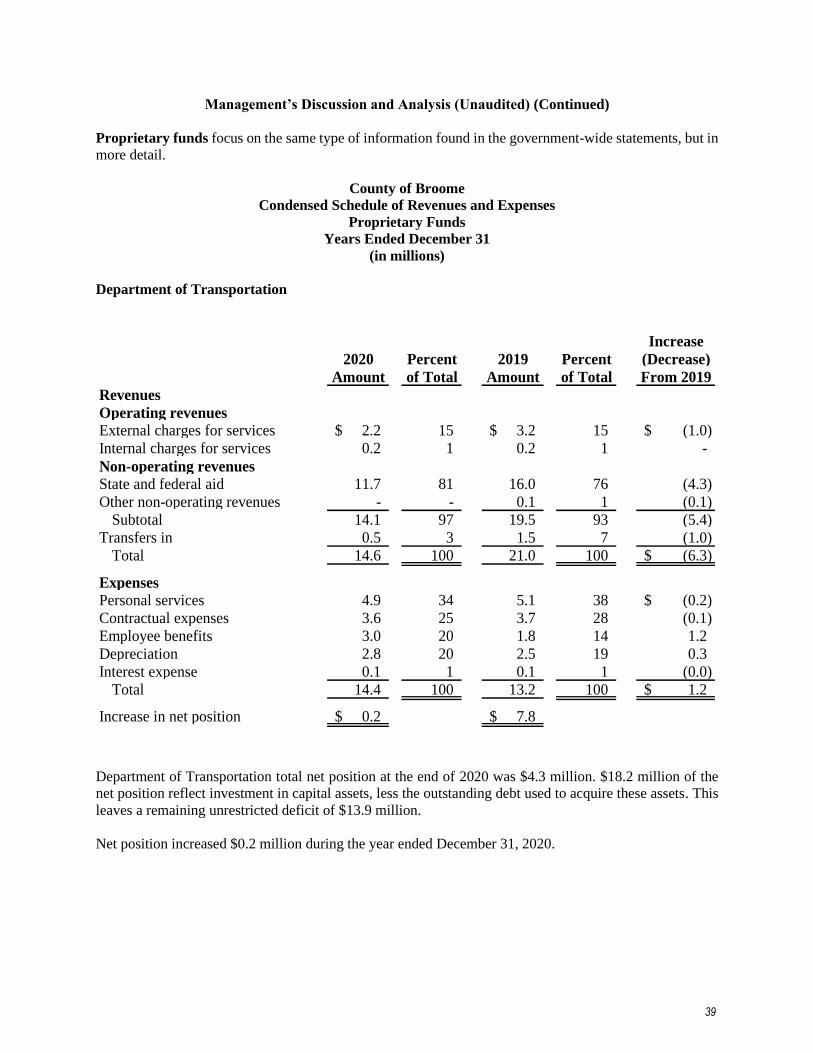
Management’s Discussion and Analysis (Unaudited) (Continued)
Proprietary funds focus on the same type of information found in the government-wide statements, but in
more detail.
County of Broome
Condensed Schedule of Revenues and Expenses
Proprietary Funds
Years Ended December 31
(in millions)
Department of Transportation
Increase
2020 Percent 2019 Percent (Decrease)
Amount of Total Amount of Total From 2019
Revenues
Operating revenues
External charges for services 2.2$ 15 3.2$ 15 (1.0)$
Internal charges for services 0.2 1 0.2 1 -
Non-operating revenues
State and federal aid 11.7 81 16.0 76 (4.3)
Other non-operating revenues - - 0.1 1 (0.1)
Subtotal 14.1 97 19.5 93 (5.4)
Transfers in 0.5 3 1.5 7 (1.0)
Total 14.6 100 21.0 100 (6.3)$
Expenses
Personal services 4.9 34 5.1 38 (0.2)$
Contractual expenses 3.6 25 3.7 28 (0.1)
Employee benefits 3.0 20 1.8 14 1.2
Depreciation 2.8 20 2.5 19 0.3
Interest expense 0.1 1 0.1 1 (0.0)
Total 14.4 100 13.2 100 1.2$
Increase in net position 0.2$ 7.8$
Department of Transportation total net position at the end of 2020 was $4.3 million. $18.2 million of the
net position reflect investment in capital assets, less the outstanding debt used to acquire these assets. This
leaves a remaining unrestricted deficit of $13.9 million.
Net position increased $0.2 million during the year ended December 31, 2020.
39
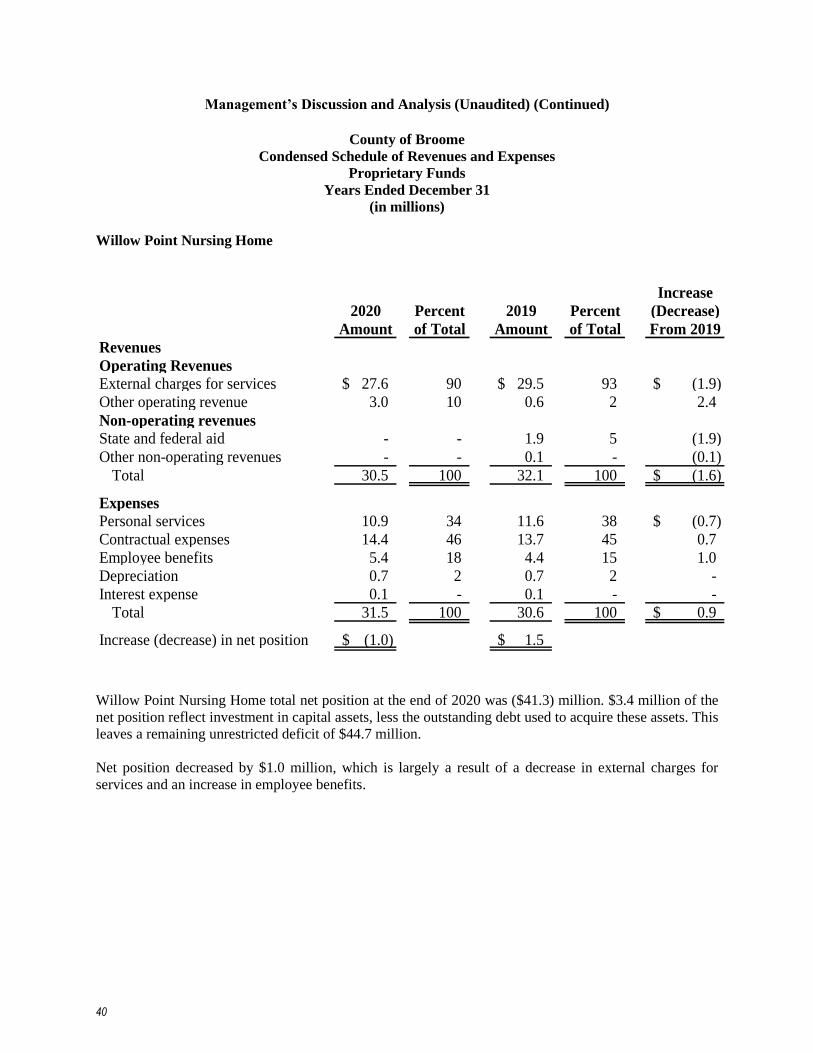
Management’s Discussion and Analysis (Unaudited) (Continued)
County of Broome
Condensed Schedule of Revenues and Expenses
Proprietary Funds
Years Ended December 31
(in millions)
Willow Point Nursing Home
Increase
2020 Percent 2019 Percent (Decrease)
Amount of Total Amount of Total From 2019
Revenues
Operating Revenues
External charges for services 27.6$ 90 29.5$ 93 (1.9)$
Other operating revenue 3.0 10 0.6 2 2.4
Non-operating revenues
State and federal aid - - 1.9 5 (1.9)
Other non-operating revenues - - 0.1 - (0.1)
Total 30.5 100 32.1 100 (1.6)$
Expenses
Personal services 10.9 34 11.6 38 (0.7)$
Contractual expenses 14.4 46 13.7 45 0.7
Employee benefits 5.4 18 4.4 15 1.0
Depreciation 0.7 2 0.7 2 -
Interest expense 0.1 - 0.1 - -
Total 31.5 100 30.6 100 0.9$
Increase (decrease) in net position (1.0)$ 1.5$
Willow Point Nursing Home total net position at the end of 2020 was ($41.3) million. $3.4 million of the
net position reflect investment in capital assets, less the outstanding debt used to acquire these assets. This
leaves a remaining unrestricted deficit of $44.7 million.
Net position decreased by $1.0 million, which is largely a result of a decrease in external charges for
services and an increase in employee benefits.
40

Management’s Discussion and Analysis (Unaudited) (Continued)
County of Broome
Condensed Schedule of Revenues and Expenses
Proprietary Funds
Years Ended December 31
(in millions)
Solid Waste Management
Increase
2020 Percent 2019 Percent (Decrease)
Amount of Total Amount of Total From 2019
Revenues
Operating Revenues
External charges for services 9.1$ 90 9.2$ 92 (0.1)$
Internal charges for services 0.1 1 0.2 2 (0.1)
Other operating revenue 0.8 7 0.2 2 0.6
Non-operating revenues
State and federal aid 0.1 1 0.1 1 -
Interest revenue - - 0.2 2 (0.2)
Other non-operating revenues 0.1 1 0.1 1 -
Total 10.1 100 10.0 100 0.1$
Expenses
Personal services 1.2 18 1.1 13 0.1$
Contractual expenses 0.9 14 3.5 42 (2.6)
Employee benefits 0.6 10 0.4 4 0.2
Depreciation 3.2 50 2.9 34 0.3
Interest expense 0.5 8 0.6 7 (0.1)
Total 6.4 100 8.4 100 (2.1)$
Increase in net position 3.8$ 1.6$
Solid Waste Management total net position at the end of 2020 was $28.2 million. $25.5 million of the net
position reflect investment in capital assets, less the outstanding debt used to acquire these assets. This
leaves a remaining unrestricted net position of $2.7 million.
Net position increased by $3.8 million due to a decrease in contracted costs.
41

Management’s Discussion and Analysis (Unaudited) (Continued)
County of Broome
Condensed Schedule of Revenues and Expenses
Proprietary Funds
Years Ended December 31
(in millions)
Aviation
Increase
2020 Percent 2019 Percent (Decrease)
Amount of Total Amount of Total From 2019
Revenues
Operating revenues
External charges for services 1.3$ 14 1.8$ 21 (0.5)$
Non-operating revenues
State and federal aid 7.3 75 4.3 51 3.0
Other non-operating revenues 0.2 2 0.5 6 (0.3)
Subtotal 8.9 91 6.6 78 2.3
Transfers in 0.9 9 1.8 22 (0.9)
Total 9.8 100 8.4 100 1.4$
Expenses
Personal services 0.9 13 0.9 12 -$
Contractual expenses 2.0 28 2.0 25 -
Employee benefits 0.3 4 0.6 8 (0.3)
Depreciation 3.9 53 4.2 53 (0.3)
Interest expense 0.2 2 0.2 2 -
Total 7.3 100 7.9 100 (0.6)$
Increase in net position 2.4$ 0.5$
Aviation total net position at the end of 2020 was $43.4 million. $47.0 million of the net position reflects
investment in capital assets, less the outstanding debt used to acquire these assets. The remaining ($3.6)
million is unrestricted.
Net position increased $2.4 million due to an increase in State and Federal aid.
42
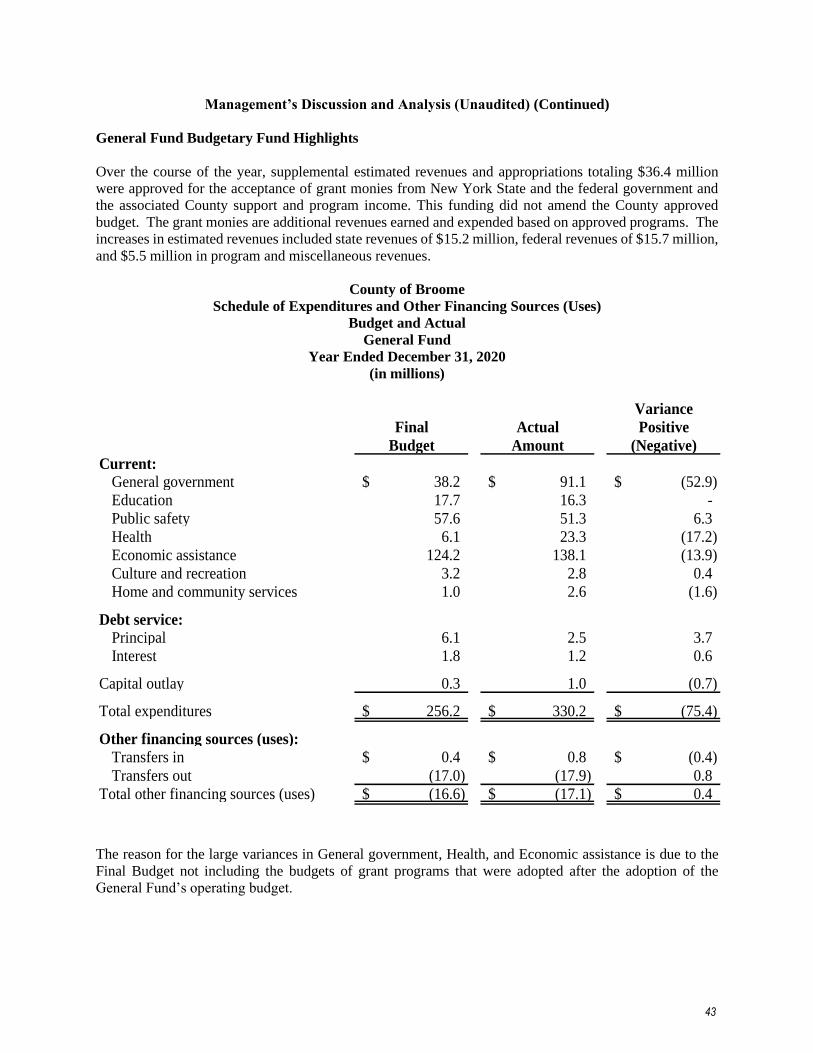
Management’s Discussion and Analysis (Unaudited) (Continued)
General Fund Budgetary Fund Highlights
Over the course of the year, supplemental estimated revenues and appropriations totaling $36.4 million
were approved for the acceptance of grant monies from New York State and the federal government and
the associated County support and program income. This funding did not amend the County approved
budget. The grant monies are additional revenues earned and expended based on approved programs. The
increases in estimated revenues included state revenues of $15.2 million, federal revenues of $15.7 million,
and $5.5 million in program and miscellaneous revenues.
County of Broome
Schedule of Expenditures and Other Financing Sources (Uses)
Budget and Actual
General Fund
Year Ended December 31, 2020
(in millions)
Variance
Final Actual Positive
Budget Amount (Negative)
Current:
General government 38.2$ 91.1$ (52.9)$
Education 17.7 16.3 -
Public safety 57.6 51.3 6.3
Health 6.1 23.3 (17.2)
Economic assistance 124.2 138.1 (13.9)
Culture and recreation 3.2 2.8 0.4
Home and community services 1.0 2.6 (1.6)
Debt service:
Principal 6.1 2.5 3.7
Interest 1.8 1.2 0.6
Capital outlay 0.3 1.0 (0.7)
Total expenditures 256.2$ 330.2$ (75.4)$
Other financing sources (uses):
Transfers in 0.4$ 0.8$ (0.4)$
Transfers out (17.0) (17.9) 0.8
Total other financing sources (uses) (16.6)$ (17.1)$ 0.4$
The reason for the large variances in General government, Health, and Economic assistance is due to the
Final Budget not including the budgets of grant programs that were adopted after the adoption of the
General Fund’s operating budget.
43
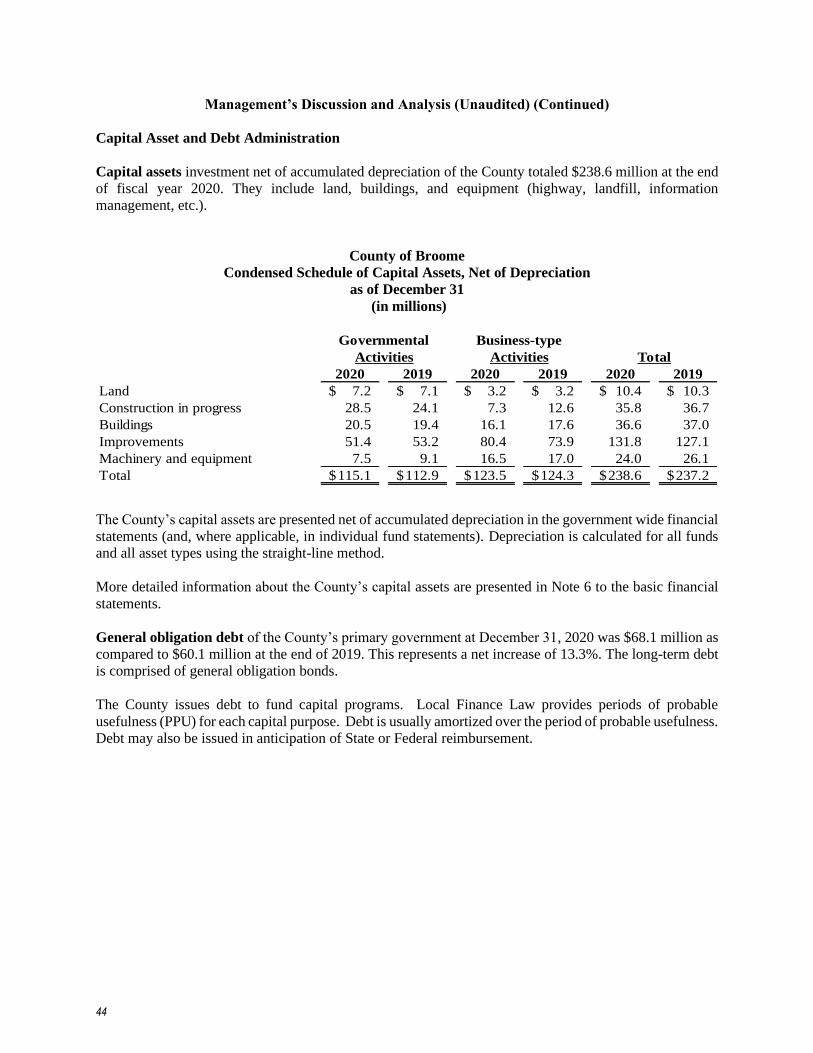
Management’s Discussion and Analysis (Unaudited) (Continued)
Capital Asset and Debt Administration
Capital assets investment net of accumulated depreciation of the County totaled $238.6 million at the end
of fiscal year 2020. They include land, buildings, and equipment (highway, landfill, information
management, etc.).
County of Broome
Condensed Schedule of Capital Assets, Net of Depreciation
as of December 31
(in millions)
2020 2019 2020 2019 2020 2019
Land 7.2$ 7.1$ 3.2$ 3.2$ 10.4$ 10.3$
Construction in progress 28.5 24.1 7.3 12.6 35.8 36.7
Buildings 20.5 19.4 16.1 17.6 36.6 37.0
Improvements 51.4 53.2 80.4 73.9 131.8 127.1
Machinery and equipment 7.5 9.1 16.5 17.0 24.0 26.1
Total 115.1$ 112.9$ 123.5$ 124.3$ 238.6$ 237.2$
Activities Activities Total
Governmental Business-type
The County’s capital assets are presented net of accumulated depreciation in the government wide financial
statements (and, where applicable, in individual fund statements). Depreciation is calculated for all funds
and all asset types using the straight-line method.
More detailed information about the County’s capital assets are presented in Note 6 to the basic financial
statements.
General obligation debt of the County’s primary government at December 31, 2020 was $68.1 million as
compared to $60.1 million at the end of 2019. This represents a net increase of 13.3%. The long-term debt
is comprised of general obligation bonds.
The County issues debt to fund capital programs. Local Finance Law provides periods of probable
usefulness (PPU) for each capital purpose. Debt is usually amortized over the period of probable usefulness.
Debt may also be issued in anticipation of State or Federal reimbursement.
44

Management’s Discussion and Analysis (Unaudited) (Continued)
County of Broome
Condensed Schedule of Outstanding Debt
as of December 31st
(in millions)
2020 2019 2020 2019 2020 2019
General obligation bonds 47.6$ 44.7$ 20.5$ 15.4$ 68.1$ 60.1$
Total 47.6$ 44.7$ 20.5$ 15.4$ 68.1$ 60.1$
Total
Governmental Business-type
Activities Activities
Payments totaling $5.9 million were made in 2020 on serial bonds issued in previous years of which $4.3
million was for governmental activities and $1.6 million for business-type activities.
In December 2013, the Moody’s Rating Report upgraded the County’s outstanding general obligation bond
rating from an A2- rating to an A2 rating with no outlook. In April 2014, Standard & Poor’s upgraded the
County’s outstanding general obligation bond rating to A+ stable from a previous “A” rating. Both ratings
were re-affirmed in January 2019 and April 2017, respectively. In April 2019, Standard & Poor’s changed
the County’s rating from A+ to AA. Additionally, in April 2020, the Moody’s Investors Service has
assigned a MIG 1 rating to Broome County which reflects the long-term credit of Broome County in the
A2 long-term rating
New York State statutes limit the amount of the general obligation debt the County may issue to 7% of the
average full valuation of its taxable real estate for the most recent five-year period. The current debt
limitation for the County is $692,063,441. The County’s current obligations amount to only 19.69% of the
allowable debt limitation.
In April of 2020, the County issued $25,000,000 and $29,720,000 in bond anticipation notes at par value
with interest rates of 2.0% and 3.0% respectively as well as $13,418,000 in federally taxable bond
anticipation notes at par value with an interest rate of 1.75%. The purpose of the notes is to fund various
capital programs including the renovation, repair, and enhancement of County buildings, roads, bridges,
and other facilities.
In December of 2020, the County issued $30,600,000 of tax anticipation notes at an interest rate of 1.5%.
The purpose of the notes is to provide moneys to meet a cash flow deficit expected to occur during the
period the notes are outstanding.
More detailed information about the County’s short-term and long-term liabilities is presented in Notes 7
and 8 to the financial statements.
45

Management’s Discussion and Analysis (Unaudited) (Continued)
Economic Factors and Next Year’s Budget and Rates
The Broome County unemployment rate at December 2020 was 8.7%. This is an increase
from the 2019 rate of 4.7%. At December 2020, New York State and national rates were 10.0%
and 6.7%, respectively.
Contacting the County’s Financial Management
This financial report is designed to provide our citizens, taxpayers, and investors with a general overview
of the County’s finances and to demonstrate the County’s accountability for the monies it administers. For
questions about this report and requests for additional information, contact the Broome County Office of
Management and Budget, Edwin L. Crawford Office Building, P. O. Box 1766, Binghamton, New York,
13902.
46

Financial Statements
47

This page left blank intentionally.
48
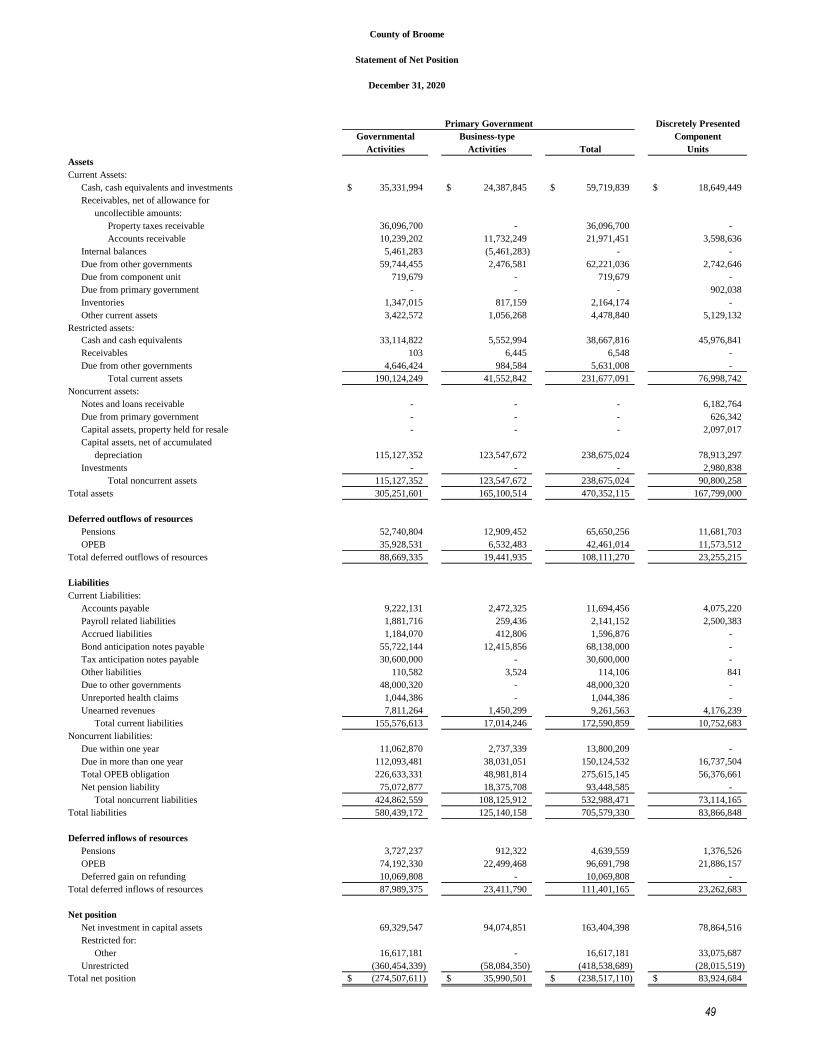
Discretely Presented
Governmental Business-type Component
Activities Activities Total Units
Assets
Current Assets:
Cash, cash equivalents and investments 35,331,994$ 24,387,845$ 59,719,839$ 18,649,449$
Receivables, net of allowance for
uncollectible amounts:
Property taxes receivable 36,096,700 - 36,096,700 -
Accounts receivable 10,239,202 11,732,249 21,971,451 3,598,636
Internal balances 5,461,283 (5,461,283) - -
Due from other governments 59,744,455 2,476,581 62,221,036 2,742,646
Due from component unit 719,679 - 719,679 -
Due from primary government - - - 902,038
Inventories 1,347,015 817,159 2,164,174 -
Other current assets 3,422,572 1,056,268 4,478,840 5,129,132
Restricted assets:
Cash and cash equivalents 33,114,822 5,552,994 38,667,816 45,976,841
Receivables 103 6,445 6,548 -
Due from other governments 4,646,424 984,584 5,631,008 -
Total current assets 190,124,249 41,552,842 231,677,091 76,998,742
Noncurrent assets:
Notes and loans receivable - - - 6,182,764
Due from primary government - - - 626,342
Capital assets, property held for resale - - - 2,097,017
Capital assets, net of accumulated
depreciation 115,127,352 123,547,672 238,675,024 78,913,297
Investments - - - 2,980,838
Total noncurrent assets 115,127,352 123,547,672 238,675,024 90,800,258
Total assets 305,251,601 165,100,514 470,352,115 167,799,000
Deferred outflows of resources
Pensions 52,740,804 12,909,452 65,650,256 11,681,703
OPEB 35,928,531 6,532,483 42,461,014 11,573,512
Total deferred outflows of resources 88,669,335 19,441,935 108,111,270 23,255,215
Liabilities
Current Liabilities:
Accounts payable 9,222,131 2,472,325 11,694,456 4,075,220
Payroll related liabilities 1,881,716 259,436 2,141,152 2,500,383
Accrued liabilities 1,184,070 412,806 1,596,876 -
Bond anticipation notes payable 55,722,144 12,415,856 68,138,000 -
Tax anticipation notes payable 30,600,000 - 30,600,000 -
Other liabilities 110,582 3,524 114,106 841
Due to other governments 48,000,320 - 48,000,320 -
Unreported health claims 1,044,386 - 1,044,386 -
Unearned revenues 7,811,264 1,450,299 9,261,563 4,176,239
Total current liabilities 155,576,613 17,014,246 172,590,859 10,752,683
Noncurrent liabilities:
Due within one year 11,062,870 2,737,339 13,800,209 -
Due in more than one year 112,093,481 38,031,051 150,124,532 16,737,504
Total OPEB obligation 226,633,331 48,981,814 275,615,145 56,376,661
Net pension liability 75,072,877 18,375,708 93,448,585 -
Total noncurrent liabilities 424,862,559 108,125,912 532,988,471 73,114,165
Total liabilities 580,439,172 125,140,158 705,579,330 83,866,848
Deferred inflows of resources
Pensions 3,727,237 912,322 4,639,559 1,376,526
OPEB 74,192,330 22,499,468 96,691,798 21,886,157
Deferred gain on refunding 10,069,808 - 10,069,808 -
Total deferred inflows of resources 87,989,375 23,411,790 111,401,165 23,262,683
Net position
Net investment in capital assets 69,329,547 94,074,851 163,404,398 78,864,516
Restricted for:
Other 16,617,181 - 16,617,181 33,075,687
Unrestricted (360,454,339) (58,084,350) (418,538,689) (28,015,519)
Total net position (274,507,611)$ 35,990,501$ (238,517,110)$ 83,924,684$
County of Broome
Statement of Net Position
December 31, 2020
Primary Government
49

Net
(E
xp
ense
)
Rev
en
ue
an
d
Ch
arg
es f
or
Op
era
tin
g G
ran
tsC
ap
ita
l G
ran
tsC
ha
ng
es i
n
Fu
nct
ion
s/P
rog
ra
ms
Ex
pen
ses
Ser
vic
es
an
d C
on
trib
uti
on
sa
nd
Co
ntr
ibu
tio
ns
Net
Po
siti
on
Pri
ma
ry g
ov
ern
men
t:
Gover
nm
enta
l ac
tivit
ies
Gen
eral
gover
nm
ent
10
6,4
92
,51
3$
26
,95
6,5
61
$
5
,55
5,1
75
$
74
,24
4$
(7
3,9
06
,53
3)
$
Ed
uca
tion
19
,09
6,6
47
1,1
21
,25
6
1
,87
9,7
65
1,4
26
,25
3
(1
4,6
69
,37
3)
Pu
bli
c sa
fety
50
,22
6,5
64
4,4
36
,13
8
2
,69
5,6
37
-
(43
,09
4,7
89
)
Hea
lth
2
3,2
74
,40
4
6
39
,76
9
19
,07
8,3
21
-
(3
,55
6,3
14
)
Tra
nsp
ort
atio
n2
0,6
76
,53
0
1
17
,53
4
2,9
84
,88
2
5
,55
2,1
99
(12
,02
1,9
15
)
Eco
nom
ic a
ssis
tan
ce1
41
,23
1,3
11
1
1,9
90
,02
9
66
,82
7,0
15
-
(6
2,4
14
,26
7)
Cu
ltu
re a
nd
rec
reat
ion
10
,34
3,2
89
2,1
14
,12
4
3
52
,70
4
38
4,3
73
(7
,49
2,0
88
)
Hom
e an
d c
om
mu
nit
y s
ervic
es2
,97
2,8
42
3
0,5
00
90
0,5
14
-
(2
,04
1,8
28
)
Inte
rest
on
long-t
erm
deb
t4
,73
9,0
13
-
-
-
(4
,73
9,0
13
)
Tota
l gover
nm
enta
l ac
tivit
ies
37
9,0
53
,11
3
47
,40
5,9
11
1
00
,27
4,0
13
7,4
37
,06
9
(2
23
,93
6,1
20
)
Bu
sin
ess-
typ
e ac
tivit
ies:
Dep
artm
ent
of
tran
sport
atio
n1
4,4
45
,27
0
2
,40
9,9
85
11
,72
4,1
16
-
(3
11
,16
9)
Nu
rsin
g h
om
e3
1,6
46
,45
2
3
0,6
10
,64
0
-
-
(1,0
35
,81
2)
Soli
d w
aste
man
agem
ent
6,4
12
,27
4
9,9
27
,08
0
1
12
,43
7
-
3,6
27
,24
3
Air
port
7,3
09
,54
9
1,3
21
,59
3
7
,32
8,9
73
-
1,3
41
,01
7
Eco
nom
ic a
ssis
tan
ce -
Loca
l D
evel
op
men
t C
orp
ora
tion
14
9,6
65
4
49
,67
5
-
-
30
0,0
10
Eco
nom
ic a
ssis
tan
ce -
Lan
d B
ank
Corp
ora
tion
18
0,6
52
4
78
,35
1
-
-
29
7,6
99
Tota
l b
usi
nes
s-ty
pe
acti
vit
ies
60
,14
3,8
62
45
,19
7,3
24
1
9,1
65
,52
6
-
4,2
18
,98
8
Tota
l p
rim
ary g
over
nm
ent
43
9,1
96
,97
5$
92
,60
3,2
35
$
1
19
,43
9,5
39
$
7,4
37
,06
9$
(2
19
,71
7,1
32
)$
Dis
cre
tely
Pre
sen
ted
Co
mp
on
ent
un
its:
Ed
uca
tion
69
,32
9,5
61
37
,67
4,0
58
3
5,8
28
,71
1
-
4,1
73
,20
8
Eco
nom
ic a
ssis
tan
ce1
,94
7,5
06
7
17
,16
9
16
6,6
68
-
(1
,06
3,6
69
)
Hom
e an
d c
om
mu
nit
y s
ervic
es4
21
,64
6
93
,84
2
3
27
,91
1
-
10
7
T
ota
l d
iscr
etel
y p
rese
nte
d c
om
pon
ent
un
its
71
,69
8,7
13
$
38
,48
5,0
69
$
3
6,3
23
,29
0$
-$
3,1
09
,64
6$
(c
on
tin
ued
)
Co
un
ty o
f B
roo
me
Sta
tem
ent
of
Act
ivit
ies
Fo
r th
e Y
ear E
nd
ed D
ecem
ber
31
, 2
02
0
Pro
gra
m R
even
ues
50
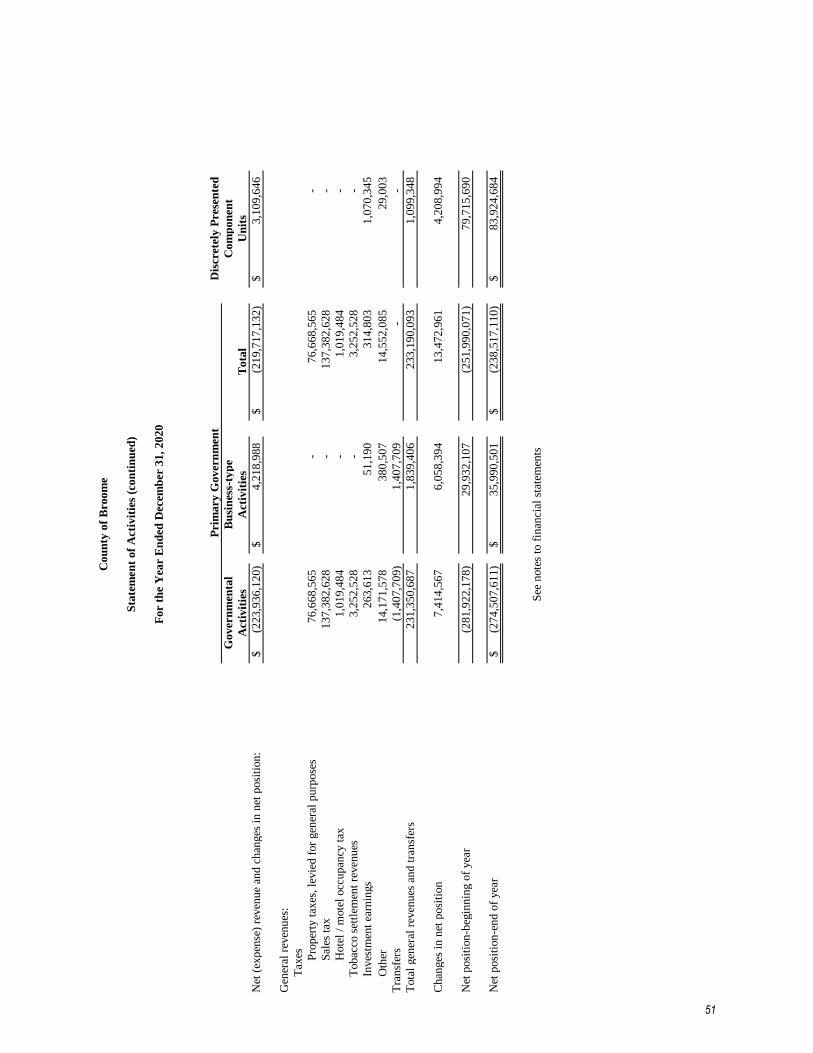
D
iscre
tely
Pre
sen
ted
Go
ver
nm
enta
lB
usi
nes
s-ty
pe
Co
mp
on
ent
Act
ivit
ies
Act
ivit
ies
To
tal
Un
its
Net
(ex
pen
se)
reven
ue
and
ch
anges
in
net
posi
tion
:(2
23
,93
6,1
20
)$
4,2
18
,98
8$
(2
19
,71
7,1
32
)$
3,1
09
,64
6$
Gen
eral
rev
enu
es:
Tax
es Pro
per
ty t
axes
, le
vie
d f
or
gen
eral
pu
rpose
s7
6,6
68
,56
5
-
7
6,6
68
,56
5
-
Sal
es t
ax1
37
,38
2,6
28
-
1
37
,38
2,6
28
-
Hote
l /
mote
l occ
up
ancy
tax
1,0
19
,48
4
-
1,0
19
,48
4
-
Tob
acco
set
tlem
ent
reven
ues
3,2
52
,52
8
-
3,2
52
,52
8
-
Inves
tmen
t ea
rnin
gs
26
3,6
13
5
1,1
90
31
4,8
03
1
,07
0,3
45
Oth
er1
4,1
71
,57
8
3
80
,50
7
14
,55
2,0
85
2
9,0
03
Tra
nsf
ers
(1,4
07
,70
9)
1
,40
7,7
09
-
-
Tota
l gen
eral
rev
enu
es a
nd
tra
nsf
ers
23
1,3
50
,68
7
1,8
39
,40
6
2
33
,19
0,0
93
1,0
99
,34
8
Chan
ges
in
net
posi
tion
7,4
14
,56
7
6,0
58
,39
4
1
3,4
72
,96
1
4,2
08
,99
4
Net
posi
tion
-beg
inn
ing o
f yea
r(2
81
,92
2,1
78
)
29
,93
2,1
07
(2
51
,99
0,0
71
)
79
,71
5,6
90
Net
posi
tion
-en
d o
f yea
r(2
74
,50
7,6
11
)$
35
,99
0,5
01
$
(2
38
,51
7,1
10
)$
83
,92
4,6
84
$
See
note
s to
fin
anci
al s
tate
men
ts
Co
un
ty o
f B
roo
me
Sta
tem
ent
of
Act
ivit
ies
(co
nti
nu
ed)
Fo
r th
e Y
ear E
nd
ed D
ecem
ber
31
, 2
02
0
Pri
ma
ry G
ov
ern
men
t
51

Capital Debt Nonmajor
General Projects Service BTASC Governmental
Fund Fund Fund Fund Funds Total
Assets
Cash and cash equivalents 12,640,326$ -$ -$ -$ 1,324,051$ 13,964,377$
Receivables:
Property taxes receivable, net 36,096,700 - - - - 36,096,700
Accounts receivable 3,318,987 - - - 15,940 3,334,927
Due from other funds 8,873,894 - 823 - 2,189,984 11,064,701
Due from other governments 53,400,773 3,122,905 - - 1,703,158 58,226,836
Inventory 302,815 - - - 1,025,942 1,328,757
Other assets 2,548,052 - - 3,983 173,636 2,725,671
Restricted assets:
Cash, cash equivalents and investments 12,164,473 10,486,837 1,915,975 2,987,984 437,461 27,992,730
Receivables - - - - 103 103
Due from other governments 1,722,067 - - - 124,357 1,846,424
Total assets 131,068,087$ 13,609,742$ 1,916,798$ 2,991,967$ 6,994,632$ 156,581,226$
Liabilities, deferred inflows of resources and fund balances (deficit)
Liabilities:
Accounts payable 7,050,043$ 1,217,074$ -$ -$ 411,912$ 8,679,029$
Payroll related liabilities 1,775,776 - - - 97,855 1,873,631
Due to other funds - 3,478,418 - - 1,875,000 5,353,418
Due to other governments 47,951,445 - - - 280 47,951,725
Bond anticipation notes payable - 55,210,939 - - - 55,210,939
Tax anticipation notes payable 30,600,000 - - - - 30,600,000
Unearned revenues 5,054,939 - - - 528,202 5,583,141
Total liabilities 92,432,203 59,906,431$ - - 2,913,249 155,251,883
Deferred inflows of resources:
Unavailable property tax revenue 10,454,046 - - - - 10,454,046
Prepayment of events/membership - - - - 24,079 24,079
Total deferred inflows of resources 10,454,046 - - - 24,079 10,478,125
Fund balances:
Nonspendable 2,850,867 - - - 1,199,578 4,050,445
Restricted 7,109,534 - 1,916,798 2,991,967 7,875 12,026,174
Assigned 9,315,857 - - - 3,003,492 12,319,349
Unassigned 8,905,580 (46,296,689) - - (153,641) (37,544,750)
Total fund balances (deficits) 28,181,838 (46,296,689) 1,916,798 2,991,967 4,057,304 (9,148,782)
Total liabilities, deferred inflows of resources and fund balances (deficit) 131,068,087$ 13,609,742$ 1,916,798$ 2,991,967$ 6,994,632$ 156,581,226$
County of Broome
Balance Sheet
Governmental Funds
December 31, 2020
See notes to financial statements
52

Total fund balances (deficits) - governmental funds (9,148,782)$
Capital assets used in governmental activities are not financial resources and therefore not
reported in the funds. 114,931,471
Certain of the County's revenues related to tobacco settlement are not available to pay for current
period expenditures and are therefore deferred in the funds. 2,800,000
Deferred outflows and inflows of resources related to pension are applicable to future periods and, therefore are not
reported in the fund statements.
Deferred outflows related to employer contributions 8,150,610$
Deferred outflows related to experience, change of assumption, and investment earnings 44,590,194
Deferred inflows related to pension plans (3,727,237) 49,013,567
Deferred outflows and inflows of resources related to OPEB are applicable to future
periods and, therefore, are not reported to the funds:
Deferred outflows related to OPEB liability 35,775,066$
Deferred inflows related to OPEB liability (73,754,228) (37,979,162)
Other receivables not currently available are reported as unearned revenues. 8,832,696
Internal service funds are used by management to charge the costs of certain activities, such
as fleet services and insurances to individual funds. This portion of assets and liabilities
of the internal service funds are included in governmental activities in the statement of net position. 19,227,762
Long-term liabilities are not due and payable in the current period and therefore are not reported in
the funds ¹ (422,185,163)
Net position of governmental activities (274,507,611)$
General obligation bonds 47,263,244$
Asset Backed Bonds - BTASC 52,379,631
Compensated absences 10,785,833
Early retirement incentive costs 535,005
Obligations under capital leases 1,120,956
Total OPEB obligation 222,751,770
Due to NYS ERS 982,808
Net pension liability 75,072,877
Accrual of interest on long-term debt 1,221,360
Accrual of MBBA fees 3,455
Accrual of MBBA subsidy revenue (53,196)
Deferral of gain on refunding 10,069,808
Deferral of charge back to SUNY Broome 51,612
Net adjustments 422,185,163$
¹ Long-term liabilites applicable to the County's governmental activities are not due and payable in the current period and accordingly are not reported as fund liabilities. All liabilities, both current and long-term, are
Balances of the long-term liabilities at December 31, 2020 were:
County of Broome
Reconciliation of the Governmental Funds Balance Sheet to the Statement of Net Position of Governmental Activities
December 31, 2020
53

Capital Debt Nonmajor
General Projects Service BTASC Governmental
Fund Fund Fund Fund Funds Total
Revenues
Real property taxes 68,973,872$ -$ -$ -$ -$ 68,973,872$
Other real property revenue 7,296,423 - - - - 7,296,423
Sales and use taxes 137,382,628 - - - - 137,382,628
Licenses, permits, fees, charges for services and refunds 20,139,233 - - - 1,971,454 22,110,687
Intergovernmental charges 13,095,102 - - - 662,575 13,757,677
Tobacco settlement revenue - - - 3,152,528 - 3,152,528
Investment earnings 157,401 27,055 2,142 25,952 14,422 226,972
State and federal aid 93,695,127 7,437,069 - - 5,079,833 106,212,029
Other revenues 5,634,501 45,606 663,813 - 54,603 6,398,523
Total revenues 346,374,287 7,509,730 665,955 3,178,480 7,782,887 365,511,339
Expenditures
Current:
General government 91,085,447 - - 42,182 - 91,127,629
Education 16,321,660 - - - - 16,321,660
Public safety 51,347,137 - - - - 51,347,137
Health 23,326,655 - - - - 23,326,655
Transportation - - - - 8,306,951 8,306,951
Economic assistance 138,076,475 - - - 2,803,179 140,879,654
Culture and recreation 2,821,156 - - - 4,355,713 7,176,869
Home and community services 2,585,131 - - - - 2,585,131
Debt service:
Principal 2,461,408 165,145 - 905,000 2,044,953 5,576,506
Interest 1,197,602 6,513 - 2,282,872 1,293,468 4,780,455
Capital outlay 965,681 19,887,370 - - 5,789 20,858,840
Total expenditures 330,188,352 20,059,028 - 3,230,054 18,810,053 372,287,487
Excess (deficiency) of revenues over expenditures 16,185,935 (12,549,298) 665,955 (51,574) (11,027,166) (6,776,148)
Other financing sources (uses)
Proceeds from bond issuance - 7,183,633 - - - 7,183,633
Proceeds from capital leases - 759,572 - - - 759,572
Transfers in 769,464 5,749,905 25,413 - 13,424,771 19,969,553
Transfers out (17,872,268) (518,285) (1,278,878) - (1,707,831) (21,377,262)
Total other financing sources and uses (17,102,804) 13,174,825 (1,253,465) - 11,716,940 6,535,496
Net changes in fund balances (916,869) 625,527 (587,510) (51,574) 689,774 (240,652)
Fund balances(deficits)-beginning of year 29,098,707 (46,922,216) 2,504,308 3,043,541 3,367,530 (8,908,130)
Fund balances(deficits)-end of year 28,181,838$ (46,296,689)$ 1,916,798$ 2,991,967$ 4,057,304$ (9,148,782)$
County of Broome
Statement of Revenues, Expenditures, and Changes in Fund Balances (Deficits)
Governmental Funds
For the Year Ended December 31, 2020
See notes to financial statements
54
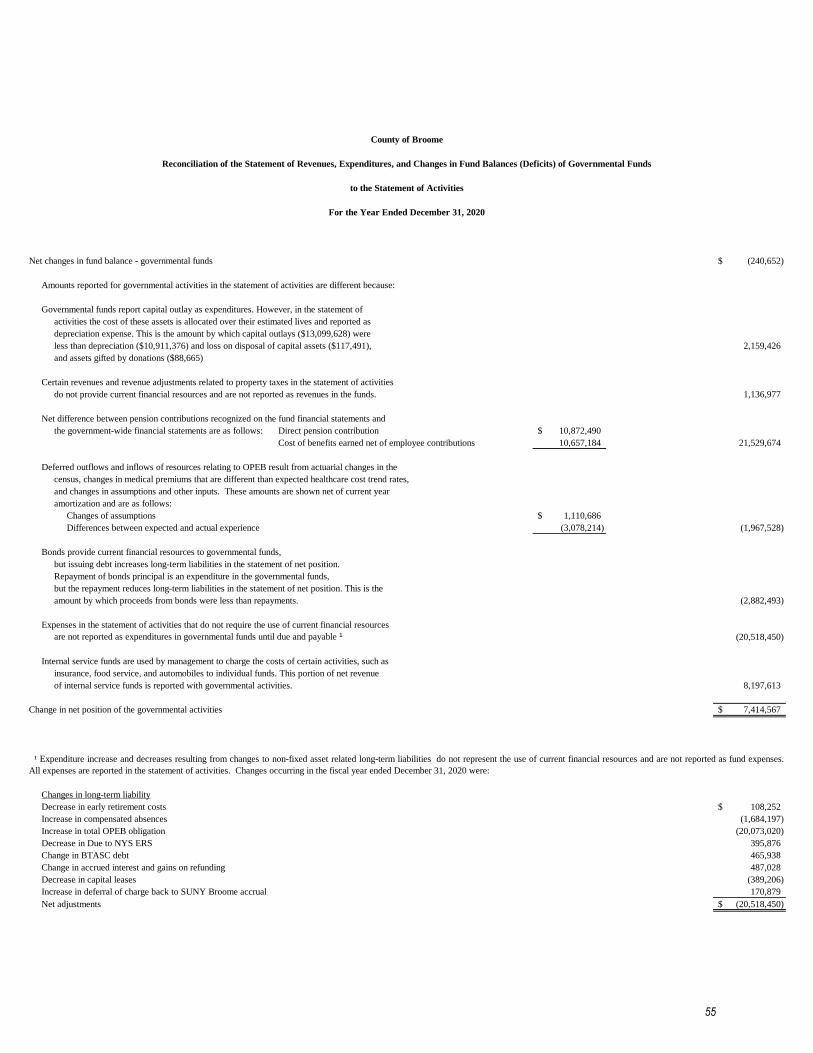
Net changes in fund balance - governmental funds (240,652)$
Amounts reported for governmental activities in the statement of activities are different because:
Governmental funds report capital outlay as expenditures. However, in the statement of
activities the cost of these assets is allocated over their estimated lives and reported as
depreciation expense. This is the amount by which capital outlays ($13,099,628) were
less than depreciation ($10,911,376) and loss on disposal of capital assets ($117,491), 2,159,426
and assets gifted by donations ($88,665)
Certain revenues and revenue adjustments related to property taxes in the statement of activities
do not provide current financial resources and are not reported as revenues in the funds. 1,136,977
Net difference between pension contributions recognized on the fund financial statements and
the government-wide financial statements are as follows: Direct pension contribution 10,872,490$
Cost of benefits earned net of employee contributions 10,657,184 21,529,674
Deferred outflows and inflows of resources relating to OPEB result from actuarial changes in the
census, changes in medical premiums that are different than expected healthcare cost trend rates,
and changes in assumptions and other inputs. These amounts are shown net of current year
amortization and are as follows:
Changes of assumptions 1,110,686$
Differences between expected and actual experience (3,078,214) (1,967,528)
Bonds provide current financial resources to governmental funds,
but issuing debt increases long-term liabilities in the statement of net position.
Repayment of bonds principal is an expenditure in the governmental funds,
but the repayment reduces long-term liabilities in the statement of net position. This is the
amount by which proceeds from bonds were less than repayments. (2,882,493)
Expenses in the statement of activities that do not require the use of current financial resources
are not reported as expenditures in governmental funds until due and payable ¹ (20,518,450)
Internal service funds are used by management to charge the costs of certain activities, such as
insurance, food service, and automobiles to individual funds. This portion of net revenue
of internal service funds is reported with governmental activities. 8,197,613
Change in net position of the governmental activities 7,414,567$
Changes in long-term liability
Decrease in early retirement costs 108,252$
Increase in compensated absences (1,684,197)
Increase in total OPEB obligation (20,073,020)
Decrease in Due to NYS ERS 395,876
Change in BTASC debt 465,938
Change in accrued interest and gains on refunding 487,028
Decrease in capital leases (389,206)
Increase in deferral of charge back to SUNY Broome accrual 170,879
Net adjustments (20,518,450)$
For the Year Ended December 31, 2020
¹ Expenditure increase and decreases resulting from changes to non-fixed asset related long-term liabilities do not represent the use of current financial resources and are not reported as fund expenses.
All expenses are reported in the statement of activities. Changes occurring in the fiscal year ended December 31, 2020 were:
County of Broome
Reconciliation of the Statement of Revenues, Expenditures, and Changes in Fund Balances (Deficits) of Governmental Funds
to the Statement of Activities
55

This page left blank intentionally.
56

GAAP to Actual Variance with
Budgetary Amounts Final Budget
Original Final Basis Budgetary Favorable
Budget Budget Actual Conversion Basis (Unfavorable)
Revenues
Real property taxes 71,818,797$ 71,818,797$ 68,973,872$ -$ 68,973,872$ (2,844,925)$
Other real property revenue 8,233,765 8,233,765 7,296,423 - 7,296,423 (937,342)
Sales and use taxes 90,405,571 90,405,571 137,382,628 (51,518,486) 85,864,142 (4,541,429)
Licenses, permits, fees, charges for services
and refunds 17,135,743 17,135,743 20,139,233 - 20,139,233 3,003,490
Intergovernmental charges 10,524,819 10,524,819 13,095,102 - 13,095,102 2,570,283
Investment earnings 341,453 341,453 157,401 - 157,401 (184,052)
State and federal aid 66,679,729 66,679,729 93,695,127 (15,440,504) 78,254,623 11,574,894
Other revenues 4,480,694 5,031,469 5,634,501 - 5,634,501 603,032
Total revenues 269,620,571 270,171,346 346,374,287 (66,958,990) 279,415,297 9,243,951
Expenditures
Current:
General government 37,742,900 38,248,625 91,085,447 (50,084,373) 41,001,074 (2,752,449)
Education 17,466,012 17,701,012 16,321,660 9,414,462 25,736,122 (8,035,110)
Public safety 56,650,849 57,616,068 51,347,137 (10,878) 51,336,259 6,279,809
Health 6,059,831 6,078,360 23,326,655 (2,304,856) 21,021,799 (14,943,439)
Economic assistance 123,342,670 124,167,303 138,076,475 (13,158,500) 124,917,975 (750,672)
Culture and recreation 3,068,014 3,170,153 2,821,156 - 2,821,156 348,997
Home and community services 991,282 1,008,177 2,585,131 (708) 2,584,423 (1,576,246)
Debt service:
Principal 6,067,209 6,067,209 2,461,408 (1,188,588) 1,272,820 4,794,389
Interest 1,814,077 1,814,077 1,197,602 (581,114) 616,488 1,197,589
Capital outlay 117,049 338,114 965,681 - 965,681 (627,567)
Total expenditures 253,319,893 256,209,098 330,188,352 (57,914,555) 272,273,797 (16,064,699)
Excess (deficiency) of revenues over expenditures 16,300,678 13,962,248 16,185,935 (9,044,435) 7,141,500 (6,820,748)
Other financing sources (uses)
Transfers in 373,000 373,000 769,464 - 769,464 396,464
Transfers out (16,673,678) (17,052,803) (17,872,268) 1,637,050 (16,235,218) 817,585
Transfers to component units - - - 7,407,385 7,407,385 7,407,385
Total other financing sources and uses (16,300,678) (16,679,803) (17,102,804) 9,044,435 (8,058,369) 8,621,434
Net changes in fund balance -$ (2,717,555)$ (916,869)$ -$ (916,869)$ 1,800,686$
For the Year Ended December 31, 2020
See notes to financial statements
County of Broome
Statement of Revenues, Expenditures, and Changes in Fund Balance
Budget and Actual - General Fund
57
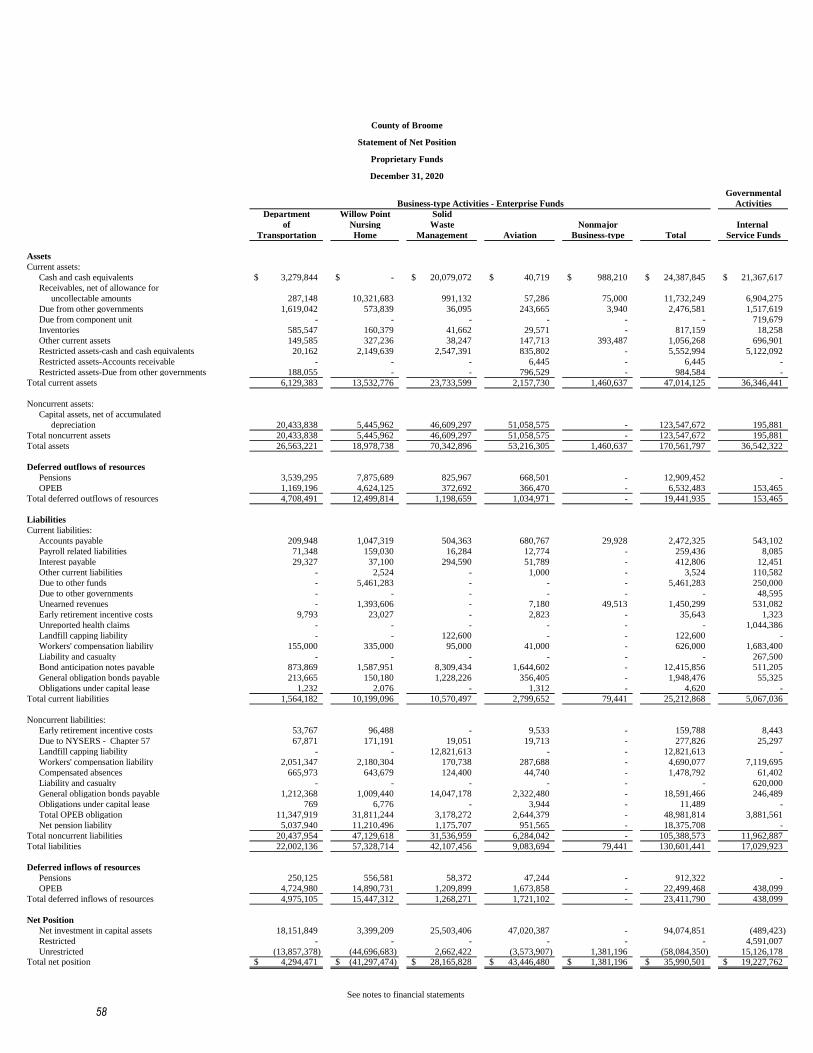
Governmental
Activities
Department Willow Point Solid
of Nursing Waste Nonmajor Internal
Transportation Home Management Aviation Business-type Total Service Funds
Assets
Current assets:
Cash and cash equivalents 3,279,844$ -$ 20,079,072$ 40,719$ 988,210$ 24,387,845$ 21,367,617$
Receivables, net of allowance for
uncollectable amounts 287,148 10,321,683 991,132 57,286 75,000 11,732,249 6,904,275
Due from other governments 1,619,042 573,839 36,095 243,665 3,940 2,476,581 1,517,619
Due from component unit - - - - - - 719,679
Inventories 585,547 160,379 41,662 29,571 - 817,159 18,258
Other current assets 149,585 327,236 38,247 147,713 393,487 1,056,268 696,901
Restricted assets-cash and cash equivalents 20,162 2,149,639 2,547,391 835,802 - 5,552,994 5,122,092
Restricted assets-Accounts receivable - - - 6,445 - 6,445 -
Restricted assets-Due from other governments 188,055 - - 796,529 - 984,584 -
Total current assets 6,129,383 13,532,776 23,733,599 2,157,730 1,460,637 47,014,125 36,346,441
Noncurrent assets:
Capital assets, net of accumulated
depreciation 20,433,838 5,445,962 46,609,297 51,058,575 - 123,547,672 195,881
Total noncurrent assets 20,433,838 5,445,962 46,609,297 51,058,575 - 123,547,672 195,881
Total assets 26,563,221 18,978,738 70,342,896 53,216,305 1,460,637 170,561,797 36,542,322
Deferred outflows of resources
Pensions 3,539,295 7,875,689 825,967 668,501 - 12,909,452 -
OPEB 1,169,196 4,624,125 372,692 366,470 - 6,532,483 153,465
Total deferred outflows of resources 4,708,491 12,499,814 1,198,659 1,034,971 - 19,441,935 153,465
Liabilities
Current liabilities:
Accounts payable 209,948 1,047,319 504,363 680,767 29,928 2,472,325 543,102
Payroll related liabilities 71,348 159,030 16,284 12,774 - 259,436 8,085
Interest payable 29,327 37,100 294,590 51,789 - 412,806 12,451
Other current liabilities - 2,524 - 1,000 - 3,524 110,582
Due to other funds - 5,461,283 - - - 5,461,283 250,000
Due to other governments - - - - - - 48,595
Unearned revenues - 1,393,606 - 7,180 49,513 1,450,299 531,082
Early retirement incentive costs 9,793 23,027 - 2,823 - 35,643 1,323
Unreported health claims - - - - - - 1,044,386
Landfill capping liability - - 122,600 - - 122,600 -
Workers' compensation liability 155,000 335,000 95,000 41,000 - 626,000 1,683,400
Liability and casualty - - - - - - 267,500
Bond anticipation notes payable 873,869 1,587,951 8,309,434 1,644,602 - 12,415,856 511,205
General obligation bonds payable 213,665 150,180 1,228,226 356,405 - 1,948,476 55,325
Obligations under capital lease 1,232 2,076 - 1,312 - 4,620 -
Total current liabilities 1,564,182 10,199,096 10,570,497 2,799,652 79,441 25,212,868 5,067,036
Noncurrent liabilities:
Early retirement incentive costs 53,767 96,488 - 9,533 - 159,788 8,443
Due to NYSERS - Chapter 57 67,871 171,191 19,051 19,713 - 277,826 25,297
Landfill capping liability - - 12,821,613 - - 12,821,613 -
Workers' compensation liability 2,051,347 2,180,304 170,738 287,688 - 4,690,077 7,119,695
Compensated absences 665,973 643,679 124,400 44,740 - 1,478,792 61,402
Liability and casualty - - - - - - 620,000
General obligation bonds payable 1,212,368 1,009,440 14,047,178 2,322,480 - 18,591,466 246,489
Obligations under capital lease 769 6,776 - 3,944 - 11,489 -
Total OPEB obligation 11,347,919 31,811,244 3,178,272 2,644,379 - 48,981,814 3,881,561
Net pension liability 5,037,940 11,210,496 1,175,707 951,565 - 18,375,708 -
Total noncurrent liabilities 20,437,954 47,129,618 31,536,959 6,284,042 - 105,388,573 11,962,887
Total liabilities 22,002,136 57,328,714 42,107,456 9,083,694 79,441 130,601,441 17,029,923
Deferred inflows of resources
Pensions 250,125 556,581 58,372 47,244 - 912,322 -
OPEB 4,724,980 14,890,731 1,209,899 1,673,858 - 22,499,468 438,099
Total deferred inflows of resources 4,975,105 15,447,312 1,268,271 1,721,102 - 23,411,790 438,099
Net Position
Net investment in capital assets 18,151,849 3,399,209 25,503,406 47,020,387 - 94,074,851 (489,423)
Restricted - - - - - - 4,591,007
Unrestricted (13,857,378) (44,696,683) 2,662,422 (3,573,907) 1,381,196 (58,084,350) 15,126,178 Total net position 4,294,471$ (41,297,474)$ 28,165,828$ 43,446,480$ 1,381,196$ 35,990,501$ 19,227,762$
County of Broome
Statement of Net Position
Proprietary Funds
December 31, 2020
See notes to financial statements
Business-type Activities - Enterprise Funds
58
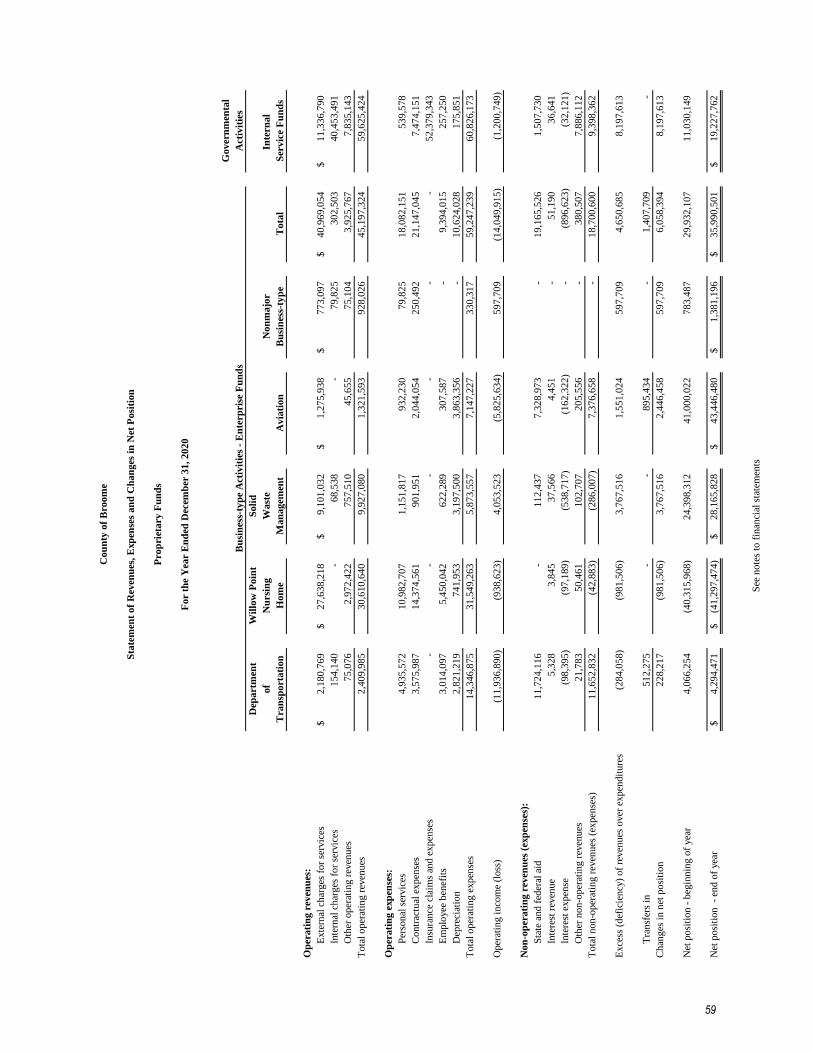
Go
ver
nm
enta
l
Act
ivit
ies
Dep
art
men
tW
illo
w P
oin
tS
oli
d
of
Nu
rsin
gW
ast
eN
on
ma
jor
Inte
rna
l
Tra
nsp
ort
ati
on
Hom
eM
an
agem
ent
Avia
tion
Bu
sin
ess-
typ
eT
ota
lS
erv
ice
Fu
nd
s
Op
erati
ng r
even
ues
:
Exte
rnal
char
ges
for
serv
ices
2,1
80,7
69
$
27,6
38,2
18
$
9,1
01,0
32
$
1,2
75,9
38
$
7
73
,09
7$
40
,96
9,0
54
$
11
,33
6,7
90
$
Inte
rnal
char
ges
for
serv
ices
154,1
40
-
68,5
38
-
7
9,8
25
30
2,5
03
40
,45
3,4
91
Oth
er o
per
atin
g r
even
ues
75,0
76
2,9
72,4
22
757,5
10
45,6
55
7
5,1
04
3,9
25
,76
7
7,8
35
,14
3
Tota
l oper
atin
g r
even
ues
2,4
09,9
85
30,6
10,6
40
9,9
27,0
80
1,3
21,5
93
9
28
,02
6
45
,19
7,3
24
59
,62
5,4
24
Op
erati
ng e
xp
ense
s:
Per
sonal
ser
vic
es4,9
35,5
72
10,9
82,7
07
1,1
51,8
17
932,2
30
79
,82
5
18
,08
2,1
51
53
9,5
78
Contr
actu
al e
xpen
ses
3,5
75,9
87
14,3
74,5
61
901,9
51
2,0
44,0
54
2
50
,49
2
21
,14
7,0
45
7,4
74
,15
1
Insu
rance
cla
ims
and e
xpen
ses
-
-
-
-
-
-
52
,37
9,3
43
Em
plo
yee
ben
efit
s3,0
14,0
97
5,4
50,0
42
622,2
89
307,5
87
-
9,3
94
,01
5
25
7,2
50
Dep
reci
atio
n2,8
21,2
19
741,9
53
3,1
97,5
00
3,8
63,3
56
-
10
,62
4,0
28
17
5,8
51
Tota
l oper
atin
g e
xpen
ses
14,3
46,8
75
31,5
49,2
63
5,8
73,5
57
7,1
47,2
27
3
30
,31
7
59
,24
7,2
39
60
,82
6,1
73
Oper
atin
g i
nco
me
(loss
)(1
1,9
36,8
90)
(9
38,6
23)
4,0
53,5
23
(5
,825,6
34)
59
7,7
09
(14
,04
9,9
15
)
(1,2
00
,74
9)
Non
-op
erati
ng r
even
ues
(ex
pen
ses)
:
Sta
te a
nd f
eder
al a
id11,7
24,1
16
-
112,4
37
7,3
28,9
73
-
19
,16
5,5
26
1,5
07
,73
0
Inte
rest
rev
enue
5,3
28
3,8
45
37,5
66
4,4
51
-
51
,19
0
36
,64
1
Inte
rest
expen
se(9
8,3
95)
(9
7,1
89)
(5
38,7
17)
(162,3
22)
-
(89
6,6
23
)
(32
,12
1)
Oth
er n
on-o
per
atin
g r
even
ues
21,7
83
50,4
61
102,7
07
205,5
56
-
38
0,5
07
7,8
86
,11
2
Tota
l non-o
per
atin
g r
even
ues
(ex
pen
ses)
11,6
52,8
32
(42,8
83)
(2
86,0
07)
7,3
76,6
58
-
18
,70
0,6
00
9,3
98
,36
2
Exce
ss (
def
icie
ncy
) of
reven
ues
over
expen
dit
ure
s(2
84,0
58)
(981,5
06)
3,7
67,5
16
1,5
51,0
24
5
97
,70
9
4,6
50
,68
5
8,1
97
,61
3
Tra
nsf
ers
in512,2
75
-
-
895,4
34
-
1,4
07
,70
9
-
Chan
ges
in n
et p
osi
tion
228,2
17
(981,5
06)
3,7
67,5
16
2,4
46,4
58
5
97
,70
9
6,0
58
,39
4
8,1
97
,61
3
Net
posi
tion -
beg
innin
g o
f yea
r4,0
66,2
54
(4
0,3
15,9
68)
24,3
98,3
12
41,0
00,0
22
78
3,4
87
29
,93
2,1
07
11
,03
0,1
49
Net
posi
tion -
end o
f yea
r4,2
94,4
71
$
(4
1,2
97,4
74)
$
28,1
65,8
28
$
43,4
46,4
80
$
1,3
81
,19
6$
35
,99
0,5
01
$
19
,22
7,7
62
$
Cou
nty
of
Bro
om
e
Sta
tem
ent
of
Rev
enu
es,
Exp
ense
s an
d C
han
ges
in
Net
Posi
tion
Pro
pri
etary
Fu
nd
s
For
the
Yea
r E
nd
ed D
ecem
ber
31,
2020
Bu
sin
ess-
typ
e A
ctiv
itie
s -
En
terp
rise
Fu
nd
s
See
note
s to
fin
anci
al s
tate
men
ts
59
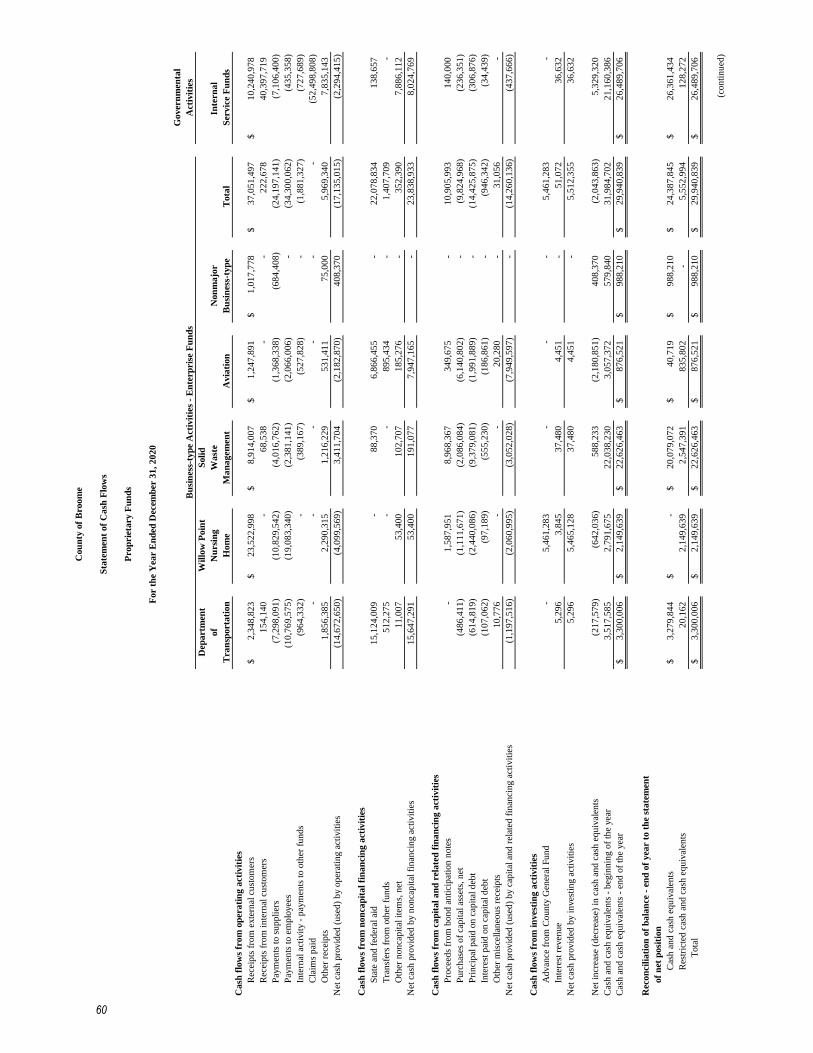
Gover
nm
enta
l
Act
ivit
ies
Dep
art
men
tW
illo
w P
oin
tS
oli
d
of
Nu
rsin
gW
ast
eN
on
ma
jor
Inte
rna
l
Tra
nsp
ort
ati
on
Hom
eM
an
ag
emen
tA
via
tion
Bu
sin
ess-
typ
eT
ota
lS
ervic
e F
un
ds
Ca
sh f
low
s fr
om
op
era
tin
g a
ctiv
itie
s
Rec
eip
ts f
rom
exte
rnal
cu
stom
ers
2,3
48
,82
3$
2
3,5
22
,99
8$
8,9
14
,00
7$
1
,24
7,8
91
$
1,0
17
,77
8$
3
7,0
51
,49
7$
1
0,2
40
,97
8$
Rec
eip
ts f
rom
in
tern
al c
ust
om
ers
15
4,1
40
-
68
,53
8
-
-
22
2,6
78
4
0,3
97
,71
9
Pay
men
ts t
o s
up
pli
ers
(7,2
98
,09
1)
(1
0,8
29
,54
2)
(4,0
16
,76
2)
(1
,36
8,3
38
)
(68
4,4
08
)
(2
4,1
97
,14
1)
(7,1
06
,40
0)
Pay
men
ts t
o e
mp
loyee
s(1
0,7
69
,57
5)
(19
,08
3,3
40
)
(2
,38
1,1
41
)
(2,0
66
,00
6)
-
(3
4,3
00
,06
2)
(43
5,3
58
)
Inte
rnal
act
ivit
y -
pay
men
ts t
o o
ther
fu
nd
s(9
64
,33
2)
-
(3
89
,16
7)
(5
27
,82
8)
-
(1,8
81
,32
7)
(7
27
,68
9)
Cla
ims
pai
d-
-
-
-
-
-
(5
2,4
98
,80
8)
Oth
er r
ecei
pts
1,8
56
,38
5
2
,29
0,3
15
1,2
16
,22
9
5
31
,41
1
75
,00
0
5
,96
9,3
40
7
,83
5,1
43
Net
cas
h p
rovid
ed (
use
d)
by o
per
atin
g a
ctiv
itie
s(1
4,6
72
,65
0)
(4,0
99
,56
9)
3
,41
1,7
04
(2,1
82
,87
0)
4
08
,37
0
(17
,13
5,0
15
)
(2
,29
4,4
15
)
Ca
sh f
low
s fr
om
non
cap
ita
l fi
na
nci
ng
act
ivit
ies
Sta
te a
nd
fed
eral
aid
15
,12
4,0
09
-
88
,37
0
6,8
66
,45
5
-
2
2,0
78
,83
4
1
38
,65
7
Tra
nsf
ers
from
oth
er f
un
ds
51
2,2
75
-
-
8
95
,43
4
-
1,4
07
,70
9
-
Oth
er n
on
cap
ital
ite
ms,
net
11
,00
7
5
3,4
00
1
02
,70
7
1
85
,27
6
-
35
2,3
90
7
,88
6,1
12
Net
cas
h p
rovid
ed b
y n
on
cap
ital
fin
anci
ng a
ctiv
itie
s1
5,6
47
,29
1
53
,40
0
19
1,0
77
7,9
47
,16
5
-
2
3,8
38
,93
3
8
,02
4,7
69
Ca
sh f
low
s fr
om
ca
pit
al
an
d r
ela
ted
fin
an
cin
g a
ctiv
itie
s
Pro
ceed
s fr
om
bon
d a
nti
cip
atio
n n
ote
s-
1
,58
7,9
51
8,9
68
,36
7
3
49
,67
5
-
10
,90
5,9
93
14
0,0
00
Pu
rch
ases
of
cap
ital
ass
ets,
net
(48
6,4
11
)
(1
,11
1,6
71
)
(2,0
86
,08
4)
(6
,14
0,8
02
)
-
(9,8
24
,96
8)
(2
36
,35
1)
Pri
nci
pal
pai
d o
n c
apit
al d
ebt
(61
4,8
19
)
(2
,44
0,0
86
)
(9,3
79
,08
1)
(1
,99
1,8
89
)
-
(14
,42
5,8
75
)
(3
06
,87
6)
Inte
rest
pai
d o
n c
apit
al d
ebt
(10
7,0
62
)
(9
7,1
89
)
(5
55
,23
0)
(1
86
,86
1)
-
(94
6,3
42
)
(3
4,4
39
)
Oth
er m
isce
llan
eou
s re
ceip
ts1
0,7
76
-
-
20
,28
0
-
3
1,0
56
-
Net
cas
h p
rovid
ed (
use
d)
by c
apit
al a
nd
rel
ated
fin
anci
ng a
ctiv
itie
s(1
,19
7,5
16
)
(2,0
60
,99
5)
(3
,05
2,0
28
)
(7,9
49
,59
7)
-
(1
4,2
60
,13
6)
(43
7,6
66
)
Ca
sh f
low
s fr
om
in
ves
tin
g a
ctiv
itie
s
Ad
van
ce f
rom
Cou
nty
Gen
eral
Fu
nd
-
5,4
61
,28
3
-
-
-
5,4
61
,28
3
-
Inte
rest
rev
enu
e5
,29
6
3,8
45
37
,48
0
4,4
51
-
5
1,0
72
36
,63
2
Net
cas
h p
rovid
ed b
y i
nves
tin
g a
ctiv
itie
s5
,29
6
5,4
65
,12
8
3
7,4
80
4
,45
1
-
5,5
12
,35
5
36
,63
2
Net
in
crea
se (
dec
reas
e) i
n c
ash
an
d c
ash
eq
uiv
alen
ts(2
17
,57
9)
(64
2,0
36
)
58
8,2
33
(2,1
80
,85
1)
4
08
,37
0
(2,0
43
,86
3)
5
,32
9,3
20
Cas
h a
nd
cas
h e
qu
ival
ents
- b
egin
nin
g o
f th
e yea
r3
,51
7,5
85
2,7
91
,67
5
2
2,0
38
,23
0
3,0
57
,37
2
5
79
,84
0
31
,98
4,7
02
21
,16
0,3
86
Cas
h a
nd
cas
h e
qu
ival
ents
- e
nd
of
the
yea
r3
,30
0,0
06
$
2,1
49
,63
9$
2
2,6
26
,46
3$
87
6,5
21
$
9
88
,21
0$
29
,94
0,8
39
$
26
,48
9,7
06
$
Rec
on
cili
ati
on
of
ba
lan
ce -
en
d o
f yea
r to
th
e st
ate
men
t
of
net
posi
tion
Cas
h a
nd
cas
h e
qu
ival
ents
3,2
79
,84
4$
-
$
20
,07
9,0
72
$
4
0,7
19
$
98
8,2
10
$
2
4,3
87
,84
5$
2
6,3
61
,43
4$
Res
tric
ted
cas
h a
nd
cas
h e
qu
ival
ents
20
,16
2
2
,14
9,6
39
2,5
47
,39
1
8
35
,80
2
-
5,5
52
,99
4
12
8,2
72
Tota
l3
,30
0,0
06
$
2,1
49
,63
9$
2
2,6
26
,46
3$
87
6,5
21
$
9
88
,21
0$
29
,94
0,8
39
$
26
,48
9,7
06
$
(con
tin
ued
)
Bu
sin
ess-
typ
e A
ctiv
itie
s -
En
terp
rise
Fu
nd
s
Cou
nty
of
Bro
om
e
Sta
tem
ent
of
Ca
sh F
low
s
Pro
pri
eta
ry F
un
ds
For
the
Yea
r E
nd
ed D
ecem
ber
31
, 2
02
0
60
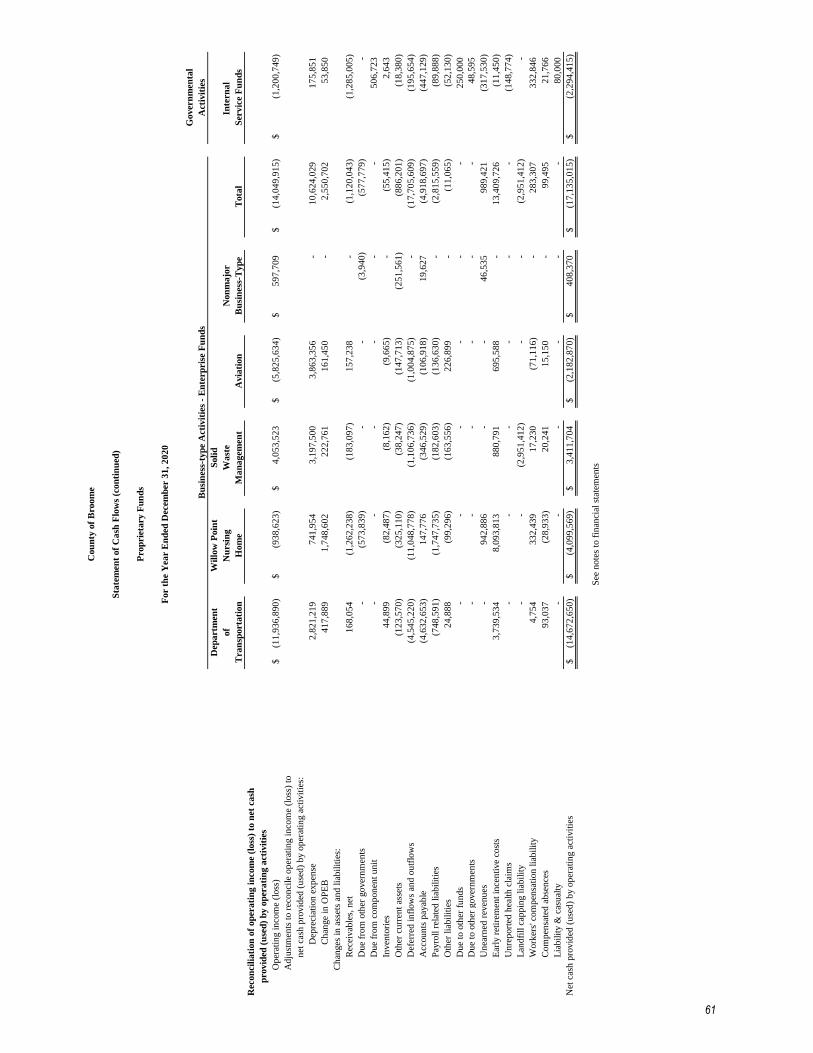
Gover
nm
enta
l
Act
ivit
ies
Dep
art
men
tW
illo
w P
oin
tS
oli
d
of
Nu
rsin
gW
ast
eN
on
ma
jor
Inte
rna
l
Tra
nsp
ort
ati
on
Hom
eM
an
ag
emen
tA
via
tion
Bu
sin
ess-
Typ
eT
ota
lS
ervic
e F
un
ds
Rec
on
cili
ati
on
of
op
era
tin
g i
nco
me
(loss
) to
net
ca
sh
pro
vid
ed (
use
d)
by o
per
ati
ng
act
ivit
ies
Op
erat
ing i
nco
me
(loss
)(1
1,9
36
,89
0)
$
(93
8,6
23
)$
4,0
53
,52
3$
(5
,82
5,6
34
)$
59
7,7
09
$
(1
4,0
49
,91
5)
$
(1,2
00
,74
9)
$
Ad
just
men
ts t
o r
econ
cile
op
erat
ing i
nco
me
(loss
) to
net
cas
h p
rovid
ed (
use
d)
by o
per
atin
g a
ctiv
itie
s:
Dep
reci
atio
n e
xp
ense
2,8
21
,21
9
7
41
,95
4
3
,19
7,5
00
3,8
63
,35
6
-
1
0,6
24
,02
9
1
75
,85
1
Ch
ange
in O
PE
B4
17
,88
9
1,7
48
,60
2
2
22
,76
1
1
61
,45
0
-
2,5
50
,70
2
53
,85
0
Ch
anges
in
ass
ets
and
lia
bil
itie
s:
Rec
eivab
les,
net
1
68
,05
4
(1,2
62
,23
8)
(1
83
,09
7)
1
57
,23
8
-
(1,1
20
,04
3)
(1
,28
5,0
05
)
Du
e fr
om
oth
er g
over
nm
ents
-
(57
3,8
39
)
-
-
(3
,94
0)
(57
7,7
79
)
-
Du
e fr
om
com
pon
ent
un
it-
-
-
-
-
-
5
06
,72
3
Inven
tori
es4
4,8
99
(82
,48
7)
(8,1
62
)
(9,6
65
)
-
(5
5,4
15
)
2,6
43
Oth
er c
urr
ent
asse
ts(1
23
,57
0)
(32
5,1
10
)
(38
,24
7)
(14
7,7
13
)
(2
51
,56
1)
(88
6,2
01
)
(1
8,3
80
)
Def
erre
d i
nfl
ow
s an
d o
utf
low
s(4
,54
5,2
20
)
(11
,04
8,7
78
)
(1
,10
6,7
36
)
(1,0
04
,87
5)
-
(1
7,7
05
,60
9)
(19
5,6
54
)
Acc
ou
nts
pay
able
(4,6
32
,65
3)
1
47
,77
6
(3
46
,52
9)
(1
06
,91
8)
19
,62
7
(4
,91
8,6
97
)
(44
7,1
29
)
Pay
roll
rel
ated
lia
bil
itie
s(7
48
,59
1)
(1,7
47
,73
5)
(1
82
,60
3)
(1
36
,63
0)
-
(2,8
15
,55
9)
(8
9,8
88
)
Oth
er l
iab
ilit
ies
24
,88
8
(9
9,2
96
)
(1
63
,55
6)
2
26
,89
9
-
(11
,06
5)
(5
2,1
30
)
Du
e to
oth
er f
un
ds
-
-
-
-
-
-
25
0,0
00
Du
e to
oth
er g
over
nm
ents
-
-
-
-
-
-
48
,59
5
Un
earn
ed r
even
ues
-
94
2,8
86
-
-
4
6,5
35
98
9,4
21
(3
17
,53
0)
Ear
ly r
etir
emen
t in
cen
tive
cost
s 3
,73
9,5
34
8,0
93
,81
3
8
80
,79
1
6
95
,58
8
-
13
,40
9,7
26
(11
,45
0)
Un
rep
ort
ed h
ealt
h c
laim
s-
-
-
-
-
-
(1
48
,77
4)
Lan
dfi
ll c
app
ing l
iab
ilit
y-
-
(2,9
51
,41
2)
-
-
(2
,95
1,4
12
)
-
Work
ers'
com
pen
sati
on
lia
bil
ity
4,7
54
3
32
,43
9
1
7,2
30
(7
1,1
16
)
-
28
3,3
07
3
32
,84
6
Com
pen
sate
d a
bse
nce
s9
3,0
37
(28
,93
3)
20
,24
1
15
,15
0
-
9
9,4
95
21
,76
6
Lia
bil
ity &
cas
ual
ty-
-
-
-
-
-
8
0,0
00
Net
cas
h p
rovid
ed (
use
d)
by o
per
atin
g a
ctiv
itie
s(1
4,6
72
,65
0)
$
(4,0
99
,56
9)
$
3
,41
1,7
04
$
(2,1
82
,87
0)
$
4
08
,37
0$
(17
,13
5,0
15
)$
(2
,29
4,4
15
)$
See
note
s to
fin
anci
al s
tate
men
ts
Cou
nty
of
Bro
om
e
Sta
tem
ent
of
Ca
sh F
low
s (c
on
tin
ued
)
Pro
pri
eta
ry F
un
ds
For
the
Yea
r E
nd
ed D
ecem
ber
31
, 2
02
0
Bu
sin
ess-
typ
e A
ctiv
itie
s -
En
terp
rise
Fu
nd
s
61
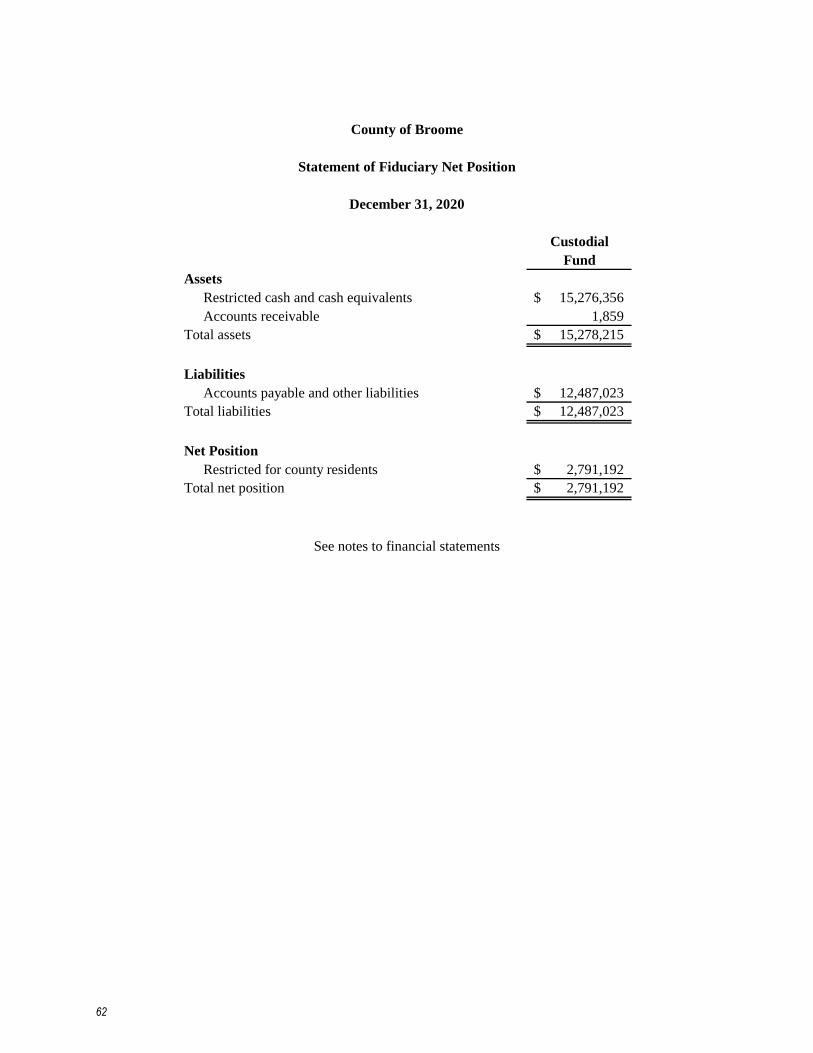
Custodial
Fund
Assets
Restricted cash and cash equivalents 15,276,356$
Accounts receivable 1,859
Total assets 15,278,215$
Liabilities
Accounts payable and other liabilities 12,487,023$
Total liabilities 12,487,023$
Net Position
Restricted for county residents 2,791,192$
Total net position 2,791,192$
County of Broome
Statement of Fiduciary Net Position
December 31, 2020
See notes to financial statements
62
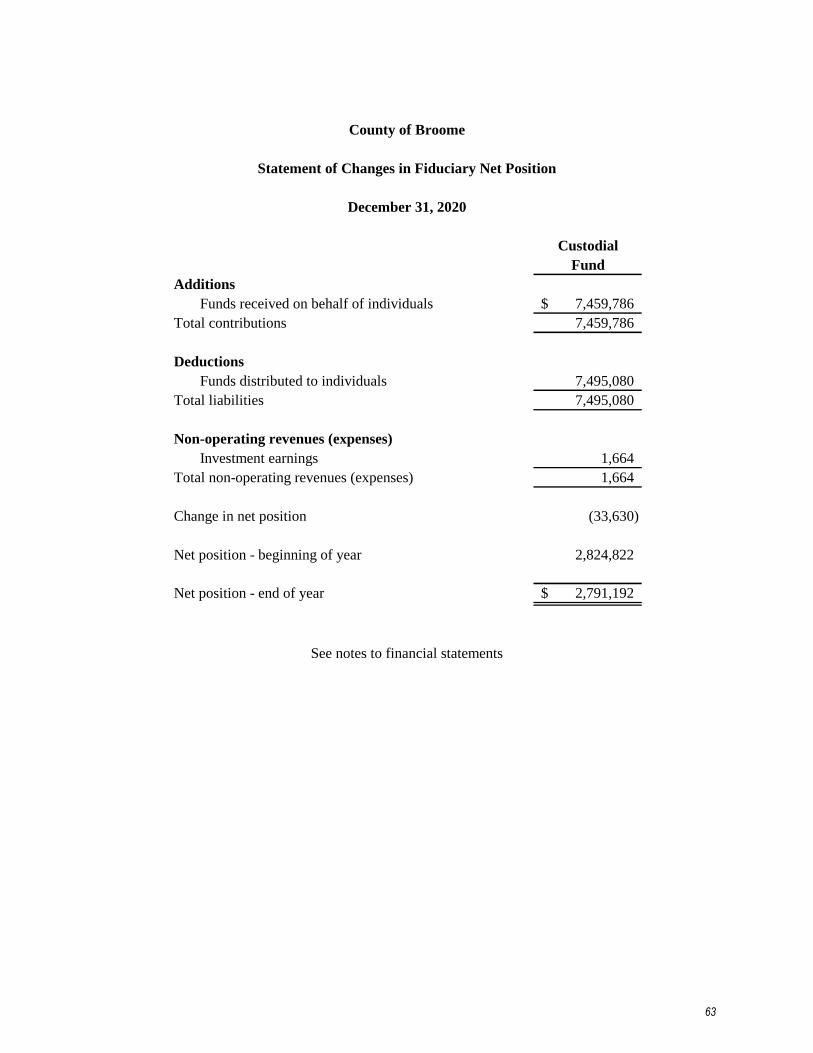
Custodial
Fund
Additions
Funds received on behalf of individuals 7,459,786$
Total contributions 7,459,786
Deductions
Funds distributed to individuals 7,495,080
Total liabilities 7,495,080
Non-operating revenues (expenses)
Investment earnings 1,664
Total non-operating revenues (expenses) 1,664
Change in net position (33,630)
Net position - beginning of year 2,824,822
Net position - end of year 2,791,192$
County of Broome
Statement of Changes in Fiduciary Net Position
December 31, 2020
See notes to financial statements
63
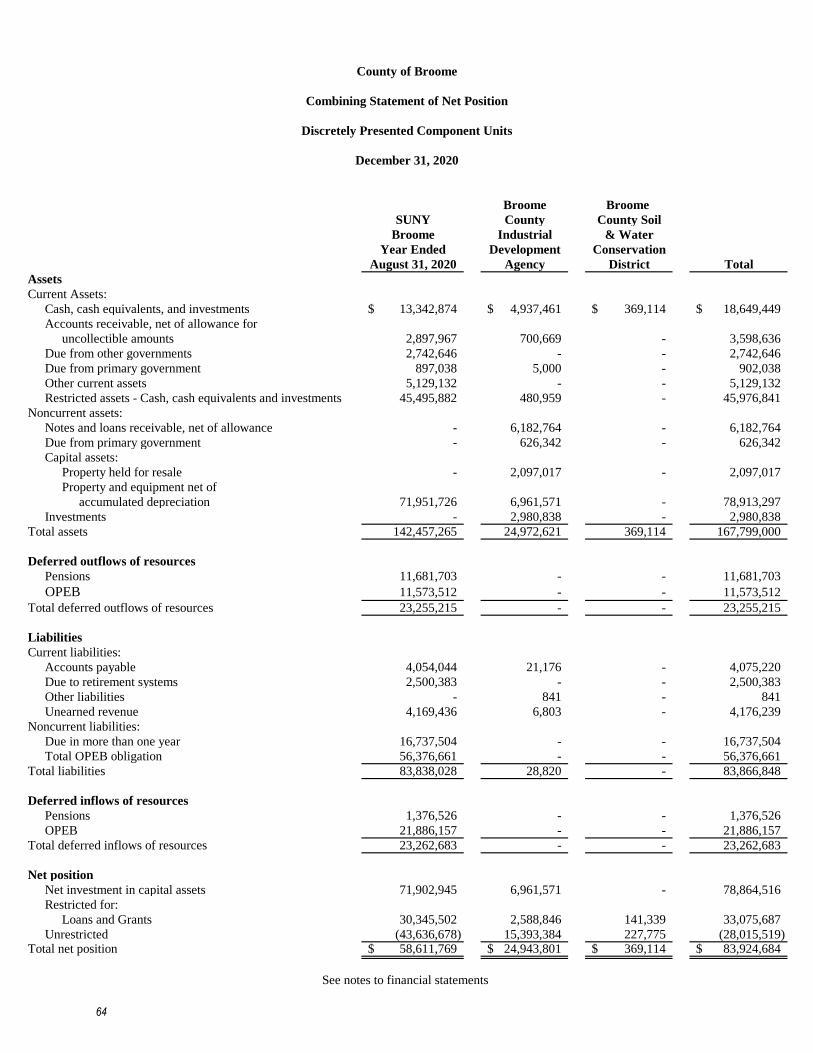
Broome Broome
SUNY County County Soil
Broome Industrial & Water
Year Ended Development Conservation
August 31, 2020 Agency District Total
Assets
Current Assets:
Cash, cash equivalents, and investments 13,342,874$ 4,937,461$ 369,114$ 18,649,449$
Accounts receivable, net of allowance for
uncollectible amounts 2,897,967 700,669 - 3,598,636
Due from other governments 2,742,646 - - 2,742,646
Due from primary government 897,038 5,000 - 902,038
Other current assets 5,129,132 - - 5,129,132
Restricted assets - Cash, cash equivalents and investments 45,495,882 480,959 - 45,976,841
Noncurrent assets:
Notes and loans receivable, net of allowance - 6,182,764 - 6,182,764
Due from primary government - 626,342 - 626,342
Capital assets:
Property held for resale - 2,097,017 - 2,097,017
Property and equipment net of
accumulated depreciation 71,951,726 6,961,571 - 78,913,297
Investments - 2,980,838 - 2,980,838
Total assets 142,457,265 24,972,621 369,114 167,799,000
Deferred outflows of resources
Pensions 11,681,703 - - 11,681,703
OPEB 11,573,512 - - 11,573,512
Total deferred outflows of resources 23,255,215 - - 23,255,215
Liabilities
Current liabilities:
Accounts payable 4,054,044 21,176 - 4,075,220
Due to retirement systems 2,500,383 - - 2,500,383
Other liabilities - 841 - 841
Unearned revenue 4,169,436 6,803 - 4,176,239
Noncurrent liabilities:
Due in more than one year 16,737,504 - - 16,737,504
Total OPEB obligation 56,376,661 - - 56,376,661
Total liabilities 83,838,028 28,820 - 83,866,848
Deferred inflows of resources
Pensions 1,376,526 - - 1,376,526
OPEB 21,886,157 - - 21,886,157
Total deferred inflows of resources 23,262,683 - - 23,262,683
Net position
Net investment in capital assets 71,902,945 6,961,571 - 78,864,516
Restricted for:
Loans and Grants 30,345,502 2,588,846 141,339 33,075,687
Unrestricted (43,636,678) 15,393,384 227,775 (28,015,519) Total net position 58,611,769$ 24,943,801$ 369,114$ 83,924,684$
See notes to financial statements
County of Broome
Combining Statement of Net Position
Discretely Presented Component Units
December 31, 2020
64

Bro
om
e
SU
NY
Co
un
ty S
oil
Op
erati
ng
Bro
om
eIn
du
stri
al
& W
ate
r
Ch
arg
es f
or
Gra
nts
an
dY
ear
En
ded
Dev
elo
pm
ent
Co
nse
rva
tio
n
Ex
pen
ses
Ser
vic
esC
on
trib
uti
on
sA
ug
ust
31
, 20
20
Ag
ency
Dis
tric
tT
ota
l
SU
NY
Bro
om
e
Ed
uca
tion
69
,32
9,5
61
$
3
7,6
74
,05
8$
3
5,8
28
,71
1$
4
,17
3,2
08
$
-$
-
$
4
,17
3,2
08
$
Ind
ust
rial
Dev
elop
men
t A
gen
cy
Eco
nom
ic a
ssis
tance
1,9
47
,50
6
71
7,1
69
1
66
,66
8
-
(1,0
63
,66
9)
-
(1
,06
3,6
69
)
Bro
om
e C
ou
nty
Soil
& W
ate
r C
on
serv
ati
on
Dis
tric
t
Hom
e an
d c
om
munit
y s
ervic
es4
21
,64
6
93
,84
2
32
7,9
11
-
-
1
07
10
7
Tota
l dis
cret
ely p
rese
nte
d c
om
pon
ent
un
its
71
,69
8,7
13
$
3
8,4
85
,06
9$
3
6,3
23
,29
0$
3
,10
9,6
46
$
Gen
eral
rev
enu
es
I
nves
tmen
t ea
rnin
gs
83
9,3
18
23
0,7
87
2
40
1,0
70
,34
5
O
ther
11
,21
1
-
1
7,7
92
2
9,0
03
Tota
l gen
eral
rev
enu
es85
0,5
29
23
0,7
87
18
,03
2
1
,09
9,3
48
Ch
anges
in
net
posi
tion
5,0
23
,73
7(8
32
,88
2)
18
,13
9
4
,20
8,9
94
Net
posi
tion
-beg
inn
ing o
f yea
r5
3,5
88
,03
22
5,7
76
,68
33
50
,97
5
7
9,7
15
,69
0
Net
posi
tion
-en
din
g5
8,6
11
,76
9$
2
4,9
43
,80
1$
36
9,1
14
$
8
3,9
24
,68
4$
Net
(E
xp
ense
) R
even
ue
an
d C
ha
ng
es i
n N
et P
osi
tio
n
See
note
s to
fin
anci
al s
tate
men
ts
Co
un
ty o
f B
roo
me
Co
mb
inin
g S
tate
men
t o
f A
ctiv
itie
s
Dis
cret
ely
Pre
sen
ted
Co
mp
on
ent
Un
its
Fo
r th
e Y
ear
En
ded
Dec
emb
er 3
1,
20
20
Pro
gra
m R
even
ues
65

This page left blank intentionally.
66

County of Broome, New York
Notes to the Basic Financial Statements
For the Year Ended December 31, 2020
1. Summary of Significant Accounting Policies
The following summary of significant accounting policies and reporting practices of the County of
Broome, New York (the “County”) are reflected in the accompanying basic financial statements
that have been prepared in conformity with accounting principles generally accepted in the United
States of America, (GAAP) as applied to governmental entities. The Governmental Accounting
Standards Board (GASB) is the accepted standard setting body for governmental accounting and
financial reporting principles.
A. Financial Reporting Entity
The County was incorporated in 1806, and is governed by the Charter of the County of
Broome, the County Law, and other general laws of the State of New York. The County
Legislature is the legislative body responsible for the overall operation of the County. The
County Executive serves as Chief Executive Officer and The Director of the Office of
Management and Budget serves as the Chief Fiscal Officer. The County is a municipal
corporation established in New York State.
The financial reporting entity includes the primary government and component units. A
component unit is either a legally separate organization for which the elected County of
Broome officials are financially accountable, or another organization for which the nature
and significance of its relationship with the County is such that exclusion would cause the
County’s basic financial statements to be misleading or incomplete.
Based upon these criteria, six component units exist requiring inclusion in the County’s
basic financial statements.
67
County of Broome, New York
Notes to the Basic Financial Statements
For the Year Ended December 31, 2020
1. Summary of Significant Accounting Policies (Continued)
A. Financial Reporting Entity (Continued)
Blended Component Units
Broome Tobacco Asset Securitization Corporation - The Broome Tobacco Asset
Securitization Corporation (the “Corporation”) is a special purpose, bankruptcy remote,
local development corporation, organized in 2001 under the Not-For-Profit Corporation
Law of New York State. The Corporation administers the Tobacco Settlement revenues
received by the County under the Master Settlement Agreement and in accordance with the
Decree and Final Judgment of the New York State Supreme Court. Operating as an
instrumentality of, but separate from the County, the Corporation is included in the
County’s reporting entity because three of its four directors are officials of the County, and
the County can impose its will on the Corporation. The outstanding debt of the corporation
is not an obligation of the County.
On July 15, 2001, pursuant to a Purchase and Sale Agreement with the County, the County
sold to the Corporation all its future right, title, and interest in the Tobacco Settlement
Revenues (“TSRs”) under the Master Settlement Agreement (“MSA”) and the Decree and
Final Judgment (the “Decree”).
The MSA resolved cigarette smoking-related litigation between the settling states and the
Participating Manufacturers (“PMs”), released the PMs from past and present smoking-
related claims, and provides for a continuing release of future smoking-related claims, in
exchange for certain payments to be made to the settling states, as well as, among other
things, certain tobacco advertising and marketing restrictions. The Decree, which was
entered by the Supreme Court of the State, allocated to the County a share of the TSRs
under the MSA. The future rights, title, and interest of the County’s share were sold to the
Corporation.
The Corporation issued serial bonds secured by the future right, title, and interest of the
County under the MSA. A residual Certificate representing the entitlement to receive all
amounts required to be distributed after the payment of debt service, operating expenses,
and certain other costs as set forth in the indenture. Payments on the Residual Certificate
from TSR collections are subordinate to payments on the bonds and payment of certain
other costs specified in the indenture. Excess TSRs not required by the Corporation to pay
68

County of Broome, New York
Notes to the Basic Financial Statements
For the Year Ended December 31, 2020
1. Summary of Significant Accounting Policies (Continued)
A. Financial Reporting Entity (Continued)
Broome Tobacco Asset Securitization Corporation (continued)
various expenses, or required reserves with respect to the bonds are transferred to the
Broome County Tax Stabilization Trust (the “Trust”) as owner of the Residual Certificate.
The County is the beneficial owner of the Trust and thus the funds received by the Trust
will ultimately transfer to the County. As of December 31, 2020, there were no excess
TSRs transferred to the Trust.
Financial Statements of the Broome Tobacco Asset Securitization Corporation are
available from the Corporation at the Edwin L. Crawford Office Building, P O Box 1766,
Binghamton, New York, 13902.
Broome County Local Development Corporation - Broome County Local Development
Corporation (the “LDC”) was established in 2011 and is governed by its Articles of
Incorporation, bylaws and general laws of the State of New York. The LDC is a blended
component unit of the County’s basic financial statements due to the County’s ability to
influence the decisions of the LDC. The LDC’s Board of Directors is comprised of
individuals appointed by the County.
Financial Statements of the Broome County Local Development Corporation are available
from the LDC at 5 South College Drive, Binghamton, NY 13905
Broome County Land Bank Corporation - The Broome County Land Bank Corporation,
(the “LBC”) was incorporated June 11, 2013 and is a 501(c)3 public benefit corporation.
The mission of the LBC is to foster economic and community development by acquiring,
holding, managing, developing and marketing distressed, vacant, abandoned and
underutilized properties. The LBC will attempt to stem disinvestment surrounding
abandoned properties, secure and remediate abandoned properties, return vacant,
abandoned, and tax-delinquent properties to productive use, turn vacant spaces into vibrant
spaces, coordinate reuse of flood impacted properties, and promote increased levels of
home ownership. The Broome County Legislature acting as the sole Member of the
Corporation appoints a board consisting of seven directors The LBC is operated
exclusively for the charitable and public purposes of benefiting and furthering the activities
of Broome County.
Financial Statements of the Broome County Land Bank Corporation are available from the
LBC at Edwin L. Crawford County Office Building, P.O. Box 1766, Binghamton, NY
13902.
69
County of Broome, New York
Notes to the Basic Financial Statements
For the Year Ended December 31, 2020
1. Summary of Significant Accounting Policies (Continued)
A. Financial Reporting Entity (Continued)
Discretely Presented Component Units
SUNY Broome – SUNY Broome (the “College”) is a discretely presented component unit
of the County. Since the passage of Local Law Number 8 of 1990, the College has had a
substantial degree of operational autonomy. The College is included in the County's
reporting entity because of the significant financial relationship with the County. The
County is financially accountable for the College. The County appoints five of the nine
members on the Board of Trustees, significantly controls operations through its annual
appropriation of the sponsor's contribution, and is legally responsible for the issuance and
repayment of debt incurred for College purposes. The College’s fiscal year-end is August
31. The Faculty Student Association, Inc. (FSA) of SUNY Broome is organized under the
not-for-profit laws of New York State to supplement and conduct activities and services
for the students., faculty, staff and alumni of the College. The FSA is presented as a
component unit of the College and its fiscal year-end is August 31. The Broome
Community College Foundation, Inc. (Foundation) is organized under the not-for-profit
laws of New York State to raise funds to provide scholarships and to provide support for
initiatives that will have a significant and measurable impact on the students, faculty and
staff of the College. The Foundation is a component unit of the College and its fiscal year-
end is August 31.
The College was organized in 1946 when the State University of New York trustees
approved its establishment as a two-year community college of the State University of New
York. Established under the sponsorship of Broome County pursuant to the New York
State Education Law, the operations of the College are funded principally by New York
State, Broome County, and the College’s students.
Financial statements of SUNY Broome are available from the College by writing to P.O.
Box 1017, Binghamton, New York, 13902.
70
County of Broome, New York
Notes to the Basic Financial Statements
For the Year Ended December 31, 2020
1. Summary of Significant Accounting Policies (Continued)
A. Financial Reporting Entity (Continued)
Broome County Soil & Water Conservation District - The Broome County Soil & Water
Conservation District, (the “District”) was created by County resolution number 115 of
1944 pursuant to the Broome County Charter and the New York State Municipal Home
Rule Law including section 10, paragraph 1 B, sub-paragraph (8). The District provides
technical assistance relative to natural resource conservation and water quality to the
residents of the County. The assistance, available on an individual basis, includes soil
information, drainage, water resources, critical area seeding, tree planting for reforestation,
fish stocking, and pond/lake management and protection. The District provides soil
classifications data to landowners applying for agricultural exemptions on their property
assessments and provides best management practices to farm land operators to reduce soil
loss through erosion and to protect water quality within the watersheds in the County.
While the District operates autonomously, it is included in the County’s reporting entity as
a discretely presented component unit because the County appoints all members of the
Board of Directors and annually appropriates significant financial support for the District.
Financial Statements of the Broome County Soil & Water Conservation District are filed
with the New York State Comptroller’s Office and the New York State Soil and Water
Conservation Committee. The District’s offices are located at 1163 Upper Front Street,
Binghamton, NY 13905.
Broome County Industrial Development Agency – The Broome County Industrial
Development Agency (the “IDA”) is a Public Benefit Corporation created by State
legislation to promote the economic welfare, recreation opportunities and prosperity of the
County’s inhabitants. While the IDA operates autonomously, it is included in the County’s
reporting entity as a discretely presented component unit because the County appoints all
members of the Board of Directors and can impose its will on the IDA.
The IDA was established to aid the County in promoting the economic welfare of its
inhabitants, through the assistance in constructing, maintaining and equipping industrial,
commercial, manufacturing and research facilities, and to develop economically sound
commerce and industry through the sale of industrial revenue bonds.
Financial Statements of the Broome County Industrial Development Agency are available
from the IDA at 5 South College Drive, Binghamton, NY 13905.
71
County of Broome, New York
Notes to the Basic Financial Statements
For the Year Ended December 31, 2020
1. Summary of Significant Accounting Policies (Continued)
B. Government-wide and Fund Financial Statements
The government-wide statements, i.e., the statement of net position and the statement of
activities report information on all the non-fiduciary activities of the County (primary
government) and its component units. Certain eliminations have been made in regards to
interfund activities, payables and receivables. All internal balances in the statement of net
position have been eliminated except those representing balances between the
governmental activities and the business-type activities, which are presented as internal
balances and eliminated in the total primary government column. In the statement of
activities, internal service fund transactions have been eliminated; however, those
transactions between governmental and business-type activities have not been eliminated.
Governmental activities are presented separately from business-type activities. Likewise,
the primary government is reported separately from certain legally separate component
units for which the primary government is accountable. Fiduciary funds are excluded
because their assets may not be used to finance the County’s operations.
The statement of activities demonstrates the degree to which the direct expenses of a given
function are offset by program revenue. Direct expenses are those clearly identifiable with
a specific function. Program revenues include 1) charges to customers or applicants who
purchase or use, or directly benefit from goods, services, or privileges provided by a given
function and 2) grants and contributions that are restricted to meeting the operational or
capital requirements of a function. Tax and other items not properly included among
program revenue are presented as general revenues.
Separate financial statements are provided for governmental funds, proprietary funds, and
fiduciary funds even though the latter are excluded from the government-wide statements.
Major individual governmental funds and major individual proprietary funds are reported
as separate columns in the fund financial statements.
C. Measurement Focus, Basis of Accounting, and Financial Statement Presentation
Measurement focus is the determination of what is expressed in reporting an entity’s
financial performance and position. A measurement focus is accomplished by considering
what resources will be measured and the basis of accounting.
Basis of accounting refers to when revenues, expenditures/expenses, and related assets and
deferred outflows of resources, and liabilities and deferred inflows of resources are
recognized and reported in the financial statements. Basis of accounting relates to the
timing of the measurement made, regardless of the measurement focus.
72
County of Broome, New York
Notes to the Basic Financial Statements
For the Year Ended December 31, 2020
1. Summary of Significant Accounting Policies (Continued)
C. Measurement Focus, Basis of Accounting, and Financial Statement Presentation
(Continued)
Government-wide Financial Statements
Government-wide financial statements report information about the County. The
statements include all the assets, liabilities, deferred outflows/inflows of resources,
revenues, and expenses of the County. Fiduciary funds are excluded because their assets
may not be used to finance the County’s operations. The accounts of the County are
grouped into governmental and business-type activities.
Governmental activities account for most of administrative services of the County. These
activities are normally supported by taxes and intergovernmental revenues. Activities of
this type include executive, legislative, public health, and social services.
Business-type activities account for those activities financed primarily through user fees.
Activities of this type include the airport, public transportation (bus system), solid waste
management, and the nursing home.
Government-wide financial statements are reported using the economic resources
measurement focus and the accrual basis of accounting. Under this basis of accounting,
revenues are recorded in the period in which they are earned and expenses are recorded in
the period in which they are incurred. All assets and liabilities are presented, financial as
well as capital, and both short-term and long-term. Property taxes are recognized as
revenues in the year for which they are levied. Grants and similar items are recognized as
revenue as soon as all eligibility requirements have been met.
Fund Financial Statements
The accounts of the County are grouped into funds, each of which is considered a separate
accounting entity. The financial activity of each fund is accounted for in a separate set of
self-balancing accounts that details assets, liabilities, fund balance, revenues, and
expenditures or expenses. Some funds are required to be established by New York State
law or by bond covenants. The County also establishes funds to control and manage
monies for purposes.
Government resources are allocated to and accounted for in individual funds based upon
the purpose for which they are spent and how spending activities are controlled. The
presentation of a fund is based upon whether it is a major or nonmajor fund.
73

County of Broome, New York
Notes to the Basic Financial Statements
For the Year Ended December 31, 2020
1. Summary of Significant Accounting Policies (Continued)
C. Measurement Focus, Basis of Accounting, and Financial Statement Presentation
(Continued)
The County’s major funds are presented separately, while the nonmajor funds are presented
in aggregate. A fund is reported as major when its total assets, liabilities, revenues, or
expenditures/expenses are at least 10% of the corresponding total for all funds in that
category (either governmental or enterprise) and at least 5% of the corresponding total for
all governmental and enterprise funds combined. A fund that does not meet these criteria
is presented as major if it is of importance to the financial statement users for reasons such
as public interest or consistency.
Governmental fund financial statements are presented using the current financial
resources focus and the modified accrual basis of accounting. Revenues are recorded when
they are susceptible to accrual, that is, both measurable and available. The County defines
available as collectible within the current period, or soon enough thereafter, 365 days for
grants and 90 days for all other revenues, to be used to pay liabilities of the current period.
Grants, including State and Federal aid, are recognized as revenue as soon as all eligibility
requirements have been met and amounts are considered measurable and available.
Other intergovernmental charges are recognized as soon as the exchange has occurred and
the related amounts become available to liquidate liabilities of the current period.
Real property tax revenue is recognized in the year for which the levy is made to the extent
that taxes are collected. Taxes become a lien on the related property on the first day of
January, of the year levied. Delinquent property taxes at year-end, excluding collections
during the sixty-day subsequent period, in accordance with accounting principles generally
accepted with the United States of America, are recorded as unavailable revenue and are
reported net of allowance for doubtful accounts.
Sales tax is accrued as revenue based on the date of the underlying transaction and when
the amounts are considered measurable and available.
Interest revenue is recorded on a modified accrual basis when measurable and available.
Expenditures are recorded when incurred, like the accrual basis, except for expenditures
for debt service and certain long-term liabilities such as compensated absences and claims
and judgments, which are recorded when due and payable. Interest expenditures are
recorded when the cash is disbursed.
74

County of Broome, New York
Notes to the Basic Financial Statements
For the Year Ended December 31, 2020
1. Summary of Significant Accounting Policies (Continued)
C. Measurement Focus, Basis of Accounting, and Financial Statement Presentation
(Continued)
The County reports the following governmental funds:
General Fund (major fund) – The General fund is the general operating fund of the County.
It is used to account for all financial resources except those required to be accounted for in
another fund. Services accounted for in the General fund include public health, public
safety, and social services and general administrative services such as those provided by
the County Legal Department and Department of Management and Budget.
Capital Projects Fund (major fund) – The Capital Projects fund is used to account for the
financial resources of the County allocated for the acquisition or construction of capital
assets (other than those financed by the operations of the Proprietary funds, SUNY
Broome, the Broome County Industrial Development Agency, the Broome County Soil &
Water Conservation District, the Broome Tobacco Asset Securitization Corporation, the
Broome County Land Bank Corporation, and the Broome County Local Development
Corporation).
Debt Service Fund (major fund) – The Debt Service fund is used to account for the financial
resources and uses of the County’s bond activities.
BTASC Fund (major fund) – The BTASC fund accounts for the financial resources of
BTASC, a blended component unit of the government. BTASC issues bonds backed by
the County’s interests in the MSA in exchange for the County’s future rights to a portion
of this revenue stream.
Other Governmental Funds – The Other Governmental Funds are the County’s nonmajor
governmental funds used to account for the proceeds of specific revenue sources (other
than capital projects) that are restricted to expenditures for specified purposes or for which
separate accounting is required. The County Road, County Road Machinery, Library, the
Broome County Veterans Memorial Arena, Office of Employment and Training, and the
En Joie Golf Course are activities accounted for as nonmajor special revenue funds.
Proprietary fund financial statements are presented using the economic resources
measurement focus and the accrual basis of accounting. Under this basis of accounting,
revenues are recorded in the period in which they are earned and expenses are recorded in
the period in which they are incurred. All assets and liabilities are presented, financial as
well as capital and both short-term and long-term.
75
County of Broome, New York
Notes to the Basic Financial Statements
For the Year Ended December 31, 2020
1. Summary of Significant Accounting Policies (Continued)
C. Measurement Focus, Basis of Accounting, and Financial Statement Presentation
(Continued)
Proprietary funds distinguish operating revenues and expenses from non-operating items.
Operating revenues and expenses generally result from providing services and producing
and delivering goods about a proprietary fund’s principal ongoing operations. The principal
operating revenue of the Department of Transportation, Willow Point Nursing Home, Solid
Waste Management, Aviation, and the County’s internal service funds are charges to
customers for sales and services. Operating expenses for enterprise and internal service
funds include cost of sales and services, administrative expenses, and depreciation of
capital assets. All revenues and expenses not meeting this definition including interest
expense are reported as non-operating revenues and expenses.
Net resident service revenue at the Willow Point Nursing Home is reported at the estimated
net realized amounts from residents, third party payers and others for services rendered.
Revenue under third party payer agreements is subject to audit and retroactive adjustment.
Provisions for estimated third party payer settlements are provided in the period the related
services are rendered. Differences between the estimated amounts accrued and interim and
final settlements are reported in operations in the year of settlement.
The County reports two types of proprietary funds; enterprise funds and internal service
funds.
Enterprise Funds – The enterprise funds are used to account for operations that are financed
and operated in a manner like private business enterprises where the intent of the County
is that the costs, including depreciation, of providing goods or services to the general public
on a continuing basis be financed or recovered primarily through user charges.
Major enterprise funds include the following:
Department of Transportation Fund – The Department of Transportation Fund is used to
account for the activities of the County’s fixed route department of transportation system.
Willow Point Nursing Home Fund – The Willow Point Nursing Home Fund is used to
account for the activities of the County’s nursing home.
Solid Waste Management Fund – The Solid Waste Management Fund is used to account
for the recycling and solid waste disposal activities of the County, in section IV of the
Colesville Landfill.
76
County of Broome, New York
Notes to the Basic Financial Statements
For the Year Ended December 31, 2020
1. Summary of Significant Accounting Policies (Continued)
C. Measurement Focus, Basis of Accounting, and Financial Statement Presentation
(Continued)
Aviation Fund – The Aviation Fund is used to account for the activities of the Greater
Binghamton Airport.
The County’s nonmajor enterprise funds are:
Local Development Corporation – The Local Development Corporation is used to account
for the financial transactions of a component unit which promotes local development for
the County.
Land Bank Corporation – The Lank Bank Corporation is used to account for the financial
transactions of a component unit which fosters economic and community development for
the County.
Internal Service Funds – The internal service funds are accounted for in a manner like
enterprise funds. Unlike enterprise funds, in which the costs of services are financed
through user charges, internal service funds generate revenues largely through the charge
for services provided to County departments. Depreciation expense is included in rates
charged to service users in conformity with GAAP. The inclusion of depreciation
generates funds for future capital asset replacement. Net position reflects the accumulation
of these amounts. Internal service funds include Fleet Management, Central Kitchen,
Health Insurance, Workers' Compensation, Insurance Reserve, and Unemployment
Insurance. These funds are presented in the aggregate as nonmajor funds in the statement
of revenues, expenses, and changes in net position – proprietary funds, but they are
included in the governmental activities’ column in the statement of net position.
Fiduciary Fund Financial Statement is used to present the County’s only fiduciary fund,
the Custodial fund.
Custodial Funds – The Custodial fund is used to account for assets held by the County in
a trustee capacity or as an agent for individuals, private organizations, other governmental
units and other funds. They are custodial in nature and do not involve measurement of
results of operations.
77
County of Broome, New York
Notes to the Basic Financial Statements
For the Year Ended December 31, 2020
1. Summary of Significant Accounting Policies (Continued)
D. Elimination of Internal Activity - Government-wide Statements
Eliminations to the statement of activities have been made to remove the “doubling-up”
effect of internal service fund activity and similar events. These activities are eliminated
so that the expenses are reported only in the function in which they were allocated.
Internal Service Fund activity is eliminated by adjusting the internal charges to a break-
even point. An increase in Internal Service Fund net position would result in a pro rata
reduction in the amounts charged to the functions. A decrease in Internal Service Fund net
position would result in a pro rata increase in the amounts charged to the functions.
During operations, the government has activity between funds for various purposes. Any
residual balances outstanding at year end are reported as due from/to other funds. While
these balances are reported in the fund financial statements, certain eliminations are made
in the preparation of the government-wide financial statements. Balances between the
funds included in governmental activities column. Further, certain activity occurs during
the year involving transfers of resources between funds. In the fund financial statements,
these amounts are reported at gross amounts as transfers in/out. While reported in the fund
financial statements, certain eliminations are made in the preparation of the government-
wide financial statements. Transfers between the funds included in governmental activities
are eliminated so that only the net amount is included as transfers in the governmental
activities column.
E. Encumbrances
Encumbrances represent commitments related to unperformed contracts for goods or
services. Encumbrance accounting, under which purchase orders, contracts, and other
commitments for the expenditure of monies are recorded for budgetary control purposes to
reserve that portion of the applicable appropriations, is employed in all County
governmental funds except the BTASC fund. Outstanding encumbrances at year end, not
previously designated as restricted or committed, are presented for GAAP reporting
purposes as assigned fund balance and do not constitute expenditures or liabilities because
they are commitments not previously presented as restricted or committed. The
unexpended encumbrances are brought forward into the next year along with additional
appropriations so as not to require the use of the subsequent year’s appropriations.
78

County of Broome, New York
Notes to the Basic Financial Statements
For the Year Ended December 31, 2020
1. Summary of Significant Accounting Policies (Continued)
F. Budgets and Budgetary Accounting
Annual budgets of the General Fund, Special Revenue Funds, Enterprise Funds and
Internal Service Funds are legally adopted and are under formal budgetary control. The
individual grant programs related to these funds, the financing for which are entirely or
almost entirely from outside sources (federal aid, state aid, etc.), and the individual capital
programs of the Capital Projects Fund have budgets adopted at various times of the year
based on the program's fiscal year.
Unencumbered appropriations lapse at year-end. Encumbrances outstanding at year-end
are reported in the appropriate fund balance classification and are re-appropriated in the
ensuing year's budget.
The Capital Projects Fund includes the various capital programs in progress. A capital
project's budget is a financial plan for a period longer than one fiscal year.
The following procedures establish the budgetary data reflected in the financial statements:
Original Budget
1) Departmental and agency hearings are conducted by the County Executive's Office to
review proposed annual budgets submitted by departments and agencies. Final budget
information is accumulated by the Director of Office of Management and Budget and
submitted to the County Executive.
2) On or before September 15, the County Executive submits the proposed budget to the
County Legislature, along with a Capital Improvement Program for the next six fiscal
years.
3) A public hearing is conducted by the County Legislature to obtain public comment on
the tentative budget.
4) Changes made to the budget by the Legislature are returned to the County Executive
for review and possible veto. Vetoed items are returned to the Legislature. These
vetoes can be overridden by a two-thirds majority vote of the Legislature.
5) A second public hearing is held to review changes recommended by the Legislature.
79
County of Broome, New York
Notes to the Basic Financial Statements
For the Year Ended December 31, 2020
1. Summary of Significant Accounting Policies (Continued)
F. Budgets and Budgetary Accounting (Continued)
6) No later than November 25th, the annual budget completed by adoption of an
appropriation ordinance, which is the legal authority for enactment of the budget. The
legal level of budgetary control is character at a department level. Character is a
grouping of related expenditure accounts such as contractual and personal services.
Budget and actual data at the legal level of budgetary control is not presented in this
report due to the excessive detail involved. However, a separate budgetary comparison
report is available containing this information.
Budget Modification Process
1) Certain annual appropriations are budgeted on a project or program basis. These
include capital projects and grant programs funded through State or Federal sources.
If such projects or programs are not completed at the end of the fiscal year, unexpended
appropriations are carried forward to the following fiscal year.
2) The County Executive may at any time during the fiscal year transfer part or all any
unencumbered appropriation balance between classifications of expenditures within
the same administrative unit, if prior approval by resolution of the County Legislature
shall be required if the proposed transfer would affect any salary rate or salary total.
The County Executive may request, in writing, that the County Legislature transfer by
resolution, part or all any unencumbered appropriation balance from one County
administrative unit to another, or from a contingent fund to any administrative unit. No
such transfer shall be made from appropriations for debt service, or reduce any
appropriation below the amount required by law.
The County Legislature may make emergency appropriations in the event of a public
emergency affecting life, health or property. To the extent that there are no legally
available unappropriated balances to meet such appropriations, the County Legislature may
authorize the issuance of obligations pursuant to the Local Finance Law.
The County’s annual budgets are adopted on a basis consistent with GAAP with certain
exceptions. The differences between the County’s budgetary basis and GAAP require
adjustments for the following:
Debt Service – The accounting for debt service payments and contributions to the
Community College. The amounts are budgeted as debt service payments and transfers
respectively, but the actual expenditures are presented in the education line.
80

County of Broome, New York
Notes to the Basic Financial Statements
For the Year Ended December 31, 2020
1. Summary of Significant Accounting Policies (Continued)
F. Budgets and Budgetary Accounting (Continued)
Indirect Costs – The accounting for indirect costs provided by the General Fund to other
County funds more than those budgeted. The additional unbudgeted revenue is presented
in the General Fund as intergovernmental charges but is also offset by an equal amount of
transfers out. In the other County funds the unbudgeted costs are presented as functional
expenditures in the governmental funds and contractual expenses in the proprietary funds
but are also offset by an equal amount of transfers in.
Capital Lease Principal and Interest – The accounting for capital lease principal and interest
amounts are budgeted as contractual expenditures in the appropriate expenditure
categories. The actual expenditures are presented as principal and interest.
Sales Tax Revenue – Sales tax revenues are budgeted on a net basis but presented on a
gross basis. Therefore, equal amounts of sales and use taxes and governmental
expenditures representing the portion paid to the municipalities were not budgeted within
the general fund.
Non-cash assistance – Non-cash assistance from state and federal agencies is recorded for
financial statement purposes but is not budgeted for in the general fund.
Excess of Expenditures Over Appropriations – During the year, the County will receive
grants from federal and state agencies. These items are not included within the final budget
amount. Accordingly, there are revenues received and corresponding expenditures
incurred in excess of the final budgeted amounts. Such excesses were noted within the
following County functions: general government support, education, health, economic
assistance, home and community services, and capital outlay.
81
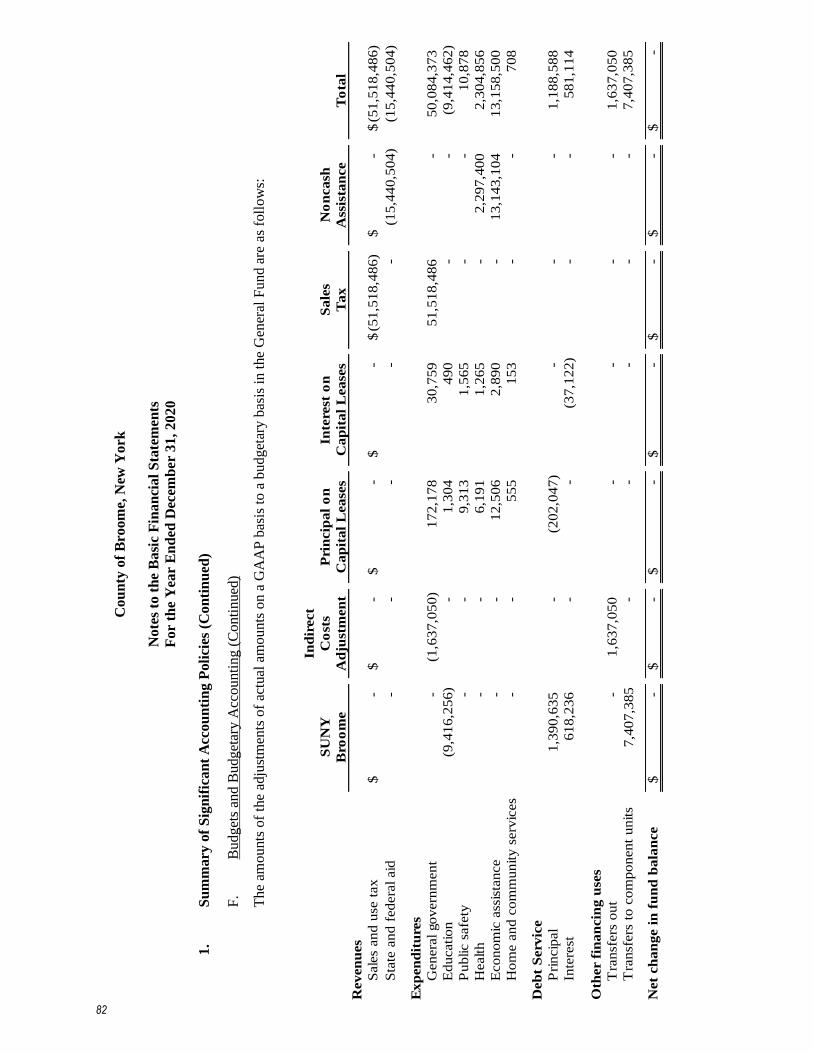
Cou
nty
of
Bro
om
e, N
ew Y
ork
Note
s to
th
e B
asi
c F
inan
cial
Sta
tem
ents
For
the
Yea
r E
nd
ed D
ecem
ber
31
, 2020
1.
Su
mm
ary
of
Sig
nif
ica
nt
Acc
ou
nti
ng P
oli
cies
(C
on
tin
ued
) F
. B
ud
get
s an
d B
udg
etar
y A
ccounti
ng (
Conti
nued
) T
he
amo
unts
of
the
adju
stm
ents
of
actu
al a
mounts
on a
GA
AP
bas
is t
o a
budget
ary b
asis
in t
he
Gen
eral
Fu
nd
are
as
foll
ow
s:
In
dir
ect
SU
NY
Co
sts
Pri
ncip
al
on
Inte
rest
on
Sale
sN
on
cash
Bro
om
eA
dju
stm
en
tC
ap
ita
l L
ease
sC
ap
ita
l L
ease
sT
ax
Ass
ista
nce
To
tal
Reven
ues
Sale
s an
d u
se t
ax
-$
-$
-$
-
$
(51
,518,4
86)
$
-$
(51,5
18,4
86)
$
Sta
te a
nd
fed
era
l aid
-
-
-
-
-
(1
5,4
40,5
04)
(15,4
40,5
04)
Ex
pen
dit
ure
s
Genera
l go
vern
men
t-
(1
,63
7,0
50)
17
2,1
78
30
,75
9
51
,518,4
86
-
5
0,0
84,3
73
Ed
ucatio
n(9
,41
6,2
56)
-
1,3
04
490
-
-
(9
,41
4,4
62)
Pu
blic s
afe
ty-
-
9
,31
3
1
,56
5
-
-
1
0,8
78
Health
-
-
6
,19
1
1
,26
5
-
2,2
97,4
00
2
,30
4,8
56
Econ
om
ic a
ssis
tance
-
-
12
,50
6
2,8
90
-
13
,14
3,1
04
1
3,1
58,5
00
Ho
me a
nd
co
mm
un
ity
serv
ices
-
-
555
153
-
-
708
Deb
t S
erv
ice
Pri
ncip
al
1,3
90,6
35
-
(20
2,0
47)
-
-
-
1
,18
8,5
88
Inte
rest
61
8,2
36
-
-
(3
7,1
22)
-
-
58
1,1
14
Oth
er
fin
an
cin
g u
ses
Tra
nsf
ers
ou
t-
1
,63
7,0
50
-
-
-
-
1,6
37,0
50
Tra
nsf
ers
to
co
mp
onen
t u
nits
7,4
07,3
85
-
-
-
-
-
7,4
07,3
85
Net
ch
an
ge i
n f
un
d b
ala
nce
-$
-$
-$
-
$
-$
-$
-$
82
County of Broome, New York
Notes to the Basic Financial Statements
For the Year Ended December 31, 2020
1. Summary of Significant Accounting Policies (Continued)
G. Cash, Cash Equivalents and Investments
The focus for the purposes of reporting cash flows is cash and cash equivalents.
Cash and cash equivalents include demand deposits accounts and all highly liquid debt
instruments purchased with original maturities of three months or less. The County's cash
and cash equivalents include money market accounts and Treasury Bills (See Note 2) and
are recorded at original cost plus accrued interest.
Investments within the policies referred to in Note 2 with maturities greater than one year
are recorded at fair value.
The Director of Office of Management and Budget has the responsibility for investing idle
funds. Cash, certificates of deposit, and money market accounts are maintained with
commercial banks doing business in the County.
The County follows the practice of pooling cash, cash equivalents and investments of all
funds not legally required to be segregated. Interest earned is allocated to the funds based
on the average cash balances within these funds and the total interest earnings for the
period. Capital project cash generated from the issuance of debt and monies generated for
the County's Self-Health Insurance Plan are examples of segregated cash.
The County has a compensating balance agreement with their banking institution, M&T
Bank. M&T Bank average required amount of the compensating balance for 2020 was
$12,000,000. By maintaining these cash balances, the County is exempt from bank service
charges pertaining to these accounts.
Deposits
New York State Law requires all cash deposits and cash equivalents to be collateralized or
insured. Collateral is required for all deposits not covered by the Federal Deposit Insurance
Corporation. Banking institutions may satisfy collateral requirements by furnishing a letter
of credit, surety bond, or pledging eligible securities held by a third party as specified by
Section 10 of the New York State Municipal Law.
The New York State Law serves as the County’s only policy regarding deposits. All
deposits of the County’s non-debt service funds, including certificates of deposit and
special time deposits, are insured under the provisions of the Federal Deposit Insurance
Act. Excess deposits are collateralized. The collateral is held by a third party.
83

County of Broome, New York
Notes to the Basic Financial Statements
For the Year Ended December 31, 2020
1. Summary of Significant Accounting Policies (Continued)
G. Cash, Cash Equivalents and Investments (Continued)
Investments
Interest Rate Risk – The County does not have a formal investment policy that limits
investment maturities as a means of managing exposure to fair value losses.
The County had the following depository accounts. All deposits are carried at cost plus
accrued interest. The County deposit policy requires that all funds be insured or
collateralized.
Bank Disclosure Schedules for the County’s primary government and fiduciary funds:
Total Balance FDIC
M&T Bank 26,547,687$ 500,000$
Chase 13,643 13,643
Key Bank 66,456 66,456
NBT 596,586 500,000
Total 27,224,372 1,080,098
Money Market Deposits 82,463,445 82,463,445
BTASC (including Treasury Bills) 2,987,984 62,155
Nonmajor business-type activities 988,210
Total cash, cash equivalents & investments 113,664,011$
Carrying
Depository Account Balance
Insured 1,080,098$
Collateralized:
Collateral held by pledging bank's trust in the County's name 112,583,913
Total Deposits 113,664,011$
The IDA categorizes its fair value measurements within the fair value hierarchy established
by generally accepted accounting principles. The hierarchy is based on the valuation of
inputs used to measure the fair value of the asset. Level 1 inputs are quoted prices in active
markets for the identical assets; Level 2 inputs are significant other observable inputs;
Level 3 inputs are significant unobservable inputs.
The IDA has the following recurring fair value measurements as of December 31, 2020:
US Treasury notes of $7,132,513 are valued using quoted market prices (Level 1).
The County’s primary government reports investments of $2,921,307 consisting of
BTASC U.S. Treasury Bills.
84
County of Broome, New York
Notes to the Basic Financial Statements
For the Year Ended December 31, 2020
1. Summary of Significant Accounting Policies (Continued)
H. Real Property Taxes
County, town, and village operations are primarily funded by real property taxes. School
district operations are also significantly funded by real property taxes. Delinquent school
and village property taxes are returned to the County in November of each year to be re-
levied on the next Town and County real property tax bill the following January. The State
Legislature has authorized the Broome County Legislature to levy real property taxes for
town and county purposes, through various provisions of the Real Property Tax Law
including Article 9, entitled the Levy and Collection of Taxes.
Assessment and Levy – All municipalities in the County value real property within their
boundaries. The final assessment rolls are complete on the first day of July of each year.
The amount of operations to be financed by real property taxes is determined during the
budget process for towns and the County. Town budgets are forwarded to the County for
use in the preparation of the town and county real property tax bills. The amount of real
property taxes to be levied for County operations is distributed across the municipalities
within the county based on their proportionate share of taxable full value. The real property
tax amounts to be levied for town operations are identified in their adopted budgets. Other
items included in the real property tax levy are workers' compensation assessments to
municipalities participating in the County’s worker’s compensation plan pool, real
property tax refunds made by the County on behalf of the municipalities, election board
costs and returned delinquent school and village real property taxes.
Tax Levy Process
January Real property tax bills are mailed to taxpayers.
January - March Town and County real property taxes are collected by the town tax
collectors except for the towns of Binghamton, Conklin,
Dickinson, Kirkwood, Fenton, Nanticoke and Union, and the City
of Binghamton. The County acts as tax collector for these
municipalities.
April Town Tax Collector warrants expire at the end of March. The tax
collectors individually settle their warrants with the Director of
Office of Management and Budget by April 30th. Town
Supervisors have received the amount of their tax levy from the
collectors by this time. The Director of Office of Management and
Budget collects unpaid taxes from April 1st forward.
85

County of Broome, New York
Notes to the Basic Financial Statements
For the Year Ended December 31, 2020
1. Summary of Significant Accounting Policies (Continued)
H. Real Property Taxes (Continued)
November Local municipalities notify the County of the amount of sales tax
they elect to apply to the next year's County tax levy. This
information is aggregated into a resolution submitted to the
County Legislature for approval. It is incorporated in the
preparation of the tax warrants and tax bills.
November - December Assessments for each of the municipal participants in the County
Sponsored Workers’ Compensation Pool are computed and
approved by the County Legislature. The municipalities notify
the County whether they will elect to pay the amounts in cash or
have the amounts added to the real property tax levy.
November-December Municipalities are notified of real property tax refunds made by
the County on their behalf as well as their share of election board
costs. Municipalities notify the County whether they will pay the
amounts in cash or have the amounts added to the real property
tax levy.
November-December Unpaid school district and village real property taxes are returned
to the County in November. These are re-levied on the next year's
town and county real property tax levy. They are recorded as both
an asset, property tax receivable, and an offsetting liability in due
to other governments on the County's General Fund balance sheet.
The unpaid school taxes for the City of Binghamton are not added
to the City real property tax levy, they are held for a period after
which the real property becomes subject to sale.
December Equalization rates are calculated by New York State. The County
accepts the equalization rates by Legislative approval. Tax
warrants are prepared. They are then approved by the County
Legislature, and signed by the County Executive before being
distributed to municipalities. Tax bills are printed and distributed
to town tax collectors.
December The tax levy for the City of Binghamton, which is prepared by the
City, is approved by the County Legislature.
86
County of Broome, New York
Notes to the Basic Financial Statements
For the Year Ended December 31, 2020
1. Summary of Significant Accounting Policies (Continued)
H. Real Property Taxes (Continued)
Collection – Real property taxes are collected by the town tax collectors from January 1
through March 31st. Town tax collectors settle the warrant with the Director of Office of
Management and Budget in April. The County makes collections thereafter. A five
percent penalty is added to unpaid items as of April 1, in accordance with ¶936 of the Real
Property Tax Law. Interest of 12 percent per annum is added to the returned amount until
October, when they become a lien. The redemption period for the taxes is 24 months after
the lien date.
Pursuant to County Legislative Resolution 568 of 1996, adopting Local Law 1 of 1996, the
Director of Real Property Tax Services is authorized to enter agreements with delinquent
taxpayers allowing them to pay such delinquent amounts in installments on a monthly,
quarterly, or semiannual basis. Interest is accrued on the delinquent amount at a rate of 12
percent per annum.
I. Due from Other Governments
Due from other governments includes reimbursement claims for various grant-in-aid
programs from State and Federal agencies and a receivable from a municipality to
reimburse incurred capital costs.
J. Inventories
Inventories are stated at the lower of cost (first-in, first-out), or market. They are expensed
on the consumption method for both the accrual and modified accrual basis of accounting.
K. Other Assets
Other assets include prepaid expenses and deposits with various local service agencies.
87

County of Broome, New York
Notes to the Basic Financial Statements
For the Year Ended December 31, 2020
1. Summary of Significant Accounting Policies (Continued)
L. Capital Assets
Property, equipment, and infrastructure expenses of $5,000 or greater are capitalized.
Expenses of less than $5,000 are charged to operations as incurred except for the Willow
Point Nursing Home which utilizes a $500 or greater threshold for the amortization of
capital assets. All property, equipment, and infrastructure expenses of the Nursing Home
are capitalized. Purchased capital assets are reported at historical cost and donated capital
assets are reported at acquisition value. Additional expenditures occurring after the asset
has been placed into service which will increase its useful life or capacity (betterment) will
be capitalized. Simple maintenance expenditures will be expensed. Interest on debt issued
for business-type activities and proprietary fund capital assets is capitalized for assets being
constructed (buildings, etc.) only and not for direct purchases (automobiles, etc.).
Depreciation is calculated using the straight-line method over the following estimated
useful lives:
Asset
Estimated Life
(Years)
Bridges 25
Buildings 20
Improvements 20
Roads 20
Full Size Transit Coaches 12
Construction Vehicles 10
Landfill Equipment 5
Police Interceptors 3
Other Vehicles 5
M. Compensated Absences - Government-wide Statements
Vacation benefits and sick leave compensation are earned and accumulated by County
employees pursuant to bargaining agreements and employment contracts. For certain
bargaining units, employees are paid for unused vacation and sick time earned at
termination. An accrual of unpaid vacation and sick time costs, including social security
expenses is recorded as an accrued liability in the government-wide statements.
1. Governmental Fund Types Compensated Absences - Fund Financial Statements –
Liabilities for compensated absences are recorded when due and payable.
2. Proprietary Fund Types Compensated Absences - Fund Financial Statements –
Total unpaid earned vacation and sick time costs, including FICA, are reflected as
liabilities in the Proprietary Fund Types fund financial statements in the same
manner as the government-wide statements.
88
County of Broome, New York
Notes to the Basic Financial Statements
For the Year Ended December 31, 2020
1. Summary of Significant Accounting Policies (Continued)
N. Net Position and Fund Balance Classifications
Government-wide Statements
Net position is displayed in three components:
a. Net investment in capital assets – capital assets including restricted capital assets, net
of accumulated depreciation and reduced by the outstanding balances of any bonds,
mortgages, notes or other borrowings that are attributable to the acquisition,
construction or improvement of those assets.
b. Restricted net position – net position with constraints placed on the use either by (1)
external groups such as creditors (such as through debt covenants), grantors,
contributors or laws or regulations of other governments; or (2) law through
constitutional provisions or enabling legislation.
c. Unrestricted net position – all other net position that do not meet the definition of
“restricted” or “net investment in capital assets” and are deemed to be available for
general use by the County.
Fund Statements
Classifications of fund balance reflect spending constraints on resources, rather than
availability for appropriation to provide users more consistent and understandable
information about a fund’s net resources. Constraints are broken down into five different
classifications: nonspendable, restricted, committed, assigned and unassigned. The
classifications serve to inform readers of the financial statements of the extent to which the
government is bound to honor constraints on the specific purposes for which resources in
a fund can be spent.
In the fund, financial statements the five classifications of fund balance are defined as:
a. Nonspendable fund balance – Includes amounts that cannot be spent because they are
either not in spendable form or legally or contractually required to be maintained intact.
b. Restricted – Includes amounts with constraints placed on the use of resources either
externally imposed by creditors, grantors, contributors or laws or regulations of other
governments; or imposed by law through constitutional provisions or enabling
legislation.
89
County of Broome, New York
Notes to the Basic Financial Statements
For the Year Ended December 31, 2020
1. Summary of Significant Accounting Policies (Continued)
N. Net Position and Fund Balance Classifications (Continued)
c. Committed – Includes amounts that can only be used for the specific purposes pursuant
to constraints imposed by formal action of the County’s highest level of decision-
making authority, the Legislature.
d. Assigned – Includes amounts that are constrained by the County’s intent to be used for
specific purposes but are neither restricted nor committed. Any remaining fund
balance amounts for funds other than the general fund are classified as assigned fund
balance. The Legislature is the official authorized body to assign amounts for a specific
purpose.
e. Unassigned – Includes remaining fund balance that does not meet the definition of the
above four classifications and are deemed to be available for general use by the
County’s General Fund. Any special revenue funds that have a remaining deficit after
the non-spendable, restricted and committed classifications have been recorded must
reflect the deficit as unassigned.
Proprietary net position is classified the same as in the government-wide statements.
Order of Use of Fund Balance
The County’s policy is to apply expenditures first against nonspendable fund balance,
restricted fund balance, committed fund balance, assigned fund balance and then
unassigned fund balance at the end of the fiscal year. For all funds, nonspendable fund
balances are determined first and then restricted fund balances for specific purposes are
determined. In the General Fund, committed fund balance is determined next and then
assigned. The remaining amounts are reported as unassigned.
O. Interfund Activity
Interfund transfers are generally recorded as transfers in or out of a fund. Charges for
services and costs paid for services acquired are recorded as revenues of the supplier fund
and expenses / expenditures of the consumer fund. Unbilled costs and unpaid invoices are
recognized as interfund receivables and payables at the end of the fiscal year. See Note 14
for additional details.
90

County of Broome, New York
Notes to the Basic Financial Statements
For the Year Ended December 31, 2020
1. Summary of Significant Accounting Policies (Continued)
P. Program Revenues
Program revenues are presented on the statement of activities in government-wide
statements. These are revenues derived directly from the program itself or from parties
outside the reporting government’s taxpayers or citizenry. They reduce the net cost of the
function to be financed by the County’s general revenues. They are reported in three
categories.
1. Charges for Services – Includes revenues based on exchange or exchange-like
transactions. These revenues arise from those who purchase, use or directly benefit
from the goods, services or privileges provided. Revenues in this category include
fees charged for specific services such as mental health fees and public health fees,
licenses and permits such as pistol permits, fines and forfeitures assessed such as
Stop DWI fines and forfeited bail.
2. Operating Grants and Contributions – Includes revenues arising from mandatory
and voluntary non-exchange transactions with other governments, organizations,
or individuals that are restricted for use in a program for other than capital
purposes. Revenues in this category include state and federal aid for programs like
Temporary Assistance for Needy Families, Services for Recipients, Social
Services Administration and Employment and Training.
3. Capital Grants and Contributions – Includes revenues arising from mandatory and
voluntary non-exchange transactions with other governments, organizations, or
individuals that are restricted for use in a capital program.
Q. Use of Estimates
The preparation of basic financial statements, in conformity with accounting principles
generally accepted in the United States of America, requires management to make
estimates and assumptions that affect the reported amounts of assets, liabilities, deferred
outflows/inflows of resources, and disclosure of contingencies at the date of the financial
statement, and the revenues and expenditures, or expenses, during the reporting period.
Actual results could differ from those estimates.
91
County of Broome, New York
Notes to the Basic Financial Statements
For the Year Ended December 31, 2020
1. Summary of Significant Accounting Policies (Continued)
R. GASB Newly Adopted Accounting Standard
During the year ended December 31, 2020, the County implemented GASB Statement No.
95, Postponement of the Effective Dates of Certain Authoritative Guidance. Additionally,
the County early implemented GASB Statements No. 92, Omnibus 2020; and No. 97,
Certain Component Unit Criteria, and Accounting and Financial Reporting for Internal
Revenue Code Section 457 Deferred Compensation Plans—an amendment of GASB
Statements No. 14 and No. 84, and a suppression of GASB Statement No. 32. GASB
Statement No. 95 provides temporary relief to governments and other stakeholders
considering the COVID-19 pandemic by postponing the effective dates of certain
provisions in Statements and Implementation Guides that first became effective or are
scheduled to become effective for periods beginning after June 15, 2018, and later. GASB
Statement No. 92 enhances comparability in accounting and financial reporting and
improves the consistency of authoritative literature by addressing practice issues that have
been identified during implementation and application of certain GASB Statements. GASB
Statement No. 97 increases consistency and comparability related to the reporting of
fiduciary component units, mitigates costs associated with the reporting of certain defined
contribution plans and enhances the relevance, consistency and comparability of the
accounting and reporting for internal Revenue Code Section 457 deferred compensation
plans. The implementation of GASB Statements No. 92, 95, and 97 did not have a material
impact on the County’s financial position or results from operations.
92

Cou
nty
of
Bro
om
e, N
ew Y
ork
Note
s to
th
e B
asi
c F
inan
cial
Sta
tem
ents
For
the
Yea
r E
nd
ed D
ecem
ber
31
, 2020
2.
Cash
, C
ash
Eq
uiv
ale
nts
, an
d I
nves
tmen
ts
At
Dec
ember
31
, 2
020
, (A
ug
ust
31
, 2
020
, fo
r th
e C
oll
ege)
cas
h,
cash
equiv
alen
ts (
incl
udin
g r
estr
icte
d c
ash
) an
d i
nv
estm
ents
co
nsi
sts
of
the
foll
ow
ing:
To
tal
No
nm
ajo
rG
ov
ern
men
tal
Gen
era
lC
ap
ita
l P
roje
cts
Deb
t S
erv
ice
BT
AS
CG
ov
ern
men
tal
Fu
nd
s
Cas
h an
d C
ash
Equ
ival
ents
:
Cas
h 82
4,52
1$
-
$
-$
-$
1,32
4,05
1$
2,
148,
572
$
Mon
ey m
arke
t de
posi
ts11
,815
,805
-
-
-
-
11
,815
,805
Tot
al C
ash
and
Cas
h E
quiv
alen
ts12
,640
,326
-
-
-
1,
324,
051
13,9
64,3
77
Cas
h, C
ash
Equ
ival
ents
and
Inv
estm
ents
- R
estr
icte
d:
Cas
h-
2,78
5,54
2
1,
782,
138
62
,155
43
7,46
1
5,
067,
296
Mon
ey m
arke
t de
posi
ts12
,164
,473
7,70
1,29
5
13
3,83
7
4,52
2
-
20
,004
,127
Inve
stm
ents
-
-
-
2,
921,
307
-
2,
921,
307
Tot
al C
ash,
Cas
h E
quiv
alen
ts a
nd I
nves
tmen
ts -
Res
tric
ted
12,1
64,4
73
10
,486
,837
1,
915,
975
2,
987,
984
43
7,46
1
27
,992
,730
Tot
al24
,804
,799
$
10,4
86,8
37$
1,
915,
975
$
2,
987,
984
$
1,
761,
512
$
41,9
57,1
07$
Go
ver
nm
enta
l F
un
d T
yp
es
BT
AS
C h
as t
he
foll
ow
ing
rec
urr
ing
fai
r val
ue
mea
sure
men
ts a
s of
Dec
ember
31
, 2020
; U
.S.
Tre
asury
Bil
ls o
f $
2,9
21
,30
7 a
re v
alu
ed u
sin
g q
uote
d
mar
ket
pri
ces
(Lev
el 1
).
93

Cou
nty
of
Broom
e, N
ew Y
ork
Note
s to
th
e B
asi
c F
inan
cial
Sta
tem
ents
For
the
Yea
r E
nd
ed D
ecem
ber
31
, 2020
2.
Cash
, C
ash
Eq
uiv
ale
nts
an
d I
nves
tmen
ts (
Con
tin
ued
)
To
tal
Dep
art
men
t o
fW
illo
w P
oin
tS
oli
d W
ast
eN
on
ma
jor
En
terp
rise
Inte
rna
l
Tra
nsp
ort
ati
on
Nu
rsin
g H
om
eM
an
ag
emen
tA
via
tio
nB
usi
nes
s-ty
pe
Fu
nd
sS
erv
ice
Cas
h a
nd
Cas
h E
quiv
alen
ts:
Cas
h
65
6,7
44
$
-$
4
3,7
80
$
4
0,7
19
$
9
88,2
10
$
1,7
29,4
54
$
3
,87
1,3
38
$
Mon
ey m
ark
et d
eposi
ts2
,62
3,1
00
-
2
0,0
35,2
92
-
-
22
,65
8,3
92
17
,49
6,2
79
To
tal C
ash
an
d C
ash
Eq
uiv
alen
ts3
,27
9,8
44
-
2
0,0
79,0
72
40
,71
9
98
8,2
10
24
,38
7,8
45
21
,36
7,6
17
Cas
h a
nd
Cas
h E
quiv
alen
ts -
Res
tric
ted:
Cas
h1
2
59,6
94
83
,42
7
54
4,4
66
-
88
7,5
88
3,7
80
Mon
ey m
ark
et d
eposi
ts2
0,1
61
1
,88
9,9
45
2
,46
3,9
64
2
91,3
36
-
4,6
65,4
06
5
,11
8,3
12
To
tal C
ash
an
d C
ash
Eq
uiv
alen
ts -
Res
tric
ted
20
,16
2
2,1
49,6
39
2
,54
7,3
91
8
35,8
02
-
5,5
52,9
94
5
,12
2,0
92
To
tal
3,3
00,0
06
$
2
,14
9,6
39
$
2
2,6
26,4
63
$
87
6,5
21
$
98
8,2
10
$
29
,94
0,8
39
$
26
,48
9,7
09
$
Pro
pri
etary
Fu
nd
Ty
pes
94
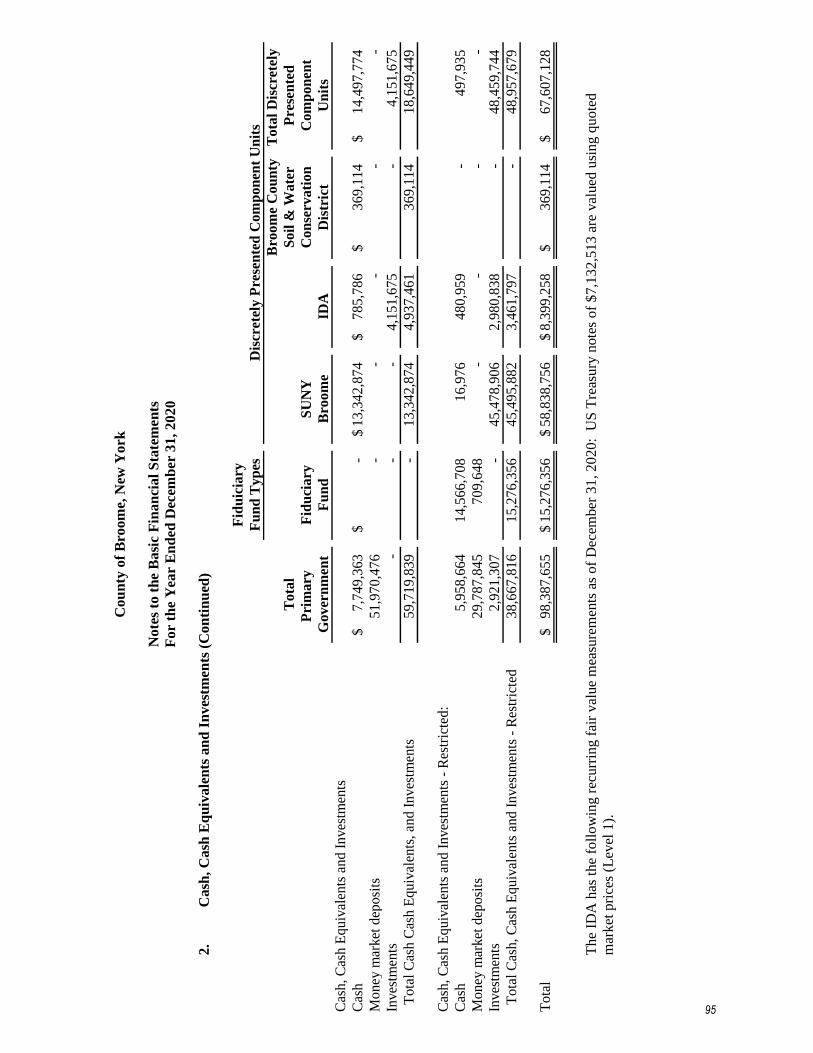
Cou
nty
of
Bro
om
e, N
ew Y
ork
Note
s to
th
e B
asi
c F
inan
cial
Sta
tem
ents
For
the
Yea
r E
nd
ed D
ecem
ber
31,
2020
2.
Cash
, C
ash
Eq
uiv
ale
nts
an
d I
nves
tmen
ts (
Con
tin
ued
)
Fid
uic
iary
Fu
nd
Ty
pes
Bro
om
e C
ou
nty
To
tal
Dis
cret
ely
To
tal
So
il &
Wa
ter
Pre
sen
ted
Pri
ma
ry
Fid
uci
ary
SU
NY
Co
nse
rva
tio
nC
om
po
nen
t
Go
ver
nm
ent
Fu
nd
Bro
om
eID
AD
istr
ict
Un
its
Cas
h,
Cas
h E
qu
ival
ents
an
d I
nves
tmen
ts
Cas
h
7,7
49
,36
3$
-
$
13
,34
2,8
74
$
78
5,7
86
$
3
69
,11
4$
1
4,4
97
,77
4$
Mo
ney
mar
ket
dep
osi
ts5
1,9
70
,47
6
-
-
-
-
-
Inves
tmen
ts-
-
-
4
,15
1,6
75
-
4
,15
1,6
75
To
tal
Cas
h C
ash
Eq
uiv
alen
ts,
and
In
ves
tmen
ts5
9,7
19
,83
9
-
1
3,3
42
,87
4
4
,93
7,4
61
36
9,1
14
18
,64
9,4
49
Cas
h,
Cas
h E
qu
ival
ents
an
d I
nves
tmen
ts -
Res
tric
ted
:
Cas
h5
,95
8,6
64
14
,56
6,7
08
16
,97
6
48
0,9
59
-
49
7,9
35
Mo
ney
mar
ket
dep
osi
ts2
9,7
87
,84
5
70
9,6
48
-
-
-
-
Inves
tmen
ts2
,92
1,3
07
-
4
5,4
78
,90
6
2
,98
0,8
38
-
4
8,4
59
,74
4
To
tal
Cas
h,
Cas
h E
qu
ival
ents
an
d I
nves
tmen
ts -
Res
tric
ted
38
,66
7,8
16
1
5,2
76
,35
6
4
5,4
95
,88
2
3
,46
1,7
97
-
4
8,9
57
,67
9
To
tal
98
,38
7,6
55
$
1
5,2
76
,35
6$
5
8,8
38
,75
6$
8
,39
9,2
58
$
36
9,1
14
$
67
,60
7,1
28
$
Dis
cret
ely
Pre
sen
ted
Co
mp
on
ent
Un
its
T
he
IDA
has
th
e fo
llo
win
g r
ecurr
ing
fai
r val
ue
mea
sure
men
ts a
s of
Dec
ember
31
, 2020
: U
S T
reas
ury
note
s o
f $
7,1
32
,513
are
val
ued
usi
ng
qu
ote
d
mar
ket
pri
ces
(Lev
el 1
).
95
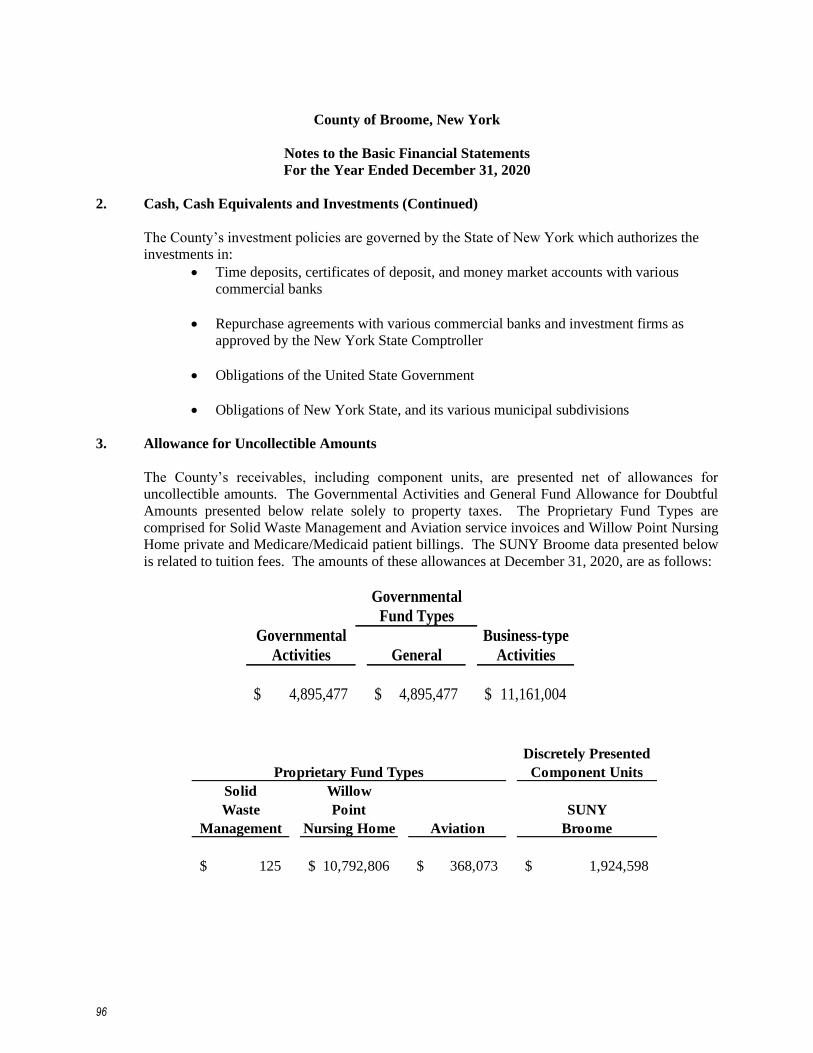
County of Broome, New York
Notes to the Basic Financial Statements
For the Year Ended December 31, 2020
2. Cash, Cash Equivalents and Investments (Continued)
The County’s investment policies are governed by the State of New York which authorizes the
investments in:
• Time deposits, certificates of deposit, and money market accounts with various
commercial banks
• Repurchase agreements with various commercial banks and investment firms as
approved by the New York State Comptroller
• Obligations of the United State Government
• Obligations of New York State, and its various municipal subdivisions
3. Allowance for Uncollectible Amounts
The County’s receivables, including component units, are presented net of allowances for
uncollectible amounts. The Governmental Activities and General Fund Allowance for Doubtful
Amounts presented below relate solely to property taxes. The Proprietary Fund Types are
comprised for Solid Waste Management and Aviation service invoices and Willow Point Nursing
Home private and Medicare/Medicaid patient billings. The SUNY Broome data presented below
is related to tuition fees. The amounts of these allowances at December 31, 2020, are as follows:
Governmental
Fund Types
Governmental Business-type
Activities General Activities
4,895,477$ 4,895,477$ 11,161,004$
Discretely Presented
Component Units
Solid Willow
Waste Point SUNY
Management Nursing Home Aviation Broome
125$ 10,792,806$ 368,073$ 1,924,598$
Proprietary Fund Types
96

Cou
nty
of
Bro
om
e, N
ew Y
ork
Note
s to
th
e B
asi
c F
inan
cial
Sta
tem
ents
For
the
Yea
r E
nd
ed D
ecem
ber
31
, 2020
4.
Res
tric
ted
Ass
ets
At
Dec
ember
31
, 2
02
0, re
stri
cted
ass
ets
consi
st o
f th
e fo
llow
ing:
Will
ow
Tot
alD
epar
tmen
tP
oint
Solid
Inte
rnal
Tot
al
Cap
ital
Deb
t O
ther
Gov
ernm
enta
lof
Nur
sing
Was
teSe
rvic
eP
ropr
ieta
ry
Gen
eral
Pro
ject
sSe
rvic
eB
TA
SCG
over
nmen
tal
Fun
dsT
rans
port
atio
nH
ome
Man
agem
ent
Avi
atio
nF
unds
Fun
ds
Deb
t Ser
vice
-$
-
$
1,91
5,97
5$
2,98
7,98
4$
-$
4,90
3,95
9$
20
,162
$
258,
469
$
102,
494
$
235,
556
$
6,35
7$
623,
038
$
Cap
ital P
roje
cts
-
10
,486
,837
-
-
-
10
,486
,837
188,
055
497,
563
2,44
4,89
7
1,39
6,04
0
121,
915
4,64
8,47
0
Gra
nts
Prog
ram
s1,
722,
067
-
-
-
55
4,04
6
2,
276,
113
-
-
-
-
-
-
Une
arne
d R
even
ues
5,05
4,93
9
-
-
-
-
5,05
4,93
9
-
-
-
7,
180
-
7,
180
Res
trict
ed F
und
Bal
ance
7,10
9,53
4
-
-
-
7,87
5
7,11
7,40
9
-
1,
393,
607
-
-
4,
993,
820
6,
387,
427
Tota
l13
,886
,540
$
10
,486
,837
$
1,
915,
975
$
2,
987,
984
$
56
1,92
1$
29
,839
,257
$
208,
217
$
2,14
9,63
9$
2,54
7,39
1$
1,63
8,77
6$
5,12
2,09
2$
11,6
66,1
15$
Pro
prie
tary
Fun
dsG
over
nmen
tal F
unds
A
ddit
ional
ly, th
e C
ust
odia
l F
un
d r
epo
rts
rest
rict
ed c
ash a
nd c
ash e
quiv
alen
ts t
ota
ling $
15,2
76,3
56 r
epre
sen
ting
am
ou
nts
hel
d o
n b
ehal
f of
oth
ers.
Am
ounts
res
tric
ted b
y b
ond
in
den
ture
s fo
r deb
t se
rvic
e re
pre
sent
unex
pen
ded
pro
ceed
s of
borr
ow
ing
s on
co
mple
ted c
apit
al p
roje
cts
and
in
tere
st
earn
ed f
rom
the
inv
estm
ent
of
deb
t pro
ceed
s w
hic
h w
ill
be
use
d t
o r
educe
futu
re d
ebt
serv
ice.
Am
ounts
res
tric
ted
fo
r ca
pit
al p
roje
cts
repre
sent
funds
rela
ted t
o c
apit
al p
roje
cts
of
the
County
’s g
over
nm
enta
l an
d p
rop
riet
ary
fu
nd
s.
Am
ounts
res
tric
ted
fo
r gra
nt
pro
gra
ms
repre
sent
monie
s, r
ecei
vab
les,
and p
repai
d e
xpen
ses
rela
ted t
o t
he
Co
un
ty’s
fed
eral
an
d s
tate
gra
nts
.
97
County of Broome, New York
Notes to the Basic Financial Statements
For the Year Ended December 31, 2020
5. Sales Tax
The County is authorized to impose a sales tax pursuant to Articles 28 and 29 of New York State
Tax Law. The sales tax rate within Broome County is eight percent. Of the 8% the County share is
4%. The remaining 4% is the State sales and compensating use tax. Sales tax collections are
administered by the New York State Commissioner of Taxation and Finance. The amount of sales
tax collections made by the State Commissioner is remitted to the County after deducting the State
Commissioner's administrative expenses. Remittances to the County are made twice each month
except for the months of June and December in which there are three.
Of the 4% County sales tax, the County retains 1% and shares 37.5% of the remaining 3% with the
local municipalities within the County. Using 2010 Federal Census figures, distributions to
municipalities are made quarterly in January, April, July, and October based on their proportionate
share of population. For towns containing villages a further proration is made based on the town
and village populations. Amounts due to the local municipalities of $5,401,261 as of December 31,
2020, are included in due to other governments in the general fund.
Sales tax receipts on sales made in 2020 totaled approximately $137.4 million of which
approximately $85.9 million was retained by the County pursuant to local legislative enactments.
The remaining amounts were distributed. The distributions totaled:
County Towns $ 31.1 million
County Villages $ 8.6 million
City of Binghamton $ 11.8 million
New York State periodically audits its distribution of sales tax revenues to counties throughout the
state, although the County has never been so audited. Subsequent revisions to the revenues recorded
as of December 31, 2020, if any, would be recorded in the year that they are calculated.
98

County of Broome, New York
Notes to the Basic Financial Statements
For the Year Ended December 31, 2020
6. Capital Assets
1/1/2020 12/31/2020
Beginning Ending
Governmental activities Balance Increases Decreases Balance
Capital assets, non-depreciable:
Land 7,066,819$ 105,783$ -$ 7,172,601$
Construction in progress 24,049,073 6,632,988 (2,149,905) 28,532,156
Total capital assets, non-depreciable 31,115,892 6,738,771 (2,149,905) 35,704,757
Capital assets, being depreciated:
Buildings 134,014,812 1,933,318 - 135,948,130
Improvements other than buildings 169,101,793 3,793,901 - 172,895,694
Machinery and equipment 49,818,870 3,108,559 (6,081,096) 46,846,333
Total capital assets, being depreciated 352,935,475 8,835,778 (6,081,096) 355,690,157
Less accumulated depreciation for:
Buildings (114,570,117) (2,652,856) 1,810,635 (115,412,338)
Improvements other than buildings (115,882,865) (5,624,119) - (121,506,984)
Machinery and equipment (40,690,959) (2,810,252) 4,152,970 (39,348,241)
Total accumulated depreciation (271,143,941) (11,087,227) 5,963,605 (276,267,562)
Capital assets, being depreciated, net 81,791,534 (2,251,449) (117,491) 79,422,595
Governmental activities capital assets, net 112,907,426$ 4,487,322$ (2,267,396)$ 115,127,352$
Depreciation expense was charged to functions as follows:
Governmental activities
General government 3,140,003$
Education 1,399
Public safety 601,360
Health 20,858
Transportation 5,541,816
Economic assistance 238,431
Culture and recreation 70,959
Home and community services 1,296,550
Depreciation charged on fixed assets held by the internal service funds 175,851
Total governmental activities depreciation expense 11,087,227$
99

County of Broome, New York
Notes to the Basic Financial Statements
For the Year Ended December 31, 2020
6. Capital Assets (Continued)
1/1/2020 12/31/2020
Beginning Ending
Business-type activities Balance Increases Decrease Balance
Capital assets, non-depreciable:
Land 3,223,960$ -$ -$ 3,223,960$
Construction in progress 12,626,066 5,664,055 (10,970,477) 7,319,644
Total capital assets, non-depreciable 15,850,026 5,664,055 (10,970,477) 10,543,604
Capital assets, being depreciated:
Buildings 70,729,197 - - 70,729,197
Improvements other than buildings 219,184,768 12,444,715 - 231,629,483
Machinery and equipment 45,088,765 2,737,613 (671,308) 47,155,070
Total capital assets being depreciated 335,002,730 15,182,328 (671,308) 349,513,750
Less accumulated depreciation for:
Buildings (53,128,062) (1,502,901) - (54,630,963)
Improvements other than buildings (145,307,508) (5,949,005) - (151,256,514)
Machinery and equipment (28,067,515) (3,172,123) 617,434 (30,622,204)
Total accumulated depreciation (226,503,085) (10,624,028) 617,434 (236,509,681)
Capital assets, being depreciated, net 108,499,645 4,558,300 (53,874) 113,004,069
Business-type activities capital assets, net 124,349,670$ 10,222,355$ (11,024,351)$ 123,547,672$
Depreciation expense was charged to functions as follows:
Business-type activities
Department of transportation 2,821,219$
Nursing home 741,953
Solid waste management 3,197,500
Airport 3,863,356
Total business-type activities depreciation expense 10,624,028$
100

County of Broome, New York
Notes to the Basic Financial Statements
For the Year Ended December 31, 2020
6. Capital Assets (Continued)
9/1/2019 8/31/2020
Beginning Ending
SUNY Broome Balance Increases Decreases Balance
Capital assets, non-depreciable:
Land 144,935$ -$ -$ 144,935$
Construction in progress 14,490,809 4,383,733 (596,283) 18,278,259
Total capital assets, non-depreciable 14,635,744 4,383,733 (596,283) 18,423,194
Capital assets, being depreciated:
Buildings 89,587,261 286,050 - 89,873,311
Land improvements 2,460,828 150,630 - 2,611,458
Machinery and equipment 9,468,691 606,630 (133,890) 9,941,431
Infrastructure 4,395,614 528,290 (21,406) 4,902,498
Total capital assets, being depreciated 105,912,394 1,571,600 (155,296) 107,328,698
Less accumulated depreciation for:
Buildings (41,213,003) (2,205,385) - (43,418,388)
Land improvements (1,305,122) (103,991) - (1,409,113)
Machinery and equipment (6,215,768) (668,248) 133,890 (6,750,126)
Infrastructure (2,103,406) (167,914) - (2,271,320)
Total accumulated depreciation (50,837,299) (3,145,538) 133,890 (53,848,947)
Capital assets, being depreciated, net 55,075,095 (1,573,938) (21,406) 53,479,751
SUNY Broome capital assets, net 69,710,839$ 2,809,795$ (617,689)$ 71,902,945$
SUNY Broome’s capital assets reported on the Statement of Net Position includes their component units
BCC Foundation capital assets of $6,768 and Faculty & Student Association capital assets of $42,013,
which are excluded from the table above.
101
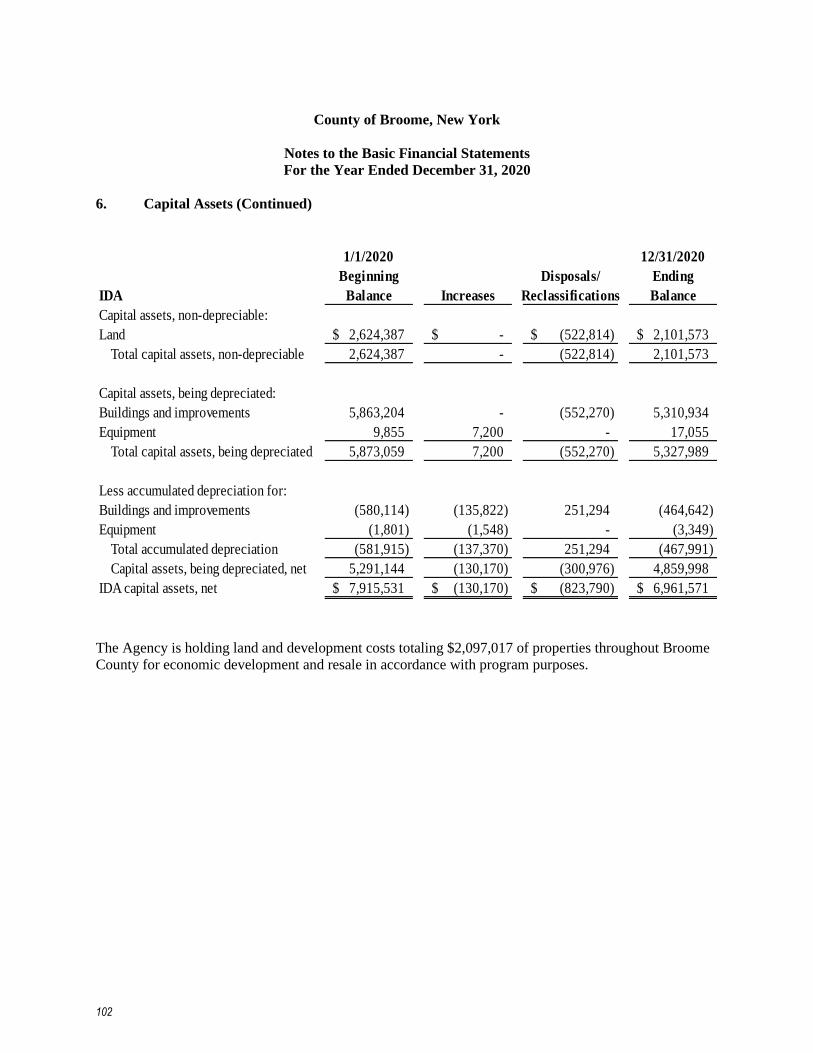
County of Broome, New York
Notes to the Basic Financial Statements
For the Year Ended December 31, 2020
6. Capital Assets (Continued)
1/1/2020 12/31/2020
Beginning Disposals/ Ending
IDA Balance Increases Reclassifications Balance
Capital assets, non-depreciable:
Land 2,624,387$ -$ (522,814)$ 2,101,573$
Total capital assets, non-depreciable 2,624,387 - (522,814) 2,101,573
Capital assets, being depreciated:
Buildings and improvements 5,863,204 - (552,270) 5,310,934
Equipment 9,855 7,200 - 17,055
Total capital assets, being depreciated 5,873,059 7,200 (552,270) 5,327,989
Less accumulated depreciation for:
Buildings and improvements (580,114) (135,822) 251,294 (464,642)
Equipment (1,801) (1,548) - (3,349)
Total accumulated depreciation (581,915) (137,370) 251,294 (467,991)
Capital assets, being depreciated, net 5,291,144 (130,170) (300,976) 4,859,998
IDA capital assets, net 7,915,531$ (130,170)$ (823,790)$ 6,961,571$
The Agency is holding land and development costs totaling $2,097,017 of properties throughout Broome
County for economic development and resale in accordance with program purposes.
102

County of Broome, New York
Notes to the Basic Financial Statements
For the Year Ended December 31, 2020
7. Short-term Liabilities
The County redeemed bond and tax anticipation notes in 2020 and issued additional notes to meet
cash management objectives. Short-term debt activity for the year ended December 31, 2020 is as
follows:
Beginning Ending
Balance Issued Redeemed Balance
Tax Anticipation Notes $ 6,750,000 $ 30,600,000 $ (6,750,000) $ 30,600,000
Bond Anticipation Notes (BANS) 76,544,000 68,138,000 (76,544,000) 68,138,000
$ 83,294,000 $ 98,738,000 $ (83,294,000) $ 98,738,000
8. Long-term Liabilities
This note contains several tables providing information on the County's long-term liabilities for the
year ending December 31, 2020. The presentation includes governmental activities, business-type
activities, and discretely presented component unit information for long-term debt obligations.
There are restrictions contained in the various bond indentures. Management believes that the
County is following all such restrictions.
Other Long-term Liabilities
In addition to long-term debt obligations, the County incurs a variety of other long-term liabilities.
Long-term liabilities of this kind related to governmental funds have been typically liquidated in
prior years using resources of the General and other governmental funds. Descriptions of these
liabilities are as follows:
Early Retirement Incentive Costs – This amount represents health insurance costs that the County
will incur for retirees, up to a capped amount. These benefits were part of early retirement packages
offered in 2011, 2012 and again in 2013. No early retirement incentives were offered in 2020.
Landfill Capping Liability – This account shows the future costs associated with the capping and
long-term maintenance of the County's Nanticoke Landfill. Estimated capping and long-term
maintenance costs associated with Sections II and III of the Nanticoke Landfill are included in the
business-type activities and the Solid Waste Management Fund. Capping and long-term
maintenance costs are components of the tipping fee. See Note 17 for further discussion.
Workers' Compensation Liability – This amount represents the discounted value of all outstanding
workers’ compensation claims including incurred but not reported claims.
103

County of Broome, New York
Notes to the Basic Financial Statements
For the Year Ended December 31, 2020
8. Long-term Liabilities (Continued)
Compensated Absences – This account presents the value of vested vacation and sick time.
Liability and Casualty – This amount represents the value of all outstanding liability claims.
Obligations Under Capital Leases – This account represents the capital lease obligations. The
County has various lease agreements for buildings and equipment that have been determined to be
capital leases. Accordingly, the leases have been recorded as capital assets at an amount equal to
the present value of the minimum lease payments at the inception of the lease. Assets acquired
under capital leases are recorded as capital assets in the government-wide financial statements;
additionally, those associated with business-type activities reported in the proprietary funds’
financial statements.
Due to NYSERS – Chapter 57 – This liability represents the result of the enactment of Chapter 57
of the Law of 2010 of the State of New York to allow the amortization of a portion of the County’s
retirement bill for 10 years in accordance with certain stipulations, which are partially discussed in
Note 10.
Total OPEB Obligation – As explained in Note 11, the County provides a portion of health care
benefits for retirees. The County’s annual OPEB cost is measured as the portion of the present
value of projected benefit payments to be provided to current active and inactive employees that is
attributed to those employees’ past periods of service (total OPEB liability). The County’s primary
government long-term OPEB obligation is estimated to be $275,615,145 at December 31, 2020
with governmental activities of $226,633,331 and business-type activities of $48,981,814.
Net Pension Liability – The County reports a liability for its proportionate share of the net pension
liability for the Employees’ Retirement System. More information on the net pension liability is
presented in Note 10.
104
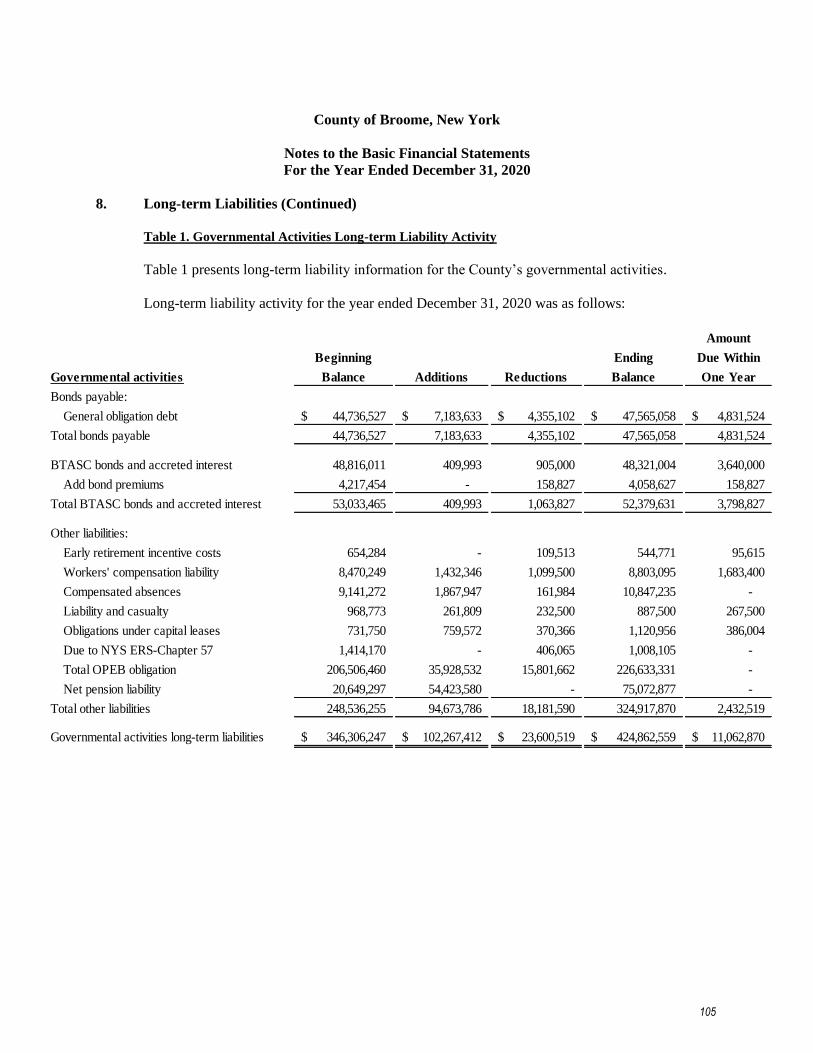
County of Broome, New York
Notes to the Basic Financial Statements
For the Year Ended December 31, 2020
8. Long-term Liabilities (Continued)
Table 1. Governmental Activities Long-term Liability Activity
Table 1 presents long-term liability information for the County’s governmental activities.
Long-term liability activity for the year ended December 31, 2020 was as follows:
Amount
Beginning Ending Due Within
Governmental activities Balance Additions Reductions Balance One Year
Bonds payable:
General obligation debt 44,736,527$ 7,183,633$ 4,355,102$ 47,565,058$ 4,831,524$
Total bonds payable 44,736,527 7,183,633 4,355,102 47,565,058 4,831,524
BTASC bonds and accreted interest 48,816,011 409,993 905,000 48,321,004 3,640,000
Add bond premiums 4,217,454 - 158,827 4,058,627 158,827
Total BTASC bonds and accreted interest 53,033,465 409,993 1,063,827 52,379,631 3,798,827
Other liabilities:
Early retirement incentive costs 654,284 - 109,513 544,771 95,615
Workers' compensation liability 8,470,249 1,432,346 1,099,500 8,803,095 1,683,400
Compensated absences 9,141,272 1,867,947 161,984 10,847,235 -
Liability and casualty 968,773 261,809 232,500 887,500 267,500
Obligations under capital leases 731,750 759,572 370,366 1,120,956 386,004
Due to NYS ERS-Chapter 57 1,414,170 - 406,065 1,008,105 -
Total OPEB obligation 206,506,460 35,928,532 15,801,662 226,633,331 -
Net pension liability 20,649,297 54,423,580 - 75,072,877 -
Total other liabilities 248,536,255 94,673,786 18,181,590 324,917,870 2,432,519
Governmental activities long-term liabilities 346,306,247$ 102,267,412$ 23,600,519$ 424,862,559$ 11,062,870$
105

County of Broome, New York
Notes to the Basic Financial Statements
For the Year Ended December 31, 2020
8. Long-term Liabilities (Continued)
Table 2. Business-type Activities Long-term Liability Activity
Table 2 presents long-term liability information for the County’s business-type activities.
Amount
Beginning Ending Due Within
Business-type activities Balance Additions Reductions Balance One Year
Bonds payable:
General obligation debt 15,398,473$ 6,706,367$ 1,564,898$ 20,539,942$ 1,948,476$
Total bonds payable 15,398,473 6,706,367 1,564,898 20,539,942 1,948,476
Other liabilities:
Early retirement incentive costs 242,449 - 47,018 195,431 35,643
Landfill capping liability 15,895,625 - 2,951,412 12,944,213 122,600
Workers' compensation liability 5,032,770 933,423 650,116 5,316,077 626,000
Compensated absences 1,379,297 1,478,792 1,379,297 1,478,792 -
Obligations under capital lease 14,708 5,675 4,274 16,109 4,620
Due to NYS ERS 389,735 - 111,909 277,826 -
Total OPEB obligation 46,431,112 6,532,483 3,981,781 48,981,814 -
Net pension liability 4,876,010 13,499,698 - 18,375,708 -
Total other liabilities 74,261,706 22,450,071 9,125,807 87,585,970 788,863
Business-type activities long-term liabilities 89,660,179$ 29,156,438$ 10,690,705$ 108,125,912$ 2,737,339$
106

County of Broome, New York
Notes to the Basic Financial Statements
For the Year Ended December 31, 2020
8. Long-term Liabilities (Continued)
Long-term Debt Obligations
General Obligation Bonds (Including Amounts Issued for the Discretely Presented Component
Unit – SUNY Broome)
State of New York Municipal Bond Bank Agency Recovery Act Bonds, 2010, Series 2010B1 -
Issue 20 aggregating $30,765,000 was for various property acquisitions, construction and/or
improvement of facilities, construction and/or rehabilitation of roads and bridges and equipment
purchases throughout the County. Purposes included highway reconstruction, bridge
reconstruction, new landfill construction, and partial landfill closure. The issue is subject to federal
arbitrage regulations. The remaining installments aggregating $3,855,000 are at interest rate of
5.0% and are due annually each April as follows:
Year
Ending Principal Interest Total
2021 3,855,000$ 96,375$ 3,951,375$
3,855,000$ 96,375$ 3,951,375$
State of New York Municipal Bond Bank Agency Recovery Act Bonds, 2010, Series 2010B2
(Taxable BABs) - Issue 21 aggregating $17,455,000 was for various property acquisitions,
construction and/or improvement of facilities, construction and/or rehabilitation of roads and
bridges and equipment purchases throughout the County. Purposes included Highway
Reconstruction, Bridge Reconstruction, New Landfill Construction, and Partial Landfill Closure.
The issue is not subject to federal arbitrage regulations. The remaining installments aggregating
$13,695,000 are at interest rate of 5.3% to 5.9% depending on maturity are due annually each April
as follows:
Year
Ending Principal Interest Total
2021 -$ 819,064$ 819,064$
2022 4,045,000 698,685 4,743,685
2023 4,205,000 453,165 4,658,165
2024 4,375,000 197,824 4,572,824
2025 1,070,000 33,812 1,103,812
13,695,000$ 2,202,550$ 15,897,550$
107
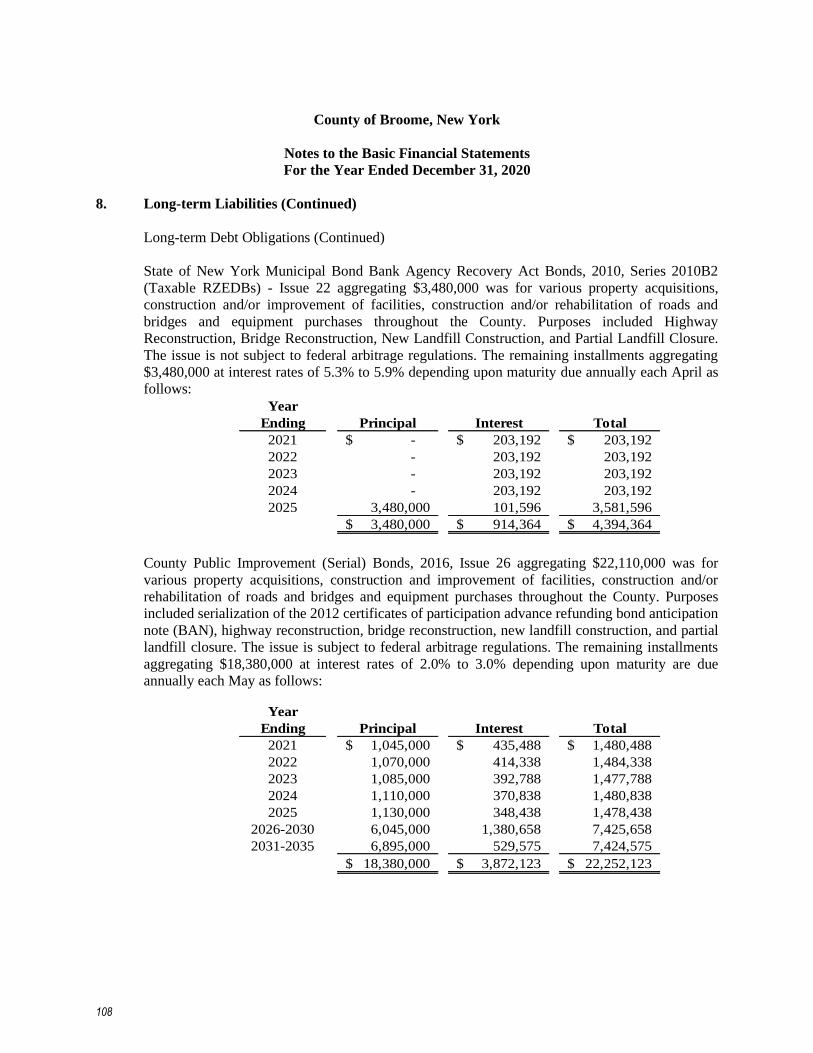
County of Broome, New York
Notes to the Basic Financial Statements
For the Year Ended December 31, 2020
8. Long-term Liabilities (Continued)
Long-term Debt Obligations (Continued)
State of New York Municipal Bond Bank Agency Recovery Act Bonds, 2010, Series 2010B2
(Taxable RZEDBs) - Issue 22 aggregating $3,480,000 was for various property acquisitions,
construction and/or improvement of facilities, construction and/or rehabilitation of roads and
bridges and equipment purchases throughout the County. Purposes included Highway
Reconstruction, Bridge Reconstruction, New Landfill Construction, and Partial Landfill Closure.
The issue is not subject to federal arbitrage regulations. The remaining installments aggregating
$3,480,000 at interest rates of 5.3% to 5.9% depending upon maturity due annually each April as
follows:
Year
Ending Principal Interest Total
2021 -$ 203,192$ 203,192$
2022 - 203,192 203,192
2023 - 203,192 203,192
2024 - 203,192 203,192
2025 3,480,000 101,596 3,581,596
3,480,000$ 914,364$ 4,394,364$
County Public Improvement (Serial) Bonds, 2016, Issue 26 aggregating $22,110,000 was for
various property acquisitions, construction and improvement of facilities, construction and/or
rehabilitation of roads and bridges and equipment purchases throughout the County. Purposes
included serialization of the 2012 certificates of participation advance refunding bond anticipation
note (BAN), highway reconstruction, bridge reconstruction, new landfill construction, and partial
landfill closure. The issue is subject to federal arbitrage regulations. The remaining installments
aggregating $18,380,000 at interest rates of 2.0% to 3.0% depending upon maturity are due
annually each May as follows:
Year
Ending Principal Interest Total
2021 1,045,000$ 435,488$ 1,480,488$
2022 1,070,000 414,338 1,484,338
2023 1,085,000 392,788 1,477,788
2024 1,110,000 370,838 1,480,838
2025 1,130,000 348,438 1,478,438
2026-2030 6,045,000 1,380,658 7,425,658
2031-2035 6,895,000 529,575 7,424,575
18,380,000$ 3,872,123$ 22,252,123$
108

County of Broome, New York
Notes to the Basic Financial Statements
For the Year Ended December 31, 2020
8. Long-term Liabilities (Continued)
Long-term Debt Obligations (Continued)
County Public Improvement (Serial) Bonds, 2018, Issue 27 aggregating $16,815,000 was for
various property acquisitions, construction and improvement of facilities, construction and/or
rehabilitation of roads and bridges and equipment purchases throughout the County. Purposes
included highway reconstruction, bridge reconstruction, landfill sewer line, the public safety
facility, and the Science Building for the college. The issue is subject to federal arbitrage
regulations. The remaining installments aggregating $14,805,000 at interest rate of 2.85% are due
annually each May as follows:
Year
Ending Principal Interest Total
2021 1,165,000$ 426,675$ 1,591,675$
2022 1,195,000 391,275 1,586,275
2023 1,230,000 354,900 1,584,900
2024 1,260,000 317,550 1,577,550
2025 1,300,000 279,150 1,579,150
2026-2030 7,100,000 778,800 7,878,800
2031 1,555,000 23,325 1,578,325
14,805,000$ 2,571,675$ 17,376,675$
County Public Improvement (Serial) Bonds, 2020, Issue 28 aggregating $13,890,000 was for
various property acquisitions, construction and improvement of facilities, construction and/or
rehabilitation of roads and bridges and equipment purchases throughout the County. Purposes
included highway reconstruction, bridge reconstruction, landfill sewer line, and the public safety
facility. The issue is subject to federal arbitrage regulations. The installments aggregating
$13,890,000 at interest rate of 2.85% are due annually each May as follows:
Year
Ending Principal Interest Total
2021 715,000$ 425,756$ 1,140,756$
2022 875,000 273,800 1,148,800
2023 890,000 256,150 1,146,150
2024 910,000 238,150 1,148,150
2025 935,000 219,700 1,154,700
2026-2030 5,050,000 792,956 5,842,956
2031-2034 4,515,000 205,819 4,720,819
13,890,000$ 2,412,331$ 16,302,331$
109

County of Broome, New York
Notes to the Basic Financial Statements
For the Year Ended December 31, 2020
8. Long-term Liabilities (Continued)
Table 3. General Obligation Bonds - Governmental Activities
Table 3 presents the amortization of general obligation bonds and the outstanding balances for the
governmental activities.
Year
Ending Principal Interest Total
2021 4,831,524$ 1,682,583$ 6,514,107$
2022 5,093,093 1,404,606 6,497,699
2023 5,254,440 1,174,312 6,428,752
2024 5,429,201 935,709 6,364,910
2025 5,614,135 688,326 6,302,461
2026-2030 12,636,055 2,047,567 14,683,622
2031-2035 8,706,610 521,461 9,228,071
47,565,058$ 8,454,565$ 56,019,623$
Table 4. General Obligation Bonds – BTASC
On August 8, 2001, BTASC along with six other counties, created a trust known as the New York
Counties Tobacco Trust II (NYCTT II). The trust issued $215,220,000 in aggregate principal
Tobacco Settlement Pass-Through Bonds Series 2001. BTASC issued $50,620,000 bearing interest
rates ranging from 5% to 6%. The debt was payable solely from and secured by pledged Tobacco
Settlement Rights and investment earnings on amounts on deposit. On September 22, 2016,
BTASC issued $44,190,000 of Tobacco Settlement Asset Backed Refunding Bonds, Series 2016.
The proceeds of the $24,555,000 Series A1 bonds were used to currently refund $24,555,000 in
2001 Bonds. Pursuant to the Purchase and Exchange agreement between BTASC and the 2001
Bond Holders, at closing, the Bond Holders tendered $24,555,000 in 2001 Bonds in exchange for
$24,555,000 in Series A1 bonds. The Series A1 interest rates and final maturity dates were the same
as the tendered 2001 Bonds. The proceeds of the $19,635,000 Series A2 bonds, in addition to
certain other funds as described below, were used to currently refund $8,845,000 in 2001 Bonds
and currently refund $43,411,883 in principal and accreted interest of the 2005 bonds. BTASC
deposited $9,043,873 in an irrevocable escrow account to redeem, on October 24, 2016, $8,845,000
in 2001 Bonds plus accrued interest due thereon. Additionally, $17,658,127 of bond proceeds and
other funds noted below, were used to completely defease the S1, S2, and S4 series of the 2015
Bonds. At closing, $5,488,881 was used to redeem at 101% the accreted value of $5,431,887
($2,853,273 in principal and $2,578,613 in accreted interest) of the S1 series. BTASC used
$12,685,591 of bond proceeds and other funds noted below, to purchase at negotiated prices
pursuant to a Purchase and Exchange Agreement between the bond holders and BTASC, all of the
S2 and S4 Bonds. BTASC was able to defease at closing $24,016,093 of accreted value
($11,110,630 in principal and $12,905,463 in accreted interest) of the S2 and S3 bonds.
110
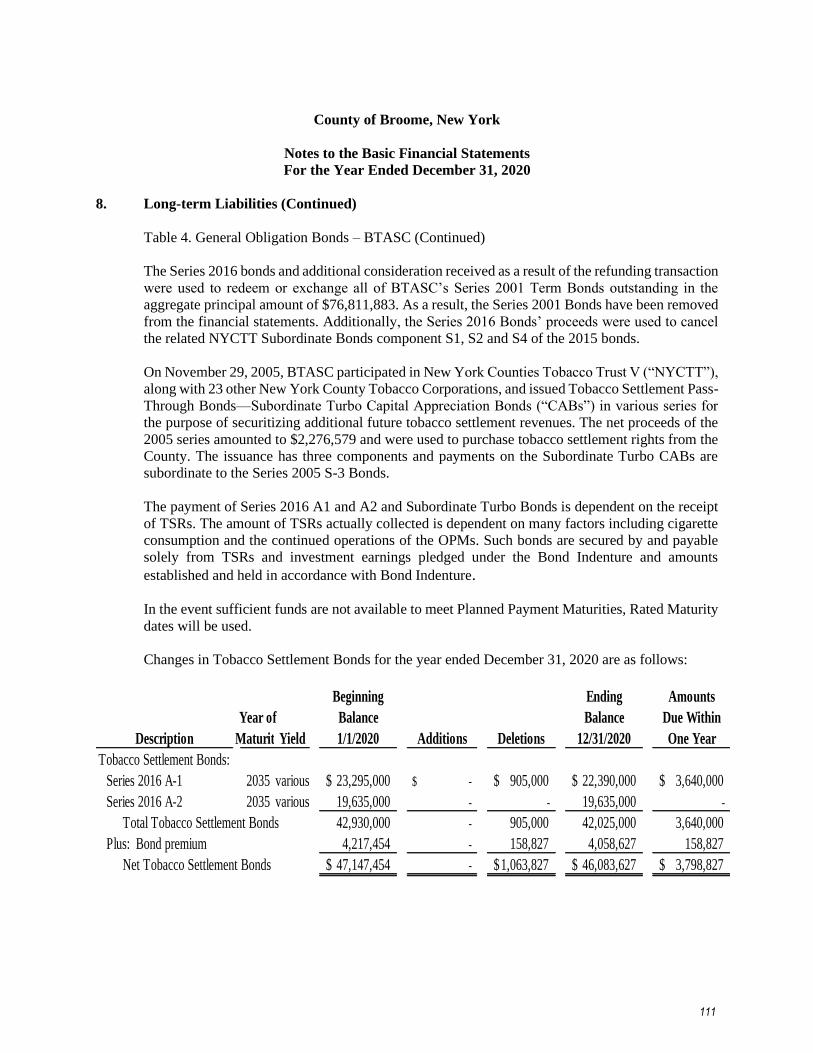
County of Broome, New York
Notes to the Basic Financial Statements
For the Year Ended December 31, 2020
8. Long-term Liabilities (Continued)
Table 4. General Obligation Bonds – BTASC (Continued)
The Series 2016 bonds and additional consideration received as a result of the refunding transaction
were used to redeem or exchange all of BTASC’s Series 2001 Term Bonds outstanding in the
aggregate principal amount of $76,811,883. As a result, the Series 2001 Bonds have been removed
from the financial statements. Additionally, the Series 2016 Bonds’ proceeds were used to cancel
the related NYCTT Subordinate Bonds component S1, S2 and S4 of the 2015 bonds.
On November 29, 2005, BTASC participated in New York Counties Tobacco Trust V (“NYCTT”),
along with 23 other New York County Tobacco Corporations, and issued Tobacco Settlement Pass-
Through Bonds—Subordinate Turbo Capital Appreciation Bonds (“CABs”) in various series for
the purpose of securitizing additional future tobacco settlement revenues. The net proceeds of the
2005 series amounted to $2,276,579 and were used to purchase tobacco settlement rights from the
County. The issuance has three components and payments on the Subordinate Turbo CABs are
subordinate to the Series 2005 S-3 Bonds.
The payment of Series 2016 A1 and A2 and Subordinate Turbo Bonds is dependent on the receipt
of TSRs. The amount of TSRs actually collected is dependent on many factors including cigarette
consumption and the continued operations of the OPMs. Such bonds are secured by and payable
solely from TSRs and investment earnings pledged under the Bond Indenture and amounts
established and held in accordance with Bond Indenture.
In the event sufficient funds are not available to meet Planned Payment Maturities, Rated Maturity
dates will be used.
Changes in Tobacco Settlement Bonds for the year ended December 31, 2020 are as follows:
Beginning Ending Amounts
Year of Balance Balance Due Within
MaturityYield 1/1/2020 Additions Deletions 12/31/2020 One Year
Tobacco Settlement Bonds:
Series 2016 A-1 2035 various 23,295,000$ -$ 905,000$ 22,390,000$ 3,640,000$
Series 2016 A-2 2035 various 19,635,000 - - 19,635,000 -
Total Tobacco Settlement Bonds 42,930,000 - 905,000 42,025,000 3,640,000
Plus: Bond premium 4,217,454 - 158,827 4,058,627 158,827
Net Tobacco Settlement Bonds 47,147,454$ - 1,063,827$ 46,083,627$ 3,798,827$
Description
111
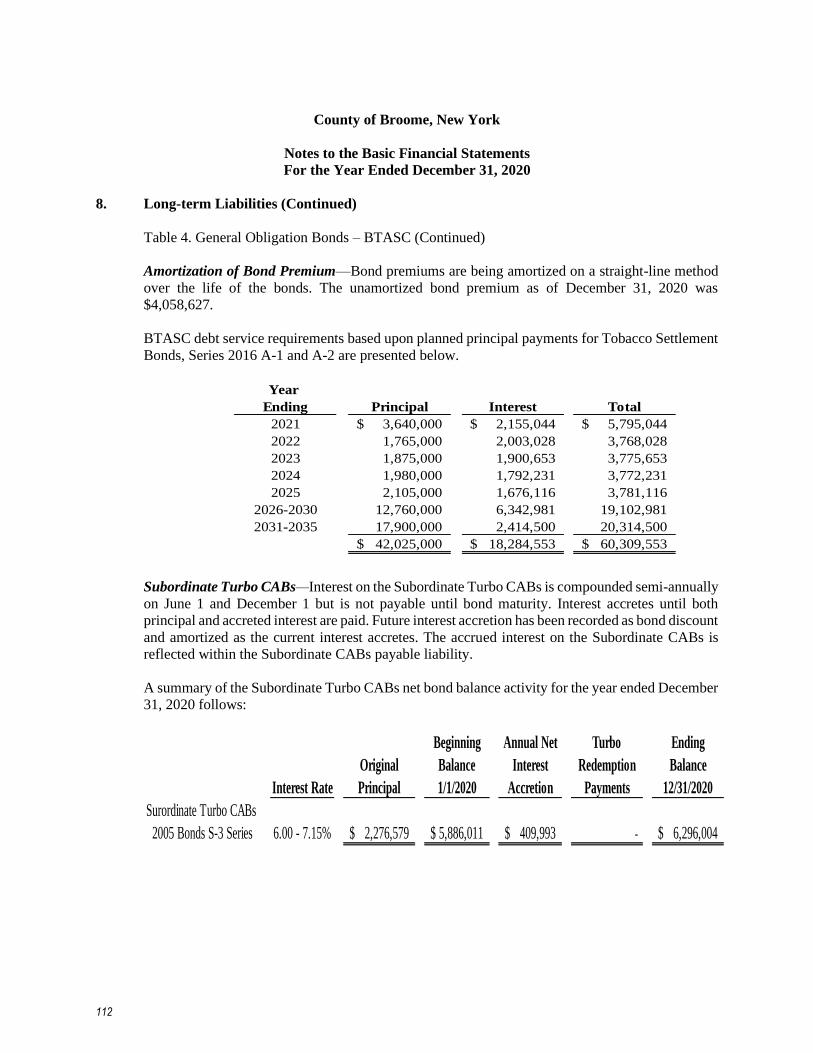
County of Broome, New York
Notes to the Basic Financial Statements
For the Year Ended December 31, 2020
8. Long-term Liabilities (Continued)
Table 4. General Obligation Bonds – BTASC (Continued)
Amortization of Bond Premium—Bond premiums are being amortized on a straight-line method
over the life of the bonds. The unamortized bond premium as of December 31, 2020 was
$4,058,627.
BTASC debt service requirements based upon planned principal payments for Tobacco Settlement
Bonds, Series 2016 A-1 and A-2 are presented below.
Year
Ending Principal Interest Total
2021 3,640,000$ 2,155,044$ 5,795,044$
2022 1,765,000 2,003,028 3,768,028
2023 1,875,000 1,900,653 3,775,653
2024 1,980,000 1,792,231 3,772,231
2025 2,105,000 1,676,116 3,781,116
2026-2030 12,760,000 6,342,981 19,102,981
2031-2035 17,900,000 2,414,500 20,314,500
42,025,000$ 18,284,553$ 60,309,553$
Subordinate Turbo CABs—Interest on the Subordinate Turbo CABs is compounded semi-annually
on June 1 and December 1 but is not payable until bond maturity. Interest accretes until both
principal and accreted interest are paid. Future interest accretion has been recorded as bond discount
and amortized as the current interest accretes. The accrued interest on the Subordinate CABs is
reflected within the Subordinate CABs payable liability.
A summary of the Subordinate Turbo CABs net bond balance activity for the year ended December
31, 2020 follows:
Beginning Annual Net Turbo Ending
Original Balance Interest Redemption Balance
Principal 1/1/2020 Accretion Payments 12/31/2020
Surordinate Turbo CABs
2005 Bonds S-3 Series 2,276,579$ 5,886,011$ 409,993$ - 6,296,004$
Interest Rate
6.00 - 7.15%
112

County of Broome, New York
Notes to the Basic Financial Statements
For the Year Ended December 31, 2020
8. Long-term Liabilities (Continued)
Table 4. General Obligation Bonds – BTASC (Continued)
Redemption of the Subordinate CABs as outlined in the original official statement totals $2,276,579
with interest ranging from 6.00% to 7.15%. During the year ended December 31, 2020 funds were
not available to make redemption payments. Any debt service amounts not paid in accordance with
the Subordinate Turbo CABs redemption payments schedule will be due and payable on the June
1, 2055 maturity date.
Table 5. General Obligation Bonds - Business-type Activities
Table 5 presents the amortization of general obligation bonds and outstanding balances of general
obligation serial bonds for the County’s business-type activities.
Year
Ending Principal Interest Total
2021 1,948,476$ 723,966$ 2,672,442$
2022 2,091,907 576,683 2,668,590
2023 2,155,560 485,882 2,641,442
2024 2,225,799 391,845 2,617,644
2025 2,300,865 294,369 2,595,234
2026-2030 5,558,945 904,846 6,463,791
2031-2035 4,258,390 237,257 4,495,647
20,539,942$ 3,614,850$ 24,154,791$
113

County of Broome, New York
Notes to the Basic Financial Statements
For the Year Ended December 31, 2020
9. Fund Balance
In the fund financial statements, the five classifications of fund balance are defined as:
a. Nonspendable fund balance – Includes amounts that cannot be spent because they are not in
spendable form or are legally or contractually required to be maintained.
b. Restricted – Includes amounts with constraints placed on the use of resources either externally
imposed by creditors, grantors, contributors or laws or regulations of other governments, or
imposed by law through constitutional provisions or enabling legislation.
c. Committed – Includes amounts that can only be used for the specific purposes pursuant to
constraints imposed by formal action of the County’s legislature, the highest level of decision-
making authority. As of December 31, 2020, the County reported no committed fund balance.
d. Assigned – Includes amounts that are constrained by the County’s intent to be used for specific
purposes but are neither restricted nor committed. Any remaining fund balance amounts for
funds other than the general fund are classified as assigned fund balance. The Legislature is
the body authorized to assign amounts for a specific purpose.
e. Unassigned – Includes remaining fund balance that do not meet the definition of the above four
classifications and are deemed to be available for general use by the County. Any capital
projects funds and special revenue funds that have a remaining deficit after the nonspendable,
restricted and committed classifications have been recorded must reflect the deficit as
unassigned.
Proprietary net position is classified the same as in the government-wide statements.
114

County of Broome, New York
Notes to the Basic Financial Statements
For the Year Ended December 31, 2020
9. Fund Balance (Continued)
Major Funds
Capital Debt Nonmajor
General Projects Service BTASC Governmental
Fund Fund Fund Fund Funds Total
Nonspendable:
Long-term receivables 17,850$ -$ -$ -$ -$ 17,850$
Prepaid expense 2,530,202 - - - 173,636 2,703,838
Inventory 302,815 - - - 1,025,942 1,328,757
Total nonspendable 2,850,867 - - - 1,199,578 4,050,445
Restricted for:
Debt - - 1,916,798 2,991,967 - 4,908,765
Tax stabilization 277,244 - - - - 277,244
Stop-DWI 157,471 - - - - 157,471
Economic development 1,217,785 - - - - 1,217,785
911 system costs 2,353,944 - - - - 2,353,944
Veterans service programs 1,062,899 - - - - 1,062,899
Dog shelter services 252,591 - - - - 252,591
Handicapped parking programs 7,230 - - - - 7,230
Traffic diversion 488,230 - - - - 488,230
Trust 1,292,140 - - - 7,875 1,300,015
Total restricted 7,109,534 - 1,916,798 2,991,967 7,875 12,026,174
Assigned to:
Prior year obligations 8,015,857 - - - 501,041 8,516,898
Future payment 1,300,000 - - - - 1,300,000
Special use - - - - 2,502,451 2,502,451
Total Assigned 9,315,857 - - - 3,003,492 12,319,349
Unassigned 8,905,580 (46,296,689) - - (153,641) (37,544,750)
Total fund balances 28,181,838$ (46,296,689)$ 1,916,798$ 2,991,967$ 4,057,304$ (9,148,782)$
County of Broome
Fund Balance
Governmental Funds
December 31, 2020
115

County of Broome, New York
Notes to the Basic Financial Statements
For the Year Ended December 31, 2020
10. Employee Retirement Systems and Pension Plans
Retirement Plan – Primary Government
Pension Plans
Broome County participates in the New York State and Local Employees’ Retirement System
(ERS) as well as the Term Life Insurance plan. This is a cost-sharing multiple-employer retirement
systems. The System provides retirement benefits as well as death and disability benefits.
Obligations of employers and employees to contribute and benefits to employees are governed by
the New York State Retirement and Social Security Law (NYSRSSL). As set forth in the
NYSRSSL, the Comptroller of the State of New York (Comptroller) serves as sole trustee and
administrative head of the Systems. The Comptroller shall adopt and may amend rules and
regulations for the administration and transaction of the business of the Systems and for the custody
and control of their funds. The System issues a publicly available financial report that includes
financial statements and required supplementary information. That report may be found at:
http://www.osc.state.ny.us/retire/publications/index.php or obtained by writing to the New York
State and Local Retirement Systems, 110 State Street, Albany, NY 12244.
Funding Policy
The System is noncontributory for employees who joined the New York State and Local
Employees’ Retirement System prior to July 27, 1976, most which are no longer active. After this
date, employees contributed 3.0% of their salary for the first ten years of membership. Employees
who joined on or after January 1, 2010 generally contribute 3.5% of their salary for the entire length
of service. Starting April 1, 2013 all new hires a subject to a scaling contribution rate based on their
annual salary. The basis for contributions made is as follows:
Contribution
Wages Rate
$45,000 or less 3.0%
$45,000.01 to $55,000 3.5%
$55,000.01 to $75,000 4.5%
$75,000.01 to $100,000 5.8%
More than $100,000 6.0%
For the first 3 years of membership Tier 6 employee’s contribution rate is based on annual wages.
Thereafter, contribution rate is based on what employees earned 2 years prior.
116
County of Broome, New York
Notes to the Basic Financial Statements
For the Year Ended December 31, 2020
10. Employee Retirement Systems and Pension Plans (Continued)
Under the authority of the NYSRSSL, the Comptroller annually certifies the actuarially determined
rates expressed used in computing the employers’ contributions based on salaries paid during the
Systems’ fiscal year ending March 31.
Chapter 57 of the Laws of 2010 of the State of New York was enacted that allows local employers
to amortize a portion of their retirement bill for 10 years in accordance with the following
stipulations:
• For State, fiscal year 2010-11, the amount more than the graded rate of 9.5 percent of
employees covered pensionable salaries, with the first payment of those pension costs not
due until that fiscal year in which amortization was instituted.
• For subsequent State fiscal years, the graded rate will increase or decrease by up to one
percent depending on the gap between the increase or decrease in the System’s average
rate and the previous graded rate.
• The interest rate will be set annually and will be comparable to taxable fixed income
investments of the similar duration.
• For subsequent State fiscal years, in which the System’s average rates are lower than the
graded rates, the employer will be required to pay the graded rate. Any additional
contributions made will first be used to pay off existing amortizations, and then any excess
will be deposited into a reserve account and will be used to offset future increases in
contribution rates.
This law requires participating employers to make payments on a current basis while amortizing
existing unpaid amounts relating to the System’s fiscal years when the local employer opts to
participate in the program. The total unpaid liability at the end of December 31, 2020 was
$1,285,931 of which $277,826 is reported in the Proprietary funds and $1,008,105 in the
Governmental funds. The actual cash payment did not begin until 2020.
Pension Liabilities, Pension Expense, and Deferred Outflows/Inflows of Resources Related to
Pensions
At December 31, 2020, the County reported a net pension liability of $75,072,877 and $18,375,708
for its proportionate share of the NYSERS net pension liability relating to governmental activities
and business-type activities, respectively. The net pension liability was measured as of March 31,
2020, and the total pension liability used to calculate the net pension liability was determined by
the actuarial valuation as of April 1, 2019. The County’s proportion of the net pension liability was
based on a projection of The County’s long-term share of contributions to the pension plan relative
to the projected contributions of all participating members, actuarially determined.
At December 31, 2020, the County’s proportion was 80.3% and 19.7% for NYSERS net pension
liability relating to governmental activities and business-type activities, respectively, which was a
decrease of .6% and an increase of .6%, respectively from its proportionate share as measured at
March 31, 2019.
117
County of Broome, New York
Notes to the Basic Financial Statements
For the Year Ended December 31, 2020
10. Employee Retirement Systems and Pension Plans (Continued)
For the year ended December 31, 2020, the County recognized pension expense of $24,376,933
and $5,966,781 for governmental and business-type activities, respectively. At December 31,
2020, the County reported deferred outflows of resources and deferred inflows of resources related
to pensions from the following sources:
Governmental activities
Deferred
Outflows
of
Resources
Deferred
Inflows
of
Resources
Differences between expected and actual experiences 4,418,342$ -$
Change in assumptions 1,511,612 1,305,251
Net difference between projected and actual earnings
on pension plan investments 38,486,006 -
Changes in proportion and differences between the County's
contributions and proportionate share of contributions 174,233 2,421,986
Contributions subsequent to the measurement date 8,150,610 -
Total 52,740,804$ 3,727,237$
Business-type activities
Deferred
Outflows
of
Resources
Deferred
Inflows
of
Resources
Differences between expected and actual experiences 1,081,485$ -$
Change in assumptions 370,000 319,488
Net difference between projected and actual earnings
on pension plan investments 9,420,281 -
Changes in proportion and differences between the County's
contributions and proportionate share of contributions 42,647 592,834
Contributions subsequent to the measurement date 1,995,039 -
Total 12,909,452$ 912,322$
118
County of Broome, New York
Notes to the Basic Financial Statements
For the Year Ended December 31, 2020
10. Employee Retirement Systems and Pension Plans (Continued)
$8,150,610 and $1,995,039 for governmental activities and business-type activities, respectively,
were reported as deferred outflows of resources related to pensions resulting from the County
contributions after the measurement date will be recognized as a reduction of the net pension
liability in the year ending December 31, 2021. Other amounts reported as deferred outflows of
resources and deferred inflows of resources related to pensions will be recognized in the pension
expense as follows:
Governmental Business-type
Plan's Year Ended March 31: Activities Activities
2021 6,370,464$ 1,559,309$
2022 10,191,230 2,494,524
2023 13,358,632 3,269,814
2024 10,942,630 2,678,444
40,862,957$ 10,002,091$ -
Actuarial Assumptions
The total pension liability at March 31, 2020 was determined by using an actuarial valuation as of
April 1, 2019, with update procedures used to roll forward the total pension liability to March 31,
2020. Best estimates of arithmetic real rates of return for each major asset class included in the
target asset allocation as of March 31, 2020 are summarized below:
Target
Allocations
Asset type in %
Domestic equity 36.0 4.1
International equity 14.0 6.2
Private equity 10.0 6.8
Real estate 10.0 5.0
Absolute return 2.0 3.3
Opportunistic portfolio 3.0 4.7
Real asset 3.0 9.0
Bonds & mortgages 17.0 0.8
Cash 1.0 -
Inflation-indexed bonds 4.0 0.5
100.0
Long-term
Expected Real
Rate of Return in %
119

County of Broome, New York
Notes to the Basic Financial Statements
For the Year Ended December 31, 2020
10. Employee Retirement Systems and Pension Plans (Continued)
Sensitivity of the Proportionate Share of the Net Pension Liability to the Discount Rate
Assumption
The following presents the County’s proportionate share of the net pension liability calculated using
the discount rate of 6.8%, as well as what the County’s proportionate share of the net-pension
liability would be if it were calculated using a discount rate that is 1-percentage point lower (5.8%)
or 1-percentage-point higher (7.8%) than the current rate: 1% Current 1%
Decrease Discount Increase
5.8% 6.8% 7.8%
137,779,925$ 75,072,877$ 17,319,420$
Business-type activities: Proportionate share of net pension 33,724,612 18,375,708 4,239,302
Governmental activities: Proportionate share of net pension
Pension Plan Fiduciary Net Position (in thousands)
The components of the current-year net pension liability of the employers as of the valuation date
of April 1, 2019 for Employees’ Retirement System follow:
Employers' total pension liability 194,596,261$
Plan Fiduciary net position (168,115,682)
Employers' net pension liability 26,480,579$
ERS Fiduciary net position as a percentage of total pension liability 86.39
11. Other Postemployment Benefits
Plan Description - In addition to providing pension benefits, the County provides health insurance
coverage and/or payment for fractional values of unused sick leave to eligible retired employees
through a single -employer plan. Substantially all the county’s full-time employees may become
eligible for these benefits upon retirement. The value of the employee’s unused compensatory time
is used as the basis for the County’s liability. The County is obligated to pay such benefits because
of union contracts and County Legislature rules and regulation for nonunion employees. Health
care benefits are provided through insurance companies whose premiums are based on the benefits
paid during the year. As of the valuation date, there are 1,596 retires receiving health care benefits.
Employees Covered by Benefits Terms - At December 31, 2020, the following employees were
covered by the benefit terms:
Active employees 1,280
Inactive employees or beneficiaries currently receiving benefit payments 1,617
Total 2,897
120
County of Broome, New York
Notes to the Basic Financial Statements
For the Year Ended December 31, 2020
11. Other Postemployment Benefits (Continued)
Under GASB Statement No. 75, the total OPEB liability represents the sum of expected future
benefit payments which may be attributed to past services (or “earned”), discounted to the end of
the fiscal year using the current discount rate. The Total OPEB liability is analogous to the
Unfunded Actuarial Accrued Liability (“UAAL”) under GASB Statement No. 45
Total OPEB Liability – The County’s total OPEB liability of $275,615,145 was measured as of
December 31, 2020 and was determined by an actuarial valuation as of January 1, 2020.
Actuarial Methods and Assumptions – Calculations are based on the types of benefits provided
under the terms of the substantive plan, the plan as understood by the employer and the plan
members, at the time of the valuation and on the pattern of cost sharing between the employer and
plan members. The projection of benefits does not incorporate the potential effect of a change in
the pattern of cost sharing between the employer and plan members in the future. Calculations
reflect a long-term perspective, so methods and assumptions used include techniques that are
designed to reduce short-term volatility.
In the January 1, 2020, actuarial valuation, the Entry Age Normal actuarial method, over a level
percent of pay was used. The single discount rate changed from 2.75% effective January 1, 2020
to 2.00% effective December 31, 2020. The salary scale assumed to increase at 2.50% per year.
The RPH-2014 Total Dataset Mortality Tables, adjusted for mortality improvements with scale
MP-2019 on a fully generational basis, were used for mortality rates. The 2019 New York State
Employee’ Retirement System rate were used for retirement rates. The rate based on the April 1,
2010 to March 31, 2020 experience study released by the Retirement Systems Actuary and
published in their August 2020 report. To estimate the change in the cost of healthcare, the
actuaries’ initial healthcare cost trend rate used is 4.5%. An inflation rate of 2.00% was assumed
for developing the rate of increase in healthcare costs.
Changes in the Total OPEB Liability – The following table presents the changes to the total
OPEB liability during the fiscal year, by source:
Governmental Business-type
Activities Activities
Balance at December 31, 2019 206,506,460$ 46,431,112$
Changes for the year:
Service Cost 6,373,173 1,361,623
Interest 5,707,881 1,277,785
Differences between expected and actual experience (2,903,608) (764,798)
Changes of assumptions 27,578,188 4,661,049
Changes of benefit terms (5,988,279) (1,329,396)
Benefit payments (10,640,484) (2,655,561)
Net changes 20,126,871 2,550,702
Balance at December 31, 2020 226,633,331$ 48,981,814$
Total OPEB Liability
121

County of Broome, New York
Notes to the Basic Financial Statements
For the Year Ended December 31, 2020
11. Other Postemployment Benefits (Continued)
Sensitivity of the Total OPEB Liability to the Change in the Discount Rate and Healthcare
Cost Trend Rate – The discount rate assumption can have an impact on the net OPEB liability.
The following table presents the effect of a 1% change in the discount rate assumption would have
on the net OPEB liability:
1% Current 1%
Decrease Discount Rate Increase
(1.0%) (2.0%) (3.0%)
Governmental activities: Total OPEB liability 260,084,541$ 226,633,331$ 199,048,560$
Business-type activities: Total OPEB liability 56,211,558 48,981,814 43,019,972
Additionally, healthcare costs can be subject to considerable volatility over time. The following
table presents the effect on the OPEB liability of a 1% change in the initial (4.50%) and ultimate
(3.78%) healthcare cost trend rates.
1% Current 1%
Decrease Discount Rate Increase
(3.5%/2.78%) (4.5%/3.78%) (5.50%/4.78%)
Governmental activities: Total OPEB liability 195,415,803$ 226,633,331$ 266,137,657$
Business-type activities: Total OPEB liability 42,234,831 48,981,814 57,519,806
Funding Policy – Authorization for the County to pay retiree health insurance premiums was
enacted by through union contracts, which are approved by the County Legislature. Retirees that
meet the age and years of service requirements are not required to contribute to postretirement
healthcare benefits. Additionally, retirees in Management Union groups are not required to
contribute to postretirement dental and vision benefits. Spouses receive the same benefits as the
retiree. Surviving spouses are permitted to continue coverage at no cost and at the cost of 100%
the premium for Management Union groups and non-Management Union groups, respectively.
122

County of Broome, New York
Notes to the Basic Financial Statements
For the Year Ended December 31, 2020
11. Other Postemployment Benefits (Continued)
OPEB Expense and Deferred Outflows of Resources and Deferred Inflows of Resources
Related to OPEB – The County reports deferred outflows of resources and deferred inflows of
resources due to differences during the measurement period between the employer’s contribution
and its proportionate share of the total of certain contributions from employers included in the
collective net OPEB liability. The table below presents the County’s deferred inflows of resources
at December 31, 2020.
Deferred Deferred Deferred Deferred
Outflows Inflows Outflows Inflows
of Resources of Resources of Resources of Resources
Differences between expected and actual experience 1,825,337$ 50,202,258$ 531,308$ 16,339,787$
Changes of assumption 34,103,194 23,990,072 6,001,075 6,159,681
Total 35,928,531$ 74,192,330$ 6,532,383$ 22,499,468$
Governmental Activities Business-type Activities
The amounts reported as deferred inflows of resources related to OPEB will be recognized in OPEB
expense as follows:
Year Ending Governmental Business-type
December 31, Activities Activities
2021 (9,269,301)$ (3,842,099)$
2022 (8,821,335) (3,842,099)
2023 (8,692,363) (3,842,099)
2024 (8,616,166) (3,228,903)
2025 (2,838,874) (1,346,614)
Thereafter (48,042) 157,111
12. Self-Insurance
General Liability
The County assumes liability for most risk including property damage and personal injury liability.
The County purchases the following policies: Property Insurance with a self-retention of $50,000
and a limit of $200,000,000, Aviation Insurance with a coverage limit of $100,000,000, a Crime
Policy with coverage limits of $5 million per employee and $5 million for Director of OMB with
a self-retention of $1,000, and Cyber Insurance coverage of $4,000,000 with a self-retention of
$25,000. All other liability claims are handled internally.
123
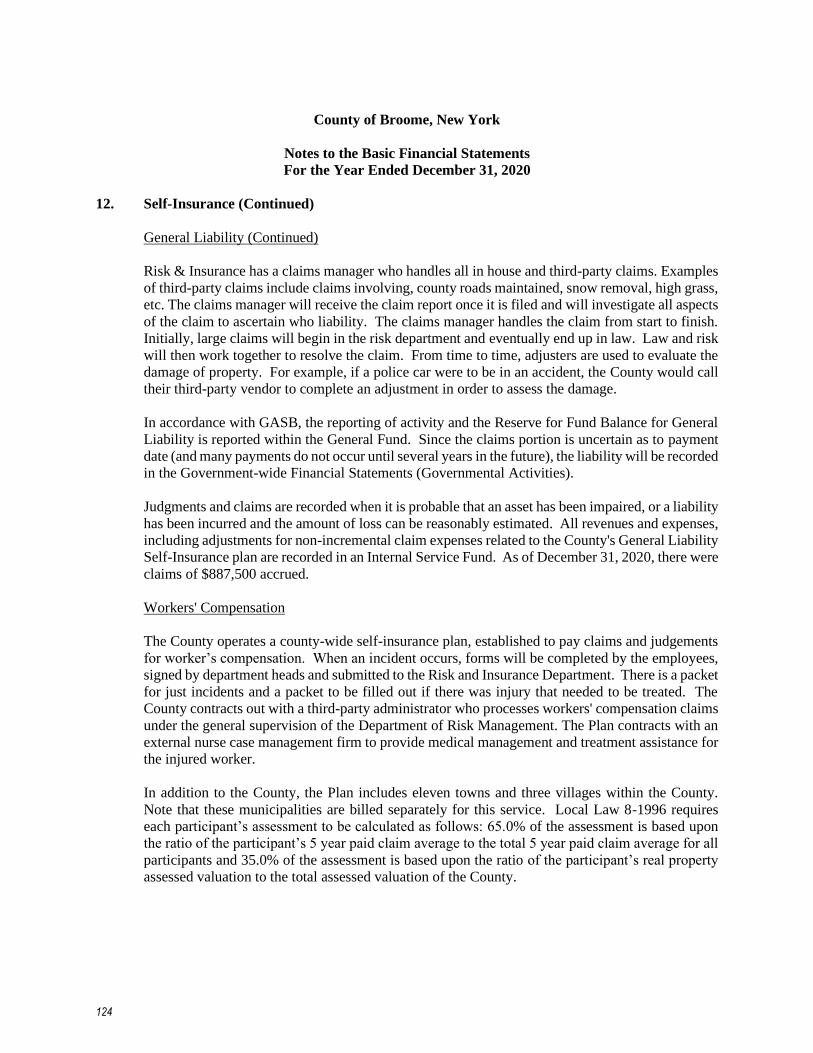
County of Broome, New York
Notes to the Basic Financial Statements
For the Year Ended December 31, 2020
12. Self-Insurance (Continued)
General Liability (Continued)
Risk & Insurance has a claims manager who handles all in house and third-party claims. Examples
of third-party claims include claims involving, county roads maintained, snow removal, high grass,
etc. The claims manager will receive the claim report once it is filed and will investigate all aspects
of the claim to ascertain who liability. The claims manager handles the claim from start to finish.
Initially, large claims will begin in the risk department and eventually end up in law. Law and risk
will then work together to resolve the claim. From time to time, adjusters are used to evaluate the
damage of property. For example, if a police car were to be in an accident, the County would call
their third-party vendor to complete an adjustment in order to assess the damage.
In accordance with GASB, the reporting of activity and the Reserve for Fund Balance for General
Liability is reported within the General Fund. Since the claims portion is uncertain as to payment
date (and many payments do not occur until several years in the future), the liability will be recorded
in the Government-wide Financial Statements (Governmental Activities).
Judgments and claims are recorded when it is probable that an asset has been impaired, or a liability
has been incurred and the amount of loss can be reasonably estimated. All revenues and expenses,
including adjustments for non-incremental claim expenses related to the County's General Liability
Self-Insurance plan are recorded in an Internal Service Fund. As of December 31, 2020, there were
claims of $887,500 accrued.
Workers' Compensation
The County operates a county-wide self-insurance plan, established to pay claims and judgements
for worker’s compensation. When an incident occurs, forms will be completed by the employees,
signed by department heads and submitted to the Risk and Insurance Department. There is a packet
for just incidents and a packet to be filled out if there was injury that needed to be treated. The
County contracts out with a third-party administrator who processes workers' compensation claims
under the general supervision of the Department of Risk Management. The Plan contracts with an
external nurse case management firm to provide medical management and treatment assistance for
the injured worker.
In addition to the County, the Plan includes eleven towns and three villages within the County.
Note that these municipalities are billed separately for this service. Local Law 8-1996 requires
each participant’s assessment to be calculated as follows: 65.0% of the assessment is based upon
the ratio of the participant’s 5 year paid claim average to the total 5 year paid claim average for all
participants and 35.0% of the assessment is based upon the ratio of the participant’s real property
assessed valuation to the total assessed valuation of the County.
124

County of Broome, New York
Notes to the Basic Financial Statements
For the Year Ended December 31, 2020
12. Self-Insurance (Continued)
Workers’ Compensation (Continued)
The County portion is charged back to departments quarterly. The net cost to the County is included
in its annual tax levy. All revenue and expenses related to the Workers' Compensation Self-
Insurance Plan have been recorded and presented as an internal service fund. Resolution 2012-326
which amends Local Law 76-8 was approved in 2012 to increase the workers compensation reserve
to $1,500,000. The reserve balance at December 31, 2020, was at the maximum level. Workers’
compensation liability, inclusive of incurred but not reported claims, was $2,313,900 at December
31, 2020.
A rate of return of 2.0% was used for the liability calculation. Workers' compensation liabilities
relating to Enterprise and Internal Service funds are recorded when incurred and presented within
the respective funds. These liabilities amounted to $5,316,077 and $181,767 respectively at
December 31, 2020. The liability related to governmental funds and municipalities other than the
County amounting to $4,643,426 and $3,977,902, respectively in the Workers’ Compensation
Fund, an internal service fund.
These self-insurance liabilities are presented at their present value and estimated using information
on claims provided by the plan's third-party administrator. The liability of the County and other
participants was determined based upon the amount of the outstanding long-term liability
attributable to each. This does not necessarily correspond to the expected future contributions since
they are based upon future payroll figures, future assessed real property valuations, and claims
incurred. These are not readily determinable at this time.
Health Insurance
The County offers three health insurance plans to its employees and retirees with at least 20 years
of service. All plans are self-insured. The County has third-party nurse case managers and
administrators who assist and answer questions for active members, pre-65 and post-65 members.
The County has implemented the use of Express-Scripts in order to lower costs for the County. In
2002, a retiree health plan amendment went into effect that affords the surviving spouses of former
employees an opportunity to receive a health benefits premium reduction if they meet income
guidelines. There is also an option for retiring employees to purchase “joint/survivor” protection
for their spouses. As of December 31, 2020, there were 21 surviving spouses with 4 of them
approved for the reduced premium.
The liabilities in the Health Insurance Fund, an internal service fund, are based upon individual
case estimates for claims incurred but not reported at December 31, 2020. The estimated
outstanding claims expected to be liquidated with future financial resources aggregate $1,044,386
for health claims and $110,582 for prescription drug costs presented in other current liabilities at
December 31, 2020.
125
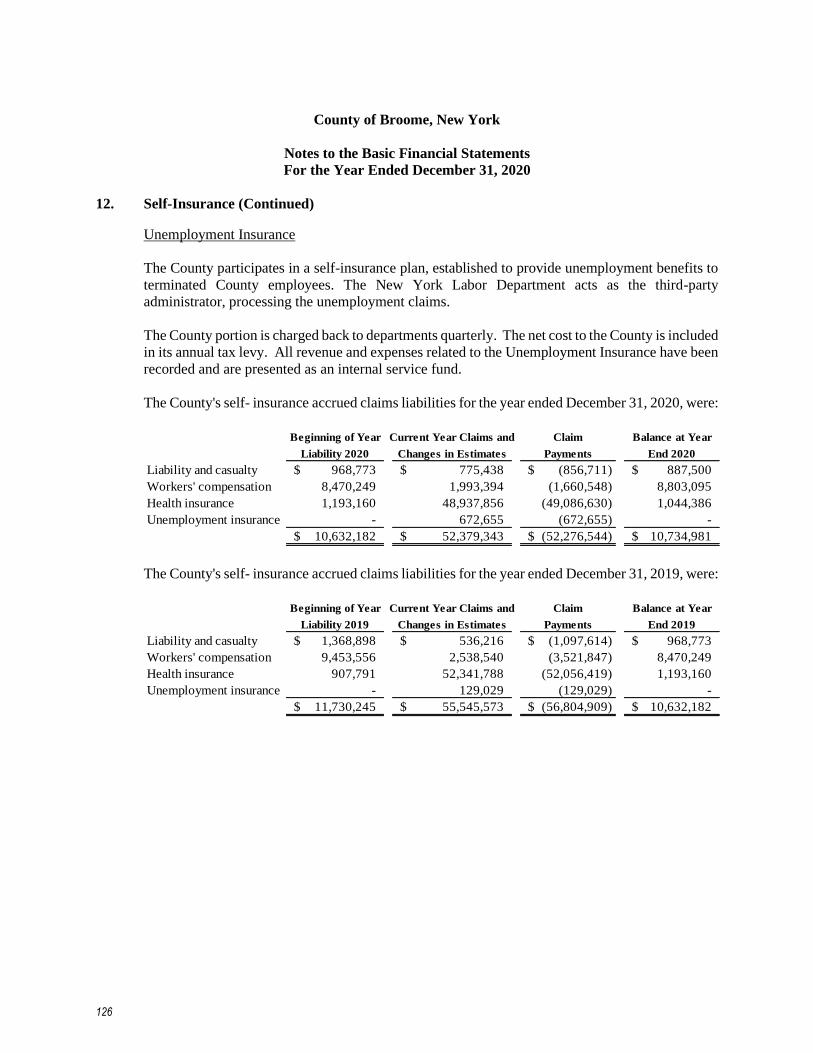
County of Broome, New York
Notes to the Basic Financial Statements
For the Year Ended December 31, 2020
12. Self-Insurance (Continued)
Unemployment Insurance
The County participates in a self-insurance plan, established to provide unemployment benefits to
terminated County employees. The New York Labor Department acts as the third-party
administrator, processing the unemployment claims.
The County portion is charged back to departments quarterly. The net cost to the County is included
in its annual tax levy. All revenue and expenses related to the Unemployment Insurance have been
recorded and are presented as an internal service fund.
The County's self- insurance accrued claims liabilities for the year ended December 31, 2020, were:
Beginning of Year Current Year Claims and Claim Balance at Year
Liability 2020 Changes in Estimates Payments End 2020
Liability and casualty 968,773$ 775,438$ (856,711)$ 887,500$
Workers' compensation 8,470,249 1,993,394 (1,660,548) 8,803,095
Health insurance 1,193,160 48,937,856 (49,086,630) 1,044,386
Unemployment insurance - 672,655 (672,655) -
10,632,182$ 52,379,343$ (52,276,544)$ 10,734,981$
The County's self- insurance accrued claims liabilities for the year ended December 31, 2019, were:
Beginning of Year Current Year Claims and Claim Balance at Year
Liability 2019 Changes in Estimates Payments End 2019
Liability and casualty 1,368,898$ 536,216$ (1,097,614)$ 968,773$
Workers' compensation 9,453,556 2,538,540 (3,521,847) 8,470,249
Health insurance 907,791 52,341,788 (52,056,419) 1,193,160
Unemployment insurance - 129,029 (129,029) -
11,730,245$ 55,545,573$ (56,804,909)$ 10,632,182$
126

County of Broome, New York
Notes to the Basic Financial Statements
For the Year Ended December 31, 2020
13. Lease Obligations
Capital Leases
The following is a schedule of future minimum lease payments under capital leases together with
the net present value of the minimum lease payments as of December 31, 2020.
Capital Leases
Governmental Business-type
Year ending December 31, Activities Activities Total
2021 421,821$ 6,084$ 427,905$
2022 403,835 5,519 409,354
2023 233,369 4,728 238,097
2024 72,813 2,892 75,705
2025 10,419 - 10,419
2026-2030 24,051 - 24,051
2031-2035 25,000 - 25,000
2036 5,000 - 5,000
Minimum lease payments for all capital 1,196,308 19,223 1,215,531
leases
Less: Amounts representing interest, either
as explicitly stated in the lease terms or
imputed at the County's incremental
borrowing rate of interest of 1.22% 75,352 3,114 78,467
Present value of minimum lease payments 1,120,956$ 16,109$ 1,137,064$
Future minimum lease payments for the proprietary funds are Willow Point Nursing Home of
$11,158, Transit of $2,147, and Aviation of $5,918 comprising the business-type activities.
127
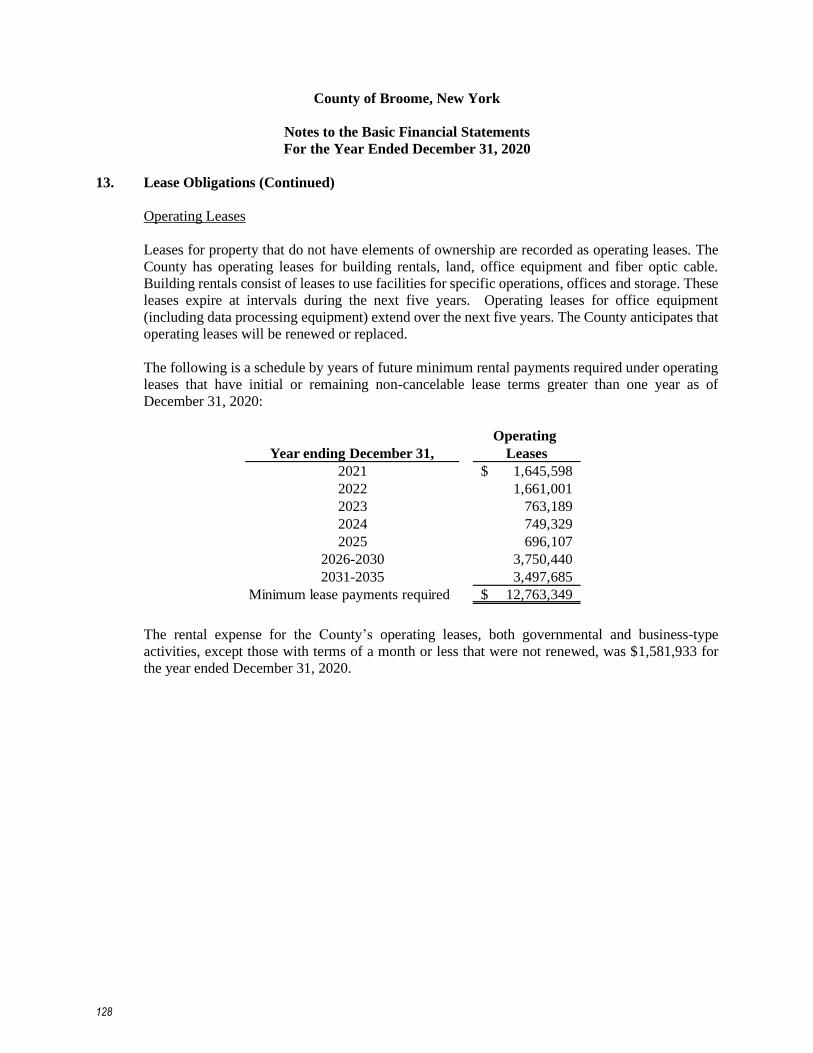
County of Broome, New York
Notes to the Basic Financial Statements
For the Year Ended December 31, 2020
13. Lease Obligations (Continued)
Operating Leases
Leases for property that do not have elements of ownership are recorded as operating leases. The
County has operating leases for building rentals, land, office equipment and fiber optic cable.
Building rentals consist of leases to use facilities for specific operations, offices and storage. These
leases expire at intervals during the next five years. Operating leases for office equipment
(including data processing equipment) extend over the next five years. The County anticipates that
operating leases will be renewed or replaced.
The following is a schedule by years of future minimum rental payments required under operating
leases that have initial or remaining non-cancelable lease terms greater than one year as of
December 31, 2020:
Operating
Year ending December 31, Leases
2021 1,645,598$
2022 1,661,001
2023 763,189
2024 749,329
2025 696,107
2026-2030 3,750,440
2031-2035 3,497,685
Minimum lease payments required 12,763,349$
The rental expense for the County’s operating leases, both governmental and business-type
activities, except those with terms of a month or less that were not renewed, was $1,581,933 for
the year ended December 31, 2020.
128
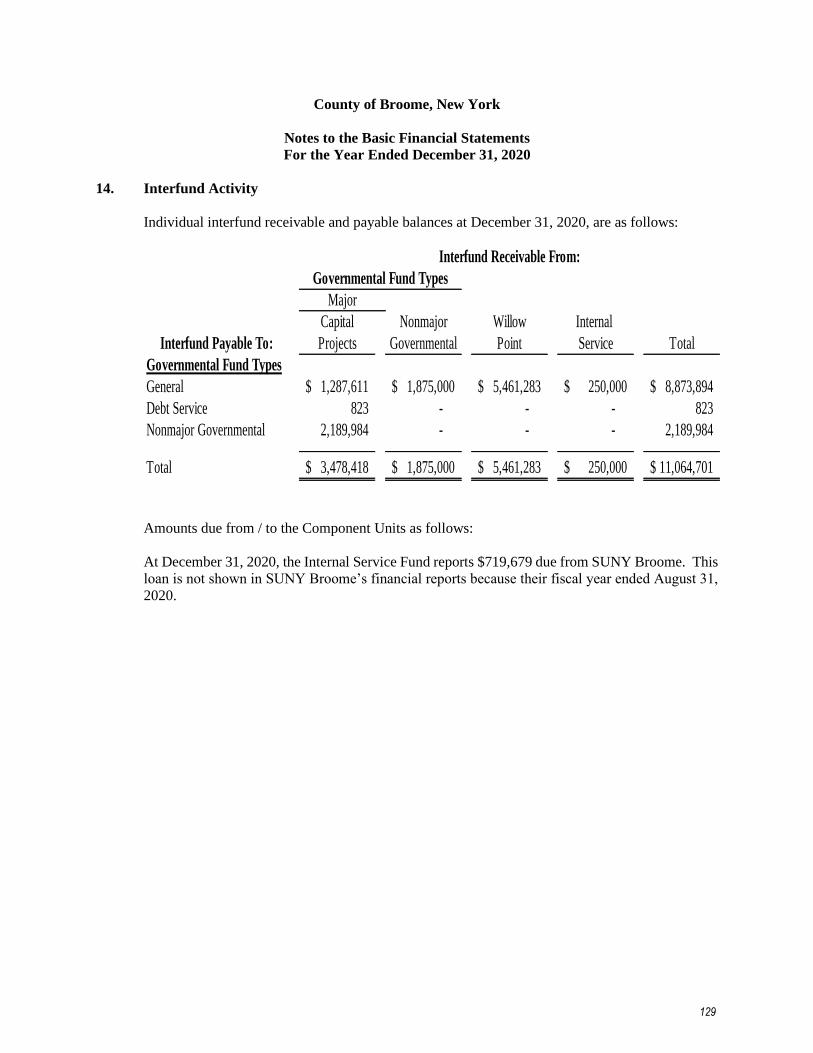
County of Broome, New York
Notes to the Basic Financial Statements
For the Year Ended December 31, 2020
14. Interfund Activity
Individual interfund receivable and payable balances at December 31, 2020, are as follows:
Capital Nonmajor Willow Internal
Interfund Payable To: Projects Governmental Point Service Total
Governmental Fund Types
General 1,287,611$ 1,875,000$ 5,461,283$ 250,000$ 8,873,894$
Debt Service 823 - - - 823
Nonmajor Governmental 2,189,984 - - - 2,189,984
Total 3,478,418$ 1,875,000$ 5,461,283$ 250,000$ 11,064,701$
Major
Governmental Fund Types
Interfund Receivable From:
Amounts due from / to the Component Units as follows:
At December 31, 2020, the Internal Service Fund reports $719,679 due from SUNY Broome. This
loan is not shown in SUNY Broome’s financial reports because their fiscal year ended August 31,
2020.
129
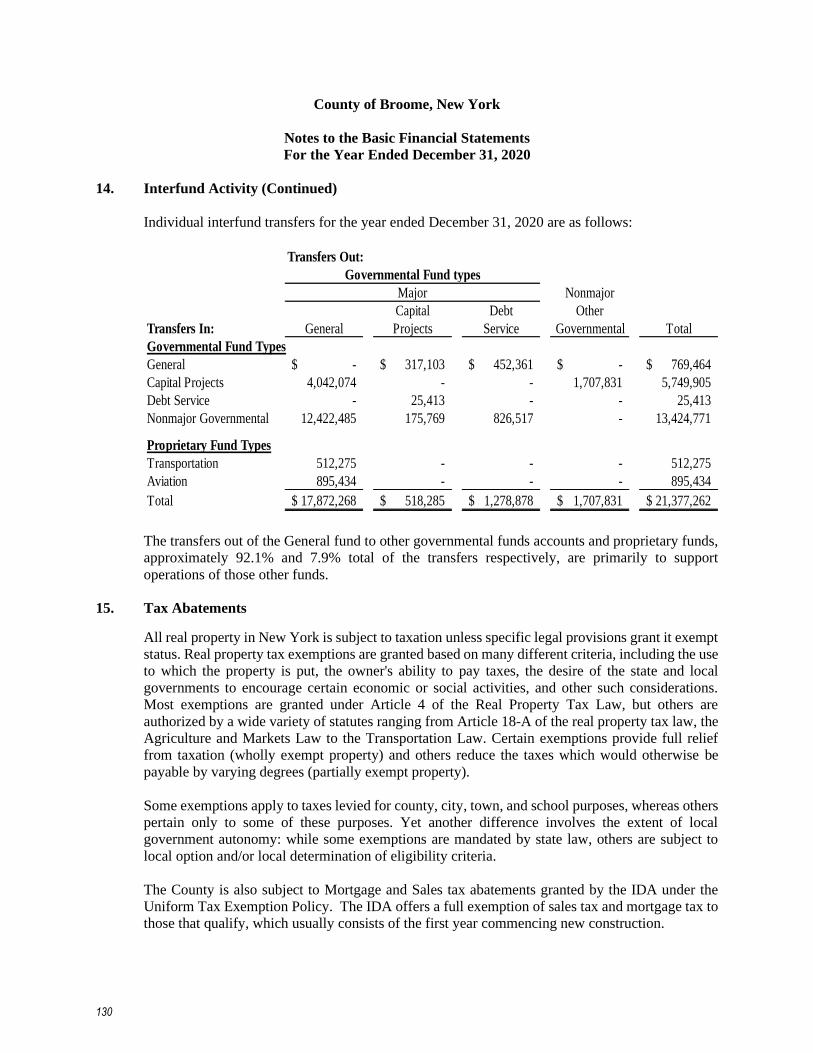
County of Broome, New York
Notes to the Basic Financial Statements
For the Year Ended December 31, 2020
14. Interfund Activity (Continued)
Individual interfund transfers for the year ended December 31, 2020 are as follows:
Nonmajor
Capital Debt Other
Transfers In: General Projects Service Governmental Total
Governmental Fund Types
General -$ 317,103$ 452,361$ -$ 769,464$
Capital Projects 4,042,074 - - 1,707,831 5,749,905
Debt Service - 25,413 - - 25,413
Nonmajor Governmental 12,422,485 175,769 826,517 - 13,424,771
Proprietary Fund Types
Transportation 512,275 - - - 512,275
Aviation 895,434 - - - 895,434
Total 17,872,268$ 518,285$ 1,278,878$ 1,707,831$ 21,377,262$
Major
Governmental Fund types
Transfers Out:
The transfers out of the General fund to other governmental funds accounts and proprietary funds,
approximately 92.1% and 7.9% total of the transfers respectively, are primarily to support
operations of those other funds.
15. Tax Abatements
All real property in New York is subject to taxation unless specific legal provisions grant it exempt
status. Real property tax exemptions are granted based on many different criteria, including the use
to which the property is put, the owner's ability to pay taxes, the desire of the state and local
governments to encourage certain economic or social activities, and other such considerations.
Most exemptions are granted under Article 4 of the Real Property Tax Law, but others are
authorized by a wide variety of statutes ranging from Article 18-A of the real property tax law, the
Agriculture and Markets Law to the Transportation Law. Certain exemptions provide full relief
from taxation (wholly exempt property) and others reduce the taxes which would otherwise be
payable by varying degrees (partially exempt property).
Some exemptions apply to taxes levied for county, city, town, and school purposes, whereas others
pertain only to some of these purposes. Yet another difference involves the extent of local
government autonomy: while some exemptions are mandated by state law, others are subject to
local option and/or local determination of eligibility criteria.
The County is also subject to Mortgage and Sales tax abatements granted by the IDA under the
Uniform Tax Exemption Policy. The IDA offers a full exemption of sales tax and mortgage tax to
those that qualify, which usually consists of the first year commencing new construction.
130

County of Broome, New York
Notes to the Basic Financial Statements
For the Year Ended December 31, 2020
15. Tax Abatements (Continued)
The amount of mortgage and sales tax abated in the County for the year ended December 31, 2020
was $581,808.
Agreements Taxes owed Taxes paid Abated
L3 Technologies 70,600$ -$ 100%
One North Depot 55,000 - 100%
Spark Broome, LLC 90,000 - 100%
Total 215,600$ -$ 100%
Agreements Taxes owed Taxes paid Abated
159 Washington Street Holdings 16,119$ -$ 100%
AOM 128 Grand Ave 55,338 - 100%
Beer Tree Brew Works, Inc. (sm. Bus. Incentive) 44,487 - 100%
Binghamton ASC, LLC (Sm. Bus Incentive) 15,976 - 100%
Broome Culinary 24,574 - 100%
Davidge Holdings, LLC (Small Business Incentive) 4,417 - 100%
EMT (Small Business Incentive) 1,528 - 100%
Freewheelin ANSCO 676 - 100%
GJS Property Group, LLC (Sm. Bus. Incentive) 368 - 100%
Hashey Enterprises (Sm. Bus. Incentive) 7,976 - 100%
1435-1439 Marchuska, LLC (408 Commerce) 31,318 - 100%
National Pipe & Plastics 61,710 - 100%
Ophthalmic Associates Of S.T.(Sm. Bus. Incen.) 12,854 - 100%
Sam A. Lupo & Sons, Inc. (SSE3, LLC) 32,794 - 100%
Simulation & Control Technologies, Inc. (Sm. Bus. Incentive) 5,996 - 100%
Spark Broome, LLC 50,076 - 100%
Total 366,208$ -$ 100%
Mortgage Tax
Sales Tax
The County has 45 real property tax abatement agreements entered by either the Broome County
IDA, the City of Binghamton and local municipalities. These agreements provide for abatement
of real property taxes in exchange for a payment in lieu of taxes (PILOT) in compliance with the
Tax Exemption Policy. PILOT’s are granted in accordance with various activities such as new
construction, purchasing of an existing facility, or the improvement or expansion of an existing
facility. There are also policies for recapture of PILOTs should the applicant not meet certain
criteria.
For the year ending December 31, 2020 the County collected approximately $1.2 million from
properties under the PILOT program and abated $1.1 million (47.9% of tax value).
PILOT agreements are often negotiated with the assumption that tax rates will increase over the
course of the agreement at a rate greater than what is agreed to. In the scenarios on the following
page where the PILOT amount is greater than the tax value, the primary cause is due to the County
rate decreasing for two consecutive years.
131
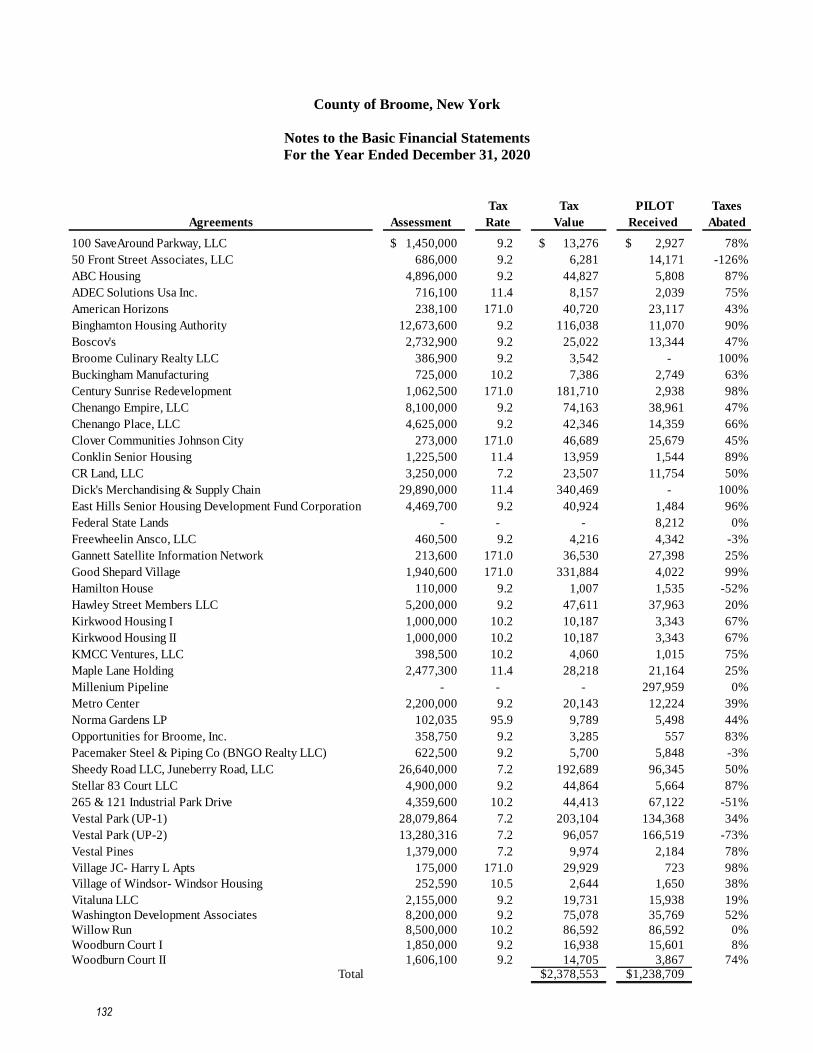
County of Broome, New York
Notes to the Basic Financial Statements
For the Year Ended December 31, 2020
Tax Tax PILOT Taxes
Agreements Assessment Rate Value Received Abated
100 SaveAround Parkway, LLC 1,450,000$ 9.2 13,276$ 2,927$ 78%
50 Front Street Associates, LLC 686,000 9.2 6,281 14,171 -126%
ABC Housing 4,896,000 9.2 44,827 5,808 87%
ADEC Solutions Usa Inc. 716,100 11.4 8,157 2,039 75%
American Horizons 238,100 171.0 40,720 23,117 43%
Binghamton Housing Authority 12,673,600 9.2 116,038 11,070 90%
Boscov's 2,732,900 9.2 25,022 13,344 47%
Broome Culinary Realty LLC 386,900 9.2 3,542 - 100%
Buckingham Manufacturing 725,000 10.2 7,386 2,749 63%
Century Sunrise Redevelopment 1,062,500 171.0 181,710 2,938 98%
Chenango Empire, LLC 8,100,000 9.2 74,163 38,961 47%
Chenango Place, LLC 4,625,000 9.2 42,346 14,359 66%
Clover Communities Johnson City 273,000 171.0 46,689 25,679 45%
Conklin Senior Housing 1,225,500 11.4 13,959 1,544 89%
CR Land, LLC 3,250,000 7.2 23,507 11,754 50%
Dick's Merchandising & Supply Chain 29,890,000 11.4 340,469 - 100%
East Hills Senior Housing Development Fund Corporation 4,469,700 9.2 40,924 1,484 96%
Federal State Lands - - - 8,212 0%
Freewheelin Ansco, LLC 460,500 9.2 4,216 4,342 -3%
Gannett Satellite Information Network 213,600 171.0 36,530 27,398 25%
Good Shepard Village 1,940,600 171.0 331,884 4,022 99%
Hamilton House 110,000 9.2 1,007 1,535 -52%
Hawley Street Members LLC 5,200,000 9.2 47,611 37,963 20%
Kirkwood Housing I 1,000,000 10.2 10,187 3,343 67%
Kirkwood Housing II 1,000,000 10.2 10,187 3,343 67%
KMCC Ventures, LLC 398,500 10.2 4,060 1,015 75%
Maple Lane Holding 2,477,300 11.4 28,218 21,164 25%
Millenium Pipeline - - - 297,959 0%
Metro Center 2,200,000 9.2 20,143 12,224 39%
Norma Gardens LP 102,035 95.9 9,789 5,498 44%
Opportunities for Broome, Inc. 358,750 9.2 3,285 557 83%
Pacemaker Steel & Piping Co (BNGO Realty LLC) 622,500 9.2 5,700 5,848 -3%
Sheedy Road LLC, Juneberry Road, LLC 26,640,000 7.2 192,689 96,345 50%
Stellar 83 Court LLC 4,900,000 9.2 44,864 5,664 87%
265 & 121 Industrial Park Drive 4,359,600 10.2 44,413 67,122 -51%
Vestal Park (UP-1) 28,079,864 7.2 203,104 134,368 34%
Vestal Park (UP-2) 13,280,316 7.2 96,057 166,519 -73%
Vestal Pines 1,379,000 7.2 9,974 2,184 78%
Village JC- Harry L Apts 175,000 171.0 29,929 723 98%
Village of Windsor- Windsor Housing 252,590 10.5 2,644 1,650 38%
Vitaluna LLC 2,155,000 9.2 19,731 15,938 19%
Washington Development Associates 8,200,000 9.2 75,078 35,769 52%
Willow Run 8,500,000 10.2 86,592 86,592 0%
Woodburn Court I 1,850,000 9.2 16,938 15,601 8%
Woodburn Court II 1,606,100 9.2 14,705 3,867 74%Total 2,378,553$ 1,238,709$
132

County of Broome, New York
Notes to the Basic Financial Statements
For the Year Ended December 31, 2020
16. Commitments and Contingencies
1.) Lawsuits – The County is a defendant in many lawsuits. In the opinion of the County Attorney,
after considering all relevant facts, such litigation will not, in the aggregate, have a material adverse
effect on the financial position of the County.
2.) Certiorari Actions – The County is regularly involved in certiorari actions brought on by real
property owners to have their assessment reduced. Should these requests be granted, the amount
of taxes collected from these taxpayers would be reduced and the overall taxes that could be
collected would be affected.
3.) Contracts – The County has entered various contracts with outside vendors for goods and
services, which were unperformed at year-end. The County has provided authority to fund these
transactions in the subsequent year’s budget.
4.) Labor Relation – County employees are represented by eight bargaining units with the balance
governed by County rules and regulations. Two of these bargaining units expired on December 31,
2020 and are under negotiations.
5.) Environmental Risks – Certain facilities are subject to federal, state, and local regulations
relating to the discharge of materials into the environment. Compliance with these provisions has
not had, nor does the County expect such compliance to have, any material affects upon the capital
expenditures or financial condition of the County. The County believes that its current practices
and procedures for control and disposition or regulated wastes comply with applicable federal,
state, and local requirements.
6.) Regulatory Environment (Willow Point Nursing Home) – The health care industry is subject to
numerous laws and regulations of federal, state and local governments. Compliance with these laws
and regulations is subject to future government review and interpretation as well as regulatory
actions unknown or unasserted at the time. Recently, government activity has increased with
respect to investigations and allegations concerning possible violations by health care providers of
fraud and abuse statutes and regulations, which could result in the imposition of significant fines
and penalties as well as significant repayments for patient services previously billed. While no
regulatory inquires have been made at the Nursing Home, compliance with such laws and
regulations can be subject to future government review and interpretations as well as regulatory
actions unknown or unasserted at this time. It is the opinion of management and its legal counsel
that there will not be any material adverse effects on the Nursing Home’s financial statements as a
result of these actions
133

County of Broome, New York
Notes to the Basic Financial Statements
For the Year Ended December 31, 2020
16. Commitments and Contingencies (Continued)
6.) Regulatory Environment (Willow Point Nursing Home) (Continued) – On January 31, 2020,
the United States Secretary of HHS declared a public health emergency related to the global spread
of the coronavirus COVID-19, and a pandemic was declared by the World Health Organization in
February 2020. Efforts to fight the widespread disease included limiting or closing many businesses
and resulted in a severe disruption of operations for organizations. Financial markets also
experienced significant fluctuations in value. The extent of the impact of COVID-19 on the Nursing
Home’s operational and financial performance will depend on further developments, including the
duration and spread of the outbreak, impact on patients, employees and vendors all of which cannot
be predicted.
To help subsidize the Nursing Home for lost revenues and incremental expenses associated with
the pandemic, the Nursing Home received $2,986,653 from the Provider Relief Fund. Future
funding levels, if any, are uncertain.
7.) Federal and State Funded Programs – The County participates in many Federal and State grant
and assistance programs. These programs are subject to financial and compliance audits by the
grantors or their representatives. Any expenditures disallowed by the granting agencies cannot be
determined at this time, although the County expects these amounts to be immaterial. Expenditures
disallowed by completed audits have generally been immaterial in nature and have been reflected
as adjustments to revenues in the year the expenditure was determined to be unallowable.
8.) The ability of BTASC to meet debt service payments of bonds is contingent upon the receipt of
TSRs. TSRs are principally dependent upon future levels of domestic consumption. A significant
decline in the overall consumption of cigarettes could have a material adverse effect on the
payments by the OPMs under the MSA and the amounts available to BTASC to make payments of
principal and interest on their bonds.
Certain smokers, smokers’ rights organizations, consumer groups, cigarette importers, cigarette
distributors, cigarette manufacturers, Native American tribes, taxpayer, taxpayers’ groups and other
parties have filed actions against some, and in certain cases all, of the signatories to the MSA. In
the event of an adverse court ruling in such types of litigation, Bondholders could incur a complete
loss of their investment.
Additionally, the OPMs are also exposed to liability from various lawsuits including individual
lawsuits, class action lawsuits and health care cost recovery litigation. Ultimately, the outcome of
these and any other pending or future lawsuits is uncertain. One or more adverse judgment could
result in delays in, or reductions of amounts available for, payments on the bonds.
134
County of Broome, New York
Notes to the Basic Financial Statements
For the Year Ended December 31, 2020
17. Solid Waste Management
Landfill Closure and Post-Closure Costs - Costs incurred for Nanticoke Landfill Cells II, III, and
IV are reported in the Solid Waste Management Enterprise Fund. Cells II and III were expanded
in 2006 and are now considered one cell. State and Federal laws require that the County place a
final cover on its landfills when closed and perform maintenance and monitoring functions at the
sites for 30 years after closure. An expense provision to recognize the liability for future closure
and post-closure costs is included in the operating plan. The recognition of the landfill closure and
post-closure costs is based on landfill capacity used through December 31, 2020. The estimated
liability in the Solid Waste Fund is $12,944,213 as of December 31, 2020. The liability is based
on 100% utilization of Combined Cells II / III and 71.2% utilization of Cell IV. The County will
recognize the remaining estimated closure and post-closure costs of $10,854,713, as the remaining
capacity is used at Cell IV. These amounts are based on the cost if all equipment, facilities and
services made to close, monitor, and maintain the landfill were made as of December 31, 2020. The
actual cost of closure and post-closure care may be higher due to inflation, changes in technology
or landfill laws and regulations. Costs of closure and post-closure will be recovered through user
tipping fees.
Only Nanticoke Landfill Section IV remains open, with an estimated remaining life of 35 years.
All the other landfill cells are closed.
The federal Environmental Protection Agency set forth criteria requiring owners and operators of
municipal solid waste landfills to demonstrate financial responsibility for the costs of closure, post-
closure, and corrective action associated with their facilities. This is intended to assure that
adequate funds are available to cover these costs. The effective date of the requirements was April
9, 1997. The criteria provide for a few financial methods that can be used to demonstrate financial
assurance. The County elected to use the Local Government Financial Test mechanism. There are
four steps to this test.
135
County of Broome, New York
Notes to the Basic Financial Statements
For the Year Ended December 31, 2020
17. Solid Waste Management (Continued)
1. The County must meet each of these qualifications.
• The government must have a current investment grade bond rating of Baa3 or better as
issued by Moody’s or BBB or better as issued by Standard and Poor’s on all
outstanding general obligation bonds.
• The government’s financial statements do not show an operating deficit of 5.0% or
greater of the total annual revenue for each of the past two years.
• The government’s most recent financial statements did not receive an adverse or
qualified opinion.
2. The government must include in its annual budget or financial statements the estimated
cost of closure, post-closure, corrective action liabilities and when the costs will be
incurred.
3. The following must be placed in the facility operations record:
• A letter signed by the local government’s chief financial officer showing compliance.
• The independently audited year-end financial statements.
• The opinion prepared by the government’s year-end financial statement auditors.
• A statement signed by the auditor or the state agency confirming the data in the Chief
Financial Officer’s letter.
4. Financial assurance is demonstrated for the costs of the local government’s total
environmental obligations up to 43.0% of its total annual revenue.
The County management believes that it meets the requirements for demonstrating its financial
ability each year by filing documentation of compliance with each of the above steps with the New
York State Department of Environmental Conservation each year.
18. Deficit Fund Balances / Net Position
The Governmental Activities has an overall deficit net position of $274,507,611, mainly due to
GASB 75 OPEB obligation of $226,633,331 and related deferred inflows of resources of
$74,192,327, coupled with the pension liability of $75,072,877.
The fund balance of the Capital Projects Fund increased by $625,527, resulting in a fiscal year
ending fund balance deficit of $46,296,689. This deficit is due to Bond Anticipation Notes (BANs)
proceeds being used in part to fund the acquisition/construction of capital assets. Until the BANs
are serialized and bond proceeds recognized as other financing sources, the fund balance shall
remain in deficit.
.
136
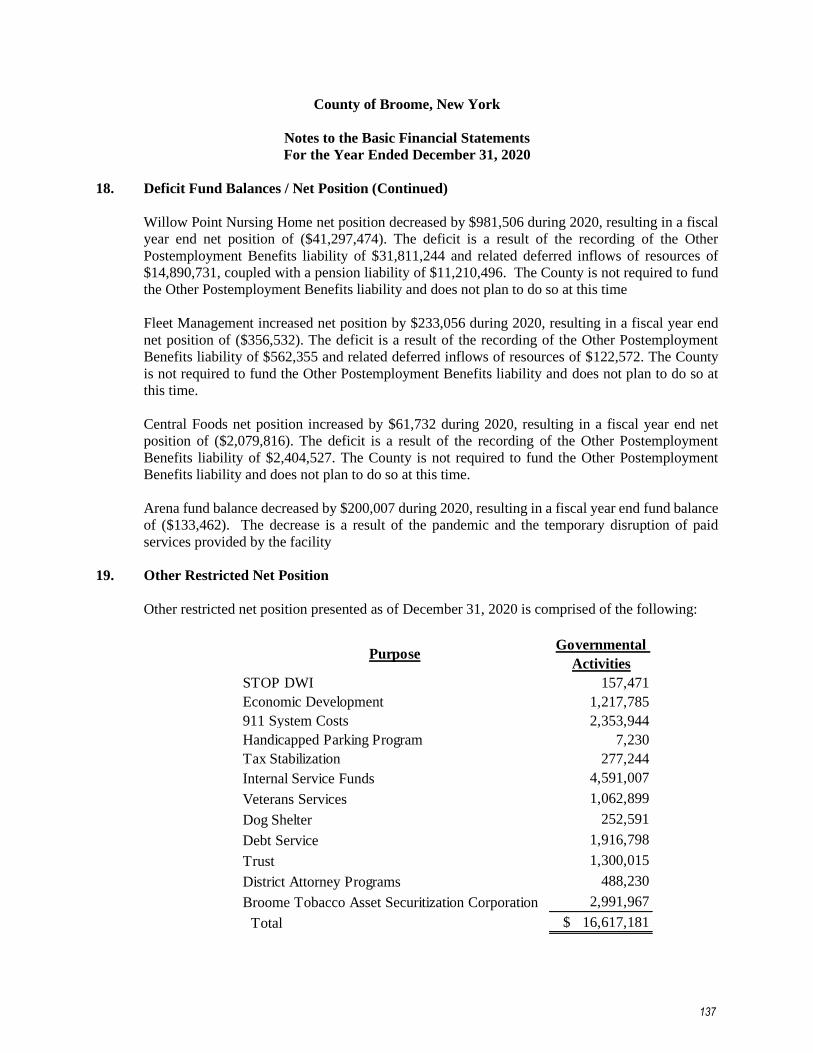
County of Broome, New York
Notes to the Basic Financial Statements
For the Year Ended December 31, 2020
18. Deficit Fund Balances / Net Position (Continued)
Willow Point Nursing Home net position decreased by $981,506 during 2020, resulting in a fiscal
year end net position of ($41,297,474). The deficit is a result of the recording of the Other
Postemployment Benefits liability of $31,811,244 and related deferred inflows of resources of
$14,890,731, coupled with a pension liability of $11,210,496. The County is not required to fund
the Other Postemployment Benefits liability and does not plan to do so at this time
Fleet Management increased net position by $233,056 during 2020, resulting in a fiscal year end
net position of ($356,532). The deficit is a result of the recording of the Other Postemployment
Benefits liability of $562,355 and related deferred inflows of resources of $122,572. The County
is not required to fund the Other Postemployment Benefits liability and does not plan to do so at
this time.
Central Foods net position increased by $61,732 during 2020, resulting in a fiscal year end net
position of ($2,079,816). The deficit is a result of the recording of the Other Postemployment
Benefits liability of $2,404,527. The County is not required to fund the Other Postemployment
Benefits liability and does not plan to do so at this time.
Arena fund balance decreased by $200,007 during 2020, resulting in a fiscal year end fund balance
of ($133,462). The decrease is a result of the pandemic and the temporary disruption of paid
services provided by the facility
19. Other Restricted Net Position
Other restricted net position presented as of December 31, 2020 is comprised of the following:
PurposeGovernmental
Activities
STOP DWI 157,471
Economic Development 1,217,785
911 System Costs 2,353,944
Handicapped Parking Program 7,230
Tax Stabilization 277,244
Internal Service Funds 4,591,007
Veterans Services 1,062,899
Dog Shelter 252,591
Debt Service 1,916,798
Trust 1,300,015
District Attorney Programs 488,230
Broome Tobacco Asset Securitization Corporation 2,991,967
Total $ 16,617,181
137

County of Broome, New York
Notes to the Basic Financial Statements For the Year Ended December 31, 2020
20. Subsequent Events
In April of 2021, the County issued $64,175,000 in bond anticipation notes at par value with an interest rate of 1.5% and $11,708,091 in federally taxable bond anticipation notes at par value with an interest rate of 1.0%.
As of January 1, 2021, Floyd L. Maines Veterans’ Memorial Arena officially changed to Visions
Veterans Memorial Arena. The Binghamton Black Bears of the Federal Prospects Hockey League
will start its 2021-22 season in Broome County, replacing Binghamton Devils American Hockey
League team.
21. Related Party Transactions
The County provides BTASC with administrative services. The cost of these services has been
included as expenses on BTASC’s statements of activities. BTASC paid the County $3,963 for the
year ended December 31, 2020.
The County, through a purchase agreement, reimbursed the IDA $5,000 for land in the Broome
Corporate Park. The amount has been paid for out of the governmental funds for Department of
Public Works.
The County, through budget resolution, provided administrative support for salaries and benefits
to the LBC of $79,825 for the year ended December 31, 2020.
22. Accounting Pronouncements Issued Not Yet Implemented
The County has not completed the process of evaluating the impact that will result from adopting GASB Statements No. 89, Accounting for Interest Cost Incurred before the End of a Construction Period; and No. 93, Replacement of Interbank Offered Rates, effective for the year ending December 31, 2021, No. 87, Leases; and No. 91, Conduit Debt Obligations effective for the year ending December 31, 2022, No. 94, Public-Private and Public-Public Partnerships and Availability Payment Arrangements; and No. 96, Subscription-Based Information Technology Arrangements, effective for the year ending December 31, 2023. The County is, therefore, unable to disclose the impact that adopting GASB Statements No. 87, 89, 91, 93, 94, and 96 will have on its financial position and results of operations when such statements are adopted.
138

Required Supplementary Information
139

This page left blank intentionally.
140
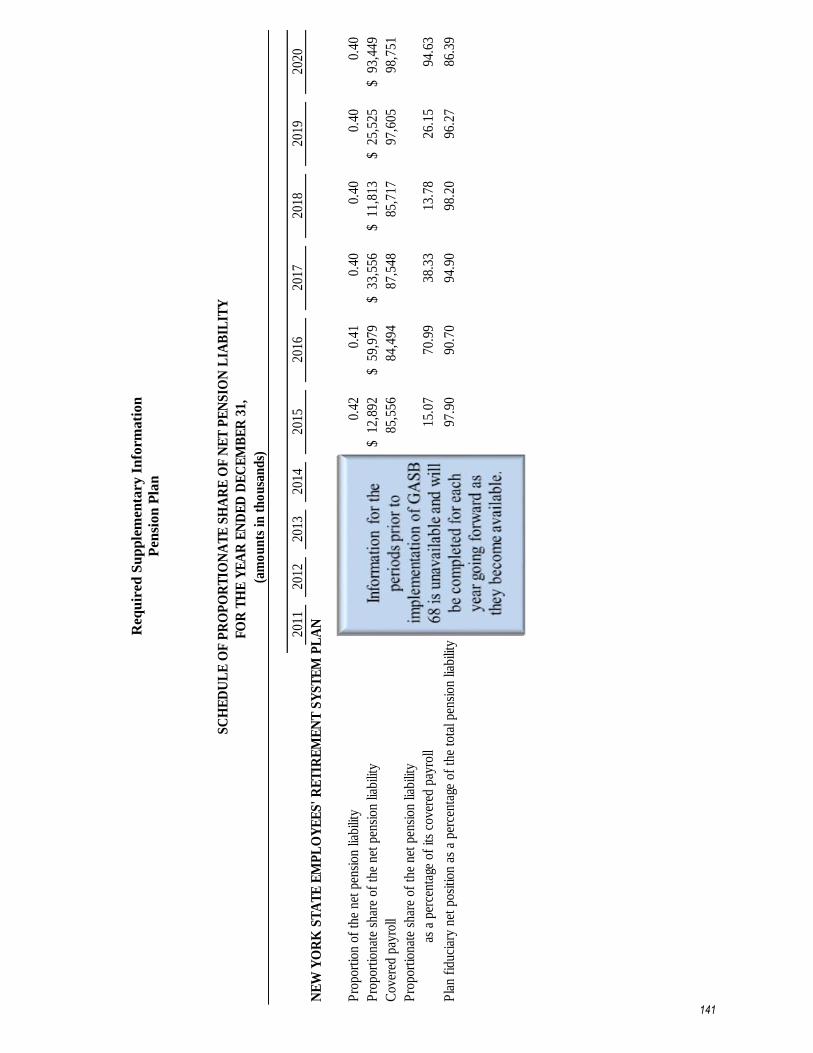
Req
uir
ed S
up
ple
men
tary
In
form
ati
on
Pen
sion
Pla
n
2011
2012
2013
2014
2015
2016
2017
2018
2019
2020
NE
W Y
OR
K S
TA
TE
EM
PL
OY
EE
S'
RE
TIR
EM
EN
T S
YS
TE
M P
LA
N
Pro
port
ion
of t
he n
et p
ensi
on li
abili
ty0.
42
0.
41
0.
40
0.
40
0.
40
0.
40
Pro
port
iona
te s
hare
of
the
net
pens
ion
liabi
lity
12,8
92$
59
,979
$
33,5
56$
11
,813
$
25,5
25$
93
,449
$
Cov
ered
pay
roll
85,5
56
84
,494
87,5
48
85
,717
97,6
05
98
,751
Pro
port
iona
te s
hare
of
the
net
pens
ion
liabi
lity
as a
per
cent
age
of it
s co
vere
d pa
yrol
l15
.07
70
.99
38
.33
13
.78
26
.15
94
.63
Pla
n fi
duci
ary
net
posi
tion
as a
per
cent
age
of t
he t
otal
pen
sion
liab
ility
97.9
0
90.7
0
94.9
0
98.2
0
96.2
7
86.3
9
SC
HE
DU
LE
OF
PR
OP
OR
TIO
NA
TE
SH
AR
E O
F N
ET
PE
NS
ION
LIA
BIL
ITY
(am
ou
nts
in
th
ou
san
ds)
FO
R T
HE
YE
AR
EN
DE
D D
EC
EM
BE
R 3
1,
141
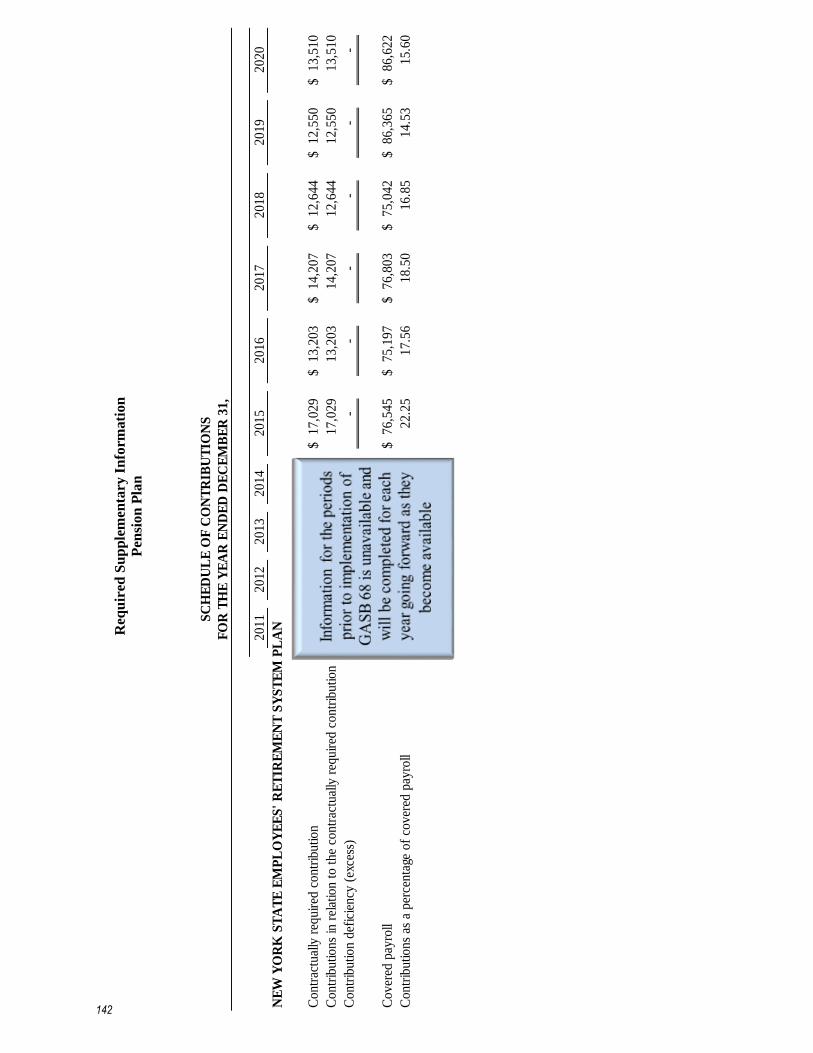
Req
uir
ed S
up
ple
men
tary
In
form
ati
on
Pen
sion
Pla
n
2011
2012
2013
2014
2015
2016
2017
2018
2019
2020
NE
W Y
OR
K S
TA
TE
EM
PL
OY
EE
S'
RE
TIR
EM
EN
T S
YS
TE
M P
LA
N
Contr
actu
ally
req
uir
ed c
ontr
ibution
17,0
29
$
13,2
03
$
14,2
07
$
12,6
44
$
12,5
50
$
13,5
10
$
Contr
ibutions
in r
elat
ion t
o t
he
contr
actu
ally
req
uir
ed c
ontr
ibution
17,0
29
13,2
03
14,2
07
12,6
44
12,5
50
13,5
10
Contr
ibution d
efic
iency
(ex
cess
)-
-
-
-
-
-
Cover
ed p
ayro
ll76,5
45
$
75,1
97
$
76,8
03
$
75,0
42
$
86,3
65
$
86,6
22
$
Contr
ibutions
as a
per
centa
ge o
f co
ver
ed p
ayro
ll22.2
5
17.5
6
18.5
0
16.8
5
14.5
3
15.6
0
SC
HE
DU
LE
OF
CO
NT
RIB
UT
ION
S
FO
R T
HE
YE
AR
EN
DE
D D
EC
EM
BE
R 3
1,
142

Req
uir
ed S
up
ple
men
tary
In
form
ati
on
OP
EB
Lia
bil
ity
Sch
edu
le o
f C
han
ge
in t
he County’s
Tota
l O
PE
B L
iab
ilit
y a
nd
Rel
ate
d R
ati
os
Last
Th
ree
Fis
cal
Yea
rs*
2018
201
920
20
Govern
men
tal
acti
vit
es:
Tota
l O
PE
B l
iab
ilit
y
Serv
ice c
ost
8,7
70,9
29
$
5,9
04
,356
$
6,3
73,1
73
$
Inte
rest
9,7
06,9
30
7,7
84
,227
5,7
07,8
81
Dif
fere
nces
betw
een e
xpecte
d a
nd a
ctu
al
experi
ence
(40,5
25,9
11)
(69,2
22,7
83)
(2,9
03
,608)
Changes
of
ass
um
pti
ons
3,1
53,6
88
15,6
96
,017
27,5
78,1
88
Changes
of
benefi
t te
rms
(28,8
40)
(1,2
69,2
46)
(5,9
88
,279)
Benefi
t paym
ents
(11,4
74,5
20)
(12,2
15,4
54)
(10,6
40
,484)
N
et
changes
in t
ota
l O
PE
B l
iabil
ity
(30,3
97,7
24)
(53,3
22,8
83)
20,1
26,8
71
Tota
l O
PE
B l
iabil
ity -
begin
nin
g, as
rest
ate
d290,2
27,0
67
259,8
29
,343
206,5
06,4
60
Tota
l O
PE
B l
iabil
ity -
endin
g259,8
29,3
43
$
206,5
06
,460
$
226,6
33,3
31
$
Pla
n f
idu
cia
ry n
ew
posi
tion
Contr
ibuti
ons
- em
plo
yer
11,4
74,5
20
$
12,2
15
,454
$
10,6
40,4
84
$
Benefi
t paym
ents
(11,4
74,5
20)
(12,2
15,4
54)
(10,6
40
,484)
N
et
change i
n p
lan f
iducia
ry n
et
posi
tion
-
-
-
Pla
n f
iducia
ry n
et
posi
tion -
begin
nin
g-
-
-
Pla
n f
iducia
ry n
et
posi
tion -
endin
g-
$
-
$
-$
Cou
nty
's n
et
OP
EB
lia
bil
ity -
en
din
g259,8
29,3
43
$
206,5
06
,460
$
226,6
33,3
31
$
Pla
n's
fid
ucia
ry n
et
posi
tion a
s a p
erc
enta
ge o
f th
e t
ota
l O
PE
B l
iabil
ity
0.0
%0.0
%0.0
%
Covere
d p
ayro
ll69,7
51,8
09
$
70,8
80
,240
$
72,6
08,0
85
$
County
's n
et
OP
EB
lia
bil
ity a
s a p
erc
enta
ge o
f covere
d p
ayro
ll372.5
%29
1.3
%3
12.1
%
Year E
nd
ed
Decem
ber 3
1,
*In
form
atio
n p
rio
r to
th
e yea
r en
ded
Dec
ember
31,
2018 i
s not
avai
lable
.
143

Req
uir
ed S
up
ple
men
tary
In
form
ati
on
OP
EB
Lia
bil
ity
Sch
edu
le o
f C
han
ge
in t
he County’s
Tota
l O
PE
B L
iab
ilit
y a
nd
Rel
ate
d R
ati
os
Last
Th
ree
Fis
cal
Yea
rs*
2018
2019
2020
Bu
sin
ess
-ty
pe a
cti
vit
ies:
To
tal
OP
EB
lia
bil
ity
Serv
ice c
ost
2,3
22,4
54
$
1
,27
0,6
61
$
1,3
61,6
23
$
Inte
rest
2,4
84,4
20
1
,75
9,0
47
1,2
77,7
85
Dif
fere
nces
betw
een
exp
ecte
d a
nd
actu
al exp
eri
en
ce
(10
,28
2,0
92)
(2
3,0
77,1
85)
(7
64,7
98)
Chan
ges
of
ass
um
ptio
ns
89
5,6
91
3,0
46,4
87
4,6
61,0
49
Chan
ges
of
ben
efi
t te
rms
-
(19
6,5
75)
(1
,32
9,3
96)
Benefi
t p
ay
men
ts(3
,25
8,9
18)
(2,8
97,9
02)
(2,6
55,5
61)
N
et
ch
anges
in t
ota
l O
PE
B lia
bilit
y(7
,83
8,4
45)
(20
,09
5,4
67)
2,5
50,7
02
To
tal O
PE
B lia
bilit
y -
begin
nin
g,
as
rest
ate
d7
4,3
65,0
24
66
,52
6,5
79
46
,43
1,1
12
To
tal O
PE
B lia
bilit
y -
en
din
g6
6,5
26,5
79
$
46
,43
1,1
12
$
48
,98
1,8
14
$
Pla
n f
idu
cia
ry n
ew
po
siti
on
Con
trib
utio
ns
- em
plo
yer
3,2
58,9
18
$
2
,89
7,9
02
$
2,6
55,5
61
$
Benefi
t p
ay
men
ts(3
,25
8,9
18)
(2,8
97,9
02)
(2,6
55,5
61)
N
et
ch
ange in
pla
n f
idu
cia
ry n
et
po
sitio
n-
-
-
Pla
n f
idu
cia
ry n
et
po
sitio
n -
begin
nin
g-
-
-
Pla
n f
idu
cia
ry n
et
po
sitio
n -
en
din
g-
$
-
$
-
$
Co
un
ty's
net
OP
EB
lia
bil
ity
- e
nd
ing
66
,52
6,5
79
$
46
,43
1,1
12
$
48
,981,8
14
$
Pla
n's
fid
ucia
ry n
et
po
sitio
n a
s a p
erc
en
tage o
f th
e t
ota
l O
PE
B lia
bilit
y0
.0%
0.0
%0
.0%
Cov
ere
d p
ay
roll
18
,20
5,7
95
$
17
,94
3,9
26
$
17
,645,3
49
$
Cou
nty
's n
et
OP
EB
lia
bilit
y a
s a p
erc
en
tage o
f co
vere
d p
ay
roll
36
5.4
%2
58.8
%2
77.6
%
Yea
r E
nd
ed
Decem
ber
31,
*In
form
atio
n p
rio
r to
th
e yea
r en
ded
Dec
ember
31,
2018 i
s not
avai
lable
.
144

Required Supplementary Information
OPEB Liability
Note to the Required Supplementary Information
Changes of Assumption – The actuarial cost method used as of December 31, 2020 was the Entry Age
Normal Level Percent of Pay method as prescribed under GASB 75. Previously, when the plan was subject
to GASB 45, the Projected Unit Credit cost method was utilized. The revised cost method resulted in
increase in the total OPEB liability.
The rate used to discount future plan cash flows decreased from 2.75% to 2.00% as of December 31, 2020
based on a review of the Fidelity General obligation 20-Year AA Municipal Bond Index.
The mortality assumption as of January 1, 2020 to the sex-distinct RPH-2014 Mortality Tables for
employees and healthy annuitants, adjusted for mortality improvements with scale MP-2019 on a fully
generational basis.
145

This page left blank intentionally.
146
Supplementary Information
147

This page left blank intentionally.
148
Combining Individual Fund Financial Statements and Schedules
149

This page left blank intentionally.
150

Nonmajor Governmental Funds
151

This page left blank intentionally.
152

Nonmajor Governmental Funds
Special Revenue Funds
The Special Revenue Funds account for and report the proceeds of specific revenue sources that are
designated for specified purposes, other than debt service or capital projects.
County Road - Used to account for monies collected for administering County highway programs.
Expenditures are for highway maintenance and traffic control.
County Road Machinery - Used to account for the financial transactions relating to the purchase, repair,
maintenance, and construction of highway machinery tools, equipment, storage buildings, materials, and
supplies.
Library - Used to account for the financial transactions of the County of Broome Library System.
Arena - Used to account for the financial transactions of the Broome County Veterans Memorial Arena.
Office of Employment and Training - Used to account for monies received under the Workforce
Investment and Workforce Innovation and Opportunity Acts. Expenditures made from this fund support
programs designed to increase the employability of unemployed youth, displaced workers, and the
chronically unemployed.
En Joie Golf Course - Used to account for the financial transactions of the County golf course.
153

This page left blank intentionally.
154

Off
ice
of
Cou
nty
Em
plo
ym
ent
En
Joie
Cou
nty
Road
an
dG
olf
Road
Mach
iner
yL
ibra
ryA
ren
aT
rain
ing
Cou
rse
Tota
l
Ass
ets
Cas
h a
nd
cas
h e
qu
ival
ents
3
2,7
71
$
34
2,1
90
$
51
1,0
29
$
31
6,9
99
$
17
,40
8$
10
3,6
54
$
1,3
24
,05
1$
Acc
ou
nts
rec
eivab
le1
0,7
83
29
1
5,1
26
-
1
15
,94
0
Du
e fr
om
oth
er f
un
ds
2,1
85
,66
4
-
-
4
,32
0
-
-
2
,18
9,9
84
Du
e fr
om
oth
er g
over
nm
ents
1,6
89
,88
7
8
,08
0
2
79
4
,50
7
-
4
05
1
,70
3,1
58
Inven
tory
55
0,9
70
4
68
,83
2
-
-
-
6
,14
0
1
,02
5,9
42
Oth
er a
sset
s9
7,2
36
20
,87
1
21
,15
5
12
,91
6
14
,79
2
6,6
66
17
3,6
36
Res
tric
ted
ass
ets:
Cas
h a
nd
cas
h e
qu
ival
ents
-
-
7,8
75
30
,00
0
39
9,5
86
-
43
7,4
61
Rec
eivab
les
-
-
-
-
10
3
-
10
3
Du
e fr
om
oth
er g
over
nm
ents
-
-
-
-
12
4,3
57
-
12
4,3
57
To
tal
asse
ts4
,56
7,3
11
$
84
0,0
02
$
54
0,3
39
$
37
3,8
68
$
55
6,2
46
$
11
6,8
66
$
6,9
94
,63
2$
Lia
bil
itie
s, d
efer
red
in
flow
s of
reso
urc
es a
nd
fu
nd
bala
nce
s (d
efic
it)
Lia
bil
itie
s:
Acc
ou
nts
pay
able
38
,01
0$
3
0,9
99
$
4
3,3
49
$
2
47
,20
9$
4
3,0
22
$
9
,32
3$
4
11
,91
2$
Pay
roll
rel
ated
lia
bil
itie
s4
7,6
54
10
,66
2
23
,82
5
5,1
21
7,4
93
3,1
00
97
,85
5
Du
e to
oth
er f
un
ds
1,6
50
,00
0
-
-
2
25
,00
0
-
-
1
,87
5,0
00
Du
e to
oth
er g
over
nm
ents
-
-
-
-
-
28
0
28
0
Un
earn
ed r
even
ues
-
-
-
30
,00
0
49
8,2
02
-
52
8,2
02
To
tal
liab
ilit
ies
1,7
35
,66
4
4
1,6
61
6
7,1
74
5
07
,33
0
5
48
,71
7
1
2,7
03
2
,91
3,2
49
Def
erre
d i
nfl
ow
s o
f re
sou
rces
:
Pre
pay
men
t o
f ev
ents
/mem
ber
ship
-
-
-
-
-
24
,07
9
24
,07
9
To
tal
def
erre
d i
nfl
ow
s o
f re
sou
rces
-
-
-
-
-
24
,07
9
24
,07
9
Fu
nd
bal
ance
s:
No
nsp
end
able
64
8,2
06
4
89
,70
3
2
1,1
55
1
2,9
16
1
4,7
92
1
2,8
06
1
,19
9,5
78
Res
tric
ted
-
-
7,8
75
-
-
-
7,8
75
Ass
ign
ed2
,18
3,4
41
30
8,6
38
44
4,1
35
-
-
67
,27
8
3,0
03
,49
2
Un
assi
gn
ed-
-
-
(1
46
,37
8)
(7
,26
3)
-
(1
53
,64
1)
To
tal
fun
d b
alan
ces
(def
icit
)2
,83
1,6
47
79
8,3
41
47
3,1
65
(13
3,4
62
)
7,5
29
80
,08
4
4,0
57
,30
4
To
tal
liab
ilit
ies,
def
erre
d i
nfl
ow
s o
f re
sou
rces
and
fu
nd
bal
ance
s4
,56
7,3
11
$
84
0,0
02
$
54
0,3
39
$
37
3,8
68
$
55
6,2
46
$
11
6,8
66
$
6,9
94
,63
2$
See
no
tes
to f
inan
cial
sta
tem
ents
Cou
nty
of
Bro
om
e
Com
bin
ing
Bala
nce
Sh
eet
Non
majo
r G
over
nm
enta
l F
un
ds
Dec
emb
er 3
1,
20
20
Sp
ecia
l R
even
ue
Fu
nd
s
155
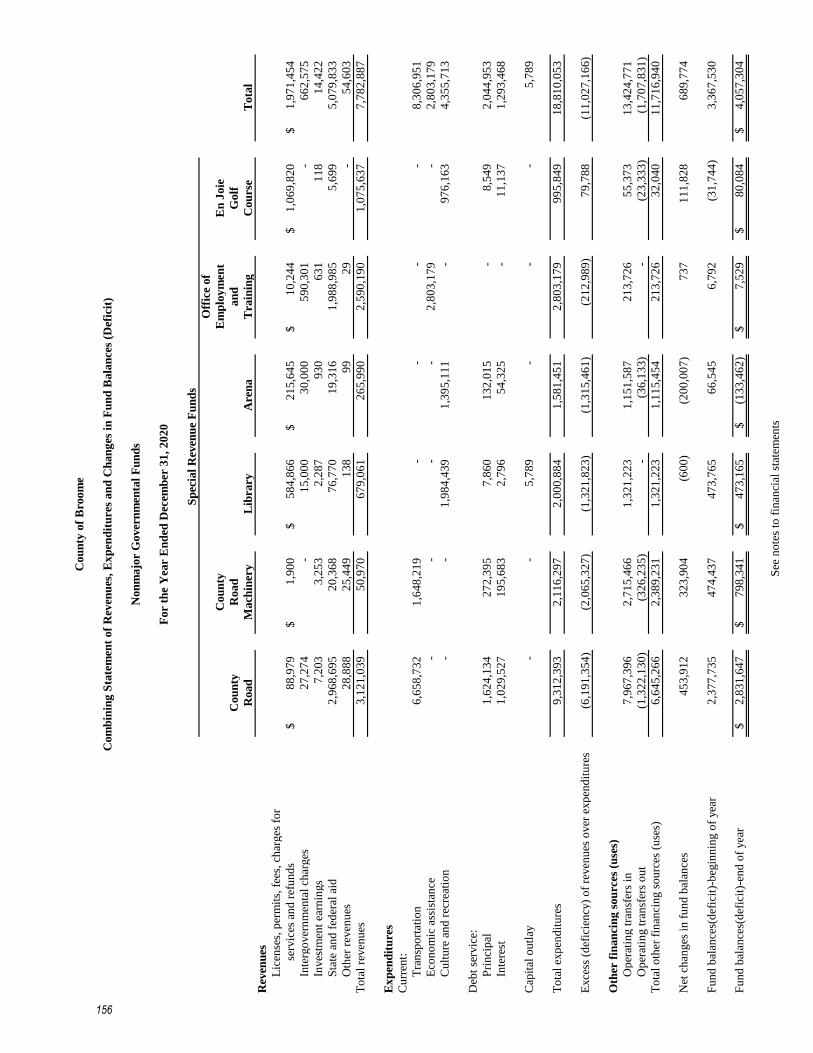
Off
ice
of
Cou
nty
Em
plo
ym
ent
En
Joie
Cou
nty
Road
an
dG
olf
Road
Mach
iner
yL
ibra
ryA
ren
aT
rain
ing
Cou
rse
Tota
l
Rev
enu
es
Lic
ense
s, p
erm
its,
fee
s, c
har
ges
fo
r
serv
ices
an
d r
efu
nd
s8
8,9
79
$
1
,90
0$
5
84
,86
6$
2
15
,64
5$
1
0,2
44
$
1
,06
9,8
20
$
1,9
71
,45
4$
Inte
rgo
ver
nm
enta
l ch
arges
27
,27
4
-
15
,00
0
30
,00
0
59
0,3
01
-
66
2,5
75
Inves
tmen
t ea
rnin
gs
7,2
03
3,2
53
2,2
87
93
0
63
1
11
8
14
,42
2
Sta
te a
nd
fed
eral
aid
2,9
68
,69
5
20
,36
8
76
,77
0
19
,31
6
1,9
88
,98
5
5
,69
9
5
,07
9,8
33
Oth
er r
even
ues
28
,88
8
25
,44
9
13
8
99
29
-
54
,60
3
To
tal
reven
ues
3,1
21
,03
9
50
,97
0
67
9,0
61
26
5,9
90
2,5
90
,19
0
1
,07
5,6
37
7,7
82
,88
7
Ex
pen
dit
ure
s
Cu
rren
t:
Tra
nsp
ort
atio
n6
,65
8,7
32
1
,64
8,2
19
-
-
-
-
8,3
06
,95
1
Eco
no
mic
ass
ista
nce
-
-
-
-
2
,80
3,1
79
-
2,8
03
,17
9
Cu
ltu
re a
nd
rec
reat
ion
-
-
1
,98
4,4
39
1,3
95
,11
1
-
9
76
,16
3
4
,35
5,7
13
Deb
t se
rvic
e:
Pri
nci
pal
1,6
24
,13
4
27
2,3
95
7,8
60
13
2,0
15
-
8,5
49
2,0
44
,95
3
Inte
rest
1,0
29
,52
7
19
5,6
83
2,7
96
54
,32
5
-
11
,13
7
1,2
93
,46
8
Cap
ital
ou
tlay
-
-
5
,78
9
-
-
-
5
,78
9
To
tal
exp
end
itu
res
9,3
12
,39
3
2,1
16
,29
7
2
,00
0,8
84
1,5
81
,45
1
2
,80
3,1
79
99
5,8
49
18
,81
0,0
53
Exce
ss (
def
icie
ncy
) o
f re
ven
ues
over
exp
end
itu
res
(6,1
91
,35
4)
(2,0
65
,32
7)
(1
,32
1,8
23
)
(1,3
15
,46
1)
(2
12
,98
9)
7
9,7
88
(1
1,0
27
,16
6)
Oth
er f
inan
cin
g s
ou
rces
(u
ses)
Op
erat
ing t
ran
sfer
s in
7,9
67
,39
6
2,7
15
,46
6
1
,32
1,2
23
1,1
51
,58
7
2
13
,72
6
5
5,3
73
1
3,4
24
,77
1
Op
erat
ing t
ran
sfer
s o
ut
(1,3
22
,13
0)
(32
6,2
35
)
-
(36
,13
3)
-
(23
,33
3)
(1,7
07
,83
1)
To
tal
oth
er f
inan
cin
g s
ou
rces
(u
ses)
6,6
45
,26
6
2,3
89
,23
1
1
,32
1,2
23
1,1
15
,45
4
2
13
,72
6
3
2,0
40
1
1,7
16
,94
0
Net
ch
anges
in
fu
nd
bal
ance
s4
53
,91
2
3
23
,90
4
(6
00
)
(2
00
,00
7)
7
37
1
11
,82
8
6
89
,77
4
Fu
nd
bal
ance
s(d
efic
it)-
beg
inn
ing o
f yea
r2
,37
7,7
35
4
74
,43
7
4
73
,76
5
6
6,5
45
6
,79
2
(3
1,7
44
)
3
,36
7,5
30
Fu
nd
bal
ance
s(d
efic
it)-
end
of
yea
r2
,83
1,6
47
$
7
98
,34
1$
4
73
,16
5$
(1
33
,46
2)
$
7
,52
9$
8
0,0
84
$
4
,05
7,3
04
$
See
no
tes
to f
inan
cial
sta
tem
ents
Sp
ecia
l R
even
ue
Fu
nd
s
Cou
nty
of
Bro
om
e
Com
bin
ing
Sta
tem
ent
of
Rev
enu
es,
Ex
pen
dit
ure
s an
d C
han
ges
in
Fu
nd
Bala
nce
s (D
efic
it)
Non
majo
r G
over
nm
enta
l F
un
ds
For
the
Yea
r E
nd
ed D
ecem
ber
31
, 2
02
0
156
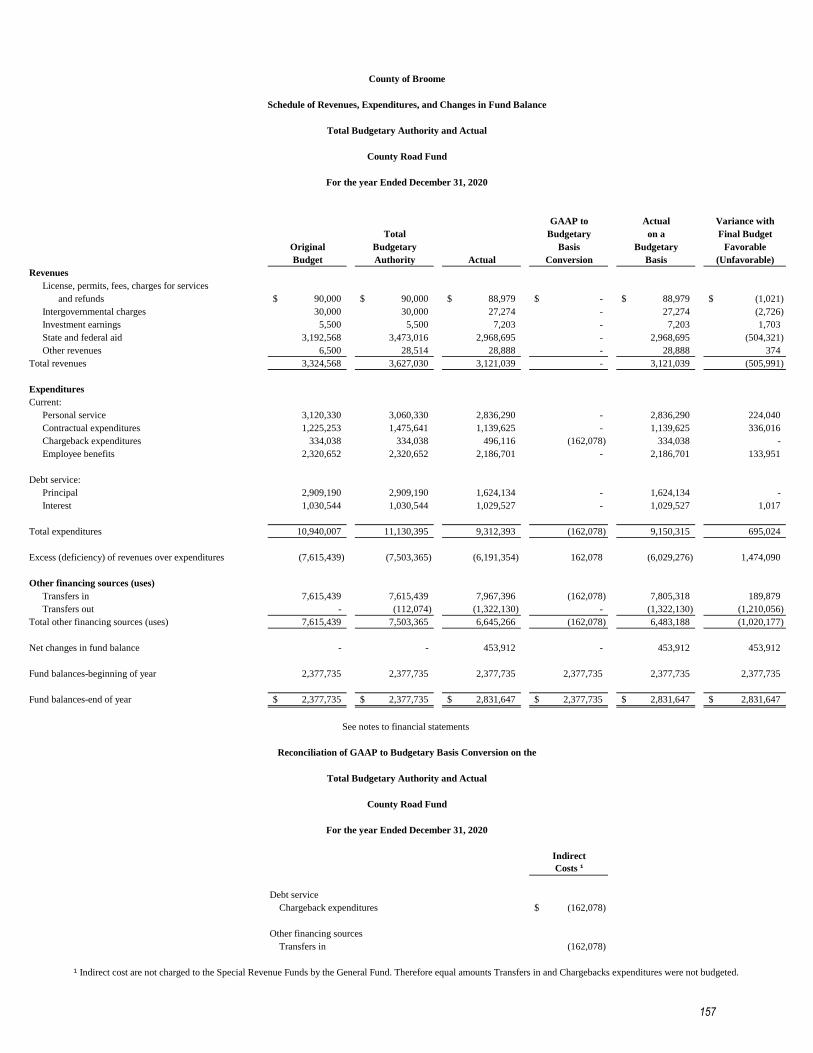
GAAP to Actual Variance with
Total Budgetary on a Final Budget
Original Budgetary Basis Budgetary Favorable
Budget Authority Actual Conversion Basis (Unfavorable)
Revenues
License, permits, fees, charges for services
and refunds 90,000$ 90,000$ 88,979$ -$ 88,979$ (1,021)$
Intergovernmental charges 30,000 30,000 27,274 - 27,274 (2,726)
Investment earnings 5,500 5,500 7,203 - 7,203 1,703
State and federal aid 3,192,568 3,473,016 2,968,695 - 2,968,695 (504,321)
Other revenues 6,500 28,514 28,888 - 28,888 374
Total revenues 3,324,568 3,627,030 3,121,039 - 3,121,039 (505,991)
Expenditures
Current:
Personal service 3,120,330 3,060,330 2,836,290 - 2,836,290 224,040
Contractual expenditures 1,225,253 1,475,641 1,139,625 - 1,139,625 336,016
Chargeback expenditures 334,038 334,038 496,116 (162,078) 334,038 -
Employee benefits 2,320,652 2,320,652 2,186,701 - 2,186,701 133,951
Debt service:
Principal 2,909,190 2,909,190 1,624,134 - 1,624,134 -
Interest 1,030,544 1,030,544 1,029,527 - 1,029,527 1,017
Total expenditures 10,940,007 11,130,395 9,312,393 (162,078) 9,150,315 695,024
Excess (deficiency) of revenues over expenditures (7,615,439) (7,503,365) (6,191,354) 162,078 (6,029,276) 1,474,090
Other financing sources (uses)
Transfers in 7,615,439 7,615,439 7,967,396 (162,078) 7,805,318 189,879
Transfers out - (112,074) (1,322,130) - (1,322,130) (1,210,056)
Total other financing sources (uses) 7,615,439 7,503,365 6,645,266 (162,078) 6,483,188 (1,020,177)
Net changes in fund balance - - 453,912 - 453,912 453,912
Fund balances-beginning of year 2,377,735 2,377,735 2,377,735 2,377,735 2,377,735 2,377,735
Fund balances-end of year 2,377,735$ 2,377,735$ 2,831,647$ 2,377,735$ 2,831,647$ 2,831,647$
Indirect
Costs ¹
Debt service
Chargeback expenditures (162,078)$
Other financing sources
Transfers in (162,078)
County of Broome
Schedule of Revenues, Expenditures, and Changes in Fund Balance
Total Budgetary Authority and Actual
County Road Fund
For the year Ended December 31, 2020
¹ Indirect cost are not charged to the Special Revenue Funds by the General Fund. Therefore equal amounts Transfers in and Chargebacks expenditures were not budgeted.
For the year Ended December 31, 2020
Reconciliation of GAAP to Budgetary Basis Conversion on the
Total Budgetary Authority and Actual
County Road Fund
See notes to financial statements
157
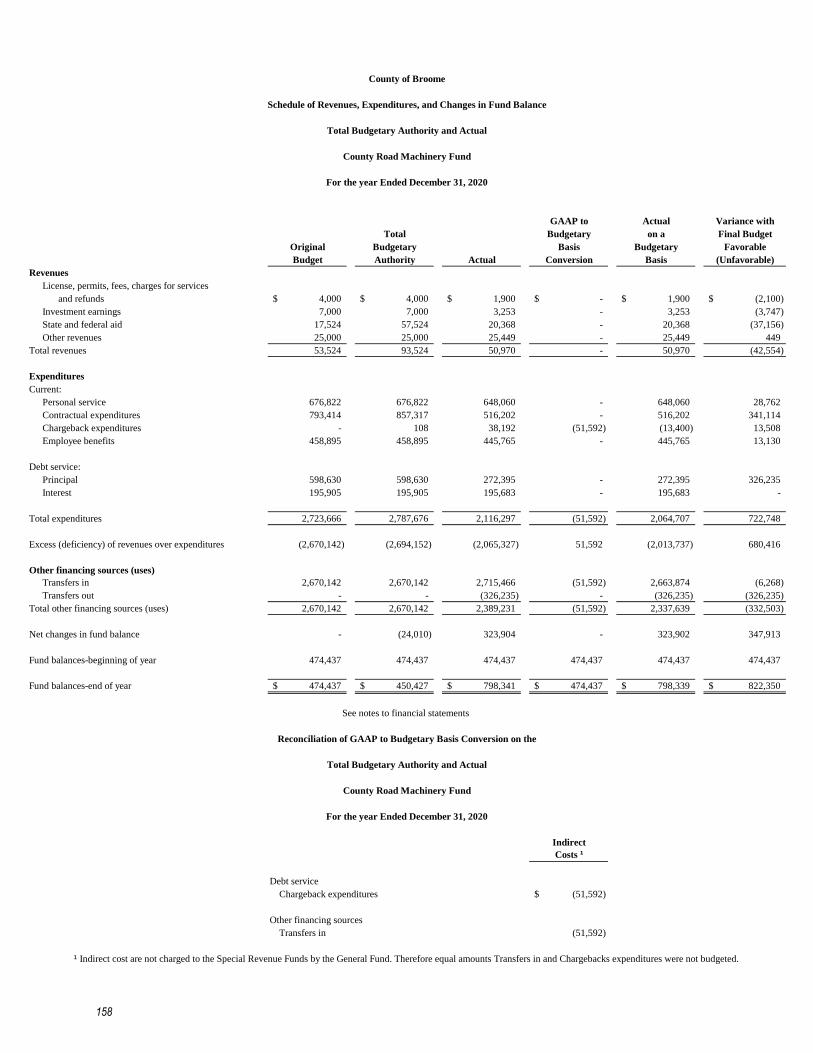
GAAP to Actual Variance with
Total Budgetary on a Final Budget
Original Budgetary Basis Budgetary Favorable
Budget Authority Actual Conversion Basis (Unfavorable)
Revenues
License, permits, fees, charges for services
and refunds 4,000$ 4,000$ 1,900$ -$ 1,900$ (2,100)$
Investment earnings 7,000 7,000 3,253 - 3,253 (3,747)
State and federal aid 17,524 57,524 20,368 - 20,368 (37,156)
Other revenues 25,000 25,000 25,449 - 25,449 449
Total revenues 53,524 93,524 50,970 - 50,970 (42,554)
Expenditures
Current:
Personal service 676,822 676,822 648,060 - 648,060 28,762
Contractual expenditures 793,414 857,317 516,202 - 516,202 341,114
Chargeback expenditures - 108 38,192 (51,592) (13,400) 13,508
Employee benefits 458,895 458,895 445,765 - 445,765 13,130
Debt service:
Principal 598,630 598,630 272,395 - 272,395 326,235
Interest 195,905 195,905 195,683 - 195,683 -
Total expenditures 2,723,666 2,787,676 2,116,297 (51,592) 2,064,707 722,748
Excess (deficiency) of revenues over expenditures (2,670,142) (2,694,152) (2,065,327) 51,592 (2,013,737) 680,416
Other financing sources (uses)
Transfers in 2,670,142 2,670,142 2,715,466 (51,592) 2,663,874 (6,268)
Transfers out - - (326,235) - (326,235) (326,235)
Total other financing sources (uses) 2,670,142 2,670,142 2,389,231 (51,592) 2,337,639 (332,503)
Net changes in fund balance - (24,010) 323,904 - 323,902 347,913
Fund balances-beginning of year 474,437 474,437 474,437 474,437 474,437 474,437
Fund balances-end of year 474,437$ 450,427$ 798,341$ 474,437$ 798,339$ 822,350$
Indirect
Costs ¹
Debt service
Chargeback expenditures (51,592)$
Other financing sources
Transfers in (51,592)
County of Broome
Schedule of Revenues, Expenditures, and Changes in Fund Balance
Total Budgetary Authority and Actual
County Road Machinery Fund
For the year Ended December 31, 2020
¹ Indirect cost are not charged to the Special Revenue Funds by the General Fund. Therefore equal amounts Transfers in and Chargebacks expenditures were not budgeted.
For the year Ended December 31, 2020
Reconciliation of GAAP to Budgetary Basis Conversion on the
Total Budgetary Authority and Actual
County Road Machinery Fund
See notes to financial statements
158

GAAP to Actual Variance with
Total Budgetary on a Final Budget
Original Budgetary Basis Budgetary Favorable
Budget Authority Actual Conversion Basis (Unfavorable)
Revenues
License, permits, fees, charges for services
and refunds 787,440$ 787,440$ 584,866$ -$ 584,866$ (202,574)$
Intergovernmental charges 15,000 15,000 15,000 - 15,000 -
Investment earnings 3,000 3,000 2,287 - 2,287 (713)
State and federal aid 80,232 80,232 76,770 - 76,770 (3,462)
Other revenues 550 550 138 - 138 (412)
Total revenues 886,222 886,222 679,061 - 679,061 (207,161)
Expenditures
Current:
Personal service 718,795 718,795 658,000 - 658,000 60,795
Equipment and capital outlay 5,975 5,975 5,789 - 5,789 186
Contractual expenditures 447,410 463,657 426,491 2,712 429,203 34,454
Chargeback expenditures 245,388 246,797 344,021 (141,380) 202,641 44,155
Employee benefits 640,553 640,553 555,927 - 555,927 84,626
Debt service:
Principal 5,885 5,885 7,860 (1,975) 5,885 -
Interest 2,059 2,059 2,796 (737) 2,059 -
Total expenditures 2,066,065 2,083,721 2,000,884 (141,380) 1,859,504 224,216
Excess (deficiency) of revenues over expenditures (1,179,843) (1,197,499) (1,321,823) 141,380 (1,180,443) 17,056
Other financing sources
Transfers in 1,179,843 1,179,843 1,321,223 (141,380) 1,179,843 -
Total other financing sources 1,179,843 1,179,843 1,321,223 (141,380) 1,179,843 -
Net changes in fund balance - (17,656) (600) - (600) 17,056
Fund balances-beginning of year 473,765 473,765 473,765 473,765 473,765 473,765
Fund balances-end of year 473,765$ 456,109$ 473,165$ 473,765$ 473,165$ 490,821$
Indirect
Costs ¹
Debt service
Chargeback expenditures (141,380)$
Other financing sources
Transfers in (141,380)
County of Broome
Schedule of Revenues, Expenditures, and Changes in Fund Balance
Total Budgetary Authority and Actual
Library Fund
For the year Ended December 31, 2020
¹ Indirect cost are not charged to the Special Revenue Funds by the General Fund. Therefore equal amounts Transfers in and Chargebacks expenditures were not budgeted.
For the year Ended December 31, 2020
Reconciliation of GAAP to Budgetary Basis Conversion on the
Total Budgetary Authority and Actual
Library Fund
See notes to financial statements
159

GAAP to Actual Variance with
Total Budgetary on a Final Budget
Original Budgetary Basis Budgetary Favorable
Budget Authority Actual Conversion Basis (Unfavorable)
Revenues
License, permits, fees, charges for services
and refunds 669,174$ 669,174$ 215,645$ -$ 215,645$ (453,529)$
Intergovernmental charges 30,000 30,000 30,000 - 30,000 -
Investment earnings 1,750 1,750 930 - 930 (820)
State and federal aid 9,775 9,775 19,316 - 19,316 9,541
Other revenues 50 50 99 - 99 49
Total revenues 710,749 710,749 265,990 - 265,990 (444,759)
Expenditures
Current:
Personal service 578,379 578,379 425,211 - 425,211 153,168
Contractual expenditures 531,148 535,100 451,613 1,341 452,954 82,146
Chargeback expenditures 128,218 128,218 342,297 (214,973) 127,324 894
Employee benefits 189,769 189,769 175,989 - 175,989 13,780
Debt service:
Principal 166,948 166,948 132,015 (1,200) 130,815 -
Interest 54,198 54,198 54,325 (141) 54,184 14
Total expenditures 1,648,660 1,652,612 1,581,451 (214,973) 1,366,478 250,002
Excess (deficiency) of revenues over expenditures (937,911) (941,863) (1,315,461) 214,973 (1,100,488) (158,624)
Other financing sources (uses)
Transfers in 937,911 937,911 1,151,587 (214,973) 936,614 (1,297)
Transfers out - - (36,133) - (36,133) (36,133)
Total other financing sources (uses) 937,911 937,911 1,115,454 (214,973) 900,481 (37,430)
Net changes in fund balance - (3,952) (200,007) - (200,007) (196,054)
Fund balances-beginning of year 66,545 66,545 66,545 66,545 66,545 66,545
Fund balance(deficit)-end of year 66,545$ 62,593$ (133,462)$ 66,545$ (133,462)$ (129,509)$
Indirect
Costs ¹
Debt service
Chargeback expenditures (214,973)$
Other financing sources
Transfers in (214,973)
County of Broome
Schedule of Revenues, Expenditures, and Changes in Fund Balance (Deficit)
Total Budgetary Authority and Actual
Arena Fund
For the year Ended December 31, 2020
¹ Indirect cost are not charged to the Special Revenue Funds by the General Fund. Therefore equal amounts Transfers in and Chargebacks expenditures were not budgeted.
For the year Ended December 31, 2020
Reconciliation of GAAP to Budgetary Basis Conversion on the
Total Budgetary Authority and Actual
Arena Fund
See notes to financial statements
160

GAAP to Actual Variance with
Total Budgetary on a Final Budget
Original Budgetary Basis Budgetary Favorable
Budget Authority Actual Conversion Basis (Unfavorable)
Revenues
License, permits, fees, charges for services
and refunds 1,089,000$ 1,089,000$ 1,069,820$ -$ 1,069,820$ (19,180)$
Investment earnings - - 118 - 118 118
Sales and use taxes 878 878 5,699 - 5,699 4,821
Total revenues 1,089,878 1,089,878 1,075,637 - 1,075,637 (14,241)
Expenditures
Current:
Personal service 493,460 484,940 384,369 - 384,369 100,571
Equipment and capital outlay - 22,000 - - - 22,000
Contractual expenditures 384,126 362,126 375,430 - 375,430 (13,304)
Chargeback expenditures 43,017 43,017 76,492 (36,125) 40,367 2,650
Employee benefits 147,618 156,138 139,873 - 139,873 16,265
Debt service:
Principal 31,882 31,882 8,549 - 8,549 23,333
Interest 11,158 11,158 11,137 - 11,137 -
Total expenditures 1,111,261 1,111,261 995,849 (36,125) 959,724 151,516
Excess (deficiency) of revenues over expenditures (21,383) (21,383) 79,788 36,125 115,913 137,296
Other financing sources (uses)
Transfers in 21,383 21,383 55,373 (36,125) 19,248 (2,135)
Transfers out - - (23,333) - (23,333) (23,333)
Total other financing sources (uses) 21,383 21,383 32,040 (36,125) (4,085) (25,468)
Net changes in fund balance - - 111,828 - 111,828 111,828
Fund balance(deficit)-beginning of year (31,744) (31,744) (31,744) (31,744) (31,744) (31,744)
Fund balance(deficit)-end of year (31,744)$ (31,744)$ 80,084$ (31,744)$ 80,084$ 80,084$
Indirect
Costs ¹
Debt service
Chargeback expenditures (36,125)$
Other financing sources
Transfers in (36,125)
County of Broome
Schedule of Revenues, Expenditures, and Changes in Fund Balance (Deficit)
Total Budgetary Authority and Actual
En Joie Golf Course Fund
For the year Ended December 31, 2020
¹ Indirect cost are not charged to the Special Revenue Funds by the General Fund. Therefore equal amounts Transfers in and Chargebacks expenditures were not budgeted.
For the year Ended December 31, 2020
Reconciliation of GAAP to Budgetary Basis Conversion on the
Total Budgetary Authority and Actual
En Joie Golf Course Fund
See notes to financial statements
161

This page left blank intentionally.
162
Nonmajor Business-Type Activities
163

This page left blank intentionally.
164

Nonmajor Business-Type Activities
Nonmajor Business-Type Activities account for the blended component units which operate exclusively for
the charitable and public purposes of benefiting and furthering the activities of Broome County.
Local Development Corporation – Used in account for the financial transactions of a component unit
which promotes local development for the County.
Land Bank Corporation – Used to account for the financial transactions of a component unit which fosters
economic and community development for the County.
165

This page left blank intentionally.
166
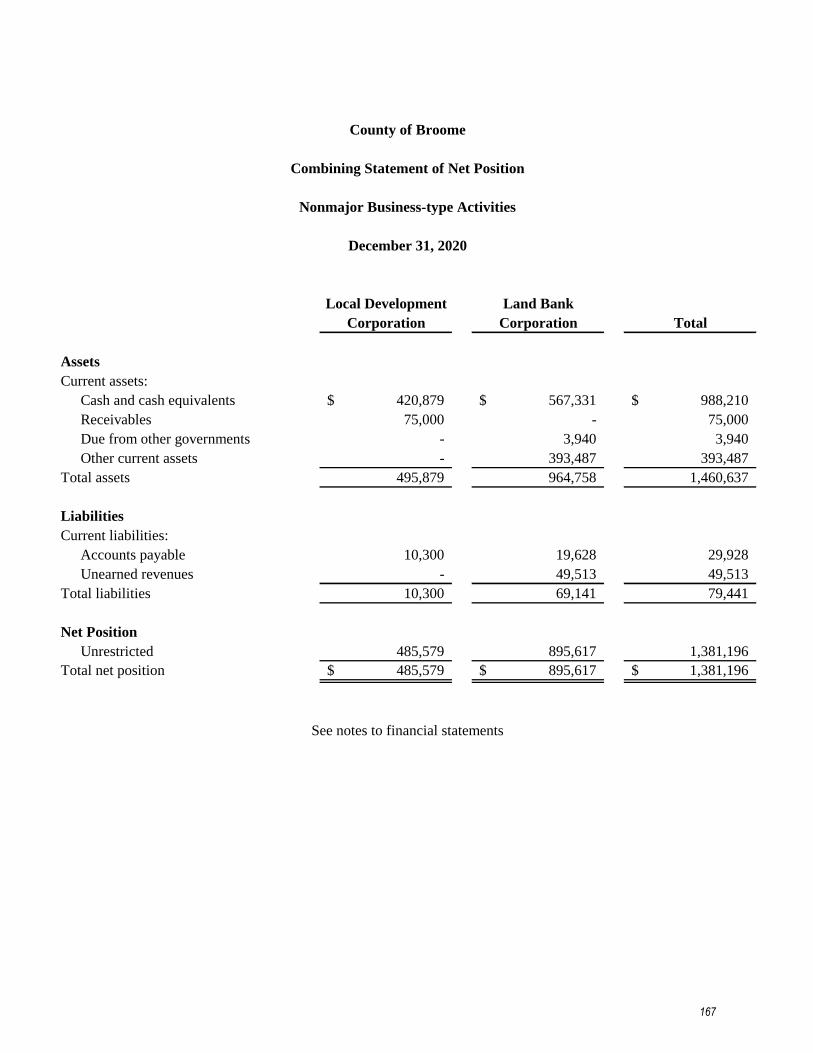
Local Development Land Bank
Corporation Corporation Total
Assets
Current assets:
Cash and cash equivalents 420,879$ 567,331$ 988,210$
Receivables 75,000 - 75,000
Due from other governments - 3,940 3,940
Other current assets - 393,487 393,487
Total assets 495,879 964,758 1,460,637
Liabilities
Current liabilities:
Accounts payable 10,300 19,628 29,928
Unearned revenues - 49,513 49,513
Total liabilities 10,300 69,141 79,441
Net Position
Unrestricted 485,579 895,617 1,381,196
Total net position 485,579$ 895,617$ 1,381,196$
County of Broome
Combining Statement of Net Position
Nonmajor Business-type Activities
December 31, 2020
See notes to financial statements
167
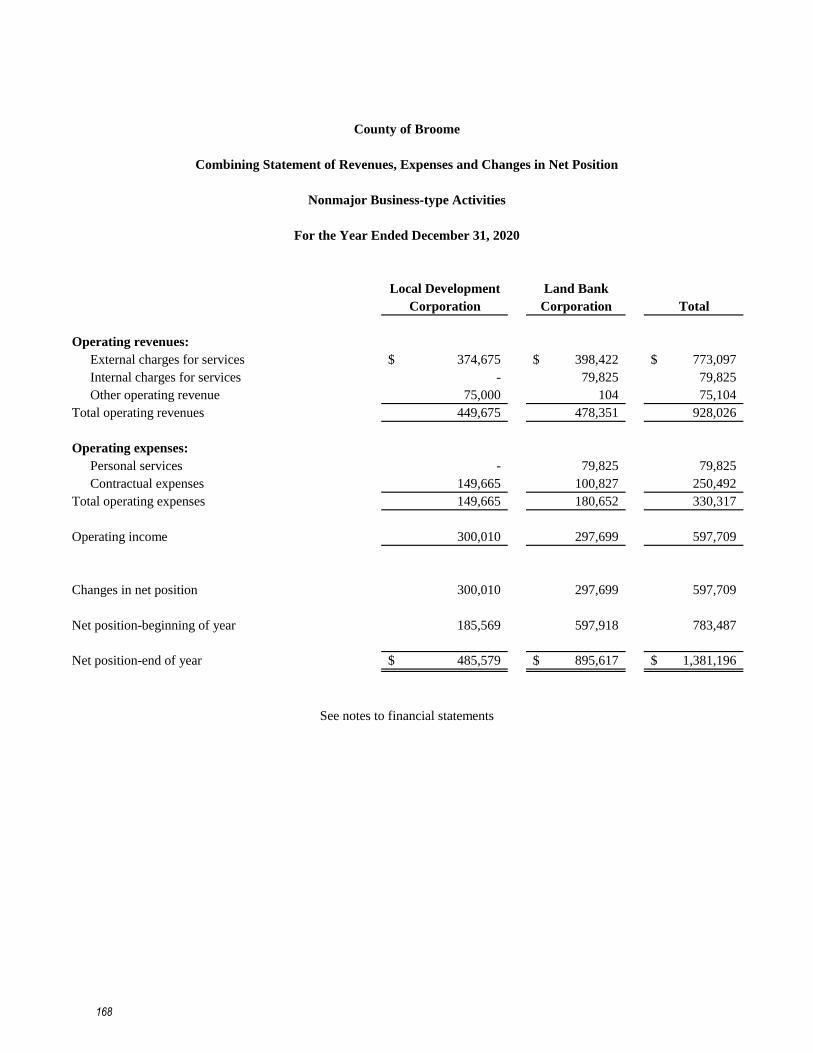
Local Development Land Bank
Corporation Corporation Total
Operating revenues:
External charges for services 374,675$ 398,422$ 773,097$
Internal charges for services - 79,825 79,825
Other operating revenue 75,000 104 75,104
Total operating revenues 449,675 478,351 928,026
Operating expenses:
Personal services - 79,825 79,825
Contractual expenses 149,665 100,827 250,492
Total operating expenses 149,665 180,652 330,317
Operating income 300,010 297,699 597,709
Changes in net position 300,010 297,699 597,709
Net position-beginning of year 185,569 597,918 783,487
Net position-end of year 485,579$ 895,617$ 1,381,196$
County of Broome
Combining Statement of Revenues, Expenses and Changes in Net Position
Nonmajor Business-type Activities
For the Year Ended December 31, 2020
See notes to financial statements
168

Local Development Land Bank
Corporation Corporation Total
Cash flows from operating activities
Receipts from external customers 374,675$ 643,103$ 1,017,778$
Payments to suppliers (143,065) (541,343) (684,408)
Other receipts 75,000 - 75,000
Net cash provided by operating activities 306,610 101,760 408,370
Net increase in cash and cash equivalents 306,610 101,760 408,370
Cash and cash equivalents - beginning of the year 114,269 465,571 579,840
Cash and cash equivalents - end of the year 420,879$ 567,331$ 988,210$
Reconciliation of balance - end of year to the statement
of net position
Cash and cash equivalents 420,879$ 567,331$ 988,210$
Total 420,879$ 567,331$ 988,210$
Reconciliation of operating income to net cash
provided by operating activities
Operating income 300,010$ 297,699$ 597,709$
Due from other governments - (3,940) (3,940)
Other current assets - (251,561) (251,561)
Accounts payable 6,600 13,027 19,627
Unearned revenues - 46,535 46,535
Net cash provided by operating activities 306,610$ 101,760$ 408,370$
See notes to financial statements
County of Broome
Statement of Cash Flows
Nonmajor Business-type Activities
For the Year Ended December 31, 2020
169

This page left blank intentionally.
170

Internal Service Funds
171

This page left blank intentionally.
172

Internal Service Funds
Internal Service Funds account for the operations of County departments rendering services to other County
departments on a cost-reimbursement basis.
Fleet Management - Used to account for the financial transactions of the County's fleet of vehicles.
Central Foods - Used to account for the food costs provided to the Sheriff Department, Willow Point
Nursing Home, and the Office for the Aging.
Health Insurance - Used to account for the County's self-insured program for health benefits which
includes program administration, claims administration, consultant actuary services and other fees, health
claims including prescription, medical and hospital claims, and stop-loss insurance associated with health
benefits coverage.
Workers' Compensation - Used to account for the financial transactions of the County's administrated
self-insured program for workers' compensation.
Insurance Reserve - Used to account for the financial transactions of the operation of the County's portion
of self-insured casualty and liability claims.
Unemployment Insurance - Used to account for the financial transactions of the County’s administrated
self-insured unemployment insurance program.
173

This page left blank intentionally.
174

Fleet Central Health Workers' Insurance Unemployment
Management Foods Insurance Compensation Reserve Insurance Total
Assets
Current assets:
Cash and cash equivalents 761,539$ 1,047,176$ 8,899,127$ 7,280,652$ 3,119,016$ 260,107$ 21,367,617$
Receivables 8,817 6 2,833,318 4,060,352 1,782 - 6,904,275
Due from other governments 1,326 2,507 1,513,786 - - - 1,517,619
Due from component unit - - 719,679 - - - 719,679
Inventories 18,258 - - - - - 18,258
Other current assets 5,090 - 629,000 49,521 13,290 - 696,901
Restricted assets
Cash and cash equivalents 8,844 - 3,550,434 1,549,524 13,290 - 5,122,092
Total current assets 803,874 1,049,689 18,145,344 12,940,049 3,147,378 260,107 36,346,441
Noncurrent assets:
Capital assets, net of accumulated
depreciation 195,881 - - - - - 195,881
Total noncurrent assets 195,881 - - - - - 195,881
Total assets 999,755 1,049,689 18,145,344 12,940,049 3,147,378 260,107 36,542,322
Deferred outflows of resources
OPEB 34,998 - - - 118,467 - 153,465
Total deferred outflows of resources 34,998 - - - 118,467 - 153,465
Liabilities
Current liabilities:
Accounts payable 55,688 326,190 150,439 - 10,785 - 543,102
Payroll related liabilities 2,230 - - - 5,855 - 8,085
Interest payable 10,038 2,413 - - - - 12,451
Other current liabilities - - 110,582 - - - 110,582
Due to other funds - - 250,000 - - - 250,000
Due to other government - - - - - 48,595 48,595
Unearned revenues - - 531,082 - - - 531,082
Early retirement incentive costs - - - - 1,323 - 1,323
Unreported health claims - - 1,044,386 - - - 1,044,386
Workers' compensation liability - 11,000 - 1,672,400 - - 1,683,400
Liability & casualty - - - - 267,500 - 267,500
Bond anticipation notes payable 511,205 - - - - - 511,205
General obligation bonds payable 19,140 36,185 - - - - 55,325
Total current liabilities 598,301 375,788 2,086,489 1,672,400 285,463 48,595 5,067,036
Noncurrent liabilities:
Early retirement incentive costs - - - - 8,443 - 8,443
Due to NYSERS - Chapter 57 2,361 17,207 - - 5,729 - 25,297
Workers' compensation liability - 170,767 - 6,948,928 - - 7,119,695
Compensated absences 20,423 - - - 40,979 - 61,402
Liability & casualty - - - - 620,000 - 620,000
General obligation bonds payable 85,273 161,216 - - - - 246,489
Total OPEB obligation 562,355 2,404,527 - - 914,679 - 3,881,561
Total noncurrent liabilities 670,412 2,753,717 - 6,948,928 1,589,830 - 11,962,887
Total liabilities 1,268,713 3,129,505 2,086,489 8,621,328 1,875,293 48,595 17,029,923
Deferred inflows of resources
OPEB 122,572 - - - 315,527 - 438,099
Total deferred inflows of resources 122,572 - - - 315,527 - 438,099
Net Position
Net investment in capital assets
related debt (292,022) (197,401) - - - - (489,423)
Restricted 8,844 - 3,019,352 1,549,521 13,290 - 4,591,007
Unrestricted (73,354) (1,882,415) 13,039,503 2,769,197 1,061,735 211,512 15,126,178 Total net position (356,532)$ (2,079,816)$ 16,058,855$ 4,318,718$ 1,075,025$ 211,512$ 19,227,762$
See notes to financial statements
County of Broome
Combining Statement of Net Position
Internal Service Funds
December 31, 2020
175
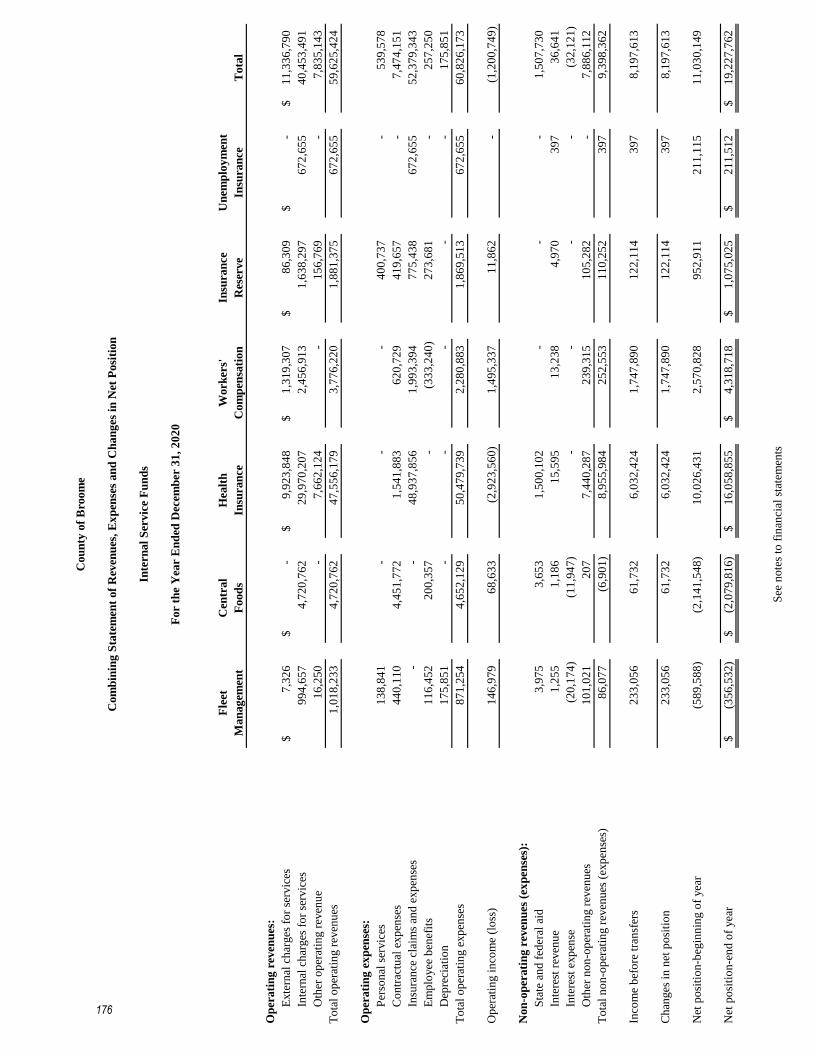
Fle
etC
entr
al
Hea
lth
Work
ers'
Insu
ran
ceU
nem
plo
ym
ent
Man
ag
emen
tF
ood
sIn
sura
nce
Com
pen
sati
on
Res
erve
Insu
ran
ceT
ota
l
Op
erati
ng
rev
enu
es:
Exte
rnal
ch
arges
fo
r se
rvic
es7
,32
6$
-$
9
,92
3,8
48
$
1,3
19
,30
7$
86
,30
9$
-
$
11
,33
6,7
90
$
Inte
rnal
ch
arges
fo
r se
rvic
es
99
4,6
57
4
,72
0,7
62
2
9,9
70
,20
7
2,4
56
,91
3
1,6
38
,29
7
67
2,6
55
4
0,4
53
,49
1
Oth
er o
per
atin
g r
even
ue
16
,25
0
-
7,6
62
,12
4
-
15
6,7
69
-
7,8
35
,14
3
To
tal
op
erat
ing r
even
ues
1,0
18
,23
3
4,7
20
,76
2
47
,55
6,1
79
3
,77
6,2
20
1
,88
1,3
75
6
72
,65
5
59
,62
5,4
24
Op
erati
ng
ex
pen
ses:
Per
son
al s
ervic
es1
38
,84
1
-
-
-
40
0,7
37
-
53
9,5
78
Co
ntr
actu
al e
xp
ense
s4
40
,11
0
4,4
51
,77
2
1,5
41
,88
3
6
20
,72
9
41
9,6
57
-
7,4
74
,15
1
Insu
ran
ce c
laim
s an
d e
xp
ense
s-
-
4
8,9
37
,85
6
1,9
93
,39
4
77
5,4
38
6
72
,65
5
52
,37
9,3
43
Em
plo
yee
ben
efit
s1
16
,45
2
20
0,3
57
-
(3
33
,24
0)
27
3,6
81
-
25
7,2
50
Dep
reci
atio
n1
75
,85
1
-
-
-
-
-
17
5,8
51
To
tal
op
erat
ing e
xp
ense
s8
71
,25
4
4,6
52
,12
9
50
,47
9,7
39
2
,28
0,8
83
1
,86
9,5
13
6
72
,65
5
60
,82
6,1
73
Op
erat
ing i
nco
me
(lo
ss)
14
6,9
79
6
8,6
33
(2,9
23
,56
0)
1
,49
5,3
37
1
1,8
62
-
(1
,20
0,7
49
)
Non
-op
erati
ng
rev
enu
es (
exp
ense
s):
Sta
te a
nd
fed
eral
aid
3,9
75
3
,65
3
1,5
00
,10
2
-
-
-
1,5
07
,73
0
Inte
rest
rev
enu
e1
,25
5
1,1
86
1
5,5
95
13
,23
8
4
,97
0
39
7
3
6,6
41
Inte
rest
exp
ense
(20
,17
4)
(1
1,9
47
)
-
-
-
-
(3
2,1
21
)
Oth
er n
on
-op
erat
ing r
even
ues
10
1,0
21
2
07
7,4
40
,28
7
2
39
,31
5
10
5,2
82
-
7,8
86
,11
2
To
tal
no
n-o
per
atin
g r
even
ues
(ex
pen
ses)
86
,07
7
(6
,90
1)
8,9
55
,98
4
2
52
,55
3
11
0,2
52
3
97
9,3
98
,36
2
Inco
me
bef
ore
tra
nsf
ers
23
3,0
56
6
1,7
32
6,0
32
,42
4
1
,74
7,8
90
1
22
,11
4
39
7
8
,19
7,6
13
Ch
anges
in
net
po
siti
on
2
33
,05
6
61
,73
2
6
,03
2,4
24
1,7
47
,89
0
12
2,1
14
3
97
8,1
97
,61
3
Net
po
siti
on
-beg
inn
ing o
f yea
r(5
89
,58
8)
(2,1
41
,54
8)
10
,02
6,4
31
2
,57
0,8
28
9
52
,91
1
21
1,1
15
1
1,0
30
,14
9
Net
po
siti
on
-en
d o
f yea
r(3
56
,53
2)
$
(2,0
79
,81
6)
$
16
,05
8,8
55
$
4
,31
8,7
18
$
1
,07
5,0
25
$
2
11
,51
2$
19
,22
7,7
62
$
See
no
tes
to f
inan
cial
sta
tem
ents
Cou
nty
of
Bro
om
e
Com
bin
ing
Sta
tem
ent
of
Rev
enu
es,
Ex
pen
ses
an
d C
han
ges
in
Net
Posi
tion
Inte
rnal
Ser
vic
e F
un
ds
For
the
Yea
r E
nd
ed D
ecem
ber
31
, 2
02
0
176

Fleet Central Health Workers' Insurance Unemployment
Management Foods Insurance Compensation Reserve Insurance Total
Cash flows from operating activities
Receipts from external customers 11,413$ -$ 9,513,368$ 629,983$ 86,214$ -$ 10,240,978$
Receipts from internal customers 994,657 4,720,762 29,970,207 2,401,141 1,638,297 672,655 40,397,719
Payments to suppliers (351,053) (4,462,523) (1,718,478) (414,009) (208,932) 48,595 (7,106,400)
Payments to employees (349,191) (225,496) 250,000 677,129 (787,800) - (435,358)
Internal Activity - payments to other funds (52,656) (21,545) (215,390) (206,720) (231,378) - (727,689)
Claims paid - - (49,137,321) (1,993,394) (695,438) (672,655) (52,498,808)
Other receipts 16,250 - 7,662,124 - 156,769 - 7,835,143
Net cash provided (used) by operating activities 269,420 11,198 (3,675,490) 1,094,130 (42,268) 48,595 (2,294,415)
Cash flows from noncapital financing activities
State and federal aid 3,091 1,981 133,585 - - - 138,657
Other non-capital items, net 101,021 207 7,440,287 239,315 105,282 - 7,886,112
Net cash provided by noncapital financing activities 104,112 2,188 7,573,872 239,315 105,282 - 8,024,769
Cash flows from capital and related financing activities
Proceeds from bond anticpation notes 140,000 - - - - - 140,000
Purchases of capital assets, net (236,351) - - - - - (236,351)
Principal paid on capital debt (271,582) (35,294) - - - - (306,876)
Interest paid on capital debt (22,095) (12,344) - - - - (34,439)
Net cash (used) by capital and related financing activities (390,028) (47,638) - - - - (437,666)
Cash flows from investing activities
Interest revenue 1,252 1,180 15,595 13,238 4,970 397 36,632
Net increase (decrease) in cash and cash equivalents (15,244) (33,072) 3,913,977 1,346,683 67,984 48,992 5,329,320
Cash and cash equivalents - beginning of the year 785,627 1,080,248 8,535,584 7,483,490 3,064,322 211,115 21,160,386
Cash and cash equivalents - end of the year 770,383$ 1,047,176$ 12,449,561$ 8,830,173$ 3,132,306$ 260,107$ 26,489,706$
Reconciliation of balance - end of year to the combining
statement of net position
Cash and cash equivalents 642,111$ 1,047,176$ 12,449,561$ 8,830,173$ 3,132,306$ 260,107$ 26,361,434$
Restricted cash and cash equivalents 128,272 - - - - - 128,272
Total 770,383$ 1,047,176$ 12,449,561$ 8,830,173$ 3,132,306$ 260,107$ 26,489,706$
Reconciliation of operating income (loss) to net cash
provided (used) by operating activities
Operating income (loss) 146,979$ 68,633$ (2,923,560)$ 1,495,337$ 11,862$ -$ (1,200,749)$
Adjustments to reconcile operating (loss) to
net cash provided (used) by operating activities:
Depreciation expense 175,851 - - - - - 175,851
Change in OPEB 21,080 (208) - - 32,978 - 53,850
Changes in assets and liabilities:
Receivables, net 4,087 - (599,673) (689,324) (95) - (1,285,005)
Due from component unit - - 506,723 - - - 506,723
Inventories 2,643 - - - - - 2,643
Other current assets (5,090) - - - (13,290) - (18,380)
Deferred inflows and outflows (94,715) - - - (100,939) - (195,654)
Accounts payable 38,854 (32,288) (391,985) (55,772) (5,938) - (447,129)
Payroll related liabilities (25,225) (6,958) - - (57,705) - (89,888)
Other liabilities (6) (8) (50,691) - (1,425) - (52,130)
Due to other funds - - 250,000 - - - 250,000
Due to other governments - - - - - 48,595 48,595
Early retirement incentive costs (951) (6,930) - - (3,569) - (11,450)
Unreported health claims - - (148,774) - - - (148,774)
Workers' compensation liability - (11,043) - 343,889 - - 332,846
Compensated absences 5,913 - - - 15,853 - 21,766
Liability & casualty - - - - 80,000 - 80,000
Net cash provided (used) by operating activities 269,420$ 11,198$ (3,675,490)$ 1,094,130$ (42,268)$ 48,595$ (2,294,415)$
See notes to financial statements
County of Broome
Combining Statement of Cash Flows
Internal Service Funds
For the Year Ended December 31, 2020
177

This page left blank intentionally.
178

Other Information
179

This page left blank intentionally.
180

General Fund
181

This page left blank intentionally.
182

General Fund
The General Fund is used to account for all resources of the County except for those required to be
accounted for in another fund.
183

This page left blank intentionally.
184
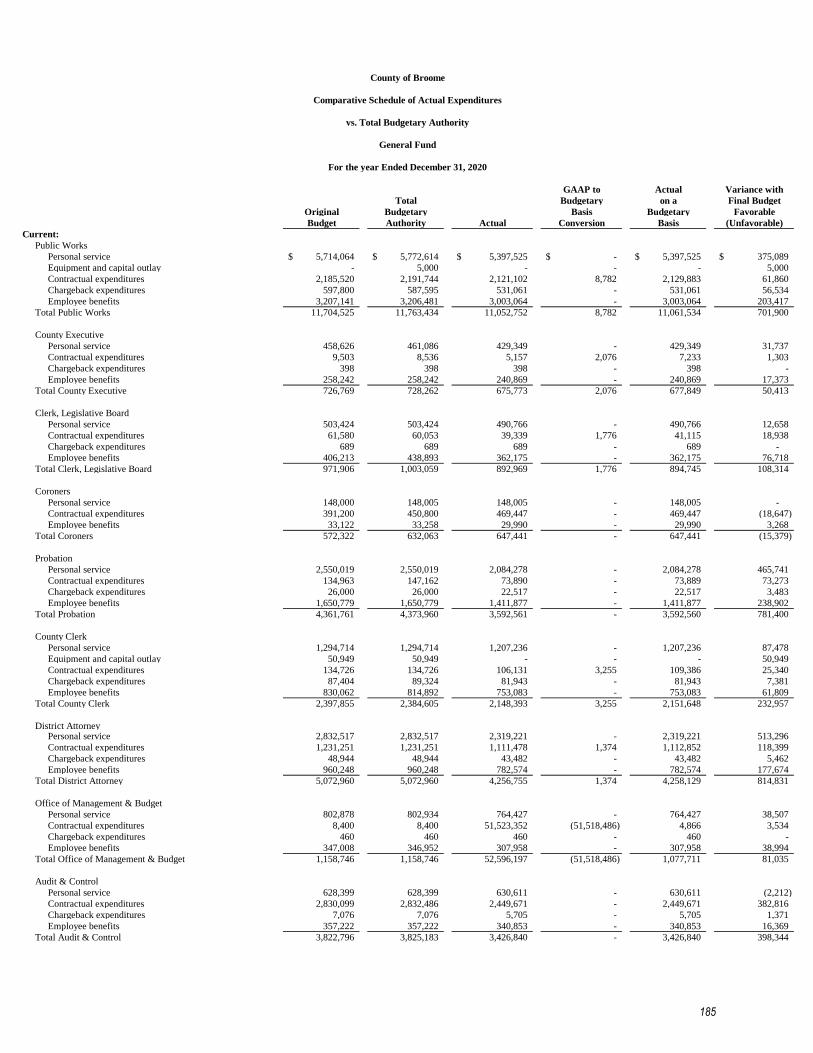
GAAP to Actual Variance with
Total Budgetary on a Final Budget
Original Budgetary Basis Budgetary Favorable
Budget Authority Actual Conversion Basis (Unfavorable)
Current:
Public Works
Personal service 5,714,064$ 5,772,614$ 5,397,525$ -$ 5,397,525$ 375,089$
Equipment and capital outlay - 5,000 - - - 5,000
Contractual expenditures 2,185,520 2,191,744 2,121,102 8,782 2,129,883 61,860
Chargeback expenditures 597,800 587,595 531,061 - 531,061 56,534
Employee benefits 3,207,141 3,206,481 3,003,064 - 3,003,064 203,417
Total Public Works 11,704,525 11,763,434 11,052,752 8,782 11,061,534 701,900
County Executive
Personal service 458,626 461,086 429,349 - 429,349 31,737
Contractual expenditures 9,503 8,536 5,157 2,076 7,233 1,303
Chargeback expenditures 398 398 398 - 398 -
Employee benefits 258,242 258,242 240,869 - 240,869 17,373
Total County Executive 726,769 728,262 675,773 2,076 677,849 50,413
Clerk, Legislative Board
Personal service 503,424 503,424 490,766 - 490,766 12,658
Contractual expenditures 61,580 60,053 39,339 1,776 41,115 18,938
Chargeback expenditures 689 689 689 - 689 -
Employee benefits 406,213 438,893 362,175 - 362,175 76,718
Total Clerk, Legislative Board 971,906 1,003,059 892,969 1,776 894,745 108,314
Coroners
Personal service 148,000 148,005 148,005 - 148,005 -
Contractual expenditures 391,200 450,800 469,447 - 469,447 (18,647)
Employee benefits 33,122 33,258 29,990 - 29,990 3,268
Total Coroners 572,322 632,063 647,441 - 647,441 (15,379)
Probation
Personal service 2,550,019 2,550,019 2,084,278 - 2,084,278 465,741
Contractual expenditures 134,963 147,162 73,890 - 73,889 73,273
Chargeback expenditures 26,000 26,000 22,517 - 22,517 3,483
Employee benefits 1,650,779 1,650,779 1,411,877 - 1,411,877 238,902
Total Probation 4,361,761 4,373,960 3,592,561 - 3,592,560 781,400
County Clerk
Personal service 1,294,714 1,294,714 1,207,236 - 1,207,236 87,478
Equipment and capital outlay 50,949 50,949 - - - 50,949
Contractual expenditures 134,726 134,726 106,131 3,255 109,386 25,340
Chargeback expenditures 87,404 89,324 81,943 - 81,943 7,381
Employee benefits 830,062 814,892 753,083 - 753,083 61,809
Total County Clerk 2,397,855 2,384,605 2,148,393 3,255 2,151,648 232,957
District AttorneyPersonal service 2,832,517 2,832,517 2,319,221 - 2,319,221 513,296
Contractual expenditures 1,231,251 1,231,251 1,111,478 1,374 1,112,852 118,399
Chargeback expenditures 48,944 48,944 43,482 - 43,482 5,462
Employee benefits 960,248 960,248 782,574 - 782,574 177,674
Total District Attorney 5,072,960 5,072,960 4,256,755 1,374 4,258,129 814,831
Office of Management & Budget
Personal service 802,878 802,934 764,427 - 764,427 38,507
Contractual expenditures 8,400 8,400 51,523,352 (51,518,486) 4,866 3,534
Chargeback expenditures 460 460 460 - 460 -
Employee benefits 347,008 346,952 307,958 - 307,958 38,994
Total Office of Management & Budget 1,158,746 1,158,746 52,596,197 (51,518,486) 1,077,711 81,035
Audit & Control
Personal service 628,399 628,399 630,611 - 630,611 (2,212)
Contractual expenditures 2,830,099 2,832,486 2,449,671 - 2,449,671 382,816
Chargeback expenditures 7,076 7,076 5,705 - 5,705 1,371
Employee benefits 357,222 357,222 340,853 - 340,853 16,369
Total Audit & Control 3,822,796 3,825,183 3,426,840 - 3,426,840 398,344
For the year Ended December 31, 2020
County of Broome
Comparative Schedule of Actual Expenditures
vs. Total Budgetary Authority
General Fund
185

GAAP to Actual Variance with
Total Budgetary on a Final Budget
Original Budgetary Basis Budgetary Favorable
Budget Authority Actual Conversion Basis (Unfavorable)
Information Technology
Personal service 2,054,228$ 2,054,228$ 1,915,173$ -$ 1,915,173$ 139,055$
Equipment and capital outlay 7,000 80,021 72,413 - 72,413 7,608
Contractual expenditures 4,276,799 4,432,879 4,219,384 176,874 4,396,257 36,621
Chargeback expenditures 17,221 17,221 14,954 - 14,954 2,267
Employee benefits 1,030,526 994,775 988,204 - 988,204 6,571
Total Information Technology 7,385,774 7,579,122 7,210,129 176,874 7,387,002 192,121
Law
Personal service 1,512,516 1,528,766 1,485,603 - 1,485,603 43,163
Contractual expenditures 107,695 151,695 144,186 1,620 145,806 5,889
Chargeback expenditures 3,906 3,906 3,682 - 3,682 224
Employee benefits 836,078 794,138 762,325 - 762,325 31,813
Total Law 2,460,195 2,478,505 2,395,796 1,620 2,397,416 81,090
Personnel
Personal service 493,114 493,114 427,283 - 427,283 65,831
Contractual expenditures 14,200 14,200 17,125 - 17,125 (2,925)
Chargeback expenditures 407 407 407 - 407 -
Employee benefits 396,957 396,957 328,834 - 328,834 68,123
Total Personnel 904,678 904,678 773,650 - 773,650 131,028
Elections
Personal service 681,735 681,735 627,133 - 627,133 54,602
Equipment and capital outlay - 41,000 - - - 41,000
Contractual expenditures 678,260 638,903 497,347 - 497,347 141,556
Chargeback expenditures 87,080 87,080 75,613 - 75,613 11,467
Employee benefits 283,743 282,543 296,934 - 296,934 (14,391)
Total Elections 1,730,818 1,731,261 1,497,027 - 1,497,027 234,234
Veterans' Services
Personal service 156,752 156,752 105,723 - 105,723 51,029
Contractual expenditures 202,990 202,990 72,031 - 72,031 130,959
Chargeback expenditures 124,855 124,855 46,039 - 46,039 78,816
Employee benefits 78,213 78,213 59,565 - 59,565 18,648
Total Veterans' Services 562,810 562,810 283,357 - 283,357 279,453
Planning & Economic Development
Personal service 547,646 547,646 493,448 - 493,448 54,198
Contractual expenditures 164,534 181,429 118,081 354 118,435 62,994
Chargeback expenditures 3,636 3,636 1,576 - 1,576 2,060
Employee benefits 275,466 275,466 223,939 - 223,939 51,527
Total Planning & Economic Development 991,282 1,008,177 837,045 354 837,399 170,778
Sheriff
Personal service 20,763,398 20,796,693 18,922,924 - 18,922,924 1,873,769
Equipment and capital outlay 29,100 131,144 102,044 - 102,044 29,100
Contractual expenditures 5,581,152 6,379,095 6,213,776 5,380 6,219,156 159,938
Chargeback expenditures 1,600,401 1,601,591 1,337,827 - 1,337,827 263,764
Employee benefits 11,322,522 11,325,167 9,984,543 - 9,984,543 1,340,624
Total Sheriff 39,296,573 40,233,690 36,561,113 5,380 36,566,493 3,667,197
Emergency Services
Personal service 3,680,961 3,700,836 3,419,831 - 3,419,831 281,005
Equipment and capital outlay 30,000 30,000 89,793 - 89,793 (59,793)
Contractual expenditures 3,353,943 3,697,211 1,059,599 3,672 1,063,271 2,633,940
Chargeback expenditures 210,174 210,174 165,421 - 165,421 44,753
Employee benefits 1,611,472 1,349,597 1,297,260 - 1,297,260 52,337
Total Emergency Services 8,886,550 8,987,818 6,031,903 3,672 6,035,575 2,952,243
Mental Health
Personal service 125,808 125,808 125,895 - 125,895 (87)
Contractual expenditures 209,295 225,213 131,565 1,660 133,225 91,989
Chargeback expenditures 114,546 114,546 102,901 - 102,901 11,645
Employee benefits 499,877 499,877 472,681 - 472,681 27,196
Total Mental Health 949,526 965,444 833,040 1,660 834,700 130,744
For the year Ended December 31, 2020
County of Broome
Comparative Schedule of Actual Expenditures
vs. Total Budgetary Authority
General Fund
186
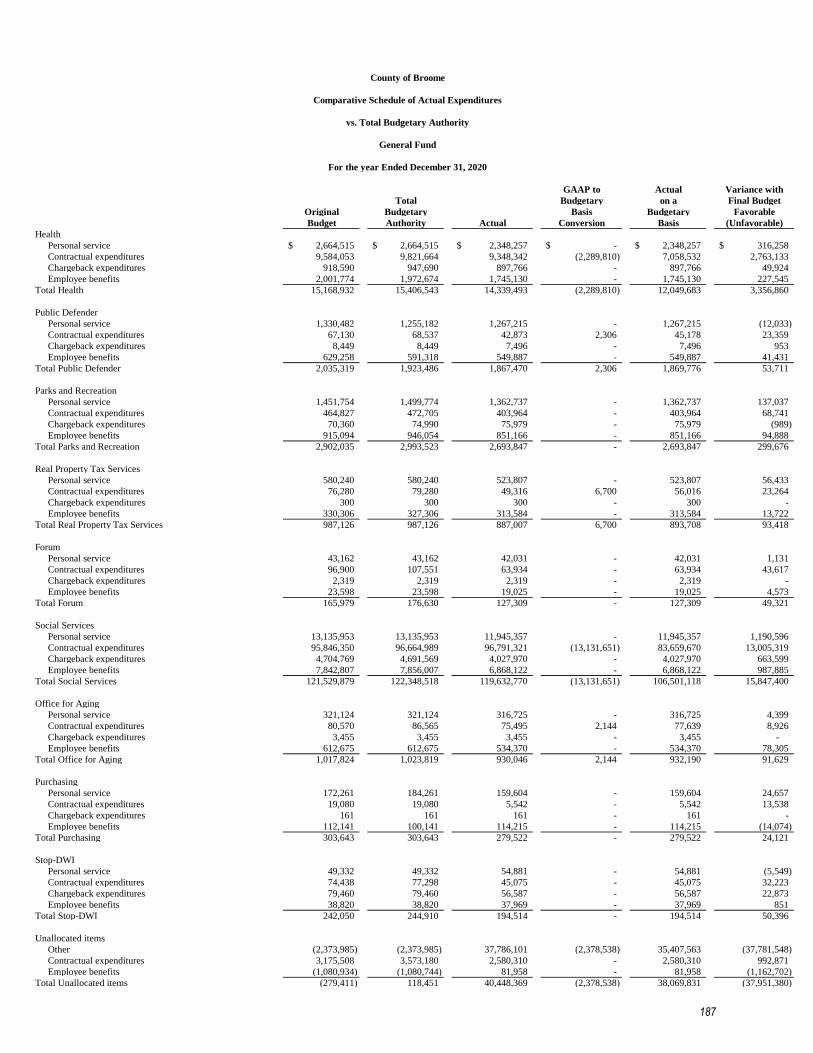
GAAP to Actual Variance with
Total Budgetary on a Final Budget
Original Budgetary Basis Budgetary Favorable
Budget Authority Actual Conversion Basis (Unfavorable)
For the year Ended December 31, 2020
County of Broome
Comparative Schedule of Actual Expenditures
vs. Total Budgetary Authority
General Fund
Health
Personal service 2,664,515$ 2,664,515$ 2,348,257$ -$ 2,348,257$ 316,258$
Contractual expenditures 9,584,053 9,821,664 9,348,342 (2,289,810) 7,058,532 2,763,133
Chargeback expenditures 918,590 947,690 897,766 - 897,766 49,924
Employee benefits 2,001,774 1,972,674 1,745,130 - 1,745,130 227,545
Total Health 15,168,932 15,406,543 14,339,493 (2,289,810) 12,049,683 3,356,860
Public Defender
Personal service 1,330,482 1,255,182 1,267,215 - 1,267,215 (12,033)
Contractual expenditures 67,130 68,537 42,873 2,306 45,178 23,359
Chargeback expenditures 8,449 8,449 7,496 - 7,496 953
Employee benefits 629,258 591,318 549,887 - 549,887 41,431
Total Public Defender 2,035,319 1,923,486 1,867,470 2,306 1,869,776 53,711
Parks and Recreation
Personal service 1,451,754 1,499,774 1,362,737 - 1,362,737 137,037
Contractual expenditures 464,827 472,705 403,964 - 403,964 68,741
Chargeback expenditures 70,360 74,990 75,979 - 75,979 (989)
Employee benefits 915,094 946,054 851,166 - 851,166 94,888
Total Parks and Recreation 2,902,035 2,993,523 2,693,847 - 2,693,847 299,676
Real Property Tax Services
Personal service 580,240 580,240 523,807 - 523,807 56,433
Contractual expenditures 76,280 79,280 49,316 6,700 56,016 23,264
Chargeback expenditures 300 300 300 - 300 -
Employee benefits 330,306 327,306 313,584 - 313,584 13,722
Total Real Property Tax Services 987,126 987,126 887,007 6,700 893,708 93,418
Forum
Personal service 43,162 43,162 42,031 - 42,031 1,131
Contractual expenditures 96,900 107,551 63,934 - 63,934 43,617
Chargeback expenditures 2,319 2,319 2,319 - 2,319 -
Employee benefits 23,598 23,598 19,025 - 19,025 4,573
Total Forum 165,979 176,630 127,309 - 127,309 49,321
Social Services
Personal service 13,135,953 13,135,953 11,945,357 - 11,945,357 1,190,596
Contractual expenditures 95,846,350 96,664,989 96,791,321 (13,131,651) 83,659,670 13,005,319
Chargeback expenditures 4,704,769 4,691,569 4,027,970 - 4,027,970 663,599
Employee benefits 7,842,807 7,856,007 6,868,122 - 6,868,122 987,885
Total Social Services 121,529,879 122,348,518 119,632,770 (13,131,651) 106,501,118 15,847,400
Office for Aging
Personal service 321,124 321,124 316,725 - 316,725 4,399
Contractual expenditures 80,570 86,565 75,495 2,144 77,639 8,926
Chargeback expenditures 3,455 3,455 3,455 - 3,455 -
Employee benefits 612,675 612,675 534,370 - 534,370 78,305
Total Office for Aging 1,017,824 1,023,819 930,046 2,144 932,190 91,629
Purchasing
Personal service 172,261 184,261 159,604 - 159,604 24,657
Contractual expenditures 19,080 19,080 5,542 - 5,542 13,538
Chargeback expenditures 161 161 161 - 161 -
Employee benefits 112,141 100,141 114,215 - 114,215 (14,074)
Total Purchasing 303,643 303,643 279,522 - 279,522 24,121
Stop-DWI
Personal service 49,332 49,332 54,881 - 54,881 (5,549)
Contractual expenditures 74,438 77,298 45,075 - 45,075 32,223
Chargeback expenditures 79,460 79,460 56,587 - 56,587 22,873
Employee benefits 38,820 38,820 37,969 - 37,969 851
Total Stop-DWI 242,050 244,910 194,514 - 194,514 50,396
Unallocated items
Other (2,373,985) (2,373,985) 37,786,101 (2,378,538) 35,407,563 (37,781,548)
Contractual expenditures 3,175,508 3,573,180 2,580,310 - 2,580,310 992,871
Employee benefits (1,080,934) (1,080,744) 81,958 - 81,958 (1,162,702)
Total Unallocated items (279,411) 118,451 40,448,369 (2,378,538) 38,069,831 (37,951,380)
187
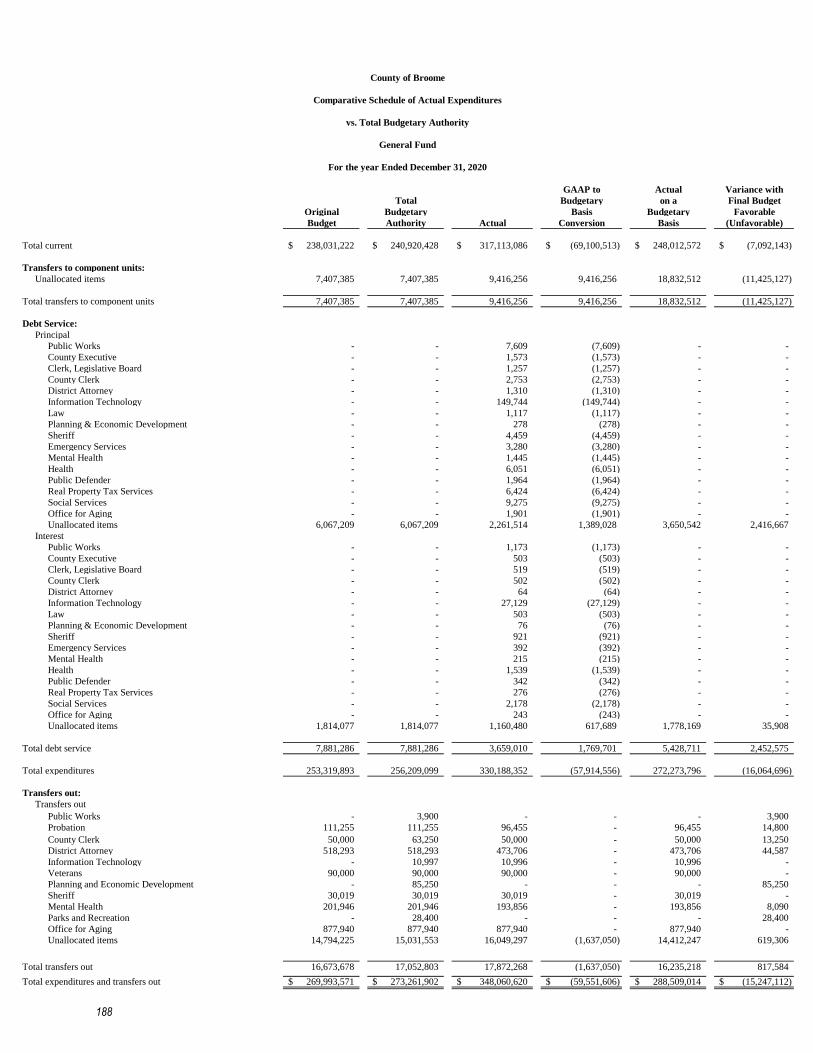
GAAP to Actual Variance with
Total Budgetary on a Final Budget
Original Budgetary Basis Budgetary Favorable
Budget Authority Actual Conversion Basis (Unfavorable)
For the year Ended December 31, 2020
County of Broome
Comparative Schedule of Actual Expenditures
vs. Total Budgetary Authority
General Fund
Total current 238,031,222$ 240,920,428$ 317,113,086$ (69,100,513)$ 248,012,572$ (7,092,143)$
Transfers to component units:
Unallocated items 7,407,385 7,407,385 9,416,256 9,416,256 18,832,512 (11,425,127)
Total transfers to component units 7,407,385 7,407,385 9,416,256 9,416,256 18,832,512 (11,425,127)
Debt Service:
Principal
Public Works - - 7,609 (7,609) - -
County Executive - - 1,573 (1,573) - -
Clerk, Legislative Board - - 1,257 (1,257) - -
County Clerk - - 2,753 (2,753) - -
District Attorney - - 1,310 (1,310) - -
Information Technology - - 149,744 (149,744) - -
Law - - 1,117 (1,117) - -
Planning & Economic Development - - 278 (278) - -
Sheriff - - 4,459 (4,459) - -
Emergency Services - - 3,280 (3,280) - -
Mental Health - - 1,445 (1,445) - -
Health - - 6,051 (6,051) - -
Public Defender - - 1,964 (1,964) - -
Real Property Tax Services - - 6,424 (6,424) - -
Social Services - - 9,275 (9,275) - -
Office for Aging - - 1,901 (1,901) - -
Unallocated items 6,067,209 6,067,209 2,261,514 1,389,028 3,650,542 2,416,667
Interest
Public Works - - 1,173 (1,173) - -
County Executive - - 503 (503) - -
Clerk, Legislative Board - - 519 (519) - -
County Clerk - - 502 (502) - -
District Attorney - - 64 (64) - -
Information Technology - - 27,129 (27,129) - -
Law - - 503 (503) - -
Planning & Economic Development - - 76 (76) - -
Sheriff - - 921 (921) - -
Emergency Services - - 392 (392) - -
Mental Health - - 215 (215) - -
Health - - 1,539 (1,539) - -
Public Defender - - 342 (342) - -
Real Property Tax Services - - 276 (276) - -
Social Services - - 2,178 (2,178) - -
Office for Aging - - 243 (243) - -
Unallocated items 1,814,077 1,814,077 1,160,480 617,689 1,778,169 35,908
Total debt service 7,881,286 7,881,286 3,659,010 1,769,701 5,428,711 2,452,575
Total expenditures 253,319,893 256,209,099 330,188,352 (57,914,556) 272,273,796 (16,064,696)
Transfers out:
Transfers out
Public Works - 3,900 - - - 3,900
Probation 111,255 111,255 96,455 - 96,455 14,800
County Clerk 50,000 63,250 50,000 - 50,000 13,250
District Attorney 518,293 518,293 473,706 - 473,706 44,587
Information Technology - 10,997 10,996 - 10,996 -
Veterans 90,000 90,000 90,000 - 90,000 -
Planning and Economic Development - 85,250 - - - 85,250
Sheriff 30,019 30,019 30,019 - 30,019 -
Mental Health 201,946 201,946 193,856 - 193,856 8,090
Parks and Recreation - 28,400 - - - 28,400
Office for Aging 877,940 877,940 877,940 - 877,940 -
Unallocated items 14,794,225 15,031,553 16,049,297 (1,637,050) 14,412,247 619,306
Total transfers out 16,673,678 17,052,803 17,872,268 (1,637,050) 16,235,218 817,584
Total expenditures and transfers out 269,993,571$ 273,261,902$ 348,060,620$ (59,551,606)$ 288,509,014$ (15,247,112)$
188

Capital Capital
SUNY Indirect Leases Leases Sales Noncash
Broome 1
Costs 2
Principal 3
Interest 3
Tax 4
Assistance 5
Total
Expenditures
Public Works -$ -$ 7,609$ 1,173$ -$ -$ 8,782$
Office of Management & Budget - - - - (51,518,486) - (51,518,486)
County Executive - - 1,573 503 - - 2,076
Clerk, Legislative Board - - 1,257 519 - - 1,776
County Clerk - - 1,310 502 - - 1,812
District Attorney - - 1,310 64 - - 1,374
Information Technology - - 149,744 27,129 - - 176,874
Law - - 1,117 503 - - 1,620
Sheriff - - 4,459 921 - - 5,380
Emergency Services - - 3,280 392 - - 3,672
Mental Health - - 1,445 215 - - 1,660
Health - - 6,051 1,539 - (2,297,400) (2,289,810)
Public Defender - - 1,964 342 - - 2,307
Real Property Tax Services - - 6,424 276 - - 6,701
Social Services - - 9,275 2,178 - (13,143,104) (13,131,650)
Office for Aging - - 1,901 243 - - 2,144
Unallocated items (9,416,256) - - - - - (9,416,256)
Debt service
Public Works - - (7,609) (1,173) - - (8,782)
County Executive - - (1,573) (503) - - (2,076)
Clerk, Legislative Board - - (1,257) (519) - - (1,776)
County Clerk - - (2,753) (502) - - (3,255)
District Attorney - - (1,310) (64) - - (1,374)
Information Technology - - (149,744) (27,129) - - (176,874)
Law - - (1,117) (503) - - (1,620)
Sheriff - - (4,459) (921) - - (5,380)
Emergency Services - - (3,280) (392) - - (3,672)
Mental Health - - (1,445) (215) - - (1,660)
Health - - (6,051) (1,539) - - (7,590)
Public Defender - - (1,964) (342) - - (2,307)
Real Property Tax Services - - (6,424) (276) - - (6,701)
Social Services - - (9,275) (2,178) - - (11,453)
Office for Aging - - (1,901) (243) - - (2,144)
Unallocated items 2,008,871 - - - - - 2,008,871
Other financing sources (uses)
Transfers out - (1,637,050) - - - - (1,637,050)
Transfers to component units 7,407,385 - - - - - 7,407,385
1Debt service payments and contributions to the Community College are budgeted as transfers but the actual expenditures are presented as
education expenditures.
2Certain indirect costs are not charged to County departments by the General Fund. Therefore equal amounts Transfers out and contractual
expenditures were not budgeted.
3Principal and interest associated with capital leases are budgeted as contractual expenditures in the appropriate expenditure categories. The
actual expenditures are presented as principal and interest.
4Sales tax revenues are budgeted on a net basis but presented on a gross basis. Therefore equal amounts of sales and use taxes and governmental
expenditures representing the portion paid to the municipalities were not budgeted within the general fund.
5The WIC, Food Stamps, and HEAP programs are budgeted on a net basis but presented on a gross basis. Therefore equal amounts of federal aid &
program expenditures representing the portion paid for on behalf of the the County were not budgeted within the general fund.
Budget and Actual - General Fund
For the Year Ended December 31, 2020
County of Broome
Reconciliation of GAAP to Budgetary Basis Conversion on the
Comparative Schedule of Actual Expenditures
vs. Total Budgetary Authority
189

This page left blank intentionally.
190

Statistical and Economic Data (Unaudited)
This section presents tables that reflect social and economic data, and financial trends of the County. In
some cases, the tables include statistical information for the towns, cities, villages, and school districts
which are not part of the County reporting entity. It is intended to provide readers of this report with a
broader and more complete understanding of the County and its financial condition than is possible from
the financial statements and schedules included in the Financial Section. Many tables in this section include
several fiscal years for comparative purposes and may present data from outside of the County’s accounting
records.
Contents Page
Financial Trends 193
These schedules contain trend information to assist the reader to understand how the County’s financial
performance and well-being have changed over time.
Revenue Capacity 199
These schedules contain information to assist the reader in assessing the County’s most significant local
revenue sources; principally, property and sales taxes.
Debt Capacity 208
These schedules present information to assist the reader in assessing the affordability of the County’s
current levels of outstanding debt and the County’s ability to issue additional debt in the future.
Demographic and Economic Information 213
These schedules offer demographic and economic indicators to assist the reader in understanding the
environment within which the County’s financial activities take place.
Operating Information 220
These schedules contain service and infrastructure data to assist the reader in understanding how the
information in the County’s financial report relates to the services the County provides and the activities it
performs.
191

This page left blank intentionally.
192
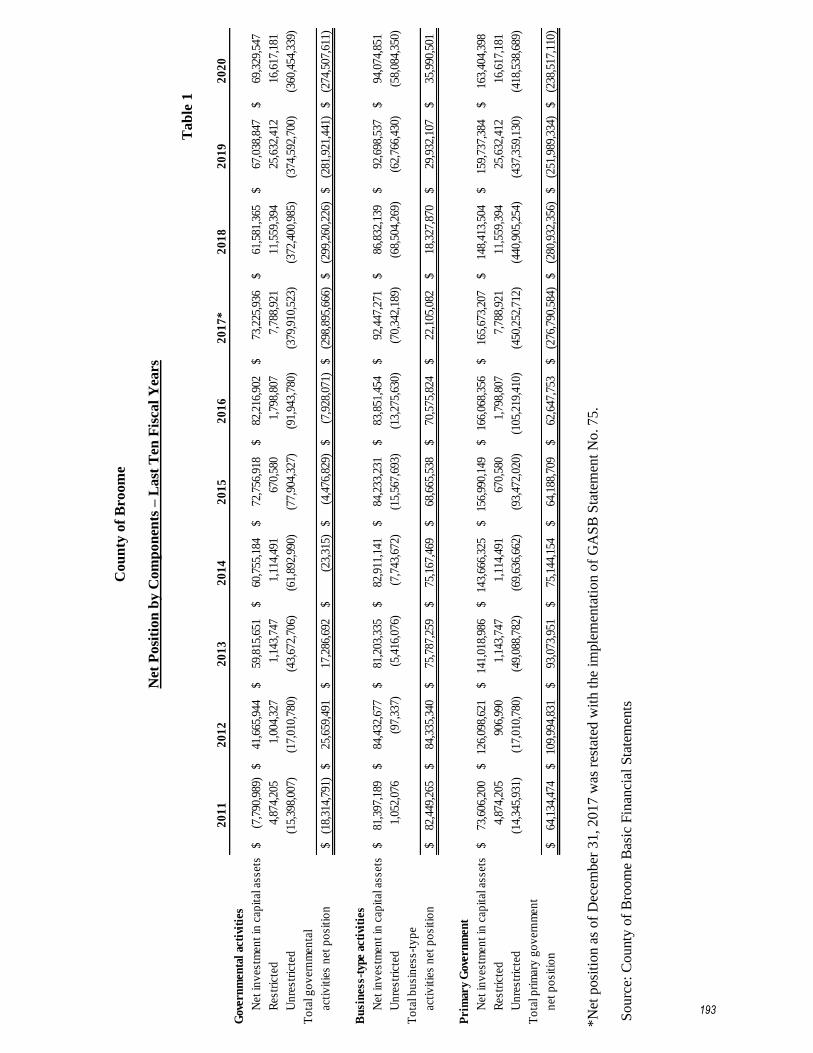
Cou
nty
of
Bro
om
e
Net
Posi
tion
by C
om
pon
ents
– L
ast
Ten
Fis
cal
Yea
rs
Ta
ble
1
20
11
20
12
20
13
20
14
20
15
20
16
20
17
*2
01
82
01
92
02
0
Gov
ern
men
tal
acti
viti
es
Net
inv
estm
ent
in c
apit
al a
sset
s(7
,790
,989
)$
41,6
65,9
44$
59,8
15,6
51$
60,7
55,1
84$
72,7
56,9
18$
82,2
16,9
02$
73,2
25,9
36$
61
,581
,365
$
67,0
38,8
47$
69
,329
,547
$
Res
tric
ted
4,87
4,20
5
1,00
4,32
7
1,
143,
747
1,11
4,49
1
67
0,58
0
1,79
8,80
7
7,
788,
921
11,5
59,3
94
25
,632
,412
16,6
17,1
81
Un
rest
rict
ed(1
5,39
8,00
7)
(1
7,01
0,78
0)
(43,
672,
706)
(6
1,89
2,99
0)
(77,
904,
327)
(9
1,94
3,78
0)
(379
,910
,523
)
(3
72,4
00,9
85)
(374
,592
,700
)
(3
60,4
54,3
39)
To
tal g
ov
ern
men
tal
acti
vit
ies
net
po
siti
on
(18,
314,
791)
$
25,6
59,4
91$
17,2
86,6
92$
(23,
315)
$
(4
,476
,829
)$
(7,9
28,0
71)
$
(2
98,8
95,6
66)
$
(299
,260
,226
)$
(2
81,9
21,4
41)
$
(274
,507
,611
)$
Bu
sin
ess-
type
act
ivit
ies
Net
inv
estm
ent
in c
apit
al a
sset
s81
,397
,189
$
84
,432
,677
$
81
,203
,335
$
82
,911
,141
$
84
,233
,231
$
83
,851
,454
$
92
,447
,271
$
86,8
32,1
39$
92
,698
,537
$
94,0
74,8
51$
Un
rest
rict
ed1,
052,
076
(9
7,33
7)
(5,4
16,0
76)
(7
,743
,672
)
(15,
567,
693)
(1
3,27
5,63
0)
(70,
342,
189)
(6
8,50
4,26
9)
(62,
766,
430)
(5
8,08
4,35
0)
To
tal b
usi
nes
s-ty
pe
acti
vit
ies
net
po
siti
on
82,4
49,2
65$
84,3
35,3
40$
75,7
87,2
59$
75,1
67,4
69$
68,6
65,5
38$
70,5
75,8
24$
22,1
05,0
82$
18
,327
,870
$
29,9
32,1
07$
35
,990
,501
$
Pri
mar
y G
over
nm
ent
Net
inv
estm
ent
in c
apit
al a
sset
s73
,606
,200
$
12
6,09
8,62
1$
14
1,01
8,98
6$
14
3,66
6,32
5$
15
6,99
0,14
9$
16
6,06
8,35
6$
16
5,67
3,20
7$
148,
413,
504
$
15
9,73
7,38
4$
163,
404,
398
$
Res
tric
ted
4,87
4,20
5
906,
990
1,
143,
747
1,11
4,49
1
67
0,58
0
1,79
8,80
7
7,
788,
921
11,5
59,3
94
25
,632
,412
16,6
17,1
81
Un
rest
rict
ed(1
4,34
5,93
1)
(1
7,01
0,78
0)
(49,
088,
782)
(6
9,63
6,66
2)
(93,
472,
020)
(1
05,2
19,4
10)
(450
,252
,712
)
(4
40,9
05,2
54)
(437
,359
,130
)
(4
18,5
38,6
89)
To
tal p
rim
ary
go
ver
nm
ent
net
po
siti
on
64,1
34,4
74$
109,
994,
831
$
93,0
73,9
51$
75,1
44,1
54$
64,1
88,7
09$
62,6
47,7
53$
(276
,790
,584
)$
(2
80,9
32,3
56)
$
(251
,989
,334
)$
(2
38,5
17,1
10)
$
*N
et p
osi
tion a
s of
Dec
ember
31
, 2
01
7 w
as r
esta
ted
wit
h t
he
imple
men
tati
on o
f G
AS
B S
tate
men
t N
o. 75.
So
urc
e: C
ounty
of
Bro
om
e B
asic
Fin
anci
al S
tate
men
ts
193
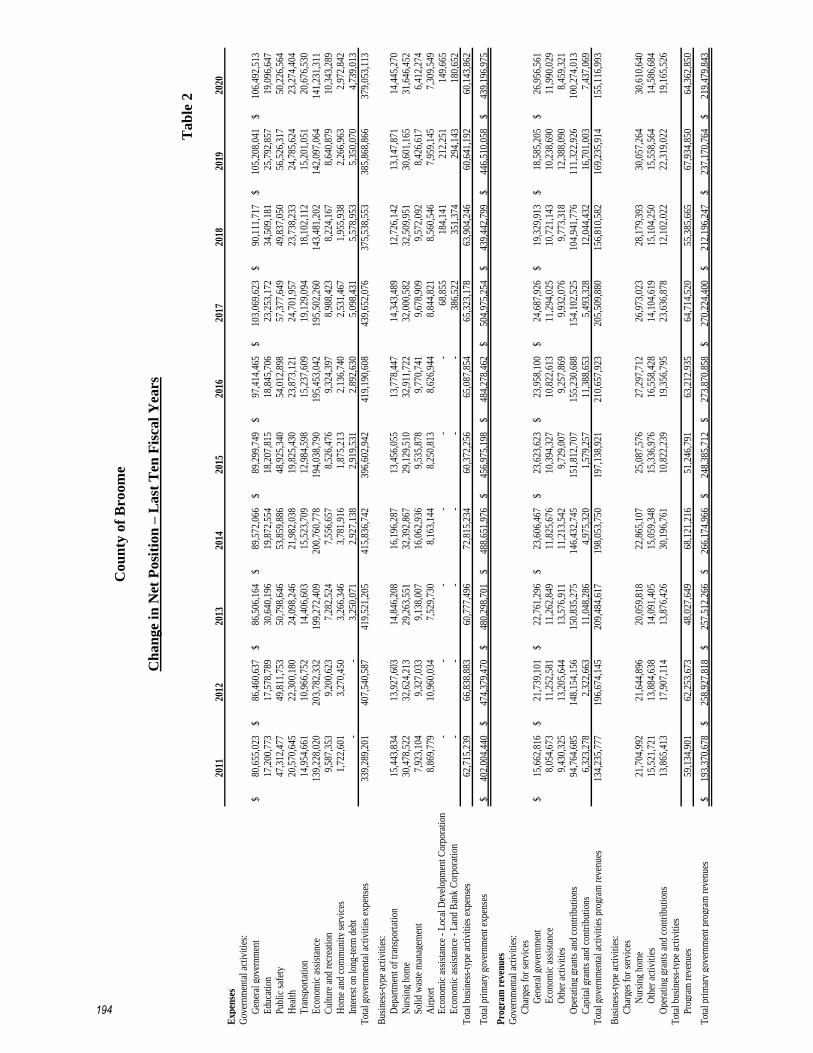
Cou
nty
of
Bro
om
e
Ch
an
ge
in N
et P
osi
tion
– L
ast
Ten
Fis
cal
Yea
rs
Ta
ble
2
2011
2012
2013
2014
2015
2016
2017
2018
2019
2020
Exp
ense
s
Gov
ernm
enta
l act
ivit
ies:
Gen
eral
gov
ernm
ent
80,6
55,0
23$
86
,460
,637
$
86,5
06,1
64$
89
,572
,066
$
89,2
99,7
49$
97
,414
,465
$
103,
069,
623
$
90
,111
,717
$
105,
208,
041
$
10
6,49
2,51
3$
Edu
cati
on17
,200
,773
17,5
78,7
89
30
,640
,196
19,8
72,5
54
18
,207
,815
18,8
45,7
06
23
,253
,172
34,5
09,1
81
25
,792
,857
19,0
96,6
47
P
ubli
c sa
fety
47,3
12,4
77
49
,811
,753
50,7
98,6
46
53
,859
,886
48,9
25,3
40
54
,012
,898
57,3
77,6
49
49
,837
,050
56,5
26,3
17
50
,226
,564
Hea
lth
20,5
70,6
45
22
,300
,180
24,0
98,2
46
21
,982
,038
19,8
25,4
30
23
,873
,121
24,7
01,9
57
23
,738
,233
24,7
85,6
24
23
,274
,404
Tra
nspo
rtat
ion
14,9
54,6
61
10
,966
,752
14,4
06,6
03
15
,523
,709
12,9
84,5
98
15
,237
,609
19,1
29,0
94
18
,102
,112
15,2
01,0
51
20
,676
,530
Eco
nom
ic a
ssis
tanc
e13
9,22
8,02
0
203,
782,
332
19
9,27
2,40
9
200,
760,
778
19
4,03
8,79
0
195,
453,
042
19
5,50
2,26
0
143,
481,
202
14
2,09
7,06
4
141,
231,
311
C
ultu
re a
nd r
ecre
atio
n9,
587,
353
9,
200,
623
7,
282,
524
7,
556,
657
8,
526,
476
9,
324,
397
8,
988,
423
8,
224,
167
8,
640,
879
10
,343
,289
Hom
e an
d co
mm
unit
y se
rvic
es1,
722,
601
3,
270,
450
3,
266,
346
3,
781,
916
1,
875,
213
2,
136,
740
2,
531,
467
1,
955,
938
2,
266,
963
2,
972,
842
In
tere
st o
n lo
ng-t
erm
deb
t-
-
3,
250,
071
2,
927,
138
2,
919,
531
2,
892,
630
5,
098,
431
5,
578,
953
5,
350,
070
4,
739,
013
T
otal
gov
ernm
enta
l act
ivit
ies
expe
nses
339,
289,
201
40
7,54
0,58
7
419,
521,
205
41
5,83
6,74
2
396,
602,
942
41
9,19
0,60
8
439,
652,
076
37
5,53
8,55
3
385,
868,
866
37
9,05
3,11
3
Bus
ines
s-ty
pe a
ctiv
itie
s:D
epar
tmen
t of
tra
nspo
rtat
ion
15,4
43,8
34
13
,927
,603
14,8
46,2
08
16
,196
,287
13,4
56,0
55
13
,778
,447
14,3
43,4
89
12
,726
,142
13,1
47,8
71
14
,445
,270
Nur
sing
hom
e30
,478
,522
32,6
24,2
13
29
,263
,551
32,3
92,8
67
29
,129
,510
32,9
11,7
22
32
,000
,582
32,5
09,9
51
30
,601
,165
31,6
46,4
52
S
olid
was
te m
anag
emen
t7,
923,
104
9,
327,
033
9,
138,
007
16
,062
,936
9,53
5,87
8
9,77
0,74
1
9,67
8,90
9
9,57
2,09
2
8,42
6,61
7
6,41
2,27
4
Air
port
8,86
9,77
9
10,9
60,0
34
7,
529,
730
8,
163,
144
8,
250,
813
8,
626,
944
8,
844,
821
8,
560,
546
7,
959,
145
7,
309,
549
E
cono
mic
ass
ista
nce
- L
ocal
Dev
elop
men
t C
orpo
rati
on-
-
-
-
-
-
68
,855
184,
141
212,
251
149,
665
Eco
nom
ic a
ssis
tanc
e -
Lan
d B
ank
Cor
pora
tion
-
-
-
-
-
-
386,
522
351,
374
294,
143
180,
652
Tot
al b
usin
ess-
type
act
ivit
ies
expe
nses
62,7
15,2
39
66
,838
,883
60,7
77,4
96
72
,815
,234
60,3
72,2
56
65
,087
,854
65,3
23,1
78
63
,904
,246
60,6
41,1
92
60
,143
,862
Tot
al p
rim
ary
gove
rnm
ent
expe
nses
402,
004,
440
$
47
4,37
9,47
0$
480,
298,
701
$
48
8,65
1,97
6$
456,
975,
198
$
48
4,27
8,46
2$
504,
975,
254
$
43
9,44
2,79
9$
446,
510,
058
$
43
9,19
6,97
5$
Pro
gram
rev
enu
es
Gov
ernm
enta
l act
ivit
ies:
Cha
rges
for
ser
vice
sG
ener
al g
over
nmen
t15
,662
,816
$
21,7
39,1
01$
22
,761
,296
$
23,6
06,4
67$
23
,623
,623
$
23,9
58,1
00$
24
,687
,926
$
19,3
29,9
13$
18
,585
,205
$
26,9
56,5
61$
E
cono
mic
ass
ista
nce
8,05
4,67
3
11,2
52,5
81
11
,262
,849
11,8
25,6
76
10
,394
,327
10,8
22,6
13
11
,294
,025
10,7
21,1
43
10
,238
,690
11,9
90,0
29
O
ther
act
ivit
ies
9,43
0,32
5
13,2
05,6
44
13
,576
,911
11,2
13,5
42
9,
729,
007
9,
257,
869
9,
932,
076
9,
773,
318
12
,388
,090
8,45
9,32
1
Ope
rati
ng g
rant
s an
d co
ntri
buti
ons
94,7
64,6
85
14
8,15
4,15
6
150,
835,
275
14
6,43
2,74
5
151,
812,
707
15
5,23
0,68
8
154,
102,
525
10
4,94
1,77
6
111,
322,
926
10
0,27
4,01
3
Cap
ital
gra
nts
and
cont
ribu
tion
s6,
323,
278
2,
322,
663
11
,048
,286
4,97
5,32
0
1,57
9,25
7
11,3
88,6
53
5,
493,
328
12
,044
,432
16,7
01,0
03
7,
437,
069
T
otal
gov
ernm
enta
l act
ivit
ies
prog
ram
rev
enue
s13
4,23
5,77
7
196,
674,
145
20
9,48
4,61
7
198,
053,
750
19
7,13
8,92
1
210,
657,
923
20
5,50
9,88
0
156,
810,
582
16
9,23
5,91
4
155,
116,
993
Bus
ines
s-ty
pe a
ctiv
itie
s:C
harg
es f
or s
ervi
ces
Nur
sing
hom
e21
,704
,992
21,6
44,8
96
20
,059
,818
22,8
65,1
07
25
,087
,576
27,2
97,7
12
26
,973
,023
28,1
79,3
93
30
,057
,264
30,6
10,6
40
O
ther
act
ivit
ies
15,5
21,7
21
13
,884
,638
14,0
91,4
05
15
,059
,348
15,3
36,9
76
16
,558
,428
14,1
04,6
19
15
,104
,250
15,5
58,5
64
14
,586
,684
Ope
rati
ng g
rant
s an
d co
ntri
buti
ons
13,8
65,4
13
17
,907
,114
13,8
76,4
26
30
,196
,761
10,8
22,2
39
19
,356
,795
23,6
36,8
78
12
,102
,022
22,3
19,0
22
19
,165
,526
Tot
al b
usin
ess-
type
act
ivit
ies
Pro
gram
rev
enue
s59
,134
,901
62,2
53,6
73
48
,027
,649
68,1
21,2
16
51
,246
,791
63,2
12,9
35
64
,714
,520
55,3
85,6
65
67
,934
,850
64,3
62,8
50
Tot
al p
rim
ary
gove
rnm
ent
prog
ram
rev
enue
s19
3,37
0,67
8$
258,
927,
818
$
25
7,51
2,26
6$
266,
174,
966
$
24
8,38
5,71
2$
273,
870,
858
$
27
0,22
4,40
0$
212,
196,
247
$
23
7,17
0,76
4$
219,
479,
843
$
194
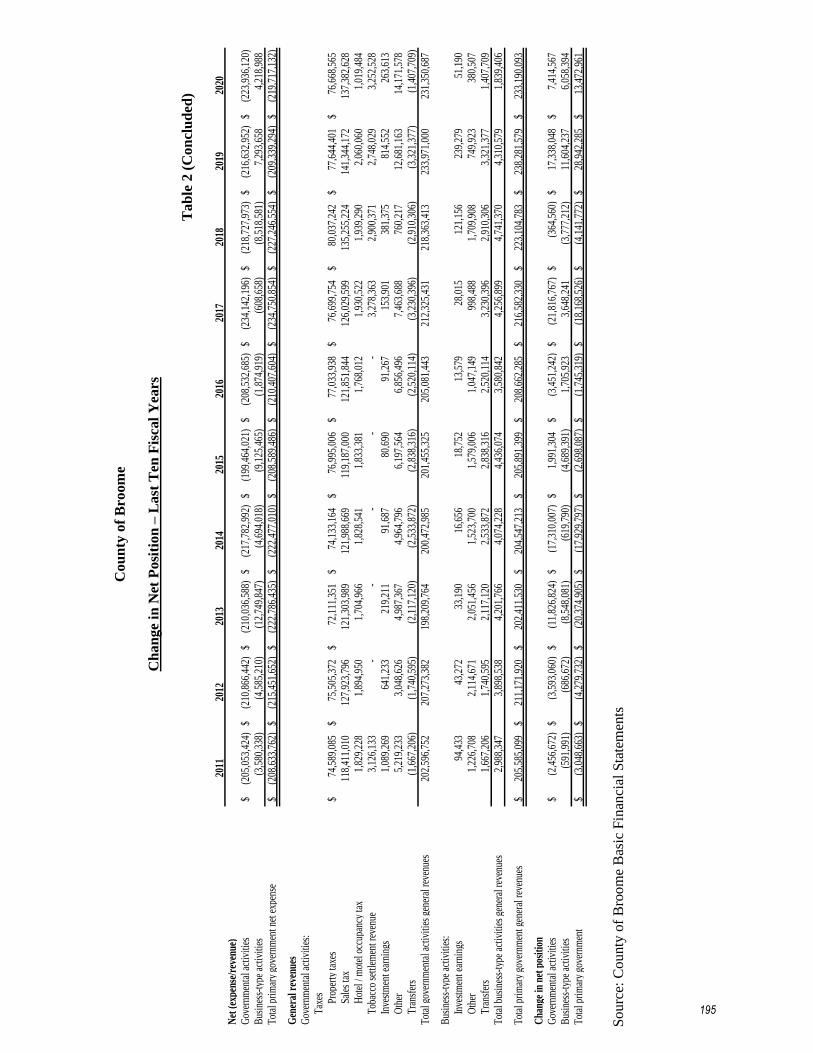
Cou
nty
of
Bro
om
e
Ch
an
ge
in N
et P
osi
tion
– L
ast
Ten
Fis
cal
Yea
rs
Ta
ble
2 (
Co
ncl
ud
ed)
2011
2012
2013
2014
2015
2016
2017
2018
2019
2020
Net
(ex
pens
e/re
venu
e)
Gov
ernm
enta
l act
iviti
es(2
05,0
53,4
24)
$
(2
10,8
66,4
42)
$
(2
10,0
36,5
88)
$
(2
17,7
82,9
92)
$
(1
99,4
64,0
21)
$
(2
08,5
32,6
85)
$
(2
34,1
42,1
96)
$
(2
18,7
27,9
73)
$
(2
16,6
32,9
52)
$
(2
23,9
36,1
20)
$
Bus
ines
s-ty
pe a
ctiv
ities
(3,5
80,3
38)
(4,5
85,2
10)
(12,
749,
847)
(4,6
94,0
18)
(9,1
25,4
65)
(1,8
74,9
19)
(608
,658
)
(8,5
18,5
81)
7,29
3,65
8
4,21
8,98
8
Tot
al p
rim
ary
gove
rnm
ent n
et e
xpen
se(2
08,6
33,7
62)
$
(2
15,4
51,6
52)
$
(2
22,7
86,4
35)
$
(2
22,4
77,0
10)
$
(2
08,5
89,4
86)
$
(2
10,4
07,6
04)
$
(2
34,7
50,8
54)
$
(2
27,2
46,5
54)
$
(2
09,3
39,2
94)
$
(2
19,7
17,1
32)
$
Gen
eral
rev
enue
s
Gov
ernm
enta
l act
iviti
es:
Tax
es Prop
erty
taxe
s74
,589
,085
$
75,5
05,3
72$
72
,111
,351
$
74,1
33,1
64$
76
,995
,006
$
77,0
33,9
38$
76
,699
,754
$
80,0
37,2
42$
77
,644
,401
$
76,6
68,5
65$
Sa
les
tax
118,
411,
010
12
7,92
3,79
6
121,
303,
989
12
1,98
8,66
9
119,
187,
000
12
1,85
1,84
4
126,
029,
599
13
5,25
5,22
4
141,
344,
172
13
7,38
2,62
8
Hot
el /
mot
el o
ccup
ancy
tax
1,82
9,22
8
1,89
4,95
0
1,70
4,96
6
1,82
8,54
1
1,83
3,38
1
1,76
8,01
2
1,93
0,52
2
1,93
9,29
0
2,06
0,06
0
1,01
9,48
4
Tob
acco
set
tlem
ent r
even
ue3,
126,
133
-
-
-
-
-
3,27
8,36
3
2,90
0,37
1
2,74
8,02
9
3,25
2,52
8
Inve
stm
ent e
arni
ngs
1,08
9,26
9
641,
233
219,
211
91,6
87
80
,690
91,2
67
15
3,90
1
38
1,37
5
81
4,55
2
26
3,61
3
O
ther
5,21
9,23
3
3,04
8,62
6
4,98
7,36
7
4,96
4,79
6
6,19
7,56
4
6,85
6,49
6
7,46
3,68
8
760,
217
12,6
81,1
63
14
,171
,578
Tra
nsfe
rs(1
,667
,206
)
(1
,740
,595
)
(2
,117
,120
)
(2
,533
,872
)
(2
,838
,316
)
(2
,520
,114
)
(3
,230
,396
)
(2
,910
,306
)
(3
,321
,377
)
(1
,407
,709
)
T
otal
gov
ernm
enta
l act
iviti
es g
ener
al re
venu
es20
2,59
6,75
2
207,
273,
382
19
8,20
9,76
4
200,
472,
985
20
1,45
5,32
5
205,
081,
443
21
2,32
5,43
1
218,
363,
413
23
3,97
1,00
0
231,
350,
687
Bus
ines
s-ty
pe a
ctiv
ities
:In
vest
men
t ear
ning
s94
,433
43,2
72
33
,190
16,6
56
18
,752
13,5
79
28
,015
121,
156
239,
279
51,1
90
O
ther
1,22
6,70
8
2,11
4,67
1
2,05
1,45
6
1,52
3,70
0
1,57
9,00
6
1,04
7,14
9
998,
488
1,70
9,90
8
749,
923
380,
507
Tra
nsfe
rs1,
667,
206
1,
740,
595
2,
117,
120
2,
533,
872
2,
838,
316
2,
520,
114
3,
230,
396
2,
910,
306
3,
321,
377
1,
407,
709
Tot
al b
usin
ess-
type
act
iviti
es g
ener
al re
venu
es2,
988,
347
3,
898,
538
4,
201,
766
4,
074,
228
4,
436,
074
3,
580,
842
4,
256,
899
4,
741,
370
4,
310,
579
1,
839,
406
Tot
al p
rim
ary
gove
rnm
ent g
ener
al re
venu
es20
5,58
5,09
9$
211,
171,
920
$
20
2,41
1,53
0$
204,
547,
213
$
20
5,89
1,39
9$
208,
662,
285
$
21
6,58
2,33
0$
223,
104,
783
$
23
8,28
1,57
9$
233,
190,
093
$
Cha
nge
in n
et p
osit
ion
Gov
ernm
enta
l act
iviti
es(2
,456
,672
)$
(3
,593
,060
)$
(1
1,82
6,82
4)$
(1
7,31
0,00
7)$
1,
991,
304
$
(3
,451
,242
)$
(2
1,81
6,76
7)$
(3
64,5
60)
$
17
,338
,048
$
7,41
4,56
7$
Bus
ines
s-ty
pe a
ctiv
ities
(591
,991
)
(686
,672
)
(8,5
48,0
81)
(619
,790
)
(4,6
89,3
91)
1,70
5,92
3
3,64
8,24
1
(3,7
77,2
12)
11,6
04,2
37
6,
058,
394
Tot
al p
rim
ary
gove
rnm
ent
(3,0
48,6
63)
$
(4,2
79,7
32)
$
(20,
374,
905)
$
(17,
929,
797)
$
(2,6
98,0
87)
$
(1,7
45,3
19)
$
(18,
168,
526)
$
(4,1
41,7
72)
$
28,9
42,2
85$
13
,472
,961
$
So
urc
e: C
ounty
of
Bro
om
e B
asic
Fin
anci
al S
tate
men
ts
195
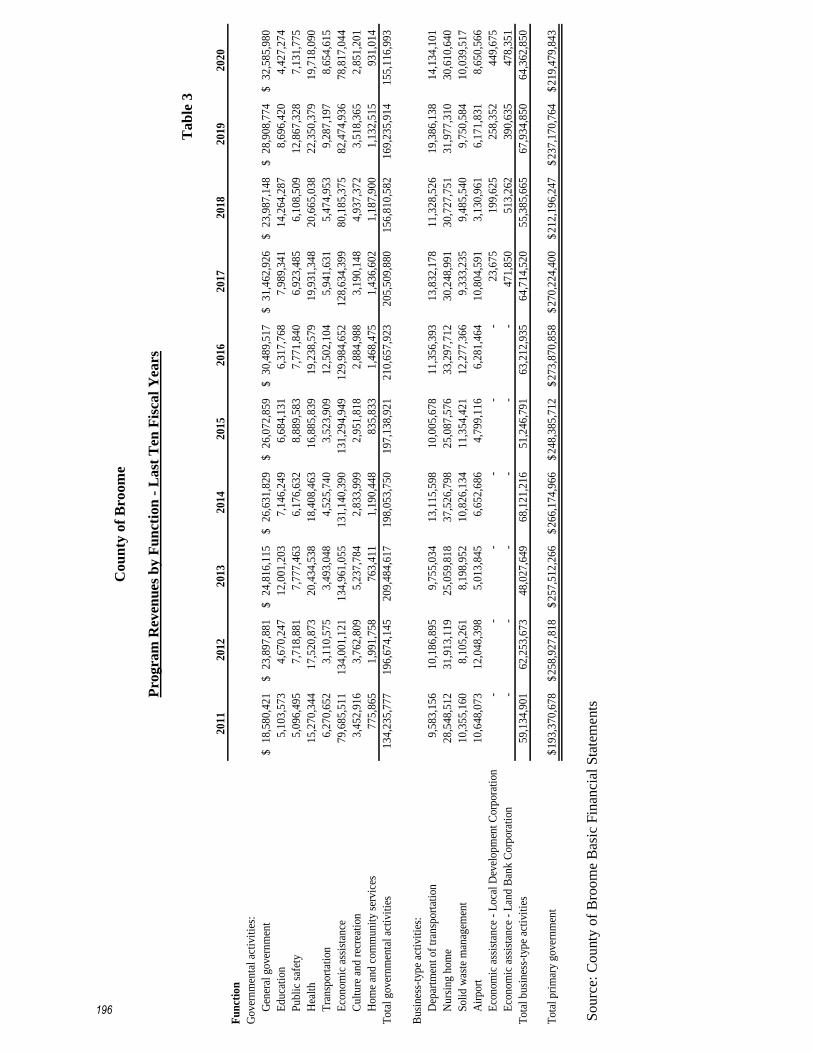
Cou
nty
of
Bro
om
e
Pro
gra
m R
even
ues
by F
un
ctio
n -
Last
Ten
Fis
cal
Yea
rs
Ta
ble
3
20
11
20
12
20
13
20
14
20
15
20
16
20
17
20
18
20
19
20
20
Fu
nct
ion
Gover
nm
enta
l ac
tivit
ies:
Gen
eral
gover
nm
ent
18
,58
0,4
21
$
2
3,8
97
,88
1$
24
,81
6,1
15
$
2
6,6
31
,82
9$
26
,07
2,8
59
$
3
0,4
89
,51
7$
31
,46
2,9
26
$
2
3,9
87
,14
8$
28
,90
8,7
74
$
3
2,5
85
,98
0$
Ed
uca
tion
5,1
03
,57
3
4
,67
0,2
47
12
,00
1,2
03
7
,14
6,2
49
6,6
84
,13
1
6
,31
7,7
68
7,9
89
,34
1
1
4,2
64
,28
7
8,6
96
,42
0
4
,42
7,2
74
Pu
bli
c sa
fety
5,0
96
,49
5
7
,71
8,8
81
7,7
77
,46
3
6
,17
6,6
32
8,8
89
,58
3
7
,77
1,8
40
6,9
23
,48
5
6
,10
8,5
09
12
,86
7,3
28
7
,13
1,7
75
Hea
lth
15
,27
0,3
44
1
7,5
20
,87
3
20
,43
4,5
38
1
8,4
08
,46
3
16
,88
5,8
39
1
9,2
38
,57
9
19
,93
1,3
48
2
0,6
65
,03
8
22
,35
0,3
79
1
9,7
18
,09
0
Tra
nsp
ort
atio
n6
,27
0,6
52
3,1
10
,57
5
3
,49
3,0
48
4,5
25
,74
0
3
,52
3,9
09
12
,50
2,1
04
5
,94
1,6
31
5,4
74
,95
3
9
,28
7,1
97
8,6
54
,61
5
Eco
nom
ic a
ssis
tan
ce7
9,6
85
,51
1
13
4,0
01
,12
1
1
34
,96
1,0
55
13
1,1
40
,39
0
1
31
,29
4,9
49
12
9,9
84
,65
2
1
28
,63
4,3
99
80
,18
5,3
75
8
2,4
74
,93
6
78
,81
7,0
44
Cu
ltu
re a
nd
rec
reat
ion
3,4
52
,91
6
3
,76
2,8
09
5,2
37
,78
4
2
,83
3,9
99
2,9
51
,81
8
2
,88
4,9
88
3,1
90
,14
8
4
,93
7,3
72
3,5
18
,36
5
2
,85
1,2
01
Hom
e an
d c
om
mu
nit
y se
rvic
es7
75
,86
5
1,9
91
,75
8
7
63
,41
1
1,1
90
,44
8
8
35
,83
3
1,4
68
,47
5
1
,43
6,6
02
1,1
87
,90
0
1
,13
2,5
15
93
1,0
14
Tota
l gover
nm
enta
l ac
tivit
ies
13
4,2
35
,77
7
1
96
,67
4,1
45
20
9,4
84
,61
7
1
98
,05
3,7
50
19
7,1
38
,92
1
2
10
,65
7,9
23
20
5,5
09
,88
0
1
56
,81
0,5
82
16
9,2
35
,91
4
1
55
,11
6,9
93
Bu
sin
ess-
typ
e ac
tivit
ies:
Dep
artm
ent
of
tran
sport
atio
n9
,58
3,1
56
10
,18
6,8
95
9
,75
5,0
34
13
,11
5,5
98
1
0,0
05
,67
8
11
,35
6,3
93
1
3,8
32
,17
8
11
,32
8,5
26
1
9,3
86
,13
8
14
,13
4,1
01
Nu
rsin
g h
om
e2
8,5
48
,51
2
31
,91
3,1
19
2
5,0
59
,81
8
37
,52
6,7
98
2
5,0
87
,57
6
33
,29
7,7
12
3
0,2
48
,99
1
30
,72
7,7
51
3
1,9
77
,31
0
30
,61
0,6
40
Soli
d w
aste
man
agem
ent
10
,35
5,1
60
8
,10
5,2
61
8,1
98
,95
2
1
0,8
26
,13
4
11
,35
4,4
21
1
2,2
77
,36
6
9,3
33
,23
5
9
,48
5,5
40
9,7
50
,58
4
1
0,0
39
,51
7
Air
port
10
,64
8,0
73
1
2,0
48
,39
8
5,0
13
,84
5
6
,65
2,6
86
4,7
99
,11
6
6
,28
1,4
64
10
,80
4,5
91
3
,13
0,9
61
6,1
71
,83
1
8
,65
0,5
66
Eco
nom
ic a
ssis
tan
ce -
Loca
l D
evel
op
men
t C
orp
ora
tion
-
-
-
-
-
-
23
,67
5
1
99
,62
5
25
8,3
52
4
49
,67
5
Eco
nom
ic a
ssis
tan
ce -
Lan
d B
ank
Corp
ora
tion
-
-
-
-
-
-
47
1,8
50
5
13
,26
2
39
0,6
35
4
78
,35
1
Tota
l b
usi
nes
s-ty
pe
acti
vit
ies
59
,13
4,9
01
6
2,2
53
,67
3
48
,02
7,6
49
6
8,1
21
,21
6
51
,24
6,7
91
6
3,2
12
,93
5
64
,71
4,5
20
5
5,3
85
,66
5
67
,93
4,8
50
6
4,3
62
,85
0
Tota
l p
rim
ary
gover
nm
ent
19
3,3
70
,67
8$
2
58
,92
7,8
18
$
25
7,5
12
,26
6$
2
66
,17
4,9
66
$
24
8,3
85
,71
2$
2
73
,87
0,8
58
$
27
0,2
24
,40
0$
2
12
,19
6,2
47
$
23
7,1
70
,76
4$
2
19
,47
9,8
43
$
So
urc
e: C
ounty
of
Bro
om
e B
asic
Fin
anci
al S
tate
men
ts
196
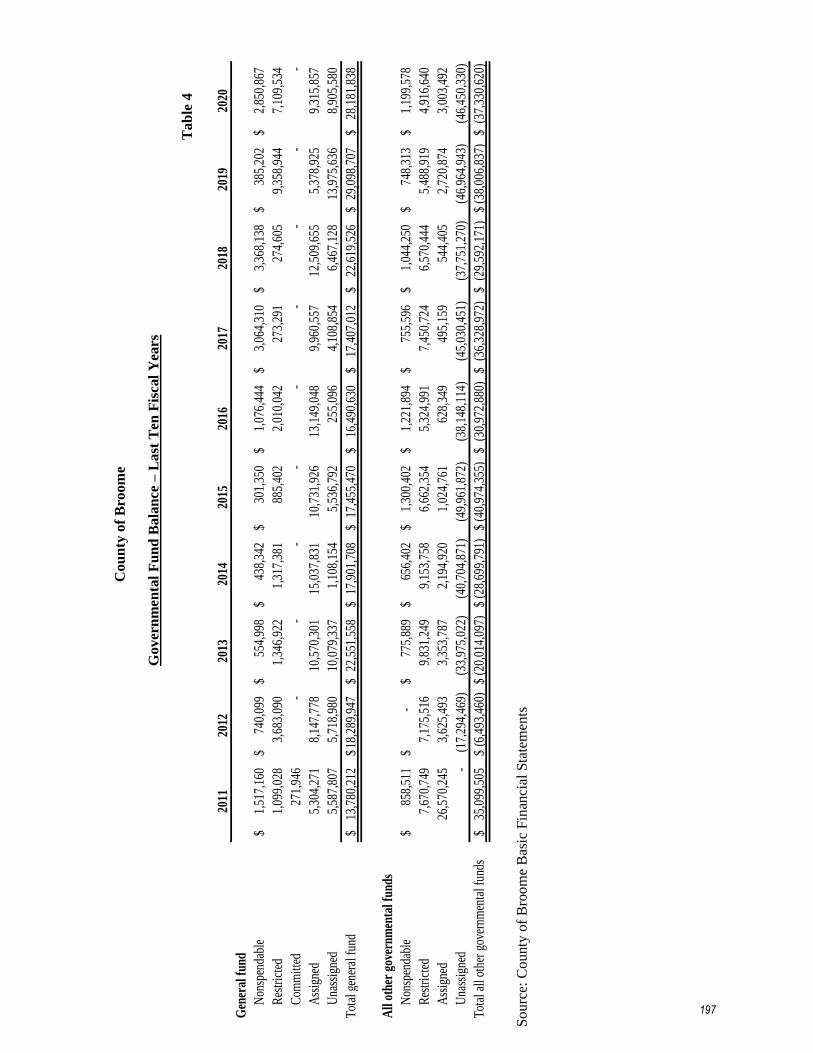
Cou
nty
of
Bro
om
e
Gover
nm
enta
l F
un
d B
ala
nce
– L
ast
Ten
Fis
cal
Yea
rs
Ta
ble
4
2011
2012
2013
2014
2015
2016
2017
2018
2019
2020
Gen
eral
fun
d
Non
spen
dabl
e1,
517,
160
$
74
0,09
9$
554,
998
$
438,
342
$
301,
350
$
1,07
6,44
4$
3,06
4,31
0$
3,36
8,13
8$
385,
202
$
2,85
0,86
7$
Res
tric
ted
1,09
9,02
8
3,68
3,09
0
1,
346,
922
1,
317,
381
88
5,40
2
2,
010,
042
273,
291
274,
605
9,35
8,94
4
7,10
9,53
4
Com
mitt
ed27
1,94
6
-
-
-
-
-
-
-
-
-
Ass
igne
d5,
304,
271
8,
147,
778
10,5
70,3
01
15
,037
,831
10,7
31,9
26
13
,149
,048
9,96
0,55
7
12,5
09,6
55
5,
378,
925
9,
315,
857
Una
ssig
ned
5,58
7,80
7
5,71
8,98
0
10
,079
,337
1,10
8,15
4
5,53
6,79
2
255,
096
4,10
8,85
4
6,46
7,12
8
13,9
75,6
36
8,
905,
580
Tot
al g
ener
al f
und
13,7
80,2
12$
18
,289
,947
$ 22
,551
,558
$
17,9
01,7
08$
17
,455
,470
$
16,4
90,6
30$
17
,407
,012
$
22,6
19,5
26$
29
,098
,707
$
28,1
81,8
38$
All
oth
er g
over
nmen
tal f
unds
Non
spen
dabl
e85
8,51
1$
-
$
775,
889
$
656,
402
$
1,30
0,40
2$
1,22
1,89
4$
755,
596
$
1,04
4,25
0$
748,
313
$
1,19
9,57
8$
Res
tric
ted
7,67
0,74
9
7,17
5,51
6
9,
831,
249
9,
153,
758
6,
662,
354
5,
324,
991
7,
450,
724
6,
570,
444
5,
488,
919
4,
916,
640
Ass
igne
d26
,570
,245
3,62
5,49
3
3,
353,
787
2,
194,
920
1,
024,
761
62
8,34
9
49
5,15
9
54
4,40
5
2,
720,
874
3,
003,
492
Una
ssig
ned
-
(1
7,29
4,46
9)
(33,
975,
022)
(40,
704,
871)
(49,
961,
872)
(38,
148,
114)
(45,
030,
451)
(37,
751,
270)
(46,
964,
943)
(46,
450,
330)
Tot
al a
ll ot
her
gove
rnm
enta
l fun
ds35
,099
,505
$
(6,4
93,4
60)
$
(20,
014,
097)
$
(28,
699,
791)
$
(40,
974,
355)
$
(30,
972,
880)
$
(36,
328,
972)
$
(29,
592,
171)
$
(38,
006,
837)
$
(37,
330,
620)
$
So
urc
e: C
ounty
of
Bro
om
e B
asic
Fin
anci
al S
tate
men
ts
197
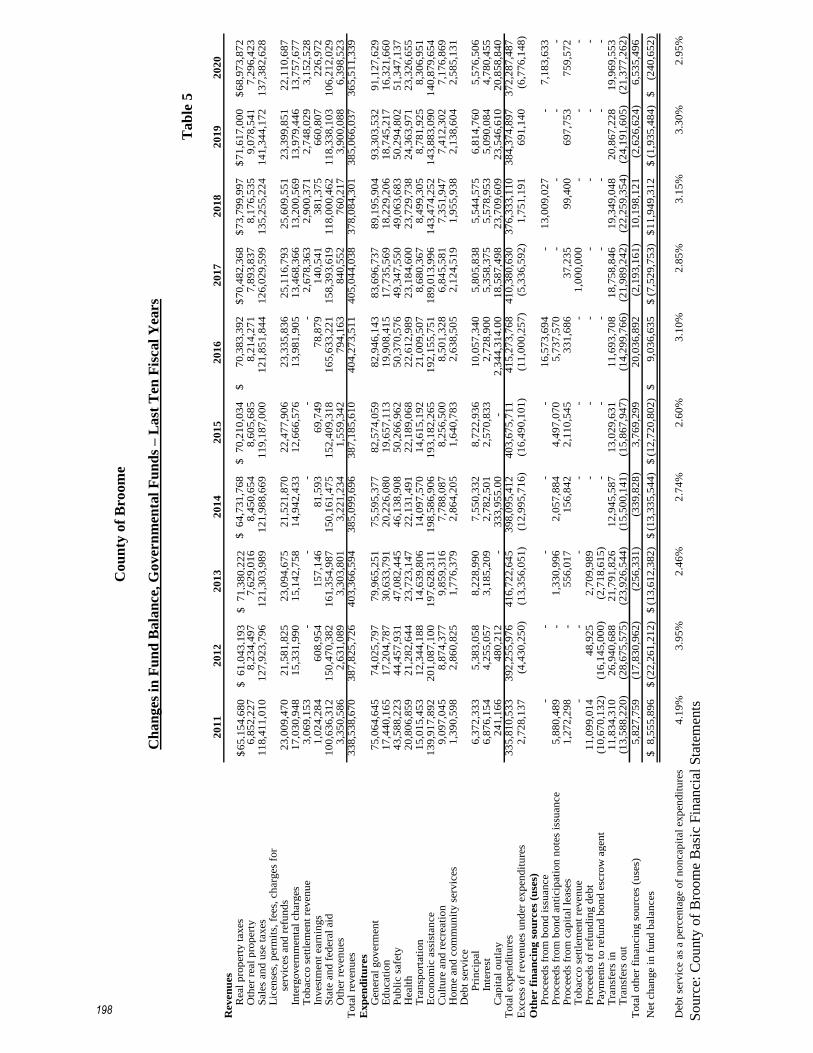
Cou
nty
of
Bro
om
e
Ch
an
ges
in
Fu
nd
Bala
nce
, G
over
nm
enta
l F
un
ds –
Last
Ten
Fis
cal
Yea
rs
Ta
ble
5
2
01
12
01
22
01
32
01
42
01
52
01
62
01
72
01
82
01
92
02
0R
even
ues
Rea
l p
rop
erty
taxes
65
,15
4,6
80
$
61
,04
3,1
93
$
7
1,3
80
,22
2$
64
,73
1,7
68
$
7
0,2
10
,03
4$
70
,38
3,3
92
$
7
0,4
82
,36
8$
7
3,7
99
,99
7$
7
1,6
17
,00
0$
6
8,9
73
,87
2$
O
ther
rea
l p
rop
erty
6
,85
2,2
27
8
,23
4,4
97
7,6
29
,01
6
8
,45
0,6
54
8,6
05
,68
58
,21
4,2
71
7,8
93
,83
7
8,1
76
,53
5
9,0
78
,54
1
7,2
96
,42
3
Sale
s an
d u
se t
axes
11
8,4
11
,01
0
12
7,9
23
,79
6
1
21
,30
3,9
89
12
1,9
88
,66
91
19
,18
7,0
00
12
1,8
51
,84
41
26
,02
9,5
99
1
35
,25
5,2
24
1
41
,34
4,1
72
1
37
,38
2,6
28
L
icen
ses,
per
mit
s, f
ees,
ch
arg
es f
or
ser
vic
es a
nd
ref
un
ds
23
,00
9,4
70
21
,58
1,8
25
2
3,0
94
,67
5
21
,52
1,8
70
22
,47
7,9
06
23
,33
5,8
36
25
,11
6,7
93
25
,60
9,5
51
23
,39
9,8
51
22
,11
0,6
87
Inte
rgover
nm
enta
l ch
arg
es1
7,0
30
,94
8
1
5,3
31
,99
0
15
,14
2,7
58
1
4,9
42
,43
31
2,6
66
,57
61
3,9
81
,90
51
3,4
68
,36
6
1
3,2
00
,56
9
1
3,9
79
,44
6
1
3,7
57
,67
7
T
ob
acco s
ettl
emen
t re
ven
ue
3,0
69
,15
3
-
-
-
-
-
2,6
78
,36
3
2,9
00
,37
1
2,7
48
,02
9
3,1
52
,52
8
Inves
tmen
t ea
rnin
gs
1,0
24
,28
4
60
8,9
54
1
57
,14
6
81
,59
36
9,7
49
78
,87
91
40
,54
1
3
81
,37
5
6
60
,80
7
2
26
,97
2
S
tate
an
d f
eder
al
aid
10
0,6
36
,31
2
15
0,4
70
,38
2
1
61
,35
4,9
87
15
0,1
61
,47
51
52
,40
9,3
18
16
5,6
33
,22
11
58
,39
3,6
19
1
18
,00
0,4
62
1
18
,33
8,1
03
1
06
,21
2,0
29
O
ther
rev
enu
es3
,35
0,5
86
2
,63
1,0
89
3,3
03
,80
1
3
,22
1,2
34
1,5
59
,34
27
94
,16
38
40
,55
2
7
60
,21
7
3
,90
0,0
88
6
,39
8,5
23
T
ota
l re
ven
ues
33
8,5
38
,67
0
38
7,8
25
,72
6
4
03
,36
6,5
94
38
5,0
99
,69
6
3
87
,18
5,6
10
40
4,2
73
,51
1
4
05
,04
4,0
38
3
78
,08
4,3
01
3
85
,06
6,0
37
3
65
,51
1,3
39
1
,74
3,4
18
E
xp
en
dit
ures
Gen
eral
gover
men
t 7
5,0
64
,64
5
7
4,0
25
,79
7
79
,96
5,2
51
7
5,5
95
,37
78
2,5
74
,05
98
2,9
46
,14
38
3,6
96
,73
7
8
9,1
95
,90
4
9
3,3
03
,53
2
9
1,1
27
,62
9
E
du
cati
on
17
,44
0,1
65
17
,20
4,7
87
3
0,6
33
,79
1
20
,22
6,0
80
19
,65
7,1
13
19
,90
8,4
15
17
,73
5,5
69
18
,22
9,2
06
18
,74
5,2
17
16
,32
1,6
60
Pu
bli
c s
afe
ty4
3,5
88
,22
3
4
4,4
57
,93
1
47
,08
2,4
45
4
6,1
38
,90
85
0,2
66
,96
25
0,3
70
,57
64
9,3
47
,55
0
4
9,0
63
,68
3
5
0,2
94
,80
2
5
1,3
47
,13
7
H
ealt
h2
0,8
06
,85
9
2
1,2
82
,64
4
23
,72
3,1
47
2
2,1
31
,49
12
2,1
89
,06
82
2,6
12
,98
92
3,1
84
,60
0
2
3,7
29
,73
8
2
4,3
63
,97
1
2
3,3
26
,65
5
T
ran
sport
ati
on
15
,01
5,4
53
12
,34
4,1
88
1
4,6
39
,80
6
14
,09
7,5
70
14
,61
5,1
92
21
,00
9,5
07
8,6
80
,36
7
8,4
99
,30
5
8,7
81
,92
5
8,3
06
,95
1
Econ
om
ic a
ssis
tan
ce
13
9,9
17
,89
2
20
1,0
87
,10
0
1
97
,62
8,3
11
19
8,5
86
,90
61
93
,18
2,2
65
19
2,1
55
,75
11
89
,01
3,9
96
1
43
,47
4,2
52
1
43
,88
3,0
90
1
40
,87
9,6
54
C
ult
ure
an
d r
ecre
ati
on
9,0
97
,04
5
8,8
74
,37
7
9
,85
9,3
16
7,7
88
,08
78
,25
6,5
00
8,5
01
,32
86
,84
5,5
81
7
,35
1,9
47
7
,41
2,3
02
7
,17
6,8
69
H
om
e an
d c
om
mu
nit
y s
ervic
es1
,39
0,5
98
2
,86
0,8
25
1,7
76
,37
9
2
,86
4,2
05
1,6
40
,78
32
,63
8,5
05
2,1
24
,51
9
1,9
55
,93
8
2,1
38
,60
4
2,5
85
,13
1
Deb
t se
rvic
e
P
rin
cip
al
6,3
72
,33
3
5,3
83
,05
8
8
,22
8,9
90
7,5
50
,33
28
,72
2,9
36
10
,05
7,3
40
5,8
05
,83
8
5,5
44
,57
5
6,8
14
,76
0
5,5
76
,50
6
In
tere
st6
,87
6,1
54
4
,25
5,0
57
3,1
85
,20
9
2
,78
2,5
01
2,5
70
,83
32
,72
8,9
00
5,3
58
,37
5
5,5
78
,95
3
5,0
90
,08
4
4,7
80
,45
5
Cap
ital
ou
tlay
24
1,1
66
48
0,2
12
-
3
33
,95
5.0
0
-
2,3
44
,31
4.0
0
18
,58
7,4
98
23
,70
9,6
09
23
,54
6,6
10
20
,85
8,8
40
Tota
l ex
pen
dit
ure
s3
35
,81
0,5
33
3
92
,25
5,9
76
41
6,7
22
,64
5
3
98
,09
5,4
12
40
3,6
75
,71
1
4
15
,27
3,7
68
41
0,3
80
,63
0
37
6,3
33
,11
0
38
4,3
74
,89
7
37
2,2
87
,48
7
Exces
s of
reven
ues
un
der
exp
end
itu
res
2,7
28
,13
7
(4,4
30
,25
0)
(1
3,3
56
,05
1)
(12
,99
5,7
16
)
(1
6,4
90
,10
1)
(11
,00
0,2
57
)
(5
,33
6,5
92
)
1
,75
1,1
91
6
91
,14
0
(6
,77
6,1
48
)
Oth
er f
ina
ncin
g s
ou
rces
(use
s)P
rocee
ds
from
bon
d i
ssu
an
ce
-
-
-
-
-
1
6,5
73
,69
4
-
1
3,0
09
,02
7
-
7,1
83
,63
3
Pro
cee
ds
from
bon
d a
nti
cip
ati
on
note
s is
suan
ce
5,8
80
,48
9
-
1,3
30
,99
6
2
,05
7,8
84
4,4
97
,07
05
,73
7,5
70
-
-
-
-
Pro
cee
ds
from
cap
ital
lease
s1
,27
2,2
98
-
5
56
,01
7
15
6,8
42
2
,11
0,5
45
33
1,6
86
37
,23
5
99
,40
0
69
7,7
53
75
9,5
72
Tob
acco s
ettl
emen
t re
ven
ue
-
-
-
-
-
-
1
,00
0,0
00
-
-
-
Pro
cee
ds
of
refu
nd
ing d
ebt
11
,09
9,0
14
48
,92
5
2
,70
9,9
89
-
-
-
-
-
-
-
Paym
ents
to r
efu
nd
bon
d e
scro
w a
gen
t(1
0,6
70
,13
2)
(1
6,1
45
,00
0)
(2,7
18
,61
5)
-
-
-
-
-
-
-
T
ran
sfer
s in
11
,83
4,3
10
26
,94
0,6
88
2
1,7
91
,82
6
12
,94
5,5
87
13
,02
9,6
31
11
,69
3,7
08
18
,75
8,8
46
19
,34
9,0
48
20
,86
7,2
28
19
,96
9,5
53
Tra
nsf
ers
ou
t(1
3,5
88
,22
0)
(2
8,6
75
,57
5)
(23
,92
6,5
44
)
(1
5,5
00
,14
1)
(15
,86
7,9
47
)(1
4,2
99
,76
6)
(21
,98
9,2
42
)
(22
,25
9,3
54
)
(24
,19
1,6
05
)
(21
,37
7,2
62
)
Tota
l oth
er f
inan
cin
g s
ou
rces
(u
ses)
5,8
27
,75
9
(17
,83
0,9
62
)
(2
56
,33
1)
(33
9,8
28
)
3
,76
9,2
99
20
,03
6,8
92
(2
,19
3,1
61
)
1
0,1
98
,12
1
(2
,62
6,6
24
)
6
,53
5,4
96
Net
ch
an
ge
in f
un
d b
ala
nces
8,5
55
,89
6$
(22
,26
1,2
12
)$
(1
3,6
12
,38
2)
$
(13
,33
5,5
44
)$
(1
2,7
20
,80
2)
$
9,0
36
,63
5$
(7
,52
9,7
53
)$
1
1,9
49
,31
2$
(1
,93
5,4
84
)$
(2
40
,65
2)
$
Deb
t se
rvic
e as
a p
ercen
tage
of
non
cap
ital
exp
end
itu
res
4.1
9%
3.9
5%
2.4
6%
2.7
4%
2.6
0%
3.1
0%
2.8
5%
3.1
5%
3.3
0%
2.9
5%
S
ou
rce:
County
of
Bro
om
e B
asic
Fin
anci
al S
tate
men
ts
198

C
ou
nty
of
Bro
om
e
Ass
esse
d V
alu
e an
d A
ctu
al
Valu
e of
Taxab
le P
rop
erty
– L
ast
Fis
ca
l T
en Y
ears
Ta
ble
6
Tot
al T
axab
leT
otal
Dir
ect
Act
ual
Per
cen
tage
of
Sta
teS
pec
ial
Wh
olly
Les
sA
sses
sed
Tax
Rat
eT
axab
leE
stim
ated
Act
ual
Yea
rT
axab
leO
wn
edF
ran
chis
eU
tili
ties
Rai
lroa
ds
Exe
mp
tT
otal
Tax
-Exe
mp
tV
alu
e(P
er $
1,00
0)V
alu
eT
axab
le V
alu
e
2011
5,53
8,06
9,35
1$
4,
597,
549
$
125,
624,
461
$
141,
649,
292
$
12,5
38,7
17$
2,
276,
840,
195
$
8,09
9,31
9,56
5$
2,
338,
750,
855
$
5,76
0,56
8,71
0$
12
.38
10,0
01,0
25,6
65$
57
.60
2012
5,56
0,97
0,07
34,
708,
311
124,
946,
633
140,
519,
741
13,7
83,4
352,
007,
745,
510
7,85
2,67
3,70
3
2,
340,
982,
904
5,51
1,69
0,79
912
.32
9,73
2,72
3,09
8
56.6
3
2013
5,58
4,26
6,18
84,
698,
679
131,
579,
532
141,
006,
427
15,3
49,7
381,
996,
064,
366
7,87
2,96
4,93
0
2,
323,
257,
444
5,54
9,70
7,48
612
.23
9,37
4,31
4,87
6
59.2
0
2014
5,61
2,44
9,19
95,
060,
869
137,
897,
617
163,
849,
219
17,8
63,5
812,
001,
520,
158
7,93
8,64
0,64
3
2,
357,
085,
210
5,58
1,55
5,43
312
.38
9,38
6,69
0,11
1
59.4
6
2015
5,66
4,02
3,28
85,
646,
769
143,
805,
833
168,
575,
703
18,4
17,0
002,
039,
726,
061
8,04
0,19
4,65
4
2,
400,
255,
159
5,63
9,93
9,49
512
.56
9,52
7,42
3,49
0
59.2
0
2016
5,65
5,33
5,01
15,
629,
169
152,
959,
934
171,
251,
989
19,9
90,1
362,
084,
149,
923
8,08
9,31
6,16
2
2,
434,
572,
427
5,65
4,74
3,73
512
.76
9,76
2,20
7,43
2
57.9
2
2017
5,67
7,30
8,40
95,
629,
169
152,
228,
463
185,
139,
811
23,0
14,2
152,
090,
454,
836
8,13
3,77
4,90
3
2,
449,
195,
953
5,68
4,57
8,95
012
.77
9,61
2,98
5,60
7
59.1
3
2018
5,72
4,17
9,20
65,
634,
769
151,
310,
460
184,
232,
175
27,7
15,0
392,
066,
349,
193
8,15
9,42
0,84
2
2,
449,
127,
699
5,71
0,29
3,14
312
.91
9,71
4,72
9,10
7
58.7
8
2019
5,73
0,93
3,32
15,
645,
769
137,
085,
171
201,
324,
234
28,3
90,8
582,
083,
568,
617
8,18
6,94
7,97
0
2,
457,
134,
066
5,72
9,81
3,90
412
.79
9,79
5,23
0,77
3
58.5
0
2020
5,71
0,28
8,01
75,
634,
469
133,
151,
003
204,
095,
087
28,5
12,2
012,
122,
725,
429
8,20
4,40
6,20
6
2,
463,
309,
255
5,74
1,09
6,95
112
.63
10,0
26,1
19,9
58
57
.26
S
ou
rces
:
Ann
ual
Budget
Docu
men
ts
Co
nst
ituti
onal
Tax
Lim
it
Co
un
ty o
f B
room
e R
eal
Pro
per
ty T
ax R
oll
s
199
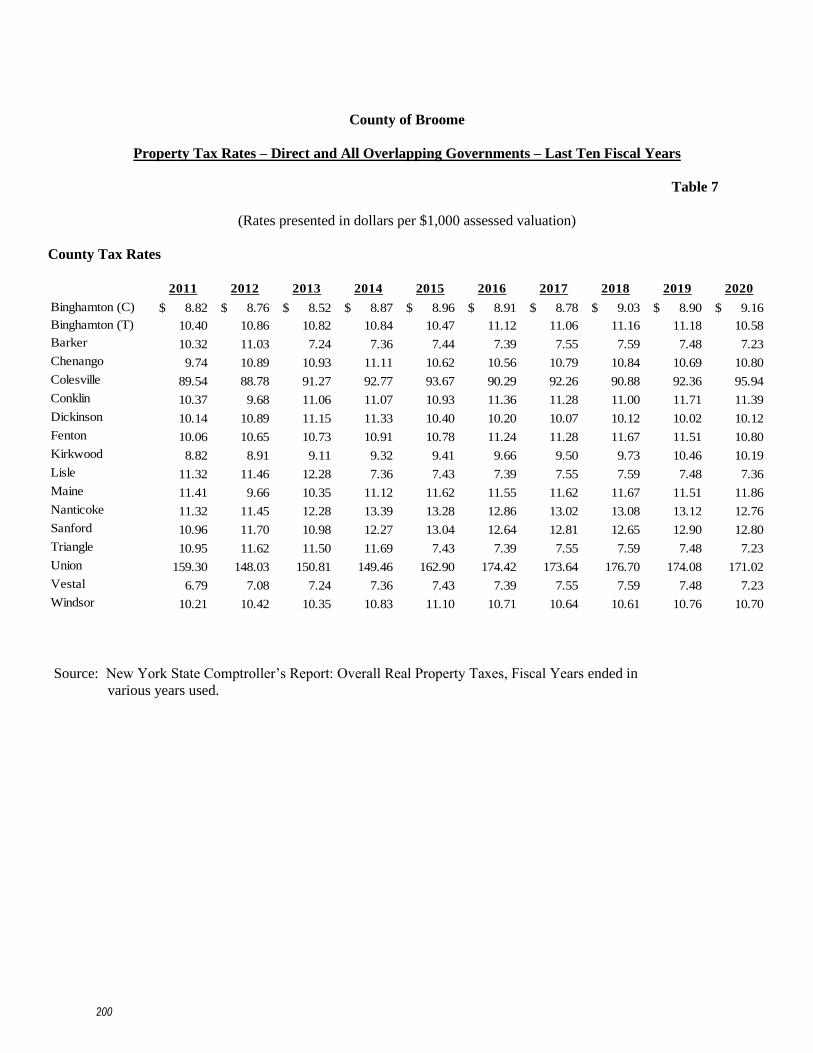
County of Broome
Property Tax Rates – Direct and All Overlapping Governments – Last Ten Fiscal Years
Table 7
(Rates presented in dollars per $1,000 assessed valuation)
County Tax Rates
2011 2012 2013 2014 2015 2016 2017 2018 2019 2020
Binghamton (C) 8.82$ 8.76$ 8.52$ 8.87$ 8.96$ 8.91$ 8.78$ 9.03$ 8.90$ 9.16$
Binghamton (T) 10.40 10.86 10.82 10.84 10.47 11.12 11.06 11.16 11.18 10.58
Barker 10.32 11.03 7.24 7.36 7.44 7.39 7.55 7.59 7.48 7.23
Chenango 9.74 10.89 10.93 11.11 10.62 10.56 10.79 10.84 10.69 10.80
Colesville 89.54 88.78 91.27 92.77 93.67 90.29 92.26 90.88 92.36 95.94
Conklin 10.37 9.68 11.06 11.07 10.93 11.36 11.28 11.00 11.71 11.39
Dickinson 10.14 10.89 11.15 11.33 10.40 10.20 10.07 10.12 10.02 10.12
Fenton 10.06 10.65 10.73 10.91 10.78 11.24 11.28 11.67 11.51 10.80
Kirkwood 8.82 8.91 9.11 9.32 9.41 9.66 9.50 9.73 10.46 10.19
Lisle 11.32 11.46 12.28 7.36 7.43 7.39 7.55 7.59 7.48 7.36
Maine 11.41 9.66 10.35 11.12 11.62 11.55 11.62 11.67 11.51 11.86
Nanticoke 11.32 11.45 12.28 13.39 13.28 12.86 13.02 13.08 13.12 12.76
Sanford 10.96 11.70 10.98 12.27 13.04 12.64 12.81 12.65 12.90 12.80
Triangle 10.95 11.62 11.50 11.69 7.43 7.39 7.55 7.59 7.48 7.23
Union 159.30 148.03 150.81 149.46 162.90 174.42 173.64 176.70 174.08 171.02
Vestal 6.79 7.08 7.24 7.36 7.43 7.39 7.55 7.59 7.48 7.23
Windsor 10.21 10.42 10.35 10.83 11.10 10.71 10.64 10.61 10.76 10.70
Source: New York State Comptroller’s Report: Overall Real Property Taxes, Fiscal Years ended in
various years used.
200
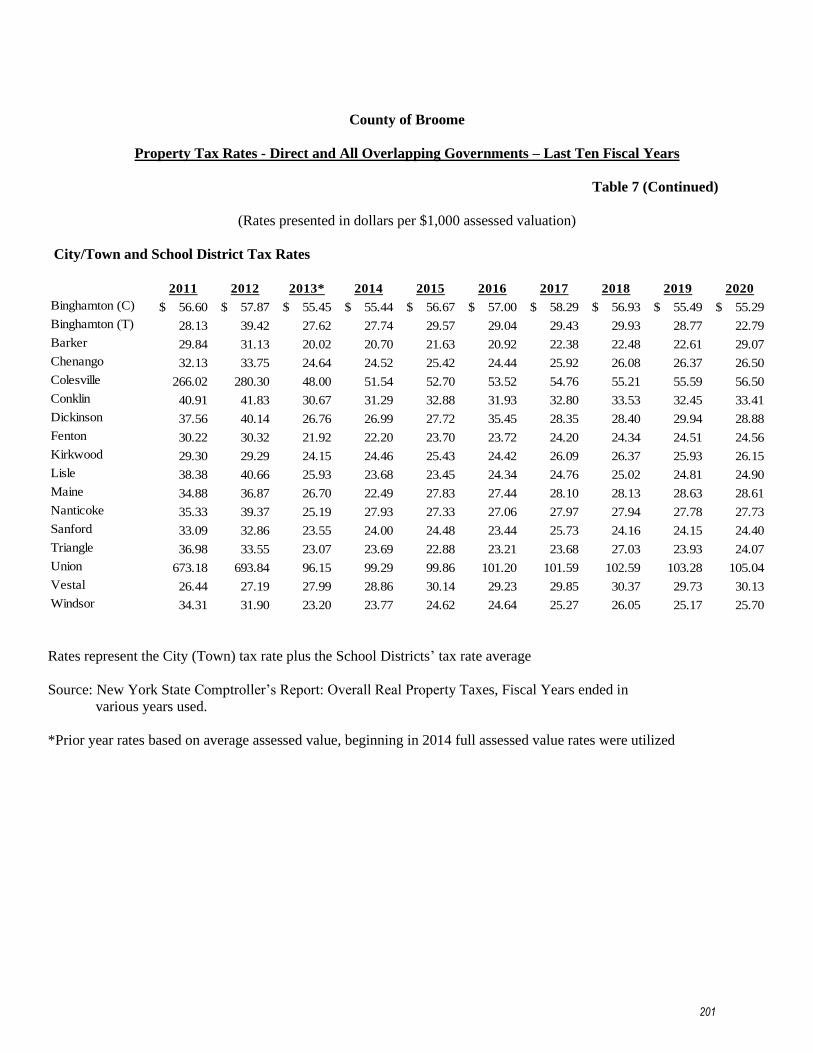
County of Broome
Property Tax Rates - Direct and All Overlapping Governments – Last Ten Fiscal Years
Table 7 (Continued)
(Rates presented in dollars per $1,000 assessed valuation)
City/Town and School District Tax Rates
2011 2012 2013* 2014 2015 2016 2017 2018 2019 2020
Binghamton (C) 56.60$ 57.87$ 55.45$ 55.44$ 56.67$ 57.00$ 58.29$ 56.93$ 55.49$ 55.29$
Binghamton (T) 28.13 39.42 27.62 27.74 29.57 29.04 29.43 29.93 28.77 22.79
Barker 29.84 31.13 20.02 20.70 21.63 20.92 22.38 22.48 22.61 29.07
Chenango 32.13 33.75 24.64 24.52 25.42 24.44 25.92 26.08 26.37 26.50
Colesville 266.02 280.30 48.00 51.54 52.70 53.52 54.76 55.21 55.59 56.50
Conklin 40.91 41.83 30.67 31.29 32.88 31.93 32.80 33.53 32.45 33.41
Dickinson 37.56 40.14 26.76 26.99 27.72 35.45 28.35 28.40 29.94 28.88
Fenton 30.22 30.32 21.92 22.20 23.70 23.72 24.20 24.34 24.51 24.56
Kirkwood 29.30 29.29 24.15 24.46 25.43 24.42 26.09 26.37 25.93 26.15
Lisle 38.38 40.66 25.93 23.68 23.45 24.34 24.76 25.02 24.81 24.90
Maine 34.88 36.87 26.70 22.49 27.83 27.44 28.10 28.13 28.63 28.61
Nanticoke 35.33 39.37 25.19 27.93 27.33 27.06 27.97 27.94 27.78 27.73
Sanford 33.09 32.86 23.55 24.00 24.48 23.44 25.73 24.16 24.15 24.40
Triangle 36.98 33.55 23.07 23.69 22.88 23.21 23.68 27.03 23.93 24.07
Union 673.18 693.84 96.15 99.29 99.86 101.20 101.59 102.59 103.28 105.04
Vestal 26.44 27.19 27.99 28.86 30.14 29.23 29.85 30.37 29.73 30.13
Windsor 34.31 31.90 23.20 23.77 24.62 24.64 25.27 26.05 25.17 25.70
Rates represent the City (Town) tax rate plus the School Districts’ tax rate average
Source: New York State Comptroller’s Report: Overall Real Property Taxes, Fiscal Years ended in
various years used.
*Prior year rates based on average assessed value, beginning in 2014 full assessed value rates were utilized
201

Cou
nty
of
Bro
om
e
Pri
nci
pal
Taxp
ayer
s –
Last
Ten
Fis
cal
Yea
rs
Ta
ble
8
Per
cen
tage
Per
cen
tage
Per
cen
tage
Taxab
leo
f T
axab
leT
axab
leo
f T
axab
leT
axab
leo
f T
axab
le
Ass
esse
dA
sses
sed
Ass
esse
dA
sses
sed
Ass
esse
dA
sses
sed
Valu
eR
an
kV
alu
eV
alu
eR
an
kV
alu
eV
alu
eR
an
kV
alu
e
NY
S E
lect
ric
& G
as C
orp
ora
tion
406,4
34,8
79
$
14.0
6
407,7
11,9
19
$
14.1
9
404,9
70,6
95
$
14.3
2
Huro
n R
ealty
174,9
32,5
32
21.7
5
41,6
01,0
31
5
0.4
3
40,5
96,5
79
6
0.4
3
United
Hea
lth S
ervic
es76,5
49,0
00
3
0.7
7
71,7
44,6
11
2
0.7
4
71,8
95,9
05
2
0.7
7
Our
Lad
y o
f L
ourd
es63,5
03,9
74
4
0.6
3
58,2
74,2
35
4
0.6
0
59,6
78,4
34
3
0.6
4
Oak
dal
e M
all A
ssoci
ates
LP
61,8
46,3
19
5
0.6
2
59,9
33,5
46
3
0.6
2
58,4
86,4
59
4
0.6
2
NG
E G
ener
atio
n I
nc
52,3
95,2
98
6
0.5
2
27,4
28,5
57
6
0.2
8
26,7
65,8
95
7
0.2
9
Gle
nco
tt R
ealty C
orp
26,1
33,9
79
7
0.2
6
25,3
25,7
11
8
0.2
6
24,7
14,2
25
10
0.2
6
Tow
n S
quar
e M
all A
ssoci
ates
25,3
56,5
00
8
0.2
5
25,3
56,5
00
7
0.2
6
-
-
Ver
izon
25,1
54,6
81
9
0.2
5
18,5
21,0
06
10
0.1
9
-
-
FG
R R
ealty L
LC
23,1
72,0
24
10
0.2
3
23,2
47,6
45
9
0.2
4
-
-
Las
er N
ort
hea
st G
ather
ing
Co
-
-
-
-
43,9
74,6
88
5
0.4
7
Ves
tal P
arkw
ay P
laza
LL
C-
-
-
-
26,3
99,1
01
8
0.2
8
Ves
tal T
ow
n S
quar
e L
LC
-
-
-
-
25,3
56,5
00
9
0.2
7
935,4
79,1
86
$
9.3
4
759,1
44,7
61
$
7.8
1
782,8
38,4
81
$
8.3
5
2011
2012
2013
202
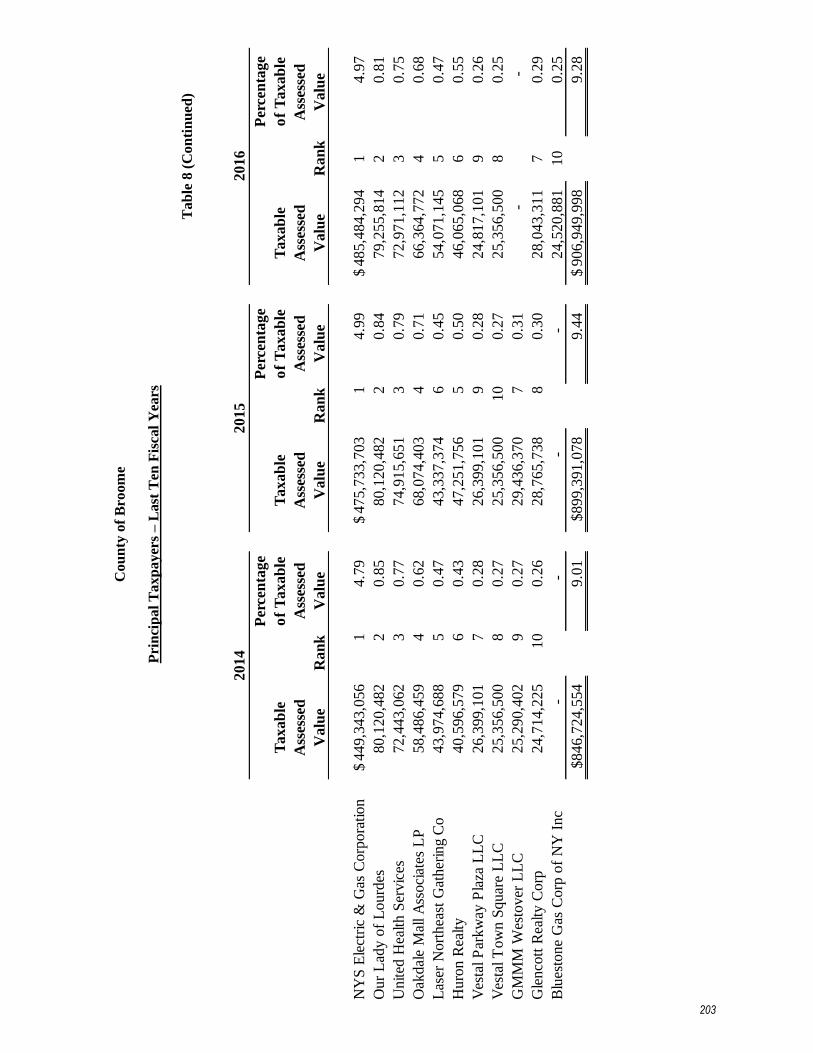
Cou
nty
of
Bro
om
e
Pri
nci
pal
Taxp
ayer
s –
Last
Ten
Fis
cal
Yea
rs
Ta
ble
8 (
Co
nti
nu
ed)
Per
cen
tage
Per
cen
tage
Per
cen
tage
Taxab
leo
f T
axab
leT
axab
leo
f T
axab
leT
axab
leo
f T
axab
le
Ass
esse
dA
sses
sed
Ass
esse
dA
sses
sed
Ass
esse
dA
sses
sed
Valu
eR
an
kV
alu
eV
alu
eR
an
kV
alu
eV
alu
eR
an
kV
alu
e
NY
S E
lect
ric
& G
as C
orp
ora
tion
449,3
43,0
56
$
14.7
9
475,7
33,7
03
$
14.9
9
485,4
84,2
94
$
14.9
7
Our
Lad
y o
f L
ourd
es80,1
20,4
82
2
0.8
5
80,1
20,4
82
2
0.8
4
79,2
55,8
14
2
0.8
1
United
Hea
lth S
ervic
es72,4
43,0
62
3
0.7
7
74,9
15,6
51
3
0.7
9
72,9
71,1
12
3
0.7
5
Oak
dal
e M
all A
ssoci
ates
LP
58,4
86,4
59
4
0.6
2
68,0
74,4
03
4
0.7
1
66,3
64,7
72
4
0.6
8
Las
er N
ort
hea
st G
ather
ing
Co
43,9
74,6
88
5
0.4
7
43,3
37,3
74
6
0.4
5
54,0
71,1
45
5
0.4
7
Huro
n R
ealty
40,5
96,5
79
6
0.4
3
47,2
51,7
56
5
0.5
0
46,0
65,0
68
6
0.5
5
Ves
tal P
arkw
ay P
laza
LL
C26,3
99,1
01
7
0.2
8
26,3
99,1
01
9
0.2
8
24,8
17,1
01
9
0.2
6
Ves
tal T
ow
n S
quar
e L
LC
25,3
56,5
00
8
0.2
7
25,3
56,5
00
10
0.2
7
25,3
56,5
00
8
0.2
5
GM
MM
Wes
tover
LL
C
25,2
90,4
02
9
0.2
7
29,4
36,3
70
7
0.3
1
-
-
Gle
nco
tt R
ealty C
orp
24,7
14,2
25
10
0.2
6
28,7
65,7
38
8
0.3
0
28,0
43,3
11
7
0.2
9
Blu
esto
ne
Gas
Corp
of
NY
Inc
-
-
-
-
24,5
20,8
81
10
0.2
5
846,7
24,5
54
$
9.0
1
899,3
91,0
78
$
9.4
4
906,9
49,9
98
$
9.2
8
2014
2015
2016
203

Cou
nty
of
Bro
om
e
Pri
nci
pal
Taxp
ayer
s –
Last
Ten
Fis
cal
Yea
rs
Ta
ble
8 (
Co
nti
nu
ed)
Perc
en
tag
eP
erc
en
tag
eP
erc
en
tag
e
Ta
xab
leo
f T
ax
ab
leT
ax
ab
leo
f T
ax
ab
leT
ax
ab
leo
f T
ax
ab
le
Ass
ess
ed
Ass
ess
ed
Ass
ess
ed
Ass
ess
ed
Ass
ess
ed
Ass
ess
ed
Valu
eR
an
kV
alu
eV
alu
eR
an
kV
alu
eV
alu
eR
an
kV
alu
e
NY
S E
lectr
ic &
Gas
Corp
ora
tio
n4
88,9
03,1
99
$
15
.09
4
81,4
79,6
02
$
14
.96
4
80,9
39,7
58
$
14
.91
Ou
r L
ady
of
Lo
urd
es
81
,04
1,6
67
2
0.8
4
81
,04
1,6
67
2
0.8
3
81
,04
1,6
67
2
0.8
3
Un
ited
Health
Serv
ices
74
,48
5,0
80
3
0.7
7
74
,51
6,9
96
4
0.6
5
74
,51
6,9
96
4
0.7
6
Oakd
ale
Mall I
I L
LC
67
,28
6,5
05
4
0.7
0
67
,28
6,5
05
5
0.6
9
67
,28
6,5
05
5
0.6
9
Lase
r N
ort
heast
Gath
eri
ng C
o6
3,7
03,9
05
5
0.6
6
76
,00
0,0
42
3
0.7
8
76
,00
0,0
42
3
0.7
8
Hu
ron
Realt
y4
6,7
04,8
61
6
0.4
9
46
,70
4,8
61
6
0.4
8
46
,70
4,8
61
6
0.4
8
No
rfo
lk S
outh
ern
Corp
ora
tio
n4
2,0
65,7
67
70
.44
4
3,6
28,6
64
7
0.4
5
43
,62
8,6
64
7
0.4
5
Gle
ncott
Realt
y C
orp
2
8,4
32,8
01
8
0.3
0
28
,43
2,8
01
8
0.2
9
28
,43
2,8
01
8
0.2
9
Vest
al T
ow
n S
quare
LL
C
25
,35
6,5
00
9
0.2
6
25
,35
6,5
00
10
0.2
6
25
,35
6,5
00
10
0.2
6
Vest
al P
ark
way
Pla
za L
LC
2
4,8
17,1
01
10
0.2
6
--
-
-
Blu
est
on
e G
as
Corp
of
NY
In
c-
-2
5,6
54,8
74
9
0.2
6
25
,65
4,8
74
9
0.2
6
94
2,7
97,3
85
$
9.8
1
95
0,1
02,5
12
$
0.1
0
94
9,5
62,6
68
$
9.7
1
2017
2018
2019
204

Cou
nty
of
Bro
om
e
Pri
nci
pal
Taxp
ayer
s –
Last
Ten
Fis
cal
Yea
rs
Ta
ble
8 (
Co
ncl
ud
ed)
Perc
en
tage
Taxab
leo
f T
axab
le
Ass
ess
ed
Ass
ess
ed
Valu
eR
an
kV
alu
e
NY
S E
lectr
ic &
Gas
Corp
ora
tion
483,4
37,5
08
$
1
4.8
2
Our
Lady o
f L
ourd
es
86,1
70,8
86
20.8
6
United H
ealth S
erv
ices,
Inc.
79,5
60,6
70
30.7
9
Oakdale
Mall I
I, L
LC
66,7
18,9
88
40.6
7
FG
R R
eal
ty,
LL
C52,4
30,4
20
50.5
2
Huro
n R
eal
Est
ate
Ass
oc.
LL
C44,7
08,2
35
60.4
5
Norf
olk
South
ern
Corp
ora
tion
43,8
32,7
01
70.4
4
William
s F
ield
Serv
ices
Co,
LL
C41,3
16,4
04
80.4
1
Lase
r N
ort
heas
t G
ath
eri
ng
37,0
17,2
10
90.3
7
NG
E G
enera
tion,
Inc.
31,1
73,2
94
10
0.3
1
966,3
66,3
16
$
9.6
4
2020
Sourc
e: C
ounty
of
Bro
om
e R
eal
Pro
per
ty T
ax R
oll
s
205

Cou
nty
of
Bro
om
e
Pro
per
ty T
ax L
evie
s an
d C
oll
ecti
on
s –
Last
Ten
Fis
cal
Yea
rs
Ta
ble
9
Co
llecti
on
s
Year
Pro
pert
y T
axes
In
En
din
gL
evie
d f
or
the
Fir
st Y
ear
Perc
en
tage
Su
bse
qu
en
tP
erc
en
tage
Perc
en
tage
12/3
1F
iscal
Year
Am
ou
nt
of
Levy
Years
Am
ou
nt
of
Levy
Am
ou
nt
of
Levy
2011
147,6
42,3
22
$
139,4
02,0
19
$
94.4
2
8,1
36,4
59
$
147,5
38,4
78
$
99.9
3103,8
44
$
0.0
7
2012
150,1
30,7
92
142,4
76,3
43
94.9
0
7,5
46,6
90
150,0
23,0
33
99.9
3107,7
59
0.0
7
2013
151,0
59,4
78
143,8
78,2
10
95.2
5
7,0
91,8
82
150,9
70,0
93
99.9
489,3
85
0.0
6
2014
154,1
01,3
19
146,7
33,8
10
95.2
2
7,2
40,6
68
153,9
74,4
78
99.9
2126,8
41
0.0
8
2015
156,1
00,4
96
147,5
70,0
98
94.5
4
8,3
56,2
86
155,9
26,3
84
99.8
9174,1
12
0.1
1
2016
158,1
71,0
32
149,1
39,5
77
94.2
9
8,5
78,5
14
157,7
18,0
91
99.7
1452,9
41
0.2
9
2017
158,3
89,8
09
149,5
94,7
63
94.4
5
7,7
43,8
38
157,3
38,6
01
99.3
41,0
51,2
08
0.6
6
2018
159,5
60,3
79
150,9
38,5
83
94.6
0
6,3
83,2
29
157,3
21,8
11
98.6
02,2
38,5
68
1.4
0
2019
160,1
96,3
19
151,0
11,8
12
94.2
7
4,0
95,0
22
155,1
06,8
34
96.8
25,0
89,4
85
3.1
8
2020
160,0
63,0
44
150,4
28,8
81
93.9
8
N/A
150,4
28,8
81
93.9
89,6
34,1
63
6.0
2
Co
llecte
d W
ith
in t
he
Ou
tsta
nd
ing
Fis
cal
Year
of
the L
evy
To
tal
Co
llecti
on
s to
Date
Deli
nq
uen
t T
axes
N
A -
Dat
a no
t yet
av
aila
ble
Note
: In
cludes
Sta
te, C
ou
nty
, T
ow
n, an
d S
pec
ial
Dis
tric
t T
axes
. S
ourc
e:
Bro
om
e C
ou
nty
Off
ice
of
Man
agem
ent
& B
udget
206
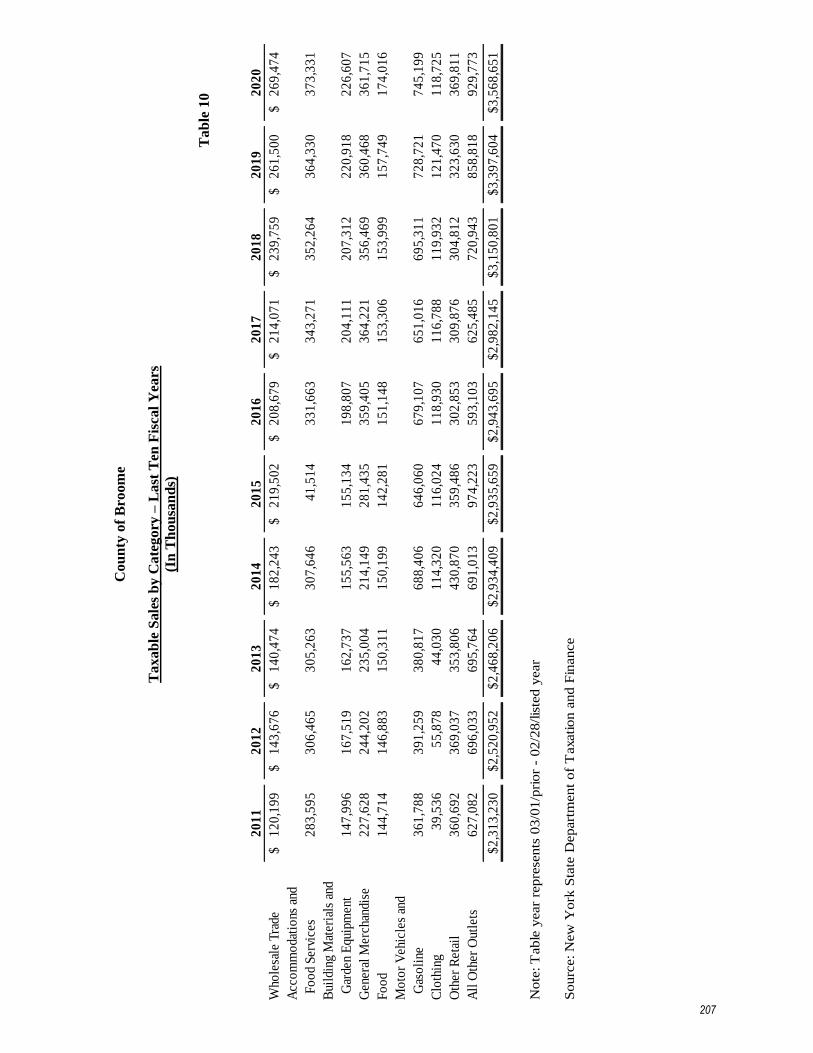
Cou
nty
of
Bro
om
e
Taxab
le S
ale
s b
y C
ate
gory
– L
ast
Ten
Fis
cal
Yea
rs
(In
Th
ou
san
ds)
Ta
ble
10
20
11
20
12
20
13
20
14
20
15
20
16
20
17
20
18
20
19
20
20
Who
lesa
le T
rade
12
0,1
99
$
1
43
,67
6$
14
0,4
74
$
1
82
,24
3$
21
9,5
02
$
2
08
,67
9$
21
4,0
71
$
2
39
,75
9$
26
1,5
00
$
2
69
,47
4$
Acc
om
mo
dati
ons
and
Fo
od
Ser
vice
s2
83
,59
5
3
06
,46
53
05
,26
33
07
,64
6
4
1,5
14
3
31
,66
3
3
43
,27
1
3
52
,26
4
3
64
,33
0
3
73
,33
1
Bui
ldin
g M
ater
ials
and
Gar
den
Equ
ipm
ent
14
7,9
96
16
7,5
19
16
2,7
37
15
5,5
63
15
5,1
34
19
8,8
07
20
4,1
11
20
7,3
12
22
0,9
18
22
6,6
07
Gen
eral
Mer
chan
dise
22
7,6
28
24
4,2
02
23
5,0
04
21
4,1
49
28
1,4
35
35
9,4
05
36
4,2
21
35
6,4
69
36
0,4
68
36
1,7
15
Fo
od
14
4,7
14
14
6,8
83
15
0,3
11
15
0,1
99
14
2,2
81
15
1,1
48
15
3,3
06
15
3,9
99
15
7,7
49
17
4,0
16
Mo
tor
Veh
icle
s an
d
Gas
oli
ne3
61
,78
8
3
91
,25
93
80
,81
76
88
,40
6
6
46
,06
0
6
79
,10
7
6
51
,01
6
6
95
,31
1
7
28
,72
1
7
45
,19
9
Clo
thin
g3
9,5
36
5
5,8
78
44
,03
01
14
,32
0
1
16
,02
4
1
18
,93
0
1
16
,78
8
1
19
,93
2
1
21
,47
0
1
18
,72
5
Oth
er R
etai
l3
60
,69
2
3
69
,03
73
53
,80
64
30
,87
0
3
59
,48
6
3
02
,85
3
3
09
,87
6
3
04
,81
2
3
23
,63
0
3
69
,81
1
All
Oth
er O
utle
ts6
27
,08
2
6
96
,03
3
6
95
,76
4
6
91
,01
3
9
74
,22
3
5
93
,10
3
6
25
,48
5
7
20
,94
3
8
58
,81
8
9
29
,77
3
2,3
13
,23
0$
2
,52
0,9
52
$
2,4
68
,20
6$
2
,93
4,4
09
$
2,9
35
,65
9$
2
,94
3,6
95
$
2,9
82
,14
5$
3
,15
0,8
01
$
3,3
97
,60
4$
3
,56
8,6
51
$
Note
: T
able
year
repre
sents
03/0
1/p
rior
- 02/2
8/lis
ted y
ear
Sourc
e: N
ew
York
Sta
te D
epart
ment
of
Taxation a
nd F
inance
207

Cou
nty
of
Bro
om
e
Rati
o o
f O
uts
tan
din
g D
ebt
by T
yp
e -
Last
Ten
Fis
cal
Yea
rs
Ta
ble
11
Per
cen
tage
Gen
eral
Bo
nd
Cer
tifi
cate
sG
ener
alB
on
dT
ota
lo
f
Ob
liga
tio
nA
nti
cip
atio
no
fC
apit
alO
bli
gati
on
An
tici
pat
ion
Cap
ital
Pri
mar
yP
erso
nal
Per
Yea
rB
on
ds
No
tes
Par
tici
pat
ion
Lea
ses
Bo
nd
sN
ote
sL
ease
sG
ove
rnm
ent
Inco
me a
Cap
ita a
2011
51,2
85,8
08$
5,92
1,29
7$
16,1
45,0
00$
4,42
9,24
4$
28,3
72,7
62$
10,4
41,0
03$
299,
466
$
11
6,89
4,58
0$
1.
63
586.
39$
2012
52,1
45,1
48
29
,316
,398
-
3,
608,
218
25,4
95,6
52
10
,495
,602
174,
188
121,
235,
206
1.
59
610.
27
2013
45,6
24,0
91
43
,270
,702
-
2,
715,
444
21,8
13,9
09
12
,399
,298
17,9
31
125,
841,
375
1.
62
635.
85
2014
40,6
35,6
55
49
,237
,877
-
1,
544,
811
18,7
75,8
45
21
,741
,123
17,9
31
131,
953,
242
1.
76
668.
96
2015
35,9
89,1
7249
,237
,877
-
2,
756,
252
15,8
65,8
2833
,124
,337
15,7
77
136,
989,
244
1.
77
699.
66
2016
47,7
71,9
5342
,244
,153
-
2,
109,
415
18,5
78,0
4717
,375
,847
9,17
4
13
6,33
5,80
3
1.75
70
1.51
2017
42,2
59,7
3354
,570
,753
-
1,
395,
866
15,8
25,2
6717
,723
,247
10,9
38
131,
785,
803
1.
59
682.
97
2018
50,4
33,4
1446
,106
,592
-
73
7,67
3
17,6
51,5
8614
,038
,408
7,27
2
12
8,97
4,94
5
1.51
67
2.94
2019
44,7
36,5
2755
,463
,556
-
73
1,75
0
15,3
98,4
7321
,080
,444
14,7
08
137,
425,
458
1.
56
721.
44
2020
47,5
65,0
5855
,722
,144
-
1,
120,
956
20,5
39,9
4212
,415
,856
16,1
10
137,
380,
065
N
/AN
/A
Go
vern
men
tal
Act
ivit
ies
Bu
sin
ess-
typ
e A
ctiv
itie
s
a See
Tab
le 1
5 f
or
per
sonal
in
com
e an
d p
opu
lati
on
dat
a
N/A
- D
ata
not
yet
avai
lable
So
urc
e:
County
Gen
eral
Pu
rpo
se/B
asic
Fin
anci
al S
tate
men
ts
208

Cou
nty
of
Bro
om
e
Ra
tio
of
Net
Gen
eral
Bon
ded
Deb
t O
uts
tan
din
g -
Last
Ten
Fis
cal
Yea
rs
Ta
ble
12
Perc
en
tage o
f
Gen
era
lB
on
dA
ctu
al
Taxab
le
Ob
ligati
on
An
ticip
ati
on
Valu
e o
fP
er
Bo
nd
s a
No
tes
To
tal
Pro
pert
y a
Cap
ita b
85,0
23,6
00
$
16,4
40,0
00
$
101,4
63,6
00
$
1.0
1
509.7
9$
77,6
40,8
00
39,8
12,0
00
117,4
52,8
00
1.2
1
593.0
2
71,9
45,6
94
55,6
70,0
00
127,6
15,6
94
1.3
6
646.0
4
59,4
11,5
00
70,9
79,0
00
130,3
90,5
00
1.3
9
660.7
1
51,8
55,0
00
91,1
00,0
00
142,9
55,0
00
1.5
0
727.2
6
66,3
50,0
00
59,6
20,0
00
125,9
70,0
00
1.2
9
648.1
8
58,0
85,0
00
72,2
94,0
00
130,3
79,0
00
1.3
6
675.6
8
68,0
85,0
00
60,1
45,0
00
128,2
30,0
00
1.3
2
669.0
5
60,1
35,0
00
76,5
44,0
00
136,6
79,0
00
1.4
0
717.5
2
68,1
05,0
00
68,1
38,0
00
136,2
43,0
00
1.3
6
715.2
3
aS
ee T
able
6 f
or
pro
per
ty t
ax d
ata.
bS
ee T
able
15 f
or
popula
tion d
ata.
Year
2011
2012
2018
2019
2020
2013
2014
2015
2016
2017
So
urc
e: C
ou
nty
Gen
eral
Purp
ose
/Bas
ic F
inan
cial
Sta
tem
ents
209

County of Broome
Direct and Overlapping Governmental Activities Debt
Table 13
Debt Excluded Estimated Estimated Share
from Debt Debt Subject Total Percentage of Overlapping
Limit a to Debt Limit Indebteness Applicable
b Debt
City of Binghamton 54,736,628$ 185,553,900$ 240,290,528$ 100 240,290,528$
Towns Binghamton 400,000 775,000 1,175,000 100 1,175,000
Chenango 2,772,633 4,947,667 7,720,299 100 7,720,299
Conklin 701,277 777,968 1,479,245 100 1,479,245
Dickinson 620,000 24,167 644,167 100 644,167
Fenton 331,250 105,957 437,207 100 437,207
Kirkwood 2,455,000 34,398 2,489,398 100 2,489,398
Lisle 144,000 - 144,000 100 144,000
Maine 685,000 - 685,000 100 685,000
Nanticoke 100,800 114,254 215,054 100 215,054
Sanford 1,680,000 - 1,680,000 100 1,680,000
Union 13,242,134 151,440 13,393,574 100 13,393,574
Vestal 11,100,333 5,462,483 16,562,816 100 16,562,816
Windsor 5,226,035 - 5,226,035 100 5,226,035
Villages Deposit 1,215,749 2,300,505 3,516,254 100 3,516,254
Endicott 17,317,609 152,722 17,470,331 100 17,470,331
Johnson City 18,179,465 102,447,576 120,627,041 100 120,627,041
Port Dickinson 113,587 - 113,587 100 113,587
Whitney Point 312,911 4,898,863 5,211,774 100 5,211,774
School Districts Binghamton 62,270,000 5,000,000 67,270,000 100 67,270,000
Chenango Forks 26,298,000 - 26,298,000 99 25,913,297
Chenango Valley 27,727,480 - 27,727,480 100 27,727,480
Deposit 9,004,505 - 9,004,505 38 3,410,624
Harpursville 13,317,000 - 13,317,000 90 12,046,344
Johnson City 43,681,187 - 43,681,187 100 43,681,187
Maine Endwell 39,992,639 - 39,992,639 98 39,264,903
Susquehanna Valley 32,679,264 - 32,679,264 100 32,679,264
Union - Endicott 48,398,960 - 48,398,960 87 42,305,150
Vestal 23,668,828 - 23,668,828 90 21,330,136
Whitney Point 34,026,270 - 34,026,270 98 33,333,879
Windsor 22,247,578 - 22,247,578 100 22,247,578
Fire Districts Endwell 2,490,000 - 2,490,000 100 2,490,000
West Corners - 103,600 103,600 100 103,600
West Endicott 377,600 - 377,600 100 377,600
Subtotal Overlapping Debt 517,513,721$ 312,850,499$ 830,364,220$ 813,262,351
County Debt 137,363,956
Total Direct and Overlapping Debt 950,626,307$
210
County of Broome
Direct and Overlapping Debt Activities
Table 13 (Concluded)
Many governmental subdivisions located within the County of Broome have authority to issue debt and
levy taxes or cause taxes to be levied on the taxable real property within their boundaries. The amount of
total debt outstanding at the end of fiscal years completed in 2020 as reported in the Special Report on
Municipal Affairs is presented above. Amounts includable and amounts excludable from the debt limit are
presented separately. The debt limit is a percentage of the five-year average full valuation of real property
taxable for the specific municipality's purpose. The percentage is 7.0% for cities, towns and villages, 5.0%
for school districts located wholly or partly in a city with a population under 125,000, and 10.0% for all
other school districts.
Note: Overlapping governments are those that coincide, at least in part, with the geographic boundaries of
the County. This table estimates the portion of the outstanding debt that is borne by the residents and
businesses of the County. This process recognizes that, when considering the County’s ability to issue and
repay long-term debt, the entire debt burden borne by the residents and business should be considered.
However, this does not imply that every taxpayer is a resident, and therefore responsible for repaying the
debt, of each overlapping government.
a Pursuant to applicable constitutional and statutory provisions, this indebtedness is excludable from
gross indebtedness for purposes of computing the amount of the debt limit exercised.
b The percentage of overlapping debt applicable is estimated using the taxable full value for property
tax purposes. Applicable percentages were estimated by determining the portion of another
governmental unit’s taxable full value that is within the County’s boundaries and dividing it by each
government’s total full value.
211

Cou
nty
of
Bro
om
e
Leg
al
Deb
t M
arg
in –
Last
Ten
Fis
cal
Yea
rs
Ta
ble
14
Fiv
e Y
ear
Avera
ge V
alu
ation o
f T
axable
Real P
ropert
y9,8
86,6
20,5
85
$
Debt
Lim
it (
7%
there
of)
692,0
63,4
41
Debt
Applic
able
to L
imit
Bonds
(inclu
din
g B
room
e C
om
munity C
olle
ge)
68,1
05,0
00
Bond A
nticip
ation N
ote
s (i
nclu
din
g B
room
e C
om
munity C
olle
ge)
68,1
38,0
00
Tota
l N
et
Debt
Applic
able
to L
imit
136,2
43,0
00
Legal D
ebt
Marg
in555,8
20,4
41
$
Debt
Contr
acting P
ow
er
Exhaust
ed
19.6
9
Le
gal
De
bt
Marg
in C
alc
ula
tio
n f
or
Fis
cal
Ye
ar
20
20
2011
2012
2013
2014
2015
2016
2017
2018
2019
2020
Deb
t L
imit
564,
462,
347
$
603,
909,
310
$
675,
077,
153
$
668,
363,
168
$
668,
238,
802
$
666,
948,
373
$
672,
056,
098
$
677,
503,
536
$
684,
757,
820
$
692,
063,
441
$
Tot
al N
et D
ebt
App
licab
le
to
Lim
it10
1,46
3,60
011
7,45
2,80
012
7,61
5,69
313
0,39
0,49
914
2,95
4,99
912
5,96
9,99
913
0,37
9,00
012
8,23
0,00
013
6,67
9,00
013
6,24
3,00
0
Leg
al D
ebt
Mar
gin
462,
998,
747
$
486,
456,
510
$
547,
461,
460
$
537,
972,
669
$
525,
283,
803
$
540,
978,
374
$
541,
677,
098
$
549,
273,
536
$
548,
078,
820
$
555,
820,
441
$
Tot
al N
et D
ebt
App
licab
le t
o
th
e L
imit
as a
Per
cent
age
of
D
ebt
Lim
it17
.98
19
.45
18
.90
19
.51
21
.39
18
.89
19
.40
18
.93
19
.96
19
.69
So
urc
e: C
onst
ituti
onal
Tax
Lim
it
212

Cou
nty
of
Bro
om
e
Dem
ogra
ph
ic S
tati
stic
s – L
ast
Ten
Fis
cal
Yea
rs
Ta
ble
15
Tot
alP
ub
lic
Per
son
alP
er C
apit
aS
choo
lC
olle
ge
Inco
me
Per
son
alE
nro
llm
ent
En
roll
men
tB
room
eU
nit
ed
Yea
rP
opu
lati
on(i
n T
hou
san
ds)
Inco
me
(K -
12)
(Fu
ll-T
ime)
Cou
nty
Sta
te
Sta
tes
2011
199,
346
7,30
6,76
6$
36,6
54$
28,2
94
19,4
84
8
.60
8
.30
8.93
2012
198,
658
7,50
6,92
8
37,7
88
27,5
31
20,2
53
8
.70
8
.50
8.08
2013
197,
911
7,48
0,46
137
,797
26
,978
20,1
20
7
.80
7
.70
7.36
2014
197,
251
7,54
9,91
138
,276
26
,555
20,9
13
6.6
0
6.3
0 6.
16
2015
195,
794
7,80
9,50
439
,886
26
,194
21,1
39
6.0
0
5.3
0 5.
28
2016
194,
345
7,89
3,02
340
,613
28
,231
24,5
43
5.4
0
4.9
0 4.
88
2017
192,
959
8,29
1,51
8
42,9
70
25,5
72
24,4
40
5.5
0
4.7
0 4.
34
2018
191,
659
8,53
6,49
7
44,5
40
25,2
91
24,7
27
4.9
0
4.1
0 3.
89
2019
191,
659
8,83
1,15
5
46,3
61
24,9
82
24,2
75
4.7
0
4.0
0 3.
67
2020
190,
488
N/A
N/A
N/A
24,4
23
8.6
7
1
0.04
8.
12
Un
emp
loym
ent
Rat
e
N
/A -
Dat
a not
yet
avai
lable
Sourc
es:
Popula
tion
20
11
– 2
020
are
the
annual
est
imat
es o
f th
e popula
tion (
revis
ed J
uly
1, 20
21)
by
the
U.
S.
Cen
sus
Bu
reau
.
Per
Cap
ita
Inco
me
Un
ited
Sta
tes
Dep
artm
ent
of
Eco
nom
ic D
evel
opm
ent,
Bure
au o
f E
conom
ic A
nal
ysi
s
Sch
ool
Enro
llm
ent
New
Yo
rk S
tate
Dep
artm
ent
of
Educa
tion
Unem
plo
ym
ent
Rat
es
New
Yo
rk S
tate
Dep
artm
ent
of
Lab
or
/ U
nit
ed S
tate
Dep
artm
ent
of
Lab
or
213

Cou
nty
of
Bro
om
e
Pri
nci
pal
Em
plo
yer
s –
Last
Ten
Fis
cal
Yea
rs
Ta
ble
16
Perc
en
tag
eP
erc
en
tag
eP
erc
en
tag
e
of
To
tal
of
To
tal
of
To
tal
Co
un
tyC
ou
nty
Co
un
ty
Em
plo
yees
Ran
kE
mp
loy
ees
Em
plo
yees
Ran
kE
mp
loy
ees
Em
plo
yees
Ran
kE
mp
loy
ees
Bin
gh
am
ton U
niv
ers
ity
5,4
93
15
.86
5,4
93
15
.94
5,4
93
26
.04
Un
ited
Health
Serv
ices
5,4
28
25
.79
5,4
28
25
.87
5,5
08
16
.05
Ou
r L
ady
of
Lo
urd
es
Ho
spital
2,3
11
42
.46
2,3
11
32
.50
2,3
61
32
.59
New
Yo
rk S
tate
2,0
34
52
.17
2,0
34
42
.20
2,0
34
42
.24
Bro
om
e C
ou
nty
2,5
00
32
.67
1,9
13
52
.07
1,9
13
52
.10
Bro
om
e D
evelo
pm
en
tal C
ente
r1
,40
07
1.4
9
1
,40
06
1.5
2
1
,40
06
1.5
4
BA
E C
on
trol S
yst
em
s1
,30
08
1.3
9
1
,35
07
1.4
6
1
,35
07
1.4
8
En
dic
ott
In
terc
onn
ect
Tech
no
logie
s1
,60
06
1.7
1
1
,10
08
1.1
9
1
,10
08
1.2
1
Main
es
Pap
er
& F
ood
Serv
ice
1,1
00
91
.17
1,1
00
91
.19
1,0
49
91
.15
Board
of
Coo
pera
tiv
e E
ducatio
nal S
erv
ices
1,0
49
10
1.1
2
1
,04
910
1.1
4
NB
T B
ank
1,0
39
10
1.1
4
24
,21
52
5.8
22
3,1
78
25
.08
23
,24
72
5.5
4
Labo
r F
orc
e9
3,8
00
92
,40
09
1,0
00
2011
2012
2013
214
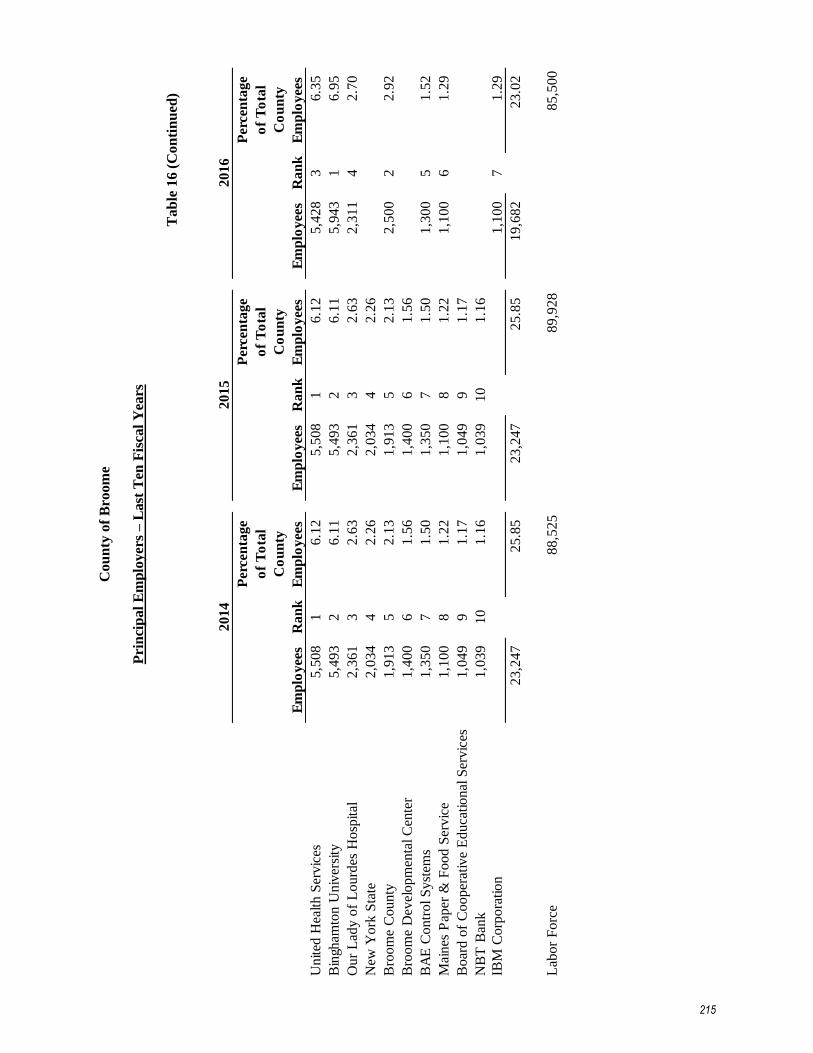
Cou
nty
of
Bro
om
e
Pri
nci
pal
Em
plo
yer
s –
Last
Ten
Fis
cal
Yea
rs
Ta
ble
16
(C
on
tin
ued
)
Per
cen
tag
eP
erce
nta
ge
Per
cen
tag
e
of
To
tal
of
To
tal
of
To
tal
Co
un
tyC
ou
nty
Co
un
ty
Em
plo
yee
sR
an
kE
mp
loy
ees
Em
plo
yee
sR
an
kE
mp
loy
ees
Em
plo
yee
sR
an
kE
mp
loy
ees
Un
ited
Hea
lth
Ser
vic
es5
,50
81
6.1
2
5
,50
8
16
.12
5,4
28
3
6.3
5
Bin
gham
ton U
niv
ersi
ty5
,49
32
6.1
1
5
,49
3
26
.11
5,9
43
16
.95
Ou
r L
ady
of
Lo
urd
es H
osp
ital
2,3
61
32
.63
2,3
61
3
2.6
3
2
,31
14
2.7
0
New
Yo
rk S
tate
2,0
34
42
.26
2,0
34
4
2.2
6
Bro
om
e C
ou
nty
1,9
13
52
.13
1,9
13
5
2.1
3
2
,50
0
22
.92
Bro
om
e D
evel
op
men
tal C
ente
r1
,40
06
1.5
6
1
,40
0
61
.56
BA
E C
on
trol S
yst
ems
1,3
50
71
.50
1,3
50
7
1.5
0
1
,30
0
51
.52
Mai
nes
Pap
er &
Fo
od
Ser
vic
e1
,10
08
1.2
2
1
,10
0
81
.22
1,1
00
6
1.2
9
Boar
d o
f C
oo
per
ativ
e E
duca
tio
nal
Ser
vic
es1
,04
99
1.1
7
1
,04
9
91
.17
NB
T B
ank
1,0
39
10
1.1
6
1
,03
9
10
1.1
6
IBM
Corp
ora
tio
n1
,10
0
71
.29
23
,24
72
5.8
52
3,2
47
25
.85
19
,68
22
3.0
2
Lab
or
Fo
rce
88
,52
58
9,9
28
85
,50
0
2015
2016
2014
215
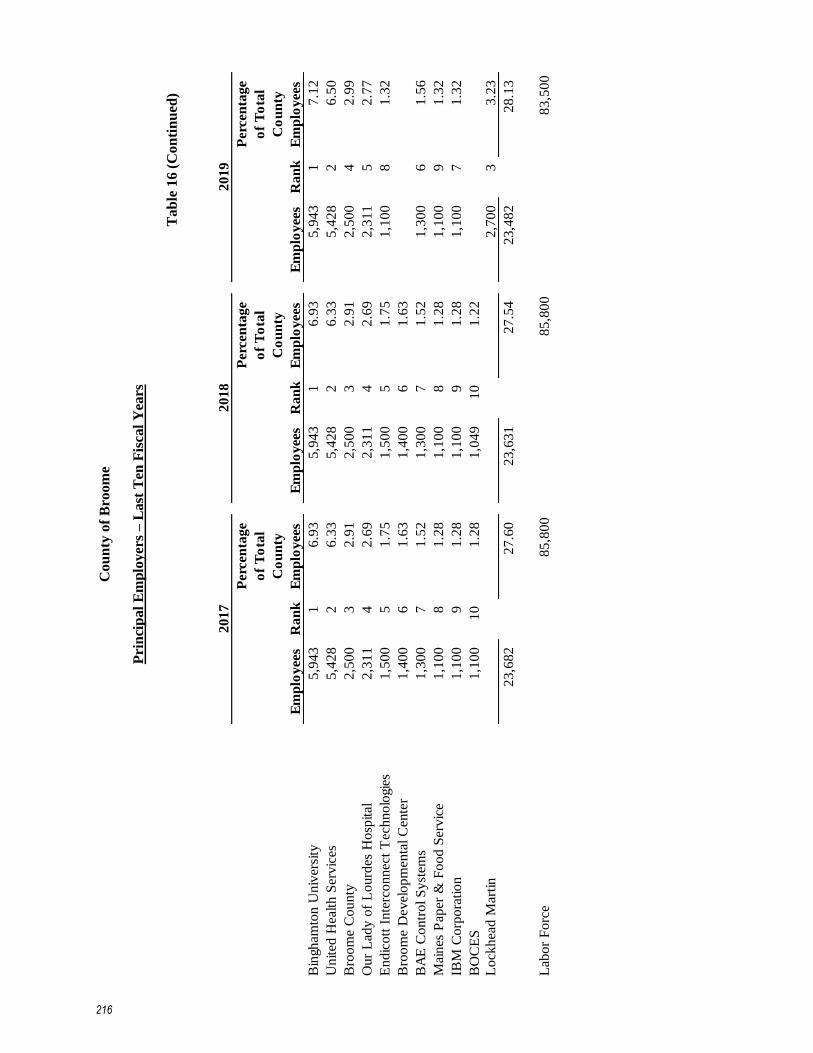
Cou
nty
of
Bro
om
e
Pri
nci
pal
Em
plo
yer
s –
Last
Ten
Fis
cal
Yea
rs
Ta
ble
16
(C
on
tin
ued
)
Perc
en
tag
eP
erc
en
tag
eP
erc
en
tag
e
of
To
tal
of
To
tal
of
To
tal
Co
un
tyC
ou
nty
Co
un
ty
Em
plo
yees
Ran
kE
mp
loy
ees
Em
plo
yees
Ran
kE
mp
loy
ees
Em
plo
yees
Ran
kE
mp
loy
ees
Bin
gham
ton U
niv
ersi
ty5
,94
3
1
6.9
3
5
,94
3
1
6.9
3
5
,94
3
1
7.1
2
Un
ited
Hea
lth
Ser
vic
es5
,42
8
2
6.3
3
5
,42
8
2
6.3
3
5
,42
8
2
6.5
0
Bro
om
e C
ou
nty
2,5
00
3
2
.91
2,5
00
3
2
.91
2,5
00
4
2
.99
Ou
r L
ady
of
Lo
urd
es H
osp
ital
2,3
11
4
2
.69
2,3
11
4
2
.69
2,3
11
5
2
.77
En
dic
ott
In
terc
onn
ect
Tec
hno
logi
es1
,50
0
5
1.7
5
1
,50
0
5
1.7
5
1
,10
0
8
1.3
2
Bro
om
e D
evel
op
men
tal C
ente
r1
,40
0
6
1.6
3
1
,40
0
6
1.6
3
BA
E C
on
trol S
yst
ems
1,3
00
7
1
.52
1,3
00
7
1
.52
1,3
00
6
1
.56
Mai
nes
Pap
er &
Fo
od
Ser
vic
e1
,10
0
8
1.2
8
1
,10
0
8
1.2
8
1
,10
0
9
1.3
2
IBM
Corp
ora
tio
n1
,10
0
9
1.2
8
1
,10
0
9
1.2
8
1
,10
0
7
1.3
2
BO
CE
S1
,10
0
10
1.2
8
1
,04
9
10
1.2
2
Lock
hea
d M
artin
2,7
00
3
3
.23
23
,68
22
7.6
02
3,6
31
27
.54
23
,48
22
8.1
3
Lab
or
Fo
rce
85
,80
08
5,8
00
83
,50
0
2019
2018
2017
216

Cou
nty
of
Bro
om
e
Pri
nci
pal
Em
plo
yer
s –
Last
Ten
Fis
cal
Yea
rs
Ta
ble
16
(C
on
clu
ded
)
Perc
en
tag
e
of
To
tal
Co
un
ty
Em
plo
yees
Ra
nk
Em
plo
yees
Un
ited
Health
Serv
ices
4,0
00
1
5
.36
Bin
gh
am
ton
Un
ivers
ity
3,0
00
2
4
.02
Bro
om
e C
ou
nty
1,8
83
3
2
.52
Lourd
es
Hosp
ital
1,8
00
4
2
.41
En
dic
ott
In
terc
onn
ect
1,8
00
5
2
.41
Main
es
Pap
er
& F
ood
Serv
ice
1,5
00
6
2
.01
IBM
Corp
ora
tio
n1
,45
0
7
1.9
4
BA
E S
yst
em
s1
,40
0
8
1.8
8
I3 E
lectr
on
ics
1,1
00
9
1
.47
Main
es
Pap
er
& F
ood
Serv
ices
1,1
00
10
1.4
7
19
,03
32
5.5
2
Labo
r F
orc
e7
4,5
81
2020
P
reli
min
ary d
ata,
su
bje
ct t
o r
evis
ion
.
Sourc
e: B
room
e C
ou
nty
ID
A
217

County of Broome
Construction and Bank Deposits – Last Ten Fiscal Years
Table 17
Bank
Fiscal Number Number Deposits in
Year of Permits Value of Permits Value Thousands b
2011 25 11,808,769$ 100 9,585,000$ 4,776,252$
2012 23 8,522,500 96 9,662,834 5,161,673
2013 59 34,842,189 135 17,411,323 5,310,332
2014 15 43,860,150 112 12,426,580 5,548,048
2015 37 78,640,485 152 25,262,837 5,845,010
2016 38 70,791,500 104 17,618,695 5,987,768
2017 188 41,445,060 129 39,822,016 3,451,127
2018 65 6,929,028 96 29,704,356 2,767,177
2019 24 8,985,470 75 11,859,075 2,875,796
2020 41 5,936,280 99 29,087,301 4,309,002
Residential
ConstructionConstruction a
Non-Residential
a Includes commercial, industrial, and public/semipublic construction b Includes FDIC, FSLIC, and NCUA insured banks.
Sources: Construction Data: County of Broome Planning Department
Bank Deposit Data: Federal Deposit Insurance Corporation (FDIC) and National
Credit Union Administration (NCUA)
218
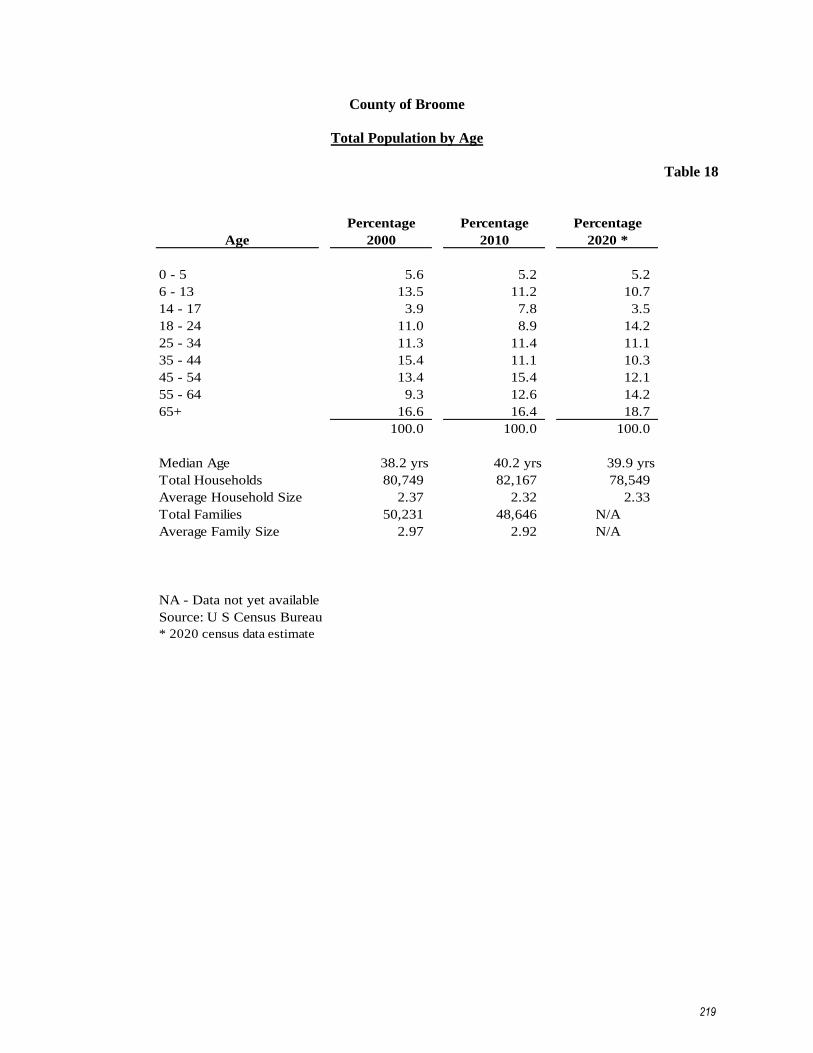
County of Broome
Total Population by Age
Table 18
Percentage Percentage Percentage
Age 2000 2010 2020 *
0 - 5 5.6 5.2 5.2
6 - 13 13.5 11.2 10.7
14 - 17 3.9 7.8 3.5
18 - 24 11.0 8.9 14.2
25 - 34 11.3 11.4 11.1
35 - 44 15.4 11.1 10.3
45 - 54 13.4 15.4 12.1
55 - 64 9.3 12.6 14.2
65+ 16.6 16.4 18.7
100.0 100.0 100.0
Median Age 38.2 yrs 40.2 yrs 39.9 yrs
Total Households 80,749 82,167 78,549
Average Household Size 2.37 2.32 2.33
Total Families 50,231 48,646 N/A
Average Family Size 2.97 2.92 N/A
NA - Data not yet available
Source: U S Census Bureau
* 2020 census data estimate
219
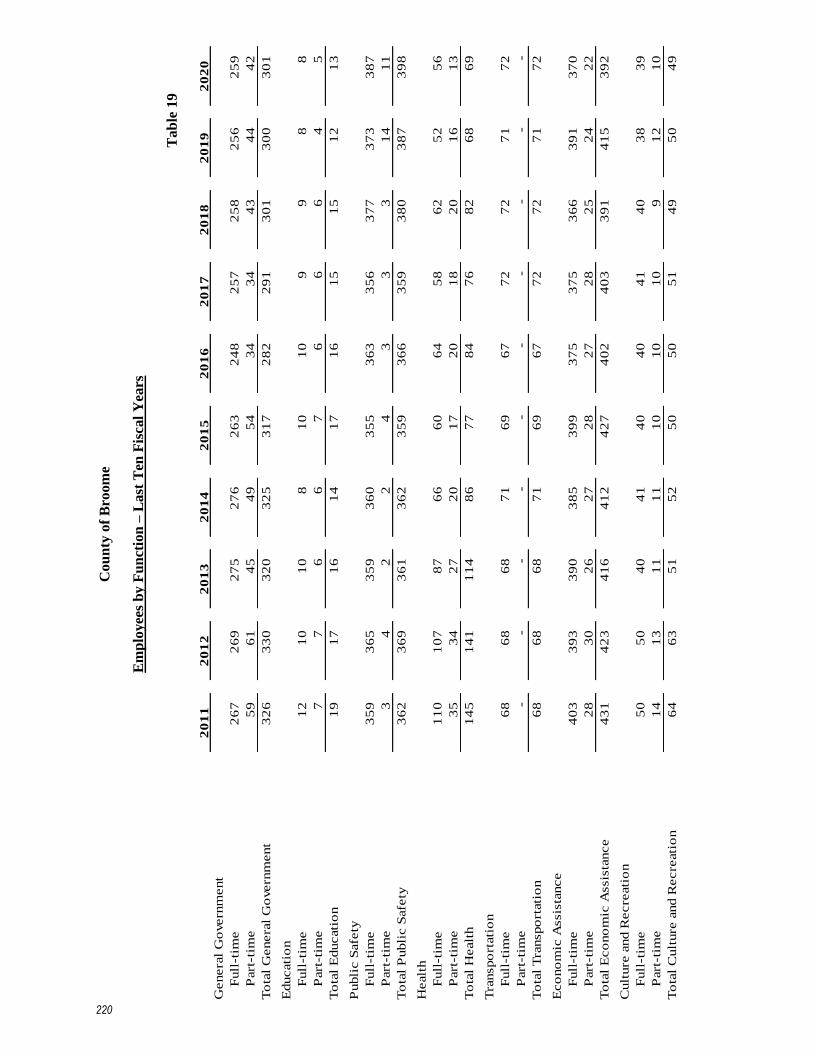
Cou
nty
of
Bro
om
e
Em
plo
yee
s b
y F
un
ctio
n –
Last
Ten
Fis
cal
Yea
rs
Ta
ble
19
20
11
20
12
20
13
20
14
20
15
20
16
20
17
20
18
20
19
20
20
Genera
l G
overn
ment
Full
-tim
e2
67
26
9
27
5
27
6
26
3
24
8
25
7
25
8
25
6
25
9
Part
-tim
e5
9
61
45
49
54
34
34
43
44
42
To
tal
Genera
l G
overn
ment
32
6
33
0
32
0
32
5
31
7
28
2
29
1
30
1
30
0
30
1
Educati
on
Full
-tim
e1
2
10
10
8
10
10
9
9
8
8
Part
-tim
e7
7
6
6
7
6
6
6
4
5
To
tal
Educati
on
19
17
16
14
17
16
15
15
12
13
Publi
c S
afe
ty
Full
-tim
e3
59
36
5
35
9
36
0
35
5
36
3
35
6
37
7
37
3
38
7
Part
-tim
e3
4
2
2
4
3
3
3
14
11
To
tal
Publi
c S
afe
ty3
62
36
9
36
1
36
2
35
9
36
6
35
9
38
0
38
7
39
8
Healt
h
Full
-tim
e1
10
10
7
87
66
60
64
58
62
52
56
Part
-tim
e3
5
34
27
20
17
20
18
20
16
13
To
tal
Healt
h1
45
14
1
11
4
86
77
84
76
82
68
69
Tra
nspo
rtati
on
Full
-tim
e6
8
68
68
71
69
67
72
72
71
72
Part
-tim
e-
-
-
-
-
-
-
-
-
-
To
tal
Tra
nspo
rtati
on
68
68
68
71
69
67
72
72
71
72
Eco
no
mic
Assis
tance
Full
-tim
e4
03
39
3
39
0
38
5
39
9
37
5
37
5
36
6
39
1
37
0
Part
-tim
e2
8
30
26
27
28
27
28
25
24
22
To
tal
Eco
no
mic
Assis
tance
43
1
42
3
41
6
41
2
42
7
40
2
40
3
39
1
41
5
39
2
Cult
ure
and R
ecre
ati
on
Full
-tim
e5
0
50
40
41
40
40
41
40
38
39
Part
-tim
e1
4
13
11
11
10
10
10
9
12
10
To
tal
Cult
ure
and R
ecre
ati
on
64
63
51
52
50
50
51
49
50
49
220
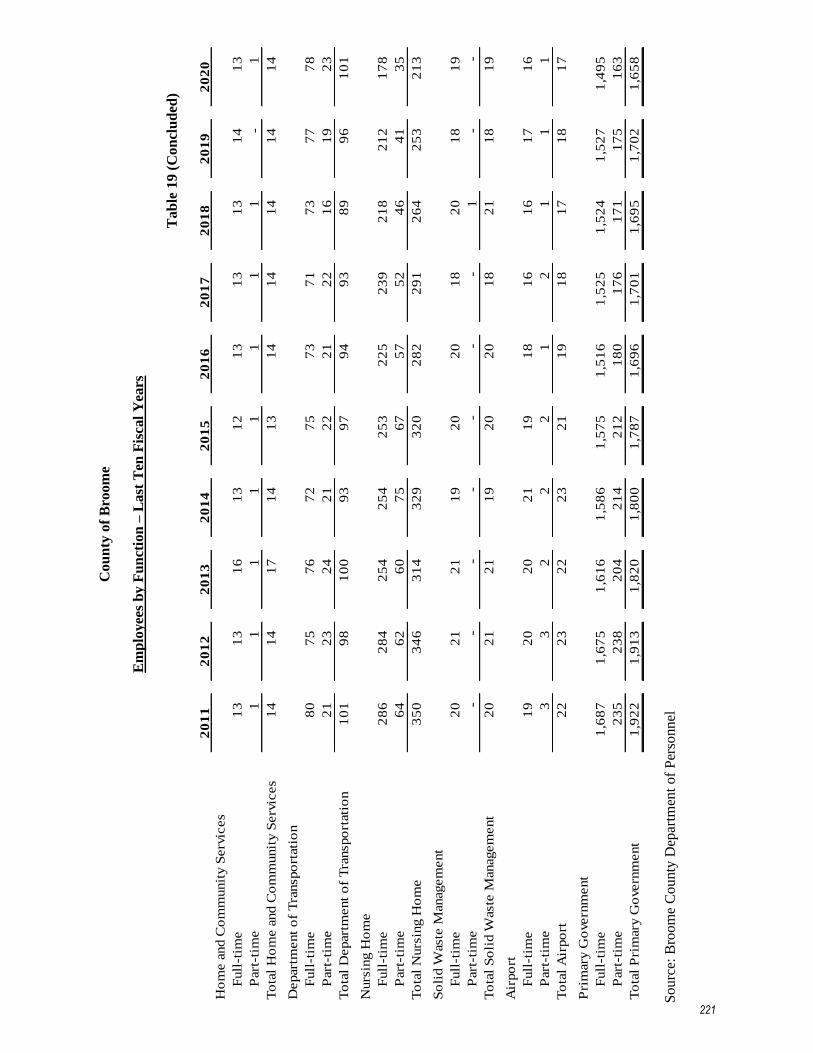
Cou
nty
of
Bro
om
e
Em
plo
yee
s b
y F
un
ctio
n –
Last
Ten
Fis
cal
Yea
rs
Ta
ble
19
(C
on
clu
ded
) 2
01
12
01
22
01
32
01
42
01
52
01
62
01
72
01
82
01
92
02
0
Ho
me a
nd C
om
munit
y S
erv
ices
Full
-tim
e1
3
13
16
13
12
13
13
13
14
13
Part
-tim
e1
1
1
1
1
1
1
1
-
1
To
tal
Ho
me a
nd C
om
munit
y S
erv
ices
14
14
17
14
13
14
14
14
14
14
Depart
ment
of
Tra
nspo
rtati
on
Full
-tim
e8
0
75
76
72
75
73
71
73
77
78
Part
-tim
e2
1
23
24
21
22
21
22
16
19
23
To
tal
Depart
ment
of
Tra
nspo
rtati
on
10
1
98
10
0
93
97
94
93
89
96
10
1
Nurs
ing H
om
e
Full
-tim
e2
86
28
4
25
4
25
4
25
3
22
5
23
9
21
8
21
2
17
8
Part
-tim
e6
4
62
60
75
67
57
52
46
41
35
To
tal
Nurs
ing H
om
e3
50
34
6
31
4
32
9
32
0
28
2
29
1
26
4
25
3
21
3
So
lid W
aste
Managem
ent
Full
-tim
e2
0
21
21
19
20
20
18
20
18
19
Part
-tim
e-
-
-
-
-
-
-
1
-
-
To
tal
So
lid W
aste
Managem
ent
20
21
21
19
20
20
18
21
18
19
Air
po
rt
Full
-tim
e1
9
20
20
21
19
18
16
16
17
16
Part
-tim
e3
3
2
2
2
1
2
1
1
1
To
tal
Air
po
rt2
2
23
22
23
21
19
18
17
18
17
Pri
mary
Go
vern
ment
Full
-tim
e1
,68
7
1,6
75
1,6
16
1,5
86
1,5
75
1,5
16
1,5
25
1,5
24
1,5
27
1,4
95
Part
-tim
e2
35
23
8
20
4
21
4
21
2
18
0
17
6
17
1
17
5
16
3
To
tal
Pri
mary
Go
vern
ment
1,9
22
1,9
13
1,8
20
1,8
00
1,7
87
1,6
96
1,7
01
1,6
95
1,7
02
1,6
58
S
ou
rce:
Bro
om
e C
ou
nty
Dep
artm
ent
of
Per
sonn
el
221
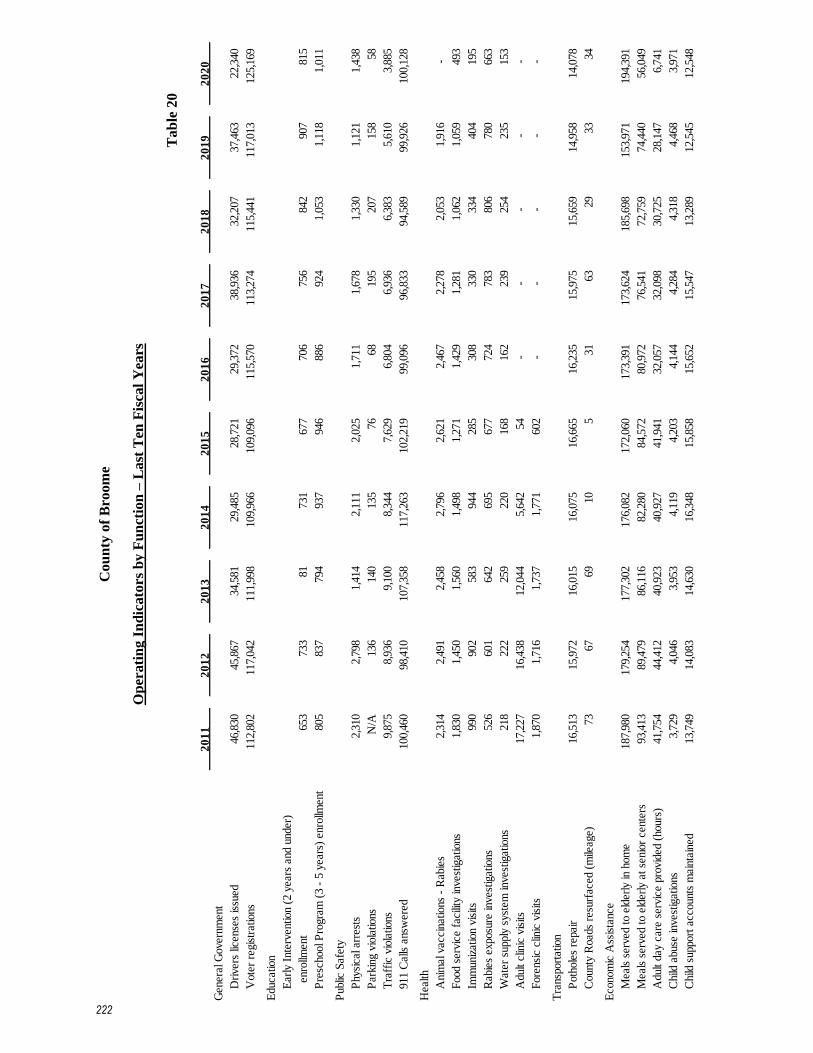
Cou
nty
of
Bro
om
e
Op
erati
ng I
nd
icato
rs b
y F
un
ctio
n –
Last
Ten
Fis
cal
Yea
rs
Ta
ble
20
2
01
12
01
22
01
32
01
42
01
52
01
62
01
72
01
82
01
92
02
0
Gen
eral
Gov
ernm
ent
Dri
vers
lice
nses
issu
ed46
,830
45,8
67
34
,581
29,4
85
28
,721
29,3
72
38
,936
32,2
07
37
,463
22,3
40
Vot
er r
egis
trat
ions
112,
802
11
7,04
2
111,
998
10
9,96
6
109,
096
11
5,57
0
113,
274
11
5,44
1
117,
013
12
5,16
9
Edu
catio
n
Ear
ly I
nter
vent
ion
(2 y
ears
and
und
er)
en
rollm
ent
653
733
81
731
677
706
756
842
907
815
Pre
scho
ol P
rogr
am (
3 -
5 ye
ars)
enr
ollm
ent
805
837
794
937
946
886
924
1,05
3
1,11
8
1,01
1
Pub
lic S
afet
y
Phy
sica
l arr
ests
2,31
0
2,79
8
1,41
4
2,11
1
2,02
5
1,71
1
1,67
8
1,33
0
1,12
1
1,43
8
Par
king
vio
latio
nsN
/A13
6
14
0
13
5
76
68
19
5
20
7
15
8
58
Tra
ffic
vio
latio
ns9,
875
8,
936
9,
100
8,
344
7,
629
6,
804
6,
936
6,
383
5,
610
3,
885
911
Cal
ls a
nsw
ered
100,
460
98
,410
107,
358
11
7,26
3
102,
219
99
,096
96,8
33
94
,589
99,9
26
10
0,12
8
Hea
lth
Ani
mal
vac
cina
tions
- R
abie
s2,
314
2,
491
2,
458
2,
796
2,
621
2,
467
2,
278
2,
053
1,
916
-
Foo
d se
rvic
e fa
cilit
y in
vest
igat
ions
1,83
0
1,45
0
1,56
0
1,49
8
1,27
1
1,42
9
1,28
1
1,06
2
1,05
9
493
Imm
uniz
atio
n vi
sits
990
902
583
944
285
308
330
334
404
195
Rab
ies
expo
sure
inve
stig
atio
ns52
6
60
1
64
2
69
5
67
7
72
4
78
3
80
6
78
0
66
3
Wat
er s
uppl
y sy
stem
inve
stig
atio
ns21
8
22
2
25
9
22
0
16
8
16
2
23
9
25
4
23
5
15
3
Adu
lt cl
inic
vis
its17
,227
16,4
38
12
,044
5,64
2
54
-
-
-
-
-
For
ensi
c cl
inic
vis
its1,
870
1,
716
1,
737
1,
771
60
2
-
-
-
-
-
Tra
nspo
rtat
ion
Pot
hole
s re
pair
16,5
13
15
,972
16,0
15
16
,075
16,6
65
16
,235
15,9
75
15
,659
14,9
58
14
,078
Cou
nty
Roa
ds r
esur
face
d (m
ileag
e)73
67
69
10
5
31
63
29
33
34
Eco
nom
ic A
ssis
tanc
e
Mea
ls s
erve
d to
eld
erly
in h
ome
187,
980
17
9,25
4
177,
302
17
6,08
2
172,
060
17
3,39
1
173,
624
18
5,69
8
153,
971
19
4,39
1
Mea
ls s
erve
d to
eld
erly
at
seni
or c
ente
rs93
,413
89,4
79
86
,116
82,2
80
84
,572
80,9
72
76
,541
72,7
59
74
,440
56,0
49
Adu
lt da
y ca
re s
ervi
ce p
rovi
ded
(hou
rs)
41,7
54
44
,412
40,9
23
40
,927
41,9
41
32
,057
32,0
98
30
,725
28,1
47
6,
741
Chi
ld a
buse
inve
stig
atio
ns3,
729
4,
046
3,
953
4,
119
4,
203
4,
144
4,
284
4,
318
4,
468
3,
971
Chi
ld s
uppo
rt a
ccou
nts
mai
ntai
ned
13,7
49
14
,083
14,6
30
16
,348
15,8
58
15
,652
15,5
47
13
,289
12,5
45
12
,548
222

Cou
nty
of
Bro
om
e
Op
erati
ng I
nd
icato
rs b
y F
un
ctio
n –
Last
Ten
Fis
cal
Yea
rs
Ta
ble
20 (
Co
ncl
ud
ed)
2
01
12
01
22
01
32
01
42
01
52
01
62
01
72
01
82
01
92
02
0
Culture
and R
ecre
ation
Volu
mes
in c
olle
ction
213,7
53
219,9
24
234,1
95
235,8
58
234,9
66
240,4
87
254,3
41
254,9
21
240,6
74
241,1
46
Volu
mes
borr
ow
ed
398,1
03
398,0
67
398,0
32
361,5
89
325,1
18
323,3
07
321,8
28
243,5
95
302,8
04
135,1
29
Are
na a
ttendance
251,3
14
203,2
94
210,6
86
201,3
23
178,7
50
190,8
93
184,8
98
201,7
03
169,2
56
63,4
07
Foru
m a
ttendance
45,8
97
34,3
55
33,5
54
38,6
87
37,4
64
40,9
05
36,0
09
45,7
80
40,8
29
8,8
07
Park
att
endance
1,8
31,7
36
1,9
09,0
44
2,0
60,9
60
2,0
04,0
11
1,9
29,4
76
2,2
58,6
96
1,8
81,4
40
1,5
90,6
97
1,5
81,3
42
2,2
26,9
68
Hom
e a
nd C
om
munity S
erv
ices
Land u
se r
evie
ws
and o
pin
ions
170
204
182
168
170
195
190
162
165
184
Riv
erb
ank a
rea c
leaned (
mile
age)
-
6
7
8
12
12
10
9
11
11
Riv
erb
ank w
ast
e r
em
oved (
tonnage)
-
1
3
2
2
2
2
1
1
1
Depart
ment
of
Tra
nsp
ort
ation
Tota
l bus
mile
age
1,2
87,1
93
1,1
25,5
37
1,1
19,3
50
1,2
61,4
19
1,2
83,7
85
1,2
50,1
51
1,1
41,4
96
1,1
67,6
31
1,6
31,8
18
1,4
19,4
08
Bus
pass
engers
2,4
67,4
81
2,3
71,6
12
2,2
64,6
16
2,3
57,1
25
2,2
64,0
73
2,0
54,8
06
1,9
84,9
41
1,9
52,6
82
1,7
85,7
01
1,0
10,0
42
BC
Lif
t /
Off
ice f
or
Agin
g m
ini-
bus
pass
engers
71,8
20
70,9
78
95,2
57
77,4
93
81,2
30
79,6
82
78,4
28
70,8
51
70,0
88
34,8
19
Nurs
ing H
om
e
Resi
dent
days
109,7
37
105,9
69
96,4
21
100,0
66
101,6
29
105,3
11
105,1
12
104,9
29
104,7
15
88,6
11
Physi
cal T
hera
py s
ess
ions
9,1
21
9,0
11
23,3
97
23,0
84
7,8
25
9,5
54
10,3
66
10,1
58
16,8
68
11,7
96
Occupational T
hera
py s
ess
ions
4,4
61
3,7
55
14,5
25
15,6
71
6,2
09
7,7
08
7,4
82
8,0
06
14,3
08
9,6
57
Speech T
hera
py s
ess
ions
540
796
2,9
28
4,5
95
1,4
90
2,3
04
2,0
47
1,9
22
1,9
86
1,9
84
Solid
Wast
e M
anagem
ent
Tonnage landfi
lled
255,8
70
232,8
95
239,5
90
250,6
10
248,8
10
273,0
96
254,6
04
262,7
26
268,7
40
262,2
16
Tonnage r
ecycle
d4,0
10
14,8
78
4,6
79
421
833
1,1
67
1,9
63
1,6
52
1,7
53
5,2
51
Tonnage h
aza
rdous
wast
e d
isposa
l92
116
119
101
226
196
140
118
141
280
Air
port
Air
lines
availa
ble
3
3
3
3
3
3
1
1
1
1
Num
ber
of
flig
hts
8,1
65
7,7
59
6,8
64
6,2
40
5,8
12
5,0
73
2,9
77
2,8
38
2,8
38
1,1
66
Pass
engers
109,4
08
106,9
47
191,3
50
163,7
40
77,8
82
69,4
02
33,6
66
36,6
47
38,0
71
8,6
92
So
urc
e: C
ounty
of
Bro
om
e D
epar
tmen
ts
223
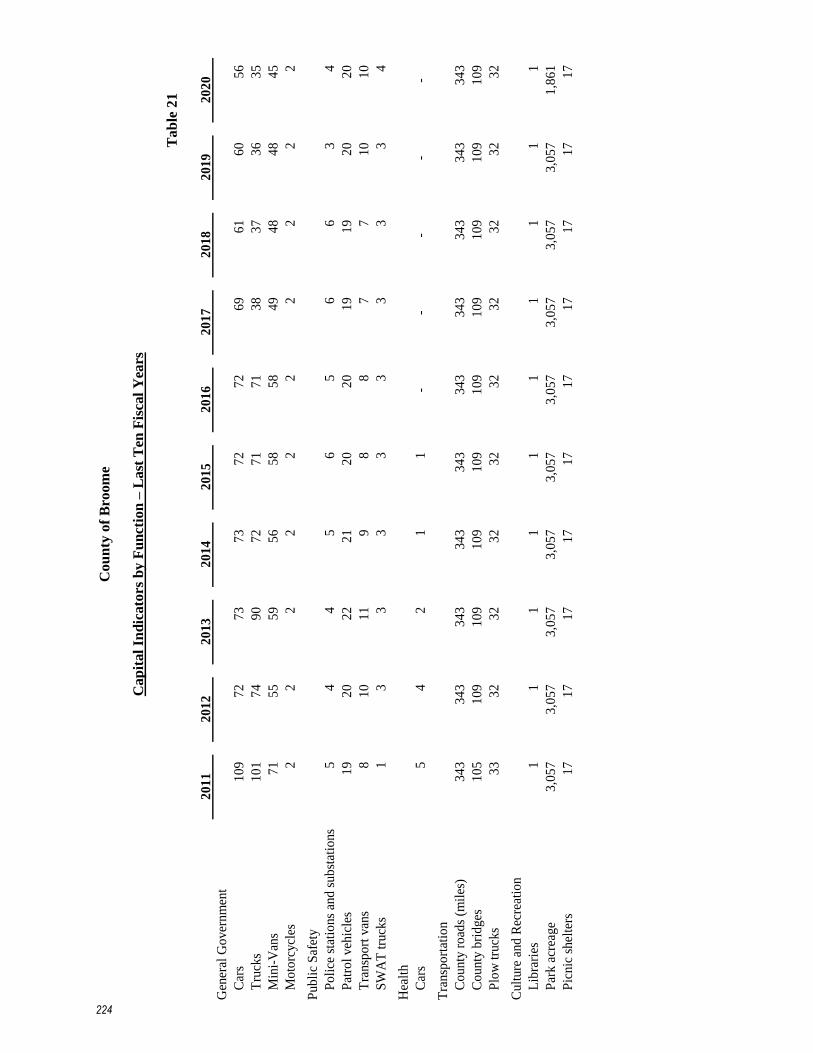
Cou
nty
of
Bro
om
e
Cap
ital
Ind
icato
rs b
y F
un
ctio
n –
Last
Ten
Fis
cal
Yea
rs
Ta
ble
21
20
11
20
12
20
13
20
14
20
15
20
16
20
17
20
18
20
19
20
20
Gen
eral
Go
ver
nm
ent
Car
s1
09
7
2
7
3
7
3
7
2
7
2
6
9
6
1
6
0
5
6
Tru
cks
10
1
74
90
72
71
71
38
37
36
35
Min
i-V
ans
71
55
59
56
58
58
49
48
48
45
Mo
torc
ycl
es2
2
2
2
2
2
2
2
2
2
Pub
lic
Saf
ety
Po
lice
sta
tio
ns
and
sub
stat
ions
5
4
4
5
6
5
6
6
3
4
Pat
rol
veh
icle
s1
9
2
0
2
2
2
1
2
0
2
0
1
9
1
9
2
0
2
0
Tra
nsp
ort
van
s8
1
0
1
1
9
8
8
7
7
1
0
1
0
SW
AT
tru
cks
1
3
3
3
3
3
3
3
3
4
Hea
lth
Car
s5
4
2
1
1
-
-
-
-
-
Tra
nsp
ort
atio
n
Co
unty
ro
ads
(mil
es)
34
3
34
3
34
3
34
3
34
3
34
3
34
3
34
3
34
3
34
3
Co
unty
bri
dges
10
5
10
9
10
9
10
9
10
9
10
9
10
9
10
9
10
9
10
9
Plo
w t
ruck
s3
3
3
2
3
2
3
2
3
2
3
2
3
2
3
2
3
2
3
2
Cult
ure
and
Rec
reat
ion
Lib
r ari
es1
1
1
1
1
1
1
1
1
1
Par
k a
crea
ge
3,0
57
3,0
57
3,0
57
3,0
57
3,0
57
3,0
57
3,0
57
3,0
57
3,0
57
1,8
61
Pic
nic
shel
ters
17
17
17
17
17
17
17
17
17
17
224

Cou
nty
of
Bro
om
e
Cap
ital
Ind
icato
rs b
y F
un
ctio
n –
Last
Ten
Fis
cal
Yea
rs
Ta
ble
21
(C
on
clu
ded
)
20
11
20
12
20
13
20
14
20
15
20
16
20
17
20
18
20
19
20
20
Ho
me
and
Co
mm
unit
y S
ervi
ces
Lan
dfil
l ac
reag
e
Clo
sed
40
40
40
40
40
40
40
40
40
40
Ava
ilab
le1
2
1
2
2
0
2
0
1
4
8
8
8
1
0
1
0
Pla
nned
88
88
80
80
80
80
80
80
80
80
Dep
artm
ent
of
Tra
nspo
rtat
ion
Bus
es5
0
4
7
4
7
4
7
4
3
4
0
4
2
4
6
5
1
4
5
Min
i-B
uses
10
10
11
12
12
12
11
11
12
22
Nur
sing
Ho
me
Nur
sing
ho
me
faci
liti
es1
1
1
1
1
1
1
1
1
1
Nur
sing
ho
me
squa
re f
oo
tage
39
3,9
40
3
93
,94
0
39
3,9
40
3
93
,94
0
39
3,9
40
3
93
,94
0
39
3,9
40
3
93
,94
0
39
3,9
40
3
93
,94
0
So
lid
Was
te M
anag
emen
t
Co
mpa
cto
rs2
2
2
3
3
3
3
3
3
4
Dum
p tr
ucks
2
2
2
2
1
1
1
1
1
1
Bul
l do
zers
2
2
2
2
2
2
2
2
2
2
Air
port
Ter
min
als
1
1
1
1
1
1
1
1
1
1
Run
way
s2
2
2
2
2
2
2
2
2
2
Pub
lic
park
ing
area
(sp
aces
)7
29
7
29
7
29
7
29
9
00
5
73
6
82
6
82
6
82
6
82
So
urc
e: C
ounty
of
Bro
om
e D
epar
tmen
ts
225

This page left blank intentionally.
226


![APPENDIX E - Broome County...PHYSICAL ACTIVITY & NUTRITION.....11 E 10. Physical Activity and Nutrition among Adults [Age-Adjusted], Broome County, New York State, E 11. No Leisure-time](https://static.fdocuments.in/doc/165x107/5fb30369a0059f7a8e3a6ef3/appendix-e-broome-physical-activity-nutrition11-e-10-physical.jpg)


