COUNTY GOVERNMENT OF NAKURU ANNUAL DEVELOPMENT PLAN (2017...
146
REPUBLIC OF KENYA COUNTY GOVERNMENT OF NAKURU ANNUAL DEVELOPMENT PLAN (2017-2018) FINANCE AND ECONOMIC PLANNING 2016
Transcript of COUNTY GOVERNMENT OF NAKURU ANNUAL DEVELOPMENT PLAN (2017...

REPUBLIC OF KENYA
COUNTY GOVERNMENT OF NAKURU
ANNUAL DEVELOPMENT PLAN
(2017-2018)
FINANCE AND ECONOMIC PLANNING
2016

2
VISION A secure, cohesive and industrialized County
MISSION To formulate citizen-oriented policies, promote sustainable socio-economic and technological development

3
Table of Contents VISION .........................................................................................................................................................................................2
MISSION ......................................................................................................................................................................................2
FOREWORD .................................................................................................................................................................................4
ACKNOWLEDGEMENT .................................................................................................................................................................6
LEGAL BASIS FOR THE ANNUAL DEVELOPMENT PLAN ................................................................................................................7
AGRICULTURE, RURAL AND URBAN DEVELOPMENT SECTOR .....................................................................................................8
Sector Vision and Mission .......................................................................................................................................................8
AGRICULTURE SUB SECTOR .....................................................................................................................................................9
LANDS, PHYSICAL PLANNING AND HOUSING SUBSECTOR ......................................................................................................2
ENERGY, INFRASTRACTURE AND ICT SECTOR .......................................................................................................................... 10
Sector Vision and Mission .................................................................................................................................................... 10
ROADS, TRANSPORT AND PUBLIC WORKS SUB SECTOR .................................................................................................. 11
ICT SUBSECTOR ................................................................................................................................................................. 20
HEALTH ..................................................................................................................................................................................... 25
Sector vision and mission ..................................................................................................................................................... 25
EDUCATION .............................................................................................................................................................................. 33
Sector vision and mission ..................................................................................................................................................... 33
GENERAL ECONOMIC, COMMERCIAL AND LABOUR AFFAIRS .................................................................................................. 58
Sector Vision and Mission .................................................................................................................................................... 58
Cooperatives Sub-Sector .................................................................................................................................................. 60
Trade Sub-Sector .............................................................................................................................................................. 63
ENVIRONMENT, NATURAL RESOURCES, WATER AND ENERGY ............................................................................................... 69
Sector Vision and Mission .................................................................................................................................................... 69
ENVIRONMENT SUBSECTOR ................................................................................................................................................. 69
WATER SUBSECTOR .......................................................................................................................................................... 77
PUBLIC ADMINISTRATION AND INTERNAL RELATIONS(PAIR) .................................................................................................. 82
OFFICE OF THE GOVERNOR AND DEPUTY GOVERNOR ........................................................................................................ 82
PUBLIC SERVICE MANAGEMENT .......................................................................................................................................... 88
COUNTY TREASURY .............................................................................................................................................................. 98
COUNTY PUBLIC SERVICE BOARD ....................................................................................................................................... 107

4
FOREWORD
The 2017/2018 Nakuru County Annual Development Plan (ADP) marks the last one-year development plan
that will actualize the first Nakuru County Integrated Development Plan (CIDP 2013-2017). The plan contains
the strategic priority development programmes/projects and activities that shall be implemented during the
financial year 2017/2018.
The ADP was developed in a consultative and participatory manner in line with the constitutional and public
finance management requirements, of public and stakeholder participation and engagement. It follows the
Medium Term Expenditure Framework (MTEF) perspective, as required in planning and budgeting.
It also adopted the same preparation process approach used in earlier plans and budgets. It is important to note
that the County has included Green Economy Plans in its departmental plan. This is a project in which Nakuru
County is one of the pilot counties participating in the project implementation. Efforts to mainstream green
economy plans within departmental annual plans was made possible with the assistance and collaboration of
GIZ (Deutsche Gesellschaft fur Internationale Zusammenarbeit, United Nations Environment Programme the
Ministry of Environment and Natural Resources. This is in line with the national Green Economy Strategy and
Implementation Plan (GESIP), a national blue print for green economy transition in Kenya. the various Sector
Working Groups in the county played a central role in formulating their respective sectors inputs to the plan.
In this regard, the 2016/2017 ADP has identified county development objectives in all sectors and proposed
programmes which are designed to meet the respective sectors objectives. It is worth-noting that the priority
programmes identified and included in the 2017/2018 ADP, are also geared towards the attainment of the
‘Economic Excellence Agenda’ as expressed in the County Fiscal Strategy Papers, running for the MTEF
period. The county development priorities include:
(1) Creating an enabling environment for business and private sector participation in county development.
(2) Development of County Physical and Social Infrastructure facilities including feeder roads, water, ICT,
in order to stimulate growth.
(3) Provision of health services through investing in quality and affordable health services.
(4) Promotion of value addition for agricultural produce, food security and environmental conservation.
(5) Promotion of equitable social economic development for county stability, and

5
(6) Enhancing governance, transparency and accountability in the delivery of public goods and services by
promoting citizen participation in governance.
The Annual Development Plan will therefore provide all stakeholders with important information necessary
for carrying out the monitoring and evaluation of projects and programmes, as a way of informing the citizenry
about the projects’ actual performance. The feedback obtained by carrying out monitoring and evaluation of
projects will be used to make evidence based decisions at both the County and National government level. It
will also inform the preparation of the next Nakuru CIDP(2018-2022).
ANN NJENGA
Ag C.EC MEMBER, FINANCE AND ECONOMIC PLANNING

6
ACKNOWLEDGEMENT
The 2017-2018 Annual Development Plan (ADP), was harmonized by a joint team of representatives of the
Macro working group at the County Treasury together with the County Sector Working Groups. I would like
to thank all those who contributed to the preparation and subsequent finalization of this ADP in one way or
another. I wish to specifically thank the Chief Officers who provided able leadership in their respective
departments in consolidating their projects and programmes. I sincerely thank the conveners of the Sector
Working Groups (SWGs), who dedicated their time and other resources to ensure that the preparation as well
as finalization of the document became a reality.
I wish to acknowledge H.E. the Governor and Deputy Governor for their leadership and continued support in
developing this Annual Plan. Special recognition goes to the County Executive Member for Finance and
Economic Planning, under whose direction and guidance, this assignment was undertaken successfully.
It is also appreciated that the preparation and production of this Annual Plan was made possible by the
invaluable contributions of several individuals. In this regard, I would like to recognize the roles played by the
entire team of the Nakuru County Secretariat that worked in close collaboration with various stakeholders
including county departments.
Special thanks goes Deutsche Gesellschaft fur Internationale Zusammenarbeit(GIZ), University of Nairobi,
Institute for Climate Change and Adaptation, United Nations Environment Programme and the National
Ministry of Environment and Natural Resources who provided invaluable support to the preparation and
production of the ADP through training of the Sector Working Groups on the Mainstreaming of Green
Economy options in planning which are evident in this document
Finally, I wish to assure all users that this ADP 2017-2018 can be found on the Nakuru County website
(www.nakuru.go.ke)
P.K TOROME
CHIEF OFFICER – FINANCE AND ECONOMIC PLANNING

7
LEGAL BASIS FOR THE ANNUAL DEVELOPMENT PLAN The 2016/2017 ADP has been prepared in reference with the following article of Public Finance Management
Act (PFM) 2012) 126;
Every county government shall prepare a development plan in accordance with Article 220 (2) Of the
Constitution that include: -
Strategic priorities for the medium term that reflect the county government’s priorities and plans;
A description of how the county government is responding to changes in the financial and economic
environment.
Programmes to be delivered with details for each programme of-
The strategic priorities to which the programme will contribute;
The services or goods to be provided;
Measurable indicators of performance where feasible; and
The budget allocated to the programme;
Payments to be made on behalf of the county government, including details of any grants, benefits and
subsidies that are to be paid;
A description of significant capital developments;
A detailed description of proposals with respect to the development of physical, Intellectual, human
and other resources of the county, including measurable Indicators where those are feasible
Such other matters as may be required by the Constitution or this Act.
The County Executive Committee member responsible for planning shall, prepare the development plan in
accordance with the format prescribed by regulations.
The County Executive Committee member responsible for planning, shall, not later than 1st September in each
year, submit the development plan to the county assembly for approval, and send a copy to the Commission
on Revenue Allocation and National Treasury.
The County Executive Committee member responsible for planning shall publish and publicize the annual
development plan within seven days after its submission to County Assembly.

8
AGRICULTURE, RURAL AND URBAN DEVELOPMENT SECTOR The sub-sectors under this sector include Agriculture, Livestock Development, Cooperative Development and
Marketing, Lands, Fisheries Development, Forestry and Wildlife, National Land Commission and related
Research and Development.
Sector Vision and Mission Vision
An innovative, commercially-oriented and modern Agriculture and Rural Development sector.
Mission
To improve livelihoods of Kenyans through promotion of competitive Agriculture, sustainable livestock and
fisheries sub-sectors, growth of a viable cooperatives sub-sector, equitable distributions and sustainable
management of land resources and conservation of forestry and wildlife resources”.
Sector’s overall goal
To attain food security, sustainable land management, development of affordable housing and urban
infrastructure.
Over the Medium Term, the sector aims to raise agricultural productivity through value addition and adoption
of new technologies, creating an enabling policy and legal framework, improving efficiency and effectiveness
of sector institutions, effective administration and sustainable management of land resource, and rehabilitation
of existing housing estates.

9
AGRICULTURE SUB SECTOR Vision
A food secure, industrialized and wealthy County
Mission
To offer client oriented extension services: promote commercialized and sustainable ALF industry
Strategic Goal
The Strategic goal for the sector is to attain food security, sustainable land management and improve market
access and trade.
Strategic objectives of the subsector
The ministry strategic objectives are;
1. To increase livestock production, productivity, health and improved livestock products and byproducts
to enhance food security in the county.
2. To increase fish production for enhanced food security, employment creation, income generation and
poverty eradication.
3. To enhance dissemination of agriculture information to the farming communities for improved
agriculture productivity, food security and farm incomes
Subsector and their mandate
The mandate of the Agriculture, Livestock and Fisheries sub-sector is to ensure sustainable
development of agriculture, livestock and fisheries for food security and economic development.
According to Executive Order No. 1/2014 of January, 2014 the specific mandates include; Crop husbandry
and all related services, Animal husbandry and all related services, Plant and animal disease control and all
related services, Fisheries and related services, Agriculture policy and services, veterinary services, Fisheries
policy, Livestock policy management, development and control of Livestock.

10
BACKGROUND INFORMATION ON PROGRAMMES/PROJECTS IMPLEMENTATION IN FY
2014/2015 and 2015/2016
During the period under review, Agriculture Sector implemented programmes as outlined in the Medium Term
Plan 2014/2015 and 2015/2016. The sector implemented 4 programmes as indicated below:-
1. Administration, planning and Support Services
2. Livestock Resources Management and Development
3. Fisheries Management and Development
4. Crop Development and Management
The agriculture department had some outstanding achievements in the following areas;
1. Farm input support Programme. Farm inputs support to vulnerable/resource poor farmers in the County
and 3,600 farmers were assisted to access farm inputs. Farmers were also supported with pyrethrum
planting materials in collaboration with Agriculture Sector Development Support Programme
(ASDSP).
2. Exhibitions. The department held and participated in three exhibitions in collaboration with partners
namely Nakuru County Pyrethrum Exhibition in Kuresoi South, Agribusiness Expo in Kabarak
University and RVIST College.
3. Field days: The department held agricultural field days in all sub-counties in collaboration with Agro
Dealer Association of Kenya (AAK). The department trained 19 officers on e-extension and
dissemination of technical information to farmers. Campaigns on post-harvest management awareness
were also done by our staff in the sub counties in collaboration with various stakeholders such as
CIMMYT/KARI, CDN, PICS Bag to increase awareness on the availability of improved post-harvest
technologies to assist farmers reduce the post-harvest losses they incur. The department held 13 plant
health clinics in Subukia and Nakuru North sub counties and a total of 26 trained plant doctors in
collaboration with CABI/PLANTWISE it has trained a total of 6 TOTs Plant doctors in Nakuru, Rongai
and Subukia. Four staff and 8 farmer trainings were held at the Agriculture Training Centre-Nakuru.
The Livestock production in conjunction with the Veterinary departments had the following achievements;
1. The department carried out 3 value addition projects (milk coolers in Kiptororo, Bulgei, and
Kiptangwany). It also purchased and distributed 3 pasteurizers to Suka, Canaan and Kuresoi Dairy Co-
operative.

11
2. Contracts for procurement of egg incubators were also done. The department also rehabilitated 16
cattle dips.
3. It also carried out livestock disease surveillance and vaccinations where 19,035 heads of cattle were
vaccinated against Foot and Mouth disease, 20,517 heads of cattle against Lumpy Skin Disease, 2,920
heads against East Coast Fever, 60,638 heads against Anthrax 8,642 chicken against Newcastle disease
3,292 chicken against Fowl typhoid, 700,292 chicken against Gumboro disease, and 2,711 against Fowl
pox. The department also vaccinated 4,980 sheep and goats. It also vaccinated 6,369 dogs against
rabies.
4. 11 A I kits were procured and distributed across the County (one for every sub county). The department
licensed 95 registered artificial insemination service providers.
The Fisheries department recorded achievements in the following areas
1. Registration of Fisher folks. The Fisheries department developed an inventory and registered all fish
traders, supermarkets, and fish feeds processors, fishermen and fish boats owners within the County.
A total of Kshs 2,630,000 was collected as registration and license fees. About 489,271 kgs of fish
valued at Kshs 66,427,021 was produced from Lake Naivasha by end of June 2015.
2. Control and surveillance. To enhance co-management of Lake Naivasha, the Department acquired 4
MCS patrol boats and also did restocking with over 100,000 tilapia fingerlings over the period. The
number of fishermen increased from 300 to 400 while the number of boats was capped at 100.
Aquaculture produced 1,208,299 kgs of fish valued at Kshs 19,140,293 during the 2014/2015 FY. The
number of operational ponds now stands at 821 in the County with the enhancement of local fish feed
formulation, support for 50 pond liners and stocking of operationalised ponds. Through the support
from KAPPAP and ASDSP project Fish Farmers barazas and field days for mobilization on cooperative
formation were also conducted and as a result Njoro fish farmers’ cooperative and Bahati fish
cooperative were formed and registered. Spot checks in fish outlets for quality assurances were also
conducted. The world fisheries day celebration and other exhibitions were held as fisheries awareness
campaign which has increased the county’s fish consumption per capita /person/year compared to
previous where communities used not to eat fish as part of their die

2
PLANNED PROJECTS AND PROGRAMMES FOR IMPLEMENTATION IN THE FINANCIAL YEAR 2017/2018
Programm
e
Strategic
priority
Projects Description of
activities
Key Outputs Key
Performance
Indicators
Targets 2017-18 Budget
estimate
(Ksh)
Administra
tion,
Planning
and
Support
Services
For effective
planning and
coordination
in service
delivery
Administratio
n, Planning
and Support
Services
preparation of
Strategic Plan
2018-2024
Startegic
plan in place.
No of
strategic
plans.
1 64,612,400.60
Hold draft copy
Review
meetings.
Meeting
reports.
Number of
meeting to
Reviews draft
copy.
3
Review of the
draft reports.
Progress
report.
Copies of
reviewed
progress
report
1
Conduct
Customer
satisfaction
survey on the
Implementation
of Service
Charter
Customer
satisfaction
on the
Implementati
on of Service
Charter
Level of
Customer
satisfaction.
80%
Hold
administration
management
review meetings
administratio
n
Management
Review
meetings
Number of
administratio
n
Management
Review
meetings
done
4
Preparation of
annual work
Annual work
plan and
budgeting
Number of
annual work
1

3
Programm
e
Strategic
priority
Projects Description of
activities
Key Outputs Key
Performance
Indicators
Targets 2017-18 Budget
estimate
(Ksh)
plans and
budgets.
plan and
budgets
Human
Resource
Staff Training Trained staffs No of staffs
trained.
100 432,755,052.4
0
Livestock
resource
managemen
t and
developmen
t
Promotion of
Dairy and
small stock
Production,
Breeding and
Disease
control
27,569,704
Strengthen
live stock
extension
services
Collection of
County dairy
data
Dairy data
collected
Types of data
collected
-Dairy
County
Report
generated
1
Hold Farmers
trainings/semina
rs
Farmers
trained
-Farmers
adopting
-Number of
farmers
trained
- Number of
Farmers
adopting
2000
400
Farmers
exchange
visits/education
visits
Exchange
visits/educati
on visits
done
Exchange
visits/educati
on visits done
2

4
Programm
e
Strategic
priority
Projects Description of
activities
Key Outputs Key
Performance
Indicators
Targets 2017-18 Budget
estimate
(Ksh)
Individual farm
visits
farm visits
done
Number of
farm visits
done
550
Supervision
visits/backstoppi
ng visits
Monitoring
and
Supervision
visits done
-Number of
supervision
visits done -
M&E reports
4
Participation in
Agricultural
shows/
Exhibitions
Agricultural
shows/
Exhibitions
participated
Number of
Agricultural
shows/
Exhibitions
participated
2
Hold Farm
demonstrations.
Farm
demonstratio
ns done
Number of
Farm
demonstratio
ns done
22
Conduct field
days
Conduct field
days done
Number of
field days
done
12
Hold
stakeholder’s
fora
stakeholder’s
fora done
Number of
stakeholder’s
fora held
4
Promotion of
pasture and
fodder
production
and
conservation
and land
management
Hold on-farm
pasture and
fodder
establishment
demonstrations.
-On-farm
pasture and
fodder
establishment
demonstratio
ns done
-Farmers
adopting
Number of
On-farm
pasture and
fodder
establishment
demonstratio
ns done
22

5
Programm
e
Strategic
priority
Projects Description of
activities
Key Outputs Key
Performance
Indicators
Targets 2017-18 Budget
estimate
(Ksh)
- Number of
Farmers
adopting
Establishment
of fodder tree
nurseries
Fodder tree
nurseries
established
Number of
fodder tree
nurseries
established
11
Demonstration
of silage and hay
conservation and
crop residue
treatment
Annual
Tonnage of
silage and
bales of hay
achieved
Amount of
silage and
number of
bales of hay
made
22,000 tons
250,000 bales
Training of
farmer on
Pasture and
fodder
management and
dairy cattle
feeding
-Farmers
trained
-Increased
milk
produced
-Number of
Farmers
trained
Increase of
milk
production
from per cow
per day
1100
5 liters to 7 liters
per day per cow
Procurement of
pasture and
fodder seeds
Procured
pasture and
fodder seeds
Types of
Procured
pasture and
fodder seeds
6
Promotion of
A.I services
Purchase of
Artificial
Insemination
Kits
Artificial
Insemination
Kits procured
Number of
Artificial
Insemination
Kits
11
11

6
Programm
e
Strategic
priority
Projects Description of
activities
Key Outputs Key
Performance
Indicators
Targets 2017-18 Budget
estimate
(Ksh)
Registration and
licensing of
private A.I
providers
Registered
and licensed
private A.I
providers
Number of
registered and
licensed
private A.I
providers
Holding
meetings with
A.I providers
Meetings
held
Number of
A.I.
provider’s
meetings held
2
Supervision of
the A.I
providers.
Supervisions
done
Number of
supervisions
done
4
Promote use
of biogas
energy at
household,
and
institutions
Training and
installation of
biogas units
Biogas units
installed
Number of
Biogas units
installed
12
Training on
composting and
use of slurry
Farmers
trained
Number of
farmers
trained
220
Promote
market
access and
value
addition of
livestock
produce.
Promotion of
Value
Addition of
Livestock and
Livestock
Products
Milk marketing
groups trainings
on value
addition
technologies
Dairy groups
trained
Number of
dairy groups
trained
11 47,192,645
Construction of
market
information bill
boards
market
information
bill boards
constructed
Number of
market
information
bill boards
constructed
11
Formation and
strengthening
dairy
Cooperative
Number of
dairy
11

7
Programm
e
Strategic
priority
Projects Description of
activities
Key Outputs Key
Performance
Indicators
Targets 2017-18 Budget
estimate
(Ksh)
dairy
Cooperative
societies
societies
strengthened
Cooperative
societies
strengthened
Hold
sensitization and
mobilization
meetings on
Livestock
registration with
Kenya stud book
Sensitization
and
mobilization
meetings
held
Number of
sensitization
and
mobilization
meetings held
22
Conduct field
visits for
livestock
inspection and
registration
field visits
held
Number of
field visits
held
22
Procure ear tag
applicators and
ear tags
ear tag
applicators
and ear tags
procured
ear tag
applicators
and ear tags
procured
12 ear tag
applicators
550 ear tags
Improve
post-harvest
technologies
through milk
packaging
materials,
milk cooling
and chilling
facilities
Construction of
milk bulking and
chilling plants
milk bulking
and chilling
plants
constructed
Number of
milk bulking
and chilling
plants
constructed
3
Purchase of milk
coolers
milk coolers
purchased
number of
milk coolers
purchased
3
Purchase of
batch desterilizes
batch
desterilizes
purchased
number of
neutralizers
purchased
3

8
Programm
e
Strategic
priority
Projects Description of
activities
Key Outputs Key
Performance
Indicators
Targets 2017-18 Budget
estimate
(Ksh)
Purchase of milk
dispensers
milk
dispensers
purchased
number of
dispensers
purchased
3
Reduce post-
harvest loses
by improving
efficiency
along the
value chain
(transportatio
n, storage,
processing
and
marketing)
Training milk
traders on pre-
and post-milk
production,
handling and
transportation
milk traders
trained
Number of
milk traders
trained
220
Demonstration
on food grade
packaging
materials
Demonstratio
n done
Number of
demonstratio
n done
22
Procure milk
quality testing
kits
milk quality
testing kits
procured
Number of
milk quality
testing kits
procured
11
Energy
efficiency
usage in milk
bulking and
chilling
plants
Procure and
installation of
solar panel for
powering milk
bulking and
chilling plants
Reduced
production
costs
-Increased
milk
products
shelf life
Number of
solar panels
procured and
installed
3
Promotion of
Non-
ruminants
and Emerging
Vaccination of
Animals
Vaccinated
animals
Percentage of
animals
Vaccinated-
Dogs/Cats
65% 13,642,645

9
Programm
e
Strategic
priority
Projects Description of
activities
Key Outputs Key
Performance
Indicators
Targets 2017-18 Budget
estimate
(Ksh)
Livestock
Enterprises
Farmers
trainings on
proper
management
Farmers
trained
Number of
farmers
trained
2000
Participate in
Show/Exhibition
s
Show/Exhibit
ions
participated
Number of
show/exhibiti
ons
participated
1
Hold Field days Field days
held
Number of
field days
held
2
Hold
stakeholder’s
fora
stakeholder’s
fora done
Number of
stakeholder’s
fora done
2
Demonstration
on poultry waste
management and
utilization
Demonstratio
ns done
Number of
demonstratio
ns done
4
Monitoring and
Supervision
visits
monitoring
and
supervision
visits done
Number of
monitoring
and
supervision
visits done
4
Increase
honey
production,
bee products
and improve
market
access
Promotion of
Apiculture
Farmers training Farmers
training
Number of
farmer’s
trainings done
2000 8,185,587
Show/Exhibition
s/Workshops
Show/Exhibit
ions/Worksh
ops
Number of
show/exhibiti
ons/workshop
s participated
2

10
Programm
e
Strategic
priority
Projects Description of
activities
Key Outputs Key
Performance
Indicators
Targets 2017-18 Budget
estimate
(Ksh)
Field days and
stakeholder’s
fora
Field days
and
stakeholder’s
fora
Number of
field days and
stakeholder’s
fora held
4
Construction of
mini honey
refinery facility
mini honey
refinery
facility
constructed
Number of
mini honey
refinery
facility
constructed
1
Purchase of
honey harvesting
kits
honey
harvesting
kits procured
Number of
honey
harvesting
kits procured
12
Purchase of
honey processing
kits
honey
processing
kits procured
Number of
honey
processing
kits procured
1
Demonstrations
on value
addition and
honey product
development.
Bee products
developed
and KEBS
certified
Types of bee
products
developed
and KEBS
certified
1
Monitoring and
Supervision
visits
Monitoring
and
Supervision
visits
Quarterly
monitoring
and
supervision
visits and
M&E reports
4
Energy
efficiency
usage in mini
Procure and
installation of
solar panel for
Reduced
production
costs
Number of
solar panels
2

11
Programm
e
Strategic
priority
Projects Description of
activities
Key Outputs Key
Performance
Indicators
Targets 2017-18 Budget
estimate
(Ksh)
honey
processing
plants
powering mini
honey
processing plants
-Increased
bee products
shelf life
procured and
installed
Improve
quality and
safety of
meat and
revenue
collection in
the County
Promote meat
safety and
inspection.
Licensing of
slaughter houses
and collection of
revenue from
meat inspection
services
slaughter
houses
licensed and
revenue from
meat
inspection
services
Number of
slaughter
houses
licensed and
Amount of
revenue
raised
90 slaughter
houses
Kshs. 5,000,000
Licensing of
hides and skin
premises and
flayers and
revenue
collection
hides and
skin premises
and flayers
licensed and
revenue
collected
hides and
skin premises
and flayers
licensed
Amount of
revenue
raised
70 premises
Kshs. 40,000
Field days and
stakeholder’s
fora
Number of
field days and
stakeholder’s
fora held
4
Carry out meat
market
surveillance
meat market
surveillance
visits done
Number of
meat market
surveillance
visits done
46
Renovation of
slaughterhouses
Slaughterhou
ses renovated
number of
slaughterhous
es renovated
2

12
Programm
e
Strategic
priority
Projects Description of
activities
Key Outputs Key
Performance
Indicators
Targets 2017-18 Budget
estimate
(Ksh)
Monitoring and
Supervision
visits
Monitoring
and
Supervision
visits done
Number of
monitoring
and
Supervision
visits done
4
Rehabilitation of
cattle dip
cattle dips
rehabilitated
Number of
Rehabilitation
cattle dip
6
Control the
occurrence
and spread of
notifiable and
zoonotic
diseases.
Livestock
disease
management
and control
Vaccination of
animals
Percentage of
animals
vaccinated
(Normal)
- Percentage
of animals
vaccinated
(Outbreak)
60%
100%
57,425,291
Procure vaccines
Vaccines
procured
Types of
vaccines
procured
5
Control of
livestock
movements
Number of
surveillance
reports filled
100
No of
quarantine
imposed
1
Carry out stock
routes and
auction yards’
inspection visits
stock routes
and auction
yards’
inspection
visits done
Number of
stock routes
& auction
yards
inspected
22

13
Programm
e
Strategic
priority
Projects Description of
activities
Key Outputs Key
Performance
Indicators
Targets 2017-18 Budget
estimate
(Ksh)
Carry out
livestock market
surveillance
visits
surveillance
visits done
surveillance
visits done
22
Policy
formulation
Draft policy
in place
Number of
draft policy in
place
1
Waste
disposal from
slaughter
houses and
disposal of
dead animals
Training of
butchers on
handling and
management of
blood and oval
wastes
Butchers
trained
Number of
butchers
trained
45
Demonstration
on processing
and utilization of
blood and oval
wastes
Demonstratio
ns done
Number of
demonstratio
ns done
4
Procure a
demonstration
kits
demonstratio
n kits
procured
Number of
demonstratio
n kits
procured
4
Policy
formulation on
Animal Welfare
Draft policy
in place
Number of
draft policy in
place
1
Fisheries
developmen
t
Strengthen
fâcheries
extension
services
Aquaculture
Development
Training of
farmers on fish
farming
technologies
-Farmers
trained
-
Technologies
adopted
Number of
farmers
trained,
1700 14,731,707
14
Programm
e
Strategic
priority
Projects Description of
activities
Key Outputs Key
Performance
Indicators
Targets 2017-18 Budget
estimate
(Ksh)
Types of
technologies
adopted
Farm visits -Farmers
visited
-
Interventions
done
Number of
farmers
visited
-Interventions
addressed
52
Hold Farm
demonstrations.
Demonstratio
ns done
Number of
demonstratio
ns done
11
Establishment of
fish cottage
industry
Fish feed
pelletizing
machines
installed
Number of
fish feed
pelletizers
installed.
1
Supervision
backstopping
visits.
Supervisions
done
Number of
supervisions
11
Participation in
Agricultural
shows/
Exhibitions
Agricultural
shows
participated
No. of shows
done 1
Monitoring and
evaluation
M& E
reports done
Number of
M&E vests
done
2
Purchase of
extension kit
Extension
kits
purchased
Number of
Extension kits
purchased
5

15
Programm
e
Strategic
priority
Projects Description of
activities
Key Outputs Key
Performance
Indicators
Targets 2017-18 Budget
estimate
(Ksh)
Conduct field
days and eat
more fish
campaigns
Field days
and
campaigns
done
Number of
field days,
Eat fish
campaign
11
Provisions of
quality inputs
including,
fingerlings
and feeds.
Establishing
fingerlings seeds
bulking centre.
Fingerlings
seeds bulking
centre
established
Number of
fingerlings
seeds bulking
centre
established
4 7,500,000
Regular
inspections to
enforce
standards on
feeds and seeds
Authenticate
d hatcheries
and aqua
shops
Number of
Authenticated
hatcheries
and aqua
shops
inspected
4
Establishmen
t of fish
ponds
Construction of
fish ponds
Fish ponds
constructed
Number of
fish ponds
constructed
25
3,500,000
Purchase of
pond liners
pond liners
purchased
Number of
pond liners
purchased
25
Enhance
sustainable
management
of natural
ecosystems
i.e. Promote
Development
of capture
fisheries
resources
Hold
participatory
stakeholder’s
fora on
implementation
Three months
closed season
in L.
Naivasha
-Number of
stakeholders
held
-Minutes of
proceedings
4
9,464,028

16
Programm
e
Strategic
priority
Projects Description of
activities
Key Outputs Key
Performance
Indicators
Targets 2017-18 Budget
estimate
(Ksh)
sustainable
fishing of
Lake
Naivasha.
of policy on
closed season.
Dam stocking
and lake
restocking.
Fingerlings
restocked
Number of
Fingerlings
restocked
1,000,000
Conduct
surveillance
visits
Monitoring
and
surveillance
visits done
Number of
monitoring
and
surveillance
visits done
52
Training of
Beach
management
units
Beach
management
units trained
Number of
BMUs
trainings done
16
Promotion of
cage culture
fabricate local
fish cages.
local fish
cages
fabricated
Number of
local fish
cages
fabricated
20
Training on cage
culture.
-Fishermen
trained
Number of
fishermen
trained
50
Protection of
riparian land
on rivers and
lakes.
Plant trees in the
river banks and
lakes.
Trees planted Number of
trees planted
5,000
Environmental
education
/sensitization/aw
areness meetings
Protected
riparian land
Number of
sensitization/
awareness
meetings
16

17
Programm
e
Strategic
priority
Projects Description of
activities
Key Outputs Key
Performance
Indicators
Targets 2017-18 Budget
estimate
(Ksh)
Improve
post-harvest
technologies
through
improved
fish handling
facilities.
Fish quality
assurance
value addition
and
marketing
Training of fish
farmers and
traders on fish
hygiene and
handling
Farmers
trained
Number of
farmers
trained
1,000
15,000,000
Establishment of
fish bulking,
preservation and
mini processor.
Mini
Processing
plant in place
Number of
Mini
Processing
plant
established
1
Licensing and
inspection of
beaches and fish
markets.
Licensed
traders
Number of
licensed
traders
400
Promote
market
access and
value
addition of
fish produce.
Training of fish
farmers and
traders on home
economics and
importance on
the nutritional
value of fish.
Fish traders
trained
Number of
fish traders
trained
400
Demonstrations
on value
addition and fish
Fish products
developed
and KEBS
certified
Types of Fish
products
developed
1

18
Programm
e
Strategic
priority
Projects Description of
activities
Key Outputs Key
Performance
Indicators
Targets 2017-18 Budget
estimate
(Ksh)
product
development.
and KEBS
certified
Establishment of
fish auction
centers and
market stalls.
Fish auction
centers and
market stalls
established
Number of
fish auction
centers and
market stalls.
4
Promote safe
fish waste
disposal and
utilization
Training on safe
fish waste
disposal and
utilization by
composting
-Fish traders
trained
Number of
fish traders
trained
400
Purchase of
closed fish waste
bins
Closed fish
waste bins
purchased
Number of
closed fish
waste bins
purchased
20
Energy
efficiency
usage in fish
processing/pr
eservation
Procure and
installation of
solar panel for
powering icing
machine and fish
preservation
freezers
Reduced
post-harvest
losses
-Increased
fish shelf life
Number of
solar panels
procured and
installed
10
Crop
production
and
managemen
t.
To enhance
disseminatio
n of
agriculture
information
to the
farming
Agricultural
Extension
Research and
Training
Training of
farmers on good
agricultural
practices
Farmers
trained
farmers
adopting
technologies
Number of
farmers
trained.
Level of
adoption
2500
20% adoption
8,260,115.38

19
Programm
e
Strategic
priority
Projects Description of
activities
Key Outputs Key
Performance
Indicators
Targets 2017-18 Budget
estimate
(Ksh)
communities
for improved
agriculture
productivity,
food security
and farm
incomes
Research
extension
training linkages
Research,
extension
and farmer’s
meetings
held
Number of
research,
extension and
farmer’s
meetings held
2
48,260,115
Supervision
/backstopping
visits
Supervisions
held
No. of
supervisions
done
4
Hold
stakeholders
workshops
Workshops
held
No. of
workshops
done 2
Individual farm
visits
Farm visits
done
No. of visits
done 1100
Participation in
Agricultural
shows/
Exhibitions
Agricultural
shows
participated
No. of shows
done
1
Hold Farm
demonstrations.
Demonstratio
ns done
No. of
demonstratio
ns done
11

20
Programm
e
Strategic
priority
Projects Description of
activities
Key Outputs Key
Performance
Indicators
Targets 2017-18 Budget
estimate
(Ksh)
Hold field days Field days
done
No. of field
days done
22
Establish
farmers &
stakeholders’
linkages-
research and
training
institutions,
financial
institutions,
agrochemical
companies,
inputs
suppliers,
market
outlets,
regulatory
bodies,
CBOs, FBOs,
NGOs and
private sector
to develop a
platform for
information
sharing.
Conduct
Professional
group meetings
Professional
meetings
No. Of
professional
meetings
done
2

21
Programm
e
Strategic
priority
Projects Description of
activities
Key Outputs Key
Performance
Indicators
Targets 2017-18 Budget
estimate
(Ksh)
Research-
extension liaison
meetings.
Research,
extension
and farmer’s
meetings
held
Number of
research,
extension and
farmer’s
meetings held
2
Platform for
Information
sourcing
Platform
meeting
No of
platform
meetings held
2
Hold
stakeholder’s
fora’s. Workshops
held
No. of
workshops
done 2
Promote
drought
tolerant food
crops like
cassava,
sorghum and
sweet
potatoes
Crop
Production
and Food
security
Implement food
security
programmes
Programs
implemented
No of
Programs
implemented
6 43,775,352.50
Farmers
recruitment
Farmers
recruited
No of farmers
recruited
1,200
Purchase and
distribution of
sweet potatoes
vines.
Sweet Potato
vines
purchased
Number of
Sweet Potato
vines
purchased
and
300,000

22
Programm
e
Strategic
priority
Projects Description of
activities
Key Outputs Key
Performance
Indicators
Targets 2017-18 Budget
estimate
(Ksh)
distributed to
farmers
Promote use
of improved
home
gardening
utilization
technologies
Hold
Demonstrations
Demonstratio
ns held.
No of
Demonstratio
ns
4
Hold trainings
on Urban
agriculture and
Peril Urban
Agriculture
(UPAP)
farmer
trainings held
on Urban
agriculture
and Peril
Urban
Agriculture
(UPAP)
No of farmer
trainings held
on Urban
agriculture
and Peril
Urban
Agriculture
(UPAP)
32
Provisions of
quality inputs
including
planting
materials.ie
Grow fast
maturing
high value
crops, trees
that have
multiple
Purchase &
distribution
banana seedlings
farmers
supported
with banana
seedlings
Number of
farmers
supported
with banana
seedlings
600
Purchase &
distribution of
avocado
seedlings
farmers
supported
with avocado
seedlings
Number of
farmers
supported
with avocado
seedlings
600
Conduct field
days and
demonstrations
on fast maturing
Increased no.
Of farmers
growing
multipurpose
trees.
Level of
adoption
10%

23
Programm
e
Strategic
priority
Projects Description of
activities
Key Outputs Key
Performance
Indicators
Targets 2017-18 Budget
estimate
(Ksh)
commercial
uses.
crops and
multiuse trees.
Improving
production
and
management
for crops.
Purchase of
green houses for
crop production
green houses
constructed
Number of
greenhouses
constructed
6
Conduct Crop
pests & disease
Surveillance Crop pests &
disease
Surveillance
Number of
Crop pests &
disease
Surveillance
and
Management
done
44
Strengthen
consumer
protection
through
inspection of
produce.
Warehouse/store
s inspection
Warehouse/st
ores
compliancy.
level of
Warehouse/st
ore
compliancy
10%
Field inspection field
inspections
reports
No of field
inspections
44
Training of
farmers on
quality
assurance.
Trained
farmers.
No of farmers
trained.
200
Construction
of water
harvesting
Farm Land
Utilization,
Conservation
Conduct
hydrology site
survey.
Sites
surveyed.
No of sites
surveyed.
4 55,073,152.86

24
Programm
e
Strategic
priority
Projects Description of
activities
Key Outputs Key
Performance
Indicators
Targets 2017-18 Budget
estimate
(Ksh)
structures,
water pans,
dams, for
irrigation to
increase crop
production
and
mechanization
services
Conduct green
architectural
design
Architectural
design.
No of design
done
4
Excavation of
the structures.
Excavated
structures.
No of
structures
done
4
Transfer
technology
on soil
conservation
Agriculture:
minimum
tillage, use of
cover crops,
fodder shrubs
and mulching
to reduce soil
fertility loss,
water
conservation
for increased
crop
production
and
productivity.
Training of
farmers on
Layout & design
of structures
Trained
farmers
No of farmers
trained.
2,500
Construct Soil
Conservation
structures
Soil
conservation
structures
laid.
No of Soil
conservation
structures
200km laid
Holding farmers
field days
Field days. No of filed
days held.
11
Hold
participatory
stakeholder’s
fora on
implementation
of policy on soil
conservation.
Stakeholders
fora
No of fora. 1
Move
towards 10%
tree cover.
Developing tree
nursery
Tree
nurseries.
No od tree
nurseries
established.
22
Farmers
adopting 10%
tree cover.
Farm forest
cover
achieved
percentage of
trees cover
per farm.
10% of acreage.

25
Programm
e
Strategic
priority
Projects Description of
activities
Key Outputs Key
Performance
Indicators
Targets 2017-18 Budget
estimate
(Ksh)
No of farmers
adopting 10%
farm forest
tree cover
550.
Stakeholders
fora for Policy
implementation
on farm forest.
Fora on farm
forest policy
implementati
on.
No of fora
held
1
Promote
market
access and
value
addition of
crop produce.
Agribusiness
development
and
marketing
Dissemination of
market
information to
clients
Agricultural
produce
marketing
information
systems.
Farmers
trained.
Number of
market
information
systems in
place.
2 33,710,121.50
Agricultural
produce
marketing and
value addition
initiatives
trainings
Number of
trainings on
marketing,
Value
addition &
demonstratio
n on
utilization of
crops in 11
sub counties
11
Develop farm
plans
Farm
Business
Plans
Prepared
Number of
Farm
Business
Plans
developed
100

26
Programm
e
Strategic
priority
Projects Description of
activities
Key Outputs Key
Performance
Indicators
Targets 2017-18 Budget
estimate
(Ksh)
Adopting
energy
efficiency
drying
technologies.
Training farmers
on solar drier for
pyrethrum and
vegetables.
Farmers
trained
No of farmers
trained
550
Fabricating of
the solar dries
for youth group.
Fabricated
driers.
No of dries
fabricated
12
Reduction of
crop losses
and improved
post-harvest
technologies
i.e. gunny
bags use for
packaging
cereals and
Ware
housing.
Training of
farmers on post
harvest
technologies
Trained
farmers.
No of farmers
trained.
2500
Warehousing
receipting Farmers
using
warehousing
receipting.
No of farmers
using
warehousing
receipting
240

2
LANDS, PHYSICAL PLANNING AND HOUSING SUBSECTOR
Vision
Secure and Diversified human settlement.
Mission To facilitate participatory planning, affordable housing, and sustainable development of rural and urban areas. Sub-Sector goal To ensure that human settlements are well planned and surveyed & housed in a clean and healthy environment
Sub-sector’s Mandate
To implement Land Policy, undertake Physical Planning, Land Surveys and Mapping and provide affordable
and accessible housing
Performance Overview and Back ground for Programmes
Land use planinng and Survey
Purchase of two (2) land meant for market ground at Barut ward and milk Cooler plant at Elementaita
ward.
80% completion of Preparation of valuation roll.
40% completion of Development of spatial plan
85% completion of Development of land information management
Development and Management of Houses
FINANCIAL
YEAR
PROJECTS ACHIEVEMENTS
2013-2014 Renovation Works in County Estates
1. Flamingo Phase II estate
2. Lumumba estate
3. Abongoloweya estate
4. Reconstruction of toilets at Flamingo
estate, Kaloleni B estate, and Baharini
estate (jointly with NAWASCO)
1. 232 units renovated
2. 192 units renovated
3. 64 units renovated
4. 16no. Toilet blocks of 20 doors each
(320 toilets) and 450m sewer system in
Flamingo and Kaloleni has been
rehabilitated.
2014-2015 Renovation Works in County Estates
1. Naivasha Municipal Estate
2. Paul Machanga Estate
3. Kaloleni B Estate
1. 54 units renovated
2. 116 units renovated
3. 140 units renovated

3
4. Moi Flats Estate
5. Njoro Posta Estate
6. Reconstruction of toilets at Kivumbini
estate
4. 5 flats re-roofed
5. 14 units renovated
6. 8 blocks 20 no. door toilets
constructed as well as 200 meters of
sewer rehabilitation
2015-2016 Renovation Works in County Estates
1. Naivasha estate
2. Kaloleni B estate
3. Paul Machanga estate
4. Kimathi estate
5. Kimathi Estate
6. Flamingo 1 estate
7. Toilets rehabilitation in Machanga estate
8. Shauri yako estate
9. Sewer rehabilitation in Lumumba estate
10. Sewer rehabilitation in Kivumbini estate
11. Former Mayor’s House
12. Njoro estate
B. Proposed Construction of Alternative
Building Materials Technology Centres in:
1. Kagoto Polytechnic- Bahati Sub county
2. Molo Polytechnic-Molo Subcounty
3. Mirera Polytechnic- Naivasha Subcounty
C. Procurement of Inter-Locking Block
Making (Hydraform) Machines
3 no Hydraform machines procured
1. 66 units to be renovated
2. 132 units renovated
3. 136 units renovated
4. 116 units renovated
5. 36No. door toilet done
6. 220 units renovated
7. 130No. toilets rehabilitated
8. 158no. toilets rehabilitated
9. 218 mts of sewer upgraded
10. 573 mts of sewer upgrade
11. Rehabilitation works done
12. Septic tank and fence done
Construction of 3 no ABMTs ongoing
3 hydra form machines delivered
Constraints and Challenges in implementing the 2015/2016 budget
The major challenges facing the department include:
Increased population due to natural growth and migration exerting pressure on land and housing
infrastructure.
Uneconomical and un-coordinated land sub-division
Encroachment on ecologically fragile land such as riparian reserves, wetlands
Land conflicts
Urban sprawl/informal settlements
High rate of urbanization
Low level capacity for land administration
Poor land use practices
Limited public awareness on land policy, laws and regulation
Change of user for agricultural land to industrial and commercial purposes threatening food production

4
Increased cost of materials and inputs
Despite the challenges, the Land Management Information system will go a long way in enhancing data
updating and retrieval, whilst the County spatial plan will enhance investment in socio-economic devel

5
PLANNED PROJECTS AND PROGRAMMES FOR IMPLEMENTATION IN THE FINANCIAL YEAR 2017/2018
Programme Strategic
priority/objective
Project Project
activities
Expected
output
Targets
2017/2018
Key performance
indicators
Budget
estimates
Nakuru
County Land
Use plan
Preparation of
Nakuru County
spatial plan
Nakuru
County
spatial plan
Topo-
cadastral
mapping
Property
boundaries
Public
notices
Stakeholders
meeting
Data
collection
Data analysis
Plan
proposal
Draft plan
Plan
approval
Publication
Topo-cadastral
layers
Stakeholders
meeting held
Progress report
Analyzed data
Draft plan
proposal
Approved
county spatial
plan
Infrastructural
master plan
County
investment
plan
County spatial
plan
implementation
matrix
Stakeholders
meetings
held
Aerial
mapping
done
Data
collection
County
Spatial Plan
done to 65%
Number of
Stakeholders meetings
held
Aerial mapping done
and maps generated
Data collection reports
Progress report of the
spatial plan
250,000,000
Improved Land
administration
Valuation roll Public
participation
forums
Draft Valuation
Report
Completion
of valuation
roll
Copy of draft valuation
report
Copy of approved
Valuation roll
15,000, 000

6
Dispute
resolution
Approval of
valuation roll
A Copy
approved
valuation roll
Approval of
the
valuation
roll
Urban
planning and
Development
Local Physical
Development
plans for
Secondary towns
and trading
centers
Physical
Development
Planning for
Urban areas
Planning
needs
assessment
Public
notices
Stakeholders
meeting
Data
collection
Data analysis
Plan
proposals
Draft plan
Plan
approval
Publications
Progress report
Base map
Draft plan
Infrastructure
master plan
Investment
plan
Implementation
matrix
Approved
Local Physical
Development
Plan
3 no.
physical
development
plans
completed
and
approved
3 physical development
plans in place
25,000,000
Physical
Development
Planning
Implementation
and adherence to
approved Physical
Development
Plans
Physical
Development
Planning
Monitoring
of programs
and projects
in approved
Physical
Development
Plans
Development
plans properly
designed,
approved and
implemented
100%
Number of people and
institutions with access
to Physical Planning
Regulations
A percentage of
compliance with
10,000,000

7
Provision
of planning
advisory
services
70% Physical Planning
Regulations
Strengthening of
Development
Control units in
11 Sub Counties
Sub-county
Development
Control Units
Purchase of
2 No.
motorcycle
for each sub
county
Purchase of
2 No. 4-
wheel Drive
Vehicles to
be shared by
Sub Counties
Development
Control
Units
Establishing
of Sub
County
physical
planning
offices
Purchased
motorcycles
Purchased
motor vehicles
Furnished and
equipped sub
county land,
physical
planning
offices and
housing
22 No.
motorcycles
2No. motor
vehicles
Functional
development
control units
established
in all 11 Sub
Counties
22 No. motorcycles
purchased
2No. motor vehicles
purchased
Functional
development control
units established in all
11 Sub Counties
10,000,000
Capacity
building
Capacity building
and development
Capacity
building to
physical
Training of
technical
staff on:-
No. of trained
staff
40 staffs Training minutes
Copy of certificates
issued
3,000,000

8
planning
staffs
Spatial
planning
Development
Control
Record
keeping
Information
technology
No. of
certificates
issued
Land
Information
Management
Systems
(LIMS)
Establishment of
GIS Lab
GIS Lab at
Ardhi House
Purchase of
equipment
and furniture
Setting up
room for
GIS
Training of
staff
Purchase of
Software
Fully equipped
and functional
GIS LAB
An equipped
and
operational
GIS lab
Furniture and
equipment purchased
Personnel trained
Functional GIS Lab
35,000,000
Survey and
Mapping
Establishing a
Land Survey
Section
Purchase of
survey
equipment
Purchase of
3 total
stations and
6 Handheld
GPS
Fully equipped
Land Survey
Section
3 No. total
stations
installed
6 No.
Handheld
GPS
Survey Equipment
Purchased and installed
15,000
Housing
Technology
Sensitize the
public on new
building
technologies and
Establishment
of Alternative
Building
Construction
of
Technology
Centers
2 no. ABT
centers
established
2017/18 No. of ABT centers
established/Constructed
15,000,000

9
thus facilitate low
cost housing
Technology
Centers
Acquisition
of
Interlocking
Block
Making
Machines
Procurement
of Machines
for
Technology
Transfer
2 no. Machines
Delivered
2017/18 No. of Machines
Procured and Delivered
12,000,000
Maintenance
of County
Estates
Improve the living
conditions of our
tenants
Renovation
of County
Estates
Re-roofing,
Construction
of Toilets &
Upgrading
Sewer Lines
200 housing
units
rehabilitated
2017/18 No. of rehabilitated
estates
40,000,000
Developing
of Housing
Infrastructure
Install supportive
housing
infrastructure in
County estates
Development
of Supportive
Housing
Infrastructure
Construction
of Drainage
and
sewerage
line
3 km of Trunk
sewer line laid
2017/18 The length of sewer
laid & the no. of new
households connected
to trunk sewer
20,000,000
Construction
of new office
Block
(Extension of
Ardhi house)
Provide adequate
office space
Construction
of office
space
Construction
of office
block
400 square ft.
of office space
2017/18 Amount of office space
created
20,000,000
TOTAL 447,003,000

10
ENERGY, INFRASTRACTURE AND ICT SECTOR The Physical infrastructure sector consists of, Roads, Transport, Energy, Public Works,
Information and Communication, Research and Development sub-sectors. This sector has been
recognized as an enabler for sustained development of the economy and in particular to the key
sectors identified under the economic pillar of the Kenya Vision 2030 strategy.
Sector Vision and Mission Vision
A World class provider of cost-effective physical and ICT infrastructure facilities and services.
Mission
To provide efficient, affordable and reliable infrastructure for sustainable economic growth and
development through construction, modernization, rehabilitation and effective management of all
infrastructure facilities.
Physical infrastructure sector largely focuses on measures aimed at improving the performance of
the other sectors. Major focus is on sustainable energy use, roads and communication
infrastructure. The sector policy is geared towards provision of quality roads and other public
works. The sector is also charged with providing reliable transport services and provision of timely
and reliable information, decent and affordable housing and provision of affordable, reliable,
secure and sustainable energy services for national development. The major transport
infrastructure in the county is road and railway.
The sector is a beneficiary of some flagship project as contained in Kenya’s Vision 2030. This
include the KMP whose objective is to improve the physical infrastructure of the Nakuru and
Naivasha municipalities. The Geothermal Power Exploration at Ol Karia and Menengai seeks to
increase the production of power to the national grid and provide a sustainable power source. The
Rural electrification Programme seeks to increase power access in rural areas and more so to the
public utilities.

11
ROADS, TRANSPORT AND PUBLIC WORKS SUB SECTOR Strategic objectives of the sector
The strategic objectives of the sector are in line with the four main programmes as follows:
Programme 1.0: Administration, Planning and Support Services.
To provide efficient services to physical infrastructure affiliated bodies/ departments.
Programme 2.0: Infrastructure, Development & Maintenance.
To develop, maintain and rehabilitate road network, transport facilities and government buildings
to enhance security, mobility, efficiency and safety.
Programme 3.0: Street Lighting.
To install and maintain lighting facilities within the county to improve on the security of the
County, its citizens and its environs and further enhance rural electrification programme.
Programme 4.0: Firefighting & Disaster Management.
To enhance the level of fire safety and response to disasters in the County.
12
PLANNED PROJECTS AND PROGRAMMES FOR IMPLEMENTATION IN THE FINANCIAL YEAR 2017/2018
Programme Strategic
priority
Project Description
of activity
Expected
output
Target
FY
2017/18
Key
performance
indicators
Budget
estimates
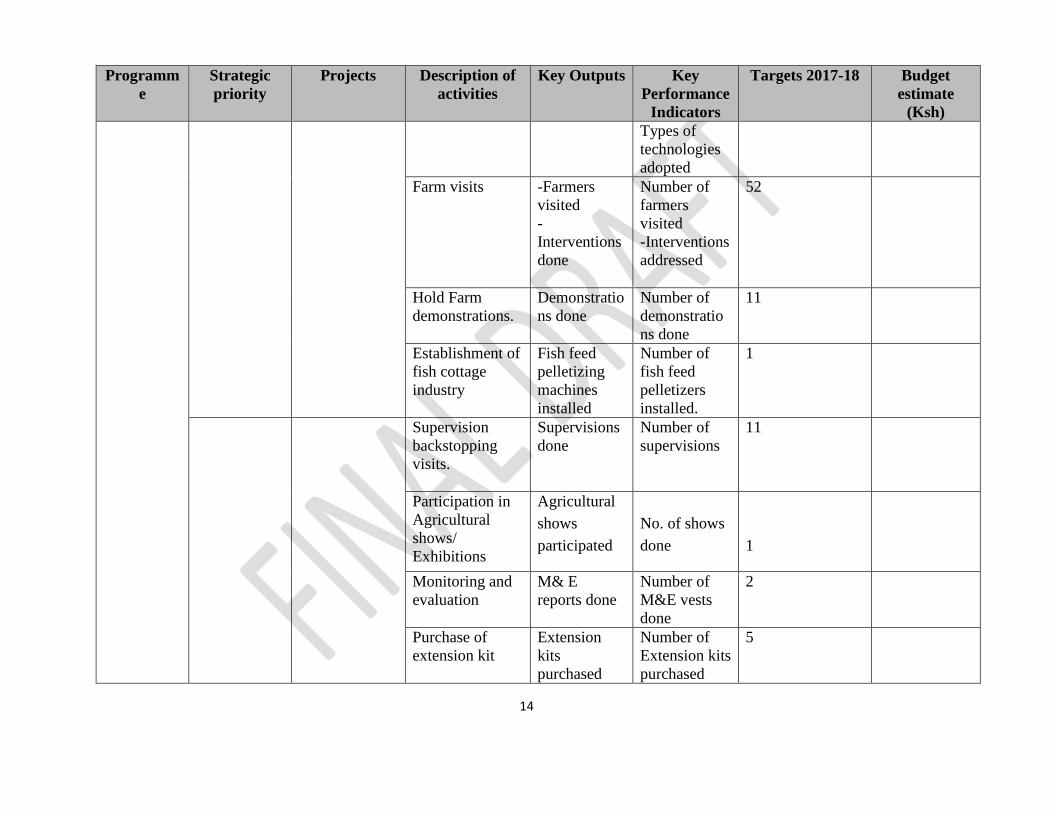
ADMINISTRATION
PLANNING &
SUPPORT
SERVICES
Develop and
enhance
implementation
of policies
Develop Fleet
Management
Policy
Decongesting of
town policy
Develop new
strategic plan
Customer
satisfaction
survey
Drafting of
Bills and
Legislation
Carry out
customer
satisfaction
survey
Policies
developed
Strategic
plan
developed
Customer
satisfaction
survey
carried out
April
2018
Number of
policies
developed
Strategic plan
Customer
survey report
15,000,000
Enhance
resource
mobilization
Foster
partnerships with
other
Stakeholders
Draft
proposals for
financial &
technical
support
Proposals
developed
June
2018
Number of
proposals
developed
4,000,000
Improve
service
delivery
Capacity
building of staff
Enhance
supervision of
projects
Identify and
train staff
Assign
officers to
carry out
Staff trained 120 Number of staff
trained
Training reports
5,000,000

13
Programme Strategic
priority
Project Description
of activity
Expected
output
Target
FY
2017/18
Key
performance
indicators
Budget
estimates
supervision
and prepare
reports
Project
supervision
reports
Enhance
monitoring and
evaluation
practices
Develop and
implement
monitoring and
evaluation
programs
Develop
monitoring
and
evaluation
programs
Implement
monitoring
and
evaluation
programs
Monitoring
and
evaluation
program
developed
Monitoring
and
evaluation
program
implemented
Quarterly Monitoring and
evaluation
program
Monitoring and
evaluation
reports
1,000,000
INFRASTRUCTURE,
DEVELOPMENT &
MAINTENANCE.
Improve road
infrastructure
within the
county
Improve the
roads in the
county to all
weather roads
Continuous
routine and
periodic
maintenance of
roads
Grading and
gravelling of
roads within
the County
Continuous
maintenance
of roads
Roads
graveled and
graded
Roads
routinely and
continuously
maintained
2000Km Number of
Kilometers of
graded and
graveled roads
Status reports
1,200,000,000

14
Programme Strategic
priority
Project Description
of activity
Expected
output
Target
FY
2017/18
Key
performance
indicators
Budget
estimates
Invest in plant
and machinery
for
maintenance of
roads
Purchase of roads
maintenance
plants and
machinery
Purchase of
plant and
machinery
Plant and
machinery
purchased
3
Graders
1 Dozer
Number of plant
and machinery
acquired
100,000,000
Develop storm
water master
plan for the
urban areas
within the
county
To develop storm
water master plan
for the major
urban centers
Development
of the storm
water master
plan for the
major urban
centers in the
county
Storm water
master plan
for the urban
areas
developed
3No Storm water
master plan
15,000,000
Develop storm
water
management
policy
Draft storm water
management
policy
Drafting of
Bills and
Legislation
Policy
developed
1No Storm water
management
Policy
15,000,000
Invest in storm
water drainage
networks as per
the storm water
master plan
Construct storm
water drains
Construction
of storm
water drains
Storm water
drains
constructed
2Km Number of
storm water
drains
constructed
20,000,000
Construct of
bridges and
culverts in build-
up areas
Construction
of bridges
and culverts
Bridges and
culverts in
build-up
25No Number of
bridges and
culverts
40,000,000

15
Programme Strategic
priority
Project Description
of activity
Expected
output
Target
FY
2017/18
Key
performance
indicators
Budget
estimates
in build-up
areas
areas
constructed
constructed in
build-up areas
Design and
construct lorry
parks
Design and
construct lorry
parks
Design and
construction
of lorry
parks
Lorry parks
designed &
Constructed
2Lorry
parks
Number of lorry
parks designed
and Constructed
30,000,000
Carry out
traffic flow
management
studies in
Nakuru and
Naivasha
towns with the
aim of
decongesting
the towns
Traffic flow
management
studies in
Naivasha and
Nakuru
Conduct
actual study
on traffic
flow in
Naivasha
and Nakuru
Study on
traffic flow
in Naivasha
and Nakuru
carried out
1 No Study report on
traffic flow in
Naivasha and
Nakuru
10,000,000
Put in place
traffic flow
management
measures
recommended
e.g. installation
of traffic
Implement traffic
flow
management
recommendations
Install
signage and
road
furniture at
the
appropriate
points
Signage and
road
furniture
installed
1 No Number of signs
installed
10,000,000

16
Programme Strategic
priority
Project Description
of activity
Expected
output
Target
FY
2017/18
Key
performance
indicators
Budget
estimates
signals, road
furniture
STREET LIGHTING Develop street
lighting master
plan
Develop street
lighting master
plan
Develop
street
lighting
master plan
Street
lighting
master plan
developed
1 No Street lighting
master plan
15,000,000
Invest in street
lighting
infrastructure
Construct street
lighting
structures as per
the master plan
Installation
and
rehabilitation
of street
lighting
facilities
Installed and
rehabilitated
streetlight
facilities
500 No Number of
installed and
rehabilitated
streetlight
facilities
150,000,000
Develop street
lighting
management
plan and policy
Draft street
lighting
management plan
and policy
Develop
street
lighting
management
plan and
policy
Street
lighting
management
plan and
policy
developed
1 No Street lighting
management
plan and policy
15,000,000
Develop local
legal
framework to
address
vandalism of
To develop street
lighting
management plan
and policy
Drafting of
plan and
policy on
local legal
framework
Street
lighting local
legal
framework
to address
1 No Local legal
framework to
address
vandalism of
5,000,000

17
Programme Strategic
priority
Project Description
of activity
Expected
output
Target
FY
2017/18
Key
performance
indicators
Budget
estimates
streetlights and
road furniture
to address
vandalism of
streetlights
and road
furniture
vandalism of
streetlights
and road
furniture
streetlights and
road furniture
FIREFIGHTING
AND EMERGENCY
SERVICES.
Enhance fire
prevention
activities in our
major towns
and
establishment
by carrying fire
safety
inspections
Conduct fire
safety
inspections
Carry out
fire safety
inspections
Fire safety
inspections
carried out
250 Fire safety
inspection
reports
5,000,000
Purchase of
plant and
machinery for
the sub-stations
Purchase of
firefighting and
disaster response
equipment and
facilities such as
fire engines,
rapid response
vehicles and fire
engine tow
Purchase of
firefighting
and disaster
response
equipment
and facilities
Equipment
and facilities
purchased
Various Number of plant
and machinery
acquired
70,000,000

18
Programme Strategic
priority
Project Description
of activity
Expected
output
Target
FY
2017/18
Key
performance
indicators
Budget
estimates
Ensure reliable
and easily
accessible
disaster
response
facilities and
units
Construction of
disaster response
facilities and
units
Construction
of disaster
response
facilities and
units
Disaster
response
facilities and
units
constructed
3 No Number of
accessible
disaster
response
facilities and
units
15,000,000
Ensure that the
personnel
responding to
disaster is well
equipped and
trained
Training of fire
fighters and
disaster response
personnel both
local and external
Training of
fire fighters
and disaster
response
personnel
both local
and external
Fire fighters
and disaster
response
personnel
trained
20 No Number fire
fighters and
disaster
response
personnel
trained
10,000,000
Develop
disaster
mitigation
legal
frameworks
and
enforcements
procedures e.g.
fire compliance
develop disaster
mitigation legal
frameworks and
enforcements
procedures
develop
disaster
mitigation
legal
frameworks
and
enforcements
procedures
disaster
mitigation
legal
frameworks
and
enforcements
procedures
developed
1 No disaster
mitigation legal
frameworks and
enforcements
procedures
15,000,000

19
Programme Strategic
priority
Project Description
of activity
Expected
output
Target
FY
2017/18
Key
performance
indicators
Budget
estimates
TOTAL 1,764,000,000

20
ICT SUBSECTOR Sub-Sector’s Overall Goal and Strategic Objectives
The overall goal of the ICT sub-sector is to have a fully automated county.
The strategic objectives are:
1. To improve on ICT human capital and workforce development in Nakuru County.
2. To promote public digital literacy among the Nakuru County citizenry.
3. To improve on digital connectivity in Nakuru County.
4. To enhance data access, protection and sharing.
5. To enhance e-government services in the county public institutions
Overview of the importance of the ICT sub-sector
Prior to the inception of ICT department in the county, ICT penetration in the county stood at about
20%. Since the inception of the ICT department, ICT penetration has increased tremendously up
to 70%. The department has been able to equip the sub-counties with ICT equipment, installed
software and commissioned structured cabling.
Other gains made include:
Internet connectivity in sub-counties and departmental offices.
Installation of IP telephones in the county headquarters and departmental offices.
Acquisition and installation of computer hardware and software at the sub- counties and
departmental offices.
Development of Nakuru County interactive website www.nakuru.go.ke
Installation of CCTV cameras at the county headquarters and in departmental offices at
the former PC’s headquarters.
Installation of firewall security in various sub-counties.
Development of a county asset management system

21
PLANNED PROJECTS AND PROGRAMMES FOR IMPLEMENTATION IN THE FINANCIAL YEAR 2017/2018
Programme Strategic
priority
Project Description of
activity
Expected
output
Target fy
2017/2018
Key
performance
indicators
Budget
estimates
ADMINISTRAT
ION AND
PLANNING
SERVICES
Enhance
staff
competency
and efficient
service
delivery.
Train staff on
emerging ICT
trends
Recruitment
of ICT staff
Conduct staff
training on
emerging ICT
trends
Conduct
recruitment of
ICT staff
Staff trained
Staff
recruited
25%
5
4
Number of staff
trained
Number of
trainings
conducted
Number of staff
recruited
20,000,000
To enhance
revenue
collection
and staff
mobility.
Purchase of
vehicles
Actual purchase
of vehicles
Vehicles
purchased
2 Number of
vehicles
purchased
10,000,000
To ensure
business
continuity in
case of a
disaster
Procure
consultancy
services
Hire consultant Consultancy
services
procured
ICT service
charter
developed
Communica
tion strategy
developed
111 5,500,000

22
Programme Strategic
priority
Project Description of
activity
Expected
output
Target fy
2017/2018
Key
performance
indicators
Budget
estimates
INFORMATIO
N AND
COMMUNICAT
ION SERVICES
Promote
accurate and
timely
disseminatio
n of
information
among the
Nakuru
county staff
and citizens
Maintain
updated
county
website
Hold
professional
forums and
stakeholders’
meetings
Conduct
awareness
campaigns
within the
wards.
Hold forums
with media
fraternity in
order to
promote good
media
Routine
updating of the
County website
Organize
professional
forums and
stakeholder
meetings
Conduct
awareness
campaigns
within wards
Organize
forums with
media fraternity
County
website
routinely
updated
Professional
forums and
stakeholder
meetings
held
Awareness
campaigns
conducted
Forums with
media
fraternity
organized/h
eld
30
3
30 wards
Website traffic
Number of
forums and
meetings held
Number of
roadshows held
Number of
wards supplied
with newsletters
and brochures
Number of press
conferences held
Number of
luncheons/dinner
s held with local
journalists held
43,529,950
4,000,000

23
Programme Strategic
priority
Project Description of
activity
Expected
output
Target fy
2017/2018
Key
performance
indicators
Budget
estimates
relations.
Produce
Documentary
on County
information
Filming of the
documentaries
documentari
es in both
print and
electronic
form
produced
No. of
issues/editions
produced
Promote
County
image
Branding Assets
branded
50%of
assets
branded
Number of assets
branded
10,000,000
ICT
INFRASTRUCT
URE
DEVELOPMEN
T
Digitize
service
delivery
Acquire and
install ICT
equipment
Establish
digital centres
in sub-
counties
Acquisition and
installation of
ICT equipment
Actual setting
up and
equipping of
digital centres
ICT
equipment
acquired
and installed
Digital
centres
established
50
computers
and
various
accessorie
s
3 digital
centres
Number/List of
equipment
procured
Number of
digital centers
set up and
equipped
8,000,000
15,000,000

24
Programme Strategic
priority
Project Description of
activity
Expected
output
Target fy
2017/2018
Key
performance
indicators
Budget
estimates
Ease
communicat
ion and
access to
information
Installation of
Wide area
networks
connecting
sub-counties
to the County
Headquarters
security
systems
installed
Installation of
WAN's to
connect sub-
counties and
county
headquarters
WAN network
installed
Number of
CCTV systems
installed
41,000,000
10,000,000
Promote
access to
county
government
services
online
Automation
of county
services
County
services
automated
19,000,000
TOTAL 468,029,950

25
HEALTH Sector vision and mission Vision
A healthy County.
Mission
We provide integrated quality health services for all.
STRATEGIC GOALS/OBJECTIVES OF THE SECTOR
The strategic plan will be guided by the tenets highlighted in the KHSSP 2013-2017, vision 2030
and the constitution. This will assist the county to operate in harmony with the rest of the country
in service delivery.
The focus of the strategic plan shall be on the two policy obligation;
a) Human Rights based approach- this will aim to attain the right to health in response to the
role of the health sector as outlined in the bill of rights. The document will focus on
strategies that will enable rights holders to enjoy accessible and quality health services.
Good health is an end in itself and is based on an assumption that the rights holder desires
good health for itself.
b) Health contribution to development- the document will ensure that Nakuru county
population participates in development activities maximally as envisaged in the role of the
health sector in development as a part of the social pillar in vision 2030.
The county strategic health plan is developed and guided by NHSSPIII and other international
goals eg SDG development goals, Abuja Declaration etc. Its overall goal is to reduce inequalities
in health care services and reverse the downward trend in health-related outcome indicators in the
county. The strategic objectives set for the realization of this goal are:
Equitable access to health services increased.
The quality and responsiveness of services in the county.
The efficiency and effectiveness of service delivery.
The fostering of partnerships.
Improve financing of the health service in the county.
The six policy objectives are:

26
1. Eliminate Communicable Conditions
2. Halt, and reverse the rising burden of non-communicable conditions
3. Reduce the burden of violence and injuries
4. Minimize exposure to health risk factors
5. Provide essential health services
6. Strengthen collaboration with health related sectors
SECTOR MANDATE
The following Sector mandates are derived from the Constitution of Kenya 2010, Sixth schedule
as read with section 23 and 24 of the Transition to Devolved Government Act 2012, and further to
the legal notice no. 157 of 2013. Promoting access to health services in the County.
a) Address discrimination of marginalized areas and vulnerable groups.
b) Ensuring efficiency of Health Services.
c) Ensuring equity of health services
d) Promoting access to health services throughout Nakuru County
e) Ensure efficiency is at the core of its health department and services
f) Address problems of low quality health services
In-order to achieve the sector mandates and obligations the following services are offered,
Medical, Primary Health Care, Sanitation, Cemetery, Mortuary and Revenue Collection Services.
The following are the health sectors programmes:
Curative health services
Promotive health services
Preventive health services
Rehabilitative health services
Human resource for health
Research and Development

27
PROJECT IMPLEMENTATION FY 2014/2015
On the implementation of development projects in the financial year 2014/015 a total of Ksh
250,085,337.34 was allocated for construction, renovation, upgrading and completion of various
Health Facilities in various wards within the county which also included sanitary blocks.
We also purchase of 4 ambulances and tractors amounting to Ksh 32,258,867 and 3,450,000
respectively.
Furthermore, equipment amounting to Ksh. 5,326,000 was purchased for equipping the various
health facilities.
PROJECT IMPLEMENTATION FY 2015/2016
In the FY 2015/16, for level 5 hospitals there was a purchase of Plant and Equipment amounting
Ksh 45 million and medical and dental equipment amounting to Ksh 45million
The sector received a total Ksh 232,697,563 for the construction; renovations and equipping of
Health facilities in this regard, all the projects are still ongoing due prolong procurement process.

28
PLANNED PROJECTS AND PROGRAMMES FOR IMPLEMENTATION IN THE FINANCIAL YEAR 2017/2018
Programme
Strategic
Priority
Project Description of
Activity
Expected
Out Put
Target
FY
2017/18
Key
Performance
Indicators
Budget
Estimates
(Kshs)
Administrati
on and
Planning
Have a
strong and
vibrant
Health
Information
System in
place
Procure
computers
Review
meetings and
harmonize data
tools
Set up a
county health
information
website
Purchase
computers and
distribute to the
needy sub-
county
Hold regular
review meetings
at all levels
Improve
quality of
data for
decision
making
100% health
facilities
reports through
DHIS
No of computers
procured
Number of
quarterly Review
meetings (in %)
Number of
stakeholders
meetings health
4,248,640
Enhance
provision of
quality
health
service
Establish
HFMC/Board
Health Facility
management
committee
formed
All health
facilities
form
HFMC/Boa
rds
100% of health
facilities have
HFMC/Boards
100% 64,332,400
Effective
and
efficiency
leadership
Prepare health
operation
manual
Operation
manual
developed
Operation
manual
developed
1 operation
manual
1 5,000,000
Improve
staff
performance
Recruitment of
health
workforce
Recruit more
staff
Staffs
recruited
Recruit about
200 health
Number of
health workers
recruited
3,341,169,109

29
Programme
Strategic
Priority
Project Description of
Activity
Expected
Out Put
Target
FY
2017/18
Key
Performance
Indicators
Budget
Estimates
(Kshs)
and
motivation
workers from
all cadres
Staffs
promotion
Recommend
staffs due for
promotion to
CPSB
staffs
promoted
200 Number of staffs
promoted
Improved
scientific
solution to
health
problems
Funding of
research and
development
Conduct
regularly
research
Enhanced
evidence
based
interventio
n
2
research/surve
ys
Research/survey
reports
2,750,000
Increase
access to
health care
Construct
additional
health facilities
Procurement of
construction
service
Additional
health
facilities
constructed
55 new health
facilities
Number of
Health facilities
constructed
466,030,436.30
Preventive
and
Promotive
services
Increase %
of pregnant
mothers
attending at
least 4 ANC
Visits
Strengthen RH
Service
Equip all Health
Centres and
dispensaries to
offer Antenatal
services
Improve
Antenatal
clinic
attendance
60% of ANC
pregnant
mothers
attending to at-
least 4 ANC
clinics
Number of
pregnant women
attending at least
4 ANC visit (%)
258,198,037.68
Reduce
maternal
deaths in the
county
Funding
maternal
health services
in the county
Construction of
more maternity
wings
Maternity
wings
constructed
75% of all
pregnant
mothers
deliver at
health facilities
% of all
deliveries
conducted by
skilled health
workers
Improve
health care
seeking
behavior
Procure more
IEC materials
Carry out
massive
distribution of
IEC materials to
Increase
population
reached
70% of house
hold reached
with health
messages
Percentage of
population
reached with
health Messages

30
Programme
Strategic
Priority
Project Description of
Activity
Expected
Out Put
Target
FY
2017/18
Key
Performance
Indicators
Budget
Estimates
(Kshs)
all House Hold
in the county
with health
messages
Improve
health at
facility
levels in the
county
Establish
additional CU
Identify and
recruit
Community
Health workers
Functional
community
units
established
220
community
units by 2017
Number of
community units
establish
Have OD
free County
Construction
of more toilets
at the
household
Vigorous
campaign to
sensitize public
on importance
of toilets in the
house hold
Increase
number of
household
with
functional
toilets
90% of the
household in
the county with
functional
toilets
% of household
with functional
toilets
74,478,899
Reduce
increase in
diseases due
to poor
environment
Supply of
equipment of
hand washing
facilities in all
schools and
House holds
Procure and
supply schools
with hand
washing
facilities
Increased
number of
schools
with
functional
hand
washing
facilities
40 schools
with adequate
hand washing
facilities
Number of
schools with
functional hand
washing
facilities
Improve
waste
management
in the county
Acquisition of
land for
dumpsites
Procure
dumpsites in the
county
Increase
percentage
of acreage
for
dumpsite
Procure 20
hectare of land
for dumpsite
activities
Percentage
acreage for
dumpsite
Construct
modern
incinerators in
all major
Procure
construction
service
Modern
incinerators
constructed
Construct 10
modern
incinerators in
county
Number of health
facilities with
modern medical

31
Programme
Strategic
Priority
Project Description of
Activity
Expected
Out Put
Target
FY
2017/18
Key
Performance
Indicators
Budget
Estimates
(Kshs)
hospital in the
county
waste
incinerators
Have a county
free from open
defecations
Carry out open
defecation free
campaigns
across the
county
Increase
number of
open
defecation
free
villages
1400 ODF free
villages by
2017
Number of
villages certified
to be open
defecation free
(Number)
Timely
disease
outbreak
response
Have a strong
disease
surveillance
system in the
county
Carry out
regular disease
surveillance
across the
county
Increase in
case
detection
and
response
100% of
disease
outbreaks
detected and
investigated
Percentage of
cases detected
and investigated
2,684,000
Improved
health
seeking
behaviour
Procure
enough IEC
Materials in
the county
Vigorous
campaign and
distribution of
IEC materials to
all house hold in
the county
Increase
population
reached
with health
messages
70% of all
household to
be reached
with health
messages
Percentage of
population
reached with
health messages
(50%)
3,850,000
Improve
public
health
lifestyles
Sensitize
community on
health risk
factors
Plan well on
advocacy
meetings and
house to house
campaigns
Increase
population
aware of
risk factors
to health
Regular
periodic
meetings and
commemoratio
n days
Number of
advocacy/comm
emoration of
health days
observed
Curative and
Rehabilitativ
e services
Reduction of
infant
mortality
rate in the
county
Elimination of
communicable
disease in the
county
Supply adequate
drugs, cold
Chain and
vaccines to all
immunizing
Increase
population
under one
year
protected
90% of fully
immunized
children in the
county by 2017
Percentage of
fully immunized
children (%)
505,525,293.06

32
Programme
Strategic
Priority
Project Description of
Activity
Expected
Out Put
Target
FY
2017/18
Key
Performance
Indicators
Budget
Estimates
(Kshs)
facilities in the
county
from
immunizab
le
conditions
Halt and
reverse non
communicab
le diseases
in the
county
Sensitize
populations on
change of
lifestyle
Procure enough
condoms,
increase
enrolment on
HAART/ART
and reaching
more
populations on
lifestyle change
Increase
Number of
HIV
positive
pregnant
mothers
receiving
Preventive
ARVS
100% of all
HIV pregnant
mothers put on
ARVS
Percentage of
HIV positive
pregnant Mother
receiving
preventive
ARVS
76,689,961.30
Protect
population
against
Cervical and
Prostate
cancer
Have both
Female and
Male go for
cancer
screenings
More health
facilities to have
screening centre
for attending to
those
volunteering for
screening
Increase
uptake of
cervical
cancer
screening
50% of women
of reproductive
age coming for
cervical cancer
screening
Percentage of
women of
reproductive age
screened for
cervical cancer
(%)
38,345,420.65
TOTAL 4,843,302,196.99

33
EDUCATION Sector vision and mission Vision
An empowered and cohesive society.
Mission:
To formulate and implement responsive policies, provide quality education, nurture talents and
enhance diversity.
Strategic goal
Provision of overall policy and leadership direction on matters pertaining to human resource
management, planning, coordination, of Youth Affairs and Vocational Training, Education,
Culture and Gender and Social Services
Background
The sector comprises of Directorates namely: - Education (ECDE), Culture & Gender, Youth
Affairs & Vocational Training, Sports and Social Services
The development plan is being prepared for the period 2017/18 in line with (PFMA), 2012. The
sector has ensured that this proposal gives priority to areas that support social development and
economic growth and transformation.

34
Programme Strategic
Priority
Projects Description of
Activity
Expected
output
Targets
2017/18
Key performance
Indicators
Budget
Estimates
Promotion
of Early
Childhood
Education
Provide
quality ECD
Education
for a good
foundation
ECD
Infrastructure
Construction of
new ECD
classrooms
Improved
infrastructure
165
(three per
ward)
No. of new ECD
classrooms
constructed
198,000,000
ECD
equipment
Equipping existing
ECD classrooms
Child friendly
classrooms
165
(3 per
ward)
No. of ECD
classrooms equipped
with tables, chairs
and outdoor playing
equipment
16,500,000
ECD teacher
recruitment
and
engagement
Employ ECD
Teachers/Assistants
Improved
teacher
satisfaction
850
(One
teacher per
school
No. of ECD
Teachers/assistants
engaged
255,000,000
ECD
instructional
materials
Provide ECD
instructional
materials for public
ECDs
Improved
ECDE
education
850 Public
ECDs
No. of instructional
materials purchased 25,581,000
Ensure and
safeguard
rights and
welfare of all
children
ECD school
feeding
programme
Implement an all-
inclusive School
Feeding
Programme
Enhanced
health and
Nutrition of
ECDE children
850
(all public
ECDs)
Number of ECD
Centres under School
Feeding Programme
21,250,000
ECD special
education
Equipping Special
Need ECD Units
Easy mobility
Social
inclusion
55
(one per
ward)
No. of Special Need
ECD Units equipped 16,500,000
Improvement
of sanitation
facilities
ECD
sanitation
Construction of
ECD toilet blocks
with every new
ECD classrooms
Improved
sanitation
165
(3 per
ward)
No. of ECD toilets
put up 132,000,000

35
Programme Strategic
Priority
Projects Description of
Activity
Expected
output
Targets
2017/18
Key performance
Indicators
Budget
Estimates
ECD health
and nutrition
Construction of
hand washing
points and
provision of water
storage tanks in
every ECD
Improved
hygiene
850
(all public
ECDs)
No. of hand washing
points and water
storage tanks put up
85,000,000
Provide
quality and
integrated
services for
wholistic
Development
of children
ECD
capacity
building
In service Training
and Capacity
building workshops
for ECD teachers
and staff
Efficient
curriculum
implementation
36
(one
w/shop per
term in
every sub
county and
Directorate
No. of workshops
mounted for training
ECD Teachers
10,800,000
ECD quality
and
assessment
Quality assessment
of ECD Institutions
and monitoring
Effective
service
delivery
990
(90
schools
per Sub
County)
No. of quality
Assurance/monitoring
visits done per year
3,960,000
Research and
Development
Conducting
Research studies
Improved
ECDE
education
2 No. of research
conducted to identify
gaps and plan
interventions
6,000,000
Primary and
Secondary
Education
Support
Ensure
retention and
participation
by primary
and
secondary
school
students
Secondary
Bursary
Provide Bursary to
needy students in
secondary schools
Reduced
number of
drop-outs in
secondary
schools
20% Percentage increase
in number of students
under bursary
programme
165,000,000
Sanitary
towels for
secondary
schools
Provision of
sanitary towels for
mature girls in
Reduced
absenteeism to
school of
mature
30% Proportion of eligible
school girls targeted
and benefiting from
sanitary towels
68,000,000

36
Programme Strategic
Priority
Projects Description of
Activity
Expected
output
Targets
2017/18
Key performance
Indicators
Budget
Estimates
primary and
secondary schools
Tertiary
Education
Ensure and
safeguard
rights and
welfare of all
students
University
Bursary
Provide bursary to
students in colleges
and universities
Increased
completion
rates of
university
students
20% Percentage increase
in number of Tertiary
students under
bursary programme
26,400,000
TOTAL 831,991,000
Programme Strategic
Priority
Projects
Description of
Activity
Expected
output
Targets 2017/18
Key performance
Indicators
Budget
Estimates
Children
services
To rehabilitate
the street children
through support
and care
To eliminate the
use of Alcohol
and Drug Abuse
(ADA) among
the street children
Street children
drop in and
rehabilitation
facility
Psychosocial
and medical
support to
victims of
ADA
Construction and
furnishing of the
facilities
Provide
psychosocial and
medical support
to victims of
ADA
Reduced
number of
children
living in the
streets
Reduced
cases of
Alcohol and
Drug Abuse
among the
street
children
Naivasha,Gilgil
Nakuru East,
Nakuru West,
Molo,Njoro,Rongai
towns
ADA victims
No. of facilities
constructed
No. of children
rescued from the
streets
No. of children
reintegrated into the
society/families
No. of children on
ADA supported
15
Million

37
Programme Strategic
Priority
Projects
Description of
Activity
Expected
output
Targets 2017/18
Key performance
Indicators
Budget
Estimates
Women
empowerment
To empower
women
economically
through revenue
stream and
employment
Women
empowerment
centre at Njoro
Homecraft
Construction of
the women centre
Equipping the
centre
Economically
empowered
women
Employment
opportunities
created
1 No. building No. of rooms
completed and in
use
8 Million
Older persons
program
To renovate and
upgrade Alms
House
To sensitize the
community on
care and support
for the elderly
To reunite the
elderly with their
families/kin
Renovation
and upgrade of
Alms House
Renovating of the
existing Alms
House
Expansion of the
structure
Conducting
awareness
meetings
M&E
Refurbished
facility
Reduced
congestion in
Alms House
Reduced
vulnerability
among the
older persons
in the
community
Alms House
Nakuru
Refurbished facility
No. of older
persons reunited
with their families
No. of wards
sensitized on the
importance of care
and support for the
elderly
10
Million
Pre-
feasibility
survey and
Research
studies
Avail data about
women policies,
street children,
older persons and
persons with
disabilities.
Research on
implementation
of social
programs
To carry out
baseline survey
and report on the
findings
Carrying out the
research studies
and report on the
findings
Baseline
Surveys
Research
Reports
3 No. of baseline
surveys
3 No. of research
reports
No. of baseline
surveys carried out
No. of research
conducted and
reports compiled
5 Million

38
Programme Strategic
Priority
Projects
Description of
Activity
Expected
output
Targets 2017/18
Key performance
Indicators
Budget
Estimates
Formulation
of Service
Charter
To develop a
Directorates
service charter to
guide the
implementation
of service
delivery
Social Services
Directorate
Service Charter
Have a
stakeholders
meeting to
develop a service
charter
Developing of
service charter
Departmental
Service
Charter
1 Service Charter
developed
Several copies for
the 11 sub counties
Service charter in
place
No. of copies
printed and
supplied
2,000,000
Monitoring
and
Evaluation
To carry out
monitoring and
evaluation of
Directorate’s
activities
Monitoring and
Evaluation
Develop Action
Plan for M&E
Activities
Undertake M&E
Enhance
service
delivery
Customer
satisfaction
M&E report on
street children,
women, older
persons and PWDs
activities
No. of M&E
Reports written and
presented
3,000,000
Disability
Programmes
Profiling of
PWDs
Vetting and
disbursement of
PWD
funds/devices/kits
to beneficiaries
Disability
mainstreaming on
development
issues
County
Disability Fund
To profile all
PWDs
To disburse
funds/devices/kits
to beneficiaries
Capacity building
workshops on
procurement
processes
Have facts
and figures of
number of
PWDs per
ward, sub
county and
county.Built
capacities of
PWDs on
socio-
economic
Social
upliftment
All 55 wards No. of PWDs per
ward
No. of PWDs
trained
No. of PWDs
received
funds/devices/kits
55
Million

39
Programme Strategic
Priority
Projects
Description of
Activity
Expected
output
Targets 2017/18
Key performance
Indicators
Budget
Estimates
HIV
Programmes
Conduct
awareness
creation on HIV
HIV
Awareness
Programme
Hold seminars
and workshops
for staff and
community
members
Reduced
stigma of
PLWHIV
Reduced
cases of new
infections
Increased
awareness
11 sub counties No. of
trainings/workshops
held
No. of people
attended
Number of cases
reduced (%)
5 Million
Training and
mentorship
Capacity build
ability of
employees for
effective service
delivery
Capacity
Building
Conducting
training
workshops
Improved
service
delivery
Improved
employee
motivation
level
Improved
customer
satisfaction
County Staff
No. of officers
trained
No. of workshops
conducted
5 Million
TOTAL
DIRECTORATE OF YOUTH AFFAIRS AND VOCATIONAL TRAINING
Programme Strategic
Priority
Projects Description
of Activity
Expected
output
Targets 2017/18
Key
performance
Indicators
Budget
Estimates
Revitalizatio
n of Youth
Polytechnics
To equip
refurbish
and
Purchase of
Equipment and
tools.
Media and
Enhancing
enrolment in
the
Trainees increased
by1,500
Number of
trainees
enrolled.
68,000,000

40
Programme Strategic
Priority
Projects Description
of Activity
Expected
output
Targets 2017/18
Key
performance
Indicators
Budget
Estimates
upgrade
infrastructu
re in YP
Provide
adequate
and
conducive
learning
environmen
t
Rehabilitation
of facilities.
advertisemen
t
Re-branding
of YPs
Conducting
needs
assessment
for tools &
equipment.
Developing
the list of
tools &
equipment
Linking up
with
procurement.
Receipt &
Delivery of
tools
&equipment
Developing
list of
polytechnics
and service
delivery
Increased
number of
Youth
polytechnics
equipped
Enhance better
training and
learning
environment
YPs equipped
5Yps rehabilitated
twin workshops in
10 polytechnics
and
Flagship project
completed at
Nakuru YP
No. of YPs
equipped
No. of media
and print
advertised
No. of YPs
equipped with
tools and
equipment
Acknowledgem
ent letters.
No. of YPs
rehabilitated
Minutes of
M&E
No. of flagship
projects
No. of projects
monitored and
assessed.

41
Programme Strategic
Priority
Projects Description
of Activity
Expected
output
Targets 2017/18
Key
performance
Indicators
Budget
Estimates
number of
youth
polytechnics
rehabilitated
Education&
Vocational
Training
To improve
quality of
training
programs
Research
studies on
training needs
and training
facilities
Conduct
feasibility
study on
service
delivery
Collaborate
with other
stakeholder
to capacity
build officers
&trainers on
curriculum
implementati
on and
service
delivery.
Enhancing
service
delivery
Nurturing
Talents
2 studies to be
conducted
30 officers to be
capacity build.
21 Institutions to
be assessed in 11
sub-counties
To host 5
championships
5 activities
conducted
No. of
feasibility study
Reports
List of
Examination
Administrators
No. of QAS
officers trained.
Reports
No. sporting
championship
No. of Drama
&Triple E
24,500,000

42
Programme Strategic
Priority
Projects Description
of Activity
Expected
output
Targets 2017/18
Key
performance
Indicators
Budget
Estimates
Conduct
quality
assessment.
Coordination
of co-
curriculum
activities-
sports,
Drama and
Triple E
Youth
development
and
empowerme
nt
Co-ordinate
and
promote
youth
participatio
n in
National
and County
decision
making.
Development
of Youth skills
Capacity
building
and
sensitization
programmes
to
empower
youths on
entrepreneur
ship
( empower
youth
with skills)
Developing a
holistic youth
through
entrepreneursh
ip
participation.
2,000 youths to be
sensitized
3 programs to be
conducted in 11
sub-counties
Quarterly youth
and vocational
training magazine
No. of youths
sensitized
No of
workshops
Report.
Business
incubation
centers
identified.
21,500,000

43
Programme Strategic
Priority
Projects Description
of Activity
Expected
output
Targets 2017/18
Key
performance
Indicators
Budget
Estimates
County
youth and
vocational
Training
magazine
Collection
of
information.
Printing of
the
document.
Distribution
of the
magazines.
Mobilizing
and
arrangement
of
participants
within the
county for
youth week.
Co-
ordination
Developing a
holistic youth
through
entrepreneursh
ip participation
2,000 youths to be
entrepreneurially
developed
International
Youth week
conducted.
County youth &
vocational
exhibition/symposi
um
No. of
magazine
produced and
distributed.
Attendance list
to the
International
Youth Week
No. of
innovative
products from
each sub-county
displayed by
youths
30,000,000

44
Programme Strategic
Priority
Projects Description
of Activity
Expected
output
Targets 2017/18
Key
performance
Indicators
Budget
Estimates
of
vocational
training
exhibitions
and
symposium
TOTAL 144,000,000
DIRECTORATE OF CULTURE AND GENDER.
Programme Strategic
Priority
Projects Description of
Activity
Expected
output
Targets
2017/18
Key
performance
Indicators
Budget
Estimates
Cultural
Heritage &
the Art
Promotion
To preserve,
promote and
develop
cultural
heritage and
the art
Establishment
of a music
recording
studio within
Nakuru
Players
Theatre.
Construction of
recording
studio.
Renovation of
the stage and
wiring for the
lighting system
Equipping the
theatre
A fully
functional
music
recording
studio.
A performance
stage to be
used by the
artists
Well
refurbished
culture and
art facility in
the County
% of work
completion
through
progress
reports
No. of
Recorded
works of art.
15,000,000

45
Programme Strategic
Priority
Projects Description of
Activity
Expected
output
Targets
2017/18
Key
performance
Indicators
Budget
Estimates
Perimeter wall
and
Security gates
construction
Landscaping
Number of
chairs and
tables fixed
Number of
upcoming
artists using
the facility
Number of
youth
involved in
the
renovation
process.
To preserve,
promote and
develop
cultural
heritage and
the art
Establishment
of 2
community
based culture
and art facility
Acquisition of
land
Production of
MoU with the
community
members
Construction of
2 cultural
centres
2 Community
based cultural
facilities
established at:
Gilgil Sub-
County
Njoro Sub-
County
5 Acres of
land
acquired in
collaboration
with
community
members
2 No.
community
culture
centres
constructed
Land
acquisition
documents
%work
completion
through
progress
reports
20,000,000

46
Programme Strategic
Priority
Projects Description of
Activity
Expected
output
Targets
2017/18
Key
performance
Indicators
Budget
Estimates
County
Heritage and
Culture policy
Identification
of stakeholders
Public
participation
forums
Drafting of the
Policy
document
County
Heritage and
Culture Policy
in place
Draft
County
Heritage and
Culture
Policy
Copy of
Draft County
Heritage and
Culture
Policy
List of
participants
Workshop
reports
4,500,000
Capacity
building of
staff members
through
meetings
Quarterly
meetings (4
meetings)
Staffs
equipped with
skills to
improve
service
delivery
Quarterly
meetings (4
meetings)
Copies of
certificates
issued
Meetings
reports
500,000
Production of
County
cultural
magazine
Identification
of stakeholders
Engage experts
in writing the
articles through
adverts and
competitions.
Forums with
Language
committee
members
A County
cultural
magazine in
place
A County
cultural
magazine
500 copies
produced
Number of
articles
addressing
cultural
issues
Copies of
magazines
produced
1,000,000

47
Programme Strategic
Priority
Projects Description of
Activity
Expected
output
Targets
2017/18
Key
performance
Indicators
Budget
Estimates
Production of
Service
Charter for the
Directorate
Drafting of
activities of the
Directorate
Service
Charter
Directorate
Service
Charter
500 copies 500,000
Cultural
preservation
and promotion
Exhibition of
traditional
cuisines
(Traditional
food)
Sourcing of
participants
Sourcing and
preparation of
venue
Traditional
foods
promoted to
the community
1 event
organized
per sub-
county
1 county
event
List of
participants
Number of
visitors
3,000,000
County herbal
medicine
exhibitions
County herbal
medicine
exhibitions
conducted
Herbal
medicine
promoted to
the community
Six (6)
herbalists
per sub
county (i.e
33
herbalists)
66 herbal
medicine
practitioners
from the 11
sub counties
2,000,000
Establish a
botanical
garden for
herbalists
Identification
of space for the
gardens
Provision of
seedlings
A herbalists’
botanical
garden in place
A
functioning
herbal
botanical
garden
Number of
seedlings
Types of
seedlings
preserved
Number of
visitors
2,000,000
To develop,
promote and
preserve
visual arts.
Skills
development
for self-
reliance
among
Capacity
building
workshop and
exhibition for
Visuals artists
empowered
Participants
rom 11 sub-
counties
Number of
artists trained
List of
participants
9,000,000.00

48
Programme Strategic
Priority
Projects Description of
Activity
Expected
output
Targets
2017/18
Key
performance
Indicators
Budget
Estimates
upcoming
artists
visual artists
(five days)
Workshop
report
To develop,
preserve and
promote
performing
arts
Skills
development
for self-
reliance
among
upcoming
artists
Mobilization
workshop for
coordination of
KM& CF ( one
day per sub-
county)
Mobilization
workshop held
11 sub-
county
workshop
County
workshop
List of
participants
Reports of
the workshop
Awards
1,000,000.00
Community
based cultural
festivals
Sensitization
and
mobilization of
communities to
participate in
the festivals
Community
mobilization
conducted
Cultural
festivals
conducted
11 sub-
counties
festivals
Number of
communities
mobilized
Festival
reports
Attendance
lists
2,000,000
Kenya Music
and Cultural
Festival
County –
National
festivals
Sensitization
and
mobilization of
community
groups to
participate in
the festival
Training of the
adjudicators
Sensitization
and
mobilization
conducted
1 County
1 Regional
1 National
Number of
communities
in the festival
Reports
Photos
5,000,000

49
Programme Strategic
Priority
Projects Description of
Activity
Expected
output
Targets
2017/18
Key
performance
Indicators
Budget
Estimates
and
coordinators
Adjudicators
and
coordinators
trained
Cultural
exchange
Nakuru
County Choir
Other culture
and art group
exchange
programs
Bench
marking.
Exchange
programs
conducted
Benchmarking
conducted
One
program
Exchange
program
reports
5,000,000
Youth Talent
Development
in Music,
theatre and
Dance
Capacity
building
workshops for
upcoming art
groups
Formation of a
musical band
Increased
registration
Number of art
groups trained
Registration
increased
Musical
instruments
purchased
60 youths
Musical
instruments
purchased
Number of
youth trained
Number of
groups/bands
registered
2, 000, 000.00
Grants to
cultural
organizations
Empowerment
of culture and
art groups
Purchase of
costumes
Costumes
purchased
Number of
groups
receiving
costumes
1,500,000
Miss World
Kenya
Community
based events
Organize local
miss world
event
Local miss
world events
organized
11Sub-
counties for
auditions
1 County
1 National
Number of
teams
Photos
Report
10,000,000.00
Governors
Christmas
Carols
Organize
Christmas
carols
Christmas
carols
organized
One-day
activity
Number of
teams
Photos
Report
2,000,000.00

50
Programme Strategic
Priority
Projects Description of
Activity
Expected
output
Targets
2017/18
Key
performance
Indicators
Budget
Estimates
To develop
indigenous
languages and
Kenyan
traditions.
Formation of
language
committees at
County and
Sub County
levels
Identification
of language
and heritage
experts
Committees
formed
50 experts
100 target
The No. of
experts
identified
Number of
workshops
2,000,000.00
Organize
meetings with
Language
committees
Meetings
organized
Number of
tribes
represented
Number of
meetings
2,000,000.00
Mark
International
Mother
Language Day
International
Mother
Language Day
observed
1
Reports
3,000,000.00
Survey on the
position of
indigenous
knowledge
among
community
members
Collection and
documentation
of TCH
Data collected 100 Report on
survey 2,000, 000.00

51
Programme Strategic
Priority
Projects Description of
Activity
Expected
output
Targets
2017/18
Key
performance
Indicators
Budget
Estimates
To Promote
Gender
Equality and
Empowerment
of Women
and girls
Prevention
and response
to sexual and
gender based
violence in the
county
Formation of
Sub County
GBV Clusters
Community
sensitization
on GBV
issues
Sensitization of
community
members on
issues of
gender that
affect them
Sub County
GBV clusters
formed
Enlightened
community
members
12 Number of
clusters
Number of
cases dealt
with
Number of
reports
Number of
workshops
4,000,000
Gender
mainstreaming
on issues of
community
development
Capacity
building
workshops on
gender
mainstreaming
in community
development
processes
Sensitization of
community
members on
issues of
gender that
affect them
Involvement of
public
participation at
Enlightened
community
members
Community
members
sensitized
Public
participation
conducted
12 Number of
workshops
on awareness
and
sensitization
List of
participants
Reports
2,000,000
Follow ups on
implementation
of gender
mainstreaming
in development
processes
Improved
development
processes
where both
genders are
involved
12 Number of
follow ups 2,000,000

52
Programme Strategic
Priority
Projects Description of
Activity
Expected
output
Targets
2017/18
Key
performance
Indicators
Budget
Estimates
Development
of gender
policy
framework at
county level
Identification
of
stakeholders
Organize
public forum to
discuss the
policy
document
Public for on
policy
discussion
conducted
1policy Policy
document in
place
1,000,000
Women
empowerment
projects
Mobilization
workshops at
Sub County
levels
Organize
gender
workshop for
women
empowerment
Workshop for
women
empowerment
organized
Number of
workshops
Number of
women in
attendance
2,000,000
Gender crisis
Centre
Acquisition of
land
Construction
of Rescue
centre
Coordination
of the process
in
collaboration
with
stakeholders
Land acquired
Crisis centre
constructed
1
Land deed
50,000,000
To Mark
National and
International
Days.
UNESCO
activity
Formation of
working
committees
Coordination
of the process
in
collaboration
with
stakeholders
Committees
formed
1 county
1 national
1
international
No. of teams
Photos
Report
3,000,000.00
Culture and
heritage
conventions
day
UNESCO
activity
Formation of
working
committees
Working
committees
formed
1 county
1 national
1
international
Number of
teams
Photos
Report
1,000,000.00

53
Programme Strategic
Priority
Projects Description of
Activity
Expected
output
Targets
2017/18
Key
performance
Indicators
Budget
Estimates
Celebration of
International
Women’s Day
Formation of
working
committees
Organize the
events of the
International
Women’s Day
One activity
organized
12
List of
committee
members
Minutes
Reports
2,000,000.00
Marking
World Aids
Day
Formation of
working
committees
Organize the
events of the
World AIDS
Day
One activity
organized
List of
committee
members
Minutes
Reports
1 1,000,000.00
TOTAL 165,500,000
DIRECTORATE OF SPORTS.

54
Programme Strategic Priority
Projects/
Activities
Description
of activities
Expected
output
Key
performance
indicators
Targets
2017/18
Budget
Estimates
Development
of Sports
Infrastructure
Development and
upgrading of sports
facilities
Stadiums
redevelopment
and
rehabilitation
Grounds
graded.
Stadiums
rehabilitated
Actual
grading of
grounds.
Stadia
rehabilitated
Grounds
graded
Number of
stadia
rehabilitated
Number of
grounds
graded
5
6
200,000,000
18,000,000
Development and
upgrading of sports
facilities
Development
of Sports
Centre’s in
every sub-
county
Acquisition of
land in sub
counties
Sport centres
constructed
and equipped
Sport centres
in sub
counties
developed
Number of
sports centres
established.
11 55,000,000
Sporting
Tournament
Identification and
development of sports
talent
Increased
participation
in sports
Talented
youth enlisted
Registration
of teams
Participation
of youth in
sports
increased
Number of
sports talents
nurtured.
1,200
30,000,000
Increased
participation
in sports
discipline.
Organize
sport
tournaments
Increased
participation
in sports
Number of
tournaments
organized.
80
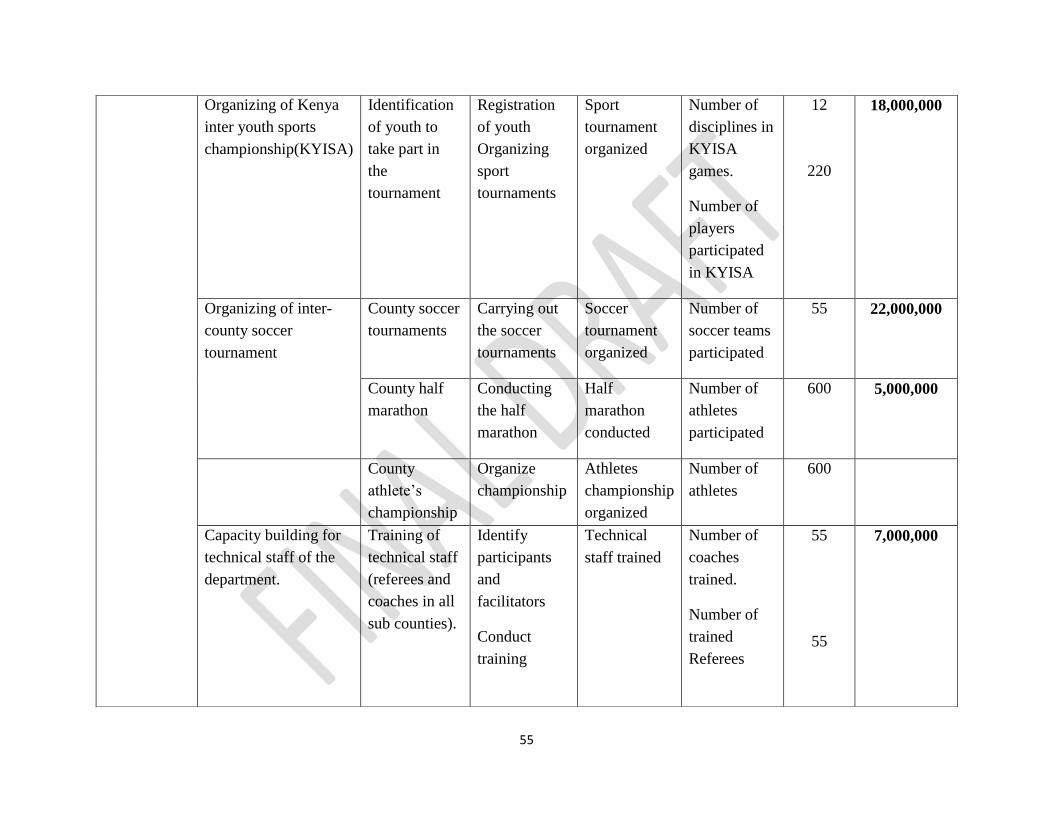
55
Organizing of Kenya
inter youth sports
championship(KYISA)
Identification
of youth to
take part in
the
tournament
Registration
of youth
Organizing
sport
tournaments
Sport
tournament
organized
Number of
disciplines in
KYISA
games.
Number of
players
participated
in KYISA
12
220
18,000,000
Organizing of inter-
county soccer
tournament
County soccer
tournaments
Carrying out
the soccer
tournaments
Soccer
tournament
organized
Number of
soccer teams
participated
55 22,000,000
County half
marathon
Conducting
the half
marathon
Half
marathon
conducted
Number of
athletes
participated
600 5,000,000
County
athlete’s
championship
Organize
championship
Athletes
championship
organized
Number of
athletes
600
Capacity building for
technical staff of the
department.
Training of
technical staff
(referees and
coaches in all
sub counties).
Identify
participants
and
facilitators
Conduct
training
Technical
staff trained
Number of
coaches
trained.
Number of
trained
Referees
55
55
7,000,000

56
Investing on people
with disabilities to tap
Paralympics
Development
of sports for
PWD
(Paralympics
and
Deaflympics)
Purchase of
buses for
transportation
PWD’s
identified and
registered for
Paralympics
Procurement
process
PWD’s
identified
Buses
purchased
Number of
participants
Number of
buses
300
3
3,000,000
18,000,000
Registration of sports
teams
Issuance of
certificates
Identify and
register sports
teams
Teams
registered
Number of
teams issued
with
certificates
600 500,000
Development of sports
bill and sports act
Sports bill and
act
Form
committees to
develop the
bill and act
Sports Bill
drafted
Bill and act
in place
1 500,000
Sports
Funding.
To organize annual
sports and nurture
talents.
Funding of
Sports teams
and Sports
persons
Identify sport
teams and
individuals
Sports teams
and
individuals
funded
Number of
teams and
individuals
funded.
130
6,000,000
Provision of sports
equipment and items
Funding of
Sports teams
Purchase
sport
equipment
Sports
equipment
Number of
teams and
individuals
funded.
2,000
4,500,000

57
and Sports
persons
Procurement
process
and items
purchased
To organize annual
sports tournaments
Wards Sports
tournament
Identify sports
teams in
wards
Organize
sports
tournaments
Ward
tournaments
organized
Number of
Sports
Tournaments
in Wards.
Number of
sports talent
nurtured at
the ward
55 58,850,000
Kenya inter-
county sports
and cultural
Association
(KICOSCA)
KICOSCA Enhance
participation
in sports
Increase
sports events
and
championship
Identify teams
and register
them in
KICOSCA
Participation
in KICOSCA
increased
Number of
disciplines
participated
in(
KICOSCA)
No of
disciplines
participated
in
(EALASCA)
8
7
18,000,000
TOTAL 481,350,000

58
GENERAL ECONOMIC, COMMERCIAL AND LABOUR AFFAIRS Sector Vision and Mission Vision
A Destination of Choice for Visitors, Enterprise Development and Investment
Mission
To promote, facilitate and regulate a dynamic, innovative and industrial development environment
for sustainable socio-economic prosperity.
Sector Goal
The GECA Sector works towards achievement of creating conducive environment for the
development and growth of trade and industrialization, Cooperatives and Tourism.
Sub Sectors and their Mandates
The GECA Sector is made up of Trade, Industrialization, Tourism and Wildlife Management and
Cooperatives Sub Sectors whose mandates are as listed below:-
Industrialization Sub-sector is mandated to promote growth of Micro, Small and Medium
Industries, attract local and foreign investors and promote County Niche Products.
The Trade Sub-sector enhances the growth and development of enterprises, physical
markets and fair trade practices.
The Cooperative sub-sector is mandated to facilitate the development of Co-operatives and
value addition of products whereas the Tourism sub-sector is mandated to facilitate the
development and promotion of tourism in the County.

59
Programmes/Projects Implementation in FY 2014/15 And 2015/16
Nakuru County Alcoholic Drinks Control Act, 2015 and Nakuru County Alcoholic Drinks
Control Regulations, 2015 were operationalized
Increased financial access through the existing Sacco’s and 30 newly registered Sacco’s
which cut accross all the sectors of the County economy
Improved management of Marketing Co-operatives, Value Addition and Market linkages
Improved business performance through business selling and SME training
Facilitation of 13 Producer Business Groups through groups formations and market
linkages
Increased level of compliance of Weights & Measures
Improved markets infrastructure through development of new markets and rehabilitation
of existing markets
Increased access to Tourism information through development of Tourism Website

60
PLANNED PROJECTS AND PROGRAMMES FOR IMPLEMENTATION IN THE FINANCIAL YEAR 2017/2018
The tables below detail the planned programmes and activities in the Directorates of Cooperatives, Trade, Markets and Tourism.
Cooperatives Sub-Sector Programme Strategic
priority
Project Description of activity Expected output Target
FY
2017/18
Key performance
indicators
Budget
estimates
Cooperative
development
and
management
Enhance
marketing
cooperative
management
Revival of marketing
cooperatives
Holding members
information days, special
general meetings, electing
officials, sensitizing and
capacity building of
committees
Well-functioning
marketing
cooperative
societies
4 No. of revived
marketing
cooperative
societies
1,321,568
Training on value
addition
Trainings on value addition
and adoption of technology
Co-operatives
doing value
addition on
produce
Cooperative
marketing
strategy
developed
10 No. of trainings on
value addition
% Increase in
members payment
No. of co-
operatives
undertaking value
addition
1,800,000
Forming of
Partnerships and
networking
Holding stakeholder forums
in the different value chains-
dairy, pyrethrum, fish,
potato, bee, rabbit
Improved
volumes and
market linkages
5 No. of partnerships
and networking
created
1,000,000
Mobilization of
members savings for
capital development
Holding Sensitization and
capacity building meetings
for members of marketing
co-operatives
Increased share
capital and fixed
assets
30 No. of co-
operatives societies
whose members
are sensitized
2,000,000
Purchase of
Hatcheries, for
issuance to
Cooperatives
Identification of the poultry
co-operatives, sourcing and
purchase
Well-functioning
marketing and
self-reliant
cooperative
societies
6 No of hatcheries
purchased
1,000,000

61
Programme Strategic
priority
Project Description of activity Expected output Target
FY
2017/18
Key performance
indicators
Budget
estimates
Purchase of small
chicken slaughter
production lines
Identification of the poultry
co-operatives, sourcing and
purchase
Better prices for
the farmers
6 No of production
lines purchased
1,000,000
Sacco
members’
empowerment
Capacity building on
development of
business plans
Develop new savings and
credit products
Competitive New
savings and
credit products
15 No of products
developed
4,000,000
Training on
enterprise
development
Capacity building forums on
enterprise development
Increase
investment by
cooperatives.
25
meetings
No of sensitization
meetings carried
3,000,000
Capacity building on
savings mobilization
Holding Sensitization and
capacity building meetings
for SACCOs
Enhanced
governance,
increased savings
and regulations
of SACCOs
30 No of sensitization
meetings and
trainings carried
4,000,000
Establishment of
Sacco revolving
funds
Vetting and issuing of loans
by the fund committee,
collection of loans given and
administration
Increased access
by Saccos to
cheaper credit
140 No. of Saccos
benefiting from the
fund and amount
given
12,838,053
Enforcement of
compliance in
cooperatives
Youth and gender
main streaming
Prepare and implement
cooperative sector gender
and youth development and
HIV/AIDS, alcoholism, drug
abuse action plans
Cooperative
sector gender,
youth and
HIV/AIDS,
alcoholism, drug
abuse action
plans
10 No. of sensitization
meeting for youth
and women carried
out
398,062
Development of code
of conduct
Develop alternative
cooperative conflict
resolution mechanisms
Management of
cooperatives
improved
20 No. of code of
conduct developed
300,000

62
Programme Strategic
priority
Project Description of activity Expected output Target
FY
2017/18
Key performance
indicators
Budget
estimates
Societies compliance
with legislations
Sensitization Programme for
Cooperatives And
Department Staff
Management of
Co-operatives
improved
500 No. of people
sensitized
No. of Societies
that are compliant
600,000
Extension
services
Improved
management skills
Carrying out Trainings for
staff of co-operatives
Performance and
quality of service
delivery
improved
10 No. of cooperatives
staff members
trained
1,263,649
Cooperative member
education on
management
Carry out training for
cooperatives members
Management of
cooperatives
improved
100 No of cooperative
societies whose
members are
trained
1,400,000
Cooperative board of
directors training
Carry out training for
cooperatives leaders-board
of directors
Management of
cooperatives
improved
36 No of board of
directors trained
500,000
Field visits/
exchange
Mobilization of co-operative
leaders, hire of transport
Performance and
quality of service
delivery
improved
5 No. visits and
exchanges done
400,000
Trade fairs/ show Mobilization of co-
operatives and collection of
exhibits, payment of show
charges,
Improved
cooperative
investment
1 No. of trade affairs
and shows
400,000
Inspection of
cooperative societies
Enforcing compliance
through spot-checks,
impromptu and scheduled
inspections
Improved
compliance of
co-operatives
150 No. of inspections
carried out
400,000
Cooperatives Audits Computerizing of audit
services
Cooperative
audit service
computerized
180 No. of cooperatives
audited.
600,000

63
Trade Sub-Sector Programme Strategic
Priority
Project Description of
Activity
Expected
Output
Target FY
2017/2018
Key
Performance
Indicators
Budget
Estimates
Commerce and
Enterprise
To provide
Business
Development
Services to
SMEs
Counseling/Advi
sing SMEs
Mobilize the
entrepreneurs
Offer counseling
/advisory
services to
SMEs.
Provide business
information
An enlightened
business
community
450 No. of traders
counseled/advise
d
350,000
SMEs Training Recruitment of
course
participants
Conduct actual
training
Evaluate the
trainings
Make follow ups
Skilled and
empowered
business
community
400 No. of SMEs
trainedED
550,000
SMEs Funding Organize
stakeholders’
forums.
Vet and finance
individual
SMEs.
Collect
repayments from
loanees
Follow-up
defaulters.
Financially
stable and self-
sustaining
businesses
18,000,000
600 SMEs
Amount
disbursed
No. of SMEs
funded
18,000,000
Trade Licensing Mapping of
business
activities
Inspection of
business
premises
Legally
recognized,
identifiable,
traceable and
known business
activities
17,000 No. of licenses
issued
5,000,000

64
Programme Strategic
Priority
Project Description of
Activity
Expected
Output
Target FY
2017/2018
Key
Performance
Indicators
Budget
Estimates
Issuance of
invoices
Issuance of
Trade and
Liquor licenses
Organizing
Investors
Conferences
Prepare
promotional
materials
Distribution of
promotional
materials
Register
participants
Conduct the
actual
conference
An attractive
and conducive
business
environment to
existing and
potential
investors.
1 No. of
conferences
held.
No. of new
investments
established
50,000,000
Commerce and
Enterprise
To facilitate
Producer
Business Groups
Formation of
producer
Business Groups
Mobilize
members
Sensitize them
on group
formation
Assist willing
members to
form groups
Facilitate group
registration
Vibrant groups
fully involved in
supply chain.
25 No. of producer
groups formed.
450,000
Training of
producer
Business groups
Sensitize group
members on the
importance of
group
cohesiveness
Train groups on
management and
group dynamics
Informed and
stable producer
business groups
30 No. of Producer
Groups
sensitized and
trained.
440,000

65
Programme Strategic
Priority
Project Description of
Activity
Expected
Output
Target FY
2017/2018
Key
Performance
Indicators
Budget
Estimates
Linking
producer
business Groups
to local and
external markets
To organize and
participate in
trade fairs and
exhibitions
Follow up
groups for
sustainability
Market focused
groups
35 No. of trade fairs
conducted
No. of groups
linked to
markets
514,,018
Ensure fair trade
practice
/consumer
protection
Calibration of
weighing and
measuring
instruments in
use for trade
Draw itinerary
visits to various
trading centres,
Inspect the
weighing
machines
Issuance of
compliance
certificate.
Fully calibrated
scales
Total conformity
to relevant
weights and
measures Act.
Fully equipped
weight and
measures
workshop.
15000
3000
50
No. of fully
calibrated scales
Number of
compliant
certificates
issued.
Number of tools
and standards
purchased.
6,117,964
Commerce and
Enterprise
Ensure fair trade
practice/consum
er protection.
Carry out
inspection to
ensure
uniformity in
application of
measure units,
correct usage of
measuring
equipment,
correct
packaging of
goods for sale
and correct
description of
goods and
service in trade.
Visit various
business
premises;
Inspect the
product and
weighing
machines.
Issuance of
compliance
certificate.
Total conformity
to relevant
weights and
measures Act.
250 Number of
business
premises visited
2,000,000

66
Markets Sub-Sector
Programme Strategic
Priority
Project Description of Activity Expected
Output
Target
FY
2017/2018
Key Performance
Indicators
Budget
Estimates
Market
Rehabilitation
and
development
To provide a
market where
Buyers and
Sellers can
meet for
exchange
purpose.
Construction and
rehabilitation of
major retail and
wholesale market.
Site identification,
development of budget,
sourcing of funds,
construction of physical
facilities.
Operational
markets
10 Number of markets
constructed.
27,416,832
Market users
delivery
Services
Purchase of
Sanitation
Equipment
Identification of gaps in
market sanitation, develop
sanitation facilities
management plans and
rehabilitate sanitation
facilities in existing markets.
Well-functioning
sanitation and
drainage systems
3
4
30
Number of trucks
purchased
Number of toilets
constructed
Number of skips
purchased
61,172,254
Tourism Sub-Sector
Programme Strategic Priority Project Description of
Activity
Expected Output Target FY
2017/2018
Key
Performance
Indicators
Budget Estimates
Promotion of
Tourism and
Marketing
Promotion of
Local Tourism
Management of
tourism website.
County Tourism
Website
Maintenance
More tourists
visiting the
county
4000 viewers No of viewers
to the website

67
Continuous
online
marketing for
Nakuru County
Tourism sites.
Promotion of
Miss Nakuru
County.
Auditions in all
the 11 Sub
Counties
Marketing of the
county. 14 Auditions
No of miss
tourism
auditions held
Talents creation
Youth
empowerment
Surveying and
Mapping
Baseline
survey report.
Operating the
beach by
clearing the
bushes
No of new
tourism sites.
No of tourist
site mapped.
Mapping of
Tourism Site
Forums and
conferencing
Profited tourist
sites.
No of beaches
rehabilitated
Sporting tourism. - 13,428,776
A developed
picnic site.
No of
sensitization
programs held
Rehabilitation of
public beaches
A green economy
sensitized society
Green economy
promotion
Establishment and
Management Of
County Tourism
Information
Centers
Establishment of
Tourism
Information
Centres
Construction A developed
Tourism Office
Information
Centre
Tourism
Information
Centers
established
13,915,000

68
Information
Tourism Centre
Equipped and
operational
Procurement of
Office Furniture
Fittings and
computer
A vibrant
Tourism
Infrastructure
600 visitors No of visitors
at the center

69
ENVIRONMENT, NATURAL RESOURCES, WATER AND ENERGY Sector Vision and Mission
Vision
A self-reliant, secure and quality life
Mission
To conserve environment, provide potable water and sustainable energy.
ENVIRONMENT SUBSECTOR Sector Goal
To improve environment, natural resource management, water and sewerage services and
enhance energy within the county.
Sector Mandate
The mandate of the sector is derived from Governors Executive order No. 1 and this includes
Environmental Policy Management
Forest development policy Management
Solid waste management and enforcement of waste policies, standards and regulations.
Enforcement of waste management policies, standards and regulations
Public nuisance, air, land and noise pollution control
Water catchment and riparian land protection, regulation and conservation
Conservation of County Parks, gardens beaches and recreation facilities
Energy regulation Security and conservation
Identification of renewable Energy sites for development as per legal notice No.157
Promotion of green economy initiative
Electricity and gas reticulation and energy regulation.

70
Borehole site identification and drilling.
Water and sanitation services including rural water and sanitation services in small and
medium towns without formal service providers,
Brief background information on programs/project implementation F/Y 2014/15, 2015/16
1) Project name: climate change mitigation tree planting F/Y 2014/15
S/NO. SUB-COUNTY NO OF TREES
PLANTED
AMOUNT(KSH)
1. Molo 2,800 470,830.00
2. Njoro 9,876 1,619,898.00
3. Naivasha 5,266 879,050.00
4. Nakuru Town East 5,542 1,335,642.00
5. Nakuru Town West 9,600 1,585,631.00
6. Gilgil 8,817 1,348,012.00
7. Subukia 3,895 658,829.00
8. Bahati 3,209
549,844.50
9. Rongai 8,817 1,440,840.00
10. Kuresoi North 6,512 1,078,784.00
11. Kuresoi South 6,512 1,045,137.00
12. Lions Garden Rehabilitation 2,975,758.68
TOTAL 70846 14,988,255.68
SUMMARY
1. The total amount spent on tree planting Ksh.12, 192,497.00
2. The average tree planted survival rate is 65%.
3. Lions Garden Nakuru (Fencing, Rehabilitation, beautification and tree planting 98 % complete
Cost Ksh. 2,975,758.68
4. The total amount spent on climate change mitigation project was K.shs. 14,988,255.68
2) PROJECTS IN F/Y 2015/16
1. Part Storm water retention pond desilting at old town treatment works at a cost of Ksh. 8,000,000
Status; complete

71
2. Purchase of solid waste disposal sites (transfer stations) for Kiptagich, Molo Njoro and Gilgil
respectively at cost of Ksh.16, 500,000.
Status: undergoing procurement process.
3. Purchase of 2 No. Refuse trucks at a cost of Ksh.20,000,000
Status: undergoing procurement process
3) PROJECTS UNDER F/Y 2015/16
1. Purchase of 2 No. Refuse trucks at a cost of Ksh.20,000,000
Status: not done
2. Purchase of solid waste disposal sites (transfer stations)
Status: not done
3. Completion of desilting storm water retention ponds at old town treatment works at a
cost of Ksh.21,000,000
Status: not done

72
Programme Strategic
priorities
Project Description of Activities Expected output Key
Performance
indicators
Target Budget
Estimate
(KSH)
Energy
planning,
regulation
operation and
development
Formulation of
energy policy,
action plan for
Petroleum
products.
Biomass
Solar and wind
Hydropower
Preparation and
legislation of
energy policy and
preparation of
action plan
Pre-feasibility
study
Draft policy preparation
stakeholder’s
involvement
Energy Policy
draft
and draft energy
action plan
Stakeholders’
feedback
Draft notes
policy
Draft energy
policy
Draft energy
action plan
1,500,000
Preparation of
energy master
plan
Energy survey
Energy audit
Draft energy
master plan
Survey report
Draft master plan
report
Survey
report 12,000,000
Harmonization of
functions and
resources with the
relevant
departments as
per executive
order. no 1
Harmonization of
executive order no. 1 and
standing orders.
-preparation of a cabinet
memo
Executive order
with
harmonized
functions and
resources
Cabinet memo
Review circulars
500,000
Awareness
creation on
energy saving
technologies
I.E.C materials on energy
saving technologies
Promoting voluntary
energy technologies
Increased uptake
of energy saving
technology
No. of energy
saving
technologies
registered
No. HH with
Energy saving
technology
New
technologies
adopted
100 5,000,000
Identify and
promote alternative
energy use
Map stakeholders
in alternative
energy sources
Promoting
alternative energy
Categorizing alternative
energy used
Identification of green
buildings/ institutions
Updated database
Data on
alternative
energy use
Updated
database
2,000,000
Energy and gas
reticulation
Awareness and
sensitization on
sustainable
energy
Preparation of energy
awareness programmes
Stake holders mapping
Community Barazas,
seminars and workshops.
Sustainable
energy awareness
fora held
Sustainable
energy projects
undertaken
11 fora held-
1 per sub-
county
2,000,000

73
Collect and
maintain energy
data
Undertake feasibility
studies and maintain
energy data
Energy Data bank
created
Energy data bank
in place
Updated
energy data
bank
5,000,000
Solid waste
Management
Development of
Integrated Solid
Waste Management
Plan(ISWMP)
waste streams
survey
Solid waste data
collection
Solid waste management
plan preparation.
ISWMP in place Waste streams
survey report
By 30th June
2018 3,000,000
Waste boundaries
survey
Zoning Waste zones
created
No. of waste
established zones
30 2,000,000
Promotion of
waste sorting and
recovery
Install sorting litter bins
in designated areas
Litter bins
installed
No. of sorting
litter bins
installed
50 5,000,000
Purchase of
refuse trucks
Procurement process
Trucks procured
No. of trucks
procured
2 20,000,000
Acquisition of
land for solid
waste
management
transfer station
EOI No. of transfer
stations procured
Land acquired
for transfer
stations
10Ha 30,000,000
Purchase of
commercial
incinerator
Procurement process
Commercial
incinerator
procured
Operational
commercial
incinerator
1 30,000,000
Working
tools/equipment
and protective
gears
Procurement of
Tools/equipment and
PPE’s
Tools/equipment
and PPE’s
purchased
Tools/equipment
and PPE’s
provided.
Gloves,
spades,
rakes,
protective
gears
5,000,000
Develop
legislation on
extended
producer
responsibility for
sustainable
management of
emerging waste
streams including
Formulation of emerging
waste draft policy
Emerging waste
draft policy
Stakeholders’
feedback
Draft policy
Draft energy
policy
5,000,000

74
e-waste and
plastics
Disposal site
management
Improving waste
disposal facilities
Improving waste
disposal facilities
in Nakuru,
Naivasha, Mai
Mahiu, Molo
Fencing
Development of
motorable roads
Demarcation of tipping
zones
Installation of
weighbridge
Construction of
administrative office
Secured and
accessible
disposal site
KM of roads
maintained
No of
weighbridges
installed
A functional
office
4 disposal
sites
1
1
300,000,000
Transformation of
solid waste
disposal
management
Preliminaries for
Construction of
Sanitary Landfill
Feasibility study on the
suitability of site for
landfill
EoI to provide land for
Landfill
ESIA
Procure land
Feasibility study
report
Procured land for
landfill
ESIA done
-Land acquired
Feasibility study
completed
Contracted
ESIA Experts
1 200,000,000
Environmental
Education and
awareness on
SWM
Preparation of
SWM awareness
programmes
Press awareness
campaigns on EE
Stake holders
Mapping
IEC materials
Community Barazas,
seminars and workshops
No. of for a held
on SWM
Number of
awareness
programmes
held and
participants
trained
11-1 per
sub-county
10,000,000
Greening and
beautification
Increase forest
cover and green
areas for 10%
National policy
Nurseries
establishment
Procurement of seeds and
seedlings
Beautification and
landscaping
Increased tree
cover
No of trees
planted
100,000 25,000,000
Pollution
control on
land, air and
water
pollution
Pollution control
and management
Formulation of
policies on land,
air and water
pollution control
Preparation of pollution
control draft policy
Drafting policy
document
Pollution control
draft policy
Draft policy 3,000,000
Training of
environment
officers on
pollution control
and prevention
Hire of facilitators
Identify officers to
environment officers to
be trained
Officers trained No of officers
trained
20 5,000,000

75
Rehabilitation
and equipping
pollution and
quality control
laboratory in
Naivasha, Nakuru
and Molo.
Procurement
Pollution control
resource centre
rehabilitated
No of pollution
control resource
centres
rehabilitated
1 5,000,000
Purchase of
sampling kits
Procurement Sampling kits
procured
No. of sampling
kits procured
3 1,000,000
Natural
resource
management
Develop a natural
resource
accounting system
Natural resource
mapping
Collection of data and
survey
County natural
resources data
bank
Natural resource
data base
1 120,000,000
Establishment of
County Forest
Source land to be
utilized as a
county forest
(100 Ha )
Grow fast
maturing, high
value trees that
have multiple
commercial uses.
Criterion preparation for
suitable land
-EOI
Land acquired
Increased
forest cover
County Forest
land
3%
Indigenous forest
in the depleted
forest sites and
improved
surveillance on
exploitation of
forest resources.
promote use of
indigenous and
traditional
knowledge
technology
Identification of
deforested indigenous
forests
Area covered by
indigenous
forests
4%
Reclamation of
degraded land
Develop draft
policy on
quarrying
activities
regulation
Promote
community
participation in
Site survey
Project identification for
suitable
rehabilitation/reclamation
project
Community involvement
in rehabilitation practices
Draft policy
document
No of
people/groups
involved in
-Draft policy
report
-Survey report
Communities
members
1 10,000,000

76
conservation and
management of
land resources.
rehabilitation
projects
involved in the
rehabilitation
TOTAL 807,000,000

77
WATER SUBSECTOR FINANCIAL YEAR 2014/15
9 boreholes drilled and 7 boreholes equipped with new pumps
2 water towers with two 10,000 litres water tanks constructed
6 water pans and 2 draw off points
Construction of pipe networks in 36 water projects
Construction of 5 intakes
Construction of 9 water tanks: one with the capacity to hold 25 cubic meters of water, three
others with capacity for 50 cubic meters of water each and five tanks with capacity for 100
cubic meters of water each.
Total cost of Ksh 201 Million
2015/2016 financial year (Cost Ksh 160,000,000.00)
Drilling of 10 boreholes
Construction of 10 storage tanks.
Desilting/construction of 1dams/pans
Construction of 1 water kiosks
Construction of one intake point (Mawalebo)
Construction and extension of pipe networks in 17 water projects

78
PLANNED PROJECTS AND PROGRAMMES FOR IMPLEMENTATION IN THE FINANCIAL YEAR 2017/2018
Programme Strategic
priorities Project Description of Activities
Expected
output
Target FY
2017/18
Key
Performance
indicators
Budget
Estimate
(KSH)
Administration
Effective
planning,
Management
and execution
of service to
all section.
Training of sector staff Train staff Staff Trained 10 No. Number of Staff
trained 30,000,000
Control of
Departmental
Expenditure
Relay timely reports Reports
relayed
2 No. Number of reports
50,000
Regular compilation of
quarterly reports
Analyze and compile
Reports No. of report Continuous.
Number of reports
compiled 20,000
Water and
Sewerage
Management
Increase
water
coverage
within the
County
through
Expansion,
upgrading
and
construction
of new Water
Supply
Projects
Ground Water
Exploration and
Development.
Procure Groundwater
exploration Equipment
Equipment
procured 1 No. List of equipment 2,500,000
Carry out Hydro-
geological survey
Hydro
Geological
Survey
conducted
10 No.
Number of
Hydro-geological
survey reports
developed
350,000
Drill boreholes Boreholes
drilled 10 No.
Number of
boreholes drilled 30,000,000
Equip boreholes with
solar powered
submersible pump sets
Solar powered
installations
done.
10 No.
No of boreholes
equipped with
solar power
50,000,000
Construction of new
dams/pans Construct Dams/Pans
Dam/Pan
constructed 3 No.
Number of Dams
and Pans
constructed
50,000,000
Desilting of Pans and
dams Desilt Dams/ Pans
Dam/Pan
Desilted 5 No
Number of Dams
and Pans desilted 20,000,000
Spring protection Protection of spring Spring
protected 5 No.
Number of
springs protected 2,500,000

79
Rehabilitation of water
projects
Construct Elevated Steel
towers
Projects
Rehabilitated 7No.
Number of
Projects
rehabilitated
30,000,000
Construct storage
facilities
Storage
facilities
constructed
10No. Number of
Storage facilities 20,000,000
Lay pipe network Increased
coverage area 66% % Area covered 200,000,000
Replace/Repair of
electro-mechanical
components eg pumps
and motors.
Operational
Water projects 6 No.
Number of
components
replaced/repaired
8,000,000
Implementation of
New project
Carry out feasibility
studies
Feasibility
studies carried
out
30 No. Number of
Reports 5,000,000
Carry out, investigations,
survey and design works Design Report 25 No.
Number of
Design reports 10,000,000
Implement projects Projects
implemented 25No.
Number of
Projects
Implemented and
operational
150,000,000
Expand and
Upgrade
Sewerage
infrastructure
Construction of New
Sewerage facility
Land Acquisition Land acquired
in hectares. 5 ha Land acquired 50,000,000
Construct Sewerage
facilities
Sewerage
treatment
facilities
constructed
3No.
Number of
treatment
facilities
constructed and
operational
350,000,000
Sewer line
construction/extension Laying of sewer line
Households
connected to
sewer line
500 No
Number of
Households
connected to
sewer line
65,000,000
Rehabilitation of
Sewerage Works Desludge ponds
Operational,
and Efficient
Ponds
2 No. Number of Ponds
desludged 8,000,000

80
Repair filters and fencing Operational
filters 2 No.
Number of filters
repaired 10,000,000
Construct Perimeter
fence around the
treatment works
Perimeter
fence
constructed
300m. Length
constructed 15,000,000
Enhance
water Use
efficiency in
urban and
Rural areas
Streamline water sector
co-ordination
challenges between
National and County
government
Clearly define the roles
and functions of the
institutions as per the
Water Act
County water
bill drafted 80%
Draft County
Water Bill
developed
2,000,000
CBOs/WSPs
registered 100 No.
Number of
Certificates issued
to CBO’s/WSPs
5,000,000
Streamline Water
Management
Challenges
Capacity building of
project officials Officials
trained 100 No. Workshop Report 1,250,000
Reduce Non-Revenue
Water to 10% on the
Supply side
Monitor periodically and
Evaluate the progress
Reduced Non
Revenue
Water
35% Reduction in Non
Revenue Water 10,000,000
Meter all consumers
Reduced Non-
Revenue
Water
35%
Reduction in
Non-Revenue
Water
100,000,000
Capacity building on new
innovations/technologies
which are efficient and
water saving.
Staff trained 200 No. Workshop Report 2,500,000
Water Quality and
Pollution Control
Procure Water Quality
Analysis Equipment
Parameters
analyzed
3 No. Number of
Equipment
procured
6,000,000
Procure
reagents/chemicals and
glassware.
Reagent sets
procured
150 No. Number of
Reagents set
procured 2,000,000
Collect samples in the
field
Samples
collected
100 No. Number of
Samples collected 500,000

81
Carry out Water Analysis Samples
analyzed
100 No Number of
samples 400,000
Compile quarterly
Assessment Report
Water Quality
Assessment
Report
4No Number of
Reports 10,000
TOTAL 1,236,080,000

82
PUBLIC ADMINISTRATION AND INTERNAL RELATIONS(PAIR)
OFFICE OF THE GOVERNOR AND DEPUTY GOVERNOR Vision
A leading sector in public policy formulation coordination supervision legislation and resource
management
Mission
To provide overall leadership and policy direction in resource mobilization management and
accountability for quality service delivery
Programme objectives/overall outcome
1. Programme1: Management of County Affairs.
Objective: To ensure effective and efficient running of the county affairs as provided for by
the constitution.
2. Programme 2: Coordination and Supervisory services.
Objective: To oversee the running of the various ministries and county entities.
3. Programme 3: Public Sector Advisory Services.
Objective: To provide timely advisory services to both county entities and the public.

83
PLANNED PROJECTS AND PROGRAMMES FOR IMPLEMENTATION IN THE FINANCIAL YEAR 2017/2018
Programme Strategic
priority
Projects/Sub-
programme
Description of
Activities
Expected Out
Put
Measurable
indicators
Target
2017/201
8
Budget
estimates
Management
of county
affairs
Administr
ation and
coordinati
on of
county
affairs
Improve day to day
running of county
affairs.
Organising
cabinet meetings
Issuance of
cabinet circulars
Cabinet meetings
held
Executive
circulars
Cabinet meeting
minutes
No of executive
Orders released
Monthly 40,000,000
Efficiency
in service
delivery
Communication to
the public
Hold press briefs Press briefs held Number of press
releases
10,000,000
Rehabilitation of
offices
Procure
rehabilitation
services
Offices
rehabilitated
No of offices
rehabilitated
5 6,000,000

84
Programme Strategic
priority
Projects/Sub-
programme
Description of
Activities
Expected Out
Put
Measurable
indicators
Target
2017/201
8
Budget
estimates
Convene Cabinet
meetings
Cabinet
meetings held
Number of
cabinet meetings
held
Monthly 30,000,000
Purchase of motor
vehicle
Procure motor
vehicles
Motor vehicles
procured
Number of motor
vehicles procured
5 25,000,000
Ensure
complianc
e
Generating county
executive bills
Draft County
executive Bills
County
Executive bills
drafted
Number of bills
generated
25,000,000
Annual progress
report
Submission of
annual progress
report to county
assembly
Annual progress
report submitted
to the County
Assembly
Copies of annual
progress report
15,000,000
Delivering of
annual state of
county address
State of County
address
State of county
address delivered
Copy of annual
state of the
county speech
15,000,000

85
Programme Strategic
priority
Projects/Sub-
programme
Description of
Activities
Expected Out
Put
Measurable
indicators
Target
2017/201
8
Budget
estimates
Policy
formulatio
n and
implement
ation
County bills
formulated
Form committees
Collect views
Submission to
the assembly
County bills
formulated
Number of bills
generated
30,000,000
Mitigate
uncertainti
es
Emergency funds
Provision of
emergency funds
Emergency kitty
enhanced
Emergency fund
kitty
110,000,000
Public sector
advisory
services
Enhance
cohesion
and
integration
within
county
communiti
es.
Peace fora Hold peace for a
across the county
Form peace
committees
Peace for a held
Number of peace
committees held
Number of peace
for a held
10 50,000,000

86
Programme Strategic
priority
Projects/Sub-
programme
Description of
Activities
Expected Out
Put
Measurable
indicators
Target
2017/201
8
Budget
estimates
Economic,
social and
political
services
Meetings of the
county budget
and economic
council
Attending
council of
governors
meeting
Budget and
Economic
Council meetings
held
Number of
meetings held
Number of
intergovernmenta
l meetings held
4 65,000,000
Inspection and
launch of county
projects at
various Wards
Project launch
and visit
Number of visits
to the wards
60,000,000
Public
participat
ion
Disseminate
information on
county affairs
Produce county
newsletter -
County
newsletter
published
Copies of county
newsletter
Frequency of
publishing
1000
Quarterly
60,000,000
Paid up Print, Tv,
and Radio
advertisements
County
advertisements
Number of
adverts in Print,
radio and Tv
13,011,850

87
Programme Strategic
priority
Projects/Sub-
programme
Description of
Activities
Expected Out
Put
Measurable
indicators
Target
2017/201
8
Budget
estimates
Meet the people
tour
Sub-county
meetings held
Sub-county Monthly 50,000,000
Total 604,011,850

88
PUBLIC SERVICE MANAGEMENT Part A: Vision
An efficient and cohesive County Public Service.
Part B: Mission
Provision of relevant service in resource management, public relations, policy formulation and
implementation.
Part C: Strategic Objectives of the Programmes
Programme 1: General Administration, Planning and Support Services
Objective: To plan and implement policies and programmes that provides efficient services to
various county entities, bodies and members of the public.
Programme 2: Co-ordination of County Policy Formulation
Objective: To ensure that all county government departments, sub-counties and other units render
efficient services to the residents of the County.
Programme 3: Human Resources Management and Development
Objective: To implement policies that relate to training and career development so as to equip the
county manpower with requisite skills at all levels.
Programme 4: Performance Management
Objective: To improve Human resource productivity through employee empowerment,
motivation and implementation of an effective employee appraisal and reward mechanism.

89
PLANNED PROJECTS AND PROGRAMMES FOR IMPLEMENTATION IN THE FINANCIAL YEAR 2017/2018
Programme Strategic
priority
Projects/Sub-
programme
Description of
Activity
Expected Out
Put
Measurable
indicators
Target
2017/201
8
Budget
estimates
General
administratio
n planning
and support
services
Improve
service
delivery
Customer
satisfaction survey
Procurement of
complains and
complement
register.
Procure
Consultancy
services.
Customer
satisfaction
survey report
Survey Report 1 3,000,000
HIV/AIDs/Alcohol
and Drug Abuse
and pornography
at workplace
survey.
Procure
Consultancy
services.
HIV/AIDs/Alcoh
ol and Drug
Abuse and
pornography at
workplace survey
report
Survey Report 1 1,500,000
Employee
satisfaction survey
Procure
Consultancy
services.
Improved service
delivery
Survey Report 1 4,500,000
Gender
mainstreaming at
workplace
Procure
consultancy
service
Survey Report 1 15,000,000

90
Programme Strategic
priority
Projects/Sub-
programme
Description of
Activity
Expected Out
Put
Measurable
indicators
Target
2017/201
8
Budget
estimates
Construction of
sub-county/ward
offices and
enforcement
offices
Procure
construction
services
Functional
offices in place
No of offices
constructed
6 sub-
county
offices
2
enforcem
ent
offices
22 ward
offices
140,000,000
Refurbishment of
existing offices
& Old county Hall
Procurement of
rehabilitation.
Refurbished
offices
Number of
offices
refurbished
5 22,000,000
Equipping of
existing offices
Procurement of
office furniture
and computers,
printers
Equipped offices Number of
offices equipped
20 40,000,000
Purchase of motor
vehicle
Procurement of
motor vehicles
Motor vehicles
procured
Number of
vehicles procured
15 65,000,000

91
Programme Strategic
priority
Projects/Sub-
programme
Description of
Activity
Expected Out
Put
Measurable
indicators
Target
2017/201
8
Budget
estimates
Occupatio
nal Health
and safety
Occupational
Health and safety
assessment
Inspection of
County offices at
HQ on
occupation
Health Safety
Occupational
Health and safety
assessment
conducted
Assessment
report
1
assessme
nt report
7,000,000
Co-
ordination of
County
policy
Formulation
Enhance
participati
on in
governanc
e and
public
policy
formulatio
n and
implement
ation
Coordination of
Public
participation and
community
programmes
Mobilize citizens
to participate in
budget making
process, Finance
Bill
Increased
participants
attending public
participation fora
Number of
public
participation for
a held.
Eight
held per
sub-
county/w
ard
44,000,000
Stakeholder
mapping
Carry
stakeholders
meetings
List of
stakeholders in
various sectors
per ward
No. of
stakeholders
mapped
Per ward 11,500,000

92
Programme Strategic
priority
Projects/Sub-
programme
Description of
Activity
Expected Out
Put
Measurable
indicators
Target
2017/201
8
Budget
estimates
Civic
education
and
advocacy
Civic education
and awareness
campaigns on
major county
policies and
legislation
Develop
guidelines and
regulations on
civic education
Prepare IEC
materials for
citizens
Civic education
guidelines in
place.
IEC materials in
place
Civic education
for a held
No. IEC
materials
prepared
4 per
ward
1000
(budget,
ongoing
projects,
Approve
d bills)
55,000,000
County
Policy
formulatio
n and
Enforceme
nt
Recruitment of
enforcement
officers
Make requisition
for recruitment to
the CPSB
Enforcement
officers recruited
No. of
enforcement
officers recruited
400 106,667,667
Purchase of
uniform for
enforcement
officers
Procurement of
uniforms
Uniforms
procured
No. of uniforms
procured
400 16,500,000

93
Programme Strategic
priority
Projects/Sub-
programme
Description of
Activity
Expected Out
Put
Measurable
indicators
Target
2017/201
8
Budget
estimates
Paramilitary
training
Paramilitary
training
Skilled
enforcement
officers.
No. of officers
trained
400 64,000,000
Compliance and
enforcement
survey
Procure
consultancy
service
Compliance and
enforcement
survey report
Compliance and
enforcement
survey report
1 5,000,000
Purchase of
working tools
Procurement of
working tools
Working tool
procured
No. of handcuffs.
No. of batons
No. of Swagger
canes
No. of badges of
ranks procured
400 4,500,000
Construction and
equipping of
County legal
Library
Construction of a
library.
Procurement of
equipment for
the library
A functional
legal library
A functional
county legal
Library
1 county
legal
Library
20,000,000

94
Programme Strategic
priority
Projects/Sub-
programme
Description of
Activity
Expected Out
Put
Measurable
indicators
Target
2017/201
8
Budget
estimates
Recruitment of
legal officers
Written request
to the CPSB
Legal officer
recruited
No. of legal
officers recruited
8 10,000,000
Human
resources
Management
and
Development
Manageme
nt of staff
records
Human Resources
Management
Information
system
Procure HRMIS
software.
Training staff in
use of HRMIS
Procure Mobile
shelves
HRMIS software
procured
No. of staff
trained on
HRMIS
No. of staff
records
uploaded.
No. of files
(physical) staff
records
1
software
5,200
uploads
5,200
files
20,000,000
Capacity
building to
increase
technical
capacities
of county
employees
Conduct training
need assessment
Procure
consultancy
service for TNA
Training Needs
Assessment
report
TNA report
1 TNA
report
7,500,000

95
Programme Strategic
priority
Projects/Sub-
programme
Description of
Activity
Expected Out
Put
Measurable
indicators
Target
2017/201
8
Budget
estimates
Pre-retirement
training
Hire facilitators
Procure training
hall
Employees
proceeding for
retirement
trained
No. of employees
trained
300 5,000,000
Implementation of
scheme of service
Rate of
implementation
of scheme of
service
100% 5,000,000
Development of
Human Resource
policy
Procure
consultancy
services
Draft HR policy
in place
No. of Human
Resource policies
developed
1 5,000,000
HIV/AIDs
mainstrea
ming at
workplace
Train peer
educators
Hire facilitators Peer educators
trained.
No of peer
educators trained
100 5,000,000
Alcohol
and Drug
Abuse/por
nography
Train peer
educators
Hire facilitators Peer educators
trained
No of peer
educators trained
50 5,000,000

96
Programme Strategic
priority
Projects/Sub-
programme
Description of
Activity
Expected Out
Put
Measurable
indicators
Target
2017/201
8
Budget
estimates
Establishment of
guiding and
counselling unit
Train staffs in
guiding and
counselling
A functional
guiding and
counselling unit
established
A functional
guiding and
counselling unit
established
5 staffs trained
1 5,000,000
Disaster
preparedne
ss
Staff awareness on
disaster
preparedness
IEC materials
produced on
disaster
preparedness
Hire facilitators
Staffs trained on
disaster
preparedness
No. of staffs
trained on
disaster
preparedness
5,000,000
Gender
and
Disability
mainstrea
ming at
workplace
Training customer
care staffs on sign
language
Hire sign
language
instructor
Customers care
staffs trained in
sign language
No. of staffs
trained in sign
language
60 7,500,000
Performance
management
Improve
human
resource
Staff promotion Prepare list of
staff due for
promotion
Staffs promoted No of staffs
promoted
200 23,000,000

97
Programme Strategic
priority
Projects/Sub-
programme
Description of
Activity
Expected Out
Put
Measurable
indicators
Target
2017/201
8
Budget
estimates
productivit
y.
Develop employee
skills and
competences
Procure training
services
Staffs trained No. of employees
trained
150 20,000,000
Implement
an
effective
employee
performan
ce
appraisal
and reward
mechanis
m
Establishment of
Performance
Appraisal Unit
Placement of
Staffs in
Performance
Appraisal
Performance
Appraisal unit
established
A functional
Performance
Appraisal Unit
1 11,500,000
Review ministerial
Annual Work
plans
Review Annual
work plans
Annual work
plans reviewed
No. of work
plans reviewed
12
Signing of
performance
contracts
Prepare
performance
contracts tool
Performance
contracting tools
prepared.
No. of officers
under
Performance
Contracting
100
TOTAL 678,106,667

98
COUNTY TREASURY Sector vision and mission
Vision
A leading sector in legislation, public policy formulation, coordination, supervision and prudent
resource management.
Mission
To provide overall leadership and policy direction in resource mobilization, management and
accountability for quality public service delivery.
Sector Mandate:
The mandates of the County Treasury is largely drawn from the Public Financial Management Act
2012. Section 104 of the PFM Act clearly illustrate the responsibilities and power of county
treasury. As per the Act a County Treasury shall monitor, evaluate and oversee the management
of public finances and economic affairs of the County Government.

99
Programme Strategic
Priority
Project Description of
Activity
Expected
Output
Key
Performance
Indicators
Target FY
2017/18
Budget
Estimates
A. Administration Department
Administration,
Planning and
Support
Services
Construction of sub-
county Treasury offices
(Subukia, Nakuru west,
Gilgil and Kuresoi
South)
Preparation of
Project Designs
and BoQs
Procurement.
and
Construction of
Building
Sub County
Treasury
offices
Constructed
Copies of
Design and
BoQs,
No of Offices
Constructed
4 Sub
County
Offices
Constructed 40,000,000
Improvement of
Office Space
Construction of
treasury Archives at the
headquarters
Preparation of
Project Designs
and BoQs
Procurement.
and
Construction of
Building
Treasury
Archives
Constructed
Copies of
Design and
BoQs,
Treasury
Archives
Constructed
One Treasury
Archives
Constructed
11,000,000
Improvement of
Office Space
Expansion of office
space.
Space for staff
operations
Sub County
Treasury
offices
Constructed
Copies of
Design and
BoQs,
No of Offices
Constructed
1 no
Procurement
Office
procured
2,000,000
B. Finance and Accounting Directorate
Public Finance
Management
Improvement of
Service Delivery
Recruitment of
accountants
Budgeting
Submission of
Proposal to the
County Public
Service Board
Officers
Recruited
and placed
No of
officers
recruited and
placed
20
12,196,800

100
Programme Strategic
Priority
Project Description of
Activity
Expected
Output
Key
Performance
Indicators
Target FY
2017/18
Budget
Estimates
Improvement
employee skills
Training and
development of staff
Conduct
Training needs
assessment;
prepare for
training; Train
officers and
prepare training
reports
Officers
trained
No of
officers
trained
200
20,000,000
C. Internal Audit Directorate
Public Finance
Management
Strengthening of
the Internal
Control Systems
Audit software -
Teammate & IDEA
Rapid
assessment of
Departmental
requirements
RFQ for
consultancy
services
Procurement,
Installation and
Commissioning
IDEA
System
Installed
IDEA
System
Installed
By June 2018
22,500,000
Recruitment of Audit
Staff (13@ Ksh.
60,000)
Budgeting
Submission of
Proposal to the
County Public
Service Board
Officers
Recruited
and placed
No of
officers
recruited and
placed
13
9,360,000
Improvement of
service delivery
Purchase of ICT and
other related equipment
Rapid
assessment of
Departmental
requirements
ICT and
other
related
No. of ICT
and other
related
20
Computers
procured 3,600,000

101
Programme Strategic
Priority
Project Description of
Activity
Expected
Output
Key
Performance
Indicators
Target FY
2017/18
Budget
Estimates
Preparation of
Procurement
plans and
procurement
equipment
procured
equipment
procured
20 assorted
equipment
Training &
development of staff
Conduct
Training needs
assessment;
prepare for
training; Train
officers and
prepare training
reports
Officers
trained
No of
officers
trained
Copies of
Training
reports;
Copies of
Needs
Assessment
reports
30
5,000,000
D. Directorate of Revenue
Revenue
Mobilization
Improvement of
Office Space
Construction of Offices Preparation of
Project Designs
and BoQs
Procurement.
and
Construction of
Building
Offices
Constructed
No of offices
Constructed
11
110,000,000
Revenue
Mobilization
Improve Mobility Purchase of Revenue
Enhancement Vehicles
Rapid
assessment of
Departmental
requirements
Preparation of
Procurement
Vehicles
procured
11 no. Utility
vehicles
procured
11
55,000,000

102
Programme Strategic
Priority
Project Description of
Activity
Expected
Output
Key
Performance
Indicators
Target FY
2017/18
Budget
Estimates
plans and
procurement
Improvement of
service delivery
and Revenue
Enhancement
Purchase of ICT and
other related equipment
Rapid
assessment of
Departmental
requirements
Preparation of
Procurement
plans and
procurement
ICT and
other
related
equipment
procured
No. of ICT
and other
related
equipment
procured
50
Computers
procured
8 Assorted
other ICT
equipment
191 assorted
equipment
16,000,000
Purchase of Standby
generators
Rapid
assessment of
Departmental
requirements
Procurement
planning and
procurement
Generators
procured
No of
Generators
procured
11
11,000,000
E: Supply Chain Management
Public
Procurement
and Disposal
Services
Improvement of
employee skills
and competences
Training and capacity
development
Identification of
employee’s
needs;
Selection and
recommendatio
n for training
Officers
selected and
recommend
ed for
training
Certificates
No of
employees
trained
10 Post-
graduates
30 short
courses
5,000,000

103
Programme Strategic
Priority
Project Description of
Activity
Expected
Output
Key
Performance
Indicators
Target FY
2017/18
Budget
Estimates
General
administration
Improved
Mobility
Purchase of Motor
Vehicle.
Procurement
Planning and
procurement of
vehicles
Vehicles
procured
No. of
Vehicles
procured
1 No.
Vehicle
procured 6,000,000
Improvement of
Service delivery
Purchase of ICT and
other related equipment
Rapid
assessment of
Departmental
requirements
Preparation of
Procurement
plans and
procurement
ICT and
other
related
equipment
procured
No. of ICT
and other
related
equipment
procured
15 No.
Computers
20 Laptops.
25 no.
Assorted
Furniture.
5,000,000
Performance
management
Staff Recruitment
and Promotion
Promoting current
Employees and recruiting
new staff.
Work efficiency
and motivation of
staff.
Staff
motivation
and reduction
of workload.
No. of
employees
promoted
No. of
employee
recruited
50 Employees
for promotion
20 employees
to be recruited. 80,000,000
F. Budget Formulation, Coordination and Management
Public Finance
Management
Deliver timely
Budget outputs
as per PFM Act and
Budget
timelines/calendar
Stakeholders
involvement in budget
Making Process;
Stakeholder
mapping;
Conducting
public
participation;
CBEF Meetings;
Review of Public
Participation
memoranda’s
Increased
budgetary
resources
allocated
towards
development
Budget
Number of
stakeholders
involved in
budget
preparation;
Percentage
change in
ratio of
development expenditure to
total
All
stakeholders;
10% increase
in
Development
Expenditure
25,000,000

104
Programme Strategic
Priority
Project Description of
Activity
Expected
Output
Key
Performance
Indicators
Target FY
2017/18
Budget
Estimates
budget;
Training of Officers
across departments
on MTEF and
Conduct
Training needs
assessment;
prepare for
training; Train
officers and
prepare training
reports
No. of
officers
trained in
MTEF and
programme-
based
No of
officers
trained;
Copies of
Training
reports;
Copies of
Needs
Assessment
reports
All sector
Working
Group
Members
5,000,000
G. Directorate of Economic Planning
Fiscal Planning
Strengthen the
County Planning
System
Preparation of the Annual
Development Plan (ADP)
2018/2019
Collection of
inputs from line
County
Government
depts;
Drafting of the
ADP;
Sharing with
CBEF;
Submission of
Draft ADP to
County
Executive and
C. Assembly.
Completed
Annual
Development
Plan
Copies of Draft
ADP By 1st Sept
2017
3,500,000
Monitoring and
Evaluation
Strengthening
County Reporting
Annual Performance
Reviews Field M&E;
Review of
Departmental
Reports
Annual M&E
Reports
Copies of the
Annual M&E
Reports
One Annual
M&E Reports 8,000,000

105
Programme Strategic
Priority
Project Description of
Activity
Expected
Output
Key
Performance
Indicators
Target FY
2017/18
Budget
Estimates
Preparation of
M&E Reports
H. Kenya Devolution Support Program (KDSP)
County Fiscal
Planning
Strengthening
County
Development
Planning
Prepare Departmental
guidelines for Specific
Statutory Plans and
Documents
Identify a
technical team to
prepare
comprehensive
guidelines on
preparation of
Statutory Docs;
Prepare
Disseminating of
the prepared
guidelines to
SWGS
Guidelines
and manuals
prepared
SWG
sensitised as
per KDSP
Capacity
Building
Plan
No of
Guidelines
prepared;
No of
Officers/SWGs
sensitized on
Guidelines for
preparation of
Statutory Docs;
11,000,000
Monitoring and
Evaluation
Strengthening
County Reporting
Structured learning
through training Identification of
Participants/Fac
ilitators;
Preparing
content/organiz
ing for training
venue;
Conduct
training;
Prepare training
report
Training
conducted as
per KDSP
Capacity
Building Plan
Copies of
report;
Attendance
register;
Copy of
training report
All M&E
Unit Staff
6,000,000
Public Finance
Management
Strengthening
County Finance and Accounting
Structured learning
through training Identification of
Participants/Fac
ilitators;
Training
conducted as per KDSP
Copies of
report;
Attendance
register;
Key PFM
Staff in
Budget,
Revenue,
11,000,000

106
Programme Strategic
Priority
Project Description of
Activity
Expected
Output
Key
Performance
Indicators
Target FY
2017/18
Budget
Estimates
Preparing
content/organiz
ing for training
venue;
Conduct
training;
Prepare training
report
Capacity
Building Plan Copy of
training report Finance and
Acc. and
Internal
Audit.

107
COUNTY PUBLIC SERVICE BOARD Strategic Goals / Objectives of the Sector
The overall goal of this sector is to ensure that high standards of professional ethics are maintained
by affording adequate and equal opportunities at all levels of the public service.
The objectives of NCPSB include the following: -
(a) To promote integrity in the public service and improve human resources practices.
(b) To enhance human resource policy formulation and guidelines.
(c) To promote values and principles of good governance.
2Sub - Sector Mandate
As outlined in Section 59 of the County Government Act, the County Public Service Board is
mandated and stipulated with the following functions: -
(a) To establish and abolish offices in the county public service;
(b) To appoint persons to hold or act in offices of the county public service including in the Boards
of cities and urban areas within the county and to confirm appointments;
(c) To exercise disciplinary control over, and remove, persons holding or acting in those offices
as provided for under this Part;
(d) To prepare regular reports for submission to the county assembly on the execution of the
functions of the Board;
(e) To promote in the county public service, the values and principles referred to in Articles 10
and 232;
(f) To evaluate and report to the county assembly on the extent to which the values and principles
referred to in Articles 10 and 232 are complied with in the county public service;
(g) To facilitate the development of coherent, integrated human resource planning and budgeting
for personnel emoluments in counties;
(h) To advise the county government on human resource management and development;
(i) To advise county government on implementation and monitoring of the national performance
management system in counties;
(j) Make recommendations to the Salaries and Remuneration Commission on behalf of the county
government, on the remuneration, pensions and gratuities for county public service employees.

108
PLANNED PROJECTS AND PROGRAMMES FOR IMPLEMENTATION IN THE FINANCIAL YEAR 2017/2018
Programme Strategic
Priority
Project Description of
activity
Expected Output Targets
2017/18
Key
Performance
Indicators
Budget
Estimates
Promotion of
national values
and principles
of governance
To promote
values and
principles
referred to in
Articles 10 &
232 of the
Constitution
of Kenya
(2012).
Sensitization
and awareness
programmes.
Conduct staff
training
Identify public
participants
Conduct actual
sensitization
sessions
Staff identified
and trained
Sensitization
forums held and
Staff trained
4No.
Forums
4No.
Trainings
Number of
public forums
held.
No of trainings
conducted.
Number of
trainings
conducted
24,000,000
To enhance
integrity in
the County
Public
Service.
Conduct a
Baseline
Survey.
Conduct actual
baseline survey
Baseline survey
conducted
70% Baseline survey
report
Human
Resource
Planning and
policy
To fasten the
implementati
on of human
resource
Customize and
implement HR
Policies
Review
existing HR
policies and
implement
them
HR policies
reviewed and
implemented
5 Policies Reviewed
policies
Implementation
progress reports
6,000,000

109
implementatio
n
policies and
guidelines.
To improve
human
resources
practices for
an enhanced
service
delivery.
Recruitment of
various cadres
of staff
Advertisement
of vacant
positions and
actual
recruitment of
staff
100% of
requested
officers.
10,000,000
Evaluation and
implementatio
n of the
recommendati
ons of the
Ministerial HR
Advisory
Committees.
Implementatio
n of Ministerial
HR
Committees
recommendatio
ns
Promote/upgra
de staff
Increase in
number of
handled
discplinary
cases
Recommendation
s implemented
Staff
promoted/upgrade
d
Discplinary cases
handled
100% of
staff
promoted
/
upgraded.
10% of
disciplina
ry cases
finalized.
Percentage of
staff
promoted/upgra
ded
Percentage of
disciplinary
cases handled

110
Provision of
HR Advisory
Services
To advise the
County
Government
on human
resource
management
and
development
Conduct
training for
staff in various
ministries.
Identify staff
from various
and conduct
actual training
Staff trained 30% of
the staff
in each
ministry
are
trained.
Percentage of
staff trained per
each ministry
19,000,000
To advise the
County
Government
on the
implementati
on and
monitoring of
the national
performance
management
system.
Organize
training for the
Board
Members & its
Secretariat.
Train board
and secretariat
members
Board members
and staff trained
3No.
Trainings
Number of
trainings
conducted
TOTAL 59,000,000

111