County Council Of Howard County, Maryland - …fixhoco.com/aeolus/2.pdfAN ACT adopting PlanHoward...
197
Introduced Public Hearing Council Action Executive Action Effective Date County Council Of Howard County, Maryland 2012 Legislative Session Legislative Day No. 8 . Bill No. 26 -2012 Introduced by: The Chairperson at the request of the County Executive AN ACT adopting PlanHoward 2030 as the general plan for Howard County, Maryland, for the purpose of planning for land use and land conservation and multiyear development planning for transportation, public facilities, water, sewerage, parkland, housing, human services, and environmental protection; and generally relating to planning, zoning, and land use in Howard County, Maryland. Introduced and read first time , 2012. Ordered posted and hearing scheduled. By order Stephen LeGendre, Administrator Having been posted and notice of time & place of hearing & title of Bill having been published according to Charter, the Bill was read for a second time at a public hearing on , 2012. By order Stephen LeGendre, Administrator This Bill was read the third time on ____________, 2012 and Passed ___, Passed with amendments _______, Failed _______. By order Stephen LeGendre, Administrator Sealed with the County Seal and presented to the County Executive for approval this day of , 2012 at ___ a.m./p.m. By order Stephen LeGendre, Administrator Approved/Vetoed by the County Executive , 2012 Ken Ulman, County Executive NOTE: [[text in brackets]] indicates deletions from existing law; TEXT IN SMALL CAPITALS indicates additions to existing law; Strike-out indicates material deleted by amendment; Underlining indicates material added by amendment
Transcript of County Council Of Howard County, Maryland - …fixhoco.com/aeolus/2.pdfAN ACT adopting PlanHoward...

Introduced
Public Hearing
Council Action
Executive Action
Effective Date
County Council Of Howard County, Maryland 2012 Legislative Session Legislative Day No. 8 .
Bill No. 26 -2012
Introduced by: The Chairperson at the request of the County Executive
AN ACT adopting PlanHoward 2030 as the general plan for Howard County, Maryland, for the
purpose of planning for land use and land conservation and multiyear development
planning for transportation, public facilities, water, sewerage, parkland, housing, human
services, and environmental protection; and generally relating to planning, zoning, and
land use in Howard County, Maryland.
Introduced and read first time , 2012. Ordered posted and hearing scheduled.
By order
Stephen LeGendre, Administrator
Having been posted and notice of time & place of hearing & title of Bill having been published according to Charter, the Bill was read for a second
time at a public hearing on , 2012.
By order
Stephen LeGendre, Administrator
This Bill was read the third time on ____________, 2012 and Passed ___, Passed with amendments _______, Failed _______.
By order
Stephen LeGendre, Administrator
Sealed with the County Seal and presented to the County Executive for approval this day of , 2012 at ___ a.m./p.m.
By order
Stephen LeGendre, Administrator
Approved/Vetoed by the County Executive , 2012
Ken Ulman, County Executive
NOTE: [[text in brackets]] indicates deletions from existing law; TEXT IN SMALL CAPITALS indicates additions to existing law; Strike-out
indicates material deleted by amendment; Underlining indicates material added by amendment

1
WHEREAS, the Howard County Department of Planning and Zoning has prepared 1
PlanHoward 2030 as the general plan for Howard County following guidelines promulgated by 2
the Planning Board and adopted by the County Council in Council Resolution No. 117-2011; and 3
4
WHEREAS, as required by Section 16.801(c) of the Howard County Code, PlanHoward 5
2030 includes, without limitation, a plan for land use and land conservation and multiyear 6
development plans for transportation, public facilities, water, sewerage, parkland, housing, 7
human services, and environmental protection; and 8
9
WHEREAS, PlanHoward 2030 also complies with State law by addressing sensitive 10
areas, water resources, transportation, land development, land development regulations, 11
implementation strategies, and mineral resources; by adopting the growth tiers authorized by the 12
2012 Maryland General Assembly in Senate Bill 236; and by designating four place types called 13
for by the State development plan, PlanMaryland; and 14
15
WHEREAS, PlanHoward 2030 is an update to General Plan 2000; accordingly two 16
recently adopted amendments to the General Plan 2000, the Water Resource Element and the 17
Downtown Columbia Plan, will not be modified or replaced and are included in PlanHoward 18
2030 by reference; and 19
20
WHEREAS, the Planning Board held a hearing on the proposed PlanHoward 2030 on 21
April 18, 2012 and issued its recommendations on May 24, 2012; and 22
23
WHEREAS, the County Executive has submitted PlanHoward 2030 to the County 24
Council. 25
26
NOW, THEREFORE, 27
28
Section 1. Be It Enacted by the County Council of Howard County, Maryland that PlanHoward 29

2
2030, substantially in the form attached hereto as Exhibit A, is adopted as the General Plan for 1
Howard County. 2
3
Section 2. And Be It Further Enacted by the County Council of Howard County, Maryland that the 4
Director of the Department of Planning and Zoning may correct obvious errors, capitalization, 5
spelling, grammar, headings and similar matters and may publish PlanHoward 2030 by adding or 6
amending covers, title pages, a table of contents, and graphics to improve readability. 7
8
Section 3. And Be It Further Enacted by the County Council of Howard County, Maryland that 9
this Act shall become effective 61 days after its enactment. 10

PlanHoward 2O3O
Howard County MarylandProposed May 2012

ACKNOWLEDGEMENTS
Executive Ken Ulman County Executive
Jessica Feldmark Chief of Staff
Ian Kennedy Deputy Chief of Staff
County Council Mary Kay Sigaty, Chair District IV
Courtney Watson, Vice Chair District I
Dr. Calvin Ball, III District II
Greg Fox District V
Jen Terrasa District III
Planning Board Dave Grabowski, Chair Josh Tzuker
Jacqueline Easley Paul Yelder
Bill Santos
Task Force Ned Tillman, Chair Joe Mezzanotte
Tudy Adler Maria Miller
Nina Basu Chris Murn
Kal Bhatti Sang Oh
Steve Breeden Jay Parekh
Martha Anne Clark Elizabeth Rendon
Phil Engelke Steven Rice
Doug Erdmann Dwayne Robinson
Anwar Hasan Brent Rutley
Karol Hess Bill Santos
Sarah Husain Peter Scheidt
Andrea Ingram Maurice Simpkins
Daraius Irani Felícita Solá-Carter
Barbara Kellner Sue Song
Grace Kubofcik David Steele
Joan Lancos Robert Turner
Ted Mariani Sharonlee Vogel
Val McGuire Cathy Ward

ACKNOWLEDGEMENTS
Department of Marsha McLaughlin Planning Director
Planning & Zoning Kimberley Flowers Deputy Director
Dace Blaumanis Lisa Hill
Laura Boone Elmina Hilsenrath
Jeff Bronow Doug Kampe
Randy Clay Bradley Killian
David Cookson Joy Levy
Lindsay DeMarzo Brian Muldoon
Jill Farrar Susan Overstreet
Carrie Grosch Ben Pickar
Bill Mackey Mary Smith
Sharon Melis Samantha Stoney
Agencies County Administration Office of Environmental Sustainability
Citizen Services Police Department
Fire and Rescue Services Public Works
Health Department Recreation & Parks
Housing & Community Development Technology & Communication Services
Inspections, Licenses & Permits
Economic Development Authority Howard County Library
Howard Community College Howard County Public School System
Howard County Arts Council
Consultants Robert Charles Lesser & Company Mahan Rykiel Associates, Inc.
Parsons Brinckerhoff
Sabra, Wang & Associates, Inc.

A Letter from the County Executive
Dear Friends,
What a great place Howard County is to live, work, and play. And what a privilege it is for me to serve our residents, business owners, nonprofits, and everyone who is a part of the many communities that make up Howard County. Together, you make this one of the best places to live in the United States.
I’m pleased to present this Revised Draft of PlanHoward 2030 for consideration by the Howard County Council. The draft incorporates much of what community members have said in response to the preliminary draft and as recommended by the Planning Board.
This revised plan continues to reflect the County’s commitment to sustainability and its steady march toward being greener, smarter, and a leader in Maryland and the nation.
Review by the County Council represents the final step in the dynamic public process. As a former Councilmember, I understand the important role that the Council has to incorporate additional changes in response to further input and feedback from the public received by during the hearings on this plan. This is the reiterative public process at its finest.
Thank you for your time and participation as together we plan for the future of Howard County.
Sincerely,
Ken Ulman County Executive

A Letter from the Planning Director
To All County Participants,
The Department of Planning and Zoning is pleased to present the revised draft of PlanHoward 2030 for consideration by the Howard County Council. This document is the result of the combined efforts of a large citizens’ task force, two special-focus work groups, many County agencies, professional consultants, the Howard County Planning Board, and DPZ staff.
PlanHoward 2030 is organized with chapters addressing each of the 12 Maryland State Planning Visions. The first two, which are overarching goals – Quality of Life and Sustainability, as well as Public Participation – form the Introduction. The core of the plan organizes chapters by the three aspects of sustainability: our environment, our economy, and our community. The final chapters articulate the implementation strategy and our shared stewardship roles in enhancing our environment, our economy, and the quality of life in our communities.
I encourage everyone who reads this revised plan to submit feedback and suggestions to the Howard County Council at the public hearing or by using the uComment page at www.PlanHoward.org. The comments received to date have greatly assisted DPZ and the Planning Board in revising the preliminary draft in preparation for the County Council’s review and approval. Thank you for your continued participation.
Sincerely,
Marsha S. McLaughlin Director

EXECUTIVE SUMMARY
PlanHoward 2030 is the County’s new general plan. With this new name comes a new, forward-looking approach and an exciting launch into a greener and more sustainable future–environmentally, economically, and for our communities. PlanHoward 2030 celebrates accomplishments and charts the next steps forward so Howard County can continue to enhance our high quality of life. Howard County’s plan includes many of the new planning approaches from PlanMaryland, the new statewide development plan. This document is available online, as are all PlanHoward 2030-related materials, at www.PlanHoward.org.
This plan highlights key issues and goals for future planning efforts. In other words, PlanHoward 2030 is a framework that sets out a scope of work and policies for the next two decades. Each policy includes appropriate implementation actions that are prioritized as one of three categories: short-term (one to three years), mid-term (four to seven years), and long-term (eight years or more). For a quick overview, summary matrices of policies and implementing actions are in Appendix A.
Overview PlanHoward 2030 is structurally organized into three major parts to address the three key aspects of sustainability – environment, economy, and community quality of life. With an introductory section and concluding implementation section, the plan is comprised a total of five sections. PlanHoward 2030 uses the 12 Maryland State Planning Visions to structure 12 chapters.
Section I, Introduction, includes the two overarching Maryland visions that guide PlanHoward2030: Quality of Life & Sustainability and Public Participation. The second section, Environment, addresses two visions: Environmental Protection and Resource Conservation. The third, Economy, is comprised of three visions: Economic Development, Growth, and Transportation. The fourth, Community, addresses three visions: Public Facilities and Services, Housing, and Community Design. The last section, Action!, ends with two visions: Implementation and Stewardship.
PlanHoward 2030 is an update to General Plan 2000. Two recently adopted general plan amendments, the Water Resource Element (WRE) and the Downtown Columbia Plan (DCP) will not be modified or replaced. These are included in PlanHoward 2030 by reference.
Key Issues Since adoption of General Plan 2000, changing circumstances, new priorities and approaches, and the recent recession have modified what is needed in Howard County to sustain its high quality of life. For the next 20 years, the population will continue to increase and become more diverse with more diverse needs. The recent recession and slow recovery means State and local funding will likely remain constricted in the near term while needs are increasing. Partnerships and collaboration are essential to achieving PlanHoward 2030 goals. Howard County has a progressive and innovative culture on which to build. Key initiatives include:
Environmental Protection. New actions focus on implementation of a Watershed Implementation Plan to achieve mandatory water quality goals and promotion of environmental stewardship by diverse stakeholders.
Resource Conservation. A new Green Infrastructure Network Plan is proposed; the land and character of the Rural West will be protected through strategies to enhance the farm economy and to balance agricultural, residential, and commercial uses; and expanded historic preservation initiatives are proposed.
Economic Development. Strategies are recommended to promote business innovation and growth, and to make Howard County a leader in 21st century technologies. Particular attention is given to the US 1 Corridor and changing economic conditions identified by a market study.

Workforce development and the promotion of training in science, technology, engineering, and math (STEM) are another focus.
Growth. Addressing new State Smart Growth requirements, the County’s existing pace of housing allocations is maintained but redistributed based on designated place types and “growth tiers”. Maintaining adequate public facilities remains a strong focus for the future, so a Fiscal Impact Analysis was prepared as a technical supplement.
Transportation. Transit, bicycle, and pedestrian transportation receive greater emphasis, while also providing for the existing roadway network to be improved. Goals for strategies are proposed for enhancing the existing transit system via new service and increased regional cooperation, and for reducing personal vehicle miles traveled to improve air quality.
Public Facilities and Services. County agencies’ key programs and capital project needs are presented, as well as budget constraints and strategies for coordinated planning, priority setting, and partnerships.
Housing. The County will continue to develop new models to provide sustainably affordable housing in mixed income communities, and to educate both home-seekers and the general public on the many benefits of compact, mixed-use, mixed income, location-efficient homes.
Community Design. The County will encourage well designed, context sensitive redevelopment in revitalization area, as well as selective infill in existing neighborhoods to create more complete communities. Community plans, updates to zoning regulations, and other mechanisms will implement these goals.
Implementation and Stewardship. County government must continue to innovate and provide leadership; however, everyone has a stake in enhancing Howard County’s high quality of life. The foundation is laid for broad stakeholder collaboration and coordination to advance sustainability.
uComment PlanHoward 2030’s motto is “Your County. Your Plan.” The County invites your comments and input on this document via a new feedback tool–uComment. uComment allows anyone to read and provide feedback on PlanHoward 2030 anytime, 24 hours a day, seven days a week. PlanHoward 2030 will be posted online in uComment for the duration of the public review process, so you may actively participate. Please visit the website and provide feedback at www.PlanHoward.org. The PlanHoward 2030 website will also post notices about meetings and County Council hearings.


TABLE OF CONTENTS
Acknowledgements Letter from the County Executive Letter from the Planning Director Executive Summary
I: INTRODUCTION ................................................................................. 1 1. Quality of Life & Sustainability ............................................................... 3
2. Public Participation ................................................................................ 7
II: ENVIRONMENT ................................................................................. 11 3. Environmental Protection ..................................................................... 13
4. Resource Conservation ........................................................................ 27
III: ECONOMY ....................................................................................... 45 5. Economic Development ....................................................................... 47
6. Growth .................................................................................................. 61
7. Transportation ...................................................................................... 83
IV: COMMUNITY .................................................................................... 99 8. Public Facilities & Services ................................................................. 101
9. Housing ................................................................................................ 123
10. Community Design .............................................................................. 135
V: ACTION! .......................................................................................... 147 11. Implementation .................................................................................... 149
12. Stewardship ......................................................................................... 153
APPENDIX A: .......................................................................................... 157 Policies & Implementation Actions Summary Matrix .................................. 159


1
PlanHoward 2030 not only promotes, but is organized around the concept of sustainability. The paradigm of sustainability involves three equally important and integrated dynamics – the sustainability and health of the environment, the sustainability of a prosperous economy, and the sustainability of our community and quality of life. PlanHoward 2030 addresses the 12 Maryland State Planning Visions in three sections on these three aspects of sustainability. With introductory and concluding sections, the plan is comprised of five parts.
Section I, Introduction, includes the two overarching Maryland visions that guide PlanHoward 2030: Quality of Life & Sustainability and Public Participation.
Section II, Environment, addresses two visions: Environmental Protection and Resource Conservation.
Section III, Economy, is comprised of three visions: Economic Development, Growth, and Transportation.
Section IV, Community, addresses three visions: Public Facilities & Services, Housing, and Community Design.
Section V, Action!, ends with two visions: Implementation and Stewardship.
I: INTRODUCTION

2

3
Overview Howard County enjoys an enviable, high quality of life, which the County wants to ensure for future generations. This chapter introduces the broadest, overarching ideas for the entire plan. The many and varied aspects of sustainability that support the quality of life are addressed in the chapters that follow.
PlanHoward 2030 articulates policies and actions to move us to further sustainability while enhancing the quality of life. As such, it is both a framework and a work scope for the County in the coming years. As we study the ideas proposed here, ideas for implementing them will arise. PlanHoward 2030 needs to be flexible enough to serve both the current and emerging needs of the residents, businesses, and community groups that comprise Howard County. Our quality of life will depend on it.
State of Maryland Vision A high quality of life is achieved through universal stewardship of the land, water, and air resulting in sustainable communities and protection of the environment.
County Context Howard County is currently recognized as one of the best places to live in the United States of America. Maintaining the existing very high quality of life and seizing opportunities for improvement are key challenges for the years ahead.
1. Quality of Life & Sustainability
Elizabeth Katsion, Grade 8, Mount View Middle School

4
Progress under General Plan 2000 General Plan 2000 promotes sustainable development using six overarching goals based on the prior set of Maryland Planning Visions from the 1992 Planning Act. Each goal is explored in the six sections which organize General Plan 2000: Responsible Regionalism, Preservation of the Rural West, Balanced and Phased Growth, Community Conservation and Enhancement, Working with Nature, and Implementation. Quality of life and sustainability are addressed by 80 official policy groupings containing a total of 320 specific action statements. Based on repeated national rankings for “Best Place to Live” in magazines and by national organizations, the County’s achievements are well documented.
Context Situated in Maryland’s Piedmont between the Chesapeake Bay and the Appalachian Mountains, Howard County is historically characterized by its pastoral landscapes. Regional growth during the 1960s and 1970s initiated a demand for suburban communities, and people began moving to Howard County, drawn by attractive communities and services, and for many, Columbia’s ideals of social and economic diversity. Since then, the County has enjoyed many advantages due to its proximity to the metropolitan centers of Baltimore, MD and Washington, D.C. while retaining the physical, economic, and social qualities that make it a popular place to live, work, and play.
Though some of Howard County’s success can be attributed to its location and strong job base, the County’s high quality of life is a product of more than just its geography. County government, with support from community groups and private-sector partners, purposefully and diligently works to create institutional frameworks that support and enrich the lives of its residents. Today Howard County boasts among its numerous distinguishing features a first-rate system of education, libraries, public safety, health and human services, parks and recreational facilities, more than 60,000 acres of preserved land, modern business parks and shopping destinations, and unique historic districts. It is this combination of civic, social, business, and physical qualities that help define residents’ high quality of life and maintain the County’s economic stability.
Future Challenges and Opportunities Population growth and change, environmental improvements, and energy conservation initiatives will present new challenges and opportunities for Howard County. As the County and the community contemplate policies and actions to pursue over the 20-year horizon of PlanHoward 2030, potential impediments must be overcome in order to maintain the County’s high quality of life. PlanHoward 2030 acknowledges a number of critical national, State, and regional challenges and opportunities that will affect Howard County’s efforts to address growth, preservation, and sustainability.
State Smart Growth and PlanMaryland In 2008, the Maryland Task Force on the Future for Growth and Development developed 12 visions that were adopted into law. Today these visions provide a foundation for State policies affecting economic growth, resource conservation, and community development. These visions also form the basis for Maryland’s first State Development Plan, PlanMaryland, which outlines goals for achieving more sustainable patterns of growth and development throughout the State.
PlanHoward 2030 celebrates Howard County’s nationally recognized high quality of life and seeks to maintain it.

5
Though general, PlanMaryland articulates growth management objectives and priorities to aid coordination among State agencies and local governments.
The objectives in PlanMaryland also identify opportunities for the State and local governments to implement programs and policies in support of the plan. These include identifying and promoting centers of development that are well designed, compact, and support high quality of life; protecting natural resource areas by limiting growth outside of development centers; reducing energy consumption and greenhouse gas emissions; and improving opportunities for low-income populations. Howard County shares these goals. PlanHoward 2030 addresses the goals of PlanMaryland through the 12 Maryland Planning Visions in a manner tailored to the specific conditions and priorities of the County.
Bay Restoration The Chesapeake Bay is one of Maryland’s greatest natural resources and a major economic asset. With more than 90% of Maryland’s acreage falling within the Chesapeake Bay watershed, improving the health of the Bay is a State, as well as a regional, priority. The Chesapeake Bay Program (CBP) directs restoration and protection efforts including Bay water quality and upstream watersheds. Howard County is bordered by the Patapsco and Patuxent Rivers; these two major watersheds feed the Chesapeake Bay. Naturally, Howard County continues to be a committed partner in improving the health of the Bay.
As such, the County is preparing a Watershed Implementation Plan (WIP) to demonstrate how the County will meet EPA nutrient-reduction targets for 2017 and 2025. Supporting policies and actions outlined in PlanHoward 2030 will aid in meeting targets for sediment and nutrient loads. Improving the Bay’s health is a major and crucial goal for all jurisdictions in the Chesapeake Bay watershed.
Climate Change In 2008, the Maryland Commission on Climate Change released the State’s first Climate Action Plan (MDCAP). The MDCAP elaborated on the potential causes and consequences of climate change and established State targets for reducing greenhouse gas (GHG) emissions. Among the consequences of climate change are sea-level rise and water quality impairment in the State’s numerous coastal ecosystems including the Chesapeake Bay. Implementing the recommended actions to meet State benchmarks will require coordination between State and local governments, as well as with private businesses and households.
Howard County will not be impacted by rising sea levels like Maryland’s coastal communities; however, the increased potential for flooding, drought, and wildfires is a concern. Since the global, State, and regional benefits of mitigating climate change are great and the consequences of inaction severe, Howard County has adopted a plan, the Howard County Climate Action Plan, to reduce its carbon footprint. Meeting the benchmarks identified in the County’s Climate Action Plan will aid in achieving regional and State goals.
Restoring the Chesapeake Bay is an important commitment for Howard County and this Plan.
GREEN TIP!
PlanHoward 2030 is full of tips to help you live more
sustainably, so look for the Green Tip boxes.

6
7
Overview PlanHoward 2030 outlines how Howard County can maintain its high quality of life by enhancing the environment, economy, and community. All stakeholders – community and nonprofit organizations, businesses, and individuals – are encouraged to participate in shaping PlanHoward 2030 and its implementation. Participating in the public process that creates, adopts, and implements the plan is vital. The process must include a diverse range of viewpoints and broaden public awareness of the many challenges ahead.
Public participation is twofold. The first aspect is public participation in the formation of the plan itself. The second aspect is public participation over time and through plan implementation. This chapter addresses setting out the direction for outreach, public input, and participation in PlanHoward 2030.
State of Maryland Vision Citizens are active partners in the planning and implementation of community initiatives and are sensitive to their responsibilities in achieving community goals.
County Context Many of Howard County’s residents, business owners, and nonprofits from the diverse communities that comprise the County are actively engaged in improving Howard County’s environment, economy, and community quality of life.
2. Public Participation
Emari Gordon, Grade 5, Waterloo Elementary School

8
Progress under General Plan 2000 In general, the amount of public outreach and education has increased tremendously since the adoption of General Plan 2000, as is evident in the numerous ad hoc committees, public forums, corridor studies for Route 1 and Route 40, and a public planning charrette conducted for Downtown Columbia. Overall, communication has been broadened, based on the large numbers of participants at events and public meetings over the last ten years. General Plan 2000 established the vision that “Our citizens will take part in the decisions and actions that affect them.” Much has been accomplished to create new avenues for input. The County has a new, dynamic, user-friendly website with easy interfaces such as My Neighborhood to link users to interactive maps and postings for meetings.
Formation of PlanHoward 2030 The Howard County Charter and Code set forth parameters for the County’s general plan. The plan must include land use; land conservation; and multiyear development plans for transportation, public facilities, water, sewerage, parkland, housing, human services, and environmental protection. Additionally, Article 66B of the Annotated Code of Maryland provides parameters for comprehensive planning as well. Plans by local jurisdictions must address sensitive areas, water resources, transportation, land development, land development regulations, implementation strategies, and mineral resources.
General Plan Task Force To initiate the planning process, County Executive Ken Ulman appointed a diverse group of 36 residents, representing a broad range of backgrounds, experiences, and interests, to serve as members of the General Plan Task Force. That the Task Force members reflected various community perspectives was a crucial component in developing guiding principles, a framework, policies, and implementing actions for PlanHoward 2030. Although Task Force members have many different professional and community affiliations, each served as an individual resident, not as a representative of any group or organization.
PlanHoward 2030 includes the early input of hundreds of Howard County students through the youth outreach initiative.
The General Plan Task Force guided the County in its preparation of PlanHoward 2030
9
Advisory Committees Two advisory committees were formed to help identify key issues and approaches. The Route 1 Advisory Committee considered the impacts of the existing General Plan 2000 and the Route 1 Revitalization Study (2001-2002) on development and economic activity in the Route 1 Corridor over the past decade. The Rural West Advisory Committee reviewed permitted and conditional commercial and residential uses, and potential new uses related to farming and rural businesses.
Market Study In 2011, DPZ hired Robert Charles Lesser & Company (RCLCO), a market research and real estate advisory firm, to evaluate the commercial and industrial market conditions influencing redevelopment potential in the Route 1 Corridor and Snowden River Parkway Area and to recommend appropriate redevelopment strategies. RCLCO compiled data on a variety of market indicators, established an economic profile for the study area, analyzed existing zoning and land use conditions, and identified potential gaps in the existing redevelopment strategy. Based on these analyses, RCLCO generated recommendations that included opportunity sites for development and redevelopment as well as strategies for zoning, transportation improvements, and economic development.
Youth Engagement DPZ met with several Howard County youth organizations to obtain input for PlanHoward 2030: Columbia Association’s Teen Advisory Committee, Leadership U, Howard County Association of Student Councils, the Howard Community College Student Government Association, and Voices for Change. Given that the youth of today will be the community leaders, business owners, parents, and residents of Howard County in the future, their input on current issues is important to planning for tomorrow. These teens responded to questions about quality of life, transportation, technology, environment, social needs, civic involvement, our regional location, and the future of the County.
Social Media To build public awareness and outreach, DPZ launched and integrated Facebook, Twitter, RSS, and a website, www.PlanHoward.org. The tools provided on the website include materials from the Task Force’s summer informational sessions, Planning Board meetings, and other informational sessions; presentations made during every phase of the process; new reading materials from national sources on pertinent subject matter; previous plans and County studies for background and reference materials; and an exciting, new, feedback tool – uComment.
uComment uComment allows anyone to read and provide feedback on PlanHoward 2030 – 24 hours a day, seven days a week. A test version was successfully launched during the general plan guidelines development phase in spring 2011. PlanHoward 2030 will remain online in uComment for the duration of the public review process, so the public may comments and be actively engaged. uComment is a custom-built application developed by Howard County’s
PlanHoward 2030 contains student quotes from the youth outreach initiative
inside clouds like this one.

10
Department of Technology and Communication Services for the purpose of public input.
Monitoring and Implementation After adoption of PlanHoward 2030, DPZ will continue to seek to broaden stakeholder partnership in the diverse implementing tasks. As part of implementation, a public review to be done every five years is described in Implementation, Chapter 11.
Stewardship, Chapter 12, focuses on plan implementation and how the County will continue to foster and broaden public participation by all members and groups. A strong stewardship program will engage the entire community in strengthening all three aspects of sustainability to achieve a healthy environment, a strong economy, and a high quality of community life.
Policies & Implementing Actions POLICY 2.1 – Promote dialog throughout development and implementation of PlanHoward 2030 with a broad range of community participants including those groups who are underrepresented or are part of a special population.
Implementing Actions
a. Involvement. Engage the full spectrum of the County’s population in planning and implementing actions.
b. Monitoring. Engage diverse stakeholder groups in the monitoring process with the first monitoring report due three years after plan adoption and the second monitoring report due five years after the first report.
uComment on the web allows public input at any time on PlanHoward 2030.

11
In this plan the aspect of the environment encompasses two Maryland Planning Visions – Environmental Protection and Resource Conservation.
Chapter 3, Environmental Protection, takes a sweeping look at the macro-system of the Chesapeake Bay and the interrelated forces that affect it. PlanHoward 2030 establishes policies for water resources to protect the Bay via a Watershed Implementation Plan (WIP). PlanHoward 2030 also encourages and supports increased participation in resource protection by private and nonprofit partners.
Chapter 4, Resource Conservation, will guide Howard County in administering agricultural, cultural, and historic resources for the benefit of both present and future generations. Under resource conservation, PlanHoward 2030 considers a Green Infrastructure Network Plan to create interconnected hubs and corridors where plant and animal communities can thrive.
II: ENVIRONMENT

12

13
Overview
Environmental Protection is the first thing that most people think of when sustainability is discussed. Preserving and enhancing the natural world is the basis not only for protecting the air, water, and land resources, but it also plays an important supporting role towards both prosperity for the economy and health within the community. PlanHoward 2030 addresses the protection of the environment as part of a sustainable future in important, strategic, and regionally significant ways.
State of Maryland Vision Land and water resources, including the Chesapeake and coastal bays, are carefully managed to restore and maintain healthy air and water, natural systems, and living resources.
County Context
Howard County is a leader in exploring ways to address environmental challenges by establishing an Office of Environmental Sustainability and an Environmental Sustainability Board, developing a Climate Action Plan, adopting Green Building and Green Neighborhood regulations, instituting aggressive recycling programs, purchasing hybrid buses and other fleet vehicles, and organizing numerous public education strategies. PlanHoward 2030 is an opportunity for the County and all participants in the process to envision an environmentally sustainable future and the strategies necessary to attain it.
3. Environmental Protection
Isabelle Zahn, Grade 4, Dayton Oaks Elementary School

14
Progress under General Plan 2000
Under General Plan 2000 Working with Nature polices, the County expanded the use of watershed planning and management to comprehensively guide efforts to protect, restore, and improve the County’s water resources. Regulatory protections for environmentally sensitive features were strengthened by increasing stream buffer requirements in the Rural West and by requiring sensitive features to be located in open space. Protections for less steep but highly erodible lands were not adopted, but stormwater management requirements for redevelopment were increased.
Watershed Planning and Management
The health of wetlands, streams, lakes, and reservoirs is directly linked to the use of land within their watersheds. For this reason, a holistic approach to protecting, restoring, and improving water resources should be based on a comprehensive assessment of land use, water quality, and habitat conditions for the entire watershed. The County takes a comprehensive, watershed-based approach to improve water quality and habitat within local streams by conducting watershed studies to analyze conditions and design improvements (Map 3-1).
Watershed planning and management can help improve the health of our wetlands, streams, lakes, and reservoirs.
3
MILES
1.5
Map 3-1Major Watersheds
0
L e g e n d
PATUXENT WATERSHED
WATERSHED BOUNDARY
PATAPSCO WATERSHED
MAJOR STREAM ANDMAJOR IMPOUNDMENT
Source: Howard County DPZ, 2012.
TriadelphiaTriadelphiaTriadelphiaTriadelphiaTriadelphiaTriadelphiaTriadelphiaTriadelphiaTriadelphiaTriadelphiaTriadelphiaTriadelphiaTriadelphiaTriadelphiaTriadelphiaTriadelphiaTriadelphiaTriadelphiaTriadelphiaTriadelphiaTriadelphiaTriadelphiaTriadelphiaTriadelphiaTriadelphiaTriadelphiaTriadelphiaTriadelphiaTriadelphiaTriadelphiaTriadelphiaTriadelphiaTriadelphiaTriadelphiaTriadelphiaTriadelphiaTriadelphiaTriadelphiaTriadelphiaTriadelphiaTriadelphiaTriadelphiaTriadelphiaTriadelphiaTriadelphiaTriadelphiaTriadelphiaTriadelphiaTriadelphiaReservoirReservoirReservoirReservoirReservoirReservoirReservoirReservoirReservoirReservoirReservoirReservoirReservoirReservoirReservoirReservoirReservoirReservoirReservoirReservoirReservoirReservoirReservoirReservoirReservoirReservoirReservoirReservoirReservoirReservoirReservoirReservoirReservoirReservoirReservoirReservoirReservoirReservoirReservoirReservoirReservoirReservoirReservoirReservoirReservoirReservoirReservoirReservoirReservoir
MiddleMiddleMiddleMiddleMiddleMiddleMiddleMiddleMiddleMiddleMiddleMiddleMiddleMiddleMiddleMiddleMiddleMiddleMiddleMiddleMiddleMiddleMiddleMiddleMiddleMiddleMiddleMiddleMiddleMiddleMiddleMiddleMiddleMiddleMiddleMiddleMiddleMiddleMiddleMiddleMiddleMiddleMiddleMiddleMiddleMiddleMiddleMiddleMiddlePatuxentPatuxentPatuxentPatuxentPatuxentPatuxentPatuxentPatuxentPatuxentPatuxentPatuxentPatuxentPatuxentPatuxentPatuxentPatuxentPatuxentPatuxentPatuxentPatuxentPatuxentPatuxentPatuxentPatuxentPatuxentPatuxentPatuxentPatuxentPatuxentPatuxentPatuxentPatuxentPatuxentPatuxentPatuxentPatuxentPatuxentPatuxentPatuxentPatuxentPatuxentPatuxentPatuxentPatuxentPatuxentPatuxentPatuxentPatuxentPatuxent LittleLittleLittleLittleLittleLittleLittleLittleLittleLittleLittleLittleLittleLittleLittleLittleLittleLittleLittleLittleLittleLittleLittleLittleLittleLittleLittleLittleLittleLittleLittleLittleLittleLittleLittleLittleLittleLittleLittleLittleLittleLittleLittleLittleLittleLittleLittleLittleLittle
PatuxentPatuxentPatuxentPatuxentPatuxentPatuxentPatuxentPatuxentPatuxentPatuxentPatuxentPatuxentPatuxentPatuxentPatuxentPatuxentPatuxentPatuxentPatuxentPatuxentPatuxentPatuxentPatuxentPatuxentPatuxentPatuxentPatuxentPatuxentPatuxentPatuxentPatuxentPatuxentPatuxentPatuxentPatuxentPatuxentPatuxentPatuxentPatuxentPatuxentPatuxentPatuxentPatuxentPatuxentPatuxentPatuxentPatuxentPatuxentPatuxent
North BranchNorth BranchNorth BranchNorth BranchNorth BranchNorth BranchNorth BranchNorth BranchNorth BranchNorth BranchNorth BranchNorth BranchNorth BranchNorth BranchNorth BranchNorth BranchNorth BranchNorth BranchNorth BranchNorth BranchNorth BranchNorth BranchNorth BranchNorth BranchNorth BranchNorth BranchNorth BranchNorth BranchNorth BranchNorth BranchNorth BranchNorth BranchNorth BranchNorth BranchNorth BranchNorth BranchNorth BranchNorth BranchNorth BranchNorth BranchNorth BranchNorth BranchNorth BranchNorth BranchNorth BranchNorth BranchNorth BranchNorth BranchNorth BranchPatapscoPatapscoPatapscoPatapscoPatapscoPatapscoPatapscoPatapscoPatapscoPatapscoPatapscoPatapscoPatapscoPatapscoPatapscoPatapscoPatapscoPatapscoPatapscoPatapscoPatapscoPatapscoPatapscoPatapscoPatapscoPatapscoPatapscoPatapscoPatapscoPatapscoPatapscoPatapscoPatapscoPatapscoPatapscoPatapscoPatapscoPatapscoPatapscoPatapscoPatapscoPatapscoPatapscoPatapscoPatapscoPatapscoPatapscoPatapscoPatapsco
South BranchSouth BranchSouth BranchSouth BranchSouth BranchSouth BranchSouth BranchSouth BranchSouth BranchSouth BranchSouth BranchSouth BranchSouth BranchSouth BranchSouth BranchSouth BranchSouth BranchSouth BranchSouth BranchSouth BranchSouth BranchSouth BranchSouth BranchSouth BranchSouth BranchSouth BranchSouth BranchSouth BranchSouth BranchSouth BranchSouth BranchSouth BranchSouth BranchSouth BranchSouth BranchSouth BranchSouth BranchSouth BranchSouth BranchSouth BranchSouth BranchSouth BranchSouth BranchSouth BranchSouth BranchSouth BranchSouth BranchSouth BranchSouth BranchPatapscoPatapscoPatapscoPatapscoPatapscoPatapscoPatapscoPatapscoPatapscoPatapscoPatapscoPatapscoPatapscoPatapscoPatapscoPatapscoPatapscoPatapscoPatapscoPatapscoPatapscoPatapscoPatapscoPatapscoPatapscoPatapscoPatapscoPatapscoPatapscoPatapscoPatapscoPatapscoPatapscoPatapscoPatapscoPatapscoPatapscoPatapscoPatapscoPatapscoPatapscoPatapscoPatapscoPatapscoPatapscoPatapscoPatapscoPatapscoPatapsco
PatuxentPatuxentPatuxentPatuxentPatuxentPatuxentPatuxentPatuxentPatuxentPatuxentPatuxentPatuxentPatuxentPatuxentPatuxentPatuxentPatuxentPatuxentPatuxentPatuxentPatuxentPatuxentPatuxentPatuxentPatuxentPatuxentPatuxentPatuxentPatuxentPatuxentPatuxentPatuxentPatuxentPatuxentPatuxentPatuxentPatuxentPatuxentPatuxentPatuxentPatuxentPatuxentPatuxentPatuxentPatuxentPatuxentPatuxentPatuxentPatuxentRiver UpperRiver UpperRiver UpperRiver UpperRiver UpperRiver UpperRiver UpperRiver UpperRiver UpperRiver UpperRiver UpperRiver UpperRiver UpperRiver UpperRiver UpperRiver UpperRiver UpperRiver UpperRiver UpperRiver UpperRiver UpperRiver UpperRiver UpperRiver UpperRiver UpperRiver UpperRiver UpperRiver UpperRiver UpperRiver UpperRiver UpperRiver UpperRiver UpperRiver UpperRiver UpperRiver UpperRiver UpperRiver UpperRiver UpperRiver UpperRiver UpperRiver UpperRiver UpperRiver UpperRiver UpperRiver UpperRiver UpperRiver UpperRiver Upper
Rocky GorgeRocky GorgeRocky GorgeRocky GorgeRocky GorgeRocky GorgeRocky GorgeRocky GorgeRocky GorgeRocky GorgeRocky GorgeRocky GorgeRocky GorgeRocky GorgeRocky GorgeRocky GorgeRocky GorgeRocky GorgeRocky GorgeRocky GorgeRocky GorgeRocky GorgeRocky GorgeRocky GorgeRocky GorgeRocky GorgeRocky GorgeRocky GorgeRocky GorgeRocky GorgeRocky GorgeRocky GorgeRocky GorgeRocky GorgeRocky GorgeRocky GorgeRocky GorgeRocky GorgeRocky GorgeRocky GorgeRocky GorgeRocky GorgeRocky GorgeRocky GorgeRocky GorgeRocky GorgeRocky GorgeRocky GorgeRocky GorgeReservoirReservoirReservoirReservoirReservoirReservoirReservoirReservoirReservoirReservoirReservoirReservoirReservoirReservoirReservoirReservoirReservoirReservoirReservoirReservoirReservoirReservoirReservoirReservoirReservoirReservoirReservoirReservoirReservoirReservoirReservoirReservoirReservoirReservoirReservoirReservoirReservoirReservoirReservoirReservoirReservoirReservoirReservoirReservoirReservoirReservoirReservoirReservoirReservoir

15
In 2001, the County initiated a long-term, countywide biological monitoring program to track water quality and habitat trends in local streams. The results of this sampling indicate most streams in the County suffer from degraded water quality and habitat conditions. Stream corridor assessment surveys have also been conducted for all major watersheds. These surveys indicate eroding stream channels, missing riparian buffers, and eroding pipe outfalls can be some of the more common problems in the watersheds. In addition, most water bodies do not meet State water quality standards.
The County is charged with improving water quality and habitat in local streams to meet Federal Clean Water Act requirements, including discharge permit requirements for the stormwater management system. The County has completed a number of watershed management plans that identify potential restoration projects. Restoration projects can include: building new stormwater management facilities; retrofitting existing stormwater management facilities to add or improve water quality treatment; planting forest, especially to establish buffers along streams and wetlands; restoring and creating wetlands; and stabilizing stream channels and restoring in-stream habitat. The current list of potential restoration projects exceeds 150, while the current County budget allows for about five projects to proceed each year.
County watershed studies have focused primarily on the more developed watersheds in the eastern portion of the County. However, watershed management plans are needed for each watershed in the County to set priorities and guide efforts to protect, restore, and improve the County’s water resources. To assure watershed goals are being met, all watershed management plans should be revisited and updated as needed, on a regular cycle.
Watershed protection and restoration goals may vary by watershed. In a healthy watershed, the goal may be to protect and maintain current conditions, whereas in a degraded watershed, the goal may be to actively restore and improve current conditions. It is easier and more cost effective to protect high quality resources in a watershed than to restore degraded resources. Work in other jurisdictions shows that the more degraded a watershed is, the more difficult restoration becomes, and in some more highly developed watersheds conditions may be so degraded that full restoration is prohibitively expensive.
Currently, watershed studies are focused on stream water quality and habitat. Wetlands, another important water resource, are not currently mapped or assessed. State and Federal wetland maps exist for the County but are incomplete or outdated. Wetlands are mapped on individual properties as part of the development review process, but this information is not compiled into a countywide inventory. A wetland program to inventory and map the County’s wetlands, assess opportunities to restore and protect existing wetlands, and create new wetlands could provide additional water quality and habitat benefits.
In addition to watershed planning and management for local water resources, it’s also important to remember that the County is part of the larger Patuxent and Patapsco River basins. The Patuxent and Patapsco Rivers are major tributaries to the Chesapeake Bay. The multistate effort to restore the Chesapeake Bay has been and continues to be a strong influence in promoting watershed-based planning and management efforts to protect not only the Chesapeake Bay, but also the Bay’s numerous tributary rivers and streams.
The Patapsco River is a major tributary to the Chesapeake Bay.

16
Restoring the Chesapeake Bay
The Chesapeake Bay is the largest estuary in the United States and one of the most productive on earth. The Bay is a valued source of beauty, recreation, and commercial activity in Maryland, and it has played an important role in Maryland’s history and development.
The Chesapeake Bay watershed covers more than 64,000 square miles and includes parts of six states — Delaware, Maryland, New York, Pennsylvania, Virginia, and West Virginia — and the District of Columbia. Unfortunately, development within the watershed, particularly since the 1950s, has degraded water quality and habitat in the Bay, leading to a decline in commercially important species such as crabs, oysters, rockfish, and shad. The Bay suffers from excess sediment and nutrients (nitrogen and phosphorus) that rob the water of oxygen and light needed by underwater grasses, fish, and other aquatic life. The primary sources of these pollutants are runoff from urban, suburban, and agricultural lands; emissions from burning fossil fuels; and discharges from wastewater treatment plants, industrial plants, and septic systems.
In 1983, the U.S. Environmental Protection Agency (EPA), Maryland, Virginia, Pennsylvania, and the District of Columbia signed the first Chesapeake Bay Agreement and began voluntarily working together to improve the health of the Bay. Subsequent agreements renewed that commitment, and the most recent Chesapeake 2000 Agreement set a deadline of 2010 to achieve water quality goals for the Bay. However, as the 2010 deadline approached, it became clear that voluntary efforts would not achieve Bay cleanup goals. The EPA determined that a stronger regulatory approach was required, as specified under the Federal Clean Water Act.
In response, the EPA developed the Chesapeake Bay Total Maximum Daily Loads (TMDLs), which set limits on the amounts of nitrogen, phosphorus, and sediment that can enter the Chesapeake Bay, to ensure the Bay meets water quality standards necessary to restore the Bay’s ecology. These limits are significantly lower than the current pollution levels. The Bay TMDLs were finalized in December 2010. Watershed Implementation Plans (WIPs) developed by the Bay States will contain a list of actions that must be implemented by 2025, to help achieve the Bay TMDLs.
Watershed Implementation Plans
The WIPs will be developed in three phases. The Phase I WIP was finalized in December 2010 and specifies statewide actions that must be taken to achieve pollution reductions and maintain these levels in the face of future growth. The Phase I WIP also sets interim targets for 2017. The Phase II WIP will specify how these statewide actions will be implemented at the local government level to achieve the 2017 interim targets. The Phase II WIP will incorporate local government plans to achieve these reductions. A draft of these local plans was submitted to the State in November 2011. The State submitted a final Phase II WIP to EPA in March 2012. The Phase III WIP will be prepared in 2017 and address needed reductions from 2018 to 2025.
The Maryland Phase I WIP provides strategies to address pollution reductions from point sources (municipal and industrial wastewater treatment plants), urban stormwater, septic systems, agriculture, natural filters on public land, and air. Reductions from air will be achieved through the Federal Clean Air Act. The majority of reductions by 2017 will occur in point sources through upgrades of major municipal wastewater treatment plants (WWTPs) to provide enhanced
GREEN TIP!
Stop using your garbage disposal. One less food scrap is one less item to treat at the wastewater
treatment plant. Try composting instead.
Watershed Implementation Plans will guide future efforts to restore the Chesapeake Bay.

17
nutrient removal (ENR), which is state-of-the-art treatment for nutrient removal. Reductions after 2017 will rely more heavily on reductions from other sources. Since WWTPs and urban stormwater systems are regulated under the Federal Clean Water Act through National Pollutant Discharge Elimination System (NPDES) permits, EPA can require increased pollution reductions from these two sources, if overall reductions are not adequate.
Howard County’s Phase II WIP will specify local actions to achieve assigned pollution reductions from municipal wastewater treatment plants, urban stormwater, septic systems, and agriculture. Implementing actions to achieve these reductions will be divided into two-year increments or milestones. These may include programmatic changes, as well as project implementation. Actions taken to address Howard County’s share of the Chesapeake Bay cleanup will also help improve water quality and habitat in the County’s local streams.
Waste Water Treatment Plant Reductions. Howard County is served by two major WWTPs, the Patapsco and the Little Patuxent. Both plants have assigned pollution caps to meet the Bay TMDLs, and both plants are currently undergoing upgrades to ENR. The Little Patuxent upgrade will be completed in 2012, and the Patapsco upgrade should be completed in 2016.
Stormwater Reductions. The Phase I WIP requires that the County provide nutrient and sediment reductions equivalent to retrofitting 30% of the impervious area in the County. This means providing new or improved stormwater treatment for areas that do not currently have adequate treatment. This requirement will be incorporated into the County’s NPDES stormwater permit. The current permit requires that 10% of the untreated impervious area in the County be retrofitted. The new permit, which should be issued in 2012, will require an additional 20% of the untreated impervious area to be retrofitted. This is approximately 13,500 acres of impervious area that needs retrofitting. The County expended about $35 million in capital and operating funds since 1998 to treat about 3% of the untreated impervious area in the County.
The Phase I WIP indicates that in 2012, the State will consider legislation to require local governments to institute dedicated sources of funding for stormwater management programs. Legislation passed in the 2012 session requires larger jurisdictions with NPDES permits, such as Howard County, establish such a fund, often called a stormwater utility fund. Howard County is currently studying options for stormwater utility funding.
Septic Systems Reductions. Septic systems are not a significant source of phosphorus, but they are a source of nitrogen. Nitrogen reductions from septic systems can be achieved by upgrading existing systems to include nitrogen reducing technologies. Another option is to connect properties with septic systems to WWTPs with ENR. The County has approximately 15,200 septic systems in the Rural West and 350 to 400 systems remaining within the Planned Service Area.
Upgrading an existing septic system costs approximately $13,000 and there is an additional annual cost of approximately $150 to $300 to run the mechanical and electrical components of the system. Partial funding for septic system upgrades is available through the State Bay Restoration Fund. However, this fund is prioritized to replace failing systems within the Chesapeake Bay and Coastal Bays Critical Areas (areas within 1,000 feet of tidal waters).
Agricultural Reductions. Ensuring adequate reductions from agriculture will be a shared responsibility between the agricultural community, the Howard Soil Conservation District, and the Maryland Department of Agriculture. The County and State provide funding for the Howard Soil Conservation District (HCSD),
Planting forested stream buffers will help improve water quality and habitat in our local streams and the Chesapeake Bay. Photo: HSCD.

18
which provides best management practice (BMP) planning services to the agricultural community. The State provides cost share funds to supplement Federal funds for BMP implementation. In addition, the State has jurisdiction over the requirements for nutrient management plans on farms. HCSD is currently visiting County farms to inventory both completed BMPs and the potential for additional measures. Based on initial assessments, required agricultural pollution reductions can be achieved and there is considerable potential for additional nutrient reduction.
Nutrient Offsets. To address pollution from future growth, Maryland has proposed to develop and implement a system of nutrient offsets by 2013 for new development. The proposed approach would divide the State into three areas with low, medium, and high nutrient loads per capita. The system would encourage development in already developed areas by having the lowest offset requirements for growth in more densely developed areas that are served by WWTPs with ENR. Development in low density areas served by septic systems would have the highest offset requirements. The offsets would be based on nutrient trading systems.
Nutrient Trading. Maryland has established nutrient trading policies for trading between point sources, trading involving the removal of septic systems, and trading involving the purchase of nonpoint source credits from agriculture. Trades involving regulated point sources, such as WWTPs, will be implemented through the discharge permits for the point source. An exception is made for trades involving regulated stormwater management systems, which will not be incorporated into the NDPES permit. Trading must take place within the Potomac, Patuxent, or Eastern Shore and Western Shore basins. Approximately 75% of Howard County lies within the Patuxent River basin while the remaining 25% lies within the Patapsco River basin, which is located within the larger Western Shore basin.
Phase II WIP. The County is working closely with the State, interested stakeholders, such as the Columbia Association, the Howard County Public School System, and the general public to develop Howard County’s Phase II WIP. The County is a member of the Patuxent River Commission that is working to coordinate Phase II WIP planning efforts in the Patuxent River watershed.
A key issue for the County will be how to pay for the many public and private actions needed to achieve the assigned reductions. Wastewater treatment plant upgrades and agricultural BMPs implementation are more cost-effective measures to achieve nutrient reductions than stormwater retrofits or septic system upgrades. The County may wish to supplement funding to increase agricultural BMP planning and implementation in order to generate nutrient trading opportunities. The State, however, has indicated that reductions must occur from each source, so trading may be an early option to buy implementation time for reductions in other sources that will take more time and money to achieve. The County will also continue to pursue Federal and State grants, loans, and cost-share opportunities to help fund implementation activities.
Water Resources Element. The Water Resources Element (WRE), an amendment to General Plan 2000, was adopted in April 2010. The WRE is intended to ensure the County has adequate land and water capacity for the treatment of wastewater and stormwater in order to support future growth. The WRE contains the following policies and actions to help the County manage water resources more sustainably to ensure that, as the County continues to grow, water resources will be conserved, protected, and restored to health. The WRE is included in PlanHoward 2030 by reference and may be updated in the
GREEN TIP!
Go low-flow. Change your showerhead, toilet, and faucets to low-flow and
still maintain water pressure.
Adopted in 2010, the Water Resources Element is a supporting document for PlanHoward 2030.

19
future to reflect evolving water and sewer demand and pollution reduction requirements.
Policies and Implementing Actions
POLICY 3.1 – Ensure the adequacy of wastewater treatment capacity.
Implementing Actions
a. Plant Expansion and Upgrade. Accommodate flows from projected growth in the Planned Service Area by completing the expansion and upgrade of the Little Patuxent Water Reclamation Plant.
b. Flows and Nutrient Loads. Require that properties added to the current Planned Service Area (PSA), large redevelopment sites within the PSA, and large sites with zoning intensification within the PSA minimize increases in flow and the nutrient concentration in flow sent to the wastewater treatment plants.
c. Wastewater Reuse and Nutrient Trading. Encourage the State to expand options for wastewater reuse and nutrient trading to reduce nutrient flows and help maintain the nutrient cap at the Little Patuxent Water Reclamation Plant and the Patapsco Waste Water Treatment Plant.
POLICY 3.2 – Reduce pollution loads to surface and groundwater.
Implementing Actions
a. Stormwater Utility. Institute a dedicated fund to ensure increased and sustained funding for stormwater and watershed management programs.
b. State Grant Funds. Conduct public outreach and education to encourage use of State grant funds for septic system upgrades to nitrogen-reducing systems when the funds are available on a statewide basis.
c. Financial Incentives. Provide financial incentives such as tax credits, low-interest loans, and grants to promote the use of nitrogen-reducing treatment for new and upgraded septic systems.
d. Inspection and Maintenance. Establish and maintain a long-term septic system inspection and maintenance infrastructure for nitrogen-reducing systems.
e. Nutrient Trading. Explore the potential for cross-sector nutrient trading to utilize the most cost-effective nutrient reduction strategies.
POLICY 3.3 – Use watershed management plans to guide the protection and restoration of water resources.
Implementing Actions
a. Watershed Management Plans. Prepare comprehensive watershed management plans for all watersheds, to set priorities and guide efforts to protect, restore, and improve the County’s water resources. Complete and update all watershed management plans on a regular cycle.
b. Forest Cover and Riparian Forest Buffers. Establish and achieve measurable goals for forest cover and riparian forest buffers in all County watersheds.
GREEN TIP!
Use reusable bags. Over 100 billion plastic bags are thrown away every year.
State-of-the-art technology and facilities are hallmarks of Howard County’s wastewater treatment.

20
c. Resident Participation. Encourage active participation of individuals, businesses, and local community and environmental organizations in restoration activities.
d. Wetlands. Develop a wetlands program to inventory, map, protect, and enhance wetland resources.
e. Grant and Cost-Share Opportunities. Pursue Federal and State grant and cost-share opportunities to secure additional resources for restoration efforts. Apply jointly with community and environmental organizations, and with neighboring jurisdictions, as appropriate.
POLICY 3.4 – Coordinate regional protection of water resources.
Implementing Action
a. Patuxent and Patapsco Rivers. Coordinate and cooperate with other local, regional, and State agencies and organizations on joint watershed planning and management for the Patuxent and the Patapsco Rivers.
POLICY 3.5 – Promote individual environmental stewardship.
Implementing Actions
b. Stewardship. Conduct public outreach and education to encourage individuals and businesses to be both good stewards of their own property and participants in community environmental enhancement efforts.
c. Best Management Practices. Expand current outreach and education efforts to promote and assist private property owners with the implementation of best management practices, including installing rain gardens and rain barrels, planting stream buffers, replacing lawn with native plants, increasing tree canopy, and limiting use of lawn chemicals.
d. Agriculture. Encourage the agricultural community to continue to work with local, State, and Federal agencies and programs to implement best management practices.
Safeguarding Water Reservoir Systems
The Rocky Gorge and Triadelphia Reservoirs on the Patuxent River are a public drinking water source for residents in Montgomery County and Prince George’s County, as well as for a small portion of Howard County. The watershed for the Patuxent Reservoirs lies primarily within Howard County and Montgomery County.
Howard County receives the majority of its public water supply from Baltimore City. The primary water sources for Baltimore City include Loch Raven, Prettyboy, and Liberty Reservoirs, with the Susquehanna River as a backup source. The watersheds for the Baltimore reservoirs lie primarily within Carroll County and Baltimore County.
The Baltimore Reservoirs and the Patuxent Reservoirs are both subjects of interjurisdictional watershed management and protection agreements. As a customer of the Baltimore water supply system, Howard County participates in the Baltimore Reservoirs Agreement but is not a signatory to the agreement. Howard County is a signatory to the Patuxent Reservoirs Agreement.
Signatories to these agreements are working together to protect and improve the quality of the water flowing to these reservoirs. The Baltimore Reservoirs effort is guided by an Action Strategy and the Patuxent Reservoirs effort is guided by a
The Rocky Gorge Reservoir is an important source of public drinking water. Photo: WSSC
21
Priority Resource Protection Program. Ongoing activities include implementing agricultural best management practices, stream buffer plantings, stream channel stabilization, stormwater retrofits, water quality monitoring, and outreach and education. These activities control nonpoint source pollution from agricultural and developed land, and encourage environmental stewardship among those living, working, and recreating in the watersheds. Many of these activities are ongoing, but additional resources are needed to meet the goals of the watershed protection programs.
Policies and Implementing Actions
POLICY 3.6 – Safeguard the environmental integrity of the region’s reservoir systems.
Implementing Action
a. Funding and Support. Increase funding and support for implementation of the Baltimore Reservoirs Action Strategy and the Patuxent Reservoirs Priority Resource Protection Program.
Protecting & Enhancing Environmental Resources
A key to the overall environmental health of the County is development and redevelopment that minimizes the loss and degradation of environmental resources and restores, where possible, the environmental quality that has been degraded by past actions. Much of the environmental losses associated with development stem from the clearing and grading that remove existing vegetation and lead to increased runoff, accelerated erosion, transportation of sediments and nutrients into streams and rivers, and loss of wildlife habitats.
Development regulations that established stream and wetland buffer requirements, protections for floodplains and steep slopes, the Forest Conservation Act, and residential cluster development have helped reduce the removal or drastic modification of original environmental elements. The new 2010 stormwater management regulations have furthered this effort by requiring the use of environmental site design (ESD) techniques. ESD emphasizes reducing the amount of stormwater runoff by using site design techniques that limit site disturbance and reduce the creation of impervious surfaces.
The new stormwater management regulations also increase stormwater management requirements for redeveloping sites. Redevelopment sites must reduce impervious cover by 50% or provide an equivalent water quality treatment using ESD techniques. Requiring stormwater management for redevelopment sites offers an important opportunity to improve water quality and quantity controls for stormwater runoff in areas that were developed prior to current stormwater management regulations.
County regulations require undisturbed streamside buffer areas of 75 to 100 feet along perennial streams in residential zoning districts and 50 feet along intermittent streams in all zoning districts and along perennial streams in nonresidential zoning districts. County regulations require a 25-foot undisturbed buffering around nontidal wetlands. Additionally, most wetlands in the County are found within the 100-year floodplain, where the County prohibits development. Streams, wetlands, and their buffers must be located in open space or nonbuildable preservation parcels and may only be located outside these areas on residential lots of ten acres or greater.
“Sustainability is when what you do doesn’t damage the
environment or does the least amount of damage
possible.” HCC Student Government
Association
GREEN TIP!
Howard County tap water is far cleaner than any bottled
water. Each person can help save the planet from
up to 75 plastic water bottles a year by drinking tap water with a reusable
bottle.

22
The effectiveness of stream and wetland buffers depends on the buffer width, vegetation, and management practices. To provide the greatest benefit, buffers should be wide enough to allow adequate filtering of overland runoff and include adjacent steep slopes and highly erodible soils. A forested buffer provides the greatest benefits in terms of filtering pollutants, nutrient uptake through plant roots, erosion prevention, improved habitat for a variety of plant and animal species, and shading to keep water temperatures cool.
County regulations prohibit the disturbance of larger areas of steep slopes, which are defined as contiguous areas greater than 20,000 square feet with a slope of 25% or greater. Once disturbed, steep slopes are often difficult to stabilize. Disturbance of these areas generates excessive erosion and sedimentation that can be difficult to prevent even with enhanced sediment and erosion control practices. When steep slopes occur in conjunction with erodible soils, these erosion and sedimentation problems are intensified. There are currently no protections for highly erodible soils in areas of less than a 25% slope. It is particularly important to protect steep slopes and erodible soils when they are adjacent to water resources because of the increased potential for direct harm to water quality and habitat.
Current regulations should be evaluated for effectiveness in protecting streams, wetlands, and floodplains. Consideration should be given to increasing buffer width requirements for streams and wetlands, including adjacent areas of highly erodible soils with less than a 25% slope in the buffer. Also, evaluation of whether intermittent and perennial streams located in nonresidential areas should have the same protections as perennial streams located in residential areas needs to be conducted.
Three residential zoning categories presently address environmental and green space concerns. The Residential-Environmental Development (R-ED) zoning district in the East allows smaller lots, clustered together to keep development impacts away from sensitive steep slopes and stream valleys. The Rural Conservation (RC) and Rural Residential (RR) zoning districts in the Rural West allow low density, clustered residential development to protect natural resources and agricultural lands. This type of clustering may also be appropriate to enhance environmental protection in other residential zoning districts.
Protection Incentives
Much of the remaining undeveloped residential land in the East is located in small, infill sites that are surrounded by adjacent development. These sites are often undeveloped because they contain extensive environmentally sensitive features such as steep slopes, streams, wetlands, and forest. Use of the density exchange option for neighborhood preservation parcels could allow these types of parcels to be permanently protected while their allowable development potential is sent to a more appropriate development site.
Incentives and/or requirements could also be instituted for better resource protection in higher-density residential projects and commercial, office, and manufacturing areas. These could include density bonuses, limits on amounts of disturbed area, and/or a maximum percentage of impermeable surfaces.
To increase the pace of restoration, the County could also offer incentives to encourage environmental restoration that exceeds minimum regulatory requirements when properties are rezoned for more intense development or redeveloped. Incentives could include tax credits, housing allocations, density bonuses, assistance with design, and permitting for stream/wetland restoration.
The County has examples of how incentives work in the Downtown Columbia Plan and the Green Neighborhood Program. The Downtown Columbia Plan
Environmental Site Design techniques, such as this rain garden, are required by the new stormwater management regulations.
23
requires a number of environmental and community enhancements in exchange for increased density. The proposed environmental enhancements are based on watershed assessments conducted by the applicant. The County’s Green Neighborhood Program is a voluntary, point-based program that provides housing allocations as an incentive for more environmentally friendly development. Applicants earn points for a wide variety of green practices, including restoring and creating wetlands, stabilizing stream channels, restoring in-stream habitat, and exceeding forest conservation requirements.
The following Policies and Actions will help address environmental protection during development and environmental restoration through the redevelopment process. Policy 3.8 and related actions are from the Water Resources Element.
Policies and Implementing Actions
POLICY 3.7 – Secure better protection of environmental resources within new developments.
Implementing Actions
a. Streams, Wetlands, and Floodplains. Evaluate the effectiveness of current regulations in protecting streams, wetlands, and floodplains.
b. Environmentally Sensitive Development. Encourage more environmentally sensitive design in residential zoning districts other than the R-ED District. Promote the use of the neighborhood preservation parcel option, as well as the use of smaller, tightly clustered lots to limit site disturbance and maximize open space for natural resource protection.
c. Higher Intensity Development. Institute development requirements and/or incentives for better resource protection in higher density residential projects and commercial, office, and manufacturing areas.
POLICY 3.8 – Improve stormwater management practices throughout the County to help restore and protect water resources.
Implementing Actions
a. Redevelopment. Ensure redevelopment is designed and implemented to reduce stormwater runoff rate, volume, and pollution to the maximum extent practicable.
b. Incentives for Enhancements. Create incentives for new development and redevelopment to provide on-site or off-site water quality enhancements that exceed minimum regulatory requirements.
Business and Community Sustainability
Land and water resource protection, forward-thinking conservation, and planning are vital to maintaining and improving the high quality of life in the County. The Howard County Water Resources Element outlines the importance of protecting water resources and offers suggestions for the future. Similarly, an energy plan that examines options for localized and community-generated energy, infrastructure needs, and standards for measuring impacts of future growth and change on energy resources could also be beneficial for the County.
Another benefit to the community is the potential role that the private and nonprofit sectors could play when interacting with nature. This role could amplify countywide efforts to ensure sustainability of resources. Altering daily operations
“Sustainability means reusing resources.”
Melinda, Voices for Change

24
in favor of more sustainable alternatives is one option to conserve resources, such as utilizing alternative energy sources, reusing gray water, and reducing carbon footprints. The newly formed Howard County Green Business Council may be an avenue for sharing these sustainability ideas and enhancements between sectors and organizations. The Green Business Council could also define standards for green businesses, services, and products within the County, such as those listed in the existing Green Business Directory located on the Green Central Station website. The formation of a Sustainability Center, as a joint effort between the County and public and private partners, could also assist the Green Business Council in working with private businesses and community organizations. Such a Center could lead the charge to promote standards defined by the Council and work with businesses and organizations to implement effective green practices.
Private businesses can influence their customers’ purchasing habits through a variety of methods, particularly marketing and product costs. Therefore, the long-term benefits of costlier, green products must be emphasized and instilled in customers. Incentives and cost-assistance programs may also be helpful in promoting new, green technology and initiatives. The life cycle costs and overall sustainability of products should be considerations in purchase decision making. Likewise, the private sector should also consider the overall sustainability of the products they produce, the methods they use, and the corresponding impacts they make on natural resources.
Howard County’s annual GreenFest provides a forum to promote sustainable practices and products of local businesses and organizations. GreenFest primarily focuses on promoting local vendors to the public and educating residents on sustainability issues. In collaboration with a Sustainability Center and the Green Business Council, increasing networking opportunities and idea sharing between groups could be useful additions to GreenFest.
Finally, community organizations offer ample opportunities for the public to get involved and learn about natural resources. Local nonprofits are frequently able to offer expertise and may be able to assist residents and businesses with sustainability efforts. Nonprofits are also a resource to aid in implementing projects. These projects could serve as case studies for new technology. Also, nonprofits could review their own practices and the long-term impacts of their work.
Policies and Implementing Actions
POLICY 3.9 – Increase collaboration between residents, businesses, nonprofit groups, and the County on implementing state-of-the-art sustainability practices and techniques.
Implementing Actions
a. Sustainability Center. Consider developing an online center, associated with Green Central Station, which provides information about reducing the community’s carbon footprint and about cost-effective green practices and products.
b. Green Directory. Work with the local business and nonprofit communities to instill sustainability principles in their products and services, and help them by promoting them in the Green Business Directory.
c. Expanding Green Network. Establish criteria for joining the Green Business Directory and Green Business Council; create incentives
GREEN TIP!
Reduce employee travel. Use videoconferencing and other tech solutions
for meetings.

25
for joining. Promote membership and use of the Directory on Green Central Station.
d. Education and Incentives. Work with the financial and real estate communities to promote green buildings and neighborhoods, through education on environmental and financial benefits and incentives for residents implementing sustainable practices. Incorporate benefits of green technologies and ecosystem services into building and property values.

26
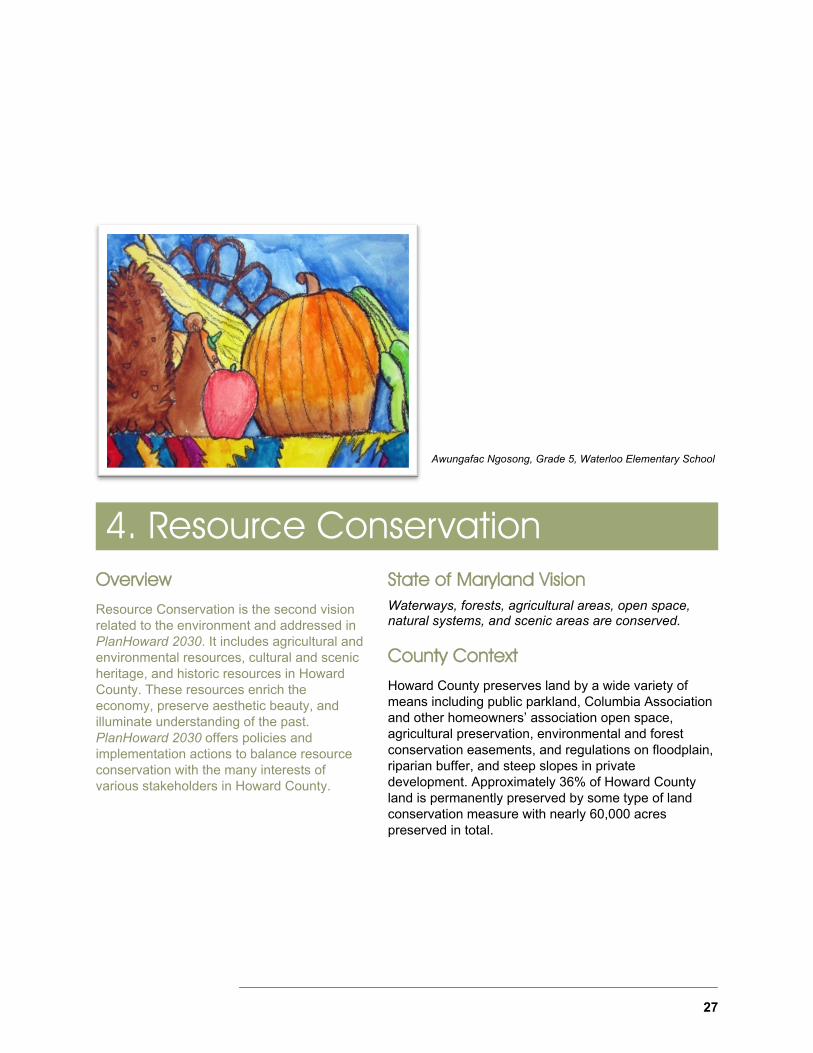
27
Overview
Resource Conservation is the second vision related to the environment and addressed in PlanHoward 2030. It includes agricultural and environmental resources, cultural and scenic heritage, and historic resources in Howard County. These resources enrich the economy, preserve aesthetic beauty, and illuminate understanding of the past. PlanHoward 2030 offers policies and implementation actions to balance resource conservation with the many interests of various stakeholders in Howard County.
State of Maryland Vision Waterways, forests, agricultural areas, open space, natural systems, and scenic areas are conserved.
County Context
Howard County preserves land by a wide variety of means including public parkland, Columbia Association and other homeowners’ association open space, agricultural preservation, environmental and forest conservation easements, and regulations on floodplain, riparian buffer, and steep slopes in private development. Approximately 36% of Howard County land is permanently preserved by some type of land conservation measure with nearly 60,000 acres preserved in total.
4. Resource Conservation
Awungafac Ngosong, Grade 5, Waterloo Elementary School
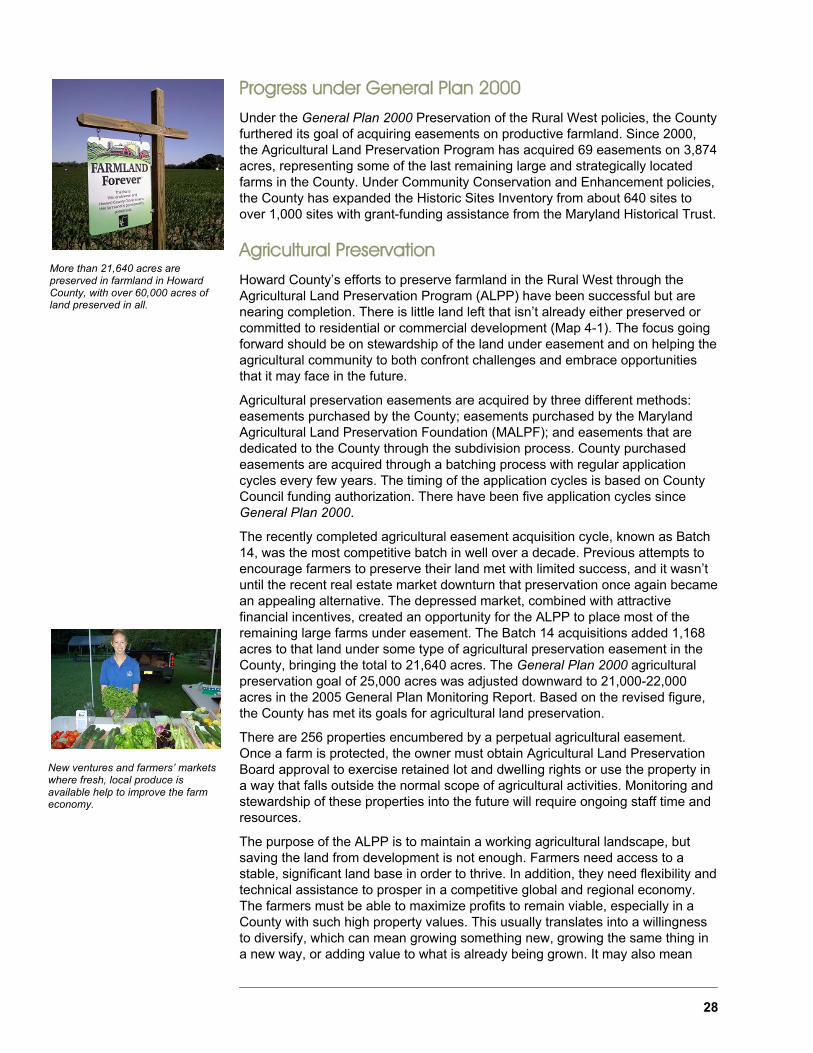
28
Progress under General Plan 2000
Under the General Plan 2000 Preservation of the Rural West policies, the County furthered its goal of acquiring easements on productive farmland. Since 2000, the Agricultural Land Preservation Program has acquired 69 easements on 3,874 acres, representing some of the last remaining large and strategically located farms in the County. Under Community Conservation and Enhancement policies, the County has expanded the Historic Sites Inventory from about 640 sites to over 1,000 sites with grant-funding assistance from the Maryland Historical Trust.
Agricultural Preservation
Howard County’s efforts to preserve farmland in the Rural West through the Agricultural Land Preservation Program (ALPP) have been successful but are nearing completion. There is little land left that isn’t already either preserved or committed to residential or commercial development (Map 4-1). The focus going forward should be on stewardship of the land under easement and on helping the agricultural community to both confront challenges and embrace opportunities that it may face in the future.
Agricultural preservation easements are acquired by three different methods: easements purchased by the County; easements purchased by the Maryland Agricultural Land Preservation Foundation (MALPF); and easements that are dedicated to the County through the subdivision process. County purchased easements are acquired through a batching process with regular application cycles every few years. The timing of the application cycles is based on County Council funding authorization. There have been five application cycles since General Plan 2000.
The recently completed agricultural easement acquisition cycle, known as Batch 14, was the most competitive batch in well over a decade. Previous attempts to encourage farmers to preserve their land met with limited success, and it wasn’t until the recent real estate market downturn that preservation once again became an appealing alternative. The depressed market, combined with attractive financial incentives, created an opportunity for the ALPP to place most of the remaining large farms under easement. The Batch 14 acquisitions added 1,168 acres to that land under some type of agricultural preservation easement in the County, bringing the total to 21,640 acres. The General Plan 2000 agricultural preservation goal of 25,000 acres was adjusted downward to 21,000-22,000 acres in the 2005 General Plan Monitoring Report. Based on the revised figure, the County has met its goals for agricultural land preservation.
There are 256 properties encumbered by a perpetual agricultural easement. Once a farm is protected, the owner must obtain Agricultural Land Preservation Board approval to exercise retained lot and dwelling rights or use the property in a way that falls outside the normal scope of agricultural activities. Monitoring and stewardship of these properties into the future will require ongoing staff time and resources.
The purpose of the ALPP is to maintain a working agricultural landscape, but saving the land from development is not enough. Farmers need access to a stable, significant land base in order to thrive. In addition, they need flexibility and technical assistance to prosper in a competitive global and regional economy. The farmers must be able to maximize profits to remain viable, especially in a County with such high property values. This usually translates into a willingness to diversify, which can mean growing something new, growing the same thing in a new way, or adding value to what is already being grown. It may also mean
More than 21,640 acres are preserved in farmland in Howard County, with over 60,000 acres of land preserved in all.
New ventures and farmers’ markets where fresh, local produce is available help to improve the farm economy.

29
inviting the public onto the property to facilitate direct sales of the farm’s harvest, sometimes in conjunction with educational or entertainment activities. Howard County farmers are engaged in agritourism, value-added processing, and direct farm marketing; however, recent trends suggest that these activities may need to broaden in scale and scope in order to continue to provide profitability.
Per policies in General Plan 2000, all of the above activities were added to the Zoning Regulations to facilitate growth and expansion of the farm economy. In anticipation of PlanHoward 2030, there has been an ongoing dialogue between County staff and members of the farm community regarding a wide range of topics, including a review of permitted uses on agricultural land, reducing farm / nonfarm neighbor conflict, Right-to-Farm law updates, and topics related to increasing opportunities and addressing challenges. A well-established partnership exists between the ALPP and the Agricultural Marketing Program within the Economic Development Authority (EDA). The EDA Program provides excellent business development assistance to the agricultural community and has had great success in helping the next generation of Howard County farmers identify new business opportunities.
It is noteworthy that in the last several years a number of families with farms in preservation have begun a new venture under the direction and management of the children of the original easement grantors. This transition is critical, and these entrepreneurs need guidance on a broad range of topics, not the least of which is navigating the County’s zoning and land use regulatory framework.
GREEN TIP!
Support your local farmer by buying at one of
Howard County’s many farmers’ markets!
3
MILES
1.5
Map 4-1Rural Land
Preservation
0
AGRICULTURAL EASEMENTS
OTHER RURAL EASEMENTS
INSTITUTIONAL LAND USE
L e g e n d
ZONING
PRIORITY FUNDING AREA / PSA
COMMERCIAL ZONING
PARK AND OPEN SPACE
Source: Howard County DPZ, 2012.
RC-DEORC-DEORC-DEORC-DEORC-DEORC-DEORC-DEORC-DEORC-DEORC-DEORC-DEORC-DEORC-DEORC-DEORC-DEORC-DEORC-DEORC-DEORC-DEORC-DEORC-DEORC-DEORC-DEORC-DEORC-DEORC-DEORC-DEORC-DEORC-DEORC-DEORC-DEORC-DEORC-DEORC-DEORC-DEORC-DEORC-DEORC-DEORC-DEORC-DEORC-DEORC-DEORC-DEORC-DEORC-DEORC-DEORC-DEORC-DEORC-DEO
RR-DEORR-DEORR-DEORR-DEORR-DEORR-DEORR-DEORR-DEORR-DEORR-DEORR-DEORR-DEORR-DEORR-DEORR-DEORR-DEORR-DEORR-DEORR-DEORR-DEORR-DEORR-DEORR-DEORR-DEORR-DEORR-DEORR-DEORR-DEORR-DEORR-DEORR-DEORR-DEORR-DEORR-DEORR-DEORR-DEORR-DEORR-DEORR-DEORR-DEORR-DEORR-DEORR-DEORR-DEORR-DEORR-DEORR-DEORR-DEORR-DEO
RC-DEORC-DEORC-DEORC-DEORC-DEORC-DEORC-DEORC-DEORC-DEORC-DEORC-DEORC-DEORC-DEORC-DEORC-DEORC-DEORC-DEORC-DEORC-DEORC-DEORC-DEORC-DEORC-DEORC-DEORC-DEORC-DEORC-DEORC-DEORC-DEORC-DEORC-DEORC-DEORC-DEORC-DEORC-DEORC-DEORC-DEORC-DEORC-DEORC-DEORC-DEORC-DEORC-DEORC-DEORC-DEORC-DEORC-DEORC-DEORC-DEO

30
Policies and Implementing Actions
POLICY 4.1 – Promote additional agricultural preservation opportunities.
Implementing Actions
a. Future Application Cycles. Facilitate additional Agricultural Land Preservation Program application cycles and recruit owners of uncommitted land to preserve their farms.
b. Other Preservation Options. Promote other preservation options such as the dedication of easements to the County through the subdivision process, the purchase of easements by the MALPF program, and the donation of easements to nonprofit land trusts.
Funding of Agricultural Preservation
Since 1978 the ALPP has been funded by a 25% share of the local transfer tax. This dedicated funding source has been critical to the success of the program over the years. In particular, the County’s ability to enter into installment purchase agreements (IPAs), which began in 1989 and are long-term financial obligations of the County, has aided the program. Of the over 250 properties encumbered by some type of agricultural easement, 113 are funded by IPAs, with final payment dates beginning in 2019 and continuing through 2031.
For most of the 2000s, the ALPP was not able to compete with development and attract applicants to the program. During this time, the balance in the ALPP fund grew significantly due to an active real estate market and limited easement acquisitions. As a result, there was periodic consideration given to reallocating a portion of the dedicated transfer tax for use in other conservation initiatives. A 2005 analysis of the ALPP budget, prior to Batch 13, suggested that adequate funding for the program would remain if a portion, perhaps half, of the 25% share was reallocated.
The two subsequent acquisition cycles, particularly Batch 14, have changed that equation. In 2005, it would have been impossible to predict the downturn of the real estate market and the effect it would have on interest in the ALPP. According to updated projections provided by the County Department of Finance, the ten Batch 13 and 14 acquisitions have fully committed the ALPP’s budget until the end of this decade. Based on those projections, the ALPP’s share of the transfer tax cannot realistically be reallocated until at least 2020. This also means that there is no County funding available for additional batches.
In the meantime, there is some limited funding available in the ALPP budget that could be used for projects that assist the agricultural community to diversify and prosper. Since a particular interest of the ALPP is to enable the continued vitality of preservation farms as they transfer from the easement grantor generation to the next, programs targeted at young and / or beginning farmers as well as agribusiness innovations would be particularly useful. The Maryland Agricultural Resource Business Investment Corporation (MARBIDCO) also has matching funds for innovative practices.
Policies and Implementing Actions
POLICY 4.2 – Enhance and expand the partnership between the ALPP, the EDA, and the farming community to assist farmers as agriculture continues to evolve and diversify.
Support for agriculture may need to take many forms in the future.
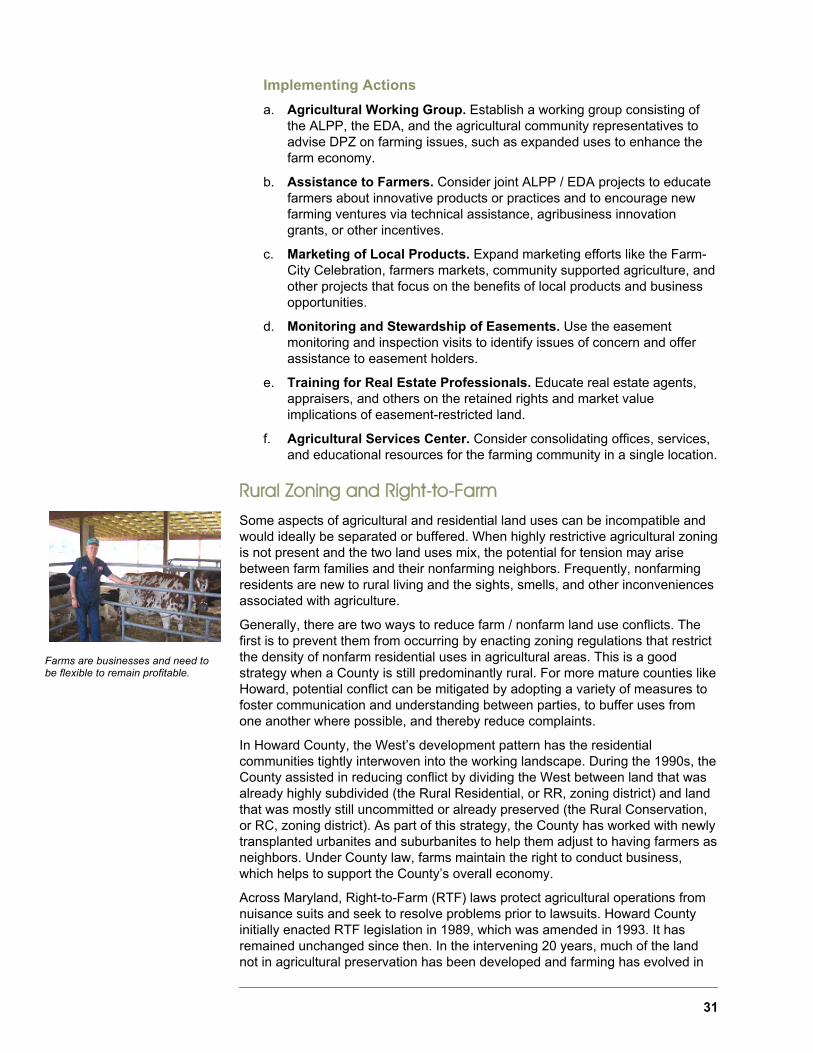
31
Implementing Actions
a. Agricultural Working Group. Establish a working group consisting of the ALPP, the EDA, and the agricultural community representatives to advise DPZ on farming issues, such as expanded uses to enhance the farm economy.
b. Assistance to Farmers. Consider joint ALPP / EDA projects to educate farmers about innovative products or practices and to encourage new farming ventures via technical assistance, agribusiness innovation grants, or other incentives.
c. Marketing of Local Products. Expand marketing efforts like the Farm-City Celebration, farmers markets, community supported agriculture, and other projects that focus on the benefits of local products and business opportunities.
d. Monitoring and Stewardship of Easements. Use the easement monitoring and inspection visits to identify issues of concern and offer assistance to easement holders.
e. Training for Real Estate Professionals. Educate real estate agents, appraisers, and others on the retained rights and market value implications of easement-restricted land.
f. Agricultural Services Center. Consider consolidating offices, services, and educational resources for the farming community in a single location.
Rural Zoning and Right-to-Farm
Some aspects of agricultural and residential land uses can be incompatible and would ideally be separated or buffered. When highly restrictive agricultural zoning is not present and the two land uses mix, the potential for tension may arise between farm families and their nonfarming neighbors. Frequently, nonfarming residents are new to rural living and the sights, smells, and other inconveniences associated with agriculture.
Generally, there are two ways to reduce farm / nonfarm land use conflicts. The first is to prevent them from occurring by enacting zoning regulations that restrict the density of nonfarm residential uses in agricultural areas. This is a good strategy when a County is still predominantly rural. For more mature counties like Howard, potential conflict can be mitigated by adopting a variety of measures to foster communication and understanding between parties, to buffer uses from one another where possible, and thereby reduce complaints.
In Howard County, the West’s development pattern has the residential communities tightly interwoven into the working landscape. During the 1990s, the County assisted in reducing conflict by dividing the West between land that was already highly subdivided (the Rural Residential, or RR, zoning district) and land that was mostly still uncommitted or already preserved (the Rural Conservation, or RC, zoning district). As part of this strategy, the County has worked with newly transplanted urbanites and suburbanites to help them adjust to having farmers as neighbors. Under County law, farms maintain the right to conduct business, which helps to support the County’s overall economy.
Across Maryland, Right-to-Farm (RTF) laws protect agricultural operations from nuisance suits and seek to resolve problems prior to lawsuits. Howard County initially enacted RTF legislation in 1989, which was amended in 1993. It has remained unchanged since then. In the intervening 20 years, much of the land not in agricultural preservation has been developed and farming has evolved in
Farms are businesses and need to be flexible to remain profitable.

32
ways that could potentially cause neighbor conflicts. As an example, significant increases of on-farm sales and marketing activities can create additional traffic, noise, and other concerns for nearby residential property owners. The RTF law should be reviewed and updated with an eye towards future trends in farming.
Policies and Implementing Actions
POLICY 4.3 – Educate rural residents about the County’s Right-to-Farm Law.
Implementing Actions
a. Right-to-Farm Update. Evaluate the clarity and effectiveness of current Right-to-Farm provisions with input from the farm community.
b. Educational Materials. Produce and distribute educational materials that bridge the gap between farm and nonfarm neighbors.
Rural Zoning and Development Regulations
To further the interests of both farmers and residents, greater distinctions need to be made between the Rural Conservation (RC) and the Rural Residential (RR) zoning districts, so regulations governing each district are consistent with their stated purposes. The goal would be to balance the various interests of multiple stakeholders in the West. PlanHoward 2030 does not propose any change to zoning densities or significant amendments to regulations governing residential subdivision. However, improvements in the design of new residential developments could help reduce potential conflicts and are being proposed as detailed below.
Buffering a developing parcel from neighboring farmland is a relatively easy way to address a multitude of potential issues. It is particularly important that agricultural easement properties are adequately buffered when the adjoining land use changes, since a preserved farm will always remain in agricultural use.
Perhaps the best buffer between residential lots and adjoining agricultural uses is plenty of space. It would be helpful if the regulations either required or strongly encouraged preservation parcel location between the residential lots and any adjoining easement property. Although adequate space is more important if the adjoining land is under easement, ideally any working farm could be amply buffered.
The Subdivision Regulations contain language in Section 16.126, Protection of Agricultural Land and Rural Character, requiring landscaping to optimize the buffering between cluster lots and agricultural preservation easements. Depending on subdivision layout, however, the current planting density in the regulations may be inadequate to optimize the buffering of adjoining farm uses.
The use of fencing is another, complementary approach to a vegetative buffer for delineating a clear property boundary line for cluster lot subdivisions. Some farmers have observed inadvertent trespassing, and some nonfarm residents may be unaware that land behind their homes is not community open space. It is understandable why residential property owners in such subdivisions might have this impression, if there are no physical clues that a property line exists.
Policies and Implementing Actions
POLICY 4.4 – Require more robust separation between cluster lots and adjoining agricultural properties.
PlanHoward 2030 recommends review of zoning regulations to help farmers and nonfarming residents enjoy use of the land.

33
Implementing Action
a. Better Buffers. Amend the Subdivision Regulations to require fencing, a landscape buffer, or a nonbuildable preservation parcel buffer between cluster lots and adjoining agricultural properties.
Review of Agricultural and Commercial Uses
The vast majority of land in the Rural West is zoned either Rural Conservation (RC) or Rural Residential (RR). These two zoning districts are oriented towards agricultural and residential uses, respectively, but both land uses are allowed in both districts, as indicated in Figure 4-1. There is also a very small amount of land that is commercially zoned in the Rural West. In the last several years, different groups of residents have raised concerns about some land uses that they feel may be inappropriate in rural areas. Recently proposed uses such as cell towers and wedding receptions on farm parcels have been a source of tension between some neighboring property owners. Some residents sought relief by appealing related County decisions or via proposed Zoning Regulations Amendments.
As part of PlanHoward 2030, the County established a Rural West Advisory Committee to be a sounding board on various land use issues in the Rural West. The committee was comprised of farmers, nonfarming residents, and business owners representing a diversity of views. The committee considered agricultural uses, specifically those that are typically ancillary to the primary farming use,
RC RR TotalEasements (Purchased and Dedicated) Agricultural Easements 20,588 1,047 21,635 Other Rural Easements 6,284 1,495 7,780Total Easements 26,872 2,542 29,414
Parks/Recreation/WSSC 7,055 4,318 11,373
Total Protected Land 33,927 6,860 40,787
Residential Uses Existing 15,331 17,596 32,926 Remaining Potential 8,013 5,913 13,927Total Residential 23,344 23,509 46,853
Non-Residential Uses Commercial 109 145 254 Industrial 29 3 32 Government & Institutional 2,578 805 3,383 Transportation, Utilities & Misc. 1,885 1,008 2,892Total Non-Residential 4,600 1,961 6,561
Total Residential & Non-Residential 27,944 25,470 53,414
TOTAL LAND 61,871 32,330 94,201Source: Howard County DPZ
Figure 4-1Rural West Land Use Acreage
January 1, 2011
Zoning

34
commercially-zoned land including appropriate businesses and applicable regulations, and conditional uses (those that the zoning regulations allow but only if approved by the Hearing Examiner after a public process).
Another issue reviewed by the committee is the difference in uses and related standards between the RC and the RR zoning districts. Currently, there are not enough significant differences between the uses permitted in the two districts to reflect the purpose of each district. The purpose of the RC is “to conserve farmland and to encourage agricultural activities, thereby helping to ensure that commercial agriculture will continue as a long term land use and a viable economic activity within the County.” The purpose of the RR is “to allow low density residential development within a rural environment,” while still allowing agriculture to continue as a permitted use. Given these differences, it would be appropriate to increase flexibility in the RC for innovative farm practices. Conversely, although farming should remain an allowed use in the RR, new innovative practices may be more limited.
Regarding commercial zoning, the committee expressed a wide range of opinion as to the proper level of development intensity on commercial parcels. In general, residents did not support certain types of commercial uses felt to be disruptive to maintaining the West’s rural character. Business owners supported flexibility for permitted uses and site standards to maintain profitability in the future. Other issues were identified such as the small size of many of the commercially-zoned properties, which limit their use under current setbacks, rights-of-way, and well and septic requirements. It was suggested that some “crossroad communities” could develop their own master plans to begin to address these and other issues.
The committee also discussed the conditional uses allowed on RC- and RR-zoned land. Conditional uses are subject to a public hearing process and approval by the Hearing Examiner, and they are presumed to be appropriate in the zoning districts where they are allowed. Some residents had assumed these uses were prohibited unless a case could be made as to why it should be permitted. This was cited as a source of some of the tensions that may arise regarding conditional use hearings.
The committee expressed a preference for a process with conditions that must be met in order for a conditional use to be allowed. A thorough review of the zoning regulations during Comprehensive Zoning should take into account the permitted by right / permitted by permit / permitted by conditional use structure to see if they need an overhaul. The uses themselves should also be reviewed to determine if there are additional uses that could be added, or if there are some uses that are no longer relevant and could be deleted. The County anticipates and desires the continued involvement of the Rural West Advisory Committee.
Policies and Implementing Actions
POLICY 4.5 – Differentiate between the Rural Conservation (RC) and the Rural Residential (RR) zoning districts, so the RC provides greater flexibility for the agricultural community and the RR better balances farming operations and residential quality of life.
Implementing Actions
a. Review of Permitted Uses. Examine and amend where appropriate the list of accessory and conditional uses in the RC and RR districts, and refine uses and standards for approval.
b. Use Designations. Review use designations (permitted by right, by permit, and conditional) in each Rural West zoning district, and
GREEN TIP!
Reduce your fertilizer use. Consider making
your own fertilizer with a compost bin.

35
determine whether amendments are needed to make some uses less or more restrictive.
Green Infrastructure Network Plan
Green infrastructure is an interconnected network of waterways, wetlands, woodlands, wildlife habitats, and other natural areas. It can include greenways, parks, open space, and other conservation lands as well as working farms and forests. A green infrastructure network supports native species, maintains natural ecological processes, sustains air and water resources, and contributes to the health and quality of life for residents.
The basic building blocks of a green infrastructure network are hubs and corridors. Hubs anchor green infrastructure networks and are large, ecologically significant, natural areas that provide habitat for native plants and wildlife. They may include protected areas such as State and County parks that are managed for natural values as well as private lands where natural features and ecological processes are protected and / or restored. Large contiguous blocks of interior forest and large wetland complexes are essential components of the network.
Corridors are linear features that tie the hubs together and serve as biological conduits for native plants and wildlife. Corridors should be located along the best ecological or natural route. They should provide habitat similar to the hubs that are being connected (forest to forest, aquatic to aquatic), where feasible. Most corridors will be centered on streams, but they should also include upland areas for cross watershed connections.
Howard County’s Green Infrastructure Network Plan (GI Plan) will enable planners to consider important natural resources when implementing PlanHoward 2030 as well as the Land Preservation, Recreation and Parks Plan, transportation plans, watershed plans, and community plans (Map 4-2). The GI Plan will also aid in decision making about zoning and development proposals, acquiring land for parks and public facilities, and obtaining agricultural, environmental, and other land preservation easements. The GI Plan will offer a comprehensive approach to land and water conservation that takes into account the County’s development plans. It will refine and expand on statewide planning efforts by the Maryland Department of Natural Resources (DNR), adapting the State methodology to a County-scale for analyses and planning priorities.
The GI Plan will also address ways to both protect and enhance the network. Potential tools include stewardship, tax credits or other financial incentives, regulatory protections, easements, and public and quasi-public ownership. The GI Plan is one of the future planning activities envisioned by PlanHoward 2030 and is a short-term priority, with preparation of a protection strategy scheduled for 2012.
Policies and Implementing Actions
POLICY 4.6 – Formalize a Green Infrastructure Network Plan in Howard County.
Implementing Actions
a. Green Infrastructure Network. Define, protect, and enhance a Green Infrastructure Network that includes and links the most ecologically significant natural areas in Howard County.
b. Protection and Enhancement Strategy. Develop a Green Infrastructure Protection and Enhancement Strategy that identifies property owner
The Green Infrastructure Network will help support native plants and animals.
Photo: The Chesapeake Bay Program
The Middle Patuxent River is a major corridor that connects many valuable hubs in the Green Infrastructure Network.

36
education, land management, preservation incentives, acquisition, and regulatory tools and also includes implementation priorities.
c. Land Preservation, Recreation and Parks Plan. Incorporate the Green Infrastructure Network into the Department of Recreation and Park’s Land Preservation, Recreation and Parks Plan.
Forest Conservation
The County currently has approximately 45,464 acres or 28% of the County in forest cover. This forest cover is comprised of 1,454 forest patches that range in size from less than one acre to 1,443 acres with an average size of 31 acres. The majority of this forest cover (62%) occurs in forest patches of 100 acres or more. Forest cover in the eastern portion of the County is prevalent primarily within stream valley areas where sensitive resources have discouraged development or within publicly-owned conservation areas, such as the Patapsco Valley State Park and the Middle Patuxent Environmental Area. In the Rural West, upland and stream valley forests are more extensive.
Many benefits are derived from maintaining large tracts of undisturbed forest. Such stands help reduce stormwater runoff, minimize erosion and sedimentation
MILES
31.5
Map 4-2Draft Green
Infrastructure Network
0
MAJOR WATERSHED BOUNDARY
MAJOR ROAD
500 FT CORRIDOR
STREAM
RESERVOIR, LAKE OR POND
L e g e n d
Source: Howard County DPZ, 2012.
WETLAND
FOREST
HUB

37
of streams, provide wildlife habitats, and provide shade to help moderate local temperatures. They form visual buffers and are scenic in their own right. Trees and forests are the most efficient means to control and mitigate the most common sources of water quality degradation and the problems this degradation causes for local streams and the Chesapeake Bay.
Although there is a significant amount of forest cover left, continuing loss from development for new homes, stores, and workplaces threatens this habitat. In addition to the loss of forest, the loss of species diversity, forest fragmentation, and degradation by invasive exotic species are also concerns.
Forest loss and fragmentation result in a continuing decline in forest interior habitat (defined as forest at least 300 feet from the forest edge). Forest interior habitat is generally more isolated with a closed canopy that creates moist, shaded growing conditions, with less predation by edge species and fewer invasive species. Only 17% of the forest cover in the County is forest interior habitat. The loss of forest interior habitat threatens the survival of species that require this type of habitat, such as reptiles, amphibians, and migratory birds.
Since 1993, Howard County’s Forest Conservation Act has mitigated forest loss caused by development. This Act works to limit the area of forest that is cleared for new development and includes reforestation requirements for forest that is cleared. Afforestation (planting of areas presently without forest cover) is also required on sites that don’t meet certain minimum forest cover specifications.
The County’s Forest Conservation Act has been in place for 19 years and may need a comprehensive assessment of its effectiveness. There are currently 2,739 forest conservation easements in the County, containing approximately 5,293 acres of forest. These easements range in size from less than an acre to 65 acres with an average size of two acres. Of the total easement acreage, 72% is in an easement of ten acres or less.
The County could prioritize retention and reforestation areas to minimize forest fragmentation. This could be achieved through enhanced implementation of the Forest Conservation Act, existing State programs to preserve forest land, and the efforts of private landowners and organizations. The Green Infrastructure Network Plan will include large areas of forest interior habitat in the network and can help guide efforts to protect and enhance this resource. Watershed management plans can also be used to establish goals for forest cover and forested stream buffers in each County watershed. In developed watersheds, it may be appropriate to establish tree canopy goals or a combination forest cover and tree canopy goals to better reflect the environment of these watersheds.
In addition to promoting forest conservation, using native species for landscaping in residential and commercial developments should also be encouraged. Native plants are often hardier because they are adapted to local growing conditions and provide food and habitat for a variety of wildlife species. The use of invasive exotic species should be discouraged in existing developed areas and prohibited in new development projects.
Another issue is damage to forests by an overpopulation of deer. When deer exceed the carrying capacity of a forest, they begin to eat the majority of the understory trees, shrubs, and herbaceous vegetation. Overgrazing of understory damages the ability of forests to regenerate, eliminates shrub and herbaceous species, and reduces bird species that nest within understory habitat. Additional issues of overpopulation include damage to agricultural crops, damage to commercial and residential landscaping, an increased incidence of Lyme Disease as a result of deer tick infection, and increased deer-vehicle accidents.
Large tracts of healthy forests provide many benefits.

38
The Howard County Department of Recreation and Parks implements a comprehensive deer management program that is intended to maintain a stable, balanced deer population. The plan describes deer management alternatives, discusses the associated costs and benefits of each, and sets guidelines for the implementation of population management options, including managed hunting programs to reduce deer numbers where necessary. Controlling deer-related impacts through the use of a variety of management tools requires a cooperative effort between public agencies and private residents.
Policies and Implementing Actions
POLICY 4.7 – Continue to protect, restore, and expand forested lands.
Implementing Actions
a. Forest Integrity. Prioritize retention and reforestation areas, guide efforts to minimize forest fragmentation, and increase forest interior habitat.
b. Native and Invasive Exotic Plants. Expand on current endorsements regarding the use of native plants and continue to discourage and prohibit the use of invasive exotic plants for landscape planting in new projects.
c. Deer Management. Continue to expand a comprehensive deer management program.
Rare, Threatened, and Endangered Species
The 2010 Maryland Department of Natural Resources (DNR) list of current and historical rare, threatened, and endangered species identifies 59 species within Howard County. Of these 59 species, 13 are animals and 46 are plants. The loss of these species is primarily caused by habitat destruction, particularly of wetlands, riparian areas, steep slopes, and forests. Therefore, protective measures for these important habitats also benefit these species.
The DNR mapped the known habitat areas for rare, threatened, and endangered species in Howard County. This map is used by the County for initial screening of development proposals. If this screening indicates that such habitat may be present, the developer is referred to the DNR for guidance on protecting the species and the associated habitat.
The Green Infrastructure Network Plan will include many of these habitat areas and contain recommendations to protect and enhance these areas. However, there will be some small, isolated areas that will not fit into the network. The County should work to ensure these areas also remain protected and enhanced.
The DNR habitat map is based on information recorded from the mid-1980s to the present. Changes in habitat as a result of development may mean that currently mapped habitat may no longer be viable. Conversely, there may be areas of viable habitat that have not been delineated for protection.
Policies and Implementing Actions
POLICY 4.8 – Expand the protection of rare, threatened, and endangered species.
Implementing Actions
“More programs like invasive pulls in the parks would help get people out of houses and
spread awareness about environmental issues.”
HCC Student Government Association

39
a. Habitat Information. Work with the DNR to update information on rare, threatened, and endangered species habitat currently present within the County.
b. Development Regulations. Evaluate the effectiveness of current regulations on forest conservation, wetlands, stream buffers, and steep slopes and on criteria for open space acquisitions to enhance habitat protection. Refine the development regulations, where appropriate, to ensure habitat is included in protective easements or open space.
Mineral Resources
A 1981 Maryland Geological Survey study identified Howard County’s principal mineral resources as sand and gravel. These materials are of great importance to the construction industry. These resources are confined mainly to the Coastal Plain portion of the County, specifically from the Howard and Anne Arundel County border westward to approximately midway between US 29 and I-95. The Maryland Geological Survey also indicates there is potential for crushed stone production west of I-95, based on mineral resources endemic to the Piedmont region of Howard County, but locations have not been identified.
The 1981 study identified a number of factors which served to constrain or limit the mining industry in Howard County, including urbanization, high property values, incompatible zoning, legal restrictions, easements, and environmental concerns associated with surface mining. The report stated if these influences continued, closings would occur and the County’s sand and gravel needs would eventually be met by importing the materials from other counties. This change has occurred, and sand and gravel are no longer mined in Howard County.
The Maryland Department of the Environment (MDE) issues mining permits per the Surface Mining Act of 1975. MDE identified three mining operations in Howard County, one in Marriotsville, and two in Jessup. However, one of the Jessup facilities is no longer mining. Both active facilities quarry stone or hard rock.
Howard County’s Zoning Regulations allow quarries as conditional uses in rural and industrial areas, subject to conditions. Pre-and post-extraction planning and ongoing management are required to ensure mining operations do not impact quality of life in adjacent neighborhoods. Existing infrastructure, such as roads, must be sufficient. Final use of a mined site is planned prior to any extraction.
Industrially zoned areas, where mining is a conditional use, are primarily in the Route 1 Corridor and coincide with the Coastal Plain area of the County. This could afford potential opportunities for additional mining, if feasible, but such activities seem unlikely, given existing and planned development in the corridor.
Policies and Implementing Actions
POLICY 4.9 – Balance the potential for mineral extraction with other land uses.
Implementing Action
a. Development Regulations. Review current regulations to address mineral extraction operations and site reclamation.

40
Historic Preservation
General Plan 2000 set forth several policies and actions to aid in preservation of the County’s historic resources. The General Plan recommended giving high priority to updating the Historic Sites Inventory. In 2000 the Inventory had approximately 640 sites listed. The County funds the Inventory jointly with a grant from the Maryland Historical Trust (MHT). Currently, in the final year of the grant, over 1,000 sites are listed. Some of the most significant properties are being updated. General Plan 2000 also recommended creating a Preservation Plan, which was deferred until the completion of the Historic Sites Inventory. Only a few Maryland counties have preservation plans. A review of the contents and effectiveness of these preservation plans should be undertaken.
Howard County’s 1,000 Inventory properties are also listed jointly on the Maryland Inventory of Historic Properties. Thirty-six of these properties are individually listed on the National Register of Historic Places. There are three National Register Historic Districts and four National Historic Landmarks.
The Ellicott City and Lawyers Hill National Register Historic Districts are also local historic districts. Changes to exteriors of buildings and landscape site features in these districts are subject to approval by the Howard County Historic District Commission (HDC). Savage Mill is another National Register District but it is not a local historic district, so property changes do not require HDC approval. In the past some residents have been interested in Savage becoming a local historic district, which could further protect this historic resource.
Now that the Sites Inventory work is nearly complete, other measures could be undertaken to strengthen historic preservation in Howard County. The County currently does not have regulations to prevent demolition of historic buildings outside of the local historic districts. There are currently no protections for buildings listed on the Historic Sites Inventory or for other historic buildings in the County. Legislation to create protection from demolition for significant historic buildings outside of local historic districts would help preservation efforts. In addition to significant landmark buildings, protection for vernacular structures around Howard County should also be addressed.
Howard County currently provides a local, 10% historic property tax credit to incentivize repair of historic buildings. The tax credit must be preapproved by the Historic District Commission and is typically limited to exterior repair. Tax credits have been relatively effective as leverage for owner reinvestment (10% is a small portion of the cost of repair). The County could investigate expanding the tax credit to further incentivize both investment and maintenance of historic properties. Property owners also should be encouraged to utilize the State and Federal 20% tax credit programs to enable them to properly restore historic buildings.
There are additional State and national programs that could assist historic preservation efforts as well. The Ellicott City Historic District has a unique Main Street that could benefit from participation in Maryland’s Main Street program. The Main Street program has been successful in many places around the State, such as in Frederick. Efforts to investigate its potential benefits in Howard County and the desire of area businesses to support it are in progress.
Other educational opportunities for the public could increase awareness about local historic and cultural resources. The County has grown tremendously in the past several decades; as a result of growing up elsewhere, many people are unaware of local history. The Department of Recreation and Parks and Howard County Tourism have programs related to local history and historic sites. Schools
More than 1,000 buildings are listed on Howard County’s Historic Sites Inventory.
Old Firehouse in the Ellicott City Historic District.

41
could also play an influential role by educating children about local history and providing field trip opportunities to visit local historic sites.
In addition to the inventory of historic sites, the County also has an inventory of historic cemeteries. This inventory and the associated regulations ensure that cemeteries must be preserved, be provided access, and be buffered, if surrounding property is developed. However, since most historic cemeteries are small and not commercially owned, there is a need for outreach to cemetery owners regarding best practices for maintenance and restoration, as well as the potential for historic preservation tax credits.
Policies and Implementing Actions
POLICY 4.10 – Expand on existing programs to enhance historic preservation.
Implementing Actions
a. Historic Tax Credits. Promote greater use of County historic tax credits for properties in local historic districts or listed on the Historic Sites Inventory.
b. Programs and Laws. Strengthen historic preservation programs and laws both to prevent demolition and incentivize restoration and adaptive reuse.
c. Historic Sites Inventory. Continue to update the Historic Sites Inventory.
d. Grants. Apply for Maryland Historical Trust grants for documentation of archeological resources, museum collections, and oral histories.
e. Potential New Districts. Work with property owners regarding the merits of establishing new historic districts, where owners have expressed interest.
f. Main Street Program. Explore establishing a Main Street program for Ellicott City.
g. Historic Preservation Strategic Plan. Work with historic preservation advocates and other stakeholder groups to define more detailed goals and actions to enhance historic preservation in Howard County.
h. Public Awareness. Increase public awareness of historic preservation by expanding and promoting educational opportunities for residents to learn about the County’s history and historic sites.
i. Cemeteries. Undertake outreach to historic cemetery owners regarding best practices for maintenance, restoration, and historic tax credit.
Scenic Roads
Howard County adopted a Scenic Roads Act in 1994. Its purpose is “to protect the character of certain roads or road segments in the County which have outstanding scenic or historic value, and pass through areas of the County where forest, agricultural or historic features are predominant.” It addresses new development adjacent to scenic roads and improvements to the roads.
In 1994, an inventory of roads was conducted for designation by the Act (Map 4-3). The inventory was amended to add several roads in 2006 and again in 2008. Most scenic roads in Howard County are located in the Rural West. Scenic roads
Scenic roads are part of the County’s high quality of life.
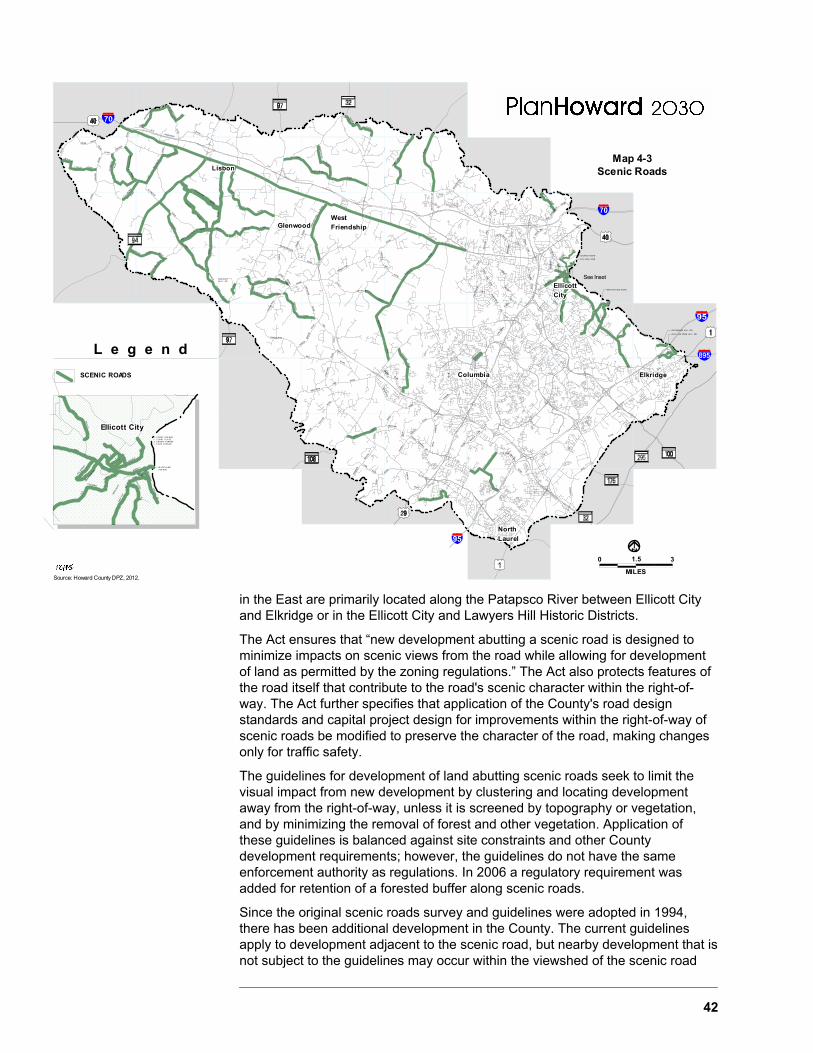
42
in the East are primarily located along the Patapsco River between Ellicott City and Elkridge or in the Ellicott City and Lawyers Hill Historic Districts.
The Act ensures that “new development abutting a scenic road is designed to minimize impacts on scenic views from the road while allowing for development of land as permitted by the zoning regulations.” The Act also protects features of the road itself that contribute to the road's scenic character within the right-of-way. The Act further specifies that application of the County's road design standards and capital project design for improvements within the right-of-way of scenic roads be modified to preserve the character of the road, making changes only for traffic safety.
The guidelines for development of land abutting scenic roads seek to limit the visual impact from new development by clustering and locating development away from the right-of-way, unless it is screened by topography or vegetation, and by minimizing the removal of forest and other vegetation. Application of these guidelines is balanced against site constraints and other County development requirements; however, the guidelines do not have the same enforcement authority as regulations. In 2006 a regulatory requirement was added for retention of a forested buffer along scenic roads.
Since the original scenic roads survey and guidelines were adopted in 1994, there has been additional development in the County. The current guidelines apply to development adjacent to the scenic road, but nearby development that is not subject to the guidelines may occur within the viewshed of the scenic road
LA
WY
ER
S
H I L L RD
.
ROC KBUR N HIL L RD .
OL D L AW YERS HIL L RD.
HA
NO
VE
R
OL D
WA S H
ING T O
N
RD
.
RO
AD
RA
CE
RO
AD
RO
AD
RO
AD
LA
ND
ING
RO
AD
MO
NT
EV
I DE
O
RD
.
ROAD
NO
RR
IS
LN.
BEE CHW OOD R OAD
HU
NT
CL
UB
RD
.
DU
CK
ET
TS
LA
NE
M A R S H A L E ED R
I V E
M O N T G O M E RYRD.
M A Y F I E L D
A V E .
COLLEGE
AVENUE
DR.
SYL VAN L ANE
CHU RCH ROAD
RO
AD
BO
NN
I E
NE
WC
UT
DRIVE
B RA N C
H
I LCH E S
T E R
K E R G E R
CO
RR
I DO
R
DO
RS
EY
RUN
R O A D
RO
AD
RO
AD
ROAD
FRED
ERIC
K
OLD
RD.
DAN
IELS
RO
AD
COLUMBIA
AV
EN
UE
OLD
PIKE
RO
AD
BR
ITT
AN
YPARK
GU
I LF
OR
D
M I S S I ON
BAL TI M O RE
GU
I LF
OR
DR
D.
RID
GE
N.
LAN
E
JOH
N'S
WAY
ST.
RO
GE
RS
ST
.JO
HN
SLA
NE
DO
BB
I N
OA
KL
AN
DM
I LL
S
RD
.
RO
AD
SN
OW
DE
N
RI V
ER
TA
MA
R
PH
ELP
S
TO
R
HIL
L
D R .
KI L I M A NG
AR
O RD
.
RO
AD
PK
WY .
R E D
LU
CK
TH
UN
DE
R
HI L
LR
D.
D R .H I G
H
BR
AN
CH
RD
.
STREE T
G O R M A N RD
.
BO
TTO
M
RD
.
SE
N
HI L
L
RO
AD VOLL MER HAU
ROAD
SA
VA
GE
WE
LL
F A R E
R D .
D L E
RO
CK W
AY
C R A
ST
EV
EN
S
FO
RE
ST
RD
.
ST
EP
HE
NS
WH
I SK
EY
AL
L
SA
I NT
S
RD
.
NO
RT
H
LA
UR
EL
B A L T I M O R E A V
ROADD
R.
ANN
APO
LIS
RD.
TE
N
OL
D
DR
IVE
GR
EE
NW
AY
AECH
MILL
RD.
LAN
E
BE
THA
NY
MI
L'S
CO
LUM
BIAM I L L S
RD
.
ROCK
GR
AY
FO
NT
HILL
DR
.
CE
NT
EN
NIA
LLA
NE
OLD
L A N D
RD
.
PATUX ENT
BR
OK
EN
PA
RK
WA
Y
WN
R D .
RD
.
SE
NE
CA
DR
.
R D .
RD
.S T A
NS
FIE
LD
PA
RK
WA
Y
PK
WY
.
GO
V. W
AR
FIE
LD
EDEN
GO
RM
AN
MU
RR
AY
R OA D
RO
AD
BROOK
DR.
LE
ISH
EA
R
RO
AD
R I V E R S
ER
USOA
KR
D
H ES P
DR
.
TW
IN
L IT T L E
B R O
CEDAR
LAN
E
SU
NN
Y
SP
RIN
G
O W E N
FR
EE
TO
WN
RO
AD
MA
RT
IN
NE
WB
ER
RY
DR
.
ROAD
HOPKINSRD.
RO
AD
G R A E L O C H
H A R D IN G
R O A D
S C A G GSV
IL L E
R D.
CE
DA
RL
N.
EL
IOT
S
HA
RP
ER
S
FA
RM
R D .
LAN
E
TRO
TTER
ROAD
FO
LLY
QUARTER
RO
AD
SIMPSON
SHOP
RO
AD
RO
AD
RO
AD SCHOOL
JOHNS
SA
NN
ER
ROAD
STAR
GU
ILF
OR
D
ROAD
GREAT
DR.
RO
AD
WO
OD
STO
CK
MA
RR
IOT
TS
VIL
LE
ROAD
RO
AD
ROAD
ROAD
HEN
RYT
ON
RO
AD
PIN
DE
LL
ROAD
BRID
GE
LIME
KILN MU
RP
HY
RO
AD
PF
EF
FE
RK
OR
N
TRIADELPHIA
ROAD
ROAD
CA
RR
OL
L
MILL
RO
AD
QUA RTER
FOLLY
ROAD
LINT
HIC
UM
RO
AD
SH
EP
PA
RD
MIN
K
HALL
BR
OW
N'S
RESERVOIR
HO
LLO
W
DAM
BRIGHTON
ROAD
RO
AD
HA
VIL
AN
DM
ILL
R D .
ROAD
MILL
RO
AD
TEN
OA
KS
ROAD
HIG
HL
AN
D
RO
AD
ROAD
FREDERICK
OLD
UN
DE
RW
OO
D
RIVE
R
RO
AD
BURNTWOODS
SHA
RP
RO
AD
M C K E N D R E E
TRIADELPHIA
GREEN
BR
IDG
E
SH
AD
Y
LANE
TR
IAD
ELPH
IA
ROAD
SH
ARP
RO
AD
MILL ROAD
ROAD
HO
WA
RD
ROAD
CARR
S
RO
AD
UNION CHAPEL ROAD
ROAD
MILL
ROX BURYM IL L RD . DORSEY
ROXBURY
JENN
ING
S
CH
APEL
RO
AD
ROAD
ROAD
ROAD
DA
ISY
RO
AD
DUVALL
CHAPEL
A E MULLINIX
ROAD
WARFIE
LD
ED
ROCK
ROAD
ANNAPOLIS ROAD
HIP
SLE
Y M
ILL
RD.
JENN
ING
S
ST
.
FLORENCE
SH
AF
FE
RS
VILL
E
RO
AD
MIC
HA
ELS
RO
AD
HARDY ROAD
FLO
REN
CER
OAD
RO
AD
FREDERICK
WA
TER
SV
I LLE
RO
AD
OLD
WEST
WAT
ERSV
ILLE
ROAD
RO
AD
LON
G
CO
RN
ER
FLO
RE
NC
E
PENN
CORNER
SHOP
RO
AD
LONG
RO
AD
RID
GE
RO
ADWINDSOR
FOREST ROAD
MILES
31.5
Map 4-3Scenic Roads
0
SCENIC ROADS
L e g e n d
Source: Howard County DPZ, 2012.
ElkridgeElkridgeElkridgeElkridgeElkridgeElkridgeElkridgeElkridgeElkridgeElkridgeElkridgeElkridgeElkridgeElkridgeElkridgeElkridgeElkridgeElkridgeElkridgeElkridgeElkridgeElkridgeElkridgeElkridgeElkridgeElkridgeElkridgeElkridgeElkridgeElkridgeElkridgeElkridgeElkridgeElkridgeElkridgeElkridgeElkridgeElkridgeElkridgeElkridgeElkridgeElkridgeElkridgeElkridgeElkridgeElkridgeElkridgeElkridgeElkridge
EllicottEllicottEllicottEllicottEllicottEllicottEllicottEllicottEllicottEllicottEllicottEllicottEllicottEllicottEllicottEllicottEllicottEllicottEllicottEllicottEllicottEllicottEllicottEllicottEllicottEllicottEllicottEllicottEllicottEllicottEllicottEllicottEllicottEllicottEllicottEllicottEllicottEllicottEllicottEllicottEllicottEllicottEllicottEllicottEllicottEllicottEllicottEllicottEllicottCityCityCityCityCityCityCityCityCityCityCityCityCityCityCityCityCityCityCityCityCityCityCityCityCityCityCityCityCityCityCityCityCityCityCityCityCityCityCityCityCityCityCityCityCityCityCityCityCity
ColumbiaColumbiaColumbiaColumbiaColumbiaColumbiaColumbiaColumbiaColumbiaColumbiaColumbiaColumbiaColumbiaColumbiaColumbiaColumbiaColumbiaColumbiaColumbiaColumbiaColumbiaColumbiaColumbiaColumbiaColumbiaColumbiaColumbiaColumbiaColumbiaColumbiaColumbiaColumbiaColumbiaColumbiaColumbiaColumbiaColumbiaColumbiaColumbiaColumbiaColumbiaColumbiaColumbiaColumbiaColumbiaColumbiaColumbiaColumbiaColumbia
NorthNorthNorthNorthNorthNorthNorthNorthNorthNorthNorthNorthNorthNorthNorthNorthNorthNorthNorthNorthNorthNorthNorthNorthNorthNorthNorthNorthNorthNorthNorthNorthNorthNorthNorthNorthNorthNorthNorthNorthNorthNorthNorthNorthNorthNorthNorthNorthNorthLaurelLaurelLaurelLaurelLaurelLaurelLaurelLaurelLaurelLaurelLaurelLaurelLaurelLaurelLaurelLaurelLaurelLaurelLaurelLaurelLaurelLaurelLaurelLaurelLaurelLaurelLaurelLaurelLaurelLaurelLaurelLaurelLaurelLaurelLaurelLaurelLaurelLaurelLaurelLaurelLaurelLaurelLaurelLaurelLaurelLaurelLaurelLaurelLaurel
LisbonLisbonLisbonLisbonLisbonLisbonLisbonLisbonLisbonLisbonLisbonLisbonLisbonLisbonLisbonLisbonLisbonLisbonLisbonLisbonLisbonLisbonLisbonLisbonLisbonLisbonLisbonLisbonLisbonLisbonLisbonLisbonLisbonLisbonLisbonLisbonLisbonLisbonLisbonLisbonLisbonLisbonLisbonLisbonLisbonLisbonLisbonLisbonLisbon
GlenwoodGlenwoodGlenwoodGlenwoodGlenwoodGlenwoodGlenwoodGlenwoodGlenwoodGlenwoodGlenwoodGlenwoodGlenwoodGlenwoodGlenwoodGlenwoodGlenwoodGlenwoodGlenwoodGlenwoodGlenwoodGlenwoodGlenwoodGlenwoodGlenwoodGlenwoodGlenwoodGlenwoodGlenwoodGlenwoodGlenwoodGlenwoodGlenwoodGlenwoodGlenwoodGlenwoodGlenwoodGlenwoodGlenwoodGlenwoodGlenwoodGlenwoodGlenwoodGlenwoodGlenwoodGlenwoodGlenwoodGlenwoodGlenwoodWestWestWestWestWestWestWestWestWestWestWestWestWestWestWestWestWestWestWestWestWestWestWestWestWestWestWestWestWestWestWestWestWestWestWestWestWestWestWestWestWestWestWestWestWestWestWestWestWestFriendshipFriendshipFriendshipFriendshipFriendshipFriendshipFriendshipFriendshipFriendshipFriendshipFriendshipFriendshipFriendshipFriendshipFriendshipFriendshipFriendshipFriendshipFriendshipFriendshipFriendshipFriendshipFriendshipFriendshipFriendshipFriendshipFriendshipFriendshipFriendshipFriendshipFriendshipFriendshipFriendshipFriendshipFriendshipFriendshipFriendshipFriendshipFriendshipFriendshipFriendshipFriendshipFriendshipFriendshipFriendshipFriendshipFriendshipFriendshipFriendship
M A RYL A NDAVE NUE
CHURCH
RD
.
STREET
1 . C OURT AVE NUE2 . C OURT PL A CE3 . E M OR Y STR EET4 . P ARK AVEN UE
CO
LLE
GE
PAUL
MU
LLIG
AN
S
ST.
LN.
HILL
AV
E.
ST.
NE
W C
UT
RD
.
4 3
Ellicott CityEllicott CityEllicott CityEllicott CityEllicott CityEllicott CityEllicott CityEllicott CityEllicott CityEllicott CityEllicott CityEllicott CityEllicott CityEllicott CityEllicott CityEllicott CityEllicott CityEllicott CityEllicott CityEllicott CityEllicott CityEllicott CityEllicott CityEllicott CityEllicott CityEllicott CityEllicott CityEllicott CityEllicott CityEllicott CityEllicott CityEllicott CityEllicott CityEllicott CityEllicott CityEllicott CityEllicott CityEllicott CityEllicott CityEllicott CityEllicott CityEllicott CityEllicott CityEllicott CityEllicott CityEllicott CityEllicott CityEllicott CityEllicott City
1
2
FE
LS
LN
.
4
HIL
L STR
EET
MER
RYM
AN S
T.
PIK
E
MAIN
OL
D
TIB
ER
ALLE
Y
COLUMBIA
See Inset

43
and impact the scenic quality of the road. This may be more likely to occur in the rolling, open farmland in the western portion of the County where many designated scenic roads are located. The County could consider reviewing the current status of designated scenic roads and their viewsheds to determine if adjustments to the designation status or the regulations may be needed.
Policies and Implementing Actions
POLICY 4.11 – Review current conditions and regulations related to the County’s designated scenic roads.
Implementing Actions
a. Survey Update. Conduct a survey of the roads currently on the scenic roads inventory to evaluate whether the roads still qualify for scenic road status.
b. Regulations Update. Determine if amendments to the County Code and / or Design Manual could further enhance protections for scenic roads.
Energy Resources
Businesses and communities depend on the availability of cheap, abundant energy and water supplies. This is true across North America, not just in Howard County. The current economy and lifestyles are largely dependent upon transportation energy derived from petroleum and electricity generated from large‐scale power plants. This energy paradigm involves home, work, commerce, recreation, and food production. Markets and even government can take for granted the availability of cheap energy. This section of PlanHoward 2030 asks, “What if?” What if the future were to involve energy shortages or even a radical restructuring of energy markets, technology applications, and supply sources?
Under such scenarios, there would potentially be many unknowns in the long-range energy future. The cheapest option may not be the cleanest, and supply security or equity of distribution might be compromised. What if the cleanest energy production were subject to intermittent availability? Given these possibilities, it would not be practicable to fully predict which energy sources would best fit future needs. This section proposes that more compact development patterns would be better able to provide a platform for energy solutions that could facilitate not only energy conservation but new distribution and production options.
One possible scenario for the future is district energy. This would require large-scale planning and implementation efforts. Most district energy systems are community-centric, aggregating heating and cooling production in a central plant that dispatches the heating and cooling to consumers through a localized distribution network within a one-mile radius or less. The concept is not new. Such systems can be found in select areas of the Northeast and Midwest, since the economics of district energy require relatively dense development.
Another important “What if?” to consider is that petroleum directly shapes the markets for food products. Again, this is due to the relative availability of cheap energy. What if during the next 20 years we see a massive restructuring of food production and distribution, made necessary by the changing availability of cheap energy? This possibility has given rise to new movements like “urban agriculture,” which focus on highly localized food production.
Most of our current fuel use leads to increased green houses gases. This reduction in air quality will also affect food production and availability due to
Solar panel demonstration projects are located on a number of Howard County facilities. They save energy and promote sustainability.

44
climate change. Human and ecosystem health will be impacted by the continued use of this fuel as well.
Alternative and renewable energy sources should be explored as another option to the existing cheap fuel. Solar, wind, geothermal, and biofuel are examples of alternatives that may offer reliable sources of fuel in the future.
Most importantly, changes in the availability of cheap energy could significantly affect the transportation network. What if the currently inexpensive oil that led to sprawl and inefficient transportation were no longer available? Planning now for the more compact, complete communities that could support reduced auto dependence and increased mass transit would be crucial for the transition and long-term sustainability of the community under a changed energy scenario.
Policies and Implementing Actions
POLICY 4.12 – Develop an energy plan that prepares for different future energy scenarios, examines options for various kinds of future energy sustainability, promotes conservation and renewable resources, and sets targets to reduce greenhouse gases.
Implementing Actions
a. Education and Outreach. Establish County policies and outreach efforts that educate communities about the potential for a changing relationship with energy resources.
b. Regulations Review. Review County development regulations that promote more compact, complete communities through design for comparison with the “What if?” scenarios in this section.
c. Scenario Study. Investigate development regulations and infrastructure policies related to future energy options, such as implementing localized community-based power generation and alternative energy sources.
d. Climate Action Plan. Implement the County’s 2010 Climate Action Plan (referenced in Chapters 1, 3, and 12), which relates to future energy technology, such as wind, solar, geothermal, and other renewable sources.
e. Business Partnering. Work closely with businesses and nonprofits to address their energy supply planning and potential infrastructure needs.
f. Extensive Greening. Continue to enhance the County’s facilities and fleet energy portfolio based on various energy sources and availability scenarios.
g. Market Demand. Explore evolving energy markets, plus options for enabling “smart grid” technologies, which reveal new opportunities to create, store, consume, and invest in energy commodities and related assets.
GREEN TIP!
Wash laundry in cold water. Hot water requires
more energy.

45
Economy is the second aspect of sustainability. A sustainable economy supports a sustainable environment, and in turn supports a sustainable community.
Chapter 5, Economic Development, is the first of the Maryland State Visions to be addressed. PlanHoward 2030 sets out policies to grow the County’s economy through continued collaboration among the Howard County Economic Development Authority, County agencies, and the business community.
Chapter 6, Growth, presents job and housing projections and incorporates the new “place designations” as set forth in PlanMaryland which is the State’s first proposed statewide plan.
Chapter 7, Transportation, focuses on job accessibility, transit, bicycle and pedestrian facilities, as well as highway priorities to create a better transportation network for the County and the region.
III: ECOMOMY

46

47
Overview Economic development that is sustainable must meet local and regional needs in the context of national and global economic conditions. Sustainability seeks to utilize renewable resources while conserving finite or longer-cycle resources. Ensuring a sustainable workforce is another crucial component, so a well-educated and properly trained labor pool is available for business ventures as opportunities arise.
Building upon the successes of General Plan 2000, PlanHoward 2030 updates the current employment information in the previous general plan, reviews the innovative work and policies of Howard County’s Economic Development Authority (EDA), and examines the results of a study by Robert Charles Lesser & Co. (RCLCO) to set policies and implementation actions for the next 20 years.
State of Maryland Vision Economic development and natural resource-based businesses that promote employment opportunities for all income levels within the capacity of the State’s natural resources, public services and public facilities are encouraged.
County Context Howard County is extremely well located and has been successful in attracting and growing diverse businesses. While the County has been impacted by the economic downturn, it has been to a lesser degree than many other counties. Over the next two decades, growth associated with Fort George G. Meade in conjunction with the innovative work of the Howard County Economic Development Authority (EDA) will accelerate recovery in the County. EDA’s proven experience has been applied to the County’s recent launch of the Maryland Center for Entrepreneurship, which is dedicated to strengthening economic development opportunities throughout Maryland by fostering innovation at the local level and creating a culture of entrepreneurship.
Michelle Seu, Grade 12, River Hill High School
5. Economic Development

48
Progress under General Plan 2000 General Plan 2000 addresses economic development in two different contexts as an important element of balanced and phased growth in the County: (1) the preservation and enhancement of commercial and industrial areas, and (2) agricultural growth and commercial development in the Rural West.
To promote balanced and phased growth, General Plan 2000 set targets for job growth that were achieved, as discussed in Chapter 6. Enhancement of commercial and industrial areas occurred through policies aimed to encourage continued construction in various business parks and shopping centers as well as a renewed focus on revitalization and redevelopment. The Route 1 Corridor, Route 40 Corridor, and Downtown Columbia were the targets and beneficiaries of these approaches. To promote redevelopment and increase project quality, new zoning and design guidelines were adopted for all three areas. To further support revitalization, regulatory flexibility, development incentives, and supporting infrastructure and services were provided. Due to the economic downturn that began in 2008 and the limited demand for nonresidential development, not all the potential for growth was realized.
Under General Plan 2000, the County continued to focus on the economic viability of the farm community. Additional acreage was added to the County’s Agricultural Land Preservation Program (ALPP), thus shielding it from further development and preserving land for farming. Progress in the Howard County agriculture industry over the last ten years includes:
The ability for farms to incorporate agritourism into their farm enterprise.
An increase in value-added processing on Howard County farms.
An increase in direct marketing, farmers’ markets, and on-farm markets as the demand for locally grown food has increased.
Employment Growth General Plan 2000 set job growth targets of 4,000 new jobs per year between 2000 and 2010 and 3,000 jobs per year between 2010 and 2020. This was based on a rationale that the strong job growth of the mid- and late-1990s would continue into the first decade of the plan before slowing down in the following decade. Actual job growth between 2000 and 2009 averaged about 3,100 jobs per year, less than the 4,000 annual growth targets for this initial decade. Considering the recession, the County fared relatively well, as shown in Figure 5-1. This was due to strong job growth in the middle of the last decade.
Jurisdiction Jobs Percent Jobs Percent Jobs % IncreaseAnne Arundel County 295.2 11% 357.0 13% 61.8 21%Baltimore County 448.5 17% 505.6 18% 57.1 13%Carroll County 68.1 3% 82.0 3% 13.9 20%Harford County 97.1 4% 114.9 4% 17.8 18%Howard County 159.2 6% 187.1 7% 27.9 18%Baltimore City 446.4 17% 384.8 14% (61.6) -14%Frederick County 103.9 4% 127.3 4% 23.4 23%Montgomery County 593.0 23% 645.2 23% 52.2 9%Prince George's County 391.2 15% 428.4 15% 37.2 10%TOTAL 2,602.5 100% 2,832.4 100% 229.9 9%Source: U.S. Bureau of Economic Analysis, May 2011
2000 2009 2000 to 2009
Figure 5-1Central Maryland Employment (1,000's)
Business services, biotech, cyber security, life sciences and information technology are growing fast in Howard.

49
Jobs by Type in Howard County Howard County offers a diverse job base. Jobs discussed in this section include all employment within Howard County and are not limited to jobs held by residents of Howard County, albeit home-based jobs are held by residents.
In 2009, about 83% of all jobs in the County were wage and salary jobs, while the remaining 17% were proprietor or self-employed. Proprietors increased by 42% from 2001 to 2009, a larger increase than the 9% increase in wage and salary jobs. This trend is likely to continue as both home-based and small businesses continue to prosper due to technological innovation and the changing economy.
Of the major job classifications, professional and technical services take the lead with 31,159 jobs in 2009, or 17% of the total. This is followed by retail trade and government jobs at 10% each. Although retail jobs remain the second largest category in 2009, this sector had the greatest losses of all categories between 2001 and 2009. This is due to the recession, which began in 2008, and perhaps the changing retail job landscape associated with the growth of web-based commerce. Manufacturing, construction, transportation, and warehousing jobs also experienced declines. All other categories saw increases and are summarized in Figure 5-2.
As shown in Figure 5-3, compared to other Central Maryland jurisdictions, Howard County is less dependent upon Federal civilian employment. In 2009, there were about 600 Federal civilian jobs, which is only 0.34% of the total jobs in the County. (However, 10% of Howard County residents worked in Federal jobs located outside the county.) By comparison, 11% of Anne Arundel County’s job base was Federal. Prince George’s and Montgomery Counties’ had 6% and 7%, respectively. Consequently, if the Federal government downsizes over the next decade, the impact may be less in Howard County than in other jurisdictions.
Of all Central Maryland jurisdictions, Howard County has the greatest percentage of professional and service jobs. These jobs are expected to grow with the growth of the knowledge economy.
Unemployment Trends Howard County continues to have a strong and growing labor force which is closely correlated with employment growth. The only exception was during the recent “great recession” beginning in 2008, when the labor force declined slightly due to some residents no longer looking for work. Employment declined during the same period. Similar patterns occurred nationally, but comparatively the dip in employment was relatively modest in Howard County. This trend is not expected to last as the economy continues to rebound and the County’s highly educated workforce fills the growing technical and professional job base. Figure 5-4 summarizes labor force and employment trends since 1990 in Howard County.
Howard County consistently has lower unemployment rates than the statewide average. In general, the County has had the lowest unemployment rate of all jurisdictions in the state. This is due to a highly educated workforce and ample job opportunities in both the Washington and Baltimore metropolitan areas. It is anticipated that this trend will continue as the County continues to attract a highly educated population, given its quality of life and locational advantages.
Science and technology firms are major employers and innovators in Howard County.

50
Anne Baltimore PrinceMajor Job Category Howard Montgomery Arundel Baltimore City Frederick Carroll George's Harford TOTAL
Construction 6% 6% 6% 6% 3% 9% 10% 9% 7% 6%Manufacturing 3% 2% 4% 4% 4% 4% 6% 3% 4% 3%Retail Trade 10% 8% 11% 11% 5% 11% 13% 11% 13% 9%Finance & Insurance 5% 6% 3% 7% 5% 7% 4% 3% 4% 5%Real Estate & Rental & Leasing 5% 6% 5% 6% 3% 4% 5% 4% 5% 5%Professional & Technical Services 17% 16% 9% 9% 7% 11% 6% 8% 9% 11%Administrative & Waste Services 7% 7% 5% 6% 5% 5% 7% 7% 5% 6%Educational Services 2% 3% 1% 3% 8% 3% 2% 2% 1% 3%Health Care & Social Assistance 8% 11% 8% 14% 20% 9% 12% 9% 10% 12%Accommodation & Food Services 6% 5% 7% 6% 6% 7% 7% 6% 7% 6%Federal, civilian 0% 7% 11% 3% 3% 3% 0% 6% 8% 5%State and Local 9% 6% 8% 8% 18% 9% 10% 15% 8% 10%Source: U.S. Bureau of Economic Analysis
Figure 5-3Percent of Total Jobs by Job Type for Central Maryland Counties - 2009(Excluding job type categories that are small percentages of the total)
Year ==> Jobs Percent Jobs Percent Jobs % IncreaseBy Type Wage and salary 142,284 86% 154,944 83% 12,660 9% Proprietors 22,700 14% 32,152 17% 9,452 42% Farm proprietors 330 0% 270 0% (60) -18% Nonfarm proprietors (1) 22,370 14% 31,882 17% 9,512 43%By Major Industry Farm 581 0% 476 0% (105) -18% Nonfarm 164,403 100% 186,620 100% 22,217 14%Private 147,856 90% 167,860 90% 20,004 14% Forestry, fishing, related activities, and other (D) (D) (D) (D) (D) (D) Mining (D) (D) (D) (D) (D) (D) Utilities 232 0% 212 0% (20) -9% Construction 13,530 8% 12,065 6% (1,465) -11% Manufacturing 8,639 5% 6,312 3% (2,327) -27% Wholesale trade 13,400 8% 15,262 8% 1,862 14% Retail Trade 21,058 13% 18,075 10% (2,983) -14% Transportation and warehousing 5,380 3% 4,391 2% (989) -18% Information 2,855 2% 4,472 2% 1,617 57% Finance and insurance 7,132 4% 9,228 5% 2,096 29% Real estate and rental and leasing 5,734 3% 9,173 5% 3,439 60% Professional and technical services 23,299 14% 31,159 17% 7,860 34% Management of companies and enterprises 312 0% 1,622 1% 1,310 420% Administrative and waste services 9,483 6% 12,531 7% 3,048 32% Educational services 2,296 1% 4,358 2% 2,062 90% Health care and social assistance 13,081 8% 15,303 8% 2,222 17% Arts, entertainment, and recreation 3,901 2% 4,112 2% 211 5% Accommodation and food services 9,417 6% 10,745 6% 1,328 14% Other services, except public administration 7,883 5% 8,586 5% 703 9%Government and Government Enterprises 16,547 10% 18,760 10% 2,213 13% Federal, civilian 735 0% 628 0% (107) -15% Military 876 1% 823 0% (53) -6% State and local 14,936 9% 17,309 9% 2,373 16% State 3,908 2% 3,305 2% (603) -15% Local 11,028 7% 14,004 7% 2,976 27%TOTAL JOBS 164,984 100% 187,096 100% 22,112 13%Source: U.S. Bureau of Economic Analysis, May 2011 Classification is NAICS, which replaced SIC starting in 2001.
(1) Excludes limited partners.
"(D)" Not shown to avoid disclosure of confidential information, but estimates for this item are included in the totals.
Figure 5-2Jobs in Howard County by Detailed Job Type
2001 2009 2001 to 2009
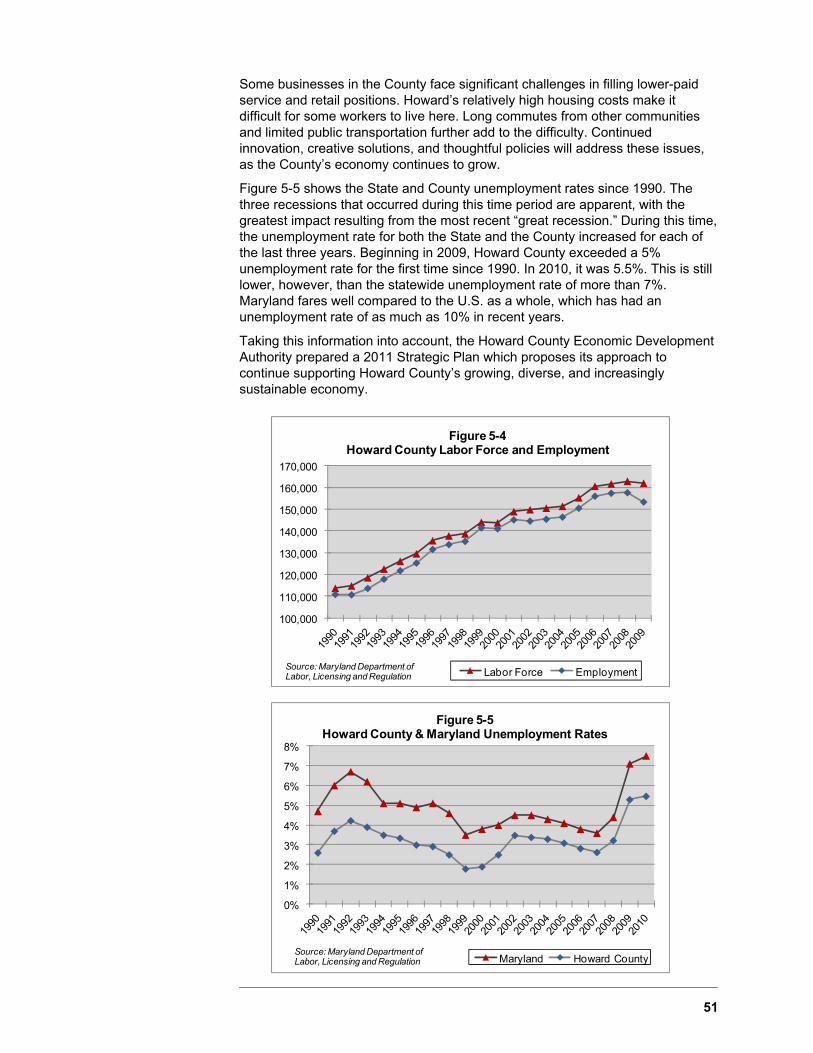
51
Some businesses in the County face significant challenges in filling lower-paid service and retail positions. Howard’s relatively high housing costs make it difficult for some workers to live here. Long commutes from other communities and limited public transportation further add to the difficulty. Continued innovation, creative solutions, and thoughtful policies will address these issues, as the County’s economy continues to grow.
Figure 5-5 shows the State and County unemployment rates since 1990. The three recessions that occurred during this time period are apparent, with the greatest impact resulting from the most recent “great recession.” During this time, the unemployment rate for both the State and the County increased for each of the last three years. Beginning in 2009, Howard County exceeded a 5% unemployment rate for the first time since 1990. In 2010, it was 5.5%. This is still lower, however, than the statewide unemployment rate of more than 7%. Maryland fares well compared to the U.S. as a whole, which has had an unemployment rate of as much as 10% in recent years.
Taking this information into account, the Howard County Economic Development Authority prepared a 2011 Strategic Plan which proposes its approach to continue supporting Howard County’s growing, diverse, and increasingly sustainable economy.
100,000
110,000
120,000
130,000
140,000
150,000
160,000
170,000
Figure 5-4Howard County Labor Force and Employment
Labor Force EmploymentSource: Maryland Department of Labor, Licensing and Regulation
0%
1%
2%
3%
4%
5%
6%
7%
8%
Figure 5-5Howard County & Maryland Unemployment Rates
Maryland Howard CountySource: Maryland Department of Labor, Licensing and Regulation

52
EDA’s 2011 Strategic Plan The Howard County Economic Development Authority (EDA) is a nonprofit organization whose mission is to promote economic growth and stability in Howard County by supporting existing businesses, attracting targeted new businesses such as corporate and / or regional headquarters, and serving as the liaison between public and private economic development and planning organizations. EDA promotes small business growth, entrepreneurship, and innovation through various initiatives and makes policy recommendations to County government in support of the achievement of planned economic goals.
As part of its support of businesses, EDA assists companies with land and building selection, financing, employee recruitment and training, permit and regulatory issues, and other development support services. Developing a strategic plan in collaboration with the business community is an important part of business support.
Howard County is widely recognized as one of the best places in the U.S. to live, work, and operate a business. To help ensure the continued success of Howard County, part of EDA’s work is to promote the County’s successes and describe the reasons behind those successes and to expand them.
As part of the expanding successes for Howard County, the Maryland Center for Entrepreneurship (MCE) will encompass the business incubator (formerly the NeoTech Incubator), the Business Resource Center, the Howard Technology Council, and the Catalyst Loan Fund. The programs offered at the MCE will be provided in partnership with other Howard County and State-based resources, including research institutions that will facilitate the commercialization of technologies to help spur innovation and create new businesses.
EDA’s 2011 Strategic Plan identified four themes designed to describe the business community in Howard County. A summary of the four themes appears below and are followed by policies and implementation actions developed by DPZ in tandem with EDA.
Knowledge Community. This theme focuses on the importance of a highly educated population and excellent education resources to the County’s economic and quality of life success. The top priorities for the knowledge theme are development of a comprehensive workforce strategy, prekindergarten through college education, and lifelong learning.
Connected Community. The Connected Community theme is designed to highlight, promote, and improve access to regional, national, and global markets and to emphasize the importance of local and regional partnership among government, business, education, and not-for-profit entities. The critical components of this theme are Fort Meade growth, the most comprehensive public and private broadband networks, efficient local and regional transportation, and strategic alliances and partnerships.
Reinvent the Community. This theme focuses on preserving key characteristics and qualities valued by the community and devising new ways to accommodate healthy and necessary growth in Howard County. The components are implementing the Downtown Columbia plan; redeveloping existing employment centers and business parks; creating great, diverse, unique, and renewed communities; ensuring adequate natural resources; and developing the tools to make these priorities a reality.
“The advantage to our location is that we can get to
either city quickly. The disadvantage, however, is not being able to go to the city by
bus.” HCC Student Government
Association

53
Innovation Community. Howard County and Central Maryland are rich with the innovation and quality of life assets found in the nation’s best-known tech centers. The Innovation theme stresses the importance of entrepreneurship; new product and technology development; problem-solving; information sharing; the attraction of young, upwardly mobile professionals; and the creation of a culture of innovation.
Together these four themes describe a community that is well poised for job growth and economic development. In anticipation of demand for new skills in a growing economy, the County and EDA could work to expand the knowledge base and training in science, technology, engineering, and math (STEM) at all levels of public and private education. The Maryland Department of Labor, Licensing and Regulation estimates the recent job growth trends by skill levels in Figure 5-6.
Additionally, EDA estimates total direct, indirect, and induced employment related to Fort Meade will grow from 134,000 to 195,695 jobs in several years due to BRAC, Cyber Command, NSA, and other planned expansions. This will have a profound impact on Howard County in terms of new and expanding IT and government contractors, an increasing residential population, and spin-off development.
Policies and Implementing Actions POLICY 5.1 – Implement key actions from EDA’s 2011 Strategic Plan to foster a diversified economy and encourage innovation and entrepreneurship.
Implementing Actions
a. Fort Meade Economic and Job Growth. Focus on the anticipated growth due to BRAC, Cyber Command, NSA, and other planned expansions to capture new growth.
b. Branding. Develop and implement a comprehensive branding effort for Howard County to establish a distinct and readily identifiable research
Total OpeningsSkill Level Occupational Group in 2008 to 2012
High Management 5,850Business & Finance 4,790Professional & Related 25,420
Middle Sales & Related 10,110Office & Administration 13,025Construction 4,255Installation & Repair 3,625Production 2,415Transportation & Material Moving 5,400
Low Service Occupations 25,100Farm, Fish & Forestry 175
Source: Maryland Department of Labor, Licensing and Regulation
Howard County Fact Sheet, July 2001
Figure 5-6
Skill Level by Occupational GroupHoward County Job Openings

54
and technology brand in the global marketplace as a “top global tech center.”
c. Entrepreneurship. Develop a comprehensive strategy to enable entrepreneurs to be creative, grow their businesses, and access capital.
d. Downtown Columbia Revitalization. Implement the Downtown Columbia Plan to create a vibrant, mixed-use urban center for Howard County. This walkable, livable, revitalized Downtown will create a needed urban anchor that will attract and retain the creative class, and will advance the rebranding of Howard County for the 21st century.
e. Renewed Approach to Route 1 and Existing Business Parks. Address the demand for business growth in the Baltimore-Washington Corridor, despite the declining availability of greenfield development sites, through new redevelopment strategies.
f. Funding for Transportation. Expand multimodal transportation options and connectivity to ensure an adequate workforce for Howard County employers and to maintain quality of life.
g. Workforce Development Strategy. Ensure an adequate, trained workforce is available to meet the need for service, entry level, and highly skilled workers through the provision of pre-kindergarten through college education, lifelong learning, diverse housing, commuting and transportation, health care, and benefits costs.
POLICY 5.2 – Establish Howard County as a leader in 21st century entrepreneurship, information technology, and cyber security.
Implementing Actions
a. Marketing. Create a development and marketing program to attract prime information technology and cyber businesses, as well as the critical skilled workforce.
b. Infrastructure Capacity. Define broadband, mobile communications, and utility infrastructure requirements, and ensure that service capacity and quality are available.
c. Innovation. Develop programs and facilities to promote a new culture of entrepreneurship and innovation. Encourage the creation of technology-driven entrepreneurial businesses.
d. Education. Engage with local businesses to identify the need for leading programs in science, technology, engineering, and math (STEM) in the public schools, Howard Community College, and branch campuses of leading Maryland universities. Increase participation by minorities and females.
POLICY 5.3 – Promote future energy and green industries.
Implementing Actions
a. Differentiation. Integrate forward-thinking energy and resource use into the County’s economic development agenda, particularly considering green infrastructure and transportation solutions that differentiate the County from neighboring jurisdictions.
b. Management. Explore evolving energy markets, plus options for enabling “smart grid” technologies, which reveal new opportunities to create, store, consume, and invest in energy commodities and related assets.
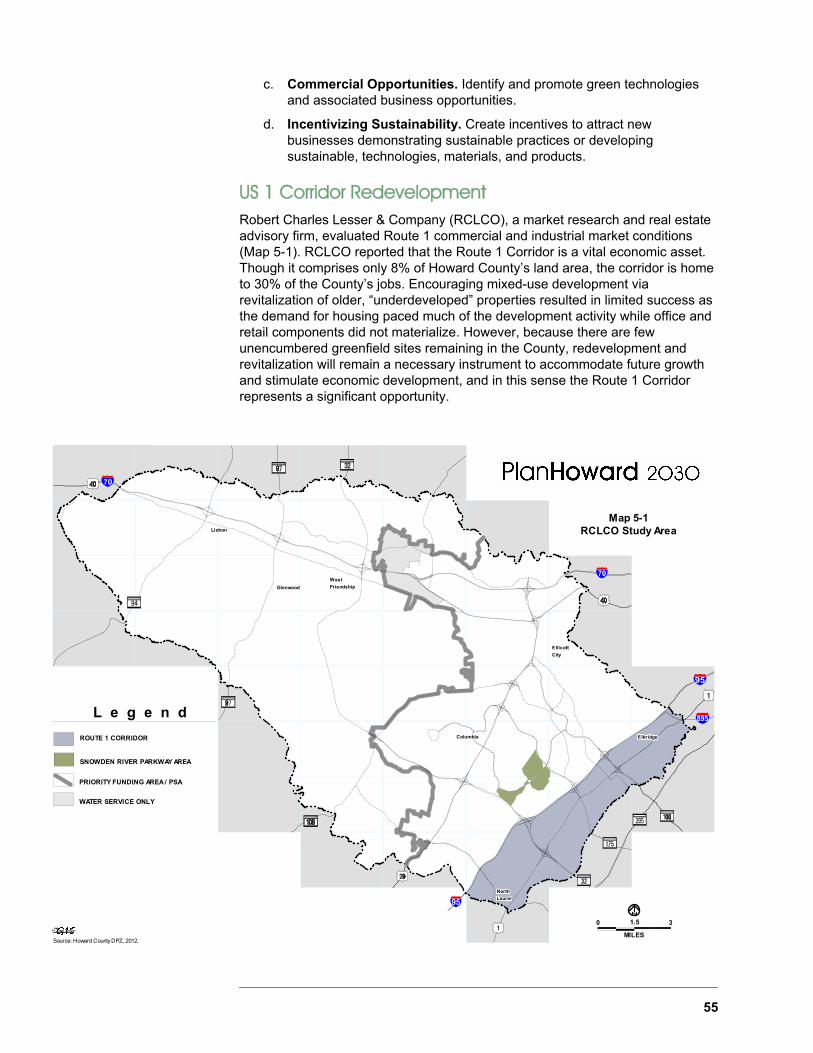
55
c. Commercial Opportunities. Identify and promote green technologies and associated business opportunities.
d. Incentivizing Sustainability. Create incentives to attract new businesses demonstrating sustainable practices or developing sustainable, technologies, materials, and products.
US 1 Corridor Redevelopment Robert Charles Lesser & Company (RCLCO), a market research and real estate advisory firm, evaluated Route 1 commercial and industrial market conditions (Map 5-1). RCLCO reported that the Route 1 Corridor is a vital economic asset. Though it comprises only 8% of Howard County’s land area, the corridor is home to 30% of the County’s jobs. Encouraging mixed-use development via revitalization of older, “underdeveloped” properties resulted in limited success as the demand for housing paced much of the development activity while office and retail components did not materialize. However, because there are few unencumbered greenfield sites remaining in the County, redevelopment and revitalization will remain a necessary instrument to accommodate future growth and stimulate economic development, and in this sense the Route 1 Corridor represents a significant opportunity.
MILES
31.5
Map 5-1RCLCO Study Area
0
SNOWDEN RIVER PARKWAY AREA
PRIORITY FUNDING AREA / PSA
L e g e n d
ROUTE 1 CORRIDOR
WATER SERVICE ONLY
Source: Howard County DPZ, 2012.
EllicottEllicottEllicottEllicottEllicottEllicottEllicottEllicottEllicottEllicottEllicottEllicottEllicottEllicottEllicottEllicottEllicottEllicottEllicottEllicottEllicottEllicottEllicottEllicottEllicottEllicottEllicottEllicottEllicottEllicottEllicottEllicottEllicottEllicottEllicottEllicottEllicottEllicottEllicottEllicottEllicottEllicottEllicottEllicottEllicottEllicottEllicottEllicottEllicottCityCityCityCityCityCityCityCityCityCityCityCityCityCityCityCityCityCityCityCityCityCityCityCityCityCityCityCityCityCityCityCityCityCityCityCityCityCityCityCityCityCityCityCityCityCityCityCityCity
ElkridgeElkridgeElkridgeElkridgeElkridgeElkridgeElkridgeElkridgeElkridgeElkridgeElkridgeElkridgeElkridgeElkridgeElkridgeElkridgeElkridgeElkridgeElkridgeElkridgeElkridgeElkridgeElkridgeElkridgeElkridgeElkridgeElkridgeElkridgeElkridgeElkridgeElkridgeElkridgeElkridgeElkridgeElkridgeElkridgeElkridgeElkridgeElkridgeElkridgeElkridgeElkridgeElkridgeElkridgeElkridgeElkridgeElkridgeElkridgeElkridgeColumbiaColumbiaColumbiaColumbiaColumbiaColumbiaColumbiaColumbiaColumbiaColumbiaColumbiaColumbiaColumbiaColumbiaColumbiaColumbiaColumbiaColumbiaColumbiaColumbiaColumbiaColumbiaColumbiaColumbiaColumbiaColumbiaColumbiaColumbiaColumbiaColumbiaColumbiaColumbiaColumbiaColumbiaColumbiaColumbiaColumbiaColumbiaColumbiaColumbiaColumbiaColumbiaColumbiaColumbiaColumbiaColumbiaColumbiaColumbiaColumbia
NorthNorthNorthNorthNorthNorthNorthNorthNorthNorthNorthNorthNorthNorthNorthNorthNorthNorthNorthNorthNorthNorthNorthNorthNorthNorthNorthNorthNorthNorthNorthNorthNorthNorthNorthNorthNorthNorthNorthNorthNorthNorthNorthNorthNorthNorthNorthNorthNorthLaurelLaurelLaurelLaurelLaurelLaurelLaurelLaurelLaurelLaurelLaurelLaurelLaurelLaurelLaurelLaurelLaurelLaurelLaurelLaurelLaurelLaurelLaurelLaurelLaurelLaurelLaurelLaurelLaurelLaurelLaurelLaurelLaurelLaurelLaurelLaurelLaurelLaurelLaurelLaurelLaurelLaurelLaurelLaurelLaurelLaurelLaurelLaurelLaurel
WestWestWestWestWestWestWestWestWestWestWestWestWestWestWestWestWestWestWestWestWestWestWestWestWestWestWestWestWestWestWestWestWestWestWestWestWestWestWestWestWestWestWestWestWestWestWestWestWestFriendshipFriendshipFriendshipFriendshipFriendshipFriendshipFriendshipFriendshipFriendshipFriendshipFriendshipFriendshipFriendshipFriendshipFriendshipFriendshipFriendshipFriendshipFriendshipFriendshipFriendshipFriendshipFriendshipFriendshipFriendshipFriendshipFriendshipFriendshipFriendshipFriendshipFriendshipFriendshipFriendshipFriendshipFriendshipFriendshipFriendshipFriendshipFriendshipFriendshipFriendshipFriendshipFriendshipFriendshipFriendshipFriendshipFriendshipFriendshipFriendship
LisbonLisbonLisbonLisbonLisbonLisbonLisbonLisbonLisbonLisbonLisbonLisbonLisbonLisbonLisbonLisbonLisbonLisbonLisbonLisbonLisbonLisbonLisbonLisbonLisbonLisbonLisbonLisbonLisbonLisbonLisbonLisbonLisbonLisbonLisbonLisbonLisbonLisbonLisbonLisbonLisbonLisbonLisbonLisbonLisbonLisbonLisbonLisbonLisbon
GlenwoodGlenwoodGlenwoodGlenwoodGlenwoodGlenwoodGlenwoodGlenwoodGlenwoodGlenwoodGlenwoodGlenwoodGlenwoodGlenwoodGlenwoodGlenwoodGlenwoodGlenwoodGlenwoodGlenwoodGlenwoodGlenwoodGlenwoodGlenwoodGlenwoodGlenwoodGlenwoodGlenwoodGlenwoodGlenwoodGlenwoodGlenwoodGlenwoodGlenwoodGlenwoodGlenwoodGlenwoodGlenwoodGlenwoodGlenwoodGlenwoodGlenwoodGlenwoodGlenwoodGlenwoodGlenwoodGlenwoodGlenwoodGlenwood

56
Projections show regional demand for Class A/B+ office space will be low relative to the projected capacity. Through 2030, the demand for office space is expected to peak at just over three million square feet. This demand is low when compared to the 14.1 million square feet of approved office space in the pipeline in Howard and Anne Arundel Counties. Yet while this suggests a challenging environment, Howard County, and Route 1 in particular, holds competitive advantages in several key sectors (e.g., financial services, information technology, life science industries, and cyber security support) that may present opportunities for targeted development of high-visibility employment areas. The expansion of jobs within the Route 1 Corridor will also generate additional opportunities for commercial and residential development, some of which may be absorbed through the redevelopment of sites with marginal or very-low-intensity uses.
The Route 1 Corridor is 90% “built out” with much of the remaining 10% already committed to future residential or commercial development. While this limits readily apparent greenfield development opportunities, the sheer size of the corridor in Howard County (21 square miles) means there are sizeable opportunities for strategic redevelopment in the near term, as well as some opportunity for future development of uncommitted sites. To maximize these opportunities and achieve the desired vision for the Route 1 Corridor, the County will need to consider employing strategies that offset any inherent drawbacks associated with redevelopment. The “redevelopment toolbox” would be comprised of specific instruments aimed at facilitating new development and redevelopment projects that catalyze economic growth, protect existing employment areas, and enhance existing communities. Potential strategies include creating tiered development incentives, establishing servicing districts to help brand and market the corridor, and developing a corridor land bank. These and other recommendations should be evaluated as part of a long-term strategic plan for the Route 1 Corridor. The full report is available online at DPZ’s site for the PlanHoward 2030 process.
Policies and Implementing Actions POLICY 5.4 – Enhance the Route 1 Corridor revitalization strategy to recognize the distinct character and market potential of diverse corridor segments, and the potential at various intersections, crossings, and nodes for additional retail, restaurant, and employment development as identified in the 2011 Route 1 Market Analysis.
Implementing Actions
a. Opportunities. Focus planning efforts to maximize development potential in four types of land-use opportunity areas: redevelopment of high-visibility employment areas; greenfield development of high-visibility employment areas; major industrial park development; and mixed-use opportunity sites.
b. Zoning Review. Evaluate the efficacy of existing Route 1 zoning districts (CE, CAC, TOD); consider more flexibility, especially regarding commercial uses, and revise zoning as needed to ensure County vision is achieved.
c. Residential Expansion and Employment Preservation. Accommodate residential development in key nodes in the Route 1 Corridor so that it does not erode opportunities to preserve or redevelop employment areas.
d. Refine the Vision. Clarify residential and nonresidential land use goals as a framework for evaluating future proposals.
The Route 1 Corridor presents opportunities for sustainable growth of the local economy.

57
e. Transportation. Develop transit and road improvements solutions to support revitalization of the US 1 Corridor.
POLICY 5.5 – Proactively consider innovative tools to enhance the Route 1 Corridor’s competitiveness, attract and retain businesses, and maximize redevelopment opportunities.
Implementing Actions
a. Economic Growth. Focus incentives on opportunity sites within the Route 1 Corridor and on key industry market sectors with strong growth potential in Howard County.
b. Beneficial Projects. Adopt a tiered incentive program that provides benefits commensurate with the proposed project’s potential benefit to the County.
c. Nodes. Develop plans for key opportunity areas that allow for significant future intensification, while maximizing current and intermediate development potential.
d. Land Assembly. Encourage land assembly to prevent piecemeal redevelopment and facilitate projects that are integral to the County’s long-term development strategy.
e. Partnering. Evaluate specific scenarios where the County might benefit from engaging in public / private development partnerships (i.e., County / EDA as developer).
Snowden River Parkway Area RCLCO also evaluated market demand and redevelopment potential for the Snowden River Parkway area including Dobbin Road and the former General Electric (GE) Appliance buildings (Map 5-1). RCLCO reported that although the Snowden area comprises less than 1% of the County’s land area, it is home to 5% of the County’s jobs and is an opportunity area for new Class A office space in conjunction with mixed-use development, particularly on the east side of Snowden River Parkway. Scattered, uncoordinated redevelopment is already occurring along Snowden River Parkway. Restrictive covenants on the former GE properties begin to expire in 2017, which affords time to evaluate options and plan for redevelopment.
RCLCO recommended Howard County take a proactive role in planning for redevelopment. Land-use mix, intensity, and design need to be studied in conjunction with transportation options. Rezoning of the Snowden-GE area will be needed, as well as road and transit improvements to support intensification. Owners of redevelopment projects should participate in the funding of transit and amenity improvements.
Similar to Downtown Columbia, the Snowden River Parkway area may also benefit from either a public-private partnership or a private organization, such as a Business Improvement District or Commercial District Management Authority, to provide enhanced services for mixed-use, transit-oriented redevelopment.
Policies and Implementing Actions POLICY 5.6 –Plan for Class A office and mixed-use redevelopment of commercial and industrial properties within the Snowden River Parkway area.
GREEN TIP!
Share a ride to work. Carpool to work and save money and reduce your
vehicular GHG emissions!

58
Implementing Actions
a. Plan for Redevelopment. Work with area property owners and other stakeholders to evaluate market, infrastructure, and design options to develop a plan for transitioning the Snowden River Parkway area into a more intensive and integrated mix of Class A office, residential, retail, and amenity spaces, with multimodal transportation options.
b. Partner on Implementation. Consider establishing a partnership or special servicing district to promote and manage redevelopment.
Transportation Connections between Economic Centers RCLCO also identified the potential for enhancing transportation connections between the County’s major economic activity areas. To improve transit service, RCLCO recommended study of a potential Bus Rapid Transit (BRT) line to connect Downtown Columbia to the Snowden River Parkway area, Gateway Business Park, Route 1, and Fort Meade. To obtain the necessary rights-of-way (ROW) to create the Howard County portion of the system, the County would need to acquire railroad ROW now being abandoned in a piecemeal manner by CSX.
RCLCO recommended a new roadway connection between Snowden River Parkway and Route 1, bridging over I-95. As redevelopment occurs in the study area, improving the local east-west traffic circulation across the corridor through improved local roadway connectivity is a critical means to reduce traffic congestion on existing roadways such as MD 32, Snowden River Parkway, MD 175, I-95 and US 1. RCLCO suggested that providing a new arterial between Snowden River Parkway and US 1 would also create direct access to multiple parcels, thus increasing the potential for additional economic development.
Policies and Implementing Actions POLICY 5.7 – Plan for future transit and road capacity to service and connect Downtown Columbia, the Snowden River Parkway area, Gateway, and Route 1 to regional connections to Baltimore, Washington, and Fort Meade.
Implementing Actions
a. Connect Development Nodes. Study the feasibility of regional Bus Rapid Transit (BRT), as well as enhanced local bus service between major business and residential nodes from Downtown Columbia through the Snowden River Parkway area, Gateway Business Park, and the Route 1 corridor to Fort Meade and Odenton in Anne Arundel County. If viable, take action to secure existing CSX rail spur ROW.
b. Make More Connections. Study the feasibility and cost-benefits of a new roadway connection crossing I-95 between US 1 and Gateway Business Park.
Route 40 Corridor and Columbia’s Village Centers General Plan 2000 identified both the Route 40 Corridor and older Columbia Village Centers for study regarding possibilities for redevelopment and enhancements. As the Route 40 Corridor and Columbia’s Village Centers have matured, there is increasing potential for new projects that take advantage of growing demand for mixed-use, pedestrian- and transit-friendly development.
“I think Columbia is pretty perfect. There are so many
amenities within a two-minute drive or walk.”
CA Teen Advisory Committee

59
In 2004, the Route 40 Corridor Enhancement Study was completed, followed by some rezoning, and adoption of the Route 40 Design Manual. In 2009, the County adopted new zoning for the revitalization of Village Centers in Columbia. PlanHoward 2030 endorses implementation of these initiatives and supports the continued evolution of both the Village Centers and the Route 40 Corridor using the frameworks established under the Village Center Revitalization zoning process and Route 40’s Zoning, Design Manual, and Streetscape Master Plan, respectively.
Policies and Implementing Actions POLICY 5.8 – Continue to enhance the vitality of the Route 40 Corridor and Columbia’s Village Centers.
Implementing Actions
a. Enhance Route 40. Encourage commercial renovation and where appropriate mixed-use redevelopment by promoting collaboration between owners and neighbors to create attractive focal points that serve the community.
b. Strengthen Village Centers. Encourage Village Center property owners, Village Boards, and residents to develop and implement plans for enhancing and / or redeveloping older Village Centers. Collaborate with the Columbia Association to undertake market assessment to assist in repositioning older centers in relation to each other, Downtown Columbia, and other competing commercial centers.
Agribusiness Cultivating the next generation of farmers, whether young or just new to farming, is critically important. The national trend of an aging farmer population, and concerns about who will replace them, is relevant in Howard County. Most of the original agricultural easement grantors are approaching, or are already beyond, retirement age. A very positive development within the last several years is the number of preservation farm families where the next generation has either taken over the daily operation of the farm or is preparing to do so. In most cases, the younger farmers have transitioned the operation or added a new venture in order to increase profitability. This is a very encouraging trend, one that will hopefully continue.
The County has taken a very active role in assisting the agricultural community to expand, diversify, and succeed since the Agricultural Marketing Program was established within the Economic Development Authority (EDA) in 1994. Due to its location, Howard County and its farmers have long been at the forefront of adapting to the transition from commodity-based agriculture to specialized, higher-value operations. As farmers have diversified over the years, the County has responded by amending its regulations. As a result of policies in General Plan 2000, the Zoning Regulations were changed to allow value-added processing, direct farm marketing, and agritourism enterprises.
Farming on the “urban fringe” presents both challenges and opportunities. Trends suggest that agritourism and other on-farm production and sales activities will increase. High land values will encourage these activities on smaller farm parcels than in the past. As a result, the next generation of farmers will likely face more nonfarm neighbor conflict than their parents did. However, they will also have access to an expanding market of affluent consumers increasingly interested in buying locally grown and produced food. Just in the last few years,
The County is supporting the next generation of farmers.

60
the growth in CSAs (community supported agriculture) has been tremendous, both in the number of farms that are participating in CSAs and the number of subscribers the CSAs have, and also in the financial success enjoyed by the CSA farmers. The CSA model is still relatively new and evolving; it is an example of innovative marketing trends aimed at keeping both the food and food dollar local.
The increasing diversity in farming operations often necessitates a broadening and deepening of the farmer’s skills. In addition to the mechanics of a new farming venture, there are other, related fields of expertise for which a farmer must have a working knowledge. These include elements such as marketing, logistics, financial planning, public relations, and a familiarity with health department and land use regulations. The County and EDA have been addressing this need through a variety of educational seminars and training sessions for many years. The need for this type of technical assistance will continue and most likely increase over the planning horizon.
Along these same lines, educational opportunities in agricultural related fields for the County’s youth must be reintroduced. Although farming continues to be one of the largest employers in Maryland, the Howard County Public School System has not included agriculture education in their course offerings for many years. According to the Maryland Agricultural Education Foundation, “Incorporating agriculture into teaching and learning creates the foundation that students, as future citizens, need to make educated decisions regarding food choices and nutrition, community issues, land use planning and natural resource conservation.” In addition, expanding the current curricula to include the wide variety of disciplines that agriculture covers will help ensure food security into the future.
Policies and Implementing Actions POLICY 5.9 – Expand programs to support and enhance agribusiness.
Implementing Actions
a. Training. Promote County and regional training programs for existing and new farmers to enhance critical business skills.
b. Diversification. Use Agricultural Land Preservation Program funds to offer matching grants for farmers to diversify their agriculture operations through agribusiness innovations.
c. Mentoring. Create a mentoring program that will connect the younger generation of farmers with experienced farmers and also with farmers who may have property but no one to farm it.
d. New Leaders. Establish an agricultural leadership program for middle / high school students to teach a broad range of skills both specific to agriculture and also general skills such as team building and public speaking. Work with the Howard County public schools to introduce elements of agricultural education back into the public school curriculum.
GREEN TIP!
Buy local. It's fresher: Produce shipped from
outside the country travels up to two weeks
before it arrives in grocery stores.
61
Overview PlanHoward 2030 incorporates the framework and the designated place types called for in the new statewide plan, PlanMaryland. PlanMaryland proposes five “place types” as the central organizing element for coordinating State and local growth policies and resources. The PlanHoward 2030 map of designated places in this chapter (Map 6-2) categorizes all land in Howard County as one of the PlanMaryland place types. These new place designations will play a major role achieving the sustainability goals expressed in PlanHoward 2030.
This chapter includes growth projections for housing, population, and employment. The housing projections will be utilized to set the Adequate Public Facilities housing allocation schedule. The chapter concludes with a section addressing the need for more compact development.
State of Maryland Vision Growth is concentrated in existing population and business centers, growth areas adjacent to these centers, or strategically selected new centers.
County Context In response to long-standing State Smart Growth requirements, General Plan 2000 established Howard County's growth boundary and Priority Funding Area (PFA) as all land within the Planned Service Area for both public water and sewerage. Our PFA occupies the easternmost 40% of the County. Maryland’s new State Development Plan, PlanMaryland, calls for local jurisdictions to refine their PFAs by identifying more focused areas for future growth as well as clarifying growth policies for rural areas. The State’s five designated place types include three within the PFA: growth and revitalization areas, established community areas, and future growth areas, and two for rural areas outside the PFA: low density development areas and rural resource areas. This approach seeks to focus and coordinate local and State resources to support smart growth goals.
6. Growth
Irene Lu, Grade 6, Hammond Middle School

62
PlanHoward 2030 also incorporates the recently adopted State legislation that implements new restrictions on major subdivisions using septic systems in rural areas. This legislation, known as the Sustainable Growth and Agricultural Preservation Act, requires local jurisdictions to classify land into one of four “Growth Tiers.” The intent of this legislation is to prohibit major subdivisions of five or more lots in Tier IV areas. The tiers for Howard County are designated in accordance with this 2012 law and are also shown in this chapter on Map 6-3.
Progress under General Plan 2000 Since adoption of General Plan 2000, most residential and nonresidential growth has occurred in the County’s PFA. Zoning changes were approved allowing higher-density, mixed-use development in targeted areas, particularly along the Route 1 Corridor where several projects have been completed and others are under construction or planned. Some mixed-use development has also been planned in parts of the Route 40 Corridor. The Downtown Columbia Plan was adopted, establishing the framework for progressive redevelopment and intensification of Howard County’s urban center. Regulations allowing revitalization of older Columbia Village Centers have also been adopted.
Map 6-1 is the Policies Map from General Plan 2000 summarizing the major land use policies implemented with that plan. This map shows the five planning areas established under General Plan 2000. In that plan growth projections were established for each of the planning areas and serve as the basis for the annual
Map 6-1

63
housing unit allocations as part of the County’s Adequate Public Facilities (APF) Act, first adopted in 1992. These allocations, along with the open/closed schools test, have been used to phase residential growth to ensure that adequate school capacity and other public infrastructure is built to accommodate new development. PlanHoward 2030 proposes that allocations be granted based on the designated place types rather than the five planning areas. This change is discussed later in this chapter.
Population and Household Growth The population of Howard County has grown by 16% over the last decade, from 247,842 residents in 2000 to 287,085 residents in 2010, an increase of about 39,000 according to the U.S. Census. This is half the growth rate of the 1990s when the County grew by 32%, or 60,500 residents. The slower growth rate of the last decade was dictated in large part by General Plan 2000 policies and the APF Act. General Plan 2000 set the pace of growth and the County’s APF Regulations are the control measure. Prior to this, the County had grown by 68,800 residents in the 1980s and 56,700 residents in the 1970s. Figures 6-1 and 6-2 demonstrate the population increases.
36,152 61,911
118,572
187,328
247,842
287,085
0
50,000
100,000
150,000
200,000
250,000
300,000
1960 1970 1980 1990 2000 2010
Figure 6-1Howard County Population
1960 to 2010
Source: U.S. Census Bureau
25,759
56,661
68,756
60,514
39,243
71%
92%
58%
32%
16%
0%10%20%30%40%50%60%70%80%90%100%
0
10,000
20,000
30,000
40,000
50,000
60,000
70,000
80,000
1960 to 1970
1970 to 1980
1980 to 1990
1990 to 2000
2000 to 2010
Figure 6-2Howard County Population Growth
1960 to 2010
Absolute Growth Percent IncreaseSource: U.S. Census Bureau

64
General Plan 2000 anticipated that by 2010 there would be 107,450 housing units in the County. The 2010 Census recently counted 109,282 housing units, slightly more than General Plan 2000’s projection. It is likely that the 2010 Census included newly constructed homes that were nearly complete but did not yet have certificates of occupancy. DPZ’s estimate of total units based on certificates of occupancy on April 2010 was 106,420. This is an increase of about 16,500 new units over ten years, an average of 1,650 per year.
A Diversifying Population
The 2010 Census shows that the population of Howard County is 59% non-Hispanic White, 17% non-Hispanic African American, 14% non-Hispanic Asian, and close to 6% Hispanic. About 3% of the population indicated that they were of more than one race. The remaining 0.5% is of another race including a small number of American Indians and Native Alaskans. Hispanics can be of any race (Figure 6-3).
Compared to a decade ago, it is clear that the County has become increasingly diverse (Figure 6-4). In 2000, the non-Hispanic White population was 73% of the total. The remaining 27% consisted of minority populations. By 2010, the minority populations have increased to 41% of the total, a significant increase over a relatively short period of time.
The non-Hispanic Asian population increased the most between 2000 and 2010, by more than 22,000 people, a 116% increase. This is followed by the non-Hispanic African American population which grew by close to 14,000 residents, a 39% increase. Hispanics increased by about 9,200 residents, representing the largest growth rate at 123%. By comparison, the non-Hispanic White population decreased by 10,000 residents, a 5.6% decline.
This is the first time the non-Hispanic White population has decreased in Howard County between decennial censuses. At the current rate of change it is likely that Howard County will be a “majority-minority” county sometime over the next five to ten years.
White, 59.2%
Black, 17.1%
American Indian and Alaska Native, 0.2% Other, 0.3%
Two or More Races, 3.1%
Hispanic, 5.8%
Asian Indian, 4.3%
Chinese (Except Taiwanese), 2.6%
Filipino, 0.6% Korean, 4.3%
Pakistani, 0.7%
Vietnamese, 0.5%
Other Asian, 1.3%Asian, 14.4%
Figure 6-3Race and Ethnicity in Howard County in 2010
Source:US Census Bureau

65
An Aging Population
There has been much discussion in the press and among policy makers, both nationally and locally, regarding the rapid aging of the population. Baby boomers, defined as those born between 1946 and 1964, currently make up a significant share of the national population. The first baby boomers are turning 65 now and over the next two decades will be entering their retirement years. Whereas the total U.S. population grew by 9.7% from 2000 to 2010, those entering the 45 to 64 year age cohort, the approximate ages of the baby boomers, increased by 31.5% during that time period. Baby boomers currently make up about 29% of the countywide population and are starting to move into the 65-plus age cohort (Figure 6-5).
Those currently age 65 and older have also increased over the last decade. Whereas the overall County population increased by 16%, those 65 and over increased by 57%. There are now 10,577 more residents 65 and older compared to ten years ago – 29,045 total in 2010 compared to 18,468 in 2000. Almost 27% of the total increase of 39,243 residents over the decade was comprised of those aged 65 and older. The very old, 85 and over, increased by 47%.
This trend will continue as the baby boomers continue to age. A key question is whether residents will “age in place,” or will they instead retire to some other place. Although some residents do move when they retire, the majority are expected to stay in Howard County. This was evidenced in a 2006 Maryland task force report (The Dynamics of Elderly and Retiree Migration into and out of Maryland, 2006) that documented a trend of the people moving back after initially moving away post-retirement. These trends should be followed closely over the
Population of One Race Alone (Non-Hispanic) 235,591 95.1% 261,585 91.1% 25,994 11.0% White (Non-Hispanic) 180,010 72.6% 169,972 59.2% (10,038) -5.6% African American (Non-Hispanic) 35,353 14.3% 49,150 17.1% 13,797 39.0% Amer. Ind. & Alaska Native (Non-Hispanic) 515 0.2% 511 0.2% (4) -0.8% Asian & Pacific Islander (Non-Hispanic) 19,057 7.7% 41,206 14.4% 22,149 116.2% Some Other Race (Non-Hispanic) 656 0.3% 746 0.3% 90 13.7%Population of Two or More Races (Non-Hispanic) (1) 4,761 1.9% 8,771 3.1% 4,010 84.2%TOTAL NON-HISPANIC POPULATION 240,352 97.0% 270,356 94.2% 30,004 12.5%
TOTAL HISPANIC POPULATION (2) 7,490 3.0% 16,729 5.8% 9,239 123.4%
GRAND TOTAL POPULATION 247,842 100.0% 287,085 100.0% 39,243 15.8%(1) This option was available for the first time in the 2000 Census.
(2) Hispanic Origin can be from any race.
Source: U.S. Census Bureau
Howard County Population by Race - 2000 to 2010
2000 2010 Growth
Figure 6-4
Under 5 17,363 6.0% 22,039 6.5% 4,676 27%5 to 19 63,360 22.1% 67,688 19.8% 4,328 7%20 to 44 92,961 32.4% 112,923 33.1% 19,962 21%45 to 64 84,356 29.4% 72,710 21.3% (11,646) -14%65 and over 29,045 10.1% 65,907 19.3% 36,862 127%Total 287,085 100.0% 341,267 100.0% 54,182 19%Source: 2010 from Census - 2020 through 2030 age breakdown are estimates based
on adjusted MDP cohort model (from round 7D).
Howard County Population by Age - 2010 to 2030
2010 2030 2010 to 2030 Growth
Figure 6-5

66
next five to ten years in order to fully understand the choices of older Howard County residents, so policies and resources can be appropriately adopted and adjusted.
Figure 6-6 summarizes the Howard County population by age from 1970 to 2010, with projections to 2030. The chart clearly shows that the growth rate of the 65-plus population has accelerated over the last ten years and is expected to accelerate even more over the next 20. On the other end of the age spectrum, the number of school-aged children five to 19 has also grown over the last ten years and makes up about 22% of the population. As a result school enrollments in Howard County have increased during the past decade. However, young children under five have decreased from 18,248 in 2000 to 17,363 in 2010, a 5% decline. As the baby boomers age, the children of the baby boomers are aging as well, putting less pressure on school enrollments.
Changing Household Types
The suburban single-family detached home is associated typically with a nuclear family of parents and children. However, the population of Howard County, just as the population of the United States, is diversifying with a trend towards smaller households, particularly as the population ages (Figure 6-7). While the total number of households in Howard County has increased by 53% between 1990 and 2010, family households with children under 18 have increased by only 47%. During this same time period, the number of residents living alone has increased by 75% and those residents 65 and older living alone has increased by 154%. Consequently, the single-family detached house is no longer preferred by many households. Smaller-sized housing will be in greater demand in the future. This demographic shift aligns well with the decreasing availability of land for the traditional single-family detached home and the increased emphasis on planning for more compact, higher-density residential development. Condominiums, apartments, and townhouses also will be a greater portion of the new homes built in the County in the future.
0
50,000
100,000
150,000
200,000
250,000
300,000
350,000
Figure 6-6Howard County Population by Age
1970 to 2030
0-4 5-19 20-44 45-64 65+Source: U.S Census Bureau, Projections based on Round 7D Adjusted.

67
Location of Future Residential Development Current Residential Development Capacity
Figure 6-8 provides information on the location and mix of existing residential development, as well as future capacity for additional development under current zoning. Map 6-1 shows the locations of each of the planning areas referred to in the chart. General Plan 2000 policies and County zoning limit development in the Rural West and direct growth into more compact development patterns in the East, primarily along the Route 1 Corridor and in Downtown Columbia, but also in the Route 40 corridor and potentially Columbia’s older Village Centers. The result is a total current capacity of 141,000 housing units, which would be an increase of an additional 34,000 units over the built total in 2010 of 107,000, if all the potential units are eventually built. Due to the stable zoning and land preservation goals being met, the capacity in the Rural West portion of the County has remained about the same at a total of 17,750 units.
Figure 6-8 also shows existing units, permitted units (those under construction), recorded unbuilt lots, in-process units (those with a subdivision or site plan under review), and undeveloped units. About 45% of the additional 34,000 units allowed under current zoning are either in-process, recorded but unbuilt, or permitted. Consequently, the exact location and type of these units is already determined. They include a significant number of larger phased plans in the Route 1 Corridor. Note that many of these in-process units have been delayed over the past three to four years due to the recent economic downturn. Including the 5,500 Downtown Columbia units (which are counted in the undeveloped category), more than 60% of future housing units are known in detail, including location, type, and likely phasing.
Over the past two decades, 55% of all new homes built were single-family detached and 45% were townhouses, condominiums, or apartments. Based on current zoning, only 33% of future new homes will be single-family detached and 67% will be townhouses, condominiums, or apartments (Figure 6-9).
Category Number Percent Number Percent Growth % IncreaseFamily Households 50,691 74.2% 76,333 72.9% 25,642 50.6% With children under 18 26,442 38.7% 38,764 37.0% 12,322 46.6% With no children under 18 24,249 35.5% 37,569 35.9% 13,320 54.9%Nonfamily households 17,646 25.8% 28,416 27.1% 10,770 61.0% Householder living alone 13,088 19.2% 22,903 21.9% 9,815 75.0% Householder 65 years and older 2,664 3.9% 6,754 6.4% 4,090 153.5%Total Households 68,337 100.0% 104,749 100.0% 36,412 53.3%Source: U.S. Census
1990 2010 1990 to 2010
Figure 6-7Household Type in Howard County
Single-family detached homes form the dominant development pattern in parts of the County.
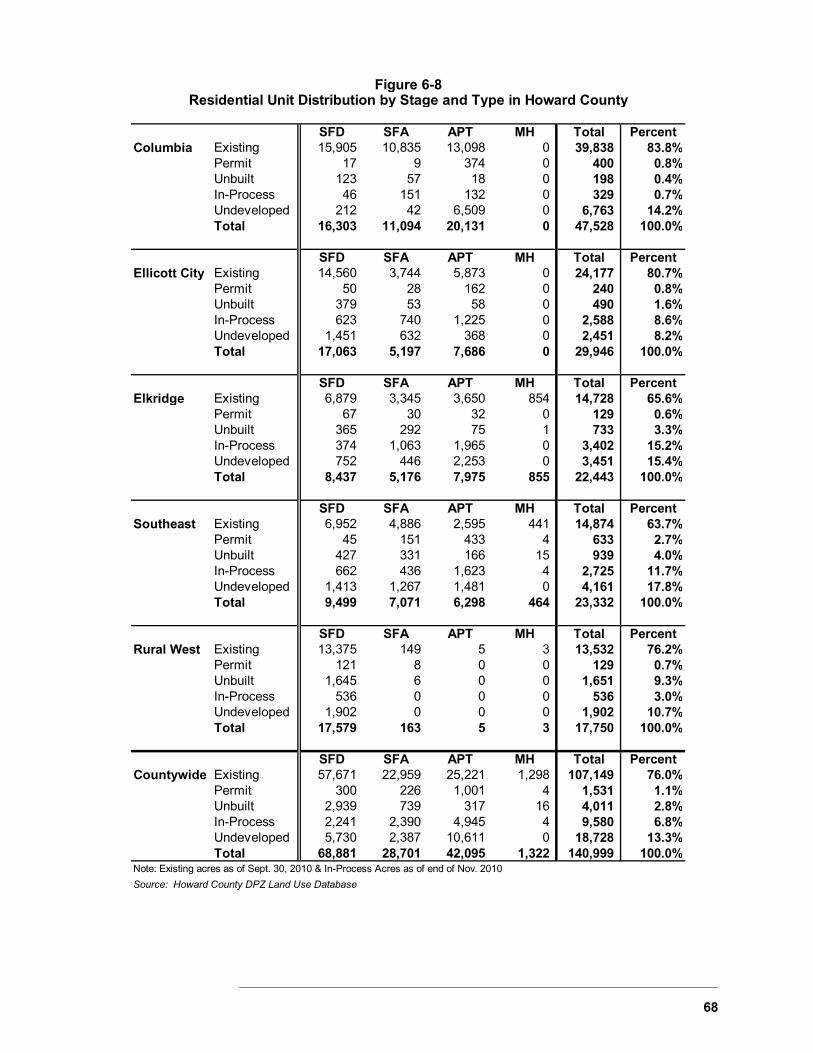
68
SFD SFA APT MH Total PercentColumbia Existing 15,905 10,835 13,098 0 39,838 83.8%
Permit 17 9 374 0 400 0.8%Unbuilt 123 57 18 0 198 0.4%In-Process 46 151 132 0 329 0.7%Undeveloped 212 42 6,509 0 6,763 14.2%Total 16,303 11,094 20,131 0 47,528 100.0%
SFD SFA APT MH Total PercentEllicott City Existing 14,560 3,744 5,873 0 24,177 80.7%
Permit 50 28 162 0 240 0.8%Unbuilt 379 53 58 0 490 1.6%In-Process 623 740 1,225 0 2,588 8.6%Undeveloped 1,451 632 368 0 2,451 8.2%Total 17,063 5,197 7,686 0 29,946 100.0%
SFD SFA APT MH Total PercentElkridge Existing 6,879 3,345 3,650 854 14,728 65.6%
Permit 67 30 32 0 129 0.6%Unbuilt 365 292 75 1 733 3.3%In-Process 374 1,063 1,965 0 3,402 15.2%Undeveloped 752 446 2,253 0 3,451 15.4%Total 8,437 5,176 7,975 855 22,443 100.0%
SFD SFA APT MH Total PercentSoutheast Existing 6,952 4,886 2,595 441 14,874 63.7%
Permit 45 151 433 4 633 2.7%Unbuilt 427 331 166 15 939 4.0%In-Process 662 436 1,623 4 2,725 11.7%Undeveloped 1,413 1,267 1,481 0 4,161 17.8%Total 9,499 7,071 6,298 464 23,332 100.0%
SFD SFA APT MH Total PercentRural West Existing 13,375 149 5 3 13,532 76.2%
Permit 121 8 0 0 129 0.7%Unbuilt 1,645 6 0 0 1,651 9.3%In-Process 536 0 0 0 536 3.0%Undeveloped 1,902 0 0 0 1,902 10.7%Total 17,579 163 5 3 17,750 100.0%
SFD SFA APT MH Total PercentCountywide Existing 57,671 22,959 25,221 1,298 107,149 76.0%
Permit 300 226 1,001 4 1,531 1.1%Unbuilt 2,939 739 317 16 4,011 2.8%In-Process 2,241 2,390 4,945 4 9,580 6.8%Undeveloped 5,730 2,387 10,611 0 18,728 13.3%Total 68,881 28,701 42,095 1,322 140,999 100.0%
Note: Existing acres as of Sept. 30, 2010 & In-Process Acres as of end of Nov. 2010
Source: Howard County DPZ Land Use Database
Figure 6-8Residential Unit Distribution by Stage and Type in Howard County

69
Expansion of the Planned Service Area
Expansions to the Planned Service Area (PSA) since 1990 have been very limited. In 1993, the County Council voted to extend water service to include the area around the Alpha Ridge Landfill. This extension was done solely out of concern for potential future groundwater contamination that might originate from the Alpha Ridge Landfill; therefore, only water service is provided in this area. No sewer service is allowed and no change from rural land uses or zoning is authorized. Map 6-1 shows the current boundary for public water and sewer as well as the water-service-only area.
The boundary of the PSA for both water and sewer service is important not only to determine which parcels will be served by public water and sewer service, but also because the PSA is Howard County’s designated growth boundary or Priority Funding Area per the State’s Smart Growth Act. The PFA/PSA is also the boundary for PlanHoward 2030’s rural place designations. As such, adjustments to the PSA would have significant ramifications in terms of both permitted development intensity and the level of other County and State services.
PlanHoward 2030 proposes three minor expansions of the Planned Service Area (adjoining Ellicott City, Clarksville, and Maple Lawn). To achieve Bay restoration goals it is preferable to include these properties in the PSA, rather than have them utilize septic systems.
In the future, it should be anticipated that there may be isolated situations where minor PSA adjustments may be appropriate. A PSA revision requires a General Plan Amendment to Map 6-2. Any requests for a General Plan Amendment for expansion of the PSA should be denied unless either:
1) The proposed expansion of the Planned Service Area is intended to provide for a public or institutional use such as a religious facility, philanthropic institution, or academic school; or
2) The proposed expansion of the Planned Service Area includes a zoning proposal that is consistent with the General Plan and Smart Growth policies. Sewer and water infrastructure capacity and costs must be analyzed to confirm the feasibility and availability of scheduled capacity.
Existing Dwelling
Units107,150 (76%)
Future Units(18,728) (13%)
Building Permits
1,531 (1%)
Recorded4,011 (3%)
In Process9,580 (7%)
Figure 6-9 - Housing UnitsBuildout Based on Current Zoning
Total = 141,000 Dwelling Units
Committed Units14,796 (11%)
Source: Howard County DPZ, September 30, 2010

70
As established in General Plan 2000 and subsequent amendments, institutional or public use expansions of the Planned Service Area boundary are limited to:
1) Properties adjoining the existing PSA boundary without including an intervening privately owned parcel;
2) The minimum area necessary to serve the proposed use. Subdivision of the parcel consistent with the PSA boundary amendment is required after approval of the General Plan amendment and prior to the inclusion of the parcel into the Metropolitan District; and
3) The particular use proposed at the time of expansion, with a deadline for the completion of the improvements for the proposed use and connection to the public water and/or sewerage system. If the proposed public or institutional use is not actually constructed and connected to the public water and/or sewerage system by the deadline specified in the Bill, the Planned Service Area expansion shall be null and void and the Planned Service Area automatically shall revert to its location prior to the Council Bill approving the expansion.
Map 6-2Designated Place Types
30 1.5
MILES
COLUMBIA VILLAGE CENTER REVITALIZATION
PROPOSED PRIORITY FUNDING AREA / PSA
PROPOSED WATER SERVICE ONLY AREA
Source: Howard County DPZ, 2012.
ESTABLISHED COMMUNITY
GROWTH AND REVITALIZATION
LOW DENSITY DEVELOPMENT
RURAL RESOURCE
PLANNING AREA BOUNDARY
L e g e n d ElkridgeElkridgeElkridgeElkridgeElkridgeElkridgeElkridgeElkridgeElkridgeElkridgeElkridgeElkridgeElkridgeElkridgeElkridgeElkridgeElkridgeElkridgeElkridgeElkridgeElkridgeElkridgeElkridgeElkridgeElkridgeElkridgeElkridgeElkridgeElkridgeElkridgeElkridgeElkridgeElkridgeElkridgeElkridgeElkridgeElkridgeElkridgeElkridgeElkridgeElkridgeElkridgeElkridgeElkridgeElkridgeElkridgeElkridgeElkridgeElkridge
EllicottEllicottEllicottEllicottEllicottEllicottEllicottEllicottEllicottEllicottEllicottEllicottEllicottEllicottEllicottEllicottEllicottEllicottEllicottEllicottEllicottEllicottEllicottEllicottEllicottEllicottEllicottEllicottEllicottEllicottEllicottEllicottEllicottEllicottEllicottEllicottEllicottEllicottEllicottEllicottEllicottEllicottEllicottEllicottEllicottEllicottEllicottEllicottEllicottCityCityCityCityCityCityCityCityCityCityCityCityCityCityCityCityCityCityCityCityCityCityCityCityCityCityCityCityCityCityCityCityCityCityCityCityCityCityCityCityCityCityCityCityCityCityCityCityCity
ColumbiaColumbiaColumbiaColumbiaColumbiaColumbiaColumbiaColumbiaColumbiaColumbiaColumbiaColumbiaColumbiaColumbiaColumbiaColumbiaColumbiaColumbiaColumbiaColumbiaColumbiaColumbiaColumbiaColumbiaColumbiaColumbiaColumbiaColumbiaColumbiaColumbiaColumbiaColumbiaColumbiaColumbiaColumbiaColumbiaColumbiaColumbiaColumbiaColumbiaColumbiaColumbiaColumbiaColumbiaColumbiaColumbiaColumbiaColumbiaColumbia
NorthNorthNorthNorthNorthNorthNorthNorthNorthNorthNorthNorthNorthNorthNorthNorthNorthNorthNorthNorthNorthNorthNorthNorthNorthNorthNorthNorthNorthNorthNorthNorthNorthNorthNorthNorthNorthNorthNorthNorthNorthNorthNorthNorthNorthNorthNorthNorthNorthLaurelLaurelLaurelLaurelLaurelLaurelLaurelLaurelLaurelLaurelLaurelLaurelLaurelLaurelLaurelLaurelLaurelLaurelLaurelLaurelLaurelLaurelLaurelLaurelLaurelLaurelLaurelLaurelLaurelLaurelLaurelLaurelLaurelLaurelLaurelLaurelLaurelLaurelLaurelLaurelLaurelLaurelLaurelLaurelLaurelLaurelLaurelLaurelLaurel
LisbonLisbonLisbonLisbonLisbonLisbonLisbonLisbonLisbonLisbonLisbonLisbonLisbonLisbonLisbonLisbonLisbonLisbonLisbonLisbonLisbonLisbonLisbonLisbonLisbonLisbonLisbonLisbonLisbonLisbonLisbonLisbonLisbonLisbonLisbonLisbonLisbonLisbonLisbonLisbonLisbonLisbonLisbonLisbonLisbonLisbonLisbonLisbonLisbon
GlenwoodGlenwoodGlenwoodGlenwoodGlenwoodGlenwoodGlenwoodGlenwoodGlenwoodGlenwoodGlenwoodGlenwoodGlenwoodGlenwoodGlenwoodGlenwoodGlenwoodGlenwoodGlenwoodGlenwoodGlenwoodGlenwoodGlenwoodGlenwoodGlenwoodGlenwoodGlenwoodGlenwoodGlenwoodGlenwoodGlenwoodGlenwoodGlenwoodGlenwoodGlenwoodGlenwoodGlenwoodGlenwoodGlenwoodGlenwoodGlenwoodGlenwoodGlenwoodGlenwoodGlenwoodGlenwoodGlenwoodGlenwoodGlenwoodWestWestWestWestWestWestWestWestWestWestWestWestWestWestWestWestWestWestWestWestWestWestWestWestWestWestWestWestWestWestWestWestWestWestWestWestWestWestWestWestWestWestWestWestWestWestWestWestWestFriendshipFriendshipFriendshipFriendshipFriendshipFriendshipFriendshipFriendshipFriendshipFriendshipFriendshipFriendshipFriendshipFriendshipFriendshipFriendshipFriendshipFriendshipFriendshipFriendshipFriendshipFriendshipFriendshipFriendshipFriendshipFriendshipFriendshipFriendshipFriendshipFriendshipFriendshipFriendshipFriendshipFriendshipFriendshipFriendshipFriendshipFriendshipFriendshipFriendshipFriendshipFriendshipFriendshipFriendshipFriendshipFriendshipFriendshipFriendshipFriendship
COLUMBIACOLUMBIACOLUMBIACOLUMBIACOLUMBIACOLUMBIACOLUMBIACOLUMBIACOLUMBIACOLUMBIACOLUMBIACOLUMBIACOLUMBIACOLUMBIACOLUMBIACOLUMBIACOLUMBIACOLUMBIACOLUMBIACOLUMBIACOLUMBIACOLUMBIACOLUMBIACOLUMBIACOLUMBIACOLUMBIACOLUMBIACOLUMBIACOLUMBIACOLUMBIACOLUMBIACOLUMBIACOLUMBIACOLUMBIACOLUMBIACOLUMBIACOLUMBIACOLUMBIACOLUMBIACOLUMBIACOLUMBIACOLUMBIACOLUMBIACOLUMBIACOLUMBIACOLUMBIACOLUMBIACOLUMBIACOLUMBIA
ELLICOTTELLICOTTELLICOTTELLICOTTELLICOTTELLICOTTELLICOTTELLICOTTELLICOTTELLICOTTELLICOTTELLICOTTELLICOTTELLICOTTELLICOTTELLICOTTELLICOTTELLICOTTELLICOTTELLICOTTELLICOTTELLICOTTELLICOTTELLICOTTELLICOTTELLICOTTELLICOTTELLICOTTELLICOTTELLICOTTELLICOTTELLICOTTELLICOTTELLICOTTELLICOTTELLICOTTELLICOTTELLICOTTELLICOTTELLICOTTELLICOTTELLICOTTELLICOTTELLICOTTELLICOTTELLICOTTELLICOTTELLICOTTELLICOTTCITYCITYCITYCITYCITYCITYCITYCITYCITYCITYCITYCITYCITYCITYCITYCITYCITYCITYCITYCITYCITYCITYCITYCITYCITYCITYCITYCITYCITYCITYCITYCITYCITYCITYCITYCITYCITYCITYCITYCITYCITYCITYCITYCITYCITYCITYCITYCITYCITY
SOUTHEASTSOUTHEASTSOUTHEASTSOUTHEASTSOUTHEASTSOUTHEASTSOUTHEASTSOUTHEASTSOUTHEASTSOUTHEASTSOUTHEASTSOUTHEASTSOUTHEASTSOUTHEASTSOUTHEASTSOUTHEASTSOUTHEASTSOUTHEASTSOUTHEASTSOUTHEASTSOUTHEASTSOUTHEASTSOUTHEASTSOUTHEASTSOUTHEASTSOUTHEASTSOUTHEASTSOUTHEASTSOUTHEASTSOUTHEASTSOUTHEASTSOUTHEASTSOUTHEASTSOUTHEASTSOUTHEASTSOUTHEASTSOUTHEASTSOUTHEASTSOUTHEASTSOUTHEASTSOUTHEASTSOUTHEASTSOUTHEASTSOUTHEASTSOUTHEASTSOUTHEASTSOUTHEASTSOUTHEASTSOUTHEAST
ELKRIDGEELKRIDGEELKRIDGEELKRIDGEELKRIDGEELKRIDGEELKRIDGEELKRIDGEELKRIDGEELKRIDGEELKRIDGEELKRIDGEELKRIDGEELKRIDGEELKRIDGEELKRIDGEELKRIDGEELKRIDGEELKRIDGEELKRIDGEELKRIDGEELKRIDGEELKRIDGEELKRIDGEELKRIDGEELKRIDGEELKRIDGEELKRIDGEELKRIDGEELKRIDGEELKRIDGEELKRIDGEELKRIDGEELKRIDGEELKRIDGEELKRIDGEELKRIDGEELKRIDGEELKRIDGEELKRIDGEELKRIDGEELKRIDGEELKRIDGEELKRIDGEELKRIDGEELKRIDGEELKRIDGEELKRIDGEELKRIDGE
RURAL WESTRURAL WESTRURAL WESTRURAL WESTRURAL WESTRURAL WESTRURAL WESTRURAL WESTRURAL WESTRURAL WESTRURAL WESTRURAL WESTRURAL WESTRURAL WESTRURAL WESTRURAL WESTRURAL WESTRURAL WESTRURAL WESTRURAL WESTRURAL WESTRURAL WESTRURAL WESTRURAL WESTRURAL WESTRURAL WESTRURAL WESTRURAL WESTRURAL WESTRURAL WESTRURAL WESTRURAL WESTRURAL WESTRURAL WESTRURAL WESTRURAL WESTRURAL WESTRURAL WESTRURAL WESTRURAL WESTRURAL WESTRURAL WESTRURAL WESTRURAL WESTRURAL WESTRURAL WESTRURAL WESTRURAL WESTRURAL WEST
71
Designated Place Types – Future Residential Development
As indicated at the beginning of this chapter, PlanMaryland asks local jurisdictions to refine their Priority Funding Areas (PFA) by identifying more focused target areas for future growth. These include three designated place types within the PFA: Growth and Revitalization areas, Established Community areas, and Future Growth areas. The Future Growth area is not proposed for Howard County as this place type applies to large areas of rural land outside the PFA/PSA that are planned for extension of public water and sewer service in the future. An example of this would be a Maryland county that has municipalities with future annexation potential. The other two place types are for rural areas outside the PFA: Low Density Development areas and Rural Resource areas where agricultural land preservation has priority. These correspond to the County’s RR (Rural Residential) and RC (Rural Conservation) zoning districts. PlanMaryland place designations are intended both to decrease sprawl via compact development and to focus local and State resources to support smart growth. Map 6-2 designates the relevant four place types for Howard County.
Map 6-2 also shows the five planning areas that were introduced and have been utilized since the adoption of General Plan 2000 (also shown in Map 6-1). These five planning areas will continue to be used for some development tracking and statistical purposes, coordination with other County master plans such as the Howard County Land Preservation, Recreation and Parks Plan, and potential small area planning efforts.
Sustainable Growth and Agricultural Preservation Act of 2012
New restrictions on the development of major subdivisions using septic systems in rural areas were adopted by the Maryland General Assembly in April 2012 through the Sustainable Growth and Agricultural Preservation Act (Senate Bill 236). This Act requires local jurisdictions to classify land into one of four “Growth Tiers” based on the following:
Tier I - designated growth area served by public sewer;
Tier II - designated for future extension of public sewer service;
Tier III - not planned for sewer service, not dominated by agricultural or forest, and planned for large lot development with septic systems;
Tier IV - not planned for sewer service, dominated by agricultural and forest land planned for resource protection.
The intent of this legislation is to prohibit major subdivisions or five or more lots in Tier IV areas. Local jurisdictions must adopt tier designations by December 31, 2012 or all areas not served by public sewer will be restricted to minor subdivisions of four or fewer lots. Map 6-3 shows the Growth Tiers for Howard County. Tier I is our Priority Funding Area, which is the Planned Public Water and Sewer Service Area. No areas are designated for Tier II, since there are no plans for further extension of the Public Water and Sewer Service Area in the future. Tier III equates to the RR zoning district and Tier IV is the RC zoning district. The purpose statements in these two zoning districts clearly reflect the planning objectives for these two tiers.
Two amendments were adopted to this State law to moderate the impact of prohibiting new major subdivisions in Tier IV. One is to “grandfather” any subdivision rights that were specifically retained in an agricultural, environmental, or historic preservation easement for a particular property. The other is an allowance for the possibility of density transfer of development rights from Tier IV properties. Howard County’s DEO (Density Exchange Option) zoning district
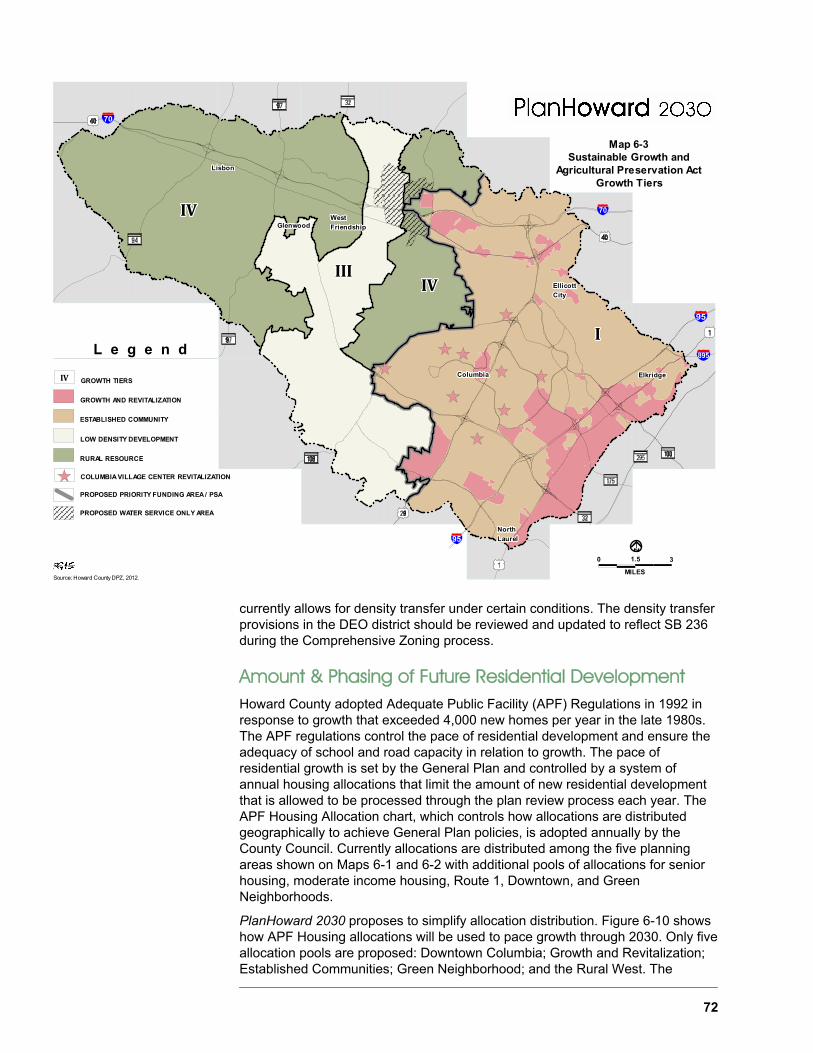
72
currently allows for density transfer under certain conditions. The density transfer provisions in the DEO district should be reviewed and updated to reflect SB 236 during the Comprehensive Zoning process.
Amount & Phasing of Future Residential Development Howard County adopted Adequate Public Facility (APF) Regulations in 1992 in response to growth that exceeded 4,000 new homes per year in the late 1980s. The APF regulations control the pace of residential development and ensure the adequacy of school and road capacity in relation to growth. The pace of residential growth is set by the General Plan and controlled by a system of annual housing allocations that limit the amount of new residential development that is allowed to be processed through the plan review process each year. The APF Housing Allocation chart, which controls how allocations are distributed geographically to achieve General Plan policies, is adopted annually by the County Council. Currently allocations are distributed among the five planning areas shown on Maps 6-1 and 6-2 with additional pools of allocations for senior housing, moderate income housing, Route 1, Downtown, and Green Neighborhoods.
PlanHoward 2030 proposes to simplify allocation distribution. Figure 6-10 shows how APF Housing allocations will be used to pace growth through 2030. Only five allocation pools are proposed: Downtown Columbia; Growth and Revitalization; Established Communities; Green Neighborhood; and the Rural West. The
Map 6-3Sustainable Growth and
Agricultural Preservation ActGrowth Tiers
30 1.5
MILES
COLUMBIA VILLAGE CENTER REVITALIZATION
PROPOSED PRIORITY FUNDING AREA / PSA
PROPOSED WATER SERVICE ONLY AREA
Source: Howard County DPZ, 2012.
L e g e n d
GROWTH AND REVITALIZATION
ESTABLISHED COMMUNITY
LOW DENSITY DEVELOPMENT
IVIVIVIVIVIVIVIVIVIVIVIVIVIVIVIVIVIVIVIVIVIVIVIVIVIVIVIVIVIVIVIVIVIVIVIVIVIVIVIVIVIVIVIVIVIVIVIVIV
RURAL RESOURCE
GROWTH TIERSElkridgeElkridgeElkridgeElkridgeElkridgeElkridgeElkridgeElkridgeElkridgeElkridgeElkridgeElkridgeElkridgeElkridgeElkridgeElkridgeElkridgeElkridgeElkridgeElkridgeElkridgeElkridgeElkridgeElkridgeElkridgeElkridgeElkridgeElkridgeElkridgeElkridgeElkridgeElkridgeElkridgeElkridgeElkridgeElkridgeElkridgeElkridgeElkridgeElkridgeElkridgeElkridgeElkridgeElkridgeElkridgeElkridgeElkridgeElkridgeElkridge
EllicottEllicottEllicottEllicottEllicottEllicottEllicottEllicottEllicottEllicottEllicottEllicottEllicottEllicottEllicottEllicottEllicottEllicottEllicottEllicottEllicottEllicottEllicottEllicottEllicottEllicottEllicottEllicottEllicottEllicottEllicottEllicottEllicottEllicottEllicottEllicottEllicottEllicottEllicottEllicottEllicottEllicottEllicottEllicottEllicottEllicottEllicottEllicottEllicottCityCityCityCityCityCityCityCityCityCityCityCityCityCityCityCityCityCityCityCityCityCityCityCityCityCityCityCityCityCityCityCityCityCityCityCityCityCityCityCityCityCityCityCityCityCityCityCityCity
ColumbiaColumbiaColumbiaColumbiaColumbiaColumbiaColumbiaColumbiaColumbiaColumbiaColumbiaColumbiaColumbiaColumbiaColumbiaColumbiaColumbiaColumbiaColumbiaColumbiaColumbiaColumbiaColumbiaColumbiaColumbiaColumbiaColumbiaColumbiaColumbiaColumbiaColumbiaColumbiaColumbiaColumbiaColumbiaColumbiaColumbiaColumbiaColumbiaColumbiaColumbiaColumbiaColumbiaColumbiaColumbiaColumbiaColumbiaColumbiaColumbia
NorthNorthNorthNorthNorthNorthNorthNorthNorthNorthNorthNorthNorthNorthNorthNorthNorthNorthNorthNorthNorthNorthNorthNorthNorthNorthNorthNorthNorthNorthNorthNorthNorthNorthNorthNorthNorthNorthNorthNorthNorthNorthNorthNorthNorthNorthNorthNorthNorthLaurelLaurelLaurelLaurelLaurelLaurelLaurelLaurelLaurelLaurelLaurelLaurelLaurelLaurelLaurelLaurelLaurelLaurelLaurelLaurelLaurelLaurelLaurelLaurelLaurelLaurelLaurelLaurelLaurelLaurelLaurelLaurelLaurelLaurelLaurelLaurelLaurelLaurelLaurelLaurelLaurelLaurelLaurelLaurelLaurelLaurelLaurelLaurelLaurel
LisbonLisbonLisbonLisbonLisbonLisbonLisbonLisbonLisbonLisbonLisbonLisbonLisbonLisbonLisbonLisbonLisbonLisbonLisbonLisbonLisbonLisbonLisbonLisbonLisbonLisbonLisbonLisbonLisbonLisbonLisbonLisbonLisbonLisbonLisbonLisbonLisbonLisbonLisbonLisbonLisbonLisbonLisbonLisbonLisbonLisbonLisbonLisbonLisbon
GlenwoodGlenwoodGlenwoodGlenwoodGlenwoodGlenwoodGlenwoodGlenwoodGlenwoodGlenwoodGlenwoodGlenwoodGlenwoodGlenwoodGlenwoodGlenwoodGlenwoodGlenwoodGlenwoodGlenwoodGlenwoodGlenwoodGlenwoodGlenwoodGlenwoodGlenwoodGlenwoodGlenwoodGlenwoodGlenwoodGlenwoodGlenwoodGlenwoodGlenwoodGlenwoodGlenwoodGlenwoodGlenwoodGlenwoodGlenwoodGlenwoodGlenwoodGlenwoodGlenwoodGlenwoodGlenwoodGlenwoodGlenwoodGlenwoodWestWestWestWestWestWestWestWestWestWestWestWestWestWestWestWestWestWestWestWestWestWestWestWestWestWestWestWestWestWestWestWestWestWestWestWestWestWestWestWestWestWestWestWestWestWestWestWestWestFriendshipFriendshipFriendshipFriendshipFriendshipFriendshipFriendshipFriendshipFriendshipFriendshipFriendshipFriendshipFriendshipFriendshipFriendshipFriendshipFriendshipFriendshipFriendshipFriendshipFriendshipFriendshipFriendshipFriendshipFriendshipFriendshipFriendshipFriendshipFriendshipFriendshipFriendshipFriendshipFriendshipFriendshipFriendshipFriendshipFriendshipFriendshipFriendshipFriendshipFriendshipFriendshipFriendshipFriendshipFriendshipFriendshipFriendshipFriendshipFriendship
IIIIIIIIIIIIIIIIIIIIIIIIIIIIIIIIIIIIIIIIIIIIIIIII
IVIVIVIVIVIVIVIVIVIVIVIVIVIVIVIVIVIVIVIVIVIVIVIVIVIVIVIVIVIVIVIVIVIVIVIVIVIVIVIVIVIVIVIVIVIVIVIVIV
IIIIIIIIIIIIIIIIIIIIIIIIIIIIIIIIIIIIIIIIIIIIIIIIIIIIIIIIIIIIIIIIIIIIIIIIIIIIIIIIIIIIIIIIIIIIIIIIIIIIIIIIIIIIIIIIIIIIIIIIIIIIIIIIIIIIIIIIIIIIIIIIIIIIVIVIVIVIVIVIVIVIVIVIVIVIVIVIVIVIVIVIVIVIVIVIVIVIVIVIVIVIVIVIVIVIVIVIVIVIVIVIVIVIVIVIVIVIVIVIVIVIV

73
Downtown Columbia, Growth and Revitalization, Established Communities, and Rural West areas are shown on Map 6-2. Green Neighborhood allocations can be granted anywhere in the PFA for development meeting green neighborhood design standards. Allocations are granted at the initial planning stage when sketch or preliminary plans are first reviewed by DPZ. Since it typically takes several years from initial plans to the construction and occupancy of all units in a project, allocations are granted three years in the future per the APF law. The first allocation year in Figure 6-10 is thus 2015, three years after the 2012 adoption year of PlanHoward 2030.
Downtown Columbia. These allocations are based on the Downtown Columbia Plan adopted in 2010. The annualized pace of growth shown in Figure 6-10 is based on the current housing unit allocation chart adopted by the County Council. Over the 16-year allocation period from 2015 through 2030, 3,750 Downtown Columbia allocations are available. Including the 950 allocations that were made available in the 2013 and 2014 allocation years in previous allocation charts, a total of 4,700 of the 5,500 ultimate approved Downtown units will be allocated, reflecting the maximum units allowed in the first two of the three total growth phases in the Downtown Plan.
Growth and Revitalization. These areas are defined on Map 6-2 and include the Route 1 Corridor, the Snowden River Parkway area, Maple Lawn, Emerson, Turf Valley, Waverly Woods, Columbia Village Centers, nodes along the Route 40 Corridor, and other locations. These are areas where current policies, zoning, and other regulations, as well as policies suggested in PlanHoward 2030, seek to focus most future County growth. Allocations for the entire Growth and Revitalization area are set at 1,200 housing units per year.
Established Communities. These areas are also defined on Map 6-2 and consist of already established residential and commercial areas in the eastern portion of the County where limited growth is expected, primarily through residential infill development. This entire area is much larger than the entire Growth and Revitalization area, but has much less
Downtown Growth and Established Green Rural TotalYear Columbia Revitalization Communities Neighborhood West County2015 400 1,200 400 150 100 2,2502016 350 1,200 400 150 100 2,2002017 300 1,200 400 150 100 2,1502018 100 1,200 400 150 100 1,9502019 100 1,200 400 150 100 1,9502020 96 1,200 400 150 100 1,9462021 400 1,200 400 150 100 2,2502022 350 1,200 400 150 100 2,2002023 300 1,200 400 150 100 2,1502024 225 1,200 400 150 100 2,0752025 200 1,200 400 150 100 2,0502026 200 1,200 400 150 100 2,0502027 200 1,200 400 150 100 2,0502028 179 1,200 400 150 100 2,0292029 175 1,200 400 150 100 2,0252030 175 1,200 400 150 100 2,025
20 Year Totals 3,750 19,200 6,400 2,400 1,600 33,350Source: Howard County DPZ
Figure 6-10Howard County APFO Allocations Chart

74
growth capacity and at 400 units per year contains only a third of the phased growth compared to the Growth and Revitalization area.
Green Neighborhood. This category replicates the Green Neighborhood set-aside in the currently adopted APF allocation chart. This set-aside was first added to the allocation chart in 2007. These units can be built anywhere in the County if the proposed plans meet Green Neighborhood standards as defined in the Howard County Subdivision and Land Development Regulations. The current APF chart includes 100 Green Neighborhood allocations per year. PlanHoward 2030 increases the annual number to 150 with the goal of promoting more green development in Howard County.
Rural West. This area is outside of the Priority Funding Area, is not served by public water and sewer, and includes both the Low Density Development and Rural Resource designated place types. The current APF chart includes 150 Rural West allocations per year. PlanHoward 2030 decreases the annual number to 100, slowing future development in the West through 2030. There are, however, currently a significant number of grandfathered lots.
The total annual pace in Figure 6-10 for all areas combined is based on the current adopted APF allocation totals through 2020, with the same pace extended through 2030. Development has slowed due to the recession that began at the end of 2008, but it is expected that as the economy picks up over the next several years the housing market will return to more typical levels. The APF allocation chart based on Figure 6-10 allows for renewed development opportunities, while still capping growth so that it will not exceed current housing allocation levels. The APF schools test will continue to prevent development in areas of school overcrowding.
As noted above, Figure 6-10 does not include the Senior East, Route 1 and MIHU allocation set-asides, nor the Columbia, Elkridge, Ellicott City, and Southeast Planning areas that are included in the current APF chart, thus reducing the number of allocation pools from ten to five. Age-restricted units and moderate income housing units can continue to be built, but rather than having their own allocation pool, they will utilize allocations from the areas in the new APF chart. The new chart simplifies APF and better targets future development to intended growth and revitalization areas.
As stated earlier, a lot of future development will consist of higher density projects. Numerous allocation categories with small numbers of allocations have not worked well for larger multifamily or mixed-use projects. Project design, financing, and market flexibility will be better supported by having larger numbers of allocations available in fewer areas, while retaining the same overall residential development cap.
Policies and Implementing Actions POLICY 6.1 – Maintain adequate facilities and services to accommodate growth.
Implementing Actions
a. Place Types and Tiers. Obtain State concurrence on PlanHoward 2030 place designations and tiers in accordance with PlanMaryland’s final criteria and procedures and the Sustainable Growth and Agricultural Preservation Act.

75
b. Revise APF Regulations. Amend the current Adequate Public Facilities regulations to reduce allocation categories and reflect designated places.
c. APF Housing Allocations. Incorporate the PlanHoward 2030 housing forecasts into the Adequate Public Facilities Housing Allocation Chart.
d. Zoning. Reduce competition for land resources by promoting more compact development in appropriate growth and revitalization areas.
e. Density Exchange Option. Review and, as appropriate, amend the density exchange provisions of the DEO zoning district during the Comprehensive Zoning process to help mitigate subdivision restrictions placed on Tier IV properties.
f. Targeted Funding. Optimize the use of State and County infrastructure funding and program resources targeted to County-designated place types.
POLICY 6.2 – Ensure that the County’s needs for land for government facilities and land preservation are met in light of competing needs for housing and economic development.
Implementing Actions
a. Infrastructure Concurrency. Determine the amount and location of land needed for future schools and other facilities, including park and green infrastructure preservation priorities.
b. Capital Improvements Master Plan. Implement land acquisition priorities and funding via the ten-year Capital Improvement Master Plan.
Nonresidential Growth and Development Job Growth
Job growth in Howard County has been robust over the past two decades. In 1990, there were 106,000 jobs in the County. By 2009, the total increased to 187,000 jobs. This is an average growth of about 4,280 new jobs per year over the 19-year period. This time period includes three recessions – 1990/91, 2001, and 2008/09. Despite these recessionary periods, Howard County only lost jobs during the most recent recession, known as the “great recession,” when there was a 2,300 job decline between 2008 and 2009. Job growth remained basically flat in Howard County as a result of the other two recessions. From 2000 to 2009, Howard gained 27,900 new jobs, an 18% increase. This ranks Howard fifth in Central Maryland in absolute job growth for this most recent nine-year period, following Anne Arundel, Baltimore, Montgomery, and Prince George’s Counties, respectively. Baltimore City has experienced job declines over the last two decades. Figure 6-11 summarizes this historical job growth.
Significant job increases that have occurred over the past 20 years necessitate new nonresidential development. Figure 6-12 summarizes the total nonresidential rentable building area by building type for jurisdictions in the Baltimore region as of 2010. About 15%, or 71 million of the total 485 million square feet, is located in Howard County. Baltimore County, Baltimore City, and Anne Arundel County have the greatest amount of total space, respectively.
General Plan 2000 set job growth targets of 4,000 new jobs per year between 2000 and 2010 and 3,000 jobs per year between 2010 and 2020. This was based on a rationale that the strong job growth of the mid- and late-1990s would continue for a while before slowing down into the next decade as undeveloped land became scarcer. Actual job growth between 2000 and 2009 averaged about

76
3,100 jobs per year, less than the 4,000 annual growth targets for this initial decade. However, considering that the two recessions that occurred since 2000 had not been anticipated, the County fared relatively well due to strong job growth in the middle of the last decade.
Capacity for Future Nonresidential Growth
In 2010 there was a total of 10,000 acres of developed commercial (office and retail), industrial, and institutional land. About 314 additional acres had signed site plans where construction was already under way or would begin soon. Another 227 acres were being reviewed for proposed future development. The remaining 1,351 acres with additional nonresidential capacity based on current zoning were undeveloped with no plans for them yet. This includes 614 commercially zoned acres and 737 industrially zoned acres. Figure 6-13 shows these acres, including their distribution in each planning area.
This nonresidential land use capacity can be translated into potential jobs based on zoning density. Based on current zoning, there is an estimated capacity for an additional 78,000 jobs in Howard County. This includes new jobs associated with the Downtown Columbia plan. The Downtown acreage for this is not included in Figure 6-14 since it is primarily a redevelopment or intensification project. With just over 11% of nonresidential land in Howard County undeveloped, much of the future economic growth will occur through redevelopment or a more intensive use of existing properties.
Jurisdiction Jobs Percent Jobs Percent Jobs PercentAnne Arundel County 250.1 11% 295.2 11% 357.0 13%Baltimore County 399.5 17% 448.5 17% 505.6 18%Carroll County 52.4 2% 68.1 3% 82.0 3%Harford County 75.1 3% 97.1 4% 114.9 4%Howard County 105.8 5% 159.2 6% 187.1 7%Baltimore City 508.5 22% 446.4 17% 384.8 14%Frederick County 72.3 3% 103.9 4% 127.3 4%Montgomery County 512.6 22% 593.0 23% 645.2 23%Prince George's County 372.4 16% 391.2 15% 428.4 15%TOTAL 2,348.6 100% 2,602.5 100% 2,832.4 100%Source: U.S. Bureau of Economic Analysis, May 2011
1990 2000 2009
Figure 6-11Central Maryland Employment (1,000s)
Jurisdiction Area Percent Area Percent Area Percent Area Percent Area PercentBaltimore County 37,300 30% 17,200 35% 44,100 24% 44,400 35% 143,000 29%Baltimore City 45,400 36% 5,700 12% 54,800 30% 27,100 21% 133,000 27%Anne Arundel County 19,800 16% 11,000 22% 25,100 14% 27,000 21% 82,900 17%Howard County 16,800 13% 11,500 23% 31,300 17% 11,000 9% 70,600 15%Harford County 4,600 4% 2,700 6% 19,200 11% 11,500 9% 38,000 8%Carroll County 2,100 2% 900 2% 7,900 4% 7,000 5% 17,900 4%TOTAL 126,000 100% 49,000 100% 182,400 100% 128,000 100% 485,400 100%Source: Howard County Economic Development Authority, 4th quarter 2010 data
Office Space Flex Space
Figure 6-12Baltimore Region Rentable Building Area by Type in 2010 (X 1,000 sq. ft.)
Industrial Space Retail Space Total Space
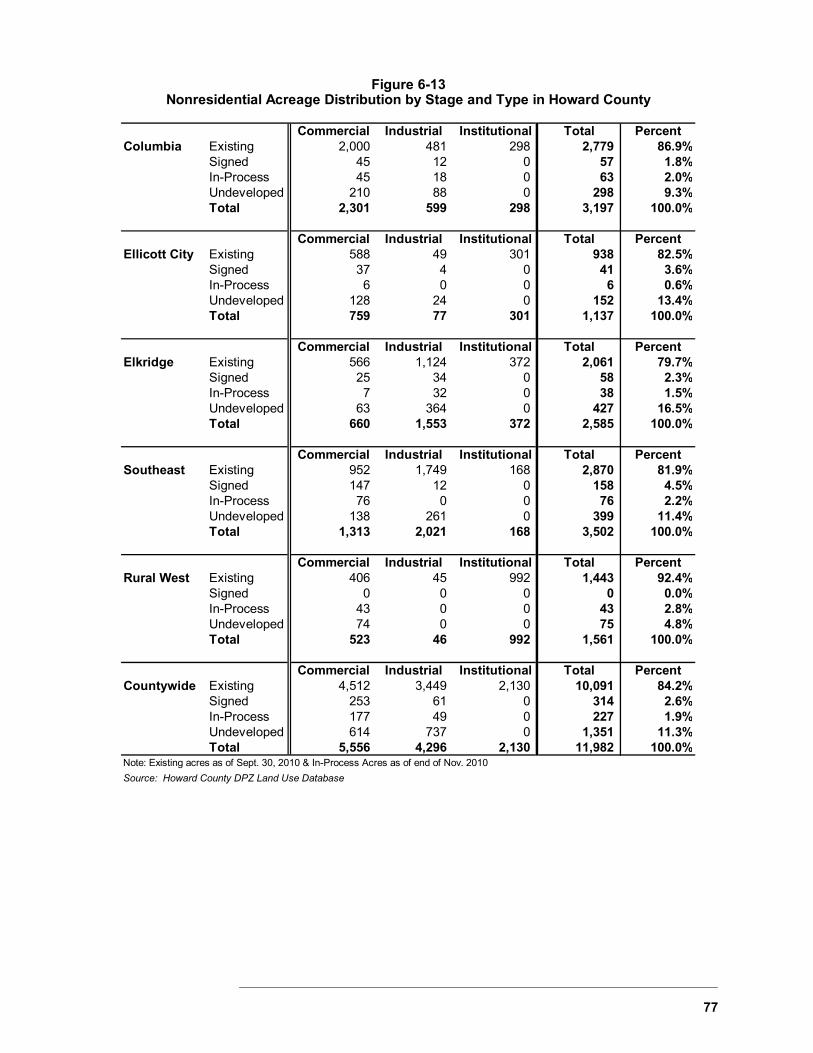
77
Commercial Industrial Institutional Total PercentColumbia Existing 2,000 481 298 2,779 86.9%
Signed 45 12 0 57 1.8%In-Process 45 18 0 63 2.0%Undeveloped 210 88 0 298 9.3%Total 2,301 599 298 3,197 100.0%
Commercial Industrial Institutional Total PercentEllicott City Existing 588 49 301 938 82.5%
Signed 37 4 0 41 3.6%In-Process 6 0 0 6 0.6%Undeveloped 128 24 0 152 13.4%Total 759 77 301 1,137 100.0%
Commercial Industrial Institutional Total PercentElkridge Existing 566 1,124 372 2,061 79.7%
Signed 25 34 0 58 2.3%In-Process 7 32 0 38 1.5%Undeveloped 63 364 0 427 16.5%Total 660 1,553 372 2,585 100.0%
Commercial Industrial Institutional Total PercentSoutheast Existing 952 1,749 168 2,870 81.9%
Signed 147 12 0 158 4.5%In-Process 76 0 0 76 2.2%Undeveloped 138 261 0 399 11.4%Total 1,313 2,021 168 3,502 100.0%
Commercial Industrial Institutional Total PercentRural West Existing 406 45 992 1,443 92.4%
Signed 0 0 0 0 0.0%In-Process 43 0 0 43 2.8%Undeveloped 74 0 0 75 4.8%Total 523 46 992 1,561 100.0%
Commercial Industrial Institutional Total PercentCountywide Existing 4,512 3,449 2,130 10,091 84.2%
Signed 253 61 0 314 2.6%In-Process 177 49 0 227 1.9%Undeveloped 614 737 0 1,351 11.3%Total 5,556 4,296 2,130 11,982 100.0%
Note: Existing acres as of Sept. 30, 2010 & In-Process Acres as of end of Nov. 2010
Source: Howard County DPZ Land Use Database
Figure 6-13Nonresidential Acreage Distribution by Stage and Type in Howard County

78
Job Growth to 2030
Based on the average pace of job growth in Howard County of about 3,100 new jobs per year over the last decade, continuing to add 3,000 new jobs per year between 2010 and 2030 is a reasonable job target for this general plan. Figure 6-14 summarizes these projections.
Therefore, over the 20-year period a total of 60,000 new jobs are forecast. Based on the available nonresidential land in the County described above and future redevelopment and intensification projects such as Downtown Columbia, there is enough land capacity to accommodate these projected jobs. At this rate it is estimated that there will be about 249,000 jobs in the County by 2030. Howard County’s prime location between Baltimore and Washington is a natural attractor of new businesses which will lead to continued job growth.
Jobs / Housing Balance
Since job growth also depends on having the workforce to fill the jobs, a common measure of how growth has been balanced is the ratio of jobs to housing. Figure 6-15 summarizes the jobs to housing ratio in Howard County since 1990. The jobs to housing ratio has increased from 1.51 in 1990 to 1.78 in 2009. This is a result of continued job growth in the County even while there have been constraints on residential growth due to the County’s Adequate Public Facilities Act. Setting housing limits too low in relation to job growth and associated housing demand contributes to higher housing prices, forcing many Howard County workers to commute greater distances for affordable housing.
Howard County’s current jobs to housing ratio is similar to those in Montgomery and Anne Arundel Counties. In 2010 all three are essentially the same at 1.77, 1.79 and 1.80, respectively. These three counties all have significant numbers of
Year Job Increase Total Jobs2000 159,200 2010 29,900 189,100 2015 15,000 204,100 2020 15,000 219,100 2025 15,000 234,100 2030 15,000 249,100
Source: 2000 job total from U.S. BEA
2010 job estimate from MDP
Howard County Employment Growth TargetsFigure 6-14
Jobs/Year Jobs Households Households1990 105,800 70,000 1.512000 159,200 90,000 1.772009 187,100 105,000 1.78
Source: Jobs data - U.S. Bureau of Economic Analysis
Households - Howard County DPZ
(Data rounded to the nearest 100)
Jobs to Housing Ratio in Howard CountyFigure 6-15
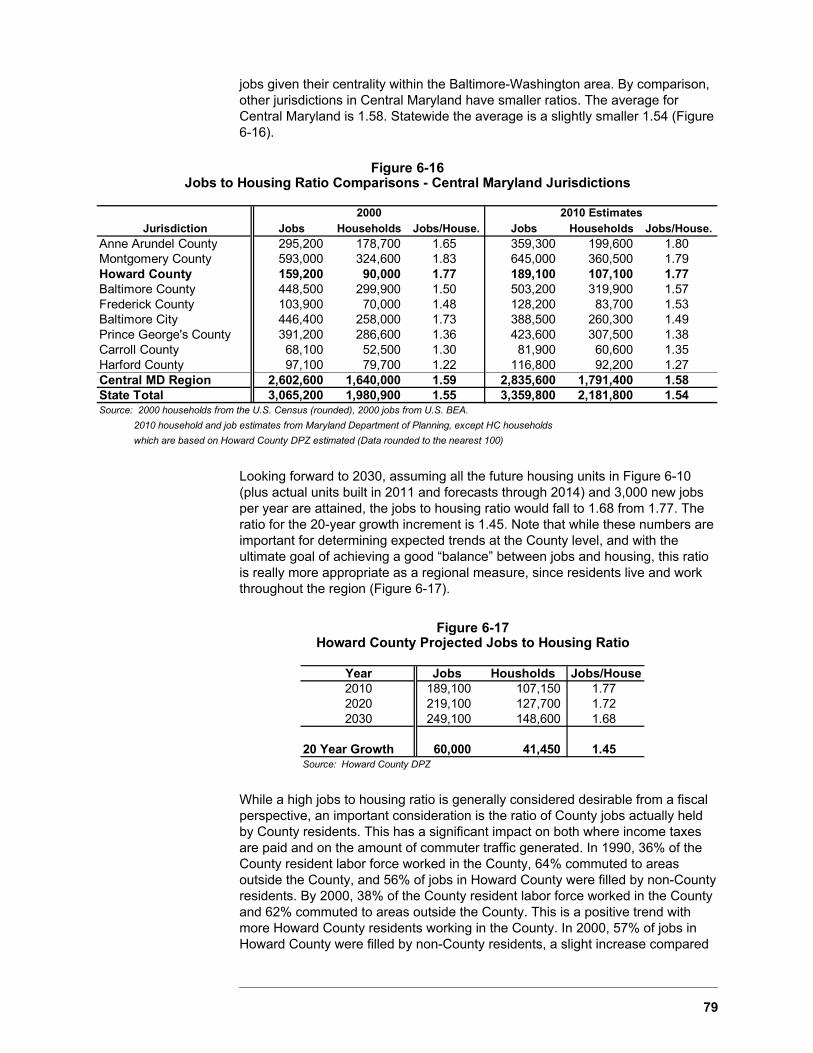
79
jobs given their centrality within the Baltimore-Washington area. By comparison, other jurisdictions in Central Maryland have smaller ratios. The average for Central Maryland is 1.58. Statewide the average is a slightly smaller 1.54 (Figure 6-16).
Looking forward to 2030, assuming all the future housing units in Figure 6-10 (plus actual units built in 2011 and forecasts through 2014) and 3,000 new jobs per year are attained, the jobs to housing ratio would fall to 1.68 from 1.77. The ratio for the 20-year growth increment is 1.45. Note that while these numbers are important for determining expected trends at the County level, and with the ultimate goal of achieving a good “balance” between jobs and housing, this ratio is really more appropriate as a regional measure, since residents live and work throughout the region (Figure 6-17).
While a high jobs to housing ratio is generally considered desirable from a fiscal perspective, an important consideration is the ratio of County jobs actually held by County residents. This has a significant impact on both where income taxes are paid and on the amount of commuter traffic generated. In 1990, 36% of the County resident labor force worked in the County, 64% commuted to areas outside the County, and 56% of jobs in Howard County were filled by non-County residents. By 2000, 38% of the County resident labor force worked in the County and 62% commuted to areas outside the County. This is a positive trend with more Howard County residents working in the County. In 2000, 57% of jobs in Howard County were filled by non-County residents, a slight increase compared
Year Jobs Housholds Jobs/House2010 189,100 107,150 1.772020 219,100 127,700 1.722030 249,100 148,600 1.68
20 Year Growth 60,000 41,450 1.45Source: Howard County DPZ
Figure 6-17Howard County Projected Jobs to Housing Ratio
Jurisdiction Jobs Households Jobs/House. Jobs Households Jobs/House.Anne Arundel County 295,200 178,700 1.65 359,300 199,600 1.80Montgomery County 593,000 324,600 1.83 645,000 360,500 1.79Howard County 159,200 90,000 1.77 189,100 107,100 1.77Baltimore County 448,500 299,900 1.50 503,200 319,900 1.57Frederick County 103,900 70,000 1.48 128,200 83,700 1.53Baltimore City 446,400 258,000 1.73 388,500 260,300 1.49Prince George's County 391,200 286,600 1.36 423,600 307,500 1.38Carroll County 68,100 52,500 1.30 81,900 60,600 1.35Harford County 97,100 79,700 1.22 116,800 92,200 1.27Central MD Region 2,602,600 1,640,000 1.59 2,835,600 1,791,400 1.58State Total 3,065,200 1,980,900 1.55 3,359,800 2,181,800 1.54Source: 2000 households from the U.S. Census (rounded), 2000 jobs from U.S. BEA.
2010 household and job estimates from Maryland Department of Planning, except HC households
which are based on Howard County DPZ estimated (Data rounded to the nearest 100)
Figure 6-16Jobs to Housing Ratio Comparisons - Central Maryland Jurisdictions
2000 2010 Estimates

80
to 1990. Chapter 7, Transportation, includes further discussion on the implications of regional workforce community patterns.
Fiscal Impacts
A fiscal impact study has been conducted as part of PlanHoward 2030. The fiscal study is provided as a supplement to this document and summarizes the fiscal impacts of various growth and market value scenarios. Overall, the study shows that future job and housing growth outlined in this plan pays for itself. That is, revenues such as property and income taxes from new development are enough to cover costs for public services. The study does show, however, that with property and income taxes making up about 90% of General Fund revenues, trends in market values should be watched closely. This is important particularly because the net fiscal margins from multifamily units, which will be built at a higher proportion in the future, are not as great as from single-family detached units. Trends in public school enrollments should also be closely watched given school costs account for about 60% of General Fund costs. Generally, multifamily units generate fewer school children, but if there are fewer single-family detached units built, student yields in these types of units could potentially rise.
The fiscal study also shows that the residential and nonresidential growth targets outlined in this plan achieve a good balance in the commercial-residential assessable base ratio maintaining existing levels. This relates to the importance of achieving an optimal jobs/housing balance as discussed earlier. Similar to the importance of having a diverse job base, maintaining a diverse tax base is healthy from a fiscal perspective to avoid too much reliance on a single land use type.
Policies and Implementing Actions POLICY 6.3 – Use PlanHoward 2030 job and housing forecasts to guide County, regional, and State agency decision making regarding infrastructure and services.
Implementing Actions
a. Baltimore Metropolitan Council. Incorporate PlanHoward 2030 housing, population, and job forecasts into the Baltimore Metropolitan Council’s official regional forecasts.
b. Monitoring. Monitor the amount, type, and location of actual housing, population, and job growth for comparison with PlanHoward 2030 forecasts.
POLICY 6.4 – Ensure that the County continues to capture future job and business growth opportunities.
Implementing Actions
a. Economic Development. Partner with the Economic Development Authority to develop County policies and programs to implement the County’s Strategic Plan for Economic Development.
b. Zoning Regulations. Update zoning and other regulations to address the evolving commercial and industrial markets and development trends.
The Need for More Compact Development Howard County is centrally located within the Baltimore-Washington corridor. With its highly educated workforce Howard County is poised for growth in

81
business and professional services, biotechnology, the health sciences, and alternative energy opportunities. BRAC, cyber security, and related information sciences will also play a central role in the County’s future.
The total Central Maryland population in 2000 was 4.38 million (Figure 6-18). This includes Anne Arundel, Baltimore, Baltimore City, Carroll, Harford, Howard, Frederick, Montgomery, and Prince George’s Counties. Over the last ten years the total population has grown by 350,000, totaling 4.73 million by 2010. This represents a regional growth rate of 8% over the decade (Figure 6-19). Howard County represents about 11% of this total growth and with 287,000 residents; it is currently about 6% of the total regional population.
Based on projections from the Maryland Department of Planning, the state will grow by an additional 890,000 residents by 2030. The Central Maryland region is expected to accommodate 588,000 of these new residents. About 7% of that growth, 41,000 new residents, will occur in Howard County. By 2030 Howard County will be 6% of the total regional population, similar to its share in 2010.
Jurisdiction Population Percent Population Percent Population PercentAnne Arundel County 489,656 11.2% 537,656 11.4% 574,300 10.8%Baltimore County 754,292 17.2% 805,029 17.0% 857,000 16.1%Carroll County 150,897 3.4% 167,134 3.5% 207,300 3.9%Harford County 218,590 5.0% 244,826 5.2% 287,700 5.4%Howard County 247,842 5.7% 287,085 6.1% 328,200 6.2%Baltimore City 651,154 14.9% 620,961 13.1% 682,950 12.8%Frederick County 195,277 4.5% 233,385 4.9% 328,550 6.2%Montgomery County 873,341 19.9% 971,777 20.5% 1,125,000 21.1%Prince George's County 801,515 18.3% 863,420 18.2% 928,300 17.5%Central MD Region 4,382,564 100.0% 4,731,273 100.0% 5,319,300 100.0%State Total 5,296,486 5,773,552 6,664,250Source: 2000 and 2010 from U.S. Census. 2030 from Maryland Department of Planning as of
May, 2011
2000 2010 2030
Figure 6-18Central Maryland and State Population 2000, 2010 and 2030
Jurisdiction Population % Increase Population % IncreaseAnne Arundel County 48,000 9.8% 36,644 6.8%Baltimore County 50,737 6.7% 51,971 6.5%Carroll County 16,237 10.8% 40,166 24.0%Harford County 26,236 12.0% 42,874 17.5%Howard County 39,243 15.8% 41,115 14.3%Baltimore City (30,193) -4.6% 61,989 10.0%Frederick County 38,108 19.5% 95,165 40.8%Montgomery County 98,436 11.3% 153,223 15.8%Prince George's County 61,905 7.7% 64,880 7.5%Central MD Region 348,709 8.0% 588,027 12.4%State Total 649,418 9.0% 890,698 15.4%Source: 2000 and 2010 from U.S. Census. 2030 from Maryland Department
of Planning as of May, 2011
2010 to 2030
Figure 6-19Central Maryland and State Population Growth
2000 to 2010

82
Smarter Growth Under General Plan 2000, Howard County designated areas for increased compact, mixed-use development. These included planned new communities such as Maple Lawn, Emerson, Waverly, and Turf Valley, as well as the redevelopment of Downtown Columbia, Route 1, and Route 40. In 2004 comprehensive rezoning established mixed-use zones along the Route 1 Corridor. In 2008 the Route 40 Study resulted in a mixed-use overlay zone for that corridor. In 2010 the Downtown Columbia Plan established the strategy for mixed-use revitalization in the County’s urban center. The earliest mixed-use zones in the Route 1 Corridor should now be reevaluated and revised, if necessary, based on experience gained over the last eight years. Because Howard County’s population will continue to increase while the amount of land available for development in the Priority Funding Area will continue to decrease, more compact development will be needed to accommodate future growth.
Challenges and Opportunities
Current challenges for redevelopment that have been recognized, particularly along the Route 1 Corridor, include assembly of smaller parcels, business relocation, zoning impediments, land use incompatibility issues, higher costs of multifamily development with structured parking, and financing and infrastructure needs. These challenges need to be addressed to facilitate new growth and capitalize on redevelopment opportunities.
On the other hand, opportunities exist in select locations within both Existing Communities and Growth and Revitalization areas for well-designed, compact development that enhances the surrounding community. In both types of areas new development needs to be context sensitive so that it fits well into the surrounding area in terms of uses and design. More flexibility is needed within the Zoning Regulations to allow and promote context sensitive design rather than uniform approaches. Planned Unit Development (PUD) zoning allows for such flexibility and should be included as a zoning strategy during the Comprehensive Zoning process.
Policies and Implementing Actions POLICY 6.5 – Plan compact and complete communities through the Comprehensive Zoning process.
Implementing Actions
a. Zoning Regulations. Revise the Zoning Regulations to better promote compact redevelopment and appropriate infill.
b. Development Opportunities. Designate appropriate additional areas within the County’s Priority Funding Area for well-designed, compact development in order to accommodate future job and housing growth.
c. Planned Unit Development. Consider Planned Unit Development (PUD) zoning to allow increased flexibility for unique, well-designed, site-specific developments.

83
Overview Howard County has a n extensive interstate and intrastate highway network that provides connectivity to Washington, DC; Baltimore; Thurgood Marshall BWI airport; the Port of Baltimore; Annapolis; and Fort George G. Meade, as well as good access to the Eastern seaboard and the Midwest. Freight and passenger rail service is also available. However, existing peak hour road and highway congestion is projected to increase significantly.
While opportunities for highway improvements are identified, PlanHoward 2030 also focuses on transit, cycling, and pedestrian alternatives, with particular attention paid to supporting sustainable future growth.
State of Maryland Vision A well-maintained, multimodal transportation system facilitates the safe, convenient, affordable, and efficient movement of people, goods, and services within and between population and business centers.
County Context Howard County is well located in terms of access to the State and Federal highway system, rail service, BWI airport, and the Port of Baltimore. High projected employment, housing, and freight volume require significant investment to address the anticpated capacity constraints and congestion. Commuter bus and rail service to both Baltimore and Washington is available at several locations in the County. The County’s transit system, Howard Transit, provides fixed route and paratransit service to most of eastern Howard County and limited paratransit service to the Rural West. However, the frequency and reliability of both regional and local transit service is restricted. To promote other modes of travel, the County is implementing a Pedestrian Master Plan and developing a Bicycle Master Plan in 2012.
7. Transportation
Jennifer Fourney, Grade 4, Gorman Crossing Elementary School

84
Progress under General Plan 2000 Over the last decade, the County achieved the following as called for in General Plan 2000:
Built the MD 32 / Burntwoods Road Interchange
Expanded MD 216 to four lanes from US 29 to Maple Lawn Boulevard
Built MD 216 as a new four-lane roadway from US 29 to I-95
Built a new four-lane roadway from Gorman Road to MD 216 interchange
Built the MD 216 / Loop Road East Interchange
Expanded Dorsey Run Road to four lanes from the CSX railroad spur to MD 32
Built Maple Lawn Boulevard, a new two-lane road from Johns Hopkins Road to MD 216
Expanded and upgraded transit fleet, passenger amenities, and bus shelters
Provided more paratransit service to medical centers
Expanded public outreach and marketing programs including the development of Howard Transit and Commuter Solutions Internet sites
Implemented Pedestrian Plan and initial sidewalk projects
Existing Transportation System The overall regional transportation network is challenged by congestion, energy consumption, greenhouse gases, ozone emission restrictions, the limited availability of additional land for rights-of-way, and constricted Federal, State, and local funding.
The County offers a variety of multimodal transportation options. Currently, Howard County residents and visitors choose the automobile for most travel in and out of the County. About 90% of work, school, and shopping trips are primarily by car. Based on regional trends, the share of car trips is expected to rise to 98% by 2030.
The regional and local economy relies on an efficient transportation system to allow people to get to jobs and shopping, move goods to stores, and transport freight through the region. The County has an extensive road and highway network, linked to one of the nation’s largest port facilities, rail terminals, food and retail distribution centers, and major airports. Due to changing distribution and warehousing business practices, freight movement nationally and in the region is expected to grow at an increasing rate. From 2006 to 2035, freight traffic in, out, and through the State by truck, rail, water, and air is projected to increase from 692 to 1,422 million tons a year, a 105% increase.
The continued growth in trips and congestion will result in increased demand for congestion relief. Some congestion relief can be achieved through highway capacity improvements; however, opportunities for relief will be limited due to limited available rights-of-way, funding, and cost-effectiveness. Congestion can also be partially mitigated through alternative transportation programs including expanding and increasing the frequency of public transit services, high occupancy vehicle and high occupancy toll lanes, ride sharing, and car sharing.
Howard Transit serves the local community connecting riders to their destinations.
GREEN TIP!
Bike or walk. Save gas, save money, and save the
environment.
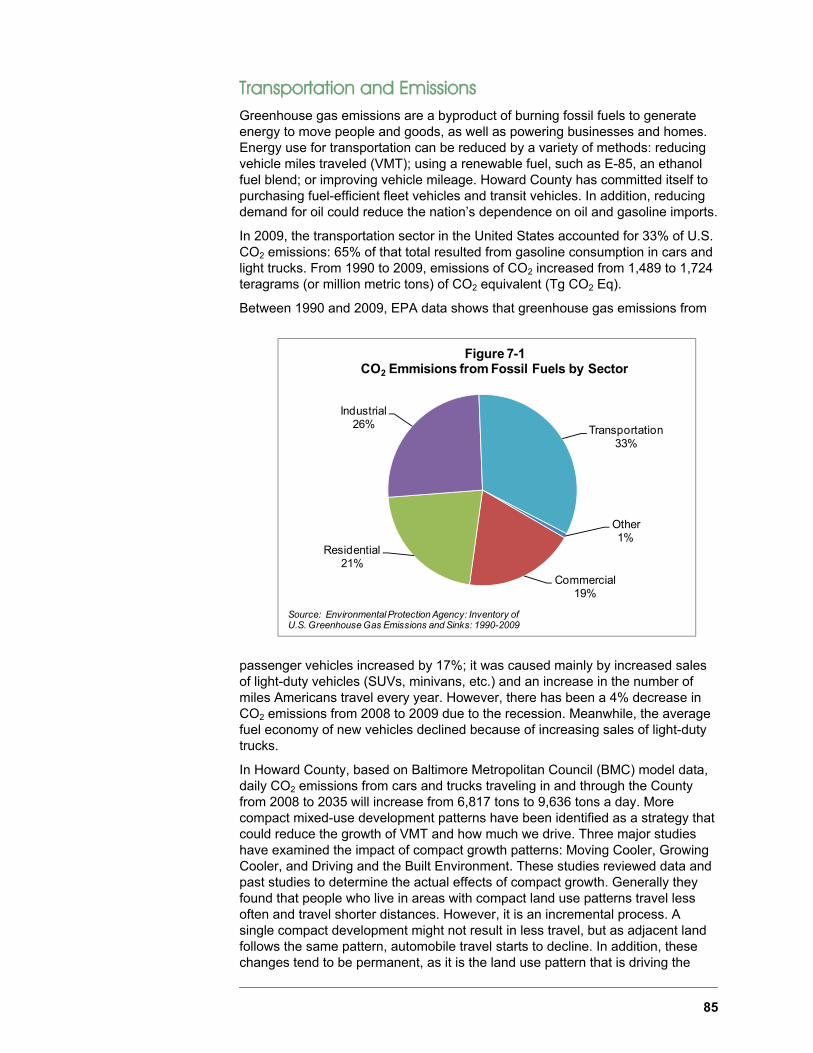
85
Transportation and Emissions Greenhouse gas emissions are a byproduct of burning fossil fuels to generate energy to move people and goods, as well as powering businesses and homes. Energy use for transportation can be reduced by a variety of methods: reducing vehicle miles traveled (VMT); using a renewable fuel, such as E-85, an ethanol fuel blend; or improving vehicle mileage. Howard County has committed itself to purchasing fuel-efficient fleet vehicles and transit vehicles. In addition, reducing demand for oil could reduce the nation’s dependence on oil and gasoline imports.
In 2009, the transportation sector in the United States accounted for 33% of U.S. CO2 emissions: 65% of that total resulted from gasoline consumption in cars and light trucks. From 1990 to 2009, emissions of CO2 increased from 1,489 to 1,724 teragrams (or million metric tons) of CO2 equivalent (Tg CO2 Eq).
Between 1990 and 2009, EPA data shows that greenhouse gas emissions from
passenger vehicles increased by 17%; it was caused mainly by increased sales of light-duty vehicles (SUVs, minivans, etc.) and an increase in the number of miles Americans travel every year. However, there has been a 4% decrease in CO2 emissions from 2008 to 2009 due to the recession. Meanwhile, the average fuel economy of new vehicles declined because of increasing sales of light-duty trucks.
In Howard County, based on Baltimore Metropolitan Council (BMC) model data, daily CO2 emissions from cars and trucks traveling in and through the County from 2008 to 2035 will increase from 6,817 tons to 9,636 tons a day. More compact mixed-use development patterns have been identified as a strategy that could reduce the growth of VMT and how much we drive. Three major studies have examined the impact of compact growth patterns: Moving Cooler, Growing Cooler, and Driving and the Built Environment. These studies reviewed data and past studies to determine the actual effects of compact growth. Generally they found that people who live in areas with compact land use patterns travel less often and travel shorter distances. However, it is an incremental process. A single compact development might not result in less travel, but as adjacent land follows the same pattern, automobile travel starts to decline. In addition, these changes tend to be permanent, as it is the land use pattern that is driving the
Other1%
Commercial19%
Residential 21%
Industrial26% Transportation
33%
Figure 7-1CO2 Emmisions from Fossil Fuels by Sector
Source: Environmental Protection Agency: Inventory of U.S. Greenhouse Gas Emissions and Sinks: 1990-2009
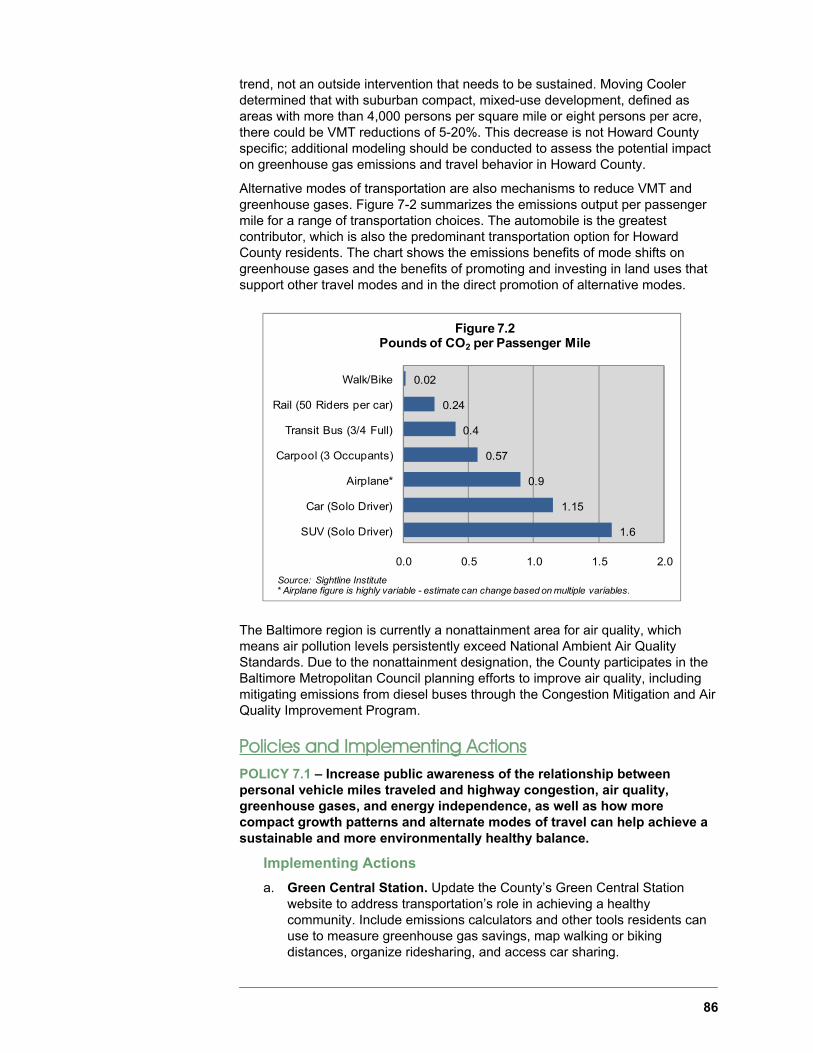
86
trend, not an outside intervention that needs to be sustained. Moving Cooler determined that with suburban compact, mixed-use development, defined as areas with more than 4,000 persons per square mile or eight persons per acre, there could be VMT reductions of 5-20%. This decrease is not Howard County specific; additional modeling should be conducted to assess the potential impact on greenhouse gas emissions and travel behavior in Howard County.
Alternative modes of transportation are also mechanisms to reduce VMT and greenhouse gases. Figure 7-2 summarizes the emissions output per passenger mile for a range of transportation choices. The automobile is the greatest contributor, which is also the predominant transportation option for Howard County residents. The chart shows the emissions benefits of mode shifts on greenhouse gases and the benefits of promoting and investing in land uses that support other travel modes and in the direct promotion of alternative modes.
The Baltimore region is currently a nonattainment area for air quality, which means air pollution levels persistently exceed National Ambient Air Quality Standards. Due to the nonattainment designation, the County participates in the Baltimore Metropolitan Council planning efforts to improve air quality, including mitigating emissions from diesel buses through the Congestion Mitigation and Air Quality Improvement Program.
Policies and Implementing Actions POLICY 7.1 – Increase public awareness of the relationship between personal vehicle miles traveled and highway congestion, air quality, greenhouse gases, and energy independence, as well as how more compact growth patterns and alternate modes of travel can help achieve a sustainable and more environmentally healthy balance.
Implementing Actions
a. Green Central Station. Update the County’s Green Central Station website to address transportation’s role in achieving a healthy community. Include emissions calculators and other tools residents can use to measure greenhouse gas savings, map walking or biking distances, organize ridesharing, and access car sharing.
1.6
1.15
0.9
0.57
0.4
0.24
0.02
0.0 0.5 1.0 1.5 2.0
SUV (Solo Driver)
Car (Solo Driver)
Airplane*
Carpool (3 Occupants)
Transit Bus (3/4 Full)
Rail (50 Riders per car)
Walk/Bike
Figure 7.2 Pounds of CO2 per Passenger Mile
Source: Sightline Institute * Airplane figure is highly variable - estimate can change based on multiple variables.

87
b. Awareness. Expand resident and business awareness and use of alternative transportation modes, including transit, carpooling, walking, and cycling.
c. Safe Routes. Expand and promote the Safe Routes to School Program.
Regional and Local Transportation Planning Howard County actively participates in a variety of regional transportation planning initiatives as a member of the Baltimore Regional Transportation Board (BRTB). The County participates every four years in the Baltimore region’s long-range transportation plan. BRTB’s 2011 long-range transportation plan, Plan-It 2035, was adopted on November 14, 2011.
Traditionally in the United States, transportation planning has focused on vehicle speed, congestion mitigation, and cost as the primary indicators in the evaluation of transportation investments. In recent years, planning practices have evolved to encompass a broader approach that provides for a more balanced set of evaluation criteria, including impact on climate change, negative environmental impacts, and disproportionate negative impacts on low income and minority populations.
Howard County, as a member of the BRTB and a participant in the Plan-It 2035 process, endorsed an updated process to evaluate regionally significant transportation projects. The process assessed the three major types of infrastructure projects: highways, transit, and bicycle/pedestrian from a qualitative policy and technical quantitative perspective. The key evaluation criteria were:
Improve Transportation System Safety
Improve Accessibility
Increase Mobility
Preserve the Environment
Improve Transportation System Security
Promote Prosperity and Economic Opportunity
Foster Participation and Cooperation among All Stakeholders
The BRTB models used to test projects extend beyond the Baltimore Region and also incorporate data from the Washington Council of Governments. Because the BRTB process is used regionally and represents a consensus view among all the Counties in the region, the criteria provide a suitable foundation to evaluate local transportation options.
Howard County also plans for local transportation improvements to implement the General Plan. Additionally, every five years the County’s Transit Development Plan is updated to assess and prioritize transit needs for Howard County’s local transit services. The County also has a pedestrian master plan, which will be updated during 2012 to 2013, and the County is initiating a bicycle plan. The planning process results in prioritization of funding for State and local transit, freight, highway, bicycle, and pedestrian projects.
The major goal of Plan-It 2035 and Howard County’s local planning effort is to develop plans that better balance highway, transit, bicycle, and pedestrian needs and reflect expected funding constraints.
Key Transportation Improvements Anticipated by 2025 (Map 7-1) and Key Transportation Improvements Anticipated by 2035 (Map 7-2) are the major transportation improvements that have been identified from these planning
“Columbia is in a great location with proximity to
Baltimore and D.C. I would like more transit options to
get to and from those places.”
CA Teen Advisory Committee
Regional cooperation is crucial to coordinate the road network to serve local, regional, as well as interstate traffic and commerce.

88
initiatives. Figures 7-3 and 7-4, located at the end of this chapter, provide more information on specific transportation improvements.
Policies and Implementing Actions POLICY 7.2 – Coordinate State, regional, and local planning and implementation for critical improvements and new transportation facilities based on evaluation of options using a wide range of performance, health, environmental, and financial criteria.
Implementing Actions
a. Key Projects. Refine transportation plans and fund the County’s share of projects as identified in: Key Transportation Improvements Anticipated by 2025 (Map 7-1); Key Transportation Improvements Anticipated by 2035 (Map 7-2); Road, Bicycle and Pedestrian Improvements (Figure 7-3); and Transit Priorities (Figure 7-4).
b. Regional Cooperation. Engage in State and regional discussions to develop solutions to transportation funding shortfalls.
M
M
M
M
M
MMILES
31.50
INTERCHANGE / INTERSECTIONIMPROVEMENT
MARC CAMDEN LINE(GROWTH AND INVESTMENT PLAN - 2020 PLAN)
TRANSIT ORIENTED DEVELOPMENT (TOD) SITES
ROAD CAPACITY IMPROVEMENT
L e g e n d
MARC STATION
Source: Howard County DPZ, 2012.
PARK & RIDE LOT
M

89
Roads and Highways The road and highway network in Howard County consists of 1,200 miles of local roads, collectors, and arterials. Each roadway type has a defined traffic carrying function and depends on the functioning of other roads in the network. The entire highway network depends upon the regionally significant highways with the greatest traffic carrying capacity operating efficiently and effectively.
Map 7-3 shows the functional classifications for the County’s road network. These functional classifications are used to determine the right-of-way and road improvements required for both private developments and County capital projects.
Principal Arterial: Provides for efficient and uninterrupted travel across state and metropolitan areas through elimination of intersections and signals.
Intermediate Arterial: Provides access between principal arterial highways and major streets in highly developed areas through the limitation of the type and number of access points from adjacent land uses.
M
M
M
M
M
M
3
MILES
1.5
TRANSIT ORIENTED DEVELOPMENT (TOD) SITES
US 29 RAPID TRANSIT (RT)(DOWNTOWN COLUMBIA TOSILVER SPRING)
0
YELLOW LINE LIGHT RAIL EXTENSION(BWI TO MD 32)
MARC CAMDEN LINE(GROWTH AND INVESTMENT PLAN)
ROAD CAPACITY IMPROVEMENT
INTERCHANGE / INTERSECTIONIMPROVEMENT
RAPID TRANSIT (RT)(DOWNTOWN COLUMBIA TOODENTON MARC STATION)
HOV LANE
L e g e n d
Source: Howard County DPZ, 2012.
MARC STATION
PARK & RIDE LOT
M

90
Minor Arterial: Provides interconnection between principal and intermediate arterials, as well as access to or through high density residential, commercial, retail, or industrial land areas.
Major Collector: Provides primary access to an arterial road for one or more neighborhoods, as well as travel through neighborhoods from external points.
Minor Collector: Connects local roads to one or more major collectors. Provides direct access to abutting properties and internal trips within a neighborhood.
Local Road: Comprises all roads not classified as an arterial or collector. Provides direct access to abutting land uses and higher order roadway classes.
The BMC travel model indicates that congestion and travel time delay in Howard County and the region will continue to increase. Model projections for vehicle travel hours indicate that from 2008 to 2035 vehicle hours of delay will increase by 57%. Vehicle hours of delay are the number of hours drivers will experience due to congestion as compared to free-flowing roads and highways. In addition, significant segments of highways, especially those highways used to transport goods through the region and get people to work, will continue to experience peak period traffic congestion.
Map 7-3Functional Road Classification
MILES
31.50
NEW/UPGRADED INTERCHANGE
NEW/UPGRADED INTERSECTION IMPROVEMENT
EXISTING PARK AND RIDE LOT
FUTURE PARK AND RIDE LOT
L e g e n d
PRINCIPAL ARTERIAL
INTERMEDIATE ARTERIAL
MAJOR COLLECTOR
MINOR ARTERIAL
MINOR COLLECTOR
Source: Howard County DPZ, 2012.

91
Congestion can be mitigated either by increasing the capacity of roads and highways or by reducing demand.
The County’s Adequate Public Facilities (APF) legislation was enacted in 1992 to assess the impact of new development proposals on the level of service at nearby intersections and to require improvements to mitigate congestion, if needed. Highway Level of Service (LOS) is a quantitative and qualitative measure of how well traffic flows through an intersection. LOS relates to such factors as number of lanes, percentage of trucks, total traffic volume, turning movements, signal timing, and other factors which affect intersection congestion. LOS can be described as follows:
Level A is a condition with low traffic volumes, high speeds, and free-flow conditions.
Level B is a condition with light traffic volumes, minor speed restrictions, and stable flow.
Level C is a condition with moderate traffic volumes, where speed and maneuvering are restricted to a limited degree.
Level D is a condition with heavy traffic operating at reasonable speeds, although temporary slowdowns may occur.
Level E is a condition of very heavy flow, relatively low speeds, and short stoppage may occur.
Level F is a condition of extremely heavy flow, with frequent stoppage, and very slow speeds.
New development is also charged a road excise tax, to help fund high priority road improvements anywhere in the County highway network. The tax rate was set in 1992 but was not indexed to inflation until 2008, which has reduced available funding, despite significant increases in highway construction costs in the interim.
Increasing road capacity reduces congestion; however, the effects are not always long-lasting, as people increase their driving in response. Reducing congestion can be accomplished by promoting mechanisms to shift driving to off-peak hours and alternate travel modes (transit, car pools, bicycle, and walking). The APF regulations for Downtown Columbia were amended to include analysis of alternate travel modes and the option to count bicycle and pedestrian improvements in required mitigation.
Policies and Implementing Actions POLICY 7.3 – Prioritize and pursue cost-effective, long-term capacity improvements to the road and highway network.
Implementing Actions
a. Capital Planning. Use Howard County’s Capital Improvement Master Plan to provide predictable funding for the County’s highest priority road projects.
b. APF Regulations. Evaluate the merits of amending the APF regulations to evaluate alternative modes of travel, as well as both increasing the APF road excise tax and allowing a portion of the funds to be used for transit, bicycle, or pedestrian improvements.
GREEN TIP!
Check your tire pressure. Increase
your gas mileage by keeping your tires properly inflated.
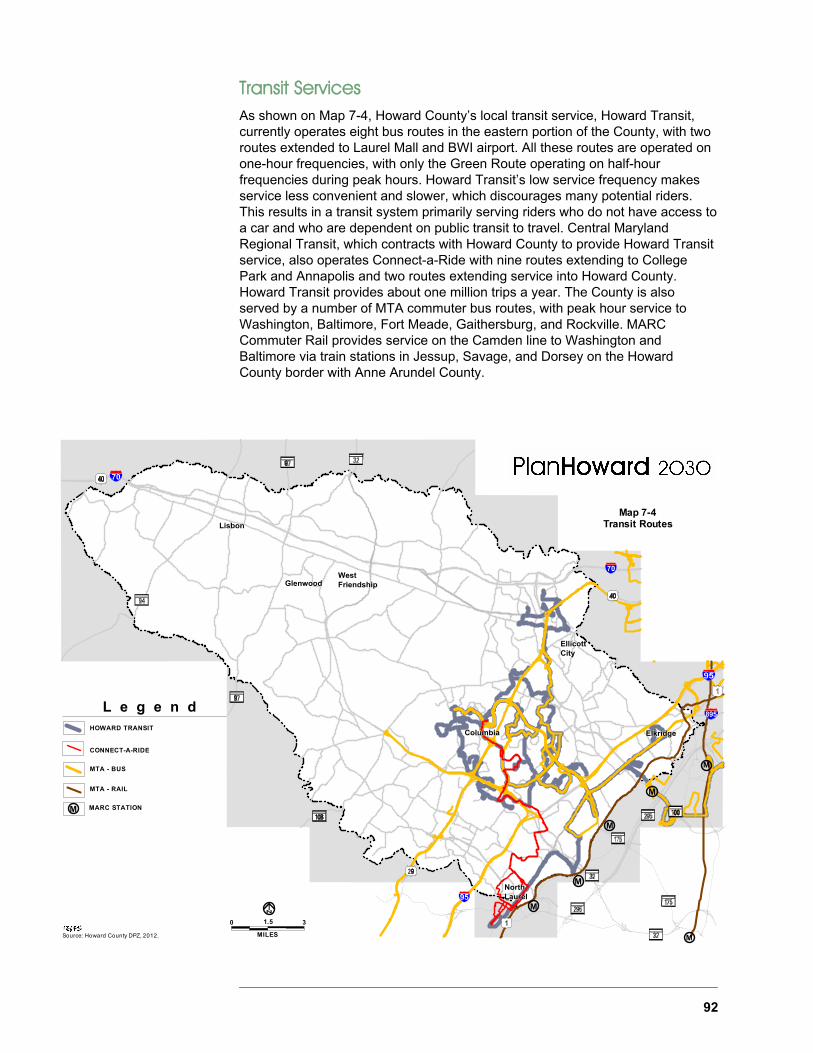
92
Transit Services As shown on Map 7-4, Howard County’s local transit service, Howard Transit, currently operates eight bus routes in the eastern portion of the County, with two routes extended to Laurel Mall and BWI airport. All these routes are operated on one-hour frequencies, with only the Green Route operating on half-hour frequencies during peak hours. Howard Transit’s low service frequency makes service less convenient and slower, which discourages many potential riders. This results in a transit system primarily serving riders who do not have access to a car and who are dependent on public transit to travel. Central Maryland Regional Transit, which contracts with Howard County to provide Howard Transit service, also operates Connect-a-Ride with nine routes extending to College Park and Annapolis and two routes extending service into Howard County. Howard Transit provides about one million trips a year. The County is also served by a number of MTA commuter bus routes, with peak hour service to Washington, Baltimore, Fort Meade, Gaithersburg, and Rockville. MARC Commuter Rail provides service on the Camden line to Washington and Baltimore via train stations in Jessup, Savage, and Dorsey on the Howard County border with Anne Arundel County.
M
M
M
M
M
M
Map 7-4Transit Routes
MILES
31.5
MARC STATION
0
MTA - RAIL
L e g e n d
MTA - BUS
HOWARD TRANSIT
CONNECT-A-RIDE
Source: Howard County DPZ, 2012.
M

93
Howard Transit also operates HT Ride. HT Ride provides specialized paratransit curb-to-curb transportation for individuals with disabilities and senior citizens. HT Ride is provided for those individuals who cannot use the fixed-route Howard Transit services. This specialized service is categorized in two forms:
1) General Services transportation is provided, for those eligible, to and from locations within Howard County with limited service available to medical centers in Baltimore.
2) Americans with Disabilities Act (ADA) transportation service is limited to areas that are within three-quarters of a mile from the Howard Transit fixed-route service. HT Ride has initiated a pilot program using taxis to serve paratransit customers more cost-effectively.
Transit services continue to face a number of issues and challenges that need to be addressed, as they affect financial viability, reliability, public perception, and demand for transit services.
Howard Transit’s Federal and State funding has remained flat for several years while the cost of providing transit services has increased. In 2012, the County is expected to expend about $8 million to support transit services, which is about 77% of the total operating cost for the service. In addition, bus replacement costs are projected at $2 to $2.5 million per year. Increasing service frequency is a highly desirable goal outlined in Howard County’s 2009 Short-Range Transportation Development Plan (see page ES-10 of that document); however, securing additional funding for increased frequency is a challenge.
The Federal Americans with Disabilities Act of 1990 requires the provision of complementary paratransit services when a fixed-route service is offered in a jurisdiction. Service providers must fulfill each ADA trip requested; therefore, ADA service costs are unconstrained. An expansion of fixed-route service areas would result in an increased paratransit obligation.
Howard County’s land use and road design policies have resulted in a street network that can be disconnected and indirect in some situations. This has led to circuitous bus routes that are not serving passengers efficiently. This has also resulted in limited pedestrian and bicycle connections between bus stops and surrounding areas and communities. Howard County expects future development and growth to be directed to Downtown Columbia and nodes along Routes 1 and 40. Concentrating development would support easier and more efficient transit service.
Maps 7-1 and 7-2 and Figures 7-3 and 7-4 identify transit improvements. In 2012, the Baltimore Metropolitan Council is initiating a regional transit study to evaluate existing and potential transit corridors to determine how to more efficiently plan, fund, and coordinate transit options to support future growth.
In 2011, an appointed Transportation Commission recommended the County establish a new Office of Transportation to determine how to enhance the efficiency and quality of the County’s existing transit system, as well as explore regional service models as a cost-effective option of providing increased service. The new office is also intended to facilitate coordination between transit and other transportation modes to enhance connectivity and effectiveness.
Policies and Implementing Actions POLICY 7.4 – Enhance the accessibility and quality of existing transit services.
The increasing number of diesel-hybrid buses in the Howard County transit system contribute to cleaner air.

94
Implementing Actions
a. Transit Operations Facility. Develop a transit operations facility to reduce costs by centralizing fleet maintenance and opening competitive bidding to additional transit service operators.
b. Efficiency and Route Alignment. Maximize efficiency of Howard Transit and HT Ride operations via route alignment and paratransit taxi services.
c. Other Jurisdictions. Expand and maximize efficiency of mid-corridor regional transit with Anne Arundel County, Baltimore County, Montgomery County, Prince George’s County, the City of Laurel, and Fort Meade. Evaluate potential and, if advantageous, establish a new multijurisdictional regional transit agency to provide enhanced mid-corridor bus service that also maximizes investment and connectivity with other Baltimore-Washington regional transportation facilities.
d. Service Frequency. Enhance Howard Transit by implementing half-hour service frequencies, increasing connectivity to other Baltimore-Washington regional transportation facilities (MARC, park-and-ride, pedestrian and bicycle facilites, and Transportation Demand Management initiatives), and instituting other service improvements identified in the Transit Development Plan.
POLICY 7.5 – Utilize the BMC’s Regional Transit Study to develop an effective plan for significantly expanded regional transit service.
Implementing Actions
a. Corridor Evaluation. Evaluate existing and potential transit corridors for future ridership, transit mode options, and cost-effectiveness in order to prioritize public investment within transit corridors.
b. Rights-of-Way. Preserve transit rights-of-way within existing and potential transit corridors.
c. Transit Nodes. Identify locations within the Growth and Revitalization areas for more detailed planning for the development of transit-supportive densities and land uses, as well as pedestrian and bicycle connectivity.
d. Compact Development. Adopt land use policies and regulations to promote compact development patterns that support transit demand through sufficient densities and interconnected street and pedestrian networks.
e. Downtown Columbia. Develop the Downtown Columbia multimodal transit facility and circulator.
Pedestrian and Bicycle Master Plans Most of Howard County’s growth has occurred since 1950, coinciding with the rise in automobile ownership and resulting in the County’s automobile-oriented development patterns. This has resulted in poorly connected bicycle, and pedestrian transportation networks, leaving most residents dependent on the personal automobile to travel to nearly all destinations in and around the County.
A major asset of any community is choice -- including choices in how one travels. Being able to make transportation choices means that for any particular trip, a person would have many viable and efficient transportation options from which to

95
choose: bus, bicycle, car, or on foot. Mode choice provides people with the flexibility to adapt their transportation behaviors depending on the goals of their trip, weather, time, and cost. The concept of “complete streets” is an approach to road design that incorporates pedestrian, bicycle, and transit with motor vehicles so that they are safe and comfortable and allow convenient transfer between modes.
For several decades in Howard County sidewalks were not an integral part of the road improvements. Sidewalk requirements have been strengthened and in 2007, a Pedestrian Master Plan was completed to enable the County to develop safe and reliable pedestrian connections. The economic downturn since 2008 has limited implementation funding, although a number of projects indentified in the plan have been initiated. However, the rate of pedestrian improvements and projects identified in the plan should be accelerated.
Cycling is also an excellent option for many trips. There are many areas in the County where residents are close enough to bicycle to shops, school, or work. However, they are often faced with physical and safety barriers that hinder access and utilization; only a few are willing to breach these barriers. A Bicycle Master Plan has been funded and will be initiated in early 2012 to identify a network of cycling routes, identify barriers, and prioritize projects for implementation. The County’s work on the Bicycle Master Plan will be coordinated with the Columbia Association which is developing an “Active Transportation Action Agenda” for the Columbia pathway system.
Policies and Implementing Actions POLICY 7.6 – Reduce highway congestion, energy consumption, and greenhouse gases by increasing the number of residents using alternate modes of transportation.
Implementing Actions
a. Bicycle Master Plan. Develop a Bicycle Master Plan that defines priority projects and identifies those that can be integrated with pedestrian improvements and transit facilities. Establish an implementation schedule and identify funding.
b. Complete Streets. Promote complete streets by amending the Design Manual for road improvements to address bus stops and transit shelters, as well as pedestrian pathways, crossings, and bicycle improvements.
c. Pedestrian Master Plan. Assess progress and refine priorities of the existing Pedestrian Master Plan.
d. Evaluate Alternative Mobility Options. Evaluate the options to meet the needs of seniors and people with disabilities.
e. Capital Projects. Establish an interdepartmental team including the Howard County Office of Transportation, Department of Planning and Zoning, Department of Public Works, and Department of Recreation and Parks to prioritize and coordinate implementation of the Bicycle and Pedestrian Master Plans through both capital projects and review of private sector development plans.
f. Bus Stops. Expand the study of bus stop needs to identify gaps in bicycle and pedestrian connections between bus stops and surrounding destinations.
g. Public Outreach. Develop strategies to promote public awareness and use of alternative travel modes for work, errands, and recreation.
“I’d like there to be connections made to other
communities, so you can get to them without having to
drive.” CA Teen
Advisory Committee

96
TDM Transportation Demand Management (TDM) involves diverse programs designed to alter travel behavior by mode, frequency, time, route, or trip length. It is also used to maximize the efficiency and sustainable use of transportation facilities. These programs can be used to address a range of objectives, including reducing congestion, emissions, and energy use.
Some typical TDM programs are Transit, Transportation Management Associations, HOV Lanes, Congestion Pricing, High Occupancy Toll Lanes, Ridesharing Programs, Bike to Work Programs, Telecommuting, and Video Conferencing.
Howard County has run a successful commuter rideshare program that provides assistance with transit services, ride matching, van pools, and shuttle bus development, in addition to other services to get people to jobs in and out of the County.
Technology can be integrated into TDMs to reduce congestion by coordinating signals, integrating freeway and arterial operations, improving traffic flow, reducing incident clearance times, improving bus travel through the use of priority signals for buses and bus arrival information, and enhancing special event traffic management. Howard Commuter Solutions manages a ride matching database that is linked to the greater Baltimore-Washington region.
Howard Transit provides real time bus arrival information to all transit riders via telephone or a smart phone application. Furthermore, more transit agencies have opened up data feeds to independent developers, which have resulted in the development of new applications to provide detailed and customized transit data to individuals.
Policies and Implementing Actions POLICY 7.7 – Reduce highway congestion, energy consumption, and greenhouse gases through transportation demand management and innovative technologies.
Implementing Actions
a. Ride Sharing. Promote car share and bike share systems, HOV programs, and expanded park and ride lots.
b. TDM Program. Study and develop additional TDM programs as mechanisms to mitigate traffic/congestion impacts and expand transit services.
c. Data Sharing. Investigate sharing of bus location data generated by Howard Transit for potential use by independent software developers to promote transit and transit alternatives.
d. Broadband Connections. Leverage the County’s investment in the intra-County broadband network to develop a Howard County traffic control center to monitor traffic conditions and coordinate with Maryland State Highway Administration traffic control.
“Transit is convenient when parents are
working.” Leadership U

97
Project Number
Project Description 2010-2025 Post 2025
R-101I-70 and Marriottsville Road: Capacity, ramp and bridge improvements over I-70; Expansion of Marriottsville Road to 4 and 6 lanes from MD 99 to US 40
R-102 MD 32 and Linden Church Road: New Interchange
R-103 MD 216 and Skylark Boulevard Extended: New signalized intersection
R-104 US 29: Interchange at Corporate Boulevard Extended to access Downtown Columbia
R-105 Broken Land Parkway and Snowden River Parkway: Roadway capacity improvements
R-106US 1 - Montevideo Road and Port Capital Drive: Realignment of roadway and new 4-way intersection
R-107 US 1 - MD 100 to the Prince George's County line: Expand to closed section with 6 lanes
R-108 US 29 - Middle Patuxent River to MD 175: Expand to 6 lanes
R-109 MD 108 - Trotter Road to MD 32: Expand to 5 lanes
R-110 Dorsey Run Road - Montevideo Road to MD 103: Expand to 4 lanes
R-111 Dorsey Run Road - New 4 lane road: CSX Railroad Bridge spur to Guilford Road
R-113 North Ridge Road - Terminus to Town & Country Boulevard: Extend existing 2-lane road
R-114 Patuxent Range Road - US 1 to Dorsey Run Road: Expand to 4 lanes
R-115Sanner Road - Hopkins Road to Guilford Road: Expand to 2 lane sections, left turn capacity and bike lanes
R-116Snowden River Parkway - Oakland Mills Road to Broken Land Parkway: Expand to 6 lanes
R-117 MD 32 - I-70 to MD 108: Expand to 4 lanes
R-118 US 1: Urban Interchange at MD 175
R-119 MD 32: New interchanges at Dayton SHA Facility, Rosemary Lane and MD 144
R-120 I-95: Upgrade interchange for capacity and safety at MD 175
R-121 I-70: Reconstruct interchange at US 29 to allow for I-70 to be widened to 6 lanes
R-122I-95: Upgrade interchange at MD 100 to allow for 6-lane expansion on MD 100 and capacity expansion on I-95
R-123 I-70 - US 29 to US 40: Expand to 6 lanes
R-124 MD 32 - I-70 to the Carroll County border: Expand to 4 lanes
R-125 MD 100 - I-95 to Anne Arundel County border: Expand to 6 / 8 lanes
R-126 MD 32 - Cedar Lane to Anne Arundel Co.: Expand to 8 / 10 lanes with HOV
R-127 MD 175 / MD 108 / Columbia Gateway Drive: New grade separated intersection
R-128 MD 175: US 1 interim intersection improvements
R-129 Broken Land Parkway and North South Collector: Interchange Modification
R-130 North South Collector: Broken Land Parkway and Little Patuxent Parkway - new 4-lane road
R-131 MD 108: Woodland Road to Centennial Lane - Expand to 5 lanes
R-132 Gorman Road - Skylark Road and Leishear Road: Modify alignment
R-133 Oakland Mills Road and MD 175: Limited access interchange for Blandair Park
R-134 Kit Kat Road: Extension/connection to Dorsey Run Road
R-135MD 32/US 1 Park and Ride Lot: Park and Ride lot located on the northwest quadrant of MD 32 and US 1
R-136US 29/MD 99 Park and Ride Lot: Park and Ride lot located north of the intersection of MD 29 and MD 99
R-137 MD 100, MD 108 and Snowden River Parkway: Intersection and interchange upgrades
B-101 Bicycle Facility Projects: Proposed in pending Bicycle Master Plan and BRTB Plan
P-101 Transit Stops: Improve pedestrian and bicycle access
P-102 Pedestrian Facility Projects: Proposed in Pedestrian Master Plan and BRTB Plan
Figure 7-3Road, Bike and Pedestrian Priorities

98
Project Number
Project Description 2010-2025 Post 2025
T-101Central Maryland Transit Operations Facility: New facility for Howard Transit, western Anne Arundel and Connect-a-Ride
T-102 Howard Transit: Continue expansion and upgrade of buses
T-103 Howard Transit: Increase frequency and service hours
T-104 Downtown Circulator: New circulator using hybrid and/or electric buses
T-105 Regional Transfers: MTA, WMATA, MARC, Connect-a-Ride
T-106 Howard Transit: Improve amenities at bus stops and shelters
T-107MARC: Camden Line Growth and Investment Plan: Frequency and Service improvements; 2020 Phase Improvements
T-108 Transit-Oriented Developments (TOD): Savage, North Laurel, and Dorsey MARC Stations
T-109 Bus Rapid Transit: Along US 29 from Downtown Columbia to Burtonsville
T-110 Yellow Line Light Rail: Service from Dorsey MARC Station to MD 32
Figure 7-4Transit Priorities

99
The third aspect of sustainability is the community. The community is influenced and supported by both the environment and the economy. It is also the critical force responsible for the other two. Members of the community are both beneficiaries and responsible parties. PlanHoward 2030 recognizes and celebrates the diversity of Howard County’s communities. The three chapters in Section IV address three Maryland State Planning Visions:
Chapter 8, Public Facilities & Services, addresses the Maryland vision to ensure efficient and environmentally sustainable growth through the provision of appropriate infrastructure and prudent use of resources.
Chapter 9, Housing, discusses the Maryland vision of providing housing of all types to citizens of all ages and incomes. The high cost of housing in Howard County requires innovative programs to advance this goal.
Chapter 10, Community Design, in accord with the Maryland vision, advocates for the design of compact, mixed-use, walkable communities in the proper locations where the use of transit options can be implemented.
IV: COMMUNITY

100

101
Overview This chapter addresses both the physical facilities and services needed to support growth and enhance sustainability in the future. County agencies anticipate evolving service needs as the population grows, ages, and becomes more socially and economically diverse.
PlanHoward 2030 examines the County’s revenue projections and its ability to fund new facilities and services and to maintain existing ones.
State of Maryland Vision Growth areas have the water resources and infrastructure to accommodate population and business expansion in an orderly, efficient, and environmentally sustainable manner.
County Context Howard County’s Planned Service Area (PSA) for public water and sewerage has long been established as the urban-rural growth boundary and Priority Funding Area (PFA) for Howard County. As future growth is accommodated in Howard County’s PSA/PFA, ensuring sufficient capacity is vital for water, sewer, and stormwater management infrastructure, as well as for public schools, fire and rescue, police, libraries, parks, and other government facilities and services.
8. Public Facilities & Services
Savage Mill by Katie Akin, Grade 7, Hammond Middle School

102
Progress under General Plan 2000 Since 2000, the County has invested in long-term, capital improvements both to enhance and expand the public facilities. Many of these projects include new construction or major renovations to create greener and more sustainable facilities. To a lesser degree, funding has also been directed to maintaining and renovating older, existing infrastructure and facilities.
This chapter examines the public facilities needed to support existing communities and future growth. Additionally, although new and enhanced facilities contribute greatly to Howard County’s high quality of life, balancing the budget annually requires decisions on the relative cost-benefits of routine maintenance vs. major renovations vs. construction of new facilities. Incorporation of energy-efficient and green technologies can yield cost savings over the long term. Complicating the budget decision making process are costly Federal and State mandates for the restoration of the Chesapeake Bay, which are discussed in Chapter 3, Environmental Protection. Policies and actions in this chapter are intended to provide guidance for decision makers over the coming decade.
Supporting Growth & Enhancing Existing Communities Based on long-standing General Plan policies, the County’s Planned Service Area for Public Water and Sewer (PSA) has effectively directed the majority of new growth to developed areas in the eastern portions of the County while conserving resources in the Rural West. In accordance with State law, the PSA growth boundary is also designated as Howard County’s Priority Funding Area (PFA). This designation targets certain State resources to support infrastructure and services within the County’s PFA.
As discussed in Chapter 6, Growth, the State’s new PlanMaryland encourages local governments to refine their PFAs by designating new subareas for both “Growth and Revitalization” to accommodate most future growth and “Existing Communities” to accept more limited, infill development. The intent of these new designations is to encourage State and local agencies to prioritize funding for infrastructure and services in a more targeted and coordinated manner.
In general, Growth and Revitalization areas are more likely to need expanded public facilities and developers of new projects are expected to either construct or contribute to facility capacity. Within Existing Communities, facility maintenance and renovation would be the focus. The addition of sidewalks, stormwater management, or new open space could be beneficial in areas where these were not required under previous regulations. Since the Rural West will experience only limited growth, maintenance of existing facilities is a priority.
Budget constraints will require a balanced approach to making funding decisions that support both growth and the enhancement of existing communities while continuing to maintain and renovate older, existing infrastructure and facilities.
The Capital Improvement Program
The Capital Improvement Master Plan (CIMP) establishes a six-year schedule for planning and constructing facilities and infrastructure needed to support the delivery of County services. Agencies often evaluate capital project needs via an agency master plan or similar assessment and then propose priority projects for inclusion in the CIMP. Each year the County adopts a Capital Budget for the fiscal year.

103
The CIMP is supported by a variety of funding sources. Some sources have specific restrictions. For example, projects for water and sewer services are supported by user fees. These projects would not need to compete with other projects supported by the County’s General Fund.
The General Fund is the County’s largest and most flexible funding source. Figures 8-1 and 8-2 illustrate the revenue sources and expenditures for Fiscal Year 2013 used to support County facilities and services. Of the General Fund revenues allocated to the capital budget, nearly 65% support the Howard County public schools and Howard Community College. The remaining 35% is distributed among various agencies for services and other new and renovated facilities. Revenue for the County’s General Fund is generated primarily from property and income tax, which account for nearly 90% of all funds. The remaining 10% is collected through other charges and service fees.
Property Taxes50%
Income Taxes37%
Other Local Taxes
3%
State Shared Taxes
1%
Licenses & Permits
1%
Revenues from Other Agencies
1% Charges for Service
1%
Interest, Use of Money
1%Interfund Reimburs.
3%
Prior Year Funds
2%
Figure 8-1How the General Fund Budget is Funded
Source: Howard County Proposed FY13 Operating Budget
Education64%
Capital, Debt Service & Reserves
8%
General Govern.
3%
Legislative & Judicial
2%
Community Services
5%
Public Facilities7%
Public Safety11%
Figure 8-2How the General Fund Budget is Spent
Source: Howard County Proposed FY13 Operating Budget
104
For a number of program areas including fire and rescue services, trash removal, and public schools and roads, there are dedicated revenue sources to cover a portion of the costs for facilities. State and Federal funds may also be available for some types of facilities, although these funding sources have been decreasing. New or creative funding mechanisms will be a necessary part of the County’s strategy for balancing new facility needs with the ongoing maintenance, renovation, and replacement of older ones, as well as with mandated or desirable environmental initiatives like Chesapeake Bay restoration projects and enhanced recycling.
The Operating Budget
The County’s Operating Budget provides funding for County services. It includes the operation of facilities and equipment, employee salaries, and other costs to provide the many services available to citizens. Maintaining the high quality of County services, including schools, libraries, community college, parks and recreation, senior centers, and public safety, is critical. The Fiscal Year 2013 proposed General Fund Operating Budget was about $900 million. Sustainable Budgeting
The goal of creating a sustainable budget – one that balances continued investment in environmental, economic, and community infrastructure – must address the challenges posed by competing interests and limited funding. For several decades, Howard County has benefited from vigorous growth in both property and income tax revenue. This translated into strong operating and capital budgets. The County’s high quality of life stems, in part, from the very high quality of facilities and services provided for residents and businesses by the prudent investment of this steady stream of revenue growth.
The economic downturn that began in 2008 is expected to have some long-term effects. If a slow economy limits income growth and housing prices, income tax and property tax revenue growth will not be comparable with revenue growth in previous budgets. As the national and regional economies continue to adjust, PlanHoward 2030 currently envisions a “new normal” of more modest growth in revenues that would need to be carefully prioritized.
In order to evaluate and set priorities, it will be essential for County agencies to continue to update their facility master plans or develop similar tools to assess the cost-effectiveness of maintenance and renovation versus the costs for new facilities. An important consideration would also be how agency programs and facilities need to adapt to an aging and more diverse population in the future.
The County’s capital budgeting functions must become more strategic in targeting capital maintenance and enhancement programs to communities where needed improvements have been identified or where redevelopment is desired. PlanHoward 2030’s proposed place designations on Map 6-2 and subsequent community plans can be used to target and coordinate funding in specific areas. Given anticipated County funding constraints, incentives for private sector enhancements and public-private partnerships should be explored.
Some types of infrastructure may be appropriately funded via Tax-Increment Financing or other mechanisms that capitalize on increased property tax assessments. Various revitalization programs and transportation enhancements such as new streetscape or transit improvements, as envisioned in PlanHoward 2030, are generators of increased value that such mechanisms can leverage. The County could also consider special taxing districts or public-private ventures such as lease-purchase or other mechanisms for private sector participation in public facility construction or service delivery.
A prudent budget and ongoing evaluation of available resources will lead to a sustainable future.

105
Fiscal Impact Assessment
To assist in future decision making and balancing of priorities, an assessment of the fiscal impacts of projected growth and the corresponding infrastructure and services is provided as a supplement to PlanHoward 2030. This is discussed more fully in Chapter 6, Growth.
Policies and Implementing Actions POLICY 8.1 – Refine the Capital Improvement Master Plan process by further strengthening the project evaluation criteria, the prioritization process, and the project implementation phasing schedule.
Implementing Actions
a. Agency Master Plans. Direct County agencies to regularly update facility master plans that include maintenance and systemic renovations, as well as new or expanded facilities.
b. Capital Budget Review Committee. Continue to strengthen the interagency review committee’s assessments to assist in setting capital project priorities, phasing, and funding strategies.
c. State Funds. Explore how under PlanMaryland, State agency funds and programs can be targeted to priority projects within designated Growth and Revitalization areas and Existing Communities.
d. Innovative Funding. Identify new or creative funding sources and methods such as public-private partnerships.
POLICY 8.2 – Continue to lead by example in further reducing Howard County Government’s environmental impacts and incorporating green building practices into new and renovated public facilities.
Implementing Actions
a. Enhance Sustainability. Expand the use of cost-effective, resource-conserving green technologies in new and renovated County facilities.
b. Monitoring. Monitor County buildings and vehicles to document environment, health, and safety benefits, as well as cost-effectiveness.
c. Public Outreach and Education. Communicate the monitoring data and results of demonstration projects to the public.
POLICY 8.3 – Use the operating budget process to optimize public services and use of funds.
Implementing Actions
a. Ongoing Management. Continue to provide high-quality services to the County’s residents and businesses while maintaining fiscally-prudent budget assumptions.
b. Regular Review. Direct County agencies to continue their annual review of services and service delivery to address evolving needs and changing demographics.
Water and Sewer Water and sewer capital projects and service delivery are supported by user fees and developer contributions; therefore, they don’t compete for General Fund revenues. Water and sewer infrastructure and services are necessary to both
GREEN TIP!
Help us protect our streams from sewer overflows by never
washing fats, oils, or grease down the drain.
Collect it in a can or plastic container, add
some cornmeal and make a bird feeder out of it.

106
sustain existing development and support future growth. State law requires local governments to adopt both a Water Resources Element (WRE) as part of the General Plan and regular updates of a Water and Sewer Master Plan. The WRE was adopted in 2010 and is incorporated into PlanHoward 2030 by reference. The WRE evaluates infrastructure capacity in relation to projected growth.
The pace of residential and employment growth in the County is directly related to the need for additional public water and sewer service. The growth rate must not exceed the sewage treatment capacity of the Little Patuxent and Patapsco Wastewater Treatment Plants and the Baltimore City and Washington Suburban Sanitary Commission (WSSC) water supply systems that serve eastern Howard County. Map 6-2 establishes the County’s growth boundary which determines the Planned Service Area for both Water and Sewer (PSA).
Every three years, the Water and Sewerage Master Plan must be updated and approved by the Maryland Department of the Environment. This Master Plan confirms the PSA and identifies the remainder of the County as not planned for service. Prior to the provision of public water or sewer service, a property must be included in the PSA and must enter the County’s Metropolitan District. Within the service area, extension of the public water and sewer system is controlled through the ten-year Capital Improvement Master Plan, the Metropolitan District entry process, the development review process, and water and sewer capacity allocation procedures.
The Department of Public Work’s ongoing water and sewer facility assessments identify facilities that require systemic maintenance, as well as capacity expansions. Renovation of service lines for older communities in the County’s PSA will be an increasingly important component of both short- and long-term budgeting.
Policies and Implementing Actions POLICY 8.4 – Ensure the adequacy of water and sewer services.
Implementing Actions
a. Wastewater Treatment Plant Capacity. Monitor flows to the Little Patuxent Water Reclamation Plant to ensure sufficient capacity for projected growth in the Planned Service Area.
b. Master Plan for Water and Sewerage. Identify capital project priorities for capacity expansion and systemic renovations, as well as innovative approaches to reduce water consumption and recycle treated waste water.
Transportation As the County continues to grow and mature, the County must make transportation infrastructure and programs more efficient, diverse, and responsive to environmental and community concerns.
Transportation needs are discussed in Chapter 7, Transportation, which identifies road, park and ride, transit, pedestrian, and bike capital improvements that are needed to reduce congestion, enhance safety, and expand travel mode choices. See Maps 7-1 and 7-2 Key Transportation Improvements Anticipated by 2025 and by 2035, as well as Figures 7-3 and 7-4 for Road, Bike, and Pedestrian Priorities and Transit Priorities.
The County’s APF road excise tax funds capital projects that expand road capacity; as established, it cannot be used for road maintenance or other
Howard County provides a network of interconnected roadways and modal options.

107
transportation modes. In recent years, State funding for highway improvements and maintenance has been greatly reduced. Maintenance of existing roads requires significant funding, which limits the County’s ability to fund new road, transit, bike, and pedestrian improvements.
The County’s operating and capital budgets for Howard Transit are significant and have been steadily increasing for the past decade to cover service expansion and declining State and Federal funding. Expanding transit service is an important priority and a significant funding challenge.
Policies and Implementing Actions POLICY 8.5 – Continue to invest in multimodal transportation infrastructure to enhance mobility and access to diverse transportation options.
Implementing Actions
a. Road Improvements. Continue to use APF-generated excise tax revenues to leverage State and Federal funding for highway capacity improvements. Consider legislation to allow use for other transportation modes.
b. Transit Development Program. Update the County’s Transit Development Program every five years to evaluate and prioritize Howard Transit improvements, as well as connections to regional transit.
c. Innovative Transit Funding. Explore additional public and private funding sources to expand and improve the quality of fixed-route and paratransit service.
d. Pedestrian and Bicycle Connections. Implement priority pedestrian and bicycle improvement projects and, whenever possible, include as part of road construction or maintenance projects.
Solid Waste A significant shift in solid waste management has occurred since 1990, when Alpha Ridge Landfill was the destination for most of Howard County’s solid waste. Much of the County’s private waste stream is now recycled; most of the rest is transported by waste hauling contractors to less expensive private landfill facilities in Virginia and Pennsylvania. In 1990, there were 208,418 tons buried at the Alpha Ridge Landfill. In 2012, there were 46,717 tons sent to Alpha Ridge with most of the remainder shipped to the King George Landfill in Virginia.
The County manages contracting for most residential trash and recycling. Commercial service is contracted by individual businesses. The County’s Alpha Ridge Landfill accepts some solid waste deposits but also serves as a collection center for items which are recycled elsewhere. County solid waste services are supported by residential trash fees and landfill charges.
The County’s waste reduction program stresses public outreach about product reuse and diverse recycling options. The County’s innovative and successful recycling program has increased the County’s recycling rate from approximately 8% of solid waste in 1991 to approximately 46% in 2010.
The County’s goal is to increase recycling to more than 75% by 2030. A pilot program to collect and compost residential food waste was initiated in 2010 and is being expanded. Recycling will continue to be expanded as markets are established for materials not currently targeted for recycling.
Recycling material together has increased the amount being recycled every day.
“I’ve grown up here for the past twenty years and can
walk everywhere.” HCC Student Government
Association

108
Given the very limited amount of material deposited, the landfill has a long remaining life expectancy at its current fill rate. However, since it is unlikely that another County-operated landfill will be sited in Howard County, due to the lack of an appropriate 400- to 500-acre site, the County is prepared for long-term reliance on source reduction and reuse, recycling, composting, and waste export either to a landfill or a waste-to-energy (WTE) facility. The County will continue to need a combination of local and regional or out-of-region facilities.
Alpha Ridge Landfill is the County’s back-up disposal site if other disposal and recycling options are insufficient. Approximately two years would be required to design and build a new fill cell at the Alpha Ridge Landfill. The Solid Waste Management Plan proposes an annual evaluation of the current cell and initiates a capital project to build a new cell if available capacity is projected to drop below a two-year capacity.
The County continually explores options to enhance solid waste management, considering air and water quality, energy consumption from transportation and waste disposal, as well as the cost-effectiveness of new programs.
Policies and Implementing Actions POLICY 8.6 – Provide for environmentally sound and cost-effective solid waste management.
Implementing Actions
a. Promote Solid Waste Reduction. Continue to expand programs for solid waste reduction, reuse, recycling, and composting. Expand recycling programs to include additional materials as technologies and markets become available, including the possibility of recovery of items from the landfill.
b. Plan for Future Capacity. Ensure that the County has reliable options for solid waste processing and disposal that allow sufficient lead time for planning and construction of a new cell at the Alpha Ridge Landfill or other new facilities, or for instituting new programs.
Watershed and Chesapeake Bay Restoration Chapter 3, Environmental Protection, discusses Federal and State mandates for Chesapeake Bay and local watershed restoration by 2035. Preliminary cost estimates for Howard County’s Watershed Implementation Plan (WIP) to meet Bay restoration requirements indicate very significant ongoing costs to the County. This warrants further evaluation of additional dedicated funding sources, particularly to achieve stormwater management and septic nutrient reduction targets. From 2012 through 2035, capital funding will be needed for facilities that reduce pollution to achieve the mandatory nitrogen, phosphorus, and sediment reduction levels. Additional operating funds for inspection, maintenance, and enforcement will also be needed on an ongoing basis to ensure continuing compliance.
Policies and Implementing Actions POLICY 8.7 – Identify and fund the most cost-effective strategies for Watershed Implementation Plan execution.
Implementing Actions
a. Funding. Evaluate options and adopt a dedicated funding mechanism.
“We need to do more stream clean ups. We only have one
earth. It needs to be preserved for people to come.”
HCC Student Government Association
GREEN TIP!
Compost your garbage. Keep biodegradable food waste out of landfills with
easy at-home composting.

109
b. Best Management Practices. Monitor and evaluate the cost-effectiveness of diverse best management practices to maximize nutrient reduction from the funds expended.
Public Schools Howard County’s Public School System (HCPSS) consistently ranks among the top systems in the nation. The excellence of schools is integral to the County’s quality of life and is a major attractor for both residents and businesses.
This creates continuing demand for more school capacity. Some of this demand is associated with new housing development, but much is due to turnover of housing in existing neighborhoods from empty nesters to young families. As discussed in Chapter 6, Growth, Howard County’s Adequate Public Facilities Act (APF) controls the pace of residential growth and requires that schools and roads are adequate to serve new development. The APF provides predictability for planning additional school capacity and postpones the approval of new housing, if adequate school capacity is not available. Enrollment increases are expected to slow over the next two decades as the County’s population ages. School System projections based on their latest feasibility report show increases of 8,660 students between 2012 and 2022.
Redistricting of school boundaries to optimize any available capacity in adjoining schools is the most cost-effective means of addressing expanding enrollments, followed by temporary classrooms or permanent additions to existing schools where feasible. Where these options are not feasible, new school sites and schools will need to be provided.
Finding sites for new schools is a challenge, particularly for HCPSS’s large site, suburban school prototype. HCPSS introduced a two-story school design for smaller, more urban sites. More of these urban school designs may be necessary in the future. School facility design could include co-location with other agencies to reduce costs and maximize community use.
Systemic renovation of aging schools is a major component of the school capital budget and will continue to be a priority on an ongoing basis. Renovations may involve heating and air conditioning systems, roof replacement, classrooms or core facilities, and upgrading of technology or other facilities to meet current school facility and program standards.
The County’s school system provides a diverse and very widely-regarded range of programs to meet the needs of children at all levels and with diverse cultural backgrounds. The impact of anticipated demographic trends on the schools’ operating budget is unclear and needs to be monitored given the large size of the schools operating budget.
The Public School System annually proposes a Capital Budget and a five-year Capital Improvement Program. It also annually updates its ten-year long-term capital plan and redistricting options as required by the State Department of Education. This plan compiles data on current and projected enrollment and school capacities to determine site acquisition, school capacity expansion, and school renovations needs.
Policies and Implementing Actions POLICY 8.8 – Optimize planning and use of available funds to ensure school facilities continue to support high-quality school programs.
Education is a high priority in Howard County and a major contributor to quality of life.
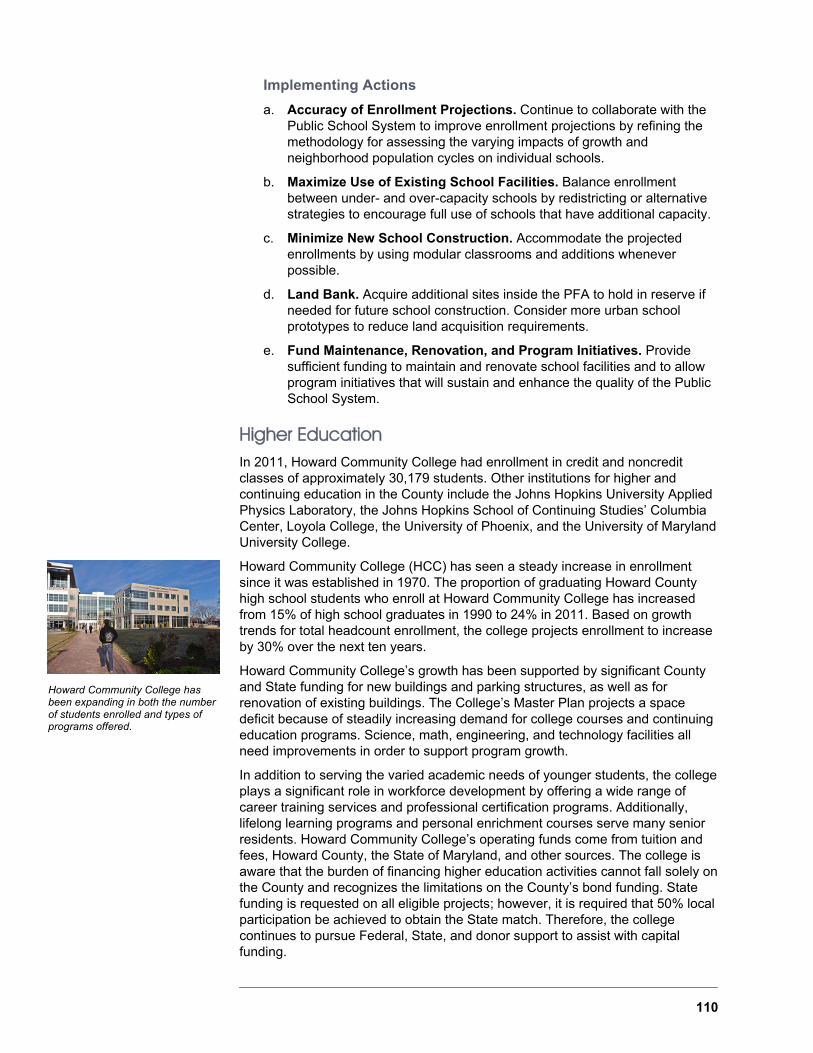
110
Implementing Actions
a. Accuracy of Enrollment Projections. Continue to collaborate with the Public School System to improve enrollment projections by refining the methodology for assessing the varying impacts of growth and neighborhood population cycles on individual schools.
b. Maximize Use of Existing School Facilities. Balance enrollment between under- and over-capacity schools by redistricting or alternative strategies to encourage full use of schools that have additional capacity.
c. Minimize New School Construction. Accommodate the projected enrollments by using modular classrooms and additions whenever possible.
d. Land Bank. Acquire additional sites inside the PFA to hold in reserve if needed for future school construction. Consider more urban school prototypes to reduce land acquisition requirements.
e. Fund Maintenance, Renovation, and Program Initiatives. Provide sufficient funding to maintain and renovate school facilities and to allow program initiatives that will sustain and enhance the quality of the Public School System.
Higher Education In 2011, Howard Community College had enrollment in credit and noncredit classes of approximately 30,179 students. Other institutions for higher and continuing education in the County include the Johns Hopkins University Applied Physics Laboratory, the Johns Hopkins School of Continuing Studies’ Columbia Center, Loyola College, the University of Phoenix, and the University of Maryland University College.
Howard Community College (HCC) has seen a steady increase in enrollment since it was established in 1970. The proportion of graduating Howard County high school students who enroll at Howard Community College has increased from 15% of high school graduates in 1990 to 24% in 2011. Based on growth trends for total headcount enrollment, the college projects enrollment to increase by 30% over the next ten years.
Howard Community College’s growth has been supported by significant County and State funding for new buildings and parking structures, as well as for renovation of existing buildings. The College’s Master Plan projects a space deficit because of steadily increasing demand for college courses and continuing education programs. Science, math, engineering, and technology facilities all need improvements in order to support program growth.
In addition to serving the varied academic needs of younger students, the college plays a significant role in workforce development by offering a wide range of career training services and professional certification programs. Additionally, lifelong learning programs and personal enrichment courses serve many senior residents. Howard Community College’s operating funds come from tuition and fees, Howard County, the State of Maryland, and other sources. The college is aware that the burden of financing higher education activities cannot fall solely on the County and recognizes the limitations on the County’s bond funding. State funding is requested on all eligible projects; however, it is required that 50% local participation be achieved to obtain the State match. Therefore, the college continues to pursue Federal, State, and donor support to assist with capital funding.
Howard Community College has been expanding in both the number of students enrolled and types of programs offered.
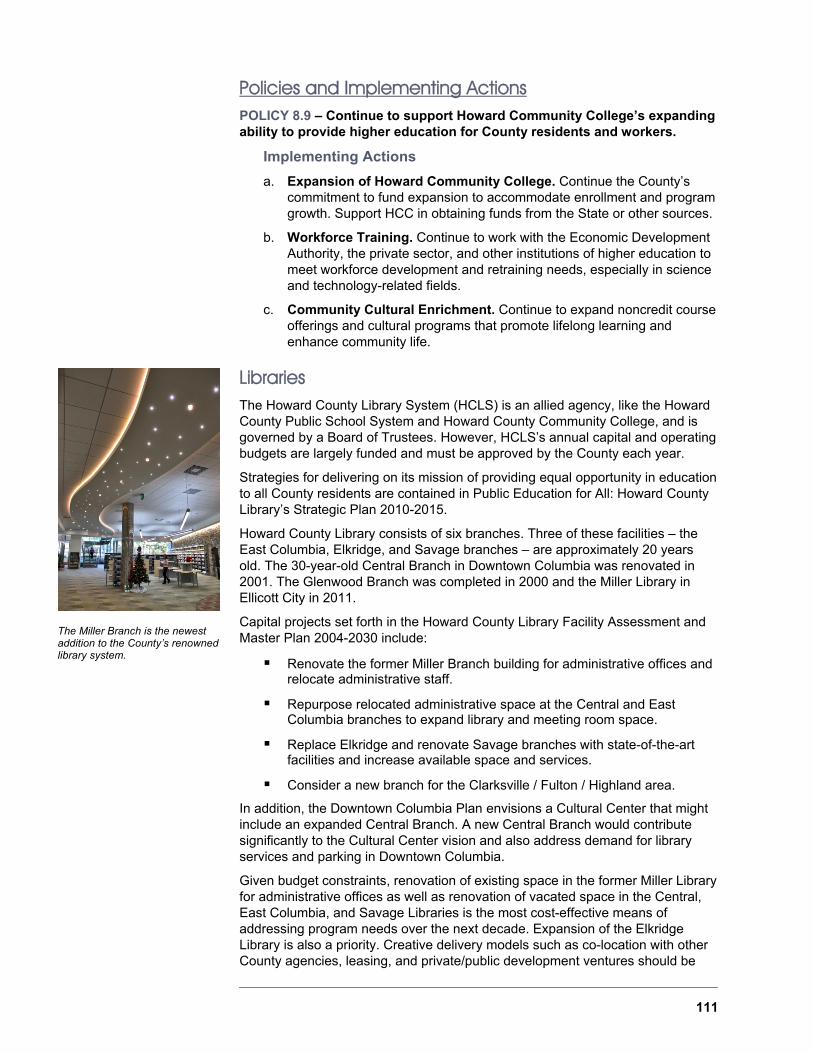
111
Policies and Implementing Actions POLICY 8.9 – Continue to support Howard Community College’s expanding ability to provide higher education for County residents and workers.
Implementing Actions
a. Expansion of Howard Community College. Continue the County’s commitment to fund expansion to accommodate enrollment and program growth. Support HCC in obtaining funds from the State or other sources.
b. Workforce Training. Continue to work with the Economic Development Authority, the private sector, and other institutions of higher education to meet workforce development and retraining needs, especially in science and technology-related fields.
c. Community Cultural Enrichment. Continue to expand noncredit course offerings and cultural programs that promote lifelong learning and enhance community life.
Libraries The Howard County Library System (HCLS) is an allied agency, like the Howard County Public School System and Howard County Community College, and is governed by a Board of Trustees. However, HCLS’s annual capital and operating budgets are largely funded and must be approved by the County each year.
Strategies for delivering on its mission of providing equal opportunity in education to all County residents are contained in Public Education for All: Howard County Library’s Strategic Plan 2010-2015.
Howard County Library consists of six branches. Three of these facilities – the East Columbia, Elkridge, and Savage branches – are approximately 20 years old. The 30-year-old Central Branch in Downtown Columbia was renovated in 2001. The Glenwood Branch was completed in 2000 and the Miller Library in Ellicott City in 2011.
Capital projects set forth in the Howard County Library Facility Assessment and Master Plan 2004-2030 include:
Renovate the former Miller Branch building for administrative offices and relocate administrative staff.
Repurpose relocated administrative space at the Central and East Columbia branches to expand library and meeting room space.
Replace Elkridge and renovate Savage branches with state-of-the-art facilities and increase available space and services.
Consider a new branch for the Clarksville / Fulton / Highland area.
In addition, the Downtown Columbia Plan envisions a Cultural Center that might include an expanded Central Branch. A new Central Branch would contribute significantly to the Cultural Center vision and also address demand for library services and parking in Downtown Columbia.
Given budget constraints, renovation of existing space in the former Miller Library for administrative offices as well as renovation of vacated space in the Central, East Columbia, and Savage Libraries is the most cost-effective means of addressing program needs over the next decade. Expansion of the Elkridge Library is also a priority. Creative delivery models such as co-location with other County agencies, leasing, and private/public development ventures should be
The Miller Branch is the newest addition to the County’s renowned library system.

112
considered. The Library Facility Assessment and Master Plan recommends that the County’s libraries be completely renovated including roofing and heating, air conditioning, and electrical systems on a 20-year cycle.
Program offerings by the library system have expanded significantly over time, requiring more meeting room space. On the other hand, in the future, increased use of digital information is likely to reduce space needed to stock books, periodicals, and other hard copy materials. With limited funding anticipated in the coming years, it will be important to continually review facility and program priorities.
Policies and Implementing Actions POLICY 8.10 – Enhance residents’ access to high quality library resources.
Implementing Actions
a. Master Plan. Evaluate the need for additional library capacity to serve planned population and program growth, considering the impact of the Internet and other digital access to information. Provide necessary expansion via additions or new facilities within the Planned Service Area.
b. Libraries as Educational and Community Focal Points. Enhance the design of existing and any future libraries to both optimize the delivery of service at each library branch and help create a civic focal point. Where feasible, integrate libraries with other complementary public or private facilities.
Arts and Culture The many arts and cultural programs in Howard County contribute significantly to the county’s high quality of life. In 1984, the County Council designated the Howard County Arts Council as the local agency responsible for administering County and State funds for the arts. The grant programs subsequently established have been cited for excellence by the Maryland State Arts Council and used as a model for other county arts councils around the state. The Arts Council, which operates the Howard County Center for the Arts, is funded through the County and State in combination with private and corporate support, as well as through earned income.
Arts and culture not only enrich and enliven communities, they contribute significantly to our quality and enjoyment of life including:
Civic & Community Engagement. Arts and cultural programs create a welcoming sense of place, attract tourists, businesses, and residents, and create ideas.
Cultural Preservation. Howard County will continue to experience demographic and ethnic changes. The arts preserve and celebrate culture and heritage, passing cultural traditions along to future generations while providing opportunities to gain greater knowledge and understanding of diversity.
Economic Development. A strong arts sector is an economic asset that stimulates business activity, attracts tourism revenue, retains a high quality work force, and enhances property values. The arts, both for-profit and nonprofit, are an important part of the County’s small business sector.
The Patapsco Female Institute provides a unique setting for theater in Howard County.

113
Education. The arts provoke thought and foster creativity and imagination. There is a need for education in the arts for school-age children and a growing demand for arts education and hands-on learning in the arts at all ages in the County.
Health & Wellness. The arts have a positive impact on community health and wellness. The medical field uses visual art, music, dance, and drama to treat patients with a variety of therapeutic needs.
Communities that embrace and invest in the arts create exciting and vibrant places to live, work, learn, and play. In turn, these investments attract new people, businesses, and ideas. By fostering community arts initiatives, and providing broad access to the arts, Howard County has created a strong foundation to build on and enhance its high quality of life in the coming decades.
Policies and Implementing Actions POLICY 8-11 – Ensure County residents and visitors have access to a wide variety of arts and cultural programs; cultivate artists; and develop a creative workforce.
Implementing Actions
a. Arts Council. Continue to support the operations and programs of the Arts Council through financial and in-kind resources and services.
b. Community Service Partnership. Continue to utilize the Community Service Partnership with the Howard County Arts Council to distribute public funds to local and regional arts organizations through competitive grant programs and to manage art facilities.
c. Business Partnerships. Encourage partnerships between the arts community and the Howard County Economic Development Authority, Howard County Tourism, and private and business sectors to increase awareness of the value of the arts and provide creative funding to support programs and facilities.
d. Arts and Entertainment Districts. Explore options to create one or more “Arts and Entertainment” districts in Howard County.
e. Support for Artists. Increase opportunities for artists to live, work, learn, and present work in Howard County.
f. Development. Include art or arts spaces in new public construction when appropriate.
Parks and Recreation Parks, open space, and varied types of recreation, from organized sports to arts programs, contribute to the high quality of life County residents enjoy. This variety requires many different types of facilities and makes planning and managing the parks and recreation system challenging. The Howard County Land Preservation and Recreation Plan (LPRPP) is the County’s primary vehicle for determining park, open space, and recreation needs. The 2012 LPRPP analyzes future needs based on expected population growth, demographic characteristics, the acreage needed for anticipated facilities, and the land resources needing protection. The 2012 LPRPP is required by State law and is incorporated into PlanHoward 2030 by reference. The Maryland Department of Natural Resources (DNR) helps local jurisdictions acquire parkland through Program Open Space (POS), which is funded by property transfer taxes. To
Department of Recreation and Parks provides award-winning facilities and programs across Howard County.

114
qualify for POS funds, the County is working to meet the State standard of 30 acres of County-owned parkland for each 1,000 residents.
Map 8-1 shows the land preservation and open space areas that have already preserved in Howard County. The 2012 LPRPP sets goals for future parkland acquisition and development of active recreation sites based on current holdings, potential land availability, and funding constraints. Most future acquisition and development of park and recreation facilities should take place within the County’s PSA in the East. However, the East has limited and more expensive undeveloped land. In light of competing budget priorities, it will be difficult to achieve the parkland acquisition goal. Creative funding alternatives should be explored.
Balancing Preservation and Active Recreation. The State standard for parkland of 30 acres per 1,000 residents does not specify the proportion that should be developed for active recreation. Of the 9,087 total acres, 7,867 acres remain passive environmental holdings while 1,220 acres are developed for active recreation. However, in evaluating environmental preservation goals, the National Recreation and Parks Association standard increases from 30 acres to 60 acres per 1,000 population due to the importance placed upon land preservation. Howard County exceeds this standard in part because of the large amount of State parkland, Columbia Association open space, and WSSC-owned land along the Patapsco and Patuxent Rivers.
3
MILES
1.5
Map 8-1Land Preservationand Open Space
0
PRIORITY FUNDING AREA / PSA
AGRICULTURAL EASEMENTS
OTHER RURAL EASEMENTS
INSTITUTIONAL LAND USE
L e g e n d
PARK AND OPEN SPACE
Source: Howard County DPZ, 2012.
115
Open Space and Pathway Networks. Another challenge is linking parkland and open space. Most of the County’s open space holdings have been acquired through dedication during the subdivision process and do not form a continuous network of open spaces, except in Columbia. As discussed in Chapter 4, Resource Conservation, a Green Infrastructure network of open space and parkland allows better protection of the County’s streams, rivers, and forest corridors; provides wildlife habitat and corridors; and offers opportunities for pathway systems.
As the County’s pathway system develops, a common signage system needs to be established for Columbia and County pathway systems. The Columbia Association and the County began collaboration on this task in early 2012.
Funding. Park and recreation funding has come from several sources: Program Open Space, Transfer Tax, the County General Fund, and General Obligation Bonds. The extent to which parks and recreation facilities are developed is closely correlated with funding needed to maintain and operate these facilities.
Phased completion of the master plans for the new Blandair and Troy Regional Parks has high priority for park and recreation funding. Systemic renovations of older facilities are also needed to maintain service levels and enhance existing programs. Establishing priorities among new facilities, renovation of existing facilities, and acquisition of land for both environmental protection and future recreation needs will be a challenge.
Programs and Facilities. Alongside the extensive array of active and passive recreational land managed by the Department of Recreation and Parks (DRP), new community facilities for environmental learning and community services will continue to define Howard’s vision of a green and sustainable County. The Robinson Nature Center was completed in 2011 as a LEED Certified Platinum facility and provides residents with a unique nature education experience adjacent to the Middle Patuxent Environmental Area. The North Laurel Community Center was also completed in 2011 and is the newest community facility in the County, featuring fitness areas, classrooms, and agency services. The integration of environmental and community programming within the design of these facilities provides a model for future County projects.
Changing demographics will create a need for new programs. Currently, the most frequently expressed concern is that the demand for youth activities exceeds supply due to facility shortages. Since 1976, DRP has charged user fees for recreation programs. This policy supports program expansion based on population growth and demand.
Effective planning for the County’s recreation and parks system will require analysis of the needs of an aging and more diverse population, clear acquisition priorities, adequate funding, and close coordination with other service providers.
Policies and Implementing Actions POLICY 8.12 – Expand the County park system and recreational facilities.
Implementing Actions
a. Land Acquisition. Establish acquisition goals for environmental conservation and active recreation in the 2012 update to the Howard
GREEN TIP!
Exercise outside in one of our parks, not in an air
conditioned gym.

116
County Land Preservation and Recreation Plan (LPRPP). Accelerate land acquisition to meet long-term recreation needs while suitable sites are still available, particularly inside the Planned Service Area where population is greatest.
b. Recreation Planning. Update the LPRPP regularly to establish countywide goals and priorities for development of facilities and recreation programs.
POLICY 8.13 – Enhance community recreational opportunities.
Implementing Actions
a. Cooperation with Howard County Public School System. Continue to collaborate on the design, development, management, and maintenance of shared recreation facilities on school sites.
b. Coordinate the Columbia Association, Recreation Organizations, and Private Recreation Providers. Expand partnerships with other recreation providers so that the Department of Recreation and Parks programs complement and support efforts by other providers. Provide information on opportunities available through other organizations.
Health and Human Services Howard County has a broad array of high quality health and human services delivered by numerous public, nonprofit, and for-profit providers. However, coordination among service providers to optimize the service delivery is a challenge.
Considerable effort is required to keep information about service providers up to date and readily available to the public, since there are several hundred nonprofit, for-profit, and government providers in the County. Data collection and management is difficult because many of the nonprofit providers lack the necessary skills and staff resources. Also, defining planning and performance standards are a challenge for health and human services because of the array and complexity of services.
Coordinating health and human services to enhance efficiency and effectiveness is a high priority. Service integration is crucial to maximizing resources and coordinating efforts to efficiently help people needing more than one form of assistance. Planning efforts must assess the impacts of changing demographics and address coordination of services among providers. They must also consider the means of addressing service gaps or duplication, accessibility of services, and strategies for improving cost-effectiveness. Barriers to accessing available services include lack of health insurance, financial constraints, inconvenient or limited hours of service, transportation, and linguistic / cultural differences. These must be first determined and then addressed.
Human Services
Human services enhance a community’s quality of life by promoting social and economic well-being for individuals and families. The wide spectrum of human services covers services related to seniors, children, and people with disabilities, as well as programs to address social, economic, legal, workforce, childcare, and other needs. Our human services system includes a broad network of organizations:
The Department of Citizen Services (DSC) is the County’s primary human service agency and includes the Offices on Aging, Children’s

117
Services, and Consumer Affairs. The Department also provides information and assistance on disability issues and serves as the lead agency for the County’s Continuum of Care for homeless services. DCS operates seven County senior centers – Bain, East Columbia, Elkridge, Ellicott City, Longwood, Glenwood, and North Laurel. Senior Center Plus programs, which provide specialized services for more frail older adults, are co-located in the Ellicott City, Glenwood and North Laurel Senior Centers. In addition, DCS administers the County’s funding to nonprofit human service providers through the Community Service Partnership program.
The Department of County Administration manages Howard County’s Office of Workforce Development.
The Department of Social Services administers a wide range of public assistance programs and is responsible for the safety of vulnerable children and adults. It is a State agency but receives some County funding.
The State Department of Labor, Licensing and Regulations operates job services and unemployment insurance programs.
The Division of Rehabilitation Services, part of the Maryland Department of Education, provides supports for people with disabilities.
The State Department of Juvenile Services has programs for delinquent youth.
The Federal Social Security Administration administers retirement programs and financial assistance to people with disabilities.
Over 200 private, nonprofit human service providers in the County offer diverse services from crisis intervention and mental health counseling to mentoring programs for youth.
Private, for-profit providers include three nursing homes, ten large assisted living facilities (17+ residents), over 66 small assisted living group homes (16 or fewer residents), as well as family and center-based childcare providers.
The North Laurel-Savage Multiservice Center provides residents in the Southeast with easier access to a range of services provided by nonprofit and government agencies.
The Day Resource Center on Route 1 provides services for the homeless, largely through volunteers from the faith community.
People of all ages and socioeconomic groups utilize this network of human services. However, population characteristics, especially age and income, have an important direct effect on service needs and the population’s ability to obtain them.
Aging of the population is already a significant factor in planning for human services and will become increasingly important over the next two decades. Growth in the elderly population, particularly those over 85, will result in increased needs for senior centers, home modifications and maintenance assistance, personal care services, day care, specialized housing, and other services. A master plan for senior centers that evaluates the needs of an aging population, priorities, and options for cost-effective service delivery is needed. The housing needs of seniors, the disabled, and special needs population, as well as low and moderate income households, are discussed in Chapter 9, Housing.
Health and Human Services enrich many Howard County residents’ lives.

118
As the population grows, youth and families will also require additional services. Working parents require child care. Employment training is important to people entering or reentering the workforce and to persons with disabilities seeking an independent life. Parenting skills and other preventative support services will help some families.
Health Services
Howard County residents benefit from a wide variety of high quality local health care providers and services, and from close proximity to excellent health care facilities and academic medical centers in the Baltimore and Washington Metro areas. The health care delivery system is complex and depends upon the resources of many organizations, including the Howard County Health Department (HCHD), Howard County General Hospital, the Horizon Foundation, Sheppard Pratt, special nursing and assisted-living facilities, hospice services, urgent care clinics, numerous nonprofit providers, and private practitioners.
The Howard County Health Department provides a variety of clinical and preventive services to County residents. Clinical services include family planning, child health, communicable disease, Women’s Infants and Children program, and addictions treatment. Preventive services focus on immunizations, chronic disease prevention, tobacco cessation, cancer screening, senior health, veterans’ health, and community health education and outreach. In addition, the HCHD has an Emergency Preparedness program and an Environmental Health Bureau. HCHD leads or co-leads various community health groups, including Howard County’s Local Health Improvement Coalition, the Howard County Cancer and Tobacco Coalition, and the Howard County School Health Council.
Within a suburban, auto-dependent environment, the location of clinics is paramount to the accessibility of care for lower income residents. Health Department services are located in Ellicott City, Columbia, and North Laurel but have limited transit access. Based on household income, additional health services in the Elkridge area may be needed. In 2011, Healthy Howard, Inc. launched The Door to Health at the Howard County Health Department site in Columbia. This program offers a one-door approach to helping uninsured Howard County residents connect with health care by providing eligibility screening and assistance with program applications.
The Howard County Health Department continues to innovate and lead broad-based efforts to support health and wellness across the community. Key focus areas include addressing the social determinants of health and improving health disparities. The Health Department is the convening agency for the Local Health Improvement Coalition (LHIC), a diverse coalition of experts, advocates, and leaders from the government, nonprofit, medical, philanthropic, faith-based, educational, and community sectors that was formed in December 2011 as part of the County’s participation in the State Health Improvement Process (SHIP). The LHIC’s 2012-2014 Local Health Improvement Action Plan is a two-year action plan that replaces the ten-year Comprehensive Health Improvement Plan of 2002. It focuses on three local health priorities selected for their disproportionately negative impact on local health and / or high level of disparities among subgroups – increasing access to affordable health care, preventing obesity through healthy eating and physical activity across the life span, and improving behavioral health outcomes.
Coordinating Health and Human Services
The Department of Citizen Services is taking the lead in convening the public health and human service agencies to better integrate planning and service delivery among these service providers. Co-location of health and human service

119
agencies is a tool for coordinating services that allows convenient access and efficient use of space and resources. The County has developed multiservice community centers in Glenwood and North Laurel that include senior centers, health centers, and recreation facilities, which are good models for future service enhancements in the Elkridge area.
Policies and Implementing Actions POLICY 8.14 – Plan for Health and Human Services.
Implementing Actions
a. Comprehensive and Coordinated Health and Human Services Planning. Continue to develop data-driven, measurable plans for both Health Services and Human Services. Plans should reflect comprehensive assessment of needs, resources, proposed actions, and implementation strategies with a clear identification of priorities, partner roles, and funding mechanisms.
b. Capacity Building. Continue to build positive, collaborative relationships with the Horizon Foundation, Association of Community Services, United Way, the Columbia Foundation, and other capacity-building organizations, as well as the business community, as essential resources for achieving health and human services goals.
POLICY 8.15 – Enhance the delivery and accessibility of health and human services.
Implementing Actions
a. Access to Information. Enhance access to data and information technology to facilitate program coordination and strengthen health and human service delivery systems.
b. Partnerships for Health and Human Services Delivery. Continue to expand partnerships among government, business, and nonprofit sectors to coordinate health and human services delivery.
c. Co-location of Services. Establish multiservice centers, where feasible, in prominent, transit-accessible locations. These centers should be used as focal points for the distribution of health and human services.
Fire and Rescue Howard County’s Department of Fire and Rescue Services (DFRS) is responsible for emergency medical services, fire suppression and prevention, emergency services training, and rescue services. In addition, the Department is responsible for the Office of Emergency Management which is responsible for the Emergency Operations Center and managing County agency and partner responses to emergencies and extreme weather events.
The DFRS is a combination career and volunteer department. The Department operates 12 fire stations, with over 100 emergency vehicles. Volunteers manage seven of the 12 stations (Elkridge, Ellicott City, West Friendship, Lisbon, Clarksville, Savage, and Bethany).The Banneker, Long Reach, Rivers Park, Scaggsville, and Glenwood Stations are County-managed. Ten of the 12 stations have a complement of full-time career employees. Supplemental resources are provided through Mutual Aid Agreements with each of the surrounding jurisdictions and with a private fire station at the Johns Hopkins Applied Physics Laboratory.
The Department of Fire and Rescue Services has a combination career and volunteer firefighters.

120
The Department of Fire and Rescue Services responded to 31,902 emergency incidents in 2011. An incident is a fire, rescue, emergency medical service (EMS), or other emergency requests. A total of 70% percent of these incidents were for EMS, 3% were fire-related, and 27% were other calls. Other calls may include hazardous materials or technical rescues. Since an incident may elicit a response from one or more stations, the responses exceed the incidents.
The proportion of EMS calls increased from 64% of all incidents in 2000 to 70% in 2011. The proportion of EMS calls is expected to continue to increase as the County’s population ages.
The increase in population and calls for service has led to a need for expanded fire and rescue facilities. The Capital Improvement Program calls for a new Waterloo Fire Station and replacement of the Elkridge and Banneker Stations. Limited growth, requirements for residential sprinklers, and the continued installation of underground cisterns should reduce fire service needs in the Rural West, although two additional stations would improve response time. Rescue vehicles and equipment are quite expensive and need replacement on a regular cycle.
Policies and Implementing Actions POLICY 8.16 – Minimize loss of life, loss of property, and injury due to fire or medical emergencies.
Implementing Actions
a. New Fire Stations. Construct and staff the new and replacement fire stations in the current Capital Improvement Program (Waterloo, Elkridge, and Banneker).
b. Underground Cisterns. Continue to construct underground cisterns to support fire suppression in the Rural West.
c. Fire and Rescue Vehicles. Provide funding to replace fire and rescue vehicles when needed.
Police Police protection is a visible, critical component of the criminal justice system in Howard County, which also includes the Howard County Detention Center, and Howard County District and Circuit Courts.
The Police Department’s Operations Command, which includes Patrol, Criminal Investigations, and the Special Operations Division, requires the majority of the Department’s resources. The Administration Command provides necessary support services, thus allowing the Operations Command to concentrate on patrol operations and investigations.
The Department’s patrol function received 128,884 calls for service in 2011, divided between the Northern and Southern Districts.
The Police Department has significantly expanded its staffing and operations in recent years but not its facilities. The expansion and renovation of existing office space is badly needed to accommodate expanded police units. A separate expanded building for Child and Victims’ Services is also needed. While functions are currently organized around the Northern and Southern District operations, population and operational changes, in addition to continuing County growth, warrant further evaluation of both the need for a new central district station and the need to better organize various Police units.
“I like the safety and minimum crime rate.”
HCC Student Government Association

121
Unlike the Department of Fire and Rescue Services, Police services do not have dedicated revenue sources and are primarily funded through the County’s General Fund, with some State and Federal assistance.
The Police Department continues to accommodate the differing needs of Howard County’s diverse population. Liaisons now provide critical assistance to senior and minority residents. Additionally, a full-time Spanish interpreter is available to aid officers on service calls and traffic stops. Other programs, including the School Resource Officer program, provide critical ties to the community.
Policies and Implementing Actions Policy 8.17 – Enhance Police protection.
Implementing Actions
a. Organizational and Facility Assessment. Evaluate the options for organizing Police functions and the need for a new central district to develop a plan for new or modified Police Department facilities.
b. Adequate Resources. Ensure the Police Department has adequate staff and equipment based on levels of crime and demand for services.
c. Community Policing and Youth Programs. Continue to focus on community policing programs that allow police officers to work in partnership with communities to solve crimes and work proactively with schools.
Other Community Needs Technology and Communications. As the County and the general culture becomes increasingly computer dependent, the budget for hardware and software system upgrading has resulted in steadily increasing budget needs. The One Maryland Broadband Plan, managed by the County’s Department of Technology and Communication, provides a significant opportunity to strengthen and expand new technology and communication throughout Central Maryland. The new broadband infrastructure created by this project will provide capacity for future County projects and programs that incorporate advanced technology.
Systemic County Facility Renovations. Planning for systemic renovations to County office space is ongoing, beginning in 2010 with a major renovation of the George Howard Building in Ellicott City. The Dorsey, Gateway, and Warfield Buildings need substantial upgrading to meet the growing demand for enhanced services, personnel, and technology. Recreation and park buildings, senior centers, and other County buildings also need to be programmed for routine maintenance and systemic renovations to extend their useful lives.
Community Enhancements. Initiated through policies in General Plan 2000, there are several capital projects that support the revitalization of the Route 1 and Route 40 Corridors, as well as enhancements to other, older communities. Streetscape, pedestrian, and public space improvements are important ongoing projects that demonstrate public sector support and encourage private investment in renovation or new development. Given budget constraints and the slow economy, the County should evaluate new strategies for advancing revitalization, including State Sustainable Communities funding.

122
Policies and Implementing Actions POLICY 8.18 – Continue to invest selectively to maintain and enhance County facilities.
Implementing Actions
a. Funding Priorities. Use the Capital Improvement Program to evaluate and prioritize County investments in technology upgrades and systemic renovation for County offices and other facilities.
b. Community Revitalization. Continue to invest in renovation of community infrastructure as well as catalytic community revitalization projects, seeking grants and public-private partnerships whenever possible.

123
Overview The center of everyone’s sense of community is their home. Howard County offers a wide variety of housing options; however, the County’s housing prices are among the highest in the state and nation. This limits the ability to provide a full spectrum of housing for people within all income ranges.
PlanHoward 2030 proposes the expansion of Howard County’s moderate income housing unit (MIHU) program. The Howard County Department of Housing and Community Development is currently developing a number of mixed income, green, healthy, and walkable communities. Replication of similar cutting-edge ventures will put Howard County at the forefront of providing attractive, sustainable, full spectrum housing options.
State of Maryland Vision A range of housing densities, types, and sizes provides residential options for citizens of all ages and incomes.
County Context Howard County’s choice location has created high housing demand and prices. While Howard County has innovative affordable housing programs that provide options for some households with incomes below the County median, many people who work in the County commute long distances to obtain more affordable housing elsewhere. Therefore, a focus on diverse and affordable housing will become increasingly more important. Special consideration must also be given to expanding housing choice for the growing senior citizen population and residents living with disabilities.
While Howard County has a wide variety of housing types, densities, and designs, limited land resources and County growth policies are shifting the focus from past patterns where single-family detached homes dominated to a current mix that includes more townhouses and apartments, a trend that can help increase affordable housing choices.
9. Housing
Katie Sarich, Grade 3, Guilford Elementary School

124
Progress under General Plan 2000 General Plan 2000 called for the provision of affordable housing for existing low and moderate income residents, and for the diverse labor force needed for continuing economic growth. Progress achieved since 2000 includes:
The Department of Housing and Community Development (DHCD) has been developing affordable housing that is sustainable, has innovative design, and accommodates a mix of incomes. Examples of new or renovated housing developments, which are models for the future include:
o Construction of the 106-unit Ellicott Gardens, an affordable, green apartment community.
o Redevelopment of the 100-unit Guilford Gardens low income project into a 269-unit mixed income, amenity-rich, multigenerational sustainable community.
o Redevelopment of the Hilltop (94 units) and Ellicott Terrace (60 units) communities into a 273-unit mixed income and sustainable community.
o Construction of the Cottages at Greenwood, a community of ten single-family detached homes, constructed with universally accessible and sustainable features, with an emphasis on affordability.
In 2001, age-restricted adult housing (ARAH) opportunities were created in the PSC and POR zoning districts and through the conditional use process in other residential districts. Moderate income housing unit and universal design requirements were included. These age-restricted adult housing amendments are anticipated to result in the construction of over 3,300 ARAH units countywide.
In 2004, the County adopted zoning regulations that expanded the MIHU requirement to most zoning districts that include townhomes and apartments. This has resulted in 76 moderately-priced for-sale homes and 394 moderately-priced rental units in eastern Howard County.
The County has utilized alternative funding sources to expand the County’s supply of affordable housing. Examples include the use of low income tax credits, as well as leveraging bonds, payment-in-lieu-of-taxes, and project-based subsidies for various developments within the planned service area. Another example of this type of support is the assistance provided to Bridges to Housing Stability (formerly Congregations Concerned for the Homeless), with the acquisition of a new headquarters after the original location succumbed to fire.
Housing Supply and Demand Howard County continues to be very desirable for families due to its high performing public schools, its first-class library system, parks, and other attractive amenities. Additionally, the County’s relative proximity to major metropolitan areas and its access to key highways makes it both an employment center and an ideal location for commuters to live. These factors create a demand for housing, that when coupled with the limited amount of available land, result in housing prices that are unaffordable, or a barrier to living in the County, for many in the County workforce such as teachers, police officers, hospital, retail, service, hospitality, and entry level workers in many fields, as well as for many disabled
Housing goals include a full spectrum of housing for all.

125
and elderly. As shown in Figure 9.1, Howard County’s median home price and median gross rent are among the highest in the region.
General Plan 2000 set a policy to provide diverse housing options in appropriate locations. In accordance with State Smart Growth requirements, higher density housing is directed inside Howard County’s growth boundary, the Priority Funding Area (PFA). The PFA is the eastern 40% of the County, which is served by public water and sewer. Included within the PFA are the preponderance of the County’s jobs, public and commercial services, and amenities. As discussed and shown on the Designated Places map in Chapter 6, the County’s growth policies are being refined to direct most higher density and mixed-use housing to Growth and Revitalization areas while more limited housing intensification, as infill, is directed to Existing Communities. The County’s PFA with new place designations is an important sustainability policy for the County, because it allows for both convenient access to services by most residents and cost-effective delivery of critical public infrastructure. Based on land availability and current zoning, it is projected that by 2030 one-third of all new homes will be single-family detached and two-thirds will be townhouses or apartments. These are typically more affordable housing products and will help accommodate diverse housing needs. All of these product types will be located in the PFA and most within the Growth and Revitalization areas.
Affordability
Figure 9.2 shows existing Howard County household income levels. Over half (51%) of the County’s households earn $100,000 or more annually.
Jurisdiction Median Value Median RentAnne Arundel $343,400 $1,371Baltimore $166,100 $874Baltimore County $265,200 $1,071Carroll $332,800 $990Harford $286,400 $1,003Howard $415,400 $1,374Frederick $314,300 $1,158Montgomery $447,200 $1,466Prince George’s $286,100 $1,182Source: U.S. Census, 2010 ACS
Average Median Home ValuesFigure 9-1
and Rent by Jurisdiction
Income Range Households Percent$24,999 and less 7,688 7%$25,000 to $49,999 13,695 13%$50,000 to $99,999 30,157 29%$100,000 and above 53,818 51%Total Households 105,358 100%Source: U.S. Census Bureau, 2010 ACS
Howard CountyFigure 9-2
Household Income (2010)

126
The Maryland Department of Labor, Licensing and Regulation reports the average annual salary for the Howard County workforce as $57,694. However, the County workforce is quite diverse including highly paid professionals and more modestly paid workers including hospital, retail and service workers, teachers, firefighters, police, and other local and State government employees. Generally housing is considered affordable if it accounts for 30% or less of monthly household income. According to this standard, a home affordable to the average County worker would be priced at $224,000 or approximately $1,300 in monthly rent. These prices are significantly less than the County’s median home price and median gross rents. Transportation costs for the nonresident workforce are an additional expense.
Transportation costs (i.e., cost of fuel, vehicle maintenance, transit fares, travel time, etc.) are not typically factored when determining affordability. However, affordable housing experts suggest that in order to understand the true cost of where one chooses to live, transportation costs must be considered.
Location Efficiency
Housing becomes less affordable, the further it is from employment, services, and amenities, since there is a direct correlation between the distance from work to home and the amount spent (gas, fare, vehicle maintenance, time) to travel that distance. Therefore, housing is more affordable and considered “location efficient,” if it is located in a neighborhood with convenient access to employment, schools, services, and public transit and/or other low-cost transportation alternatives to the automobile such as walking, biking, or carpooling, etc. “Location efficient” housing encourages less reliance on the automobile, which not only minimizes the costs associated with vehicle miles traveled, but also mitigates congestion, energy consumption, greenhouse gas, and air pollution. By targeting growth to location efficient areas, County housing options increase and become more affordable for all families. Location inefficiency is a factor that adds to housing costs for many commuting households (resident versus nonresident households). Policies supporting location efficiency would also likely result in enhanced access to jobs, services, and overall opportunities for greater quality of life.
Diversity in New Housing Types
Housing experts state that within the next 20 years, over 60% of new housing demand will be for multifamily dwelling units. Some of this demand shift reflects the increasing ratio of smaller households including seniors, singles, and single parents. However, much of the shift in housing demand from single-family to multifamily is attributed to changing attitudes about homeownership. More stringent home financing regulations and the national economic downturn have resulted in a shift in consumer attitudes about homeownership. Increasingly, households are deciding to rent, rather than take on the significant debt associated with homeownership.
Young families, service workforce, and older residents will need housing that accommodates their lifestyles. The suburban single-family detached home is associated typically with a nuclear family of parents and children. However, the population of Howard County, just as the population of the United States, is diversifying with a trend towards smaller households, particularly as the population ages (Figure 9-3). While the overall population in Howard County has increased by 53% between 1990 to 2010, family households with children under the age of 18 increased by 47% during the same period. Also during this period, the number of residents living alone increased by 75% and residents 65 and older living alone increased by 154%. Consequently, the single-family detached
GREEN TIP!
Apply weather stripping to doors and windows.
Creating a tight seal will keep heat and air
conditioning inside.

127
house is no longer preferred by many households. Smaller-sized housing will be in greater demand in the future. The data shows a demographic shift that aligns well with the decreasing availability of land for the traditional single-family detached home and the increased emphasis on planning for more compact higher-density residential development. From this perspective, condominium and rental apartments and townhome developments will be a greater portion of new homes built in the County in the future.
The findings of the County’s 2011 Analysis to Impediments to Fair Housing Choice offers a contrasting perspective to the trend toward smaller-sized housing. The report points out that the demand for larger, affordable units to accommodate various familial statuses is actually not being met. The County’s Asian / Pacific Islander, African American, and Hispanic households are shown to be more likely than White households to include within it members beyond the nuclear family and, therefore, require larger quarters. As the County becomes increasingly more diverse, it will need to establish housing policies that can accommodate the inherent familial status of its various resident groups.
As shown in Figure 9.4, the current regional housing is heavily weighted to single-family stock. The more urbanized Prince George’s County, Montgomery County, Baltimore County, and Baltimore City lead in the ratio of apartments to single-family detached and attached units. While the chart shows Howard County’s apartments at 25% of the total housing units, remaining development capacity and current zoning will support a better balance over time.
Category Number Percent Number Percent Number Percent Growth % IncreaseFamily Households 50,691 74.2% 65,790 73.1% 76,333 72.9% 25,642 50.6% With children under 18 26,442 38.7% 36,058 40.0% 38,764 37.0% 12,322 46.6% With no children under 18 24,249 35.5% 29,732 33.0% 37,569 35.9% 13,320 54.9%Nonfamily households 17,646 25.8% 24,253 26.9% 28,416 27.1% 10,770 61.0% Householder living alone 13,088 19.2% 18,767 20.8% 22,903 21.9% 9,815 75.0% Householder 65 years and older 2,664 3.9% 4,132 4.6% 6,754 6.4% 4,090 153.5%Total Households 68,337 100% 90,043 100% 104,749 100% 36,412 53.3%Source: U.S. Census, Decennial Census
Household Types Figure 9-3
1990 2000 2010 1990 to 2010
in Howard County
Jurisdiction SF APT MH Total APT %Anne Arundel 170,310 36,870 4,250 211,430 17%Baltimore 235,718 95,886 3,003 334,607 29%Baltimore City 197,366 98,663 565 296,594 33%Carroll 54,151 7,347 803 62,301 12%Harford 76,844 14,938 3,544 95,326 16%Howard 80,062 27,006 1,214 108,282 25%Montgomery 249,646 124,587 433 374,666 33%Prince George's 216,860 108,746 1,603 327,209 33%Total 514,043 1,810,415 28%Source: 2008-2010 ACS data, U.S. Census Bureau
Regional Housing UnitsFigure 9-4
By Structure Type

128
Howard County’s housing stock includes a greater diversity mix of housing types than many suburban communities, which helps accommodate various lifestyles. However, single-family (detached and attached) homeownership still represents 76% of the County’s housing stock. Among the single-family unit types, single-family detached units constitute the majority (54%). These units are financially out of the reach for many, particularly entry level workers, single income, and senior households. As noted in Chapter 6, based on limited land resources and County growth policy, future housing growth will be primarily single-family attached and apartment units. This will assist in providing for more diverse housing needs.
In order to both provide better options for the County’s diverse households and foster the robust workforce needed to maintain the County’s economy and County services, a shift toward housing policies that encourage the construction of well-designed and sustainable apartments will be critical.
Policy and Implementing Actions POLICY 9.1 – Increase public awareness of how combined housing and transportation costs affect housing affordability, traffic patterns, resource consumption, and pollution, to promote support for compact, mixed income, and mixed-use communities that meet the diverse housing needs.
Implementation Actions
a. Education on Housing Costs. Utilize diverse strategies such as collaboration with the Board of Realtors, nonprofits, and business groups to educate residents, policy makers, and housing advocates on affordability / value of location efficiency.
b. Location Efficient Mortgages. Expand advocacy for location-efficient mortgages to continue to increase the number of households that qualify for homeownership.
Affordable Housing Advocates for Full Spectrum Housing
In 2006, a 23-member task force was commissioned to examine affordable housing in the County and approaches to providing more affordable housing for the County’s diverse population, especially its workforce. The task force made a series of recommendations. Among the recommendations was the goal of achieving a “full spectrum of housing.” The task force defined full spectrum housing as housing that accommodates various income levels and life stages. It should offer appropriate and proportionate housing for residents of all socioeconomic groups and ages.
The County’s moderate income housing zoning helps support the goal of affordable housing, but only for moderate income households earning 50-80% of the Howard County median income. Per the County’s zoning regulations, in ten of the zoning districts, 5 to 25% of any new residential development must be affordable to moderate income households. As shown in Figure 9-5, most (84%) of the MIHUs are apartment rental units, located in the eastern part of the County (Elkridge and Southeast). Of the 76 owner-occupied MIHUs, 70% are located in Elkridge. The larger quantities of MIHUs in these areas are proportionate to the overall quantity of new residential units constructed.
GREEN TIP!
Unplug. 40% of the electricity used to power
home electronics is consumed while they're
turned off.

129
The American Communities Survey estimated the County’s 2010 median household income to be $101,771. However, the 2010 median home price for the County is $415,400 and market rent ranges from $1,131 for an efficiency to $2,466 for a four-bedroom apartment. The imbalance between median income and the median home price and median gross rents significantly limits residential opportunities for many in the County workforce, resulting in long commutes and higher combined costs.
Howard County is a recipient of Community Development Block Grant funds from the U.S. Department of Housing and Urban Development, thus designating it an entitlement jurisdiction. As such, the County is obligated to affirmatively advance fair housing by:
1) Conducting an analysis to identify impediments to fair housing choice within the jurisdiction,
2) Taking appropriate actions to overcome the effects of any impediments identified through the analysis,
3) Maintaining records reflecting the analysis and actions taken.
Preservation of Existing Affordable Housing
The County’s Department of Housing and Community Development administers several housing preservation programs designed to preserve the County’s existing affordable housing options. The County should continue to support these programs since rehabilitating aids in maintaining the character and stability of existing neighborhoods. As much as possible, existing housing should be modernized to make units more energy efficient. Countywide, there are 2,884 housing units designated as affordable (2,836 rental and 48 owner-occupied). In addition to designated affordable housing units, there are less expensive rental and homeownership opportunities in mature neighborhoods where homes are older with more modest square footage and lot sizes.
Overall, the County’s 2011 impediment analysis concludes that the dominant impediment to affordable housing choice is the inadequate supply of affordable housing choice due to high housing prices and continued increases in the number of households who are below the median area income level. To address these impediments, the County will need to identify and implement actions to expand housing choice for groups such as Blacks, Hispanics, female-headed households, persons with disabilities, and families with at least one foreign-born parent, that have struggled to cover housing costs in the County due to lower household incomes.
SFA APT SFA APTColumbia 0 0 2 27Elkridge 43 0 38 153Ellicott City 6 10 0 15Rural West 0 0 0 0Southeast 17 0 0 159Total 66 10 40 354Source: Howard County Department of Housing &
Community Development
MIHUs by Planning AreaFigure 9-5
Owner Occupied Rental
Owner Occupied and Rental Units
GREEN TIP!
Insulate hot water pipes for more immediate hot
water at the faucet and for energy savings.

130
The County is home to some older Federally-funded housing, which has affordability requirements that will eventually expire. It will be important for County agencies to work together to develop strategies to ensure there will be an inventory of affordable housing options available for residents of various income levels.
Policy and Implementing Actions POLICY 9.2 – Expand housing for residents at diverse income levels and life stages by encouraging high quality, mixed income, multigenerational, well designed, and sustainable communities.
Implementation Actions
a. Range of Affordable Options. Continue to expand current options for full spectrum, affordable housing through affordable housing requirements in additional zoning districts; increased regulatory flexibility to provide low and middle alternatives to moderate income housing; institution of density or other incentives; use of fee-in-lieu option; accessory apartments; establishment of public, private, and nonprofit partnerships; and promotion of business community support for workforce housing.
b. Diverse Rental Opportunities. Work with developers to provide increased rental choice for all incomes and ages throughout Howard County, especially in areas designated for increased density and revitalization.
c. Redevelop Older and Affordable Housing. Expand zoning or other financial incentives to redevelop older, lower income housing into mixed income, sustainable communities.
d. Expanded Funding Sources. Pursue additional funding to enable DHCD to continue expanding supplies of affordable housing for low and moderate income households, seniors, and persons with disabilities.
e. Transportation Connections. Consider and include transportation in all planning and renovations.
POLICY 9.3 – Expand innovative programs to enable existing housing to meet full spectrum housing needs.
Implementation Actions
a. Education and Outreach. Continue DHCD and DCS efforts to educate home seekers on existing affordable housing programs, Fair Housing law, location-efficient mortgage concepts, and mortgage and lending requirements that assist with decision making on home rental or purchase.
b. Preservation of Existing Units. Evaluate legislation to create a “right of first offer” for the County when rental projects are being converted into condominiums to allow for preservation of affordable units.
c. Protection during Conversions. Expand existing protections for low income and elderly renters in buildings undergoing condominium conversions.
d. Condominium Financing. Evaluate the effects of condominium fee delinquency on the availability of mortgages and home prices to determine an appropriate response.
Howard County strives for a full spectrum of housing for people of all ages and incomes.

131
e. Existing Homes. Continue to pursue programs to support use of existing, older homes as another means of addressing affordable housing needs.
Housing for Senior Citizens and the Disabled Senior Housing
Figure 9-6 shows that nearly 20% of Howard County residents will be over the age of 65 by 2030, which is a 127% increase of that age group currently residing in the County.
The County’s housing stock should support the aging population and will need to continue General Plan 2000 policies to promote diverse senior housing for those that wish or need to downsize to more easily maintained units as they age. The policies should also continue to support seniors who choose to age in place in their own homes or in their own communities. As shown in Figure 9-7, there are more than 3,000 units located throughout the County, designated specifically for senior citizen lifestyles. Nearly half (45%) of these units are located within the Ellicott City Planning Area.
For those that want to relocate from a large family home to a home that is smaller with less maintenance and with a bedroom on the first floor, County housing stock should include options that are affordable and have been universally designed to meet the needs of this population. The County’s policies should build upon the current Moderate Income Housing Unit regulations, which require that 5-25% of newly constructed housing, in certain zoning districts, accommodate households with incomes up to 80% of the County’s median income.
Columbia Elkridge Ellicott City Rural West Southeast TotalSFD 6 0 0 94 22 122SFA 419 60 485 149 22 1,135Apartments 416 408 1,156 0 156 2,136Total 841 468 1,641 243 200 3,393Source: Howard County Department of Planning and Zoning
Units by Planning Area
Figure 9-7Age Restricted Adult Housing (ARAH)
AgeRange Number % Number % Growth % Change
0-4 17,363 6.0% 22,039 6.5% 4,676 26.9%5-19 63,360 22.1% 67,688 19.8% 4,328 6.8%20-44 92,961 32.4% 112,923 33.1% 19,962 21.5%45-64 84,356 29.4% 72,710 21.3% (11,646) -13.8%65+ 29,045 10.1% 65,907 19.3% 36,862 126.9%Total 287,085 100.0% 341,267 100.0% 54,182 18.9%Source: 2010 from Census - 2020 through 2030 age breakdown are estimates based on
adjusted MDP cohort model (from round 7D)
Figure 9-6Howard County Population
by Age, 2000-2030
2010 2030 2010 to 2030

132
While universal design, which is the production of buildings and environments that are intentionally designed to be accessible to people with and without disabilities, is currently required by the age-restricted adult housing regulations, retrofitting existing, older homes remains a challenge. It should be noted that age-restricted adult housing does not necessarily correspond to the housing demand and needs of residents age 65 and older. Specifically, age-restricted adult housing is intended to allow empty nesters the option of downsizing. As seniors relocate to ARAH, their former homes become available for younger families.
The County also recognizes that as older residents’ ability to live independently diminishes, they often need to move to housing that provides support services. There are both nursing and assisted living options for seniors in the County, offering a continuum of services, from acute care to congregate and group housing to in-home services. In order to accommodate the projected 19% of residents age 65 and older by 2030, the County’s support of continuing care housing and services must be maintained.
Housing for Residents with Disabilities
According to the U.S. Census Bureau, 7% of County residents are living with disabilities, such as hearing, vision, cognitive, and ambulatory difficulties. In order to accommodate this population, County agencies will need to work cooperatively to comprehensively evaluate the specific needs of this population so that there is an understanding of actual housing demand. Furthermore, outreach such as housing fairs is needed to educate residents on various housing resources including housing vouchers. Outreach to property owners, management companies, and real estate agents is also necessary, since many are not knowledgeable about ADA law as it pertains to the provision of housing and accommodations.
As with the aging population, the County’s housing stock should reflect and support the demand for housing generated by disabled residents. In order to achieve the County’s housing goal of providing a range of housing types for residents of all ages and incomes, there must be continued support for the construction and rehabilitation of housing that provides choices for living independently or in congregate settings and that facilitates access to services and transportation options.
Homelessness
In 2011, the County’s Board to Promote Self-Sufficiency published its Plan to End Homelessness, which outlines strategies to support the vision of all residents having a safe and stable place to call home. According to the plan, over 200 people each day are living in shelters, outdoors, or in vehicles in Howard County. The County will continue to support the efforts of its agencies and nonprofit organizations to achieve the two goals set in the plan: The first goal is to prevent homelessness for at-risk households, which are those that experience sudden health challenges, loss of employment, or other life challenges. The objective for at-risk households is to assist before the person or family becomes homeless. The second goal is to end chronic homelessness, typically for persons with physical disabilities, mental health difficulties, substance abuse challenges, etc., and who need residential stability in order to effectively address the underlying issues.
While the Departments of Citizen Services and Housing and Community Development are the lead agencies, achieving these goals will require significant coordination with other County agencies and the nonprofit community, as well as innovative thought on how to develop policy to establish and support an effective
GREEN TIP!
Install solar panels. Heat your home the natural
way.

133
continuum of housing resources and services to address causes of homelessness.
Policy and Implementing Actions POLICY 9.4 – Expand housing options to accommodate the County’s senior population who prefer to age in place and people with special needs.
Implementation Actions
a. Universal Design. Continue partnering with public, private, and nonprofit organizations to assist senior citizens and residents with special needs by doing universal design renovations.
b. Promoting Self-Sufficiency. Encourage the development of personal service and home maintenance businesses to promote self-sufficiency for those choosing to age in place.
c. Increasing Awareness. Expand outreach to senior citizens and residents with disabilities to increase awareness of existing County, nonprofit, and business services.
d. Transportation and Transit. Incorporate transportation options.
POLICY 9.5 – Support the efforts of County agencies, nonprofits, and other organizations to prevent temporary and chronic homelessness.
Implementation Actions
a. Partnering. Continue to partner with public, private, and nonprofit organizations on key actions to implement the Plan to End Homelessness.
b. Annual Review. Charge the Board to Promote Self-Sufficiency to annually review the Plan to End Homelessness and make recommendations for funding and implementation of targeted initiatives.
c. Housing Needs. Partner with DHCD, DCS, and others to address the transitional housing needs of homeless individuals and families challenged by chronic disabilities, health, mental health, and substance abuse.
Innovative Housing Design The County will continue to promote design innovation for all housing types, including green building standards, and for a greater variety of housing products to meet the needs of increasing diverse households (i.e., young workforce, families, single parents, empty nesters, special needs residents, homeless, etc). Programs and policies that advance sustainable housing design and construction practices not only make sense from an environmental perspective, but their long-term cost-effectiveness enhances the County’s affordability goals.
The County’s approach to housing design should integrate functionality, aesthetics, and sustainability in ways that accommodate the County’s spectrum of households. The Affordable Housing-Design Advisor (AHDA), a partnership of the U.S. Department of Housing and Urban Development, The American Institute of Architects, and various advocacy and community development organizations, explains that good design is more than aesthetics. AHDA uses four criteria to determine the quality of housing design. It assesses whether the design meets the user’s needs, is contextually compatible, enhances the neighborhood, and is built to last. These criteria support a housing stock that is not only sustainable,
Innovative, compact, mixed income, multigenerational, and financially sustainable housing in Howard County is a goal.

134
but also advances the County’s desire to accommodate the diverse housing needs of the residents.
Among the tools the County has employed since the adoption of General Plan 2000 are the universal design standards, which are currently required for age-restricted adult housing and work well to accommodate this population. These required standards only include design features that are appropriate for a broad range of disabilities. There are far more other universal design features that are optional but are not required. In consideration of the County’s desire to expand housing options for its diverse population, the universal design standards should be reviewed to determine whether additional features should be required and the standards applied to all housing, not just to age-restricted adult housing.
Policy and Implementing Actions POLICY 9.6 – Promote design innovation for all housing types, utilizing cost-effective sustainability principles, to meet the housing and transportation needs of the County’s diverse households.
Implementation Actions
a. Universal Design Options. Promote the creation of additional housing developments with universal design features by incentivizing innovative and replicable design and building practices through the use of expedited review and permitting, density bonuses, property tax credits, fee reductions, grants, revolving loans, or marketing assistance as well as the creative use of mixed income developments.
b. Recognize Innovations. Continue to recognize and highlight design innovation in high quality, cost-effective, sustainable, mixed income and multigenerational housing.
c. Design Review. Include innovative affordable housing concepts and guidelines in the documents used by the Design Advisory Panel in its review of projects.
“A sustainable community is affordable housing, jobs, and
security.” HCC Student Government
Association
135
Overview Community Design reviews the way neighborhoods and communities are developed and how design and community services affect the ways people use, enjoy, and impact the built and natural environments.
PlanHoward 2030 builds on the County’s experience with new approaches to community design. Planned communities such as Maple Lawn and Turf Valley are well underway. New projects in the Route 1 Corridor and in Downtown Columbia are in progress and will be models for more complete and sustainable communities in the future.
Compact, mixed-use, walkable design is central to achieving sustainable communities. Access and connectivity for transit users, cyclists, and pedestrians are key. Projects should address complete streets, complete communities, and universal design for all ages and abilities.
Maryland State Vision Compact, mixed-use, walkable design consistent with existing community character and located near available or planned transit options is encouraged to ensure efficient use of land and transportation resources and preservation and enhancement of natural systems, open spaces, recreational areas, and historical, cultural, and archeological resources.
County Context Howard County began growing rapidly in the 1960s with scattered auto-oriented, suburban developments. Columbia, as a planned community, demonstrated how planned open space protection and the clustering of residential and commercial development could be highly successful. Since then, newer planned communities including the Timbers, Waverly, Emerson, Maple Lawn, and Turf Valley have been developed in Howard County, building upon the lessons learned. These are both mixed-use and more compact but are also suburban and auto-oriented. Future communities should increase options for pedestrians, cyclists, and transit users.
10. Community Design
Eric Higgins, Grade 9, Reservoir High School

136
Progress under General Plan 2000 Per policies adopted under General Plan 2000, Route 1 Corridor Revitalization Studies were completed, followed by rezoning and new design standards to promote Transit Oriented Development (TOD) nodes at MARC stations and Corridor Activity Centers (CAC) as focal points along US 1. A study to enhance the Route 40 Corridor was also completed. New design requirements and zoning changes for the Route 40 Study Area encourage inclusion of compact, mixed-use development at select retail sites to become attractive community focal points.
Also, new County facilities for libraries, senior centers, and recreation in Glenwood, North Laurel, and Ellicott City have been built to create focal points that strengthen existing communities.
General Plan 2000 also called for redevelopment of Downtown Columbia as Howard County’s urban center. After extensive public discussions, the Downtown Columbia Plan and corresponding zoning regulation amendments, APF amendments, and Design Guidelines were adopted. Together these tools will create a balance of residences, commercial establishments, amenities, environmental restoration, and transportation options that will evolve into a vibrant, urban setting.
Creating More Complete Communities This section presents a framework for enhancing the sustainable qualities of Howard County’s communities through the use of planning and design concepts that build on the best characteristics of established and emerging communities. Map 6-2, in Chapter 6, Growth, identifies areas with Established Communities where enhancements will primarily focus on maintaining infrastructure and creating more complete communities, as well as Growth and Revitalization areas where community patterns are expected to experience more change.
Previous General Plans promoted the preservation of rural agricultural lands, the clustering of low-density residential development in the Rural West, and diverse patterns of residential, commercial, and industrial development at different suburban scales in the East. The diversity of housing and business environments developed over the years is instrumental in establishing Howard County’s highly-regarded quality of life.
PlanHoward 2030’s vision for sustaining and improving the County’s livability focuses on creating more complete communities via a two-part strategy: enhancing existing communities and creating new ones. Established Communities predominately consist of existing single-family neighborhoods or business areas to be respected, with limited infill and enhancement, whereas the Growth and Revitalization areas offer opportunities to create more compact, complete communities at densities that can support a mix of uses and transportation options. Higher density, mixed-use development is critical to accommodating future growth that minimizes impacts on the environment, existing communities, and the Rural West. New complete communities should be designed to ensure that they:
Exhibit housing, jobs, and service diversity;
Have streets and buildings that are well integrated and of a human-scale design;
Are walkable, bikeable, and have access to good transit service;
Support shared parking;
Howard County has a long history of truly innovative community building, starting with Columbia.
“Where I live in Columbia I’m surrounded by things that are
necessary for day-to-day – proximity to schools, retail, village centers, and parks.” HCC Student Government
Association

137
Contain vibrant public spaces and activity-filled destinations;
Minimize adverse impacts and restore degraded environment features;
Meet green building standards, including use of renewable energy; and
Are compatible with neighboring uses.
There is a growing understanding that neighborhood planning and design can play a major role in promoting public health within communities by increasing access to essential transportation, healthy foods, and recreational opportunities. PlanHoward 2030’s vision for complete community design provides guidance for future land use decisions that positively impact the health and health behaviors of Howard County residents.
One example and model for future communities is the Downtown Columbia Plan, which sets forth the strategy for transitioning a first-generation, suburban, town center into the County’s 21st century urban center. The plan includes a signature sustainability framework which will guide the restoration and development of the community.
New and redeveloped communities offer opportunities for greater community diversity by incorporating multistory housing with retail and office uses. Proximity to regional transportation corridors will critically influence the ability to create less auto-dependent settings by providing good access to transit, pedestrian, and bike options.
Over time, however, many Established Communities can also become more complete. Any changes need to be carefully considered so the community’s best characteristics are preserved and promoted to strengthen community identity. Character defining elements can include dominant development patterns such as architectural style, block layout, and connections to nearby areas. Communities become more complete by supplementing valued features with those that enhance a community’s design. These can include sidewalks, bike routes, or transit to improve access to surrounding employment, services, and open space. Added features could in some cases include appropriately sited and scaled new residential, institutional, or commercial development.
New tools are needed to balance preservation and enhancement of Established Communities and also to provide flexibility and promote innovative design for Growth and Revitalization areas. Designated Growth and Revitalization areas will become primary focal points for the County’s next generation of development.
Sustaining Established Communities One of Howard County’s greatest assets is the strength of its communities. Many of these communities are maturing and may require maintenance or replacement of aging public facilities. Others could benefit from enhancements of other kinds. Identifying community needs and establishing priorities is critical. Existing communities have four main issues:
Aging infrastructure that may require maintenance or replacement;
Missing infrastructure that was not required when the development was built, such as storm drains or sidewalks;
Environmental remediation that may be needed due to limited stormwater management, which resulted in stream erosion, and where stream buffer planting could yield a significant benefit; and
More compact development patterns make good use of scarce land.
138
Opportunities for limited, compatible, infill development, such as senior housing for residents wishing to downsize but stay in their communities.
Balancing the management of new growth with the concerns of Established Communities is an important challenge. Residential infill development of scattered, large parcels in older, established communities will continue to be a concern as the County’s inventory of undeveloped land dwindles.
The County needs to identify ways to preserve the existing character of established neighborhoods while accommodating some continuing growth. Consideration should be given to identifying those neighborhoods whose existing character is homogeneous and where infill changes should be controlled. This could occur by mitigating impacts that can make infill seem incompatible with established neighborhoods, such as excessive clearing and grading, different lot sizes, home sizes, or architectural styles, as well as flag lots which create odd relationships between existing and newly built homes.
On the other hand, there may also be neighborhoods where some land use diversity is desirable because it would enhance the community’s access to open space, services, transit, housing options, or jobs. Consideration should be given to how infill development might help provide community enhancements. In developing regulatory strategies, it will be important to evaluate what sort of development flexibility would enable developers to provide community open space or other amenities and that would help promote more walkable, bikeable, and transit-friendly communities.
Policies and Implementing Actions POLICY 10.1 – Protect and enhance established communities through compatible infill, sustainability improvements, and strategic public infrastructure investments.
Implementing Actions
a. Infrastructure Maintenance. Identify and set priorities for aging infrastructure that requires maintenance or replacement.
b. Infrastructure Gaps. Expand existing infrastructure for older communities that were constructed under prior regulations, so these communities could benefit from additional improvements such as storm drains and sidewalks.
c. Environmental Enhancement. Expand environmental remediation to address storm water management, stream bank erosion, and buffer conservation.
d. Flexible Infill. Consider zoning modifications that would allow more flexibility in order to encourage limited, compatible infill that enhances an existing community.
Growth and Revitalization Beginning with General Plan 2000, the County has embraced the need to renovate or redevelop certain corridors and community centers. This approach provides opportunities for encouraging revitalization of underutilized commercial areas and stimulating economic growth that also strengthens older communities.
In 2010, the County approved a 30-year plan for redevelopment of Columbia’s Downtown. The plan emphasizes environmental sustainability and the preservation of specific buildings, open spaces, and amenities that are important
GREEN TIP!
Use a rain barrel. These containers collect natural
rainwater that you can use to water your garden and plants which do not
require treated tap water.

139
to the community. The plan stresses the importance of balancing traditional community values with new development aimed at introducing vitality into the County’s evolving urban center. As of 2012, initial development projects have been proposed – enhancements to Symphony Woods, as well as residential and retail developments near the Mall.
New regulations have also been adopted to promote revitalization of older Columbia Village Centers. Plans have been initiated for redevelopment of the Wilde Lake Village Center, Columbia’s oldest. The proposed plan reflects considerable discussion among residents, Village Center Board members, and retail owners about preserving and enhancing signature features of the Village Center as redevelopment occurs. Community plans for other Columbia villages will similarly identify important features to be preserved or enhanced as their redevelopments occur over time.
Considerable efforts to promote revitalization have also been extended to Route 1 and Route 40. Renewal of the Route 1 Corridor is building momentum, as planned development moves into construction and as the County partners with the State and developers to construct road and streetscape improvements that enhance the physical and operational quality of the corridor. Additional school, library, senior center, recreation, and fire station capacity will be provided. The County also seeks to leverage public and private investment along the Route 40 Corridor, where streetscape improvements and two new mixed-use developments are proposed. Additional planning is needed in some areas of Route 1 and Route 40 to refine revitalization goals and strategies.
Figure 10-1 represents a key transportation improvement strategy for establishing more unified and connected patterns of streets and paths within corridor areas. By identifying road connections for streets linked through new development and redevelopment areas, a more interconnected street pattern expands the local travel network and reduces reliance on more heavily traveled roadways such as Route 1.
Growth during the next two decades will continue to focus on Downtown Columbia, the Route 1 and Route 40 Corridors, some older Columbia Village Centers, select older commercial or industrial properties such as the Snowden River Parkway area, and shopping centers that are likely to be renovated or completely redeveloped to respond to changing market conditions.
The Downtown Columbia Plan provides for a 30-year vision for Howard County’s urban core.
Figure 10-1 Key Street Connections Diagram
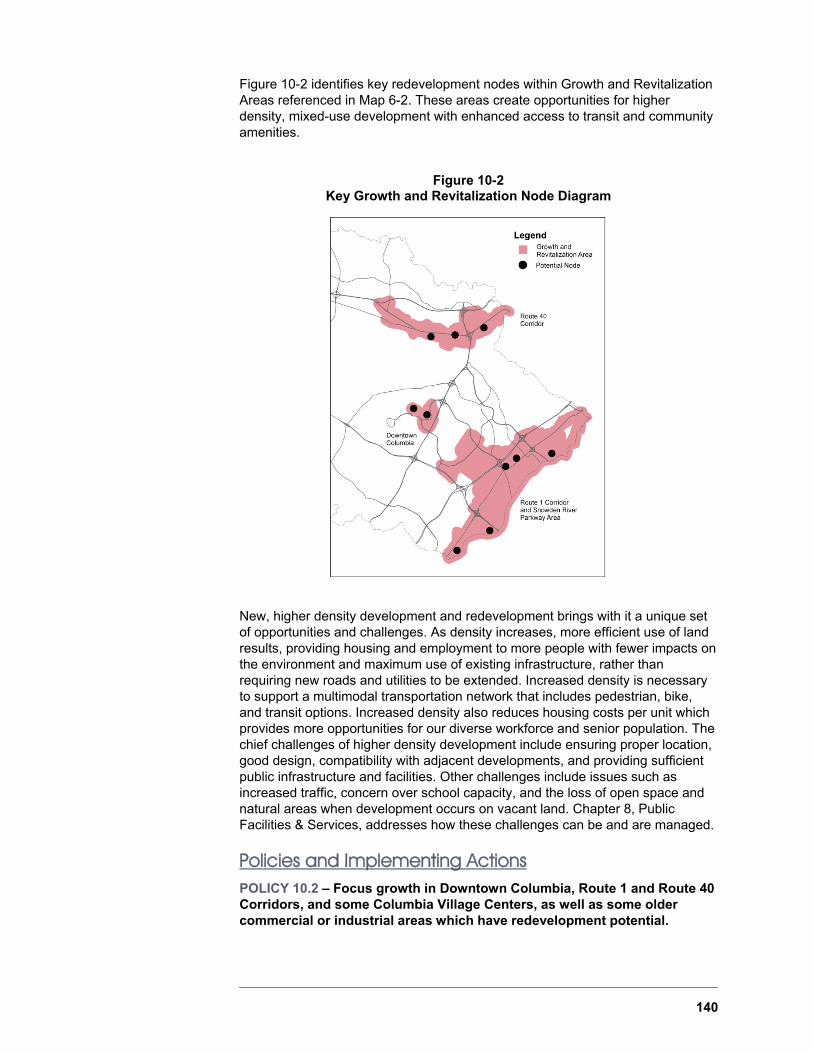
140
Figure 10-2 identifies key redevelopment nodes within Growth and Revitalization Areas referenced in Map 6-2. These areas create opportunities for higher density, mixed-use development with enhanced access to transit and community amenities.
New, higher density development and redevelopment brings with it a unique set of opportunities and challenges. As density increases, more efficient use of land results, providing housing and employment to more people with fewer impacts on the environment and maximum use of existing infrastructure, rather than requiring new roads and utilities to be extended. Increased density is necessary to support a multimodal transportation network that includes pedestrian, bike, and transit options. Increased density also reduces housing costs per unit which provides more opportunities for our diverse workforce and senior population. The chief challenges of higher density development include ensuring proper location, good design, compatibility with adjacent developments, and providing sufficient public infrastructure and facilities. Other challenges include issues such as increased traffic, concern over school capacity, and the loss of open space and natural areas when development occurs on vacant land. Chapter 8, Public Facilities & Services, addresses how these challenges can be and are managed.
Policies and Implementing Actions POLICY 10.2 – Focus growth in Downtown Columbia, Route 1 and Route 40 Corridors, and some Columbia Village Centers, as well as some older commercial or industrial areas which have redevelopment potential.
Figure 10-2 Key Growth and Revitalization Node Diagram

141
Implementing Actions
a. Monitor Redevelopment. Monitor and, as needed, refine the redevelopment goals and strategies for Route 1, Route 40, Downtown, and Columbia Village Centers.
b. Other Opportunities. Identify other older commercial or industrial areas such as the Snowden River Parkway area that are expected to have redevelopment potential by 2030. Determine redevelopment goals and implementing actions.
c. Incentives and Tools. Identify redevelopment tools that may be of assistance in Howard County, such as incentives to maintain and renovate vacant or obsolete commercial properties.
d. Leveraging Investment. Prioritize and leverage public and private investment to achieve revitalization goals.
Community Plans In some instances community-based plans would be helpful in assessing how to promote livability by maintaining and enhancing Established Communities, as well as by significantly redeveloping other older areas. The following elements should be considered to determine opportunities and challenges to be addressed: market conditions, community demographics, existing land uses, adequacy of infrastructure and transportation connections, open space and amenities, historic and cultural resources, and design character. Community plans can help foster more complete communities, while reinforcing the identity of each.
Community plans can be at different scales from an entire planning area to sub areas like historic Ellicott City, Columbia Village Centers, or particular neighborhoods, as shown in Figure 10-3.
Figure 10-3 Community Planning Areas Diagram
“We have the Mall and movies but sometimes you
want something new to experience.”
CA Teen Advisory Committee

142
Policies and Implementing Actions POLICY 10.3 – Enhance the County’s existing high quality of life and sustainability through community-based planning and design for both Established Communities and areas designated for Growth and Revitalization.
Implementing Actions
a. Community Planning. Expand the range and scope of community planning to identify facilities, services, transportation options, environmental enhancements, arts and cultural opportunities, or other amenities that would create more complete communities and reflect community diversity.
b. Sustainable Communities Program. Utilize community plans to guide public and private investment strategies and regulatory change. Seek State designation as Sustainable Communities, if State programs would be helpful.
c. New Tools. Develop additional zoning and finance tools to continue to promote and expand complete communities and context sensitive design solutions.
d. Review Process. Review and update County development regulations to address changes in demographics and markets and to improve design quality.
Updating Regulations As development patterns in the County evolve, the existing regulatory structure should be reviewed and amended as needed to better meet the County’s goals for Established Communities and Growth and Revitalization areas. County regulations need to not only allow but also support the County goals to protect and enhance existing communities, advance redevelopment of designated areas, expand affordable housing, preserve open space, protect the environment, and meet other County objectives.
Topics for review include redevelopment flexibility and amenity requirements; parking; pedestrian, bicycle and transit improvements; compatibility of infill development; green building; historic preservation; forest conservation; landscaping; open space; and scenic roads.
Streamlining Regulations
While new or revised regulations may be needed to address the challenges of infill and redevelopment, care should be taken to avoid regulatory conflicts and burdensome processes. Conflicting, overlapping, and excessive regulatory requirements increase the review time and the costs of development which may have negative impacts, such as financial infeasibility, increased housing costs, and confusion for residents and developers. Agencies involved with the development review process should be encouraged to review the currency and efficiency of their regulations to determine if there are regulatory conflicts or obsolescence and whether processes could be condensed or even eliminated to reduce overall review time. The County’s interagency review committee should undertake this assessment.
A comprehensive review of the regulations will enable the County to move forward more rapidly in approving development proposals that promote more complete and sustainable communities.
As communities mature there may be new opportunities for revitalization involving broad public input.

143
Flexible, Context Sensitive Zoning
With the exception of Columbia, Maple Lawn, Turf Valley, and a few mixed-use districts, most of Howard County has developed under standard single-use “Euclidian” zoning provisions that are typical of post-World War II suburban development patterns. However, as the County is faced with redevelopment opportunities, a one-size-fits-all standard zoning approach is no longer desirable. Redevelopment must be contextually sensitive in terms of uses, intensity, heights, setbacks, and design in order to be compatible with surrounding, existing developments.
“Planned Unit Development” zoning districts, which can be either floating districts or overlay districts, provide land-use and design flexibility in exchange for greater design quality and community enhancements such as affordable housing, open space amenities, pedestrian and bike connections, or environmental restoration. Flexibility to address changing market conditions and to be context sensitive is critical for redevelopment that is both financially viable and a “good neighbor” to the surrounding community.
The County has some existing experience with overlay and floating zones that require approval of a preliminary development concept as a condition of using the zoning option. For example, the current Mixed Use District (MXD) allows flexible combinations of housing, employment, commercial, and open space uses via a mapped overlay zone which is restricted to a minimum of 25 acres and a maximum density of three to six dwelling units per acre depending on which district is used. The Planned Senior Community (PSC) district is a floating zone that requires at least two types of senior housing and allows supporting services. PlanHoward 2030 envisions creating one or more new overlay or floating zones, which can be initiated by property owners to capture redevelopment opportunities in either designated areas or under defined circumstances.
Policies and Implementing Actions POLICY 10.4 – Review and update all County development regulations to respond to County General Plan development goals and changing market conditions, and to improve the efficiency of the County’s review process.
Implementing Actions
a. More Flexible Zoning. Develop Zoning Regulations that better address infill and redevelopment goals and issues.
b. Streamlined Processes. Amend development regulations and manuals to streamline the review process to the maximum extent possible.
State Resources State funding and programs can also provide resources for communities. Created by the Sustainable Communities Act of 2010, the Sustainable Communities program provides an opportunity to better integrate community planning and investment to achieve more sustainable development. These goals include a mix of land uses; affordable housing; greater employment options; growth and development practices that protect the environment and conserve air, water, and energy resources; more walkability and access to transit; expanded recreational opportunities; and protection and appreciation of historical and cultural resources.
The Zoning Regulations are a tool to implement the policies and actions of PlanHoward 2030.
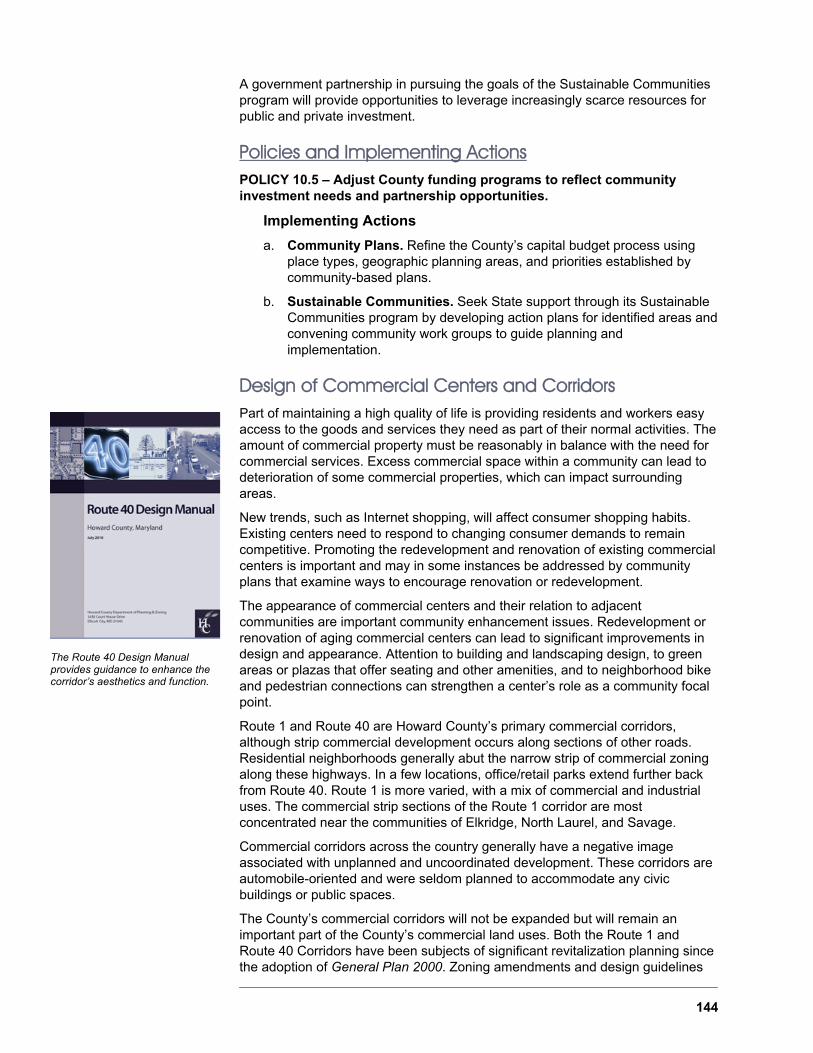
144
A government partnership in pursuing the goals of the Sustainable Communities program will provide opportunities to leverage increasingly scarce resources for public and private investment.
Policies and Implementing Actions POLICY 10.5 – Adjust County funding programs to reflect community investment needs and partnership opportunities.
Implementing Actions
a. Community Plans. Refine the County’s capital budget process using place types, geographic planning areas, and priorities established by community-based plans.
b. Sustainable Communities. Seek State support through its Sustainable Communities program by developing action plans for identified areas and convening community work groups to guide planning and implementation.
Design of Commercial Centers and Corridors Part of maintaining a high quality of life is providing residents and workers easy access to the goods and services they need as part of their normal activities. The amount of commercial property must be reasonably in balance with the need for commercial services. Excess commercial space within a community can lead to deterioration of some commercial properties, which can impact surrounding areas.
New trends, such as Internet shopping, will affect consumer shopping habits. Existing centers need to respond to changing consumer demands to remain competitive. Promoting the redevelopment and renovation of existing commercial centers is important and may in some instances be addressed by community plans that examine ways to encourage renovation or redevelopment.
The appearance of commercial centers and their relation to adjacent communities are important community enhancement issues. Redevelopment or renovation of aging commercial centers can lead to significant improvements in design and appearance. Attention to building and landscaping design, to green areas or plazas that offer seating and other amenities, and to neighborhood bike and pedestrian connections can strengthen a center’s role as a community focal point.
Route 1 and Route 40 are Howard County’s primary commercial corridors, although strip commercial development occurs along sections of other roads. Residential neighborhoods generally abut the narrow strip of commercial zoning along these highways. In a few locations, office/retail parks extend further back from Route 40. Route 1 is more varied, with a mix of commercial and industrial uses. The commercial strip sections of the Route 1 corridor are most concentrated near the communities of Elkridge, North Laurel, and Savage.
Commercial corridors across the country generally have a negative image associated with unplanned and uncoordinated development. These corridors are automobile-oriented and were seldom planned to accommodate any civic buildings or public spaces.
The County’s commercial corridors will not be expanded but will remain an important part of the County’s commercial land uses. Both the Route 1 and Route 40 Corridors have been subjects of significant revitalization planning since the adoption of General Plan 2000. Zoning amendments and design guidelines
The Route 40 Design Manual provides guidance to enhance the corridor’s aesthetics and function.

145
have been adopted for these two corridors. Streetscape studies and improvements have also been undertaken. Revitalization of both commercial corridors will continue to be County priorities to improve their economic viability, appearance, and ability to serve the surrounding communities.
Policies and Implementing Actions POLICY 10.6 – Improve the competitiveness and design of commercial areas.
Implementing Actions
a. No Extension of Commercial Strips. Reaffirm the policy of past General Plans to not extend strip commercial development on major roads beyond their present limits.
b. Older Commercial Properties. Develop strategies to encourage older commercial centers to become stronger community focal points through design improvements and renovation.
c. Building Design. Adopt standards that require commercial structures to be in scale with adjacent residences and to enhance design by articulating facades and roof lines. Require all facades that are visible from surrounding roads or properties to be similar to the front façade. Prohibit the use of blank rear or side walls in visible locations.
d. Parking Design. Discourage large parking lots in locations that dominate the public image of the site along main roads. Increase the requirements for internal parking lot landscaping to visually break up large lots, provide more shade, and improve the pedestrian environment.
e. Pedestrian Improvements. Install sidewalks along roads that provide access to commercial centers and connect store entrances to street crossings and transit stops for increased pedestrian safety and convenience. Adopt standards that encourage provision of pedestrian-scale spaces, such as landscaped plazas and sitting areas.
f. Sign Code. Review the County Sign Code for possible revisions to commercial signs.
Rural Commercial Crossroads The County has varying types and scales of businesses throughout the Rural West that serve the needs of both agricultural and residential communities. Many are located at traditional rural crossroads. Rural residential growth and the changing character of agriculture have impacted how commercial crossroad areas function. There is a need to reassess the role and ability of rural commercial crossroads to serve farmers’ and residents’ needs. Most commercial crossroads are quite small, which limits business growth and competitiveness. Well and septic capacity are major constraints. A framework for commercial uses in the County’s western communities needs to balance economic opportunities and compatibility with surrounding agricultural and residential uses. Figure 10-4 illustrates the range of commercial crossroads.
Prior to Euclidean zoning and the separation of land uses, the intersections of rural residential and farming communities at crossroads provided for a diverse mix of uses with well-defined building and site design character. Common features of rural crossroads include:
Highland is an example of a commercial crossroads in the County’s Rural West.

146
Compactness of form;
Buildings close to the road;
Commercial uses meeting everyday needs;
Residential communities close to the center, sometimes with house lots abutting commercial property;
Gathering places;
Accessibility for both pedestrians and vehicles;
Traditional architecture; and
Incremental growth from the center outward.
Many of these characteristics can be found in areas such as Lisbon and Highland where crossroad development patterns integrate a variety of uses within traditional crossroads design. In the case of Highland, a set of design guidelines were developed by Highland residents to articulate the desired pattern of new development in relation to the existing crossroads character. Rural crossroads should be evaluated to assess the potential and desirability of some additional growth that would be compatible with neighboring uses and rural crossroads design character.
Policies and Implementing Actions POLICY 10.7 – Improve the functioning and design of rural commercial crossroads
Implementation Actions
a. Commercial Crossroads Plans. Identify and prioritize areas in the West that would benefit from planning activities that assess business and community needs and determine strategies to support the economic function and design of rural commercial crossroads.
Figure 10-4 Rural Commercial Inventory

147
The final section of PlanHoward 2030 addresses plan implementation and the role of the entire Howard County community in caring for a sustainable environment and economy.
Chapter 11, Implementation, defines a framework for action by establishing a monitoring process and a partnering perspective. As with the previous General Plan 2000, a series of indicators are provided for tracking over the planning timeframe of PlanHoward 2030. These are the same indicators required to be monitored by the Maryland Department of Planning under the Smart, Green and Growing legislation.
Chapter 12, Stewardship focuses on how all stakeholders are needed to assist in plan implementation.
V: ACTION!

148

149
Overview PlanHoward 2030 is designed to be a work scope for the next 20 years and beyond. Throughout this planning document a wide variety of policies and actions are set forth. An overall framework is presented here for monitoring and partnering in order to successfully achieve the PlanHoward 2030 goals.
State of Maryland Vision Strategies, policies, programs, and funding for growth and development, resource conservation, infrastructure, and transportation are integrated across the local, regional, State and interstate levels to achieve these Visions.
County Context The County’s General Plans have been effective in establishing a broad range of growth management policies and implementing actions. However, as the scope and complexity of issues have increased, it has become increasingly important to set implementation priorities. General Plan 2000 established select implementation indicators and reporting requirements, which were helpful, but not sufficient. Current budget constraints reinforce the need to establish clear implementation priorities.
11. Implementation
Sebastian Jonner, Grade 2, Waterloo Elementary

150
Progress under General Plan 2000 Key actions, specific measures, and a schedule for implementation were established in General Plan 2000. Some tasks were scheduled to be completed in the first reporting period; some were not scheduled to be completed or even started until the second reporting period; while others were identified as ongoing actions with progress expected in all reporting periods. For the first time, General Plan 2000 established a monitoring report requirement. Reports were submitted to the Planning Board at a public meeting then transmitted to the Council. Three General Plan Monitoring Reports were completed, which describe the County’s achievements on various indicators and identify some issues requiring further effort.
PlanHoward 2030 Implementation Priorities Numerous Policies and Actions are set forth in the preceding chapters of PlanHoward 2030. These have been assigned an implementation time frame: short term (up to three years); midterm (four to seven years) or longer term (eight or more years). Some tasks, however, will be ongoing. The implementation schedule is presented as a summary matrix in Appendix A.
Monitoring In 2008, the State’s Smart, Green and Growing legislation established annual reporting requirements for all Counties on a variety of trends and indicators. Pursuant to the Smart, Green and Growing legislative requirements, the indicators in Figure 11-1 must be reported.
Planned Service Area (PSA) and Priority Funding Area (PFA) Frequency
Amount and share of growth that is located inside PFA Annual Amount and share of growth that is located outside PFA Annual Net density of growth that is located inside PFA Annual Net density of growth that is located outside PFA Annual Creation of new lots and issuance of residential permits inside PFA Annual Creation of new lots and issuance of residential permits outside PFA Annual Creation of new lots and issuance of commercial building permits inside PFA Annual Creation of new lots and issuance of commercial building permits outside PFA Annual Development capacity analysis, updated triannually or when significant zoning or land use change Three years Amount of acreage preserved using local agricultural land preservation funding Annual
Local Growth Goal for Priority Funding Area (PFA) Frequency
Time frame for achieving a local goal (max percentage of growth outside PFA) Annual Resources necessary for infrastructure inside the PFA Annual Resources necessary for land preservation outside the PFA Annual Incremental progress made towards achieving the local goal Annual
Adequate Public Facilities (APF) Frequency
The location of the APF restriction Biennial The type of infrastructure affected by the APF restriction Biennial The proposed resolution of the APF restriction, if available Biennial The estimated date for the resolution of the APF restriction, if available Biennial If a restriction was lifted, the date the APF restriction was lifted Biennial The resolution that lifted the APF restriction Biennial
Figure 11-1PlanHoward 2030 Indicators
The General Plan Monitoring Reports follow the progress of the general plan, as it is implemented over ten years.

151
The State requirements are more detailed than the indicators in General Plan 2000 monitoring reports, but are very similar to the County’s existing Development Monitoring System (DMS) reports, which are required by the Howard County Adequate Public Facilities Act adopted in 1992.
Howard County has issued a Development Monitoring System report (DMS) each year since 1992. In 2011, the reporting period was adjusted to include the full 2010 calendar year, rather than October 1 through September 30 (which originally was set to include public schools enrollment data). This change allows the DMS to meet the requirements in the Smart, Green and Growing legislation that requires local jurisdictions to report on development activity, comment on consistency with State and local smart growth goals, track defined indicators, and list Adequate Public Facilities Act restrictions within designated Priority Funding Areas. The State-required reports are due in July covering development activity for the previous calendar year.
The first DMS report that incorporates the State’s new requirements was submitted in July 2011. It included the new State planning requirements. Its integration into DPZ’s existing DMS reporting format provides a better understanding of land development issues, policies, and goals.
Policies and Implementing Actions POLICY 11.1 – Monitor progress implementing PlanHoward 2030 policies and actions.
Implementing Actions
a. PlanHoward 2030 Monitoring Report. Publish a PlanHoward 2030 Monitoring Report which assesses progress in implementing this Plan and identifies potential adjustments to policies or implementing actions. Present the first monitoring report to the Planning Board for its recommendations and public comment three years after plan adoption and the second monitoring report five years after the first report.
b. State-Required Indicators. Include General Plan related, State-required indicators in the annual Development Monitoring System report.
Partnering The complexity of issues concerning sustainability makes it imperative that the County government seek partners and efficiently deploy limited financial resources and personnel. Because many issues do not conform to political boundaries, or are not the responsibility of a single entity, coordination among regional and local stakeholders is also required. At the forefront of partnering related to the environment, the Office of Environmental Sustainability (OES) was established to help coordinate the sustainability efforts of all County agencies, as well as those of other State and local governments, the private sector, and community organizations.
As Howard County continues to pursue a multipronged strategy for achieving environmental, economic, and community sustainability, it will become increasingly important to establish and maintain working relationships with diverse partners. Partnerships will enable the County to continue to expand and coordinate sustainability work by community groups, businesses, and nongovernmental organizations. Strategies for expanding partnerships are addressed in Chapter 12, Stewardship.
GREEN TIP!
Email and read documents online and
avoid printing. Communicate more
efficiently and save trees.
“There could be ways of connecting organizations so
they showcase ideas and learn from each other. Right
now, we’re working on starting a bike share program with the
college, the Mall, and Merriweather.” HCC Student Government Association

152

153
Overview Everyone has a part! Stewardship is about the stakeholders in the private and nonprofit sectors, community groups, and the entire community coming together help to implement PlanHoward 2030. We hope that you will utilize PlanHoward 2030 as your plan as well! Your County. Your Plan.
State of Maryland Vision Government, business entities, and residents are responsible for the creation of sustainable communities by collaborating to balance efficient growth with resource protection.
County Context Howard County is a community characterized by activism, in many spheres and in many responsibilities. Recent initiatives such as the Climate Action Plan have focused on the community’s role in responsible stewardship by including areas of responsibility for both the County government and for all individuals.
12. Stewardship
Nicole Bennett, Grade 12, Grade Marriotts Ridge High School

154
Progress under General Plan 2000 General Plan 2000 focused on the role of government in protecting the environment. It also noted conducting public outreach and education encourages individuals to be good environmental stewards. To date, successful outreach programs that have encouraged residents to be good stewards of the environment include expanded recycling programs, tree planting programs, GreenFest, home energy audits and tax credits, “buy local” food campaigns, rain barrel distribution, and the Howard County Legacy Leadership on the Environment program. The Robinson Nature Center is a great new resource for educating residents, businesses, and nonprofits about ways to continue to be good stewards of their property and participate in environmental enhancement and protection efforts throughout the County.
Stewardship Reducing greenhouse gas (GHG) emissions, protecting natural resources, and supporting local businesses and farms are important goals. Creating new and sustainable jobs, affordable and sustainable housing, and improving land, water, and air quality are a few of the challenges in creating a sustainable community. True sustainability requires the efforts from all stakeholders – the County, businesses, community groups, and residents acting together.
Howard County is already a very active community, with many residents volunteering at schools, recreational programs, public libraries, and numerous other community services. And the County continues to explore new and innovative ways to reach others in the community to improve understanding of sustainability efforts and to promote greater sustainability in the community, the economy, and the environment. The understanding that everyone plays a stewardship role is critical to this effort.
The County has reduced its impacts on the environment through monitoring, conserving, and restoring natural resources and through other innovative approaches. These reduced impacts can save money at the same time they provide benefits to our natural world. One example of the County acting as a steward is the decision to renovate the George Howard Building as a LEED Silver building. This project also includes examples of rain gardens, native plants, solar panels, and energy reduction including touch screens in the lobby to explain features of the green renovation and the financial savings from this green initiative.
The County can also create new tools – incentives and regulations – which alter the fundamentals for the business community, nonprofits, and residents in favor of stewardship. These tools may include rewarding the private sector for implementing and finding new sustainability strategies in housing, jobs, energy, waste, transportation, resource protection, and air quality. Other tools may be incentives that encourage residents to protect water resources, such as the rain barrel and rain garden workshops with discounted materials. The Green Neighborhood program provides incentives for residential developers to build with sustainability principles by reducing impacts on natural resources and providing enhanced amenities for the community. Regulations and requirements, such as the 2007 Green Building legislation that mandates certain public and private buildings be constructed to meet various LEED guidelines, is another strategy the County uses.
For individuals and business owners, daily actions can have long-term beneficial effects on larger regional challenges such as air quality, Bay restoration, and traffic congestion. Small changes can lead to big impacts. For instance, daily
The Robinson Nature Center is a showcase for private and public collaboration creating a world class, LEED Platinum project for the community.
GREEN TIP!
Try to pick up one piece of litter every day and volunteer for a local
community or stream clean up.

155
actions to recycle and compost, rather than waste reusable resources, can significantly reduce both the trash load and associated costs to ship waste outside the County.
Howard County and its residents can be proud of their accomplishments. Recognizing successes reinforces sustainability throughout the community. Green Central Station, the County’s green resources web portal, is one mechanism for promoting the sustainability work of the community throughout the County. The annual GreenFest is another opportunity for residents, businesses, and nonprofit organizations to meet with green vendors, attend workshops and lectures, and explore ways to protect limited resources with their family and friends. Typically, serving as good stewards and striving toward greater sustainability are directly correlated to financial benefits and increased quality of life. Stewardship is inherently about the preservation and strengthening of our community and the sense of place it provides.
Policies and Implementing Actions POLICY 12.1 – Howard County Government will continue to lead by example as a good steward of the shared resources within the community and the region.
Implementing Actions
a. Regional Collaboration. Monitor regional efforts to conserve or restore environmental quality (i.e., air, land, water), while expanding all efforts to protect water and air quality and natural resources.
b. Continuous Innovation. Implement new strategies for improving the efficiency and sustainability of County services provided to the community.
c. New Opportunities. Identify additional solutions to assist County businesses and residents in implementing new, more sustainable technologies.
d. Reducing GHGs. Continue to reduce greenhouse gas emissions through an expanding focus on energy, mass transit, bicycle, and pedestrian initiatives.
e. Enhanced Recycling. Continue to look for additional ways to increase donation, recycling, and food waste collections to expand the County’s progress in these areas.
f. Commercial Options. Consider reexamination of business recycling as an option for business and apartments in Howard County, if found to be cost-effective and efficient.
POLICY 12.2 – Engage all members of the County’s socially and economically diverse community and highlight stewardship goals specific to the unique situations of each audience and community group.
Implementing Actions
a. Multicultural Outreach. Continue to provide targeted outreach to minority populations, as well as multilingual outreach materials and approaches.
b. Cross Jurisdictional Outreach. Increase partnering efforts with public, private, and nonprofit communities to expand and coordinate all
“I like Howard County because of the good
schools, diversity, and its a unique place within the
State.” Tina, Voice for Change

156
messages regarding sustainability efforts with a focus on outreach to immediately adjacent, neighboring jurisdictions.
c. Expanded Programming. Expand on current offerings and programs to provide more sustainability workshops and speaker series for individuals, businesses, and nonprofits.
POLICY 12.3 – Increase currently successful, collaborative efforts between residents, businesses, nonprofit groups, and the County to continue implementing state-of-the art, cost-effective, sustainability practices and techniques.
Implementing Actions
a. Networking. Expand networking and resource sharing for businesses and nonprofits, such as expanding networking opportunities at GreenFest, through the Green Business Council, and via the Office of Environmental Sustainability.
b. Demonstration Projects. Increase demonstration sites and provide tours throughout the County of various techniques for living more sustainably, such as rain water reuse, alternative energy, and protecting natural resources and habitat areas.
c. Public Education Resources. Expand work with schools and educational centers to incorporate case studies and demonstration projects into curricula and lessons.
d. Ongoing Advancement. Revise regulations, such as Green Building Legislation, and implement new cost-effective requirements in order to maintain cutting-edge sustainability standards.
The recent renovation of the George Howard Building is a Leadership in Energy and Environmental Design (LEED) Silver building.
157
Policies & Implementing Actions Summary Matrix
APPENDIX A:

158

159
1. Quality of Life & Sustainability
This chapter does not contain Policies and Actions
2. Public Participation
Policies and Implementing Actions Short Mid Long
Policy 2.1 – Promote dialog throughout development and implementation of PlanHoward 2030 with a broad range of community participants including those groups who are underrepresented or are part of a special population.
a. Involvement. Engage the full spectrum of the County’s population in planning and implementing actions.
b. Monitoring. Engage diverse stakeholder groups in the monitoring process with the first monitoring report due three years after plan adoption and the second monitoring report due five years after the first report.
I: INTRODUCTION

160
3. Environmental Protection
Policies and Implementing Actions Short Mid Long
Policy 3.1 – Ensure the adequacy of wastewater treatment capacity.a. Plant Expansion and Upgrade. Accommodate flows from projected growth
in the Planned Service Area by completing the expansion and upgrade of the Little Patuxent Water Reclamation Plant.
b. Flows and Nutrient Loads. Require that properties added to the current Planned Service Area (PSA), large redevelopment sites within the PSA, and large sites with zoning intensification within the PSA minimize increases in flow and the nutrient concentration in flow sent to the wastewater treatment plants.
c. Wastewater Reuse and Nutrient Trading. Encourage the State to expand options for wastewater reuse and nutrient trading to reduce nutrient flows and help maintain the nutrient cap at the Little Patuxent Water Reclamation Plant and the Patapsco Waste Water Treatment Plant.
Policy 3.2 – Reduce pollution loads to surface and groundwater.a. Stormwater Utility. Institute a dedicated fund to ensure increased and
sustained funding for stormwater and watershed management programs
b. State Grant Funds. Conduct public outreach and education to encourage use of State grant funds for septic system upgrades to nitrogen-reducing systems when the funds are available on a statewide basis.
c. Financial Incentives. Provide financial incentives such as tax credits, low-interest loans, and grants to promote the use of nitrogen-reducing treatment for new and upgraded septic systems.
d. Inspections and Maintenance. Establish and maintain a long-term septic system inspection and maintenance infrastructure for nitrogen-reducing systems.
e. Nutrient Trading. Explore the potential for cross-sector nutrient trading to utilize the most cost-effective nutrient reduction strategies.
II: ENVIRONMENT

161
Policies and Implementing Actions Short Mid Long
Policy 3.3 – Use watershed management plans to guide the protection and restoration of water resources.
a. Watershed Management Plans. Prepare comprehensive watershed management plans for all watersheds, to set priorities and guide efforts to protect, restore, and improve the County’s water resources. Complete and update all watershed management plans on a regular cycle.
b. Forest Cover and Riparian Forest Buffers. Establish and achieve measurable goals for forest cover and riparian forest buffers in all County watersheds.
c. Resident Participation. Encourage active participation of individuals, businesses, and local community and environmental organizations in restoration activities.
d. Wetlands. Develop a wetlands program to inventory, map, protect, and enhance wetland resources.
e. Dedicated Funding. Institute a dedicated fund (often referred to as a stormwater utility) to ensure increased and sustained funding for the watershed management program.
f. Grant and Cost-Share Opportunities. Pursue Federal and State grant and cost-share opportunities to secure additional resources for restoration efforts. Apply jointly with community and environmental organizations, and with neighboring jurisdictions, as appropriate.
Policy 3.4 – Coordinate regional protection of water resources. a. Patuxent and Patapsco Rivers. Coordinate and cooperate with other local,
regional, and State agencies and organizations on joint watershed planning and management for the Patuxent and the Patapsco Rivers.
Policy 3.5 – Promote individual environmental stewardship. a. Stewardship. Conduct public outreach and education to encourage
individuals and businesses both to be good stewards of their own property and participants in community environmental enhancement efforts.
b. Best Management Practices. Expand current outreach and education efforts to promote and assist private property owners with the implementation of best management practices, including installing rain gardens and rain barrels, planting stream buffers, replacing lawn with native plants, and increasing tree canopy, and limiting use of lawn chemicals.
c. Agriculture. Encourage the agricultural community to continue to work with local, State, and Federal agencies and programs to implement best management practices.
Policy 3.6 – Safeguard the environmental integrity of the region’s reservoir systems. a. Funding and Support. Increase funding and support for implementation of
the Baltimore Reservoirs Action Strategy and the Patuxent Reservoirs Priority Resource Protection Program.
Policy 3.7 – Secure better protection of environmental resources within new developments. a. Streams, Wetlands, and Floodplains. Evaluate the effectiveness of current
regulations in protecting streams, wetlands, and floodplains.
b. Environmentally Sensitive Development. Encourage more environmentally sensitive design in residential zoning districts other than the R-ED District. Promote the use of the neighborhood preservation parcel option, as well as the use of smaller, tightly clustered lots to limit site disturbance and maximize open space for natural resource protection.
c. Higher Intensity Development. Institute development requirements and/or incentives for better resource protection in higher density residential projects and commercial, office, and manufacturing areas.

162
Policies and Implementing Actions Short Mid Long
Policy 3.8 – Improve stormwater management practices throughout the County to help restore and protect water resources.
a. Redevelopment. Ensure redevelopment is designed and implemented to reduce stormwater runoff rate, volume, and pollution to the maximum extent practicable.
b. Incentives for Enhancements. Create incentives for new development and redevelopment to provide onsite or on-site or off-site water quality enhancements that exceed minimum regulatory requirements.
Policy 3.9 – Increase collaboration between residents, businesses, nonprofit groups, and the County on implementing state-of-the art sustainability practices and techniques.
a. Sustainability Center. Consider developing an online center, associated with Green Central Station, which provides information about reducing the community’s carbon footprint and about cost-effective green practices and products.
b. Green Directory. Work with the local business and nonprofit communities to instill sustainability principles in their products and services, and help them by promoting them in the Green Business Directory.
c. Expanding Green Network. Establish criteria for joining the Green Business Directory and Green Business Council; create incentives for joining. Promote membership and use of the Directory on Green Central Station.
d. Education and Incentives. Work with the financial and real estate communities to promote green buildings and neighborhoods, through education on environmental and financial benefits and incentives for residents implementing sustainable practices. Incorporate benefits of green technologies and ecosystem services into building and property values.
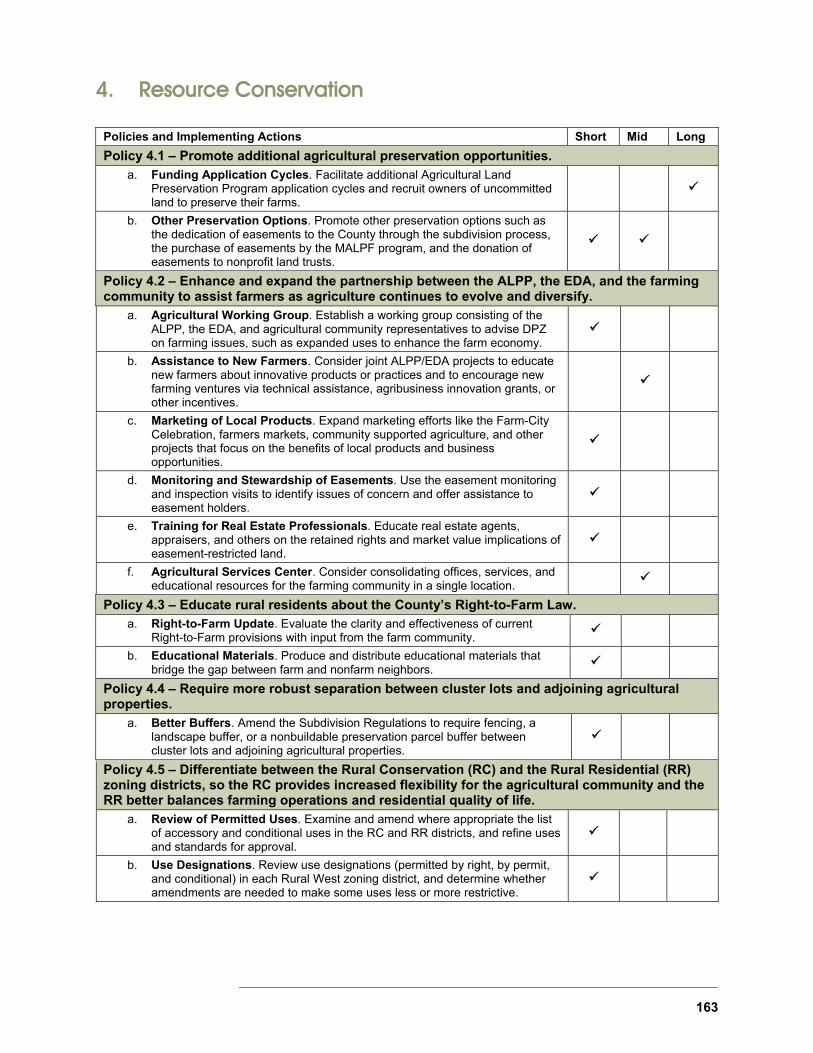
163
4. Resource Conservation
Policies and Implementing Actions Short Mid Long
Policy 4.1 – Promote additional agricultural preservation opportunities. a. Funding Application Cycles. Facilitate additional Agricultural Land
Preservation Program application cycles and recruit owners of uncommitted land to preserve their farms.
b. Other Preservation Options. Promote other preservation options such as the dedication of easements to the County through the subdivision process, the purchase of easements by the MALPF program, and the donation of easements to nonprofit land trusts.
Policy 4.2 – Enhance and expand the partnership between the ALPP, the EDA, and the farming community to assist farmers as agriculture continues to evolve and diversify.
a. Agricultural Working Group. Establish a working group consisting of the ALPP, the EDA, and agricultural community representatives to advise DPZ on farming issues, such as expanded uses to enhance the farm economy.
b. Assistance to New Farmers. Consider joint ALPP/EDA projects to educate new farmers about innovative products or practices and to encourage new farming ventures via technical assistance, agribusiness innovation grants, or other incentives.
c. Marketing of Local Products. Expand marketing efforts like the Farm-City Celebration, farmers markets, community supported agriculture, and other projects that focus on the benefits of local products and business opportunities.
d. Monitoring and Stewardship of Easements. Use the easement monitoring and inspection visits to identify issues of concern and offer assistance to easement holders.
e. Training for Real Estate Professionals. Educate real estate agents, appraisers, and others on the retained rights and market value implications of easement-restricted land.
f. Agricultural Services Center. Consider consolidating offices, services, and educational resources for the farming community in a single location.
Policy 4.3 – Educate rural residents about the County’s Right-to-Farm Law. a. Right-to-Farm Update. Evaluate the clarity and effectiveness of current
Right-to-Farm provisions with input from the farm community.
b. Educational Materials. Produce and distribute educational materials that bridge the gap between farm and nonfarm neighbors.
Policy 4.4 – Require more robust separation between cluster lots and adjoining agricultural properties.
a. Better Buffers. Amend the Subdivision Regulations to require fencing, a landscape buffer, or a nonbuildable preservation parcel buffer between cluster lots and adjoining agricultural properties.
Policy 4.5 – Differentiate between the Rural Conservation (RC) and the Rural Residential (RR) zoning districts, so the RC provides increased flexibility for the agricultural community and the RR better balances farming operations and residential quality of life.
a. Review of Permitted Uses. Examine and amend where appropriate the list of accessory and conditional uses in the RC and RR districts, and refine uses and standards for approval.
b. Use Designations. Review use designations (permitted by right, by permit, and conditional) in each Rural West zoning district, and determine whether amendments are needed to make some uses less or more restrictive.
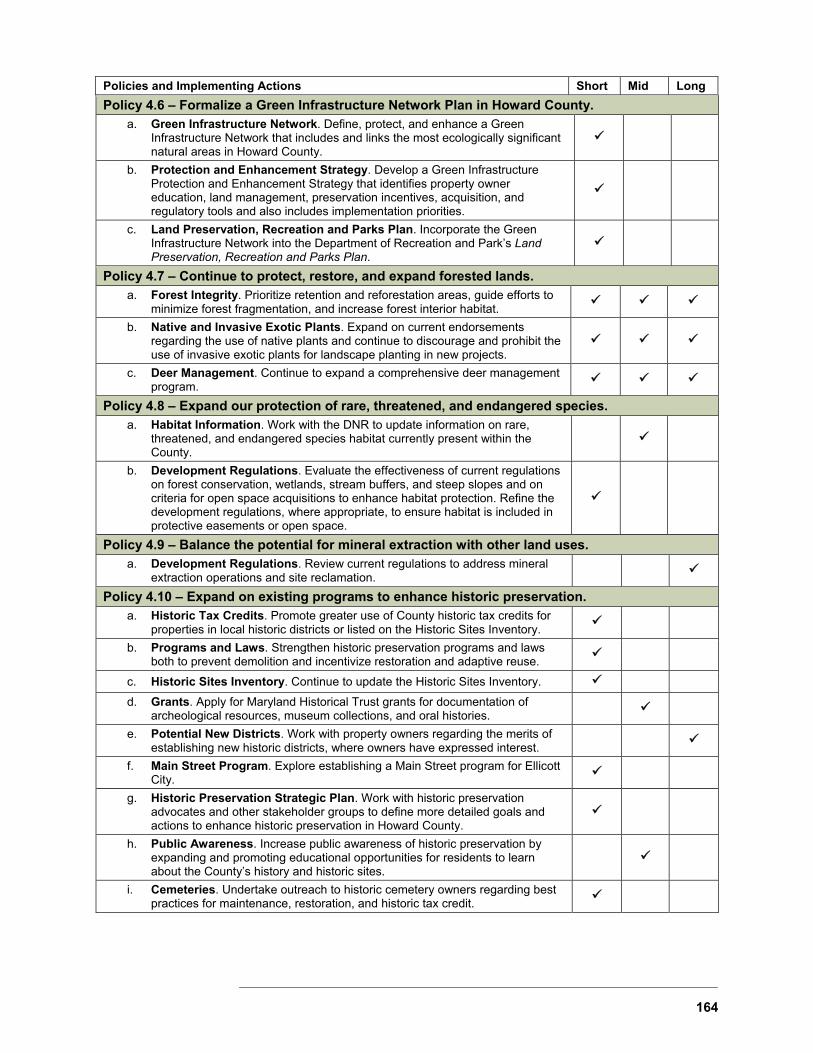
164
Policies and Implementing Actions Short Mid Long
Policy 4.6 – Formalize a Green Infrastructure Network Plan in Howard County. a. Green Infrastructure Network. Define, protect, and enhance a Green
Infrastructure Network that includes and links the most ecologically significant natural areas in Howard County.
b. Protection and Enhancement Strategy. Develop a Green Infrastructure Protection and Enhancement Strategy that identifies property owner education, land management, preservation incentives, acquisition, and regulatory tools and also includes implementation priorities.
c. Land Preservation, Recreation and Parks Plan. Incorporate the Green Infrastructure Network into the Department of Recreation and Park’s Land Preservation, Recreation and Parks Plan.
Policy 4.7 – Continue to protect, restore, and expand forested lands. a. Forest Integrity. Prioritize retention and reforestation areas, guide efforts to
minimize forest fragmentation, and increase forest interior habitat.
b. Native and Invasive Exotic Plants. Expand on current endorsements regarding the use of native plants and continue to discourage and prohibit the use of invasive exotic plants for landscape planting in new projects.
c. Deer Management. Continue to expand a comprehensive deer management program.
Policy 4.8 – Expand our protection of rare, threatened, and endangered species. a. Habitat Information. Work with the DNR to update information on rare,
threatened, and endangered species habitat currently present within the County.
b. Development Regulations. Evaluate the effectiveness of current regulations on forest conservation, wetlands, stream buffers, and steep slopes and on criteria for open space acquisitions to enhance habitat protection. Refine the development regulations, where appropriate, to ensure habitat is included in protective easements or open space.
Policy 4.9 – Balance the potential for mineral extraction with other land uses. a. Development Regulations. Review current regulations to address mineral
extraction operations and site reclamation.
Policy 4.10 – Expand on existing programs to enhance historic preservation. a. Historic Tax Credits. Promote greater use of County historic tax credits for
properties in local historic districts or listed on the Historic Sites Inventory.
b. Programs and Laws. Strengthen historic preservation programs and laws both to prevent demolition and incentivize restoration and adaptive reuse.
c. Historic Sites Inventory. Continue to update the Historic Sites Inventory.
d. Grants. Apply for Maryland Historical Trust grants for documentation of archeological resources, museum collections, and oral histories.
e. Potential New Districts. Work with property owners regarding the merits of establishing new historic districts, where owners have expressed interest.
f. Main Street Program. Explore establishing a Main Street program for Ellicott City.
g. Historic Preservation Strategic Plan. Work with historic preservation advocates and other stakeholder groups to define more detailed goals and actions to enhance historic preservation in Howard County.
h. Public Awareness. Increase public awareness of historic preservation by expanding and promoting educational opportunities for residents to learn about the County’s history and historic sites.
i. Cemeteries. Undertake outreach to historic cemetery owners regarding best practices for maintenance, restoration, and historic tax credit.
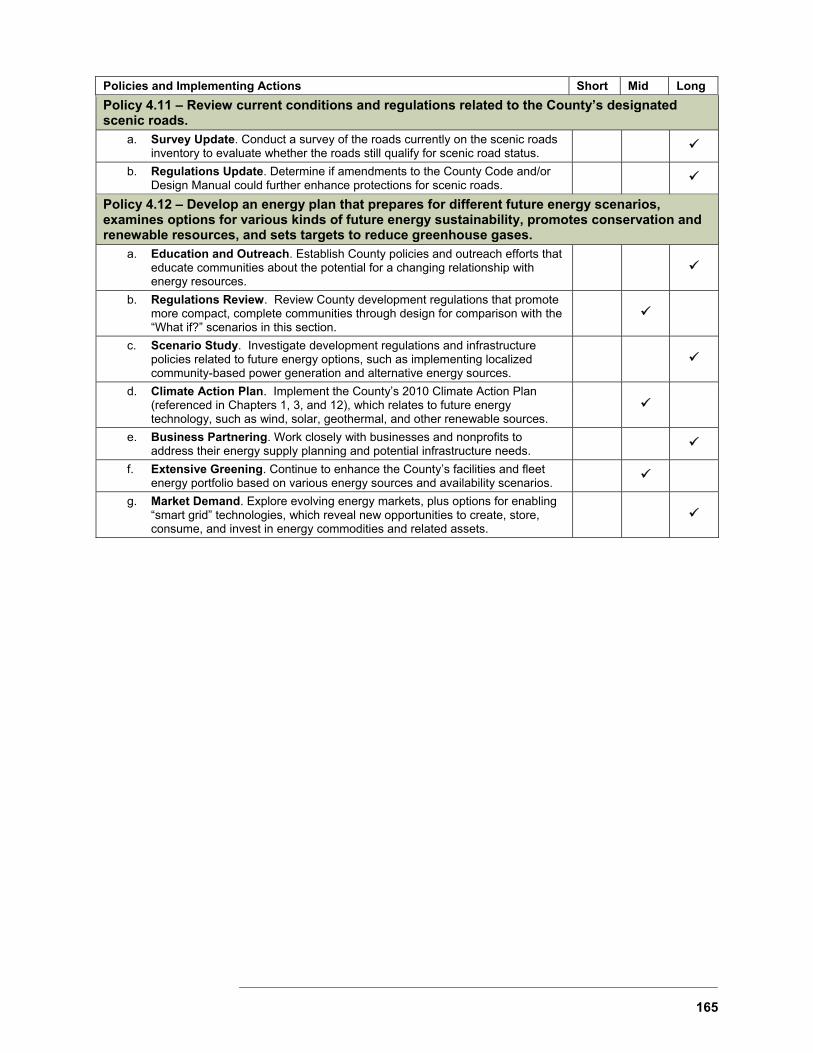
165
Policies and Implementing Actions Short Mid Long
Policy 4.11 – Review current conditions and regulations related to the County’s designated scenic roads.
a. Survey Update. Conduct a survey of the roads currently on the scenic roads inventory to evaluate whether the roads still qualify for scenic road status.
b. Regulations Update. Determine if amendments to the County Code and/or Design Manual could further enhance protections for scenic roads.
Policy 4.12 – Develop an energy plan that prepares for different future energy scenarios, examines options for various kinds of future energy sustainability, promotes conservation and renewable resources, and sets targets to reduce greenhouse gases.
a. Education and Outreach. Establish County policies and outreach efforts that educate communities about the potential for a changing relationship with energy resources.
b. Regulations Review. Review County development regulations that promote more compact, complete communities through design for comparison with the “What if?” scenarios in this section.
c. Scenario Study. Investigate development regulations and infrastructure policies related to future energy options, such as implementing localized community-based power generation and alternative energy sources.
d. Climate Action Plan. Implement the County’s 2010 Climate Action Plan (referenced in Chapters 1, 3, and 12), which relates to future energy technology, such as wind, solar, geothermal, and other renewable sources.
e. Business Partnering. Work closely with businesses and nonprofits to address their energy supply planning and potential infrastructure needs.
f. Extensive Greening. Continue to enhance the County’s facilities and fleet energy portfolio based on various energy sources and availability scenarios.
g. Market Demand. Explore evolving energy markets, plus options for enabling “smart grid” technologies, which reveal new opportunities to create, store, consume, and invest in energy commodities and related assets.

166
5. Economic Development
Policies and Implementing Actions Short Mid Long
Policy 5.1 – Implement key actions from EDA’s 2011 Strategic Plan to foster a diversified economy and encourage innovation and entrepreneurship.
a. Fort Meade Economic and Job Growth. Focus on the anticipated growth due to BRAC, Cyber Command, NSA, and other planned expansions to capture new growth.
b. Branding. Develop and implement a comprehensive branding effort for Howard County to establish a distinct and readily identifiable research and technology brand in the global marketplace as a “top global tech center.”
c. Entrepreneurship. Develop a comprehensive strategy to enable entrepreneurs to be creative, grow their businesses, and access capital.
d. Downtown Columbia Revitalization. Implement the Downtown Columbia Plan to create a vibrant, mixed-use urban center for Howard County. This walkable, livable, revitalized Downtown will create a needed urban anchor that will attract and retain the creative class, and will advance the rebranding of Howard County for the 21st century.
e. Renewed Approach to Route 1 and Existing Business Parks. Address the demand for business growth in the Baltimore-Washington Corridor, despite the declining availability of greenfield development sites, through new redevelopment strategies.
f. Funding for Transportation. Expand multimodal transportation options and connectivity to ensure an adequate workforce for Howard County employers and to maintain quality of life.
g. Workforce Development Strategy. Ensure an adequate, trained workforce is available to meet the need for service, entry level, and highly skilled workers through the provision of P-20 education, lifelong learning, diverse housing, commuting and transportation, health care, and benefits costs.
Policy 5.2 – Establish Howard County as a leader in 21st century entrepreneurship, information technology, and cyber security.
a. Marketing. Create a development and marketing program to attract prime information technology and cyber businesses, as well as the critical skilled workforce.
b. Infrastructure Capacity. Define broadband, mobile communications, and utility infrastructure requirements, and ensure that service capacity and quality are available.
c. Innovation. Develop programs and facilities to promote a new culture of entrepreneurship and innovation. Encourage the creation of technology-driven entrepreneurial businesses.
d. Education. Work with local businesses to identify the need for leading programs in science, technology, engineering, and math (STEM) in the public schools, Howard Community College, and branch campuses of leading Maryland Universities. Increase participation by minorities and females.
III: ECOMOMY

167
Policies and Implementing Actions Short Mid Long
Policy 5.3 – Promote future energy and green industries. a. Differentiation. Integrate forward-thinking energy and resource use into the
County’s economic development agenda, particularly considering green infrastructure and transportation solutions that differentiate the County from neighboring jurisdictions.
b. Management. Explore evolving energy markets, plus options for enabling “smart grid” technologies, which reveal new opportunities to create, store, consume, and invest in energy commodities and related assets.
c. Commercial Opportunities. Identify and promote green technologies and associated business opportunities.
d. Incentivizing Sustainability. Create incentives to attract new businesses demonstrating sustainable practices or developing sustainable, technologies, materials, and products.
Policy 5.4 – Enhance the Route 1 Corridor revitalization strategy to recognize the distinct character and market potential of diverse corridor segments, and the potential at various intersections, crossings, and nodes for additional retail, restaurant, and employment development as identified in the 2011 Route 1 Market Analysis.
a. Opportunities. Focus planning efforts to maximize development potential in four types of land-use opportunity areas: redevelopment of high-visibility employment areas; greenfield development of high-visibility employment areas; major industrial park development; and mixed-use opportunity sites.
b. Zoning Review. Evaluate the efficacy of existing Route 1 zoning districts (CE, CAC, TOD); consider more flexibility, especially regarding commercial uses, and revise zoning as needed to ensure County vision is achieved.
c. Residential Expansion and Employment Preservation. Accommodate residential development in key nodes in the Route 1 Corridor so that it does not erode opportunities to preserve or redevelop employment areas.
d. Refine the Vision. Clarify residential and nonresidential land use goals as a framework for evaluating future proposals.
e. Transportation. Develop transit and road improvement solutions to support revitalization of the US 1 Corridor.
Policy 5.5 – Proactively consider innovative tools to enhance the Route 1 Corridor’s competitiveness, attract and retain businesses, and maximize redevelopment opportunities.
a. Economic Growth. Focus incentives on opportunity sites within the Route 1 Corridor and on key industry market sectors with strong growth potential in Howard County.
b. Beneficial Projects. Adopt a tiered incentive program that provides benefits commensurate with the proposed project’s potential benefit to the County.
c. Nodes. Develop plans for key opportunity areas that allow for significant future intensification, while maximizing current and intermediate development potential.
d. Land Assembly. Encourage land assembly to prevent piecemeal redevelopment and facilitate projects that are integral to the County’s long-term development strategy.
e. Partnering. Evaluate specific scenarios where the County might benefit from engaging in public / private development partnerships (i.e. County/EDA as developer).

168
Policies and Implementing Actions Short Mid Long
Policy 5.6 – Plan for Class A office and mixed-use redevelopment of commercial and industrial properties within the Snowden River Parkway area.
a. Plan for Redevelopment. Work with area property owners and other stakeholders to evaluate market, infrastructure, and design options to develop a plan for transitioning the Snowden River Parkway area into a more intensive and integrated mix of Class A office, residential, retail, and amenity spaces, with multimodal transportation options.
b. Partner on Implementation. Consider establishing a partnership or special servicing district to promote and manage redevelopment.
Policy 5.7 – Plan for future transit and road capacity to service and connect Downtown Columbia, the Snowden River Parkway area, Gateway, andRoute 1 to regional connections to Baltimore, Washington, and Fort Meade.
a. Connect Development Nodes. Study the feasibility of regional Bus Rapid Transit (BRT), as well as enhanced local bus service between major business and residential nodes from Downtown Columbia through the Snowden River Parkway area, Gateway Business Park, and the Route 1 corridor to Fort Meade and Odenton in Anne Arundel County. If viable, take action to secure existing CSX rail spur ROW.
b. Make More Connections. Study the feasibility and cost-benefits of a new roadway connection crossing I-95 between US 1 and Gateway Business Park.
Policy 5.8 – Continue to enhance the vitality of the Route 40 Corridor and Columbia’s Village Centers.
a. Enhance Route 40. Encourage commercial renovation and where appropriate mixed-use redevelopment by promoting collaboration between owners and neighbors to create attractive focal points that serve the community.
b. Strengthen Village Centers. Encourage Village Center property owners, Village Boards, and residents to develop and implement plans for enhancing and / or redeveloping older Village Centers. Collaborate with the Columbia Association to undertake market assessment to assist in repositioning older centers in relation to each other, Downtown Columbia, and other competing commercial centers.
Policy 5.9 – Expand programs to support and enhance agribusiness. a. Training. Promote County and regional training programs for existing and
new farmers to enhance critical business skills.
b. Diversification. Use Agricultural Land Preservation Program funds to offer matching grants for farms to diversify their agriculture operations through agribusiness innovations.
c. Mentoring. Create a mentoring program that will connect the younger generation of farmers with experienced farmers and also with farmers who may have property but no one to farm it.
d. New Leaders. Establish an agricultural leadership program for middle / high school students to teach a broad range of skills both specific to agriculture and also general skills such as team building and public speaking. Work with the Howard County public schools to introduce elements of agricultural education back into the public school curriculum.

169
6. Growth
Policies and Implementing Actions Short Mid Long
Policy 6.1 – Maintain adequate facilities and services to accommodate growth. a. Place Types and Tiers. Obtain State concurrence on PlanHoward 2030
place designations and tiers in accordance with PlanMaryland’s final criteria and procedures and the Sustainable Growth and Agricultural Preservation Act.
b. Revise APF Regulations. Amend the current Adequate Public Facilities regulations to reduce allocation categories and reflect designated places.
c. APF Housing Allocations. Incorporate the PlanHoward 2030 housing forecasts into the Adequate Public Facilities Housing Allocation Chart.
d. Zoning. Reduce competition for land resources by promoting more compact development in appropriate growth and revitalization areas.
e. Density Exchange Option. Review and, as appropriate, amend the density exchange provisions of the DEO zoning district during the Comprehensive Zoning process to help mitigate subdivision restrictions placed on Tier IV properties.
f. Targeted Funding. Optimize the use of State and County infrastructure funding and program resources targeted to County-designated place types.
Policy 6.2 – Ensure that the County’s needs for land for government facilities and land preservation are met in light of competing needs for housing and economic development.
a. Infrastructure Concurrency. Determine the amount and location of land needed for future schools and other facilities, including park and green infrastructure preservation priorities.
b. Capital Improvements Master Plan. Implement land acquisition priorities and funding via the ten-year Capital Improvement Master Plan.
Policy 6.3 – Use PlanHoward 2030 job and housing forecasts to guide County, regional, and State agency decision making regarding infrastructure and services.
a. Baltimore Metropolitan Council. Incorporate PlanHoward 2030 housing, population, and job forecasts into the Baltimore Metropolitan Council’s official regional forecasts.
b. Monitoring. Monitor the amount, type, and location of actual housing, population, and job growth for comparison with PlanHoward 2030 forecasts.
Policy 6.4 – Ensure that the County continues to capture future job and business growth opportunities.
a. Economic Development. Partner with the Economic Development Authority to develop County policies and programs to implement the County’s Strategic Plan for Economic Development.
b. Zoning Regulations. Update zoning and other regulations to address the evolving commercial and industrial markets and development trends.
Policy 6.5 – Plan compact and complete communities through the Comprehensive Zoning process.
a. Zoning Regulations. Revise the Zoning Regulations to better promote compact redevelopment and appropriate infill.
b. Development Opportunities. Designate appropriate additional areas within the County’s Priority Funding Area for well-designed, compact development in order to accommodate future job and housing growth.
c. Planned Unit Development. Consider Planned Unit Development (PUD) zoning to allow increased flexibility for unique, well-designed, site-specific developments.

170
7. Transportation
Policies and Implementing Actions Short Mid Long
Policy 7.1 – Increase public awareness of the relationship between personal vehicle miles traveled and highway congestion, air quality, greenhouse gases, and energy independence, as well as how more compact growth patterns and alternate modes of travel can help achieve a sustainable and more environmentally healthy balance.
a. Green Central Station. Update the County’s Green Central Station website to address transportation’s role in achieving a healthy community. Include emissions calculators and other tools residents can use to measure greenhouse gas savings, map walking or biking distances, organize ridesharing, and access car sharing.
b. Awareness. Expand resident and business awareness and use of alternative transportation modes, including transit, carpooling, walking, and cycling.
c. Safe Routes. Expand and promote the Safe Routes to School program.
Policy 7.2 – Coordinate State, regional, and local planning and implementation for critical improvements and new transportation facilities based on evaluation of options using a wide range of performance, health, environmental, and financial criteria.
a. Key Projects. Refine transportation plans and fund the County’s share of projects as indentified in: Key Transportation Improvements Anticipated by 2025 (Map 7-1); Key Transportation Improvements Anticipated by 2035 (Map 7-2); Road, Bicycle and Pedestrian Improvements (Figure 7-3); and Transit Priorities (Figure 7-4).
b. Regional Cooperation. Engage in State and regional discussions to develop solutions to transportation funding shortfalls.
Policy 7.3 – Prioritize and pursue cost-effective, long-term capacity improvements to the road and highway network.
a. Capital Planning. Use Howard County’s Capital Improvement Master Plan to provide predictable funding for the County’s highest priority road projects.
b. APF Regulations. Evaluate the merits of amending the APF regulations to evaluate alternative modes of travel, as well as both increasing the APF road excise tax and allowing a portion of the funds to be used for transit, bicycle, or pedestrian improvements.
Policy 7.4 – Enhance the accessibility and quality of existing transit services. a. Transit Operations Facility. Develop a transit operations facility to reduce
costs by centralizing fleet maintenance and opening competitive bidding to additional transit service operators.
b. Efficiency and Route Alignment. Maximize efficiency of Howard Transit and HT Ride operations via route alignment and paratransit taxi services.
c. Other Jurisdictions. Expand and maximize efficiency of mid-corridor regional transit with Anne Arundel County, Baltimore County, Montgomery County, Prince George’s County, the City of Laurel, and Fort Meade. Evaluate potential and, if advantageous, establish a new multijurisdictional regional transit agency to provide enhanced mid-corridor bus service that also maximizes investment and connectivity with other Baltimore-Washington regional transportation facilities.
d. Service Frequency. Enhance Howard Transit by implementing half-hour service frequencies, increasing connectivity to other Baltimore-Washington regional transportation facilities (MARC, park-and-ride, pedestrian and bicycle facilities, and Transportation Demand Management initiatives), and instituting other service improvements identified in the Transit Development Plan.

171
Policies and Implementing Actions Short Mid Long
Policy 7.5 – Utilize the BMC’s Regional Transit Study to develop an effective plan for significantly expanded regional transit service.
a. Corridor Evaluation. Evaluate existing and potential transit corridors for future ridership, transit mode options, and cost-effectiveness in order to prioritize public investment within transit corridors.
b. Rights-of-Way. Preserve transit rights-of-way within existing and potential transit corridors.
c. Transit Nodes. Identify locations within the Growth and Revitalization areas for more detailed planning for the development of transit-supportive densities and land uses, as well as pedestrian and bicycle connectivity.
d. Compact Development. Adopt land use policies and regulations to promote compact development patterns that support transit demand through sufficient densities and interconnected street and pedestrian networks.
e. Downtown Columbia. Develop the Downtown Columbia multimodal transit facility and circulator.
Policy 7.6 – Reduce highway congestion, energy consumption, and greenhouse gases by increasing the number of residents using alternate modes of transportation.
a. Bicycle Master Plan. Develop a Bicycle Master Plan that defines priority projects and identifies those that can be integrated with pedestrian improvements and transit facilities. Establish an implementation schedule and identify funding.
b. Complete Streets. Promote complete streets by amending the Design Manual for road improvements to address bus stops and transit shelters, as well as pedestrian pathways, crossings, and bicycle improvements.
c. Pedestrian Master Plan. Assess progress and refine priorities of the existing Pedestrian Master Plan.
d. Evaluate Alternative Mobility Options. Evaluate the options to meet the needs of seniors and people with disabilities.
e. Bus Stops. Expand the study of bus stop needs to identify gaps in bicycle and pedestrian connections between bus stops and surrounding destinations.
f. Public Outreach. Develop strategies to promote public awareness and use of alternative travel modes for work, errands, and recreation.
Policy 7.7 – Reduce highway congestion, energy consumption, and greenhouse gases through transportation demand management and innovative technologies.
a. Ride Sharing. Promote car share and bike share systems, HOV programs, and expanded park and ride lots.
b. TDM Program. Study and develop additional TDM programs as mechanisms to mitigate traffic/congestion impacts and expand transit services.
c. Data Sharing. Investigate sharing of bus location data generated by Howard Transit for potential use by independent software developers to promote transit and transit alternatives.
d. Broadband Connections. Leverage the County’s investment in the intra-County broadband network to develop a Howard County traffic control center to monitor traffic conditions and coordinate with Maryland State Highway Administration traffic control.

172
8. Public Facilities and Services
Policies and Implementing Actions Short Mid Long
Policy 8.1 – Refine the Capital Improvement Master Plan process by further strengthening the project evaluation criteria, the prioritization process, and the project implementation phasing schedule.
a. Agency Master Plans. Direct County agencies to regularly update facility master plans that include maintenance and systemic renovations, as well as new or expanded facilities.
b. Capital Budget Review Committee. Continue to strengthen the interagency review committee’s assessments to assist in setting capital project priorities, phasing, and funding strategies.
c. State Funds. Explore how under PlanMaryland, State agency funds and programs can be targeted to priority projects within designated Growth and Revitalization areas and Existing Communities.
d. Innovative Funding. Identify new or creative funding sources and methods such as public-private partnerships.
Policy 8.2 – Continue to lead by example in further reducing Howard County Government’s environmental impacts and incorporating green building practices into new and renovated public facilities.
a. Enhance Sustainability. Expand the use of cost-effective, resource-conserving green technologies in new and renovated County facilities.
b. Monitoring. Monitor County buildings and vehicles to document environment, health, and safety benefits, as well as cost-effectiveness.
c. Public Outreach and Education. Communicate the monitoring data and results of demonstration projects to the public.
Policy 8.3 – Use the operating budget process to optimize public services and use of funds. a. Ongoing Management. Continue to provide high-quality services to the
County’s residents and businesses while maintaining fiscally-prudent budget assumptions.
b. Regular Review. Direct County agencies to continue their annual review of services and service delivery to address evolving needs and changing demographics.
Policy 8.4 – Ensure the adequacy of water and sewer services. a. Wastewater Treatment Plant Capacity. Monitor flows to the Little Patuxent
Water Reclamation Plant to ensure sufficient capacity for projected growth in the Planned Service Area.
b. Master Plan for Water and Sewerage. Identify capital project priorities for capacity expansion and systemic renovations, as well as innovative approaches to reduce water consumption and recycle treated waste water.
IV: COMMUNITY

173
Policies and Implementing Actions Short Mid Long
Policy 8.5 – Continue to invest in multimodal transportation infrastructure to enhance mobility and access to diverse transportation options.
a. Road improvements. Continue to use APF-generated excise tax revenues to leverage State and Federal funding for highway capacity improvements. Consider legislation to allow use for other transportation modes.
b. Transit Development Program. Update the County’s Transit Development Program every five years to evaluate and prioritize Howard Transit improvements, as well as connections to regional transit.
c. Innovative Transit Funding. Explore additional public and private funding sources to expand and improve the quality of fixed-route and paratransit service.
d. Pedestrian and Bicycle Connections. Implement priority pedestrian and bicycle improvement projects and, whenever possible, include as part of road construction or maintenance projects
Policy 8.6 – Provide for environmentally sound and cost-effective solid waste management. a. Promote Solid Waste Reduction. Continue to expand programs for solid
waste reduction, reuse, recycling, and composting. Expand recycling programs to include additional materials as technologies and markets become available, including the possibility of recovery of items from the landfill.
b. Plan for Future Capacity. Ensure that the County has reliable options for solid waste processing and disposal that allow sufficient lead time for planning and construction of a new cell at the Alpha Ridge Landfill or other new facilities, or for instituting new programs.
Policy 8.7 – Identify and fund the most cost-effective strategies for Watershed Implementation Plan execution.
a. Funding. Evaluate options and adopt a dedicated funding mechanism.
b. Best Management Practices. Monitor and evaluate the cost-effectiveness of diverse best management practices to maximize nutrient reduction from the funds expended.
Policy 8.8 – Optimize planning and use of available funds to ensure school facilities continue to support high-quality school programs.
a. Accuracy of Enrollment Projections. Continue to collaborate with the Public School System to improve enrollment projections by refining the methodology for assessing the varying impacts of growth and neighborhood population cycles on individual schools.
b. Maximize Use of Existing School Facilities. Balance enrollment between under- and over-capacity schools by redistricting or alternative strategies to encourage full use of schools that have additional capacity.
c. Minimize New School Construction. Accommodate the projected enrollments by using modular classrooms and additions whenever possible.
d. Land Bank. Acquire additional sites inside the PFA to hold in reserve if needed for future school construction. Consider more urban school prototypes to reduce land acquisition requirements.
e. Fund Maintenance, Renovation, and Program Initiatives. Provide sufficient funding to maintain and renovate school facilities and to allow program initiatives that will sustain and enhance the quality of the Public School System.

174
Policies and Implementing Actions Short Mid Long
Policy 8.9 – Continue to support Howard Community College’s expanding ability to provide higher education for County residents and workers.
a. Expansion of Howard Community College. Continue the County’s commitment to fund expansion to accommodate enrollment and program growth. Support HCC in obtaining funds from the State or other sources.
b. Work Force Training. Continue to work with the Economic Development Authority, the private sector, and other institutions of higher education to meet workforce development and retraining needs, especially in science and technology-related fields.
c. Community Cultural Enrichment. Continue to expand noncredit course offerings and cultural programs that promote lifelong learning and enhance community life.
Policy 8.10 – Enhance residents’ access to high quality library resources. a. Master Plan. Evaluate the need for additional library capacity to serve
planned population and program growth, considering the impact of the Internet and other digital access to information. Provide necessary expansion via additions or new facilities within the Planned Service Area.
b. Libraries as Educational and Community Focal Points. Enhance the design of existing and any future libraries to both optimize the delivery of service at each library branch and help create a civic focal point. Where feasible, integrate libraries with other complementary public or private facilities.
Policy 8.11 – Ensure County residents and visitors have access to a wide variety of arts and cultural programs; cultivate artists; and develop creative workforce.
a. Arts Council. Continue to support the operations and programs of the Arts Council through financial and in-kind resources and services.
b. Community Service Partnership. Continue to utilize the Community Service Partnership with the Howard County Arts Council to distribute public funds to local and regional arts organizations through competitive grant programs and to manage art facilities.
c. Business Partnerships. Encourage partnerships between the arts community and the Howard County Economic Development Authority, Howard County Tourism, and private and business sectors to increase awareness of the value of the arts and provide creative funding to support programs and facilities.
d. Arts and Entertainment Districts. Explore options to create one or more “Arts and Entertainment” districts in Howard County.
e. Support for Artists. Increase opportunities for artists to live, work, learn, and present work in Howard County.
f. Development. Include art or arts spaces in new public construction when appropriate.
Policy 8.12 – Expand the County park system and recreational facilities. a. Land Acquisition. Establish acquisition goals for environmental conservation
and active recreation in the 2012 update to the Howard County Land Preservation and Recreation Plan (LPRP). Accelerate land acquisition to meet long-term recreation needs while suitable sites are still available, particularly inside the Planned Service Area where population is greatest.
b. Recreation Planning. Update the LPRP regularly to establish countywide goals and priorities for development of facilities and recreation programs.

175
Policies and Implementing Actions Short Mid Long
Policy 8.13 – Enhance community recreational opportunities. a. Cooperation with Howard County Public School System. Continue to
collaborate on the design, development, management, and maintenance of shared recreation facilities on school sites.
b. Coordinate the Columbia Association, Recreation Organizations, and Private Recreation Providers. Expand partnerships with other recreation providers so that the Department of Recreation and Parks programs complement and support efforts by other providers. Provide information on opportunities available through other organizations.
Policy 8.14 – Plan for Health and Human Services. a. Comprehensive and Coordinated Health and Human Services Planning.
Continue to develop data-driven, measureable plans for both Health Services and Human Services. Plans should reflect comprehensive assessment of needs, resources, proposed actions, and implementation strategies with a clear identification of priorities, partner roles, and funding mechanisms.
b. Capacity Building. Continue to build positive, collaborative relationships with the Horizon Foundation, Association of Community Services, United Way, the Columbia Foundation, and other capacity-building organizations, as well as the business community, as essential resources for achieving health and human services goals.
Policy 8.15 – Enhance the delivery and accessibility of health and human services. a. Access to information. Enhance access to data and information technology
to facilitate program coordination and strengthen health and human service delivery systems.
b. Partnerships for Health and Human Services Delivery. Continue to expand partnerships among government, business, and nonprofit sectors to coordinate health and human services delivery.
c. Co-location of Services. Establish multiservice centers, where feasible, in prominent, transit-accessible locations. These centers should be used as focal points for the distribution of health and human services.
Policy 8.16 – Minimize loss of life, loss of property, and injury due to fire or medical emergencies.
a. New Fire Stations. Construct and staff the new and replacement fire stations in the current Capital Improvement Program (Waterloo, Elkridge, and Banneker).
b. Underground Cisterns. Continue to construct underground cisterns to support fire suppression in the Rural West.
c. Fire and Rescue Vehicles. Provide funding to replace fire and rescue vehicles when needed.
Policy 8.17 – Enhance Police protection. a. Organizational and Facility Assessment. Evaluate the options for
organizing Police functions and the need for a new central district to develop a plan for new or modified Police Department facilities.
b. Adequate Resources. Ensure the Police Department has adequate staff and equipment based on levels of crime and demand for services.
c. Community Policing and Youth Programs. Continue to focus on community policing programs that allow police officers to work in partnership with communities to solve crimes and work proactively with schools.

176
Policies and Implementing Actions Short Mid Long
Policy 8.18 – Continue to invest selectively to maintain and enhance County facilities. a. Funding Priorities. Use the Capital Improvement Program to evaluate and
prioritize County investments in technology upgrades and systemic renovation for County offices and other facilities.
b. Community Revitalization. Continue to invest in renovation of community infrastructure as well as catalytic community revitalization projects, seeking grants and public-private partnerships whenever possible.
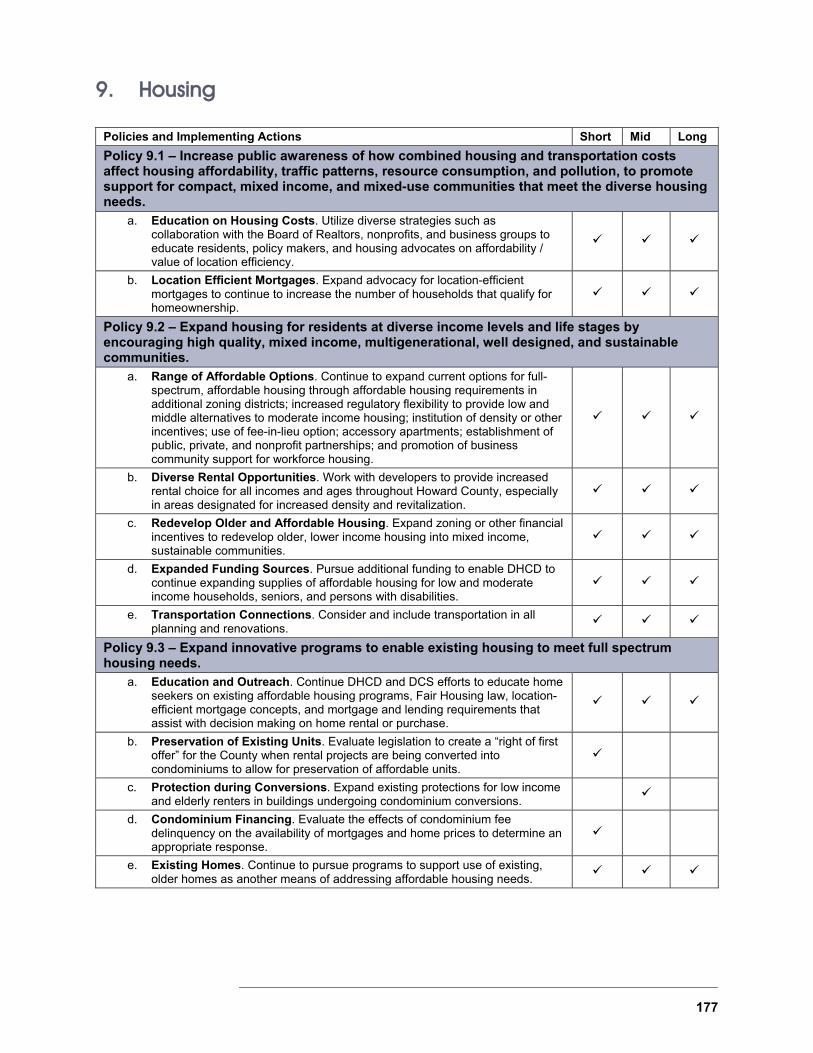
177
9. Housing
Policies and Implementing Actions Short Mid Long
Policy 9.1 – Increase public awareness of how combined housing and transportation costs affect housing affordability, traffic patterns, resource consumption, and pollution, to promote support for compact, mixed income, and mixed-use communities that meet the diverse housing needs.
a. Education on Housing Costs. Utilize diverse strategies such as collaboration with the Board of Realtors, nonprofits, and business groups to educate residents, policy makers, and housing advocates on affordability / value of location efficiency.
b. Location Efficient Mortgages. Expand advocacy for location-efficient mortgages to continue to increase the number of households that qualify for homeownership.
Policy 9.2 – Expand housing for residents at diverse income levels and life stages by encouraging high quality, mixed income, multigenerational, well designed, and sustainable communities.
a. Range of Affordable Options. Continue to expand current options for full-spectrum, affordable housing through affordable housing requirements in additional zoning districts; increased regulatory flexibility to provide low and middle alternatives to moderate income housing; institution of density or other incentives; use of fee-in-lieu option; accessory apartments; establishment of public, private, and nonprofit partnerships; and promotion of business community support for workforce housing.
b. Diverse Rental Opportunities. Work with developers to provide increased rental choice for all incomes and ages throughout Howard County, especially in areas designated for increased density and revitalization.
c. Redevelop Older and Affordable Housing. Expand zoning or other financial incentives to redevelop older, lower income housing into mixed income, sustainable communities.
d. Expanded Funding Sources. Pursue additional funding to enable DHCD to continue expanding supplies of affordable housing for low and moderate income households, seniors, and persons with disabilities.
e. Transportation Connections. Consider and include transportation in all planning and renovations.
Policy 9.3 – Expand innovative programs to enable existing housing to meet full spectrum housing needs.
a. Education and Outreach. Continue DHCD and DCS efforts to educate home seekers on existing affordable housing programs, Fair Housing law, location-efficient mortgage concepts, and mortgage and lending requirements that assist with decision making on home rental or purchase.
b. Preservation of Existing Units. Evaluate legislation to create a “right of first offer” for the County when rental projects are being converted into condominiums to allow for preservation of affordable units.
c. Protection during Conversions. Expand existing protections for low income and elderly renters in buildings undergoing condominium conversions.
d. Condominium Financing. Evaluate the effects of condominium fee delinquency on the availability of mortgages and home prices to determine an appropriate response.
e. Existing Homes. Continue to pursue programs to support use of existing, older homes as another means of addressing affordable housing needs.
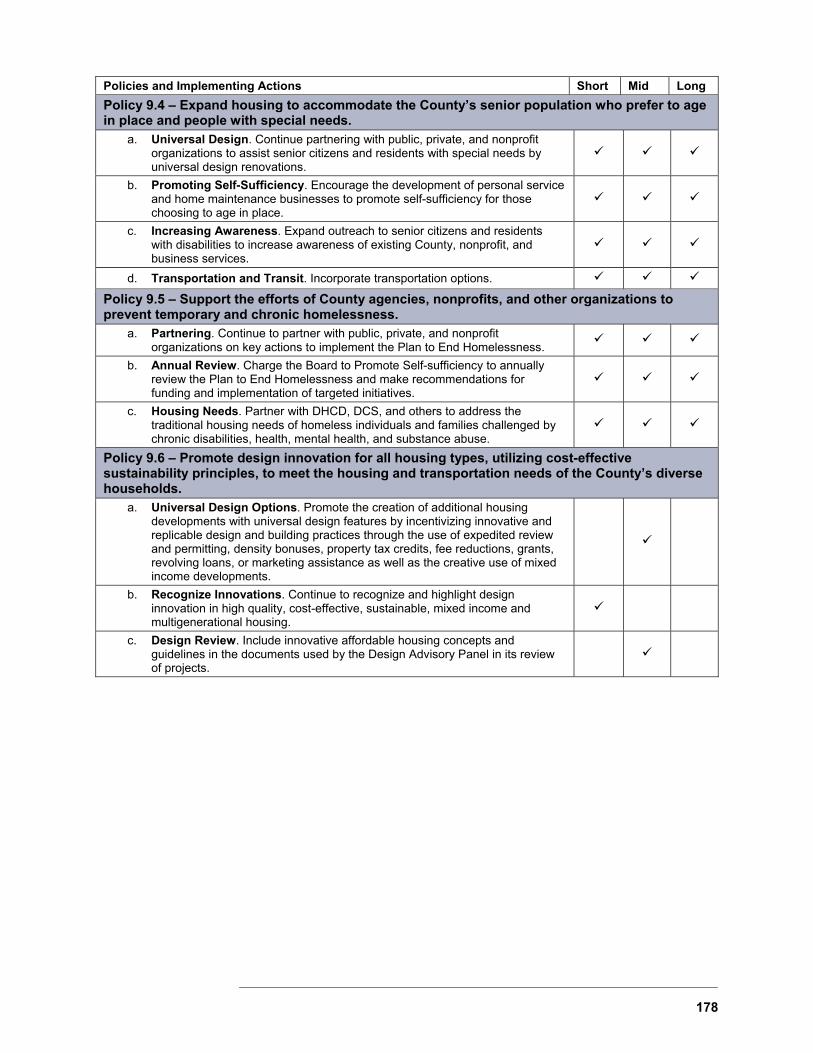
178
Policies and Implementing Actions Short Mid Long
Policy 9.4 – Expand housing to accommodate the County’s senior population who prefer to age in place and people with special needs.
a. Universal Design. Continue partnering with public, private, and nonprofit organizations to assist senior citizens and residents with special needs by universal design renovations.
b. Promoting Self-Sufficiency. Encourage the development of personal service and home maintenance businesses to promote self-sufficiency for those choosing to age in place.
c. Increasing Awareness. Expand outreach to senior citizens and residents with disabilities to increase awareness of existing County, nonprofit, and business services.
d. Transportation and Transit. Incorporate transportation options.
Policy 9.5 – Support the efforts of County agencies, nonprofits, and other organizations to prevent temporary and chronic homelessness.
a. Partnering. Continue to partner with public, private, and nonprofit organizations on key actions to implement the Plan to End Homelessness.
b. Annual Review. Charge the Board to Promote Self-sufficiency to annually review the Plan to End Homelessness and make recommendations for funding and implementation of targeted initiatives.
c. Housing Needs. Partner with DHCD, DCS, and others to address the traditional housing needs of homeless individuals and families challenged by chronic disabilities, health, mental health, and substance abuse.
Policy 9.6 – Promote design innovation for all housing types, utilizing cost-effective sustainability principles, to meet the housing and transportation needs of the County’s diverse households.
a. Universal Design Options. Promote the creation of additional housing developments with universal design features by incentivizing innovative and replicable design and building practices through the use of expedited review and permitting, density bonuses, property tax credits, fee reductions, grants, revolving loans, or marketing assistance as well as the creative use of mixed income developments.
b. Recognize Innovations. Continue to recognize and highlight design innovation in high quality, cost-effective, sustainable, mixed income and multigenerational housing.
c. Design Review. Include innovative affordable housing concepts and guidelines in the documents used by the Design Advisory Panel in its review of projects.
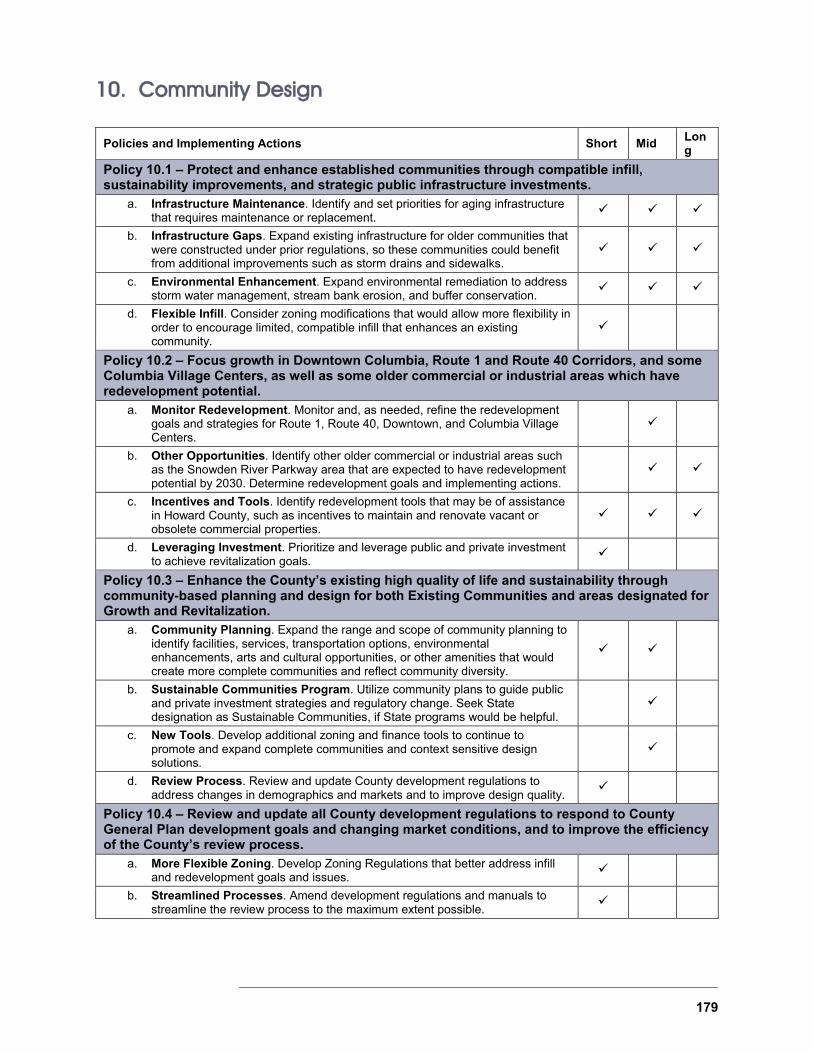
179
10. Community Design
Policies and Implementing Actions Short Mid Long
Policy 10.1 – Protect and enhance established communities through compatible infill, sustainability improvements, and strategic public infrastructure investments.
a. Infrastructure Maintenance. Identify and set priorities for aging infrastructure that requires maintenance or replacement.
b. Infrastructure Gaps. Expand existing infrastructure for older communities that were constructed under prior regulations, so these communities could benefit from additional improvements such as storm drains and sidewalks.
c. Environmental Enhancement. Expand environmental remediation to address storm water management, stream bank erosion, and buffer conservation.
d. Flexible Infill. Consider zoning modifications that would allow more flexibility in order to encourage limited, compatible infill that enhances an existing community.
Policy 10.2 – Focus growth in Downtown Columbia, Route 1 and Route 40 Corridors, and some Columbia Village Centers, as well as some older commercial or industrial areas which have redevelopment potential.
a. Monitor Redevelopment. Monitor and, as needed, refine the redevelopment goals and strategies for Route 1, Route 40, Downtown, and Columbia Village Centers.
b. Other Opportunities. Identify other older commercial or industrial areas such as the Snowden River Parkway area that are expected to have redevelopment potential by 2030. Determine redevelopment goals and implementing actions.
c. Incentives and Tools. Identify redevelopment tools that may be of assistance in Howard County, such as incentives to maintain and renovate vacant or obsolete commercial properties.
d. Leveraging Investment. Prioritize and leverage public and private investment to achieve revitalization goals.
Policy 10.3 – Enhance the County’s existing high quality of life and sustainability through community-based planning and design for both Existing Communities and areas designated for Growth and Revitalization.
a. Community Planning. Expand the range and scope of community planning to identify facilities, services, transportation options, environmental enhancements, arts and cultural opportunities, or other amenities that would create more complete communities and reflect community diversity.
b. Sustainable Communities Program. Utilize community plans to guide public and private investment strategies and regulatory change. Seek State designation as Sustainable Communities, if State programs would be helpful.
c. New Tools. Develop additional zoning and finance tools to continue to promote and expand complete communities and context sensitive design solutions.
d. Review Process. Review and update County development regulations to address changes in demographics and markets and to improve design quality.
Policy 10.4 – Review and update all County development regulations to respond to County General Plan development goals and changing market conditions, and to improve the efficiency of the County’s review process.
a. More Flexible Zoning. Develop Zoning Regulations that better address infill and redevelopment goals and issues.
b. Streamlined Processes. Amend development regulations and manuals to streamline the review process to the maximum extent possible.

180
Policies and Implementing Actions Short Mid Long
Policy 10.5 – Adjust County funding programs to reflect community investment needs and partnership opportunities.
a. Community Plans. Refine the County’s capital budget process using place types, geographic planning areas, and priorities established by community-based plans.
b. Sustainable Communities. Seek State support through its Sustainable Communities program by developing action plans for identified areas and convening community work groups to guide planning and implementation.
Policy 10.6 – Improve the competitiveness and design of commercial areas. a. No Extension of Commercial Strips. Reaffirm the policy of past General
Plans to not extend strip commercial development on major roads beyond their present limits.
b. Older Commercial Properties. Develop strategies to encourage older commercial centers to become stronger community focal points through design improvements and renovation.
c. Building Design. Adopt standards that require commercial structures to be in scale with adjacent residences and to enhance design by articulating facades and roof lines. Require all facades that are visible from surrounding roads or properties to be similar to the front façade. Prohibit the use of blank rear or side walls in visible locations.
d. Parking Design. Discourage large parking lots in locations that dominate the public image of the site along main roads. Increase the requirements for internal parking lot landscaping to visually break up large lots, provide more shade, and improve the pedestrian environment.
e. Pedestrian Improvements. Install sidewalks along roads that provide access to commercial centers and connect store entrances to street crossings and transit stops for increased pedestrian safety and convenience. Adopt standards that encourage provision of pedestrian-scale spaces, such as landscaped plazas and sitting areas.
f. Sign Code. Review the County Sign Code for possible revisions to commercial signs.
Policy 10.7 – Improve the functioning and design of rural commercial crossroads. a. Commercial Crossroads Plans. Identify and prioritize areas in the West that
would benefit from planning activities that assess business and community needs and determine strategies to support the economic function and design of rural commercial crossroads.

181
11. Implementation
Policies and Implementing Actions Short Mid Long
Policy 11.1 – Monitor progress in implementing PlanHoward 2030 policies and actions. a. PlanHoward 2030 Monitoring Report. Publish a PlanHoward 2030
Monitoring Report which assesses progress in implementing this Plan and identifies potential adjustments to policies or implementing actions. Present the first monitoring report to the Planning Board for its recommendations and public comment three years after plan adoption and the second monitoring report five years after the first report.
b. State-Required Indicators. Include General Plan related, State-required indicators in the annual Development Monitoring System report.
12. Stewardship
Policies and Implementing Actions Short Mid Long
Policy 12.1 – Howard County Government will continue to lead by example as a good steward of the shared resources within the community and the region.
a. Regional Collaboration. Monitor regional efforts to conserve or restore environmental quality (i.e. air, land, water), while expanding all efforts to protect water and air quality and natural resources.
b. Continuous Innovation. Implement new strategies for improving the efficiency and sustainability of County services provided to the community.
c. New Opportunities. Identify additional solutions to assist County businesses and residents in implementing new, more sustainable technologies.
d. Reducing GHGs. Continue to reduce greenhouse gas emissions through an expanding focus on energy, mass transit, bicycle, and pedestrian initiatives.
e. Enhanced Recycling. Continue to look for additional ways to increase donation, recycling, and food waste collections to expand the County’s progress in these areas.
f. Commercial Options. Consider reexamination of business recycling as an option for business and apartments in Howard County, if found to be cost-effective and efficient.
Policy 12.2 – Engage all members of the County’s socially and economically diverse community and highlight stewardship goals specific to the unique situations of each audience and community group.
a. Multicultural Outreach. Continue to provide targeted outreach to minority populations, as well as multilingual outreach materials and approaches.
b. Cross-Jurisdictional Outreach. Increase partnering efforts with public, private, and nonprofit communities to expand and coordinate all messages regarding sustainability efforts with a focus on outreach to immediately adjacent, neighboring jurisdictions.
c. Expanded Programming. Expand on current offerings and programs to provide more sustainability workshops and speaker series for individuals, businesses, and nonprofits.
V: ACTION!
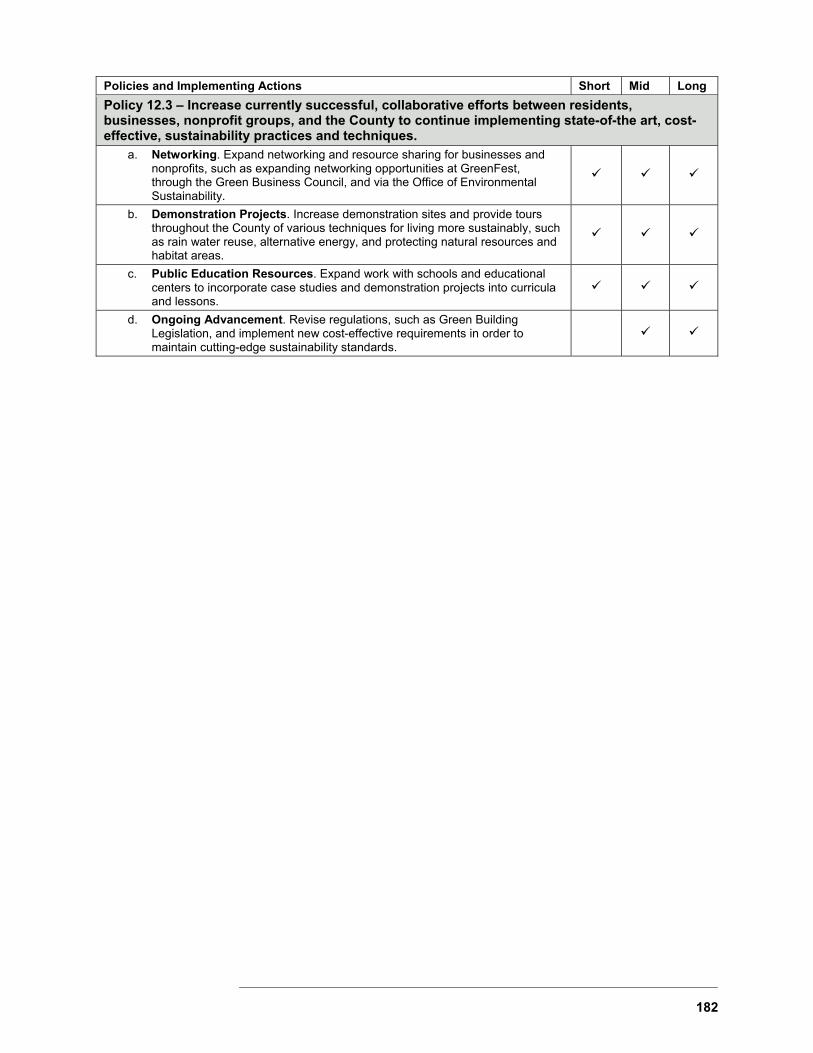
182
Policies and Implementing Actions Short Mid Long
Policy 12.3 – Increase currently successful, collaborative efforts between residents, businesses, nonprofit groups, and the County to continue implementing state-of-the art, cost-effective, sustainability practices and techniques.
a. Networking. Expand networking and resource sharing for businesses and nonprofits, such as expanding networking opportunities at GreenFest, through the Green Business Council, and via the Office of Environmental Sustainability.
b. Demonstration Projects. Increase demonstration sites and provide tours throughout the County of various techniques for living more sustainably, such as rain water reuse, alternative energy, and protecting natural resources and habitat areas.
c. Public Education Resources. Expand work with schools and educational centers to incorporate case studies and demonstration projects into curricula and lessons.
d. Ongoing Advancement. Revise regulations, such as Green Building Legislation, and implement new cost-effective requirements in order to maintain cutting-edge sustainability standards.


Howard County Department of Planning & Zoning 3430 Courthouse Drive Ellicott City, MD 21043
410-313-2350 http://howardcountymd.gov/