Country Tables - unctad.org · FDI in Least Developed Countries at a Glance 34 Largest foreign...
21
Sources and Definitions 31 Country Tables
Transcript of Country Tables - unctad.org · FDI in Least Developed Countries at a Glance 34 Largest foreign...

S o u r c e s a n d D e f i n i t i o n s3 1
Country Tables

Afghanistan3 3
Afghanistan
Area ( ‘000 km2 ) : 652.1Population (millions) : 2000 25.6Capital city : KabulOfficial language : Pashto and DariCurrency: Afghani Exchange rate (period average): ..GDP in current prices (millions of dollars) : 1999 1,718.3Exports of goods and services (millions of dollars): 1996 80.0Imports of goods and services (millions of dollars): 1996 150.0Official development assistance (millions of dollars): 1999 104.1External debt (millions of dollars): 1998 ..
Inward FDI: geographical breakdown, by source(Millions of dollars)
Region/economy Inflows Year Inward stock Year
France -6.4 1999 .. ..Japan .. .. 0.8 a 1998
a Approval/notified data.
FDI inflows, 1985-1999 (Millions of dollars)
DTTs, 1 January 2000
Economy Date of signature
India 14 September 1975

FDI in Least Developed Countries at a Glance3 4
Largest foreign affiliates, 1999
Sales Year ofCompany Home economy Industry ($ million) Employment establishment
Mm Telefongy Rt S Kereskedelmi CommunicationsKorl Tolt Feleloss Gu T Rsas G Hungary equipment 3.3 230 1998
Derivados De Gasa S.A. De C.V. Mexico .. .. 19 ..
Caola Kozmetikai Es Perfumes,Haztartasvegyipari cosmetics,Reszvenytarsasag Hungary toilet preparations .. .. 1999
Other relevant information
• Membership of relevant international agreements as of April 2001: ICSID
• Address and website of investment promotion agency: None
• Fortune 500 investors: None
• Member of WAIPA as of March 2001: No

Angola3 5
Angola
Area ( ‘000 km2 ) : 1,246.7Population (millions) : 2000 12.8Capital city : LuandaOfficial language : PortugueseCurrency: 1999 Kwanza Exchange rate (period average): 1999 Kz2,790.7=$1GDP in current prices (millions of dollars): 1999 5,861.4Exports of goods and services (millions of dollars): 1998 4,440.1Imports of goods and services (millions of dollars): 1996 4,463.8Official development assistance (millions of dollars): 1999 251.8External debt (millions of dollars): 1998 12,173
Inward FDI: geographical breakdown, by source(Millions of dollars)
Region/economy Inflows Year Inward stock Year
Developed economiesBelgium/Luxembourg -0.1 1998 .. ..France 484.7 1999 118.5 1998Japan 1.1 1995 1.1 1995Portugal 1.5 1994 .. ..United Kingdom .. .. 1.5 1992United States 288.0 1998 1 218.0 1999
Developing economies China .. .. 2.0a 1995
a Approval data.
FDI inflows, 1985-1999 (Billions of dollars)
FDI inflows as a percentage of gross fixed capital formation, 1985-1999

FDI in Least Developed Countries at a Glance3 6
Largest cross-border M&A deals, 1987-1999Value
Acquired company Industry Acquiring company Home economy ($ million) Year
Block 7 Oil Field,Angola Oil and gas; petroleum refining Phillips Petroleum Co., Inc. United States .. 1998Angola Diamond Corp Mining Alpha Diamond Corp. Canada .. 1998Royal Dutch/Shell-Oil Block Oil and gas; petroleum refining Texaco Inc. United States .. 1998Cabinda Association Oil and gas; petroleum refining Soc Nationale Elf Aquitaine France .. 1991SONANGAL-Block 4 Concessiona Oil and gas; petroleum refining Ranger Oil Ltd. Canada .. 1991GE-Angola,2 Other Service Ops Repair services ABB Asea Brown Boveri Ltd. Switzerland .. 1988
BITs, 1 January 2000
Economy Date of signature
Cape Verde 30 September 1997Italy 10 July 1997Portugal 24 October 1997
Largest foreign affiliates, 1999
Sales Year ofCompany Home economy Industry ($ million) Employment establishment
Osel Odebrecht Servicos No Exterior Ltda Brazil Nonresidential construction 785.3 4 000 ..Cabinda Gulf Oil Company Ltd. United States Petroleum refining 12.5 1 800 ..Industrias Termicas De Angola Sarl United Kingdom Heating and air cond supplies 4.1 12 1968Blackwood Hodge Angola Ltda Portugal Industrial machinery & equipment 1 50 1991Fina Petroleos D’ Angola S A R L France Crude petroleum and natural gas .. 1 125 1957Elf Aquitaine Angola S A France Oil and gas exploration .. 1 000 ..Fina Petroleos De Angola S A R L France Drilling oil and gas wells .. 650 1957Hull Blyth (Angola) Ltd. United Kingdom Other water transport .. 400 ..Braspetro Oil Services Company Brazil Drilling oil and gas wells .. 280 ..Uniao Comercial De Automoveis S A R L United Kingdom Cars and other motor vehicles .. 220 ..Sociedade Comercial Luso- Holandesa S A R L United Kingdom Electrical appliances .. 180 1941Robert Hudson Ltd. Portugal Cars and other motor vehicles .. 150 1926Tintas Cin De Angola S A R L Portugal Paints varnishes and supplies .. 60 ..Braspetro Oil Services Company Brazil Drilling oil and gas wells .. 10 ..Foraid Angola France .. .. .. ..Friedlander Angola France .. .. .. ..I C I Angola Ltda United Kingdom .. .. .. ..Johnson and Johnson Angola Ltda United States Orthopedic/prosthetic appliances .. .. ..Pfizer Ltda United States Chemicals .. .. ..Sarel S A R L United Kingdom .. .. .. ..Toyota de Angola S A R L Japan Motor Vehicles sales .. .. 1973Zuid Casa Holandesa Lda Netherlands Nondurable goods .. .. ..
Other relevant information
• Membership of relevant international agreements as of April 2001: MIGA, TRIMs, GATS, TRIPS
• Address and website of investment promotion agency: Instituto do Investimento Estrangeiro (IIE)Edificio do Ministerio da Industria Rua Cerqueira Lukoki 25, 9 Andar, Luanda;Tel: (244-2) 39 14 34 / Fax: (244-2) 39 33 81
• Fortune 500 investors : ABB, Chevron, Elf Aquitaine, Imperial Chemical Industries, Johnson & Johnson,Phillips Petroleum, Pfizer, Texaco, Total Fina Elf, Toyota Tsusho .
• Member of WAIPA as of March 2001 : Yes
a Privatization.
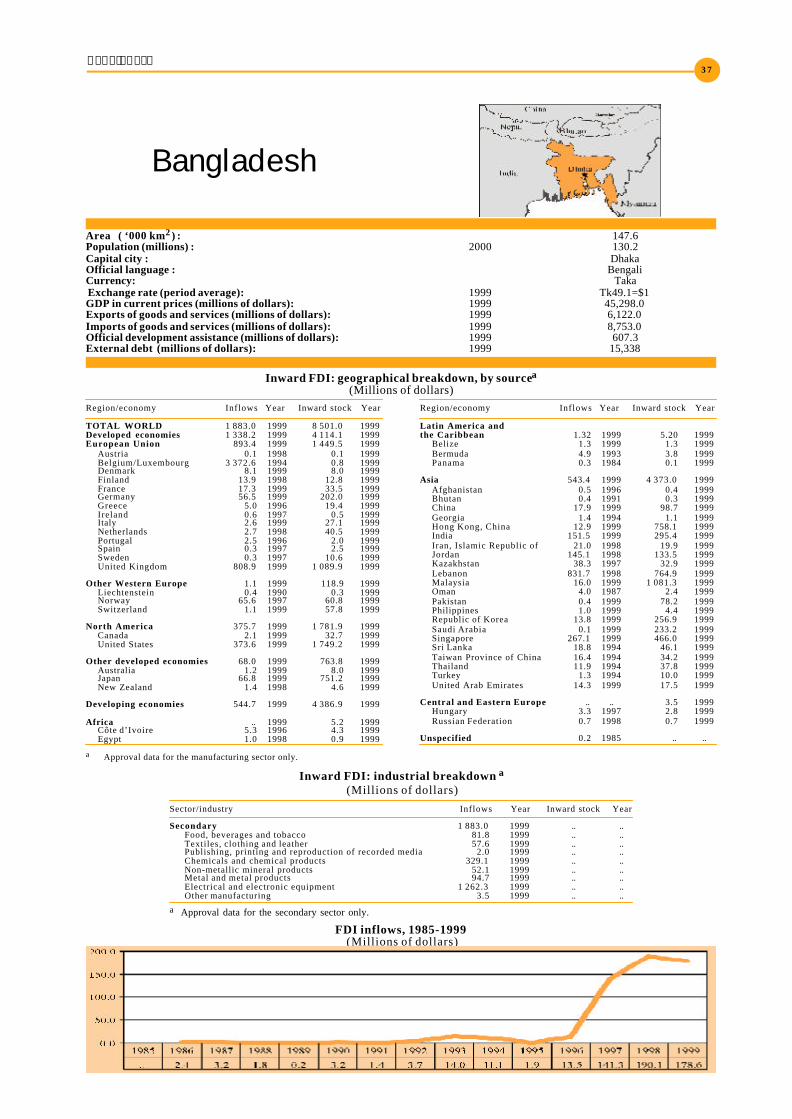
Bangladesh3 7
Bangladesh
Area ( ‘000 km2 ) : 147.6Population (millions) : 2000 130.2Capital city : DhakaOfficial language : BengaliCurrency: Taka Exchange rate (period average): 1999 Tk49.1=$1GDP in current prices (millions of dollars): 1999 45,298.0Exports of goods and services (millions of dollars): 1999 6,122.0Imports of goods and services (millions of dollars): 1999 8,753.0Official development assistance (millions of dollars): 1999 607.3External debt (millions of dollars): 1999 15,338
Region/economy Inflows Year Inward stock Year
TOTAL WORLD 1 883.0 1999 8 501.0 1999Developed economies 1 338.2 1999 4 114.1 1999European Union 893.4 1999 1 449.5 1999
Austria 0.1 1998 0.1 1999Belgium/Luxembourg 3 372.6 1994 0.8 1999Denmark 8.1 1999 8.0 1999Finland 13.9 1998 12.8 1999France 17.3 1999 33.5 1999Germany 56.5 1999 202.0 1999Greece 5.0 1996 19.4 1999Ireland 0.6 1997 0.5 1999Italy 2.6 1999 27.1 1999Netherlands 2.7 1998 40.5 1999Portugal 2.5 1996 2.0 1999Spain 0.3 1997 2.5 1999Sweden 0.3 1997 10.6 1999United Kingdom 808.9 1999 1 089.9 1999
Other Western Europe 1.1 1999 118.9 1999Liechtenstein 0.4 1990 0.3 1999Norway 65.6 1997 60.8 1999Switzerland 1.1 1999 57.8 1999
North America 375.7 1999 1 781.9 1999Canada 2.1 1999 32.7 1999United States 373.6 1999 1 749.2 1999
Other developed economies 68.0 1999 763.8 1999Australia 1.2 1999 8.0 1999Japan 66.8 1999 751.2 1999New Zealand 1.4 1998 4.6 1999
Developing economies 544.7 1999 4 386.9 1999
Africa .. 1999 5.2 1999Côte d’Ivoire 5.3 1996 4.3 1999Egypt 1.0 1998 0.9 1999
Region/economy Inflows Year Inward stock Year
Latin America andthe Caribbean 1.32 1999 5.20 1999
Belize 1.3 1999 1.3 1999Bermuda 4.9 1993 3.8 1999Panama 0.3 1984 0.1 1999
Asia 543.4 1999 4 373.0 1999Afghanistan 0.5 1996 0.4 1999Bhutan 0.4 1991 0.3 1999China 17.9 1999 98.7 1999Georgia 1.4 1994 1.1 1999Hong Kong, China 12.9 1999 758.1 1999India 151.5 1999 295.4 1999Iran, Islamic Republic of 21.0 1998 19.9 1999Jordan 145.1 1998 133.5 1999Kazakhstan 38.3 1997 32.9 1999Lebanon 831.7 1998 764.9 1999Malaysia 16.0 1999 1 081.3 1999Oman 4.0 1987 2.4 1999Pakistan 0.4 1999 78.2 1999Philippines 1.0 1999 4.4 1999Republic of Korea 13.8 1999 256.9 1999Saudi Arabia 0.1 1999 233.2 1999Singapore 267.1 1999 466.0 1999Sri Lanka 18.8 1994 46.1 1999Taiwan Province of China 16.4 1994 34.2 1999Thailand 11.9 1994 37.8 1999Turkey 1.3 1994 10.0 1999United Arab Emirates 14.3 1999 17.5 1999
Central and Eastern Europe .. .. 3.5 1999Hungary 3.3 1997 2.8 1999Russian Federation 0.7 1998 0.7 1999
Unspecified 0.2 1985 .. ..
Inward FDI: geographical breakdown, by sourcea(Millions of dollars)
a Approval data for the manufacturing sector only.
Inward FDI: industrial breakdown a
(Millions of dollars)
Sector/industry Inflows Year Inward stock Year
Secondary 1 883.0 1999 .. ..Food, beverages and tobacco 81.8 1999 .. ..Textiles, clothing and leather 57.6 1999 .. ..Publishing, printing and reproduction of recorded media 2.0 1999 .. ..Chemicals and chemical products 329.1 1999 .. ..Non-metallic mineral products 52.1 1999 .. ..Metal and metal products 94.7 1999 .. ..Electrical and electronic equipment 1 262.3 1999 .. ..Other manufacturing 3.5 1999 .. ..
a Approval data for the secondary sector only.
FDI inflows, 1985-1999 (Millions of dollars)

FDI in Least Developed Countries at a Glance3 8
FDI inflows as a percentage of gross fixed capital formation, 1985-1999
Cross-border M&As, sales and purchases, 1987-1999 (Millions of dollars)
Largest cross-border M&A deals, 1987-1999
Acquired company Industry Acquiring company Home economy Value ($ million) Year
Barge-Mounted Power Plant Wholesale trade-durable goods Coastal Power Co. United States 33.0 1998Alita (BD ) Ltd, Ace Bicycles (BD) Transportation equipment Akoko Sdn Bhd Singapore .. 1995Tecribel Food and kindred products Allied-Lyons PLC-J Lyons United Kingdom .. 1988
BITs, 1 January 2000
Economy Date of signature
Belgium/Luxembourg 22 May 1981China 12 September 1996France 10 September 1985Germany 6 May 1981Indonesia 9 February 1998Italy 20 March 1990Japan 10 November 1998Democratic People’s Republic of Korea 21 June 1999Republic of Korea 18 June 1986Malaysia 12 October 1994Netherlands 1 November 1994Pakistan 24 October 1995Philippines 8 September 97Poland 8 July 1998Romania 13 March 1987Thailand 13 March 1988Turkey 12 November 1987United Kingdom 19 June 1980United States 12 March 1986
DTTs, 1 January 2000
Economy Date of signature
Belgium 18 October 1990Canada 15 February 1982China 12 September 1996Denmark 16 July 1996France 9 March 1987Germany 29 May 1990India 27 August 1991Italy 20 March 1990Japan 28 February 1991Republic of Korea 10 May 1983Malaysia 19 April 1983Netherlands 13 July 1993Pakistan 15 October 1981Poland 8 July 1997Romania 13 March 1987Singapore 19 December 1980Sri Lanka 24 July 1986Sweden 3 May 1982Thailand 20 April 1997United Kingdom 8 August 1979United States 6 October 1980
Largest foreign affiliates, 1999
Sales Year ofCompany Home economy Industry ($ million) Employment establishment
Fisons Bangladesh Ltd. France Pharmaceutical preparations 48.4 1 300 1964The General Electric Co. of Bangladesh Ltd. United Kingdom Motors and generators 37.7 1 200 1962Mamiya-Op (Bangladesh) Ltd. Japan Sporting and athletic goods 16.7 600 1991Organon Bangladesh Ltd. Netherlands Pharmaceutical preparations 9 .1 1 000 1965Ananda Computers United States Office equipment 8 .7 40 1987Citech Co. Ltd. United States Office equipment 4 .6 50 1985Bengal Fisheries Ltd. Japan Fishing 2.4 a 143 1980Toka Ink (Bangladesh) Ltd. Japan Printing Ink 1.4 b 20 1993Highspeed Shipbuilduing and Heavy Engineering Co. Ltd. Japan Construction and engineering 0.2 b 100 1982Bangladesh Oxygen Ltd. United Kingdom Industrial gases .. 5 000 1964Glaxo Wellcome Bangladesh Ltd. United Kingdom Pharmaceutical preparations .. 2 700 1962Renata Limited United States Pharmaceutical preparations .. 600 1979Vanik Bangladesh Limited Sri Lanka Other depository bank functions .. 150 1997Tm International (Bangladesh) Ltd. Malaysia Electronic parts and equipment .. 15 1996Bangladesh Tobacco Co. Ltd. United Kingdom Cigarettes .. .. ..Basf Bangladesh Ltd. Germany .. .. .. ..Bayer (Bangladesh) Ltd. Germany .. .. .. ..Boc Bangladesh Limited United Kingdom Industrial gases .. .. ..Deutz Bangladesh Ltd. Germany .. .. .. ..Gec Fans Bangladesh Ltd. United Kingdom .. .. .. ..Gestetner Bangladesh Ltd. United Kingdom Office equipment .. .. ..Hyundai Cements (Bangladesh) Co. Ltd. Republic of Korea Cement hydraulic .. .. ..Nestle Switzerland .. .. .. ..Nippon Express Bangladesh Ltd. Japan .. .. .. ..a Data refer to 1997. b Data refer to 1996.
Other relevant information
• Membership of relevant international agreements as of April 2001: CREFAA, ICSID, MIGA, TRIMs, GATS, TRIPS• Address and website of investment promotion agency: Board of Investment (BOI), Prime Minister's Office
Jiban Bima Tower - 19thFloor, 10, Dilkusha Commercial Area, Dhaka-1000; Tel: (880-2) 95 59 378; Fax: (880-2) 95 62 312• Fortune 500 investors: Akzo Nobel, Aventis, BASF, Bayer Ag, Glaxo Wellcome, Lloyds TSB Group, Mitsui, Nestlé, Nippon Express, Pfizer.• Member of WAIPA as of March 2001: Yes

Benin3 9
Benin
Area ( ‘000 km2 ) : 112.6Population (millions) : 2000 6.2Capital city : Porto NovoOfficial language : FrenchCurrency: CFA Franc Exchange rate (period average): 1999 CFAfr615.7=$1GDP in current prices (millions of dollars): 1999 2,401.6Exports of goods and services (millions of dollars): 1999 655.9Imports of goods and services (millions of dollars): 1999 831.3Official development assistance (millions of dollars): 1999 119.3External debt (millions of dollars): 1998 1,647
Inward FDI: geographical breakdown, by source(Millions of dollars)
Region/economy Inflows Year Inward stock Year
Belgium/Luxembourg -0.1 1998 .. .. France 8.5 1999 .. ..
FDI inflows, 1985-1999 (Millions of dollars)
FDI inflows as a percentage of gross fixed capital formation, 1985-1999

FDI in Least Developed Countries at a Glance4 0
Largest cross-border M&A deals, 1987-1999Value
Acquired company Industry Acquiring company Home economy ($ million) Year
Afronetwork Benin Telecommunications Tital Corp. United States .. 1998
Tarpon-Benin SA Oil and gas; petroleum refining Profco Resources Ltd. Canada .. 1997
BITs, 1 January 2000
Economy Date of signature
Germany 29 June 1978Switzerland 20 April 1966United Kingdom 28 November 1987
DTTs, 1 January 2000
Economy Date of signature
France 27 February 1975Norway 29 May 1979
Largest foreign affiliates, 1999
Sales Year ofCompany Home economy Industry ($ million) Employment establishment
John Walkden and Cie United Kingdom Piece goods 39.2 74 ..Societe Beninoise De Pieces Automobiles De Tourisme France New and used car dealers .. 50 ..Promo Pharma S A R L France Drugs proprietaries and sundries .. 15 1991Etde Benin France .. .. .. ..Prezioso Benin France .. .. .. ..
Other relevant information
• Membership of relevant international agreements as of April 2001: CREFAA, ICSID, MIGA, TRIMs,GATS, TRIPS
• Address and website of investment promotion agency:Centre de Promotion des Investissements01 BP 2022, Cotonou; Tel: (229) 30 10 33; Fax: (229) 30 01 67/30 16 60BK Sarl, Agence des Promoteurs d’Investissementsc/824 Missite, 06 BP 413, Cotonou; Tel: (229) 32 45 01; Fax: (229) 31 38 09
• Fortune 500 investors : Bouygues, Groupe Pinault-Printemps, Unilever.
• Member of WAIPA as of March 2001 : Yes

Bhutan4 1
Bhutan
Area (‘000 km2 ): 47.0Population (millions): 0.6Capital city: ThimphuOfficial language: DzongkhaCurrency: Ngultrum Exchange rate (period average): 1999 Nu43.1=$1GDP in current prices (millions of dollars): ..Exports of goods and services (millions of dollars): 1998 111.0Imports of goods and services (millions of dollars): 1998 136.0Official development assistance (millions of dollars): 1999 53.0External debt (millions of dollars): 1998 119.6
Inward FDI: geographical breakdown, by source(Millions of dollars)
Region/economy Inflows Year Inward stock Year
Japana 2.1 1990 2.3 1998
a Approval/notified data.
FDI inflows, 1985-1999 (Millions of dollars)

FDI in Least Developed Countries at a Glance4 2
Largest cross-border M&A deals, 1987-1999Value
Acquired company Industry Acquiring company Home economy ($ million) Year
Bhutan National Bank Commercial banks,bank holding companies Asian Development Bank Republic of Korea .. 1998
Bhutan National Banka Commercial banks,bank holding companies Citibank NA (Citigroup Inc.) United States .. 1997
a Privatization.
Other relevant information
• Membership of relevant international agreements as of April 2001: Observer Government to the WTO
• Address and website of investment promotion agency: None
• Fortune 500 investors: Citigroup.
• Member of WAIPA as of March 2001: No

Burkina Faso4 3
Burkina Faso
Area (‘000 km2 ): 274.0Population (millions): 2000 12.1Capital city: OuagadougouOfficial language: FrenchCurrency: CFA Franc Exchange rate (period average): 1999 CFAfr615.7=$1GDP in current prices (millions of dollars): 1999 2,643.3Exports of goods and services (millions of dollars): 1998 381.6Imports of goods and services (millions of dollars): 1998 768.9Official development assistance (millions of dollars): 1999 232.0External debt (millions of dollars): 1998 1,399
Inward FDI: geographical breakdown, by source(Millions of dollars)
Region/economy Inflows Year Inward stock Year
Developed economiesBelgium/Luxembourg 0.1 1997 .. ..France 2.0 1999 .. ..Japan .. .. 3.1 a 1998Sweden 0.1 1996 .. ..United States 1.0 1997 2.0 1999
Developing economiesChina .. .. 0.03 b 1995
a Approval/notified data.b Approval data.
FDI inflows, 1985-1999 (Millions of dollars)

FDI in Least Developed Countries at a Glance4 4
Largest cross-border M&A deals, 1987-1999Value
Acquired company Industry Acquiring company Home economy ($ million) Year
Poura Gold Mine Mining Sahelian goldfields Canada .. 1997Poura Gold Mine (Burkina Faso) a Mining International gold resources Canada .. 1996a Privatization.
BITs, 1 January 2000
Economy Date of signature
Germany 23 October 1996Malaysia 23 April 1998Switzerland 6 May 1969Tunisia 7 January 1993
DTTs, 1 January 2000
Economy Date of signature
France 11 August 1965
Largest foreign affiliates, 1999
Sales Year ofCompany Home economy Industry ($ million) Employment establishment
Manufacture Burkinabe De Cigarettes SA France Cigarettes 25.9 150 ..Cica Burkina France Cars and other motor vehicles 21.0 150 1991Scac Delmas Vilejeu France Freight transport arrangers 6.8 350 ..Compagnie Burkinabe Pour La Transformation De Metaux SA India Blast furnace and steel mills 6.0 100 ..Societe Nationale Du Transit Burkina Sarl France Freight transport arrangers 3.8 200 1995Eeri France .. .. .. ..Sdv Burkina Faso France .. .. .. ..Ste Burkinabe Des Gaz Industriels France .. .. .. ..
Other relevant information
• Membership of relevant international agreements as of April 2001: CREFAA, ICSID, MIGA, TRIMs,GATS
• Address and website of investment promotion agency: None
• Fortune 500 investors: Groupe Pinault-Printemps.
• Member of WAIPA as of March 2001: No
FDI inflows as a percentage of gross fixed capital formation, 1985-1999

Burundi4 5
Burundi
Area (‘000 km2): 27.8Population (millions): 2000 7.0Capital city: BujumburaOfficial language: French and KirundiCurrency: Burundi Franc Exchange rate (period average): 2000 Bufr720.7=$1GDP in current prices (millions of dollars): 1999 816.7Exports of goods and services (millions of dollars): 1999 51.2Imports of goods and services (millions of dollars): 1999 129.1Official development assistance (millions of dollars): 1999 52.0External debt (millions of dollars): 2000 1,095
Inward FDI: geographical breakdown, by source(Millions of dollars)
Region/economy Inflows Year Inward stock Year
Developed economiesBelgium/Luxembourg 0.2 1998 .. ..France 0.2 1997 .. ..United States -1.0 1985 1.0 1984
Developing economiesChina .. .. 0.7 a 1995
a Approval data.
FDI inflows, 1985-1999 (Millions of dollars)

FDI in Least Developed Countries at a Glance4 6
FDI inflows as a percentage of gross fixed capital formation, 1985-1999
BITs, 1 January 2000
Economy Date of signature
Belgium/Luxembourg 13 April 1989Germany 10 September 1984United Kingdom 13 September 1990
Largest foreign affiliates, 1999
Sales Year ofCompany Home economy Industry ($ million) Employment establishment
Brasseries Et Limonaderies Du Burundi Sarl Netherlands Bottled and canned soft drinks 46.2 1 350 1997Chanic Burundi S A R L France Farm/garden machinery
and equipment 1.6 51 ..Ami Burundi S A R L Belgium . . .. .. ..
Other relevant information
• Membership of relevant international agreements as of April 2001: ICSID, MIGA, TRIMs, GATS, TRIPS
• Address and website of investment promotion agency: None
• Fortune 500 investors: Suez Lyonnaise des Eaux.
• Member of WAIPA as of March 2001: No

Cambodia4 7
Cambodia
Area (‘000 km2): 181.0Population (millions): 2000 11.2Capital city: Phnom PenhOfficial language: KhmerCurrency: Riel Exchange rate (period average): 1999 CR3,807.8=$1GDP in current prices (millions of dollars): 1999 3,117.0Exports of goods and services (millions of dollars): 1998 815.2Imports of goods and services (millions of dollars): 1998 1,286.2Official development assistance (millions of dollars): 1999 167.1External debt (millions of dollars): 1998 2,210
Inward FDI: geographical breakdown, by source a
(Millions of dollars)
Region/economy Inflows Year Inward stock Year
TOTAL WORLD 759.3 1997 4 534.4 1997Developed economies 140.6 1997 788.8 1997European Union 20.7 1997 292.1 1997
Belgium/Luxembourg .. .. 1 .9 1997France 0 .7 1997 191.5 1997Germany 0 .1 1997 0 .2 1997Netherlands .. .. 13.5 1997Portugal 1 .4 1997 2 .4 1997Sweden 12.0 1997 12.0 1997United Kingdom 6.4 1997 72.5 1997
Other Western Europe .. .. 6 .0 1997Switzerland .. .. 6 .0 1997
North America 97.0 1997 446.7 1997Canada 11.3 1997 53.2 1997United States 85.8 1997 393.5 1997
Other developedeconomies 22.9 1997 44.0 1997
Australia 22.2 1997 31.7 1997Israel 0 .4 1997 0 .4 1997Japan 0 .3 1997 11.9 1997New Zealand .. .. 0.01 1997
Developing economies 618.7 1997 3 745.6 1997
Asia 618.7 1997 3 745.6 1997Cambodiab 166.7 1997 1 028.2 1997China 36.2 1997 105.7 1997Hong Kong, China 72.3 1997 109.3 1997India .. .. 0 .3 1997Indonesia 1 .3 1997 41.1 1997Macau 0 .7 1997 0 .7 1997Malaysia 65.8 1997 1 720.4 1997Republic of Korea 189.0 1997 196.1 1997Singapore 15.1 1997 196.7 1997Sri Lanka .. .. 0 .3 1997Taiwan Province of China 44.4 1997 223.1 1997Thailand 27.3 1997 123.5 1997Viet Nam .. .. 0 .2 1997
Unspecified .. .. 0.03 1997
a Approval data.b Investment by foreign companies in Cambodia.
Inward FDI: industrial breakdown a
(Millions of dollars)
Sector/industry Inflows Year Inward stock Year
TOTAL 759.3 1997 .. ..
Primary 61.4 1997 .. ..
Agriculture, hunting, forestry and fishing 61.4 1997 .. ..Mining, quarrying and petroleum 5.0 1996 .. ..
Secondary 531.5 1997 .. ..Unspecified secondary 3.6 1996 .. ..Food, beverages and tobacco 24.6 1997 .. ..Textiles, clothing and leather 114.4 1997 .. ..
Wood and wood products 47.9 1997 .. ..Coke, petroleum products and nuclear fuel 111.7 1997 .. ..Chemicals and chemical products 1.8 1997 .. ..Rubber and plastic products 3.7 1997 .. ..Non-metallic mineral products 210.0 1997 .. ..Metal and metal products 0.4 1997 .. ..Machinery and equipment 2.2 1997 .. ..Electrical and electronic equipment 9.5 1996 .. ..Precision instruments 0.1 1996 .. ..Other manufacturing 14.7 1997 .. ..
Tertiary 166.5 1997 .. ..Electricity, gas and water 0.5 1996 .. ..Construction 21.9 1997 .. ..Hotels and restaurants 40.1 1997 .. ..Transport, storage and communications 54.5 1997 .. ..Business activities 0.9 1995 .. ..Education 0.3 1996 .. ..Health and social services 0.4 1995 .. ..Community, social and personal service activities 0.9 1996 .. ..Other services 50.0 1997 .. ..
Unspecified -0.1 1996 .. ..
a Approval data.

FDI in Least Developed Countries at a Glance4 8
FDI inflows as a percentage of gross fixed capital formation, 1985-1999
Cross-border M&As, sales and purchases, 1987-1999 (Millions of dollars)
Largest cross-border M&A deals, 1987-1999
ValueAcquired company Industry Acquiring company Home economy ($ million) Year
Regent College (Ariston) Educational services Melewar Academia Holdings Malaysia 0.5 1997Shanghai Mainland Construction Construction firms Low Keng Huat International Malaysia 0.2 1996Asbina Hotel and Property Real estate; mortgage
bankers and brokers Alangka-Suka International Ltd. Malaysia .. 1997Low Keng Huat (Cambodia) Construction firms Low Keng Huat Construction Co. Malaysia .. 1996Premier Oil Pacific Ltd. Oil and gas; petroleum refining Idemitsu Oil and Gas Ltd. Japan .. 1994Royal Air Cambodia Air transportation and shipping Singapore Airlines Ltd. Singapore .. 1993
BITs, 1 January 2000
Economy Date of signature
China 19 July 1996Germany 15 February 1999Indonesia 16 March 1999Republic of Korea 10 February 1997Malaysia 17 August 1994Singapore 4 November 96Switzerland 12 October 1996Thailand 29 March 1995
Largest foreign affiliates, 1999
Sales Year ofCompany Home economy Industry ($ million) Employment establishment
Èastern Steel Industry Corp. Japan Motor vehicles parts .. 161 1994T.TH.K. Co., Ltd. Japan Motor vehicles .. 38 1995
Other relevant information
• Membership of relevant international agreements as of April 2001: CREFAA, ICSID, MIGA,Observer member to WTO
• Address and website of investment promotion agency: Cambodian Investment Board - Council for the Developmentof Cambodia; Sisowath Quay, Wat Phnom - Pnom Penh; Tel: (855) 23 981 163/ 981 156; Fax: (855) 23 428 426/ 428 953-4
• Fortune 500 investors: Sumitomo, Toyota Tsusho.
• Member of WAIPA as of March 2001: No
FDI inflows, 1985-1999 (Millions of dollars)

Cape Verde4 9
Area (‘000 km2): 4.0Population (millions): 2000 0.4Capital city: PraiaOfficial language: PortugueseCurrency: Cape Verde escudo Exchange rate (period average): 1999 CVEsc102.7=$1GDP in current prices (millions of dollars): 1999 580.6Exports of goods and services (millions of dollars): 1998 119.1Imports of goods and services (millions of dollars): 1998 308.9Official development assistance (millions of dollars): 1999 88.7External debt (millions of dollars): 1998 243.7
TOTAL 27.9 1995 .. ..
Secondary 4.6 1995 .. ..Food, beverages and tobacco 1.5 1995 .. ..Textiles, clothing and leather 2.0 1995 .. ..
Non-metallic mineral products 0.3 1995 .. ..Machinery & equipment 0.5 1995 .. ..Motor vehicles and other transport equipment 1.5 1994 .. ..Other manufacturing 0.2 1995 .. ..
Tertiary 23.3 1995 .. ..Construction 0.1 1995 .. ..Trade 2.2 1994 .. ..Transport, storage and communications 23.1 1995 .. ..Other services 0.1 1995 .. ..
Cape Verde
Inward FDI: geographical breakdown, by source(Millions of dollars)
Region/economy Inflows Year Inward stock Year
TOTAL WORLD 27.9 1995 52.3 1995Developed economies 26.3 1995 49.9 1995
Belgium 26.3 1995 49.9 1995Belgium/Luxembourg 1.6 1995 1.6 1995Denmark .. .. 1.6 1995Germany .. .. 0.001 1995Italy 0.5 1995 0.5 1995Portugal 24.2 1995 33.2 1995United Kingdom .. .. 12.9 1995
Developing economies 1.6 1995 2.4 1995
Africa .. .. 0.8 1995Senegal .. .. 0.8 1995
Asia 0.002 1995 1.5 1995Hong Kong, China 0.002 1995 1.5 1995
Central and Eastern Europe .. .. 0.003 1995
Russian Federation .. .. 0.003 1995
Inward FDI: industrial breakdown (Millions of dollars)
Sector/industry Inflows Year Inward stock Year
FDI inflows, 1985-1999 (Millions of dollars)

FDI in Least Developed Countries at a Glance5 0
FDI inflows as a percentage of gross fixed capital formation, 1985-1999
Cross-border M&As, sales and purchases, 1987-1999 (Millions of dollars)
Largest cross-border M&A deals, 1987-1999Value
Acquired company Industry Acquiring company Home economy ($ million) Year
Electra Eletric, gas and water distribution Investor Group Portugal 83.3 1999
BITs, 1 January 2000
Economy Date of signature
Angola 30 September 1997Austria 3 September 1991China 27 April 1998Cuba 22 May 1997Germany 18 January 1990Italy 12 June 1990Netherlands 11 November 1991Portugal 26 October 1990Switzerland 28 October 1991
Other relevant information
• Membership of relevant international agreements as of April 2001: MIGA, Observer member to WTO
• Address and website of investment promotion agency: Center for Investment, Expert and Tourism Promotion(PROMEX); Avenida OUA, Achada St Antonio Praia Santiago - Cape VerdeTel: (238) 62 2736/2621 Fax: (238) 62 2737/2689
• Fortune 500 investors: None
• Member of WAIPA as of March 2001: Yes
DTTs, 1 January 2000
Economy Date of signature
Portugal 22 March 1999

Central African Republic5 1
Area (‘000 km2): 623.0Population (millions): 2000 3.6Capital city: BanguiOfficial language: French and SangoCurrency: CFA franc Exchange rate (period average): 1999 CFAfr615.7=$1GDP in current prices (millions of dollars): 1999 1,052.8Exports of goods and services (millions of dollars): 1996 200.8Imports of goods and services (millions of dollars): 1996 230.6Official development assistance (millions of dollars): 1999 59.1External debt (millions of dollars): 1998 921.3
Central African Republic
Inward FDI: geographical breakdown, by source(Millions of dollars)
Region/economy Inflows Year Inward stock Year
Developed economiesBelgium/Luxembourg 1.1 1998 .. ..France 3.0 1999 .. ..United States -2.0 1986 2.0 1985
Developing economiesChina .. .. 1.8 a 1995India .. .. 10.3 1992
a Approval data.
FDI inflows, 1985-1999 (Millions of dollars)
FDI inflows as a percentage of gross fixed capital formation, 1985-1999

FDI in Least Developed Countries at a Glance5 2
Cross-border M&As, sales and purchases, 1987-1999 (Millions of dollars)
Largest cross-border M&A deals, 1987-1999Value
Acquired company Industry Acquiring company Home economy ($ million) Year
Banque Internationale Commercial banks, bank Banque Belgolaise holding companies (Generale Bk) Belgium 1.0 1999
BITs, 1 January 2000
Economy Date of signature
France 13 August 1960Germany 23 August 1965Switzerland 28 February 1973
DTTs, 1 January 2000
Economy Date of signature
France 13 December 1969
Largest foreign affiliates, 1999
Sales Year ofCompany Home economy Industry ($ million) Employment establishment
Societe Centrafricaine Des Gaz Industriels SA France Industrial gases 2.1 27 ..Societe Centrafricaine De Cigarettes SA France Cigarettes .. 115 ..C F A O Centrafrique SA France Nondurable goods nec .. .. ..Sodeca France .. .. .. ..
Other relevant information
• Membership of relevant international agreements as of April 2001: CREFAA, ICSID, MIGA, TRIMs,GATS, TRIPS
• Address and website of investment promotion agency: Banque Centrafricaine d'Investissement (BCI)B.P. 93 Bangui - République Centrafricaine; Tel: (236) 61 0064
• Fortune 500 investors: Bouygues, Fortis, Groupe Pinault-Printemps.
• Member of WAIPA as of March 2001: No