
Country-specific equity market characteristics and foreign equity
40
1 Country-specific equity market characteristics and foreign equity portfolio allocation Chandra Thapa a,* and Sunil S. Poshakwale b Updated version: 15 May 2011 *Corresponding Author a,* Accounting and Finance Division, Stirling School of Management, Scotland, FK9 4LA, Tel: +44 (0) 1786 467341, Fax: +44 (0) 1786 467308, Email:[email protected] b Centre for Research in Economic and Finance, Cranfield School of Management, England, MK43 0AL, Tel: +44 (0) 1234 754404, Fax: +44 (0) 1234 752554, Email:[email protected]
Transcript of Country-specific equity market characteristics and foreign equity
1
Country-specific equity market characteristics and foreign equity portfolio
allocation
Chandra Thapaa,*
and Sunil S. Poshakwaleb
Updated version: 15 May 2011
*Corresponding Author
a,* Accounting and Finance Division, Stirling School of Management, Scotland, FK9 4LA, Tel: +44 (0)
1786 467341, Fax: +44 (0) 1786 467308, Email:[email protected]
b Centre for Research in Economic and Finance, Cranfield School of Management, England, MK43 0AL,
Tel: +44 (0) 1234 754404, Fax: +44 (0) 1234 752554, Email:[email protected]

2
Country-specific equity market characteristics and foreign equity portfolio
allocation
Abstract
Do country-specific equity market characteristics explain variations in foreign equity
portfolio allocation? We study this question using comprehensive foreign equity portfolio
holdings data and different measures of country-specific equity market factors for 36 host
countries. Employing panel and cross-sectional econometric estimations, our investigation
shows that foreign investors prefer to invest more in larger and highly visible developed
markets, which are more liquid, exhibit a higher degree of market efficiency and have lower
trading costs. The findings imply that by improving the preconditions necessary for well-
functioning capital markets, policymakers should be able to attract higher levels of foreign
equity portfolio investments.
JEL classification: G11, G14, G15, F3
Key words: Foreign equity portfolio allocations; stock market development; panel data
models

3
1. Introduction
The global financial crisis and its consequences continue to preoccupy policymakers. Capital
markets around the world have been volatile, and governments are facing the difficult task of
financing the investment needs of their local economy. There is a vast body of literature on
the positive role of finance on economic development (Goldsmith, 1969; McKinnon, 1973;
Fry, 1988; Levine, 1992). Among the different forms of finance, equity financing is an
important source, and the role of foreign investors in funding the requirements of domestic
economies has never been more vital. Errunza (2001) suggests that foreign equity portfolio
investors have a significant positive impact on the development of local equity markets,
which in turn should drive domestic economic development. Given the importance of foreign
equity portfolio investment, it is imperative for policymakers to appreciate factors influencing
the country allocation decision of foreign investors. This paper investigates whether the
investment decisions of foreign investors are affected by the host country-specific equity
market characteristics.
The benefits of international diversification of portfolio investment are well established (see
Grubel, 1968; Levy and Sarnat, 1970; Solnik, 1974a; Errunza, 1977, among others). The
International Capital Asset Pricing (ICAPM) model suggests that international investors
should hold the world market as the benchmark portfolio because it provides the best mean
variance efficiency (Tesar and Werner, 1995; Solnik and McLeavy, 2004; Chan et al., 2005;
Fidora et al., 2007). Studies also document the gradual removal of capital controls by
developed countries beginning in the early 1980s (French and Poterba, 1991), and by
developing countries by the late 1980s and early 1990s (Errunza, 2001; Harvey, 2003).
However, despite increased access to financial markets across the globe, an extensive number
of investigations demonstrate the prevalence of home bias, i.e., the tendency to overweight
home markets relative to the theoretical prescription of the ICAPM (see Cooper and
Kaplanis, 1994; Tesar and Werner, 1995; Warnock, 2001; Chan et al., 2005; Fidora et al.,
2007).
The investigations on home bias document a number of potential barriers impeding foreign
investors from holding the world market portfolio. These barriers may be direct legal
restrictions due to different legal status accorded to foreign and domestic investors (Bekaert,
1995) or indirect barriers arising from differences in available information and investor
4
protection (Bekaert and Harvey, 1995; Errunza, 2001; Bekaert et al., 2003; Hunter, 2006).
Similarly, market-specific risks, such as diversification opportunities, liquidity, transaction
costs and level of host market efficiency, commonly known as stock market development
factors, could also potentially impede foreign investment (Chan et al., 2005). However,
empirical studies documenting the role of country-specific equity market factors on country
allocation decisions are limited. The persistence of home bias indicates that, on aggregate,
foreign investors allocate a relatively large fraction of their wealth to domestic assets. This
suggests that if we are able to control for home bias, we should be able to explain the role of
different country-specific equity market characteristics in explaining bilateral cross-country
foreign equity country allocation.
Chan et al. (2005) note that a major factor limiting research on foreign equity portfolio
investment is the lack of cross-border holdings data. We make use of the recently available
IMF’s Co-ordinated Portfolio Investment Survey (CPIS) foreign equity portfolio holding
data. Similarly, as Chan et al. (2005) state, most existing studies are from the perspective of
U.S. investors, and they leave the question open of whether the explanations for a wide cross-
section of other source countries are similar or not. Furthermore, a very small number of
existing studies, which use multiple source and host countries in their sample, only
investigate the investments from developed into other developed countries. Since the U.S.
and other developed countries’ equity markets exhibit higher levels of development relative
to emerging markets, it remains to be tested whether the inclusion of the latter markets as
host countries along with developed markets yields similar results.
Our study makes three important contributions to the literature. First, we try to explain the
role of country-specific equity market characteristics in explaining the cross-sectional and
temporal variation of foreign equity country allocation. Apart from Gelos and Wei (2005),
who include emerging markets only, and Chan et al. (2005), who explain foreign bias, no
study has undertaken comprehensive empirical investigation modeling cross-country
allocations. Second, as noted earlier, despite the theoretical suggestions of ICAPM, global
investors do not hold the world market as their benchmark portfolio. The ICAPM makes a
number of assumptions, such as that global financial markets are perfectly integrated and
fully efficient, investors incur no transaction costs, purchasing power parity perfectly holds
and there are no barriers to international investments. Most earlier studies on international
investments offer abstract theoretical explanations of why foreign investors may not hold the

5
world market portfolio (see Solnik, 1974b; Black, 1974; Sercu, 1980; Stulz, 1981a,b; Adler
and Dumas, 1983; Errunza and Losq, 1985; Eun and Janakiramanan, 1986; Cooper and
Kaplanis, 1986, 1994). The majority of the equilibrium frameworks suggest that the violation
of unrealistic ICAPM assumptions, which create costs/risks for global investors, should
explain the under- or over-weighting of foreign countries relative to ICAPM. However,
empirical evidence modeling the violations of the underlying assumptions are scarce and
limited by the unavailability of high quality data. We fill the gap by using different proxies of
the underlying assumptions to model cross-country allocation.
Finally, we pool bilateral data from 36 countries, developed and developing, spanning a
period of six years (2001-2006), with more than 562 cross-section units yielding
approximately 3,000 observations. Such a comprehensive dataset with wide cross-sectional
and temporal variation affords us the statistical confidence for testing our hypotheses using
panel and cross-section econometric estimations. Baltagi (1995) demonstrates that, compared
to purely cross-section, panel data set-up supplies more information, more variability, less co-
linearity, greater degrees of freedom and higher statistical efficiency, yielding reliable
parameter estimates. Furthermore, the application of fixed effect model controls for
individual heterogeneity; studies not controlling for unit-specific effects run the risk of
producing biased estimates.
The findings show that country-specific equity market factors, particularly market size,
liquidity, level of market efficiency and transaction costs, are the key factors influencing the
country allocation decisions of foreign equity portfolio investors. We demonstrate that
country-specific equity market characteristics, predominantly stock market development
factors, explain almost 47% of the total variation in foreign equity portfolio allocations. One
of the key implications of our study is that by improving the preconditions necessary for a
well-functioning capital market, policymakers should be able to attract higher levels of
foreign equity portfolio investments.
The rest of the paper is organized as follows. Section 2 briefly explains the the theoretical
framework underlying our empirical analysis and provides a detailed discussion of the
variables used. Section 3 reports and discusses empirical results and section 4 concludes the
paper.
6
2. Data
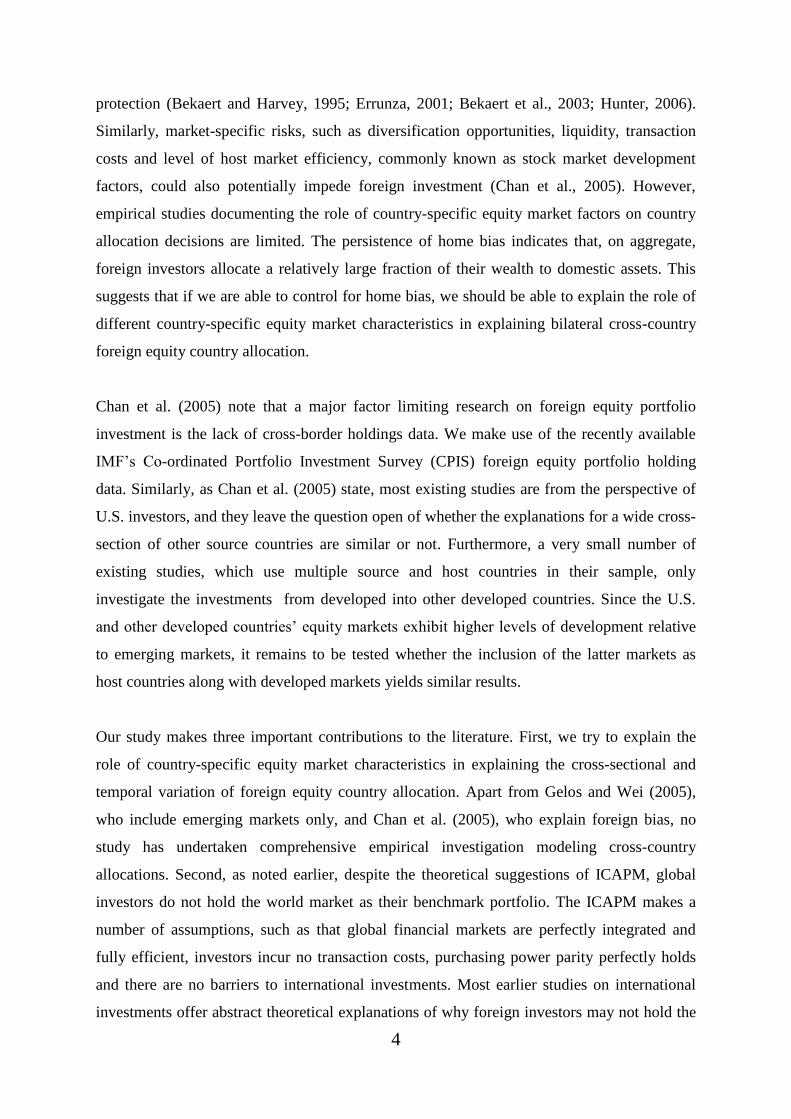
We follow the theoretical framework developed by Cooper and Kaplanis (1986). They model
portfolio allocation as follows:
where xi is a column vector of weights containing foreign portfolio weightings, the nth
element (xin) corresponds to the weight of individual i’s total wealth invested in risky assets
of country n. ci is the column vector of deadweight cost of investor i arising from different
barriers to international investments. The nth element of ci is cin, which is the deadweight cost
for holding the asset in country n. Wi is the proportion of world wealth owned by country i, M
is a column with the corresponding ith element of whichis Mi and Mi is the proportion of the
world market capitalization in country i’s market. Clearly, if there are not costs (c) all
investors should hold Mn. However, with presence of deadweight costs, the above
relationship shows that the greater the deadweight cost is (c), the lower the allocation from
investors of country i into country n will be. In the following sections we first describe the
proxy of foreign equity portfolio allocations (i.e. xi), followed by the direct and indirect
investment barriers that may potentially influence the country allocation decision of foreign
investors (i.e. cin).
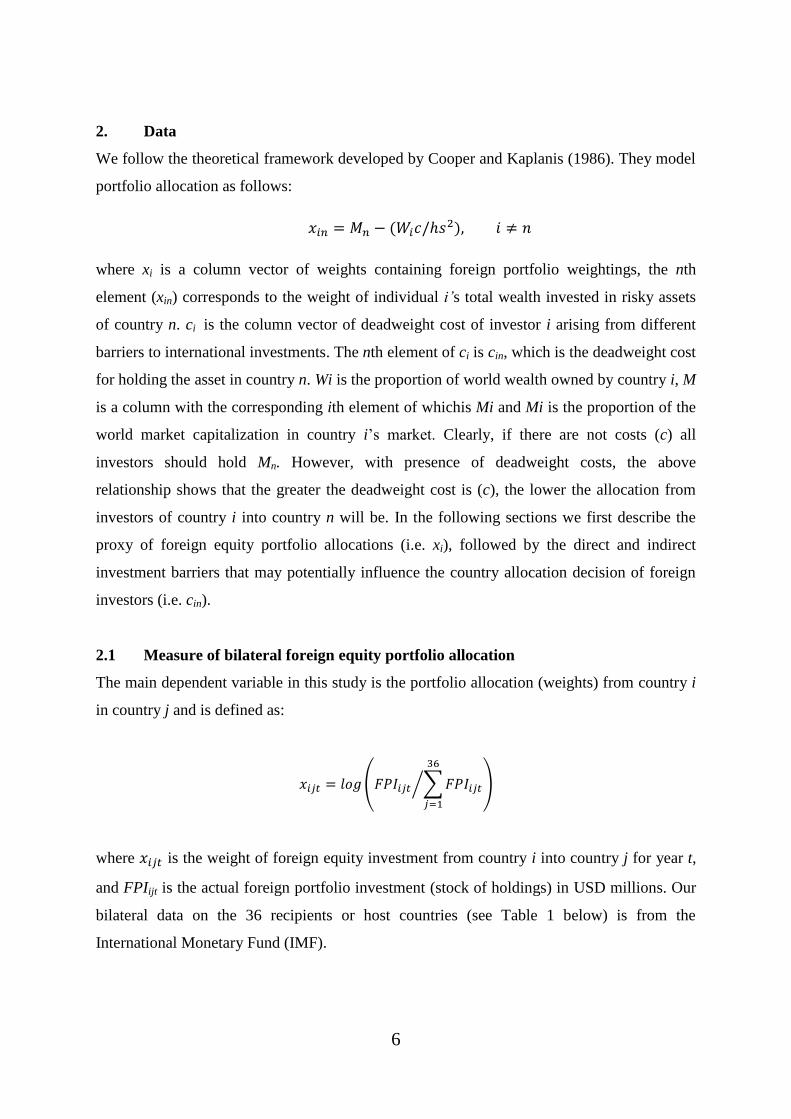
2.1 Measure of bilateral foreign equity portfolio allocation
The main dependent variable in this study is the portfolio allocation (weights) from country i
in country j and is defined as:
( ∑
⁄ )
where is the weight of foreign equity investment from country i into country j for year t,
and FPIijt is the actual foreign portfolio investment (stock of holdings) in USD millions. Our
bilateral data on the 36 recipients or host countries (see Table 1 below) is from the
International Monetary Fund (IMF).
7
The Co-ordinated Portfolio Investment Survey (CPIS) of the IMF provides detailed and
bilateral country-by-country foreign equity portfolio holding data. Most of the investments in
the survey are from developed countries to other developed markets. The stock holding of
developing countries is negligible. For this reason, we consider only developed countries as
source countries.1 The number of investor or source countries is 16 (Australia, Austria,
Belgium, Canada, Denmark, France, Germany, Ireland, Italy, Japan, the Netherlands,
Norway, Sweden, Switzerland, the United Kingdom and the United States). Following other
studies (see Chan et al., 2005 and Fidora et al., 2007); we too exclude offshore financial
centers, such as Luxembourg, which are considered tax havens.
Table 1 presents the sample averages of foreign portfolio equity allocation received by all the
host countries j for the six-year period 2001-2006. As seen from the second column, Peru
received the lowest allocation (0.02%), whereas investors’ most favoured destination is the
United States, with the highest allocation of 37.76. The top ten countries in terms of
allocation are all developed markets (the United States, the United Kingdom, Switzerland,
Sweden, Japan, Italy, Germany, France, Finland and Canada), whereas nine of the bottom ten
are developing countries (Argentina, Chile, the Czech Republic, Malaysia, Peru, the
Philippines, Thailand, Poland and Turkey).
………......Insert Table 1 about here..............
2.2 Country-specific equity market proxies
As our investigation underscores the importance of country-specific equity market
characteristics, we first describe proxies of country-specific equity market factors followed
by the control variables. We use six different variables to capture key equity market features2.
The first variable (Stock market size) encapsulates the relative breadth (size) of the equity
market, reflecting the significance of the capital market in the economy. Levine and Zervos
1 In terms of coverage of the survey, most of the financial market participants included in the survey are, but are
not limited to, the primary end-investors (e.g. banks, security dealers, pension funds, insurance companies,
mutual funds, non-financial corporations, households) and primary custodians who hold or manage securities on
behalf of others. However, some caveats deserve due attention in using the data. Any investment below USD
500,000 is not reported. In addition, some data, despite being available, may not be reported by a country due to
confidentiality reasons.
2 We also consider number of listed companies scaled by total population and trade volume scaled by GDP as
alternative measures. However, because these measures are highly correlated with stock market development
and turnover ratio, we do not include them since they do not add any additional information. However, when
regressed individually both these measures are highly significant in all our regressions.

8
(1996) claim that developed markets, which are bigger in size, are better at mobilizing capital
and diversifying risk. Bekaert and Harvey (2000) and Chan et al. (2005) suggest that foreign
investors tend to allocate more wealth to bigger and developed markets. Similarly, Chan et al.
(2005) conjecture that bigger stock markets are more visible, more recognized and more
developed, and therefore are able to attract more foreign equity portfolio investment.
Following Levine and Zervos (1996) and Chan et al. (2005), we add the logarithmic ratio of
stock market capitalization to GDP as a measure of stock market size. This variable is
sourced from the World Development Indicator (WDI) of the World Bank. Table 1 (column
3) shows that the top ten countries ranking against this measure are all developed markets,
with the exception of Chile and Malaysia. Similarly, the bottom ten countries generally
represent emerging markets, with the exception of Austria, New Zealand and Portugal. The
regression coefficient on this variable should carry a positive sign.
The next two variables we use are the proxies that capture relative development of the market
microstructure. In a relatively more developed market, transaction costs would be lower.
Solnik and McLeavey (2004) argue that the effect of transaction costs is often neglected in
international portfolio management. They claim that the impact of transaction costs should be
integrated in active global portfolio management, as these vary significantly amongst
different countries. Higher transaction costs may reduce the expected return and diminish the
benefits of global diversification and therefore the effect of transaction cost should be a key
consideration, particularly when investing in emerging markets. Keim and Madhavan (1995),
who highlight the importance of transaction costs in determining investment performance,
also suggest that transaction costs may materially lower the expected value of an investment
strategy, which otherwise may appear lucrative. Similarly, Rowland (1999) shows the
inverse relationship between higher transaction costs and benefits of international portfolio
diversification. Furthermore, De Roon et al. (2001) demonstrate that for US investors
investing in emerging markets, the diversification benefits become smaller when short selling
and transaction costs constraints are incorporated. Similarly, studies investigating the
association between transaction costs and asset pricing generally conjecture that equities with
higher transaction costs trade at lower prices compared to their expected cash flows (see
Amihud and Mendelson, 1986; Brennan and Subrahmanyam, 1996; Datar et al., 1998).
The available empirical findings imply that despite the inherent diversification benefit,
foreign investors may prefer to underweight countries that have higher transaction costs. We

9
use a composite estimate of country level transaction cost associated with trading
international securities. The transaction costs variable is estimated and maintained by Elkins-
Sherry (E/S) and documented in the yearly Global Stock Market Factbook of Standard and
Poor (S&P). E/S provides transaction cost analysis for global institutional investors, such as
pension funds, investment managers and other investment companies. The estimates of total
trading cost comprise three sub-components. The first is the average commission; the second
is the average fee. It is worth noting that for the UK, the buying fee is significantly higher
because of stamp duty. We have taken the average of the buy and sell figures, as investors
pay more for buying but are compensated significantly less for selling. The third component
is the average cost of market impact. Market impact is the difference between the price at
which a trade is executed and the average of the stock’s high, low, opening and closing prices
during the trading period. More specifically, it is the average cost of trade versus the average
price. Solnik and McLeavy (2004) define market impact as the difference between the actual
execution cost and the price that would have prevailed in a case of no-trade by the manager.
We aggregate all three components of transaction cost to form a composite measure
denominated in basis points. As presented in Table 1 (column 4) the ten markets with the
highest transaction costs are all emerging markets, with the exception of Greece. The
Philippines has the highest transaction cost, with almost 1% per average transaction.
Similarly, the ten countries with the lowest transaction costs are all developed markets, with
Japan having the lowest average cost of 20 bps, followed by the U.S., with 25 bps. In our
regression, we expect this variable to bear a negative sign, since higher transaction costs
would be associated with lower equity portfolio allocations.
Following Bekeart and Harvey (2000), the other microstructure variable we use captures the
liquidity of the market. As noted earlier, studies show assets with lower liquidity trade at a
lower price relative to their expected cash flows (Amihud and Mendelson, 1986; Brennan and
Subrahmanyam, 1996; Datar et al., 1998). This suggests that illiquid assets demand an extra
risk premium and therefore should have higher expected returns, which further implies that
foreign investors should underweight countries with illiquid markets. Bekeart et al. (2007)
claim that the effect of liquidity is more pronounced in emerging markets, where it takes
considerable time to execute transactions. Following Levine and Zervos (1996), we use the
turnover ratio (Market liquidity) as proxy of market liquidity. Bekaert and Hodrick (2008)
further suggest that although turnover ratio is often regarded as an indicator of liquidity, it
can also reflect the arrival of news that instigates trades. Damodaran (2010) remarks that one
10
of the minimum requirements for a market to be efficient, with prices therefore the best
estimates of true values, is that trading should be inexpensive, instantaneous and easy. This
conjecture implies that liquidity measures may also reflect the degree of market efficiency.
Furthermore, turnover also complements the stock market development/size measure, given
the argument that a large market may not be the most active market. For example, the value
of stocks traded in Canada for the year 2006 is USD 1,290,246 million (market capitalization
of USD 1,700,708 million) with a turnover ratio of 81%. For the same year, value traded in
Sweden is almost half of that in Canada, i.e. USD 677,122 million (market capitalization of
USD 573,250 million), but the turnover ratio is 139%. We incorporate the average value
traded as a percentage of mean market capitalization sourced from different issues of Global
Stock Market Factbook of S&P. As seen from Table 1 (column 5), the majority of the
countries with the highest turnover ratio are developed markets, with the exception of India,
Taiwan and Korea. The regression coefficient is expected to take on a positive sign.
We further add two variables to reflect potential market volatility. The first variable we
include is the three-year moving standard deviation (Local equity market volatility) of stock
market returns, constructed using the previous 36 months’ total return index denominated in
local currency. We obtain the monthly total return index from Morgan Stanley Capital
Investment (MSCI). Following the conceptual framework of Cooper and Kaplanis (1986),
variance negatively affects returns, suggesting foreign investors may avoid countries with a
certain level of volatility. As shown in column 6 of Table 1, except for Belgium most of the
ten countries with the highest stock market volatility are emerging markets, indicating greater
future uncertainty (risk) relative to developed markets. As such, investors may shy away or
underweight markets with higher stock market volatility. The regression coefficient of this
variable should carry a negative sign.
Solnik and McLeavy (2004) remark that currency risk premium must be earned by foreign
investors for taking systematic risk which cannot be diversified away. They claim that despite
diversification, the world market portfolio is sensitive to foreign exchange risk; therefore, the
latter needs to be taken into consideration in international portfolio management. Such
arguments conjecture that exchange rate movements should also affect investors’ decisions
(see Solnik and McLeavey, 2004). Following the risk-return relationship argument of the
ICAPM, investors should underweight countries with higher movements in real exchange

11
rate. This may be particularly important when investing in emerging markets, which
experience wide swings in foreign exchange rates. As the second measure of earnings
volatility relevant to foreign investors, we use the three-year moving average standard
deviation (Exchange rate volatility) based on monthly figures of trade weighted real effective
exchange rate (REER) variable obtained from the Bank of International Settlement (BIS).
The trade weighted effective exchange rate is a better indicator of the macroeconomic effects
of exchange rates than purely a single bilateral rate (see Mark and Fung, 2006). The REER
used in this study is the nominal effective exchange rate (NEER) adjusted by relative
consumer prices levels. The NEER is calculated as the geometric weighted average of a
basket of bilateral exchange rates, which implies that variation in the REER incorporates both
developments in nominal exchange rate and the inflation differential vis-à-vis trading
partners. Carrieri et al. (2006) note that the use of REER should be preferred to NEER
because inflation rates are generally non-random and hence nominal exchange rate may not
reflect the true effect of exchange rate risk. They note that because REER is measured taking
account of the combined effect of changes in the inflation differential and changes in nominal
currency value, it is a better proxy as it captures the true effect of exchange rate risk arising
from the deviation of PPP. The BIS REER basket used in this study incorporates 52
economies, including emerging markets. For further details, please refer to Mark and Fung
(2006) and Carrieri et al. (2006). The summary average for all countries over the six-year
period is reported in Table 1 (column 7). The ten markets with the highest real exchange rate
volatility are generally found in emerging countries, with the exception of Australia and New
Zealand. Turkey reveals the highest exchange rate volatility. On the other hand, eight of the
top ten countries with the lowest exchange rate volatility are developed markets. In our
sample, Austria exhibits the lowest real exchange rate volatility, with 1.9% moving average
standard deviation. We expect this variable to yield negative regression coefficient.
Finally, we add a dummy (EM dummy) taking the value of one for emerging markets and
zero otherwise, following S&P/IFC for the classification of emerging markets. Existing
literature suggests that compared to developed markets, emerging capital markets are smaller
in size (Chan et al., 2005). Similarly, relative to developed markets, emerging markets are
less efficient (Harvey, 1995a, b; Fama and French, 1998). Harvey (1995a, b) notes that
returns in emerging markets are more predictable than in developed markets. Harvey (1995b)
and Kawakatsu and Moorey (1999) provide empirical evidence on the lower degree of
efficiency level for the emerging markets and attribute it to factors such as infrequent trading
12
and slow adjustment to information released in the market. Similarly, Fama and French
(1998) and Rouwenhorst (1999) show that market characteristics in emerging markets can be
exploited to generate excess return over a given benchmark. The empirical evidence on the
level of stock market development in emerging markets and their level of efficiency suggests
that the emerging market dummy should be negatively associated with portfolio allocation.
The significance of the dummy should provide strong indication that foreign investors should
prefer well-developed markets in terms of market breadth, depth (liquidity) and informational
efficiency.
2.2 Control variables
The first issue to control is the widely studied home bias phenomenon. It is evident from the
literature (see French and Poterba 1991; Tesar and Werner, 1995; Warnock, 2001; Karlsson
and Norden, 2007; Chan et al., 2005; Fidora, et al., 2007) that investors tend to significantly
overweight their home market and therefore actual portfolios deviate from the theoretically
derived world market portfolio. Chan et al. (2005) note that if foreign investors overweight
their local market, then the rest of their allocation should also be disproportionately lower.
Consequently, home bias could be an important explanatory variable for explaining foreign
allocation. As investors deviate from holding the world market portfolio, following Fidora et
al. (2007) we construct the following bilateral home bias (Hbiasijt) to control for the impact of
home bias on foreign equity allocation:
where Hbiasijt is bilateral home bias observed by investor country i for country j at time t.
BWTijt is defined as the benchmark weight and is computed as:
(∑ )
where MCjt is the market capitalization of the recipient or host country j at time t.
As seen from column 2 of Table 2 below, all investor countries exhibit significant home bias.
Among the top ten countries ranking highest on the scale of Home bias, six are developing
countries (Argentina, Chile, China, India, Peru and Taiwan) and four are developed countries
13
(Australia, Canada, New Zealand and Greece). This shows that investors manifest home bias
not only towards developing countries but also towards developed countries, suggesting a
strong rationale for controlling the impact of the domestic bias on foreign portfolio allocation.
Following the evidence on home bias, this variable should yield negative regression
coefficient.
………......Insert Table 2 about here..............
We include the logarithmic value of the GDP per capita income and GDP growth figure for
each country to control for the level of economic development and economic growth. Both
these variables are obtained from the World Development Indicator. We also control for any
capital control measure that a country might have imposed on inward foreign portfolio
investment. As a proxy for the degree of financial liberalization we use the capital control
intensity measure (Equity market openness) suggested by Edison and Warnok (2003). The
latter measure is constructed by taking the ratio of market capitalization represented by
S&P/IFC investable indices (correcting for foreign ownership) to the market capitalization
denominated by S&P/IFC global indices. This variable ranges from zero to one, with one
implying total domestic market capitalization freely open to foreign investors, and zero
implying a completed closed market. Since these indices are mostly available for developing
countries in the S&P’s Global Stock Market Factbook, they have been set to one for all
developed countries. For more details see Edison and Warnok (2003) and various issues of
S&P Global Stock Market Factbooks. The Equity market openness variable is a time varying
proxy and therefore captures the time variation in the financial liberalization process (see De
Jong et al., 2005). The regression coefficient on this variable is expected to carry a positive
sign. Our equity market openness measure is based on the assumption that all the developed
markets’ stocks are fully free floated, which may not be the case. Dahlquist et al. (2003) note
that only a small portion of the market capitalization in most countries is available to
international investors who are not controlling shareholders. They compute the percentage of
firms closely held for many countries. We employ the variable (Closely held firms) of
Dahlquist et al. (2003) as the percentage of closely held shares of market capitalization to
complement the Equity market openness measure. As Dahlquist et al. (2003) imply, the
Closely held firms variable is expected to capture the prevalence of ownership restrictions,
particularly in countries with poor investor protection rights, and is expected to have negative
regression coefficient.

14
We also control for the bilateral familiarity or information asymmetry variables. It is highly
likely that bilateral investments may be influenced by long-term bilateral relationship,
geographic proximity and market familiarity. We employ a language dummy (Common
language dummy), which takes the value of one if a pair of countries shares a common
language. Countries like the United States, the United Kingdom, Australia, New Zealand and
India share a common language (i.e. English). Similarly, we also include the distance (Log
distance) between the capital cities of the pair countries. On average, European countries are
closer to each other, with Australia and New Zealand being the furthest. Both variables are
obtained from www.nber.org/~wei/data.html and used by Subramanian and Wei (2007).
Further, Chan et al. (2005) suggest that investors are more confident in holding stocks of
foreign companies whose goods and services are well known to them. Hence, we include the
bilateral trade (Log bilateral trade) obtained from the Bilateral Trade Statistics database of
the IMF. It is constructed by adding the logarithmic value of the paired country’s total export
and import values. Countries such as the United States, the United Kingdom and Germany
share the highest average bilateral trade. Most of the emerging countries score lower on this
measure. All the bilateral familiarity measures used in our study predict the probability of
bilateral information flow and measure the barriers that foreign investors may encounter
when seeking inforamtion overseas. It is worth noting that the three bilateral familiarity
variables and Equity market openness measure are orthogonalized with the home bias
measure, as a number of studies show that the latter factors explain home bias to a significant
extent (see Chan et al., 2005; Fidora et al., 2007).3 This does not affect the competitiveness of
the Home bias variable, three bilateral familiarity variables and the Equity market openness
measure with any of our key variables of interest.
We also add a three-year moving average return (Historical return) to capture the prevalence
of return chasing or feedback behavior (see Bohn and Tesar, 1996; Froot et al., 2001;
Richards, 2005; Bekaert et al., 2002; Dahlquist and Robertson, 2004; Griffin et al., 2004).
Following the return chasing hypothesis, we expect the regression coefficient on this variable
to bear a positive sign.
3 In fact, a simple regression of the three bilateral familiarity variables and Equity market openness measure
explain almost 17% of the variation in home bias, and all four independent variables are statistically significant.
Due to space constraints we do not report the results but they can be obtained from the authors on request.

15
Aggarwal et al. (2005) demonstrate that U.S. funds tend to invest in open markets exhibiting
stronger shareholder rights and legal frameworks. However, in sharp contrast, Chan et al.
(2005) claim that investor protection does not influence the decisions of foreign investors.
We add a composite measure of investor protection sourced from the World Bank
Governance Indicator. This variable is composed of two broader aspects of regulatory
environment. The first is the regulatory quality based on a scale of 1-100, capturing the
perceptions of local government’s ability to formulate and implement sound policies effective
for private sector development. The second, which is also measured on a scale of 0-100, is
the rule of law. The latter captures the perception of the extent to which agents show
confidence in and follow the rules of society, especially the quality of contract enforcement,
property rights, the police and the courts. Both these variables are aggregated and scaled by
0.5 to yield a rating of 0-100. A higher rating denotes greater investor protection rights and
therefore greater propensity of foreign investment. The regression coefficient on this variable
should carry a positive sign, following the claim in existing literature that investors prefer
countries having better investor protection measures in place. Following La Porta (1998), it is
shown that the English common law system provides better legal protection rights to
shareholders than the German and French civil law system. We generate a dummy (English
common law dummy) which takes the value of one for common law countries and zero
otherwise.
The summary statistics of all control variables are shown in Table 2. As expected, all the
variables show that emerging markets have lower economic development, although higher
economic growth. Developed markets score higher on the investor protection measure and,
following the financial liberalization measures, developed markets are more open and firms’
ownerships are less closely held relative to emerging markets.
3. Result of regression analysis
Do foreign investors allocate a greater share of their wealth to relatively more developed
equity markets? Our univariate analysis, as shown in Table 1 and discussed earlier, does
indicate so. To further substantiate our initial findings we run a number of regressions
addressing several robustness issues. In contrast to the preferred fixed effect model, the use of
the random effect estimations for the majority of our regressions is dictated by the inclusion
of time invariant factors such as the English common law dummy, Emerging market dummy,

16
Common language and Distance. We first discuss the results of our key variables of interest
and reserve examination of the control variables until the end of this section.
3.1 Basic regression
As multi-collinearity is not a major problem (see Table 3 below) for our country-specific
equity market characteristic ( ) measures, except between Transaction cost and
Emerging market dummy, we include all six variables in the following specification (1)
without the controls.
………......Insert Table 3 about here..............
The results are presented in Table 4. Column 2 shows that except for the exchange rate
volatility, all other variables are highly significant with correct predicted signs, even
at 1% significance level. The overall R2 of the above specification shows that
account for 47% of cross-sectional and temporal variation in the foreign equity portfolio
allocation. The outcomes suggest that is the influential factor in foreign investors’
country allocation decision.
………......Insert Table 4 about here..............
The statistical significance of the Stock market size variable with an estimate of 0.726 is in
line with previous studies validating the claim that investors prefer to invest in relatively
bigger markets. Consistent with the suggestions of existing studies (see Chan et al., 2005), the
results confirm that because larger stock markets are more visible, more recognized and more
developed, they are better at attracting higher levels of foreign equity portfolio investments.
The predicted signs of the coefficients and the statistical significance of two micro-structural
variables, Transaction cost and Market liquidity, support the claim that foreign investors
prefer to invest more of their wealth in more cost effective, more efficient and more liquid
markets. The coefficient of -0.82 on transaction cost implies that investors favor markets with
lower transaction costs. Similarly, a higher level of market liquidity with a positive
coefficient of 0.280 clearly supports the conjecture that foreign investors are more inclined to
overweight their portfolio in relatively more liquid markets, which also reflect a higher
(1)

17
degree of market efficiency. Again, these findings are consistent with our analysis of
summary statistics supporting the evidence that markets which are relatively more liquid and
more cost effective are the major recipients of foreign equity investments.
The estimate of Local equity market volatility is also significant, with an expected negative
sign. The coefficient of -0.165 and test statistic of -3.17 provide indication that investors tend
to avoid more volatile markets, as higher volatility implies higher risk of investment. The
effect of higher volatility is more significant in smaller emerging markets that offer lower
levels of industrial diversification for mitigating firm-specific risks. The Exchange rate
volatility variable, reflecting the foreign exchange risk, is not statistically significant but bears
the expected sign. Finally, the statistical significance of Emerging market dummy with an
estimate of -2.045 and test statistic of almost 15 reconfirms that foreign investors favor
bigger and more developed stock markets with higher liquidity and greater efficiency.
Although most of our variables are statistically significant, they may be biased in the absence
of other control variables or may be plagued by endogeniety problems. To ensure the
robustness of our results we undertake a number of additional regressions and tackle concerns
that could challenge the rigor of our findings.
3.2 Omitted variable bias
The estimates of specification (1) may be biased in the absence of other factors, particularly if
they are correlated with . Similarly, as we have used 36 countries with a six-year
time dimension, there could be significant country-specific and time effects. To mitigate the
omitted variable bias, we undertake two additional regressions. First, we run specification (2)
including and home bias variable. We report the results in Table 4 (column 3).
As expected, the inclusion of the home bias measure significantly increases the adequacy of
the model. The overall R2 rises to 66% and the Home bias coefficient carries the expected
sign and is statistically significant. This statistical significance of Home bias confirms the
claim that foreign investors still prefer their home markets relative to the mean-variance
prescription. All the coefficients of are still statistically significant, even at 1%
significance level, and bear expected signs. In contrast to the previous regression, the
(2)
18
Exchange rate volatility variable is now statistically significant. It signifies that investors tend
to invest less in countries experiencing higher movement in their exchange rates. The size of
all coefficients does change, which is understandable, as the addition of Home bias factor
mitigates omitted variable bias to a considerable extent.
We further add all other observed control variables and time dummies in specification (3)
below and report the results in Table 4 (column 4).
As expected, the magnitudes of the estimates do alter but the adequacy of the model further
improves, as indicated by R2 of 82%. Although the size of the estimates changes, the
coefficients of all our key variables are still statistically significant at the conventional
significance level of 5%.
One of the key reasons for employing panel data framework is to allow for the unobserved
time invariant unit-specific effects which, if correlated with any of the regressors, may
potentially produce biased estimates. Although we have been able to control for most of the
time varying and observed time invariant variables, unit-specific effects may also bias our
estimates significantly from their true values. Examples of such effect could be special
treaties between pair countries, favorite country, cultural ties and common colonial history.
We address the issue of unobserved individual heterogeneity by running specification (4),
which is similar to specification (3) but here we use fixed effect estimation instead of random
effect estimation. However, we can only apply the fixed effect model at the cost of excluding
any time invariant variables. Furthermore, although the estimates of fixed effect estimations
are relatively more unbiased, they may not be the most efficient compared to random effect
estimation because the former only uses the within variations in the dataset (see Wooldridge,
2002 for technical details).
As shown in Table 4 (column 5), all our measures are still statistically significant.
This further substantiates that even after including all the observed and unobserved
covariates, have a strong influence on investors’ country allocation decision.
(3)
(4)

19
3.3 The problem of free investability
Our Home bias measure, as constructed in Section 2.2, is based on the assumption that the
entire market capitalization for a given country is freely available for investment to foreign
investors. This may not be true, particularly for emerging markets. In order to address this
issue we included two variables in our previous regressions which potentially control for this
deficiency. The first was Equity market openness and the second Closely held firms. We
further deal with the potential investability problem by constructing a freely floated home
bias measure using the S&P/IFC’s freely investable market capitalization variable instead of
the S&P/IFC’s global market capitalization. However, a caveat is worth noting here. The
S&P/IFC’s freely investable market capitalization is only available for emerging markets;
therefore, for the developed markets we assume that the entire market value is freely
available to foreign investors, which may not be true. Nonetheless, we believe the addition of
the Closely held firms variable captures the deficiency, if any. We run the following
specification (5) using the freely floated (FA_Hbias) home bias variable. We present the
output in Table 4 (column 6).
The coefficient on home bias becomes smaller, as expected, but is still highly statistically
significant. All our variables of interest, i.e, , are highly statistically significant with
expected sign.
3.4 Indirect exposures
We next resolve the effect of investors having indirect exposure to foreign equities in major
financial centers. Our dataset on international equity portfolio investments includes direct
purchase in the domestic markets and investment in global shares and depository receipts.
Solnik and McLeavey (2004) note that big and internationally active companies issue/list
their stocks on multiple and major stock exchanges, such as London, New York or Tokyo, for
greater investor base, broader visibility, higher liquidity, and to avoid stringent and costly
home regulatory stipulation. If this is the case, market-specific development and stability
features may not matter to foreign investors as they can have exposure to foreign stocks in
their own major financial centers. To overcome the potential problem of major financial
centers, we run the following specification (6) but exclude the U.S., the UK and Japan as
investor countries.
(5)

20
As shown in Table 4 (column 7), even after removing the investors from the major financial
centers, the coefficients of all our factors are still statistically significant,
supporting the view that country-specific capital market features play a prominent role in
foreign equity portfolio allocation decisions.
3.5 Year-wise cross-sectional regressions
We further investigate whether the results presented in the previous regressions are able to
withstand the robustness test across the cross-sectional estimations for each year. We run the
following regression (7) for each of the six years and report the results in Table 5. However,
the estimates may not be the most efficient ones, as each of the six regressions does not
include more than 490 observations and, unlike random effect estimations, it does not exploit
any within variation information.
The results imply that generally, except for the two volatility variables (i.e. Local equity
market and Exchange rate volatility), all the stock market development variables are
statistically significant and bear the expected sign. This confirms that, even in the absence of
within variation information, which avoids any persistency in our variable set and model, our
study makes the strong assertion that stock market development factors, particularly size,
transaction cost, liquidity and degree of market efficiency, are the key determinants of
foreign equity portfolio allocations.
……......Insert Table 5 about here..............
3.6 Relative importance of each CSEMC measure
What is the relative importance of each of the factors? We demonstrate the
incremental contribution of each of the factors in explaining variation in foreign equity
portfolio allocation using the R2 metric. We run six different specifications beginning with
Stock market size only in the first regression and increasing the variable numbers by adding
(6)
(7)
21
each of the factors subsequently. It is worth noting that the R2 metric may not
produce reliable results if the sample size varies substantially across the regressions. As
shown in Table 6 below, the only difference in sample size observed is between the first
regression and the remaining five regressions. However, the difference is less than 10% and
should therefore not materially affect our result.
The outputs across all the year-wise regressions clearly show that the most important variable
is the size of the stock market. As discussed earlier, the statistical significance of the Stock
market size with an R2 of 22% indicates that investors are more inclined to invest in more
visible, more industrially diversified and more developed capital markets.
………......Insert Table 6 about here..............
The second most important variable is Transaction cost, with an additional Goodness of fit
contribution of 14%. The significance of transaction cost again confirms the claim that
foreign investors may shy away from markets with significantly higher trading costs. Market
liquidity adds a further 6%, but the volatility measures do not show signs of any further
addition. Emerging market dummy, which further captures the market development features
not reflected by other variables, further explains the allocations by almost 4%. The
statistical significance of market development variables, except for the volatility measures,
clearly suggests that foreign investors favor investing in bigger, highly visible and more
liquid stock markets.
3.7 Endogeneity
Finally, endogeneity may be a potential problem for our results. Errunza (2001) notes that the
growth in foreign equity portfolio investment may itself trigger reform measures towards
greater development of local capital markets. In the sample used, it is likely that our estimates
may suffer from endogeneity problem arising from reverse causality. To resolve the reverse
causality problem we first generate a fitted variable using specification (1) but only including
the most consistently robust variables, i.e. Stock market size, Transaction cost, Market
Liquidity and Emerging market dummy and we refer to it as Development proxy. Following

22
Gelos and Wei (2005), we use one-year lag value of the Development proxy and run the
following specification (8) 4
.
As reported in Table 7 below, the Development proxy, which is the fitted value of Stock
market size, Transaction cost, Market Liquidity and Emerging market dummy, is highly
statistically significant. This confirms that our results do not suffer from reverse causality
problem.
………......Insert Table 7 about here..............
3.8 Control variables
Not all the controls have the expected sign and statistical significance and are able to stand
the robustness tests across the wide range of specifications. The most important and
consistent across the extensive spectrum of estimations are the familiarity variables. The
significance of bilateral trade measure in all specifications is an indication that investors
regard the problem of information asymmetry as a potential barrier when investing in foreign
securities (see Portes and Rey, 2005; Chan et al., 2005; Fidora et al., 2007). Similarly,
investors tend to invest more of their wealth in countries nearer to them than farther from
them, as reflected by the significance of the distance variable. The significance of common
language across all specifications also shows that investors are more prepared to invest in
countries sharing a common language as this mitigates the information asymmetry problem to
some extent (see Chan et al., 2005; Fidora et al., 2007).
The issue of investor protection is debatable in the literature, with mixed conclusions reported
by a number of existing studies (Aggarwal et al., 2005 and Chan et al., 2005). Aggarwal et al.
(2005), using U.S. data, find that U.S. investors are inclined to allocate more funds to
countries with better investor protection rights in place. However, Chan et al. (2005), using
data on 26 countries (emerging and developed), show that investors are influenced more by
stock market development and bilateral familiarity issues, and investor protection does not
play any significant role in their investment decisions. In fact, their study finds that the
4 We also use one-year lag values of the individual CSEMCs, and find all of the measures to be statistically
significant at 5% significance level. We do not report the results but these can be obtained from the authors on
request.
(8)
23
investor protection measures carry an unexpected sign, similar to what our results reveal for
the World Bank’s Investor protection measure, particularly for the cross-section estimations.
However, we find that the legal dummy is statistically significant across all specifications.
Bekaert et al. (2007) conjecture that foreign investors may be more concerned about those
aspects of regulatory environment that directly affect foreign investments, such as
repatriation risk, exchange control risk, etc. It could be that the legal dummy captures
investor protection effects specifically related to foreign investment, as most of the countries
following English common law have relatively higher levels of investor protection rights for
foreign investors. However, the issue needs further investigation. The capital control
measures (Equity market openness and Closely held firms) are generally consistent and carry
the expected sign, indicating that despite motivation to invest, investors may face legal
restrictions imposed by host countries. We do not find economic development, economic
growth and historical returns to be significant and consistent in terms of predicted signs
across different specifications, mostly for the cross-section models. Similar results are also
reported by other studies (see Gelos and Wei, 2005; Chan et al., 2005).
4. Conclusion
This study presents a comprehensive and thorough assessment of the impact of country-
specific equity market characteristics on the allocation decisions of foreign equity portfolio
investors. We show that stock market development factors play an important role in
explaining a significant proportion of the cross-sectional and time variation in foreign equity
portfolio allocations. Our results confirm that foreign equity portfolio investors prefer to
invest more of their wealth in larger, more liquid and more efficient markets with lower
trading costs. The robust findings of our study imply that by improving the preconditions
necessary for well-functioning capital market, policymakers should be able to attract higher
levels of foreign equity portfolio investments.
24
References
Aggarwal, R., Klapper, L., Wysocki, P. D., 2005. Portfolio preferences of foreign
institutional investors. Journal of Banking and Finance. 29, 2919-2946.
Alder, M., Dumas, B., 1983. International portfolio choice and corporation finance: A
synthesis. Journal of Finance. 38, 925-984.
Amihud, Y., Mendelson, H., 1986. Asset pricing and the bid-ask spread. Journal of Financial
Economics. 17, 31-56.
Baltagi, B. H., 1995. Econometric Analysis of Panel Data, second ed. Wiley, New York.
Bekaert, G., 1995. Market integration and investment barriers in emerging equity markets.
The World Bank Economic Review. 9, 75-107.
Bekaert, G., Harvey, C. R., 1995. Time-varying world market integration. Journal of Finance.
50, 403-444.
Bekaert, G., Harvey, C., 2000. Foreign Speculator and Emerging Equity Markets. Journal of
Finance. 55, 565-613.
Bekaert, G., Harvey, C. R., Lumsdaine, R. L., 2002. The dynamics of emerging market equity
flows. Journal of International Money and Finance. 21, 295-350.
Bekaert, G., Harvey, C. R., Lundblad, C. T., 2003. Equity market liberalization in emerging
markets. The Journal of Financial Research. 26, 275-299.
Bekaert, G., Harvey, C. R., Lundblad, C., Siegel, S., 2007. Global Growth Opportunities and
Market Integration. Journal of Finance 62, 1081-831.
Bekaert, G., Hodrick, R. J., 2008. International Financial Management. Pearson Education
International, New Jersey.

25
Black, F., 1974. International capital market equilibrium with investment barriers. Journal of
Financial Economics. 1, 337-352.
Bohn, H., Tesar, L., 1996. U.S. equity investment in foreign markets: Portfolio rebalancing or
return chasing? American Economic Review. 86, 77-81.
Brennan, M. J., Subrahmanyam, A., 1996. Market micro structure and asset pricing: On the
compensation for illiquidity in stock returns. Journal of Financial Economics. 41, 441-
464.
Carrieri, F., Errunza, V., Majerbi, B., 2006. Does emerging market exchange risk affect
global equity prices? Journal of Financial and Quantitative Analysis. 41, 511- 540.
Chan, K., Covrig, V., Ng, L., 2005. What determines the domestic bias and foreign bias?
Evidence from mutual fund equity allocations worldwide. Journal of Finance. 60, 1495-
1534.
Cooper, I., Kaplanis, C., 1986. Costs to crossborder investment and international equity
market equilibrium, in: Edwards, J., Franks, J., Mayer, C., Schaefer, S. (Eds.), Recent
Developments in Corporate Finance. Cambridge University Press, New York, pp. 209-
237.
Cooper, I., Kaplanis, E., 1994. Home bias in equity portfolios, inflation hedging, and
international capital market equilibrium. Review of Financial Studies. 7, 45-60.
Dahlquist, M., Pinkowitz, L., Stulz, R. M., Williamson, R., 2003. Corporate governance and
the home bias. Journal of Financial and Quantitative Analysis. 38, 87-110.
Dahlquist, M., Robertson, G., 2004. A note on foreigners’ trading and price effects across
firms. Journal of Banking and Finance. 28, 615-632.
Damodaran, A., 2010. Applied Corporate Finance, third ed. John Wiley and Sons, New York.

26
Datar, V.T., Nail, N.N., Radeliffe, R., 1998. Liquidity and asset returns: An alternative test.
Journal of Financial Markets. 1, 203-219.
De Roon, F.A., Nijman, T.E., Werker, B.J.M., 2001. Testing for mean-variance spanning
with short sales constraints and transaction costs: The case of Emerging Markets. Journal
of Finance. 56, 721-742.
De Jong, F., De Roon, F.A., 2005. Time-varying market integration and expected returns in
emerging markets. Journal of Financial Economics. 78, 583-613.
Edison, H.J., Warnock, F.E., 2003. A simple measure of the intensity of capital controls.
Journal of Empirical Finance. 10, 81-103.
Errunza, V.R., 1977. Gains from portfolio diversification into less developed countries'
securities. Journal of International Business Studies. 8, 83-99.
Errunza, V.R., 1994. Emerging markets: Some new concepts. Journal of Portfolio
Management. 20. 82-87.
Errunza, V.R., 2001. Foreign portfolio equity investments, financial liberalization, and
economic development. Review of International Economics. 9, 703-726.
Errunza, V.R., Losq, E., 1985, International asset pricing under mild segmentation: Theory
and test. Journal of Finance. 40, 105-124.
Eun, C.S., Janakiramanan, S., 1986. A Model of international asset pricing with a constraint
on the foreign equity ownership. Journal of Finance. 41, 897-914.
Fama, E., French, K.R., 1998. Value versus growth: International evidence. Journal of
Finance. 53, 1975-2000.
French, K.R., Poterba, J.M., 1991. Investor diversification and international equity markets.
American Economic Review. 81, 222-226.

27
Fidora, M., Fratzscher, M., Thimann, C., 2007. Home bias in global bond and equity markets:
The role of real exchange rate volatility. Journal of International Money and Finance. 26,
631-655.
Froot, K.A., O'Connell, P., Seasholes, M.S., 2001. The portfolio flows of international
investors. Journal of Financial Economics. 59, 151-193.
Gelos, R.G., Shang-Jin, Wei, 2005. Transparency and International Portfolio Holdings.
Journal of Finance. 60, 2987-3020.
Goldsmith, R., 1969. Financial Structure and Development. Yale University Press, New
Haven.
Griffin, J. M., Nardari, F., Stulz, R. M., 2004. Are daily cross-border equity flows: Pushed or
pulled? Review of Economics and Statistics. 86, 641-657.
Grubel, H.G., 1968. Internationally diversified portfolios. American Economic Review. 58,
1299-1314.
Harvey, C.R., 1995a. The risk exposure of emerging equity markets. The World Bank
Economic Review. 9, 19-59.
Harvey, C.R., 1995b. Predictable risk and returns in emerging markets. The Review of
Financial Studies. 8, 773-816.
Hunter, D.M., 2006. The evolution of stock market integration in the post-liberalization
period - A look at Latin America. Journal of International Money and Finance. 25, 795-
280.
Kawakatsu, H., Morey, M.R., 1999. An empirical examination of financial liberalization and
the efficiency of emerging stock prices. The Journal of Financial Research. 22, 385-411.

28
Karlsson, A., Nordén, L., 2007. Home sweet home: Home bias and international
diversification among individual investors. Journal of Banking and Finance. 31, 317-
333.
Keim, D.B., Madhavan, A., 1995. Execution cost and investment performance: An empirical
analysis of institutional equity trades. Working paper. University of Pennsylvania.
La Porta, R., Lopez-De-Silanes, F., Shleifer, A., 1998. Law and finance. Journal of Political
Economy. 106, 1113-1155.
Levine. R., 1992. Financial structures and economic development. World Bank Working
Paper. WPS-849.
Levine, R., Zervos, S., 1996. Stock market development and long-run growth. World Bank
Economic Review. 10, 323-339.
Levy, H., Sarnat, M., 1970. International diversification of investment portfolios. American
Economic Review. 60, 668-675.
McKinnon, R., 1973. Money and capital in economic development. Brookings Institution,
Washington D.C.
Mark, K., Fung, S.S, 2006. The new BIS effective rate indices. BIS Quarterly Review.
March, 51-65.
Portes, R., Rey, H. 2005. The determinants of cross-border equity flows, Journal of
International Economics. 65, 269-296.
Richards, A., 2005. Big fish in small ponds: The trading behavior and price impact of foreign
investors in Asian emerging equity markets. Journal of Financial and Quantitative
Analysis. 40, 1-27.
Rouwenhorst, K.G., 1999. Local return factors and turnover in emerging stock markets,
Journal of Finance. 54, 1439-1464.
29
Rowland, P.F., 1999. Transaction costs and international portfolio diversification. Journal of
International Economics. 49, 145-170.
Sercu, P., 1980. A generalization of the international asset pricing model, Revue de L'
Association Francaise de Finance. 19, 91-135.
Solnik, B., 1974a. Why not diversify internationally rather than domestically? Financial
Analysts' Journal. 30, 48-54.
Solnik, B. 1974b. An equilibrium model of the international capital market. Journal of
Economic Theory. 8, 500-524.
Solnik, B., McLeavey, D., 2004. International Investments, fifth ed. Pearson Addison
Wesley, New York.
Subramanian, A., Wei, S., 2007. The WTO promotes trade, strongly but unevenly. Journal of
International Economics. 72, 151-175.
Stulz, R.M. 1981a. On the effects of barriers to international investment. Journal of Finance.
36, 923-934.
Stulz, R.M., 1981b. A model of international asset pricing. Journal of Financial Economics.
9, 383-406.
Tesar, L.L., Werner, I.M., 1995. Home bias and high turnover. Journal of International
Money and Finance. 14, 467-492.
Warnock, F.E., 2001. Home bias and high turnover reconsidered. Journal of International
Money and Finance. 21, 795-805.
Wooldridge, J.M. 2002. Econometric Analysis of Cross Section and Panel Data. MIT Press.
Cambridge.

30
Table 1
Summary statistics of key variables
Country Portfolio
allocation
Stock market
size (% of
GDP)
Transaction cost
(BPS per
average
transaction in
USD).
Market
liquidity
(%)
Local
equity
market
volatility
(%)
Exchange
rate
volatility
(%)
Argentina 0.0005 51.20 74.21 10.38 50.57 15.98
Australia 0.0146 110.39 34.06 76.70 17.08 7.20
Austria 0.0045 30.05 30.61 76.68 25.85 1.91
Belgium 0.0108 72.08 29.34 25.13 33.36 2.36
Brazil 0.0054 45.14 45.99 35.50 52.10 15.50
Canada 0.0171 110.50 32.52 66.45 21.10 5.08
Chile 0.0004 104.53 73.63 11.71 24.64 7.36
China 0.0041 45.67 NA 88.30 32.68 6.36
Czech 0.0009 24.54 58.10 67.52 34.21 5.02
Denmark 0.0056 61.87 35.52 75.23 27.83 2.32
Finland 0.0210 115.00 43.13 116.28 26.81 2.89
France 0.1081 82.55 27.98 83.83 21.30 2.46
Germany 0.0882 46.52 27.53 131.00 26.77 3.38
Greece 0.0028 51.91 59.81 40.10 20.66 4.01
Hungary 0.0020 25.54 58.03 63.22 22.69 5.26
India 0.0031 51.35 62.82 133.67 31.27 4.41
Indonesia 0.0101 24.65 72.29 43.82 31.28 13.14
Italy 0.0343 45.63 31.38 120.27 23.14 2.68
Japan 0.0794 78.59 20.14 97.17 20.19 6.66
Korea 0.0107 65.31 59.73 249.15 18.24 5.24
Malaysia 0.0015 144.92 56.87 27.87 12.66 3.32
Mexico 0.0042 25.47 38.08 26.49 23.47 6.51
New Zealand 0.0015 39.56 37.59 41.80 18.47 6.88
Norway 0.0057 53.11 32.56 102.80 28.11 5.05
Peru 0.0002 34.37 66.07 7.50 27.29 3.79
Philippines 0.0004 45.19 90.21 12.96 25.91 5.51
Poland 0.0017 24.68 NA 31.84 42.50 7.76
Portugal 0.0027 40.10 33.97 50.73 17.63 2.04
Russia 0.0058 55.82 NA 45.98 21.36 13.19
Sweden 0.0209 107.61 31.16 117.16 33.76 4.17
Switzerland 0.0533 246.67 29.11 93.00 15.95 3.50
Taiwan 0.0058 76.05 53.75 182.28 14.51 4.36
Thailand 0.0018 60.42 58.42 101.51 32.18 3.76
Turkey 0.0019 32.82 56.97 44.96 49.18 16.77
United Kingdom 0.1573 138.75 78.38 112.83 16.85 3.90
United States 0.3776 133.22 25.07 160.50 20.49 3.76

31
Table 2
Summary statistics of control variables
Country Home
Bias
GDP Per
Capita (in
USD)
GDP
Growth
(%)
Equity market
openness (0-1)
Closely
Held Firm
(%)
Log
Bilateral
trade
Log
distance
Common
language
Returns
(%)
Investor
protection
(0-100)
English
common
law dummy
Argentina 1.92 7,503 3.25 0.93 52.68 6.36 8.90 0.00 20.76 31.78 0
Australia 1.65 22,414 3.16 1.00 24.85 7.77 9.08 0.33 19.91 95.05 1
Austria 0.76 24,914 1.74 1.00 54.85 8.15 6.95 0.13 26.76 95.10 0
Belgium 1.01 23,445 1.75 1.00 47.14 9.34 6.71 0.33 35.18 89.87 0
Brazil 1.03 3,842 2.92 0.94 67.13 7.71 8.69 0.00 31.06 51.34 0
Canada 2.21 24,783 2.61 1.00 48.82 8.37 8.21 0.53 15.79 94.45 1
Chile 2.71 5,400 4.18 0.92 64.94 6.54 8.89 0.00 21.71 88.63 0
China 1.76 1,282 9.76 0.49 68.74 9.50 8.43 0.00 10.30 41.43 0
Czech 0.33 6,240 4.13 0.99 78.10 7.57 6.80 0.00 38.89 76.50 0
Denmark 1.09 30,874 1.66 1.00 25.10 8.26 6.88 0.33 16.89 97.83 0
Finland 0.10 25,495 3.02 1.00 23.00 8.04 7.33 0.06 5.61 98.43 0
France 0.49 23,292 1.69 1.00 38.00 9.91 6.98 0.20 8.73 86.60 0
Germany 0.42 23,628 1.00 1.00 45.00 10.65 6.73 0.20 8.46 93.12 0
Greece 1.67 15,165 4.34 1.00 75.00 7.09 7.48 0.00 4.92 74.86 0
Hungary 0.32 5,493 4.24 0.97 49.48 7.44 7.08 0.00 26.56 79.19 0
India 1.91 537 7.32 0.60 40.32 7.67 8.44 0.38 26.52 49.81 1
Indonesia 1.46 894 4.85 0.91 68.97 7.14 8.79 0.00 27.97 27.01 0
Italy 0.81 19,540 0.90 1.00 38.00 9.57 7.19 0.05 9.25 74.19 0
Japan 1.47 37,954 1.43 1.00 38.00 9.27 8.62 0.00 6.42 84.75 0
Korea 1.16 12,535 4.64 0.95 39.23 8.39 8.44 0.38 27.70 71.97 0
Malaysia 1.44 4,143 4.64 0.93 52.15 7.68 8.73 0.00 11.76 65.40 1
Mexico 1.36 6,031 2.27 0.99 26.15 7.55 8.53 0.00 24.21 52.71 0

32
New Zealand 1.83 14,729 3.22 1.00 77.00 6.31 9.16 0.39 21.88 96.49 1
Norway 1.03 39,454 2.31 1.00 41.00 8.24 7.10 0.00 21.35 93.98 0
Peru 2.01 2,262 4.77 0.84 68.60 5.36 8.75 0.00 32.20 44.83 0
Philippines 1.58 1,068 4.64 0.56 51.13 6.70 8.68 0.37 5.67 44.15 0
Poland 0.83 4,952 3.56 0.97 64.26 7.79 7.07 0.00 18.26 67.55 0
Portugal 1.02 11,123 0.88 1.00 35.00 7.43 7.42 0.00 -1.70 84.93 0
Russia 1.30 2,211 6.22 0.67 NA 8.24 8.17 0.00 58.63 27.57 0
Sweden 0.73 29,062 2.64 1.00 21.00 8.77 7.15 0.00 9.73 95.52 0
Switzerland 0.42 34,611 1.43 1.00 26.00 8.69 6.84 0.40 13.80 96.87 0
Taiwan 1.73 14,298 3.51 0.76 22.26 NA 9.05 0.00 6.72 78.28 0
Thailand 0.92 2,322 5.06 0.60 57.83 7.52 8.61 0.35 27.77 59.69 1
Turkey 1.01 3,132 4.66 0.97 70.86 7.80 7.71 0.00 30.42 55.53 0
United Kingdom 0.51 26,256 2.51 1.00 10.00 10.12 6.91 0.33 6.92 95.37 1
United States 1.40 35,932 2.49 1.00 8.00 10.48 8.44 0.33 6.21 92.67 1

33
Table 3
Correlation between different measures of country-specific equity market characteristics
Stock
market
size
Transaction
cost
Market
liquidity
Local equity
market
volatility
Exchange
rate
volatility
Emerging
market
dummy
Stock market size 1.00
Transaction cost -0.26 1.00
Market liquidity 0.24 -0.24 1.00
Local equity market volatility -0.14 0.12 -0.11 1.00
Exchange rate volatility -0.29 0.35 -0.27 0.32 1.00
Emerging market dummy -0.38 0.70 -0.17 0.15 0.42 1.00

34
Table 4
Regressions out of different specifications
CSEMC With home bias
as control
All controls and
time dummies
All controls and fixed
effect estimation
Controlling
for free float
Controlling for major
financial centers
Stock market size 0.726*** 0.782*** 0.674*** 0.617*** 0.680*** 0.668*** (15.55) (44.72) (31.13) (27.98) (24.06) (27.61) Transaction cost -0.827*** -0.702*** -0.528*** -0.318*** -0.510*** -0.523*** (-4.35) (-11.26) (-7.98) (-4.91) (-6.08) (-7.06) Market Liquidity 0.280*** 0.0891*** 0.0531*** 0.0791*** 0.0518*** 0.0511*** (7.67) (5.07) (4.06) (7.23) (2.60) (3.56) Local equity market volatility -0.165*** -0.123*** -0.149*** -0.121*** -0.169*** -0.149*** (-3.17) (-5.95) (-6.11) (-4.85) (-6.25) (-5.49) Exchange rate volatility -0.776 -3.040*** -1.710*** -1.050*** -1.318*** -1.702***
(-1.05) (-12.45) (-6.26) (-4.37) (-4.28) (-5.55)
Emerging market dummy -2.045*** -2.509*** -0.548*** NA -0.392** -0.587*** (-14.91) (-26.06) (-4.56) (-2.45) (-4.34) Home bias -0.938*** -0.931*** -0.926*** -0.837*** -0.936*** (-88.29) (-100.78) (-104.13) (-71.55) (-94.42) GDP per capita 0.368*** 2.469*** 0.410*** 0.373*** (6.71) (17.20) (5.57) (6.07) GDP growth rate 0.185 -0.837*** 0.537* 0.170 (0.81) (-3.97) (1.73) (0.65)
35
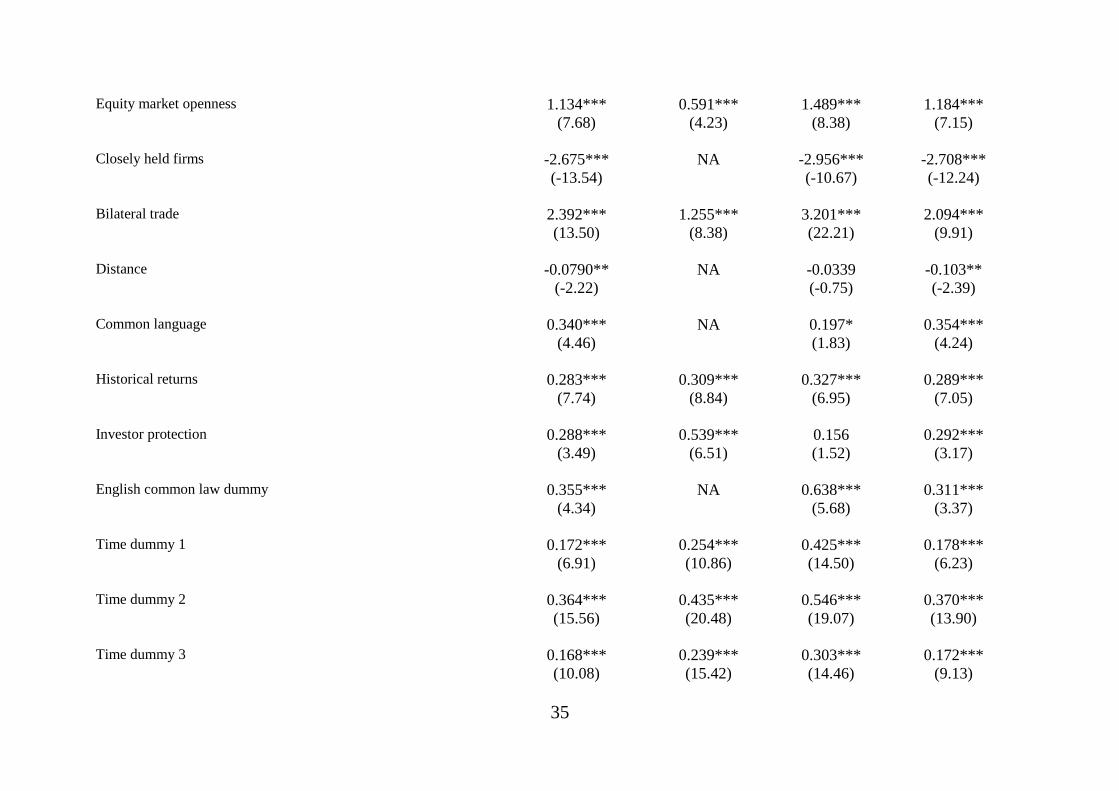
Equity market openness 1.134*** 0.591*** 1.489*** 1.184*** (7.68) (4.23) (8.38) (7.15) Closely held firms -2.675*** NA -2.956*** -2.708*** (-13.54) (-10.67) (-12.24) Bilateral trade 2.392*** 1.255*** 3.201*** 2.094*** (13.50) (8.38) (22.21) (9.91) Distance -0.0790** NA -0.0339 -0.103** (-2.22) (-0.75) (-2.39) Common language 0.340*** NA 0.197* 0.354*** (4.46) (1.83) (4.24) Historical returns 0.283*** 0.309*** 0.327*** 0.289*** (7.74) (8.84) (6.95) (7.05) Investor protection 0.288*** 0.539*** 0.156 0.292*** (3.49) (6.51) (1.52) (3.17) English common law dummy 0.355*** NA 0.638*** 0.311***
(4.34) (5.68) (3.37)
Time dummy 1 0.172*** 0.254*** 0.425*** 0.178*** (6.91) (10.86) (14.50) (6.23) Time dummy 2 0.364*** 0.435*** 0.546*** 0.370*** (15.56) (20.48) (19.07) (13.90) Time dummy 3 0.168*** 0.239*** 0.303*** 0.172*** (10.08) (15.42) (14.46) (9.13)
36
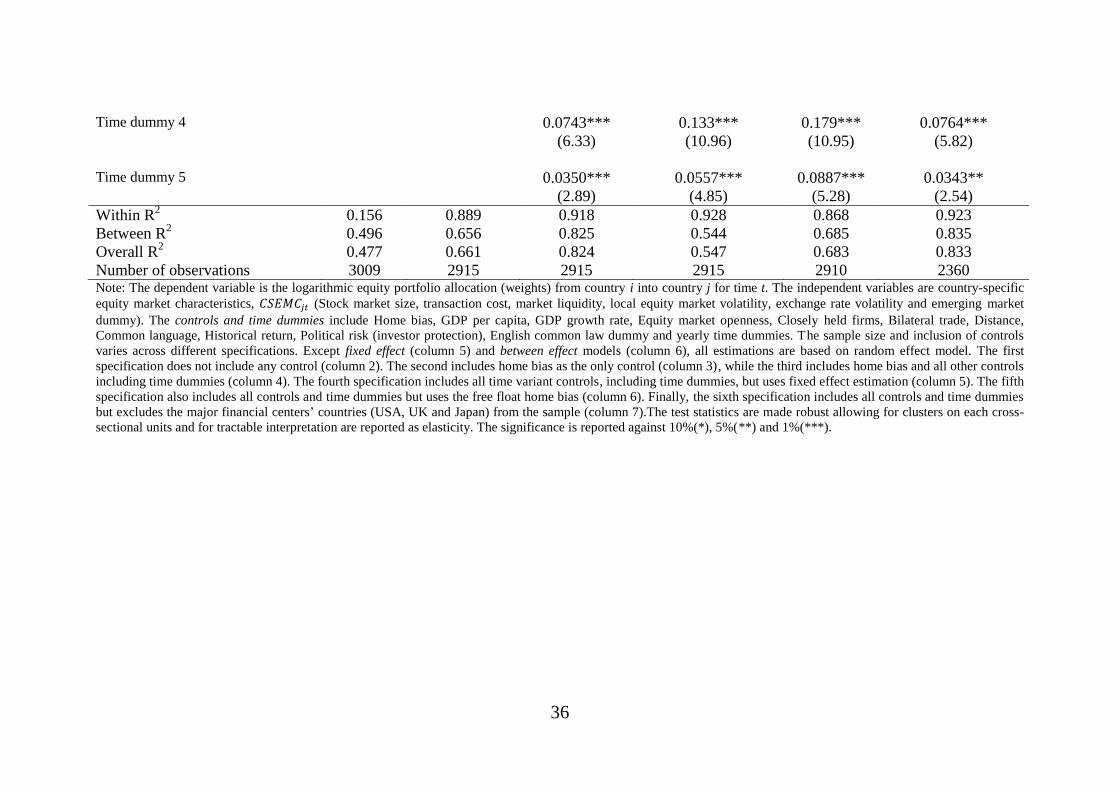
Time dummy 4 0.0743*** 0.133*** 0.179*** 0.0764*** (6.33) (10.96) (10.95) (5.82) Time dummy 5 0.0350*** 0.0557*** 0.0887*** 0.0343**
(2.89) (4.85) (5.28) (2.54)
Within R2 0.156 0.889 0.918 0.928 0.868 0.923
Between R2 0.496 0.656 0.825 0.544 0.685 0.835
Overall R2 0.477 0.661 0.824 0.547 0.683 0.833
Number of observations 3009 2915 2915 2915 2910 2360 Note: The dependent variable is the logarithmic equity portfolio allocation (weights) from country i into country j for time t. The independent variables are country-specific
equity market characteristics, (Stock market size, transaction cost, market liquidity, local equity market volatility, exchange rate volatility and emerging market
dummy). The controls and time dummies include Home bias, GDP per capita, GDP growth rate, Equity market openness, Closely held firms, Bilateral trade, Distance,
Common language, Historical return, Political risk (investor protection), English common law dummy and yearly time dummies. The sample size and inclusion of controls
varies across different specifications. Except fixed effect (column 5) and between effect models (column 6), all estimations are based on random effect model. The first
specification does not include any control (column 2). The second includes home bias as the only control (column 3), while the third includes home bias and all other controls
including time dummies (column 4). The fourth specification includes all time variant controls, including time dummies, but uses fixed effect estimation (column 5). The fifth
specification also includes all controls and time dummies but uses the free float home bias (column 6). Finally, the sixth specification includes all controls and time dummies
but excludes the major financial centers’ countries (USA, UK and Japan) from the sample (column 7).The test statistics are made robust allowing for clusters on each cross-
sectional units and for tractable interpretation are reported as elasticity. The significance is reported against 10%(*), 5%(**) and 1%(***).

37
Table 5
Yearly cross-section regression outputs 2001 2002 2003 2004 2005 2006
Stock market size 1.068*** 0.689*** 0.784*** 0.972*** 1.159*** 1.191***
(13.92) (8.84) (10.88) (9.89) (13.92) (13.95)
Transaction cost -3.340*** -2.718*** -0.366 -2.535*** -4.333*** -3.056***
(-8.85) (-9.63) (-1.00) (-6.62) (-9.94) (-8.40)
Market liquidity 0.548*** 0.669*** 1.192*** 1.138*** 1.296*** 1.308***
(6.68) (10.73) (14.57) (11.40) (15.02) (13.77)
Local equity market volatility 0.348 -3.036*** 0.607*** 0.0413 -0.840*** -0.00276
(0.87) (-8.53) (2.87) (0.13) (-2.94) (-0.01)
Exchange rate volatility 7.924*** -2.564** -3.082** -1.616 16.89*** 6.383***
(7.40) (-2.19) (-2.37) (-1.29) (8.74) (3.86)
Emerging market dummy -0.963*** -0.167 -1.221*** -1.156*** -1.309*** -1.131***
(-4.36) (-0.90) (-7.07) (-6.57) (-8.70) (-7.73)
Home bias -0.769*** -0.875*** -0.837*** -0.836*** -0.863*** -0.890***
(-25.73) (-30.08) (-27.60) (-24.87) (-26.37) (-26.32)
GDP per capita 0.575*** 0.310*** 0.0582 -0.0595 -0.242*** 0.0327
(3.65) (2.94) (0.63) (-0.62) (-2.75) (0.43)
GDP growth 11.04*** 1.044 -20.95*** -11.48*** -11.41*** -20.00***
(4.26) (0.59) (-7.16) (-2.89) (-4.40) (-7.63)
Equity market openness 0.272 4.256*** 4.417*** 3.175*** 0.500 0.811*
(0.48) (7.98) (6.05) (5.71) (0.98) (1.66)
Closely held firms -2.077*** -1.818*** -1.110*** -0.764*** -1.008*** -0.983***
(-7.63) (-6.63) (-3.69) (-2.72) (-4.30) (-4.23)

38
Bilateral trade 2.219*** 2.148*** 2.384*** 2.481*** 2.108*** 2.235***
(12.22) (12.29) (13.28) (13.39) (12.26) (12.75)
Distance -0.250*** -0.177*** -0.156*** -0.138*** -0.248*** -0.228***
(-6.23) (-4.58) (-4.06) (-3.57) (-6.80) (-6.61)
Common language 0.215** 0.401*** 0.421*** 0.451*** 0.363*** 0.354***
(2.23) (4.21) (4.37) (4.76) (4.29) (4.24)
Historical returns -0.161 -5.907*** -1.898*** -0.972*** 0.0121 1.258***
(-0.49) (-9.99) (-5.23) (-2.97) (0.04) (3.25)
Investor protection -2.203*** -0.998*** -1.922*** -1.636*** -1.378*** -2.023***
(-8.10) (-5.12) (-9.01) (-7.17) (-8.94) (-12.25)
English common law dummy 0.367*** 0.514*** 1.039*** 0.443*** 0.367*** 0.436***
(2.80) (4.82) (8.24) (4.16) (3.98) (5.02)
Adjusted R2 0.913 0.916 0.910 0.907 0.919 0.912
Number of observations 492 493 490 475 475 490 Note: The dependent variable is the logarithmic equity portfolio allocation (weights) from country i into country j for time t. The independent variables are country-specific
equity market characteristics, (Stock market size, transaction cost, market liquidity, local equity market volatility, exchange rate volatility and emerging market
dummy). The controls include Home bias, GDP per capita, GDP growth rate, Equity market openness, Closely held firms, Bilateral trade, Distance, Common language
dummy, Historical return, Political risk (investor protection) and English common law dummy. The test statistics are made robust and for tractable interpretation are reported
as elasticity. The significance is reported against 10%(*), 5%(**) and 1%(***).
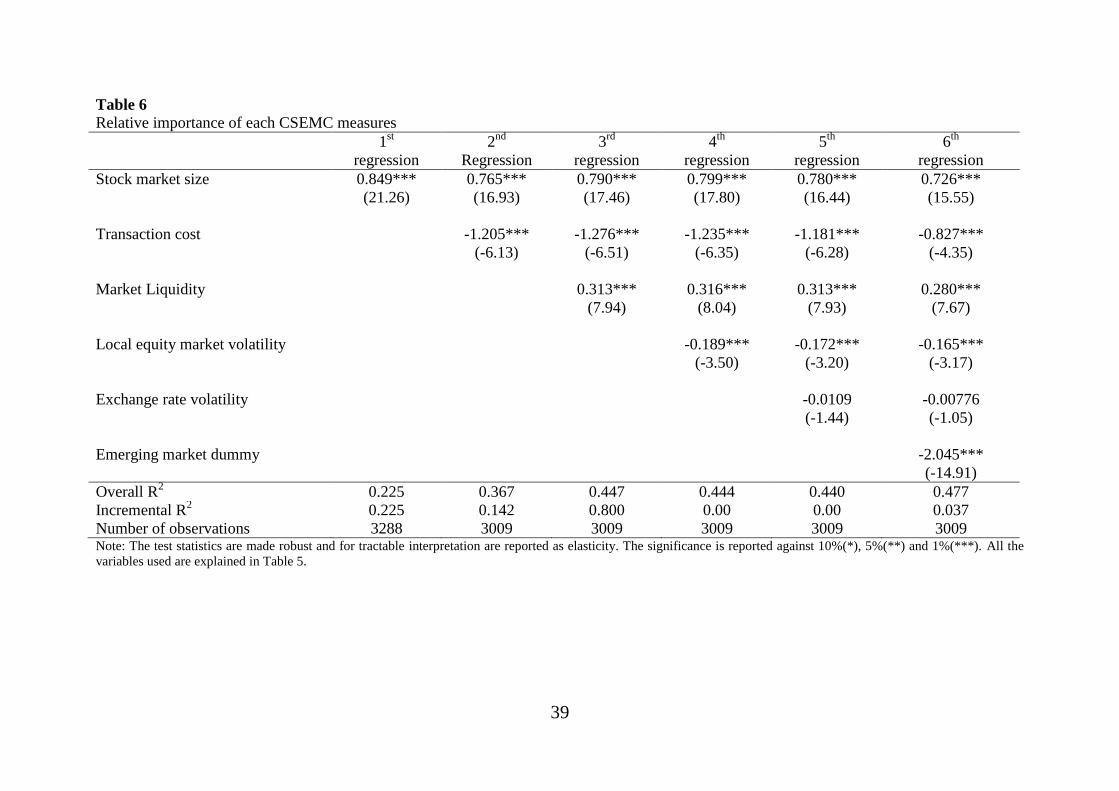
39
Table 6
Relative importance of each CSEMC measures
1st
regression
2nd
Regression
3rd
regression
4th
regression
5th
regression
6th
regression
Stock market size 0.849*** 0.765*** 0.790*** 0.799*** 0.780*** 0.726***
(21.26) (16.93) (17.46) (17.80) (16.44) (15.55)
Transaction cost -1.205*** -1.276*** -1.235*** -1.181*** -0.827***
(-6.13) (-6.51) (-6.35) (-6.28) (-4.35)
Market Liquidity 0.313*** 0.316*** 0.313*** 0.280***
(7.94) (8.04) (7.93) (7.67)
Local equity market volatility -0.189*** -0.172*** -0.165***
(-3.50) (-3.20) (-3.17)
Exchange rate volatility -0.0109 -0.00776
(-1.44) (-1.05)
Emerging market dummy -2.045***
(-14.91)
Overall R2 0.225 0.367 0.447 0.444 0.440 0.477
Incremental R2 0.225 0.142 0.800 0.00 0.00 0.037
Number of observations 3288 3009 3009 3009 3009 3009 Note: The test statistics are made robust and for tractable interpretation are reported as elasticity. The significance is reported against 10%(*), 5%(**) and 1%(***). All the
variables used are explained in Table 5.

40
Table 7
Reverse causality problem All controls and lagged development proxy
Development proxy 0.427***
(16.45)
Home bias -0.952***
(-100.57)
GDP per capita 0.393***
(7.63)
GDP growth rate 0.477
(1.41)
Equity market openness 2.160***
(14.50)
Closely held firms -3.129***
(-14.38)
Bilateral trade 2.421***
(16.34)
Distance -0.101
(2.52)**
Common language 0.402***
(3.92)
Historical returns 0.514***
(15.79)
Investor protection -0.138
(-1.76)
English common law dummy 0.677***
(6.85)
Time effect Yes
Within R2 0.921
Between R2 0.830
Overall R2 0.831
Number of observations 2390 Note: The dependent variable is the logarithmic equity portfolio allocation (weights) from country i into country
j for time t. The independent variables Development proxy (fitted value of Stock market size, transaction cost,
market liquidity and emerging market dummy). The controls and time dummies include Home bias, GDP per
capita, GDP growth rate, Equity market openness, Closely held firms, Bilateral trade, Distance, Common
language, Historical return, Political risk (investor protection), English common law dummy, and yearly time
dummies.The test statistics of random effect estimation are made robust allowing for clusters on each cross-
sectional units and for tractable interpretation are reported as elasticity. The significance is reported against
10%(*), 5%(**) and 1%(***).


