COUNTRY REPORT PERU - Chiba Uares.tu.chiba-u.jp/peru/pdf/meeting/140307/2014Sympo_03Peru.pdf ·...
25
COUNTRY REPORT PERU Dr. Carlos ZAVALA Dr. Miguel ESTRADA ‐ Dr. Zenon AGUILAR – Eng. Alberto BISBAL CISMID‐FIC‐UNI Science and Technology Research Partnership for Sustainable Development : SATREPS DHN IGP INDECI UNMSM CON UPT CONIDA National System for Disaster Risk Management (SINAGERD): A new strategic decision model to reduce the disaster risk (LAW 29664 ) Centro Nacional de Estimación, Prevención y Reducción del Riesgo de Desastres ‐ CENEPRED SECTORS, REGIONAL & LOCAL GVMTs Strategic level Political level Financial Management on DRM National Development Plan with DRR approach at the 3 government levels ‐ CEPLAN
Transcript of COUNTRY REPORT PERU - Chiba Uares.tu.chiba-u.jp/peru/pdf/meeting/140307/2014Sympo_03Peru.pdf ·...

COUNTRY REPORTPERU
Dr. Carlos ZAVALA
Dr. Miguel ESTRADA ‐ Dr. Zenon AGUILAR – Eng. Alberto BISBAL
CISMID‐FIC‐UNI
Science and Technology Research Partnership
for Sustainable Development : SATREPS
DHN IGP INDECI UNMSM CON UPTCONIDA
National System for Disaster Risk Management (SINAGERD): A new strategic decision model to reduce the disaster risk
(LAW 29664 )
Centro Nacional de Estimación, Prevención y Reducción del Riesgo de Desastres ‐ CENEPRED
SECTORS, REGIONAL & LOCAL GVMTs
Strategic level
Political level
Financial Management on DRM
National Development Plan with DRR approach at the 3
government levels ‐ CEPLAN

TECHNICAL TOOLS FOR PLANNING AND MANAGEMENT THE RISK (SOURCE: CENEPRED)
RISK REDUCTION PLAN BY SECTORFOR EXAMPLE: EDUCATION
RISK REDUCTION PLAN BY SECTORFOR EXAMPLE: HOUSING ANDCONSTRUCTION
RISK REDUCTION PLAN FOR DRAIN SYSTEMS AND WATER
SUPPLY
RISK REDUCTION PLAN OFTRANSPORTATION SYSTEM AND HIGWAYS AND BRIDGES
NATIONAL PLAN OF RISK REDUCTION
ACTIONS TAKEN BY CISMID‐FIC‐UNI AFTER PISCO EARTHQUAKE 15/8/2007

THE PISCO QUAKE AUGUST 15TH 2007Geophysical Institute of Peru (IGP) reports the following parameters (2007)
Depth : 26 kmMagnitude : 7.0 ML (Richter)
7.9Mw (moment magnitude)
Epicenter at 74 km on West direction fromPisco. La circle represents a focal inverse mechanism (Tavera, et al 2007)
Time : 18 hrs, 40 min, 53.6 sec.Location : Latitude -13.49°Longitude : -76.85°
ZON
A 2
ZON
A 3
ECUADOR
COLOMBIA
BRASIL
BO
LIV
IA
CHILE
ZONA 1

EXPLORATION OF SOILS
AFTER QUAKE MICROZONING MAP ‐ PISCO
Zone I: with load capacity between 2.0 kg/cm2 to 3.5 kg/cm2 and natural periods less than 0.1 sec.
Zone II: with load capacity between 1.5 kg/cm2 to 2.0 kg/cm2and natural periods less than 0.1 sec.
Zone III: with load capacity between 0.8 kg/cm2 to 1.0 kg/cm2and natural periods between 0.1 sec to 0.16 sec.
Zone IV‐A: conformed of soils of debris and wet mud, Zone IV‐B: wet, loose sand with high liquefaction potential

PROGRESS AND IMPLEMENTATION OF RESULTSOF SATREPS PROJECT
ACTIVITIES DEVELOPED G1 ‐ Seismology
• Seismic monitoring by the cismid ground motion network at lima city
• Ground response analysis for lima city
• Ground motion accelerograph instalation in tacna city
• Ground response analysis for tacna city
• Updating of the ground motion network monitoring center
• Advice to SENCICO for improvement of the peruvianseismic code

CISMID’S STRONG GROUND MOTION NETWORK AT LIMA CITY
0
50
100
150
200
250
0 500 1000 1500 2000 2500 3000 3500
DEPT
H (m
)
SHEAR WAVE VELOCITY (m/s)
EMO
0
50
100
150
200
250
0 500 1000 1500 2000
DEPT
H (m
)
SHEAR WAVE VELOCITY (m/s)
MOL
0
50
100
150
200
250
0 500 1000 1500 2000
DEPT
H(m)
SHEAR WAVE VELOCITY (m/s)
CSM
0
50
100
150
200
250
0 500 1000 1500 2000
DEPT
H (m
)
SHEAR WAVE VELOCITY (m/s)
PPI
0
200
400
600
800
1000
0 500 1000 1500 2000 2500 3000 3500
DEPT
H (m
)
SHEAR VELOCITY (m/s)
CMA
0
200
400
600
800
1000
0 500 1000 1500 2000 2500 3000 3500
DEPT
H (m
)
SHEAR WAVE VELOCITY (m/s)
VSV

GPS ANTENNA
ACCELEROGRAPH INSTALLATION AT UPT STATION ‐ TACNA CITY
PROFILES DISTRICT
TAC1, TAC3, TAC5 CIUDAD NUEVA
TAC6 TACNA
TAC2, TAC4 POCOLLAY
GROUND RESPONSE ANALYSIS FOR TACNA CITY

REAL TIME MONITORING OF GROUND MOTION ACCELEROGRAPHS ‐ REDACIS
IMPROVEMENT OF SEISMIC NEW STANDARDS WITH SATREPS OUTPUTS TARGET RESPONSE SPECTRA FOR SEISMIC ZONE 3 IN PERU
0.0
0.2
0.4
0.6
0.8
1.0
1.2
1.4
1.6
0.0 0.5 1.0 1.5 2.0 2.5 3.0 3.5 4.0
AC
EL
ER
AC
IÓN
ES
PE
CT
RA
L (
g)
PERIODO (s)
COMPARACIÓN DE ESPECTROS DE DISEÑO - E-030 - IBC - EPU - TR=475 AÑOS
Norma E030 Suelo Tipo 1
Norma E030 Suelo Tipo 2
Norma E030 Suelo Tipo 3
IBC Suelo Tipo B
IBC Suelo Tipo C
IBC Suelo Tipo D
Espectro Peligro Uniforme Suelo Tipo B
Espectro Peligro uniforme Suelo Tipo C
Espectro Peligro Uniforme Suelo Tipo D

IMPLEMENTACION DE LA REDSSAT - IGP
ACTIVITIES DEVELOPED G2 ‐ Tsunami
• Elaborate tsunami scenarios using the seismic source.
• To develop propagation and inundation models
• Evaluate the probable impact over the buildings.
• Propose countermeasures to reduce the impact.

TSUNAMI SIMULATION FOR EACH EARTHQUAKE SCENARIO
Propagation and Inundation modeling for the 4th Scenario
ReGiD, IRIDeS, Tohoku University
ReGiD, IRIDeS, Tohoku University
TSUNAMI SIMULATION FOR EACH EARTHQUAKE SCENARIO
Model_01
Max. = 6.87
Model_02
Max. = 7.82
Model_03
Max. = 6.46
Model_04
Max. = 7.98
Model_05
Max. = 6.09
Model_06
Max. = 7.55
Model_07
Max. = 6.93
0 1 2 3 4 5 6 7 8 9 10
Inund. depth (m)
Model_08
Max. = 6.21
0 1 2 3 4 5 6 7 8 9 10
Inund. depth (m)
Model_09
Max. = 7.00
0 1 2 3 4 5 6 7 8 9 10
Inund. depth (m)
Model_10
Max. = 6.15
0 1 2 3 4 5 6 7 8 9 10
Inund. depth (m)
Model_11
Max. = 7.86
0 1 2 3 4 5 6 7 8 9 10
Inund. depth (m)
Model_12
Max. = 6.59
0 1 2 3 4 5 6 7 8 9 10
Inund. depth (m)

DAMAGE ESTIMATION – La Punta
B. Adriano, E. Mas, S. Koshimura, Y. Fujii (2013). Proceedings of International Sessions in Coastal Engineering, JSCE, Vol.4, 2013, JAPAN
Applying fragility curve (FC) for a probabilistic estimation
Low Medium High
RC 54 32 0
Masonry 35 399 113
Wood 3 9 126
Total 92 440 239
Suppasri et al, 2012 Nat Hazards
Avrg. S.D. Max Avrg. S.D. Max Avrg. S.D. MaxKids 38 2 42 4 1 7 4 1 7Teens 29 3 34 4 1 7 4 1 8Adult 28 1 30 4 0 5 4 0 5Elder 47 1 50 4 1 6 4 1 6Car 32 34 87 - - - 34 35 100
Total (pers.) 271 - - 16 - - 153 - -
Horizontal Vertical Horiz. & VerticalType
(*) Unit: person / vehicle
Casualty Estimation Results
SIMULATION OF HORIZONTAL – VERTICALEVACUATION AND CASUALTIES ASSESTMENT

ACTIVITIES DEVELOPED G3 ‐ Buildings
• Implementation of seismic monitoring building network
• Verification of materials for masonry buildings
• Implementation of data base for masonry & concrete walls
• Test of walls considering perpendicular wall contribution
NATIONAL UNIVERSITY OF ENGINEERINGFACULTY OF CIVIL ENGINEERING
JAPAN-PERU CENTER FOR EARTHQUAKEENGINEERING RESEARCH ANDDISASTER MITIGATION - CISMID
ITK1‐00x (CentUNI)ITK2‐00x (G2‐FIC)
ITK3‐00x (HOSP)3 Buildings in Lima
ITK Sensor Building Monitoring Network

Material conventional. Widely used for housing• Low cost• Good sound and heat insulation• Easy availability of materials and
skilled labour
MASONRY BUILDINGS
TEST PROGRAM
Direct shear specimen(48 specimens)
Wallets(48 specimens)
Prism(48 specimens)
0
10000
20000
30000
40000
50000
60000
70000
80000
0 50 100 150
E (kg/cm
2)
Compresion Stress (kg/cm2)
Artesanal
Industrial
E= 500 f´m Current value of NTE‐070 Standards should be modified
E = 439f'm
EXPERIMENTAL DATABASE
OF MASONRYWALLS TEST
Typical Wall
WS-SATREPS March, 2014 @ Tokyo, Japan
QUAD-LINEAR MODEL
• 4 Linear segments
• Craking Point
• Yielding Point
• Maximun Point
• Ultimate Point

Cyclic Load Test Plane and H – Masonry and Low Ductility Concrete Wall
‐15
‐10
‐5
0
5
10
15
1
201
401
601
801
1,001
1,201
1,401
1,601
1,801
2,001
2,201
2,401
2,601
2,801
3,001
3,201
3,401
3,601
3,801
4,001
4,201
4,401
4,601
4,801
5,001
5,201
5,401
5,601
5,801
6,001
6,201
6,401
6,601
6,801
7,001
7,201
7,401
-10.00
-8.00
-6.00
-4.00
-2.00
0.00
2.00
4.00
6.00
8.00
10.00
-0.015 -0.012 -0.009 -0.006 -0.003 0 0.003 0.006 0.009 0.012 0.015S
tres
s (k
g/c
m2)
Drift
CISMID/FIC/UNI - SATREPS Confined Masonry Wall TestsInfluence of Brick type use- Thickness 15 cm
Comparison with Plane and H wall
SolidHandmade
SolidFactory
TubularFactory
ACTIVITIES DEVELOPED G4 – Damage Assessment
• Geo‐spatial dataset construction from satellite imagery (PRISM,Landsat, IKONOS, WV‐2, etc.)
• Building inventory construction and vulnerability assessmentusing spatial information such as satellite image and censusdata
• Building damage estimation for scenario earthquake based oninventory data
• Development of damage detection methodologies usingremotely sensed data

Damage Assessment of Scenario Earthquake
Scenario Earthquake
Building Inventory• Field survey• GIS and Remote sensing data
Ground Motion
Fragility Curve
Building Damage Distribution
Flow of Building Damage Assessment
(Tokyo Tech., Chiba Univ. and CISMID)
Building Damage Ratio
INEI Census Data
CISMID Field Survey Data・Building Stories, Structure, Use typeof typical block.
Lima 11 districts (5500 blocks)(2007~)
Stories:16FStructure:RCUse:Apartment
Satellite Data・Digital surface model(DSM) by Stereo images to estimate building height
whole Lima (66000blocks)(2006~2008)
+ ⇒
Block
EstimatedHeight ofblock
Field Survey Data・Number of buildings, Stories, Household, and Use type
Lima 8 districts (50 block )(2010~2013)
Block
+
+
+
Block
Whole Lima (75000blocks)(2007)
Social Class1~5 (Low~high)
EstimatedHeight(m)

Total number of households in Lima: 1,840,000
‐ Adobe etc: 290,000 (A)
‐ Low earthquake‐resistant masonry: 370,000 (M1+M2)
‐ High earthquake‐resistant masonry: 1,100,000 (M3+M4)
‐ RC building: 80,000 (M5+M6)
Ratio of Low Earthquake‐resistant Building ( A + M1 + M2 ) / ALL
Distribution of Vulnerable Buildings
Adobe etc.(Low-rise)
Non‐engineered masonry (Low-rise)
Reinforced or confined masonry with flexible slabs (Low-rise)
Reinforced or confined masonry with rigid slabs(Low-rise) (Mid-rise)
Reinforced concrete frames(Mid-rise) (High-rise)
M1
M2
M3 M4
M5 M6
ABuilding Construction TypeA
12 broadband slip models
9 possible starting points considering of rupture for each slip model
Scenario Earthquake
Pulido (2013) estimated PGA maps of 108 (12 x 9) scenario earthquakes, their average, and standard deviation
Mw 8.9 Gigantic Earthquake
MAX : 684gal
5km
MAX : 1036gal
Average + one s.d.
5km
Average
PGA(cm/s2)PGA(cm/s2)
Ground Motion (PGA Map)
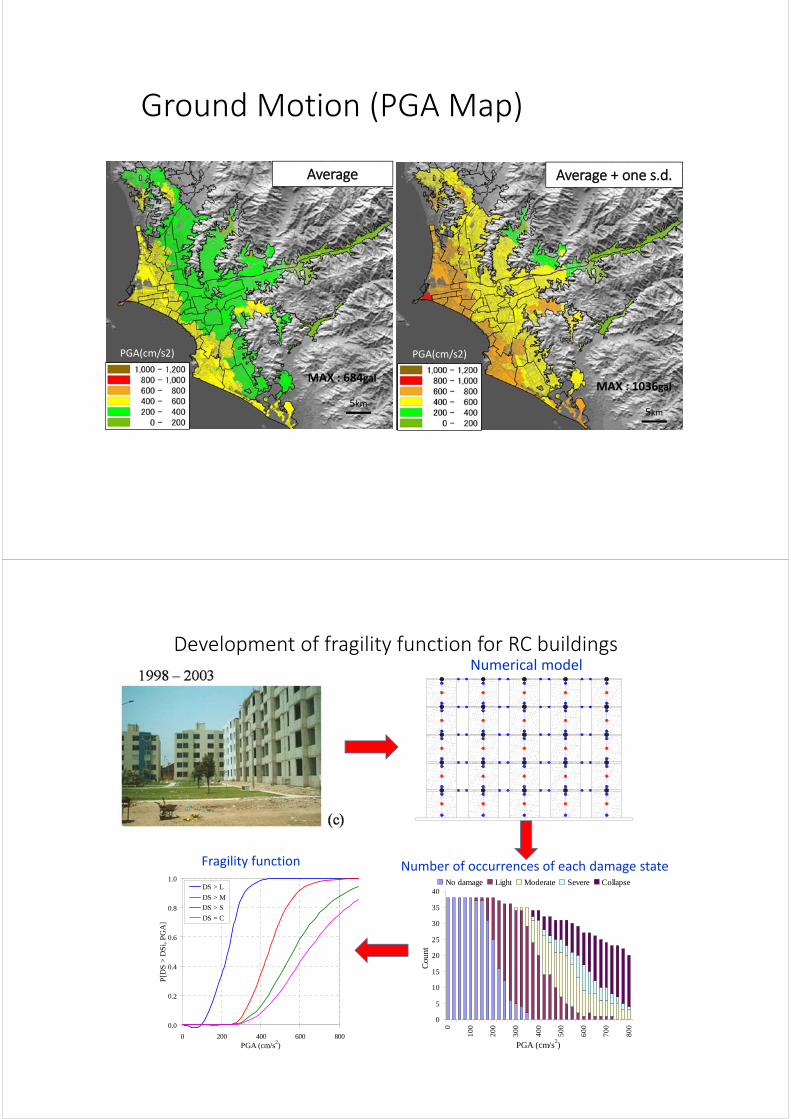
Development of fragility function for RC buildings
Numerical model
0
5
10
15
20
25
30
35
40
0
100
200
300
400
500
600
700
800
PGA (cm/s2)
Cou
nt
No damage Light Moderate Severe Collapse
Number of occurrences of each damage state
0.0
0.2
0.4
0.6
0.8
1.0
0 200 400 600 800PGA (cm/s2)
P[D
S >
DS
i, P
GA
]
DS > L
DS > M
DS > S
DS = C
Fragility function

0%
20%
40%
60%
80%
100%
0 200 400 600 800 1000 1200
Pro
bab
ility
of
Dam
age (%)
(1)(2)
(3)(4)
(5)
(1) & (3): Matsuzaki et al(2013)(4) & (5): Quiroz and Maruyama (2014)(2): Estimated from (1)&(3)
Classification of visual interpretation:
By EMS1998
Classification of field survey:
By CISMID
Grade1 Fall of small piecesonly
SIN DAÑO(No damage)
Grade2 Moderate non-structural damage
LEVE (Slight damage)
Grade3 Large cracks, non-structural damage
SEVERO (moderately-
Severe)
Grade4 Serious failure of walls, partial failure of roofs and floors
GRAVE(Serious)
Grade5 Total collapse
Fragility Curve (Serious Damage)Probability
PGA (cm/s/s)
(
(
(
(
(
(1) Adobe etc. (A)
(2) Low quake‐resistant masonry (M1+M2)
(3) High quake‐resistant masonry (M3+M4)
(4) RC mid‐rise building (M5)
(5) RC high‐rise building (M6)
Damage EstimationTotal Number of Serious Damage Households : 430,000
PGA (Average + one s.d.)
Ratio of Low Earthquake‐resistant
Building ( A + M1 + M2 ) / ALL
Ground Motion Map (PGA)

Synthetic Aperture Radar (SAR) Observation for Earthquake Damage Detection
ALOS/PALSAR Images
(a) 2007/7/12 [before Earthq.] (b) 2007/8/27 [after Earthq.]
Schematic Figure of Backscattering Characteristics of Buildings
ACTIVITIES DEVELOPED G5 – Disaster Mitigation Planning
1. Formulate Land-use Policies for Disaster Mitigation
2. Develop Local Disaster Mitigation Plans for the Study Areas
3. Awareness Raising and Dissemination Activities

• POPULATION RESETTLEMENT ACT FOR AREAS WITH VERYHIGH RISK CAN NOT BE MITIGATED.
Law 29869. Regulated on October 23, 2013 by SupremeDecree No. 115-2013-PCM
Local governments will submitted to Ministry of Housing andSanitation, the feasibility of the resettlement plan. Otherwise,suggest measures to reduce damage to any disaster.
1. Formulate Land-use Policies for DisasterMitigation
On going Activities:
• Standard for Construction Earthquake Resistant (in adoption).National Building Regulations. Ministry of Housing
• Guidelines for mapping seismic hazard. CENEPRED
• Technical guidance for the post-disaster damage assessment usinggeoespacial information. INDECI-CISMID
• GUIDELINES FOR IMPLEMENTATION TSUNAMIDRILLS FOR NATIONWIDEDIRECTIVE Nº 001-2014-INDECI/10.3 (formulation)This directive regulates the steps for the development of drillsTsunami Evacuation in coastal areas. It also includesguidelines for vertical evacuation in coastal urban areas withbuildings over 3 floors.
2. Develop Local Disaster Mitigation Plansfor the Study Areas

New macrozonation
• Includes work developed by researches fromSATREPS Project.
• Changes in acceleration values. (Proposed by G1)
2. Develop Local Disaster Mitigation Plansfor the Study Areas

• 2 AWARENESS CENTER IN PERU
• Lima Awareness Center in CISMID• Arequipa Awareness Center in INDECI
Installation Place: CISMID Awareness Center Hall
INDECI Arequipa Public Awareness Center
Schedule: Procurement- June and July, 2013Delivery- in February, 2014
INDECI ArequipaCISMID
3. Awareness Raising and Dissemination Activities

EWBS PROJECT
DHN
IGP
COENControl
PC
WL LAN
Internet
EWBSServer
DigitalTV
UP Link
IRD
INDECICOEN IRTP
COE• Activación• Código de Área• Mensaje de Texto
MTC - IRTP
Receptor
TRANSMISSION STATIONS
Cerro Azul
Atico
Caleta Grau
La Planchada
TIDE GAGES
Lima
Trujillo
Yungay
Cañete
Pisco
Arequipa
Camaná
Ilo
La Cruz
Bayovar
Huarmey
Huacho

Land use: Location of Schools, Hospitals, Recreational
Technical Tools for planning and managementthe risk in Peru Using SATREPS OUTPUTS
RISK REDUCTION PLAN BY SECTOR FOR EXAMPLE: LOCAL GOVERNMENT
NATIONAL PLA
N OF RISK
RED
UCTION
G1: Superficial Movement Microzoning Map
G2: Superficial Movement Tsunami Propagation Map
G3: Geoespacial Data Base Capacity & Behavior ofBuilding = Vulnerability
G4: Damage Evaluation & Detection Risk Map
G5: Disaster Mitigation Plan Stakeholder Plan
Vertical and Horizontal Evacuation Routes and countermeasures
Vulnerability of Buildings – Retrofit policiesLimit of Story Height – Recommendations for New buildings
Identification of Risk zones – Plans for Relocations Identification of number of casualties prior event
Plans for countermeasures for disaster attentionEmergency budget for restoration‐ Emergency action plan
Final Remarks
• The goals has been achieved on SATREPS project.
• The develop of methodologies and rules for the evaluation of theearthquake and tsunami risk under SATREPS project, has beenadopted for the National Government by the Program PREVAEDPP‐068 and assure sustainability on time for the project.
• The dissemination of the achievements of SATREPS project must beconducted to promote a disaster risk reduction culture amongdecision makers and also general public for safe and sustainable cities

GraciasThank Youありがとう
VISIT PERU
Machu Picchu ‐ Cuzco Santa Catalina ‐ Arequipa
San IsidroLima