Country Report Peru c174
7
To access data, charts and background documentation, visi t: http://www.govindicators.org The data and research reported here do not reflect the official views of the World Bank, its Executive Directors, or the countries they represent. The WGI are not used by the World Bank Group to allocate resources. Country Data Report for P ERU, 1996-2009 This Data Report provides a summary of the six aggregate governance indicators, together with all of the publicly-a vailable disaggregate d data on which the aggregate indicators are based. The underlying data as well as methodological issues are described more fully in "The Worldwide Governance Indicators: Methodology , and Analytical Issues" (September 2010). The Report displays the country's performance for all available years between 1996 and 2009 in six governance dimensions: i) Voice & Accountabilit y, ii) Political Stability and Lack of Violence/Terr orism, iii) Government Effectiveness, iv) Regulatory Quality , v) Rule of Law, and vi) Control of Corruption. Each page shows the country's percentile rank on one of the six governance indic ators. Percentile ranks indicate the percentage of countries worldwide that rate below the selected country. Higher values thus indicate better governance ratings. The graph also reports the margins of error displayed in the line charts by dashed lines, and corresponding to a 90% confidence interval. This means that there is a 90 percent probability that governan ce is within the indicated range. Underneath the line charts, the Report also displays data from all the underlying sources used for that indicator. Individual ratings have been rescaled to run from 0 (low) to 1 (high). These scores are comparable over time and across countries since most individual measures are based on similar methodologies over time. Scores from different individual indicators are not however directly comparable with each other since the different data sources use different units and cover different sets of countries. The data from the individual indicato rs are in fact further rescaled to make them comparable across data sources before cons tructing the aggregate governance indicators. Note that for some variables we present an "NP", where "NP" stands for "Not Public", because the data is confidential and cannot be publicly disclosed at the request of the organizatio ns producing the data. To find out more about each source/organization click on the provided links. More information about each of the underlying organization/source can also be found in the website. Disclaimer Page 1
-
Upload
feresdekyrea -
Category
Documents
-
view
221 -
download
0
Transcript of Country Report Peru c174

8/8/2019 Country Report Peru c174
http://slidepdf.com/reader/full/country-report-peru-c174 1/7
To access data, charts and background documentation, visit:
http://www.govindicators.org
The data and research reported here do not reflect the official views of the World Bank, its Executive Directors, or the countries they represent. The WGI are not
used by the World Bank Group to allocate resources.
Country Data Report for PERU, 1996-2009
This Data Report provides a summary of the six aggregate governance indicators, together with all of the publicly-available disaggregated data
on which the aggregate indicators are based. The underlying data as well as methodological issues are described more fully in "The Worldwide
Governance Indicators: Methodology, and Analytical Issues" (September 2010).
The Report displays the country's performance for all available years between 1996 and 2009 in six governance dimensions: i) Voice &
Accountability, ii) Political Stability and Lack of Violence/Terrorism, iii) Government Effectiveness, iv) Regulatory Quality, v) Rule of Law, and vi)
Control of Corruption. Each page shows the country's percentile rank on one of the six governance indicators. Percentile ranks indicate the
percentage of countries worldwide that rate below the selected country. Higher values thus indicate better governance ratings. The graph also
reports the margins of error displayed in the line charts by dashed lines, and corresponding to a 90% confidence interval. This means that there
is a 90 percent probability that governance is within the indicated range.
Underneath the line charts, the Report also displays data from all the underlying sources used for that indicator. Individual ratings have been
rescaled to run from 0 (low) to 1 (high). These scores are comparable over time and across countries since most individual measures are based
on similar methodologies over time. Scores from different individual indicators are not however directly comparable with each other since the
different data sources use different units and cover different sets of countries. The data from the individual indicators are in fact further rescaled
to make them comparable across data sources before constructing the aggregate governance indicators. Note that for some variables we
present an "NP", where "NP" stands for "Not Public", because the data is confidential and cannot be publicly disclosed at the request of the
organizations producing the data. To find out more about each source/organization click on the provided links. More information about each of
the underlying organization/source can also be found in the website.
Disclaimer
Page 1

8/8/2019 Country Report Peru c174
http://slidepdf.com/reader/full/country-report-peru-c174 2/7
PERU, 1996-2009
Aggregate Indicator: Voice & Accountabillity
Individual Indicators used to construct Voice & Accountability
Code Source Website 1996 1998 2000 2002 2003 2004 2005 2006 2007 2008 2009
AFR Afrobarometer http://www.afrobarometer.org .. .. .. .. .. .. .. .. .. .. ..
BTI Bertelsmann Transformation Index http://www.bertelsmann-transformation-index.de/ .. .. .. 0.58 0.58 0.67 0.67 0.67 0.63 0.63 0.65
CCR Freedom House Countries at the Crossroads http://www.freedomhouse.org .. .. .. .. .. 0.66 0.66 0.62 0.62 0.62 0.62
EIU Economist Intelligence Unit http://www.eiu.com 0.44 0.44 0.38 0.44 0.44 0.38 0.38 0.49 0.49 0.50 0.50
FRH Freedom House http://www.freedomhouse.org 0.51 0.39 0.56 0.70 0.71 0.68 0.68 0.67 0.66 0.66 0.66
GCS World Economic Forum Global Competitiveness Survey http://www.weforum.org .. .. 0.32 0.38 0.38 0.37 0.38 0.48 0.45 0.48 0.47
GII Global Integrity Index http://www.globalintegrity.org/ .. .. .. .. .. .. .. .. 0.61 0.61 0.61
GWP Gallup World Poll http://www.gallupworldpoll.com.. .. .. .. .. .. .. 0.38 0.31 0.26 0.26
HUM Cingranelli-Richards (CIRI) Human Rights Database http://www.humanrightsdata.com 0.50 0.63 0.63 0.63 0.38 0.63 0.75 0.75 0.75 0.88 0.88
IFD IFAD Rural Sector Performance Assessments http://www.ifad.org .. .. .. .. .. 0.66 0.72 0.73 0.67 0.69 0.65
IPD Institutional Profiles Database http://www.cepii.fr/ .. .. .. .. .. .. .. 0.72 0.72 0.72 0.71
IRP IREEP African Electoral Index http://www.ireep.org .. .. .. .. .. .. .. .. .. .. ..
LBO Latinobarometro http://www.latinobarometro.org 0.32 0.24 0.25 0.24 0.09 0.14 0.15 0.24 0.17 0.14 0.19
MSI IREX Media Sustainability Index http://www.irex.org .. .. .. .. .. .. .. .. .. .. ..
OBI International Budget Project Open Budget Index http://www.internationalbudget.org/ .. .. .. .. .. .. 0.77 0.77 0.77 0.66 0.66
PRS Political Risk Services International Country Risk Guide http://www.prsgroup.com 0.25 0.33 0.75 0.83 0.83 0.83 0.83 0.83 0.83 0.83 0.79
RSF Reporters Without Borders Press Freedom Index http://www.rsf.org .. .. .. 0.91 0.90 0.63 0.69 0.74 0.67 0.74 0.82
VAB Vanderbilt University Americas Barometer Survey http://www.lapopsurveys.org .. .. .. .. .. .. .. 0.35 0.35 0.38 0.38
WCY Institute for management & development World Competitiveness Yearbook http://www.imd.ch .. .. .. .. .. .. .. .. .. 0.43 0.26
WMO Global Insight Business Conditions and Risk Indicators http://www.globalinsight.com .. 0.44 0.31 0.50 0.44 0.40 0.44 0.44 0.44 0.50 0.44
0
10
20
30
40
50
60
70
80
90
100
1996 1998 2000 2002 2003 2004 2005 2006 2007 2008 2009
P e r c e n t i l e R a n k
Page 2

8/8/2019 Country Report Peru c174
http://slidepdf.com/reader/full/country-report-peru-c174 3/7
PERU, 1996-2009
Aggregate Indicator: Political Stability and Absence of Violence
Individual Indicators used to construct Political Stability and Absence of Violence
Code Source Website 1996 1998 2000 2002 2003 2004 2005 2006 2007 2008 2009
DRI Global Insight Global Risk Service http://www.globalinsight.com 0.65 0.63 0.59 0.67 0.63 0.68 0.68 0.72 0.77 0.76 0.76
EIU Economist Intelligence Unit http://www.eiu.com 0.40 0.50 0.25 0.45 0.35 0.40 0.35 0.45 0.48 0.50 0.50
GCS World Economic Forum Global Competitiveness Survey http://www.weforum.org .. .. .. 0.49 0.64 0.65 0.60 0.55 0.72 0.65 0.71
HUM Cingranelli-Richards Human Rights Database & Political Terror Scale http://www.humanrightsdata.com 0.21 0.58 0.50 0.56 0.50 0.56 0.65 0.58 0.77 0.63 0.63
IJT iJET Country Security Risk Ratings https://worldcue.ijet.com/tic/login.jsp .. .. .. .. .. 0.50 0.50 0.50 0.50 0.50 0.25
IPD Institutional Profiles Database http://www.cepii.fr/ .. .. .. .. .. .. .. 0.56 0.56 0.56 0.67
PRS Political Risk Services International Country Risk Guide http://www.prsgroup.com 0.63 0.63 0.74 0.56 0.56 0.59 0.58 0.59 0.61 0.57 0.58
WCY Institute for management & development World Competitiveness Yearbook http://www.imd.ch .. .. .. .. .. .. .. .. .. 0.53 0.49
WMO Global Insight Business Conditions and Risk Indicators http://www.globalinsight.com .. 0.50 0.44 0.38 0.38 0.38 0.38 0.44 0.44 0.44 0.38
0
10
20
30
40
50
60
70
80
90100
1996 1998 2000 2002 2003 2004 2005 2006 2007 2008 2009
P e r c e n t i l e R a n k
Page 3
8/8/2019 Country Report Peru c174
http://slidepdf.com/reader/full/country-report-peru-c174 4/7
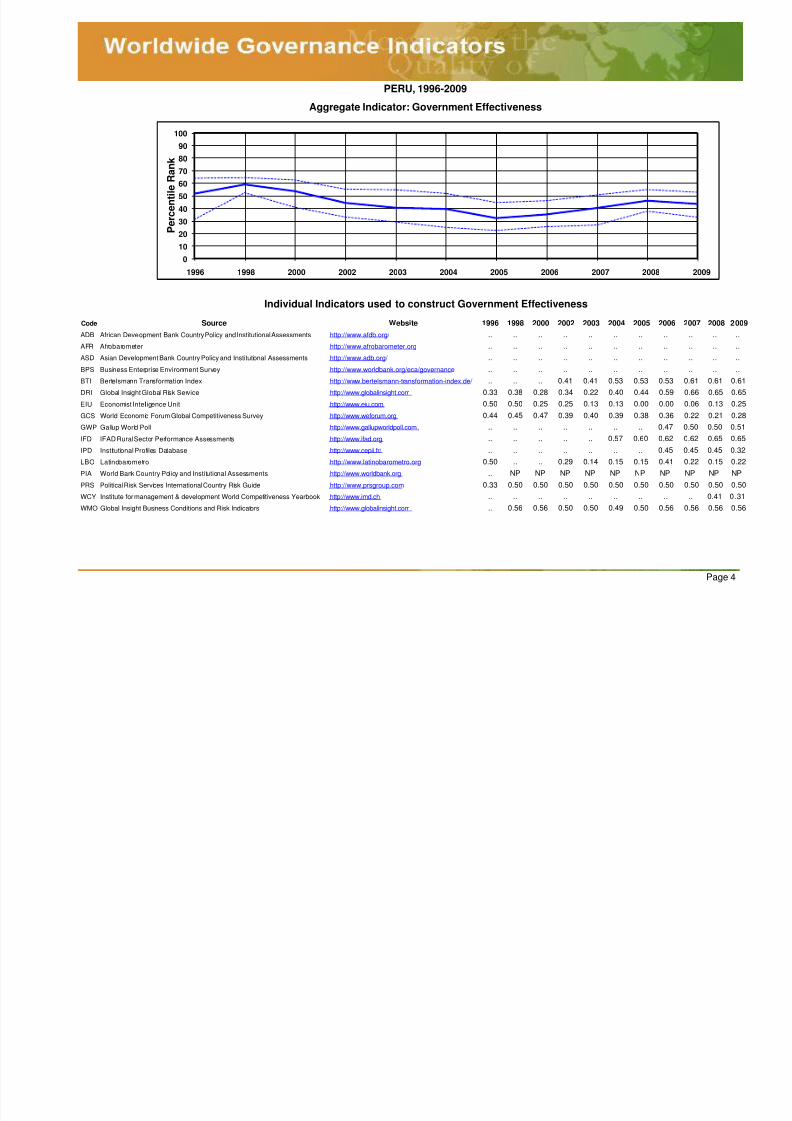
PERU, 1996-2009
Aggregate Indicator: Government Effectiveness
Individual Indicators used to construct Government Effectiveness
Code Source Website 1996 1998 2000 2002 2003 2004 2005 2006 2007 2008 2009
ADB African Development Bank Country Policy and Institutional Assessments http://www.afdb.org/ .. .. .. .. .. .. .. .. .. .. ..
AFR Afrobarometer http://www.afrobarometer.org .. .. .. .. .. .. .. .. .. .. ..
ASD Asian Development Bank Country Policy and Institutional Assessments http://www.adb.org/ .. .. .. .. .. .. .. .. .. .. ..
BPS Business Enterprise Environment Survey http://www.worldbank.org/eca/governance .. .. .. .. .. .. .. .. .. .. ..
BTI Bertelsmann Transformation Index http://www.bertelsmann-transformation-index.de/ .. .. .. 0.41 0.41 0.53 0.53 0.53 0.61 0.61 0.61
DRI Global Insight Global Risk Service http://www.globalinsight.com 0.33 0.38 0.28 0.34 0.22 0.40 0.44 0.59 0.66 0.65 0.65
EIU Economist Intelligence Unit http://www.eiu.com 0.50 0.50 0.25 0.25 0.13 0.13 0.00 0.00 0.06 0.13 0.25
GCS World Economic Forum Global Competitiveness Survey http://www.weforum.org 0.44 0.45 0.47 0.39 0.40 0.39 0.38 0.36 0.22 0.21 0.28
GWP Gallup World Poll http://www.gallupworldpoll.com .. .. .. .. .. .. .. 0.47 0.50 0.50 0.51
IFD IFAD Rural Sector Performance Assessments http://www.ifad.org .. .. .. .. .. 0.57 0.60 0.62 0.62 0.65 0.65
IPD Institutional Profiles Database http://www.cepii.fr/ .. .. .. .. .. .. .. 0.45 0.45 0.45 0.32
LBO Latinobarometro http://www.latinobarometro.org 0.50 .. .. 0.29 0.14 0.15 0.15 0.41 0.22 0.15 0.22
PIA World Bank Country Policy and Institutional Assessments http://www.worldbank.org .. NP NP NP NP NP NP NP NP NP NP
PRS Political Risk Services International Country Risk Guide http://www.prsgroup.com 0.33 0.50 0.50 0.50 0.50 0.50 0.50 0.50 0.50 0.50 0.50
WCY Institute for management & development World Competitiveness Yearbook http://www.imd.ch .. .. .. .. .. .. .. .. .. 0.41 0.31
WMO Global Insight Business Conditions and Risk Indicators http://www.globalinsight.com .. 0.56 0.56 0.50 0.50 0.49 0.50 0.56 0.56 0.56 0.56
0
10
20
30
40
50
60
70
80
90
100
1996 1998 2000 2002 2003 2004 2005 2006 2007 2008 2009
P e r c e n t i l e R a n k
Page 4
8/8/2019 Country Report Peru c174
http://slidepdf.com/reader/full/country-report-peru-c174 5/7
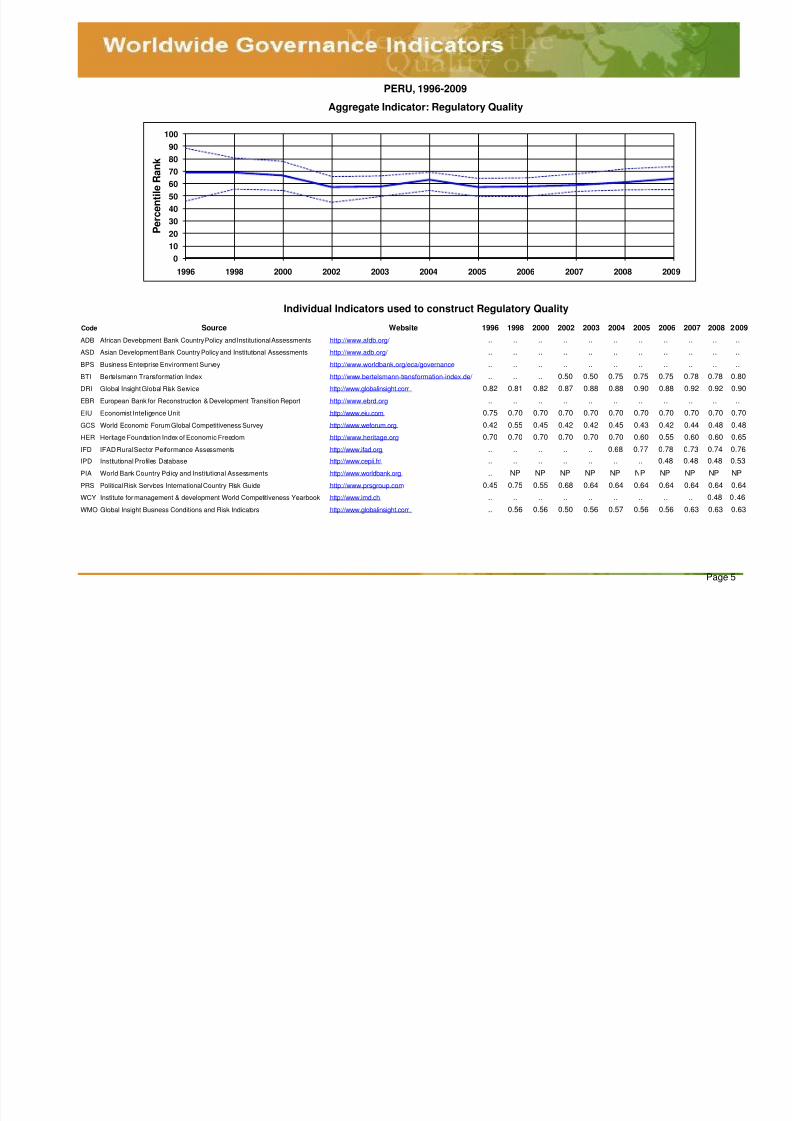
PERU, 1996-2009
Aggregate Indicator: Regulatory Quality
Individual Indicators used to construct Regulatory Quality
Code Source Website 1996 1998 2000 2002 2003 2004 2005 2006 2007 2008 2009
ADB African Development Bank Country Policy and Institutional Assessments http://www.afdb.org/ .. .. .. .. .. .. .. .. .. .. ..
ASD Asian Development Bank Country Policy and Institutional Assessments http://www.adb.org/ .. .. .. .. .. .. .. .. .. .. ..
BPS Business Enterprise Environment Survey http://www.worldbank.org/eca/governance .. .. .. .. .. .. .. .. .. .. ..
BTI Bertelsmann Transformation Index http://www.bertelsmann-transformation-index.de/ .. .. .. 0.50 0.50 0.75 0.75 0.75 0.78 0.78 0.80
DRI Global Insight Global Risk Service http://www.globalinsight.com 0.82 0.81 0.82 0.87 0.88 0.88 0.90 0.88 0.92 0.92 0.90
EBR European Bank for Reconstruction & Development Transition Report http://www.ebrd.org .. .. .. .. .. .. .. .. .. .. ..
EIU Economist Intelligence Unit http://www.eiu.com 0.75 0.70 0.70 0.70 0.70 0.70 0.70 0.70 0.70 0.70 0.70GCS World Economic Forum Global Competitiveness Survey http://www.weforum.org 0.42 0.55 0.45 0.42 0.42 0.45 0.43 0.42 0.44 0.48 0.48
HER Heritage Foundation Index of Economic Freedom http://www.heritage.org 0.70 0.70 0.70 0.70 0.70 0.70 0.60 0.55 0.60 0.60 0.65
IFD IFAD Rural Sector Performance Assessments http://www.ifad.org .. .. .. .. .. 0.68 0.77 0.78 0.73 0.74 0.76
IPD Institutional Profiles Database http://www.cepii.fr/ .. .. .. .. .. .. .. 0.48 0.48 0.48 0.53
PIA World Bank Country Policy and Institutional Assessments http://www.worldbank.org .. NP NP NP NP NP NP NP NP NP NP
PRS Political Risk Services International Country Risk Guide http://www.prsgroup.com 0.45 0.75 0.55 0.68 0.64 0.64 0.64 0.64 0.64 0.64 0.64
WCY Institute for management & development World Competitiveness Yearbook http://www.imd.ch .. .. .. .. .. .. .. .. .. 0.48 0.46
WMO Global Insight Business Conditions and Risk Indicators http://www.globalinsight.com .. 0.56 0.56 0.50 0.56 0.57 0.56 0.56 0.63 0.63 0.63
0
10
20
30
40
50
60
70
80
90100
1996 1998 2000 2002 2003 2004 2005 2006 2007 2008 2009
P e r c e n t i l e R a n k
Page 5
8/8/2019 Country Report Peru c174
http://slidepdf.com/reader/full/country-report-peru-c174 6/7
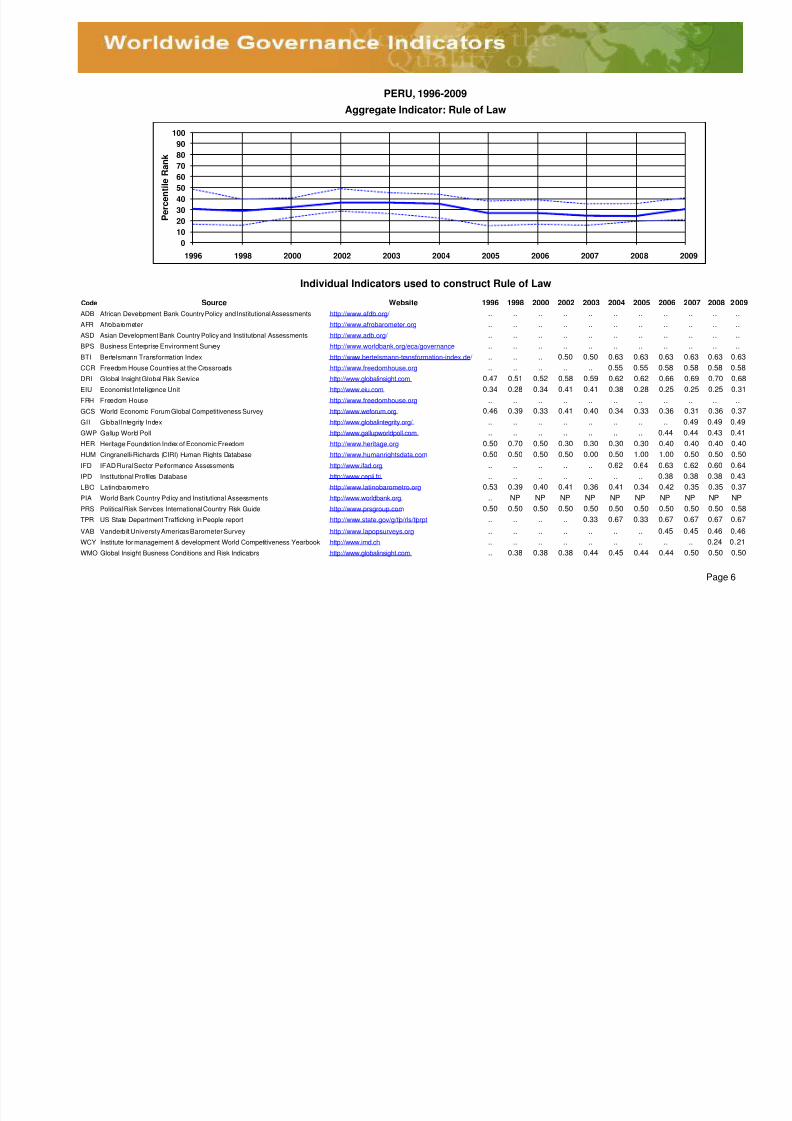
PERU, 1996-2009
Aggregate Indicator: Rule of Law
Individual Indicators used to construct Rule of Law
Code Source Website 1996 1998 2000 2002 2003 2004 2005 2006 2007 2008 2009
ADB African Development Bank Country Policy and Institutional Assessments http://www.afdb.org/ .. .. .. .. .. .. .. .. .. .. ..
AFR Afrobarometer http://www.afrobarometer.org .. .. .. .. .. .. .. .. .. .. ..
ASD Asian Development Bank Country Policy and Institutional Assessments http://www.adb.org/ .. .. .. .. .. .. .. .. .. .. ..
BPS Business Enterprise Environment Survey http://www.worldbank.org/eca/governance .. .. .. .. .. .. .. .. .. .. ..
BTI Bertelsmann Transformation Index http://www.bertelsmann-transformation-index.de/ .. .. .. 0.50 0.50 0.63 0.63 0.63 0.63 0.63 0.63
CCR Freedom House Countries at the Crossroads http://www.freedomhouse.org .. .. .. .. .. 0.55 0.55 0.58 0.58 0.58 0.58
DRI Global Insight Global Risk Service http://www.globalinsight.com 0.47 0.51 0.52 0.58 0.59 0.62 0.62 0.66 0.69 0.70 0.68
EIU Economist Intelligence Unit http://www.eiu.com 0.34 0.28 0.34 0.41 0.41 0.38 0.28 0.25 0.25 0.25 0.31
FRH Freedom House http://www.freedomhouse.org .. .. .. .. .. .. .. .. .. .. ..
GCS World Economic Forum Global Competitiveness Survey http://www.weforum.org 0.46 0.39 0.33 0.41 0.40 0.34 0.33 0.36 0.31 0.36 0.37GII Global Integrity Index http://www.globalintegrity.org/ .. .. .. .. .. .. .. .. 0.49 0.49 0.49
GWP Gallup World Poll http://www.gallupworldpoll.com .. .. .. .. .. .. .. 0.44 0.44 0.43 0.41
HER Heritage Foundation Index of Economic Freedom http://www.heritage.org 0.50 0.70 0.50 0.30 0.30 0.30 0.30 0.40 0.40 0.40 0.40
HUM Cingranelli-Richards (CIRI) Human Rights Database http://www.humanrightsdata.com 0.50 0.50 0.50 0.50 0.00 0.50 1.00 1.00 0.50 0.50 0.50
IFD IFAD Rural Sector Performance Assessments http://www.ifad.org .. .. .. .. .. 0.62 0.64 0.63 0.62 0.60 0.64
IPD Institutional Profiles Database http://www.cepii.fr/ .. .. .. .. .. .. .. 0.38 0.38 0.38 0.43
LBO Latinobarometro http://www.latinobarometro.org 0.53 0.39 0.40 0.41 0.36 0.41 0.34 0.42 0.35 0.35 0.37
PIA World Bank Country Policy and Institutional Assessments http://www.worldbank.org .. NP NP NP NP NP NP NP NP NP NP
PRS Political Risk Services International Country Risk Guide http://www.prsgroup.com 0.50 0.50 0.50 0.50 0.50 0.50 0.50 0.50 0.50 0.50 0.58
TPR US State Department Trafficking in People report http://www.state.gov/g/tip/rls/tiprpt .. .. .. .. 0.33 0.67 0.33 0.67 0.67 0.67 0.67
VAB Vanderbilt University Americas Barometer Survey http://www.lapopsurveys.org .. .. .. .. .. .. .. 0.45 0.45 0.46 0.46
WCY Institute for management & development World Competitiveness Yearbook http://www.imd.ch .. .. .. .. .. .. .. .. .. 0.24 0.21
WMO Global Insight Business Conditions and Risk Indicators http://www.globalinsight.com .. 0.38 0.38 0.38 0.44 0.45 0.44 0.44 0.50 0.50 0.50
0
10
20
30
40
50
60
70
80
90
100
1996 1998 2000 2002 2003 2004 2005 2006 2007 2008 2009
P e r c e n t i l e R a n k
Page 6

8/8/2019 Country Report Peru c174
http://slidepdf.com/reader/full/country-report-peru-c174 7/7
PERU, 1996-2009
Aggregate Indicator: Control of Corruption
Individual Indicators used to construct Control of Corruption
Code Source Website 1996 1998 2000 2002 2003 2004 2005 2006 2007 2008 2009
ADB African Development Bank Country Policy and Institutional Assessments http://www.afdb.org/ .. .. .. .. .. .. .. .. .. .. ..
AFR Afrobarometer http://www.afrobarometer.org .. .. .. .. .. .. .. .. .. .. ..
ASD Asian Development Bank Country Policy and Institutional Assessments http://www.adb.org/ .. .. .. .. .. .. .. .. .. .. ..
BPS Business Enterprise Environment Survey http://www.worldbank.org/eca/governance .. .. .. .. .. .. .. .. .. .. ..
BTI Bertelsmann Transformation Index http://www.bertelsmann-transformation-index.de/ .. .. .. .. .. 0.50 0.50 0.50 0.50 0.50 0.50
CCR Freedom House Countries at the Crossroads http://www.freedomhouse.org .. .. .. .. .. 0.46 0.46 0.50 0.50 0.50 0.50
DRI Global Insight Global Risk Service http://www.globalinsight.com 0.45 0.36 0.45 0.63 0.51 0.46 0.30 0.30 0.30 0.30 0.28
EIU Economist Intelligence Unit http://www.eiu.com 0.25 0.25 0.00 0.25 0.25 0.00 0.00 0.25 0.25 0.25 0.25
FRH Freedom House http://www.freedomhouse.org .. .. .. .. .. .. .. .. .. .. ..
GCB Transparency International Global Corruption Barometer Survey http://www.transparency.org .. .. .. .. .. 0.53 0.55 0.59 0.64 0.53 0.55
GCS World Economic Forum Global Competitiveness Survey http://www.weforum.org 0.61 0.42 0.57 0.46 0.47 0.51 0.50 0.53 0.44 0.48 0.42
GII Global Integrity Index http://www.globalintegrity.org/ .. .. .. .. .. .. .. .. 0.03 0.03 0.03
GWP Gallup World Poll http://www.gallupworldpoll.com .. .. .. .. .. .. .. 0.11 0.12 0.14 0.15
IFD IFAD Rural Sector Performance Assessments http://www.ifad.org .. .. .. .. .. 0.56 0.56 0.58 0.62 0.63 0.60
IPD Institutional Profiles Database http://www.cepii.fr/ .. .. .. .. .. .. .. 0.33 0.33 0.33 0.42
LBO Latinobarometro http://www.latinobarometro.org .. .. 0.78 0.74 0.88 0.84 0.86 0.88 0.77 0.83 0.88
PIA World Bank Country Policy and Institutional Assessments http://www.worldbank.org .. NP NP NP NP NP NP NP NP NP NP
PRC Political Economic Risk Consultancy Corruption in Asia http://www.asiarisk.com/ .. .. .. .. .. .. .. .. .. .. ..
PRS Political Risk Services International Country Risk Guide http://www.prsgroup.com 0.50 0.50 0.67 0.33 0.42 0.42 0.42 0.42 0.42 0.42 0.42
VAB Vanderbilt University Americas Barometer Survey http://www.lapopsurveys.org .. .. .. .. .. .. .. 0.20 0.20 0.24 0.24
WCY Institute for management & development World Competitiveness Yearbook http://www.imd.ch .. .. .. .. .. .. .. .. .. 0.24 0.15
WMO Global Insight Business Conditions and Risk Indicators http://www.globalinsight.com .. 0.38 0.38 0.38 0.50 0.50 0.50 0.50 0.50 0.50 0.50
0
10
20
30
40
50
60
70
80
90
100
1996 1998 2000 2002 2003 2004 2005 2006 2007 2008 2009
P e r c e n t i l e R a n k
Page 7