Country of Origin Impact on Consumer Perception of Value ...
82
University of Nebraska - Lincoln University of Nebraska - Lincoln DigitalCommons@University of Nebraska - Lincoln DigitalCommons@University of Nebraska - Lincoln Textiles, Merchandising and Fashion Design: Dissertations, Theses, & Student Research Textiles, Merchandising and Fashion Design, Department of 12-2019 Country of Origin Impact on Consumer Perception of Value in Fast Country of Origin Impact on Consumer Perception of Value in Fast Fashion Fashion Katherine Walter University of Nebraska - Lincoln, [email protected] Follow this and additional works at: https://digitalcommons.unl.edu/textilesdiss Part of the Fashion Business Commons, and the Industrial and Product Design Commons Walter, Katherine, "Country of Origin Impact on Consumer Perception of Value in Fast Fashion" (2019). Textiles, Merchandising and Fashion Design: Dissertations, Theses, & Student Research. 15. https://digitalcommons.unl.edu/textilesdiss/15 This Thesis is brought to you for free and open access by the Textiles, Merchandising and Fashion Design, Department of at DigitalCommons@University of Nebraska - Lincoln. It has been accepted for inclusion in Textiles, Merchandising and Fashion Design: Dissertations, Theses, & Student Research by an authorized administrator of DigitalCommons@University of Nebraska - Lincoln.
Transcript of Country of Origin Impact on Consumer Perception of Value ...

University of Nebraska - Lincoln University of Nebraska - Lincoln
DigitalCommons@University of Nebraska - Lincoln DigitalCommons@University of Nebraska - Lincoln
Textiles, Merchandising and Fashion Design: Dissertations, Theses, & Student Research
Textiles, Merchandising and Fashion Design, Department of
12-2019
Country of Origin Impact on Consumer Perception of Value in Fast Country of Origin Impact on Consumer Perception of Value in Fast
Fashion Fashion
Katherine Walter University of Nebraska - Lincoln, [email protected]
Follow this and additional works at: https://digitalcommons.unl.edu/textilesdiss
Part of the Fashion Business Commons, and the Industrial and Product Design Commons
Walter, Katherine, "Country of Origin Impact on Consumer Perception of Value in Fast Fashion" (2019). Textiles, Merchandising and Fashion Design: Dissertations, Theses, & Student Research. 15. https://digitalcommons.unl.edu/textilesdiss/15
This Thesis is brought to you for free and open access by the Textiles, Merchandising and Fashion Design, Department of at DigitalCommons@University of Nebraska - Lincoln. It has been accepted for inclusion in Textiles, Merchandising and Fashion Design: Dissertations, Theses, & Student Research by an authorized administrator of DigitalCommons@University of Nebraska - Lincoln.

COUNTRY OF ORIGIN IMPACT ON CONSUMER
PERCEPTION OF VALUE IN FAST FASHION
by
Katherine Walter
A THESIS
Presented to the Faculty of
The Graduate College at the University of Nebraska
In Partial Fulfillment of Requirements
For the Degree of Master of Science
Major: Textiles, Merchandising and Fashion Design
Under the Supervision of Professor Jennifer Jorgensen
Lincoln, Nebraska
December, 2019
COUNTRY OF ORIGIN IMPACT ON CONSUMER
PERCEPTION OF VALUE IN FAST FASHION
Katherine Elizabeth Walter, M.S.
University of Nebraska, 2019
Advisor: Jennifer Jorgensen
With fast fashion growing rapidly, insight onto consumers perception of the value for the
country of origin in this sector of the retail industry is a topic that needs to be delved into deeper.
While there are studies over the impact of country of origin and fast fashion separately, the
correlation between these two dimensions has yet to be reviewed. The purpose of this study is to
identify consumers perception of the overall value of fast fashion merchandise based on country
of origin. Through a questionnaire, participants were asked open and closed-ended questions
about specific factors of value based on country of origin in apparel products. These factors
included perceived innovativeness, willingness to buy, perceived price, country familiarity, and
quality. Through Amazon Mechanical Turk, participants were recruited to take this virtual
survey. Because of the popularity of fast fashion with Millennials and their growing purchasing
power, the outcomes of this study are tailored to this generation. The implications of this study
can be used throughout the retail and fashion industries. When decisions of outsourcing or
insourcing products are being made, understanding how the country of origin impacts their
perception of value will provide critical information companies and brands in all retail sectors
can use.

TABLE OF CONTENTS
CHAPTER 1 .................................................................................................................. 1
INTRODUCTION ............................................................................................................. 1
Fast Fashion History ................................................................................................ 2
Global Effect ............................................................................................................ 3
Fast Fashion Around the World ................................................................................ 5
Fast Fashion Revenue ............................................................................................... 5
Fast Fashion Made in America ................................................................................. 6
Economic Impact ...................................................................................................... 7
Fast Fashion Future ................................................................................................. 8
Disadvantages of Fast Fashion ................................................................................. 9
COO ......................................................................................................................... 9
STATEMENT OF CHANGES IN FAST FASHION ................................................................ 10
STATEMENT OF PROBLEM ........................................................................................... 10
DEFINITION OF TERMS ................................................................................................ 11
PRIOR RESEARCH ........................................................................................................ 12
SIGNIFICANCE OF THE STUDY ...................................................................................... 13
CHAPTER 2 ................................................................................................................ 13
LITERATURE REVIEW .................................................................................................. 13
Fast Fashion and Sustainability .............................................................................. 14
COO Effect ............................................................................................................. 14
COO Labeling ........................................................................................................ 16
Quality Perceptions ................................................................................................ 17
COO and Consumer Perception .............................................................................. 19
Consumer Purchasing Decisions ............................................................................ 21
Perceived Innovativeness of Product ....................................................................... 22
Consumer Behavior ................................................................................................ 23
COO Impacting Perceived Price ............................................................................. 23
Design and Workmanship Influence on Perceptions of COO ................................... 26
Differences in Social Class Perceiving COO ........................................................... 27
COO in Developing Countries ................................................................................ 28
COO Impact on Purchasing Behavior in Luxury Brands ......................................... 29
Millennials.............................................................................................................. 31
Millennials Perception of COO ............................................................................... 32
HYPOTHESES .............................................................................................................. 33
THEORY ..................................................................................................................... 34
CHAPTER 3 ................................................................................................................ 35
METHODOLOGY .......................................................................................................... 35
Procedure ............................................................................................................... 37
Data Analysis ......................................................................................................... 40
CHAPTER 4 ................................................................................................................ 41
RESULTS..................................................................................................................... 41
Section 1: Analysis of Millennials ........................................................................... 42

Perception of Value ........................................................................................ 42
Perceived Innovativeness ............................................................................... 43
Willingness to Buy........................................................................................... 44
Perceived Price ............................................................................................... 44
Familiarity of Country’s Product .................................................................... 45
Perceived Quality............................................................................................ 46
Themes ............................................................................................................. 47
Section 2: Analysis of People Aged 36 and Older .................................................... 47
Perception of Value ......................................................................................... 47
Perceived Innovativeness ................................................................................ 48
Willingness to Buy............................................................................................ 48
Perceived Price ................................................................................................ 49
Familiarity of Country’s Product ..................................................................... 50
Perceived Quality ............................................................................................. 50
Themes.............................................................................................................. 51
DISCUSSION ................................................................................................................ 51
Limitations.............................................................................................................. 58
Implications and Conclusion ................................................................................... 60

TABLE OF FIGURES
FIGURE 2.1. CONCEPTUAL MODEL............................................................................... 35
TABLE 4.1. MILLENNIALS PERCEIVED PRICE OF SHIRT UNDER DIFFERENT COO
CONDITIONS ............................................................................................. 45
TABLE 4.2. PARTICIPANTS 36 & OLDER PERCEIVED PRICE OF SHIRT UNDER DIFFERENT COO
CONDITIONS ............................................................................................... 50
APPENDIX A. SURVEY QUESTIONS ............................................................................... 70
APPENDIX B. INFORMED CONSENT .............................................................................. 74
APPENDIX C. IRB APPROVAL LETTER............................................................................ 76

1
CHAPTER 1: INTRODUCTION
Fast fashion is a growing revolution in the fashion industry, continuing to impact
consumers and employees in the retail and fashion industry alike. Unlike contributing to
fashion’s two major seasons, fast fashion retailers provide new merchandise to consumers
weekly. Companies such as Zara, H&M, and Forever 21 are leaders in the fast fashion industry,
continuing to offer thousands of products to consumers through online and brick and mortar
stores (Loeb, 2015).
For fast fashion retailers, offering thousands of products at low prices with quick turnaround
times provides major benefits. For companies such as Zara, replenishment and markdowns are
no longer as big of a task. With bringing in the new product, companies now can focus on
offering new merchandise to consumers, which takes place of having to restock older
merchandise that has sold out (Loeb, 2015). Consumers also reap the benefits of lower prices and
new merchandise to choose from at a rapid pace.
These growths of fast fashion in the United States and Europe have impacted the global
industry. After working with China, many fast fashion retailers have shifted to lower-cost
manufacturing centers in countries such as Vietnam and Bangladesh (Bédat, 2015). These
centers offer lower end machinery to produce the product and do not have the correct trained
leadership to demand higher wages. In return, companies such as H&M and Forever 21 are able
to create low priced, high quantity merchandise for consumers rapidly (Fast Fashion, 2016). In
contrast, Zara has been able to keep manufacturing in the UK and USA. Although they have to
pay more in cost, they are able to avoid longer wait times between the design and distribution in

2
stores due to shipping and working with individuals further from their headquarters (Cachon &
Swinney, 2011).
Fast fashion history. Beginning in the 1980s, the quick response needed to meet consumer
demand developed in the US. Fast fashion started in the late 1990s and early 2000s and has since
become a widespread division of the retail industry (Fast Fashion, 2016). Fast fashion has been a
key component in the rise of consumer intake of clothing, as well as moving domestic production
to cheaper overseas options. Typical fast fashion apparel items are known for not being of
"lifetime" quality, but are on trend and are more affordable for the average consumer (Fast
Fashion, 2016).
Some elements to consider when determining if a product is "fast fashion" are price,
manufacturing timeline, availability, trend-based and disposability (Fast Fashion, 2016). Fast
fashion companies are to have the best prices and be able to compete with each other in certain
aspects. For instance, Zara, H&M and Forever 21 sell their denim pants starting from $12.90 all
the way to $69. While Forever 21 has the lowest retailed price jeans, it is also notable that the
$69 pair of denim at Zara can be seen as a good deal in comparison to many other competitors
(Fast Fashion, 2016).
Manufacturing and availability are key components of what makes a company a fast fashion
retailer. Like stated before, the typical designer or fashion company will have two fashion
seasons they are involved in. Fast fashion can manufacture and distribute products as fast as two
weeks, many having new garments and accessories in their stores every four to six weeks. This
rapid speed is what gives the name “fast fashion” to these retailers. The rapid delivery speeds
give these companies a cutting edge over the competition, as some are not able to provide to their
3
consumers as often (Fast Fashion, 2016). Being trend-based, fast fashion retailers have products
that are most on trend at the moment, as many designs are being derived from the latest runway
shows. Online fast fashion retailers, such as Fashion Nova, have been known to have knockoff
products available for pre-order or join waitlists to known when the garment will be ready to buy
within 24 hours of socialites or celebrities wearing the product. This method of copying high-end
produced goods poses threats to the industry, as many times the high-end or original garments
that are being copied have not been available to consumers before fast fashion retailers have the
item available (Fast Fashion, 2016).
Because of how quickly products are available and how quickly trends fade, fast fashion
retailers know that their merchandise must be disposable. While many people may have “basic”
products such as a plain pair of denim, black pants, or t-shirts, fashion products will come and go
with the trends and retailers need to stay on top of these consumer preferences. Consumers who
partake in fast fashion trends are known for wearing the item once or twice before being ready to
move on to the next trend (Fast Fashion, 2016).
Global effect. Among many developing countries, India, Cambodia, Vietnam, Indonesia, and
Turkey are popular countries for manufacturing factories (Fast Fashion, 2016). Although labor is
cheap in these areas, the impact on its workers and communities is widely known. In 2013, the
Rana Plaza factory in Bangladesh that housed workers for fast fashion retailer Primark collapsed,
killing over 1,100 people. This devastating situation led to retailers and the Bangladesh
government to promise reforms in order to better the conditions that workers face each day
(Burke, 2015). Retailers set up two consortia themselves, including the Accord on Fire and

4
Building Safety and the Alliance for Bangladesh Worker Safety. These were to help guide
inspections of factories and help local employers fund structural improvements (Burke, 2015).
With some promises and changes made, Bangladesh’s government aimed to help increase the
number of unions. Although this initiative was put in place, workers who formed unions are
being treated wrongfully, as some are faced with abuse threats, intimidation, dismissal, and
sometimes physical assault by managers or hired thugs (Burke, 2015). Through interviewing
more than 160 garment workers in surrounding areas or in Dhaka who supply for companies
based in the US, UK, and Australia, complaints of physical assault, verbal abuse, forced
overtime, unsanitary conditions, denial of paid maternity leave, and failure to pay wages on time
or in full were heard (Burke, 2015).
Hasan Ashraf, a Bangladeshi anthropologist, conducted six months of fieldwork at a
Dhaka factory and was able to discuss the findings of everyday health risks the workers were
exposed to. In the factories, workers inhaled dust and smoke due to lack of ventilation. Factories
were often noisy, with exposure to lights, electric wires, and chemical adhesives (Neve &
Prentice, 2017). Many workers were forced to choose between making a living or caring for
themselves, in which many would choose to work, leaving them with eyestrain, musculoskeletal
pain and stress. Similar to Bangladesh factories, reports on Cambodia factories also include
workers fainting, in part, caused by exhaustion, overheating, and malnutrition (Neve & Prentice,
2017).
Dr. Rebecca Prentice, Senior Lecturer in Anthropology at the University of Sussex,
conducted research to determine what factory workers were experiencing daily. The Delhi
capital region reported 10 to 12-hour work days for 67% of workers, 39% experiencing strained
5
eyes and 41% experiencing exhaustion (University of Sussex, 2017). Fellow Professor of
Anthropology at the University of Sussex, Dr. Geert De Neve noted that improvements have
been made since the disaster at Rana Plaza and Tazreen, but initiatives have not gone far enough.
Codes of conduct have been poorly implemented and the health and well-being of workers is still
a threat to their daily lives in the result of their working conditions (University of Sussex, 2017).
Fast fashion around the world. With the main benefit of outsourcing from developing countries
being cheap labor, consumers typically can expect the higher price tag on a "Made in the USA"
label. American Apparel, a well-known company based and sourced in the USA filed for
bankruptcy after struggling to keep up with costs in the ever-changing retail industry. The higher
wages that come with manufacturing in the US and the management costs of the "Made in the
USA" came at a price. Although consumers can view this as more ethical or politically correct,
the expensive price is hard to maintain for retailers (Sharma, 2016).
Major retailers today use manufacturing factories from all over the world, including
developing countries such as Turkey, India, Sir Lanka and Bangladesh (Tokatli et al., 2008).
Issues at hand with global sourcing begin with the poor treatment at the factories, inadequate
working conditions, and corporate personnel responsible for creating guidelines for owners and
managers of these factories to enforce (Tokatli et al., 2008). These factors are considered when
determining an image of a country and the perceived quality of a product manufactured in them.
Fast fashion revenue. Although some fast fashion retailers are privately own companies, public
companies highlight the success in this sector of the industry. The top four fast fashion retailers,
Zara, H&M, Gap and Uniqlo, had total revenue of $85.6 billion in 2018 (Olanubi, 2018). Zara
had the highest revenue at $28.8 billion, followed by H&M at $22.7 billion. Uniqlo and Gap

6
brands had $18.2 billion and $15.9 billion respectfully (Olanubi, 2018).). Fashion Nova’s CEO
Richard Saghian has not shared specifics on the company’s revenue, however, some sites suggest
nearly $490 million in 2018 (Hughes, 2018). Forever 21 is also a leading fast fashion retailer,
however, as a private company their revenue is unknown to the public. In addition to fast
fashion, off-price and discount retailers are contributing high amounts of revenue in annual sales
as well, with the TJX companies bringing in $31 billion in 2015. With this amount of revenue, it
is not surprising that fashion is the most labor-intensive industry in the world, with 1-in-6 people
involved worldwide (Sharma, 2016).
In 2018, worldwide revenue in the fashion industry was reported at $481.2 billion
(Orendorff, 2019). Revenue in the fashion industry is expected to reach $712.9 billion by 2022
(Orendorff, 2019). With the revenue from the top four fast fashion companies at $85.6 billion,
fast fashion is at least 18% of total revenue of the fashion industry. With this growth in the
fashion industry, threats to establishing brands come from fast fashion’s ability to create and
release styles on demand, therefore, a rise in fast fashion can be expected in coming years.
Fast fashion made in America. While sourcing products, materials and finished products from
countries outside of the United States is most popular, some fast fashion and retailers still use
manufacturers in the United States. Fast fashion retailer H&M has one manufacturer located in
the United States (H&M, n.d.). Fashionnova works with more than 1,000 manufacturers. In the
summer months, 80 percent are made in the USA, which allow for their quick turnaround time
on products. In the colder months, 80 percent are made overseas (Hughes, 2018). Uniqulo
currently manufactures in China and other Asian countries (Uniqlo, n.d.). Forever 21 works with
independent Southern California factories for some of their merchandise. Although these

7
factories are in the United States, they have been found to pay workers much less than the
minimum wage, around $4 an hour (Kitroeff, 2016). The investigation led to 77 factories being
found of underpaying workers by $1.1 million from April to July. Retailers using these factories
are able to avoid penalized by not working directly with the workers, instead, multiple layers of
suppliers (Kitroeff, 2016).
American made fast fashion products are difficult to come by, as 97% of garments that
are sold in the United States are made elsewhere (Uranga, 2017). American Apparel was known
for their “Made in America – Sweatshop Free” logo, but not being able to adapt to the demands
of fast fashion like other retailers, American Apparel filed for bankruptcy. After filing for
bankruptcy in 2015 they were acquired by Gildan Activewear in 2017 (Robertson, 2017) As a
well-known retailer that sourced out of the United States, the failure of this company shows the
impact that fast fashion has on apparel retailers and brands.
Economic impact. Fast fashion has made quite an impact on the US and other developed nations
across the world. The US can see the changes in how much the industry has grown to outsource
over the course of time. In the 1960s, 95% of clothing in America was made in the United States
(Sharma, 2016). Today that 95% has become only 3%, with 97% being outsourced. While some
may offshore to other developed countries, many are choosing to take the cheaper options such
as Bangladesh, India, Cambodia, Chinese and Vietnam (Sharma, 2016).
These developing countries are popular because of their low wages, less stringent local labor
laws, and agreements of free trade. The people making these products are most affected by these
laws and agreements, as many workers are women who are left without health benefits or
financial security. In addition to no benefits provided to the workers themselves, the pay is very
8
low (Sharma, 2016). An average worker makes about $67 a month, making their daily pay a little
over $2 (Sharma, 2016). This low pay requires them to work long hours without breaks to
provide for themselves and their families. While COO is an important factor to some consumers
when determining where and what to buy, in a Gallup poll from 2013, it was found that over
55% of US consumers surveyed make no efforts in knowing where their clothing came from
(Sharma, 2016).
Fast fashion future. Retailers are finding the trend of fast fashion hard to maintain. H&M is a
global leader in the fast fashion market had $4 billion of inventory, which led to major discounts
on products to clear the merchandise out. With this, they began closing stores, starting with 160
brick-and-mortar locations. In addition, popular fast-fashion retailer Charlotte Russe filed for
bankruptcy and has begun closing locations after closing their online website (Stein, 2019).
New retailers are making a difference in how fast fashion sells in past years. The use of
social media has made companies like Boohoo, ASOS, and Fashion Nova some of the most
sought-after fast fashion brands in 2018, with Fashion Nova being the most searched retailer in
2018 (Stein, 2019). Centering their platforms mainly online with limited brick-and-mortar stores,
these retailers have successfully worked up large inventories that are selling. For example,
Fashion Nova has been providing consumers with 600-900 new items weekly (Stein, 2019).
Social media, celebrity and highly followed influencers, discounts and large assortments are
strategies in which these companies have used to raise brand awareness and make purchases
(Stein, 2019). Using popular celebrities, brand ambassadors and offering discount codes through
their social media platforms, companies like Fashion Nova can use this marketing technique to

9
reach a mass of followers that can be easily linked to their site. Sales that include free shipping
and percentage off discounts are popular ways to increase dollars per sales (Stein, 2019).
While consumers reap the benefits of low-cost items and wide assortments to choose
from, hundreds of consumers are lobbying against fast fashion brands (Stein, 2019). In order to
bring awareness and influence consumers to choose more sustainable options, some consumers
are joining together to enlighten others on the consequences of these mass operations. In
addition, 73% of Millennials in one survey demonstrated they are willing to pay more for
products that are sustainable (Stein, 2019).
Disadvantages of fast fashion. While fast fashion is growing quickly, consumers are aware of
the disadvantages that come from quickly made, inexpensive products. Some disadvantages
include being unsustainable, imitation of high-end originals and tough competition (Motkar,
n.d.). As mentioned before, being able to compete with other fast fashion retailers is difficult, as
consumers have multiple ways to find the product and price they are wanting and willing to pay.
Because of the short product life cycle, products made for the fast fashion market are also
perceived to be unstainable. Quality may fall short of expectations, as being quickly made can
increase the likeliness of error in the process (Motkar, n.d.).
COO. The Country of Origin effect has been studied multiple times. The COO effect has been
defined by Samiee (1987) as an influence, positive or negative, that the country of manufacture
might have on the consumer’s choice processes or subsequent behavior (Abraham & Patro,
2014). COO and image can be based on many factors surrounding the country itself. The
familiarity with the country, past experiences, historical ties and rating a country’s product can
all impact how a consumer perceives COO as labeled on a product (Khachaturian &

10
Morganosky, 1990). Through the research provided in Khachaturian & Morganosky’s (1990)
study, it was found that attitudes towards product based on their country of origin can be skewed
based on the product category.
Regarding how consumers feel about COO, it was stated that “the label provides a great deal
of information to consumers as a result of past experiences with representative national products,
learned stereotypes and reputations of national products, and perhaps more general images of
traditions and customs of foreign peoples” (Khachaturian & Morganosky, 1990). The review of
literature in this area indicated that COO had a considerable influence on the consumers'
perception of product quality.
Statement of Changes in Fast Fashion
Recently the industry has experienced changes that are impacting fast fashion companies.
In 2019, multiple fast fashion retailers filed for bankruptcy, announce they were closing stores or
closed their company completely. Leading fast fashion brand Forever 21 filed for bankruptcy on
September 29, 2019 (Staff, 2019). While working on restructuring, they will close up to 178
stores in the United States, and most locations in Asia and Europe. Another retailer, Topshop, is
set to close all of their United States stores and 23 locations in the United Kingdom. Charlotte
Russe filed for Chapter 11 in February of 2019 (Staff, 2019). After failing to secure a buyer for
the company, Charlotte Russe announced it will shut down all stores. The Chief restructuring
officer confirmed that the company was unable to keep up with “rapidly evolving fashion trends”
that is expected in fast fashion (Staff, 2019).
Statement of Problem

11
The purpose of this study is to evaluate consumers’ perception of value based on the
Country of Origin (COO) in the fast fashion retail industry. Many studies have been conducted
on how COO impacts brand image, likeliness to buy, the perception of quality and overall value
of products based on this attribute. While past studies have delved into luxury brands and the
perception of value based on COO in the luxury retail industry, there has been a void in research
regarding fast fashion and COO impacting consumers' perception of the value of these products.
While fast fashion is a new segment to the retail industry, it is continuing to expand. This study
will give insight on to how COO may impact consumers’ buying behavior within the fast fashion
retail market.
Definition of Terms
Key terms of this research study are fast fashion, value, country of origin, country of
manufacturing, manufacturing factories, sustainability, and first, second and third world
countries. Fast fashion is the rapid manufacturing of runway and fashionable looks designed for
ready to wear at a low-cost. It is designed to be replaced quickly, more so for need than desire
(Quora, 2017). Value commonly is defined as price, although characteristics of value are also
including quality, assortment, convenience, service and the shopping experience (Gilliam, 2000).
In this study, the perception of value is being studied, so it is important to note that priorities in
perception change with timelines, innovation, the economic cycle and the available alternatives
(Gilliam, 2000). Country of Origin (COO) is defined as a concept of where the products or
services were manufactured (Ha-Brookshire & Yoon, 2012). In this study, COO represents
“Made in America/ Made in China”, being that the product was made in with products from the
given country, unless otherwise stated.

12
Over time, this has expanded to more terms as the product development cycle grew. These
terms include the following: country of design (COD) which is defined as the country where the
final product was initially conceptualized and designed; country of parts (COP), defined as the
country where component parts are manufactured; country of assembly (COA) which is defined
as the country where the product is partially or fully assembled, but not ready to be sold; and
country of manufacturing (COM) which is defined as the country where final product is
manufactured (Ha-Brookshire & Yoon, 2012).
Manufacturing factories are defined as a factory that processes, prepares, and makes,
including cutting and sewing woven or knit materials such as leather, rubberized fabrics, plastics,
and furs, into wearable apparel items (Manufacturing Industry, 1996). Sustainability in this study
will be used with the context of meeting the economic, ecological and social needs of the day
without impairing the chances or development of future generations, such as upcycling, making
less of an economic impact and reducing waste (Bagrcraft, n.d.). First world countries are
developed, capitalist and industrial countries, including North America, Western Europe, Japan,
and Australia. Second World countries refer to former communist-socialist and industrial states,
including Russia, Eastern Europe, some Turk States, and China. Third world countries are
roughly described as developing countries, including Africa, Asia, and Latin America (First,
Second and Third World, n.d.). These are note-able terms as this study will focus on the
difference of consumer perception of countries that are known as developed (first world) or
developing (second and third world) countries.
Prior Research

13
Numerous studies have been conducted on the effect of COO and COM and the impact
on purchasing decisions and the quality that is perceived of a product. Without focusing on the
fast fashion industry - the COO effect, perceived price based on COO, the influence of design
and workmanship, and stereotypes have all been studied. The fast fashion sector of the retail
industry and information on consumer perceptions of the quality of a product based on this factor
has limited research.
Significance of the study
Like stated before, fast fashion is growing and changing the way the fashion and retail
industry operates. The need to maintain and compete with leading fast fashion retailers is
important for current and future retailers to understand. In addition, this study will give insight
into the quality’s consumers use to characterize and value merchandise and how they perceive
products from developing and developed countries. With sustainability in the fashion industry is
growing and consumers are becoming more economically conscious on their purchasing
decisions. The outcomes of this study can provide guidance as companies decide on best
practices with outsourcing or working with American made manufacturing.
CHAPTER 2: LITERATURE REVIEW
For some consumers, knowing where products are made is an important aspect of a
purchase decision. To further explain the impact of COO in retail, research on the COO effect,
COO labeling, quality perceptions, consumer perceptions, purchasing decisions, consumer
behavior, perceived price, design, and workmanship, and differences in class is conducted. In

14
addition to research on COO, fast fashion and sustainability, along with perceptions of
developing countries manufacturing will be assessed.
Fast fashion and sustainability. Loyal consumers are key to making fast fashion retailers
successful. There are numerous outlets and opportunities for consumers to shop with multiple
companies. Customer loyalty can give retailers the edge they need to compete within this
growing market. Retailers can create loyal customers multiple ways including social media
marketing, online interactions, and online brand communities within their social media
platforms. (Kim, Park, & Glovinsky, 2018). The product variety is another opportunity for
retailers to gain and retain customers. The product variety is defined as "the number of versions
of a product offered by a firm at a single point in time". This can be the same style in multiple
colors, patterns and prints or different style features such as shape and structure (Mehrjoo &
Pasek, 2014). Fast fashion retailer Fashion Nova’s CEO has stated that his goal is to provide a
wide assortment with the best prices. Their assortment is extremely large, with additional styles
being added weekly (Hughes, 2018). Not only does this allow consumers to shop with them
more often and find new products each time, but this also allows them to turn over product
quickly (Hughes, 2018).
COO effect. Through past studies, it has been found that Made in the USA products are most
desirable thanks to the COO effect. One study defined the COO effect as a consumer’s
dependency on COO when forming opinions on the quality of a product (Ha-Brookshire &
Yoon, 2012). An example of this is “Made in America” vs. “Made in China”. When a consumer
sees “Made in America”, they may perceive the product to be of higher quality and value,
particularly when the price is unknown (Ha-Brookshire& Yoon, 2012). Certain factors such as

15
brand name or COO are helpful for consumers to form their own opinion on what the product
price would be, in return, impacting purchase intention (Ha-Brookshiren & Yoon, 2012). In one
study, it was found that when using the US and China as COP and COM for cotton apparel, the
study assessed the effect of consumers’ demographic characteristics, prior knowledge, and
perceived sustainability on their perceived price (Ha-Brookshire & Yoon, 2012).
In an article written about the COO effect, it is mentioned how the country’s name
provides a complex connotation to the name of a company that can result in the gain or loss of
relevant customers. Italy’s reputation in the fashion industry has given this COO a positive
impact for companies based in this country (Kimani, 2016). They are known for high fashion
and quality garments all over the world. In addition, a study of French consumers had a high
COO image for their own country and therefore, was willing to spend more on apparel from
France (Kimani, 2016).
Another example of how the COO effect can impact consumers’ perception of a brand is
in Kenya. While there are outstanding and inspiring designers and clothing that come from
Kenya, the fashion industry overall has many economic challenges (Kimani, 2016). Some of
these challenges include mismanagement, stiff competition from second-hand products and
imports, lack of investment in the industry and the termination of regional trade treaties. In one
study, it was found that 89.76% of consumers in Nairobi, the capital of Kenya, prefer products
made in Western countries. This could be because of the admiration consumers in developing
countries have for those in more developed countries (Kimani, 2016). It has been found that the
exception to this would be those with a strong sense of national pride and patriotism or for
companies that have marketing schemes that show to be effective. Addressing COO as a factor in

16
the consumer decision-making process is important for companies as if they do not, it can hinder
their quest for globalization (Kimani, 2016).
COO labeling. "Made in…" labels can disclose a wide variety of information to the consumer.
Not only does this tell you where the garment was produced, but it can also provide attributes
that can give insight into the conditions in which the garment was made. "Made in.." is an
indicator that tells the consumer what regulations and health, safety and wage standards the
product was created under (Does ‘Made in' matter, 2015). Today, the manufacturing of apparel
products can be a complex field. With new factors such as COM, COA, and COP, it is hard to
determine where the product was specifically made. While some companies are manufacturing
products in low-labor costs countries like China, the product can be packaged in France or the
UK, therefore, holding a "Made in France" or "Made in the UK" label (Does ‘Made in' matter?
2015). In situations like this, COM, COA, and COP become important for consumers to know, as
this can give a more in-depth look as to how the garment was truly produced. The European
Union's regulations state that a company only needs a certain amount of the product
manufactured in a country before they are able to claim a "Made in…" label (Does ‘Made in'
matter? 2015).
"Made in the USA" labels have regulations they must follow as well. For instance, if the
item is made in the USA with materials from the USA, a "Made in the USA" label can be on the
garment. If an item is made in the USA with imported materials, the label must read "Made in
the USA of imported materials" (Harms, n.d.). For consumers, this allows them to make
presumptions on material quality and value when choosing a product. In addition, a label must

17
include an identification number of the manufacturer, importer or other firms in which the
handling of the product was done, as these are FTC standards (Harms, n.d.).
Quality perceptions. “Made in the USA” has been a preferred COO of many products in
general, and specific categories such as food, electronics, and textiles. In one study, researcher
Gaedeke (1973) delved into how participants would rank in quality the US, Philippines, and
Indonesia (Khachaturian & Morganosky, 1990). The US was ranked with the highest quality,
followed by the Philippines and lastly Indonesia (Khachaturian & Morganosky, 1990).
In the foundational study by Janet Khachaturian and Michelle Morganosky (1990), they
aimed to determine how American participants rated COO in different retail situations. It is
important to note that this study is dated in 1990, making it likely that findings have become
different over time. It was found that the US made clothing was perceived as having the highest
quality, followed by (2) Italy, (3) China, (4) Korea, and (5) Costa Rica. In addition, they delved
into which type of store is associated with the best quality and price (Khachaturian, J., &
Morganosky, M., 1990). In this, it was found that department stores were ranked number one,
off-price stores ranked number two and discount stores ranked number three. In addition,
rankings for discount stores were improved when associated with the US made and Italian made
apparel. Off-price stores were perceived higher when selling the US made apparel and
significantly lower when associated with Korea, China and Costa Rica (Khachaturian &
Morganosky, 1990). Overall, foreign countries in this study, with the exception of Italy, were all
perceived to be of lower quality, while US products were perceived as the best (Khachaturian &
Morganosky, 1990).

18
Schurenberg (2012), describes that the perception consumers may have of "Made in the
USA" items can go one of two ways. One is that the consumer is receiving a "rugged, sturdy, no-
frills, American quality" item. Another being that they are embracing an “artisanal, moral,
locavore sensibility” motion by purchasing the item (Schurenberg, 2012). Consumers who agree
to these assumptions by Schurenberg can see the use of stereotypes that can impact consumers’
perceptions. It is noted in the article that “Made in the USA” items are far more than the
descriptions above, and by only thinking of items as “no-frills” or “moral”, you are selling
“Made in the USA” short of its reputable quality. In terms of market research, the USA ranked
number one, ahead of Germany and the UK (Schurenberg, 2012).
While the quality of “Made in the USA” is noted as being one of the best, domestic
consumers are less impressed by American quality and innovation than other countries. In
contrast to this information, Ha-Brookshire (2012) found that when consumers were offered a
basic t-shirt made in the U.S. with U.S cotton versus one made in China with local materials,
Americans preferred the U.S. garment (Schurenberg, 2012). In addition, Americans valued the
garment at almost twice of what they valued the “Made in China” garment at. It is also noted that
America’s reputation is on the incline in terms of product quality and awareness (Schurenberg,
2012).
To go against studies on American consumers, Rahman, Fung, Chen, and Gao's (2017)
study found that Canadian and Chinese consumers viewed COO and brand name as the least
important product cues when deciding on purchasing a product (Rahman et al, 2017). Although
Chinese consumers' ranked brand name as one of the least important cues, there was a significant
difference in scores between the two country’s consumers, suggesting that brand name is a more

19
influential cue in China. In addition, Canadian consumers ranked COO higher in influential cues
than Chinese consumers. Participants from both countries said that the most important cues for
deciding on a product were fit, style, price and quality/workmanship (Rahman et al, 2017).
COO and consumer perception. With the COO effect being used by consumers to make
perceptions about quality and price, the halo effect and summary effect can factor into purchase
decisions. The halo effect, regarding COO, is when consumers are not aware of the country’s
product and forms beliefs off of the country image. The summary effect is when they are aware
of the country and its product, and form a country image based on past experiences with product
attributes and characteristics. In one study, it was found that COO plays a major role in shaping
a consumer’s decision process when purchasing items (Saran & Gupta, 2012). In addition, there
have been multiple studies that have found how COO is the main factor in consumers’
perception of overall value and quality of products (Saran & Gupta, 2012).
Another concept to consider is the concept of brand origin (BO). Through the research of
Thakor and Kohli (1996), BO was defined as “the place, region or country to which the brand is
perceived to belong by its target consumers” (Saran & Gupta, 2012). The perception of BO can
differ from COO because of lack of information about a brand. Along with being described as
the origin of a brand, it is also a part of brand personality (Saran & Gupta, 2012). Brand
personality is defined as a mind-based thought developed by the consumer, who forms mental
pictures about the brand through his or her experiences, perceptions, misconceptions, and value
systems. This can come about after an experience between a brand and a consumer (Chiang &
Yang, 2018). Marketers can develop brands to have a humanized effect, making them more
appealing to consumers. In addition to BO, the nation in which an item was created can also

20
impact how consumers perceive its products and brands, finding that COO can have a direct and
positive effect on a consumer's evaluation of the quality of a product (Chiang & Yang, 2018).
Brand image was defined as “perceptions about a brand as reflected by the brand
associations held in consumer memory” (Chiang & Yang, 2018). This is a characteristic that
individuals may use to reflect upon the brand and the way they perceive the brand. Positive
brand images can increase likeliness to buy, as consumers with positive brand images view the
products from that brand in a positive manner (Chiang & Yang, 2018). Both brand image and
brand personality can play a major role in how consumers view a brand and their perceptions of
the value of their products (Chiang & Yang, 2018).
BO is directly related to brand image, as it plays a major role in determining a
consumer’s perception of the brand. In one study, based in the emerging markets of India, the
effect of BO was researched. It was found that BO was influenced by social motivation and
identity (Saran & Gupta, 2012). In this study, the association of BO was “the activities or
processes that consumers are engaged in, to associate the brand with images of a particular place
or region or country”. When comparing COO to the BO, the COO is centered around the country
at a product level, while the BO is centered at the brand level (Saran & Gupta, 2012).
In a study by Ahmed and d’Astous (1996), they interestingly determined that COD and
COA impacted consumers’ perception of quality and value more so than a brand name (Saran &
Gupta, 2012). In another study, conducted by Elliott and Cameron (1994), it was found that price
and quality played a more important role in the desire to buy, in comparison to COO (Saran &
Gupta, 2012). Although the two influences of COO that widely affect consumers’ evaluation of a

21
product are quality and purchase value, when deciding to buy, this dimension falls short of price
and quality the consumers can assess at the moment (Saran & Gupta, 2012).
Consumer purchasing decisions. Purchasing behavior can be monitored in a multitude of ways.
One model describes five steps that can lead to a decision when deciding on if the individual will
purchase a product or not (Johnston, 2016). The first step was recognizing a problem or need. In
the fast fashion industry, this could be the consumer needing a new apparel item, shoes or
accessories quickly and on trend. The second listed in this model is an information search
(Johnston, 2016). With the use of technology, this is readily available at the fingertips of most
consumers, as they can use online websites and searches, mobile devices and apps to search for
items on a plethora of platforms. The third step is the evaluation of alternatives (Johnston, 2016).
In fast fashion, products are often similar, on trend and readily available at a fast pace. An
evaluation can be done on price and other attributes such as in-stores availability, whether the
product is available online or not, and shipping rates and times from online orders. Evaluating
the product and retailer can give the consumer the information needed to make the best choice.
The fourth step in this model is the purchase decision (Johnston, 2016). After an evaluation is
done and a choice is made, a consumer can now decide to buy the item if it is still desired. The
last step in this model is the post-purchase behavior. This could include buyer’s remorse if the
product was not what was expected, as well as satisfaction if the product was up to expectations
(Johnston, 2016).
There are three attributes that are economic stimuli for purchasing fashion products
according to Rajagopal (2011), as found in their study over consumer culture and purchase
intentions toward the fashion apparel industry in Mexico. These three attributes are uniqueness,
22
price level and sales or discounts (Rajagopal, 2011). When thinking of fast fashion, it is evident
that those three attributes are important to the shopper as (1) uniqueness will offer them
something different from those around them. With so many options and styles in fast fashion,
this is easy to achieve. Price level (2) is important in fast fashion because trends and fads can
come and go. Consumers view fast fashion as a less expensive option to have items in real time
and be able to afford the next trendy piece. Sales and discounts (3) can encourage consumers in
their purchase decision to make a purchase.
While evaluating the product, information such as COO will become evident and vital in
determining where to shop. In one study, where 100 women were surveyed at House of Ria
Miranda in Malang, Indonesia, it was found that brand image had a positive and significant
effect on purchase decisions. With COO being highly related to brand image and how consumers
view a retailer or label, we can see the correlation of brand image and COO to purchase
decisions in this regard (Devita & Sahara, 2018). Consumer purchasing decisions can be
encouraged by multiple factors, including the ones listed above. Retailers must keep these
aspects in mind when working with manufacturers, advertisers, and how they market to reach the
most consumers (Johnston, 2016).
Perceived innovativeness of product. In Gleim, Lawson, and Robinson (2015) study, they
found that perceived innovativeness positively affects perceived product quality and anticipated
satisfaction of a product. With this, it is determined that countries that have a higher
innovativeness ranking, would then be seen as having a higher valued product. In Dr. Dhiraj's
(2018) most innovative countries article, he listed the United States at number six and China at
number 17. Using Gleim et al., (2015) method, this would make the United State perceived

23
innovativeness higher than that of China's. While there are still limited studies on perceived
innovativeness, Gleim et al., (2015) study have highlighted how this is an important factor for
companies and brands of all industries to consider when making business decisions. Consumers
of all industries are continuously changing and expecting new product offerings that meet their
needs. Innovativeness through new processes, services, or goods are ways firms have effectively
utilized prior research to satisfy consumer demand.
Consumer behavior. The process where individuals or groups select, purchase, use or dispose
of products, services, ideas or experiences to satisfy their needs and desires is known as
consumer behavior (Rahman, Haque, & Hussain, 2012). Studying how the country of origin
impacts consumers’ shopping habits in fast fashion, knowing what impacts consumer behavior,
in general, will give insight into how the consumers' purchase decision is made. When deciding
to make a purchase, the COO or COM can interfere or encourage a consumer to buy, as this is
part of the evaluation process of a product.
COO impacting perceived price. Country of origin is a concept of where the products or
services were manufactured. In recent times, this has expanded to COP, COM, COB, and COD.
Each of these concepts offers different information to consumers, where they gain more specific
designations to evaluate product attributes. In regard to the country of manufacturing, consumers
want to know this information to determine if the product is safe and made in a safe manner. In
addition, COM can allow consumers to exercise their support for the domestic economy and
local communities. COP helps consumers make appropriate judgments on a country's
involvement in the overall manufacturing process. COD and COB help communicate added

24
values contributed by a country that is well known for excellence in the product category (Ha-
Brookshire & Yoon, 2012).
Through past studies, it has been found that Made in the USA products are most desirable
thanks to the COO effect. The COO effect refers to a consumer’s dependency on COO when
forming opinions on the quality of a product. An example of this is Made in America versus
Made in China (Ha-Brookshire & Yoon, 2012). When a consumer sees a Made in America label,
they may perceive the product to be of higher quality and value, particularly when the price is
unknown. Certain factors such as brand name or COO are helpful for consumers to form their
own opinion on what the product price would be, in return, impacting purchase intention (Ha-
Brookshire & Yoon, 2012).
Based on past studies, it is found that COO plays a major role in consumers’ decision-
making processes and influences how consumers view and evaluate product attributes. For
example, in one study, it has been found that US female consumers evaluated foreign products
higher than the US made products (Ha-Brookshire & Yoon, 2012). Similarly, younger
consumers and educated consumers with higher income were more likely to accept foreign-made
products in comparison to older people or lower income consumers with limited education.
Developing countries also suffer from negative stereotypes as consumers judge products based
on COO. Higher quality ratings were given to products that were produced in countries that are
more economically developed and politically free (Ha-Brookshire & Yoon, 2012).
When investigating in today’s businesses, the COO effect is no longer a simple task to
grasp. With raw materials being brought in from all over the world to one country to be
produced, determining the COO is a tricky task. We commonly find multinational products –

25
products with more than one COO- in today’s marketplace (Ha-Brookshire, J., & Yoon, S.,
2012). Most industries will use the COM as the "one-country" when choosing origin designation.
Because of these multinational products, the concepts of the country of design, country of
assembly and country of parts were introduced to be useful when consumers are judging values.
Through studies, these attributes were found to affect consumers evaluations on product quality
(Bettman et al., 1998; Ha-Brookshire & Yoon, 2012; Zeithaml, 1988).
Price can be used as a predictor of quality, particularly when the consumer has limited
knowledge of product or offers. Product quality can be naturally formed by a consumer based on
price. This causes the consumer to believe that higher quality products are more expensive and
lower quality products are generally cheaper (Ha-Brookshire & Yoon, 2012). This price/quality
relationship is described as the price-reliance schema. Although the relationship between quality
and price has been discussed, the relationship between COO and how this influences price has
rarely been discussed in prior research. However, one study was done to test the relationship
between COO and price (Ha-Brookshire & Yoon, 2012). In this study, it was found that US
consumers were willing to pay a 37% premium for US-made shoes and 105% premium for US-
made toothpaste, compared to the same products made in China (Ha-Brookshire & Yoon, 2012).
In one study, both COP and COM of the US and China were selected to be tested. This
study tested how these two aspects impact the COO designation of hybrid or multinational
products. In total, cotton from the USA made in the USA was found most valuable in price,
cotton from the USA made in China followed in second, cotton from China made in the USA
was close behind in third, and by quite a difference, cotton from China made in China was found
least valuable in price (Ha-Brookshire & Yoon, 2012).

26
Design and workmanship influence on perceptions of COO. COO can be used to evaluate
brands and product attributes. The COO image is influential in consumers’ purchase decisions.
With a favorable country image, consumers are more willing to buy products made in that
country. For unknown brands, COO information can be an indicator to determine the true quality
of a product (Kim, Shin, Cheng, Lennon, & Liu, 2015)
Studies have examined COO effects for product image dimensions in which specific
countries have established reputations for certain product categories. For example, one study
found that both US and Japanese consumers prefer products made in their own countries, as they
have a favorable opinion of the workmanship on products made there (Kim et. al., 2015).
Brand familiarity is defined as "the accumulated related experiences that customers have
had with a brand" (Kim et. al., 2015). Brand familiarity can be built by a consumer through
exposure to the brand such as past experiences, advertisements, and word-of-mouth (Kim et. al,
2015). This is also linked to positive product evaluations and favorable brand perceptions. In
addition, when a consumer is familiar with a country a product is made in, the consumers'
experiences with that country will reflect in their view of the product (Kim et. al., 2015).
Through Kim et al., (2015) study, it was determined that the design and workmanship of
apparel are still the dominant factors for evaluating fashion brands. When evaluating Chinese
products, US consumers considered the workmanship of the product a major factor in
determining the overall value and quality (Kim et. al., 2015). Apart from Italy as COO, US
consumers’ familiarity with a brand COO impacted the attitude towards the brand significantly.
Kim et. al. (2015) found that there is a need for companies and brands to have strong global
marketing schemes, as this can help familiarize consumers with the brand. With familiarity with

27
the brand comes positive brand image and attitudes the consumer can base its perception from
(Kim et. al., 2015).
Differences in social class perceiving COO. Cheap labor is the main benefits companies gain
when offshoring to developing countries. Ashill and Sinha (2004) believe that the higher the
competence of the workers, the higher the quality of the product. While working with cheap
labor in developing countries, it is believed that the workers' competence is lower,
stereotypically providing lower quality products. With a strong brand name, companies can use
these low-cost laborers to gain higher profit or sell items at a lower price, beating out
competitors. In a study by Cordell (1992), it was stated that consumers who are more familiar
with a brand are less reliant on COO. Because of this, consumers who are familiar with a brand,
their quality, price, and personality, may not view COO as an important factor when making
purchasing decisions. A country's competence can also impact which brands a consumer views
as "superior" or "inferior" to others, which is another factor in the ability for brands to produce
offshore and maintain a positive brand image and reputation (Miranda & Parkvithee, 2013).
Through a study conducted by Miranda and Parkvithee (2013), middle class and
working-class consumers participated to determine the effect of COO, brand equity and purchase
involvement regarding the standard and high-fashion apparel made in different countries with
different competence levels. The study was in two parts, one was a questionnaire to identify the
favorable and unfavorable consumer perceptions of the country’s ability to produce apparel
items. Part two was a questionnaire aimed to evaluate the product and their likeliness to buy a
product. Miranda and Parkyithee (2013) found that although COO, brand equity and consumers’

28
product purchase involvement all had an impact on consumers’ evaluation and purchase
intention separately and at different levels, all dimensions impact consumers’ likelihood to buy.
COO in developing countries. From previous studies, it was found that developed countries use
COO and/or COM as significant factors in determining what a consumer’s attitude or belief of a
brand or product would be. It has been found that COO has created “expressive and “image”
elements, and these elements are then associated with the products from that country (Schultz &
Jain, 2015). Consumers in developing nations are likely to find products made in their countries
to be of less value or lower quality than those made in developed countries. This could be
because of stereotypes that impact how consumers all over the world view their COOs and other
nations’ COOs. These stereotypes can be formed from national, economic, political, historical,
cultural characteristics and traditions. Innovation, design, prestige, and workmanship impact the
elements that develop consumer images of products. Overall, historical beliefs play a role in how
a consumer views their own goods, as well as the value of luxury goods (Schultz & Jain, 2015)
In a study by Agbonifoh and Elimimian (1999), the attitudes of Nigerian consumers for
products made in Nigeria, Ghana, the USA, Japan, Taiwan, and the UK were researched. It is
stated in this study that the USA, UK, and Japan are typically known as developed countries in
comparison to Nigeria, Ghana, and Taiwan by most consumers (Agbonifoh & Elimimian, 1999).
The need to understand the implications that COO makes to consumers is important in
developing countries as there are two attitudes that can create marketing problems. For the home
economy, the need for products to come from the country is critical. In addition, globalization
can be halted by invisible barriers when discrimination to a certain country is created (Agbonifoh
& Elimimian, 1999).

29
Agbonifoh and Elimimian’s (1999) study, which was conducted with participants from
Benin City and Warri (both cities in Nigeria), set out to determine the attitudes of products from
six countries. The results found that the Nigerian participants found their own homemade goods
to have negative ratings, as well as the most negative image. Ghana followed in second lowest
for both categories. The rest of the countries, including the USA, UK, Japan, and Taiwan all had
positive product ratings (Agbonifoh & Elimimian, 1999). With consumers in developing
countries finding their own products to be of less value and to have a negative image, shows the
importance of COO when determining manufacturing locations (Agbonifoh & Elimimian, 1999).
COO impact on purchasing behavior in luxury brands. Certain factors in luxury products
have become important in the discussion of COO. First, the emergence and evolution of COO;
second the influence of COO on purchase decisions; and third, how the COO is used in
developed and emerging nations (Schultz & Jain, 2015). Emergence and evolution of COO
historically start with the term "made in" and was used by brands to identify the source of the
product. As mentioned before, today there have been terms to specially identify characteristics
such as country of parts, country of design and country of manufacturing (Schultz & Jain, 2015).
Labeling COO on products led to consumers questioning and having concerns about the
quality and manufacturing process for products made in countries with limited available
information. The concerns from consumers came from the competitive prices they began seeing
when companies started outsourcing manufacturing (Schultz & Jain, 2015). Because prices had
dropped, they began to question the quality and value of the products and the circumstances in
which they were being made. As an informative cue of brand image and quality, COO can
influence cognitive, affective and normative mindsets of consumers (Schultz & Jain, 2015).

30
Established markets, such as Europe or America, are able to provide more detailed
information about a garment. With a COO of a developing country, consumers have a harder
time finding information about the whereabouts of the products’ life cycle (Schultz & Jain,
2015). In addition, COO and price co-relate, as consumers may view products from developing
countries as lower quality, and in return, be priced at a lower cost. COO plays a significant role
in consumer purchasing decisions, as price, quality, labeling and consumer perception of value
are often seen as characteristics of COO (Schultz & Jain, 2015).
In Schultz and Jain’s (2015) study, an exploration of the perceptions, purchase decisions
and behaviors of Indian consumers toward COO of luxury brands was conducted through focus
groups and interviews (Schultz & Jain, 2015). Focused groups were used to determine
consumers’ needs, perceptions, attitudes, and behaviors within the luxury fashion industry. The
focus groups were done with participants between the ages of 18 and 35 that are consumers of
luxury brands in India (Schultz & Jain, 2015). The second study was done through interviews
with consumers, luxury retail managers, and luxury brand managers. It was present in both
studies that COO is important for luxury consumers as they compare products from different
countries based on quality, products features, and innovation (Schultz & Jain, 2015). Developed
countries, such as Germany and the United States, are known for being further developed in
technology, therefore, offering more innovative products (Schultz & Jain, 2015).
It is interesting to note that although consumers in India are price sensitive, they are also
value conscious, meaning they are willing to pay more for higher quality goods (Schultz & Jain,
2015). In India, this could mean opting to buy products made outside of their own nation, as it
was found that many perceive goods made in this country to be of lesser value than those made

31
outside of this country. This study found how important it is for consumers who buy luxury
goods to know where their garments are made and produced, as the value of these goods can be
based on these measures (Schultz & Jain, 2015).
There are some obvious differences between fast fashion and luxury companies. Fast
fashion is known for mimicking these high-end brands at a low cost. This low cost can provide
the wide assortments that retailers and their consumers want in today's retail industry (Slow
fashion vs. fast fashion, 2016). Luxury retailers (also referred to as slow retailers) are known for
recognizing the impact that clothing makes on society and are aware of the importance of
consumer perception of quality. Luxury goods are known for being made in ethical
manufacturing factories, where consumers can be assured their clothing is being made in a safe
working environment (Slow fashion vs. fast fashion, 2016).
Millennials. Millennials, otherwise known as Generation Y, are individuals who were born
between the early 1980s and 1990s. Positively, this generation has been described as open-
minded, confident, self-expressive, upbeat and receptive to new ideas and ways of living (Main,
2017). In addition, Millennials are known to have distinct values, predilections, habits, and fears
tied to their earing and spending habits (Landrum, 2017). It was found that Millennials prefer to
do business with corporations and brands with pro-social messages, sustainable manufacturing
methods and ethical business standards (Landrum, 2017). With this, 81% of Millennials expect
their favorite companies to make public declarations of their corporate citizenship, making
positive ethical practices important for companies targeting this generation (Landrum, 2017).
While Millennials take notice of the quality and where a product is made, it is important
to note that this generation is very money cautious. A sale or coupon can become the deciding

32
factor in a purchase decision (Kestenbaum, 2017). With fast fashion notorious for its cheap
prices and quick turn-around of products in store, Millennials shopping with fast fashion retailers
is no surprise (Bain, 2015). Retailers such as Forever 21 and H&M have mastered the art of
catering their target market by receiving new products every day and offering low prices (Bain,
2015). Millennials also look for excitement with shopping, which is not often found in a
department store setting (Loeb, 2015). Fast fashion retailers often have stores located in malls
with online and mobile apps, allowing consumers to shop when and where they want. While
older Millennials take advantage of mobile apps, younger Millennials often shop in-store or on a
computer (Loeb, 2015). While Millennials are coming of age, they are beginning to have large
amounts of purchasing power. Because of this, retailers will need to adjust their strategies and
stores to align with this generation wants and needs (Loeb, 2015).
Millennials perception of COO. Transparency is a growing characteristic that Millennials look
for in the manufacturers of their products. A current trend in the food industry is to check where
the products are coming from, and this is growing more and more in the fashion industry
(Salfino, 2018). Consumers between the ages of 25 and 34 were 10% more likely to check
clothes for the country of origin while shopping than consumers 35 to 55 (Salfino, 2018). In
addition, consumers are also checking for fabric content and where the material itself is coming
from (Salfino, 2018). In a study consuming of 9 million millennials, research has found that 90%
of participants would feel good about wearing apparel with cotton grown in the U.S., while 58%
of these consumers were willing to pay more for U.S. grown cotton clothes (Salfino, 2018).
In Tjandra, Omar and Ensor's (2014) study over COO effect on Millennials’ perception, it
was found that individuals from developed countries preferred a product from developed
33
countries, as they listed quality of product and ethical values to be their reasoning. When asked
about emerging countries specifically from participants from developed countries, many related
terms associated with ethical issues such as chap work, child labor, poverty, and exploitation
were used (Tjandra et al., 2015). In contrast, participants from emerging countries main concern
with products made in emerging countries were the quality of product, prestige, and price
(Tjandra et al., 2015). These participants related the terms premium, status, design, quality and
value for money to products made in emerging countries.
When given the option of two T-shirts with identical brand names, style, color, and price
but one was made in a developed country and one in an emerging country, participants from both
developed and emerging countries favored the t-shirt made in the developed country (Tjandra et
al., 2015). When asked to explain why, developed country participants listed quality of product
and ethical issues as their main reasoning. Participants from emerging countries stated that a T-
shirt made in a developed country or advanced economy would be known for having better
product quality, making this their decision factor (Tjandra et al., 2015). Overall, it was found that
Millennials preferred products from developed countries, otherwise stated as advanced
economies, due to the reputation of product quality and manufacturing practices (Tjandra et al.,
2015).
Hypotheses
Hypothesis One: Consumer perception of value for apparel merchandise is impacted by country
of origin.
Hypothesis Two: Consumer perception of value is higher for fast fashion garments manufactured
in the United States than in China.
Hypothesis Three: Millennials’ perceived innovativeness of products made in the United States
is higher than in China.

34
Hypothesis Four: Millennials willingness to buy fast fashion products made in the United States
is higher than in China.
Hypothesis Five: Millennials have a higher perceived price for fast fashion products made in the
United States than China.
Hypothesis Six: Millennials are more familiar with fast fashion products made in the United
States China.
Hypothesis Seven: Millennials are expected to view a fast fashion apparel product made in the
United States to be of higher quality than China.
Theory. Roth and Romeo's (1992) study measured country image based on four dimensions:
innovativeness, design, prestige (status and brand name reputation), and workmanship (quality).
Roth and Romeo (1992) stated that a plausible explanation is that consumers’ perceptions are
formed by relating what they know about a country’s ability to produce goods to a product. Their
study focused on the product-country matching within the dimensions of innovativeness,
willingness to buy, prestige and workmanship. A match between product-country would occur
when the perceived strengths of a country are important product features or benefits for the
particular product category.
From their study, findings indicated that product-country match may be an indicator of
willingness to buy foreign products. Within Roth and Romeo's (1992) theory, products that were
rated highly for one dimension were also rated highly on all other dimensions. This study is
finding the connection between country of origin and perception of value based on perceived
innovativeness, willingness to buy, perceived price, familiarity of country’s product and quality.
Using Roth and Romeo’s (1992) theory that higher rankings of these dimensions relate to a
positive product-country perception will be used in determining perception of value based on
country of origin in this study. Roth and Romeo’s (1992) framework has been used in other

35
studies including Matarazzo & Resciniti (2012); Mohamad, Ahmed, Honeycutt, & Tyebkhan
(2000); and Fischer & Zeugner-Roth (2017).
Figure 2.1: Conceptual Model
CHAPTER 3: METHODOLOGY
Using mixed methods, using both quantitative and qualitative research will be conducted.
Mixed methods research is defined as the combining or integration of qualitative and quantitative
research and data in a research study (Creswell, 2014). Furthermore, qualitative data tends to be
open-ended without predetermined responses while quantitative data usually includes close-
ended responses such as found on questionnaires (Creswell, 2014). This research method is best
to define this study, as there will be both open and closed-ended questions. These questions will
be asked through a survey, provided to participants to take through Amazon’s Mechanical Turk
(MTurk). Participants will be recruited through MTurk, which is a crowdsourcing marketplace
that will distribute questionnaires to participants virtually. MTurk has access to a global, on
demand, 24/7 workforce with a diverse range of ages and demographics (Amazon Mechanical

36
Turk, n.d.). Participants will receive a survey link that is posted on their website. MTurk is a paid
survey site, that allows requesters to pay a fee for their questionnaires to be available to their
users. The price includes both the pay for the participants and the fee for using MTurks system,
with a minimum fee of $0.01 per assignment (Amazon Mechanical Turk, n.d.). The expected
number of participants is between 200 and 250 consumers based on the expected fee of $0.15 per
assignment.
Due to the popularity of fast fashion with Millennial consumers, the hypotheses in this
study will be limited to those aged 18 to 35. Millennials are categorized as those who were born
in the 1980’s and the 1990’s (Main, 2017). One research center listed that Millennials were those
who were in the age range from 20 to 35 (Fry, 2018). Generation Z are those who were born
between 1997 and 2012, any participants who fall into this category will be categorized as
Millennials, due to the closeness of age and small quantity of participants that fall into this range
(Dimock, 2019). As mentioned before, Millennials purchasing power is growing and will
continue to grow which makes them an important consumer group to understand, as their needs
and wants can differ from those of other generations.
Participants who are 36 and older will also be able to participate in this research study,
whose results will be used in comparison to the Millennials. The age groups in this study will be
broken down to Millennials and 36 and older. The reason for only using two age groups in this
study will be to focus on the Millennials results and their perception of value of fast fashion
products based on COO.
The countries selected to be studied are the United States and China. China is selected
because of the popularity of manufacturing in this country for fast fashion retailers. Forever 21,

37
H&M and the Gap are three fast fashion retailers who manufacture products in China (Hicken,
2012; Supplier List, n.d.; Supplier Partnerships, n.d.). The United States is selected for this study
because manufacturing factories in this country provide safer work environments, has a
minimum wage requirement and workers are generally more experienced. (Livingston, n.d.).
Procedure. To determine how COO impacts consumers’ perception of fast fashion, participants
will be asked a series of questions. The initial question asked will come from Wang, Siu, and
Hui’s (2004) study about consumers’ decision-making style when given domestic and imported
products. Participants will be asked, "do you prefer to buy domestic brands, imported brands or
both and why when shopping with fast fashion retailers?". Using Roth and Romeo’s (1992)
survey questions, participants will be asked to measure their perception of the United States and
China. Participants will be given a statement and using a 7-point scale (1- not innovative; 7-very
innovative), which will measure their perspective of innovativeness of a country’s apparel
product. This question will gain insight into how consumers view a country’s use of technology
and engineering advancements, which can be applied while producing apparel items, as well as
within the style themselves.
In the second section, with data collected using Roth and Romeo’s (1992) survey items,
participants are asked how willing they are to purchase products and how familiar they are with
apparel products made the United States and China. Like Roth and Romeo’s (1992) study, this
will measure how product-country relates to purchasing behavior. Participants will be given the
following statements, "how willing are you to purchase apparel products from the United States"
and “how willing are you to purchase apparel products from China”. Using a 7-point scale (1
being strongly not willing and 7 being very willing) participants will rate their perceptions of this
38
measure. The following questions will also be asked where participants will use a 7- point scale
(1 being strongly not familiar and 7 being very familiar) to rate their perception of the following
measure: "how familiar are you with apparel products made in the United States” and “how
familiar are you with apparel products made in China".
Following Acharya and Elliott's (2001) study, a scenario will be given to participants to
find the perception of quality. In this method, they will be given the scenario of a pair of jeans
from fast fashion retailer Forever 21 retailed at $12.90 (starting price for basic jeans). This will
be presented to participants with the following: “would you expect the quality of a pair of
Forever 21 jeans, retailed at $12.90, made in the United States (China) to be (select one)?"
followed by a 7-point scale (1 being extremely poor, 7 being extremely good). The follow-up
question will be presented to the participants with the following: "how likely are you to buy a
pair of Forever 21 jeans, retailed at $12.90, made in the United States (China) to be (select one)?’
using a 5-point scale (1 being definitely not buy, 5 being definitely buy).
Using Joung’s (2014) study, screening questions will be asked to grasp our participants'
involvement in shopping with fast fashion brands and companies. For fast fashion purchase, a
yes/no statement will be used: “I purchase apparel products in stores that carry fast fashion
brands (e.g. H&M, Forever 21, Zara, Gap, etc.)” (Joung, 2014). To measure amount of apparel
product purchase, a single question was developed; “Approximately how many items of apparel
products do you purchase a year?” and the respondents answered on a ten-point scale with 5-
apparel item intervals (1 - fewer than 5 items, 2 – 5 to 9 items, 10- 45 or more items) (Joung,
2014). For a measurement of apparel disposing, a question asked “How many items of apparel
products do you dispose of in a year?” and the respondents answered on a ten-point scale with 5-

39
apparel item intervals (1 - fewer than 5 items, 2 – 5 to 9 items, 10- 45 or more items) (Joung,
2014).
Using the same survey items as Collett, Cluver, and Chen (2013), consumer perception of
fast fashion will be measured. This approach will be done by using a qualitative questionnaire
consisting of open-ended questions to allow participants to expand their thoughts on this sector
of retail. Participants will be asked to describe how they feel about fast fashion retailers. This
approach can provide insight into the consumers' perception of the fast fashion industry as a
whole. Participants will also be prompted with the statement: "Fast fashion retailers encourage
consumers to make frequent purchases in their stores by continually bringing in new fashion-
oriented clothing items and selling them at low prices" followed by two questions: "is this a
good, bad, or neutral thing for consumers?" and "is this a good, bad, or neutral thing for
society?". These two questions will enable us to learn how consumers feel about the limited
lifespan of fast fashion apparel items (Collett, Cluver, & Chen, 2013).
Questions about the demographics of the participants will be included in the survey as
well. Using the same methods as Wang, Siu, and Hui (2004), a variable such as age, education
level, and annual income will be asked. While the participants are already asked how much they
typically spend on apparel and fast fashion items in this study, they will also be asked the
frequency of shopping and frequency of reading fashion magazines (Wang, Siu, and Hui, 2004).
These questions can give insight into how much consumers are involved with keeping up with
fashion trends and topics.
40
Cronbach’s alpha, developed in 1951 by Lee Cronbach, measures the reliability or
internal consistency of a quantitative test (Stephanie, 2014). A result of alpha at a 0.7 and higher
is an acceptable rating using this method. Roth and Romeo’s (1992) study had an alpha of 0.76,
making this study acceptable. Acharya and Elliott’s (2001) study had an alpha of 0.680. While
this study did not make the 0.70 mark, according to Cronbach’s study an unacceptable rating is
an alpha of 0.5 or less (Stephanie, 2014). Because of this mark, Acharya and Elliott’s (2001) will
be deemed reliable for this study. In Wang et al. (2004) study, alpha was 0.739, deeming this
study reliable. The reliability of Joung’s (2014) survey questions used in this study had an alpha
of 0.84, deeming this study reliable.
Data analysis. The convergent parallel mixed methods approach will be used to analyze the
data. This method is typically used when data is being collected at the same time and then both
qualitative and quantitative information is integrated (Creswell, 2014). Using this method,
qualitative and quantitative data will be analyzed separately, and then compared to see if the
findings confirm or disconfirm each other (Creswell, 2014). Because both open and closed-
ended will be used in the same survey, the sample of participants is anticipated to be the same.
Using the same participants is typically used in this method to create a better comparison of
results (Creswell, 2014).
To analyze the two forms of data, the side-by-side comparison approach will be used. In this
approach, the quantitative statistical results will be reported first, followed by a discussion of the
qualitative results (themes) to confirm or disconfirm the statistical results (Creswell, 2014). The
quantitative data will be analyzed through the method of correlation, specifically the Pearson
Product Moment Correlation (PPMC). This method shows a linear line between the two sets of
41
data, the dependent variable and the independent variable, which indicates a positive, negative or
no relation. The independent variable is the country of origin. The dependent variables are
perceived innovativeness, willingness to buy, the familiarity of countries product, perceived
sustainability, perceived price, and quality. The relation between each country as COO and the
consumers' perceptions will be found using the PPMC method, giving positive, negative or no
relation between the two indicating weather COO impacts consumers perception of products.
Qualitative data will be analyzed through coding to find common themes. Coding is the
process of organizing the data by bracketing text segments and writing a word representing a
category in the margins (Rossman & Rallis, 2012). In other terms, the text data and sentences
that are gathered during data collection will then be put into labeled categories, often a term
based in the actual language of the participant (Creswell, 2014). Using the traditional process of
this method, codes will emerge during the data analysis procedures. The final step of the data
analyzing involves making an interpretation in qualitative research of the findings (Creswell,
2014). The side-by-side comparison used in the convergent parallel mixed methods approach
will be used to compare themes found through qualitative research with the findings from the
PPMC approach for quantitative data.
CHAPTER 4: RESULTS
Multiple regression was used to analyze the results of the quantitative data in this study.
Perception of value, perceived innovativeness, willingness to buy, perceived price, familiarity of
country’s product and perceived quality were all analyzed using this method. Qualitative data
was analyzed by finding common themes in the participants open-ended questions. Results will
be analyzed in two sections, millennials and participants 36 and older. After determining the

42
results for each age group separately, they will be compared to determine similarities and
differences between the two.
Throughout the survey, participants were presented fast fashion in the sense of fast
fashion products, compared to fast fashion brands, in all but one question. Fast fashion products
are specific products that are made in fast fashion manufacturing factories and fall into the
description of fast fashion, which is low price, high quantity merchandise that is made for
consumers rapidly (Fast Fashion, 2016). A fast fashion brand or company has been defined as
low-cost clothing collections that mimic current luxury fashion trends (Slow fashion vs. fast
fashion, 2016). By focusing on fast fashion products, participants are able to have a precise idea
of what is being presented or asked of them.
Section 1: Analysis of Millennials
Perception of value. A variance of 8.2% was found to predict the United States and China’s
relationship with perception of value and age (R2=0.082, F(10,146)=1.826, p=0.061). Perception
of value is based on perceived innovativeness, willingness to buy, perceived price, familiarity of
country’s product and perceived quality. All variables, in addition to age, were inputted into a
multiple regression. The Cronbach’s alpha for all survey questions measuring perception of
value is 0.522. While there was a direct relationship between United States and perceived
innovativeness, willingness to buy, perceived price and perceived quality; familiarity of
country’s product was found to have an inverse relationship. (p. innovativeness: t= 0.655,
p=0.514; willingness to buy: t= 1.414, p=0.16; p. price: t=1.625, p= 0.106, p. quality: t=0.893,
p=0.373; familiarity: t=-.1861, p=0.065). China and perceived innovativeness, willingness to
buy, perceived price and familiarity of countries product all had inverse relationships, while

43
China and quality had a direct relationship (p. innovativeness: t= -1.686, p=0.094; willingness to
buy: t= -0.500, p=0.618; p. price: t=-0.952 p= 0.343, p. quality: t=0.700, p=0.485; familiarity: t=-
.190, p=0.849). In addition to the directional results, the p value in this multiple regression was
greater than 0.05, deeming this multiple regression insignificant. Thus, hypothesis one and two
are not supported.
The nonsignificant result of this multiple regression could be a result of the sample size
(n= 146). The results do indicate directional relationships between perceived innovativeness,
willingness to buy, perceived price, familiarity of country’s product and perceived quality. The
United States and these variables resulted in a direct relationship, while China and these
variables were found to have an inverse relationship.
Perceived Innovativeness. A variance of 1.9% was found to predict the United States and
China’s relationship with perceived innovativeness and age (R2=0.019, F(2,161)=1.581,
p=0.209). The Cronbach’s alpha for all survey questions measuring perceived innovativeness is
0.039. The United States was found to have a direct relationship with perceived innovativeness
and age; however, the multiple regression was not found to be significant as the p value was
greater than 0.05 (t=0.487, p=0.627). China was found to have an inverse relationship with
perceived innovativeness and age, this multiple regression was also not found to be significant
with a p value greater than 0.05 (t=-1.778, p=0.077). Thus, hypothesis three is not supported.
Perceived innovativeness was presented to participants where innovativeness meant the
use of new technology and engineering advances. The results indicated a directional relationship,
with the United States having a positive t value and China having a negative t value. The p value

44
of this multiple regression being greater than 0.05 indicates a nonsignificant multiple regression,
thus, not confirming hypothesis three.
Willingness to buy. A variance of 2.9% was found to predict the United States and China’s
relationship with willingness to buy and age (R2=0.029, F(2,162)=2.435, p=0.091). The
Cronbach’s alpha for all survey questions measuring willingness to buy is 0.153. The United
States was found to have a direct relationship with willingness to buy and age, this multiple
regression was supported as the p value less than 0.05 (t=2.135, p=0.034). China was found to
have an inverse relationship with willingness to buy and age, this multiple regression was not
found to be significant with a p value greater than 0.05 (t=-1.231, p=0.220). Although the United
States relationship with willingness to buy was supported, China’s relationship with willingness
to buy was not supported with a p value of 0.05. Thus, hypothesis four is partially supported.
Willingness to buy fast fashion products was presented to participants as a 7-point scale
question (1- very unlikely, 7- very likely). There was a directional relationship found within the
results, as the United States had a positive t value and China had a negative t value. The United
States multiple regression was found to be significant, with a p value less than 0.05, however the
overall multiple regression was found to be nonsignificant with a p value greater than 0.05.
Although there was a directional relationship, this multiple regression was not significant, thus
the hypothesis cannot be supported.
Perceived price. A variance of 3.5% was found to predict the United States and China’s
relationship with perceived price and age (R2=0.035, F(2,156)=2.816, p=0.63). The Cronbach’s
alpha for all survey questions measuring perceived price is 0.691. The United States was found
to have a direct relationship with perceived price and age. This multiple regression was found to

45
be significant with a p value less than 0.05 (t=1.983, p=0.049). China was found to have an
inverse relationship with perceived price and age; however, this multiple regression was not
found to be significant with a p value greater than 0.05 (t=-1.175, p=0.242). Although the United
States was found to have a significant direct relationship with perceived price, China did not
have a significant relationship with perceived price; thus, hypothesis five is partially supported.
Perceived price was determined through an open-ended question allowing participants to
provide the maximum retail price they were willing to pay for a fitted blazer made in the United
States (China) and sold at H&M. The average answer for the product made in the United States
was $66.61, while China had an average answer of $58 by Millennials. Although the multiple
regression was found to be insignificant, the directional relationship aligns with these findings.
In addition to this scenario, participants were asked how much they believed a cotton shirt
would be based on where the material (cotton) originated and where the product was made
(United States, China) in compared to a $40 (average price) shirt that was made of 100% cotton
and has a ‘Made in China’ label. Again, these findings were aligned with the directional
relationship that was found in the multiple regression analysis. Table 4.1 shows participants
evaluation of each category given.
Table 4.1. Millennials Perceived Price of Shirt Under Different COO Conditions

46
Familiarity of country’s product. A variance of 1.4% was found to predict the United States
and China’s relationship with familiarity of country’s product and age (R2=.014, F(2,161)=1.150,
p=0.319). The Cronbach’s alpha for all survey questions measuring familiarity of country’s
product is 0.061. The United States was found to have a direct relationship with familiarity of
country’s product and age; however, the multiple regression was not found to be significant as
the p value was greater than 0.05 (t=0.959, p=0.339). China was found to have an inverse
relationship with familiarity of country’s product and age, this multiple regression was also not
found to be significant with a p value greater than 0.05 (t=-0.781, p=0.436). Thus, hypothesis six
is not supported.
The evaluation for familiarity of countries product was presented to participants as it was
in Roth & Romeo’s (1992) study. The multiple regression results in this study coming in as
insignificant can be due to differences in the studies variables. In Roth & Romeo’s (1992) study,
they were presented with 10 countries, greater than the two presented in this study. The products
presented also differ from Roth & Romeo’s (1992) study, as participants were presented with
multiple industries, oppose to this study with the specific category of fast fashion. Although there
is a directional relationship with a positive t value for the United States and a negative
relationship with China as the t value is negative, the p value in this study too high to confirm the
relationship of variables in this study.
Perceived quality. A variance of 0.9% was found to predict the United States and China’s
relationship with quality and age (R2=.009, F(2,162)=0.719, p=0.489). The Cronbach’s alpha for
all survey questions measuring perceived quality is 0.191. The United States was found to have a
direct relationship with quality and age; however, the multiple regression was not found to be

47
significant as the p value was greater than 0.05 (t=1.061, p=0.290). China was found to have an
inverse relationship with quality and age, this multiple regression was also not found to be
significant with a p value greater than 0.05 (t=-0.17, p=0.986). Thus, hypothesis seven is not
supported.
To determine perceived quality, participants were asked what they expected the quality of
a pair of Forever 21 jeans, retailed at $12.90 and made in the United States (China) would be on
a 7-point scale (1-extremely poor, 7- extremely good). The insignificance in this multiple
regression could come from the proposed question or the sample size (n=162). The results did
show a directional relationship, as the United States had a direct relationship and China had an
inverse relationship. The results and hypothesis were unable to be supported due to the p value in
the multiple regression analysis.
Themes. Participants were asked open ended questions to grasp their thoughts and participation
in shopping with fast fashion retailers. Of the 165 Millennials that participated, 136 stated that
they do shop with fast fashion retailers. Of those that do shop fast fashion brands, 55 preferred
domestic brands. Common themes for those who preferred domestic brands were higher quality
in the products, better working conditions and supporting the United States economy and jobs.
65 participants stated that they prefer both, with common themes of finding the best retail price
regardless of country of origin, quality can vary in products regardless of country of origin and
country of origin is not a concern or something they look for when shopping. The fast fashion
industry had various reactions from Millennials. Fast fashion products being of bad quality was a
common theme when asked how participants felt about the fast fashion industry, as well as being
an affordable option in comparison to other sectors of the retail industry.

48
Section 2: Analysis of People Aged 36 and Older
Perception of value. Participants 36 and older also had nonsignificant results in the six multiple
regression that were done. A variance of 5.9% was found to predict the United States and
China’s relationship with perception of value and age (R2= 0.059, F(10,110)=0.684, p=0.737).
The Cronbach’s alpha for all survey questions measuring perception of value is 0.493. A direct
relationship was found between the United States and familiarity of countries product and
perceived quality, while perceived price, perceived innovativeness and willingness had an
inverse relationship (p. innovativeness: t= -1.045, p=0.298; willingness to buy: t=-0.271,
p=0.787; p. price: t=-0.184, p= 0.854, p. quality: t=0.034, p=0.973; familiarity: t=0.285,
p=0.776). A direct relationship was found between perceived innovativeness and perceived
quality, while perceived price, familiarity of countries product and willingness had inverse
relationships (p. innovativeness: t= 0.410, p=0.682; willingness to buy: t=-0.261, p=0.795; p.
price: t=-0.125, p= 0.901, p. quality: t=0.545, p=0.587; familiarity: t=-1.479, p=0.142). These
results differ from those found from the multiple regression ran on Millennials.
Perceived innovativeness. A variance of 1.6% was found to predict the United States and
China’s relationship with perceived innovativeness and age (R2=0.016, F(2,123)=1.010,
p=0.367). The Cronbach’s alpha for all survey questions measuring perceived innovativeness is
0.788. The United States was found to have an inverse relationship with perceived
innovativeness and age; however, the multiple regression was not found to be significant as the p
value was greater than 0.05 (t=-1.340, p=0.183). China was found to have a direct relationship
with perceived innovativeness and age, this multiple regression was also not found to be
significant with a p value greater than 0.05 (t=0.644, p=0.521). This differs from the Millennials

49
analysis which found the United States to have a direct relationship with perceived
innovativeness and age, while China was found to have an inverse relationship.
Willingness to buy. A variance of 1.4% was found to predict the United States and China’s
relationship with willingness to buy and age (R2=0.014, F(2,123)=0.875, p=0.419). The
Cronbach’s alpha for all survey questions measuring willingness to buy is 0.789. The United
States was found to have an inverse relationship with willingness to buy and age; however, this
multiple regression was not supported as the p value greater than 0.05 (t=-1.293, p=0.198). China
was found to have an inverse relationship with willingness to buy and age, this multiple
regression was not found to be significant with a p value greater than 0.05 (t=-0.056, p=0.955).
These results differ from Millennials, as the United States was found to have a direct
relationship, while China was found to have a negative relationship.
Perceived price. A variance of 0.8% was found to predict the United States and China’s
relationship with perceived price and age (R2=0.008, F(2,120)=0.458, p=0.633). The Cronbach’s
alpha for all survey questions measuring perceived price is 0.672. The United States was found
to have an inverse relationship with perceived price and age. This multiple regression was not
found to be significant with a p value greater than 0.05 (t=-0.645, p=0.520). China was found to
have a direct relationship with perceived price and age; however, this multiple regression was
not found to be significant with a p value greater than 0.05 (t=0.136, p=0.892). This differs from
the multiple regression on Millennials, as a direct relationship was found with the United States
and an inverse relationship was found with China.
When asked how much participants 36 and older were willing to pay for a fitted blazer
made in the United States (China) and sold at H&M, results were similar to those of the

50
Millennials. The average retail price this category was willing to pay for the product made in the
United States was $52.97, while the average retail price for the product made in China was
$38.96. While both categories of participants were willing to pay more for made in the United
States products, Millennials found the perceived price to be higher for each country of origin
than those 36 and above. In addition to the scenario above, participants were asked how much
they believed a cotton shirt would be based on where the material (cotton) originated and where
the product was made (United States, China) in compared to a $40 (average price) shirt that was
made of 100% cotton and has a ‘Made in China’ label. As shown in Table 4.2, respondents
evaluated the product similarly to Millennials.
Table 4.2. Participants 36 & Older Perceived Price of Shirt Under Different COO Conditions
Familiarity of country’s product. A variance of 2.9% was found to predict the United States
and China’s relationship with familiarity of country’s product and age (R2=.029, F(2,124)=1.828,
p=0.165). The Cronbach’s alpha for all survey questions measuring familiarity of country’s
product is 0.771. The United States was found to have a direct relationship with familiarity of
country’s product and age; however, the multiple regression was not found to be significant as
the p value was greater than 0.05 (t=0.103, p=0.918). China was found to have an inverse
relationship with familiarity of country’s product and age, this multiple regression was also not
found to be significant with a p value greater than 0.05 (t=-1.851, p=0.067). These results align

51
with those found from the Millennial multiple regression, resulting in a directional relationship.
Due to the p value, this multiple regression is not significant.
Perceived quality. A variance of 0.5% was found to predict the United States and China’s
relationship with quality and age (R2=.005, F(2,124)=0.332, p=0.718). The Cronbach’s alpha for
all survey questions measuring perceived quality is 0.772. The United States was found to have
an inverse relationship with quality and age; however, the multiple regression was not found to
be significant as the p value was greater than 0.05 (t=-0.555, p=0.580). China was found to have
a direct relationship with quality and age, this multiple regression was also not found to be
significant with a p value greater than 0.05 (t=0.815, p=0.417). These results differ from those of
the Millennials multiple regression. Results from the Millennials multiple regression analysis
identified a direct relationship with the United States and quality, while China had an inverse
relationship with quality and age. This multiple regression for participants 36 and up is found to
be nonsignificant, as the p value is greater than 0.05.
Themes. Out of the 131 participants who 36 and older, 111 stated that they shopped fast fashion
retailers. Similar to Millennials, a common theme in preferring domestic made products was to
support the economy and creating jobs in the United States. In addition, this age group found
domestic made products to be made with higher quality and have a better fit. Again, similar to
Millennials, those who preferred both said they look for the best price and good deals when
shopping fast fashion, regardless of where the product was made. A majority (53.5%) of the
participants 36 and over implied positive feelings for fast fashion, deeming this option
convenient and affordable, similar themes that were found with Millennial participants. Themes

52
from those who implied negative feelings found fast fashion to be low quality products and
harmful for the environment.
Discussion
Overall, both Millennials and participants 36 and older had similar views of the fast
fashion industry. While many of them shop this sector of the retail industry, they mentioned bad
quality but affordable prices for fast fashion products. Creating jobs and supporting the United
States economy were the most common themes in why participants prefer domestic goods.
Majority of both age groups will shop both domestic and imported fast fashion products, as they
have a wider variety and can find the best price. In addition to determining the participants
thoughts of fast fashion, COO was tested against other factors to determine the importance of
COO in making a decision to buy.
Prior research has delved into how COO impacts brand image, likeliness to buy,
perception of quality and overall quality in luxury brands, leaving a need for fast fashion to be
studied. Determining if fast fashion products made in the United States had a greater perception
of value than China, perceived innovativeness, willingness to buy, perceived price, familiarity of
countries product and perceived quality were key elements in this study. The study was
presented to participants in an online survey, where they answered multiple choice, scale and
open-ended questions. As shown in the results, multiple regression was used to analyze the
closed ended questions, while open-ended questions were analyzed by finding common themes
and applying these to the qualitative results.

53
The multiple regression in this study were unfortunately found to be nonsignificant due to
the p values. There were directional results, positive relationship with COO and the United States
and negative relationships with COO and China, found when analyzing each dimension
(perceived innovativeness, willingness to buy, perceived price, perceived quality, familiarity of
country’s product). While the qualitative results did support some of the directional relationships
found in the quantitative data (perceived price, familiarity of countries product), it is important to
note that 39.4% of participants said they would shop both countries, with reasonings ranging
from finding the best retail prices to not being concerned about COO.
Roth & Romeo’s (1995) study found that participants rated their willingness to buy for
their home country higher than those of other countries. This study was opened to consumers in
the United States, where a direct line was found between the United States and willingness to
buy when analyzing the results of the Millennials multiple regression. Participants 36 and older
had different views from Millennials when willingness to buy was analyzed. The older age group
had inverse directional results with both the United States and China and willingness to buy.
Although these results indicate this negative reaction to willingness to buy for the older age
group, 46% of participants had a positive reaction to fast fashion with common themes being that
fast fashion is a convenient and affordable option. 30% of the older participants had a negative
reaction to fast fashion, with common themes being poor- or low-quality product and the harm
fast fashion causes the environment.
Similar to willingness to buy, perceived innovativeness also was found to be
nonsignificant due to the p value, but a directional line was found between the variables. In
Arora, Arora, and Xiao (2017) study determining how COO impacts purchasing decision based
54
on product innovativeness, developed countries were found to be preferred for high design
newness in comparison to emerging countries. When analyzing the results from the Millennials
multiple regression, a directional relationship was found as the United States had a direct
relationship and China had an inverse relationship. Participants 36 and older had the opposite
results from the Millennials; a direct relationship with China and an inverse relationship with the
United States. Understanding the participants viewpoints on innovativeness and why they found
a country to be or not to be innovative would have been helpful in the overall study.
Perceived innovativeness was presented to participants as a 7-point scale question, where
perceived innovativeness was defined as the use of new technology and engineering advances.
Based on the results that were found, the way this dimension was studied could have been
improved. Although this study was focused on fast fashion, this question specifically did not
mention fast fashion products as others had. Participants may have viewed innovation in forms
of electronic technology, opposed to technology in apparel or in the making of products. For
future studies, an opportunity would be expanding this question to grasp the participants thoughts
on innovativeness with fast fashion.
COO’s impact on perception of quality has also been researched, finding that this
dimension has an impact with consumers (Bilkey & Nes, 1982). As it was found in this study,
participants reasoning for choosing to shop with domestic brands was persuaded by quality of
product, while other participants who shopped both domestic and imported mentioned that low
quality was expected with fast fashion. Both Millennials and participants 36 and older had the
same directional relationship with the United States, China and perceived quality. The United
States was found to have a direct relationship, while China had an inverse relationship. These

55
results are not surprising, as both age groups implied that the United States had better quality and
workmanship in comparison to China, which was viewed as low or poor quality.
Previous studies have found that Millennials are money, earning and spending, cautious
(Landrum, 2017). The quantitative results finding that participants shop both countries because
they are looking for the best price is not surprising. Through open-ended questions where
participants were asked how much they would expect the retail price to be for a cotton t-shirt
made in the United States (China), made with cotton from the United States (China), Millennials
and older participants found that made in the USA with cotton from the United States would be
higher than that made in China with cotton from China. Although their perception of made in the
United States may be higher than that of China, based on the quantitative results, Millennials will
look for best price before they look at where the product was made when making their purchase
decisions.
In Sandberg, Larsson, & Christiansson’s (2018) study, a common motive found in
consuming fast fashion products was the lower retail price and the wider variety that fast fashion
offers. Participants in this study identified the wider assortment as a reason they would shop with
both imported and domestic products, as well as lower price. Although the participants sacrificed
for what was perceived as poor- or low- quality products, Millennials were still active when
shopping fast fashion companies and brands. In another study, it was found that consumers
expected fast fashion companies to keep prices low, in order to purchase more products
(Pookulangara & Shepard, 2013). Fast fashion has been characterized as disposable products,
and after few wears, the consumer rids of the garment (Fast Fashion, 2016). The findings in

56
these studies suggest consumers are more concerned with large assortments and purchasing low
cost products, than they are with COO when making purchasing decisions in fast fashion.
In the multiple regression analysis, the results for the Millennials found that the United
States had a direct relationship with perceived price, while China had an inverse relationship.
Participants 36 and older results were the opposite of the Millennials, where results found that
China had a direct relationship and the United States had an inverse relationship. These results
were unexpected, as the open-ended questions resulted in higher average retails for made in the
United States in comparison to made in China from the older age group.
Both Millennials and older participants had directional relationships with the United
States, China and familiarity of the country’s product. The United States had a direct
relationship, while China had an inverse relationship. Consumers can become more familiar with
a country’s products due to exposure, past experience, advertisements and word-of-mouth (Kim
et. al, 2015). With participants in this study living in the United States, their access to exposure,
experience and advertisement could be more likely, as well as more positive than that of made in
China products. An opportunity in this study would be a follow up question allowing participants
to expand on why and how they were more familiar with the products made in the United States
than they were with made in China products. Understanding what factors play a part in their
familiarity of a country’s products would be beneficial for future studies.
From the quantitative results, 33% of Millennial participants stated that they prefer to
shop only domestic fast fashion brands. Millennials are known to be more economically aware
and prefer to work with sustainable brands (Landrum, 2017). Sustainable being less waste, better
for the environment and the use of recycled product (Bagcraft, n.d.). From this 33%, better

57
working conditions in manufactories and supporting the United States economy were common
themes that were found. It is evident that Millennials who do shop with only United States
brands are cautious about where and how the product is made. 5% of Millennials stated that they
only shop with imported brands, with lower price being the only theme found. Again,
Millennials are highly aware of spending habits, understanding why this 5% would choose to
shop with the lower price products.
Overall, identifying the perception of value based on perceived innovativeness,
willingness to buy, perceived price, familiarity of countries product, and perceived quality was
found to be nonsignificant in the multiple regression; however, directional relationships were
distinguished. When analyzed in a multiple regression with every dimension in this study, there
were direct relationships with all factors besides familiarity of country’s product, which had an
inverse relationship. Familiarity of country’s product being found to have an inverse relationship
was surprising, as previous research has shown that it is common for consumers to view products
from their home country greater than that of others (Ha-Brookshire & Yoon, 2012).
In Strašek’s (2011) study about the relationship between COO and brand name value, it
was found that the brand name value was significantly impacted by the COO. Brand name value
in this study was based on dimensions of promotion, price, product, distribution and COO.
Determining the dimensions in which is studied against COO to find the impact on value is a key
element in these studies. Price and COO are used in this study, which also has three other
dimensions that differ from Strašek’s (2011) study. Consumers finding that COO impacts their
perception of value of brand name in Strašek’s (2011) study aligns with this study directional
relationships that are found with perception of value.

58
In a 2015 study, it was found that 8 in 10 Americans consumers preferred American
made product, in oppose to imported products. The same study found that more than 60% of
these consumers were willing to pay 10% more for products made in America (Consumer
Reports, 2015). The goal of this study was to identify the dimensions that consumers find
important in fast fashion, as this sector in the retail industry is growing. The fashion industry is
constantly changing, from trends to how consumers shop, and retailers and brands must stay
current with every change to be competitive. This study identified which dimensions Millennials
and older consumers viewed as important when determining what to buy and were to shop.
Millennials and the United States had direct relationships with all dimensions: perceived
innovativeness, willingness to buy, perceived price, familiarity of products country and
perceived quality.
The quantitative data did indicate that some participants did not use COO as a purchasing
decision factor and price was a bigger concern. A finding in this study was the perceived priced
for the United States having a direct relationship, oppose to the inverse relationship found with
China. Retailers who sell American made products, can use this information and retail their
products at a higher price. For those consumers who are not concerned about COO or do not look
at this factor when making purchases initially, a higher retail for a made in an America product
would be justified and understood.
Limitations. In addition, the hypothesis in this study were based on Millennials perception of
value, a narrow age window of 23 to 35-year-old consumers. It was important to understand this
age group, as their purchasing power continues to grow. There was a total of 165 participants
who fell into the Millennial age group, with 131 participants being 36 and older. Each age group

59
was studied separately, which may be a reason for the nonsignificant multiple regression results.
With a larger sample size per each age group, the multiple regression may have resulted in
significant results that would have supported the hypothesis.
In future research, a suggestion would be to break the 36 and older participants age group
into smaller categories. In this study, the oldest participant was 68, which created a group with
31 different ages. The perceptions of value in fast fashion could be drastically different for a
participant who is 36 and one who is 46 and so on. Breaking this group down could help indicate
at which age we start seeing the changes of perception of value starting from Millennial
participants. With future research, this could be a key element in finding significant results and
having a more in-depth understanding of each generation thereafter.
Throughout the study, there was one question that asked participants to explain their
initial answer. This open-ended question gave a better insight to understanding the reasoning’s
behind their answer. More questions that prompt participants to expand their thoughts or
reasoning would have given a stronger sense of participants perception of value for fast fashion
product. Understanding the “why” to the qualitative questions would have been important
information when analyzing this data. For instance, through the quantitative data, some
participants listed that the United States had better quality and fit. A question prompting
participants to expand thoughts on quality would have been helpful in understanding what their
experiences have been with both the United States and China. This information could have also
led to knowledge on consumers awareness of where the product was made; if this is something
they look for before or after purchase.

60
Open-ended follow up questions would be helpful after each quantitative question to
better analyze each dimension and the participants view of each. Having more qualitative data
directly aligned with the quantitative data could help when using the convergent parallel method
when confirming or disconfirming the results. In addition, these results can help support any
consistent findings between the quantitative and qualitative data.
As mentioned before, this study focused on fast fashion products. There was one question
in the survey that asked participants if they preferred to shop with imported, domestic or both
fast fashion brands. While this question gave great insight into the participants participation in
shopping with fast fashion, adjusting this to ask if they prefer to shop with imported, domestic
or both fast fashion products would provide a consistent framework of questions in the survey.
In addition to more open-ended questions, a visual representation of product in given
scenarios would also be helpful to have a concise image of the product being described. While
participants were given style, price, where it was made and where it was sold, giving a visual
will allow for all participants to have the same reference point for the scenario. Perceived price
could have been impacted with a visual representation of the describe product, as participants
could have different ideas of the product themselves, which could lead to differences in the
perceived price. Furthermore, adding in an additional question with an image of a product,
where it was sold and made in either the United State or China at different price points, where
the United States is retailed higher and China is retailed lower, could determine participants
willingness to buy. Future researchers can expand their studies to further understand the
consumer and their perception of value in fast fashion.
Implications and Conclusion

61
The purpose of this study was to establish how COO impacts consumer perception of
value in fast fashion. Using an online Qualtrics survey, and Amazon’s MTurk to recruit
participants, this study was conducted. Both open and closed ended questions were used,
including yes/no, scale and multiple-choice answers. The quantitative data was analyzed using
multiple regression. This technique allowed directional relationships to be discovered, if there
were any, between the variables. Qualitative data was analyzed through coding; finding common
words and generating themes from the open-ended questions. Quantitative data was analyzed
first, followed by qualitative data. The qualitative data was then used, when appropriate, to
confirm or disconfirm the quantitative data. The quantitative results indicated directional lines
between the dimensions (perceived innovativeness, willingness to buy, perceived price,
perceived quality and familiarity to buy) and COO. The United States had a direct line, or a
positive t stat, while China had an inverse relationship, or a negative t stat. The qualitative data
confirmed these directional relationships with perceived price and perceived quality.
A key element in this study for individuals in the industry is the perceived price of made
in the United States products. While fast fashion is known for importing a majority of their
goods to combat high prices, this study indicated the perceived price for made in the United
States products was higher than that of China. Fast fashion brands and companies can use this
information to justify decisions in deciding where to source products from and understanding
what their consumer is willing to pay more for. Buyers in the industry can warrant paying higher
costs and having higher retails, due to the product being made in the United States and knowing
their consumer will view the product itself as higher quality.

62
In addition, familiarity of country’s product often comes from advertisements, word-of-
mouth or exposure. Marketing personnel and copy writers can use made in the United States to
highlight the product when presenting the products to consumers. As found in the research,
consumers find themselves being most familiar with products made in their home country,
allowing for those in the United States to have a sense of familiarity with the product, how it was
made and where it came from. Developing a relationship with the consumer is important as
retailers continuously have to compete with each other; creating that bond with made in the
United States products can create a buzz around a brand or a company, especially in fast fashion.
Fast fashion is sector in the retail industry that has impacted the way consumers shop and
how much they buy. Creating a sense of urgency to have a product now, staying on trend and
having a wide assortment allows for top fast fashion companies to create loyalty from
consumers. As Millennials continue to grow in purchasing power, these companies will have to
adjust to meet the needs and wants of the products being offered. This study highlighted how
price is an important factor when making a purchasing decision, and although these participants
may view the United States as having a higher perception of value, this did not impact their
purchasing behavior. This study was able to identify the importance of being at the right price in
fast fashion, as many consumers are shopping this sector of the retail industry.

63
References
Abraham, A. & Patro, S. (2014). ‘Country-of-Origin’ effect and consumer decision-making.
Management and Labour Studies, 39(3). 311
Acharya, & Elliott. (2001). An Examination of the Effects of ‘Country-of-Design’ and ‘Country-
of Assembly’ on Quality Perceptions and Purchase Intentions. Australasian Marketing
Journal (AMJ), 9(1), 61-75.
Agbonifoh, B. A. & Elimimian, J. U. (1999) Attitudes of Developing Counties Towards
"Country-of-Origin" Products in an Era of Multiple Brands, Journal of International
Consumer Marketing, 11:4, 97-116, DOI: 10.1300/J046v11n04_06
Ahmed S A and d’Astous A (1996), “Country of Origin and Brand Effects: A Multi-Dimensional
and Multi-Attribute Study", Journal of International Consumer Marketing, Vol. 9, No. 2,
pp. 93-115.
Amazon Mechanical Turk (n.d.) Amazon Mechanical Turk. Retrieved from
https://www.mturk.com/
Arora, A. S., Arora, A., & Ge Xiao. (2017). Part H: Innovations and New Product Development:
Consumer Responses to New Products: The Role of Developed Versus Emerging
Country-of-Origin in Product Innovativeness. AMA Summer Educators’ Conference
Proceedings, 28, H-50. direct=true&db=bth&AN=125148975&site=ehost-live
Bagcraft. (n.d.). Glossary of sustainability terms. Bagcraft. https://www.bagcraft.com/glossary-
of-sustainable-terms/
Bain, M. (March 25, 2015). The neurological pleasures of fast fashion. The Atlantic. Retrieved
from https://www.theatlantic.com/entertainment/archive/2015/03/the-neurological-
pleasures-of-modern-shopping/388577/
Bédat, M. (2015). Fast fashion’s dirty secret – and a solution made in America. CNBC. Retrieved
from https://www.cnbc.com/2015/07/03/fast-fashions-dirty-secret-and-a-solution-made-
in-america-commentary.html
Bettman, J. (1979), An Information Processing Theory of Consumer Choice, Addision-Wesley,
Reading, MA.
Bilkey, J. and Nes, E. (1982),“Country-of-Origin Effects on Product Evaluations,” Journal of
International Business Studies, (Spring-Summer), pp. 89-99.
Burke, J. (2015). Bangladesh garment workers suffer poor conditions two years after reform
vows. The Guardian. Retrieved from
https://www.theguardian.com/world/2015/apr/22/garment-workers-in-bangladesh-still-
suffering-two-years-after-factory-collapse
Cachon, G. P. & Swinney, R. (2011). The Value of Fast Fashion: Quick Response, Enhanced
Design, and Strategic Consumer Behavior. Management Science, 57(4), 778-795.

64
Chiang, & Yang. (2018). Does country-of-origin brand personality generate retail customer
lifetime value? A Big Data analytics approach. Technological Forecasting & Social
Change, 130, 177-187.
Collett, M., Cluver, B., & Chen, H. (2013). Consumer Perceptions the Limited Lifespan of Fast
Fashion Apparel. Research Journal of Textile and Apparel, 17(2), 61-68.
Consume Reports. (May 21, 2015). Made in America. Consumer Reports.
https://www.consumerreports.org/cro/magazine/2015/05/made-in-america/index.htm
Correlation coefficient. (n.d.). Statistics How To. Retrieved from ,
https://www.statisticshowto.datasciencecentral.com/probability-and-statistics/correlation-
coefficient-formula/#definition
Devita L.D.R, & Sahara A. (2018). The influence of fashion consciousness and brand image on
purchase decision: a survey on female consumer at house of Ria Miranda. Russian
Journal of Agricultural and Socio-Economic Sciences, 77(5), 54-59.
Dhiraj, A. (July 12, 2018). What the world’s most innovative countries 2018: ranked. CEO
World. Retrieved from https://ceoworld.biz/2018/07/12/what-are-worlds-25-most-
innovative-countries-2018-ranked/
Dimock, M. (January 17, 2019). Defining generations: where millennials end and generation Z
begins. Pew Research Center. Retrieved from https://www.pewresearch.org/fact-
tank/2019/01/17/where-millennials-end-and-generation-z-begins/
Does ‘Made in’ matter? (June 14, 2015). Business of Fashion. Retrieved from
https://www.businessoffashion.com/community/voices/discussions/does-made-in-
matter/the-made-in-dilemma-to-label-or-not-to-label
Elliott G R and Cameron R C (1994), “Consumer Perception of Product Quality and the
Country-Of-Origin Effect”, Journal of International Marketing, Vol. 2, No. 2, pp. 49-62.
Fast fashion. (October 3, 2016). The Fashion Law. Retrieved from
http://www.thefashionlaw.com/learn/fast-fashions-green-initiatives-dont-believe-the-
hype
Fischer, P. M., & Zeugner-Roth, K. P. (2017). Disentangling country-of-origin effects: the
interplay of product ethnicity, national identity, and consumer ethnocentrism. Marketing
Letters, 28(2), 189-204.
First, Second and Third World (n.d.). One World Nations Online. Retrieved from
http://www.nationsonline.org/oneworld/third_world_countries.htm
Fry, R. (March 1, 2018). Millennials projected to overtake baby boomers as America’s largest
generation. Pew Research Center. Retrieved from https://www.pewresearch.org/fact-
tank/2018/03/01/millennials-overtake-baby-boomers/

65
H&M Group. (n.d.). Supplier list. H&M.
https://sustainability.hm.com/en/sustainability/downloads-resources/resources/supplier-
list.html
Harms, L. (n.d.). Laws on clothing label requirements. Legal Beagle. Retrieved from
https://legalbeagle.com/6082830-laws-clothing-label-requirements.html
Ha-Brookshire, J., & Yoon, S. (2012). Country of origin factors influencing US consumers'
perceived price for multinational products. Journal of Consumer Marketing, 29(6), 445-
454.
Hughes, A. (February 28, 2018). How Fashionnova won the internet. WWD. Retrieved from
https://wwd.com/fashion-news/fashion-features/inside-fashion-nova-cardi-b-
1202595964/
Gaedeke, R., (1973). "Consumer Attitudes toward Products 'Made in' Developing Countries",
Journal of Retailing, Vol. 49, 1973, pp. 13-24.
Gilliam, M. (2000). The perception of value. Retail Merchandiser, 40(5), 36,38.
Gleim, M., Lawson, S., & Robinson, S. (2015). When perception isn’t reality: an examination of
consumer perceptions of innovation. The Marketing Management Journal, 25(1), 16-26.
Johnston, E. (May 18, 2016). 5 steps to understanding your customer’s buying process. B2B
Marketing. Retrieved from https://www.b2bmarketing.net/en/resources/blog/5-steps-
understanding-your-customers-buying-process
Joung, H. (2014). Fast-fashion consumers’ post-purchase behaviours. International Journal of
Retail & Distribution Management, 42(8), 688-697.
Kestenbaum, R. (June 14, 2017). This is how Millennials shop. Forbes. Retrieved from
https://www.forbes.com/sites/richardkestenbaum/2017/06/14/this-is-how-millennials-
shop/#2f641180244c
Kimani, N. (June 22, 2016). The COO effect. The Designers Studio. Retrieved from
http://tdsblog.com/the-country-of-origin-effect/
Kim, H., Shin, E., Cheng, A., Lennon, S., & Liu, W. (2015). Influence of design, workmanship,
and familiarity on perceptions of country-of-origin apparel brands: A study of consumers
in the US, China and Japan. Journal of Global Fashion Marketing, 6(4), 265-277.
Khachaturian, J., & Morganosky, M. (1990). QUALITY PERCEPTIONS BY COUNTRY OF
ORIGIN. International Journal of Retail & Distribution Management, 18(5), 21.
Kim, J., Park, J., & Glovinsky, P. (2018). Customer involvement, fashion consciousness, and
loyalty for fast-fashion retailers. Journal of Fashion Marketing and Management: An
International Journal, 22(3), 301-316.
https://www.forbes.com/sites/richardkestenbaum/2017/06/14/this-is-how-millennials-shop/#2f641180244c

66
Kitroeff, N. (2016). Factories that made clothes for Forever 21, Ross paid workers $4 an hour,
Labor Department says. LA Times. https://www.latimes.com/business/la-fi-wage-theft-
forever-ross-20161116-story.html
Koschate-Fischer, N., Diamantopoulos, A., & Oldenkotte, K. (2012). Are consumers really
willing to pay more for a favorable country image? A study of country-of-origin effects
on willingness to pay. Journal of International Marketing, 20(1), 19-41.
Landrum, S. (March 17, 2017). Millennials driving brands to practice socially responsible
marketing. Forbes. Retrieved from
https://www.forbes.com/sites/sarahlandrum/2017/03/17/millennials-driving-brands-to-
practice-socially-responsible-marketing/#57e1a0674990
Loeb, W. (2015). Who are the fast fashion leaders and why does it matter? Forbes. Retrieved
from https://www.forbes.com/sites/walterloeb/2015/10/23/who-are-the-fast-fashion-
leaders-and-why-does-it-matter/#dbe5f511555c
Loeb, W. (May 15, 2015). Why don’t Millennials want to shop at Macy’s? Forbes. Retrieved
from https://www.forbes.com/sites/walterloeb/2015/05/15/why-dont-millennials-want-to-
shop-at-macys/#47c9f8e53223
Livingston, A. (n.d.) Products Made in the USA – Reasons to buy American-made goods.
Money Crashers. Retrieved from https://www.moneycrashers.com/products-made-usa-
american-made/
Main, D. (September 8, 2017). Who are the Millennials? Live Science. Retrieved from
https://www.livescience.com/38061-millennials-generation-y.html
Mohamad, O., Ahmed, Z. U., Honeycutt Jr., E. D., & Tyebkhan, T. H. (2000). Does “Made In...”
Matter to Consumers? A Malaysian Study of Country of Origin Effect. Multinational
Business Review (St. Louis University), 8(2), 69. Retrieved from
http://search.ebscohost.com/login.aspx?direct=true&db=bth&AN=3413102&site=ehost-
live
Motkar, S. (n.d.) Fast fashion and its disadvantages. Business Zeal. Retrieved from
https://businesszeal.com/fast-fashion-its-disadvantages
Mehrjoo, & Pasek. (2014). Impact of Product Variety on Supply Chain in Fast Fashion Apparel
Industry. Procedia CIRP, 17(C), 296-301.
Manufacturing Industry (1996). Sustainable Development Indicator Group. Retrieved from
https://www.hq.nasa.gov/iwgsdi/Manufacturing.html
Miranda, M. J. & Parkvithee, N. (2013). The influence of social class on the perceptions of
country of origin. Marketing Intelligence and Planning, Vol, 31 No. 4. 388-404
Neve, G. & Prentice, R. (2017). Five years after deadly factor fire, Bangladesh’s garment
workers are still vulnerable. The Conversation. Retrieved from

67
https://theconversation.com/five-years-after-deadly-factory-fire-bangladeshs-garment-
workers-are-still-vulnerable-88027
Olanubi, S. (2018). Top five largest fashion retailers in the world. Tharawat Magazine.
https://www.tharawat-magazine.com/facts/top-5-largest-fashion-clothing-retailers-
world/#gs.g107ox
Orendorff, A. (January 10, 2019). The state of the ecommerce fashion industry: statistics, trends
& strategy. Shopify Plus. https://www.shopify.com/enterprise/ecommerce-fashion-
industry
Pookulangara, S., & Shepard, A. (2013). A Slow fashion movement: Understanding consumer
perceptions—An exploratory study. Journal of Retailing and Consumer Services, Vol. 20,
Issue 2, pp. 200-206
Quora (2017). Fast Fashion is a Disaster for Women and the Environment. Forbes. Retrieved
from https://www.forbes.com/sites/quora/2017/07/26/fast-fashion-is-a-disaster-for-
women-and-the-environment/#461c65311fa4
Rahman, M.S., Haque, M., & Hussain, B. (2012). Brand image and its impact on consumer’s
perception: structural equation modeling approach on young consumer’s in Bangladesh.
Journal of Applied Sciences, 12(8). 2-8
Rahman, O., Fung, B., Chen, Z., & Gao, X. (2017). A cross-national study of apparel consumer
preferences and the role of product-evaluative cues. Asia Pacific Journal of Marketing
and Logistics, 29(4), 796-812.
Rajagopal. (2011). Consumer culture and purchase intentions toward fashion apparel in
Mexico. Journal of Database Marketing & Customer Strategy Management,18(4), 286-
307.
Resciniti, R., Matarazzo, M., & Iavarone, A. (2012). Product/country image effects and entry
strategies in foreign markets. In Proceedings of 11th IACCM Annual Conference.
Robertson, M. (January 15, 2017). American Apparel to close all of its stores. SF Gate.
https://www.sfgate.com/news/article/American-Apparel-to-close-all-of-its-stores-
10857158.php
Roth, M., & Romeo, J. (1992). Matching Product Category and Country Image Perceptions: A
Framework for Managing Country-of-Origin Effects. Journal of International Business
Studies, 23(3), 477.
Rossman, G., & Rallis, S. (2012). Learning in the field: An introduction to qualitative research
(3rd ed.). Thousand Oaks, Calif.: SAGE.
Salfino, C. (July 31, 2018). Will Millennials force apparel industry into transparency? Sourcing
Journal. Retrieved from https://sourcingjournal.com/topics/lifestyle-monitor/millennials-
apparel-transparency-113786/

68
Samiee, S. (1987). Customer evaluation of products in a global market. Unpublished manuscript,
College of Business Administration, University of South Carolina
Sandberg, L., Larsson, A., & Christiansson, E. (2018). Exploring the Motivations and Attitudes
of Swedish Students Toward Decreasing Consumption of Fast Fashion: A study of Anti-
Consumption Strategies.
Sharma, J. (November 25, 2016). ‘Made in America’ versus fast fashion. Observer. Retrieved
from https://observer.com/2016/11/made-in-america-versus-fast-fashion/
Staff (October 14, 2019). Retail store closures: all the companies that are downsizing in 2019.
Footwear News. Retrieved from https://footwearnews.com/2019/business/retail/retail-
store-closings-list-2019-out-of-business-downsizing-1202765735/
Strašek, R. (2011). The structural model of relations between country of origin and the perceived
brand name value. World's Poultry Science Journal, 67(1), 59-72.
Stein, S. (February 10, 019). How could changing consumer trends affect fast-fashion leaders
H&M and Zara? Forbes. Retrieved from
https://www.forbes.com/sites/sanfordstein/2019/02/10/how-could-changing-consumer-
trends-affect-fast-fashion-leaders-hm-and-zara/#139e2e346f48
Stephanie. (December 8, 2014). Cronbach’s Alpha: simple definition, use and interpretation.
Statics How To. Retrieved from
https://www.statisticshowto.datasciencecentral.com/cronbachs-alpha-spss/
Schurenberg, E. (November 2, 2012). What is ‘Made in America’ worth? Inc. Retrieved from
https://www.inc.com/eric-schurenberg/what-is-made-in-america-worth.html
Slow fashion vs. fast fashion. (May 17, 2016). Trusted Clothes. Retrieved from
https://www.trustedclothes.com/blog/2016/05/17/slow-fashion-vs-fast-fashion/
Schultz, D., & Jain, V. (2015). Exploring luxury brand country of origin impact on purchasing
behaviors in India. Asia-Pacific Journal of Business Administration, 7(3), 216-236.
Saran, R., & Gupta, N. (2012). Country of Origin Vs. Consumer Perception: A Literature
Review. IUP Journal of Marketing Management, 11(4), 66-75.
Thakor, M. V. & Kohli, C. S. (1996), “Brand Origin: Conceptualization and Review”, Journal of
Consumer Marketing, Vol. 13, No. 3, pp. 27-42.
Tjandra, N., Omar, M., & Ensor, J. (2015). Advanced and emerging economies Generation Y's
perception towards country-of-origin. International Journal of Emerging Markets, 10(4),
858-874
Uddin, J., Parvin, S., & Rahman, M. L. (2013). Factors influencing importance of country of
brand and country of manufacturing in consumer product evaluation.
Uniqlo. (n.d.). Manufacturing. Uniqlo. http://www.uniqlo.com/sg/corp/production/

69
University of Sussex (2017). New study shows ‘fast fashion’ continues to risk garment workers’
health and well-being. Phys.Org. Retrieved from https://phys.org/news/2017-11-fast-
fashion-garment-workers-health.html
Uranga, R. (January 15, 2017). Fashion: worn in the USA, but made oversears. Press Telegram.
https://www.presstelegram.com/2017/01/15/fashion-worn-in-the-usa-but-made-overseas/
Wang, C., Siu, N., & Hui, A. (2004). Consumer decision-making styles on domestic and
imported brand clothing. European Journal of Marketing, 38(1/2), 239-252
Zeithaml, V. (1988), “Consumer perceptions of price, quality and value: a means-end model and
synthesis of evidence”, Journal of Marketing, Vol. 52, pp. 2-22.
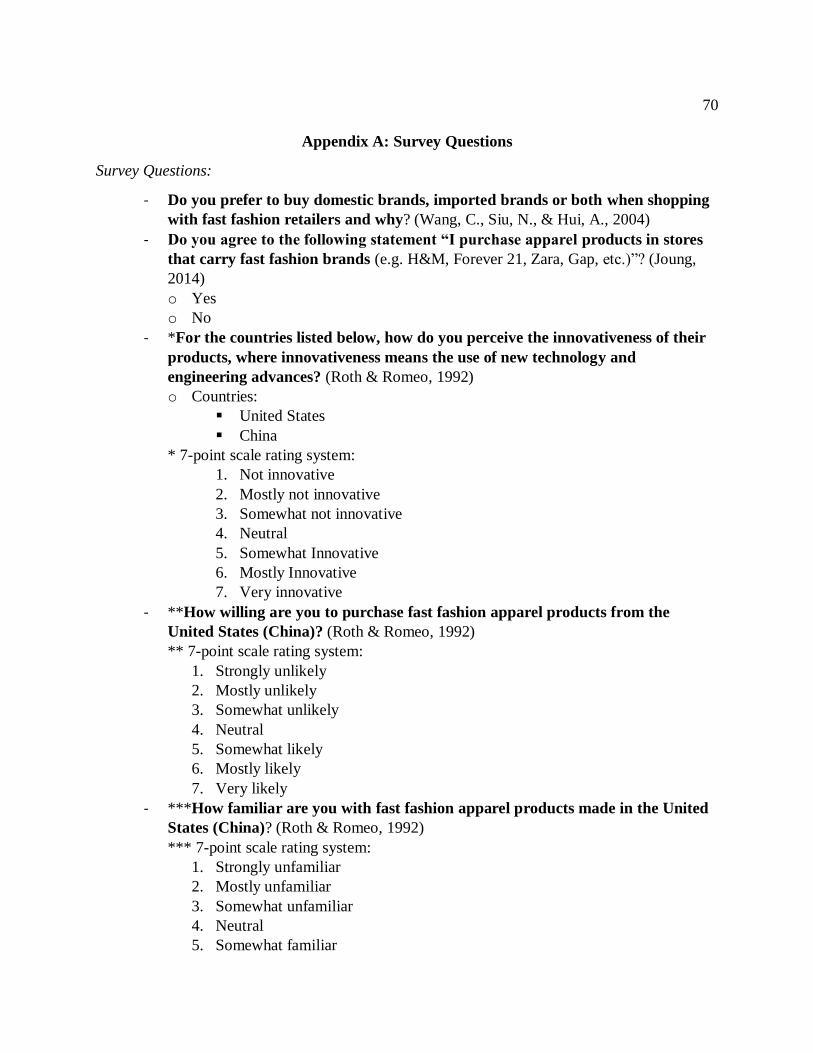
70
Appendix A: Survey Questions
Survey Questions:
- Do you prefer to buy domestic brands, imported brands or both when shopping
with fast fashion retailers and why? (Wang, C., Siu, N., & Hui, A., 2004)
- Do you agree to the following statement “I purchase apparel products in stores
that carry fast fashion brands (e.g. H&M, Forever 21, Zara, Gap, etc.)”? (Joung,
2014)
o Yes
o No
- *For the countries listed below, how do you perceive the innovativeness of their
products, where innovativeness means the use of new technology and
engineering advances? (Roth & Romeo, 1992)
o Countries:
▪ United States
▪ China
* 7-point scale rating system:
1. Not innovative
2. Mostly not innovative
3. Somewhat not innovative
4. Neutral
5. Somewhat Innovative
6. Mostly Innovative
7. Very innovative
- **How willing are you to purchase fast fashion apparel products from the
United States (China)? (Roth & Romeo, 1992)
** 7-point scale rating system:
1. Strongly unlikely
2. Mostly unlikely
3. Somewhat unlikely
4. Neutral
5. Somewhat likely
6. Mostly likely
7. Very likely
- ***How familiar are you with fast fashion apparel products made in the United
States (China)? (Roth & Romeo, 1992)
*** 7-point scale rating system:
1. Strongly unfamiliar
2. Mostly unfamiliar
3. Somewhat unfamiliar
4. Neutral
5. Somewhat familiar

71
6. Mostly familiar
7. Very familiar
- How do you feel about fast fashion retailers? (Collett, Cluver, & Chen, 2013)
- Approximately how many items of fast fashion products do you purchase a
year? (Joung, 2014)
1. Fewer than 5 items
2. 5 - 9 items
3. 10 - 14 items
4. 15 - 19 items
5. 20 - 24 items
6. 25 - 29 items
7. 30 - 34 items
8. 35 - 40 items
9. 40 – 44 items
10. 45 or more items
- How many items of fast fashion products do you dispose of in a year? (Joung,
2014)
1. Fewer than 5 items
2. 5 - 9 items
3. 10 - 14 items
4. 15 - 19 items
5. 20 - 24 items
6. 25 - 29 items
7. 30 - 34 items
8. 35 - 40 items
9. 40 – 44 items
10. 45 or more items
- Would you expect the quality of a pair of Forever 21 jeans, retailed at $12.90,
made in the United States (China) to be (select one)? (Acharya & Elliott, 2001)
1. Extremely Poor
2. Very Poor
3. Poor
4. Average
5. Good
6. Very Good
7. Extremely Good
- How likely are you to buy a pair of Forever 21 jeans, retailed at $12.90, made in
the United States (China) to be (select one)? (Acharya & Elliott, 2001)
1. Definitely Not Buy
2. Probably Not Buy
3. Might Buy

72
4. Probably Buy
5. Definitely Buy
- It’s been found out that a typical cotton t-shirt sold in major stores in the US is
made out of 100 percent cotton and has a label of ‘Made in China.’ The average
price of this shirt is $40. Compared to a $40 shirt, how much do you believe that
other options would cost at a retail store? Please indicate one retail price for
each option while considering the sustainability impact of each option. (Ha-
Brookshire & Yoon, 2012)
o 100 percent Cotton from the USA (China). Made in USA (China).
- Given the following scenario, list the maximum retail price you are willing to
pay. (Koschate-Fischer, Diamantopoulos & Oldenkotte, 2012)
o Item: Fitted Blazer
o Made in the USA
o Sold at H&M
- Given the following scenario, list the maximum retail price you are willing to
pay. (Koschate-Fischer, Diamantopoulos & Oldenkotte, 2012)
o Item: Fitted Blazer
o Made in the China
o Sold at H&M
- Using a five-point scale (5- strongly agree, 1- strongly disagree), rate the
following statements. (Uddin, Parvin &Rahman, 2012)
o The reliability of a fast fashion good is of more importance than COO/COM
image.
o The durability of a fast fashion good is of more importance than COO/COM
image.
o The performance of a fast fashion good is of more importance than COO/COM
image.
o The price level of a fast fashion good is of more importance than COO/COM
image.
- **How much do you believe you have spent on apparel items in the past 12
months? (Collett, Cluver, & Chen, 2013)
- **How much of this was on fast fashion items? (Collett, Cluver, & Chen, 2013)
- After the following prompt: “Fast fashion retailers encourage consumers to
make frequent purchases in their stores by continually bringing in new fashion-
oriented clothing items and selling them at low prices”, the following questions
will be asked: (Collett, Cluver, & Chen, 2013)
- Is this a good, bad, or neutral thing for consumers?
- Is this a good, bad, or neutral thing for society?
- How frequently do you shop? (Wang, C., Siu, N., & Hui, A., 2004)
- How frequently do you read fashion magazines? (Wang, C., Siu, N., & Hui, A.,
2004)
- What is your age?

73
- What is your annual income range?
o $30,000 and below annually
o $30,000 to $50,000 annually
o $50,000 and above annually
o Prefer not to answer
- What is your education level?
o Undergraduate Degree
o Master’s Degree
o Doctored Degree
o No College

74
APPENDIX B: INFORMED CONSENT FORM
IRB Number #
Study Title: Country of Origin Impact on Consumer Perception of Value in Fast Fashion
Invitation
Dear participant,
My name is Katherine Walter. I am conducting a study on how country of origin can impact
consumers perception of value in fast fashion. Perceived value will be determined through
studying perceived innovativeness, willingness to buy, perceived price, familiarity of the
country’s product and quality of product. This study will identify the importance of country of
origin in a products perceived value while being tested against other consumer purchasing
decision factors. If you are between the ages of 23 and 35 and are located in the United States,
you may participate in this research.
Participation in this study will require approximately 15 to 20 minutes You will be asked to
complete an online survey. The questionnaire will have a variety of questions including open-
ended, scenario and multiple-choice questions. Multiple-choice questions will include multi-
point scale and yes or no answers. Open ended questions are asked to find your involvement and
thoughts of the fast fashion retail industry. Scenario questions are asked to determine your
perspective of a country. Participation will take place on a personal computer or mobile device in
your own space.
There are no known risks or discomforts associated with this research, as this is not sensitive in
nature.
The results of this study aim to establish if fast fashion apparel made in the United States has a
higher perceived value than fast fashion apparel made in China. The information found will
provide data to indicate how perception of value is impacted by country of origin. Determining
the significance of how country of origin relates to the perception of value in a fast fashion
product will provide insight for industry professionals on their consumers expectations of
products, allowing better relations between consumer, product and company.
Your responses to this survey will be kept confidential. By using Amazon’s Mechanical Turk,
your personal information will be stored in their secured data base and only used with consent
from you. Identifiable information will not by collected for this survey. All data collected will be
kept in a secure Box folder, that only the researches will have access to. The Box folder will not
have any identifiable information. This information will be stored for three years in the Box
folder, and then permanently deleted. The aggregate results will be used for a thesis and potential
publications/manuscripts and the anonymous data may be shared as needed based on publishing
requirements.

75
You may ask any questions concerning this research and have those questions answered before
agreeing to participate in or during the study.
For study related questions, please contact the investigators:
Katherine Walter: [email protected]
Jennifer Johnson Jorgensen: [email protected]
For questions concerning your rights or complaints about the research contact the Institutional
Review Board (IRB):
• Phone: 1(402)472-6965
• Email: [email protected]
You will receive $0.15 payment for your participation once the questionnaire has been
completed. This payment will be accessible to you on your Amazon Mechanical Turk dashboard
and earnings page once your questionnaire has been approved. You will be able to transfer this
payment to your bank account when you desire.
You can decide not to be in this research study, or you can stop being in this research study
(“withdraw’) at any time before, during, or after the research begins for any reason. Deciding not
to be in this research study or deciding to withdraw will not affect your relationship with the
investigator or with the University of Nebraska-Lincoln (list others as applicable).
You will not lose any benefits to which you are entitled.
Documentation of Informed Consent
You are voluntarily making a decision whether or not to participate in this research study. By
clicking on the I Agree button below, your consent to participate is implied. You should print a
copy of this page for your records.
I agree I do not agree

76
APPENDIX C: IRB APPROVAL LETTER