Country Information Sheet: ARGENTINA - World...
275
1 Annex E International Experiences with Agricultural Insurance: Findings from a World Bank Survey of 65 Countries
Transcript of Country Information Sheet: ARGENTINA - World...

1
Annex E International Experiences with Agricultural Insurance: Findings from a World Bank Survey of 65 Countries

2
Table of Contents Acknowledgements ......................................................................................................................... 4 Introduction ..................................................................................................................................... 5 Overview on Agricultural Insurance: ARGENTINA ..................................................................... 6 Overview on Agricultural Insurance: AUSTRALIA .................................................................... 11 Overview on Agricultural Insurance: AUSTRIA ......................................................................... 14 Overview on Agricultural Insurance: BOLIVIA .......................................................................... 19 Overview on Agricultural Insurance: BRAZIL ............................................................................ 22 Overview on Agricultural Insurance: BULGARIA ...................................................................... 33 Overview on Agricultural Insurance: CANADA ......................................................................... 37 Overview on Agricultural Insurance: CHILE ............................................................................... 41 Overview on Agricultural Insurance: CHINA .............................................................................. 46 Overview on Agricultural Insurance: COLOMBIA ..................................................................... 51 Overview on Agricultural Insurance: COSTA RICA ................................................................... 55 Overview on Agricultural Insurance: CYPRUS ........................................................................... 59 Overview on Agricultural Insurance: CZECH REPUBLIC ......................................................... 62 Overview on Agricultural Insurance: DOMINICAN REPUBLIC ............................................... 65 Overview on Agricultural Insurance: ECUADOR ....................................................................... 69 Overview on Agricultural Insurance: EL SALVADOR ............................................................... 73 Overview on Agricultural Insurance: ETHIOPIA ........................................................................ 76 Overview on Agricultural Insurance: FRANCE ........................................................................... 79 Overview on Agricultural Insurance: GERMANY ...................................................................... 84 Overview on Agricultural Insurance: GREECE ........................................................................... 88 Overview on Agricultural Insurance: GUATEMALA ................................................................. 93 Overview on Agricultural Insurance: HONDURAS .................................................................... 96 Overview on Agricultural Insurance: HUNGARY ....................................................................... 99 Overview on Agricultural Insurance: INDIA ............................................................................. 102 Overview on Agricultural Insurance: IRAN ............................................................................... 110 Overview on Agricultural Insurance: ISRAEL ........................................................................... 114 Overview on Agricultural Insurance: ITALY ............................................................................. 118 Overview on Agricultural Insurance: JAMAICA ....................................................................... 123 Overview on Agricultural Insurance: JAPAN ............................................................................ 126 Overview on Agricultural Insurance: KAZAKHSTAN ............................................................. 132 Overview on Agricultural Insurance: MALAWI ........................................................................ 136 Overview on Agricultural Insurance: MAURITIUS .................................................................. 139 Overview on Agricultural Insurance: MEXICO ......................................................................... 142 Overview on Agricultural Insurance: MOLDOVA .................................................................... 153 Overview on Agricultural Insurance: MONGOLIA ................................................................... 156 Overview on Agricultural Insurance: MOROCCO .................................................................... 158 Overview on Agricultural Insurance: NEPAL ............................................................................ 162 Overview on Agricultural Insurance: NEW ZEALAND ............................................................ 166 Overview on Agricultural Insurance: NICARAGUA ................................................................. 169 Overview on Agricultural Insurance: PANAMA ....................................................................... 172 Overview on Agricultural Insurance: PARAGUAY .................................................................. 178

3
Overview on Agricultural Insurance: PERU .............................................................................. 180 Overview on Agricultural Insurance: PHILIPPINES ................................................................. 184 Overview on Agricultural Insurance: POLAND ........................................................................ 189 Overview on Agricultural Insurance: PORTUGAL ................................................................... 193 Overview on Agricultural Insurance: ROMANIA ..................................................................... 199 Overview on Agricultural Insurance: RUSSIA .......................................................................... 203 Overview on Agricultural Insurance: SLOVENIA ..................................................................... 207 Overview on Agricultural Insurance: SOUTH AFRICA ............................................................ 211 Overview on Agricultural Insurance: SOUTH KOREA ............................................................ 214 Overview on Agricultural Insurance: SPAIN ............................................................................. 219 Overview on Agricultural Insurance: SUDAN ........................................................................... 226 Overview on Agricultural Insurance: SWEDEN ........................................................................ 230 Overview on Agricultural Insurance: SWITZERLAND ............................................................ 234 Overview on Agricultural Insurance: THAILAND .................................................................... 237 Overview on Agricultural Insurance: THE NETHERLANDS ................................................... 240 Overview on Agricultural Insurance: UKRAINE ....................................................................... 247 Overview on Agricultural Insurance: URUGUAY ..................................................................... 251 Overview on Agricultural Insurance: UNITED STATES .......................................................... 256 Overview on Agricultural Insurance: VENEZUELA ................................................................. 268 Overview on Agricultural Insurance: WINDWARD ISLANDS................................................ 272

4
Acknowledgements This document provides an overview the status of agricultural insurance markets in 62 developed and developing countries. It is based on the World Bank survey of agricultural insurance markets conducted in 2008 under the leadership of Olivier Mahul (Insurance for the Poor Program Coordinator, Non-Bank Financial Institutions unit in the Global Capital Markets Development Department (GCMNB), World Bank) and Charles Stutley (International Agricultural Insurance Consultant, GCMNB, World Bank). The team also comprised of William Dick (Consultant, Commodity Risk Management Group, Agricultural and Rural Development, World Bank), Barry Goodwin (Professor of Agricultural Economics, North Carolina State University), Ramiro Iturrioz (Senior Agricultural Insurance Specialist, GCMNB, World Bank); Roman Shynkarenko (Consultant, GCMNB, World Bank), and Ligia Vado (Consultant, GCMNB, World Bank). It is Annex E of the book Government Support to Agricultural Insurance: Challenges and Options for Develpoing Countries, co-authored by Olivier Mahul and Charles Stutley. The authors sincerely thank the many respondents who kindly completed the questionnaire sent to them as part of the World Bank Survey on agricultural insurance in 2008, or who separately provided country information. They are listed below.
Agriculture Financial Services Corporation (Alberta, Canada)
Agria Djurförsäkring (Sweden) Agricultural Insurance Fund (A.P.I.F.) (Iran) Agricultural Insurance Pool (TARSIM) (Turkey) Agriculture Insurance Company of India Ltd.
(AICI) (India) Agriculture Insurance Consultant (China) Agroasemex, S.A. (Mexico) Agrodosa (Dominican Republic) Agroseguro, S.A. (Spain) Aon Re (Argentina) Aon Re (Australia) Aon Re (New Zealand) Aon Re (South Africa) Aseguradora Magallanes (Chile) Asiban SA (Romania) Banco de Seguros del Estado del (Uruguay) CA Seguros, S.A. (Portugal) Cámara Hondureña de Aseguradores (Honduras) CGM Gallagher Group (Jamaica) Concordia Polska TUW (Poland) Ethiopian Insurance Corporation (Ethiopia) Federal Agency of State Support of Insurance in
Agroindustrial Production (Russia) GlobalAgRisk (UNITED STATES) Hannover Re (Germany) Index Based Livestock Insurance Project
Implementation Unit (Mongolia) Instituto Nacional de Seguros (Costa Rica) Instituto Nicaragüense de Seguros y Reaseguros
(Nicaragua) Ismea (Italy) Kanat (Israel) League of Insurance Organizations of Ukraine
(Ukraine)
Mapfre Colombia (Colombia) Mclarens Toplis Peru S.A. (Peru) Ministère de l’Alimentation, de l’Agriculture et de
la Pêche (France) Ministerio de Ganadería, Agricultura y Pesca
(MGAP) (Uruguay) Ministry of Finance (Azerbaijan) Moldasig (Republic of Moldova) Munich Re (Argentina) Nico General Insurance Company Limited (Malawi) Nigerian Agricultural Insurance Corporation
(Nigeria) North Carolina State University (United States) Nyala Insurance S.C. (Ethiopia) Office of the Insurance Commission (Thailand) Oficina de Riesgo Agropecuario (Argentina) OTP Garancia Insurance Ltd. Co (Hungary) Paris Re (France) Partner Re (Chile) Philippine Crop Insurance Corporation (The
Philippines) Schweizer Hagel (Switzerland) Seguros Colonial (Ecuador) Shiekan Insurance & Reinsurance Co. Ltd. (Sudan) Siam Commercial Samaggi Insurance Public
Company Limited (Thailand) Société Centrale de Réassurance (Morocco) State Agency for Regulation of Finance Market and Finance Institutions (Kazakhstan) Swiss Re (Brazil) Swiss Re (Switzerland) Swiss Re America Corporation (United States) TAGH Gestión (Argentina) Thai Re Insurance Public Co., Ltd. (Thailand) Windward Islands Crop Insurance Ltd. (Dominica)

5
Introduction Agriculture remains a source of livelihood for almost half of humanity. It is also a source of growth for national economies, and can be a provider of investment opportunities for the private sector. However, millions of poor people face prospects of tragic crop failure or livestock mortality when, as a result of climate change, rainfall patterns shift or extreme events such as drought and floods become more frequent. Agricultural insurance is key in assisting farmers, herders, and governments lessen the negative financial impact of these adverse natural events. Based on a unique survey of agricultural insurance programs in 65 advanced and emerging countries, we have pulled together collective knowledge and experiences to help policymakers promote sound agricultural insurance programs. The key objectives of the survey were to document international experience with public and private agricultural insurance in developed and developing economies and to examine the ways in which governments support agricultural insurance. The findings of the survey were used to make some recommendations for developing countries that plan to develop agricultural insurance. The survey was based on a questionnaire designed by the World Bank to elicit information about the organizational structure of agricultural insurance in each country; the type of agricultural insurer (public or private); and, in markets with public sector intervention, the nature and types of support and their cost to the public sector. The study was also designed to allow for a simple comparison of the financial performance of private and public sector agricultural insurance programs. Questionnaires were distributed to agricultural insurance companies in all 104 countries that were known to have some form of agricultural insurance provision in 2008. Sixty-five countries returned the questionnaire. The World Bank team supplemented these questionnaires with information drawn from third-party sources, including interviews and insurance company websites. In some cases, the data may have been entered incorrectly by the respondents and, despite the best efforts of the World Bank team, these errors may not have been identified by the team in the analysis and interpretation of this data. Furthermore, in order to compare financial figures across a wide number of territories, all original currency data has been converted into U.S. dollars using average currency exchange rates for each year. It is recognized that this may slightly alter the estimated long-term ratios for the transformed U.S. dollar dataset. While every attempt has been made by the World Bank team faithfully and accurately to report the original questionnaire data provided by each respondent, any errors and omissions or incorrect interpretation of the data and results presented in this chapter are the sole responsibility of the team leaders. The survey included 65 countries (62 percent of all countries with agricultural insurance), including 21 high-income, 18 upper-middle-income, 20 lower-middle-income, and 6 low-income countries. As the main focus of this study is on agricultural insurance in developing countries, the very high proportion of responses received from respondents in low- and middle-income countries make the survey highly representative of and informative about the agricultural insurance market in developing countries. We hope that this analysis provides policymakers with a current picture of the spectrum of institutional frameworks and experiences with agricultural insurance - ranging from countries in which the public sector provides no support to those in which governments heavily subsidize agricultural insurance – and will thus make a compelling case for public-private partnerships in the promotion of agricultural insurance.

6
Overview on Agricultural Insurance: ARGENTINA
1. Agricultural Insurance Market Review History of Agricultural Insurance Crop hail insurance was first introduced in 1874. This product was marketed mainly by mutual companies and cooperatives until 1994 when several private insurance companies started to offer crop insurance. The most demanded and marketed product is crop hail, damage-based insurance. Due to the high competition within the crop insurance market during the last few years, the number of products, the risks covered, and the levels of coverage have been expanded. Therefore, companies commonly offer products like multi-peril crop insurance (MPCI), MPCI portfolio coverage, and insurance coverage for hail plus additional risks like wind, freeze, excess of moisture, and other named risks. Large farms purchase some of these products; however, traditional crop hail insurance still accounts for about 95% of the total market premium volume. In spite of the importance of beef production and exports to the Argentinean economy, livestock insurance products are very under-developed in Argentina and, despite many attempts to introduce this class of business, the demand is still limited to high value animals (mainly bloodstock).
Federal government support to agricultural insurance in Argentina is limited to assisting provinces and insurance companies in the development of agricultural insurance programs, basically by providing technical support and information. However, in the recent years, several provinces have developed their own subsidized crop insurance programs in order to provide protection to their local farmers (for example Mendoza, Río Negro, and Chaco Provinces). There is no special agricultural insurance legislation. Agricultural Insurance Market Structure (2008)
In 2008 there were about 30 insurance companies offering agricultural insurance products. Twenty-three were private insurance companies, six were cooperatives, and one was a public insurance company. The two main insurers, La Segunda and Sancor, both cooperatives, have together about 50% of the market share in terms of written premiums, and the five biggest players underwrite 75% of the agricultural insurance premiums in this market. Agricultural Insurance Products Available The most popular product is traditional crop hail insurance (crop hail policy with a 6% damage franchise). Due to the strong competition in the market over the last decade, the range of products, types of coverage, and covered risk has been diversified and expanded. Therefore, products like MPCI, MPCI global portfolio covers, and traditional crop hail insurance are available for different deductible levels, and hail plus additional risk covers like wind, freeze, excess rain at harvest and, in some cases, even drought are commonly offered in the Argentinean market. Delivery Channels
The most important delivery channels are through the insurance agents and insurance brokers. There are also some cases where the delivery channel is through input suppliers. Programs with suppliers in Argentina are placed and managed as corporate programs, which are usually placed through insurance

7
brokers. There are no specialized delivery channels for small and marginal farmers. The exception is a public-private partnership which provides greenhouse insurance for small farmers in Corrientes by using the structure of the PRODERNEA (FIDA- BID) Program with approximately 40 policies issued. Table 1.1: Agricultural Insurance Available 2008 Crop Insurance Products Available Greenhouse Forestry MPCI Named-peril Crop Revenue Index-based Yes Yes No Yes, a few
“tailor-made” frost-index products for fruit companies
Yes Yes
Livestock Insurance Products Available Aquaculture All Risk Accident &
Mortality Epidemic Disease
Other Index-based
No Yes, limited coverage
No Yes, limited voluntary market for bloodstock insurance
No Yes, one voluntary policy
Source: World Bank Survey (2008). Voluntary vs. Compulsory Insurance Crop insurance is mainly voluntary. However, there are some cases where crop insurance is compulsory for farmers who access seasonal crop loans from banks. This represents, however, less than 5% of the total premium. Livestock insurance is voluntary. Agricultural Reinsurance Argentina represented the largest crop insurance and reinsurance market in Latin America in 2008/09. Local companies can readily access reinsurance capacity for crop hail but, in the case of MPCI coverage, reinsurance capacity is much more restricted. The reinsurance capacity for standing timber fire cover is also restricted. Crop hail insurance companies have increased their risk retention in recent years, while the agricultural reinsurance markets have softened until end of 2008. Argentinean crop insurers purchase a combination of proportional and non-proportional treaty reinsurance.
2. Public Support for Agricultural Insurance Types of Public Support for Agricultural Insurance Traditionally, the Argentinean crop hail insurance market has been a completely private commercial market which has operated for more than a hundred years with no support from the federal government. In 2008 there were three public sector supported programs for agricultural insurance: (i) Mendoza Province Fruits and Vineyard Hail Crop Insurance Scheme, (ii) Rio Negro Province Fruit-Hail Crop Insurance Scheme, and (iii) PRODERNEA (FIDA–BID).
Mendoza Province Fruits and Vineyard Hail Crop Insurance Scheme. The province purchased catastrophic hail coverage for all registered fruits and vineyard producers within Mendoza Provincethrough a bidding process among the insurance companies.

8
Rio Negro Province Hail Crop Insurance Scheme. The provincial government subsidizes a portion of the commercial premium for hail coverage for apples, pears, and cherries.
PRODERNEA (FIDA–BID). Under this program, the federal government provides subsidies as a percentage of commercial premiums for greenhouse insurance. There are also some studies to implement a subsidized cotton insurance scheme in Chaco Province. It is still unclear whether the government will subsidize an index product or an indemnity-based product. Premium subsidies
The estimated volume of premium subsidies for the whole market is USD 5 million.
3. Agricultural Insurance Penetration Insurance Penetration Rate
About 130,000 crop insurance policies were issued in 2007/08, and the insured area reached 16,592,000 ha, representing about 50% of total national cropped area.
The number of crop insurance policies and the insured area has been increasing after Argentina’s economic crisis in 2001. This process has been driven by two factors: (i) improvement in agricultural products’ gross margins, and (ii) increase in international commodity prices. Both factors have contributed to an increase in the value of assets at risk and therefore an increased demand for crop insurance. Table 1.3 shows that, over the past 5 years, there has been a major increase in the crop insurance market with a 240% increase in Total sum insured (TSI) to USD 6.3 billion and a 220% increase in crop insurance premiums to USD 240 million in 2007/08. The bulk, or more than 95% of this business, is crop hail insurance, and this is reflected by the relatively low average premium rate of 3.8% in 2007/08.
The demand for livestock insurance in Argentina is very low, with less than 0.5% of the total herd insured.
Forestry insurance has grown rapidly in Argentina. Insurance penetration is still low with about 123,112 hectares insured, which represents about 8% of the commercial forestry plantations surface.
4. Financial Performance 5-Year Results The average loss ratio for the whole market over the last five years is estimated at 62%1
. Despite the fact that the average premium rates remained relatively stable, the breadth of coverage offered by insurance companies has increased every year throughout this period (Table 1.3).
Cost of Agricultural Insurance Provision
Market costs are shown in Table 1.4 as a percentage of the original gross premium rate. For the whole market the cost ratios with respect to the original gross premiums (OGP) are: acquisition and local 1 All average loss ratios presented in this Annex are based on the 5-year (or actual number of years available data) long-term loss ratios which are calculated as total claims divided by total premiums and multiplied by 100%

9
brokerage, 10 to 15%; company’s administrative costs, 8 to 10%; loss adjustments expenses (LAE), 5%; and total costs, 23 to 30%. In addition, insurance sales tax (including VAT, provincial taxes, stamp duty, and issuance rights) of about 24% is payable on agricultural insurance premiums. The combined ratio is estimated at about 87% for crop insurance.
5. Public Disaster Assistance Programs Federal government ad hoc post disaster relief assistance is available under the Agricultural and Livestock Emergency Law “Ley de Emergencia Agropecuaria (22913/81)” and is implemented by the Secretariat of Agriculture, Livestock, Fisheries, and Food, SAGPyA. In addition, each province operates its own Ley de Emergencia Agropecuaria. Under this law, the farmers whose losses represent more than 50% of their production are eligible for disaster relief compensation.
Covered perils include climatic perils, earthquake, and biological perils. In practice, compensation payments to farmers under the Agricultural Disaster Relief Program are limited to subsidized interest rates for those loans issued by state-owned banks, federal and provincial tax waivers, and tax exemptions.
Since the application of this law is still not ratified, and since it therefore has no budget, it has several interpretation and application problems. The Argentine Parliament has on various occasions considered reviewing and amending the law, including its funding, but no changes have been introduced to date.
6. Additional Tables Table 1.2: Estimated Crop Insurance Penetration
Year
Number of Crop
Policies
Percentage of Farmers Purchasing
Insured Area (mil of ha)
Percentage of National Crop Area
Insured 2003 100,325 -- 10.3 35% 2004 101,964 -- 10.9 36% 2005 103,024 -- 11.6 40% 2006 115,000 -- 14.6 47% 2007 120,000 -- -- --
Source: World Bank Survey (2008).

10
Table 1.3: Crop and Livestock Insurance Results, 2003 to 2007
Year
Number of
Policies
TSI (USD
million)
Premium (USD
million)
Paid Claims
(USD million)
Average Policy
Size (USD)
Average Policy
Premium (USD)
Average Rate
Loss Ratio
Crops 2003 100,325 2,584.0 107.3 53.7 25,756 1,070 4.2% 50% 2004 101,964 2,221.3 91.3 42.3 21,785 896 4.1% 46% 2005 103,024 2,728.0 104.7 69.3 26,479 1,016 3.8% 66% 2006 115,000 4,438.3 153.8 121.6 38,594 1,338 3.5% 79% 2007 120,000 6,315.8 240.0 156.0 52,632 2,000 3.8% 65%
Average 108,063 3,657.5 139.4 88.6 33,049 1,264 3.8% 62% Including Livestock and Forestry
2003 100,325 2,584.0 107.3 53.7 25,756 1,070 4.15% 50% 2004 101,964 2,221.3 91.3 42.3 21,785 896 4.11% 46%
2005* 103,024 2,877.0 105.4 69.3 27,926 1,023 3.66% 66% 2006* 115,000 4,779.0 155.3 122.0 41,557 1,351 3.25% 79% 2007* 120,000 6,315.8 240.0 156.0 52,632 2,000 3.80% 65%
Average 108,063 3,755.4 139.9 88.7 33,931 1,268 3.72% 62% Source: World Bank Survey (2008). Table 1.4: Insurers’ Costs as a Percent of OGP
Source: World Bank Survey (2008). Source of Country Overview Information: World Bank Survey (2008).
Costs Crop
Marketing and Acquisition 10%-15%
Administration 8%-10% Loss Adjustment 5% Total A&O Costs 23%-30% Insurance Premium Taxes 24% Total 48%-58%

11
Overview on Agricultural Insurance: AUSTRALIA
1. Agricultural Insurance Market Review History of Agricultural Insurance
Crop insurance started in Australia in 1918 but did not expand much until the 1960s. Crop insurance now is very well established in Australia, is handled by private insurers, and is competitive. Expansion of the traditional broad acre hail insurance to many other crops happened from the 1980s onwards. Forestry insurance is also important. Livestock insurance is a much smaller industry than crop insurance but includes equine, livestock, and aquaculture insurance. Agricultural Insurance Market Structure (2008)
Three private sector insurers underwrite crop and livestock business; nine offer crop insurance only, and three offer livestock only. Insurance companies write most broad acre crop insurance (e.g. cereals, oilseeds). Three managing underwriting agencies write specialist lines such as cotton and horticulture, and there are a few specialist livestock agencies, mainly focusing on racehorses. Forestry insurance is also offered by insurers and through agencies. Agricultural Insurance Products Available
Crop hail and named-peril crop insurance are available, but not revenue-based or multi-peril crop insurance (MPCI) policies. Greenhouse insurance is available. Although “broad acre” crop insurance is the dominant and longstanding crop insurance, which covers principally hail and fire, in the 1980s and 1990s there was an expansion of schemes for specific crop sectors, notably cotton and viticulture. Forestry insurance is also an important product in Australia. Livestock insurance covering accident and mortality is available, as well as aquaculture insurance. A number of weather derivatives are transacted. There are no weather index insurance products, although these have been researched in the private sector. Table 2.1: Agricultural Insurance Available 2008 Crop Insurance Products Available Greenhouse Forestry MPCI Named-peril Crop Revenue Index-based No Yes No No Yes Yes Livestock Insurance Products Available Aquaculture All Risk Accident &
Mortality Epidemic Disease
Other Index-based
No Yes No No No Yes Source: World Bank Survey (2008). Delivery Channels
For crop insurance, brokers are the most important distribution channel. In decreasing order of importance after brokers are the insurer’s own agents, producer associations and cooperatives, input suppliers (“stock and station agents”), and banks. There are specialist association schemes with their own distribution channels, for example the forest growers association, the dried fruit industry, and cotton ginners. Distribution networks are well established and competitive. For livestock insurance, the same channels

12
are important, although linkages with banks are less developed. There are no special delivery channels or programs for small farmers. Voluntary vs. Compulsory Insurance Crop and livestock insurance is voluntary. Agricultural Reinsurance Private sector reinsurance (quota-share, surplus, and stop-loss) is widely developed and competitive. It is not considered a constraint for named-peril crop insurance, livestock insurance, or index insurance. For initiatives in Australia developed to investigate the possibility of multiple-peril yield insurance, reinsurance is a moderate constraint. Drought is a major catastrophic hazard in Australia.
2. Public Support for Agricultural Insurance Types of Public Support for Agricultural Insurance There is no form of public support for agricultural insurance in Australia. Premium Subsidies There is no premium subsidy on agricultural insurance in Australia. Public Cost of Agricultural Insurance
There is no cost to the government in support of agricultural insurance.
3. Agricultural Insurance Penetration Insurance Penetration Rate
Information on the agricultural sector is an estimate and is provided for 2007. For crop insurance, it is estimated that 25,000 crop insurance policies were issued and that 50% of farmers were insured. The area insured was 15 million ha or 50% of cropped area. The figure has been relatively stable over time and reflects the significant penetration of insurance in the large broad acre crop sector in Australia. There has been growth in specialist sectors such as viticulture. For livestock insurance, it is estimated that only 5% of the national cattle herd is insured. Data for forestry insurance is not available but, as noted, forestry insurance is well developed in Australia.
4. Financial Performance 5-Year Results Estimates are not available for the industry as a whole. One company involved in all crop insurance sectors shows loss ratios varying from 29% to 71% over a five-year period. Companies writing a national portfolio have a diversification of risk, for example spatially from western to southeastern Australia and

13
Queensland for broad acre, several viticulture regions, and different product types. Premium income for the agricultural insurance market in Australia is volatile and is influenced by drought (affecting cropped area which is insured) and more recently by commodity prices (affecting the value of crops insured). An estimate of the market premium income in Australia by class of business is provided for 2008 below: Table 2.2: Estimated Crop and Forestry Premium Income 2008
Class of Business Market Premium Income (USD
million)
Comment
Broad acre crops 96.0
Substantially increased in 2008 as a result of commodity prices
Cotton 11.5 Area of cotton is still much reduced as a result of the drought. Premium income has reached USD 47.7 million in the past
Viticulture 17.2 -- Orchard 1.9 -- Forestry 28.8 --
Source: World Bank Survey (2008). Livestock accident and disease insurance premium estimates for the market are $A 50 million (USD 47.5 million). However, a majority of this figure is bloodstock insurance. There is no livestock epidemic insurance. The figure of 5% of livestock being insured is due to catastrophe cover being available for feedlot cattle, a high proportion of which are insured. There is a limited amount of aquaculture insurance, estimated at $A 1 million (USD 0.95 million) of premium income. Cost of Agricultural Insurance Provision
For both crop and livestock insurance, the following are estimates for companies in the market of costs compared to original gross premium (OGP): marketing and acquisitions (commissions) 13.0%; insurer administration excluding loss adjustment 7.0%; loss adjustment costs 2.5%, and total costs 22.5%. Note that overseas reinsurers pay a premium tax of 3% of OGP.
5. Public Disaster Assistance Programs Australian farmers have suffered from major drought problems in the last decade. These affect both rainfed annual cereal cropping areas and the major irrigation zones (for example in the tributaries to the Darling River), where headwater reservoirs have been subject to major limits on water allocations.
Australia has an "Exceptional Circumstances” (EC) payment which has especially been applied for drought and bushfire losses. These amounted to $A 1.7 billion (USD 1.6 billion) in 2007 and $A 1.3 billion (USD 1.2 billion) in 2006. Grain farmers received $A 760 million (USD 722), and dairy farmers also received subsidies. Australian government expenditure on drought assistance in the five years to 2006 was more than $A 41.6 billion (USD 39.5 billion).
EC payments provide several forms of assistance to farmers (and to small businesses deriving at least 70% of their turnover directly from agriculture). Areas must be declared as disaster-affected. Direct payments may be made (relief payments) as special exit payments for farmer quitting agriculture, for re-training or relocation, and as tax deferrals. Source of Country Overview Information: World Bank Survey (2008).

14
Overview on Agricultural Insurance: AUSTRIA
1. Agricultural Insurance Market Review History of Agricultural Insurance
Agricultural insurance in Austria is provided through the Austrian Hail Insurance Company, which is a mutual organization. The Austrian insurance system aims to provide a broad risk management framework for the agricultural sector. Multi-peril crop insurance (MPCI) has been developed since 1995. Before this date agricultural insurance companies offered crop and greenhouse insurance mostly against hail and storms. Since 1995 the insurance companies started to offer comprehensive insurance coverage against hail, drought, storms, floods, frost, and some other risks. Livestock insurance was introduced in 2003.
Blanket agricultural insurance was introduced in 1987; that is, farmers willing to insure crops against hail had to insure all arable crops. That program became the basis for the introduction of MPCI insurance.
The Austrian government has established a partnership program with the private insurance companies to control EU area-based subsidies. Under this program insurance companies receive area data (area, type of crops, yields) for preparation of annual crop insurance plans. Government contributions (in the form of premium subsidies) have stimulated farmers to adopt risk management strategies. A public-private insurance system is seen as an effective solution to substitute ex-post disaster compensations. Agricultural Insurance Market Structure
Agricultural insurance is offered through a special mutual organization founded by 17 insurance companies. The main objective of the Austrian Hail Insurance Company is to proviside high quality agricultural insurance products and services. The premium rates are established based on actuarial calculations and risk statistics. The system targets a loss ratio of 75% to leverage interests of insurance providers and farmers. Agricultural Insurance Products Available
The Austrian agricultural insurance system offers crop hail and crop MPCI products (Table 3.1). A farmer cannot insure selected fields, but rather all arable area must be insured. This rule is applied to all crops including field crops, grapes, and fruits. Insurance policies for field crops cover yield losses. For grapes and fruits, insurance policies cover both yield and quality loss. Premium rates are set by the insurer based on the loss experience. The bonus system is used separately for MPCI insurance and hail policies for field crops. The bonus-malus system is used for grapes and fruits. Settlement of claims is usually performed no later than two weeks after the harvest is completed.
There is no revenue insurance in Austria. Index insurance is not yet present. However, during the last three years insurance companies have designed a drought monitoring system based on a rainfall index. This system is used to assess crop losses due to drought. Multi-peril livestock insurance is present in Austria, but information was not available. Delivery Channels
The insurance agent network is the primary delivery channel. There are no special organizations or programs for small and marginal farmers.

15
Table 3.1: Agricultural Insurance Available 2008 Crop Insurance Products Available Greenhouse Forestry MPCI Named-peril Crop Revenue Index-based Yes Yes No No Yes No Livestock Insurance Products Available Aquaculture All Risk Accident &
Mortality Epidemic Disease
Other Index-based
No Yes No No No No Source: World Bank Survey (2008). Voluntary vs. Compulsory Insurance
Both crop and livestock insurance are voluntary in Austria. There are no mandatory requirements. Farmers cannot get ad hoc public assistance in case of hail or frost. The government considers that premium subsidies are sufficient to attract farmers to purchase insurance coverage.
Agricultural Reinsurance
Reinsurance of agricultural risks in Austria is provided through private domestic and international reinsurance companies. About 25% of the agricultural risks are ceded on a proportional basis to the pool of Austrian insurance companies. The remaining risk is reinsured through international reinsurance companies through stop-loss treaties which protect the insurance company retention against its liabilities in excess of a 110% loss ratio and up to a 150% loss ratio. The main international reinsurers are Munich Re, SCOR, Hannover Re, Swiss Re, and Sirius Re.
2. Public Support for Agricultural Insurance Types of Public Support for Agricultural Insurance There is national legislation on agricultural insurance and subsidization of insurance premiums. Ad hoc assistance is sometimes provided but not for the risks that can be insured through subsidized crop insurance products (hail and MPCI).
Premium Subsidies The total premium subsidy is 50% of the commercial premium with 25% paid by the central government and 25% paid by the regional government. Premium subsidies are offered only for hail and frost risks. Other agricultural insurance products are not subsidized. Public Cost of Agricultural Insurance
The government accumulates funds necessary for the 25% premium subsidy program in the National Catastrophe Fund. Another 25% subsidy is paid by the regional authorities. The total premium subsidy is 50% of premium. The national government subsidy payment is linked to the confirmation of the payments from the regional government budget. The overall public cost of agricultural insurance premium subsidies was US$ 31 million in 2006.

16
The government plays an important role in the development of agricultural insurance in Austria, though the main responsibility is with farmers and private insurers. The provision of subsidies is considered as the key factor for agricultural insurance development in the country, especially for MPCI.
3. Agricultural Insurance Penetration Insurance Penetration Rate
About 80% of crops or 1 million heactares are insured against hail. About 60% of crops are insured against multi-perils (Table 3.2). About 80% of farmers purchase crop and livestock insurance (68,000 farms). The number of policies in 2005 was 78,418. Data on agricultural insurance is limited, see Table 3.3. The data was available only for years 2003 to 2005.
4. Financial Performance 5-Year Results
Some limited data is available on the financial performance of agricultural insurance for the years 2003 to 2005 (see Table 3.4). Cost of Agricultural Insurance Provision
The overall public cost of premium subsidies to agricultural insurance was US$ 31 million in 2006.
5. Public Disaster Assistance Programs The government provides ad hoc assistance, but very rarely, and only for crop loss or damage that was caused by non-insurable risks. The national government follows the rules set by the European Union for assistance. During the period 2000-2004, the Austrian Catastrophe Fund paid US$ 72 millon mainly due to the occurrence of severe flood, frost, and drought events.
6. Additional Tables Table 3.2: Hail and MPCI Insurance Penetration
Hail Insured Area
Percentage of the Hail Area also Insured under MPCI
Field crops 79% 60% Grapes 60% 9% Fruits 58% --
Grassland 22% 90% Greenhouses 92% 85%
Source: World Bank Survey (2008).

17
Table 3.3: Estimated Crop and Livestock Insurance Penetration, 2003 to 2005
Year Number of Farms
Covered Percentage of Area Insured
Insured Area (mil of Ha)
Percentage of Animals Insured
Number of Animals Insured
2003
69,791 76.9% 1.0 9% 170,132
2004
68,896 78.0% 1.1 13% 258,783
2005
67,866 79.0% 1.1 19% 383,817 Source: World Bank Survey (2008). Table 3.4: Crop Insurance Results, 2003 to 2005
Year Number of
Policies
Total Sum Insured
(USD million)
Premium, Including Subsidies
(USD million)
Paid Claims
(USD million)
Loss Ratio
2003 -- 2,760.7 74.5 64.1 86% 2004 -- 2,925.3 77.0 41.6 54% 2005 -- 3,095.8 78.1 34.3 44%
Source: World Bank Survey (2008).
7. Other Information Types of Coverage Available In Austria there are 5 main types of crop insurance policy available including: a) Basic Hail Insurance. Available for all crops. Hail coverage indemnifies percentage damage to the
crop as determined by the insurance company’s loss adjusters. The indemnity is calculated as the percentage of loss times the sum insured less the deductible which for this case is 8% of the total sum insured over the affected area.
b) Multi-peril Crop Insurance covering yield loss in arable crops. Insured perils are hail, storm, frost, flood, rain, drought, drift, sprouting and pests. In case of hail losses are adjusted on a percentage damage basis. In the case of all other perils this insurance indemnifies losses when the actual yield obtained by the insured on its insured unit is below 50% of the expected yield. In such cases, the insured will receive a fixed indemnity of € 175 per hectare.
c) Vineyards Insurance is offered to protect wine-grape production against hail, frost and additional expenses after hail. This coverage also indemnifies qualitative losses. This coverage is a damage-based indemnity policy. In this case the basis of indemnity is the same as explained above for basic hail insurance. The difference is that in the case of frost damage the deductible to be applied is 35% of the total sum insured.
d) Fruit Hail Insurance. This insurance insures quantitative and qualitative aspects of fruit crops production against hail damage. This coverage offers protection from ground-up, subject to the application of deductibles that can vary from 10% to 30% of the total sum insured of the affected area depending on the loss experience of each insured unit.
e) Grassland and Silage Hail and Flood Coverage. This coverage protects the silage against hail damage, subject to a deductible of 8% of the total sum insured. In case of floods no deductible applies but the indemnities are limited to € 440 perhectare.

18
Options of Coverage The standard crop policy wording for the Austrian market is a named-peril damage-based indemnity policy. The policy is structured such that by purchasing basic hail coverage, the insured then has the option to select coverage for other perils in addition to hail by paying an extra premium. Under this modality farmers have the option to choose among single-risk insurance or combined-perils insurance. The top of the line option is yield insurance (multi-peril crop insurance) which is available only for arable crops. The possible combinations of perils are determined by the type of crop:
1) Hail coverage is available for all agricultural crops and greenhouses; 2) Storm insurance is available for: corn, tobacco, greenhouses and hail protection for fruits; 3) Drought protection is offered for cereals; corn; field pea; soybeans; sunflower; potatoes and oil
squash; 4) Flood insurance is offered to all arable crops, grassland and horticulture; 5) Frost coverage is available for all arable crops and vineyards; 6) Sprouting is covered on cereals and poppy crops; 7) Upsilting is protected on sugar-beets crops; 8) Damage caused by snails (pests) is available for all arable crops; 9) Damage caused by crows is a protection offered only for cereals, corn and oil-squash; 10) Unseasonal rainfall at harvest cover is offered for corn, potatoes and soybeans; and 11) Hail-coverage for round hay bales and polyethylene covering for horizontal silage clamps is also
offered. Sources of Country Overview Information: World Bank Survey (2008); European Commission (2006).

19
Overview on Agricultural Insurance: BOLIVIA
1. Agricultural Insurance Market Review History of Agricultural Insurance
Agricultural insurance was introduced in the country in 1979 by “Aseguradora Boliviana Agropecuaria” (ABA) which managed a pilot project with the support of the Organization of American States (OAS) and the Bolivian Institute of Agricultural Sciences. Due to the adverse effects of inflation and cessation of external funding in 1984 the company was closed in 1985.
In 1994 the Credit Finance Unit of CORDECRUZ (UCF) introduced the "Agricultural Insurance Study”, offering insurance to cover excess of rain peril on soybeans, corn, and wheat crops grown in Santa Cruz Province. Cyclical recurrence of excess of rainfall and, above all, lack of reinsurance, made the insurance industry reluctant to offer this product.
In 1999 the former state-owned company, Compañía Nacional de Seguros y Reaseguros, requested the authorization to market an agricultural insurance policy to cover excess rainfall, drought, and flood perils on soybean crops, again in Santa Cruz Province2
. But severe weather before the launch of the product discouraged the insurance company to offer the product.
In 2006 a rainfall index-based insurance pilot program managed by BISA Seguros y Reaseguros S.A and supported by USAID was developed to protect the farmers’ input costs against excess rainfall in Santa Cruz Province. The product was launched but then discontinued because of lack of demand. Agricultural Insurance Market Structure
Since 2008 two private commercial insurance companies, Latina Seguros Patrimoniales, S.A. and BISA have separately offered multi-peril crop insurance (MPCI) on a very selective basis and only for large soybean farmers in Santa Cruz Province. Both companies are technically supported by an Argentinean agricultural insurance company and reinsurance broker.
Up to 2009 there was no formal evidence of federal government support to agricultural insurance. Nevertheless, the government of Bolivia is currently conducting a study to implement a national Agricultural Insurance Scheme. There is no livestock insurance market in Bolivia, although some large commercial cattle owners may purchase voluntary cover from national/international markets. There is some limited demand for standing timber forestry fire insurance, which is placed in international markets on a voluntary basis. There is no form of special agricultural insurance legislation. Agricultural Insurance Products Available
The product available in this market is individual grower MPCI yield shortfall cover. Initially, MPCI policies were offered to cover soybeans (summer and winter crops) and sunflower production. The product is expected to be expanded to other crops in the near future. The policy covers all types of weather risks and fire but excludes non-controllable biological perils. Guaranteed yields under this policy
2 A risk management and insurance planning study for soybean insurance was commissioned through an international agricultural risk management specialist, ARM Ltd, UK.

20
vary from 40%-60% of the actual production history, depending on the crop/region and the product. These products are offered on an individual farmer basis and are mainly linked to input suppliers’ loans. Table 4.1: Agricultural Insurance Available 2008 Crop Insurance Products Available Greenhouse Forestry MPCI Named-peril Crop Revenue Index-based Yes No No No No Yes, facultative Livestock Insurance Products Available Aquaculture All Risk Accident &
Mortality Epidemic Disease
Other Index-based
No No No No No No Source: World Bank Survey (2008). Delivery Channels
The most important delivery channels are through the insurance brokers who usually work with input suppliers. There are no specialized delivery channels for small and marginal farmers. Voluntary vs. Compulsory Insurance
Crop insurance is voluntary. Agricultural Reinsurance
Argentinean insurance companies and International reinsurers offer reinsurance support to the local market.
2. Public Support for Agricultural Insurance Types of Public Support for Agricultural Insurance There is no evidence of public support for agricultural insurance. Premium Subsidies
There are no premium subsidies to agricultural insurance. Public Cost of Agricultural Insurance
Not applicable. Role of Public Sector Intervention in Agricultural Insurance The government of Bolivia and several regional governments have expressed interest in supporting the development of weather-based crop insurance, especially as a means to reduce income variability to small farmers. They currently provide financial and technical assistance from international donors to develop pilot crop insurance projects.

21
3. Agricultural Insurance Penetration Insurance Penetration Rate
In 2008 approximately 20,000 ha of soybeans were planned to be insured in Santa Cruz Department, but the final status of this program is not known.
4. Financial Performance 5-Year Results No data available. Cost of Agricultural Insurance Provision
No data available.
5. Public Disaster Assistance Programs No data available. Source of Country Overview Information: World Bank Survey (2008).

22
Overview on Agricultural Insurance: BRAZIL 1. Agricultural Insurance Market Review History of Agricultural Insurance Public sector crop insurance in Brazil dates back to 1954 when the federal government of Brazil formed PROAGRO (Guarantee Program for Agriculture and Livestock Activities, Programa de Garantia da Actividade Agropequária), a national, individual grower multi-peril crop insurance (MPCI) program linked to crop credit. Following this, various state governments formed their own public sector state-level crop and/or livestock insurance schemes, including Sao Paulo (COSESP), Minas Gerais (COCAMIG), and Rio da Janeiro3
. These state-level public sector MPCI programs carried high levels of premium subsidies. All operated at a financial loss, and the last one, COSESP, was terminated in 2005. PROAGRO, however, continued to operate in 2008 along with several other federal government crop insurance initiatives.
Between 1939 and 2007, the Brazilian insurance market was protected by law, and all reinsurances had to be offered to the national reinsurer, the Instituto Nacional de Resseguro do Brasil (IRB). During this period the IRB acted as a monopoly reinsurer in the Brazilian market, and international reinsurers were involved on a retrocession basis only. The Brazilian market was opened up to competition in 20074
, and the IRB was registered as a local reinsurer, IRB-Brasil Resseguros S.A.
The first private sector crop insurance initiative in Brazil dates back to 1997/98 when Porto Seguro, in collaboration with Partner Reinsurance Company, Zurich Branch, started a private crop hail program for apples and pears in various southern states of Brazil.
The federal government of Brazil is highly committed to promoting agricultural insurance and since 2005 has offered premium subsidies on private commercial agricultural insurance. This has been accompanied by a major expansion in commercial crop, livestock, and forestry insurance.
Agricultural Insurance Market Structure
Commercial Agricultural Insurers. In the past decade the private insurance sector has started to
become actively involved in agricultural insurance in Brazil. In 2003 there were only two commercial agricultural crop and or livestock insurers in the market, but in 2007, seven private commercial companies were actively underwriting crops and/or forestry and/or livestock. Aliança do Brasil is the largest commercial crop insurer with about 51% of the market premium volume in 2007/08, followed by Nobre Seguros with a 22% market share (Table 5.2). In 2008, a total of eight private commercial companies were operating in the Brazilian agricultural insurance market.
Public Sector Crop Insurance. The PROAGRO program has been administered through the
Central Bank of Brazil and is a federal government individual grower subsidized MPCI program which is designed to ensure that, in the event of crop failure, the growers’ production credit repayments are guaranteed as well as a percentage of the expected net revenue for that crop. The PROAGRO traditional 3 For a detailed evaluation of PROAGRO and COSESP operations and performance up to 1983 see Hazell et al., eds. 1986. Crop Insurance for Agricultural Development: Issues and Experience. Baltimore, John Hopkins University Press.. 4 This process of liberalising the reinsurance market will be fully completed in 2010.

23
program was extensively reformulated in 2004 and two new programs were created: (a) PROAGRO MAIS (PROAGRO “More”), and SEAF (Insurance for Family Agriculture, Seguro da Agricultura Familiar). Both of these programs are compulsory crop-credit insurance programs targeted at smallholder farmers who access seasonal production credit from PRONAF (National Program for the Strengthening of Family Agriculture – Programa Nacional de Fortalecimento da Agricultura Familiar). SEAF is administered by the Secretariat of Family Agriculture (Secretaria de Agricultura Familiar) and the Ministry of Agrarian Development (Ministério do Desenvolvimento Agrário). Further details of the SEAF program are provided in Box 1.
Agricultural Insurance Products Available The range of private sector commercial crop, livestock, and forestry insurance products available in Brazil are reported in Table 5.2, and then in Table 5.3 by insurance company. Individual grower MPCI yield-based indemnity cover for soybeans, maize, wheat, and other grain crops is the most common product underwritten by six companies. This is followed by a damage-based fruit hail policy (underwritten by four companies), and since 2004 forestry fire plus allied-peril insurance (underwritten by five companies).
Livestock and/or bloodstock insurance have been offered by Porto Seguro and Seguradora Brasileira Rural for a number of years, but in 2008 Porto Seguro has exited from this class of business. Cover is restricted to accident and mortality cover in cattle and horses, and epidemic disease cover is currently not insured. There is a very small amount of mortality insurance for sheep. Brazil, Uruguay, Venezuela, Argentina, and Ecuador are the only countries in South America which currently offer commercial livestock insurance.
For a number of years, one company, Nobre Seguros, in conjunction with Agrobrasil, underwrote a crop area-yield index insurance program in Rio Grande do Sul State for hybrid maize seed, but this state government-subsidized program has not been renewed in 2008/09. The PRAGRO policy is an individual grower MPCI yield shortfall product which covers a wide range of climatic and naturally occurring perils and uncontrollable pests and diseases and which indemnifies losses that exceed 30% of the expected revenue for the insured crop. Table 5.1: Agricultural Insurance Available 2008 Crop Insurance Products Available Greenhouse Forestry MPCI Named-peril Crop Revenue Index-based Yes Yes No Yes, Area-
Yield Index No Yes
Livestock Insurance Products Available Aquaculture All Risk Accident &
Mortality Epidemic Disease
Other Index-based
No Yes No Yes, bloodstock
No No
Source: World Bank Survey (2008). Delivery channels
In Brazil, the key delivery channels for commercial agricultural crop insurance include: (1) local insurance brokers; (2) the banks (for example, Alianca do Brazil, the largest crop insurer, is owned by the Bank of Brazil and has a major crop-credit portfolio); and (3) producer associations and cooperatives, which are very active in Brazil and provide their members with a range of services including credit, input, and output marketing. The Ministry for Agrarian Development (Ministerio de Desenvolvimiento Agrario) delivers coverage through PROAGRO and SEAF to small and marginal Brazilian farmers.

24
Voluntary vs. Compulsory Insurance Private sector agricultural insurance is voluntary in Brazil. The rural banks may, however, require borrowers to take out a crop insurance policy to protect their seasonal crop production loans. The public sector PROAGRO and SEAF crop credit insurance programs are compulsory for crop credit recipients of PRONAF. Agricultural Reinsurance
The IRB acted as a monopoly national reinsurer between 1939 and 2007. The IRB retroceded the agricultural reinsurance business on a quota-share treaty or voluntary proportional basis to specialist international agricultural reinsurers.
In January 2007 legislation5
was enacted to permit foreign reinsurers to enter the Brazilian domestic reinsurance market. International reinsurers, which are registered as fully admitted local reinsurers, may now compete directly with IRB for business. The IRB is now registered as a local reinsurer under the name IRB-Brasil Resseguros S.A.; it is a privately-held mixed capital corporation linked to the Ministry of Finance (it is classified as a public sector reinsurer for the purposes of this survey).
Traditionally, the IRB managed a special government stop-loss reinsurance fund for agriculture termed FESR, Stability Fund for Rural Insurance (Fundo de estabilidade do seguro rural). This fund was open to both public and private agricultural insurers, and COSESP was a major beneficiary up to 2004/05 when the company went into receivership with major financial losses. Although FESR is open to all insurance companies that sell agricultural insurance in Brazil, currently only two companies, Aliança do Brasil and AGF Brazil, are using this fund. Currently, the Government and insurers are studying the possibility of replacing the FESR by another catastrophe reinsurance facility termed the Rural Catastrophe Fund (Fundo do Catástrofe Rural).
In 2008 all the major international commercial agricultural reinsurers6
were operating in Brazil either as local or admitted or alien reinsurers. These reinsurers are offering a mix of facultative proportional reinsurance (especially for large forestry accounts) and quota-share and stop-loss treaty reinsurance to the private commercial agricultural insurers. Access to reinsurance capacity is not considered to be a constraint in Brazil for existing crop hail and MPCI business or for livestock mortality cover.
The PROAGRO crop insurance program is underwritten by the Central Bank of Brazil. It does not attract reinsurance from the IRB or International Reinsurers.
5 Supplementary Law No. 126 of January 2007 recognizes three types of reinsurer in the Brazilian market: (1) Local Reinsurer based in the country and incorporated as a company, (2) Admitted Reinsurer based abroad but with a local office and authorized to conduct reinsurance activities, and (3) Alien Reinsurer based abroad and with no local office in Brazil. 6 This list includes Swiss Re, Munich Re, Partner Re, Hannover Re, SCOR, Mapfre Re, various syndicates at Lloyd’s, and various Bermudan reinsurers.

25
2. Public Support for Agricultural Insurance Types of Public Support for Agricultural Insurance The federal government PROAGRO and SEAF programs provide subsidized crop insurance to the farmers who are automatically insured under these programs. In the case of SEAF, a fixed capped crop insurance premium rate of 2% is charged to the grower, and the government provides a 75% premium subsidy. Since 2004/05, the federal government has also provided premium subsidies to private commercial insurers for crops, livestock, and aquaculture insurance, and recently, in 2007, the premium subsidy program has been extended to forestry.
The federal government has also provided agricultural reinsurance through the national monopoly reinsurer IRB and through FESR. The government is also developing agricultural risk management training and education programs with several universities. Some state-level governments have also provided premium subsides for commercial crop insurance (including Rio Grande do Sul, Sao Paulo, and Minas Gerais).
Subsidies on Private Commercial Agricultural Insurance Premiums The Brazilian government has been very committed to supporting private commercial agricultural insurance since 2005 through the provision of premium subsidies. The following premium subsidy levels were available for each class of insurance in 2007/08:
• Livestock, forestry and aquaculture: 30% premium subsidy • Crops (cereals, fruits, etc.): 40%-60% premium subsidy • The maximum permitted premium subsidy per farmer was R$ 32,000 for each insurance group
(three crop groups, livestock, forestry; six groups in total), or a maximum of R$ 192,000 for all groups.
In 2008/09 the maximum premium subsidy level has been increased to 70 percent, and the subsidy limit per farmer has been increased to R$ 96,000.
The budgeted premium subsidy amounts of the federal government and utilization by commercial agricultural insurers are presented in Table 5.4 for the period 2005/06 to 2007/08. There has been a major expansion in agricultural insurance premiums and in the federal government’s premium subsidy budget in the past three years. In 2005/06, the total market premium amounted to only USD 18 million, with used premium subsidies amounting to about USD 111,111. In 2007/08, the government’s allocated premium subsidy budget amounted to R$ 100 million (USD 55.6 million): actual written premiums increased to USD 73.3 million (a three-fold increase in three years), and premium subsidies amounted to USD 33.9 million or 46% of premiums.
The government has budgeted agricultural insurance premium subsidies for 2008/09 of R$ 150 million (USD 94 million), and for 2009/10 of R$ 200 million.

26
3. Agricultural Insurance Penetration Insurance Penetration Rate Commercial Agricultural Insurance. The Brazilian insurance market generated R$58.6 billion (USD 30 billion) in written premiums during 2007 and about R$ 70 million (USD 36 billion) with the inclusion of health insurance, equivalent to about 3.7% of GDP7
. Agricultural production in 2007 amounted to about 3.5% of GDP, but private commercial company agricultural insurance premiums were only USD 73.3 million or 0.2% of total market premium.
In 2007 a total of 2.27 million hectares of crops were insured by private commercial insurers in Brazil, representing 2.6% of total cropped area of the insured crops. The bulk of the insured cropped area was comprised of cereals and textile crops (Table 5.5).
Livestock insurance uptake is exceedingly low in Brazil. After a decade of livestock insurance it is estimated that in 2007 there were only about 6,000 insured head of cattle out of a total national herd of nearly 206 million, and bloodstock insurance accounts for a further estimated 2,000 animals (Table 5.6).
In 2007/08 the Brazilian commercial agricultural insurance market TSI for crops, forestry, and livestock was estimated at USD 1.53 billion, with premiums of USD 73.2 million and an average rate of 4.8%. Agricultural insurance is currently purchased by medium and larger commercial farmers with an average sum insured of nearly USD 49,000 and average premium of nearly USD 2,250 per policy.
Public Sector Crop Insurance. It is not possible to report the results for the public sector
programs. It is understood that PROAGRO is currently insuring more than one million farmers. In 2004/05, the first year of operation of SEAF, 543,800 farmers were insured under this crop credit insurance program with a TSI of R$ 2.5 billion8
4. Financial Performance
, and currently it is understood that more than 600,000 smallholders are insured under SEAF.
5-Year Results
The Brazilian private commercial market crop insurance results for the past 4 years are reported in Table 5.8. On account of the major injection of premium subsidies by the Brazilian government, the demand for crop insurance has nearly doubled (in terms of premium volume) in the last two years, and in 2007/08 it stood at USD 73.0 million. In 2004/05 Brazil experienced severe drought, and companies underwriting MPCI incurred major losses as shown by the overall loss ratio of 263%. The market for crop insurance shrank in 2005/06 due to the collapse of COSESP (former public-sector agricultural insurer in Sao Paulo) and also Alianca do Brazil’s decision to highly restrict its underwriting in that year. 2005/06 was also a severe drought year in southern Brazil. The 4-year long term loss ratio at end of 2007/08 was 81% against an average annual loss ratio of 109%.
7 IRB-BrasilRe Annual Report 2007. 8 Zukowski J C 2008, Gestao de Riscos na agricultura familiar: Interccao entre o SEAF e o Sistema de ATER. www.mda.gov.br/saf/arquivos/0806509632.pdf.

27
The market livestock insurance results are not available. It is not possible to report the underwriting results for PRAGRO, PROAGRO MAIZ or SEAF over the past five years.
Cost of Agricultural Insurance Provision
Typical or average commercial insurers’ market acquisition costs and administration costs are reported in Table 5.9 for crops and livestock. 5. Public Disaster Assistance Programs Stability Fund for Rural Insurance FESR (Fundo de estabilidade do seguro rural)
As noted above, the IRB traditionally managed the FESR. This voluntary catastrophe reinsurance fund for agricultural classes of insurance provides stop-loss reinsurance for the following layering:
• Layer 1: losses from a 100% loss ratio up to 150% loss ratio, and • Layer 2: all losses exceeding a 250% loss ratio.
FESR is funded from a range of sources, including the underwriting profits of the agricultural insurers, the underwriting profits of the Penhor Rural program, and finally through federal government support in the event that the funds are inadequate to settle claims. In 2007 the government appointed a working group to study proposals to replace FESR by a Rural Catastrophe Fund (Fundo de Catástrofe Rural).
PROAGRO and SEAF
Since 1954 the federal government of Brazil has operated through the Central Bank of Brazil a subsidized crop credit insurance program called PROAGRO. In 2004/05, SEAF, a special crop credit insurance program for smallholder farmers was initiated by the Secretariat of Family Agriculture (Secretaria de Agricultura Familiar) and the Ministry of Agrarian Development (Ministério do Desenvolvimento Agrário). Features of this program are included in Box 5.1.

28
Box 5.1: SEAF Crop-Credit Insurance Program of the Federal Government of Brazil
SEAF is a federal government of Brazil compulsory crop credit insurance program for smallholder farmers who access seasonal production credit from PRONAF (National Program for the Strengthening of Family Agriculture – Programa Nacional de Fortalecimento da Agricultura Familiar). Nature of Cover: Automatic cover for beneficiaries of PRONAF Seasonal Credit. Type of Policy: Multi-Peril Yield Shortfall Policy, which indemnifies growers by the amount that actual crop revenue falls short of the sum insured (see below for definition of sum insured). Insured Crops: A wide range of crops identified under the agricultural zoning program (zoneamento agricola), including rainfed and irrigated cereals, legumes, oilseeds, fiber crops, root crops (cassava), grapes, and tree fruits. Insured perils: Drought, excess rain, frost, hail, excess variation in temperatures, strong winds, cold winds, crop pests, and diseases which are uncontrollable either technically or economically. Basis of Sum Insured: The sum insured is based on the amount of seasonal production credit loaned to the farmer, plus the interest due on the principal, plus up to 65% of the estimated net revenue of the crop, subject to a maximum of R$ 2,500 per farmer. The estimated gross and net revenue are determined by the bank and the crop inspector at the time of policy issuance. Premium Rate: 2% fixed rate paid by the insured for each insured crop. Premium Subsidy: Government pays a 75% premium subsidy on the SEAF program. Basis of Indemnity: Losses must exceed 30% of the expected gross revenue for the crop in order to qualify for an indemnity.
Indemnity Examples:
Item Farmer 1 Farmer 2 Sum Insured (R$) (R$) Finance (Seasoned Production Credit) 3,000 8,000 Expected Gross Return 5,000 13,000 Net Return (Gross – Finance) 2,000 5,000 65% of Net Return or Cap of R$2,500 1,300 2,500 Sum Insured (Finance + 65% Net Return) 4,300 10,500 Claims Example 1: Total (100%) Loss Prior to Harvest, Part of Credit Not Utilized Sum Insured 4,300 10,500 Minus Saving in Credit Not Utilized -750 -2,000 Indemnity Payment 3,550 8,500 Claims Example 2: Partial Loss (50% of Gross Revenue) Sum Insured 4,300 10,500 Minus Actual Gross Revenue Obtained (50%) -2,500 -6,500 Indemnity Payment 1,800 4,000 Source: MDA, 17/08/2005: Seguro da Agricultura Familiar.

29
6. Additional Tables Table 5.2: Main Private Commercial Agricultural Insurance Companies 2007
Company Premium (USD million)
Market Share
Allianz 1.2 1.7% Aliança do Brasil 37.4 51.0%
Mapfre Seguros 9.3 12.7% Nobre Seguros 16.1 22.0%
Porto Seguro 0.2 0.2% Seguradora Brasileira Rural,
SBR 9.1 12.4% Total 73.3 100.0%
Source: World Bank Survey (2008).
Table 5.3: Type of Agricultural Insurance Product by Private Company Ceding Company Fruit/Hail Grains/MPCI Forestry Livestock Bloodstock Farm
Owners Allianz X X X Aliança do Brasil X X Itaú Seguros* X X X Mapfre Seguros X X X X Nobre Seguros X X Porto Seguro X X Seguradora Brasileira Rural, SBR
X X X X X X
Unibanco X X Source: World Bank Survey (2008). * Itaú operates as fronting in MPCI for Archer Daniel Midland's coverage.
Table 5.4: Agricultural Insurance Premium Subsidy Budget and Use, FY2005 to FY2007
Season Available Subsidy
(USD million) Used Subsidy (USD million)
Percentage Subsidy Used
Total Premium (USD million)
Subsidy as Percent of Premium
FY2006 1.7 0.1 7% 18.0 0.6% FY2007 33.3 17.6 53% 38.0 46.3% FY2008 55.6 33.9 61% 73.3 46.2%
Source: World Bank Survey (2008).

30
Table 5.5: Estimated Policy Sales and Insured Area by Crop Type FY2008
Type of Crop Number of
Policies* Planted Area
(milion ha) Insured Area (ha)
Percent of National
Crop Area Insured
Coffee 21 2.3 369 .. Forestry 100 5.8 99,309 1.7%
Fruits 5,974 1.1 35,920 3.3% Grains-Textile 24,033 49.0 2.1 mil 4.4%
Horticulture 821 29.0 5,409 .. Tobacco 0 0.5 0 0%
Total 30,949 87.7 2.3 mil 2.6% Source: World Bank Survey (2008). * In addition there were 455 policy sales for sugar cane, making a total of 31,404.
Table 5.6: Estimated Private Livestock Insurance Penetration FY2008
Species National Stock Insured Livestock Market Penetration Livestock 205.9 mil 6,000 .. Bubaline 1.2 mil 0 0%
Bloodstock 5.7 mil 2,000 0.03% Sheep 16.0 mil 1,000 0.01%
Poultry 1,013.2 mil 0 0% Pork 35.2 mil 0 0%
Source: World Bank Survey (2008). Table 5.7: Commercial Share of TSI and Premium by Crop Type FY2008
Type of Crop
Number of
Policies
TSI (USD
million)
Total Premium
(USD million)
Average Premium
Rate
Average Sum Insured
(USD)
Average Premium
(USD) Coffee 21 1.1 0.02 2.2% 53,416 1,161
Forestry 100 98.4 1.5 1.6% 983,527 15,278 Fruits 5,974 319.6 21.2 6.6% 53,493 3,544
Grains-Textile 24,033 1,010.9 45.1 4.5% 42,064 1,876 Horticulture 821 42.1 2.2 5.2% 51,339 2,652 Livestock & Bloodstock 1,645* 56.2 3.3 5.9% 34,190 2,004
Total 32,594 1,528.4 73.3 4.8% 46,891 2,248 Source: World Bank Survey (2008). * Estimated number of livestock policies

31
2007/08 PREMIUM DISTRIBUTION (%)
Grains-Textile63%
Fruits29%
Livestock & Bloodstock
3%Forestry
2%Horticulture3%
Table 5.8: Private Commercial Crop Insurance Results, 2004 to 2007
Year Sum Insured* (USD million)
Premium (USD million)
Claims (USD million) Loss Ratio
2004 494.3 23.7 62.3 263% 2005 323.3 15.5 15.2 98% 2006 813.4 39.0 11.0 28%
2007** 1,528.4 73.0 34.0 47% Total 3,159.4 151.2 122.5 81%
Annual Average 789.9 37.8 30.6 109% Source: World Bank Survey (2008). * TSI values not available; estimations made on average premium rates for 2007 of 4.8% ** 2007 estimated claims and loss ratio
Premium Claims L/R

32
Table 5.9: Insurers’ A&O Costs as a Percent of OGP Costs Crop Livestock
Marketing & Acquisition 10% 25% Administration 23% 25%
Loss Adjustment 3% 2%
Total 36%
52% Source: World Bank Survey (2008). Note: In both cases, insurance premium taxes were negligible and were therefore not included. Appendix 1: Superintendência de Seguros Privados (SUSEP) Historical Crop Insurance Results, FY1996 to FY2005
Year
Premium (USD
million)
Claims (USD
million) Loss Ratio FY1996 5.0 4.4 89.2% FY1997 6.0 3.0 48.9% FY1998 7.8 9.3 119.4% FY1999 9.9 6.4 65.1% FY2000 20.0 18.8 94.2% FY2001 14.9 67.4 451.5% FY2002 13.1 29.8 226.9% FY2003 13.0 2.0 15.5% FY2004 12.0 33.3 277.3% FY2005 14.9 30.2 202.3%
Total 254.5 483.4 190.0% Source: World Bank Survey (2008).
89%49%
119%
65%94%
452%
227%
16%
277%
202
Source of Country Overview Information: World Bank Survey (2008).

33
Overview on Agricultural Insurance: BULGARIA
1. Agricultural Insurance Market Review History of Agricultural Insurance
An agricultural insurance law on voluntary crop insurance was adopted in Bulgaria in 1910. From 1910 until 1935 agricultural insurance services were offered only by the Bulgarian Cooperative Bank. From 1935 to 1946 crop insurance was administered by the Bulgarian Agricultural and Cooperative Bank. The State Insurance Institute (DZI) was established in 1946, and this institution was appointed as the responsible authority for crop insurance.
Over time Bulgaria has tested different forms of agricultural insurance including mandatory, voluntary, and mixed systems. From 1980 to 1991 agricultural insurance was mandatory for farmers, but the system was abolished after the end of the socialist system. The insurance coverage under the mandatory agricultural insurance framework included protection against a wide list of risks numbering approximately 40 perils.
In 1992 crop insurance became voluntary. Initially, crop policies provided coverage against two risks – hail and storm. Later the list of perils was extended to include excessive rain, fire, frost, and floods. Coverage for winter crops also includes freeze, slush, and water accumulation risks. Agricultural Insurance Market Structure
Seven insurance companies offer crop insurance. The market is dominated by three insurance companies including DZI-Obsto zastrahovane, Allianz Bulgaria, and Vitosha. The market is competitive, though competition is mostly price-based. Premium rates are calculated by actuaries, but rates are subject to approval by the Financial Supervision Commission. The latter organization has a right to revise the premium rates, and in case they are inadequate, sanctions can be applied to the companies using incorrect pricing policies. In 2005, total crop insurance premium was estimated at US$ 7.9 million.
All insurers use statistical data of the DZI, which has collected insurance-related data for the last 50 years.
Four companies offer livestock insurance. Many companies declare that they have livestock insurance products developed, but actual transactions are rare. The active players in the livestock insurance segment are DZI-Obsto zastrahovane, Vitosha, Allianz Bulgaria, and Bulstrad. In 2005 the premium sum on livestock insurance amounted to USD 1.8 million.
Official information on the agricultural insurance market is not available. Crop insurance is included in the general statistical reports on fire and the natural calamities insurance class. Livestock insurance is included in the reports on property insurance.
Agricultural Insurance Products Available
Insurance companies offer named-peril insurance, which is available for almost all crops produced in Bulgaria. The list of perils includes hail, thunderstorm, excessive rainfall, fire, frost, and floods. The coverage for winter crops also includes snow, freeze, and water accumulation risk. Indemnity payouts are made after crop harvest.

34
Field crops are insured for the whole production season from germination till harvest. Perennial plants are insured under SAPARD. SAPARD is the EU Special Accession Programme for Agriculture and Rural Development. It is offered to new members of the EU. It supports measures to enhance efficiency and competitiveness in farming and the food industry and to create employment and sustainable economic development in rural areas.
There is no multi-peril crop insurance (MPCI) insurance in Bulgaria. Price and income agricultural insurance is not offered. An index insurance product also does not exist.
Agricultural insurance is not subsidized in Bulgaria.
Livestock insurance products offer the farmers options for a range of perils they wish to insure. In general, coverage is available against death of the animal due to fire, weather, and natural perils, accidental death, non-contagious diseases, and forced slaughter due to contagious diseases. Subjective risks due to poor livestock management are not covered. Table 6.1: Agricultural Insurance Available 2008 Crop Insurance Products Available Greenhouse Forestry MPCI Named-peril Crop Revenue Index-based No Yes No No No No Livestock Insurance Products Available Aquaculture All Risk Accident &
Mortality Epidemic Disease
Other Index-based
No Yes Yes No No No Source: World Bank Survey (2008). Delivery Channels
The insurance agents’ network is the most important delivery channel for insurance companies for both crop and livestock insurance. There are no special organizations or programs for small and marginal farmers. Voluntary vs. Compulsory Insurance
Agricultural insurance in Bulgaria is voluntary.
Agricultural Reinsurance
Reinsurance is done through private international reinsurance companies.
2. Public Support for Agricultural Insurance Types of Public Support for Agricultural Insurance There is a national legislation with specific terms defined on agricultural insurance. The government does not subsidize agricultural insurance premiums. There are no prohibitions or limitations on using public funds for compensating farmers’ losses caused by natural disasters.

35
Premium Subsidies There are no premium subsidies. Public Cost of Agricultural Insurance Not applicable.
3. Agricultural Insurance Penetration Insurance Penetration Rate
Participation rate grew from 2003 to 2005 due to an increase of production subsidies and development of agricultural credit programs in Bulgaria. In 2003 about 37.5% of farmers purchased agricultural insurance policies. The participation rate in 2005 was 46.8%. Considering crop insurance, farmers tend to mostly insure winter grain crops, corn, and sunflower. Table 6.2 Estimated Crop Insurance Penetration, 2003 to 2005 Crops 2003 2004 2005 Wheat and Barley Area Insured (ha) 667,476 757,257 665,041 Percentage of Total 55% 58% 60% Corn Area Insured (ha) 244,244 254,800 158,317 Percentage of Total 50% 52% 53% Sunflower Area Insured (ha) 337,442 308,238 336,551 Percentage of Total 50% 52% 53% Grapes Area Insured (ha) 26,213 25,916 25,368 Percentage of Total 23% 24% 25% Fruits Area Insured (ha) 6,362 9,998 4,741 Percentage of Total 16% 26% 18%
Although livestock insurance is less popular in Bulgaria than crop insurance, in 2005 the farmers insured about 28% of cows (188,160 animals), 15% of sheep and goats (361,500 animals), and 70% of the poultry population (14 million birds).

36
4. Financial Performance 5-Year Results
Financial results are only available for 2003 to 2005. The 3-year long-term loss ratio is 74% for crops and 76% for livestock with an overall loss ratio of 75%.
Year Number
of Policies
TSI (USD
million)
Premium Including Subsidies
(USD million)
Paid Claims
(USD million) Loss Ratio
Crops 2003 -- 164.2 7.8 9.2 118% 2004 -- 175.3 7.8 2.7 34% 2005 -- 153.4 7.9 5.6 71% Livestock 2003 -- 225.7 2.3 2.3 102% 2004 -- 206.2 1.7 0.7 39% 2005 -- 235.5 1.8 1.4 76% Total 2003 -- 389.9 10.1 11.5 114% 2004 -- 381.5 9.5 3.3 35% 2005 -- 388.9 9.7 7.0 72%
Premiums are market-based but influenced by the government regulations. Over this period average premium rates for crops have been 4.8% and for livestock 0.9%.
Cost of Agricultural Insurance Provision
Data is not available.
5. Public Disaster Assistance Programs The Permanent Commission for Disasters manages the post-disaster assistance. In 2005 the government provided USD 90,460 to compensate farmers’ losses due to natural disasters (ad hoc payments), and in 2006 the government provided USD 82,922 for ad hoc assistance. The government also provides funds for insect pest control against Moroccan locust. In 2004 the government spent USD 194,040 for these purposes. Sources of Country Overview Information: World Bank Survey (2008) and European Commission (2006).

37
Overview on Agricultural Insurance: CANADA
1. Agricultural Insurance Market Review History of Agricultural Insurance Hail and crop insurance products were introduced in 1938 and 1964, respectively. Private sector livestock insurance for high-value animals has been offered since 1950. Public livestock insurance has been offered in the province of Nova Scotia on a very limited basis since 1978. Livestock insurance will start to be offered in Alberta and on a wider basis from 2009-2010; it will likely be offered on an unsubsidized basis.
Agricultural Insurance Market Structure In 2007/08 ten public insurance companies sold crop and livestock insurance. Nine private companies carried hail insurance and 30 livestock associations (mutual/cooperative) offered livestock insurance. Also, one public insurance company exclusively sold livestock insurance.
Agricultural Insurance Products Available Various indemnity-based and index-based insurance programs are offered in Canada. Indemnity-based insurance products include crop hail, multi-peril crop insurance (MPCI), and livestock accident and mortality insurance, among others. Among the index-based products offered are weather index insurance, NDVI/IRS insurance, and area-yield index insurance (Table 7.1). Table 7.1: Agricultural Insurance Available 2008 Crop Insurance Products Available Greenhouse Forestry MPCI Named-peril Crop Revenue Index-based Yes Yes Yes Yes Yes Yes Livestock Insurance Products Available Aquaculture All Risk Accident &
Mortality Epidemic Disease
Other Index-based
Yes Yes No No No Yes Source: World Bank Survey (2008). Delivery Channels The most important delivery channel for crop insurance is the insurers’ own agent network, followed by insurance brokers. Livestock insurance is mainly delivered through producer associations and cooperatives and to a lesser degree through insurers’ own agent networks. There are no special delivery channels or programs for small or marginal farmers.
Voluntary vs. Compulsory Insurance Crop and livestock insurance are voluntary. However, ad hoc disaster program payments made to producers are reduced by the estimated payments farmers would have received had they being enrolled in existing crop/livestock insurance programs. This approach is taken to avoid undermining existing programs and to encourage farmers to take an active role in risk management. It would not be politically acceptable in Canada to mandate participation.

38
Agricultural Reinsurance The federal government offers a form of stop-loss coverage to provincial crop insurance agencies. However, this practice is more consistent with cash flow smoothing than with reinsurance and is not a true risk transfer since claims must be repaid over time. Aside from this cash flow smoothing offered by the federal government, many provinces purchase reinsurance in the private reinsurance sector.
2. Public Support for Agricultural Insurance Types of Public Support for Agricultural Insurance The types of public support include:
a) Agricultural insurance legislation (laws). The Farm Income Protection Act governs federal subsidies. Moreover, many provinces have their own crop insurance acts.
b) Premium subsidies (see below).
c) Subsidies on insurers' administrative & operating expenses. Funding for livestock administration costs will start in 2009 with the introduction of new programs.
d) Government-funded staff is involved in loss assessment.
e) There are subsidies for training and education as well as for product and research
development. Exemptions of sales taxes on agricultural insurance premiums are also provided. However, there are no subsidies on reinsurance premium.
Premium Subsidies
Premiums are subsidized for crops according to four federal cost-sharing categories:
a) Unsubsidized; b) Comprehensive subsidy which accounts for 60% of premiums applicable to crop insurance or
index-based product offered on the whole crop; c) High-cost subsidy of 32% of premiums applicable to spot loss hail or field-level insurance; and d) Catastrophic 100% subsidy, which is available for catastrophic events where it is proven that
farmers will not pay the involved premium. The events must have a frequency less than 1/15 to be considered catastrophic.
No federal premium subsidy is available for livestock insurance. Government Department that Provides Agricultural Insurance Premium Subsidies The federal government provides 60% of crop insurance premium subsidies, while the remaining 40% is provided by provincial governments. On the other hand, provincial governments pay 100% of existing livestock insurance premium subsidies. The regulations associated with federal funding for livestock insurance are under negotiation. Eventually, federal subsidies will be available for insurers’ administration expenses.

39
Premium Subsidies for Crops and Livestock in 2007-2008 Premium subsidies are available for all crops but not for all livestock products. Insurance products for cattle, hogs, and poultry are under development. All types of crop producers are eligible for premium subsidies. No same premium subsidies are applicable for all farmers regardless of their condition (see section 2 for a description of premium subsidies available).
Public Cost of Agricultural Insurance Table 7.2 contains premium subsidies and administration and operating expenses subsidies for crop insurance. Based on the AFSC best practices review, administration and operating expenses subsidies represent 7% of total premiums over the period.
3. Agricultural Insurance Penetration Insurance Penetration Rate Table 7.3 contains crop insurance penetration rates for the period 2003 to 2007. The percent of national crop area insured decreased over that period from 74% in 2003 to 63% in 2007.
4. Financial Performance 5-Year Results Table 7.4 contains financial results for crop and hail insurance in Canada for the period 2003 to 2007. Both crop and hail insurance experienced increases in sum insured over the period, with the hail insurance sum insured increasing 20.8% from 2004 to 2007, and crop insurance sum insured rising by 6.9% from 2003 to 2007. It is worth noticing that, while the crop insurance loss ratio decreased by going from 76% in 2003 to 66% in 2007, the hail insurance loss ratio rose over the period, increasing from 64% in 2004 to 98% in 2007. The long-term (2003-2007) loss ratio was 74%.
Cost of Agricultural Insurance Provision The total original gross premium (OGP) rate of 7% is composed of 0.1% to cover marketing and acquisition costs, 4.4% of insurers’ administration costs, and 2.5% loss adjustment expenses. This means that 62.9% of premiums cover administrative and operating costs, 35.7% is directed towards loss adjustment costs, and only 1.4% accounts for marketing and acquisition costs.
5. Public Disaster Assistance Programs The Agricultural Income Disaster Assistance (AIDA) Program was a farm income support program introduced in 1998. The program provided assistance in the case of events resulting in sudden declines in income. Payments were calculated based on the decline in the gross margin relative to the average margin over the five previous years (after eliminating the highest and lowest margins in those years); the amount could not exceed 70% of that average. The program was funded 60% by the federal government and 40% by the provinces. This program was replaced by a similar program, the Canadian Farm Income Program, in 2000.

40
6. Additional Tables Table 7.2: Public Cost of Agricultural Insurance, 2003 to 2007
Year Insurance Premium Subsidies* (USD million)
A&O Cost Subsidies (USD million)
2003 435.8 50.4 2004 402.2 46.3 2005 404.5 46.6 2006 428.5 49.6 2007 545.7 62.5
Source: World Bank Survey (2008). *Subsidies amounts are for crop insurance only. Livestock insurance was not subsidized over the period. Table 7.3: Estimated Crop Insurance Penetration, 2003 to 2007
Year Number of Policies Insured Area
(million of ha) Percent of National Crop
Area Insured 2003 113,689 28.9 74% 2004 100,932 24.0 61% 2005 90,594 26.0 66% 2006 86,295 24.7 63% 2007 84,221 24.8 63%
Source: World Bank Survey (2008). Table 7.4: Agricultural Insurance Results, 2003 to 2007
Year
Estimated Number of
Policies
TSI (USD
million)
Premium, Including Subsidies (USD
million)
Paid Claims (USD
million) Loss Ratio Crop
2003 113,689 6,426.5 720.1 544.7 76% 2004 100,932 5,457.9 661.3 638.3 97% 2005 90,594 560.6 665.4 481.5 72% 2006 86,295 6,528.9 708.6 401.1 57% 2007 84,221 8,635.1 892.1 591.5 66%
Hail 2003 -- -- -- -- -- 2004 -- 2,879.7 119.2 76.5 64% 2005 -- 3,183.7 137.9 89.3 65% 2006 -- 3,076.5 138.1 118.2 86% 2007 -- 3,854.2 189.3 184.6 98%
Total Crop and Hail 2003 -- -- -- -- -- 2004 -- 8,337.6 780.5 714.8 92% 2005 -- 3,744.2 803.3 570.8 71% 2006 -- 9,605.4 846.6 519.4 61% 2007 -- 12,489.3 1,081.3 776.1 72%
Source: World Bank Survey (2008). Source of Country Overview Information: World Bank Survey (2008).

41
Overview on Agricultural Insurance: CHILE
1. Agricultural Insurance Market Review History of Agricultural Insurance Crop insurance in Chile dates back to 1981, when the Consorcio Nacional de Seguros (CNS) introduced an individual grower multi-peril crop insurance (MPCI) yield shortfall policy for fruit trees, cereals, and rapeseed. This program carried no government subsidies and was reinsured on a proportional and non-proportional basis by private international reinsurers. The program was terminated in 1988 because of low demand, lack of premium volume, and spread of risk. Following this there was no crop insurance in Chile for more than a decade.
In 1999 the government of Chile commissioned a feasibility study for a national crop insurance program which would be exclusively implemented through the private commercial insurance sector with government committing its support to the program in the form of premium subsidies.
In 2000 a pool of three local commercial insurance companies led by Mapfre Seguros launched the national subsidized crop insurance scheme for a total of 17 cereal crops, field row crops, and horticultural crops. The scheme adopted a MPCI yield shortfall policy. The pool only operated for two years before the insurers elected to underwrite their business separately, but since then the companies have continued to agree to underwrite common crop policies with similar agreed rates and deductibles.
Government provides limited financial support to the program in the form of a fixed 50% premium subsidy which is administered by the Comité de Seguro Agricola (COMSA; Agricultural Insurance Committee), which also provides technical assistance to the design and rating of new products. The commercial insurance companies are fully responsible for making their own reinsurance arrangements with international reinsurers.
Chile also has a history of more than a decade of voluntary forestry fire insurance and marine aquaculture insurance.
Agricultural Insurance Market Structure
In 2008 the Chilean subsidized crop insurance scheme was underwritten by two insurance companies, Aseguradora Magallanes with about a 67% market share and Mapfre Seguros with about a 33% market share. In addition, there is an active and well-established insurance market for forestry fire insurance and off-shore sea salmon and sea trout aquaculture insurance. They are underwritten by Royal Sun Alliance, Penta Seguros, Zurich Chile, Mapfre, and Magallanes. To date there is no developed livestock insurance for cattle, pigs, sheep, goats, and poultry. Some voluntary livestock covers may be placed with international reinsurers.
Agricultural Insurance Products Available The crop, aquaculture and forestry insurance products available in Chile are reported in Table 8.1.
The crop insurance policy is an MPCI yield shortfall cover which insures losses due to drought, excess rain and flood, frost, hail, snow, and wind. Pests and diseases are excluded from the main policy9
9 However for one important client, IANSA (sugar beet) program diseases (rhizotocnia) are included.
. For

42
rice, the coverage includes low temperature at the time of flowering. The sum insured is established as a percentage (about 75%) of the expected yield for each crop in each county (comuna) and valued at the farm gate price for the crop. Currently, insured crops include cereals, horticultural crops, legumes, industrial crops (e.g. sugar beet), and greenhouse crops. Table 8.1: Agricultural Insurance Available 2008 Crop Insurance Products Available Greenhouse Forestry MPCI Named-peril Crop Revenue Index-based Yes No No No No Yes Livestock Insurance Products Available Aquaculture All Risk Accident &
Mortality Epidemic Disease
Other Index-based
No No No No No Yes Source: World Bank Survey (2008).
The Chilean forestry policy insures standing timber against fire, civil commotion, riot, and allied perils including wind, floods, avalanches, frost, snow, and tsunami. The forestry policy typically carries first loss limits of US$ 5 to 10 million, save for the very largest companies which have larger loss limits: a deductible is applied, which is typically 10% of the value of the claim subject to a minimum dollar amount. The policy is widely purchased by the commercial forestry sector in Chile, including small plantations with 2,000-3,000 hectares of timber valued at USD 5 to 10 million, medium-sized plantations with USD 50 to 100 million of timber, and two extremely large commercial timber companies with more than half a million hectares of forests valued of between USD 2 to 3 billion.
The Chilean aquaculture policies provide very broad named-peril cover against loss of the installations (fish cages and nets), equipment, and the fish stock. Insured perils include storm, tidal waves, strong currents, red tides (algae), diseases in fish stock, attack by predators, theft, etc. The aquaculture industry is dominated by medium to extremely large multinational companies with investments in fish farming worth hundreds of millions.
Delivery Channels
In Chile, crop insurance is primarily purchased by small and medium farmers. The key delivery channels in order of importance for Magallanes include: (1) INDAP, the Agricultural Development Agency which arranges crop credit small farmers; (2) agroindustry: the sugar beet and industrial tomato sector, which contracts large numbers of small producers to grow these crops under contract and arranges collective crop insurance for its farmers; (3) insurance brokers; and (4) insurers’ own sales agents.
INDAP is a development agency which arranges crop loans through the Banco de Chile for smallholder farmers in Chile. It promotes crop insurance to its loanees. Magallanes has developed a very innovative online underwriting system with INDAP, which permits INDAP to submit crop insurance proposals electronically, and if these are within the ranges accepted by the insurer, the policies are automatically underwritten, printed, and billed.
Voluntary vs. Compulsory Insurance Crop insurance is voluntary in Chile. The banks may, however, require borrowers to take out a crop insurance policy to protect their seasonal crop production loans.

43
Agricultural Reinsurance There is no government support for agricultural reinsurance in Chile. All crops, aquaculture, and forestry are reinsured with specialist international agricultural reinsurers. Crop insurance is reinsured on a Quota-share Treaty basis. Aquaculture involves both voluntary proportional reinsurance and treaty reinsurance, and most forestry is reinsured on a voluntary basis. Chile has one of the largest aquaculture and forestry insurance and reinsurance markets in emerging economies.
2. Public Support for Agricultural Insurance Types of Public Support for Agricultural Insurance In Chile, government support to agricultural insurance is restricted to crop insurance in the form of subsidies on crop insurance premiums, which are administered by the COMSA, and limited technical and financial support for new product development and training through the COMSA. There is no government intervention or support for the forestry and aquaculture insurance sectors.
Subsidies on Crop Insurance Premiums. At the inception of the national crop insurance
program in 2000, a fixed 50% premium subsidy level was introduced for all crops plus a fixed amount of UF10
1.5 (USD 48) per policy and with a maximum premium subsidy per farmer per season of UF 55 (USD 1,760). This unique feature of the Chilean program was designed to prevent large farmers from benefiting disproportionately from the premium subsidies.
In 2008 the premium subsidy remained at 50% for most crops, but the maximum subsidy limit per farmer was raised to UF 80 (USD 2,560). In 2008, several crops, including wheat and rice, attracted higher premium subsidy levels of 75% of premium plus a fixed subsidy of UF 0.6 per policy and with a limit of UF 80. The government’s premium subsidy budget has been in the order of USD 5 million per year since 2000, rising to USD 8 million in 2008. On November 30, 2008, the crop insurance premium volume amounted to about USD 5.0 million, of which the premium subsidy accounted for USD 2.6 million, or 52% of premium. 3. Agricultural Insurance Penetration Insurance Penetration Rate The crop insurance policy sales numbers and insured area in hectares are reported in Table 8.2. Over the past five years approximately 5% of Chile’s farmers have purchased subsidized crop insurance. The insurance penetration rates for non-subsidized aquaculture and forestry insurance, which have been marketed for over 15 years in Chile, are estimated by the authors to be higher than 65% for commercial companies involved in these sectors.
10 Unidad de Fomento, in 2008 worth about USD 32.

44
4. Financial Performance 5-Year Results
The Chilean subsidized crop insurance program results are presented in Table 8.3 for the whole crop market and in Table 8.4 for Magallanes alone. Over the past five years the premium volume of the program has more than doubled in size from slightly over USD 2 million in 2003 to USD 5.4 million in 2007. The claims record has been very stable over this period with an overall average loss ratio of 45%. Magallanes’ results are also shown.
Average premium rates over the past five years have been about 4.2%, which is very low for an MPCI program that includes potentially catastrophe perils of droughts and floods. The program is currently targeted at Chile’s small to medium farmers, and this is reflected by the average size of risk underwritten by Magallanes with average sum insured per policy of USD 8,000, generating an average premium of USD 371 per policy.
It is not possible to report the results of the separate forestry and aquaculture programs. These are large, mature programs: for forestry insurance the 2008 market premium was estimated at about USD 15 million, and the total aquaculture insurance premiums are probably of a similar magnitude.
Cost of Agricultural Insurance Provision
Magallanes’ acquisition costs and administration costs excluding loss assessment amount to 18% of original gross premium (OGP). These costs are very reasonable for a predominantly smallholder crop MPCI insurance program. The loading applied to their premium rates to cover loss assessment costs is not reported. In addition, farmers are responsible for paying insurance sales tax equal to 19% of the final commercial premium.
5. Public Disaster Assistance Programs The Ministry of Agriculture provides ad hoc disaster relief for crops and regions that are not covered by the crop insurance program. For example, in 2007, relief was provided for frost damage in sub-tropical fruits (currently not insurable) and early season crops. The relief assistance took the form of rescheduled credit payments and waiving of taxes.
6. Additional Tables
Table 8.2: Estimated Crop Insurance Penetration, 2003 to 2007
Year Number of
Crop Policies Estimated Percent
of Farmers Insured Insured Area
(ha) Percent of National Crop Area Insured
2003 9,711 5% 63,713 -- 2004 8,877 5% 58,917 -- 2005 8,106 5% 48,271 -- 2006 8,920 5% 50,039 -- 2007 11,120 5% 68,746 --
Average 9,347 5% 57,937 -- Source: World Bank Survey (2008).

45
Table 8.3: Whole Market Crop Insurance Results, 2003 to 2007
Year
Estimated Number
of Policies TSI
Premium (USD
million)
Paid Claims (USD
million) Loss
Ratio
Average Premium
per Policy 2003 9,711 -- 2.1 0.6 27% 219 2004 8,877 -- 2.0 0.8 41% 229 2005 8,106 -- 2.1 1.1 52% 260 2006 8,920 -- 2.3 1.3 55% 260 2007 11,120 -- 5.4 2.5 46% 484
Average 9,347 -- 2.8 1.2 45% 290 Source: World Bank Survey (2008).
Table 8.4: Aseguradora Magallanes Crop Insurance Results, 2003 to 2007
Year
Number of
Policies
TSI (USD
million)
Premium (USD
million)
Paid Claims
(USD million)
Loss Ratio
Average Sum
Insured (USD)
Average Premium
per Policy
Average Premium
Rate 2003 7,992 77.6 1.8 0.4 23% 9,713 224 2.3% 2004 3,927 21.8 1.2 0.7 57% 5,546 308 5.6% 2005 3,143 21.1 1.5 0.5 36% 6,718 469 7.0% 2006 5,661 33.7 1.8 0.6 35% 5,965 326 5.5% 2007 8,286 102.3 4.4 3.7 85% 12,346 527 4.3%
Average 5,802 51.3 2.1 1.2 57% 8,058 371 4.2% Source: World Bank Survey (2008). Table 8.5: Crop Insurers’ Costs as a Percent of OGP
Costs Percent of OGP Marketing & Acquisition 12% Administration 6% Loss Adjustment -- Total A&O 18% Insurance Premium taxes 19%
Total 37% Source: World Bank Survey (2008). Source of Country Overview Information: World Bank Survey (2008).

46
Overview on Agricultural Insurance: CHINA
1. Agricultural Insurance Market Review History of Agricultural Insurance
Agricultural insurance in China started in 1982 with the introduction of both livestock and crop insurance. There were two phases in the development of agricultural insurance. The first was from 1982 to 2002, when agricultural insurance was developed by PICC (Peoples Insurance Company of China) and extended into rural areas through local government. Insurance was operated as a social welfare mechanism to protect farmers against natural disasters. Agricultural premium income peaked at CNY 816 million (USD 98 million) in 1992 but declined to CNY 330 million (USD 40 million) by 200211
. During this period, underwriting results were poor, and PICC reduced its involvement in the lead up to its partial privatization.
A second phase has been the major expansion leading to the present market, starting with the introduction of new, subsidized agricultural insurance programs in 2003. Government has promoted the expansion of new agricultural insurance companies, and confirmed in 2006 and 2007 the importance of agricultural insurance as a core part of its agricultural development policy. Subsidized agricultural insurance has become an important component in promoting agricultural production and stabilizing and enhancing rural incomes. Since 2003 the China United Insurance Company and PICC were followed by four specialized agricultural insurance companies (Sunlight, Anxin, Anhua, and Groupama). In 2005 the market was still very small at CNY 729 million (USD 91.1million), with China United and Sunlight holding 34% and 30% market shares, respectively. A detailed analysis of the market was contained in a report by World Bank in 200712
. Since 2005 the market has expanded rapidly, fueled by premium subsidies, increasing from USD 106 million in 2006 to USD 682 million in 2007. Aon Re Global estimated the 2008 market premium at USD 1,753 million, a 130% increase from 2007.
Agricultural Insurance Market Structure (2008)
The 2008 agricultural insurance market was varied in structure. The following is a summary:
- Three specialist insurers provided crop and livestock insurance (Anxin, Ancheng, Anhua); - Two property and casualty general insurers also provided crop and livestock insurance (PICC,
and China United Property Insurance Company, CUPIC); - Two provincial pools led by PICC operated for crop and livestock insurance (Zeijiang, Hainan); - One specialist mutual insurer provided crop insurance only (Sunlight); - One mutual insurer provided crop and livestock insurance (Groupama); and - One private insurer provided crop insurance (Guoyuan).
Given China’s vast territory, most initiatives are provincially-based, with development of specific crop and livestock products relevant to a province. However, PICC and China United operate in several provinces. The market consists of a mix of general insurers, specialist agricultural insurers, mutual and private insurers, and pools. In 2008 all agricultural insurance was provided by private and or mutual insurance companies; there are no public sector agricultural insurers in China.
11 Swiss Re, (2008). An insurance recipe for the Chinese food and agricultural industry. Swiss Re Group Publication 7/2008. 12 World Bank (2007). China: Innovations in Agricultural Insurance.

47
In 2008, 16 provinces were selected for subsidized crop insurance, and subsidized sow insurance is nationwide. Agricultural Insurance Products Available
Table 9.1: Agricultural Insurance Available 2008 Crop Insurance Products Available Greenhouse Forestry MPCI Named-peril Crop Revenue Index-based Yes Yes No Yes Yes Yes Livestock Insurance Products Available Aquaculture All Risk Accident &
Mortality Epidemic Disease
Other Index-based
Yes Yes Yes No No Yes Source: World Bank Survey (2008).
The majority of China’s crop insurance is individual grower multiple peril crop insurance (MPCI). This is the universal policy which receives subsidies from the central and provincial government. However, some products based on named-peril crop insurance are available. A small crop weather index pilot project is underway with the Anxin Insurance Company. The main crops insured in China are maize, rice, soybeans, wheat, and cotton.
Livestock insurance is extended to include government slaughter orders. There has been a major expansion of livestock insurance as a result of the government’s decision to subsidize sow insurance and, more recently, dairy cow insurance. In the event of government compensation following government slaughter orders, insurers pay the difference between the compensation level and the sum insured of the animal concerned. The main livestock insured in China are breeding sows. Additionally, dairy cattle and poultry are insured as well as other farm livestock.
Delivery Channels In decreasing order of importance, the delivery channels in China are: producer associations, cooperatives and village committees; insurance brokers; input suppliers; banks; and the insurer’s own agent network. Farmers often participate in insurance due to collective decision-making at the village or cooperative level. Issuance of group policies is an important administrative feature in China. The majority of farmers in China are small-scale. There are no specific measures for small and marginal farmers, but the group policy at the village or cooperative level, mentioned above, is an important measure to allow small farmers to access insurance. Voluntary vs. Compulsory Insurance
Under Chinese regulations, insurance is voluntary for both crops and livestock. However, heavy subsidy levels and collective decisions by farmer groups encourage participation. In one example, farmers not participating (by not paying their share of premium) were automatically enrolled for insurance for the portion of premium related to the subsidy. Agricultural Reinsurance
Reinsurance (quota-share and stop-loss) is provided by the national reinsurer, China Re. In addition, private and international reinsurers provide layers of stop-loss cover for specific lines of crops or livestock. Provincial governments may also act as reinsurer or co-reinsurer of last resort for specific

48
programs, in the event that reinsurance limits are exceeded. Such agreements are case-by-case. An example in Zhejiang province is provided by World Bank13
2. Public Support for Agricultural Insurance
.
Types of Public Support for Agricultural Insurance At the present there is no specific agricultural insurance legislation, although the government is understood to be intending to introduce legislation in the future. Most new provincial agricultural insurers are set up with some financial assistance from the government. The most important financial contribution of the government is the premium subsidy (see below).
There are no subsidies to the insurers for administrative costs or loss adjustment costs. However, in the case of livestock losses, government officials may be involved in loss adjustment, and such costs are borne by provincial governments. There are also no subsidies for training and education. CIRC (the Regulatory Authority for Insurance) is providing some research and development assistance to insurers, apart from other services to support insurance activities and regulation. Provincial and local governments are working with insurance companies to implement agricultural insurance.
As noted above, under the pool coinsurance programs operating in several states, the provincial governments are participating in the reinsurance programs as a catastrophe stop-loss reinsurer. This reinsurance protection is provided free of cost. All premium taxes for agricultural products are exempted. Premium Subsidies During the development of pilot crop and livestock insurance, subsidies have ranged from 20% to100%, depending on the province, but typically were in the region of 50%. The premium subsidy for crops in 2007 was 25% provided by central government, plus 25% paid by provincial government, and the remaining 50% of crop premiums were payable by farmers. Central government increased its share to a 35% subsidy in 2008, thereby increasing the overall premium subsidy level to 60% for crops14
.
The premium subsidy for sow insurance in 2007 was 50% from central government and 25% from provincial government. In 2008 this increased to 50% central government and 30% provincial government, i.e. an 80% subsidy in total. For dairy cow insurance, the combined subsidy is 60%. The proportions between the central and provincial governments may vary. Local county governments, or contract farming operations, may additionally add to subsidies on a case-by-case basis. Public Cost of Agricultural Insurance
The cost of premium subsidies in 2007 was estimated at CNY 1 billion (USD 132 million) for crop insurance, and CNY 1.15 billion (USD 151 million) for livestock insurance. The cost of premium subsidies in 2008 is not available. Indirect costs incurred by provincial governments are also not available, including information on provincial government catastrophe reinsurance payments.
13 World Bank (2008). China: Innovations in Agricultural Insurance; technical annex. 14 Swiss Re (2008) op.cit.

49
3. Agricultural Insurance Penetration Insurance Penetration Rate
Agricultural insurance has expanded rapidly since 2005, based on developments in specific provinces. The following summarizes the penetration:
For crops, in 2007 an estimated 50 million policyholders were insured on 15.33 million hectares. This compares to a national cropping area of 153.6 million hectares, or a penetration of approximately 10% of the area. The insured area increased to this figure from 3.73 million hectares in 2005 and 9.66 million hectares in 2006. A substantial expansion was expected in 2008. Additional crops to be insured in 2008 were peanuts and rapeseed.
For livestock, in 2007, a total of 51.5 million breeding sows were insured, which represents approximately 80% of all sows in China. An additional 5.2 million of livestock of other types were insured, together with 325,000 poultry.
4. Financial Performance 5-Year Results
Insurance underwriting results of the whole market comprising 10 insurance companies operating in 16 provinces for the years 2003 to 2007 are presented below.
Table 9.2: Whole Market Agricultural Insurance Results, 2003 to 2007
Year
Premium (USD
million)
Paid Claims (USD
million) Loss
Ratio 2003 58 40 69% 2004 48 51 106% 2005 91 70 77% 2006 106 73 69% 2007 682 302 44%
Average 197 107 55% Source: World Bank Survey (2008).
Cost of Agricultural Insurance Provision
No information is available on the costs of administering agricultural insurance programs by company. In general terms, for agricultural insurance, the overall costs of acquisition, administration, and loss adjustment are 20% to 30% of gross premium. There is no premium tax for agricultural insurance in China.
5. Public Disaster Assistance Programs Government intervenes extensively to support agriculture in China through policy reforms and subsidies. With respect of agricultural insurance specifically, the most important inputs are premium subsidies, followed by support from government technical agencies (e.g. in loss assessment) and through government reinsurance as a last resort.

50
Natural disasters may be compensated on a case-by-case basis. For example, the February 2008 snowstorm destroyed 9.4 million ha of crops and 15.8 million head/birds of livestock and poultry, including 73,000 pigs. The insured paid loss was only CNY 77.4 million (USD 10.8 million) and mainly for the insured breeding sows. Government announced input subsidies for seeds, seedlings, breeders, CNY 1,500 (USD 208) for each farm house destroyed, and CNY 3,000 (USD 417) per affected family. As noted, government compensates for compulsory slaughter of livestock as a result of diseases.
Each year, about 40 million ha of crops have been destroyed by insect pests, diseases, hail, typhoons, floods, drought, and other perils, with losses amounting to USD 12.5 billion (CNY 100 billion) annually. In 2004 alone, China experienced five rounds of severe flooding, seven typhoons, and four earthquakes, with economic losses amounting to USD 6.3 billion (CNY 50 billion).
There has been an increasing trend of agricultural damage as a percentage of total crop value15
. Annual public agriculture subsidies amount to about USD 8.6 billion, and a part of these funds is being channeled to agricultural insurance premium subsidies. Further information on government support to agricultural is contained in Box 1.
Box 1: Government Measures to Support Agriculture In addition to the plan to eliminate agricultural taxes, in 2004 the central government announced direct subsidies to farmers for grain production. Direct agricultural subsidies from the center are provided primarily to grain farmers, based on the number of acres planted. In Heilongjiang and Shanghai, farmers are given subsidies through Bank of China branches. In Shanghai, farmers can receive a debit card to obtain their subsidy. In the first year of this subsidy program, the Ministry of Finance (MoF) allocated CNY 11.6 billion (USD 1.5 billion) in direct grain subsidies, with the majority of this subsidy, CNY 10.3 billion (USD 1.3 billion), going to 13 major grain-producing provinces (Jilin, Liaoning, Hebei, Henan, Shandong, Jiangsu, Anhui, Hunan, Hubei, Sichuan, Jiangxi, and Inner Mongolia Autonomous Region). The net increase in income per family is estimated to be approximately CNY 75 (USD 9.4).
Central government
subsidies are often supplemented with provincial funds, resulting in different levels of subsidies across provinces. In Heilongjiang, improved soybean and cornseed subsidies were CNY 10 per mu, and CNY 15 per mu for rice.
The total subsidy per household was approximately CNY 55. In 2006, the Ministry of
Finance increased the subsidy by allocating CNY 14.2 billion (USD 1.8 billion) in direct grain subsidies to 30 provinces and autonomous regions. Other agricultural subsidies include support for seeds and machinery. Source: World Bank (2007) main report, paragraph 2.4.
Source of Country Overview Information: World Bank Survey (2008).
15 World Bank, 2007.

51
Overview on Agricultural Insurance: COLOMBIA
1. Agricultural Insurance Market Review History of Agricultural Insurance Crop insurance was initiated in 1993 with government enacting crop insurance legislation (Law No. 69, 1993). This law provided a public-private framework for crop insurance and authorized the provision of premium subsidies by government. A pilot banana wind and flood insurance scheme was implemented in Uraba and Magdalena Proivinces by the public-sector-owned Caja Agraria in 1998, which had quota-share treaty reinsurance provided by various European crop reinsurers. The banana treaty was then transferred to La Previsora (national reinsurer) in 1999/2000 and operated up to 2002, when premium subsidy support was withdrawn. The banana insurance program was subsequently reinstated by La Previsora in 2004 and from 2007 has been continued by Mapfre. In 2007, subsidized crop insurance was re-launched by Mapfre Seguros Colombia with premium subsidies from government. Livestock insurance in Colombia started in 2000.
Agricultural Insurance Market Structure
In 2008 agricultural crop and livestock insurance was implemented exclusively by the private commercial insurance sector. Mapfre Colombia was the only company offering a combination of crop and livestock insurance. Two other companies, Liberty and QBE, underwrite livestock.
Agricultural Insurance Products Available Since 2007 Mapfre Colombia has underwritten a multi-peril “loss of investment costs” policy (Seguro a la Inversion) which can be written either as a loss of yield indemnity policy (yield guarantee cover) or as a damage-based indemnity policy (direct damage to the plant cover)16
. This product is being offered for a wide range of annual crops.
The livestock insurance product offered by Mapfre Colombia is an individual animal accident and mortality cover which also includes the perils of theft and terrorism. Livestock insurance in Colombia is linked to the securitization of livestock bonds issued by the Bolsa Nacional Agropecuaria. In 2008 there was no aquaculture, forestry, or weather index insurance in Colombia (Table 10.1). Forestry insurance was offered in the 1990s but was withdrawn from the market because reinsurers were unwilling to offer terrorism cover after 2001. It is notable that in 2006 La Previsora introduced a weather index rainfall product for rice, cotton and maize crops, but this product was discontinued in 2007. Delivery Channels
For Mapfre crop insurance, insurance brokers are the most important sales channel, followed by the company’s own agents. For livestock, the company’s sales agents are the most important delivery channel. There are no specific programs or delivery channels for small farmers or livestock breeders.
16 The Loss of Investment costs policy was originally developed in Venezuela in the 1980s and then adapted by the Mexican market in the 1990s under a loss of yield or direct damage basis of indemnity.

52
Voluntary vs. Compulsory Insurance Crop and livestock insurance are voluntary in Colombia. Table 10.1: Agricultural Insurance Available 2008 Crop Insurance Products Available Greenhouse Forestry MPCI Named-peril Crop Revenue Index-based Yes No No No No No Livestock Insurance Products Available Aquaculture All Risk Accident &
Mortality Epidemic Disease
Other Index-based
No Yes No Yes (terrorism) No No Source: World Bank Survey (2008). Agricultural Reinsurance
Mapfre Colombia’s crop and livestock portfolios are reinsured on a quota-share treaty basis with private international reinsurers. The company identifies access to reinsurance capacity as a moderate constraint for crop hail/named-peril, MPCI, and crop weather index insurance, and a severe constraint for livestock mortality and livestock epidemic disease cover.
2. Public Support for Agricultural Insurance Types of Public Support for Agricultural Insurance Federal government support to agricultural insurance takes two forms:
(a) Insurance legislation as contained in the agricultural insurance law No. 69 of 1993; and (b) Crop insurance premium subsidies, which vary from 30% of premium for individual policies to
60% for collective policies. In 2007, Mapfre Colombia received USD 3.0 million of premium subsidies from government, equivalent to 60% of its crop premium income (Table 10.2).
Livestock insurance does not attract any form of premium subsidy support or other forms of support from government.
3. Agricultural Insurance Penetration Insurance Penetration Rate Mapfre Colombia had only been operating for one year when the Bank’s survey was undertaken. In 2007, the company achieved very respectable crop sales of 1,566 policies with an insured area of 30,500 ha (nearly 1% of national cropped area) with an average of 19 ha per policy (Table 10.3). In 2007 the company sold one large livestock policy to insure 700 head of cattle (Table 10.4).

53
4. Financial Performance 5-Year Results Mapfre’s 2007 crop and livestock insurance results are reported in Table 10.5. For the crop portfolio, TSI amounted to USD 88.8 million with premiums of USD 5.0 million at an average premium rate of 5.6%. The loss ratio was 47%, which is very acceptable for crop MPCI coverage. The average size of policy was USD 57,000 with an average premium of USD 3,191. It is noted that an average premium subsidy of 60% would have reduced the premium cost to the grower to USD 1,276 per policy on average.
The single and very large livestock (cattle) policy was insured at a premium rate of 5.0% and incurred a very low 12% loss ratio. Livestock insurance does not attract government premium subsidies. It is not possible to report the livestock insurance results for the other private livestock insurers.
Cost of Agricultural Insurance Provision
It is not possible to report the company’s administration and operating expenses.
5. Public Disaster Assistance Programs The government, through the Ministry of Agriculture, provides financial disaster relief for frost, floods, and avalanche damage in crops; in 2007 it paid out USD 17 million in crop disaster relief. Disaster relief is also provided for livestock losses due to floods and avalanches, and in 2007, livestock compensation payments amounted to USD 1.3 million. Government disaster relief is not dependent on the farmer/livestock producer first purchasing crop or livestock insurance. 6. Additional Tables
Table 10.2: Mapfre Colombia Crop Premium Subsidies 2007*
Year
Insurance Premium Subsidies
(USD million)
Percent of
Premium 2007 3.0 60.4%
Source: World Bank Survey (2008). *The company only started underwriting crops in 2007. Table 10.3: Mapfre Colombia Estimated Crop Insurance Penetration 2007*
Year
Number of Crop Policies
Issued
Percent of Farmers
Purchasing Insured Area
(ha)
Percent of National Crop Area Insured
2007 1,566 -- 30,500 0.92% Source: World Bank Survey (2008). *The company only started underwriting crops in 2007.

54
Table 10.4: Mapfre Colombia Estimated Livestock Insurance Penetration 2007*
Year
Number of Insured
Cattle
Percent of National Cattle
Insured 2007 700 --
Source: World Bank Survey (2008). *The company only started underwriting livestock in 2007.
Table 10.5: Mapfre Colombia Crop and Livestock Insurance Results 2007
Class
Number of
Policies
TSI (USD
million) Premiu
m (USD)
Paid Claim
s (USD)
Loss Ratio
Loss Cost
Average Sum
Insured (USD)
Average Premium
(USD)
Average Premium
Rate Crops 1,566 88.8 5.0 mil 2.4 mil 47% 2.6% 56,677 3,191 5.6%
Livestock 1 1.2 60,000 7,000 12% 0.6% 1.2 mil 60,000 5.0% Total 1,567 90.0 5.1 mil 2.4 mil 47% 2.6% -- -- --
Source: World Bank Survey (2008). *The company only started underwriting crops and livestock in 2007. Source of Country Overview Information: World Bank Survey (2008).

55
Overview on Agricultural Insurance: COSTA RICA
1. Agricultural Insurance Market Review History of Agricultural Insurance
Crop insurance was first introduced in Costa Rica in 1970. Two years later, in 1972, a livestock insurance product was released. Costa Rica’s insurance market was controlled by a state-owned insurance monopoly, “Instituto Nacional de Seguros” (INS), until 2008 when the insurance market was opened up to competition. Crop insurance in Costa Rica is regulated by the Integral Law of the Insurance of Crops that was promulgated in 1969.
This market is well diversified in terms of agricultural insurance products. Products like multi-peril crop insurance (MPCI), livestock insurance, and aquaculture insurance are offered. However, despite the product diversification, the agricultural insurance penetration is very low. The federal government is supporting agricultural insurance development by a premium subsidy scheme established through INS.
Agricultural Insurance Market Structure (2008) Costa Rica’s insurance market used to be a state-owned monopoly until July 2008. The public insurance company Instituto Nacional de Seguros (INS) is the only insurance company offering agricultural insurance in Costa Rica. Agricultural Insurance Products Available
Crop Insurance (MPCI Yield Shortfall Cover). MPCI is offered for rice, banana, corn, black
beans, sugarcane, peppers, melons, palm, potato, passion fruit, pineapples, watermelon, tobacco, and carrots against perils like: excess moisture, volcanic eruption, water-logging of the soil during harvest (prevention of harvest), hail, fire, floods, weeds, drought, earthquakes, and wind.
The policy wording protects the direct costs incurred by the insured on the insured unit. Therefore, the guaranteed yield is equal to the direct investment made by the insured, divided by the agreed price for the insured crop at the beginning of the policy period. It is stated that a maximum guaranteed yield is 70% of the expected yield (based on yield average in the canton in which the farm is located); this implies a 30% deductible. If the actual yield is less than the guaranteed yield then the insured receives an indemnity equal to the yield shortfall below the guaranteed yield, times the agreed price at the beginning of the policy period. Original gross rates vary from 3% to 8%, depending on the crop and location. Original gross rates also have a differentiation in terms of rates in function of the size of the farm.
Forestry Insurance. Forestry insurance covers the standing timber value of commercial forestry
plantations against fire exclusively. Valuation criteria in case of indemnities could be the initial costs or the commercial value, depending on the age of plantations. Coverage is subject to a deductible of 15% of the loss on each and every loss. For normal forestry plantations original gross rates vary from 2.0% to 3.5% of TSI depending on the region, type of plantation, protection measures, contingency plans implemented by the insured, deductibles, and indemnity limits.
Livestock and Bloodstock Insurance. Insured animals include cattle, goats, sheep, horses,
buffaloes, and pigs (swine) on grassland production, expositions, and inland transportation. For cattle, basic coverage is against animal mortality caused by one or the combination of accidents or epidemic

56
disease. In addition, the insured can purchase additional cover for inland transportation, death during parturition, loss of function, death caused by anaplasmosis, and death due to lightning.
Pig and horse insurance covers animal mortality caused by accident or diseases; loss of function; death caused by anaplasmosis or anthrax; accidental mortality inside the insured premises due to causes attributable to external factors; authorized slaughtering; inland transportation; and death following surgical intervention. For both covers the deductible is 15% of TSI.
Aquaculture Insurance (Shrimp Farming). Basic coverage is against biomass mortality and natural perils. Coverage also includes the following perils: extreme temperatures, excessive rain, uncontrollable pest and diseases, volcanic eruption, floods, and earthquakes. For both covers the deductible is between 15% and 20% of TSI.
Table 11.1: Agricultural Insurance Available 2008 Crop Insurance Products Available Greenhouse Forestry MPCI Named-peril Crop Revenue Index-based Yes No No No No Yes Livestock Insurance Products Available Aquaculture All Risk Accident &
Mortality Epidemic Disease
Other Index-based
No Yes Yes No No Yes Source: World Bank Survey (2008). Delivery Channels
The most important delivery channels are through the cooperatives and farmers’ associations, as well as through financial institutions. The Ministry of Agriculture used to deliver crop insurance products to farmers. Retail brokers play an important role in the delivery of livestock insurance. There are no specialized delivery channels for small and marginal farmers. Voluntary vs. Compulsory Insurance Agricultural insurance is voluntary for farmers in Costa Rica. Agricultural Reinsurance
All agricultural insurance programs operated by the Instituto Nacional de Seguros are 100% retained by the insurance company.
2. Public Support for Agricultural Insurance Types of Public Support for Agricultural Insurance In 2008, the government of Costa Rica, through INS, supported crop insurance through premium subsidies for rice, beans, and corn crops. Premium Subsidies
The average crop insurance premium subsidy in terms of percentage of premiums for the crops involved in the scheme is 49%. The premium subsidies received by the farmers depend on the crop and the farm

57
size. Bean crops receive a 50% premium subsidy, and corn crops receive a 65% premium subsidy. For rice, premium subsidies depend on the farm size: small farmers receive premium subsidies of 65 %; medium farmers, 55 %; and big farmers, 40 %. Public Cost of Agricultural Insurance The Instituto Nacional de Seguros (INS) budget for crop insurance premium subsidies for 2008 was USD 7.3 million. The cost of the crop insurance premium subsidy scheme is funded by INS, which has allocated 8% of 2007 net profit to finance the scheme.
3. Agricultural Insurance Penetration Insurance Penetration Rate
The crop insurance penetration rate is very low in Costa Rica. In 2007 only 8,600 hectares were insured, representing 2% of the total planted area. The main insured crop is paddy, with 70% of the insured area. Other insured crops are beans, pineapples, bananas, and palms. Livestock insurance is also undeveloped; only 700 heads are insured in the country, representing far less than 1% of the national herd. Forestry and aquaculture insurance, although available, are not purchased in Costa Rica.
4. Financial Performance 5-Year Results
The average pure loss ratio for the whole market for the period 2003-2007, combining all lines of business, was 86%, and the combined loss ratio exceeded 100%.
5. Public Disaster Assistance Programs The government of Costa Rica has an ad-hoc Disaster Relief Program in order to support farmers affected by natural catastrophes. This program is managed by the “Comision Nacional de Emergencia” (CNE), supported by the Ministry of Agriculture in cases of agricultural disasters. The benefits farmers received under this program are financial bailouts for those who had obligations with “Banca de Desarrollo” and credit loans. 6. Additional Tables Table 11.2: Estimated Crop Insurance Penetration, 2003 to 2007
Year Number of
Policies
Percent of Farmers Insured
Insured Area (ha)
Percentage of National Crop Area Insured
2003 649 <1% 5,877 <1% 2004 559 <1% 7,578 <1% 2005 649 <1% 6,871 <1% 2006 658 <1% 6,589 <1% 2007 257 <1% 8,214 <1%
Source: World Bank Survey (2008).

58
Table 11.3: Crop and Livestock Insurance Results, 2003 to 2007
Year Number
of Policies
TSI (USD
million)
Premium (USD)
Paid Claims (USD)
Average Sum
Insured (USD)
Average Premium
(USD)
Average Rate
Loss Ratio
Crops 2003 649 4.4 208,090 331,340 6,819 320 4.7% 159% 2004 559 5.4 307,874 387,777 9,689 551 5.7% 126% 2005 649 5.3 327,694 215,746 8,207 505 6.2% 66% 2006 658 2.8 249,156 214,537 4,254 379 8.9% 86% 2007 257 6.9 480,680 259,079 27,021 1,870 6.9% 54% Average 554 5.0 314,699 281,696 8,987 508 6.3% 90% Livestock 2003 -- -- 40,592 9,180 -- -- -- 23% 2004 -- -- 19,135 25,766 -- -- -- 135% 2005 -- -- 18,519 5,028 -- -- -- 27% 2006 -- -- 28,532 10,541 -- -- -- 37% 2007 -- -- 15,820 4,845 -- -- -- 31% Average -- -- 24,519 11,072 -- -- -- 45%
Source: World Bank Survey (2008). Source of Country Overview Information: World Bank Survey (2008).

59
Overview on Agricultural Insurance: CYPRUS
1. Agricultural Insurance Market Review History of Agricultural Insurance The concept of natural disasters was specified in 1977 when the government prepared the first legislation to create the Agriculture Insurance Organization (AIO) and a relevant scheme (Agricultural Insurance Scheme), which was initiated in 1978. The scheme is compulsory and heavily subsidized by the government. The major perils covered are hail, frost, drought, rain, floods, water logging, windstorm, strong dry wind, heat wave, and warm dry air. There is no livestock product on this market. Ad hoc post-disaster assistance is provided for products not covered by the public scheme, but the eligibility conditions are not specified. Agricultural Insurance Market Structure (2008)
AIO is the only insurance operating in Cyprus. AIO is a parastatal, non-profit organization under the Ministry of Agriculture, Natural Resources and Environment. Table 12.1: Agricultural Insurance Available 2008 Crop Insurance Products Available Greenhouse Forestry MPCI Named-peril Crop Revenue Index-based No Yes No No Yes No Livestock Insurance Products Available Aquaculture All Risk Accident &
Mortality Epidemic Disease
Other Index-based
No No No No No Named-peril Source: World Bank Survey (2008). Agricultural Insurance Products Available
Named-peril crop insurance products are available. The covered perils vary by crop (Table 12.2). Delivery Channels
Crop insurance is mainly delivered through cooperatives and farmers associations. There is no specific delivery channel for small and marginal farmers. Voluntary vs. Compulsory Insurance
Crop insurance against natural hazards is compulsory for all crops covered by the scheme. Agricultural Reinsurance
AIO is not reinsured and thus retains 100% of the liability.

60
2. Public Support for Agricultural Insurance Types of Public Support for Agricultural Insurance Crop insurance is heavily subsidized in Cyprus. Public subsidies are provided to the Agricultural Insurance Organization to operate the Scheme and pay indemnities. In addition, every year the government of Cyprus compensates farmers who grow crops that cannot be insured under the Scheme. Premium Subsidies
In 2006 premium subsidies were equal to 50% of the gross premium, which is the maximum possible under the EU’s current guidelines. Farmers pay insurance premiums which cannot exceed 4% of the expected production, as specified in the Insurance Law.
Public Cost of Agricultural Insurance (i) Premium subsidies: USD 5.8 mil
(ii) Ad hoc relief for those crops not included on the insurance scheme: USD 9.6 mil
These funds were allocated to premium subsidies and ad hoc assistance in 2004.
3. Agricultural Insurance Penetration Insurance Penetration Rate
In 2005 about 50,000 policies were issued, and the insured area reached 112,000 ha.
4. Financial Performance 5-Year Results
The average pure loss ratio for the whole market based on gross figures for the analyzed period was 52% over the 2002 to 2006 period.
Cost of Agricultural Insurance Provision
No data available.
5. Public Disaster Assistance Programs The Government provides post-disaster financial assistance for farmers who face losses on crops that are not eligible for insurance.

61
6. Additional Tables
Table 12.2: Covered Perils Crop/Plantation Covered Perils Fruits Hail, frost, rain, and windstorm Citrus Hail, frost, windstorm, water spot, and dry wind Grapes Hail, frost, heat wave, rain, windstorm, and dry wind Cereals Hail, rust, and drought Potatoes Hail, frost, and flood Beans Hail, frost, flood, warm and dry air Artichokes Hail and frost Source: World Bank Survey (2008). Table 12.3: Deductibles and Franchise Levels Franchise or Trigger Deductible (Percent of Insured Value) Hail, frost, and wind 15%
Hail, flood and drought 12%
Rust, flood, heat wave, dry wind, and warm air
20% Wind, heat, rain, water spot, dry wind, and warm air
15%
Water spot 35% Rust 25% Drought 40% Drought 30% Source: World Bank Survey (2008). Table 12.4: Estimated Crop Insurance Penetration 2005
Year
Number of Crop Policies
Percent of Farmers Insured
Insured Area (ha)
Percent of National Crop Area Insured
2005 50,000 100% 112,173 100% Source: World Bank Survey (2008). Table 12.5: Crop Insurance Results, 2001 to 2004
Year
Number of
Policies
TSI (USD
million)
Premium (USD
million)
Paid Claims
(USD million)
Average Sum
Insured (ha)
Average Premium
(USD) Average
Rate Loss
Ratio 2001-2004
Average 49,954 143.3 10.3 5.3 2.25 206 7.2% 52% Source: World Bank Survey (2008). Sources of Country Overview Information: World Bank Survey (2008); European Commission (2006).

62
Overview on Agricultural Insurance: CZECH REPUBLIC
1. Agricultural Insurance Market Review History of Agricultural Insurance
Agricultural insurance was mandatory in the Czech Republic until 1990. Since then there was a significant drop in agricultural insurance volume due to the difficult economic situation in the sector. Market competition was very strong, leading to the decrease of premium rates. In 2003 the premium rates increased, and more insurers started to be interested in agricultural insurance. The market has been dominated by one company with a market share of 86% in 2005. Agricultural Insurance Market Structure
According to the Czech Insurance Association, five insurance companies offered agricultural insurance services in 2007. Four companies offered crop insurance; three offered livestock insurance including epidemic disease coverage, and five companies provided forest insurance. The companies active in the market include CP (Ceska pojistovna), CSOBP, Generali Pojistovna, HVP (Hasicska vzajemna pojistovna), and Uniqa. The companies currently compete on both price and quality of services. Ceska Pojistovna is the leading company in the agricultural insurance market.
Agricultural Insurance Products Available
Insurance companies offer named-peril insurance which is applied to almost all crops produced in the Czech Republic (Table 13.1). The perils covered are hail, fire, storms, floods, landslides, winter frost, and spring frost. Coverage for grapes also includes frost damage. Livestock insurance is offered on the basis of named-peril, where the farmers can choose the perils to be covered: infectious and non-infectious diseases, accidental death, floods, fire, poisoning, and individual losses. There is no multi-peril crop insurance (MPCI) in the Czech Republic. The bonus-malus system is applied only to crop insurance coverage. Payouts are usually paid within three months after harvest time. Table 13.1: Agricultural Insurance Available 2008 Crop Insurance Products Available Greenhouse Forestry MPCI Named-peril Crop Revenue Index-based No Yes No No No Yes Livestock Insurance Products Available Aquaculture All Risk Accident &
Mortality Epidemic Disease
Other Index-based
No Yes Yes Yes No -- Source: World Bank Survey (2008). Delivery Channels Insurance agents are the most important delivery channel for crop and livestock insurance companies. There are no special organizations or programs for small and marginal farmers. Voluntary vs. Compulsory Insurance
Agricultural insurance in Czech Republic is voluntary.

63
Agricultural Reinsurance The agricultural insurance portfolio is reinsured through private international reinsurance companies.
2. Public Support for Agricultural Insurance Types of Public Support for Agricultural Insurance A Guarantee Fund for farmers and forestry has been established in 2005. This fund offers crop and farm animal insurance subsidies. This Fund aims to increase agricultural insurance penetration among farmers.
Premium Subsidies The Guarantee Fund provided a 30% crop insurance subsidy and a 15% livestock insurance subsidy in 2005. In 2006 the Fund subsidized 35% of crop insurance, 20% of livestock insurance premiums, and 50% of insurance premiums on fruits and vegetables. Public Cost of Agricultural Insurance No data is available.
3. Agricultural Insurance Penetration Insurance Penetration Rate
In 2006 about 34% of arable land was insured; in 2007 the rate was 37%. The insured area was about one million ha, and approximately 4,000 farms purchased insurance policies. The livestock insurance penetration rate was above 80% in 2005. The cattle insurance penetration rate is regularly higher (more than 80%), while it is much lower for pigs and poultry. 4. Financial Performance 5-Year Results Insurance data is limited; see Tables 13.2 and 13.3. Cost of Agricultural Insurance Provision
Data is not available.
5. Public Disaster Assistance Programs The government provides ad hoc assistance for farmers suffering from unfavorable weather events. In 2003 the government paid USD 700 million to farmers hit by frost and USD 37 million to farmers hit by floods. In 2004 the government spent USD 0.5 million on flood assistance.

64
6. Additional Tables Table 13.2: Insurance Coverage, 2003-2005
Year Number of Crop
Policies Percent of
Farmers Insured Insured Area
(mil of ha)
Percent of National Crop Area Insured
2003 -- 35% 1.1 35.1% 2004 -- 35% 1.1 35.4% 2005 -- 33% 1.0 34.4%
Source: World Bank Survey (2008). Table 13.3: Loss Ratios for Crops and Livestock, 2003-2005
Year
Premium (USD
million) Paid Claims
(USD million) Loss Ratio Crop
2003 27.1 16.7 62% 2004 26.7 11.9 45% 2005 29.7 14.1 48%
Livestock 2003 18.7 10.2 55% 2004 16.8 7.8 47% 2005 16.3 7.7 48%
Total 2003 45.8 26.9 59% 2004 43.5 19.8 46% 2005 46.0 21.8 48%
Source: World Bank Survey (2008). Sources of Country Overview Information: World Bank Survey (2008); European Commission (2006).

65
Overview on Agricultural Insurance: DOMINICAN REPUBLIC
1. Agricultural Insurance Market Review History of Agricultural Insurance
Agricultural insurance was first introduced in 1984 by Aseguradora Dominicana Agropecuaria, CA (ADACA), a majority state-owned entity, in order to provide insurance as collateral for the loans given by Banco Agricola de la República Dominicana to subsistence farmers. Most policies were issued on a collective basis, linked to group loans. The company underwrote a multi-peril crop insurance (MPCI) policy for a wide range of annual crops, tree crops, and horticultural crops, including, most importantly, rice. Crop coverage levels ranged from 70% up to a maximum of 85% of estimated yield valued on a cost of production basis, according to the amount of loan. Livestock insurance was also provided for dairy and beef cattle. ADACA was reinsured on a proportional basis by European reinsurers. ADACA ceased its activities in 1997 mainly due to the withdrawal of support from the Banco Agricola.
In 2002 Aseguradora Agropecuaria Dominicana (AGRODOSA) re-launched crop insurance in the Dominican Republic, starting with rice. The company continues to be the sole supplier of crop insurance. AGRODOSA offers an MPCI loss of yield policy for rice covering hail, floods, wind, excess rain, drought, cyclone (including tropical storms and hurricanes), and unknown pests and diseases17
, as well as a damage-based policy for banana plantations which insures losses due to wind and flood. There is no livestock insurance product offered in this market. The federal government supports agricultural insurance mainly through premium subsidies and by financing the start-up cost for AGRODOSA, in which it owns a share of 50%. There is no special agricultural insurance legislation.
Agricultural Insurance Market Structure (2008)
AGRODOSA is the only insurance company offering agricultural crop insurance to farmers in the Dominican Republic. The company is a private-public partnership, but it is managed on strictly commercial insurance principles and is subject to private insurance regulations. . Agricultural Insurance Products Available
AGRODOSA currently works with two types of crop insurance policy: (1) an MPCI yield shortfall policy covering drought, floods, excess of rain, wind/cyclone (including tropical storms and hurricanes), hail, and unknown pest and diseases, which is offered to rice producers, and (2) a damage-based policy which insures against wind/cyclone (including tropical storms and hurricanes) in bananas. The objective is to incorporate new crops each year.
Rice crops are covered against floods, excess of rain, wind, hail, cyclone, and unknown pest and diseases. The coverage is triggered once the actual yield obtained by the insured on its insured unit falls below the guaranteed yield (which is usually set at a maximum of 70% of the normal average yield) determined for each county and crop season. The indemnities are subject to the application of deductibles equivalent to 10% of TSI in case of drought and of 5% of the TSI for the remaining covered perils. The indemnity formula in the case of loss is the percentage of yield shortfall with respect to the guaranteed yield, times the sum insured, less the deductibles.
17 Unknown pests and diseases include exotic pests or diseases which are currently not present in Dominican Republic as defined by the Ministry of Agriculture.

66
In the case of banana plantations the insured perils are floods and wind (tropical storms and hurricanes). The coverage is based on damage to the banana plants including snapping, toppling, and uprooting caused by wind, and rotting of the plants due to flood. In case of losses the insured will receive an indemnity proportional to the percentage damage to the plant population on the insured unit, times the sum insured, less 20% of the TSI as deductible. There is no livestock insurance product available on the Dominican market. Table 14.1: Agricultural Insurance Available 2008 Crop Insurance Products Available Greenhouse Forestry MPCI Named-peril Crop Revenue Index-based Yes Yes No No No No Livestock Insurance Products Available Aquaculture All Risk Accident &
Mortality Epidemic Disease
Other Index-based
No No No No No No Source: World Bank Survey (2008). Delivery Channels
The most important delivery channel in the Dominican Republic is “Banco Agrícola” which is the main finance institution for the rural sector. Nevertheless, recently other channels like agents’ and farmers’ associations and cooperatives have begun to have more importance. The specialized delivery channel for small and marginal farmers is “Banco Agrícola”. Voluntary vs. Compulsory Insurance
Crop insurance purchase in the Dominican Republic is voluntary.
Agricultural Reinsurance
The AGRODOSA Crop Insurance Program is reinsured under a proportional (quota-share) treaty agreement with leading international reinsurers in this class of business. AGRODOSA does not face any constraints to access private reinsurance for its current crop insurance products and programs. Only reinsurance for the poultry sector has some constraints to access to the international markets due to its exposure to hurricanes.
2. Public Support for Agricultural Insurance Types of Public Support for Agricultural Insurance The government had an active role in the formulation of the agricultural insurance law and the creation of AGRODOSA. Each year the government spends approximately RD $29 million (USD 830,000) for insurance premium subsidies, ranging from 33% to 50% of crop insurance premiums. It also covers part of the administration and operational costs of the insurance company.
Premium Subsidies
The estimated volume of premium subsidies for the whole market in 2007 was USD 830,000. .

67
Public Cost of Agricultural Insurance It was estimated at USD 830,000 in 2007.
3. Agricultural Insurance Penetration Insurance Penetration Rate
During the 2007/08 campaign 5,300 policies were issued for a total insured area of 15,000 ha of mainly rice and some bananas, representing 1.7%18
4. Financial Performance
of total national cultivated area and about 10% of the cultivated rice area.
5-Year Results
AGRODOSA’s long-term average annual loss ratio is estimated at 46% for the 5-year period 2003 to 2007, which is remarkable, given the country’s exposure to tropical cyclones. However, it is important to note that the Dominican Republic has not experienced any major losses caused by hurricanes during this period (Table 14.3). Cost of Agricultural Insurance Provision
The overall operational and marketing costs are estimated at 24.5%. The insurance sales tax is not applicable for agricultural insurance policies. Estimated loss adjustments expenses amount to about 5% of the premiums. Claim payments plus administration and marketing expenses generate a combined ratio of 71% for crop insurance.
5. Public Disaster Assistance Programs No other forms of financial support to the agricultural sector exist in this market.
6. Additional Tables Table 14.2: Estimated Crop Insurance Penetration, 2003 to 2007
Year
Number of Crop
Policies
Percent of Farmers Insured
Insured Area (ha)
Percent of National Crop Area Insured
2003 5,496 -- 20,833 2.4% 2004 5,423 -- 19,756 2.4% 2005 5,935 -- 20,742 2.5% 2006 4,511 -- 9,914 1.2% 2007 5,292 -- 15,007 1.7%
Source: World Bank Survey (2008).
18 According to FAO in 2007/08 total cultivated area was 876,352 ha with 145,000 ha rice in the Dominican Republic (www.fao.org)

68
Table 14.3: Crop Insurance Results, 2003 to 2007
Year
Number of
Policies
TSI (USD
million) Premium
(USD)
Paid Claims (USD)
Loss Ratio
Average Sum
Insured (USD)
Average Premium
(USD) Average
Rate 2003 5,496 6.6 463,168 101,075 22% 1,193 84 7.1% 2004 5,423 14.3 977,785 869,878 89% 2,630 180 6.9% 2005 5,935 20.9 1.5 mil 636,479 44% 3,526 245 6.9% 2006 4,511 11.9 798,664 43,858 5% 2,644 177 6.7% 2007 5,292 23.8 1.3 mil 627,216 48% 4,500 247 5.5%
Average 5,331 15.5 1.0 mil 455,701 46% 2,907 187 6.5% Source: World Bank Survey (2008). Source of Country Overview Information: World Bank Survey (2008).

69
Overview on Agricultural Insurance: ECUADOR
1. Agricultural Insurance Market Review History of Agricultural Insurance
Crop and livestock insurance were first introduced in 1980 under CONASA, a government of Ecuador Public Sector Insurance Company. The public sector program was discontinued by the end of the 1980s. Crop and livestock insurance were reintroduced in 1997/98 by Colonial de Seguros, the leading private commercial insurance company. There is no form of special agricultural insurance legislation. Agricultural Insurance Market Structure (2008) In 2008 there was only one private commercial crop and livestock insurer in Ecuador, Colonial de Seguros. Agricultural Insurance Products Available Colonial provides a range of crop, livestock, and forestry insurance products to Ecuadorian farmers. For crops the company offers individual grower multi-peril crop insurance (MPCI), and for livestock individual animal mortality cover and epidemic disease cover. Livestock insurance is provided for cattle (5% of sales) and horses (95% of sales).
Table 15.1: Agricultural Insurance Available 2008 Crop Insurance Products Available Greenhouse Forestry MPCI Named-peril Crop Revenue Index-based Yes Yes No No Yes Yes Livestock Insurance Products Available Aquaculture All Risk Accident &
Mortality Epidemic Disease
Other Index-based
No Yes Yes No No No Source: World Bank Survey (2008). Delivery Channels
For crops the most important delivery channel is through the banks. Colonial is offering a crop-credit insurance product. For livestock, most policy sales are through the company’s own sales agents. Colonial works closely with the small farmer agricultural development bank in Ecuador to provide crop-credit linked insurance. Voluntary vs. Compulsory Insurance Crop insurance is compulsory for small and marginal farmers who access public sector seasonal crop loans. Livestock insurance is voluntary.

70
Agricultural Reinsurance Colonial’s crop and livestock insurance programs are both reinsured with international reinsurers under quota-share treaty arrangements. The company identified access to private international reinsurance as a moderate constraint for MPCI as well as for livestock mortality and epidemic disease covers.
2. Public Support for Agricultural Insurance Types of Public Support for Agricultural Insurance In 2008 there was no form of government support to agricultural insurance in Ecuador. Premium Subsidies In 2008 there were no subsidies; however, Colonial de Seguro was in discussions with government about a premium subsidy provision. Public Cost of Agricultural Insurance None.
3. Agricultural Insurance Penetration Insurance Penetration Rate Colonial has implemented crop and livestock insurance for the past 10 years. For crops the penetration rate is currently very low at about 3,228 policies, with an insured area of 27,000 ha of mainly cereals, representing about 2.0% of total national cropped area. In 2006 the maximum insured area was 48,000 ha, or 2.5% of cropped area (Table 15.1).
Colonial’s livestock insurance policy is mainly purchased by equine owners, and the insurance penetration is very low but stable at about 500 animals per year. The company also offers cover for dairy cattle and beef cattle, but this policy is voluntary and demand is very low (Table 15.2).
4. Financial Performance 5-Year Results The results of Colonial’s crop and livestock insurance programs are very stable over the past five years, with an average loss ratio of 64% for MPCI cover (average rate of 3.8%) and for livestock an average loss ratio of 62% (6.5% average rate; Table 15.3). Average premium rates have remained very stable over the past five years. Cost of Agricultural Insurance Provision Colonial’s costs are shown in Table 15.4 as a percentage of the original gross premium (OGP) rate. For both crop and livestock the company calculates its average costs at 8% (acquisition – local brokerage); the company’s administrative costs at 7%, and loss adjustments costs at 4%, for a total of 19% costs. These

71
costs are very reasonable for individual grower crop and livestock insurance, based on international experience. An insurance sales tax of 16.28% is payable on agricultural insurance premiums. The addition of claims payments plus administration expenses amounts to a combined ratio of 83% for crop and 81% for livestock.
5. Public Disaster Assistance Programs There was no form of government disaster relief for crop or livestock insurance in 2008.
6. Additional Tables Table 15.2: Estimated Crop Insurance Penetration, 2003 to 2007
Year
Number of Crop Policies
Percent of Farmers
Purchasing
Approx. Insured
Area (ha)
Percentage of National Crop Area Insured
2003 1746 >2% 19,000 >1.0% 2004 1725 >2% 19,000 >1.0% 2005 2620 >4% 35,800 >2.0% 2006 3814 >5% 48,000 >2.5% 2007 3228 >4% 27,000 >2.0%
Source: World Bank Survey (2008). Table 15.3: Crop and Livestock Insurance Results, 2003 to 2007
Year
Number of
Policies
TSI (USD millio
n) Premium
(USD)
Paid Claims (USD)
Average Sum
Insured (USD)
Average Premium
(USD) Average
Rate Loss
Ratio Crop
2003 1,746 7.0 287,396 154,873 4,009 165 4.1% 53.9% 2004 1,725 7.0 276,895 267,506 4,058 161 4.0% 96.6% 2005 2,620 15.0 469,497 337,448 5,725 179 3.1% 71.9% 2006 3,814 22.0 885,545 642,981 5,768 232 4.0% 72.6% 2007 3,228 17.0 639,488 225,404 5,266 198 3.8% 35.2%
Average 2,627 13.6 511,764 325,642 4,965 187 3.8% 63.6% Livestock
2003 52 2.4 153,200 130,250 46,154 2,946 6.4% 85.0% 2004 107 5.0 317,856 206,472 46,729 2,971 6.4% 65.0% 2005 78 3.9 234,337 121,173 50,000 3,004 6.0% 51.7% 2006 126 5.3 368,141 235,176 41,667 2,922 7.0% 63.9% 2007 102 5.0 317,118 166,950 49,020 3,109 6.3% 52.6%
Average 93 4.3 278,130 172,004 46,714 2,990 6.5% 61.8% Total
2003 1,798 9.4 440,596 285,123 5,228 245 4.7% 64.7% 2004 1,832 12.0 594,751 473,978 6,550 325 5.0% 79.7% 2005 2,698 18.9 703,834 458,621 7,005 261 3.7% 65.2% 2006 3,940 27.3 1.3 mil 878,157 6,916 318 4.6% 70.0% 2007 3,330 22.0 956,606 392,354 6,607 287 4.3% 41.0%
Average 2,720 17.9 789,895 497,647 6,425 287 4.4% 63.0% Source: World Bank Survey (2008).

72
Table 15.4: Insurers’ Costs as a Percent of OGP Costs Crop Livestock Marketing & Acquisition 8.0% 8.0% Administration 7.0% 7.0% Loss Adjustment 4.0% 4.0% Total A&O 19.0% 19.0% Insurance Premium Taxes 16.3% 16.3%
Total 35.3% 35.3% Source: World Bank Survey (2008). Source of Country Overview Information: World Bank Survey (2008).

73
Overview on Agricultural Insurance: EL SALVADOR 1. Agricultural Insurance Market Review History of Agricultural Insurance
Crop insurance was first introduced in the country in 2001 after the severe wind and flood losses suffered by the agricultural sector caused by Hurricane Mitch, a major category 5 hurricane event.
Agricultural Insurance Market Structure (2008) Two insurance companies, Seguros e Inversiones S.A. (SISA) and Aseguradora Pacifico S.A., offer crop and livestock insurance products in the country. Agricultural Insurance Products Available Individual Plant Insurance (this is a named-peril, damage-based policy). It protects against damage to individual plants caused by adverse weather conditions and biological perils. The total sum insured (TSI) is defined by the value of each individual plant in the insured plantation. A deducible from 5% to 10% over TSI applies. This crop insurance product is targetted at high value crops, including banana plantations. In case of losses due to any of the covered perils, the insured will be indemnified with the agreed value established for the plant, multipled by the number of affected plants, above an aggregate deductible.
Crop Investment Insurance (Seguro a la Inversion): (1) Loss adjustment based on crop damage: This protects the direct investment (production costs,
including input costs, land preparation and sowing costs, etc.) in the insured crop against losses due to frost, flooding, hail, fire, hurricane, tornadoes, winds, and windstorms. The sum insured is defined by the direct investments in growing the insured crop. In the case of a claim, the policy indemnifies the amount of the investment made by the insured up to the date of the loss. Deductibles vary from 5% to 15% of the TSI.
(2) Loss adjustment based on insured crop yield performance: This insurance product protects the
direct investment made by the insured in the insured crop against weather and biological perils and also against crop germination or pre-emergence failure (due to perils such as soil-capping associated with excess rain)19
. The sum insured is defined by the direct investments made by the insured on the insured crop up to the time of the claim. Under this coverage the insured has to bear part of the risk by sharing 5%, 30%, and 25% of the claim for losses in regards with weather perils drought, pest, and diseases, respectively. In the case of a claim, the policy indemnifies the amount of the investment made by the insured up to the date of the loss, deducting the revenue obtained on the insured unit and the insured loss participation.
19 Most crop insurance policies only insure the crop from the time of crop emergence and full stand establishment. However, in Central America, it is common for crop insurance policies to include coverage against losses in the pre-germination/pre-emergence stage (coverage extending to germination failure due to any cause, soil capping due to excess rain in heavy soils, drought-induced germination failure, etc.).

74
Guaranteed Yield, Multi-Peril Crop Insurance (MPCI). This insurance protects a percentage of the expected individual crop yield at farm level. Covered perils are weather, biological, and crop pre-emergence perils as described above. Farmers can choose among three levels of guaranteed yield levels: 70%, 60%, or 50% of the expected crop yield. The insured has to retain 30% of losses due to drought and 25% in case of damage due to biological perils.
Livestock Insurance. It covers animal mortality due to accidents, disease or slaughtering ordered by the authorities for cattle, hogs, sheep, goats, and poultry under individual, group, and herd modalities. Table 16.1: Agricultural Insurance Available 2008 Crop Insurance Products Available Greenhouse Forestry MPCI Named-peril Crop Revenue Index-based Yes Yes No No No No Livestock Insurance Products Available Aquaculture All Risk Accident &
Mortality Epidemic Disease
Other Index-based
No Yes No No No No Source: World Bank Survey (2008). Delivery Channels
Insurance agents are the main delivery channel for agricultural insurance. There is no specific channel to deliver agricultural insurance to small and marginal farmers in El Salvador. Voluntary vs. Compulsory Insurance
Agricultural insurance is voluntary in El Salvador. Agricultural Reinsurance
Crop insurance programs in El Salvador have been supported by international reinsurers on a quota-share basis (10% retained, 90% ceded), mainly through a facility provided by Proagro, a Mexican agricultural insurer.
2. Public Support for Agricultural Insurance Types of Public Support for Agricultural Insurance The public sector supports the development of agricultural insurance in the country by providing premium subsidies equal to 50% of the original gross premium (OGP) for cotton crops. Premium subsidies are not available for other crops or for livestock insurance. Premium Subsidies
Estimated cotton crop premium subsidies in 2006 were USD 60,000. . Public Cost of Agricultural Insurance The public cost in 2006 was USD 60,000 for crop premium subsidies.

75
3. Agricultural Insurance Penetration Insurance Penetration Rate
The agricultural insurance penetration rate is currently very low. In 2006 only 4,715 ha (0.52% of the total cultivated area) were insured, and about 4,000 heads of cattle were insured (less than 1% of the national herd). The total agricultural insurance premium volume was estimated at about USD 200,000 in 2006.
4. Financial Performance 5-Year Results
No data available.
Cost of Agricultural Insurance Provision
No data available.
5. Public Disaster Assistance Programs There is no evidence of any other form of agricultural support mechanism in the country. Source of Country Overview Information: World Bank Survey (2008).

76
Overview on Agricultural Insurance: ETHIOPIA
1. Agricultural Insurance Market Review History of Agricultural Insurance There has been very limited development of crop or livestock insurance in Ethiopia. Livestock insurance was piloted in 1980 and crop insurance in 2004. A pilot rainfall index insurance program was designed by the Ethiopian Insurance Corporation and the Commodity Risk Management Group of the World Bank in 2003/04. However, while concepts were tested, it was not implemented. A “macro” drought index risk transfer product was designed by the World Food Program in 2003/04, as a market-based mechanism to support financing of humanitarian food aid, or in other words an ex-ante disaster risk financing product. In 2006/07 this product was placed directly with AxaRe (it did not involve the Ethiopian insurance market) with a TSI of US$ 7.1 million and premium of US$ 930,000 which was largely financed by USAID. The policy was free of claims in 2006/07 and subsequently was not renewed by Government of Ethiopia. Significant research is ongoing into the possible role of index insurance within the context of food security systems in Ethiopia, by the World Food Program. A further pilot index insurance project is under development with IRI in 2008 in Tigray. Agricultural Insurance Market Structure (2008)
Two insurers have been interested in agricultural insurance in Ethiopia. The Ethiopian Insurance Corporation (EIC), which is state-owned, has issued a limited number of crop insurance policies on a pilot basis. It also offers livestock insurance. Nyala Insurance Company, in the private sector, has also piloted crop insurance on a small scale, starting in 2004.
Agricultural Insurance Products Available
Nyala has piloted a limited multiple-peril crop insurance (MPCI) test. No details are available of the livestock insurance product offered. Table 17.1: Agricultural Insurance Available 2008 Crop Insurance Products Available Greenhouse Forestry MPCI Named-peril Crop Revenue Index-based Yes No No No Yes No Livestock Insurance Products Available Aquaculture All Risk Accident &
Mortality Epidemic Disease
Other Index-based
No Yes Yes No No No Source: World Bank Survey (2008). Delivery Channels
The main delivery channels for the EIC are through their agents, through producer cooperatives, and through linkage to credit. The Nyala Insurance Company delivery channels are through producer cooperatives and their own agent network. The majority of farmers are small-scale producers; so there is no special delivery channel or program for small farmers.

77
Voluntary vs. Compulsory Insurance
Crop insurance is voluntary, although in the case of the EIC it has been linked to crop loans. Agricultural Reinsurance
The EIC does not purchase reinsurance, since the size of the portfolio can be retained by the company. Nyala purchases quota-share reinsurance.
2. Public Support for Agricultural Insurance Types of Public Support for Agricultural Insurance There are no special laws relating to agricultural insurance. Premium Subsidies No premium subsidies are available. Public Cost of Agricultural Insurance None.
3. Agricultural Insurance Penetration Insurance Penetration Rate Crop insurance penetration is extremely small. Nyala reports that 246 ha were insured in 2007 on a pilot basis. No information is available on the extent of livestock insurance.
4. Financial Performance 5-Year Results No information is available, and penetration is too low to be meaningful. Cost of Agricultural Insurance Provision
Nyala points out that the marketing costs of their pilot in 2007 exceeded the premium income. This project may be considered at a developmental stage, and the cost structure is not meaningful in relation to a fully implemented program. Nyala comments that, under the MPCI policy offered, administration costs are very high, since fields must be inspected for crop emergence.

78
5. Public Disaster Assistance Programs There is no form of government disaster payment to farmers. However, programs of food-for-work, suspension of credit repayments, and subsidized fertilizer inputs have been used to alleviate stress following drought. It should be noted that the government of Ethiopia has well-established systems and an organizational structure to respond to drought and that food security systems have a high priority at the national and regional level. The Disaster Prevention and Preparedness Commission is responsible for administration of relief.
6. Additional Tables Table 17.2: Crop and Livestock Insurance Results, 2007
Year Number of
Policies TSI
(USD) Premium
(USD) Paid
Claims Loss
Ratio 2007 3 74,696 3,518 0 --
Source: World Bank Survey (2008). Source of Country Overview Information: World Bank Survey (2008).

79
Overview on Agricultural Insurance: FRANCE
1. Agricultural Insurance Market Review History of Agricultural Insurance
There is a long tradition of agricultural insurance in France. One of the first hail insurance policies was introduced in France at the end of the 19th century by a specialized agricultural insurance company. Groupama, now an international insurance company and one of the largest insurers in Europe, was initially an agricultural mutual insurance company established by farmer cooperatives.
For decades, the agricultural insurance market was limited to hail and livestock insurance. Since 2005 insurers have promoted multi-peril crop insurance (MPCI) with public financial support. However, the market is still limited, mainly because of ad hoc payment programs offered by the government after a disaster, which do not provide incentives to farmers to purchase agricultural insurance. In addition, French agriculture was not exposed to major and recurrent disasters, although these last 10 years have seen several drought years.
Agricultural Insurance Market Structure Fourteen insurance companies sold agricultural insurance in 2007. The leader, Groupama, has a 57% market share. One insurance company, Etoile, is a specialized agricultural insurance company; 99% of its business is generated from agricultural insurance. The French agricultural insurance market is concentrated: the first three insurers (Gropama, Axa, and Pacifica) have a 75% market share. In comparison, the first three insurers on the property insurance market have a market share of only 40%.
Agricultural Insurance Products Available Hail insurance has been offered to French farmers since the end of the 19th century. Other named-peril crop insurance products are also available. Since 2005 MPCI has been offered with public financial support. Insured perils include hail, drought, floods, excessive rainfall, and wind. The deductible is at least 20%, and at least 80% of a farmer’s cropped area should be covered. Traditional livestock products are available. Epidemic diseases are not covered by insurance. Table 18.1: Agricultural Insurance Available 2008 Crop Insurance Products Available Greenhouse Forestry MPCI Named-peril Crop Revenue Index-based Yes Yes No Yes, a few “tailor-
made” frost index products for fruit companies
Yes Yes
Livestock Insurance Products Available Aquaculture All Risk Accident &
Mortality Epidemic Disease
Other Index-based
No Yes, very limited
No Yes, very limited facultative market for bloodstock
No Yes, limited to a few facultative policies
Source: World Bank Survey (2008).

80
Delivery Channels Crop insurance is almost exclusively distributed through insurance agents. In 2007 96% of the crop insurance products were distributed by insurance agents and 3.5% by insurance brokers. Livestock insurance is mainly distributed through insurance agents. In 2007 59% of the livestock insurance products were distributed by insurance agents and 41% by insurance brokers. There are no special delivery channels or programs for small or marginal farmers.
Voluntary vs. Compulsory Insurance Crop insurance programs are voluntary in France.
Agricultural Reinsurance Crop insurance programs are reinsured by private local reinsurers and private international reinsurers. Access to private international agricultural reinsurance is not considered a constraint for the development of crop hail insurance but a moderate constraint for MPCI. Domestic insurers ceded 36% of their premium volume to reinsurers.
2. Public Support for Agricultural Insurance Types of Public Support for Agricultural Insurance Agricultural insurance legislation and crop insurance premium subsidies are the two avenues of public sector support to crop insurance in France.
Premium Subsidies
Most agricultural insurance products in France are not subsidized. Hail insurance can be marginally subsidized by local authorities up to 10%. Under the MPCI program initiated in 2005, the government provides 35% premium subsidies. Premium subsidies increase up to 40% for newly established farmers.
Public Cost of Agricultural Insurance The public cost of premium subsidies provided by central government amounted to USD 27 million in 2005, USD 28 million in 2006, and USD 32 million in 2007.
3. Agricultural Insurance Penetration Insurance Penetration Rate Table 18.2 shows the number of crop insurance policies issued and crop insurance penetration rates. The percentage of national crop area insured was 22.7% in 2005 and 24.2% in 2006.

81
4. Financial Performance 5-Year Results The total premium volume for the agricultural insurance line of business (including property insurance for agricultural assets) was estimated at USD 1.3 billion in 2007, of which USD 865 million was for crop and livestock insurance. The average loss ratio over the 2003 to 2007 period was estimated at 78% for hail insurance and 85% for livestock insurance. The average loss ratio for MPCI over 2005-07 was estimated at 105%, mainly because of the 2006 drought year, which caused major crop losses. Cost of Agricultural Insurance Provision Data is not available.
5. Public Disaster Assistance Programs Government support is provided through the National Fund for Agricultural Calamities (Fonds National de Garantie des Calamités Agricoles). The Fund is financed by the producers (40%) through a tax on their insurance premiums (11%) and by the government (60%) through an annual budget allocation. The government is in charge of its implementation. The Fund covers exceptional climatic events and natural disasters. When a state of agricultural calamities is declared in a specific area after the occurrence of a major natural event affecting the agricultural sector, a farmer located in the area is eligible for financial compensation if his total loss is greater than 30% of his agricultural revenue or greater than 13% of the damaged crop. Table 18.3 contains total disaster payments paid by year. This public scheme can be completed by lending programs with subsidized interest rates. These subsidized agricultural loans are estimated at USD 838 million in 2004 (drought year), USD 107 million in 2005, and USD 325 million in 2006. In case of major events like the “mad cow disease” crisis in 2001 and the avian flu crisis in 2006, the government can provide exceptional financial assistance. In 2006 the government allocated more than USD 150 million to compensate herders affected by various contagious diseases. 6. Additional Tables Table 18.2: Estimated Crop Insurance Penetration, 2005 to 2007
Year Number of
Policies
Insured Area
(mil of ha)
Percent of National Crop Area Insured
2005 57,883 3.4 22.7%
2006 66,294 3.6 24.2%
2007 69,288 3.8 -- Source: World Bank Survey (2008).

82
Table 18.3 Disaster Relief Amounts Paid to Crop Producers
Year
Financial Compensations
(USD million)
Government Contribution
(USD million)
Farmer Contribution
(USD million)
2003 548.6 323.7 120.9 2004 529.1 256.1 119.6 2005 117 10.4 117 2006 375.7 57.2 11.8
Average 392.6 161.9 119.0 Source: World Bank Survey (2008). Table 18.4: Agricultural Insurance Results, 2003 to 2007
Year Number
of Policies
Premium (USD
million)
Paid Claims
(USD million)
Loss Ratio
Hail 2003 -- 263.9 250.7 95% 2004 -- 283.4 155.9 55% 2005 -- 304.2 200.8 66% 2006 -- 283.4 215.4 76% 2007 -- 338.0 331.2 98%
Average -- 294.6 230.8 78% Livestock
2003 -- 354 293 83% 2004 -- 360 306 85% 2005 -- 367 312 85% 2006 -- 377 313 83% 2007 -- 387 345 89%
Average -- 369 314 85% MPCI
2005 57,175 105.6 85.5 81% 2006 63,367 117.9 114.4 97% 2007 61,367 139.9 181.8 130%
Average 60,636 121.1 127.2 105% Agriculture and Livestock
2003 -- 617.5 544.2 88% 2004 -- 643.5 462.0 72% 2005 -- 776.4 617.9 80% 2006 -- 778.3 646.2 83% 2007 -- 865.3 815.9 94%
Average -- 736.2 617.2 84% Source: World Bank Survey (2008).

83
Table 18.5: Crop Insurers’ Costs as a Percent of OGP
Costs Percent of OGP Marketing & Acquisition 17% Administration 3% Loss Adjustment 4% Total A&O 24% Contribution to the National Calamity Fund 11%
Total 35% Source: World Bank Survey (2008). Source of Country Overview Information: World Bank Survey (2008).

84
Overview on Agricultural Insurance: GERMANY
1. Agricultural Insurance Market Review History of Agricultural Insurance
The German agricultural insurance market is well developed. Two kinds of products are offered on this market: crop hail insurance and livestock insurance. Crop hail insurance has a long history in Germany. This product was first introduced in 1733 and is mainly marketed by mutual insurance companies and cooperatives. Sixty percent of the total crop area in the country is insured against hail. Cattle insurance was introduced in Germany in 1830. Many mutual insurers have commercialized livestock insurance since the eighteenth century. Multi-peril crop insurance (MPCI) is also offered in Germany but is still undeveloped, mainly due to strict underwriting conditions. However, the German Underwriting Association (GDV) - under the leadership by the market leader Vereinigte Hagelversicherung VVaG - currently prepares private MPCI products for the German agricultural market in close contact with the farmer associations.
Agricultural Insurance Market Structure (2008)
Crop insurance is underwritten by mutual insurance companies, private insurance companies, and public insurance companies. The competition for crop insurance products on the German market is very active with about fourteen insurance companies offering hail crop insurance and only one offering MPCI. The leading company is Vereinigte Hagelversicherung VVaG. The crop insurance premium volume for German’s market was on average USD 171 million for the period 2001 to 2003.
Livestock insurance is very important in Germany. Two types of livestock insurance products coexist in the market. The first type of livestock insurance is the Tierseuchenkassen, which is a private-public fund covering animal losses due to epidemic diseases. The second type is the product provided by the private insurance companies, which offers insurance against production interruption due to accidents, fire, epidemic diseases, and movement restrictions, among others. The average livestock insurance premium offered by private insurance companies for the period starting in underwriting year 2001 and up to and including underwriting year 2003 in the German market was USD 60 million. The supply of livestock insurance in Germany is concentrated; the two biggest companies together have an 80% marked share. The main companies operating this product are: R+V VTV (60% market share), Uelzener Allgemeine (20% market share), Bayerischer Versicherungsverband (2% market share), Allianz (3% market share), Agila (3% market share), and LVM (7% market share). Agricultural Insurance Products Available
Hail insurance is the most popular crop insurance product (crop hail with 8% franchise). Crops covered are: all arable crops plus vineyards, fruits plantations, and vegetables. Animal losses due to epidemic diseases and obligatory slaughter as well as culling and rendering costs in general are covered by the Animal Disease Fund, Tierseuchenkassen. This Fund can be described as private-public funds at the state level. In order to finance the Animal Disease Fund, the state bears 50% of the costs and the farmers finance the remaining 50% by obligatory levies differentiated among livestock species. If there is a reimbursement by the commission (usually 50% of the eligible costs), then half of the reimbursement will go to the State and half to the Tierseuchenkassen. Large outbreaks above a Fund’s reserve have to be refinanced by higher levies in the following years. The compensation values are based on the actual market value, and they have to be assessed by the public veterinarian. Maximum values per species are

85
set out by the law concerning epidemic diseases. The Funds also finance programs to eradicate specific diseases.
In addition to the compensation provided by the Animal Disease Fund, private insurance companies insure livestock losses from problems in production due to interruption of production, decrease of production, decrease in product quality, constraints on selling (movement standstills), or ban on selling products (including milk), as well as direct losses due to veterinary costs. The production insurance covers notifiable epidemic livestock diseases, other communicable diseases such as Mastitis or foot diseases, accidents such as contaminated feed or breakdown of ventilation, theft, and also contaminated products such as milk. The compensation depends on the contract, e.g. lump sum payment per day or week of interruption or loss of profit for a given period (e.g. a year). The compensation is limited to the sum insured or a maximum time period for compensation of consequential losses due to production problems. Deductibles depend on the contract design (percentage of sum insured; constant sum per animal or day; or no deductible). Only farmers who generate income mainly from livestock production can purchase such insurance cover.
Livestock revenue insurance is available in Germany and widely accepted by the farmers. More than 50% of the farmers in Germany have a policy against consequential losses for animal diseases like foot and mouth disease and cow diseases. Table 19.1: Agricultural Insurance Available 2008 Crop Insurance Products Available Greenhouse Forestry MPCI Named-peril Crop Revenue Index-based Yes Yes No No Yes Yes Livestock Insurance Products Available Aquaculture All Risk Accident &
Mortality Epidemic Disease
Other Index-based
Yes Yes Yes No No Yes Source: World Bank Survey (2008). Delivery Channels
Agricultural insurance is mainly delivered through cooperatives and farmers associations. There is no specific delivery channel for small and marginal farmers in Germany.
Voluntary vs. Compulsory Insurance
Agricultural insurance is voluntary in Germany. Agricultural Reinsurance Insurance companies do not face constraints to access international private reinsurance. About 30 reinsurers offer reinsurance on a quota-share or stop-loss basis. There is no public support for reinsurance.
2. Public Support for Agricultural Insurance Types of Public Support for Agricultural Insurance There is no form of public support for agricultural insurance in Germany. However, the federal government has set up a statutory system to co-finance epidemic losses for livestock production.

86
Premium Subsidies
Premiums are not subsidized. . Public Cost of Agricultural Insurance There are no public subsidies for crop insurance. The farmers bear 100%.
3. Agricultural Insurance Penetration Insurance Penetration Rate
The insurance penetration rate for crop hail insurance is high. About 7.3 million ha are insured, representing about 60% of total national arable and planted land. Demand for livestock insurance is also very high. More than 50% of herders in Germany have a livestock policy against consequential losses for animal diseases, like foot and mouth disease, and about 50% of all cows and 30% of the sows are insured. MPCI has a very low penetration rate.
4. Financial Performance 5-Year Results The average loss ratio for the whole market was 82% over the 2003 to 2005 period. Cost of Agricultural Insurance Provision
No data available. 5. Public Disaster Assistance Programs No data available.
6. Additional Tables Table 19.2: Estimated Crop Insurance Penetration, 2003 to 2007
Year
Number of Crop Policies
Percent of Farmers Insured
Insured Area (milionl ha)
Percent of National Crop Area Insured
2003 -- -- 7.2 60% 2004 -- -- 7.3 60% 2005 -- -- 7.3 60% 2006 -- -- -- -- 2007 -- -- -- --

87
Table 19.3: Crop and Livestock Insurance Results, 2003 to 2005
Year
Number of
Policies
TSI (USD
million)
Premium (USD
million)
Paid Claims
(USD million)
Average Sum Insured
Average Premium
Average Rate
Loss Ratio
Crops 2003 -- 9,687.8 163.6 158.8 -- -- 1.1% 97% 2004 -- 9,400.9 181.3 149.3 -- -- 1.2% 82% 2005 -- 9,392.4 170.8 110.0 -- -- 1.1% 64%
Livestock 2003 65,200 -- 63.8 46.6 -- -- -- 73% 2004 59,700 -- 59.3 45.6 -- -- -- 77% 2005 56,800 -- 57.2 45.2 -- -- -- 79%
Total 2003 -- -- 227.4 205.3 -- -- -- 93% 2004 -- -- 240.6 194.9 -- -- -- 83% 2005 -- -- 228.0 155.2 -- -- -- 70%
Source: World Bank Survey (2008). Source of Country Overview Information: World Bank Survey (2008).

88
Overview on Agricultural Insurance: GREECE 1. Agricultural Insurance Market Review History of Agricultural Insurance
Several private insurance companies have underwritten agricultural insurance, mainly against the risks of hail and livestock mortality, since the mid-1920s. During that period, agricultural cooperatives have established insurance schemes, covering against the risks of hailstorms, livestock mortality, and fire.
The government established the Agricultural Insurance Fund (TGA) to provide reinsurance capacity to the domestic mutual insurers. Besides its role as a reinsurer for mutual organizations, the Fund also offered direct hail and frost insurance on a voluntary basis. TGA operated till 1954 when it was merged with the Agricultural Bank of Greece (ABG).
The Organization for Agricultural Insurance (OGA) was established in 1961. OGA was a public entity, aiming at providing a safety net program for farmers and protecting the farmers against losses caused by hail and frost on a compulsory basis. During the time the OGA was operating, insurance companies withdrew from the agricultural insurance business.
In 1988 the OGA section in charge of compensation of crop losses was dismantled, and a new state organization was created, named Hellenic Agricultural Insurance (ELGA). OGA, ELGA, the Ministry of Agriculture and the ABG continued to act in a complementary way by assisting farmers affected by catastrophic events with financial assistance on an ad hoc basis. ABG runs a voluntary insurance scheme against the risk of hailstorms for the crops not covered under OGA as well as a livestock insurance scheme. The Agrotiki Insurance S.A has undertaken the ABG activities since 1980. Agricultural Insurance Market Structure (2008)
The majority of Greek farms are covered by ELGA’s programs, and most of the private market products are complementary to this public program. The ELGA scheme is not an insurance program, but rather a safety net program. ELGA covers all Greek farmers. There are franchises and deductibles, which limit the ELGA protection to a maximum 60%-75% of the TSI. Under the ELGA scheme, farmers pay a compulsory fee called special insurance contribution. The special insurance contribution (“premium”) paid by farmers to ELGA is based on the value of the gross sale of the agricultural products and sub-products and corresponds to 3% for crops and 0.5% for livestock. These rates are applicable country-wide.
The Ministry of Agriculture, whenever it is considered as necessary and financially feasible, provides post-disaster financial assistance, in cases of extensive and serious losses suffered by the farmers, due to the occurrence of natural calamities or similar events.
The private insurance companies cover a small part of the total agricultural risks. Agrotiki Insurance dominates the Greek agricultural insurance market. In some lines of business such as crop hail, Agrotiki is the only provider in the Greek market. The company also runs a well-established aquaculture insurance scheme, a sector which is not covered under the ELGA scheme.

89
Agricultural Insurance Products Available
ELGA Products: Named-perils crop coverage. Crops covered: main crop species and varieties, which are developed within their ecological
environment. Covered perils include: hail, frost, windstorms, floods, excessive heat, excessive or out-of-season
rainfalls, snowfall, sea water and damages caused by bears and wild boars. Franchise and deductible:
Category Franchise
(fixed) Deductible (changing) Compensation Limits
All risks 20% Z*12% + 13.2% (Z-15%)*88% 74.8 % Special coverage Risk of frost for fruit trees during flowering
30% Z*12% + 26.4% (Z-30%)*88% 61.6 %
Damage caused by bears and wild boars
5% 0 100% 100%
Source: N. Georgiadis, “Agricultural Risk Management Policies, Past - Present - Future”, 2003
• Z means total crop loss damage. • For all risks covered by the ELGA, losses below 20% per crop and per field (franchise)
are not covered, and hence they are not subject to indemnity. • In the event that the loss exceeds 20% per crop and per field, ELGA shall pay an
indemnity equal to the total loss minus the deductible (Column 3). • For damages occurring at the early stages of the growing period, ELGA covers the
sowing expenses incurred by the farmer. Moreover, an additional compensation is payable to offset any loss of income related to re-sowing.
• Damages up to 30% per crop and per field, caused to fruit trees production by frost during flowering (until fruit formation), are not subject to indemnity. If the damage occurred exceeds that percentage, ELGA shall pay compensation equal to the total loss minus the deductible (Column 3).
• Damage caused to crops by bears and wild boars are indemnified by 100%, on the condition that the damage exceeds 5% of the production of the field.
Livestock coverage. Type of coverage: animal mortality. Covered species include: equines,
sheep, goats, poultry, and bovines. Covered perils: weather risks related to hailstorms, extreme cold weather, snowfall, windstorms, floods, thunderstorms and fire caused by thunderstorms, losses caused by wild animals and diseases, including splenic fever (anthrax), blackleg, viral diarrhea, malignant catarrhal fever, gangrenous mastitis, pathological dystocia, and contagious agalactia. In the event of damages caused by covered risks, the compensation paid by ELGA covers 80% of an amount equal to the total loss minus the deductible shown in Column 3 which varies depending on the kind of animal. The franchise/deductible applies to the number of animals of each “autonomous breeding unit”. For horses, sheep, goats, and bovines the compensation covers 80% of the damage.

90
Franchise and deductible:
Category Franchise
(fixed) Deductible (changing) Compensation Limits
Equines, bovines, sheep and goats 0%* 20% 100% 80.0%
Breeding sows, boars 4% Z*20% + 2.4% (Z-3%)*80% 77.6% Piglets, fattening pigs, and
bees 8% Z*20% + 4,0% (Z-5%)*80% 76.0% Bred hunting birds, rabbits,
and fattening chickens 12% Z*20% + 6.4% (Z-8%)*80% 73.6% Source: N. Georgiadis, “Agricultural Risk Management Policies, Past - Present - Future”, 2003 *In sheep and goats a franchise is set at 8% for losses caused by contagious agalactia and at 20% for animals up to seven days old.
Private insurance products The Greek private agricultural insurance market is not well developed. The volume of the premium represents only a little fraction of the market total premium volume.
Crop insurance products. Private companies offer hail crop insurance as a complement of
ELGA products. The maximum liability of the insurance company does not exceed 25% of the total sum insured (the remaining 75% of the risk is covered by ELGA). A franchise of 15% is set in the crop insurance policy. Rates are defined per region and crop. The average premium rates are 2.3%. Farmers can also buy fire policies for outdoor crops and an extensive cover for crops in greenhouses.
Livestock insurance products. An “all mortality risk” insurance for cows, sheep & goats, pigs,
and poultry is the basic livestock cover in the Greek insurance market. The insurance of the herd or the flock with a franchise and deductible close to 1%-2% of the total population is the predominant type of livestock cover. Any indemnity paid by ELGA is considered as an additional deductible for this policy. Livestock premium rates depend on the type of livestock to be covered, ages, and mitigation measures taken by the insured. The average premium rate is about 8% for cattle and 1% for poultry.
Aquaculture insurance products. Greece has a well-developed aquaculture industry which is
not covered under the ELGA scheme. Private insurers offer an insurance product covering biomass stock (including biomass in transit), equipment, and vessels against “all mortality risk” and theft. The average premium rate is about 1.5%. Table 20.1: Agricultural Insurance Available 2008 Crop Insurance Products Available Greenhouse Forestry MPCI Named-peril Crop Revenue Index-based No Yes No No Yes No Livestock Insurance Products Available Aquaculture All Risk Accident &
Mortality Epidemic Disease
Other Index-based
Yes Yes No No No Yes, limited to facultative risk
Source: World Bank Survey (2008). Delivery Channels
The most important delivery channel is through the cooperatives. There is no specific delivery channel for small and marginal farmers in Greece.

91
Voluntary vs. Compulsory Insurance
The ELGA agricultural insurance scheme is compulsory for all crops in Greece. Greenhouses, poultry, and pig farms can be covered on voluntary basis. Private agricultural insurance complements ELGA coverage and is voluntary. Agricultural Reinsurance
There is no public reinsurance. ELGA is not reinsured. Private agricultural insurance programs are mainly reinsured on a stop-loss basis. Aquaculture risks are reinsured with quota-share and surplus risk cessions.
2. Public Support for Agricultural Insurance Types of Public Support for Agricultural Insurance The government of Greece supports agricultural insurance by bearing 75% of the agricultural insurance liability of the country through ELGA. Premium Subsidies
There are no formal premium subsidies for commercial agricultural insurance products in Greece. Nevertheless, it is important to take into consideration that under the ELGA system the government bears 75% of the total liabilities, and the insured only pay a contribution of 25%. Public Cost of Agricultural Insurance During the period 2000 to 2004 ELGA spent on average USD 200 million annually to support the ELGA agricultural protection scheme. ELGA expenditures increased significantly during 2003 and 2004, with USD 300 million and USD 250 million, respectively. The losses are basically financed by the farmers’ “special insurance contribution” and the state subsidies. The figures per source of financing are not available.
3. Agricultural Insurance Penetration Insurance Penetration Rate
The vast majority of the Greek farms are covered by ELGA’s programs. ELGA is a compulsory program for Greek farmers. There were 700 private crop insurance policies issued in Greece in 2006, protecting about 50,000 ha, which represents a penetration rate of 1.3%. No information is available for livestock insurance.

92
4. Financial Performance 5-Year Results
The average pure loss ratio for the agricultural (crop and livestock) market was 64% over the 2001 to 2005 period. The pure loss ratio for crop insurance was 75%, and the pure loss ratio for livestock insurance was 29%. Cost of Agricultural Insurance Provision
No data available.
5. Public Disaster Assistance Programs
Post-disaster assistance. In cases of extensive losses caused by non-foreseeable and manageable, mainly natural, events not covered by the ELGA compensation scheme, the Ministry of Agriculture can provide post-disaster financial assistance. The assistance depends on the availability of funds and on the classification of the loss event as “calamity”. In order to access the benefits of ad hoc relief from the Ministry of Agriculture, farmers must be insured under ELGA. Non-financial post-disaster assistance: one of ELGA's main activities is the development of technical programs aimed at mitigating agricultural risks. 6. Additional Tables Table 20.2 Estimated Crop Insurance Penetration, 2003 to 2004
Year Number
of Policies
Percent of Farmers Insured
Insured Area (ha)
Percent of National Crop Area Insured
2003 500 -- 38,000 1.0% 2004 700 -- 50,000 1.3%
Source: World Bank Survey (2008). Table 20.3: Crop and Livestock Insurance Results, 2003 to 2004
Year
Number of
Policies
TSI (USD
million) Premium
(USD)
Paid Claims (USD)
Average Sum
Insured (USD)
Average Premium
(USD) Average
Rate Loss
Ratio Crop
2003 500 11.2 258,000 249,400 22,360 516 2.3% 97% 2004 700 12.3 287,000 164,000 17,571 410 2.3% 57%
Livestock 2003 -- 5.2 163,400 66,220 -- -- 6.0% 31% 2004 -- 4.1 100,860 25,420 -- -- 8.3% 25%
Total 2003 -- 16.3 421,400 315,620 -- -- 2.8% 78% 2004 -- 16.4 387,860 189,420 -- -- 2.7% 51%
Source: World Bank Survey (2008). Sources of Country Overview Information: World Bank Survey (2008); European Commission (2006).

93
Overview on Agricultural Insurance: GUATEMALA
1. Agricultural Insurance Market Review History of Agricultural Insurance
Agricultural crop insurance was first introduced in the country in 1998. One private insurance company, with the support of the Ministry of Agriculture and Livestock (MAGA), piloted crop insurance for corn against drought, rain, wind, and flood perils on the south coast. This product was discontinued due to a lack of demand from farmers. In late 1998, after Hurricane Mitch, agricultural insurance was offered again and, besides corn, other crops were introduced under the insurance scheme. Several insurance companies provided agricultural insurance with technical support from Mexican insurance companies. At present there is a prospect to implement agricultural weather index insurance in the country. The federal government, through the project “Guate Invierte”, is actively involved in agricultural insurance, mainly through premium subsidies. Agricultural Insurance Market Structure (2008) Five insurance companies offer crop and livestock insurance products in the country. Agricultural Insurance Products Available
Crop Insurance Individual plant insurance. It protects against damage to individual plants caused by adverse
weather conditions and biological perils. The TSI is defined by the value of each individual plant of the plantation. A deductible (5% to 10% of the TSI) applies. In case of losses due to insured perils the indemnity payout is equal to the agreed value established per plant times the number of affected plants, minus the deductible. Crop damage. This insurance protects the production costs against freeze, flooding, hail, fire, hurricane, tornadoes, winds, windstorms, and lag of soil at harvest. The sum insured is defined by the production costs up to the time of the claim. A deductible (5% to 15% of the production cost) applies. Input cost insurance (“Seguro de Inversion”). It protects the direct investment made by the insured against weather, and biological and crop pre-emergence perils. The sum insured is defined by the direct investments made by the insured in the insured crop up to the time of the claim. Under this coverage, the insured has to bear part of the risk by sharing 5%, 30%, and 25% of the loss for losses with regard to weather perils, drought, and pest and diseases, respectively. In case of a claim, the insurer indemnifies the amount of the investment made by the insured up to the date of the loss, deducting the revenue obtained on the insured unit and the insured loss participation.
Multi-peril crop insurance. It guarantees a percentage of the expected yield at farm level.
Covered perils are weather, biological, and crop sowing and germination failure (e.g. soil capping due to excess rain). Farmers can choose among three levels of guaranteed yield levels: 70%, 60%, or 50% of the expected crop yield, and this yield may be valued either on a cost of production basis or as a percentage of the farmgate price. If the actual yield of the insured unit falls below the guaranteed yield, indemnity payout is equal to the percentage of actual yield shortfall with respect to the guaranteed yield times the sum insured.

94
Livestock Insurance
It covers animal mortality due to accidents and disease on cattle, hogs, sheep, goats, and poultry. Animals may be insured on an individual animal basis and/or on a group animal (herd/flock) basis.
Weather-based Index Crop Insurance
An insurance company has developed a weather-based crop insurance product for Chinese pea crops on a pilot basis. The product covers excess of rain and minimum temperatures measured at a selected weather station.
Table 21.1: Agricultural Insurance Available 2008 Crop Insurance Products Available Greenhouse Forestry MPCI Named-peril Crop Revenue Index-based Yes Yes No Yes, weather
index No No
Livestock Insurance Products Available Aquaculture All Risk Accident &
Mortality Epidemic Disease
Other Index-based
No Yes No No No No Source: World Bank Survey (2008). Delivery Channels
Insurance agents are the main delivery channel for agricultural insurance. There is no specific channel for small and marginal farmers in Guatemala. Voluntary vs. Compulsory Insurance
Agricultural insurance is voluntary in Guatemala. Agricultural Reinsurance
Crop insurance programs in Guatemala are supported by international reinsurers on quota-share basis (10% retained, 90% ceded), mainly through the Mexican insurance facility managed by PROAGRO.
2. Public Support for Agricultural Insurance Types of Public Support for Agricultural Insurance The government supports the development of agricultural insurance through the project “Guate Invierte”, providing premium subsidies of up to 70% of the gross premiums. Premium Subsidies
Estimated premium income since the inception of the Guate Invierte Program (December 2005) is USD 1.9 million. Since its inception, the program has been subsidizing agricultural insurance premiums by about USD 640,000 per year. .

95
Public Cost of Agricultural Insurance The average annual premium subsidies have amounted to USD 640,000 since the Guate Invierte Program inception in 2005.
3. Agricultural Insurance Penetration Insurance Penetration Rate
The agricultural insurance penetration level is currently very low. Since inception the program has insured a total of 3,638 farmers. The total volume of agricultural insurance premiums since the inception of Guate Invierte Program is USD 1.9 million.
4. Financial Performance 5-Year Results
No data available.
Cost of Agricultural Insurance Provision
No data available.
5. Public Disaster Assistance Programs There is no evidence of other forms of agricultural support. Source of Country Overview Information: World Bank Survey (2008).

96
Overview on Agricultural Insurance: HONDURAS
1. Agricultural Insurance Market Review History of Agricultural Insurance
Crop insurance was first introduced in the year 2000 and livestock insurance in 2004. Although agricultural insurance is relatively new in Honduras, several insurance products for crops, livestock, greenhouses, and aquaculture are available. Crop insurance products include traditional named-perils crop insurance, multi-peril crop insurance (MPCI), and weather index insurance. Livestock insurance is undeveloped in Honduras. Less than 1% of the national herd is insured. Federal government support to agricultural insurance is restricted to technical assistance, capacity building (e.g. workshops and training programs), and tax exemptions on agricultural insurance premiums. The government does not currently finance premium subsidies. There is no form of special agricultural insurance legislation. Agricultural Insurance Market Structure (2008)
Four private insurance companies provide agricultural insurance in Honduras, namely Interamericana, Equidad, HSBC, and Atlantida; all of these companies offer crop insurance, but only two companies underwrite small livestock portfolios. Agricultural Insurance Products Available
Traditional and non-traditional crop insurance, livestock insurance, and insurance products to protect greenhouses and aquaculture farming are offered. Products like named-perils crop insurance, MPCI and weather index-based crop insurance are available in the market to protect rice, cucumbers, watermelons, bananas, zucchini, corn, melons, pepper, oil palm, banana, sorghum, beans, and sugar cane crops. The perils covered are hail, frost, drought, winds, and floods. Mortality livestock insurance is relatively new and still undeveloped, with a penetration rate of less than 1%. Aquaculture insurance and greenhouse insurance are also available, mainly to cover against hurricanes/tropical storm damage. Table 22.1: Agricultural Insurance Available 2008 Crop Insurance Products Available Greenhouse Forestry MPCI Named-peril Crop Revenue Index-based Yes Yes No Yes Yes No Livestock Insurance Products Available Aquaculture All Risk Accident &
Mortality Epidemic Disease
Other Index-based
No Yes No No No Yes Source: World Bank Survey (2008). Delivery Channels
The main delivery channel is through insurance agents. Some financial institutions (e.g. rural banks) also deliver agricultural insurance. Two insurance companies are specialized in servicing agricultural insurance to small farmers: Seguros Atlantida and Seguros Equidad. Both insurance companies are currently in the process of obtaining approval from the insurance regulator to operate weather index insurance for maize and sorghum.

97
Voluntary vs. Compulsory Insurance
Agricultural insurance is mainly voluntary. However, the state-owned bank BANADESA requires farmers to insure their agricultural loans on a compulsory basis. This is the main reason of the expansion of agricultural insurance in Honduras. However, the recent reduction of BANADESA agricultural lending has contributed to the stagnation of the agricultural insurance penetration. Agricultural Reinsurance
The agricultural insurance programs currently in place in Honduras have support from the international reinsurance market. Capacity is available for MPCI and may be slightly more difficult to secure for livestock insurance and index-based crop insurance.
2. Public Support for Agricultural Insurance Types of Public Support for Agricultural Insurance There are no forms of government financial support to agricultural crop and livestock insurance.
Premium Subsidies
Government does not provide any agricultural insurance premium subsidies.
3. Agricultural Insurance Penetration Insurance Penetration Rate
Only 1.9% of the cropped area is currently insured by all types of crop insurance. The percentage of the national total herd insured is less than 1%.
4. Financial Performance 5-Year Results
Table 22.2 shows that crop insurance premiums have increased nearly threefold over the five years, with 2007 premiums of USD 1.7 million and an annual average loss ratio for crops of 61%. Livestock insurance is much smaller, and the loss ratio 2006-2007 was 66%. The annual average loss ratio for the whole crop and livestock market is estimated at 62% over the 2003 to 2007 period. Cost of Agricultural Insurance Provision
Market costs are shown in Table 22.3 as a percentage of the original gross premium (OGP) rate. For the whole market, on average, the cost ratios with respect to the OGP are: 10% for acquisition expenses, 15% for company’s administrative costs, and 10% loss adjustments costs for a total of 35% costs. The combined ratio (including claims and operating expenses) is estimated at 96.5% for agricultural insurance.

98
5. Public Disaster Assistance Programs There are no Public Disaster Assistance Programs in Honduras.
6. Additional Tables Table 22.2: Crop and Livestock Insurance Results, 2003 to 2007
Year
Number of
Policies TSI Premium
(USD)
Paid Claims (USD)
Average Sum
Insured Average
Premium Average
Rate Loss
Ratio Crop
2003 -- -- 667,895 383,741 -- -- -- 57% 2004 -- -- 769,283 473,016 -- -- -- 61% 2005 -- -- 1.4 mil 1.3 mil -- -- -- 99% 2006 -- -- 1.5 mil 959,784 -- -- -- 63% 2007 -- -- 1.7 mil 557,840 -- -- -- 32%
Average -- -- 1.2 mil 742,582 -- -- -- 61% Livestock
2006 -- -- 11,428 21,332 -- -- -- 187% 2007 -- -- 94,853 48,925 -- -- -- 52%
Average -- -- 53,140 35,129 -- -- -- 66% Total
2003 -- -- 667,895 383,741 -- -- -- 57% 2004 -- -- 769,283 473,016 -- -- -- 61% 2005 -- -- 1.4 mil 1.3 mil -- -- -- 99% 2006 -- -- 1.5 mil 981,116 -- -- -- 64% 2007 -- -- 1.8 mil 606,765 -- -- -- 33%
Average -- -- 1.2 mil 756,634 -- -- -- 62% Source: World Bank Survey (2008). Table 22.3: Crop Insurers’ Costs as a Percent of OGP
Costs Crop Marketing & Acquisition 10% Administration 15% Loss Adjustment 10% Total 35%
Source: World Bank Survey (2008). Note: Insurance premium taxes were negligible and were therefore not included. Source of Country Overview Information: World Bank Survey (2008).

99
Overview on Agricultural Insurance: HUNGARY
1. Agricultural Insurance Market Review History of Agricultural Insurance Crop insurance in Hungary dates back to the 19th century (1838) when the local mutual insurance companies started to offer coverage for crops against hail damage. Livestock insurance was introduced in 1902.
There is agricultural insurance legislation and regulation in the country. The national government defines the framework for agricultural insurance mostly through regulations: operation of agricultural mutual insurance fund (2001); allocation of agricultural subsidies (2002), compensations to farmers suffering from frost and drought (2003), livestock (2005), etc.
Agricultural insurance is offered by private insurers without direct public involvement. There is strong competition in the Hungarian insurance market. The companies mostly compete on prices (premium rates) and less on quality of the services.
In 2007 the government established an Agricultural Calamity Fund. The Fund is financed by the government and participating farmers on a 50%-50% basis. The government does not offer agricultural insurance subsidies. Index-based insurance products are not available in Hungary. Agricultural Insurance Market Structure (2008)
Agricultural insurance is provided by four private insurance companies (Argosz, Generali, Allianz-Hungaria, and OTP Garancia) and by mutual insurance funds. Mutual insurance funds have a minor share of the agricultural insurance market (2.5%). Allianz-Hungaria is the leading agricultural insurer in Hungary with 47% of the market share. OTP Garancia is the second largest agricultural insurer with 27% of the market share. All insurance companies provide coverage for both crops and livestock.
Agricultural Insurance Products Available
Insurance companies predominantly offer named-peril insurance products (indemnity-based). Coverage is available for most agricultural crops and livestock produced in Hungary. The policies are specific and adapted to each crop or livestock product. They cover key weather perils, including drought in arable crops. Livestock insurance (accidental loss and mortality) is available against weather perils, accidents, and against most infectious diseases. Insurance companies offer forestry insurance for timber growers. Forestry coverage provides tree protection against such major perils as fire, hail, storm, ice-break, snow pressure, etc. MPCI programs are not offered in Hungary. Quality loss and income insurance is not offered in Hungary. Delivery Channels Agricultural insurance is mainly distributed through insurance agents. Insurance brokers and producer associations and cooperatives also deliver crop insurance. There are no special organizations or programs for small and marginal farmers.

100
Table 23.1: Agricultural Insurance Available 2008 Crop Insurance Products Available Greenhouse Forestry MPCI Named-peril Crop Revenue Index-based No Yes No No Yes Yes Livestock Insurance Products Available Aquaculture All Risk Accident &
Mortality Epidemic Disease
Other Index-based
-- -- -- -- -- -- Source: World Bank Survey (2008). Voluntary vs. Compulsory Insurance Agricultural insurance in Hungary is voluntary. However, the government provides emergency assistance only to farmers who purchase insurance and contribute to the agricultural emergency fund. Agricultural Reinsurance Reinsurance of agricultural risks is the responsibility of insurance companies. There is no public reinsurance available. The companies reinsure risks through their parent companies or through brokers on the international reinsurance market. Crop insurance portfolios are mainly insured through stop-loss treaties. Reinsurance of agricultural portfolios is considered difficult, and insurance companies report it as a major constraint.
2. Public Support for Agricultural Insurance Types of Public Support for Agricultural Insurance The government does not provide assistance to agricultural insurance in the country.
Premium Subsidies There are no premium subsidies.
Public Cost of Agricultural Insurance There are no public costs; agricultural insurance is provided on a private basis.
3. Agricultural Insurance Penetration Insurance Penetration Rate
There is no reliable statistical data on agricultural insurance in Hungary. OTP Garancia reported 2,369 agricultural insurance contracts signed and 617,586 ha of arable land insured in 2007. According to this company, approximately 40-45% of arable land is insured annually in Hungary against hail and fire.

101
4. Financial Performance 5-Year Results
The overall results of the OTP Garancia Co agricultural insurance program are shown in Table 23.3. The number of policies is comparatively high for a small country: 12,758 in 2006 and 12,380 in 2007. During the 2004 to 2007 period, the annual premium volume was about USD 40 million (see Table 23.3). The pure loss ratio is high (75%-80% on average). Premiums are market-based and subject to market competition. The bonus-malus system is used by the insurance companies.
Cost of Agricultural Insurance Provision
Total insurer’s costs (inclusive of reinsurance premiums) are estimated at 27.4%. No breakdown is available separately for crop and livestock lines of business.
Costs Percent of OGP Marketing & Acquisition 17.6% Administration 7.3% Loss Adjustment 0.3% Total A&O 25.2% Insurance Premium taxes 2.2%
Total 27.4%
5. Public Disaster Assistance Programs
Agricultural Calamity Fund. Since 2007 there has been an opportunity between the state and the mutual insurance companies to compensate agricultural losses that cannot be insured. The natural perils are floods, drought, and frost. The agricultural producers and the state provide financial resources to mitigate losses on a 50%-50% basis. The farmer has to contribute HUF 1,000 (USD 5.81) per ha in case of the tilling of arable land and HUF 3,000 (USD 17.43) in case of plantation, for example of a vineyard or fruit plantation. Compensation is provided only when the crop losses exceed 30% of the whole farm revenue. The loss events have to be reported to the county agricultural administrative offices or county branch of the Agricultural and Country Development Office.
6. Additional Tables Table 23.2 OTP Garancia Crop and Livestock Insurance Results, 2003 to 2007
Year Number
of Policies TSI
Premium (USD
million)
Paid Claims (USD
million) Loss Ratio 2003 -- -- 114.0 86.5 75.9% 2004 -- -- 39.5 25.5 64.5% 2005 -- -- 40.9 33.0 80.9% 2006 12,758 -- 39.6 31.5 79.7% 2007 12,380 -- 43.7 37.4 85.6%
Source: World Bank Survey (2008). Sources of Country Overview Information: World Bank Survey (2008); European Commission (2006).

102
Overview on Agricultural Insurance: INDIA
1. Agricultural Insurance Market Review History of Agricultural Insurance Crop insurance began in 1972 on a pilot basis. India has implemented subsidized public-sector “area-yield index” multi-peril crop insurance (MPCI) since 1979. In 1985 the Comprehensive Crop Insurance Scheme (CCIS) was introduced in sixteen states and two union territories by the General Insurance Corporation of India (GIC). The CCIS was provided only to recipients of crop credit (loanees) on a compulsory basis. The CCIS was replaced by the National Agricultural Insurance Scheme (NAIS) in the Rabi season 1999-2000. The NAIS was closely modeled on the CCIS area-based approach. The objectives of this subsidized national crop insurance scheme are threefold: (a) to provide a measure of financial support to farmers in the event of crop failure as a result of an insured peril; (b) to restore the credit eligibility of the farmer after a crop failure for the next season, and (c) to support and stimulate the production of cereals, pulses, and oilseeds.
Livestock insurance was introduced in the late 1960s but assumed importance only after the general insurance industry was nationalized in 1972.
Agricultural Insurance Market Structure
The entire insurance business in India was nationalized in 1972 under the General Insurance Business (Nationalization) Act. In 1972 the government of India created the GIC, a national insurer, to supervise, control and provide general insurance business. Between 1985 and 2002 the CCIS and then the NAIS was insured by the GIC. In 2000 GIC was restructured as a national reinsurance company providing direct reinsurance to the general insurance companies in the Indian market, and in 2001 the insurance sector was opened up to private insurance companies.
In 2002 the Agriculture Insurance Company of India Limited (AIC), a specialist public sector crop insurance company, was formed by government, and responsibility for implementation of the NAIS area-yield index scheme was transferred from GIC to AIC. Since 2001 two private insurers, ICICI Lombard and IFFCO-Tokyo, have invested in crop weather index insurance for poor resource farmers. In addition, there are six public insurance companies providing livestock insurance to Indian livestock producers.
Agricultural Insurance Products Available AIC is the largest and sole public sector crop insurer in India. Traditionally, AIC has only insured a single product, an area-yield index MPCI Insurance policy under the NAIS. This scheme is heavily subsidized by federal and state governments. The area-yield index policy insures a wide range of food crops, oil seeds, horticultural, and commercial crops. The policy insures against yield loss due to non-preventable risks including: (a) natural fire and lightning, (b) storm, hailstorm, cyclone, typhoon, tempest, hurricane, tornado, etc., (c) floods, inundation and landslides, (d) drought, dry spells, and (e) pests/diseases.
Since 2001/02 ICICI Lombard, a private commercial company in conjunction with BASIX, a local NGO, has underwritten a portfolio of crop weather index insurance products for small and marginal Indian farmers. IFFCO-Tokyo has also started marketing crop weather index insurance for a number of years.

103
Prior to 2007/08 these private sector crop insurance initiatives did not attract a government premium subsidy.
Since 2004/05, AIC has conducted major research and development into crop weather index insurance and applications of Remote Sensing (NSVI/RS) insurance to agriculture, and beginning in the 2006/07 season AIC’s weather index program has attracted government premium subsidies.
The public sector livestock insurance companies are offering livestock accident and mortality cover. Some aquaculture insurance is also available through the public sector insurers.
Table 24.1: Agricultural Insurance Available 2008 Crop Insurance Products Available Greenhouse Forestry MPCI Named-peril Crop Revenue Index-based No Yes No Yes, area yield
and weather index
No No
Livestock Insurance Products Available Aquaculture All Risk Accident &
Mortality Epidemic Disease
Other Index-based
No Yes No No No Yes Source: World Bank Survey (2008). Delivery Channels
The NAIS crop insurance program is marketed exclusively by the banks on behalf of AIC in each state. In 2006/07 the NAIS insured almost 20 million Indian farmers including owner occupiers, sharecroppers, and tenant farmers. AIC’s crop weather index insurance program is also marketed through the state banks. Crop weather index insurance is marketed by the private commercial insurers through their own agents, local Micro-Finance Institutions (MFIs), and producer associations. Livestock insurance is predominantly sold by the public insurers’ own sales agents, followed in order of importance by the banks, MFIs, and producer associations.
Since 2006 the Insurance Regulator has licensed Micro-Insurance Agents (MFIs, NGOs and self-help groups) to market micro-insurance products (all rural insurances including crop and livestock insurance) to farmers. Voluntary vs. Compulsory Insurance Public sector crop insurance through AIC is compulsory for all farmers who access seasonal crop production credit from the lending institutions (e.g. loanee farmers). However, AIC crop insurance is voluntary for non-loanee farmers. Private-sector crop weather index insurance offered by the commercial insurance companies is purely voluntary. Livestock insurance in India is voluntary. Agricultural Reinsurance
Since inception in 1985 the CCIS and its successor, the NAIS, have been reinsured by government under a 50%:50% excess of loss agreement by the federal governmant and participating state governments and union territories. For food crops and oilseeds any losses incurred by AIC in excess of a 100% loss ratio are reinsured by government, and for commercial and horticultural crops losses in excess of a 150% loss ratio are reinsured by government. GIC, the national reinsurance company, does not reinsure the NAIS.

104
AIC’s crop weather index program is reinsured on a proportional (quota-share) treaty basis partly by GIC under a program of compulsory cessions, and partly by international reinsurers. Similarly, the private company crop weather index insurance programs are reinsured on a proportional (quota-share) basis both by GIC (compulsory cessions) and by international reinsurers. Where these weather index programs are actuarially rated, access to reinsurance capacity has not been a major constraint.
Currently, in India, access to commercial reinsurance is considered a moderate constraint for livestock mortality insurance and for weather index insurance. Lack of reinsurance is considered to be a major constraint for livestock epidemic disease insurance, and this cover is not currently available in India. AIC noted that, in the future, if the NAIS is turned into a more market-oriented scheme and is actuarially rated and reinsured by the private commercial sector, reinsurance may be a major constraint given the enormous size of this national scheme.
2. Public Support for Agricultural Insurance Types of Public Support for Agricultural Insurance The NAIS scheme represents a public sector undertaking which has both social and economic objectives, namely to provide India’s predominantly small and marginal farmers access to seasonal production credit at affordable premium rates. Government financial support to the NAIS is shared on a 50%:50% basis by the federal government and the state and union territory governments and includes:
• Affordable premium rates which are capped at well below the actuarially required rates for
food crops and oilseeds. The rates charged for commercial and horticultural crops are closer to the actuarially determined rates (see Table 24.2).
• Subsidies on agricultural insurance premiums paid by small and marginal farmers
(defined as farmers with less than 2 ha of land and less than 1 ha of land, respectively). Under NAIS the premium subsidy level was originally set at 50%, and this has been reduced in subsequent years to 30% in 2003/04, 20% in 2004/05, and 10% thereafter up to 2007. Reference to Table 24.3 shows that in 2006/07 premium subsidies paid to small and marginal farmers amounted to nearly USD 7 million or 5% of total premium income.
• Subsidies on AIC’s administration and operating expenses. AIC pays a fee of 2.5%
premium to the state-level banks for their services in marketing and administering the NAIS policy on behalf of the insurer. AIC in turn receives a subsidy on its own administration and operating expenses, which in 2003/04 amounted to a reimbursement of 60% of the company’s annual operating expenses, 40% of its expenses in 2004/05, and 20% of its operating expenses thereafter up to 2007. Table 24.3 shows that, over the past five years, the A&O subsidy has averaged about 3.3% of AIC’s total premium income from the NAIS.
• Free loss assessment. The state governments are responsible for conducting seasonal in-
field sample crop-cutting surveys (CCEs), which are used to determine the average yield for each crop in each block or village panchayat as part of the national system of recording crop production and yields. The NAIS uses the CCE results to indemnify area-yield losses at the block or village panchayat level (termed the insured unit). In 2006 the about 700,000 CCEs were conducted at an average cost of about Rs. 300 per CCE or a total cost of Rs. 210 million (about USD 5.3 million). AIC receives the CCE results free of charge; but the downside is that the company may have to wait for more than 6 months after the crop season for the

105
official CCE yield results to be published, and loss settlements may therefore be very delayed.
• Excess of loss reinsurance by government on NAIS. The government has incurred very
high financial costs in settling excess claims, with an average cost of USD 228 million over the past five years (equivalent to 71% of all claims) and a high in the 2002/03 season of USD 335 million (82% of annual total claims).
• Premium subsidies on crop weather insurance since 2006/07. In 2006/07 government
authorized the payment of premium subsidies on AIC’s crop weather index portfolio. In 2007/08 government premium subsidies amounted to Rs. 1 billion (USD 25 million). In 2007/08 various state governments have also approved the payment of premium subsidies to private insurance companies offering crop weather index insurance.
Public sector livestock insurance does not attract premium subsidies. The excess losses (over and above collected premiums) paid by the public sector insurers amounted to Rs. 242.1 million in 2005/06 and Rs. 251 million in 2006/07 (about USD 6 million in both years).
3. Agricultural Insurance Penetration Insurance Penetration Rate The NAIS is the world’s largest crop insurance program, and in 2006/07 it sold a total of 20 million policies, equivalent to about 15% of all Indian farmers. The insured area has been very stable over the past five years at about 192 million ha or 14% of total gross cropped area (Table 24.4).
Figures for livestock insurance show that in 2003/04 a total of 6.7 million head of cattle (2.5% of the national herd) were insured, and in 2004/05 this figure rose to 7.9 million cattle (3% of total; Table 24.5).
In 2007/08, crop weather insurance was purchased by a total of 627,000 farmers on 984,000 ha, which is a remarkable achievement for a program which has only been implemented on a commercial basis for about four years (Table 24.7).
4. Financial Performance 5-Year Results AIC’s 5-year crop insurance results for NAIC are reported in Table 24.6. Over the past five years the program has expanded from 12.9 million policies in 2002/03 with TSI of USD 2.3 billion and premium of USD 72.5 million to 20 million policies (55% increase) in 2006/07, TSI of 4.0 billion (89% increase) and premium of 132 million (72% increase). After 23 years of operation, the NAIS is a very large smallholder crop insurance program.
Over the past five years the average rate has been 3.1% against a long-term average loss cost of 9.7% and a corresponding five-year loss ratio of 314%, which indicates that the program has been very underrated. As noted previously, a central objective of the government is to provide as many Indian farmers as possible access to crop insurance at affordable rates, and government policy has therefore been to cap rates at well below the commercial rates of about 12.5% to 15% they would need to levy in order to cover expected claims and acquisition and administration costs.

106
The very small average size of a policy is shown in Table 24.6 with average sum insured per policy (per farmer) of USD 200 and average premium per policy of USD 6.2. With such a low premium volume per policy it would not be feasible for AIC to offer individual farmer MPCI insurance; thus an area-yield index approach is the only viable option.
The AIC 2007/08 crop weather index results are reported in Table 24.7 and show TSI of 412 million with premiums of USD 33 million at an average rate of 8.0%. Crop weather insurance in India is priced at the full and actuarially determined commercial premium rate required to attract support from international reinsurers. The loss ratio in 2007/08 was 73%.
It is not possible to report the 5-year results for the crop weather index programs underwritten by the private commercial insurance companies in India. It is also not possible to report the public sector livestock insurance results.
Cost of Agricultural Insurance Provision
AIC is heavily subsidized by federal and state governments. The banks are responsible for marketing and administering the NAIS scheme on behalf of AIC, and their charges amount to 5% of premium. AIC’s own administration and operating costs amount to a further 2% of premium. AIC does not pay for loss assessment, namely the results of the CCEs on which basis area-yields are determined and losses are settled. As such, the company operates at a very low overall cost structure of only 7% of premium (Table 24.8).
5. Public Disaster Assistance Programs The Indian government provides a wide range of additional support to agriculture including:
a. Input subsidies on the price of fertilizers, irrigation, power, credit, etc. b. Output subsidies including “Minimum Support Prices” for key commodities, and c. Disaster relief.
Details of the national disaster relief programs are contained in Table 24.9.

107
6. Additional Tables
Table 24.2: NAIS Premium Rates
Season Crops Premium Rate
Kharif Bajra and oilseeds 3.5% of sum insured or actuarial rate, whichever is less
Other crops (cereals, other millets, and pulses) 2.5% of sum insured or actuarial rate, whichever is less
Rabi Wheat 1.5% of sum insured or actuarial rate, whichever is less
Other crops (other cereals, millets, pulses, and oilseeds) 2.0% of sum insured or actuarial rate, whichever is less
Kharif & Rabi
Annual commercial and horticultural crops Actuarial rates
Source: World Bank Survey (2008).
Table 24.3: NAIC/AICI Subsidies and Government Reinsurance, FY2003 to FY2007
Year
Premium Subsidies
(USD million)
Percent of
Premium
A&O Expense
Subsidies (USD
million)
Percent of
Premium
LAE Sub-
sidies
Reinsur-ance
Premium Subsidies
Claims Paid by
Government (USD
million)
Percent of
Claims FY2003 9.9 14% 2.8 3.8% yes no 335.5 82% FY2004 6.1 9% 2.6 3.8% yes no 202.7 82% FY2005 4.9 4% 3.3 2.9% yes no 175.6 68% FY2006 5.5 4% 4.0 3.2% yes no 214.2 67% FY2007 7.0 5% 3.8 2.9% yes no 213.1 55% Average 6.7 7% 3.3 3.3% N/A N/A 228.2 71% Source: World Bank Survey (2008).
Table 24.4: Estimated NAIS/AIC Crop Insurance Penetration, FY2004 to FY2008
Year Number
of Policies
Percent of Farmers Insured*
Insured Area
(mil of ha)
Percentage of National
Crop Area Insured**
FY2003 12.9 mil 10% 18.4 10% FY2004 16.2 mil 12% 29.6 16% FY2005 16.6 mil 12% 27.7 14% FY2006 17.9 mil 13% 27.3 14% FY2007 20.0 mil 15% 30.0 16% Average 16.7 mil 13% 26.6 14%
Source: World Bank Survey (2008). * Calculated on the basis of AIC estimates of 130 million farming families in 2007 (assumed constant past five years) ** Calculated on the basis of MOA/GOI gross cultivated area for FY2003 to FY2005 (area for FY2006 and FY2007 not available and assumed at 2005/06 level)

108
Table 24.5: Estimated Livestock Insurance Penetration, 2003 to 2004 Year Number of
Insured Cattle Percent of National Cattle
Herd Insured
2003 6.7 million 2.5% 2004 7.9 million 3.0% 2005 -- -- 2006 -- -- 2007 -- --
Average -- -- Source: World Bank Survey (2008). Note: Data for swine, sheep, goats and poultry were not available. Table 24.6: NAIS/AIC Crop Insurance Results, FY2003 to FY2007
Year
Number of
Policies
TSI (USD
million)
Premium (USD
million)
Paid Claims
(USD million)
Loss Ratio
Loss Cost
Average Sum
Insured (USD)
Average Premium
(USD)
Average Premium
Rate FY2003 12.9 mil 2,302.3 72.5 410.8 566% 17.8% 178 5.6 3.1% FY2004 16.2 mil 2,403.6 69.3 245.7 354% 10.2% 148 4.3 2.9% FY2005 16.6 mil 3,680.3 116.2 259.8 224% 7.1% 222 7.0 3.2% FY2006 17.9 mil 4,263.5 126.8 320.4 253% 7.5% 238 7.1 3.0% FY2007 20.0 mil 4,030.1 132.2 384.8 291% 9.5% 202 6.6 3.3% Average 16.7 mil 3,336.0 103.4 324.3 314% 9.7% 200 6.2 3.1% Source: World Bank Survey (2008). Table 24.7: AIC Crop Weather Insurance Results, FY2007
Number of
Policies
Insured Area (ha)
TSI (USD millio
n)
Premium (USD
million)
Paid Claims
(USD million
) Loss
Ratio Loss Cost
Average Premium
Rate 627,000 984,000 412.4 33.1 24.1 73% 5.8% 8.0% Source: World Bank Survey (2008). Table 24.8: AICI Costs as a Percent of OGP for Crop Insurance
Costs Percent of OGP Marketing & Acquisition 5% Administration 2% Loss Adjustment --
Total 7% Source: World Bank Survey (2008). Note: Insurance premium taxes were negligible and were therefore not included.

109
Table 24.9: Government Disaster Relief Programs Information
Name of Program/Fund Calamity Relief Fund (CRF) and National Calamity
Contingency Fund (NCCF) Organizations Responsible for
Funding Federal government (CRF and NCCF) and provincial
government (CRF) Organizations Responsible for
Implementation Mainly provincial governments
Perils/Events Covered by Disaster Relief Fund
Cyclone, drought, earthquake, fire, flood, tsunami, hailstorm, landslide, avalanche, cloud burst, and pest
attack Criteria for Declaring a Disaster to
Receive Compensation Largely scientific Eligibility for Disaster Relief
Dependant on Agricultural Experience Not linked
Disaster Relief Paid by the Government to Producers (USD million)
2003 782.0 2004 824.0 2005 1,521.7 2006 1,340.0 2007 --
Source: World Bank Survey (2008).
Source of Country Overview Information: World Bank Survey (2008).

110
Overview on Agricultural Insurance: IRAN
1. Agricultural Insurance Market Review History of Agricultural Insurance
Crop insurance was first introduced in 1984 and livestock insurance in 1993. Agricultural insurance in Iran is administered by the government-owned Agricultural Insurance Fund. There is agricultural insurance legislation and regulation. Agricultural Insurance Market Structure (2008)
Agricultural insurance is offered exclusively through the government institution, the Agricultural Insurance Fund.
Agricultural Insurance Products Available
There is a wide variety of agricultural insurance products in Iran. The state institution offers multi-peril crop insurance (MPCI), crop income insurance, greenhouse insurance, and forestry insurance products. Aquaculture is insured through a special program. Livestock insurance is available against accident and mortality from epidemic disease.
The farmers can insure their crops through an area-yield index insurance product. Weather index (rainfall) is currently in the research stage. The government expects weather index products to be introduced within the next two years. The research teams have been working for the last three years in 50 pilot locations. Rainfall index insurance will be introduced in these locations initially, and later weather index will be expanded to all agricultural regions.
Table 25.1: Agricultural Insurance Available 2008 Crop Insurance Products Available Greenhouse Forestry MPCI Named-peril Crop Revenue Index-based Yes No Yes Yes Yes Yes Livestock Insurance Products Available Aquaculture All Risk Accident &
Mortality Epidemic Disease
Other Index-based
Yes Yes Yes No No Yes Source: World Bank Survey (2008).
Delivery Channels
Agricultural insurance is delivered primarily through insurance agents. Financial institutions are the second most important channel for crop insurance. Producer organizations are the second important delivery channel for livestock insurance. Insurance brokers play only a minor role in agricultural insurance practice in Iran. There are no special organizations or programs in Iran for servicing agricultural insurance to small and marginal farmers. Voluntary vs. Compulsory Insurance Both crop and livestock insurance are voluntary.

111
Agricultural Reinsurance
Crop and livestock insurance programs are reinsured by the Government.
2. Public Support for Agricultural Insurance Types of Public Support for Agricultural Insurance Government supports agricultural insurance through premium subsidies that are available for both crop and livestock insurance programs. There is special legislation on agricultural insurance. Agricultural insurance premiums are exempt from sales taxes.
Premium Subsidies Government premium subsidies are 60% for crop and livestock insurance products. A special premium subsidy regime is applied to high-value crops. Information on special crop insurance subsidies is provided in Table 25.2 below. Public Cost of Agricultural Insurance Premium subsidies amounted to USD 530 million for the period of 2003 to 2007. Government provided USD 366 million for crop insurance subsidies and USD 164 million for livestock insurance subsidies. The premium subsidy program averaged USD 106 million per annum over the last five years (see Table 25.3).
3. Agricultural Insurance Penetration Insurance Penetration Rate
About 35% of farmers purchased crop insurance policies in 2006 to 2007. Before that time the participation rate was below 30%. Farmers insure 35% to 40% of the crop area (see Table 25.4). Less than 10% of the cow and sheep/goat herd is insured. The insurance rate for poultry is much higher with approximately 68% being insured in 2007 (see Table 25.5).
4. Financial Performance 5-Year Results
The number of insurance policies grew during the last five years. The premium volume was USD 230 million in 2007. The pure loss ratio was 170% in 2007, although it has improved over the last five years. The loss ratio for the crop insurance program was 101% in 2007. The five-year long-term average loss ratio was 151% for crops. The loss ratio for livestock insurance was even higher, with a 5-year long-term average of 624% (see Table 25.6).
There is no information about premium rate calculation procedures used in Iran. The Agricultural Insurance Fund is looking now for professional advice to train national experts on actuarial principles applied to calculate premium rates.

112
Cost of Agricultural Insurance Provision
Information on the cost for provision of the agricultural insurance services is not available.
5. Public Disaster Assistance Programs The Disaster Relief Fund operated in Iran until 2005. It was financed by the government. This facility was administered by the agricultural bank. Support was provided to both crop and livestock sectors when disasters took place. In 2005 the government decided to replace the relief program with the subsidized agricultural insurance program. 6. Additional Tables Table 25.2: Agricultural Insurance Premium Subsidies
Crop Government
Share Farmer
Share Pomegranate 60% 40% Non-irrigated fig 70% 30% Irrigated grape 65% 35% Non-irrigated grape 65% 35% Irrigated almond 70% 30% Non-irrigated almond 50% 50% Orange 70% 30% Pistachio 60% 40% Tea 80% 20% Palm 65% 35% Apricot 20% 80% Saffron 66% 34% Olive 68% 32% Cumin 40% 60% Apple 65% 35% Walnut 17% 83% Grapefruit 0% 100% Rose 0% 100% Gladiola 0% 100% Rose (mohammadi flower) 40% 60% Clove 0% 100% Lime/Lemon 41% 59% Sweet lemon 41% 59% Tangerine 48% 52% Peach/Nectarine 20% 80%
Source: World Bank Survey (2008).

113
Table 25.3: Public Premium Subsidies, 2003 to 2007
Year Public Premium Subsidies (USD
million) 2003 60.2 2004 107.3 2005 80.2 2006 143.2 2007 139.5
Source: World Bank Survey (2008). Table 25.4: Estimated Crop Insurance Penetration, 2003 to 2007
Year
Percent of Farmers Insured
Insured Area
(mil of ha)
Percentage of National Crop Area
Insured 2003 23.2% 6.6 31.8% 2004 25.2% 7.8 37.1% 2005 31.3% 8.4 40% 2006 36.2% 8.6 41.2% 2007 34.1% 7.3 35%
Source: World Bank Survey (2008). Table 25.5: Livestock Insurance Penetration, 2003 to 2007
Year
Number of Insured
Cattle
Percent of National
Herd Insured
Number of Insured
Sheep and Goats
Percent of National
Sheep Flock Insured
Number of Insured Poultry
Birds
Percent of National Poultry Insured
2003 253,530 3.2% 3.4 mil 4.3% 11.8 mil 1.7% 2004 315,043 4% 3.8 mil 4.9% 289.7 mil 38.4% 2005 492,039 6.2% 5.6 mil 7.2% 375.8 mil 49.8% 2006 558,800 7% 6.4 mil 8.3% 500.7 mil 66.4% 2007 645,280 8.2% 6.8 mil 8.7% 513.4 mil 68.1%
Source: World Bank Survey (2008). Table 25.6: Agricultural Insurance Loss Ratios, 2003 to 2007
Year Crop Loss Ratio Livestock Loss Ratio 2003 283% 1026% 2004 141% 898% 2005 181% 1284% 2006 153% 539% 2007 101% 324%
Source: World Bank Survey (2008). Table 25.7: Calamity Program Payments, 2003 to 2005
Year Crop Disaster Payments
(USD million) Livestock Disaster Payments
(USD million) 2003 720.7 1.1 2004 537.3 3.5 2005 1,018.1 3.2
Source: World Bank Survey (2008). Source of Country Overview Information: World Bank Survey (2008).

114
Overview on Agricultural Insurance: ISRAEL
1. Agricultural Insurance Market Review History of Agricultural Insurance Crop insurance was first introduced in 1967 and livestock insurance in 1975. KANAT is owned 50% by government and 50% by production and marketing boards. Since 2000 KANAT has also managed a program “Insurance for Natural Disasters” (IND) on behalf of the Government. There is agricultural insurance legislation and regulation. Agricultural Insurance Market Structure (2008) In 2008 KANAT was the sole crop insurance organization. Livestock insurance was provided by KANAT and by one other company. In the past, private sector insurers have been involved in specific crop sectors and livestock insurance.
Agricultural Insurance Products Available
KANAT provides cover for almost all crops, livestock, and aquaculture in Israel. The policies are technically highly developed, and perils covered are numerous but specific and adapted to each crop or livestock product. They cover key weather perils, including drought in arable crops, and limited disease cover. Quantity and quality loss is covered. Livestock and poultry are covered against mortality. Cover provided by the IND program is for specified but numerous natural disasters on certain types of fruit crops, mainly tree fruits not covered under the main program. If trees are damaged, replanting costs are also covered. The loss adjustment is yield-based.
Table 26.1: Agricultural Insurance Available 2008 Crop Insurance Products Available Greenhouse Forestry MPCI Named-peril Crop Revenue Index-based No Yes No No Yes No Livestock Insurance Products Available Aquaculture All Risk Accident &
Mortality Epidemic Disease
Other Index-based
No Yes Yes No No Yes Source: World Bank Survey (2008). Delivery Channels For crops and livestock the most important delivery channel is through KANAT’s own sales agents. Products are also distributed through producer associations and cooperatives. There are no special organizations or programs for small and marginal farmers. Voluntary vs. Compulsory Insurance Participation levels are extremely high, with an estimated 90% of national crops and 100% of livestock and poultry insured.

115
Agricultural Reinsurance KANAT purchases quota-share and stop-loss reinsurance in the international market. KANAT is also protected by government stop-loss reinsurance.
2. Public Support for Agricultural Insurance Types of Public Support for Agricultural Insurance Government supports agricultural insurance through premium subsidies and through stop-loss reinsurance.
Premium Subsidies Government premium subsidies are 35% on all crop and livestock insurance products. The farmer is responsible for payment of 65% of premium. Government also pays 80% of premium under the IND program. Public Cost of Agricultural Insurance The cost of premium subsidies averaged USD 5.9 million over the last five years (Table 26.6). The government also provides stop-loss reinsurance.
3. Agricultural Insurance Penetration Insurance Penetration Rate Crop insurance penetration is extremely high (Table 26.2). Through KANAT, 85% of farmers have purchased crop insurance for the last five years, covering 90% of the national crop and an average 212,000 ha. Livestock insurance penetration is shown at 100%, covering 220,000 heads of cattle, and an average number of poultry over the last five years of 203.6 million (Table 26.3). KANAT has operated for a long time, and penetration has been consistently high.
4. Financial Performance 5-Year Results Overall results of KANAT’s program are shown in Table 26.4. In spite of the large size of the program, with average premium over the last five years of USD 24.5 million, loss ratios have varied from 46% to 114%, reflecting the relatively small geographical size of the country and perils covered. The average loss ratio has been 85% over this period. Premiums are actuarially calculated, on long term results, and a no claims bonus system operates for farmers.
Cost of Agricultural Insurance Provision
Total insurer’s costs (inclusive of reinsurance premiums) are 25%. No breakdown is available.

116
5. Public Disaster Assistance Programs The Natural Disaster Program (IND) is operated by KANAT on behalf of the government. Amounts paid by the government in claims have averaged USD 8.9 million over the last five years (Table 26.5). It is noted that farmers must subscribe to the program and pay 20% of premiums due.
6. Additional Tables Table 26.2: Estimated Crop Insurance Penetration, 2003 to 2007
Year
Number of Crop Policies
Percent of Farmers
Purchasing Insured
Area (ha)
Percent of National Crop Area Insured
2003 -- 85% 210,273 90% 2004 -- 85% 217,741 90% 2005 -- 85% 203,368 90% 2006 -- 85% 213,696 90% 2007 -- 85% 214,179 90%
Source: World Bank Survey (2008). Table 26.3: Estimated Livestock Insurance Penetration, 2003 to 2007
Year
Number of Insured
Cattle
Percentage of National Cattle
Herd Insured
Number of Insured
Poultry Birds
Percentage of National Poultry
Insured 2003 220,000 100% 178.6 mil 100% 2004 220,000 100% 192.1 mil 100% 2005 220,000 100% 201.3 mil 100% 2006 220,000 100% 218.7 mil 100% 2007 220,000 100% 227.4 mil 100%
Source: World Bank Survey (2008). Note: The number of insured swine, sheep, and goats was not available. Table 26.4: KANAT Crop and Livestock Insurance Results, 2003 to 2007
Year Number
of Policies
TSI (USD
million)
Premium, Including Subsidies
(USD million)
Paid Claims
(USD million)
Loss Ratio
2003 --
1,372.0
22.8
23.6 104%
2004 --
1,430.1
23.2
26.4 114%
2005 --
1,507.3
25.9
11.8 46%
2006 --
1,588.5
22.0
18.4 83%
2007 --
1,868.2
28.4
23.8 84% Source: World Bank Survey (2008).

117
Table 26.5: Natural Disaster Program Payments
Year Payments (USD
million) 2003 9.5 2004 8.5 2005 8.7 2006 8.4 2007 9.2
Source: World Bank Survey (2008). Table 26.6: Government Premium Subsidies
Year Premium Subsidies
(USD million) 2003 3.8 2004 6.3 2005 6.4 2006 4.5 2007 8.3
Source: World Bank Survey (2008). Source of Country Overview Information: World Bank Survey (2008).

118
Overview on Agricultural Insurance: ITALY
1. Agricultural Insurance Market Review History of Agricultural Insurance
State intervention on risk management in agriculture has been through the National Solidarity Fund since 1970. The Fund provided preventive and compensatory actions for damage to agricultural produce and livestock. In 2000 a specialized Risk Reinsurance Fund (FRR) was created to promote innovative insurance in the agricultural sector. The purpose of the FRR was to provide insurance companies with two reinsurance mechanisms including stop-loss and quota-share reinsurance. Both mechanisms are applied to combined risks and multi-peril insurance policies. In 2003 the government established the Agricultural Risk Data Bank to supply information to the parties concerned. The online database contains over one million data entries based on statistical, insurance, and economic data relating to risk management in agriculture, livestock production, and aquaculture. The country has extensive legislative provisions on agricultural risk management, definition of disaster and coverage supporting agricultural insurance, and provision of ad hoc assistance.
Agricultural Insurance Market Structure (2008)
There is one public-private coinsurance pool in charge of agricultural risk management in the country. Twenty-five private insurance companies and several mutual/cooperative entities participate in the agricultural insurance system. The main insurance company is FATA Assigurazioni, founded in 1927, which is specialized in agricultural insurance. In 2005 its market share was estimated at 13%. The other two companies keeping a 7% to 8% share of the market are Toro and ARA Assigurazioni. The insurance companies set their own premium rates, but the companies coordinate pricing policies with the Ministry of Agriculture, including the maximum levels of insurance premiums eligible for a subsidy.
Agricultural Insurance Products Available
The public reinsurance fund provides multi-peril crop insurance (MPCI) coverage. The private insurance companies offer named-peril and MPCI coverage. Greenhouse insurance is widely available in the country through private insurers. Private insurance companies offer livestock accident and mortality and aquaculture insurance. There is no public support to livestock and aquaculture insurance in Italy. There is also no index insurance product available in Italy. Competition is predominantly based on quality of insurance services. MPCI was introduced in Italy in 2003, and in 2005 its share in the overall portfolio was 2% of the total insurance premium volume. Table 27.1: Agricultural Insurance Available 2008 Crop Insurance Products Available Greenhouse Forestry MPCI Named-peril Crop Revenue Index-based Yes Yes No No Yes No Livestock Insurance Products Available Aquaculture All Risk Accident &
Mortality Epidemic Disease
Other Index-based
No Yes No No No Yes Source: World Bank Survey (2008).

119
Delivery Channels
For crop insurance, insurance agents, brokers, and producer organizations are the main delivery channels. Livestock insurance is predominantly marketed through insurance brokers. There are no special organizations or programs for small and marginal farmers. Voluntary vs. Compulsory Insurance
Both crop and livestock insurance are voluntary in Italy. There are no mandatory requirements.
Agricultural Reinsurance
Public and private reinsurers operate in the Italian agricultural risk system. Private reinsurers limit their activities almost entirely to the sector of traditional policies (single-peril and some combined and multi-peril). Crop insurance is reinsured through the government (through FRR) on quota-share and stop-loss treaties. Some part of the crop insurance portfolio is reinsured through international private reinsurers based on stop-loss treaties. The livestock insurance portfolio is reinsured through private international reinsurance companies through stop-loss treaties.
2. Public Support for Agricultural Insurance Types of Public Support for Agricultural Insurance There is a law on agricultural insurance regulating crop and livestock insurance. The government subsidizes premiums on crop and livestock insurance. As a reinsurer, the government allocates government staff to adjust losses under the government-sponsored reinsurance program. Italian government allocates funds for product development and research. Agricultural insurance premiums are exempt of sales taxes.
Premium Subsidies Premium subsidies are paid by the central government. The government subsidizes 66% of crop insurance premiums and 50% of livestock insurance premiums. Premium subsidies are available for selected crops, including fruits, grapes, cereals, and tomatoes. Livestock insurance premium subsidies are available on cows’ insurance. According to European Union legislation, the subsidies can reach up to 80% of the premiums in case the policy includes a trigger of 30% of loss. In all other situation the subsidies can be as high as 50% of the premium. Public Cost of Agricultural Insurance
The Risk Reinsurance Fund (FRR) operates as a reinsurance player. The government finances the Fund with annual payment of USD 13 million as risk capital. Through this capital the FRR reinsures treaties, and profits or losses recorded are managed as reinsurance player. Data on government cost of premium subsidies is provided in Table 27.2.

120
3. Agricultural Insurance Penetration Insurance Penetration Rate
During the 2007 agricultural insurance campaign, contribution subsidies on insurance premiums could be obtained for vegetable crops, structures, and livestock farms. More specifically, as laid down in the 2007 annual Agricultural Insurance Plan, it was possible to purchase subsidized insurance for:
a) All herbaceous crops, fruit trees, shrubs and nurseries, trees for wood and seed plants against the following events: hail, wind, frost, drought, excess rain, floods, plant diseases;
b) Greenhouses with metal framework and coverings with tempered glass, greenhouses with metal
framework and coverings with non-tempered glass or rigid plastic material (fiberglass, two-way PVC, vedril, polycarbonate, plexiglas), and greenhouses or tunnels with metal framework and coverings with plastic film (double or single) and anti-hail nets against the following events: hail, snow, wind, tornadoes, hurricanes, and lightning; and
c) Cattle and buffalo farms against the following diseases: foot-and-mouth disease, brucellosis,
pleuropneumonia, tuberculosis and enzootic leukosis, up to the value of the animals not compensable by any other state contribution, for lack of revenue for the period of stoppage of the farm and the costs of disposing of dead animals not compensated by any other state contribution.
Data on crop insurance is provided in Table 27.3. No other information was provided by the responding company. The MPCI insurance market chase is evaluated at 2% to 3% from the total agricultural insurance premium volume.
4. Financial Performance 5-Year Results
The volume of agricultural insurance has been relatively stable for the last five years. The 4-year long-term loss ratio (2003-06) for crops was 57%. Data on livestock insurance is available for the last two years (2006-2007). The reported loss ratio was 26% in 2007. Cost of Agricultural Insurance Provision
Each company independently fixes tariffs and other conditions of coverage. However, generally speaking, the insurance companies tend to tailor their tariffs to the contribution parameters drawn up by the Ministry of Agricultural and Forestry Policies when fixing the maximum level of insurance costs eligible for a subsidy. The contribution parameters are calculated every year for every single coverage/product/municipality combination eligible for a subsidy, taking into account the time series of the insurance data (sum insured, premium, sum compensated, quantity insured, quantity damaged, etc.). The method for calculating the contribution parameters is laid down in the annual Agricultural Insurance Plan. Information on the cost of providing agricultural insurance services was not provided by the responding company.

121
5. Public Disaster Assistance Programs In Italy, since 1970, state intervention with regard to risk management in agriculture has been given through the National Solidarity Fund (FSN), aimed at promoting preventive and compensatory actions for damage to agricultural produce and livestock and to farms and agricultural infrastructures, caused by natural disasters or exceptional occurrences. FSN action takes three forms:
a) Measures aimed at encouraging insurance purchased against damage to agricultural produce (crops and livestock) and structures (greenhouses and anti-hail nets), as laid down each year in a specific insurance plan, approved by a ministerial decree;
b) Grants of compensation, only in the case of damage to produce and structures not covered by the
above-mentioned agricultural insurance plan, for the purpose of the economic and productive recovery of farms that have suffered losses; and
c) Actions to restore the infrastructures related to the farming activity, including irrigation and
reclamation, according to the primary needs of the farms. The National Solidarity Fund for Fisheries and Aquaculture (FSNPA) manages risks in the fisheries and aquaculture sectors in Italy. Article 14 of Legislative Decree No. 154 (26 May 2004), integrated by Legislative Decree no. 100 in 2005, deals with the FSNPA, reforming the national Solidarity Fund for Fisheries set up by Law 5 No. 72 (February 1992), for the purpose of promoting preventive actions to cope with damage to produce and to productive structures in the fisheries and aquaculture sector caused by natural disasters or exceptionally bad weather. Recourse to the FSNPA is aimed at the adoption of:
a) Measures intended to encourage the taking out of insurance policies by fishery and aquaculture enterprises to cover risks related to serious damage to structures, including the sinking of craft, as a result of disasters, or to fluctuation of the prices of raw materials. In particular, although public subsidies to insurance premiums are provided for, this facility has not yet been put into force due to the fact that a yearly insurance plan has not been established;
b) Grants of compensation, solely in the case of damage to products and structures not included in
the annual insurance plan, aimed at the economic and productive recovery of the fishery enterprises; and
c) Measures in favor of the direct heirs of seamen embarked on craft or workers on aquaculture
plants who die as a result of service or following sinking. 6. Additional Tables Table 27.2: Insurance Premium Subsidies, 2003 to 2007
Year Insurance Premium Subsidies
(USD million) 2003 148.5 2004 186.0 2005 214.3 2006 226.4 2007 280.2
Source: World Bank Survey (2008).

122
Table 27.3 Estimated Crop Insurance Penetration, 2003 to 2007
Year Number
of Policies Percent of
Farmers Insured Insured Area
(mil of ha) Percentage of Total
National Area Insured 2003 212,988 -- 1.0 7.8% 2004 209,201 -- 1.0 8.1% 2005 209,363 -- 1.1 8.2% 2006 208,385 -- 1.1 -- 2007 238,501 -- 1.3 --
Source: World Bank Survey (2008). Table 27.4: Crop Insurance Results, 2003 to 2007
Year Number of
Policies
TSI (USD
million)
Premium, Including Subsidies
(USD million)
Paid Claims
(USD million)
Loss Ratio
2003 212,988 3,800.2 314.1 134.2 43% 2004 209,201 4,288.2 319.3 216.4 68% 2005 209,363 4,306.6 315.2 193.5 61% 2006 208,385 4,372.9 320.6 184.8 58% 2007 238,501 5,320.0 380.7 -- --
Source: World Bank Survey (2008). Table 27.5: Livestock Insurance Results, 2006 to 2007
Year Number of
Policies
TSI (USD
million)
Premium, Including Subsidies (USD
million)
Paid Claims (USD
million) Loss
Ratio 2006 -- 260.5 1.1 -- -- 2007 -- 421.1 2.0 0.5 26%
Source: World Bank Survey (2008). Source of Country Overview Information: World Bank Survey (2008) and European Union (2006).

123
Overview on Agricultural Insurance: JAMAICA
1. Agricultural Insurance Market Review History of Agricultural Insurance
Since the 1980s, several catastrophe windstorm agricultural insurance (regulated and non regulated) schemes have been implemented in Jamaica. Almost all of them operated as industry schemes for smallholder producers, meaning that all the production was insured on a compulsory basis. The exceptions included the insurance of the large sugar cane estates and several large private banana estates. Coffee, cocoa, coconuts, bananas and sugarcane have all had some form of insurance program in the past; at present only coconuts are insured. The sugarcane coverage, when in operation, was not an agricultural policy but rather an extended fire policy as an accommodation for a large client. These traditional crops have experimented with commercial agricultural insurance by utilizing international crop insurers. Cocoa carried insurance for two to three years in the early 1980s but the cover was discontinued due to underwriting problems and affordability. Drought was one of the perils insured against but no acceptable definition could be determined, so losses could not be adjusted. Bananas had an industry-level program for small-scale producers termed the Banana Industry Insurance Fund (BIIF) providing cover against tropical cyclones and floods, which was reinsured with the major crop reinsurers for many years; however, with the most recent loss history and the decision of the major grower to stop producing for export, the program is currently suspended. Reinsurers are also reluctant to resume cover following the extremely poor claim results over the last five years. Several large private estates also purchased facultative wind and flood cover in the 1990s and early 2000s. Coconuts have an industry-wide compulsory program going back over twenty-five years. The present program, Coconuts Board's Common Fund scheme, has been modified to allow farmers to buy additional contractual cover. Their program covers destruction of trees by windstorm, and made its last payout in 1988 (Hurricane Gilbert). The program is currently not reinsured. Farmers are covered on the basis of the sale of nuts for copra from the previous crop, with a designated number of nuts making up a unit, and a set number of nuts equating to a tree. Ornamental horticulture has had cover on specific farms. These covers are on an individual basis and have never been on an industry basis. Again the cover has been a fire policy in most cases. Controlled environments (green/shade house and high technology poultry and goat production units) producers in both livestock and crops have formed themselves into associations, all of which have expressed an interest to not only cover the physical structures but also the biological components (crop or livestock). Poultry Houses are currently insured under a group policy and the live chickens are insured by the contracting company (e.g. Jamaica Broilers, and Caribbean Broilers) under commercial policies reinsured into the international markets. The crop farmers are in need of cover for both the houses and the plants. Coffee production used to be covered under the Coffee Industry Board (CIB) scheme for twenty years before it was discontinued after Hurricane Ivan in 2004. The CIB insurance scheme used to be the main

124
insurance scheme in Jamaica. Currently the CIB is working to create the environment with the reinsurance market to again seek and obtain cover. The main obstacle to obtain reinsurance capacity for this scheme is the lack of confidence in the data provided with respect to farmers and their production. Agricultural Insurance Market Structure (2008)
In 2008 only one non-regulated agricultural insurance scheme was operating in Jamaica. The Coconut Board currently manages the Coconuts Board's Common Fund scheme that is compulsory for farmers selling nuts for copra. Agricultural Insurance Products Available
The Coconut Board’s product is a named-peril policy covering destruction of trees due to windstorms. Farmers are covered on the basis of the sale of nuts for copra from the previous crop, with a designated number of nuts making up a unit and a set number of nuts equating to a tree. For example, if a farmer sells coconuts to the Board, for every 100 nuts that are sold, the farmers gets $65 that goes towards an automatic insurance. The farmers’ contribution to the Coconuts Board's Common Fund is 4.5% of their sales and the coverage indemnifies them up to J$ 500 per tree.
Delivery Channels
The most important delivery channel used in Jamaica is through the Commodity Boards. There is no specialized delivery channel for small and marginal farmers in Jamaica. Voluntary vs. Compulsory Insurance
The Cocount Board program is a compulsory windstorm insurance scheme for coconut producers. In the case of the former CIB scheme for coffee farmers, crop insurance purchase was not a farmer decision since it was purchased directly by the CIB. In the case of the former BIIF banana insurance scheme the purchase of insurance was voluntary. Agricultural Reinsurance
The CIB accessed reinsurance from the international markets until 2004. After Hurricane Ivan, reinsurers decided to withdraw. In addition, reinsurers criticized the lack of clarity of the loss adjustment procedures. After the bankruptcy of the insurance company who used to underwrite the program in Jamaica, no insurance company was willing to underwrite this business. The problems were similar for the BIIF banana growers’ scheme.
2. Public Support for Agricultural Insurance Types of Public Support for Agricultural Insurance There is no public sector intervention on the agricultural sector.
Premium Subsidies
There are no agricultural premium subsidies in Jamaica. .

125
Public Cost of Agricultural Insurance Not applicable.
3. Agricultural Insurance Penetration Insurance Penetration Rate
Prior to 2004 about 20,000 farmers cultivating about 6,000 ha of coffee had access to crop insurance indirectly through the CIB.
4. Financial Performance 5-Year Results
The CIB average pure loss ratio for the period 2003 to 2004 was 332%. Cost of Agricultural Insurance Provision
The estimated overall operational and marketing costs were 20% of the premium volume. The estimated loss adjustment expenses were about 3% of the premium volume.
5. Public Disaster Assistance Programs There is no formal disaster relief act in Jamaica. Decisions with regards to agricultural ad hoc assistance in the case of disaster events affecting agriculture sector are made on case-by-case basis depending on the available resources.
6. Additional Tables Table 28.2*: Estimated Crop Insurance Penetration, 2003 to 2004**
Year Number of Crop Policies
Percent of Farmers Purchasing
Insured Area (ha)
Percent of National Crop Area Insured
2003 6,000 -- 4,000 1.43% 2004 6,000 -- 4,000 1.43%
Source: World Bank Survey (2008). *There is no Table 28.1. ** Program discontinued after 2004
Table 28.3: Crop Insurance Results, 2003 to 2004*
Year Number of
Policies
TSI (USD
million) Premium
(USD)
Paid Claims (USD)
Average Sum Insured
(USD)
Average Premium
(USD) Average
Rate Loss
Ratio 2003 6,000 11.3 689,666 0 1,884 115 6.1% 0% 2004 6,000 8.8 470,184 3.1 mil 1,461 78 5.4% 667%
Source: World Bank Survey (2008). *Program discontinued after 2004. Source of Country Overview Information: World Bank Survey (2008).

126
Overview on Agricultural Insurance: JAPAN
1. Agricultural Insurance Market Review History of Agricultural Insurance
In 1929 the Livestock Insurance Act was enacted as a modern disaster relief measure. The National Forest Insurance Law was enacted in 1937 in order to compensate forest owners for damage by fire, weather impacts (wind, water, snow, drought, frost, tidal waves), and volcanic eruptions. The Crop Insurance Act was established in 1938.
The Agricultural Cooperative Association Law was enacted in 1947. This law became the main pillar of the reorganization of agricultural organizations as a part of the democratization and modernization of farm villages in Japan. Under this law, the Agricultural Disaster Compensation Program aims at providing stability to farm businesses by compensating losses that farmers may incur as a result of unexpected accidents. The Agricultural Disaster Compensation consolidates livestock insurance and crop insurance and provides relief to farmers whose crops or livestock have been damaged by weather events, diseases, and pests.
The Agricultural Insurance Scheme relies on the principle of solidarity among farmers. Each cooperative creates a fund where farmers contribute through premiums. The scheme now insures almost all major crops. Agricultural Insurance Market Structure (2008)
The Agricultural Insurance Scheme is based on the principle of solidarity among farmers. It relies on a network of cooperatives at the local, regional, and national levels. Premium rates are set when the cooperatives/federations pay reinsurance premiums to the government. Management fees of cooperatives and federations for operating the scheme are included in the national budget every year. There are currently about 300 cooperatives nation-wide.
Agricultural Insurance Products Available
The insurance products available under the Japanese agriculture insurance scheme are specified by law. The policy wording used for this market is “all risk” policy.
Listed below are the types of agricultural insurance products available in Japan:
• Rice, wheat, barley insurance (nation-wide program) • Livestock insurance (nation-wide program) • Fruit production and fruit tree insurance (optional program) • Field crop and sericulture insurance (optional program) • Greenhouse insurance (optional program)
Forestry insurance covers against fire, weather perils such as wind, water, snow, drought, frost, tidal waves, and volcanic eruption.
127
Table 29.1: Agricultural Insurance Available 2008 Crop Insurance Products Available Greenhouse Forestry MPCI Named-peril Crop Revenue Index-based Yes Yes No No Yes Yes Livestock Insurance Products Available Aquaculture All Risk Accident &
Mortality Epidemic Disease
Other Index-based
Yes Yes Yes No No Yes Source: World Bank Survey (2008). Delivery Channels
The only delivery channel of agriculture insurance in Japan is through about 300 cooperatives. There is not any specialized delivery channel for small and marginal farmers. Almost all farmers in Japan are small size farmers with an average of 1.9 cultivated ha each. Voluntary vs. Compulsory Insurance
The voluntary or compulsory nature of Japanese agriculture insurance scheme depends on the type of insurance product and the farm size. Main agriculture products like wheat, barley, and rice are insured on a compulsory basis. However, farmers who do not meet some criteria (such as minimum insured area) are not eligible for the compulsory cover and can opt to purchase a policy on a voluntary basis. Other agricultural insurance products like livestock insurance, fruit and fruit tree insurance, field crop insurance, and greenhouse insurance are voluntary.
Agricultural Reinsurance
100% of the agricultural insurance liability is reinsured by the Japanese government.
2. Public Support for Agricultural Insurance Types of Public Support for Agricultural Insurance The Japanese government has a deep commitment for the development of agricultural insurance. The government provides approximately 50% premium subsidies. In addition, it acts as reinsurer of last resort for the whole agricultural insurance scheme. Premium Subsidies
According to estimates from the Management Improvement Bureau of the Ministry of Agriculture, Forestry, and Fisheries of Japan for the period from 1990 to 2005, the government of Japan spends, on average, USD 640 million every year to subsidize 50% of the cost of agricultural mutual relief premiums. . Public Cost of Agricultural Insurance (i) Agricultural mutual relief premiums subsidies USD 640 million on average per year (ii) Grants to federations USD 44 million on average per year

128
The government of Japan acts also as reinsurer of last resort for the whole agricultural insurance scheme. The average loss ratio for the government reinsuring the agricultural insurance scheme for the period 2003-2005 is 125%.
3. Agricultural Insurance Penetration Insurance Penetration Rate
In 2005 about 2.4 million policies were issued, and the insured area reached 2.1 million ha, representing about 53.0% of total national cropped area. The number of insured livestock in Japan in 2005 was 6.7 million heads. Forestry insurance is a big business in Japan with 394,000 ha insured and 31,000 policies issued.
4. Financial Performance 5-Year Results
The average loss ratio for the whole market was 94% for the period 1986 to 1995 (see Table 29.3). Cost of Agricultural Insurance Provision
No data available.
5. Public Disaster Assistance Programs
Disaster Countermeasure Basic Act of 1951. The Disaster Countermeasure Basic Act is the basis of disaster management in Japan. Under this law the farmers affected by natural disasters are eligible for a variety of low interest loans with rather generous conditions in comparison with the normal ones. Affected farmers also are entitled to tax reductions or exemptions. In case the area where the farm is located is declared an “Extreme Severity Disaster”, farmers have access to additional special services.
6. Additional Tables Table 29.2: Estimated Crop Insurance Penetration, 2003 to 2005
Year
Number of Crop Policies
Percent of Farmers
Purchasing Insured Area
(mil of ha)
Percentage of National Crop Area
Insured 2003 2.4 mil -- 2.2 55% 2004 2.3 mil -- 2.1 53% 2005 2.3 mil -- 1.8 46%
Source: World Bank Survey (2008).

129
Table 29.3: Crop and Livestock Insurance Results, 2003 to 2005
Year
Number of
Policies
TSI (USD
million)
Premium (USD
million)
Paid Claims
(USD million)
Average Sum Insured
(USD)
Average Premium
(USD) Average
Rate Loss
Ratio Crops
2003 2.4 mil 11,776.8 420.2 805.7 89,114 3,180 3.6% 192% 2004 2.3 mil 13,030.9 456.8 320.1 101,377 3,554 3.5% 70% 2005 2.2 mil 11,821.0 398.2 24.5 -- -- 3.4% --
Livestock 2003 5.9 mil 11,006.7 547.0 524.3 1,861 92 5.0% 96% 2004 6.6 mil 12,938.1 604.2 586.6 1,973 92 4.7% 97% 2005 6.7 mil 12,827.2 596.9 570.6 1,921 89 4.7% 96%
Total 2003 8.3 mil 22,783.5 967.3 1,330.0 3,769 160 4.3% 138% 2004 9.2 mil 25,969.0 1,061.0 906.7 3,883.8 159 4.1% 85% 2005 8.9 mil 24,648.1 995.1 595.1 -- -- 4.0% -- %
Source: World Bank Survey (2008). Diagram 1: Organization of the Japanese Agricultural Scheme
Prefectural Federations [Reinsures]
Farmers Premiums Indemnities
indemnities
indemnities Premiums
Premiums
Cooperatives [Insurers]
Supervision
Governor
Supervision
Minister of A.F.F
The Ministry of Agriculture, Forestry and Fisheries of Japan
[Re-reinsures]

130
Diagram 2: Loss Assessment Process on the Japanese Agricultural Scheme
Prefectural Federations [Reinsures]
Farmers
Notification of Damage
Cooperatives [Insurers]
The Ministry of Agriculture, Forestry and Fisheries of Japan
[Re-reinsures]
Loss Assessment Committee
Loss Assessment Committee
Inspection under MAFF
1st Report of Damage
1st Report of Damage
Approval of Report
Final Report of Damage
Sampling Loss Assessment
Entire Plot Assessment
Sampling Loss Assessment
Prefectural Federations [Reinsures] Loss Assessment
Committee
Sampling Loss Assessment

131
Requirements for Conclusion of Insurance Contracts of Each Insurance Program Compulsory or voluntary Insurance Program, etc. Requirements for Conclusion of Insurance
Contract Founding Regulation
Com
puls
ory
Subs
crip
tion
Syst
em In
sura
nce
Ric
e, W
heat
and
Bar
ley
Insu
ranc
e
Farmers, etc., eligible for ipso facto subscription
Farmers within the scope of 20-40 acres of paddy rice or 10-30 acres of upland rice, wheat or barley (in the case of Hokkaido, 30-100 acres of paddy rice or upland rice or 40-100 acres of wheat or barley) and meeting or exceeding the criterion stipulated by the prefectural governor shall have concluded an insurance contract because of the fact of the act of crop cultivation
Article 104 of the Agricultural Disaster Law
Farmers, etc., eligible for optional subscription
Farmers who do not satisfy the above criteria and whose total cultivated acreage of paddy rice, upland rice or wheat or barley meets or exceeds the criterion stipulated by the cooperative (not exceeding 10 acres) shall be able to conclude an insurance contract if the cooperative has not refused the farmer's application for subscription within 20 days of its filing
Article 104-2 of the Agricultural Disaster Law
Vol
unta
ry S
ubsc
riptio
n Sy
stem
Insu
ranc
e
Livestock Insurance
A person engaged in the business of raising cattle, horses, or swine shall apply for subscription, and the insurance contract shall be concluded through a cooperative approving this application.
Article 111 of the Agricultural Disaster Law
Fruit and Fruit-tree Insurance
Farmers within the scope of 5-30 acres of any of the items eligible for harvest insurance and tree insurance and meeting or exceeding the criterion stipulated by a cooperative shall apply for subscription, and the insurance contract shall be concluded through the cooperative approving this application
Article 120-2 of the Agricultural Disaster Law
Field Crop Insurance Farmers within the scope of 5-30 acres (in the case of Hokkaido, 30-100 acres) of any of the items eligible and meeting or exceeding the criterion stipulated by a cooperative shall apply for subscription, and the insurance contract shall be concluded through the cooperative approving this application
Article 120-12 of the Agricultural Disaster Law
Greenhouse Insurance Farmers whose installation acreage of designated greenhouses owned or managed is within the scope of 2-5 acres and meeting or exceeding the criterion stipulated by a cooperative shall apply for subscription, and the insurance contract shall be concluded through the cooperative approving this application
Article 120-19 of the Agricultural Disaster Law
Note: Based on information from the Ministry of Agriculture, Forestry and Fisheries.
Source of Country Overview Information: World Bank Survey (2008).

132
Overview on Agricultural Insurance: KAZAKHSTAN
1. Agricultural Insurance Market Review History of Agricultural Insurance
Before 1990 there was a state system of agricultural insurance in Kazakhstan. Agricultural insurance services were offered by the single state insurance company that provided both crop and livestock insurance. Agricultural insurance was mandatory. After 1990 the agricultural insurance system disintegrated, and insurance services for the agricultural sector were provided through private insurance companies on a voluntary basis. Insurance companies targeted large farms to optimize administrative costs.
In 1997 Kazakhstan introduced mandatory agricultural insurance through a special provision in the Insurance Law. Agricultural insurance services were offered through a specialized state insurance company named Kazagropolis, but the agricultural insurance uptake was low. During the period from 1998 to 2002 the number of insurance companies offering agricultural insurance decreased from 13 to 7. Premium rates were high, reaching 20%. In 2003 the government adopted a law on the state regulation of finance market and finance institutions. In 2004 a law on mandatory crop insurance was adopted. Currently agricultural insurance is mandatory for all crop producers.
Agricultural Insurance Market Structure (2008)
The subsidized crop insurance system is administered by the state-owned joint-stock company “Fund for Finance Support of Agriculture”. This company distributes funds allocated by the government to promote agricultural insurance. There are eight private insurance companies and 45 mutual insurance companies offering agricultural insurance services under the subsidized program. The companies offer premium rates as established by the state. Livestock insurance is voluntary; information about it is unavailable.
Agricultural Insurance Products Available
Multi-peril crop insurance (MPCI) is offered against weather risks that can cause crop damage or total loss: hail, frost, drought, and floods. Table 30.1: Agricultural Insurance Available 2008 Crop Insurance Products Available Greenhouse Forestry MPCI Named-peril Crop Revenue Index-based Yes, weather perils
No No No No No
Livestock Insurance Products Available Aquaculture All Risk Accident &
Mortality Epidemic Disease
Other Index-based
-- -- -- -- -- -- Source: World Bank Survey (2008).
Information on livestock insurance is not available.

133
Delivery Channels
Mandatory crop insurance is offered through insurance agents and through the mutual insurance societies. There are no special organizations or programs delivering insurance services to small and marginal farmers. Voluntary vs. Compulsory Insurance
Crop insurance is mandatory. Livestock insurance is voluntary.
Agricultural Reinsurance
All agricultural risks are retained by the insurance companies in the country. Government compensates 50% of losses reported by the participating insurance companies. Access to international reinsurance is a major constraint.
2. Public Support for Agricultural Insurance Types of Public Support for Agricultural Insurance Government supports agricultural insurance by paying 50% of the insurance indemnities reported by the insurance companies. This is similar to a free quota-share (50%-50%). Government payouts are made to private insurance companies and to mutual insurance societies.
Premium Subsidies Government subsidizes 50% of the insurance indemnity payouts. Public Cost of Agricultural Insurance Government started to provide payout subsidies in 2005. Annual subsidies vary depending on the actual aggregate insured losses.
3. Agricultural Insurance Penetration Insurance Penetration Rate
The government strictly supervises the enrollment of the farmers under the compulsory crop insurance program. The number of contracts signed was increasing steadily during 2005 to 2008. Total agricultural area in Kazakhstan is 222.6 million ha, which includes 24 million ha arable land (10.8%), 5 million ha hayfields (2.2%), and 189 million ha pastures (85%). Table 30.3 shows that for crops the percentage insured area is very high, having risen from 43.5% of total national arable area in 2005 to 61.2% of area (14.7 million ha) in 2008. This finding is not surprising, since crop insurance is compulsory in Kazakhstan. Information about livestock insurance is not available.

134
4. Financial Performance 5-Year Results
For the past three years the crop insurance program has achieved an average TSI of nearly USD 200 million per annum, generating annual average premiums of nearly USD 6 million with an annual average rate of 3.4%. It is noticeable that average rates have been reduced over time and were only 2.3% in 2008. From 2006 to 2008 the average annual loss ratio was 92.2%, rising to 97% over the past 4 years. Once acquisition costs and insurers’ own administration costs are taken into account, the scheme would have operated at a loss over the past 4 years (i.e. combined ratio > 1).
Table 30.5 shows that the average size of insured policy was 564 ha with average sum insured of USD 8,973 per policy, generating an average of premium of USD 342 per policy during the reference period or, in other words, fairly large farmers have been insured under the compulsory program. However, the average sum insured provided by insurers is extremely low in Kazakhstan at only USD 16.4 per ha, which must represent a very small percentage of the actual costs of production and expected revenue. It is not known whether the very low sums insured are due to the fact that farmers are not willing to pay higher premiums for higher levels of coverage under this compulsory program.
Cost of Agricultural Insurance Provision
Information is not available.
5. Public Disaster Assistance Programs The government monitors emergency situations and provides assistance in case of extensive fire, epidemic livestock diseases, and crop diseases. The government maintains an extensive program for controlling the livestock sector and assisting producers in case epidemic diseases would be identified. 6. Additional Tables Table 30.2: Government Support of Agricultural Insurance, 2005 to 2007
Year Public Indemnity Payout
(USD million) 2005 4.1 2006 1.8 2007 2.2
Source: World Bank Survey (2008).

135
Table 30.3: Estimated Crop Insurance Penetration, 2005 to 2008
Year Number of
Policies Percent of
Farmers Insured Insured Area
(mil of ha) Percentage of National
Crop Area Insured 2005 19,008 65.1% 10.5 43.6% 2006 12,436 62.4% 8.9 37.3% 2007 22,908 80.6% 11.8 49.2% 2008 31,301 88.6% 14.7 61.3%
Source: World Bank Survey (2008). Table 30.4: Crop Insurance Results, 2004 to 2008*
Year
TSI (USD
million) Premium (USD
million) Paid Claims
(USD million) Loss Ratio Loss Cost
Average Premium
Rate 2004 -- 6.3 -- -- -- -- 2005 -- 7.3 8.1 112.0% -- -- 2006 106.7 5.2 3.7 70.4% 3.4% 4.9% 2007 233.5 7.0 4.0 57.8% 1.7% 3.0% 2008 254.9 5.8 14.8 257.0% 3.4% 2.3% Total 595.1 17.9 16.2 90.6% 2.7% 3.0%
Average 198.4 6.0 5.4 92.2% 2.8% 3.4% Source: World Bank Survey (2008). Note: * caution should be exercised in interpreting the results because the reported claims figures for 2005 and 2006 may be inconsistent Table 30.5: Crop Insurance Averages, 2005 to 2008
Year
Average Insured Area
(ha)
Average Sum Insured
(USD)
Average Premium
(USD)
Average Sum Insured per
Hectare (USD/ha)
Average Premium per
Hectare (USD/ha)
2005 550 -- 334 N/A 0.7 2006 719 8,582 586 11.9 0.6 2007 515 10,195 226 19.8 0.6 2008 470 8,142 223 17.3 0.4
Average 564 8,973 342 16.4 0.6 Source: World Bank Survey (2008). Source of Country Overview Information: World Bank Survey (2008).

136
Overview on Agricultural Insurance: MALAWI
1. Agricultural Insurance Market Review History of Agricultural Insurance
An index insurance product was introduced in Malawi with technical assistance provided by the Commodity Risk Management Group (CRMG) of the World Bank. Development work started in 2003, and the product was first launched for the 2005/06 cropping season. During the initial 2005/06 cropping season, 892 groundnut farmers located within 20 km of four weather stations purchased index-based weather insurance. During the 2006/07 cropping season, the groundnut pilot expanded, with the addition of a fifth weather station, to 1,710 groundnut farmers. During the 2007/08 season, the program was expanded to the tobacco sector. Livestock insurance was launched in 2008 by NICO General Insurance Company. Agricultural Insurance Market Structure (2008)
Nine Malawi-registered insurance companies have combined to form a coinsurance pool, under the umbrella of the Insurance Association of Malawi, to underwrite the weather index insurance program. One insurance company underwrites livestock insurance. Agricultural Insurance Products Available Table 31.1: Agricultural Insurance Available 2008 Crop Insurance Products Available Greenhouse Forestry MPCI Named-peril Crop Revenue Index-based No Yes No Yes No No Livestock Insurance Products Available Aquaculture All Risk Accident &
Mortality Epidemic Disease
Other Index-based
No Yes Yes No No No Source: World Bank Survey (2008).
The index insurance product is a rainfall-deficit (drought) product. Details of the livestock product are not available. Delivery Channels
The index insurance product is distributed as a package through supply chain actors, so that insurance is supplied with input requirements to cropping farmers and with credit made available by local financial institutions. An objective of the insurance is to facilitate access to credit by farmers and to link the insurance to improved production capacity, e.g. improved seeds and practices. The key delivery channels are therefore MFIs, local banks, and contract farming companies. In 2007/08 and 2008/09 weather index-based insurance was bundled with tobacco production loans and retailed as a package to small farmers who work within tobacco contract farming supply chains, where they also receive extension services, quality inputs, and access to output markets. Maize seed and fertilizer are also included in the package so that farmers can also grow a food crop for consumption. Both the bank and contract farming company work together to deliver the product and related information to farmers. In 2005/06 and 2006/07 insurance contracts were bundled with groundnut productions loans. The stakeholders were local banks and

137
NASFAM, a smallholder farmer association. This program was discontinued in 2007 due to problems within the groundnut supply chain (side-selling) and not with problems related to the insurance product. Livestock insurance is delivered through insurance brokers. Special delivery channels include the packaging of insurance products to contract farming companies to streamline delivery to small farmers. The majority of farms in Malawi are small, and a “stand alone” insurance product would not be viable. The distribution arrangements above allow the insurance product to reach smallholders and to deliver additional services than insurance alone. Voluntary vs. Compulsory Insurance The index insurance is voluntary. However, due to the linkage of insurance to finance and inputs, farmers are enrolled in the insurance when entering the contract to grow the crop. Livestock insurance is voluntary. Agricultural Reinsurance The index insurance policy has been reinsured with a proportional (quota-share) reinsurance contract in the 2007 and 2008 seasons. Although the transaction size was small, it was of interest to international reinsurers, who are actively looking to expand index products, including in developing country programs. Availability of reinsurance is not considered a constraint to expansion of index insurance in Malawi.
2. Public Support for Agricultural Insurance Types of Public Support for Agricultural Insurance There is no form of government support for agricultural insurance in Malawi. Premium Subsidies There is no premium subsidy available in Malawi. Public Cost of Agricultural Insurance There is no public cost for agricultural insurance in Malawi. The development of rainfall index insurance has been carried out with technical assistance from donors. Apart from the farmer-level (micro-level) rainfall index product described, the government has also worked with the World Bank to develop an index-based macro-level food security product. Premiums for the insurance in this macro product, which is intermediated through the World Bank treasury to the private market, have been paid by donors in 2008.
3. Agricultural Insurance Penetration Insurance Penetration Rate
The pilot index insurance program, started in 2005, has a small penetration at present.In 2005 and 2006 only groundnut (2005) and groundnut and maize (2006) farmers were insured. In 2006 1,710 farmers bought 2,537 policies (some farmers bought just groundnut and some groundnut and maize). In 2007 the product was extended to tobacco. There are approximately 300,000 tobacco farmers in Malawi and

138
approximately 140,000 tobacco cropping ha in Malawi. Livestock insurance only started in 2008, when 102 policies were sold.
4. Financial Performance 5-Year Results
During the three years of operation, the rainfall index insurance has incurred a loss ratio of 6%.
Year Premium (USD) Paid Claims (USD) Loss Ratio 2005 2,948 154 5% 2006 9,190 1,308 14% 2007 13,627 9 0%
The sums insured have been approximately USD 34,250, USD 100,000, and USD 310,000 in 2005, 2006, and 2007, respectively. Cost of Agricultural Insurance Provision
No information is available on the costs of administering the index insurance program. In view of the small premium income generated to date (approximately USD 25,000 over three years), the market has been going through a period of capacity building in preparation for future expansion. Analysis of current costs for insurers and available margins from premium for administration are not meaningful. External technical assistance and linkage to MFIs and NGOs has been an important factor in facilitating the start-up of the program. The Insurance Association of Malawi considers that its involvement in the program provides a diversification of product lines and is also undertaken for reasons of social responsibility.
5. Public Disaster Assistance Programs There are no other forms of disaster compensation available to farmers. 6. Additional Tables Table 31.2: Estimated Crop Insurance Penetration, 2005 to 2008
Year
Number of
Policies
Percent of Farmers Insured
Insured Area (ha)
Percent of National
Crop Area Insured
2005 892 0% 2,204 2% 2006 2,537 1% 6,269 4% 2007 425 0% 425 0% 2008 2,587 1% 2,587 2%
Source: World Bank Survey (2008). Source of Country Overview Information: World Bank Survey (2008).

139
Overview on Agricultural Insurance: MAURITIUS
1. Agricultural Insurance Market Review History of Agricultural Insurance The Sugar Insurance Fund Board (SIFB) was established in 1946; it has one of the longest continuous agricultural insurance programs outside Europe and North America. Sugar is the predominant crop on the island, and insurance is compulsory for sugar growers. Although a public sector body, SIFB follows established commercial insurance principles and practices and operates under specific legislation. The current Agricultural Insurance Act dates from 1974, with subsequent amendments. Agricultural Insurance Market Structure (2008) The major crop insurer on the island is SIFB. There is also a small program operated by the Small Planters Welfare Fund for certain vegetable crops. Agricultural Insurance Products Available
SIFB provides protection to sugar producers for named-perils of cyclone, drought, excessive rainfall, and fire. The policy indemnifies growers on a yield-based measurement, following a declared loss, based on production at the sugar mills. Compensation is based on yield loss, sugar content, and sugar price obtained by the industry for the crop year concerned. Farmers are ranked individually according to claims experience, which determines their individual premium rates due and deductible levels.
Table 32.1: Agricultural Insurance Available 2008 Crop Insurance Products Available Greenhouse Forestry MPCI Named-peril Crop Revenue Index-based No Yes No No No Yes Livestock Insurance Products Available Aquaculture All Risk Accident &
Mortality Epidemic Disease
Other Index-based
-- -- -- -- -- -- Source: World Bank Survey (2008). Delivery Channels The main delivery channel is the Mauritius Sugar Syndicate but also producer associations and cooperatives. It should be noted that all sugar is processed through mills, allowing a clear route for farmer enrollment. All fields are recorded. Note that participation is compulsory for all sugar farmers and that premium is deducted at source from growers’ accounts. The majority of farmers are small-scale producers, so there is no special delivery channel or program for small farmers. Voluntary vs. Compulsory Insurance Crop insurance is compulsory for all farmers growing more than 1 Arpent (0.04 ha) of sugar.

140
Agricultural Reinsurance SIFB purchases non-proportional reinsurance from the international reinsurance market (aggregate excess of loss reinsurance).
2. Public Support for Agricultural Insurance Types of Public Support for Agricultural Insurance Government established the legislation for the operation of SIFB. There is limited other government support to agricultural insurance in Mauritius. Following a disaster, loans at a discounted rate may be provided by the Development Bank of Mauritius. Premium Subsidies Premiums are fully funded by sugar farmers, although there may be minor provisions of premium subsidies. Subsidies amount to less than 1% of the overall premiums. Public Cost of Agricultural Insurance There is no public cost involved.
3. Agricultural Insurance Penetration Insurance Penetration Rate No specific information is provided. However, since the program is compulsory, participation is 100% in the sugar sector. There were 71,500 ha under sugar cultivation (2006). Table 32.2 shows that there were 24,300 policies issued in 2007.
4. Financial Performance 5-Year Results SIFB’s average loss ratio for the 2003 to 2007 period has been 70%, with the highest figure of 102% in 2007 (Table 32.3). However, the scheme is covering the catastrophe peril of cyclone and is exposed to infrequent but severe events, which needs to be managed financially through reserves and reinsurance. Loss ratios since 1980 have varied between 8% and 350%. Cost of Agricultural Insurance Provision SIFB’s overhead costs are shown in Table 32.4 as 12% of the original gross premium (OGP) rate. There are no acquisition costs. Loss adjustment costs are not separately specified, and inspectors are on the staff of SIFB. SIFB accounts for 2006 showed investment income on reserves equivalent to approximately 180% of the administrative costs.

141
5. Public Disaster Assistance Programs There is no form of government disaster relief.
6. Additional Tables Table 32.2: Estimated Crop Insurance Penetration, 2003 to 2007
Year
Number of
Policies
Percent of Farmers Insured*
Insured Area (ha)
Percentage of National Crop Area
Insured 2003 28,000 100% -- -- 2004 27,600 100% -- -- 2005 26,900 100% -- -- 2006 25,600 100% -- -- 2007 24,300 100% -- --
Source: World Bank Survey (2008). * 100% for sugar farmers Table 32.3: Crop Insurance Results, 2003 to 2007
Year Number of
Policies TSI (USD
million) Premium
(USD million) Paid Claims
(USD million) Loss Ratio 2003 28,000 349.4 28.9 21.7 75% 2004 27,600 370.7 30.8 12.7 41% 2005 26,900 376.5 30.9 20.0 64% 2006 25,600 337.3 27.7 19.2 69% 2007 24,300 327.0 26.6 27.2 102%
Source: World Bank Survey (2008). Table 32.4: Insurers’ Costs as a Percent of OGP
Costs Percent of OGP Marketing & Acquisition 0% Administration 12% Loss Adjustment 0%
Total 12% Source: World Bank Survey (2008). Note: Insurance premium taxes were negligible and were therefore not included. Source of Country Overview Information: World Bank Survey (2008).

142
Overview on Agricultural Insurance: MEXICO
1. Agricultural Insurance Market Review History of Agricultural Insurance Crop insurance in Mexico dates back to 1926. Many of the early schemes were mutual in nature, wherein agricultural cooperatives often constituted special funds to cover crop losses caused by natural disasters.
In 1961 the government, through Aseguradora Nacional Agricola y Ganadera S.A. (ANAGSA), started to underwrite a multi-peril crop insurance (MPCI) policy supported by federal government premium subsidies of between 45% and 61% of the original gross premium (OGP) rate. The most important feature of the ANAGSA program was that crop insurance was a prerequisite for approval of loans from the state-owned agricultural development bank (i.e. compulsory crop-credit insurance). ANAGSA experienced very poor underwriting results; premiums were not set on an actuarial basis; claims adjustment and loss assessment was often poorly implemented, and the program incurred very high administrative expenses. Therefore, in 1990 the federal government terminated the program.
In 1990 Agroasemex replaced ANAGSA as the national public sector crop and livestock insurance company, operating along strictly commercial insurance principles and with greatly improved management systems and procedures. Agroasemex also acted as a stop-loss reinsurer of the small farmer mutual crop and livestock insurance funds (“Fondos de Aseguramiento”) which are a unique feature of Mexican agricultural insurance. Other functions were to serve as a technical adviser to the Fondos and to manage the federal government’s agricultural insurance premium subsidies. In the early 1990s several private commercial insurers also started offering crop and livestock insurance.
In 2001, the Mexican government redefined the role of Agroasemex: The company withdrew from the direct agricultural insurance market in order to focus on its new role as a national agricultural reinsurer, agricultural insurance research and development provider, and manager of the federal agricultural insurance premium subsidy scheme. Agricultural Insurance Market Structure (2008)
Mexico has a well-defined public-private partnership for agricultural insurance termed the National System for Insurance of the Rural Sector (Sistema Nacional de Aseguramiento al Medio Rural, SNAMR), which involves three key insurance entities: Agroasemex, the national agricultural reinsurer; private commercial insurance companies; and mutual insurance companies, including most importantly the “Fondos de Aseguramento” (Fondos), or small farmer agricultural insurance mutual funds that are a unique feature of Mexico.
There are currently up to six20
private insurance companies authorized to operate agricultural crop, livestock, forestry, and aquaculture insurance in Mexico. In addition to the private agricultural insurance companies, there is one mutual insurance society, Torreon Mutual Insurance Society, and about 270 Fondos, which have a special status within the insurance regulations to offer crop and livestock insurance products and services to their members.
20 These companies include Proagro, General de Seguros and Mapfre Tepeyac Mexico, Royal and Sun Alliance, Grupo Nacional Provincial, and Inbursa.

143
Since 2003 Agroasemex, the national agricultural insurer, has started to offer catastrophe crop index insurance to the federal and state governments in Mexico. Furthermore since 2006 Agroasemex has offered an NVDI/Remote sensing pasture index product to the state governments.
Agricultural Insurance Products Available
A wide range of agricultural (crop and livestock) insurance products is available on the Mexican market. These are classified into two major categories.
1) Traditional or commercial crop and livestock insurance products, which are offered by the
private commercial insurance companies, the mutual societies, and the Fondos and which are conventional indemnity-based insurance products that can be contracted individually or on a collective basis. These products qualify for government premium subsidies.
For crops, a wide range of product types is available through the private companies and the Fondos including: (a) single-peril hail and named-peril damage-based insurance and indemnity policies (termed “individual plant insurance”), (b) Loss of Investment Cost Insurance (Seguro a La Inversion), a multiple-peril salvage-based loss of yield insurance policy which indemnifies growers against loss of their production costs invested in growing the crop up to the time of loss, and (c) traditional MPCI yield-based indemnity insurance whereby farmers are provided a yield guarantee (which typically ranges from 50% to 70% maximum of expected yield) against a wide range of climatic, biological (pests and diseases), and pre-emergence perils (including germination failure and soil capping)21
. Greenhouse material damage insurance and forestry insurance are also available (Table 33.1).
Mexico has the largest and most developed livestock insurance market in Latin America. Livestock insurance is available for a wide range of livestock including dairy and beef cattle, pigs (swine), sheep and goats, horses, deer, poultry, and bees. In addition, aquaculture insurance is available for shrimp and fish species. For livestock, there are two main covers: (a) accident and mortality insurance, and (b) livestock epidemic disease cover. Traditionally, the most popular form of cover was individual animal insurance, but in 2005 premium subsidy support was switched from individual animal covers to a new livestock insurance policy for high mortality events (Seguro pecuario para eventos de alta mortalidad), which is a herd-based policy carrying a number of animals per event deductible. This policy insures against accidents, diseases, and forced slaughter of injured animals. The policy specifically excludes government slaughter orders, pre-existing diseases, or diseases which can be vaccinated against. The policy charges very low premium rates. In 2007 more than 3.2 million head of animals (22% of all insured animals) were insured by the private companies and Fondos under this policy. The second and most important type of policy is epidemic disease cover against Classical Swine Fever (CSF), which was purchased for 9.1 million head of swine or 62% of all insured animals in 2007. The CSF Policy indemnifies against mortality and compulsory slaughter ordered by the Ministry of Agriculture in the event of a CSF outbreak. The policy is only offered in states which are declared free of CSF.
2) Catastrophic insurance products are the second major category. These were first introduced in 2002, and they include parametric (index) products protecting against catastrophe climatic events, which are aimed at small-scale producers who cannot access commercial crop or
21 Most crop insurance policies only insure the crop from the point of crop emergence and full stand establishment up to the completion of harvest. The Mexican market, however, offers coverage for losses in the pre-emergence phase, including germination failure due to perils like excess rain leading to soil capping.

144
livestock insurance. The catastrophe insurance schemes operate under the regulations of the Fund to Protect the Rural Population Affected by Climatologic Contingencies (Fundo para Atender a la Poblacion Rural Afectada por Contingencias Climatologicas, FAPRACC). These large-scale insurance programs operate at a macro-level (as opposed to providing individual farmer insurance cover) and are purchased by the federal and or state governments through: (i) the private commercial insurers (area-yield index insurance) and through Agroasemex (rainfall deficit insurance and NDVI pasture index insurance). The catastrophe insurance programs are 100% subsidized by federal and state governments.
Private commercial insurers have been involved for several years in offering area-yield index insurance covers on a massive scale to the state governments. In 2007 the insured area of these products amounted to 880,355 ha (about 20% of the total insured area). Since 2003 Agroasemex has insured a macro-level rainfall deficit index insurance cover for the federal government under the “Program to Assist Climatologic Contingencies (PACC). PACC is administered by the Ministry of Agriculture (SAGARPA) and implemented either in conjunction with the state governments or directly with low-income farmers, defined as those owning less than 5 ha. In the event of a rainfall deficit being triggered at an insured weather station, Agroasemex indemnifies the state government, which is responsible for distributing the indemnity to the insured farmers (beneficiaries). The program has now operated for six years with major crops such as corn, sorghum, and beans and in 2007 covered more than 18 States with a total insured area of 1.5 million ha (34% of total insured area), insured through 230 weather stations with TSI of USD 83.8 million and premium of USD 10.7 million22
.
In 2007 Agroasemex also launched a pilot Pasture Satellite Insurance Program. The Program uses NDVI to measure the amount of biomass available as cattle fodder. In 2007 the NDVI pasture index program insured 13.1 million ha of pasture land and 913,000 head of cattle for a sum insured of USD 22.5 million and premiums of USD 1.8 million23
.
Catastrophe Livestock Insurance Covers. The private commercial insurers also underwrite a catastrophe livestock product for the federal and state governments, and in 2007 a total of 312,800 head of livestock were insured under this program.
Table 33.1: Agricultural Insurance Available 2008 Crop Insurance Products Available Greenhouse Forestry MPCI Named-peril Crop Revenue Index-based Yes Yes No Yes Yes Yes Livestock Insurance Products Available Aquaculture All Risk Accident &
Mortality Epidemic Disease
Other Index-based
No Yes Yes No No Yes Source: World Bank Survey (2008).
Delivery Channels
The private insurance companies market their crop and livestock insurance products through their own agent networks. The Fondos and mutual companies market directly to their members. Catastrophe crop 22 Agroasemex 2007. Sistema Nacional de Aseguramento al Medio Rural, Informe Final de Operaciones al cierre del ejercicio 2007 23 Agroasemex 2007, Agricultural Insurance Market: The Mexican Experience, paper presented at SwissRe conference October 2007

145
and livestock insurance products are marketed through federal and state governments. Very little agricultural insurance is sold through retail brokers. The Fondos or mutual insurance scheme was originally established as a mechanism for small farmers to gain access group credit and crop and livestock insurance. In addition, the catastrophe and climatic contingency schemes offered under FAPRAC and PACC by the federal and state governments are specifically targeted towards small and marginal farmers. Voluntary vs. Compulsory Insurance
Agricultural insurance is voluntary in Mexico, although there is some evidence of linkage with credit provision.
Agricultural Reinsurance
The agricultural reinsurance market in Mexico is well-developed. A group of 6 to 7 international reinsurers that specialize in agricultural reinsurance provide a combination of proportional and non-proportional reinsurance support to the private commercial reinsurers.
Agroasemex as the parastatal agricultural reinsurer has to compete on a commercial basis with the international reinsurers. Agroasemex provides stop-loss reinsurance protection to the Fondos and typically a combination of proportional (quota-share) treaty reinsurance and facultative reinsurance protection to the local private insurers. It also retrocedes part of its commercial agricultural insurance portfolio to international reinsurers. The company purchases quota-share reinsurance for its rainfall deficit weather index program.
Access to agricultural reinsurance is considered a major constraint by the respondent company, and this applies to all classes of agricultural crop and livestock insurance (crop hail and named-peril insurance, MPCI, livestock mortality cover, livestock epidemic disease cover, and non-traditional weather index cover).
2. Public Support for Agricultural Insurance In Mexico government support to agricultural insurance takes the following forms:
a) Premium subsidy support to commercial insurers/the Fondos for crop, livestock, forestry, and
aquaculture insurance; b) Agricultural reinsurance through the national agricultural reinsurer, Agroasemex; c) Subsidies for training and education. The government budgets financial assistance for training
programs for the Fondos; d) Assistance through Agroasemex in product design and rating and in the design of loss adjusting
systems and procedures. The private commercial insurers are provided access to this technology by Agroasemex; and
e) Catastrophe insurance protection for small farmers under the FAPRACC programs, which are 100% subsidized by government.

146
Figure 33.1: Public-Private Partnership for Agricultural Insurance
Premium Subsidies
The premium subsidy levels for 2008 are reported in Table 33.2 for traditional commercial crop and livestock insurance products and programs underwritten by the private insurance companies and the mutual insurers/FondosS. A group of basic or priority crops carry premium subsidy levels of between 35% and a maximum of 60% according to geographic region and exposure to loss; for all other crops a flat rate premium subsidy of 35% applies. For livestock, premium subsidy levels range between 20% for aquaculture to a maximum of 50% for exotic diseases cover, flood cover, and high mortality insurance. Mexico is one of few countries which provides epidemic disease insurance including for death of the animal and culling under government slaughter order (Table 33.2).
In the case of the catastrophe index insurance, the costs of premiums are 100% subsidized by government on the following basis: 70%-90% federal government and 10%-30% by state governments. The volume of premium subsidies for the whole market (traditional or commercial insurance and catastrophe index insurance) in 2007 was USD 61.6 million divided into USD 53.4 million of crop insurance premium subsidies (87% of total) and USD 8.2 million of premium subsidies for livestock insurance (13% of total). Over the past five years the volume of premium subsidies has nearly doubled due to two factors: (a) an increase in written premiums and (b) an increase in premium subsidy levels from an average of 31% of premiums in 2003 to 43% of premiums in 2007 (Table 33.3). Annex 33.1 shows the split of premium subsidies between traditional commercial insurance products and catastrophe index insurance covers for the past five years. In 2007, traditional insurance accounted for USD 39.5 million, or 64% of total premium subsidies, and catastrophe index insurance, USD 22.1 million of premium subsidies (34% of total).

147
3. Agricultural Insurance Penetration Insurance Penetration Rate
Table 33.4 reports the crop insurance uptake for both traditional and catastrophe insurance products over the past five years. In 2007, a total of nearly 1 million farmers (17% of total) were insured with an insured crop area of 4.4 million ha (21% of national cropped area). The most notable feature is the growth of catastrophe crop insurance coverage over this period: in 2003 only 7% of total insured area was under catastrophe insurance, but in 2007 the area insured under catastrophe area-yield index and drought index insurance covers had risen to 2.4 million ha (54% of total insured crop area).
In 2007, 15.3 million head of livestock were insured. The most important classes of insured animals included pigs (swine), accounting for 10.8 million insured head or about 72% of the national herd, and cattle, 4.4 million head insured or nearly 15% of the national cattle herd (Table 33.5). Aquaculture insurance for shrimps is another niche class of insurance with high penetration rates.
4. Financial Performance 5-Year Results
The results for the whole Mexican crop and livestock insurance market are presented in Table 33.6. For crops, the 5-year long-term average loss ratio is 43% with a maximum loss ratio of 73% in 2004. In 2007, the TSI for crops amounted to USD 1.68 billion with premiums of USD 123 million, making this the second largest crop insurance market in Latin America after Argentina. Over the past five years, average crop premium rates have declined from 8.5% in 2003 to 7.3% in 2007, with an average premium rate of 7.7% (Table 33.6), but this varies from an average of 7.6% for traditional commercial insurance policies (mainly individual grower MPCI) to a high average rate of 11.8% for the new catastrophe (mainly drought) index products (Annex 1).
Livestock insurance has operated at a higher 5-year long-term average loss ratio of 70%, and in both 2003 and 2004 the combined ratio would have exceeded 100%. The demand for livestock insurance has decreased from a peak TSI of nearly USD 4.4 billion and premiums of nearly USD 50 million in 2003 to only TSI of USD 2.4 billion and premiums of USD 19.5 million in 2007. The main feature of the results is the very low 5-year average premium rate of only 1.1% charged for the high mortality herd-based insurance and epidemic disease covers.
The overall crop and livestock results for the Mexican market over the past five years shows total annual average premiums of about USD 122 million and a long-term loss ratio of 50% (Table 33.6). These results indicate a sustained level of profitability of private, mutual, and public agricultural insurance in the 2000s compared to the very poor public sector results experienced by ANAGSA in the 1990s. The Drought Index Program has operated between 2003 and 207 with a 32% loss ratio. Cost of Agricultural Insurance Provision
The costs of insurance provision are shown for each type of agricultural insurer in Table 33.8. The market average costs are 18% for insurers’ administrative expenses and 7% for acquisition costs for a total of 25%, but costs range from an average low of 15% for catastrophe crop insurance covers to a high of about 42% for private company crop insurance. Agricultural insurance is exempted from the payment of value added tax (VAT).

148
5. Public Disaster Assistance Programs
The Mexican government operates a system of natural disaster relief payments to small crop and livestock producers. Between 1969 and 2002, disaster relief payments were made under FONDEN (Fund for Natural Disasters), and since 2003 FAPRACC (Fund to Protect the Rural Population Affected by Climatologic Contingencies) has operated a disaster relief program. The Weather Contingency Fund is managed by SAGARPA (Ministry of Agriculture) and covers disasters related to drought, tropical cyclone, severe storms, snow and hail, flooding, tornadoes, and forest fires. The National Water Commission is responsible for assessing and reporting the damages following a natural disaster, and compensation payments are settled on a 50%:50% basis by SAGARPA and the state governments. Disaster compensation payments are only made in those municipalities where crops and livestock are not insured under the catastrophe insurance programs. In 2007 the disaster compensation payments amounted to USD 23.1 million, of which 97% was compensation to crop producers and 3% to livestock producers (Table 33.9). 6. Additional Tables Table 33.2: Premium Subsidy Levels for Crop and Livestock Insurance, 2007 Basic Crops* Area of Country Subsidy Rate Region 1: Campeche, Chiapas, Guerrero, Oaxaca, Quintana Roo, Tabasco, Veracruz and Yucatán 60% Region 2: Aguascalientes, Distrito Federal, Guanajuato, Hidalgo, Mexico, Michoacán, Morelos, Puebla, Querétaro, San Luis Potosi, Tlaxcala and Zacatecas 45% Region 3: Chihuahua, Coahuila, Colima, Durango, Jalisco, Nayarit, Nuevo León and Tamaulipas 40% Region 4: Baja California, Baja California Sur, Sinaloa and Sonora 35% Livestock and Other Insurance Product Subsidy Rate High mortality 50% Milk loss production caused by high mortality 50% Loss on non-born animal caused by high mortality 50% Exotic diseases (Death) 50% Exotic diseases (Slaughter) 50% Flood 50% Losses for specific medical treatments 50% Development programs 30% Sanitary campaigns 30% Radication 30% Adaptation 30% Transport 30% Temporal Stay 30% Quarantine Stations 30% Ordinary Transit Risks 30% Aquaculture 20% Accidents: Poultry, Bees and Swine 20% Source: World Bank Survey (2008). Note: Basic crops include sesame, cotton, rice, oats, peanut, cártamo, barley, beans, chick pea, broad bean, lentil, corn, sorghum, soy beans, and wheat. For all other crops the applicable rate will be 35%. The total subsidy provided will not exceed Mex$2,000.00 (about USD 149) per ha. The livestock subsidy depends on two criteria, whichever occurs first: the rate indicated for each insurance product or the maximum insurance subsidy per insurable unit (heads) for each animal function.

149
Table 33.3: Premium Subsidy Payments for Crop and Livestock, 2003 to 2007
Year
Crop Premium Subsidies
(USD million)
Percent of Crop
Premium
Livestock Premium Subsidies
(USD million)
Percent of Livestock Premium
Total Premium Subsidies
(USD million)
Percent of Total
Premium 2003 19.9 32.9% 13.5 29.3% 33.4 31.3% 2004 21.0 35.6% 12.4 28.9% 33.4 32.8% 2005 39.7 40.8% 8.8 27.2% 48.5 37.4% 2006 51.0 42.0% 3.1 30.7% 54.1 41.2% 2007 53.4 43.5% 8.2 42.1% 61.6 43.3%
Average 37.0 39.0% 9.2 31.6% 46.2 37.2% Source: World Bank Survey (2008). Table 33.4: Estimated Crop Insurance Penetration, 2003 to 2007
Year Number
of Policies
Number of Farmers Insured
Percent of Farmers Insured
Insured Area
(mil of ha)
Percent of National
Crop Area Insured
Average Area per
Farmer (ha) 2003 41,740 209,739 3% 1.6 7% 7.5 2004 41,503 246,751 4% 1.6 7% 6.4 2005 48,399 663,913 11% 3.2 15% 4.8 2006 63,650 950,719 16% 4.4 20% 4.6 2007 54,559 984,981 17% 4.4 21% 4.5
Average 49,970 611,221 10% 3.0 14% 5.0 Source: World Bank Survey (2008).
Table 33.5: Estimated Livestock Insurance Penetration, 2003 to 2007
Year
Number of Insured
Cattle
Percent of National
Cattle Herd Insured
Number of
Insured Swine
Percent of National
Swine Herd
Insured
Number of Sheep &
Goats Insured
Percent of National
Goat/Sheep Flock
Insured 2003 5.5 mil 18.0% 10.7 mil 73.0% 168,210 1.0% 2004 4.6 mil 15.0% 17.2 mil 100.0% 282,144 2.0% 2005 2.5 mil 8.0% 8.3 mil 54.0% 214,106 1.0%
2006* 1.6 mil 5.4% 11.3 mil 75.5% 104,937 1.5% 2007* 4.4 mil 14.5% 10.8 mil 72.3% 139,980 2.0%
Average 3.7 mil 12.2% 11.7 mil 75.0% 181,875 1.5% Source: World Bank Survey (2008). Note: In 2005 about 50,000 poultry were also insured. * Percentage uptake rates for livestock estimated by authors for 2006 and 2007

150
Table 33.6: Crop and Livestock Insurance Results, 2003 to 2007
Year
Number of
Policies
TSI (USD
million)
Premium (USD
million)
Paid Claims
(USD million)
Loss Ratio
Average Sum
Insured (USD)
Average Premium
(USD)
Average Premium
Rate Crops
2003 41,752 714.7 60.5 33.8 56% 17,117 1,450 8.5% 2004 41,546 711.3 59.0 43.3 73% 17,121 1,421 8.3% 2005 48,663 1,211.2 97.4 43.8 45% 24,890 2,002 8.0% 2006 64,060 1,639.2 121.2 33.0 27% 25,588 1,892 7.4% 2007 54,892 1,680.4 122.7 46.2 38% 30,612 2,236 7.3%
Average 50,183 1,191.3 92.2 40.0 43% 23,740 1,837 7.7% Livestock
2003 17,018 4,388.8 46.0 34.7 75% 257,893 2,703 1.0% 2004 15,563 3,605.4 43.0 39.2 91% 231,665 2,762 1.2% 2005 7,577 2,343.8 32.4 18.1 56% 309,325 4,271 1.4% 2006 7,991 1,129.3 10.1 5.0 49% 141,321 1,268 0.9% 2007 15,057 2,387.7 19.5 8.4 43% 158,575 1,297 0.8%
Average 12,641 2,771.0 30.2 21.1 70% 219,203 2,389 1.1% Total
2003 58,770 5,103.5 106.5 68.4 64% 86,838 1,813 2.1% 2004 57,109 4,316.7 102.0 82.5 81% 75,587 1,786 2.4% 2005 56,240 3,555.0 129.8 61.9 48% 63,211 2,307 3.7% 2006 72,051 2,768.5 131.4 38.0 29% 38,424 1,823 4.7% 2007 69,949 4,068.0 142.3 54.4 38% 58,157 2,034 3.5%
Average 62,824 3,962.3 122.4 61.0 50% 63,071 1,948 3.1% Source: World Bank Survey (2008). Table 33.7: Average Costs of Premium Subsidy per Policy
Year
Crop Premium
Subsidy per Policy (USD)
Crop Premium
Subsidy per Hectare
(USD)
Livestock Premium
Subsidy per Policy (USD)
Livestock Premium
Subsidy per Animal (USD)
2003 477.2 12.6 791.9 0.8 2004 505.9 13.2 798.4 0.6 2005 820.9 12.5 1,159.7 0.8 2006 800.6 11.7 389.7 0.2 2007 979.1 12.1 545.3 0.5
Average 716.7 12.4 737.0 0.6 Source: World Bank Survey (2008).

151
Table 33.8: Insurer's Costs as a Percent of OGP
Program
Target Claims
Ratio Administration
Costs Acquisition
Costs Profit Crop Self Insurance Funds (Reinsurance) 65% 32% 0% 3%
Private Companies (Reinsurance) 55% 22% 20% 3% Catastrophic Insurance 82% 15% 0% 3%
Average 67% 23% 7% 3% Livestock Self Insurance Funds (Reinsurance) 70% 27% 0% 3%
Private Companies (Reinsurance) 65% 12% 20% 3% Catastrophic Insurance 80% 17% 0% 3%
Average 72% 18% 7% 3% Source: World Bank Survey (2008).
Table 33.9: Weather Contingency Fund Disaster Relief Payments
Year
Crop Compensation
Payments (USD million)
Crop Percent of Total
Livestock Compensation
Payments (USD million)
Livestock Percent of Total
Total Compensation
Payments (USD million)
2003 7.2 99% 0.1 1% 7.3 2004 11.2 66% 5.8 34% 17.0 2005 45.0 91% 4.2 9% 49.2 2006 11.8 44% 14.8 56% 26.6 2007 22.4 97% 0.7 3% 23.1
Average 19.5 80% 5.1 20% 24.6 Source: World Bank Survey (2008).

152
Annex 33.1: Distribution of Premium Subsidies between Traditional and Catastrophe Insurance Policies
Year
Traditional Insurance
(USD million) Percent of Total
Catastrophe Insurance
(USD million) Percent of
Total
Total Premium Subsidies
(USD million) Crop
2003 19.6 98% 0.4 2% 19.9 2004 18.7 89% 2.2 11% 21.0 2005 28.2 71% 11.6 29% 39.7 2006 33.9 67% 17.0 33% 51.0 2007 34.1 64% 19.3 36% 53.4
Average 26.9 78% 10.1 22% 37.0 Livestock
2003 13.5 100% 0 0% 13.5 2004 12.4 100% 0 0% 12.4 2005 8.8 100% 0 0% 8.8 2006 2.4 76% 0.7 24% 3.1 2007 5.3 65% 2.9 35% 8.2
Average 8.5 88% 1.8 12% 9.2 Total
2003 33.0 99% 0.4 1% 33.4 2004 31.2 93% 2.2 7% 33.4 2005 37.0 76% 11.6 24% 48.5 2006 36.3 67% 17.8 33% 54.1 2007 39.5 64% 22.1 36% 61.6
Average 35.4 80% 10.8 20% 46.2 Source: World Bank Survey (2008).
Annex 2: Comparison of Traditional Indemnity-based vs. Catastrophe Insurance Products
Year
Traditional (Indemnity-based) Crop Products Catastrophe (Index-based) Crop Products
Number of
Policies
Average Sum
Insured (USD)
Aver-age
Prem-ium
(USD)
Aver-age
Prem-ium Rate
Loss Ratio
Number of
Policies
Average Sum
Insured (USD)
Aver-age
Prem-ium
(USD)
Aver-age
Prem-ium
Rate Loss
Ratio Crop
2003 41,740 17,036 1,442 8.5% 56.1% 12 308,931 29,626 9.6% 0.0% 2004 41,503 16,662 1,368 8.2% 76.1% 43 462,963 52,325 11.3% 3.9% 2005 48,399 23,288 1,774 7.6% 39.1% 264 319,485 43,805 13.7% 88.7% 2006 63,650 23,579 1,637 6.9% 27.5% 410 338,110 41,511 12.3% 25.7% 2007 54,559 27,867 1,896 6.8% 38.1% 333 479,589 57,904 12.1% 35.0%
Average 49,970 21,686 1,623 7.6% 47.4% 212 381,816 45,034 11.8% 30.7% Livestock
2003 17,018 257,942 2,703 1.0% 75.4% -- -- -- -- -- 2004 15,563 231,705 2,762 1.2% 91.2% -- -- -- -- -- 2005 7,577 309,382 4,272 1.4% 55.9% -- -- -- -- -- 2006 7,990 140,257 1,175 0.8% 49.3% 1 8,802,393 741,161 8.4% 44.5% 2007 14,788 159,151 1,126 0.7% 36.4% 269 125,539 10,653 8.5% 83.2%
Average 12,587 219,687 2,408 1.0% 61.6% 135 4,463,966 375,907 8.5% 63.9% Source: World Bank Survey (2008).
Source of Country Overview Information: World Bank Survey (2008).

153
Overview on Agricultural Insurance: MOLDOVA
1. Agricultural Insurance Market Review History of Agricultural Insurance Moldova was a part of the Soviet Union until 1991. The subsidized agricultural insurance system was available in the whole country. Agricultural insurance was offered on mandatory basis by the state insurance company Gosstrakh. After the independence of the country, the agricultural insurance almost stopped.
In 2004 the national parliament adopted a Law on Agricultural Insurance. Subsidized agricultural insurance was implemented in 2005. The law defines the basic features of the subsidized agricultural insurance, including the premium subsidies. The farmers pay only their share of the premium due on the insurance policy. The rest is paid by the government directly to the insurance companies. In practice the insurers receive the subsidized share of the premiums from the government within 2 to 3 weeks after the sales of the contracts (4-week term is established by the Law on Agricultural Insurance). The government subsidizes premiums on most crops, fruits, vegetables, and grapes. Livestock insurance is also subsidized. Agricultural Insurance Market Structure
Subsidized agricultural insurance is offered only by private insurance companies. Currently, four companies participate in the program, but the biggest market share (about 80%) belongs to the Moldasig insurance company. The insurers offer both crop and livestock insurance services. Data on voluntary agricultural insurance is not available. In 2007 only 3.7% of the crops were insured (by area). Agricultural Insurance Products Available
The insurance companies offer named-peril and multi-peril crop insurance (MPCI) products. Farmers can choose the perils to be covered by the subsidized MPCI contract. The MPCI product differs from the traditional understanding of MPCI insurance because the farmer can select the list of perils covered. The insurance companies use maximum authorized premium rates as benchmarks (up to 15%), but usually the premium rates are set much lower than the highest value. The premium rates are identified by the underwriters based on the information provided by the farmer. Underwriters have a good knowledge of the agricultural production, and expert assessment is a driving factor for setting the premium rate for each individual applicant.
Livestock insurance is a multi-peril product where the client can choose the perils to be insured. The insurance companies insure livestock, sheep, goats, bees, and fish. Usually a livestock insurance contract includes perils such as weather perils, fire, epidemic diseases, accidental loss, and unlawful actions of third parties (theft, robbery, etc.).
Delivery Channels Insurance agents are the main delivery channels. Insurance brokers are the second most important delivery channel. Banks and other finance institutions as delivery channels are marginal. There are no specific organizations in Moldova for delivering agricultural insurance services to small and marginal farmers.

154
Table 34.1: Agricultural Insurance Available 2008 Crop Insurance Products Available Greenhouse Forestry MPCI Named-peril Crop Revenue Index-based Yes Yes No No No No Livestock Insurance Products Available Aquaculture All Risk Accident &
Mortality Epidemic Disease
Other Index-based
Yes Yes Yes No No Yes, some Source: World Bank Survey (2008). Voluntary vs. Compulsory Insurance
Crop and livestock insurance is voluntary. There are no mandatory requirements on agricultural insurance though the financial institutions might require insurance policy as collateral. Agricultural Reinsurance Both crop and livestock insurance portfolios are reinsured on the private international reinsurance markets. Government does not provide any reinsurance. Access to the reinsurance market is reported by the private insurer as adequate, although smaller insurers might experience difficulties with portfolio reinsurance due to small volume of the agricultural insurance portfolio. Quota-share reinsurance agreements are signed with reinsurers.
2. Public Support for Agricultural Insurance Types of Public Support for Agricultural Insurance The government of Moldova subsidizes agricultural insurance premiums. The premium subsidy in 2007/08 was 80% of the OGP premium for both crops and livestock. The farmer should pay his share of the insurance premium when the insurance contract is signed. The rest of the premium is paid by the government directly to the insurance company. The government pays its premium contribution (80%) to the insurance companies within 3 to 4 weeks. The insurance premium paid on agricultural insurance contracts is exempt from taxes. Premium Subsidies The government subsidizes 80% of the premium sum which is paid directly to the insurance company. The farmer pays only a share of 20%. Public Cost of Agricultural Insurance Information about government costs for crop insurance premium subsidy is provided in Table 34.2.
3. Agricultural Insurance Penetration Insurance Penetration Rate
Data on the whole agricultural insurance market is not available. Some data is available on the subsidized crop insurance program. In 2007 private insurers signed 145 crop insurance contracts under the

155
subsidized program. The participation rate is low. Only 3.7% of the crops (by area), or 72,900 ha, is insured (Table 34.3).
4. Financial Performance 5-Year Results The average premium rates are at 6%-12% for crops. The loss ratio data is volatile, ranging from 2% in 2006 to 29.5% in 2007. The higher loss ratio in 2007 is explained by drought, although some insured farmers use irrigation to mitigate drought risk.
Year Number of
Policies
Total Sum Insured
(USD million) Premium, Including
Subsidies (USD) Paid
Claims Loss
Ratio 2005 9 0.9 30,417 -- -- 2006 121 13.5 760,180 16,238 2.1% 2007 178 40.6 2.6 mil 765,540 29.5%
Cost of Agricultural Insurance Provision The average delivery, loss adjustment, and administration costs amount to a total of 5% of the original gross premium (OGP). Marketing and acquisition costs are 3%, and loss adjustment costs are 2%. The insurance companies explain low operating costs by their good knowledge of clients and small size of the country.
5. Public Disaster Assistance Programs The government of Moldova provides CAT ad hoc assistance to farmers who suffered from adverse weather events like drought in 2007 or excessive rainfall and floods in 2008. In 2007 the government paid USD 9.6 per hectare of the field crops after agricultural production was effected by drought. No payments were recently provided to livestock producers. 6. Additional Tables Table 34.2 Agricultural Insurance Subsidies for Crop and Livestock, 2005 to 2007
Year Public Premium Subsidies (USD) 2005 8,750 2006 615,934 2007 2.2 mil
Source: World Bank Survey (2008). Table 34.3 Estimated Agricultural Insurance Penetration, 2005 to 2007
Year Contracts
Signed Percent of
Farmers Insured Total Area
Insured (ha) Percent of National Crop Area
Insured 2005 9 -- 1,200 0.1% 2006 121 8% 17,900 0.9% 2007 178 10% 72,900 3.7%
Source: World Bank Survey (2008). Source of Country Overview Information: World Bank Survey (2008).
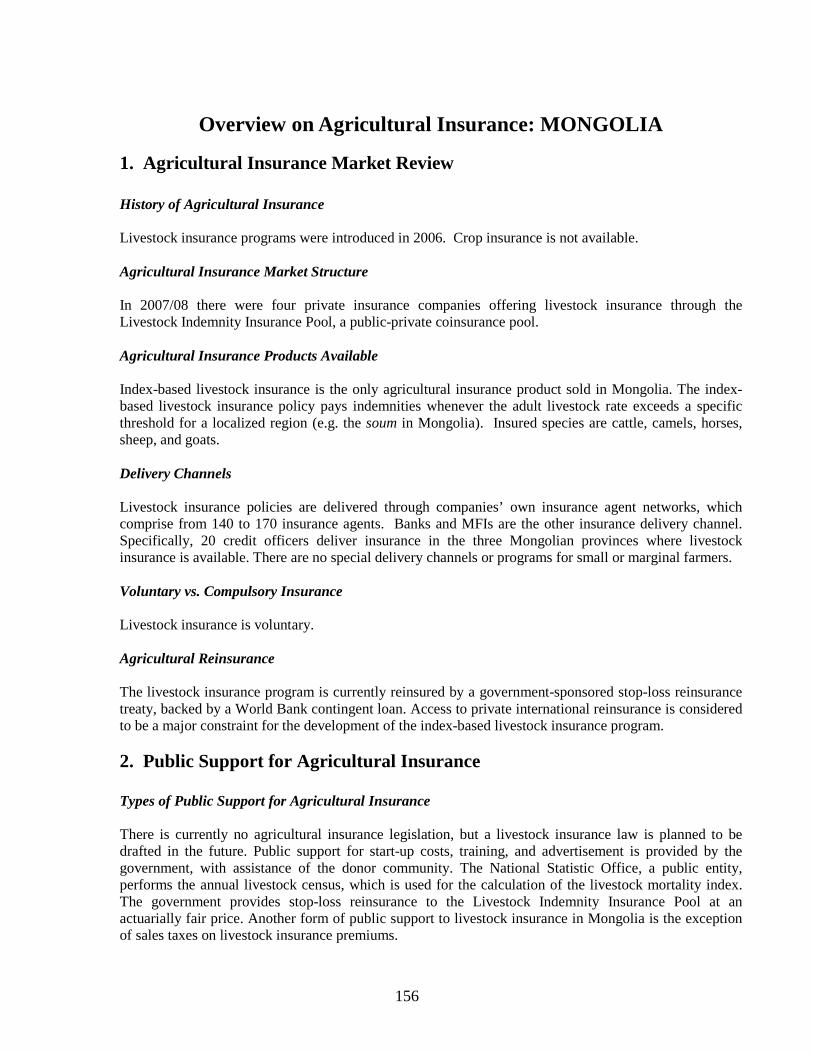
156
Overview on Agricultural Insurance: MONGOLIA
1. Agricultural Insurance Market Review History of Agricultural Insurance Livestock insurance programs were introduced in 2006. Crop insurance is not available.
Agricultural Insurance Market Structure In 2007/08 there were four private insurance companies offering livestock insurance through the Livestock Indemnity Insurance Pool, a public-private coinsurance pool.
Agricultural Insurance Products Available Index-based livestock insurance is the only agricultural insurance product sold in Mongolia. The index-based livestock insurance policy pays indemnities whenever the adult livestock rate exceeds a specific threshold for a localized region (e.g. the soum in Mongolia). Insured species are cattle, camels, horses, sheep, and goats.
Delivery Channels Livestock insurance policies are delivered through companies’ own insurance agent networks, which comprise from 140 to 170 insurance agents. Banks and MFIs are the other insurance delivery channel. Specifically, 20 credit officers deliver insurance in the three Mongolian provinces where livestock insurance is available. There are no special delivery channels or programs for small or marginal farmers.
Voluntary vs. Compulsory Insurance Livestock insurance is voluntary.
Agricultural Reinsurance The livestock insurance program is currently reinsured by a government-sponsored stop-loss reinsurance treaty, backed by a World Bank contingent loan. Access to private international reinsurance is considered to be a major constraint for the development of the index-based livestock insurance program.
2. Public Support for Agricultural Insurance Types of Public Support for Agricultural Insurance There is currently no agricultural insurance legislation, but a livestock insurance law is planned to be drafted in the future. Public support for start-up costs, training, and advertisement is provided by the government, with assistance of the donor community. The National Statistic Office, a public entity, performs the annual livestock census, which is used for the calculation of the livestock mortality index. The government provides stop-loss reinsurance to the Livestock Indemnity Insurance Pool at an actuarially fair price. Another form of public support to livestock insurance in Mongolia is the exception of sales taxes on livestock insurance premiums.

157
Premium Subsidies No premium subsidies are provided to producers. Public Cost of Agricultural Insurance The public cost of insurance has been relative high during the first years of pilot implementation due to start-up costs, mostly funded by the donor community. However, the program is designed to be financially sustainable without heavy public subsidies.
3. Agricultural Insurance Penetration Insurance Penetration Rate The number of insured animals was 246,200 for the 2007 season; 286,700 for the 2008 season; and 309,000 for the 2009 season in the three pilot aimags. This represents an insurance penetration rate of 14% for the 2009 season.
4. Financial Performance 5-Year Results Table 35.2 presents whole market livestock insurance results for 2007 and 2008. Table 35.2* Livestock Insurance Results, 2007 to 2009
Year Number of
Policies TSI
(USD million) Premium
(USD) Paid Claims (USD) Loss Ratio 2007 2,222 4.6 71,972 977 1.4% 2008 3,034 5.8 104,409 202,105 193.6% 2009 3,281 5.0 87,342 -- --
Source: World Bank Survey (2008). *There is no Table 35.1 Cost of Agricultural Insurance Provision Operating costs represent 45-50% of the original gross premium (OGP). These costs are mainly driven by the delivery costs (including insurance agents’ commissions) but do not include start-up costs covered by the donor community.
5. Public Disaster Assistance Programs
Other forms of disaster assistance to agricultural producers are available in Mongolia. After major catastrophic events the government provides financial support to the herders and farmers. The National Emergency Management Agency is in charge of the program’s implementation. Dzud (hard winter events) is the major cause of livestock mortality and is the peril covered by the disaster relief program. The disaster relief program in Mongolia covers losses in excess of a 30% livestock mortality rate. Source of Country Overview Information: World Bank Survey (2008).

158
Overview on Agricultural Insurance: MOROCCO
1. Agricultural Insurance Market Review History of Agricultural Insurance
A drought insurance program has operated in Morocco since 1994. In 1994/95 there was a test program. In 1995/96 a wider insurance program was instigated, and from 1999 to 2004 a 5-year drought insurance program was agreed upon under a convention between an insurer, Mutuelle Agricole Marocaine D’Assurances (MAMDA), Crédit Agricole (CNCA), Ministère de l'Agriculture, and Ministère des Finances. The convention was renewed for a further 3-year period from 2005 to 2007.
Agricultural Insurance Market Structure (2008)
MAMDA is the sole provider of agricultural insurance in Morocco; it is structured as a mutual. There were 18 national insurance companies and one state reinsurance company operating in Morocco in 2004.24
Agricultural Insurance Products Available
Table 36.1: Agricultural Insurance Available 2008 Crop Insurance Products Available Greenhouse Forestry MPCI Named-peril Crop Revenue Index-based No Yes No No Yes No Livestock Insurance Products Available Aquaculture All Risk Accident &
Mortality Epidemic Disease
Other Index-based
No Yes No No No No Source: World Bank Survey (2008). MAMDA’s products can be divided between the drought insurance program, which is subsidized and operated under the convention, and other product lines which are sold in the open market without subsidy. These include named-peril fire and hail insurance on crops and livestock mortality insurance. MAMDA also provides a range of property, auto, and liability insurance products and covers for greenhouses.
The drought insurance product is not intended to cover perils other than rainfall deficit. It is a yield-based insurance, where farmers are enrolled into one of three categories. Smaller farmers with limited technology are enrolled into Category 1, where claims are assessed on an area-yield basis, and all farmers within defined areas are compensated based on the area-yield assessments. Category 2 and 3 farmers are those conforming to higher technology levels who receive higher yield guarantees and whose claims are adjusted on an individual farmer basis. The drought insurance scheme has proved operationally challenging, especially in relation to loss adjustment.
The drought insurance is available in defined areas of the country, subject to a maximum insured area of 300,000 ha, and restricted to the main cereals (hard wheat (blé dur), soft wheat (blé tendre), and barley (orge). The total area under these three crops in the whole of Morocco in 2004/05 was 5.1 million hectares25
24 AXCO (2005): Morocco Non-Life (P&C) report.
. The actual area insured (averaged over three years 2003/04 to 2005/06) was 117,096 hectares.
25 www.madrpm.gov.ma/systeme_information.htm

159
Cereal production in Morocco is mainly rainfed and is highly susceptible to drought and to significant annual variation of yields.26
Rainfall index insurance has been the subject of research, and was developed to a point close to implementation on a test basis.
Delivery Channels
Under the drought insurance program, distribution has been through two routes: first by linkage to loans made by Crédit Agricole and second by direct marketing of the offices and agents of MAMDA. Named-peril and livestock insurance is sold via MAMDA offices and agents. There are no special delivery channels or programs for small and emerging farmers in Morocco. Voluntary vs. Compulsory Insurance The drought insurance program is compulsory for borrowing farmers in whose areas the program operates. It may also be purchased voluntarily by farmers within the program areas. Hail and fire insurance and livestock insurance are voluntary. Agricultural Reinsurance The drought program is structured so that the government carries the primary layer of risk. Above that level, reinsurers protect the portfolio. The excess level above which non-proportional reinsurers are involved is approximately 30% of the total original sums insured.27
2. Public Support for Agricultural Insurance
Hail and livestock insurance are protected by quota-share and stop-loss reinsurance. Availability of reinsurance is not considered a constraint to agricultural insurance.
Types of Public Support for Agricultural Insurance There is agricultural insurance legislation. The government subsidizes premiums for farmers participating in the drought program and carries a primary layer of risk during major drought years, when aggregate claims exceed approximately 30% of the total sum insured, being covered by commercial reinsurers. Government officials are involved in the loss assessment process for the drought program, and these officials are paid by government. Premium Subsidies There is a premium subsidy of 50% of under the drought insurance program. The premium rate is 12%, with farmers paying 6% and government 6%. As noted, the crops within the drought insurance program are limited to hard and soft wheat and barley, in defined regions. There are no other premium subsidies for commercial lines such as livestock, hail, or fire insurance on crops. 26 Skees, J., Gober, S., Varangis, P., Lester, R. & Kalavakonda, V. (2002). Developing Rainfall-Based Index Insurance in Morocco. Policy Research Working Paper 2577. 27 Braham-chaouch, F. (2005). Risques et assurances agricoles – cas du Maroc. Presentation at 4th Forum des Assurances d’Alger, 28 & 29 November 2005.

160
Public Cost of Agricultural Insurance
The average cost of premium subsidies over the three years 2003/04 to 2005/06 was USD 1.8 million per year. The average area insured over these three years was 117,096 ha. This cost does not include costs to the government of meeting any deficits between premium collected (net of reinsurance costs) and claims incurred in the primary insurance fund, prior to reinsurance recoveries. Information is not available on these amounts.
3. Agricultural Insurance Penetration Insurance Penetration Rate
The maximum area which can be insured under the drought insurance program is 300,000 ha annually. Actual uptake in the three years for which data are provided (2003/04 to 2006/07) was 117,096 ha, or 39% of the maximum area. However, when compared to the total area planted for the three crops (2004/05) of 5.1 million ha, the penetration level of the drought program compared to the national crop area is 2.3%.
Year Number of
Policies Percent of Farmers
Insured Insured Area (ha) Percent of National Crop Area Insured
FY2004 16,088 -- 122,698 2.4% FY2005 10,353 -- 120,946 2.4% FY2006 8,540 -- 107,644 2.1%
Source: World Bank Survey (2008).
4. Financial Performance 5-Year Results
Insurance underwriting results were not provided by the respondent. Insurance underwriting results of the original program for the years 1999/2000 to 2003/04 are provided by Braham-chaouch (2005), op. cit., as follows:
Year Insured Area (ha) Premium (USD
million) Claims (USD
million) FY2000 111,610 2.4 18.5 FY2001 244,453 6.7 10.8 FY2002 221,610 6.4 22.0 FY2003 158,616 4.8 0.9 FY2004 122,698 3.5 3.5
Source: World Bank Survey (2008). Cost of Agricultural Insurance Provision
No information is available on the costs of administering the drought insurance program. There is no premium tax for the drought insurance program.

161
5. Public Disaster Assistance Programs The Fonds National des Calamités Agricoles is established to provide disaster relief. There is no information available on payments made by the Fund. It is understood that ad hoc relief measures have been put in place in past major catastrophes, which include relief of loan repayments borne by government. Skees et al. (2002) report that about USD 650 million was to be incurred by government on drought relief, following the major 1999/2000 drought. Source of Country Overview Information: World Bank Survey (2008).

162
Overview on Agricultural Insurance: NEPAL 1. Agricultural Insurance Market Review History of Agricultural Insurance Nepal has 3.4 million agricultural households cultivating an average of 0.79 ha per household. About 90% of these own livestock, with cattle the most important class of animal, followed by sheep, goats, and buffalo; the typical household owns one or two large ruminants only28
.
Livestock insurance in Nepal dates back to 1987 when the Nepal Rastra Bank (Central Bank of Nepal) and the public sector Deposit Insurance and Credit Guarantee Corporation (DICGC) jointly developed an individual animal all risks mortality livestock insurance scheme, designed to protect the livestock investment loans provided by the public sector banks to small-scale farmers. At the same time, in 1987, the private cooperative (mutual) sector also developed a very similar livestock–credit all risks mortality insurance cover operated by the Small Farmer Cooperatives Limited (SFCL). Subsequently, other organizations have also developed livestock insurance. Government provides limited financial support to the program in the form of a fixed 50% premium subsidy for livestock insurance through DICGC and SFCL.
Crop insurance is in its infancy, having first been introduced in 2007/08 on a very small pilot-scale by two cooperatives in conjunction with the Department of Agriculture.
Agricultural Insurance Market Structure
The Nepalese insurance market is regulated by the Insurance Board (Beema Samiti), Ministry of Finance. In 2008 the Nepalese insurance market consisted of 22 registered life and non-life insurance companies; with the exception of one state life/non-life company, the market is comprised of private commercial insurance companies. The non-life insurance market was about USD 114 million in 2007/08, representing about 2% of non-agricultural GDP and less than USD 2.3 per capita.
To date none of the regulated insurance companies have insured agriculture, and any livestock or crop insurance available has been implemented by the non-regulated or informal sector including the DICGC, SFCL, Community Development Program, and Centre for Self Help. The livestock and crop insurance products offered by these companies are not approved by the Insurance Board, and they are therefore considered to be credit-guarantee protection covers. There are currently about 400 individual cooperatives in Nepal offering livestock insurance to their members. The government of Nepal provides fixed 50% premium subsidies to the DICGC and SFCL livestock insurance programs but not to the other livestock or crop insurance programs. There is no tradition of crop insurance in Nepal. However, since 2007 two cooperatives have commenced pilot crop insurance schemes for named crops and perils.
To date there has been no reinsurance of either crops or livestock in Nepal. In view of the limited capital reserves of the individual cooperatives, these programs are very exposed to catastrophe losses (e.g. epidemic diseases in livestock or wind and floods in crops).
28 National Agricultural Census 2001.

163
Agricultural Insurance Products Available The range of livestock and crop insurance products offered by the non-regulated sector are very restricted at present in Nepal (Table 37.1). The livestock-credit insurance cover offered by all non-regulated insurers is an all risks mortality policy for individual animals and cover also includes loss of use of the animal. Cattle and buffalo account for most of the livestock underwritten in Nepal, but under the Community Development Program (CLDP), financed by the Asian Development Bank (ADB) and with technical assistance from FAO, there is a small ruminant (goats) insurance program. In 2008 premium rates for livestock insurance varied from 10% charged by the SFCL program to 6% by DICGC and 3% for the CLDP program. Named-peril crop insurance is currently being pilot tested by two cooperatives in Nepal for windstorm in bananas and for drought, floods, frost, and hail in paddy, maize, and vegetables. Table 37.1: Agricultural Insurance Available 2008 Crop Insurance Products Available Greenhouse Forestry MPCI Named-peril Crop Revenue Index-based No Yes No No No No Livestock Insurance Products Available Aquaculture All Risk Accident &
Mortality Epidemic Disease
Other Index-based
Yes Yes, part of All Risk coverage
Yes, part of All Risk coverage
-- No No
Source: World Bank Survey (2008). Delivery Channels
In Nepal nearly all livestock insurance is linked to credit either though the rural banks or the MFIs, including most importantly the cooperatives. With the exception of the DICGC Livestock Insurance Scheme, all livestock and crop insurance is implemented by the MFIs and cooperatives on behalf of their members.
Voluntary vs. Compulsory Insurance The DICGC Livestock Insurance Program is compulsory for farmers wishing to access livestock investment loans from the rural development banks and one MFI. The cooperatives link livestock loans and livestock insurance, although this is not mandatory in most cases. Crop insurance is voluntary in Nepal. Agricultural Reinsurance
There is no tradition of agricultural crop or livestock reinsurance in Nepal. The non-regulated mutual livestock and crop insurers are therefore very exposed to catastrophe losses, which would exceed their reserves. The DICGC Livestock Credit Guarantee Program is effectively underwritten by the government of Nepal.
2. Public Support for Agricultural Insurance Types of Public Support for Agricultural Insurance In Nepal, government support to agricultural insurance includes:

164
a) 50% premium subsidies on the DICGC and SFCL livestock insurance programs (see Table 37.2); b) Capital start-up costs for the two pilot cooperative mutual crop insurance schemes; and c) Technical support and training from the Departments of Livestock and Agriculture, Ministry of
Agriculture, and Cooperatives.
3. Agricultural Insurance Penetration Insurance Penetration Rate Livestock insurance figures for the whole market are not available. The DICGC and SFCL combined figures are shown in Table 37.3. These two programs have insured an average of about 12,500 livestock (cattle and buffalo) over the past five years which represents only 0.1% of Nepal’s cattle and buffalo herd of 11.4 million heads of animals in 2006/07. Crop insurance is only in its second year of being pilot-tested in Nepal, and less than 150 farmers are currently insured.
4. Financial Performance 5-Year Results
Livestock Insurance. The combined DICGC and SFCL combined livestock insurance results for
the past four years are summarized in Table 37.3 and show a very low long-term average loss ratio of 18.2% (over the past 20 years the DICGG loss ratio has averaged 38% and the SFCL has averaged 9%).
Crop Insurance. The pilot programs are too new and too small to report results.
Cost of Agricultural Insurance Provision
The DICGC’s A&O costs for livestock insurance are compared with SFCL in Table 37.4. The DICGC implements its program through the development and commercial banks and faces a very high cost structure, averaging 57% of premiums over 20 years and, from 2003/04 to 2006/07, during which the numbers of insured animals has declined significantly, their costs were as high as 108% of premiums, which is unsustainable. Conversely, SFCL reports a very low average cost of only 3.6% of premiums. SFCL elect its own members to manage the livestock insurance schemes and, as these posts are unsalaried, this explains their very low operating overheads for livestock insurance.
5. Public Disaster Assistance Programs The Ministry of Agriculture and Cooperatives provides limited ad hoc disaster relief for crops and livestock. Compensation for catastrophe events (e.g. floods) is usually paid in kind in the form of free seeds or other crop inputs.

165
6. Additional Tables
Table 37.2: Crop and Livestock Insurance Penetration, FY2004 to FY2008
Crop
Year Number of
Policies Percent of Farmers
Insured Insured
Area (ha) Percent of National Crop Area Insured
FY2008 103 (two
mutual coops) .. 4.1 .. Note: Prior to FY2008 there was no crop insurance in Nepal. Livestock
Year Number of
Policies Number of Insured
Cattle/Buffalo Percentage of National
Herd Insured FY2004 11,399 13,678 0.12% FY2005 10,950 12,591 0.11% FY2006 11,470 13,738 0.12% FY2007 8,462 9,450 0.08% Average 10,570 12,364 0.11%
Source: World Bank Survey (2008).
Table 37.3: Livestock Insurance Results, FY2004 to FY2007
Year
Number of
Policies
Number of
Insured Livestock
TSI (USD
million) Premium
(USD) Paid
Claims Loss
Ratio
Average Sum
Insured (USD)
Average Premium
(USD)
Average Premium
Rate FY2004 11,399 13,678 2.2 186,576 30,688 16.4% 192 16.4 8.5% FY2005 10,950 12,591 2.2 173,769 27,176 15.6% 204 15.9 7.8% FY2006 11,470 13,738 2.7 233,778 33,844 14.5% 239 20.4 8.5% FY2007 8,462 9,450 1.8 133,220 40,690 30.5% 214 15.7 7.3% Average 10,570 12,364 2.2 181,836 33,099 18.2% 212 17.1 8.0% Source: World Bank Survey (2008). Table 37.4: Livestock Insurers’ Costs as a Percent of OGP
Costs
DICGC Livestock Insurance
(20-Year Average)
DICGC Livestock Insurance
(2003-2007) SFCL Livestock
Insurance Marketing & Acquisition 12.0% 13.7% -- Administration 45.2% 94.6% -- Loss Adjustment -- -- --
Total 37% 108.3% 3.6% Source: World Bank Survey (2008). Note: Insurance premium taxes were negligible and were therefore not included. Source of Country Overview Information: World Bank Survey (2008).

166
Overview on Agricultural Insurance: NEW ZEALAND
1. Agricultural Insurance Market Review History of Agricultural Insurance
Crop insurance started expanding significantly after 1981, although it existed for cereal crops prior to that date. Livestock insurance was started in the 1970s. Agricultural Insurance Market Structure (2008)
Four private sector insurers and one mutual insurer offer both crop and livestock insurance. One private company offers only livestock insurance. There is no public sector insurance. Lloyd’s of London is also licensed as a direct insurer and offers equine and livestock insurance through three facilities. Forestry insurance is also offered. Agricultural Insurance Products Available
Named-peril crop insurance, principally hail, plus specialist policies for hail, frost, and other namedperils, is being offered. Specialist policies for different fruit and vegetable crops have been developed. Forestry insurance is an important product in New Zealand. Livestock insurance covers accident and mortality, and livestock epidemic cover is offered. Aquaculture insurance is available for marine and on-land fish farms. Some yield-based and index products have been developed, but they are not actively marketed. Table 38.1: Agricultural Insurance Available 2008 Crop Insurance Products Available Greenhouse Forestry MPCI Named-peril Crop Revenue Index-based No Yes No Yes Yes Yes Livestock Insurance Products Available Aquaculture All Risk Accident &
Mortality Epidemic Disease
Other Index-based
No Yes Yes No No Yes Source: World Bank Survey (2008). Delivery Channels
Insurance brokers are the most important distribution channel. The insurers’ agent networks (including agencies of input suppliers) are used. Producer associations are also important for certain crops, such as the fruit sector. For livestock insurance, brokers and agent networks are the main distribution channels. There are no special delivery channels or programs for small farmers. Voluntary vs. Compulsory Insurance Crop insurance is voluntary. In the case of the kiwifruit industry, decisions on an industry scheme that is compulsory for all growers are taken by the industry growers association.

167
Agricultural Reinsurance Private sector reinsurance (quota-share and stop-loss) is widely developed. It is not considered a constraint for named-peril crop insurance, livestock insurance or index insurance. It is a moderate constraint for epidemic livestock disease insurance and multi-peril crop insurance (MPCI).
2. Public Support for Agricultural Insurance Types of Public Support for Agricultural Insurance There is no form of public support for agricultural insurance in New Zealand. Premium Subsidies There are no premium subsidies on agricultural insurance in New Zealand. Public Cost of Agricultural Insurance
There is no cost to the government in support of agricultural insurance.
3. Agricultural Insurance Penetration Insurance Penetration Rate
The information on agricultural insurance is an estimate and is provided for 2007. For crop insurance, it is estimated that 1,500 crop insurance policies were issued, that 5% of farmers are insured, and that the area insured is 10,000 ha. This figure does not include the kiwifruit sector, where collective decisions of the sector result in a single policy for the industry being issued. For livestock insurance, it is estimated that only 2% of farmers are insured, and this is mainly restricted to high value stud bulls. Transit of livestock is routinely insured. Data for forestry insurance are not available; but various schemes are offered for smaller investors and growers, and some corporate entities also insure.
4. Financial Performance 5-Year Results
Estimates are provided for the industry as a whole, including average loss ratios. For crop insurance (including forestry), premium income is estimated at $NZ 15 million (USD 10 million) with an average loss ratio of 50%. This is estimated at approximately 55% forestry, 10% cereals, 20% fruit (including kiwifruit), and 15% other, including greenhouses. TSI is estimated at $NZ 500 million (USD 330 million), but this figure only includes first loss limits, which are frequent in forestry policies. Total values of insured assets may be at least $NZ 1.5 billion (USD 1.0 billion). For livestock insurance (including both equine and livestock), premium income is also estimated at $NZ 15 million (USD 10 million). Of this, 70% is estimated as equine and 3% livestock and aquaculture. TSI is estimated at $NZ 500 million (USD 330 million).

168
Cost of Agricultural Insurance Provision
For both crop and livestock insurance, the following are estimates of cost as a percent of original gross premium (OGP):
Marketing and acquisitions (commissions) 12% of OGP Insurer administration excluding loss adjustment 7% of OGP Loss adjustment costs 3% of OGP Total costs 22% of OGP
Overseas reinsurers are subject to 3.3% tax.
5. Public Disaster Assistance Programs Nominated epidemics of diseases not known in New Zealand are compensated at market value but only if no insurance is available. There is no form of government compensation for farmers. In the event of a major natural catastrophe, government may contribute to low-cost loans, tax relief if livestock has to be sold due to natural disaster, or access to low-cost labor, etc. Declaration of such measures is case-by-case. This is on a highly restricted basis, so farmers are largely required to manage their own risks. Source of Country Overview Information: World Bank Survey (2008).

169
Overview on Agricultural Insurance: NICARAGUA
1. Agricultural Insurance Market Review History of Agricultural Insurance
A first attempt to introduce crop insurance on an indemnity basis was made in 2004, but due to commercial and legal reasons, this endeavor failed. Afterwards, government and the Instituto Nicaraguense de Seguros y Reaseguros (INISER) have been working in order to develop a Weather Index Insurance Scheme for Nicaragua. In 2006 Nicaragua’s Insurance Authority approved the regulation to operate Weather Index Insurance, and in 2007 INISER started to market and underwrite a Weather Index Product for peanuts. The federal government is supporting the development of agricultural insurance through promoting a legal framework, financing the start-up cost, administrative and operational cost, and R&D for new products, and by providing tax exemptions for agricultural insurance. There is no livestock insurance product offered.
Agricultural Insurance Market Structure (2008)
In 2008 there were two insurance companies in Nicaragua offering crop insurance: INISER (public owned insurance company) and LAFISE (private insurance company). In spite of INISER being a publicly-owned insurance company, it is subject to common market insurance regulations.
. Agricultural Insurance Products Available
This market works with a weather index policy, covering drought and excess rainfall at selected weather stations. The insured crop is peanuts, but currently insurance companies are analyzing to expand their crop portfolio to soybeans, sorghum, rice, beans, sesame, corn, peanuts, and coffee. Insurance companies are also studying the possibility to introduce livestock insurance. Delivery Channels
The most important delivery channel in Nicaragua is the insurance company’s own agent network. Nevertheless, recently other channels like banks and farmers associations and cooperatives have begun to have more importance in marketing crop insurance products. There is no specialized delivery channel for small and marginal farmers. Voluntary vs. Compulsory Insurance
Crop insurance is voluntary. However, there are some cases mainly related to financial institutions that are requesting a crop insurance policy as collateral for the loan.
Agricultural Reinsurance Crop insurance programs in Nicaragua have support from international reinsurers on a quota-share basis. According to INISER’s opinion, the main constraint they face is that they cannot find enough international reinsurers interested in supporting weather index products.

170
2. Public Support for Agricultural Insurance Types of Public Support for Agricultural Insurance The public sector in Nicaragua has been supporting the development of the agricultural insurance products in several ways. First, government had an active participation in the formulation of the agricultural insurance regulatory framework. Second, government is indirectly subsidizing agricultural insurance development in Nicaragua through financing research and development and start-up costs of pilot programs (e.g. the MAGFOR Project) in order to develop a weather index insurance scheme for corn, rice, and beans targeted to small farmers. Third, government, through the National Weather Service, has been investing in improving the national weather station network and data collection. Finally, government has been supporting the development of agricultural insurance products by establishing tax exemptions to agricultural insurance premiums.
Premium Subsidies
The government does not provide premium subsidies. . Public Cost of Agricultural Insurance No information available.
3. Agricultural Insurance Penetration Insurance Penetration Rate
According to 2008 data the penetration rate for crop insurance is still very low. Only 16 policies were issued on an insured area of 1,737 ha, representing around 1% of total national cropped area.
4. Financial Performance 5-Year Results
Since the Program started only in 2006, there is not enough information to make a 5-year evaluation of its performance (Table 39.2). Cost of Agricultural Insurance Provision
The estimated overall operational and marketing costs are 30%. The insurance sales tax is not applied to agricultural insurance policies (Table 39.3). In underwriting year 2007 (the only year available), the combined loss ratio for the program was 56%.
5. Public Disaster Assistance Programs No other forms of financial support to the agricultural sector exist.

171
6. Additional Tables Table 39.2*: Crop and Livestock Insurance Results, 2007 to 2008
Year Number
of Policies TSI
(USD) Premium
(USD)
Paid Claims (USD)
Average Sum
Insured (USD)
Average Premium
(USD) Average
Rate Loss
Ratio 2007 2 216,000 7,000 2,500 108,000 3,500 3.2% 36% 2008 16 1.6 mil 88,972 -- 97,425 5,561 5.7% --
Average 9 887,400 47,986 -- 102,713 4,530 5.4% -- Source: World Bank Survey (2008). *There is no Table 39.1. Table 39.3: Insurers’ Costs as a Percent of OGP
Costs Percent of OGP Marketing & Acquisition 5% Administration 25% Loss Adjustment 0%
Total 30% Source: World Bank Survey (2008). Note: Insurance premium taxes were negligible and were therefore not included. Source of Country Overview Information: World Bank Survey (2008).

172
Overview on Agricultural Insurance: PANAMA
1. Agricultural Insurance Market Review History of Agricultural Insurance
Crop insurance was first introduced in the country in 1975 under Law No. 68 which led to the creation of the Instituto de Seguro Agropecuario (ISA), a public sector company, to provide agricultural insurance. Subsequently, in 1996, the government enacted the Law No. 39, updating the crop insurance scheme and incorporating livestock and forestry insurance. The federal government does not provide financial support to agricultural insurance in the country.
Agricultural Insurance Market Structure (2008) Currently, there are three insurance companies offering crop, livestock, and forestry insurance products in Panama. The traditional agricultural insurer is the public sector insurance company ISA, which has underwritten individual grower multi-peril crop insurance (MPCI) since 1977 and livestock insurance since 1978, while the other two companies are privately-owned insurers. One of the private insurance companies operates a crop insurance program backed from Mexico and the other acts as a front company, issuing the policy for a large facultative vegetable and horticultural risk for an agribusiness firm based in Panama. Agricultural Insurance Products Available MPCI. ISA’s MPCI yield loss policies protect a wide range of annual and perennial crops against excess rain, floods, drought, wind, fire or lighting, and exotic29
pests and diseases. Maize and sorghum are the main insured crops in the country.
The ISA MPCI policy is a salvage-based loss of investment cost cover that insures against the loss of direct costs of production invested in growing the crop; in the event of loss only the direct costs incurred by the insured on its insured unit up to the moment of the loss are indemnified. In the case of partial loss the value of the remaining production and yield (salvage) is deducted from the loss.
A deductible (coinsurance) of 10% of the loss is applicable for maize and rice crops, while sorghum has a deductible of 20% of the loss and melon crops a deductible of between 25 to 30% of the loss. Original gross rates vary from: (i) rice – 4.5 to 7% depending on the location, (ii) maize – 6%, (iii) sorghum – 7%, and (iv) melons – 8%.
Forestry Insurance. Forestry insurance covers the standing timber value of commercial forestry plantations against fire exclusively. The sum insured for standing timber insurance is typically based on: (i) the establishment and annual maintenance costs of the forest plantation up to the age when the trees have a commercial timber volume/value, and (ii) for older plantation stands, the commercial value of the standing timber (volume of timber valued at the in-field standing timber market price). Coverage is subject to a coinsurance on the claim of 20% of the loss on each and every loss. For normal forestry plantations the original gross rates vary from 1%-2% Total sum insured (TSI) depending on the region,
29 Exotic pests and diseases are defined as being uncontrollable using the recommended technology specified by the relevant authorities (Ministry of Agriculture, MIDA)

173
type of plantation, protection measures, contingency plans implemented by the insured, and deductibles and indemnity limits.
Livestock Insurance. Livestock insurance is offered by ISA for cattle, goats, sheep, horses, buffaloes, and swine for grassland production, expositions, and inland transportation.
Basic livestock insurance covers death arising from accidents, asphyxia, electrocution, fire, lightning, attack by wild animals, fractures, abortion, death due to birth-related complications and slaughter of an injured animal if stipulated by a certified veterinarian. All diseases are excluded from cover.
Deductibles vary according to the class of insured animal, breed, and production system. In the event of loss, the insured is responsible for a coinsurance (retention) of between 10% (cattle and pigs) to 20% (horses and goats) of the value of the claim. ISA’s original gross rates also vary depending on the type of animal and age of the animal. For cattle rates vary: calves 7%, extensive fattening cows 3%, dairy cattle 2.5%. For swine the rates are: boars 4.75-5.50%, hogs 3%, sows 4-6%; sheep and goats: 2-3.5%, depending on the production system. Complementary Insurance Since 2004 ISA has also offered complementary insurance covers for agricultural transport, machinery and equipment, grain silos/stores, and farm infrastructure. Table 40.1: Agricultural Insurance Available 2008 Crop Insurance Products Available Greenhouse Forestry MPCI Named-peril Crop Revenue Index-based Yes No No No No Yes Livestock Insurance Products Available Aquaculture All Risk Accident &
Mortality Epidemic Disease
Other Index-based
No Yes No No No No Source: World Bank Survey (2008). Delivery Channels
For crops and livestock insurance the most important delivery channel is through insurance brokers and, in second place, through the insurance companies’ own agent network. Currently there is no formal provision for special channels to deliver agricultural insurance to small and marginal farmers in the Panama. Voluntary vs. Compulsory Insurance
It is understood that agricultural insurance is voluntary in Panama although some banks lending to small and medium farmers may require the farmer to purchase insurance. Agricultural Reinsurance
Both public and private agricultural insurance in Panama are reinsured by international reinsurers. The insurance companies’ retention is 10% on average. The reinsurance cession is 90% on average, and the cession modality is quota-share.

174
2. Public Support to Agricultural Insurance Types of Public Support to Agricultural Insurance ISA has underwritten agriculture for 31 years. Traditionally, the government of Panama did not provide any premium subsidy support, but since 2008 it is understood that government has been studying proposals to introduce a flat 50% premium subsidy on agricultural insurance policies. Premium Subsidies
It is understood that since 2008 the government of Panama has studied proposals to introduce 50% premium subsidies on agricultural insurance policies. . Public Cost of Agricultural Insurance No data available.
Agricultural Insurance Penetration Rate
In 2007 ISA insured 15,652 ha of annual, perennial and permanent crops or about 5% of total cropped area30. In 2007 ISA insured a total of 28,688 heads of livestock (cattle, pigs, sheep and goats and horses)31
4. Financial Performance
. It is apparent that after more than 30 years of operations the demand for ISA’s crop and livestock insurance products is not very high (see, however, further comments below about the increase in agricultural insurance coverage in 2008).
5-Year Results
Details of ISA’s crop and livestock portfolio are presented in Tables 40.2 and 40.3. In 2007 ISA issued 15,652 ha of crops with TSI of USD 9.8 million and premium of USD 2.7 million with an average premium rate of 5.0%. The 5-year (2003 to 2007) long-term average loss ratio for crops is 87%, and this compares with a higher long-term average loss ratio for the 31-year period 1977 to 2008 of 102% (Table 40.2).
The livestock results show that in 2007 ISA insured a total of 28,688 heads of livestock with a TSI of 19.4 million, generating total premium of USD 500,000 with an average premium rate of 3.6%. The 5-year long-term loss ratio for livestock is 40% and over 31 years was slightly higher at 46%. Average premium rates have decreased slightly for livestock over the past five years.
ISA’s long-term loss ratio for all lines of business over the past 31 years is 82%, and this suggests that once administration and operating expenses are taken into account that the average combined ratio will have exceeded 100% over this 31-year period. The results over the past five years, from 2003 to 2007, are, however, considerably improved with a 5-year average loss ratio of 68% for crops and livestock, and of 65%, if other classes are included.
30 According to FAO in 2007 the total harvested area of primary crops was slightly greater than 344,000 ha. 31 This represents less than 1.5% of the national livestock herd for these classes of animals, estimated by FAO at 2.15 million heads of animals in 2007.

175
It is notable that in 2008 ISA’s crop portfolio experienced a major increase to nearly 29,000 ha with TSI of 46.1 million and premium of USD 2.3 million, and in the case of livestock the number of insured animals and premium income increased by about 85%. It is understood that this may coincide with the introduction by government of 50% premium subsidies.
Cost of Agricultural Insurance Provision
No data available. 5. Public Disaster Assistance Programs It is not known if there are any other forms of support to the agricultural sector in Panama, including disaster relief programs.

176
6. Additional Tables Table 40.2: ISA Agricultural Insurance Results, 2003 to 2007*
Year
Insured Area (ha)
TSI (USD
million) Premium
(USD)
Average Premium
Rate
Area Indemnified
(ha)
Paid Claims (USD)
Loss Cost
Loss Ratio
Crop 2003 6,076 5.2 276,496 5.3% 114 217,263 4.2% 79% 2004 5,507 5.1 227,944 4.5% 2,257 73,734 1.5% 32% 2005 13,480 13.3 643,183 4.9% 1,605 474,662 3.6% 74% 2006 12,427 12.4 610,690 4.9% 4,011 889,660 7.2% 146% 2007 15,652 19.8 990,013 5.0% 3,012 726,033 3.7% 73%
Average 10,628 11.2 549,665 4.9% 2,200 476,270 4.0% 87% 2008 28,872 46.1 2.3 mil 5.0% 692 1.1 mil 2.5% 49%
1997-2008 Total -- -- 18.2 mil -- -- 18.7 mil 5.7% 102%
Livestock
Year
Number of
Insured Animals
TSI (USD
million) Premium
(USD)
Average Premium
Rate
Number of Animals
Indemnified
Paid Claims (USD)
Loss Cost
Loss Ratio
2003 17,702 6.7 291,798 4.3% 97 103,690 1.5% 36% 2004 14,448 5.7 259,711 4.6% 326 112,618 2.0% 43% 2005 16,086 6.8 260,494 3.8% 340 120,200 1.8% 46% 2006 26,826 11.3 430,138 3.8% 335 149,996 1.3% 35% 2007 28,688 13.7 499,191 3.6% 538 201,474 1.5% 40%
Average 20,750 8.9 348,267 4.0% 327 137,596 1.6% 40% 2008 52,207 19.4 925,807 4.8% 275 103,542 0.5% 11%
1997-2008 Total -- 133.7 6.5 mil -- -- 3.0 mil 2.2% 46%
Total
Year
TSI (USD
million) Premium
(USD)
Average Premium
Rate
Paid Claims (USD)
Loss Cost
Loss Ratio
2003 12.0 568,294 4.7% 320,953 2.7% 56% 2004 11.0 491,771 4.5% 186,352 1.7% 38% 2005 20.6 910,169 4.4% 594,862 2.9% 65% 2006 24.7 1.0 mil 4.2% 1.0 mil 4.2% 99% 2007 39.5 1.7 mil 4.2% 927,506 2.3% 55% Total -- 4.7 mil 4.4% 3.1 mil 2.8% 65%
Average 21.6 938,006 4.4% 613,866 2.8% 63% 2008 98.3 4.6 mil 4.7% 1.2 mil 1.3% 27%
Source: World Bank Survey (2008). *ISA figures are presented in Panamanian Balbao. The exchange rate is assumed at 1.00 PB = USD 1.00

177
Table 40.3: ISA Crop and Livestock Insurance Results, 2003 to 2007* Crop
Year
Insured Area (ha)
Average Sum
Insured per ha (USD/ha)
Average Premium
per ha (USD/ha)
Ratio Damaged
Area to Insured
Area
Average Claim per
Damaged ha (USD/ha)
2003 6,076 859 46 2% 1,906 2004 5,507 921 41 41% 33 2005 13,480 983 48 12% 296 2006 12,427 1,000 49 32% 222 2007 15,652 1,266 63 19% 241
Average 10,628 1,006 49 21% 539 Livestock
Year
Number of
Animals Insured
Average Sum
Insured per Animal
(USD/head)
Average Premium
per Animal (USD/head)
Percent Mortality
Rate in Insured
Livestock
Average Claim per
Animal (USD/head)
2003 17,702 381 16 0.5% 1,069 2004 14,448 393 18 2.3% 345 2005 16,086 424 16 2.1% 354 2006 26,826 423 16 1.2% 448 2007 28,688 478 17 1.9% 374
Average 20,750 420 17 1.6% 518 Source: World Bank Survey (2008). *Figures presented in USD assuming exchange rate of 1 Panamanian Balbao = 1 US$. Source of Country Overview Information: World Bank Survey (2008).

178
Overview on Agricultural Insurance: PARAGUAY
1. Agricultural Insurance Market Review History of Agricultural Insurance The Paraguayan agricultural insurance market is in the initial stage of development but is growing rapidly. Crop insurance was introduced in 2006 after a big drought hit the country in the previous years, and in 2007 the crop coverage reached 30,000 insured hectares. Crop insurance is provided by private local insurance companies that offer multi-peril crop insurance (MPCI) in partnership with agricultural input suppliers. Currently, no insurance company is offering livestock insurance. The country does not have any form of special agricultural insurance legislation, and there is no public sector intervention. Agricultural Insurance Market Structure (2008)
There are nine insurance companies that have agricultural insurance products approved by the Regulator, but only three of them were actively underwriting crop insurance products in 2009. Agricultural Insurance Products Available
The main agricultural insurance product available in Paraguay is MPCI. Under MPCI policies, all weather-related perils are covered. This insurance product is offered for soybeans, corn, and wheat grown in eastern Paraguay districts on an individual basis and on a portfolio basis as well. Guaranteed yields32
vary from 50% to 70% actual production history, depending on the crop/region. Original gross premium (OGP) rates for individual MPCI vary from 5% to 8% of the TSI, depending on the insured crop and the region where the farm is located and the coverage level.
Table 41.1: Agricultural Insurance Available 2008 Crop Insurance Products Available Greenhouse Forestry MPCI Named-peril Crop Revenue Index-based Yes No No No No No Livestock Insurance Products Available Aquaculture All Risk Accident &
Mortality Epidemic Disease
Other Index-based
No No No No No No Source: World Bank Survey (2008). Delivery Channels
The agricultural insurance delivery channels in Paraguay rely heavily on insurance brokers, who have the contacts with the agricultural input suppliers’ network. Currently there are no special channels to deliver agricultural insurance to small and marginal farmers in the country. Voluntary vs. Compulsory Insurance
Agricultural insurance is voluntary in Paraguay.
32 The Guaranteed Yield is also known as the Insured Yield “Coverage level” and is commonly expressed as a percentage of the normal average yield of the crop.

179
Agricultural Reinsurance
Insurance companies have no difficulties to access private reinsurance. Currently there are four international reinsurers supporting crop programs in the country.
2. Public Support for Agricultural Insurance Types of Public Support for Agricultural Insurance There is no public sector financial or other support to agricultural insurance in Paraguay. Premium Subsidies
Agricultural insurance premiums are not subsidized in Paraguay. . Public Cost of Agricultural Insurance Since the public sector does not participate in agricultural insurance there are no costs involved. 3. Agricultural Insurance Penetration MPCI Insurance is a new product in the country. According to 2007/08 data, only 30,000 ha were insured. Nevertheless, there is strong interest from part of the agricultural input supplier sector to promote this product, and since its introduction every year the amount of insured area has been increasing. The total volume of agricultural crop insurance premium in this market in the underwriting year 2007/08 was USD 2.4 million.
4. Financial Performance 5-Year Results
Over the period 2006 to 2007 the average loss ratio for the whole market was 61% but with considerable variation in results each year, as the insured crop portfolio is not yet stable.
Cost of Agricultural Insurance Provision
The average cost ratio in respect to the OGP for the Paraguayan market is 61%. The addition of claims payments plus administration expenses amounts to a combined ratio of 101% for crop insurance. 5. Public Disaster Assistance Programs Information is not available on any other form of government support to agriculture in Paraguay. Source of Country Overview Information: World Bank Survey (2008).

180
Overview on Agricultural Insurance: PERU
1. Agricultural Insurance Market Review History of Agricultural Insurance
Agricultural crop insurance was formally introduced in Peru in 1996/97 by five private insurers, several of which were subsidiaries of financial banking groups lending to agriculture. This program offered multi-peril loss of yield crop insurance coverage based on the Mexican “Seguro a la Inversion or salvage-based loss of investment costs policy”33 for five crops (including rice, sugar cane, asparagus, mango, and lemons) grown in the coastal area of Peru. The program was reinsured on a proportional quota-share treaty basis by international reinsurers. The multi-peril crop insurance (MPCI) Policy was introduced into the market at the time of the severe 1996/97 El Niño in Peru, and in order to avoid anti-selection, it was agreed to market the product through the banks as a compulsory crop-credit insurance cover. In view of the very severe El Niño conditions in Peru that year, underwriters and their reinsurers restricted the underwriting of crops to a small pilot portfolio of mainly rice, sugar cane, and asparagus, and although losses exceeded a 100% loss ratio, the losses were carefully managed. However, in 1997/98, few of the insurers/their banks were willing to link credit and crop insurance once the El Niño conditions had dissipated, and under a purely voluntary program the volume of sales was disappointingly low. The program was terminated at the end of 1999 due to lack of interest from farmers, local brokers, local insurers and their reinsurers. Since then, agricultural insurance in Peru has been restricted to some facultative risks placed in the insurance market for corporate clients34
.
In 2008, aiming to protect farmers’ income against natural catastrophes, the government of Peru enacted a law (28,939), creating a Fund of S/.40 million (USD 14 million) for the development of crop insurance in the country. This Fund is utilized to subsidize agricultural insurance premiums. The amount of the subsidy depends on the farmer size and the insurance product, varying from 30% up to 100% of the original gross premium (OGP). In 2008, only one insurance company, La Positiva, offered area-yield index insurance for cotton in the Ica valley, but it is expected that in the near future other insurance companies will start to offer the product. A pilot index-based insurance using the ENSO index is expected to be implemented in the near future. Agricultural Insurance Market Structure (2008)
There are four private commercial insurance companies interested in underwriting crop insurance products in Peru. One of these companies currently offers area-yield index insurance. 33 The Seguro a la Inversion Policy is a yield shortfall policy which establishes a sum insured based on a pre-determined yield which is valued on a cost of production basis. In the event of loss, the policy only indemnifies the insured according to the amount of production costs invested in the crop up to the time of the loss, and the value of any remaining crop yield/production which can be harvested, termed the “salvage”, is deducted from the claim. This policy was first developed in Venezuela and then adopted by Mexican crop insurers in the 1980s. Under the Peruvian Crop Insurance Program, the insured perils were restricted to hail, floods, lack of irrigation water leading to drought, and uncontrollable pests and diseases. 34 An individual grower rice MPCI policy was developed in 1999 for a local rice trading company and placed with a leading Peruvian insurance company under a Quota-share Treaty placed with international reinsurers. However, the program was never launched as the rice trader went into liquidation.

181
Agricultural Insurance Products Available
There are four products available:
(a) “Agro Protege”. This is a product targeted at small and subsistence farmers. Under this program the purchaser of the insurance is a regional government, but the beneficiary of the possible payouts is the farmer.
(b) Catastrophe Aggregate Yield Shortfall Cover for Rural Communities This product is designed to provide insurance for small and medium-size farmers through a community framework. Under this coverage, insured farmers organized into rural communities will be offered insurance for rice, corn, potato, and cotton crops against drought, excess of moisture, hail, wind, frost, and flood perils. Rural community for the purposes of this cover is defined as a group of farmers who decide to associate in order to be insured, and this definition will be used to define the insured unit. Therefore, the actual yield obtained by the insured at the end of the policy period would be the whole area sown by the community with the insured crop. The indemnity will proceed when the actual aggregate yield obtained by the community is below the guaranteed aggregate yield established on the policy. OGP rates are not known at the time of preparation of this report but the cost of this coverage for the farmer shall not exceed USD 25 per ha. The federal government can subsidize premiums up to 100% of the premium cost.
(c) Area-yield Index Crop Insurance
This product is being implemented on a pilot basis in 2008 for cotton producers in the ICA Valley. Under this coverage, insured farmers located within one municipality or district considered as insured unit protect their crops against the adverse effects of drought, excess rain, hail, wind, frost, and flood perils. Under this insurance the indemnities proceeds when the actual average yield for the insured crop over the whole insured unit (the municipality or district where the insured is located) is below the agreed guaranteed yield. In such cases, the insured farmers all receive an indemnity equal to the proportion of shortfall below the guaranteed yield times the sum insured. Original gross rates are not known at the time of the preparation of this report but the cost of this coverage for the farmer shall not exceed USD 25 per ha. The federal government can subsidize premiums up to 100% of it cost.
(d) Traditional MPCI
This is a conventional MPCI loss of yield product which will be offered to commercial farmers on an individual basis covering drought, excess rain, hail, wind, frost, and flood perils in rice, corn, potato, and cotton crops. In case of a claim, this insurance considers the whole area sown with the insured crop within the insured farm as one insured unit. Indemnity proceeds only if the actual yield obtained by the farmer on its insured unit is below the guaranteed yield established on the policy. In such cases, the farmer receives an indemnity equivalent to the proportion of its actual yield shortfall below the guaranteed yield times the sum insured. Government subsidies for this kind of product are capped at 30% of the OGP. Delivery Channels
The crop insurance scheme is new and the commercial channels to deliver agricultural insurance are not yet fully defined. However, due to the characteristics of the insurance products, most probably, provincial governments and municipalities will have an important role to play in delivering agricultural insurance to the farmers. The banks lending to agriculture may also be important for distributing this product to farmers. The Agro Protégé program is specifically targeted at small and marginal farmers.

182
Table 42.1: Agricultural Insurance Available 2008 Crop Insurance Products Available Greenhouse Forestry MPCI Named-peril Crop Revenue Index-based Yes No No Yes, area yield
index No No
Livestock Insurance Products Available Aquaculture All Risk Accident &
Mortality Epidemic Disease
Other Index-based
No No No No No No Source: World Bank Survey (2008). Voluntary vs. Compulsory Insurance
Agricultural insurance purchasing is voluntary in Peru. Agricultural Reinsurance
The new Area-Yield Index Crop Insurance Program which is operating in 2008 in Peru has 100% reinsurance from one international reinsurer. With respect to other potential programs that could be in place in the near future, it is too early to say if there will be any constraints to obtaining agricultural reinsurance from the international market.
2. Public Support for Agricultural Insurance Types of Public Support for Agricultural Insurance Aiming to promote agricultural insurance as an effective tool to transfer risk from the agricultural sector, the government of Peru has enacted the law (28,939) of 2008, creating a Fund of S/.40 million (USD 14 million) in order to subsidize crop insurance premiums. The level of the agricultural insurance premium subsidy depends on the type of product purchased by the farmer and varies from 30% up to 100% of the OGP. Premium Subsidies
The government of Peru has budgeted S/.40 million (USD 14 million) in order to subsidize agricultural insurance premiums for FY2008. Public Cost of Agricultural Insurance Besides premium subsidies there is no available data on the other potential roles and costs of government support to the new agricultural insurance schemes in Peru.
3. Agricultural Insurance Penetration Insurance Penetration Rate The pilot Area-Yield Index Crop Insurance Program is in its first year of implementation, and results are not yet available.

183
4. Financial Performance 5-Year Results The pilot crop Area-Yield Index Insurance Program is in its first year of pilot project implementation, and results are not yet available.
Cost of Agricultural Insurance Provision
No data available.
5. Public Disaster Assistance Programs No data available. Source of Country Overview Information: World Bank Survey (2008).

184
Overview on Agricultural Insurance: PHILIPPINES
1. Agricultural Insurance Market Review History of Agricultural Insurance
Crop insurance was first introduced in 1978 with the formation of the Philippines Crop Insurance Corporation (PCIC). PCIC is the sole crop insurance provider in the Philippines. PCIC was created under Presidential Decree 1467 issued on June 11, 1978. Agricultural crop insurance was introduced in May 1981 and livestock insurance in 1988. PCIC is 100% owned by government entities. PCIC is governed by agricultural insurance legislation and regulation, which were most recently revised in 1995 (“Revised PCIC Charter”). Livestock insurance is regulated as a commercial line of insurance. Agricultural Insurance Market Structure (2008)
PCIC is the sole crop insurance organization. With regard to livestock, the Government Service Insurance System (GSIS) is part of a pool with private insurers: the Philippine Livestock Management Services Corporation (PLMSC). GSIS provides livestock insurance for livestock owned by government institutions. PCIC was a member of this group since it started in 1988 until 2005 when it disengaged from PLMSC to gain flexibility and strengthen control on underwriting, claims adjustment, and settlement. The PLMSC has 14 participating insurers.
Agricultural Insurance Products Available
PCIC’s main insurance lines are multi-peril crop insurance (MPCI) policies for palay (rice) and corn. These two products accounted for 75% and 16% of PCIC premium income (2006), respectively. Cover includes losses for natural calamity and for pest and disease. PCIC also offers high-value commercial crop insurance for higher value crops, particularly fruits and vegetables. Greenhouses and forestry are included in the high-value commercial crop (HVCC) insurance program of PCIC. PCIC has insurance packages for the following HVCCs: abaca, ampalaya (bitter gourd), asparagus, banana, cabbage, carrot, cassava, coffee, commercial trees, cotton, garlic, ginger, mongo, onion, papaya, peanut, pineapple, sugarcane, sweet potato, tobacco, tomato, water melon, white potato, and others. Livestock insurance against accidental death and disease is offered by PCIC and other commercial insurers for all classes of commercial farm livestock. Livestock epidemic disease coverage is subject to additional premium loading and other conditions. PCIC also offers life insurance and accident insurance to individuals or linked to loans from financial institutions to farmers and fisherfolk. The main insurance lines for palay and corn are provided to individual farmers. Loss assessment formulas have been developed to assign damage functions and indemnity schedules related to type of damage, timing of the damage in relation to crop calendar, and other criteria. Area-based assessment of damage can occur if there are extensive events. Main causes of loss are typhoon, floods, and drought in corn, but pest and disease is also a very significant factor in claims by cause of loss. Farmers may choose

185
between MPCI or natural disaster cover, the main difference being that the latter does not include pest and disease. The majority purchase MPCI, which is required by lending institutions.
Table 43.1: Agricultural Insurance Available 2008 Crop Insurance Products Available Greenhouse Forestry MPCI Named-peril Crop Revenue Index-based Yes Yes No No Yes Yes Livestock Insurance Products Available Aquaculture All Risk Accident &
Mortality Epidemic Disease
Other Index-based
Yes Yes Yes No No No Source: World Bank Survey (2008). Delivery Channels
For crop insurance, the most important delivery channel is through linkage to agricultural credit for farmers through the Land Bank of the Philippines (LBP). Other outlets are through sales to cooperatives, through PCIC agents and offices, and through brokers. For livestock insurance, most sales are through cooperatives and producer associations, followed by agricultural banks, and PCIC agents and brokers. There are no special organizations or programs for small and marginal farmers. The majority of farmer clients of PCIC are small-scale and subsistence producers. Voluntary vs. Compulsory Insurance
The majority of formal seasonal credit for rice and corn production is through LBP, and borrowers are required to insure. However, 18% of rice premium and 21% of corn premium (2005/06) was derived from non-borrowing farmers. Livestock insurance is voluntary. Financial institutions’ lending for livestock production may require that insurance is taken out. Agricultural Reinsurance
PCIC has been purchasing reinsurance from the private market since inception of the company. Reinsurance schemes are as follows: rice and corn crops -- stop-loss; high-value crops (cassava) – quota-cum-surplus; other high value crops -- facultative; livestock -- facultative; non-crop agricultural assets – quota-cum-surplus/facultative. Access to reinsurance has not been a significant constraint over the history of PCIC. There are many reinsurance brokers and reinsurers who are interested to participate in the reinsurance programs of PCIC. There is no involvement of government in the reinsurance of PCIC.
2. Public Support for Agricultural Insurance Types of Public Support for Agricultural Insurance Government financed the start-up costs of PCIC. Government’s main ongoing support for agricultural insurance is through premium subsidies for PCIC’s main lines of rice and corn insurance. A serious constraint to PCIC has been the accumulation of arrears of subsidy which remain due from government to the company. There is limited other involvement of government in crop insurance; however, government extension staff assist with loss assessment activities. Under regulation 8175, a State Reserve Fund for Catastrophic Losses amounting to P500 million is to be provided by government. Exemption from premium taxes is granted for subsidized rice and corn insurance.

186
Premium Subsidies Rice and corn insurance is subsidized. Premium subsidies are payable by government and vary between 48% and 63% of the original gross premium (OGP) in the case of rice insurance. For borrowing farmers, the lending institutions make a contribution (Table 43.2). The farmer pays a variable rate according to the risk zone. Government pays a fixed rate of subsidy as a percent of sum insured (e.g. 5.9% of sum insured for multi-risk cover); the farmer pays a variable rate. Borrowing farmers benefit from additional subsidies from the lending institution. Insurance for livestock and commercially rated high-value crops is not subsidized. Public Cost of Agricultural Insurance Cost of premium subsidies averaged P48.5 million (USD 90,700) between 2003 and 2006. Note that government allocates a specific sum annually for premium subsidies, and this limits the scope of operations of PCIC. Subsidies are also in arrears (see comments below), and this constrains PCIC’s overall financial and operating position.
3. Agricultural Insurance Penetration Insurance Penetration Rate
Crop insurance penetration has varied during the period of PCIC’s existence. It is estimated that only 2% of rice farmers and 1.76% of national area cropped are now insured by PCIC (Table 43.2). The peak penetration of crop insurance was in 1991, when 15% of farmers were insured. 6,837 livestock farmers were insured in 2006 and 6,273 in 2007. The extent of penetration in the sectors is not available.
4. Financial Performance 5-Year Results
PCIC sets gross premium rates (inclusive of farmer premium, government subsidy, and lending institutions) to cover anticipated long-term loss costs, plus a margin of approximately 20% to cover marketing and acquisition costs and costs directly related to underwriting. PCIC does not include a margin for reserve accumulation, or administrative overhead of the company, within this rate (see below). Table 43.3 shows that loss ratios in the last five years have averaged 73% for crop insurance (rice and corn) and 57% for livestock insurance and 72% for the combined crop and livestock programs.
Cost of Agricultural Insurance Provision
PCIC’s intention is that administrative overhead costs of the company should be met out of investment income and interest on reserves. Marketing and acquisition costs (10% for rice and corn crop insurance, up to 30% for livestock and other lines) are intended to be met out of gross premium income, and this is reflected in the loss ratios being achieved. The company has been hampered in its objectives of meeting company overheads from investment income and interest by late payment of government subsidies and a declining client base, plus costs associated with an infrastructure of offices originally established to serve farmers in all regions. Table 43.4 shows that overhead costs of the company (over all lines), excluding loss adjustment, represent 87% of OGP income. Loss adjustment costs do not exceed 12% of claims cost. Marketing and

187
acquisition costs are 10% of gross premium for crops, 30% for livestock, and between 10% and 30% for other lines of business.
5. Public Disaster Assistance Programs There is no scheme for financial compensation of farmers following losses. In-kind provision of seed, fertilizer, and inputs may be provided post-disaster by local and central government on an ad hoc basis. Emergency food and shelter may be supplied by government or NGOs. Rescheduling of credit repayments or interest may be granted by financial institutions. Infrastructure rehabilitation (e.g. irrigation) is the responsibility of government, and calamity funds or re-allocations of other funds are applied to relief and rehabilitation. However, there is no financial compensation for farmers. The National Calamity Fund is established for rehabilitation (e.g. irrigation facilities). There is an extensive system for Disaster Management by government organizations, under the umbrella of the National Disaster Coordinating Council (NDCC) and the Department of National Defense (DND). The Department of Budget and Management (DBM) is responsible for the budget for agricultural relief activities.
6. Additional Tables Table 43.2: Estimated Crop Insurance Penetration, 2003 to 2007
Year Number of
Policies Percent of
Farmers Insured Insured Area
(ha) Percent of National Crop Area Insured
2003 39,939 -- 68,275 -- 2004 46,053 -- 79,194 -- 2005 44,663 -- 68,602 -- 2006 37,243 -- 61,952 -- 2007 37,810 -- 70,036 1.8
Source: World Bank Survey (2008). Note: Number of policies and insured area includes rice, corn, and high value crop types. Percentage of national crop area insured includes irrigated rice and yellow corn crop areas only. Table 43.3: Estimated Livestock Insurance Penetration, 2003 to 2007
Year
Number of
Insured Cattle
Percent of National
Cattle Herd
Insured
Number of
Insured Swine
Percent of National
Swine Herd
Insured
Number of
Insured Sheep &
Goats
Percent of National
Sheep Flock
Insured
Number of
Insured Poultry
Birds
Percent of
National Poultry Insured
2003 4,197 -- 5,533 -- 813 -- -- -- 2004 4,030 -- 5,728 -- 1,096 -- -- -- 2005 2,447 -- 4,767 -- 952 -- -- -- 2006 3,543 -- 7,075 -- 1,421 -- -- -- 2007 3,597 -- 6,606 -- 1,145 -- -- --
Source: World Bank Survey (2008). Note: 6,837 livestock farmers were insured in 2006 and 6,273 livestock farmers in 2007.

188
Table 43.4: Crop and Livestock Insurance Results, 2003 to 2007
Year Number of
Policies
TSI (USD
million) Premiums
(USD) Paid Claims
(USD) Loss
Ratio Crops
2003 39,939 14.6 1.6 mil 1.2 mil 76% 2004 46,053 16.2 1.9 mil 1.3 mil 71% 2005 44,663 15.3 1.8 mil 1.4 mil 77% 2006 37,243 15.4 1.8 mil 1.5 mil 83% 2007 37,810 20.6 2.4 mil 1.5 mil 62%
Livestock 2003 7,824 1.2 41,434 35,531 86% 2004 7,572 1.2 68,225 31,398 46% 2005 6,133 1.1 53,849 31,701 59% 2006 6,837 1.6 67,043 38,005 57% 2007 6,273 2.1 95,957 50,952 53%
Total 2003 47,763 15.8 1.7 mil 1.3 mil 76% 2004 53,625 17.4 2.0 mil 1.4 mil 70% 2005 50,796 16.4 1.8 mil 1.4 mil 77% 2006 44,080 16.9 1.9 mil 1.6 mil 82% 2007 44,083 22.8 2.5 mil 1.5 mil 61%
Source: World Bank Survey (2008). Table 43.5: Insurers’ Costs as a Percent of OGP
Costs Crop Livestock Marketing & Acquisition 10% 30% Administration 87% 87%
Loss Adjustment ≤12% of losses or
claims ≤12% of losses or
claims Insurance Premium Taxes 5% + DST 5% + DST
Total -- Variable Source: World Bank Survey (2008). Note: There are no insurance premium taxes for rice and corn. DST = Documentary stamp tax. Source of Country Overview Information: World Bank Survey (2008).

189
Overview on Agricultural Insurance: POLAND
1. Agricultural Insurance Market Review History of Agricultural Insurance Agricultural insurance started in Poland in the first half of the 19th century. After the Second World War, livestock, crop, and farm insurance was mandatory for farmers. After 1990 agricultural insurance became voluntary. Government provided ad hoc assistance in case of catastrophic weather events. Multi-peril crop insurance (MPCI) was introduced in 2005. There is a legislative rule about agricultural insurance in the country. From July 2008 onwards farmers are required to insure at least 50% of their crop. Four companies are licensed to sell mandatory crop insurance. Agricultural Insurance Market Structure (2008)
There is one public company offering both crop and livestock insurance. Additionally, two mutual/cooperative institutions offer livestock insurance coverage. There are two private insurance companies and two mutual/cooperative funds offering crop and livestock insurance in Poland. PZU, a former state-owned insurance company, is the leading agricultural insurer, with an approximately 70% share of the agricultural insurance market.
Agricultural Insurance Products Available
Insurance companies offer named-peril and MPCI, greenhouse insurance, and livestock accident and mortality insurance. These are offered through public and private insurance companies. Subsidized insurance is offered by the authorized insurance companies as decided by the authorities. Table 44.1: Agricultural Insurance Available 2008 Crop Insurance Products Available Greenhouse Forestry MPCI Named-peril Crop Revenue Index-based Yes Yes No No Yes No Livestock Insurance Products Available Aquaculture All Risk Accident &
Mortality Epidemic Disease
Other Index-based
No Yes No No No Yes Source: World Bank Survey (2008). Delivery Channels
The agents’ network is the most important delivery channel for insurance companies for both crop and livestock insurance. Brokers are the second important delivery channel. Input suppliers are the third channel for crop insurance. Finance institutions play a minor role in crop insurance sales. There are no special organizations or programs for small and marginal farmers.

190
Voluntary vs. Compulsory Insurance
Livestock insurance is voluntary. Crop insurance is compulsory for farmers obtaining land subsidies from the European Union. They must insure at least 50% of their area against at least one of the following risks: hail, frost, winterkill, drought, or floods.
Agricultural Reinsurance
Government provides reinsurance for crop insurance against drought. The insurance companies cede other risks to international private reinsurance companies. Livestock insurance is reinsured with private international reinsurance companies only. The companies cede risks to the international reinsurance companies through stop-loss and quota-share treaties. Some companies sign excess of loss reinsurance treaties with the private international reinsurance companies for reinsurance of livestock portfolios. Named-peril products are easy to reinsure. MPCI and livestock accident and mortality insurance have moderate constraints with reinsurance. Polish insurers experience significant problems with reinsurance of livestock epidemic disease coverage.
2. Public Support for Agricultural Insurance Types of Public Support for Agricultural Insurance The Law on Agricultural Insurance Subsidies includes regulations on MPCI. The Law establishes the terms and conditions on crop insurance as well as allocation of subsidies and forms of the governmental reinsurance. The government subsidizes crop and livestock insurance premiums as regulated by the Law, which includes regulations on: MPCI, premium subsidies, and public reinsurance. The government also reinsures claims on drought under specific conditions mentioned in the Law.
Premium Subsidies Agricultural insurance subsidies are paid by the central government. Crop insurance premium subsidies are available for canola, small grains (cereals), corn, sugar beet, and potato. Livestock insurance premium subsidies are provided for cows, pigs, poultry, horses, and sheep. Subsidies are allocated only to small and medium-size farmers. Government subsidizes 50% of the premium, which is paid directly to the insurance companies. The maximum premium subsidy cannot exceed 2.5% of the sum insured. In case the original premium rate exceeds 6%, there is no premium subsidy. Such a condition is applied only to crop insurance but not to livestock insurance contracts. Public Cost of Agricultural Insurance In 2005/06 the government provided only premium subsidies for crops and livestock. In 2007 the government partially reinsured claims. The data is provided in Table 44.2.
3. Agricultural Insurance Penetration Insurance Penetration Rate
About 3% of Polish farmers were insured in 2005. About 6.6% of the crop area was covered by the insurance. Livestock insurance was purchased for 4% of the cows and 7% of the horse population. The

191
table below represents data submitted by the responding company for crop insurance. Data on livestock insurance is not available.
4. Financial Performance 5-Year Results Crop and livestock insurance results of Concordia Polska TUW are shown in Table 44.4 below. Premiums are market-based but influenced by the government regulations, and particularly the 6% cap on the premiums. During the 4-year period 2004-2007, the average loss ratios were 101% for crops, 60% for the very small livestock portfolio and 100% for crops and livestock. Over this 4-year period underwriting results have not been profitable. Cost of Agricultural Insurance Provision
The cost of insurance provision is indicated in Table 44.5.
5. Public Disaster Assistance Programs In case of epidemic diseases, the government pays for all livestock that was slaughtered. In case of calamities on crops, there is a governmental subsidy on interest paid on production loans. The national government makes decision on declaration of disaster for both crops and livestock. The Calamity Fund allocates ad hoc payments in case of natural disasters on crops and epidemic diseases in livestock sector.
6. Additional Tables Table 44.2: Government Subsidies and Reinsurance, 2006 to 2007
Year
Insurance Premium
Subsidies (USD) A&O Expense
Subsidies LAE
Subsidies
Reinsurance Premium Subsidies
Government Reinsurance
Claims Paid (USD) 2006 122,266 -- -- -- - 2007 2.8 mil -- -- -- 242,915
Source: World Bank Survey (2008). Table 44.3: Estimated Crop Insurance Penetration, 2003 to 2007
Year Number of
Policies Percent of Farmers
Insured Insured Area
(ha) Percentage of National Crop
Area Insured 2003 4,000 0.8% 140,000 1.3% 2004 6,000 1.2% 180,000 1.7% 2005 9,000 1.8% 270,000 2.5% 2006 13,000 2.6% 380,000 3.6% 2007 15,000 3.0% 450,000 4.2%
Source: World Bank Survey (2008).

192
Table 44.4: Crop and Livestock Insurance Results, 2004 to 2007
Year Number of
Policies TSI
(USD million)
Premium Including
Subsidies (USD) Paid Claims (USD) Loss Ratio Crop 2004 4,800 431.7 2.4 mil 916,194 39.8% 2005 8,900 553.9 3.4 mil 2.6 mil 79.3% 2006 11,600 633.5 4.7 mil 1.8 mil 40.4% 2007 22,900 1,237.8 6.7 mil 12.1 mil 185.7% Livestock 2004 -- -- 216,194 151,417 76.5% 2005 -- -- 108,907 44,130 31.9% 2006 -- -- 71,660 27,125 47.9% 2007 -- -- 125,506 91,903 95.2% Total 2004 -- -- 2.6 mil 1.1 mil 42.8% 2005 -- -- 3.5 mil 2.7 mil 77.8% 2006 -- -- 4.7 mi 1.8 mil 40.5% 2007 -- -- 6.8 mil 12.2 mil 184.0% Source: World Bank Survey (2008). Table 44.5: Insurers’ Costs as a Percent of OGP
Costs Crop Livestock Marketing & Acquisition 23.9% 22.6% Administration 10.7% 11.6% Loss Adjustment 3.9% 12.0% Insurance Premium Taxes 0% 0%
Total 38.5% 46.2% Source: World Bank Survey (2008). Table 44.6: Total Agricultural Insurance Subsidies, 2006 to 2007
Year
Insurance Premium Subsidies
A&O Expense Subsidies
LAE Subsidies
Reinsurance Premium Subsidies
Government Reinsurance Claims Paid
2006 122,266 -- -- -- -- 2007 2.8 mil -- -- -- 242,915
Source: World Bank Survey (2008). Sources of Country Overview Information: World Bank Survey (2008); European Union (2006).

193
Overview on Agricultural Insurance: PORTUGAL
1. Agricultural Insurance Market Review History of Agricultural Insurance Portugal introduced a national subsidized “Joint Pool” multi-peril crop insurance (MPCI) scheme in the early 1980s, which was modeled on the Spanish Pool scheme. The main differences of the Portuguese Pool Coinsurance scheme were:
(a) Insurance cover was restricted to crops only (no livestock insurance was provided); (b) The Crop Insurance Program offered a single uniform policy with two peril options: basic hail and fire cover plus complementary or integral cover for additional climatic perils (in Spain a wide range of named-peril and MPCI covers were designed); and (c) Drought was excluded from cover as it was deemed too risky (drought, but not floods, was insured under the Spanish program from inception).
The Joint Pool scheme operated during the 1980s under the period of nationalization of the Portuguese insurance industry but incurred major underwriting losses and suffered from very poor loss adjustment. The Joint Pool scheme was terminated under the reprivatization of the Portuguese insurance industry in 1989/90, and crop insurance reverted to being underwritten by private commercial insurance companies on an individual basis.
In 1996 the Portuguese government conducted a major review and reform of crop insurance in Portugal and introduced a new system termed Integrated System of Protection against Climatic Perils (Sistema Integrado de Proteccao contra as Aleatoriedades Climaticas; SIPAC). SIPAC consists of three key components:
• Subsidized Crop Insurance, which is promoted through the private commercial insurance
companies; • Catastrophe Compensation Fund (Fundo de Calamidades) which is designed to
compensate farmers for catastrophe events that are not covered by crop insurance; and • Stop-loss Reinsurance Fund (Compensacao de Sinistralidade) which is a national
reinsurance fund that crop insurers can access on a voluntary basis.
SIPAC is administered by IFAP, the Financial Institute for Agriculture and Fisheries (Instituto de Financiamento da Agricultura e Pescas) of the Ministry of Agriculture.
Agricultural Insurance Market Structure
In 2008 crop insurance was underwritten by 12 commercial insurance companies registered with and approved to underwrite by the Portuguese Institute (ISP; Instituto de Seguros de Portugal) Uniform Crop Insurance Policy. The questionnaire respondent, CA Seguros, is a leading Portuguese Agricultural Insurance Company that has a significant share of the crop insurance market.

194
Agricultural Insurance Products Available In Portugal any insurance company that wishes to access government premium subsidies and stop-loss reinsurance protection is required to underwrite the single ISP approved “Uniform Crop Insurance Policy” (Polica Uniforme). This is a standard loss of yield policy that provides two levels of cover:
• Basic Cover (Cobertura Basica): hail plus fire • Complementary or Integral Cover (Cobertura Complementaria): hail plus fire, tornado, snow,
excess rain, frost, and snow.
In addition to the above perils, in recent years, cover has been extended to include excess rain in cherries at harvest, leading to splitting of the fruit, and continuous rainfall damage in industrial tomatoes. This single policy form is used to underwrite a wide range of crops grown in Portugal including cereals and oilseeds, legumes, cotton, tobacco, pipfruit and stonefruit, olives, and grapes as well as horticultural and vegetable crops grown in open air or in greenhouses. The policy carries a standard 5% qualifying damage franchise followed by a 20% coinsurance on the value of the loss.
The Uniform Policy specifically excludes the catastrophe perils of flood and drought. Portuguese insurance companies consider the drought exposure too risky to be insurable under a Uniform Policy available for all crops in all regions. The main drawback of the Policy is that there is no differentiation or competition in the Portuguese crop insurance market and a lack of product development of tailor-made named-peril covers for specific crops.
Livestock insurance is not offered by the Portuguese insurance market, although some companies front facultative livestock or bloodstock covers with European reinsurers. CA Seguros does not insure livestock. There is a small local market in Portugal for forestry fire insurance involving cork trees and cut and stacked cork bark. Currently, crop weather index insurance is not offered by any Portuguese insurance company. Table 45.1: Agricultural Insurance Available 2008 Crop Insurance Products Available Greenhouse Forestry MPCI Named-peril Crop Revenue Index-based Yes, integral coverage
Yes, basic coverage
No No Yes, but coverage includes crop only
Yes, cork trees
Livestock Insurance Products Available Aquaculture All Risk Accident &
Mortality Epidemic Disease
Other Index-based
No No No No No No Source: World Bank Survey (2008). Note: These insurance products are those offered by CA Seguros. Delivery Channels
CA Seguros exclusively markets its crop insurance policies through the Agricultural Credit Banks (Caixas) which have an extensive rural branch network throughout Portugal, and the company does not conduct any direct marketing itself. In Portugal crop insurers either market their policies on an individual basis to individual farmers or collectively market policies through the Rural Producer Associations and Cooperatives and which include

195
the very important Regional Grape Producer Cooperatives. CA Seguros’ largest single crop insurance account is Vinho Verde, which includes 25,000 to 30,000 individual small grape producers. There are major cost savings in arranging a single master crop insurance policy for all members of this cooperative.
Voluntary vs. Compulsory Insurance Crop insurance is voluntary. The rural banks may, however, require borrowers to take out a crop insurance policy. Agricultural Reinsurance
Portuguese crop insurers may either use: (a) the government Stop-loss Reinsurance Program (see next section for details), or (b) purchase reinsurance from international reinsurers. CA Seguros purchases a combination of government stop-loss reinsurance and then quota-share treaty reinsurance on its primary retention.
2. Public Support for Agricultural Insurance Types of Public Support for Agricultural Insurance The Portuguese SIPAC system represents a public-private partnership under which the national government, through its implementing agency IFAP, provides the following types of support for crop insurance to Portuguese farmers:
• Insurance legislation; • Subsidies on crop insurance premiums; • Stop-loss reinsurance protection through the Stop-loss Reinsurance Fund; and • Natural disaster payments to subscribing farmers for losses due to perils which are not
insured by the Uniform Crop Insurance Policy through the Catastrophe Fund (See Section 5).
Insurance Legislation. The SIPAC 1996 crop insurance legislation recognizes only the Uniform Crop Insurance Policy that all insurance companies are required to underwrite, defines the five geographic risk regions A to E for Portugal and the reference rates for each crop in each region against which premium subsidies are established, and defines the terms of operation of the Stop-loss Reinsurance Fund and the Catastrophe Fund.
Subsidies on Crop Insurance Premiums. The SIPAC premium subsidy levels applicable to
individual and group policy sales are presented in Table 45.2 and vary from a minimum of 45% to a maximum of 75% of the commercial premium rate paid by farmers. Together with Spain, Portugal has some of the highest premium subsidy levels in the developed world. The premium subsidies are administered through IFAP and are paid directly by IFAP to the insurance companies. In other words, the farmer only pays his non-subsidized share of the commercial premium to the insurer. CA’s premium subsidy receipts are presented in Table 45.3 and over the four years 2003 to 2006 averaged about 67% of full premium. Whole market crop insurance premium subsidy levels for Portugal are not available.

196
Government Stop-loss Reinsurance Fund. The Government Stop-loss Program is optional. This is a non-proportional “stop-loss” reinsurance program with the following maximum limits of liability for the direct insurer in each Climatic Risk Zone:
Risk Zone Limit of Direct
Insurer’s Liability* Government Crop
Reinsurance Program A (lowest frost
exposure) 110% 85% of losses in excess B 110% 85% of losses in excess C 110% 85% of losses in excess D 80% 85% of losses in excess
E (highest frost exposure) 65% 85% of losses in excess
Source: World Bank Survey (2008). *Collected premium divided by claims, including allowance for a maximum of 10% loss adjustment expenses in calculation of the indemnity amount.
Between 1996 and 1999 IFAP assumed 100% liability for all claims in excess of the stop-loss threshold levels in each risk zone. Since 2000 the government’s liability has been reduced to 85%, causing the reassured (direct insurer) to coinsure 15% of the value of claims that fall in the stop-loss layer. The stop-loss reinsurance premium rates applicable in 2008 are:
Risk Zone Stop-loss Premium Rates
A, B, C 6.3% of total collected premium D 9.0% of total collected premium E 10.8% of total collected premium
3. Agricultural Insurance Penetration Insurance Penetration Rate Data for reporting on the national level crop insurance penetration levels is not available. In general terms, producers of relatively low-value rainfed cereals do not purchase crop insurance, as their main exposure is drought, which is uninsurable. Conversely, farmers of tree fruit, vegetables, and wine grapes in the Center and North of Portugal traditionally buy crop insurance to protect again the high risk of spring frost losses and hail storm damage. CA Seguros’ 5-year uptake figures are presented in Table 45.3. In common with the rest of the Portuguese insurance market, the company has seen a decline in the demand for crop insurance over the past five years.
4. Financial Performance 5-Year Results
CA Seguros’ crop-underwriting results are presented in Table 45.5 and show a 5-year (2003-2007) long-term average loss ratio of 29.4%, which is very low for an MPCI program, although in this case the cover excudes drought. In this context it is noted that Portugal has been free of major frost events over the reference period. CA Seguros has seen a major decline in the demand for crop insurance by Portuguese farmers over the past five years from a peak of over 49,000 insured farmers in 2003 to 29,000 farmers in 2007. The very small average size of policy is reflected by the average sum insured of USD 4,287 per farmer and average premium of only USD 285, with an average rate of 6.7%. Given the very small size

197
of insured farmers and low premium per policy, CA Seguros’ practice of exclusively marketing and administering its policies through the Agricultural Credit Banks (Caixas) is economically sound.
Cost of Agricultural Insurance Provision
CA Seguros achieves very low marketing expenses, averaging 10% of gross premium and administration expenses of only 2% under its exclusive sales agreement with the Agricultural Credit Bank. The company maintains its own network of part-time specialist crop loss assessors, and crop assessment expenses are estimated at a further 5%, which is very reasonable for MPCI insurance. The company’s average expenses amount to about 17%, compared to typical costs of between 20% and 25% for the rest of the Portuguese crop insurance market. Finally, with the inclusion of insurance premium taxes of 11%, the total costs amount to 28% of the commercial premium rate paid by the farmer.
5. Public Disaster Assistance Programs Under the SIPAC Catastrophe Fund (Fundo de Calamites), IFAP manages a separate ex-post Disaster Relief Scheme for farmers. The Catastrophe Fund provides compensation against perils that are not insured by the Uniform Crop Insurance Policy (e.g. drought or flood). Farmers are only eligible for compensation by the Catastrophe Fund if they have: (a) purchased crop insurance, and (b) paid additional premium for catastrophe insurance at a rate of 0.2% applied to their sum insured. A catastrophe is declared when the loss of a crop(s) at a hamlet (Conselho) level exceeds 50% of the normal production of that crop. The Ministry of Agriculture (MAPF) is responsible for estimating and declaring the loss. This form of compensation includes payment of the interest due on the farmers’ credit or provision of subsidy payments. 6. Additional Tables Table 45.2: SIPAC Portugal Crop Insurance Premium Subsidy Levels 2008 (a) Individually Contracted Insurance Polices
Basic Cover Complementary Cover Reference Rate Risk Region
Maxi-mum
Subsidy
Con
ditio
n
Cer
eals
Oth
er c
rops
Pipfruit, stonefruit, and grapes
in poor locations
Pipfruit, stonefruit, and grapes
in good locations O
ther
cro
ps
1.9%<Rate<6%
6%<Rate<8% Rate>8% D E
Subsidy 30% 25% 10% 20% 10% 10% 15% 20% 5% 10% 75% (b) Collectively Contracted Insurance Policies
Basic Cover
Comple-mentary
Cover Reference Rate Risk Region Collective Contract
Maxi-mum
Subsidy
Condition Cereals Other crops N/A
1.7%<Rate<5.4%
5.4% <Rate<7.2% >7.2% D E N/A N/A
Subsidy 30% 25% 10% 10% 15% 20% 5% 10% 10% 75% Source: World Bank Survey (2008).

198
Table 45.3: CA Seguros Portugal Crop Insurance Premium Subsidy Payments, 2003 to 2006
Year Crop Premium Subsidies
(USD million) Percent of Crop
Premium 2003 9.1 66% 2004 10.4 68% 2005 6.5 67% 2006 5.4 67%
Average 7.8 67% Source: World Bank Survey (2008). Table 45.4: CA Seguros Portugal Crop Insurance Penetration, 2003 to 2007
Year Number of
Policies
Number of Farmers Insured
Percent of Farmers Insured
Insured Area (ha)
Percent of National Crop Area Insured
2003 1,946 49,303 -- 103,345 -- 2004 1,505 48,533 -- 94,060 -- 2005 1,499 33,874 -- 81,162 -- 2006 1,142 32,115 -- 69,696 -- 2007 796 29,015 -- 51,797 --
Average 1,378 38,568 -- 80,012 -- Source: World Bank Survey (2008).
Table 45.5: CA Seguros’ Portugal Crop Insurance Results, 2003 to 2007
Year
Number of
Policies
Number of
Farmers Insured
TSI (USD
million)
Premiums (USD
million)
Paid Claims
(USD million)
Loss Ratio
Average Sum
Insured* (USD)
Average Premium*
(USD) Average
Rate 2003 1,946 49,303 219.3 13.8 0.9 6% 4,449 280 6.3% 2004 1,505 48,533 203.6 15.4 4.0 26% 4,195 318 7.6% 2005 1,499 33,874 152.9 9.7 2.8 29% 4,513 286 6.3% 2006 1,142 32,115 125.5 8.1 2.9 36% 3,909 253 6.5% 2007 796 29,015 126.8 8.3 5.7 69% 4,370 286 6.5%
Average 1,378 38,568 165.6 11.1 3.3 29% 4,287 285 6.7% Source: World Bank Survey (2008). *Average sum insured and average premium calculated per farmer. Table 45.6: CA Seguros’ Insurance Costs as a Percent of OGP
Costs Percent of OGP Marketing & Acquisition 10% Administration 2% Loss Adjustment 5% Total A&O 17% Insurance Premium Taxes (Sales tax paid by insured) 11%
Total 28% Source: World Bank Survey (2008). Source of Country Overview Information: World Bank Survey (2008).

199
Overview on Agricultural Insurance: ROMANIA
1. Agricultural Insurance Market Review History of Agricultural Insurance
Agricultural insurance in Romania started in 1871 when the first mutual insurance groups originated. The first agricultural insurance company was founded in 1906. During the Socialist period agricultural insurance was provided through the state company, ADAS, which insured farms and operated as reinsurance capacity. Agricultural insurance was mandatory. After 1990 agricultural insurance was reformed and became voluntary. Natural disasters had a very negative impact on agricultural production during last five years. The country suffered from droughts (2002, 2003), winterkill of crops (2003), and floods (2004, 2005, 2008). These disasters transformed agricultural insurance from an expensive risk mitigation tool into an important risk instrument. The agricultural insurance is currently undergoing changes under the leadership of the government. Agricultural Insurance Market Structure (2008)
Ten companies offer crop and livestock insurance services. One company specializes in livestock insurance only. The list of companies participating in the subsidy program is approved by the government. The farmers can get premium subsidies only if they purchase insurance from the approved insurance providers. Romanian insurance companies try to offer different insurance products to meet farmers’ demand in risk mitigation. Competition in the market is fierce. Premium rates are set by the private insurance companies individually without control from the government. In 2005 about 70% of the market (premiums collected) belonged to three insurance companies – AGRAS, Allianz TIRIAC, and ASIROM – but the market structure was volatile and changing yearly. Agricultural Insurance Products Available
Insurers offer different insurance products trying to get better access to farmers’ target groups. The crop insurance policies are named-peril and can include up to nine weather risks and fire. The risk selection is done by the client. The standard deductible is 10% for field crops and 15% for fruit trees and grapes. Insurers also offer greenhouse insurance. Livestock policies cover all mortality risks except for infectious diseases. The government compensates farmers’ losses caused by infectious diseases, so there is no need for insurance coverage of this risk. There is aquaculture insurance in Romania.
Table 46.1: Agricultural Insurance Available 2008 Crop Insurance Products Available Greenhouse Forestry MPCI Named-peril Crop Revenue Index-based No Yes No Yes Yes No Livestock Insurance Products Available Aquaculture All Risk Accident &
Mortality Epidemic Disease
Other Index-based
No Yes No No No Yes Source: World Bank Survey (2008). Premium rates are market-based, and the pricing policy is driven by market competition. The average crop insurance rate is 2% with a range from 1% to 3%. AGRAS introduced index policies for small

200
farmers with an area up to 5 hectares. The policy compensates a fixed amount of production cost per area unit. Delivery Channels The agents’ network is the primary delivery channel for agricultural insurance products. Brokers are the second most important delivery channel. For livestock insurance the third channel is finance providers. Producer associations and cooperatives are the third channel for crop insurance. There are no special organizations for delivering agricultural insurance to small and marginal farmers. One company (AGRAS) introduced a specific index program for smallholders (1 to 5 ha). Small farmers can purchase agricultural insurance with a fixed amount of the sum insured per ha of USD 180. The premium is USD 5. The insurance coverage is equal to the cost of production of agricultural commodities per area unit (ha) and pays when a crop is destroyed by weather events. Voluntary vs. Compulsory Insurance
Both crop and livestock insurance are voluntary for farmers. Loan providers can require credit-linked insurance, but this is subject to specific individual policy of finance institutions. Agricultural Reinsurance
Insurance companies in Romania reinsure risks with the private international reinsurance companies. They reinsure crop risks mainly through quota-share treaties.
2. Public Support for Agricultural Insurance Types of Public Support for Agricultural Insurance Agricultural insurance in Romania is governed by Law 381, dated June 13, 2003. This legislative document sets the framework for agricultural insurance and government assistance in case of natural calamities. Premium Subsidies As of 2008, there is no premium subsidy program in Romania. The government decided to stop the agricultural insurance subsidy program. Public Cost of Agricultural Insurance There are no subsidies or other government support to agricultural insurance.
3. Agricultural Insurance Penetration Insurance Penetration Rate According to national statistical data (2006) about 12% of the arable land is insured in Romania. Approximately 18% of commercial farms purchase crop and livestock insurance policies. Considering the total number of farms in Romania is 4.2 million, most of which are small farms with a cultivated area

201
up to 10 ha, the overall participation rate is about 1% (43,003 farms being insured in 2006, out of which 41,818 are crop farms and the rest livestock producers).
In 2007 the government provided subsidies to small farms on the condition they present a valid insurance contract. This government policy increased farmers’ demand for crop insurance.
4. Financial Performance 5-Year Results
The results of ASIBAN SA insurance company are provided in Table 46.3 below. The company portfolio includes both crop and livestock risks, though the share of livestock insurance is marginal. The company has underwritten agricultural insurance only since 2006. The average loss ratio was 18% in 2006 and 23% in 2007. Cost of Agricultural Insurance Provision
ASIBAN costs are presented in Table 46.4 below. In general, costs for offering crop and livestock insurance are the same. The cost for marketing and acquisition is higher for livestock.
5. Public Disaster Assistance Programs The government provides assistance to agricultural producers in case of disasters. In nearly each of the last five years the government provided ad hoc assistance to farmers suffering from droughts, floods, and winterkill (that is, total loss of winter crops due to unfavorable weather conditions during winter). The government also covers losses of livestock farmers in case of livestock death or slaughter due to epidemic diseases. During 2003 to 2006 the Romanian government provided ad hoc assistance to farmers for the total sum of USD 83.6 million. 6. Additional Tables Table 46.2: ASIBAN SA Crop Insurance, 2004 to 2007
Year Number of
Policies Percent of Farmers
Insured Insured
Area (ha) Percent of National Crop Area Insured
2004 159 -- 27,446 0.3% 2005 239 -- 36,105 0.4% 2006 619 -- 78,920 0.9% 2007 6,643 -- 137,596 1.5%
Source: World Bank Survey (2008). Table 46.3: Agricultural Insurance Results, 2006 to 2007
Year Number of
Policies
TSI (USD
million) Premium, Including
Subsidies (USD) Paid Claims
(USD) Loss Ratio 2006 707 5.2 112,482 20,329 18.1% 2007 6712 8.6 177,250 40,869 23.1%
Source: World Bank Survey (2008).

202
Table 46.4: Insurers’ Costs as a Percent of OGP Costs Crop Livestock Marketing & Acquisition 12% 15% Administration 10% 10% Loss Adjustment 15% 10% Insurance Premium Taxes 1.3% 1.3%
Total 38.3% 36.3% Source: World Bank Survey (2008). Sources of Country Overview Information: World Bank Survey (2008); European Union (2006).

203
Overview on Agricultural Insurance: RUSSIA
1. Agricultural Insurance Market Review History of Agricultural Insurance Mandatory agricultural insurance was introduced in the Soviet Union in 1969. Crop insurance was reintroduced in 1991 as a voluntary program after the collapse of the former Soviet Union. Federal Agency is a state institution supervising subsidized crop insurance program. The crop insurance subsidy program was introduced in Russia in 2004. There is no specific agricultural insurance legislation or regulation. Currently a draft law on agricultural insurance is under preparation. The draft law is expected to be adopted by the national federal parliament in the near future, possibly in 2010. Agricultural Insurance Market Structure (2008) In 2007 there were 69 private insurance companies offering subsidized crop insurance. Livestock insurance is not subsidized, and it is voluntary.
Agricultural Insurance Products Available Private insurance companies offer multi-peril crop insurance (MPCI), livestock accident and mortality cover, and livestock epidemic disease insurance. Most crops produced in Russia are covered under the subsidized MPCI program. The policies are technically well developed and perils covered are wide. Crop policies are based on standard MPCI and cover most perils that can cause crop damage or loss, including drought, excessive rainfall, frost, hail, fire, etc. Quality loss is not covered. Winter crops are insured for the full vegetation cycle, although if perished during winter season, the insured farm receives compensation of reseeding costs necessary to plant spring crop in the same field. Livestock products cover most perils including weather perils, epidemic diseases, accidental death, fire, and unlawful actions of third parties. There is no index-based insurance program in Russia. Most insurance companies do not offer commercial crop insurance. There are some credit-linked insurance products. The biggest share of agricultural credits is provided by two banks. Farmers should purchase agricultural insurance to apply for subsidized credit. Subsidized credits for the livestock sector are serviced by commercial insurance policies. Table 47.1: Agricultural Insurance Available 2008 Crop Insurance Products Available Greenhouse Forestry MPCI Named-peril Crop Revenue Index-based Yes Yes No No Yes No Livestock Insurance Products Available Aquaculture All Risk Accident &
Mortality Epidemic Disease
Other Index-based
Yes Yes Yes Yes No Yes Source: World Bank Survey (2008).

204
Delivery Channels Crop and livestock insurance is mainly sold through insurance agents. Sales through producer associations and cooperatives are marginal. There are no special organizations or programs for small and marginal farmers. Voluntary vs. Compulsory Insurance Both crop and livestock insurance products are voluntary. In 2008 the insurance companies proposed to shift crop insurance from voluntary to mandatory, at least for the farmers that receive public agricultural subsidies (e.g. credit). Agricultural Reinsurance Subsidized crop insurance is reinsured on both national and international reinsurance markets. The reinsurance policy is defined by the insurance companies individually. Livestock insurance is also reinsured on both national and international reinsurance markets. Access to the private reinsurance facilities is not a constraint for Russian agricultural insurers. In 2008 the Federal Agency of the State proposed that 25% of the agricultural risks should be reinsured through the Federal Agency via the special reinsurance facility. This proposal is being discussed by the market players, but there is no unified position yet. In 2009 the insurance companies participating in the subsidized crop insurance program (selected by the Federal Agency) should reinsure at least 20% of the risk with the agricultural insurance pool. Non-qualified insurance companies can participate in the program, but they should reinsure all risks with the Agricultural Insurance Pool. This provision was adopted in March 2009.
2. Public Support for Agricultural Insurance Types of Public Support for Agricultural Insurance Government supports agricultural crop insurance through premium subsidies only. The Federal Agency supervising subsidized crop insurance programs is financed by the government.
Premium Subsidies Federal government subsidies are 40% of the premiums on MPCI products. Regional (local) governments subsidize 10% of premium. The farmer is responsible for the payment of 50% of premium. Federal subsidies are paid only if the regional government pays its share. Premium subsidies are paid for all crops. The farmer should be registered as a farmer. Firms that produce agricultural commodities but are not registered as farmers do not get crop insurance premium subsidy. Livestock insurance is not subsidized. There are no special premium subsidies for small and marginal farmers. Public Cost of Agricultural Insurance The cost of premium subsidies of the subsidized crop insurance program for the last five years amounted to USD 500.7 million (Table 47.3).

205
3. Agricultural Insurance Penetration Insurance Penetration Rate Crop insurance penetration is low. In 2007 subsidized crop insurance contracts were signed with 10,143 farms, including commercial and private farms. This amounts to 3.4% of farms insured though subsidized crop insurance policies, most purchased by commercial farmers. The number of commercial farms in Russia was reported at 47,700. The farmers insured 20.2 million ha of crops in 2007, which amounted to 28.3% of the total agricultural land.
4. Financial Performance 5-Year Results Results of the subsidized Crop Insurance Program in Russia are shown in Table 47.3. In spite of the large size of the Program, with average annual premium volume of USD 200 million over the last five years, loss ratios were from 46% to 114%, reflecting the relatively small geographical diversification of the agricultural insurance portfolio and perils covered. The average loss ratio has been 61% over this period. Premiums are actuarially priced on long-term results, and a no claims bonus system operates for farmers.
Cost of Agricultural Insurance Provision Data on agricultural insurance provision is not available.
5. Public Disaster Assistance Programs The federal government provides a wide range on financial support programs including payments per arable area unit (per ha), and payments for livestock (per animal). The government also subsidizes agricultural credits through interest rate subsidies.
6. Additional Tables Table 47.2: Crop and Livestock Insurance, 2003 to 2007
Year Number of Policies TSI
(USD million) Premium, Including Subsidies
(USD million) Paid Claims
(USD million) Loss Ratio 2003 5,392 1,311.4 89.9 70.4 78.2% 2004 7,256 2,307.1 143.5 94.4 65.8% 2005 9,894 3,899.4 260.6 175.5 67.4% 2006 10,725 3,574.9 236.7 135.9 67.5% 2007 10,143 4,638.4 314.6 159.5 54.0% Source: World Bank Survey (2008).

206
Table 47.3: Government Premium Subsidies, 2003 to 2007
Year Subsidy
(USD million) 2003 37.9 2004 78.4 2005 94.3 2006 133.8 2007 156.3
Source: World Bank Survey (2008). Sources of Country Overview Information: World Bank Survey (2008); European Union (2006).

207
Overview on Agricultural Insurance: SLOVENIA
1. Agricultural Insurance Market Review History of Agricultural Insurance
Agricultural insurance in Slovenia was introduced in the 18th century when farmers founded an association to protect members against hail and fire risks. Modern insurance systems go back to 1990 when the government adopted a number of laws regulating the insurance sector. In 2000 the insurance legislation was harmonized with the EU legislative provisions, and the government began to provide post-disaster financial assistance to farmers hit by calamities. In 2003 the government enacted a law for disaster relief in agriculture. Since 2006 the national government initiated a subsidized agricultural insurance program. It is based on a public-private partnership. The program is administered by the Agency for Agricultural Markets and Rural Development. Large farms (defined according to EC regulation No 70/2001) are not eligible for insurance subsidies. The subsidy is paid from the municipal and the regional budgets. Agricultural Insurance Market Structure (2008)
Four insurance companies offer agricultural insurance services in Slovenia. About 90% of agricultural insurance premiums are collected by two insurers (Triglav and Maribor). Two other companies are much smaller, and agricultural insurance is not their core business. Market competition is strong. The two largest insurers originated from one company and use similar methods to rate premiums. Although agricultural insurance is loss-making, insurance companies consider the agricultural sector a promising one because of other insurance business lines (cross-sales). The insurers tolerate high loss ratios for agricultural insurance for the sake of profits made on household, motor, individual accident, and life insurance. Premium rates are not supervised by the government, though there is a list of maximum premium rates eligible for state subsidies. The premium rates are reported to reflect the risk profile for crops insured at the specific territorial units.
Agricultural Insurance Products Available
Insurance companies in Slovenia offer named-peril crop insurance. The most insured crops are grapes and fruits, though farmers can purchase insurance coverage for the main crops produced in the country. A small area of wheat is insured at the northeast of the country. The whole territory of Slovenia is exposed to summer hail, so this is the main peril insured in the country. Although insurance companies offer named-peril insurance, the providers can also provide coverage against various perils, including loss of quality for seed grain, spring frost for fruits and grapes, greenhouse insurance, floods, etc.
Multi-peril crop insurance (MPCI), income and price insurance are not available in the country. No index insurance products are available. Crop diseases are not covered by crop insurance products in Slovenia.
Premium is usually paid in two installments: 20% of the premium sum is paid when the contract is signed and the rest is paid after harvesting crops, or latest October 31. Deductibles are low, with an average of 5%.
Livestock insurance is offered for two categories of animals: breeding animals and fattening animals. The basic overage includes protection against diseases, accidental death, and emergency slaughter. Extended coverage includes medical expenses, loss of fertility by heifers and cows, transportation risks, and

208
quarantine measures. The animals are usually insured for one year. There is a time deductible on livestock diseases (30 days in average). A bonus-malus system is applied to livestock insurance depending on management practice. Table 48.1: Agricultural Insurance Available 2008 Crop Insurance Products Available Greenhouse Forestry MPCI Named-peril Crop Revenue Index-based No Yes No No Yes No Livestock Insurance Products Available Aquaculture All Risk Accident &
Mortality Epidemic Disease
Other Index-based
Yes Yes Yes No No -- Source: World Bank Survey (2008). Delivery Channels
The agent network is the primary delivery channel for agricultural insurance products. The crop insurance subsidy program is offered only to small and medium-size farms. Large farms (as identified according to EC rules) are not eligible for the program. Voluntary vs. Compulsory Insurance
Both crop and livestock insurance are voluntary for farmers in Slovenia. Premium subsidies are only available for crops. Agricultural Reinsurance
Reinsurance of agricultural risks is Slovenia is private and is offered only through two domestic reinsurance companies. Their market shares are 40% and 60%, respectively. Risks are reinsured predominantly through stop-loss treaties. No risk is ceded to the international reinsurance market.
2. Public Support for Agricultural Insurance Types of Public Support for Agricultural Insurance The agricultural insurance premium subsidy program is administered by the Agency for Agricultural Markets and Rural Development. Central government covers 30% of the premium. Municipalities can participate in the program by adding funds for premium compensation. The maximum premium subsidy allowed by the legislation is 50% (including both central and municipal funding). Subsidies include insurance sales taxes. Subsidies are available only for basic risk coverage, including hail, fire, and thunderstorm.
The government compensates farmers against calamities. The average compensation rate is 40% of the losses for non-insured farms. The government compensates 60% of the losses for the insured when the insurance payout exceeds 30% of the total sum of damage. This post-disaster assistance program is administered by the Administration for Civil Protection and Disaster Relief. The national government adopts a special decree prior to any post-disaster assistance paid to farmers suffering damage.

209
Premium Subsidies
Central government subsidies are 30% of the premium for small and medium farmers. The municipal governments can add another 20%. The total premium subsidies are limited to 50% of the premium, including insurance sales tax. Public Cost of Agricultural Insurance In 2004 the government provided USD 600,000 crop insurance premium subsidies. Out of 210 municipalities, 102 provided premium subsidies for crop insurance.
3. Agricultural Insurance Penetration Insurance Penetration Rate
In 2004 about 16.8% of the total crop value was insured. Insurance coverage for animal production amounted to 15.4%.
4. Financial Performance 5-Year Results
Crop insurance volumes were growing during 2003 to 2005. Volumes of livestock insurance were decreasing in terms of contract number and premium sums (Table 48.2). Over the 3-year period 2003 to 2005 the loss ratio has been an average of 47% for crops and livestock (Table 48.3) Cost of Agricultural Insurance Provision
Not available.
5. Public Disaster Assistance Programs The government of Slovenia provides a range of ad hoc assistance to agricultural producers. Assistance is provided in case of natural disasters and for crop and livestock losses. Compensation of damage from the natural disasters includes state aid in case of drought, hail, and frost. The average annual government expenditures for natural disaster aid during 1994 to 2004 were estimated at USD 12 million. Government allocated for disaster assistance USD 26.6 million in 2003 and USD 29.5 million in 2004.

210
6. Additional Tables Table 48.2 Estimated Agricultural Insurance Penetration, 2003 to 2005
Year Number of Crop
Policies Percent of National Crop
Area Insured 2003 16,735 19.0% 2004 16,255 16.8% 2005 17,427 --
Year Number of Livestock
Policies Percent of National Animals
Population Insured 2003 60,131 16.5% 2004 46,754 15.4% 2005 40,674 --
Source: World Bank Survey (2008). Table 48.3 Agricultural Insurance Results, 2003 to 2005
Year Number of
Policies TSI
Premium, Including Subsidies
(USD million) Paid Claims
(USD million) Loss Ratio 2003 76,866 -- 13.8 4.9 36% 2004 63,009 -- 13.9 8.8 64% 2005 58,101 -- 14.0 5.8 42%
Source: World Bank Survey (2008). Sources of Country Overview Information: World Bank Survey (2008); European Union (2006).

211
Overview on Agricultural Insurance: SOUTH AFRICA
1. Agricultural Insurance Market Review History of Agricultural Insurance
Crop insurance started in South Africa in the early 1900s. Crop insurance now is well established in South Africa, handled by private insurers, and targeted to commercial farmers.
Agricultural Insurance Market Structure (2008)
One private sector insurer underwrites crop and livestock business; four offer crop insurance only, and two offer livestock only. In the past, two cooperatives have acted as insurers on behalf of members, but they are not currently active. Sentraoes was the original cooperative insurer, which developed many crop insurances including the pre-cursor of the current multi-peril crop insurance (MPCI). Forestry insurance is also offered by insurers and by Lloyd’s, which is licensed to write direct insurance in South Africa. Lloyd’s has also been active in crop insurance for many years through a broker.
Specialist underwriting agencies, responsible for underwriting the agricultural insurance business, play an important role in the market. These agencies promote adapted product design and technical underwriting. The largest agency in the market, ARS, was formed from the business of the former cooperative company, Sentraoes, and Commercial Union Agricultural services. ARS was purchased by a major insurer, Santam, which now also acts as the insurer for that agency. The second largest market participant is an independent underwriting agency, Agricola. Other market participants are ABSA and the Mutual and Federal Insurance Company. Agricultural Insurance Products Available
Crop hail insurance and MPCI is available through a well-developed market. Standard hail cover is sometimes extended to include frost cover. MPCI cover (called Input Costs Cover in South Africa) was developed in response to the needs of financiers of agriculture. Hail is estimated to be 75% of premium for crop insurance in the market and MPCI, 25%. The main classes of crop insurance are cereals, maize, tobacco, table grapes, pipfruits, and citrus fruits. No crop revenue insurance is available, although it is under consideration. Reduction of crop quality as well as crop volume is covered. Table 49.1: Agricultural Insurance Available 2008 Crop Insurance Products Available Greenhouse Forestry MPCI Named-peril Crop Revenue Index-based Yes Yes No No Yes Yes Livestock Insurance Products Available Aquaculture All Risk Accident &
Mortality Epidemic Disease
Other Index-based
No Yes Yes No No No Source: World Bank Survey (2008). The livestock market in South Africa is extremely limited although growing. Racehorses are insured, and there is a market for wildlife in game parks. South Africa has a very well-established and sophisticated marketplace, supporting agricultural production, services, and agro-finance. This has centered on a well-developed cooperative movement. Forestry insurance is also important in South Africa.

212
Delivery Channels
For crop insurance, insurance brokers are the most important distribution channel. In decreasing order of importance after brokers are the insurers’ own agents, banks, and producer associations and cooperatives. The strong cooperative movement (some cooperatives have converted into companies) has associated insurance brokers who handle all their business. Similarly, banks can have associated brokers. Hence, most business is transacted through linked brokers. For livestock insurance, the same distribution channels are important. There are no special delivery channels or programs for small and emerging farmers in South Africa. The insurance industry has developed based on services provided to commercial farmers. There is a strong recognition of the need to adapt insurance products to meet the needs of smaller-scale and emerging farmer sectors and the financiers of these sectors. However, commercial insurers have found it difficult to justify servicing small farmers, especially with MPCI, due to uncertainty of yield and delivery costs. This also affects the availability of finances to small farmers.
A study is being undertaken on access for small farmers to insurance. A committee involving the main insurers, reinsurers, academics, and government has been formed for some years and has been supported by consulting by the National Crop Insurance Services (NCIS) of the United States. Voluntary vs. Compulsory Insurance Crop and livestock insurance is voluntary. Banks frequently insist that insurance is in place prior to committing finance. Banks may require either crop hail insurance or MPCI, depending on the equity status of the farmer (crop hail being a less expensive option for the farmer). Agricultural Reinsurance Private sector reinsurance (quota-share and stop-loss) is taken up by insurers in South Africa. MPCI reinsurance arrangements are considered more of a constraint than hail reinsurance. MPCI in South Africa has had volatile results and is challenging for reinsurers to price. Commission margins are a key issue during negotiation of quota-share reinsurance treaties.
2. Public Support for Agricultural Insurance Types of Public Support for Agricultural Insurance There is no form of public support for agricultural insurance in South Africa. Premium Subsidies There is no premium subsidy on agricultural insurance in South Africa. Public Cost of Agricultural Insurance
There is no cost to the government in support of agricultural insurance.

213
3. Agricultural Insurance Penetration Insurance Penetration Rate
In 2007 an estimated 18,000 crop insurance policies were issued, and 25% of farmers and 25% of the national crop area (1.3 million ha) were insured. These figures reflect that insurance is purchased by the commercial farming sector and not by the emergent sector. Where there are emergent farms as part of outgrower schemes there have been efforts to ensure that those farmers can participate in the same products. There has also been a wider debate as to how private sector agricultural insurers could be encouraged to move into small farmer emergent areas.
4. Financial Performance 5-Year Results
Estimates for the crop insurance premium income in the market are between R 350 million (USD 50 million) and R 750 million (USD 106 million), depending on drought status of the country in any particular year. One company involved in all crop insurance sectors shows loss ratios varying from 55% to 177% over a 4-year period. Information on forestry insurance is not available. Livestock insurance premium estimates are also not available. Cost of Agricultural Insurance Provision
For both types of crop insurance, the following are cost estimates for companies:
Marketing and acquisitions (commissions) 10% of OGP Insurer administration excluding loss adjustment 7% of OGP Loss adjustment costs 4% of OGP Total costs 21% of OGP
It should be noted that insurers are highly dependent on reinsurance support, and commissions allowed by reinsurers on quota-share reinsurance are limited due to the narrow profit margins on this class of business, particularly for MPCI. The higher costs of operating MPCI compared to crop hail is recognized by the market, and insurers have to meet higher operating costs by an element out of overall margins available from reinsurers. These margins follow through to narrower commission margins available to direct brokers in South Africa, compared to others, for selling crop insurance.
5. Public Disaster Assistance Programs There is no form of financial compensation available to farmers in South Africa. Source of Country Overview Information: World Bank Survey (2008).

214
Overview on Agricultural Insurance: SOUTH KOREA
1. Agricultural Insurance Market Review History of Agricultural Insurance
Agricultural insurance was introduced in South Korea in order to compensate farmers affected by natural disasters. The agricultural insurance scheme in this country is managed by the National Agriculture Cooperative Federation (NACF). The federal government, through the Ministry of Agriculture, plays an active direct role in the NACF scheme and also participates as reinsurer of last resort through a catastrophic stop-loss protection in excess of a 180% loss ratio. The NACF jointly with the Ministry of Agriculture introduced crop insurance. Initially the coverage was limited to apple, pear, and peach plantations against possible loss or damage caused by hail or typhoon. Livestock mortality insurance was introduced in 1997 in order to facilitate livestock management as well as to guarantee livestock farmers’ income in the event of fire and/or natural disasters. Agricultural Insurance Market Structure
The agricultural insurance scheme is managed by the NACF. This cooperative has reinsurance support on a quota-share basis from a group of domestic reinsurers, including Korean Re and a group of private insurance companies. Agricultural Insurance Products Available
Livestock insurance is offered for cattle, sheep, pigs, horses, poultry, and deer. Basic coverage includes accidental death plus emergency slaughter. As an extension of the basic coverage, the insurance could also protect sheds against damages as a direct result of fire (including lightning), snow damage, typhoon, twister, windstorm, rainstorm, floods and tidal waves, and electronic equipment business interruption.
The livestock insurance program is comprehensive. Cattle, sheep, pigs, horses, poultry and deer can be covered. Basic coverage includes accidental death and emergency slaughter. Animal sheds can also be covered against damages as a direct result of fire (including lightning), snow damage, typhoon, twister, windstorm, rainstorm, floods, and tidal waves.
Crop insurance is offered through named-peril and multi-peril crop insurance (MPCI) policies. The crop insurance program is based on two types of policy wordings: named-peril policy and MPCI policy. Apple, pear, peach, grape, sweet persimmon, tangerine, and astringent persimmon plantations are covered through the named-peril policy. Basic risks covered under this policy are hail and typhoon. In addition, farmers have the option to purchase insurance for spring frost and freezing, fall frost and freezing, excessive rain (torrential rain), and fruit tree damage. In 2007 NACF introduced MPCI coverage for chestnuts, kiwifruits, and prunes on a pilot basis.
The Ministry of Agriculture and the NACF are continuously improving the scheme both in terms of coverage as well on crops. Currently, both institutions are working on a pilot program for soybeans, potatoes, watermelons, onions and red pepper, and they are performing a feasibility study for rice crops and vegetables.

215
Table 50.1: Agricultural Insurance Available 2008 Crop Insurance Products Available Greenhouse Forestry MPCI Named-peril Crop Revenue Index-based Yes Yes No No No No Livestock Insurance Products Available Aquaculture All Risk Accident &
Mortality Epidemic Disease
Other Index-based
No Yes Yes No No No Source: World Bank Survey (2008). Delivery Channels
The delivery channel in Korea is through the NACF. There is no specific delivery channel for small and marginal farmers.
Voluntary vs. Compulsory Insurance
Crop and livestock insurance is voluntary in Korea. Agricultural Reinsurance
According to the information collected from the international agricultural reinsurance market, agricultural insurance in South Korea does not face constraints in terms of reinsurance. The NACF is reinsured on a quota-share basis with local reinsurers. Only the liability in excess of 110% local market loss ratio and up to 180% local market loss ratio is transferred to the international reinsurance market. The government acts as a reinsurer of last resort for all the liability in excess of a 180% local market loss ratio.
2. Public Support for Agricultural Insurance Types of Public Support for Agricultural Insurance Agricultural insurance in South Korea is heavily supported by the public sector in four different ways:
(i) The federal government provides 50% premium subsidies; (ii) The federal government also acts as a reinsurer of last resort for the liability in excess
of 180% local market loss ratio; (iii) 100% of the NACF’s crop insurance operational expenses and 50% of livestock
insurance operational expenses are subsidized by federal government budget; and (iv) The federal government, through the Ministry of Agriculture, has an active
participation in product research and development.
Premium Subsidies
The estimated volume of premium subsidies for the whole market on average for the period 2003 to 2007 was USD 28 million.

216
Public Cost of Agricultural Insurance
The estimated public cost of agricultural insurance in South Korea for the period 2003 to 2007 is as follows:
(i) Premium subsidies USD 28.0 million (ii) NACF’s administrative and operating expenses USD 15.6 million Agricultural Insurance Annual Average Public Cost USD 43.4 million
Federal Government Catastrophic Protection was introduced in 2005 and had not been triggered yet as of end 2008. Nevertheless, an “as if” analysis shows that this protection would have been triggered in 2003 due to the occurrence of Typhoon Maemi and would have generated a loss for the South Korean government estimated at USD 15.3 million.
3. Agricultural Insurance Penetration Insurance Penetration Rate
According to 2007/08 data the penetration rate for crop insurance is very low. About 38,000 policies were written in 2007, representing about 1.1% of total number of farmers. It is important to mention that crop insurance is only offered for some types of fruits, and crop insurance is currently not available for cereals. In 2006 7.1% of the national cattle herd, 67% of the swine population, and 40% of the poultry farms were insured.
4. Financial Performance 5-Year Results
The average loss ratio for the crop and livestock insurance market for the period 2003 to 2007 was 73%. Crop insurance performed worse than livestock insurance with 75% versus 70% average loss ratio, respectively (see Table 50.4). Cost of Agricultural Insurance Provision
It is estimated that the aggregate costs of agricultural insurance provision are 25% of OGP for crop insurance and 30% of OGP for livestock insurance.
5. Public Disaster Assistance Programs The Act on Agricultural and Fishery Disasters enacted in 1995 stipulates financial support against disasters affecting agriculture and fishery, such as damage from disease, harmful pests, and drought.

217
6. Additional Tables Table 50.2 Premium Subsidies, 2003 to 2007
Year
Insurance Premium Subsidies
(USD million)
A&O Expense
Subsidies (USD
million)
Total Subsidies
(USD million)
2003 17.0 6.7 23.7 2004 23.7 11.5 35.2 2005 30.5 19.2 49.7 2006 38.3 21.6 59.9 2007 29.9 18.7 48.6
Average 27.9 15.5 43.4 Source: World Bank Survey (2008). Table 50.3: Crop and Livestock Insurance Penetration, 2003 to 2007
Crops
Year Number of Crop Policies
issued Percent of Farmers
Insured Insured Area (ha) Percent of National Crop Area Insured
2003 -- 0% -- -- 2004 -- 0% -- -- 2005 -- 0% -- -- 2006 -- 0% -- -- 2007 37,849 1.1% -- -- Livestock
Year
Number of
Insured Cattle
Percent of National
Cattle Herd
Insured
Number of
Insured Swine
Percent of National
Swine Herd
Insured
Number of
Insured Sheep &
Goats
Percent of National
Sheep Flock
Insured
Number of
Insured Poultry
Birds
Percent of
National Poultry Insured
2003 141,000 7.1% 4.0 mil 43% -- -- 17.2 mil 17% 2004 156,000 7.2% 4.4 mil 48% -- -- 23.8 mil 24% 2005 158,000 6.9% 5.1 mil 57% -- -- 40.6 mil 37% 2006 176,000 7.1% 6.3 mil 67% -- -- 46.9 mil 39% 2007 -- -- -- -- -- -- -- --
Source: World Bank Survey (2008).

218
Table 50.4: Crop and Livestock Insurance Results, 2003 to 2007
Year
Number of
Policies
TSI (USD
million)
Premiums (USD
million)
Paid Claims
(USD million)
Average Sum Insured
(USD)
Average Premium
(USD) Average
Rate Loss
Ratio Crops
2003 -- 232.6 15.1 42.5 -- -- 6.5% 282% 2004 -- 456.2 31.3 13.4 -- -- 6.9% 43% 2005 -- 571.8 57.0 24.8 -- -- 10.0% 43% 2006 -- 721.5 61.5 22.5 -- -- 8.5% 36% 2007 37,849 891.4 58.7 65.1 23,552 1,550 6.6% 111%
Average -- 574.7 44.7 33.6 -- -- 7.8% 75% Livestock
2003 -- 266.3 18.9 20.6 -- -- 7.1% 109% 2004 -- 346.9 24.7 19.0 -- -- 7.1% 77% 2005 4,751 437.0 31.1 24.0 91,991 6,545 7.1% 77% 2006 10,920 548.6 39.0 32.4 50,237 3,574 7.1% 83% 2007 11,645 482.6 34.3 7.9 41,442 2,948 7.1% 23%
Average -- 416.3 29.6 20.8 -- -- 7.1% 70% Total
2003 -- 498.8 34.0 63.1 -- -- 6.8% 186% 2004 -- 803.1 56.0 32.4 -- -- 7.0% 58% 2005 -- 1,008.9 88.1 48.8 -- -- 8.7% 55% 2006 -- 1,270.0 100.6 54.9 -- -- 7.9% 55% 2007 49,494 1,374.0 93.0 72.9 27,761 1,879 6.8% 78%
Average -- 991.0 74.3 54.4 -- -- 7.5% 73% Source: World Bank Survey (2008). Source of Country Overview Information: World Bank Survey (2008).

219
Overview on Agricultural Insurance: SPAIN
1. Agricultural Insurance Market Review History of Agricultural Insurance Prior to 1980 there was limited crop hail insurance provision in Spain. In 1980 the government enacted legislation to create a national agricultural insurance program, termed the Combined Agricultural Insurance (Seguros Agrarios Combinados) Program, a public-private partnership underwritten by Agroseguro, a private Coinsurance Pool with a mandate to provide subsidized agricultural insurance to all of Spain’s regions and farmers on a voluntary basis. In 2008 Agroseguro was Europe’s largest and most comprehensive national agricultural insurance program, underwriting more than 200 different crop, livestock, aquaculture, and forestry programs and generating annual premiums in the order of USD 800 million.
Agricultural Insurance Market Structure
In 2008 the Agroseguro Pool was comprised of 28 private insurance companies (21 limited companies and 7 mutual societies) and the national reinsurer, Consorcio de Compensación de Seguros, CCS. Agroseguro’s agricultural insurance policies attract premium subsidies, which are financed by the national and provincial governments. By virtue of its extremely comprehensive coverage of practically all crop types and livestock species in Spain allied to the provision of premium subsidies, Agroseguro underwrites practically all agricultural insurance in Spain.
In Spain any insurance company may issue its own agricultural insurance policies to Spanish farmers, but in this case the policies do not qualify for premium subsidies. There is some very limited underwriting by local companies of products which are not offered by Agroseguro, including bloodstock, commercial forestry for pulp and paper, greenhouses, and all risk cover in aquaculture.
Agricultural Insurance Products Available Over the past 28 years Agroseguro has designed, tested and, once approved, then introduced into the market more than 200 different crop, livestock, forestry, and aquaculture products. The company offers a comprehensive range of named-peril and multi-peril crop insurance policies and a wide range of livestock insurance covers for cattle, sheep, and goats, and both freshwater and marine aquaculture policies (Table 51.1). For insurance and reinsurance purposes Agroseguro distinguishes between two major classes of agricultural underwriting:
• Viable lines. These include the less volatile crop and livestock insurance programs including
hail and named-peril crop insurance and individual animal mortality cover, etc. This class of business specifically excludes potentially catastrophe perils of drought, floods, and epidemic diseases;
• Experimental lines. These include the more volatile lines such as comprehensive multi-peril
crop insurance (MPCI) yield shortfall policies providing drought cover, all flood policies, aquaculture, livestock insurance for sheep and goats, livestock insurance for carcass destruction and clean-up costs, aquaculture, forestry, pasture index cover, etc.

220
Drought is only offered as an experimental cover for the Integral Winter Cereal Program and the loss of yield policies for specific crops such as grapes, olives, and sugar beet. As such, Agroseguro is very careful to ensure that MPCI cover is restricted to a small percentage of its overall portfolio liability. Flood protection has only been included as an insured peril since the 1999 season. In order to minimize anti-selection, flood protection is an obligatory peril on all crop insurance programs. Drought and flood protection are only offered on experimental lines and are reinsured by CCS. To date the company has not underwritten any crop revenue protection policies, namely those covers which include both loss of yield and price protection.
Agroseguro has also started to develop index-based products starting with a satellite-based remote sensing NDVI (normalized difference vegetation index) drought insurance in pasture policy, which has been marketed since 2002. In 2005 extreme drought conditions led to high claims on this pasture index policy.
Table 51.1: Agricultural Insurance Available 2008 Crop Insurance Products Available Greenhouse Forestry MPCI Named-peril Crop Revenue Index-based Yes Yes, wide-
range coverage No Yes, NDVI Yes, crop
coverage only Yes, small scale reforestation
Livestock Insurance Products Available Aquaculture All Risk Accident &
Mortality Epidemic Disease
Other Index-based
No Yes Yes No No Yes Source: World Bank Survey (2008). Delivery Channels
The majority of Agroseguro’s 28 pool coinsurers are actively involved in the marketing of Agroseguro’s standard agricultural insurance policies on their own paper through their own sales agent network in return for a commission fee. The insurer agent network is the most important distribution channel for both crop and livestock policies in Spain. Producer associations and cooperatives are the second most important delivery channel for both crop and livestock products. Insurance brokers are ranked third for crops and livestock and finally, in fourth place, banks play a role in marketing crop and livestock insurance. There are no special organizations for delivering agricultural insurance to small and marginal farmers in Spain; but the producer associations are active in promoting collective policy sales to their members, and government offers additional premium subsidies to promote special types of farmers in disadvantaged regions. Voluntary vs. Compulsory Insurance Agricultural crop and livestock insurance is voluntary in Spain. Agricultural Reinsurance
A unique feature of the Spanish agricultural insurance model is the central role played by Concorsio de Compensación de Seguros (CCS), which is a public sector reinsurer formed in 1956 to reinsure catastrophe perils including earthquakes, floods, and terrorism. CCS is both a direct pool coinsurer and provides extremely comprehensive stop-loss reinsurance protection for all the Agroseguro Pool coinsurers. For the viable lines, CCS provides layered stop-loss reinsurance up to a 160% loss ratio,

221
above which CCS reinsures 100% of losses. For the experimental lines, CCS provides even more comprehensive excess of loss reinsurance protection. The commercial premium rates paid by Spanish producers include CCS’s reinsurance premium element, which is approximately 21% of the original premium cost. CCS operates on a strictly commercial basis. In addition, individual Pool members may elect to purchase stop-loss reinsurance on their viable line retentions from private international reinsurers. Agroseguro arranges this voluntary private reinsurance cover on behalf of interest coinsurers. Finally, CCS has purchased multi-year stop-loss retrocession protection for many years from international reinsurers to protect itself against a catastrophe drought, flood, frost, or epidemic disease year.
2. Public Support for Agricultural Insurance Types of Public Support for Agricultural Insurance The Spanish Combined Agrarian Program represents a public-private partnership under which there is a tri-partite working agreement between: (1) the national government through the active participation of ENESA (the National Agricultural Insurance Agency, La Entitad Estatal de Seguros Agrarios) and the Ministries of Finance and Agriculture; (2) the autonomous state/regional governments and producers associations; and (3) the Agroseguro Pool and CCS.
Government support to agricultural insurance in Spain centers on:
• Insurance legislation; • Subsidies on agricultural insurance premiums paid by farmers and livestock producers; and • Coinsurance and reinsurance through CCS.
Under the Spanish model premium subsidies are used as a policy instrument to promote the widest possible voluntary uptake and adoption of agricultural insurance by farmers. While Agroseguro is solely responsible for setting premium rates at actuarially determined levels, government is responsible for fixing premium subsidy levels. A system of differential premium subsidies applies, which provides different levels of premium subsidies for each category of crops and livestock and the type of insurance product (named-peril, etc.), and additional subsidies are provided for collectively purchased policies through associations, for target groups of farmers including young farmers, and for the contracting of multi-crop policies or multi-year covers. In 2006 the maximum premium subsidies available ranged from 27% for Group 1 insured crops and livestock through to a very high level of 75% premium subsidy on Group 6 commodities (Table 51.2). Currently, the costs of premium subsidies are shared between national and the provincial governments of Spain on the following basis:
Subsidy Provider Share of Premium Subsidy for Crops
Share of Premium Subsidy for Livestock
National Government 74.0% 63.7% Provincial Government 26.1% 36.3%
Source: World Bank Survey (2008). The costs to the government from Agroseguro premium subsidies are reported in Table 51.3 for the 5-year period from 2003 to 2007. Over this period the costs of premium subsides have increased significantly, as the program has grown from USD 326 million in 2003 to USD 581 million in 2007 (78% increase). In 2007 crop insurance premium subsidies amounted to USD 361 million (62% of total premium subsidies), and livestock insurance premium subsides were USD 220 million (38% of total). For crops the premium subsidy level has risen from 61% of total crop premium in 2003 to 70% in 2007: in the

222
case of livestock, premium subsidies have decreased from a high of 91% of livestock premium in 2003 to 74% in 2007. Overall, in 2007, the level of premium subsidy was 72% of premium. Spain has among the highest levels of premium subsidies of any agricultural insurance program in the world. Figure 51.1: Public-Private Partnership for Agricultural Insurance
3. Agricultural Insurance Penetration Insurance Penetration Rate Over the past five years Agroseguro’s uptake rates for crop insurance have remained very stable with an average of 289,000 crop policies sold and insured area of 6.4 million ha, representing about 25% of national cropped area (Table 51.4). These figures do not, however, provide a completely representative picture of adoption rates. For high value cash crops uptake rates are very high, including 100% of cultivated area for bananas, more than 85% of area for tobacco and winter tomatoes, more than 70% of area for rice, and more than 60% for tree fruit like apricots. Conversely, in large-scale low-value row crops such as spring cereals the adoption rate is only about 25% of the cultivated area, and only 33% of the winter cereals is insured.
Livestock insurance rates are shown for cattle, sheep and goats, and poultry in Table 51.5. For cattle the take-up rate of insurance has again remained very stable over the past five years at about 1.2 million head of cattle each year or slightly below 20% of the national herd. However, these figures exclude the innovative insurance cover Agroseguro provides for cattle for the costs of carcass destruction in the event of death, for which approximately 6 million head of cattle are insured or nearly 100% of animals. There are about 27 million head of sheep and goats in Spain, and in this case the adoption rates of the accident and mortality insurance policy are fairly low, at 8% of the national flock. Poultry insurance is new in the past three years only, and it is still too early to assess the demand for this policy. To date Agroseguro does not insure pigs or equine species.

223
4. Financial Performance 5-Year Results Agroseguro’s original results prior to reinsurance reimbursements are presented in Table 51.6. After 28 years of operation the program is now very large with TSI of USD 13.5 billion in 2007 and total premium of USD 637 million, with an average rate of 6%.
The 5-year average loss ratio is 85% for all programs, 83% for crops, and 88% for livestock. Agroseguro incurred losses in 2005 both on the crop and livestock insurance programs. The crop program was severely impacted by a combination of early season frost losses especially in winter tomatoes and citrus, major early season hail losses, and then finally major drought losses in the winter cereal program. The fact that the loss ratio on the crop program was only 121% is a reflection of Agroseguro’s careful approach to underwriting and the major spread of risk and portfolio balance that has now been achieved on this mature program.
Other features of Table 51.5 include the relatively small average size of crop policy of USD 25,701 sum insured and premium of USD 1,452 and the slightly smaller average size of livestock policy at USD 22,343 and premium of USD 1,072. Average premium rates have been increasing over the past five years both for crops and especially for livestock. With the very high current premium subsidy levels, Spanish farmers are only paying for an average rate of about 1.5% for both crop and livestock insurance, or an average of about USD 350 per crop policy and an average of about USD 250 per livestock policy.
Cost of Agricultural Insurance Provision
No information was provided by the responding company. It is understood, however, that Agroseguro’s annual operating overheads amount to less than 5% of premium receipts.
5. Public Disaster Assistance Programs The Spanish government adopts a similar practice to the U.S. government in that separate ex-post disaster relief is provided to farmers for catastrophe crop losses or perils which are not insured, such as epidemic diseases in livestock, but this is conditional on the farmer/livestock producer having first purchased a crop or livestock insurance policy.

224
6. Additional Tables Table 51.2: Agricultural Insurance Premium Subsidy Levels Paid by Growers 2006
Groups of Insurance Lines/Products
Category of Premium Subsidy Group
I Group
II Group
III Group
IV Group
V Group
VI Basic subsidy applicable to all farmers 4% 9% 16% 18% 22% 39%
Additional Subsidies Collectively subscribed policies 5% 5% 5% 5% 5% 5%
According to the insured’s characteristics including Professional Farmer, Autonomous
Farmer, or member of producer organizations Young Farmer
5% +2%
14% +2%
14% +2%
14% +2%
14% +2%
14% +2%
Multiple crops contracted under one policy 2% 2% 2% 2% 2% -- Renewal of contracts:
Insured in 2005 Insured in both 2004 and 2005
3% 6%
3% 6%
3% 6%
6% 9%
6% 9%
6% 9%
Maximum subsidy levels 27% 41% 47% 56% 60% 75% Source: World Bank Survey (2008); Ministry of the Presidency, Order PRE/262/2006 (9 February 2006).
Table 51.3: Crop and Livestock Premium Subsidy Payments, 2003 to 2007
Year
Crop Premium Subsidies
(USD million)
Percent of Crop
Premium
Livestock Premium Subsidies
(USD million)
Percent of Livestock Premium
Total Premium Subsidies*
(USD million)
Percent of Total
Premium 2003 203.2 61% 123.2 91% 333.1 71% 2004 217.4 59% 131.9 82% 356.5 67% 2005 291.4 73% 178.0 89% 471.2 78% 2006 303.3 64% 200.6 73% 506.9 67% 2007 361.8 70% 219.6 74% 585.6 72%
Average 275.4 66% 170.7 80% 450.6 71% Source: World Bank Survey (2008). *Total premium subsidies include crop, livestock, aquaculture, and forestry.
Table 51.4: Estimated Crop Insurance Penetration, 2003 to 2007
Year Number of
Policies Percent of
Farmers Insured Insured Area
(mil of ha) Percent of National Crop Area Insured
2003 283,116 -- 5.5 21.4% 2004 288,904 -- 5.9 22.6% 2005 322,776 -- 7.0 26.8% 2006 246,214 -- 6.9 26.5% 2007 303,305 -- 6.8 26.5%
Average 288,863 -- 6.4 24.7% Source: World Bank Survey (2008).

225
Table 51.5: Estimated Livestock Insurance Penetration, 2003 to 2007
Year
Number of Insured Cattle
Percent of National
Cattle Herd Insured
Number of
Insured Swine
Percent of
National Swine Herd
Insured
Number of Insured
Sheep & Goats
Percent of
National Sheep Flock
Insured
Number of
Insured Poultry
Birds
Percent of
National Poultry Insured
2003 1.1 mil 19.3% -- -- 1.7 mil 6.0% --- 2004 1.1 mil 17.4% -- -- 2.3 mil 8.4% --- 2005 1.2 mil 17.6% -- -- 2.2 mil 8.8% 4.4 mil -- 2006 1.2 mil 17.6% -- -- 2.1 mil 8.4% 2.7 mil -- 2007 1.3 mil 19.4% -- -- 2.2 mil 8.6% 3.9 mil --
Average 1.2 mil 18.2% -- -- 2.1 mil 8.1% 3.3 mil --
Source: World Bank Survey (2008).
Table 51.6: Crop and Livestock Insurance Results, 2003 to 2007
Year
Number of
Policies
TSI (USD
million)
Premium (USD
million)
Paid Claims
(USD million)
Loss Ratio
Average Sum
Insured (USD)
Average Premium
(USD) Average
Rate Crops
2003 283,116 6,134.9 330.6 189.3 57% 21,669 1,168 5.4% 2004 287,881 6,719.6 370.0 320.1 87% 23,342 1,285 5.5% 2005 321,790 8,139.4 401.7 485.6 121% 25,294 1,248 4.9% 2006 245,005 7,401.0 475.1 353.4 74% 30,208 1,939 6.4% 2007 301,963 8,607.9 513.7 395.8 77% 28,506 1,701 6.0%
Average 287,951 7,400.6 418.2 348.8 83% 25,701 1,452 5.7% Livestock
2003 157,436 3,461.5 136.1 121.3 89% 21,987 865 3.9% 2004 179,124 4,143.6 161.7 136.4 84% 23,133 903 3.9% 2005 221,370 4,826.1 199.8 236.8 119% 21,801 902 4.1% 2006 224,480 4,958.1 274.1 207.1 76% 22,087 1,221 5.5% 2007 213,121 4,854.2 295.0 240.7 82% 22,777 1,384 6.1%
Average 199,106 4,448.7 213.3 188.5 88% 22,343 1,072 4.8% Total
2003 440,583 9,663.0 469.5 313.4 67% 21,932 1,066 4.9% 2004 468,063 10,939.7 534.8 462.5 86% 23,372 1,143 4.9% 2005 544,171 13,023.9 604.6 722.4 119% 23,933 1,111 4.6% 2006 470,708 12,409.1 751.7 560.7 75% 26,363 1,597 6.1% 2007 516,438 13,542.9 811.0 637.0 79% 26,224 1,570 6.0%
Average 487,993 11,915.7 634.3 539.2 85% 24,418 1,300 5.3% Source: World Bank Survey (2008). Source of Country Overview Information: World Bank Survey (2008).

226
Overview on Agricultural Insurance: SUDAN
1. Agricultural Insurance Market Review History of Agricultural Insurance
Livestock insurance was started by private companies in the early 1960s when Friesian cows were imported. Crop insurance was started by Shiekan in 2002. Feasibility studies were undertaken by a consulting firm, Agricultural Risk Management Ltd. in 1995/96, and further extended by Partner Reinsurance Co. in 2001. The initial crop studied was cotton, and further technical and economic studies were carried out by Shiekan on other crops and livestock between 2003 and 2007, notably on sugar cane, horticultural and export crops, dates, gum Arabic, and poultry.
Crop insurance started in one zone (group) with 6,300 farmers on 22,065 Feddan (9,267.3 ha) within the Gezira irrigation area for cotton in 2002/03. It was extended to other groups in Gezira, to other irrigation areas, and to other crops such as dura (sorghum), maize, sesame, wheat, and horticultural crops. Insurance in rainfed areas has gradually expanded, starting in 2003/04, principally into the mechanized rainfed area (rainfall 45-80 cm/year). By 2006/07 278,165 ha and 130,000 farmers were insured. The area insured in 2007/08 is reported to have risen to 521,429 ha.
National and international training has been undertaken and exchanges made with other programs and with the International Hail Insurance Association. In 2004 a Fund (the Fund for Alleviating the Impacts of Natural Hazards) was established. Its purpose is for premium subsidy and reinsurance. It will also address losses where insurance is not available. The Fund is expected to receive resources from federal and state governments, financial institutions and agricultural corporations, and regional and international organizations.
Agricultural Insurance Market Structure (2008)
Apart from Shiekan, which writes crop and livestock insurance, one other company started underwriting crop insurance in 2007. Including Shiekan, four insurers underwrite livestock insurance. Agricultural Insurance Products Available
Shiekan’s crop insurance policy is for wide named perils and is yield-based. It is more similar to an area-based multi-peril crop insurance (MPCI) policy than a named-peril policy. In irrigation areas it operates as a collective policy basis for farmers who farm specific “numbers” (plots of land under common land use and management) within the Gezira irrigation area. Losses are adjusted on an area basis, per number, and not for individual farmers. Typically 100 farmers may be in a number. Perils covered in irrigated areas may include excessive rain, insufficient irrigation water, shortage or bad distribution or rains (in dryland areas), windstorm, and sharp temperature changes. Farmers are required to farm in recommended areas and use recommended practices. Shiekan has been actively involved in working with other organizations to overcome input, credit and other operational constraints facing farmers.
Livestock insurance has mainly been for intensive production (e.g. dairy cows and poultry) near urban areas, as well as horses and poultry. Mortality from accident and disease is offered. Shiekan is reviewing the potential applications of index insurance.

227
Table 52.1: Agricultural Insurance Available 2008 Crop Insurance Products Available Greenhouse Forestry MPCI Named-peril Crop Revenue Index-based Yes Yes No No No No Livestock Insurance Products Available Aquaculture All Risk Accident &
Mortality Epidemic Disease
Other Index-based
No Yes Yes No No No Source: World Bank Survey (2008). Delivery Channels For crop insurance, the main delivery channels are through the insurers’ agent network, through banks, and through producer associations and cooperatives. It should be noted that all sugar is processed through mills, allowing a clear route for farmer enrollment. All fields are recorded. For livestock insurance, the agent network is used. There are no special delivery channels or programs for small farmers. Voluntary vs. Compulsory Insurance Crop insurance is voluntary. However, for borrowing farmers, insurance is preferred. Agricultural Reinsurance Shiekan purchases stop-loss reinsurance as well as quota-share for crops. Livestock reinsurance is quota-share. Availability of reinsurance has not been a constraint to Shiekan’s development of agricultural insurance.
2. Public Support for Agricultural Insurance Types of Public Support for Agricultural Insurance There are no special laws governing agricultural insurance. However, development of agricultural insurance is a government priority as part of the development of the agricultural sector. The main financial support is by government through a 50% premium subsidy for crop insurance. Some government-salaried staff takes part in loss adjustment. There are no research and development funds or subsidies to the insurer, which is majority state-owned, although operating commercially in the market-place. It is also noted that government has established the Fund for Alleviating the Impacts of Natural Hazards (see above). Premium Subsidies Crop insurance premiums are 50% subsidized directly by the Ministry of Finance. Livestock premiums are not subsidized. Public Cost of Agricultural Insurance
The cost to government of premium subsidies has risen from USD 370,000 in 2002/03 to USD 3.9 million in 2006/07.

228
3. Agricultural Insurance Penetration Insurance Penetration Rate
Crop Insurance has reached 521,429 ha out of a total of 18 million national cropped ha in 2007/08 (Table 52.2). Of the 18 million ha, about 4 million are under irrigation. The insurance scheme has therefore shown consistent growth since its start in 2002.
Livestock insurance has low penetration at 3,000 head and is mainly restricted to milking cows in closed farms out of a natural grazing herd of 40 million heads (Table 52.3). The figure for sheep refers to export stock in confined farms for fattening. In 2008 Shiekan is starting open herd insurance for sheep in mixed farms in north and central Sudan. Poultry farms will be insured starting in 2008. A limited number of race horses and police dogs are also insured.
4. Financial Performance 5-Year Results
Shiekan’s crop insurance results over the last five years show a 34% long-term average loss ratio for crops and corresponding 31% loss ratio for livestock. The overall loss ratio for crops and livestock is a very acceptable 34% (Table 52.4). Cost of Agricultural Insurance Provision
Shiekan’s operating expenses are not available, as the agricultural department has not been separately accounted from the overall company operations.
5. Public Disaster Assistance Programs There is no form of government compensation for farmers. As noted, a Fund is being established.
6. Additional Tables Table 52.2: Estimated Crop Insurance Penetration, 2003 to 2007
Year Number of
Policies Percent of
Farmers Insured Insured Area
(ha) Percent of National Crop Area
Insured 2003 6,300 -- 9,271 2004 15,110 -- 27,339 2005 29,000 -- 75,895 2006 37,949 -- 84,267 2007 130,000 -- 278,165
Source: World Bank Survey (2008). Note: In 2008 the insured area reached 521,429 ha. The national crop area is about 18 million ha.

229
Table 52.3: Estimated Livestock Insurance Penetration 2007
Year
Number of
Insured Cattle
Percent of National
Cattle Herd
Insured
Number of
Insured Swine
Percent of National
Swine Herd
Insured
Number of
Insured Sheep &
Goats
Percent of National
Sheep Flock
Insured
Number of
Insured Poultry
Birds
Percent of
National Poultry Insured
2007 3,000 -- -- -- 680,000 -- -- -- Source: World Bank Survey (2008). Table 52.4: Crop and Livestock Insurance Results, 2003 to 2007
Year
Number of
Policies
TSI (USD
million) Premium
(US)
Paid Claims (USD)
Loss Ratio
Crops 2003 6,300 0.5 342,883 40,041 11.6% 2004 15,110 13.3 928,768 184,473 20.0% 2005 29,000 33.1 2.3 mil 331,853 14.3% 2006 37,949 36.6 2.6 mil 961,102 37.6% 2007 130,000 102.3 7.2 mil 3.0 mil 32.2%
Livestock 2003 -- 2.3 154,759 82,222 32.2% 2004 -- 1.8 202,863 54,103 27.9% 2005 -- 3.1 343,335 101,405 29.5% 2006 -- 3.2 356,643 99,379 27.8% 2007 -- 3.6 390,843 108,909 27.8%
Source: World Bank Survey (2008). Source of Country Overview Information: World Bank Survey (2008).

230
Overview on Agricultural Insurance: SWEDEN
1. Agricultural Insurance Market Review History of Agricultural Insurance
Crop insurance was first introduced in Sweden in 1928 and livestock insurance in 1890. In 1952 Sweden introduced the first area-yield index crop insurance scheme, but this was subsequently terminated. During the 1961 to 1987 period, agricultural insurance was supervised by the government and was mandatory for farms with more than 2 ha. Government crop insurance covered large losses, and the average deductible was 15.5%. The system was abolished in 1987 and was replaced by a disaster aid program in case of total crop loss. The disaster aid program was administered by the Federation of Swedish Farmers. This system was abolished in 1994.
Currently, agricultural production is regarded as any other sector of the national economy. The governmental risk management framework in Sweden has moved towards less government involvement. Assistance tools for agriculture in Sweden are limited to disaster relief, and this includes few regulated measures and some ad hoc assistance. Agricultural Insurance Market Structure (2008)
Today, agricultural crop and livestock insurance is provided by three private mutual insurance companies. The agricultural insurance market is dominated by Lansforsakringar with its subsidiary company Agria. Its market share is estimated at 80%-85%. The other insurance company Dina underwrites approximately 10%-15% of the agricultural insurance market. Both insurers have regional insurance subdivisions (companies) working in close cooperation within their conglomerates. Area-yield insurance was introduced in the 1970s, but was stopped later on.
Agricultural Insurance Products Available
Insurance products are similar, and both insurers offer all farm insurance services including buildings, transportation, liability, etc. Insurance product lines include named-peril, crop income, greenhouse, and forest insurance products. Crop insurance is offered to most crops covering hail risk and replanting options. Insurance policies are offered for grain crops, pulses, oil seeds, sugar beet, potato and vegetables. Livestock insurance covers accident and mortality and epidemic diseases. Livestock insurance is well-developed, and the coverage can be purchased either on an individual animal basis or on a group animal, herd basis with a first loss deductible. The farmers can also purchase optional coverage for veterinarian treatment. The bonus-malus system is applied only to livestock insurance. Table 53.1: Agricultural Insurance Available 2008 Crop Insurance Products Available Greenhouse Forestry MPCI Named-peril Crop Revenue Index-based No Yes Yes No Yes Yes Livestock Insurance Products Available Aquaculture All Risk Accident &
Mortality Epidemic Disease
Other Index-based
No Yes Yes No No No Source: World Bank Survey (2008).

231
Delivery Channels
Agricultural (both livestock and crop) insurance is mainly delivered through insurance agents. Producer associations and cooperatives are the second delivery channel for livestock insurance. There are no special organizations or programs for small and marginal farmers. Voluntary vs. Compulsory Insurance
Agricultural insurance is voluntary. There is no government assistance to agricultural insurance, though the participation rate is high for both crop insurance (60%) and livestock (80% for cows and 90% for pigs and broiler chicken). Agricultural Reinsurance
Insurance companies reinsure agricultural portfolios through private international reinsurance companies. There are no constraints for crop named-peril and livestock accident and mortality insurance. There are moderate constraints for epidemic disease reinsurance.
2. Public Support for Agricultural Insurance Types of Public Support for Agricultural Insurance There is no government support for agricultural insurance in Sweden.
Premium Subsidies There are no subsidies. Public Cost of Agricultural Insurance There is no public cost of insurance.
3. Agricultural Insurance Penetration Insurance Penetration Rate
Crop insurance penetration is extremely high in Sweden. In 2007, Agria underwrote 9,653 crop policies with total insured area of 647,478 ha, representing about 52% of the total national cultivated area (Table 53.2). Livestock insurance penetration is also very high, and, according to Agria, almost 70% of the national cattle herd was insured by the company in 2007 along with 75 million poultry, representing almost 100% of the national poultry flock (Table 53.2).
4. Financial Performance 5-Year Results
Agria’s 5-year underwriting results for crop and livestock insurance are presented in Table 53.3. For crops, the company has underwritten an average of more than 10,000 policies per year with an average

232
insured area of about 650,000 ha, generating annual average premiums of about USD 2.6 million, with an average loss ratio of 41%. The crop portfolio is very stable, as evidenced by the maximum loss ratio of 58%.
Agria’s livestock portfolio is considerably larger, with annual sales of about 25,000 policies, generating annual premiums of about USD 8.4 million, with an average loss ratio of 48%. Results are again very stable for livestock. Overall, their portfolio has operated at a 46% loss ratio over the past five years. Premiums are actuarially calculated based on historical data and underwriting results. The bonus-malus system is used only for livestock insurance.
Cost of Agricultural Insurance Provision
Total insurer’s costs (inclusive of reinsurance premiums) are 29.2% for crop insurance and 31% for livestock insurance. No breakdown is available.
5. Public Disaster Assistance Programs Epidemic diseases have a governmental cover between 50% and 70% of economic loss. The program is supervised by the Swedish Board of Agriculture. Epidemic disease losses are covered directly from the state budget. 6. Additional Tables Table 53.2: Estimated Crop and Livestock Insurance Penetration, 2003 to 2007 Crop
Year Number of
Policies Percent of
Farmers Insured Insured
Area (ha) Percent of National
Crop Area
Average Insured Area
(ha) 2003 11,573 -- 652,619 47% 56.4 2004 11,198 -- 655,757 47% 58.6 2005 10,662 -- 646,431 50% 60.6 2006 10,113 -- 648,543 52% 64.1 2007 9,653 -- 647,738 52% 67.1
Average 10,640 650,218 50% 61.4 Livestock
Year
Number of Insured
Cattle
Percent of National Herd
Insured
Number of Insured
Swine
Percent of National Herd
Insured
Number of Insured Poultry
Birds 2003 -- -- -- -- -- 2004 1.1 mil 73.0% -- -- -- 2005 1.1 mil 71.0% -- -- -- 2006 1.0 mil 73.0% 3.0 mil -- -- 2007 1.0 mil 69.0% 2.8 mil -- 75 mil
Average 1.0 mil 71.5% 2.9 mil -- -- Source: World Bank Survey (2008).

233
Table 53.3: Crop and Livestock Insurance Results, 2003 to 2007
Year Number of
Policies TSI Crop Premium
(USD million) Crop Claims
(USD million) Loss Ratio Crops
2003 11,573 -- 2.3 1.2 51.9% 2004 11,198 -- 2.6 0.7 27.7% 2005 10,662 -- 2.5 1.1 42.3% 2006 10,113 -- 2.8 1.6 58.3% 2007 9,653 -- 2.9 0.6 22.1%
Average 10,640 -- 2.6 1.0 40.5% Livestock
2003 25,706 -- 6.9 3.2 46.0% 2004 25,016 -- 8.5 4.7 55.2% 2005 24,516 -- 8.2 3.4 41.9% 2006 24,312 -- 9.1 3.8 41.9% 2007 23,147 -- 9.2 5.0 53.7%
Average 24,539 -- 8.3 4.0 47.7% Total
2003 37,279 -- 9.2 4.4 47.5% 2004 36,214 -- 11.1 5.4 48.7% 2005 35,178 -- 10.7 4.5 42.0% 2006 34,425 -- 11.8 5.4 45.7% 2007 32,800 -- 12.1 5.6 46.2%
Average 35,179 -- 11.0 5.1 46.0% Source: World Bank Survey (2008). Table 53.4: Government Disaster Relief for Epidemic Diseases Paid to Livestock Producers, 2007 to 2007
Year Amount Paid (USD
million) 2004 2.2 2005 4.1 2006 8.0 2007 5.5
Source of Country Overview Information: World Bank Survey (2008); European Union (2006).

234
Overview on Agricultural Insurance: SWITZERLAND
1. Agricultural Insurance Market Review History of Agricultural Insurance
Crop insurance in Switzerland was introduced in 1880. Livestock insurance was initiated in 1901. Agricultural Insurance Market Structure (2008)
Livestock insurance services are offered by 27 insurance companies. Crop insurance is practiced by one mutual insurance society. There are no insurance companies offering both crop and livestock insurance. Agricultural Insurance Products Available
The core product primarily covers hail damage and is available for all types of crops. The hail products also cover additional named natural hazard perils. In 2008 the insurer Swiss Hail has introduced a multi-peril crop insurance (MPCI) product in limited regions. Greenhouse cover is available. The policies are technically highly developed, and adapted to each crop type. Livestock accident and mortality insurance is provided by private insurance companies, while livestock epidemic disease insurance is available through the public sector insurer. Table 54.1: Agricultural Insurance Available 2008 Crop Insurance Products Available Greenhouse Forestry MPCI Named-peril Crop Revenue Index-based Yes Yes No No Yes Yes Livestock Insurance Products Available Aquaculture All Risk Accident &
Mortality Epidemic Disease
Other Index-based
No Yes Yes No No No Source: World Bank Survey (2008). Delivery Channels
The agents’ network is a primary delivery channel for crop insurance providers. Producer associations and cooperatives are the second important delivery channel. Insurance brokers are the least important delivery channel. No information was provided on other delivery channels. Information about livestock insurance delivery channels is unavailable. There are no special organizations for delivering agricultural insurance to small and marginal farmers. Voluntary vs. Compulsory Insurance
Crop insurance is voluntary in Switzerland. Livestock insurance against infectious diseases is mandatory, and it is regulated through legislation of the cantons. Agricultural Reinsurance
Crop insurance portfolios are ceded to private national and international reinsurance companies. The insurance companies sign stop-loss and quota-share reinsurance treaties. There are no constraints with

235
reinsurance of livestock epidemic disease portfolios, as it is mandatory and regulated by cantonal authorities. The respondent indicated that reinsurance of livestock accident and mortality and crop insurance programs is a moderate constraint in Switzerland.
2. Public Support for Agricultural Insurance Types of Public Support for Agricultural Insurance There are specific agricultural insurance regulations in some cantons. The types of government support differ within the regions of the country, and they are subject to cantonal policy. Some cantons subsidize crop insurance premiums. Local governments can also provide subsidies for livestock insurance, including compensation of administrative and operating expenses and loss assessment costs.
Premium Subsidies
There is no national premium subsidy program, but some cantons provide some financial support on a selected basis.
3. Agricultural Insurance Penetration Insurance Penetration Rate
The responding company insures about 70% of the national crop area. About 70% of farmers purchase crop insurance from the responding company. The number of contracts signed was relatively stable for the last five years, being close to 40,000 on average. Information about livestock insurance is not available.
Year Number of
Policies Percent of
Farmers Insured Insured
Area Percent of National Crop Area Insured
2003 44,233 70% -- circa 75% 2004 42,390 70% -- circa 75% 2005 41,595 70% -- circa 75% 2006 40,701 70% -- circa 75% 2007 39,704 70% -- circa 75%
Source: World Bank Survey (2008).

236
4. Financial Performance 5-Year Results
The responding company signs about 40,000 crop insurance policies per annum. The premium sum for the last five years fluctuated within USD 45 to 47.5 million per year. The loss ratio is volatile, being the lowest in 2006 at 71% and the highest in 2004 at 152% with a 5-year average loss ratio of 115%.
Year Number of
Policies TSI Premium, Including
Subsidies (USD million) Paid Claims (USD
million) Loss Ratio 2003 44,233 -- 46.9 40.9 87% 2004 42,390 -- 47.0 71.3 152% 2005 41,595 -- 47.6 68.1 143% 2006 40,701 -- 47.1 33.6 71% 2007 39,704 -- 45.3 55.5 123%
Source: World Bank Survey (2008). Cost of Agricultural Insurance Provision
Information on the cost for agricultural insurance product delivery is not available.
5. Public Disaster Assistance Programs Regional authorities provide epidemic disease compensation for livestock producers. Ad hoc payments for crop producers for uninsurable perils are performed when needed. Regional (cantonal) authorities are responsible for support funding and administration. Criteria for crop damage assistance is notification that cultivated land suffered from natural perils. Government assistance is paid to livestock producers only if they purchased epidemic disease insurance policy and only when the epidemic disease breakout was registered in the region. Source of Country Overview Information: World Bank Survey (2008).

237
Overview on Agricultural Insurance: THAILAND
1. Agricultural Insurance Market Review History of Agricultural Insurance A crop insurance program operated in Thailand between 1978 and 1990. The program was a multi-peril crop insurance (MPCI) product covering cotton, maize, and soybeans. It was closed principally due to high administrative and loss adjustment costs. Livestock insurance was available during 1979/80. In 2006 a weather index insurance pilot was developed with technical assistance from the World Bank. The program was introduced in 2006 without insurance contracts and implemented on a small pilot scale with insurance contracts in 2007. It has expanded further in 2008. Agricultural Insurance Market Structure (2008)
The weather index insurance program is underwritten by a coinsurance pool of nine insurance companies and the Thai reinsurance company. The General Insurance Association of Thailand is an important stakeholder under which the introduction of project has been coordinated within the market. The Department of Insurance is involved as regulator. The Bank of Agriculture and Agricultural Cooperatives (BAAC) is the distribution channel for weather index insurance. Agricultural Insurance Products Available
The weather index insurance product is designed for deficit rainfall (drought) for maize crops. In 2007 it was introduced in one province, and in 2008 it has been adapted and expanded into five provinces. Table 55.1: Agricultural Insurance Available 2008 Crop Insurance Products Available Greenhouse Forestry MPCI Named-peril Crop Revenue Index-based No No No Yes No No Livestock Insurance Products Available Aquaculture All Risk Accident &
Mortality Epidemic Disease
Other Index-based
No No No No No No Source: World Bank Survey (2008). Delivery Channels
For weather index insurance, the sole delivery channel at present is BAAC, which has been an instrumental stakeholder in the development of the program. BAAC has a major outreach to farmers, as an agricultural bank, throughout the country, and has been involved in many extension activities to educate and enroll farmers on the weather index program. BAAC was also involved in the earlier crop insurance program in the 1980s. There are no special delivery channels or programs for small and emerging farmers in Thailand, as the majority of farmers are small scale producers. Voluntary vs. Compulsory Insurance The weather index program is voluntary. Insurance has not been made a pre-condition for access to loans by BAAC.

238
Agricultural Reinsurance This program is too small at present to need a specific reinsurance program, and capacity is provided by the pool of nine insurers and one reinsurer operating in a coinsurance arrangement.
2. Public Support for Agricultural Insurance Types of Public Support for Agricultural Insurance There is no direct public support for a pilot weather index program in Thailand, but there is indirect support in that the program development costs are being carried by BAAC (a public company) as well as by the private sector insurance companies. The program overheads are not yet economically sustainable from the premium generated. Premium Subsidies There is no premium subsidy on agricultural insurance in Thailand. Public Cost of Agricultural Insurance
There is no direct cost to the government in support of agricultural insurance.
3. Agricultural Insurance Penetration Insurance Penetration Rate
The pilot weather index insurance program is extremely small at present. In 2007 it covered 35 farmers on 154 hectares (representing 0.02 percent of crop area). In 2008 it expanded to 556 farmers on 630 ha.
4. Financial Performance 5-Year Results
The pilot program is too new and too small at present, with only one year of experience and nominal premium income, to provide any meaningful information on the underwriting performance. Cost of Agricultural Insurance Provision
The weather index insurance is currently in an early phase of implementation. As with any new product, a heavy investment is required, and such investment costs are not able to be supported by the initial low premium income volumes. At present the cost structure (percentage of premium income) of a mature program cannot yet be stated. During this initial phase, it was agreed by stakeholders that the percentage of premium to be deducted as overhead expenses would be set at 5% of premium income, payable to insurers, and for marketing and distribution 5%, payable to BAAC. The premium tax is 7.43% of premium income.

239
5. Public Disaster Assistance Programs A system of financial compensation is operated in Thailand by the Ministry of Agriculture and Cooperatives. This program provides compensation to farmers on an ad hoc basis for losses caused by drought and floods. The existence of this compensation scheme, which has operated for several years, operates in parallel with weather index insurance. Source of Country Overview Information: World Bank Survey (2008).

240
Overview on Agricultural Insurance: THE NETHERLANDS
1. Agricultural Insurance Market Review History of Agricultural Insurance
Hail crop insurance is the main product in the Dutch agricultural insurance market. This product was first introduced at the beginning of 20th century, mainly through mutual insurance. A compulsory insurance Fund to cover livestock infectious and zoonotic diseases affecting cattle, pigs, poultry, sheep, and goats is in place in The Netherlands. The Fund runs on a compulsory basis and is financed by levies on livestock products that are retained from the final price to the farmers. This Fund covers the value of culled animals and the replacement costs of the infected feed and materials that cannot be disinfected. The costs of culling and rendering, diagnostics, transport to rendering plant, and other costs associated to elimination of the outbreak are covered by the government up to a certain pre-agreed value per animal. Business interruption is not covered.
Agricultural Insurance Market Structure (2008)
Due to the high number of private insurance companies offering hail crop insurance, the Dutch crop insurance market is very competitive in terms of prices and quality of services. Tariffs and conditions are fixed by the private market. Agricultural Insurance Products Available The crop insurance product offered on this market is the traditional hail crop insurance. The average annual hail insurance premiums are set at 0.625% of TSI for wheat, 1.75% for sugar beet, and 0.75% for potatoes. Franchise and deductible levels depend on the product insured.
The livestock disease cover scheme provides payouts for culling and rendering, diagnostics, transport to rendering plant, and other costs the farmers incur in order to mitigate the effect of infectious or zoonotic diseases. In such cases the Fund indemnifies the replacement cost of the slaughtered animals as well as the replacement costs of infected feed and materials that cannot be disinfected. Business interruption is not covered; it is important to note that this cover cannot be considered as an insurance product. Table 56.1: Agricultural Insurance Available 2008 Crop Insurance Products Available Greenhouse Forestry MPCI Named-peril Crop Revenue Index-based No Yes No No Yes No Livestock Insurance Products Available Aquaculture All Risk Accident &
Mortality Epidemic Disease
Other Index-based
No Yes No Yes No No Source: World Bank Survey (2008). Delivery Channels
The most important delivery channel used for hail crop insurance commercialization is through farmers associations and cooperatives. There are no specialized delivery channels for small and marginal farmers in the Netherlands.

241
Voluntary vs. Compulsory Insurance
Hail crop insurance is voluntary. The Livestock Disease Cover Scheme is compulsory for herders. Agricultural Reinsurance
Traditional hail crop insurance is reinsured on the international private market. No major constraints to access to reinsurance capacity for this product are identified in the Dutch market. The Livestock Disease Protection Scheme is financed by the Dutch government.
2. Public Support for Agricultural Insurance Types of Public Support for Agricultural Insurance The Dutch government is of the opinion that farmers should take care of themselves and that weather adversaries are for agricultural businesses a normal entrepreneur’s risk for which they have to make their own provisions without any public help. Therefore, there is no crop insurance subsidy program in place in The Netherlands. The Dutch government only intervenes on agricultural insurance markets by financing the mutual Fund established to cover infectious and epizootic diseases. Premium Subsidies
There is no insurance premiums subsidy in the Dutch agricultural insurance market. . Public Cost of Agricultural Insurance No data available.
3. Agricultural Insurance Penetration Insurance Penetration Rate
No data available.
4. Financial Performance 5-Year Results No data available. Cost of Agricultural Insurance Provision
No data available.
5. Public Disaster Assistance Programs There is government support to agriculture in case of natural calamites.
Sources of Country Overview Information: World Bank Survey (2008); European Union (2006).

242
Overview on Agricultural Insurance: TURKEY
1. Agricultural Insurance Market Review History of Agricultural Insurance
Crop insurance was introduced in the country in 1957. Livestock insurance was introduced in 1960. Until 2006 the agricultural crop and livestock insurance in Turkey was underwritten by 15 private commercial insurance companies that competed against each other to underwrite a series of products, including, most notably, crop hail (plus pilot frost), livestock, poultry, and greenhouse insurance. In 2005 the market leaders were Guven and Basak with 37% and 34% shares, respectively, of total agricultural insurance market premiums of Turkish Lira 49 million (USD 36 million). During this period, a market tariff system was applied by international reinsurers and with the agreement of local insurers in the crop hail business; each company placed its own reinsurances with the national reinsurer (Milli Re) and/or international reinsurers on a proportional and/or non-proportional basis.
In 2005, with the agreement of government and the private commercial insurers, legislation was enacted under the Agricultural Insurance Law No 5363, dated June 14, 2005, to create an Agricultural Insurance Pool under the administration of a new managing underwriter, TARSIM, and to define the role and functions of federal government support in the form of financial subsidies and excess of loss reinsurance protection.
Agricultural Insurance Market Structure (2008)
Figure 57.1 shows the institutional structure for the TARSIM Pool. It is a public-private partnership involving the government, the private insurance companies, and supporting organizations (insurance association, Ministry of Agriculture, etc). A management committee comprised of representation from each of these organizations is responsible for policy decisions regarding the operations of the Pool, for determination of crops, risks, and regions to be supported, and for determination of subsidy levels.
The TARSIM Agricultural Insurance Pool functions as a conventional coinsurance pool, and its shareholders and coinsurers include the 16 former agricultural insurance companies, each with a 6.25% share in the pool. The coinsurers issue TARSIM’s approved and standard insurance contracts (policies) on their own paper; the companies receive an agreed commission for bringing business to the Pool, and all risks and premium are 100% ceded to the Insurance Pool. TARSIM is responsible for product design and setting standard rates, for premium collection, for loss assessment and claims settlement, and for reinsurance arrangements. Agricultural Insurance Products Available TARSIM offers a wide range of specialist agricultural insurance products as summarized in Table 57.1 and described in more detail in Table 57.5. The company does not underwrite multi-peril crop insurance (MPCI) covers. Rather, it offers a named-peril hail policy plus additional perils for all crops. For fruit and vegetables and ornamentals additional cover may be purchased against frost damage. The company also underwrites a material damage policy for loss of greenhouse structures and the crops grown under cover.
The company insures dairy cattle against a wide range of perils including diseases, but excluding notifiable diseases, and a similar comprehensive cover is offered for poultry. The company also underwrites a marine aquaculture policy against a wide range of perils including pollution, diseases, and algae bloom.

243
Figure 57.1: Public-Private Partnership for Agricultural Insurance in Turkey
.
Table 57.1: Agricultural Insurance Available 2008 Crop Insurance Products Available Greenhouse Forestry MPCI Named-peril Crop Revenue Index-based No Yes No No Yes No Livestock Insurance Products Available Aquaculture All Risk Accident &
Mortality Epidemic Disease
Other Index-based
No Yes No -- No No Source: World Bank Survey (2008). Delivery Channels
The main delivery channel for agricultural insurance services is the insurance agents’ network (for both crop and livestock). Financial institutions and input suppliers are the second important delivery channel for crop insurance. Another significant delivery channel for both crop and livestock insurance is producers’ associations and cooperatives. Insurance brokers are marginal. There are no specific institutions for delivering agricultural insurance to small and marginal farmers in Turkey. Voluntary vs. Compulsory Insurance Agricultural insurance is voluntary for all farmers. Agricultural Reinsurance
TARSIM is responsible for deciding on its risk retention and reinsurance strategy. The company is permitted to retrocede business back to the insurers and/or to reinsure through MilliRe and international
Source: TARSIM (2006)
Turkey Public Private Partnership for Agricultural Insurance
Agricultural Insurance Pool
TARSIM
TSV (field loss assessment
services)
Organizations Insurance and Agriculture
Association of the Insurance and Reinsurance
Companies of Turkey
Union of the Turkish Chamber of Agriculture
Government Private Sector
Ministry of Agriculture and
Rural Affairs Undersecretariat of the Treasury
Insurance Companies

244
reinsurers. It is also understood that, in cases where sufficient reinsurance capacity is not available through commercial reinsurers, government may accept to share in the risk financing.35
2. Public Support for Agricultural Insurance
Types of Public Support for Agricultural Insurance Public support to agricultural insurance is important in Turkey. The government provides a wide range of support under the new TARSIM Pool arrangement including:
• Agricultural insurance legislation enacted in 2005 to create the national Pool Scheme and to
define the roles of public and private sectors; • Agricultural insurance premium subsidies, which are fixed at 50% of the premium cost for
both crops and livestock and which are paid by government directly to the Pool (TARSIM); • Subsidies on TARSIM’s administration and operating expenses and on loss adjustment
expenses; • Government support to the reinsurance program; and • Agricultural insurance premiums sales tax exemptions.
The costs of government premium subsidies and other forms of financial support to the Program are detailed in Table 57.2 for 2007, which was the first full year of operation of the new TARSIM Pool agricultural insurance scheme.
3. Agricultural Insurance Penetration Insurance Penetration Rate
In 2007 TARSIM reported that a total of 207,328 crop policies were issued to 150,000 farmers with an estimated coverage of 3% of the national cropped area. For livestock, a total of 55,783 dairy cattle were insured, representing about 0.5% of the national population of cattle. Details for poultry and aquaculture insurance are not available.
4. Financial Performance 5-Year Results
The Pool results for 2007, the first full year of operation, are presented in Table 57.3. Under the subsidized Pool Agricultural Insurance Scheme, the volume of sales and premiums in 2007 was nearly USD 55 million in 2007. In 2007 the average premium rate for crops was 4.3% and for livestock, 8.4%. The crop program incurred a loss ratio of 91%, livestock a loss ratio of 42%, and overall a loss ratio of 76%. Cost of Agricultural Insurance Provision
According to the responding entity the insurers’ acquisition costs amounted to 17% of premium in 2007 and loss adjustment expenses. LAE were 5% of premium and were the same for both crops and livestock (Table 57.4). No details are provided of TARSIM’s own administration and operating overheads. Given 35 Bora 2005, Public-Private Partnerships for Risk Management in Agriculture: Turkish Experience.

245
the fact that LAE are subsidized by Government, it is not known if the 5% LAEs are charged by TARSIM in its rating.
5. Public Disaster Assistance Programs National legislation contains provisions for offering state support to the farmers suffering from adverse weather events. However, under the new voluntary subsidized agricultural insurance scheme, farmers who decline to purchase insurance will not be eligible for compensation for any losses which are caused by insurable perils. Assistance is offered to farmers whose crops were damaged more than 40% by natural perils if the farmers have no seeds and opportunity to borrow credit for re-seeding. The government provides credit, donations of goods or cash, and technical aid of compensation of recovery expenses (rebuilding or repair). There is a calamity fund in which funds are used to provide support to farmers suffering from adverse risk events. 6. Additional Tables Table 57.2: TARSIM Subsidies Paid by Federal Government 2007
Premium Subsidies
A&O Expenses Subsidies
LAE Subsidies Total
Percent of Premium
Crop 50% 6% 5% 61% Livestock 50% 6% 5% 61%
Amount (USD million)
Crop 20.0 2.4 2.0 24.4 Livestock 6.1 0.7 0.6 7.4
Total 26.1 3.1 2.6 31.8 Source: World Bank Survey (2008). Note: Figures for A&O and LAE subsidies were calculated by the World Bank. Table 57.3: TARSIM Pool Agricultural Insurance First Year Results 2007
Class Number of
Policies TSI
(USD million)
Total Premium
(USD million)
Paid Claims
(USD million)
Loss Ratio
Loss Cost
Average Premium
Rate
Crop
207,328 935.9 40.0 36.4 91% 3.9% 4.3%
Livestock
10,113 144.0 12.1 5.1 42% 3.6% 8.4%
Total
218,938 1,079.9 54.8 41.5 76% 3.8% 5.1% Source: World Bank Survey (2008).

246
Table 57.4: TARSIM Insurance Costs as a Percent of OGP Costs Crop Livestock Marketing & Acquisition 17% 17% Administration -- -- Loss Adjustment 5% 5% Total (excluding operating expenses) 22% 22%
Source: World Bank Survey (2008). Table 57.5: TARSIM Crop and Livestock Products and Insured Perils Class of Insurance Insured Crops/Livestock Insured Perils
Crop: Hail (Standard) All crops (fruits, vegetables, field crops, and ornamental plants)
Loss of quantity arising from hail, storm, fire, tornado, landslide, and earthquake
Crop: Additional Cover Fruit, vegetables, and ornamentals
Loss of quantity from frost; loss of quality from hail
Greenhouse Greenhouses and crops grown in greenhouses
Hail, fire, storm, tornado, landslide, snow, earthquake, vehicle impact
Livestock Dairy cattle (registered pedigree or pedigree system)
Death and obligatory slaughter due to disease (but excluding notifiable infectious diseases like tuberculosis, brucellosis, FMD and BSE), pregnancy, labor, surgery, abortion, accident, snake and insect bites, poisoning, natural disasters, sunstroke, fire, and explosion
Poultry
Poultry raised within enclosed premises under bio security and hygienic rules
Disease (but excluding infectious diseases stated in Code #3285), accident, poisoning, natural disasters, deaths, obligatory slaughter, fire, and explosion
Aquaculture Fish reared in sea cages, registered with NARS
Disease (excluding diseases defined under A.3 Exclusions 1 & 2), pollution and poisoning beyond management control, all natural hazards, accident, predators, and algae bloom
Source: World Bank Survey (2008). Source of Country Overview Information: World Bank Survey (2008).

247
Overview on Agricultural Insurance: UKRAINE
1. Agricultural Insurance Market Review History of Agricultural Insurance Crop and livestock insurance were available when Ukraine was a part of the Soviet Union. The agricultural insurance system in the Soviet Union was based on solidarity principle, and its operations were not actuarially sound. All insurance services were provided by the state insurance company, Gosstrakh. This company had very large historical database of agricultural insurance records. The insurance company Oranta replaced Gosstrakh. The company was privatized in the mid-1990s.
After the independence in 1991, agricultural insurance became marginal, and agricultural insurance services were provided mostly by the Oranta insurance company. In 2000 private insurance companies started to offer agricultural insurance. Crop and livestock insurance was made compulsory by law in 2002/03. Premium subsidies were supposed to be provided by the government. Due to budgetary constraints, mandatory agricultural insurance did not work. The program was inadequately designed and lacked major elements of a modern agricultural insurance system. Currently, crop and livestock insurance is still mandatory but not enforced (de facto voluntary), but subsidized by the national government.
There is no special agricultural insurance legislation; however, several legislative and regulatory documents include provisions relating to agricultural insurance. Several versions of a draft agricultural insurance law were prepared by the insurance community, government entities, and international donors in 2005 to 2007, but until mid-2008 there was no special law in Ukraine. Agricultural Insurance Market Structure (2008) In 2007 the Ministry of Agrarian Policy informed that 62 private insurance companies participated in the subsidized crop insurance program. There are two agricultural insurance pools in Ukraine with approximately 15 insurance companies. Data on the number of voluntary agricultural insurance providers is not available. Agricultural Insurance Products Available There is a wide choice of agricultural insurance products in Ukraine. Insurance products can be broadly separated into subsidized crop insurance products and non-subsidized crop and livestock products. The range of subsidized products includes multi-peril crop insurance (MPCI), total loss for winter crops, partial and total loss for winter crops, and area-yield index insurance.
Non-subsidized crop insurance products include MPCI and named-peril insurance with flexible coverage features. Livestock insurance is mostly provided for cattle, pigs, horses, sheep, fur animals, and goats. Insurance of other types of agricultural animals, bees, and aquaculture is less popular. Livestock insurance products offer flexible coverage when the farmer can insure livestock against risk groups of his choice. Usually, the group risk groups include weather perils, fire, epidemic diseases, and accidental loss and unlawful actions of third parties (theft, robbery, etc.).

248
Table 58.1: Agricultural Insurance Available 2008 Crop Insurance Products Available Greenhouse Forestry MPCI Named-peril Crop Revenue Index-based Yes Yes No Yes, area-yield No, not
practically No
Livestock Insurance Products Available Aquaculture All Risk Accident &
Mortality Epidemic Disease
Other Index-based
Yes Yes Yes No No No Source: World Bank Survey (2008). Delivery Channels
The most important delivery channel is the sales agents’ network and the regional branch offices. Banks and other financial institutions are the second most important delivery channel because, according to the national legislation, all collateral property should be insured prior to contracting a loan. Insurance brokers are relatively important channel for marketing crop insurance products and less important for the livestock segment. There are no specific organizations in Ukraine for delivering agricultural insurance services to small and marginal farmers. Voluntary vs. Compulsory Insurance Crop and livestock insurance is compulsory according to the legislation, but de facto it is voluntary because the government does not subsidize all premiums under the mandatory programs, mainly because some farmers do not apply for subsidies, given the cumbersome procedure. In practice, private insurance companies sell agricultural insurance under their property license while separate licenses for mandatory crop and livestock insurance are required. Financial institutions require an insurance policy for crops or livestock offered as collateral but finance institutions themselves stimulate issuance of formal insurance policies with low premium rates and extremely limited coverage. Agricultural Reinsurance Crop and livestock insurance portfolios are reinsured on private national and international reinsurance markets. Government does not provide any reinsurance. Access to private international reinsurance is a moderate constraint for crop insurance products. Some amount of Ukrainian agricultural risks is reinsured on the regional reinsurance market. Access to the international reinsurance facilities is identified as major constraint for livestock epidemic disease covers.
2. Public Support for Agricultural Insurance Types of Public Support for Agricultural Insurance The Ukrainian government subsidizes crop insurance premiums under certain conditions. The government subsidizes premiums (50%) mostly on grain and oil crops, corn, sunflower, hops, flax, hemp, soybeans, and sugar beet. The farmer pays the premium, and later he/she can apply for the subsidy through the local agricultural department. The procedure to apply for premium subsidies is very bureaucratic. As a result, large commercial farms have a better access to crop insurance subsidies than small farms and private farmers. The conditions for premium subsidies are defined by law. In addition, the government adjusts the terms of the crop insurance subsidy program at the beginning of each cropping season. Spring-summer agricultural season experiences certain difficulties due to the late publication of crop insurance subsidy terms and procedures. There is no livestock subsidy.

249
Premium Subsidies The government has provided crop insurance subsidies since 2005. Data on subsidy plans and subsidies paid to farmers are provided in the table below. Table 58.2: Government Subsidies Paid to Farmers, 2005 to 2007
Year
Subsidies Allocated in the State Budget
(USD million)
Actual Subsidies Paid to Farmers
(USD million) 2005 10.1 1.1 2006 2.0 2.0 2007 10.0 9.5
Source: World Bank Survey (2008). Public Cost of Agricultural Insurance The public cost of agricultural insurance is through premium subsidies (see table above).
3. Agricultural Insurance Penetration Insurance Penetration Rate
The data on the whole agricultural insurance market is not available. Some data on the subsidized Crop Insurance Program are available. In 2007 private insurers underwrote 4,397 crop insurance contracts under the subsidized Program. The penetration rate was 7.9%. About 2.4 million ha of agricultural crop area were insured in 2007, accounting for 9% of the total cultivated land. Table 58.3 Estimated Crop Insurance Penetration, 2005 to 2007
Year Number of Contracts
Percent of Farmers Insured
Total Area Insured (ha)
Premium Sum (USD million)
Percent of National Crop Area insured
2005 930 1.6% 390,600 2.2 2.0% 2006 1,330 2.4% 668,100 5.6 3.5% 2007 4,397 7.9% 2.4 mil 23.2 9.0%
Source: World Bank Survey (2008).
4. Financial Performance 5-Year Results The agricultural insurance market in Ukraine has rapidly developed since 2002. The average premium rates are low compared to other MPCI programs (4.5% on average). The loss ratio data is not available as neither the professional NGO (the League of Insurance Organizations) nor government institutions are able to collect payout and loss ratio data from participating insurance companies. According to non-official sources, the loss ratio on subsidized crop insurance products is between 20% and 45%.

250
Cost of Agricultural Insurance Provision The average delivery and administration costs are estimated at 28% of the premium amount. Of that, 25% is allocated to marketing and acquisition costs, and insurance companies pay 3% tax on gross premiums collected. Specific data on voluntary crop and livestock insurance costs is not available.
5. Public Disaster Assistance Programs The government provides post-disaster assistance to the producers affected by natural calamities or infectious diseases. The government paid lump sums by area unit (ha) for crops destroyed by winterkill (2003) and drought (2007). Livestock producers also can get post-disaster assistance against epidemic disease (e.g. bird flu in 2005). Source of Country Overview Information: World Bank Survey (2008).

251
Overview on Agricultural Insurance: URUGUAY
1. Agricultural Insurance Market Review History of Agricultural Insurance The Uruguayan agricultural insurance market is a very well developed and has a long history. Crop insurance was introduced in 1912 and currently approximately 550,000 ha are insured in the country, representing 80% of the area sown. The most demanded and marketed crop insurance products are hail insurance and hail plus additional named-perils (wind, freeze, excess of moisture). During recent years, new insurance products like multi-peril crop insurance (MPCI) became popular, particularly among large farmers.
Forestry insurance is also a very popular product in Uruguay. Introduced in the 1990s, this line of business has expanded over time. Currently, 90% of the total forested area in the country (1 million ha) is insured. Livestock insurance is marginal in the country.
Federal government intervention in agricultural insurance is active. Main governmental efforts are through: (i) the exemptions on VAT for crop insurance, (ii) the financing of the development of new agricultural insurance products for small farmers, and (iii) the financing of capacity building. In some special cases, like horticulture production, the federal government also provides premium subsidies. There is no form of special agricultural insurance legislation. Agricultural Insurance Market Structure (2008)
Four insurance companies offer agricultural insurance products. Two of the four are private insurance companies, one is a cooperative, and one is a public company. The leading insurance company is “Banco de Seguros del Estado” (BSE) with a market share of 70% on crop insurance and 90% on forestry insurance. It is important to mention that BSE used to have the monopoly of insurance in Uruguay from 1912 to 1993. Agricultural mutual insurance is well developed in Uruguay. They are not considered insurance companies, but they are very active in Uruguay and have an important share on premiums and on insured area as well. Under this category we can include Maltería Uruguay Mutual, covering around 100,000 ha of barley and the mutual created by Rice Farmer Association with another 30,000 ha. Agricultural Insurance Products Available The traditional named-peril coverage is the standard hail plus fire insurance. In addition to hail the farmer can select to cover wind, freeze, and excess of moisture at harvest. The standard hail coverage has a 6% TSI franchise, but several alternatives in terms of franchises and deductibles are available in the market. Almost all crops, fruits, and vegetables growing in Uruguay are eligible with this product. Original gross rates for hail standard coverage vary from 2% in low-risk areas up to 4.5% in risk-prone areas. The rates vary according to the crop insured, the region and the selected deductible/franchise level.
Additional coverage for wind, freeze, and excess of moisture at harvest are only offered for wheat, soybeans, corn, barley, and sunflower. Original rates vary depending on the crop and type of additional peril. Deductibles apply for these additional perils and can reach up to 20% of the TSI. Another named-

252
peril product offered in Uruguay is the Vineyard Freeze Damage Insurance covering yield shortfall in vineyards due to freeze perils.
MPCI is offered only for soybeans, corn, sunflower, wheat, and barley. Guaranteed yields under this coverage vary from 50% to 65% of the actual production history depending on the crop/region/selected guaranteed yield and recommendations of the inspection report. The product is offered on an individual or portfolio basis (all crops in all locations). Original gross rates for individual MPCI vary from 3.5% to 5.5% of TSI depending on the crop, region, and coverage level. MPCI portfolio covers original gross rates vary from 1% to 4% depending on the crops, regions portfolio distribution, and coverage level.
Forestry insurance covers the standing timber value of commercial forestry plantations against fire, wind, and, in very specific cases, hail and freeze. Optional additional coverage includes debris removal and firefighting expenses. This type of insurance is subject to the application of a deductible per event and an annual aggregate indemnity limit. Original gross rates vary from 0.3% to 1% of TSI depending on the region, type of plantation, protection measures, contingency plans implemented by the insured in case of fire, deductible, and indemnity limit.
Greenhouse insurance covers losses on greenhouse structures with option to content (crops) due to fire, windstorm, hail, and flood. A 10% deductible applies. Original gross rates vary depending on the type of structure and the region the risk is located but range from 0.2% to 0.6%.
Table 59.1: Agricultural Insurance Available 2008
Crop Insurance Products Available Greenhouse Forestry MPCI Named-peril Crop Revenue Index-based Yes Yes No No Yes Yes Livestock Insurance Products Available Aquaculture All Risk Accident &
Mortality Epidemic Disease
Other Index-based
No Yes No No No No Source: World Bank Survey (2008). Delivery Channels
The delivery channel used by the insurers depends on the products. For standard hail crop insurance, the most common delivery channel is through agent brokers who belong to the insurance company network. MPCI and forestry insurance are more often delivered through insurance brokers. There is no provision for special channels to deliver agricultural insurance to small and marginal farmers. Voluntary vs. Compulsory Insurance
Agricultural insurance is voluntary in Uruguay. Agricultural Reinsurance
At least for the commonly marketed insurance products, insurance companies do not face specific constraints to access private reinsurance. Currently, there are six international reinsurers supporting crops and forestry programs in the country.

253
2. Public Support for Agricultural Insurance Types of Public Support for Agricultural Insurance Federal government support to agricultural insurance is very active in Uruguay. Main governmental efforts are through: (i) VAT tax exemption on agricultural insurance premiums; (ii) the development of information systems, capacity building, and insurance schemes development; and (iii) premium subsidies for horticulture and fruit production. In 2002 the Congress enacted the bill creating the "Fondo de Reconstruccion y Fomento de la Granja” (Fund for Development and Reconstruction of the Farms). Under this Program the Ministry of Livestock, Agriculture and Fisheries manages a Fund of up to USD 2 million in order to subsidize up to 60% of hail insurance premiums and funding a Climatic Emergency Fund for horticulture and fruit sector. Premium Subsidies
The estimated volume of premium subsidies for the whole market in 2007 was USD 100,000. . Public Cost of Agricultural Insurance The estimated volume of premium subsidies for the whole market in 2007 was USD 100,000.
3. Agricultural Insurance Penetration Insurance Penetration Rate
According to data corresponding to underwriting year 2007 the total agricultural insurance premiums written in Uruguay reached USD 7.5 million. Crop insurance is well spread in the country. Approximately 550,000 hectares are insured every year, representing 65% of the cultivated area in the country. Forestry insurance has also high penetration with 90% of the forested area insured.
4. Financial Performance 5-Year Results
The average loss ratio for the whole market is 37%. However, during recent years, the increase of market competitors made original terms and conditions less strict. It is thus expected that the financial performance of the market will deteriorate in the future. Forestry insurance also shows outstanding results with a 14% average loss ratio, but this loss ratio is expected to increase in the future due to less strict terms and conditions driven by market competition.

254
Cost of Agricultural Insurance Provision
Average cost ratios with respect to the OGPs for the Uruguayan market are 31% for crop insurance and 32.5% for forestry insurance. The breakdown of such costs is as follows:
o 15% (acquisition – local brokerage); o 10% company’s administrative costs; o 5% loss adjustments costs for a total of 30% costs; o 1% insurance tax for crop insurance, and 2.5% insurance tax and firefighter tax for
forestry insurance, respectively.
Therefore, the combined ratio is estimated at 68% for crop insurance and 46.5% for forestry insurance.
5. Public Disaster Assistance Programs Beside the ad hoc assistance program established under the "Fondo de Reconstruccion y Fomento de la Granja” Law (Law on the Fund for Development and Reconstruction of the Farms) exclusively for the fruit and horticulture sector, there is no formal mechanism to assist farmers affected by natural calamities. However, there is a record of public intervention in case of natural calamities in the rural sector. For example, in October 2001 and March 2002, the Uruguayan farmers were severely affected by the occurrence of excess of rain events. In 2001 the federal government, through the national bank “Banco de la República”, put in place a credit line of USD 3 million with no interest. In 2002 the government directly indemnified affected farmers for an amount of USD 2.2 million.
6. Additional Tables Table 59.2: Estimated Crop Insurance Penetration, 2003 to 2007
Year
Number of Crop Policies
Percent of Farmers
Purchasing
Insured Area (ha)
Percentage of National Crop Area Insured
2003 -- -- 533,362 65.6% 2004 -- -- 516,925 63.6% 2005 -- -- 361,796 44.5% 2006 -- -- 442,565 54.5% 2007 -- -- 550,000 67.7%
Source: World Bank Survey (2008).

255
Table 59.3: Crop and Livestock Insurance Results, 2003 to 2007
Year
Number of
Policies
TSI (USD
million)
Premium (USD
million)
Paid Claims (USD)
Average Sum
Insured (USD)
Average Policy
premium (USD)
Average Rate
Loss Ratio
Crops 2003 -- 81.6 3.5 879,683 -- -- 4.3% 25% 2004 -- 81.3 3.7 1.5 mil -- -- 4.5% 40% 2005 -- 67.7 2.7 263,464 -- -- 4.0% 10% 2006 -- 85.2 3.0 1.1 mil -- -- 3.6% 35% 2007 -- 128.4 4.6 2.8 mil -- -- 3.6% 61%
Average -- 88.8 3.5 1.3 mil -- -- 3.9% 37% Forestry
2003 914 549.6 1.9 261,095 601,323 2,046 0.3% 14% 2004 1,013 513.3 1.9 1.3 mil 506,667 1,913 0.4% 68% 2005 993 892.3 2.5 78,948 898,575 2,477 0.3% 3% 2006 1,016 927.3 2.9 0 912,737 2,836 0.3% 0% 2007 983 1,117.5 2.9 36,016 1.1 mil 3,000 0.3% 1%
Average 692 800.0 2.4 338,080 811,225 2,454 0.3% 14% Total
2003 914 631.2 5.4 1.1 mil 690,583 5,861 0.9% 21% 2004 1,013 594.5 5.6 2.8 mil 586,907 5,531 0.9% 50% 2005 993 959.9 5.2 342,412 966,707 5,194 0.5% 7% 2006 1,016 1,012.5 5.9 1.1 mil 996,571 5,836 0.6% 18% 2007 983 1,245.9 7.5 2.8 mil 1.3 mil 7,641 0.6% 37%
Average 984 888.8 5.9 1.6 mil 901,650 6,013 0.7% 27% Source: Washington Bank Survey (2008). Source of Country Overview Information: World Bank Survey (2008).

256
Overview on Agricultural Insurance: UNITED STATES
1. Agricultural Insurance Market Review History of Agricultural Insurance Private mutual company and commercial company crop hail insurance has operated for more than a century in the USA. Public-sector crop insurance was introduced in the United States in 1938 under the Federal Crop Insurance Corporation’s subsidized multiple peril crop insurance (MPCI) program . Livestock insurance programs were introduced in 2002, starting with pilot programs for Iowa swine producers.
Agricultural Insurance Market Structure In 2008 there were 17 private insurance companies selling agricultural insurance, of which seven sold crop insurance only, one sold livestock insurance only, and nine sold both crop and livestock insurance. Table 60.2 contains a list of companies designated by the U.S. Department of Agriculture (USDA) to provide FCIC insurance coverage through the Standard Reinsurance Agreement (SRA) for the year 2008.
Agricultural Insurance Products Available Various indemnity-based and index-based insurance programs offered among indemnity-based insurance products include crop hail or named-peril, multi-peril crop insurance (MPCI), crop income protection, livestock insurance, and aquaculture (clams) insurance. Among the index-based products offered are area-yield index insurance, weather insurance, and NDVI/IRS insurance (see Table 60.3 for a list of available insurance programs in 2008).
Table 60.1: Agricultural Insurance Available 2008 Crop Insurance Products Available Greenhouse Forestry MPCI Named-peril Crop Revenue Index-based Yes Yes Yes Yes Yes Yes Livestock Insurance Products Available Aquaculture All Risk Accident &
Mortality Epidemic Disease
Other Index-based
Yes Yes Yes No No Yes Source: World Bank Survey (2008).
Delivery Channels The most important delivery channel is companies’ insurance agents’ networks for both crop and livestock insurance. There are no special delivery channels or programs for small or marginal farmers.
Voluntary vs. Compulsory Insurance Crop and livestock insurance programs are voluntary; however, they are compulsory for producers who want to be eligible for program crop disaster assistance payments. There is also a crop disaster payment program which covers non-insurable crops in case of catastrophes.

257
Agricultural Reinsurance Private sector crop hail insurance is reinsured by commercial reinsurers. The public-sector crop and livestock insurance programs are reinsured by proportional and non-proportional reinsurance agreements provided by the government though the Federal Crop Insurance Corporation (FCIC). The Standard Reinsurance Agreement (SRA) and the Livestock Price Reinsurance Agreements (LPR) are cooperative reinsurance agreements between the FCIC and insurance companies. FCIC is a government corporation within the USDA authorized to carry out programs of the Federal Crop Insurance Act. Access to international reinsurance is not considered a constraint for the development of any kind of crop or livestock insurance in the United States since reinsurance agreements are provided by the government.
2. Public Support for Agricultural Insurance Types of Public Support for Agricultural Insurance There are many ways in which agricultural insurance is supported in the United States, including by:
1. Agricultural Insurance Legislation (Laws): Legislation affecting RMA crop insurance programs include the Federal Crop Insurance Act, the Farm Bill, the Agricultural Risk Protection Plan, and appropriation legislation, among others.
2. Insurance Premium Subsidies: For APH and CRC plans, the premium subsidy is a percentage of actuarially sound premiums that vary with coverage level, and is 67%, 64%, 64%, 59%, 59% 48% and 35% for 50%, 55%, 60%, 65%, 70%, 75%, 80% and 85% coverage levels, respectively. For livestock insurance, the premium subsidy is a flat rate of 13%.
3. Subsidies on Insurers' Administration & Operating Expenses: These subsidies have covered the companies’ total operating and administrative expenses so far. The subsidy paid to insurance companies to administer the federal program has ranged between 20% and 25% of total net premiums in recent years. The new Farm Bill mandates the decrease of this percentage to 18% of total premiums (based on communication with RMA personnel).
4. Subsidies on Loss Assessment Costs: Subsidies are provided to insurance companies to help cover all expenses, including loss assessment-related costs.
5. Government Reinsurance of Claims: Reinsurance contracts are based on the loss ratio, which is a function of claims, and thus it could be said that there is government reinsurance on claims.
6. Subsidies for Training & Education: The Risk Management Agency (RMA) is a USDA Agency that oversees and operates agricultural insurance programs in the United States. RMA offers funds to research and development, education, and community outreach through the Risk Management Partnership Agreements (RMA).
7. Subsidies for Product Research and Development: Product research and development are funded by RMA though Risk Management Partnership Agreements (RMA).
Premium Subsidies
Table 60.4 contains a list of all FCIC crops insurable in 2008. Premium subsidies are available for all insurable crops. All crops and livestock producers are eligible for subsidies. Table 60.5 contains livestock products for which premium subsidies are available. For all FCIP crop insurance programs save for GRP and GRIP, the crop insurance premium subsidies that apply to each coverage level are as follows: subsidies of 67%, 64%, 64% 59%, 59%, 55%, 48% and 38% of net premium for 50%, 55%, 60%, 65%, 70%, 75%, 80% and 85% coverage levels, respectively. The premium subsidy levels for GRP and GRIP are shown in Table 60.7. A single fixed premium subsidy of 13% (6%-7% according to table 60.10) is

258
provided by the government to livestock insured producers. Producers pay the remaining 87% of the premium.
Public Cost of Agricultural Insurance Federal government premium subsidies and grower premium and administration and operation expenses subsidies are reported for the years 2001 to 2008 in Table 60.8. Under the FCIC program, the total premium is reported on a “net premium” basis and does not include administration and operating overhead expenses or loading for profit margins. Table 60.8 shows that total premium has increased threefold in the past 8 years from US$ 3.0 billion (2001) to US$ 9.8 billion (2008). Over this period the cost of government premium subsidies has increased from US$ 1.8 billion or 60% of Total Premium in 2001 to a substantial US$ 5.7 billion or 58% of Total Premium in 2008. Adminsitration and operating (A&O) subsidies are a significant cost to the federal government and have increased from US$ 0.7 billion in 2001 to US$ 2.1 billion in 2008. Administration and operation expenses subsidies provided to private insurance companies represented 25% of total premiums in 2003 and 2004. From 2005 to 2007, this percentage was limited to 20%, and the farm bill approved by Congress in May 2008 further decreased this percentage to approximately 18%. These subsidies are intended to cover loss adjustment expenses as well. Despite the decrease in the subsidies as a percentage of premiums, total costs of administration and operation expenses subsidies have increased over the last five years. In order to provide an estimate of original gross premium for the FCIC program and to make comparisons with OGP from other countries, the World Bank has added the A&O expenses to the total premium, and these estimates of OGP are shown in the final column of Table 60.8. In 2007, FCIC OGP was estimated at US$ 8.02 billion. The net cost to government of the SRA reinsurance program is reported in Table 60.9 for the period 2003 to 2007 during which the total costs of reinsured claims has amounted to US$ 4.4 billion. The total costs to federal government of the FCIC program between 2003 and 2007 amounted to US$ 13.4 billion in premium subsidies and a further US$ 9.1 billion in delivery costs (A&O expenses and reinsurance costs; see Table 60.9). Further details of the costs of the program for the period 1981 to 2008 are shown in Table 60.11).
3. Agricultural Insurance Penetration Insurance Penetration Rate
Table 60.6 contains crop insurance participation rates for the FCIC program. Total cropland is available for 2002 in the National Agricultural Statistics Service’ 2002 Census of Agriculture. The participation rate measured as the ratio of insured area to total 2002 harvested cropland in the U.S increased from 72% in 2003 to 90% in 2007. This is one of the highest insurance penetration rate of any voluntary crop insurance program in the World.

259
4. Financial Performance 5-Year Results The FCIC’s crop insurance results are presented in Table 60.9 for the 5-year period 2003 to 2007 and show an average loss ratio of 70% (total premium basis). Over the longer period 1981 to 2008 the loss ratio has been higher at 92% (Table 60.11). The corresponding “producer loss ratios” are 170% (2003-2007) and 196% (1981 to 2008). The FCIC’s livestock insurance results are presented in Table 60.10 for the period 2003-07. This is a much newer and smaller subsidized federal program, and over the reporting period the number of insured livestock has varied from a low of 335,832 head to a maximum of 1,027,822 head. In 2007 total premium was US$ 3.2 million with premium subsidies of US$ 165 and 476, or a 5% premium subsidy rate. Over the 5-year period the average loss ratio has been 67%. Private-crop hail results are reported for the period 1996 to 2008 in Table 60.12. This voluntary program carries no government premium subsidies, but its popularity with US farmers is apparent from the fact that crop hail premiums have increased from US$ 488 million in 2007 to US$ 667 million in 2008. The loss ratio between 2003 to 2007 was 51% against a long-term loss ratio between 1915 and 2005 of 67%. The results, in terms of loss ratios, of private crop hail and subsidized FCIC/MPCI are compared in Figure 60.1 and show that the crop hail program has operated profitably over this period, while the MPCI program has loss ratios in excess of 100% in 4 years. Cost of Agricultural Insurance Provision
In 2006 marketing and acquisition costs (commissions) as a percentage of OGP were 15.6%; insurer’s own administration costs excluding in-field losses represented 6.2% of OGP, and loss adjusting costs amounted to 2.9% of OGP. This amounted to total expenses equivalent to 24.7% of OGP.
The average expenses to premium ratios for the 1999-2006 period are:
Marketing & acquisition (commissions) 15.6% Insurer’s own administrations costs 7.3% Loss adjusting costs 3.3% Total expenses/OGP 26.2%
5. Public Disaster Assistance Programs
Other forms of crop and livestock disaster assistance support programs are listed in Table 60.13. The organization responsible for funding these programs is the Farm Service Agency (FSA). Perils covered by the disaster assistance program are damaging weather events such as drought, freeze, hail, excessive moisture, excessive wind or hurricanes, earthquakes or floods, excessive heat, and disease or insect infestation. For weather events to be declared as disasters, they must have either reduced the expected unit production of the crop by more than 50% or prevented the producer from planting more than 35% of the intended crop acreage. For program crops, crop insurance enrollment is a requirement for farmers to be eligible to disaster assistance. However, there is also disaster assistance for non-program crops that are not eligible for insurance.

260
Disaster assistance payments made to producers during the 2003 to 2007 period are presented in Table 60.14. Ad hoc disaster payments varied considerably over years, totaling USD 2.9 billion in 2003, reducing to USD 3.1 million in 2005 and reaching a peak of USD 5 billion in 2007. It is worth noticing that livestock disaster payments for 2004 and 2005 are negative. These numbers can be negative for a few reasons. First, these are calendar years. Second, overpayments must be repaid later in the year--so someone could get paid too much one and have to repay some the next year, making a negative number.
6. Additional Tables Table 60.2: Agricultural Insurance Markets
Company Type
1 Ace Property and Casualty Insurance Company C & L Rain and Hail L.L.C.
2 Agrinational Insurance Company
C Agriserve, INC
3 American Agri-Business Insurance Company
C & L ARMtech Insurance Services, Inc
4 American Agricultural Insurance Company C & L American Farm Bureau Insurance Services, Inc
5 Austin Mutual Insurance Company
C CGB Diversified Services
6 Clearwater Insurance Company
C Crop USA
7 Country Mutual Insurance Company C 8 Farmers Mutual Hail Insurance Company of Iowa C 9 Great American Insurance Company C & L 10 NAU Country Insurance Company C & L 11 Producers Agriculture Insurance Company C
12 Rural Community Insurance Company C & L Rural Community Insurance Services
13 Stonington Insurance Company C & L Agro National LLC
14 Western Agricultural Insurance Companies
C & L Crop 1
15 Westfield Insurance Company C John Deere Risk Protection, Inc
16 XL Reinsurance America, Inc C & L Heartland Crop Insurance, Inc
17 County Mutual Insurance L Source: World Bank Survey (2008). Note: These companies are designated by USDA to provide insurance coverage through the Standard Reinsurance Agreement (SRA) for the year 2008. Type of insurance specifies which of either crop (C), livestock (L) or both (C & L) insurance products are sold by the insurance company.

261
Table 60.3: Agricultural Insurance Products Available 2007 Acronym Crop Insurance Program Name Indemnity-based AGR Adjusted Gross Revenue AGRL Adjusted Gross Revenue Lite APH Actual Production History (MPCI) ARC Average Crop Revenue CRC Crop Revenue Coverage DOL Dollar Plan of Insurance GRIP Group Risk Income Protection GRP Group Risk Protection IAPH Income APH IIP Indexed Income Protection IP Income Protection PRV Pecan Revenue RA Revenue Assurance YDO Yield-Based Dollar Amount of Insurance TDO Tree Based Dollar Amount of Insurance Index-Based RAINF Rainfall Index VEGAT GRP Vegetation Index Livestock LRP Livestock Risk Protection LGM Livestock Gross Margin AQU Cultivated Clams Insurance (Pilot)
Source: World Bank Survey (2008). Table 60.4: Insurable Crops 2008 Crop*** Programs**** Crop Programs Almonds Forage APH, GRP Apples Forage Seed Alfalfa Avocados Revenue, APH Forage Seeding
Bananas AGR Fresh Market Sweet Corn
Banana Trees AGR Fresh Market Tomatoes APH, Dollar
Barley APH, IP*, RA** Grain Sorghum APH, CRC**, GRIP***, GRP, IP*
Blueberries Grapes
Cabbage* Green Beans for Canning
Canola (APH,RA**) Green Peas Cherry Dollar Hybrid Corn Seed
Chile Peppers* Hybrid Grain Sorghum

262
Citrus Macadamia Nuts Grapefruit Macadamia Trees Lemons Millet Limes Mint* Mandarins Mustard Murcotts Naval Oranges Citrus Dollar*, APH Oranges Oats Tangelos Onions Tangerines Papaya* Citrus Tree (Texas) Papaya Trees* Peaches Coffee* Peanuts APH, GRP Coffee Trees* Pears
Corn APH,CRC**, GRIP**, GRP, IP*, IIP*, RA** Pecan Revenue
Cotton APH,CRC**, GRIP**, GRP, IP*, RA** Peppers
Cranberries Plums Cultivated Wild Rice* Popcorn Dry Beans Potatoes Dry Peas Prunes ELS Cotton Raisins Figs Rice APH, CRC**, RA** Flax Rye Florida Fruit Trees* Safflower Avocado Trees Silage Sorghum*
Carambola Trees Soybeans APH,CRC**, GRIP**, GRP, IP*, IIP*, RA**
Grapefruit Trees Stonefruits Lemon Trees Apricots Lime Trees Nectarines Mango Trees Peaches Orange Trees Strawberries* Other Citrus Trees (Tangerines, Tangelos, and Murcotts) Sugarcane Sunflowers APH, RA** Sweet Corn for Canning Sweet Potatoes* Table Grapes Tobacco Tomatoes (Canning and Processing) Walnuts
Wheat APH,CRC**, GRIP**, GRP, IP*, RA**
Sugar Beats Source: World Bank Survey (2008). *Crops/crop programs currently insured under pilot programs of limited scope and duration. **Crops/crop programs submitted and approved under section 508(h) of the FCI Act. *** 52 specialty crops/58 specialty crop-plan combinations shown in bold print (for example, avocado has two plans). ****See Table 60.3 for insurance product names

263
Table 60.5: Insurable Livestock Products 2008 Product Program Description Swine Lamb Cattle
The Livestock Gross Margin (LGM) protects the gross margin between the value of animals and the cost of corn and soybean meal. The Livestock Risk Protection (LRP) protects against drop in livestock prices.
Clams*
AQU Insurance plan protects cultivated clam producers from clam deaths related to oxygen depletion due to vegetation, microbial activity, harmful algae bloom, and other causes such as diseases, hurricanes, storms, freeze, tidal wave, and other catastrophic weather events defined by the National Oceanic & Atmospheric Administration (NOAA).
Source: World Bank Survey (2008). *Programs currently insured under pilot programs of limited scope and duration. Table 60.6: Estimated Crop Insurance Penetration, 2003 to 2007
Year
Number of Policies with
Premium
Percent of Farmers Insured
Insured Area (ha)
Percentage of National Crop Area
Insured 2003 1.241 mil 90% 88.0 mil 72% 2004 1.229 mil 93% 89.4 mil 73% 2005 1.191 mil 93% 99.5 mil 81% 2006 1.148 mil 92% 98.0 mil 80% 2007 1.138 mil 91% 110.0 mil 90%
Source: World Bank Survey (2008). Table 60.7: Federal Crop Insurance Program: Premium Subsidy Levels Applicable in 2009
Coverage Level CAT 50 55 60 65 70 75 80* 85* 90* Premium subsidy factor** 100% 67% 64% 64% 59% 59% 55% 48% 38% NA GRP premium subsidy factor 100% NA NA NA NA 59% 59% 55% 55% 51% GRIP premium subsidy factor NA NA NA NA NA 59% 55% 55% 49% 44% Source: http://www.rma.usda.gov/data/premium.html
* where applicable ** Applies to all plans of insurance except GRP and GRIP and livestock

264
Table 60.8: Federal Crop Insurance Program: World Bank Estimates of AS-IF Original Gross Premium, Premium Subsidies, and A&O Expense Subsidies (US$ Billion)
Crop Year Farmer
Premium Premium subsidy
Total premium
A&O Expenses
Other program
fund costs
Other A&O
Expenses
Total As If Original
Gross Premium
2008 4.161 5.691 9.852 2.004 0.084 0.053 11.993 2007 2.739 3.823 6.562 1.335 0.070 0.053 8.020 2006 1.897 2.682 4.579 0.962 0.081 0.044 5.666 2005 1.612 2.337 3.949 0.833 0.058 0.081 4.921 2004 1.714 2.472 4.186 0.894 0.060 0.083 5.223 2003 1.390 2.042 3.431 0.736 0.061 0.088 4.316 2002 1.175 1.741 2.916 0.628 0.024 0.091 3.659 2001 1.191 1.771 2.962 0.644 0.009 0.073 3.688
TOTAL 2001-2008 15.878 22.560
38.438
8.036
0.447
0.566
47.487
Source: Risk Management Agency website 2009 Table 60.9: Federal Crop Insurance Program Insurance Results, 2003 to 2007 (US$ Million)
Year 2003 2004 2005 2006 2007 2008 TOTAL 2003-07
TOTAL 1981 to
2008
Indemnity 3,260 3,210 2,367 3,504 3,546 8,634 15,887 53,583
Total Premium* 3,431 4,186 3,949 4,579 6,562 9,852 22,708 58,291
Premium Subsidy 2,042 2,477 2,344 2,682 3,823 5,691 13,368 31,003
Producer premium 1,389 1,709 1,605 1,897 2,739 4,161 9,340 27,288
Net indemnity 1,871 1,501 762 1,606 808 4,474 6,548 26,295
A&O expense subsidies 734 888 829 962 1,335 2,004 4,748 n.a.
SRA Net Underwriting Gain 378 692 915 819 1,569 1,119 4,373 n.a.
Total Delivery costs** 1,112 1,580 1,744 1,781 2,904 3,123 9,121 20,453
Total insurance outlays 2,982 3,081 2,506 3,387 3,712 7,596 15,668 46,749
Loss Ratio (Total Premium basis) 95% 77% 60% 77% 54% 88% 70% 92%
Producer loss ratio a/ 235% 188% 147% 185% 129% 208% 170% 196%
Hazell ratio b/ 315% 280% 256% 279% 236% 283% 389% 208%
Transfer efficiency c/ 63% 49% 30% 47% 22% 59% 42% 56%
A&O Expense Ratio 21% 21% 21% 21% 20% 20% 21% n.a.
Source. Glauber (2006) * Total Premium is comprised of Premium subsidies and Producer paid premiums
** Total delivery costs includes A&O expense subsidies and Reinsured Claims (SRA Net Underwriting Gain)
a/ Producer loss ratio = indemnities / producer premium b/ Hazell ratio = (indemnities + delivery costs)/ producer premium
c/ Efficiency ratio = net indemnities / total insurance outlays

265
Table 60.10: Federal LIVESTOCK Insurance Program Results, 2003 to 2007
Year No
Policies No Insured
Head TSI (US$) Premium
(US$)
Premium subsidy (US$)
Claim (US$)
Avge Rate
Premium Subsidy
Loss Ratio
2003 227 335,832 23,807,768 1,331,821 94,269 328,856 5.6% 7% 25% 2004 443 1,027,822 195,324,502 7,053,387 494,632 7,128,629 3.6% 7% 101% 2005 2,775 778,231 155,412,863 5,067,399 288,840 1,838,726 3.3% 6% 36% 2006 3,593 715,715 189,529,859 4,927,801 302,033 2,890,741 2.6% 6% 59% 2007 4,907 515,975 109,511,064 3,205,044 165,476 2,332,570 2.9% 5% 73%
2003 to 2007 11,945 3,373,575 673,586,056 21,585,452 1,345,250 14,519,522 3.2% 6% 67% Source: RMA website. Livestock Insurance program as of 1st Aug 2009 (Federal State Insurance Corporation) Reinsurance Year Stats.
Table 60.11: Federal CROP Insurance Program Insurance Results, 1981 to 2008 (US$ Million)
Year Indemnity Total premium
Premium Subsidy
Producer premium
Net indemnity
Delivery costs
Total insurance outlays
Producer loss ratio a/
Hazell ratio b/
Transfer efficiency
c/ Loss Ratio
1981 407.3 376.8 47 329.8 77.5 4.5 82 123% 125% 95% 108%
1982 529.1 396.1 91.3 304.8 224.2 26.3 250.5 174% 182% 90% 134%
1983 583.7 285.8 63.7 222.1 361.6 32.1 393.7 263% 277% 92% 204%
1984 638.4 433.9 98.3 335.6 302.9 84.1 387 190% 215% 78% 147%
1985 683.1 439.8 100.1 339.7 343.4 104.2 447.6 201% 232% 77% 155%
1986 615.7 379.7 88.1 291.6 324.1 110.6 434.7 211% 249% 75% 162%
1987 369.8 365.1 87.6 277.5 92.3 122.3 214.6 133% 177% 43% 101%
1988 1,067.60 436.4 108 328.4 739.2 129.5 868.7 325% 365% 85% 245%
1989 1,215.30 819.4 206.3 613.1 602.1 290.5 892.6 198% 246% 67% 148%
1990 1,033.60 835.5 215.1 620.5 413.2 320.4 733.6 167% 218% 56% 124%
1991 955.3 737 190.5 546.5 408.8 276.7 685.5 175% 225% 60% 130%
1992 918.2 758.8 196.8 562 356.2 262.6 618.8 163% 210% 58% 121%
1993 1,655.50 755.7 200.1 555.6 1,099.90 160.2 1,260.10 298% 327% 87% 219%
1994 601.1 949.4 255.3 694.1 -93 386 293 87% 142% -32% 63%
1995 1,567.70 1,543.30 889.5 653.8 913.9 509.3 1,423.20 240% 318% 64% 102%
1996 1,492.70 1,838.60 982.1 856.4 636.2 714 1,350.20 174% 258% 47% 81%
1997 993.6 1,775.40 903.1 872.3 121.3 793.1 914.3 114% 205% 13% 56%
1998 1,677.50 1,875.90 947.6 928.4 749.2 715.5 1,464.70 181% 258% 51% 89%
1999 2,434.70 2,310.10 1,394.00 916.2 1,518.50 770.3 2,288.90 266% 350% 66% 105%
2000 2,594.80 2,540.20 1,365.80 1,174.30 1,420.50 824.8 2,245.30 221% 291% 63% 102%
2001 2,960.10 2,961.80 1,771.80 1,190.10 1,770.00 994.1 2,764.20 249% 332% 64% 100%
2002 4,066.70 2,915.90 1,741.40 1,174.50 2,892.20 578.5 3,470.70 346% 396% 83% 139%
2003 3,260.00 3,431.20 2,041.90 1,389.30 1,870.80 1,111.50 2,982.20 235% 315% 63% 95%
2004 3,209.72 4,186.13 2,477.42 1,708.71 1,501.02 1,579.90 3,080.91 188% 280% 49% 77%
2005 2,367.32 3,949.23 2,343.83 1,605.40 761.92 1,744.22 2,506.14 147% 256% 30% 60%

266
2006 3,503.66 4,579.28 2,681.85 1,897.43 1,606.23 1,780.73 3,386.96 185% 279% 47% 77%
2007 3,546.40 6,562.25 3,823.43 2,738.83 807.58 2,904.41 3,711.99 129% 236% 22% 54%
2008 8,634.39 9,852.18 5,691.37 4,160.81 4,473.58 3,122.85 7,596.43 208% 283% 59% 88%
TOTAL ALL YEARS 53583 58290.88 31003.3 27287.78 26295.32 20453.21 46748.53 196% 208% 56% 92%
TOTAL 2003-07 15,887.11 22,708.10 13,368.43 9,339.67 6,547.54 9,120.76 15,668.20 170% 389% 42% 70% Source: Glauber (2007)
a/ Producer loss ratio = indemnities / producer premium
b/ Hazell ratio = (indemnities + delivery costs)/ producer premium
c/ Efficiency ratio = net indemnities / total insurance outlays
Table 60.12: U.S. Private Crop Hail Insurance Results, 1996-2008 (US$ Million)
Year Liability Premium Claims Loss Ratio
Average Rate
1996 13,155 501 403 80.4% 3.8% 1997 15,466 561 332 59.1% 3.6% 1998 15,732 543 463 85.3% 3.5% 1999 14,480 486 382 78.6% 3.4% 2000 14,132 448 309 68.9% 3.2% 2001 13,289 415 295 71.1% 3.1% 2002 12,985 388 283 72.9% 3.0% 2003 12,906 403 227 56.3% 3.1% 2004 13,648 408 238 58.4% 3.0% 2005 13,936 415 186 44.8% 3.0% 2006 15,538 404 202 49.9% 2.6% 2007 19,377 488 235 48.2% 2.5% 2008 27,639 667 526 78.9% 2.4%
1996-2008 202,282 6,126 4,079 66.6% 3.0% 2003-2007 75,405 2,117 1,087 51.3% 2.8%
1915-2005 364,246 13,137 8,838 67.3% 3.6% Source: National Crop Insurance Services, 2005.

267
Table 60.13: Other Forms of Disaster Assistance Programs 01-02 Crop disaster assistance Emergency feed 200 Florida nursery losses Flood conservation program AIFLP-apportioned Idaho Oust program American Indian-livestock feed Karnal bunt fungus payment Apple and potato quality loss LIP-contract growers Avian influenza indemnity program Livestock compensation program Cattle feed program Livestock emergency assistance Citrus losses in California Livestock indemnity program Crop disaster program Nap-supplemental appropriation Crop loss disaster assistance Noninsured assistance program Dairy disaster assistance Nursery losses in Florida Dairy indemnity Pasture flood compensation Disaster Pasture recovery program Disaster - non-program crops Poultry enteritis syndrome Disaster - program crops Quality losses program Disaster reserve assistance Sugar beet disaster program Emergency conservation Tobacco disaster assistance Emergency conservation program
Source: World Bank Survey (2008). Table 60.14: Disaster Assistance Payments
Year Crop (USD
million) Livestock
(USD) Total (USD
million) 2003 2,575.2 360.5 mil 2,935.7 2004 217.3 -505,530 216.7 2005 3.2 -16,253 3.2 2006 -- -- 166.0 2007 -- -- 5,007.0
Source: World Bank Survey (2008). Source of Country Overview Information: World Bank Survey (2008).

268
Overview on Agricultural Insurance: VENEZUELA
1. Agricultural Insurance Market Review History of Agricultural Insurance
Agricultural insurance was first introduced in Venezuela in 1998. The product was a named-peril crop insurance product covering the production costs made on the insured crop up to the time of the claim. In 2003 the product was modified to a traditional multi-peril crop insurance (MPCI) to respond to the farmers’ demand. Livestock insurance was introduced in 2003 but is still very marginal, and the demand is mainly limited to high value animals. The federal government does not provide any support to agricultural insurance, and the country does not have any form of special agricultural insurance legislation. Until 2007 the agricultural reinsurance business was handled by a single reinsurance broker who acted as an insurance agent.
Agricultural Insurance Market Structure (2008)
There are six private insurance companies offering agricultural insurance in Venezuela. Two offer crop and livestock insurance; the others only offer crop insurance. Agricultural insurance companies can be divided into two groups. The first group includes insurance companies which do not have technical departments for this line of business and rely on the services of the reinsurance broker. The second group includes one insurance company which has a technical department and underwrites agricultural insurance business on its own. Agricultural Insurance Products Available
MPCI is offered to protect a wide spectrum of annual and perennial crops (where corn and sorghum are the main crops) against excess rain, floods, drought, wind, fire or lighting, social risks, and pest and diseases. Guaranteed yields under this coverage vary from 50% to 65% of the farmers’ actual production history (APH) depending on the crop and the region. The insured unit is the field sown. The coverage indemnifies the production costs. Original gross rates vary from 6.5% to 12.4% depending on the crop, location, and coverage level.
Livestock and bloodstock insurance coverage available in Venezuela are “all risk” coverage: accidental mortality and nominated diseases are covered, but epidemic diseases are excluded. In the case of bloodstock insurance the coverage has an annual aggregate limit as of USD 25,000 per animal. There are two options for the deductible: 10% and 20% of TSI. Medical and surgery expenses are not covered. Rates vary from 3.75% to 6.05% of the value of the animal. Table 61.1: Agricultural Insurance Available 2008 Crop Insurance Products Available Greenhouse Forestry MPCI Named-peril Crop Revenue Index-based Yes Yes No No No No Livestock Insurance Products Available Aquaculture All Risk Accident &
Mortality Epidemic Disease
Other Index-based
Yes No No No No No Source: World Bank Survey (2008).

269
Livestock insurance is offered only for cattle herds. The coverage has a deductible of 10% of the loss and the original gross rates vary according to the final animal (dairy, breeding, or fattening) and herd size. For example: original gross rates for herds between 30 and 100 animals are 4% for dairy cattle and 3% for fattening cattle. Delivery Channels
The most common channel to deliver agricultural insurance in Venezuela is through financial agents (e.g. rural banks) or farmers associations. Agent brokers have also an active participation in delivering the product to individual farmers and broking with farmers associations. There are no specialized delivery channels for small and marginal farmers in Venezuela. Voluntary vs. Compulsory Insurance
Agricultural insurance is voluntary in Venezuela. Nevertheless, in some specific cases, rural banks ask for credit-linked crop insurance, but such cases represent less than 5% of the total premium. Livestock insurance is voluntary. Agricultural Reinsurance
At least for the commonly marketed insurance products, insurance companies are able to place their business on the international reinsurance market.
2. Public Support for Agricultural Insurance Types of Public Support for Agricultural Insurance The government does not provide any support for agricultural insurance. Premium Subsidies
There is no agricultural insurance subsidy program in Venezuela. . Public Cost of Agricultural Insurance There is no public cost of agricultural insurance.
3. Agricultural Insurance Penetration Insurance Penetration Rate
According to 2007/08 data the crop insurance penetration is very low. About 18,000 ha have been insured, representing less than 1% of the cropped area. Livestock insurance also has a very low penetration rate with less than 100 insured animals.

270
4. Financial Performance 5-Year Results
The average loss ratio for the whole market for the last five years was 90% (Table 61.3). Cost of Agricultural Insurance Provision
The cost of agricultural insurance provision in Venezuela is estimated at 48% of OGP, including 24% for insurance premium taxes (see Table 61.4). The combined loss ratio was estimated at 119% over the last five years.
5. Public Disaster Assistance Programs There are no public disaster assistance programs.
6. Additional Tables Table 61.2: Estimated Crop Insurance Penetration, 2003 to 2007
Year
Number of Crop
Policies
Percent of Farmers Insured
Insured Area (ha)
Percent of National Crop Area Insured
2003 1,188 0.30% 43,805 1.3% 2004 1,226 0.31% 45,183 1.3% 2005 1,522 0.38% 56,106 1.6% 2006 635 0.16% 23,394 0.7% 2007 491 0.12% 18,094 0.5%
Source: World Bank Survey (2008). Table 61.3: Crop Insurance Results, 2003 to 2007
Year
Number of
Policies
TSI (USD
million)
Premium (USD
million)
Paid Claims
(USD million)
Average Sum
Insured (USD)
Average Premium
(USD) Average
Rate Loss
Ratio 2003 1,188 10.2 0.7 0.2 8,610 565 6.6% 37% 2004 1,226 11.6 0.9 0.5 9,490 736 7.8% 56% 2005 1,522 34.3 2.0 2.4 22,516 1,329 5.9% 117% 2006 635 16.7 0.8 0.5 26,238 1,305 5.0% 62% 2007 491 14.9 0.9 1.2 30,290 1,894 6.3% 129%
Average 1,012 87.7 5.4 4.8 19,429 1,166 6.1% 90% Source: World Bank Survey (2008).

271
Table 61.4: Insurers’ Costs as a Percent of OGP Costs Percent of OGP Marketing & Acquisition 11% Administration 8% Loss Adjustment 5% Total A&O 24% Insurance Premium Taxes 24%
Total 48% Source: World Bank Survey (2008). Source of Country Overview Information: World Bank Survey (2008).

272
Overview on Agricultural Insurance: WINDWARD ISLANDS
1. Agricultural Insurance Market Review History of Agricultural Insurance The Windward Islands, comprised of Dominica, St. Lucia, St. Vincent and Grenada, lie at the western fringe of the Caribbean. Smallholder banana production for export has been a mainstay of the Island economies since the 1950s. The Islands are extremely exposed to North Atlantic and Caribbean tropical cyclones. Bananas are vulnerable to windstorm damage (snapping, toppling and uprooting of the plants) even at subtropical storm wind speeds36
, and in the event of a direct hit by a hurricane, losses can be 100% of the banana production on a single Island. Since the 1950s the Island governments and/or the Banana Growers’ Associations (BGAs), at various times, have attempted to operate mutual insurance schemes against windstorms in bananas. Most of these earlier mutual schemes failed either due to a lack of spread of risk because individual islands elected to insure by themselves as opposed to pooling their risk or due to the lack of excess of loss reinsurance protection against major hurricane events.
The Windward Islands Crop Insurance Limited (WINCROP) was incorporated in Dominica under the Companies Act of 1988 as a limited company which is authorized to conduct crop insurance business on the four Islands and to purchase reinsurance against any and all risks assumed by the company. WINCROP was established under the special crop insurance legislation of the Banana Insurance Act of 1988, which made windstorm cover in bananas compulsory for all export banana growers on the four Islands. The Act sets out the basis of the Windstorm insurance cover provided to farmers. The Act was passed on three of the Islands but in the case of St Lucia has never been ratified; on that Island windstorm insurance has been made purely voluntary since 2002. Agricultural Insurance Market Structure WINCROP is the only insurance company in the Windward Islands that offers crop insurance. There is no crop insurance for other crops and no livestock insurance, although some larger commercial enterprises may purchase specific covers on a facultative basis through local agents of international insurers. WINCROP is constituted as a mutual insurance company owned by the Island BGAs and their members. WINCROP operates on a strictly commercial basis but does not pay dividends to its shareholders. Trading surpluses are used to strengthen claims reserves. In recent years most of the BGAs have been privatized. Agricultural Insurance Products Available WINCROP provides named-peril crop insurance for windstorms (including localized windstorms, tropical storms and hurricane) and volcanic eruption damage in the single crop of bananas. The WINCROP Banana Policy is a standard damage-based indemnity policy that was specifically designed to be simple and transparent and to operate at low cost for large numbers of smallholder banana growers often with an average of 1 ha or less of bananas. The policy protects against physical damage by wind to the banana plants defined as snapping, toppling, and uprooting of the plant and leaf stripping. The sum insured is established on the basis of each grower’s three-year rolling average banana production and deliveries to the BGAs. Premium is deducted at source by the BGAs and paid to WINCROP. Simple damage count loss assessment procedures are used to estimate the percentage damage to the total number of banana 36 Localised wind storms associated with wind speeds of less than 39 mph.

273
plants insured holdings, and this percent damage is applied to the sum insured. For the past 15 years the policy on all Islands has maintained a standard 20% damage deductible for each and every loss. This high deductible level is required to maintain premium rates at affordable levels for farmers. Delivery Channels Between 1988 and 2002 all the BGAs required that their banana exporting members were insured by WINCROP on a compulsory basis. Any registered active member producing and exporting bananas was therefore automatically insured by WINCROP, and premium was deducted by the BGAs on the sales of each grower’s bananas and paid to WINCROP.
Since 2002 the BGAs have been privatized on all Islands except for St. Vincent. In the case of St. Lucia the banana export business has been divided up between five private companies, and crop insurance has been made voluntary. Under the voluntary scheme now operating on this island, crop insurance is now beginning to be marketed through WINCROP’s local agents, insurance brokers, and the banks. WINCROP was designed as a program for smallholder banana growers, and it continues today to protect predominantly smallholder banana producers on each island. Voluntary vs. Compulsory Insurance WINCROP crop insurance was compulsory for all banana growers between 1988 and 2002, but since then St. Lucia has elected to market the windstorm policy on a voluntary basis. Agricultural Reinsurance WINCROP’s banana insurance program has been reinsured with specialist international agricultural reinsurers since inception in 1988. In the early years the company purchased a combination of proportional quota-share and non-proportional excess of loss reinsurance, but as its reserves strengthened it switched to non-proportional excess of loss reinsurance.
WINCROP identified access to private international reinsurance capacity as a moderate constraint for its program. Windstorm reinsurance capacity is very restricted for crops grown in the Caribbean and is very expensive to purchase. WINCROP has traditionally paid about 20% of its gross premium to purchase excess of loss reinsurance protection.
2. Public Support for Agricultural Insurance Types of Public Support for Agricultural Insurance In the establishment phase of WINCROP, government support was provided in two forms:
(a) Enactment of crop insurance legislation (the Banana Insurance Act of 1988). This legislation
has been very important to the success of WINCROP by providing it with a mandate to provide compulsory windstorm insurance in export bananas on all Islands, thereby permitting the company to achieve both spread of risk and a critical premium mass and also to experience much-reduced marketing and operating costs because of the compulsory nature of cover.
(b) Start-up capital provided by the Island governments through the BGAs to form WINCROP’s
paid-up share capital.

274
Since WINCROP commenced operations in the 1987/88 season, government has not provided any form of financial subsidy or support to WINCROP. In the past, one of the Island BGAs elected to provide premium subsidy support to its grower members but was forced to withdraw this support when its reserves were exhausted.
The issue of premium subsidies is very pertinent to WINCROP. The actuarially determined premiums for windstorm cover are high, ranging from 20% on the most exposed Northern Islands to 11% on the least exposed Southern Islands in the Windward chain. In view of the high premium rates, the BGAs have traditionally maintained the sums insured at only about 35% of the full production costs for bananas. In the event of windstorm damage the indemnity amount has therefore only covered the basic re-establishment costs of the banana holding. On various occasions in the past, the BGAs have therefore requested government to consider providing premium subsidies in order that farmers could afford the higher premiums associated with higher sums insured. This request has never been agreed to.
3. Agricultural Insurance Penetration Insurance Penetration Rate At its peak in the early 1990s WINCROP insured more than 25,000 mainly smallholder banana producers on the four Islands and insured nearly 300,000 tons of export bananas annually with a total sum insured (TSI) of about USD 25 million, generating annual premiums in the order of USD 4 million. At that time 100% of export growers were automatically insured by WINCROP. On account of the decline in the Windward Islands Banana Insurance Industry the number of active banana growers registered with WINCROP has decreased annually, and this process has been accelerated during the past five years with the introduction of voluntary insurance cover on at least one Island. In 2007 WINCROP had 2,767 insured growers, representing about 63% of the total export banana growers and 62% of the cultivated area of this crop (Table 62.2).
4. Financial Performance 5-Year Results WINCROP’s original results prior to reinsurance collections are presented in Table 62.3. The company experienced major windstorm losses in both 2004/05 and especially in 2007/08 with the result that the company’s 5-year original loss ratio stands at 118%. The average size of policy is small as shown by the average sum insured of USD 1,351 per farmer, generating an average premium of USD 158 per policy over the past five years (Table 62.3).
Cost of Agricultural Insurance Provision WINCROP has traditionally maintained a small team of permanent staff on each of the four Islands and has been very cost-conscious. When the banana industry was at its height and premium volume was in the order of USD 4 million per annum, WINCROP’s total operating expenses amounted to about 10% of premium. Loss adjustment expenses were also maintained at a minimum by using part-time assessors on each Island and paying them a flat rate of EC$20 per claim (about USD 7.50). With the major decline in the number of banana growers on each Island WINCROP’s 2007 premium has fallen to less than USD 500,000, and although the company has reduced its staff complement to a bare minimum, the company’s operating costs now represent a very high 52% of total premium; WINCROP recognizes that this is unsustainable (Table 62.4). Against an average 2007 premium per policy of USD 158, WINCROP’s overhead expenses amount to USD 86 per policy. The costs of loss assessment continue to be very

275
reasonable or only 5% of premium in 2007, in spite of this being a severe windstorm loss year with high numbers of claims.
5. Public Disaster Assistance Programs WINCROP’s crop insurance policy only compensates growers for loss of their banana plants. In the event of major hurricanes associated with heavy rains and landslides and flooding, farm infrastructure and drainage and irrigation equipment may be destroyed. In these cases the Island governments on occasions have made separate disaster relief payments to growers to rehabilitate their farm infrastructure. In 2007 following the major hurricane losses, the Island governments made payments of USD 11.6 million to farmers using WINCROP to administer these payments. 6. Additional Tables Table 62.2*: Estimated Banana Windstorm Insurance Penetration, 2003 to 2007
Year Number of Insured Farmers
Percent of Banana Growers Insured
Percent of National Banana Area Insured
FY2004 4,831 80% 85% FY2005 5,400 78% 82% FY2006 2,613 78% 60% FY2007 3,175 65% 60% FY2008 2,767 63% 62%
Average 3,757 73% 70% Source: World Bank Survey (2008). *There is no Table 62.1. Table 62.3: Crop Insurance Results, 2003 to 2007
Year
Number of
Policies
TSI (USD
million) Premium
(USD)
Average Premium
Rate*
Paid Claims
(USD million)
Loss Ratio
Average Sum
Insured (USD)
Average Premium
(USD) FY2004 -- 7.0 654,277 9.4% 371,359 57% 1,445 135 FY2005 -- 5.3 750,998 14.2% 874,311 116% 978 139 FY2006 -- 4.5 549,725 12.2% 513,865 93% 1,727 210 FY2007 -- 4.2 558,154 13.2% 170,612 31% 1,335 176 FY2008 -- 4.4 456,315 10.5% 1.6 mil 342% 1,575 165 Average -- 5.0 593,894 11.9% 698,187 118% 1,351 158 Source: World Bank Survey (2008). *Actual FY2008 rates in Dominica and St. Lucia were 20% and 11% in St. Vincent and Grenada. Table 62.4: WINCROP Insurance Costs as a Percent of OGP
Costs Percent of OGP Marketing & Acquisition 0% Administration 52.0% Loss Adjustment 4.9% Total 56.9%
Source: World Bank Survey (2008). Note: Insurance premium taxes were negligible and were therefore not included. Source of Country Overview Information: World Bank Survey (2008).