Counting on their Migration Home: An Examination of Monitoring
220
Counting on their Migration Home: An Examination of Monitoring Protocols and Saanich First Nations‘ Perspectives of Coho (Oncorhynchus kisutch), Chinook (O. tshawytscha) and Chum (O. keta) Pacific Salmon at Goldstream River and Saanich Inlet, Southern Vancouver Island, British Columbia by Roxanne Paul B.Sc., University of Victoria, 2000 A Thesis Submitted in Partial Fulfillment of the Requirements for the Degree of MASTER OF SCIENCE in Interdisciplinary Studies © Roxanne Paul, 2006 University of Victoria All rights reserved. This thesis may not be reproduced in whole or in part, by photocopy or other means, without the permission of the author.
Transcript of Counting on their Migration Home: An Examination of Monitoring

Counting on their Migration Home: An Examination of Monitoring Protocols and
Saanich First Nations‘ Perspectives of Coho (Oncorhynchus kisutch), Chinook (O.
tshawytscha) and Chum (O. keta) Pacific Salmon at Goldstream River and Saanich
Inlet, Southern Vancouver Island, British Columbia
by
Roxanne Paul
B.Sc., University of Victoria, 2000
A Thesis Submitted in Partial Fulfillment of
the Requirements for the Degree of
MASTER OF SCIENCE
in Interdisciplinary Studies
© Roxanne Paul, 2006
University of Victoria
All rights reserved. This thesis may not be reproduced in whole or in part, by photocopy
or other means, without the permission of the author.

ii
SUPERVISORY COMMITTEE
Counting on their Migration Home: An Examination of Monitoring Protocols and
Saanich First Nations Perspectives of Coho (Oncorhynchus kisutch), Chinook (O.
tshawytscha) and Chum (O. keta) Pacific salmon at Goldstream River and Saanich Inlet,
Southern Vancouver Island, British Columbia
by
Roxanne Paul
B.Sc., University of Victoria, 2000
Supervisory Committee
Dr. Michael C.R. Edgell (Department of Geography)
Co-Supervisor
Dr. Nancy J. Turner (School of Environmental Studies)
Co-Supervisor
Dr. Tom E. Reimchen (Department of Biology)
Outside Member

iii
Supervisory Committee
Dr. Michael C.R. Edgell (Department of Geography)
Co-Supervisor
Dr. Nancy J. Turner (School of Environmental Studies)
Co-Supervisor
Dr. Tom E. Reimchen (Department of Biology)
Outside Member
ABSTRACT
Records of abundance of salmon that return to their natal spawning stream
(escapements) are important indices that can assist with monitoring, conservation,
and management of a salmon population over time. On their own, however these
data reveal very little about the habitat, ecosystem and human communities that
salmon encounter on their journey from freshwater to sea and back again. This
research examines monitoring protocols for Goldstream River salmon stocks (coho,
chinook and chum Pacific salmon). It includes and reaches beyond biostatistics from
stream surveys to gauge First Nations‘ artisanal fishing activities at Goldstream
River and Saanich Inlet as well as their commercial chum fishing endeavours in
Saanich Inlet on south Vancouver Island, British Columbia. Methods included
summations of major themes from interviews on traditional ecological knowledge
(TEK) shared by local Saanich First Nation fishers whose families have lived in the
communities around Goldstream River and Saanich Inlet for more than 200 years.
Analyses of Goldstream salmon escapements for the period 1932 to 2004 and native
harvest statistics of chum caught from Saanich Inlet between 1982 and 2004 are
integrated with results from analysis of TEK research undertaken for this project.
Key recommendations arising from the results of this research are: stream habitat
restoration in response to loss and degradation of salmon-bearing streams;

iv
modification of stream survey procedures to measure for morphological and
physiological attributes including indicators of the health of Goldstream salmon;
monitoring and eliminating sources of pollution to Saanich Inlet waters;
implementing precautionary measures to ensure that overfishing of Goldstream
salmon and shrimp in Saanich Inlet does not recur; and safeguarding naturally
abundant Goldstream chum populations at the river. Under current management of
the Goldstream chum fishery, the maximum carrying capacity (K) or target
escapement of chum that the Goldstream River spawning grounds sustain is 15,000.
Based on population assessments as well as physiography and ecosystem dynamics,
I infer that Goldstream River‘s K for its natural chum population is between ~16,000
and 18,000; ~1,500 for the mixed stocks of natural and hatchery enhanced coho; and
~50 for chinook (based on the river‘s naturally occurring populations between 1932
and 1973) or ~385 enhanced chinook (based on the returning population from 1975
to 2002 since hatchery enhancement took place). A co-management relationship
exists between Fisheries and Oceans Canada (DFO) resource managers and the
Saanich First Nations bands (Saanich Tribal Fisheries councilors). Improvements to
communication, collaboration and information sharing between DFO resource
managers, Goldstream hatchery operators and Saanich First Nations with regards to
decisions made about Goldstream salmon stocks are, however, necessary. In this
thesis, I propose a model with recommendations for compatible fisheries
management goals and techniques including adaptive management and ecosystem-
based management to address this problem.

v
Table of Contents
Preliminaries
Supervisory Committee…..…………………………………………………. ii
Abstract…………………………………………………………………….. iii
Table of Contents…………………………………………………………… v
List of Tables….…………………………………………………………….. vii
List of Figures………………………………………………………………. viii
List of Appendices………………………………………………………….. ix
Acknowledgements…………………………………………………………. x
Chapter 1 - Introduction: Rationale for Goldstream Salmon Monitoring
Research
1.0 Introduction and Background to the Study………………………………… 1
1.1 Research Goals and Objectives.……………………………………………. 1
1.2 Thesis Framework.…………………………………………………………. 4
Chapter 2 - Habitat and Natural History of Goldstream Salmon
2.0 Study Sites – Saanich Inlet and Goldstream River Watersheds..………….. 5
2.1 Life History Patterns of BC Coho, Chinook and Chum Pacific Salmon ..... 12
2.2 BC Salmon Fisheries as Predators within the Salmon Food Web……….… 15
2.3 Population Trends in BC Wild Salmon Stocks…………………………….. 16
Chapter 3 - The Goldstream River Fishery
3.0 Management of Goldstream River Salmon ………………………………... 20
3.1 Goldstream River Salmon Enhancement ……………….…………………. 25
3.2 Saanich Inlet Chum Surplus Fishery………………. ……………………… 26
3.3 The State of the Saanich First Nation Salmon Fishery…………………….. 26
Chapter 4 - Management Systems and Associated Issues
4.0 The Nature of Traditional Ecological Knowledge…………..……………… 29
4.1 Integrating Traditional Ecological Knowledge (TEK) with Scientific
Ecological Knowledge (SEK) to Assess and Monitor Fish Stocks ….…….. 32
4.2 The Importance of TEK in Identifying Changes to Fisheries and the
Coastal Environment……………………………………………………….. 34
4.3 Conservation Practices as TEK of Canada‘s Indigenous Peoples………….. 37
4.4 Incorporating TEK with Wildlife Assessments…………………………….. 39

vi
4.5 Monitoring Wild and Hatchery Enhanced Pacific Salmon…………………. 40
4.6 Use of Native Harvest Statistics in Assessing Fisheries‘ Sustainability…… 47
4.7 Wild Salmon Monitoring and Management Efforts …………................…. 48
Chapter 5 - Methods
5.0 Overview of Methods Used for this Research…………………………….. 54
5.1 Interviews with Saanich First Nation Fishers..……………………………. 56
5.2 Escapement Enumeration.………………………………………………….. 60
5.3 Saanich Inlet Excess Salmon to Spawning Requirement and Food, Social
and Ceremonial Chum Fisheries Data Processing…………………………. 68
Chapter 6 - Research Results
6.0 Introduction to Research Results.………………………………………….. 69
6.1 Interviews with Saanich Fishers..…………………………………………... 69
6.2 Results from Goldstream Salmon Biostatistics…………………………….. 93
6.3 Summary of Main Findings………………………………………………… 121
Chapter 7 - Discussion
7.0 Introduction and Overview………………………………………………… 124
7.1 Discussion of Interview Results……………………………………………. 125
7.2 Discussion of Goldstream Salmon Fisheries Statistics..…………………… 144
Chapter 8 - Recommendations and Conclusion
8.0 Recommendations ………………………………………………………… 159
8.1 Conclusions ……………………………………………………..………… 165
References Cited………………………………………………………………… 167
vii
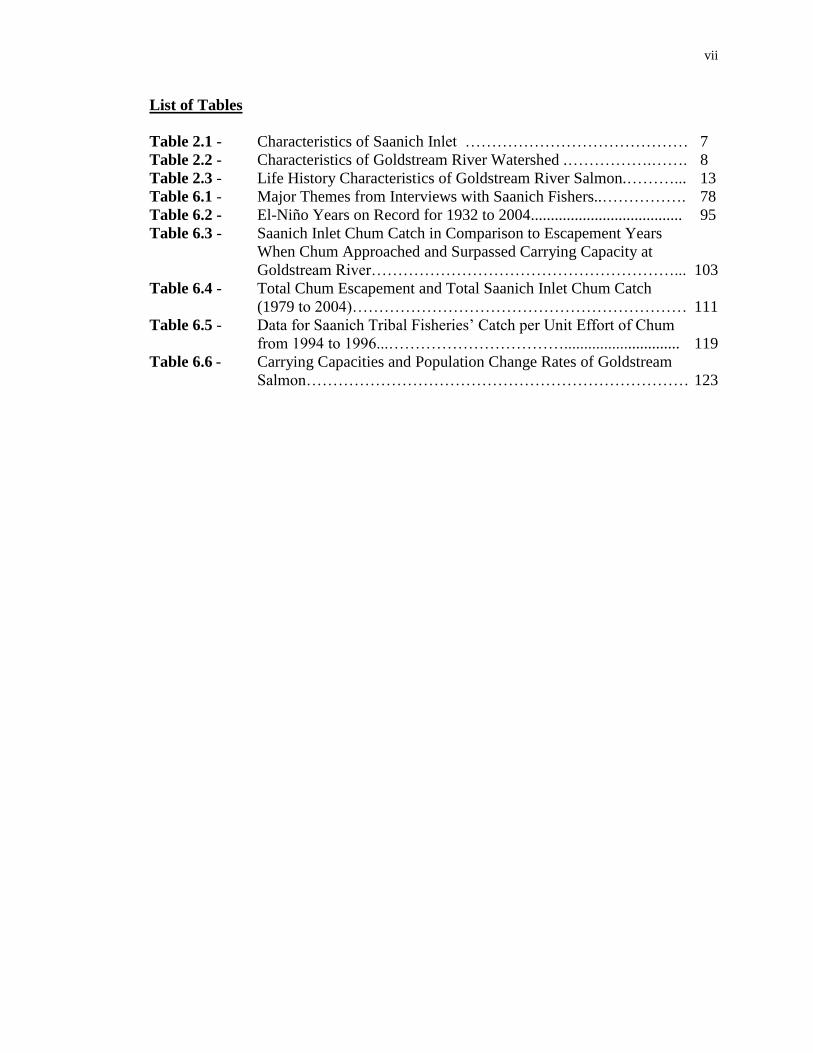
List of Tables
Table 2.1 - Characteristics of Saanich Inlet …………………………………… 7
Table 2.2 - Characteristics of Goldstream River Watershed .…………….……. 8
Table 2.3 - Life History Characteristics of Goldstream River Salmon.………... 13
Table 6.1 - Major Themes from Interviews with Saanich Fishers..……………. 78
Table 6.2 - El-Niño Years on Record for 1932 to 2004...................................... 95
Table 6.3 - Saanich Inlet Chum Catch in Comparison to Escapement Years
When Chum Approached and Surpassed Carrying Capacity at
Goldstream River…………………………………………………... 103
Table 6.4 - Total Chum Escapement and Total Saanich Inlet Chum Catch
(1979 to 2004)……………………………………………………… 111
Table 6.5 - Data for Saanich Tribal Fisheries‘ Catch per Unit Effort of Chum
from 1994 to 1996...……………………………............................. 119
Table 6.6 - Carrying Capacities and Population Change Rates of Goldstream
Salmon……………………………………………………………… 123
viii
List of Figures
Figure 1 Watersheds and Salmon Migration Routes Leading to Saanich
Inlet…...…………………………….……………………………… 2
Figure 2.1 Location of Saanich First Nation Bands ………………………….. 6
Figure 2.2 Lower Salmon Bearing Reaches of Goldstream River …………… 10
Figure 5.1 Integrated Research Approach for Monitoring Wild Salmon
Stocks at Goldstream River and Saanich Inlet, Southern
Vancouver Island, B.C..……………………………………………. 55
Figure 5.2 Quadrat Formed for a Visual Survey of Adult Chum at Goldstream
River………………………………………………………………... 62
Figure 6.1 Coho Escapement Trends at Goldstream River from 1932 to 2004.. 94
Figure 6.2 Chinook Escapement Trends at Goldstream River from 1932 to
2004………....................................................................................... 97
Figure 6.3 Chum Escapement Trends at Goldstream River from 1932 to 2004. 100
Figure 6.4 Abundance of Chum Saanich Tribal Fisheries Caught with Excess
Salmon to Spawning Requirement Fishing Licenses in DFO
Statistical Area 19, Saanich Inlet from 1982-2004 ……………….. 104
Figure 6.5 Saanich Peoples‘ Food, Social and Ceremonial Chum Catch from
Area 19, Saanich Inlet from 1978 to 2004 ………………………... 106
Figure 6.6 Total Saanich Inlet (Area 19) Chum Catch (Excess Salmon to
Spawning Requirement and Food, Social and Ceremonial Chum
Catch Combined) from 1979 to 2002…………………................... 108
Figure 6.7 Abundance of Chum Salmon Caught in DFO Area 19 , Saanich
Inlet in Comparison to Chum Escapements at Goldstream River
between 1979 and 2002…………………………………………...... 109
Figure 6.8 Three-Year Rolling Averages of Saanich Inlet Excess Salmon to
Spawning Requirement Chum Catch in Area 19, Saanich Inlet and
Escapements Returning to Goldstream River from 1980 to 2004…. 114
Figure 6.9 Three-Year Rolling Averages of Food, Social and Ceremonial
Chum Catch in Area 19, Saanich Inlet in Comparison to Chum
Escapement at Goldstream River from 1978 to 2003 ...................... 115
Figure 6.10 Goldstream River Chum Escapement and Saanich Inlet Excess
Salmon to Spawning Requirement and Food, Social and Ceremonial
Chum Catch Three-Year Rolling Averages from 1978 to 2004....... 118
Figure 7.1 Saanich Peninsula Creeks Along the South Coast of Vancouver
Island, BC ………………………………………........................... 126
Figure 7.2 Co-Management, Adaptive Management, First Nations‘ Traditional
Resource Management and Ecosystem-Based Management for
Goldstream Salmon Stocks Monitoring, Assessment and
Management………………………………………………………... 156

ix
List of Appendices
Appendix A - Glossary of Specialized Terms Used in This Thesis…………….. 191
Appendix B - Summary of Habitat Descriptions of Reaches 1 to 3 Goldstream
River, Salmon Escapement Enumeration Survey Area….………. 193
Appendix C - Common, Scientific and Saanich Language Names for BC
Salmon Species …………………................................................ 194
Appendix D - Fishing Management Area 19
(Saanich First Nations‘ Fishing Area).…………………………... 195
Appendix E - Saanich First Nation Fisher Interviewees.…...…………………... 196
Appendix F - University of Victoria Human Research Ethics Committee
Certificate of Approval for Research and Other Activities
Involving Human Subjects..……………………………………… 197
Appendix G - Saanich Fisher Interview Participants Recruited by Peer Selection 198
Appendix H - Interview Survey Guidelines and Questionnaire for Interviewing
Saanich First Nation Fishers………………..…………………... 199
Appendix I - Letter of Understanding between Roxanne Paul and Fisheries
And Oceans Canada...…………………………………………… 203
Appendix J - Metadata for Goldstream Salmon Escapements 1932-2002........ 204
x
Acknowledgements
This master‘s project was made possible in part by the Saanich fishers who
gave selflessly and openly of their time, knowledge and experience. The Saanich
People I would like to thank are: Joe Bartleman, Earl Claxton Sr., Emmanuel
Cooper, John Elliott Sr., Ivan Morris, Sandy Morris and Simon Smith. Dr. Nancy J.
Turner, Dr. Michael C.R. Edgell and Dr. Tom E. Reimchen were all very attentive to
my interests from the outset and throughout my graduate studies. All three of these
remarkable people provided me with excellent guidance and were outstanding in
their commitment to me as supervisors and supporters. This Master‘s program
would not have come to fruition without their participation, contributions, patience
and encouragement. I would also like to extend my appreciation to Dr. Rosemary
Ommer for stepping up as my External Examiner and offering her thought-
provoking insights about this thesis. Thanks to Krista Roessingh for her
transcribing work and interest in volunteering to help with this project during my
busy field season.
I enjoyed working as a teaching and laboratory assistant in both Geography
and Environmental Studies at the University of Victoria (UVIC) and value the
experiences I have had with so many great thinkers (students, staff and faculty). I
am grateful to the Graduate Studies Office and especially Dr. Frances Ricks, our
former Associate Dean [retired in 2005]. Frances not only employed me as her
research assistant, but she also showed me that creative brilliance and efficiency
combined with enthusiasm can indeed change the world when applied
conscientiously. Thanks also to the people of the Victoria Experimental Network
Under the Sea (VENUS) Project for the wonderful experience of working on marine
conservation planning as part of their very fun and talented research team for my
first graduate co-op term.
Thanks to Sean MacConnachie and Glen Rasmussen, my employers with
Fisheries and Oceans Canada for my second co-op term as a coastal and marine
planning researcher and to Dr. Mark Johannes who had me placed as his teaching
assistant twice over the past three years. I thank these gentlemen for consistently
coaxing me to finish up my thesis and for the learning experiences I gained from
them while working together with marine and freshwater systems.
Thanks are also owed to the Sierra Club of British Columbia, to the Edward
Bassett Family Foundation, and the Lorene Kennedy Environmental Studies
bursaries for the funds provided that have helped to sponsor my studies. Thank you
also to my mother, father, brother-in-law, grandmother, and my late grandfather for
their support and a special thanks to my sister for her encouragement, devotion and
guidance during my academic pursuits at UVIC. Thanks to all the graduate students
and friends who have shared their experiences with me and helped me ―think outside
the box‖ between thesis pages, including Marian, Sarah, Carrie, Kate, Jeremy,
Rachel and Alison.

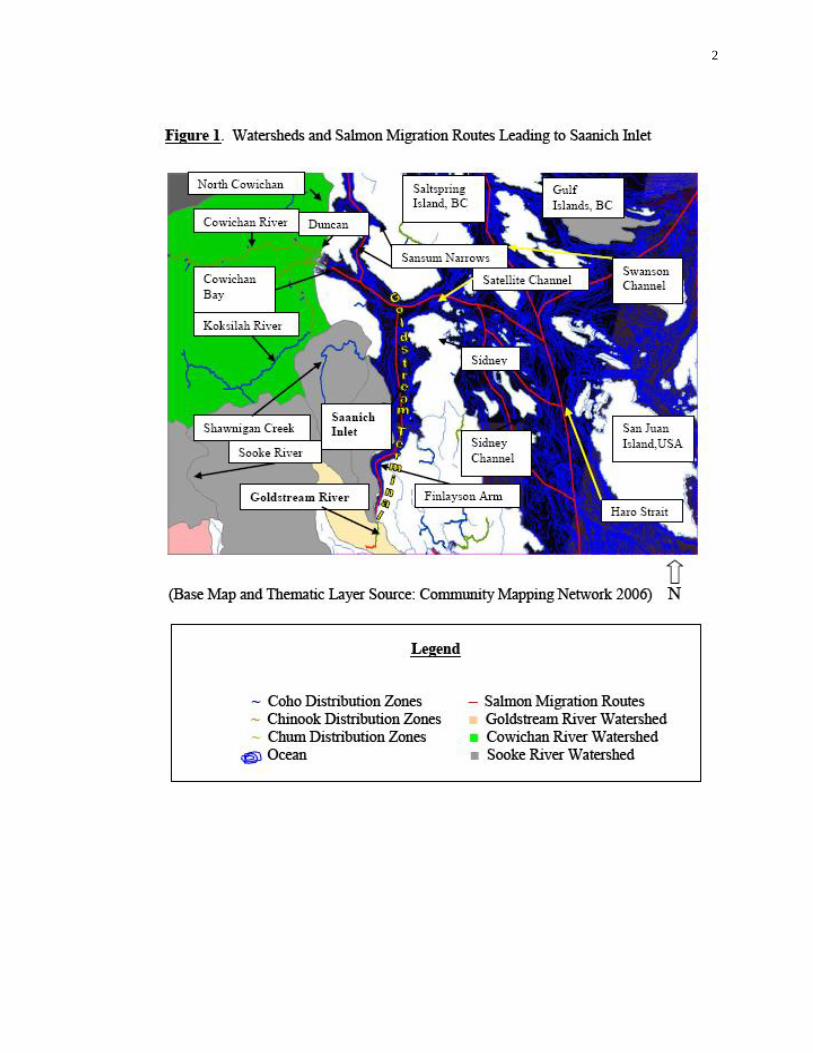
CHAPTER 1 - INTRODUCTION: RATIONALE FOR GOLDSTREAM SALMON
MONITORING RESEARCH
1.0 Introduction and Background to the Study
Three species of Pacific salmon – coho (Oncorhynchus kisutch), chinook (O.
tshawytscha) and chum (O. keta) – migrate through Saanich Inlet to access Goldstream
River, along the southern coast of Vancouver Island, as a spawning stream (Figure 1).
These salmon have enormous cultural, nutritional and economic value for people of the
Saanich First Nation who continue to fish for salmon at Goldstream River and Saanich
Inlet. The salmon are also valued in the adjacent tidal water sport fishery and the
offshore commercial fishery. Goldstream River salmon are genetically distinct from any
other anadromous salmon population. As shown in this study, there are ongoing
concerns over the long-term viability of the Goldstream salmon, including unexplained
fluctuations in their populations (DFO 1999a 1999b, 1999d, 2001c, 2001d, 2002d,
2004b, 2004c, 2004d, 2004e, 2006a, 2006b).
1.1 Research Goals and Objectives
This research was undertaken in the interest of contributing to wild salmon
conservation and future sustainable fisheries management planning. I hope that my
findings will be useful to those working towards protecting, sustaining and enhancing
the Pacific salmon fishery. The purpose of this research was to examine Goldstream
salmon population trends in order to determine if, and how, historical and current
records of salmon populations and Saanich First Nations‘ fishers‘ traditional ecological
knowledge (TEK) about the salmon can effectively contribute to improving monitoring
protocols for assessing annual returning populations of wild coho, chinook, and chum
salmon at Goldstream River and Saanich Inlet.
2
3
The ultimate goal was to assist in conserving, protecting and sustaining wild and
natural salmon stocks1. A further objective was to develop a framework that addresses
the complexities of monitoring and assessing salmon stocks and managing the local
salmon fisheries. To that end, this study adopted an adaptive management, co-
management and traditional management systems approach toward assessing returning
salmon populations. The methodology for this research involved the integration of two
emerging knowledge systems relevant to monitoring salmon and salmon fisheries:
quantitative methods creating time series graphs from annual escapement2 (Appendix
A); and native harvest statistics; and social science methods yielding indigenous
knowledge and perspectives of the Goldstream salmon fisheries.
Data gathering for this study was carried out over one field season (2002).
Methods included stream surveys to learn how escapement data used in this study (DFO
1932-2004) are collected, and interviews with Saanich fishers about their traditional and
current salmon fishing methods, and about the Goldstream salmon. In addition to these
two research methodologies, I used the logistic growth model to determine the rate of
population increase of Goldstream salmon. I also conducted a catch-per-unit-effort
(CPUE) analysis with the limited data available to illustrate its function as a monitoring
tool for Saanich fishers3.
1 ‗Salmon stocks‘ and ‗wild‘, ‗natural‘ and ‗hatchery‘ salmon are defined in Appendix A.
2 Salmon escapements are records of abundance of (wild or hatchery-raised) adult salmon that escaped
capture by inshore, offshore or freshwater fisheries, as well as freshwater or marine wildlife predators
during their migration from freshwater to sea and back again and were identified at their natal spawning
ground (Appendix A). 3 A catch-per-unit-effort (CPUE) of the modern Saanich Inlet chum fishery operated by Saanich First
Nation bands was originally proposed for this project. Due to inconsistencies in catch and effort data, a
statistically meaningful CPUE analysis and measure of sustainability could not be attained and so the
CPUE data and results are intended only as an example of the merits of CPUE analyses.

4
1.2 Thesis Framework
In Chapter 2, the geography and ecology of the Goldstream River salmon habitat
and populations are described based on my review of the literature and personal
observation. Chapter 3 presents an overview of current salmon management practices;
salmon enhancement of Goldstream coho and chinook stocks; Fisheries and Oceans
Canada‘s (DFO‘s) administration of the Saanich Inlet chum surplus fishery; and an
overview of Saanich and other First Nations‘ perspectives of salmon and coastal
fisheries. Both science and social science methods were used to address the complex
question of salmon populations and monitoring protocols. Chapter 4 summarizes
relevant literature about the contributions of traditional ecological knowledge and
western scientific knowledge to wild salmon conservation and includes the topics of past
and present fishing activities, ecological relationships, conservation practices of First
Nation fishers, wildlife population assessments, mixed stocks of wild and enhanced
salmon, native harvest statistics and wild salmon monitoring and management efforts.
Chapter 5 presents methods used in the study, including field monitoring of returning
salmon populations, population assessments from escapement records, analysis of native
harvest statistics, and interviews with Saanich fishers. Results from these different
approaches are reported and analysed in Chapter 6, and the findings are discussed in
Chapter 7, in relation to the goals of this research. Chapter 8 presents recommendations
and conclusions emerging from the study.
5
CHAPTER 2 - HABITAT AND NATURAL HISTORY OF GOLDSTREAM
SALMON
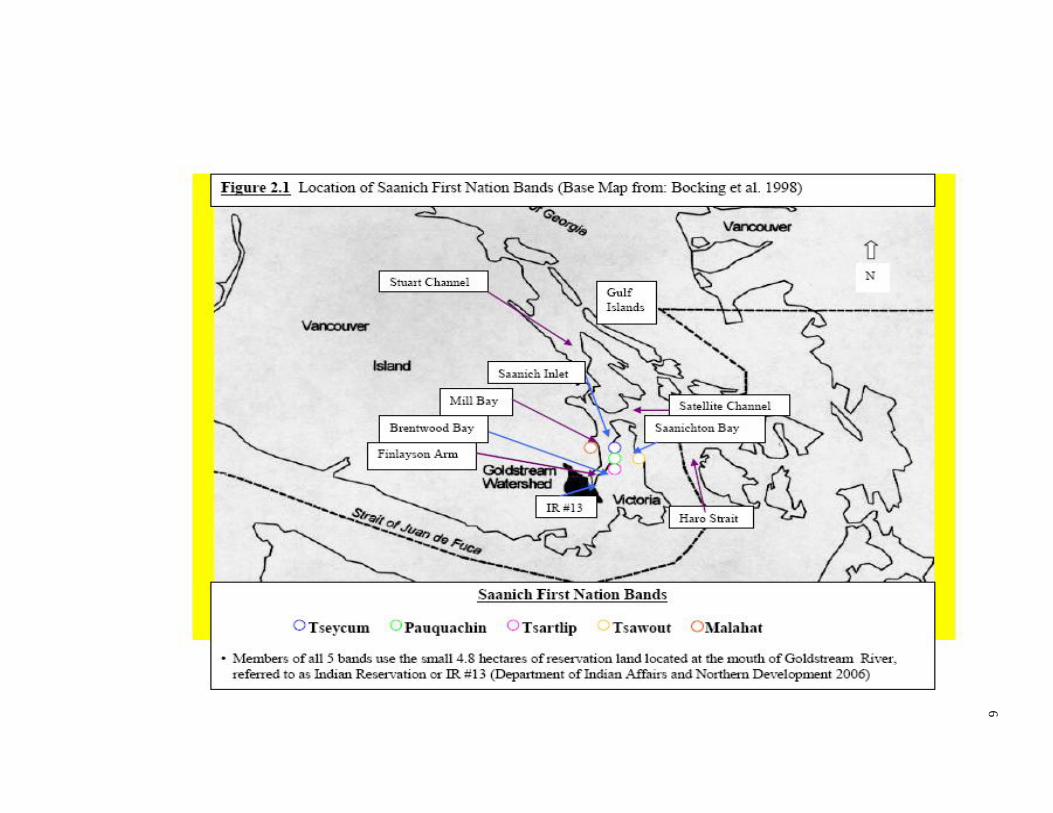
2.0 Study Sites: Saanich Inlet and Goldstream River Watersheds
The migratory route of Goldstream salmon consisting of Saanich Inlet and
Goldstream River watersheds is referred to as the Goldstream terminal (DFO 1978-
2004) (Figure 1). Saanich Inlet is a temperate marine fjord on the southeastern tip of
Vancouver Island located on the west side of the Saanich Peninsula extending
approximately 21 kilometres north of Goldstream River. Goldstream River flows into
Saanich Inlet, and both the river and the inlet are important traditional fishing localities
for the Saanich First Nations (Figure 2.1).
Saanich Inlet has unique oceanographic characteristics related to particulars of
inflow of ocean and freshwater sources, ocean currents, low vertical mixing and a high
level of algal or phytoplanktonic primary production of single-celled diatoms and
dinoflagellates (Table 2.1) (VENUS 2004). These features influence the salmon
populations‘ path of migration, as well as their supply of oxygen and food throughout
the inlet (e.g. zooplanktonic crustaceans such as copepods and krill).
The Goldstream watershed is located at the head of Saanich Inlet (Finlayson
Arm) about 15 km NW of Victoria. Environmental conditions and human use
(summarized in Table 2.2) can affect fall season salmon runs. Precipitation, and storage
and diversion of water affect the hydrology of Goldstream River, and impact water
6
6
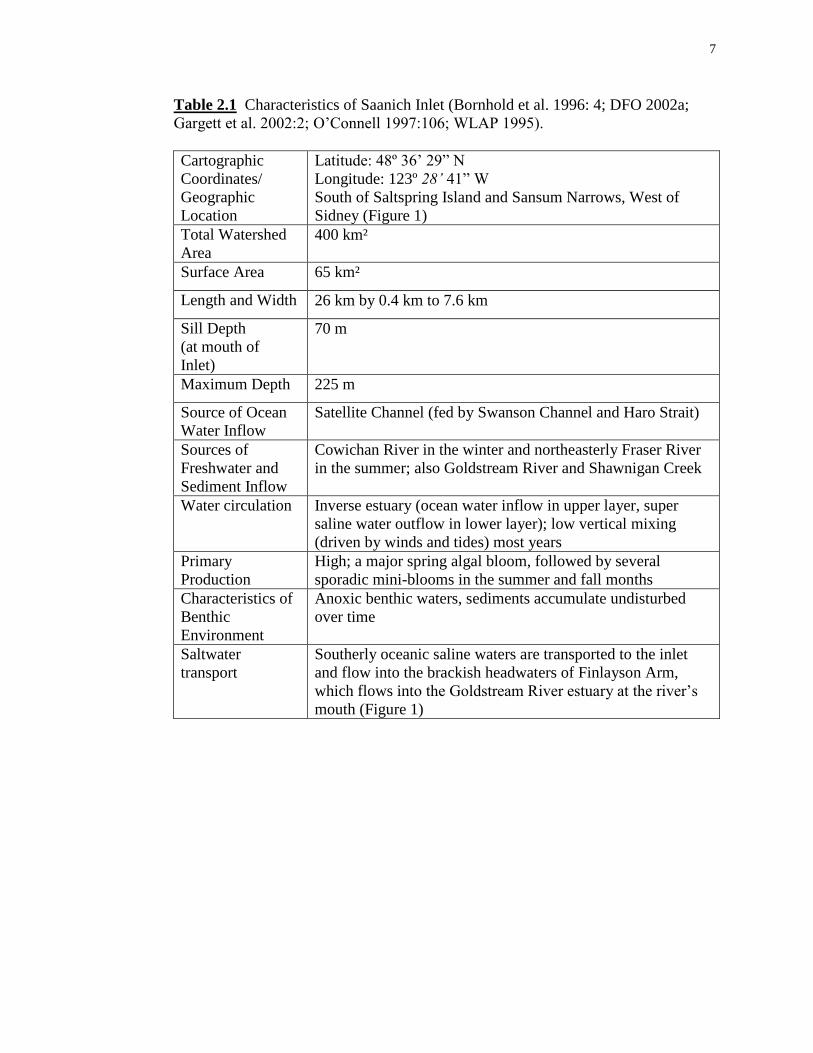
Table 2.1 Characteristics of Saanich Inlet (Bornhold et al. 1996: 4; DFO 2002a;
Gargett et al. 2002:2; O‘Connell 1997:106; WLAP 1995).
Cartographic
Coordinates/
Geographic
Location
Latitude: 48º 36‘ 29‖ N
Longitude: 123º 28’ 41‖ W
South of Saltspring Island and Sansum Narrows, West of
Sidney (Figure 1)
Total Watershed
Area
400 km²
Surface Area 65 km²
Length and Width 26 km by 0.4 km to 7.6 km
Sill Depth
(at mouth of
Inlet)
70 m
Maximum Depth 225 m
Source of Ocean
Water Inflow
Satellite Channel (fed by Swanson Channel and Haro Strait)
Sources of
Freshwater and
Sediment Inflow
Cowichan River in the winter and northeasterly Fraser River
in the summer; also Goldstream River and Shawnigan Creek
Water circulation Inverse estuary (ocean water inflow in upper layer, super
saline water outflow in lower layer); low vertical mixing
(driven by winds and tides) most years
Primary
Production
High; a major spring algal bloom, followed by several
sporadic mini-blooms in the summer and fall months
Characteristics of
Benthic
Environment
Anoxic benthic waters, sediments accumulate undisturbed
over time
Saltwater
transport
Southerly oceanic saline waters are transported to the inlet
and flow into the brackish headwaters of Finlayson Arm,
which flows into the Goldstream River estuary at the river‘s
mouth (Figure 1)
7

8
Table 2.2 Characteristics of Goldstream River Watershed (BC Fisheries 2001; BC
Ministry of Forests 1999a, 1999b; Bocking et al.1998; CRD 2003a; CRD 2006)
Geographic
Location &
Ecological
Features
Latitude: 48º 29' 00" N. Longitude: 123º 33' 00" W
at river‘s mouth. 15 km NW of Victoria (Figure 2.1). Part of
the Vancouver Island Forest Region (Nanaimo Lowlands
Physiographic Region). Within the warmer, drier Coastal
Douglas-Fir Biogeoclimatic Zone (ranging from sea level to
100 m elevation in the adjacent forested riparian area that
extends from reach 1 to 4 along the river) and within the
wetter, cooler Coastal Western Hemlock Biogeoclimatic zone
in areas extending from sea level to 200 m elevation and
higher (e.g. forested area adjacent to upper reaches 5 to 8 of
the river) (Figure 2.2). The upper portion of the watershed is
part of the Greater Victoria Water District, a designated
conservation area.
Length 12.5 km
Area 40 km²
Stream Flow
Direction
Southeasterly (coming from the southeast)
Stream type Third Order Stream (formed by the joining of two First Order
streams in the drainage basin which forms a Second Order
stream whose tributary joins to the main stream, forming a
Third Order stream) (Christopherson 1994:420).
Annual
Precipitation
Averages 800 mm regionally, mostly in form of rain, heaviest
in winter months (Nov-Mar), lowest in autumn (Aug-Sept)
Surficial materials Tills of varying depth (primarily with a sandy loam matrix),
colluvium, exposed bedrock
Water
Management
Dams were constructed at the outlets of Goldstream, Lubbe and
Butchard lakes between 1892 and 1914 and were upgraded in
1995 to meet seismic standards. Water released from the lakes
is diverted into Japan Gulch Reservoir water supply system
near the Goldstream salmon hatchery. The Capital Regional
District Water Department (CRDWD) maintains minimum
flows to Goldstream for salmon fishery enhancement.
Waterflows in excess of requirement pass down Goldstream
River, north into Finlayson Arm. CRDWD used to divert
water from Goldstream and one of its tributaries, Waugh Creek
to provide Greater Victoria with ~20% of their water supply
until 2003 when the Sooke dam was raised and began
providing 100% of the water supply to area residents.
Goldstream system reservoirs now provide only backup storage
water for use during drought conditions, annual routine
maintenance or emergencies when water cannot be supplied
from Sooke Reservoir (CRD 2006).
9
levels critical for supporting fall salmon spawning runs. In 2003, for example, hatchery
workers at Goldstream River observed ―hundreds‖ of chum dying in the estuary and
unable to access spawning grounds upstream due to critically low water levels
(McCully P. pers. comm. 2003).
The lower, 5 km salmon-bearing portion of Goldstream River watershed is
within Goldstream Provincial Park, which is less than 100 to 180 m in elevation above
sea level, and is lined by hills and sharp cliffs. I used this same lower Goldstream field
site that hatchery volunteers use to do the annual escapement enumeration of salmon
that is described in the Methods chapter. This stretch of river is about 3 km long,
extending from the mouth of the river at Reach 1, upstream to Reach 4 where the
hatchery-counting fence (salmon trap) and the Water Survey of Canada Gauge Station
are located (Figure 2.2).
Salmon returning to Goldstream River pass through Reach 1, near the mouth of
the river, and either remain there or migrate further upstream to spawn in Reaches 2 and
3. All three reaches surveyed are quite shallow and are primary salmon habitat assessed
as having high habitat value (Bocking et al. 1998). Channel stability is important for
salmon spawning grounds. Degradation from erosional processes such as bank erosion
causes deposition of fine sediments over the riverbed, which can destroy salmon redds
(spawning sites in gravel). Bank erosion may also reduce channel stability by lowering
the riverbed or changing the riverbed slope (Brye et al. 2004; Parkyn et al. 2005; Payne
and Lapointe 1997). Most of Reach 1 of Goldstream was assessed as having mostly
‗good‘ quality salmon spawning gravel. Overall quality of spawning gravel in both
the upper parts of Reach 1 and Reach 2 further upstream, however were rated as only
‗fair‘ (Bocking et al. 1998) (Appendix B).

Study Site Escapement Survey Area - Reaches 1 - 3 = 2.83 km (Bocking et al. 1998: Insert)
Figure 2.2 - Lower Salmon Bearing Reaches of Goldstream River
R1=Reach 1 of Goldstream River (930 m long)
(North end of river)
R2=Reach 2
(1,270 m long) R3 = Reach 3
(630 m long)
Goldstream Hatchery Counting
Fence & Water Survey of Canada
Gauge Station
R4 = Reach 4
(250 m)
10
Nature
House
Parking
& Picnic
Area
Foot
Bridge
Bridge

11
The Goldstream watershed currently consists of mixed canopies of western
redcedar (Thuja plicata), red alder (Alnus rubra) bigleaf maple (Acer macrophyllum)
and Douglas-fir (Pseudotsuga menziesii) with salal (Gaultheria shallon), sword fern
(Polystichum munitum) and red huckleberry (Vaccinium parvifolium) comprising some
of the dominant under story species (Bocking et al. 1998). Goldstream acquired its
name from Peter Leech who found gold-bearing gravel in the river in 1858. A small
gold rush ensued from 1863 to 1864 when about 300 men worked along the river in
search of gold (Akrigg and Akrigg 1998). There is scientific evidence from Saanich Inlet
sediment cores that the woodlands surrounding Saanich Inlet were dominated by cedar,
western hemlock and Douglas-fir (characteristic of old growth forests) 2,000 years ago
(Heusser 1983). Tunnicliffe (2000) found that the ratio of western redcedar
(characteristic of mature forest) to alder (a first colonist in riparian habitat) in this region
has changed from 3:2 in 1865 and 1918 to 1:4 in 1935, with the presence of alder more
than doubling between 1900 and 1970 (after Heusser 1983).
Prior to road and dam construction and logging activities in the mid and late
1800s and from 1938 to 1995, (when the Greater Victoria Water District lands at
Goldstream were designated as an ecological reserve and logging activities were
terminated), the riparian zone was dominated by coniferous trees that characterize old
growth forest of the coastal Douglas-fir zone. That habitat includes coastal Douglas-fir,
Grand fir (Abies grandis) and Western redcedar (Pojar et al. 2004). The shrub layer is
dominated by dull Oregon-grape (Mahonia nervosa), salal, oceanspray (Holodiscus
discolor), and trailing blackberry (Rubus ursinus). The underlying herb layer consists of
Broad-leaved starflower (Trientalis borealis ssp. latifolia), sword fern and bracken fern
(Pteridium aquilinum). Oregon beaked moss (Kindbergia oregana), electrified cat‘s-tail
11

12
moss (Rhytidiadelphus triquetrus) and step moss (Hylocomium splendens) comprise the
dominant species in the moss layer in old-growth forests of this type (Green and Klinka
1994).
The ecological integrity of Goldstream River habitat is critical to the
perpetuation of healthy Goldstream salmon populations and of the Saanich First
Peoples‘ salmon fishery. More detailed physical descriptions characterizing the salmon
spawning habitat within the Goldstream survey area are listed in Appendix B.
2.1 Life History Patterns of BC Coho, Chinook and Chum Pacific Salmon
The various names of the Goldstream salmon, including the Saanich language
terms, are listed in Appendix C. Pacific salmon species, including the Goldstream
salmon (coho, chinook, chum), are anadromous, hatching in fresh water, migrating to
the ocean where they spend most of their adult lives, and returning to freshwater to
spawn. After spawning, the adults die and the fertilized eggs remain in the gravel
spawning beds until they hatch and the young fry salmon emerge from the gravel beds
into the river, then swim downstream to the estuary, and then into the saline ocean
waters as smolts. The lower salmon-bearing reaches of Goldstream River are shown in
Figure 2.2. A summary of life history characteristics of the Goldstream salmon,
including amount of time they spend in the river prior to their migration to saline
waters, is provided in Table 2.3 below. More detailed life histories and ecologies of the
three Goldstream salmon species follow 4.
4 There are no records of pink (Oncorhynchus gorbuscha) or sockeye (O. nerka) salmon populations
for Goldstream River.
13
Coho spawn later than chinook or chum, from late October and early November
until late December and early January. Eggs remain in the gravel until spring or early
summer (See Table 2.3 for approximate number of eggs laid per female). The fry
spend one year growing in freshwater, then as smolts they swim out to sea. Many
remain close to shore throughout their marine lives, others move out to deeper ocean
waters. Coho spend between six and 18 months at sea before returning to their natal
freshwater stream. Average adult weight is 4 kg (Baxter 2000:21) (Table 2.3).
Salmon returning to freshwater after only one year at sea are also called grilse. This is
true of chinook and chum as well, but coho are the species that most commonly return
from sea within just one year. Upon returning to freshwater, the coho migrate upstream
diurnally, leaping out of the water frequently and moving quickly through rapids or
Table 2.3 Life History Characteristics of Goldstream River Salmon
(Baxter 2000; Candy and Quinn 1996; Harvey and MacDuffee 2002)
Salmon
Species
Average
Spawning
Age
Spawning
Season
Average
Adult
Fork
Length5
Average
Adult
Weight
# Eggs
Laid/
Female
Average
Age of Fry
at Ocean
Migration/
Smolt Stage
Coho 3 yrs old Nov-Jan 55 cm 4 kg > 5000 12 months
Chinook 3 yrs old Oct-Dec 80 cm 16 kg < 4000 -
>14,000
< 3 months
Chum 5 yrs old Sept-Dec 65 cm 5 kg 2,000 -
4,000
< 1 week6
shallow riffles during spawning peaks. They usually remain out of sight in deeper
pools or shady areas under streambanks when resting and are therefore more difficult to
see from the streambank than chum or chinook. Coho are known to have a seasonal
5 Tip of nose to fork of tail fin.
6 Chum fry swim to estuary immediately after emerging from gravel and migrate from estuary to sea after
a few weeks.

14
competitive advantage over other salmon, which spawn in earlier autumn; coho females
tend to dig up and destroy existing redds to lay their own eggs (Baxter 2000). Coho
can travel further upstream to spawn than chum, because they are able to leap over
obstacles which chum cannot. Coho do not generally migrate as far inland as chinook,
however, and tend to select finer gravel in which to dig redds (Harvey and MacDuffee
2002). Coho die within approximately two weeks of entering freshwater to spawn
(Baxter 2000).
Chinook (also known as ―Spring‖ or ―King‖ salmon) spawn at Goldstream from
about mid October to December. Eggs remain in the gravel until spring or early
summer. The fry then travel downstream to the estuary right after emerging from gravel
redds and spend about three months growing in freshwater before swimming out to sea.
The smolts remain in sheltered coastal waters during summer before migrating
northward to deeper ocean waters. Most chinook spend about two and a half years at
sea and remain within approximately 1000 km of their natal river. They return to spawn
at ages three to four although males tend to be younger than females, commonly
returning to freshwater as two-year-olds (Baxter 2000; Healey 1991). Average weight
of males and females is about 16 kg (Table 2.3) though weights of 45 kg are not unusual
(Harvey and MacDuffee 2002:100). Chinook are the largest but least numerous of the
Pacific salmon, with many spawning populations estimated at less than 1000 spawners
(Baxter 2000:21; Harvey and MacDuffee 2002:100). Chinook spawn in tiny tributaries,
streams or main river channels and die between approximately 4 and 25 days after
spawning (NOAA 2005).
Chum spawn between September and December. Eggs hatch in the gravel in the
spring and the alevins, which feed on their yolk sac, remain in gravel beds for about a

15
month, then emerge as fry and travel downstream to the estuary immediately. The fry
spend about three months growing in brackish waters of the estuary before swimming
out to sea as smolts in the summer (between May and August). Juveniles remain in
nearshore, sheltered coastal waters over the summer before migrating out into deeper
ocean waters within about 35 km of the coastline in autumn and early winter as adults.
Chum will spend between two and a half and four and a half years at sea before
returning to their natal river. The average weight of an adult male or female chum is 5.4
kg (Baxter 2000; Hicks 2002 in Harvey and MacDuffee 2002:99) (Table 2.3). Chum
migration from the estuary of the river to spawning grounds upstream is cued by
increased water flow. They are strong, fast swimmers (maximum swimming speed of
3.05 m/s with short burst speeds of 4.6m/s) but they do not leap, are reluctant to enter
long-span fish ladders and their migration distance upstream is stopped by the first
significant barrier. Chum enter freshwater, spawn and die within three to 11 days
(Baxter 2000: 28; Rawding and Hillson 2003:23).
2.2 BC Salmon Fisheries as Predators within the Salmon Food Web
It is evident that BC coho and chinook stocks declined from the 1970s through to
2005 (as is detailed in section 2.3). The resulting decrease in commercial and
recreational Pacific salmon fishing opportunities negatively impacted the economies of
BC‘s coastal fishing communities (BC WLAP 1995, 1996; Copes 1998; DFO 1998,
1999a, 1999c, 2001d, 2002d, 2004a, 2004c, 2004d; Edwards and Glavin 1999; First
Nation Panel on Fisheries 2004; Haggan 2000; Haggan et al. 2003; Morrell 1989;
Walters 1995). This predator-prey dynamic between humans and salmon exemplifies
the importance of salmon in human societies and economies, which exists in addition to

16
their role as keystone species7 in marine and aquatic ecosystems. Under the current
commercial salmon fishery regime, humans as predators take proportionately three to 20
times more Pacific Coast salmon than non-human predators (e.g. bears, wolves, eagles
and seals) consume in a natural multi-predator, predator-prey relationship (Reimchen in:
Harvey and MacDuffee 2002:96).
In addition to providing a direct source of food energy for a range of predator
and scavenger species, salmon play a key role in aquatic and terrestrial ecosystems as
sources of nutrients for tree growth in the riparian zone8 and in many other parts of the
food web (Bilby et al. 2003; Helfield and Naiman 2001; Hocking and Reimchen 2002;
Honea 2005; Naiman et al. 2002; Reimchen 2001; Sucre et al. 2005). Salmon are a
keystone species in the southern Vancouver Island coastal ecosystem and are also
providers of substantial amounts of nitrogen (~ 23%) contributing to the growth rate of
trees and shrubs within the riparian zone (Helfield and Naiman 200:2403). The
continuance of abundant returns of Goldsteam salmon spawners (or escapements) to
their natal river is therefore very important to the Goldstream riparian ecosystem as well
as to human and non-human predators.
2.3 Population Trends in BC Wild Salmon Stocks
Stocks of wild salmon in BC have declined dramatically from their original
numbers since large-scale commercial fishing began at the turn of the 20th
century
(Morrell 1989; PFRCC 1999; Pinkerton and Weinstein 1995; Wood 2001; DFO 2002d).
7 Keystone species is defined by Power et al. (1996:609) as ―a species whose effect is large, and
disproportionately large relative to its abundance‖. 8 Isotopic analyses demonstrate that trees and shrubs near spawning streams derive ~ 22-24% of their
foliar nitrogen (N) from spawning salmon (Helfield and Naiman 2001:2403).

17
Gresh et al. (2000) document a 70% to 90% reduction of adult salmon escapement to
coastal North American river systems, at least in Wasington, Oregon and California,
since 1890. Public interest groups, scientists and fisheries managers and other
researchers have been advising the public about potential effects of over-fishing and
habitat destruction upon BC wild salmon stocks for decades (Coward et al. 2000). The
decline in BC salmon stocks was most apparent to commercial, recreational and First
Nation fishers, fisheries managers, scientists and researchers by the 1970s and through
the 1990s. In 1998, an independent panel of scientists informed DFO that unless
meaningful action was undertaken immediately, the BC wild salmon resource could
suffer a collapse from which it might never recover (NRDC 2001). Fisheries managers
have since reported that BC salmon stocks are in a state of crisis (Copes 1998; DFO
1998, 1999a, 1999b, 1999c, 2004b, 2004c, 2004d; Fisheries Renewal BC 1998; Harvey
and MacDuffee 2002; Walters 1995). This decrease in salmon stocks led to federal
initiatives for conservation management (e.g. fishing restrictions and salmon
enhancement), which targeted those stocks with the most severe population declines.
It is difficult to assess the details of the long-term decline of the BC west coast
salmon runs because reliable data on the status of many stocks are unavailable. Lack of
reliable, consistent data from stock assessments (such as mortality abundances along
inshore terminals) was also a problem for the Newfoundland and Labrador (northwest)
Atlantic cod (Gadus morhua) runs that collapsed in 1992 (Neis et al. 1996, 1998).
Scientists have found that 43% of Canada‘s 9,662 west coast anadromous salmon and
trout stocks could not be assessed due to absence of reliable data (Slaney et al. 1996).
Of the 5,507 stocks for which reliable data were obtained, results showed that 142 west
coast stocks have disappeared over the last century, 624 are at high risk of extinction, 78

18
are at moderate risk and 230 are of special concern. Habitat degradation from logging,
urbanization and hydroelectric power was cited as the main reason for the 142 west
coast salmon and trout extinctions (Slaney et al. 1996). Escapement data for Goldstream
salmon stocks do exist for the period 1932 to 2004 and my findings from analyzing
these data are included in the results of this thesis. Possible reasons for the emerging
patterns I observed relating to Goldstream salmon stock escapement data are relayed in
the discussion of this thesis.
BC salmon catches were lower in the five-year period from 1996 to 2001 than at
any time 50 years prior to that (1951 to 1996). The number of stocks contributing to the
1996 to 2001 catches also declined, with stocks shifting from many diverse runs to
fewer strong runs (PFRCC 1999; Wood 2001), resulting in part from hatchery
enhancement of salmon populations.
Goldstream salmon fall within the BC South Coast, West Coast Vancouver
Island (WCVI) and southern Strait of Georgia salmon stock categories assigned by DFO
(DFO 1999b, 1999, 2001d, 2002d). According to DFO stock assessments, South Coast
BC coho stocks, Southern Strait of Georgia coho and chinook stocks and WCVI chinook
stocks dropped to ―seriously low‖ population levels from the 1970s to the 1990s and at
the beginning of the 21st century. By 1999, coho salmon populations had decreased
below long-term averages more drastically than other BC salmon species (Baxter 2000;
DFO 1999c, 1999d). These stocks remained at low abundances in 2005 but were
projected to increase slightly in 2006 (DFO 2005c).9
9 Though conservation efforts are in place, WCVI coho and chinook stocks are not listed as species at risk
under Canada‘s Species at Risk Act (Baxter 2000; DFO 1999; Environment Canada 2005).
19
Due to high mortality rates at sea over the 25-year period leading up to 1999,
WCVI and southern Strait of Georgia coho and chinook stocks were subjected to
intensive conservation measures (Copes 1998; DFO 1999d). Efforts to restore these
declining coho and chinook populations include enhancement programs implemented
under DFO management plans such as the hatchery coho and chinook stock
enhancement initiative in place at Goldstream River.
WCVI coho and chinook stocks appeared to be generally increasing in 2003
(DFO 2004d). Southern Strait of Georgia coho returned in low abundance due to poor
marine survival in 2004. However WCVI coho returned in higher abundances and
limited fishing opportunities for wild coho were anticipated and permitted in tidal
waters, including Saanich Inlet, for the 2005 fishing season (DFO 2005c, 2006a, 2006b).
Several south coast (of the BC mainland and of Vancouver Island) coho stocks were
depleted and expected to have low returns in 2006 (SeaChoice 2006). Chinook stocks
remained strong in 2004 and were projected to return in high numbers in 2005 (DFO
2005c). Though expected returns were mixed, some WCVI (as well as Fraser River and
Georgia Strait) chinook stocks were projected to be poor (SeaChoice 2006). WCVI
chum stocks were assessed as poor to average (ranging from below average to near
average) in 1999 and were projected to remain between these two status categories in
2003 (DFO 2002d). WCVI chum were reported to be generally returning in good,
strong numbers in 2003 (DFO 2004d), and were projected to return at average to above
average numbers in 2005 (DFO 2005c) and 2006 though according to SeaChoice (2006)
data is lacking.

20
CHAPTER 3 - THE GOLDSTREAM RIVER FISHERY
3.0 Management of Goldstream River Salmon
Saanich Peninsula and the area around Saanich Inlet are within the traditional
territory of the Saanich First Nation people (Claxton and Elliott 1994; Jenness 1938;
Mos et al. 2004). For many generations, the families of the North Saanich (Tseycum
and Pauquachin), South Saanich (Tsartlip and Tsawout) and the Malahat (who live on
the west shore of Saanich Inlet) have fished coho, chinook and chum stocks in
Goldstream River, the waters of Saanich Inlet, and adjacent straits (Figure 2.1). Chum,
being the most abundant salmon species returning to Goldstream River were and are a
major food resource, harvested each year from mid or late October to early December.
The administrative body responsible for managing the fishery resources of the Tsartlip,
Tsawout and Pauquachin bands, including Goldstream River and Saanich Inlet salmon
stocks is Saanich Tribal Fisheries. The Tseycum and Malahat bands manage their
fisheries independently but in consultation with Saanich Tribal Fisheries. Saanich First
Nations‘ management of Goldstream salmon is discussed further in Chapter 6 (Results).
The hatchery at Goldstream River is called the Howard English Hatchery (herein
Goldstream hatchery). Goldstream River is a modern day example of a mixed salmon
stock fishery (wild and enhanced salmon stocks inhabiting the same spawning habitat).
Hatchery stocks originated from wild coho and chinook brood stocks indigenous to
Goldstream. DFO officers and Goldstream hatchery technicians manage Goldstream
River to a 15,000 total population ―carrying capacity‖ (or target escapement) of chum
(see Appendix A for definitions). This annual figure was determined by DFO in 1985
(DFO 2001b). It represents the optimum abundance of adult chum spawners that the
river can sustain and was put in place to prevent overspawning (additional chum digging

21
up existing redds and destroying fertilized eggs of salmon that have already spawned,
which can result when too many chum enter the river), and to prevent population
declines of chum, which may occur if too few chum return to the river to spawn. If for
example, 50,000 Goldstream chum entered Saanich Inlet and were migrating towards
Goldstream River to spawn, DFO would allow a total of 35,000 chum to be fished from
Saanich Inlet once 15,000 chum reached the river. Another function of the chum target
escapement is to allow enough spawning gravel space in the river to maximize the
abundance of natural10
coho and chinook stocks that can spawn. This strategy is in
keeping with DFO‘s current goals for coho and chinook stock enhancement at
Goldstream River. Goldstream is also referred to as an indicator river by DFO as there
are plans to monitor the Goldstream hatchery contribution of coho and chinook salmon
(also referred to as indicator stocks) caught or observed at sea or upon their return to
freshwater (DFO 1932-2004, 2002b; McCully P. pers. comm. 2002; Till 2005). (Further
details about enhancement follow in this chapter.)
DFO issues an ―Excess Salmon to Spawning Requirement‖ (ESSR11
) communal,
commercial fishing license to Saanich Tribal Fisheries as well as the Tsecyum and
Malahat bands on an annual basis (DFO 2001a, 2001b). These licenses have permitted
Saanich First Nation bands to catch and sell chum returning to Saanich Inlet and have
been issued to both purse seine12
and gillnet fishing vessels13
contracted by Saanich
10
Natural salmon: Any salmon produced in the natural environment as a result of natural reproduction. A
natural salmon could be either wild or the progeny of hatchery parents that spawned in the natural
environment. It is impossible to distinguish a natural and wild salmon by field observation alone. 11
ESSR is referred to as both ‗Excess Salmon to Spawning Requirement‘ and ‗Escapement Surplus to
Spawning Requirement‘ in the Canadian fisheries literature (e.g. in DFO reports). 12
Purse seine pelagic fishing vessels use a net that encircles salmon in midwater sea depths (~ 100 to 115
m in the deepest waters of Saanich Inlet) with a net that was on average 366 m long, 15 m deep and
large enough to catch 20,000 salmon in one set. The seine net is then drawn into a pouch and reeled up
on deck (WCVIAMB 2001).

22
Tribal Fisheries over the past 23 years (1982 to 2005). This fishery is only supposed to
be permitted after 15,000 chum enter Goldstream River which, as shown in my results,
has not always been the case. Two seine and one gillnet vessel currently receive this
ESSR fishing license (DFO 2004e). (Further details about this fishery follow in this
chapter.) Saanich Tribal Fisheries as well as the Tseycum and Malahat bands also fish
chum from Saanich Inlet for ―Food, Social and Ceremonial‖ (FSC) purposes, once target
escapement is met (DFO 2001b). No other commercial (seine, gillnet, troll, trawl or
weir) salmon fishing was permitted in Saanich Inlet between 1982 and 2005 however
prawn and shrimp traps are still permitted. DFO managers and Saanich Tribal Fisheries
council members recently agreed, however, that 80% of future chum salmon caught in
Saanich Inlet would be allocated to the Saanich Nation (Pauquachin, Tseycum, Tsartlip,
Tsawout and Malahat bands) for their ESSR fisheries (Figure 2.1). The other 20% of
chum in Saanich Inlet will be allocated to commercial fishing vessels (other than those
contracted by Saanich Tribal Fisheries, the Tseycum or the Malahat bands) in the form
of ESSR licenses (Jacks V. pers. comm. 2004).
Goldstream River Park visitors are limited to rod and reel catch and release of all
salmon species in Goldstream River and its tributaries during the fishing season and this
fishery is managed by the BC Ministry of Environment‘s Fish and Wildlife Branch (BC
Ministry of Environment 2006; DFO 2004b, 2006b). The use of fish weirs for catching
salmon in BC coastal rivers was abandoned in accordance with DFO‘s Fisheries Act
(forbidding the use of any barricade or obstruction in non-tidal waters) in the early
13
Gillnet vessels in deeper waters use buoyed and anchored nets suspended at surface or midwater sea
depths from vessels ranging 10 to 13 m long. Nets may span 30 to 75 m with a mesh size of 130 mm
for salmon fishing. Nets run horizontal to the seabed and perpendicular to the path of the salmon so
incoming fish will get their heads but not their bodies through the mesh (WCVIAMB 2001).
23
1900s (Harris 2001). As I will discuss in the results, Saanich First Nations retain and
exercise their aboriginal rights to fish any salmon they catch for their FSC purposes at
Goldstream River and Saanich Inlet.
Prior to the moratorium on commercial and sport coho salmon fishing in the
1960s, there were 300 to 400 boats (operated by native and non-native sport fishing
outfitters and Saanich fishers fishing for FSC purposes) fishing mostly for coho salmon
in Saanich Inlet each day of the fishing season (Jacks V. pers. comm. 2004). Boat sizes
ranged from 5 m long canoes using purse seine nets or troll hook and line gear, ~ 10 to
20 m long motorized troll or purse seining vessels, and 10 to 15 m long gillnet fishing
vessels (FIGIS 2001; UBC Fisheries 2006; WCVIAMB 2001). The subsequent decline
in coastwide Pacific coho salmon stocks triggered the closure of the coho commercial
fishery in the inlet, and this has remained in effect for approximately 40 years (~1965 to
2005) (DFO 2001c, 2002d, 2004c).
The decline of Pacific coho and chinook salmon stocks to critically low levels in
recent years (1985 to 2005) is due in great part to commercial over-fishing of these
stocks at sea, as well as their popularity with anglers as prized sports kill fish (Copes
1998; DFO 1999a, 1999d). DFO conservation officers have enforced annual moratoria
on fishing coho and chinook at Saanich Inlet over the past 20 years (1985 to 2005) and
are currently managing coho and chinook as ―species of special concern‖ (DFO 2006a).
Recent fishing restrictions and conservation efforts include limiting recreational (or
sport) fishers to a maximum catch of 2 coho14
, non-retention of chinook and 4 chum by
14
In 2005, coho fishing was restricted to only 2 hatchery marked coho, this changed to a maximum of 2
coho, only one of which may be wild, in 2006.
24
using barbless hook and line gear. The daily sport catch limit for all Pacific salmon
species from tidal and non-tidal water combined is 4 (DFO 2006a, 2006b, 2006c).
Closures and elimination of licenses to other commercial salmon fishing (e.g. trawling
and non-native commercial kill fisheries) in Saanich Inlet have been in place since 1912
so as to protect the recreational fishery (DFO 2006b; WLAP 1995).
DFO also funds coho and chinook stock enhancement programs as part of its
overall salmon conservation effort. These programs involve incubating fertilized
salmon eggs and rearing then releasing the fry to nearby freshwater environments, a
practice carried out in salmon spawning streams throughout the province. Hatchery
enhancement has been promoted as an effective restoration strategy that could increase
declining salmon stocks at their natal spawning grounds. However, as will be reviewed
in Chapter 4, there are some concerns over mixing of hatchery-raised and naturally
spawned salmon in the same spawning grounds. Coho enhancement activities such as
incubation and introduction of coho transplanted from other systems began at
Goldstream in 1974 (Bocking et al. 1998). DFO officials and hatchery technicians
continue to enhance coho, and now also chinook stocks at Goldstream, but at time of
writing [2006] had not attempted to augment naturally occurring chum populations at
this site. Hatchery volunteers perform annual direct count surveys, also known as visual
surveys or soft counts, that estimate total numbers of live coho, chinook and chum
salmon returning to the Goldstream spawning grounds from October to December. As
reported in the Methods chapter of this thesis, I participated with these surveys in 2002.

25
3.1 Goldstream River Salmon Enhancement
Adipose and ventral fin clipping, coded wire tagging (CWT) (implanting 1 mm
long metallic wires into the nasal cartilage of 5 cm to 7.5 cm long smolts), and release of
hatchery raised coho and chinook stocks, has been undertaken through the DFO Salmon
Enhancement Programs (SEP) since 1991 (DFO 1998; pers obs. 2002). Goldsteam
hatchery-raised chinook salmon that are released at Goldstream River are not currently
tagged (McCully P. pers. comm. 2003). The hatchery coho are marked to assist with
estimating the hatchery contribution to the general salmon population, and to provide
corresponding recommendations for fisheries management, hatchery production
strategies, experimental design, and international negotiations (Nichols and Hillaby
1990:1). In particular, hatchery coho marking is carried out to determine the hatchery
contribution to declining stocks of wild southern Strait of Georgia and West Coast
Vancouver Island (WCVI) coho salmon (McCully P. pers. comm. 2003).
There are currently many more hatchery-raised than wild or naturally spawned
coho and chinook in Goldstream River (Bocking et al. 1998; DFO 2002b), with a ratio
of hatchery-raised to wild stocks of approximately 9:1 (DFO 2002c; McCully, pers
comm. 2002). Some of these hatchery fish are released at Goldstream and other sites
where salmon enhancement programs are in place (e.g. Craigflower, Noble, Tod and
Colquitz Creeks) (Goldstream Volunteer Salmonid Enhancement Association [GVSEA]
2001; Till 2005). The remaining 10% wild brood stocks of coho and chinook returning
to Goldstream are at high risk of being extirpated by the domestically raised, hatchery
stocks returning to this spawning site. Notably, DFO officers identify hatchery salmon
as ―wild‖ stocks after the second generation of hatchery raised salmon spawn at the river

26
(DFO 2002b, 2002c). Goldstream chum, on the other hand, have retained 100% of their
natural genetic lineage (GVSEA 2005; Mc.Cully P. pers comm. 2002).
3.2 Saanich Inlet Chum Surplus Fishery
DFO uses fisheries management units to delineate the fishing areas where
Saanich First Nation (Tsartlip, Tsawout, Tseycum, Pauquachin and Malahat bands) are
entitled to fish salmon for commercial and communal cultural purposes, which includes
their food fishery (DFO 2001:6). These designated areas include Saanich Inlet and part
of Goldstream River (within DFO Fisheries Management Area 19), from the bridge over
the river in Goldstream Provincial Park to a location at the estuary 1.6 km downstream
(DFO 2001; Friedlaender and Reif 1979: A25 and A28) (Appendix D). Once the target
escapement is reached at Goldstream River, the Saanich Peoples‘ fishing crews (of
Saanich Tribal Fisheries, Tseycum and Malahat) are permitted to fish chum in Saanich
Inlet and around the Saanich Peninsula15
under the specifications of the annual ESSR
chum fishing license (DFO 2001a, 2005b).
3.3 The State of the Saanich First Nation Salmon Fishery
Saanich First Nation people have fished salmon from Goldstream River and
Saanich Inlet since pre-European settlement times (Bocking et al. 1998:3), and have
continued to rely on fresh and dried salmon as a staple source of protein year round
(Elliott 1990; Mos et al. 2004; Simonsen et al. 1995: online). The Saanich, like other
First Nations of the BC coast, have expressed a general dissatisfaction with how
15
This area under discussion lies within the DFO management Subareas 18-6, 19-4, 19-5, 19-6, 19-7,
19-8, 19-9, 19-10m 19-11 and 19-12.

27
enforcement of DFO‘s conservation laws has impacted their traditional fishing practices
(Morrell 1989; Nuu-chah-nulth Tribal Council 1998; Richardson and Green 1989).
There is also a perceived lack of consultation by DFO managers with BC‘s coastal First
Nations about the management of their salmon and other fisheries (Edwards and Glavin
1999; Elliott 2003; Macleod 1989; Walters 1995).
Until the 1950s, Saanich people obtained much of their food from the waters of
Saanich Inlet by fishing for direct family subsistence or working as wage labourers in
commercial fisheries. Saanich elders recall times past when they knew exactly when the
chum salmon were returning to Saanich Inlet because they could hear the killer whales
coming into the inlet feeding upon them (Simonsen et al. 1997: 111). This era is
remembered as a time of plentiful fish and food when there was little poverty.
Unfortunately, once the fisheries became licensed, and opened up to fishers from outside
the Saanich First Nation community in the 1950s, ―Native people were displaced and no
longer able to compete‖ (Sampson 1996 in Simonsen et al. 1997:36). As detailed
earlier, however, non-indigenous sport fishers are now restricted to catch and release
salmon fishing at Goldstream River, and to daily limits of 4 salmon from Saanich Inlet
per person.
As well as direct losses of salmon through overfishing, increased pollution of
Saanich Inlet poses a threat to Goldstream salmon that are migrating through the inlet,
and to the health of the Saanich people. Salmon (Onchorhynchus spp.), herring (Clupea
pallasi) and eelgrass plants (Zostera marina) have all significantly declined in
conjunction with increased pollution of the Saanich Inlet marine ecosystem where these
interdependent species once thrived (WLAP 1995). A common perception amongst
Saanich people is that oil leakage from freighters may be polluting beaches in

28
Brentwood Bay, and that most of the inlet‘s marine resources, most notably salmon and
shellfish, are in steady decline (Simonsen et al. 1995). Further studies show that fecal
coliform in nearshore areas may be the primary contributor to pollution of beaches,
shellfish, eelgrass and juvenile fish in local embayments (e.g. Tod Inlet and Brentwood
Bay) where water circulation is lowest (WLAP 1996).
Despite the long-term risks and impacts of overfishing and pollution, Saanich
people continue to exercise their rights to fish salmon at Goldstream River and Saanich
Inlet. Saanich Peoples‘ rights ―to fish as formerly‖ are set out in the 1852 Douglas
Treaties signed by those First Nations referred to then as the South Saanich tribes (which
are the bands now referred to as Tsartlip and Tsawout and the Malahat band who are
descendents of the South Saanich Tribes) and North Saanich tribes (now called the
Pauquachin and Tseycum bands). The Douglas Treaties stated that Saanich people
would ―retain their hunting and fishing rights on unoccupied lands‖ (Madill 1981: 9;
Province of BC 200; Union of BC Indian Chiefs 2003) (Figure 1.1). DFO officially
acknowledges First Nations‘ rights to ―food fisheries,‖ reconfirmed through the Sparrow
case Supreme Court ruling (Supreme Court of Canada 1990; Usher 1991: 21), by
overseeing the Aboriginal Fisheries Strategy (AFS) program, which applies ―where
DFO manages the fishery and where land claims settlements are not in place‖ (DFO
2000a: 5). Food fisheries recognized by the program entitle First Nations to fish for
FSC purposes in certain fisheries management areas. Commercial sale of those fish is
not, however, officially permitted or legalized under the AFS agreements (DFO 2000a).

29
CHAPTER 4 – MANAGEMENT SYSTEMS AND ASSOCIATED ISSUES
4.0 The Nature of Traditional Ecological Knowledge
The United Nations Environment Programme‘s (UNEP) signatories to the 1997
Convention on Biological Diversity called for recognition, protection, and promotion of
indigenous knowledge (UNEP 1997). The application of indigenous ecological
knowledge (herein termed traditional ecological knowledge or TEK) in biodiversity
conservation initiatives is gradually gaining more widespread acceptance as it is
becoming increasingly recognized that science alone has proven insufficient in
alleviating loss of biodiversity and other issues of environmental degradation facing
society today (Brodnig and Mayer-Schoenberger 2000; Flett et al. 1996; Garvin 2001;
Mackinson 2001; Nigel et al. 2003; Turner 1997; Turner et al. 2000).
Native fishers, for example, hold extensive, long-accumulated local knowledge
about distribution patterns, morphology, behaviour and life cycles of fish, as well as
overall productivity of fishery resources, which they apply to the harvest, use and
management of those resources (Berkes 1999). A prominent definition of TEK referred
to by many researchers on the subject (Huntington 2000; Kimmerer 2000, 2002; Notzke
1995) has evolved from the work of Fikret Berkes (1993, 1995, 1999): Traditional
ecological knowledge is ―…a cumulative body of knowledge, practice, and belief,
evolving by adaptive processes and handed down through generations by cultural
transmission, about the relationship of living things (including humans) with one another
and with their environment.‖ (Berkes 1999:8). Kimmerer (2000:9) identified TEK as
being ―…born of long intimacy and attentiveness to a homeland,‖ and noted that TEK
can arise ―wherever people are materially and spiritually integrated with their
landscape.‖ Mauro and Hardison (2000) described TEK as ―…rational and reliable

30
knowledge that has been developed through generations of intimate contact by native
peoples with their lands‖ (Mauro and Hardison 2000 in Kimmerer 2002:433). It was
also described as the ―intellectual twin to science‖ (Deloria 1995 in Kimmerer
2002:433), though the formal acceptance of TEK into traditional, western scientific
research has often been met with resistance (Berkes 1999; Bill et al. 1996; Howard and
Widdowson 1997; Salmon 1996). In the case of the Saanich indigenous salmon fishery,
and as will be shown in my results, the Saanich tribal chiefs, elders and fishers hold
longstanding and extensive knowledge about salmon ecology, methods that protect and
respect salmon and salmon habitat, salmon fishing practices, and conservation.
Prior to the 1900s, First Nations used fish nets of various types (e.g. seine, gillnet
and hand-held dip nets) made from spun fibres harvested from stinging nettle plants
(Urtica dioica) to catch salmon in streams and at sea (Newell 1993). First Nations‘
fishing technologies used prior to the 1900s included adjusting fish net mesh sizes, using
hand carved, steam bent gaff and bentwood hooks (made of yew wood, deer bone barb
and cedar wood lashing) and spears carved from pine wood (Newell 1993). Fishing
technologies probably also included considerations and methods for targeting the
species, run, size and gender of the fish in accordance to what they believed would
sustain future fish populations (Berkes 1999).
Some natural resource managers and biologists have taken a dismissive attitude
to TEK and the possibility of its integration with Scientific Ecological Knowledge
(SEK) in the past (Johannes 1989). Howard and Widdowson (1996, 1997) negatively
critiqued TEK research established by Berkes and Henley (1997) who integrated First
Peoples‘ knowledge within their scientific research (Berkes 1977, 1979, 1989; Henley et
al. 2002a, 2002b). Howard and Widdowson (1997:47) stated that TEK‘s cultural
31
context and spiritual component ―…prevent us from exposing fraudulent claims behind
T(E)K research‖. They asserted, ―Scientific methodology is based on vigorous testing
of hypotheses. Validity depends in turn, on the efficacy of the tests used, and can
therefore be reevaluated at a later date‖ (Howard and Widdowson 1997:46). These
authors, however, did not conduct any applied, scientific methods (as Berkes and Henley
did). They did not provide any bona fide data, results or offer evidence about real or
potential drawbacks inherent to methodologies that have been used to integrate
traditional ecological knowledge with western scientific paradigms and were therefore
unable to scientifically prove or disprove their assertions. Instead, these writers
insistently concluded and recommended that the scientific community should reject the
integration of traditional ecological knowledge and scientific ecological knowledge
outright. In contrast, Colorado (1988:49) proposed a balanced approach to the
integration of traditional ecological knowledge and western scientific knowledge
(WSK). She defined the term ‗integration‘ as referring to ―a blending of research
efforts, not the domination or extension of ideological control by one culture‘s science.‖
Traditional ecological knowledge differs from scientific ecological knowledge in
many ways. The main difference is that traditional ecological knowledge is derived
from direct observations of a given locality over several to many generations, and
consists of a holistic, open approach that may include social, political, ecological and
spiritual components. By contrast, western scientific ecological knowledge is derived
from direct, relatively short-term observations of organisms from a range of sites, and
involves a more deductive, quantitative, and biological context (Berkes 1999; Kimmerer
2000). Both approaches provide legitimate means by which to understand ecosystems
and biodiversity conservation. Traditional ecological knowledge may strengthen

32
western scientific knowledge by providing historical and spiritual insights about the
natural environment that are passed on orally from one generation of First Nations
people to the next or contribute new ecological concepts learned and methods practiced
and passed on by the next generation of First Peoples. Scientific ecological knowledge
may contribute extensive, reliable, comparative data and rigorous mathematical,
statistical and ecological models, or new technologies for measuring and analyzing
information. Convergence of traditional ecological knowledge and scientific ecological
knowledge may be useful in resolving multi-stakeholder conflict situations concerning
protection of animals and biodiversity conservation (Peirotti and Wildcat 2000:1333).
For example, research that blends traditional ecological knowledge and scientific
ecological knowledge methods that address the question of the status of an animal
population (such as Goldstream coho) will yield recommendations for protection of the
species and its habitat that integrate cultural fishing rights and activities and provide
greater insight to a greater diversity of stakeholders (e.g. First Nations people, fishers,
fisheries officers and managers, marine planners and biologists) than conclusions based
on either traditional ecological knowledge or scientific ecological knowlege research
could do on their own. The following sections demonstrate how integrating traditional
ecological knowledge with scientific ecological knowledge can complement, enrich, and
strengthen conservation science, monitoring and research.
4.1 Integrating Traditional Ecological Knowledge with Scientific Ecological
Knowledge to Assess and Monitor Fish Stocks
Traditional ecological knowledge acquired by fishers that is specific to fish
species, stocks, populations and commercial and non-commercial fisheries is sometimes
33
referred to as fisher‘s ecological knowledge (Johannes et al. 2000). Makinson and
Nottestad (1998) proposed that the combination and utilization of traditional ecological
knowledge (or fishers‘ ecological knowledge) with available scientific data is urgently
required in the midst of our uncertainty about fish stocks. Johannes (1978) illustrated
how knowledge of Paulan fishers in Micronesia surpassed the base of the scientific
understanding of fish stocks. Despite potentially biased perceptions of resource
abundance and of their own impacts upon fish stocks, most fishers know a lot about fish
distribution and behaviour. Much of this knowledge is based not only on individual
observations and experiences, but also those of parents, grandparents and others they
have been fishing with (Makinson and Nottestad 1998:483).
Fishers‘ livelihoods depend upon acquiring knowledge that ultimately optimizes
fish catch and minimizes effort (Neis et al. 1996, 1999). Interviews with fishers can
elicit important information about fish behaviour and fishing practices. Fishers tend to
closely observe environmental features or ecological attributes that are linked to fishing
success such as:
…seasonal movements, habitat preferences, feeding behaviour and abundance
dynamics; as well as those physical attributes that affect fish distribution, the
performance of gear and fishing time: wind direction, currents, water
temperature and clarity, bottom characteristics and local assemblages structures
as well as gear fouling (Neis et al. 1996 in Mackinson and Nottestad 1998:483).
Other common observations yielded by fishers include population distribution,
body morphology and presence or abundance of mature females returning to spawning
grounds (Hutchings 1996). Catch rates reported by fishers from the same site over time
may help identify local changes in fish abundance (Hutchings and Myers 1994).
Catch-per-unit-effort (CPUE) analyses, (e.g. using number of fish caught per
fishing vessel per day), are also sometimes used for estimating the population of a stock
34
(Neis et al. 1999). Cross-checking CPUE data with data from those from other fish
stock surveys is also useful for assessing localized fish abundance and for monitoring
populations (Moller et al. 2004).
As shown in this thesis, the integration of fisher‘s ecological knowledge with
scientific ecological knowledge can improve our information base about the status of
fish populations such as the coho, chinook and chum Pacific salmon populations
harvested by Saanich First Nation fishers at Goldstream River and Saanich Inlet.
4.2 The Importance of Traditional Ecological Knowledge in Identifying
Changes to Fisheries and the Coastal Environment
In the late 18th
century, crown officials of the British Empire imposed social,
cultural and political displacement and assimilation policies upon First Nations people
that were carried forward and put into effect by Canadian government officials post
confederation (after 1867). Policies promoting displacement and assimilation are those
that effectively denied Aboriginal people access to their traditional territories and
include the establishment of colonial schools that undermined the ability of aboriginal
people to pass on their traditional language, knowledge, and cultural practices. These
policies have fragmented much of the empirical knowledge of ecological relationships
held by diverse indigenous groups but this specialized knowledge persists on
reservations and in traditional communities (Indian and Northern Affairs Canada 1991;
Indian Residential Schools Resolution Canada 2006; Kimmerer 2000).
Reports from the oral history of the Nuu-Chah-Nulth First Nation who reside on
the west coast of Vancouver Island further illustrate the importance of traditional
ecological knowledge contributions to our understanding of past BC ecosystems.
Though previously unknown to ecologists or historians, past BC ecosystems supported

35
bluefin tuna (Thunnus thynnus) whose populations have subsequently been extirpated in
this region (Haggan 2000). This oral testimony was, subsequently, further supported by
archaeological evidence (Crockford 1994, 1997), which confirmed the former existence
of a bluefin tuna fishery along BC‘s Pacific coastline.
One of the major changes impacting Saanich Peoples‘ traditional fishing
practices since the 1950s is the imposed restriction of land access to the coastal
shoreline. Other impacts observed by Saanich people include:
1. Pollution of the water bodies and lands around Saanich Inlet.
2. Human encroachment in the form of development, resource
extraction, and general invasion of privacy at sacred places and in
other traditional-use areas.
3. Lack of employment due to loss of subsistence activities within the inlet
and other activities such as a viable commercial fishery (Simonsen et al.
1995)
A Saanich First Nation fisher interviewed during the Bamberton Project
consultations (1995) stated that he was fishing Saanich Inlet at least every second day in
the summer of 1994 but failed to catch any salmon. ―This never occurred in the past
when salmon and other fish species were plentiful‖ (Smith in Simonsen et al. 1995).
This fisher‘s testimony of former and current fishing experiences supports the results
from Simonsen et al.‘s interviews with Saanich People: that external human
encroachment and commercial developments have caused major impacts to the coastal
environment around Saanich Inlet since European settlement. These impacts have
caused a decline in opportunities for the Saanich First Nation people to pursue their
traditional and modern fishing practices in Saanich Inlet and at Goldstream River.
Saanich First Peoples bore witness to the pollution of the Saanich Inlet marine
ecosystem, caused in part by commercial development of their traditional fishing places.
They began noticing changes in marine life due to pollution in the inlet in the 1950s and

36
attributed the decline in the health of the marine ecosystem to adverse effects from
sewage, urban run-off and run-off from pesticides and fertilizers flowing into the inlet
from agricultural lands (Bruce I. pers.comm. 2005; Duerden 1996:4; Simonsen et al.
1997). At that time, Saanich Inlet was under great strain from water contamination,
however, none of the Goldstream salmon species had yet been assessed under
conservation guidelines or been recognized as species of concern by DFO or any other
governmental or legislative body. This underscores a point made by Wilder et al.
(1999:58) who surmised that we could do great damage to an ecological system
―without actually endangering a species, by fundamentally altering the habitat or the
system itself.‖ Tracking the fecal coliform content and point and non-point sources of
pollution in the water over time are important means by which to measure the inlet‘s
pollution levels (BC Ministry of Environment 2001; CRD 2003b). It is also advisable to
consult with, listen to and learn from coastal First Peoples whose ancestors lived around
Saanich Inlet before Eureopean settlement times. This is important because the First
Nations communities should be consulted about pollution monitoring activities and
because they may be able to contribute extensive knowledge about the effects that
pollution and overfishing have had on their traditional fishing waters during their own
and their ancestors‘ lifetimes.
Research on integrating fishers‘ ecological knowledge in fish biology and
fisheries management suggests that one of the main failures of former fisheries
management systems has been the exclusion of the dynamics or behaviour of the fishers
(e.g. frequency, location and target of fishing effort) as an essential consideration of the
system (Freire and Garcia-Allut 1999; Hilborn et al. 1995). As noted, Saanich people
hold important ecological knowledge about the state of the marine ecosystem and fish

37
populations comprising their past and current subsistence and commercial First Nation
fisheries at Goldstream River and Saanich Inlet. This knowledge results directly from
generations of Saanich First Nations families‘ dependence upon a wide, complex and
interconnected variety of food items obtained through unique, localized subsistence
practices within the coastal habitat within which they live (Mos et al. 2004). As
demonstrated in the results of this thesis, the retention of local subsistence practices (e.g
traditional chum fishing practices in Saanich Inlet and Goldtream River) and traditional
ecological knowledge is also directly linked to the ecosystem integrity and biodiversity
of coastal and marine habitat encompassing the Saanich Peoples‘ homelands. Saanich
First Nations‘ salmon fishing patterns and dynamics were included as part of the natural
system (here, the Goldstream terminal salmon migration route) upon assessing past and
present salmon populations for this research and are reported in the Discussion chapter.
4.3 Conservation Practices as Traditional Ecological Knowledge of Canada’s
Indigenous Peoples
Traditional ecological knowledge incorporates conservation practices passed on
from many generations of indigenous people who were life-long fishers. Alcorn,
(1993:425) stated that: ―…the commitment of indigenous peoples to conservation is
complex and very old.‖ Among the many examples of First Nations communities that
have developed conservation practices and limited their fishing efforts to conserve fish
stocks, are the Cree People of northern Canada (Anderson 1994; Berkes 1993;
McGoodwin 2002). Chisasibi Cree fishers used short, intensive fishing cycles at various
fishing sites to a specified catch-per-unit of effort (CPUE) threshold level, also known as
pulse fishing. In this case, biodiversity conservation (rotation of fishing areas) was an

38
indirect effect of maintaining the general productivity of the fish habitat (Berkes
1993:154). Berkes (1977, 1999) also observed Cree fishers allowing fish to escape, and
exercising careful restraint from fishing in designated sanctuaries holding plentiful
supplies of their main target fish stocks to prevent depletion of those stocks.
The Vuntut Gwich‘in in the Yukon, Northwest Territories historically controlled
the size and number of the fish they caught by determining fish net mesh size, and
adjusting length and number of nets according to the quantity required for that family‘s
fish preserves for the winter (Sherry and Myers 2002). Fish harvest levels for the
Gwich‘in and other First Nation communities are also controlled by numerous rules
adhered to in the form of traditional knowledge practice and belief, territory systems and
prohibitions against waste (Gottesfeld and Johnson 1994:459; Sherry and Myers 2002).
Conservation and resource management in small-scale traditional societies are
commonly undertaken for the benefit of individuals, families and future generations
(Healy 1993 in: Williams and Baines 1993:23). A community‘s self-interest in the
management of local resources does not, however, imply that their conservation
practices will be ineffective. Parties engaged and invested in attaining healthy and
plentiful fish stocks are more likely to take active steps towards restoring and protecting
the population into the future. In the case of Goldstream River and Saanich Inlet,
generations of Saanich fishers have diligently practiced their trade and shared and
passed on their accumulated knowledge about their artisanal salmon fishery for probably
thousands of years. This form of passing on of accumulated knowledge has existed ―for
centuries before marine biology emerged as a discipline. Moreover, there are many
times as many such fishers as there are marine biologists‖ (Johannes 1993 in: Williams
and Baines 1993:144). In her concise review of fishing peoples and societies,
39
McGoodwin (2002:6) also underscored that self-management practices of many
localized fishers show distinct regard for ―sound biological-conservationist principles.‖
This type of practice is also exercised by Saanich fishers and is reported in my Results
chapter.
4.4 Incorporating Traditional Ecological Knowledge with Wildlife Assessments
Scientific investigations that also make use of traditional ecological knowledge
are likely to be particularly successful. The literature consulted on the topic provided
important guidance about effective methods for documenting traditional ecological
knowledge, including knowledge about local wildlife, fisheries and related topics
(Berkes 1977, 1979, 1989, 1993, 1999; Berkes et al. 2000; Healy 1993 in: Williams and
Baines 1993; Huntington 2000; Neis et al. 1999; Usher and Wenzel 1987; Usher 2000).
Two main aspects of traditional ecological knowledge of value for scientific knowledge
are: 1. local people‘s specialized knowledge of the environment frequently makes them
the most appropriate guides and advisers to assist scientists wishing to locate particular
organisms and resources and, 2. traditional ecological knowledge can be a ―useful tool
for compiling inventories of elements of local ecosystems‖ (Healy 1993 in: Williams
and Baines 1993:25). TEK can provide important data in the survey work aspect of
environmental research in biological sciences. TEK is a system of communicating
knowledge about governance and systems of proprietorship as well as knowledge about
local ecosystems within a human community.

40
4.5 Monitoring Wild and Hatchery Enhanced Pacific Salmon
Population and Behavioural Dynamics of Enhanced and Wild Pacific Salmon Stocks
Canada‘s Salmonid Enhancement Program (SEP) has been experimenting with
the planting (or release) of all life stages of hatchery-reared fish in rivers and streams to
increase natural production and enhance natural populations of anadromous salmon
(Winton and Hilborn 1994). Major genetic pollution of a population may occur when
the quantity of hatchery salmon begins to outnumber the quantity of wild salmon
returning to a natal freshwater system where enhancement procedures are in place
(Fedorenko and Shepherd 1986). Waples and Do (1994) studied effects of mixing wild
and hatchery salmon populations in the Pacific Northwest. They concluded that
although hatchery enhancement may temporarily improve population demographic
problems, enhancement could also cause genetic and harvest changes to a population
that could subsequently lead to its extinction once (or if) salmon supplementation were
to stop.
Nickelson et al. (1986) compared natural spawning times of hatchery-raised and
wild Pacific coho salmon returning to the same spawning stream in Oregon,
Washington. Results showed that hatchery coho had a tendency to spawn substantially
earlier than the wild strains. Quinn et al. (2002) found that hatchery coho and chinook
whose ancestral lineage was linked to the Lake Washington basin had been spawning
earlier since the 1950s (for chinook) and the 1960s (for coho) due to inadvertent
selection at three Washington State hatcheries. It has also been found that random
planting of hatchery stocks may effectively reduce natural production. For example,
earlier spawning times of hatchery stock resulted in incubating eggs in the stream being
exposed to fall freshets and bed movement resulting in increased overall mortality of
41
coho (Nickelson et al. 1986; Lichatowich et al. 1999). Hatchery coho exhibited
intrinsically lower ocean survival rates in early years of their life stages compared to
wild coho smolts, which had comparatively higher ocean survival rates (Nickeslon 1986;
Pearcy 1992). Pearcy and Fisher (1988) reported that wild Pacific Oregon coho smolts
migrated further north than Pacific Oregon hatchery stocks. Further studies reported
observations of hatchery-raised coho progeny displaying weaker territorial behaviour
than wild salmon progeny (Norman 1987; Utter et al. 1993). Once released in the wild,
cultured stocks may also demonstrate poor concealment behaviour, inept foraging
behaviour and habitat utilization, and strong aggression, resulting in greater expenditure
of energy, and placing them at greater risk of predation (Currens et al. 1997; Hesthagen
et al. 1995; Hindar et al. 1991; Maynard et al. 1995, 1996). In addition, research on
Oregon steelhead trout (another anadromous salmonid) demonstrated that, for this
species, hatchery-raised fish that entered into natural production areas and reproduced
with wild steelhead produced offspring with lower survival rates than their purely wild
counterparts (Chilcote et al. 1986; Kostow 2004; Reisenbichler and McIntyre 1977).
These studies provide empirical, scientific evidence that there are significant differences
in life-history patterns and behaviours of hatchery-raised, naturally spawned, and wild
salmon stocks (See Appendix B for definitions of terms).
McGie (1980) assessed relationships between hatchery coho salmon transplants
and adult escapements in Oregon coastal watersheds. His research concluded that
planting of domesticated hatchery coho stocks into natural production areas did not
increase total salmon production. In fact, research at other sites showed that harvesting
mixed stocks of hatchery and wild salmon (as is done by Saanich First Nation fishers at
Goldstream River and Saanich Inlet), led to over-harvest, decline and extinction of wild

42
populations (Flagg et al. 1995; Wright 1993). Reimchen (2000) found that black bears
(Ursus americanus) in an old-growth watershed (Moresby Island, Haida Gwaii, BC)
were eating a greater proportion of spawning chum males (than females), which may
lead to a greater range of male spawners for any single female (predator-induced
polygamy) and increase the genetic variance of the fertilized eggs of salmon. Assuming
this premise for Goldstream salmon, the absence of bears within the salmon-bearing
reaches of this watershed‘s mature forested area (that now regularly accommodates high
numbers of park visitors) has probably resulted in a reduction in genetic diversity of
fertilized eggs of Golstream chum.
It is important to take into account that information about the status of salmon
stocks in one river system may not be applicable to another as each river system and its
stocks, and hatchery operations, are unique. Winton and Hilborn (1994), however,
provided some interesting insights about supplementation of chinook at four different
hatcheries with the same overarching enhancement program goals, operating in British
Columbia river systems. They provided synopses of hatchery operations in two coastal
(Snootli and Kitimat Creeks) and two interior (Quesnel and Spius Creeks) systems. The
DFO Salmonid Enhancement Program‘s goals for hatcheries (including the Goldstream
hatchery programs administered by DFO) are to increase harvest and enhance, preserve
and rehabilitate natural stocks in a cost effective manner. The authors found that while
each of the four hatcheries had experimented with different spawning, rearing and
releasing strategies, none had ever monitored natural stock survival or escapement (nor
had any other Canadian Salmonid Enhancement Program stock supplementation
hatcheries) (Winton and Hilborn 1994). The importance of accounting for effects, or
potential costs and benefits, of hatchery fish interactions on natural stocks was simply

43
not a consideration within the SEP hatchery operations framework. Although the goal
of the hatcheries was to increase harvests in the Canadian commercial and Georgia Strait
sport fisheries, numbers of chinook salmon caught continued to decrease from the period
1978 to 1989 (Winton and Hilborn 1994:11) with the hatchery chinook salmon
contribution generally declining from 1983 to 1987. This was a period when enhanced
chinook stock releases were expected to contribute in quantities enabling increase of the
total catch. The authors concluded the chinook SEPs did not appear to be ―markedly‖
contributing to increased chinook harvests (Winton and Hilborn 1994:11).
The studies cited above indicate that Pacific salmon stock enhancement has not
increased salmon production, but instead has contributed to mismanagement of a mixed
stock fishery in which the wild population component is over-fished, has had its genetic
diversity substantially reduced, and even brought to extinction. Furthermore, hatchery
managers have failed to implement monitoring strategies for measuring natural stock
survival, escapement, or effects of hatchery fish interactions with wild brood stocks
(also called demes).
Assessments of Salmon Escapement Records from BC’s Central and North Coasts
Habitat destruction (logging, damming, road construction agriculture and
urbanization), enhancement programs, commercial fishing and the introduction of
cultured fish resulting in a mixed stock fishery (wild and enhanced) are all factors that
can lead to reduced escapement and genetic diversity of wild salmon (Kostow 2004;
NRC 1996; Slaney et al. 1996; Wood 2001).
Escapement enumeration is the main method used to measure, assess and
monitor salmon stock returns and to determine and allocate annual allowable salmon

44
harvest yields. Thomson and MacDuffee (2002) assessed salmon escapements from
DFO‘s salmon escapement database system (SEDS). The data they used for conducting
assessments represented estimates of annual abundance of salmon spawners that
returned to their natal streams in DFO statistical management areas 3 to 10 within the
north and central coast of BC. BC 16 reports are official records of annual stream
survey field reports collected from sites where surveying and monitoring occurred, and
are archived in DFO office files. The salmon escapement database system accessed by
Thomson and MacDuffee contains DFO‘s salmon escapement data (from BC 16 reports)
dating from the 1950s to present. These data are limited in their ability to disclose
important trends in salmon population (or deme16
) survivorship, in part because
commercial logging, fishing, and watershed development were already extensive
throughout most of BC‘s coastal salmon habitat by the 1950s when the database was
initiated (Thomson and MacDuffee 2002:71).
There are over 1000 freshwater ecosystems (drainage basins) supporting more
than 2500 runs of salmon on the north and central coasts of BC (Thomson and
MacDuffee 2002:18). Efforts to survey and estimate abundances of sockeye, coho, pink
and chum escapements (1950-1999) have fluctuated over time. The greatest reduction
in enumeration effort for north and central coast coho occurred in 1999. Only 2% of all
central coast coho systems had reliable coho escapement data between 1950 and 1999.
Sockeye had the second poorest enumeration record, followed by chinook, pink and
chum (Thomson and MacDuffee 2002:74). DFO monitoring efforts (escapement
surveys) were evidently focused on the most commercially important stream runs.
16
See Appendix A for definitions of ‗spawner‘ ‗population‘, 'deme‘.

45
Monitoring efforts neglected the importance of smaller streams and tributaries that are
vital to the survival of many salmon demes; the ecological role of salmon; and the
importance of these smaller runs to First Nations‘ food fisheries.
The authors also found that, due to the limitations of the escapement database,
only 10% of the salmon rearing streams, rivers and tributaries with escapement data
(biased towards larger, more productive runs) had reliable salmon escapement data
(Thomson and MacDuffee 2002:74). After assessing the status of salmon based on data
from indicator systems that did have reliable data, the authors determined that central
coast coho have been declining since the 1950s. No reliable status could be provided for
the north coast as only 14 of 891 systems had been reliably surveyed. North coast coho
catches have been declining since the 1970s, and all coho systems were deemed critical
in the 1980s, yet none of the indicator systems were surveyed in the 1990s. High
exploitation rates (60 to 80%) combined with poor escapement data caused extensive
overfishing of coho coastwide. DFO finally issued fisheries restrictions on coho catches
in 1998 and the data from 2000 and 2001 demonstrated improvement in some systems.
DFO reported that fisheries restrictions and improved ocean survival in conjunction with
the 1998 ocean regime shift explain the increase in 2000-2001 coho returns (PFRCC
1999). Thomson and MacDuffee (2002:80) cited poor sampling as a potential barrier to
assessing coho returns and status, however, warning that habitat changes in logged
watersheds and declining productivity in headwater streams may also have affected wild
north coast coho runs.
To summarize, 56% of indicator system chinook runs on the north coast were
assessed as ―very depressed‖ (less than 40% of spawner target escapement was met) and
22% were categorized as ―depressed‖ (40% to 79% of target escapement was met).

46
Commercial catches of central coast chinook have declined significantly since the
1970s, but escapement goals are still falling short. Bella Coola, a system enhanced by
hatchery fish, is the only central coast indicator system that met its target chinook
escapement goals in 1990 and 1991 (Thomson and MacDuffee 2002: 81). Pink salmon
were the healthiest species within the central coast salmon indicator systems, while 75%
of chum indicator systems were classified as ―depressed‖ or ―very depressed‖. North
coast indicator chum systems declined in the 1980s and 1990s at a time when harvest
levels (for Areas 3 and 4) were above average. Only one north coast chum system met
its escapement target in the 1990s with preliminary data from 2000 and 2001 showing
no change to this condition. All indicator chum systems on the central coast (within
Areas 9 and 10) were classified as ―very depressed‖ in the 1990s, and limited sampling
in several areas hindered the possibility to make adequate assessments of improvements
or declines in central coast chum returns (Thomson and MacDuffee 2002:80-81).
Sockeye on the north and central coasts were classified as ―depressed‖ or ―very
depressed‖ in 73% of the indicator systems. Two of the north coast indicator systems
showed some improvement from 1991 to 2001 while the status of central coast sockeye
remained ‗very depressed‘ despite fishing reductions. Eight out of 18 sockeye systems
on the north coast met their target escapement goals, whereas none of the indicator
streams on the central coast met theirs (Thomson and MacDuffee 2002:81). Central
coast sockeye are not recovering and fishing pressure, habitat loss, global warming
influences and/or marine conditions continue to threaten the status of these stocks.
Thomson and MacDuffee (2002:77) acknowledged that many small runs of sockeye
used to contribute significantly to local First Nations fisheries, and that they were once
47
important to the commercial fishery, and recommended that the status of these runs be
assessed.
4.6 Use of Native Harvest Statistics in Assessing Fisheries’ Sustainability
Usher and Wenzel (1987:145) defined native harvest statistics as counts, or
estimates, of the quantity of a particular species of fish, or wildlife, by category taken in
a specific area by a specific group of native people during a specific time period. The
authors reviewed and assessed two common types of native harvest data – administrative
and monitoring records, and special-purpose studies. The existing body of information
on native harvest data can be used to recreate a meaningful historical statistical series for
biological as well as socio-economic research purposes (Usher and Wenzel 1987). The
native harvest data from the Excess Salmon to Spawning Requirement (ESSR) licenses
and the BC 16 reports containing Goldstream River coho, chinook and chum
escapement data that I used for this project were categorized by Usher and Wenzel
(1987:146) as ―administrative and monitoring data.‖ These data can be used to monitor
harvesting trends and as potential indicators of fish abundance. ESSR native harvest
statistics can be used for conducting catch per unit effort (CPUE) analyses of First
Nations‘ commercial and/or communal salmon fisheries (as exemplified in the Results
chapter). CPUE analysis using native harvest statistics can be an indicator of salmon
abundance and harvesting trends but is not a very precise measurement tool for research
and management. CPUE will be described in greater detail in Chapter 6.
48
4.7 Wild Salmon Monitoring and Management Efforts
Co-management
Joint stewardship and applied resource management practices built on First
Nations‘ rights to fish (and to harvest other natural resources), is commonly referred to
as cooperative management or ―co-management‖ (Berkes and Henley 1997; Berkes et
al. 1991; Notzke 1995; Pinkerton 1989). Co-management as defined by the Royal
Commission on Aboriginal Peoples involves ―institutional arrangements whereby
governments and Aboriginal [and sometimes other parties] enter into formal agreements
specifying their respective rights, powers, and obligations with reference to the
management and allocation of resources in a particular area‖ (RCAP 2:666 In: Berkes
and Henley, 1997:29).
In the Haida Nation v. British Columbia (Ministry of Forests) 2004 case
decision, the provincial and federal governments were imposed with the legal duty to
undertake ‗meaningful consultation‘ with First Nations when conduct may adversely
affect existing or potential Aboriginal rights or title. According to legal counsel of the
BC Aboriginal Fisheries Commission, ―(M)eaningful consultation should also translate
into greater inclusion and actual substantive participation by First Nations who are
involved in co-management relationships with DFO and to provide incentive for those
who aren‘t‖ (Braker and Company Barristers and Solicitors 2006).
Numerous case studies highlight strengths and weaknesses, successes, trials and
tribulations resulting from co-management efforts between federal (or state-level) and
First Nations (or local-level) authorities (Berkes 1999; Confederacy of Nations 2004;
DFO 2001b, 2005a; First Nations Panel on Fisheries 2004; Gitxsan Chief‘s Office 1998,
2006; Notzke 1995; Pinkerton and Weinstein 1995; Robinson 2001). For a

49
comprehensive, case-by-case listing, refer to Notzke‘s analysis in ―A New Perspective
in Aboriginal Management: Co-management‖ (1995). Schrieber (2001) emphasized
that lack of attention to local concerns is the dominant contributor to biological and
social crises in fisheries. The flow of social and economic benefits from the fishery
back into the community is integral to power-sharing and meaningful co-management
arrangements with government fisheries managers (Schrieber 2001).
The Gitxsan‘s Selective Surplus Salmon Fishery, similar to that of the Saanich
First Nation Excess Salmon to Spawning Requirement (ESSR) fishery, is a legalized,
commercial sale fishery entered into by agreement between and co-managed by DFO
fisheries managers and the First Nation band councilors (DFO 2005a; First Nation Panel
on Fisheries 2004: 28; Notzke 1995; Pinkerton and Weinstein 1995). The joint
agreement enables and permits harvest and sale of fish, in addition to the Gitxsan‘s
rights to fish for Food, Social and Ceremonial (FSC) purposes, as is the case with the
Saanich Peoples‘ fishing rights. These agreements (both for the Gitxsan and Saanich
First Nations) were developed in part as fishers began exploring options for conducting
more selective fishing methods in order to target enhanced or plentiful stocks, and
rebuild depressed wild stocks that had been over-harvested in mixed-stock fisheries
(Gitxsan Wet‘suwet‘en Watershed Authority 1998; Pinkerton and Weinstein 1995:66;
Taylor 2003).
The ESSR communal fishing license of the Gitxsan allows Native fishers a
commercial harvest of Babine River sockeye salmon in river waters once the enhanced
sockeye stocks reach a target escapement at Babine River (subject to changes in fisheries
management plans) (DFO 2005a; Pinkerton and Weinstein 1995:66). The Gitxsan
perform catch-surveys using standard sampling surveys of CPUE and total effort and
50
have trained a number of their people in salmon population monitoring and management
methods and in the operations of the traditional fisheries management system. The
Gitxsan have since published their current catch monitoring methods and data, spelling
out sample size, methods, and confidence limits (reliability) ―making (itself) accountable
to scientific and political scrutiny‖ (DFO 2005a; Pinkerton and Weinstein 1995:65;
Taylor 2003). Regional DFO staff interviewed in 1995 stated that the Gitxsan catch
monitoring system was ―as good as you can get at this point without excessive expenses
which would only improve the data a little more‖ (Interview with DFO field staff 1995
in: Pinkerton and Weinstein 1995:65). This co-management situation between Gitxsan
and DFO was ongoing at the time of writing (Pinkerton E. pers. comm. to Turner, N.J.
July 2006). In 2004, chief negotiatior of the Gitxsan Hereditary Chiefs, Elmer Derrick,
was confident that the Gitxsan would be able to reach an understanding on the
allocation, management, protection and enhancement of salmon and stated that: ―What
we do want is to co-manage our territories, and the resources within those territories, for
the benefit of the Gitxsan and for the Crown, too‖ (BC Treaty Commission 2004:47).
The theory behind the ESSR fisheries is that they give the highest possible catch
per unit of effort, using the most effective gear available by season and area, and
purposefully concentrate on aggregations of the most efficiently exploitable fish (Berkes
1999; DFO 2005a; Pinkerton and Weinstein 1995; Pinkerton E. pers. comm. 2002;
Taylor 2003). From the literature reviewed, the Gitsxan‘s Babine River ESSR sockeye
fishery appeared to be one of the most successful examples of a co-management effort
established and maintained between DFO and a BC First Nations community. Robinson
(2001) referred to the Gitxsan‘s experiences, problems, prospects and approaches with
building co-management partnerships for the Skeena River salmon fishery as a useful

51
model for addressing and resolving native title issues in Australia. The efficiency of the
Gitxsan‘s ESSR sockeye salmon fishery is also an important case study because it
closely parallels the co-management initiative between DFO and the Saanich Tribal
Fisheries regarding Goldstream River chum stocks and the ESSR chum fishery in
Saanich Inlet.
Adaptive Management
Another resource management framework, which carries some advantages for
integrating First Peoples‘ Traditional Ecological Knowledge regarding wild salmon
conservation, is ―adaptive management‖ (Berkes 1999). Links between TEK and
adaptive management outlined by Berkes (1999:126) include: ―learning-by-doing, a mix
of trial-and-error and feedback learning, and social learning with elders and stewards in
charge‖. In his experience with the James Bay, Ontario Cree fishing system, Berkes
observed that in the Cree system, research and management were synonymous. They
also assume that they cannot control nature or predict yields; they are managing the
unknown, as is characteristic of adaptive management. In light of his research findings,
Berkes (1999) proposed that adaptive management be considered a ―rediscovery‖ of
traditional management. The synchrony between research and management of fishery
resources characteristic of adaptive management also exists in the Saanich First Nations‘
fishery management system. This is evidenced in the interview results and discussion of
this thesis (Chapters 6 and 7).
According to a review of case studies, ecosystem resilience or possibility for
restoration of resilience of ecological components of the ecosystem and flexibility of
existing power relationships among stakeholders comprising the social component of the

52
management system are attributes of successful adaptive management institutions
(Gunderson 1999). According to Walters (1997), lack of data on key processes that are
difficult to study and differences in ecological values are key barriers to successful
administration of adaptive management institutions. Pinkerton (1999) identified distrust
and resistance of management agencies and lack of broadly organized political support
as additional barriers to successful implementation of adaptive management efforts in
BC fisheries. In adaptive management, all parties are actively learning (Berkes 1999;
Gunderson 1999; Johnson 1999; Lee 1999; Pinkerton 1999; Walters 1997). Uncertainty
about relationships among ecological and social components, user response to
management, and abundance of the natural resource are inherent to natural resource
management; therefore, elements of risk and ambiguity must be embraced when
engaging in adaptive management processes (Johnson 1999).
Ecosystem Management
The Coast Information Team (CIT), consisting of representatives from the
Province of BC, First Nations, local governments of BC‘s Central and North Coasts and
non-government organization reached consensus on a definition of ecosystem-based
management that is equally applicable to southern Vancouver Island interests. In April
2001, the Coast Information Team defined ecosystem based management as:
…an adaptive approach to managing human activities that seeks to ensure the
coexistence of healthy, fully functioning ecosystems and human communities.
The intent is to maintain those spatial and temporal characteristics of ecosystems
such that component species and ecological processes can be sustained, and
human well-being supported and improved (CIT 2001).
The First Nation Panel on Fisheries (2004:2) has since listed an ecosystem
approach to management as a top priority in their vision for BC fisheries. The literature

53
on ecosystem based fisheries management showed a trend in recommendations to
simultaneously adopt a precautionary principle (e.g. preventing fishing in areas where
the status of and impact upon the ecosystem is unknown). Ecosystem based
management integrates an adaptive management approach enabling flexibility in the
face of changes in ecosystem and community dynamics. It is holistic in nature and
avoids command and control pathways to resource management (CIT 2001; Larkin
1996; Olsson and Folke 2001). In practice, ecosystem-based management includes
effective, efficient time and resources applied to monitoring of ecosystems and
ecosystem resources such as individual species (Olsson and Folke 2001).

54
CHAPTER 5 – METHODS
5.0 Overview of Methods Used for this Research
I used both qualitative and quantitative research methods in this study of
Goldstream salmon stocks monitoring. Traditional Ecological Knowledge (TEK) was
brought out from interviews with Saanich fishers and combined with analyses of salmon
abundances returning to their natal stream (Goldstream coho, chinook and chum
escapements) as well as abundances of chum salmon caught from Saanich Inlet (native
harvest statistics). Thematic analysis of traditional ecological knowledge from
interviews and analyses of fish stock data (scientific ecological knowledge) are each
based on separate knowledge claims and each imparts partially different information
(Usher 2000). Neither the qualitative nature of traditional ecological knowledge, nor the
quantitative data of salmon catch or escapement could, independently, sufficiently
inform us about the status of Goldstream salmon stocks. An interdisciplinary research
approach, blending science and social science methods was therefore undertaken to
address the question of how escapement counts contribute to Goldstream salmon
monitoring protocols. This approach was undertaken in order to generate an inclusive
and well-rounded picture of the monitoring protocols and conservation practices in place
for the Goldstream salmon and of the Saanich First Nation fishers‘ perspectives of these.
This chapter describes the quantitative methods (direct fish counts, time series graphing,
three year rolling averages and assessment of biostatistics) and qualitative methods
(interviews, transcription and analysis of traditional ecological knowledge reported)
used for this research. My integrated research approach (Figure 5.1) may be used in
conservation biology, ecology and other life science projects.
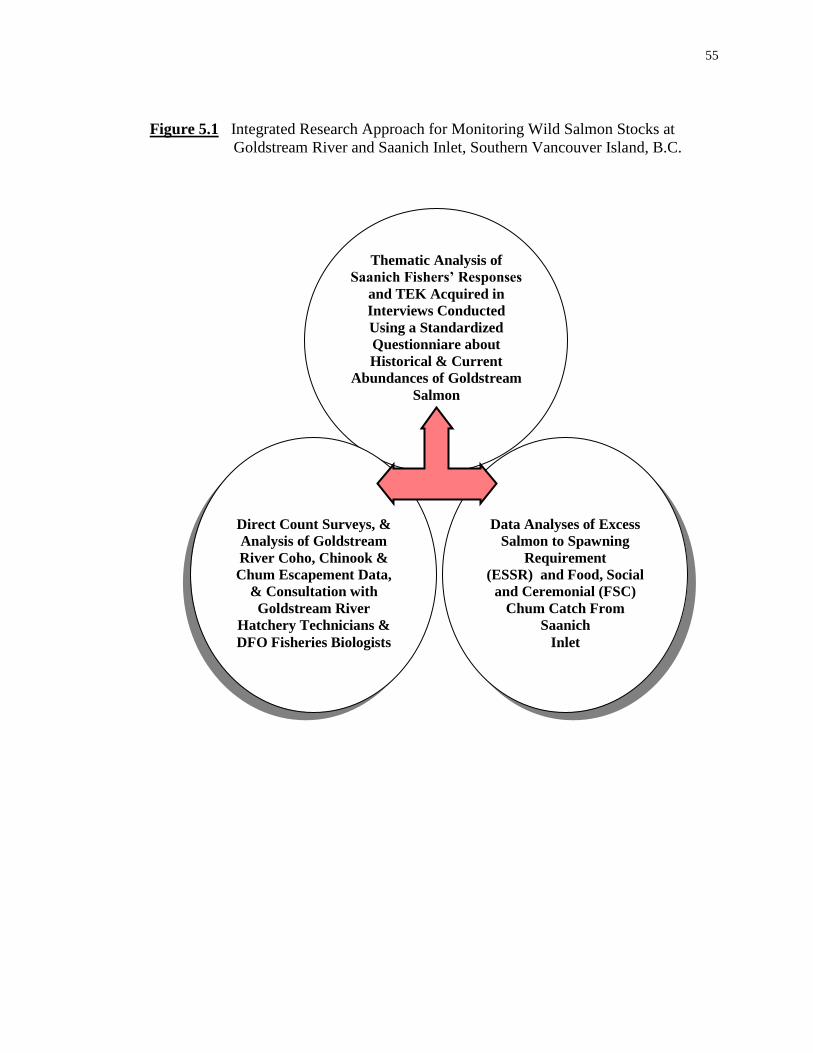
55
Figure 5.1 Integrated Research Approach for Monitoring Wild Salmon Stocks at
Goldstream River and Saanich Inlet, Southern Vancouver Island, B.C.
Data Analyses of Excess
Salmon to Spawning
Requirement
(ESSR) and Food, Social
and Ceremonial (FSC)
Chum Catch From
Saanich
Inlet
Thematic Analysis of
Saanich Fishers’ Responses
and TEK Acquired in
Interviews Conducted
Using a Standardized
Questionniare about
Historical & Current
Abundances of Goldstream
Salmon
Direct Count Surveys, &
Analysis of Goldstream
River Coho, Chinook &
Chum Escapement Data,
& Consultation with
Goldstream River
Hatchery Technicians &
DFO Fisheries Biologists

56
5.1 Interviews with Saanich First Nation Fishers
Background
Traditional ecological knowledge (TEK) of fishers, also referred to as fisher‘s
ecological knowledge (FEK), of the Saanich peoples‘ salmon fishery, was documented
through collaboration with Saanich First Nation fishers. Saanich fishers were asked to
share their knowledge and perspectives about the Goldstream and Saanich Inlet fishery
in semi-directed interviews that ranged in duration from one to four hours. A
standardized survey research instrument was created for conducting these interviews.
The overarching goal of the questionnaire was to document knowledge and life
experiences of Saanich People who have fished these waters for subsistence purposes
over several to many years. The survey was also designed to obtain qualitative and
quantitative information about Saanich fishers‘ observations of coho, chinook and chum
salmon over time (Appendix E).
I applied to the University of Victoria Human Research Ethics Committee to
undertake interviews for this research. The questionnaire and Participant Consent Form
designed for conducting interviews with Saanich fishers were submitted in this
application. The application was approved and a Certificate of Approval was obtained,
allowing me to recruit and interview participants for this project for the period of July 26
2002 to July 25 2003 (Appendix F).
Interviewees were selected on a chain referral basis to identify key informants
rather than a random sampling of the community as this is a recommended approach
when undertaking research involving traditional ecological knowledge (Huntington
2000). Experienced fishers referred by their peers, were asked to participate in a face-
to-face interview with me. Dr. Nancy Turner who had worked with him previously

57
referred the first interviewee (Earl Claxton Sr.) to me. Three subsequent participants
assisted with guiding the selection process by using peer selection, referring other
fishers and offering their contact information for the purposes of the study. All fishers
referred by other expert fishers were interviewed until no new names came up. A total
of seven fishers were interviewed (Appendix G).
Upon reading, understanding and signing the Participant Consent Form, each
interviewee provided me with permission to tape-record the session and use the
information within this master‘s thesis (Appendix H)17
.
Interviews were subsequently transcribed ver batim as closely as possible. Each
participant received a copy of the transcript of his own interview, and was asked to
review the transcription for accuracy, completeness, and approval. Participants were
asked again for approval to use their interviews in my thesis and if they would like the
audiotape of their interview archived with either the Saanich Native Heritage Society or
the Saanich Adult Education Centre library at the Saanich Tribal School located at 7449
West Saanich Road, BC.
The relevant results from the interviews are presented both as part of the
thematic analysis procedure, and as separate topics in my results chapter.
Thematic Analysis
Thematic analysis is commonly used to categorize qualitative information (e.g.
from interviews). It allows for the translation of statements from interviews (qualitative
17
On occasion participants asked that information discussed be left off record. In these instances, the
tape recorder was shut off until the person expressed that they would like to resume the interview for
the purposes of the research.

58
data) into quantitative data. It is a process of encoding qualitative information by using
a series of codes or flags such as particular themes. A theme is a pattern found in
interview responses that will describe and organize the possible observations and may be
extended to interpret aspects of the phenomenon. Boyatzis (1998:4) described thematic
analysis as a useful tool for ―…systematically observing a person, an interaction, a
situation, an organization, or a culture.‖ Thematic analysis assists in communication
between positivistic science and interpretive science (Silverman 1993). It can bridge or
translate methods and results into forms accessible to readers from different fields,
orientations or traditions of inquiry (Silverman 1993). Thematic analysis is a good
methodology to use with interviews regarding TEK within a First Nation community, as
it is useful for analyzing individual and shared responses to questions within the
questionnaire.
Thematic analysis of interview transcripts was undertaken in order to encode
qualitative information (TEK) and document dominant, emerging themes regarding
Saanich Peoples‘ past and present salmon fishing experiences at Goldstream River and
Saanich Inlet. Transcripts were reviewed to identify, organize and systematically
observe recurring topics and/or details (e.g. varying attributes of fishing effort over
time), emerging from participants‘ qualitative and quantitative responses to the
questions posed in the survey (Boyatzis 1998; Silverman 1993). Themes were coded by
using different symbols for identifying each theme. Depending on participant responses,
a topic raised from a question in the research instrument such as ‗change in size and
configuration of salmon over time‘, may or may not result in a predominant theme upon
analysis. In this research, the theme (e.g. former fishing methods) is the unit of coding
and the Saanich First Nation fisher is the constant unit of analysis. If a recurring theme

59
was identified in the responses of most of the participants, it was considered a major
theme.
The descriptive and quantitative themes that were generated from thematic
analysis of interviews are tabulated in Chapter 6. This process enabled me to
systematically identify, list, describe and examine Saanich First Peoples‘ observations,
interactions and cultural relationships with salmon. It also provided a structural
framework from which to observe Saanich Peoples‘ past and present circumstances with
the wild salmon fishery at Goldstream River and Saanich Inlet.
Limitations, Assumptions and Advantages of Non-random Chain Referral Participant
Selection and Thematic Analysis
A limitation of the non-random chain-referral approach to selecting interview
participants was that the total resulting number of participants (here n=7) was probably
not a statistically robust subset of the total Saanich First Nation fishing population. In
addition, all interview participants were men however women have also traditionally
participated in the fishery. There are no census or other statistics reporting the number
of Saanich People who have fished Goldstream River or Saanich Inlet for salmon
throughout their lives so the ratio of Saanich fishers interviewed to the total number of
Saanich fishers could not be determined. The participant selection process did,
however, ensure that only experienced fishers were recruited for interviews.
A limitation of thematic analysis is that summation of interviewee responses can result
in loss of depth and context of First Peoples‘ knowledge (Stevenson, 1998).
Categorizing dominant themes from interviews (Table 6.1) however, allows an overview
of large amounts of qualitative data.

60
5.2 Escapement Enumeration
Purpose of Escapement Surveys
Escapement enumeration is the process of estimating abundance of salmon
completing their life cycle at their natal freshwater habitat18
. I conducted Goldstream
escapement enumeration for this project in consultation and in conjunction with Howard
English hatchery technicians and DFO salmon biologists during the Fall 2002 salmon
run season (Appendix I). Two to three surveyors conducted these annual salmon stock
counts at Goldstream River once a week on the same day each week from Wednesday,
September 25 to Wednesday, December 4, 2002. This work was undertaken in order to
determine how escapement data were obtained and recorded in DFO‘s field report files
(DFO BC 16 reports) (DFO 1932-2004). Annual escapement counts build upon existing
baseline data and enable observation and comparison of ocean survival trends of
individual salmon stocks at a particular site (or between a number of sites) over time.
These data serve as points of reference and measurement for ongoing wild salmon
stocks monitoring and scientific study. Escapement data also provides researchers with
updated information for preparing annual forecasts and prescriptions for wild salmon
conservation strategies.
Surveyors used two or three pocket-sized manual counters, wore stream waders
and used waterproof notebooks and pencils for recording field notes.
18
Escapement counts acquired from enumeration surveys are sometimes referred to as soft counts
because they are best estimates or approximations of the total number of salmon returning to their natal
river to spawn.

61
Visual Survey Procedure
The four salmon spawning reaches of Goldstream River that comprise this study
site (reaches 1 to 3) were visually surveyed during a 2.8 km stream walk. The stream
walk involved hiking through the river‘s adjacent riparian zone (Table 2.2) and wading
through shallow river currents (~ 2.5 cm to 60 cm in depth) on gravelly, spawning
ground waters. Surveyors scanned spawning ground waters along the riverbanks (used
as parallel transect lines) and within the bankfull width19
(used for perpendicular lines to
those of the riverbanks) that formed the quadrat.
Quadrats varied in length and size and were visually outlined on site. Surveyors
used the bankfull width (the distance from one side of the stream bank to the other) and
the distance between two points identified on each side of the stream to demark a visual
quadrat. Four objects used for visualizing a quadrat are, for example, a tree and boulder
on one side of the river, and a shrub and piece of large woody debris across the bankfull
width. The four markers indicate the plot within which stream waters were surveyed for
salmon abundance (escapements) (Figure 5.2).
Surveyors stood at a point along a transect line (the streambank of their quadrat)
and used their counters to record the total number of live salmon (of the species that they
were responsible to count during that stream walk) that they observed within
their quadrat, then moved downriver to plot and examine another quadrat. Each
consecutive plot was delineated and surveyed within about 5 minutes when counting
in the river and about 10 minutes when traversing the woods along the riverbank.
19
Bankfull width: The width of flow within a stream channel that is just contained with the channel
banks; Commonly known as the distance perpendicular to streamflow between the limits of terrestrial
vegetation on both sides of the stream (BC Ministry of Forests 2001:1).

62
Figure 5.2 Quadrat Formed for a Visual Survey of Adult Chum at Goldstream River
x-axis = streambank length ≈ 10 m
Streambank
y-
axis=
bank-
full
width
≈ 15
m
LWD Large Woody Debris (LWD)
Log Large
Boulder
Surveyor
z-axis =
river
depth
≈ 1 m
1m
Quadrat Characteristics x-axis = streambank length
y-axis = bankfull width
z-axis = water depth
= river water
= 1 chum
= visual scan of plot
Let X = # of chum
X = 9

63
These quadrats were established approximately every 10 m where observation of
river waters was possible until the full 2.8 km stretch of river was surveyed and all
salmon migrating upriver or spawning at the river were counted. During my field
season in 2002, I was trained by an experienced stream surveyor and hatchery volunteer
named Art Inglis who has conducted weekly counts of Goldstream salmon for several
years. Surveyors are trained to identify each of the salmon species present (coho,
chinook and chum), to calibrate their field of vision within four ocular distance intervals,
to mark out each quadrat surveyed, to be visually aware of and alert for all migrating
salmon within the reach of river surveyed and were careful not to recount the same
salmon in two or more separate quadrat plots along the length of the river. Weekly
counts or estimates of salmon captured, roughly, the total number of salmon returning to
the river as is done in a population census (complete count) (Thomas et al. 2004). The
general movement of migrating salmon is from downriver to upriver therefore surveyors
counted the salmon from upstream to downstream, in a northbound direction (beginning
at the terminus of Reach 4 and moving towards Reach 1). This was done in an effort to
reduce the chance of recounting the same salmon twice in one day.
Escapement enumeration was conducted at 10 to 15 elevated observer
checkpoints at heights ranging from approximately 2.5 m to 13 m above water surface
level throughout Reach 3, and for about half the length of Reach 2 (totaling ≈ 1.5 km of
river length). Quadrats surveyed from those observer points (located about 1.3 km
upstream from the mouth of the river) enabled clearer observation of those deeper water
pools where coho typically prefer to rest. The remainder of Reach 2 and Reach 1 (which
is ≈ 1.3 km) was surveyed using quadrats at lower elevations, along the riverbank or
within river waters (at eye-level of the observer, or ≈ 1.5 m to 2 m above water level).
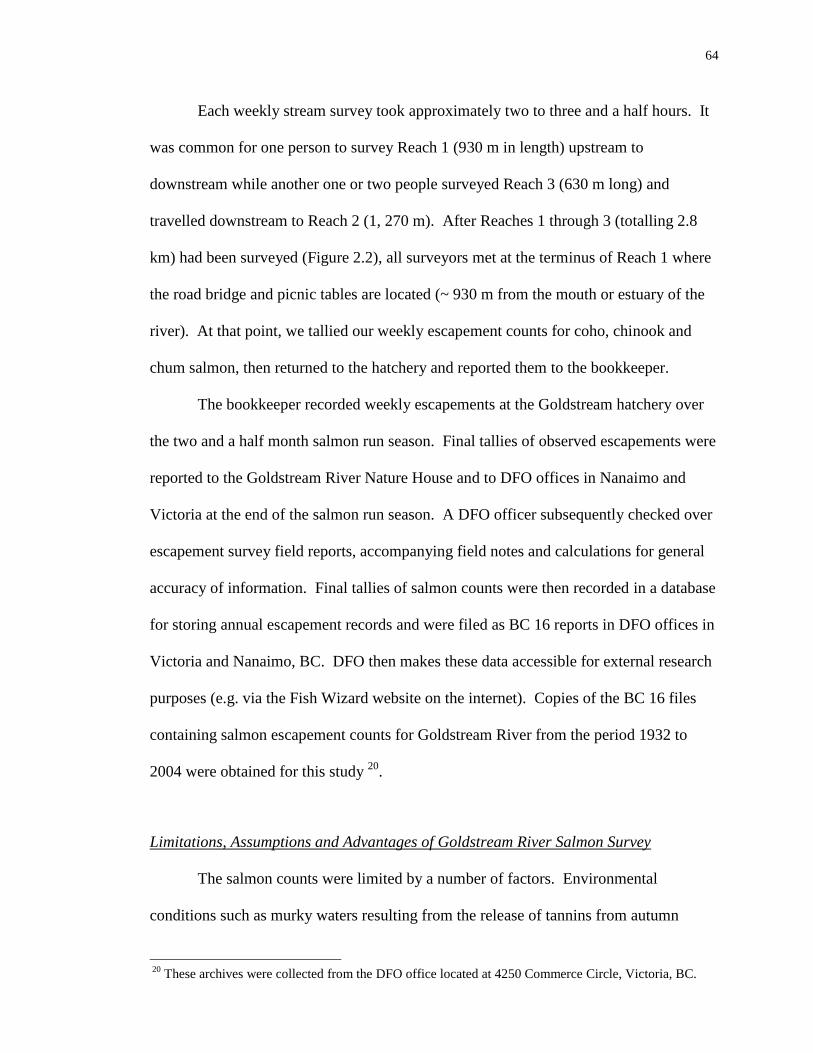
64
Each weekly stream survey took approximately two to three and a half hours. It
was common for one person to survey Reach 1 (930 m in length) upstream to
downstream while another one or two people surveyed Reach 3 (630 m long) and
travelled downstream to Reach 2 (1, 270 m). After Reaches 1 through 3 (totalling 2.8
km) had been surveyed (Figure 2.2), all surveyors met at the terminus of Reach 1 where
the road bridge and picnic tables are located (~ 930 m from the mouth or estuary of the
river). At that point, we tallied our weekly escapement counts for coho, chinook and
chum salmon, then returned to the hatchery and reported them to the bookkeeper.
The bookkeeper recorded weekly escapements at the Goldstream hatchery over
the two and a half month salmon run season. Final tallies of observed escapements were
reported to the Goldstream River Nature House and to DFO offices in Nanaimo and
Victoria at the end of the salmon run season. A DFO officer subsequently checked over
escapement survey field reports, accompanying field notes and calculations for general
accuracy of information. Final tallies of salmon counts were then recorded in a database
for storing annual escapement records and were filed as BC 16 reports in DFO offices in
Victoria and Nanaimo, BC. DFO then makes these data accessible for external research
purposes (e.g. via the Fish Wizard website on the internet). Copies of the BC 16 files
containing salmon escapement counts for Goldstream River from the period 1932 to
2004 were obtained for this study 20
.
Limitations, Assumptions and Advantages of Goldstream River Salmon Survey
The salmon counts were limited by a number of factors. Environmental
conditions such as murky waters resulting from the release of tannins from autumn
20
These archives were collected from the DFO office located at 4250 Commerce Circle, Victoria, BC.
65
leaves that fell into the river made it difficult to see past the surface of the water on some
occasions and at some locations within the stream survey circuit. Since coho preferred
to remain hidden in deep, dark pools of water or under rocks and riverbanks, they were
more difficult to observe from the stream bank and individuals that remained invisible
would have been missed. Coho and chum that were counted one week may have been
recounted for the same survey the following week because their senescence period is
about two weeks. This was probably not the case for chinook counts however as their
senescence period after spawning is about 2 days (Baxter 2000; Morbey et al. 2005;
NOAA 2005; Rawding and Hillson 2003).
Escapement reports represent estimates of all salmon returning to their natal
river. In practice, however, the procedure yields a rough estimate of all visible salmon
encountered and accounted for during a period of three to four hours, once a week
during the fall spawning season (September to December). It is important for scientists
and/or researchers to understand how salmon escapement data are collected so that
inherent margins of error in estimation of salmon abundance can be recognized.
Coho, Chinook and Chum Escapements (1932 to 2004)
Records of Goldstream River coho, chinook and chum escapement were
retrieved from Fisheries and Oceans Canada‘s (DFO‘s) stream survey reports (filed as
DFO BC 16 reports) for all years on record (i.e. the period 1932 to 2004). Escapement
counts recorded from 1932 to1959 stream surveys were categorized under very wide
numerical ranges, which were coded alphabetically in stream inspection logs. More
recent live counts (1960 to 2004) of returning salmon were conducted using more
precise enumeration methods (DFO 1932-2004). I composed detailed metadata

66
descriptions for all the salmon escapement data gathered from Goldstream River stream
inspection logs dating from 1932 to 2004 (Appendix J).
Processing Escapement Data with a Three-Year Rolling Average
Escapements from stream inspection log sheets were entered into Microsoft
Excel (©2001) database spreadsheets to create frequency tables of discrete data for each
salmon species. The purpose of plotting the escapement data was to graphically
illustrate a time-series distribution for identifying and analyzing significant or
noteworthy fluctuations in numbers of coho, chinook and chum salmon returning to
Goldstream River spawning grounds over the past 70 years. Three-year rolling average
intervals (e.g. averages for 1932-1933-1934, 1933-1934-1935, 1934-1935-1936, etc.)
were logged in order to smooth out arbitrary fluctuations within the 1932-2004 dataset.
Graphs were constructed with time plotted on the X-axis and three-year averages of
escapements plotted on the Y-axis. This was done for each of coho, chinook and chum
salmon escapement data. Moving averages effectively smooth out arbitrary, local
fluctuations in raw data.
Saanich Tribal Fisheries’ Saanich Inlet Commercial Chum Catch Dataset
Saanich Tribal Fisheries‘ total allowable catch of chum varies annually
depending on the ―excess‖ number of chum (escapements) that successfully completed
their return migration to Goldstream River spawning grounds. Managing Pacific salmon
stocks on the basis of a target escapement goal is also known as a constant-stock-size
strategy (Hilborn and Walters 1992: 453). Once the annual escapement target of 15,000
chum salmon are accounted for in the river, harvesting activities as outlined and agreed
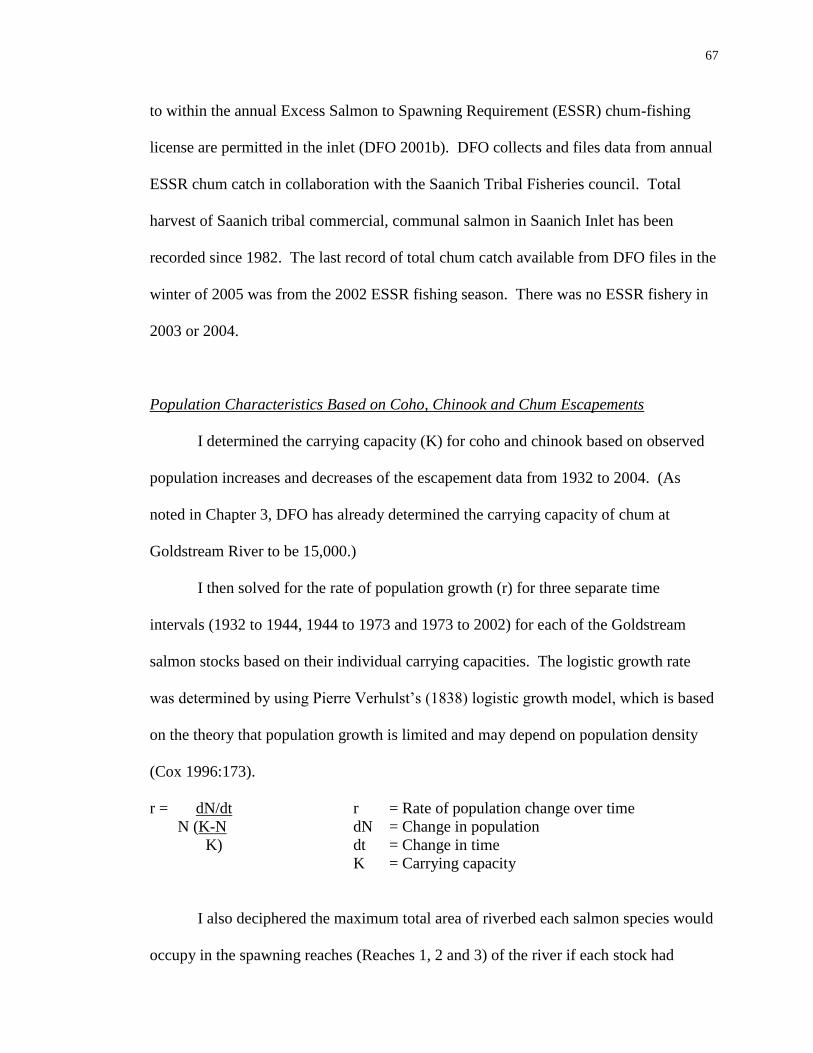
67
to within the annual Excess Salmon to Spawning Requirement (ESSR) chum-fishing
license are permitted in the inlet (DFO 2001b). DFO collects and files data from annual
ESSR chum catch in collaboration with the Saanich Tribal Fisheries council. Total
harvest of Saanich tribal commercial, communal salmon in Saanich Inlet has been
recorded since 1982. The last record of total chum catch available from DFO files in the
winter of 2005 was from the 2002 ESSR fishing season. There was no ESSR fishery in
2003 or 2004.
Population Characteristics Based on Coho, Chinook and Chum Escapements
I determined the carrying capacity (K) for coho and chinook based on observed
population increases and decreases of the escapement data from 1932 to 2004. (As
noted in Chapter 3, DFO has already determined the carrying capacity of chum at
Goldstream River to be 15,000.)
I then solved for the rate of population growth (r) for three separate time
intervals (1932 to 1944, 1944 to 1973 and 1973 to 2002) for each of the Goldstream
salmon stocks based on their individual carrying capacities. The logistic growth rate
was determined by using Pierre Verhulst‘s (1838) logistic growth model, which is based
on the theory that population growth is limited and may depend on population density
(Cox 1996:173).
r = dN/dt r = Rate of population change over time
N (K-N dN = Change in population
K) dt = Change in time
K = Carrying capacity
I also deciphered the maximum total area of riverbed each salmon species would
occupy in the spawning reaches (Reaches 1, 2 and 3) of the river if each stock had

68
reached its maximum carrying capacity for the river during spawning season (October to
December). I did this to find out if there is enough spawning habitat to accommodate
the maximum carrying capacities proposed for Goldstream coho, chinook and chum
stocks at this river.
5.3 Saanich Inlet Excess Salmon to Spawning Requirement and
Food, Social and Ceremonial Chum Fisheries Data Processing
Chum catch data from annual ESSR fishing licenses issued for Saanich Tribal
Fisheries Saanich Inlet commercial fishery between 1982 and 2002 and from their Food,
Social and Ceremonial (FSC) chum catch for the 25 year period from 1978 to 2002 were
collected from DFO fisheries managers for this research project (DFO 2001a, 2001b).
These data were input into a spreadsheet database (Microsoft Office Excel Program ©
2001) and modeled into a 20-year time series graph with a three-point moving average
applied to them. These graphs were also used for comparing trends in Saanich Inlet
chum catch against trends in coho, chinook and chum salmon escapements from the
same time period (1980 to 2002).
Example of a Catch per Unit Effort (CPUE) Analysis
Catch per unit effort (CPUE) was proposed for this project because of its
potential for measuring the fishing activity and sustainability of the Saanich First
Nation‘s ESSR and FSC chum fisheries in Saanich Inlet. Contiguous ESSR and FSC
data for the total number of chum caught (the measure for catch) per number of days
fished in a year (the unit of effort) for the period 1994 to 1996 were used for the CPUE
for this study.

69
CHAPTER 6 - RESEARCH RESULTS
6.0 Introduction to Research Results
Important findings and major themes that emerged from analysis of interviews
with Saanich fishers are provided in this chapter. Results and analysis of three-year
rolling averages of Goldstream River escapement data, Excess Salmon to Spawning
Requirement (ESSR) and Food, Social and Ceremonial (FSC) biostatistics are also
presented. The catch per unit effort (CPUE) data and results for the period 1996 to 1998
are included at the end of this chapter.
6.1 Interviews with Saanich Fishers
The Saanich Nation comprises the communities of Tsartlip, Tseycum and
Pauquachin on the west side of the Saanich Peninsula and the Tsawout on the east side
as well as the Malahat on the west bank of Saanich Inlet (Figure 2.1). The total on-
reserve population of these communities is approximately 2250 (Aboriginal Canada
Portal 2006; Department of Indian Affairs and Northern Development 2006; Mos et al.
2004).
The traditional ecological knowledge (TEK) component of this project consisted
of the insights voiced by Saanich fishers relating to the cultural and environmental
aspects of the Goldstream and Saanich Inlet salmon fishery. The peer selection
recruitment process of participants resulted in interviews with seven experienced
Saanich fishers including six from Tsartlip and one from Tsawout21
. Six of the seven
participants agreed that they would like the tapes of their recorded interviews archived
21
This method was used to identify specialized fishers and did not aim to or result in equal representation
of the total Saanich First Nation population.

70
with either the Saanich Native Heritage Society or the Saanich Adult Education Centre
library located at the Saanich Tribal School grounds at 7449 West Saanich Road, BC
(Appendix E and G).
The Saanich fishers interviewed conveyed valuable traditional ecological
knowledge including descriptive, biological information about morphology, physical
characteristics, the food web, feeding behaviour and migration patterns of Goldstream
salmon as well as alterations to salmon habitat they have observed and their own
conservation and restoration efforts at Goldstream River and Saanich Inlet over time.
They also relayed knowledge about their former and current fishing practices and
technologies used to fish salmon. Some observations of size and abundance of salmon
caught, and accounts of relatives‘ fishing experiences were recorded during the
interviews. Some notable quantitative and qualitative descriptions of cultural fishing
practices at these sites were also documented in this process and are reported in the
following sections.
In general, according to those interviewed, Saanich salmon fishing opportunities
have markedly declined over the past 150 years or so. Some of the reasons for this are
eradication of many small, local salmon-bearing streams due to road construction,
pollution, and overfishing of salmon and shrimp (a primary food source for salmon).
Habitat Loss
In the 1870‘s, the province (BC Department of Lands and Works) paved over
several tiny but ecologically significant salmon streams (or creeks) that flowed through
East Saanich into Saanich Inlet. The creeks were probably fragmented by wooden
culverts (in the 19th
century) and eliminated (completely filled in with gravel and

71
debris)22
to provide road access to the Saanich Peninsula. At the time, (1873), road
development was protested by the Saanich People. The Saanich First Nation,
collectively, wrote official letters to petition the provincial government‘s plans for
further road development through the Saanich First Nations‘ lands in both East and
South Saanich (BC Archives 2003). However, East and West Saanich roads (which
intercept the Tsartlip, Pauquachin and Tseycum or North and South Saanich bands‘
lands) were eventually built despite the Saanich Nation‘s opposition to the process.
―They blasted some rock…in Fairmont…they cut off that stream that goes down our
way so as the water won‘t flow up that way. That was about 1940‖ (Claxton Sr. E. pers.
comm. 2002). Patricia Bay Highway, which intercepts the Tsawout band‘s lands in East
Saanich, was built in 1960 and then widened in 1970 (Tsawout First Nation Band 2006;
Wikipedia 2006a).
Substances that are deleterious to salmon spawning and rearing habitat in local
creeks or streams include: large and small deposits of rock and soil debris from rock
excavation (blasting) that occurred during highway road construction in Saanich in the
1870s, around 1940 and in 1960; and deposits from gravel, asphalt and concrete rubble
that were used to pave roads in the 1940s and 1960s (Arizona Department of
Transportation 2004; Statistics Canada 1999). This assortment of construction debris
was probably either directly deposited by road builders or indirectly deposited by rain
and downslope gravitational movement from the construction sites to nearby
streambanks and waters. This in turn would have caused bank erosion, siltation and
22
The summation of construction and existence of wooden culverts and filling in of streams to build roads
in the 1870s was derived from literature about California, and New Zealand (State of California 1995;
Victoria University of Wellington 2005). No detailed information from BC sources was found for the
1870s era of highway roads construction and engineering.

72
nutrification of stream water at those times in recent history. In addition, the
introduction of clay, concrete or steel culverts during the 1940 road construction
activities in Saanich fragmented the connectivity of the stream habitat, created barriers
to salmon migration pathways and altered the pressure and flow of water where the
culverts were placed (Arizona Department of Transportation 2004; Hoel and Short 2006;
Statistics Canada 1999).
Saanich Inlet tributaries are important habitat for anadromous salmon (Elliott J.
pers. comm. 2002; Simonsen et al. 1995: online; Simonsen et al. 1997). ―The coho
spawn in little streams…they just seem like ditches to some people‖ (Elliott J. pers.
comm. 2002). The elimination of numerous small streams through East and West
Saanich on southern Vancouver Island has disrupted the Saanich Inlet ecosystem by
cutting off, fragmenting and altering the direction of surficial and groundwater flow to
local creeks and streams. ―So when they put in the…West Saanich Road, it started to
knock off all those streams, change their direction‖ (Elliott J. pers. comm. 2002).
Elliott observed that these roads acted as physical barriers, forcing coho salmon to
reroute their migration path and subsequently attempt to dig redds (spawning nests) and
lay eggs in inhospitable aquatic environments where spawning and rearing of juveniles
could not occur (e.g. the banks of the inlet). The roads and culverts also blocked
nutrients originating from those streams from flowing into Saanich Inlet to nourish the
shrimp and other marine organisms that subsisted upon them.
…Those are the streams that are feeding our Inlet and they‘re feeding the coho. That‘s
what they are there for. They eat those [nutrients] and whatever comes out of those
streams, that is their food. And, it is also feeding the young salmon, the ones that are
just coming out of the stream…. (Elliott J. pers. comm. 2002).
73
John Elliott, Earl Claxton and other Saanich fishers recalled their elders teaching them
that Saanich Inlet was a nursery and important feeding ground for wild salmon
migrating through and feeding on the then plentiful food sources within it (Claxton Sr.
E. pers. comm. 2002; Elliott J. pers. comm. 2002).
…My dad always said that this, Saanich Inlet is a nursery for salmon. That‘s the way he
described it…. They come here, they are born, the little [salmon smolts] feed, they grow
up here and then they leave and they go up… anything to do with fishing is lessening it
(Elliott J. pers. comm. 2002).
The Shrimp of the Inlet
A notable decrease in shrimp has taken place in Saanich Inlet since those roads
were built throughout the reserve (Elliott J. pers. comm. 2002). John Elliott and Joe
Bartleman (pers comm. 2002) expressed that the decrease of shrimp in the region is
likely due to increased commercial shrimp fishing and pollution in the inlet. The
continuance of the commercial shrimp (and prawn) fishery23
that was established as a
test fishery in Saanich Inlet in 1999 is increasing the demand for shrimp and causing
further decline to the shrimp population (Bartleman J. pers. comm. 2002). Shrimp are a
major prey for salmon so a declining shrimp population may be a contributing factor to
the subsequent decrease in size and abundance of salmon and other fish stocks that used
to pass through Saanich Inlet in the thousands (Claxton Sr. E. pers. comm. 2002; Elliott
J. pers. comm. 2002). This has negatively affected the livelihoods of Saanich fishers
dependent on fishing declining numbers of salmon, shrimp, and other fish in the Inlet for
their food (Elliott J. pers. comm. 2002).
23
Prawns are large shrimp and all licenses for shrimp fishing in BC nearshore Pacific Ocean waters fall
under the legislation of the ‗Prawn and Shrimp License‘ designation issued through DFO.

74
John Elliott (pers. comm. 2002) dissected the stomachs of recently deceased
salmon at Goldstream River to determine what they had been eating. He found mostly
shrimp in the stomachs of these salmon, indicating that shrimp is a main part of the diet
of the salmon feeding in Saanich Inlet prior to migrating upriver (to Goldstream River
spawning grounds).
Conservation Practices of Saanich First Nation Fishers
The Saanich were aware of the necessity to control and limit their fish catch.
Earl Claxton Sr. (pers. comm. 2002), for example, was careful to teach his grandchildren
about conserving the fish: ―My grandchildren are the ones that like to go and catch the
fish…but I always say don’t get anymore than about 30, even 30’s too much.‖ Earl
Claxton leads field trips for children attending kindergarten to grade eight classes at the
Saanich Tribal School and shows them how to fish Goldstream River salmon in the least
wasteful ways. He also teaches them not to catch more than is needed for their families‘
winter supply of chum during the fishing season.
Joe Bartleman (pers. comm. 2002) and his family (of the Tsartlip band) have
fished Goldstream River and Saanich Inlet for over 200 years. They especially like to
fish grilse coho salmon, which were caught in the inlet at approximately 30 cm long24
.
The coho grilse were a main part of the Saanich Peoples‘ food fish but have
subsequently been eliminated from their diet due to coho fishing restrictions over the
past 15 to 20 years. ―I must have been in my early 20s last time I ever went out for
24
Michielsens et al. (2006) define grilse as: ― Salmon that return after one winter at sea.‖

75
those, because they closed it completely, and when it reopened again, we could still take
them at 12 inches, and I resisted‖ (Bartleman J. pers comm. 2002). Bartleman has
witnessed a decline of coho returning to Saanich Inlet feeding grounds first-hand over
the past twenty years. His testimony illustrated that even during times when DFO
reopened coho fishing in Saanich Inlet, he exercised restraint from his traditional coho
fishing practice in the interest of protecting future generations of coho salmon. A
similar conservation ethic was evident from the interview with Tsartlip Chief, and
lifelong fisher, Simon Smith (pers comm. 2002). “…for the chum, our People believe
these are ready to spawn so they don't want to catch them…eggs are something our
People like too and we do believe in conservation, we won't fish them if we believe
there isn't enough in the river.” Earl Claxton, Joe Bartleman and Simon Smith‘s
accounts of their families‘ fishing practices illustrated that Saanich fishers are cautious
of the quantity of salmon that they fish and that conservation is a well-ingrained and
intrinsic part of their fishing practices.
Changes to Saanich Peoples’ Salmon Fishing Efforts
In the past (prior to the 1950s), traditional, rotational fishing practices
maintained the general productivity and abundance of Goldstream salmon stocks. Joe
Bartleman spoke of his parents‘ experiences with rotation fishing of chum at Goldstream
River (between 50 and 70 years ago).
I think we had more of a demand on the resource at that time, as there were
always different families in that stream doing their fishing at different times. It
was never all of us there at once. We couldn‘t possibly leave them enough room.
But, because there was all that rotation, and with all these people taking fish out
of the stream, we could allow more than 17,000 (chum) because we were taking
them as they come in. (Bartleman J. pers. comm. 2002)

76
Over the past 50 to 70 years, there has been a transition in fishing effort from
traditional, rotational family fishing practices which entailed catching more salmon at
the river to a modern commercial seine boat (chum) salmon fishery taking place in
Saanich Inlet.
But now they come out from the boats out here in the Sound, there, we
guesstimate the amount they catch, and we guesstimate about all the schools
that are sitting in the Bay (Saanich Inlet)‖ (Bartleman J. pers. comm. 2002).
In these modern fishing times (e.g. 2000 to 2005), there are guardians on duty on
board the seine vessels that fish the Saanich Tribal Fisheries ESSR chum fishery in
Saanich Inlet each year. Guardians monitor abundance of salmon caught and estimate
abundance of salmon present in the inlet during spawning season (Smith S. pers. comm.
2002). (See Saanich Tribal Fisheries section later in this chapter for further context
regarding the Saanich First Nation‘s fisheries management practices.)
Changes to the Goldstream River Salmon Stock Fishery
Six out of seven fishers confirmed that Goldstream has historically been a
predominantly chum salmon-bearing stream. As noted previously, today, Goldstream
River is a mixed salmon stock fishery providing spawning habitat for enhanced coho
and chinook stocks as well as naturally spawning chum. Five of the seven fishers
expressed concern that hatchery enhancement of coho and chinook to higher levels than
the stream‘s natural, historical populations could negatively impact its wild chum
populations (Appendix A). In addition, two out of seven fishers relayed that Goldstream
coho and chum were smaller in length, girth and weight than they were when they fished
them in the past. John Elliott (pers comm. 2002), for example, observed that the coho he

77
caught in Saanich Inlet in the past two years were about the same length but a lot thinner
(~2 lbs lighter) than the ones he caught in the previous 40 years.
The following table describes the predominant themes that emerged from the
interviews with Saanich fishers (Table 6.1). The first column reports recurring themes
expressed by all seven Saanich fishers. Information specific to Goldstream River and
Saanich Inlet (the second and third columns) are summaries of detailed examples that
characterize the major theme, provided by the majority (4 or more) of project
participants. Some of the findings, and quotes representing the themes presented in this
table include accounts of observations (TEK) passed down from elders, relatives or
other Saanich fishers.

78
Table 6.1 Major Themes from Interviews with Saanich Fishers
Theme A. Findings Specific to
Goldstream River
B. Findings Specific to
Saanich Inlet
Example Quote
1. Observations and
experiences regarding
changes to the (aquatic)
environment
2. Fishing practices
a.) Fishing practices and
technologies used from pre-
European settlement times
to the 1960s
i. Width of river reduced and
restricted partially due to
encroachment of park‘s
recreational facilities such as the
picnic area (paved area with
picnic tables) at the river‘s edge
(terminus of reach 1).
i. Set up fishing and smoking
camps near riverbeds (Oct.-
Dec.).
ii. Started fishing at the mouth of
the river and moved their way
upriver to the top (so that they
were not taking all the fish from
the same place).
iii. Fished at night.
i. Pollution in Saanich Inlet.
ii. Development eliminated
several streams flowing into
Saanich Inlet.
i. Canoes docked at the beach
along the Brentwood Bay
shoreline.
ii. Fished near the mouth of
Goldstream River and in the
inlet waters throughout the
Saanich Peninsula.
iii. People fished with their
families all day and at night.
1.B.i. ―We can‘t go out and get
the fresh fish we used to
get…because of pollution. We
got some food from the sea
(Saanich Inlet) not very long
ago, about a month ago…and
we ate it and my wife and I
both got sick. What‘s in that
fish? Pollution caused that.‖
(Morris S. pers. comm. 2002)
2.a.) A. i-iii. ―They (elders) had
a way of knowing when it was
time for the fish to go up
(Goldstream River). There was
times when they would spend
two nights overnight…catching
and smoking (salmon)…There
used to be a big smokehouse
there… maybe 30-40 feet long
(9-12 m long) …10-12 feet
high (3-3.5 m high). It was
only recently that they took it
down…(about 10 years ago)…
78

79
Theme A. Findings Specific to
Goldstream River
B. Findings Specific to
Saanich Inlet
Example Quote
2. Fishing practices
a.) Fishing practices and
technologies used from pre-
European settlement times
to the 1960s (continued)
iv. Wooden shafts, gaff hooks,
spears, nettle fibre fishing nets,
dip-nets, stakes and weirs were
handmade (e.g. dip-nets were
made from boughs bent into 0.5
to 1 m diameter circles, bound
with tree sap and twine with a 1
to 1.5 m long bough handle
attached (Smith S. pers. comm.
2002). Stakes and weirs were
used for stakes luring; a 2.5 - 3.5
m wide net, with 2 - 7 kg weights
keeping it submersed below water
was secured by 8 cm wooden
posts driven into the riverbed to
keep the net in place. The net trap
ran across half the width of the
river at ~ 45º angle to the
riverbank and lured salmon to one
side of the stream for catching
(Bartleman J. pers. comm. 2002).
v. Chum were caught and cured
(cut, salted and laid out in
containers to dry overnight) or
staked and hung to dry under a
canopy in the sun and wind.
iv. Canoes or wooden boats
using hook and line or net
fishing. Beach seine net fishing,
rod and line as well as spear
fishing salmon from the
shoreline (for family, cultural
and communal Food, Social and
Ceremonial as well as small-
scale trade and sale purposes).
Gillnet, seine and troller (hook
and line) boat fishing of coho,
chinook and chum (for family
cultural and communal Food,
Social and Ceremonial as well
as trade and small scale
commercial sale).
People used to catch many more
chum in Saanich Inlet by: seine
net, troll (using 65-90 m of wire
line and 4.5 kg cannon balls for
trolling), canoes mounted with
line or net, and by spear fishing
in the past than they do now.
(Salmon species not specified.)
They used to smoke the fish
right there.‖ (Morris S. pers.
comm. 2002)
79

80
Theme A. Findings Specific to
Goldstream River
B. Findings Specific to
Saanich Inlet
Example Quote
2. Fishing practices
a.) Fishing practices and
technologies used from pre-
European settlement times
to the 1960s (continued)
They were also smoked by
hanging over burning alder at the
campsite by the river.25
Salmon
were then piled in layers and
bundled with rope, or strung
together on a rope line.
vi. Salmon transported from the
river by canoe, rowboat (or other
boat) horse and buggy, and in
later years (early to mid 1900s)
by car.
vii. Mostly chum caught in river.
v. Salmon were stored in
wooden boxes or crates on the
boat. Once freezers were kept at
home (~ the 1930s), fishers kept
salmon they caught on ice in
boxes on board the boat.
vi. Crates were stored on the
beach overnight. Salmon could
be left in crates overnight and
carried home or transported by
horse and buggy up to the mid
1900s and by car thereafter.
vii. Caught chum, coho and
chinook.
See quote 2.a.) A. i-iii. on
previous page.
2. Fishing practices
b.) Recent fishing practices
and technologies used
(1960s-present)
i. Gaff hooks, spears, dip-nets,
weirs, (for stakes luring), used for
salmon fishing during day or
nighttime fishing trips. Salmon
then strung together on a rope,
pulled downriver and transported
home where they smoke or airdry
the fish.
i. There are currently 1-4 seine
boats (contracted by Saanich
Tribal Fisheries) fishing chum
during a 10-day fishing season
(Oct); fish are loaded onto a
truck, and delivered to the home
residences of Saanich First
Nations people living in
2.b.) B.i. ―Our band gets a
truckload of fish, and we get
about 4 fish each-each family-
not very much. We just got 4
fish about a week ago. They‘re
supposed to bring another
load…We used to have our
own boats go out and catch the
25
Hard or dry smoking hardens and dries the salmon and it can be eaten at once after smoking or stored over winter as dry food. Cold or half-smoking half cooks
the chum, adding alder wood smoked flavour to the fish, which can be vacuum-sealed and stored in a freezer for winter food supply. Smoked salmon can also
be transported to a cannery, jarred in its own salmon oil and kept in dry storage for a winter food supply and refrigerated (once the compressed-sealed jar is
opened. Salmon caught for ceremonial purposes (some ceremonies require one male and one female salmon) are hard-smoked (Smith S. pers. comm. 2002).
80

81
Theme A. Findings Specific to
Goldstream River
B. Findings Specific to
Saanich Inlet
Example Quote
2. Fishing practices
b.) Recent fishing practices
and technologies used
(1960s-present) (continued)
ii. Bring home chum caught from
the river raw (in cedar boxes or
other containers) and freeze them;
or bring them to a local
smokehouse; or smoke them at a
smokehouse built on their
residential property where they
are cured (cut, salted, laid out to
dry overnight, staked, hung, then
cold or hard-smoked by cooking
them over burning alderwood).
the Tsawout, Tseycum,
Pauquachin and Tsartlip
villages.
fish for our people (until about
1998) but…they (Saanich
Tribal Fisheries) went in the
hole (bankrupt) and they had to
sell that boat.‖ (Morris Sr. I.
pers. comm. 2002)
2. Fishing practices
c.) Changes in fishing
technologies used to fish
salmon (1940s to present)
Since the 1940s, synthetic fibre
fishing nets, line, hooks, weights,
rods and knives have usually been
purchased at department stores
rather than hand-made. Nets, lines
and twine (used for binding gaff
hooks to fishing poles) were
woven from stinging nettle plant
stems in the past. Hooks, weights,
poles, spears, knives and axes, (to
chop cedar, alder or other trees for
fishing poles and firewood), used
to be made of carved stone and
cedar.
Seine fishing used to be done
from cedar canoes by drifting
cotton nets with mesh sizes
adjusted to the size of salmon
they wanted to catch. Since
~1940, metal and fiberglass seine
boats with synthetic nets and 110
- 130 horsepower (hp) gasoline
powered motors were used to
fish chum; or 5 -7 hp motor if
coho or chinook fishing as they
are slower swimmers. Wire for
seine bough poles, barline,
cannonballs, spoons, other lures,
flashers, buoys and weights for 3
spool lines are attached to both
sides of the vessel.
2.c.) B. ―When I was a kid (in
the 1940s), we didn‘t have…
any sort of an engine to get
around with. We had oars…if
you had a canoe and paddles
you were quite well off …
insofar as your ownership of
the canoe…my grandfather
made me a canoe.‖ (Claxton
pers comm. 2002)
81

82
Theme A. Findings Specific to
Goldstream River
B. Findings Specific to
Saanich Inlet
Example Quote
2. Fishing practices
d.) Spiritual
ceremonies and beliefs
about salmon
Saanich people bring their
children to Goldstream to teach
them about their heritage and
ancient connection to the river so
that the younger generation will
feel connected to the stream and
learn and pass on the spiritual
beliefs their parents and elders
learned (e.g. the salmon have a
species name and a prayer name
that Saanich People use to honour
and respect the salmon and which
reflects their beliefs of gathering
food; and, how to fish without
needlessly wasting or injuring the
salmon; and, how to fish in a way
that will protect the next
generation of salmon).
Chum (annual abundances of
which are detailed later in this
chapter) and a small number of
coho salmon (e.g. 1 male and 1
female for one of the
[unspecified] annual longhouse
ceremonies) are caught from
Saanich Inlet by Saanich Tribal
Fisheries‘ fishers for their Food,
Social and Ceremonial purposes
(Smith S. pers. comm. 2002).
This catch is used for
communal, cultural celebrations
and longhouse ceremonies such
as potlatch, naming and blessing
ceremonies.
2.d.) A. ―We always bring …
along … our elders who were
there first, and before we even
start to fish (Goldstream River),
we‘ll say a prayer together to
honour the fish, and we thank
for our food.‖ (Elliott J. pers.
comm. 2002)
3. Traditional knowledge of
salmon ecology and biology
i. Sockeye and pink salmon are
not endemic to Goldstream.
Salmon are sensitive to pollution
and the smell of the river.
i. Observed changes in salmon
populations over time (fewer
coho, chinook and chum to be
caught in Saanich Inlet).
3.A.ii. & B.ii. ―They (the
salmon) wouldn‘t go into
Goldstream…It is becoming so
contaminated, they can‘t even
put their nose in that river.
There is something wrong
when the fish won‘t go into
their creek. They try, they
82

83
Theme A. Findings Specific to
Goldstream River
B. Findings Specific to
Saanich Inlet
Example Quote
3. Traditional knowledge of
salmon ecology and biology
(continued)
ii. Observed changes in salmon
population dynamics over time
(fewer salmon returning to the
river now than in the past).
Pollution from oil leaks from
boats in the inlet and overfishing
of salmon (especially coho and
chinook) at sea/offshore.
ii. Observed changes in salmon
migration behaviour over time
– Feeding habitat and migration
paths have changed (i.e. coho
are no longer using their former
migration routes to spawn in
local creeks; naturally spawned
juveniles no longer feed in local
creeks in the abundance that
they used to; fewer salmon
return to Saanich Inlet from
local creeks or remain in the
inlet after migrating from
Goldstream River (probably due
to pollution in the inlet in recent
years) though the inlet was
commonly used by salmon as
nursery and feeding grounds.
- Overfishing of all salmon
(especially coho and chinook)
offshore.
-Shrimp is a main food of
salmon.
- Salmon are staying at greater
depths in the water column.
- Adult salmon returning to
Saanich Inlet are smaller.
can‘t do it, but they have to
spawn. So they look for another
little place to go and spawn.
They do spawn but their eggs
won‘t hatch.‖ (Claxton Sr. E.
pers. comm. 2002)
3. A.ii & Bi.―Fish have gotten
smaller than previous. The
coho seem to be on average
now about 8 lbs (3.6 kg), and
we‘d catch the ones that were
18 lbs (8.2 kg) before, it was a
lot of them. 12 lbs (5.4 kg)
would be a big fish (in the
past), usually about 10 lbs (4.5
kg) is big now.‖ (Bartleman J.
pers. comm. 2002)
3. B.ii. ―Salmon in Saanich
Inlet have gone deeper. We
used to catch them in the top 6
feet (1.8 m) of water. In the last
10 years, we‘ve had to use line
to catch them around 190 to
200 feet (58 to 61 m) below the
surface.‖ (Bartleman pers
comm. 2002)
83

84
Theme A. Findings Specific to
Goldstream River
B. Findings Specific to
Saanich Inlet
Example Quote
4. Salmon conservation,
restoration and stewardship
efforts by Saanich Peoples
i. Refraining from harvesting
river stocks (including adult coho,
coho grilse and all species of
salmon eggs/roe).
ii. Restoring riparian zone by:
planting native vegetation along
streambanks to improve salmon
spawning and rearing habitat and
to decrease erosion processes in
wetlands, along streambanks and
in creek beds; removing invasive
vegetation such as Himalayan
Blackberry, English Holly and
English Ivy. (Wetland
stewardship viewed as a part of
fishery conservation efforts-
Saanich people partake in
streamkeepers and wetland
keepers projects in Saanich.)
iii. On-going in-stream salmon
population surveying.
i. Refrain from fishing coho.
ii. Fish excess chum in Saanich
Inlet to reduce effects of
overspawning in the river.
iii. Keep log of abundance of
chum caught in Saanich Inlet for
the ESSR and FSC chum
fishery and report total annual
catch to DFO officers.
4. A.i. ―There are three runs of
salmon….the first one is all
males…my ancestors used to
say… you take all the fish you
want there …The second run,
you take what you want …
they‘re mixed in, half and half
there, females and males...the
third run…you leave alone.
That‘s the last one…you don‘t
catch that run. That ensures
your river.‖ (Cooper E. pers.
comm. 2002)
5. Changes resulting from
federal fisheries‘ (DFO)
management of Goldstream
salmon
i. Grants from DFO to augment
coho and chinook place the
natural chum population at risk.
The river has historically been a
i. Representatives of the
Saanich First Nations have
attended meetings with DFO in
which they have expressed that
5. A.i. & B.i. ―We‘re
negotiating our fishing with
DFO all the time because they
don‘t believe we still have the
84

85
Theme A. Findings Specific to
Goldstream River
B. Findings Specific to
Saanich Inlet
Example Quote
5. Changes resulting from
federal fisheries (DFO)
management of Goldstream
salmon (continued)
predominantly chum-bearing
stream with very few coho and
chinook. Prioritizing coho and
chinook stocks will compromise
chum habitat.
ii. The river is now managed as a
tourist attraction
- Goldstream River is poorly
managed (the park, river waters
and salmon fishery).
- DFO swung the river to the
other side (southwesterly), away
from the reserve, (reason not
specified) and employed Saanich
people to assist with that project.
- Several Saanich people were
also employed (by DFO) to build
trails. This led to increased
access, traffic and tourism to the
river.
iii. There has been too much
enhancement of salmon species
not originally using this river.
they can no longer eat fish from
the inlet due to pollution. They
can no longer live off of the fish
the way they used to because the
polluted fish and seafood
(salmon, codfish, octopus, crab,
clams and shrimp) makes them
ill.
ii. Commercial salmon fisheries
should not be allowed in
Satellite Channel or Saanich
Inlet until the freshwater target
escapement for the (chum)
salmon is reached. DFO was
however, allowing a commercial
chum fishery in Satellite
Channel (in Oct. 2002) before
the Cowichan River escapement
target (of 110,000) was met.
This is a double standard and
gives the impression that DFO is
using a strong hand with the
Saanich First Nation over the
Cowichan First Nation in their
acts and regulations (Smith S.
pers. comm. 2002).
total rights that we tell them we
do (to fish as formerly under
the Douglas Treaty).‖ (Smith S.
pers. comm. 2002)
5.A.i. & B.ii. ―You have to
protect that second run (of
chum) and if you‘re going to
open up the Saanich Inlet to
harvesting once they reach
15,000 (target escapement),
they (DFO) are not protecting
that second run.‖ (Bartleman J.
pers. comm. 2002)
5. A.i-iii. & B.ii. ―I really
believe that they (DFO) have
been trying to push this stream
to become a coho stream rather
than a chum stream.‖ (Elliott J.
pers. comm. 2002)
85
86
Attributes of Saanich Fishers’ Fishing Efforts Over Time (1940s to 2002)
It cost a fisher approximately $2,500.00 (for spools of wire for the bough poles,
bar lines, cannonballs, hoochies, flashers and gas) to operate a hook and line fishing boat
(in Saanich Inlet) each fishing season (Cooper E. pers. comm. 2002). Using this
financial estimate as a benchmark, a 10-day ESSR chum fishery in Saanich Inlet (now
done by seine and gillnet fishing boats) costs Saanich Tribal Fisheries approximately
$250.00 a day to operate a boat and equipment and this does not account for fishers‘
wages which are paid out in cents per pound of salmon caught and sold at the market
value price of a given fishing season (See Figure 6.4 for the total ESSR chum catch from
1982 to 2004).
In the past (prior to 1960) Saanich fishers caught on average 120 fish each during
a 9-hour fishing trip and each person made a total of 12 trips to Goldstream River over
the three-month long fishing season to provide for a seven-person family. This supplied
the Saanich People with approximately 1440 salmon a year per family. According to the
fishers interviewed, the average weight of chum salmon caught in the past and present
(between the mid-1940s to 2002) ranged from about 3.6 to 6.8 kg. A conservative
weight of 4.5 kg was selected from this range in order to estimate annual intake of
salmon per person (by weight). This amounted to each person receiving and consuming
just over 200 salmon or about 930 kg of salmon a year (or 2.5 kg of salmon per person a
day, year round). More recently (1960 to present), total averages reported for 9-hour
fishing trips made three times per fishing season, has yielded a total of under 200 salmon
per four-person family per year. This amounts to an allocation of just under 50 salmon
(or 220 kg of salmon) per person annually or just over 1/2 kg of salmon per person a
day, year-round. These estimates were derived from fishers‘ responses about the

87
number of annual fishing trips made to Goldstream River, the duration of each trip, the
quantity of salmon caught per trip and the number of people in the family to feed with
the total annual catch (Appendices E, G and H).
Traditional Ecological Knowledge of the Goldstream Salmon Run
By listening to their elders, some Saanich fishers have learned to recognize
environmental cues that signal the timing and abundance of the upcoming season‘s
Goldstream River salmon run. Earl Claxton Sr. (pers. comm. 2002) recalled his mother
(Elsie Claxton) teaching him that seasonal stages of local plants indicate the timing of
the (Goldstream) salmon run: ―My mother said that when the Spiraea or the Oceanspray
(Holodiscus discolor) is in full blossom, it is time for you to go out there and get ready
for the salmon run… When the Spiraea is just starting to turn brown, it is time to set up
your (fishing) camps.‖ Earl‘s mother also passed on to him the knowledge that
extremely low tides occur when the moon is full.26
Emmanuel Cooper (pers. comm. 2002) also spoke of environmental indicators
about abundance and timing of the salmon run which he learned from his ancestors: ―If
there are a lot of fir cones on the (Douglas) fir tree in the Springtime, you know there is
a big salmon run coming…When blackberries are ripe, [these berries were assumed to
be those from the trailing blackberry bush {Rubus ursinus}that is native to BC], you
26
Salmon tend to gather near estuaries to feed during spring tides when river and ocean floor sediment is
disrupted due to upwelling caused by the moon‘s magnetic pull on the water when flood and ebb tidal
currents are strong. This phenomenon occurs for two to three days before and after the full (or new)
moon because the disruption of gravel and sediment uncovers and transports smaller organisms out of
the river to the estuary and near-shore saltwater environments where salmon swim in to feed upon them
(DFO 1996; Stowe 1996).

88
know the salmon run is coming down.‖ These ecological indicators guided the timing of
Saanich peoples‘ salmon fishing activities over many generations.
A little known fact is that there are two runs of chum salmon at Goldstream
River. ―The first run in October, are longer, skinnier. They are leaner. The fat is
burned off them. The lean ones are really good for smoking. The fat ones (from the
second run around November) are purely for sport (Bartleman J. pers. comm. 2002).
Difficult Experiences with Fishing in Goldstream Park
Three of the Saanich fishers interviewed relayed that DFO conservation officers
as well as visitors to Goldstream Park expressed discontent and reprimanded them for
conducting their traditional spear and gaff fishing in public view near or within
Goldstream Park over the past twenty years or so (Bartleman J. pers. comm. 2002;
Claxton Sr. E. pers. comm. 2002; Cooper E. pers. comm. 2002). The park encompasses
all three salmon-bearing reaches of the river. However only Reach 1 (from the mouth of
the river to the bridge about 1 km upstream) is made accessible to the public with paths
and bridges within the park. The fishers who were reprimanded by the conser_Olvation
officers and members of the public about their fishing have since decided to fish in
waters further upstream (Reaches 2 and 3), out of sight from the visiting public‘s view.
Saanich Tribal Fisheries
The committee of Saanich People who have become officially known as Saanich
Tribal Fisheries was originally a group of family representatives that would gather
together on a voluntary basis to work out any problems that surfaced regarding fisheries.
Today, Saanich Tribal Fisheries consists of a formal body of three community leaders

89
voted in by the Saanich First Nation to serve their communities and to work towards
making the most informed decisions that they can. Saanich Tribal Fisheries has regular
meetings with elders and people who fish for the four bands (Bartleman J. pers. comm.
2002).
In the past, Saanich fishers could travel by canoe to sell or trade salmon they
caught in Saanich Inlet for tea, sugar, flour, bread and other products in coastal
communities of British Columbia and the United States. Current federal and
international trade, fisheries and immigration laws now delimit the range in which
Saanich fishers can travel to catch, trade or sell salmon. Salmon caught in Saanich Inlet
was sometimes brought as a gift or for trade when people were visiting relatives or other
members of local tribes. Saanich fishers also used to sell salmon caught in the inlet to
the market in the town of Sidney or along the side of West Saanich Road. The money
from the sale of the salmon was used for purchasing fishing gear, food, and anything
else they needed for the next fishing trip (Claxton Sr. E. pers. comm. 2002).
Salmon fishing in Saanich Inlet has been federally regulated and intermittently
closed to commercial fishing since 1912. Salmon are still caught by Saanich fishers at
Goldstream River, primarily to feed themselves and their families. The Saanich Tribal
Fisheries‘ ESSR chum (in place since 1982) and the Saanich First Nations‘ FSC chum
fisheries have taken priority over any other salmon fishing (e.g. commercial sports
fishing) in Saanich Inlet since the 1960s. Saanich Tribal Fisheries is entitled to sell only
the salmon caught from the ESSR chum fishery in Saanich Inlet. Saanich fishers
expressed concerns that current DFO laws prevent them from selling the salmon they are
entitled to catch in Saanich Inlet, their traditional fishing waters. Saanich Tribal
Fisheries, the Malahat and Tseycum ESSR chum licenses prohibit retention of any other

90
salmon (i.e. coho or chinook) from the inlet. A requirement of the Saanich First
Nations‘ ESSR chum fishery (co-managed by DFO and Saanich Tribal Fisheries) is that
all profits from the sale of those salmon be placed into fisheries related programs for
Saanich Tribal Fisheries (Bartleman J. pers. comm. 2002; Claxton Sr. E. pers. comm.
2002; Smith S. pers. comm. 2002).
It was tradition for heads of families to safeguard traditional ecological
knowledge about river, estuarine and ocean stewardship, including the presence (or
absence and relative abundance) of salmon and other environmental considerations
pertinent to Goldstream River and Saanich Inlet waters. This history (like an almanac
but not recorded) is passed on orally during social gatherings and may take on religious
and spiritual contexts important among families within the four Saanich villages. Such
information is sometimes used for predicting when a good salmon run will occur and
may be passed on when one or more families take fishing trips together. Joe Bartleman
(pers. comm. 2002) relayed that: ―Before immigration laws and fisheries restrictions,
Saanich fishers used to rotate fishing areas much more frequently.‖ Fisheries
management protocols for Goldstream River salmon were quite different prior to the
time when DFO fisheries restrictions and management regimes came into place at
Goldstream River and Saanich Inlet.
The modern Saanich Tribal Fisheries council of the 1980s arose from the
necessity to bring the Saanich First Nation communities together to communicate to
DFO that ―…the Saanich people need (the salmon) and are going to get together to fish
the surplus chum in Saanich Inlet…and (that they) are the ones to do the job‖
(Bartleman J. pers. comm. 2002). Saanich Tribal Fisheries used to have their own
licensed commercial boat to fish salmon in Saanich Inlet. Due to high costs of

91
maintaining the boat, the license and boat were sold in 1989 (Bartleman J. pers. comm.
2002; Morris Sr. I. pers. comm. 2002; Smith S. pers. comm. 2002).
Under current Saanich Tribal Fisheries management practices, equal numbers of
salmon (4 salmon per family or household) are distributed to the Saanich people of
Tsartlip, Tsawout and Pauquachin two or more times a year. (The Tseycum and
Malahat bands have their own vessels that fish, sell and distribute chum independently
of the Saanich Tribal Fisheries). Some of these salmon (i.e. chum) are from Saanich
Inlet, whereas some sockeye are caught, transported and delivered to families of the
Saanich bands from other fishing locations such as the mouth of the Fraser River or
Sooke River (Bartleman J. pers. comm. 2002; Claxton Sr. E. pers. comm. 2002; Cooper
E. pers. comm. 2002; Morris S. pers. comm. 2002). Saanich Tribal Fisheries, the
Tseycum and the Malahat bands can also catch chum in Saanich Inlet for their FSC
purposes each year during the salmon run season (October to December). This fishery is
entitled to the Saanich above and beyond the ESSR chum fishery in Saanich Inlet, which
occurs annually during the salmon run season once the 15,000 chum target escapement
goal has been met at Goldstream River.
In recent years (1989-2004), Saanich Tribal Fisheries has contracted a fishing
boat captain and crew that lease seine vessels to carry out the ESSR chum fishing in
Saanich Inlet. Salmon caught in the ESSR chum fishery are usually sold to buyers in
Vancouver, BC. However if the Canadian market is full, then they will sell them to
Washington State buyers27
. Buyers take inventory of the quantity of male and female
27
The contractors may bid and win the contract at 10 cents per pound of salmon for example and be paid
by the sale of those fish on the market. STF will earn the remaining profit to put back into funding for
STF. For example, if the ESSR chum were sold for 15 cents a pound, STF will earn 5 cents for each
pound of salmon sold.

92
chum purchased (from the seine vessel conducting the ESSR), but Saanich Tribal
Fisheries does not. Any profits gained by the ESSR fishery are used to fund Saanich
Tribal Fisheries‘ management needs including the administering of funds for ongoing
surveying, guardianship and conservation work at Goldstream River and Saanich Inlet.
Annual funds from Saanich Tribal Fisheries‘ ESSR fishery goes towards paying a
fishing guardian who oversees the fishing activity on the seine vessel in Saanich Inlet
while the ESSR chum fishing is being conducted, as well as to funding a shore patrol
that monitors the salmon at Goldstream River. This includes employment of a night
shore patrol whose job is to make sure that people do not illegally fish the river for
salmon roe or coho to sell on the market. Stream surveyors are hired to carry out direct
counts of coho, chinook and chum salmon stocks 24 hours a day, 7 days a week during
the salmon run season. Other stewardship activities such as creation, maintenance and
protection of salmon-bearing arms or reaches at Goldstream River are also funded by
Saanich Tribal Fisheries (Bartleman J. pers. comm. 2002; Claxton Sr. E. pers. comm.
2002; Cooper E. pers. comm. 2002; Morris Sr. I. pers. comm. 2002).
Saanich Tribal Fisheries‘ shore patrol may ask fishers how many salmon they
caught at Goldstream River and keep record of those accounts. This is not always an
accurate count because if Saanich people fishing at the river do not wish to relay that
information that is considered their right (Smith S. pers. comm. 2002). Saanich Tribal
Fisheries takes inventory of the chum caught in Saanich Inlet and provides that
information to DFO each year. DFO is now requesting more detailed counts of salmon
at Goldstream River, so Saanich Tribal Fisheries has hired counters to do that and report
it, which costs additional funds (Smith pers comm. 2002).

93
Recently, there has been some uncertainty about the quantity of chum in Saanich
Inlet that are Goldstream chum and the number of chum that are Cowichan River chum
that are caught by fishers from each of the bands. Saanich Tribal Fisheries has
addressed this issue by cost sharing chum-tagging efforts in Saanich Inlet with DFO and
having DNA tests done to determine which salmon are from Goldstream and which are
from Cowichan River (Bartleman J. pers. comm. 2002). Saanich Tribal Fisheries also
pays for any necessary consulting work (e.g. scientific research about the native fishery)
from the sale of chum from the inlet.
6.2 Results from Goldstream Salmon Biostatistics
This section relays results from graphing three-year rolling averages of
Goldstream coho, chinook and chum escapements spanning the time-period from 1932
through 2004 (DFO 1932-2004). Three-year rolling averages of Saanich Inlet Excess
Salmon to Spawning Requirement (ESSR) and Food, Social and Ceremonial (FSC)
native harvest statistics graphed for the period between 1978 and 2003 (or the earliest to
latest time periods available) are also reported (DFO 2001a, 2001b). A catch-per-unit
effort (CPUE) analysis is also included at the end of this section.
Less than 500 coho per year returned to Goldstream River between 1932 and
1940 (Figure 6.1)28
. Coho returned in abundances greater than 500 from 1942 to 1952
28
Raw data for coho escapements for 1932 (=500 coho), 1933 (=500) & 1934 (=400) were added together
resuling in a count of 1,400 coho for the period 1932-1933-1934. The raw data for 1932-1934 were
grouped together in Figure 6.1 so that the 3-year average time-series data could be illustrated in
alignment with the raw data intervals showing coho escapements for the period 1932-2004.

94
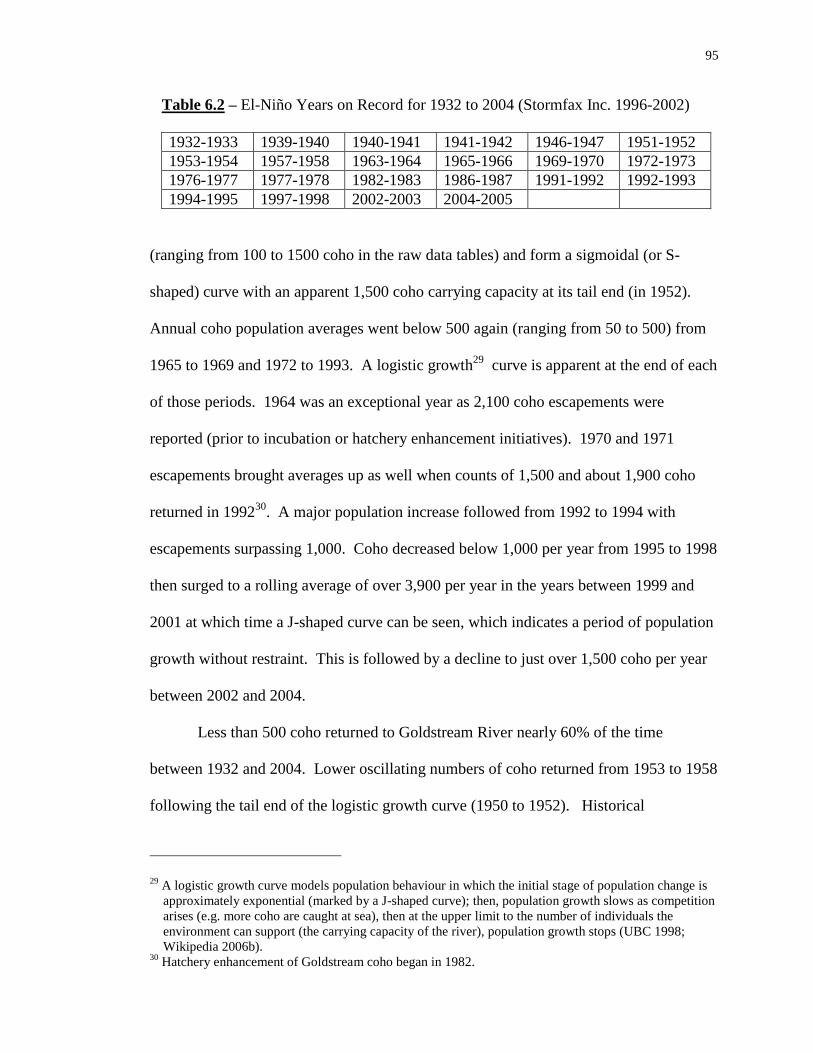
95
Table 6.2 – El-Niño Years on Record for 1932 to 2004 (Stormfax Inc. 1996-2002)
1932-1933 1939-1940 1940-1941 1941-1942 1946-1947 1951-1952
1953-1954 1957-1958 1963-1964 1965-1966 1969-1970 1972-1973
1976-1977 1977-1978 1982-1983 1986-1987 1991-1992 1992-1993
1994-1995 1997-1998 2002-2003 2004-2005
(ranging from 100 to 1500 coho in the raw data tables) and form a sigmoidal (or S-
shaped) curve with an apparent 1,500 coho carrying capacity at its tail end (in 1952).
Annual coho population averages went below 500 again (ranging from 50 to 500) from
1965 to 1969 and 1972 to 1993. A logistic growth29
curve is apparent at the end of each
of those periods. 1964 was an exceptional year as 2,100 coho escapements were
reported (prior to incubation or hatchery enhancement initiatives). 1970 and 1971
escapements brought averages up as well when counts of 1,500 and about 1,900 coho
returned in 199230
. A major population increase followed from 1992 to 1994 with
escapements surpassing 1,000. Coho decreased below 1,000 per year from 1995 to 1998
then surged to a rolling average of over 3,900 per year in the years between 1999 and
2001 at which time a J-shaped curve can be seen, which indicates a period of population
growth without restraint. This is followed by a decline to just over 1,500 coho per year
between 2002 and 2004.
Less than 500 coho returned to Goldstream River nearly 60% of the time
between 1932 and 2004. Lower oscillating numbers of coho returned from 1953 to 1958
following the tail end of the logistic growth curve (1950 to 1952). Historical
29
A logistic growth curve models population behaviour in which the initial stage of population change is
approximately exponential (marked by a J-shaped curve); then, population growth slows as competition
arises (e.g. more coho are caught at sea), then at the upper limit to the number of individuals the
environment can support (the carrying capacity of the river), population growth stops (UBC 1998;
Wikipedia 2006b). 30
Hatchery enhancement of Goldstream coho began in 1982.
96
escapement trends for the 70-year period leading up to the coho population dieback that
occurred between 2002 and 2004 indicate that the river‘s maximum carrying capacity
(K) for spawning coho may be approximately 1,500 coho annually.
Using the logistic population growth model31
, standard deviation of the
population as the measure for population variation (Triola 1995) and assuming this
carrying capacity (K) of 1,500 coho (as a prospective target escapement for the river),
the rate of population change (r) for Goldstream coho from 1932 to 2004 is as follows:
- For the period 1932 to 1944, annual rate of population change for coho salmon was
r = 5.02%
- From 1944 to 1973 (prior to hatchery enhancement of coho)
r = 7.79%
- From 1973 to 2002 (prior to, during and following coho population
enhancement at the Goldstream hatchery which began in 1982)
r = 64.54%
Goldstream coho increased at the highest rate from 1973 to 2002, the period
during which hatchery enhancement of coho was initiated at the river (Figure 6.1).
There were less than 25 chinook per year at Goldstream from the 1930s to the
mid 1960s though no data were logged for 24 of the 30 years between 1932 and 1962
(Figure 6.2, Appendix J). Three-year averages show less than 50 chinook annually
between 1962 and 1993; however, 100 chinook were observed in 1994. Fewer than 50
chinook annually returned between 1995 and 1999. The original escapement count was
75 (before the 3-year rolling average algorithm was applied) for the year 2000, just prior
31
dN/dt=rN(K-N/K) where N is the number of individuals at outset of time interval, dt is per unit time,
r is the rate of population change or per capita growth rate and K is the carrying capacity (Cox 1996).

97
Figure 6.2 Chinook Escapement Trends at Goldstream River from 1932 to 2004
Goldstream Chinook Escapements (1932-2004)
0
50
100
150
200
250
300
350
400
450
500
550
2004
2002
2000
1998
1996
1994
1992
1990
1988
1986
1984
1982
1980
1978
1976
1974
1972
1970
1968
1966
1964
1962
1960
1958
1956
1954
1952
1950
1948
1946
1944
1942
1940
1938
1936
1932
-193
3-19
34
Year
Ch
ino
ok
Es
ca
pe
me
nts
Chinook Raw Data
Chinook 3-Year Avg
Hatchery
enhancement of
chinook begins
(1982)
= Major El Niño event (1982 to 1983, 1986 to 1987, 1990 to 1995 and 1997 to 1998) 97

98
to a major population boom that occurred between 2001 and 2004 with counts ranging
between about 130 and 500 in the original dataset.
These data show that recent hatchery enhancement efforts have resulted in a
rapid increase in chinook abundance, which greatly surpasses historical population
levels at this site. About 50 or fewer chinook returned to this river system
approximately 84% of the time between 1962 and 2004 (the period for which
consecutive annual chinook enumeration records exist). Chinook have only exceeded an
average annual return of 50 about 14% of the time over the 72-year period between 1932
and 2004, all of which occurred over the past twelve years, since 1992 averages. It is
therefore difficult to estimate a chinook stock carrying capacity for the river.
Approximately 50 individuals appeared to be the best target escapement for chinook
based on natural, historical populations (e.g 1932 to 1973). The recent chinook
population boom (for the period 2001 to 2004), which followed approximately 20 years
of Goldstream chinook stock hatchery enhancement efforts, however, shows exponential
population growth (in the form of a J-curve) that peaked at a count of 383 chinook (for
2001 to 2003 averages), then dropped to 259 (in three-year averages) the following year
(2002 to 2004 averages). This more recent trendline shows that a target of
approximately 385 individuals may be used as a more current baseline maximum
carrying capacity for gauging changes in the population and monitoring hatchery
enhanced chinook stocks at this site.
I used the same intervals as I did previously with coho for the chinook
escapement dataset, assuming a carrying capacity (K) of 50 chinook for the 1932 to
1944 (12 year), 1944 to 1973 (29 year) and 1973 to 2002 (29-year) period intervals. The

99
logistic population growth and limitation model equation yielded a rate of population
change (r) of:
r = 15.36% a year for chinook salmon for the period 1932 to 1944
r = 4.16% from 1944 to 1973 (prior to hatchery enhancement of chinook),
r = 4.65% from 1973 to 2002 (just prior to, during and following chinook population
enhancement at the Goldstream hatchery which began in 1982).
If the K for chinook was set at 380, which I proposed could be used as a modern
baseline K for the period 1973 to 2002 alone, the rate of population growth (r) for 1973
to 2002 is comparatively smaller (than 4.65%) at 4.08% (Figure 6.2 and Appendix J).
Chum abundance at Goldstream River fell below the assumed 15,000 target
escapement goal between 1932 and 1942 with a sudden increase occurring within the
system between 1942 and 1948, followed by a crash between 1949 and 1955 (Appendix
J, Figure 6.3). The system received relatively low but stable chum returns of less than
10,000 individuals, at about two-thirds the current maximum carrying capacity
between1952 and 1975. Three major population booms occurred between 1975 and
2004. Escapements escalated between 1975 and 1980 then decreased between 1980 and
1983. Thereafter, chum returns soared from the 1982 to 1984 rolling average of 17,000
to the 1986 to 1988 return of 46,000 chum, more than 3 times the current carrying
capacity. The ensuing decline from 1989 to 1996 is indicative of chum returns ranging
from as low as 14,000 (in 1989) and as high as 45,000 in 1994. Another incline shows
overall increase from 1995 to 1999, then a steep dip in returns appears again as a result
of only 10,500 chum returning to the river in 2000. The highest annual return of chum
on record for this site totaled 62,000 and occurred in 2001. This was followed by

100
10
0
101
another big return of 51,000 chum in 2002. The 2002 to 2004 rolling average reveals a
subsequent decrease in returns averaging 29,600 chum.
Total escapements have fallen below the 15,000 Goldstream River chum
carrying capacity three times since 198032
. Before 1980, Goldstream River chum counts
remained below the current 15,000 target escapement for about 33 years (1932 to 1942
and 1952 to 1975), which is just over 45% of the total 72-year period time between 1932
and 2004. These stocks have not been enhanced by the hatchery at this river, however
overall abundance of chum has far surpassed historical levels in recent years (i.e. 1975
to 2002) as discussed in Chapter 7.
Using the same intervals as I did for coho and chinook and assuming the carrying
capacity (K) of 15,000 chum (determined and assumed by DFO for annual Goldstream
chum fisheries management) the rates of population change for Goldstream chum are as
follows:
r = 2.55% a year for the 3-year rolling averages of chum salmon from
1932 to 1944.
r = 9.74% for the period 1944 to 1973 (prior to hatchery enhancement of coho and
chinook).
r = 52.97% for the period 1973 to 2002 (just prior to, during and following coho and
chinook population enhancement at the Goldstream hatchery which began in 1982),
The Goldstream chum population generally increased at relatively slow rate from
1932 to 1944, then declined between 1944 and 1973 (a 29-year period) however the
population growth rate for that period was much higher (at r = 9.74%). The population
32
The first record of Saanich Tribal Fisheries fishing Goldstream River ESSR chum in Saanich Inlet on
file is for the year 1982.

102
increased at an exceedlingly fast rate of 52.97% for the 29-year interval from 1973 to
2002, which includes the period following coho and chinook enhancement at the river
from 1982 to 2002 (Figure 6.3). Figures 6.1, 6.2 and 6.3 show that overall Goldstream
coho, chinook and chum stock averages have all generally increased from 1932 to 2002.
The rates of growth reported above show that the rate of population generally increased
from 1932 to 2002 as well.
The length and width of each of the three salmon-bearing reaches (Reaches 1, 2
and 3) of Goldstream River divided by the carrying capacities (K) for each of the coho,
chinook and chum stocks listed above yields the area of spawning habitat that would be
used by each of these species at their maximum capacity (K). Coho and chinook use
mostly Reaches 2 and 3 and chum use mostly Reaches 1 and 2 of the river to spawn
(pers. obs.). Assuming equal distribution of each salmon species at their proposed
maximum carrying capacities (K) at the river:
Reach 1 (12, 834 m²) + Reach 2 (18,284 m²)
= 31,116 m² per 15,000 chum
= 2.1 m² of riverbed per spawning chum at maximum capacity
Reach 2 (18,284 m²) + Reach 3 (8,460 m²)
= 26,744 m² per 1,500 coho and per 380 chinook
= 14.2 m² spawning habitat per coho and chinook inclusively33
.
(See Appendix B for descriptions of spawning habitat including spawning gravel quality
at Reaches 1 to 3 of Goldstream River.) As shown above, chum salmon have
approximately 2 m² while coho and chinook have about 14 m² each in which to spawn at
maximum carrying capacity (K). (Further assessment follows in the Discussion chapter.)
33
Source of length and width measurements of Goldstream River from Bocking et al. 1998

103
The ESSR chum fishery has been fished by Saanich Tribal Fisheries in Saanich
Inlet since its inception in 1982 but was closed to fishing intermittently in seven
different years (1986 to 1988, 1997, 2000, 2003 and 2004). Average annual catches
peaked twice over the 24-year period from 1982 to 2004 (Figure 6.4). The first major
increase occurred between 1990 and 1994, the lowest catch being 17,260 chum in 1993
and the highest being 80,000 in 1992. The second wave of increased chum catch years
began with 57,000 chum caught in 1999 and ended in a catch of about 75,030 in 2002.
The highest ESSR chum catch on record is for the year 2001 when approximately
129,300 chum were fished from Saanich Inlet.
The ESSR is permitted to Saanich Tribal Fisheries once 15,000 chum reach
Goldstream River. Comparison of ESSR and escapement records show three years
when fewer than 15,000 chum returned since 1982 (the inception of Saanich Tribal
Fisheries). Table 6.3 shows the abundance of chum fished from the inlet by Saanich
Table 6.3 Saanich Inlet Chum Catch in Comparison to Escapement Years when Chum
Approached and Surpassed Carrying Capacity at Goldstream River
(DFO 1932-2004, 1982-2002, 2001a, 2001b)
Year Escapement
Goal
Goldstream
River
Chum
Escapements
Chum caught
in Saanich
Inlet ESSR
fishery
Chum
caught in
Saanich
Inlet FSC
fishery
Saanich Inlet
Chum
(potentially)
overfished
1983 15,000 14,000 3,250 3,600 1,000
1989 15,000 14,500 9,750 5,125 500
2000 15,000 10,500 0 0 0
2003 15,000 21,400 0 60 -6,400
2004 15,000 16,400 0 No Data 0

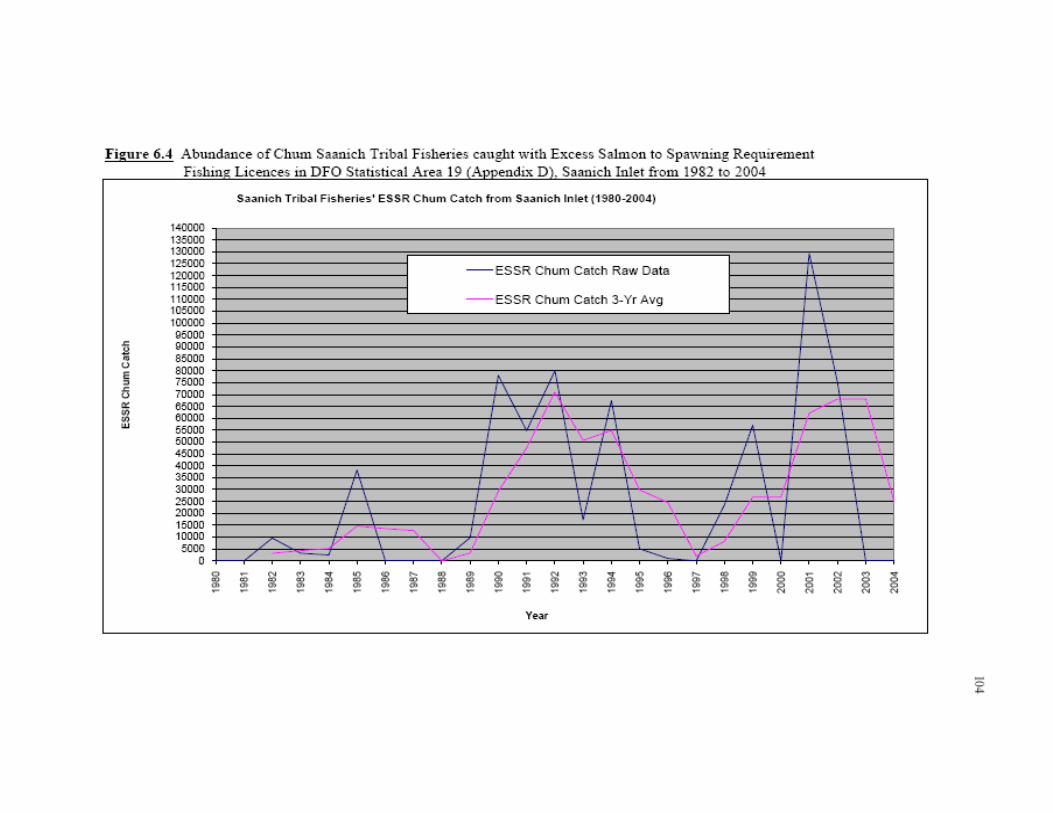
105

Tribal Fisheries when escapement counts approached and surpassed the 15,000 chum
target escapement goal. The number of overfished chum reported indicate the
abundance of chum caught in the inlet that would otherwise have migrated to the mouth
of Goldstream River or been available as prey for other predators in the ecosystem such
as otters, sea lions, seals, otters, bears and seagulls.
In 1983 and 1989, thousands of chum returning to Goldstream River were
removed by chum fishing activity in Saanich Inlet before the established escapement
goal of 15,000 chum was reached (6,850 and about 14, 880 chum respectively). In
contrast, only 10,500 chum returned to Goldstream in the year 2000 (4,500 chum below
target escapement) and no chum fishing activity (ESSR or FSC chum fishing) took place
in Saanich Inlet that year. Chum escapements were above target goals by about 6,400
and 1,400 in 2003 and 2004 respectively yet no ESSR chum fishing took place in either
of those years and only 60 chum were fished for the FSC fishery in 2003. The trendline
for Saanich First Nation FSC chum catch from Saanich Inlet shows two major periods of
catch increase followed by periods of significant decline (Figure 6.5). FSC chum
catches increased steadily from 1,470 chum in 1977 to 1979 to approximately 8,300
chum in 1985 to 1987 averages. Catches declined to just over 6,550 in 1987 to 1989 and
dropped again to just over 4,440 in 1988 to 1990. The FSC fishery rebounded when a
sizeable increase to just over 8,500 chum were caught between 1991 and 1993, then
fluctuated between 8,000 and 9,000 chum until the period average for 1995 to 1997. A
significant decrease in catch ensued for the seven-year period between 1997 and 2004
with average catches below 4,000 in 1996 to 1998 and below 2,000 from 1997 to 2004,
105
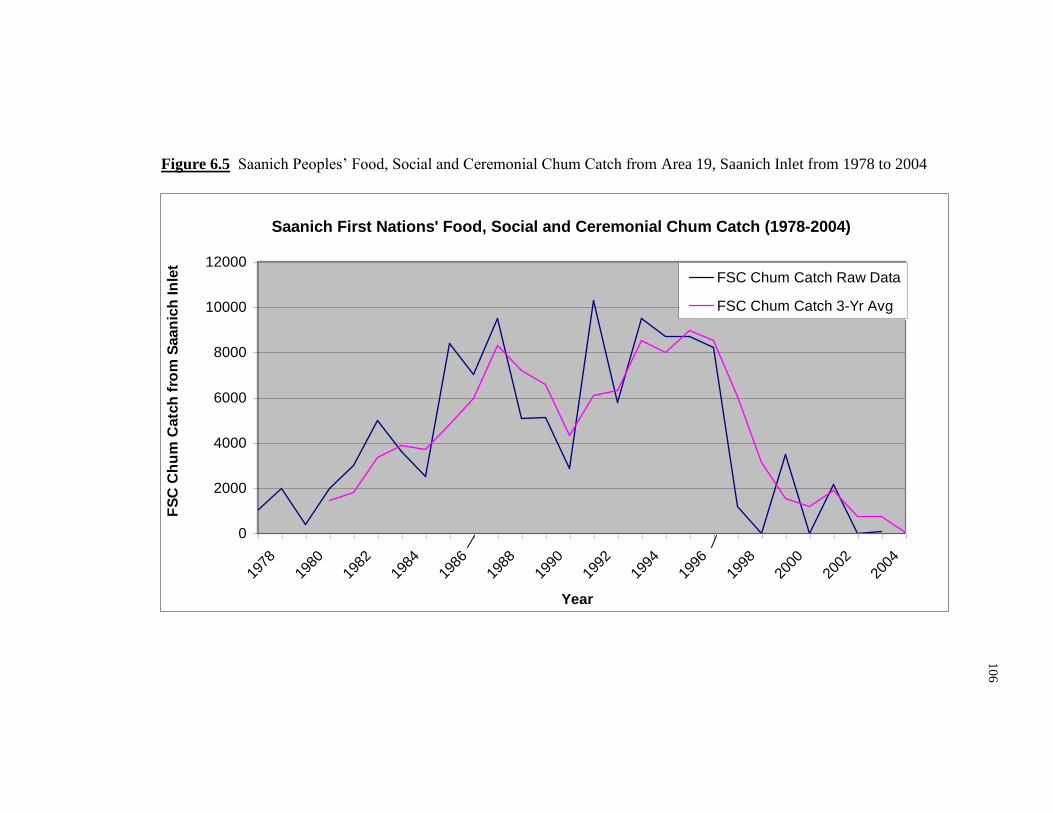
106
Figure 6.5 Saanich Peoples‘ Food, Social and Ceremonial Chum Catch from Area 19, Saanich Inlet from 1978 to 2004
Saanich First Nations' Food, Social and Ceremonial Chum Catch (1978-2004)
0
2000
4000
6000
8000
10000
12000
2004
2002
2000
1998
1996
1994
1992
1990
1988
1986
1984
1982
1980
1978
Year
FS
C C
hu
m C
atc
h f
rom
Saan
ich
In
let
FSC Chum Catch Raw Data
FSC Chum Catch 3-Yr Avg
1
06
107
ranging from no catch in four of those seven years (1998, 2000, 2002 and 2004) to
3,500 (the highest total annual catch for this seven-year period) in 1999.
There were four dominant phases of increase and three prevalent stages of
decline in total chum catch from 1979 to 2002 (Figure 6.6). Total Saanich Inlet chum
catch (ESSR and FSC chum catch combined) mostly increased between 1978 and
1986 with the three-year average catch of 1,800 in the period 1979 to 1981 increasing
more than eleven times in six years to over 21,000 (for the period 1985 to 1987).
Chum catch remained below 10,000 from 1987 to 1989, then soared to around 33,590
from 1988 to 1990, and continued to increase over time, peaking at about 77,220 in the
period 1990 and 1992. Catches remained above 20,000 over the next four years, as
illustrated by the steep, continuously declining trendline for the period 1990 to 1994,
(with the exception of a slight increase from 1991 to 1992 averages). The decline
continued until 1995 to 1997 when only about 8,000 chum were caught. Catches
increased to above 20,000 in 1997 and 1998 averages, more than doubled to
approximately 64,000 in the 1999 average total, then almost doubled again to about
124,240 for the period 2000 to 2002.
Overall, total chum catch increased between 1979 and 1981 (1,800
chum caught) and 2001 to 2003 averages (about 124,270 chum caught). The same is
true of chum escapements with the exception of the periods 1981 to 1983, 1982 to
1984 and 1983 to 1985 when average escapements (approximately 20,670, 17,000 and
17,170 chum respectively) were generally lower than those reported for 1979 to 1981
(21,200 chum escapements) at the inception of the ESSR fishery (Figure 6.7).

108
Figure 6.6 Total Saanich Inlet (Area 19) Chum Catch (Excess Salmon to Spawning Requirement and Food, Social and Ceremonial
Catch Combined) from 1979 to 2002
3-Yr Rolling Averages of Total Saanich Inlet Chum Catch 1979 to 2002
0
20000
40000
60000
80000
100000
120000
140000
2000-2001-20021995-1996-19971990-1991-19921985-1986-19871980-1981-1982
Year
To
tal
Chum
Catch
10
9
11
2 1
08

109
Figure 6.7 Abundance of Chum Salmon Caught in DFO Area 19, Saanich Inlet in Comparison to
Chum Escapements at Goldstream River between 1979 and 2002
Saanich Inlet Chum Catches
and Goldstream River Chum Escapements (1979-2002)
0
20000
40000
60000
80000
100000
120000
140000
2002-2003-20041997-1998-19991992-1993-19941987-1988-19891982-1983-1984
Year
Ch
um
Catc
h a
nd
Escap
em
en
t
Escapement
Total Catch
10
9

Total escapements have been as low as 8,000 (in 1979) and as high as 62,000
(in 2001) over the past 25 years (1979 to 2004) while total harvest has been as low as
0 (in 2000 and 2004) and as high as approximately 85,800 chum (in 1992). In years
when very few escapements returned to the river, the otters and seagulls as well as the
Saanich First Nation fishers would have had fewer salmon upon which to feed. The
bacteria and plants that benefit from the remains of salmon carcasses in the watershed
would also have had less nitrogen available to them in those years.
Table 6.4 shows that total chum catch increased nine times (blue cells) and
decreased five times (yellow cells) within seven timeline intervals of 5000 chum
escapements for the period between 1979 and 2004. There is no apparent, emerging
pattern of total chum catch increasing, decreasing or being managed solely in direct
connection with reports of escapement abundance for the 25 years for which data was
available.34
I used purple cells to highlight notable differences in total chum catch
abundance in relation to escapements in the same (or relatively close) numeric
intervals. For example, there were no chum caught in 2004 when there were 16,400
chum escapements but there were approximately 85,800 chum caught in 1992 when
there were 7,000 escapements (8,000 fewer chum than the 1,500 target escapement).
Years that I highlighted in yellow in Table 6.4 depict times when total catch
decreased from the previous year(s) in an escapement interval. Years that I
highlighted in blue represent those years when total catch increased from the previous
year within that escapement interval.
Table 6.4 shows that there was a lot of variation between escapement and total
catch between years. It also illustrates that closer monitoring of the chum fishery on an
110

111
Table 6.4 Total Chum Escapement and Total Saanich Inlet Chum Catch (1979 to 2004)
(DFO 1932-2004, 2001a, 2001b)
34
Intervals with only one or with no escapement years on record are omitted from the table.
Table Coding
--- Total catch decreased over time (Year column)
--- Total catch increased over time (Year column)
--- Notable change in total catch in relation to escapements within and between
intervals
* Each escapement interval lists annual escapement alongside total annual chum
catch in chronological order from most to least recent year on record
(i.e. 2004 to 1981).
Escapement Range Total Escapement Total Catch Year
10,000-14,999 10,500 0 2000
14,500 14,881 1989
14,000 6,850 1983
15,000-19,999
16,400 0 2004
17,000 85,814 1992
16,500 46,600 1985
16,000 14,600 1982
20,000-24,999
21,400 60 2003
22,300 13,750 1995
22,000 26,760 1993
21,000 5,000 1984
25,000-29,999
25,400 60,509 1999
27,500 9,264 1996
26,000 2,000 1980
30,000-34,999
34,000 65,000 1991
32,000 3,000 1981
40,000-44,999
40,500 23,441 1998
42,000 1,165 1997
45,000 76,076 1994
43,500 5,050 1988
42,000 7,000 1986
50,000-54,999
51,000 241,235 2002
53,000 9,500 1987

annual basis could better protect the chum population returning to Goldstream by ensuring
that at least 15,000 chum return to the river. Chum counts surpassed the carrying capacity
(K) of 15,000 established by DFO by 1,000 or more for 20 of the 23 years listed in Table
6.4. In 1991, 34,000 chum returned to Goldstream River and 65,000 chum were caught in
Saanich Inlet whereas ten years prior in 1981, 32,000 chum returned to the river but only
3,000 were caught in the inlet. In 1983, total escapement was 14,000 (1,000 chum below
the target escapement goal) and total catch was 6,850 whereas in 1986, total escapement
was three times that of 1983 at 42,000 chum while total chum catch was only 7,000 (only
150 more total chum caught than in 1983). These data demonstrate that under the current
15,000 chum target escapement Saanich Tribal Fisheries could have harvested 28,000
more chum than they did for commercial and community fishing purposes in Saanich Inlet
in 1986 as set out in the ESSR fishing licenses under DFO regulation. A comparable
dynamic occurred in the system in 1996 when total chum catch in Saanich Inlet was
around 9,260 and escapement was 27,500. Nine years prior, in 1987, there was a similar
total catch of about 9,500 chum when escapements were reported at 53,000 chum, almost
two times that of 1996 (Table 6.4). This shows that Saanich Tribal Fisheries could have
caught 12,500 more chum in 1996 and 38,000 more chum from Saanich Inlet in 1987 for
either their commercial ESSR chum fishing or FSC purposes. The abundance of chum that
returned to Goldstream in those years should have provided a surge of nitrogen to the river
and riparian zone ecosystem and increased salmon prey abundance available for other
species such as seagulls, bears, and river otter.
Examining Saanich Inlet ESSR chum catch alongside Goldstream chum
escapements for the period 1982 to 2004 revealed several inverse relationships (Figure
112

113
6.8). For example, ESSR chum catch averages increased from 3,200 to 14,650 between
1980 and 1983 while escapements decreased from 24,670 to 17,170 (just 2,000 over the
15,000 chum target escapement). In contrast, ESSR catch decreased from 13,570 to 0
while escapements escalated from 26,500 to 46,170 in 1984 to 1986 averages. Also, the
ESSR catch progressively increased from 3,250 to 70,900 chum between 1987 and 1990
while escapements decreased from 37,000 to 29,450 during the same time interval.
ESSR catch and escapements increased (from 50,650 to 54,870 and from 24,330
to 28,000 chum) simultaneously between 1991 and 1992. Chum escapements then
increased slightly from 29,770 to 30,600 between 1993 and 1995 while the ESSR
fishery underwent a sizeable decrease in three-year average catches from 29,870 to
2,030 chum. Escapements remained over 26,000 averages (undergoing two periods of
increase and decrease ranging from 26,812 to 44,800 chum) from 1996 to 2002. During
that time, the ESSR fishery increased continuously and markedly from a catch of 8,158
in 1996 to approximately 68,120 in 2001. The ESSR chum fishery then decreased (to
25,011) in 2002 at the same time that escapements dropped from 44,800 to 29,600 in
2001 to 2002 rolling averages.
Figure 6.9 illustrates that the Saanich First Nation‘s FSC chum fishery
underwent two discernable waves of increase between 1978 and 2003. The first wave
coincides with a period of increase in chum escapement between 1983 and 1986 (three
year rolling averages). The second increase in FSC catch occurred between 1989 and
1994. Chum escapements were on the rise again during this time with the exception of

1
14

Figure 6.9 Three-Year Rolling Averages of Food, Social and Ceremonial Chum Catch in Area 19, Saanich Inlet in Comparison
to Chum Escapement at Goldstream River from 1978 to 2003.
Three-Year Rolling Averages of FSC Chum Catch and Chum Escapement
(1978-2003)
0
5000
10000
15000
20000
25000
30000
35000
40000
45000
50000
2002-2003-20041997-1998-19991992-1993-19941987-1988-19891982-1983-1984
Year
Ch
um
Catc
h &
Escap
em
en
t
FSC Chum Catch
Chum Escapement
11
5

the 1991 three year rolling average when a sudden decrease of 5,000 chum
escapements from the previous year (to around 24,330 chum) is evident. FSC
chum catch has, on average, remained below 9,000.
Escapements fluctuated between a low of about 17,000 and a high of
about 46,170 chum and FSC chum catches range between a low of 20 and a high
of 8,970 for the same 25-year period. FSC catches began to decline in 1985 and
1986 (from 8,300 to 7,180 averages) while escapements were soaring towards
their highest point (from approximately 37,170 to 46,170) in those same years.
The decline in FSC chum catch for that period persisted until 1988 to 1990 when
only 4,340 chum were caught and during which time escapements also
progressively declined to a 1988-1990 average of about 31,790 chum.
The most interesting trendline resulting from examining FSC and escapement
data concurrently is the most recently recorded one spanning from 1996 to 2001 when
FSC chum catch decreased from just over 3,000 to 20 while escapement (and thus
fishing potential) increased and fluctuated between 30,000 and 45,000 chum (Figure
6.9).
Between 1980 and 2004 chum escapements fluctuated between 17,000 and
46,000, and remained above 28,000 from 1992 to 2002 (i.e. 1992 to 1994 through to
2002 to 2004 averages inclusively). ESSR chum catch was highly unstable ranging
from 0 to 79,000 over the same 24-year period. ESSR catch increased from 8,500
between 1980 and 1985 to 79,000 from 1986 to 1991. There were more than 52,800
ESSR chum caught from 1992 to 1997 and over 41,300 taken from 1998 to 2002.
Several short-term intervals of both negative, inverse and parallel or positive
relationships exist between the Saanich Inlet ESSR chum catch and chum escapement
116

117
datasets spanning the period 1980 to 2002: ESSR chum catch in the inlet increased
while chum escapement to the river decreased (1988 to 1990); the ESSR fishery
decreased while chum escapement increased (1983 to 1986 and 1992 to 1993); parallel
relationships occurred when both ESSR chum catch and the river‘s chum escapement
counts increased (1995 to 1997 and 1998 to 2001) and decreased (2001 to 2002) at the
same time. These data showed that annual chum catch does not consistently increase or
decrease in direct relation to annual increase or decrease in chum escapements (i.e. there
is not a consistent, positive or negative correlation between these two datasets) (Figure
6.10). There was however a continuous, parallel relationship between ESSR chum
catch and escapement from 1998 to 2002 when both these indices for Goldstream chum
abundance increased and then decreased simultaneously over time. FSC chum catch in
Saanich Inlet remained below 9,000 during that same 24-year period (1980 to 2004).
FSC chum catch generally increased in years when escapement increased for
most years on record up until 1996. FSC also took on a pattern of increased catch in
periods when ESSR chum catches were decreasing though this pattern was not the case
when the ESSR fishery crashed in 2002. FSC chum catch averages dropped and
remained below 2,000 in 1997 to 2001 averages though escapement and ESSR catches
increased (Figure 6.10). Another interesting observation resulting from examining
ESSR, FSC and chum escapement data together is that no ESSR fishery occurred in
1986, 1987 or 1988 when escapements were very high at 42,000, 53,000 and 43,500
respectively, and the number of FSC chum caught was 7,000, 9,500 and 5,050 for those
same years. (These latter results are derived from the original datasets without the three-
year average algorithm applied to them.) The three-year average for 1986 to 1988 FSC
chum catch was relatively high at around 7,180. By contrast the total average FSC

11
8

catch for the period 1978-2003 was 4,280. There was no ESSR chum catch from 1986 to
1988 though escapements for that period averaged approximately 46,170 chum (which is
16,440 units higher than the 29,730 average escapements for 1978 to 2003). Total
average ESSR chum catch for the whole 1978 to 2003 timeline was comparatively much
higher, at around 25,060.
Catch per Unit Effort of Chum in Saanich Inlet (1994 to 1996)
Catch per unit effort or CPUE (a measure of abundance of salmon caught per
number of days, hours or fishing excursions) is a useful tool for fishers to use to
determine how time-effective their fishing practices, vessel, crew and gear are in relation
to abundance of fish they catch for food or for selling. Data retrieved from DFO archives
and field reports as well as Saanich Tribal Fisheries’ native harvest statistics were used to
produce CPUE results for Saanich Tribal Fisheries’ ESSR and FSC Saanich Inlet chum
fisheries. Table 6.5 shows total ESSR and FSC chum catch, and number of days Saanich
Tribal Fisheries employed a seine fishing vessel for the three consecutive years for which
these data were available on record (1994 to 1996).
Table 6.5 Data for Saanich Tribal Fisheries CPUE of Chum from 1994 to 1996
(DFO 2001a, 2001b)
Year Gold -
stream
Chum
Escape-
ment
Saanich
Inlet
ESSR
Chum
Catch
Days
Fished
in
Saanich
Inlet
Fishing
Boats
ESSR
Chum
CPUE (Effort
in days)
Saanich
Inlet
FSC
Chum
Catch
Days
Fished
in
Saanich
Inlet
FSC
Chum
CPUE (Effort
in
days)
1994 45,000 67,355 8 2 seine 8,419 8,713 1 8,713
1995 22,300 5,044 6 1 seine 841 8,700 8 1,088
1996 27,500 1,036 2 1 seine 518 8,226 8 1,028
119

120
Saanich Tribal Fisheries caught more than 8,000 chum per day in both the ESSR
and FSC fisheries in 1994. That amounts to over 16 times more chum caught per day in
the ESSR fishery and more than 8 times more chum caught per day in the FSC fishery
than in 1996 (Table 6.5). This is defensible under current management however, as the
1994 chum escapement was more than three times over the established 15,000 chum
salmon carrying capacity (DFO 2001a, 2001b).
No data on number of fishing days or number and type of fishing boats (effort)
was found for FSC chum catch for the more recent period of 1997 to 200435
however,
FSC catch averages decreased sharply from about 1,560 to 750 chum during that time.
The decline in FSC chum catch from 1997 to 2004 indicates that there is either much less
success or much less effort with the Saanich Tribal Fisheries‘ pursuit of chum for FSC
purposes than there was in the period 1980 to 1996 when FSC catch was much higher.
There was no data for fishing effort for the Saanich Tribal Fisheries‘ ESSR chum
catch for the period 1980 to 1993 or 1997 to 1999. However, 2 to 3 seine vessels and 1
gillnet fishing boat were used for an average of 15 days each year in 2001 (when 68,120
chum were caught) and 2002 (when about 25,010 chum were caught), resulting in about
3,100 chum per fishing day 36
. By contrast, the ESSR chum catch ranged from 3,330 to
70,900 between 1980 and 1996 (using 1 or 2 seine vessels between 1992 and 1999).
Though effort is not exactly known, the 1980 to 2004 data indicate that overall, there
were two periods of very high and two periods of very low total catch of chum per unit of
annual effort (number of days spent fishing by seine or gillnet vessel). A discussion of
35
There was no FSC chum fishery in Saanich Inlet in the years 2000, 2002 and 2004.

121
the estimated costs and benefits of running a seine vessel for the ESSR chum fishery is
provided in Chapter 7.
6.3 Summary of Main Findings
Alteration to the coastal landscape including loss of streams and wetlands from
construction of roads and urban development and the redirection of Goldstream River
water flow as well as pollution of Saanich Inlet from sewage and oil leaks from boats are
some of the main concerns Saanich fishers expressed about the Goldstream River and
Saanich Inlet ecosystems (Table 6.1). Saanich fishers interviewed were concerned about
the established Goldstream coho and chinook hatchery and DFO fisheries managers
altering Goldstream River from its original state as a chum-bearing stream to one that
accommodates sport and commercial fishery interests by augmenting coho and chinook
populations. All fishers interviewed expressed dissatisfaction with DFO fisheries
management of the river and inlet and did not think that fisheries officers had consulted
with them appropriately or sufficiently about past decisions regarding administration and
management of their salmon fishery.
Traditional, rotational fishing practices exercised by families fishing at
Goldstream River and Saanich Inlet have declined over the past 70 years. Prior to the
1960s, Saanich fishers made on average 12 trips to Goldstream River per fishing season
and caught about 1,400 salmon per family per year or 206 salmon per person per year.
From 1960 to 2002, by contrast, fishers caught about 196 salmon per family per year or
49 salmon per person per year, which is roughly 25% of what they used to catch from the
river. Most of the Saanich Peoples‘ salmon fishing in Saanich Inlet is currently
undertaken by the Saanich Tribal Fisheries council, which hires a captain and crew with a
122
seine vessel to fish the ESSR commercial chum fishery. These salmon are both sold on
the market and delivered by truck to Saanich First Nations households in all four villages
(Tsartlip, Tsawout, Tseycum and Pauquachin). This modern fishery service helps those
who are unable to fish but does not provide incentive for the current generation of
Saanich youth to learn how to fish, or to acquire the cultural knowledge associated with
salmon fishing. All proceeds from the Saanich Tribal Fisheries‘ ESSR chum fishery
sales are put towards fisheries programs including monitoring and stewardship activities
at Goldstream River and Saanich Inlet (e.g. employing fisheries guardians to monitor
fishing activity on board the ESSR fishing vessel, escapement surveying at the river, and
restoring river channels and local creeks on the peninsula or tributaries of Goldstream
where salmon can spawn and alevins can feed.) In recent years, the ESSR chum fishery
has increased yet the FSC chum catch has decreased (Figure 6.10). This is beneficial for
the perpetuation and development of Saanich Tribal Fisheries‘ stewardship and
monitoring projects, which are funded by the profits from the ESSR fishery. This trend
is, however, also problematic for the Saanich community especially if the number of FSC
chum caught in future years is less than the number of salmon requested for food for
social and ceremonial gatherings.
There was a general increase in the population of all three salmon stocks (coho,
chinook and chum escapements) that returned to Goldstream River between 1932 and
2004 (Figure 6.1, 6.2, 6.3). The maximum carrying capacity (K) of coho at Goldstream
River is 1,500. K for chinook was 50 for the period 1932 to 1973 and 380 for the period
1973 to 2002 (Figure 6.2 and Table 6.6). K for chum is 15,000. At K, each chum uses
about 2 m² of riverbed as spawning ground in reaches 1 and 2 of the river. Coho and
chinook would have access to about 14 m² of spawning habitat each if both species were

123
at their proposed carrying capacities (Table 6.6). Chum were overfished in Saanich Inlet
in 1983 and 1989 when fishing occurred prior to the river having met its 15,000
escapement target. Low fishing activity in the inlet relative to river escapements
occurred in 1981 when only 3,000 chum were caught in the inlet and chum abundance at
the river exceeded the current carrying capacity at more than double the target abundance
(32,000 chum). This trend is observed again in 1987 when 9,500 chum were caught in
the inlet and 53,000 chum returned to the river. Chum fishing activity increased from
about 1,500 to 77,200 between 1979 and 1990 then declined substantially to about 8,050
in 1995 averages and increased markedly again to 124,240 in the year 2000 (Figure 6.6).
Overall, FSC chum catch has clearly declined over the past ten years while the ESSR
chum fishery has generally increased (Figure 6.10). Between 1994 and 1995, CPUE
notably decreased for both the ESSR and FSC chum fisheries (Table 6.6).
Table 6.6 Carrying Capacities and Population Change Rates of Goldstream Salmon
(Derived from equations applied to escapement data [DFO 1932-2004].)
Salmon
Species/
Years
Carrying
Capacity
(K)
Rate of
Population
Change (r)
1932-1944
r
1944 to
1973
r
1973 to
2002
Spawning
habitat (m²)
per salmon
At K
Coho
1932-2002
1,500 5.02% 7.79% 64.54% 14
Chinook
1932-2002
50 15.36% 4.16% 4.65% 14
Chinook
1973-2002
380 N/A N/A 4.08% 14
Chum
1932-2002
15,00037
2.55% 9.74% 52.97% 2
37
15,000 chum K was determined by DFO. All other calculations in Table 6.6 are my own.
124
CHAPTER 7- DISCUSSION
7.0 Introduction and Overview
Collectively, the voices of the Saanich fishers interviewed for this project
provided a distinctive contribution of traditional ecological knowledge in the form of oral
testimonies rich in history, and respect for the land, people, resources, cultural, social and
spiritual traditions. Fishers shared their knowledge of Goldstream salmon, the salmon
habitat and the fishery, as well as traditional and modern fishing methods. The following
discussion of interview results elaborates on topics presented in the previous chapter
(Results). This section discusses the five major themes resulting from thematic analysis
of interviews with Saanich First Nation fishers: ‗observations and experiences regarding
changes to the (aquatic) environment‘, ‗cultural practices‘, ‗salmon ecology and biology‘,
‗salmon conservation, restoration, and stewardship efforts‘ and ‗changes to federal
fisheries management (DFO) of Goldstream River salmon‘. These areas under discussion
are key variables for biodiversity and sustainable harvesting considerations and Saanich
fishers‘ discussions about these topics provided a useful qualitative lens with which to
examine monitoring protocols for coho, chinook and chum Pacific salmon at Goldstream
River and Saanich Inlet.
The descriptive results from interviews with Saanich fishers provided some
insights about how and why changes in salmon abundance and conservation efforts came
about over the past 130 years or so (since road construction began in East Saanich in the
1870s). The major changes to the landscape, physiography, quality of the river waters,
the inlet waters, salmon abundance, enhancement and migration patterns, the salmon food
web and adjustments to Saanich fishers‘ fishing methods and conservation practices
relayed in my Results chapter are important local observations which are not immediately
125
apparent to those engaged solely with population assessment, monitoring, enhancement
and other salmon conservation initiatives at local and regional scales. These
environmental indicators are not discovered or monitored by natural scientists on a
frequent basis. Researchers engaged with salmon population monitoring at Goldstream
River, Saanich Inlet and beyond may find it useful to learn how historic changes to the
local landscape and aquatic environments measure up alongside historic changes in
salmon abundance at the river (from 1932 to 2004).
7.1 Discussion of Interview Results
Loss of Creeks Impacts Saanich Inlet
As illustrated by the testimonies of Saanich fishers in the results, elimination of
streams throughout the Saanich region has disrupted the Saanich Inlet ecosystem and
salmon populations. Further loss of creeks in this region will negatively impact salmon
and their habitat. This in turn may result in further reduction in the local wild salmon
stocks available to Saanich First Nations for Food, Social and Ceremonial (FSC)
purposes or for commercial sale.
Tod and Hagan creeks located on the southwest side of the Saanich Peninsula, and
Ten-Ten, Tseycum and Tatlow creeks located along the northwestern shores of the
Saanich Peninsula all drain directly into Saanich Inlet, the saltwater environment from
which Goldstream River salmon feed and where Saanich People fish (Figure 7.1). These
creeks are an important component of the Saanich Inlet ecosystem and are important to
the health of the salmon and to the Saanich People as well. These freshwater bodies
carry microinvertebrate and macroinvertebrate plankton and other food sources (such as

126
Figure 7.1 Saanich Peninsula Creeks along the South Coast of Vancouver Island, BC
(Peninsula Streams Society 2004)
Deep
Cove
Coles
Bay
Patricia Bay
Brentwood
Bay
Swartz
Bay
Bazan Bay
Roberts Bank
Tsehum
Harbour
Saanichton
Bay
Saanich
Inlet
N
Saanich First Nation Place Names
Tsartlip Pauquachin
Tseycum Tsawout
127
juvenile herring, another anadromous pelagic fish) as well as dissolved minerals and
nutrients consumed by salmon. Goldstream salmon feed on small planktonic
crustaceans such as decapods, especially shrimp, such as pandalid shrimp (Pandalidae),
euphausiids such as krill (Euphausia pacifica), and mysids such as opossum shrimp
(Mysis relicta) at Saanich Inlet. Adult salmon will also feed upon juvenile salmon,
usually of other species (e.g. adult coho and chinook will prey on juvenile chum salmon)
(Fresh et al. 1981; Kaczynski et al. 1973; Pearsons and Fritts 1999). Juvenile chum and
coho prey on gammarid amphipods (Gammarus palustris), harpacticoid copepods
(Harpacticoida) and isopod crustaceans (Feller and Kaczynski 1975; Washington State
Department of Ecology 2006). Goldstream salmon, in turn, provide a regular source of
protein and fatty acids (including omega-3) to Saanich Peoples‘ diets and comprise 42%
of all marine meals they consume (Health Canada 1995; Mos et al. 2004).
The remaining creeks that continue to flow through Tsartlip, Tseycum,
Pauquachin and Tsawout lands are at risk of further degradation from urbanization and
associated impacts such as non-point source pollution (Claxton J. pers. comm. 2002;
Simonsen et al. 1995). Pollutants emitted from fertilizers and pesticides used on local
farmlands for example, are absorbed through the soil matrix and transported to the
streams by rain and underground water systems.
Using Goldstream River as an outdoor laboratory for conducting research, a
knowledgeable Saanich fisher dissected several deceased salmon during spawning season
and discovered that shrimp was the major prey of salmon passing through Saanich Inlet
to return to their natal river (Elliott J. pers. comm. 2002). Saanich fishers are noticing a
decline in abundance of shrimp, another one of their Saanich Inlet marine food sources,
and as noted, a major prey for chum and other salmon. This decline in shrimp

128
populations was attributed to loss of creeks from urban and road development and to an
increase in commercial shrimp fishing in the inlet. As noted in Chapter 6, Saanich fishers
have explained that Saanich Inlet was a nursery and important feeding ground for salmon
feeding on plankton and shrimp. Any further loss of creeks, or failure to restore and
protect existing creeks along the Saanich Peninsula in Central and North Saanich
districts, will likely result in further diminishing the amount of planktonic food prey
available to the salmon. It is foreseeable that the increase in commercial shrimp fishing,
occurring since 1999 (DFO 2000b, 2001d), will further contribute to the decline in
shrimp size and abundance available for salmon to feed upon in Saanich Inlet, the
historical nursing grounds of Goldstream River salmon stocks (Bartleman J. pers. comm.
2002; Morris Sr. I. pers. comm. 2002). Lack of shrimp and planktonic food sources from
streams could lead to salmon feeding less, becoming leaner, switching prey or switching
migration routes. This is difficult to gauge given our limited understanding of the
ecosystem dynamics of Saanich Inlet and Goldstream River. Based on their own research
and observations, however Saanich fishers (Appendix E) identified particular fisheries
management issues that should be addressed such as local stream restoration. These
Saanich fishers demonstrated that there is a synchrony between fisheries research and
management. This common thread between research and management is characteristic of
adaptive management and indicates that this type of management is, on some level,
inherent within the Saanich First Nation communities.
Saanich fishers made direct observations of cumulative impacts upon coastal and
marine ecosystems caused by changes to the landscape and marine biodiversity (e.g. loss
of streams and lowered abundance of shrimp or other sources of salmon nourishment, and
redirection of water flow of Goldstream River). Adding provisions for measuring for
129
salmon size and diet to the existing annual escapement survey procedures could assist
with monitoring these impacts and changes to the marine ecosystem over time.
Saanich First Nation members should be invited to assist with drafting,
coordinating and implementing these proposed changes to Goldstream salmon
escapement surveys. Such an effort would be another step towards adaptive
management, incorporating what is learned from experience to implement plans for
improving existing management or monitoring methods. This process would also be
another worthwhile step towards co-management, as it would assist hatchery technicians
and DFO staff in charge of organizing and conducting escapement surveys and
monitoring of salmon stocks at Goldstream River.
Saanich fishers’ testimonies about the link between Saanich Inlet salmon and
shrimp life cycles is comparable to Berkes’ (1999:11) observations of Cree First Nations’
fishing practices in James Bay, Ontario within the Chisasibi whitefish fishery in
that:“…extensive local knowledge existed on distributions, behaviour, and life cycles of
fish simply because such information was essential for productive fishing, as any fisher
knows, and was at one time essential to survival.” In situ observations of nearshore and
freshwater fish populations combined with scientific knowledge of the fishery are
integral for effective ecosystem-based management where harvesting of marine resources
occurs on a continuous basis. A learning-by-doing approach to community-based salmon
stocks monitoring evident with the Cree and Saanich people’s respective fisheries bodes
well for the adaptive management approach which, as I discuss later in this chapter, is
essential for an effective management model for Saanich Tribal Fisheries and the Saanich
communities.

130
Adaptive management proved very successful in the case of western Sweden’s
Lake Racken Fishing Association (LRFA) who restored spawning gravel beds and
followed up with monitoring the lake’s brown trout spawning grounds. An accident had
occurred at a power plant upstream38
, causing siltation of spawning grounds and
destruction of trout eggs after the restoration work had been done at the lake. Due to the
knowledge they acquired during their work, however, LRFA fishers were able to quickly
identify the effects of the accident and acquire the funds to restore the trout habitat
(Olsson and Folke 2001). This case study exemplifies the effectiveness of fishers’
experiential knowledge in helping to protect fish and fish habitat. The inclusion and
perpetuation of experiential knowledge that local Saanich fishers have about the
Goldstream salmon fishery should also be included when planning and implementing
conservation and monitoring protocols for Goldstream salmon.
Conservation Initiatives of Saanich Fishers
Berkes (1999) described Cree First Nation People’s self-imposing fishing gear
restrictions and refraining from fishing their main target fish stocks at times. Results
from thematic analysis (Table 6.1) demonstrated that these same overarching, fishery
conservation strategies were employed by Saanich fishers who targeted coho and chum
salmon at Goldstream River and Saanich Inlet over approximately the past 40 to 60 years
(Bartleman J. pers. comm. 2002; Claxton Sr. E. pers. comm. 2002; Smith S. pers. comm.
2002). Deliberate restraint from exercising traditional fishing rights during times when
coho stocks were replenishing contributed to conserving and protecting the coho
38
No date listed but timelines in article indicate that the accident occurred between 1986 & 2001.

131
population. This type of effort provided Goldstream coho stocks with a greater chance
for undisturbed, natural regeneration over time, and could replace enhancement as a wild
coho population conservation and regeneration strategy. In many cultures, First Nation
peoples’ commitments to caring for their natural resources are deep-rooted (Alcorn 1993;
Barsh 1982; Berkes 1999:152; Dwyer 1994; Gadgil et al. 1993; George 2003:73; Jones
1997:12). In the case of Saanich fishers, this moral commitment to conservation was
manifested by their voluntary monitoring and control of coho and chum fishing,
irrespective of coho fishing openings administered by DFO when stocks began to
rebound, and despite their continuous cultural rights to fish for FSC purposes at
Goldstream River and Saanich Inlet. This is a good example of how Saanich First
Nations practice conservation at these two traditional fishing sites.
Changes in Traditional Saanich First Nation Fishing Methods
Saanich First Peoples have moved away from their original fishing practices.
Fifty to 70 years ago, families caught their year’s supply of salmon by travelling to
Goldstream, camping and fishing together at the river, then smoking and preserving the
salmon (Table 6.1). Families travelled by canoe in Saanich Inlet in search of food, where
they caught chum and other fish from the inlet waters39
. In recent years, families have
received their salmon from the ESSR and FSC chum fisheries caught by seine vessel in
Saanich Inlet.
The delivery of salmon to peoples’ homes is helpful for those unable to access or
attain the resource for themselves. This modern method of salmon catch and delivery,
39
Harvesting also involved berry picking (e.g. for salal and salmonberries) and root vegetable digging
(e.g. for camas bulbs) along the coast in late summer and duck, deer and seal hunting in the fall (George

132
however, reduced the need for families to travel together to fish for their own food in the
inlet or the river. This change in salmon fishing practices and Saanich Tribal Fisheries’
management could lead to loss of shared traditional ecological knowledge about salmon
fishing methods as fewer people are actively engaged with the process of fishing for their
or their family’s annual supply of salmon. The loss of traditional ecological knowledge
about salmon habitat and other environmental indicators previously learned and passed
on among the people of the Saanich First Nation communities could subsequently lead to
the erosion of intergenerational bonding and cultural ties between and among the Saanich
families. This loss of knowledge, practice and belief about salmon and fishing could also
prevent future generations of Saanich people from learning about fishing methods,
conservation and stewardship efforts as well as their traditional and ongoing fishing
rights at Goldstream River and Saanich Inlet. The perpetuation of traditional ecological
knowledge about Goldstream salmon is very important for Saanich people because it is
intricately connected to the current and future wellbeing of the Saanich First Nation
culture.
Recent Changes to the Goldstream River and Saanich Inlet Salmon Fishery
The observed change to coho stocks‘ morphology (physical form and structure)
over recent time (i.e. Goldstream coho generally becoming thinner in the past two years
than approximately 40 years prior to that) serves as a point of reference for further
salmon stock monitoring at these sites.
2003) probably allowed rotation or alternation of harvesting pressure for the then, more plentiful
resources along the Pacific Coast.
133
Six of the seven Saanich fishers interviewed affirmed that Goldstream River has
always (historically and currently) been predominantly a chum salmon-bearing stream.
This corroborates the biostatistics that showed annual chum escapements far exceeding
those of coho and chinook from the period 1932 to 2004. Most (five of seven) fishers
expressed concern that the recent (1980s to present) enhancement of coho and chinook
stocks will negatively affect the natural chum population. Further studies investigating
for interspecific competition among species are required to determine if enhanced coho
and chinook stocks are negatively affecting wild chum stocks. (See Chapter 8 for further
recommendations.)
Major Themes from Interviews with Saanich First Nation Fishers
Table 6.1 summarized results from thematic analysis of interviews conducted
with Saanich fishers. Participants‘ observations and experiences in relation to changes to
the aquatic environment (Goldstream River and Saanich Inlet) included reduction in the
river‘s width and restriction of the size, number and productivity of streams flowing into
Saanich Inlet over the past 50 years, as well as the onset of pollution and sickness from
eating fish from the inlet over the past 10 years (Bartleman J. pers. comm. 2002; Morris I.
Sr. pers. comm. 2002; Morris S. pers. comm. 2002; Smith pers. comm. 2002). These
environmental changes are directly linked to the health of the aquatic ecosystem and of
humans. Accounting for these impacts in addition to fluctuating escapements of native
stocks and total (chum) catch provides a more holistic picture with which to evaluate the
fluctuating status of wild and enhanced salmon stocks than would be possible from
examining escapement data alone.
134
Sub themes of fishing practices that emerged from interviews with Saanich fishers
(past and recent changes to fishing practices and technologies) illustrated prevailing
changes to Saanich First Peoples‘ traditional fishing practices over time. As noted, there
was a shift from pre-European times (1800s) to the 1960s when families travelled to,
fished and camped at Goldstream River overnight, and smoked their salmon at the
smokehouse on site. Implements used for fishing such as gaff hooks and spears were
formerly hand-made. Since the 1960s, fishers have stopped setting up fishing camps and
smoking salmon at the river. Tourism at the provincial park area of Goldstream River
(Reach 1) has increased (Figure 2.2). The smokehouse has been taken down. Saanich
and Malahat First Nation fishers are permitted to fish the river for their Food, Social and
Ceremonial purposes (Simonsen et al. 1997) (Appendix E): however only descendants of
the families comprising these bands can fish in the river. Some park visitors, members of
the public, media and park wardens who observed Saanich fishers spear fishing salmon at
Goldstream River in the past expressed opposition to it (Bartleman J. pers. comm. 2002;
Cooper E. pers. comm. 2002; Morris Sr. I. pers. comm. 2002). The management of the
salmon-bearing reaches of Goldstream River as a tourist attraction for park visitors since
its inception as a BC provincial park in 1958 (BC Ministry of Lands, Parks and Housing
1986) has inconvenienced, imposed upon and altered the fishing behaviour of Saanich
fishers fishing at Goldstream River. In contrast, modern day amenities such as gaff
hooks or dip-nets made from synthetic materials can now be purchased at department
stores. Salmon caught at the river are now smoked at smokehouses in the communities of
Tsartlip, Tseycum, Tsawout and Pauquachin First Nations, which accommodates fishers
who do not have smokehouse facilities at their homes (Table 6.1). These modern
adaptations are quite useful to fishers and probably save them considerable time and

135
effort in catching and processing their salmon food but they are also disadvantageous
because the opportunity to learn how to make one‘s own dip-net or prepare and hang
their salmon for smoking is lost in the transition.
The practice of saltwater salmon fishing in Saanich Inlet has shifted away from
families taking fishing trips in hand-carved wood canoes or crafted wooden rowboats to
families purchasing and using fiberglass motorboats or seine vessels for fishing. Prior to
the 1960s, it was common for many families to fish for salmon in the inlet from
September to December. In recent years however (since the 1980s), the Saanich Tribal
Fisheries owned and subsequently sold, then contracted a seine boat to conduct the ESSR
chum salmon fishery in the inlet. Families very rarely will fish for salmon or other fish in
the inlet anymore. This may be in part due to increased pollution and awareness of
pollution in the inlet and a fear of becoming poisoned and sick from eating fish caught
from the inlet (Morris Sr. I. pers. comm. 2002). The decline in salmon fishing activity in
Saanich Inlet by Saanich Peoples could also be a result of lifestyle changes such as the
option of purchasing salmon fillets from a local grocery store instead of having solely the
option to catch fish from the inlet (which entails the additional requirements of killing,
skinning and cutting the salmon). The fact that each family receives a number of salmon
pieces caught by the Saanich Tribal Fisheries vessel and then delivered to their doors
several times throughout the year may also be contributing to the decline in fishing
activity at both Saanich Inlet and Goldstream River.
Conversations about salmon ecology and biology, another theme derived from
interviews with fishers, revealed that fishers have observed changes in salmon behaviour
over time such as selection of feeding habitat and migration paths at the river. Fishers
also stated that there has been a decrease in abundance of salmon returning to the river in
136
recent years (i.e. the past 50 years). Escapement data for Goldstream River salmon
stocks indicated that fluctuations in abundance occur annually. This coupled with
seasonal fluctuations in timing of salmon runs and abundance may account for why
fishers believed they saw more salmon at the river in the past than they did recently (i.e.
2000 to 2002). Overall, however, salmon escapement (total abundance of salmon
returning to the river) has increased over the past 50 years (Figure 6.1, 6.2, 6.3).
Fishers also stated that there were fewer coho, chinook and chum salmon to be
caught in the inlet now (2002) than there were in the past (e.g. earlier on in the 50-year
period during which they had fished). This discrepancy may in part be due to ongoing
conservation measures that have led to coho and chinook fishery closures in Saanich Inlet
over the past twenty years (since the 1980s). There never was a great abundance of
chinook at the river: however escapement data showed that an overall increase in chinook
to the river has occurred since the 1960s (Figure 6.2) probably resulting from both
Goldstream chinook stock enhancement and fishery closures. The number of chum that
may be caught has been much more closely monitored and controlled by the ESSR
licenses in accordance with the target 15,000 Goldstream River chum escapement goal
since 1980. This may be part of the reason for the majority perception that there has been
a decrease in abundance of salmon to be caught in Saanich Inlet, though records of total
catch for Saanich Inlet chum (or other salmon) are not available for any period prior to
1980.
Saanich fishers partake in a variety of conservation, restoration and stewardship
efforts to protect salmon stocks and habitat (Table 6.1). These range from practical
restoration activities (e.g. planting native vegetation along creek banks) to reporting
abundance of salmon fished in the river and caught in the inlet, and exercising restraint

137
from fishing their favourite foods (e.g. grilse) in order to protect declining BC coho
populations. The former examples are characteristic of modern fisheries monitoring and
management techniques whereas the latter conservation effort (restraint from fishing or
rotating fishing effort) is characteristic of a traditional tribal fishery management practice.
Some fishers engage in spiritual practices that include a prayer for the salmon as well as
the ancestors and relatives of the salmon being caught for their food. This is a show of
respect and appreciation of nature and emphasizes the cultural tradition and belief of
fishing in the least harmful ways to the animal and its habitat.
Pollution in Saanich Inlet is reportedly contaminating the fish, seafood and
shellfish in the inlet (Table 6.1). Pollution in the inlet comes mainly from non-point
sources such as oil spills and leaks from boats and marinas, sewage from pleasure crafts
and houseboats as well as runoff from agricultural and residential lands carrying
carcinogenic chemicals from herbicides and pesticides (Simonsen et al. 1995; Spliid
2005). Consumption of these local food sources from the inlet is ascribed as cause of
illness to fishers and their families. This is a health concern that was brought forward to
Fisheries and Oceans Canada personnel. It is apparent that pollution is an important
issue, which the Saanich First Nation community would like to see addressed and
remedied. Another major concern regarding Saanich Inlet waters was DFO‘s decision to
allow non-native commercial harvesters access to the salmon fishery before the
Cowichan River target escapement goal was met (year not known) (Table 6.1). This
action led to disproportionate advantage and allocation of chum stocks to non-First
Nations parties prior to First Nations and is contrary to the Aboriginal Fisheries Strategy
(AFS). This is an important issue regarding equity, Saanich First Nations‘ Douglas

138
Treaty rights to fish as formerly40
and their legal entitlement to first priority (to fish for
FSC purposes rather than commercially) over other uses of the resource (after
conservation concerns have been addressed) as provided under federal fisheries
legislation (DFO 2000a).
Costs and Benefits of Running a Seine Fishing Vessel
Using information gathered from interviews, a very rough estimate of the cost of
operating a fishing vessel in Saanich Inlet is $2,500 per fishing season. The captain and
crew are paid from the sale of the chum (e.g. 10 cents per pound of salmon sold). A total
of 75,034 chum were caught in the ESSR fishery in 2002. Given an average weight of
approximately 3.6 kg per chum salmon (assuming the lower end of the 3.6 to 4.5 kg
average weight reported in results), then about 270,122 kg of chum were sold on the
market. Assuming a market sale price of fifteen cents a pound and 10 cents a pound paid
out to the captain and crew and 5 cents per pound returned to Saanich Tribal Fisheries
(Smith S. pers. comm. 2002) the ESSR fishery earned about $27,000 (from which $2,500
is subtracted for vessel operation costs). The result from this example is that Saanich
Tribal Fisheries would have profited $24,500 from their ESSR commercial chum fishery
in 2002 (Smith S. pers. comm. 2002).
A requirement of Saanich Tribal Fisheries‘ ESSR fishery is that all profits be
reported to DFO (DFO 2001b) and reinvested in the operational costs of the fishery, as
well as training Saanich people to do surveying, monitoring, stock assessment,
stewardship or related fisheries project work (Smith S. pers. comm. 2002). There was no
40
The Saanich Douglas Treaty tribes are made up of the Tsartlip, Tseycum, Tsawout, Pauquachin and
Malahat bands.

139
ESSR chum fishery and thus no profits for Saanich Tribal Fisheries in 2003 or 2004, so
the approximate profit of $24,500 from 2002 (and any other compounded savings from
previous years) would have been carried over for paying for operations and jobs listed
above over the three-year period from 2002 to 2005. Given the above, it is apparent that
job placement in stock assessment work is not providing stable revenue for Saanich First
Nations over the long term. The income from the ESSR fishery does, nevertheless,
provide a source of income, training and work experience that contributes to the
improvement of monitoring protocols of Goldstream River salmon stocks at present.
Abundance of Salmon Caught at Goldstream River Over Time
As presented in my results, Saanich fishers reported catching less than one fifth of
the quantity of salmon from Goldstream River (for food for themselves and their
families) from 1960 to 2005 than they did in the period between 1930 and 1960. This
may account for the majority perception of the fishers interviewed that there are far fewer
salmon at Goldstream River than there were in the past. Escapement records do show a
significant reduction in chum between 1948 and 1975 with annual returns of chum
exceeding 15,000 for most years thereafter (Table 6.4). This perception of lower
abundance of salmon returning to Goldstream River may be resultant of less fishing
activity by Saanich First Nations since that time (1960), when escapements were low.
Discrete Indicators of Varying Salmon Morphology and Seasonal Spawning Times
Changes in salmon morphology include changes in girth, length and body mass of
adult salmon returning to Goldstream over time. Only two fishers interviewed noticed

140
changes in salmon morphology of coho and chinook returning to Goldstream River in
recent years, compared to past runs.
There are two runs of chum salmon, the first run, in October, consisting of chum
of smaller body mass than the second run, which are larger in body mass and valued as
sports fish. The fact that there are two runs of chum, one smaller than the other may
contribute to the perception that chum have decreased in size in recent years that fishers
have caught them. If the fishers caught salmon in the later part of the season (the larger
sized salmon of the second run) in previous years, then fished during the earlier part of
the salmon run season (October) in latter years, for example, their impression would be
that the salmon returning in recent years seem smaller than they had in previous years. It
is difficult to cross-check or assess the validity or potential relationship between these
two discrete findings as there are no detailed records about abundance of chum salmon
for each of the two runs at Goldstream River nor are there records of variables measuring
for proportional morphology for these escapements over time. This finding does
however point to the possibility of the interruption or loss of traditional ecological
knowledge about Goldstream salmon over time.
Nature’s Indicators and Provisions for the Goldstream River Salmon Run
Some seasonal cues informed fishers about the time of year when they should
begin collecting their fishing technologies and preparing to set up their fishing camps at
Goldstream River. Saanich People have learned about the natural history of their home
place from their elders through their stories (the passing on of traditional ecological
knowledge). Saanich fishers learned that when oceanspray, also called ‗Wild Spiraea‘
(Holodiscus discolor), a deciduous, woody shrub of the rose family, is in full-blossom

141
and its creamy white flowers are just beginning to go to fruit and turn brown, and when
the trailing blackberries (Rubus ursinus) have turned ripe on their thorny bushes in July,
the (chum) salmon will soon be returning to the river. Saanich and Cowichan people
historically used the wood from oceanspray to make salmon-barbecuing sticks and
needles for weaving cattail camp and travel mats used for shading their canoes (Claxton
and Elliott 1994:12; Pojar and MacKinnon 1994:78). Fishers have also learned that a
great abundance of fir cones on coniferous trees (i.e. Douglas fir [Pseudotsuga
menziesii]) in the spring season indicates that there will be a great abundance of salmon
returning to the river that fall. First Nations people along the Pacific Coast used the
wood from Douglas fir trees for making fire tongs, spear handles, dip-net poles and
salmon weirs. The pitch was also used for sealing joints of gaffs and fishhooks and for
caulking canoes and water vessels (Pojar and MacKinnon 1994:32). It is important to
document the knowledge about the natural history of a place as well as the sustainable
harvesting practices used to harvest food from the land and waters. This knowledge,
when shared, illustrates the pathway from the past so that this generation and future
generations may learn an appreciation for protecting their natural habitat, learning
sustainable plant and salmon harvesting methods and making informed decisions about
how to become stewards of their homelands and waters.
Saanich Tribal Fisheries
Prior to the onset of DFO fisheries laws, restrictions, regulations, licenses and
policies coming into place at Goldstream River and Saanich Inlet, the salmon stocks were
closely safeguarded by the heads of Saanich First Nation families who knew the inlet, the
river, the fish and the coastal lands intimately. The ecological knowledge of these places

142
would be passed on to other members of the community during harvesting and at social
and cultural gatherings and events. These people would in turn become stewards of the
river, the inlet and the fishery. One of the main changes in the fishery is that in the past,
there was a lot more rotation of fishing, so that all the families would have enough room,
enough time and enough salmon to fish. The knowledge from experienced Saanich First
Nations who were managing the fishery was preserved and passed on in a more localized
manner in the past when more families were fishing together in the inlet or camping at
the river in groups. Saanich Tribal Fisheries arose out of the need for families concerned
with fisheries issues to come together to address them collectively and, in more recent
times, to address fisheries concerns with DFO.
Families do not fish the inlet or river as often as they used to, in part because of
the closure of coho fisheries in Saanich Inlet and the onset of modern commercial vessels
doing the salmon fishing and distributing the salmon to them. Another reason why
Saanich People do not camp and fish at the river as much now as they did in the past is
due to complaints from park visitors offended by witnessing Saanich People fishing in
their traditional way by gaff hook, or spear or by using modern (synthetic) net poles, then
clubbing the salmon on the head to kill them for their food. Fishers who do not wish to
be bothered by offended spectators are likely to stop fishing at the river altogether
(Bartleman J. pers. comm. 2002; Cooper E. pers. comm. 2002; Morris Sr. I. pers. comm.
2002). Visitors to Goldstream Park may not be aware of Saanich Peoples‘ traditional
fishing methods and rights to fish for FSC purposes even though there are information
signs posted in the park to educate the public about the Saanich Peoples‘ cultural fishing
practices at the river. As noted earlier, the smokehouse that was formerly used by
Saanich people at the river was torn down around 1992 (Morris Sr. I. pers.comm. 2002).

143
Prior to its removal, fishers used to invite park visitors to the smokehouse to demonstrate
their traditional salmon fishing, cutting and smoking methods. These relatively recent
changes to cultural fishing practices have probably resulted in fewer opportunities for
experienced fishers to share their knowledge of the salmon and teach fishing methods
that were formerly passed on from family to family and from one generation to the next
over time. In 2005, however DFO Minister Geoff Regan announced the need to focus on
First Nations‘ fishing opportunities and Goldstream River was identified as one of the
places where this should occur (DFO 2005d).
Current Saanich Tribal Fisheries Management Practices
Saanich Tribal Fisheries works with DFO to provide records of their annual
Excess Salmon to Spawning Requirement (ESSR) and Food, Social and Ceremonial
(FSC) chum catch to assist with monitoring protocols (Figure 6.10). Saanich Tribal
Fisheries has also worked cooperatively with DFO on other conservation and fisheries
matters pertaining to Goldstream River and Saanich Inlet. For example, Saanich fishers
have refrained from fishing coho from the inlet and the river when their populations were
reportedly low province-wide, even though it is their cultural right to fish them
(Bartleman J. pers. comm. 2002; Smith S. pers. comm. 2002). Though there is a lot of
progress that could be made, I think that Sannich Tribal Fisheries provides a good
example of how co-management between First Nations and DFO can occur. Saanich
Tribal Fisheries also serves in addressing Saanich Peoples‘ interests, concerns, conflicts
and disputes regarding fisheries matters such as salmon allocation, distribution and
entitlements of external parties seeking access to the Saanich Inlet chum fishery. For
example, when DFO decided to allow non-First Nation commercial fishers access to the

144
Saanich Inlet ESSR chum, Saanich Tribal Fisheries defended Saanich Peoples‘
commercial chum fishery (Smith S. pers. comm. 2002). The result was negotiations with
DFO that led to the decision to allocate 80% of the future Saanich Inlet chum catch to
Saanich people and 20% to non-Saanich First Nation fishers (DFO 2005d; Jacks V. pers.
comm. 2004).
7.2 Discussion of Goldstream Salmon Fisheries Statistics
Goldstream Coho Escapements (1932 to 2004)
An examination of population patterns of the available time-series escapement
data (1932-2004) lead to a suggested carrying capacity (K) of about 1,500 spawning coho
per year. Recent observations revealed a tendency for WCVI coho to migrate from the
west coast of Vancouver Island to the southern Strait of Georgia (perhaps due to the
pursuit of more abundant food sources in those waters). Mature coho migrating through
the southern Strait of Georgia are more likely headed to the Fraser River basin spawning
grounds (DFO 2001). This change in migratory patterns of coho may have occurred due
to the effects of the 1997 to 1998 El-Niño and may have contributed to the decline in
coho escapement at Goldststream in 2002 (i.e. averages dropped from 3,990 coho in 2001
to 1,570 coho in 2002, which is just over the proposed carrying capacity) (Figure 6.1).
Another noteworthy emerging pattern regarding target escapement or carrying capacity is
that Goldstream has supported less than 500 coho approximately 60% of the time
between 1932 and 2004. The time-series graph also illustrates that the most common and
sustainable population of coho spawners at the river over the long term is probably about
500, which is a different target population than the maximum carrying capacity. The
rates of population change (Table 6.6) show that coho stocks at Goldstream have

145
increased at the highest rate between 1978 and 2004, during the time when hatchery
enhancement of coho began. This indicates that overall, the enhancement of the coho
population has been successful at this river.
The concept of a natural, historical carrying capacity for coho stocks (here,
suggested to be about 1,500) would likely interest Saanich fishers because five of the
seven fishers interviewed expressed concern that recent (DFO funded) enhancement of
coho (as well as chinook) stocks will negatively affect the natural chum population that
has historically outnumbered coho and chinook stocks. This is a legitimate concern as
coho and chinook stocks are species of conservation concern province-wide, are an
indicator stock undergoing stock enhancement at Goldstream and are generally more
highly valued in both the cash economies of sport and commercial fishery sectors than
chum salmon. It is therefore conceivable that future efforts and program funds by DFO
to augment, monitor and protect coho and chinook stocks will take precedence over
management efforts for sustaining, monitoring and protecting the existing natural chum
population at the river which is highly valued by the Saanich people for their Excess
Salmon to Spawning Requirement and Food Social and Ceremonial fisheries as well as
for their intrinsic value to their culture and to Goldstream River (Table 6.1).
Chinook Escapements at Goldstream River (1932 to 2004)
Results from time series graphs of chinook escapements (1932 to 2004)
corroborate Saanich First Nation fishers‘ assertions that Goldstream River was not a
major chinook stream (Figure 6.2). The natural, historical carrying capacity of chinook at
Goldstream (from 1932 to 2001) is 50 individuals. In the past few years (from 2001 to
2004) however, chinook stocks have risen more than nine times beyond historical levels

146
of the previous 68 years to quantities ranging from about 195 to 385 individuals. The
higher figure of 385 is a (maximum) carrying capacity, which I proposed based on
average chinook escapements from 2001 to 2004 alone. This target escapement carries
an element of uncertainty and risk because it is derived from escapements over a very
short term. The Goldstream chinook escapement population should be monitored and
considered carefully over the next few years before a target escapement for chinook is
officially put into place. The main fisheries management issue to consider about
selection of a carrying capacity or target escapement goal of 50 versus 385 chinook is:
whether the enhanced population should take precedence over the chinook that would
occur if the chinook were left to spawn naturally without the intervention of hatchery
enhancement of the population. Target escapements and carrying capacity abundances
are based on shifting fishing quotas both offshore (in international fishing waters) and
nearshore (in inlets, channels and passes). Consequently, these data do not reflect the
abundance of wild salmon that occurred at Goldstream prior to the onset of commercial
fishing, logging, pollution, road and home construction as well as commercial and
facilities developments that occurred around the mid 1800s.
As noted in Chapter 3, Goldstream River is being managed by DFO as an
indicator river because the coho and chinook populations are being enhanced. The
Goldstream coho are called indicator stocks because the enhanced stocks are tagged and
fin-clipped annually (pers. obs.), which enables scientists to monitor the population
through tag and recapture studies (Pacific States Marine Fisheries Commission 1997;
SFEC 2004). Goldstream chinook salmon are also called indicator stocks because the
population is being augmented at the hatchery. Chinook are not currently tagged,
however which constrains monitoring of chinook to escapement surveys of mixed stocks

147
(hatchery and wild stocks) at the river. This is problematic as there is no means by which
to measure the hatchery contribution of chinook salmon to the total catch of offshore and
nearshore (i.e. Saanich Inlet) fishing vessels or to the natural chinook stocks returning to
Goldstream. It is also not possible to separate out and measure for possible impacts of
hatchery and wild chinook upon coho, chum or other chinook salmon at the river.
Chum Escapements at Goldstream River (1932 to 2004)
Although chum stocks are not enhanced at Goldstream River, numbers of chum
have actually increased over recent time (since 1975). Hatchery enhancement of coho
and chinook stocks since the 1980s have apparently, therefore not as yet constrained the
annual abundance of chum escapements (Figure 6.3; Table 6.6). Saanich First Nation
fishers interviewed believed that there were fewer salmon returning to the river: however
escapement records indicated otherwise. As noted in my results, Saanich People have not
been fishing at the river as often in recent years compared to the past (i.e. they fished
there nearly six times more often in the years before 1960) (Appendix E). This decrease
in fishing activity over the past 45 years may be contributing to the increase in abundance
of chum at the river that began in the 1970s and continued on up to 2004 (Figure 6.3).
Chum escapement declines occurred at Goldstream and throughout much of the BC coast
in 1952 and 1953. This is probably due in great part to a major expansion of chum
fishing activity at that time (Reimchen, T.E. pers. comm. 2006). There may have been a
delayed effect in the relationship between decreased fishing activity in the 1960s and the
increase in Goldstream chum escapements after 1970 (given the average chum spawning
age of 5 years) as at least two generations of Goldstream chum broodstocks would have
returned to their natal river during that time; one in 1960 and one in 1965. (Figure 6.3;

148
Table 2.3). Though the perception of fishers is that there are less salmon to fish from the
river, Saanich First Nations could have fished more (chum) salmon as a food source from
the river than they did in recent years, with the exception of 2000, 2003 and 2004 when
escapements were below the 15,000 target (Figure 6.3; Table 6.4).
The 15,000 chum target escapement put in place by DFO is intended to ensure
that there are enough chum to secure the next generation of Goldstream chum to spawn at
the river. This figure may not, however, accommodate other important ecosystem
dynamics such as the role of salmon as a food source for eagles, bears and mink that
forage in the river and the role of salmon carcasses in providing important nutrients to the
river and its riparian zone. Closer monitoring of the chum population may ensure that
enough chum return to the river and could also prevent an overabundance of chum from
entering the river which is known to lead to overspawning, digging up of established
redds and crowding among chum spawners. Chum escapements surpassed the currently
established target escapement or carrying capacity (K) of 15,000 by 1,000 or more for 20
out of 23 years between 1979 and 2004 (Table 6.4). If closer monitoring of total chum
escapement in relation to total chum catch had been done on an annual basis in the past,
the Saanich First Nation could have accessed a thousand more to many thousand more
chum per year for commercial or communal purposes than they did in most years
between 1979 and 2004. More specifically, Saanich Tribal Fisheries could have fished
about 276,500 more chum from Saanich Inlet over the past 25 years than they did.
Goldstream Salmon and El-Niño
El-Niño Southern Oscillation (ENSO) events are known to cause: increased sea
surface temperatures in Pacific Ocean waters; change in salmon migration paths; salmon

149
to migrate deeper into the ocean water column; and mortality of salmon (Appendix A;
Beamish et al. 1999; Mysak 1986; NOAA 2006). Chum escapements recorded for 1982
and 1983 were very low compared to previous and ensuing years on record (Table 6.4).
This may be linked to the major El-Niño event of 1982 to 1983, however other El-Niño
events have occurred since then. Coho and chinook escapements were also low in 1982
and 1983 and while it is possible that these populations were impacted by the El-Niño in
those years, the difference in population between those and other years on record for
these species were not on average noteworthy. Chum escapements decreased in
conjunction with El Niño events from 1986 to 1987 as well, and escapements for
Goldstream coho, chinook and chum were all considerably lower during the major 1997
and 1998 ENSO than in the two-to three-year period leading up to that event (Figure 6.1,
6.2, 6.3; Table 6.4). The discussion of El-Niño events in relation to concurrent
Goldstream salmon abundances opens the dialogue for considering natural events as
causes for decreases in salmon populations along with anthropogenic causes such as
overfishing, pollution, global warming and destruction of salmon habitat from urban
developments such as road construction.
Goldstream Salmon Spawning Spaces
In the absence of competition for spawning habitat, hatchery and wild salmon
breed freely. When competition for space is a factor however, reduced redd numbers,
delayed spawning and increased egg loss through retention are reported (Flemming and
Gross 1992). The number of spawning female fish produced in a given year is strongly
density dependent on the (initial) number of females that lay eggs at the time of spawning
(Elliott and Hurlsy 1998). The naturally occurring chum population has enough room to

150
spawn at its maximum carrying capacity (K). Individual chum were, however, probably
competing with each other for spawning space in years when chum escapements were
between 35,000 (1948 averages) and 45,000 (1988 averages) (Figure 6.3). Coho and
chinook (which are hatchery enhanced stocks) tend to migrate further upstream to spawn
than chum and are therefore probably not frequently in direct competition with chum for
spawning space (particularly when chum are at or below the 15,000 chum carrying
capacity). Coho and chinook are probably not at risk of overspawning (digging up and
destroying one another‘s gravel redds as a result of direct competition for space) as each
has more than sufficient access to spawning ground space (14 m² each) in Reaches 2 and
3 of the river (Figure 2.2, Table 6.6).
Saanich Inlet ESSR Chum Catch (1982 to 2004)
Goldstream River chum fishery management and monitoring efforts have been
improving over time as target goals are successfully met and fishing activity is curbed
accordingly. Comparisons of ESSR catch and escapement data showed that Saanich
Tribal Fisheries overfished chum in Saanich Inlet in 1983 and 1989 (2 out of their total of
22 fishing years on record from 1982 to 2004) (Figure 6.4; Table 6.4). The chum
population was below its carrying capacity in the years 2000, 2003 and 2004. However
no ESSR chum fishery occurred in those years and so local overfishing did not contribute
to the decrease in the chum population in those years. The time series graph of annual
native harvest statistics also indicates that Saanich Tribal Fisheries did not acquire any
income from an ESSR chum fishery to fund and sustain conservation (shore patrol,
stream surveyors), restoration (stream and wetland protection), stewardship (day and
night river patrol personnel) or other fisheries related programs for three of the five years

151
between 2000 and 2004 (inclusively). The facilitation and progress of these programs is
entirely dependent on and vulnerable to unpredictable abundances of chum returning to
Goldstream River and Saanich Inlet. The danger in the strategy of using ESSR funds to
administer these programs is that when there are continuous, consecutive or closely
intermittent years when fewer than 15,000 chum return to Goldstream, Saanich Tribal
Fisheries is at risk of bankruptcy, and conservation, restoration and stewardship activities
are at risk of being terminated, just when they are most needed.
Food, Social and Ceremonial Chum Catch (1978 to 2003)
Saanich Tribal Fisheries seems to be shifting away from fishing chum from
Saanich Inlet for Food, Social and Ceremonial (FSC) purposes. A steep decline in FSC
chum catch is apparent over the past few years (1997 to 2004) compared to previous
years (1982 to 1997). This is probably due in part to unpredictable, oscillating salmon
escapements at the river, Saanich Peoples‘ perception that there are fewer salmon
returning to the river and the inlet, the pollution of the inlet and to an increase in or shift
towards ESSR chum fishing activity which coincides with the decrease to the FSC chum
fishery over recent time (Figure 6.5). This transition from FSC to ESSR chum fishing
may represent a conscious shift in fishing effort implemented by Saanich Tribal Fisheries
in order to economically sustain the costs of the ESSR chum fishery and other
Goldstream salmon monitoring programs described earlier. This transition in fishing
effort bodes well for increasing funds for the ESSR fishery and for stewardship and
supporting fisheries projects in years when there is a sufficient abundance of chum to
allow the fishery in the inlet.

152
The decrease in FSC chum fishing in the inlet, however, indicates that there are
fewer salmon available for social events, ceremonies and feasts customary to Saanich
People (Claxton and Elliott 1993; 1994). Some of the salmon stocks migrating through
Saanich Inlet during the fall run fishing season are Cowichan River chum stocks and
some are Goldstream River chum stocks: however some stocks migrate from offshore
waters of the United States. Though unpredictable, this is an important factor to consider
in regards to establishing fishing limits to prevent overfishing of chum stocks in Saanich
Inlet (even after target escapements have been met at Goldstream River) because the
1985 Pacific Salmon Treaty between BC and the US requires that Canada and the US
monitor, measure and ensure equity of southern Pacific Coast chum catch between these
two countries (Pacific Salmon Commission 2005). Cowichan First Nations received their
own ESSR chum fishery license in 2002 and caught 11,169 chum in Satellite Channel
(DFO Statistical Management Area 18-located north of Area 19, the Saanich bands‘
fishing location) in that year while Saanich Tribal Fisheries caught just over 75,000 chum
(DFO 1982-2004, 2002).
The Cowichan band‘s ESSR fishery is allowed once a considerably higher target
chum escapement (110,000) reaches Cowichan River (DFO 2002). As many Goldstream
chum enter Saanich Inlet by way of Satellite Channel, it is important that equitable
abundances of chum remain available to the Saanich Inlet ESSR fishery as they are
passing through the Cowichan bands‘ fishing waters. If annual chum catch and
escapements continue to be recorded by both the Cowichan and Saanich First Nation
bands, improvements and advances to monitoring of chum populations, catches and
establishment of ceilings for maximum catch at Saanich Inlet and Satellite Channel
153
(Areas 19 and 18) may be attainable over time41
. This step could occur by averaging
total ESSR catch for each of Saanich Inlet and Satellite Channel over time and solving
for a catch ceiling that can represent and enable equitable allocation of chum catch for the
Saanich and Cowichan bands. The figure for annual ESSR chum catch ceilings could be
determined from, for example, an equation that includes solving for the variables of total
chum escapements at each of Goldstream and Cowichan rivers, total chum catch from the
Saanich and Cowichan bands‘ ESSR fisheries, the bands‘ total on-reserve population and
economic needs from the fishery.
Chum Escapement, ESSR and FSC Catch (1980 to 2004)
This research raises questions about whether relationships between Goldstream
salmon escapement abundance and the two chum fisheries in Saanich Inlet are occurring
randomly or whether they can be explained by fishing activity or fisheries management
practices. Examining chum escapement, ESSR and FSC catch together allowed for
observations and comparisons of parallel or inverse relationships between the two chum
fisheries and chum escapements at the river (Figure 6.10). There is an apparent link
between decreased chum fishing activity and an increase in adult chum spawners that
have evolved from both the parent and offspring generations returning to the river.
Variables for Monitoring Saanich Inlet Salmon
Catch per unit effort (CPUE) analysis is used for gauging the abundance of fish
caught for a given amount of energy (time and/or money spent by fishing vessel and
41
According to Simonsen et al. (1997), Saanich Inlet was a traditional fishing place of the Cowichan as
well as Saanich bands (which includes the Malahat band).

154
crew). The extent of CPUE depends in great part on how abundant the annual chum
salmon run is at particular times when fishing occurs at particular fishing areas and how
much effort the fishing vessel, captain and crew expend on fishing. Annual catch and
effort data can assist with a posteriori accounting for costs of operating a fishing vessel
during the fishing season. There was insufficient data to conduct a meaningful CPUE for
Saanich Tribal Fisheries‘ ESSR chum fishery. Consistent annual data for monitoring
salmon catch and fishing effort (e.g. reports of date, time, weather, accurate listing of
location, tide, currents, net hours, numbers of fishers as well as gender, weight, number
of chum and by-catch fish caught during each fishing trip) were missing for most years
(1982 to 2004) for which there were records of Saanich Inlet ESSR chum catch.
Recording and examining the abundance of (tagged and untagged) incidental coho and
chinook bycatch caught during ESSR fishing trips in Saanich Inlet could also help with
monitoring Goldstream coho, chinook and chum salmon stocks over time.
Integrated Fisheries Management of Goldstream Salmon Stocks
As noted in the results section, Saanich fishers expressed a number of concerns
pertaining to salmon fisheries and conservation. Two of the main concerns were
enhancement of salmon stocks at Goldstream River and lack of consultation from DFO
regarding management decisions about Saanich peoples‘ traditional salmon resources.
Councilors representing Saanich First Nations (or Saanich Tribal Fisheries) and DFO
officers have worked together to negotiate license agreements for the ESSR chum fishery
in Saanich Inlet and have co-managed this fishery since 1978. Given that a co-
management work relationship already exists between these two bodies, the processes of
consultation, cooperation and information sharing towards the mutual goal of improving
155
stock assessments and monitoring protocols is certainly attainable through a more
comprehensive co-management strategy that includes learning-by-doing (Berkes 1994).
Conflict management or resolution (guiding conflicts towards constructive results) and
social communication (creating meaning and enriching common knowledge in the face of
change) are important features of any co-management endeavour (Borrini-Feyerabend et
al. 2000:7-15) (Figure 7.2).
Learning-by-doing, collaborating and information sharing are active processes
inherent to the adaptive management approach to fisheries management as well. In
practice, the adaptive management approach should accommodate a mix of trial-and-
error, feedback learning and social learning with elders and stewards in charge and would
be designed to incorporate the traditional ecological knowledge of Saanich fishers,
stewards and elders as in a traditional management system (Berkes 1999; Figure 7.2). In
the adaptive management approach proposed in this model, Saanich People learn about
the salmon resource from the perspective of their elders and gain cultural and ecological
knowledge that is important for protecting their salmon and salmon fisheries. I propose
this approach because I believe it would allow Saanich Tribal Fisheries to continue with
and advance current fisheries projects while returning to the original concept upon which
the council was founded: to gather together with elders, community leaders and stewards

Figure 7.2 Co-Management, Adaptive Management, First Nations‘ Traditional Resource Management and Ecosystem-Based
Management for Goldstream Salmon Stocks Monitoring, Assessment and Management (Berkes 1999; Borrini-
Feyerabend et al. 2000; CIT 2001)
2a. Adaptive Management: Integrates co-management &
STF‘s traditional management
approach (Proposed for the year
2007 & onwards)
1c. Processes: i. Consultation
ii. Cooperation & building of trust
iii. Information sharing
iv. Learning-by-doing
v. Conflict management
vi. Social communication
vii. Share visioning of mutual goals
2c. Processes: i. See 1.c.
ii. Trial & error
iii. Feedback learning
iv. Social learning with elders &
stewards in charge (includes TEK
about salmon)
v. Power sharing & equity
3a. Ecosystem-Based
Management: Blends adaptive
management & co-management with
a precautionary approach to
protecting ecosystems (For 2007
onwards)
3c. Processes:
i. See 1.c. & 2.c.
ii. Transparency about actions &
decisions
iii. Support & improve the health &
sustainability of human communities
& natural ecosystems (including the
streams‘, ocean inlet‘s & forests‘
species‘ biodiversity)
1b. Goal setting: Example
- Improve stock
assessment & monitoring
protocols of Goldstream salmon in 2007 & onwards
2b. Goal setting: Example
- Consultation from DFO to
STF while making decisions
about Goldstream salmon
management including coho
& chinook enhancement
3b. Goal setting: Example
- Saanich People strengthen
salmon & habitat protection,
conservation, monitoring &
stewardship programs fostering
TEK & work skills
1a. Co-management:
DFO & Saanich Tribal Fisheries
(STF) have co-managed the
Saanich Inlet ESSR chum fishery
since 1978
15
6
of the lands and waters to discuss and work towards solving fisheries issues that arise
within the community (Bartleman J. pers. comm. 2002).
Saanich fishers‘ concerns about a lack of meaningful consultation by DFO
regarding decisions about salmon resources (including hatchery enhancement of coho
and chinook stocks at Goldstream River) can be communicated with the knowledge and
confidence that power-sharing and equity in the adaptive management approach of their
fisheries is expected (Figure 7.2). In this schematic model, stakeholders42
ultimately
work collaboratively to collect data, monitor and assess naturally spawned and hatchery-
enhanced salmon stocks returning to Saanich Inlet feeding grounds and Goldstream
River spawning grounds.
Ecosystem-based management embraces adaptive management as well as some
of the attributes of co-management such as transparency and willingness of each party to
accept the others‘ philosophies (e.g. DFO accepting Saanich peoples‘ traditional
ecological knowledge and fisheries management practices and Saanich People being
open to considering science-based management recommendations). It has the additional
goal of maintaining spatial and temporal characteristics of ecosystems such that
component species and ecological processes can be sustained (CIT 2001); promoting
restoration of the Goldstream salmon species to their most common, healthy or
sustainable abundances over time, for example. Ecosystem based management also
mandates that human well-being be supported and improved (CIT 2001) (Figure 7.2).
For example, Saanich communities would continue benefiting from the development of
42
Stakeholders: Those who have an interest in a particular decision, either as individuals or
representatives of a group. This includes people who influence a decision or can influence it as well as
those affected by it (Stakeholder Forum for Our Common Future 2002).
157

158
stewardship and monitoring programs including training and employment opportunities
that are funded by the profits from the ESSR chum harvest sales. As illustrated in
Chapter 4, a precautionary approach to fisheries management is often incorporated with
ecosystem-based fisheries management (CIT 2001; First Nation Panel on Fisheries
2004; Larkin 1996; Olsson and Folke 2001). Precautionary measures for Goldstream
salmon may include, for example; refraining from enhancing a population at levels not
previously documented when its long term effects on an ecosystem are unknown; and
prohibiting the harvest of stocks thought to be of concern due to declining numbers even
if exact population parameters are unknown.

159
CHAPTER 8 – RECOMMENDATIONS AND CONCLUSIONS
8.0 Recommendations
Observations of aquatic changes and environmental impacts such as reductions
or changes to the width of Goldstream River and its tributaries, reduced number and
quality of streams flowing into Saanich Inlet and the onset of pollution in the inlet since
the 1950s need to be documented and considered along with monitoring of fluctuations
of escapement and total catch of coho, chinook and chum salmon at these sites over
time. This will improve existing monitoring protocols, which to date only account for
total abundance (i.e. catch and escapement) of salmon stocks. As it is difficult and
probably impossible to accurately predict annual returns of chum, a good precaution
would be to ensure a safeguard of 1,000 to 3,000 chum escapements beyond the current
annual target goal of 15,000 chum. This will help with sustaining the next generations
of wild chum stocks. Adding a moderate buffer to the existing target escapement of
chum would increase the amount of nutrients entering the ecosystem for organisms
(such as mink) and microorganisms (such as bacteria) that feed upon salmon and salmon
carcasses. Increasing the abundance of chum salmon carcasses in the river would also
increase the amounts of the element nitrogen entering the ecosystem43
, which in turn
promotes the growth of plants and trees in the Goldstream River riparian zone (Helfield
and Naiman 2001; Reimchen 2003). Promoting the growth of plants such as common
lady fern (Athyrium filix-femina [L.]Roth) and deciduous trees such as red alder (Alnus
rubra) along the Goldstream River streambanks (Bocking et al. 1998) reduces stream
43
In the cycling of nitrogen, microorganisms feed on the flesh of decaying salmon or salmon
carcasses, processing the nitrogen as they feed and releasing it when they die so that the nitrogen is
transported through the river water, riverbed, streambanks and riparian zone soils and made available
for uptake by grasses, plants, shrubs and trees (Reimchen et al. 2003).

160
bank erosion, which can lead to siltation and suffocation of fertilized salmon eggs.
Growth of plant and tree foliage along the streambanks of salmon spawning waters also
provides shade and refuge for salmon, especially coho, which prefer cooler, shadier
waters. Shading from streamside vegetation also prevents stream waters from
overheating which can lead to salmon mortality (Michalski et al. 2000; Slaney and
Martin 1997).
For future analyses, protocols for counting and assessing returning salmon could
be improved by modifying the stream survey methodology to incorporate records of
physical characteristics of salmon such as gender, length, width, girth and weight as well
as morphological indicators of health (such as open wounds, scars or disfigurations) and
spawning behaviour to accompany the escapement data and current stream survey
reports. This additional assessment would allow more effective identification of
changes to the morphology and health of returning salmon over time, contributing to
more refined baseline information for future decision-making regarding conservation of
Goldstream salmon and salmon habitat. This might include decisions to curb fishing
effort of certain stocks and restore or enhance spawning, rearing and feeding habitat. In
addition, annual assessment of the stomach contents of deceased coho, chinook and
chum salmon could provide an indication of the main prey of Goldstream salmon (e.g.
shrimp, herring or other species they may have consumed from Saanich Inlet). Such
studies could also determine whether or not one species (e.g. coho) is out-competing
another species (e.g. chum) for the same limited food resources (e.g. nearshore herring
and shrimp). Together with escapement data (annual abundance of returning stocks), this

161
information could improve our current understanding and management of the
Goldstream salmon stocks.
Additionally, repeated seasonal monitoring of salmon redds dug by each of the
three salmon species spawning at the river over time would assist in gauging whether
(enhanced) coho and chinook stocks are impacting or outcompeting natural chum
populations at this site. The Saanich fishers believe this to be the case.
People of the Saanich First Nation communities should be consulted and invited
to participate with drafting, coordinating and implementing these and other proposed
changes that may occur to the current Goldstream River escapement enumeration and
monitoring procedures. I suggest that monitoring efforts employed by Saanich Tribal
Fisheries for recording total catch of Saanich Inlet chum could be improved if variables
for catch and effort such as time, date, number of fishers, net hours, weight of salmon
caught, bycatch, weather conditions, tides, currents and nautical chart or geographical
positioning system coordinate readings of areas where fishing effort occurred were
tabulated for each fishing event.
Further communication and consultation about the issue of mixed salmon stock
management and the coho and chinook stock enhancement occurring at Goldstream
River are required in order to address Saanich fishers‘ concerns with DFO fisheries
management. Specifically, the Saanich are concerned that their traditionally important
chum populations are being eclipsed by the enhanced coho and chinook. Studies
monitoring for interspecies competition over spawning habitat at Goldstream River may
clarify whether or not enhanced coho and chinook stocks place additional competition or
stress on the naturally occurring chum population and/or between each of the enhanced

162
stocks. Studies assessing relationships between coho, chinook and chum escapements at
the river and availability or abundance of food prey in Saanich Inlet within the same
fishing season may be helpful for determining whether enhanced coho and chinook
stocks place additional competition or stress upon chum at Saanich Inlet feeding
grounds. Saanich fishers deliberately restrained from exercising their traditional fishing
rights during times when coho stocks were replenishing which provided Goldstream
coho stocks a chance for natural, undisturbed regeneration over time and undoubtedly
helped increase coho populations. This type of fisheries management practice could
replace salmon enhancement as a coho and chinook population conservation and
regeneration strategy.
DFO‘s decision in 2002 to allow priority to a non-First Nations commercial
chum fishery in Saanich Inlet before either the Cowichan or Saanich Peoples‘ chum
fisheries had begun, compromised and limited Saanich and Cowichan Peoples‘ access to
their own natural and economic resources (Table 6.1). Though this decision occurred
only for the 2002 salmon fishing season, it was one that was contrary to the
constitutional rights of First Nations to have first priority over the Food, Social and
Ceremonial fisheries (once conservation objectives have been addressed) as established
in the R. vs. Sparrow case (DFO 2000a; Supreme Court of Canada 1990). This issue is
complex and calls for open, trilateral discussion among the three parties concerned:
DFO, commercial harvesters, and Saanich Tribal Fisheries. The management model I
proposed in Figure 7.2 includes goals and processes for addressing issues and conflicts
among parties with common interests in Goldstream River (and Saanich Inlet) salmon.
This framework integrates adaptive management, co-management, traditional

163
management and ecosystem-based management approaches. Processes include
consultation, learning-by-doing, collaborative decision-making, a precautionary
approach and flexibility with environmental and cultural changes in the monitoring,
assessment and management of salmon stocks.
Recording CPUE variables such as time, date, total number, sex and weight of
salmon caught (including any bycatch fish), weather conditions, tide, currents, number
of net hours, type and number of fishing vessels and number of fishing crew members
on board each vessel each fishing season would allow Saanich Tribal Fisheries to
consider what their annual catch and profits are in relation to effort and costs expended
in the ESSR chum fishery in Saanich Inlet over time. It would also be advantageous if
the captain and crew operating the ESSR fishery vessel in Saanich Inlet accurately
recorded the specific location, parameters (i.e. longitude and latitude, or Geographic
Positioning System [GPS] coordinates) and water depth in which salmon were caught
alongside the variables required for complete CPUE analyses over time as these data
could be used to identify and track specific locations where the greatest abundance of
salmon were fished in the past (e.g. over a five-year period). This would enable rotation
of fishing pressure by seine and trolling vessels from heavily fished to less frequently
fished areas and allow Saanich Inlet‘s ecosystem resources time to recover from the
continuous, annual commercial troll and seine chum salmon fishing activities. Three-to
five-or even ten-year rotations of fishing effort in fishing areas of Saanich Inlet along
with the proposed 16,000 to 19,000 chum target escapement at Goldsteam River could
also assist with preventing chum in Saanich Inlet from becoming overfished over the
long term.

164
The Saanich Inlet ESSR chum fishery enables Saanich Tribal Fisheries to train
and pay workers to work as guardians and surveyors. As noted in the discussion about
costs and benefits of running a fishing vessel (Chapter 6), however, the work and
income from the fishery is unstable. If a ten-year average of profits (e.g. 1995 to 2005
ESSR profits) were assessed, then a fixed annual fund could be put aside for training and
employing guardians, surveyors and stewards. In addition, a monitoring program could
be put in place that would allow individuals in the community to train and work at those
jobs on a regular, annual basis (e.g. four months a year full-time and four to eight
months a year part-time).
Saanich people are not fishing Saanich Inlet or Goldstream River with their
families as much now as they did in the past. To remedy this, a portion of profits from
the ESSR fishery could be allocated to sponsoring Saanich First Nations guided
educational field trips to Goldstream River and Saanich Inlet to teach traditional fishing
methods to children and adults interesting in learning about Saanich fishers‘ cultural
ways, traditions, and heritage. Alternatively, ESSR funds could be put aside to sponsor
and provide an incentive for families to participate in guided family fishing excursions
to Saanich Inlet and Goldstream River. Finally, external funding is advisable for
projects and jobs that facilitate monitoring of Goldstream salmon stocks, restoring and
stewarding Goldsteam‘s tributaries, the other creeks running into Saanich Inlet and the
wetlands of the Goldstream riparian zone, as well as for addressing and monitoring the
problems with pollution in Saanich Inlet. Funding from external bodies such as DFO,
the BC Ministry of Agriculture, Food and Fisheries or non-government environmental
organizations such as the David Suzuki Foundation or the Sierra Club of BC would help

165
Saanich Tribal Fisheries and the Saanich People with carrying forward those jobs and
projects in years when the ESSR fishery has poor profit margins or deficits or in the
event of a 10-year lull in the ESSR fishery occurring, for example. This is a timely
recommendation since DFO and Saanich Tribal Fisheries recently negotiated that 20%
of the ESSR chum fishery in Saanich Inlet will be opened up and allocated to
commercial fishers from outside the Saanich or Malahat First Nation (Jacks V. pers.
comm. 2004).
8.1 Conclusions
More complete counts and assessments of returning salmon during escapement
surveys can effectively contribute to improving monitoring protocols for Goldstream
salmon. The baseline of data available about coho, chinook and chum abundance in
Goldstream River spans a period of 73 years (1932 to 2004), and is useful for showing
trends in changes in abundance of each of the three salmon species over this time period.
These data are also useful when applied as a tool for measuring, monitoring and
benchmarking ESSR and FSC chum fishing activity in Saanich Inlet. When used
together escapement data (from 1932 to 2004) and native harvest statistics (from 1978 to
2005) can provide supporting information for determining whether chum fishing activity
should be increased, decreased, or remain more or less constant in a five year life-cycle
following a given escapement year. For example, if chum populations were below
15,000 in 2004, then fishing activity should be monitored so that a minimum of 15,000
chum make it through Saanich Inlet to Goldstream River in the 2009 salmon spawning
cohort.
166
Salmon are an important indicator species for the Goldstream River and Saanich
Inlet ecosystems and are culturally and economically important to the Saanich First
Nation peoples. This research provides concrete suggestions based on interviews and
documenting knowledge and perspectives of Saanich fishers, as well as examining
existing population data and monitoring protocols for the three salmon species
frequenting Saanich Inlet and spawning at Goldstream River (coho, chinook and chum),
for improving the processes and effectiveness of monitoring, assessing and managing
these stocks. Given that Saanich peoples have relied on salmon of Saanich Inlet and
Goldstream River since time immemorial, probably thousands of years, and given that
they have rights to fish these salmon as defined in the Canadian Constitution, they need
to be even more closely involved as participants in monitoring, management and
decision-making protocols affecting the salmon and their fisheries. Accordingly, I have
presented in this thesis several recommendations that will improve their overall
participation in salmon management. Ultimately, the addition of the Saanich fishers‘
knowledge and cultural practices to a true co-management situation will benefit the
salmon populations and their habitats as well as the health and well being of the Saanich
people.

167
REFERENCES CITED
Aboriginal Canada Portal. 2006. First Nation community connectivity profiles. [online]
URL: www.aboriginalcanada.gc.ca/acp/site.nsf/en/index.html Accessed: 27 June
2006. Site last updated: 8 August 2006.
Akrigg, Helen B. and G.P.V. Akrigg. 1998. British Columbia Place Names. 3rd
ed.
Vancouver: UBC Press.
Alcorn, J. B. 1993. Indigenous Peoples and conservation. Conservation Biology.
7(2):424-427.
Arizona Department of Transportation. 2004. Which historic roads are worthy of
preservation? Environmental Planning Group of the Intermodal Transportation
Division. File #: 11344\130/final\report 03-04.
Barsh, R. L. 1982. The economics of a traditional coastal Indian salmon fishery. Human
Organization. 41(2):170-176
Baxter, J. M. 2000. Salmon. Stillwater: Voyageur Press Inc.
BC Archives. 1873. Saanich settlers‘ position regarding East Saanich Road. GR-
0868. British Columbia Department of Lands and Works. Originals, 1871-1883,
44 cm. Letters inward to the Chief Commissioner of Lands and Works. Province
of BC. 2001. [online] URL: www.search.bcarchives.gov.bc.ca
/sn1A91DF1/bsearch/TextualRecords#form Accessed: 5 April 2003.
BC Fisheries. 2001. FishInfo BC Fish Wizard. Stream Report for Goldstream River,
Vancouver Island, BC. [online] URL: www.pisces.env.gov.bc.ca/FishWizard
Frames.asp. Accessed 15 January 2004.
BC Ministry of Environment. 2001. Tackling non point source water pollution in
British Columbia – An Action Plan. BC Ministry of Environment –
Environmental Protection Division - Water, Air and Climate Branch.
BC Ministry of Environment. 2006. Goldstream River Provincial Park. [online]
URL: www.env.gov.bc.ca/bcparks/explore/parkpgs/goldstre.html#fishing
Accessed: 24 June 2006. BC Parks.
BC Ministry of Forests. 1999a. The ecology of the Coastal Western Hemlock Zone.
[online] URL: http://www.for.gov.bc.ca/hfd/pubs/docs/Bro/bro31.pdf
BC Ministry of Forests. 1999b. The ecology of the Coastal Douglas Fir Zone.
[online] URL: http://www.for.gov.bc.ca/hfd/pubs/docs/Bro/bro30.pdf
168
BC Ministry of Forests. 2001. Hillslope restoration in BC. Watershed Technical
Restoration Circular, No. 3.
BC Ministry of Lands, Parks and Housing. 1986. Goldstream Provincial Park Master
Plan. Parks and Outdoor Recreation Division-BC Ministry of Lands, Parks and
Housing – South Coast Region. Province of BC.
BC Ministry of Water, Land and Air Protection (BC WLAP). 1995. Saanich Inlet Study
Newsletter Two. Victoria: Province of BC.
BC Ministry of Water, Land and Air Protection (BC WLAP). 1996. Saanich Inlet Study
Synthesis Report Summary. Victoria: Province of BC.
BC Treaty Commission. 2004. BC Treaty Commission Annual Report-2004. BC Treaty
Commission.
Beamish, R. J., D. J. Noakes, G. A. McFarlane, L. Klyashtorin, V. V. Ivanov and
V. Kurashov. 1999. The regime concept and natural trends in the production
of Pacific salmon. Canadian Journal of Fisheries and Aquatic Sciences. 56:516-
526.
Berkes, F. 1977. Fishery resource use in a subarctic Indian community. Human Ecology.
5:89-307.
Berkes, F. 1979. An investigation of Cree Indian domestic fisheries in northern Quebec.
Arctic Journal. 32:46-70.
Berkes, F. 1989. Native subsistence fisheries: A synthesis of harvest studies in Canada.
Arctic Journal. 43(1):35-42.
Berkes, F., P. George and R. J. Preston. 1991. Co-management: The evolution in
theory and practice of the joint administration of living resources. Alternatives
Journal. 18(2):12-18.
Berkes, F. 1993. Cree fishermen of the Eastern Subarctic: Stewards of the commons
in: Environmental Stewardship – Studies in Active Earthkeeping. Edited by
Lerner, Sally. Department of Geography Publication Series No. 39. University
of Waterloo. Waterloo. Pps. 157-177.
Berkes, F. 1994. Co-management: bridging the two solitudes. Northern Perspectives.
22(2-3):18-20.
Berkes, F., C. Folke and M. Gadgil. 1995. Traditional ecological knowledge,
biodiversity, resilience and sustainability in: Biodiversity Conservation:
Problems and Policies. Edited by Perrigs, C.A. et al. Dordrecht (The
Netherlands): Kluwer Academic. Pps. 281-289.

169
Berkes, F., and T. Henley. 1997. Co-management and traditional knowledge: Threat or
opportunity? Policy Options. March:29-35.
Berkes, F. 1999. Sacred ecology: Traditional ecological knowledge and resource
management. Philadelphia: Taylor and Francis.
Berkes, F., Colding J. AND C. Folke. 2000. Rediscovery of traditional ecological
knowledge as adaptive management. Journal of Ecological Applications.
10(5):1251-1262.
Bilby, R. E., E. W. Beach, B. R. Fransen and J. K. Walter. 2003. Transfer of nutrients
from spawning salmon to riparian vegetation in western Washington.
Transactions of the American Fisheries Society. 132:733-745.
Bocking, R., Firth, R., Ferguson, J. and S. Yazvenko. LGL Limited Environmental
Research Associates. 1998. Goldstream River overview and level 1 fish
habitat assessment and rehabilitation opportunities (including riparian).
Sidney: Te`mexw Treaty Association, and the Ministry of Environment, Lands
and Parks.
Boggs, C. 1997. Local pelagic catch and effort data analysis and integrated modeling to
quantify the effects of local fisheries on fish availability (RCUH Project 2041).
Joint Institute for Marine and Atmospheric Research. University of Hawaii.
Bornhold, B. D., J. F. Firth, P. J. Fox and J. Bauldauf. March 1996. Ocean drilling
program leg 169S scientific prospectus Saanich Inlet. Scientific Prospectus No.
69S. [online] URL: www-odp.tamu.edu/publications. Accessed: 30 December
2003
Borrini-Feyerabend, G., M. T. Farvar, J. C. Nguinguiri and V. A. Ndangang. 2000.
Co-management of natural resources: Organizing, negotiating and learning-
by-doing. GTZ and IUCN, Kasparek Verlag, Heidelberg (Germany).
Boyatzis, R. E. 1998. Transforming qualitative information: Thematic analysis and
code development. Thousand Oaks: Sage Publications.
Braker and Company Barristers and Solicitors. 2006. Haida/Taku Supreme Court of
Canada decisions and potential implications for fisheries issues. Letter of legal
opinion to BC Aboriginal Fisheries Commission. [online] URL:
www.bcafc.org/documents/HaidaTakuFish.doc Accessed: 22 February 2006.
Brodnig, G., and V. Mayer-Schoenberger. 2000. Bridging the gap: The role of
spatial information technologies in the integration of traditional environmental
knowledge and western science. The Electronic Journal of Information Systems
in Developing Countries. 1(1):1-15. [online] URL:
http://www.is.cityu.edu.hk/research/ejisdc/vol1.htm Accessed: 24 January 2005.

170
Bruce, I. 2005. Tseycum First Nation and the restoration of the Patricia Bay
watershed. Proceedings of the 2005 Puget Sound Georgia Basin Research
Conference. [online] URL: http://www.psat.wa.gov/Publications/05_proceedings
/Papers/F8_BRUCE.pdf. Accessed: 5 July 2006.
Brye, K. R., T. L. Morris, D. M. Miller, S. J. Formica and M. A. Van Eps. 2004.
Estimating bulk density in vertically exposed stoney alluvium using a modified
excavation method. Journal of Environmental Quality. 33:1937-1942.
Candy, J.R., and T.P. Quinn. 1999. Behavior of adult chinook salmon (oncorhynchus
tshawytscha) in British Columbia coastal waters determined from ultrasonic
telemetry. Canadian Journal of Zoology. 77:1161-1169.
Capital Regional District (CRD). 2003a. The water supply areas. [online] URL:
http://www.crd.bc.ca/water/watersupplyarea/watersheds.htm Accessed: 20 June
2006.
Capital Regional District. 2003b. Shellfish. Stormwater News. December 2003. 1(2):5
Capital Regional District. 2006. Sooke and Goldstream Watersheds [online] URL:
http://www.crd.bc.ca/water/watersupplyarea/watersheds.htm Accessed: 24 June
2006
Cayan D. R., and R. H. Webb. 1992. El Niño/Southern Oscillation and stream flow
in the western United States. El Niño: Historical and paleoclimatic aspects of
the Southern Oscillation. Edited by H. Dias and V. Markgraph. Cambridge
Univesity Press. London. UK. pps. 29-68.
Chilcote M. W., S. A. Leider and J. J. Loch. 1986. Differential success of hatchery
and wild summer-run steelhead under natural conditions. Transactions of the
American Fisheries Society. 115:726-735.
Christopherson, R. W. 1994. Geosystems: An introduction to physical geography.
2nd
edition. Toronto: MacMillan College Publishing Company.
Claxton, E. Sr., and J. Elliott Sr. 1994. Reef Net Technology of the Saltwater
People. Brentwood Bay: Saanich Indian School Board.
Coast Information Team (CIT). 2001. Ecosystem based management. [online] URL:
www.citbc.org/ebm.html Accessed: 25 February 2006.
Colorado, P. 1988. Bridging native and western science. Convergence. 21(2/3):49-68.
Community Mapping Network. 2006. Base map and thematic layers for
Cowichan River, Saanich Inlet and Goldstream River watersheds, Southern
Vancouver Island, BC. [online] URL: www.shim.bc.ca/atlases/BCWsheds/

171
main.htm. Accessed: 13 June 2006.
Confederacy of Nations. 2004. Resolution No. 9. Nuu-chah-nulth fisheries
litigation. Saskatoon, Saskatchewan. Assembly of First Nations. May 18, 19
and 20, 2004.
Copes, P. 1998. Coping with the coho crisis: a conservation-minded, stakeholder
sensitive and community-oriented strategy (An interim report to the Honourable
Dennis Streifel, Minister of Fisheries of British Columbia).
Victoria: BC Ministry of Fisheries.
Coward, H. Ommer, R. and Pitcher, T. 2000. Just Fish: Ethics and Canadian Marine
Fisheries. St. John‘s: Institute of Social and Economic Research.
Cox, G. W. 1996. Laboratory manual of general ecology. 7th
ed. Wm. C. Brown.
Times Mirror Higher Education Group Inc.
Crockford, S. 1994. New archaeological and ethnographic evidence of an extinct fishery
for giant blue fin tuna on the Pacific North Coast of North America. Fish
Exploitation in the Past. Proceedings of the 7th
meeting of the ICAZ Fish
Remains Working Group. Van Neer, W. (ed.). Annales du Muse Royal de
l’Afrique Central.Sciences Zoologiques. No. 274. Tervuren.
Crockford, S. 1997. Archaeological evidence of large northern bluefin tuna in coastal
waters of British Columbia and northern Washington. Fishery Bulletin. 95:11-24.
Currens K. P., A. R. Hemmingsen, R. A. French, D.V. Buchanan, C. B. Schreck and H.
W. Li. 1997. Introgression and susceptibility to disease in a wild population of
rainbow trout. North American Journal of Fisheries Management. 17:1065-1078.
Daily, G. C., and P. R. Ehrlich. 1992. Population, sustainability and earth‘s carrying
capacity: A framework for estimating population sizes and lifestyles that could
be sustained without undermining future generations. Bioscience. 42:761-771.
Dalzell, P., and S. Pooley. 2002. Recreational meta data project. Pacific Fisheries
Research Council. [online] URL:www.soest.Hawaii.edu/PFRP/pdf/
dalzell02.pdf Accessed 15 March, 2003.
Department of Indian Affairs and Northern Development (DIAND). 2006. First Nation
profiles. Registered population of Malahat First Nation as of May 2006.
[Online]. URL: http://pse2-esd2.aincinac.gc.ca/FNProfiles/FNProfiles_
GeneralInformation. asp?BAND_NUMBER=647&BAND_NAME=
Malahat+First+Nation. Accessed: 27 June 2006.
Duerden, F. 1996. Report on socio-economic impacts in the First Nations context:
Bamberton Development Project (Appendix 3). Bastion Group Heritage
Consultants.

172
Dwyer, P. D. 1994. Modern conservation and indigenous peoples: in search of wisdom.
Pacific Conservation Biology. 1:91-97.
Edwards, D., and T. Glavin. 1999. Set adrift: The plight of British Columbia‘s fishing
communities. Vancouver: David Suzuki Foundation.
Elliott, D. Sr. 1990. Janet Poth ed. Saltwater People: A resource book for the
Saanich Native Studies program. School District # 63 (Saanich).
Elliott, J. 2003. Fisheries and Oceans Canada: Chums or chumps? North Saanich
Online Perspective - Saanich Inlet Protections Society (SIPS). [online] URL:
www.northsaanichonline.com Accessed: 9 January 2004.
Elliott, J.M. and M.A. Hurley. 1998. Population regulation in adult, but not juvenile,
resident trout (Salmo trutta) in a lake district stream. Journal of Animal Ecology.
67:280-286.
Environment Canada. 2005. Consultation on amending the list of species under the
Species at Risk Act. Her Majesty the Queen in Right of Canada. National
Library of Canada.
Fedorenko, A. Y., and B.G. Shepherd. 1986. Review of salmon transplant procedures
and suggested transplant guidelines. Vancouver: Salmonid Enhancement
Program. Department of Fisheries and Oceans.
Feller, R. J., and V. W. Kaczynski. 1975. Size selective predation by juvenile chum
salmon (Oncorhynchus keta) on epibenthic prey in Puget Sound. Journal of
Fisheries Research Board Canada. 32(8):1419-1429.
First Nation Panel on Fisheries. 2004. Our place at the table: First Nations in the BC
Fishery. Canada. Budget Printing.
Fisheries and Oceans Canada (DFO). 1932-2004. DFO BC 16 Reports. Annual reports
of salmon stream and spawning grounds for Goldstream River flowing into
Finlayson Arm/Saanich Inlet. Victoria: Fisheries and Oceans Canada.
Fisheries and Oceans Canada. 1978-2004. Area E Chum fishery catch estimates for Area
18. Victoria: Fisheries and Oceans Canada Pacific Region.
Fisheries and Oceans Canada. 1996. Ecology: Nutrient cycling in the coastal zone in:
Introductory Module (Science Module One). [online] URL: www.glf.dfo-
mpo.gc.ca/sci-sci/bysea-enmer/about-ausujet-e.html. Accessed: 18 January 2006.
Fisheries and Oceans Canada. 1998. A new direction for Canada's Pacific salmon
fisheries. Vancouver: Fisheries and Oceans Canada.

173
Fisheries and Oceans Canada. 1999a. Canadian fisheries responsible fisheries summary
1999/2000. Nanaimo: Fisheries and Oceans Canada.
Fisheries and Oceans Canada. Pacific Region. 1999b. West Coast Vancouver Island
(WCVI) sockeye. DFO science stock status Report. D6-05 (1999). Nanaimo:
Fisheries and Oceans Canada.
Fisheries and Oceans Canada. 1999c. Pacific fisheries adjustment and restructuring
program resource manual. Vancouver: Fisheries and Oceans Canada Pacific
Region, Communications Branch.
Fisheries and Oceans Canada. 1999d. Southern chinook salmon. Nanaimo: Fisheries and
Oceans Canada.
Fisheries and Oceans Canada. 2000a. Aboriginal Fisheries Strategy Annual Report
1999-2000. Victoria: Fisheries and Oceans Canada Pacific Region. [online]
URL: www.qc.dfo-mpo.gc.ca/peches/en/peche_au/pdf/afsannrep_en1999-
2000.pdf. Accessed: 9 January 2004.
Fisheries and Oceans Canada. 2000b. Report of the Pacific Scientific Advice Review
Committee (PSARC) Invertebrate Subcommittee meeting. November 28-29,
2000. PSARC Advisory Document 00—08. Canadian Stock Assessment
Secretariat Proceedings Series. 2000/26.
Fisheries and Oceans Canada. 2001a. Aboriginal communal fishing license for Saanich
Tribal Fisheries: Multi-Species. SCD-01-CL0006-Saanich Tribal Fisheries.
Victoria: Fisheries and Oceans Canada Pacific Region.
Fisheries and Oceans Canada. 2001b. Excess Salmon to Spawning Requirements
(ESSR) License 2001-2009 for Saanich Tribal Fisheries-Area 19. Victoria:
Fisheries and Canada Pacific Region.
Fisheries and Oceans Canada. 2001c. Salmon Update – Southern BC and Fraser River.
Victoria: Fisheries and Oceans Canada Pacific Region. [online] URL:
www-comm.pac.dfo-mpo.gc.ca/pages/release/p-releas/2001/nr039_e.htm
Accessed:27 May 2004.
Fisheries and Oceans Canada. 2001d. Pacific stock status report. Vancouver. Fisheries
and Oceans Canada.
Fisheries and Oceans Canada (DFO). 2002a. Long term trends in deep water properties
of BC inlets. Ocean science and productivity research activities.
[online] URL: www-sci.pac.dfo-mpo.gc.ca/osap/projects/bcinlets/saanich_
inlet_e.htm Accessed: 28 October 2003.
Fisheries and Oceans Canada. 2002b. Personal communication With Kathleen McNair.

174
DFO Administrator Re: 15,000 maximum carrying capacity and chum salmon
fished by communal fishing license at Goldstream River. 5 February 2002.
Victoria: Fisheries and Oceans Canada Pacific Region.
Fisheries and Oceans Canada. 2002c. Personal communication with Gerry Kelly.
South Coast Area Fisheries Manager Re: Enhanced coho and chinook stocks at
Goldstream River. 12 November 2002. Pacific Biological Station. Nanaimo,
BC.
Fisheries and Oceans Canada. 2002d. 2003 Salmon stock outlook: Final public.
Nanaimo: Fisheries and Oceans Canada.
Fisheries and Oceans Operations Centre. 2004a. [online] URL: www.pac.dfo-
mpo.gc.ca. Accessed: 19 January 2005.
Fisheries and Oceans Canada. 2004b. BC freshwater salmon supplement updates
2003-2005– Region 1 – Vancouver Island. [online] URL: www.comm.pac.dfo-
mpo.gc.ca/pages/freshwater/regions/region1_e.htm
Accessed: 14 January 2004.
Fisheries and Oceans Canada. 2004c. BC tidal water sport fishing guide. Salmon
species and limits table. [online] URL: www-comm.pac.dfo-mpo.gc.ca/
pages/sfg/tables/salmon_e.htm. Accessed: 14 January 2004.
Fisheries and Oceans Canada. 2004d. Backgrounder - 2003 salmon fishing opportunities
coastwide. [online] URL: www- comm.pac.dfo.mpo.gc.ca/pages/release/bckgrnd
/2004/bg001_e.htm. Accessed: 27 May 2004.
Fisheries and Oceans Canada. 2004e. Fishery notice report 1005. Commercial salmon:
Gillnet (Area E) and Seine (Area B) - Aboriginal interim economic opportunity –
Saanich tribes - Mid Vancouver Island - Chum Update.
Fisheries and Oceans Canada. 2005a. First Nations-North Coast-Commercial salmon.
[online] URL: www.pac.dfo-mpo.gc.ca/northcoast/commercl/default.htm
Accessed: 24 February 2005.
Fisheries and Oceans Canada. 2005b. Sub area map of fishery Management Area
19. [online] URL: www.pac.dfo-mpo.gc.ca/ops/fm/Areas/area_19_e.htm
Accessed: 17 March 2006.
Fisheries and Oceans Canada. 2005c. 2005 detailed salmon season overview. [online]
URL: http://www.coastangler.com/fishing/salmon_2005.shtml
Accessed: 19 June 2006.
Fisheries and Oceans Canada. 2005d. Personal communication with Gerry Kelly.

175
South Coast Area Fisheries Manager. Telephone interview Re: ESSR chum
fishery and Goldstream Salmon. 29 March 2005. Pacific Biological Station.
Nanaimo, BC.
Fisheries and Oceans Canada. 2006a. Pacific Region recreational fishing. Area 19.
[online] URL:www.pac.dfo-mpo.gc.ca/recfish/Tidal/area19_e.htm Accessed: 20
March 2006.
Fisheries and Oceans Canada. 2006b. Pacific Region integrated fisheries management
plan-Salmon-Southern BC-1 June 2005-31 May 2006. Queen‘s Printer.
Government of Canada.
Fisheries Global Information System (FIGIS). 2001. Fisheries industry and technology
gear type fact sheet. [online] URL: www.fao.org/figis/servlet/geartype?fid=249
Accessed: 24 June 2006.
Fisheries Renewal BC. 1998. Fisheries renewal BC strategic plan.Victoria: Queen‘s
Printer for British Columbia.
Flagg, T. A., F. W. Waknitz, D. J. Maynard, G. B. Milner and C. V. W. Mahken. 1995.
The effect of hatcheries on native coho salmon populations in the lower
Columbia River in: Uses and Effects of Cultured Fishes in Aquatic Ecosystems.
Edited by H.L. Schramm Jr. and R.G. Piper. American Fisheries Society
Symposium 15, Bethesde, MD. Pp., 366-375.
Flemming, I. and M.R. Gross. 1992. Reproductive behaviour of hatchery and wild coho
salmon (Oncorhynchus kisutch): does it differ? Aquaculture. 103(2):101-121.
Flett, L., L. Bill, J. Crozier and D. Surrendi. 1996. A report of wisdom synthesized from
the traditional knowledge component studies. Northern River Basins Study
Synthesis Report No. 12.
Freire, J., and A. Garcia-Allut. 1999. Integration of fisher‘s ecological knowledge in
fisheries biology and management. A proposal for the case of the artisanal
coastal fisheries of Galicia (NW Spain). International Council for the
Exploration of the Sea (ICES). Theme Session S: Evaluation of complete
fisheries systems. Economic, social and ecological analyses. C.M.1999/S:07. 17
pp.
Fresh, K. L., R. D. Cardwell and R. R. Koons. 1981. Food habits of Pacific salmon
baitfish and their potential competitors and predators in the marine waters of
Washington - August 1978 to September 1979. State of Washington Department
of Fisheries Program. Rep. No. 145.
Friedlaender, M. J., and J. Reif. 1979. Working paper on Indian food fisheries and
176
salmonid enhancement. Fisheries and Oceans Canada. Vancouver: Edwin, Reid
and Associates Ltd.
Gadgil, M., F. Berkes and C. Folke. 1993. Indigenous knowledge for biodiversity
conservation. Ambio. 22(2):151-156.
George, E. M. 2003. Living on the edge: Nuu-Chah_Nulth history from an Ahousaht
chief‘s perspective. Winlaw: Sono Nis Press.
Gargett, A. E., D. Stucchi and F. Whitney. 2002. Physical processes associated
with high primary production in Saanich Inlet, British Columbia. Institute of
Ocean Sciences, Patricia Bay, Sidney, BC.
Garvin, T., S. Nelson, E. Ellehoj and B. Redmond. 2001. A guide to conducting a
traditional knowledge and land use study. Edmonton: Natural Resources
Canada. Canadian Forest Service.
Gitxsan Chief‘s Office. 2006. Treaty talks. [online] URL:
www.gitxsan.com/html/treaty.htm. Acccessed: 22 Feb 06.
Gitxsan Wet‘suwet‘en Watershed Authority. 1998. Year of crisis for Pacific fisheries: Is
there a future for salmon and for commercial fishing? BC Aboriginal Fisheries
Commission. BC Aboriginal Fisheries Journal. 4(2):4
Goldstream Volunteer Salmonid Enhancement Association [GVSEA]. 2001. Goldstream
Annual Newsletter-December 2001. GVSEA.
Goldstream Volunteer Enhancement Association [GVSEA]. 2005. Goldstream Annual
Newsletter-December 2005. GVSEA.
Gottesfeld, L. and M. Johnson. 1994. Conservation, territory, and traditional beliefs: An
analysis of Gitksan and Wet‘suwet‘en subsistence, Northwest British Columbia,
Canada. Human Ecology. 22(4):443-464.
Green, R.N. and K. Klinka. 1994. A field guide to site identification and interpretation
for the Vancouver Forest Region. BC Ministry of Forests. Victoria. BC Land
Management Handbook No. 28.
Gresh, T., J. Lichatowich, and P. Schoonmaker. 2000. An estimation of historic and
current levels of salmon production in the Northeast Pacific ecosystem: evidence
of a nutrient deficit in the freshwater systems of the Pacific Northwest. Fisheries.
25(1):15-21.
Gulland, J.A. 1969. Manual of methods for fish stock assessment: Part 1 - Fish
population analysis. Rome: Food and Agriculture Organization of the United
Nations.

177
Gunderson, L. 1999. Resilience, flexibility and adaptive management - antidotes for
spurious certitude? Conservation Ecology. 3(1):7.
Haggan, N., T. Pitcher and S. Rashid. 3 April 2003. Back to the future in the Strait of
Georgia. University of British Columbia Fisheries Centre.
Proceedings from the Georgia Basin/Puget Sound Research Conference.
Puget Sound Action Team. Westin Bayshore, Vancouver, BC.
Haggan, N. 2000. Back to the future and creative justice: recalling and restoring
forgotten abundance in Canada‘s marine ecosystems. Pps. 83-89 in: Coward,
Harold, Ommer, Rosemary, and Pitcher, Tony (eds.). 2000. Just fish: Ethics in
the Canadian coastal fisheries. ISER Books. St. John‘s Newfoundland.
Haida Nation v. British Columbia (Minister of Forests), 2004 SCC 73.
Harley, S. J., R. A. Myers and A. Dunn. 2001. Is catch per unit effort proportional to
abundance? Canadian Journal of Fisheries and Aquatic Sciences 58: 1760-1772.
Harris, D. 2001. Fish, Law and Colonialism. The Legal Capture of Salmon in British
Columbia. Toronto: University of Toronto Press.
Harvey, B., and M. MacDuffee. 2002. Ghost runs: The future of wild salmon on the
north and central coasts of British Columbia.Victoria: Raincoast Conservation
Society.
Havasi, A., and Z. Zlatev. 2002. Trends of Hungarian air pollution level on a long time-
scale. Atmospheric Environment. 36:4145-4156.
Health Canada. 1995. Native foods and nutrition. An illustrated reference manual.
Ottawa: Medical Services Branch. Health Canada.
Healey, M. C. 1991. Life history of chinook salmon (Oncorhynchus tsawytscha) in:
Pacific salmon life histories. Edited by C. Groot and L. Margolis (eds.). UBC
Press. Vancouver. Pps. 313-393.
Healy, C. 1993. The significance and application of TEK: Traditional Ecological
Knowledge (Wisdom for Sustainable Development). Edited by Williams, N.
Centre for Resource and Environmental Studies. Canberra: Australian National
University. Pps. 21-27.
Helfield, J. M., and R.J. Naiman. 2001. Effects of salmon derived nitrogen on riparian
forest growth and implications for stream productivity. Ecology. 2 (9):2403-
2409.
Henley, T., H. Fast and S.T. Newton. 2002a. Sustainable development for Canada‘s

178
Arctic and Subarctic communities: A backcasting approach to Churchill,
Manitoba. Arctic Journal. 55(3):281-290
Henley, T., H. Fast and S. Eddy. 2002b. Integrated management planning in Canada‘s
northern marine environment: Engaging coastal communities. Arctic Journal.
55(3):291-301.
Hesthagen, T., O. Heggen, J. Skurdal.and B.K. Dervo. 1995. Differences in habitat
utilization among native, native stocked, and non-native stocked brown trout
(Salmo trutta) in a hydroelectric reservoir. Canadian Journal of Fisheries
Sciences. 52:2159-2167.
Hicks, B. J. 2002. Gravel galore: impacts of clear-cut logging on salmon and their
Habitat In Ghost Runs. Edited by Harvey, B. and M. MacDuffey.
Hilborn, R.C., C.J. Walters. 1992. Quantitative fisheries stock assessment: Choice,
dynamics and uncertainty. London: Chapman and Hall.
Hilborn, R., C. J. Walters and D. Ludwig. 1995. Sustainable exploitation of renewable
resources. Annual Review of Ecology and Systematics. 26:45-67.
Hindar, K., N. Ryman and F. Utter. 1991. Genetic effects of cultured fish on natural fish
populations. Canadian Journal of Fisheries and Aquatic Sciences. 48:945-957.
Hocking, M. D., and T. E. Reimchen. 2002. Salmon-derived nitrogen in terrestrial
invertebrates from coniferous forests of the Pacific Northwest. BioMed Central
Ecology. 2:4-14.
Hoel, L. A., and A. J. Short. 2006. The engineering of the interstate highway system: a
50-year retrospective of advances and contributions. Transportation Research
News. 244 (May-June 2006):22-29
Honea, J. M. 2005. Effect of marine-derived nutrients from spawning salmon on
seasonal changes in structure and function of the macroinvertebrate community
of Kennedy Creek, Puget Sound. 25 February 2005. Graduate Student
Symposium Presentation. Session 4. Anderson Club Room. College of Forest
Resources. University of Washington. Seattle, Washington.
Howard, A., and F. Widdowson. 1996. Traditional knowledge threatens environmental
assessment. Policy Options. November: 34-36.
Howard, A., and F. Widdowson. 1997. Traditional knowledge advocates weave a
tangled web. Policy Options. April: 46-49.
Hutchings, J. A., and R. A. Myers. 1994. What can be learned from the collapse of a
renewable resource? Atlantic cod Gadus morhua, of Newfoundland and

179
Labrador. Canadian Journal of Fisheries and Aquatic Sciences. 51:2126-
2146.
Hutchings, J. A. 1996. Spatial and temporal variation in the density of northern cod
and a review of hypotheses for the stock‘s collapse. Canadian Journal of
Fisheries and Aquatic Sciences. 53:943-962.
Huntington. H. P. 2000. Using traditional ecological knowledge in science: Methods and
applications. Ecological Applications. 10(5):1270-1274.
Independent Scientific Group. 1996. Return to the river: Restoration of salmonid fishes
in the Columbia River ecosystem. Northwest Power Planning Council, Portland,
Oregon.
Indian and Northern Affairs Canada. 1991. Stage three: Displacement and assimilation,
Volume 1, Part 1, Chapter 6 of the Report of the Royal Commission on
Aboriginal Peoples Indian and Northern Affairs Canada.
Indian Residential Schools Resolution Canada. 2006. Statement of reconciliation.
Government of Canada.
Jacks, Vern. 2004. Tseycum First Nation. Personal communication Re: Past and Present
Fishing Experiences at Goldstream River and Saanich Inlet. 9 November 2004.
Jenness, D. 1938. The Saanich Indians of Vancouver Island. Unpublished Manuscript.
Available in type in Special Collections, UBC and Provincial Archives, Victoria.
Johannes, R. E. 1978. Words of the lagoon: Fishing and marine law in the Palau District
of Micronesia. Berkeley, CA: University of California Press. 245 pp.
Johannes, R. E. 1989. Traditional ecological essays: A collection of essays. Gland,
Switzerland: IUCN. World Conservation Union. 77 pp.
Johannes, R. E. 1993. Traditional ecological knowledge of fishers and marine hunters in:
Traditional ecological knowledge (Wisdom for Sustainable Development).
Centre for Resource and Environmental Studies. Canberra: Australian National
University. Pp. 144-146.
Johannes, R. E., M. M. R. Freeman and R. J. Hamilton. 2000. Ignore fishers‘
knowledge and miss the boat. Fish and Fisheries. 1(2):257.
Johnson, B. L. 1999. Introduction to the special feature: adaptive management –
scientifically sound, socially challenged? Conservation Ecology 3(1):10
Jones, J. 1997. Survival, stewardship and culture: Living in harmony with coastal marine

180
environments (Environmental Studies 580 Research Essay) in: University of
Victoria Traditional Systems of Land and Resource Management Coursepack.
2002.
Kaczynski, V. W., R. J. Feller and J. Clayton. 1973. Trophic analysis of juvenile pink
and chum salmon (Oncorhynchus gobusha and O. keta) in Puget Sound. Journal
of the Fisheries Research Board of Canada. 30:1003-1008.
Kimmerer, R. W. 2000. Native knowledge for native ecosystems. Journal of Forestry.
August 2000:4-9.
Kimmerer, R. W. 2002. Weaving traditional ecological knowledge into biological
education: A call to action. Journal of Bioscience. 52(5):432-439.
Kostow, K. E. 2004. Differences in juvenile phenotypes and survival between hatchery
stocks and a natural population provide evidence for modified selection due to
captive breeding. Canadian Journal of Fisheries and Aquatic Sciences. 61:577-
589
Larkin, P. A. 1996. Concepts and issues in marine ecosystem management. Reviews in
Fish Biology and Fisheries. 6(2):139-164.
Lee, K. N. 1999. Appraising adaptive management. Conservation Ecology 3(2):3.
Lichatowich, J., L. Mobrand AND L. Lestelle. 1999. Depletion and extinction of Pacific
salmon (Oncorhynchus spp.): A different perspective. ICES Journal of Marine
Science. 56:467-472.
Lichatowich, J. 2001. Salmon hatcheries: Past, present and future. Alder Fork
Consulting. Prepared for the Oregon Business Council. Columbia City, Oregon.
Mackinson, S., and L. Nottestad. 1998. Combining local and scientific knowledge.
Reviews in Fish Biology and Fisheries. 8:481-490.
Mackinson, S. April 2001. Integrating local and scientific knowledge: An example
in fisheries management. Journal of Environmental Management. 27(4):533-545.
MacLeod, J. R. 1989. Strategies and possibilities for Indian leadership in co-
management initiatives in British Columbia in: Co-operative management of
local fisheries: New directions for improved management and community
development. Vancouver: University of British Columbia.
Maynard, D. J., T. A. Flagg and C. V. W. Mahnken. 1995. A review of semi-natural
culture strategies for enhancing the post-release survival of anadromous
salmonids in: Uses and effects of cultured fishes in aquatic ecosystems. Edited

181
by H.L. Schramm, Jr. and R.G. Piper. American Fisheries Society. Bethesda,
Maryland.
Maynard, D. J., T. A. Flagg, C. V. W. Mahnken and S. L. Schroder. 1996. Natural
rearing technologies for increasing post-release survival of hatchery-reared
salmon. Bulletin of the Natural Resources Institute of Aquatculture Suppl. 2:71-
77.
McCully, Peter. 2002. Howard English Hatchery Manager. Personal communication Re:
Hatchery enhancement of Goldstream coho and chinook stocks. 20 November
2002.
McCully, Peter. 2003. Howard English Hatchery Manager. Personal communication
Re: Coho, chinook and chum stocks at Goldstream River. 26 October 2003.
McGie, A. M. 1980. Analysis of relationships between hatchery coho salmon transplants
and adult escapements in Oregon coastal watersheds. Oregon Department of Fish
and Wildlife, Information Report 80-6, Portland, OR.
McGoodwin, J. R. 2002. Integrating fishers‘ knowledge into fisheries science and
management: Possibilities, prospects, and problems. Workshop Paper. Prince
Rupert: Local Knowledge, Natural Resources, and Community Survival:
Charting a Way Forward.
Michalski, T. A., G. E. Reid and G.E. Stewart. 2000. Urban salmon habitat program
assessment procedures for Vancouver Island. Nanaimo, BC. BC Ministry of
Environment, Lands and Parks.
Michielsens, C. G. J., M. K. McAllister, S. Kuikka, T. Pakarinen, L. Karlsson, A.
Romakkaniemi, Perä, I. and S. Mäntyniemi. 2006. A bayesian state-space mark-
recapture model to estimate exploitation rates in mixed-stock fisheries. Canadian
Journal of Fisheries and Aquatic Sciences. 63(2):321-334.
Moller, H., F. Berkes, P. O. Lyver and M. Kislalioglu. 2004. Combining science and
traditional ecological knowledge: Monitoring populations for co-management.
Ecology and Society. 9(3):2 [online] URL: www.ecologyandsociety.org
/vol9/iss3/art2
Morbey, Y., C. E. Brassi and A. P. Hendry. 2005. Rapid senescence in Pacific salmon.
The American Naturalist. 166(5):556-568
Morrell, M. 1989. The Struggle to integrate traditional Indian systems and state
management in the salmon fisheries of the Skeena River, British Columbia In:
Co-Operative Management of Local Fisheries: New Directions for Improved
Management and Community Development. Vancouver: University of British
Columbia.

182
Mos, L., Janel, J., Cullon, D., Montour, L., Alleyne, C. and P. S. Ross. 2004. The
importance of marine foods to a near-urban First Nation community in coastal
British Columbia, Canada: Toward a risk-benefit assessment. Journal of
Toxicology and Environmental Health. Part A. 67: 791-808.
Mysak, L. A. 1986. Interannual variability and fisheries in the Northeast Pacific Ocean.
Canadian Journal of Fisheries and Aquatic Sciences. 43(3):464-497.
Naiman, R. J. R. E. Bilby, D. E. Schindler and J. M. Helfield. 2002. Pacific salmon,
nutrients, and the dynamics of freshwater and riparian Ecosystems. Ecosystems.
5:399-417.
National Oceanic and Atmospheric Administration‘s (NOAA) National Marine Fisheries
Service (NMFS). 2004. Glossary of fisheries technical terms. [online] URL:
www. nefsc.noaa.gov/techniques/tech_terms.html#cau
National Oceanic and Atmospheric Administration‘s (NOAA) National Marine Fisheries
Service (NMFS) Office of Protected Resources. 2005. Chinook species biology.
[online] URL: www.nmfs.noaa.gov/pr/species/fish/chinook.htm
National Oceanic and Atmospheric Administration‘s (NOAA) National Marine Fisheries
Service (NMFS). 2006. What is an El Niño? [online]
URL:http://www.pmel.noaa.gov/tao/elnino/el-nino-story.html
Neis, B., D. C. Schneider, F. Lawrence, R. L. Haedrich, J. Fischer and J. A. Hutchings.
1996. Northern cod stock assessment: What can be learned from interviewing
resource users? Fisheries and Oceans Canada Atlantic Fisheries Resources
Document 96/45 28 pp.
Neis, B., D. C. Schneider, F. Lawrence, R. L. Haedrich, J. Fischer and J. A. Hutchings.
1999. Fisheries assessment: what can be learned from interviewing resource
users? Canadian Journal of Fisheries and Aquatic Sciences. 56:1949-1963
Nichols T. L., and J. E. Hillaby. 1990. Manual for coded-wire tagging and fin
clipping of juvenile salmonids at enhancement operations facilities. Fisheries
and Oceans Canada. Vancouver: Streamline Consulting Services Limited.
Nickelson, T. E., M. F. Sollazzi and S. L. Johnson. 1986. Use of hatchery coho salmon
(Oncorhynchus kisutch) presmolts to rebuild wild populations in Oregon coastal
streams. Canadian Journal of Fisheries and Aquatic Sciences. 43:2443-2449.
Norman, L. 1987. Stream aquarium observations of territorial behaviour in young
salmon (Salmo salar) of wild and hatchery origin. Salmon Research Institute.
Akvkarleby Report. 1987:2 (in Swedish, English summary).
Northern Territory Department of Infrastructure, Planning and Environment. 2005.

183
Glossary of hydrology terms. Northern Territory Government. [online] URL:
www.ipe.nt.gov.au Accessed: 9 March 2005.
Notzke, C. 1995. A new perspective in aboriginal natural resource management: Co-
management. Geoforum Journal. 26(2): 187-209.
Nuu-chah-nulth Tribal Council. 1998. Fisheries for the future: A Nuu-chah-nulth
perspective. Port Alberni: Nuu-chah-nulth Tribal Council.
O‘Connell, J. M. 1997. Earth and ocean sciences – oceanography unit. Vancouver:
University of British Columbia.
Olsson, P., and C. Folke. 2001. Local ecological knowledge and institutional dynamics
for ecosystem management: A study of Lake Racken Watershed, Sweden.
Ecosystems. 4(2): 85-104.
Pacific Fisheries Resource Conservation Council (PFRCC). 1999. Conference
proceedings. Climate change and salmon stocks. Vancouver BC. 27 October
1999.
Pacific Salmon Commission. 2005. Nineteenth Annual Report 2003/2004. Vancouver,
Canada. Pacific Salmon Commission.
Pacific States Marine Fisheries Commission. 1997. Coded wire tag historic database –
Harvest/recoveries-Goldstream River hatchery. Regional mark information
system. [online] URL: www.cbr.washington.edu/dart/cwt_rec.html Accessed: 8
February 2006.
Parkyn, S., R. J. Davies-Colley, A. B. Cooper and M. J. Stroud. 2005. Predictions of
stream nutrient and sediment yield changes following restoration of forested
riparian habitats. Ecological Engineering. 24(5):551-558
Payne, B, A., and M. F. Lapointe. 1997. Channel morphology and lateral stability:
effects on distribution of spawning and rearing habitat for Atlantic salmon in a
wandering cobble-bed river. Canadian Journal of Fisheries and Aquatic
Sciences. 54:2627-2636.
Pearcy, W. G., and J. Fisher. 1988. Migrations of coho salmon Oncorhynchus kisutch,
during their first summer in the ocean. Fishery Bulletin. 86(2):173-195.
Pearcy, W. G. 1992. Ocean ecology of North Pacific salmonids. Seattle: University of
Washington Press. Washington Sea Grant Program.
184
Pearsons, T.N., and A.L. Fritts. 1999. Maximum size of chinook salmon consumed by
juvenile coho salmon. North American Journal of Fisheries Management.
19:165-170.
Peninsula Streams Society. 2004. Map of Saanich Peninsula. [online] URL:
www.peninsulastreams.com/home_creeks.shtml Accessed: 15 December 2005.
Pierotti, R., and D. Wildcat. 2000. Traditional ecological knowledge: The third
alternative (commentary). Ecological Applications. 10(5): 1333-1340.
Pinkerton, E.. ed. 1989. Co-operative management of local fisheries: New directions for
improved management and community development. Vancouver: University of
British Columbia Press.
Pinkerton, E., and M. Weinstein. 1995. Fisheries that work: Sustainability through
community-based management. Vancouver: The David Suzuki Foundation.
Pinkerton, E. 1999. Factors in overcoming barriers to implementing co-management in
British Columbia salmon fisheries. Conservation Ecology. 3(2):2
Pinkerton, E. 2002. Sustainable Community Fisheries Researcher. Personal
Communication Re: Co-management and sustainable fisheries. 22 July 2002.
Pinkerton, E. 2006. ―Regarding Gitxsan First Nations ongoing salmon fishery co-
management arrangement with DFO.‖ E-mail to Dr. Nancy Turner 24 July
2006.
Pojar, J., S. Flynn and C. Cadrin. 2004. Douglas-Fir/Dull Oregon Grape Plant
Community Information. Accounts and measures for managing identified
wildlife. Accounts V. Province of BC.
Poirier, G.A. 2002. Catch and effort data used in the assessment of herring populations
in the Southern Gulf of St. Lawrence. Fisheries and Oceans Canada. Moncton:
Canadian Science Advisory Secretariat.
Power, M. E., D. Tilman, J.A. Estes, B. A. Menge, W. J. Bond, L. S. Mills, G. Daily, J.
C. Castilla, J. Lubchenco and R. T. Paine. 1996. Challenges in the quest for
keystones. Bioscience. 46:609-620.
Province of British Columbia (BC). 2001. References. Douglas Treaty payments.
[online] URL: www.gov.bc.ca/tno/history/payment.Htm Accessed: 5 April
2003. Government of British Columbia Treaty Negotiations Office.
Quinn, T. P., A.P. Jeramie, F.G.Vincent, W. K. Hershberger and E. L. Brannon. 2002.

185
Artificial selection and environmental change: countervailing factors affecting
the timing of spawning by coho and chinook salmon. Transactions of the
American Fisheries Society. 131:591-598.
Rawding, D., and T. Hillson. 2003. Population estimates for chum salmon spawning in
the mainstem Columbia River. Bonneville Power Administration (BPA)
Technical Report to the U.S. Department of Energy (DOE). Project No. 2001-
05300. 47 pps. BPA Report DOE/BP-00007373-3
Reimchen, T.E. 2000. Some ecological and evolutionary aspects of bear-salmon
interactions in Coastal British Columbia. Canadian Journal of Zoology. 78:448-
4570.
Reimchen, T. E. 2001. Salmon nutrients, nitrogen isotopes and coastal forests.
Ecoforestry. 16:13-17.
Reimchen T. E., D. Mathewson, M. D. Hocking, J. Moran and D. Harris. 2003. Isotopic
evidence for enrichment of salmon-derived nutrients in vegetation, soil and
insects in riparian zones in coastal British Columbia. American Fisheries Society
Symposium. 34:59-69
Reimchen, T. E. 2004. Marine and terrestrial ecosystem linkages: the major role of
salmon and bears to riparian communities. Botanical Electronic News.
BEN#328. [online] URL: www.ou.edu/cas/botany-micro/ben/ben328.html
Accessed: 18 January 2006.
Reimchen, T.E. 2006. Personal Communication. Master of Science Oral Defense of
Roxanne Paul. George and Ida Halpern Building. Rm. 108. 22 November 2006.
University of Victoria.
Reisenbichler, R. R., and J. D. McIntyre. 1977. Genetic differences in growth and
survival of juvenile hatchery and wild steelhead trout (Salmo Gairdneri).
Journal of the Fisheries Research Board of Canada. 34:123-128.
Richardson, M., and B. Green. 1989. The fisheries co-management initiative in Haida
Gwaii in: Co-operative management of local fisheries: New directions for
improved management and community development. Vancouver: University of
British Columbia.
Ricker, W. E. 1972. Hereditary and environmental factors affecting certain salmonid
populations in: R. C. Simon and P. A. Larkin (eds.). The stock concept in Pacific
salmon. H. R. MacMillan lectures in fisheries, University of British Columbia,
Vancouver, BC. Pp. 19-160.
Robinson, C. 2001. Working towards regional agreements: Recent developments in co-
operartive resource management in Canada‘s British Columbia. Australian
186
Geographical Studies. 39(2):183-197.
Schreiber, D. K. 2001. Co-Management without involvement: the plight of fishing
Communities. Fish and Fisheries. 4(2):376-384.
Seachoice. 2006. Overall Salmon Recommendation. September 2006. [online] URL:
http://www.seachoice.org Accessed: 6 December 2006.
Selective Fishery Evaluation Committee (SFEC). 2004. Review of 2004 mass marking
proposals. Report SFEC (04)-1.
Sherry, E., and H. Myers. 2002. Policy reviews and essays: Traditional environmental
knowledge in practice. Society and Natural Resources.15:345-358.
Silverman, D. 1993. Interpreting qualitative data: methods for analyzing talk, text and
interaction. London: Sage Publishing.
Simons, C. M. 1993. Some methods of analysis of fishery catch-effort data. Master of
science thesis. Department of Mathematics and Statistics. University of
Victoria.
Simonsen, B. O., A. Davis and J. Haggarty. 1995. Saanich Inlet Study Report on First
Nations consultation. BC Ministry of Environment, Lands and Parks. June 1995.
[online] URL: http://wlapwww.gov.bc.ca/wat/wq/saanich/sisrofnc.html
Accessed: 29 October, 2003.
Simonsen, B. O., S. Peacock, J. Haggerty, J. Secter and F. Duerden. 1997. Report
of the First Nations cultural heritage impact assessment and consultation
component; Bamberton town development project. BC Environmental
Assessment Office. 23 Dec. 1997. Greystone Properties Limited.
Simpson, K. 2002. Southern Vancouver Island coho specialist and Fisheries Officer.
Fisheries and Oceans Canada. Personal Communication Re: Goldstream salmon.
12 November 2002.
Slaney, T. L, D. Hyatt, T. G. Northcote and R. J. Fielden. 1996. Status of anadromous
salmon and trout in British Columbia and Yukon. Special Issue on Southeastern
Alaska and British Columbia salmonid stocks at risk. American Fisheries Society
North Pacific International Chapter. Fisheries. 21(10).
Slaney, P. A., and D. Zaldokas. 1997. Fish habitat rehabilitation procedures. Watershed
Restoration Programs, British Columbia Ministry of Environment, Lands, and
Parks and Ministry of Forests, Vancouver, B.C. Watershed Restoration
Technical Circular No. 9.
Smith, Simon. 2003. Tsartlip band chief. Goldstream River and Saanich Inlet fisher.

187
Personal communication Re: Saanich Tribal Fisheries licenses, boats and annual
catch per unit effort (CPUE). 28 Oct. 2003.
Spliid, N. H., A. Helweg and K. Heinrichson. 2006. Leaching and degradation of 21
pesticides in a full-scale model biobed. Elsevier Ltd. Chemosphere.
doi:10.1016/j.chemosphere.2006.05.049
Stakeholder Forum for Our Common Future. 2002. Stakeholders: A definition.
[online] URL: http://www.earthsummit2002.org/ic/process/stakeholders.htm
Accessed: 5 September 2006.
State of California Department of Fish and Game. 1995. Fish species of special concern
in California Eagle Lake rainbow trout. Habitat Conservation Planning Branch.
State of Oregon. 2000. Oregon administrative rules. Salem, Oregon: Department of Fish
and Wildlife Division. 7 635-7-0501.
State of the Salmon Consortium. 2006. Resources: Glossary. [online] URL:
http://www.stateofthesalmon.org/resource/glossary Accessed: 5 May 2006.
Statistics Canada. 1999. Historical Statistics of Canada. Section R: Manufactures. File #
11-516-XIE. Toronto: Queen‘s Printer. Government of Canada.
Stevenson, M. G. 1998. Traditional knowledge in environmental management? From
commodity to process. Conference paper. National Aboriginal Forestry
Association conference: Celebrating partnerships. 14-18 Sept. Prince Albert:
Sustainable Forest Management Network.
Stormfax Incorporated. 2006. El-Nino Years. Stormfax 1996-2006. [online] URL:
http://www.stormfax.com Accessed: 11 December 2006.
Stowe, K. 1996. Exploring ocean science. 2nd
Ed. New York: John Wiley and Sons Inc.
Sucre E. B., R. B. Harrison, E. C. Tumblom and D. G. Briggs. 25 February 2005.
Estimating response of Douglas-fir to area in western Oregon andWashington.
Graduate Student Symposium Presentation. Session 2. Anderson Club Room.
College of Forest Resources. Seattle: University of Washington.
Supreme Court of Canada. 1990. R. vs. Sparrow. 1. C.S.R. 1075. File No. 20311.
Taylor, G. 2003. Perspective of the commercial salmon fishery in: Solutions for salmon
conservation-Proceedings from the World Summit on Salmon. 10-13 June 2003.
Vancouver : Simon Fraser University.
Thomas L., R. Williams and D. Sandilands. 2 June 2004. Designing a line transect
188
survey for cetaceans in British Columbia. Unpublished Research Presentation.
Centre for Research into Ecological and Environmental Modelling (CREEM).
University of St. Andrews. St. Andrews, Fife, Scotland; Raincoast Conservation
Society, Victoria, BC, Canada; Vancouver Aquarium, Vancouver BC, Canada.
[online] URL: www.creem.st-and.ac.uk/len/talks/ThomasBC2004.pdf Accessed:
25 July 2006.
Thomson, S., and M. MacDuffee. 2002. Taking stock: Assessment of salmon runs on
the north and central coasts of BC in: Ghost runs: The future of wild salmon on
the north and central coasts of British Columbia. Edited by Harvey, B. and M.
MacDuffee. Victoria: Raincoast Conservation Society.
Till, J. 2005. Proposed thermal marks for salmon from brood year 2005. North Pacific
Anadromous Fish Commission (NPAFC) (Doc 856). Nanaimo, British
Columbia: Fisheries and Oceans Canada.
Triola, M.F. 1995. Elementary Statistics. 6th
ed. Poughkeepsie: Addison-Wesley
Publishing Company Inc.
Tsawout First Nation Band. 2006. Tsawout First Nation band home page. [online]
URL:www.tsawout.ca Tsawout First Nation. Site last updated 2006 Accessed: 19
August 2006.
Tunnicliffe, V. 2000. A fine-scale record of 130 years of organic carbon deposition in an
anoxic fjord, Saaanich Inlet, British Columbia. Journal of Limnology and
Oceanography. 45(6):1380-1387.
Turner, N. J. 1997. Traditional ecological knowledge in: The rainforests of home:
Profile of a North American bioregion. Washington, D.C.: Island Press. Pp. 275-
298.
Turner, N. J., M. B. Ignace and R. Ignace. 2000. Traditional ecological knowledge and
wisdom of Aboriginal Peoples in British Columbia. Ecological Applications.10
(5):1275-1287.
Union of BC Indian Chiefs. 2003. The Douglas Reserve policy. Vancouver: Union of
BC Indian Chiefs (UBCIC). [online] URL: www.ubcic.bc.ca/douglas.htm
Accessed: 5 April 2003.
University of British Columbia (UBC). 1998. Limited and unlimited growth. UBC
Calculus online math notes. [online] URL: http://www.ugrad.math.ubc.ca/
coursedoc/math100/notes/mordifeqs/logistic.html Accessed: 7 August 2006.
University of British Columbia (UBC). 2006. Back to the Future Project: Chronology of
Northern BC Ecosystems - Historical Reference Points to Marine Resource
Exploitation in the West Coast. [online] URL: www.fisheries.ubc.ca/

189
projects/ btf/ weblinks. asp?gr=northernbcchronology.l Accessed: 26
September 2006.
Usher, P. J., and G. Wenzel. 1987. Native harvest surveys and statistics: A critique of
their construction and use. Arctic Journal. 40(2):145-160.
Usher, P. J. 1991. Some implications of the Sparrow judgment for resource conservation
and management. Alternatives. 18(2):20-22.
Usher, P. J. 2000. Traditional ecological knowledge in environmental assessment and
management. Arctic. 53(2):183-193.
Utter, F.M., K. Hindar, and N. Ryman. 1993. Genetic effects of aquaculture on natural
salmonid populations in: Salmon aquaculture. Edited by K. Heen, R.L. Monahan,
and F. Utter. Oxford: Fishing News Books. pp. 145-165.
Victoria Experimental Network Under the Sea (VENUS) Project. 2004. The Biological
Setting of Saanich Inlet. VENUS Home Page. [online] URL:
http://www.venus.uvic.ca/locations/saanich_inlet.html Accessed: 10 October
2006.
Victoria University of Wellington. 2005. Time and space, the 1880s: A cross-hatch
pattern. New Zealand Electronic Text Centre. [online] URL:
http://www.nzetc.org/tm/scholarly/tei-ArnSett-c1.html Accessed: 23 July 2006.
Walters, C. 1995. Fish on the line: The future of Pacific fisheries. Vancouver: David
Suzuki Foundation.
Walters, C. 1997. Challenges in adaptive management of riparian and coastal
ecosystems. Conservation Ecology. 1(2):1
Waples, R. S. 1991. Genetic interactions between hatchery and wild salmonids: Lessons
from the Pacific Northwest. Canadian Journal of Fisheries and Aquatic Sciences
(Suppl. 1):124-133.
Waples, R., and C. Do. 1994. Genetic risk associated with supplementation of Pacific
salmonids. I. Captive broodstock programs. Canadian Journal of Fisheries and
Aquatic Sciences. 51(1):310-329.
Washington State Department of Ecology. 2006. Puget Sound shorelines - Salmon
species. [online] URL: www.ecy.wa.gov/programs/sea/pugetsound/species
salmon.html Accessed: 22 August 2006.
West Coast Vancouver Island Aquatic Management Board (WCVIAMB). 2001.
Fisheries by gear type. [online] URL:
www.westcoastaquatic.ca/fisheries overview.htm. Accessed: May 2004.
190
Wikipedia. 2006a. The free encyclopedia: British Columbia provincial highway 17.
[online] URL: http://en.wikipedia.org/wiki/British_Columbia_provincial_
highway_17 Accessed: 1 August 2006.
Wikipedia. 2006b. The free encyclopedia: Logistic growth. [online] URL:
http://en.wikipedia.org/wiki/Logistic_growth Accessed: 7 August 2006.
Wilder, R. J., M. J. Tegner and P. K. Dayton. 1999. Saving marine biodiversity. Issues
in Science and Technology. Spring:57-64.
Williams, N. and G. Baines (eds.). 1993.Traditional ecological knowledge: Wisdom for
sustainable development. Canberra, ACT: Centre for Resource and
Environmental Studies, Australian National University.
Winton, J., and R. Hilborn. 1994. Lessons from supplementation of Chinook salmon in
British Columbia. North American Journal of Fisheries Management. 14:1-13.
Wood, C. C. 2001. Managing biodiversity In Pacific salmon: the evolution of the Skeena
River sockeye salmon fishery in British Columbia. Paper presented at the
International conference Blue Millennium: Managing fisheries biodiversity.
Victoria. Canada. 25-27. June 2001. World Fisheries Trust.
Wright, S. 1993. Fishery Management of the wild Pacific salmon stocks to prevent
extinctions. Fisheries. 18:3-4.

191
Appendix A - Glossary of Specialized Terms Used in This Thesis
1. Terms Relating to Salmon
Carrying Capacity: The maximal population size of a given species that an area can
support without reducing its ability to support the same species in the future.
Catch-per-unit-effort: The catch of fish in numbers or in weight, taken by a defined unit
of fishing effort.
Deme: Reproductive or breeding unit (spawning site) comprised of individuals who are
likely to breed with each other (i.e. well mixed). A single population may include more
than one deme and demes may be partially isolated from one another. Their partial
isolation may or may not be persistent over generations. There will always be at least as
many demes as populations.
Escapement: The quantity of sexually mature adult salmon (typically measured by
number or biomass) that successfully pass through a fishery to reach the spawning
grounds.
El Niño: El Niño is a disruption of the ocean-atmosphere system in the tropical Pacific
having important consequences for weather around the globe.
Enhancement: The application of biological and technical knowledge and capabilities to
increase the productivity of fish stocks. It may be achieved by altering habitat attributes
(e.g., habitat restoration) or by using fish culture techniques (e.g., hatcheries, production
spawning channels).
Hatchery Salmon: A salmon whose parents were born in a hatchery or a salmon that has
spent a portion of its life cycle in an artificial environment; Any salmon incubated or
reared under artificial conditions for a part of its life. This definition does not distinguish
between a salmon one generation removed from the wild and a salmon whose parents
were highly domesticated products of the hatchery.
Native Harvest Statistics: Counts or estimates of the number of animals by category
taken by a specific group of native people during a specific time period
Natural Salmon: Any salmon produced in the natural environment as a result of natural
reproduction. A natural salmon could be wild (see definition below) or it could be the
progeny of hatchery parents that spawned in the natural environment. It is impossible to
distinguish a natural and wild salmon by field observation alone.
Population: Group of interbreeding salmon that is sufficiently isolated from other
populations so that there will be persistent adaptations to the local habitat.
Salmonid: Fish of the family Salmonidae, including salmon and steelhead.

192
Spawner: Sexually mature individual, either male or female.
Stock: A group of salmon spawning in a specific stream at a specific season, which do
not interbreed to a substantial degree with any other group of salmon. Several stocks
linked by a low level of straying may constitute a metapopulation.
Wild Salmon: A salmon whose parents have spawned in the wild and has spent its life
in the natural environment; Any naturally, spawned salmon belonging to an indigenous
population. Indigenous means a population whose lineage can be traced back to 1800 in
the same geographical area or that resulted from natural colonization from another
indigenous population. This is a difficult definition to apply since we do not have
continuous records of salmon populations going back to the 1800s. Its application is
more appropriate in defining what is not wild rather than what is wild. For example, a
hatchery salmon population introduced recently by humans to a creek would not be
considered wild. Where there is doubt, a population should be considered wild unless
there is clear proof that it is not.
1. Hydrology Terms
Cascade Habitat: A series of small steps, slides or falls characterized by a step height,
<1m, 5-60º gradient and strong currents.
Glide Habitat: Shallow, slow flowing water section characterized by < 0.1m depth, 1-3º
gradient, small currents and an unbroken and smooth waters surface.
Pool: A deep body of still or slow moving water, generally occurring in the main
channel in an alternating sequence with riffles or runs. Pools are characterized by a
depth >0.5m,where the stream widens or deepens and the current declines.
Reach: A homogeneous segment of a drainage network characterized by uniform
channel pattern gradient, substrate and channel confinement.
Riffle Habitat: Shallow area of a stream, often separating pools, characterized by 0.1-
0.3m depth, 1-3º gradient, moderate currents and an unbroken/unsmooth water surface.
Definitions adapted from: Brannon et al. 2005; Daily and Ehrlich 1992; Independent
Scientific Group 1996; Lichatowich 2001; NOAA 2004, 2006; Northern Territory
Department of Infrastructure, Planning & Environment 2005; Ricker 1972; Slaney &
Zaldokas 1997; State of Oregon 2000; State of the Salmon Consortium 2006; Usher &
Wenzel 1987; Waples 1991.

Appendix B - Summary of Habitat Descriptions of Reaches 1 to 3 Goldstream River, Salmon Escapement Enumeration Survey
Area (Modified from Bocking et al. 1999.)
Habitat Descriptors Reach 1 Reach 2 Reach 3 Total Reaches 1-3
Total Area (Reach length x
Avg. bankfull width) 16,275 m² 20,828 m² 9,261 m² Range = 46,364 –
45,846 m² = 518 m²;
Mean = 46,105 m²
Reach Length 930 m 1,270 m 630 m 2,830 m
Gradient 1.2% 1.4% 1.7% Average = 1.4%
Salmon Habitat Length 735 m 1,327 m 564 m 2,626 m
Habitat Types (See Appendix B)
71.8% glide,
23.7% riffle,
4.5% pool
38.6 % glide, 54.8 %
riffle, 6.6% pool
36.5% glide, 52.2%
riffle, 8% pool,
3.2% cascade
Average = 49 % glide,
43.6 % riffle, 6.4%
pool, 1% cascade
Average Bankfull Width 17.5 m 16.4 m 14.7 m Average = 16.2 m
Average Wetted Width 12.7 m 11.7 m 13.4 m Average = 12.6 m
Salmon Rearing Habitat
Area (Habitat length x bankfull
width)
12,255 m² 21,763 m² 9,261 m² Range = 45,846 m²-
43,279 m²= 2,567 m²;
Mean = 44,563 m²
Average Water Depth 0.5 m 0.7 m 0.6 m Average = 0.6 m
Volume of Salmon Habitat
Waters (Salmon Habitat
Length x Avg Bankfull Width
x Avg Water Depth)
6,431 m³ =
6,431,000 L
15,234 m³ =
15,234,000 L
4,975 m³ =
4,975,000 L
Range = 26,640 –
25,525 m³ = 1,115 m³;
Mean = 26,083 m³ =
26,083,000 L
Overall Spawning Gravel
Quality
Good – 9% low,
64% medium,
27% high quality
Fair – 31% low, 59
% medium, 10%
high quality
Fair – 38 % low, 56
% medium, 6 %
high quality
Fair/Good- 26 % low,
60% medium, 14 %
high quality
19
3

Appendix C - Common, Scientific and Saanich Language Names for BC Salmon
Species (Baxter 2000; Claxton and Elliott 1994)
i. Saanich language salmon species names sourced from: Claxton, Earl Sr. and Elliott, J. Sr. 1994. Reef
Net Technology of the Saltwater People. Brentwood Bay: Saanich Indian School Board.
Common
Name
Vernacular
Names
Scientific
Name
Saanich
Language
Name i.
Coho Bluebacks,
Silver
Oncorhynchus
kisutch
ŦÁ,WEN
Chinook Spring, King,
Tyee
O.
tshawytscha
STOKI
Chum Dog, Calico O. keta QOLEW
Sockeye Sukkai, Red O. nerka ŦEKI
Pink Humpback O. gorbuscha HENNEN
194

195
Appendix D - Fishing Management Area 19 (Saanich First Nations‘ Fishing Area)
18.6 (located southwest of Pender Island)
N
(DFO 2005b: online)
196
Appendix E - Saanich First Nation Fisher Interviewees
Bartleman, Joe. Tsartlip Elder. Goldstream River and Saanich Inlet fisher. Personal
Interview. Standardized Survey Instrument. Saanich Tribal Fishery Interview
Questionnaire Transcript: Historical and Current Fishing Methods and Practices (at
Goldstream River and Saanich Inlet). 10 December, 2002. 848 Stelly‘s Cross-Road,
Brentwood Bay, Saanich, BC.
Claxton, Earl. 2002. Tsawout. Cultural Historian and Researcher, Saanich Indian
School Board. Goldstream River and Saanich Inlet fisher. Personal Interview.
Standardized Survey Instrument. Saanich Tribal Fishery Interview Questionnaire
Transcript: Historical and Current Fishing Methods and Practices (at Goldstream
River and Saanich Inlet). 22 July, 2002. Language Centre – 7449 West Saanich Road,
Brentwood Bay, Saanich, BC.
Cooper, Emmanuel. 2002. Tsartlip Elder. Goldstream River and Saanich Inlet
fisher. Personal Interview. Standardized Survey Instrument. Saanich Tribal Fishery
Interview Questionnaire Transcript: Historical and Current Fishing Methods and
Practices (at Goldstream River and Saanich Inlet). 29 August, 2002. 7543 West
Saanich Road, Brentwood Bay, Saanich BC
Elliott, John. 2002. Tsartlip. Linguist and Cultural Historian, Saanich Indian School
Board. Goldstream River and Saanich Inlet fisher. Personal Interview. Standardized
Survey Instrument. Saanich Tribal Fishery Interview Questionnaire Transcript:
Historical and Current Fishing Methods and Practices (at Goldstream River and
Saanich Inlet). 18 Sept., 2002. Language Centre. 7449 West, Saanich Road,
Brentwood Bay, Saanich, BC.
Morris, Ivan Sr. 2002. Tsartlip Elder. Goldsteam River and Saanich Inlet fisher.
Personal Interview. Standardized Survey Instrument. Saanich Tribal Fishery Interview
Questionnaire Transcript: Historical and Current Fishing Methods and Practices (at
Goldstream River and Saanich Inlet). 7 Aug., 2002. 45 Tsartlip Drive, Brentwood Bay,
Saanich, BC.
Morris, Sandy. 2002. Tsartlip Elder. Goldstream River and Saanich Inlet fisher.
Personal Interview. Standardized Survey Instrument. Saanich Tribal Fishery Interview
Questionnaire Transcript: Historical and Current Fishing Methods and Practices (at
Goldstream River and Saanich Inlet). 7 August 2002. Church Road, Brentwood Bay,
Saanich.
Smith, Simon. 2002. Tsartlip Band Chief. Goldstream River and Saanich Inlet fisher.
Personal Interview. Standardized Survey Instrument. Saanich Tribal Fishery Interview
Questionnaire Transcript: Historical and Current Fishing Methods and Practices (at
Goldstream River and Saanich Inlet). 30 October, 2002. Tsartlip Band Office. Stelly‘s
Cross-Road, Brentwood Bay, Saanich, BC.

197
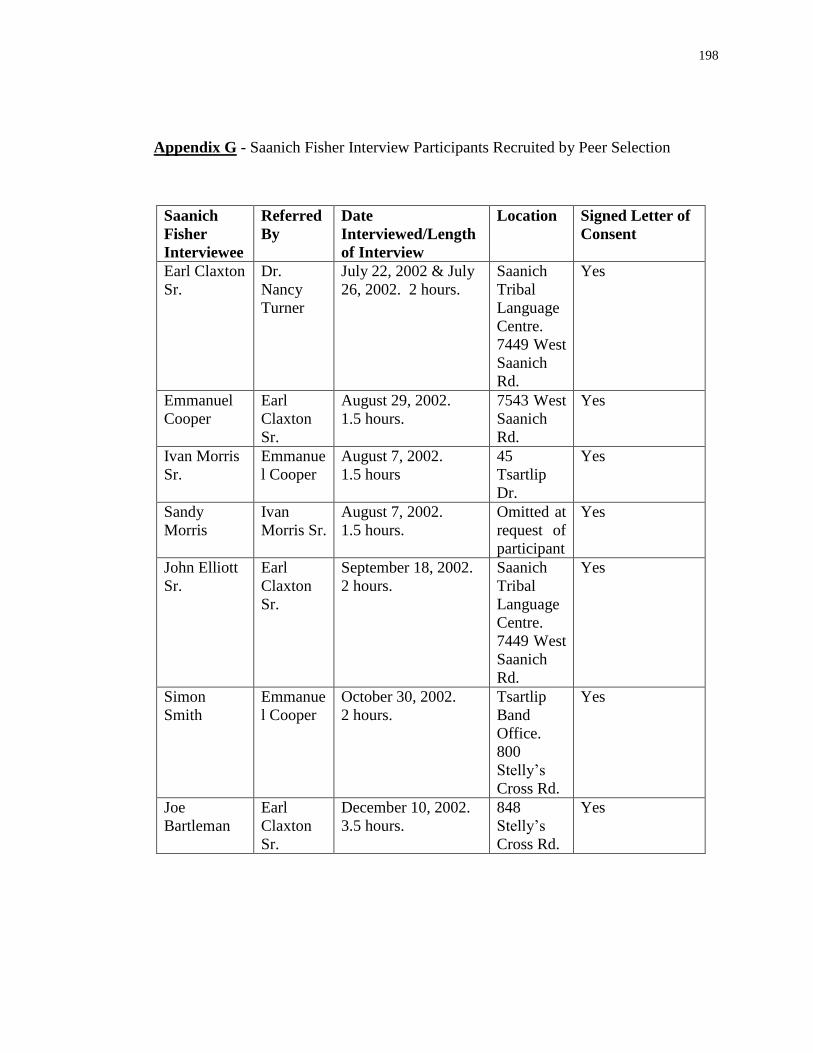
198
Appendix G - Saanich Fisher Interview Participants Recruited by Peer Selection
Saanich
Fisher
Interviewee
Referred
By
Date
Interviewed/Length
of Interview
Location Signed Letter of
Consent
Earl Claxton
Sr.
Dr.
Nancy
Turner
July 22, 2002 & July
26, 2002. 2 hours.
Saanich
Tribal
Language
Centre.
7449 West
Saanich
Rd.
Yes
Emmanuel
Cooper
Earl
Claxton
Sr.
August 29, 2002.
1.5 hours.
7543 West
Saanich
Rd.
Yes
Ivan Morris
Sr.
Emmanue
l Cooper
August 7, 2002.
1.5 hours
45
Tsartlip
Dr.
Yes
Sandy
Morris
Ivan
Morris Sr.
August 7, 2002.
1.5 hours.
Omitted at
request of
participant
Yes
John Elliott
Sr.
Earl
Claxton
Sr.
September 18, 2002.
2 hours.
Saanich
Tribal
Language
Centre.
7449 West
Saanich
Rd.
Yes
Simon
Smith
Emmanue
l Cooper
October 30, 2002.
2 hours.
Tsartlip
Band
Office.
800
Stelly‘s
Cross Rd.
Yes
Joe
Bartleman
Earl
Claxton
Sr.
December 10, 2002.
3.5 hours.
848
Stelly‘s
Cross Rd.
Yes

199
Appendix H - Interview Survey Guidelines and Questionnaire for Interviewing Saanich
First Nation Fishers
Re: Assessing Historical and Current Abundances of Coho, Chinook and Chum Salmon
at Goldstream River
Some of the topics to be discussed with you (the participant) are:
- Your fishing experiences at Goldstream: practices, protocols, traditions
- Your opinions about the different species of salmon (populations) that
inhabit the Goldstream River
- Federal Fisheries restrictions and licenses
- Salmon lifecycles, optimal habitats
- Cultural importance of salmon to your people
- Importance of salmon to peoples‘ health
- Stories, or other information about salmon
- Learning about salmon; where did this knowledge come from?
- Opinions about hatcheries, fish farms, and wild salmon
- Your opinions about the current hatchery at Goldstream River.
- Your opinions about a potential future, Saanich, tribal chum hatchery
at Goldstream River.
Interview Questions
1. Where/when were you born? Where did you grow up? What schooling have you
had (Formal? Informal?)
2. How long have you been fishing?
3. Who taught you to fish? (Describe first fishing experiences)
4. What kind of fishing have you done?

200
5. Do you fish Goldstream River? (Yes, No, Sometimes, Have in the Past, My
friends/relatives did)
6. Where at Goldstream River do you fish? (Did you fish at the mouth, estuary?
Other? Saanich Inlet?)
7. What kind of fish have you caught at Goldstream River?
a.) Do you currently fish chum at Goldstream River?
b.) If yes, at what times of the year do you fish? How often do you make fishing
trips? (e.g. ten times a month, 6 months a year)
c.) If yes, approximately how long is each fishing excursion you make (e.g. 6 hours
a day)?
d.) What kind of fishing gear and equipment do you currently use to fish chum
(and/or other stocks)? (What kind of methods and technologies do you use to
fish?) Do you use a boat? What type of boat? Speed of boat (HP)? Cost of boat
and boat maintenance costs? Gas costs? (Relates to CPUE Analysis component
of study.)
e.) What is the relative size of the chum salmon that you catch at Goldstream? (e.g.
Relative to past fishing experiences fishing chum? Length & width in feet or
metres, weight in pounds or kilograms – current & past chum catches?) Catch
male? Female? Or both?
f.) What is the relative condition of the chum that you catch at Goldstream? (e.g.
Relative to past fishing experiences fishing chum? Are they hatchery or
naturally spawned - was a clipped adipose fin noted? Healthy in size and
configuration? Discoloured?)
g.) What is the approximate annual cost (in dollars) accrued to you in maintaining
your current (chum) fishing practice (e.g. in modern fishing gear expenses, etc?)
h.) Do you keep record or inventory of how many chum and/or other salmon stocks
you catch at Goldstream River when you fish?
i.) If so, can you tell me how, and why?
8. How many fish are caught per family per year (approximately)?
9. How are these fish processed?
10. Can you tell me a bit about your recollections of populations of fish: Good

201
years? Bad years? Fisheries restrictions?
11. Can you tell me a bit about your early memories about fishing, or about stories
from the past you‘ve heard from your parents, grandparents and others?
12. How important do you think salmon species diversity is for the Goldstream
River system? (In your opinion, are the currently abundant chum - the
threatened, but hatchery enhanced coho and chinook – and the less abundant
sockeye and pink salmon species of equal value to the Goldstream River
ecosystem?)
13. What do you think about the success of hatcheries and salmon enhancement?
(Do you think current Federal salmon fisheries conservation management at
Goldstream River is proper? Effective? Appropriate?)
a.) Did you fish coho prior to the coho enhancement initiative at Goldstream? (e.g.
prior to establishment of the hatchery in 1982? Prior to incubation box culturing
of coho at Goldstream in 1974?)
b.) Do you remember what the relative size of coho salmon that you (or your
relatives or friends) caught at Goldstream River was? (e.g. Length & width in
feet or metres, weight in pounds or kilograms?)
c.) Do you remember what the relative condition of coho salmon that you caught at
Goldstream River was? (e.g. Were they hatchery or naturally spawned - did you
note a clipped adipose fin? Healthy in size and configuration? Discoloured?)
d.) Do you remember what the relative size of chinook salmon that you caught at
Goldstream River was? (e.g. Length & width in feet or metres, weight in pounds
or kilograms?)
e.) Do you remember what the relative condition of chinook salmon that you caught
at Goldstream River was? (e.g. Were they hatchery or naturally spawned - did
you note a clipped adipose fin? Healthy in size and configuration?
Discoloured?)
14.) Did your elders fish salmon at Goldstream River?
a.) If so, can you tell me approximately how long ago (in years), and how often
(in months, weeks, days, hours)?
b.) If yes, can you tell me what methods and technologies (fishing gear and
equipment) your elders used when fishing chum (coho, chinook) and other
salmon stocks? (e.g. stakes luring, reef net fishing?)
15.) Did they keep any (historical) records of the quantity and species of salmon they

202
fished?
a.) If so, how?
16.) Are you interested in the idea of compiling historical records of fishing practices
employed by the Saanich First Nations fishers of Goldstream River?
17.) Any other information you would like to share?
(These interview questions are drafted for the purposes of gathering knowledge and
information held by the Saanich First People‘s fishing community fishing salmon at
Goldstream River and Saanich Inlet.)

203
Appendix I - Letter of Understanding Between Roxanne Paul and Fisheries and Oceans
Canada
Date: Tue, 23 Jul 2002 11:11:48 –0400
From: [email protected]
Subject: Goldstream River Salmon Study
Roxanne:
Please consider this a letter of understanding between yourself and
the Dept. of Fisheries and Oceans. You may carry out your fish counts and
research, utilizing all areas, including the lower reaches of Goldstream.
Periodic up dates to this office on fish counts and a summary of your total
counts would be greatly appreciated by this office.
They can run, but they can't hide!
Robert (Bob) MacDonald / K-9 Chrissy
Fishery Officer/Dog Master
Victoria Field Unit
tel: 250-363-3252
fax:250-363-0191
4250 Commerce Circle
Victoria B.C.
V8Z 4M2

204
Appendix J - Metadata for Goldstream Salmon Escapements (1932 to 2002)
The salmon population estimation codes used by field observers for Goldstream
River stream inspection forms from 1932 to 1959 were as follows:
A=1-50 B=50-100 C=100-300 D=300-500 E=500-1000 F=1000-2000
G=2000-5000 H=5000-10000 K=10000-20000 L=20000-50000 M=50000-
100000 N=Over 100000
In addition to these run size estimation codes, ‗Size of Run‘ was described
qualitatively with a category of Heavy (―HVY.‖), Medium (―MED.‖) or Light (―LT.‖)
from 1932 to 1984 (DFO 1932-1984) in stream inspection logs. No alphabetic-numeric
population estimation range was provided for coho, chinook or chum categories at
Goldstream River for 1932, the first escapement year on file in BC 16 reports. The 1932
salmon runs were recorded using categories of Heavy (coho), Medium (chinook) or
Light (chum) with notes indicating that each of the runs were similar compared to the
brood year stock runs, which are neither available nor evidenced qualitatively or
quantitatively within the BC 16 "Report on Salmon Stream" archival records. Size of
run is interpreted as either light, medium or heavy as compared to the run size pattern(s)
for that species from previous years. For example, a ‗C` (Lt) run refers to the 100-300
range listed above and is recorded as 100, the number occurring at the lower end of the
range. A medium (Med) run in the ‗H‘ (5,000-10,000 range) is recorded as 7,500, the
number falling within the middle of the numeric range, and a ‗K‘ (10,000-20,000) heavy
(Hvy) is entered as 20,000 at the higher end of the range. Upon inputting these data into
Excel spreadsheets, I took measures to be as consistent as the data, and previous field

205
observer(s)‘ recorded notes allowed. Data input consistency was achieved by
comparing and verifying ‗light‘, ‗medium‘ and ‗heavy‘ counts within each of the
alphabetically coded numeric ranges recorded for each year against those recorded from
each of the previous years (pattern recognition). This process enabled me to transfer the
descriptive, interval data from BC 16 reports from the years 1932 to 1984 to numerical
spreadsheet format. This in turn allowed for more consistent categorical population
estimation, analysis and comparisons.
In most cases, (except 1941, 1945 and 1946), when I entered escapement data
that had previously been recorded with coded numerical ranges (e.g. H=5,000-10,000)
with a medium (Med.)‗size of run‘, I input 7,500 chum into the spreadsheet cell,
assuming the middle number of the 5,000-10,000 range to be the most appropriate
estimate for the year. Exceptions to this rule were made if a specific number or note
comparing the run size to either the previous year or the brood year (3 or 4 years prior)
was logged alongside the alphabetic code. For example, the chum run for 1941 was
recorded as H, a heavy run, Larger than 1937-38 brood year. As chum runs for 1937
and 1938 were both recorded as H medium runs, the middle, upper range of the 5,000-
10,000 H category (midrange between 7,500 and 10,000) 8,750 was input for the 1941
Goldstream River chum escapement total.
There is no record of any sockeye escapements in BC 16 reports from 1932 to
present. It was noted that there is "no record of pink frequenting this stream" in 1934
(BC 16, 1934). Light runs of pink salmon were recorded in the "A" estimate number
range (1-50) for October of 1938 and 1939 (BC 16, 1938:1939). Data from stream
survey reports indicate that no pink salmon stocks have been observed or recorded at

206
Goldstream River for any year after 1939. I input the Pink salmon data into an Excel
worksheet for statistical analysis however these numbers are too low and infrequent to
produce graphical output and therefore will not be presented with results.
Chinook counts first appeared in Goldstream River BC 16 logs under the
Estimate Number code B (50-100 range), LT. (Light run size) in 1934. Specific chinook
counts first appeared on record, with "Two fish spawning" observed on Oct 27, 1947.
(DFO, BC 16 file, 1947). No numerical notes of more specific counts were provided for
chinook from 1949-1961 (no data), 1962-1966 (A-range), 1968 (no data), 1976-1977
(A-range) and 1979 (A-range). A more exact quantity of chinook (―40 pcs.‖) is
recorded on the 1967 stream log in the Comments category, and 30 were recorded for
1978. All observations of chinook recorded from 1934-1984 were categorized as light
sized runs (Lt.). For years when no data were recorded in BC 16 records, I input "no
data" into the Excel spreadsheet cells. More exact counts of chinook were consistently
recorded on file from 1980-2002, which I logged into Excel spreadsheets for the
purposes of conducting the chinook escapement population estimation and analyses.
From 1960 onwards, numerical field notes appear progressively more specific
(e.g. 2,200 chum, 500 chum and 0 data for chinook recorded), with these more exact
numbers accompanying the numeric range estimates logged in the ‗Total Number on
Grounds‘ box, or the ‗Comments on any Other Conditions Affecting This Stream‘
section of the inspection sheet. This pattern continued with the exception of 1962 and
1963 coho, and chum counts. The alphabetic-numeric range codes were used to record
1962 and 1963 coho and chum total estimates, as well as 1972, 1974, 1975, 1976, and
1977 chum estimates. 1980-2002 BC16 Annual Reports of Salmon Stream and

207
Spawning Grounds for Goldstream River have total numbers of coho, chinook and chum
logged in using these more precise numerical estimates.
Use of light, medium or heavy run size was completely eliminated as a
descriptive variable for salmon stream and spawning grounds log inspection forms in
1985. Use of alphabetized coded ranges was also completely eliminated in 1985 (BC 16
Reports for Goldstream River, 1932-2002). This latter change in logging population
estimates occurred following a five-year period from 1980 to 1985 during which time
more specific, consistent, annual, numeric, on-site counts accompanied each alphabetic
range value logged for each ensuing annual record (DFO BC 16 Reports for Goldstream
River 1980-1985). This transition of record keeping format improved upon previous
escapement monitoring protocols. Total escapement estimates based on the common
inspection log forms used from 1932 to 1980 could (for example) demonstrate a range
between as many as 20,000 and 35,000 chum for an ‗L‘ (20,000-50,000) category, with
a light (Lt) run size description. Use of specific ratio numeric estimates (as was done
from 1980 to 2002) are probably more precise indicators of the returning population
than the former interval alphabetic numeric range value format used for estimating
salmon populations from 1933-1980 allowed. The more current ratio numeric data on
record from 1980-2002 are a marked improvement from the first available record (1932)
when nominal descriptive values of light, medium and heavy runs were the sole
indication of salmon run size.
(N.B.: The chum run estimate for 1934 was also described using solely the
nominal "medium" run size descriptive variable. A specific interval numeric value of
500 coho, and 0 observed chinook were also logged on file for that year.)

208
Stream inspection reports for Goldstream River first listed "Optimum
Escapement" of Goldstream River coho (750), chinook (100) and chum (15,000) in
1985. There is no further listing for optimum escapement on stream inspection reports
from 1985 to 1992. In 1993 and 1994, optimum escapement numbers for Goldstream
River salmon stocks reappear as follows: coho (1000), chinook (500), chum (15,000).
The 1998 DFO stream inspection form ("Annual Report of Salmon Streams and
Spawning Populations") relays optimum escapement of coho at 4,000, with no optimum
escapement logged for either chinook or chum stocks. This was the last account of
"optimum escapement" reported and filed with Goldstream River BC 16 archives at the
Pacific Biological Station, 3190 Hammond Bay Road, Nanaimo, BC, and 4250
Commerce Circle, Victoria, BC, Fisheries and Oceans Canada offices.
From 1994 to 2005, volunteers working with the Goldstream Hatchery have
undertaken direct count surveys of Goldstream coho, chinook and chum and submitted
observed live salmon escapement counts to Fisheries and Oceans DFO offices in
Victoria and Nanaimo for their BC 16 files. The survey takes place from the mouth of
the river (the estuary) to the hatchery fish counting fence, about 2.8 km upstream. Some
of the current reports in BC 16 files are recorded via e-mail correspondence with DFO
fishery officers.
Escapement data for Goldstream River (1953-1999) compiled by DFO may be
accessed through the Fish Wizard website, jointly operated by DFO and the BC
provincial government (Fish Wizard 2001).