Counterpoint Global Insights The Impact of Intangibles on ...
13
Counterpoint Global Insights The Impact of Intangibles on Base Rates CONSILIENT OBSERVER | June 23, 2021 Introduction The cover of the Economist newspaper on March 25, 2017 showed a city landscape beneath a menacing spacecraft marked by the Amazon logo. The headline was, “Amazon’s empire.” An article in the issue had a title that asked, “Are investors too opt imistic about Amazon?” 1 The stock would go on to appreciate 37.8 percent annually in the next four years versus a total shareholder return of 15.8 percent for the S&P 500 Index. That growth translated into an increase in market capitalization of more than $1 trillion. The body of the article cites an analyst who forecasted that Amazon would grow its sales at a 16 percent compound annual rate through 2025. Of note, Amazon’s total sales were $136 billion in 2016, suggesting the company’s sales at the end of t he period would be $517 billion. The same paragraph mentions work that we did in 2016 revealing that no company with $100 billion or more in base year sales had ever grown at that mid-teens rate for that long. 2 Our data were from 1950-2015 and reflected sales figures unadjusted for acquisitions and divestitures but adjusted for inflation. The analysis was not specific to any particular business, but the clear implication was that it was improbable that a company that big could grow that fast. Amazon will be at a $515 billion-plus sales run rate by the second quarter of 2022 and will have a 6-year sales growth rate ended 2022 of 27.6 percent, if the consensus estimates are accurate. That growth rate is more than 11 percentage points above the analyst’s seemingly “too optimistic” view. If achieved, Amazon’s results will recast the base rate data. AUTHORS Michael J. Mauboussin [email protected] Dan Callahan, CFA [email protected]
Transcript of Counterpoint Global Insights The Impact of Intangibles on ...

Counterpoint Global Insights
The Impact of Intangibles on Base Rates
CONSILIENT OBSERVER | June 23, 2021
Introduction
The cover of the Economist newspaper on March 25, 2017 showed
a city landscape beneath a menacing spacecraft marked by the
Amazon logo. The headline was, “Amazon’s empire.” An article in
the issue had a title that asked, “Are investors too optimistic about
Amazon?”1 The stock would go on to appreciate 37.8 percent
annually in the next four years versus a total shareholder return of
15.8 percent for the S&P 500 Index. That growth translated into an
increase in market capitalization of more than $1 trillion.
The body of the article cites an analyst who forecasted that
Amazon would grow its sales at a 16 percent compound annual
rate through 2025. Of note, Amazon’s total sales were $136 billion
in 2016, suggesting the company’s sales at the end of the period
would be $517 billion.
The same paragraph mentions work that we did in 2016 revealing
that no company with $100 billion or more in base year sales had
ever grown at that mid-teens rate for that long.2 Our data were from
1950-2015 and reflected sales figures unadjusted for acquisitions
and divestitures but adjusted for inflation. The analysis was not
specific to any particular business, but the clear implication was
that it was improbable that a company that big could grow that fast.
Amazon will be at a $515 billion-plus sales run rate by the second
quarter of 2022 and will have a 6-year sales growth rate ended
2022 of 27.6 percent, if the consensus estimates are accurate. That
growth rate is more than 11 percentage points above the analyst’s
seemingly “too optimistic” view. If achieved, Amazon’s results will
recast the base rate data.
AUTHORS
Michael J. Mauboussin [email protected]
Dan Callahan, CFA [email protected]
© 2021 Morgan Stanley. 3637440 Exp. 06/30/2022 2
Two Ways to Make a Forecast
There are broadly two ways to make a forecast, which is really a judgment about the future.3 The first method is
to think causally, which is called taking the inside view. You gather lots of information about what is of interest,
combine it with your own input and experience, and project into the future. Analyst models are a good example
of this approach. The analyst studies a company’s businesses and projects sales and operating profit margins
based on a combination of macroeconomic factors, industry trends, and the company’s competitive position.
Causal thinking is a form of storytelling that comes naturally. It is a compelling way to anticipate the future and
a convincing way to explain the past. Our minds are great at creating facile narratives to explain what happens
in the world around us.
The second method is to think statistically, commonly referred to as the outside view. Rather than weaving a
story based on causal links, the statistical approach examines what happened to an appropriate reference class
of cases in the past. The results of the reference class are called base rates. Now the analyst builds her model
not by seeking causal links but rather by asking, “how did other companies perform that were in a similar position
to the one I am studying?” Instead of relying on your own experience, you tap the experience of others.
This type of thinking is unnatural because it features statistics rather than stories. Further, base rates may not
be readily available. But research shows that a thoughtful combination of the inside and outside views leads to
more accurate forecasts.4
One of the keys to using base rates effectively is finding an appropriate reference class. In many instances, the
distribution of outcomes is straightforward. In these cases, the outcomes don’t fall too far from the average, and
outliers are rare. Measures of corporate results, such as sales growth rates, generally fit into this camp. Base
rates are very effective for assessing outcomes that follow, or resemble, a bell-shaped distribution.
In other instances, the distribution of outcomes has a variance that is large, the concept of an average is
meaningless, and outliers skew the results.5 For example, most books, songs, and movies have very modest
sales while only a handful are blockbusters. Base rates are more difficult to apply, but knowledge of the
distribution itself is very useful. In our experience, underutilization of base rates is a bigger problem than
overutilization of them.
One important point to bear in mind is that outcomes of a proper reference class can change over time.6 That
Amazon’s sales growth is on pace to be greater than anything we have seen in the past 70 years proves the
point. That means that base rates can be very instructive but are not the final word. Indeed, there is reason to
believe that some measures of corporate performance are shifting because the nature of business has changed.
Growth Rates in a World of Intangible Assets
The basic way that companies grow is by earning a return on investments. Return is measured by profits, which
are the product of sales and margins. Investments can be tangible or intangible assets. Tangible assets are
things you can touch and feel, such as factories, trucks, and machines. Intangible assets lack a physical
existence and include software, the secret recipe for Coca-Cola, and the formulation of a life-saving drug.
One important distinction between corporate tangible and intangible assets is access. Only one company can
use a tangible asset at a time, whereas many can use an intangible asset at the same time.7 In reality, the
© 2021 Morgan Stanley. 3637440 Exp. 06/30/2022 3
distinction is less stark as assets fall on a continuum. But the main point is that the marginal cost of sharing an
intangible asset can be very low.
Intangible assets have two characteristics that are important for considering corporate growth rates.8 The first is
that they can enjoy strong economies of scale because they are commonly cheap to reproduce and share.
Economies of scale are a measure of cost per unit as a function of output. Think of software as an example. The
original code may be very expensive to produce but the cost per unit sold drops rapidly because it is inexpensive
to share. That is the good news.
The second is obsolescence and the related concept of sunkenness. The value of intangible assets can drop
precipitously when a new and better version comes along and makes the old version obsolete. And because the
old version has very limited value, the investment cost is sunk. Let’s continue with our example of software.
Once a company introduces a new operating system for a computer or mobile phone, the old one is of little
relevance or value. That is the bad news.
These characteristics highlight the contrast between tangible and intangible assets that are relevant for growth
rates. Intangible assets are more scalable than tangible assets. That means successful companies that rely on
intangible assets can grow faster than companies built on tangible assets. As the overall mix of investments
shifts from tangible to intangible, we should expect to see faster growth rates for the winners than we have seen
in the base rate data.
On the other hand, obsolescence means that companies that rely on intangible assets can decline more rapidly
than those built on tangible assets. Intangible assets are rarely standard, unlike tangible assets, which means
they have limited salvage value. A company with obsolete software cannot get much for it while a company with
a failed store can recoup some value by selling inventory and furnishings. This means that we should also expect
to see slower growth rates, or a greater rate of decline, for the losers than the base rate data reflect.
These observations about growth rates are important because overall investment spending has shifted in recent
decades from being predominately tangible to intangible. We estimate that intangible investments for companies
in the Russell 3000, which captures the vast majority of the investable U.S. equity market, was around $1.8
trillion in 2020. This is more than double the $800 billion those companies spent on capital expenditures.
This discussion suggests two hypotheses that we can test. The first is that intangible-based businesses can
grow faster than what the base rate data show. In essence, the right tail of the distribution of growth rates is
extending outward from the average. Amazon’s results provide anecdotal evidence for this.
The second is that we should observe greater variance in the distribution of growth rates for intangible-based
businesses. That means that the left tail of the distribution of growth rates is also spreading further from the
average. BlackBerry’s 26.7 percent average annual revenue decline in the past decade through February 2021
is a case in point.
This provides investors with good and bad news. The good news is there will be some businesses that grow in
excess of what history would suggest, creating opportunity. The bad news is some businesses will lose their
positions of prominence and decline more rapidly than their predecessors did. Base rates remain extremely
informative, but we must have the mental flexibility to acknowledge how the population of companies has
changed over time.
© 2021 Morgan Stanley. 3637440 Exp. 06/30/2022 4
Base Rates Based on Intangible Asset Intensity
To test these ideas, we first need to sort the companies based on their intangible asset intensity. In a recent
paper, three finance professors built a model to infer the value of intangible assets by examining market prices
and merger and acquisition (M&A) deals.9 High market prices relative to stated book values suggest a failure to
recognize some intangible assets. When one company acquires another, the acquirer’s accountants have to
record the difference between the purchase price and tangible assets as goodwill or intangible assets. Using
popular measures of knowledge and organizational capital as a benchmark, they found that the M&A data did a
better job of estimating the value of intangible assets than did the market price technique.
The professors applied the M&A method to a large sample of companies from 1978-2017 to figure out where
intangible asset intensity was highest. They found that the order of ranking from highest to lowest by industry
was healthcare, technology, consumer, and manufacturing. They also placed about one-third of the companies
into an “other” category because they didn’t fit neatly into one of the industries.
We calculated the median sales growth rate for companies in each of those categories using the constituents of
the Russell 3000 from 1984-2020. We also examined the standard deviation, a measure of the dispersion, of
the distributions. Exhibit 1 shows the results for the full sample.
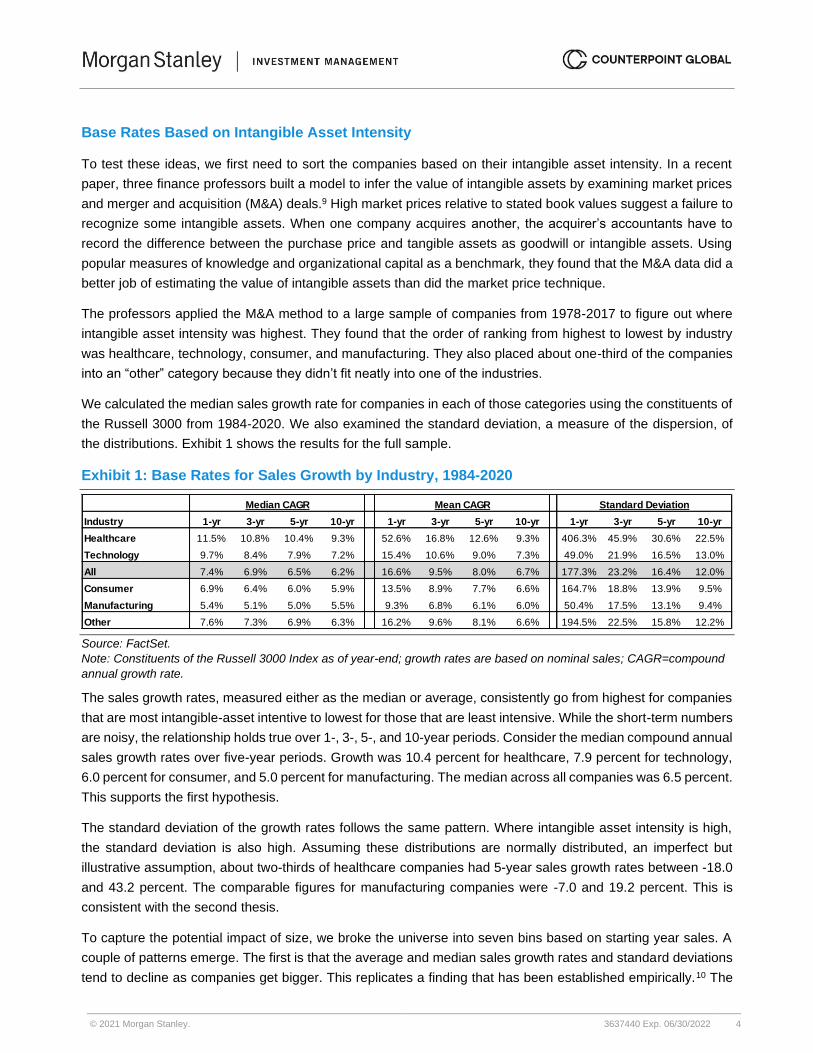
Exhibit 1: Base Rates for Sales Growth by Industry, 1984-2020
Source: FactSet.
Note: Constituents of the Russell 3000 Index as of year-end; growth rates are based on nominal sales; CAGR=compound
annual growth rate.
The sales growth rates, measured either as the median or average, consistently go from highest for companies
that are most intangible-asset intentive to lowest for those that are least intensive. While the short-term numbers
are noisy, the relationship holds true over 1-, 3-, 5-, and 10-year periods. Consider the median compound annual
sales growth rates over five-year periods. Growth was 10.4 percent for healthcare, 7.9 percent for technology,
6.0 percent for consumer, and 5.0 percent for manufacturing. The median across all companies was 6.5 percent.
This supports the first hypothesis.
The standard deviation of the growth rates follows the same pattern. Where intangible asset intensity is high,
the standard deviation is also high. Assuming these distributions are normally distributed, an imperfect but
illustrative assumption, about two-thirds of healthcare companies had 5-year sales growth rates between -18.0
and 43.2 percent. The comparable figures for manufacturing companies were -7.0 and 19.2 percent. This is
consistent with the second thesis.
To capture the potential impact of size, we broke the universe into seven bins based on starting year sales. A
couple of patterns emerge. The first is that the average and median sales growth rates and standard deviations
tend to decline as companies get bigger. This replicates a finding that has been established empirically.10 The
Industry 1-yr 3-yr 5-yr 10-yr 1-yr 3-yr 5-yr 10-yr 1-yr 3-yr 5-yr 10-yr
Healthcare 11.5% 10.8% 10.4% 9.3% 52.6% 16.8% 12.6% 9.3% 406.3% 45.9% 30.6% 22.5%
Technology 9.7% 8.4% 7.9% 7.2% 15.4% 10.6% 9.0% 7.3% 49.0% 21.9% 16.5% 13.0%
All 7.4% 6.9% 6.5% 6.2% 16.6% 9.5% 8.0% 6.7% 177.3% 23.2% 16.4% 12.0%
Consumer 6.9% 6.4% 6.0% 5.9% 13.5% 8.9% 7.7% 6.6% 164.7% 18.8% 13.9% 9.5%
Manufacturing 5.4% 5.1% 5.0% 5.5% 9.3% 6.8% 6.1% 6.0% 50.4% 17.5% 13.1% 9.4%
Other 7.6% 7.3% 6.9% 6.3% 16.2% 9.6% 8.1% 6.6% 194.5% 22.5% 15.8% 12.2%
Median CAGR Mean CAGR Standard Deviation
© 2021 Morgan Stanley. 3637440 Exp. 06/30/2022 5
second is that the basic relationship between high intangible asset intensity and high growth rates tends to hold
across all size bins. (See the appendix for more detail.)
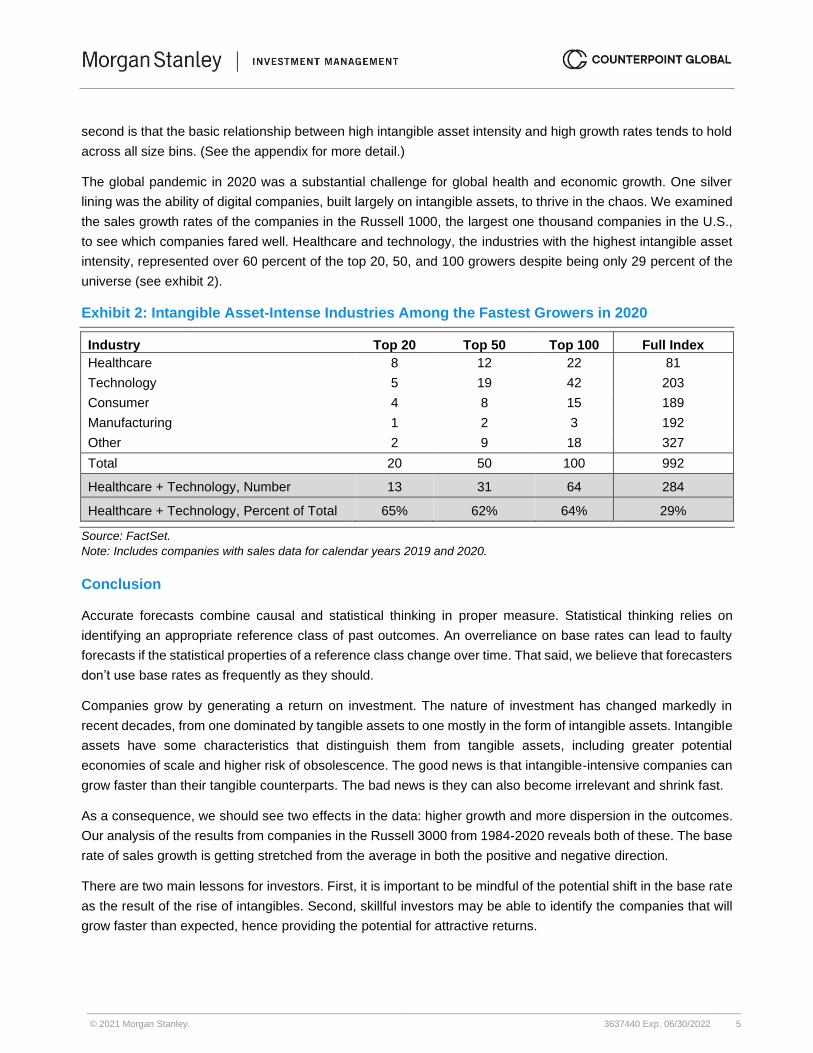
The global pandemic in 2020 was a substantial challenge for global health and economic growth. One silver
lining was the ability of digital companies, built largely on intangible assets, to thrive in the chaos. We examined
the sales growth rates of the companies in the Russell 1000, the largest one thousand companies in the U.S.,
to see which companies fared well. Healthcare and technology, the industries with the highest intangible asset
intensity, represented over 60 percent of the top 20, 50, and 100 growers despite being only 29 percent of the
universe (see exhibit 2).
Exhibit 2: Intangible Asset-Intense Industries Among the Fastest Growers in 2020
Industry Top 20 Top 50 Top 100 Full Index
Healthcare 8 12 22 81
Technology 5 19 42 203
Consumer 4 8 15 189
Manufacturing 1 2 3 192
Other 2 9 18 327
Total 20 50 100 992
Healthcare + Technology, Number 13 31 64 284
Healthcare + Technology, Percent of Total 65% 62% 64% 29%
Source: FactSet.
Note: Includes companies with sales data for calendar years 2019 and 2020.
Conclusion
Accurate forecasts combine causal and statistical thinking in proper measure. Statistical thinking relies on
identifying an appropriate reference class of past outcomes. An overreliance on base rates can lead to faulty
forecasts if the statistical properties of a reference class change over time. That said, we believe that forecasters
don’t use base rates as frequently as they should.
Companies grow by generating a return on investment. The nature of investment has changed markedly in
recent decades, from one dominated by tangible assets to one mostly in the form of intangible assets. Intangible
assets have some characteristics that distinguish them from tangible assets, including greater potential
economies of scale and higher risk of obsolescence. The good news is that intangible-intensive companies can
grow faster than their tangible counterparts. The bad news is they can also become irrelevant and shrink fast.
As a consequence, we should see two effects in the data: higher growth and more dispersion in the outcomes.
Our analysis of the results from companies in the Russell 3000 from 1984-2020 reveals both of these. The base
rate of sales growth is getting stretched from the average in both the positive and negative direction.
There are two main lessons for investors. First, it is important to be mindful of the potential shift in the base rate
as the result of the rise of intangibles. Second, skillful investors may be able to identify the companies that will
grow faster than expected, hence providing the potential for attractive returns.
© 2021 Morgan Stanley. 3637440 Exp. 06/30/2022 6
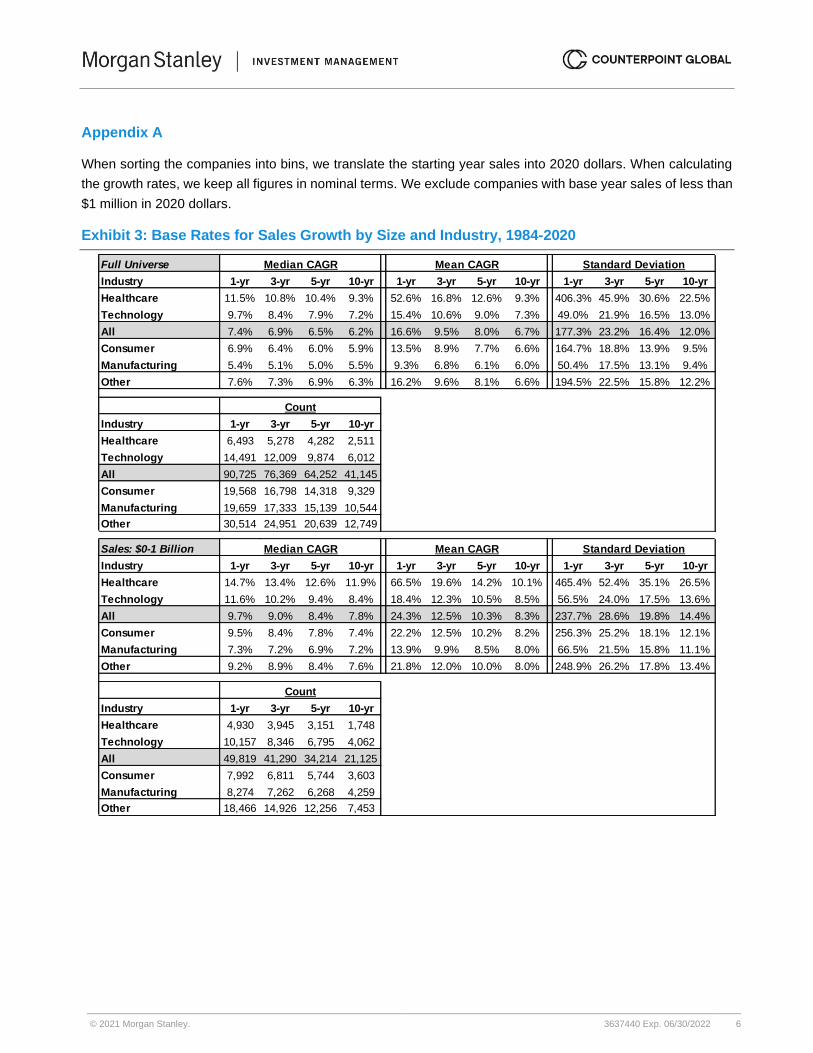
Appendix A
When sorting the companies into bins, we translate the starting year sales into 2020 dollars. When calculating
the growth rates, we keep all figures in nominal terms. We exclude companies with base year sales of less than
$1 million in 2020 dollars.
Exhibit 3: Base Rates for Sales Growth by Size and Industry, 1984-2020
Full Universe
Industry 1-yr 3-yr 5-yr 10-yr 1-yr 3-yr 5-yr 10-yr 1-yr 3-yr 5-yr 10-yr
Healthcare 11.5% 10.8% 10.4% 9.3% 52.6% 16.8% 12.6% 9.3% 406.3% 45.9% 30.6% 22.5%
Technology 9.7% 8.4% 7.9% 7.2% 15.4% 10.6% 9.0% 7.3% 49.0% 21.9% 16.5% 13.0%
All 7.4% 6.9% 6.5% 6.2% 16.6% 9.5% 8.0% 6.7% 177.3% 23.2% 16.4% 12.0%
Consumer 6.9% 6.4% 6.0% 5.9% 13.5% 8.9% 7.7% 6.6% 164.7% 18.8% 13.9% 9.5%
Manufacturing 5.4% 5.1% 5.0% 5.5% 9.3% 6.8% 6.1% 6.0% 50.4% 17.5% 13.1% 9.4%
Other 7.6% 7.3% 6.9% 6.3% 16.2% 9.6% 8.1% 6.6% 194.5% 22.5% 15.8% 12.2%
Industry 1-yr 3-yr 5-yr 10-yr
Healthcare 6,493 5,278 4,282 2,511
Technology 14,491 12,009 9,874 6,012
All 90,725 76,369 64,252 41,145
Consumer 19,568 16,798 14,318 9,329
Manufacturing 19,659 17,333 15,139 10,544
Other 30,514 24,951 20,639 12,749
Median CAGR Mean CAGR Standard Deviation
Count
Sales: $0-1 Billion
Industry 1-yr 3-yr 5-yr 10-yr 1-yr 3-yr 5-yr 10-yr 1-yr 3-yr 5-yr 10-yr
Healthcare 14.7% 13.4% 12.6% 11.9% 66.5% 19.6% 14.2% 10.1% 465.4% 52.4% 35.1% 26.5%
Technology 11.6% 10.2% 9.4% 8.4% 18.4% 12.3% 10.5% 8.5% 56.5% 24.0% 17.5% 13.6%
All 9.7% 9.0% 8.4% 7.8% 24.3% 12.5% 10.3% 8.3% 237.7% 28.6% 19.8% 14.4%
Consumer 9.5% 8.4% 7.8% 7.4% 22.2% 12.5% 10.2% 8.2% 256.3% 25.2% 18.1% 12.1%
Manufacturing 7.3% 7.2% 6.9% 7.2% 13.9% 9.9% 8.5% 8.0% 66.5% 21.5% 15.8% 11.1%
Other 9.2% 8.9% 8.4% 7.6% 21.8% 12.0% 10.0% 8.0% 248.9% 26.2% 17.8% 13.4%
Industry 1-yr 3-yr 5-yr 10-yr
Healthcare 4,930 3,945 3,151 1,748
Technology 10,157 8,346 6,795 4,062
All 49,819 41,290 34,214 21,125
Consumer 7,992 6,811 5,744 3,603
Manufacturing 8,274 7,262 6,268 4,259
Other 18,466 14,926 12,256 7,453
Mean CAGR Standard DeviationMedian CAGR
Count
© 2021 Morgan Stanley. 3637440 Exp. 06/30/2022 7
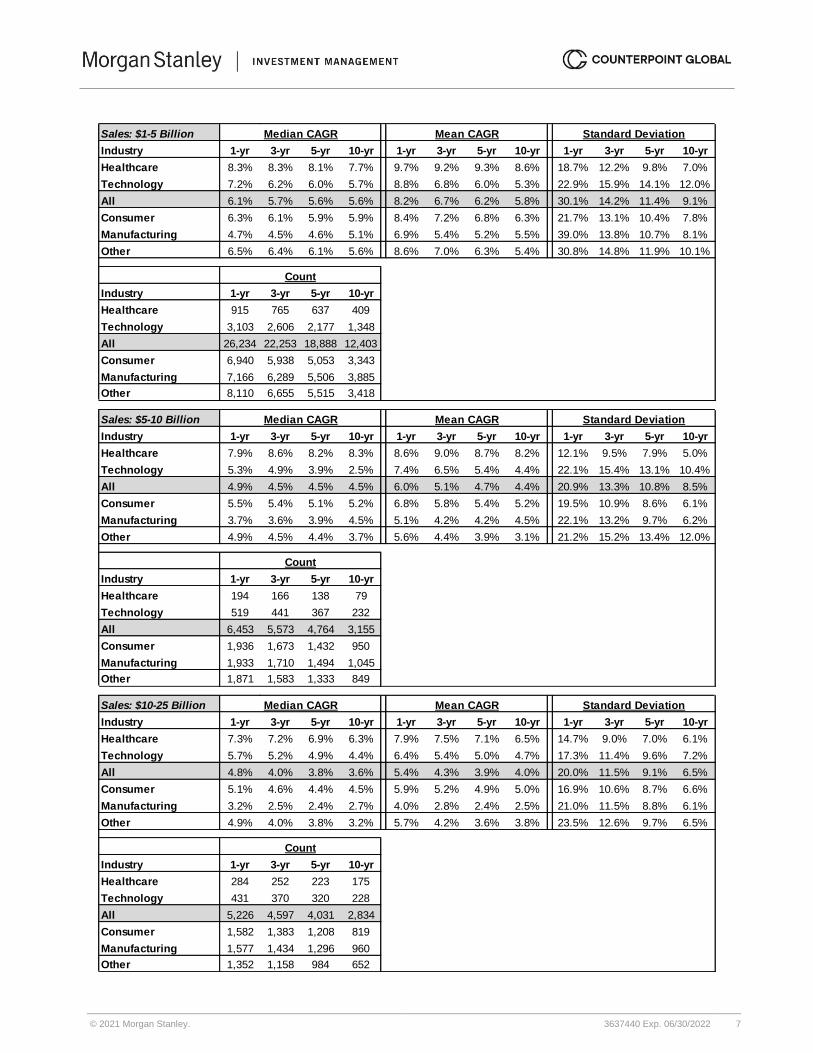
Sales: $1-5 Billion
Industry 1-yr 3-yr 5-yr 10-yr 1-yr 3-yr 5-yr 10-yr 1-yr 3-yr 5-yr 10-yr
Healthcare 8.3% 8.3% 8.1% 7.7% 9.7% 9.2% 9.3% 8.6% 18.7% 12.2% 9.8% 7.0%
Technology 7.2% 6.2% 6.0% 5.7% 8.8% 6.8% 6.0% 5.3% 22.9% 15.9% 14.1% 12.0%
All 6.1% 5.7% 5.6% 5.6% 8.2% 6.7% 6.2% 5.8% 30.1% 14.2% 11.4% 9.1%
Consumer 6.3% 6.1% 5.9% 5.9% 8.4% 7.2% 6.8% 6.3% 21.7% 13.1% 10.4% 7.8%
Manufacturing 4.7% 4.5% 4.6% 5.1% 6.9% 5.4% 5.2% 5.5% 39.0% 13.8% 10.7% 8.1%
Other 6.5% 6.4% 6.1% 5.6% 8.6% 7.0% 6.3% 5.4% 30.8% 14.8% 11.9% 10.1%
Industry 1-yr 3-yr 5-yr 10-yr
Healthcare 915 765 637 409
Technology 3,103 2,606 2,177 1,348
All 26,234 22,253 18,888 12,403
Consumer 6,940 5,938 5,053 3,343
Manufacturing 7,166 6,289 5,506 3,885
Other 8,110 6,655 5,515 3,418
Median CAGR
Count
Standard DeviationMean CAGR
Sales: $5-10 Billion
Industry 1-yr 3-yr 5-yr 10-yr 1-yr 3-yr 5-yr 10-yr 1-yr 3-yr 5-yr 10-yr
Healthcare 7.9% 8.6% 8.2% 8.3% 8.6% 9.0% 8.7% 8.2% 12.1% 9.5% 7.9% 5.0%
Technology 5.3% 4.9% 3.9% 2.5% 7.4% 6.5% 5.4% 4.4% 22.1% 15.4% 13.1% 10.4%
All 4.9% 4.5% 4.5% 4.5% 6.0% 5.1% 4.7% 4.4% 20.9% 13.3% 10.8% 8.5%
Consumer 5.5% 5.4% 5.1% 5.2% 6.8% 5.8% 5.4% 5.2% 19.5% 10.9% 8.6% 6.1%
Manufacturing 3.7% 3.6% 3.9% 4.5% 5.1% 4.2% 4.2% 4.5% 22.1% 13.2% 9.7% 6.2%
Other 4.9% 4.5% 4.4% 3.7% 5.6% 4.4% 3.9% 3.1% 21.2% 15.2% 13.4% 12.0%
Industry 1-yr 3-yr 5-yr 10-yr
Healthcare 194 166 138 79
Technology 519 441 367 232
All 6,453 5,573 4,764 3,155
Consumer 1,936 1,673 1,432 950
Manufacturing 1,933 1,710 1,494 1,045
Other 1,871 1,583 1,333 849
Median CAGR Mean CAGR
Count
Standard Deviation
Sales: $10-25 Billion
Industry 1-yr 3-yr 5-yr 10-yr 1-yr 3-yr 5-yr 10-yr 1-yr 3-yr 5-yr 10-yr
Healthcare 7.3% 7.2% 6.9% 6.3% 7.9% 7.5% 7.1% 6.5% 14.7% 9.0% 7.0% 6.1%
Technology 5.7% 5.2% 4.9% 4.4% 6.4% 5.4% 5.0% 4.7% 17.3% 11.4% 9.6% 7.2%
All 4.8% 4.0% 3.8% 3.6% 5.4% 4.3% 3.9% 4.0% 20.0% 11.5% 9.1% 6.5%
Consumer 5.1% 4.6% 4.4% 4.5% 5.9% 5.2% 4.9% 5.0% 16.9% 10.6% 8.7% 6.6%
Manufacturing 3.2% 2.5% 2.4% 2.7% 4.0% 2.8% 2.4% 2.5% 21.0% 11.5% 8.8% 6.1%
Other 4.9% 4.0% 3.8% 3.2% 5.7% 4.2% 3.6% 3.8% 23.5% 12.6% 9.7% 6.5%
Industry 1-yr 3-yr 5-yr 10-yr
Healthcare 284 252 223 175
Technology 431 370 320 228
All 5,226 4,597 4,031 2,834
Consumer 1,582 1,383 1,208 819
Manufacturing 1,577 1,434 1,296 960
Other 1,352 1,158 984 652
Standard DeviationMean CAGR
Count
Median CAGR
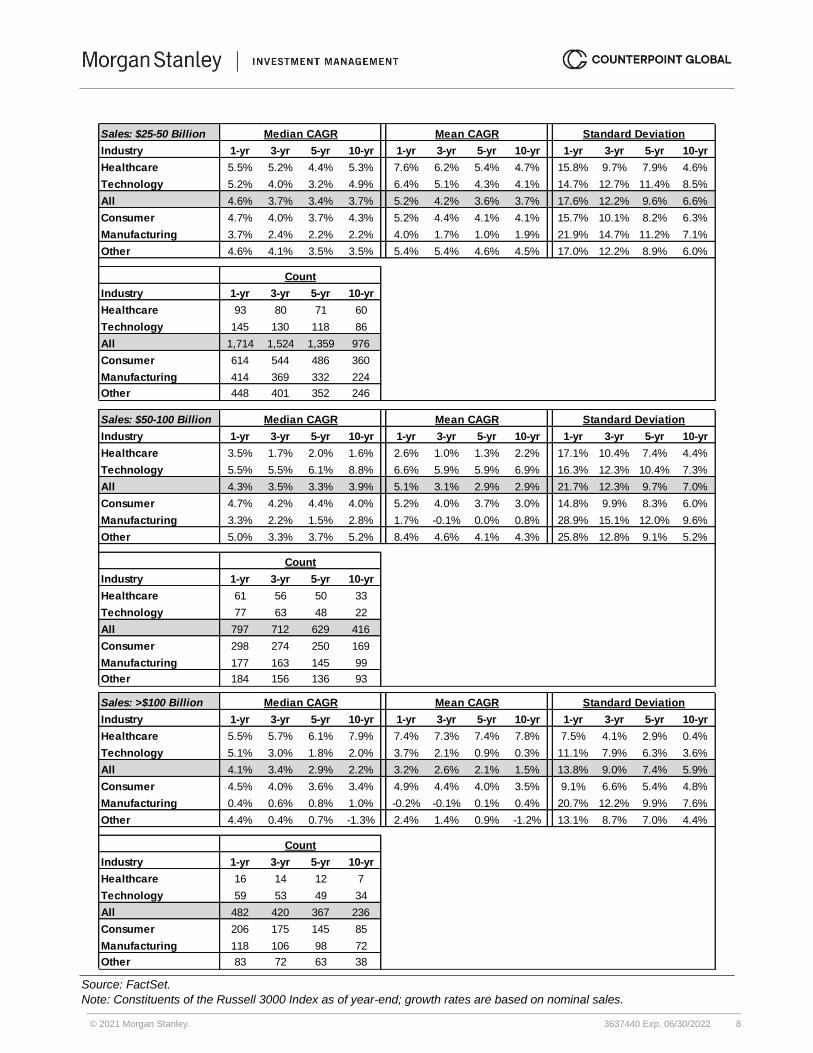
© 2021 Morgan Stanley. 3637440 Exp. 06/30/2022 8
Source: FactSet.
Note: Constituents of the Russell 3000 Index as of year-end; growth rates are based on nominal sales.
Sales: $25-50 Billion
Industry 1-yr 3-yr 5-yr 10-yr 1-yr 3-yr 5-yr 10-yr 1-yr 3-yr 5-yr 10-yr
Healthcare 5.5% 5.2% 4.4% 5.3% 7.6% 6.2% 5.4% 4.7% 15.8% 9.7% 7.9% 4.6%
Technology 5.2% 4.0% 3.2% 4.9% 6.4% 5.1% 4.3% 4.1% 14.7% 12.7% 11.4% 8.5%
All 4.6% 3.7% 3.4% 3.7% 5.2% 4.2% 3.6% 3.7% 17.6% 12.2% 9.6% 6.6%
Consumer 4.7% 4.0% 3.7% 4.3% 5.2% 4.4% 4.1% 4.1% 15.7% 10.1% 8.2% 6.3%
Manufacturing 3.7% 2.4% 2.2% 2.2% 4.0% 1.7% 1.0% 1.9% 21.9% 14.7% 11.2% 7.1%
Other 4.6% 4.1% 3.5% 3.5% 5.4% 5.4% 4.6% 4.5% 17.0% 12.2% 8.9% 6.0%
Industry 1-yr 3-yr 5-yr 10-yr
Healthcare 93 80 71 60
Technology 145 130 118 86
All 1,714 1,524 1,359 976
Consumer 614 544 486 360
Manufacturing 414 369 332 224
Other 448 401 352 246
Median CAGR Mean CAGR Standard Deviation
Count
Sales: $50-100 Billion
Industry 1-yr 3-yr 5-yr 10-yr 1-yr 3-yr 5-yr 10-yr 1-yr 3-yr 5-yr 10-yr
Healthcare 3.5% 1.7% 2.0% 1.6% 2.6% 1.0% 1.3% 2.2% 17.1% 10.4% 7.4% 4.4%
Technology 5.5% 5.5% 6.1% 8.8% 6.6% 5.9% 5.9% 6.9% 16.3% 12.3% 10.4% 7.3%
All 4.3% 3.5% 3.3% 3.9% 5.1% 3.1% 2.9% 2.9% 21.7% 12.3% 9.7% 7.0%
Consumer 4.7% 4.2% 4.4% 4.0% 5.2% 4.0% 3.7% 3.0% 14.8% 9.9% 8.3% 6.0%
Manufacturing 3.3% 2.2% 1.5% 2.8% 1.7% -0.1% 0.0% 0.8% 28.9% 15.1% 12.0% 9.6%
Other 5.0% 3.3% 3.7% 5.2% 8.4% 4.6% 4.1% 4.3% 25.8% 12.8% 9.1% 5.2%
Industry 1-yr 3-yr 5-yr 10-yr
Healthcare 61 56 50 33
Technology 77 63 48 22
All 797 712 629 416
Consumer 298 274 250 169
Manufacturing 177 163 145 99
Other 184 156 136 93
Mean CAGR
Count
Median CAGR Standard Deviation
Sales: >$100 Billion
Industry 1-yr 3-yr 5-yr 10-yr 1-yr 3-yr 5-yr 10-yr 1-yr 3-yr 5-yr 10-yr
Healthcare 5.5% 5.7% 6.1% 7.9% 7.4% 7.3% 7.4% 7.8% 7.5% 4.1% 2.9% 0.4%
Technology 5.1% 3.0% 1.8% 2.0% 3.7% 2.1% 0.9% 0.3% 11.1% 7.9% 6.3% 3.6%
All 4.1% 3.4% 2.9% 2.2% 3.2% 2.6% 2.1% 1.5% 13.8% 9.0% 7.4% 5.9%
Consumer 4.5% 4.0% 3.6% 3.4% 4.9% 4.4% 4.0% 3.5% 9.1% 6.6% 5.4% 4.8%
Manufacturing 0.4% 0.6% 0.8% 1.0% -0.2% -0.1% 0.1% 0.4% 20.7% 12.2% 9.9% 7.6%
Other 4.4% 0.4% 0.7% -1.3% 2.4% 1.4% 0.9% -1.2% 13.1% 8.7% 7.0% 4.4%
Industry 1-yr 3-yr 5-yr 10-yr
Healthcare 16 14 12 7
Technology 59 53 49 34
All 482 420 367 236
Consumer 206 175 145 85
Manufacturing 118 106 98 72
Other 83 72 63 38
Mean CAGR
Count
Median CAGR Standard Deviation
© 2021 Morgan Stanley. 3637440 Exp. 06/30/2022 9
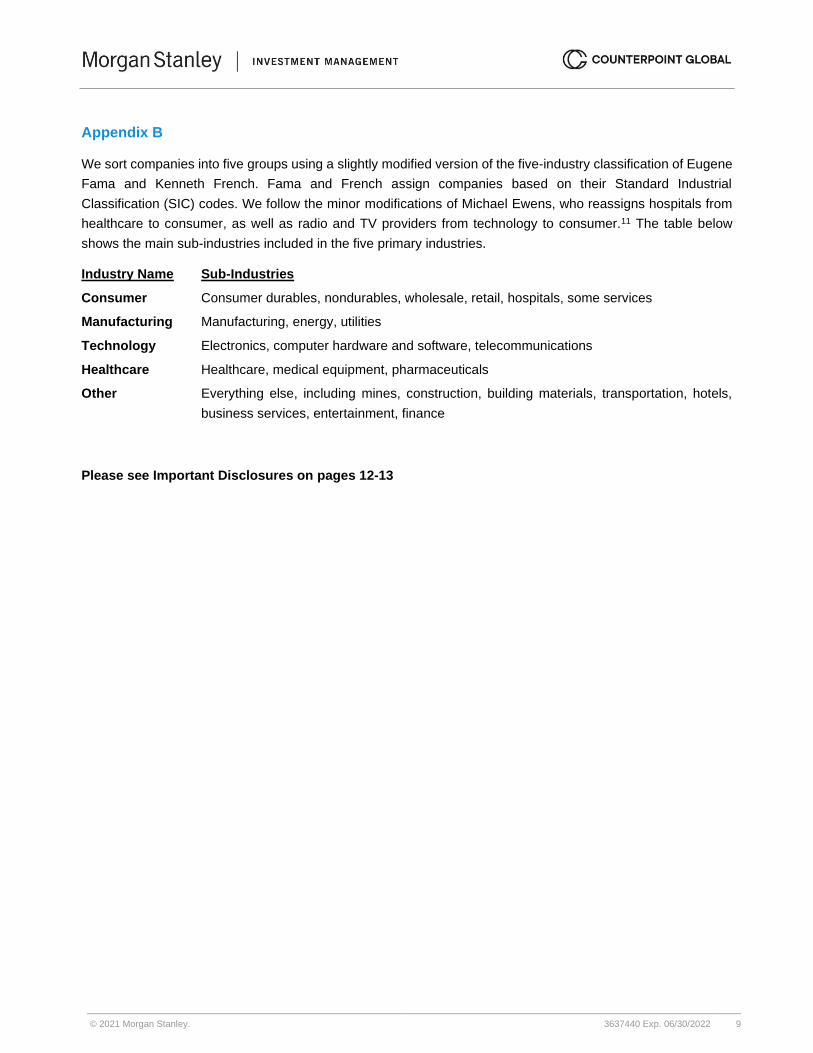
Appendix B
We sort companies into five groups using a slightly modified version of the five-industry classification of Eugene
Fama and Kenneth French. Fama and French assign companies based on their Standard Industrial
Classification (SIC) codes. We follow the minor modifications of Michael Ewens, who reassigns hospitals from
healthcare to consumer, as well as radio and TV providers from technology to consumer.11 The table below
shows the main sub-industries included in the five primary industries.
Industry Name Sub-Industries
Consumer Consumer durables, nondurables, wholesale, retail, hospitals, some services
Manufacturing Manufacturing, energy, utilities
Technology Electronics, computer hardware and software, telecommunications
Healthcare Healthcare, medical equipment, pharmaceuticals
Other Everything else, including mines, construction, building materials, transportation, hotels,
business services, entertainment, finance
Please see Important Disclosures on pages 12-13
© 2021 Morgan Stanley. 3637440 Exp. 06/30/2022 10
Endnotes
1 “Are investors too optimistic about Amazon?” Economist, March 25, 2017. 2 Michael J. Mauboussin, Dan Callahan, and Darius Majd, “The Base Rate Book: Integrating the Past to Better
Anticipate the Future,” Credit Suisse Global Financial Strategies, September 26, 2016. 3 Daniel Kahneman, Olivier Sibony, and Cass R. Sunstein, Noise: A Flaw in Human Judgment (New York: Little,
Brown Spark, 2021), 156-158. 4 Mauboussin, Callahan, and Majd, “The Base Rate Book,” 7-9. 5 This can also be understood as mild, slow, and wild randomness. See Benoit B. Mandelbrot, Fractals and
Scaling in Finance: Discontinuity, Concentration, and Risk (New York: Springer, 1997), 117-125. 6 This means that the process that generates the distribution is not stationary. In a stationary series, the statistical
properties such as the mean and standard deviation do not change over time. The distributions we are discussing
are not stationary but stable enough to be beneficial. 7 The technical term for this is a rivalrous good. 8 For a more thorough review of the characteristics of intangible assets, see Jonathan Haskel and Stian
Westlake, Capitalism Without Capital: The Rise of the Intangible Economy (Princeton, NJ: Princeton University
Press, 2017), 56-88. 9 Michael Ewens, Ryan H. Peters, and Sean Wang, “Measuring Intangible Capital with Market Prices,” Working
Paper, October 2020. 10 Michael H. R. Stanley, Luís A. N. Amaral, Sergey V. Buldyrev, Shlomo Havlin, Heiko Leschhorn, Philipp
Maass, Michael A. Salinger, and H. Eugene Stanley, “Scaling Behaviour in the Growth of Companies,” Nature,
Vol. 379, February 29, 1996, 804-806. Also, Rich Perline, Robert Axtell, and Daniel Teitelbaum, “Volatility and
Asymmetry of Small Firm Growth Rates Over Increasing Time Frames,” Small Business Research Summary,
No. 285, December 2006. 11 Michael Ewens. See https://github.com/michaelewens/Intangible-capital-stocks.
© 2021 Morgan Stanley. 3637440 Exp. 06/30/2022 11
DEFINITIONS OF TERMS
Return on investment is a performance measure used to evaluate the efficiency of an investment or to
compare the efficiency of a number of different investments.
The Russell 3000® Index measures the performance of the largest 3,000 U.S. companies, representing
approximately 98% of the investable U.S. equity market. The Russell 3000 Index is constructed to provide a
comprehensive, unbiased, and stable barometer of the broad market and is completely reconstituted annually
to ensure new and growing equities are reflected.
The Russell 1000® Index measures the performance of the 1,000 largest companies in the Russell 3000®
Index.
The S&P 500® Index measures the performance of the large cap segment of the U.S. equities market,
covering approximately 80% of the U.S. equities market. The Index includes 500 leading companies in leading
industries of the U.S. economy.
Total shareholder return reflects the change in stock price plus reinvested dividends.
© 2021 Morgan Stanley. 3637440 Exp. 06/30/2022 12
DISTRIBUTION This communication is only intended for and will only be distributed to persons resident in jurisdictions where such distribution or availability would not be contrary to local laws or regulations. EMEA: This marketing communication has been issued by MSIM Fund Management (Ireland) Limited. MSIM Fund Management (Ireland) Limited is regulated by the Central Bank of Ireland. MSIM Fund Management (Ireland) Limited is incorporated in Ireland as a private company limited by shares with company registration number 616661 and has its registered address at The Observatory, 7-11 Sir John Rogerson's Quay, Dublin 2, D02 VC42, Ireland.
U.S.: NOT FDIC INSURED | OFFER NO BANK GUARANTEE | MAY LOSE VALUE | NOT INSURED BY ANY FEDERAL GOVERNMENT AGENCY | NOT A BANK DEPOSIT Hong Kong: This document has been issued by Morgan Stanley Asia Limited for use in Hong Kong and shall only be made available to “professional investors” as defined under the Securities and Futures Ordinance of Hong Kong (Cap 571). The contents of this document have not been reviewed nor approved by any regulatory authority including the Securities and Futures Commission in Hong Kong. Accordingly, save where an exemption is available under the relevant law, this document shall not be issued, circulated, distributed, directed at, or made available to, the public in Hong Kong. Singapore: This document may not be circulated or distributed, whether directly or indirectly, to persons in Singapore other than to (i) an accredited investor (ii) an expert investor or (iii) an institutional investor as defined in Section 4A of the Securities and Futures Act, Chapter 289 of Singapore (“SFA”); or (iv) otherwise pursuant to, and in accordance with the conditions of, any other applicable provision of the SFA. This publication has not been reviewed by the Monetary Authority of Singapore. Australia: This publication is disseminated in Australia by Morgan Stanley Investment Management (Australia) Pty Limited ACN: 122040037, AFSL No. 314182, which accept responsibility for its contents. This publication, and any access to it, is intended only for “wholesale clients” within the meaning of the Australian Corporations Act.
Japan: This document may not be circulated or distributed, whether directly or indirectly, to persons in Japan other than to (i) a professional investor as defined in Article 2 of the Financial Instruments and Exchange Act (“FIEA”) or (ii) otherwise pursuant to, and in accordance with the conditions of, any other allocable provision of the FIEA. This document is disseminated in Japan by Morgan Stanley Investment Management (Japan) Co., Ltd., Registered No. 410 (Director of Kanto Local Finance Bureau (Financial Instruments Firms)), Membership: the Japan Securities Dealers Association, The Investment Trusts Association, Japan, the Japan Investment Advisers Association and the Type II Financial Instruments Firms Association. IMPORTANT INFORMATION The views and opinions are those of the author as of the date of preparation of this material and are subject to change at any time due to market or economic conditions and may not necessarily come to pass. Furthermore, the views will not be updated or otherwise revised to reflect information that subsequently becomes available or circumstances existing, or changes occurring, after the date of publication. The views expressed do not reflect the opinions of all investment teams at Morgan Stanley Investment Management (MSIM) or the views of the firm as a whole, and may not be reflected in all the strategies and products that the Firm offers. Certain information herein is based on data obtained from third party sources believed to be reliable. However, we have not verified this information, and we make no representations whatsoever as to its accuracy or completeness. The views expressed in the books and articles referenced in this whitepaper are not necessarily endorsed by Morgan Stanley Investment Management. The information herein is a general communications which is not impartial and has been prepared solely for information and educational purposes and does not constitute an offer or a recommendation to buy or sell any particular security or to adopt any specific investment strategy. The material contained herein has not been
© 2021 Morgan Stanley. 3637440 Exp. 06/30/2022 13
based on a consideration of any individual client circumstances and is not investment advice, nor should it be construed in any way as tax, accounting, legal or regulatory advice. To that end, investors should seek independent legal and financial advice, including advice as to tax consequences, before making any investment decision. Charts and graphs provided herein are for illustrative purposes only. Any securities referenced herein are solely for illustrative purposes only and should not be construed as a recommendation for investment. This communication is not a product of Morgan Stanley’s Research Department and should not be regarded as a research recommendation. The information contained herein has not been prepared in accordance with legal requirements designed to promote the independence of investment research and is not subject to any prohibition on dealing ahead of the dissemination of investment research. MSIM has not authorised financial intermediaries to use and to distribute this document, unless such use and distribution is made in accordance with applicable law and regulation. Additionally, financial intermediaries are required to satisfy themselves that the information in this document is appropriate for any person to whom they provide this document in view of that person’s circumstances and purpose. MSIM shall not be liable for, and accepts no liability for, the use or misuse of this document by any such financial intermediary. The whole or any part of this work may not be directly or indirectly reproduced, copied, modified, used to create a derivative work, performed, displayed, published, posted, licensed, framed, distributed or transmitted or any of its contents disclosed to third parties without MSIM’s express written consent. This work may not be linked to unless such hyperlink is for personal and non-commercial use. All information contained herein is proprietary and is protected under copyright and other applicable law. Morgan Stanley Investment Management is the asset management division of Morgan Stanley. This document may be translated into other languages. Where such a translation is made this English version remains definitive. If there are any discrepancies between the English version and any version of this document in another language, the English version shall prevail.