
Count me in 2010 - Care Quality Commission · Count me in 2010 Results of the 2010 national census...
66
Count me in 2010 Results of the 2010 national census of inpatients and patients on supervised community treatment in mental health and learning disability services in England and Wales April 2011
Transcript of Count me in 2010 - Care Quality Commission · Count me in 2010 Results of the 2010 national census...
Count me in 2010
Results of the 2010 national census of inpatients and patients on supervised community treatment in mental health and learning disability services in England and Wales
April 2011
About the Care Quality Commission
The Care Quality Commission is the independent regulator of health care and adult social care services in England We also protect the interests of people whose rights are restricted under the Mental Health Act
Whether services are provided by the NHS local authorities or by private or voluntary organisations we focus on
bull Identifying risks to the quality and safety of peoplersquos care
bull Acting swiftly to help eliminate poor-quality care
bull Making sure care is centred on peoplersquos needs and protects their rights
Contents
Summary 2
National organisations coordinating the census 7
Introduction 8
Data methods of analysis and interpretation 11
Results Mental health 14
A comparison between the 2005 baseline and the 2010 census 32
Results Learning disabilities 34
Data in the future Moving beyond a one-day census 40
Conclusions 42
References 46
Appendix A Methods of analysis 48
Appendix B Mental health tables 49
Appendix C Learning disability tables 61
Care Quality Commission Count me in census 2010 1
Summary
This is the sixth and last national census of the ethnicity of inpatients in NHS and independent mental health and learning disability services in England and Wales conducted on 31 March 2010
The census has been undertaken annually since 2005 in support of the Department of Healthrsquos five-year action plan for improving mental health services for Black and minority ethnic communities in England Delivering Race Equality in Mental Health Care (DRE) It also supports the Welsh Assembly Governmentrsquos Raising the Standard Race Equality Action Plan for Adult Mental Health Services in Wales published in October 2006 The aim of the census was to support these action plans by
1 Obtaining accurate figures relating to patients in mental health and learning disability services in England and Wales
2 Encouraging providers of health services to implement procedures for the comprehensive recording and monitoring of data on the ethnic group of patients
3 Providing information to help health services achieve the goals of the action plans
The DRE five-year action plan for England came to a close in 2010 While this report reviews changes in the census results since 2005 it is not a review or evaluation of the DRE programme overall (The National Mental Health Development Unit published Race Equality Action Plan a five year review in December 2010) DRErsquos underlying goal of promoting equity in health care for Black and minority ethnic communities in England continues to be reflected in government policy on tackling inequalities in health and outcomes of healthcare and is central to demonstrating compliance with equality legislation
Key findings
Mental health Information was obtained for 32799 patients who were either inpatients on the mental health wards of 261 NHS and independent healthcare organisations in England and Wales or were outpatients on a community treatment order (CTO) on census day There were 3034 patients on a CTO of these 2959 were outpatients on census day and 75 were inpatients who were either recalled or were voluntary inpatients The overall patterns emerging from this census are broadly similar to those observed in previous years This is not surprising as 31 of the patients in 2010 were also patients in 2009 and 20 of them had also been in hospital at the time of the 2008 census
Care Quality Commission Count me in census 2010 2
Summary continued
Distribution of patients
Rates of admission (excluding outpatients on a CTO)
Referral from the criminal justice system Detention under the Mental Health Act on admission
Detention under section 3741
Community treatment order Seclusion
Self-harm
Accidents
Hands-on restraint and physical assault Length of stay (from admission to census day)
Single sex accommodation
The key findings are
Number of patients 32799 (including 2959 outpatients on a CTO) of whom 23 were from Black and minority ethnic groups (that is not White British) 16 of all patients were in independent hospitals 70 of patients from Black and minority ethnic groups were at 25 of the 261 organisations involved Lower than average for the White British Indian and Chinese groups In line with the average for the Pakistani and Bangladeshi groups Higher than average for the other minority ethnic groups (particularly for the Black Caribbean Black African Other Black WhiteBlack Caribbean Mixed and WhiteBlack African Mixed groups who had rates two to six times higher than average) Higher than average rates for some Black and WhiteBlack groups
Higher than average rates for the Black Caribbean Black African Other Black and WhiteBlack Caribbean Mixed groups White Irish Other White and Other Mixed groups Higher than average rates for the Black Caribbean and Other Black groups
Higher than average rates for the South Asian and Black groups Higher than average rates for the WhiteBlack Caribbean Mixed WhiteBlack African Mixed Black Caribbean and Black African groups Higher than average rates for the White British group Lower than average rates for the Black and South Asian groups Higher than average rates for the White British group Lower than average rates for the Black groups Few ethnic differences were apparent
31 of patients had been in hospital for one year or more 20 for more than two years Length of stay longest for patients from the Black Caribbean and White Black Caribbean Mixed groups shortest for patients from the Chinese and Bangladeshi groups
61 of men and 77 of women not in a designated single sex ward 13 of men16 of women without access to designated single sex toilet and bathing facilities 37 of men39 of women without access to a designated single sex lounge areaday space (these proportions generally lower among minority ethnic groups) (see page 27 for definition of single sex accommodation)
Note The terms ldquohigherrdquo and ldquolowerrdquo than average rates used in this table relate to differences in rates from the national average that are statistically significant Ethnic differences were not apparent except where stated
Excluding outpatients on a CTO Rates for the different ethnic groups for overall applications of the Mental Health Act including CTOs showed broadly similar patterns to detention rates on admission day that excluded patients on a CTO In both cases rates were higher than average among the Black Caribbean Black African Other Black and WhiteBlack Caribbean Mixed groups
Care Quality Commission Count me in census 2010 3
Summary continued
Learning disabilities Information was obtained for 3642 patients in 129 organisations providing services for people with learning disabilities in England and Wales Again the overall patterns are very similar to those observed in previous censuses as 67 of the inpatients in 2010 were also inpatients in 2009 and 53 were also inpatients in 2008
The key findings are
Number of inpatients 3642 of whom 13 were from Black and minority ethnic groups (that is not White British)
70 of patients from Black and minority ethnic groups were at 25 of the 129 organisations involved
Lower than average among the Other White Indian Pakistani Other Asian Black African Chinese and Other groups Higher than average by 2-3 times among the WhiteBlack Caribbean Mixed Black Caribbean Other Black and Other Mixed groups
Few ethnic differences were apparent
Few ethnic differences were apparent probably due to small numbers of patients in minority ethnic groups
67 of patients had been in hospital for one year or more 31 for more than five years
47 of men and 69 of women not in a designated single sex ward 19 of men27 of women without access to designated single sex toilet and bathing facilities 32 of men44 of women without access to a designated single sex lounge areaday space (these proportions generally lower among minority ethnic groups) (see page 27 for definition of single sex accommodation)
See note under previous table for meaning of the terms ldquohigherrdquo and ldquolowerrdquo than average rates
Distribution of patients
Rates of admission
Detention under the Mental Health Act on admission
Seclusion self-harm accidents hands-on restraint and physical assault
Length of stay (from admission to census day)
Single sex accommodation
Care Quality Commission Count me in census 2010 4
Summary continued
Conclusions
Overall the results of the 2010 census show little change from those reported for previous years A detailed comparison between the 2005 baseline and the 2010 census is on page 32
Although the numbers of inpatients overall have fallen since 2005 ethnic differences in rates of admission detention under the Mental Health Act and seclusion ndash three of DRErsquos 12 goals ndash have not altered materially since the inception of DRE in 2005
bull Admission rates remain higher than average among some minority ethnic groups especially Black and WhiteBlack Mixed groups for whom rates were two or more times higher than average in 2010 (six times higher than average for the Other Black group) In contrast admission rates have consistently been lower than average among the Indian and Chinese groups and about average in the Pakistani and Bangladeshi groups
bull Detention rates have almost consistently been higher than average among the Black White Black Caribbean Mixed and Other White groups The rates for being placed on a CTO were higher among the South Asian and Black groups
bull Although there have been annual fluctuations in seclusion rates they have been higher than average for the Black WhiteBlack Mixed and Other White groups in at least three of the six censuses
These findings however do not in themselves show that mental health and learning disability services are failing to meet the needs of people using services from Black and minority ethnic groups
Ethnic differences in rates of mental illness pathways to care and factors such as socioeconomic disadvantage all contribute to the patterns observed Our previous reports have consistently highlighted the need for prevention early intervention and collaboration across sectors to reduce the risk of admission and detention without compromising the care given to patients Mental health services have a key role to play But partnership between
all statutory agencies and organisations outside the healthcare sector Black and minority ethnic communities and those who use services themselves will be needed to achieve this
This message ndash about preventing mental ill-health by addressing the contributory factors and intervening early ndash is at the heart of No health without mental health the governmentrsquos new strategy for the future of mental health care in England The strategy aims to tackle the economic social and environmental determinants and consequences of mental health problems and to improve outcomes and reduce inequalities
It is complemented by other government proposals for reforms in the NHS public health and adult social care in England all similarly aimed at improving outcomes and reducing inequalities In this new healthcare landscape the proposed NHS Commissioning Board and GP consortia will have a statutory obligation to promote equality and reduce inequalities in healthcare (something also enshrined in the Equality Act 2010) As the lead commissioners of healthcare services it will be up to GP consortia to assess with local authorities the needs of their local populations and commission the right services that meet their requirements And the strengthened public health role of local authorities offers significant potential for addressing the socio-economic disadvantages faced by Black and minority ethnic communities which adds to the burden of mental illness in these communities
Data in the future Moving beyond a one-day census The Count me in census has come to a close For the last six years it has played a key role in providing information about inpatients using mental health and learning disability services But ethnicity recording must be seen as an all-year round statutory requirement not a one-day annual event And there is a need to move on from counting patients to understanding more about care pathways for patients from Black and minority ethnic groups and the factors leading to their hospital admission and detention
Care Quality Commission Count me in census 2010 5
Summary continued
We have consistently highlighted the need for commissioners and providers to make full use of the Mental Health Minimum Data Set (MHMDS) ndash the statutory data set submitted by providers of specialist mental health services in England It provides rich data on these issues
Covering both community and hospital services ndash and now independent and third sector providers as well as NHS ndash it includes a wide range of information about individual patients the services provided to those admitted to hospital and to the much larger number who donrsquot need admission to hospital and the outcomes of care And because it includes year-round activity it is more representative of the overall picture of for example admission detention and readmission rates length of stay years in psychiatric care and contacts with services and professionals
We call on the Information Centre to routinely publish data on all admissions and uses of the Mental Health Act including CTOs in England (in both NHS and independent healthcare providers) by the ethnicity of patients making the MHMDS the definitive source of information about mental health and learning disability patients This data should be risk-adjusted for age gender and other variables as appropriate to enable reliable comparisons to be made across groups
If GP consortia and local authorities are to be effective in their needs assessment and commissioning roles the Information Centre needs to make available and promote to them the data from the MHMDS and other sources And researchers and academics must make full use of the MHMDS to explore the factors that underlie the observed ethnic patterns As effective use of the data is dependent on its quality we call on providers (NHS and independent) to ensure that the completeness and accuracy of their data meets required standards
CQCrsquos role In the meantime CQC will continue to focus strongly on the quality of care provided by mental health and learning disability services
People who find themselves admitted to mental health services or detained under the Mental Health Act and therefore counted by the Count me in census are among the most mentally unwell people in our society Our job is first and foremost to make sure that the care they receive meets the essential standards of quality and safety set out under the Health and Social Care Act 2008 and to work with providers to ensure this We act swiftly when we find services that do not Where we find systemic problems that organisations have not adequately addressed we may impose conditions on the providerrsquos registration to bring about the change needed to improve patientsrsquo experience of care
The essential standards of quality and safety include the requirement to provide single sex accommodation and we will continue to closely check that these standards are met by all mental health services
We intend to introduce a number of indicators derived from the rich information in the MHMDS into our quality and risk profiles for providers This will put greater emphasis on the experience of Black and minority ethnic patients in our regulatory activity
We will monitor the quality of MHMDS data submitted by providers (as reported by the NHS Information Centre) including independent service providers Those with poor data quality may be considered at higher risk in terms of their quality of care
In addition we will continue to monitor the progress of services in relation to the issues raised in the census and other reports including our report on the use of the Mental Health Act through our visits to services and meetings with patients by our Mental Health Act Commissioners and second opinion appointed doctors (SOADs) We will draw on patientsrsquo experiences to monitor the operation of the Mental Health Act
We will also assess the impact of advice and use of Local HealthWatch Local HealthWatch will be in a good position to make sure that providers and commissioners are held to account on matters of choice and access to services for people from Black and minority ethnic groups
Care Quality Commission Count me in census 2010 6
National organisations coordinating the census
The Care Quality Commission (CQC) and the National Mental Health Development Unit (NMHDU) were the two key partners in delivering the 2010 census CQC had lead responsibility
Until March 2009 the Healthcare Commission had overall responsibility for delivering the census in partnership with the Mental Health Act Commission (MHAC) and the National Institute for Mental Health in England (NIMHE) On 1 April 2009 the regulatory functions of the Healthcare Commission MHAC and the Commission for Social Care Inspection were superseded by CQC At the same time NIMHE was superseded by NMHDU
Care Quality Commission The Care Quality Commission is the independent regulator of health and adult social care services in England We also protect the interests of people whose rights are restricted under the Mental Health Act Whether services are provided by the NHS local authorities or by private or voluntary organisations we make sure that people get better care We do this by
bull Acting swiftly to eliminate poor quality care
bull Ensuring care is centred on peoplersquos needs and reflects their human rights
For more information visit the website wwwcqcorguk
National Mental Health Development Unit The NMHDU ran from April 2009 to March 2011 and had a range of programmes funded by the Department of Health and the NHS It provided national support for implementing mental health policy by advising on national and international best practice to improve mental health and mental health services NMHDU did this by commissioning or providing
bull Specialist expertise in priority areas of policy and delivery
bull Effective knowledge transfer on research evidence and good practice
bull Translation of national policies into practical deliverables that achieve outcomes
bull Coordination of national activity to help regional and local implementation
The NMHDU worked closely with the Department of Health and the 10 strategic health authorities It had strategic partnerships with a range of other groups such as the NHS Confederation the Association of Directors of Adult Social Services (ADASS) and the major mental health third sector organisations (wwwnmhduorguknmhdu)
Acknowledgements We acknowledge the role of the Mental Health Act Commission as the chief architect of the census and of the Healthcare Commission and the National Mental Health Development Unit as joint coordinators with MHAC from 2005 to 2009 We acknowledge and thank Jo Simpson (2005-07) and Christina Marriott (2007-10) for project management of the census Giovanna Maria Polato for coordinating the data analysis and Dr Veena Raleigh for being the main author of all six reports Finally we acknowledge and thank Professor Swaran Singh for being the independent member of the Editorial Board
Care Quality Commission Count me in census 2010 7
Introduction
Equality in healthcare means that all patients receive the same high levels of care depending on their needs To achieve this the Government has introduced legislation with which all healthcare organisations must comply
Subject to parliamentary approval the new NHS Commissioning Board will be established in 2011 under the coalition governmentrsquos reforms of the NHS It will have an explicit duty to promote equality and reduce inequalities in peoplersquos access to healthcare and in the outcomes of healthcare services for people in England1 The new focus on improving outcomes of healthcare as outlined in the White Paper Equity and excellence liberating the NHS is underpinned by the supporting NHS Outcomes Framework 201112 which notes that ldquotackling health inequalities and promoting equality is central if the NHS is to deliver health outcomes that are among the best in the worldrdquo2 The requirement to promote equality is also enshrined in the Equality Act 2010 which replaces previous anti-discrimination laws with one single Act prohibiting discrimination on grounds of age sex gender reassignment marriage and civil partnership race disability pregnancy and maternity religion or belief sexual orientation
On 31 March 2010 the Care Quality Commission (CQC) and the National Mental Health Development Unit (NMHDU) carried out a national census to record the ethnicity and other selected details of patients in hospital and outpatients on a community treatment order (CTO) in NHS and independent mental health and learning disability services in England and Wales This is the sixth and final Count me in census Similar censuses have been conducted annually since 200534567
The 2010 census presents the results for patients using mental health services separately to those for patients using learning disability services In this final census report we also include two new sections
bull A comparison of the 2010 census results for mental health patients with the results in 2005 and
bull A section on information that can be used in the future to analyse the quality of mental health services ndash both overall and for particular groups including Black and minority ethnic groups
Mental health
The Count me in censuses were carried out in support of the Department of Healthrsquos five-year action plan introduced in 2005 Delivering Race Equality in Mental Health Care (DRE) which aimed to improve mental health services for Black and minority ethnic communities in England8 The DRE action plan had three building blocks
bull More appropriate and responsive services
bull More community engagement
bull Higher quality information more intelligently used
The census was designed to help healthcare organisations with the third building block by providing information that can be used to plan and deliver services that are relevant to all groups in the community The NMHDU developed a lsquodashboardrsquo of indicators that enabled healthcare organisations to measure their progress towards DRErsquos goals Further details are available at wwwnmhduorgukour-workmhdpdelivering-race-equalitydre-dashboard
The census also supports the Welsh Assembly Governmentrsquos Raising the Standard Race Equality Action Plan for Adult Mental Health Services in Wales published in October 20069 This action plan aims to improve equality of access treatment and outcomes in the provision of adult mental health services for minority ethnic groups in Wales
Care Quality Commission Count me in census 2010 8
Introduction continued
The DRE five-year action plan for England came to a close in 2010 and as such Count me in 2010 is the last in this sequence of annual censuses conducted since 2005 DRErsquos underlying goal of promoting equity in healthcare for Black and minority ethnic communities in England continues to be reflected in the Governmentrsquos reforms of the NHS and is essential for demonstrating compliance with equality legislation
The Governmentrsquos recently announced strategy for mental health in England commits to improving ldquooutcomes for people with mental health problems through high-quality services that are equally accessible to allrdquo10 No health without mental health puts a focus on the mental health and wellbeing of the whole population and makes mental health ldquoeveryonersquos businessrdquo The strategy outlines six objectives
bull More people will have good mental health
bull More people with mental health problems will recover
bull More people with mental health problems will have good physical health
bull More people will have a positive experience of care and support
bull Fewer people will suffer avoidable harm
bull Fewer people will experience stigma and discrimination
No health without mental health has a cross-government and cross-sectoral focus on prevention and the mental wellbeing of the population through public health measures early intervention and personalised care It also recognises that levels of mental illness and the ways in which mental health services are used vary between different ethnic groups reflecting the socioeconomic and other disadvantages that people from Black and minority ethnic groups often experience The strategy provides extra funding for psychological therapies with expanded provision for specific groups including children young people and those with severe mental illness
This strategy follows on from New horizons introduced by the previous government in 2009 which similarly adopted a wider public health approach to promoting the mental health and wellbeing of the population11
Learning disabilities
In 2001 Valuing people set out the previous governmentrsquos vision for people with a learning disability based on four key principles of rights independence choice and inclusion12 Valuing people now a new three year strategy for people with learning disabilities published in 2009 set out the strategy for the next three years13 It also provided the previous governmentrsquos response to the recommendations in Healthcare for all the report of the independent inquiry into access to healthcare for people with learning disabilities14 and to the report of the Joint Committee on Human Rights A life like any other15 The vision remained as set out in Valuing people that all people with a learning disability have the right to lead their lives like any others with the same opportunities and responsibilities and to be treated with the same dignity and respect Valuing people now also set out cross-government commitments and actions to increase the capacity and capability to deliver services locally
In 2010 the Department of Health published a report describing progress made under Valuing people now 16
It focused on the key priorities of improving outcomes for people with learning disabilities in health housing and employment and showed where more work is needed to improve their lives The report includes additional guidance containing good practice examples about different aspects of the Valuing people now programme
A report by the Disability Rights Commission provides evidence that people with learning disabilities or severe mental health problems are more likely to develop serious health conditions and to die of them
Care Quality Commission Count me in census 2010 9
Introduction continued
sooner than other people They are also less likely to receive some treatments than people with the same medical condition but without a mental health condition or learning disability17 Learning difficulties and ethnicity noted that the disadvantage experienced by people from minority ethnic communities because of their ethnicity (for example in education and employment) is compounded by the disadvantage they experience because of their learning disability18
Aims of the census
The goals of the 2010 census are the same as those in previous years
bull To obtain robust figures for all inpatients in mental health and learning disability services in England and Wales The 2010 census also includes information about outpatients on CTOs
bull To encourage service providers to implement systems for recording patientsrsquo ethnicity and for using this information for ethnic monitoring
bull To provide information that will help service providers to take practical steps to achieve the goals of DRE
In 2005 the census only included inpatients in mental health services in England and Wales including those detained in hospital under the Mental Health Act 1983 From 2006 the census was extended to include inpatients in learning disability services CTOs introduced in November 2008 as a result of the Mental Health Act 2007 allow for supervised treatment of patients in the community Therefore in 2009 and 2010 the census included patients subject to supervised treatment in the community under the Mental Health Act most of whom were therefore outpatients in the community and were not in hospital on census day
As one of the aims of the census is to provide figures on inpatients and all those subject to the Mental Health Act on census day the analysis in this report is not limited to inpatients and also includes outpatients on CTOs (except where stated otherwise) If we excluded outpatients on a CTO from the analysis we would have an incomplete profile of ethnic differences in the rates of patients subject to the Mental Health Act We therefore considered it important to include these patients This provides a more rounded basis for examining the use of the Act ndash overall and in relation to CTOs ndash among different ethnic groups and is consistent with the analytical approach used in the 2009 census report
Although the census included some children and young people the terms ldquomenrdquo and ldquowomenrdquo are used throughout this report to refer to people of all ages ndash including children young people and older people The census does not include children and young people in residential settings such as paediatric wards and those looked after by social services
More information about the census and how it was carried out including the full set of results is available at wwwcqcorgukcountmein
Care Quality Commission Count me in census 2010 10
Data methods of analysis and interpretation
Ethnic groups
The ethnic categories referred to in this report are those used by the Office for National Statistics (ONS) in its 2001 census of the general population of England and Wales (see box 1) The term lsquoBlack and minority ethnic groupsrsquo defines all groups other than lsquoWhite Britishrsquo
Box 1 Ethnic categories used in this report
White British Pakistani White Irish Bangladeshi Other White Other Asian WhiteBlack Caribbean Mixed Black Caribbean WhiteBlack African Mixed Black African WhiteAsian Mixed Other Black Other Mixed Chinese Indian Other
Coverage of learning disability establishments
The 2010 census included all healthcare providers in England registered with CQC on 31 March 2010 and all healthcare providers in Wales registered with the Healthcare Inspectorate Wales to provide inpatient learning disability services It did not include care homes
In the NHS there is a continuum from inpatient services through to registered and supported homes All of these can have some links to the NHS either directly or through seconded staff Where such NHS facilities were both registered as care homes under the Care Standards Act 2000 and regulated by CQC they were included
Distinguishing between mental health inpatients and learning disability inpatients
Some healthcare providers offer both mental health and learning disability services and there is considerable overlap between them The census asked providers to distinguish between services by describing wards as either ldquomainly providing mental health servicesrdquo or ldquomainly providing learning disability servicesrdquo This separation by ward type enables us to compare the results across years and ensures that no patient is counted twice
It is important to note however that some patients on mental health wards may have a learning disability or Autistic Spectrum Disorder including Aspergerrsquos syndrome Similarly some patients on learning disability wards may have a mental health problem The distinction of mental health and learning disability patients on the basis of ward is therefore an approximation
Care Quality Commission Count me in census 2010 11
Data methods of analysis and interpretation continued
Methods of statistical analysis
The statistical methods used for data analysis in this report are given in Appendix A
For the admission rates the ONS estimates of the general population in 2007 were used as denominators The Black and minority ethnic population of England and Wales has increased significantly since the 2001 ONS census ONS has produced updated population estimates by ethnic group for 2007 (the latest year for which these estimates are available) which reflect the demographic changes since 2001 The number of people from Black and minority ethnic groups (ie excluding the White British group) in England and Wales is estimated to have increased from 65 million in 2001 to 85 million in 2007 a rise of 30 As a result the proportion of the total population that is not from the White British group increased from 13 to 16 over this period We used the 2007 population estimates to calculate the admission rates in order to present a more up-to-date and accurate picture of ethnic differences However these figures do not reflect any demographic changes between 2007 and 2010 the year of this census
To make a comparison with the DRE baseline we also present admission rates from the 2005 census derived using the 2005 ONS population estimates by ethnic group as denominators These figures will not be the same as those published in the 2005 census report which were based on the 2001 ONS census population estimates because updated estimates of populations by ethnic group were not available at that time
For all other analyses (for example rates of use of the Mental Health Act seclusion etc) the patient numbers in the census were used as denominators
Unlike the censuses of 2005 to 2008 that counted only inpatients the 2009 and 2010 censuses also included outpatients on a CTO on census day This is because (a) the census aims to cover all patients subject to the Mental Health Act on census day and (b) we would not have been able to analyse standardised ratios for CTOs for different ethnic groups if CTO patients had been excluded from the analysis However CTO outpatients are excluded from selected analyses where appropriate including the analysis of rates for admissions detentions on admission source of referral single sex accommodation and recorded incidents of seclusion restraint accidents assault and self-harm The issue relating to the analysis of outpatients on a CTO only affects the sections of the report relating to mental health patients as there were very few learning disability patients on CTOs
Some results in this report are standardised for age and gender (those relating to admission detention source of referral care programme approach seclusion restraint accidents assault self-harm consent and presence on a secure ward) This is because there are underlying differences in the age and gender profiles of different ethnic populations and comparisons based on crude rates would be misleading Standardisation allows comparisons between different ethnic groups by taking account of variations in age and gender The report uses the conventionally accepted statistical methods for standardisation
The terms ldquohigherrdquo and ldquolowerrdquo than average used in the text for ethnic comparisons relate to differences from the national average that are statistically significant at the 5 level
Care Quality Commission Count me in census 2010 12
Data methods of analysis and interpretation continued
Interpreting the results
In this report for convenience we refer to ldquoadmission ratesrdquo for mental health and learning disability patients However these are in fact population-based rates of patients who were in hospital or subject to the Mental Health Act on census day and not rates for admissions actually made on the census day itself The number of admissions on census day will differ from the number of patients in hospital on that day and both of these will differ from the number of admissions throughout the year
As with any study our results have some caveats
1 The admission rates presented for minority ethnic groups in this report are higher than would be expected because they are based on ONS population estimates by ethnic group for 200719 the latest year available rather than population estimates for 2010 Therefore the admission rates do not take into account demographic changes between 2007 and 2010 Furthermore these population estimates are described by ONS as ldquoexperimentalrdquo and are subject to margins of error
2 The results are not adjusted for diagnosis and other clinical information so they may reflect differences between ethnic groups in the levels nature or severity of mental illness or disability
3 The data collected for the census does not allow adjustment for socioeconomic factors such as poverty unemployment and inner-city residence These occur more commonly in Black and minority ethnic communities Equally it was not possible to take account of social factors such as marital status living alone separation from one or both parents or lack of social networks Both socioeconomic and social factors are known to be associated with the risk of mental illness and can affect pathways into care and the nature of patientsrsquo interaction with services
4 Rates based on small and fluctuating numbers of patients can change in either direction (high to low or vice versa) from one year to the next as a result of random rather than real variation and regression to the mean
5 The census does not assess the quality of services the experience of patients or the reasons for any differences between ethnic groups
6 We have explained the rationale for including outpatients on CTOs in this report While this enables us to comment on CTOs on census day in addition to those who are inpatients it does mean that the overall census population is not restricted to inpatients as in the reports for the years preceding 2009 and 2010
7 The census is a one-day count designed to give the number and ethnic composition of patients on that day Its value is in providing a year-by-year snapshot profile However by its very nature it cannot give the picture for the whole year As we have shown in the section lsquoData in the future Moving beyond a one-day censusrsquo a one-day picture can differ from results based on a full yearrsquos data because a one-day picture over-represents long-stay patients and under-represents short stay admissions
Care Quality Commission Count me in census 2010 13
Results mental health
We collected information on 32799 patients from the mental health services of 261 NHS and independent healthcare organisations in England and Wales This included 29840 inpatients of whom 75 were inpatients on a CTO and a further 2959 patients on a CTO who were outpatients on census day The number of inpatients in each census has declined each year from 33785 in 2005 to 29840 in 2010 (excluding the 2959 outpatients on a CTO) a fall of 12 since 2005 (see Table 1)
All eligible establishments took part in the census The total number of providers increased from 207 in 2005 to 261 in 2010 primarily due to an increase in the number of independent healthcare providers in both England and Wales In contrast the number of NHS providers in England was lower than in the baseline year 2005 and did not change much in Wales The proportion of patients cared for by independent providers has risen from 10 in 2005 to 16 in 2010
Table 1 Number of providers of mental health services and patients
NHS (England)
Independent (England)
NHS (Wales)
Independent (Wales) Total
2010 census Number of providers 78 160 9 14 261 Number of all patients 32799 (including outpatients 25653 4787 1958 401 (including 2959 on a CTO) outpatients on a CTO) of all patients 782 146 60 12 100
2009 census Number of providers 79 158 10 17 264 Number of all patients 31786 (including outpatients 24941 4594 1845 406 (including 1253 on a CTO) outpatients on a CTO) of all patients 785 145 58 13 100
2008 census Number of providers 87 141 11 16 255 Number of inpatients 24842 3931 1892 355 31020 of inpatients 801 127 61 11 100
2007 census Number of providers 82 153 11 11 257 Number of inpatients 25020 4030 1875 262 31187 of inpatients 802 129 60 08 100
2006 census Number of providers 97 125 11 5 238 Number of inpatients 26565 3341 1962 155 32023 of inpatients 830 104 61 05 100
2005 census Number of providers 92 98 10 7 Number of inpatients 28590 3078 1939 178 33785 of inpatients 846 91 57 05 100
Care Quality Commission Count me in census 2010 14
207
Results mental health continued
Ethnicity
Information about ethnicity was available for 98 of patients Of these patients 75 were White British and 23 belonged to Black and minority ethnic groups defined as all groups that are not White British This compares with 20 in 2005
Compared with the baseline year of 2005 the 2010 census recorded a lower proportion of patients from the White British White Irish and Other Black groups (see Table 2) There were increases in the proportions of patients from the Other White WhiteBlack Caribbean Mixed Black Caribbean and Black African groups Other ethnic groups showed only minor differences over the baseline year
Table 2 Mental health patients by ethnic group
Ethnic group 2010 census 2009 census 2008 census 2007 census 2006 census 2005 census
Number Number Number Number Number Number
White British 750 24593 757 24067 765 23738 776 24198 786 25170 792 26762
White Irish 16 514 19 591 18 567 17 538 18 582 22 727
Other White 43 1407 43 1360 45 1399 46 1449 38 1210 31 1055
White and Black Caribbean
13 418 11 336 11 336 09 288 09 287 08 255
White and Black African
04 139 03 91 04 110 03 91 03 102 02 71
White and Asian 04 141 04 137 04 117 03 91 03 109 03 104
Other Mixed 06 200 07 213 05 148 06 180 05 173 05 167
Indian 16 529 14 460 14 426 13 393 13 411 13 434
Pakistani 13 440 13 409 13 396 10 315 11 349 10 325
Bangladeshi 06 203 05 171 05 144 04 130 05 158 05 153
Other Asian 09 311 09 273 10 300 08 261 08 262 08 264
Black Caribbean 49 1608 47 1504 47 1468 43 1330 39 1264 41 1369
Black African 29 957 26 834 23 715 21 648 20 652 19 645
Other Black 11 368 12 384 12 376 17 545 17 535 17 569
Chinese 03 83 03 82 03 91 03 82 02 78 02 81
Other 09 296 10 322 12 362 11 356 11 338 11 357
Not stated 18 592 17 552 11 327 09 292 11 342 12 416
Invalid 0 1 01 31
100 32799 100 31786 100 31020 100 31187 100 32023 100 33785 Total
Care Quality Commission Count me in census 2010 15
Results mental health continued
As in the previous censuses patients from Black and minority ethnic groups were concentrated in a relatively small number of organisations 70 were patients in 25 of the 261 organisations that took part in the census Of all organisations 194 had fewer than 50 patients from Black and minority ethnic groups each and another 32 organisations had no patients at all from these groups
Reporting of ethnicity
Eighty-one per cent of patients reported their own ethnic group Where patients did not do so staff or relatives did so on their behalf (10 and 6 respectively) We cannot be certain that ethnicity was recorded accurately for these patients The proportion of patients who reported their own ethnicity ranged from about 81 in the White groups to 90 in the WhiteBlack African Mixed group
Care Quality Commission Count me in census 2010 16
Results mental health continued
Age and gender
Ethnic differences in the age profiles of patients largely reflect the age profiles of different minority ethnic populations The White British White Irish and Other White populations have an older age structure than other minority ethnic populations and therefore patients from the White groups are significantly older than patients from other ethnic groups (see Table 3)
Overall 58 of patients were men Men outnumbered women in all ethnic groups (see Table 3) The White British White Irish Other White and Chinese groups had smaller differences in the proportions of men and women compared with other ethnic groups
Table 3 Age and gender of patients
Ethnic group Age () Gender ()
Total (n) 0-17 18-24 25-49 50-64 65+ Men Women
White British 1 7 41 20 31 56 44 100 (24593)
White Irish 0 4 36 19 41 56 44 100 (514)
Other White 2 7 47 19 25 58 42 100 (1407) White and Black Caribbean 1 13 68 12 5 73 27 100 (418)
White and Black African 1 13 73 9 4 67 33 100 (139)
White and Asian 4 18 63 11 5 65 35 100 (141)
Other Mixed 2 13 69 11 6 62 38 100 (200)
Indian 1 4 58 21 15 63 37 100 (529)
Pakistani 2 10 73 12 4 74 26 100 (440)
Bangladeshi 2 15 69 8 6 72 28 100 (203)
Other Asian 2 12 61 13 13 70 30 100 (311)
Black Caribbean 1 6 61 20 13 70 30 100 (1608)
Black African 1 10 75 9 5 67 33 100 (957)
Other Black 1 6 78 11 3 78 22 100 (368)
Chinese 2 10 59 17 12 52 48 100 (83)
Other 2 12 57 18 11 67 33 100 (296)
1 7 46 19 27 58 42 100 Total (n=
471) (n=
2352) (n=
14998) (n=
6093) (n=
8885) (n=
19071) (n=
13684) (n=
32799)
Care Quality Commission Count me in census 2010 17
Results mental health continued
Language and religion
Similar to previous censuses 5 of patients reported that their first language was not English (see Table 4) The Chinese and Bangladeshi groups had the highest proportions of patients whose first language was not English (51 and 46 respectively) Among the Other White group 27 had a first language other than English Again similar to previous censuses about 2 of patients said they needed an interpreter and of these 24 were from the White British group
Table 4 Percentage of patients with a first language other than English
Ethnic group with first language other than English
White British 1
White Irish 3
Other White 27
White and Black Caribbean 2
White and Black African 10
White and Asian 6
Other Mixed 11
Indian 26
Pakistani 35
Bangladeshi 46
Other Asian 34
Black Caribbean 2
Black African 22
Other Black 13
Chinese 51
Other 41
Total 5
Care Quality Commission Count me in census 2010 18
Results mental health continued
Religion was not stated for 21 of patients and 15 of patients said they had no religion The proportions stating they did not have a religion were highest among the WhiteBlack Caribbean and WhiteAsian Mixed groups (23 and 21 respectively) and lowest among the South Asian groups (4) Table 5 shows the religion of patients
Table 5 Religion of patients by ethnic group
Ethnic group
Religion and faith groups ()
None Christian Buddhist Hindu Jewish Muslim Sikh Any other religion
Not stated
White British 16 58 1 0 1 0 0 3 21
White Irish 8 73 0 0 0 5 13
Other White 13 53 1 0 3 5 7 18 White and Black Caribbean 23 47 0 1 0 3 7 17
White and Black African 16 41 1 1 15 6 20
White and Asian 21 33 1 1 21 3 3 18
Other Mixed 15 41 3 3 16 8 17
Indian 5 10 0 29 15 28 2 11
Pakistani 4 3 0 1 1 80 1 2 10
Bangladeshi 4 1 1 1 76 1 5 11
Other Asian 6 14 5 12 39 5 3 16
Black Caribbean 12 59 1 0 0 2 8 17
Black African 10 45 0 0 22 0 3 19
Other Black 12 41 1 1 0 16 7 22
Chinese 18 30 16 1 4 31
Other 8 24 3 1 3 34 6 21
Total 15 54 1 1 1 4 1 4 21
Care Quality Commission Count me in census 2010 19
Results mental health continued
Sexual orientation
The results for sexual orientation were not valid for 1 of patients and for 20 the response was recorded as ldquonot knownrdquo Seventy-six per cent of patients said they were heterosexual 1 said gay lesbian 1 said bisexual and less than 1 said ldquootherrdquo The number of minority ethnic patients who were gaylesbian or bisexual was very low
The overall figure of 1 who said they were gay lesbian or bisexual is lower than some estimates of the proportions of gaylesbian or bisexual people in the general population (5 to 7)2021 However in the 200910 Integrated Household Survey of a representative sample of 238206 people in UK conducted by the Office for National Statistics 1 identified themselves as gay or lesbian 05 as bisexual 05 as ldquootherrdquo 3 responded as ldquodo not knowrdquo or refused to answer and 95 identified themselves as heterosexualstraight22
Disability
About 75 of patients said they did not have a disability and 25 said they had one or more disabilities Of these 7 were blind or visually impaired 1 were deaf or had a hearing impairment 1 had Autistic Spectrum Disorder 2 had a learning disability 4 had a mobility impairment and 2 used a wheelchair The remaining 8 had more than one disability The proportion of patients with a disability was highest among the White British White Irish and Other White groups (about 28) which could reflect the higher age profiles of these patients compared with other ethnic groups
Rates of admission (see section on interpreting the results on page 13)
The rates of admission derived using the 2007 ONS ethnic population estimates as denominators are given in Appendix B Tables B1 (all ages) and B2 (ages 65 and over) Outpatients on a CTO are excluded from these results
All ages Admission rates were lower than average for patients from the White British Indian and Chinese groups and were average for the Pakistani and Bangladeshi groups Rates were higher than average for other minority ethnic groups they were particularly high for the Black Caribbean Black African WhiteBlack Caribbean Mixed and WhiteBlack African Mixed groups who had rates two to four times higher than average and for the Other Black group with a rate six times higher
Ages 65 and over Age-standardised admission rates for minority ethnic groups at older ages show broadly similar patterns to those reported for all ages with rates two to three times higher than average among the Black and White Black Mixed groups Rates were high also in the White Irish Other White Other Asian and Other groups
Numbers of older Black and minority ethnic patients were too few in most ethnic groups to support analyses of subgroups within them for example those detained
Care Quality Commission Count me in census 2010 20
Results mental health continued
Source of referral
People can be referred to healthcare services in a number of ways Referrals for inpatient care often come from community mental health teams rather than the original source such as GPs and accident and emergency (AampE) departments Therefore referrals from these teams may include referrals from other sources Furthermore about a quarter of patients (26) were referred from tertiary care and information about their original referral source was not available We had no information about the source of referral for 13 of patients The results reflect the proportions of patients from each ethnic group that are referred from each source so a higher proportion of referrals from one source will inevitably mean that proportions from other referral sources are lower Outpatients on a CTO are excluded from these data
The referral patterns are broadly similar to those reported previously and the key results are presented below
GP referrals 7 of patients Rates were 8 higher than average among the White British group They were lower than average among the Other White Black Caribbean Black African and WhiteBlack Caribbean Mixed groups by 28 to 72 The rates of referral by GPs are given in Appendix B Table B3
Referrals from AampE departments 5 of patients The White British group had a 9 lower than average rate of such referrals The WhiteBlack African Mixed Indian Bangladeshi Black African and Other groups were more likely than average to be referred in this way
Referrals from community mental health teams 26 of patients For the White British group such referrals were 5 higher than the average rate They were lower than average among the Other White WhiteBlack African Mixed Black Caribbean Black African and
Other Black groups by 16 to 48 The rates of referral are given in Appendix B Table B4
Referrals from the criminal justice system 9 of patients This is defined as the police courts probation service prison and court liaison and diversion service
Patients from the White British group were less likely than average to be referred by the criminal justice agencies whereas the Black Caribbean Black African Other Black WhiteBlack African Mixed and Other Asian groups were 30 to 83 more likely than average to be referred in this way We observed no differences from the average rate for other ethnic groups Rates of referral by the criminal justice system are given in Appendix B Table B5
A significant proportion (26) of all referrals were from tertiary care
Tertiary care referrals from medium or high secure units 5 of patients The rate for such referrals (in NHS or independent sectors) was lower than average among the Other White and Indian groups It was higher than average among the Black Caribbean and WhiteBlack Caribbean Mixed groups by about 75
Tertiary care referrals from other inpatient services 21 of patients The rate for such referrals (NHS and independent) was higher than average among the White Irish and Other White groups by 29 and 59 respectively The rate was lower than average in the Indian and Other Black groups
Tertiary care referrals from other clinical specialties 9 of patients Rates of such referrals were higher than average among the White British and Indian groups and lower than average among the Other White WhiteBlack Caribbean Mixed Other Asian Black African Other Black and Chinese groups
Care Quality Commission Count me in census 2010 21
Results mental health continued
Detention under the Mental Health Act 1983 on day of admission
The Mental Health Act 2007 made a number of changes to the Mental Health Act 1983 These changes were reflected in the census of 2009 and 2010 which collected information on new provisions establishing supervised community treatment (section 17A) and excluded supervised discharge (section 25A) which was abolished
As in previous reports we present below the results for detention rates on the day of admission Outpatients on a CTO are excluded from these analyses After that we present rates for all patients subject to the Mental Health Act on census day (including outpatients on a CTO) followed by rates for patients on a CTO on census day
All detentions Forty-nine per cent (14637) of patients were detained under the Mental Health Act on admission to hospital This was a higher proportion than recorded in the previous censuses (40 in 2005 and 2006 43 in 2007 45 in 2008 and 47 in 2009)
Detention rates were 6 lower than average among White British patients and between 19 and 32 higher than average among the Black Caribbean Black African Other Black and WhiteBlack Caribbean Mixed groups Detention rates were also higher in the White Irish and Other White groups by about 13 and in the Other Mixed group by 22 No other ethnic differences were observed The results are given in Appendix B Table B6
These patterns are broadly similar to those reported in previous censuses
Detention under section 2 Section 2 of the Mental Health Act gives authority for a person to be detained in hospital for assessment for a period not exceeding 28 days It is mainly applied where the patient is unknown to the service or where there has been a significant interval between periods of inpatient treatment
Of all patients detained on admission 22 were detained under section 2 Rates of detention under this section were lower than average among the White British WhiteBlack Caribbean Mixed and Black Caribbean groups and higher than average among the Bangladeshi Other Asian Black African Chinese and Other groups by between 50 and 103 (see Appendix B Table B7)
Detention under section 3 Section 3 of the Act provides for the compulsory admission of a patient to hospital for lsquotreatmentrsquo and for his or her subsequent detention which can last for an initial period of up to six months and is renewable after this
Of all patients detained on admission 43 were detained under this section Rates were higher than average among the White Irish and Black Caribbean groups by 24 and 29 respectively and lower among than average among the Bangladeshi group No other ethnic differences were observed The rates of detention under section 3 are given in Appendix B Table B8
Detention under section 3741 Section 37 of the Mental Health Act allows a court to send a person to hospital for treatment when they might otherwise have been given a prison sentence and section 41 allows a court to place restrictions on a personrsquos discharge from hospital Admission to hospital rather than prison is generally regarded as a more positive outcome for the person concerned
Care Quality Commission Count me in census 2010 22
Results mental health continued
Of all patients detained on admission 14 were detained under section 37 with a section 41 restriction order applied The rates of detention are given in Appendix B Table B9 In all minority ethnic groups very few women were detained under section 3741 Among men the rate of detention for the White British group was 16 lower than average and it was higher than average in the WhiteBlack Caribbean Mixed group by 77 the Black Caribbean group by 100 the Black African group by 27 and the Other Black group by 52
A consistent pattern across all six annual censuses was the higher than average detention rate under section 3741 for the Black Caribbean and Other Black groups
Detention under sections 47 48 and 4749 These sections of the Mental Health Act allow the Ministry of Justice to issue a direction to transfer a person detained in prison to a hospital for treatment
Of all patients detained on admission 7 were detained under these sections The only ethnic differences observed were a 107 higher than average detention rate among men from the White Black African Mixed group and a lower than average rate for the Indian group We observed no other ethnic differences probably because the numbers of detentions under these sections were low in most minority ethnic groups These rates of detention are given in Appendix B Table B10
The previous four censuses also showed virtually no ethnic differences for rates of detention under sections 47 48 and 4749
Patients subject to the Mental Health Act 1983 on day of census
All patients subject to the Mental Health Act Of all the 32399 patients in the census a total of 53 (17299) were subject to the Mental Health Act on census day including 2959 outpatients and 75 inpatients on a CTO (either voluntarily or recalled) Ratios for the different ethnic groups for overall applications of the Mental Health Act including CTOs showed broadly similar patterns to detention rates on admission day from which patients on a CTO were excluded In both cases rates were higher than average among the Black Caribbean Black African Other Black and White Black Caribbean Mixed groups However the higher than average detention rates for the White Irish Other White and Other Mixed groups on admission day were not apparent on census day
The rates are given in Appendix B Table B11
Supervised community treatment under section 17A Community treatment orders (CTOs) were introduced in November 2008 as a result of the Mental Health Act 2007 They allow for supervised community treatment to be provided for up to six months with the possibility of an extension after this These orders are designed to help patients to maintain stable mental health outside hospital and to promote recovery by providing professionals with the power to set conditions on discharge from hospital and a power to recall patients if arrangements in the community are not working
Nine per cent of all patients in the census were on CTOs compared with 4 in 2009 Of all the 17299 patients subject to the Mental Health Act on census day almost 18 (3034) were on CTOs Of the patients on a CTO 2959 were outpatients and 75 were inpatients (50 voluntary and 25 recalled)
Care Quality Commission Count me in census 2010 23
Results mental health continued
The rate of supervised community treatment among all patients included in the census was lower than average in the White British and White Irish groups and higher than average in the South Asian (Indian Pakistani Bangladeshi) and Black (Black Caribbean Black African Other Black) groups by 22 to 106 The ratios are given in Appendix B Table B12
Consent
About 25 of informally admitted patients were deemed incapable of consenting to treatment The only ethnic difference observed was a higher than average rate for the Pakistani group but this was based on very few patients
About 18 of patients who were detained or on CTOs were deemed incapable of consenting to treatment These rates were lower than average by 7 in the White British group and were higher than average among the Other White WhiteBlack Caribbean Mixed and Black African groups by 21 35 and 36 respectively
In addition 13 of patients who were detained or on CTOs on census day were deemed capable of consenting to treatment but refused to do so The White British group had a rate of refusals that was 10 lower than average and rates were higher than average among the White Irish WhiteBlack Caribbean Mixed Other Mixed Black Caribbean and Black African groups by between 39 and 71
Care programme approach
The Care Programme Approach (CPA) is the process by which treatment care and support for people with serious mental health problems and accompanying health and social care needs are agreed coordinated and understood by all involved From October 2008 changes to the CPA in England
mean that it is no longer categorised into two parts (lsquostandardrsquo and lsquoenhancedrsquo) and just the one category of enhanced CPA applies This makes CPA policy in England different to that in Wales where the distinction still applies The CPA data presented here therefore includes all CPA patients in England and both lsquostandardrsquo and lsquoenhancedrsquo CPA patients in Wales
About 89 of all patients were on a CPA 3 were on a single assessment process (SAP) whereby assessments are made for adults with health and or social care needs and 8 were on neither CPA nor SAP As most patients were on a CPA no ethnic differences were observed
Recorded incidents
The 2010 census asked about the number of times that patients experienced seclusion hands-on restraint self-harm accident and physical assault in a current hospital spell or if the patientrsquos hospital spell was longer than three months the number that took place within the last three months Outpatients on a CTO are excluded from these data It should be noted that the rates of such events among minority ethnic groups can show yearly variation because of the low numbers of events in several groups
Seclusion Seclusion was defined as the supervised confinement of a patient in a room which may be locked to protect others from significant harm Four per cent of patients had experienced one or more episodes of seclusion The White British group had a seclusion rate that was 9 lower than average Rates were higher than average among the WhiteBlack Caribbean Mixed WhiteBlack African Mixed Black Caribbean and Black African groups by 80 90 36 and 56 respectively
Care Quality Commission Count me in census 2010 24
Results mental health continued
Although the number of incidents of seclusion was low in several minority ethnic groups some general patterns over the six censuses to date are
bull The proportion of all patients who had an episode of seclusion stayed fairly constant over the six censuses at about 4
bull Although there have been annual fluctuations the seclusion rate has been higher than average for the Black and WhiteBlack Mixed groups in three or four of the six censuses and in the Other White group in three censuses
Hands-on restraint This was defined as the physical restraint of a patient by one or more members of staff in response to aggressive behaviour or resistance to treatment About 12 of patients had experienced one or more episodes of hands-on restraint No ethnic differences were observed In fact very few ethnic differences have been observed in the previous censuses also and they have not shown a consistent pattern
Self-harm Eight per cent of patients had harmed themselves on one or more occasions Only the White British group had a rate that was higher than average (by 14) Rates were lower than average among several minority ethnic groups the three Black groups (Black Caribbean Black African and Other Black) by about 70 the three south Asian groups (Indian Pakistani Bangladeshi) by between 37 and 78 and the Other Mixed and Other Asian groups by about 60
In terms of comparison with previous years
bull The proportion of all patients who had harmed themselves stayed fairly constant at about 7ndash8
bull In all censuses the White British group had a higher than average rate of self-harm and the Black and South Asian groups had lower than average rates of self-harm
Accidents About 11 of patients had experienced one or more accidents Patients from the White British group experienced a rate of accidents that was 6 higher than average Rates were lower than average in the Black Caribbean Black African Other Black and Other Asian groups by about 50 to 70 No accidents were reported for the Chinese group
In terms of comparisons with previous years
bull The proportion of all patients who had had an accident stayed fairly constant
bull The rate of accidents in the different censuses was higher than average in the White British group and lower than average in the Black Caribbean group Few other ethnic differences were observed and they were not consistent
Physical assault on the patient The definition of assault includes incidents of physical assault on the patient irrespective of who committed the assault We do not have information on who committed the assault for example whether it was another patient or a member of staff Eleven per cent of patients were involved in one or more episodes of physical assault The only ethnic difference observed was a 19 lower than average rate among the Black Caribbean group
In terms of comparisons with previous years
bull The proportion of all patients who had experienced a physical assault stayed fairly constant
bull Very few ethnic differences in rates of assault were observed in the different censuses and they did not show a consistent pattern
Care Quality Commission Count me in census 2010 25
Results mental health continued
Duration of stay in hospital from admission to census day
We analysed the length of the period between each inpatientrsquos admission to hospital and the census day This period is of course shorter than a patientrsquos full length of stay in hospital which runs from admission to the date when they are discharged Outpatients on a CTO are excluded from the following analyses
bull 25 of inpatients had been in hospital for one month or less
bull 20 had been in hospital between one and three months
bull 13 had been in hospital between three and six months
bull 11 had been in hospital between six months and one year
bull 11 had been in hospital between one and two years
bull 12 had been in hospital between two and five years
bull 8 had been in hospital for more than five years
These results are similar to those of previous censuses About 31 of patients in the 2010 census had been in hospital for more than a year and had therefore also been included in the 2009 census About 20 of patients had been in hospital for more than two years and will have been included in both the 2008 and 2009 censuses
We calculated the median length of stay for different ethnic groups The median is the midpoint of the range of values so the median length of stay is the one at which half the patients had a length of stay less than the median and half had a stay longer than the median Overall and as in previous years the median amount of time that women had spent in hospital was about 25 months and the median for men was about 58 months (see Table 6) In most ethnic groups the median time spent in hospital was two to three times longer for men than for women in the Other Black group men had been in hospital four times longer than women
Median lengths of stay were longest for men from the Black Caribbean WhiteBlack Caribbean Mixed and Other Black groups and shortest for men from the Chinese Bangladeshi and Other groups Median lengths of stay were longest for women from the WhiteBlack Caribbean Mixed and Black Caribbean groups and shortest for women from the Chinese and Bangladeshi groups
A number of important factors influence a patientrsquos length of stay in hospital including age gender whether or not they are detained under the Mental Health Act (and the section under which they are detained and whether there is an additional restriction order) the type and severity of their illness the nature of their treatment and the availability of support in the community The data in the census does not allow for analysis of these factors
Table 6 Median number of days from the day of admission to the day of census
Ethnic group Men Women
White British 161 71
White Irish 218 114
Other White 238 113
White and Black Caribbean 275 191
White and Black African 182 92
White and Asian 226 78
Other Mixed 173 112
Indian 172 70
Pakistani 153 56
Bangladeshi 134 55
Other Asian 167 61
Black Caribbean 345 122
Black African 141 66
Other Black 248 58
Chinese 135 51
Other 131 76
Total 174 75
Care Quality Commission Count me in census 2010 26
Results mental health continued
Ward security
As in previous years about 11 of all patients were on a medium or high secure ward as opposed to a general (76) or low secure (13) ward
Patients from the White British Indian and Bangladeshi groups were less likely than average to be on a medium or high secure ward by 7 30 and 67 respectively Patients from the White Irish WhiteBlack Caribbean Mixed Black Caribbean and Other Black groups had a higher than average rate by between 43 and 55
Age range on wards
Among patients under 18 years of age 61 were being cared for on wards for working-age adults on census day and five patients were on a ward for older people Seven per cent of patients on wards for working-age adults were 65 or over and
8 of those on wards for older people were adults of working age There were very few lsquoout of agersquo placements among minority ethnic groups
Patients in wards designated as single sex or mixed
Providers were asked whether patients were on a ward designated as men or women only or mixed gender All the analyses of single sex accommodation and facilities exclude outpatients on a CTO Overall 61 of men and 77 of women were not in a ward designated for single sex use similar proportions as in previous years The proportion of patients not in a designated single sex ward was lower among almost all minority ethnic groups than among the White British group In all ethnic groups the proportion of men who were not in a designated single sex ward was lower than among women (see Table 7a)
Two further questions examined the single sex facilities that were available to patients
At the time of the 2010 census the following guidance from the Department of Health applied in England A ward can be described as single sex (ie the intended sex of the ward is either male or female and not mixed) when the accommodation complies with the following definition from the Department of Health of single sex accommodation ldquoSleeping areas must be segregated and members of one sex must not have to walk through an area occupied by the other sex to reach toilets or bathrooms Separate male and female only toilets and bathrooms must be provided There should be separate day rooms to which only women have accessrdquo However there is a discrepancy for providers because accommodation designated as a lsquowardrsquo for administrative purposes may incorporate single sex accommodation for both sexes that meets the guidelines ndash but in this case the ward would still be lsquomixedrsquo (based on guidance from Safety Privacy and Dignity Department of Health 2000)
As long as men and women are cared for in separate bays or rooms and have their own toilet facilities then it may well be appropriate for them to be on the same ward being cared for by the same team of doctors and nurses In practice good segregation can be achieved if men and women have separate sleeping areas (for example single sex bays) and have separate toilets and bathrooms that they can reach without having to pass through (or close to) areas for the opposite sex The layout of wards should minimise any risk of overlooking or overhearing by members of the opposite gender (from Privacy and Dignity ndash A report by the Chief Nursing Officer into mixed sex accommodation in hospitals Department of Health 2007)
The coalition governmentrsquos revised Operating Framework for 201011 requires NHS organisations to eliminate mixed-sex accommodation except under exceptional circumstances from 2011 The national guidance relating to mixed sex accommodation was issued in November 2010 and states that ldquoNo areas are exempt and every decision to mix must be justified by reference to the patientrsquos clinical needs not organisational convenience or custom and practicerdquo For mental health and learning disability trusts it states ldquoThere is no acceptable justification for admitting a mental health patient to mixed-sex accommodationrdquohellip It ldquomay be acceptable in a clinical emergency to admit a patient temporarily to a single ensuite room in the opposite-gender area of a ward In such cases a full risk-assessment must be carried out and complete safety privacy and dignity maintainedrdquo The guidance is available at wwwdhgovukenPublicationsandstatisticsLettersandcircularsProfessionallettersChiefnursingofficerlettersDH_121848
Care Quality Commission Count me in census 2010 27
Results mental health continued
Table 7a Percentage of patients not in a designated single sex ward by ethnic group
Ethnic group
Sex of patients and ward
Male Female
Male ward Female or mixed ward Female ward Male or mixed ward
White British 35 65 21 79
White Irish 41 59 28 72
Other White 44 56 28 72
White and Black Caribbean 56 44 31 69
White and Black African 48 52 41 59
White and Asian 43 57 34 66
Other Mixed 49 51 24 76
Indian 37 63 25 75
Pakistani 48 52 35 65
Bangladeshi 23 77 18 82
Other Asian 46 54 22 78
Black Caribbean 55 45 32 68
Black African 49 51 28 72
Other Black 49 51 30 70
Chinese 42 58 30 70
Other 43 57 20 80
Total 39 61 23 77
The vast majority of patients in this category were in mixed wards very few (under 05) male patients were on female-only wards or vice versa
Care Quality Commission Count me in census 2010 28
Results mental health continued
Patientsrsquo access to toilet and bathing facilities designated for single sex use
We asked providers if the patient had access to toilet and bathing facilities designated for single sex use Overall 13 of men and 16 of women
were reported as not having access to such facilities designated for single sex use This was an improvement over 2009 when these proportions were 19 and 24 respectively The proportion of patients not having access to toilet and bathing facilities designated for single sex use was lower among almost all minority ethnic groups than among the White British group (see Table 7b for details)
Table 7b Percentage of patients not having access to toilet and bathing facilities designated for single sex use by ethnic group
Ethnic group
Access to designated single sex bathing and toilet facilities
Male Female
Male facilities
Female or mixed facilities
Female facilities
Male or mixed facilities
White British 86 14 84 16
White Irish 87 13 87 13
Other White 89 11 86 14
White and Black Caribbean 93 7 93 7
White and Black African 90 10 93 7
White and Asian 90 10 84 16
Other Mixed 98 2 96 4
Indian 91 9 90 10
Pakistani 95 5 94 6
Bangladeshi 92 8 98 2
Other Asian 92 8 86 14
Black Caribbean 92 8 90 10
Black African 91 9 91 9
Other Black 92 8 89 11
Chinese 82 18 83 17
Other 87 13 90 10
Total 87 13 84 16
The vast majority of patients in this category had access to mixed facilities very few (1) of male patients had access to female-only facilities or vice versa
Care Quality Commission Count me in census 2010 29
Results mental health continued
Patientsrsquo access to a lounge area day space designated for single sex use
We also asked providers if patients had access to a lounge area or day space designated for single sex use Overall 37 of men and 39 of women were
reported as not having access to these facilities This was an improvement over 2009 when these proportions were 48 and 51 respectively The proportion of patients not having access to a lounge areaday space designated for single sex use was lower among most minority ethnic groups than among the White British group (see Table 7c for details)
Table 7c Percentage of patients not having access to a lounge areaday space designated for single sex use by ethnic group
Ethnic group
Access to a lounge areaday space designated for single sex use
Male Female
Male facilities
Female or mixed facilities
Female facilities
Male or mixed facilities
White British 59 41 60 40
White Irish 63 37 70 30
Other White 68 32 63 37
White and Black Caribbean 82 18 73 27
White and Black African 83 18 76 24
White and Asian 72 28 75 25
Other Mixed 79 21 67 33
Indian 59 41 66 34
Pakistani 80 20 72 28
Bangladeshi 53 47 52 48
Other Asian 70 30 61 39
Black Caribbean 78 22 70 30
Black African 73 27 70 30
Other Black 79 21 72 28
Chinese 59 41 60 40
Other 67 33 67 33
Total 63 37 61 39
The vast majority of patients in this category had access to mixed facilities very few (1) of male patients had access to female-only facilities or vice versa
Care Quality Commission Count me in census 2010 30
Results mental health continued
Patientsrsquo subject to deprivation of liberty safeguards
People who lack the mental capacity to consent to the care or treatment they need should be cared for in a way that is least restrictive of their rights or freedom of action In 2007 the Mental Capacity Act 2005 was amended to introduce Deprivation of Liberty Safeguards for people who lack capacity to decide about their care or treatment and who need to be deprived of their liberty to protect them from harm The Safeguards came into effect in April 2009 and strengthen the rights of hospital patients and those in care homes as well as ensuring compliance with the European Convention on Human Rights (ECHR)
The 2010 census introduced a new question ldquoIs the patient subject to deprivation of liberty authorisation on 31 March 2010rdquo Under 1 (269) patients were reported as being subject to a deprivation of liberty authorisation on census day No ethnic differences in the rates were observed which may be due to the low numbers of patients among minority ethnic groups (69)
Care Quality Commission Count me in census 2010 31
A comparison between the 2005 baseline and the 2010 census
The changes we have seen in the census results between 2005 and 2010 the timespan of the Delivering Race Equality (DRE) action plan are set out below This is not a review of the DRE programme The aim is to give an overview of how some variables in the census have changed during the course of DRE and the findings should be seen in the light of the caveats described on page 13
bull The number of inpatients went down from 33785 to 29840 ndash a fall of 12
bull The proportion of patients in independent hospitals rose from 10 to 16
bull The overall proportion of patients from minority ethnic groups increased from 20 to 23 However there have been demographic changes during this time ndash the population from Black and minority ethnic groups in England and Wales rising from 79 million in 2005 to 85 million in 2007 (the latest year for which these figures are available) an increase of 8 in two years
bull Admission rates showed similar patterns across all censuses ndash Lower than average rates among the White
British Indian and Chinese groups ndash About average rates among the Pakistani and
Bangladeshi groups ndash Higher than average rates among other
minority ethnic groups ndash particularly in the Black and WhiteBlack Mixed groups for whom rates were two or more times higher than average in 2010 The Other Black group continues to have exceptionally high rates of admission (even after the apparent reduction since 2005 see next point)
bull One of the 12 goals of DRE was a decline in admission rates among Black and minority ethnic groups Figure 1 provides a comparison between 2005 and 2010 Although admission rates for
many ethnic groups show relatively little change since 2005 the rate for the Other Black group is considerably lower in 2010 (six times higher than average) compared with 2005 (12 times higher than average) However rates for the other Black and WhiteBlack Mixed groups show small increases
bull In general rates of referral from GPs and community mental health teams were lower than average among some Black and WhiteBlack groups and referral from the criminal justice system was higher Patterns were less consistent for other minority ethnic groups
bull There was a steady increase in the overall proportion of patients subject to the Mental Health Act Compared with 40 in 2005 49 of all patients were subject to the Mental Health Act in 2010 (53 if outpatients on a CTO are excluded)
bull Another DRE goal was to reduce detention rates among Black and minority ethnic groups However detention rates have been higher than average among the Black Caribbean Black African and Other Black groups in all six censuses and almost consistently higher in the WhiteBlack Caribbean Mixed and Other White groups Rates have been average for other minority ethnic groups
bull A consistent pattern was the higher than average detention rate under section 3741 for the Black Caribbean and Other Black groups
bull Another DRE goal was to reduce seclusion among Black and minority ethnic groups Although there have been annual fluctuations in seclusion rates they have been higher than average for the Black and WhiteBlack Mixed groups and the Other White group in at least three of the six censuses Other minority ethnic groups did not show high rates
Care Quality Commission Count me in census 2010 32
A comparison between the 2005 baseline and the 2010 census continued
Figure 1 Admission ratios in the 2005 and 2010 Count me in censuses by ethnic group England and Wales
Other Black
Black Caribbean
White and Black Caribbean
White and Black African
Black African
Other Mixed
Other Asian
White and Asian
Other
White Irish
Other White
Bangladeshi
White British
Pakistani
Indian
Chinese
0 100 200 300 400 500 600 700 800 900 1000 1100 1200 1300
Ageshysex standardised admission ratios (EampW=100)
Census 2005 admission ratios using 2005 ONS populations
bull Minority ethnic groups do not compare unfavourably for other incidents Rates of self-harm have consistently been lower than average among the Black and South Asian groups Very few ethnic differences in hands-on restraint physical assault and accidents were observed across the different censuses and they did not show a consistent pattern
bull About 31 of patients in all censuses had been in hospital for one year or more and were therefore included in more than one census
Census 2010 admission ratios using ONS 2007 populations (excluding outpatients on a CTO)
(This is one reason why the census shows little change over the six years It should be noted again that because the census is a one-day count it over-represents long-stay admissions and under-represents short-stay admissions)
bull Mixed accommodation was reported for many patients across all censuses although patients from Black and minority ethnic groups were more likely to be in single sex accommodation than White British patients
The admission ratios for the 2005 census shown here are different from those published in the 2005 report This is because we updated the analysis of the 2005 admission ratios by using 2005 ONS census populations for ethnic groups as denominators These populations were not available at the time of the 2005 report which instead used the 2001 ONS population data
Care Quality Commission Count me in census 2010 33
Results learning disabilities
We obtained information about 3642 patients in 129 organisations providing services for people with learning disabilities in England and Wales Of these two were inpatients on CTOs The total number of inpatients has declined each year and by 21 from 4609 in 2006 to 3642 in 2010 The total number of providers did not change much from the baseline year of 2006 although the number of NHS providers has fallen steadily and the number of independent healthcare organisations has increased (see Table 8) The proportion of inpatients in independent
healthcare organisations increased from 20 in 2006 to 33 in 2010 This is likely to be a result of closing NHS campuses with people moving from hospital to community settings
The pattern of results for learning disability patients in 2010 is broadly similar to that reported in previous censuses This is not surprising since many of the patients had been in hospital for a considerable period of time and they therefore appear in successive censuses
Table 8 The number of providers of learning disability services and inpatients
NHS (England)
Independent (England)
NHS (Wales)
Independent (Wales) Total
2010 census Number of providers 55 61 4 9 129 Number of all patients (including patients 2304 1072 154 112 3642 on a CTO) of all patients 633 294 42 31 100
2009 census Number of providers 60 54 5 4 123 Number of all patients (including patients 2487 1014 139 55 3695 on a CTO) of all patients 673 274 38 15 100
2008 census Number of providers 62 57 5 5 129
Number of inpatients 2873 1050 143 41 4107
of inpatients 700 256 35 10 100 2007 census
Number of providers 64 47 5 4 120
Number of inpatients 3063 900 154 36 4153
of inpatients 738 217 37 09 100 2006 census
Number of providers 70 48 5 1 124
Number of inpatients 3505 930 164 10 4609
of inpatients 760 202 36 02 100
Care Quality Commission Count me in census 2010 34
Results learning disabilities continued
Ethnicity
Information about ethnicity was available for 98 of patients Of these 13 belonged to Black and minority ethnic groups defined as all groups that are not White British (see Table 9) This figure is somewhat higher than in previous years (11 in 2006) and is significantly lower than the 23 of mental health patients from minority ethnic groups as reported in the mental health section of this report
Although the patterns by ethnicity are broadly similar to previous years there was an increase between 2006 and 2010 in the proportion of patients from the Other White group and a fall in those from the White British group Some ethnic groups had very few patients
As in the previous censuses patients from Black and minority ethnic groups were concentrated in a relatively small number of organisations 70 were
Table 9 Learning disability patients by ethnic group
Ethnic group 2010 census 2009 census 2008 census 2007 census 2006 census
Number Number Number Number Number
White British 853 3106 867 3205 889 3616 883 3642 887 4037
White Irish 13 46 15 57 13 53 10 40 14 66
Other White 29 106 23 85 26 104 26 109 17 77
White and Black Caribbean 10 38 10 36 07 29 08 34 07 32
White and Black African 02 8 01 4 00 2 02 10 01 3
White and Asian 04 13 04 14 03 12 03 13 02 9
Other Mixed 07 24 05 19 03 14 04 16 03 14
Indian 09 32 09 35 07 28 08 32 11 49
Pakistani 07 24 09 33 07 30 08 32 07 34
Bangladeshi 05 20 06 21 03 11 03 11 02 9
Other Asian 04 13 03 10 03 12 02 8 03 12
Black Caribbean 26 93 22 81 23 94 26 108 28 129
Black African 08 28 09 35 07 29 08 33 07 33
Other Black 04 15 04 14 04 15 04 18 04 17
Chinese 00 1 01 2 01 5 02 8 02 7
Other 02 7 02 8 04 15 02 10 05 24
Not stated 19 68 10 36 09 38 07 29 12 57
Total 100 3642 100 3695 100 4069 100 4124 100 4552
Care Quality Commission Count me in census 2010 35
Results learning disabilities continued
patients in 25 of the 129 organisations that took part in the census Seventy-four organisations had fewer than 10 patients from Black and minority ethnic groups each and another 42 organisations had no inpatients at all from these groups
However it is important to note that the number of people with severe and profound learning disabilities in some areas is affected by past funding and placement practices especially the presence of old long stay hospitals and of people placed outside their original area of residence by funding authorities
Reporting of ethnicity
About half (56) of patients reported their own ethnic group Staff reported the ethnic group for 17 of patients and relatives for 21 This means that ethnicity could have been misreported for some patients We do not know how ethnicity was assessed for 6 of patients
Age and gender
Two per cent (59) of patients were under 18 years old The number of young inpatients from minority ethnic groups was low or zero in several ethnic minority groups
Overall 73 of patients were under 50 years old and 27 were aged 50 or over The proportion of patients under 50 was higher among patients from Black and minority ethnic groups (88) than among the White British group (71) This is not surprising given that minority ethnic populations are generally younger than the White population
Seventy per cent of patients in learning disability services were men whereas in mental health services 58 of patients were men
Language and religion
Eight per cent of patients reported that their first language was not English Non-verbal communication was the most often selected language after English accounting for 4 of patients Two per cent (84) of patients most of whom were from the White British group said they needed an interpreter
Religion was not stated for 22 of patients and 15 of patients said they had no religion South Asians (Indians Bangladeshis and Pakistanis) were mostly Muslim Hindu or Sikh and those from the White Black Caribbean and Black African groups were mostly Christian
Sexual orientation
Overall the result was not known for almost half (49) of patients 45 said they were heterosexual 2 said gaylesbian 3 said bisexual and 1 said ldquootherrdquo The numbers of patients from minority ethnic groups were too low for meaningful analysis
Disability
Of all inpatients in learning disability services
bull 4 were reported as having no disabilities
bull 44 had a learning disability only
bull 51 had multiple disabilities
The patterns among minority ethnic groups were similar in that most patients had either a learning disability or multiple disabilities
Care Quality Commission Count me in census 2010 36
Results learning disabilities continued
Rates of admission
The rates of admission based on ONS estimates of the general population in 2007 are given in Appendix C Table C1
Admission rates were lower than average among several minority ethnic groups Other White Indian Pakistani Other Asian Black African Chinese and Other Rates were two to three times higher than average among the WhiteBlack Caribbean Mixed Black Caribbean Other Black and Other Mixed groups The lower rates among the South Asian and Chinese groups and the higher rates among some Black groups are similar to patterns for inpatients in mental health establishments
These patterns of admission are similar to those we reported in previous census reports
Source of referral
As we reported in the section on mental health patients data about sources of referral must be interpreted with care as we do not always know the original referral source Furthermore in the case of inpatients with learning disabilities this information was invalid missing or unknown for 12 of patients
Because of the small numbers of patients in most minority ethnic groups we observed few ethnic differences in sources of referral
Detention under the Mental Health Act 1983 (on day of admission and on day of census)
The Mental Health Act 2007 made a number of changes to the Mental Health Act 1983 one of which was supervised community treatment (section 17A) These are reflected in the 2010 census
All detentions Of all the patients in learning disability services 48 were detained under the Mental Health Act on admission Rates of detention on the day of admission by ethnic group are in Appendix C Table C2 and no ethnic differences were observed As the number of detained patients from each minority ethnic group was low we did not undertake further analysis for individual sections of the Act
Rates of detention on census day also showed no ethnic differences with the exception of a lower than average rate for the Other White group
Consent
About 66 of informally admitted inpatients were deemed incapable of consenting to treatment which is a similar proportion to that reported previously
Among detained patients 38 were deemed incapable of consenting to treatment and 6 were deemed capable of consenting to treatment but refused
The numbers of patients from minority ethnic groups were too low for comment There were no or very few such patients among minority ethnic groups
Care Quality Commission Count me in census 2010 37
Results learning disabilities continued
Care programme approach
Details of the Care Programme Approach (CPA) are given on page 24
We found that 73 of all patients were on a CPA 2 on a single assessment process (SAP) and 25 on neither No ethnic differences were observed
Recorded incidents
The 2010 census asked about the number of times that patients experienced seclusion hands-on restraint self-harm accident and physical assault in a patientrsquos current hospital spell or if the patientrsquos hospital spell was longer than three months the number that took place within the last three months As in previous years we observed very few ethnic differences
Seclusion Five per cent of patients had experienced one or more episodes of seclusion The only ethnic differences observed were the higher than average rates among the White Irish and Other White groups but these were based on small numbers of patients
Physical assault on the patient The definition of assault includes incidents of physical assault on the patient irrespective of who committed the assault but we do not have information on who committed the assault About 28 of patients had been involved in one or more episodes of physical assault No ethnic differences were observed
Hands-on restraint self-harm accidents Thirty per cent of inpatients had experienced one or more episodes of hands-on restraint 22 had attempted to harm themselves and 24 had suffered an accident The numbers were very low in minority ethnic groups and we did not observe any ethnic differences except for a lower than average rate for self-harm among the Black Caribbean group but this was based on very few patients
Duration of stay in hospital
We analysed the length of the period between each patientrsquos admission to hospital and the census day This period is of course shorter than a patientrsquos full length of stay in hospital which runs from admission to the date when they are discharged
bull 10 of inpatients had been in hospital for one month or less
bull 6 had been in hospital between one and three months
bull 7 had been in hospital between three and six months
bull 10 had been in hospital between six months and one year
bull 14 had been in hospital between one and two years
bull 22 had been in hospital between two and five years
bull 31 had been in hospital for over five years
The patterns are very similar to those in previous censuses About 67 of patients in the 2010 census had been in hospital for more than a year and were therefore also included in the 2009 census In addition over half (53) of patients had been in hospital for more than two years and will have been included in both the 2008 and 2009 censuses A third of patients will have been included in each census since 2006
We also calculated the median length of stay (see page 26 for the definition of median) Overall the median amount of time that women had spent in hospital was about 31 months and the median for men was about 27 months This compares with a median for mental health patients of 25 months for women and 58 months for men It is not possible to reliably compare length of stay by ethnic group because of the small numbers of patients among several minority ethnic groups
Care Quality Commission Count me in census 2010 38
Results learning disabilities continued
Ward security
About 12 of all inpatients were on a medium or high secure ward as opposed to a general (54) or low secure (34) ward
As in the three previous years rates of patients on medium or high secure wards were about double the average among the White Irish and Other White groups Most other minority ethnic groups had very few patients on medium or high secure wards
Age range on wards
There were five patients under 18 years of age being cared for on wards for working-age adults and none were on wards for older people About 5 of patients on wards for working-age adults were aged 65 or over and there were very few patients (23) on wards for older people There were very few lsquoout of agersquo placements among minority ethnic groups
Patients in wards designated as single sex or mixed
We asked providers whether the patient was on a ward designated as men or women only or mixed gender Overall 47 of men and 69 of women were not in a ward designated for single sex use The numbers of such patients among minority ethnic groups were very low
Two further questions examined the single sex facilities that were available to patients Again due to the small numbers we do not present results by ethnicity for these questions
Patientsrsquo access to toilet and bathing facilities designated for single sex use
Overall 19 (497) of men and 27 (295) of women were reported as not having access to toilet and bathing facilities designated for single sex use
Patientsrsquo access to a lounge area day space designated for single sex use
Overall 32 (829) of men and 44 (470) of women were reported as not having access to a lounge area day space designated for single sex use
Patients subject to deprivation of liberty safeguards
For details of deprivation of liberty safeguards please see page 31
The 2010 census introduced a new question ldquoIs the patient subject to deprivation of liberty authorisation on 31 March 2010rdquo Two per cent (74) patients were reported as being subject to a deprivation of liberty order on census day but very few of these patients (15) were from minority ethnic groups
See footnote on single sex accommodation on page 27
Care Quality Commission Count me in census 2010 39
Data in the future Moving beyond a one-day census
For six years the Count me in census has provided a valuable one-day snapshot of inpatients in mental health and learning disability services And with the proportion of inpatients who are detained increasing steadily (from 25 in 200506 to 39 in 200910 ndash see Figure 2) ongoing ethnic monitoring of admissions and detentions becomes more vital than ever
However a one-day census only captures some events and the profile of patients can differ across a whole year For example there were
bull 29840 inpatients in the 2010 census compared with 107765 inpatients overall during 200910
bull 17299 patients in the 2010 census who were detained or on CTOs compared with 42479 new detentions and some 4100 new CTOs overall in England in 200910
bull 26 of patients in hospital for under one month and 31 for over one year per the census
whereas the MHMDS data consistently shows that for over 50 of records the average length of an inpatient stay was under one month and for 4 it was over one year
Looking ahead it is vital that robust data is available on all admitted patients and all those subject to the Mental Health Act not just those in hospital on one particular day Moreover patterns of use and outcomes of community care can have an impact on the need for admission to hospital and the risk of detention ndash therefore information about the care provided to patients before admission to hospital during their hospital stay and after they leave is also vital Furthermore under 84 of the 127 million people using specialist mental health services are admitted to hospital23 and so it is very important to examine the quality of community care for the 90 of patients who are not admitted to hospital
Figure 2 Number of people spending time in hospital 200506 to 200910
Num
ber
of p
atie
nts
90000
80000
70000
60000
50000
40000
30000
20000
10000
0 200506 200607 200708 200809 200910
Source NHS Information Centre Formally detained Not detained MHMDS Bulletin 2011
Care Quality Commission Count me in census 2010 40
Data in the future Moving beyond a one-day census continued
The Mental Health Minimum Data Set (MHMDS) is a rich source of data on people using specialist mental health services in England It covers both community and hospital services and includes a wide range of information about the demographic clinical and socioeconomic characteristics of individual patients and the services provided to those admitted to hospital and to the much larger number of those who donrsquot need a stay in hospital The data includes information about contact with services uses of the Mental Health Act and the Care Programme Approach for each individual patient All these details enable the use of services patterns of care and patient outcomes to be tracked including along pathways of care The MHMDS therefore provides a robust basis for ongoing monitoring of access to and outcomes of care for users of specialist ndash both community and hospital ndash mental health services
The MHMDS also enables an analysis of the numbers and rates of people from different ethnic groups using specialist mental health services overall (both inpatient and community) which provides an indication of the levels of mental illness and therefore the need for specialist care in different communities
At present the MHMDS does not cover high secure services and independent sector providers only started to provide data during 201011 However to support payment by results for mental health the scope of the data set will be extended to cover high secure services during 201112 (version 4 MHMDS) Further proposed changes to the dataset (version 41) will incorporate NHS-funded learning disability services and primary care mental health services A separate dataset for child and adolescent mental health services (CAMHS) has been developed and is awaiting formal approvals It is designed to include the same information about uses of the Mental Health Act as provided in the MHMDS
The latest MHMDS bulletin for 200910 provides a description of people using specialist mental health services in England including ethnic profiles of people using services hospital admissions detentions and the number of people on CPA24 It also provides information on differences by age and gender The bulletin illustrates some of the sorts of analyses that are possible using data from the MHMDS
The NHS Information Centre can provide guidance on these and other potential analyses based on MHMDS data
Care Quality Commission Count me in census 2010 41
Conclusions
While this report reviews changes in the census results since 2005 it is not a review or evaluation of the DRE programme overall Similarly the census cannot provide explanations for the patterns observed or examine whether mental health services are meeting the needs of individual ethnic minority groups As we have noted previously the results are subject to caveats in particular that the census provides a one-day snapshot that may not be representative of patients admitted to hospital throughout the year
Overview of findings
Overall the findings from the 2010 census show little change from those reported for previous annual censuses conducted since 2005 This is partly because many patients had been in hospital for a considerable period of time and had therefore been included in successive censuses The findings of this sixth and last census continue to show differences between Black and minority ethnic groups and White groups and also differences within these groups
In particular ethnic differences in rates of admission detention under the Mental Health Act and seclusion ndash three of DRErsquos 12 goals ndash have not altered materially since the inception of DRE in 2005
bull Admission rates remain higher than average among minority ethnic groups especially among Black and WhiteBlack Mixed groups for whom rates were two or more times higher than average in 2010 The Other Black group continues to have the highest admission rate ndash six times higher than average ndash although this is lower than in 2005 In contrast admission rates have consistently been lower than average among the Indian and Chinese groups and about average in the Pakistani and Bangladeshi groups
bull Detention rates remain higher than average among the Black and WhiteBlack Caribbean Mixed groups and among the Other White group A consistent pattern across all censuses was the higher than average detention rate
under section 3741 for the Black Caribbean and Other Black groups We also found that rates for being placed on a CTO were higher among the South Asian and Black groups
bull Although there have been annual fluctuations in seclusion rates they have been higher than average for the Black WhiteBlack Mixed and Other White groups in at least three of the six censuses
Overall the level of provision of single sex areas for patients continues to be unsatisfactory although there was no evidence that minority ethnic patients were disadvantaged in these respects Government policy for the NHS in England now requires that all providers of NHS-funded care including mental health trusts are expected to eliminate mixed-sex accommodation in accordance with the guidance set out in CNO201032526 From 2011 all providers of NHS-funded care must report breaches of sleeping accommodation which will attract sanctions
Implications for ways forward
The census findings do not in themselves show that mental health and learning disability services are failing to meet the needs of Black and minority ethnic service users
As noted in previous reports they need to be interpreted in the context of available evidence on ethnic differences in rates of mental illness pathways to care and factors such as socioeconomic disadvantages that all contribute to these differences Our previous reports have consistently highlighted the need for prevention early intervention and working collaboratively across sectors to reduce the risk of admission and detention where possible without compromising the care given to patients Mental health services have a key role to play but to achieve this all statutory agencies and organisations outside the healthcare sector Black and minority ethnic communities and people who use services themselves will need to work in partnership
Care Quality Commission Count me in census 2010 42
Conclusions continued
This message ndash about preventing mental ill-health by addressing the contributory factors and intervening early ndash is at the heart of No health without mental health the Department of Healthrsquos new strategy for the future of mental health care in England27
The strategy aims to tackle the economic social and environmental determinants and consequences of mental health problems and to improve outcomes and reduce inequalities
It specifies that by 2014 people in contact with the criminal justice system will have improved access to mental health services as set out in the Ministry of Justice Green Paper Breaking the Cycle Effective punishment rehabilitation and sentencing of offenders which confirms the approach outlined in Lord Bradleyrsquos report for early intervention and diversion from custody2829
Accompanying the new strategy is a supporting document that explains how its objectives will improve mental health outcomes the effective interventions and the underpinning evidence base30
The strategy is complemented by other government proposals for reforms in the NHS public health and adult social care as outlined in the NHS White Paper Equity and excellence liberating the NHS31 the public health strategy Healthy lives healthy people32 and the adult social care strategy A vision for adult social care capable communities and active citizens 33 Three outcomes frameworks have been developed alongside these strategies improving mental health outcomes and reducing inequalities is integral to them all
In this new healthcare landscape the proposed NHS Commissioning Board and GP consortia will have a statutory obligation to promote equality and reduce inequalities in healthcare (something also enshrined in the Equality Act 2010) As the lead commissioners of healthcare services it will be up to GP consortia to assess with local authorities the needs of their local populations and commission the right services that meet their requirements
And the strengthened public health role of local authorities offers significant potential for addressing the socioeconomic disadvantages faced by Black and minority ethnic communities which add to the burden of mental illness in these communities
Race Equality Action Plan A five-year review looked back at the work of the DRE action plan and describes some of the key challenges successes and learning34 Based on the experience and outcome of the DRE programme the report suggests ways forward for the next stage of mental health strategy development and implementation
Since April 2009 CQC has had a duty under the Mental Health Act 1983 to monitor how services exercise their powers in relation to patients who are detained in hospital or subject to CTOs or guardianship under the Act In its first annual report on the use of the Act CQC recommends a number of areas where improvements are needed for example over-occupancy on inpatient wards patient engagement use of control and restraint seclusion and capacity and consent35
In particular CQC highlighted a number of issues relating to the use of CTOs including concern about appropriate usage (30 of the patients in CQCrsquos sample did not have a reported history of non-compliance or disengagement with services after discharge) and over-representation of Black and minority ethnic groups CQC advised that research on the possible race equality impact of CTOs should be undertaken There were 6237 CTOs from their introduction in November 2008 to 31 March 2010 a much greater use of them than forecast for this period by the Department of Health before the power was introduced Just 31 of these orders had ended by end March 2010 suggesting that some people are being kept on supervised community treatment for long periods
Care Quality Commission Count me in census 2010 43
Conclusions continued
Data in the future Moving beyond a one-day census
Good information is the foundation of an effective healthcare system It is imperative for ensuring that services meet the needs of local populations and are equitable and that improvements are made where needed The availability of fit-for-purpose and comprehensive patient-level data sets with ethnicity and other key variables fully coded is therefore vitally important36 It enables the care provided to patients of all ethnic backgrounds to be monitored on an ongoing basis including for monitoring compliance with the Equality Act
Race Equality Action Plan A five-year review notes that better collection monitoring and use of ethnicity data to inform commissioning and provision in health and social care is required37 Key areas include good ethnic monitoring improving demographic information and ensuring good links between infomatics audit and equality and diversity leads within trusts in order to effectively use the information to inform service development monitoring and review at board management ward and community levels
The governmentrsquos proposed changes to the NHS will be supported by an information revolution aimed at improving and extending the information available to the NHS patients and the public on the quality and outcomes of NHS services including by equality dimensions38
Having information that is fit for purpose is vital for the effective regulation of mental health and learning disability services CQC uses routinely available data sets on an ongoing basis to assess the performance of health and social care organisations and their compliance with government policies and legislation We therefore expect those who commission and provide mental healthcare in the NHS and independent sector to have information systems that provide good quality data with fully
comprehensive recording and monitoring of ethnicity on an ongoing basis
Since 2005 the Count me in census has played a key role in providing information about the ethnicity and other characteristics of inpatients in mental health and learning disability services and on patients subject to the Mental Health Act It did this by providing a valuable one-day snapshot But ethnicity recording must be seen as an all-year round statutory requirement not a one-day annual event The number of inpatients throughout the year is much higher than the counts on one day and some patients will have more than one admission And there is a need to move on from counting patients to understanding more about care pathways for Black and minority ethnic patients and the factors leading to hospital admission and detention
We have consistently highlighted the need for commissioners and providers to make full use of the Mental Health Minimum Data Set (MHMDS) ndash the statutory data set submitted by providers of specialist mental health services in England It provides rich data on these issues and provides a robust information source for ongoing ethnic monitoring after this last census
Covering both community and hospital services ndash and now independent and third sector providers as well as NHS ndash it includes a wide range of information about individual patients the services provided to those admitted to hospital and to the much larger number who donrsquot need admission to hospital and the outcomes of care And because it includes year-round activity it is more representative of the overall picture of for example admission detention and readmission rates length of stay years in psychiatric care and contacts with services and professionals
We call on the Information Centre to routinely publish data on all admissions and uses of the Mental Health Act including CTOs in England (in both NHS and independent healthcare providers) by the ethnicity of
Care Quality Commission Count me in census 2010 44
Conclusions continued
patients making the MHMDS the definitive source of information about mental health and learning disability patients This data should be risk-adjusted for age gender and other variables as appropriate to enable reliable comparisons to be made across groups
It is important that all providers ndash NHS and independent ndash make strenuous efforts to improve the quality of the data they submit The Information Centre publishes reports on the quality of MHMDS data by provider (see wwwicnhsukservices mhmdsdq) and we urge providers to monitor this information and use it to improve their data quality
If GP consortia and local authorities are to be effective in their needs assessment and commissioning roles the Information Centre needs to make available and promote to them the data from the MHMDS and other sources And researchers and academics must make full use of the MHMDS to explore the factors that underlie the observed ethnic patterns
CQCrsquos role
In the meantime CQC will continue to focus strongly on the quality of care provided by mental health and learning disability services
People who find themselves admitted to mental health services or detained under the Mental Health Act and therefore counted by the Count me in census are among the most mentally unwell people in our society Our job is first and foremost to make sure that the care they receive meets the essential standards of quality and safety set out under the Health and Social Care Act 2008 and to work with providers to ensure this We act swiftly when we find services that do not Where we find systemic problems that organisations have not adequately addressed we may impose conditions on the providerrsquos registration to bring about the change needed to improve patientsrsquo experience of care
The essential standards of quality and safety include the requirement to provide single sex accommodation and we will continue to closely check that these standards are met by all mental health services
We intend to introduce a number of indicators derived from the rich information in the MHMDS into our quality and risk profiles for providers This will put greater emphasis on the experience of Black and minority ethnic patients in our regulatory activity
We will monitor the quality of MHMDS data submitted by providers (as reported by the NHS Information Centre) including independent service providers Those with poor data quality may be considered at higher risk in terms of their quality of care
In addition we will continue to monitor the progress of services in relation to the issues raised in the census and other reports including our report on the use of the Mental Health Act through our visits to services and meetings with patients by our Mental Health Act Commissioners and second opinion appointed doctors (SOADs) We will draw on patientsrsquo experiences to monitor the operation of the Mental Health Act
We will also assess the impact of advice and use of Local HealthWatch Local HealthWatch will be in a good position to make sure that providers and commissioners are held to account on matters of choice and access to services for people from Black and minority ethnic groups
Care Quality Commission Count me in census 2010 45
References
1 Department of Health Equity and excellence liberating the NHS 2010
2 Department of Health The NHS outcomes framework 201112 2010
3 Healthcare Commission Mental Health Act Commission National Institute for Mental Health in England Count me in results of a national census of inpatients in mental health hospitals and facilities in England and Wales 2005
4 Healthcare Commission Mental Health Act Commission National Institute for Mental Health in England Count me in results of the 2006 national census of inpatients in mental health and learning disability services in England and Wales 2006
5 Healthcare Commission Mental Health Act Commission National Institute for Mental Health in England Count me in results of the 2007 national census of inpatients in mental health and learning disability services in England and Wales 2007
6 Healthcare Commission Mental Health Act Commission National Institute for Mental Health in England Count me in results of the 2008 national census of inpatients in mental health and learning disability services in England and Wales 2008
7 Care Quality Commission National Mental Health Development Unit Results of the 2009 national census of inpatients and patients on supervised community treatment in mental health and learning disability services in England and Wales 2009
8 Department of Health Delivering race equality in mental health care an action plan for reform inside and outside services 2005
9 Welsh Assembly Government Adult Mental Health Services Raising the standard ndash Race Equality Action Plan for Adult Mental Health Services in Wales 2006
10Department of Health No health without mental health a cross-government mental health outcomes strategy for people of all ages 2011 wwwdhgovukprod_consum_dhgroups dh_digitalassetsdocumentsdigitalasset dh_124058pdf
11Department of Health New horizons towards a shared vision for mental health 2009 wwwdhgovukprod_consum_dhgroups dh_digitalassetsdhendocumentsdigital assetdh_109708pdf
12Department of Health Valuing people a new strategy for learning disability for the 21st century 2001
13Department of Health Valuing people now a new three year strategy for people with learning disabilities 2009
14Department of Health Healthcare for all report of the independent inquiry into access to healthcare for people with learning disabilities 2008
15Joint Committee on Human Rights A life like any other human rights of adults with learning disabilities (2008 HL Paper 401 HC 731) House of Lords House of Commons 2008
16Department of Health Valuing people now summary report March 2009 ndash September 2010 2010
17Disability Rights Commission Equal treatment investigation 2005
18Department of Health Mir G Nocon A Ahmad W Jones L Learning difficulties and ethnicity 2000
19ONS experimental population estimates by ethnic group 2007 wwwstatisticsgovukstatbase productaspvlnk=14238
Care Quality Commission Count me in census 2010 46
References continued
20Six percent of population are gay or lesbian according to Whitehall figures 2005 wwwtelegraphcouknewsmainjhtmlxml= news20051212ngay12xmlamps Sheet= news20051212ixhomehtml
21Department of Trade and Industry Amendment to Employment Equality (Sexual Orientation) Regulations 2003 2003
22Office for National Statistics Measuring sexual identity an evaluation report 2010
23 Information Centre Mental Health Bulletin Fourth report from Mental Health Minimum Dataset (MHMDS) annual returns 2010 2011 wwwicnhsukpubsmhbmhmds0910
24 Information Centre Mental Health Bulletin Fourth report from Mental Health Minimum Dataset (MHMDS) annual returns 2010 2011 wwwicnhsukpubsmhbmhmds0910
25The operating framework for the NHS in England 201112 Department of Health 2010 wwwdhgovukprod_consum_dhgroups dh_digitalassetsdhenpsdocuments digitalassetdh_122736pdf
26wwwdhgovukenPublicationsandstatistics LettersandcircularsProfessionalletters ChiefnursingofficerlettersDH_121848
27Department of Health No health without mental health a cross-government mental health outcomes strategy for people of all ages 2011 wwwdhgovukprod_consum_dhgroups dh_digitalassetsdocumentsdigitalasset dh_124058pdf
28Ministry of Justice Breaking the cycle effective punishment rehabilitation and sentencing of offenders 2010
29Department of Health The Bradley report Lord Bradleyrsquos review of people with mental health problems or learning disabilities in the criminal justice system 2009
30Department of Health No health without mental health delivering better mental health outcomes for people of all ages 2011
31Department of Health Equity and excellence liberating the NHS 2010 wwwdhgovukprod_ consum_dhgroupsdh_digitalassetsdhen psdocumentsdigitalassetdh_117794pdf
32Department of Health Healthy lives healthy people our strategy for public health in England 2010 wwwdhgovukprod_consum_dh groupsdh_digitalassetsdhenps documentsdigitalassetdh_122347pdf
33Department of Health A vision for adult social care capable communities and active citizens 2010 wwwdhgovukprod_consum_dh groupsdh_digitalassetsdhenps documentsdigitalassetdh_121971pdf
34Wilson M NMHDU Race equality action plan a five year review Delivering race equality in mental health care 2010 wwwnmhduorgukour-workmhep
35Care Quality Commission Monitoring the use of the Mental Health Act in 200910 2010
36Raleigh V S Collection of data on ethnic origin in England Editorial BMJ 20083376456
37Wilson M NMHDU Race equality action plan a five year review Delivering race equality in mental health care 2010 wwwnmhduorgukour-workmhep
38Department of Health Liberating the NHS an information revolution 2010
Care Quality Commission Count me in census 2010 47
Appendix A Methods of analysis
Standardisation by age and gender
Standardisation allows us to make comparisons between groups of the population by taking account of variations in age and gender Some differences in patterns of service use are related to the age or gender of the people using them so adjustments to the data have to be made to ensure that the interpretation of ethnic differences is reliable For example formal admissions are higher at a younger age so some Black and minority ethnic groups may have high formal admission rates simply because they have a high proportion of younger people Without adjustments for age and gender differences comparisons would be misleading
In this report most results are standardised for age and gender including those relating to admission detention source of referral care programme approach seclusion restraint accidents assault self-harm consent and presence on a secure ward The report uses the accepted statistical method of taking account of age and gender differences between groups when calculating these rates
We used the ONS estimates of total population by ethnic group for England and Wales in 2007 to standardise the rates of admission for different ethnic groups This takes account of the significant rises in the Black and ethnic minority population of England and Wales since the 2001 ONS census and hence gives more accurate and up to date estimates of admission ratios for different ethnic groups (although it does not take account of any further changes in the ethnic populations between 2007 and 2010 the date of this census) For comparison with the DRE baseline we also present admission rates from the 2005 census derived using the 2005 ONS estimates of populations by ethnic group These figures will not be the same as published in the 2005 census report which were based on the 2001 ONS census population estimates because updated estimates of populations by ethnic group were not available at that time
For other analyses we used the total number of inpatients and patients on CTOs in the census
as the basis for standardisation However CTO outpatients are excluded from selected analyses where appropriate namely the analysis of rates for admissions detentions on admission source of referral single sex accommodation and recorded incidents of seclusion restraint accidents assault and self-harm We used the statistical package STATA version 82 to derive the standardised results
It was not possible to adjust the analyses for ethnic differences in social and economic factors and in diagnosis and severity of illness Such factors could affect the ethnic differences observed in the results
For descriptive variables such as religion and language we did not use standardisation
Confidence intervals as indicators of significant statistical differences
For all standardised results the national rates for England and Wales are taken as 100 and the usual 95 confidence intervals are given Rates of less than 100 or greater than 100 for specific ethnic groups show a lower or higher rate respectively than the national average after adjusting for age and gender Whether or not the difference is statistically significant from the national average depends on the confidence interval If the confidence interval overlaps 100 the difference from the national average is not statistically significant If both values are lower or higher than 100 it indicates that the difference compared with the national average is statistically significant at the 95 level
For example if a rate is 110 with the lower confidence interval being 105 and the upper confidence interval being 115 it indicates that the 10 excess over the national average of 100 is statistically significant But if a ratio is 110 with the lower confidence interval being 95 and the upper confidence interval being 125 it indicates that the 10 excess over the national average is not statistically significant We did not attempt to adjust the confidence intervals for multiple comparisons
Care Quality Commission Count me in census 2010 48
Appendix B Mental health tables
Table B1 Standardised admission ratios by ethnic group for England and Wales (excluding outpatients on a CTO) using 2007 ONS census population denominators (England and Wales = 100) All ages
Ethnic group
Men Women Persons Standardised
admission ratio
95 confidence
interval Observed numbers
Standardised admission
ratio
95 confidence
interval Observed numbers
Standardised admission
ratio
95 confidence
interval Observed numbers
White British 88 86 89 12435 94 93 96 10157 91 89 92 22592 White Irish 130 115 146 274 122 106 140 215 126 115 138 489 Other White 117 109 126 731 129 118 141 533 122 115 129 1264 White and Black Caribbean 557 493 627 276 274 223 333 101 436 393 483 377 White and Black African 312 247 388 80 259 186 351 41 292 242 349 121 White and Asian 140 110 174 79 124 90 166 44 134 111 159 123 Other Mixed 230 189 278 108 213 165 270 67 223 192 259 175 Indian 67 59 75 286 66 56 76 172 66 60 73 458 Pakistani 105 93 119 269 65 53 79 96 91 81 100 365 Bangladeshi 123 102 147 120 82 60 109 46 108 92 126 166 Other Asian 161 139 185 192 136 107 169 79 153 135 172 271 Black Caribbean 538 505 572 980 306 277 336 418 438 415 462 1398 Black African 246 226 267 550 219 194 247 277 236 221 253 827 Other Black 792 691 903 222 314 240 403 61 596 529 670 283 Chinese 27 20 38 39 43 30 59 35 33 26 41 74 Other 140 120 162 177 110 88 136 87 128 113 145 264 Total 100 16818 100 12429 100 29247
Care Quality Commission Count me in census 2010 49
Appendix B Mental health tables continued
Table B2 Standardised admission ratios by ethnic group for England and Wales (excluding outpatients on a CTO) using 2007 ONS census population denominators (England amp Wales = 100) Ages 65 and over
Ethnic group
Men Women Persons Standardised
admission ratio
95 confidence
interval Observed numbers
Standardised admission
ratio
95 confidence
interval Observed numbers
Standardised admission
ratio
95 confidence
interval Observed numbers
White British 95 92 99 3265 95 92 98 3887 95 93 97 7152 White Irish 142 116 172 106 102 82 125 92 120 104 138 198 Other White 207 174 244 141 213 183 248 171 210 188 235 312 White and Black Caribbean 406 210 710 12 333 152 632 9 371 230 568 21 White and Black African 231 28 836 2 198 24 714 2 213 58 546 4 White and Asian 28 1 156 1 110 30 281 4 69 23 162 5 Other Mixed 146 40 374 4 228 92 470 7 189 95 339 11 Indian 97 70 132 41 83 57 116 33 90 71 113 74 Pakistani 39 17 77 8 46 18 94 7 42 23 69 15 Bangladeshi 115 53 218 9 69 14 201 3 98 51 172 12 Other Asian 234 143 361 20 215 120 354 15 225 157 313 35 Black Caribbean 216 170 269 77 310 253 376 103 261 224 302 180 Black African 142 73 248 12 365 241 531 27 246 175 337 39 Other Black 164 34 479 3 366 134 796 6 259 119 493 9 Chinese 41 8 120 3 95 38 195 7 68 33 125 10 Other 253 126 453 11 390 238 602 20 327 222 464 31 Total 100 3715 100 4393 100 8108
Care Quality Commission Count me in census 2010 50
Appendix B Mental health tables continued
Table B3 Standardised ratios by ethnic group for patients referred by a GP (England and Wales = 100)
Ethnic group
Men Women Persons Standardised
referral ratio
95 confidence
interval Observed numbers
Standardised referral ratio
95 confidence
interval Observed numbers
Standardised referral ratio
95 confidence
interval Observed numbers
White British 110 103 117 904 107 101 114 1065 108 104 113 1969 White Irish 85 50 134 18 93 57 144 20 89 63 123 38 Other White 74 51 103 33 70 49 97 36 72 56 91 69 White and Black Caribbean 27 5 78 3 30 4 109 2 28 9 65 5 White and Black African 0 0 74 9 268 2 35 4 125 2 White and Asian 165 54 386 5 0 0 86 28 201 5 Other Mixed 48 6 172 2 68 14 198 3 58 19 136 5 Indian 69 34 123 11 79 39 141 11 73 46 111 22 Pakistani 88 42 162 10 59 16 151 4 77 42 130 14 Bangladeshi 81 22 207 4 61 7 221 2 73 27 159 6 Other Asian 80 32 166 7 108 43 223 7 92 50 155 14 Black Caribbean 35 20 56 17 37 20 62 14 36 24 51 31 Black African 57 29 100 12 66 35 113 13 61 40 91 25 Other Black 62 23 135 6 40 5 144 2 54 23 107 8 Chinese 56 1 314 1 139 38 356 4 108 35 251 5 Other 106 46 208 8 0 0 53 23 105 8 Total 100 1041 100 1185 100 2226
Care Quality Commission Count me in census 2010 51
Appendix B Mental health tables continued
Table B4 Standardised ratios by ethnic group for patients referred by a community mental health team (including crisis resolution home treatment) or community learning disability team (England and Wales = 100)
Ethnic group
Men Women Persons Standardised
referral ratio
95 confidence
interval Observed numbers
Standardised referral ratio
95 confidence
interval Observed numbers
Standardised referral ratio
95 confidence
interval Observed numbers
White British 107 104 111 3255 103 100 107 3386 105 103 108 6641 White Irish 90 69 116 61 89 68 114 61 90 74 107 122 Other White 59 48 71 105 79 67 94 141 69 61 78 246 White and Black Caribbean 106 83 135 68 75 49 111 25 96 77 117 93 White and Black African 43 19 84 8 66 30 124 9 52 31 84 17 White and Asian 95 56 150 18 84 43 147 12 90 61 129 30 Other Mixed 78 48 121 20 72 41 118 16 76 53 105 36 Indian 106 83 132 76 100 76 130 56 103 86 122 132 Pakistani 108 84 135 73 89 60 128 30 102 83 123 103 Bangladeshi 98 66 141 29 90 50 148 15 95 69 128 44 Other Asian 88 63 120 40 105 70 150 29 94 73 119 69 Black Caribbean 69 59 80 167 85 71 102 123 75 67 84 290 Black African 84 70 102 112 82 65 103 77 84 72 96 189 Other Black 52 36 74 31 64 36 106 15 56 41 74 46 Chinese 112 53 205 10 101 52 176 12 105 66 160 22 Other 86 60 120 35 106 71 151 30 94 73 120 65 Total 100 4108 100 4037 100 8145
Care Quality Commission Count me in census 2010 52
Appendix B Mental health tables continued
Table B5 Standardised ratios by ethnic group for patients referred by criminal justice routes (police prison probation courts court liaison and diversion) (England and Wales = 100)
Ethnic group
Men Women Persons Standardised
referral ratio
95 confidence
interval Observed numbers
Standardised referral ratio
95 confidence
interval Observed numbers
Standardised referral ratio
95 confidence
interval Observed numbers
White British 90 86 95 1495 95 86 104 421 91 87 95 1916 White Irish 133 94 183 38 59 19 138 5 116 84 157 43 Other White 112 93 134 119 103 68 150 27 111 93 130 146 White and Black Caribbean 117 89 151 58 145 69 266 10 120 94 153 68 White and Black African 190 127 273 29 141 38 361 4 183 126 256 33 White and Asian 75 39 131 12 160 52 373 5 89 52 143 17 Other Mixed 104 65 157 22 151 61 311 7 112 75 161 29 Indian 86 61 118 38 79 32 163 7 85 62 113 45 Pakistani 118 91 150 65 89 33 194 6 115 90 145 71 Bangladeshi 74 44 115 19 29 1 162 1 68 42 105 20 Other Asian 130 95 174 45 164 71 323 8 134 101 176 53 Black Caribbean 131 114 150 208 124 81 181 26 130 114 148 234 Black African 132 112 156 145 143 93 211 25 134 114 156 170 Other Black 141 109 180 65 236 113 435 10 149 117 187 75 Chinese 83 27 194 5 146 30 426 3 99 43 195 8 Other 129 93 175 41 113 37 264 5 127 93 170 46 Total 100 2404 100 570 100 2974
Care Quality Commission Count me in census 2010 53
Appendix B Mental health tables continued
Table B6 Standardised detention ratios by ethnic group all detentions on day of admission (excluding outpatients on a CTO) (England and Wales = 100)
Ethnic group
Men Women Persons Standardised
detention ratio
95 confidence
interval Observed numbers
Standardised detention
ratio
95 confidence
interval Observed numbers
Standardised detention
ratio
95 confidence
interval Observed numbers
White British 94 92 97 6449 94 91 97 3628 94 92 96 10077 White Irish 112 95 131 154 118 96 145 94 114 101 129 248 Other White 108 98 118 451 120 106 136 251 112 104 120 702 White and Black Caribbean 123 107 141 220 129 99 167 59 124 110 140 279 White and Black African 128 99 162 68 113 70 173 21 124 100 153 89 White and Asian 96 71 126 50 109 68 164 22 99 78 125 72 Other Mixed 115 92 143 82 139 100 188 42 122 102 146 124 Indian 97 83 113 164 110 86 137 77 101 88 114 241 Pakistani 109 94 126 194 102 74 136 44 108 94 122 238 Bangladeshi 86 67 109 69 91 55 142 19 87 70 107 88 Other Asian 109 92 130 133 120 86 163 40 112 96 130 173 Black Caribbean 129 121 139 774 143 125 162 238 132 124 141 1012 Black African 115 104 127 422 131 111 153 159 119 110 129 581 Other Black 117 100 136 170 148 105 202 39 122 106 140 209 Chinese 108 71 159 26 129 78 202 19 116 85 156 45 Other 111 92 132 126 116 83 157 41 112 96 130 167 Total 100 9552 100 4793 100 14345
Care Quality Commission Count me in census 2010 54
Appendix B Mental health tables continued
Table B7 Standardised detention ratios by ethnic group detention on day of admission ndash section 2 of the Mental Health Act (England and Wales = 100)
Ethnic group
Men Women Persons Standardised
detention ratio
95 confidence
interval Observed numbers
Standardised detention
ratio
95 confidence
interval Observed numbers
Standardised detention
ratio
95 confidence
interval Observed numbers
White British 97 91 102 1156 93 87 98 1133 95 91 99 2289 White Irish 78 47 120 20 116 79 166 30 97 72 128 50 Other White 100 78 126 70 134 108 166 88 116 99 136 158 White and Black Caribbean 55 30 93 14 60 24 124 7 57 35 87 21 White and Black African 91 37 188 7 150 60 308 7 113 62 190 14 White and Asian 80 29 174 6 119 44 258 6 96 49 167 12 Other Mixed 68 28 141 7 116 53 221 9 89 51 145 16 Indian 130 91 179 37 124 81 182 26 127 98 163 63 Pakistani 126 87 176 34 138 79 225 16 130 96 171 50 Bangladeshi 166 101 256 20 140 61 276 8 158 105 228 28 Other Asian 142 93 209 26 163 93 264 16 150 108 202 42 Black Caribbean 73 57 92 70 97 72 128 51 82 68 98 121 Black African 164 131 202 87 190 146 244 62 174 147 204 149 Other Black 114 75 166 27 140 72 245 12 121 86 165 39 Chinese 165 60 358 6 212 97 402 9 190 106 313 15 Other 218 153 302 36 179 108 280 19 203 153 264 55 Total 100 1623 100 1499 100 3122
Care Quality Commission Count me in census 2010 55
Appendix B Mental health tables continued
Table B8 Standardised detention ratios by ethnic group detention on day of admission ndash section 3 of the Mental Health Act (England and Wales = 100)
Ethnic group
Men Women Persons Standardised
detention ratio
95 confidence
interval Observed numbers
Standardised detention
ratio
95 confidence
interval Observed numbers
Standardised detention
ratio
95 confidence
interval Observed numbers
White British 99 95 103 2684 96 91 100 1852 98 95 101 4536 White Irish 116 89 149 60 135 101 177 52 124 102 149 112 Other White 112 96 129 186 110 92 132 121 111 99 124 307 White and Black Caribbean 114 91 143 79 130 90 183 33 119 98 143 112 White and Black African 97 60 148 21 107 54 192 11 100 69 141 32 White and Asian 84 50 133 18 97 48 173 11 89 59 127 29 Other Mixed 121 84 168 35 117 72 181 20 120 90 156 55 Indian 96 75 122 67 110 79 148 42 101 83 122 109 Pakistani 91 71 115 69 88 55 134 22 90 73 111 91 Bangladeshi 63 39 95 22 64 28 127 8 63 43 90 30 Other Asian 90 65 120 44 94 56 149 18 91 70 117 62 Black Caribbean 116 102 130 279 164 138 192 148 129 117 142 427 Black African 95 80 112 143 102 79 129 68 97 85 111 211 Other Black 75 55 99 49 99 58 159 17 80 62 102 66 Chinese 119 59 213 11 99 43 194 8 110 66 171 19 Other 85 60 116 38 84 48 136 16 84 63 110 54 Total 100 3805 100 2447 100 6252
Care Quality Commission Count me in census 2010 56
Appendix B Mental health tables continued
Table B9 Standardised detention ratios by ethnic group detention on day of admission ndash section 3741 of the Mental Health Act (England and Wales = 100)
Ethnic group
Men Women Persons Standardised
detention ratio
95 confidence
interval Observed numbers
Standardised detention
ratio
95 confidence
interval Observed numbers
Standardised detention
ratio
95 confidence
interval Observed numbers
White British 84 79 89 991 101 88 115 220 86 82 91 1211 White Irish 140 96 198 32 48 6 175 2 126 87 176 34 Other White 112 89 139 81 156 95 241 20 118 96 144 101 White and Black Caribbean 177 133 232 53 179 66 390 6 178 135 229 59 White and Black African 149 82 251 14 224 46 654 3 159 92 254 17 White and Asian 141 75 241 13 195 40 569 3 149 85 241 16 Other Mixed 144 85 227 18 264 97 575 6 162 104 242 24 Indian 86 56 126 26 44 5 160 2 80 53 116 28 Pakistani 122 87 166 40 0 0 111 79 152 40 Bangladeshi 66 32 122 10 0 0 60 29 110 10 Other Asian 99 61 151 21 0 0 89 55 136 21 Black Caribbean 200 174 229 210 78 34 153 8 189 165 216 218 Black African 127 101 157 82 84 34 172 7 122 98 150 89 Other Black 152 110 205 43 94 11 341 2 148 108 198 45 Chinese 100 27 255 4 0 0 80 22 204 4 Other 118 75 177 23 44 1 245 1 110 71 164 24 Total 100 1661 100 280 100 1941
Care Quality Commission Count me in census 2010 57
Appendix B Mental health tables continued
Table B10 Standardised detention ratios by ethnic group detention on day of admission ndash sections 47 48 4749 of the Mental Health Act (England and Wales = 100)
Ethnic group
Men Women Persons Standardised
detention ratio
95 confidence
interval Observed numbers
Standardised detention
ratio
95 confidence
interval Observed numbers
Standardised detention
ratio
95 confidence
interval Observed numbers
White British 97 90 106 583 104 81 131 73 98 91 106 656 White Irish 132 72 221 14 163 20 590 2 135 77 219 16 Other White 130 96 172 49 71 15 206 3 124 93 163 52 White and Black Caribbean 126 78 193 21 80 2 444 1 123 77 186 22 White and Black African 207 103 370 11 0 0 189 95 339 11 White and Asian 57 12 166 3 169 4 941 1 68 19 175 4 Other Mixed 112 48 221 8 233 28 843 2 125 60 230 10 Indian 57 26 108 9 0 252 0 52 24 99 9 Pakistani 92 54 147 17 0 314 0 86 50 138 17 Bangladeshi 46 12 117 4 167 4 930 1 53 17 125 5 Other Asian 101 52 177 12 0 0 95 49 166 12 Black Caribbean 126 98 159 70 125 34 319 4 126 99 158 74 Black African 74 48 107 27 104 21 303 3 76 51 108 30 Other Black 127 78 197 20 138 3 769 1 128 79 195 21 Chinese 0 0 0 0 0 0 Other 83 38 157 9 0 0 77 35 147 9 Total 100 857 100 91 100 948
Care Quality Commission Count me in census 2010 58
Appendix B Mental health tables continued
Table B11 Standardised ratios for all applications of the Mental Health Act (including outpatients on a CTO) by ethnic group on day of census (England and Wales = 100)
Ethnic group
Men Women Persons Standardised
ratio for all MHA
applications
95 confidence
interval Observed numbers
Standardised ratio for all MHA
applications
95 confidence
interval Observed numbers
Standardised ratio for all MHA
applications
95 confidence
interval Observed numbers
White British 97 94 99 7659 95 93 98 4335 96 94 98 11994 White Irish 99 83 116 147 104 84 128 95 101 89 114 242 Other White 87 79 95 427 97 85 110 249 90 84 97 676 White and Black Caribbean 117 103 133 245 130 103 163 76 120 107 134 321 White and Black African 120 95 150 79 93 58 141 22 113 92 137 101 White and Asian 101 78 128 65 119 81 169 31 106 86 129 96 Other Mixed 110 89 134 96 125 93 165 49 114 97 135 145 Indian 103 90 118 215 122 100 147 109 109 97 121 324 Pakistani 111 97 125 254 117 90 148 67 112 100 125 321 Bangladeshi 92 75 112 97 101 68 145 29 94 78 112 126 Other Asian 103 88 121 152 126 95 164 56 109 94 124 208 Black Caribbean 123 115 131 893 141 126 158 300 127 120 134 1193 Black African 112 103 122 511 121 104 140 188 114 106 123 699 Other Black 116 102 132 232 148 112 191 59 122 108 136 291 Chinese 97 64 140 27 101 61 157 19 98 72 131 46 Other 104 87 122 140 103 75 137 46 103 89 119 186 Total 100 11239 100 5730 100 16969
Care Quality Commission Count me in census 2010 59
Appendix B Mental health tables continued
Table B12 Standardised CTO ratios by ethnic group CTOs on day of census ndash section 17a of the Mental Health Act (England and Wales = 100)
Ethnic group
Men Women Persons
Standardised CTO ratio
95 confidence
interval Observed numbers
Standardised CTO ratio
95 confidence
interval Observed numbers
Standardised CTO ratio
95 confidence
interval Observed numbers
White British 94 89 99 1289 88 82 94 730 92 88 96 2019 White Irish 51 27 88 13 77 41 132 13 62 40 90 26 Other White 97 77 120 83 125 95 162 58 107 90 126 141 White and Black Caribbean 79 53 113 29 141 77 237 14 92 67 124 43 White and Black African 111 59 190 13 125 41 292 5 115 68 181 18 White and Asian 104 54 182 12 136 50 297 6 113 67 178 18 Other Mixed 102 59 166 16 136 62 257 9 112 73 166 25 Indian 134 99 177 48 152 98 226 24 139 109 175 72 Pakistani 145 110 187 59 174 101 279 17 151 119 189 76 Bangladeshi 142 93 206 27 205 99 378 10 155 109 213 37 Other Asian 107 71 155 28 182 99 305 14 124 89 168 42 Black Caribbean 121 103 142 152 171 132 218 65 133 116 152 217 Black African 116 94 142 94 139 98 192 37 122 102 145 131 Other Black 186 144 238 65 305 189 466 21 206 165 254 86 Chinese 83 23 213 4 152 49 354 5 111 51 211 9 Other 87 54 134 21 152 79 266 12 103 71 145 33 Total 100 1953 100 1040 100 2993
Care Quality Commission Count me in census 2010 60
Appendix C Learning disability tables
Table C1 Standardised admission ratios by ethnic group for England and Wales using 2007 ONS population denominators (England amp Wales = 100) All ages
Ethnic group
Men Women Persons Standardised
admission ratio
95 confidence
interval Observed numbers
Standardised admission
ratio
95 confidence
interval Observed numbers
Standardised admission
ratio
95 confidence
interval Observed numbers
White British 104 100 109 2163 108 101 115 941 105 102 109 3104 White Irish 108 72 156 28 151 89 238 18 121 89 162 46 Other White 81 65 101 85 49 30 75 21 72 59 87 106 White and Black Caribbean 280 186 405 28 246 118 453 10 270 191 371 38 White and Black African 102 33 239 5 165 34 482 3 119 51 235 8 White and Asian 66 26 135 7 154 56 335 6 89 47 152 13 Other Mixed 181 104 295 16 229 99 451 8 195 125 290 24 Indian 32 21 48 24 28 12 55 8 31 21 44 32 Pakistani 48 30 72 22 12 1 43 2 38 25 57 24 Bangladeshi 102 60 161 18 31 4 113 2 83 51 128 20 Other Asian 33 13 69 7 92 34 201 6 47 25 81 13 Black Caribbean 265 210 332 77 117 67 190 16 218 176 267 93 Black African 53 33 80 22 40 15 87 6 50 33 72 28 Other Black 228 118 399 12 134 28 392 3 200 112 330 15 Chinese 4 0 21 1 3 0 16 1 Other 26 9 56 6 11 0 59 1 21 9 44 7 Total 100 2521 100 1051 100 3572
Care Quality Commission Count me in census 2010 61
Appendix C Learning disability tables continued
Table C2 Standardised detention ratios by ethnic group all detentions on day of admission (England and Wales = 100)
Ethnic group
Persons Standardised
detention ratio
95 confidence
interval Observed numbers
White British 97 93 103 1431 White Irish 127 84 184 28 Other White 117 91 149 68 White and Black Caribbean 120 77 179 24 White and Black African 114 37 267 5 White and Asian 75 24 176 5 Other Mixed 94 49 165 12 Indian 119 72 186 19 Pakistani 110 61 181 15 Bangladeshi 144 84 231 17 Other Asian 59 16 150 4 Black Caribbean 119 90 155 57 Black African 138 85 210 21 Other Black 62 20 145 5 Chinese 0 0 Other 104 28 267 4 Total 100 1715
Care Quality Commission Count me in census 2010 62
copy Care Quality Commission and National Mental Health Development Unit 2011 Published April 2011
This publication may be reproduced in whole or in part in any format or medium for non-commercial purposes provided that it is reproduced accurately and not used in a derogatory manner or in a misleading context The source should be acknowledged by showing the publication title and copy Care Quality Commission and National Mental Health Development Unit 2011
How to contact us
Phone 03000 616161 Email enquiriescqcorguk Web wwwcqcorguk
Write to us at Care Quality Commission National Correspondence Citygate Gallowgate Newcastle upon Tyne NE1 4PA
Please contact us if you would like a summary of this publication in other formats or languages
Registered office Care Quality Commission Finsbury Tower 103ndash105 Bunhill Row London EC1Y 8TG
- Count me in 2010
- About the Care Quality Commission
- Contents
- Summary
- National organisations coordinating the census
- Introduction
- Data methods of analysis and interpretation
- Results mental health
- A comparison between the 2005 baseline and the 2010 census
- Results learning disabilities
- Data in the future Moving beyond a one-day census
- Conclusions
- References
- Appendix A Methods of analysis
- Appendix B Mental health tables
- Appendix C Learning disability tables
- How to contact us
-

Summary continued
Distribution of patients
Rates of admission (excluding outpatients on a CTO)
Referral from the criminal justice system Detention under the Mental Health Act on admission
Detention under section 3741
Community treatment order Seclusion
Self-harm
Accidents
Hands-on restraint and physical assault Length of stay (from admission to census day)
Single sex accommodation
The key findings are
Number of patients 32799 (including 2959 outpatients on a CTO) of whom 23 were from Black and minority ethnic groups (that is not White British) 16 of all patients were in independent hospitals 70 of patients from Black and minority ethnic groups were at 25 of the 261 organisations involved Lower than average for the White British Indian and Chinese groups In line with the average for the Pakistani and Bangladeshi groups Higher than average for the other minority ethnic groups (particularly for the Black Caribbean Black African Other Black WhiteBlack Caribbean Mixed and WhiteBlack African Mixed groups who had rates two to six times higher than average) Higher than average rates for some Black and WhiteBlack groups
Higher than average rates for the Black Caribbean Black African Other Black and WhiteBlack Caribbean Mixed groups White Irish Other White and Other Mixed groups Higher than average rates for the Black Caribbean and Other Black groups
Higher than average rates for the South Asian and Black groups Higher than average rates for the WhiteBlack Caribbean Mixed WhiteBlack African Mixed Black Caribbean and Black African groups Higher than average rates for the White British group Lower than average rates for the Black and South Asian groups Higher than average rates for the White British group Lower than average rates for the Black groups Few ethnic differences were apparent
31 of patients had been in hospital for one year or more 20 for more than two years Length of stay longest for patients from the Black Caribbean and White Black Caribbean Mixed groups shortest for patients from the Chinese and Bangladeshi groups
61 of men and 77 of women not in a designated single sex ward 13 of men16 of women without access to designated single sex toilet and bathing facilities 37 of men39 of women without access to a designated single sex lounge areaday space (these proportions generally lower among minority ethnic groups) (see page 27 for definition of single sex accommodation)
Note The terms ldquohigherrdquo and ldquolowerrdquo than average rates used in this table relate to differences in rates from the national average that are statistically significant Ethnic differences were not apparent except where stated
Excluding outpatients on a CTO Rates for the different ethnic groups for overall applications of the Mental Health Act including CTOs showed broadly similar patterns to detention rates on admission day that excluded patients on a CTO In both cases rates were higher than average among the Black Caribbean Black African Other Black and WhiteBlack Caribbean Mixed groups
Care Quality Commission Count me in census 2010 3
Summary continued
Learning disabilities Information was obtained for 3642 patients in 129 organisations providing services for people with learning disabilities in England and Wales Again the overall patterns are very similar to those observed in previous censuses as 67 of the inpatients in 2010 were also inpatients in 2009 and 53 were also inpatients in 2008
The key findings are
Number of inpatients 3642 of whom 13 were from Black and minority ethnic groups (that is not White British)
70 of patients from Black and minority ethnic groups were at 25 of the 129 organisations involved
Lower than average among the Other White Indian Pakistani Other Asian Black African Chinese and Other groups Higher than average by 2-3 times among the WhiteBlack Caribbean Mixed Black Caribbean Other Black and Other Mixed groups
Few ethnic differences were apparent
Few ethnic differences were apparent probably due to small numbers of patients in minority ethnic groups
67 of patients had been in hospital for one year or more 31 for more than five years
47 of men and 69 of women not in a designated single sex ward 19 of men27 of women without access to designated single sex toilet and bathing facilities 32 of men44 of women without access to a designated single sex lounge areaday space (these proportions generally lower among minority ethnic groups) (see page 27 for definition of single sex accommodation)
See note under previous table for meaning of the terms ldquohigherrdquo and ldquolowerrdquo than average rates
Distribution of patients
Rates of admission
Detention under the Mental Health Act on admission
Seclusion self-harm accidents hands-on restraint and physical assault
Length of stay (from admission to census day)
Single sex accommodation
Care Quality Commission Count me in census 2010 4
Summary continued
Conclusions
Overall the results of the 2010 census show little change from those reported for previous years A detailed comparison between the 2005 baseline and the 2010 census is on page 32
Although the numbers of inpatients overall have fallen since 2005 ethnic differences in rates of admission detention under the Mental Health Act and seclusion ndash three of DRErsquos 12 goals ndash have not altered materially since the inception of DRE in 2005
bull Admission rates remain higher than average among some minority ethnic groups especially Black and WhiteBlack Mixed groups for whom rates were two or more times higher than average in 2010 (six times higher than average for the Other Black group) In contrast admission rates have consistently been lower than average among the Indian and Chinese groups and about average in the Pakistani and Bangladeshi groups
bull Detention rates have almost consistently been higher than average among the Black White Black Caribbean Mixed and Other White groups The rates for being placed on a CTO were higher among the South Asian and Black groups
bull Although there have been annual fluctuations in seclusion rates they have been higher than average for the Black WhiteBlack Mixed and Other White groups in at least three of the six censuses
These findings however do not in themselves show that mental health and learning disability services are failing to meet the needs of people using services from Black and minority ethnic groups
Ethnic differences in rates of mental illness pathways to care and factors such as socioeconomic disadvantage all contribute to the patterns observed Our previous reports have consistently highlighted the need for prevention early intervention and collaboration across sectors to reduce the risk of admission and detention without compromising the care given to patients Mental health services have a key role to play But partnership between
all statutory agencies and organisations outside the healthcare sector Black and minority ethnic communities and those who use services themselves will be needed to achieve this
This message ndash about preventing mental ill-health by addressing the contributory factors and intervening early ndash is at the heart of No health without mental health the governmentrsquos new strategy for the future of mental health care in England The strategy aims to tackle the economic social and environmental determinants and consequences of mental health problems and to improve outcomes and reduce inequalities
It is complemented by other government proposals for reforms in the NHS public health and adult social care in England all similarly aimed at improving outcomes and reducing inequalities In this new healthcare landscape the proposed NHS Commissioning Board and GP consortia will have a statutory obligation to promote equality and reduce inequalities in healthcare (something also enshrined in the Equality Act 2010) As the lead commissioners of healthcare services it will be up to GP consortia to assess with local authorities the needs of their local populations and commission the right services that meet their requirements And the strengthened public health role of local authorities offers significant potential for addressing the socio-economic disadvantages faced by Black and minority ethnic communities which adds to the burden of mental illness in these communities
Data in the future Moving beyond a one-day census The Count me in census has come to a close For the last six years it has played a key role in providing information about inpatients using mental health and learning disability services But ethnicity recording must be seen as an all-year round statutory requirement not a one-day annual event And there is a need to move on from counting patients to understanding more about care pathways for patients from Black and minority ethnic groups and the factors leading to their hospital admission and detention
Care Quality Commission Count me in census 2010 5
Summary continued
We have consistently highlighted the need for commissioners and providers to make full use of the Mental Health Minimum Data Set (MHMDS) ndash the statutory data set submitted by providers of specialist mental health services in England It provides rich data on these issues
Covering both community and hospital services ndash and now independent and third sector providers as well as NHS ndash it includes a wide range of information about individual patients the services provided to those admitted to hospital and to the much larger number who donrsquot need admission to hospital and the outcomes of care And because it includes year-round activity it is more representative of the overall picture of for example admission detention and readmission rates length of stay years in psychiatric care and contacts with services and professionals
We call on the Information Centre to routinely publish data on all admissions and uses of the Mental Health Act including CTOs in England (in both NHS and independent healthcare providers) by the ethnicity of patients making the MHMDS the definitive source of information about mental health and learning disability patients This data should be risk-adjusted for age gender and other variables as appropriate to enable reliable comparisons to be made across groups
If GP consortia and local authorities are to be effective in their needs assessment and commissioning roles the Information Centre needs to make available and promote to them the data from the MHMDS and other sources And researchers and academics must make full use of the MHMDS to explore the factors that underlie the observed ethnic patterns As effective use of the data is dependent on its quality we call on providers (NHS and independent) to ensure that the completeness and accuracy of their data meets required standards
CQCrsquos role In the meantime CQC will continue to focus strongly on the quality of care provided by mental health and learning disability services
People who find themselves admitted to mental health services or detained under the Mental Health Act and therefore counted by the Count me in census are among the most mentally unwell people in our society Our job is first and foremost to make sure that the care they receive meets the essential standards of quality and safety set out under the Health and Social Care Act 2008 and to work with providers to ensure this We act swiftly when we find services that do not Where we find systemic problems that organisations have not adequately addressed we may impose conditions on the providerrsquos registration to bring about the change needed to improve patientsrsquo experience of care
The essential standards of quality and safety include the requirement to provide single sex accommodation and we will continue to closely check that these standards are met by all mental health services
We intend to introduce a number of indicators derived from the rich information in the MHMDS into our quality and risk profiles for providers This will put greater emphasis on the experience of Black and minority ethnic patients in our regulatory activity
We will monitor the quality of MHMDS data submitted by providers (as reported by the NHS Information Centre) including independent service providers Those with poor data quality may be considered at higher risk in terms of their quality of care
In addition we will continue to monitor the progress of services in relation to the issues raised in the census and other reports including our report on the use of the Mental Health Act through our visits to services and meetings with patients by our Mental Health Act Commissioners and second opinion appointed doctors (SOADs) We will draw on patientsrsquo experiences to monitor the operation of the Mental Health Act
We will also assess the impact of advice and use of Local HealthWatch Local HealthWatch will be in a good position to make sure that providers and commissioners are held to account on matters of choice and access to services for people from Black and minority ethnic groups
Care Quality Commission Count me in census 2010 6
National organisations coordinating the census
The Care Quality Commission (CQC) and the National Mental Health Development Unit (NMHDU) were the two key partners in delivering the 2010 census CQC had lead responsibility
Until March 2009 the Healthcare Commission had overall responsibility for delivering the census in partnership with the Mental Health Act Commission (MHAC) and the National Institute for Mental Health in England (NIMHE) On 1 April 2009 the regulatory functions of the Healthcare Commission MHAC and the Commission for Social Care Inspection were superseded by CQC At the same time NIMHE was superseded by NMHDU
Care Quality Commission The Care Quality Commission is the independent regulator of health and adult social care services in England We also protect the interests of people whose rights are restricted under the Mental Health Act Whether services are provided by the NHS local authorities or by private or voluntary organisations we make sure that people get better care We do this by
bull Acting swiftly to eliminate poor quality care
bull Ensuring care is centred on peoplersquos needs and reflects their human rights
For more information visit the website wwwcqcorguk
National Mental Health Development Unit The NMHDU ran from April 2009 to March 2011 and had a range of programmes funded by the Department of Health and the NHS It provided national support for implementing mental health policy by advising on national and international best practice to improve mental health and mental health services NMHDU did this by commissioning or providing
bull Specialist expertise in priority areas of policy and delivery
bull Effective knowledge transfer on research evidence and good practice
bull Translation of national policies into practical deliverables that achieve outcomes
bull Coordination of national activity to help regional and local implementation
The NMHDU worked closely with the Department of Health and the 10 strategic health authorities It had strategic partnerships with a range of other groups such as the NHS Confederation the Association of Directors of Adult Social Services (ADASS) and the major mental health third sector organisations (wwwnmhduorguknmhdu)
Acknowledgements We acknowledge the role of the Mental Health Act Commission as the chief architect of the census and of the Healthcare Commission and the National Mental Health Development Unit as joint coordinators with MHAC from 2005 to 2009 We acknowledge and thank Jo Simpson (2005-07) and Christina Marriott (2007-10) for project management of the census Giovanna Maria Polato for coordinating the data analysis and Dr Veena Raleigh for being the main author of all six reports Finally we acknowledge and thank Professor Swaran Singh for being the independent member of the Editorial Board
Care Quality Commission Count me in census 2010 7
Introduction
Equality in healthcare means that all patients receive the same high levels of care depending on their needs To achieve this the Government has introduced legislation with which all healthcare organisations must comply
Subject to parliamentary approval the new NHS Commissioning Board will be established in 2011 under the coalition governmentrsquos reforms of the NHS It will have an explicit duty to promote equality and reduce inequalities in peoplersquos access to healthcare and in the outcomes of healthcare services for people in England1 The new focus on improving outcomes of healthcare as outlined in the White Paper Equity and excellence liberating the NHS is underpinned by the supporting NHS Outcomes Framework 201112 which notes that ldquotackling health inequalities and promoting equality is central if the NHS is to deliver health outcomes that are among the best in the worldrdquo2 The requirement to promote equality is also enshrined in the Equality Act 2010 which replaces previous anti-discrimination laws with one single Act prohibiting discrimination on grounds of age sex gender reassignment marriage and civil partnership race disability pregnancy and maternity religion or belief sexual orientation
On 31 March 2010 the Care Quality Commission (CQC) and the National Mental Health Development Unit (NMHDU) carried out a national census to record the ethnicity and other selected details of patients in hospital and outpatients on a community treatment order (CTO) in NHS and independent mental health and learning disability services in England and Wales This is the sixth and final Count me in census Similar censuses have been conducted annually since 200534567
The 2010 census presents the results for patients using mental health services separately to those for patients using learning disability services In this final census report we also include two new sections
bull A comparison of the 2010 census results for mental health patients with the results in 2005 and
bull A section on information that can be used in the future to analyse the quality of mental health services ndash both overall and for particular groups including Black and minority ethnic groups
Mental health
The Count me in censuses were carried out in support of the Department of Healthrsquos five-year action plan introduced in 2005 Delivering Race Equality in Mental Health Care (DRE) which aimed to improve mental health services for Black and minority ethnic communities in England8 The DRE action plan had three building blocks
bull More appropriate and responsive services
bull More community engagement
bull Higher quality information more intelligently used
The census was designed to help healthcare organisations with the third building block by providing information that can be used to plan and deliver services that are relevant to all groups in the community The NMHDU developed a lsquodashboardrsquo of indicators that enabled healthcare organisations to measure their progress towards DRErsquos goals Further details are available at wwwnmhduorgukour-workmhdpdelivering-race-equalitydre-dashboard
The census also supports the Welsh Assembly Governmentrsquos Raising the Standard Race Equality Action Plan for Adult Mental Health Services in Wales published in October 20069 This action plan aims to improve equality of access treatment and outcomes in the provision of adult mental health services for minority ethnic groups in Wales
Care Quality Commission Count me in census 2010 8
Introduction continued
The DRE five-year action plan for England came to a close in 2010 and as such Count me in 2010 is the last in this sequence of annual censuses conducted since 2005 DRErsquos underlying goal of promoting equity in healthcare for Black and minority ethnic communities in England continues to be reflected in the Governmentrsquos reforms of the NHS and is essential for demonstrating compliance with equality legislation
The Governmentrsquos recently announced strategy for mental health in England commits to improving ldquooutcomes for people with mental health problems through high-quality services that are equally accessible to allrdquo10 No health without mental health puts a focus on the mental health and wellbeing of the whole population and makes mental health ldquoeveryonersquos businessrdquo The strategy outlines six objectives
bull More people will have good mental health
bull More people with mental health problems will recover
bull More people with mental health problems will have good physical health
bull More people will have a positive experience of care and support
bull Fewer people will suffer avoidable harm
bull Fewer people will experience stigma and discrimination
No health without mental health has a cross-government and cross-sectoral focus on prevention and the mental wellbeing of the population through public health measures early intervention and personalised care It also recognises that levels of mental illness and the ways in which mental health services are used vary between different ethnic groups reflecting the socioeconomic and other disadvantages that people from Black and minority ethnic groups often experience The strategy provides extra funding for psychological therapies with expanded provision for specific groups including children young people and those with severe mental illness
This strategy follows on from New horizons introduced by the previous government in 2009 which similarly adopted a wider public health approach to promoting the mental health and wellbeing of the population11
Learning disabilities
In 2001 Valuing people set out the previous governmentrsquos vision for people with a learning disability based on four key principles of rights independence choice and inclusion12 Valuing people now a new three year strategy for people with learning disabilities published in 2009 set out the strategy for the next three years13 It also provided the previous governmentrsquos response to the recommendations in Healthcare for all the report of the independent inquiry into access to healthcare for people with learning disabilities14 and to the report of the Joint Committee on Human Rights A life like any other15 The vision remained as set out in Valuing people that all people with a learning disability have the right to lead their lives like any others with the same opportunities and responsibilities and to be treated with the same dignity and respect Valuing people now also set out cross-government commitments and actions to increase the capacity and capability to deliver services locally
In 2010 the Department of Health published a report describing progress made under Valuing people now 16
It focused on the key priorities of improving outcomes for people with learning disabilities in health housing and employment and showed where more work is needed to improve their lives The report includes additional guidance containing good practice examples about different aspects of the Valuing people now programme
A report by the Disability Rights Commission provides evidence that people with learning disabilities or severe mental health problems are more likely to develop serious health conditions and to die of them
Care Quality Commission Count me in census 2010 9
Introduction continued
sooner than other people They are also less likely to receive some treatments than people with the same medical condition but without a mental health condition or learning disability17 Learning difficulties and ethnicity noted that the disadvantage experienced by people from minority ethnic communities because of their ethnicity (for example in education and employment) is compounded by the disadvantage they experience because of their learning disability18
Aims of the census
The goals of the 2010 census are the same as those in previous years
bull To obtain robust figures for all inpatients in mental health and learning disability services in England and Wales The 2010 census also includes information about outpatients on CTOs
bull To encourage service providers to implement systems for recording patientsrsquo ethnicity and for using this information for ethnic monitoring
bull To provide information that will help service providers to take practical steps to achieve the goals of DRE
In 2005 the census only included inpatients in mental health services in England and Wales including those detained in hospital under the Mental Health Act 1983 From 2006 the census was extended to include inpatients in learning disability services CTOs introduced in November 2008 as a result of the Mental Health Act 2007 allow for supervised treatment of patients in the community Therefore in 2009 and 2010 the census included patients subject to supervised treatment in the community under the Mental Health Act most of whom were therefore outpatients in the community and were not in hospital on census day
As one of the aims of the census is to provide figures on inpatients and all those subject to the Mental Health Act on census day the analysis in this report is not limited to inpatients and also includes outpatients on CTOs (except where stated otherwise) If we excluded outpatients on a CTO from the analysis we would have an incomplete profile of ethnic differences in the rates of patients subject to the Mental Health Act We therefore considered it important to include these patients This provides a more rounded basis for examining the use of the Act ndash overall and in relation to CTOs ndash among different ethnic groups and is consistent with the analytical approach used in the 2009 census report
Although the census included some children and young people the terms ldquomenrdquo and ldquowomenrdquo are used throughout this report to refer to people of all ages ndash including children young people and older people The census does not include children and young people in residential settings such as paediatric wards and those looked after by social services
More information about the census and how it was carried out including the full set of results is available at wwwcqcorgukcountmein
Care Quality Commission Count me in census 2010 10
Data methods of analysis and interpretation
Ethnic groups
The ethnic categories referred to in this report are those used by the Office for National Statistics (ONS) in its 2001 census of the general population of England and Wales (see box 1) The term lsquoBlack and minority ethnic groupsrsquo defines all groups other than lsquoWhite Britishrsquo
Box 1 Ethnic categories used in this report
White British Pakistani White Irish Bangladeshi Other White Other Asian WhiteBlack Caribbean Mixed Black Caribbean WhiteBlack African Mixed Black African WhiteAsian Mixed Other Black Other Mixed Chinese Indian Other
Coverage of learning disability establishments
The 2010 census included all healthcare providers in England registered with CQC on 31 March 2010 and all healthcare providers in Wales registered with the Healthcare Inspectorate Wales to provide inpatient learning disability services It did not include care homes
In the NHS there is a continuum from inpatient services through to registered and supported homes All of these can have some links to the NHS either directly or through seconded staff Where such NHS facilities were both registered as care homes under the Care Standards Act 2000 and regulated by CQC they were included
Distinguishing between mental health inpatients and learning disability inpatients
Some healthcare providers offer both mental health and learning disability services and there is considerable overlap between them The census asked providers to distinguish between services by describing wards as either ldquomainly providing mental health servicesrdquo or ldquomainly providing learning disability servicesrdquo This separation by ward type enables us to compare the results across years and ensures that no patient is counted twice
It is important to note however that some patients on mental health wards may have a learning disability or Autistic Spectrum Disorder including Aspergerrsquos syndrome Similarly some patients on learning disability wards may have a mental health problem The distinction of mental health and learning disability patients on the basis of ward is therefore an approximation
Care Quality Commission Count me in census 2010 11
Data methods of analysis and interpretation continued
Methods of statistical analysis
The statistical methods used for data analysis in this report are given in Appendix A
For the admission rates the ONS estimates of the general population in 2007 were used as denominators The Black and minority ethnic population of England and Wales has increased significantly since the 2001 ONS census ONS has produced updated population estimates by ethnic group for 2007 (the latest year for which these estimates are available) which reflect the demographic changes since 2001 The number of people from Black and minority ethnic groups (ie excluding the White British group) in England and Wales is estimated to have increased from 65 million in 2001 to 85 million in 2007 a rise of 30 As a result the proportion of the total population that is not from the White British group increased from 13 to 16 over this period We used the 2007 population estimates to calculate the admission rates in order to present a more up-to-date and accurate picture of ethnic differences However these figures do not reflect any demographic changes between 2007 and 2010 the year of this census
To make a comparison with the DRE baseline we also present admission rates from the 2005 census derived using the 2005 ONS population estimates by ethnic group as denominators These figures will not be the same as those published in the 2005 census report which were based on the 2001 ONS census population estimates because updated estimates of populations by ethnic group were not available at that time
For all other analyses (for example rates of use of the Mental Health Act seclusion etc) the patient numbers in the census were used as denominators
Unlike the censuses of 2005 to 2008 that counted only inpatients the 2009 and 2010 censuses also included outpatients on a CTO on census day This is because (a) the census aims to cover all patients subject to the Mental Health Act on census day and (b) we would not have been able to analyse standardised ratios for CTOs for different ethnic groups if CTO patients had been excluded from the analysis However CTO outpatients are excluded from selected analyses where appropriate including the analysis of rates for admissions detentions on admission source of referral single sex accommodation and recorded incidents of seclusion restraint accidents assault and self-harm The issue relating to the analysis of outpatients on a CTO only affects the sections of the report relating to mental health patients as there were very few learning disability patients on CTOs
Some results in this report are standardised for age and gender (those relating to admission detention source of referral care programme approach seclusion restraint accidents assault self-harm consent and presence on a secure ward) This is because there are underlying differences in the age and gender profiles of different ethnic populations and comparisons based on crude rates would be misleading Standardisation allows comparisons between different ethnic groups by taking account of variations in age and gender The report uses the conventionally accepted statistical methods for standardisation
The terms ldquohigherrdquo and ldquolowerrdquo than average used in the text for ethnic comparisons relate to differences from the national average that are statistically significant at the 5 level
Care Quality Commission Count me in census 2010 12
Data methods of analysis and interpretation continued
Interpreting the results
In this report for convenience we refer to ldquoadmission ratesrdquo for mental health and learning disability patients However these are in fact population-based rates of patients who were in hospital or subject to the Mental Health Act on census day and not rates for admissions actually made on the census day itself The number of admissions on census day will differ from the number of patients in hospital on that day and both of these will differ from the number of admissions throughout the year
As with any study our results have some caveats
1 The admission rates presented for minority ethnic groups in this report are higher than would be expected because they are based on ONS population estimates by ethnic group for 200719 the latest year available rather than population estimates for 2010 Therefore the admission rates do not take into account demographic changes between 2007 and 2010 Furthermore these population estimates are described by ONS as ldquoexperimentalrdquo and are subject to margins of error
2 The results are not adjusted for diagnosis and other clinical information so they may reflect differences between ethnic groups in the levels nature or severity of mental illness or disability
3 The data collected for the census does not allow adjustment for socioeconomic factors such as poverty unemployment and inner-city residence These occur more commonly in Black and minority ethnic communities Equally it was not possible to take account of social factors such as marital status living alone separation from one or both parents or lack of social networks Both socioeconomic and social factors are known to be associated with the risk of mental illness and can affect pathways into care and the nature of patientsrsquo interaction with services
4 Rates based on small and fluctuating numbers of patients can change in either direction (high to low or vice versa) from one year to the next as a result of random rather than real variation and regression to the mean
5 The census does not assess the quality of services the experience of patients or the reasons for any differences between ethnic groups
6 We have explained the rationale for including outpatients on CTOs in this report While this enables us to comment on CTOs on census day in addition to those who are inpatients it does mean that the overall census population is not restricted to inpatients as in the reports for the years preceding 2009 and 2010
7 The census is a one-day count designed to give the number and ethnic composition of patients on that day Its value is in providing a year-by-year snapshot profile However by its very nature it cannot give the picture for the whole year As we have shown in the section lsquoData in the future Moving beyond a one-day censusrsquo a one-day picture can differ from results based on a full yearrsquos data because a one-day picture over-represents long-stay patients and under-represents short stay admissions
Care Quality Commission Count me in census 2010 13
Results mental health
We collected information on 32799 patients from the mental health services of 261 NHS and independent healthcare organisations in England and Wales This included 29840 inpatients of whom 75 were inpatients on a CTO and a further 2959 patients on a CTO who were outpatients on census day The number of inpatients in each census has declined each year from 33785 in 2005 to 29840 in 2010 (excluding the 2959 outpatients on a CTO) a fall of 12 since 2005 (see Table 1)
All eligible establishments took part in the census The total number of providers increased from 207 in 2005 to 261 in 2010 primarily due to an increase in the number of independent healthcare providers in both England and Wales In contrast the number of NHS providers in England was lower than in the baseline year 2005 and did not change much in Wales The proportion of patients cared for by independent providers has risen from 10 in 2005 to 16 in 2010
Table 1 Number of providers of mental health services and patients
NHS (England)
Independent (England)
NHS (Wales)
Independent (Wales) Total
2010 census Number of providers 78 160 9 14 261 Number of all patients 32799 (including outpatients 25653 4787 1958 401 (including 2959 on a CTO) outpatients on a CTO) of all patients 782 146 60 12 100
2009 census Number of providers 79 158 10 17 264 Number of all patients 31786 (including outpatients 24941 4594 1845 406 (including 1253 on a CTO) outpatients on a CTO) of all patients 785 145 58 13 100
2008 census Number of providers 87 141 11 16 255 Number of inpatients 24842 3931 1892 355 31020 of inpatients 801 127 61 11 100
2007 census Number of providers 82 153 11 11 257 Number of inpatients 25020 4030 1875 262 31187 of inpatients 802 129 60 08 100
2006 census Number of providers 97 125 11 5 238 Number of inpatients 26565 3341 1962 155 32023 of inpatients 830 104 61 05 100
2005 census Number of providers 92 98 10 7 Number of inpatients 28590 3078 1939 178 33785 of inpatients 846 91 57 05 100
Care Quality Commission Count me in census 2010 14
207
Results mental health continued
Ethnicity
Information about ethnicity was available for 98 of patients Of these patients 75 were White British and 23 belonged to Black and minority ethnic groups defined as all groups that are not White British This compares with 20 in 2005
Compared with the baseline year of 2005 the 2010 census recorded a lower proportion of patients from the White British White Irish and Other Black groups (see Table 2) There were increases in the proportions of patients from the Other White WhiteBlack Caribbean Mixed Black Caribbean and Black African groups Other ethnic groups showed only minor differences over the baseline year
Table 2 Mental health patients by ethnic group
Ethnic group 2010 census 2009 census 2008 census 2007 census 2006 census 2005 census
Number Number Number Number Number Number
White British 750 24593 757 24067 765 23738 776 24198 786 25170 792 26762
White Irish 16 514 19 591 18 567 17 538 18 582 22 727
Other White 43 1407 43 1360 45 1399 46 1449 38 1210 31 1055
White and Black Caribbean
13 418 11 336 11 336 09 288 09 287 08 255
White and Black African
04 139 03 91 04 110 03 91 03 102 02 71
White and Asian 04 141 04 137 04 117 03 91 03 109 03 104
Other Mixed 06 200 07 213 05 148 06 180 05 173 05 167
Indian 16 529 14 460 14 426 13 393 13 411 13 434
Pakistani 13 440 13 409 13 396 10 315 11 349 10 325
Bangladeshi 06 203 05 171 05 144 04 130 05 158 05 153
Other Asian 09 311 09 273 10 300 08 261 08 262 08 264
Black Caribbean 49 1608 47 1504 47 1468 43 1330 39 1264 41 1369
Black African 29 957 26 834 23 715 21 648 20 652 19 645
Other Black 11 368 12 384 12 376 17 545 17 535 17 569
Chinese 03 83 03 82 03 91 03 82 02 78 02 81
Other 09 296 10 322 12 362 11 356 11 338 11 357
Not stated 18 592 17 552 11 327 09 292 11 342 12 416
Invalid 0 1 01 31
100 32799 100 31786 100 31020 100 31187 100 32023 100 33785 Total
Care Quality Commission Count me in census 2010 15
Results mental health continued
As in the previous censuses patients from Black and minority ethnic groups were concentrated in a relatively small number of organisations 70 were patients in 25 of the 261 organisations that took part in the census Of all organisations 194 had fewer than 50 patients from Black and minority ethnic groups each and another 32 organisations had no patients at all from these groups
Reporting of ethnicity
Eighty-one per cent of patients reported their own ethnic group Where patients did not do so staff or relatives did so on their behalf (10 and 6 respectively) We cannot be certain that ethnicity was recorded accurately for these patients The proportion of patients who reported their own ethnicity ranged from about 81 in the White groups to 90 in the WhiteBlack African Mixed group
Care Quality Commission Count me in census 2010 16
Results mental health continued
Age and gender
Ethnic differences in the age profiles of patients largely reflect the age profiles of different minority ethnic populations The White British White Irish and Other White populations have an older age structure than other minority ethnic populations and therefore patients from the White groups are significantly older than patients from other ethnic groups (see Table 3)
Overall 58 of patients were men Men outnumbered women in all ethnic groups (see Table 3) The White British White Irish Other White and Chinese groups had smaller differences in the proportions of men and women compared with other ethnic groups
Table 3 Age and gender of patients
Ethnic group Age () Gender ()
Total (n) 0-17 18-24 25-49 50-64 65+ Men Women
White British 1 7 41 20 31 56 44 100 (24593)
White Irish 0 4 36 19 41 56 44 100 (514)
Other White 2 7 47 19 25 58 42 100 (1407) White and Black Caribbean 1 13 68 12 5 73 27 100 (418)
White and Black African 1 13 73 9 4 67 33 100 (139)
White and Asian 4 18 63 11 5 65 35 100 (141)
Other Mixed 2 13 69 11 6 62 38 100 (200)
Indian 1 4 58 21 15 63 37 100 (529)
Pakistani 2 10 73 12 4 74 26 100 (440)
Bangladeshi 2 15 69 8 6 72 28 100 (203)
Other Asian 2 12 61 13 13 70 30 100 (311)
Black Caribbean 1 6 61 20 13 70 30 100 (1608)
Black African 1 10 75 9 5 67 33 100 (957)
Other Black 1 6 78 11 3 78 22 100 (368)
Chinese 2 10 59 17 12 52 48 100 (83)
Other 2 12 57 18 11 67 33 100 (296)
1 7 46 19 27 58 42 100 Total (n=
471) (n=
2352) (n=
14998) (n=
6093) (n=
8885) (n=
19071) (n=
13684) (n=
32799)
Care Quality Commission Count me in census 2010 17
Results mental health continued
Language and religion
Similar to previous censuses 5 of patients reported that their first language was not English (see Table 4) The Chinese and Bangladeshi groups had the highest proportions of patients whose first language was not English (51 and 46 respectively) Among the Other White group 27 had a first language other than English Again similar to previous censuses about 2 of patients said they needed an interpreter and of these 24 were from the White British group
Table 4 Percentage of patients with a first language other than English
Ethnic group with first language other than English
White British 1
White Irish 3
Other White 27
White and Black Caribbean 2
White and Black African 10
White and Asian 6
Other Mixed 11
Indian 26
Pakistani 35
Bangladeshi 46
Other Asian 34
Black Caribbean 2
Black African 22
Other Black 13
Chinese 51
Other 41
Total 5
Care Quality Commission Count me in census 2010 18
Results mental health continued
Religion was not stated for 21 of patients and 15 of patients said they had no religion The proportions stating they did not have a religion were highest among the WhiteBlack Caribbean and WhiteAsian Mixed groups (23 and 21 respectively) and lowest among the South Asian groups (4) Table 5 shows the religion of patients
Table 5 Religion of patients by ethnic group
Ethnic group
Religion and faith groups ()
None Christian Buddhist Hindu Jewish Muslim Sikh Any other religion
Not stated
White British 16 58 1 0 1 0 0 3 21
White Irish 8 73 0 0 0 5 13
Other White 13 53 1 0 3 5 7 18 White and Black Caribbean 23 47 0 1 0 3 7 17
White and Black African 16 41 1 1 15 6 20
White and Asian 21 33 1 1 21 3 3 18
Other Mixed 15 41 3 3 16 8 17
Indian 5 10 0 29 15 28 2 11
Pakistani 4 3 0 1 1 80 1 2 10
Bangladeshi 4 1 1 1 76 1 5 11
Other Asian 6 14 5 12 39 5 3 16
Black Caribbean 12 59 1 0 0 2 8 17
Black African 10 45 0 0 22 0 3 19
Other Black 12 41 1 1 0 16 7 22
Chinese 18 30 16 1 4 31
Other 8 24 3 1 3 34 6 21
Total 15 54 1 1 1 4 1 4 21
Care Quality Commission Count me in census 2010 19
Results mental health continued
Sexual orientation
The results for sexual orientation were not valid for 1 of patients and for 20 the response was recorded as ldquonot knownrdquo Seventy-six per cent of patients said they were heterosexual 1 said gay lesbian 1 said bisexual and less than 1 said ldquootherrdquo The number of minority ethnic patients who were gaylesbian or bisexual was very low
The overall figure of 1 who said they were gay lesbian or bisexual is lower than some estimates of the proportions of gaylesbian or bisexual people in the general population (5 to 7)2021 However in the 200910 Integrated Household Survey of a representative sample of 238206 people in UK conducted by the Office for National Statistics 1 identified themselves as gay or lesbian 05 as bisexual 05 as ldquootherrdquo 3 responded as ldquodo not knowrdquo or refused to answer and 95 identified themselves as heterosexualstraight22
Disability
About 75 of patients said they did not have a disability and 25 said they had one or more disabilities Of these 7 were blind or visually impaired 1 were deaf or had a hearing impairment 1 had Autistic Spectrum Disorder 2 had a learning disability 4 had a mobility impairment and 2 used a wheelchair The remaining 8 had more than one disability The proportion of patients with a disability was highest among the White British White Irish and Other White groups (about 28) which could reflect the higher age profiles of these patients compared with other ethnic groups
Rates of admission (see section on interpreting the results on page 13)
The rates of admission derived using the 2007 ONS ethnic population estimates as denominators are given in Appendix B Tables B1 (all ages) and B2 (ages 65 and over) Outpatients on a CTO are excluded from these results
All ages Admission rates were lower than average for patients from the White British Indian and Chinese groups and were average for the Pakistani and Bangladeshi groups Rates were higher than average for other minority ethnic groups they were particularly high for the Black Caribbean Black African WhiteBlack Caribbean Mixed and WhiteBlack African Mixed groups who had rates two to four times higher than average and for the Other Black group with a rate six times higher
Ages 65 and over Age-standardised admission rates for minority ethnic groups at older ages show broadly similar patterns to those reported for all ages with rates two to three times higher than average among the Black and White Black Mixed groups Rates were high also in the White Irish Other White Other Asian and Other groups
Numbers of older Black and minority ethnic patients were too few in most ethnic groups to support analyses of subgroups within them for example those detained
Care Quality Commission Count me in census 2010 20
Results mental health continued
Source of referral
People can be referred to healthcare services in a number of ways Referrals for inpatient care often come from community mental health teams rather than the original source such as GPs and accident and emergency (AampE) departments Therefore referrals from these teams may include referrals from other sources Furthermore about a quarter of patients (26) were referred from tertiary care and information about their original referral source was not available We had no information about the source of referral for 13 of patients The results reflect the proportions of patients from each ethnic group that are referred from each source so a higher proportion of referrals from one source will inevitably mean that proportions from other referral sources are lower Outpatients on a CTO are excluded from these data
The referral patterns are broadly similar to those reported previously and the key results are presented below
GP referrals 7 of patients Rates were 8 higher than average among the White British group They were lower than average among the Other White Black Caribbean Black African and WhiteBlack Caribbean Mixed groups by 28 to 72 The rates of referral by GPs are given in Appendix B Table B3
Referrals from AampE departments 5 of patients The White British group had a 9 lower than average rate of such referrals The WhiteBlack African Mixed Indian Bangladeshi Black African and Other groups were more likely than average to be referred in this way
Referrals from community mental health teams 26 of patients For the White British group such referrals were 5 higher than the average rate They were lower than average among the Other White WhiteBlack African Mixed Black Caribbean Black African and
Other Black groups by 16 to 48 The rates of referral are given in Appendix B Table B4
Referrals from the criminal justice system 9 of patients This is defined as the police courts probation service prison and court liaison and diversion service
Patients from the White British group were less likely than average to be referred by the criminal justice agencies whereas the Black Caribbean Black African Other Black WhiteBlack African Mixed and Other Asian groups were 30 to 83 more likely than average to be referred in this way We observed no differences from the average rate for other ethnic groups Rates of referral by the criminal justice system are given in Appendix B Table B5
A significant proportion (26) of all referrals were from tertiary care
Tertiary care referrals from medium or high secure units 5 of patients The rate for such referrals (in NHS or independent sectors) was lower than average among the Other White and Indian groups It was higher than average among the Black Caribbean and WhiteBlack Caribbean Mixed groups by about 75
Tertiary care referrals from other inpatient services 21 of patients The rate for such referrals (NHS and independent) was higher than average among the White Irish and Other White groups by 29 and 59 respectively The rate was lower than average in the Indian and Other Black groups
Tertiary care referrals from other clinical specialties 9 of patients Rates of such referrals were higher than average among the White British and Indian groups and lower than average among the Other White WhiteBlack Caribbean Mixed Other Asian Black African Other Black and Chinese groups
Care Quality Commission Count me in census 2010 21
Results mental health continued
Detention under the Mental Health Act 1983 on day of admission
The Mental Health Act 2007 made a number of changes to the Mental Health Act 1983 These changes were reflected in the census of 2009 and 2010 which collected information on new provisions establishing supervised community treatment (section 17A) and excluded supervised discharge (section 25A) which was abolished
As in previous reports we present below the results for detention rates on the day of admission Outpatients on a CTO are excluded from these analyses After that we present rates for all patients subject to the Mental Health Act on census day (including outpatients on a CTO) followed by rates for patients on a CTO on census day
All detentions Forty-nine per cent (14637) of patients were detained under the Mental Health Act on admission to hospital This was a higher proportion than recorded in the previous censuses (40 in 2005 and 2006 43 in 2007 45 in 2008 and 47 in 2009)
Detention rates were 6 lower than average among White British patients and between 19 and 32 higher than average among the Black Caribbean Black African Other Black and WhiteBlack Caribbean Mixed groups Detention rates were also higher in the White Irish and Other White groups by about 13 and in the Other Mixed group by 22 No other ethnic differences were observed The results are given in Appendix B Table B6
These patterns are broadly similar to those reported in previous censuses
Detention under section 2 Section 2 of the Mental Health Act gives authority for a person to be detained in hospital for assessment for a period not exceeding 28 days It is mainly applied where the patient is unknown to the service or where there has been a significant interval between periods of inpatient treatment
Of all patients detained on admission 22 were detained under section 2 Rates of detention under this section were lower than average among the White British WhiteBlack Caribbean Mixed and Black Caribbean groups and higher than average among the Bangladeshi Other Asian Black African Chinese and Other groups by between 50 and 103 (see Appendix B Table B7)
Detention under section 3 Section 3 of the Act provides for the compulsory admission of a patient to hospital for lsquotreatmentrsquo and for his or her subsequent detention which can last for an initial period of up to six months and is renewable after this
Of all patients detained on admission 43 were detained under this section Rates were higher than average among the White Irish and Black Caribbean groups by 24 and 29 respectively and lower among than average among the Bangladeshi group No other ethnic differences were observed The rates of detention under section 3 are given in Appendix B Table B8
Detention under section 3741 Section 37 of the Mental Health Act allows a court to send a person to hospital for treatment when they might otherwise have been given a prison sentence and section 41 allows a court to place restrictions on a personrsquos discharge from hospital Admission to hospital rather than prison is generally regarded as a more positive outcome for the person concerned
Care Quality Commission Count me in census 2010 22
Results mental health continued
Of all patients detained on admission 14 were detained under section 37 with a section 41 restriction order applied The rates of detention are given in Appendix B Table B9 In all minority ethnic groups very few women were detained under section 3741 Among men the rate of detention for the White British group was 16 lower than average and it was higher than average in the WhiteBlack Caribbean Mixed group by 77 the Black Caribbean group by 100 the Black African group by 27 and the Other Black group by 52
A consistent pattern across all six annual censuses was the higher than average detention rate under section 3741 for the Black Caribbean and Other Black groups
Detention under sections 47 48 and 4749 These sections of the Mental Health Act allow the Ministry of Justice to issue a direction to transfer a person detained in prison to a hospital for treatment
Of all patients detained on admission 7 were detained under these sections The only ethnic differences observed were a 107 higher than average detention rate among men from the White Black African Mixed group and a lower than average rate for the Indian group We observed no other ethnic differences probably because the numbers of detentions under these sections were low in most minority ethnic groups These rates of detention are given in Appendix B Table B10
The previous four censuses also showed virtually no ethnic differences for rates of detention under sections 47 48 and 4749
Patients subject to the Mental Health Act 1983 on day of census
All patients subject to the Mental Health Act Of all the 32399 patients in the census a total of 53 (17299) were subject to the Mental Health Act on census day including 2959 outpatients and 75 inpatients on a CTO (either voluntarily or recalled) Ratios for the different ethnic groups for overall applications of the Mental Health Act including CTOs showed broadly similar patterns to detention rates on admission day from which patients on a CTO were excluded In both cases rates were higher than average among the Black Caribbean Black African Other Black and White Black Caribbean Mixed groups However the higher than average detention rates for the White Irish Other White and Other Mixed groups on admission day were not apparent on census day
The rates are given in Appendix B Table B11
Supervised community treatment under section 17A Community treatment orders (CTOs) were introduced in November 2008 as a result of the Mental Health Act 2007 They allow for supervised community treatment to be provided for up to six months with the possibility of an extension after this These orders are designed to help patients to maintain stable mental health outside hospital and to promote recovery by providing professionals with the power to set conditions on discharge from hospital and a power to recall patients if arrangements in the community are not working
Nine per cent of all patients in the census were on CTOs compared with 4 in 2009 Of all the 17299 patients subject to the Mental Health Act on census day almost 18 (3034) were on CTOs Of the patients on a CTO 2959 were outpatients and 75 were inpatients (50 voluntary and 25 recalled)
Care Quality Commission Count me in census 2010 23
Results mental health continued
The rate of supervised community treatment among all patients included in the census was lower than average in the White British and White Irish groups and higher than average in the South Asian (Indian Pakistani Bangladeshi) and Black (Black Caribbean Black African Other Black) groups by 22 to 106 The ratios are given in Appendix B Table B12
Consent
About 25 of informally admitted patients were deemed incapable of consenting to treatment The only ethnic difference observed was a higher than average rate for the Pakistani group but this was based on very few patients
About 18 of patients who were detained or on CTOs were deemed incapable of consenting to treatment These rates were lower than average by 7 in the White British group and were higher than average among the Other White WhiteBlack Caribbean Mixed and Black African groups by 21 35 and 36 respectively
In addition 13 of patients who were detained or on CTOs on census day were deemed capable of consenting to treatment but refused to do so The White British group had a rate of refusals that was 10 lower than average and rates were higher than average among the White Irish WhiteBlack Caribbean Mixed Other Mixed Black Caribbean and Black African groups by between 39 and 71
Care programme approach
The Care Programme Approach (CPA) is the process by which treatment care and support for people with serious mental health problems and accompanying health and social care needs are agreed coordinated and understood by all involved From October 2008 changes to the CPA in England
mean that it is no longer categorised into two parts (lsquostandardrsquo and lsquoenhancedrsquo) and just the one category of enhanced CPA applies This makes CPA policy in England different to that in Wales where the distinction still applies The CPA data presented here therefore includes all CPA patients in England and both lsquostandardrsquo and lsquoenhancedrsquo CPA patients in Wales
About 89 of all patients were on a CPA 3 were on a single assessment process (SAP) whereby assessments are made for adults with health and or social care needs and 8 were on neither CPA nor SAP As most patients were on a CPA no ethnic differences were observed
Recorded incidents
The 2010 census asked about the number of times that patients experienced seclusion hands-on restraint self-harm accident and physical assault in a current hospital spell or if the patientrsquos hospital spell was longer than three months the number that took place within the last three months Outpatients on a CTO are excluded from these data It should be noted that the rates of such events among minority ethnic groups can show yearly variation because of the low numbers of events in several groups
Seclusion Seclusion was defined as the supervised confinement of a patient in a room which may be locked to protect others from significant harm Four per cent of patients had experienced one or more episodes of seclusion The White British group had a seclusion rate that was 9 lower than average Rates were higher than average among the WhiteBlack Caribbean Mixed WhiteBlack African Mixed Black Caribbean and Black African groups by 80 90 36 and 56 respectively
Care Quality Commission Count me in census 2010 24
Results mental health continued
Although the number of incidents of seclusion was low in several minority ethnic groups some general patterns over the six censuses to date are
bull The proportion of all patients who had an episode of seclusion stayed fairly constant over the six censuses at about 4
bull Although there have been annual fluctuations the seclusion rate has been higher than average for the Black and WhiteBlack Mixed groups in three or four of the six censuses and in the Other White group in three censuses
Hands-on restraint This was defined as the physical restraint of a patient by one or more members of staff in response to aggressive behaviour or resistance to treatment About 12 of patients had experienced one or more episodes of hands-on restraint No ethnic differences were observed In fact very few ethnic differences have been observed in the previous censuses also and they have not shown a consistent pattern
Self-harm Eight per cent of patients had harmed themselves on one or more occasions Only the White British group had a rate that was higher than average (by 14) Rates were lower than average among several minority ethnic groups the three Black groups (Black Caribbean Black African and Other Black) by about 70 the three south Asian groups (Indian Pakistani Bangladeshi) by between 37 and 78 and the Other Mixed and Other Asian groups by about 60
In terms of comparison with previous years
bull The proportion of all patients who had harmed themselves stayed fairly constant at about 7ndash8
bull In all censuses the White British group had a higher than average rate of self-harm and the Black and South Asian groups had lower than average rates of self-harm
Accidents About 11 of patients had experienced one or more accidents Patients from the White British group experienced a rate of accidents that was 6 higher than average Rates were lower than average in the Black Caribbean Black African Other Black and Other Asian groups by about 50 to 70 No accidents were reported for the Chinese group
In terms of comparisons with previous years
bull The proportion of all patients who had had an accident stayed fairly constant
bull The rate of accidents in the different censuses was higher than average in the White British group and lower than average in the Black Caribbean group Few other ethnic differences were observed and they were not consistent
Physical assault on the patient The definition of assault includes incidents of physical assault on the patient irrespective of who committed the assault We do not have information on who committed the assault for example whether it was another patient or a member of staff Eleven per cent of patients were involved in one or more episodes of physical assault The only ethnic difference observed was a 19 lower than average rate among the Black Caribbean group
In terms of comparisons with previous years
bull The proportion of all patients who had experienced a physical assault stayed fairly constant
bull Very few ethnic differences in rates of assault were observed in the different censuses and they did not show a consistent pattern
Care Quality Commission Count me in census 2010 25
Results mental health continued
Duration of stay in hospital from admission to census day
We analysed the length of the period between each inpatientrsquos admission to hospital and the census day This period is of course shorter than a patientrsquos full length of stay in hospital which runs from admission to the date when they are discharged Outpatients on a CTO are excluded from the following analyses
bull 25 of inpatients had been in hospital for one month or less
bull 20 had been in hospital between one and three months
bull 13 had been in hospital between three and six months
bull 11 had been in hospital between six months and one year
bull 11 had been in hospital between one and two years
bull 12 had been in hospital between two and five years
bull 8 had been in hospital for more than five years
These results are similar to those of previous censuses About 31 of patients in the 2010 census had been in hospital for more than a year and had therefore also been included in the 2009 census About 20 of patients had been in hospital for more than two years and will have been included in both the 2008 and 2009 censuses
We calculated the median length of stay for different ethnic groups The median is the midpoint of the range of values so the median length of stay is the one at which half the patients had a length of stay less than the median and half had a stay longer than the median Overall and as in previous years the median amount of time that women had spent in hospital was about 25 months and the median for men was about 58 months (see Table 6) In most ethnic groups the median time spent in hospital was two to three times longer for men than for women in the Other Black group men had been in hospital four times longer than women
Median lengths of stay were longest for men from the Black Caribbean WhiteBlack Caribbean Mixed and Other Black groups and shortest for men from the Chinese Bangladeshi and Other groups Median lengths of stay were longest for women from the WhiteBlack Caribbean Mixed and Black Caribbean groups and shortest for women from the Chinese and Bangladeshi groups
A number of important factors influence a patientrsquos length of stay in hospital including age gender whether or not they are detained under the Mental Health Act (and the section under which they are detained and whether there is an additional restriction order) the type and severity of their illness the nature of their treatment and the availability of support in the community The data in the census does not allow for analysis of these factors
Table 6 Median number of days from the day of admission to the day of census
Ethnic group Men Women
White British 161 71
White Irish 218 114
Other White 238 113
White and Black Caribbean 275 191
White and Black African 182 92
White and Asian 226 78
Other Mixed 173 112
Indian 172 70
Pakistani 153 56
Bangladeshi 134 55
Other Asian 167 61
Black Caribbean 345 122
Black African 141 66
Other Black 248 58
Chinese 135 51
Other 131 76
Total 174 75
Care Quality Commission Count me in census 2010 26
Results mental health continued
Ward security
As in previous years about 11 of all patients were on a medium or high secure ward as opposed to a general (76) or low secure (13) ward
Patients from the White British Indian and Bangladeshi groups were less likely than average to be on a medium or high secure ward by 7 30 and 67 respectively Patients from the White Irish WhiteBlack Caribbean Mixed Black Caribbean and Other Black groups had a higher than average rate by between 43 and 55
Age range on wards
Among patients under 18 years of age 61 were being cared for on wards for working-age adults on census day and five patients were on a ward for older people Seven per cent of patients on wards for working-age adults were 65 or over and
8 of those on wards for older people were adults of working age There were very few lsquoout of agersquo placements among minority ethnic groups
Patients in wards designated as single sex or mixed
Providers were asked whether patients were on a ward designated as men or women only or mixed gender All the analyses of single sex accommodation and facilities exclude outpatients on a CTO Overall 61 of men and 77 of women were not in a ward designated for single sex use similar proportions as in previous years The proportion of patients not in a designated single sex ward was lower among almost all minority ethnic groups than among the White British group In all ethnic groups the proportion of men who were not in a designated single sex ward was lower than among women (see Table 7a)
Two further questions examined the single sex facilities that were available to patients
At the time of the 2010 census the following guidance from the Department of Health applied in England A ward can be described as single sex (ie the intended sex of the ward is either male or female and not mixed) when the accommodation complies with the following definition from the Department of Health of single sex accommodation ldquoSleeping areas must be segregated and members of one sex must not have to walk through an area occupied by the other sex to reach toilets or bathrooms Separate male and female only toilets and bathrooms must be provided There should be separate day rooms to which only women have accessrdquo However there is a discrepancy for providers because accommodation designated as a lsquowardrsquo for administrative purposes may incorporate single sex accommodation for both sexes that meets the guidelines ndash but in this case the ward would still be lsquomixedrsquo (based on guidance from Safety Privacy and Dignity Department of Health 2000)
As long as men and women are cared for in separate bays or rooms and have their own toilet facilities then it may well be appropriate for them to be on the same ward being cared for by the same team of doctors and nurses In practice good segregation can be achieved if men and women have separate sleeping areas (for example single sex bays) and have separate toilets and bathrooms that they can reach without having to pass through (or close to) areas for the opposite sex The layout of wards should minimise any risk of overlooking or overhearing by members of the opposite gender (from Privacy and Dignity ndash A report by the Chief Nursing Officer into mixed sex accommodation in hospitals Department of Health 2007)
The coalition governmentrsquos revised Operating Framework for 201011 requires NHS organisations to eliminate mixed-sex accommodation except under exceptional circumstances from 2011 The national guidance relating to mixed sex accommodation was issued in November 2010 and states that ldquoNo areas are exempt and every decision to mix must be justified by reference to the patientrsquos clinical needs not organisational convenience or custom and practicerdquo For mental health and learning disability trusts it states ldquoThere is no acceptable justification for admitting a mental health patient to mixed-sex accommodationrdquohellip It ldquomay be acceptable in a clinical emergency to admit a patient temporarily to a single ensuite room in the opposite-gender area of a ward In such cases a full risk-assessment must be carried out and complete safety privacy and dignity maintainedrdquo The guidance is available at wwwdhgovukenPublicationsandstatisticsLettersandcircularsProfessionallettersChiefnursingofficerlettersDH_121848
Care Quality Commission Count me in census 2010 27
Results mental health continued
Table 7a Percentage of patients not in a designated single sex ward by ethnic group
Ethnic group
Sex of patients and ward
Male Female
Male ward Female or mixed ward Female ward Male or mixed ward
White British 35 65 21 79
White Irish 41 59 28 72
Other White 44 56 28 72
White and Black Caribbean 56 44 31 69
White and Black African 48 52 41 59
White and Asian 43 57 34 66
Other Mixed 49 51 24 76
Indian 37 63 25 75
Pakistani 48 52 35 65
Bangladeshi 23 77 18 82
Other Asian 46 54 22 78
Black Caribbean 55 45 32 68
Black African 49 51 28 72
Other Black 49 51 30 70
Chinese 42 58 30 70
Other 43 57 20 80
Total 39 61 23 77
The vast majority of patients in this category were in mixed wards very few (under 05) male patients were on female-only wards or vice versa
Care Quality Commission Count me in census 2010 28
Results mental health continued
Patientsrsquo access to toilet and bathing facilities designated for single sex use
We asked providers if the patient had access to toilet and bathing facilities designated for single sex use Overall 13 of men and 16 of women
were reported as not having access to such facilities designated for single sex use This was an improvement over 2009 when these proportions were 19 and 24 respectively The proportion of patients not having access to toilet and bathing facilities designated for single sex use was lower among almost all minority ethnic groups than among the White British group (see Table 7b for details)
Table 7b Percentage of patients not having access to toilet and bathing facilities designated for single sex use by ethnic group
Ethnic group
Access to designated single sex bathing and toilet facilities
Male Female
Male facilities
Female or mixed facilities
Female facilities
Male or mixed facilities
White British 86 14 84 16
White Irish 87 13 87 13
Other White 89 11 86 14
White and Black Caribbean 93 7 93 7
White and Black African 90 10 93 7
White and Asian 90 10 84 16
Other Mixed 98 2 96 4
Indian 91 9 90 10
Pakistani 95 5 94 6
Bangladeshi 92 8 98 2
Other Asian 92 8 86 14
Black Caribbean 92 8 90 10
Black African 91 9 91 9
Other Black 92 8 89 11
Chinese 82 18 83 17
Other 87 13 90 10
Total 87 13 84 16
The vast majority of patients in this category had access to mixed facilities very few (1) of male patients had access to female-only facilities or vice versa
Care Quality Commission Count me in census 2010 29
Results mental health continued
Patientsrsquo access to a lounge area day space designated for single sex use
We also asked providers if patients had access to a lounge area or day space designated for single sex use Overall 37 of men and 39 of women were
reported as not having access to these facilities This was an improvement over 2009 when these proportions were 48 and 51 respectively The proportion of patients not having access to a lounge areaday space designated for single sex use was lower among most minority ethnic groups than among the White British group (see Table 7c for details)
Table 7c Percentage of patients not having access to a lounge areaday space designated for single sex use by ethnic group
Ethnic group
Access to a lounge areaday space designated for single sex use
Male Female
Male facilities
Female or mixed facilities
Female facilities
Male or mixed facilities
White British 59 41 60 40
White Irish 63 37 70 30
Other White 68 32 63 37
White and Black Caribbean 82 18 73 27
White and Black African 83 18 76 24
White and Asian 72 28 75 25
Other Mixed 79 21 67 33
Indian 59 41 66 34
Pakistani 80 20 72 28
Bangladeshi 53 47 52 48
Other Asian 70 30 61 39
Black Caribbean 78 22 70 30
Black African 73 27 70 30
Other Black 79 21 72 28
Chinese 59 41 60 40
Other 67 33 67 33
Total 63 37 61 39
The vast majority of patients in this category had access to mixed facilities very few (1) of male patients had access to female-only facilities or vice versa
Care Quality Commission Count me in census 2010 30
Results mental health continued
Patientsrsquo subject to deprivation of liberty safeguards
People who lack the mental capacity to consent to the care or treatment they need should be cared for in a way that is least restrictive of their rights or freedom of action In 2007 the Mental Capacity Act 2005 was amended to introduce Deprivation of Liberty Safeguards for people who lack capacity to decide about their care or treatment and who need to be deprived of their liberty to protect them from harm The Safeguards came into effect in April 2009 and strengthen the rights of hospital patients and those in care homes as well as ensuring compliance with the European Convention on Human Rights (ECHR)
The 2010 census introduced a new question ldquoIs the patient subject to deprivation of liberty authorisation on 31 March 2010rdquo Under 1 (269) patients were reported as being subject to a deprivation of liberty authorisation on census day No ethnic differences in the rates were observed which may be due to the low numbers of patients among minority ethnic groups (69)
Care Quality Commission Count me in census 2010 31
A comparison between the 2005 baseline and the 2010 census
The changes we have seen in the census results between 2005 and 2010 the timespan of the Delivering Race Equality (DRE) action plan are set out below This is not a review of the DRE programme The aim is to give an overview of how some variables in the census have changed during the course of DRE and the findings should be seen in the light of the caveats described on page 13
bull The number of inpatients went down from 33785 to 29840 ndash a fall of 12
bull The proportion of patients in independent hospitals rose from 10 to 16
bull The overall proportion of patients from minority ethnic groups increased from 20 to 23 However there have been demographic changes during this time ndash the population from Black and minority ethnic groups in England and Wales rising from 79 million in 2005 to 85 million in 2007 (the latest year for which these figures are available) an increase of 8 in two years
bull Admission rates showed similar patterns across all censuses ndash Lower than average rates among the White
British Indian and Chinese groups ndash About average rates among the Pakistani and
Bangladeshi groups ndash Higher than average rates among other
minority ethnic groups ndash particularly in the Black and WhiteBlack Mixed groups for whom rates were two or more times higher than average in 2010 The Other Black group continues to have exceptionally high rates of admission (even after the apparent reduction since 2005 see next point)
bull One of the 12 goals of DRE was a decline in admission rates among Black and minority ethnic groups Figure 1 provides a comparison between 2005 and 2010 Although admission rates for
many ethnic groups show relatively little change since 2005 the rate for the Other Black group is considerably lower in 2010 (six times higher than average) compared with 2005 (12 times higher than average) However rates for the other Black and WhiteBlack Mixed groups show small increases
bull In general rates of referral from GPs and community mental health teams were lower than average among some Black and WhiteBlack groups and referral from the criminal justice system was higher Patterns were less consistent for other minority ethnic groups
bull There was a steady increase in the overall proportion of patients subject to the Mental Health Act Compared with 40 in 2005 49 of all patients were subject to the Mental Health Act in 2010 (53 if outpatients on a CTO are excluded)
bull Another DRE goal was to reduce detention rates among Black and minority ethnic groups However detention rates have been higher than average among the Black Caribbean Black African and Other Black groups in all six censuses and almost consistently higher in the WhiteBlack Caribbean Mixed and Other White groups Rates have been average for other minority ethnic groups
bull A consistent pattern was the higher than average detention rate under section 3741 for the Black Caribbean and Other Black groups
bull Another DRE goal was to reduce seclusion among Black and minority ethnic groups Although there have been annual fluctuations in seclusion rates they have been higher than average for the Black and WhiteBlack Mixed groups and the Other White group in at least three of the six censuses Other minority ethnic groups did not show high rates
Care Quality Commission Count me in census 2010 32
A comparison between the 2005 baseline and the 2010 census continued
Figure 1 Admission ratios in the 2005 and 2010 Count me in censuses by ethnic group England and Wales
Other Black
Black Caribbean
White and Black Caribbean
White and Black African
Black African
Other Mixed
Other Asian
White and Asian
Other
White Irish
Other White
Bangladeshi
White British
Pakistani
Indian
Chinese
0 100 200 300 400 500 600 700 800 900 1000 1100 1200 1300
Ageshysex standardised admission ratios (EampW=100)
Census 2005 admission ratios using 2005 ONS populations
bull Minority ethnic groups do not compare unfavourably for other incidents Rates of self-harm have consistently been lower than average among the Black and South Asian groups Very few ethnic differences in hands-on restraint physical assault and accidents were observed across the different censuses and they did not show a consistent pattern
bull About 31 of patients in all censuses had been in hospital for one year or more and were therefore included in more than one census
Census 2010 admission ratios using ONS 2007 populations (excluding outpatients on a CTO)
(This is one reason why the census shows little change over the six years It should be noted again that because the census is a one-day count it over-represents long-stay admissions and under-represents short-stay admissions)
bull Mixed accommodation was reported for many patients across all censuses although patients from Black and minority ethnic groups were more likely to be in single sex accommodation than White British patients
The admission ratios for the 2005 census shown here are different from those published in the 2005 report This is because we updated the analysis of the 2005 admission ratios by using 2005 ONS census populations for ethnic groups as denominators These populations were not available at the time of the 2005 report which instead used the 2001 ONS population data
Care Quality Commission Count me in census 2010 33
Results learning disabilities
We obtained information about 3642 patients in 129 organisations providing services for people with learning disabilities in England and Wales Of these two were inpatients on CTOs The total number of inpatients has declined each year and by 21 from 4609 in 2006 to 3642 in 2010 The total number of providers did not change much from the baseline year of 2006 although the number of NHS providers has fallen steadily and the number of independent healthcare organisations has increased (see Table 8) The proportion of inpatients in independent
healthcare organisations increased from 20 in 2006 to 33 in 2010 This is likely to be a result of closing NHS campuses with people moving from hospital to community settings
The pattern of results for learning disability patients in 2010 is broadly similar to that reported in previous censuses This is not surprising since many of the patients had been in hospital for a considerable period of time and they therefore appear in successive censuses
Table 8 The number of providers of learning disability services and inpatients
NHS (England)
Independent (England)
NHS (Wales)
Independent (Wales) Total
2010 census Number of providers 55 61 4 9 129 Number of all patients (including patients 2304 1072 154 112 3642 on a CTO) of all patients 633 294 42 31 100
2009 census Number of providers 60 54 5 4 123 Number of all patients (including patients 2487 1014 139 55 3695 on a CTO) of all patients 673 274 38 15 100
2008 census Number of providers 62 57 5 5 129
Number of inpatients 2873 1050 143 41 4107
of inpatients 700 256 35 10 100 2007 census
Number of providers 64 47 5 4 120
Number of inpatients 3063 900 154 36 4153
of inpatients 738 217 37 09 100 2006 census
Number of providers 70 48 5 1 124
Number of inpatients 3505 930 164 10 4609
of inpatients 760 202 36 02 100
Care Quality Commission Count me in census 2010 34
Results learning disabilities continued
Ethnicity
Information about ethnicity was available for 98 of patients Of these 13 belonged to Black and minority ethnic groups defined as all groups that are not White British (see Table 9) This figure is somewhat higher than in previous years (11 in 2006) and is significantly lower than the 23 of mental health patients from minority ethnic groups as reported in the mental health section of this report
Although the patterns by ethnicity are broadly similar to previous years there was an increase between 2006 and 2010 in the proportion of patients from the Other White group and a fall in those from the White British group Some ethnic groups had very few patients
As in the previous censuses patients from Black and minority ethnic groups were concentrated in a relatively small number of organisations 70 were
Table 9 Learning disability patients by ethnic group
Ethnic group 2010 census 2009 census 2008 census 2007 census 2006 census
Number Number Number Number Number
White British 853 3106 867 3205 889 3616 883 3642 887 4037
White Irish 13 46 15 57 13 53 10 40 14 66
Other White 29 106 23 85 26 104 26 109 17 77
White and Black Caribbean 10 38 10 36 07 29 08 34 07 32
White and Black African 02 8 01 4 00 2 02 10 01 3
White and Asian 04 13 04 14 03 12 03 13 02 9
Other Mixed 07 24 05 19 03 14 04 16 03 14
Indian 09 32 09 35 07 28 08 32 11 49
Pakistani 07 24 09 33 07 30 08 32 07 34
Bangladeshi 05 20 06 21 03 11 03 11 02 9
Other Asian 04 13 03 10 03 12 02 8 03 12
Black Caribbean 26 93 22 81 23 94 26 108 28 129
Black African 08 28 09 35 07 29 08 33 07 33
Other Black 04 15 04 14 04 15 04 18 04 17
Chinese 00 1 01 2 01 5 02 8 02 7
Other 02 7 02 8 04 15 02 10 05 24
Not stated 19 68 10 36 09 38 07 29 12 57
Total 100 3642 100 3695 100 4069 100 4124 100 4552
Care Quality Commission Count me in census 2010 35
Results learning disabilities continued
patients in 25 of the 129 organisations that took part in the census Seventy-four organisations had fewer than 10 patients from Black and minority ethnic groups each and another 42 organisations had no inpatients at all from these groups
However it is important to note that the number of people with severe and profound learning disabilities in some areas is affected by past funding and placement practices especially the presence of old long stay hospitals and of people placed outside their original area of residence by funding authorities
Reporting of ethnicity
About half (56) of patients reported their own ethnic group Staff reported the ethnic group for 17 of patients and relatives for 21 This means that ethnicity could have been misreported for some patients We do not know how ethnicity was assessed for 6 of patients
Age and gender
Two per cent (59) of patients were under 18 years old The number of young inpatients from minority ethnic groups was low or zero in several ethnic minority groups
Overall 73 of patients were under 50 years old and 27 were aged 50 or over The proportion of patients under 50 was higher among patients from Black and minority ethnic groups (88) than among the White British group (71) This is not surprising given that minority ethnic populations are generally younger than the White population
Seventy per cent of patients in learning disability services were men whereas in mental health services 58 of patients were men
Language and religion
Eight per cent of patients reported that their first language was not English Non-verbal communication was the most often selected language after English accounting for 4 of patients Two per cent (84) of patients most of whom were from the White British group said they needed an interpreter
Religion was not stated for 22 of patients and 15 of patients said they had no religion South Asians (Indians Bangladeshis and Pakistanis) were mostly Muslim Hindu or Sikh and those from the White Black Caribbean and Black African groups were mostly Christian
Sexual orientation
Overall the result was not known for almost half (49) of patients 45 said they were heterosexual 2 said gaylesbian 3 said bisexual and 1 said ldquootherrdquo The numbers of patients from minority ethnic groups were too low for meaningful analysis
Disability
Of all inpatients in learning disability services
bull 4 were reported as having no disabilities
bull 44 had a learning disability only
bull 51 had multiple disabilities
The patterns among minority ethnic groups were similar in that most patients had either a learning disability or multiple disabilities
Care Quality Commission Count me in census 2010 36
Results learning disabilities continued
Rates of admission
The rates of admission based on ONS estimates of the general population in 2007 are given in Appendix C Table C1
Admission rates were lower than average among several minority ethnic groups Other White Indian Pakistani Other Asian Black African Chinese and Other Rates were two to three times higher than average among the WhiteBlack Caribbean Mixed Black Caribbean Other Black and Other Mixed groups The lower rates among the South Asian and Chinese groups and the higher rates among some Black groups are similar to patterns for inpatients in mental health establishments
These patterns of admission are similar to those we reported in previous census reports
Source of referral
As we reported in the section on mental health patients data about sources of referral must be interpreted with care as we do not always know the original referral source Furthermore in the case of inpatients with learning disabilities this information was invalid missing or unknown for 12 of patients
Because of the small numbers of patients in most minority ethnic groups we observed few ethnic differences in sources of referral
Detention under the Mental Health Act 1983 (on day of admission and on day of census)
The Mental Health Act 2007 made a number of changes to the Mental Health Act 1983 one of which was supervised community treatment (section 17A) These are reflected in the 2010 census
All detentions Of all the patients in learning disability services 48 were detained under the Mental Health Act on admission Rates of detention on the day of admission by ethnic group are in Appendix C Table C2 and no ethnic differences were observed As the number of detained patients from each minority ethnic group was low we did not undertake further analysis for individual sections of the Act
Rates of detention on census day also showed no ethnic differences with the exception of a lower than average rate for the Other White group
Consent
About 66 of informally admitted inpatients were deemed incapable of consenting to treatment which is a similar proportion to that reported previously
Among detained patients 38 were deemed incapable of consenting to treatment and 6 were deemed capable of consenting to treatment but refused
The numbers of patients from minority ethnic groups were too low for comment There were no or very few such patients among minority ethnic groups
Care Quality Commission Count me in census 2010 37
Results learning disabilities continued
Care programme approach
Details of the Care Programme Approach (CPA) are given on page 24
We found that 73 of all patients were on a CPA 2 on a single assessment process (SAP) and 25 on neither No ethnic differences were observed
Recorded incidents
The 2010 census asked about the number of times that patients experienced seclusion hands-on restraint self-harm accident and physical assault in a patientrsquos current hospital spell or if the patientrsquos hospital spell was longer than three months the number that took place within the last three months As in previous years we observed very few ethnic differences
Seclusion Five per cent of patients had experienced one or more episodes of seclusion The only ethnic differences observed were the higher than average rates among the White Irish and Other White groups but these were based on small numbers of patients
Physical assault on the patient The definition of assault includes incidents of physical assault on the patient irrespective of who committed the assault but we do not have information on who committed the assault About 28 of patients had been involved in one or more episodes of physical assault No ethnic differences were observed
Hands-on restraint self-harm accidents Thirty per cent of inpatients had experienced one or more episodes of hands-on restraint 22 had attempted to harm themselves and 24 had suffered an accident The numbers were very low in minority ethnic groups and we did not observe any ethnic differences except for a lower than average rate for self-harm among the Black Caribbean group but this was based on very few patients
Duration of stay in hospital
We analysed the length of the period between each patientrsquos admission to hospital and the census day This period is of course shorter than a patientrsquos full length of stay in hospital which runs from admission to the date when they are discharged
bull 10 of inpatients had been in hospital for one month or less
bull 6 had been in hospital between one and three months
bull 7 had been in hospital between three and six months
bull 10 had been in hospital between six months and one year
bull 14 had been in hospital between one and two years
bull 22 had been in hospital between two and five years
bull 31 had been in hospital for over five years
The patterns are very similar to those in previous censuses About 67 of patients in the 2010 census had been in hospital for more than a year and were therefore also included in the 2009 census In addition over half (53) of patients had been in hospital for more than two years and will have been included in both the 2008 and 2009 censuses A third of patients will have been included in each census since 2006
We also calculated the median length of stay (see page 26 for the definition of median) Overall the median amount of time that women had spent in hospital was about 31 months and the median for men was about 27 months This compares with a median for mental health patients of 25 months for women and 58 months for men It is not possible to reliably compare length of stay by ethnic group because of the small numbers of patients among several minority ethnic groups
Care Quality Commission Count me in census 2010 38
Results learning disabilities continued
Ward security
About 12 of all inpatients were on a medium or high secure ward as opposed to a general (54) or low secure (34) ward
As in the three previous years rates of patients on medium or high secure wards were about double the average among the White Irish and Other White groups Most other minority ethnic groups had very few patients on medium or high secure wards
Age range on wards
There were five patients under 18 years of age being cared for on wards for working-age adults and none were on wards for older people About 5 of patients on wards for working-age adults were aged 65 or over and there were very few patients (23) on wards for older people There were very few lsquoout of agersquo placements among minority ethnic groups
Patients in wards designated as single sex or mixed
We asked providers whether the patient was on a ward designated as men or women only or mixed gender Overall 47 of men and 69 of women were not in a ward designated for single sex use The numbers of such patients among minority ethnic groups were very low
Two further questions examined the single sex facilities that were available to patients Again due to the small numbers we do not present results by ethnicity for these questions
Patientsrsquo access to toilet and bathing facilities designated for single sex use
Overall 19 (497) of men and 27 (295) of women were reported as not having access to toilet and bathing facilities designated for single sex use
Patientsrsquo access to a lounge area day space designated for single sex use
Overall 32 (829) of men and 44 (470) of women were reported as not having access to a lounge area day space designated for single sex use
Patients subject to deprivation of liberty safeguards
For details of deprivation of liberty safeguards please see page 31
The 2010 census introduced a new question ldquoIs the patient subject to deprivation of liberty authorisation on 31 March 2010rdquo Two per cent (74) patients were reported as being subject to a deprivation of liberty order on census day but very few of these patients (15) were from minority ethnic groups
See footnote on single sex accommodation on page 27
Care Quality Commission Count me in census 2010 39
Data in the future Moving beyond a one-day census
For six years the Count me in census has provided a valuable one-day snapshot of inpatients in mental health and learning disability services And with the proportion of inpatients who are detained increasing steadily (from 25 in 200506 to 39 in 200910 ndash see Figure 2) ongoing ethnic monitoring of admissions and detentions becomes more vital than ever
However a one-day census only captures some events and the profile of patients can differ across a whole year For example there were
bull 29840 inpatients in the 2010 census compared with 107765 inpatients overall during 200910
bull 17299 patients in the 2010 census who were detained or on CTOs compared with 42479 new detentions and some 4100 new CTOs overall in England in 200910
bull 26 of patients in hospital for under one month and 31 for over one year per the census
whereas the MHMDS data consistently shows that for over 50 of records the average length of an inpatient stay was under one month and for 4 it was over one year
Looking ahead it is vital that robust data is available on all admitted patients and all those subject to the Mental Health Act not just those in hospital on one particular day Moreover patterns of use and outcomes of community care can have an impact on the need for admission to hospital and the risk of detention ndash therefore information about the care provided to patients before admission to hospital during their hospital stay and after they leave is also vital Furthermore under 84 of the 127 million people using specialist mental health services are admitted to hospital23 and so it is very important to examine the quality of community care for the 90 of patients who are not admitted to hospital
Figure 2 Number of people spending time in hospital 200506 to 200910
Num
ber
of p
atie
nts
90000
80000
70000
60000
50000
40000
30000
20000
10000
0 200506 200607 200708 200809 200910
Source NHS Information Centre Formally detained Not detained MHMDS Bulletin 2011
Care Quality Commission Count me in census 2010 40
Data in the future Moving beyond a one-day census continued
The Mental Health Minimum Data Set (MHMDS) is a rich source of data on people using specialist mental health services in England It covers both community and hospital services and includes a wide range of information about the demographic clinical and socioeconomic characteristics of individual patients and the services provided to those admitted to hospital and to the much larger number of those who donrsquot need a stay in hospital The data includes information about contact with services uses of the Mental Health Act and the Care Programme Approach for each individual patient All these details enable the use of services patterns of care and patient outcomes to be tracked including along pathways of care The MHMDS therefore provides a robust basis for ongoing monitoring of access to and outcomes of care for users of specialist ndash both community and hospital ndash mental health services
The MHMDS also enables an analysis of the numbers and rates of people from different ethnic groups using specialist mental health services overall (both inpatient and community) which provides an indication of the levels of mental illness and therefore the need for specialist care in different communities
At present the MHMDS does not cover high secure services and independent sector providers only started to provide data during 201011 However to support payment by results for mental health the scope of the data set will be extended to cover high secure services during 201112 (version 4 MHMDS) Further proposed changes to the dataset (version 41) will incorporate NHS-funded learning disability services and primary care mental health services A separate dataset for child and adolescent mental health services (CAMHS) has been developed and is awaiting formal approvals It is designed to include the same information about uses of the Mental Health Act as provided in the MHMDS
The latest MHMDS bulletin for 200910 provides a description of people using specialist mental health services in England including ethnic profiles of people using services hospital admissions detentions and the number of people on CPA24 It also provides information on differences by age and gender The bulletin illustrates some of the sorts of analyses that are possible using data from the MHMDS
The NHS Information Centre can provide guidance on these and other potential analyses based on MHMDS data
Care Quality Commission Count me in census 2010 41
Conclusions
While this report reviews changes in the census results since 2005 it is not a review or evaluation of the DRE programme overall Similarly the census cannot provide explanations for the patterns observed or examine whether mental health services are meeting the needs of individual ethnic minority groups As we have noted previously the results are subject to caveats in particular that the census provides a one-day snapshot that may not be representative of patients admitted to hospital throughout the year
Overview of findings
Overall the findings from the 2010 census show little change from those reported for previous annual censuses conducted since 2005 This is partly because many patients had been in hospital for a considerable period of time and had therefore been included in successive censuses The findings of this sixth and last census continue to show differences between Black and minority ethnic groups and White groups and also differences within these groups
In particular ethnic differences in rates of admission detention under the Mental Health Act and seclusion ndash three of DRErsquos 12 goals ndash have not altered materially since the inception of DRE in 2005
bull Admission rates remain higher than average among minority ethnic groups especially among Black and WhiteBlack Mixed groups for whom rates were two or more times higher than average in 2010 The Other Black group continues to have the highest admission rate ndash six times higher than average ndash although this is lower than in 2005 In contrast admission rates have consistently been lower than average among the Indian and Chinese groups and about average in the Pakistani and Bangladeshi groups
bull Detention rates remain higher than average among the Black and WhiteBlack Caribbean Mixed groups and among the Other White group A consistent pattern across all censuses was the higher than average detention rate
under section 3741 for the Black Caribbean and Other Black groups We also found that rates for being placed on a CTO were higher among the South Asian and Black groups
bull Although there have been annual fluctuations in seclusion rates they have been higher than average for the Black WhiteBlack Mixed and Other White groups in at least three of the six censuses
Overall the level of provision of single sex areas for patients continues to be unsatisfactory although there was no evidence that minority ethnic patients were disadvantaged in these respects Government policy for the NHS in England now requires that all providers of NHS-funded care including mental health trusts are expected to eliminate mixed-sex accommodation in accordance with the guidance set out in CNO201032526 From 2011 all providers of NHS-funded care must report breaches of sleeping accommodation which will attract sanctions
Implications for ways forward
The census findings do not in themselves show that mental health and learning disability services are failing to meet the needs of Black and minority ethnic service users
As noted in previous reports they need to be interpreted in the context of available evidence on ethnic differences in rates of mental illness pathways to care and factors such as socioeconomic disadvantages that all contribute to these differences Our previous reports have consistently highlighted the need for prevention early intervention and working collaboratively across sectors to reduce the risk of admission and detention where possible without compromising the care given to patients Mental health services have a key role to play but to achieve this all statutory agencies and organisations outside the healthcare sector Black and minority ethnic communities and people who use services themselves will need to work in partnership
Care Quality Commission Count me in census 2010 42
Conclusions continued
This message ndash about preventing mental ill-health by addressing the contributory factors and intervening early ndash is at the heart of No health without mental health the Department of Healthrsquos new strategy for the future of mental health care in England27
The strategy aims to tackle the economic social and environmental determinants and consequences of mental health problems and to improve outcomes and reduce inequalities
It specifies that by 2014 people in contact with the criminal justice system will have improved access to mental health services as set out in the Ministry of Justice Green Paper Breaking the Cycle Effective punishment rehabilitation and sentencing of offenders which confirms the approach outlined in Lord Bradleyrsquos report for early intervention and diversion from custody2829
Accompanying the new strategy is a supporting document that explains how its objectives will improve mental health outcomes the effective interventions and the underpinning evidence base30
The strategy is complemented by other government proposals for reforms in the NHS public health and adult social care as outlined in the NHS White Paper Equity and excellence liberating the NHS31 the public health strategy Healthy lives healthy people32 and the adult social care strategy A vision for adult social care capable communities and active citizens 33 Three outcomes frameworks have been developed alongside these strategies improving mental health outcomes and reducing inequalities is integral to them all
In this new healthcare landscape the proposed NHS Commissioning Board and GP consortia will have a statutory obligation to promote equality and reduce inequalities in healthcare (something also enshrined in the Equality Act 2010) As the lead commissioners of healthcare services it will be up to GP consortia to assess with local authorities the needs of their local populations and commission the right services that meet their requirements
And the strengthened public health role of local authorities offers significant potential for addressing the socioeconomic disadvantages faced by Black and minority ethnic communities which add to the burden of mental illness in these communities
Race Equality Action Plan A five-year review looked back at the work of the DRE action plan and describes some of the key challenges successes and learning34 Based on the experience and outcome of the DRE programme the report suggests ways forward for the next stage of mental health strategy development and implementation
Since April 2009 CQC has had a duty under the Mental Health Act 1983 to monitor how services exercise their powers in relation to patients who are detained in hospital or subject to CTOs or guardianship under the Act In its first annual report on the use of the Act CQC recommends a number of areas where improvements are needed for example over-occupancy on inpatient wards patient engagement use of control and restraint seclusion and capacity and consent35
In particular CQC highlighted a number of issues relating to the use of CTOs including concern about appropriate usage (30 of the patients in CQCrsquos sample did not have a reported history of non-compliance or disengagement with services after discharge) and over-representation of Black and minority ethnic groups CQC advised that research on the possible race equality impact of CTOs should be undertaken There were 6237 CTOs from their introduction in November 2008 to 31 March 2010 a much greater use of them than forecast for this period by the Department of Health before the power was introduced Just 31 of these orders had ended by end March 2010 suggesting that some people are being kept on supervised community treatment for long periods
Care Quality Commission Count me in census 2010 43
Conclusions continued
Data in the future Moving beyond a one-day census
Good information is the foundation of an effective healthcare system It is imperative for ensuring that services meet the needs of local populations and are equitable and that improvements are made where needed The availability of fit-for-purpose and comprehensive patient-level data sets with ethnicity and other key variables fully coded is therefore vitally important36 It enables the care provided to patients of all ethnic backgrounds to be monitored on an ongoing basis including for monitoring compliance with the Equality Act
Race Equality Action Plan A five-year review notes that better collection monitoring and use of ethnicity data to inform commissioning and provision in health and social care is required37 Key areas include good ethnic monitoring improving demographic information and ensuring good links between infomatics audit and equality and diversity leads within trusts in order to effectively use the information to inform service development monitoring and review at board management ward and community levels
The governmentrsquos proposed changes to the NHS will be supported by an information revolution aimed at improving and extending the information available to the NHS patients and the public on the quality and outcomes of NHS services including by equality dimensions38
Having information that is fit for purpose is vital for the effective regulation of mental health and learning disability services CQC uses routinely available data sets on an ongoing basis to assess the performance of health and social care organisations and their compliance with government policies and legislation We therefore expect those who commission and provide mental healthcare in the NHS and independent sector to have information systems that provide good quality data with fully
comprehensive recording and monitoring of ethnicity on an ongoing basis
Since 2005 the Count me in census has played a key role in providing information about the ethnicity and other characteristics of inpatients in mental health and learning disability services and on patients subject to the Mental Health Act It did this by providing a valuable one-day snapshot But ethnicity recording must be seen as an all-year round statutory requirement not a one-day annual event The number of inpatients throughout the year is much higher than the counts on one day and some patients will have more than one admission And there is a need to move on from counting patients to understanding more about care pathways for Black and minority ethnic patients and the factors leading to hospital admission and detention
We have consistently highlighted the need for commissioners and providers to make full use of the Mental Health Minimum Data Set (MHMDS) ndash the statutory data set submitted by providers of specialist mental health services in England It provides rich data on these issues and provides a robust information source for ongoing ethnic monitoring after this last census
Covering both community and hospital services ndash and now independent and third sector providers as well as NHS ndash it includes a wide range of information about individual patients the services provided to those admitted to hospital and to the much larger number who donrsquot need admission to hospital and the outcomes of care And because it includes year-round activity it is more representative of the overall picture of for example admission detention and readmission rates length of stay years in psychiatric care and contacts with services and professionals
We call on the Information Centre to routinely publish data on all admissions and uses of the Mental Health Act including CTOs in England (in both NHS and independent healthcare providers) by the ethnicity of
Care Quality Commission Count me in census 2010 44
Conclusions continued
patients making the MHMDS the definitive source of information about mental health and learning disability patients This data should be risk-adjusted for age gender and other variables as appropriate to enable reliable comparisons to be made across groups
It is important that all providers ndash NHS and independent ndash make strenuous efforts to improve the quality of the data they submit The Information Centre publishes reports on the quality of MHMDS data by provider (see wwwicnhsukservices mhmdsdq) and we urge providers to monitor this information and use it to improve their data quality
If GP consortia and local authorities are to be effective in their needs assessment and commissioning roles the Information Centre needs to make available and promote to them the data from the MHMDS and other sources And researchers and academics must make full use of the MHMDS to explore the factors that underlie the observed ethnic patterns
CQCrsquos role
In the meantime CQC will continue to focus strongly on the quality of care provided by mental health and learning disability services
People who find themselves admitted to mental health services or detained under the Mental Health Act and therefore counted by the Count me in census are among the most mentally unwell people in our society Our job is first and foremost to make sure that the care they receive meets the essential standards of quality and safety set out under the Health and Social Care Act 2008 and to work with providers to ensure this We act swiftly when we find services that do not Where we find systemic problems that organisations have not adequately addressed we may impose conditions on the providerrsquos registration to bring about the change needed to improve patientsrsquo experience of care
The essential standards of quality and safety include the requirement to provide single sex accommodation and we will continue to closely check that these standards are met by all mental health services
We intend to introduce a number of indicators derived from the rich information in the MHMDS into our quality and risk profiles for providers This will put greater emphasis on the experience of Black and minority ethnic patients in our regulatory activity
We will monitor the quality of MHMDS data submitted by providers (as reported by the NHS Information Centre) including independent service providers Those with poor data quality may be considered at higher risk in terms of their quality of care
In addition we will continue to monitor the progress of services in relation to the issues raised in the census and other reports including our report on the use of the Mental Health Act through our visits to services and meetings with patients by our Mental Health Act Commissioners and second opinion appointed doctors (SOADs) We will draw on patientsrsquo experiences to monitor the operation of the Mental Health Act
We will also assess the impact of advice and use of Local HealthWatch Local HealthWatch will be in a good position to make sure that providers and commissioners are held to account on matters of choice and access to services for people from Black and minority ethnic groups
Care Quality Commission Count me in census 2010 45
References
1 Department of Health Equity and excellence liberating the NHS 2010
2 Department of Health The NHS outcomes framework 201112 2010
3 Healthcare Commission Mental Health Act Commission National Institute for Mental Health in England Count me in results of a national census of inpatients in mental health hospitals and facilities in England and Wales 2005
4 Healthcare Commission Mental Health Act Commission National Institute for Mental Health in England Count me in results of the 2006 national census of inpatients in mental health and learning disability services in England and Wales 2006
5 Healthcare Commission Mental Health Act Commission National Institute for Mental Health in England Count me in results of the 2007 national census of inpatients in mental health and learning disability services in England and Wales 2007
6 Healthcare Commission Mental Health Act Commission National Institute for Mental Health in England Count me in results of the 2008 national census of inpatients in mental health and learning disability services in England and Wales 2008
7 Care Quality Commission National Mental Health Development Unit Results of the 2009 national census of inpatients and patients on supervised community treatment in mental health and learning disability services in England and Wales 2009
8 Department of Health Delivering race equality in mental health care an action plan for reform inside and outside services 2005
9 Welsh Assembly Government Adult Mental Health Services Raising the standard ndash Race Equality Action Plan for Adult Mental Health Services in Wales 2006
10Department of Health No health without mental health a cross-government mental health outcomes strategy for people of all ages 2011 wwwdhgovukprod_consum_dhgroups dh_digitalassetsdocumentsdigitalasset dh_124058pdf
11Department of Health New horizons towards a shared vision for mental health 2009 wwwdhgovukprod_consum_dhgroups dh_digitalassetsdhendocumentsdigital assetdh_109708pdf
12Department of Health Valuing people a new strategy for learning disability for the 21st century 2001
13Department of Health Valuing people now a new three year strategy for people with learning disabilities 2009
14Department of Health Healthcare for all report of the independent inquiry into access to healthcare for people with learning disabilities 2008
15Joint Committee on Human Rights A life like any other human rights of adults with learning disabilities (2008 HL Paper 401 HC 731) House of Lords House of Commons 2008
16Department of Health Valuing people now summary report March 2009 ndash September 2010 2010
17Disability Rights Commission Equal treatment investigation 2005
18Department of Health Mir G Nocon A Ahmad W Jones L Learning difficulties and ethnicity 2000
19ONS experimental population estimates by ethnic group 2007 wwwstatisticsgovukstatbase productaspvlnk=14238
Care Quality Commission Count me in census 2010 46
References continued
20Six percent of population are gay or lesbian according to Whitehall figures 2005 wwwtelegraphcouknewsmainjhtmlxml= news20051212ngay12xmlamps Sheet= news20051212ixhomehtml
21Department of Trade and Industry Amendment to Employment Equality (Sexual Orientation) Regulations 2003 2003
22Office for National Statistics Measuring sexual identity an evaluation report 2010
23 Information Centre Mental Health Bulletin Fourth report from Mental Health Minimum Dataset (MHMDS) annual returns 2010 2011 wwwicnhsukpubsmhbmhmds0910
24 Information Centre Mental Health Bulletin Fourth report from Mental Health Minimum Dataset (MHMDS) annual returns 2010 2011 wwwicnhsukpubsmhbmhmds0910
25The operating framework for the NHS in England 201112 Department of Health 2010 wwwdhgovukprod_consum_dhgroups dh_digitalassetsdhenpsdocuments digitalassetdh_122736pdf
26wwwdhgovukenPublicationsandstatistics LettersandcircularsProfessionalletters ChiefnursingofficerlettersDH_121848
27Department of Health No health without mental health a cross-government mental health outcomes strategy for people of all ages 2011 wwwdhgovukprod_consum_dhgroups dh_digitalassetsdocumentsdigitalasset dh_124058pdf
28Ministry of Justice Breaking the cycle effective punishment rehabilitation and sentencing of offenders 2010
29Department of Health The Bradley report Lord Bradleyrsquos review of people with mental health problems or learning disabilities in the criminal justice system 2009
30Department of Health No health without mental health delivering better mental health outcomes for people of all ages 2011
31Department of Health Equity and excellence liberating the NHS 2010 wwwdhgovukprod_ consum_dhgroupsdh_digitalassetsdhen psdocumentsdigitalassetdh_117794pdf
32Department of Health Healthy lives healthy people our strategy for public health in England 2010 wwwdhgovukprod_consum_dh groupsdh_digitalassetsdhenps documentsdigitalassetdh_122347pdf
33Department of Health A vision for adult social care capable communities and active citizens 2010 wwwdhgovukprod_consum_dh groupsdh_digitalassetsdhenps documentsdigitalassetdh_121971pdf
34Wilson M NMHDU Race equality action plan a five year review Delivering race equality in mental health care 2010 wwwnmhduorgukour-workmhep
35Care Quality Commission Monitoring the use of the Mental Health Act in 200910 2010
36Raleigh V S Collection of data on ethnic origin in England Editorial BMJ 20083376456
37Wilson M NMHDU Race equality action plan a five year review Delivering race equality in mental health care 2010 wwwnmhduorgukour-workmhep
38Department of Health Liberating the NHS an information revolution 2010
Care Quality Commission Count me in census 2010 47
Appendix A Methods of analysis
Standardisation by age and gender
Standardisation allows us to make comparisons between groups of the population by taking account of variations in age and gender Some differences in patterns of service use are related to the age or gender of the people using them so adjustments to the data have to be made to ensure that the interpretation of ethnic differences is reliable For example formal admissions are higher at a younger age so some Black and minority ethnic groups may have high formal admission rates simply because they have a high proportion of younger people Without adjustments for age and gender differences comparisons would be misleading
In this report most results are standardised for age and gender including those relating to admission detention source of referral care programme approach seclusion restraint accidents assault self-harm consent and presence on a secure ward The report uses the accepted statistical method of taking account of age and gender differences between groups when calculating these rates
We used the ONS estimates of total population by ethnic group for England and Wales in 2007 to standardise the rates of admission for different ethnic groups This takes account of the significant rises in the Black and ethnic minority population of England and Wales since the 2001 ONS census and hence gives more accurate and up to date estimates of admission ratios for different ethnic groups (although it does not take account of any further changes in the ethnic populations between 2007 and 2010 the date of this census) For comparison with the DRE baseline we also present admission rates from the 2005 census derived using the 2005 ONS estimates of populations by ethnic group These figures will not be the same as published in the 2005 census report which were based on the 2001 ONS census population estimates because updated estimates of populations by ethnic group were not available at that time
For other analyses we used the total number of inpatients and patients on CTOs in the census
as the basis for standardisation However CTO outpatients are excluded from selected analyses where appropriate namely the analysis of rates for admissions detentions on admission source of referral single sex accommodation and recorded incidents of seclusion restraint accidents assault and self-harm We used the statistical package STATA version 82 to derive the standardised results
It was not possible to adjust the analyses for ethnic differences in social and economic factors and in diagnosis and severity of illness Such factors could affect the ethnic differences observed in the results
For descriptive variables such as religion and language we did not use standardisation
Confidence intervals as indicators of significant statistical differences
For all standardised results the national rates for England and Wales are taken as 100 and the usual 95 confidence intervals are given Rates of less than 100 or greater than 100 for specific ethnic groups show a lower or higher rate respectively than the national average after adjusting for age and gender Whether or not the difference is statistically significant from the national average depends on the confidence interval If the confidence interval overlaps 100 the difference from the national average is not statistically significant If both values are lower or higher than 100 it indicates that the difference compared with the national average is statistically significant at the 95 level
For example if a rate is 110 with the lower confidence interval being 105 and the upper confidence interval being 115 it indicates that the 10 excess over the national average of 100 is statistically significant But if a ratio is 110 with the lower confidence interval being 95 and the upper confidence interval being 125 it indicates that the 10 excess over the national average is not statistically significant We did not attempt to adjust the confidence intervals for multiple comparisons
Care Quality Commission Count me in census 2010 48
Appendix B Mental health tables
Table B1 Standardised admission ratios by ethnic group for England and Wales (excluding outpatients on a CTO) using 2007 ONS census population denominators (England and Wales = 100) All ages
Ethnic group
Men Women Persons Standardised
admission ratio
95 confidence
interval Observed numbers
Standardised admission
ratio
95 confidence
interval Observed numbers
Standardised admission
ratio
95 confidence
interval Observed numbers
White British 88 86 89 12435 94 93 96 10157 91 89 92 22592 White Irish 130 115 146 274 122 106 140 215 126 115 138 489 Other White 117 109 126 731 129 118 141 533 122 115 129 1264 White and Black Caribbean 557 493 627 276 274 223 333 101 436 393 483 377 White and Black African 312 247 388 80 259 186 351 41 292 242 349 121 White and Asian 140 110 174 79 124 90 166 44 134 111 159 123 Other Mixed 230 189 278 108 213 165 270 67 223 192 259 175 Indian 67 59 75 286 66 56 76 172 66 60 73 458 Pakistani 105 93 119 269 65 53 79 96 91 81 100 365 Bangladeshi 123 102 147 120 82 60 109 46 108 92 126 166 Other Asian 161 139 185 192 136 107 169 79 153 135 172 271 Black Caribbean 538 505 572 980 306 277 336 418 438 415 462 1398 Black African 246 226 267 550 219 194 247 277 236 221 253 827 Other Black 792 691 903 222 314 240 403 61 596 529 670 283 Chinese 27 20 38 39 43 30 59 35 33 26 41 74 Other 140 120 162 177 110 88 136 87 128 113 145 264 Total 100 16818 100 12429 100 29247
Care Quality Commission Count me in census 2010 49
Appendix B Mental health tables continued
Table B2 Standardised admission ratios by ethnic group for England and Wales (excluding outpatients on a CTO) using 2007 ONS census population denominators (England amp Wales = 100) Ages 65 and over
Ethnic group
Men Women Persons Standardised
admission ratio
95 confidence
interval Observed numbers
Standardised admission
ratio
95 confidence
interval Observed numbers
Standardised admission
ratio
95 confidence
interval Observed numbers
White British 95 92 99 3265 95 92 98 3887 95 93 97 7152 White Irish 142 116 172 106 102 82 125 92 120 104 138 198 Other White 207 174 244 141 213 183 248 171 210 188 235 312 White and Black Caribbean 406 210 710 12 333 152 632 9 371 230 568 21 White and Black African 231 28 836 2 198 24 714 2 213 58 546 4 White and Asian 28 1 156 1 110 30 281 4 69 23 162 5 Other Mixed 146 40 374 4 228 92 470 7 189 95 339 11 Indian 97 70 132 41 83 57 116 33 90 71 113 74 Pakistani 39 17 77 8 46 18 94 7 42 23 69 15 Bangladeshi 115 53 218 9 69 14 201 3 98 51 172 12 Other Asian 234 143 361 20 215 120 354 15 225 157 313 35 Black Caribbean 216 170 269 77 310 253 376 103 261 224 302 180 Black African 142 73 248 12 365 241 531 27 246 175 337 39 Other Black 164 34 479 3 366 134 796 6 259 119 493 9 Chinese 41 8 120 3 95 38 195 7 68 33 125 10 Other 253 126 453 11 390 238 602 20 327 222 464 31 Total 100 3715 100 4393 100 8108
Care Quality Commission Count me in census 2010 50
Appendix B Mental health tables continued
Table B3 Standardised ratios by ethnic group for patients referred by a GP (England and Wales = 100)
Ethnic group
Men Women Persons Standardised
referral ratio
95 confidence
interval Observed numbers
Standardised referral ratio
95 confidence
interval Observed numbers
Standardised referral ratio
95 confidence
interval Observed numbers
White British 110 103 117 904 107 101 114 1065 108 104 113 1969 White Irish 85 50 134 18 93 57 144 20 89 63 123 38 Other White 74 51 103 33 70 49 97 36 72 56 91 69 White and Black Caribbean 27 5 78 3 30 4 109 2 28 9 65 5 White and Black African 0 0 74 9 268 2 35 4 125 2 White and Asian 165 54 386 5 0 0 86 28 201 5 Other Mixed 48 6 172 2 68 14 198 3 58 19 136 5 Indian 69 34 123 11 79 39 141 11 73 46 111 22 Pakistani 88 42 162 10 59 16 151 4 77 42 130 14 Bangladeshi 81 22 207 4 61 7 221 2 73 27 159 6 Other Asian 80 32 166 7 108 43 223 7 92 50 155 14 Black Caribbean 35 20 56 17 37 20 62 14 36 24 51 31 Black African 57 29 100 12 66 35 113 13 61 40 91 25 Other Black 62 23 135 6 40 5 144 2 54 23 107 8 Chinese 56 1 314 1 139 38 356 4 108 35 251 5 Other 106 46 208 8 0 0 53 23 105 8 Total 100 1041 100 1185 100 2226
Care Quality Commission Count me in census 2010 51
Appendix B Mental health tables continued
Table B4 Standardised ratios by ethnic group for patients referred by a community mental health team (including crisis resolution home treatment) or community learning disability team (England and Wales = 100)
Ethnic group
Men Women Persons Standardised
referral ratio
95 confidence
interval Observed numbers
Standardised referral ratio
95 confidence
interval Observed numbers
Standardised referral ratio
95 confidence
interval Observed numbers
White British 107 104 111 3255 103 100 107 3386 105 103 108 6641 White Irish 90 69 116 61 89 68 114 61 90 74 107 122 Other White 59 48 71 105 79 67 94 141 69 61 78 246 White and Black Caribbean 106 83 135 68 75 49 111 25 96 77 117 93 White and Black African 43 19 84 8 66 30 124 9 52 31 84 17 White and Asian 95 56 150 18 84 43 147 12 90 61 129 30 Other Mixed 78 48 121 20 72 41 118 16 76 53 105 36 Indian 106 83 132 76 100 76 130 56 103 86 122 132 Pakistani 108 84 135 73 89 60 128 30 102 83 123 103 Bangladeshi 98 66 141 29 90 50 148 15 95 69 128 44 Other Asian 88 63 120 40 105 70 150 29 94 73 119 69 Black Caribbean 69 59 80 167 85 71 102 123 75 67 84 290 Black African 84 70 102 112 82 65 103 77 84 72 96 189 Other Black 52 36 74 31 64 36 106 15 56 41 74 46 Chinese 112 53 205 10 101 52 176 12 105 66 160 22 Other 86 60 120 35 106 71 151 30 94 73 120 65 Total 100 4108 100 4037 100 8145
Care Quality Commission Count me in census 2010 52
Appendix B Mental health tables continued
Table B5 Standardised ratios by ethnic group for patients referred by criminal justice routes (police prison probation courts court liaison and diversion) (England and Wales = 100)
Ethnic group
Men Women Persons Standardised
referral ratio
95 confidence
interval Observed numbers
Standardised referral ratio
95 confidence
interval Observed numbers
Standardised referral ratio
95 confidence
interval Observed numbers
White British 90 86 95 1495 95 86 104 421 91 87 95 1916 White Irish 133 94 183 38 59 19 138 5 116 84 157 43 Other White 112 93 134 119 103 68 150 27 111 93 130 146 White and Black Caribbean 117 89 151 58 145 69 266 10 120 94 153 68 White and Black African 190 127 273 29 141 38 361 4 183 126 256 33 White and Asian 75 39 131 12 160 52 373 5 89 52 143 17 Other Mixed 104 65 157 22 151 61 311 7 112 75 161 29 Indian 86 61 118 38 79 32 163 7 85 62 113 45 Pakistani 118 91 150 65 89 33 194 6 115 90 145 71 Bangladeshi 74 44 115 19 29 1 162 1 68 42 105 20 Other Asian 130 95 174 45 164 71 323 8 134 101 176 53 Black Caribbean 131 114 150 208 124 81 181 26 130 114 148 234 Black African 132 112 156 145 143 93 211 25 134 114 156 170 Other Black 141 109 180 65 236 113 435 10 149 117 187 75 Chinese 83 27 194 5 146 30 426 3 99 43 195 8 Other 129 93 175 41 113 37 264 5 127 93 170 46 Total 100 2404 100 570 100 2974
Care Quality Commission Count me in census 2010 53
Appendix B Mental health tables continued
Table B6 Standardised detention ratios by ethnic group all detentions on day of admission (excluding outpatients on a CTO) (England and Wales = 100)
Ethnic group
Men Women Persons Standardised
detention ratio
95 confidence
interval Observed numbers
Standardised detention
ratio
95 confidence
interval Observed numbers
Standardised detention
ratio
95 confidence
interval Observed numbers
White British 94 92 97 6449 94 91 97 3628 94 92 96 10077 White Irish 112 95 131 154 118 96 145 94 114 101 129 248 Other White 108 98 118 451 120 106 136 251 112 104 120 702 White and Black Caribbean 123 107 141 220 129 99 167 59 124 110 140 279 White and Black African 128 99 162 68 113 70 173 21 124 100 153 89 White and Asian 96 71 126 50 109 68 164 22 99 78 125 72 Other Mixed 115 92 143 82 139 100 188 42 122 102 146 124 Indian 97 83 113 164 110 86 137 77 101 88 114 241 Pakistani 109 94 126 194 102 74 136 44 108 94 122 238 Bangladeshi 86 67 109 69 91 55 142 19 87 70 107 88 Other Asian 109 92 130 133 120 86 163 40 112 96 130 173 Black Caribbean 129 121 139 774 143 125 162 238 132 124 141 1012 Black African 115 104 127 422 131 111 153 159 119 110 129 581 Other Black 117 100 136 170 148 105 202 39 122 106 140 209 Chinese 108 71 159 26 129 78 202 19 116 85 156 45 Other 111 92 132 126 116 83 157 41 112 96 130 167 Total 100 9552 100 4793 100 14345
Care Quality Commission Count me in census 2010 54
Appendix B Mental health tables continued
Table B7 Standardised detention ratios by ethnic group detention on day of admission ndash section 2 of the Mental Health Act (England and Wales = 100)
Ethnic group
Men Women Persons Standardised
detention ratio
95 confidence
interval Observed numbers
Standardised detention
ratio
95 confidence
interval Observed numbers
Standardised detention
ratio
95 confidence
interval Observed numbers
White British 97 91 102 1156 93 87 98 1133 95 91 99 2289 White Irish 78 47 120 20 116 79 166 30 97 72 128 50 Other White 100 78 126 70 134 108 166 88 116 99 136 158 White and Black Caribbean 55 30 93 14 60 24 124 7 57 35 87 21 White and Black African 91 37 188 7 150 60 308 7 113 62 190 14 White and Asian 80 29 174 6 119 44 258 6 96 49 167 12 Other Mixed 68 28 141 7 116 53 221 9 89 51 145 16 Indian 130 91 179 37 124 81 182 26 127 98 163 63 Pakistani 126 87 176 34 138 79 225 16 130 96 171 50 Bangladeshi 166 101 256 20 140 61 276 8 158 105 228 28 Other Asian 142 93 209 26 163 93 264 16 150 108 202 42 Black Caribbean 73 57 92 70 97 72 128 51 82 68 98 121 Black African 164 131 202 87 190 146 244 62 174 147 204 149 Other Black 114 75 166 27 140 72 245 12 121 86 165 39 Chinese 165 60 358 6 212 97 402 9 190 106 313 15 Other 218 153 302 36 179 108 280 19 203 153 264 55 Total 100 1623 100 1499 100 3122
Care Quality Commission Count me in census 2010 55
Appendix B Mental health tables continued
Table B8 Standardised detention ratios by ethnic group detention on day of admission ndash section 3 of the Mental Health Act (England and Wales = 100)
Ethnic group
Men Women Persons Standardised
detention ratio
95 confidence
interval Observed numbers
Standardised detention
ratio
95 confidence
interval Observed numbers
Standardised detention
ratio
95 confidence
interval Observed numbers
White British 99 95 103 2684 96 91 100 1852 98 95 101 4536 White Irish 116 89 149 60 135 101 177 52 124 102 149 112 Other White 112 96 129 186 110 92 132 121 111 99 124 307 White and Black Caribbean 114 91 143 79 130 90 183 33 119 98 143 112 White and Black African 97 60 148 21 107 54 192 11 100 69 141 32 White and Asian 84 50 133 18 97 48 173 11 89 59 127 29 Other Mixed 121 84 168 35 117 72 181 20 120 90 156 55 Indian 96 75 122 67 110 79 148 42 101 83 122 109 Pakistani 91 71 115 69 88 55 134 22 90 73 111 91 Bangladeshi 63 39 95 22 64 28 127 8 63 43 90 30 Other Asian 90 65 120 44 94 56 149 18 91 70 117 62 Black Caribbean 116 102 130 279 164 138 192 148 129 117 142 427 Black African 95 80 112 143 102 79 129 68 97 85 111 211 Other Black 75 55 99 49 99 58 159 17 80 62 102 66 Chinese 119 59 213 11 99 43 194 8 110 66 171 19 Other 85 60 116 38 84 48 136 16 84 63 110 54 Total 100 3805 100 2447 100 6252
Care Quality Commission Count me in census 2010 56
Appendix B Mental health tables continued
Table B9 Standardised detention ratios by ethnic group detention on day of admission ndash section 3741 of the Mental Health Act (England and Wales = 100)
Ethnic group
Men Women Persons Standardised
detention ratio
95 confidence
interval Observed numbers
Standardised detention
ratio
95 confidence
interval Observed numbers
Standardised detention
ratio
95 confidence
interval Observed numbers
White British 84 79 89 991 101 88 115 220 86 82 91 1211 White Irish 140 96 198 32 48 6 175 2 126 87 176 34 Other White 112 89 139 81 156 95 241 20 118 96 144 101 White and Black Caribbean 177 133 232 53 179 66 390 6 178 135 229 59 White and Black African 149 82 251 14 224 46 654 3 159 92 254 17 White and Asian 141 75 241 13 195 40 569 3 149 85 241 16 Other Mixed 144 85 227 18 264 97 575 6 162 104 242 24 Indian 86 56 126 26 44 5 160 2 80 53 116 28 Pakistani 122 87 166 40 0 0 111 79 152 40 Bangladeshi 66 32 122 10 0 0 60 29 110 10 Other Asian 99 61 151 21 0 0 89 55 136 21 Black Caribbean 200 174 229 210 78 34 153 8 189 165 216 218 Black African 127 101 157 82 84 34 172 7 122 98 150 89 Other Black 152 110 205 43 94 11 341 2 148 108 198 45 Chinese 100 27 255 4 0 0 80 22 204 4 Other 118 75 177 23 44 1 245 1 110 71 164 24 Total 100 1661 100 280 100 1941
Care Quality Commission Count me in census 2010 57
Appendix B Mental health tables continued
Table B10 Standardised detention ratios by ethnic group detention on day of admission ndash sections 47 48 4749 of the Mental Health Act (England and Wales = 100)
Ethnic group
Men Women Persons Standardised
detention ratio
95 confidence
interval Observed numbers
Standardised detention
ratio
95 confidence
interval Observed numbers
Standardised detention
ratio
95 confidence
interval Observed numbers
White British 97 90 106 583 104 81 131 73 98 91 106 656 White Irish 132 72 221 14 163 20 590 2 135 77 219 16 Other White 130 96 172 49 71 15 206 3 124 93 163 52 White and Black Caribbean 126 78 193 21 80 2 444 1 123 77 186 22 White and Black African 207 103 370 11 0 0 189 95 339 11 White and Asian 57 12 166 3 169 4 941 1 68 19 175 4 Other Mixed 112 48 221 8 233 28 843 2 125 60 230 10 Indian 57 26 108 9 0 252 0 52 24 99 9 Pakistani 92 54 147 17 0 314 0 86 50 138 17 Bangladeshi 46 12 117 4 167 4 930 1 53 17 125 5 Other Asian 101 52 177 12 0 0 95 49 166 12 Black Caribbean 126 98 159 70 125 34 319 4 126 99 158 74 Black African 74 48 107 27 104 21 303 3 76 51 108 30 Other Black 127 78 197 20 138 3 769 1 128 79 195 21 Chinese 0 0 0 0 0 0 Other 83 38 157 9 0 0 77 35 147 9 Total 100 857 100 91 100 948
Care Quality Commission Count me in census 2010 58
Appendix B Mental health tables continued
Table B11 Standardised ratios for all applications of the Mental Health Act (including outpatients on a CTO) by ethnic group on day of census (England and Wales = 100)
Ethnic group
Men Women Persons Standardised
ratio for all MHA
applications
95 confidence
interval Observed numbers
Standardised ratio for all MHA
applications
95 confidence
interval Observed numbers
Standardised ratio for all MHA
applications
95 confidence
interval Observed numbers
White British 97 94 99 7659 95 93 98 4335 96 94 98 11994 White Irish 99 83 116 147 104 84 128 95 101 89 114 242 Other White 87 79 95 427 97 85 110 249 90 84 97 676 White and Black Caribbean 117 103 133 245 130 103 163 76 120 107 134 321 White and Black African 120 95 150 79 93 58 141 22 113 92 137 101 White and Asian 101 78 128 65 119 81 169 31 106 86 129 96 Other Mixed 110 89 134 96 125 93 165 49 114 97 135 145 Indian 103 90 118 215 122 100 147 109 109 97 121 324 Pakistani 111 97 125 254 117 90 148 67 112 100 125 321 Bangladeshi 92 75 112 97 101 68 145 29 94 78 112 126 Other Asian 103 88 121 152 126 95 164 56 109 94 124 208 Black Caribbean 123 115 131 893 141 126 158 300 127 120 134 1193 Black African 112 103 122 511 121 104 140 188 114 106 123 699 Other Black 116 102 132 232 148 112 191 59 122 108 136 291 Chinese 97 64 140 27 101 61 157 19 98 72 131 46 Other 104 87 122 140 103 75 137 46 103 89 119 186 Total 100 11239 100 5730 100 16969
Care Quality Commission Count me in census 2010 59
Appendix B Mental health tables continued
Table B12 Standardised CTO ratios by ethnic group CTOs on day of census ndash section 17a of the Mental Health Act (England and Wales = 100)
Ethnic group
Men Women Persons
Standardised CTO ratio
95 confidence
interval Observed numbers
Standardised CTO ratio
95 confidence
interval Observed numbers
Standardised CTO ratio
95 confidence
interval Observed numbers
White British 94 89 99 1289 88 82 94 730 92 88 96 2019 White Irish 51 27 88 13 77 41 132 13 62 40 90 26 Other White 97 77 120 83 125 95 162 58 107 90 126 141 White and Black Caribbean 79 53 113 29 141 77 237 14 92 67 124 43 White and Black African 111 59 190 13 125 41 292 5 115 68 181 18 White and Asian 104 54 182 12 136 50 297 6 113 67 178 18 Other Mixed 102 59 166 16 136 62 257 9 112 73 166 25 Indian 134 99 177 48 152 98 226 24 139 109 175 72 Pakistani 145 110 187 59 174 101 279 17 151 119 189 76 Bangladeshi 142 93 206 27 205 99 378 10 155 109 213 37 Other Asian 107 71 155 28 182 99 305 14 124 89 168 42 Black Caribbean 121 103 142 152 171 132 218 65 133 116 152 217 Black African 116 94 142 94 139 98 192 37 122 102 145 131 Other Black 186 144 238 65 305 189 466 21 206 165 254 86 Chinese 83 23 213 4 152 49 354 5 111 51 211 9 Other 87 54 134 21 152 79 266 12 103 71 145 33 Total 100 1953 100 1040 100 2993
Care Quality Commission Count me in census 2010 60
Appendix C Learning disability tables
Table C1 Standardised admission ratios by ethnic group for England and Wales using 2007 ONS population denominators (England amp Wales = 100) All ages
Ethnic group
Men Women Persons Standardised
admission ratio
95 confidence
interval Observed numbers
Standardised admission
ratio
95 confidence
interval Observed numbers
Standardised admission
ratio
95 confidence
interval Observed numbers
White British 104 100 109 2163 108 101 115 941 105 102 109 3104 White Irish 108 72 156 28 151 89 238 18 121 89 162 46 Other White 81 65 101 85 49 30 75 21 72 59 87 106 White and Black Caribbean 280 186 405 28 246 118 453 10 270 191 371 38 White and Black African 102 33 239 5 165 34 482 3 119 51 235 8 White and Asian 66 26 135 7 154 56 335 6 89 47 152 13 Other Mixed 181 104 295 16 229 99 451 8 195 125 290 24 Indian 32 21 48 24 28 12 55 8 31 21 44 32 Pakistani 48 30 72 22 12 1 43 2 38 25 57 24 Bangladeshi 102 60 161 18 31 4 113 2 83 51 128 20 Other Asian 33 13 69 7 92 34 201 6 47 25 81 13 Black Caribbean 265 210 332 77 117 67 190 16 218 176 267 93 Black African 53 33 80 22 40 15 87 6 50 33 72 28 Other Black 228 118 399 12 134 28 392 3 200 112 330 15 Chinese 4 0 21 1 3 0 16 1 Other 26 9 56 6 11 0 59 1 21 9 44 7 Total 100 2521 100 1051 100 3572
Care Quality Commission Count me in census 2010 61
Appendix C Learning disability tables continued
Table C2 Standardised detention ratios by ethnic group all detentions on day of admission (England and Wales = 100)
Ethnic group
Persons Standardised
detention ratio
95 confidence
interval Observed numbers
White British 97 93 103 1431 White Irish 127 84 184 28 Other White 117 91 149 68 White and Black Caribbean 120 77 179 24 White and Black African 114 37 267 5 White and Asian 75 24 176 5 Other Mixed 94 49 165 12 Indian 119 72 186 19 Pakistani 110 61 181 15 Bangladeshi 144 84 231 17 Other Asian 59 16 150 4 Black Caribbean 119 90 155 57 Black African 138 85 210 21 Other Black 62 20 145 5 Chinese 0 0 Other 104 28 267 4 Total 100 1715
Care Quality Commission Count me in census 2010 62
copy Care Quality Commission and National Mental Health Development Unit 2011 Published April 2011
This publication may be reproduced in whole or in part in any format or medium for non-commercial purposes provided that it is reproduced accurately and not used in a derogatory manner or in a misleading context The source should be acknowledged by showing the publication title and copy Care Quality Commission and National Mental Health Development Unit 2011
How to contact us
Phone 03000 616161 Email enquiriescqcorguk Web wwwcqcorguk
Write to us at Care Quality Commission National Correspondence Citygate Gallowgate Newcastle upon Tyne NE1 4PA
Please contact us if you would like a summary of this publication in other formats or languages
Registered office Care Quality Commission Finsbury Tower 103ndash105 Bunhill Row London EC1Y 8TG
- Count me in 2010
- About the Care Quality Commission
- Contents
- Summary
- National organisations coordinating the census
- Introduction
- Data methods of analysis and interpretation
- Results mental health
- A comparison between the 2005 baseline and the 2010 census
- Results learning disabilities
- Data in the future Moving beyond a one-day census
- Conclusions
- References
- Appendix A Methods of analysis
- Appendix B Mental health tables
- Appendix C Learning disability tables
- How to contact us
-

Summary continued
Conclusions
Overall the results of the 2010 census show little change from those reported for previous years A detailed comparison between the 2005 baseline and the 2010 census is on page 32
Although the numbers of inpatients overall have fallen since 2005 ethnic differences in rates of admission detention under the Mental Health Act and seclusion ndash three of DRErsquos 12 goals ndash have not altered materially since the inception of DRE in 2005
bull Admission rates remain higher than average among some minority ethnic groups especially Black and WhiteBlack Mixed groups for whom rates were two or more times higher than average in 2010 (six times higher than average for the Other Black group) In contrast admission rates have consistently been lower than average among the Indian and Chinese groups and about average in the Pakistani and Bangladeshi groups
bull Detention rates have almost consistently been higher than average among the Black White Black Caribbean Mixed and Other White groups The rates for being placed on a CTO were higher among the South Asian and Black groups
bull Although there have been annual fluctuations in seclusion rates they have been higher than average for the Black WhiteBlack Mixed and Other White groups in at least three of the six censuses
These findings however do not in themselves show that mental health and learning disability services are failing to meet the needs of people using services from Black and minority ethnic groups
Ethnic differences in rates of mental illness pathways to care and factors such as socioeconomic disadvantage all contribute to the patterns observed Our previous reports have consistently highlighted the need for prevention early intervention and collaboration across sectors to reduce the risk of admission and detention without compromising the care given to patients Mental health services have a key role to play But partnership between
all statutory agencies and organisations outside the healthcare sector Black and minority ethnic communities and those who use services themselves will be needed to achieve this
This message ndash about preventing mental ill-health by addressing the contributory factors and intervening early ndash is at the heart of No health without mental health the governmentrsquos new strategy for the future of mental health care in England The strategy aims to tackle the economic social and environmental determinants and consequences of mental health problems and to improve outcomes and reduce inequalities
It is complemented by other government proposals for reforms in the NHS public health and adult social care in England all similarly aimed at improving outcomes and reducing inequalities In this new healthcare landscape the proposed NHS Commissioning Board and GP consortia will have a statutory obligation to promote equality and reduce inequalities in healthcare (something also enshrined in the Equality Act 2010) As the lead commissioners of healthcare services it will be up to GP consortia to assess with local authorities the needs of their local populations and commission the right services that meet their requirements And the strengthened public health role of local authorities offers significant potential for addressing the socio-economic disadvantages faced by Black and minority ethnic communities which adds to the burden of mental illness in these communities
Data in the future Moving beyond a one-day census The Count me in census has come to a close For the last six years it has played a key role in providing information about inpatients using mental health and learning disability services But ethnicity recording must be seen as an all-year round statutory requirement not a one-day annual event And there is a need to move on from counting patients to understanding more about care pathways for patients from Black and minority ethnic groups and the factors leading to their hospital admission and detention
Care Quality Commission Count me in census 2010 5
Summary continued
We have consistently highlighted the need for commissioners and providers to make full use of the Mental Health Minimum Data Set (MHMDS) ndash the statutory data set submitted by providers of specialist mental health services in England It provides rich data on these issues
Covering both community and hospital services ndash and now independent and third sector providers as well as NHS ndash it includes a wide range of information about individual patients the services provided to those admitted to hospital and to the much larger number who donrsquot need admission to hospital and the outcomes of care And because it includes year-round activity it is more representative of the overall picture of for example admission detention and readmission rates length of stay years in psychiatric care and contacts with services and professionals
We call on the Information Centre to routinely publish data on all admissions and uses of the Mental Health Act including CTOs in England (in both NHS and independent healthcare providers) by the ethnicity of patients making the MHMDS the definitive source of information about mental health and learning disability patients This data should be risk-adjusted for age gender and other variables as appropriate to enable reliable comparisons to be made across groups
If GP consortia and local authorities are to be effective in their needs assessment and commissioning roles the Information Centre needs to make available and promote to them the data from the MHMDS and other sources And researchers and academics must make full use of the MHMDS to explore the factors that underlie the observed ethnic patterns As effective use of the data is dependent on its quality we call on providers (NHS and independent) to ensure that the completeness and accuracy of their data meets required standards
CQCrsquos role In the meantime CQC will continue to focus strongly on the quality of care provided by mental health and learning disability services
People who find themselves admitted to mental health services or detained under the Mental Health Act and therefore counted by the Count me in census are among the most mentally unwell people in our society Our job is first and foremost to make sure that the care they receive meets the essential standards of quality and safety set out under the Health and Social Care Act 2008 and to work with providers to ensure this We act swiftly when we find services that do not Where we find systemic problems that organisations have not adequately addressed we may impose conditions on the providerrsquos registration to bring about the change needed to improve patientsrsquo experience of care
The essential standards of quality and safety include the requirement to provide single sex accommodation and we will continue to closely check that these standards are met by all mental health services
We intend to introduce a number of indicators derived from the rich information in the MHMDS into our quality and risk profiles for providers This will put greater emphasis on the experience of Black and minority ethnic patients in our regulatory activity
We will monitor the quality of MHMDS data submitted by providers (as reported by the NHS Information Centre) including independent service providers Those with poor data quality may be considered at higher risk in terms of their quality of care
In addition we will continue to monitor the progress of services in relation to the issues raised in the census and other reports including our report on the use of the Mental Health Act through our visits to services and meetings with patients by our Mental Health Act Commissioners and second opinion appointed doctors (SOADs) We will draw on patientsrsquo experiences to monitor the operation of the Mental Health Act
We will also assess the impact of advice and use of Local HealthWatch Local HealthWatch will be in a good position to make sure that providers and commissioners are held to account on matters of choice and access to services for people from Black and minority ethnic groups
Care Quality Commission Count me in census 2010 6
National organisations coordinating the census
The Care Quality Commission (CQC) and the National Mental Health Development Unit (NMHDU) were the two key partners in delivering the 2010 census CQC had lead responsibility
Until March 2009 the Healthcare Commission had overall responsibility for delivering the census in partnership with the Mental Health Act Commission (MHAC) and the National Institute for Mental Health in England (NIMHE) On 1 April 2009 the regulatory functions of the Healthcare Commission MHAC and the Commission for Social Care Inspection were superseded by CQC At the same time NIMHE was superseded by NMHDU
Care Quality Commission The Care Quality Commission is the independent regulator of health and adult social care services in England We also protect the interests of people whose rights are restricted under the Mental Health Act Whether services are provided by the NHS local authorities or by private or voluntary organisations we make sure that people get better care We do this by
bull Acting swiftly to eliminate poor quality care
bull Ensuring care is centred on peoplersquos needs and reflects their human rights
For more information visit the website wwwcqcorguk
National Mental Health Development Unit The NMHDU ran from April 2009 to March 2011 and had a range of programmes funded by the Department of Health and the NHS It provided national support for implementing mental health policy by advising on national and international best practice to improve mental health and mental health services NMHDU did this by commissioning or providing
bull Specialist expertise in priority areas of policy and delivery
bull Effective knowledge transfer on research evidence and good practice
bull Translation of national policies into practical deliverables that achieve outcomes
bull Coordination of national activity to help regional and local implementation
The NMHDU worked closely with the Department of Health and the 10 strategic health authorities It had strategic partnerships with a range of other groups such as the NHS Confederation the Association of Directors of Adult Social Services (ADASS) and the major mental health third sector organisations (wwwnmhduorguknmhdu)
Acknowledgements We acknowledge the role of the Mental Health Act Commission as the chief architect of the census and of the Healthcare Commission and the National Mental Health Development Unit as joint coordinators with MHAC from 2005 to 2009 We acknowledge and thank Jo Simpson (2005-07) and Christina Marriott (2007-10) for project management of the census Giovanna Maria Polato for coordinating the data analysis and Dr Veena Raleigh for being the main author of all six reports Finally we acknowledge and thank Professor Swaran Singh for being the independent member of the Editorial Board
Care Quality Commission Count me in census 2010 7
Introduction
Equality in healthcare means that all patients receive the same high levels of care depending on their needs To achieve this the Government has introduced legislation with which all healthcare organisations must comply
Subject to parliamentary approval the new NHS Commissioning Board will be established in 2011 under the coalition governmentrsquos reforms of the NHS It will have an explicit duty to promote equality and reduce inequalities in peoplersquos access to healthcare and in the outcomes of healthcare services for people in England1 The new focus on improving outcomes of healthcare as outlined in the White Paper Equity and excellence liberating the NHS is underpinned by the supporting NHS Outcomes Framework 201112 which notes that ldquotackling health inequalities and promoting equality is central if the NHS is to deliver health outcomes that are among the best in the worldrdquo2 The requirement to promote equality is also enshrined in the Equality Act 2010 which replaces previous anti-discrimination laws with one single Act prohibiting discrimination on grounds of age sex gender reassignment marriage and civil partnership race disability pregnancy and maternity religion or belief sexual orientation
On 31 March 2010 the Care Quality Commission (CQC) and the National Mental Health Development Unit (NMHDU) carried out a national census to record the ethnicity and other selected details of patients in hospital and outpatients on a community treatment order (CTO) in NHS and independent mental health and learning disability services in England and Wales This is the sixth and final Count me in census Similar censuses have been conducted annually since 200534567
The 2010 census presents the results for patients using mental health services separately to those for patients using learning disability services In this final census report we also include two new sections
bull A comparison of the 2010 census results for mental health patients with the results in 2005 and
bull A section on information that can be used in the future to analyse the quality of mental health services ndash both overall and for particular groups including Black and minority ethnic groups
Mental health
The Count me in censuses were carried out in support of the Department of Healthrsquos five-year action plan introduced in 2005 Delivering Race Equality in Mental Health Care (DRE) which aimed to improve mental health services for Black and minority ethnic communities in England8 The DRE action plan had three building blocks
bull More appropriate and responsive services
bull More community engagement
bull Higher quality information more intelligently used
The census was designed to help healthcare organisations with the third building block by providing information that can be used to plan and deliver services that are relevant to all groups in the community The NMHDU developed a lsquodashboardrsquo of indicators that enabled healthcare organisations to measure their progress towards DRErsquos goals Further details are available at wwwnmhduorgukour-workmhdpdelivering-race-equalitydre-dashboard
The census also supports the Welsh Assembly Governmentrsquos Raising the Standard Race Equality Action Plan for Adult Mental Health Services in Wales published in October 20069 This action plan aims to improve equality of access treatment and outcomes in the provision of adult mental health services for minority ethnic groups in Wales
Care Quality Commission Count me in census 2010 8
Introduction continued
The DRE five-year action plan for England came to a close in 2010 and as such Count me in 2010 is the last in this sequence of annual censuses conducted since 2005 DRErsquos underlying goal of promoting equity in healthcare for Black and minority ethnic communities in England continues to be reflected in the Governmentrsquos reforms of the NHS and is essential for demonstrating compliance with equality legislation
The Governmentrsquos recently announced strategy for mental health in England commits to improving ldquooutcomes for people with mental health problems through high-quality services that are equally accessible to allrdquo10 No health without mental health puts a focus on the mental health and wellbeing of the whole population and makes mental health ldquoeveryonersquos businessrdquo The strategy outlines six objectives
bull More people will have good mental health
bull More people with mental health problems will recover
bull More people with mental health problems will have good physical health
bull More people will have a positive experience of care and support
bull Fewer people will suffer avoidable harm
bull Fewer people will experience stigma and discrimination
No health without mental health has a cross-government and cross-sectoral focus on prevention and the mental wellbeing of the population through public health measures early intervention and personalised care It also recognises that levels of mental illness and the ways in which mental health services are used vary between different ethnic groups reflecting the socioeconomic and other disadvantages that people from Black and minority ethnic groups often experience The strategy provides extra funding for psychological therapies with expanded provision for specific groups including children young people and those with severe mental illness
This strategy follows on from New horizons introduced by the previous government in 2009 which similarly adopted a wider public health approach to promoting the mental health and wellbeing of the population11
Learning disabilities
In 2001 Valuing people set out the previous governmentrsquos vision for people with a learning disability based on four key principles of rights independence choice and inclusion12 Valuing people now a new three year strategy for people with learning disabilities published in 2009 set out the strategy for the next three years13 It also provided the previous governmentrsquos response to the recommendations in Healthcare for all the report of the independent inquiry into access to healthcare for people with learning disabilities14 and to the report of the Joint Committee on Human Rights A life like any other15 The vision remained as set out in Valuing people that all people with a learning disability have the right to lead their lives like any others with the same opportunities and responsibilities and to be treated with the same dignity and respect Valuing people now also set out cross-government commitments and actions to increase the capacity and capability to deliver services locally
In 2010 the Department of Health published a report describing progress made under Valuing people now 16
It focused on the key priorities of improving outcomes for people with learning disabilities in health housing and employment and showed where more work is needed to improve their lives The report includes additional guidance containing good practice examples about different aspects of the Valuing people now programme
A report by the Disability Rights Commission provides evidence that people with learning disabilities or severe mental health problems are more likely to develop serious health conditions and to die of them
Care Quality Commission Count me in census 2010 9
Introduction continued
sooner than other people They are also less likely to receive some treatments than people with the same medical condition but without a mental health condition or learning disability17 Learning difficulties and ethnicity noted that the disadvantage experienced by people from minority ethnic communities because of their ethnicity (for example in education and employment) is compounded by the disadvantage they experience because of their learning disability18
Aims of the census
The goals of the 2010 census are the same as those in previous years
bull To obtain robust figures for all inpatients in mental health and learning disability services in England and Wales The 2010 census also includes information about outpatients on CTOs
bull To encourage service providers to implement systems for recording patientsrsquo ethnicity and for using this information for ethnic monitoring
bull To provide information that will help service providers to take practical steps to achieve the goals of DRE
In 2005 the census only included inpatients in mental health services in England and Wales including those detained in hospital under the Mental Health Act 1983 From 2006 the census was extended to include inpatients in learning disability services CTOs introduced in November 2008 as a result of the Mental Health Act 2007 allow for supervised treatment of patients in the community Therefore in 2009 and 2010 the census included patients subject to supervised treatment in the community under the Mental Health Act most of whom were therefore outpatients in the community and were not in hospital on census day
As one of the aims of the census is to provide figures on inpatients and all those subject to the Mental Health Act on census day the analysis in this report is not limited to inpatients and also includes outpatients on CTOs (except where stated otherwise) If we excluded outpatients on a CTO from the analysis we would have an incomplete profile of ethnic differences in the rates of patients subject to the Mental Health Act We therefore considered it important to include these patients This provides a more rounded basis for examining the use of the Act ndash overall and in relation to CTOs ndash among different ethnic groups and is consistent with the analytical approach used in the 2009 census report
Although the census included some children and young people the terms ldquomenrdquo and ldquowomenrdquo are used throughout this report to refer to people of all ages ndash including children young people and older people The census does not include children and young people in residential settings such as paediatric wards and those looked after by social services
More information about the census and how it was carried out including the full set of results is available at wwwcqcorgukcountmein
Care Quality Commission Count me in census 2010 10
Data methods of analysis and interpretation
Ethnic groups
The ethnic categories referred to in this report are those used by the Office for National Statistics (ONS) in its 2001 census of the general population of England and Wales (see box 1) The term lsquoBlack and minority ethnic groupsrsquo defines all groups other than lsquoWhite Britishrsquo
Box 1 Ethnic categories used in this report
White British Pakistani White Irish Bangladeshi Other White Other Asian WhiteBlack Caribbean Mixed Black Caribbean WhiteBlack African Mixed Black African WhiteAsian Mixed Other Black Other Mixed Chinese Indian Other
Coverage of learning disability establishments
The 2010 census included all healthcare providers in England registered with CQC on 31 March 2010 and all healthcare providers in Wales registered with the Healthcare Inspectorate Wales to provide inpatient learning disability services It did not include care homes
In the NHS there is a continuum from inpatient services through to registered and supported homes All of these can have some links to the NHS either directly or through seconded staff Where such NHS facilities were both registered as care homes under the Care Standards Act 2000 and regulated by CQC they were included
Distinguishing between mental health inpatients and learning disability inpatients
Some healthcare providers offer both mental health and learning disability services and there is considerable overlap between them The census asked providers to distinguish between services by describing wards as either ldquomainly providing mental health servicesrdquo or ldquomainly providing learning disability servicesrdquo This separation by ward type enables us to compare the results across years and ensures that no patient is counted twice
It is important to note however that some patients on mental health wards may have a learning disability or Autistic Spectrum Disorder including Aspergerrsquos syndrome Similarly some patients on learning disability wards may have a mental health problem The distinction of mental health and learning disability patients on the basis of ward is therefore an approximation
Care Quality Commission Count me in census 2010 11
Data methods of analysis and interpretation continued
Methods of statistical analysis
The statistical methods used for data analysis in this report are given in Appendix A
For the admission rates the ONS estimates of the general population in 2007 were used as denominators The Black and minority ethnic population of England and Wales has increased significantly since the 2001 ONS census ONS has produced updated population estimates by ethnic group for 2007 (the latest year for which these estimates are available) which reflect the demographic changes since 2001 The number of people from Black and minority ethnic groups (ie excluding the White British group) in England and Wales is estimated to have increased from 65 million in 2001 to 85 million in 2007 a rise of 30 As a result the proportion of the total population that is not from the White British group increased from 13 to 16 over this period We used the 2007 population estimates to calculate the admission rates in order to present a more up-to-date and accurate picture of ethnic differences However these figures do not reflect any demographic changes between 2007 and 2010 the year of this census
To make a comparison with the DRE baseline we also present admission rates from the 2005 census derived using the 2005 ONS population estimates by ethnic group as denominators These figures will not be the same as those published in the 2005 census report which were based on the 2001 ONS census population estimates because updated estimates of populations by ethnic group were not available at that time
For all other analyses (for example rates of use of the Mental Health Act seclusion etc) the patient numbers in the census were used as denominators
Unlike the censuses of 2005 to 2008 that counted only inpatients the 2009 and 2010 censuses also included outpatients on a CTO on census day This is because (a) the census aims to cover all patients subject to the Mental Health Act on census day and (b) we would not have been able to analyse standardised ratios for CTOs for different ethnic groups if CTO patients had been excluded from the analysis However CTO outpatients are excluded from selected analyses where appropriate including the analysis of rates for admissions detentions on admission source of referral single sex accommodation and recorded incidents of seclusion restraint accidents assault and self-harm The issue relating to the analysis of outpatients on a CTO only affects the sections of the report relating to mental health patients as there were very few learning disability patients on CTOs
Some results in this report are standardised for age and gender (those relating to admission detention source of referral care programme approach seclusion restraint accidents assault self-harm consent and presence on a secure ward) This is because there are underlying differences in the age and gender profiles of different ethnic populations and comparisons based on crude rates would be misleading Standardisation allows comparisons between different ethnic groups by taking account of variations in age and gender The report uses the conventionally accepted statistical methods for standardisation
The terms ldquohigherrdquo and ldquolowerrdquo than average used in the text for ethnic comparisons relate to differences from the national average that are statistically significant at the 5 level
Care Quality Commission Count me in census 2010 12
Data methods of analysis and interpretation continued
Interpreting the results
In this report for convenience we refer to ldquoadmission ratesrdquo for mental health and learning disability patients However these are in fact population-based rates of patients who were in hospital or subject to the Mental Health Act on census day and not rates for admissions actually made on the census day itself The number of admissions on census day will differ from the number of patients in hospital on that day and both of these will differ from the number of admissions throughout the year
As with any study our results have some caveats
1 The admission rates presented for minority ethnic groups in this report are higher than would be expected because they are based on ONS population estimates by ethnic group for 200719 the latest year available rather than population estimates for 2010 Therefore the admission rates do not take into account demographic changes between 2007 and 2010 Furthermore these population estimates are described by ONS as ldquoexperimentalrdquo and are subject to margins of error
2 The results are not adjusted for diagnosis and other clinical information so they may reflect differences between ethnic groups in the levels nature or severity of mental illness or disability
3 The data collected for the census does not allow adjustment for socioeconomic factors such as poverty unemployment and inner-city residence These occur more commonly in Black and minority ethnic communities Equally it was not possible to take account of social factors such as marital status living alone separation from one or both parents or lack of social networks Both socioeconomic and social factors are known to be associated with the risk of mental illness and can affect pathways into care and the nature of patientsrsquo interaction with services
4 Rates based on small and fluctuating numbers of patients can change in either direction (high to low or vice versa) from one year to the next as a result of random rather than real variation and regression to the mean
5 The census does not assess the quality of services the experience of patients or the reasons for any differences between ethnic groups
6 We have explained the rationale for including outpatients on CTOs in this report While this enables us to comment on CTOs on census day in addition to those who are inpatients it does mean that the overall census population is not restricted to inpatients as in the reports for the years preceding 2009 and 2010
7 The census is a one-day count designed to give the number and ethnic composition of patients on that day Its value is in providing a year-by-year snapshot profile However by its very nature it cannot give the picture for the whole year As we have shown in the section lsquoData in the future Moving beyond a one-day censusrsquo a one-day picture can differ from results based on a full yearrsquos data because a one-day picture over-represents long-stay patients and under-represents short stay admissions
Care Quality Commission Count me in census 2010 13
Results mental health
We collected information on 32799 patients from the mental health services of 261 NHS and independent healthcare organisations in England and Wales This included 29840 inpatients of whom 75 were inpatients on a CTO and a further 2959 patients on a CTO who were outpatients on census day The number of inpatients in each census has declined each year from 33785 in 2005 to 29840 in 2010 (excluding the 2959 outpatients on a CTO) a fall of 12 since 2005 (see Table 1)
All eligible establishments took part in the census The total number of providers increased from 207 in 2005 to 261 in 2010 primarily due to an increase in the number of independent healthcare providers in both England and Wales In contrast the number of NHS providers in England was lower than in the baseline year 2005 and did not change much in Wales The proportion of patients cared for by independent providers has risen from 10 in 2005 to 16 in 2010
Table 1 Number of providers of mental health services and patients
NHS (England)
Independent (England)
NHS (Wales)
Independent (Wales) Total
2010 census Number of providers 78 160 9 14 261 Number of all patients 32799 (including outpatients 25653 4787 1958 401 (including 2959 on a CTO) outpatients on a CTO) of all patients 782 146 60 12 100
2009 census Number of providers 79 158 10 17 264 Number of all patients 31786 (including outpatients 24941 4594 1845 406 (including 1253 on a CTO) outpatients on a CTO) of all patients 785 145 58 13 100
2008 census Number of providers 87 141 11 16 255 Number of inpatients 24842 3931 1892 355 31020 of inpatients 801 127 61 11 100
2007 census Number of providers 82 153 11 11 257 Number of inpatients 25020 4030 1875 262 31187 of inpatients 802 129 60 08 100
2006 census Number of providers 97 125 11 5 238 Number of inpatients 26565 3341 1962 155 32023 of inpatients 830 104 61 05 100
2005 census Number of providers 92 98 10 7 Number of inpatients 28590 3078 1939 178 33785 of inpatients 846 91 57 05 100
Care Quality Commission Count me in census 2010 14
207
Results mental health continued
Ethnicity
Information about ethnicity was available for 98 of patients Of these patients 75 were White British and 23 belonged to Black and minority ethnic groups defined as all groups that are not White British This compares with 20 in 2005
Compared with the baseline year of 2005 the 2010 census recorded a lower proportion of patients from the White British White Irish and Other Black groups (see Table 2) There were increases in the proportions of patients from the Other White WhiteBlack Caribbean Mixed Black Caribbean and Black African groups Other ethnic groups showed only minor differences over the baseline year
Table 2 Mental health patients by ethnic group
Ethnic group 2010 census 2009 census 2008 census 2007 census 2006 census 2005 census
Number Number Number Number Number Number
White British 750 24593 757 24067 765 23738 776 24198 786 25170 792 26762
White Irish 16 514 19 591 18 567 17 538 18 582 22 727
Other White 43 1407 43 1360 45 1399 46 1449 38 1210 31 1055
White and Black Caribbean
13 418 11 336 11 336 09 288 09 287 08 255
White and Black African
04 139 03 91 04 110 03 91 03 102 02 71
White and Asian 04 141 04 137 04 117 03 91 03 109 03 104
Other Mixed 06 200 07 213 05 148 06 180 05 173 05 167
Indian 16 529 14 460 14 426 13 393 13 411 13 434
Pakistani 13 440 13 409 13 396 10 315 11 349 10 325
Bangladeshi 06 203 05 171 05 144 04 130 05 158 05 153
Other Asian 09 311 09 273 10 300 08 261 08 262 08 264
Black Caribbean 49 1608 47 1504 47 1468 43 1330 39 1264 41 1369
Black African 29 957 26 834 23 715 21 648 20 652 19 645
Other Black 11 368 12 384 12 376 17 545 17 535 17 569
Chinese 03 83 03 82 03 91 03 82 02 78 02 81
Other 09 296 10 322 12 362 11 356 11 338 11 357
Not stated 18 592 17 552 11 327 09 292 11 342 12 416
Invalid 0 1 01 31
100 32799 100 31786 100 31020 100 31187 100 32023 100 33785 Total
Care Quality Commission Count me in census 2010 15
Results mental health continued
As in the previous censuses patients from Black and minority ethnic groups were concentrated in a relatively small number of organisations 70 were patients in 25 of the 261 organisations that took part in the census Of all organisations 194 had fewer than 50 patients from Black and minority ethnic groups each and another 32 organisations had no patients at all from these groups
Reporting of ethnicity
Eighty-one per cent of patients reported their own ethnic group Where patients did not do so staff or relatives did so on their behalf (10 and 6 respectively) We cannot be certain that ethnicity was recorded accurately for these patients The proportion of patients who reported their own ethnicity ranged from about 81 in the White groups to 90 in the WhiteBlack African Mixed group
Care Quality Commission Count me in census 2010 16
Results mental health continued
Age and gender
Ethnic differences in the age profiles of patients largely reflect the age profiles of different minority ethnic populations The White British White Irish and Other White populations have an older age structure than other minority ethnic populations and therefore patients from the White groups are significantly older than patients from other ethnic groups (see Table 3)
Overall 58 of patients were men Men outnumbered women in all ethnic groups (see Table 3) The White British White Irish Other White and Chinese groups had smaller differences in the proportions of men and women compared with other ethnic groups
Table 3 Age and gender of patients
Ethnic group Age () Gender ()
Total (n) 0-17 18-24 25-49 50-64 65+ Men Women
White British 1 7 41 20 31 56 44 100 (24593)
White Irish 0 4 36 19 41 56 44 100 (514)
Other White 2 7 47 19 25 58 42 100 (1407) White and Black Caribbean 1 13 68 12 5 73 27 100 (418)
White and Black African 1 13 73 9 4 67 33 100 (139)
White and Asian 4 18 63 11 5 65 35 100 (141)
Other Mixed 2 13 69 11 6 62 38 100 (200)
Indian 1 4 58 21 15 63 37 100 (529)
Pakistani 2 10 73 12 4 74 26 100 (440)
Bangladeshi 2 15 69 8 6 72 28 100 (203)
Other Asian 2 12 61 13 13 70 30 100 (311)
Black Caribbean 1 6 61 20 13 70 30 100 (1608)
Black African 1 10 75 9 5 67 33 100 (957)
Other Black 1 6 78 11 3 78 22 100 (368)
Chinese 2 10 59 17 12 52 48 100 (83)
Other 2 12 57 18 11 67 33 100 (296)
1 7 46 19 27 58 42 100 Total (n=
471) (n=
2352) (n=
14998) (n=
6093) (n=
8885) (n=
19071) (n=
13684) (n=
32799)
Care Quality Commission Count me in census 2010 17
Results mental health continued
Language and religion
Similar to previous censuses 5 of patients reported that their first language was not English (see Table 4) The Chinese and Bangladeshi groups had the highest proportions of patients whose first language was not English (51 and 46 respectively) Among the Other White group 27 had a first language other than English Again similar to previous censuses about 2 of patients said they needed an interpreter and of these 24 were from the White British group
Table 4 Percentage of patients with a first language other than English
Ethnic group with first language other than English
White British 1
White Irish 3
Other White 27
White and Black Caribbean 2
White and Black African 10
White and Asian 6
Other Mixed 11
Indian 26
Pakistani 35
Bangladeshi 46
Other Asian 34
Black Caribbean 2
Black African 22
Other Black 13
Chinese 51
Other 41
Total 5
Care Quality Commission Count me in census 2010 18
Results mental health continued
Religion was not stated for 21 of patients and 15 of patients said they had no religion The proportions stating they did not have a religion were highest among the WhiteBlack Caribbean and WhiteAsian Mixed groups (23 and 21 respectively) and lowest among the South Asian groups (4) Table 5 shows the religion of patients
Table 5 Religion of patients by ethnic group
Ethnic group
Religion and faith groups ()
None Christian Buddhist Hindu Jewish Muslim Sikh Any other religion
Not stated
White British 16 58 1 0 1 0 0 3 21
White Irish 8 73 0 0 0 5 13
Other White 13 53 1 0 3 5 7 18 White and Black Caribbean 23 47 0 1 0 3 7 17
White and Black African 16 41 1 1 15 6 20
White and Asian 21 33 1 1 21 3 3 18
Other Mixed 15 41 3 3 16 8 17
Indian 5 10 0 29 15 28 2 11
Pakistani 4 3 0 1 1 80 1 2 10
Bangladeshi 4 1 1 1 76 1 5 11
Other Asian 6 14 5 12 39 5 3 16
Black Caribbean 12 59 1 0 0 2 8 17
Black African 10 45 0 0 22 0 3 19
Other Black 12 41 1 1 0 16 7 22
Chinese 18 30 16 1 4 31
Other 8 24 3 1 3 34 6 21
Total 15 54 1 1 1 4 1 4 21
Care Quality Commission Count me in census 2010 19
Results mental health continued
Sexual orientation
The results for sexual orientation were not valid for 1 of patients and for 20 the response was recorded as ldquonot knownrdquo Seventy-six per cent of patients said they were heterosexual 1 said gay lesbian 1 said bisexual and less than 1 said ldquootherrdquo The number of minority ethnic patients who were gaylesbian or bisexual was very low
The overall figure of 1 who said they were gay lesbian or bisexual is lower than some estimates of the proportions of gaylesbian or bisexual people in the general population (5 to 7)2021 However in the 200910 Integrated Household Survey of a representative sample of 238206 people in UK conducted by the Office for National Statistics 1 identified themselves as gay or lesbian 05 as bisexual 05 as ldquootherrdquo 3 responded as ldquodo not knowrdquo or refused to answer and 95 identified themselves as heterosexualstraight22
Disability
About 75 of patients said they did not have a disability and 25 said they had one or more disabilities Of these 7 were blind or visually impaired 1 were deaf or had a hearing impairment 1 had Autistic Spectrum Disorder 2 had a learning disability 4 had a mobility impairment and 2 used a wheelchair The remaining 8 had more than one disability The proportion of patients with a disability was highest among the White British White Irish and Other White groups (about 28) which could reflect the higher age profiles of these patients compared with other ethnic groups
Rates of admission (see section on interpreting the results on page 13)
The rates of admission derived using the 2007 ONS ethnic population estimates as denominators are given in Appendix B Tables B1 (all ages) and B2 (ages 65 and over) Outpatients on a CTO are excluded from these results
All ages Admission rates were lower than average for patients from the White British Indian and Chinese groups and were average for the Pakistani and Bangladeshi groups Rates were higher than average for other minority ethnic groups they were particularly high for the Black Caribbean Black African WhiteBlack Caribbean Mixed and WhiteBlack African Mixed groups who had rates two to four times higher than average and for the Other Black group with a rate six times higher
Ages 65 and over Age-standardised admission rates for minority ethnic groups at older ages show broadly similar patterns to those reported for all ages with rates two to three times higher than average among the Black and White Black Mixed groups Rates were high also in the White Irish Other White Other Asian and Other groups
Numbers of older Black and minority ethnic patients were too few in most ethnic groups to support analyses of subgroups within them for example those detained
Care Quality Commission Count me in census 2010 20
Results mental health continued
Source of referral
People can be referred to healthcare services in a number of ways Referrals for inpatient care often come from community mental health teams rather than the original source such as GPs and accident and emergency (AampE) departments Therefore referrals from these teams may include referrals from other sources Furthermore about a quarter of patients (26) were referred from tertiary care and information about their original referral source was not available We had no information about the source of referral for 13 of patients The results reflect the proportions of patients from each ethnic group that are referred from each source so a higher proportion of referrals from one source will inevitably mean that proportions from other referral sources are lower Outpatients on a CTO are excluded from these data
The referral patterns are broadly similar to those reported previously and the key results are presented below
GP referrals 7 of patients Rates were 8 higher than average among the White British group They were lower than average among the Other White Black Caribbean Black African and WhiteBlack Caribbean Mixed groups by 28 to 72 The rates of referral by GPs are given in Appendix B Table B3
Referrals from AampE departments 5 of patients The White British group had a 9 lower than average rate of such referrals The WhiteBlack African Mixed Indian Bangladeshi Black African and Other groups were more likely than average to be referred in this way
Referrals from community mental health teams 26 of patients For the White British group such referrals were 5 higher than the average rate They were lower than average among the Other White WhiteBlack African Mixed Black Caribbean Black African and
Other Black groups by 16 to 48 The rates of referral are given in Appendix B Table B4
Referrals from the criminal justice system 9 of patients This is defined as the police courts probation service prison and court liaison and diversion service
Patients from the White British group were less likely than average to be referred by the criminal justice agencies whereas the Black Caribbean Black African Other Black WhiteBlack African Mixed and Other Asian groups were 30 to 83 more likely than average to be referred in this way We observed no differences from the average rate for other ethnic groups Rates of referral by the criminal justice system are given in Appendix B Table B5
A significant proportion (26) of all referrals were from tertiary care
Tertiary care referrals from medium or high secure units 5 of patients The rate for such referrals (in NHS or independent sectors) was lower than average among the Other White and Indian groups It was higher than average among the Black Caribbean and WhiteBlack Caribbean Mixed groups by about 75
Tertiary care referrals from other inpatient services 21 of patients The rate for such referrals (NHS and independent) was higher than average among the White Irish and Other White groups by 29 and 59 respectively The rate was lower than average in the Indian and Other Black groups
Tertiary care referrals from other clinical specialties 9 of patients Rates of such referrals were higher than average among the White British and Indian groups and lower than average among the Other White WhiteBlack Caribbean Mixed Other Asian Black African Other Black and Chinese groups
Care Quality Commission Count me in census 2010 21
Results mental health continued
Detention under the Mental Health Act 1983 on day of admission
The Mental Health Act 2007 made a number of changes to the Mental Health Act 1983 These changes were reflected in the census of 2009 and 2010 which collected information on new provisions establishing supervised community treatment (section 17A) and excluded supervised discharge (section 25A) which was abolished
As in previous reports we present below the results for detention rates on the day of admission Outpatients on a CTO are excluded from these analyses After that we present rates for all patients subject to the Mental Health Act on census day (including outpatients on a CTO) followed by rates for patients on a CTO on census day
All detentions Forty-nine per cent (14637) of patients were detained under the Mental Health Act on admission to hospital This was a higher proportion than recorded in the previous censuses (40 in 2005 and 2006 43 in 2007 45 in 2008 and 47 in 2009)
Detention rates were 6 lower than average among White British patients and between 19 and 32 higher than average among the Black Caribbean Black African Other Black and WhiteBlack Caribbean Mixed groups Detention rates were also higher in the White Irish and Other White groups by about 13 and in the Other Mixed group by 22 No other ethnic differences were observed The results are given in Appendix B Table B6
These patterns are broadly similar to those reported in previous censuses
Detention under section 2 Section 2 of the Mental Health Act gives authority for a person to be detained in hospital for assessment for a period not exceeding 28 days It is mainly applied where the patient is unknown to the service or where there has been a significant interval between periods of inpatient treatment
Of all patients detained on admission 22 were detained under section 2 Rates of detention under this section were lower than average among the White British WhiteBlack Caribbean Mixed and Black Caribbean groups and higher than average among the Bangladeshi Other Asian Black African Chinese and Other groups by between 50 and 103 (see Appendix B Table B7)
Detention under section 3 Section 3 of the Act provides for the compulsory admission of a patient to hospital for lsquotreatmentrsquo and for his or her subsequent detention which can last for an initial period of up to six months and is renewable after this
Of all patients detained on admission 43 were detained under this section Rates were higher than average among the White Irish and Black Caribbean groups by 24 and 29 respectively and lower among than average among the Bangladeshi group No other ethnic differences were observed The rates of detention under section 3 are given in Appendix B Table B8
Detention under section 3741 Section 37 of the Mental Health Act allows a court to send a person to hospital for treatment when they might otherwise have been given a prison sentence and section 41 allows a court to place restrictions on a personrsquos discharge from hospital Admission to hospital rather than prison is generally regarded as a more positive outcome for the person concerned
Care Quality Commission Count me in census 2010 22
Results mental health continued
Of all patients detained on admission 14 were detained under section 37 with a section 41 restriction order applied The rates of detention are given in Appendix B Table B9 In all minority ethnic groups very few women were detained under section 3741 Among men the rate of detention for the White British group was 16 lower than average and it was higher than average in the WhiteBlack Caribbean Mixed group by 77 the Black Caribbean group by 100 the Black African group by 27 and the Other Black group by 52
A consistent pattern across all six annual censuses was the higher than average detention rate under section 3741 for the Black Caribbean and Other Black groups
Detention under sections 47 48 and 4749 These sections of the Mental Health Act allow the Ministry of Justice to issue a direction to transfer a person detained in prison to a hospital for treatment
Of all patients detained on admission 7 were detained under these sections The only ethnic differences observed were a 107 higher than average detention rate among men from the White Black African Mixed group and a lower than average rate for the Indian group We observed no other ethnic differences probably because the numbers of detentions under these sections were low in most minority ethnic groups These rates of detention are given in Appendix B Table B10
The previous four censuses also showed virtually no ethnic differences for rates of detention under sections 47 48 and 4749
Patients subject to the Mental Health Act 1983 on day of census
All patients subject to the Mental Health Act Of all the 32399 patients in the census a total of 53 (17299) were subject to the Mental Health Act on census day including 2959 outpatients and 75 inpatients on a CTO (either voluntarily or recalled) Ratios for the different ethnic groups for overall applications of the Mental Health Act including CTOs showed broadly similar patterns to detention rates on admission day from which patients on a CTO were excluded In both cases rates were higher than average among the Black Caribbean Black African Other Black and White Black Caribbean Mixed groups However the higher than average detention rates for the White Irish Other White and Other Mixed groups on admission day were not apparent on census day
The rates are given in Appendix B Table B11
Supervised community treatment under section 17A Community treatment orders (CTOs) were introduced in November 2008 as a result of the Mental Health Act 2007 They allow for supervised community treatment to be provided for up to six months with the possibility of an extension after this These orders are designed to help patients to maintain stable mental health outside hospital and to promote recovery by providing professionals with the power to set conditions on discharge from hospital and a power to recall patients if arrangements in the community are not working
Nine per cent of all patients in the census were on CTOs compared with 4 in 2009 Of all the 17299 patients subject to the Mental Health Act on census day almost 18 (3034) were on CTOs Of the patients on a CTO 2959 were outpatients and 75 were inpatients (50 voluntary and 25 recalled)
Care Quality Commission Count me in census 2010 23
Results mental health continued
The rate of supervised community treatment among all patients included in the census was lower than average in the White British and White Irish groups and higher than average in the South Asian (Indian Pakistani Bangladeshi) and Black (Black Caribbean Black African Other Black) groups by 22 to 106 The ratios are given in Appendix B Table B12
Consent
About 25 of informally admitted patients were deemed incapable of consenting to treatment The only ethnic difference observed was a higher than average rate for the Pakistani group but this was based on very few patients
About 18 of patients who were detained or on CTOs were deemed incapable of consenting to treatment These rates were lower than average by 7 in the White British group and were higher than average among the Other White WhiteBlack Caribbean Mixed and Black African groups by 21 35 and 36 respectively
In addition 13 of patients who were detained or on CTOs on census day were deemed capable of consenting to treatment but refused to do so The White British group had a rate of refusals that was 10 lower than average and rates were higher than average among the White Irish WhiteBlack Caribbean Mixed Other Mixed Black Caribbean and Black African groups by between 39 and 71
Care programme approach
The Care Programme Approach (CPA) is the process by which treatment care and support for people with serious mental health problems and accompanying health and social care needs are agreed coordinated and understood by all involved From October 2008 changes to the CPA in England
mean that it is no longer categorised into two parts (lsquostandardrsquo and lsquoenhancedrsquo) and just the one category of enhanced CPA applies This makes CPA policy in England different to that in Wales where the distinction still applies The CPA data presented here therefore includes all CPA patients in England and both lsquostandardrsquo and lsquoenhancedrsquo CPA patients in Wales
About 89 of all patients were on a CPA 3 were on a single assessment process (SAP) whereby assessments are made for adults with health and or social care needs and 8 were on neither CPA nor SAP As most patients were on a CPA no ethnic differences were observed
Recorded incidents
The 2010 census asked about the number of times that patients experienced seclusion hands-on restraint self-harm accident and physical assault in a current hospital spell or if the patientrsquos hospital spell was longer than three months the number that took place within the last three months Outpatients on a CTO are excluded from these data It should be noted that the rates of such events among minority ethnic groups can show yearly variation because of the low numbers of events in several groups
Seclusion Seclusion was defined as the supervised confinement of a patient in a room which may be locked to protect others from significant harm Four per cent of patients had experienced one or more episodes of seclusion The White British group had a seclusion rate that was 9 lower than average Rates were higher than average among the WhiteBlack Caribbean Mixed WhiteBlack African Mixed Black Caribbean and Black African groups by 80 90 36 and 56 respectively
Care Quality Commission Count me in census 2010 24
Results mental health continued
Although the number of incidents of seclusion was low in several minority ethnic groups some general patterns over the six censuses to date are
bull The proportion of all patients who had an episode of seclusion stayed fairly constant over the six censuses at about 4
bull Although there have been annual fluctuations the seclusion rate has been higher than average for the Black and WhiteBlack Mixed groups in three or four of the six censuses and in the Other White group in three censuses
Hands-on restraint This was defined as the physical restraint of a patient by one or more members of staff in response to aggressive behaviour or resistance to treatment About 12 of patients had experienced one or more episodes of hands-on restraint No ethnic differences were observed In fact very few ethnic differences have been observed in the previous censuses also and they have not shown a consistent pattern
Self-harm Eight per cent of patients had harmed themselves on one or more occasions Only the White British group had a rate that was higher than average (by 14) Rates were lower than average among several minority ethnic groups the three Black groups (Black Caribbean Black African and Other Black) by about 70 the three south Asian groups (Indian Pakistani Bangladeshi) by between 37 and 78 and the Other Mixed and Other Asian groups by about 60
In terms of comparison with previous years
bull The proportion of all patients who had harmed themselves stayed fairly constant at about 7ndash8
bull In all censuses the White British group had a higher than average rate of self-harm and the Black and South Asian groups had lower than average rates of self-harm
Accidents About 11 of patients had experienced one or more accidents Patients from the White British group experienced a rate of accidents that was 6 higher than average Rates were lower than average in the Black Caribbean Black African Other Black and Other Asian groups by about 50 to 70 No accidents were reported for the Chinese group
In terms of comparisons with previous years
bull The proportion of all patients who had had an accident stayed fairly constant
bull The rate of accidents in the different censuses was higher than average in the White British group and lower than average in the Black Caribbean group Few other ethnic differences were observed and they were not consistent
Physical assault on the patient The definition of assault includes incidents of physical assault on the patient irrespective of who committed the assault We do not have information on who committed the assault for example whether it was another patient or a member of staff Eleven per cent of patients were involved in one or more episodes of physical assault The only ethnic difference observed was a 19 lower than average rate among the Black Caribbean group
In terms of comparisons with previous years
bull The proportion of all patients who had experienced a physical assault stayed fairly constant
bull Very few ethnic differences in rates of assault were observed in the different censuses and they did not show a consistent pattern
Care Quality Commission Count me in census 2010 25
Results mental health continued
Duration of stay in hospital from admission to census day
We analysed the length of the period between each inpatientrsquos admission to hospital and the census day This period is of course shorter than a patientrsquos full length of stay in hospital which runs from admission to the date when they are discharged Outpatients on a CTO are excluded from the following analyses
bull 25 of inpatients had been in hospital for one month or less
bull 20 had been in hospital between one and three months
bull 13 had been in hospital between three and six months
bull 11 had been in hospital between six months and one year
bull 11 had been in hospital between one and two years
bull 12 had been in hospital between two and five years
bull 8 had been in hospital for more than five years
These results are similar to those of previous censuses About 31 of patients in the 2010 census had been in hospital for more than a year and had therefore also been included in the 2009 census About 20 of patients had been in hospital for more than two years and will have been included in both the 2008 and 2009 censuses
We calculated the median length of stay for different ethnic groups The median is the midpoint of the range of values so the median length of stay is the one at which half the patients had a length of stay less than the median and half had a stay longer than the median Overall and as in previous years the median amount of time that women had spent in hospital was about 25 months and the median for men was about 58 months (see Table 6) In most ethnic groups the median time spent in hospital was two to three times longer for men than for women in the Other Black group men had been in hospital four times longer than women
Median lengths of stay were longest for men from the Black Caribbean WhiteBlack Caribbean Mixed and Other Black groups and shortest for men from the Chinese Bangladeshi and Other groups Median lengths of stay were longest for women from the WhiteBlack Caribbean Mixed and Black Caribbean groups and shortest for women from the Chinese and Bangladeshi groups
A number of important factors influence a patientrsquos length of stay in hospital including age gender whether or not they are detained under the Mental Health Act (and the section under which they are detained and whether there is an additional restriction order) the type and severity of their illness the nature of their treatment and the availability of support in the community The data in the census does not allow for analysis of these factors
Table 6 Median number of days from the day of admission to the day of census
Ethnic group Men Women
White British 161 71
White Irish 218 114
Other White 238 113
White and Black Caribbean 275 191
White and Black African 182 92
White and Asian 226 78
Other Mixed 173 112
Indian 172 70
Pakistani 153 56
Bangladeshi 134 55
Other Asian 167 61
Black Caribbean 345 122
Black African 141 66
Other Black 248 58
Chinese 135 51
Other 131 76
Total 174 75
Care Quality Commission Count me in census 2010 26
Results mental health continued
Ward security
As in previous years about 11 of all patients were on a medium or high secure ward as opposed to a general (76) or low secure (13) ward
Patients from the White British Indian and Bangladeshi groups were less likely than average to be on a medium or high secure ward by 7 30 and 67 respectively Patients from the White Irish WhiteBlack Caribbean Mixed Black Caribbean and Other Black groups had a higher than average rate by between 43 and 55
Age range on wards
Among patients under 18 years of age 61 were being cared for on wards for working-age adults on census day and five patients were on a ward for older people Seven per cent of patients on wards for working-age adults were 65 or over and
8 of those on wards for older people were adults of working age There were very few lsquoout of agersquo placements among minority ethnic groups
Patients in wards designated as single sex or mixed
Providers were asked whether patients were on a ward designated as men or women only or mixed gender All the analyses of single sex accommodation and facilities exclude outpatients on a CTO Overall 61 of men and 77 of women were not in a ward designated for single sex use similar proportions as in previous years The proportion of patients not in a designated single sex ward was lower among almost all minority ethnic groups than among the White British group In all ethnic groups the proportion of men who were not in a designated single sex ward was lower than among women (see Table 7a)
Two further questions examined the single sex facilities that were available to patients
At the time of the 2010 census the following guidance from the Department of Health applied in England A ward can be described as single sex (ie the intended sex of the ward is either male or female and not mixed) when the accommodation complies with the following definition from the Department of Health of single sex accommodation ldquoSleeping areas must be segregated and members of one sex must not have to walk through an area occupied by the other sex to reach toilets or bathrooms Separate male and female only toilets and bathrooms must be provided There should be separate day rooms to which only women have accessrdquo However there is a discrepancy for providers because accommodation designated as a lsquowardrsquo for administrative purposes may incorporate single sex accommodation for both sexes that meets the guidelines ndash but in this case the ward would still be lsquomixedrsquo (based on guidance from Safety Privacy and Dignity Department of Health 2000)
As long as men and women are cared for in separate bays or rooms and have their own toilet facilities then it may well be appropriate for them to be on the same ward being cared for by the same team of doctors and nurses In practice good segregation can be achieved if men and women have separate sleeping areas (for example single sex bays) and have separate toilets and bathrooms that they can reach without having to pass through (or close to) areas for the opposite sex The layout of wards should minimise any risk of overlooking or overhearing by members of the opposite gender (from Privacy and Dignity ndash A report by the Chief Nursing Officer into mixed sex accommodation in hospitals Department of Health 2007)
The coalition governmentrsquos revised Operating Framework for 201011 requires NHS organisations to eliminate mixed-sex accommodation except under exceptional circumstances from 2011 The national guidance relating to mixed sex accommodation was issued in November 2010 and states that ldquoNo areas are exempt and every decision to mix must be justified by reference to the patientrsquos clinical needs not organisational convenience or custom and practicerdquo For mental health and learning disability trusts it states ldquoThere is no acceptable justification for admitting a mental health patient to mixed-sex accommodationrdquohellip It ldquomay be acceptable in a clinical emergency to admit a patient temporarily to a single ensuite room in the opposite-gender area of a ward In such cases a full risk-assessment must be carried out and complete safety privacy and dignity maintainedrdquo The guidance is available at wwwdhgovukenPublicationsandstatisticsLettersandcircularsProfessionallettersChiefnursingofficerlettersDH_121848
Care Quality Commission Count me in census 2010 27
Results mental health continued
Table 7a Percentage of patients not in a designated single sex ward by ethnic group
Ethnic group
Sex of patients and ward
Male Female
Male ward Female or mixed ward Female ward Male or mixed ward
White British 35 65 21 79
White Irish 41 59 28 72
Other White 44 56 28 72
White and Black Caribbean 56 44 31 69
White and Black African 48 52 41 59
White and Asian 43 57 34 66
Other Mixed 49 51 24 76
Indian 37 63 25 75
Pakistani 48 52 35 65
Bangladeshi 23 77 18 82
Other Asian 46 54 22 78
Black Caribbean 55 45 32 68
Black African 49 51 28 72
Other Black 49 51 30 70
Chinese 42 58 30 70
Other 43 57 20 80
Total 39 61 23 77
The vast majority of patients in this category were in mixed wards very few (under 05) male patients were on female-only wards or vice versa
Care Quality Commission Count me in census 2010 28
Results mental health continued
Patientsrsquo access to toilet and bathing facilities designated for single sex use
We asked providers if the patient had access to toilet and bathing facilities designated for single sex use Overall 13 of men and 16 of women
were reported as not having access to such facilities designated for single sex use This was an improvement over 2009 when these proportions were 19 and 24 respectively The proportion of patients not having access to toilet and bathing facilities designated for single sex use was lower among almost all minority ethnic groups than among the White British group (see Table 7b for details)
Table 7b Percentage of patients not having access to toilet and bathing facilities designated for single sex use by ethnic group
Ethnic group
Access to designated single sex bathing and toilet facilities
Male Female
Male facilities
Female or mixed facilities
Female facilities
Male or mixed facilities
White British 86 14 84 16
White Irish 87 13 87 13
Other White 89 11 86 14
White and Black Caribbean 93 7 93 7
White and Black African 90 10 93 7
White and Asian 90 10 84 16
Other Mixed 98 2 96 4
Indian 91 9 90 10
Pakistani 95 5 94 6
Bangladeshi 92 8 98 2
Other Asian 92 8 86 14
Black Caribbean 92 8 90 10
Black African 91 9 91 9
Other Black 92 8 89 11
Chinese 82 18 83 17
Other 87 13 90 10
Total 87 13 84 16
The vast majority of patients in this category had access to mixed facilities very few (1) of male patients had access to female-only facilities or vice versa
Care Quality Commission Count me in census 2010 29
Results mental health continued
Patientsrsquo access to a lounge area day space designated for single sex use
We also asked providers if patients had access to a lounge area or day space designated for single sex use Overall 37 of men and 39 of women were
reported as not having access to these facilities This was an improvement over 2009 when these proportions were 48 and 51 respectively The proportion of patients not having access to a lounge areaday space designated for single sex use was lower among most minority ethnic groups than among the White British group (see Table 7c for details)
Table 7c Percentage of patients not having access to a lounge areaday space designated for single sex use by ethnic group
Ethnic group
Access to a lounge areaday space designated for single sex use
Male Female
Male facilities
Female or mixed facilities
Female facilities
Male or mixed facilities
White British 59 41 60 40
White Irish 63 37 70 30
Other White 68 32 63 37
White and Black Caribbean 82 18 73 27
White and Black African 83 18 76 24
White and Asian 72 28 75 25
Other Mixed 79 21 67 33
Indian 59 41 66 34
Pakistani 80 20 72 28
Bangladeshi 53 47 52 48
Other Asian 70 30 61 39
Black Caribbean 78 22 70 30
Black African 73 27 70 30
Other Black 79 21 72 28
Chinese 59 41 60 40
Other 67 33 67 33
Total 63 37 61 39
The vast majority of patients in this category had access to mixed facilities very few (1) of male patients had access to female-only facilities or vice versa
Care Quality Commission Count me in census 2010 30
Results mental health continued
Patientsrsquo subject to deprivation of liberty safeguards
People who lack the mental capacity to consent to the care or treatment they need should be cared for in a way that is least restrictive of their rights or freedom of action In 2007 the Mental Capacity Act 2005 was amended to introduce Deprivation of Liberty Safeguards for people who lack capacity to decide about their care or treatment and who need to be deprived of their liberty to protect them from harm The Safeguards came into effect in April 2009 and strengthen the rights of hospital patients and those in care homes as well as ensuring compliance with the European Convention on Human Rights (ECHR)
The 2010 census introduced a new question ldquoIs the patient subject to deprivation of liberty authorisation on 31 March 2010rdquo Under 1 (269) patients were reported as being subject to a deprivation of liberty authorisation on census day No ethnic differences in the rates were observed which may be due to the low numbers of patients among minority ethnic groups (69)
Care Quality Commission Count me in census 2010 31
A comparison between the 2005 baseline and the 2010 census
The changes we have seen in the census results between 2005 and 2010 the timespan of the Delivering Race Equality (DRE) action plan are set out below This is not a review of the DRE programme The aim is to give an overview of how some variables in the census have changed during the course of DRE and the findings should be seen in the light of the caveats described on page 13
bull The number of inpatients went down from 33785 to 29840 ndash a fall of 12
bull The proportion of patients in independent hospitals rose from 10 to 16
bull The overall proportion of patients from minority ethnic groups increased from 20 to 23 However there have been demographic changes during this time ndash the population from Black and minority ethnic groups in England and Wales rising from 79 million in 2005 to 85 million in 2007 (the latest year for which these figures are available) an increase of 8 in two years
bull Admission rates showed similar patterns across all censuses ndash Lower than average rates among the White
British Indian and Chinese groups ndash About average rates among the Pakistani and
Bangladeshi groups ndash Higher than average rates among other
minority ethnic groups ndash particularly in the Black and WhiteBlack Mixed groups for whom rates were two or more times higher than average in 2010 The Other Black group continues to have exceptionally high rates of admission (even after the apparent reduction since 2005 see next point)
bull One of the 12 goals of DRE was a decline in admission rates among Black and minority ethnic groups Figure 1 provides a comparison between 2005 and 2010 Although admission rates for
many ethnic groups show relatively little change since 2005 the rate for the Other Black group is considerably lower in 2010 (six times higher than average) compared with 2005 (12 times higher than average) However rates for the other Black and WhiteBlack Mixed groups show small increases
bull In general rates of referral from GPs and community mental health teams were lower than average among some Black and WhiteBlack groups and referral from the criminal justice system was higher Patterns were less consistent for other minority ethnic groups
bull There was a steady increase in the overall proportion of patients subject to the Mental Health Act Compared with 40 in 2005 49 of all patients were subject to the Mental Health Act in 2010 (53 if outpatients on a CTO are excluded)
bull Another DRE goal was to reduce detention rates among Black and minority ethnic groups However detention rates have been higher than average among the Black Caribbean Black African and Other Black groups in all six censuses and almost consistently higher in the WhiteBlack Caribbean Mixed and Other White groups Rates have been average for other minority ethnic groups
bull A consistent pattern was the higher than average detention rate under section 3741 for the Black Caribbean and Other Black groups
bull Another DRE goal was to reduce seclusion among Black and minority ethnic groups Although there have been annual fluctuations in seclusion rates they have been higher than average for the Black and WhiteBlack Mixed groups and the Other White group in at least three of the six censuses Other minority ethnic groups did not show high rates
Care Quality Commission Count me in census 2010 32
A comparison between the 2005 baseline and the 2010 census continued
Figure 1 Admission ratios in the 2005 and 2010 Count me in censuses by ethnic group England and Wales
Other Black
Black Caribbean
White and Black Caribbean
White and Black African
Black African
Other Mixed
Other Asian
White and Asian
Other
White Irish
Other White
Bangladeshi
White British
Pakistani
Indian
Chinese
0 100 200 300 400 500 600 700 800 900 1000 1100 1200 1300
Ageshysex standardised admission ratios (EampW=100)
Census 2005 admission ratios using 2005 ONS populations
bull Minority ethnic groups do not compare unfavourably for other incidents Rates of self-harm have consistently been lower than average among the Black and South Asian groups Very few ethnic differences in hands-on restraint physical assault and accidents were observed across the different censuses and they did not show a consistent pattern
bull About 31 of patients in all censuses had been in hospital for one year or more and were therefore included in more than one census
Census 2010 admission ratios using ONS 2007 populations (excluding outpatients on a CTO)
(This is one reason why the census shows little change over the six years It should be noted again that because the census is a one-day count it over-represents long-stay admissions and under-represents short-stay admissions)
bull Mixed accommodation was reported for many patients across all censuses although patients from Black and minority ethnic groups were more likely to be in single sex accommodation than White British patients
The admission ratios for the 2005 census shown here are different from those published in the 2005 report This is because we updated the analysis of the 2005 admission ratios by using 2005 ONS census populations for ethnic groups as denominators These populations were not available at the time of the 2005 report which instead used the 2001 ONS population data
Care Quality Commission Count me in census 2010 33
Results learning disabilities
We obtained information about 3642 patients in 129 organisations providing services for people with learning disabilities in England and Wales Of these two were inpatients on CTOs The total number of inpatients has declined each year and by 21 from 4609 in 2006 to 3642 in 2010 The total number of providers did not change much from the baseline year of 2006 although the number of NHS providers has fallen steadily and the number of independent healthcare organisations has increased (see Table 8) The proportion of inpatients in independent
healthcare organisations increased from 20 in 2006 to 33 in 2010 This is likely to be a result of closing NHS campuses with people moving from hospital to community settings
The pattern of results for learning disability patients in 2010 is broadly similar to that reported in previous censuses This is not surprising since many of the patients had been in hospital for a considerable period of time and they therefore appear in successive censuses
Table 8 The number of providers of learning disability services and inpatients
NHS (England)
Independent (England)
NHS (Wales)
Independent (Wales) Total
2010 census Number of providers 55 61 4 9 129 Number of all patients (including patients 2304 1072 154 112 3642 on a CTO) of all patients 633 294 42 31 100
2009 census Number of providers 60 54 5 4 123 Number of all patients (including patients 2487 1014 139 55 3695 on a CTO) of all patients 673 274 38 15 100
2008 census Number of providers 62 57 5 5 129
Number of inpatients 2873 1050 143 41 4107
of inpatients 700 256 35 10 100 2007 census
Number of providers 64 47 5 4 120
Number of inpatients 3063 900 154 36 4153
of inpatients 738 217 37 09 100 2006 census
Number of providers 70 48 5 1 124
Number of inpatients 3505 930 164 10 4609
of inpatients 760 202 36 02 100
Care Quality Commission Count me in census 2010 34
Results learning disabilities continued
Ethnicity
Information about ethnicity was available for 98 of patients Of these 13 belonged to Black and minority ethnic groups defined as all groups that are not White British (see Table 9) This figure is somewhat higher than in previous years (11 in 2006) and is significantly lower than the 23 of mental health patients from minority ethnic groups as reported in the mental health section of this report
Although the patterns by ethnicity are broadly similar to previous years there was an increase between 2006 and 2010 in the proportion of patients from the Other White group and a fall in those from the White British group Some ethnic groups had very few patients
As in the previous censuses patients from Black and minority ethnic groups were concentrated in a relatively small number of organisations 70 were
Table 9 Learning disability patients by ethnic group
Ethnic group 2010 census 2009 census 2008 census 2007 census 2006 census
Number Number Number Number Number
White British 853 3106 867 3205 889 3616 883 3642 887 4037
White Irish 13 46 15 57 13 53 10 40 14 66
Other White 29 106 23 85 26 104 26 109 17 77
White and Black Caribbean 10 38 10 36 07 29 08 34 07 32
White and Black African 02 8 01 4 00 2 02 10 01 3
White and Asian 04 13 04 14 03 12 03 13 02 9
Other Mixed 07 24 05 19 03 14 04 16 03 14
Indian 09 32 09 35 07 28 08 32 11 49
Pakistani 07 24 09 33 07 30 08 32 07 34
Bangladeshi 05 20 06 21 03 11 03 11 02 9
Other Asian 04 13 03 10 03 12 02 8 03 12
Black Caribbean 26 93 22 81 23 94 26 108 28 129
Black African 08 28 09 35 07 29 08 33 07 33
Other Black 04 15 04 14 04 15 04 18 04 17
Chinese 00 1 01 2 01 5 02 8 02 7
Other 02 7 02 8 04 15 02 10 05 24
Not stated 19 68 10 36 09 38 07 29 12 57
Total 100 3642 100 3695 100 4069 100 4124 100 4552
Care Quality Commission Count me in census 2010 35
Results learning disabilities continued
patients in 25 of the 129 organisations that took part in the census Seventy-four organisations had fewer than 10 patients from Black and minority ethnic groups each and another 42 organisations had no inpatients at all from these groups
However it is important to note that the number of people with severe and profound learning disabilities in some areas is affected by past funding and placement practices especially the presence of old long stay hospitals and of people placed outside their original area of residence by funding authorities
Reporting of ethnicity
About half (56) of patients reported their own ethnic group Staff reported the ethnic group for 17 of patients and relatives for 21 This means that ethnicity could have been misreported for some patients We do not know how ethnicity was assessed for 6 of patients
Age and gender
Two per cent (59) of patients were under 18 years old The number of young inpatients from minority ethnic groups was low or zero in several ethnic minority groups
Overall 73 of patients were under 50 years old and 27 were aged 50 or over The proportion of patients under 50 was higher among patients from Black and minority ethnic groups (88) than among the White British group (71) This is not surprising given that minority ethnic populations are generally younger than the White population
Seventy per cent of patients in learning disability services were men whereas in mental health services 58 of patients were men
Language and religion
Eight per cent of patients reported that their first language was not English Non-verbal communication was the most often selected language after English accounting for 4 of patients Two per cent (84) of patients most of whom were from the White British group said they needed an interpreter
Religion was not stated for 22 of patients and 15 of patients said they had no religion South Asians (Indians Bangladeshis and Pakistanis) were mostly Muslim Hindu or Sikh and those from the White Black Caribbean and Black African groups were mostly Christian
Sexual orientation
Overall the result was not known for almost half (49) of patients 45 said they were heterosexual 2 said gaylesbian 3 said bisexual and 1 said ldquootherrdquo The numbers of patients from minority ethnic groups were too low for meaningful analysis
Disability
Of all inpatients in learning disability services
bull 4 were reported as having no disabilities
bull 44 had a learning disability only
bull 51 had multiple disabilities
The patterns among minority ethnic groups were similar in that most patients had either a learning disability or multiple disabilities
Care Quality Commission Count me in census 2010 36
Results learning disabilities continued
Rates of admission
The rates of admission based on ONS estimates of the general population in 2007 are given in Appendix C Table C1
Admission rates were lower than average among several minority ethnic groups Other White Indian Pakistani Other Asian Black African Chinese and Other Rates were two to three times higher than average among the WhiteBlack Caribbean Mixed Black Caribbean Other Black and Other Mixed groups The lower rates among the South Asian and Chinese groups and the higher rates among some Black groups are similar to patterns for inpatients in mental health establishments
These patterns of admission are similar to those we reported in previous census reports
Source of referral
As we reported in the section on mental health patients data about sources of referral must be interpreted with care as we do not always know the original referral source Furthermore in the case of inpatients with learning disabilities this information was invalid missing or unknown for 12 of patients
Because of the small numbers of patients in most minority ethnic groups we observed few ethnic differences in sources of referral
Detention under the Mental Health Act 1983 (on day of admission and on day of census)
The Mental Health Act 2007 made a number of changes to the Mental Health Act 1983 one of which was supervised community treatment (section 17A) These are reflected in the 2010 census
All detentions Of all the patients in learning disability services 48 were detained under the Mental Health Act on admission Rates of detention on the day of admission by ethnic group are in Appendix C Table C2 and no ethnic differences were observed As the number of detained patients from each minority ethnic group was low we did not undertake further analysis for individual sections of the Act
Rates of detention on census day also showed no ethnic differences with the exception of a lower than average rate for the Other White group
Consent
About 66 of informally admitted inpatients were deemed incapable of consenting to treatment which is a similar proportion to that reported previously
Among detained patients 38 were deemed incapable of consenting to treatment and 6 were deemed capable of consenting to treatment but refused
The numbers of patients from minority ethnic groups were too low for comment There were no or very few such patients among minority ethnic groups
Care Quality Commission Count me in census 2010 37
Results learning disabilities continued
Care programme approach
Details of the Care Programme Approach (CPA) are given on page 24
We found that 73 of all patients were on a CPA 2 on a single assessment process (SAP) and 25 on neither No ethnic differences were observed
Recorded incidents
The 2010 census asked about the number of times that patients experienced seclusion hands-on restraint self-harm accident and physical assault in a patientrsquos current hospital spell or if the patientrsquos hospital spell was longer than three months the number that took place within the last three months As in previous years we observed very few ethnic differences
Seclusion Five per cent of patients had experienced one or more episodes of seclusion The only ethnic differences observed were the higher than average rates among the White Irish and Other White groups but these were based on small numbers of patients
Physical assault on the patient The definition of assault includes incidents of physical assault on the patient irrespective of who committed the assault but we do not have information on who committed the assault About 28 of patients had been involved in one or more episodes of physical assault No ethnic differences were observed
Hands-on restraint self-harm accidents Thirty per cent of inpatients had experienced one or more episodes of hands-on restraint 22 had attempted to harm themselves and 24 had suffered an accident The numbers were very low in minority ethnic groups and we did not observe any ethnic differences except for a lower than average rate for self-harm among the Black Caribbean group but this was based on very few patients
Duration of stay in hospital
We analysed the length of the period between each patientrsquos admission to hospital and the census day This period is of course shorter than a patientrsquos full length of stay in hospital which runs from admission to the date when they are discharged
bull 10 of inpatients had been in hospital for one month or less
bull 6 had been in hospital between one and three months
bull 7 had been in hospital between three and six months
bull 10 had been in hospital between six months and one year
bull 14 had been in hospital between one and two years
bull 22 had been in hospital between two and five years
bull 31 had been in hospital for over five years
The patterns are very similar to those in previous censuses About 67 of patients in the 2010 census had been in hospital for more than a year and were therefore also included in the 2009 census In addition over half (53) of patients had been in hospital for more than two years and will have been included in both the 2008 and 2009 censuses A third of patients will have been included in each census since 2006
We also calculated the median length of stay (see page 26 for the definition of median) Overall the median amount of time that women had spent in hospital was about 31 months and the median for men was about 27 months This compares with a median for mental health patients of 25 months for women and 58 months for men It is not possible to reliably compare length of stay by ethnic group because of the small numbers of patients among several minority ethnic groups
Care Quality Commission Count me in census 2010 38
Results learning disabilities continued
Ward security
About 12 of all inpatients were on a medium or high secure ward as opposed to a general (54) or low secure (34) ward
As in the three previous years rates of patients on medium or high secure wards were about double the average among the White Irish and Other White groups Most other minority ethnic groups had very few patients on medium or high secure wards
Age range on wards
There were five patients under 18 years of age being cared for on wards for working-age adults and none were on wards for older people About 5 of patients on wards for working-age adults were aged 65 or over and there were very few patients (23) on wards for older people There were very few lsquoout of agersquo placements among minority ethnic groups
Patients in wards designated as single sex or mixed
We asked providers whether the patient was on a ward designated as men or women only or mixed gender Overall 47 of men and 69 of women were not in a ward designated for single sex use The numbers of such patients among minority ethnic groups were very low
Two further questions examined the single sex facilities that were available to patients Again due to the small numbers we do not present results by ethnicity for these questions
Patientsrsquo access to toilet and bathing facilities designated for single sex use
Overall 19 (497) of men and 27 (295) of women were reported as not having access to toilet and bathing facilities designated for single sex use
Patientsrsquo access to a lounge area day space designated for single sex use
Overall 32 (829) of men and 44 (470) of women were reported as not having access to a lounge area day space designated for single sex use
Patients subject to deprivation of liberty safeguards
For details of deprivation of liberty safeguards please see page 31
The 2010 census introduced a new question ldquoIs the patient subject to deprivation of liberty authorisation on 31 March 2010rdquo Two per cent (74) patients were reported as being subject to a deprivation of liberty order on census day but very few of these patients (15) were from minority ethnic groups
See footnote on single sex accommodation on page 27
Care Quality Commission Count me in census 2010 39
Data in the future Moving beyond a one-day census
For six years the Count me in census has provided a valuable one-day snapshot of inpatients in mental health and learning disability services And with the proportion of inpatients who are detained increasing steadily (from 25 in 200506 to 39 in 200910 ndash see Figure 2) ongoing ethnic monitoring of admissions and detentions becomes more vital than ever
However a one-day census only captures some events and the profile of patients can differ across a whole year For example there were
bull 29840 inpatients in the 2010 census compared with 107765 inpatients overall during 200910
bull 17299 patients in the 2010 census who were detained or on CTOs compared with 42479 new detentions and some 4100 new CTOs overall in England in 200910
bull 26 of patients in hospital for under one month and 31 for over one year per the census
whereas the MHMDS data consistently shows that for over 50 of records the average length of an inpatient stay was under one month and for 4 it was over one year
Looking ahead it is vital that robust data is available on all admitted patients and all those subject to the Mental Health Act not just those in hospital on one particular day Moreover patterns of use and outcomes of community care can have an impact on the need for admission to hospital and the risk of detention ndash therefore information about the care provided to patients before admission to hospital during their hospital stay and after they leave is also vital Furthermore under 84 of the 127 million people using specialist mental health services are admitted to hospital23 and so it is very important to examine the quality of community care for the 90 of patients who are not admitted to hospital
Figure 2 Number of people spending time in hospital 200506 to 200910
Num
ber
of p
atie
nts
90000
80000
70000
60000
50000
40000
30000
20000
10000
0 200506 200607 200708 200809 200910
Source NHS Information Centre Formally detained Not detained MHMDS Bulletin 2011
Care Quality Commission Count me in census 2010 40
Data in the future Moving beyond a one-day census continued
The Mental Health Minimum Data Set (MHMDS) is a rich source of data on people using specialist mental health services in England It covers both community and hospital services and includes a wide range of information about the demographic clinical and socioeconomic characteristics of individual patients and the services provided to those admitted to hospital and to the much larger number of those who donrsquot need a stay in hospital The data includes information about contact with services uses of the Mental Health Act and the Care Programme Approach for each individual patient All these details enable the use of services patterns of care and patient outcomes to be tracked including along pathways of care The MHMDS therefore provides a robust basis for ongoing monitoring of access to and outcomes of care for users of specialist ndash both community and hospital ndash mental health services
The MHMDS also enables an analysis of the numbers and rates of people from different ethnic groups using specialist mental health services overall (both inpatient and community) which provides an indication of the levels of mental illness and therefore the need for specialist care in different communities
At present the MHMDS does not cover high secure services and independent sector providers only started to provide data during 201011 However to support payment by results for mental health the scope of the data set will be extended to cover high secure services during 201112 (version 4 MHMDS) Further proposed changes to the dataset (version 41) will incorporate NHS-funded learning disability services and primary care mental health services A separate dataset for child and adolescent mental health services (CAMHS) has been developed and is awaiting formal approvals It is designed to include the same information about uses of the Mental Health Act as provided in the MHMDS
The latest MHMDS bulletin for 200910 provides a description of people using specialist mental health services in England including ethnic profiles of people using services hospital admissions detentions and the number of people on CPA24 It also provides information on differences by age and gender The bulletin illustrates some of the sorts of analyses that are possible using data from the MHMDS
The NHS Information Centre can provide guidance on these and other potential analyses based on MHMDS data
Care Quality Commission Count me in census 2010 41
Conclusions
While this report reviews changes in the census results since 2005 it is not a review or evaluation of the DRE programme overall Similarly the census cannot provide explanations for the patterns observed or examine whether mental health services are meeting the needs of individual ethnic minority groups As we have noted previously the results are subject to caveats in particular that the census provides a one-day snapshot that may not be representative of patients admitted to hospital throughout the year
Overview of findings
Overall the findings from the 2010 census show little change from those reported for previous annual censuses conducted since 2005 This is partly because many patients had been in hospital for a considerable period of time and had therefore been included in successive censuses The findings of this sixth and last census continue to show differences between Black and minority ethnic groups and White groups and also differences within these groups
In particular ethnic differences in rates of admission detention under the Mental Health Act and seclusion ndash three of DRErsquos 12 goals ndash have not altered materially since the inception of DRE in 2005
bull Admission rates remain higher than average among minority ethnic groups especially among Black and WhiteBlack Mixed groups for whom rates were two or more times higher than average in 2010 The Other Black group continues to have the highest admission rate ndash six times higher than average ndash although this is lower than in 2005 In contrast admission rates have consistently been lower than average among the Indian and Chinese groups and about average in the Pakistani and Bangladeshi groups
bull Detention rates remain higher than average among the Black and WhiteBlack Caribbean Mixed groups and among the Other White group A consistent pattern across all censuses was the higher than average detention rate
under section 3741 for the Black Caribbean and Other Black groups We also found that rates for being placed on a CTO were higher among the South Asian and Black groups
bull Although there have been annual fluctuations in seclusion rates they have been higher than average for the Black WhiteBlack Mixed and Other White groups in at least three of the six censuses
Overall the level of provision of single sex areas for patients continues to be unsatisfactory although there was no evidence that minority ethnic patients were disadvantaged in these respects Government policy for the NHS in England now requires that all providers of NHS-funded care including mental health trusts are expected to eliminate mixed-sex accommodation in accordance with the guidance set out in CNO201032526 From 2011 all providers of NHS-funded care must report breaches of sleeping accommodation which will attract sanctions
Implications for ways forward
The census findings do not in themselves show that mental health and learning disability services are failing to meet the needs of Black and minority ethnic service users
As noted in previous reports they need to be interpreted in the context of available evidence on ethnic differences in rates of mental illness pathways to care and factors such as socioeconomic disadvantages that all contribute to these differences Our previous reports have consistently highlighted the need for prevention early intervention and working collaboratively across sectors to reduce the risk of admission and detention where possible without compromising the care given to patients Mental health services have a key role to play but to achieve this all statutory agencies and organisations outside the healthcare sector Black and minority ethnic communities and people who use services themselves will need to work in partnership
Care Quality Commission Count me in census 2010 42
Conclusions continued
This message ndash about preventing mental ill-health by addressing the contributory factors and intervening early ndash is at the heart of No health without mental health the Department of Healthrsquos new strategy for the future of mental health care in England27
The strategy aims to tackle the economic social and environmental determinants and consequences of mental health problems and to improve outcomes and reduce inequalities
It specifies that by 2014 people in contact with the criminal justice system will have improved access to mental health services as set out in the Ministry of Justice Green Paper Breaking the Cycle Effective punishment rehabilitation and sentencing of offenders which confirms the approach outlined in Lord Bradleyrsquos report for early intervention and diversion from custody2829
Accompanying the new strategy is a supporting document that explains how its objectives will improve mental health outcomes the effective interventions and the underpinning evidence base30
The strategy is complemented by other government proposals for reforms in the NHS public health and adult social care as outlined in the NHS White Paper Equity and excellence liberating the NHS31 the public health strategy Healthy lives healthy people32 and the adult social care strategy A vision for adult social care capable communities and active citizens 33 Three outcomes frameworks have been developed alongside these strategies improving mental health outcomes and reducing inequalities is integral to them all
In this new healthcare landscape the proposed NHS Commissioning Board and GP consortia will have a statutory obligation to promote equality and reduce inequalities in healthcare (something also enshrined in the Equality Act 2010) As the lead commissioners of healthcare services it will be up to GP consortia to assess with local authorities the needs of their local populations and commission the right services that meet their requirements
And the strengthened public health role of local authorities offers significant potential for addressing the socioeconomic disadvantages faced by Black and minority ethnic communities which add to the burden of mental illness in these communities
Race Equality Action Plan A five-year review looked back at the work of the DRE action plan and describes some of the key challenges successes and learning34 Based on the experience and outcome of the DRE programme the report suggests ways forward for the next stage of mental health strategy development and implementation
Since April 2009 CQC has had a duty under the Mental Health Act 1983 to monitor how services exercise their powers in relation to patients who are detained in hospital or subject to CTOs or guardianship under the Act In its first annual report on the use of the Act CQC recommends a number of areas where improvements are needed for example over-occupancy on inpatient wards patient engagement use of control and restraint seclusion and capacity and consent35
In particular CQC highlighted a number of issues relating to the use of CTOs including concern about appropriate usage (30 of the patients in CQCrsquos sample did not have a reported history of non-compliance or disengagement with services after discharge) and over-representation of Black and minority ethnic groups CQC advised that research on the possible race equality impact of CTOs should be undertaken There were 6237 CTOs from their introduction in November 2008 to 31 March 2010 a much greater use of them than forecast for this period by the Department of Health before the power was introduced Just 31 of these orders had ended by end March 2010 suggesting that some people are being kept on supervised community treatment for long periods
Care Quality Commission Count me in census 2010 43
Conclusions continued
Data in the future Moving beyond a one-day census
Good information is the foundation of an effective healthcare system It is imperative for ensuring that services meet the needs of local populations and are equitable and that improvements are made where needed The availability of fit-for-purpose and comprehensive patient-level data sets with ethnicity and other key variables fully coded is therefore vitally important36 It enables the care provided to patients of all ethnic backgrounds to be monitored on an ongoing basis including for monitoring compliance with the Equality Act
Race Equality Action Plan A five-year review notes that better collection monitoring and use of ethnicity data to inform commissioning and provision in health and social care is required37 Key areas include good ethnic monitoring improving demographic information and ensuring good links between infomatics audit and equality and diversity leads within trusts in order to effectively use the information to inform service development monitoring and review at board management ward and community levels
The governmentrsquos proposed changes to the NHS will be supported by an information revolution aimed at improving and extending the information available to the NHS patients and the public on the quality and outcomes of NHS services including by equality dimensions38
Having information that is fit for purpose is vital for the effective regulation of mental health and learning disability services CQC uses routinely available data sets on an ongoing basis to assess the performance of health and social care organisations and their compliance with government policies and legislation We therefore expect those who commission and provide mental healthcare in the NHS and independent sector to have information systems that provide good quality data with fully
comprehensive recording and monitoring of ethnicity on an ongoing basis
Since 2005 the Count me in census has played a key role in providing information about the ethnicity and other characteristics of inpatients in mental health and learning disability services and on patients subject to the Mental Health Act It did this by providing a valuable one-day snapshot But ethnicity recording must be seen as an all-year round statutory requirement not a one-day annual event The number of inpatients throughout the year is much higher than the counts on one day and some patients will have more than one admission And there is a need to move on from counting patients to understanding more about care pathways for Black and minority ethnic patients and the factors leading to hospital admission and detention
We have consistently highlighted the need for commissioners and providers to make full use of the Mental Health Minimum Data Set (MHMDS) ndash the statutory data set submitted by providers of specialist mental health services in England It provides rich data on these issues and provides a robust information source for ongoing ethnic monitoring after this last census
Covering both community and hospital services ndash and now independent and third sector providers as well as NHS ndash it includes a wide range of information about individual patients the services provided to those admitted to hospital and to the much larger number who donrsquot need admission to hospital and the outcomes of care And because it includes year-round activity it is more representative of the overall picture of for example admission detention and readmission rates length of stay years in psychiatric care and contacts with services and professionals
We call on the Information Centre to routinely publish data on all admissions and uses of the Mental Health Act including CTOs in England (in both NHS and independent healthcare providers) by the ethnicity of
Care Quality Commission Count me in census 2010 44
Conclusions continued
patients making the MHMDS the definitive source of information about mental health and learning disability patients This data should be risk-adjusted for age gender and other variables as appropriate to enable reliable comparisons to be made across groups
It is important that all providers ndash NHS and independent ndash make strenuous efforts to improve the quality of the data they submit The Information Centre publishes reports on the quality of MHMDS data by provider (see wwwicnhsukservices mhmdsdq) and we urge providers to monitor this information and use it to improve their data quality
If GP consortia and local authorities are to be effective in their needs assessment and commissioning roles the Information Centre needs to make available and promote to them the data from the MHMDS and other sources And researchers and academics must make full use of the MHMDS to explore the factors that underlie the observed ethnic patterns
CQCrsquos role
In the meantime CQC will continue to focus strongly on the quality of care provided by mental health and learning disability services
People who find themselves admitted to mental health services or detained under the Mental Health Act and therefore counted by the Count me in census are among the most mentally unwell people in our society Our job is first and foremost to make sure that the care they receive meets the essential standards of quality and safety set out under the Health and Social Care Act 2008 and to work with providers to ensure this We act swiftly when we find services that do not Where we find systemic problems that organisations have not adequately addressed we may impose conditions on the providerrsquos registration to bring about the change needed to improve patientsrsquo experience of care
The essential standards of quality and safety include the requirement to provide single sex accommodation and we will continue to closely check that these standards are met by all mental health services
We intend to introduce a number of indicators derived from the rich information in the MHMDS into our quality and risk profiles for providers This will put greater emphasis on the experience of Black and minority ethnic patients in our regulatory activity
We will monitor the quality of MHMDS data submitted by providers (as reported by the NHS Information Centre) including independent service providers Those with poor data quality may be considered at higher risk in terms of their quality of care
In addition we will continue to monitor the progress of services in relation to the issues raised in the census and other reports including our report on the use of the Mental Health Act through our visits to services and meetings with patients by our Mental Health Act Commissioners and second opinion appointed doctors (SOADs) We will draw on patientsrsquo experiences to monitor the operation of the Mental Health Act
We will also assess the impact of advice and use of Local HealthWatch Local HealthWatch will be in a good position to make sure that providers and commissioners are held to account on matters of choice and access to services for people from Black and minority ethnic groups
Care Quality Commission Count me in census 2010 45
References
1 Department of Health Equity and excellence liberating the NHS 2010
2 Department of Health The NHS outcomes framework 201112 2010
3 Healthcare Commission Mental Health Act Commission National Institute for Mental Health in England Count me in results of a national census of inpatients in mental health hospitals and facilities in England and Wales 2005
4 Healthcare Commission Mental Health Act Commission National Institute for Mental Health in England Count me in results of the 2006 national census of inpatients in mental health and learning disability services in England and Wales 2006
5 Healthcare Commission Mental Health Act Commission National Institute for Mental Health in England Count me in results of the 2007 national census of inpatients in mental health and learning disability services in England and Wales 2007
6 Healthcare Commission Mental Health Act Commission National Institute for Mental Health in England Count me in results of the 2008 national census of inpatients in mental health and learning disability services in England and Wales 2008
7 Care Quality Commission National Mental Health Development Unit Results of the 2009 national census of inpatients and patients on supervised community treatment in mental health and learning disability services in England and Wales 2009
8 Department of Health Delivering race equality in mental health care an action plan for reform inside and outside services 2005
9 Welsh Assembly Government Adult Mental Health Services Raising the standard ndash Race Equality Action Plan for Adult Mental Health Services in Wales 2006
10Department of Health No health without mental health a cross-government mental health outcomes strategy for people of all ages 2011 wwwdhgovukprod_consum_dhgroups dh_digitalassetsdocumentsdigitalasset dh_124058pdf
11Department of Health New horizons towards a shared vision for mental health 2009 wwwdhgovukprod_consum_dhgroups dh_digitalassetsdhendocumentsdigital assetdh_109708pdf
12Department of Health Valuing people a new strategy for learning disability for the 21st century 2001
13Department of Health Valuing people now a new three year strategy for people with learning disabilities 2009
14Department of Health Healthcare for all report of the independent inquiry into access to healthcare for people with learning disabilities 2008
15Joint Committee on Human Rights A life like any other human rights of adults with learning disabilities (2008 HL Paper 401 HC 731) House of Lords House of Commons 2008
16Department of Health Valuing people now summary report March 2009 ndash September 2010 2010
17Disability Rights Commission Equal treatment investigation 2005
18Department of Health Mir G Nocon A Ahmad W Jones L Learning difficulties and ethnicity 2000
19ONS experimental population estimates by ethnic group 2007 wwwstatisticsgovukstatbase productaspvlnk=14238
Care Quality Commission Count me in census 2010 46
References continued
20Six percent of population are gay or lesbian according to Whitehall figures 2005 wwwtelegraphcouknewsmainjhtmlxml= news20051212ngay12xmlamps Sheet= news20051212ixhomehtml
21Department of Trade and Industry Amendment to Employment Equality (Sexual Orientation) Regulations 2003 2003
22Office for National Statistics Measuring sexual identity an evaluation report 2010
23 Information Centre Mental Health Bulletin Fourth report from Mental Health Minimum Dataset (MHMDS) annual returns 2010 2011 wwwicnhsukpubsmhbmhmds0910
24 Information Centre Mental Health Bulletin Fourth report from Mental Health Minimum Dataset (MHMDS) annual returns 2010 2011 wwwicnhsukpubsmhbmhmds0910
25The operating framework for the NHS in England 201112 Department of Health 2010 wwwdhgovukprod_consum_dhgroups dh_digitalassetsdhenpsdocuments digitalassetdh_122736pdf
26wwwdhgovukenPublicationsandstatistics LettersandcircularsProfessionalletters ChiefnursingofficerlettersDH_121848
27Department of Health No health without mental health a cross-government mental health outcomes strategy for people of all ages 2011 wwwdhgovukprod_consum_dhgroups dh_digitalassetsdocumentsdigitalasset dh_124058pdf
28Ministry of Justice Breaking the cycle effective punishment rehabilitation and sentencing of offenders 2010
29Department of Health The Bradley report Lord Bradleyrsquos review of people with mental health problems or learning disabilities in the criminal justice system 2009
30Department of Health No health without mental health delivering better mental health outcomes for people of all ages 2011
31Department of Health Equity and excellence liberating the NHS 2010 wwwdhgovukprod_ consum_dhgroupsdh_digitalassetsdhen psdocumentsdigitalassetdh_117794pdf
32Department of Health Healthy lives healthy people our strategy for public health in England 2010 wwwdhgovukprod_consum_dh groupsdh_digitalassetsdhenps documentsdigitalassetdh_122347pdf
33Department of Health A vision for adult social care capable communities and active citizens 2010 wwwdhgovukprod_consum_dh groupsdh_digitalassetsdhenps documentsdigitalassetdh_121971pdf
34Wilson M NMHDU Race equality action plan a five year review Delivering race equality in mental health care 2010 wwwnmhduorgukour-workmhep
35Care Quality Commission Monitoring the use of the Mental Health Act in 200910 2010
36Raleigh V S Collection of data on ethnic origin in England Editorial BMJ 20083376456
37Wilson M NMHDU Race equality action plan a five year review Delivering race equality in mental health care 2010 wwwnmhduorgukour-workmhep
38Department of Health Liberating the NHS an information revolution 2010
Care Quality Commission Count me in census 2010 47
Appendix A Methods of analysis
Standardisation by age and gender
Standardisation allows us to make comparisons between groups of the population by taking account of variations in age and gender Some differences in patterns of service use are related to the age or gender of the people using them so adjustments to the data have to be made to ensure that the interpretation of ethnic differences is reliable For example formal admissions are higher at a younger age so some Black and minority ethnic groups may have high formal admission rates simply because they have a high proportion of younger people Without adjustments for age and gender differences comparisons would be misleading
In this report most results are standardised for age and gender including those relating to admission detention source of referral care programme approach seclusion restraint accidents assault self-harm consent and presence on a secure ward The report uses the accepted statistical method of taking account of age and gender differences between groups when calculating these rates
We used the ONS estimates of total population by ethnic group for England and Wales in 2007 to standardise the rates of admission for different ethnic groups This takes account of the significant rises in the Black and ethnic minority population of England and Wales since the 2001 ONS census and hence gives more accurate and up to date estimates of admission ratios for different ethnic groups (although it does not take account of any further changes in the ethnic populations between 2007 and 2010 the date of this census) For comparison with the DRE baseline we also present admission rates from the 2005 census derived using the 2005 ONS estimates of populations by ethnic group These figures will not be the same as published in the 2005 census report which were based on the 2001 ONS census population estimates because updated estimates of populations by ethnic group were not available at that time
For other analyses we used the total number of inpatients and patients on CTOs in the census
as the basis for standardisation However CTO outpatients are excluded from selected analyses where appropriate namely the analysis of rates for admissions detentions on admission source of referral single sex accommodation and recorded incidents of seclusion restraint accidents assault and self-harm We used the statistical package STATA version 82 to derive the standardised results
It was not possible to adjust the analyses for ethnic differences in social and economic factors and in diagnosis and severity of illness Such factors could affect the ethnic differences observed in the results
For descriptive variables such as religion and language we did not use standardisation
Confidence intervals as indicators of significant statistical differences
For all standardised results the national rates for England and Wales are taken as 100 and the usual 95 confidence intervals are given Rates of less than 100 or greater than 100 for specific ethnic groups show a lower or higher rate respectively than the national average after adjusting for age and gender Whether or not the difference is statistically significant from the national average depends on the confidence interval If the confidence interval overlaps 100 the difference from the national average is not statistically significant If both values are lower or higher than 100 it indicates that the difference compared with the national average is statistically significant at the 95 level
For example if a rate is 110 with the lower confidence interval being 105 and the upper confidence interval being 115 it indicates that the 10 excess over the national average of 100 is statistically significant But if a ratio is 110 with the lower confidence interval being 95 and the upper confidence interval being 125 it indicates that the 10 excess over the national average is not statistically significant We did not attempt to adjust the confidence intervals for multiple comparisons
Care Quality Commission Count me in census 2010 48
Appendix B Mental health tables
Table B1 Standardised admission ratios by ethnic group for England and Wales (excluding outpatients on a CTO) using 2007 ONS census population denominators (England and Wales = 100) All ages
Ethnic group
Men Women Persons Standardised
admission ratio
95 confidence
interval Observed numbers
Standardised admission
ratio
95 confidence
interval Observed numbers
Standardised admission
ratio
95 confidence
interval Observed numbers
White British 88 86 89 12435 94 93 96 10157 91 89 92 22592 White Irish 130 115 146 274 122 106 140 215 126 115 138 489 Other White 117 109 126 731 129 118 141 533 122 115 129 1264 White and Black Caribbean 557 493 627 276 274 223 333 101 436 393 483 377 White and Black African 312 247 388 80 259 186 351 41 292 242 349 121 White and Asian 140 110 174 79 124 90 166 44 134 111 159 123 Other Mixed 230 189 278 108 213 165 270 67 223 192 259 175 Indian 67 59 75 286 66 56 76 172 66 60 73 458 Pakistani 105 93 119 269 65 53 79 96 91 81 100 365 Bangladeshi 123 102 147 120 82 60 109 46 108 92 126 166 Other Asian 161 139 185 192 136 107 169 79 153 135 172 271 Black Caribbean 538 505 572 980 306 277 336 418 438 415 462 1398 Black African 246 226 267 550 219 194 247 277 236 221 253 827 Other Black 792 691 903 222 314 240 403 61 596 529 670 283 Chinese 27 20 38 39 43 30 59 35 33 26 41 74 Other 140 120 162 177 110 88 136 87 128 113 145 264 Total 100 16818 100 12429 100 29247
Care Quality Commission Count me in census 2010 49
Appendix B Mental health tables continued
Table B2 Standardised admission ratios by ethnic group for England and Wales (excluding outpatients on a CTO) using 2007 ONS census population denominators (England amp Wales = 100) Ages 65 and over
Ethnic group
Men Women Persons Standardised
admission ratio
95 confidence
interval Observed numbers
Standardised admission
ratio
95 confidence
interval Observed numbers
Standardised admission
ratio
95 confidence
interval Observed numbers
White British 95 92 99 3265 95 92 98 3887 95 93 97 7152 White Irish 142 116 172 106 102 82 125 92 120 104 138 198 Other White 207 174 244 141 213 183 248 171 210 188 235 312 White and Black Caribbean 406 210 710 12 333 152 632 9 371 230 568 21 White and Black African 231 28 836 2 198 24 714 2 213 58 546 4 White and Asian 28 1 156 1 110 30 281 4 69 23 162 5 Other Mixed 146 40 374 4 228 92 470 7 189 95 339 11 Indian 97 70 132 41 83 57 116 33 90 71 113 74 Pakistani 39 17 77 8 46 18 94 7 42 23 69 15 Bangladeshi 115 53 218 9 69 14 201 3 98 51 172 12 Other Asian 234 143 361 20 215 120 354 15 225 157 313 35 Black Caribbean 216 170 269 77 310 253 376 103 261 224 302 180 Black African 142 73 248 12 365 241 531 27 246 175 337 39 Other Black 164 34 479 3 366 134 796 6 259 119 493 9 Chinese 41 8 120 3 95 38 195 7 68 33 125 10 Other 253 126 453 11 390 238 602 20 327 222 464 31 Total 100 3715 100 4393 100 8108
Care Quality Commission Count me in census 2010 50
Appendix B Mental health tables continued
Table B3 Standardised ratios by ethnic group for patients referred by a GP (England and Wales = 100)
Ethnic group
Men Women Persons Standardised
referral ratio
95 confidence
interval Observed numbers
Standardised referral ratio
95 confidence
interval Observed numbers
Standardised referral ratio
95 confidence
interval Observed numbers
White British 110 103 117 904 107 101 114 1065 108 104 113 1969 White Irish 85 50 134 18 93 57 144 20 89 63 123 38 Other White 74 51 103 33 70 49 97 36 72 56 91 69 White and Black Caribbean 27 5 78 3 30 4 109 2 28 9 65 5 White and Black African 0 0 74 9 268 2 35 4 125 2 White and Asian 165 54 386 5 0 0 86 28 201 5 Other Mixed 48 6 172 2 68 14 198 3 58 19 136 5 Indian 69 34 123 11 79 39 141 11 73 46 111 22 Pakistani 88 42 162 10 59 16 151 4 77 42 130 14 Bangladeshi 81 22 207 4 61 7 221 2 73 27 159 6 Other Asian 80 32 166 7 108 43 223 7 92 50 155 14 Black Caribbean 35 20 56 17 37 20 62 14 36 24 51 31 Black African 57 29 100 12 66 35 113 13 61 40 91 25 Other Black 62 23 135 6 40 5 144 2 54 23 107 8 Chinese 56 1 314 1 139 38 356 4 108 35 251 5 Other 106 46 208 8 0 0 53 23 105 8 Total 100 1041 100 1185 100 2226
Care Quality Commission Count me in census 2010 51
Appendix B Mental health tables continued
Table B4 Standardised ratios by ethnic group for patients referred by a community mental health team (including crisis resolution home treatment) or community learning disability team (England and Wales = 100)
Ethnic group
Men Women Persons Standardised
referral ratio
95 confidence
interval Observed numbers
Standardised referral ratio
95 confidence
interval Observed numbers
Standardised referral ratio
95 confidence
interval Observed numbers
White British 107 104 111 3255 103 100 107 3386 105 103 108 6641 White Irish 90 69 116 61 89 68 114 61 90 74 107 122 Other White 59 48 71 105 79 67 94 141 69 61 78 246 White and Black Caribbean 106 83 135 68 75 49 111 25 96 77 117 93 White and Black African 43 19 84 8 66 30 124 9 52 31 84 17 White and Asian 95 56 150 18 84 43 147 12 90 61 129 30 Other Mixed 78 48 121 20 72 41 118 16 76 53 105 36 Indian 106 83 132 76 100 76 130 56 103 86 122 132 Pakistani 108 84 135 73 89 60 128 30 102 83 123 103 Bangladeshi 98 66 141 29 90 50 148 15 95 69 128 44 Other Asian 88 63 120 40 105 70 150 29 94 73 119 69 Black Caribbean 69 59 80 167 85 71 102 123 75 67 84 290 Black African 84 70 102 112 82 65 103 77 84 72 96 189 Other Black 52 36 74 31 64 36 106 15 56 41 74 46 Chinese 112 53 205 10 101 52 176 12 105 66 160 22 Other 86 60 120 35 106 71 151 30 94 73 120 65 Total 100 4108 100 4037 100 8145
Care Quality Commission Count me in census 2010 52
Appendix B Mental health tables continued
Table B5 Standardised ratios by ethnic group for patients referred by criminal justice routes (police prison probation courts court liaison and diversion) (England and Wales = 100)
Ethnic group
Men Women Persons Standardised
referral ratio
95 confidence
interval Observed numbers
Standardised referral ratio
95 confidence
interval Observed numbers
Standardised referral ratio
95 confidence
interval Observed numbers
White British 90 86 95 1495 95 86 104 421 91 87 95 1916 White Irish 133 94 183 38 59 19 138 5 116 84 157 43 Other White 112 93 134 119 103 68 150 27 111 93 130 146 White and Black Caribbean 117 89 151 58 145 69 266 10 120 94 153 68 White and Black African 190 127 273 29 141 38 361 4 183 126 256 33 White and Asian 75 39 131 12 160 52 373 5 89 52 143 17 Other Mixed 104 65 157 22 151 61 311 7 112 75 161 29 Indian 86 61 118 38 79 32 163 7 85 62 113 45 Pakistani 118 91 150 65 89 33 194 6 115 90 145 71 Bangladeshi 74 44 115 19 29 1 162 1 68 42 105 20 Other Asian 130 95 174 45 164 71 323 8 134 101 176 53 Black Caribbean 131 114 150 208 124 81 181 26 130 114 148 234 Black African 132 112 156 145 143 93 211 25 134 114 156 170 Other Black 141 109 180 65 236 113 435 10 149 117 187 75 Chinese 83 27 194 5 146 30 426 3 99 43 195 8 Other 129 93 175 41 113 37 264 5 127 93 170 46 Total 100 2404 100 570 100 2974
Care Quality Commission Count me in census 2010 53
Appendix B Mental health tables continued
Table B6 Standardised detention ratios by ethnic group all detentions on day of admission (excluding outpatients on a CTO) (England and Wales = 100)
Ethnic group
Men Women Persons Standardised
detention ratio
95 confidence
interval Observed numbers
Standardised detention
ratio
95 confidence
interval Observed numbers
Standardised detention
ratio
95 confidence
interval Observed numbers
White British 94 92 97 6449 94 91 97 3628 94 92 96 10077 White Irish 112 95 131 154 118 96 145 94 114 101 129 248 Other White 108 98 118 451 120 106 136 251 112 104 120 702 White and Black Caribbean 123 107 141 220 129 99 167 59 124 110 140 279 White and Black African 128 99 162 68 113 70 173 21 124 100 153 89 White and Asian 96 71 126 50 109 68 164 22 99 78 125 72 Other Mixed 115 92 143 82 139 100 188 42 122 102 146 124 Indian 97 83 113 164 110 86 137 77 101 88 114 241 Pakistani 109 94 126 194 102 74 136 44 108 94 122 238 Bangladeshi 86 67 109 69 91 55 142 19 87 70 107 88 Other Asian 109 92 130 133 120 86 163 40 112 96 130 173 Black Caribbean 129 121 139 774 143 125 162 238 132 124 141 1012 Black African 115 104 127 422 131 111 153 159 119 110 129 581 Other Black 117 100 136 170 148 105 202 39 122 106 140 209 Chinese 108 71 159 26 129 78 202 19 116 85 156 45 Other 111 92 132 126 116 83 157 41 112 96 130 167 Total 100 9552 100 4793 100 14345
Care Quality Commission Count me in census 2010 54
Appendix B Mental health tables continued
Table B7 Standardised detention ratios by ethnic group detention on day of admission ndash section 2 of the Mental Health Act (England and Wales = 100)
Ethnic group
Men Women Persons Standardised
detention ratio
95 confidence
interval Observed numbers
Standardised detention
ratio
95 confidence
interval Observed numbers
Standardised detention
ratio
95 confidence
interval Observed numbers
White British 97 91 102 1156 93 87 98 1133 95 91 99 2289 White Irish 78 47 120 20 116 79 166 30 97 72 128 50 Other White 100 78 126 70 134 108 166 88 116 99 136 158 White and Black Caribbean 55 30 93 14 60 24 124 7 57 35 87 21 White and Black African 91 37 188 7 150 60 308 7 113 62 190 14 White and Asian 80 29 174 6 119 44 258 6 96 49 167 12 Other Mixed 68 28 141 7 116 53 221 9 89 51 145 16 Indian 130 91 179 37 124 81 182 26 127 98 163 63 Pakistani 126 87 176 34 138 79 225 16 130 96 171 50 Bangladeshi 166 101 256 20 140 61 276 8 158 105 228 28 Other Asian 142 93 209 26 163 93 264 16 150 108 202 42 Black Caribbean 73 57 92 70 97 72 128 51 82 68 98 121 Black African 164 131 202 87 190 146 244 62 174 147 204 149 Other Black 114 75 166 27 140 72 245 12 121 86 165 39 Chinese 165 60 358 6 212 97 402 9 190 106 313 15 Other 218 153 302 36 179 108 280 19 203 153 264 55 Total 100 1623 100 1499 100 3122
Care Quality Commission Count me in census 2010 55
Appendix B Mental health tables continued
Table B8 Standardised detention ratios by ethnic group detention on day of admission ndash section 3 of the Mental Health Act (England and Wales = 100)
Ethnic group
Men Women Persons Standardised
detention ratio
95 confidence
interval Observed numbers
Standardised detention
ratio
95 confidence
interval Observed numbers
Standardised detention
ratio
95 confidence
interval Observed numbers
White British 99 95 103 2684 96 91 100 1852 98 95 101 4536 White Irish 116 89 149 60 135 101 177 52 124 102 149 112 Other White 112 96 129 186 110 92 132 121 111 99 124 307 White and Black Caribbean 114 91 143 79 130 90 183 33 119 98 143 112 White and Black African 97 60 148 21 107 54 192 11 100 69 141 32 White and Asian 84 50 133 18 97 48 173 11 89 59 127 29 Other Mixed 121 84 168 35 117 72 181 20 120 90 156 55 Indian 96 75 122 67 110 79 148 42 101 83 122 109 Pakistani 91 71 115 69 88 55 134 22 90 73 111 91 Bangladeshi 63 39 95 22 64 28 127 8 63 43 90 30 Other Asian 90 65 120 44 94 56 149 18 91 70 117 62 Black Caribbean 116 102 130 279 164 138 192 148 129 117 142 427 Black African 95 80 112 143 102 79 129 68 97 85 111 211 Other Black 75 55 99 49 99 58 159 17 80 62 102 66 Chinese 119 59 213 11 99 43 194 8 110 66 171 19 Other 85 60 116 38 84 48 136 16 84 63 110 54 Total 100 3805 100 2447 100 6252
Care Quality Commission Count me in census 2010 56
Appendix B Mental health tables continued
Table B9 Standardised detention ratios by ethnic group detention on day of admission ndash section 3741 of the Mental Health Act (England and Wales = 100)
Ethnic group
Men Women Persons Standardised
detention ratio
95 confidence
interval Observed numbers
Standardised detention
ratio
95 confidence
interval Observed numbers
Standardised detention
ratio
95 confidence
interval Observed numbers
White British 84 79 89 991 101 88 115 220 86 82 91 1211 White Irish 140 96 198 32 48 6 175 2 126 87 176 34 Other White 112 89 139 81 156 95 241 20 118 96 144 101 White and Black Caribbean 177 133 232 53 179 66 390 6 178 135 229 59 White and Black African 149 82 251 14 224 46 654 3 159 92 254 17 White and Asian 141 75 241 13 195 40 569 3 149 85 241 16 Other Mixed 144 85 227 18 264 97 575 6 162 104 242 24 Indian 86 56 126 26 44 5 160 2 80 53 116 28 Pakistani 122 87 166 40 0 0 111 79 152 40 Bangladeshi 66 32 122 10 0 0 60 29 110 10 Other Asian 99 61 151 21 0 0 89 55 136 21 Black Caribbean 200 174 229 210 78 34 153 8 189 165 216 218 Black African 127 101 157 82 84 34 172 7 122 98 150 89 Other Black 152 110 205 43 94 11 341 2 148 108 198 45 Chinese 100 27 255 4 0 0 80 22 204 4 Other 118 75 177 23 44 1 245 1 110 71 164 24 Total 100 1661 100 280 100 1941
Care Quality Commission Count me in census 2010 57
Appendix B Mental health tables continued
Table B10 Standardised detention ratios by ethnic group detention on day of admission ndash sections 47 48 4749 of the Mental Health Act (England and Wales = 100)
Ethnic group
Men Women Persons Standardised
detention ratio
95 confidence
interval Observed numbers
Standardised detention
ratio
95 confidence
interval Observed numbers
Standardised detention
ratio
95 confidence
interval Observed numbers
White British 97 90 106 583 104 81 131 73 98 91 106 656 White Irish 132 72 221 14 163 20 590 2 135 77 219 16 Other White 130 96 172 49 71 15 206 3 124 93 163 52 White and Black Caribbean 126 78 193 21 80 2 444 1 123 77 186 22 White and Black African 207 103 370 11 0 0 189 95 339 11 White and Asian 57 12 166 3 169 4 941 1 68 19 175 4 Other Mixed 112 48 221 8 233 28 843 2 125 60 230 10 Indian 57 26 108 9 0 252 0 52 24 99 9 Pakistani 92 54 147 17 0 314 0 86 50 138 17 Bangladeshi 46 12 117 4 167 4 930 1 53 17 125 5 Other Asian 101 52 177 12 0 0 95 49 166 12 Black Caribbean 126 98 159 70 125 34 319 4 126 99 158 74 Black African 74 48 107 27 104 21 303 3 76 51 108 30 Other Black 127 78 197 20 138 3 769 1 128 79 195 21 Chinese 0 0 0 0 0 0 Other 83 38 157 9 0 0 77 35 147 9 Total 100 857 100 91 100 948
Care Quality Commission Count me in census 2010 58
Appendix B Mental health tables continued
Table B11 Standardised ratios for all applications of the Mental Health Act (including outpatients on a CTO) by ethnic group on day of census (England and Wales = 100)
Ethnic group
Men Women Persons Standardised
ratio for all MHA
applications
95 confidence
interval Observed numbers
Standardised ratio for all MHA
applications
95 confidence
interval Observed numbers
Standardised ratio for all MHA
applications
95 confidence
interval Observed numbers
White British 97 94 99 7659 95 93 98 4335 96 94 98 11994 White Irish 99 83 116 147 104 84 128 95 101 89 114 242 Other White 87 79 95 427 97 85 110 249 90 84 97 676 White and Black Caribbean 117 103 133 245 130 103 163 76 120 107 134 321 White and Black African 120 95 150 79 93 58 141 22 113 92 137 101 White and Asian 101 78 128 65 119 81 169 31 106 86 129 96 Other Mixed 110 89 134 96 125 93 165 49 114 97 135 145 Indian 103 90 118 215 122 100 147 109 109 97 121 324 Pakistani 111 97 125 254 117 90 148 67 112 100 125 321 Bangladeshi 92 75 112 97 101 68 145 29 94 78 112 126 Other Asian 103 88 121 152 126 95 164 56 109 94 124 208 Black Caribbean 123 115 131 893 141 126 158 300 127 120 134 1193 Black African 112 103 122 511 121 104 140 188 114 106 123 699 Other Black 116 102 132 232 148 112 191 59 122 108 136 291 Chinese 97 64 140 27 101 61 157 19 98 72 131 46 Other 104 87 122 140 103 75 137 46 103 89 119 186 Total 100 11239 100 5730 100 16969
Care Quality Commission Count me in census 2010 59
Appendix B Mental health tables continued
Table B12 Standardised CTO ratios by ethnic group CTOs on day of census ndash section 17a of the Mental Health Act (England and Wales = 100)
Ethnic group
Men Women Persons
Standardised CTO ratio
95 confidence
interval Observed numbers
Standardised CTO ratio
95 confidence
interval Observed numbers
Standardised CTO ratio
95 confidence
interval Observed numbers
White British 94 89 99 1289 88 82 94 730 92 88 96 2019 White Irish 51 27 88 13 77 41 132 13 62 40 90 26 Other White 97 77 120 83 125 95 162 58 107 90 126 141 White and Black Caribbean 79 53 113 29 141 77 237 14 92 67 124 43 White and Black African 111 59 190 13 125 41 292 5 115 68 181 18 White and Asian 104 54 182 12 136 50 297 6 113 67 178 18 Other Mixed 102 59 166 16 136 62 257 9 112 73 166 25 Indian 134 99 177 48 152 98 226 24 139 109 175 72 Pakistani 145 110 187 59 174 101 279 17 151 119 189 76 Bangladeshi 142 93 206 27 205 99 378 10 155 109 213 37 Other Asian 107 71 155 28 182 99 305 14 124 89 168 42 Black Caribbean 121 103 142 152 171 132 218 65 133 116 152 217 Black African 116 94 142 94 139 98 192 37 122 102 145 131 Other Black 186 144 238 65 305 189 466 21 206 165 254 86 Chinese 83 23 213 4 152 49 354 5 111 51 211 9 Other 87 54 134 21 152 79 266 12 103 71 145 33 Total 100 1953 100 1040 100 2993
Care Quality Commission Count me in census 2010 60
Appendix C Learning disability tables
Table C1 Standardised admission ratios by ethnic group for England and Wales using 2007 ONS population denominators (England amp Wales = 100) All ages
Ethnic group
Men Women Persons Standardised
admission ratio
95 confidence
interval Observed numbers
Standardised admission
ratio
95 confidence
interval Observed numbers
Standardised admission
ratio
95 confidence
interval Observed numbers
White British 104 100 109 2163 108 101 115 941 105 102 109 3104 White Irish 108 72 156 28 151 89 238 18 121 89 162 46 Other White 81 65 101 85 49 30 75 21 72 59 87 106 White and Black Caribbean 280 186 405 28 246 118 453 10 270 191 371 38 White and Black African 102 33 239 5 165 34 482 3 119 51 235 8 White and Asian 66 26 135 7 154 56 335 6 89 47 152 13 Other Mixed 181 104 295 16 229 99 451 8 195 125 290 24 Indian 32 21 48 24 28 12 55 8 31 21 44 32 Pakistani 48 30 72 22 12 1 43 2 38 25 57 24 Bangladeshi 102 60 161 18 31 4 113 2 83 51 128 20 Other Asian 33 13 69 7 92 34 201 6 47 25 81 13 Black Caribbean 265 210 332 77 117 67 190 16 218 176 267 93 Black African 53 33 80 22 40 15 87 6 50 33 72 28 Other Black 228 118 399 12 134 28 392 3 200 112 330 15 Chinese 4 0 21 1 3 0 16 1 Other 26 9 56 6 11 0 59 1 21 9 44 7 Total 100 2521 100 1051 100 3572
Care Quality Commission Count me in census 2010 61
Appendix C Learning disability tables continued
Table C2 Standardised detention ratios by ethnic group all detentions on day of admission (England and Wales = 100)
Ethnic group
Persons Standardised
detention ratio
95 confidence
interval Observed numbers
White British 97 93 103 1431 White Irish 127 84 184 28 Other White 117 91 149 68 White and Black Caribbean 120 77 179 24 White and Black African 114 37 267 5 White and Asian 75 24 176 5 Other Mixed 94 49 165 12 Indian 119 72 186 19 Pakistani 110 61 181 15 Bangladeshi 144 84 231 17 Other Asian 59 16 150 4 Black Caribbean 119 90 155 57 Black African 138 85 210 21 Other Black 62 20 145 5 Chinese 0 0 Other 104 28 267 4 Total 100 1715
Care Quality Commission Count me in census 2010 62
copy Care Quality Commission and National Mental Health Development Unit 2011 Published April 2011
This publication may be reproduced in whole or in part in any format or medium for non-commercial purposes provided that it is reproduced accurately and not used in a derogatory manner or in a misleading context The source should be acknowledged by showing the publication title and copy Care Quality Commission and National Mental Health Development Unit 2011
How to contact us
Phone 03000 616161 Email enquiriescqcorguk Web wwwcqcorguk
Write to us at Care Quality Commission National Correspondence Citygate Gallowgate Newcastle upon Tyne NE1 4PA
Please contact us if you would like a summary of this publication in other formats or languages
Registered office Care Quality Commission Finsbury Tower 103ndash105 Bunhill Row London EC1Y 8TG
- Count me in 2010
- About the Care Quality Commission
- Contents
- Summary
- National organisations coordinating the census
- Introduction
- Data methods of analysis and interpretation
- Results mental health
- A comparison between the 2005 baseline and the 2010 census
- Results learning disabilities
- Data in the future Moving beyond a one-day census
- Conclusions
- References
- Appendix A Methods of analysis
- Appendix B Mental health tables
- Appendix C Learning disability tables
- How to contact us
-

Summary continued
We have consistently highlighted the need for commissioners and providers to make full use of the Mental Health Minimum Data Set (MHMDS) ndash the statutory data set submitted by providers of specialist mental health services in England It provides rich data on these issues
Covering both community and hospital services ndash and now independent and third sector providers as well as NHS ndash it includes a wide range of information about individual patients the services provided to those admitted to hospital and to the much larger number who donrsquot need admission to hospital and the outcomes of care And because it includes year-round activity it is more representative of the overall picture of for example admission detention and readmission rates length of stay years in psychiatric care and contacts with services and professionals
We call on the Information Centre to routinely publish data on all admissions and uses of the Mental Health Act including CTOs in England (in both NHS and independent healthcare providers) by the ethnicity of patients making the MHMDS the definitive source of information about mental health and learning disability patients This data should be risk-adjusted for age gender and other variables as appropriate to enable reliable comparisons to be made across groups
If GP consortia and local authorities are to be effective in their needs assessment and commissioning roles the Information Centre needs to make available and promote to them the data from the MHMDS and other sources And researchers and academics must make full use of the MHMDS to explore the factors that underlie the observed ethnic patterns As effective use of the data is dependent on its quality we call on providers (NHS and independent) to ensure that the completeness and accuracy of their data meets required standards
CQCrsquos role In the meantime CQC will continue to focus strongly on the quality of care provided by mental health and learning disability services
People who find themselves admitted to mental health services or detained under the Mental Health Act and therefore counted by the Count me in census are among the most mentally unwell people in our society Our job is first and foremost to make sure that the care they receive meets the essential standards of quality and safety set out under the Health and Social Care Act 2008 and to work with providers to ensure this We act swiftly when we find services that do not Where we find systemic problems that organisations have not adequately addressed we may impose conditions on the providerrsquos registration to bring about the change needed to improve patientsrsquo experience of care
The essential standards of quality and safety include the requirement to provide single sex accommodation and we will continue to closely check that these standards are met by all mental health services
We intend to introduce a number of indicators derived from the rich information in the MHMDS into our quality and risk profiles for providers This will put greater emphasis on the experience of Black and minority ethnic patients in our regulatory activity
We will monitor the quality of MHMDS data submitted by providers (as reported by the NHS Information Centre) including independent service providers Those with poor data quality may be considered at higher risk in terms of their quality of care
In addition we will continue to monitor the progress of services in relation to the issues raised in the census and other reports including our report on the use of the Mental Health Act through our visits to services and meetings with patients by our Mental Health Act Commissioners and second opinion appointed doctors (SOADs) We will draw on patientsrsquo experiences to monitor the operation of the Mental Health Act
We will also assess the impact of advice and use of Local HealthWatch Local HealthWatch will be in a good position to make sure that providers and commissioners are held to account on matters of choice and access to services for people from Black and minority ethnic groups
Care Quality Commission Count me in census 2010 6
National organisations coordinating the census
The Care Quality Commission (CQC) and the National Mental Health Development Unit (NMHDU) were the two key partners in delivering the 2010 census CQC had lead responsibility
Until March 2009 the Healthcare Commission had overall responsibility for delivering the census in partnership with the Mental Health Act Commission (MHAC) and the National Institute for Mental Health in England (NIMHE) On 1 April 2009 the regulatory functions of the Healthcare Commission MHAC and the Commission for Social Care Inspection were superseded by CQC At the same time NIMHE was superseded by NMHDU
Care Quality Commission The Care Quality Commission is the independent regulator of health and adult social care services in England We also protect the interests of people whose rights are restricted under the Mental Health Act Whether services are provided by the NHS local authorities or by private or voluntary organisations we make sure that people get better care We do this by
bull Acting swiftly to eliminate poor quality care
bull Ensuring care is centred on peoplersquos needs and reflects their human rights
For more information visit the website wwwcqcorguk
National Mental Health Development Unit The NMHDU ran from April 2009 to March 2011 and had a range of programmes funded by the Department of Health and the NHS It provided national support for implementing mental health policy by advising on national and international best practice to improve mental health and mental health services NMHDU did this by commissioning or providing
bull Specialist expertise in priority areas of policy and delivery
bull Effective knowledge transfer on research evidence and good practice
bull Translation of national policies into practical deliverables that achieve outcomes
bull Coordination of national activity to help regional and local implementation
The NMHDU worked closely with the Department of Health and the 10 strategic health authorities It had strategic partnerships with a range of other groups such as the NHS Confederation the Association of Directors of Adult Social Services (ADASS) and the major mental health third sector organisations (wwwnmhduorguknmhdu)
Acknowledgements We acknowledge the role of the Mental Health Act Commission as the chief architect of the census and of the Healthcare Commission and the National Mental Health Development Unit as joint coordinators with MHAC from 2005 to 2009 We acknowledge and thank Jo Simpson (2005-07) and Christina Marriott (2007-10) for project management of the census Giovanna Maria Polato for coordinating the data analysis and Dr Veena Raleigh for being the main author of all six reports Finally we acknowledge and thank Professor Swaran Singh for being the independent member of the Editorial Board
Care Quality Commission Count me in census 2010 7
Introduction
Equality in healthcare means that all patients receive the same high levels of care depending on their needs To achieve this the Government has introduced legislation with which all healthcare organisations must comply
Subject to parliamentary approval the new NHS Commissioning Board will be established in 2011 under the coalition governmentrsquos reforms of the NHS It will have an explicit duty to promote equality and reduce inequalities in peoplersquos access to healthcare and in the outcomes of healthcare services for people in England1 The new focus on improving outcomes of healthcare as outlined in the White Paper Equity and excellence liberating the NHS is underpinned by the supporting NHS Outcomes Framework 201112 which notes that ldquotackling health inequalities and promoting equality is central if the NHS is to deliver health outcomes that are among the best in the worldrdquo2 The requirement to promote equality is also enshrined in the Equality Act 2010 which replaces previous anti-discrimination laws with one single Act prohibiting discrimination on grounds of age sex gender reassignment marriage and civil partnership race disability pregnancy and maternity religion or belief sexual orientation
On 31 March 2010 the Care Quality Commission (CQC) and the National Mental Health Development Unit (NMHDU) carried out a national census to record the ethnicity and other selected details of patients in hospital and outpatients on a community treatment order (CTO) in NHS and independent mental health and learning disability services in England and Wales This is the sixth and final Count me in census Similar censuses have been conducted annually since 200534567
The 2010 census presents the results for patients using mental health services separately to those for patients using learning disability services In this final census report we also include two new sections
bull A comparison of the 2010 census results for mental health patients with the results in 2005 and
bull A section on information that can be used in the future to analyse the quality of mental health services ndash both overall and for particular groups including Black and minority ethnic groups
Mental health
The Count me in censuses were carried out in support of the Department of Healthrsquos five-year action plan introduced in 2005 Delivering Race Equality in Mental Health Care (DRE) which aimed to improve mental health services for Black and minority ethnic communities in England8 The DRE action plan had three building blocks
bull More appropriate and responsive services
bull More community engagement
bull Higher quality information more intelligently used
The census was designed to help healthcare organisations with the third building block by providing information that can be used to plan and deliver services that are relevant to all groups in the community The NMHDU developed a lsquodashboardrsquo of indicators that enabled healthcare organisations to measure their progress towards DRErsquos goals Further details are available at wwwnmhduorgukour-workmhdpdelivering-race-equalitydre-dashboard
The census also supports the Welsh Assembly Governmentrsquos Raising the Standard Race Equality Action Plan for Adult Mental Health Services in Wales published in October 20069 This action plan aims to improve equality of access treatment and outcomes in the provision of adult mental health services for minority ethnic groups in Wales
Care Quality Commission Count me in census 2010 8
Introduction continued
The DRE five-year action plan for England came to a close in 2010 and as such Count me in 2010 is the last in this sequence of annual censuses conducted since 2005 DRErsquos underlying goal of promoting equity in healthcare for Black and minority ethnic communities in England continues to be reflected in the Governmentrsquos reforms of the NHS and is essential for demonstrating compliance with equality legislation
The Governmentrsquos recently announced strategy for mental health in England commits to improving ldquooutcomes for people with mental health problems through high-quality services that are equally accessible to allrdquo10 No health without mental health puts a focus on the mental health and wellbeing of the whole population and makes mental health ldquoeveryonersquos businessrdquo The strategy outlines six objectives
bull More people will have good mental health
bull More people with mental health problems will recover
bull More people with mental health problems will have good physical health
bull More people will have a positive experience of care and support
bull Fewer people will suffer avoidable harm
bull Fewer people will experience stigma and discrimination
No health without mental health has a cross-government and cross-sectoral focus on prevention and the mental wellbeing of the population through public health measures early intervention and personalised care It also recognises that levels of mental illness and the ways in which mental health services are used vary between different ethnic groups reflecting the socioeconomic and other disadvantages that people from Black and minority ethnic groups often experience The strategy provides extra funding for psychological therapies with expanded provision for specific groups including children young people and those with severe mental illness
This strategy follows on from New horizons introduced by the previous government in 2009 which similarly adopted a wider public health approach to promoting the mental health and wellbeing of the population11
Learning disabilities
In 2001 Valuing people set out the previous governmentrsquos vision for people with a learning disability based on four key principles of rights independence choice and inclusion12 Valuing people now a new three year strategy for people with learning disabilities published in 2009 set out the strategy for the next three years13 It also provided the previous governmentrsquos response to the recommendations in Healthcare for all the report of the independent inquiry into access to healthcare for people with learning disabilities14 and to the report of the Joint Committee on Human Rights A life like any other15 The vision remained as set out in Valuing people that all people with a learning disability have the right to lead their lives like any others with the same opportunities and responsibilities and to be treated with the same dignity and respect Valuing people now also set out cross-government commitments and actions to increase the capacity and capability to deliver services locally
In 2010 the Department of Health published a report describing progress made under Valuing people now 16
It focused on the key priorities of improving outcomes for people with learning disabilities in health housing and employment and showed where more work is needed to improve their lives The report includes additional guidance containing good practice examples about different aspects of the Valuing people now programme
A report by the Disability Rights Commission provides evidence that people with learning disabilities or severe mental health problems are more likely to develop serious health conditions and to die of them
Care Quality Commission Count me in census 2010 9
Introduction continued
sooner than other people They are also less likely to receive some treatments than people with the same medical condition but without a mental health condition or learning disability17 Learning difficulties and ethnicity noted that the disadvantage experienced by people from minority ethnic communities because of their ethnicity (for example in education and employment) is compounded by the disadvantage they experience because of their learning disability18
Aims of the census
The goals of the 2010 census are the same as those in previous years
bull To obtain robust figures for all inpatients in mental health and learning disability services in England and Wales The 2010 census also includes information about outpatients on CTOs
bull To encourage service providers to implement systems for recording patientsrsquo ethnicity and for using this information for ethnic monitoring
bull To provide information that will help service providers to take practical steps to achieve the goals of DRE
In 2005 the census only included inpatients in mental health services in England and Wales including those detained in hospital under the Mental Health Act 1983 From 2006 the census was extended to include inpatients in learning disability services CTOs introduced in November 2008 as a result of the Mental Health Act 2007 allow for supervised treatment of patients in the community Therefore in 2009 and 2010 the census included patients subject to supervised treatment in the community under the Mental Health Act most of whom were therefore outpatients in the community and were not in hospital on census day
As one of the aims of the census is to provide figures on inpatients and all those subject to the Mental Health Act on census day the analysis in this report is not limited to inpatients and also includes outpatients on CTOs (except where stated otherwise) If we excluded outpatients on a CTO from the analysis we would have an incomplete profile of ethnic differences in the rates of patients subject to the Mental Health Act We therefore considered it important to include these patients This provides a more rounded basis for examining the use of the Act ndash overall and in relation to CTOs ndash among different ethnic groups and is consistent with the analytical approach used in the 2009 census report
Although the census included some children and young people the terms ldquomenrdquo and ldquowomenrdquo are used throughout this report to refer to people of all ages ndash including children young people and older people The census does not include children and young people in residential settings such as paediatric wards and those looked after by social services
More information about the census and how it was carried out including the full set of results is available at wwwcqcorgukcountmein
Care Quality Commission Count me in census 2010 10
Data methods of analysis and interpretation
Ethnic groups
The ethnic categories referred to in this report are those used by the Office for National Statistics (ONS) in its 2001 census of the general population of England and Wales (see box 1) The term lsquoBlack and minority ethnic groupsrsquo defines all groups other than lsquoWhite Britishrsquo
Box 1 Ethnic categories used in this report
White British Pakistani White Irish Bangladeshi Other White Other Asian WhiteBlack Caribbean Mixed Black Caribbean WhiteBlack African Mixed Black African WhiteAsian Mixed Other Black Other Mixed Chinese Indian Other
Coverage of learning disability establishments
The 2010 census included all healthcare providers in England registered with CQC on 31 March 2010 and all healthcare providers in Wales registered with the Healthcare Inspectorate Wales to provide inpatient learning disability services It did not include care homes
In the NHS there is a continuum from inpatient services through to registered and supported homes All of these can have some links to the NHS either directly or through seconded staff Where such NHS facilities were both registered as care homes under the Care Standards Act 2000 and regulated by CQC they were included
Distinguishing between mental health inpatients and learning disability inpatients
Some healthcare providers offer both mental health and learning disability services and there is considerable overlap between them The census asked providers to distinguish between services by describing wards as either ldquomainly providing mental health servicesrdquo or ldquomainly providing learning disability servicesrdquo This separation by ward type enables us to compare the results across years and ensures that no patient is counted twice
It is important to note however that some patients on mental health wards may have a learning disability or Autistic Spectrum Disorder including Aspergerrsquos syndrome Similarly some patients on learning disability wards may have a mental health problem The distinction of mental health and learning disability patients on the basis of ward is therefore an approximation
Care Quality Commission Count me in census 2010 11
Data methods of analysis and interpretation continued
Methods of statistical analysis
The statistical methods used for data analysis in this report are given in Appendix A
For the admission rates the ONS estimates of the general population in 2007 were used as denominators The Black and minority ethnic population of England and Wales has increased significantly since the 2001 ONS census ONS has produced updated population estimates by ethnic group for 2007 (the latest year for which these estimates are available) which reflect the demographic changes since 2001 The number of people from Black and minority ethnic groups (ie excluding the White British group) in England and Wales is estimated to have increased from 65 million in 2001 to 85 million in 2007 a rise of 30 As a result the proportion of the total population that is not from the White British group increased from 13 to 16 over this period We used the 2007 population estimates to calculate the admission rates in order to present a more up-to-date and accurate picture of ethnic differences However these figures do not reflect any demographic changes between 2007 and 2010 the year of this census
To make a comparison with the DRE baseline we also present admission rates from the 2005 census derived using the 2005 ONS population estimates by ethnic group as denominators These figures will not be the same as those published in the 2005 census report which were based on the 2001 ONS census population estimates because updated estimates of populations by ethnic group were not available at that time
For all other analyses (for example rates of use of the Mental Health Act seclusion etc) the patient numbers in the census were used as denominators
Unlike the censuses of 2005 to 2008 that counted only inpatients the 2009 and 2010 censuses also included outpatients on a CTO on census day This is because (a) the census aims to cover all patients subject to the Mental Health Act on census day and (b) we would not have been able to analyse standardised ratios for CTOs for different ethnic groups if CTO patients had been excluded from the analysis However CTO outpatients are excluded from selected analyses where appropriate including the analysis of rates for admissions detentions on admission source of referral single sex accommodation and recorded incidents of seclusion restraint accidents assault and self-harm The issue relating to the analysis of outpatients on a CTO only affects the sections of the report relating to mental health patients as there were very few learning disability patients on CTOs
Some results in this report are standardised for age and gender (those relating to admission detention source of referral care programme approach seclusion restraint accidents assault self-harm consent and presence on a secure ward) This is because there are underlying differences in the age and gender profiles of different ethnic populations and comparisons based on crude rates would be misleading Standardisation allows comparisons between different ethnic groups by taking account of variations in age and gender The report uses the conventionally accepted statistical methods for standardisation
The terms ldquohigherrdquo and ldquolowerrdquo than average used in the text for ethnic comparisons relate to differences from the national average that are statistically significant at the 5 level
Care Quality Commission Count me in census 2010 12
Data methods of analysis and interpretation continued
Interpreting the results
In this report for convenience we refer to ldquoadmission ratesrdquo for mental health and learning disability patients However these are in fact population-based rates of patients who were in hospital or subject to the Mental Health Act on census day and not rates for admissions actually made on the census day itself The number of admissions on census day will differ from the number of patients in hospital on that day and both of these will differ from the number of admissions throughout the year
As with any study our results have some caveats
1 The admission rates presented for minority ethnic groups in this report are higher than would be expected because they are based on ONS population estimates by ethnic group for 200719 the latest year available rather than population estimates for 2010 Therefore the admission rates do not take into account demographic changes between 2007 and 2010 Furthermore these population estimates are described by ONS as ldquoexperimentalrdquo and are subject to margins of error
2 The results are not adjusted for diagnosis and other clinical information so they may reflect differences between ethnic groups in the levels nature or severity of mental illness or disability
3 The data collected for the census does not allow adjustment for socioeconomic factors such as poverty unemployment and inner-city residence These occur more commonly in Black and minority ethnic communities Equally it was not possible to take account of social factors such as marital status living alone separation from one or both parents or lack of social networks Both socioeconomic and social factors are known to be associated with the risk of mental illness and can affect pathways into care and the nature of patientsrsquo interaction with services
4 Rates based on small and fluctuating numbers of patients can change in either direction (high to low or vice versa) from one year to the next as a result of random rather than real variation and regression to the mean
5 The census does not assess the quality of services the experience of patients or the reasons for any differences between ethnic groups
6 We have explained the rationale for including outpatients on CTOs in this report While this enables us to comment on CTOs on census day in addition to those who are inpatients it does mean that the overall census population is not restricted to inpatients as in the reports for the years preceding 2009 and 2010
7 The census is a one-day count designed to give the number and ethnic composition of patients on that day Its value is in providing a year-by-year snapshot profile However by its very nature it cannot give the picture for the whole year As we have shown in the section lsquoData in the future Moving beyond a one-day censusrsquo a one-day picture can differ from results based on a full yearrsquos data because a one-day picture over-represents long-stay patients and under-represents short stay admissions
Care Quality Commission Count me in census 2010 13
Results mental health
We collected information on 32799 patients from the mental health services of 261 NHS and independent healthcare organisations in England and Wales This included 29840 inpatients of whom 75 were inpatients on a CTO and a further 2959 patients on a CTO who were outpatients on census day The number of inpatients in each census has declined each year from 33785 in 2005 to 29840 in 2010 (excluding the 2959 outpatients on a CTO) a fall of 12 since 2005 (see Table 1)
All eligible establishments took part in the census The total number of providers increased from 207 in 2005 to 261 in 2010 primarily due to an increase in the number of independent healthcare providers in both England and Wales In contrast the number of NHS providers in England was lower than in the baseline year 2005 and did not change much in Wales The proportion of patients cared for by independent providers has risen from 10 in 2005 to 16 in 2010
Table 1 Number of providers of mental health services and patients
NHS (England)
Independent (England)
NHS (Wales)
Independent (Wales) Total
2010 census Number of providers 78 160 9 14 261 Number of all patients 32799 (including outpatients 25653 4787 1958 401 (including 2959 on a CTO) outpatients on a CTO) of all patients 782 146 60 12 100
2009 census Number of providers 79 158 10 17 264 Number of all patients 31786 (including outpatients 24941 4594 1845 406 (including 1253 on a CTO) outpatients on a CTO) of all patients 785 145 58 13 100
2008 census Number of providers 87 141 11 16 255 Number of inpatients 24842 3931 1892 355 31020 of inpatients 801 127 61 11 100
2007 census Number of providers 82 153 11 11 257 Number of inpatients 25020 4030 1875 262 31187 of inpatients 802 129 60 08 100
2006 census Number of providers 97 125 11 5 238 Number of inpatients 26565 3341 1962 155 32023 of inpatients 830 104 61 05 100
2005 census Number of providers 92 98 10 7 Number of inpatients 28590 3078 1939 178 33785 of inpatients 846 91 57 05 100
Care Quality Commission Count me in census 2010 14
207
Results mental health continued
Ethnicity
Information about ethnicity was available for 98 of patients Of these patients 75 were White British and 23 belonged to Black and minority ethnic groups defined as all groups that are not White British This compares with 20 in 2005
Compared with the baseline year of 2005 the 2010 census recorded a lower proportion of patients from the White British White Irish and Other Black groups (see Table 2) There were increases in the proportions of patients from the Other White WhiteBlack Caribbean Mixed Black Caribbean and Black African groups Other ethnic groups showed only minor differences over the baseline year
Table 2 Mental health patients by ethnic group
Ethnic group 2010 census 2009 census 2008 census 2007 census 2006 census 2005 census
Number Number Number Number Number Number
White British 750 24593 757 24067 765 23738 776 24198 786 25170 792 26762
White Irish 16 514 19 591 18 567 17 538 18 582 22 727
Other White 43 1407 43 1360 45 1399 46 1449 38 1210 31 1055
White and Black Caribbean
13 418 11 336 11 336 09 288 09 287 08 255
White and Black African
04 139 03 91 04 110 03 91 03 102 02 71
White and Asian 04 141 04 137 04 117 03 91 03 109 03 104
Other Mixed 06 200 07 213 05 148 06 180 05 173 05 167
Indian 16 529 14 460 14 426 13 393 13 411 13 434
Pakistani 13 440 13 409 13 396 10 315 11 349 10 325
Bangladeshi 06 203 05 171 05 144 04 130 05 158 05 153
Other Asian 09 311 09 273 10 300 08 261 08 262 08 264
Black Caribbean 49 1608 47 1504 47 1468 43 1330 39 1264 41 1369
Black African 29 957 26 834 23 715 21 648 20 652 19 645
Other Black 11 368 12 384 12 376 17 545 17 535 17 569
Chinese 03 83 03 82 03 91 03 82 02 78 02 81
Other 09 296 10 322 12 362 11 356 11 338 11 357
Not stated 18 592 17 552 11 327 09 292 11 342 12 416
Invalid 0 1 01 31
100 32799 100 31786 100 31020 100 31187 100 32023 100 33785 Total
Care Quality Commission Count me in census 2010 15
Results mental health continued
As in the previous censuses patients from Black and minority ethnic groups were concentrated in a relatively small number of organisations 70 were patients in 25 of the 261 organisations that took part in the census Of all organisations 194 had fewer than 50 patients from Black and minority ethnic groups each and another 32 organisations had no patients at all from these groups
Reporting of ethnicity
Eighty-one per cent of patients reported their own ethnic group Where patients did not do so staff or relatives did so on their behalf (10 and 6 respectively) We cannot be certain that ethnicity was recorded accurately for these patients The proportion of patients who reported their own ethnicity ranged from about 81 in the White groups to 90 in the WhiteBlack African Mixed group
Care Quality Commission Count me in census 2010 16
Results mental health continued
Age and gender
Ethnic differences in the age profiles of patients largely reflect the age profiles of different minority ethnic populations The White British White Irish and Other White populations have an older age structure than other minority ethnic populations and therefore patients from the White groups are significantly older than patients from other ethnic groups (see Table 3)
Overall 58 of patients were men Men outnumbered women in all ethnic groups (see Table 3) The White British White Irish Other White and Chinese groups had smaller differences in the proportions of men and women compared with other ethnic groups
Table 3 Age and gender of patients
Ethnic group Age () Gender ()
Total (n) 0-17 18-24 25-49 50-64 65+ Men Women
White British 1 7 41 20 31 56 44 100 (24593)
White Irish 0 4 36 19 41 56 44 100 (514)
Other White 2 7 47 19 25 58 42 100 (1407) White and Black Caribbean 1 13 68 12 5 73 27 100 (418)
White and Black African 1 13 73 9 4 67 33 100 (139)
White and Asian 4 18 63 11 5 65 35 100 (141)
Other Mixed 2 13 69 11 6 62 38 100 (200)
Indian 1 4 58 21 15 63 37 100 (529)
Pakistani 2 10 73 12 4 74 26 100 (440)
Bangladeshi 2 15 69 8 6 72 28 100 (203)
Other Asian 2 12 61 13 13 70 30 100 (311)
Black Caribbean 1 6 61 20 13 70 30 100 (1608)
Black African 1 10 75 9 5 67 33 100 (957)
Other Black 1 6 78 11 3 78 22 100 (368)
Chinese 2 10 59 17 12 52 48 100 (83)
Other 2 12 57 18 11 67 33 100 (296)
1 7 46 19 27 58 42 100 Total (n=
471) (n=
2352) (n=
14998) (n=
6093) (n=
8885) (n=
19071) (n=
13684) (n=
32799)
Care Quality Commission Count me in census 2010 17
Results mental health continued
Language and religion
Similar to previous censuses 5 of patients reported that their first language was not English (see Table 4) The Chinese and Bangladeshi groups had the highest proportions of patients whose first language was not English (51 and 46 respectively) Among the Other White group 27 had a first language other than English Again similar to previous censuses about 2 of patients said they needed an interpreter and of these 24 were from the White British group
Table 4 Percentage of patients with a first language other than English
Ethnic group with first language other than English
White British 1
White Irish 3
Other White 27
White and Black Caribbean 2
White and Black African 10
White and Asian 6
Other Mixed 11
Indian 26
Pakistani 35
Bangladeshi 46
Other Asian 34
Black Caribbean 2
Black African 22
Other Black 13
Chinese 51
Other 41
Total 5
Care Quality Commission Count me in census 2010 18
Results mental health continued
Religion was not stated for 21 of patients and 15 of patients said they had no religion The proportions stating they did not have a religion were highest among the WhiteBlack Caribbean and WhiteAsian Mixed groups (23 and 21 respectively) and lowest among the South Asian groups (4) Table 5 shows the religion of patients
Table 5 Religion of patients by ethnic group
Ethnic group
Religion and faith groups ()
None Christian Buddhist Hindu Jewish Muslim Sikh Any other religion
Not stated
White British 16 58 1 0 1 0 0 3 21
White Irish 8 73 0 0 0 5 13
Other White 13 53 1 0 3 5 7 18 White and Black Caribbean 23 47 0 1 0 3 7 17
White and Black African 16 41 1 1 15 6 20
White and Asian 21 33 1 1 21 3 3 18
Other Mixed 15 41 3 3 16 8 17
Indian 5 10 0 29 15 28 2 11
Pakistani 4 3 0 1 1 80 1 2 10
Bangladeshi 4 1 1 1 76 1 5 11
Other Asian 6 14 5 12 39 5 3 16
Black Caribbean 12 59 1 0 0 2 8 17
Black African 10 45 0 0 22 0 3 19
Other Black 12 41 1 1 0 16 7 22
Chinese 18 30 16 1 4 31
Other 8 24 3 1 3 34 6 21
Total 15 54 1 1 1 4 1 4 21
Care Quality Commission Count me in census 2010 19
Results mental health continued
Sexual orientation
The results for sexual orientation were not valid for 1 of patients and for 20 the response was recorded as ldquonot knownrdquo Seventy-six per cent of patients said they were heterosexual 1 said gay lesbian 1 said bisexual and less than 1 said ldquootherrdquo The number of minority ethnic patients who were gaylesbian or bisexual was very low
The overall figure of 1 who said they were gay lesbian or bisexual is lower than some estimates of the proportions of gaylesbian or bisexual people in the general population (5 to 7)2021 However in the 200910 Integrated Household Survey of a representative sample of 238206 people in UK conducted by the Office for National Statistics 1 identified themselves as gay or lesbian 05 as bisexual 05 as ldquootherrdquo 3 responded as ldquodo not knowrdquo or refused to answer and 95 identified themselves as heterosexualstraight22
Disability
About 75 of patients said they did not have a disability and 25 said they had one or more disabilities Of these 7 were blind or visually impaired 1 were deaf or had a hearing impairment 1 had Autistic Spectrum Disorder 2 had a learning disability 4 had a mobility impairment and 2 used a wheelchair The remaining 8 had more than one disability The proportion of patients with a disability was highest among the White British White Irish and Other White groups (about 28) which could reflect the higher age profiles of these patients compared with other ethnic groups
Rates of admission (see section on interpreting the results on page 13)
The rates of admission derived using the 2007 ONS ethnic population estimates as denominators are given in Appendix B Tables B1 (all ages) and B2 (ages 65 and over) Outpatients on a CTO are excluded from these results
All ages Admission rates were lower than average for patients from the White British Indian and Chinese groups and were average for the Pakistani and Bangladeshi groups Rates were higher than average for other minority ethnic groups they were particularly high for the Black Caribbean Black African WhiteBlack Caribbean Mixed and WhiteBlack African Mixed groups who had rates two to four times higher than average and for the Other Black group with a rate six times higher
Ages 65 and over Age-standardised admission rates for minority ethnic groups at older ages show broadly similar patterns to those reported for all ages with rates two to three times higher than average among the Black and White Black Mixed groups Rates were high also in the White Irish Other White Other Asian and Other groups
Numbers of older Black and minority ethnic patients were too few in most ethnic groups to support analyses of subgroups within them for example those detained
Care Quality Commission Count me in census 2010 20
Results mental health continued
Source of referral
People can be referred to healthcare services in a number of ways Referrals for inpatient care often come from community mental health teams rather than the original source such as GPs and accident and emergency (AampE) departments Therefore referrals from these teams may include referrals from other sources Furthermore about a quarter of patients (26) were referred from tertiary care and information about their original referral source was not available We had no information about the source of referral for 13 of patients The results reflect the proportions of patients from each ethnic group that are referred from each source so a higher proportion of referrals from one source will inevitably mean that proportions from other referral sources are lower Outpatients on a CTO are excluded from these data
The referral patterns are broadly similar to those reported previously and the key results are presented below
GP referrals 7 of patients Rates were 8 higher than average among the White British group They were lower than average among the Other White Black Caribbean Black African and WhiteBlack Caribbean Mixed groups by 28 to 72 The rates of referral by GPs are given in Appendix B Table B3
Referrals from AampE departments 5 of patients The White British group had a 9 lower than average rate of such referrals The WhiteBlack African Mixed Indian Bangladeshi Black African and Other groups were more likely than average to be referred in this way
Referrals from community mental health teams 26 of patients For the White British group such referrals were 5 higher than the average rate They were lower than average among the Other White WhiteBlack African Mixed Black Caribbean Black African and
Other Black groups by 16 to 48 The rates of referral are given in Appendix B Table B4
Referrals from the criminal justice system 9 of patients This is defined as the police courts probation service prison and court liaison and diversion service
Patients from the White British group were less likely than average to be referred by the criminal justice agencies whereas the Black Caribbean Black African Other Black WhiteBlack African Mixed and Other Asian groups were 30 to 83 more likely than average to be referred in this way We observed no differences from the average rate for other ethnic groups Rates of referral by the criminal justice system are given in Appendix B Table B5
A significant proportion (26) of all referrals were from tertiary care
Tertiary care referrals from medium or high secure units 5 of patients The rate for such referrals (in NHS or independent sectors) was lower than average among the Other White and Indian groups It was higher than average among the Black Caribbean and WhiteBlack Caribbean Mixed groups by about 75
Tertiary care referrals from other inpatient services 21 of patients The rate for such referrals (NHS and independent) was higher than average among the White Irish and Other White groups by 29 and 59 respectively The rate was lower than average in the Indian and Other Black groups
Tertiary care referrals from other clinical specialties 9 of patients Rates of such referrals were higher than average among the White British and Indian groups and lower than average among the Other White WhiteBlack Caribbean Mixed Other Asian Black African Other Black and Chinese groups
Care Quality Commission Count me in census 2010 21
Results mental health continued
Detention under the Mental Health Act 1983 on day of admission
The Mental Health Act 2007 made a number of changes to the Mental Health Act 1983 These changes were reflected in the census of 2009 and 2010 which collected information on new provisions establishing supervised community treatment (section 17A) and excluded supervised discharge (section 25A) which was abolished
As in previous reports we present below the results for detention rates on the day of admission Outpatients on a CTO are excluded from these analyses After that we present rates for all patients subject to the Mental Health Act on census day (including outpatients on a CTO) followed by rates for patients on a CTO on census day
All detentions Forty-nine per cent (14637) of patients were detained under the Mental Health Act on admission to hospital This was a higher proportion than recorded in the previous censuses (40 in 2005 and 2006 43 in 2007 45 in 2008 and 47 in 2009)
Detention rates were 6 lower than average among White British patients and between 19 and 32 higher than average among the Black Caribbean Black African Other Black and WhiteBlack Caribbean Mixed groups Detention rates were also higher in the White Irish and Other White groups by about 13 and in the Other Mixed group by 22 No other ethnic differences were observed The results are given in Appendix B Table B6
These patterns are broadly similar to those reported in previous censuses
Detention under section 2 Section 2 of the Mental Health Act gives authority for a person to be detained in hospital for assessment for a period not exceeding 28 days It is mainly applied where the patient is unknown to the service or where there has been a significant interval between periods of inpatient treatment
Of all patients detained on admission 22 were detained under section 2 Rates of detention under this section were lower than average among the White British WhiteBlack Caribbean Mixed and Black Caribbean groups and higher than average among the Bangladeshi Other Asian Black African Chinese and Other groups by between 50 and 103 (see Appendix B Table B7)
Detention under section 3 Section 3 of the Act provides for the compulsory admission of a patient to hospital for lsquotreatmentrsquo and for his or her subsequent detention which can last for an initial period of up to six months and is renewable after this
Of all patients detained on admission 43 were detained under this section Rates were higher than average among the White Irish and Black Caribbean groups by 24 and 29 respectively and lower among than average among the Bangladeshi group No other ethnic differences were observed The rates of detention under section 3 are given in Appendix B Table B8
Detention under section 3741 Section 37 of the Mental Health Act allows a court to send a person to hospital for treatment when they might otherwise have been given a prison sentence and section 41 allows a court to place restrictions on a personrsquos discharge from hospital Admission to hospital rather than prison is generally regarded as a more positive outcome for the person concerned
Care Quality Commission Count me in census 2010 22
Results mental health continued
Of all patients detained on admission 14 were detained under section 37 with a section 41 restriction order applied The rates of detention are given in Appendix B Table B9 In all minority ethnic groups very few women were detained under section 3741 Among men the rate of detention for the White British group was 16 lower than average and it was higher than average in the WhiteBlack Caribbean Mixed group by 77 the Black Caribbean group by 100 the Black African group by 27 and the Other Black group by 52
A consistent pattern across all six annual censuses was the higher than average detention rate under section 3741 for the Black Caribbean and Other Black groups
Detention under sections 47 48 and 4749 These sections of the Mental Health Act allow the Ministry of Justice to issue a direction to transfer a person detained in prison to a hospital for treatment
Of all patients detained on admission 7 were detained under these sections The only ethnic differences observed were a 107 higher than average detention rate among men from the White Black African Mixed group and a lower than average rate for the Indian group We observed no other ethnic differences probably because the numbers of detentions under these sections were low in most minority ethnic groups These rates of detention are given in Appendix B Table B10
The previous four censuses also showed virtually no ethnic differences for rates of detention under sections 47 48 and 4749
Patients subject to the Mental Health Act 1983 on day of census
All patients subject to the Mental Health Act Of all the 32399 patients in the census a total of 53 (17299) were subject to the Mental Health Act on census day including 2959 outpatients and 75 inpatients on a CTO (either voluntarily or recalled) Ratios for the different ethnic groups for overall applications of the Mental Health Act including CTOs showed broadly similar patterns to detention rates on admission day from which patients on a CTO were excluded In both cases rates were higher than average among the Black Caribbean Black African Other Black and White Black Caribbean Mixed groups However the higher than average detention rates for the White Irish Other White and Other Mixed groups on admission day were not apparent on census day
The rates are given in Appendix B Table B11
Supervised community treatment under section 17A Community treatment orders (CTOs) were introduced in November 2008 as a result of the Mental Health Act 2007 They allow for supervised community treatment to be provided for up to six months with the possibility of an extension after this These orders are designed to help patients to maintain stable mental health outside hospital and to promote recovery by providing professionals with the power to set conditions on discharge from hospital and a power to recall patients if arrangements in the community are not working
Nine per cent of all patients in the census were on CTOs compared with 4 in 2009 Of all the 17299 patients subject to the Mental Health Act on census day almost 18 (3034) were on CTOs Of the patients on a CTO 2959 were outpatients and 75 were inpatients (50 voluntary and 25 recalled)
Care Quality Commission Count me in census 2010 23
Results mental health continued
The rate of supervised community treatment among all patients included in the census was lower than average in the White British and White Irish groups and higher than average in the South Asian (Indian Pakistani Bangladeshi) and Black (Black Caribbean Black African Other Black) groups by 22 to 106 The ratios are given in Appendix B Table B12
Consent
About 25 of informally admitted patients were deemed incapable of consenting to treatment The only ethnic difference observed was a higher than average rate for the Pakistani group but this was based on very few patients
About 18 of patients who were detained or on CTOs were deemed incapable of consenting to treatment These rates were lower than average by 7 in the White British group and were higher than average among the Other White WhiteBlack Caribbean Mixed and Black African groups by 21 35 and 36 respectively
In addition 13 of patients who were detained or on CTOs on census day were deemed capable of consenting to treatment but refused to do so The White British group had a rate of refusals that was 10 lower than average and rates were higher than average among the White Irish WhiteBlack Caribbean Mixed Other Mixed Black Caribbean and Black African groups by between 39 and 71
Care programme approach
The Care Programme Approach (CPA) is the process by which treatment care and support for people with serious mental health problems and accompanying health and social care needs are agreed coordinated and understood by all involved From October 2008 changes to the CPA in England
mean that it is no longer categorised into two parts (lsquostandardrsquo and lsquoenhancedrsquo) and just the one category of enhanced CPA applies This makes CPA policy in England different to that in Wales where the distinction still applies The CPA data presented here therefore includes all CPA patients in England and both lsquostandardrsquo and lsquoenhancedrsquo CPA patients in Wales
About 89 of all patients were on a CPA 3 were on a single assessment process (SAP) whereby assessments are made for adults with health and or social care needs and 8 were on neither CPA nor SAP As most patients were on a CPA no ethnic differences were observed
Recorded incidents
The 2010 census asked about the number of times that patients experienced seclusion hands-on restraint self-harm accident and physical assault in a current hospital spell or if the patientrsquos hospital spell was longer than three months the number that took place within the last three months Outpatients on a CTO are excluded from these data It should be noted that the rates of such events among minority ethnic groups can show yearly variation because of the low numbers of events in several groups
Seclusion Seclusion was defined as the supervised confinement of a patient in a room which may be locked to protect others from significant harm Four per cent of patients had experienced one or more episodes of seclusion The White British group had a seclusion rate that was 9 lower than average Rates were higher than average among the WhiteBlack Caribbean Mixed WhiteBlack African Mixed Black Caribbean and Black African groups by 80 90 36 and 56 respectively
Care Quality Commission Count me in census 2010 24
Results mental health continued
Although the number of incidents of seclusion was low in several minority ethnic groups some general patterns over the six censuses to date are
bull The proportion of all patients who had an episode of seclusion stayed fairly constant over the six censuses at about 4
bull Although there have been annual fluctuations the seclusion rate has been higher than average for the Black and WhiteBlack Mixed groups in three or four of the six censuses and in the Other White group in three censuses
Hands-on restraint This was defined as the physical restraint of a patient by one or more members of staff in response to aggressive behaviour or resistance to treatment About 12 of patients had experienced one or more episodes of hands-on restraint No ethnic differences were observed In fact very few ethnic differences have been observed in the previous censuses also and they have not shown a consistent pattern
Self-harm Eight per cent of patients had harmed themselves on one or more occasions Only the White British group had a rate that was higher than average (by 14) Rates were lower than average among several minority ethnic groups the three Black groups (Black Caribbean Black African and Other Black) by about 70 the three south Asian groups (Indian Pakistani Bangladeshi) by between 37 and 78 and the Other Mixed and Other Asian groups by about 60
In terms of comparison with previous years
bull The proportion of all patients who had harmed themselves stayed fairly constant at about 7ndash8
bull In all censuses the White British group had a higher than average rate of self-harm and the Black and South Asian groups had lower than average rates of self-harm
Accidents About 11 of patients had experienced one or more accidents Patients from the White British group experienced a rate of accidents that was 6 higher than average Rates were lower than average in the Black Caribbean Black African Other Black and Other Asian groups by about 50 to 70 No accidents were reported for the Chinese group
In terms of comparisons with previous years
bull The proportion of all patients who had had an accident stayed fairly constant
bull The rate of accidents in the different censuses was higher than average in the White British group and lower than average in the Black Caribbean group Few other ethnic differences were observed and they were not consistent
Physical assault on the patient The definition of assault includes incidents of physical assault on the patient irrespective of who committed the assault We do not have information on who committed the assault for example whether it was another patient or a member of staff Eleven per cent of patients were involved in one or more episodes of physical assault The only ethnic difference observed was a 19 lower than average rate among the Black Caribbean group
In terms of comparisons with previous years
bull The proportion of all patients who had experienced a physical assault stayed fairly constant
bull Very few ethnic differences in rates of assault were observed in the different censuses and they did not show a consistent pattern
Care Quality Commission Count me in census 2010 25
Results mental health continued
Duration of stay in hospital from admission to census day
We analysed the length of the period between each inpatientrsquos admission to hospital and the census day This period is of course shorter than a patientrsquos full length of stay in hospital which runs from admission to the date when they are discharged Outpatients on a CTO are excluded from the following analyses
bull 25 of inpatients had been in hospital for one month or less
bull 20 had been in hospital between one and three months
bull 13 had been in hospital between three and six months
bull 11 had been in hospital between six months and one year
bull 11 had been in hospital between one and two years
bull 12 had been in hospital between two and five years
bull 8 had been in hospital for more than five years
These results are similar to those of previous censuses About 31 of patients in the 2010 census had been in hospital for more than a year and had therefore also been included in the 2009 census About 20 of patients had been in hospital for more than two years and will have been included in both the 2008 and 2009 censuses
We calculated the median length of stay for different ethnic groups The median is the midpoint of the range of values so the median length of stay is the one at which half the patients had a length of stay less than the median and half had a stay longer than the median Overall and as in previous years the median amount of time that women had spent in hospital was about 25 months and the median for men was about 58 months (see Table 6) In most ethnic groups the median time spent in hospital was two to three times longer for men than for women in the Other Black group men had been in hospital four times longer than women
Median lengths of stay were longest for men from the Black Caribbean WhiteBlack Caribbean Mixed and Other Black groups and shortest for men from the Chinese Bangladeshi and Other groups Median lengths of stay were longest for women from the WhiteBlack Caribbean Mixed and Black Caribbean groups and shortest for women from the Chinese and Bangladeshi groups
A number of important factors influence a patientrsquos length of stay in hospital including age gender whether or not they are detained under the Mental Health Act (and the section under which they are detained and whether there is an additional restriction order) the type and severity of their illness the nature of their treatment and the availability of support in the community The data in the census does not allow for analysis of these factors
Table 6 Median number of days from the day of admission to the day of census
Ethnic group Men Women
White British 161 71
White Irish 218 114
Other White 238 113
White and Black Caribbean 275 191
White and Black African 182 92
White and Asian 226 78
Other Mixed 173 112
Indian 172 70
Pakistani 153 56
Bangladeshi 134 55
Other Asian 167 61
Black Caribbean 345 122
Black African 141 66
Other Black 248 58
Chinese 135 51
Other 131 76
Total 174 75
Care Quality Commission Count me in census 2010 26
Results mental health continued
Ward security
As in previous years about 11 of all patients were on a medium or high secure ward as opposed to a general (76) or low secure (13) ward
Patients from the White British Indian and Bangladeshi groups were less likely than average to be on a medium or high secure ward by 7 30 and 67 respectively Patients from the White Irish WhiteBlack Caribbean Mixed Black Caribbean and Other Black groups had a higher than average rate by between 43 and 55
Age range on wards
Among patients under 18 years of age 61 were being cared for on wards for working-age adults on census day and five patients were on a ward for older people Seven per cent of patients on wards for working-age adults were 65 or over and
8 of those on wards for older people were adults of working age There were very few lsquoout of agersquo placements among minority ethnic groups
Patients in wards designated as single sex or mixed
Providers were asked whether patients were on a ward designated as men or women only or mixed gender All the analyses of single sex accommodation and facilities exclude outpatients on a CTO Overall 61 of men and 77 of women were not in a ward designated for single sex use similar proportions as in previous years The proportion of patients not in a designated single sex ward was lower among almost all minority ethnic groups than among the White British group In all ethnic groups the proportion of men who were not in a designated single sex ward was lower than among women (see Table 7a)
Two further questions examined the single sex facilities that were available to patients
At the time of the 2010 census the following guidance from the Department of Health applied in England A ward can be described as single sex (ie the intended sex of the ward is either male or female and not mixed) when the accommodation complies with the following definition from the Department of Health of single sex accommodation ldquoSleeping areas must be segregated and members of one sex must not have to walk through an area occupied by the other sex to reach toilets or bathrooms Separate male and female only toilets and bathrooms must be provided There should be separate day rooms to which only women have accessrdquo However there is a discrepancy for providers because accommodation designated as a lsquowardrsquo for administrative purposes may incorporate single sex accommodation for both sexes that meets the guidelines ndash but in this case the ward would still be lsquomixedrsquo (based on guidance from Safety Privacy and Dignity Department of Health 2000)
As long as men and women are cared for in separate bays or rooms and have their own toilet facilities then it may well be appropriate for them to be on the same ward being cared for by the same team of doctors and nurses In practice good segregation can be achieved if men and women have separate sleeping areas (for example single sex bays) and have separate toilets and bathrooms that they can reach without having to pass through (or close to) areas for the opposite sex The layout of wards should minimise any risk of overlooking or overhearing by members of the opposite gender (from Privacy and Dignity ndash A report by the Chief Nursing Officer into mixed sex accommodation in hospitals Department of Health 2007)
The coalition governmentrsquos revised Operating Framework for 201011 requires NHS organisations to eliminate mixed-sex accommodation except under exceptional circumstances from 2011 The national guidance relating to mixed sex accommodation was issued in November 2010 and states that ldquoNo areas are exempt and every decision to mix must be justified by reference to the patientrsquos clinical needs not organisational convenience or custom and practicerdquo For mental health and learning disability trusts it states ldquoThere is no acceptable justification for admitting a mental health patient to mixed-sex accommodationrdquohellip It ldquomay be acceptable in a clinical emergency to admit a patient temporarily to a single ensuite room in the opposite-gender area of a ward In such cases a full risk-assessment must be carried out and complete safety privacy and dignity maintainedrdquo The guidance is available at wwwdhgovukenPublicationsandstatisticsLettersandcircularsProfessionallettersChiefnursingofficerlettersDH_121848
Care Quality Commission Count me in census 2010 27
Results mental health continued
Table 7a Percentage of patients not in a designated single sex ward by ethnic group
Ethnic group
Sex of patients and ward
Male Female
Male ward Female or mixed ward Female ward Male or mixed ward
White British 35 65 21 79
White Irish 41 59 28 72
Other White 44 56 28 72
White and Black Caribbean 56 44 31 69
White and Black African 48 52 41 59
White and Asian 43 57 34 66
Other Mixed 49 51 24 76
Indian 37 63 25 75
Pakistani 48 52 35 65
Bangladeshi 23 77 18 82
Other Asian 46 54 22 78
Black Caribbean 55 45 32 68
Black African 49 51 28 72
Other Black 49 51 30 70
Chinese 42 58 30 70
Other 43 57 20 80
Total 39 61 23 77
The vast majority of patients in this category were in mixed wards very few (under 05) male patients were on female-only wards or vice versa
Care Quality Commission Count me in census 2010 28
Results mental health continued
Patientsrsquo access to toilet and bathing facilities designated for single sex use
We asked providers if the patient had access to toilet and bathing facilities designated for single sex use Overall 13 of men and 16 of women
were reported as not having access to such facilities designated for single sex use This was an improvement over 2009 when these proportions were 19 and 24 respectively The proportion of patients not having access to toilet and bathing facilities designated for single sex use was lower among almost all minority ethnic groups than among the White British group (see Table 7b for details)
Table 7b Percentage of patients not having access to toilet and bathing facilities designated for single sex use by ethnic group
Ethnic group
Access to designated single sex bathing and toilet facilities
Male Female
Male facilities
Female or mixed facilities
Female facilities
Male or mixed facilities
White British 86 14 84 16
White Irish 87 13 87 13
Other White 89 11 86 14
White and Black Caribbean 93 7 93 7
White and Black African 90 10 93 7
White and Asian 90 10 84 16
Other Mixed 98 2 96 4
Indian 91 9 90 10
Pakistani 95 5 94 6
Bangladeshi 92 8 98 2
Other Asian 92 8 86 14
Black Caribbean 92 8 90 10
Black African 91 9 91 9
Other Black 92 8 89 11
Chinese 82 18 83 17
Other 87 13 90 10
Total 87 13 84 16
The vast majority of patients in this category had access to mixed facilities very few (1) of male patients had access to female-only facilities or vice versa
Care Quality Commission Count me in census 2010 29
Results mental health continued
Patientsrsquo access to a lounge area day space designated for single sex use
We also asked providers if patients had access to a lounge area or day space designated for single sex use Overall 37 of men and 39 of women were
reported as not having access to these facilities This was an improvement over 2009 when these proportions were 48 and 51 respectively The proportion of patients not having access to a lounge areaday space designated for single sex use was lower among most minority ethnic groups than among the White British group (see Table 7c for details)
Table 7c Percentage of patients not having access to a lounge areaday space designated for single sex use by ethnic group
Ethnic group
Access to a lounge areaday space designated for single sex use
Male Female
Male facilities
Female or mixed facilities
Female facilities
Male or mixed facilities
White British 59 41 60 40
White Irish 63 37 70 30
Other White 68 32 63 37
White and Black Caribbean 82 18 73 27
White and Black African 83 18 76 24
White and Asian 72 28 75 25
Other Mixed 79 21 67 33
Indian 59 41 66 34
Pakistani 80 20 72 28
Bangladeshi 53 47 52 48
Other Asian 70 30 61 39
Black Caribbean 78 22 70 30
Black African 73 27 70 30
Other Black 79 21 72 28
Chinese 59 41 60 40
Other 67 33 67 33
Total 63 37 61 39
The vast majority of patients in this category had access to mixed facilities very few (1) of male patients had access to female-only facilities or vice versa
Care Quality Commission Count me in census 2010 30
Results mental health continued
Patientsrsquo subject to deprivation of liberty safeguards
People who lack the mental capacity to consent to the care or treatment they need should be cared for in a way that is least restrictive of their rights or freedom of action In 2007 the Mental Capacity Act 2005 was amended to introduce Deprivation of Liberty Safeguards for people who lack capacity to decide about their care or treatment and who need to be deprived of their liberty to protect them from harm The Safeguards came into effect in April 2009 and strengthen the rights of hospital patients and those in care homes as well as ensuring compliance with the European Convention on Human Rights (ECHR)
The 2010 census introduced a new question ldquoIs the patient subject to deprivation of liberty authorisation on 31 March 2010rdquo Under 1 (269) patients were reported as being subject to a deprivation of liberty authorisation on census day No ethnic differences in the rates were observed which may be due to the low numbers of patients among minority ethnic groups (69)
Care Quality Commission Count me in census 2010 31
A comparison between the 2005 baseline and the 2010 census
The changes we have seen in the census results between 2005 and 2010 the timespan of the Delivering Race Equality (DRE) action plan are set out below This is not a review of the DRE programme The aim is to give an overview of how some variables in the census have changed during the course of DRE and the findings should be seen in the light of the caveats described on page 13
bull The number of inpatients went down from 33785 to 29840 ndash a fall of 12
bull The proportion of patients in independent hospitals rose from 10 to 16
bull The overall proportion of patients from minority ethnic groups increased from 20 to 23 However there have been demographic changes during this time ndash the population from Black and minority ethnic groups in England and Wales rising from 79 million in 2005 to 85 million in 2007 (the latest year for which these figures are available) an increase of 8 in two years
bull Admission rates showed similar patterns across all censuses ndash Lower than average rates among the White
British Indian and Chinese groups ndash About average rates among the Pakistani and
Bangladeshi groups ndash Higher than average rates among other
minority ethnic groups ndash particularly in the Black and WhiteBlack Mixed groups for whom rates were two or more times higher than average in 2010 The Other Black group continues to have exceptionally high rates of admission (even after the apparent reduction since 2005 see next point)
bull One of the 12 goals of DRE was a decline in admission rates among Black and minority ethnic groups Figure 1 provides a comparison between 2005 and 2010 Although admission rates for
many ethnic groups show relatively little change since 2005 the rate for the Other Black group is considerably lower in 2010 (six times higher than average) compared with 2005 (12 times higher than average) However rates for the other Black and WhiteBlack Mixed groups show small increases
bull In general rates of referral from GPs and community mental health teams were lower than average among some Black and WhiteBlack groups and referral from the criminal justice system was higher Patterns were less consistent for other minority ethnic groups
bull There was a steady increase in the overall proportion of patients subject to the Mental Health Act Compared with 40 in 2005 49 of all patients were subject to the Mental Health Act in 2010 (53 if outpatients on a CTO are excluded)
bull Another DRE goal was to reduce detention rates among Black and minority ethnic groups However detention rates have been higher than average among the Black Caribbean Black African and Other Black groups in all six censuses and almost consistently higher in the WhiteBlack Caribbean Mixed and Other White groups Rates have been average for other minority ethnic groups
bull A consistent pattern was the higher than average detention rate under section 3741 for the Black Caribbean and Other Black groups
bull Another DRE goal was to reduce seclusion among Black and minority ethnic groups Although there have been annual fluctuations in seclusion rates they have been higher than average for the Black and WhiteBlack Mixed groups and the Other White group in at least three of the six censuses Other minority ethnic groups did not show high rates
Care Quality Commission Count me in census 2010 32
A comparison between the 2005 baseline and the 2010 census continued
Figure 1 Admission ratios in the 2005 and 2010 Count me in censuses by ethnic group England and Wales
Other Black
Black Caribbean
White and Black Caribbean
White and Black African
Black African
Other Mixed
Other Asian
White and Asian
Other
White Irish
Other White
Bangladeshi
White British
Pakistani
Indian
Chinese
0 100 200 300 400 500 600 700 800 900 1000 1100 1200 1300
Ageshysex standardised admission ratios (EampW=100)
Census 2005 admission ratios using 2005 ONS populations
bull Minority ethnic groups do not compare unfavourably for other incidents Rates of self-harm have consistently been lower than average among the Black and South Asian groups Very few ethnic differences in hands-on restraint physical assault and accidents were observed across the different censuses and they did not show a consistent pattern
bull About 31 of patients in all censuses had been in hospital for one year or more and were therefore included in more than one census
Census 2010 admission ratios using ONS 2007 populations (excluding outpatients on a CTO)
(This is one reason why the census shows little change over the six years It should be noted again that because the census is a one-day count it over-represents long-stay admissions and under-represents short-stay admissions)
bull Mixed accommodation was reported for many patients across all censuses although patients from Black and minority ethnic groups were more likely to be in single sex accommodation than White British patients
The admission ratios for the 2005 census shown here are different from those published in the 2005 report This is because we updated the analysis of the 2005 admission ratios by using 2005 ONS census populations for ethnic groups as denominators These populations were not available at the time of the 2005 report which instead used the 2001 ONS population data
Care Quality Commission Count me in census 2010 33
Results learning disabilities
We obtained information about 3642 patients in 129 organisations providing services for people with learning disabilities in England and Wales Of these two were inpatients on CTOs The total number of inpatients has declined each year and by 21 from 4609 in 2006 to 3642 in 2010 The total number of providers did not change much from the baseline year of 2006 although the number of NHS providers has fallen steadily and the number of independent healthcare organisations has increased (see Table 8) The proportion of inpatients in independent
healthcare organisations increased from 20 in 2006 to 33 in 2010 This is likely to be a result of closing NHS campuses with people moving from hospital to community settings
The pattern of results for learning disability patients in 2010 is broadly similar to that reported in previous censuses This is not surprising since many of the patients had been in hospital for a considerable period of time and they therefore appear in successive censuses
Table 8 The number of providers of learning disability services and inpatients
NHS (England)
Independent (England)
NHS (Wales)
Independent (Wales) Total
2010 census Number of providers 55 61 4 9 129 Number of all patients (including patients 2304 1072 154 112 3642 on a CTO) of all patients 633 294 42 31 100
2009 census Number of providers 60 54 5 4 123 Number of all patients (including patients 2487 1014 139 55 3695 on a CTO) of all patients 673 274 38 15 100
2008 census Number of providers 62 57 5 5 129
Number of inpatients 2873 1050 143 41 4107
of inpatients 700 256 35 10 100 2007 census
Number of providers 64 47 5 4 120
Number of inpatients 3063 900 154 36 4153
of inpatients 738 217 37 09 100 2006 census
Number of providers 70 48 5 1 124
Number of inpatients 3505 930 164 10 4609
of inpatients 760 202 36 02 100
Care Quality Commission Count me in census 2010 34
Results learning disabilities continued
Ethnicity
Information about ethnicity was available for 98 of patients Of these 13 belonged to Black and minority ethnic groups defined as all groups that are not White British (see Table 9) This figure is somewhat higher than in previous years (11 in 2006) and is significantly lower than the 23 of mental health patients from minority ethnic groups as reported in the mental health section of this report
Although the patterns by ethnicity are broadly similar to previous years there was an increase between 2006 and 2010 in the proportion of patients from the Other White group and a fall in those from the White British group Some ethnic groups had very few patients
As in the previous censuses patients from Black and minority ethnic groups were concentrated in a relatively small number of organisations 70 were
Table 9 Learning disability patients by ethnic group
Ethnic group 2010 census 2009 census 2008 census 2007 census 2006 census
Number Number Number Number Number
White British 853 3106 867 3205 889 3616 883 3642 887 4037
White Irish 13 46 15 57 13 53 10 40 14 66
Other White 29 106 23 85 26 104 26 109 17 77
White and Black Caribbean 10 38 10 36 07 29 08 34 07 32
White and Black African 02 8 01 4 00 2 02 10 01 3
White and Asian 04 13 04 14 03 12 03 13 02 9
Other Mixed 07 24 05 19 03 14 04 16 03 14
Indian 09 32 09 35 07 28 08 32 11 49
Pakistani 07 24 09 33 07 30 08 32 07 34
Bangladeshi 05 20 06 21 03 11 03 11 02 9
Other Asian 04 13 03 10 03 12 02 8 03 12
Black Caribbean 26 93 22 81 23 94 26 108 28 129
Black African 08 28 09 35 07 29 08 33 07 33
Other Black 04 15 04 14 04 15 04 18 04 17
Chinese 00 1 01 2 01 5 02 8 02 7
Other 02 7 02 8 04 15 02 10 05 24
Not stated 19 68 10 36 09 38 07 29 12 57
Total 100 3642 100 3695 100 4069 100 4124 100 4552
Care Quality Commission Count me in census 2010 35
Results learning disabilities continued
patients in 25 of the 129 organisations that took part in the census Seventy-four organisations had fewer than 10 patients from Black and minority ethnic groups each and another 42 organisations had no inpatients at all from these groups
However it is important to note that the number of people with severe and profound learning disabilities in some areas is affected by past funding and placement practices especially the presence of old long stay hospitals and of people placed outside their original area of residence by funding authorities
Reporting of ethnicity
About half (56) of patients reported their own ethnic group Staff reported the ethnic group for 17 of patients and relatives for 21 This means that ethnicity could have been misreported for some patients We do not know how ethnicity was assessed for 6 of patients
Age and gender
Two per cent (59) of patients were under 18 years old The number of young inpatients from minority ethnic groups was low or zero in several ethnic minority groups
Overall 73 of patients were under 50 years old and 27 were aged 50 or over The proportion of patients under 50 was higher among patients from Black and minority ethnic groups (88) than among the White British group (71) This is not surprising given that minority ethnic populations are generally younger than the White population
Seventy per cent of patients in learning disability services were men whereas in mental health services 58 of patients were men
Language and religion
Eight per cent of patients reported that their first language was not English Non-verbal communication was the most often selected language after English accounting for 4 of patients Two per cent (84) of patients most of whom were from the White British group said they needed an interpreter
Religion was not stated for 22 of patients and 15 of patients said they had no religion South Asians (Indians Bangladeshis and Pakistanis) were mostly Muslim Hindu or Sikh and those from the White Black Caribbean and Black African groups were mostly Christian
Sexual orientation
Overall the result was not known for almost half (49) of patients 45 said they were heterosexual 2 said gaylesbian 3 said bisexual and 1 said ldquootherrdquo The numbers of patients from minority ethnic groups were too low for meaningful analysis
Disability
Of all inpatients in learning disability services
bull 4 were reported as having no disabilities
bull 44 had a learning disability only
bull 51 had multiple disabilities
The patterns among minority ethnic groups were similar in that most patients had either a learning disability or multiple disabilities
Care Quality Commission Count me in census 2010 36
Results learning disabilities continued
Rates of admission
The rates of admission based on ONS estimates of the general population in 2007 are given in Appendix C Table C1
Admission rates were lower than average among several minority ethnic groups Other White Indian Pakistani Other Asian Black African Chinese and Other Rates were two to three times higher than average among the WhiteBlack Caribbean Mixed Black Caribbean Other Black and Other Mixed groups The lower rates among the South Asian and Chinese groups and the higher rates among some Black groups are similar to patterns for inpatients in mental health establishments
These patterns of admission are similar to those we reported in previous census reports
Source of referral
As we reported in the section on mental health patients data about sources of referral must be interpreted with care as we do not always know the original referral source Furthermore in the case of inpatients with learning disabilities this information was invalid missing or unknown for 12 of patients
Because of the small numbers of patients in most minority ethnic groups we observed few ethnic differences in sources of referral
Detention under the Mental Health Act 1983 (on day of admission and on day of census)
The Mental Health Act 2007 made a number of changes to the Mental Health Act 1983 one of which was supervised community treatment (section 17A) These are reflected in the 2010 census
All detentions Of all the patients in learning disability services 48 were detained under the Mental Health Act on admission Rates of detention on the day of admission by ethnic group are in Appendix C Table C2 and no ethnic differences were observed As the number of detained patients from each minority ethnic group was low we did not undertake further analysis for individual sections of the Act
Rates of detention on census day also showed no ethnic differences with the exception of a lower than average rate for the Other White group
Consent
About 66 of informally admitted inpatients were deemed incapable of consenting to treatment which is a similar proportion to that reported previously
Among detained patients 38 were deemed incapable of consenting to treatment and 6 were deemed capable of consenting to treatment but refused
The numbers of patients from minority ethnic groups were too low for comment There were no or very few such patients among minority ethnic groups
Care Quality Commission Count me in census 2010 37
Results learning disabilities continued
Care programme approach
Details of the Care Programme Approach (CPA) are given on page 24
We found that 73 of all patients were on a CPA 2 on a single assessment process (SAP) and 25 on neither No ethnic differences were observed
Recorded incidents
The 2010 census asked about the number of times that patients experienced seclusion hands-on restraint self-harm accident and physical assault in a patientrsquos current hospital spell or if the patientrsquos hospital spell was longer than three months the number that took place within the last three months As in previous years we observed very few ethnic differences
Seclusion Five per cent of patients had experienced one or more episodes of seclusion The only ethnic differences observed were the higher than average rates among the White Irish and Other White groups but these were based on small numbers of patients
Physical assault on the patient The definition of assault includes incidents of physical assault on the patient irrespective of who committed the assault but we do not have information on who committed the assault About 28 of patients had been involved in one or more episodes of physical assault No ethnic differences were observed
Hands-on restraint self-harm accidents Thirty per cent of inpatients had experienced one or more episodes of hands-on restraint 22 had attempted to harm themselves and 24 had suffered an accident The numbers were very low in minority ethnic groups and we did not observe any ethnic differences except for a lower than average rate for self-harm among the Black Caribbean group but this was based on very few patients
Duration of stay in hospital
We analysed the length of the period between each patientrsquos admission to hospital and the census day This period is of course shorter than a patientrsquos full length of stay in hospital which runs from admission to the date when they are discharged
bull 10 of inpatients had been in hospital for one month or less
bull 6 had been in hospital between one and three months
bull 7 had been in hospital between three and six months
bull 10 had been in hospital between six months and one year
bull 14 had been in hospital between one and two years
bull 22 had been in hospital between two and five years
bull 31 had been in hospital for over five years
The patterns are very similar to those in previous censuses About 67 of patients in the 2010 census had been in hospital for more than a year and were therefore also included in the 2009 census In addition over half (53) of patients had been in hospital for more than two years and will have been included in both the 2008 and 2009 censuses A third of patients will have been included in each census since 2006
We also calculated the median length of stay (see page 26 for the definition of median) Overall the median amount of time that women had spent in hospital was about 31 months and the median for men was about 27 months This compares with a median for mental health patients of 25 months for women and 58 months for men It is not possible to reliably compare length of stay by ethnic group because of the small numbers of patients among several minority ethnic groups
Care Quality Commission Count me in census 2010 38
Results learning disabilities continued
Ward security
About 12 of all inpatients were on a medium or high secure ward as opposed to a general (54) or low secure (34) ward
As in the three previous years rates of patients on medium or high secure wards were about double the average among the White Irish and Other White groups Most other minority ethnic groups had very few patients on medium or high secure wards
Age range on wards
There were five patients under 18 years of age being cared for on wards for working-age adults and none were on wards for older people About 5 of patients on wards for working-age adults were aged 65 or over and there were very few patients (23) on wards for older people There were very few lsquoout of agersquo placements among minority ethnic groups
Patients in wards designated as single sex or mixed
We asked providers whether the patient was on a ward designated as men or women only or mixed gender Overall 47 of men and 69 of women were not in a ward designated for single sex use The numbers of such patients among minority ethnic groups were very low
Two further questions examined the single sex facilities that were available to patients Again due to the small numbers we do not present results by ethnicity for these questions
Patientsrsquo access to toilet and bathing facilities designated for single sex use
Overall 19 (497) of men and 27 (295) of women were reported as not having access to toilet and bathing facilities designated for single sex use
Patientsrsquo access to a lounge area day space designated for single sex use
Overall 32 (829) of men and 44 (470) of women were reported as not having access to a lounge area day space designated for single sex use
Patients subject to deprivation of liberty safeguards
For details of deprivation of liberty safeguards please see page 31
The 2010 census introduced a new question ldquoIs the patient subject to deprivation of liberty authorisation on 31 March 2010rdquo Two per cent (74) patients were reported as being subject to a deprivation of liberty order on census day but very few of these patients (15) were from minority ethnic groups
See footnote on single sex accommodation on page 27
Care Quality Commission Count me in census 2010 39
Data in the future Moving beyond a one-day census
For six years the Count me in census has provided a valuable one-day snapshot of inpatients in mental health and learning disability services And with the proportion of inpatients who are detained increasing steadily (from 25 in 200506 to 39 in 200910 ndash see Figure 2) ongoing ethnic monitoring of admissions and detentions becomes more vital than ever
However a one-day census only captures some events and the profile of patients can differ across a whole year For example there were
bull 29840 inpatients in the 2010 census compared with 107765 inpatients overall during 200910
bull 17299 patients in the 2010 census who were detained or on CTOs compared with 42479 new detentions and some 4100 new CTOs overall in England in 200910
bull 26 of patients in hospital for under one month and 31 for over one year per the census
whereas the MHMDS data consistently shows that for over 50 of records the average length of an inpatient stay was under one month and for 4 it was over one year
Looking ahead it is vital that robust data is available on all admitted patients and all those subject to the Mental Health Act not just those in hospital on one particular day Moreover patterns of use and outcomes of community care can have an impact on the need for admission to hospital and the risk of detention ndash therefore information about the care provided to patients before admission to hospital during their hospital stay and after they leave is also vital Furthermore under 84 of the 127 million people using specialist mental health services are admitted to hospital23 and so it is very important to examine the quality of community care for the 90 of patients who are not admitted to hospital
Figure 2 Number of people spending time in hospital 200506 to 200910
Num
ber
of p
atie
nts
90000
80000
70000
60000
50000
40000
30000
20000
10000
0 200506 200607 200708 200809 200910
Source NHS Information Centre Formally detained Not detained MHMDS Bulletin 2011
Care Quality Commission Count me in census 2010 40
Data in the future Moving beyond a one-day census continued
The Mental Health Minimum Data Set (MHMDS) is a rich source of data on people using specialist mental health services in England It covers both community and hospital services and includes a wide range of information about the demographic clinical and socioeconomic characteristics of individual patients and the services provided to those admitted to hospital and to the much larger number of those who donrsquot need a stay in hospital The data includes information about contact with services uses of the Mental Health Act and the Care Programme Approach for each individual patient All these details enable the use of services patterns of care and patient outcomes to be tracked including along pathways of care The MHMDS therefore provides a robust basis for ongoing monitoring of access to and outcomes of care for users of specialist ndash both community and hospital ndash mental health services
The MHMDS also enables an analysis of the numbers and rates of people from different ethnic groups using specialist mental health services overall (both inpatient and community) which provides an indication of the levels of mental illness and therefore the need for specialist care in different communities
At present the MHMDS does not cover high secure services and independent sector providers only started to provide data during 201011 However to support payment by results for mental health the scope of the data set will be extended to cover high secure services during 201112 (version 4 MHMDS) Further proposed changes to the dataset (version 41) will incorporate NHS-funded learning disability services and primary care mental health services A separate dataset for child and adolescent mental health services (CAMHS) has been developed and is awaiting formal approvals It is designed to include the same information about uses of the Mental Health Act as provided in the MHMDS
The latest MHMDS bulletin for 200910 provides a description of people using specialist mental health services in England including ethnic profiles of people using services hospital admissions detentions and the number of people on CPA24 It also provides information on differences by age and gender The bulletin illustrates some of the sorts of analyses that are possible using data from the MHMDS
The NHS Information Centre can provide guidance on these and other potential analyses based on MHMDS data
Care Quality Commission Count me in census 2010 41
Conclusions
While this report reviews changes in the census results since 2005 it is not a review or evaluation of the DRE programme overall Similarly the census cannot provide explanations for the patterns observed or examine whether mental health services are meeting the needs of individual ethnic minority groups As we have noted previously the results are subject to caveats in particular that the census provides a one-day snapshot that may not be representative of patients admitted to hospital throughout the year
Overview of findings
Overall the findings from the 2010 census show little change from those reported for previous annual censuses conducted since 2005 This is partly because many patients had been in hospital for a considerable period of time and had therefore been included in successive censuses The findings of this sixth and last census continue to show differences between Black and minority ethnic groups and White groups and also differences within these groups
In particular ethnic differences in rates of admission detention under the Mental Health Act and seclusion ndash three of DRErsquos 12 goals ndash have not altered materially since the inception of DRE in 2005
bull Admission rates remain higher than average among minority ethnic groups especially among Black and WhiteBlack Mixed groups for whom rates were two or more times higher than average in 2010 The Other Black group continues to have the highest admission rate ndash six times higher than average ndash although this is lower than in 2005 In contrast admission rates have consistently been lower than average among the Indian and Chinese groups and about average in the Pakistani and Bangladeshi groups
bull Detention rates remain higher than average among the Black and WhiteBlack Caribbean Mixed groups and among the Other White group A consistent pattern across all censuses was the higher than average detention rate
under section 3741 for the Black Caribbean and Other Black groups We also found that rates for being placed on a CTO were higher among the South Asian and Black groups
bull Although there have been annual fluctuations in seclusion rates they have been higher than average for the Black WhiteBlack Mixed and Other White groups in at least three of the six censuses
Overall the level of provision of single sex areas for patients continues to be unsatisfactory although there was no evidence that minority ethnic patients were disadvantaged in these respects Government policy for the NHS in England now requires that all providers of NHS-funded care including mental health trusts are expected to eliminate mixed-sex accommodation in accordance with the guidance set out in CNO201032526 From 2011 all providers of NHS-funded care must report breaches of sleeping accommodation which will attract sanctions
Implications for ways forward
The census findings do not in themselves show that mental health and learning disability services are failing to meet the needs of Black and minority ethnic service users
As noted in previous reports they need to be interpreted in the context of available evidence on ethnic differences in rates of mental illness pathways to care and factors such as socioeconomic disadvantages that all contribute to these differences Our previous reports have consistently highlighted the need for prevention early intervention and working collaboratively across sectors to reduce the risk of admission and detention where possible without compromising the care given to patients Mental health services have a key role to play but to achieve this all statutory agencies and organisations outside the healthcare sector Black and minority ethnic communities and people who use services themselves will need to work in partnership
Care Quality Commission Count me in census 2010 42
Conclusions continued
This message ndash about preventing mental ill-health by addressing the contributory factors and intervening early ndash is at the heart of No health without mental health the Department of Healthrsquos new strategy for the future of mental health care in England27
The strategy aims to tackle the economic social and environmental determinants and consequences of mental health problems and to improve outcomes and reduce inequalities
It specifies that by 2014 people in contact with the criminal justice system will have improved access to mental health services as set out in the Ministry of Justice Green Paper Breaking the Cycle Effective punishment rehabilitation and sentencing of offenders which confirms the approach outlined in Lord Bradleyrsquos report for early intervention and diversion from custody2829
Accompanying the new strategy is a supporting document that explains how its objectives will improve mental health outcomes the effective interventions and the underpinning evidence base30
The strategy is complemented by other government proposals for reforms in the NHS public health and adult social care as outlined in the NHS White Paper Equity and excellence liberating the NHS31 the public health strategy Healthy lives healthy people32 and the adult social care strategy A vision for adult social care capable communities and active citizens 33 Three outcomes frameworks have been developed alongside these strategies improving mental health outcomes and reducing inequalities is integral to them all
In this new healthcare landscape the proposed NHS Commissioning Board and GP consortia will have a statutory obligation to promote equality and reduce inequalities in healthcare (something also enshrined in the Equality Act 2010) As the lead commissioners of healthcare services it will be up to GP consortia to assess with local authorities the needs of their local populations and commission the right services that meet their requirements
And the strengthened public health role of local authorities offers significant potential for addressing the socioeconomic disadvantages faced by Black and minority ethnic communities which add to the burden of mental illness in these communities
Race Equality Action Plan A five-year review looked back at the work of the DRE action plan and describes some of the key challenges successes and learning34 Based on the experience and outcome of the DRE programme the report suggests ways forward for the next stage of mental health strategy development and implementation
Since April 2009 CQC has had a duty under the Mental Health Act 1983 to monitor how services exercise their powers in relation to patients who are detained in hospital or subject to CTOs or guardianship under the Act In its first annual report on the use of the Act CQC recommends a number of areas where improvements are needed for example over-occupancy on inpatient wards patient engagement use of control and restraint seclusion and capacity and consent35
In particular CQC highlighted a number of issues relating to the use of CTOs including concern about appropriate usage (30 of the patients in CQCrsquos sample did not have a reported history of non-compliance or disengagement with services after discharge) and over-representation of Black and minority ethnic groups CQC advised that research on the possible race equality impact of CTOs should be undertaken There were 6237 CTOs from their introduction in November 2008 to 31 March 2010 a much greater use of them than forecast for this period by the Department of Health before the power was introduced Just 31 of these orders had ended by end March 2010 suggesting that some people are being kept on supervised community treatment for long periods
Care Quality Commission Count me in census 2010 43
Conclusions continued
Data in the future Moving beyond a one-day census
Good information is the foundation of an effective healthcare system It is imperative for ensuring that services meet the needs of local populations and are equitable and that improvements are made where needed The availability of fit-for-purpose and comprehensive patient-level data sets with ethnicity and other key variables fully coded is therefore vitally important36 It enables the care provided to patients of all ethnic backgrounds to be monitored on an ongoing basis including for monitoring compliance with the Equality Act
Race Equality Action Plan A five-year review notes that better collection monitoring and use of ethnicity data to inform commissioning and provision in health and social care is required37 Key areas include good ethnic monitoring improving demographic information and ensuring good links between infomatics audit and equality and diversity leads within trusts in order to effectively use the information to inform service development monitoring and review at board management ward and community levels
The governmentrsquos proposed changes to the NHS will be supported by an information revolution aimed at improving and extending the information available to the NHS patients and the public on the quality and outcomes of NHS services including by equality dimensions38
Having information that is fit for purpose is vital for the effective regulation of mental health and learning disability services CQC uses routinely available data sets on an ongoing basis to assess the performance of health and social care organisations and their compliance with government policies and legislation We therefore expect those who commission and provide mental healthcare in the NHS and independent sector to have information systems that provide good quality data with fully
comprehensive recording and monitoring of ethnicity on an ongoing basis
Since 2005 the Count me in census has played a key role in providing information about the ethnicity and other characteristics of inpatients in mental health and learning disability services and on patients subject to the Mental Health Act It did this by providing a valuable one-day snapshot But ethnicity recording must be seen as an all-year round statutory requirement not a one-day annual event The number of inpatients throughout the year is much higher than the counts on one day and some patients will have more than one admission And there is a need to move on from counting patients to understanding more about care pathways for Black and minority ethnic patients and the factors leading to hospital admission and detention
We have consistently highlighted the need for commissioners and providers to make full use of the Mental Health Minimum Data Set (MHMDS) ndash the statutory data set submitted by providers of specialist mental health services in England It provides rich data on these issues and provides a robust information source for ongoing ethnic monitoring after this last census
Covering both community and hospital services ndash and now independent and third sector providers as well as NHS ndash it includes a wide range of information about individual patients the services provided to those admitted to hospital and to the much larger number who donrsquot need admission to hospital and the outcomes of care And because it includes year-round activity it is more representative of the overall picture of for example admission detention and readmission rates length of stay years in psychiatric care and contacts with services and professionals
We call on the Information Centre to routinely publish data on all admissions and uses of the Mental Health Act including CTOs in England (in both NHS and independent healthcare providers) by the ethnicity of
Care Quality Commission Count me in census 2010 44
Conclusions continued
patients making the MHMDS the definitive source of information about mental health and learning disability patients This data should be risk-adjusted for age gender and other variables as appropriate to enable reliable comparisons to be made across groups
It is important that all providers ndash NHS and independent ndash make strenuous efforts to improve the quality of the data they submit The Information Centre publishes reports on the quality of MHMDS data by provider (see wwwicnhsukservices mhmdsdq) and we urge providers to monitor this information and use it to improve their data quality
If GP consortia and local authorities are to be effective in their needs assessment and commissioning roles the Information Centre needs to make available and promote to them the data from the MHMDS and other sources And researchers and academics must make full use of the MHMDS to explore the factors that underlie the observed ethnic patterns
CQCrsquos role
In the meantime CQC will continue to focus strongly on the quality of care provided by mental health and learning disability services
People who find themselves admitted to mental health services or detained under the Mental Health Act and therefore counted by the Count me in census are among the most mentally unwell people in our society Our job is first and foremost to make sure that the care they receive meets the essential standards of quality and safety set out under the Health and Social Care Act 2008 and to work with providers to ensure this We act swiftly when we find services that do not Where we find systemic problems that organisations have not adequately addressed we may impose conditions on the providerrsquos registration to bring about the change needed to improve patientsrsquo experience of care
The essential standards of quality and safety include the requirement to provide single sex accommodation and we will continue to closely check that these standards are met by all mental health services
We intend to introduce a number of indicators derived from the rich information in the MHMDS into our quality and risk profiles for providers This will put greater emphasis on the experience of Black and minority ethnic patients in our regulatory activity
We will monitor the quality of MHMDS data submitted by providers (as reported by the NHS Information Centre) including independent service providers Those with poor data quality may be considered at higher risk in terms of their quality of care
In addition we will continue to monitor the progress of services in relation to the issues raised in the census and other reports including our report on the use of the Mental Health Act through our visits to services and meetings with patients by our Mental Health Act Commissioners and second opinion appointed doctors (SOADs) We will draw on patientsrsquo experiences to monitor the operation of the Mental Health Act
We will also assess the impact of advice and use of Local HealthWatch Local HealthWatch will be in a good position to make sure that providers and commissioners are held to account on matters of choice and access to services for people from Black and minority ethnic groups
Care Quality Commission Count me in census 2010 45
References
1 Department of Health Equity and excellence liberating the NHS 2010
2 Department of Health The NHS outcomes framework 201112 2010
3 Healthcare Commission Mental Health Act Commission National Institute for Mental Health in England Count me in results of a national census of inpatients in mental health hospitals and facilities in England and Wales 2005
4 Healthcare Commission Mental Health Act Commission National Institute for Mental Health in England Count me in results of the 2006 national census of inpatients in mental health and learning disability services in England and Wales 2006
5 Healthcare Commission Mental Health Act Commission National Institute for Mental Health in England Count me in results of the 2007 national census of inpatients in mental health and learning disability services in England and Wales 2007
6 Healthcare Commission Mental Health Act Commission National Institute for Mental Health in England Count me in results of the 2008 national census of inpatients in mental health and learning disability services in England and Wales 2008
7 Care Quality Commission National Mental Health Development Unit Results of the 2009 national census of inpatients and patients on supervised community treatment in mental health and learning disability services in England and Wales 2009
8 Department of Health Delivering race equality in mental health care an action plan for reform inside and outside services 2005
9 Welsh Assembly Government Adult Mental Health Services Raising the standard ndash Race Equality Action Plan for Adult Mental Health Services in Wales 2006
10Department of Health No health without mental health a cross-government mental health outcomes strategy for people of all ages 2011 wwwdhgovukprod_consum_dhgroups dh_digitalassetsdocumentsdigitalasset dh_124058pdf
11Department of Health New horizons towards a shared vision for mental health 2009 wwwdhgovukprod_consum_dhgroups dh_digitalassetsdhendocumentsdigital assetdh_109708pdf
12Department of Health Valuing people a new strategy for learning disability for the 21st century 2001
13Department of Health Valuing people now a new three year strategy for people with learning disabilities 2009
14Department of Health Healthcare for all report of the independent inquiry into access to healthcare for people with learning disabilities 2008
15Joint Committee on Human Rights A life like any other human rights of adults with learning disabilities (2008 HL Paper 401 HC 731) House of Lords House of Commons 2008
16Department of Health Valuing people now summary report March 2009 ndash September 2010 2010
17Disability Rights Commission Equal treatment investigation 2005
18Department of Health Mir G Nocon A Ahmad W Jones L Learning difficulties and ethnicity 2000
19ONS experimental population estimates by ethnic group 2007 wwwstatisticsgovukstatbase productaspvlnk=14238
Care Quality Commission Count me in census 2010 46
References continued
20Six percent of population are gay or lesbian according to Whitehall figures 2005 wwwtelegraphcouknewsmainjhtmlxml= news20051212ngay12xmlamps Sheet= news20051212ixhomehtml
21Department of Trade and Industry Amendment to Employment Equality (Sexual Orientation) Regulations 2003 2003
22Office for National Statistics Measuring sexual identity an evaluation report 2010
23 Information Centre Mental Health Bulletin Fourth report from Mental Health Minimum Dataset (MHMDS) annual returns 2010 2011 wwwicnhsukpubsmhbmhmds0910
24 Information Centre Mental Health Bulletin Fourth report from Mental Health Minimum Dataset (MHMDS) annual returns 2010 2011 wwwicnhsukpubsmhbmhmds0910
25The operating framework for the NHS in England 201112 Department of Health 2010 wwwdhgovukprod_consum_dhgroups dh_digitalassetsdhenpsdocuments digitalassetdh_122736pdf
26wwwdhgovukenPublicationsandstatistics LettersandcircularsProfessionalletters ChiefnursingofficerlettersDH_121848
27Department of Health No health without mental health a cross-government mental health outcomes strategy for people of all ages 2011 wwwdhgovukprod_consum_dhgroups dh_digitalassetsdocumentsdigitalasset dh_124058pdf
28Ministry of Justice Breaking the cycle effective punishment rehabilitation and sentencing of offenders 2010
29Department of Health The Bradley report Lord Bradleyrsquos review of people with mental health problems or learning disabilities in the criminal justice system 2009
30Department of Health No health without mental health delivering better mental health outcomes for people of all ages 2011
31Department of Health Equity and excellence liberating the NHS 2010 wwwdhgovukprod_ consum_dhgroupsdh_digitalassetsdhen psdocumentsdigitalassetdh_117794pdf
32Department of Health Healthy lives healthy people our strategy for public health in England 2010 wwwdhgovukprod_consum_dh groupsdh_digitalassetsdhenps documentsdigitalassetdh_122347pdf
33Department of Health A vision for adult social care capable communities and active citizens 2010 wwwdhgovukprod_consum_dh groupsdh_digitalassetsdhenps documentsdigitalassetdh_121971pdf
34Wilson M NMHDU Race equality action plan a five year review Delivering race equality in mental health care 2010 wwwnmhduorgukour-workmhep
35Care Quality Commission Monitoring the use of the Mental Health Act in 200910 2010
36Raleigh V S Collection of data on ethnic origin in England Editorial BMJ 20083376456
37Wilson M NMHDU Race equality action plan a five year review Delivering race equality in mental health care 2010 wwwnmhduorgukour-workmhep
38Department of Health Liberating the NHS an information revolution 2010
Care Quality Commission Count me in census 2010 47
Appendix A Methods of analysis
Standardisation by age and gender
Standardisation allows us to make comparisons between groups of the population by taking account of variations in age and gender Some differences in patterns of service use are related to the age or gender of the people using them so adjustments to the data have to be made to ensure that the interpretation of ethnic differences is reliable For example formal admissions are higher at a younger age so some Black and minority ethnic groups may have high formal admission rates simply because they have a high proportion of younger people Without adjustments for age and gender differences comparisons would be misleading
In this report most results are standardised for age and gender including those relating to admission detention source of referral care programme approach seclusion restraint accidents assault self-harm consent and presence on a secure ward The report uses the accepted statistical method of taking account of age and gender differences between groups when calculating these rates
We used the ONS estimates of total population by ethnic group for England and Wales in 2007 to standardise the rates of admission for different ethnic groups This takes account of the significant rises in the Black and ethnic minority population of England and Wales since the 2001 ONS census and hence gives more accurate and up to date estimates of admission ratios for different ethnic groups (although it does not take account of any further changes in the ethnic populations between 2007 and 2010 the date of this census) For comparison with the DRE baseline we also present admission rates from the 2005 census derived using the 2005 ONS estimates of populations by ethnic group These figures will not be the same as published in the 2005 census report which were based on the 2001 ONS census population estimates because updated estimates of populations by ethnic group were not available at that time
For other analyses we used the total number of inpatients and patients on CTOs in the census
as the basis for standardisation However CTO outpatients are excluded from selected analyses where appropriate namely the analysis of rates for admissions detentions on admission source of referral single sex accommodation and recorded incidents of seclusion restraint accidents assault and self-harm We used the statistical package STATA version 82 to derive the standardised results
It was not possible to adjust the analyses for ethnic differences in social and economic factors and in diagnosis and severity of illness Such factors could affect the ethnic differences observed in the results
For descriptive variables such as religion and language we did not use standardisation
Confidence intervals as indicators of significant statistical differences
For all standardised results the national rates for England and Wales are taken as 100 and the usual 95 confidence intervals are given Rates of less than 100 or greater than 100 for specific ethnic groups show a lower or higher rate respectively than the national average after adjusting for age and gender Whether or not the difference is statistically significant from the national average depends on the confidence interval If the confidence interval overlaps 100 the difference from the national average is not statistically significant If both values are lower or higher than 100 it indicates that the difference compared with the national average is statistically significant at the 95 level
For example if a rate is 110 with the lower confidence interval being 105 and the upper confidence interval being 115 it indicates that the 10 excess over the national average of 100 is statistically significant But if a ratio is 110 with the lower confidence interval being 95 and the upper confidence interval being 125 it indicates that the 10 excess over the national average is not statistically significant We did not attempt to adjust the confidence intervals for multiple comparisons
Care Quality Commission Count me in census 2010 48
Appendix B Mental health tables
Table B1 Standardised admission ratios by ethnic group for England and Wales (excluding outpatients on a CTO) using 2007 ONS census population denominators (England and Wales = 100) All ages
Ethnic group
Men Women Persons Standardised
admission ratio
95 confidence
interval Observed numbers
Standardised admission
ratio
95 confidence
interval Observed numbers
Standardised admission
ratio
95 confidence
interval Observed numbers
White British 88 86 89 12435 94 93 96 10157 91 89 92 22592 White Irish 130 115 146 274 122 106 140 215 126 115 138 489 Other White 117 109 126 731 129 118 141 533 122 115 129 1264 White and Black Caribbean 557 493 627 276 274 223 333 101 436 393 483 377 White and Black African 312 247 388 80 259 186 351 41 292 242 349 121 White and Asian 140 110 174 79 124 90 166 44 134 111 159 123 Other Mixed 230 189 278 108 213 165 270 67 223 192 259 175 Indian 67 59 75 286 66 56 76 172 66 60 73 458 Pakistani 105 93 119 269 65 53 79 96 91 81 100 365 Bangladeshi 123 102 147 120 82 60 109 46 108 92 126 166 Other Asian 161 139 185 192 136 107 169 79 153 135 172 271 Black Caribbean 538 505 572 980 306 277 336 418 438 415 462 1398 Black African 246 226 267 550 219 194 247 277 236 221 253 827 Other Black 792 691 903 222 314 240 403 61 596 529 670 283 Chinese 27 20 38 39 43 30 59 35 33 26 41 74 Other 140 120 162 177 110 88 136 87 128 113 145 264 Total 100 16818 100 12429 100 29247
Care Quality Commission Count me in census 2010 49
Appendix B Mental health tables continued
Table B2 Standardised admission ratios by ethnic group for England and Wales (excluding outpatients on a CTO) using 2007 ONS census population denominators (England amp Wales = 100) Ages 65 and over
Ethnic group
Men Women Persons Standardised
admission ratio
95 confidence
interval Observed numbers
Standardised admission
ratio
95 confidence
interval Observed numbers
Standardised admission
ratio
95 confidence
interval Observed numbers
White British 95 92 99 3265 95 92 98 3887 95 93 97 7152 White Irish 142 116 172 106 102 82 125 92 120 104 138 198 Other White 207 174 244 141 213 183 248 171 210 188 235 312 White and Black Caribbean 406 210 710 12 333 152 632 9 371 230 568 21 White and Black African 231 28 836 2 198 24 714 2 213 58 546 4 White and Asian 28 1 156 1 110 30 281 4 69 23 162 5 Other Mixed 146 40 374 4 228 92 470 7 189 95 339 11 Indian 97 70 132 41 83 57 116 33 90 71 113 74 Pakistani 39 17 77 8 46 18 94 7 42 23 69 15 Bangladeshi 115 53 218 9 69 14 201 3 98 51 172 12 Other Asian 234 143 361 20 215 120 354 15 225 157 313 35 Black Caribbean 216 170 269 77 310 253 376 103 261 224 302 180 Black African 142 73 248 12 365 241 531 27 246 175 337 39 Other Black 164 34 479 3 366 134 796 6 259 119 493 9 Chinese 41 8 120 3 95 38 195 7 68 33 125 10 Other 253 126 453 11 390 238 602 20 327 222 464 31 Total 100 3715 100 4393 100 8108
Care Quality Commission Count me in census 2010 50
Appendix B Mental health tables continued
Table B3 Standardised ratios by ethnic group for patients referred by a GP (England and Wales = 100)
Ethnic group
Men Women Persons Standardised
referral ratio
95 confidence
interval Observed numbers
Standardised referral ratio
95 confidence
interval Observed numbers
Standardised referral ratio
95 confidence
interval Observed numbers
White British 110 103 117 904 107 101 114 1065 108 104 113 1969 White Irish 85 50 134 18 93 57 144 20 89 63 123 38 Other White 74 51 103 33 70 49 97 36 72 56 91 69 White and Black Caribbean 27 5 78 3 30 4 109 2 28 9 65 5 White and Black African 0 0 74 9 268 2 35 4 125 2 White and Asian 165 54 386 5 0 0 86 28 201 5 Other Mixed 48 6 172 2 68 14 198 3 58 19 136 5 Indian 69 34 123 11 79 39 141 11 73 46 111 22 Pakistani 88 42 162 10 59 16 151 4 77 42 130 14 Bangladeshi 81 22 207 4 61 7 221 2 73 27 159 6 Other Asian 80 32 166 7 108 43 223 7 92 50 155 14 Black Caribbean 35 20 56 17 37 20 62 14 36 24 51 31 Black African 57 29 100 12 66 35 113 13 61 40 91 25 Other Black 62 23 135 6 40 5 144 2 54 23 107 8 Chinese 56 1 314 1 139 38 356 4 108 35 251 5 Other 106 46 208 8 0 0 53 23 105 8 Total 100 1041 100 1185 100 2226
Care Quality Commission Count me in census 2010 51
Appendix B Mental health tables continued
Table B4 Standardised ratios by ethnic group for patients referred by a community mental health team (including crisis resolution home treatment) or community learning disability team (England and Wales = 100)
Ethnic group
Men Women Persons Standardised
referral ratio
95 confidence
interval Observed numbers
Standardised referral ratio
95 confidence
interval Observed numbers
Standardised referral ratio
95 confidence
interval Observed numbers
White British 107 104 111 3255 103 100 107 3386 105 103 108 6641 White Irish 90 69 116 61 89 68 114 61 90 74 107 122 Other White 59 48 71 105 79 67 94 141 69 61 78 246 White and Black Caribbean 106 83 135 68 75 49 111 25 96 77 117 93 White and Black African 43 19 84 8 66 30 124 9 52 31 84 17 White and Asian 95 56 150 18 84 43 147 12 90 61 129 30 Other Mixed 78 48 121 20 72 41 118 16 76 53 105 36 Indian 106 83 132 76 100 76 130 56 103 86 122 132 Pakistani 108 84 135 73 89 60 128 30 102 83 123 103 Bangladeshi 98 66 141 29 90 50 148 15 95 69 128 44 Other Asian 88 63 120 40 105 70 150 29 94 73 119 69 Black Caribbean 69 59 80 167 85 71 102 123 75 67 84 290 Black African 84 70 102 112 82 65 103 77 84 72 96 189 Other Black 52 36 74 31 64 36 106 15 56 41 74 46 Chinese 112 53 205 10 101 52 176 12 105 66 160 22 Other 86 60 120 35 106 71 151 30 94 73 120 65 Total 100 4108 100 4037 100 8145
Care Quality Commission Count me in census 2010 52
Appendix B Mental health tables continued
Table B5 Standardised ratios by ethnic group for patients referred by criminal justice routes (police prison probation courts court liaison and diversion) (England and Wales = 100)
Ethnic group
Men Women Persons Standardised
referral ratio
95 confidence
interval Observed numbers
Standardised referral ratio
95 confidence
interval Observed numbers
Standardised referral ratio
95 confidence
interval Observed numbers
White British 90 86 95 1495 95 86 104 421 91 87 95 1916 White Irish 133 94 183 38 59 19 138 5 116 84 157 43 Other White 112 93 134 119 103 68 150 27 111 93 130 146 White and Black Caribbean 117 89 151 58 145 69 266 10 120 94 153 68 White and Black African 190 127 273 29 141 38 361 4 183 126 256 33 White and Asian 75 39 131 12 160 52 373 5 89 52 143 17 Other Mixed 104 65 157 22 151 61 311 7 112 75 161 29 Indian 86 61 118 38 79 32 163 7 85 62 113 45 Pakistani 118 91 150 65 89 33 194 6 115 90 145 71 Bangladeshi 74 44 115 19 29 1 162 1 68 42 105 20 Other Asian 130 95 174 45 164 71 323 8 134 101 176 53 Black Caribbean 131 114 150 208 124 81 181 26 130 114 148 234 Black African 132 112 156 145 143 93 211 25 134 114 156 170 Other Black 141 109 180 65 236 113 435 10 149 117 187 75 Chinese 83 27 194 5 146 30 426 3 99 43 195 8 Other 129 93 175 41 113 37 264 5 127 93 170 46 Total 100 2404 100 570 100 2974
Care Quality Commission Count me in census 2010 53
Appendix B Mental health tables continued
Table B6 Standardised detention ratios by ethnic group all detentions on day of admission (excluding outpatients on a CTO) (England and Wales = 100)
Ethnic group
Men Women Persons Standardised
detention ratio
95 confidence
interval Observed numbers
Standardised detention
ratio
95 confidence
interval Observed numbers
Standardised detention
ratio
95 confidence
interval Observed numbers
White British 94 92 97 6449 94 91 97 3628 94 92 96 10077 White Irish 112 95 131 154 118 96 145 94 114 101 129 248 Other White 108 98 118 451 120 106 136 251 112 104 120 702 White and Black Caribbean 123 107 141 220 129 99 167 59 124 110 140 279 White and Black African 128 99 162 68 113 70 173 21 124 100 153 89 White and Asian 96 71 126 50 109 68 164 22 99 78 125 72 Other Mixed 115 92 143 82 139 100 188 42 122 102 146 124 Indian 97 83 113 164 110 86 137 77 101 88 114 241 Pakistani 109 94 126 194 102 74 136 44 108 94 122 238 Bangladeshi 86 67 109 69 91 55 142 19 87 70 107 88 Other Asian 109 92 130 133 120 86 163 40 112 96 130 173 Black Caribbean 129 121 139 774 143 125 162 238 132 124 141 1012 Black African 115 104 127 422 131 111 153 159 119 110 129 581 Other Black 117 100 136 170 148 105 202 39 122 106 140 209 Chinese 108 71 159 26 129 78 202 19 116 85 156 45 Other 111 92 132 126 116 83 157 41 112 96 130 167 Total 100 9552 100 4793 100 14345
Care Quality Commission Count me in census 2010 54
Appendix B Mental health tables continued
Table B7 Standardised detention ratios by ethnic group detention on day of admission ndash section 2 of the Mental Health Act (England and Wales = 100)
Ethnic group
Men Women Persons Standardised
detention ratio
95 confidence
interval Observed numbers
Standardised detention
ratio
95 confidence
interval Observed numbers
Standardised detention
ratio
95 confidence
interval Observed numbers
White British 97 91 102 1156 93 87 98 1133 95 91 99 2289 White Irish 78 47 120 20 116 79 166 30 97 72 128 50 Other White 100 78 126 70 134 108 166 88 116 99 136 158 White and Black Caribbean 55 30 93 14 60 24 124 7 57 35 87 21 White and Black African 91 37 188 7 150 60 308 7 113 62 190 14 White and Asian 80 29 174 6 119 44 258 6 96 49 167 12 Other Mixed 68 28 141 7 116 53 221 9 89 51 145 16 Indian 130 91 179 37 124 81 182 26 127 98 163 63 Pakistani 126 87 176 34 138 79 225 16 130 96 171 50 Bangladeshi 166 101 256 20 140 61 276 8 158 105 228 28 Other Asian 142 93 209 26 163 93 264 16 150 108 202 42 Black Caribbean 73 57 92 70 97 72 128 51 82 68 98 121 Black African 164 131 202 87 190 146 244 62 174 147 204 149 Other Black 114 75 166 27 140 72 245 12 121 86 165 39 Chinese 165 60 358 6 212 97 402 9 190 106 313 15 Other 218 153 302 36 179 108 280 19 203 153 264 55 Total 100 1623 100 1499 100 3122
Care Quality Commission Count me in census 2010 55
Appendix B Mental health tables continued
Table B8 Standardised detention ratios by ethnic group detention on day of admission ndash section 3 of the Mental Health Act (England and Wales = 100)
Ethnic group
Men Women Persons Standardised
detention ratio
95 confidence
interval Observed numbers
Standardised detention
ratio
95 confidence
interval Observed numbers
Standardised detention
ratio
95 confidence
interval Observed numbers
White British 99 95 103 2684 96 91 100 1852 98 95 101 4536 White Irish 116 89 149 60 135 101 177 52 124 102 149 112 Other White 112 96 129 186 110 92 132 121 111 99 124 307 White and Black Caribbean 114 91 143 79 130 90 183 33 119 98 143 112 White and Black African 97 60 148 21 107 54 192 11 100 69 141 32 White and Asian 84 50 133 18 97 48 173 11 89 59 127 29 Other Mixed 121 84 168 35 117 72 181 20 120 90 156 55 Indian 96 75 122 67 110 79 148 42 101 83 122 109 Pakistani 91 71 115 69 88 55 134 22 90 73 111 91 Bangladeshi 63 39 95 22 64 28 127 8 63 43 90 30 Other Asian 90 65 120 44 94 56 149 18 91 70 117 62 Black Caribbean 116 102 130 279 164 138 192 148 129 117 142 427 Black African 95 80 112 143 102 79 129 68 97 85 111 211 Other Black 75 55 99 49 99 58 159 17 80 62 102 66 Chinese 119 59 213 11 99 43 194 8 110 66 171 19 Other 85 60 116 38 84 48 136 16 84 63 110 54 Total 100 3805 100 2447 100 6252
Care Quality Commission Count me in census 2010 56
Appendix B Mental health tables continued
Table B9 Standardised detention ratios by ethnic group detention on day of admission ndash section 3741 of the Mental Health Act (England and Wales = 100)
Ethnic group
Men Women Persons Standardised
detention ratio
95 confidence
interval Observed numbers
Standardised detention
ratio
95 confidence
interval Observed numbers
Standardised detention
ratio
95 confidence
interval Observed numbers
White British 84 79 89 991 101 88 115 220 86 82 91 1211 White Irish 140 96 198 32 48 6 175 2 126 87 176 34 Other White 112 89 139 81 156 95 241 20 118 96 144 101 White and Black Caribbean 177 133 232 53 179 66 390 6 178 135 229 59 White and Black African 149 82 251 14 224 46 654 3 159 92 254 17 White and Asian 141 75 241 13 195 40 569 3 149 85 241 16 Other Mixed 144 85 227 18 264 97 575 6 162 104 242 24 Indian 86 56 126 26 44 5 160 2 80 53 116 28 Pakistani 122 87 166 40 0 0 111 79 152 40 Bangladeshi 66 32 122 10 0 0 60 29 110 10 Other Asian 99 61 151 21 0 0 89 55 136 21 Black Caribbean 200 174 229 210 78 34 153 8 189 165 216 218 Black African 127 101 157 82 84 34 172 7 122 98 150 89 Other Black 152 110 205 43 94 11 341 2 148 108 198 45 Chinese 100 27 255 4 0 0 80 22 204 4 Other 118 75 177 23 44 1 245 1 110 71 164 24 Total 100 1661 100 280 100 1941
Care Quality Commission Count me in census 2010 57
Appendix B Mental health tables continued
Table B10 Standardised detention ratios by ethnic group detention on day of admission ndash sections 47 48 4749 of the Mental Health Act (England and Wales = 100)
Ethnic group
Men Women Persons Standardised
detention ratio
95 confidence
interval Observed numbers
Standardised detention
ratio
95 confidence
interval Observed numbers
Standardised detention
ratio
95 confidence
interval Observed numbers
White British 97 90 106 583 104 81 131 73 98 91 106 656 White Irish 132 72 221 14 163 20 590 2 135 77 219 16 Other White 130 96 172 49 71 15 206 3 124 93 163 52 White and Black Caribbean 126 78 193 21 80 2 444 1 123 77 186 22 White and Black African 207 103 370 11 0 0 189 95 339 11 White and Asian 57 12 166 3 169 4 941 1 68 19 175 4 Other Mixed 112 48 221 8 233 28 843 2 125 60 230 10 Indian 57 26 108 9 0 252 0 52 24 99 9 Pakistani 92 54 147 17 0 314 0 86 50 138 17 Bangladeshi 46 12 117 4 167 4 930 1 53 17 125 5 Other Asian 101 52 177 12 0 0 95 49 166 12 Black Caribbean 126 98 159 70 125 34 319 4 126 99 158 74 Black African 74 48 107 27 104 21 303 3 76 51 108 30 Other Black 127 78 197 20 138 3 769 1 128 79 195 21 Chinese 0 0 0 0 0 0 Other 83 38 157 9 0 0 77 35 147 9 Total 100 857 100 91 100 948
Care Quality Commission Count me in census 2010 58
Appendix B Mental health tables continued
Table B11 Standardised ratios for all applications of the Mental Health Act (including outpatients on a CTO) by ethnic group on day of census (England and Wales = 100)
Ethnic group
Men Women Persons Standardised
ratio for all MHA
applications
95 confidence
interval Observed numbers
Standardised ratio for all MHA
applications
95 confidence
interval Observed numbers
Standardised ratio for all MHA
applications
95 confidence
interval Observed numbers
White British 97 94 99 7659 95 93 98 4335 96 94 98 11994 White Irish 99 83 116 147 104 84 128 95 101 89 114 242 Other White 87 79 95 427 97 85 110 249 90 84 97 676 White and Black Caribbean 117 103 133 245 130 103 163 76 120 107 134 321 White and Black African 120 95 150 79 93 58 141 22 113 92 137 101 White and Asian 101 78 128 65 119 81 169 31 106 86 129 96 Other Mixed 110 89 134 96 125 93 165 49 114 97 135 145 Indian 103 90 118 215 122 100 147 109 109 97 121 324 Pakistani 111 97 125 254 117 90 148 67 112 100 125 321 Bangladeshi 92 75 112 97 101 68 145 29 94 78 112 126 Other Asian 103 88 121 152 126 95 164 56 109 94 124 208 Black Caribbean 123 115 131 893 141 126 158 300 127 120 134 1193 Black African 112 103 122 511 121 104 140 188 114 106 123 699 Other Black 116 102 132 232 148 112 191 59 122 108 136 291 Chinese 97 64 140 27 101 61 157 19 98 72 131 46 Other 104 87 122 140 103 75 137 46 103 89 119 186 Total 100 11239 100 5730 100 16969
Care Quality Commission Count me in census 2010 59
Appendix B Mental health tables continued
Table B12 Standardised CTO ratios by ethnic group CTOs on day of census ndash section 17a of the Mental Health Act (England and Wales = 100)
Ethnic group
Men Women Persons
Standardised CTO ratio
95 confidence
interval Observed numbers
Standardised CTO ratio
95 confidence
interval Observed numbers
Standardised CTO ratio
95 confidence
interval Observed numbers
White British 94 89 99 1289 88 82 94 730 92 88 96 2019 White Irish 51 27 88 13 77 41 132 13 62 40 90 26 Other White 97 77 120 83 125 95 162 58 107 90 126 141 White and Black Caribbean 79 53 113 29 141 77 237 14 92 67 124 43 White and Black African 111 59 190 13 125 41 292 5 115 68 181 18 White and Asian 104 54 182 12 136 50 297 6 113 67 178 18 Other Mixed 102 59 166 16 136 62 257 9 112 73 166 25 Indian 134 99 177 48 152 98 226 24 139 109 175 72 Pakistani 145 110 187 59 174 101 279 17 151 119 189 76 Bangladeshi 142 93 206 27 205 99 378 10 155 109 213 37 Other Asian 107 71 155 28 182 99 305 14 124 89 168 42 Black Caribbean 121 103 142 152 171 132 218 65 133 116 152 217 Black African 116 94 142 94 139 98 192 37 122 102 145 131 Other Black 186 144 238 65 305 189 466 21 206 165 254 86 Chinese 83 23 213 4 152 49 354 5 111 51 211 9 Other 87 54 134 21 152 79 266 12 103 71 145 33 Total 100 1953 100 1040 100 2993
Care Quality Commission Count me in census 2010 60
Appendix C Learning disability tables
Table C1 Standardised admission ratios by ethnic group for England and Wales using 2007 ONS population denominators (England amp Wales = 100) All ages
Ethnic group
Men Women Persons Standardised
admission ratio
95 confidence
interval Observed numbers
Standardised admission
ratio
95 confidence
interval Observed numbers
Standardised admission
ratio
95 confidence
interval Observed numbers
White British 104 100 109 2163 108 101 115 941 105 102 109 3104 White Irish 108 72 156 28 151 89 238 18 121 89 162 46 Other White 81 65 101 85 49 30 75 21 72 59 87 106 White and Black Caribbean 280 186 405 28 246 118 453 10 270 191 371 38 White and Black African 102 33 239 5 165 34 482 3 119 51 235 8 White and Asian 66 26 135 7 154 56 335 6 89 47 152 13 Other Mixed 181 104 295 16 229 99 451 8 195 125 290 24 Indian 32 21 48 24 28 12 55 8 31 21 44 32 Pakistani 48 30 72 22 12 1 43 2 38 25 57 24 Bangladeshi 102 60 161 18 31 4 113 2 83 51 128 20 Other Asian 33 13 69 7 92 34 201 6 47 25 81 13 Black Caribbean 265 210 332 77 117 67 190 16 218 176 267 93 Black African 53 33 80 22 40 15 87 6 50 33 72 28 Other Black 228 118 399 12 134 28 392 3 200 112 330 15 Chinese 4 0 21 1 3 0 16 1 Other 26 9 56 6 11 0 59 1 21 9 44 7 Total 100 2521 100 1051 100 3572
Care Quality Commission Count me in census 2010 61
Appendix C Learning disability tables continued
Table C2 Standardised detention ratios by ethnic group all detentions on day of admission (England and Wales = 100)
Ethnic group
Persons Standardised
detention ratio
95 confidence
interval Observed numbers
White British 97 93 103 1431 White Irish 127 84 184 28 Other White 117 91 149 68 White and Black Caribbean 120 77 179 24 White and Black African 114 37 267 5 White and Asian 75 24 176 5 Other Mixed 94 49 165 12 Indian 119 72 186 19 Pakistani 110 61 181 15 Bangladeshi 144 84 231 17 Other Asian 59 16 150 4 Black Caribbean 119 90 155 57 Black African 138 85 210 21 Other Black 62 20 145 5 Chinese 0 0 Other 104 28 267 4 Total 100 1715
Care Quality Commission Count me in census 2010 62
copy Care Quality Commission and National Mental Health Development Unit 2011 Published April 2011
This publication may be reproduced in whole or in part in any format or medium for non-commercial purposes provided that it is reproduced accurately and not used in a derogatory manner or in a misleading context The source should be acknowledged by showing the publication title and copy Care Quality Commission and National Mental Health Development Unit 2011
How to contact us
Phone 03000 616161 Email enquiriescqcorguk Web wwwcqcorguk
Write to us at Care Quality Commission National Correspondence Citygate Gallowgate Newcastle upon Tyne NE1 4PA
Please contact us if you would like a summary of this publication in other formats or languages
Registered office Care Quality Commission Finsbury Tower 103ndash105 Bunhill Row London EC1Y 8TG
- Count me in 2010
- About the Care Quality Commission
- Contents
- Summary
- National organisations coordinating the census
- Introduction
- Data methods of analysis and interpretation
- Results mental health
- A comparison between the 2005 baseline and the 2010 census
- Results learning disabilities
- Data in the future Moving beyond a one-day census
- Conclusions
- References
- Appendix A Methods of analysis
- Appendix B Mental health tables
- Appendix C Learning disability tables
- How to contact us
-
Introduction continued
sooner than other people They are also less likely to receive some treatments than people with the same medical condition but without a mental health condition or learning disability17 Learning difficulties and ethnicity noted that the disadvantage experienced by people from minority ethnic communities because of their ethnicity (for example in education and employment) is compounded by the disadvantage they experience because of their learning disability18
Aims of the census
The goals of the 2010 census are the same as those in previous years
bull To obtain robust figures for all inpatients in mental health and learning disability services in England and Wales The 2010 census also includes information about outpatients on CTOs
bull To encourage service providers to implement systems for recording patientsrsquo ethnicity and for using this information for ethnic monitoring
bull To provide information that will help service providers to take practical steps to achieve the goals of DRE
In 2005 the census only included inpatients in mental health services in England and Wales including those detained in hospital under the Mental Health Act 1983 From 2006 the census was extended to include inpatients in learning disability services CTOs introduced in November 2008 as a result of the Mental Health Act 2007 allow for supervised treatment of patients in the community Therefore in 2009 and 2010 the census included patients subject to supervised treatment in the community under the Mental Health Act most of whom were therefore outpatients in the community and were not in hospital on census day
As one of the aims of the census is to provide figures on inpatients and all those subject to the Mental Health Act on census day the analysis in this report is not limited to inpatients and also includes outpatients on CTOs (except where stated otherwise) If we excluded outpatients on a CTO from the analysis we would have an incomplete profile of ethnic differences in the rates of patients subject to the Mental Health Act We therefore considered it important to include these patients This provides a more rounded basis for examining the use of the Act ndash overall and in relation to CTOs ndash among different ethnic groups and is consistent with the analytical approach used in the 2009 census report
Although the census included some children and young people the terms ldquomenrdquo and ldquowomenrdquo are used throughout this report to refer to people of all ages ndash including children young people and older people The census does not include children and young people in residential settings such as paediatric wards and those looked after by social services
More information about the census and how it was carried out including the full set of results is available at wwwcqcorgukcountmein
Care Quality Commission Count me in census 2010 10
Data methods of analysis and interpretation
Ethnic groups
The ethnic categories referred to in this report are those used by the Office for National Statistics (ONS) in its 2001 census of the general population of England and Wales (see box 1) The term lsquoBlack and minority ethnic groupsrsquo defines all groups other than lsquoWhite Britishrsquo
Box 1 Ethnic categories used in this report
White British Pakistani White Irish Bangladeshi Other White Other Asian WhiteBlack Caribbean Mixed Black Caribbean WhiteBlack African Mixed Black African WhiteAsian Mixed Other Black Other Mixed Chinese Indian Other
Coverage of learning disability establishments
The 2010 census included all healthcare providers in England registered with CQC on 31 March 2010 and all healthcare providers in Wales registered with the Healthcare Inspectorate Wales to provide inpatient learning disability services It did not include care homes
In the NHS there is a continuum from inpatient services through to registered and supported homes All of these can have some links to the NHS either directly or through seconded staff Where such NHS facilities were both registered as care homes under the Care Standards Act 2000 and regulated by CQC they were included
Distinguishing between mental health inpatients and learning disability inpatients
Some healthcare providers offer both mental health and learning disability services and there is considerable overlap between them The census asked providers to distinguish between services by describing wards as either ldquomainly providing mental health servicesrdquo or ldquomainly providing learning disability servicesrdquo This separation by ward type enables us to compare the results across years and ensures that no patient is counted twice
It is important to note however that some patients on mental health wards may have a learning disability or Autistic Spectrum Disorder including Aspergerrsquos syndrome Similarly some patients on learning disability wards may have a mental health problem The distinction of mental health and learning disability patients on the basis of ward is therefore an approximation
Care Quality Commission Count me in census 2010 11
Data methods of analysis and interpretation continued
Methods of statistical analysis
The statistical methods used for data analysis in this report are given in Appendix A
For the admission rates the ONS estimates of the general population in 2007 were used as denominators The Black and minority ethnic population of England and Wales has increased significantly since the 2001 ONS census ONS has produced updated population estimates by ethnic group for 2007 (the latest year for which these estimates are available) which reflect the demographic changes since 2001 The number of people from Black and minority ethnic groups (ie excluding the White British group) in England and Wales is estimated to have increased from 65 million in 2001 to 85 million in 2007 a rise of 30 As a result the proportion of the total population that is not from the White British group increased from 13 to 16 over this period We used the 2007 population estimates to calculate the admission rates in order to present a more up-to-date and accurate picture of ethnic differences However these figures do not reflect any demographic changes between 2007 and 2010 the year of this census
To make a comparison with the DRE baseline we also present admission rates from the 2005 census derived using the 2005 ONS population estimates by ethnic group as denominators These figures will not be the same as those published in the 2005 census report which were based on the 2001 ONS census population estimates because updated estimates of populations by ethnic group were not available at that time
For all other analyses (for example rates of use of the Mental Health Act seclusion etc) the patient numbers in the census were used as denominators
Unlike the censuses of 2005 to 2008 that counted only inpatients the 2009 and 2010 censuses also included outpatients on a CTO on census day This is because (a) the census aims to cover all patients subject to the Mental Health Act on census day and (b) we would not have been able to analyse standardised ratios for CTOs for different ethnic groups if CTO patients had been excluded from the analysis However CTO outpatients are excluded from selected analyses where appropriate including the analysis of rates for admissions detentions on admission source of referral single sex accommodation and recorded incidents of seclusion restraint accidents assault and self-harm The issue relating to the analysis of outpatients on a CTO only affects the sections of the report relating to mental health patients as there were very few learning disability patients on CTOs
Some results in this report are standardised for age and gender (those relating to admission detention source of referral care programme approach seclusion restraint accidents assault self-harm consent and presence on a secure ward) This is because there are underlying differences in the age and gender profiles of different ethnic populations and comparisons based on crude rates would be misleading Standardisation allows comparisons between different ethnic groups by taking account of variations in age and gender The report uses the conventionally accepted statistical methods for standardisation
The terms ldquohigherrdquo and ldquolowerrdquo than average used in the text for ethnic comparisons relate to differences from the national average that are statistically significant at the 5 level
Care Quality Commission Count me in census 2010 12
Data methods of analysis and interpretation continued
Interpreting the results
In this report for convenience we refer to ldquoadmission ratesrdquo for mental health and learning disability patients However these are in fact population-based rates of patients who were in hospital or subject to the Mental Health Act on census day and not rates for admissions actually made on the census day itself The number of admissions on census day will differ from the number of patients in hospital on that day and both of these will differ from the number of admissions throughout the year
As with any study our results have some caveats
1 The admission rates presented for minority ethnic groups in this report are higher than would be expected because they are based on ONS population estimates by ethnic group for 200719 the latest year available rather than population estimates for 2010 Therefore the admission rates do not take into account demographic changes between 2007 and 2010 Furthermore these population estimates are described by ONS as ldquoexperimentalrdquo and are subject to margins of error
2 The results are not adjusted for diagnosis and other clinical information so they may reflect differences between ethnic groups in the levels nature or severity of mental illness or disability
3 The data collected for the census does not allow adjustment for socioeconomic factors such as poverty unemployment and inner-city residence These occur more commonly in Black and minority ethnic communities Equally it was not possible to take account of social factors such as marital status living alone separation from one or both parents or lack of social networks Both socioeconomic and social factors are known to be associated with the risk of mental illness and can affect pathways into care and the nature of patientsrsquo interaction with services
4 Rates based on small and fluctuating numbers of patients can change in either direction (high to low or vice versa) from one year to the next as a result of random rather than real variation and regression to the mean
5 The census does not assess the quality of services the experience of patients or the reasons for any differences between ethnic groups
6 We have explained the rationale for including outpatients on CTOs in this report While this enables us to comment on CTOs on census day in addition to those who are inpatients it does mean that the overall census population is not restricted to inpatients as in the reports for the years preceding 2009 and 2010
7 The census is a one-day count designed to give the number and ethnic composition of patients on that day Its value is in providing a year-by-year snapshot profile However by its very nature it cannot give the picture for the whole year As we have shown in the section lsquoData in the future Moving beyond a one-day censusrsquo a one-day picture can differ from results based on a full yearrsquos data because a one-day picture over-represents long-stay patients and under-represents short stay admissions
Care Quality Commission Count me in census 2010 13
Results mental health
We collected information on 32799 patients from the mental health services of 261 NHS and independent healthcare organisations in England and Wales This included 29840 inpatients of whom 75 were inpatients on a CTO and a further 2959 patients on a CTO who were outpatients on census day The number of inpatients in each census has declined each year from 33785 in 2005 to 29840 in 2010 (excluding the 2959 outpatients on a CTO) a fall of 12 since 2005 (see Table 1)
All eligible establishments took part in the census The total number of providers increased from 207 in 2005 to 261 in 2010 primarily due to an increase in the number of independent healthcare providers in both England and Wales In contrast the number of NHS providers in England was lower than in the baseline year 2005 and did not change much in Wales The proportion of patients cared for by independent providers has risen from 10 in 2005 to 16 in 2010
Table 1 Number of providers of mental health services and patients
NHS (England)
Independent (England)
NHS (Wales)
Independent (Wales) Total
2010 census Number of providers 78 160 9 14 261 Number of all patients 32799 (including outpatients 25653 4787 1958 401 (including 2959 on a CTO) outpatients on a CTO) of all patients 782 146 60 12 100
2009 census Number of providers 79 158 10 17 264 Number of all patients 31786 (including outpatients 24941 4594 1845 406 (including 1253 on a CTO) outpatients on a CTO) of all patients 785 145 58 13 100
2008 census Number of providers 87 141 11 16 255 Number of inpatients 24842 3931 1892 355 31020 of inpatients 801 127 61 11 100
2007 census Number of providers 82 153 11 11 257 Number of inpatients 25020 4030 1875 262 31187 of inpatients 802 129 60 08 100
2006 census Number of providers 97 125 11 5 238 Number of inpatients 26565 3341 1962 155 32023 of inpatients 830 104 61 05 100
2005 census Number of providers 92 98 10 7 Number of inpatients 28590 3078 1939 178 33785 of inpatients 846 91 57 05 100
Care Quality Commission Count me in census 2010 14
207
Results mental health continued
Ethnicity
Information about ethnicity was available for 98 of patients Of these patients 75 were White British and 23 belonged to Black and minority ethnic groups defined as all groups that are not White British This compares with 20 in 2005
Compared with the baseline year of 2005 the 2010 census recorded a lower proportion of patients from the White British White Irish and Other Black groups (see Table 2) There were increases in the proportions of patients from the Other White WhiteBlack Caribbean Mixed Black Caribbean and Black African groups Other ethnic groups showed only minor differences over the baseline year
Table 2 Mental health patients by ethnic group
Ethnic group 2010 census 2009 census 2008 census 2007 census 2006 census 2005 census
Number Number Number Number Number Number
White British 750 24593 757 24067 765 23738 776 24198 786 25170 792 26762
White Irish 16 514 19 591 18 567 17 538 18 582 22 727
Other White 43 1407 43 1360 45 1399 46 1449 38 1210 31 1055
White and Black Caribbean
13 418 11 336 11 336 09 288 09 287 08 255
White and Black African
04 139 03 91 04 110 03 91 03 102 02 71
White and Asian 04 141 04 137 04 117 03 91 03 109 03 104
Other Mixed 06 200 07 213 05 148 06 180 05 173 05 167
Indian 16 529 14 460 14 426 13 393 13 411 13 434
Pakistani 13 440 13 409 13 396 10 315 11 349 10 325
Bangladeshi 06 203 05 171 05 144 04 130 05 158 05 153
Other Asian 09 311 09 273 10 300 08 261 08 262 08 264
Black Caribbean 49 1608 47 1504 47 1468 43 1330 39 1264 41 1369
Black African 29 957 26 834 23 715 21 648 20 652 19 645
Other Black 11 368 12 384 12 376 17 545 17 535 17 569
Chinese 03 83 03 82 03 91 03 82 02 78 02 81
Other 09 296 10 322 12 362 11 356 11 338 11 357
Not stated 18 592 17 552 11 327 09 292 11 342 12 416
Invalid 0 1 01 31
100 32799 100 31786 100 31020 100 31187 100 32023 100 33785 Total
Care Quality Commission Count me in census 2010 15
Results mental health continued
As in the previous censuses patients from Black and minority ethnic groups were concentrated in a relatively small number of organisations 70 were patients in 25 of the 261 organisations that took part in the census Of all organisations 194 had fewer than 50 patients from Black and minority ethnic groups each and another 32 organisations had no patients at all from these groups
Reporting of ethnicity
Eighty-one per cent of patients reported their own ethnic group Where patients did not do so staff or relatives did so on their behalf (10 and 6 respectively) We cannot be certain that ethnicity was recorded accurately for these patients The proportion of patients who reported their own ethnicity ranged from about 81 in the White groups to 90 in the WhiteBlack African Mixed group
Care Quality Commission Count me in census 2010 16
Results mental health continued
Age and gender
Ethnic differences in the age profiles of patients largely reflect the age profiles of different minority ethnic populations The White British White Irish and Other White populations have an older age structure than other minority ethnic populations and therefore patients from the White groups are significantly older than patients from other ethnic groups (see Table 3)
Overall 58 of patients were men Men outnumbered women in all ethnic groups (see Table 3) The White British White Irish Other White and Chinese groups had smaller differences in the proportions of men and women compared with other ethnic groups
Table 3 Age and gender of patients
Ethnic group Age () Gender ()
Total (n) 0-17 18-24 25-49 50-64 65+ Men Women
White British 1 7 41 20 31 56 44 100 (24593)
White Irish 0 4 36 19 41 56 44 100 (514)
Other White 2 7 47 19 25 58 42 100 (1407) White and Black Caribbean 1 13 68 12 5 73 27 100 (418)
White and Black African 1 13 73 9 4 67 33 100 (139)
White and Asian 4 18 63 11 5 65 35 100 (141)
Other Mixed 2 13 69 11 6 62 38 100 (200)
Indian 1 4 58 21 15 63 37 100 (529)
Pakistani 2 10 73 12 4 74 26 100 (440)
Bangladeshi 2 15 69 8 6 72 28 100 (203)
Other Asian 2 12 61 13 13 70 30 100 (311)
Black Caribbean 1 6 61 20 13 70 30 100 (1608)
Black African 1 10 75 9 5 67 33 100 (957)
Other Black 1 6 78 11 3 78 22 100 (368)
Chinese 2 10 59 17 12 52 48 100 (83)
Other 2 12 57 18 11 67 33 100 (296)
1 7 46 19 27 58 42 100 Total (n=
471) (n=
2352) (n=
14998) (n=
6093) (n=
8885) (n=
19071) (n=
13684) (n=
32799)
Care Quality Commission Count me in census 2010 17
Results mental health continued
Language and religion
Similar to previous censuses 5 of patients reported that their first language was not English (see Table 4) The Chinese and Bangladeshi groups had the highest proportions of patients whose first language was not English (51 and 46 respectively) Among the Other White group 27 had a first language other than English Again similar to previous censuses about 2 of patients said they needed an interpreter and of these 24 were from the White British group
Table 4 Percentage of patients with a first language other than English
Ethnic group with first language other than English
White British 1
White Irish 3
Other White 27
White and Black Caribbean 2
White and Black African 10
White and Asian 6
Other Mixed 11
Indian 26
Pakistani 35
Bangladeshi 46
Other Asian 34
Black Caribbean 2
Black African 22
Other Black 13
Chinese 51
Other 41
Total 5
Care Quality Commission Count me in census 2010 18
Results mental health continued
Religion was not stated for 21 of patients and 15 of patients said they had no religion The proportions stating they did not have a religion were highest among the WhiteBlack Caribbean and WhiteAsian Mixed groups (23 and 21 respectively) and lowest among the South Asian groups (4) Table 5 shows the religion of patients
Table 5 Religion of patients by ethnic group
Ethnic group
Religion and faith groups ()
None Christian Buddhist Hindu Jewish Muslim Sikh Any other religion
Not stated
White British 16 58 1 0 1 0 0 3 21
White Irish 8 73 0 0 0 5 13
Other White 13 53 1 0 3 5 7 18 White and Black Caribbean 23 47 0 1 0 3 7 17
White and Black African 16 41 1 1 15 6 20
White and Asian 21 33 1 1 21 3 3 18
Other Mixed 15 41 3 3 16 8 17
Indian 5 10 0 29 15 28 2 11
Pakistani 4 3 0 1 1 80 1 2 10
Bangladeshi 4 1 1 1 76 1 5 11
Other Asian 6 14 5 12 39 5 3 16
Black Caribbean 12 59 1 0 0 2 8 17
Black African 10 45 0 0 22 0 3 19
Other Black 12 41 1 1 0 16 7 22
Chinese 18 30 16 1 4 31
Other 8 24 3 1 3 34 6 21
Total 15 54 1 1 1 4 1 4 21
Care Quality Commission Count me in census 2010 19
Results mental health continued
Sexual orientation
The results for sexual orientation were not valid for 1 of patients and for 20 the response was recorded as ldquonot knownrdquo Seventy-six per cent of patients said they were heterosexual 1 said gay lesbian 1 said bisexual and less than 1 said ldquootherrdquo The number of minority ethnic patients who were gaylesbian or bisexual was very low
The overall figure of 1 who said they were gay lesbian or bisexual is lower than some estimates of the proportions of gaylesbian or bisexual people in the general population (5 to 7)2021 However in the 200910 Integrated Household Survey of a representative sample of 238206 people in UK conducted by the Office for National Statistics 1 identified themselves as gay or lesbian 05 as bisexual 05 as ldquootherrdquo 3 responded as ldquodo not knowrdquo or refused to answer and 95 identified themselves as heterosexualstraight22
Disability
About 75 of patients said they did not have a disability and 25 said they had one or more disabilities Of these 7 were blind or visually impaired 1 were deaf or had a hearing impairment 1 had Autistic Spectrum Disorder 2 had a learning disability 4 had a mobility impairment and 2 used a wheelchair The remaining 8 had more than one disability The proportion of patients with a disability was highest among the White British White Irish and Other White groups (about 28) which could reflect the higher age profiles of these patients compared with other ethnic groups
Rates of admission (see section on interpreting the results on page 13)
The rates of admission derived using the 2007 ONS ethnic population estimates as denominators are given in Appendix B Tables B1 (all ages) and B2 (ages 65 and over) Outpatients on a CTO are excluded from these results
All ages Admission rates were lower than average for patients from the White British Indian and Chinese groups and were average for the Pakistani and Bangladeshi groups Rates were higher than average for other minority ethnic groups they were particularly high for the Black Caribbean Black African WhiteBlack Caribbean Mixed and WhiteBlack African Mixed groups who had rates two to four times higher than average and for the Other Black group with a rate six times higher
Ages 65 and over Age-standardised admission rates for minority ethnic groups at older ages show broadly similar patterns to those reported for all ages with rates two to three times higher than average among the Black and White Black Mixed groups Rates were high also in the White Irish Other White Other Asian and Other groups
Numbers of older Black and minority ethnic patients were too few in most ethnic groups to support analyses of subgroups within them for example those detained
Care Quality Commission Count me in census 2010 20
Results mental health continued
Source of referral
People can be referred to healthcare services in a number of ways Referrals for inpatient care often come from community mental health teams rather than the original source such as GPs and accident and emergency (AampE) departments Therefore referrals from these teams may include referrals from other sources Furthermore about a quarter of patients (26) were referred from tertiary care and information about their original referral source was not available We had no information about the source of referral for 13 of patients The results reflect the proportions of patients from each ethnic group that are referred from each source so a higher proportion of referrals from one source will inevitably mean that proportions from other referral sources are lower Outpatients on a CTO are excluded from these data
The referral patterns are broadly similar to those reported previously and the key results are presented below
GP referrals 7 of patients Rates were 8 higher than average among the White British group They were lower than average among the Other White Black Caribbean Black African and WhiteBlack Caribbean Mixed groups by 28 to 72 The rates of referral by GPs are given in Appendix B Table B3
Referrals from AampE departments 5 of patients The White British group had a 9 lower than average rate of such referrals The WhiteBlack African Mixed Indian Bangladeshi Black African and Other groups were more likely than average to be referred in this way
Referrals from community mental health teams 26 of patients For the White British group such referrals were 5 higher than the average rate They were lower than average among the Other White WhiteBlack African Mixed Black Caribbean Black African and
Other Black groups by 16 to 48 The rates of referral are given in Appendix B Table B4
Referrals from the criminal justice system 9 of patients This is defined as the police courts probation service prison and court liaison and diversion service
Patients from the White British group were less likely than average to be referred by the criminal justice agencies whereas the Black Caribbean Black African Other Black WhiteBlack African Mixed and Other Asian groups were 30 to 83 more likely than average to be referred in this way We observed no differences from the average rate for other ethnic groups Rates of referral by the criminal justice system are given in Appendix B Table B5
A significant proportion (26) of all referrals were from tertiary care
Tertiary care referrals from medium or high secure units 5 of patients The rate for such referrals (in NHS or independent sectors) was lower than average among the Other White and Indian groups It was higher than average among the Black Caribbean and WhiteBlack Caribbean Mixed groups by about 75
Tertiary care referrals from other inpatient services 21 of patients The rate for such referrals (NHS and independent) was higher than average among the White Irish and Other White groups by 29 and 59 respectively The rate was lower than average in the Indian and Other Black groups
Tertiary care referrals from other clinical specialties 9 of patients Rates of such referrals were higher than average among the White British and Indian groups and lower than average among the Other White WhiteBlack Caribbean Mixed Other Asian Black African Other Black and Chinese groups
Care Quality Commission Count me in census 2010 21
Results mental health continued
Detention under the Mental Health Act 1983 on day of admission
The Mental Health Act 2007 made a number of changes to the Mental Health Act 1983 These changes were reflected in the census of 2009 and 2010 which collected information on new provisions establishing supervised community treatment (section 17A) and excluded supervised discharge (section 25A) which was abolished
As in previous reports we present below the results for detention rates on the day of admission Outpatients on a CTO are excluded from these analyses After that we present rates for all patients subject to the Mental Health Act on census day (including outpatients on a CTO) followed by rates for patients on a CTO on census day
All detentions Forty-nine per cent (14637) of patients were detained under the Mental Health Act on admission to hospital This was a higher proportion than recorded in the previous censuses (40 in 2005 and 2006 43 in 2007 45 in 2008 and 47 in 2009)
Detention rates were 6 lower than average among White British patients and between 19 and 32 higher than average among the Black Caribbean Black African Other Black and WhiteBlack Caribbean Mixed groups Detention rates were also higher in the White Irish and Other White groups by about 13 and in the Other Mixed group by 22 No other ethnic differences were observed The results are given in Appendix B Table B6
These patterns are broadly similar to those reported in previous censuses
Detention under section 2 Section 2 of the Mental Health Act gives authority for a person to be detained in hospital for assessment for a period not exceeding 28 days It is mainly applied where the patient is unknown to the service or where there has been a significant interval between periods of inpatient treatment
Of all patients detained on admission 22 were detained under section 2 Rates of detention under this section were lower than average among the White British WhiteBlack Caribbean Mixed and Black Caribbean groups and higher than average among the Bangladeshi Other Asian Black African Chinese and Other groups by between 50 and 103 (see Appendix B Table B7)
Detention under section 3 Section 3 of the Act provides for the compulsory admission of a patient to hospital for lsquotreatmentrsquo and for his or her subsequent detention which can last for an initial period of up to six months and is renewable after this
Of all patients detained on admission 43 were detained under this section Rates were higher than average among the White Irish and Black Caribbean groups by 24 and 29 respectively and lower among than average among the Bangladeshi group No other ethnic differences were observed The rates of detention under section 3 are given in Appendix B Table B8
Detention under section 3741 Section 37 of the Mental Health Act allows a court to send a person to hospital for treatment when they might otherwise have been given a prison sentence and section 41 allows a court to place restrictions on a personrsquos discharge from hospital Admission to hospital rather than prison is generally regarded as a more positive outcome for the person concerned
Care Quality Commission Count me in census 2010 22
Results mental health continued
Of all patients detained on admission 14 were detained under section 37 with a section 41 restriction order applied The rates of detention are given in Appendix B Table B9 In all minority ethnic groups very few women were detained under section 3741 Among men the rate of detention for the White British group was 16 lower than average and it was higher than average in the WhiteBlack Caribbean Mixed group by 77 the Black Caribbean group by 100 the Black African group by 27 and the Other Black group by 52
A consistent pattern across all six annual censuses was the higher than average detention rate under section 3741 for the Black Caribbean and Other Black groups
Detention under sections 47 48 and 4749 These sections of the Mental Health Act allow the Ministry of Justice to issue a direction to transfer a person detained in prison to a hospital for treatment
Of all patients detained on admission 7 were detained under these sections The only ethnic differences observed were a 107 higher than average detention rate among men from the White Black African Mixed group and a lower than average rate for the Indian group We observed no other ethnic differences probably because the numbers of detentions under these sections were low in most minority ethnic groups These rates of detention are given in Appendix B Table B10
The previous four censuses also showed virtually no ethnic differences for rates of detention under sections 47 48 and 4749
Patients subject to the Mental Health Act 1983 on day of census
All patients subject to the Mental Health Act Of all the 32399 patients in the census a total of 53 (17299) were subject to the Mental Health Act on census day including 2959 outpatients and 75 inpatients on a CTO (either voluntarily or recalled) Ratios for the different ethnic groups for overall applications of the Mental Health Act including CTOs showed broadly similar patterns to detention rates on admission day from which patients on a CTO were excluded In both cases rates were higher than average among the Black Caribbean Black African Other Black and White Black Caribbean Mixed groups However the higher than average detention rates for the White Irish Other White and Other Mixed groups on admission day were not apparent on census day
The rates are given in Appendix B Table B11
Supervised community treatment under section 17A Community treatment orders (CTOs) were introduced in November 2008 as a result of the Mental Health Act 2007 They allow for supervised community treatment to be provided for up to six months with the possibility of an extension after this These orders are designed to help patients to maintain stable mental health outside hospital and to promote recovery by providing professionals with the power to set conditions on discharge from hospital and a power to recall patients if arrangements in the community are not working
Nine per cent of all patients in the census were on CTOs compared with 4 in 2009 Of all the 17299 patients subject to the Mental Health Act on census day almost 18 (3034) were on CTOs Of the patients on a CTO 2959 were outpatients and 75 were inpatients (50 voluntary and 25 recalled)
Care Quality Commission Count me in census 2010 23
Results mental health continued
The rate of supervised community treatment among all patients included in the census was lower than average in the White British and White Irish groups and higher than average in the South Asian (Indian Pakistani Bangladeshi) and Black (Black Caribbean Black African Other Black) groups by 22 to 106 The ratios are given in Appendix B Table B12
Consent
About 25 of informally admitted patients were deemed incapable of consenting to treatment The only ethnic difference observed was a higher than average rate for the Pakistani group but this was based on very few patients
About 18 of patients who were detained or on CTOs were deemed incapable of consenting to treatment These rates were lower than average by 7 in the White British group and were higher than average among the Other White WhiteBlack Caribbean Mixed and Black African groups by 21 35 and 36 respectively
In addition 13 of patients who were detained or on CTOs on census day were deemed capable of consenting to treatment but refused to do so The White British group had a rate of refusals that was 10 lower than average and rates were higher than average among the White Irish WhiteBlack Caribbean Mixed Other Mixed Black Caribbean and Black African groups by between 39 and 71
Care programme approach
The Care Programme Approach (CPA) is the process by which treatment care and support for people with serious mental health problems and accompanying health and social care needs are agreed coordinated and understood by all involved From October 2008 changes to the CPA in England
mean that it is no longer categorised into two parts (lsquostandardrsquo and lsquoenhancedrsquo) and just the one category of enhanced CPA applies This makes CPA policy in England different to that in Wales where the distinction still applies The CPA data presented here therefore includes all CPA patients in England and both lsquostandardrsquo and lsquoenhancedrsquo CPA patients in Wales
About 89 of all patients were on a CPA 3 were on a single assessment process (SAP) whereby assessments are made for adults with health and or social care needs and 8 were on neither CPA nor SAP As most patients were on a CPA no ethnic differences were observed
Recorded incidents
The 2010 census asked about the number of times that patients experienced seclusion hands-on restraint self-harm accident and physical assault in a current hospital spell or if the patientrsquos hospital spell was longer than three months the number that took place within the last three months Outpatients on a CTO are excluded from these data It should be noted that the rates of such events among minority ethnic groups can show yearly variation because of the low numbers of events in several groups
Seclusion Seclusion was defined as the supervised confinement of a patient in a room which may be locked to protect others from significant harm Four per cent of patients had experienced one or more episodes of seclusion The White British group had a seclusion rate that was 9 lower than average Rates were higher than average among the WhiteBlack Caribbean Mixed WhiteBlack African Mixed Black Caribbean and Black African groups by 80 90 36 and 56 respectively
Care Quality Commission Count me in census 2010 24
Results mental health continued
Although the number of incidents of seclusion was low in several minority ethnic groups some general patterns over the six censuses to date are
bull The proportion of all patients who had an episode of seclusion stayed fairly constant over the six censuses at about 4
bull Although there have been annual fluctuations the seclusion rate has been higher than average for the Black and WhiteBlack Mixed groups in three or four of the six censuses and in the Other White group in three censuses
Hands-on restraint This was defined as the physical restraint of a patient by one or more members of staff in response to aggressive behaviour or resistance to treatment About 12 of patients had experienced one or more episodes of hands-on restraint No ethnic differences were observed In fact very few ethnic differences have been observed in the previous censuses also and they have not shown a consistent pattern
Self-harm Eight per cent of patients had harmed themselves on one or more occasions Only the White British group had a rate that was higher than average (by 14) Rates were lower than average among several minority ethnic groups the three Black groups (Black Caribbean Black African and Other Black) by about 70 the three south Asian groups (Indian Pakistani Bangladeshi) by between 37 and 78 and the Other Mixed and Other Asian groups by about 60
In terms of comparison with previous years
bull The proportion of all patients who had harmed themselves stayed fairly constant at about 7ndash8
bull In all censuses the White British group had a higher than average rate of self-harm and the Black and South Asian groups had lower than average rates of self-harm
Accidents About 11 of patients had experienced one or more accidents Patients from the White British group experienced a rate of accidents that was 6 higher than average Rates were lower than average in the Black Caribbean Black African Other Black and Other Asian groups by about 50 to 70 No accidents were reported for the Chinese group
In terms of comparisons with previous years
bull The proportion of all patients who had had an accident stayed fairly constant
bull The rate of accidents in the different censuses was higher than average in the White British group and lower than average in the Black Caribbean group Few other ethnic differences were observed and they were not consistent
Physical assault on the patient The definition of assault includes incidents of physical assault on the patient irrespective of who committed the assault We do not have information on who committed the assault for example whether it was another patient or a member of staff Eleven per cent of patients were involved in one or more episodes of physical assault The only ethnic difference observed was a 19 lower than average rate among the Black Caribbean group
In terms of comparisons with previous years
bull The proportion of all patients who had experienced a physical assault stayed fairly constant
bull Very few ethnic differences in rates of assault were observed in the different censuses and they did not show a consistent pattern
Care Quality Commission Count me in census 2010 25
Results mental health continued
Duration of stay in hospital from admission to census day
We analysed the length of the period between each inpatientrsquos admission to hospital and the census day This period is of course shorter than a patientrsquos full length of stay in hospital which runs from admission to the date when they are discharged Outpatients on a CTO are excluded from the following analyses
bull 25 of inpatients had been in hospital for one month or less
bull 20 had been in hospital between one and three months
bull 13 had been in hospital between three and six months
bull 11 had been in hospital between six months and one year
bull 11 had been in hospital between one and two years
bull 12 had been in hospital between two and five years
bull 8 had been in hospital for more than five years
These results are similar to those of previous censuses About 31 of patients in the 2010 census had been in hospital for more than a year and had therefore also been included in the 2009 census About 20 of patients had been in hospital for more than two years and will have been included in both the 2008 and 2009 censuses
We calculated the median length of stay for different ethnic groups The median is the midpoint of the range of values so the median length of stay is the one at which half the patients had a length of stay less than the median and half had a stay longer than the median Overall and as in previous years the median amount of time that women had spent in hospital was about 25 months and the median for men was about 58 months (see Table 6) In most ethnic groups the median time spent in hospital was two to three times longer for men than for women in the Other Black group men had been in hospital four times longer than women
Median lengths of stay were longest for men from the Black Caribbean WhiteBlack Caribbean Mixed and Other Black groups and shortest for men from the Chinese Bangladeshi and Other groups Median lengths of stay were longest for women from the WhiteBlack Caribbean Mixed and Black Caribbean groups and shortest for women from the Chinese and Bangladeshi groups
A number of important factors influence a patientrsquos length of stay in hospital including age gender whether or not they are detained under the Mental Health Act (and the section under which they are detained and whether there is an additional restriction order) the type and severity of their illness the nature of their treatment and the availability of support in the community The data in the census does not allow for analysis of these factors
Table 6 Median number of days from the day of admission to the day of census
Ethnic group Men Women
White British 161 71
White Irish 218 114
Other White 238 113
White and Black Caribbean 275 191
White and Black African 182 92
White and Asian 226 78
Other Mixed 173 112
Indian 172 70
Pakistani 153 56
Bangladeshi 134 55
Other Asian 167 61
Black Caribbean 345 122
Black African 141 66
Other Black 248 58
Chinese 135 51
Other 131 76
Total 174 75
Care Quality Commission Count me in census 2010 26
Results mental health continued
Ward security
As in previous years about 11 of all patients were on a medium or high secure ward as opposed to a general (76) or low secure (13) ward
Patients from the White British Indian and Bangladeshi groups were less likely than average to be on a medium or high secure ward by 7 30 and 67 respectively Patients from the White Irish WhiteBlack Caribbean Mixed Black Caribbean and Other Black groups had a higher than average rate by between 43 and 55
Age range on wards
Among patients under 18 years of age 61 were being cared for on wards for working-age adults on census day and five patients were on a ward for older people Seven per cent of patients on wards for working-age adults were 65 or over and
8 of those on wards for older people were adults of working age There were very few lsquoout of agersquo placements among minority ethnic groups
Patients in wards designated as single sex or mixed
Providers were asked whether patients were on a ward designated as men or women only or mixed gender All the analyses of single sex accommodation and facilities exclude outpatients on a CTO Overall 61 of men and 77 of women were not in a ward designated for single sex use similar proportions as in previous years The proportion of patients not in a designated single sex ward was lower among almost all minority ethnic groups than among the White British group In all ethnic groups the proportion of men who were not in a designated single sex ward was lower than among women (see Table 7a)
Two further questions examined the single sex facilities that were available to patients
At the time of the 2010 census the following guidance from the Department of Health applied in England A ward can be described as single sex (ie the intended sex of the ward is either male or female and not mixed) when the accommodation complies with the following definition from the Department of Health of single sex accommodation ldquoSleeping areas must be segregated and members of one sex must not have to walk through an area occupied by the other sex to reach toilets or bathrooms Separate male and female only toilets and bathrooms must be provided There should be separate day rooms to which only women have accessrdquo However there is a discrepancy for providers because accommodation designated as a lsquowardrsquo for administrative purposes may incorporate single sex accommodation for both sexes that meets the guidelines ndash but in this case the ward would still be lsquomixedrsquo (based on guidance from Safety Privacy and Dignity Department of Health 2000)
As long as men and women are cared for in separate bays or rooms and have their own toilet facilities then it may well be appropriate for them to be on the same ward being cared for by the same team of doctors and nurses In practice good segregation can be achieved if men and women have separate sleeping areas (for example single sex bays) and have separate toilets and bathrooms that they can reach without having to pass through (or close to) areas for the opposite sex The layout of wards should minimise any risk of overlooking or overhearing by members of the opposite gender (from Privacy and Dignity ndash A report by the Chief Nursing Officer into mixed sex accommodation in hospitals Department of Health 2007)
The coalition governmentrsquos revised Operating Framework for 201011 requires NHS organisations to eliminate mixed-sex accommodation except under exceptional circumstances from 2011 The national guidance relating to mixed sex accommodation was issued in November 2010 and states that ldquoNo areas are exempt and every decision to mix must be justified by reference to the patientrsquos clinical needs not organisational convenience or custom and practicerdquo For mental health and learning disability trusts it states ldquoThere is no acceptable justification for admitting a mental health patient to mixed-sex accommodationrdquohellip It ldquomay be acceptable in a clinical emergency to admit a patient temporarily to a single ensuite room in the opposite-gender area of a ward In such cases a full risk-assessment must be carried out and complete safety privacy and dignity maintainedrdquo The guidance is available at wwwdhgovukenPublicationsandstatisticsLettersandcircularsProfessionallettersChiefnursingofficerlettersDH_121848
Care Quality Commission Count me in census 2010 27
Results mental health continued
Table 7a Percentage of patients not in a designated single sex ward by ethnic group
Ethnic group
Sex of patients and ward
Male Female
Male ward Female or mixed ward Female ward Male or mixed ward
White British 35 65 21 79
White Irish 41 59 28 72
Other White 44 56 28 72
White and Black Caribbean 56 44 31 69
White and Black African 48 52 41 59
White and Asian 43 57 34 66
Other Mixed 49 51 24 76
Indian 37 63 25 75
Pakistani 48 52 35 65
Bangladeshi 23 77 18 82
Other Asian 46 54 22 78
Black Caribbean 55 45 32 68
Black African 49 51 28 72
Other Black 49 51 30 70
Chinese 42 58 30 70
Other 43 57 20 80
Total 39 61 23 77
The vast majority of patients in this category were in mixed wards very few (under 05) male patients were on female-only wards or vice versa
Care Quality Commission Count me in census 2010 28
Results mental health continued
Patientsrsquo access to toilet and bathing facilities designated for single sex use
We asked providers if the patient had access to toilet and bathing facilities designated for single sex use Overall 13 of men and 16 of women
were reported as not having access to such facilities designated for single sex use This was an improvement over 2009 when these proportions were 19 and 24 respectively The proportion of patients not having access to toilet and bathing facilities designated for single sex use was lower among almost all minority ethnic groups than among the White British group (see Table 7b for details)
Table 7b Percentage of patients not having access to toilet and bathing facilities designated for single sex use by ethnic group
Ethnic group
Access to designated single sex bathing and toilet facilities
Male Female
Male facilities
Female or mixed facilities
Female facilities
Male or mixed facilities
White British 86 14 84 16
White Irish 87 13 87 13
Other White 89 11 86 14
White and Black Caribbean 93 7 93 7
White and Black African 90 10 93 7
White and Asian 90 10 84 16
Other Mixed 98 2 96 4
Indian 91 9 90 10
Pakistani 95 5 94 6
Bangladeshi 92 8 98 2
Other Asian 92 8 86 14
Black Caribbean 92 8 90 10
Black African 91 9 91 9
Other Black 92 8 89 11
Chinese 82 18 83 17
Other 87 13 90 10
Total 87 13 84 16
The vast majority of patients in this category had access to mixed facilities very few (1) of male patients had access to female-only facilities or vice versa
Care Quality Commission Count me in census 2010 29
Results mental health continued
Patientsrsquo access to a lounge area day space designated for single sex use
We also asked providers if patients had access to a lounge area or day space designated for single sex use Overall 37 of men and 39 of women were
reported as not having access to these facilities This was an improvement over 2009 when these proportions were 48 and 51 respectively The proportion of patients not having access to a lounge areaday space designated for single sex use was lower among most minority ethnic groups than among the White British group (see Table 7c for details)
Table 7c Percentage of patients not having access to a lounge areaday space designated for single sex use by ethnic group
Ethnic group
Access to a lounge areaday space designated for single sex use
Male Female
Male facilities
Female or mixed facilities
Female facilities
Male or mixed facilities
White British 59 41 60 40
White Irish 63 37 70 30
Other White 68 32 63 37
White and Black Caribbean 82 18 73 27
White and Black African 83 18 76 24
White and Asian 72 28 75 25
Other Mixed 79 21 67 33
Indian 59 41 66 34
Pakistani 80 20 72 28
Bangladeshi 53 47 52 48
Other Asian 70 30 61 39
Black Caribbean 78 22 70 30
Black African 73 27 70 30
Other Black 79 21 72 28
Chinese 59 41 60 40
Other 67 33 67 33
Total 63 37 61 39
The vast majority of patients in this category had access to mixed facilities very few (1) of male patients had access to female-only facilities or vice versa
Care Quality Commission Count me in census 2010 30
Results mental health continued
Patientsrsquo subject to deprivation of liberty safeguards
People who lack the mental capacity to consent to the care or treatment they need should be cared for in a way that is least restrictive of their rights or freedom of action In 2007 the Mental Capacity Act 2005 was amended to introduce Deprivation of Liberty Safeguards for people who lack capacity to decide about their care or treatment and who need to be deprived of their liberty to protect them from harm The Safeguards came into effect in April 2009 and strengthen the rights of hospital patients and those in care homes as well as ensuring compliance with the European Convention on Human Rights (ECHR)
The 2010 census introduced a new question ldquoIs the patient subject to deprivation of liberty authorisation on 31 March 2010rdquo Under 1 (269) patients were reported as being subject to a deprivation of liberty authorisation on census day No ethnic differences in the rates were observed which may be due to the low numbers of patients among minority ethnic groups (69)
Care Quality Commission Count me in census 2010 31
A comparison between the 2005 baseline and the 2010 census
The changes we have seen in the census results between 2005 and 2010 the timespan of the Delivering Race Equality (DRE) action plan are set out below This is not a review of the DRE programme The aim is to give an overview of how some variables in the census have changed during the course of DRE and the findings should be seen in the light of the caveats described on page 13
bull The number of inpatients went down from 33785 to 29840 ndash a fall of 12
bull The proportion of patients in independent hospitals rose from 10 to 16
bull The overall proportion of patients from minority ethnic groups increased from 20 to 23 However there have been demographic changes during this time ndash the population from Black and minority ethnic groups in England and Wales rising from 79 million in 2005 to 85 million in 2007 (the latest year for which these figures are available) an increase of 8 in two years
bull Admission rates showed similar patterns across all censuses ndash Lower than average rates among the White
British Indian and Chinese groups ndash About average rates among the Pakistani and
Bangladeshi groups ndash Higher than average rates among other
minority ethnic groups ndash particularly in the Black and WhiteBlack Mixed groups for whom rates were two or more times higher than average in 2010 The Other Black group continues to have exceptionally high rates of admission (even after the apparent reduction since 2005 see next point)
bull One of the 12 goals of DRE was a decline in admission rates among Black and minority ethnic groups Figure 1 provides a comparison between 2005 and 2010 Although admission rates for
many ethnic groups show relatively little change since 2005 the rate for the Other Black group is considerably lower in 2010 (six times higher than average) compared with 2005 (12 times higher than average) However rates for the other Black and WhiteBlack Mixed groups show small increases
bull In general rates of referral from GPs and community mental health teams were lower than average among some Black and WhiteBlack groups and referral from the criminal justice system was higher Patterns were less consistent for other minority ethnic groups
bull There was a steady increase in the overall proportion of patients subject to the Mental Health Act Compared with 40 in 2005 49 of all patients were subject to the Mental Health Act in 2010 (53 if outpatients on a CTO are excluded)
bull Another DRE goal was to reduce detention rates among Black and minority ethnic groups However detention rates have been higher than average among the Black Caribbean Black African and Other Black groups in all six censuses and almost consistently higher in the WhiteBlack Caribbean Mixed and Other White groups Rates have been average for other minority ethnic groups
bull A consistent pattern was the higher than average detention rate under section 3741 for the Black Caribbean and Other Black groups
bull Another DRE goal was to reduce seclusion among Black and minority ethnic groups Although there have been annual fluctuations in seclusion rates they have been higher than average for the Black and WhiteBlack Mixed groups and the Other White group in at least three of the six censuses Other minority ethnic groups did not show high rates
Care Quality Commission Count me in census 2010 32
A comparison between the 2005 baseline and the 2010 census continued
Figure 1 Admission ratios in the 2005 and 2010 Count me in censuses by ethnic group England and Wales
Other Black
Black Caribbean
White and Black Caribbean
White and Black African
Black African
Other Mixed
Other Asian
White and Asian
Other
White Irish
Other White
Bangladeshi
White British
Pakistani
Indian
Chinese
0 100 200 300 400 500 600 700 800 900 1000 1100 1200 1300
Ageshysex standardised admission ratios (EampW=100)
Census 2005 admission ratios using 2005 ONS populations
bull Minority ethnic groups do not compare unfavourably for other incidents Rates of self-harm have consistently been lower than average among the Black and South Asian groups Very few ethnic differences in hands-on restraint physical assault and accidents were observed across the different censuses and they did not show a consistent pattern
bull About 31 of patients in all censuses had been in hospital for one year or more and were therefore included in more than one census
Census 2010 admission ratios using ONS 2007 populations (excluding outpatients on a CTO)
(This is one reason why the census shows little change over the six years It should be noted again that because the census is a one-day count it over-represents long-stay admissions and under-represents short-stay admissions)
bull Mixed accommodation was reported for many patients across all censuses although patients from Black and minority ethnic groups were more likely to be in single sex accommodation than White British patients
The admission ratios for the 2005 census shown here are different from those published in the 2005 report This is because we updated the analysis of the 2005 admission ratios by using 2005 ONS census populations for ethnic groups as denominators These populations were not available at the time of the 2005 report which instead used the 2001 ONS population data
Care Quality Commission Count me in census 2010 33
Results learning disabilities
We obtained information about 3642 patients in 129 organisations providing services for people with learning disabilities in England and Wales Of these two were inpatients on CTOs The total number of inpatients has declined each year and by 21 from 4609 in 2006 to 3642 in 2010 The total number of providers did not change much from the baseline year of 2006 although the number of NHS providers has fallen steadily and the number of independent healthcare organisations has increased (see Table 8) The proportion of inpatients in independent
healthcare organisations increased from 20 in 2006 to 33 in 2010 This is likely to be a result of closing NHS campuses with people moving from hospital to community settings
The pattern of results for learning disability patients in 2010 is broadly similar to that reported in previous censuses This is not surprising since many of the patients had been in hospital for a considerable period of time and they therefore appear in successive censuses
Table 8 The number of providers of learning disability services and inpatients
NHS (England)
Independent (England)
NHS (Wales)
Independent (Wales) Total
2010 census Number of providers 55 61 4 9 129 Number of all patients (including patients 2304 1072 154 112 3642 on a CTO) of all patients 633 294 42 31 100
2009 census Number of providers 60 54 5 4 123 Number of all patients (including patients 2487 1014 139 55 3695 on a CTO) of all patients 673 274 38 15 100
2008 census Number of providers 62 57 5 5 129
Number of inpatients 2873 1050 143 41 4107
of inpatients 700 256 35 10 100 2007 census
Number of providers 64 47 5 4 120
Number of inpatients 3063 900 154 36 4153
of inpatients 738 217 37 09 100 2006 census
Number of providers 70 48 5 1 124
Number of inpatients 3505 930 164 10 4609
of inpatients 760 202 36 02 100
Care Quality Commission Count me in census 2010 34
Results learning disabilities continued
Ethnicity
Information about ethnicity was available for 98 of patients Of these 13 belonged to Black and minority ethnic groups defined as all groups that are not White British (see Table 9) This figure is somewhat higher than in previous years (11 in 2006) and is significantly lower than the 23 of mental health patients from minority ethnic groups as reported in the mental health section of this report
Although the patterns by ethnicity are broadly similar to previous years there was an increase between 2006 and 2010 in the proportion of patients from the Other White group and a fall in those from the White British group Some ethnic groups had very few patients
As in the previous censuses patients from Black and minority ethnic groups were concentrated in a relatively small number of organisations 70 were
Table 9 Learning disability patients by ethnic group
Ethnic group 2010 census 2009 census 2008 census 2007 census 2006 census
Number Number Number Number Number
White British 853 3106 867 3205 889 3616 883 3642 887 4037
White Irish 13 46 15 57 13 53 10 40 14 66
Other White 29 106 23 85 26 104 26 109 17 77
White and Black Caribbean 10 38 10 36 07 29 08 34 07 32
White and Black African 02 8 01 4 00 2 02 10 01 3
White and Asian 04 13 04 14 03 12 03 13 02 9
Other Mixed 07 24 05 19 03 14 04 16 03 14
Indian 09 32 09 35 07 28 08 32 11 49
Pakistani 07 24 09 33 07 30 08 32 07 34
Bangladeshi 05 20 06 21 03 11 03 11 02 9
Other Asian 04 13 03 10 03 12 02 8 03 12
Black Caribbean 26 93 22 81 23 94 26 108 28 129
Black African 08 28 09 35 07 29 08 33 07 33
Other Black 04 15 04 14 04 15 04 18 04 17
Chinese 00 1 01 2 01 5 02 8 02 7
Other 02 7 02 8 04 15 02 10 05 24
Not stated 19 68 10 36 09 38 07 29 12 57
Total 100 3642 100 3695 100 4069 100 4124 100 4552
Care Quality Commission Count me in census 2010 35
Results learning disabilities continued
patients in 25 of the 129 organisations that took part in the census Seventy-four organisations had fewer than 10 patients from Black and minority ethnic groups each and another 42 organisations had no inpatients at all from these groups
However it is important to note that the number of people with severe and profound learning disabilities in some areas is affected by past funding and placement practices especially the presence of old long stay hospitals and of people placed outside their original area of residence by funding authorities
Reporting of ethnicity
About half (56) of patients reported their own ethnic group Staff reported the ethnic group for 17 of patients and relatives for 21 This means that ethnicity could have been misreported for some patients We do not know how ethnicity was assessed for 6 of patients
Age and gender
Two per cent (59) of patients were under 18 years old The number of young inpatients from minority ethnic groups was low or zero in several ethnic minority groups
Overall 73 of patients were under 50 years old and 27 were aged 50 or over The proportion of patients under 50 was higher among patients from Black and minority ethnic groups (88) than among the White British group (71) This is not surprising given that minority ethnic populations are generally younger than the White population
Seventy per cent of patients in learning disability services were men whereas in mental health services 58 of patients were men
Language and religion
Eight per cent of patients reported that their first language was not English Non-verbal communication was the most often selected language after English accounting for 4 of patients Two per cent (84) of patients most of whom were from the White British group said they needed an interpreter
Religion was not stated for 22 of patients and 15 of patients said they had no religion South Asians (Indians Bangladeshis and Pakistanis) were mostly Muslim Hindu or Sikh and those from the White Black Caribbean and Black African groups were mostly Christian
Sexual orientation
Overall the result was not known for almost half (49) of patients 45 said they were heterosexual 2 said gaylesbian 3 said bisexual and 1 said ldquootherrdquo The numbers of patients from minority ethnic groups were too low for meaningful analysis
Disability
Of all inpatients in learning disability services
bull 4 were reported as having no disabilities
bull 44 had a learning disability only
bull 51 had multiple disabilities
The patterns among minority ethnic groups were similar in that most patients had either a learning disability or multiple disabilities
Care Quality Commission Count me in census 2010 36
Results learning disabilities continued
Rates of admission
The rates of admission based on ONS estimates of the general population in 2007 are given in Appendix C Table C1
Admission rates were lower than average among several minority ethnic groups Other White Indian Pakistani Other Asian Black African Chinese and Other Rates were two to three times higher than average among the WhiteBlack Caribbean Mixed Black Caribbean Other Black and Other Mixed groups The lower rates among the South Asian and Chinese groups and the higher rates among some Black groups are similar to patterns for inpatients in mental health establishments
These patterns of admission are similar to those we reported in previous census reports
Source of referral
As we reported in the section on mental health patients data about sources of referral must be interpreted with care as we do not always know the original referral source Furthermore in the case of inpatients with learning disabilities this information was invalid missing or unknown for 12 of patients
Because of the small numbers of patients in most minority ethnic groups we observed few ethnic differences in sources of referral
Detention under the Mental Health Act 1983 (on day of admission and on day of census)
The Mental Health Act 2007 made a number of changes to the Mental Health Act 1983 one of which was supervised community treatment (section 17A) These are reflected in the 2010 census
All detentions Of all the patients in learning disability services 48 were detained under the Mental Health Act on admission Rates of detention on the day of admission by ethnic group are in Appendix C Table C2 and no ethnic differences were observed As the number of detained patients from each minority ethnic group was low we did not undertake further analysis for individual sections of the Act
Rates of detention on census day also showed no ethnic differences with the exception of a lower than average rate for the Other White group
Consent
About 66 of informally admitted inpatients were deemed incapable of consenting to treatment which is a similar proportion to that reported previously
Among detained patients 38 were deemed incapable of consenting to treatment and 6 were deemed capable of consenting to treatment but refused
The numbers of patients from minority ethnic groups were too low for comment There were no or very few such patients among minority ethnic groups
Care Quality Commission Count me in census 2010 37
Results learning disabilities continued
Care programme approach
Details of the Care Programme Approach (CPA) are given on page 24
We found that 73 of all patients were on a CPA 2 on a single assessment process (SAP) and 25 on neither No ethnic differences were observed
Recorded incidents
The 2010 census asked about the number of times that patients experienced seclusion hands-on restraint self-harm accident and physical assault in a patientrsquos current hospital spell or if the patientrsquos hospital spell was longer than three months the number that took place within the last three months As in previous years we observed very few ethnic differences
Seclusion Five per cent of patients had experienced one or more episodes of seclusion The only ethnic differences observed were the higher than average rates among the White Irish and Other White groups but these were based on small numbers of patients
Physical assault on the patient The definition of assault includes incidents of physical assault on the patient irrespective of who committed the assault but we do not have information on who committed the assault About 28 of patients had been involved in one or more episodes of physical assault No ethnic differences were observed
Hands-on restraint self-harm accidents Thirty per cent of inpatients had experienced one or more episodes of hands-on restraint 22 had attempted to harm themselves and 24 had suffered an accident The numbers were very low in minority ethnic groups and we did not observe any ethnic differences except for a lower than average rate for self-harm among the Black Caribbean group but this was based on very few patients
Duration of stay in hospital
We analysed the length of the period between each patientrsquos admission to hospital and the census day This period is of course shorter than a patientrsquos full length of stay in hospital which runs from admission to the date when they are discharged
bull 10 of inpatients had been in hospital for one month or less
bull 6 had been in hospital between one and three months
bull 7 had been in hospital between three and six months
bull 10 had been in hospital between six months and one year
bull 14 had been in hospital between one and two years
bull 22 had been in hospital between two and five years
bull 31 had been in hospital for over five years
The patterns are very similar to those in previous censuses About 67 of patients in the 2010 census had been in hospital for more than a year and were therefore also included in the 2009 census In addition over half (53) of patients had been in hospital for more than two years and will have been included in both the 2008 and 2009 censuses A third of patients will have been included in each census since 2006
We also calculated the median length of stay (see page 26 for the definition of median) Overall the median amount of time that women had spent in hospital was about 31 months and the median for men was about 27 months This compares with a median for mental health patients of 25 months for women and 58 months for men It is not possible to reliably compare length of stay by ethnic group because of the small numbers of patients among several minority ethnic groups
Care Quality Commission Count me in census 2010 38
Results learning disabilities continued
Ward security
About 12 of all inpatients were on a medium or high secure ward as opposed to a general (54) or low secure (34) ward
As in the three previous years rates of patients on medium or high secure wards were about double the average among the White Irish and Other White groups Most other minority ethnic groups had very few patients on medium or high secure wards
Age range on wards
There were five patients under 18 years of age being cared for on wards for working-age adults and none were on wards for older people About 5 of patients on wards for working-age adults were aged 65 or over and there were very few patients (23) on wards for older people There were very few lsquoout of agersquo placements among minority ethnic groups
Patients in wards designated as single sex or mixed
We asked providers whether the patient was on a ward designated as men or women only or mixed gender Overall 47 of men and 69 of women were not in a ward designated for single sex use The numbers of such patients among minority ethnic groups were very low
Two further questions examined the single sex facilities that were available to patients Again due to the small numbers we do not present results by ethnicity for these questions
Patientsrsquo access to toilet and bathing facilities designated for single sex use
Overall 19 (497) of men and 27 (295) of women were reported as not having access to toilet and bathing facilities designated for single sex use
Patientsrsquo access to a lounge area day space designated for single sex use
Overall 32 (829) of men and 44 (470) of women were reported as not having access to a lounge area day space designated for single sex use
Patients subject to deprivation of liberty safeguards
For details of deprivation of liberty safeguards please see page 31
The 2010 census introduced a new question ldquoIs the patient subject to deprivation of liberty authorisation on 31 March 2010rdquo Two per cent (74) patients were reported as being subject to a deprivation of liberty order on census day but very few of these patients (15) were from minority ethnic groups
See footnote on single sex accommodation on page 27
Care Quality Commission Count me in census 2010 39
Data in the future Moving beyond a one-day census
For six years the Count me in census has provided a valuable one-day snapshot of inpatients in mental health and learning disability services And with the proportion of inpatients who are detained increasing steadily (from 25 in 200506 to 39 in 200910 ndash see Figure 2) ongoing ethnic monitoring of admissions and detentions becomes more vital than ever
However a one-day census only captures some events and the profile of patients can differ across a whole year For example there were
bull 29840 inpatients in the 2010 census compared with 107765 inpatients overall during 200910
bull 17299 patients in the 2010 census who were detained or on CTOs compared with 42479 new detentions and some 4100 new CTOs overall in England in 200910
bull 26 of patients in hospital for under one month and 31 for over one year per the census
whereas the MHMDS data consistently shows that for over 50 of records the average length of an inpatient stay was under one month and for 4 it was over one year
Looking ahead it is vital that robust data is available on all admitted patients and all those subject to the Mental Health Act not just those in hospital on one particular day Moreover patterns of use and outcomes of community care can have an impact on the need for admission to hospital and the risk of detention ndash therefore information about the care provided to patients before admission to hospital during their hospital stay and after they leave is also vital Furthermore under 84 of the 127 million people using specialist mental health services are admitted to hospital23 and so it is very important to examine the quality of community care for the 90 of patients who are not admitted to hospital
Figure 2 Number of people spending time in hospital 200506 to 200910
Num
ber
of p
atie
nts
90000
80000
70000
60000
50000
40000
30000
20000
10000
0 200506 200607 200708 200809 200910
Source NHS Information Centre Formally detained Not detained MHMDS Bulletin 2011
Care Quality Commission Count me in census 2010 40
Data in the future Moving beyond a one-day census continued
The Mental Health Minimum Data Set (MHMDS) is a rich source of data on people using specialist mental health services in England It covers both community and hospital services and includes a wide range of information about the demographic clinical and socioeconomic characteristics of individual patients and the services provided to those admitted to hospital and to the much larger number of those who donrsquot need a stay in hospital The data includes information about contact with services uses of the Mental Health Act and the Care Programme Approach for each individual patient All these details enable the use of services patterns of care and patient outcomes to be tracked including along pathways of care The MHMDS therefore provides a robust basis for ongoing monitoring of access to and outcomes of care for users of specialist ndash both community and hospital ndash mental health services
The MHMDS also enables an analysis of the numbers and rates of people from different ethnic groups using specialist mental health services overall (both inpatient and community) which provides an indication of the levels of mental illness and therefore the need for specialist care in different communities
At present the MHMDS does not cover high secure services and independent sector providers only started to provide data during 201011 However to support payment by results for mental health the scope of the data set will be extended to cover high secure services during 201112 (version 4 MHMDS) Further proposed changes to the dataset (version 41) will incorporate NHS-funded learning disability services and primary care mental health services A separate dataset for child and adolescent mental health services (CAMHS) has been developed and is awaiting formal approvals It is designed to include the same information about uses of the Mental Health Act as provided in the MHMDS
The latest MHMDS bulletin for 200910 provides a description of people using specialist mental health services in England including ethnic profiles of people using services hospital admissions detentions and the number of people on CPA24 It also provides information on differences by age and gender The bulletin illustrates some of the sorts of analyses that are possible using data from the MHMDS
The NHS Information Centre can provide guidance on these and other potential analyses based on MHMDS data
Care Quality Commission Count me in census 2010 41
Conclusions
While this report reviews changes in the census results since 2005 it is not a review or evaluation of the DRE programme overall Similarly the census cannot provide explanations for the patterns observed or examine whether mental health services are meeting the needs of individual ethnic minority groups As we have noted previously the results are subject to caveats in particular that the census provides a one-day snapshot that may not be representative of patients admitted to hospital throughout the year
Overview of findings
Overall the findings from the 2010 census show little change from those reported for previous annual censuses conducted since 2005 This is partly because many patients had been in hospital for a considerable period of time and had therefore been included in successive censuses The findings of this sixth and last census continue to show differences between Black and minority ethnic groups and White groups and also differences within these groups
In particular ethnic differences in rates of admission detention under the Mental Health Act and seclusion ndash three of DRErsquos 12 goals ndash have not altered materially since the inception of DRE in 2005
bull Admission rates remain higher than average among minority ethnic groups especially among Black and WhiteBlack Mixed groups for whom rates were two or more times higher than average in 2010 The Other Black group continues to have the highest admission rate ndash six times higher than average ndash although this is lower than in 2005 In contrast admission rates have consistently been lower than average among the Indian and Chinese groups and about average in the Pakistani and Bangladeshi groups
bull Detention rates remain higher than average among the Black and WhiteBlack Caribbean Mixed groups and among the Other White group A consistent pattern across all censuses was the higher than average detention rate
under section 3741 for the Black Caribbean and Other Black groups We also found that rates for being placed on a CTO were higher among the South Asian and Black groups
bull Although there have been annual fluctuations in seclusion rates they have been higher than average for the Black WhiteBlack Mixed and Other White groups in at least three of the six censuses
Overall the level of provision of single sex areas for patients continues to be unsatisfactory although there was no evidence that minority ethnic patients were disadvantaged in these respects Government policy for the NHS in England now requires that all providers of NHS-funded care including mental health trusts are expected to eliminate mixed-sex accommodation in accordance with the guidance set out in CNO201032526 From 2011 all providers of NHS-funded care must report breaches of sleeping accommodation which will attract sanctions
Implications for ways forward
The census findings do not in themselves show that mental health and learning disability services are failing to meet the needs of Black and minority ethnic service users
As noted in previous reports they need to be interpreted in the context of available evidence on ethnic differences in rates of mental illness pathways to care and factors such as socioeconomic disadvantages that all contribute to these differences Our previous reports have consistently highlighted the need for prevention early intervention and working collaboratively across sectors to reduce the risk of admission and detention where possible without compromising the care given to patients Mental health services have a key role to play but to achieve this all statutory agencies and organisations outside the healthcare sector Black and minority ethnic communities and people who use services themselves will need to work in partnership
Care Quality Commission Count me in census 2010 42
Conclusions continued
This message ndash about preventing mental ill-health by addressing the contributory factors and intervening early ndash is at the heart of No health without mental health the Department of Healthrsquos new strategy for the future of mental health care in England27
The strategy aims to tackle the economic social and environmental determinants and consequences of mental health problems and to improve outcomes and reduce inequalities
It specifies that by 2014 people in contact with the criminal justice system will have improved access to mental health services as set out in the Ministry of Justice Green Paper Breaking the Cycle Effective punishment rehabilitation and sentencing of offenders which confirms the approach outlined in Lord Bradleyrsquos report for early intervention and diversion from custody2829
Accompanying the new strategy is a supporting document that explains how its objectives will improve mental health outcomes the effective interventions and the underpinning evidence base30
The strategy is complemented by other government proposals for reforms in the NHS public health and adult social care as outlined in the NHS White Paper Equity and excellence liberating the NHS31 the public health strategy Healthy lives healthy people32 and the adult social care strategy A vision for adult social care capable communities and active citizens 33 Three outcomes frameworks have been developed alongside these strategies improving mental health outcomes and reducing inequalities is integral to them all
In this new healthcare landscape the proposed NHS Commissioning Board and GP consortia will have a statutory obligation to promote equality and reduce inequalities in healthcare (something also enshrined in the Equality Act 2010) As the lead commissioners of healthcare services it will be up to GP consortia to assess with local authorities the needs of their local populations and commission the right services that meet their requirements
And the strengthened public health role of local authorities offers significant potential for addressing the socioeconomic disadvantages faced by Black and minority ethnic communities which add to the burden of mental illness in these communities
Race Equality Action Plan A five-year review looked back at the work of the DRE action plan and describes some of the key challenges successes and learning34 Based on the experience and outcome of the DRE programme the report suggests ways forward for the next stage of mental health strategy development and implementation
Since April 2009 CQC has had a duty under the Mental Health Act 1983 to monitor how services exercise their powers in relation to patients who are detained in hospital or subject to CTOs or guardianship under the Act In its first annual report on the use of the Act CQC recommends a number of areas where improvements are needed for example over-occupancy on inpatient wards patient engagement use of control and restraint seclusion and capacity and consent35
In particular CQC highlighted a number of issues relating to the use of CTOs including concern about appropriate usage (30 of the patients in CQCrsquos sample did not have a reported history of non-compliance or disengagement with services after discharge) and over-representation of Black and minority ethnic groups CQC advised that research on the possible race equality impact of CTOs should be undertaken There were 6237 CTOs from their introduction in November 2008 to 31 March 2010 a much greater use of them than forecast for this period by the Department of Health before the power was introduced Just 31 of these orders had ended by end March 2010 suggesting that some people are being kept on supervised community treatment for long periods
Care Quality Commission Count me in census 2010 43
Conclusions continued
Data in the future Moving beyond a one-day census
Good information is the foundation of an effective healthcare system It is imperative for ensuring that services meet the needs of local populations and are equitable and that improvements are made where needed The availability of fit-for-purpose and comprehensive patient-level data sets with ethnicity and other key variables fully coded is therefore vitally important36 It enables the care provided to patients of all ethnic backgrounds to be monitored on an ongoing basis including for monitoring compliance with the Equality Act
Race Equality Action Plan A five-year review notes that better collection monitoring and use of ethnicity data to inform commissioning and provision in health and social care is required37 Key areas include good ethnic monitoring improving demographic information and ensuring good links between infomatics audit and equality and diversity leads within trusts in order to effectively use the information to inform service development monitoring and review at board management ward and community levels
The governmentrsquos proposed changes to the NHS will be supported by an information revolution aimed at improving and extending the information available to the NHS patients and the public on the quality and outcomes of NHS services including by equality dimensions38
Having information that is fit for purpose is vital for the effective regulation of mental health and learning disability services CQC uses routinely available data sets on an ongoing basis to assess the performance of health and social care organisations and their compliance with government policies and legislation We therefore expect those who commission and provide mental healthcare in the NHS and independent sector to have information systems that provide good quality data with fully
comprehensive recording and monitoring of ethnicity on an ongoing basis
Since 2005 the Count me in census has played a key role in providing information about the ethnicity and other characteristics of inpatients in mental health and learning disability services and on patients subject to the Mental Health Act It did this by providing a valuable one-day snapshot But ethnicity recording must be seen as an all-year round statutory requirement not a one-day annual event The number of inpatients throughout the year is much higher than the counts on one day and some patients will have more than one admission And there is a need to move on from counting patients to understanding more about care pathways for Black and minority ethnic patients and the factors leading to hospital admission and detention
We have consistently highlighted the need for commissioners and providers to make full use of the Mental Health Minimum Data Set (MHMDS) ndash the statutory data set submitted by providers of specialist mental health services in England It provides rich data on these issues and provides a robust information source for ongoing ethnic monitoring after this last census
Covering both community and hospital services ndash and now independent and third sector providers as well as NHS ndash it includes a wide range of information about individual patients the services provided to those admitted to hospital and to the much larger number who donrsquot need admission to hospital and the outcomes of care And because it includes year-round activity it is more representative of the overall picture of for example admission detention and readmission rates length of stay years in psychiatric care and contacts with services and professionals
We call on the Information Centre to routinely publish data on all admissions and uses of the Mental Health Act including CTOs in England (in both NHS and independent healthcare providers) by the ethnicity of
Care Quality Commission Count me in census 2010 44
Conclusions continued
patients making the MHMDS the definitive source of information about mental health and learning disability patients This data should be risk-adjusted for age gender and other variables as appropriate to enable reliable comparisons to be made across groups
It is important that all providers ndash NHS and independent ndash make strenuous efforts to improve the quality of the data they submit The Information Centre publishes reports on the quality of MHMDS data by provider (see wwwicnhsukservices mhmdsdq) and we urge providers to monitor this information and use it to improve their data quality
If GP consortia and local authorities are to be effective in their needs assessment and commissioning roles the Information Centre needs to make available and promote to them the data from the MHMDS and other sources And researchers and academics must make full use of the MHMDS to explore the factors that underlie the observed ethnic patterns
CQCrsquos role
In the meantime CQC will continue to focus strongly on the quality of care provided by mental health and learning disability services
People who find themselves admitted to mental health services or detained under the Mental Health Act and therefore counted by the Count me in census are among the most mentally unwell people in our society Our job is first and foremost to make sure that the care they receive meets the essential standards of quality and safety set out under the Health and Social Care Act 2008 and to work with providers to ensure this We act swiftly when we find services that do not Where we find systemic problems that organisations have not adequately addressed we may impose conditions on the providerrsquos registration to bring about the change needed to improve patientsrsquo experience of care
The essential standards of quality and safety include the requirement to provide single sex accommodation and we will continue to closely check that these standards are met by all mental health services
We intend to introduce a number of indicators derived from the rich information in the MHMDS into our quality and risk profiles for providers This will put greater emphasis on the experience of Black and minority ethnic patients in our regulatory activity
We will monitor the quality of MHMDS data submitted by providers (as reported by the NHS Information Centre) including independent service providers Those with poor data quality may be considered at higher risk in terms of their quality of care
In addition we will continue to monitor the progress of services in relation to the issues raised in the census and other reports including our report on the use of the Mental Health Act through our visits to services and meetings with patients by our Mental Health Act Commissioners and second opinion appointed doctors (SOADs) We will draw on patientsrsquo experiences to monitor the operation of the Mental Health Act
We will also assess the impact of advice and use of Local HealthWatch Local HealthWatch will be in a good position to make sure that providers and commissioners are held to account on matters of choice and access to services for people from Black and minority ethnic groups
Care Quality Commission Count me in census 2010 45
References
1 Department of Health Equity and excellence liberating the NHS 2010
2 Department of Health The NHS outcomes framework 201112 2010
3 Healthcare Commission Mental Health Act Commission National Institute for Mental Health in England Count me in results of a national census of inpatients in mental health hospitals and facilities in England and Wales 2005
4 Healthcare Commission Mental Health Act Commission National Institute for Mental Health in England Count me in results of the 2006 national census of inpatients in mental health and learning disability services in England and Wales 2006
5 Healthcare Commission Mental Health Act Commission National Institute for Mental Health in England Count me in results of the 2007 national census of inpatients in mental health and learning disability services in England and Wales 2007
6 Healthcare Commission Mental Health Act Commission National Institute for Mental Health in England Count me in results of the 2008 national census of inpatients in mental health and learning disability services in England and Wales 2008
7 Care Quality Commission National Mental Health Development Unit Results of the 2009 national census of inpatients and patients on supervised community treatment in mental health and learning disability services in England and Wales 2009
8 Department of Health Delivering race equality in mental health care an action plan for reform inside and outside services 2005
9 Welsh Assembly Government Adult Mental Health Services Raising the standard ndash Race Equality Action Plan for Adult Mental Health Services in Wales 2006
10Department of Health No health without mental health a cross-government mental health outcomes strategy for people of all ages 2011 wwwdhgovukprod_consum_dhgroups dh_digitalassetsdocumentsdigitalasset dh_124058pdf
11Department of Health New horizons towards a shared vision for mental health 2009 wwwdhgovukprod_consum_dhgroups dh_digitalassetsdhendocumentsdigital assetdh_109708pdf
12Department of Health Valuing people a new strategy for learning disability for the 21st century 2001
13Department of Health Valuing people now a new three year strategy for people with learning disabilities 2009
14Department of Health Healthcare for all report of the independent inquiry into access to healthcare for people with learning disabilities 2008
15Joint Committee on Human Rights A life like any other human rights of adults with learning disabilities (2008 HL Paper 401 HC 731) House of Lords House of Commons 2008
16Department of Health Valuing people now summary report March 2009 ndash September 2010 2010
17Disability Rights Commission Equal treatment investigation 2005
18Department of Health Mir G Nocon A Ahmad W Jones L Learning difficulties and ethnicity 2000
19ONS experimental population estimates by ethnic group 2007 wwwstatisticsgovukstatbase productaspvlnk=14238
Care Quality Commission Count me in census 2010 46
References continued
20Six percent of population are gay or lesbian according to Whitehall figures 2005 wwwtelegraphcouknewsmainjhtmlxml= news20051212ngay12xmlamps Sheet= news20051212ixhomehtml
21Department of Trade and Industry Amendment to Employment Equality (Sexual Orientation) Regulations 2003 2003
22Office for National Statistics Measuring sexual identity an evaluation report 2010
23 Information Centre Mental Health Bulletin Fourth report from Mental Health Minimum Dataset (MHMDS) annual returns 2010 2011 wwwicnhsukpubsmhbmhmds0910
24 Information Centre Mental Health Bulletin Fourth report from Mental Health Minimum Dataset (MHMDS) annual returns 2010 2011 wwwicnhsukpubsmhbmhmds0910
25The operating framework for the NHS in England 201112 Department of Health 2010 wwwdhgovukprod_consum_dhgroups dh_digitalassetsdhenpsdocuments digitalassetdh_122736pdf
26wwwdhgovukenPublicationsandstatistics LettersandcircularsProfessionalletters ChiefnursingofficerlettersDH_121848
27Department of Health No health without mental health a cross-government mental health outcomes strategy for people of all ages 2011 wwwdhgovukprod_consum_dhgroups dh_digitalassetsdocumentsdigitalasset dh_124058pdf
28Ministry of Justice Breaking the cycle effective punishment rehabilitation and sentencing of offenders 2010
29Department of Health The Bradley report Lord Bradleyrsquos review of people with mental health problems or learning disabilities in the criminal justice system 2009
30Department of Health No health without mental health delivering better mental health outcomes for people of all ages 2011
31Department of Health Equity and excellence liberating the NHS 2010 wwwdhgovukprod_ consum_dhgroupsdh_digitalassetsdhen psdocumentsdigitalassetdh_117794pdf
32Department of Health Healthy lives healthy people our strategy for public health in England 2010 wwwdhgovukprod_consum_dh groupsdh_digitalassetsdhenps documentsdigitalassetdh_122347pdf
33Department of Health A vision for adult social care capable communities and active citizens 2010 wwwdhgovukprod_consum_dh groupsdh_digitalassetsdhenps documentsdigitalassetdh_121971pdf
34Wilson M NMHDU Race equality action plan a five year review Delivering race equality in mental health care 2010 wwwnmhduorgukour-workmhep
35Care Quality Commission Monitoring the use of the Mental Health Act in 200910 2010
36Raleigh V S Collection of data on ethnic origin in England Editorial BMJ 20083376456
37Wilson M NMHDU Race equality action plan a five year review Delivering race equality in mental health care 2010 wwwnmhduorgukour-workmhep
38Department of Health Liberating the NHS an information revolution 2010
Care Quality Commission Count me in census 2010 47
Appendix A Methods of analysis
Standardisation by age and gender
Standardisation allows us to make comparisons between groups of the population by taking account of variations in age and gender Some differences in patterns of service use are related to the age or gender of the people using them so adjustments to the data have to be made to ensure that the interpretation of ethnic differences is reliable For example formal admissions are higher at a younger age so some Black and minority ethnic groups may have high formal admission rates simply because they have a high proportion of younger people Without adjustments for age and gender differences comparisons would be misleading
In this report most results are standardised for age and gender including those relating to admission detention source of referral care programme approach seclusion restraint accidents assault self-harm consent and presence on a secure ward The report uses the accepted statistical method of taking account of age and gender differences between groups when calculating these rates
We used the ONS estimates of total population by ethnic group for England and Wales in 2007 to standardise the rates of admission for different ethnic groups This takes account of the significant rises in the Black and ethnic minority population of England and Wales since the 2001 ONS census and hence gives more accurate and up to date estimates of admission ratios for different ethnic groups (although it does not take account of any further changes in the ethnic populations between 2007 and 2010 the date of this census) For comparison with the DRE baseline we also present admission rates from the 2005 census derived using the 2005 ONS estimates of populations by ethnic group These figures will not be the same as published in the 2005 census report which were based on the 2001 ONS census population estimates because updated estimates of populations by ethnic group were not available at that time
For other analyses we used the total number of inpatients and patients on CTOs in the census
as the basis for standardisation However CTO outpatients are excluded from selected analyses where appropriate namely the analysis of rates for admissions detentions on admission source of referral single sex accommodation and recorded incidents of seclusion restraint accidents assault and self-harm We used the statistical package STATA version 82 to derive the standardised results
It was not possible to adjust the analyses for ethnic differences in social and economic factors and in diagnosis and severity of illness Such factors could affect the ethnic differences observed in the results
For descriptive variables such as religion and language we did not use standardisation
Confidence intervals as indicators of significant statistical differences
For all standardised results the national rates for England and Wales are taken as 100 and the usual 95 confidence intervals are given Rates of less than 100 or greater than 100 for specific ethnic groups show a lower or higher rate respectively than the national average after adjusting for age and gender Whether or not the difference is statistically significant from the national average depends on the confidence interval If the confidence interval overlaps 100 the difference from the national average is not statistically significant If both values are lower or higher than 100 it indicates that the difference compared with the national average is statistically significant at the 95 level
For example if a rate is 110 with the lower confidence interval being 105 and the upper confidence interval being 115 it indicates that the 10 excess over the national average of 100 is statistically significant But if a ratio is 110 with the lower confidence interval being 95 and the upper confidence interval being 125 it indicates that the 10 excess over the national average is not statistically significant We did not attempt to adjust the confidence intervals for multiple comparisons
Care Quality Commission Count me in census 2010 48
Appendix B Mental health tables
Table B1 Standardised admission ratios by ethnic group for England and Wales (excluding outpatients on a CTO) using 2007 ONS census population denominators (England and Wales = 100) All ages
Ethnic group
Men Women Persons Standardised
admission ratio
95 confidence
interval Observed numbers
Standardised admission
ratio
95 confidence
interval Observed numbers
Standardised admission
ratio
95 confidence
interval Observed numbers
White British 88 86 89 12435 94 93 96 10157 91 89 92 22592 White Irish 130 115 146 274 122 106 140 215 126 115 138 489 Other White 117 109 126 731 129 118 141 533 122 115 129 1264 White and Black Caribbean 557 493 627 276 274 223 333 101 436 393 483 377 White and Black African 312 247 388 80 259 186 351 41 292 242 349 121 White and Asian 140 110 174 79 124 90 166 44 134 111 159 123 Other Mixed 230 189 278 108 213 165 270 67 223 192 259 175 Indian 67 59 75 286 66 56 76 172 66 60 73 458 Pakistani 105 93 119 269 65 53 79 96 91 81 100 365 Bangladeshi 123 102 147 120 82 60 109 46 108 92 126 166 Other Asian 161 139 185 192 136 107 169 79 153 135 172 271 Black Caribbean 538 505 572 980 306 277 336 418 438 415 462 1398 Black African 246 226 267 550 219 194 247 277 236 221 253 827 Other Black 792 691 903 222 314 240 403 61 596 529 670 283 Chinese 27 20 38 39 43 30 59 35 33 26 41 74 Other 140 120 162 177 110 88 136 87 128 113 145 264 Total 100 16818 100 12429 100 29247
Care Quality Commission Count me in census 2010 49
Appendix B Mental health tables continued
Table B2 Standardised admission ratios by ethnic group for England and Wales (excluding outpatients on a CTO) using 2007 ONS census population denominators (England amp Wales = 100) Ages 65 and over
Ethnic group
Men Women Persons Standardised
admission ratio
95 confidence
interval Observed numbers
Standardised admission
ratio
95 confidence
interval Observed numbers
Standardised admission
ratio
95 confidence
interval Observed numbers
White British 95 92 99 3265 95 92 98 3887 95 93 97 7152 White Irish 142 116 172 106 102 82 125 92 120 104 138 198 Other White 207 174 244 141 213 183 248 171 210 188 235 312 White and Black Caribbean 406 210 710 12 333 152 632 9 371 230 568 21 White and Black African 231 28 836 2 198 24 714 2 213 58 546 4 White and Asian 28 1 156 1 110 30 281 4 69 23 162 5 Other Mixed 146 40 374 4 228 92 470 7 189 95 339 11 Indian 97 70 132 41 83 57 116 33 90 71 113 74 Pakistani 39 17 77 8 46 18 94 7 42 23 69 15 Bangladeshi 115 53 218 9 69 14 201 3 98 51 172 12 Other Asian 234 143 361 20 215 120 354 15 225 157 313 35 Black Caribbean 216 170 269 77 310 253 376 103 261 224 302 180 Black African 142 73 248 12 365 241 531 27 246 175 337 39 Other Black 164 34 479 3 366 134 796 6 259 119 493 9 Chinese 41 8 120 3 95 38 195 7 68 33 125 10 Other 253 126 453 11 390 238 602 20 327 222 464 31 Total 100 3715 100 4393 100 8108
Care Quality Commission Count me in census 2010 50
Appendix B Mental health tables continued
Table B3 Standardised ratios by ethnic group for patients referred by a GP (England and Wales = 100)
Ethnic group
Men Women Persons Standardised
referral ratio
95 confidence
interval Observed numbers
Standardised referral ratio
95 confidence
interval Observed numbers
Standardised referral ratio
95 confidence
interval Observed numbers
White British 110 103 117 904 107 101 114 1065 108 104 113 1969 White Irish 85 50 134 18 93 57 144 20 89 63 123 38 Other White 74 51 103 33 70 49 97 36 72 56 91 69 White and Black Caribbean 27 5 78 3 30 4 109 2 28 9 65 5 White and Black African 0 0 74 9 268 2 35 4 125 2 White and Asian 165 54 386 5 0 0 86 28 201 5 Other Mixed 48 6 172 2 68 14 198 3 58 19 136 5 Indian 69 34 123 11 79 39 141 11 73 46 111 22 Pakistani 88 42 162 10 59 16 151 4 77 42 130 14 Bangladeshi 81 22 207 4 61 7 221 2 73 27 159 6 Other Asian 80 32 166 7 108 43 223 7 92 50 155 14 Black Caribbean 35 20 56 17 37 20 62 14 36 24 51 31 Black African 57 29 100 12 66 35 113 13 61 40 91 25 Other Black 62 23 135 6 40 5 144 2 54 23 107 8 Chinese 56 1 314 1 139 38 356 4 108 35 251 5 Other 106 46 208 8 0 0 53 23 105 8 Total 100 1041 100 1185 100 2226
Care Quality Commission Count me in census 2010 51
Appendix B Mental health tables continued
Table B4 Standardised ratios by ethnic group for patients referred by a community mental health team (including crisis resolution home treatment) or community learning disability team (England and Wales = 100)
Ethnic group
Men Women Persons Standardised
referral ratio
95 confidence
interval Observed numbers
Standardised referral ratio
95 confidence
interval Observed numbers
Standardised referral ratio
95 confidence
interval Observed numbers
White British 107 104 111 3255 103 100 107 3386 105 103 108 6641 White Irish 90 69 116 61 89 68 114 61 90 74 107 122 Other White 59 48 71 105 79 67 94 141 69 61 78 246 White and Black Caribbean 106 83 135 68 75 49 111 25 96 77 117 93 White and Black African 43 19 84 8 66 30 124 9 52 31 84 17 White and Asian 95 56 150 18 84 43 147 12 90 61 129 30 Other Mixed 78 48 121 20 72 41 118 16 76 53 105 36 Indian 106 83 132 76 100 76 130 56 103 86 122 132 Pakistani 108 84 135 73 89 60 128 30 102 83 123 103 Bangladeshi 98 66 141 29 90 50 148 15 95 69 128 44 Other Asian 88 63 120 40 105 70 150 29 94 73 119 69 Black Caribbean 69 59 80 167 85 71 102 123 75 67 84 290 Black African 84 70 102 112 82 65 103 77 84 72 96 189 Other Black 52 36 74 31 64 36 106 15 56 41 74 46 Chinese 112 53 205 10 101 52 176 12 105 66 160 22 Other 86 60 120 35 106 71 151 30 94 73 120 65 Total 100 4108 100 4037 100 8145
Care Quality Commission Count me in census 2010 52
Appendix B Mental health tables continued
Table B5 Standardised ratios by ethnic group for patients referred by criminal justice routes (police prison probation courts court liaison and diversion) (England and Wales = 100)
Ethnic group
Men Women Persons Standardised
referral ratio
95 confidence
interval Observed numbers
Standardised referral ratio
95 confidence
interval Observed numbers
Standardised referral ratio
95 confidence
interval Observed numbers
White British 90 86 95 1495 95 86 104 421 91 87 95 1916 White Irish 133 94 183 38 59 19 138 5 116 84 157 43 Other White 112 93 134 119 103 68 150 27 111 93 130 146 White and Black Caribbean 117 89 151 58 145 69 266 10 120 94 153 68 White and Black African 190 127 273 29 141 38 361 4 183 126 256 33 White and Asian 75 39 131 12 160 52 373 5 89 52 143 17 Other Mixed 104 65 157 22 151 61 311 7 112 75 161 29 Indian 86 61 118 38 79 32 163 7 85 62 113 45 Pakistani 118 91 150 65 89 33 194 6 115 90 145 71 Bangladeshi 74 44 115 19 29 1 162 1 68 42 105 20 Other Asian 130 95 174 45 164 71 323 8 134 101 176 53 Black Caribbean 131 114 150 208 124 81 181 26 130 114 148 234 Black African 132 112 156 145 143 93 211 25 134 114 156 170 Other Black 141 109 180 65 236 113 435 10 149 117 187 75 Chinese 83 27 194 5 146 30 426 3 99 43 195 8 Other 129 93 175 41 113 37 264 5 127 93 170 46 Total 100 2404 100 570 100 2974
Care Quality Commission Count me in census 2010 53
Appendix B Mental health tables continued
Table B6 Standardised detention ratios by ethnic group all detentions on day of admission (excluding outpatients on a CTO) (England and Wales = 100)
Ethnic group
Men Women Persons Standardised
detention ratio
95 confidence
interval Observed numbers
Standardised detention
ratio
95 confidence
interval Observed numbers
Standardised detention
ratio
95 confidence
interval Observed numbers
White British 94 92 97 6449 94 91 97 3628 94 92 96 10077 White Irish 112 95 131 154 118 96 145 94 114 101 129 248 Other White 108 98 118 451 120 106 136 251 112 104 120 702 White and Black Caribbean 123 107 141 220 129 99 167 59 124 110 140 279 White and Black African 128 99 162 68 113 70 173 21 124 100 153 89 White and Asian 96 71 126 50 109 68 164 22 99 78 125 72 Other Mixed 115 92 143 82 139 100 188 42 122 102 146 124 Indian 97 83 113 164 110 86 137 77 101 88 114 241 Pakistani 109 94 126 194 102 74 136 44 108 94 122 238 Bangladeshi 86 67 109 69 91 55 142 19 87 70 107 88 Other Asian 109 92 130 133 120 86 163 40 112 96 130 173 Black Caribbean 129 121 139 774 143 125 162 238 132 124 141 1012 Black African 115 104 127 422 131 111 153 159 119 110 129 581 Other Black 117 100 136 170 148 105 202 39 122 106 140 209 Chinese 108 71 159 26 129 78 202 19 116 85 156 45 Other 111 92 132 126 116 83 157 41 112 96 130 167 Total 100 9552 100 4793 100 14345
Care Quality Commission Count me in census 2010 54
Appendix B Mental health tables continued
Table B7 Standardised detention ratios by ethnic group detention on day of admission ndash section 2 of the Mental Health Act (England and Wales = 100)
Ethnic group
Men Women Persons Standardised
detention ratio
95 confidence
interval Observed numbers
Standardised detention
ratio
95 confidence
interval Observed numbers
Standardised detention
ratio
95 confidence
interval Observed numbers
White British 97 91 102 1156 93 87 98 1133 95 91 99 2289 White Irish 78 47 120 20 116 79 166 30 97 72 128 50 Other White 100 78 126 70 134 108 166 88 116 99 136 158 White and Black Caribbean 55 30 93 14 60 24 124 7 57 35 87 21 White and Black African 91 37 188 7 150 60 308 7 113 62 190 14 White and Asian 80 29 174 6 119 44 258 6 96 49 167 12 Other Mixed 68 28 141 7 116 53 221 9 89 51 145 16 Indian 130 91 179 37 124 81 182 26 127 98 163 63 Pakistani 126 87 176 34 138 79 225 16 130 96 171 50 Bangladeshi 166 101 256 20 140 61 276 8 158 105 228 28 Other Asian 142 93 209 26 163 93 264 16 150 108 202 42 Black Caribbean 73 57 92 70 97 72 128 51 82 68 98 121 Black African 164 131 202 87 190 146 244 62 174 147 204 149 Other Black 114 75 166 27 140 72 245 12 121 86 165 39 Chinese 165 60 358 6 212 97 402 9 190 106 313 15 Other 218 153 302 36 179 108 280 19 203 153 264 55 Total 100 1623 100 1499 100 3122
Care Quality Commission Count me in census 2010 55
Appendix B Mental health tables continued
Table B8 Standardised detention ratios by ethnic group detention on day of admission ndash section 3 of the Mental Health Act (England and Wales = 100)
Ethnic group
Men Women Persons Standardised
detention ratio
95 confidence
interval Observed numbers
Standardised detention
ratio
95 confidence
interval Observed numbers
Standardised detention
ratio
95 confidence
interval Observed numbers
White British 99 95 103 2684 96 91 100 1852 98 95 101 4536 White Irish 116 89 149 60 135 101 177 52 124 102 149 112 Other White 112 96 129 186 110 92 132 121 111 99 124 307 White and Black Caribbean 114 91 143 79 130 90 183 33 119 98 143 112 White and Black African 97 60 148 21 107 54 192 11 100 69 141 32 White and Asian 84 50 133 18 97 48 173 11 89 59 127 29 Other Mixed 121 84 168 35 117 72 181 20 120 90 156 55 Indian 96 75 122 67 110 79 148 42 101 83 122 109 Pakistani 91 71 115 69 88 55 134 22 90 73 111 91 Bangladeshi 63 39 95 22 64 28 127 8 63 43 90 30 Other Asian 90 65 120 44 94 56 149 18 91 70 117 62 Black Caribbean 116 102 130 279 164 138 192 148 129 117 142 427 Black African 95 80 112 143 102 79 129 68 97 85 111 211 Other Black 75 55 99 49 99 58 159 17 80 62 102 66 Chinese 119 59 213 11 99 43 194 8 110 66 171 19 Other 85 60 116 38 84 48 136 16 84 63 110 54 Total 100 3805 100 2447 100 6252
Care Quality Commission Count me in census 2010 56
Appendix B Mental health tables continued
Table B9 Standardised detention ratios by ethnic group detention on day of admission ndash section 3741 of the Mental Health Act (England and Wales = 100)
Ethnic group
Men Women Persons Standardised
detention ratio
95 confidence
interval Observed numbers
Standardised detention
ratio
95 confidence
interval Observed numbers
Standardised detention
ratio
95 confidence
interval Observed numbers
White British 84 79 89 991 101 88 115 220 86 82 91 1211 White Irish 140 96 198 32 48 6 175 2 126 87 176 34 Other White 112 89 139 81 156 95 241 20 118 96 144 101 White and Black Caribbean 177 133 232 53 179 66 390 6 178 135 229 59 White and Black African 149 82 251 14 224 46 654 3 159 92 254 17 White and Asian 141 75 241 13 195 40 569 3 149 85 241 16 Other Mixed 144 85 227 18 264 97 575 6 162 104 242 24 Indian 86 56 126 26 44 5 160 2 80 53 116 28 Pakistani 122 87 166 40 0 0 111 79 152 40 Bangladeshi 66 32 122 10 0 0 60 29 110 10 Other Asian 99 61 151 21 0 0 89 55 136 21 Black Caribbean 200 174 229 210 78 34 153 8 189 165 216 218 Black African 127 101 157 82 84 34 172 7 122 98 150 89 Other Black 152 110 205 43 94 11 341 2 148 108 198 45 Chinese 100 27 255 4 0 0 80 22 204 4 Other 118 75 177 23 44 1 245 1 110 71 164 24 Total 100 1661 100 280 100 1941
Care Quality Commission Count me in census 2010 57
Appendix B Mental health tables continued
Table B10 Standardised detention ratios by ethnic group detention on day of admission ndash sections 47 48 4749 of the Mental Health Act (England and Wales = 100)
Ethnic group
Men Women Persons Standardised
detention ratio
95 confidence
interval Observed numbers
Standardised detention
ratio
95 confidence
interval Observed numbers
Standardised detention
ratio
95 confidence
interval Observed numbers
White British 97 90 106 583 104 81 131 73 98 91 106 656 White Irish 132 72 221 14 163 20 590 2 135 77 219 16 Other White 130 96 172 49 71 15 206 3 124 93 163 52 White and Black Caribbean 126 78 193 21 80 2 444 1 123 77 186 22 White and Black African 207 103 370 11 0 0 189 95 339 11 White and Asian 57 12 166 3 169 4 941 1 68 19 175 4 Other Mixed 112 48 221 8 233 28 843 2 125 60 230 10 Indian 57 26 108 9 0 252 0 52 24 99 9 Pakistani 92 54 147 17 0 314 0 86 50 138 17 Bangladeshi 46 12 117 4 167 4 930 1 53 17 125 5 Other Asian 101 52 177 12 0 0 95 49 166 12 Black Caribbean 126 98 159 70 125 34 319 4 126 99 158 74 Black African 74 48 107 27 104 21 303 3 76 51 108 30 Other Black 127 78 197 20 138 3 769 1 128 79 195 21 Chinese 0 0 0 0 0 0 Other 83 38 157 9 0 0 77 35 147 9 Total 100 857 100 91 100 948
Care Quality Commission Count me in census 2010 58
Appendix B Mental health tables continued
Table B11 Standardised ratios for all applications of the Mental Health Act (including outpatients on a CTO) by ethnic group on day of census (England and Wales = 100)
Ethnic group
Men Women Persons Standardised
ratio for all MHA
applications
95 confidence
interval Observed numbers
Standardised ratio for all MHA
applications
95 confidence
interval Observed numbers
Standardised ratio for all MHA
applications
95 confidence
interval Observed numbers
White British 97 94 99 7659 95 93 98 4335 96 94 98 11994 White Irish 99 83 116 147 104 84 128 95 101 89 114 242 Other White 87 79 95 427 97 85 110 249 90 84 97 676 White and Black Caribbean 117 103 133 245 130 103 163 76 120 107 134 321 White and Black African 120 95 150 79 93 58 141 22 113 92 137 101 White and Asian 101 78 128 65 119 81 169 31 106 86 129 96 Other Mixed 110 89 134 96 125 93 165 49 114 97 135 145 Indian 103 90 118 215 122 100 147 109 109 97 121 324 Pakistani 111 97 125 254 117 90 148 67 112 100 125 321 Bangladeshi 92 75 112 97 101 68 145 29 94 78 112 126 Other Asian 103 88 121 152 126 95 164 56 109 94 124 208 Black Caribbean 123 115 131 893 141 126 158 300 127 120 134 1193 Black African 112 103 122 511 121 104 140 188 114 106 123 699 Other Black 116 102 132 232 148 112 191 59 122 108 136 291 Chinese 97 64 140 27 101 61 157 19 98 72 131 46 Other 104 87 122 140 103 75 137 46 103 89 119 186 Total 100 11239 100 5730 100 16969
Care Quality Commission Count me in census 2010 59
Appendix B Mental health tables continued
Table B12 Standardised CTO ratios by ethnic group CTOs on day of census ndash section 17a of the Mental Health Act (England and Wales = 100)
Ethnic group
Men Women Persons
Standardised CTO ratio
95 confidence
interval Observed numbers
Standardised CTO ratio
95 confidence
interval Observed numbers
Standardised CTO ratio
95 confidence
interval Observed numbers
White British 94 89 99 1289 88 82 94 730 92 88 96 2019 White Irish 51 27 88 13 77 41 132 13 62 40 90 26 Other White 97 77 120 83 125 95 162 58 107 90 126 141 White and Black Caribbean 79 53 113 29 141 77 237 14 92 67 124 43 White and Black African 111 59 190 13 125 41 292 5 115 68 181 18 White and Asian 104 54 182 12 136 50 297 6 113 67 178 18 Other Mixed 102 59 166 16 136 62 257 9 112 73 166 25 Indian 134 99 177 48 152 98 226 24 139 109 175 72 Pakistani 145 110 187 59 174 101 279 17 151 119 189 76 Bangladeshi 142 93 206 27 205 99 378 10 155 109 213 37 Other Asian 107 71 155 28 182 99 305 14 124 89 168 42 Black Caribbean 121 103 142 152 171 132 218 65 133 116 152 217 Black African 116 94 142 94 139 98 192 37 122 102 145 131 Other Black 186 144 238 65 305 189 466 21 206 165 254 86 Chinese 83 23 213 4 152 49 354 5 111 51 211 9 Other 87 54 134 21 152 79 266 12 103 71 145 33 Total 100 1953 100 1040 100 2993
Care Quality Commission Count me in census 2010 60
Appendix C Learning disability tables
Table C1 Standardised admission ratios by ethnic group for England and Wales using 2007 ONS population denominators (England amp Wales = 100) All ages
Ethnic group
Men Women Persons Standardised
admission ratio
95 confidence
interval Observed numbers
Standardised admission
ratio
95 confidence
interval Observed numbers
Standardised admission
ratio
95 confidence
interval Observed numbers
White British 104 100 109 2163 108 101 115 941 105 102 109 3104 White Irish 108 72 156 28 151 89 238 18 121 89 162 46 Other White 81 65 101 85 49 30 75 21 72 59 87 106 White and Black Caribbean 280 186 405 28 246 118 453 10 270 191 371 38 White and Black African 102 33 239 5 165 34 482 3 119 51 235 8 White and Asian 66 26 135 7 154 56 335 6 89 47 152 13 Other Mixed 181 104 295 16 229 99 451 8 195 125 290 24 Indian 32 21 48 24 28 12 55 8 31 21 44 32 Pakistani 48 30 72 22 12 1 43 2 38 25 57 24 Bangladeshi 102 60 161 18 31 4 113 2 83 51 128 20 Other Asian 33 13 69 7 92 34 201 6 47 25 81 13 Black Caribbean 265 210 332 77 117 67 190 16 218 176 267 93 Black African 53 33 80 22 40 15 87 6 50 33 72 28 Other Black 228 118 399 12 134 28 392 3 200 112 330 15 Chinese 4 0 21 1 3 0 16 1 Other 26 9 56 6 11 0 59 1 21 9 44 7 Total 100 2521 100 1051 100 3572
Care Quality Commission Count me in census 2010 61
Appendix C Learning disability tables continued
Table C2 Standardised detention ratios by ethnic group all detentions on day of admission (England and Wales = 100)
Ethnic group
Persons Standardised
detention ratio
95 confidence
interval Observed numbers
White British 97 93 103 1431 White Irish 127 84 184 28 Other White 117 91 149 68 White and Black Caribbean 120 77 179 24 White and Black African 114 37 267 5 White and Asian 75 24 176 5 Other Mixed 94 49 165 12 Indian 119 72 186 19 Pakistani 110 61 181 15 Bangladeshi 144 84 231 17 Other Asian 59 16 150 4 Black Caribbean 119 90 155 57 Black African 138 85 210 21 Other Black 62 20 145 5 Chinese 0 0 Other 104 28 267 4 Total 100 1715
Care Quality Commission Count me in census 2010 62
copy Care Quality Commission and National Mental Health Development Unit 2011 Published April 2011
This publication may be reproduced in whole or in part in any format or medium for non-commercial purposes provided that it is reproduced accurately and not used in a derogatory manner or in a misleading context The source should be acknowledged by showing the publication title and copy Care Quality Commission and National Mental Health Development Unit 2011
How to contact us
Phone 03000 616161 Email enquiriescqcorguk Web wwwcqcorguk
Write to us at Care Quality Commission National Correspondence Citygate Gallowgate Newcastle upon Tyne NE1 4PA
Please contact us if you would like a summary of this publication in other formats or languages
Registered office Care Quality Commission Finsbury Tower 103ndash105 Bunhill Row London EC1Y 8TG
- Count me in 2010
- About the Care Quality Commission
- Contents
- Summary
- National organisations coordinating the census
- Introduction
- Data methods of analysis and interpretation
- Results mental health
- A comparison between the 2005 baseline and the 2010 census
- Results learning disabilities
- Data in the future Moving beyond a one-day census
- Conclusions
- References
- Appendix A Methods of analysis
- Appendix B Mental health tables
- Appendix C Learning disability tables
- How to contact us
-

Data methods of analysis and interpretation continued
Methods of statistical analysis
The statistical methods used for data analysis in this report are given in Appendix A
For the admission rates the ONS estimates of the general population in 2007 were used as denominators The Black and minority ethnic population of England and Wales has increased significantly since the 2001 ONS census ONS has produced updated population estimates by ethnic group for 2007 (the latest year for which these estimates are available) which reflect the demographic changes since 2001 The number of people from Black and minority ethnic groups (ie excluding the White British group) in England and Wales is estimated to have increased from 65 million in 2001 to 85 million in 2007 a rise of 30 As a result the proportion of the total population that is not from the White British group increased from 13 to 16 over this period We used the 2007 population estimates to calculate the admission rates in order to present a more up-to-date and accurate picture of ethnic differences However these figures do not reflect any demographic changes between 2007 and 2010 the year of this census
To make a comparison with the DRE baseline we also present admission rates from the 2005 census derived using the 2005 ONS population estimates by ethnic group as denominators These figures will not be the same as those published in the 2005 census report which were based on the 2001 ONS census population estimates because updated estimates of populations by ethnic group were not available at that time
For all other analyses (for example rates of use of the Mental Health Act seclusion etc) the patient numbers in the census were used as denominators
Unlike the censuses of 2005 to 2008 that counted only inpatients the 2009 and 2010 censuses also included outpatients on a CTO on census day This is because (a) the census aims to cover all patients subject to the Mental Health Act on census day and (b) we would not have been able to analyse standardised ratios for CTOs for different ethnic groups if CTO patients had been excluded from the analysis However CTO outpatients are excluded from selected analyses where appropriate including the analysis of rates for admissions detentions on admission source of referral single sex accommodation and recorded incidents of seclusion restraint accidents assault and self-harm The issue relating to the analysis of outpatients on a CTO only affects the sections of the report relating to mental health patients as there were very few learning disability patients on CTOs
Some results in this report are standardised for age and gender (those relating to admission detention source of referral care programme approach seclusion restraint accidents assault self-harm consent and presence on a secure ward) This is because there are underlying differences in the age and gender profiles of different ethnic populations and comparisons based on crude rates would be misleading Standardisation allows comparisons between different ethnic groups by taking account of variations in age and gender The report uses the conventionally accepted statistical methods for standardisation
The terms ldquohigherrdquo and ldquolowerrdquo than average used in the text for ethnic comparisons relate to differences from the national average that are statistically significant at the 5 level
Care Quality Commission Count me in census 2010 12
Data methods of analysis and interpretation continued
Interpreting the results
In this report for convenience we refer to ldquoadmission ratesrdquo for mental health and learning disability patients However these are in fact population-based rates of patients who were in hospital or subject to the Mental Health Act on census day and not rates for admissions actually made on the census day itself The number of admissions on census day will differ from the number of patients in hospital on that day and both of these will differ from the number of admissions throughout the year
As with any study our results have some caveats
1 The admission rates presented for minority ethnic groups in this report are higher than would be expected because they are based on ONS population estimates by ethnic group for 200719 the latest year available rather than population estimates for 2010 Therefore the admission rates do not take into account demographic changes between 2007 and 2010 Furthermore these population estimates are described by ONS as ldquoexperimentalrdquo and are subject to margins of error
2 The results are not adjusted for diagnosis and other clinical information so they may reflect differences between ethnic groups in the levels nature or severity of mental illness or disability
3 The data collected for the census does not allow adjustment for socioeconomic factors such as poverty unemployment and inner-city residence These occur more commonly in Black and minority ethnic communities Equally it was not possible to take account of social factors such as marital status living alone separation from one or both parents or lack of social networks Both socioeconomic and social factors are known to be associated with the risk of mental illness and can affect pathways into care and the nature of patientsrsquo interaction with services
4 Rates based on small and fluctuating numbers of patients can change in either direction (high to low or vice versa) from one year to the next as a result of random rather than real variation and regression to the mean
5 The census does not assess the quality of services the experience of patients or the reasons for any differences between ethnic groups
6 We have explained the rationale for including outpatients on CTOs in this report While this enables us to comment on CTOs on census day in addition to those who are inpatients it does mean that the overall census population is not restricted to inpatients as in the reports for the years preceding 2009 and 2010
7 The census is a one-day count designed to give the number and ethnic composition of patients on that day Its value is in providing a year-by-year snapshot profile However by its very nature it cannot give the picture for the whole year As we have shown in the section lsquoData in the future Moving beyond a one-day censusrsquo a one-day picture can differ from results based on a full yearrsquos data because a one-day picture over-represents long-stay patients and under-represents short stay admissions
Care Quality Commission Count me in census 2010 13
Results mental health
We collected information on 32799 patients from the mental health services of 261 NHS and independent healthcare organisations in England and Wales This included 29840 inpatients of whom 75 were inpatients on a CTO and a further 2959 patients on a CTO who were outpatients on census day The number of inpatients in each census has declined each year from 33785 in 2005 to 29840 in 2010 (excluding the 2959 outpatients on a CTO) a fall of 12 since 2005 (see Table 1)
All eligible establishments took part in the census The total number of providers increased from 207 in 2005 to 261 in 2010 primarily due to an increase in the number of independent healthcare providers in both England and Wales In contrast the number of NHS providers in England was lower than in the baseline year 2005 and did not change much in Wales The proportion of patients cared for by independent providers has risen from 10 in 2005 to 16 in 2010
Table 1 Number of providers of mental health services and patients
NHS (England)
Independent (England)
NHS (Wales)
Independent (Wales) Total
2010 census Number of providers 78 160 9 14 261 Number of all patients 32799 (including outpatients 25653 4787 1958 401 (including 2959 on a CTO) outpatients on a CTO) of all patients 782 146 60 12 100
2009 census Number of providers 79 158 10 17 264 Number of all patients 31786 (including outpatients 24941 4594 1845 406 (including 1253 on a CTO) outpatients on a CTO) of all patients 785 145 58 13 100
2008 census Number of providers 87 141 11 16 255 Number of inpatients 24842 3931 1892 355 31020 of inpatients 801 127 61 11 100
2007 census Number of providers 82 153 11 11 257 Number of inpatients 25020 4030 1875 262 31187 of inpatients 802 129 60 08 100
2006 census Number of providers 97 125 11 5 238 Number of inpatients 26565 3341 1962 155 32023 of inpatients 830 104 61 05 100
2005 census Number of providers 92 98 10 7 Number of inpatients 28590 3078 1939 178 33785 of inpatients 846 91 57 05 100
Care Quality Commission Count me in census 2010 14
207
Results mental health continued
Ethnicity
Information about ethnicity was available for 98 of patients Of these patients 75 were White British and 23 belonged to Black and minority ethnic groups defined as all groups that are not White British This compares with 20 in 2005
Compared with the baseline year of 2005 the 2010 census recorded a lower proportion of patients from the White British White Irish and Other Black groups (see Table 2) There were increases in the proportions of patients from the Other White WhiteBlack Caribbean Mixed Black Caribbean and Black African groups Other ethnic groups showed only minor differences over the baseline year
Table 2 Mental health patients by ethnic group
Ethnic group 2010 census 2009 census 2008 census 2007 census 2006 census 2005 census
Number Number Number Number Number Number
White British 750 24593 757 24067 765 23738 776 24198 786 25170 792 26762
White Irish 16 514 19 591 18 567 17 538 18 582 22 727
Other White 43 1407 43 1360 45 1399 46 1449 38 1210 31 1055
White and Black Caribbean
13 418 11 336 11 336 09 288 09 287 08 255
White and Black African
04 139 03 91 04 110 03 91 03 102 02 71
White and Asian 04 141 04 137 04 117 03 91 03 109 03 104
Other Mixed 06 200 07 213 05 148 06 180 05 173 05 167
Indian 16 529 14 460 14 426 13 393 13 411 13 434
Pakistani 13 440 13 409 13 396 10 315 11 349 10 325
Bangladeshi 06 203 05 171 05 144 04 130 05 158 05 153
Other Asian 09 311 09 273 10 300 08 261 08 262 08 264
Black Caribbean 49 1608 47 1504 47 1468 43 1330 39 1264 41 1369
Black African 29 957 26 834 23 715 21 648 20 652 19 645
Other Black 11 368 12 384 12 376 17 545 17 535 17 569
Chinese 03 83 03 82 03 91 03 82 02 78 02 81
Other 09 296 10 322 12 362 11 356 11 338 11 357
Not stated 18 592 17 552 11 327 09 292 11 342 12 416
Invalid 0 1 01 31
100 32799 100 31786 100 31020 100 31187 100 32023 100 33785 Total
Care Quality Commission Count me in census 2010 15
Results mental health continued
As in the previous censuses patients from Black and minority ethnic groups were concentrated in a relatively small number of organisations 70 were patients in 25 of the 261 organisations that took part in the census Of all organisations 194 had fewer than 50 patients from Black and minority ethnic groups each and another 32 organisations had no patients at all from these groups
Reporting of ethnicity
Eighty-one per cent of patients reported their own ethnic group Where patients did not do so staff or relatives did so on their behalf (10 and 6 respectively) We cannot be certain that ethnicity was recorded accurately for these patients The proportion of patients who reported their own ethnicity ranged from about 81 in the White groups to 90 in the WhiteBlack African Mixed group
Care Quality Commission Count me in census 2010 16
Results mental health continued
Age and gender
Ethnic differences in the age profiles of patients largely reflect the age profiles of different minority ethnic populations The White British White Irish and Other White populations have an older age structure than other minority ethnic populations and therefore patients from the White groups are significantly older than patients from other ethnic groups (see Table 3)
Overall 58 of patients were men Men outnumbered women in all ethnic groups (see Table 3) The White British White Irish Other White and Chinese groups had smaller differences in the proportions of men and women compared with other ethnic groups
Table 3 Age and gender of patients
Ethnic group Age () Gender ()
Total (n) 0-17 18-24 25-49 50-64 65+ Men Women
White British 1 7 41 20 31 56 44 100 (24593)
White Irish 0 4 36 19 41 56 44 100 (514)
Other White 2 7 47 19 25 58 42 100 (1407) White and Black Caribbean 1 13 68 12 5 73 27 100 (418)
White and Black African 1 13 73 9 4 67 33 100 (139)
White and Asian 4 18 63 11 5 65 35 100 (141)
Other Mixed 2 13 69 11 6 62 38 100 (200)
Indian 1 4 58 21 15 63 37 100 (529)
Pakistani 2 10 73 12 4 74 26 100 (440)
Bangladeshi 2 15 69 8 6 72 28 100 (203)
Other Asian 2 12 61 13 13 70 30 100 (311)
Black Caribbean 1 6 61 20 13 70 30 100 (1608)
Black African 1 10 75 9 5 67 33 100 (957)
Other Black 1 6 78 11 3 78 22 100 (368)
Chinese 2 10 59 17 12 52 48 100 (83)
Other 2 12 57 18 11 67 33 100 (296)
1 7 46 19 27 58 42 100 Total (n=
471) (n=
2352) (n=
14998) (n=
6093) (n=
8885) (n=
19071) (n=
13684) (n=
32799)
Care Quality Commission Count me in census 2010 17
Results mental health continued
Language and religion
Similar to previous censuses 5 of patients reported that their first language was not English (see Table 4) The Chinese and Bangladeshi groups had the highest proportions of patients whose first language was not English (51 and 46 respectively) Among the Other White group 27 had a first language other than English Again similar to previous censuses about 2 of patients said they needed an interpreter and of these 24 were from the White British group
Table 4 Percentage of patients with a first language other than English
Ethnic group with first language other than English
White British 1
White Irish 3
Other White 27
White and Black Caribbean 2
White and Black African 10
White and Asian 6
Other Mixed 11
Indian 26
Pakistani 35
Bangladeshi 46
Other Asian 34
Black Caribbean 2
Black African 22
Other Black 13
Chinese 51
Other 41
Total 5
Care Quality Commission Count me in census 2010 18
Results mental health continued
Religion was not stated for 21 of patients and 15 of patients said they had no religion The proportions stating they did not have a religion were highest among the WhiteBlack Caribbean and WhiteAsian Mixed groups (23 and 21 respectively) and lowest among the South Asian groups (4) Table 5 shows the religion of patients
Table 5 Religion of patients by ethnic group
Ethnic group
Religion and faith groups ()
None Christian Buddhist Hindu Jewish Muslim Sikh Any other religion
Not stated
White British 16 58 1 0 1 0 0 3 21
White Irish 8 73 0 0 0 5 13
Other White 13 53 1 0 3 5 7 18 White and Black Caribbean 23 47 0 1 0 3 7 17
White and Black African 16 41 1 1 15 6 20
White and Asian 21 33 1 1 21 3 3 18
Other Mixed 15 41 3 3 16 8 17
Indian 5 10 0 29 15 28 2 11
Pakistani 4 3 0 1 1 80 1 2 10
Bangladeshi 4 1 1 1 76 1 5 11
Other Asian 6 14 5 12 39 5 3 16
Black Caribbean 12 59 1 0 0 2 8 17
Black African 10 45 0 0 22 0 3 19
Other Black 12 41 1 1 0 16 7 22
Chinese 18 30 16 1 4 31
Other 8 24 3 1 3 34 6 21
Total 15 54 1 1 1 4 1 4 21
Care Quality Commission Count me in census 2010 19
Results mental health continued
Sexual orientation
The results for sexual orientation were not valid for 1 of patients and for 20 the response was recorded as ldquonot knownrdquo Seventy-six per cent of patients said they were heterosexual 1 said gay lesbian 1 said bisexual and less than 1 said ldquootherrdquo The number of minority ethnic patients who were gaylesbian or bisexual was very low
The overall figure of 1 who said they were gay lesbian or bisexual is lower than some estimates of the proportions of gaylesbian or bisexual people in the general population (5 to 7)2021 However in the 200910 Integrated Household Survey of a representative sample of 238206 people in UK conducted by the Office for National Statistics 1 identified themselves as gay or lesbian 05 as bisexual 05 as ldquootherrdquo 3 responded as ldquodo not knowrdquo or refused to answer and 95 identified themselves as heterosexualstraight22
Disability
About 75 of patients said they did not have a disability and 25 said they had one or more disabilities Of these 7 were blind or visually impaired 1 were deaf or had a hearing impairment 1 had Autistic Spectrum Disorder 2 had a learning disability 4 had a mobility impairment and 2 used a wheelchair The remaining 8 had more than one disability The proportion of patients with a disability was highest among the White British White Irish and Other White groups (about 28) which could reflect the higher age profiles of these patients compared with other ethnic groups
Rates of admission (see section on interpreting the results on page 13)
The rates of admission derived using the 2007 ONS ethnic population estimates as denominators are given in Appendix B Tables B1 (all ages) and B2 (ages 65 and over) Outpatients on a CTO are excluded from these results
All ages Admission rates were lower than average for patients from the White British Indian and Chinese groups and were average for the Pakistani and Bangladeshi groups Rates were higher than average for other minority ethnic groups they were particularly high for the Black Caribbean Black African WhiteBlack Caribbean Mixed and WhiteBlack African Mixed groups who had rates two to four times higher than average and for the Other Black group with a rate six times higher
Ages 65 and over Age-standardised admission rates for minority ethnic groups at older ages show broadly similar patterns to those reported for all ages with rates two to three times higher than average among the Black and White Black Mixed groups Rates were high also in the White Irish Other White Other Asian and Other groups
Numbers of older Black and minority ethnic patients were too few in most ethnic groups to support analyses of subgroups within them for example those detained
Care Quality Commission Count me in census 2010 20
Results mental health continued
Source of referral
People can be referred to healthcare services in a number of ways Referrals for inpatient care often come from community mental health teams rather than the original source such as GPs and accident and emergency (AampE) departments Therefore referrals from these teams may include referrals from other sources Furthermore about a quarter of patients (26) were referred from tertiary care and information about their original referral source was not available We had no information about the source of referral for 13 of patients The results reflect the proportions of patients from each ethnic group that are referred from each source so a higher proportion of referrals from one source will inevitably mean that proportions from other referral sources are lower Outpatients on a CTO are excluded from these data
The referral patterns are broadly similar to those reported previously and the key results are presented below
GP referrals 7 of patients Rates were 8 higher than average among the White British group They were lower than average among the Other White Black Caribbean Black African and WhiteBlack Caribbean Mixed groups by 28 to 72 The rates of referral by GPs are given in Appendix B Table B3
Referrals from AampE departments 5 of patients The White British group had a 9 lower than average rate of such referrals The WhiteBlack African Mixed Indian Bangladeshi Black African and Other groups were more likely than average to be referred in this way
Referrals from community mental health teams 26 of patients For the White British group such referrals were 5 higher than the average rate They were lower than average among the Other White WhiteBlack African Mixed Black Caribbean Black African and
Other Black groups by 16 to 48 The rates of referral are given in Appendix B Table B4
Referrals from the criminal justice system 9 of patients This is defined as the police courts probation service prison and court liaison and diversion service
Patients from the White British group were less likely than average to be referred by the criminal justice agencies whereas the Black Caribbean Black African Other Black WhiteBlack African Mixed and Other Asian groups were 30 to 83 more likely than average to be referred in this way We observed no differences from the average rate for other ethnic groups Rates of referral by the criminal justice system are given in Appendix B Table B5
A significant proportion (26) of all referrals were from tertiary care
Tertiary care referrals from medium or high secure units 5 of patients The rate for such referrals (in NHS or independent sectors) was lower than average among the Other White and Indian groups It was higher than average among the Black Caribbean and WhiteBlack Caribbean Mixed groups by about 75
Tertiary care referrals from other inpatient services 21 of patients The rate for such referrals (NHS and independent) was higher than average among the White Irish and Other White groups by 29 and 59 respectively The rate was lower than average in the Indian and Other Black groups
Tertiary care referrals from other clinical specialties 9 of patients Rates of such referrals were higher than average among the White British and Indian groups and lower than average among the Other White WhiteBlack Caribbean Mixed Other Asian Black African Other Black and Chinese groups
Care Quality Commission Count me in census 2010 21
Results mental health continued
Detention under the Mental Health Act 1983 on day of admission
The Mental Health Act 2007 made a number of changes to the Mental Health Act 1983 These changes were reflected in the census of 2009 and 2010 which collected information on new provisions establishing supervised community treatment (section 17A) and excluded supervised discharge (section 25A) which was abolished
As in previous reports we present below the results for detention rates on the day of admission Outpatients on a CTO are excluded from these analyses After that we present rates for all patients subject to the Mental Health Act on census day (including outpatients on a CTO) followed by rates for patients on a CTO on census day
All detentions Forty-nine per cent (14637) of patients were detained under the Mental Health Act on admission to hospital This was a higher proportion than recorded in the previous censuses (40 in 2005 and 2006 43 in 2007 45 in 2008 and 47 in 2009)
Detention rates were 6 lower than average among White British patients and between 19 and 32 higher than average among the Black Caribbean Black African Other Black and WhiteBlack Caribbean Mixed groups Detention rates were also higher in the White Irish and Other White groups by about 13 and in the Other Mixed group by 22 No other ethnic differences were observed The results are given in Appendix B Table B6
These patterns are broadly similar to those reported in previous censuses
Detention under section 2 Section 2 of the Mental Health Act gives authority for a person to be detained in hospital for assessment for a period not exceeding 28 days It is mainly applied where the patient is unknown to the service or where there has been a significant interval between periods of inpatient treatment
Of all patients detained on admission 22 were detained under section 2 Rates of detention under this section were lower than average among the White British WhiteBlack Caribbean Mixed and Black Caribbean groups and higher than average among the Bangladeshi Other Asian Black African Chinese and Other groups by between 50 and 103 (see Appendix B Table B7)
Detention under section 3 Section 3 of the Act provides for the compulsory admission of a patient to hospital for lsquotreatmentrsquo and for his or her subsequent detention which can last for an initial period of up to six months and is renewable after this
Of all patients detained on admission 43 were detained under this section Rates were higher than average among the White Irish and Black Caribbean groups by 24 and 29 respectively and lower among than average among the Bangladeshi group No other ethnic differences were observed The rates of detention under section 3 are given in Appendix B Table B8
Detention under section 3741 Section 37 of the Mental Health Act allows a court to send a person to hospital for treatment when they might otherwise have been given a prison sentence and section 41 allows a court to place restrictions on a personrsquos discharge from hospital Admission to hospital rather than prison is generally regarded as a more positive outcome for the person concerned
Care Quality Commission Count me in census 2010 22
Results mental health continued
Of all patients detained on admission 14 were detained under section 37 with a section 41 restriction order applied The rates of detention are given in Appendix B Table B9 In all minority ethnic groups very few women were detained under section 3741 Among men the rate of detention for the White British group was 16 lower than average and it was higher than average in the WhiteBlack Caribbean Mixed group by 77 the Black Caribbean group by 100 the Black African group by 27 and the Other Black group by 52
A consistent pattern across all six annual censuses was the higher than average detention rate under section 3741 for the Black Caribbean and Other Black groups
Detention under sections 47 48 and 4749 These sections of the Mental Health Act allow the Ministry of Justice to issue a direction to transfer a person detained in prison to a hospital for treatment
Of all patients detained on admission 7 were detained under these sections The only ethnic differences observed were a 107 higher than average detention rate among men from the White Black African Mixed group and a lower than average rate for the Indian group We observed no other ethnic differences probably because the numbers of detentions under these sections were low in most minority ethnic groups These rates of detention are given in Appendix B Table B10
The previous four censuses also showed virtually no ethnic differences for rates of detention under sections 47 48 and 4749
Patients subject to the Mental Health Act 1983 on day of census
All patients subject to the Mental Health Act Of all the 32399 patients in the census a total of 53 (17299) were subject to the Mental Health Act on census day including 2959 outpatients and 75 inpatients on a CTO (either voluntarily or recalled) Ratios for the different ethnic groups for overall applications of the Mental Health Act including CTOs showed broadly similar patterns to detention rates on admission day from which patients on a CTO were excluded In both cases rates were higher than average among the Black Caribbean Black African Other Black and White Black Caribbean Mixed groups However the higher than average detention rates for the White Irish Other White and Other Mixed groups on admission day were not apparent on census day
The rates are given in Appendix B Table B11
Supervised community treatment under section 17A Community treatment orders (CTOs) were introduced in November 2008 as a result of the Mental Health Act 2007 They allow for supervised community treatment to be provided for up to six months with the possibility of an extension after this These orders are designed to help patients to maintain stable mental health outside hospital and to promote recovery by providing professionals with the power to set conditions on discharge from hospital and a power to recall patients if arrangements in the community are not working
Nine per cent of all patients in the census were on CTOs compared with 4 in 2009 Of all the 17299 patients subject to the Mental Health Act on census day almost 18 (3034) were on CTOs Of the patients on a CTO 2959 were outpatients and 75 were inpatients (50 voluntary and 25 recalled)
Care Quality Commission Count me in census 2010 23
Results mental health continued
The rate of supervised community treatment among all patients included in the census was lower than average in the White British and White Irish groups and higher than average in the South Asian (Indian Pakistani Bangladeshi) and Black (Black Caribbean Black African Other Black) groups by 22 to 106 The ratios are given in Appendix B Table B12
Consent
About 25 of informally admitted patients were deemed incapable of consenting to treatment The only ethnic difference observed was a higher than average rate for the Pakistani group but this was based on very few patients
About 18 of patients who were detained or on CTOs were deemed incapable of consenting to treatment These rates were lower than average by 7 in the White British group and were higher than average among the Other White WhiteBlack Caribbean Mixed and Black African groups by 21 35 and 36 respectively
In addition 13 of patients who were detained or on CTOs on census day were deemed capable of consenting to treatment but refused to do so The White British group had a rate of refusals that was 10 lower than average and rates were higher than average among the White Irish WhiteBlack Caribbean Mixed Other Mixed Black Caribbean and Black African groups by between 39 and 71
Care programme approach
The Care Programme Approach (CPA) is the process by which treatment care and support for people with serious mental health problems and accompanying health and social care needs are agreed coordinated and understood by all involved From October 2008 changes to the CPA in England
mean that it is no longer categorised into two parts (lsquostandardrsquo and lsquoenhancedrsquo) and just the one category of enhanced CPA applies This makes CPA policy in England different to that in Wales where the distinction still applies The CPA data presented here therefore includes all CPA patients in England and both lsquostandardrsquo and lsquoenhancedrsquo CPA patients in Wales
About 89 of all patients were on a CPA 3 were on a single assessment process (SAP) whereby assessments are made for adults with health and or social care needs and 8 were on neither CPA nor SAP As most patients were on a CPA no ethnic differences were observed
Recorded incidents
The 2010 census asked about the number of times that patients experienced seclusion hands-on restraint self-harm accident and physical assault in a current hospital spell or if the patientrsquos hospital spell was longer than three months the number that took place within the last three months Outpatients on a CTO are excluded from these data It should be noted that the rates of such events among minority ethnic groups can show yearly variation because of the low numbers of events in several groups
Seclusion Seclusion was defined as the supervised confinement of a patient in a room which may be locked to protect others from significant harm Four per cent of patients had experienced one or more episodes of seclusion The White British group had a seclusion rate that was 9 lower than average Rates were higher than average among the WhiteBlack Caribbean Mixed WhiteBlack African Mixed Black Caribbean and Black African groups by 80 90 36 and 56 respectively
Care Quality Commission Count me in census 2010 24
Results mental health continued
Although the number of incidents of seclusion was low in several minority ethnic groups some general patterns over the six censuses to date are
bull The proportion of all patients who had an episode of seclusion stayed fairly constant over the six censuses at about 4
bull Although there have been annual fluctuations the seclusion rate has been higher than average for the Black and WhiteBlack Mixed groups in three or four of the six censuses and in the Other White group in three censuses
Hands-on restraint This was defined as the physical restraint of a patient by one or more members of staff in response to aggressive behaviour or resistance to treatment About 12 of patients had experienced one or more episodes of hands-on restraint No ethnic differences were observed In fact very few ethnic differences have been observed in the previous censuses also and they have not shown a consistent pattern
Self-harm Eight per cent of patients had harmed themselves on one or more occasions Only the White British group had a rate that was higher than average (by 14) Rates were lower than average among several minority ethnic groups the three Black groups (Black Caribbean Black African and Other Black) by about 70 the three south Asian groups (Indian Pakistani Bangladeshi) by between 37 and 78 and the Other Mixed and Other Asian groups by about 60
In terms of comparison with previous years
bull The proportion of all patients who had harmed themselves stayed fairly constant at about 7ndash8
bull In all censuses the White British group had a higher than average rate of self-harm and the Black and South Asian groups had lower than average rates of self-harm
Accidents About 11 of patients had experienced one or more accidents Patients from the White British group experienced a rate of accidents that was 6 higher than average Rates were lower than average in the Black Caribbean Black African Other Black and Other Asian groups by about 50 to 70 No accidents were reported for the Chinese group
In terms of comparisons with previous years
bull The proportion of all patients who had had an accident stayed fairly constant
bull The rate of accidents in the different censuses was higher than average in the White British group and lower than average in the Black Caribbean group Few other ethnic differences were observed and they were not consistent
Physical assault on the patient The definition of assault includes incidents of physical assault on the patient irrespective of who committed the assault We do not have information on who committed the assault for example whether it was another patient or a member of staff Eleven per cent of patients were involved in one or more episodes of physical assault The only ethnic difference observed was a 19 lower than average rate among the Black Caribbean group
In terms of comparisons with previous years
bull The proportion of all patients who had experienced a physical assault stayed fairly constant
bull Very few ethnic differences in rates of assault were observed in the different censuses and they did not show a consistent pattern
Care Quality Commission Count me in census 2010 25
Results mental health continued
Duration of stay in hospital from admission to census day
We analysed the length of the period between each inpatientrsquos admission to hospital and the census day This period is of course shorter than a patientrsquos full length of stay in hospital which runs from admission to the date when they are discharged Outpatients on a CTO are excluded from the following analyses
bull 25 of inpatients had been in hospital for one month or less
bull 20 had been in hospital between one and three months
bull 13 had been in hospital between three and six months
bull 11 had been in hospital between six months and one year
bull 11 had been in hospital between one and two years
bull 12 had been in hospital between two and five years
bull 8 had been in hospital for more than five years
These results are similar to those of previous censuses About 31 of patients in the 2010 census had been in hospital for more than a year and had therefore also been included in the 2009 census About 20 of patients had been in hospital for more than two years and will have been included in both the 2008 and 2009 censuses
We calculated the median length of stay for different ethnic groups The median is the midpoint of the range of values so the median length of stay is the one at which half the patients had a length of stay less than the median and half had a stay longer than the median Overall and as in previous years the median amount of time that women had spent in hospital was about 25 months and the median for men was about 58 months (see Table 6) In most ethnic groups the median time spent in hospital was two to three times longer for men than for women in the Other Black group men had been in hospital four times longer than women
Median lengths of stay were longest for men from the Black Caribbean WhiteBlack Caribbean Mixed and Other Black groups and shortest for men from the Chinese Bangladeshi and Other groups Median lengths of stay were longest for women from the WhiteBlack Caribbean Mixed and Black Caribbean groups and shortest for women from the Chinese and Bangladeshi groups
A number of important factors influence a patientrsquos length of stay in hospital including age gender whether or not they are detained under the Mental Health Act (and the section under which they are detained and whether there is an additional restriction order) the type and severity of their illness the nature of their treatment and the availability of support in the community The data in the census does not allow for analysis of these factors
Table 6 Median number of days from the day of admission to the day of census
Ethnic group Men Women
White British 161 71
White Irish 218 114
Other White 238 113
White and Black Caribbean 275 191
White and Black African 182 92
White and Asian 226 78
Other Mixed 173 112
Indian 172 70
Pakistani 153 56
Bangladeshi 134 55
Other Asian 167 61
Black Caribbean 345 122
Black African 141 66
Other Black 248 58
Chinese 135 51
Other 131 76
Total 174 75
Care Quality Commission Count me in census 2010 26
Results mental health continued
Ward security
As in previous years about 11 of all patients were on a medium or high secure ward as opposed to a general (76) or low secure (13) ward
Patients from the White British Indian and Bangladeshi groups were less likely than average to be on a medium or high secure ward by 7 30 and 67 respectively Patients from the White Irish WhiteBlack Caribbean Mixed Black Caribbean and Other Black groups had a higher than average rate by between 43 and 55
Age range on wards
Among patients under 18 years of age 61 were being cared for on wards for working-age adults on census day and five patients were on a ward for older people Seven per cent of patients on wards for working-age adults were 65 or over and
8 of those on wards for older people were adults of working age There were very few lsquoout of agersquo placements among minority ethnic groups
Patients in wards designated as single sex or mixed
Providers were asked whether patients were on a ward designated as men or women only or mixed gender All the analyses of single sex accommodation and facilities exclude outpatients on a CTO Overall 61 of men and 77 of women were not in a ward designated for single sex use similar proportions as in previous years The proportion of patients not in a designated single sex ward was lower among almost all minority ethnic groups than among the White British group In all ethnic groups the proportion of men who were not in a designated single sex ward was lower than among women (see Table 7a)
Two further questions examined the single sex facilities that were available to patients
At the time of the 2010 census the following guidance from the Department of Health applied in England A ward can be described as single sex (ie the intended sex of the ward is either male or female and not mixed) when the accommodation complies with the following definition from the Department of Health of single sex accommodation ldquoSleeping areas must be segregated and members of one sex must not have to walk through an area occupied by the other sex to reach toilets or bathrooms Separate male and female only toilets and bathrooms must be provided There should be separate day rooms to which only women have accessrdquo However there is a discrepancy for providers because accommodation designated as a lsquowardrsquo for administrative purposes may incorporate single sex accommodation for both sexes that meets the guidelines ndash but in this case the ward would still be lsquomixedrsquo (based on guidance from Safety Privacy and Dignity Department of Health 2000)
As long as men and women are cared for in separate bays or rooms and have their own toilet facilities then it may well be appropriate for them to be on the same ward being cared for by the same team of doctors and nurses In practice good segregation can be achieved if men and women have separate sleeping areas (for example single sex bays) and have separate toilets and bathrooms that they can reach without having to pass through (or close to) areas for the opposite sex The layout of wards should minimise any risk of overlooking or overhearing by members of the opposite gender (from Privacy and Dignity ndash A report by the Chief Nursing Officer into mixed sex accommodation in hospitals Department of Health 2007)
The coalition governmentrsquos revised Operating Framework for 201011 requires NHS organisations to eliminate mixed-sex accommodation except under exceptional circumstances from 2011 The national guidance relating to mixed sex accommodation was issued in November 2010 and states that ldquoNo areas are exempt and every decision to mix must be justified by reference to the patientrsquos clinical needs not organisational convenience or custom and practicerdquo For mental health and learning disability trusts it states ldquoThere is no acceptable justification for admitting a mental health patient to mixed-sex accommodationrdquohellip It ldquomay be acceptable in a clinical emergency to admit a patient temporarily to a single ensuite room in the opposite-gender area of a ward In such cases a full risk-assessment must be carried out and complete safety privacy and dignity maintainedrdquo The guidance is available at wwwdhgovukenPublicationsandstatisticsLettersandcircularsProfessionallettersChiefnursingofficerlettersDH_121848
Care Quality Commission Count me in census 2010 27
Results mental health continued
Table 7a Percentage of patients not in a designated single sex ward by ethnic group
Ethnic group
Sex of patients and ward
Male Female
Male ward Female or mixed ward Female ward Male or mixed ward
White British 35 65 21 79
White Irish 41 59 28 72
Other White 44 56 28 72
White and Black Caribbean 56 44 31 69
White and Black African 48 52 41 59
White and Asian 43 57 34 66
Other Mixed 49 51 24 76
Indian 37 63 25 75
Pakistani 48 52 35 65
Bangladeshi 23 77 18 82
Other Asian 46 54 22 78
Black Caribbean 55 45 32 68
Black African 49 51 28 72
Other Black 49 51 30 70
Chinese 42 58 30 70
Other 43 57 20 80
Total 39 61 23 77
The vast majority of patients in this category were in mixed wards very few (under 05) male patients were on female-only wards or vice versa
Care Quality Commission Count me in census 2010 28
Results mental health continued
Patientsrsquo access to toilet and bathing facilities designated for single sex use
We asked providers if the patient had access to toilet and bathing facilities designated for single sex use Overall 13 of men and 16 of women
were reported as not having access to such facilities designated for single sex use This was an improvement over 2009 when these proportions were 19 and 24 respectively The proportion of patients not having access to toilet and bathing facilities designated for single sex use was lower among almost all minority ethnic groups than among the White British group (see Table 7b for details)
Table 7b Percentage of patients not having access to toilet and bathing facilities designated for single sex use by ethnic group
Ethnic group
Access to designated single sex bathing and toilet facilities
Male Female
Male facilities
Female or mixed facilities
Female facilities
Male or mixed facilities
White British 86 14 84 16
White Irish 87 13 87 13
Other White 89 11 86 14
White and Black Caribbean 93 7 93 7
White and Black African 90 10 93 7
White and Asian 90 10 84 16
Other Mixed 98 2 96 4
Indian 91 9 90 10
Pakistani 95 5 94 6
Bangladeshi 92 8 98 2
Other Asian 92 8 86 14
Black Caribbean 92 8 90 10
Black African 91 9 91 9
Other Black 92 8 89 11
Chinese 82 18 83 17
Other 87 13 90 10
Total 87 13 84 16
The vast majority of patients in this category had access to mixed facilities very few (1) of male patients had access to female-only facilities or vice versa
Care Quality Commission Count me in census 2010 29
Results mental health continued
Patientsrsquo access to a lounge area day space designated for single sex use
We also asked providers if patients had access to a lounge area or day space designated for single sex use Overall 37 of men and 39 of women were
reported as not having access to these facilities This was an improvement over 2009 when these proportions were 48 and 51 respectively The proportion of patients not having access to a lounge areaday space designated for single sex use was lower among most minority ethnic groups than among the White British group (see Table 7c for details)
Table 7c Percentage of patients not having access to a lounge areaday space designated for single sex use by ethnic group
Ethnic group
Access to a lounge areaday space designated for single sex use
Male Female
Male facilities
Female or mixed facilities
Female facilities
Male or mixed facilities
White British 59 41 60 40
White Irish 63 37 70 30
Other White 68 32 63 37
White and Black Caribbean 82 18 73 27
White and Black African 83 18 76 24
White and Asian 72 28 75 25
Other Mixed 79 21 67 33
Indian 59 41 66 34
Pakistani 80 20 72 28
Bangladeshi 53 47 52 48
Other Asian 70 30 61 39
Black Caribbean 78 22 70 30
Black African 73 27 70 30
Other Black 79 21 72 28
Chinese 59 41 60 40
Other 67 33 67 33
Total 63 37 61 39
The vast majority of patients in this category had access to mixed facilities very few (1) of male patients had access to female-only facilities or vice versa
Care Quality Commission Count me in census 2010 30
Results mental health continued
Patientsrsquo subject to deprivation of liberty safeguards
People who lack the mental capacity to consent to the care or treatment they need should be cared for in a way that is least restrictive of their rights or freedom of action In 2007 the Mental Capacity Act 2005 was amended to introduce Deprivation of Liberty Safeguards for people who lack capacity to decide about their care or treatment and who need to be deprived of their liberty to protect them from harm The Safeguards came into effect in April 2009 and strengthen the rights of hospital patients and those in care homes as well as ensuring compliance with the European Convention on Human Rights (ECHR)
The 2010 census introduced a new question ldquoIs the patient subject to deprivation of liberty authorisation on 31 March 2010rdquo Under 1 (269) patients were reported as being subject to a deprivation of liberty authorisation on census day No ethnic differences in the rates were observed which may be due to the low numbers of patients among minority ethnic groups (69)
Care Quality Commission Count me in census 2010 31
A comparison between the 2005 baseline and the 2010 census
The changes we have seen in the census results between 2005 and 2010 the timespan of the Delivering Race Equality (DRE) action plan are set out below This is not a review of the DRE programme The aim is to give an overview of how some variables in the census have changed during the course of DRE and the findings should be seen in the light of the caveats described on page 13
bull The number of inpatients went down from 33785 to 29840 ndash a fall of 12
bull The proportion of patients in independent hospitals rose from 10 to 16
bull The overall proportion of patients from minority ethnic groups increased from 20 to 23 However there have been demographic changes during this time ndash the population from Black and minority ethnic groups in England and Wales rising from 79 million in 2005 to 85 million in 2007 (the latest year for which these figures are available) an increase of 8 in two years
bull Admission rates showed similar patterns across all censuses ndash Lower than average rates among the White
British Indian and Chinese groups ndash About average rates among the Pakistani and
Bangladeshi groups ndash Higher than average rates among other
minority ethnic groups ndash particularly in the Black and WhiteBlack Mixed groups for whom rates were two or more times higher than average in 2010 The Other Black group continues to have exceptionally high rates of admission (even after the apparent reduction since 2005 see next point)
bull One of the 12 goals of DRE was a decline in admission rates among Black and minority ethnic groups Figure 1 provides a comparison between 2005 and 2010 Although admission rates for
many ethnic groups show relatively little change since 2005 the rate for the Other Black group is considerably lower in 2010 (six times higher than average) compared with 2005 (12 times higher than average) However rates for the other Black and WhiteBlack Mixed groups show small increases
bull In general rates of referral from GPs and community mental health teams were lower than average among some Black and WhiteBlack groups and referral from the criminal justice system was higher Patterns were less consistent for other minority ethnic groups
bull There was a steady increase in the overall proportion of patients subject to the Mental Health Act Compared with 40 in 2005 49 of all patients were subject to the Mental Health Act in 2010 (53 if outpatients on a CTO are excluded)
bull Another DRE goal was to reduce detention rates among Black and minority ethnic groups However detention rates have been higher than average among the Black Caribbean Black African and Other Black groups in all six censuses and almost consistently higher in the WhiteBlack Caribbean Mixed and Other White groups Rates have been average for other minority ethnic groups
bull A consistent pattern was the higher than average detention rate under section 3741 for the Black Caribbean and Other Black groups
bull Another DRE goal was to reduce seclusion among Black and minority ethnic groups Although there have been annual fluctuations in seclusion rates they have been higher than average for the Black and WhiteBlack Mixed groups and the Other White group in at least three of the six censuses Other minority ethnic groups did not show high rates
Care Quality Commission Count me in census 2010 32
A comparison between the 2005 baseline and the 2010 census continued
Figure 1 Admission ratios in the 2005 and 2010 Count me in censuses by ethnic group England and Wales
Other Black
Black Caribbean
White and Black Caribbean
White and Black African
Black African
Other Mixed
Other Asian
White and Asian
Other
White Irish
Other White
Bangladeshi
White British
Pakistani
Indian
Chinese
0 100 200 300 400 500 600 700 800 900 1000 1100 1200 1300
Ageshysex standardised admission ratios (EampW=100)
Census 2005 admission ratios using 2005 ONS populations
bull Minority ethnic groups do not compare unfavourably for other incidents Rates of self-harm have consistently been lower than average among the Black and South Asian groups Very few ethnic differences in hands-on restraint physical assault and accidents were observed across the different censuses and they did not show a consistent pattern
bull About 31 of patients in all censuses had been in hospital for one year or more and were therefore included in more than one census
Census 2010 admission ratios using ONS 2007 populations (excluding outpatients on a CTO)
(This is one reason why the census shows little change over the six years It should be noted again that because the census is a one-day count it over-represents long-stay admissions and under-represents short-stay admissions)
bull Mixed accommodation was reported for many patients across all censuses although patients from Black and minority ethnic groups were more likely to be in single sex accommodation than White British patients
The admission ratios for the 2005 census shown here are different from those published in the 2005 report This is because we updated the analysis of the 2005 admission ratios by using 2005 ONS census populations for ethnic groups as denominators These populations were not available at the time of the 2005 report which instead used the 2001 ONS population data
Care Quality Commission Count me in census 2010 33
Results learning disabilities
We obtained information about 3642 patients in 129 organisations providing services for people with learning disabilities in England and Wales Of these two were inpatients on CTOs The total number of inpatients has declined each year and by 21 from 4609 in 2006 to 3642 in 2010 The total number of providers did not change much from the baseline year of 2006 although the number of NHS providers has fallen steadily and the number of independent healthcare organisations has increased (see Table 8) The proportion of inpatients in independent
healthcare organisations increased from 20 in 2006 to 33 in 2010 This is likely to be a result of closing NHS campuses with people moving from hospital to community settings
The pattern of results for learning disability patients in 2010 is broadly similar to that reported in previous censuses This is not surprising since many of the patients had been in hospital for a considerable period of time and they therefore appear in successive censuses
Table 8 The number of providers of learning disability services and inpatients
NHS (England)
Independent (England)
NHS (Wales)
Independent (Wales) Total
2010 census Number of providers 55 61 4 9 129 Number of all patients (including patients 2304 1072 154 112 3642 on a CTO) of all patients 633 294 42 31 100
2009 census Number of providers 60 54 5 4 123 Number of all patients (including patients 2487 1014 139 55 3695 on a CTO) of all patients 673 274 38 15 100
2008 census Number of providers 62 57 5 5 129
Number of inpatients 2873 1050 143 41 4107
of inpatients 700 256 35 10 100 2007 census
Number of providers 64 47 5 4 120
Number of inpatients 3063 900 154 36 4153
of inpatients 738 217 37 09 100 2006 census
Number of providers 70 48 5 1 124
Number of inpatients 3505 930 164 10 4609
of inpatients 760 202 36 02 100
Care Quality Commission Count me in census 2010 34
Results learning disabilities continued
Ethnicity
Information about ethnicity was available for 98 of patients Of these 13 belonged to Black and minority ethnic groups defined as all groups that are not White British (see Table 9) This figure is somewhat higher than in previous years (11 in 2006) and is significantly lower than the 23 of mental health patients from minority ethnic groups as reported in the mental health section of this report
Although the patterns by ethnicity are broadly similar to previous years there was an increase between 2006 and 2010 in the proportion of patients from the Other White group and a fall in those from the White British group Some ethnic groups had very few patients
As in the previous censuses patients from Black and minority ethnic groups were concentrated in a relatively small number of organisations 70 were
Table 9 Learning disability patients by ethnic group
Ethnic group 2010 census 2009 census 2008 census 2007 census 2006 census
Number Number Number Number Number
White British 853 3106 867 3205 889 3616 883 3642 887 4037
White Irish 13 46 15 57 13 53 10 40 14 66
Other White 29 106 23 85 26 104 26 109 17 77
White and Black Caribbean 10 38 10 36 07 29 08 34 07 32
White and Black African 02 8 01 4 00 2 02 10 01 3
White and Asian 04 13 04 14 03 12 03 13 02 9
Other Mixed 07 24 05 19 03 14 04 16 03 14
Indian 09 32 09 35 07 28 08 32 11 49
Pakistani 07 24 09 33 07 30 08 32 07 34
Bangladeshi 05 20 06 21 03 11 03 11 02 9
Other Asian 04 13 03 10 03 12 02 8 03 12
Black Caribbean 26 93 22 81 23 94 26 108 28 129
Black African 08 28 09 35 07 29 08 33 07 33
Other Black 04 15 04 14 04 15 04 18 04 17
Chinese 00 1 01 2 01 5 02 8 02 7
Other 02 7 02 8 04 15 02 10 05 24
Not stated 19 68 10 36 09 38 07 29 12 57
Total 100 3642 100 3695 100 4069 100 4124 100 4552
Care Quality Commission Count me in census 2010 35
Results learning disabilities continued
patients in 25 of the 129 organisations that took part in the census Seventy-four organisations had fewer than 10 patients from Black and minority ethnic groups each and another 42 organisations had no inpatients at all from these groups
However it is important to note that the number of people with severe and profound learning disabilities in some areas is affected by past funding and placement practices especially the presence of old long stay hospitals and of people placed outside their original area of residence by funding authorities
Reporting of ethnicity
About half (56) of patients reported their own ethnic group Staff reported the ethnic group for 17 of patients and relatives for 21 This means that ethnicity could have been misreported for some patients We do not know how ethnicity was assessed for 6 of patients
Age and gender
Two per cent (59) of patients were under 18 years old The number of young inpatients from minority ethnic groups was low or zero in several ethnic minority groups
Overall 73 of patients were under 50 years old and 27 were aged 50 or over The proportion of patients under 50 was higher among patients from Black and minority ethnic groups (88) than among the White British group (71) This is not surprising given that minority ethnic populations are generally younger than the White population
Seventy per cent of patients in learning disability services were men whereas in mental health services 58 of patients were men
Language and religion
Eight per cent of patients reported that their first language was not English Non-verbal communication was the most often selected language after English accounting for 4 of patients Two per cent (84) of patients most of whom were from the White British group said they needed an interpreter
Religion was not stated for 22 of patients and 15 of patients said they had no religion South Asians (Indians Bangladeshis and Pakistanis) were mostly Muslim Hindu or Sikh and those from the White Black Caribbean and Black African groups were mostly Christian
Sexual orientation
Overall the result was not known for almost half (49) of patients 45 said they were heterosexual 2 said gaylesbian 3 said bisexual and 1 said ldquootherrdquo The numbers of patients from minority ethnic groups were too low for meaningful analysis
Disability
Of all inpatients in learning disability services
bull 4 were reported as having no disabilities
bull 44 had a learning disability only
bull 51 had multiple disabilities
The patterns among minority ethnic groups were similar in that most patients had either a learning disability or multiple disabilities
Care Quality Commission Count me in census 2010 36
Results learning disabilities continued
Rates of admission
The rates of admission based on ONS estimates of the general population in 2007 are given in Appendix C Table C1
Admission rates were lower than average among several minority ethnic groups Other White Indian Pakistani Other Asian Black African Chinese and Other Rates were two to three times higher than average among the WhiteBlack Caribbean Mixed Black Caribbean Other Black and Other Mixed groups The lower rates among the South Asian and Chinese groups and the higher rates among some Black groups are similar to patterns for inpatients in mental health establishments
These patterns of admission are similar to those we reported in previous census reports
Source of referral
As we reported in the section on mental health patients data about sources of referral must be interpreted with care as we do not always know the original referral source Furthermore in the case of inpatients with learning disabilities this information was invalid missing or unknown for 12 of patients
Because of the small numbers of patients in most minority ethnic groups we observed few ethnic differences in sources of referral
Detention under the Mental Health Act 1983 (on day of admission and on day of census)
The Mental Health Act 2007 made a number of changes to the Mental Health Act 1983 one of which was supervised community treatment (section 17A) These are reflected in the 2010 census
All detentions Of all the patients in learning disability services 48 were detained under the Mental Health Act on admission Rates of detention on the day of admission by ethnic group are in Appendix C Table C2 and no ethnic differences were observed As the number of detained patients from each minority ethnic group was low we did not undertake further analysis for individual sections of the Act
Rates of detention on census day also showed no ethnic differences with the exception of a lower than average rate for the Other White group
Consent
About 66 of informally admitted inpatients were deemed incapable of consenting to treatment which is a similar proportion to that reported previously
Among detained patients 38 were deemed incapable of consenting to treatment and 6 were deemed capable of consenting to treatment but refused
The numbers of patients from minority ethnic groups were too low for comment There were no or very few such patients among minority ethnic groups
Care Quality Commission Count me in census 2010 37
Results learning disabilities continued
Care programme approach
Details of the Care Programme Approach (CPA) are given on page 24
We found that 73 of all patients were on a CPA 2 on a single assessment process (SAP) and 25 on neither No ethnic differences were observed
Recorded incidents
The 2010 census asked about the number of times that patients experienced seclusion hands-on restraint self-harm accident and physical assault in a patientrsquos current hospital spell or if the patientrsquos hospital spell was longer than three months the number that took place within the last three months As in previous years we observed very few ethnic differences
Seclusion Five per cent of patients had experienced one or more episodes of seclusion The only ethnic differences observed were the higher than average rates among the White Irish and Other White groups but these were based on small numbers of patients
Physical assault on the patient The definition of assault includes incidents of physical assault on the patient irrespective of who committed the assault but we do not have information on who committed the assault About 28 of patients had been involved in one or more episodes of physical assault No ethnic differences were observed
Hands-on restraint self-harm accidents Thirty per cent of inpatients had experienced one or more episodes of hands-on restraint 22 had attempted to harm themselves and 24 had suffered an accident The numbers were very low in minority ethnic groups and we did not observe any ethnic differences except for a lower than average rate for self-harm among the Black Caribbean group but this was based on very few patients
Duration of stay in hospital
We analysed the length of the period between each patientrsquos admission to hospital and the census day This period is of course shorter than a patientrsquos full length of stay in hospital which runs from admission to the date when they are discharged
bull 10 of inpatients had been in hospital for one month or less
bull 6 had been in hospital between one and three months
bull 7 had been in hospital between three and six months
bull 10 had been in hospital between six months and one year
bull 14 had been in hospital between one and two years
bull 22 had been in hospital between two and five years
bull 31 had been in hospital for over five years
The patterns are very similar to those in previous censuses About 67 of patients in the 2010 census had been in hospital for more than a year and were therefore also included in the 2009 census In addition over half (53) of patients had been in hospital for more than two years and will have been included in both the 2008 and 2009 censuses A third of patients will have been included in each census since 2006
We also calculated the median length of stay (see page 26 for the definition of median) Overall the median amount of time that women had spent in hospital was about 31 months and the median for men was about 27 months This compares with a median for mental health patients of 25 months for women and 58 months for men It is not possible to reliably compare length of stay by ethnic group because of the small numbers of patients among several minority ethnic groups
Care Quality Commission Count me in census 2010 38
Results learning disabilities continued
Ward security
About 12 of all inpatients were on a medium or high secure ward as opposed to a general (54) or low secure (34) ward
As in the three previous years rates of patients on medium or high secure wards were about double the average among the White Irish and Other White groups Most other minority ethnic groups had very few patients on medium or high secure wards
Age range on wards
There were five patients under 18 years of age being cared for on wards for working-age adults and none were on wards for older people About 5 of patients on wards for working-age adults were aged 65 or over and there were very few patients (23) on wards for older people There were very few lsquoout of agersquo placements among minority ethnic groups
Patients in wards designated as single sex or mixed
We asked providers whether the patient was on a ward designated as men or women only or mixed gender Overall 47 of men and 69 of women were not in a ward designated for single sex use The numbers of such patients among minority ethnic groups were very low
Two further questions examined the single sex facilities that were available to patients Again due to the small numbers we do not present results by ethnicity for these questions
Patientsrsquo access to toilet and bathing facilities designated for single sex use
Overall 19 (497) of men and 27 (295) of women were reported as not having access to toilet and bathing facilities designated for single sex use
Patientsrsquo access to a lounge area day space designated for single sex use
Overall 32 (829) of men and 44 (470) of women were reported as not having access to a lounge area day space designated for single sex use
Patients subject to deprivation of liberty safeguards
For details of deprivation of liberty safeguards please see page 31
The 2010 census introduced a new question ldquoIs the patient subject to deprivation of liberty authorisation on 31 March 2010rdquo Two per cent (74) patients were reported as being subject to a deprivation of liberty order on census day but very few of these patients (15) were from minority ethnic groups
See footnote on single sex accommodation on page 27
Care Quality Commission Count me in census 2010 39
Data in the future Moving beyond a one-day census
For six years the Count me in census has provided a valuable one-day snapshot of inpatients in mental health and learning disability services And with the proportion of inpatients who are detained increasing steadily (from 25 in 200506 to 39 in 200910 ndash see Figure 2) ongoing ethnic monitoring of admissions and detentions becomes more vital than ever
However a one-day census only captures some events and the profile of patients can differ across a whole year For example there were
bull 29840 inpatients in the 2010 census compared with 107765 inpatients overall during 200910
bull 17299 patients in the 2010 census who were detained or on CTOs compared with 42479 new detentions and some 4100 new CTOs overall in England in 200910
bull 26 of patients in hospital for under one month and 31 for over one year per the census
whereas the MHMDS data consistently shows that for over 50 of records the average length of an inpatient stay was under one month and for 4 it was over one year
Looking ahead it is vital that robust data is available on all admitted patients and all those subject to the Mental Health Act not just those in hospital on one particular day Moreover patterns of use and outcomes of community care can have an impact on the need for admission to hospital and the risk of detention ndash therefore information about the care provided to patients before admission to hospital during their hospital stay and after they leave is also vital Furthermore under 84 of the 127 million people using specialist mental health services are admitted to hospital23 and so it is very important to examine the quality of community care for the 90 of patients who are not admitted to hospital
Figure 2 Number of people spending time in hospital 200506 to 200910
Num
ber
of p
atie
nts
90000
80000
70000
60000
50000
40000
30000
20000
10000
0 200506 200607 200708 200809 200910
Source NHS Information Centre Formally detained Not detained MHMDS Bulletin 2011
Care Quality Commission Count me in census 2010 40
Data in the future Moving beyond a one-day census continued
The Mental Health Minimum Data Set (MHMDS) is a rich source of data on people using specialist mental health services in England It covers both community and hospital services and includes a wide range of information about the demographic clinical and socioeconomic characteristics of individual patients and the services provided to those admitted to hospital and to the much larger number of those who donrsquot need a stay in hospital The data includes information about contact with services uses of the Mental Health Act and the Care Programme Approach for each individual patient All these details enable the use of services patterns of care and patient outcomes to be tracked including along pathways of care The MHMDS therefore provides a robust basis for ongoing monitoring of access to and outcomes of care for users of specialist ndash both community and hospital ndash mental health services
The MHMDS also enables an analysis of the numbers and rates of people from different ethnic groups using specialist mental health services overall (both inpatient and community) which provides an indication of the levels of mental illness and therefore the need for specialist care in different communities
At present the MHMDS does not cover high secure services and independent sector providers only started to provide data during 201011 However to support payment by results for mental health the scope of the data set will be extended to cover high secure services during 201112 (version 4 MHMDS) Further proposed changes to the dataset (version 41) will incorporate NHS-funded learning disability services and primary care mental health services A separate dataset for child and adolescent mental health services (CAMHS) has been developed and is awaiting formal approvals It is designed to include the same information about uses of the Mental Health Act as provided in the MHMDS
The latest MHMDS bulletin for 200910 provides a description of people using specialist mental health services in England including ethnic profiles of people using services hospital admissions detentions and the number of people on CPA24 It also provides information on differences by age and gender The bulletin illustrates some of the sorts of analyses that are possible using data from the MHMDS
The NHS Information Centre can provide guidance on these and other potential analyses based on MHMDS data
Care Quality Commission Count me in census 2010 41
Conclusions
While this report reviews changes in the census results since 2005 it is not a review or evaluation of the DRE programme overall Similarly the census cannot provide explanations for the patterns observed or examine whether mental health services are meeting the needs of individual ethnic minority groups As we have noted previously the results are subject to caveats in particular that the census provides a one-day snapshot that may not be representative of patients admitted to hospital throughout the year
Overview of findings
Overall the findings from the 2010 census show little change from those reported for previous annual censuses conducted since 2005 This is partly because many patients had been in hospital for a considerable period of time and had therefore been included in successive censuses The findings of this sixth and last census continue to show differences between Black and minority ethnic groups and White groups and also differences within these groups
In particular ethnic differences in rates of admission detention under the Mental Health Act and seclusion ndash three of DRErsquos 12 goals ndash have not altered materially since the inception of DRE in 2005
bull Admission rates remain higher than average among minority ethnic groups especially among Black and WhiteBlack Mixed groups for whom rates were two or more times higher than average in 2010 The Other Black group continues to have the highest admission rate ndash six times higher than average ndash although this is lower than in 2005 In contrast admission rates have consistently been lower than average among the Indian and Chinese groups and about average in the Pakistani and Bangladeshi groups
bull Detention rates remain higher than average among the Black and WhiteBlack Caribbean Mixed groups and among the Other White group A consistent pattern across all censuses was the higher than average detention rate
under section 3741 for the Black Caribbean and Other Black groups We also found that rates for being placed on a CTO were higher among the South Asian and Black groups
bull Although there have been annual fluctuations in seclusion rates they have been higher than average for the Black WhiteBlack Mixed and Other White groups in at least three of the six censuses
Overall the level of provision of single sex areas for patients continues to be unsatisfactory although there was no evidence that minority ethnic patients were disadvantaged in these respects Government policy for the NHS in England now requires that all providers of NHS-funded care including mental health trusts are expected to eliminate mixed-sex accommodation in accordance with the guidance set out in CNO201032526 From 2011 all providers of NHS-funded care must report breaches of sleeping accommodation which will attract sanctions
Implications for ways forward
The census findings do not in themselves show that mental health and learning disability services are failing to meet the needs of Black and minority ethnic service users
As noted in previous reports they need to be interpreted in the context of available evidence on ethnic differences in rates of mental illness pathways to care and factors such as socioeconomic disadvantages that all contribute to these differences Our previous reports have consistently highlighted the need for prevention early intervention and working collaboratively across sectors to reduce the risk of admission and detention where possible without compromising the care given to patients Mental health services have a key role to play but to achieve this all statutory agencies and organisations outside the healthcare sector Black and minority ethnic communities and people who use services themselves will need to work in partnership
Care Quality Commission Count me in census 2010 42
Conclusions continued
This message ndash about preventing mental ill-health by addressing the contributory factors and intervening early ndash is at the heart of No health without mental health the Department of Healthrsquos new strategy for the future of mental health care in England27
The strategy aims to tackle the economic social and environmental determinants and consequences of mental health problems and to improve outcomes and reduce inequalities
It specifies that by 2014 people in contact with the criminal justice system will have improved access to mental health services as set out in the Ministry of Justice Green Paper Breaking the Cycle Effective punishment rehabilitation and sentencing of offenders which confirms the approach outlined in Lord Bradleyrsquos report for early intervention and diversion from custody2829
Accompanying the new strategy is a supporting document that explains how its objectives will improve mental health outcomes the effective interventions and the underpinning evidence base30
The strategy is complemented by other government proposals for reforms in the NHS public health and adult social care as outlined in the NHS White Paper Equity and excellence liberating the NHS31 the public health strategy Healthy lives healthy people32 and the adult social care strategy A vision for adult social care capable communities and active citizens 33 Three outcomes frameworks have been developed alongside these strategies improving mental health outcomes and reducing inequalities is integral to them all
In this new healthcare landscape the proposed NHS Commissioning Board and GP consortia will have a statutory obligation to promote equality and reduce inequalities in healthcare (something also enshrined in the Equality Act 2010) As the lead commissioners of healthcare services it will be up to GP consortia to assess with local authorities the needs of their local populations and commission the right services that meet their requirements
And the strengthened public health role of local authorities offers significant potential for addressing the socioeconomic disadvantages faced by Black and minority ethnic communities which add to the burden of mental illness in these communities
Race Equality Action Plan A five-year review looked back at the work of the DRE action plan and describes some of the key challenges successes and learning34 Based on the experience and outcome of the DRE programme the report suggests ways forward for the next stage of mental health strategy development and implementation
Since April 2009 CQC has had a duty under the Mental Health Act 1983 to monitor how services exercise their powers in relation to patients who are detained in hospital or subject to CTOs or guardianship under the Act In its first annual report on the use of the Act CQC recommends a number of areas where improvements are needed for example over-occupancy on inpatient wards patient engagement use of control and restraint seclusion and capacity and consent35
In particular CQC highlighted a number of issues relating to the use of CTOs including concern about appropriate usage (30 of the patients in CQCrsquos sample did not have a reported history of non-compliance or disengagement with services after discharge) and over-representation of Black and minority ethnic groups CQC advised that research on the possible race equality impact of CTOs should be undertaken There were 6237 CTOs from their introduction in November 2008 to 31 March 2010 a much greater use of them than forecast for this period by the Department of Health before the power was introduced Just 31 of these orders had ended by end March 2010 suggesting that some people are being kept on supervised community treatment for long periods
Care Quality Commission Count me in census 2010 43
Conclusions continued
Data in the future Moving beyond a one-day census
Good information is the foundation of an effective healthcare system It is imperative for ensuring that services meet the needs of local populations and are equitable and that improvements are made where needed The availability of fit-for-purpose and comprehensive patient-level data sets with ethnicity and other key variables fully coded is therefore vitally important36 It enables the care provided to patients of all ethnic backgrounds to be monitored on an ongoing basis including for monitoring compliance with the Equality Act
Race Equality Action Plan A five-year review notes that better collection monitoring and use of ethnicity data to inform commissioning and provision in health and social care is required37 Key areas include good ethnic monitoring improving demographic information and ensuring good links between infomatics audit and equality and diversity leads within trusts in order to effectively use the information to inform service development monitoring and review at board management ward and community levels
The governmentrsquos proposed changes to the NHS will be supported by an information revolution aimed at improving and extending the information available to the NHS patients and the public on the quality and outcomes of NHS services including by equality dimensions38
Having information that is fit for purpose is vital for the effective regulation of mental health and learning disability services CQC uses routinely available data sets on an ongoing basis to assess the performance of health and social care organisations and their compliance with government policies and legislation We therefore expect those who commission and provide mental healthcare in the NHS and independent sector to have information systems that provide good quality data with fully
comprehensive recording and monitoring of ethnicity on an ongoing basis
Since 2005 the Count me in census has played a key role in providing information about the ethnicity and other characteristics of inpatients in mental health and learning disability services and on patients subject to the Mental Health Act It did this by providing a valuable one-day snapshot But ethnicity recording must be seen as an all-year round statutory requirement not a one-day annual event The number of inpatients throughout the year is much higher than the counts on one day and some patients will have more than one admission And there is a need to move on from counting patients to understanding more about care pathways for Black and minority ethnic patients and the factors leading to hospital admission and detention
We have consistently highlighted the need for commissioners and providers to make full use of the Mental Health Minimum Data Set (MHMDS) ndash the statutory data set submitted by providers of specialist mental health services in England It provides rich data on these issues and provides a robust information source for ongoing ethnic monitoring after this last census
Covering both community and hospital services ndash and now independent and third sector providers as well as NHS ndash it includes a wide range of information about individual patients the services provided to those admitted to hospital and to the much larger number who donrsquot need admission to hospital and the outcomes of care And because it includes year-round activity it is more representative of the overall picture of for example admission detention and readmission rates length of stay years in psychiatric care and contacts with services and professionals
We call on the Information Centre to routinely publish data on all admissions and uses of the Mental Health Act including CTOs in England (in both NHS and independent healthcare providers) by the ethnicity of
Care Quality Commission Count me in census 2010 44
Conclusions continued
patients making the MHMDS the definitive source of information about mental health and learning disability patients This data should be risk-adjusted for age gender and other variables as appropriate to enable reliable comparisons to be made across groups
It is important that all providers ndash NHS and independent ndash make strenuous efforts to improve the quality of the data they submit The Information Centre publishes reports on the quality of MHMDS data by provider (see wwwicnhsukservices mhmdsdq) and we urge providers to monitor this information and use it to improve their data quality
If GP consortia and local authorities are to be effective in their needs assessment and commissioning roles the Information Centre needs to make available and promote to them the data from the MHMDS and other sources And researchers and academics must make full use of the MHMDS to explore the factors that underlie the observed ethnic patterns
CQCrsquos role
In the meantime CQC will continue to focus strongly on the quality of care provided by mental health and learning disability services
People who find themselves admitted to mental health services or detained under the Mental Health Act and therefore counted by the Count me in census are among the most mentally unwell people in our society Our job is first and foremost to make sure that the care they receive meets the essential standards of quality and safety set out under the Health and Social Care Act 2008 and to work with providers to ensure this We act swiftly when we find services that do not Where we find systemic problems that organisations have not adequately addressed we may impose conditions on the providerrsquos registration to bring about the change needed to improve patientsrsquo experience of care
The essential standards of quality and safety include the requirement to provide single sex accommodation and we will continue to closely check that these standards are met by all mental health services
We intend to introduce a number of indicators derived from the rich information in the MHMDS into our quality and risk profiles for providers This will put greater emphasis on the experience of Black and minority ethnic patients in our regulatory activity
We will monitor the quality of MHMDS data submitted by providers (as reported by the NHS Information Centre) including independent service providers Those with poor data quality may be considered at higher risk in terms of their quality of care
In addition we will continue to monitor the progress of services in relation to the issues raised in the census and other reports including our report on the use of the Mental Health Act through our visits to services and meetings with patients by our Mental Health Act Commissioners and second opinion appointed doctors (SOADs) We will draw on patientsrsquo experiences to monitor the operation of the Mental Health Act
We will also assess the impact of advice and use of Local HealthWatch Local HealthWatch will be in a good position to make sure that providers and commissioners are held to account on matters of choice and access to services for people from Black and minority ethnic groups
Care Quality Commission Count me in census 2010 45
References
1 Department of Health Equity and excellence liberating the NHS 2010
2 Department of Health The NHS outcomes framework 201112 2010
3 Healthcare Commission Mental Health Act Commission National Institute for Mental Health in England Count me in results of a national census of inpatients in mental health hospitals and facilities in England and Wales 2005
4 Healthcare Commission Mental Health Act Commission National Institute for Mental Health in England Count me in results of the 2006 national census of inpatients in mental health and learning disability services in England and Wales 2006
5 Healthcare Commission Mental Health Act Commission National Institute for Mental Health in England Count me in results of the 2007 national census of inpatients in mental health and learning disability services in England and Wales 2007
6 Healthcare Commission Mental Health Act Commission National Institute for Mental Health in England Count me in results of the 2008 national census of inpatients in mental health and learning disability services in England and Wales 2008
7 Care Quality Commission National Mental Health Development Unit Results of the 2009 national census of inpatients and patients on supervised community treatment in mental health and learning disability services in England and Wales 2009
8 Department of Health Delivering race equality in mental health care an action plan for reform inside and outside services 2005
9 Welsh Assembly Government Adult Mental Health Services Raising the standard ndash Race Equality Action Plan for Adult Mental Health Services in Wales 2006
10Department of Health No health without mental health a cross-government mental health outcomes strategy for people of all ages 2011 wwwdhgovukprod_consum_dhgroups dh_digitalassetsdocumentsdigitalasset dh_124058pdf
11Department of Health New horizons towards a shared vision for mental health 2009 wwwdhgovukprod_consum_dhgroups dh_digitalassetsdhendocumentsdigital assetdh_109708pdf
12Department of Health Valuing people a new strategy for learning disability for the 21st century 2001
13Department of Health Valuing people now a new three year strategy for people with learning disabilities 2009
14Department of Health Healthcare for all report of the independent inquiry into access to healthcare for people with learning disabilities 2008
15Joint Committee on Human Rights A life like any other human rights of adults with learning disabilities (2008 HL Paper 401 HC 731) House of Lords House of Commons 2008
16Department of Health Valuing people now summary report March 2009 ndash September 2010 2010
17Disability Rights Commission Equal treatment investigation 2005
18Department of Health Mir G Nocon A Ahmad W Jones L Learning difficulties and ethnicity 2000
19ONS experimental population estimates by ethnic group 2007 wwwstatisticsgovukstatbase productaspvlnk=14238
Care Quality Commission Count me in census 2010 46
References continued
20Six percent of population are gay or lesbian according to Whitehall figures 2005 wwwtelegraphcouknewsmainjhtmlxml= news20051212ngay12xmlamps Sheet= news20051212ixhomehtml
21Department of Trade and Industry Amendment to Employment Equality (Sexual Orientation) Regulations 2003 2003
22Office for National Statistics Measuring sexual identity an evaluation report 2010
23 Information Centre Mental Health Bulletin Fourth report from Mental Health Minimum Dataset (MHMDS) annual returns 2010 2011 wwwicnhsukpubsmhbmhmds0910
24 Information Centre Mental Health Bulletin Fourth report from Mental Health Minimum Dataset (MHMDS) annual returns 2010 2011 wwwicnhsukpubsmhbmhmds0910
25The operating framework for the NHS in England 201112 Department of Health 2010 wwwdhgovukprod_consum_dhgroups dh_digitalassetsdhenpsdocuments digitalassetdh_122736pdf
26wwwdhgovukenPublicationsandstatistics LettersandcircularsProfessionalletters ChiefnursingofficerlettersDH_121848
27Department of Health No health without mental health a cross-government mental health outcomes strategy for people of all ages 2011 wwwdhgovukprod_consum_dhgroups dh_digitalassetsdocumentsdigitalasset dh_124058pdf
28Ministry of Justice Breaking the cycle effective punishment rehabilitation and sentencing of offenders 2010
29Department of Health The Bradley report Lord Bradleyrsquos review of people with mental health problems or learning disabilities in the criminal justice system 2009
30Department of Health No health without mental health delivering better mental health outcomes for people of all ages 2011
31Department of Health Equity and excellence liberating the NHS 2010 wwwdhgovukprod_ consum_dhgroupsdh_digitalassetsdhen psdocumentsdigitalassetdh_117794pdf
32Department of Health Healthy lives healthy people our strategy for public health in England 2010 wwwdhgovukprod_consum_dh groupsdh_digitalassetsdhenps documentsdigitalassetdh_122347pdf
33Department of Health A vision for adult social care capable communities and active citizens 2010 wwwdhgovukprod_consum_dh groupsdh_digitalassetsdhenps documentsdigitalassetdh_121971pdf
34Wilson M NMHDU Race equality action plan a five year review Delivering race equality in mental health care 2010 wwwnmhduorgukour-workmhep
35Care Quality Commission Monitoring the use of the Mental Health Act in 200910 2010
36Raleigh V S Collection of data on ethnic origin in England Editorial BMJ 20083376456
37Wilson M NMHDU Race equality action plan a five year review Delivering race equality in mental health care 2010 wwwnmhduorgukour-workmhep
38Department of Health Liberating the NHS an information revolution 2010
Care Quality Commission Count me in census 2010 47
Appendix A Methods of analysis
Standardisation by age and gender
Standardisation allows us to make comparisons between groups of the population by taking account of variations in age and gender Some differences in patterns of service use are related to the age or gender of the people using them so adjustments to the data have to be made to ensure that the interpretation of ethnic differences is reliable For example formal admissions are higher at a younger age so some Black and minority ethnic groups may have high formal admission rates simply because they have a high proportion of younger people Without adjustments for age and gender differences comparisons would be misleading
In this report most results are standardised for age and gender including those relating to admission detention source of referral care programme approach seclusion restraint accidents assault self-harm consent and presence on a secure ward The report uses the accepted statistical method of taking account of age and gender differences between groups when calculating these rates
We used the ONS estimates of total population by ethnic group for England and Wales in 2007 to standardise the rates of admission for different ethnic groups This takes account of the significant rises in the Black and ethnic minority population of England and Wales since the 2001 ONS census and hence gives more accurate and up to date estimates of admission ratios for different ethnic groups (although it does not take account of any further changes in the ethnic populations between 2007 and 2010 the date of this census) For comparison with the DRE baseline we also present admission rates from the 2005 census derived using the 2005 ONS estimates of populations by ethnic group These figures will not be the same as published in the 2005 census report which were based on the 2001 ONS census population estimates because updated estimates of populations by ethnic group were not available at that time
For other analyses we used the total number of inpatients and patients on CTOs in the census
as the basis for standardisation However CTO outpatients are excluded from selected analyses where appropriate namely the analysis of rates for admissions detentions on admission source of referral single sex accommodation and recorded incidents of seclusion restraint accidents assault and self-harm We used the statistical package STATA version 82 to derive the standardised results
It was not possible to adjust the analyses for ethnic differences in social and economic factors and in diagnosis and severity of illness Such factors could affect the ethnic differences observed in the results
For descriptive variables such as religion and language we did not use standardisation
Confidence intervals as indicators of significant statistical differences
For all standardised results the national rates for England and Wales are taken as 100 and the usual 95 confidence intervals are given Rates of less than 100 or greater than 100 for specific ethnic groups show a lower or higher rate respectively than the national average after adjusting for age and gender Whether or not the difference is statistically significant from the national average depends on the confidence interval If the confidence interval overlaps 100 the difference from the national average is not statistically significant If both values are lower or higher than 100 it indicates that the difference compared with the national average is statistically significant at the 95 level
For example if a rate is 110 with the lower confidence interval being 105 and the upper confidence interval being 115 it indicates that the 10 excess over the national average of 100 is statistically significant But if a ratio is 110 with the lower confidence interval being 95 and the upper confidence interval being 125 it indicates that the 10 excess over the national average is not statistically significant We did not attempt to adjust the confidence intervals for multiple comparisons
Care Quality Commission Count me in census 2010 48
Appendix B Mental health tables
Table B1 Standardised admission ratios by ethnic group for England and Wales (excluding outpatients on a CTO) using 2007 ONS census population denominators (England and Wales = 100) All ages
Ethnic group
Men Women Persons Standardised
admission ratio
95 confidence
interval Observed numbers
Standardised admission
ratio
95 confidence
interval Observed numbers
Standardised admission
ratio
95 confidence
interval Observed numbers
White British 88 86 89 12435 94 93 96 10157 91 89 92 22592 White Irish 130 115 146 274 122 106 140 215 126 115 138 489 Other White 117 109 126 731 129 118 141 533 122 115 129 1264 White and Black Caribbean 557 493 627 276 274 223 333 101 436 393 483 377 White and Black African 312 247 388 80 259 186 351 41 292 242 349 121 White and Asian 140 110 174 79 124 90 166 44 134 111 159 123 Other Mixed 230 189 278 108 213 165 270 67 223 192 259 175 Indian 67 59 75 286 66 56 76 172 66 60 73 458 Pakistani 105 93 119 269 65 53 79 96 91 81 100 365 Bangladeshi 123 102 147 120 82 60 109 46 108 92 126 166 Other Asian 161 139 185 192 136 107 169 79 153 135 172 271 Black Caribbean 538 505 572 980 306 277 336 418 438 415 462 1398 Black African 246 226 267 550 219 194 247 277 236 221 253 827 Other Black 792 691 903 222 314 240 403 61 596 529 670 283 Chinese 27 20 38 39 43 30 59 35 33 26 41 74 Other 140 120 162 177 110 88 136 87 128 113 145 264 Total 100 16818 100 12429 100 29247
Care Quality Commission Count me in census 2010 49
Appendix B Mental health tables continued
Table B2 Standardised admission ratios by ethnic group for England and Wales (excluding outpatients on a CTO) using 2007 ONS census population denominators (England amp Wales = 100) Ages 65 and over
Ethnic group
Men Women Persons Standardised
admission ratio
95 confidence
interval Observed numbers
Standardised admission
ratio
95 confidence
interval Observed numbers
Standardised admission
ratio
95 confidence
interval Observed numbers
White British 95 92 99 3265 95 92 98 3887 95 93 97 7152 White Irish 142 116 172 106 102 82 125 92 120 104 138 198 Other White 207 174 244 141 213 183 248 171 210 188 235 312 White and Black Caribbean 406 210 710 12 333 152 632 9 371 230 568 21 White and Black African 231 28 836 2 198 24 714 2 213 58 546 4 White and Asian 28 1 156 1 110 30 281 4 69 23 162 5 Other Mixed 146 40 374 4 228 92 470 7 189 95 339 11 Indian 97 70 132 41 83 57 116 33 90 71 113 74 Pakistani 39 17 77 8 46 18 94 7 42 23 69 15 Bangladeshi 115 53 218 9 69 14 201 3 98 51 172 12 Other Asian 234 143 361 20 215 120 354 15 225 157 313 35 Black Caribbean 216 170 269 77 310 253 376 103 261 224 302 180 Black African 142 73 248 12 365 241 531 27 246 175 337 39 Other Black 164 34 479 3 366 134 796 6 259 119 493 9 Chinese 41 8 120 3 95 38 195 7 68 33 125 10 Other 253 126 453 11 390 238 602 20 327 222 464 31 Total 100 3715 100 4393 100 8108
Care Quality Commission Count me in census 2010 50
Appendix B Mental health tables continued
Table B3 Standardised ratios by ethnic group for patients referred by a GP (England and Wales = 100)
Ethnic group
Men Women Persons Standardised
referral ratio
95 confidence
interval Observed numbers
Standardised referral ratio
95 confidence
interval Observed numbers
Standardised referral ratio
95 confidence
interval Observed numbers
White British 110 103 117 904 107 101 114 1065 108 104 113 1969 White Irish 85 50 134 18 93 57 144 20 89 63 123 38 Other White 74 51 103 33 70 49 97 36 72 56 91 69 White and Black Caribbean 27 5 78 3 30 4 109 2 28 9 65 5 White and Black African 0 0 74 9 268 2 35 4 125 2 White and Asian 165 54 386 5 0 0 86 28 201 5 Other Mixed 48 6 172 2 68 14 198 3 58 19 136 5 Indian 69 34 123 11 79 39 141 11 73 46 111 22 Pakistani 88 42 162 10 59 16 151 4 77 42 130 14 Bangladeshi 81 22 207 4 61 7 221 2 73 27 159 6 Other Asian 80 32 166 7 108 43 223 7 92 50 155 14 Black Caribbean 35 20 56 17 37 20 62 14 36 24 51 31 Black African 57 29 100 12 66 35 113 13 61 40 91 25 Other Black 62 23 135 6 40 5 144 2 54 23 107 8 Chinese 56 1 314 1 139 38 356 4 108 35 251 5 Other 106 46 208 8 0 0 53 23 105 8 Total 100 1041 100 1185 100 2226
Care Quality Commission Count me in census 2010 51
Appendix B Mental health tables continued
Table B4 Standardised ratios by ethnic group for patients referred by a community mental health team (including crisis resolution home treatment) or community learning disability team (England and Wales = 100)
Ethnic group
Men Women Persons Standardised
referral ratio
95 confidence
interval Observed numbers
Standardised referral ratio
95 confidence
interval Observed numbers
Standardised referral ratio
95 confidence
interval Observed numbers
White British 107 104 111 3255 103 100 107 3386 105 103 108 6641 White Irish 90 69 116 61 89 68 114 61 90 74 107 122 Other White 59 48 71 105 79 67 94 141 69 61 78 246 White and Black Caribbean 106 83 135 68 75 49 111 25 96 77 117 93 White and Black African 43 19 84 8 66 30 124 9 52 31 84 17 White and Asian 95 56 150 18 84 43 147 12 90 61 129 30 Other Mixed 78 48 121 20 72 41 118 16 76 53 105 36 Indian 106 83 132 76 100 76 130 56 103 86 122 132 Pakistani 108 84 135 73 89 60 128 30 102 83 123 103 Bangladeshi 98 66 141 29 90 50 148 15 95 69 128 44 Other Asian 88 63 120 40 105 70 150 29 94 73 119 69 Black Caribbean 69 59 80 167 85 71 102 123 75 67 84 290 Black African 84 70 102 112 82 65 103 77 84 72 96 189 Other Black 52 36 74 31 64 36 106 15 56 41 74 46 Chinese 112 53 205 10 101 52 176 12 105 66 160 22 Other 86 60 120 35 106 71 151 30 94 73 120 65 Total 100 4108 100 4037 100 8145
Care Quality Commission Count me in census 2010 52
Appendix B Mental health tables continued
Table B5 Standardised ratios by ethnic group for patients referred by criminal justice routes (police prison probation courts court liaison and diversion) (England and Wales = 100)
Ethnic group
Men Women Persons Standardised
referral ratio
95 confidence
interval Observed numbers
Standardised referral ratio
95 confidence
interval Observed numbers
Standardised referral ratio
95 confidence
interval Observed numbers
White British 90 86 95 1495 95 86 104 421 91 87 95 1916 White Irish 133 94 183 38 59 19 138 5 116 84 157 43 Other White 112 93 134 119 103 68 150 27 111 93 130 146 White and Black Caribbean 117 89 151 58 145 69 266 10 120 94 153 68 White and Black African 190 127 273 29 141 38 361 4 183 126 256 33 White and Asian 75 39 131 12 160 52 373 5 89 52 143 17 Other Mixed 104 65 157 22 151 61 311 7 112 75 161 29 Indian 86 61 118 38 79 32 163 7 85 62 113 45 Pakistani 118 91 150 65 89 33 194 6 115 90 145 71 Bangladeshi 74 44 115 19 29 1 162 1 68 42 105 20 Other Asian 130 95 174 45 164 71 323 8 134 101 176 53 Black Caribbean 131 114 150 208 124 81 181 26 130 114 148 234 Black African 132 112 156 145 143 93 211 25 134 114 156 170 Other Black 141 109 180 65 236 113 435 10 149 117 187 75 Chinese 83 27 194 5 146 30 426 3 99 43 195 8 Other 129 93 175 41 113 37 264 5 127 93 170 46 Total 100 2404 100 570 100 2974
Care Quality Commission Count me in census 2010 53
Appendix B Mental health tables continued
Table B6 Standardised detention ratios by ethnic group all detentions on day of admission (excluding outpatients on a CTO) (England and Wales = 100)
Ethnic group
Men Women Persons Standardised
detention ratio
95 confidence
interval Observed numbers
Standardised detention
ratio
95 confidence
interval Observed numbers
Standardised detention
ratio
95 confidence
interval Observed numbers
White British 94 92 97 6449 94 91 97 3628 94 92 96 10077 White Irish 112 95 131 154 118 96 145 94 114 101 129 248 Other White 108 98 118 451 120 106 136 251 112 104 120 702 White and Black Caribbean 123 107 141 220 129 99 167 59 124 110 140 279 White and Black African 128 99 162 68 113 70 173 21 124 100 153 89 White and Asian 96 71 126 50 109 68 164 22 99 78 125 72 Other Mixed 115 92 143 82 139 100 188 42 122 102 146 124 Indian 97 83 113 164 110 86 137 77 101 88 114 241 Pakistani 109 94 126 194 102 74 136 44 108 94 122 238 Bangladeshi 86 67 109 69 91 55 142 19 87 70 107 88 Other Asian 109 92 130 133 120 86 163 40 112 96 130 173 Black Caribbean 129 121 139 774 143 125 162 238 132 124 141 1012 Black African 115 104 127 422 131 111 153 159 119 110 129 581 Other Black 117 100 136 170 148 105 202 39 122 106 140 209 Chinese 108 71 159 26 129 78 202 19 116 85 156 45 Other 111 92 132 126 116 83 157 41 112 96 130 167 Total 100 9552 100 4793 100 14345
Care Quality Commission Count me in census 2010 54
Appendix B Mental health tables continued
Table B7 Standardised detention ratios by ethnic group detention on day of admission ndash section 2 of the Mental Health Act (England and Wales = 100)
Ethnic group
Men Women Persons Standardised
detention ratio
95 confidence
interval Observed numbers
Standardised detention
ratio
95 confidence
interval Observed numbers
Standardised detention
ratio
95 confidence
interval Observed numbers
White British 97 91 102 1156 93 87 98 1133 95 91 99 2289 White Irish 78 47 120 20 116 79 166 30 97 72 128 50 Other White 100 78 126 70 134 108 166 88 116 99 136 158 White and Black Caribbean 55 30 93 14 60 24 124 7 57 35 87 21 White and Black African 91 37 188 7 150 60 308 7 113 62 190 14 White and Asian 80 29 174 6 119 44 258 6 96 49 167 12 Other Mixed 68 28 141 7 116 53 221 9 89 51 145 16 Indian 130 91 179 37 124 81 182 26 127 98 163 63 Pakistani 126 87 176 34 138 79 225 16 130 96 171 50 Bangladeshi 166 101 256 20 140 61 276 8 158 105 228 28 Other Asian 142 93 209 26 163 93 264 16 150 108 202 42 Black Caribbean 73 57 92 70 97 72 128 51 82 68 98 121 Black African 164 131 202 87 190 146 244 62 174 147 204 149 Other Black 114 75 166 27 140 72 245 12 121 86 165 39 Chinese 165 60 358 6 212 97 402 9 190 106 313 15 Other 218 153 302 36 179 108 280 19 203 153 264 55 Total 100 1623 100 1499 100 3122
Care Quality Commission Count me in census 2010 55
Appendix B Mental health tables continued
Table B8 Standardised detention ratios by ethnic group detention on day of admission ndash section 3 of the Mental Health Act (England and Wales = 100)
Ethnic group
Men Women Persons Standardised
detention ratio
95 confidence
interval Observed numbers
Standardised detention
ratio
95 confidence
interval Observed numbers
Standardised detention
ratio
95 confidence
interval Observed numbers
White British 99 95 103 2684 96 91 100 1852 98 95 101 4536 White Irish 116 89 149 60 135 101 177 52 124 102 149 112 Other White 112 96 129 186 110 92 132 121 111 99 124 307 White and Black Caribbean 114 91 143 79 130 90 183 33 119 98 143 112 White and Black African 97 60 148 21 107 54 192 11 100 69 141 32 White and Asian 84 50 133 18 97 48 173 11 89 59 127 29 Other Mixed 121 84 168 35 117 72 181 20 120 90 156 55 Indian 96 75 122 67 110 79 148 42 101 83 122 109 Pakistani 91 71 115 69 88 55 134 22 90 73 111 91 Bangladeshi 63 39 95 22 64 28 127 8 63 43 90 30 Other Asian 90 65 120 44 94 56 149 18 91 70 117 62 Black Caribbean 116 102 130 279 164 138 192 148 129 117 142 427 Black African 95 80 112 143 102 79 129 68 97 85 111 211 Other Black 75 55 99 49 99 58 159 17 80 62 102 66 Chinese 119 59 213 11 99 43 194 8 110 66 171 19 Other 85 60 116 38 84 48 136 16 84 63 110 54 Total 100 3805 100 2447 100 6252
Care Quality Commission Count me in census 2010 56
Appendix B Mental health tables continued
Table B9 Standardised detention ratios by ethnic group detention on day of admission ndash section 3741 of the Mental Health Act (England and Wales = 100)
Ethnic group
Men Women Persons Standardised
detention ratio
95 confidence
interval Observed numbers
Standardised detention
ratio
95 confidence
interval Observed numbers
Standardised detention
ratio
95 confidence
interval Observed numbers
White British 84 79 89 991 101 88 115 220 86 82 91 1211 White Irish 140 96 198 32 48 6 175 2 126 87 176 34 Other White 112 89 139 81 156 95 241 20 118 96 144 101 White and Black Caribbean 177 133 232 53 179 66 390 6 178 135 229 59 White and Black African 149 82 251 14 224 46 654 3 159 92 254 17 White and Asian 141 75 241 13 195 40 569 3 149 85 241 16 Other Mixed 144 85 227 18 264 97 575 6 162 104 242 24 Indian 86 56 126 26 44 5 160 2 80 53 116 28 Pakistani 122 87 166 40 0 0 111 79 152 40 Bangladeshi 66 32 122 10 0 0 60 29 110 10 Other Asian 99 61 151 21 0 0 89 55 136 21 Black Caribbean 200 174 229 210 78 34 153 8 189 165 216 218 Black African 127 101 157 82 84 34 172 7 122 98 150 89 Other Black 152 110 205 43 94 11 341 2 148 108 198 45 Chinese 100 27 255 4 0 0 80 22 204 4 Other 118 75 177 23 44 1 245 1 110 71 164 24 Total 100 1661 100 280 100 1941
Care Quality Commission Count me in census 2010 57
Appendix B Mental health tables continued
Table B10 Standardised detention ratios by ethnic group detention on day of admission ndash sections 47 48 4749 of the Mental Health Act (England and Wales = 100)
Ethnic group
Men Women Persons Standardised
detention ratio
95 confidence
interval Observed numbers
Standardised detention
ratio
95 confidence
interval Observed numbers
Standardised detention
ratio
95 confidence
interval Observed numbers
White British 97 90 106 583 104 81 131 73 98 91 106 656 White Irish 132 72 221 14 163 20 590 2 135 77 219 16 Other White 130 96 172 49 71 15 206 3 124 93 163 52 White and Black Caribbean 126 78 193 21 80 2 444 1 123 77 186 22 White and Black African 207 103 370 11 0 0 189 95 339 11 White and Asian 57 12 166 3 169 4 941 1 68 19 175 4 Other Mixed 112 48 221 8 233 28 843 2 125 60 230 10 Indian 57 26 108 9 0 252 0 52 24 99 9 Pakistani 92 54 147 17 0 314 0 86 50 138 17 Bangladeshi 46 12 117 4 167 4 930 1 53 17 125 5 Other Asian 101 52 177 12 0 0 95 49 166 12 Black Caribbean 126 98 159 70 125 34 319 4 126 99 158 74 Black African 74 48 107 27 104 21 303 3 76 51 108 30 Other Black 127 78 197 20 138 3 769 1 128 79 195 21 Chinese 0 0 0 0 0 0 Other 83 38 157 9 0 0 77 35 147 9 Total 100 857 100 91 100 948
Care Quality Commission Count me in census 2010 58
Appendix B Mental health tables continued
Table B11 Standardised ratios for all applications of the Mental Health Act (including outpatients on a CTO) by ethnic group on day of census (England and Wales = 100)
Ethnic group
Men Women Persons Standardised
ratio for all MHA
applications
95 confidence
interval Observed numbers
Standardised ratio for all MHA
applications
95 confidence
interval Observed numbers
Standardised ratio for all MHA
applications
95 confidence
interval Observed numbers
White British 97 94 99 7659 95 93 98 4335 96 94 98 11994 White Irish 99 83 116 147 104 84 128 95 101 89 114 242 Other White 87 79 95 427 97 85 110 249 90 84 97 676 White and Black Caribbean 117 103 133 245 130 103 163 76 120 107 134 321 White and Black African 120 95 150 79 93 58 141 22 113 92 137 101 White and Asian 101 78 128 65 119 81 169 31 106 86 129 96 Other Mixed 110 89 134 96 125 93 165 49 114 97 135 145 Indian 103 90 118 215 122 100 147 109 109 97 121 324 Pakistani 111 97 125 254 117 90 148 67 112 100 125 321 Bangladeshi 92 75 112 97 101 68 145 29 94 78 112 126 Other Asian 103 88 121 152 126 95 164 56 109 94 124 208 Black Caribbean 123 115 131 893 141 126 158 300 127 120 134 1193 Black African 112 103 122 511 121 104 140 188 114 106 123 699 Other Black 116 102 132 232 148 112 191 59 122 108 136 291 Chinese 97 64 140 27 101 61 157 19 98 72 131 46 Other 104 87 122 140 103 75 137 46 103 89 119 186 Total 100 11239 100 5730 100 16969
Care Quality Commission Count me in census 2010 59
Appendix B Mental health tables continued
Table B12 Standardised CTO ratios by ethnic group CTOs on day of census ndash section 17a of the Mental Health Act (England and Wales = 100)
Ethnic group
Men Women Persons
Standardised CTO ratio
95 confidence
interval Observed numbers
Standardised CTO ratio
95 confidence
interval Observed numbers
Standardised CTO ratio
95 confidence
interval Observed numbers
White British 94 89 99 1289 88 82 94 730 92 88 96 2019 White Irish 51 27 88 13 77 41 132 13 62 40 90 26 Other White 97 77 120 83 125 95 162 58 107 90 126 141 White and Black Caribbean 79 53 113 29 141 77 237 14 92 67 124 43 White and Black African 111 59 190 13 125 41 292 5 115 68 181 18 White and Asian 104 54 182 12 136 50 297 6 113 67 178 18 Other Mixed 102 59 166 16 136 62 257 9 112 73 166 25 Indian 134 99 177 48 152 98 226 24 139 109 175 72 Pakistani 145 110 187 59 174 101 279 17 151 119 189 76 Bangladeshi 142 93 206 27 205 99 378 10 155 109 213 37 Other Asian 107 71 155 28 182 99 305 14 124 89 168 42 Black Caribbean 121 103 142 152 171 132 218 65 133 116 152 217 Black African 116 94 142 94 139 98 192 37 122 102 145 131 Other Black 186 144 238 65 305 189 466 21 206 165 254 86 Chinese 83 23 213 4 152 49 354 5 111 51 211 9 Other 87 54 134 21 152 79 266 12 103 71 145 33 Total 100 1953 100 1040 100 2993
Care Quality Commission Count me in census 2010 60
Appendix C Learning disability tables
Table C1 Standardised admission ratios by ethnic group for England and Wales using 2007 ONS population denominators (England amp Wales = 100) All ages
Ethnic group
Men Women Persons Standardised
admission ratio
95 confidence
interval Observed numbers
Standardised admission
ratio
95 confidence
interval Observed numbers
Standardised admission
ratio
95 confidence
interval Observed numbers
White British 104 100 109 2163 108 101 115 941 105 102 109 3104 White Irish 108 72 156 28 151 89 238 18 121 89 162 46 Other White 81 65 101 85 49 30 75 21 72 59 87 106 White and Black Caribbean 280 186 405 28 246 118 453 10 270 191 371 38 White and Black African 102 33 239 5 165 34 482 3 119 51 235 8 White and Asian 66 26 135 7 154 56 335 6 89 47 152 13 Other Mixed 181 104 295 16 229 99 451 8 195 125 290 24 Indian 32 21 48 24 28 12 55 8 31 21 44 32 Pakistani 48 30 72 22 12 1 43 2 38 25 57 24 Bangladeshi 102 60 161 18 31 4 113 2 83 51 128 20 Other Asian 33 13 69 7 92 34 201 6 47 25 81 13 Black Caribbean 265 210 332 77 117 67 190 16 218 176 267 93 Black African 53 33 80 22 40 15 87 6 50 33 72 28 Other Black 228 118 399 12 134 28 392 3 200 112 330 15 Chinese 4 0 21 1 3 0 16 1 Other 26 9 56 6 11 0 59 1 21 9 44 7 Total 100 2521 100 1051 100 3572
Care Quality Commission Count me in census 2010 61
Appendix C Learning disability tables continued
Table C2 Standardised detention ratios by ethnic group all detentions on day of admission (England and Wales = 100)
Ethnic group
Persons Standardised
detention ratio
95 confidence
interval Observed numbers
White British 97 93 103 1431 White Irish 127 84 184 28 Other White 117 91 149 68 White and Black Caribbean 120 77 179 24 White and Black African 114 37 267 5 White and Asian 75 24 176 5 Other Mixed 94 49 165 12 Indian 119 72 186 19 Pakistani 110 61 181 15 Bangladeshi 144 84 231 17 Other Asian 59 16 150 4 Black Caribbean 119 90 155 57 Black African 138 85 210 21 Other Black 62 20 145 5 Chinese 0 0 Other 104 28 267 4 Total 100 1715
Care Quality Commission Count me in census 2010 62
copy Care Quality Commission and National Mental Health Development Unit 2011 Published April 2011
This publication may be reproduced in whole or in part in any format or medium for non-commercial purposes provided that it is reproduced accurately and not used in a derogatory manner or in a misleading context The source should be acknowledged by showing the publication title and copy Care Quality Commission and National Mental Health Development Unit 2011
How to contact us
Phone 03000 616161 Email enquiriescqcorguk Web wwwcqcorguk
Write to us at Care Quality Commission National Correspondence Citygate Gallowgate Newcastle upon Tyne NE1 4PA
Please contact us if you would like a summary of this publication in other formats or languages
Registered office Care Quality Commission Finsbury Tower 103ndash105 Bunhill Row London EC1Y 8TG
- Count me in 2010
- About the Care Quality Commission
- Contents
- Summary
- National organisations coordinating the census
- Introduction
- Data methods of analysis and interpretation
- Results mental health
- A comparison between the 2005 baseline and the 2010 census
- Results learning disabilities
- Data in the future Moving beyond a one-day census
- Conclusions
- References
- Appendix A Methods of analysis
- Appendix B Mental health tables
- Appendix C Learning disability tables
- How to contact us
-
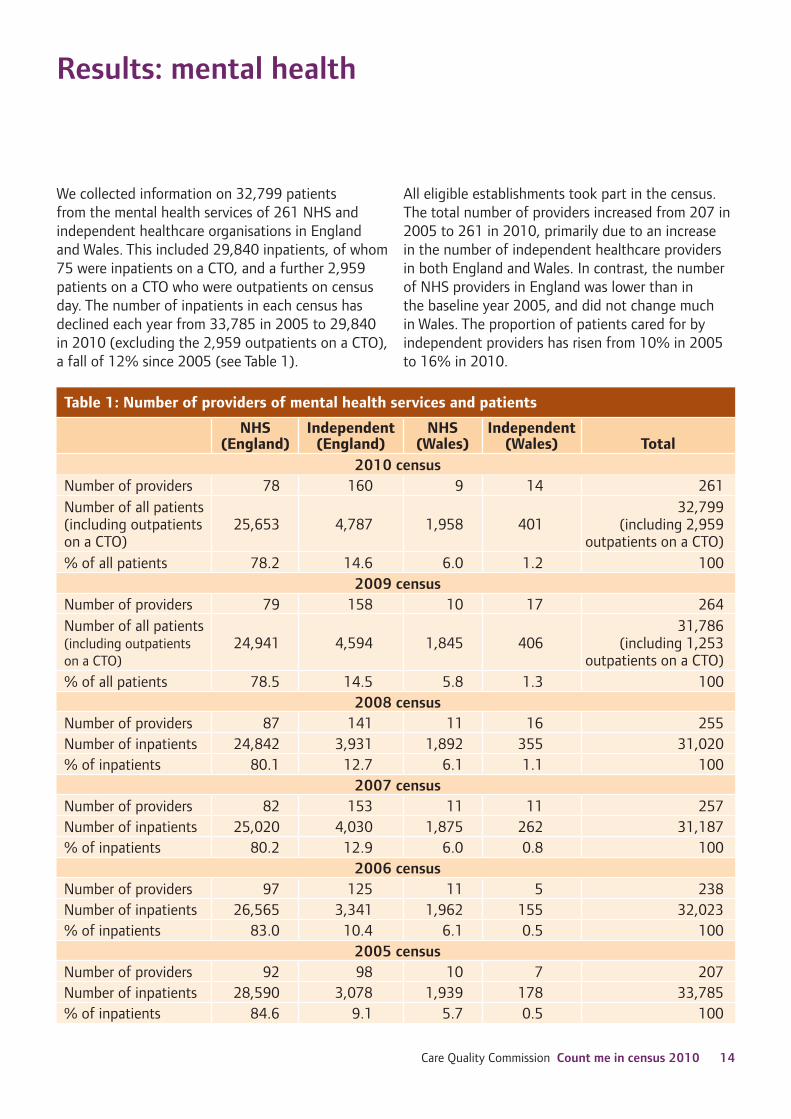

Results mental health continued
Ethnicity
Information about ethnicity was available for 98 of patients Of these patients 75 were White British and 23 belonged to Black and minority ethnic groups defined as all groups that are not White British This compares with 20 in 2005
Compared with the baseline year of 2005 the 2010 census recorded a lower proportion of patients from the White British White Irish and Other Black groups (see Table 2) There were increases in the proportions of patients from the Other White WhiteBlack Caribbean Mixed Black Caribbean and Black African groups Other ethnic groups showed only minor differences over the baseline year
Table 2 Mental health patients by ethnic group
Ethnic group 2010 census 2009 census 2008 census 2007 census 2006 census 2005 census
Number Number Number Number Number Number
White British 750 24593 757 24067 765 23738 776 24198 786 25170 792 26762
White Irish 16 514 19 591 18 567 17 538 18 582 22 727
Other White 43 1407 43 1360 45 1399 46 1449 38 1210 31 1055
White and Black Caribbean
13 418 11 336 11 336 09 288 09 287 08 255
White and Black African
04 139 03 91 04 110 03 91 03 102 02 71
White and Asian 04 141 04 137 04 117 03 91 03 109 03 104
Other Mixed 06 200 07 213 05 148 06 180 05 173 05 167
Indian 16 529 14 460 14 426 13 393 13 411 13 434
Pakistani 13 440 13 409 13 396 10 315 11 349 10 325
Bangladeshi 06 203 05 171 05 144 04 130 05 158 05 153
Other Asian 09 311 09 273 10 300 08 261 08 262 08 264
Black Caribbean 49 1608 47 1504 47 1468 43 1330 39 1264 41 1369
Black African 29 957 26 834 23 715 21 648 20 652 19 645
Other Black 11 368 12 384 12 376 17 545 17 535 17 569
Chinese 03 83 03 82 03 91 03 82 02 78 02 81
Other 09 296 10 322 12 362 11 356 11 338 11 357
Not stated 18 592 17 552 11 327 09 292 11 342 12 416
Invalid 0 1 01 31
100 32799 100 31786 100 31020 100 31187 100 32023 100 33785 Total
Care Quality Commission Count me in census 2010 15
Results mental health continued
As in the previous censuses patients from Black and minority ethnic groups were concentrated in a relatively small number of organisations 70 were patients in 25 of the 261 organisations that took part in the census Of all organisations 194 had fewer than 50 patients from Black and minority ethnic groups each and another 32 organisations had no patients at all from these groups
Reporting of ethnicity
Eighty-one per cent of patients reported their own ethnic group Where patients did not do so staff or relatives did so on their behalf (10 and 6 respectively) We cannot be certain that ethnicity was recorded accurately for these patients The proportion of patients who reported their own ethnicity ranged from about 81 in the White groups to 90 in the WhiteBlack African Mixed group
Care Quality Commission Count me in census 2010 16
Results mental health continued
Age and gender
Ethnic differences in the age profiles of patients largely reflect the age profiles of different minority ethnic populations The White British White Irish and Other White populations have an older age structure than other minority ethnic populations and therefore patients from the White groups are significantly older than patients from other ethnic groups (see Table 3)
Overall 58 of patients were men Men outnumbered women in all ethnic groups (see Table 3) The White British White Irish Other White and Chinese groups had smaller differences in the proportions of men and women compared with other ethnic groups
Table 3 Age and gender of patients
Ethnic group Age () Gender ()
Total (n) 0-17 18-24 25-49 50-64 65+ Men Women
White British 1 7 41 20 31 56 44 100 (24593)
White Irish 0 4 36 19 41 56 44 100 (514)
Other White 2 7 47 19 25 58 42 100 (1407) White and Black Caribbean 1 13 68 12 5 73 27 100 (418)
White and Black African 1 13 73 9 4 67 33 100 (139)
White and Asian 4 18 63 11 5 65 35 100 (141)
Other Mixed 2 13 69 11 6 62 38 100 (200)
Indian 1 4 58 21 15 63 37 100 (529)
Pakistani 2 10 73 12 4 74 26 100 (440)
Bangladeshi 2 15 69 8 6 72 28 100 (203)
Other Asian 2 12 61 13 13 70 30 100 (311)
Black Caribbean 1 6 61 20 13 70 30 100 (1608)
Black African 1 10 75 9 5 67 33 100 (957)
Other Black 1 6 78 11 3 78 22 100 (368)
Chinese 2 10 59 17 12 52 48 100 (83)
Other 2 12 57 18 11 67 33 100 (296)
1 7 46 19 27 58 42 100 Total (n=
471) (n=
2352) (n=
14998) (n=
6093) (n=
8885) (n=
19071) (n=
13684) (n=
32799)
Care Quality Commission Count me in census 2010 17
Results mental health continued
Language and religion
Similar to previous censuses 5 of patients reported that their first language was not English (see Table 4) The Chinese and Bangladeshi groups had the highest proportions of patients whose first language was not English (51 and 46 respectively) Among the Other White group 27 had a first language other than English Again similar to previous censuses about 2 of patients said they needed an interpreter and of these 24 were from the White British group
Table 4 Percentage of patients with a first language other than English
Ethnic group with first language other than English
White British 1
White Irish 3
Other White 27
White and Black Caribbean 2
White and Black African 10
White and Asian 6
Other Mixed 11
Indian 26
Pakistani 35
Bangladeshi 46
Other Asian 34
Black Caribbean 2
Black African 22
Other Black 13
Chinese 51
Other 41
Total 5
Care Quality Commission Count me in census 2010 18
Results mental health continued
Religion was not stated for 21 of patients and 15 of patients said they had no religion The proportions stating they did not have a religion were highest among the WhiteBlack Caribbean and WhiteAsian Mixed groups (23 and 21 respectively) and lowest among the South Asian groups (4) Table 5 shows the religion of patients
Table 5 Religion of patients by ethnic group
Ethnic group
Religion and faith groups ()
None Christian Buddhist Hindu Jewish Muslim Sikh Any other religion
Not stated
White British 16 58 1 0 1 0 0 3 21
White Irish 8 73 0 0 0 5 13
Other White 13 53 1 0 3 5 7 18 White and Black Caribbean 23 47 0 1 0 3 7 17
White and Black African 16 41 1 1 15 6 20
White and Asian 21 33 1 1 21 3 3 18
Other Mixed 15 41 3 3 16 8 17
Indian 5 10 0 29 15 28 2 11
Pakistani 4 3 0 1 1 80 1 2 10
Bangladeshi 4 1 1 1 76 1 5 11
Other Asian 6 14 5 12 39 5 3 16
Black Caribbean 12 59 1 0 0 2 8 17
Black African 10 45 0 0 22 0 3 19
Other Black 12 41 1 1 0 16 7 22
Chinese 18 30 16 1 4 31
Other 8 24 3 1 3 34 6 21
Total 15 54 1 1 1 4 1 4 21
Care Quality Commission Count me in census 2010 19
Results mental health continued
Sexual orientation
The results for sexual orientation were not valid for 1 of patients and for 20 the response was recorded as ldquonot knownrdquo Seventy-six per cent of patients said they were heterosexual 1 said gay lesbian 1 said bisexual and less than 1 said ldquootherrdquo The number of minority ethnic patients who were gaylesbian or bisexual was very low
The overall figure of 1 who said they were gay lesbian or bisexual is lower than some estimates of the proportions of gaylesbian or bisexual people in the general population (5 to 7)2021 However in the 200910 Integrated Household Survey of a representative sample of 238206 people in UK conducted by the Office for National Statistics 1 identified themselves as gay or lesbian 05 as bisexual 05 as ldquootherrdquo 3 responded as ldquodo not knowrdquo or refused to answer and 95 identified themselves as heterosexualstraight22
Disability
About 75 of patients said they did not have a disability and 25 said they had one or more disabilities Of these 7 were blind or visually impaired 1 were deaf or had a hearing impairment 1 had Autistic Spectrum Disorder 2 had a learning disability 4 had a mobility impairment and 2 used a wheelchair The remaining 8 had more than one disability The proportion of patients with a disability was highest among the White British White Irish and Other White groups (about 28) which could reflect the higher age profiles of these patients compared with other ethnic groups
Rates of admission (see section on interpreting the results on page 13)
The rates of admission derived using the 2007 ONS ethnic population estimates as denominators are given in Appendix B Tables B1 (all ages) and B2 (ages 65 and over) Outpatients on a CTO are excluded from these results
All ages Admission rates were lower than average for patients from the White British Indian and Chinese groups and were average for the Pakistani and Bangladeshi groups Rates were higher than average for other minority ethnic groups they were particularly high for the Black Caribbean Black African WhiteBlack Caribbean Mixed and WhiteBlack African Mixed groups who had rates two to four times higher than average and for the Other Black group with a rate six times higher
Ages 65 and over Age-standardised admission rates for minority ethnic groups at older ages show broadly similar patterns to those reported for all ages with rates two to three times higher than average among the Black and White Black Mixed groups Rates were high also in the White Irish Other White Other Asian and Other groups
Numbers of older Black and minority ethnic patients were too few in most ethnic groups to support analyses of subgroups within them for example those detained
Care Quality Commission Count me in census 2010 20
Results mental health continued
Source of referral
People can be referred to healthcare services in a number of ways Referrals for inpatient care often come from community mental health teams rather than the original source such as GPs and accident and emergency (AampE) departments Therefore referrals from these teams may include referrals from other sources Furthermore about a quarter of patients (26) were referred from tertiary care and information about their original referral source was not available We had no information about the source of referral for 13 of patients The results reflect the proportions of patients from each ethnic group that are referred from each source so a higher proportion of referrals from one source will inevitably mean that proportions from other referral sources are lower Outpatients on a CTO are excluded from these data
The referral patterns are broadly similar to those reported previously and the key results are presented below
GP referrals 7 of patients Rates were 8 higher than average among the White British group They were lower than average among the Other White Black Caribbean Black African and WhiteBlack Caribbean Mixed groups by 28 to 72 The rates of referral by GPs are given in Appendix B Table B3
Referrals from AampE departments 5 of patients The White British group had a 9 lower than average rate of such referrals The WhiteBlack African Mixed Indian Bangladeshi Black African and Other groups were more likely than average to be referred in this way
Referrals from community mental health teams 26 of patients For the White British group such referrals were 5 higher than the average rate They were lower than average among the Other White WhiteBlack African Mixed Black Caribbean Black African and
Other Black groups by 16 to 48 The rates of referral are given in Appendix B Table B4
Referrals from the criminal justice system 9 of patients This is defined as the police courts probation service prison and court liaison and diversion service
Patients from the White British group were less likely than average to be referred by the criminal justice agencies whereas the Black Caribbean Black African Other Black WhiteBlack African Mixed and Other Asian groups were 30 to 83 more likely than average to be referred in this way We observed no differences from the average rate for other ethnic groups Rates of referral by the criminal justice system are given in Appendix B Table B5
A significant proportion (26) of all referrals were from tertiary care
Tertiary care referrals from medium or high secure units 5 of patients The rate for such referrals (in NHS or independent sectors) was lower than average among the Other White and Indian groups It was higher than average among the Black Caribbean and WhiteBlack Caribbean Mixed groups by about 75
Tertiary care referrals from other inpatient services 21 of patients The rate for such referrals (NHS and independent) was higher than average among the White Irish and Other White groups by 29 and 59 respectively The rate was lower than average in the Indian and Other Black groups
Tertiary care referrals from other clinical specialties 9 of patients Rates of such referrals were higher than average among the White British and Indian groups and lower than average among the Other White WhiteBlack Caribbean Mixed Other Asian Black African Other Black and Chinese groups
Care Quality Commission Count me in census 2010 21
Results mental health continued
Detention under the Mental Health Act 1983 on day of admission
The Mental Health Act 2007 made a number of changes to the Mental Health Act 1983 These changes were reflected in the census of 2009 and 2010 which collected information on new provisions establishing supervised community treatment (section 17A) and excluded supervised discharge (section 25A) which was abolished
As in previous reports we present below the results for detention rates on the day of admission Outpatients on a CTO are excluded from these analyses After that we present rates for all patients subject to the Mental Health Act on census day (including outpatients on a CTO) followed by rates for patients on a CTO on census day
All detentions Forty-nine per cent (14637) of patients were detained under the Mental Health Act on admission to hospital This was a higher proportion than recorded in the previous censuses (40 in 2005 and 2006 43 in 2007 45 in 2008 and 47 in 2009)
Detention rates were 6 lower than average among White British patients and between 19 and 32 higher than average among the Black Caribbean Black African Other Black and WhiteBlack Caribbean Mixed groups Detention rates were also higher in the White Irish and Other White groups by about 13 and in the Other Mixed group by 22 No other ethnic differences were observed The results are given in Appendix B Table B6
These patterns are broadly similar to those reported in previous censuses
Detention under section 2 Section 2 of the Mental Health Act gives authority for a person to be detained in hospital for assessment for a period not exceeding 28 days It is mainly applied where the patient is unknown to the service or where there has been a significant interval between periods of inpatient treatment
Of all patients detained on admission 22 were detained under section 2 Rates of detention under this section were lower than average among the White British WhiteBlack Caribbean Mixed and Black Caribbean groups and higher than average among the Bangladeshi Other Asian Black African Chinese and Other groups by between 50 and 103 (see Appendix B Table B7)
Detention under section 3 Section 3 of the Act provides for the compulsory admission of a patient to hospital for lsquotreatmentrsquo and for his or her subsequent detention which can last for an initial period of up to six months and is renewable after this
Of all patients detained on admission 43 were detained under this section Rates were higher than average among the White Irish and Black Caribbean groups by 24 and 29 respectively and lower among than average among the Bangladeshi group No other ethnic differences were observed The rates of detention under section 3 are given in Appendix B Table B8
Detention under section 3741 Section 37 of the Mental Health Act allows a court to send a person to hospital for treatment when they might otherwise have been given a prison sentence and section 41 allows a court to place restrictions on a personrsquos discharge from hospital Admission to hospital rather than prison is generally regarded as a more positive outcome for the person concerned
Care Quality Commission Count me in census 2010 22
Results mental health continued
Of all patients detained on admission 14 were detained under section 37 with a section 41 restriction order applied The rates of detention are given in Appendix B Table B9 In all minority ethnic groups very few women were detained under section 3741 Among men the rate of detention for the White British group was 16 lower than average and it was higher than average in the WhiteBlack Caribbean Mixed group by 77 the Black Caribbean group by 100 the Black African group by 27 and the Other Black group by 52
A consistent pattern across all six annual censuses was the higher than average detention rate under section 3741 for the Black Caribbean and Other Black groups
Detention under sections 47 48 and 4749 These sections of the Mental Health Act allow the Ministry of Justice to issue a direction to transfer a person detained in prison to a hospital for treatment
Of all patients detained on admission 7 were detained under these sections The only ethnic differences observed were a 107 higher than average detention rate among men from the White Black African Mixed group and a lower than average rate for the Indian group We observed no other ethnic differences probably because the numbers of detentions under these sections were low in most minority ethnic groups These rates of detention are given in Appendix B Table B10
The previous four censuses also showed virtually no ethnic differences for rates of detention under sections 47 48 and 4749
Patients subject to the Mental Health Act 1983 on day of census
All patients subject to the Mental Health Act Of all the 32399 patients in the census a total of 53 (17299) were subject to the Mental Health Act on census day including 2959 outpatients and 75 inpatients on a CTO (either voluntarily or recalled) Ratios for the different ethnic groups for overall applications of the Mental Health Act including CTOs showed broadly similar patterns to detention rates on admission day from which patients on a CTO were excluded In both cases rates were higher than average among the Black Caribbean Black African Other Black and White Black Caribbean Mixed groups However the higher than average detention rates for the White Irish Other White and Other Mixed groups on admission day were not apparent on census day
The rates are given in Appendix B Table B11
Supervised community treatment under section 17A Community treatment orders (CTOs) were introduced in November 2008 as a result of the Mental Health Act 2007 They allow for supervised community treatment to be provided for up to six months with the possibility of an extension after this These orders are designed to help patients to maintain stable mental health outside hospital and to promote recovery by providing professionals with the power to set conditions on discharge from hospital and a power to recall patients if arrangements in the community are not working
Nine per cent of all patients in the census were on CTOs compared with 4 in 2009 Of all the 17299 patients subject to the Mental Health Act on census day almost 18 (3034) were on CTOs Of the patients on a CTO 2959 were outpatients and 75 were inpatients (50 voluntary and 25 recalled)
Care Quality Commission Count me in census 2010 23
Results mental health continued
The rate of supervised community treatment among all patients included in the census was lower than average in the White British and White Irish groups and higher than average in the South Asian (Indian Pakistani Bangladeshi) and Black (Black Caribbean Black African Other Black) groups by 22 to 106 The ratios are given in Appendix B Table B12
Consent
About 25 of informally admitted patients were deemed incapable of consenting to treatment The only ethnic difference observed was a higher than average rate for the Pakistani group but this was based on very few patients
About 18 of patients who were detained or on CTOs were deemed incapable of consenting to treatment These rates were lower than average by 7 in the White British group and were higher than average among the Other White WhiteBlack Caribbean Mixed and Black African groups by 21 35 and 36 respectively
In addition 13 of patients who were detained or on CTOs on census day were deemed capable of consenting to treatment but refused to do so The White British group had a rate of refusals that was 10 lower than average and rates were higher than average among the White Irish WhiteBlack Caribbean Mixed Other Mixed Black Caribbean and Black African groups by between 39 and 71
Care programme approach
The Care Programme Approach (CPA) is the process by which treatment care and support for people with serious mental health problems and accompanying health and social care needs are agreed coordinated and understood by all involved From October 2008 changes to the CPA in England
mean that it is no longer categorised into two parts (lsquostandardrsquo and lsquoenhancedrsquo) and just the one category of enhanced CPA applies This makes CPA policy in England different to that in Wales where the distinction still applies The CPA data presented here therefore includes all CPA patients in England and both lsquostandardrsquo and lsquoenhancedrsquo CPA patients in Wales
About 89 of all patients were on a CPA 3 were on a single assessment process (SAP) whereby assessments are made for adults with health and or social care needs and 8 were on neither CPA nor SAP As most patients were on a CPA no ethnic differences were observed
Recorded incidents
The 2010 census asked about the number of times that patients experienced seclusion hands-on restraint self-harm accident and physical assault in a current hospital spell or if the patientrsquos hospital spell was longer than three months the number that took place within the last three months Outpatients on a CTO are excluded from these data It should be noted that the rates of such events among minority ethnic groups can show yearly variation because of the low numbers of events in several groups
Seclusion Seclusion was defined as the supervised confinement of a patient in a room which may be locked to protect others from significant harm Four per cent of patients had experienced one or more episodes of seclusion The White British group had a seclusion rate that was 9 lower than average Rates were higher than average among the WhiteBlack Caribbean Mixed WhiteBlack African Mixed Black Caribbean and Black African groups by 80 90 36 and 56 respectively
Care Quality Commission Count me in census 2010 24
Results mental health continued
Although the number of incidents of seclusion was low in several minority ethnic groups some general patterns over the six censuses to date are
bull The proportion of all patients who had an episode of seclusion stayed fairly constant over the six censuses at about 4
bull Although there have been annual fluctuations the seclusion rate has been higher than average for the Black and WhiteBlack Mixed groups in three or four of the six censuses and in the Other White group in three censuses
Hands-on restraint This was defined as the physical restraint of a patient by one or more members of staff in response to aggressive behaviour or resistance to treatment About 12 of patients had experienced one or more episodes of hands-on restraint No ethnic differences were observed In fact very few ethnic differences have been observed in the previous censuses also and they have not shown a consistent pattern
Self-harm Eight per cent of patients had harmed themselves on one or more occasions Only the White British group had a rate that was higher than average (by 14) Rates were lower than average among several minority ethnic groups the three Black groups (Black Caribbean Black African and Other Black) by about 70 the three south Asian groups (Indian Pakistani Bangladeshi) by between 37 and 78 and the Other Mixed and Other Asian groups by about 60
In terms of comparison with previous years
bull The proportion of all patients who had harmed themselves stayed fairly constant at about 7ndash8
bull In all censuses the White British group had a higher than average rate of self-harm and the Black and South Asian groups had lower than average rates of self-harm
Accidents About 11 of patients had experienced one or more accidents Patients from the White British group experienced a rate of accidents that was 6 higher than average Rates were lower than average in the Black Caribbean Black African Other Black and Other Asian groups by about 50 to 70 No accidents were reported for the Chinese group
In terms of comparisons with previous years
bull The proportion of all patients who had had an accident stayed fairly constant
bull The rate of accidents in the different censuses was higher than average in the White British group and lower than average in the Black Caribbean group Few other ethnic differences were observed and they were not consistent
Physical assault on the patient The definition of assault includes incidents of physical assault on the patient irrespective of who committed the assault We do not have information on who committed the assault for example whether it was another patient or a member of staff Eleven per cent of patients were involved in one or more episodes of physical assault The only ethnic difference observed was a 19 lower than average rate among the Black Caribbean group
In terms of comparisons with previous years
bull The proportion of all patients who had experienced a physical assault stayed fairly constant
bull Very few ethnic differences in rates of assault were observed in the different censuses and they did not show a consistent pattern
Care Quality Commission Count me in census 2010 25
Results mental health continued
Duration of stay in hospital from admission to census day
We analysed the length of the period between each inpatientrsquos admission to hospital and the census day This period is of course shorter than a patientrsquos full length of stay in hospital which runs from admission to the date when they are discharged Outpatients on a CTO are excluded from the following analyses
bull 25 of inpatients had been in hospital for one month or less
bull 20 had been in hospital between one and three months
bull 13 had been in hospital between three and six months
bull 11 had been in hospital between six months and one year
bull 11 had been in hospital between one and two years
bull 12 had been in hospital between two and five years
bull 8 had been in hospital for more than five years
These results are similar to those of previous censuses About 31 of patients in the 2010 census had been in hospital for more than a year and had therefore also been included in the 2009 census About 20 of patients had been in hospital for more than two years and will have been included in both the 2008 and 2009 censuses
We calculated the median length of stay for different ethnic groups The median is the midpoint of the range of values so the median length of stay is the one at which half the patients had a length of stay less than the median and half had a stay longer than the median Overall and as in previous years the median amount of time that women had spent in hospital was about 25 months and the median for men was about 58 months (see Table 6) In most ethnic groups the median time spent in hospital was two to three times longer for men than for women in the Other Black group men had been in hospital four times longer than women
Median lengths of stay were longest for men from the Black Caribbean WhiteBlack Caribbean Mixed and Other Black groups and shortest for men from the Chinese Bangladeshi and Other groups Median lengths of stay were longest for women from the WhiteBlack Caribbean Mixed and Black Caribbean groups and shortest for women from the Chinese and Bangladeshi groups
A number of important factors influence a patientrsquos length of stay in hospital including age gender whether or not they are detained under the Mental Health Act (and the section under which they are detained and whether there is an additional restriction order) the type and severity of their illness the nature of their treatment and the availability of support in the community The data in the census does not allow for analysis of these factors
Table 6 Median number of days from the day of admission to the day of census
Ethnic group Men Women
White British 161 71
White Irish 218 114
Other White 238 113
White and Black Caribbean 275 191
White and Black African 182 92
White and Asian 226 78
Other Mixed 173 112
Indian 172 70
Pakistani 153 56
Bangladeshi 134 55
Other Asian 167 61
Black Caribbean 345 122
Black African 141 66
Other Black 248 58
Chinese 135 51
Other 131 76
Total 174 75
Care Quality Commission Count me in census 2010 26
Results mental health continued
Ward security
As in previous years about 11 of all patients were on a medium or high secure ward as opposed to a general (76) or low secure (13) ward
Patients from the White British Indian and Bangladeshi groups were less likely than average to be on a medium or high secure ward by 7 30 and 67 respectively Patients from the White Irish WhiteBlack Caribbean Mixed Black Caribbean and Other Black groups had a higher than average rate by between 43 and 55
Age range on wards
Among patients under 18 years of age 61 were being cared for on wards for working-age adults on census day and five patients were on a ward for older people Seven per cent of patients on wards for working-age adults were 65 or over and
8 of those on wards for older people were adults of working age There were very few lsquoout of agersquo placements among minority ethnic groups
Patients in wards designated as single sex or mixed
Providers were asked whether patients were on a ward designated as men or women only or mixed gender All the analyses of single sex accommodation and facilities exclude outpatients on a CTO Overall 61 of men and 77 of women were not in a ward designated for single sex use similar proportions as in previous years The proportion of patients not in a designated single sex ward was lower among almost all minority ethnic groups than among the White British group In all ethnic groups the proportion of men who were not in a designated single sex ward was lower than among women (see Table 7a)
Two further questions examined the single sex facilities that were available to patients
At the time of the 2010 census the following guidance from the Department of Health applied in England A ward can be described as single sex (ie the intended sex of the ward is either male or female and not mixed) when the accommodation complies with the following definition from the Department of Health of single sex accommodation ldquoSleeping areas must be segregated and members of one sex must not have to walk through an area occupied by the other sex to reach toilets or bathrooms Separate male and female only toilets and bathrooms must be provided There should be separate day rooms to which only women have accessrdquo However there is a discrepancy for providers because accommodation designated as a lsquowardrsquo for administrative purposes may incorporate single sex accommodation for both sexes that meets the guidelines ndash but in this case the ward would still be lsquomixedrsquo (based on guidance from Safety Privacy and Dignity Department of Health 2000)
As long as men and women are cared for in separate bays or rooms and have their own toilet facilities then it may well be appropriate for them to be on the same ward being cared for by the same team of doctors and nurses In practice good segregation can be achieved if men and women have separate sleeping areas (for example single sex bays) and have separate toilets and bathrooms that they can reach without having to pass through (or close to) areas for the opposite sex The layout of wards should minimise any risk of overlooking or overhearing by members of the opposite gender (from Privacy and Dignity ndash A report by the Chief Nursing Officer into mixed sex accommodation in hospitals Department of Health 2007)
The coalition governmentrsquos revised Operating Framework for 201011 requires NHS organisations to eliminate mixed-sex accommodation except under exceptional circumstances from 2011 The national guidance relating to mixed sex accommodation was issued in November 2010 and states that ldquoNo areas are exempt and every decision to mix must be justified by reference to the patientrsquos clinical needs not organisational convenience or custom and practicerdquo For mental health and learning disability trusts it states ldquoThere is no acceptable justification for admitting a mental health patient to mixed-sex accommodationrdquohellip It ldquomay be acceptable in a clinical emergency to admit a patient temporarily to a single ensuite room in the opposite-gender area of a ward In such cases a full risk-assessment must be carried out and complete safety privacy and dignity maintainedrdquo The guidance is available at wwwdhgovukenPublicationsandstatisticsLettersandcircularsProfessionallettersChiefnursingofficerlettersDH_121848
Care Quality Commission Count me in census 2010 27
Results mental health continued
Table 7a Percentage of patients not in a designated single sex ward by ethnic group
Ethnic group
Sex of patients and ward
Male Female
Male ward Female or mixed ward Female ward Male or mixed ward
White British 35 65 21 79
White Irish 41 59 28 72
Other White 44 56 28 72
White and Black Caribbean 56 44 31 69
White and Black African 48 52 41 59
White and Asian 43 57 34 66
Other Mixed 49 51 24 76
Indian 37 63 25 75
Pakistani 48 52 35 65
Bangladeshi 23 77 18 82
Other Asian 46 54 22 78
Black Caribbean 55 45 32 68
Black African 49 51 28 72
Other Black 49 51 30 70
Chinese 42 58 30 70
Other 43 57 20 80
Total 39 61 23 77
The vast majority of patients in this category were in mixed wards very few (under 05) male patients were on female-only wards or vice versa
Care Quality Commission Count me in census 2010 28
Results mental health continued
Patientsrsquo access to toilet and bathing facilities designated for single sex use
We asked providers if the patient had access to toilet and bathing facilities designated for single sex use Overall 13 of men and 16 of women
were reported as not having access to such facilities designated for single sex use This was an improvement over 2009 when these proportions were 19 and 24 respectively The proportion of patients not having access to toilet and bathing facilities designated for single sex use was lower among almost all minority ethnic groups than among the White British group (see Table 7b for details)
Table 7b Percentage of patients not having access to toilet and bathing facilities designated for single sex use by ethnic group
Ethnic group
Access to designated single sex bathing and toilet facilities
Male Female
Male facilities
Female or mixed facilities
Female facilities
Male or mixed facilities
White British 86 14 84 16
White Irish 87 13 87 13
Other White 89 11 86 14
White and Black Caribbean 93 7 93 7
White and Black African 90 10 93 7
White and Asian 90 10 84 16
Other Mixed 98 2 96 4
Indian 91 9 90 10
Pakistani 95 5 94 6
Bangladeshi 92 8 98 2
Other Asian 92 8 86 14
Black Caribbean 92 8 90 10
Black African 91 9 91 9
Other Black 92 8 89 11
Chinese 82 18 83 17
Other 87 13 90 10
Total 87 13 84 16
The vast majority of patients in this category had access to mixed facilities very few (1) of male patients had access to female-only facilities or vice versa
Care Quality Commission Count me in census 2010 29
Results mental health continued
Patientsrsquo access to a lounge area day space designated for single sex use
We also asked providers if patients had access to a lounge area or day space designated for single sex use Overall 37 of men and 39 of women were
reported as not having access to these facilities This was an improvement over 2009 when these proportions were 48 and 51 respectively The proportion of patients not having access to a lounge areaday space designated for single sex use was lower among most minority ethnic groups than among the White British group (see Table 7c for details)
Table 7c Percentage of patients not having access to a lounge areaday space designated for single sex use by ethnic group
Ethnic group
Access to a lounge areaday space designated for single sex use
Male Female
Male facilities
Female or mixed facilities
Female facilities
Male or mixed facilities
White British 59 41 60 40
White Irish 63 37 70 30
Other White 68 32 63 37
White and Black Caribbean 82 18 73 27
White and Black African 83 18 76 24
White and Asian 72 28 75 25
Other Mixed 79 21 67 33
Indian 59 41 66 34
Pakistani 80 20 72 28
Bangladeshi 53 47 52 48
Other Asian 70 30 61 39
Black Caribbean 78 22 70 30
Black African 73 27 70 30
Other Black 79 21 72 28
Chinese 59 41 60 40
Other 67 33 67 33
Total 63 37 61 39
The vast majority of patients in this category had access to mixed facilities very few (1) of male patients had access to female-only facilities or vice versa
Care Quality Commission Count me in census 2010 30
Results mental health continued
Patientsrsquo subject to deprivation of liberty safeguards
People who lack the mental capacity to consent to the care or treatment they need should be cared for in a way that is least restrictive of their rights or freedom of action In 2007 the Mental Capacity Act 2005 was amended to introduce Deprivation of Liberty Safeguards for people who lack capacity to decide about their care or treatment and who need to be deprived of their liberty to protect them from harm The Safeguards came into effect in April 2009 and strengthen the rights of hospital patients and those in care homes as well as ensuring compliance with the European Convention on Human Rights (ECHR)
The 2010 census introduced a new question ldquoIs the patient subject to deprivation of liberty authorisation on 31 March 2010rdquo Under 1 (269) patients were reported as being subject to a deprivation of liberty authorisation on census day No ethnic differences in the rates were observed which may be due to the low numbers of patients among minority ethnic groups (69)
Care Quality Commission Count me in census 2010 31
A comparison between the 2005 baseline and the 2010 census
The changes we have seen in the census results between 2005 and 2010 the timespan of the Delivering Race Equality (DRE) action plan are set out below This is not a review of the DRE programme The aim is to give an overview of how some variables in the census have changed during the course of DRE and the findings should be seen in the light of the caveats described on page 13
bull The number of inpatients went down from 33785 to 29840 ndash a fall of 12
bull The proportion of patients in independent hospitals rose from 10 to 16
bull The overall proportion of patients from minority ethnic groups increased from 20 to 23 However there have been demographic changes during this time ndash the population from Black and minority ethnic groups in England and Wales rising from 79 million in 2005 to 85 million in 2007 (the latest year for which these figures are available) an increase of 8 in two years
bull Admission rates showed similar patterns across all censuses ndash Lower than average rates among the White
British Indian and Chinese groups ndash About average rates among the Pakistani and
Bangladeshi groups ndash Higher than average rates among other
minority ethnic groups ndash particularly in the Black and WhiteBlack Mixed groups for whom rates were two or more times higher than average in 2010 The Other Black group continues to have exceptionally high rates of admission (even after the apparent reduction since 2005 see next point)
bull One of the 12 goals of DRE was a decline in admission rates among Black and minority ethnic groups Figure 1 provides a comparison between 2005 and 2010 Although admission rates for
many ethnic groups show relatively little change since 2005 the rate for the Other Black group is considerably lower in 2010 (six times higher than average) compared with 2005 (12 times higher than average) However rates for the other Black and WhiteBlack Mixed groups show small increases
bull In general rates of referral from GPs and community mental health teams were lower than average among some Black and WhiteBlack groups and referral from the criminal justice system was higher Patterns were less consistent for other minority ethnic groups
bull There was a steady increase in the overall proportion of patients subject to the Mental Health Act Compared with 40 in 2005 49 of all patients were subject to the Mental Health Act in 2010 (53 if outpatients on a CTO are excluded)
bull Another DRE goal was to reduce detention rates among Black and minority ethnic groups However detention rates have been higher than average among the Black Caribbean Black African and Other Black groups in all six censuses and almost consistently higher in the WhiteBlack Caribbean Mixed and Other White groups Rates have been average for other minority ethnic groups
bull A consistent pattern was the higher than average detention rate under section 3741 for the Black Caribbean and Other Black groups
bull Another DRE goal was to reduce seclusion among Black and minority ethnic groups Although there have been annual fluctuations in seclusion rates they have been higher than average for the Black and WhiteBlack Mixed groups and the Other White group in at least three of the six censuses Other minority ethnic groups did not show high rates
Care Quality Commission Count me in census 2010 32
A comparison between the 2005 baseline and the 2010 census continued
Figure 1 Admission ratios in the 2005 and 2010 Count me in censuses by ethnic group England and Wales
Other Black
Black Caribbean
White and Black Caribbean
White and Black African
Black African
Other Mixed
Other Asian
White and Asian
Other
White Irish
Other White
Bangladeshi
White British
Pakistani
Indian
Chinese
0 100 200 300 400 500 600 700 800 900 1000 1100 1200 1300
Ageshysex standardised admission ratios (EampW=100)
Census 2005 admission ratios using 2005 ONS populations
bull Minority ethnic groups do not compare unfavourably for other incidents Rates of self-harm have consistently been lower than average among the Black and South Asian groups Very few ethnic differences in hands-on restraint physical assault and accidents were observed across the different censuses and they did not show a consistent pattern
bull About 31 of patients in all censuses had been in hospital for one year or more and were therefore included in more than one census
Census 2010 admission ratios using ONS 2007 populations (excluding outpatients on a CTO)
(This is one reason why the census shows little change over the six years It should be noted again that because the census is a one-day count it over-represents long-stay admissions and under-represents short-stay admissions)
bull Mixed accommodation was reported for many patients across all censuses although patients from Black and minority ethnic groups were more likely to be in single sex accommodation than White British patients
The admission ratios for the 2005 census shown here are different from those published in the 2005 report This is because we updated the analysis of the 2005 admission ratios by using 2005 ONS census populations for ethnic groups as denominators These populations were not available at the time of the 2005 report which instead used the 2001 ONS population data
Care Quality Commission Count me in census 2010 33
Results learning disabilities
We obtained information about 3642 patients in 129 organisations providing services for people with learning disabilities in England and Wales Of these two were inpatients on CTOs The total number of inpatients has declined each year and by 21 from 4609 in 2006 to 3642 in 2010 The total number of providers did not change much from the baseline year of 2006 although the number of NHS providers has fallen steadily and the number of independent healthcare organisations has increased (see Table 8) The proportion of inpatients in independent
healthcare organisations increased from 20 in 2006 to 33 in 2010 This is likely to be a result of closing NHS campuses with people moving from hospital to community settings
The pattern of results for learning disability patients in 2010 is broadly similar to that reported in previous censuses This is not surprising since many of the patients had been in hospital for a considerable period of time and they therefore appear in successive censuses
Table 8 The number of providers of learning disability services and inpatients
NHS (England)
Independent (England)
NHS (Wales)
Independent (Wales) Total
2010 census Number of providers 55 61 4 9 129 Number of all patients (including patients 2304 1072 154 112 3642 on a CTO) of all patients 633 294 42 31 100
2009 census Number of providers 60 54 5 4 123 Number of all patients (including patients 2487 1014 139 55 3695 on a CTO) of all patients 673 274 38 15 100
2008 census Number of providers 62 57 5 5 129
Number of inpatients 2873 1050 143 41 4107
of inpatients 700 256 35 10 100 2007 census
Number of providers 64 47 5 4 120
Number of inpatients 3063 900 154 36 4153
of inpatients 738 217 37 09 100 2006 census
Number of providers 70 48 5 1 124
Number of inpatients 3505 930 164 10 4609
of inpatients 760 202 36 02 100
Care Quality Commission Count me in census 2010 34
Results learning disabilities continued
Ethnicity
Information about ethnicity was available for 98 of patients Of these 13 belonged to Black and minority ethnic groups defined as all groups that are not White British (see Table 9) This figure is somewhat higher than in previous years (11 in 2006) and is significantly lower than the 23 of mental health patients from minority ethnic groups as reported in the mental health section of this report
Although the patterns by ethnicity are broadly similar to previous years there was an increase between 2006 and 2010 in the proportion of patients from the Other White group and a fall in those from the White British group Some ethnic groups had very few patients
As in the previous censuses patients from Black and minority ethnic groups were concentrated in a relatively small number of organisations 70 were
Table 9 Learning disability patients by ethnic group
Ethnic group 2010 census 2009 census 2008 census 2007 census 2006 census
Number Number Number Number Number
White British 853 3106 867 3205 889 3616 883 3642 887 4037
White Irish 13 46 15 57 13 53 10 40 14 66
Other White 29 106 23 85 26 104 26 109 17 77
White and Black Caribbean 10 38 10 36 07 29 08 34 07 32
White and Black African 02 8 01 4 00 2 02 10 01 3
White and Asian 04 13 04 14 03 12 03 13 02 9
Other Mixed 07 24 05 19 03 14 04 16 03 14
Indian 09 32 09 35 07 28 08 32 11 49
Pakistani 07 24 09 33 07 30 08 32 07 34
Bangladeshi 05 20 06 21 03 11 03 11 02 9
Other Asian 04 13 03 10 03 12 02 8 03 12
Black Caribbean 26 93 22 81 23 94 26 108 28 129
Black African 08 28 09 35 07 29 08 33 07 33
Other Black 04 15 04 14 04 15 04 18 04 17
Chinese 00 1 01 2 01 5 02 8 02 7
Other 02 7 02 8 04 15 02 10 05 24
Not stated 19 68 10 36 09 38 07 29 12 57
Total 100 3642 100 3695 100 4069 100 4124 100 4552
Care Quality Commission Count me in census 2010 35
Results learning disabilities continued
patients in 25 of the 129 organisations that took part in the census Seventy-four organisations had fewer than 10 patients from Black and minority ethnic groups each and another 42 organisations had no inpatients at all from these groups
However it is important to note that the number of people with severe and profound learning disabilities in some areas is affected by past funding and placement practices especially the presence of old long stay hospitals and of people placed outside their original area of residence by funding authorities
Reporting of ethnicity
About half (56) of patients reported their own ethnic group Staff reported the ethnic group for 17 of patients and relatives for 21 This means that ethnicity could have been misreported for some patients We do not know how ethnicity was assessed for 6 of patients
Age and gender
Two per cent (59) of patients were under 18 years old The number of young inpatients from minority ethnic groups was low or zero in several ethnic minority groups
Overall 73 of patients were under 50 years old and 27 were aged 50 or over The proportion of patients under 50 was higher among patients from Black and minority ethnic groups (88) than among the White British group (71) This is not surprising given that minority ethnic populations are generally younger than the White population
Seventy per cent of patients in learning disability services were men whereas in mental health services 58 of patients were men
Language and religion
Eight per cent of patients reported that their first language was not English Non-verbal communication was the most often selected language after English accounting for 4 of patients Two per cent (84) of patients most of whom were from the White British group said they needed an interpreter
Religion was not stated for 22 of patients and 15 of patients said they had no religion South Asians (Indians Bangladeshis and Pakistanis) were mostly Muslim Hindu or Sikh and those from the White Black Caribbean and Black African groups were mostly Christian
Sexual orientation
Overall the result was not known for almost half (49) of patients 45 said they were heterosexual 2 said gaylesbian 3 said bisexual and 1 said ldquootherrdquo The numbers of patients from minority ethnic groups were too low for meaningful analysis
Disability
Of all inpatients in learning disability services
bull 4 were reported as having no disabilities
bull 44 had a learning disability only
bull 51 had multiple disabilities
The patterns among minority ethnic groups were similar in that most patients had either a learning disability or multiple disabilities
Care Quality Commission Count me in census 2010 36
Results learning disabilities continued
Rates of admission
The rates of admission based on ONS estimates of the general population in 2007 are given in Appendix C Table C1
Admission rates were lower than average among several minority ethnic groups Other White Indian Pakistani Other Asian Black African Chinese and Other Rates were two to three times higher than average among the WhiteBlack Caribbean Mixed Black Caribbean Other Black and Other Mixed groups The lower rates among the South Asian and Chinese groups and the higher rates among some Black groups are similar to patterns for inpatients in mental health establishments
These patterns of admission are similar to those we reported in previous census reports
Source of referral
As we reported in the section on mental health patients data about sources of referral must be interpreted with care as we do not always know the original referral source Furthermore in the case of inpatients with learning disabilities this information was invalid missing or unknown for 12 of patients
Because of the small numbers of patients in most minority ethnic groups we observed few ethnic differences in sources of referral
Detention under the Mental Health Act 1983 (on day of admission and on day of census)
The Mental Health Act 2007 made a number of changes to the Mental Health Act 1983 one of which was supervised community treatment (section 17A) These are reflected in the 2010 census
All detentions Of all the patients in learning disability services 48 were detained under the Mental Health Act on admission Rates of detention on the day of admission by ethnic group are in Appendix C Table C2 and no ethnic differences were observed As the number of detained patients from each minority ethnic group was low we did not undertake further analysis for individual sections of the Act
Rates of detention on census day also showed no ethnic differences with the exception of a lower than average rate for the Other White group
Consent
About 66 of informally admitted inpatients were deemed incapable of consenting to treatment which is a similar proportion to that reported previously
Among detained patients 38 were deemed incapable of consenting to treatment and 6 were deemed capable of consenting to treatment but refused
The numbers of patients from minority ethnic groups were too low for comment There were no or very few such patients among minority ethnic groups
Care Quality Commission Count me in census 2010 37
Results learning disabilities continued
Care programme approach
Details of the Care Programme Approach (CPA) are given on page 24
We found that 73 of all patients were on a CPA 2 on a single assessment process (SAP) and 25 on neither No ethnic differences were observed
Recorded incidents
The 2010 census asked about the number of times that patients experienced seclusion hands-on restraint self-harm accident and physical assault in a patientrsquos current hospital spell or if the patientrsquos hospital spell was longer than three months the number that took place within the last three months As in previous years we observed very few ethnic differences
Seclusion Five per cent of patients had experienced one or more episodes of seclusion The only ethnic differences observed were the higher than average rates among the White Irish and Other White groups but these were based on small numbers of patients
Physical assault on the patient The definition of assault includes incidents of physical assault on the patient irrespective of who committed the assault but we do not have information on who committed the assault About 28 of patients had been involved in one or more episodes of physical assault No ethnic differences were observed
Hands-on restraint self-harm accidents Thirty per cent of inpatients had experienced one or more episodes of hands-on restraint 22 had attempted to harm themselves and 24 had suffered an accident The numbers were very low in minority ethnic groups and we did not observe any ethnic differences except for a lower than average rate for self-harm among the Black Caribbean group but this was based on very few patients
Duration of stay in hospital
We analysed the length of the period between each patientrsquos admission to hospital and the census day This period is of course shorter than a patientrsquos full length of stay in hospital which runs from admission to the date when they are discharged
bull 10 of inpatients had been in hospital for one month or less
bull 6 had been in hospital between one and three months
bull 7 had been in hospital between three and six months
bull 10 had been in hospital between six months and one year
bull 14 had been in hospital between one and two years
bull 22 had been in hospital between two and five years
bull 31 had been in hospital for over five years
The patterns are very similar to those in previous censuses About 67 of patients in the 2010 census had been in hospital for more than a year and were therefore also included in the 2009 census In addition over half (53) of patients had been in hospital for more than two years and will have been included in both the 2008 and 2009 censuses A third of patients will have been included in each census since 2006
We also calculated the median length of stay (see page 26 for the definition of median) Overall the median amount of time that women had spent in hospital was about 31 months and the median for men was about 27 months This compares with a median for mental health patients of 25 months for women and 58 months for men It is not possible to reliably compare length of stay by ethnic group because of the small numbers of patients among several minority ethnic groups
Care Quality Commission Count me in census 2010 38
Results learning disabilities continued
Ward security
About 12 of all inpatients were on a medium or high secure ward as opposed to a general (54) or low secure (34) ward
As in the three previous years rates of patients on medium or high secure wards were about double the average among the White Irish and Other White groups Most other minority ethnic groups had very few patients on medium or high secure wards
Age range on wards
There were five patients under 18 years of age being cared for on wards for working-age adults and none were on wards for older people About 5 of patients on wards for working-age adults were aged 65 or over and there were very few patients (23) on wards for older people There were very few lsquoout of agersquo placements among minority ethnic groups
Patients in wards designated as single sex or mixed
We asked providers whether the patient was on a ward designated as men or women only or mixed gender Overall 47 of men and 69 of women were not in a ward designated for single sex use The numbers of such patients among minority ethnic groups were very low
Two further questions examined the single sex facilities that were available to patients Again due to the small numbers we do not present results by ethnicity for these questions
Patientsrsquo access to toilet and bathing facilities designated for single sex use
Overall 19 (497) of men and 27 (295) of women were reported as not having access to toilet and bathing facilities designated for single sex use
Patientsrsquo access to a lounge area day space designated for single sex use
Overall 32 (829) of men and 44 (470) of women were reported as not having access to a lounge area day space designated for single sex use
Patients subject to deprivation of liberty safeguards
For details of deprivation of liberty safeguards please see page 31
The 2010 census introduced a new question ldquoIs the patient subject to deprivation of liberty authorisation on 31 March 2010rdquo Two per cent (74) patients were reported as being subject to a deprivation of liberty order on census day but very few of these patients (15) were from minority ethnic groups
See footnote on single sex accommodation on page 27
Care Quality Commission Count me in census 2010 39
Data in the future Moving beyond a one-day census
For six years the Count me in census has provided a valuable one-day snapshot of inpatients in mental health and learning disability services And with the proportion of inpatients who are detained increasing steadily (from 25 in 200506 to 39 in 200910 ndash see Figure 2) ongoing ethnic monitoring of admissions and detentions becomes more vital than ever
However a one-day census only captures some events and the profile of patients can differ across a whole year For example there were
bull 29840 inpatients in the 2010 census compared with 107765 inpatients overall during 200910
bull 17299 patients in the 2010 census who were detained or on CTOs compared with 42479 new detentions and some 4100 new CTOs overall in England in 200910
bull 26 of patients in hospital for under one month and 31 for over one year per the census
whereas the MHMDS data consistently shows that for over 50 of records the average length of an inpatient stay was under one month and for 4 it was over one year
Looking ahead it is vital that robust data is available on all admitted patients and all those subject to the Mental Health Act not just those in hospital on one particular day Moreover patterns of use and outcomes of community care can have an impact on the need for admission to hospital and the risk of detention ndash therefore information about the care provided to patients before admission to hospital during their hospital stay and after they leave is also vital Furthermore under 84 of the 127 million people using specialist mental health services are admitted to hospital23 and so it is very important to examine the quality of community care for the 90 of patients who are not admitted to hospital
Figure 2 Number of people spending time in hospital 200506 to 200910
Num
ber
of p
atie
nts
90000
80000
70000
60000
50000
40000
30000
20000
10000
0 200506 200607 200708 200809 200910
Source NHS Information Centre Formally detained Not detained MHMDS Bulletin 2011
Care Quality Commission Count me in census 2010 40
Data in the future Moving beyond a one-day census continued
The Mental Health Minimum Data Set (MHMDS) is a rich source of data on people using specialist mental health services in England It covers both community and hospital services and includes a wide range of information about the demographic clinical and socioeconomic characteristics of individual patients and the services provided to those admitted to hospital and to the much larger number of those who donrsquot need a stay in hospital The data includes information about contact with services uses of the Mental Health Act and the Care Programme Approach for each individual patient All these details enable the use of services patterns of care and patient outcomes to be tracked including along pathways of care The MHMDS therefore provides a robust basis for ongoing monitoring of access to and outcomes of care for users of specialist ndash both community and hospital ndash mental health services
The MHMDS also enables an analysis of the numbers and rates of people from different ethnic groups using specialist mental health services overall (both inpatient and community) which provides an indication of the levels of mental illness and therefore the need for specialist care in different communities
At present the MHMDS does not cover high secure services and independent sector providers only started to provide data during 201011 However to support payment by results for mental health the scope of the data set will be extended to cover high secure services during 201112 (version 4 MHMDS) Further proposed changes to the dataset (version 41) will incorporate NHS-funded learning disability services and primary care mental health services A separate dataset for child and adolescent mental health services (CAMHS) has been developed and is awaiting formal approvals It is designed to include the same information about uses of the Mental Health Act as provided in the MHMDS
The latest MHMDS bulletin for 200910 provides a description of people using specialist mental health services in England including ethnic profiles of people using services hospital admissions detentions and the number of people on CPA24 It also provides information on differences by age and gender The bulletin illustrates some of the sorts of analyses that are possible using data from the MHMDS
The NHS Information Centre can provide guidance on these and other potential analyses based on MHMDS data
Care Quality Commission Count me in census 2010 41
Conclusions
While this report reviews changes in the census results since 2005 it is not a review or evaluation of the DRE programme overall Similarly the census cannot provide explanations for the patterns observed or examine whether mental health services are meeting the needs of individual ethnic minority groups As we have noted previously the results are subject to caveats in particular that the census provides a one-day snapshot that may not be representative of patients admitted to hospital throughout the year
Overview of findings
Overall the findings from the 2010 census show little change from those reported for previous annual censuses conducted since 2005 This is partly because many patients had been in hospital for a considerable period of time and had therefore been included in successive censuses The findings of this sixth and last census continue to show differences between Black and minority ethnic groups and White groups and also differences within these groups
In particular ethnic differences in rates of admission detention under the Mental Health Act and seclusion ndash three of DRErsquos 12 goals ndash have not altered materially since the inception of DRE in 2005
bull Admission rates remain higher than average among minority ethnic groups especially among Black and WhiteBlack Mixed groups for whom rates were two or more times higher than average in 2010 The Other Black group continues to have the highest admission rate ndash six times higher than average ndash although this is lower than in 2005 In contrast admission rates have consistently been lower than average among the Indian and Chinese groups and about average in the Pakistani and Bangladeshi groups
bull Detention rates remain higher than average among the Black and WhiteBlack Caribbean Mixed groups and among the Other White group A consistent pattern across all censuses was the higher than average detention rate
under section 3741 for the Black Caribbean and Other Black groups We also found that rates for being placed on a CTO were higher among the South Asian and Black groups
bull Although there have been annual fluctuations in seclusion rates they have been higher than average for the Black WhiteBlack Mixed and Other White groups in at least three of the six censuses
Overall the level of provision of single sex areas for patients continues to be unsatisfactory although there was no evidence that minority ethnic patients were disadvantaged in these respects Government policy for the NHS in England now requires that all providers of NHS-funded care including mental health trusts are expected to eliminate mixed-sex accommodation in accordance with the guidance set out in CNO201032526 From 2011 all providers of NHS-funded care must report breaches of sleeping accommodation which will attract sanctions
Implications for ways forward
The census findings do not in themselves show that mental health and learning disability services are failing to meet the needs of Black and minority ethnic service users
As noted in previous reports they need to be interpreted in the context of available evidence on ethnic differences in rates of mental illness pathways to care and factors such as socioeconomic disadvantages that all contribute to these differences Our previous reports have consistently highlighted the need for prevention early intervention and working collaboratively across sectors to reduce the risk of admission and detention where possible without compromising the care given to patients Mental health services have a key role to play but to achieve this all statutory agencies and organisations outside the healthcare sector Black and minority ethnic communities and people who use services themselves will need to work in partnership
Care Quality Commission Count me in census 2010 42
Conclusions continued
This message ndash about preventing mental ill-health by addressing the contributory factors and intervening early ndash is at the heart of No health without mental health the Department of Healthrsquos new strategy for the future of mental health care in England27
The strategy aims to tackle the economic social and environmental determinants and consequences of mental health problems and to improve outcomes and reduce inequalities
It specifies that by 2014 people in contact with the criminal justice system will have improved access to mental health services as set out in the Ministry of Justice Green Paper Breaking the Cycle Effective punishment rehabilitation and sentencing of offenders which confirms the approach outlined in Lord Bradleyrsquos report for early intervention and diversion from custody2829
Accompanying the new strategy is a supporting document that explains how its objectives will improve mental health outcomes the effective interventions and the underpinning evidence base30
The strategy is complemented by other government proposals for reforms in the NHS public health and adult social care as outlined in the NHS White Paper Equity and excellence liberating the NHS31 the public health strategy Healthy lives healthy people32 and the adult social care strategy A vision for adult social care capable communities and active citizens 33 Three outcomes frameworks have been developed alongside these strategies improving mental health outcomes and reducing inequalities is integral to them all
In this new healthcare landscape the proposed NHS Commissioning Board and GP consortia will have a statutory obligation to promote equality and reduce inequalities in healthcare (something also enshrined in the Equality Act 2010) As the lead commissioners of healthcare services it will be up to GP consortia to assess with local authorities the needs of their local populations and commission the right services that meet their requirements
And the strengthened public health role of local authorities offers significant potential for addressing the socioeconomic disadvantages faced by Black and minority ethnic communities which add to the burden of mental illness in these communities
Race Equality Action Plan A five-year review looked back at the work of the DRE action plan and describes some of the key challenges successes and learning34 Based on the experience and outcome of the DRE programme the report suggests ways forward for the next stage of mental health strategy development and implementation
Since April 2009 CQC has had a duty under the Mental Health Act 1983 to monitor how services exercise their powers in relation to patients who are detained in hospital or subject to CTOs or guardianship under the Act In its first annual report on the use of the Act CQC recommends a number of areas where improvements are needed for example over-occupancy on inpatient wards patient engagement use of control and restraint seclusion and capacity and consent35
In particular CQC highlighted a number of issues relating to the use of CTOs including concern about appropriate usage (30 of the patients in CQCrsquos sample did not have a reported history of non-compliance or disengagement with services after discharge) and over-representation of Black and minority ethnic groups CQC advised that research on the possible race equality impact of CTOs should be undertaken There were 6237 CTOs from their introduction in November 2008 to 31 March 2010 a much greater use of them than forecast for this period by the Department of Health before the power was introduced Just 31 of these orders had ended by end March 2010 suggesting that some people are being kept on supervised community treatment for long periods
Care Quality Commission Count me in census 2010 43
Conclusions continued
Data in the future Moving beyond a one-day census
Good information is the foundation of an effective healthcare system It is imperative for ensuring that services meet the needs of local populations and are equitable and that improvements are made where needed The availability of fit-for-purpose and comprehensive patient-level data sets with ethnicity and other key variables fully coded is therefore vitally important36 It enables the care provided to patients of all ethnic backgrounds to be monitored on an ongoing basis including for monitoring compliance with the Equality Act
Race Equality Action Plan A five-year review notes that better collection monitoring and use of ethnicity data to inform commissioning and provision in health and social care is required37 Key areas include good ethnic monitoring improving demographic information and ensuring good links between infomatics audit and equality and diversity leads within trusts in order to effectively use the information to inform service development monitoring and review at board management ward and community levels
The governmentrsquos proposed changes to the NHS will be supported by an information revolution aimed at improving and extending the information available to the NHS patients and the public on the quality and outcomes of NHS services including by equality dimensions38
Having information that is fit for purpose is vital for the effective regulation of mental health and learning disability services CQC uses routinely available data sets on an ongoing basis to assess the performance of health and social care organisations and their compliance with government policies and legislation We therefore expect those who commission and provide mental healthcare in the NHS and independent sector to have information systems that provide good quality data with fully
comprehensive recording and monitoring of ethnicity on an ongoing basis
Since 2005 the Count me in census has played a key role in providing information about the ethnicity and other characteristics of inpatients in mental health and learning disability services and on patients subject to the Mental Health Act It did this by providing a valuable one-day snapshot But ethnicity recording must be seen as an all-year round statutory requirement not a one-day annual event The number of inpatients throughout the year is much higher than the counts on one day and some patients will have more than one admission And there is a need to move on from counting patients to understanding more about care pathways for Black and minority ethnic patients and the factors leading to hospital admission and detention
We have consistently highlighted the need for commissioners and providers to make full use of the Mental Health Minimum Data Set (MHMDS) ndash the statutory data set submitted by providers of specialist mental health services in England It provides rich data on these issues and provides a robust information source for ongoing ethnic monitoring after this last census
Covering both community and hospital services ndash and now independent and third sector providers as well as NHS ndash it includes a wide range of information about individual patients the services provided to those admitted to hospital and to the much larger number who donrsquot need admission to hospital and the outcomes of care And because it includes year-round activity it is more representative of the overall picture of for example admission detention and readmission rates length of stay years in psychiatric care and contacts with services and professionals
We call on the Information Centre to routinely publish data on all admissions and uses of the Mental Health Act including CTOs in England (in both NHS and independent healthcare providers) by the ethnicity of
Care Quality Commission Count me in census 2010 44
Conclusions continued
patients making the MHMDS the definitive source of information about mental health and learning disability patients This data should be risk-adjusted for age gender and other variables as appropriate to enable reliable comparisons to be made across groups
It is important that all providers ndash NHS and independent ndash make strenuous efforts to improve the quality of the data they submit The Information Centre publishes reports on the quality of MHMDS data by provider (see wwwicnhsukservices mhmdsdq) and we urge providers to monitor this information and use it to improve their data quality
If GP consortia and local authorities are to be effective in their needs assessment and commissioning roles the Information Centre needs to make available and promote to them the data from the MHMDS and other sources And researchers and academics must make full use of the MHMDS to explore the factors that underlie the observed ethnic patterns
CQCrsquos role
In the meantime CQC will continue to focus strongly on the quality of care provided by mental health and learning disability services
People who find themselves admitted to mental health services or detained under the Mental Health Act and therefore counted by the Count me in census are among the most mentally unwell people in our society Our job is first and foremost to make sure that the care they receive meets the essential standards of quality and safety set out under the Health and Social Care Act 2008 and to work with providers to ensure this We act swiftly when we find services that do not Where we find systemic problems that organisations have not adequately addressed we may impose conditions on the providerrsquos registration to bring about the change needed to improve patientsrsquo experience of care
The essential standards of quality and safety include the requirement to provide single sex accommodation and we will continue to closely check that these standards are met by all mental health services
We intend to introduce a number of indicators derived from the rich information in the MHMDS into our quality and risk profiles for providers This will put greater emphasis on the experience of Black and minority ethnic patients in our regulatory activity
We will monitor the quality of MHMDS data submitted by providers (as reported by the NHS Information Centre) including independent service providers Those with poor data quality may be considered at higher risk in terms of their quality of care
In addition we will continue to monitor the progress of services in relation to the issues raised in the census and other reports including our report on the use of the Mental Health Act through our visits to services and meetings with patients by our Mental Health Act Commissioners and second opinion appointed doctors (SOADs) We will draw on patientsrsquo experiences to monitor the operation of the Mental Health Act
We will also assess the impact of advice and use of Local HealthWatch Local HealthWatch will be in a good position to make sure that providers and commissioners are held to account on matters of choice and access to services for people from Black and minority ethnic groups
Care Quality Commission Count me in census 2010 45
References
1 Department of Health Equity and excellence liberating the NHS 2010
2 Department of Health The NHS outcomes framework 201112 2010
3 Healthcare Commission Mental Health Act Commission National Institute for Mental Health in England Count me in results of a national census of inpatients in mental health hospitals and facilities in England and Wales 2005
4 Healthcare Commission Mental Health Act Commission National Institute for Mental Health in England Count me in results of the 2006 national census of inpatients in mental health and learning disability services in England and Wales 2006
5 Healthcare Commission Mental Health Act Commission National Institute for Mental Health in England Count me in results of the 2007 national census of inpatients in mental health and learning disability services in England and Wales 2007
6 Healthcare Commission Mental Health Act Commission National Institute for Mental Health in England Count me in results of the 2008 national census of inpatients in mental health and learning disability services in England and Wales 2008
7 Care Quality Commission National Mental Health Development Unit Results of the 2009 national census of inpatients and patients on supervised community treatment in mental health and learning disability services in England and Wales 2009
8 Department of Health Delivering race equality in mental health care an action plan for reform inside and outside services 2005
9 Welsh Assembly Government Adult Mental Health Services Raising the standard ndash Race Equality Action Plan for Adult Mental Health Services in Wales 2006
10Department of Health No health without mental health a cross-government mental health outcomes strategy for people of all ages 2011 wwwdhgovukprod_consum_dhgroups dh_digitalassetsdocumentsdigitalasset dh_124058pdf
11Department of Health New horizons towards a shared vision for mental health 2009 wwwdhgovukprod_consum_dhgroups dh_digitalassetsdhendocumentsdigital assetdh_109708pdf
12Department of Health Valuing people a new strategy for learning disability for the 21st century 2001
13Department of Health Valuing people now a new three year strategy for people with learning disabilities 2009
14Department of Health Healthcare for all report of the independent inquiry into access to healthcare for people with learning disabilities 2008
15Joint Committee on Human Rights A life like any other human rights of adults with learning disabilities (2008 HL Paper 401 HC 731) House of Lords House of Commons 2008
16Department of Health Valuing people now summary report March 2009 ndash September 2010 2010
17Disability Rights Commission Equal treatment investigation 2005
18Department of Health Mir G Nocon A Ahmad W Jones L Learning difficulties and ethnicity 2000
19ONS experimental population estimates by ethnic group 2007 wwwstatisticsgovukstatbase productaspvlnk=14238
Care Quality Commission Count me in census 2010 46
References continued
20Six percent of population are gay or lesbian according to Whitehall figures 2005 wwwtelegraphcouknewsmainjhtmlxml= news20051212ngay12xmlamps Sheet= news20051212ixhomehtml
21Department of Trade and Industry Amendment to Employment Equality (Sexual Orientation) Regulations 2003 2003
22Office for National Statistics Measuring sexual identity an evaluation report 2010
23 Information Centre Mental Health Bulletin Fourth report from Mental Health Minimum Dataset (MHMDS) annual returns 2010 2011 wwwicnhsukpubsmhbmhmds0910
24 Information Centre Mental Health Bulletin Fourth report from Mental Health Minimum Dataset (MHMDS) annual returns 2010 2011 wwwicnhsukpubsmhbmhmds0910
25The operating framework for the NHS in England 201112 Department of Health 2010 wwwdhgovukprod_consum_dhgroups dh_digitalassetsdhenpsdocuments digitalassetdh_122736pdf
26wwwdhgovukenPublicationsandstatistics LettersandcircularsProfessionalletters ChiefnursingofficerlettersDH_121848
27Department of Health No health without mental health a cross-government mental health outcomes strategy for people of all ages 2011 wwwdhgovukprod_consum_dhgroups dh_digitalassetsdocumentsdigitalasset dh_124058pdf
28Ministry of Justice Breaking the cycle effective punishment rehabilitation and sentencing of offenders 2010
29Department of Health The Bradley report Lord Bradleyrsquos review of people with mental health problems or learning disabilities in the criminal justice system 2009
30Department of Health No health without mental health delivering better mental health outcomes for people of all ages 2011
31Department of Health Equity and excellence liberating the NHS 2010 wwwdhgovukprod_ consum_dhgroupsdh_digitalassetsdhen psdocumentsdigitalassetdh_117794pdf
32Department of Health Healthy lives healthy people our strategy for public health in England 2010 wwwdhgovukprod_consum_dh groupsdh_digitalassetsdhenps documentsdigitalassetdh_122347pdf
33Department of Health A vision for adult social care capable communities and active citizens 2010 wwwdhgovukprod_consum_dh groupsdh_digitalassetsdhenps documentsdigitalassetdh_121971pdf
34Wilson M NMHDU Race equality action plan a five year review Delivering race equality in mental health care 2010 wwwnmhduorgukour-workmhep
35Care Quality Commission Monitoring the use of the Mental Health Act in 200910 2010
36Raleigh V S Collection of data on ethnic origin in England Editorial BMJ 20083376456
37Wilson M NMHDU Race equality action plan a five year review Delivering race equality in mental health care 2010 wwwnmhduorgukour-workmhep
38Department of Health Liberating the NHS an information revolution 2010
Care Quality Commission Count me in census 2010 47
Appendix A Methods of analysis
Standardisation by age and gender
Standardisation allows us to make comparisons between groups of the population by taking account of variations in age and gender Some differences in patterns of service use are related to the age or gender of the people using them so adjustments to the data have to be made to ensure that the interpretation of ethnic differences is reliable For example formal admissions are higher at a younger age so some Black and minority ethnic groups may have high formal admission rates simply because they have a high proportion of younger people Without adjustments for age and gender differences comparisons would be misleading
In this report most results are standardised for age and gender including those relating to admission detention source of referral care programme approach seclusion restraint accidents assault self-harm consent and presence on a secure ward The report uses the accepted statistical method of taking account of age and gender differences between groups when calculating these rates
We used the ONS estimates of total population by ethnic group for England and Wales in 2007 to standardise the rates of admission for different ethnic groups This takes account of the significant rises in the Black and ethnic minority population of England and Wales since the 2001 ONS census and hence gives more accurate and up to date estimates of admission ratios for different ethnic groups (although it does not take account of any further changes in the ethnic populations between 2007 and 2010 the date of this census) For comparison with the DRE baseline we also present admission rates from the 2005 census derived using the 2005 ONS estimates of populations by ethnic group These figures will not be the same as published in the 2005 census report which were based on the 2001 ONS census population estimates because updated estimates of populations by ethnic group were not available at that time
For other analyses we used the total number of inpatients and patients on CTOs in the census
as the basis for standardisation However CTO outpatients are excluded from selected analyses where appropriate namely the analysis of rates for admissions detentions on admission source of referral single sex accommodation and recorded incidents of seclusion restraint accidents assault and self-harm We used the statistical package STATA version 82 to derive the standardised results
It was not possible to adjust the analyses for ethnic differences in social and economic factors and in diagnosis and severity of illness Such factors could affect the ethnic differences observed in the results
For descriptive variables such as religion and language we did not use standardisation
Confidence intervals as indicators of significant statistical differences
For all standardised results the national rates for England and Wales are taken as 100 and the usual 95 confidence intervals are given Rates of less than 100 or greater than 100 for specific ethnic groups show a lower or higher rate respectively than the national average after adjusting for age and gender Whether or not the difference is statistically significant from the national average depends on the confidence interval If the confidence interval overlaps 100 the difference from the national average is not statistically significant If both values are lower or higher than 100 it indicates that the difference compared with the national average is statistically significant at the 95 level
For example if a rate is 110 with the lower confidence interval being 105 and the upper confidence interval being 115 it indicates that the 10 excess over the national average of 100 is statistically significant But if a ratio is 110 with the lower confidence interval being 95 and the upper confidence interval being 125 it indicates that the 10 excess over the national average is not statistically significant We did not attempt to adjust the confidence intervals for multiple comparisons
Care Quality Commission Count me in census 2010 48
Appendix B Mental health tables
Table B1 Standardised admission ratios by ethnic group for England and Wales (excluding outpatients on a CTO) using 2007 ONS census population denominators (England and Wales = 100) All ages
Ethnic group
Men Women Persons Standardised
admission ratio
95 confidence
interval Observed numbers
Standardised admission
ratio
95 confidence
interval Observed numbers
Standardised admission
ratio
95 confidence
interval Observed numbers
White British 88 86 89 12435 94 93 96 10157 91 89 92 22592 White Irish 130 115 146 274 122 106 140 215 126 115 138 489 Other White 117 109 126 731 129 118 141 533 122 115 129 1264 White and Black Caribbean 557 493 627 276 274 223 333 101 436 393 483 377 White and Black African 312 247 388 80 259 186 351 41 292 242 349 121 White and Asian 140 110 174 79 124 90 166 44 134 111 159 123 Other Mixed 230 189 278 108 213 165 270 67 223 192 259 175 Indian 67 59 75 286 66 56 76 172 66 60 73 458 Pakistani 105 93 119 269 65 53 79 96 91 81 100 365 Bangladeshi 123 102 147 120 82 60 109 46 108 92 126 166 Other Asian 161 139 185 192 136 107 169 79 153 135 172 271 Black Caribbean 538 505 572 980 306 277 336 418 438 415 462 1398 Black African 246 226 267 550 219 194 247 277 236 221 253 827 Other Black 792 691 903 222 314 240 403 61 596 529 670 283 Chinese 27 20 38 39 43 30 59 35 33 26 41 74 Other 140 120 162 177 110 88 136 87 128 113 145 264 Total 100 16818 100 12429 100 29247
Care Quality Commission Count me in census 2010 49
Appendix B Mental health tables continued
Table B2 Standardised admission ratios by ethnic group for England and Wales (excluding outpatients on a CTO) using 2007 ONS census population denominators (England amp Wales = 100) Ages 65 and over
Ethnic group
Men Women Persons Standardised
admission ratio
95 confidence
interval Observed numbers
Standardised admission
ratio
95 confidence
interval Observed numbers
Standardised admission
ratio
95 confidence
interval Observed numbers
White British 95 92 99 3265 95 92 98 3887 95 93 97 7152 White Irish 142 116 172 106 102 82 125 92 120 104 138 198 Other White 207 174 244 141 213 183 248 171 210 188 235 312 White and Black Caribbean 406 210 710 12 333 152 632 9 371 230 568 21 White and Black African 231 28 836 2 198 24 714 2 213 58 546 4 White and Asian 28 1 156 1 110 30 281 4 69 23 162 5 Other Mixed 146 40 374 4 228 92 470 7 189 95 339 11 Indian 97 70 132 41 83 57 116 33 90 71 113 74 Pakistani 39 17 77 8 46 18 94 7 42 23 69 15 Bangladeshi 115 53 218 9 69 14 201 3 98 51 172 12 Other Asian 234 143 361 20 215 120 354 15 225 157 313 35 Black Caribbean 216 170 269 77 310 253 376 103 261 224 302 180 Black African 142 73 248 12 365 241 531 27 246 175 337 39 Other Black 164 34 479 3 366 134 796 6 259 119 493 9 Chinese 41 8 120 3 95 38 195 7 68 33 125 10 Other 253 126 453 11 390 238 602 20 327 222 464 31 Total 100 3715 100 4393 100 8108
Care Quality Commission Count me in census 2010 50
Appendix B Mental health tables continued
Table B3 Standardised ratios by ethnic group for patients referred by a GP (England and Wales = 100)
Ethnic group
Men Women Persons Standardised
referral ratio
95 confidence
interval Observed numbers
Standardised referral ratio
95 confidence
interval Observed numbers
Standardised referral ratio
95 confidence
interval Observed numbers
White British 110 103 117 904 107 101 114 1065 108 104 113 1969 White Irish 85 50 134 18 93 57 144 20 89 63 123 38 Other White 74 51 103 33 70 49 97 36 72 56 91 69 White and Black Caribbean 27 5 78 3 30 4 109 2 28 9 65 5 White and Black African 0 0 74 9 268 2 35 4 125 2 White and Asian 165 54 386 5 0 0 86 28 201 5 Other Mixed 48 6 172 2 68 14 198 3 58 19 136 5 Indian 69 34 123 11 79 39 141 11 73 46 111 22 Pakistani 88 42 162 10 59 16 151 4 77 42 130 14 Bangladeshi 81 22 207 4 61 7 221 2 73 27 159 6 Other Asian 80 32 166 7 108 43 223 7 92 50 155 14 Black Caribbean 35 20 56 17 37 20 62 14 36 24 51 31 Black African 57 29 100 12 66 35 113 13 61 40 91 25 Other Black 62 23 135 6 40 5 144 2 54 23 107 8 Chinese 56 1 314 1 139 38 356 4 108 35 251 5 Other 106 46 208 8 0 0 53 23 105 8 Total 100 1041 100 1185 100 2226
Care Quality Commission Count me in census 2010 51
Appendix B Mental health tables continued
Table B4 Standardised ratios by ethnic group for patients referred by a community mental health team (including crisis resolution home treatment) or community learning disability team (England and Wales = 100)
Ethnic group
Men Women Persons Standardised
referral ratio
95 confidence
interval Observed numbers
Standardised referral ratio
95 confidence
interval Observed numbers
Standardised referral ratio
95 confidence
interval Observed numbers
White British 107 104 111 3255 103 100 107 3386 105 103 108 6641 White Irish 90 69 116 61 89 68 114 61 90 74 107 122 Other White 59 48 71 105 79 67 94 141 69 61 78 246 White and Black Caribbean 106 83 135 68 75 49 111 25 96 77 117 93 White and Black African 43 19 84 8 66 30 124 9 52 31 84 17 White and Asian 95 56 150 18 84 43 147 12 90 61 129 30 Other Mixed 78 48 121 20 72 41 118 16 76 53 105 36 Indian 106 83 132 76 100 76 130 56 103 86 122 132 Pakistani 108 84 135 73 89 60 128 30 102 83 123 103 Bangladeshi 98 66 141 29 90 50 148 15 95 69 128 44 Other Asian 88 63 120 40 105 70 150 29 94 73 119 69 Black Caribbean 69 59 80 167 85 71 102 123 75 67 84 290 Black African 84 70 102 112 82 65 103 77 84 72 96 189 Other Black 52 36 74 31 64 36 106 15 56 41 74 46 Chinese 112 53 205 10 101 52 176 12 105 66 160 22 Other 86 60 120 35 106 71 151 30 94 73 120 65 Total 100 4108 100 4037 100 8145
Care Quality Commission Count me in census 2010 52
Appendix B Mental health tables continued
Table B5 Standardised ratios by ethnic group for patients referred by criminal justice routes (police prison probation courts court liaison and diversion) (England and Wales = 100)
Ethnic group
Men Women Persons Standardised
referral ratio
95 confidence
interval Observed numbers
Standardised referral ratio
95 confidence
interval Observed numbers
Standardised referral ratio
95 confidence
interval Observed numbers
White British 90 86 95 1495 95 86 104 421 91 87 95 1916 White Irish 133 94 183 38 59 19 138 5 116 84 157 43 Other White 112 93 134 119 103 68 150 27 111 93 130 146 White and Black Caribbean 117 89 151 58 145 69 266 10 120 94 153 68 White and Black African 190 127 273 29 141 38 361 4 183 126 256 33 White and Asian 75 39 131 12 160 52 373 5 89 52 143 17 Other Mixed 104 65 157 22 151 61 311 7 112 75 161 29 Indian 86 61 118 38 79 32 163 7 85 62 113 45 Pakistani 118 91 150 65 89 33 194 6 115 90 145 71 Bangladeshi 74 44 115 19 29 1 162 1 68 42 105 20 Other Asian 130 95 174 45 164 71 323 8 134 101 176 53 Black Caribbean 131 114 150 208 124 81 181 26 130 114 148 234 Black African 132 112 156 145 143 93 211 25 134 114 156 170 Other Black 141 109 180 65 236 113 435 10 149 117 187 75 Chinese 83 27 194 5 146 30 426 3 99 43 195 8 Other 129 93 175 41 113 37 264 5 127 93 170 46 Total 100 2404 100 570 100 2974
Care Quality Commission Count me in census 2010 53
Appendix B Mental health tables continued
Table B6 Standardised detention ratios by ethnic group all detentions on day of admission (excluding outpatients on a CTO) (England and Wales = 100)
Ethnic group
Men Women Persons Standardised
detention ratio
95 confidence
interval Observed numbers
Standardised detention
ratio
95 confidence
interval Observed numbers
Standardised detention
ratio
95 confidence
interval Observed numbers
White British 94 92 97 6449 94 91 97 3628 94 92 96 10077 White Irish 112 95 131 154 118 96 145 94 114 101 129 248 Other White 108 98 118 451 120 106 136 251 112 104 120 702 White and Black Caribbean 123 107 141 220 129 99 167 59 124 110 140 279 White and Black African 128 99 162 68 113 70 173 21 124 100 153 89 White and Asian 96 71 126 50 109 68 164 22 99 78 125 72 Other Mixed 115 92 143 82 139 100 188 42 122 102 146 124 Indian 97 83 113 164 110 86 137 77 101 88 114 241 Pakistani 109 94 126 194 102 74 136 44 108 94 122 238 Bangladeshi 86 67 109 69 91 55 142 19 87 70 107 88 Other Asian 109 92 130 133 120 86 163 40 112 96 130 173 Black Caribbean 129 121 139 774 143 125 162 238 132 124 141 1012 Black African 115 104 127 422 131 111 153 159 119 110 129 581 Other Black 117 100 136 170 148 105 202 39 122 106 140 209 Chinese 108 71 159 26 129 78 202 19 116 85 156 45 Other 111 92 132 126 116 83 157 41 112 96 130 167 Total 100 9552 100 4793 100 14345
Care Quality Commission Count me in census 2010 54
Appendix B Mental health tables continued
Table B7 Standardised detention ratios by ethnic group detention on day of admission ndash section 2 of the Mental Health Act (England and Wales = 100)
Ethnic group
Men Women Persons Standardised
detention ratio
95 confidence
interval Observed numbers
Standardised detention
ratio
95 confidence
interval Observed numbers
Standardised detention
ratio
95 confidence
interval Observed numbers
White British 97 91 102 1156 93 87 98 1133 95 91 99 2289 White Irish 78 47 120 20 116 79 166 30 97 72 128 50 Other White 100 78 126 70 134 108 166 88 116 99 136 158 White and Black Caribbean 55 30 93 14 60 24 124 7 57 35 87 21 White and Black African 91 37 188 7 150 60 308 7 113 62 190 14 White and Asian 80 29 174 6 119 44 258 6 96 49 167 12 Other Mixed 68 28 141 7 116 53 221 9 89 51 145 16 Indian 130 91 179 37 124 81 182 26 127 98 163 63 Pakistani 126 87 176 34 138 79 225 16 130 96 171 50 Bangladeshi 166 101 256 20 140 61 276 8 158 105 228 28 Other Asian 142 93 209 26 163 93 264 16 150 108 202 42 Black Caribbean 73 57 92 70 97 72 128 51 82 68 98 121 Black African 164 131 202 87 190 146 244 62 174 147 204 149 Other Black 114 75 166 27 140 72 245 12 121 86 165 39 Chinese 165 60 358 6 212 97 402 9 190 106 313 15 Other 218 153 302 36 179 108 280 19 203 153 264 55 Total 100 1623 100 1499 100 3122
Care Quality Commission Count me in census 2010 55
Appendix B Mental health tables continued
Table B8 Standardised detention ratios by ethnic group detention on day of admission ndash section 3 of the Mental Health Act (England and Wales = 100)
Ethnic group
Men Women Persons Standardised
detention ratio
95 confidence
interval Observed numbers
Standardised detention
ratio
95 confidence
interval Observed numbers
Standardised detention
ratio
95 confidence
interval Observed numbers
White British 99 95 103 2684 96 91 100 1852 98 95 101 4536 White Irish 116 89 149 60 135 101 177 52 124 102 149 112 Other White 112 96 129 186 110 92 132 121 111 99 124 307 White and Black Caribbean 114 91 143 79 130 90 183 33 119 98 143 112 White and Black African 97 60 148 21 107 54 192 11 100 69 141 32 White and Asian 84 50 133 18 97 48 173 11 89 59 127 29 Other Mixed 121 84 168 35 117 72 181 20 120 90 156 55 Indian 96 75 122 67 110 79 148 42 101 83 122 109 Pakistani 91 71 115 69 88 55 134 22 90 73 111 91 Bangladeshi 63 39 95 22 64 28 127 8 63 43 90 30 Other Asian 90 65 120 44 94 56 149 18 91 70 117 62 Black Caribbean 116 102 130 279 164 138 192 148 129 117 142 427 Black African 95 80 112 143 102 79 129 68 97 85 111 211 Other Black 75 55 99 49 99 58 159 17 80 62 102 66 Chinese 119 59 213 11 99 43 194 8 110 66 171 19 Other 85 60 116 38 84 48 136 16 84 63 110 54 Total 100 3805 100 2447 100 6252
Care Quality Commission Count me in census 2010 56
Appendix B Mental health tables continued
Table B9 Standardised detention ratios by ethnic group detention on day of admission ndash section 3741 of the Mental Health Act (England and Wales = 100)
Ethnic group
Men Women Persons Standardised
detention ratio
95 confidence
interval Observed numbers
Standardised detention
ratio
95 confidence
interval Observed numbers
Standardised detention
ratio
95 confidence
interval Observed numbers
White British 84 79 89 991 101 88 115 220 86 82 91 1211 White Irish 140 96 198 32 48 6 175 2 126 87 176 34 Other White 112 89 139 81 156 95 241 20 118 96 144 101 White and Black Caribbean 177 133 232 53 179 66 390 6 178 135 229 59 White and Black African 149 82 251 14 224 46 654 3 159 92 254 17 White and Asian 141 75 241 13 195 40 569 3 149 85 241 16 Other Mixed 144 85 227 18 264 97 575 6 162 104 242 24 Indian 86 56 126 26 44 5 160 2 80 53 116 28 Pakistani 122 87 166 40 0 0 111 79 152 40 Bangladeshi 66 32 122 10 0 0 60 29 110 10 Other Asian 99 61 151 21 0 0 89 55 136 21 Black Caribbean 200 174 229 210 78 34 153 8 189 165 216 218 Black African 127 101 157 82 84 34 172 7 122 98 150 89 Other Black 152 110 205 43 94 11 341 2 148 108 198 45 Chinese 100 27 255 4 0 0 80 22 204 4 Other 118 75 177 23 44 1 245 1 110 71 164 24 Total 100 1661 100 280 100 1941
Care Quality Commission Count me in census 2010 57
Appendix B Mental health tables continued
Table B10 Standardised detention ratios by ethnic group detention on day of admission ndash sections 47 48 4749 of the Mental Health Act (England and Wales = 100)
Ethnic group
Men Women Persons Standardised
detention ratio
95 confidence
interval Observed numbers
Standardised detention
ratio
95 confidence
interval Observed numbers
Standardised detention
ratio
95 confidence
interval Observed numbers
White British 97 90 106 583 104 81 131 73 98 91 106 656 White Irish 132 72 221 14 163 20 590 2 135 77 219 16 Other White 130 96 172 49 71 15 206 3 124 93 163 52 White and Black Caribbean 126 78 193 21 80 2 444 1 123 77 186 22 White and Black African 207 103 370 11 0 0 189 95 339 11 White and Asian 57 12 166 3 169 4 941 1 68 19 175 4 Other Mixed 112 48 221 8 233 28 843 2 125 60 230 10 Indian 57 26 108 9 0 252 0 52 24 99 9 Pakistani 92 54 147 17 0 314 0 86 50 138 17 Bangladeshi 46 12 117 4 167 4 930 1 53 17 125 5 Other Asian 101 52 177 12 0 0 95 49 166 12 Black Caribbean 126 98 159 70 125 34 319 4 126 99 158 74 Black African 74 48 107 27 104 21 303 3 76 51 108 30 Other Black 127 78 197 20 138 3 769 1 128 79 195 21 Chinese 0 0 0 0 0 0 Other 83 38 157 9 0 0 77 35 147 9 Total 100 857 100 91 100 948
Care Quality Commission Count me in census 2010 58
Appendix B Mental health tables continued
Table B11 Standardised ratios for all applications of the Mental Health Act (including outpatients on a CTO) by ethnic group on day of census (England and Wales = 100)
Ethnic group
Men Women Persons Standardised
ratio for all MHA
applications
95 confidence
interval Observed numbers
Standardised ratio for all MHA
applications
95 confidence
interval Observed numbers
Standardised ratio for all MHA
applications
95 confidence
interval Observed numbers
White British 97 94 99 7659 95 93 98 4335 96 94 98 11994 White Irish 99 83 116 147 104 84 128 95 101 89 114 242 Other White 87 79 95 427 97 85 110 249 90 84 97 676 White and Black Caribbean 117 103 133 245 130 103 163 76 120 107 134 321 White and Black African 120 95 150 79 93 58 141 22 113 92 137 101 White and Asian 101 78 128 65 119 81 169 31 106 86 129 96 Other Mixed 110 89 134 96 125 93 165 49 114 97 135 145 Indian 103 90 118 215 122 100 147 109 109 97 121 324 Pakistani 111 97 125 254 117 90 148 67 112 100 125 321 Bangladeshi 92 75 112 97 101 68 145 29 94 78 112 126 Other Asian 103 88 121 152 126 95 164 56 109 94 124 208 Black Caribbean 123 115 131 893 141 126 158 300 127 120 134 1193 Black African 112 103 122 511 121 104 140 188 114 106 123 699 Other Black 116 102 132 232 148 112 191 59 122 108 136 291 Chinese 97 64 140 27 101 61 157 19 98 72 131 46 Other 104 87 122 140 103 75 137 46 103 89 119 186 Total 100 11239 100 5730 100 16969
Care Quality Commission Count me in census 2010 59
Appendix B Mental health tables continued
Table B12 Standardised CTO ratios by ethnic group CTOs on day of census ndash section 17a of the Mental Health Act (England and Wales = 100)
Ethnic group
Men Women Persons
Standardised CTO ratio
95 confidence
interval Observed numbers
Standardised CTO ratio
95 confidence
interval Observed numbers
Standardised CTO ratio
95 confidence
interval Observed numbers
White British 94 89 99 1289 88 82 94 730 92 88 96 2019 White Irish 51 27 88 13 77 41 132 13 62 40 90 26 Other White 97 77 120 83 125 95 162 58 107 90 126 141 White and Black Caribbean 79 53 113 29 141 77 237 14 92 67 124 43 White and Black African 111 59 190 13 125 41 292 5 115 68 181 18 White and Asian 104 54 182 12 136 50 297 6 113 67 178 18 Other Mixed 102 59 166 16 136 62 257 9 112 73 166 25 Indian 134 99 177 48 152 98 226 24 139 109 175 72 Pakistani 145 110 187 59 174 101 279 17 151 119 189 76 Bangladeshi 142 93 206 27 205 99 378 10 155 109 213 37 Other Asian 107 71 155 28 182 99 305 14 124 89 168 42 Black Caribbean 121 103 142 152 171 132 218 65 133 116 152 217 Black African 116 94 142 94 139 98 192 37 122 102 145 131 Other Black 186 144 238 65 305 189 466 21 206 165 254 86 Chinese 83 23 213 4 152 49 354 5 111 51 211 9 Other 87 54 134 21 152 79 266 12 103 71 145 33 Total 100 1953 100 1040 100 2993
Care Quality Commission Count me in census 2010 60
Appendix C Learning disability tables
Table C1 Standardised admission ratios by ethnic group for England and Wales using 2007 ONS population denominators (England amp Wales = 100) All ages
Ethnic group
Men Women Persons Standardised
admission ratio
95 confidence
interval Observed numbers
Standardised admission
ratio
95 confidence
interval Observed numbers
Standardised admission
ratio
95 confidence
interval Observed numbers
White British 104 100 109 2163 108 101 115 941 105 102 109 3104 White Irish 108 72 156 28 151 89 238 18 121 89 162 46 Other White 81 65 101 85 49 30 75 21 72 59 87 106 White and Black Caribbean 280 186 405 28 246 118 453 10 270 191 371 38 White and Black African 102 33 239 5 165 34 482 3 119 51 235 8 White and Asian 66 26 135 7 154 56 335 6 89 47 152 13 Other Mixed 181 104 295 16 229 99 451 8 195 125 290 24 Indian 32 21 48 24 28 12 55 8 31 21 44 32 Pakistani 48 30 72 22 12 1 43 2 38 25 57 24 Bangladeshi 102 60 161 18 31 4 113 2 83 51 128 20 Other Asian 33 13 69 7 92 34 201 6 47 25 81 13 Black Caribbean 265 210 332 77 117 67 190 16 218 176 267 93 Black African 53 33 80 22 40 15 87 6 50 33 72 28 Other Black 228 118 399 12 134 28 392 3 200 112 330 15 Chinese 4 0 21 1 3 0 16 1 Other 26 9 56 6 11 0 59 1 21 9 44 7 Total 100 2521 100 1051 100 3572
Care Quality Commission Count me in census 2010 61
Appendix C Learning disability tables continued
Table C2 Standardised detention ratios by ethnic group all detentions on day of admission (England and Wales = 100)
Ethnic group
Persons Standardised
detention ratio
95 confidence
interval Observed numbers
White British 97 93 103 1431 White Irish 127 84 184 28 Other White 117 91 149 68 White and Black Caribbean 120 77 179 24 White and Black African 114 37 267 5 White and Asian 75 24 176 5 Other Mixed 94 49 165 12 Indian 119 72 186 19 Pakistani 110 61 181 15 Bangladeshi 144 84 231 17 Other Asian 59 16 150 4 Black Caribbean 119 90 155 57 Black African 138 85 210 21 Other Black 62 20 145 5 Chinese 0 0 Other 104 28 267 4 Total 100 1715
Care Quality Commission Count me in census 2010 62
copy Care Quality Commission and National Mental Health Development Unit 2011 Published April 2011
This publication may be reproduced in whole or in part in any format or medium for non-commercial purposes provided that it is reproduced accurately and not used in a derogatory manner or in a misleading context The source should be acknowledged by showing the publication title and copy Care Quality Commission and National Mental Health Development Unit 2011
How to contact us
Phone 03000 616161 Email enquiriescqcorguk Web wwwcqcorguk
Write to us at Care Quality Commission National Correspondence Citygate Gallowgate Newcastle upon Tyne NE1 4PA
Please contact us if you would like a summary of this publication in other formats or languages
Registered office Care Quality Commission Finsbury Tower 103ndash105 Bunhill Row London EC1Y 8TG
- Count me in 2010
- About the Care Quality Commission
- Contents
- Summary
- National organisations coordinating the census
- Introduction
- Data methods of analysis and interpretation
- Results mental health
- A comparison between the 2005 baseline and the 2010 census
- Results learning disabilities
- Data in the future Moving beyond a one-day census
- Conclusions
- References
- Appendix A Methods of analysis
- Appendix B Mental health tables
- Appendix C Learning disability tables
- How to contact us
-
Results mental health continued
As in the previous censuses patients from Black and minority ethnic groups were concentrated in a relatively small number of organisations 70 were patients in 25 of the 261 organisations that took part in the census Of all organisations 194 had fewer than 50 patients from Black and minority ethnic groups each and another 32 organisations had no patients at all from these groups
Reporting of ethnicity
Eighty-one per cent of patients reported their own ethnic group Where patients did not do so staff or relatives did so on their behalf (10 and 6 respectively) We cannot be certain that ethnicity was recorded accurately for these patients The proportion of patients who reported their own ethnicity ranged from about 81 in the White groups to 90 in the WhiteBlack African Mixed group
Care Quality Commission Count me in census 2010 16
Results mental health continued
Age and gender
Ethnic differences in the age profiles of patients largely reflect the age profiles of different minority ethnic populations The White British White Irish and Other White populations have an older age structure than other minority ethnic populations and therefore patients from the White groups are significantly older than patients from other ethnic groups (see Table 3)
Overall 58 of patients were men Men outnumbered women in all ethnic groups (see Table 3) The White British White Irish Other White and Chinese groups had smaller differences in the proportions of men and women compared with other ethnic groups
Table 3 Age and gender of patients
Ethnic group Age () Gender ()
Total (n) 0-17 18-24 25-49 50-64 65+ Men Women
White British 1 7 41 20 31 56 44 100 (24593)
White Irish 0 4 36 19 41 56 44 100 (514)
Other White 2 7 47 19 25 58 42 100 (1407) White and Black Caribbean 1 13 68 12 5 73 27 100 (418)
White and Black African 1 13 73 9 4 67 33 100 (139)
White and Asian 4 18 63 11 5 65 35 100 (141)
Other Mixed 2 13 69 11 6 62 38 100 (200)
Indian 1 4 58 21 15 63 37 100 (529)
Pakistani 2 10 73 12 4 74 26 100 (440)
Bangladeshi 2 15 69 8 6 72 28 100 (203)
Other Asian 2 12 61 13 13 70 30 100 (311)
Black Caribbean 1 6 61 20 13 70 30 100 (1608)
Black African 1 10 75 9 5 67 33 100 (957)
Other Black 1 6 78 11 3 78 22 100 (368)
Chinese 2 10 59 17 12 52 48 100 (83)
Other 2 12 57 18 11 67 33 100 (296)
1 7 46 19 27 58 42 100 Total (n=
471) (n=
2352) (n=
14998) (n=
6093) (n=
8885) (n=
19071) (n=
13684) (n=
32799)
Care Quality Commission Count me in census 2010 17
Results mental health continued
Language and religion
Similar to previous censuses 5 of patients reported that their first language was not English (see Table 4) The Chinese and Bangladeshi groups had the highest proportions of patients whose first language was not English (51 and 46 respectively) Among the Other White group 27 had a first language other than English Again similar to previous censuses about 2 of patients said they needed an interpreter and of these 24 were from the White British group
Table 4 Percentage of patients with a first language other than English
Ethnic group with first language other than English
White British 1
White Irish 3
Other White 27
White and Black Caribbean 2
White and Black African 10
White and Asian 6
Other Mixed 11
Indian 26
Pakistani 35
Bangladeshi 46
Other Asian 34
Black Caribbean 2
Black African 22
Other Black 13
Chinese 51
Other 41
Total 5
Care Quality Commission Count me in census 2010 18
Results mental health continued
Religion was not stated for 21 of patients and 15 of patients said they had no religion The proportions stating they did not have a religion were highest among the WhiteBlack Caribbean and WhiteAsian Mixed groups (23 and 21 respectively) and lowest among the South Asian groups (4) Table 5 shows the religion of patients
Table 5 Religion of patients by ethnic group
Ethnic group
Religion and faith groups ()
None Christian Buddhist Hindu Jewish Muslim Sikh Any other religion
Not stated
White British 16 58 1 0 1 0 0 3 21
White Irish 8 73 0 0 0 5 13
Other White 13 53 1 0 3 5 7 18 White and Black Caribbean 23 47 0 1 0 3 7 17
White and Black African 16 41 1 1 15 6 20
White and Asian 21 33 1 1 21 3 3 18
Other Mixed 15 41 3 3 16 8 17
Indian 5 10 0 29 15 28 2 11
Pakistani 4 3 0 1 1 80 1 2 10
Bangladeshi 4 1 1 1 76 1 5 11
Other Asian 6 14 5 12 39 5 3 16
Black Caribbean 12 59 1 0 0 2 8 17
Black African 10 45 0 0 22 0 3 19
Other Black 12 41 1 1 0 16 7 22
Chinese 18 30 16 1 4 31
Other 8 24 3 1 3 34 6 21
Total 15 54 1 1 1 4 1 4 21
Care Quality Commission Count me in census 2010 19
Results mental health continued
Sexual orientation
The results for sexual orientation were not valid for 1 of patients and for 20 the response was recorded as ldquonot knownrdquo Seventy-six per cent of patients said they were heterosexual 1 said gay lesbian 1 said bisexual and less than 1 said ldquootherrdquo The number of minority ethnic patients who were gaylesbian or bisexual was very low
The overall figure of 1 who said they were gay lesbian or bisexual is lower than some estimates of the proportions of gaylesbian or bisexual people in the general population (5 to 7)2021 However in the 200910 Integrated Household Survey of a representative sample of 238206 people in UK conducted by the Office for National Statistics 1 identified themselves as gay or lesbian 05 as bisexual 05 as ldquootherrdquo 3 responded as ldquodo not knowrdquo or refused to answer and 95 identified themselves as heterosexualstraight22
Disability
About 75 of patients said they did not have a disability and 25 said they had one or more disabilities Of these 7 were blind or visually impaired 1 were deaf or had a hearing impairment 1 had Autistic Spectrum Disorder 2 had a learning disability 4 had a mobility impairment and 2 used a wheelchair The remaining 8 had more than one disability The proportion of patients with a disability was highest among the White British White Irish and Other White groups (about 28) which could reflect the higher age profiles of these patients compared with other ethnic groups
Rates of admission (see section on interpreting the results on page 13)
The rates of admission derived using the 2007 ONS ethnic population estimates as denominators are given in Appendix B Tables B1 (all ages) and B2 (ages 65 and over) Outpatients on a CTO are excluded from these results
All ages Admission rates were lower than average for patients from the White British Indian and Chinese groups and were average for the Pakistani and Bangladeshi groups Rates were higher than average for other minority ethnic groups they were particularly high for the Black Caribbean Black African WhiteBlack Caribbean Mixed and WhiteBlack African Mixed groups who had rates two to four times higher than average and for the Other Black group with a rate six times higher
Ages 65 and over Age-standardised admission rates for minority ethnic groups at older ages show broadly similar patterns to those reported for all ages with rates two to three times higher than average among the Black and White Black Mixed groups Rates were high also in the White Irish Other White Other Asian and Other groups
Numbers of older Black and minority ethnic patients were too few in most ethnic groups to support analyses of subgroups within them for example those detained
Care Quality Commission Count me in census 2010 20
Results mental health continued
Source of referral
People can be referred to healthcare services in a number of ways Referrals for inpatient care often come from community mental health teams rather than the original source such as GPs and accident and emergency (AampE) departments Therefore referrals from these teams may include referrals from other sources Furthermore about a quarter of patients (26) were referred from tertiary care and information about their original referral source was not available We had no information about the source of referral for 13 of patients The results reflect the proportions of patients from each ethnic group that are referred from each source so a higher proportion of referrals from one source will inevitably mean that proportions from other referral sources are lower Outpatients on a CTO are excluded from these data
The referral patterns are broadly similar to those reported previously and the key results are presented below
GP referrals 7 of patients Rates were 8 higher than average among the White British group They were lower than average among the Other White Black Caribbean Black African and WhiteBlack Caribbean Mixed groups by 28 to 72 The rates of referral by GPs are given in Appendix B Table B3
Referrals from AampE departments 5 of patients The White British group had a 9 lower than average rate of such referrals The WhiteBlack African Mixed Indian Bangladeshi Black African and Other groups were more likely than average to be referred in this way
Referrals from community mental health teams 26 of patients For the White British group such referrals were 5 higher than the average rate They were lower than average among the Other White WhiteBlack African Mixed Black Caribbean Black African and
Other Black groups by 16 to 48 The rates of referral are given in Appendix B Table B4
Referrals from the criminal justice system 9 of patients This is defined as the police courts probation service prison and court liaison and diversion service
Patients from the White British group were less likely than average to be referred by the criminal justice agencies whereas the Black Caribbean Black African Other Black WhiteBlack African Mixed and Other Asian groups were 30 to 83 more likely than average to be referred in this way We observed no differences from the average rate for other ethnic groups Rates of referral by the criminal justice system are given in Appendix B Table B5
A significant proportion (26) of all referrals were from tertiary care
Tertiary care referrals from medium or high secure units 5 of patients The rate for such referrals (in NHS or independent sectors) was lower than average among the Other White and Indian groups It was higher than average among the Black Caribbean and WhiteBlack Caribbean Mixed groups by about 75
Tertiary care referrals from other inpatient services 21 of patients The rate for such referrals (NHS and independent) was higher than average among the White Irish and Other White groups by 29 and 59 respectively The rate was lower than average in the Indian and Other Black groups
Tertiary care referrals from other clinical specialties 9 of patients Rates of such referrals were higher than average among the White British and Indian groups and lower than average among the Other White WhiteBlack Caribbean Mixed Other Asian Black African Other Black and Chinese groups
Care Quality Commission Count me in census 2010 21
Results mental health continued
Detention under the Mental Health Act 1983 on day of admission
The Mental Health Act 2007 made a number of changes to the Mental Health Act 1983 These changes were reflected in the census of 2009 and 2010 which collected information on new provisions establishing supervised community treatment (section 17A) and excluded supervised discharge (section 25A) which was abolished
As in previous reports we present below the results for detention rates on the day of admission Outpatients on a CTO are excluded from these analyses After that we present rates for all patients subject to the Mental Health Act on census day (including outpatients on a CTO) followed by rates for patients on a CTO on census day
All detentions Forty-nine per cent (14637) of patients were detained under the Mental Health Act on admission to hospital This was a higher proportion than recorded in the previous censuses (40 in 2005 and 2006 43 in 2007 45 in 2008 and 47 in 2009)
Detention rates were 6 lower than average among White British patients and between 19 and 32 higher than average among the Black Caribbean Black African Other Black and WhiteBlack Caribbean Mixed groups Detention rates were also higher in the White Irish and Other White groups by about 13 and in the Other Mixed group by 22 No other ethnic differences were observed The results are given in Appendix B Table B6
These patterns are broadly similar to those reported in previous censuses
Detention under section 2 Section 2 of the Mental Health Act gives authority for a person to be detained in hospital for assessment for a period not exceeding 28 days It is mainly applied where the patient is unknown to the service or where there has been a significant interval between periods of inpatient treatment
Of all patients detained on admission 22 were detained under section 2 Rates of detention under this section were lower than average among the White British WhiteBlack Caribbean Mixed and Black Caribbean groups and higher than average among the Bangladeshi Other Asian Black African Chinese and Other groups by between 50 and 103 (see Appendix B Table B7)
Detention under section 3 Section 3 of the Act provides for the compulsory admission of a patient to hospital for lsquotreatmentrsquo and for his or her subsequent detention which can last for an initial period of up to six months and is renewable after this
Of all patients detained on admission 43 were detained under this section Rates were higher than average among the White Irish and Black Caribbean groups by 24 and 29 respectively and lower among than average among the Bangladeshi group No other ethnic differences were observed The rates of detention under section 3 are given in Appendix B Table B8
Detention under section 3741 Section 37 of the Mental Health Act allows a court to send a person to hospital for treatment when they might otherwise have been given a prison sentence and section 41 allows a court to place restrictions on a personrsquos discharge from hospital Admission to hospital rather than prison is generally regarded as a more positive outcome for the person concerned
Care Quality Commission Count me in census 2010 22
Results mental health continued
Of all patients detained on admission 14 were detained under section 37 with a section 41 restriction order applied The rates of detention are given in Appendix B Table B9 In all minority ethnic groups very few women were detained under section 3741 Among men the rate of detention for the White British group was 16 lower than average and it was higher than average in the WhiteBlack Caribbean Mixed group by 77 the Black Caribbean group by 100 the Black African group by 27 and the Other Black group by 52
A consistent pattern across all six annual censuses was the higher than average detention rate under section 3741 for the Black Caribbean and Other Black groups
Detention under sections 47 48 and 4749 These sections of the Mental Health Act allow the Ministry of Justice to issue a direction to transfer a person detained in prison to a hospital for treatment
Of all patients detained on admission 7 were detained under these sections The only ethnic differences observed were a 107 higher than average detention rate among men from the White Black African Mixed group and a lower than average rate for the Indian group We observed no other ethnic differences probably because the numbers of detentions under these sections were low in most minority ethnic groups These rates of detention are given in Appendix B Table B10
The previous four censuses also showed virtually no ethnic differences for rates of detention under sections 47 48 and 4749
Patients subject to the Mental Health Act 1983 on day of census
All patients subject to the Mental Health Act Of all the 32399 patients in the census a total of 53 (17299) were subject to the Mental Health Act on census day including 2959 outpatients and 75 inpatients on a CTO (either voluntarily or recalled) Ratios for the different ethnic groups for overall applications of the Mental Health Act including CTOs showed broadly similar patterns to detention rates on admission day from which patients on a CTO were excluded In both cases rates were higher than average among the Black Caribbean Black African Other Black and White Black Caribbean Mixed groups However the higher than average detention rates for the White Irish Other White and Other Mixed groups on admission day were not apparent on census day
The rates are given in Appendix B Table B11
Supervised community treatment under section 17A Community treatment orders (CTOs) were introduced in November 2008 as a result of the Mental Health Act 2007 They allow for supervised community treatment to be provided for up to six months with the possibility of an extension after this These orders are designed to help patients to maintain stable mental health outside hospital and to promote recovery by providing professionals with the power to set conditions on discharge from hospital and a power to recall patients if arrangements in the community are not working
Nine per cent of all patients in the census were on CTOs compared with 4 in 2009 Of all the 17299 patients subject to the Mental Health Act on census day almost 18 (3034) were on CTOs Of the patients on a CTO 2959 were outpatients and 75 were inpatients (50 voluntary and 25 recalled)
Care Quality Commission Count me in census 2010 23
Results mental health continued
The rate of supervised community treatment among all patients included in the census was lower than average in the White British and White Irish groups and higher than average in the South Asian (Indian Pakistani Bangladeshi) and Black (Black Caribbean Black African Other Black) groups by 22 to 106 The ratios are given in Appendix B Table B12
Consent
About 25 of informally admitted patients were deemed incapable of consenting to treatment The only ethnic difference observed was a higher than average rate for the Pakistani group but this was based on very few patients
About 18 of patients who were detained or on CTOs were deemed incapable of consenting to treatment These rates were lower than average by 7 in the White British group and were higher than average among the Other White WhiteBlack Caribbean Mixed and Black African groups by 21 35 and 36 respectively
In addition 13 of patients who were detained or on CTOs on census day were deemed capable of consenting to treatment but refused to do so The White British group had a rate of refusals that was 10 lower than average and rates were higher than average among the White Irish WhiteBlack Caribbean Mixed Other Mixed Black Caribbean and Black African groups by between 39 and 71
Care programme approach
The Care Programme Approach (CPA) is the process by which treatment care and support for people with serious mental health problems and accompanying health and social care needs are agreed coordinated and understood by all involved From October 2008 changes to the CPA in England
mean that it is no longer categorised into two parts (lsquostandardrsquo and lsquoenhancedrsquo) and just the one category of enhanced CPA applies This makes CPA policy in England different to that in Wales where the distinction still applies The CPA data presented here therefore includes all CPA patients in England and both lsquostandardrsquo and lsquoenhancedrsquo CPA patients in Wales
About 89 of all patients were on a CPA 3 were on a single assessment process (SAP) whereby assessments are made for adults with health and or social care needs and 8 were on neither CPA nor SAP As most patients were on a CPA no ethnic differences were observed
Recorded incidents
The 2010 census asked about the number of times that patients experienced seclusion hands-on restraint self-harm accident and physical assault in a current hospital spell or if the patientrsquos hospital spell was longer than three months the number that took place within the last three months Outpatients on a CTO are excluded from these data It should be noted that the rates of such events among minority ethnic groups can show yearly variation because of the low numbers of events in several groups
Seclusion Seclusion was defined as the supervised confinement of a patient in a room which may be locked to protect others from significant harm Four per cent of patients had experienced one or more episodes of seclusion The White British group had a seclusion rate that was 9 lower than average Rates were higher than average among the WhiteBlack Caribbean Mixed WhiteBlack African Mixed Black Caribbean and Black African groups by 80 90 36 and 56 respectively
Care Quality Commission Count me in census 2010 24
Results mental health continued
Although the number of incidents of seclusion was low in several minority ethnic groups some general patterns over the six censuses to date are
bull The proportion of all patients who had an episode of seclusion stayed fairly constant over the six censuses at about 4
bull Although there have been annual fluctuations the seclusion rate has been higher than average for the Black and WhiteBlack Mixed groups in three or four of the six censuses and in the Other White group in three censuses
Hands-on restraint This was defined as the physical restraint of a patient by one or more members of staff in response to aggressive behaviour or resistance to treatment About 12 of patients had experienced one or more episodes of hands-on restraint No ethnic differences were observed In fact very few ethnic differences have been observed in the previous censuses also and they have not shown a consistent pattern
Self-harm Eight per cent of patients had harmed themselves on one or more occasions Only the White British group had a rate that was higher than average (by 14) Rates were lower than average among several minority ethnic groups the three Black groups (Black Caribbean Black African and Other Black) by about 70 the three south Asian groups (Indian Pakistani Bangladeshi) by between 37 and 78 and the Other Mixed and Other Asian groups by about 60
In terms of comparison with previous years
bull The proportion of all patients who had harmed themselves stayed fairly constant at about 7ndash8
bull In all censuses the White British group had a higher than average rate of self-harm and the Black and South Asian groups had lower than average rates of self-harm
Accidents About 11 of patients had experienced one or more accidents Patients from the White British group experienced a rate of accidents that was 6 higher than average Rates were lower than average in the Black Caribbean Black African Other Black and Other Asian groups by about 50 to 70 No accidents were reported for the Chinese group
In terms of comparisons with previous years
bull The proportion of all patients who had had an accident stayed fairly constant
bull The rate of accidents in the different censuses was higher than average in the White British group and lower than average in the Black Caribbean group Few other ethnic differences were observed and they were not consistent
Physical assault on the patient The definition of assault includes incidents of physical assault on the patient irrespective of who committed the assault We do not have information on who committed the assault for example whether it was another patient or a member of staff Eleven per cent of patients were involved in one or more episodes of physical assault The only ethnic difference observed was a 19 lower than average rate among the Black Caribbean group
In terms of comparisons with previous years
bull The proportion of all patients who had experienced a physical assault stayed fairly constant
bull Very few ethnic differences in rates of assault were observed in the different censuses and they did not show a consistent pattern
Care Quality Commission Count me in census 2010 25
Results mental health continued
Duration of stay in hospital from admission to census day
We analysed the length of the period between each inpatientrsquos admission to hospital and the census day This period is of course shorter than a patientrsquos full length of stay in hospital which runs from admission to the date when they are discharged Outpatients on a CTO are excluded from the following analyses
bull 25 of inpatients had been in hospital for one month or less
bull 20 had been in hospital between one and three months
bull 13 had been in hospital between three and six months
bull 11 had been in hospital between six months and one year
bull 11 had been in hospital between one and two years
bull 12 had been in hospital between two and five years
bull 8 had been in hospital for more than five years
These results are similar to those of previous censuses About 31 of patients in the 2010 census had been in hospital for more than a year and had therefore also been included in the 2009 census About 20 of patients had been in hospital for more than two years and will have been included in both the 2008 and 2009 censuses
We calculated the median length of stay for different ethnic groups The median is the midpoint of the range of values so the median length of stay is the one at which half the patients had a length of stay less than the median and half had a stay longer than the median Overall and as in previous years the median amount of time that women had spent in hospital was about 25 months and the median for men was about 58 months (see Table 6) In most ethnic groups the median time spent in hospital was two to three times longer for men than for women in the Other Black group men had been in hospital four times longer than women
Median lengths of stay were longest for men from the Black Caribbean WhiteBlack Caribbean Mixed and Other Black groups and shortest for men from the Chinese Bangladeshi and Other groups Median lengths of stay were longest for women from the WhiteBlack Caribbean Mixed and Black Caribbean groups and shortest for women from the Chinese and Bangladeshi groups
A number of important factors influence a patientrsquos length of stay in hospital including age gender whether or not they are detained under the Mental Health Act (and the section under which they are detained and whether there is an additional restriction order) the type and severity of their illness the nature of their treatment and the availability of support in the community The data in the census does not allow for analysis of these factors
Table 6 Median number of days from the day of admission to the day of census
Ethnic group Men Women
White British 161 71
White Irish 218 114
Other White 238 113
White and Black Caribbean 275 191
White and Black African 182 92
White and Asian 226 78
Other Mixed 173 112
Indian 172 70
Pakistani 153 56
Bangladeshi 134 55
Other Asian 167 61
Black Caribbean 345 122
Black African 141 66
Other Black 248 58
Chinese 135 51
Other 131 76
Total 174 75
Care Quality Commission Count me in census 2010 26
Results mental health continued
Ward security
As in previous years about 11 of all patients were on a medium or high secure ward as opposed to a general (76) or low secure (13) ward
Patients from the White British Indian and Bangladeshi groups were less likely than average to be on a medium or high secure ward by 7 30 and 67 respectively Patients from the White Irish WhiteBlack Caribbean Mixed Black Caribbean and Other Black groups had a higher than average rate by between 43 and 55
Age range on wards
Among patients under 18 years of age 61 were being cared for on wards for working-age adults on census day and five patients were on a ward for older people Seven per cent of patients on wards for working-age adults were 65 or over and
8 of those on wards for older people were adults of working age There were very few lsquoout of agersquo placements among minority ethnic groups
Patients in wards designated as single sex or mixed
Providers were asked whether patients were on a ward designated as men or women only or mixed gender All the analyses of single sex accommodation and facilities exclude outpatients on a CTO Overall 61 of men and 77 of women were not in a ward designated for single sex use similar proportions as in previous years The proportion of patients not in a designated single sex ward was lower among almost all minority ethnic groups than among the White British group In all ethnic groups the proportion of men who were not in a designated single sex ward was lower than among women (see Table 7a)
Two further questions examined the single sex facilities that were available to patients
At the time of the 2010 census the following guidance from the Department of Health applied in England A ward can be described as single sex (ie the intended sex of the ward is either male or female and not mixed) when the accommodation complies with the following definition from the Department of Health of single sex accommodation ldquoSleeping areas must be segregated and members of one sex must not have to walk through an area occupied by the other sex to reach toilets or bathrooms Separate male and female only toilets and bathrooms must be provided There should be separate day rooms to which only women have accessrdquo However there is a discrepancy for providers because accommodation designated as a lsquowardrsquo for administrative purposes may incorporate single sex accommodation for both sexes that meets the guidelines ndash but in this case the ward would still be lsquomixedrsquo (based on guidance from Safety Privacy and Dignity Department of Health 2000)
As long as men and women are cared for in separate bays or rooms and have their own toilet facilities then it may well be appropriate for them to be on the same ward being cared for by the same team of doctors and nurses In practice good segregation can be achieved if men and women have separate sleeping areas (for example single sex bays) and have separate toilets and bathrooms that they can reach without having to pass through (or close to) areas for the opposite sex The layout of wards should minimise any risk of overlooking or overhearing by members of the opposite gender (from Privacy and Dignity ndash A report by the Chief Nursing Officer into mixed sex accommodation in hospitals Department of Health 2007)
The coalition governmentrsquos revised Operating Framework for 201011 requires NHS organisations to eliminate mixed-sex accommodation except under exceptional circumstances from 2011 The national guidance relating to mixed sex accommodation was issued in November 2010 and states that ldquoNo areas are exempt and every decision to mix must be justified by reference to the patientrsquos clinical needs not organisational convenience or custom and practicerdquo For mental health and learning disability trusts it states ldquoThere is no acceptable justification for admitting a mental health patient to mixed-sex accommodationrdquohellip It ldquomay be acceptable in a clinical emergency to admit a patient temporarily to a single ensuite room in the opposite-gender area of a ward In such cases a full risk-assessment must be carried out and complete safety privacy and dignity maintainedrdquo The guidance is available at wwwdhgovukenPublicationsandstatisticsLettersandcircularsProfessionallettersChiefnursingofficerlettersDH_121848
Care Quality Commission Count me in census 2010 27
Results mental health continued
Table 7a Percentage of patients not in a designated single sex ward by ethnic group
Ethnic group
Sex of patients and ward
Male Female
Male ward Female or mixed ward Female ward Male or mixed ward
White British 35 65 21 79
White Irish 41 59 28 72
Other White 44 56 28 72
White and Black Caribbean 56 44 31 69
White and Black African 48 52 41 59
White and Asian 43 57 34 66
Other Mixed 49 51 24 76
Indian 37 63 25 75
Pakistani 48 52 35 65
Bangladeshi 23 77 18 82
Other Asian 46 54 22 78
Black Caribbean 55 45 32 68
Black African 49 51 28 72
Other Black 49 51 30 70
Chinese 42 58 30 70
Other 43 57 20 80
Total 39 61 23 77
The vast majority of patients in this category were in mixed wards very few (under 05) male patients were on female-only wards or vice versa
Care Quality Commission Count me in census 2010 28
Results mental health continued
Patientsrsquo access to toilet and bathing facilities designated for single sex use
We asked providers if the patient had access to toilet and bathing facilities designated for single sex use Overall 13 of men and 16 of women
were reported as not having access to such facilities designated for single sex use This was an improvement over 2009 when these proportions were 19 and 24 respectively The proportion of patients not having access to toilet and bathing facilities designated for single sex use was lower among almost all minority ethnic groups than among the White British group (see Table 7b for details)
Table 7b Percentage of patients not having access to toilet and bathing facilities designated for single sex use by ethnic group
Ethnic group
Access to designated single sex bathing and toilet facilities
Male Female
Male facilities
Female or mixed facilities
Female facilities
Male or mixed facilities
White British 86 14 84 16
White Irish 87 13 87 13
Other White 89 11 86 14
White and Black Caribbean 93 7 93 7
White and Black African 90 10 93 7
White and Asian 90 10 84 16
Other Mixed 98 2 96 4
Indian 91 9 90 10
Pakistani 95 5 94 6
Bangladeshi 92 8 98 2
Other Asian 92 8 86 14
Black Caribbean 92 8 90 10
Black African 91 9 91 9
Other Black 92 8 89 11
Chinese 82 18 83 17
Other 87 13 90 10
Total 87 13 84 16
The vast majority of patients in this category had access to mixed facilities very few (1) of male patients had access to female-only facilities or vice versa
Care Quality Commission Count me in census 2010 29
Results mental health continued
Patientsrsquo access to a lounge area day space designated for single sex use
We also asked providers if patients had access to a lounge area or day space designated for single sex use Overall 37 of men and 39 of women were
reported as not having access to these facilities This was an improvement over 2009 when these proportions were 48 and 51 respectively The proportion of patients not having access to a lounge areaday space designated for single sex use was lower among most minority ethnic groups than among the White British group (see Table 7c for details)
Table 7c Percentage of patients not having access to a lounge areaday space designated for single sex use by ethnic group
Ethnic group
Access to a lounge areaday space designated for single sex use
Male Female
Male facilities
Female or mixed facilities
Female facilities
Male or mixed facilities
White British 59 41 60 40
White Irish 63 37 70 30
Other White 68 32 63 37
White and Black Caribbean 82 18 73 27
White and Black African 83 18 76 24
White and Asian 72 28 75 25
Other Mixed 79 21 67 33
Indian 59 41 66 34
Pakistani 80 20 72 28
Bangladeshi 53 47 52 48
Other Asian 70 30 61 39
Black Caribbean 78 22 70 30
Black African 73 27 70 30
Other Black 79 21 72 28
Chinese 59 41 60 40
Other 67 33 67 33
Total 63 37 61 39
The vast majority of patients in this category had access to mixed facilities very few (1) of male patients had access to female-only facilities or vice versa
Care Quality Commission Count me in census 2010 30
Results mental health continued
Patientsrsquo subject to deprivation of liberty safeguards
People who lack the mental capacity to consent to the care or treatment they need should be cared for in a way that is least restrictive of their rights or freedom of action In 2007 the Mental Capacity Act 2005 was amended to introduce Deprivation of Liberty Safeguards for people who lack capacity to decide about their care or treatment and who need to be deprived of their liberty to protect them from harm The Safeguards came into effect in April 2009 and strengthen the rights of hospital patients and those in care homes as well as ensuring compliance with the European Convention on Human Rights (ECHR)
The 2010 census introduced a new question ldquoIs the patient subject to deprivation of liberty authorisation on 31 March 2010rdquo Under 1 (269) patients were reported as being subject to a deprivation of liberty authorisation on census day No ethnic differences in the rates were observed which may be due to the low numbers of patients among minority ethnic groups (69)
Care Quality Commission Count me in census 2010 31
A comparison between the 2005 baseline and the 2010 census
The changes we have seen in the census results between 2005 and 2010 the timespan of the Delivering Race Equality (DRE) action plan are set out below This is not a review of the DRE programme The aim is to give an overview of how some variables in the census have changed during the course of DRE and the findings should be seen in the light of the caveats described on page 13
bull The number of inpatients went down from 33785 to 29840 ndash a fall of 12
bull The proportion of patients in independent hospitals rose from 10 to 16
bull The overall proportion of patients from minority ethnic groups increased from 20 to 23 However there have been demographic changes during this time ndash the population from Black and minority ethnic groups in England and Wales rising from 79 million in 2005 to 85 million in 2007 (the latest year for which these figures are available) an increase of 8 in two years
bull Admission rates showed similar patterns across all censuses ndash Lower than average rates among the White
British Indian and Chinese groups ndash About average rates among the Pakistani and
Bangladeshi groups ndash Higher than average rates among other
minority ethnic groups ndash particularly in the Black and WhiteBlack Mixed groups for whom rates were two or more times higher than average in 2010 The Other Black group continues to have exceptionally high rates of admission (even after the apparent reduction since 2005 see next point)
bull One of the 12 goals of DRE was a decline in admission rates among Black and minority ethnic groups Figure 1 provides a comparison between 2005 and 2010 Although admission rates for
many ethnic groups show relatively little change since 2005 the rate for the Other Black group is considerably lower in 2010 (six times higher than average) compared with 2005 (12 times higher than average) However rates for the other Black and WhiteBlack Mixed groups show small increases
bull In general rates of referral from GPs and community mental health teams were lower than average among some Black and WhiteBlack groups and referral from the criminal justice system was higher Patterns were less consistent for other minority ethnic groups
bull There was a steady increase in the overall proportion of patients subject to the Mental Health Act Compared with 40 in 2005 49 of all patients were subject to the Mental Health Act in 2010 (53 if outpatients on a CTO are excluded)
bull Another DRE goal was to reduce detention rates among Black and minority ethnic groups However detention rates have been higher than average among the Black Caribbean Black African and Other Black groups in all six censuses and almost consistently higher in the WhiteBlack Caribbean Mixed and Other White groups Rates have been average for other minority ethnic groups
bull A consistent pattern was the higher than average detention rate under section 3741 for the Black Caribbean and Other Black groups
bull Another DRE goal was to reduce seclusion among Black and minority ethnic groups Although there have been annual fluctuations in seclusion rates they have been higher than average for the Black and WhiteBlack Mixed groups and the Other White group in at least three of the six censuses Other minority ethnic groups did not show high rates
Care Quality Commission Count me in census 2010 32
A comparison between the 2005 baseline and the 2010 census continued
Figure 1 Admission ratios in the 2005 and 2010 Count me in censuses by ethnic group England and Wales
Other Black
Black Caribbean
White and Black Caribbean
White and Black African
Black African
Other Mixed
Other Asian
White and Asian
Other
White Irish
Other White
Bangladeshi
White British
Pakistani
Indian
Chinese
0 100 200 300 400 500 600 700 800 900 1000 1100 1200 1300
Ageshysex standardised admission ratios (EampW=100)
Census 2005 admission ratios using 2005 ONS populations
bull Minority ethnic groups do not compare unfavourably for other incidents Rates of self-harm have consistently been lower than average among the Black and South Asian groups Very few ethnic differences in hands-on restraint physical assault and accidents were observed across the different censuses and they did not show a consistent pattern
bull About 31 of patients in all censuses had been in hospital for one year or more and were therefore included in more than one census
Census 2010 admission ratios using ONS 2007 populations (excluding outpatients on a CTO)
(This is one reason why the census shows little change over the six years It should be noted again that because the census is a one-day count it over-represents long-stay admissions and under-represents short-stay admissions)
bull Mixed accommodation was reported for many patients across all censuses although patients from Black and minority ethnic groups were more likely to be in single sex accommodation than White British patients
The admission ratios for the 2005 census shown here are different from those published in the 2005 report This is because we updated the analysis of the 2005 admission ratios by using 2005 ONS census populations for ethnic groups as denominators These populations were not available at the time of the 2005 report which instead used the 2001 ONS population data
Care Quality Commission Count me in census 2010 33
Results learning disabilities
We obtained information about 3642 patients in 129 organisations providing services for people with learning disabilities in England and Wales Of these two were inpatients on CTOs The total number of inpatients has declined each year and by 21 from 4609 in 2006 to 3642 in 2010 The total number of providers did not change much from the baseline year of 2006 although the number of NHS providers has fallen steadily and the number of independent healthcare organisations has increased (see Table 8) The proportion of inpatients in independent
healthcare organisations increased from 20 in 2006 to 33 in 2010 This is likely to be a result of closing NHS campuses with people moving from hospital to community settings
The pattern of results for learning disability patients in 2010 is broadly similar to that reported in previous censuses This is not surprising since many of the patients had been in hospital for a considerable period of time and they therefore appear in successive censuses
Table 8 The number of providers of learning disability services and inpatients
NHS (England)
Independent (England)
NHS (Wales)
Independent (Wales) Total
2010 census Number of providers 55 61 4 9 129 Number of all patients (including patients 2304 1072 154 112 3642 on a CTO) of all patients 633 294 42 31 100
2009 census Number of providers 60 54 5 4 123 Number of all patients (including patients 2487 1014 139 55 3695 on a CTO) of all patients 673 274 38 15 100
2008 census Number of providers 62 57 5 5 129
Number of inpatients 2873 1050 143 41 4107
of inpatients 700 256 35 10 100 2007 census
Number of providers 64 47 5 4 120
Number of inpatients 3063 900 154 36 4153
of inpatients 738 217 37 09 100 2006 census
Number of providers 70 48 5 1 124
Number of inpatients 3505 930 164 10 4609
of inpatients 760 202 36 02 100
Care Quality Commission Count me in census 2010 34
Results learning disabilities continued
Ethnicity
Information about ethnicity was available for 98 of patients Of these 13 belonged to Black and minority ethnic groups defined as all groups that are not White British (see Table 9) This figure is somewhat higher than in previous years (11 in 2006) and is significantly lower than the 23 of mental health patients from minority ethnic groups as reported in the mental health section of this report
Although the patterns by ethnicity are broadly similar to previous years there was an increase between 2006 and 2010 in the proportion of patients from the Other White group and a fall in those from the White British group Some ethnic groups had very few patients
As in the previous censuses patients from Black and minority ethnic groups were concentrated in a relatively small number of organisations 70 were
Table 9 Learning disability patients by ethnic group
Ethnic group 2010 census 2009 census 2008 census 2007 census 2006 census
Number Number Number Number Number
White British 853 3106 867 3205 889 3616 883 3642 887 4037
White Irish 13 46 15 57 13 53 10 40 14 66
Other White 29 106 23 85 26 104 26 109 17 77
White and Black Caribbean 10 38 10 36 07 29 08 34 07 32
White and Black African 02 8 01 4 00 2 02 10 01 3
White and Asian 04 13 04 14 03 12 03 13 02 9
Other Mixed 07 24 05 19 03 14 04 16 03 14
Indian 09 32 09 35 07 28 08 32 11 49
Pakistani 07 24 09 33 07 30 08 32 07 34
Bangladeshi 05 20 06 21 03 11 03 11 02 9
Other Asian 04 13 03 10 03 12 02 8 03 12
Black Caribbean 26 93 22 81 23 94 26 108 28 129
Black African 08 28 09 35 07 29 08 33 07 33
Other Black 04 15 04 14 04 15 04 18 04 17
Chinese 00 1 01 2 01 5 02 8 02 7
Other 02 7 02 8 04 15 02 10 05 24
Not stated 19 68 10 36 09 38 07 29 12 57
Total 100 3642 100 3695 100 4069 100 4124 100 4552
Care Quality Commission Count me in census 2010 35
Results learning disabilities continued
patients in 25 of the 129 organisations that took part in the census Seventy-four organisations had fewer than 10 patients from Black and minority ethnic groups each and another 42 organisations had no inpatients at all from these groups
However it is important to note that the number of people with severe and profound learning disabilities in some areas is affected by past funding and placement practices especially the presence of old long stay hospitals and of people placed outside their original area of residence by funding authorities
Reporting of ethnicity
About half (56) of patients reported their own ethnic group Staff reported the ethnic group for 17 of patients and relatives for 21 This means that ethnicity could have been misreported for some patients We do not know how ethnicity was assessed for 6 of patients
Age and gender
Two per cent (59) of patients were under 18 years old The number of young inpatients from minority ethnic groups was low or zero in several ethnic minority groups
Overall 73 of patients were under 50 years old and 27 were aged 50 or over The proportion of patients under 50 was higher among patients from Black and minority ethnic groups (88) than among the White British group (71) This is not surprising given that minority ethnic populations are generally younger than the White population
Seventy per cent of patients in learning disability services were men whereas in mental health services 58 of patients were men
Language and religion
Eight per cent of patients reported that their first language was not English Non-verbal communication was the most often selected language after English accounting for 4 of patients Two per cent (84) of patients most of whom were from the White British group said they needed an interpreter
Religion was not stated for 22 of patients and 15 of patients said they had no religion South Asians (Indians Bangladeshis and Pakistanis) were mostly Muslim Hindu or Sikh and those from the White Black Caribbean and Black African groups were mostly Christian
Sexual orientation
Overall the result was not known for almost half (49) of patients 45 said they were heterosexual 2 said gaylesbian 3 said bisexual and 1 said ldquootherrdquo The numbers of patients from minority ethnic groups were too low for meaningful analysis
Disability
Of all inpatients in learning disability services
bull 4 were reported as having no disabilities
bull 44 had a learning disability only
bull 51 had multiple disabilities
The patterns among minority ethnic groups were similar in that most patients had either a learning disability or multiple disabilities
Care Quality Commission Count me in census 2010 36
Results learning disabilities continued
Rates of admission
The rates of admission based on ONS estimates of the general population in 2007 are given in Appendix C Table C1
Admission rates were lower than average among several minority ethnic groups Other White Indian Pakistani Other Asian Black African Chinese and Other Rates were two to three times higher than average among the WhiteBlack Caribbean Mixed Black Caribbean Other Black and Other Mixed groups The lower rates among the South Asian and Chinese groups and the higher rates among some Black groups are similar to patterns for inpatients in mental health establishments
These patterns of admission are similar to those we reported in previous census reports
Source of referral
As we reported in the section on mental health patients data about sources of referral must be interpreted with care as we do not always know the original referral source Furthermore in the case of inpatients with learning disabilities this information was invalid missing or unknown for 12 of patients
Because of the small numbers of patients in most minority ethnic groups we observed few ethnic differences in sources of referral
Detention under the Mental Health Act 1983 (on day of admission and on day of census)
The Mental Health Act 2007 made a number of changes to the Mental Health Act 1983 one of which was supervised community treatment (section 17A) These are reflected in the 2010 census
All detentions Of all the patients in learning disability services 48 were detained under the Mental Health Act on admission Rates of detention on the day of admission by ethnic group are in Appendix C Table C2 and no ethnic differences were observed As the number of detained patients from each minority ethnic group was low we did not undertake further analysis for individual sections of the Act
Rates of detention on census day also showed no ethnic differences with the exception of a lower than average rate for the Other White group
Consent
About 66 of informally admitted inpatients were deemed incapable of consenting to treatment which is a similar proportion to that reported previously
Among detained patients 38 were deemed incapable of consenting to treatment and 6 were deemed capable of consenting to treatment but refused
The numbers of patients from minority ethnic groups were too low for comment There were no or very few such patients among minority ethnic groups
Care Quality Commission Count me in census 2010 37
Results learning disabilities continued
Care programme approach
Details of the Care Programme Approach (CPA) are given on page 24
We found that 73 of all patients were on a CPA 2 on a single assessment process (SAP) and 25 on neither No ethnic differences were observed
Recorded incidents
The 2010 census asked about the number of times that patients experienced seclusion hands-on restraint self-harm accident and physical assault in a patientrsquos current hospital spell or if the patientrsquos hospital spell was longer than three months the number that took place within the last three months As in previous years we observed very few ethnic differences
Seclusion Five per cent of patients had experienced one or more episodes of seclusion The only ethnic differences observed were the higher than average rates among the White Irish and Other White groups but these were based on small numbers of patients
Physical assault on the patient The definition of assault includes incidents of physical assault on the patient irrespective of who committed the assault but we do not have information on who committed the assault About 28 of patients had been involved in one or more episodes of physical assault No ethnic differences were observed
Hands-on restraint self-harm accidents Thirty per cent of inpatients had experienced one or more episodes of hands-on restraint 22 had attempted to harm themselves and 24 had suffered an accident The numbers were very low in minority ethnic groups and we did not observe any ethnic differences except for a lower than average rate for self-harm among the Black Caribbean group but this was based on very few patients
Duration of stay in hospital
We analysed the length of the period between each patientrsquos admission to hospital and the census day This period is of course shorter than a patientrsquos full length of stay in hospital which runs from admission to the date when they are discharged
bull 10 of inpatients had been in hospital for one month or less
bull 6 had been in hospital between one and three months
bull 7 had been in hospital between three and six months
bull 10 had been in hospital between six months and one year
bull 14 had been in hospital between one and two years
bull 22 had been in hospital between two and five years
bull 31 had been in hospital for over five years
The patterns are very similar to those in previous censuses About 67 of patients in the 2010 census had been in hospital for more than a year and were therefore also included in the 2009 census In addition over half (53) of patients had been in hospital for more than two years and will have been included in both the 2008 and 2009 censuses A third of patients will have been included in each census since 2006
We also calculated the median length of stay (see page 26 for the definition of median) Overall the median amount of time that women had spent in hospital was about 31 months and the median for men was about 27 months This compares with a median for mental health patients of 25 months for women and 58 months for men It is not possible to reliably compare length of stay by ethnic group because of the small numbers of patients among several minority ethnic groups
Care Quality Commission Count me in census 2010 38
Results learning disabilities continued
Ward security
About 12 of all inpatients were on a medium or high secure ward as opposed to a general (54) or low secure (34) ward
As in the three previous years rates of patients on medium or high secure wards were about double the average among the White Irish and Other White groups Most other minority ethnic groups had very few patients on medium or high secure wards
Age range on wards
There were five patients under 18 years of age being cared for on wards for working-age adults and none were on wards for older people About 5 of patients on wards for working-age adults were aged 65 or over and there were very few patients (23) on wards for older people There were very few lsquoout of agersquo placements among minority ethnic groups
Patients in wards designated as single sex or mixed
We asked providers whether the patient was on a ward designated as men or women only or mixed gender Overall 47 of men and 69 of women were not in a ward designated for single sex use The numbers of such patients among minority ethnic groups were very low
Two further questions examined the single sex facilities that were available to patients Again due to the small numbers we do not present results by ethnicity for these questions
Patientsrsquo access to toilet and bathing facilities designated for single sex use
Overall 19 (497) of men and 27 (295) of women were reported as not having access to toilet and bathing facilities designated for single sex use
Patientsrsquo access to a lounge area day space designated for single sex use
Overall 32 (829) of men and 44 (470) of women were reported as not having access to a lounge area day space designated for single sex use
Patients subject to deprivation of liberty safeguards
For details of deprivation of liberty safeguards please see page 31
The 2010 census introduced a new question ldquoIs the patient subject to deprivation of liberty authorisation on 31 March 2010rdquo Two per cent (74) patients were reported as being subject to a deprivation of liberty order on census day but very few of these patients (15) were from minority ethnic groups
See footnote on single sex accommodation on page 27
Care Quality Commission Count me in census 2010 39
Data in the future Moving beyond a one-day census
For six years the Count me in census has provided a valuable one-day snapshot of inpatients in mental health and learning disability services And with the proportion of inpatients who are detained increasing steadily (from 25 in 200506 to 39 in 200910 ndash see Figure 2) ongoing ethnic monitoring of admissions and detentions becomes more vital than ever
However a one-day census only captures some events and the profile of patients can differ across a whole year For example there were
bull 29840 inpatients in the 2010 census compared with 107765 inpatients overall during 200910
bull 17299 patients in the 2010 census who were detained or on CTOs compared with 42479 new detentions and some 4100 new CTOs overall in England in 200910
bull 26 of patients in hospital for under one month and 31 for over one year per the census
whereas the MHMDS data consistently shows that for over 50 of records the average length of an inpatient stay was under one month and for 4 it was over one year
Looking ahead it is vital that robust data is available on all admitted patients and all those subject to the Mental Health Act not just those in hospital on one particular day Moreover patterns of use and outcomes of community care can have an impact on the need for admission to hospital and the risk of detention ndash therefore information about the care provided to patients before admission to hospital during their hospital stay and after they leave is also vital Furthermore under 84 of the 127 million people using specialist mental health services are admitted to hospital23 and so it is very important to examine the quality of community care for the 90 of patients who are not admitted to hospital
Figure 2 Number of people spending time in hospital 200506 to 200910
Num
ber
of p
atie
nts
90000
80000
70000
60000
50000
40000
30000
20000
10000
0 200506 200607 200708 200809 200910
Source NHS Information Centre Formally detained Not detained MHMDS Bulletin 2011
Care Quality Commission Count me in census 2010 40
Data in the future Moving beyond a one-day census continued
The Mental Health Minimum Data Set (MHMDS) is a rich source of data on people using specialist mental health services in England It covers both community and hospital services and includes a wide range of information about the demographic clinical and socioeconomic characteristics of individual patients and the services provided to those admitted to hospital and to the much larger number of those who donrsquot need a stay in hospital The data includes information about contact with services uses of the Mental Health Act and the Care Programme Approach for each individual patient All these details enable the use of services patterns of care and patient outcomes to be tracked including along pathways of care The MHMDS therefore provides a robust basis for ongoing monitoring of access to and outcomes of care for users of specialist ndash both community and hospital ndash mental health services
The MHMDS also enables an analysis of the numbers and rates of people from different ethnic groups using specialist mental health services overall (both inpatient and community) which provides an indication of the levels of mental illness and therefore the need for specialist care in different communities
At present the MHMDS does not cover high secure services and independent sector providers only started to provide data during 201011 However to support payment by results for mental health the scope of the data set will be extended to cover high secure services during 201112 (version 4 MHMDS) Further proposed changes to the dataset (version 41) will incorporate NHS-funded learning disability services and primary care mental health services A separate dataset for child and adolescent mental health services (CAMHS) has been developed and is awaiting formal approvals It is designed to include the same information about uses of the Mental Health Act as provided in the MHMDS
The latest MHMDS bulletin for 200910 provides a description of people using specialist mental health services in England including ethnic profiles of people using services hospital admissions detentions and the number of people on CPA24 It also provides information on differences by age and gender The bulletin illustrates some of the sorts of analyses that are possible using data from the MHMDS
The NHS Information Centre can provide guidance on these and other potential analyses based on MHMDS data
Care Quality Commission Count me in census 2010 41
Conclusions
While this report reviews changes in the census results since 2005 it is not a review or evaluation of the DRE programme overall Similarly the census cannot provide explanations for the patterns observed or examine whether mental health services are meeting the needs of individual ethnic minority groups As we have noted previously the results are subject to caveats in particular that the census provides a one-day snapshot that may not be representative of patients admitted to hospital throughout the year
Overview of findings
Overall the findings from the 2010 census show little change from those reported for previous annual censuses conducted since 2005 This is partly because many patients had been in hospital for a considerable period of time and had therefore been included in successive censuses The findings of this sixth and last census continue to show differences between Black and minority ethnic groups and White groups and also differences within these groups
In particular ethnic differences in rates of admission detention under the Mental Health Act and seclusion ndash three of DRErsquos 12 goals ndash have not altered materially since the inception of DRE in 2005
bull Admission rates remain higher than average among minority ethnic groups especially among Black and WhiteBlack Mixed groups for whom rates were two or more times higher than average in 2010 The Other Black group continues to have the highest admission rate ndash six times higher than average ndash although this is lower than in 2005 In contrast admission rates have consistently been lower than average among the Indian and Chinese groups and about average in the Pakistani and Bangladeshi groups
bull Detention rates remain higher than average among the Black and WhiteBlack Caribbean Mixed groups and among the Other White group A consistent pattern across all censuses was the higher than average detention rate
under section 3741 for the Black Caribbean and Other Black groups We also found that rates for being placed on a CTO were higher among the South Asian and Black groups
bull Although there have been annual fluctuations in seclusion rates they have been higher than average for the Black WhiteBlack Mixed and Other White groups in at least three of the six censuses
Overall the level of provision of single sex areas for patients continues to be unsatisfactory although there was no evidence that minority ethnic patients were disadvantaged in these respects Government policy for the NHS in England now requires that all providers of NHS-funded care including mental health trusts are expected to eliminate mixed-sex accommodation in accordance with the guidance set out in CNO201032526 From 2011 all providers of NHS-funded care must report breaches of sleeping accommodation which will attract sanctions
Implications for ways forward
The census findings do not in themselves show that mental health and learning disability services are failing to meet the needs of Black and minority ethnic service users
As noted in previous reports they need to be interpreted in the context of available evidence on ethnic differences in rates of mental illness pathways to care and factors such as socioeconomic disadvantages that all contribute to these differences Our previous reports have consistently highlighted the need for prevention early intervention and working collaboratively across sectors to reduce the risk of admission and detention where possible without compromising the care given to patients Mental health services have a key role to play but to achieve this all statutory agencies and organisations outside the healthcare sector Black and minority ethnic communities and people who use services themselves will need to work in partnership
Care Quality Commission Count me in census 2010 42
Conclusions continued
This message ndash about preventing mental ill-health by addressing the contributory factors and intervening early ndash is at the heart of No health without mental health the Department of Healthrsquos new strategy for the future of mental health care in England27
The strategy aims to tackle the economic social and environmental determinants and consequences of mental health problems and to improve outcomes and reduce inequalities
It specifies that by 2014 people in contact with the criminal justice system will have improved access to mental health services as set out in the Ministry of Justice Green Paper Breaking the Cycle Effective punishment rehabilitation and sentencing of offenders which confirms the approach outlined in Lord Bradleyrsquos report for early intervention and diversion from custody2829
Accompanying the new strategy is a supporting document that explains how its objectives will improve mental health outcomes the effective interventions and the underpinning evidence base30
The strategy is complemented by other government proposals for reforms in the NHS public health and adult social care as outlined in the NHS White Paper Equity and excellence liberating the NHS31 the public health strategy Healthy lives healthy people32 and the adult social care strategy A vision for adult social care capable communities and active citizens 33 Three outcomes frameworks have been developed alongside these strategies improving mental health outcomes and reducing inequalities is integral to them all
In this new healthcare landscape the proposed NHS Commissioning Board and GP consortia will have a statutory obligation to promote equality and reduce inequalities in healthcare (something also enshrined in the Equality Act 2010) As the lead commissioners of healthcare services it will be up to GP consortia to assess with local authorities the needs of their local populations and commission the right services that meet their requirements
And the strengthened public health role of local authorities offers significant potential for addressing the socioeconomic disadvantages faced by Black and minority ethnic communities which add to the burden of mental illness in these communities
Race Equality Action Plan A five-year review looked back at the work of the DRE action plan and describes some of the key challenges successes and learning34 Based on the experience and outcome of the DRE programme the report suggests ways forward for the next stage of mental health strategy development and implementation
Since April 2009 CQC has had a duty under the Mental Health Act 1983 to monitor how services exercise their powers in relation to patients who are detained in hospital or subject to CTOs or guardianship under the Act In its first annual report on the use of the Act CQC recommends a number of areas where improvements are needed for example over-occupancy on inpatient wards patient engagement use of control and restraint seclusion and capacity and consent35
In particular CQC highlighted a number of issues relating to the use of CTOs including concern about appropriate usage (30 of the patients in CQCrsquos sample did not have a reported history of non-compliance or disengagement with services after discharge) and over-representation of Black and minority ethnic groups CQC advised that research on the possible race equality impact of CTOs should be undertaken There were 6237 CTOs from their introduction in November 2008 to 31 March 2010 a much greater use of them than forecast for this period by the Department of Health before the power was introduced Just 31 of these orders had ended by end March 2010 suggesting that some people are being kept on supervised community treatment for long periods
Care Quality Commission Count me in census 2010 43
Conclusions continued
Data in the future Moving beyond a one-day census
Good information is the foundation of an effective healthcare system It is imperative for ensuring that services meet the needs of local populations and are equitable and that improvements are made where needed The availability of fit-for-purpose and comprehensive patient-level data sets with ethnicity and other key variables fully coded is therefore vitally important36 It enables the care provided to patients of all ethnic backgrounds to be monitored on an ongoing basis including for monitoring compliance with the Equality Act
Race Equality Action Plan A five-year review notes that better collection monitoring and use of ethnicity data to inform commissioning and provision in health and social care is required37 Key areas include good ethnic monitoring improving demographic information and ensuring good links between infomatics audit and equality and diversity leads within trusts in order to effectively use the information to inform service development monitoring and review at board management ward and community levels
The governmentrsquos proposed changes to the NHS will be supported by an information revolution aimed at improving and extending the information available to the NHS patients and the public on the quality and outcomes of NHS services including by equality dimensions38
Having information that is fit for purpose is vital for the effective regulation of mental health and learning disability services CQC uses routinely available data sets on an ongoing basis to assess the performance of health and social care organisations and their compliance with government policies and legislation We therefore expect those who commission and provide mental healthcare in the NHS and independent sector to have information systems that provide good quality data with fully
comprehensive recording and monitoring of ethnicity on an ongoing basis
Since 2005 the Count me in census has played a key role in providing information about the ethnicity and other characteristics of inpatients in mental health and learning disability services and on patients subject to the Mental Health Act It did this by providing a valuable one-day snapshot But ethnicity recording must be seen as an all-year round statutory requirement not a one-day annual event The number of inpatients throughout the year is much higher than the counts on one day and some patients will have more than one admission And there is a need to move on from counting patients to understanding more about care pathways for Black and minority ethnic patients and the factors leading to hospital admission and detention
We have consistently highlighted the need for commissioners and providers to make full use of the Mental Health Minimum Data Set (MHMDS) ndash the statutory data set submitted by providers of specialist mental health services in England It provides rich data on these issues and provides a robust information source for ongoing ethnic monitoring after this last census
Covering both community and hospital services ndash and now independent and third sector providers as well as NHS ndash it includes a wide range of information about individual patients the services provided to those admitted to hospital and to the much larger number who donrsquot need admission to hospital and the outcomes of care And because it includes year-round activity it is more representative of the overall picture of for example admission detention and readmission rates length of stay years in psychiatric care and contacts with services and professionals
We call on the Information Centre to routinely publish data on all admissions and uses of the Mental Health Act including CTOs in England (in both NHS and independent healthcare providers) by the ethnicity of
Care Quality Commission Count me in census 2010 44
Conclusions continued
patients making the MHMDS the definitive source of information about mental health and learning disability patients This data should be risk-adjusted for age gender and other variables as appropriate to enable reliable comparisons to be made across groups
It is important that all providers ndash NHS and independent ndash make strenuous efforts to improve the quality of the data they submit The Information Centre publishes reports on the quality of MHMDS data by provider (see wwwicnhsukservices mhmdsdq) and we urge providers to monitor this information and use it to improve their data quality
If GP consortia and local authorities are to be effective in their needs assessment and commissioning roles the Information Centre needs to make available and promote to them the data from the MHMDS and other sources And researchers and academics must make full use of the MHMDS to explore the factors that underlie the observed ethnic patterns
CQCrsquos role
In the meantime CQC will continue to focus strongly on the quality of care provided by mental health and learning disability services
People who find themselves admitted to mental health services or detained under the Mental Health Act and therefore counted by the Count me in census are among the most mentally unwell people in our society Our job is first and foremost to make sure that the care they receive meets the essential standards of quality and safety set out under the Health and Social Care Act 2008 and to work with providers to ensure this We act swiftly when we find services that do not Where we find systemic problems that organisations have not adequately addressed we may impose conditions on the providerrsquos registration to bring about the change needed to improve patientsrsquo experience of care
The essential standards of quality and safety include the requirement to provide single sex accommodation and we will continue to closely check that these standards are met by all mental health services
We intend to introduce a number of indicators derived from the rich information in the MHMDS into our quality and risk profiles for providers This will put greater emphasis on the experience of Black and minority ethnic patients in our regulatory activity
We will monitor the quality of MHMDS data submitted by providers (as reported by the NHS Information Centre) including independent service providers Those with poor data quality may be considered at higher risk in terms of their quality of care
In addition we will continue to monitor the progress of services in relation to the issues raised in the census and other reports including our report on the use of the Mental Health Act through our visits to services and meetings with patients by our Mental Health Act Commissioners and second opinion appointed doctors (SOADs) We will draw on patientsrsquo experiences to monitor the operation of the Mental Health Act
We will also assess the impact of advice and use of Local HealthWatch Local HealthWatch will be in a good position to make sure that providers and commissioners are held to account on matters of choice and access to services for people from Black and minority ethnic groups
Care Quality Commission Count me in census 2010 45
References
1 Department of Health Equity and excellence liberating the NHS 2010
2 Department of Health The NHS outcomes framework 201112 2010
3 Healthcare Commission Mental Health Act Commission National Institute for Mental Health in England Count me in results of a national census of inpatients in mental health hospitals and facilities in England and Wales 2005
4 Healthcare Commission Mental Health Act Commission National Institute for Mental Health in England Count me in results of the 2006 national census of inpatients in mental health and learning disability services in England and Wales 2006
5 Healthcare Commission Mental Health Act Commission National Institute for Mental Health in England Count me in results of the 2007 national census of inpatients in mental health and learning disability services in England and Wales 2007
6 Healthcare Commission Mental Health Act Commission National Institute for Mental Health in England Count me in results of the 2008 national census of inpatients in mental health and learning disability services in England and Wales 2008
7 Care Quality Commission National Mental Health Development Unit Results of the 2009 national census of inpatients and patients on supervised community treatment in mental health and learning disability services in England and Wales 2009
8 Department of Health Delivering race equality in mental health care an action plan for reform inside and outside services 2005
9 Welsh Assembly Government Adult Mental Health Services Raising the standard ndash Race Equality Action Plan for Adult Mental Health Services in Wales 2006
10Department of Health No health without mental health a cross-government mental health outcomes strategy for people of all ages 2011 wwwdhgovukprod_consum_dhgroups dh_digitalassetsdocumentsdigitalasset dh_124058pdf
11Department of Health New horizons towards a shared vision for mental health 2009 wwwdhgovukprod_consum_dhgroups dh_digitalassetsdhendocumentsdigital assetdh_109708pdf
12Department of Health Valuing people a new strategy for learning disability for the 21st century 2001
13Department of Health Valuing people now a new three year strategy for people with learning disabilities 2009
14Department of Health Healthcare for all report of the independent inquiry into access to healthcare for people with learning disabilities 2008
15Joint Committee on Human Rights A life like any other human rights of adults with learning disabilities (2008 HL Paper 401 HC 731) House of Lords House of Commons 2008
16Department of Health Valuing people now summary report March 2009 ndash September 2010 2010
17Disability Rights Commission Equal treatment investigation 2005
18Department of Health Mir G Nocon A Ahmad W Jones L Learning difficulties and ethnicity 2000
19ONS experimental population estimates by ethnic group 2007 wwwstatisticsgovukstatbase productaspvlnk=14238
Care Quality Commission Count me in census 2010 46
References continued
20Six percent of population are gay or lesbian according to Whitehall figures 2005 wwwtelegraphcouknewsmainjhtmlxml= news20051212ngay12xmlamps Sheet= news20051212ixhomehtml
21Department of Trade and Industry Amendment to Employment Equality (Sexual Orientation) Regulations 2003 2003
22Office for National Statistics Measuring sexual identity an evaluation report 2010
23 Information Centre Mental Health Bulletin Fourth report from Mental Health Minimum Dataset (MHMDS) annual returns 2010 2011 wwwicnhsukpubsmhbmhmds0910
24 Information Centre Mental Health Bulletin Fourth report from Mental Health Minimum Dataset (MHMDS) annual returns 2010 2011 wwwicnhsukpubsmhbmhmds0910
25The operating framework for the NHS in England 201112 Department of Health 2010 wwwdhgovukprod_consum_dhgroups dh_digitalassetsdhenpsdocuments digitalassetdh_122736pdf
26wwwdhgovukenPublicationsandstatistics LettersandcircularsProfessionalletters ChiefnursingofficerlettersDH_121848
27Department of Health No health without mental health a cross-government mental health outcomes strategy for people of all ages 2011 wwwdhgovukprod_consum_dhgroups dh_digitalassetsdocumentsdigitalasset dh_124058pdf
28Ministry of Justice Breaking the cycle effective punishment rehabilitation and sentencing of offenders 2010
29Department of Health The Bradley report Lord Bradleyrsquos review of people with mental health problems or learning disabilities in the criminal justice system 2009
30Department of Health No health without mental health delivering better mental health outcomes for people of all ages 2011
31Department of Health Equity and excellence liberating the NHS 2010 wwwdhgovukprod_ consum_dhgroupsdh_digitalassetsdhen psdocumentsdigitalassetdh_117794pdf
32Department of Health Healthy lives healthy people our strategy for public health in England 2010 wwwdhgovukprod_consum_dh groupsdh_digitalassetsdhenps documentsdigitalassetdh_122347pdf
33Department of Health A vision for adult social care capable communities and active citizens 2010 wwwdhgovukprod_consum_dh groupsdh_digitalassetsdhenps documentsdigitalassetdh_121971pdf
34Wilson M NMHDU Race equality action plan a five year review Delivering race equality in mental health care 2010 wwwnmhduorgukour-workmhep
35Care Quality Commission Monitoring the use of the Mental Health Act in 200910 2010
36Raleigh V S Collection of data on ethnic origin in England Editorial BMJ 20083376456
37Wilson M NMHDU Race equality action plan a five year review Delivering race equality in mental health care 2010 wwwnmhduorgukour-workmhep
38Department of Health Liberating the NHS an information revolution 2010
Care Quality Commission Count me in census 2010 47
Appendix A Methods of analysis
Standardisation by age and gender
Standardisation allows us to make comparisons between groups of the population by taking account of variations in age and gender Some differences in patterns of service use are related to the age or gender of the people using them so adjustments to the data have to be made to ensure that the interpretation of ethnic differences is reliable For example formal admissions are higher at a younger age so some Black and minority ethnic groups may have high formal admission rates simply because they have a high proportion of younger people Without adjustments for age and gender differences comparisons would be misleading
In this report most results are standardised for age and gender including those relating to admission detention source of referral care programme approach seclusion restraint accidents assault self-harm consent and presence on a secure ward The report uses the accepted statistical method of taking account of age and gender differences between groups when calculating these rates
We used the ONS estimates of total population by ethnic group for England and Wales in 2007 to standardise the rates of admission for different ethnic groups This takes account of the significant rises in the Black and ethnic minority population of England and Wales since the 2001 ONS census and hence gives more accurate and up to date estimates of admission ratios for different ethnic groups (although it does not take account of any further changes in the ethnic populations between 2007 and 2010 the date of this census) For comparison with the DRE baseline we also present admission rates from the 2005 census derived using the 2005 ONS estimates of populations by ethnic group These figures will not be the same as published in the 2005 census report which were based on the 2001 ONS census population estimates because updated estimates of populations by ethnic group were not available at that time
For other analyses we used the total number of inpatients and patients on CTOs in the census
as the basis for standardisation However CTO outpatients are excluded from selected analyses where appropriate namely the analysis of rates for admissions detentions on admission source of referral single sex accommodation and recorded incidents of seclusion restraint accidents assault and self-harm We used the statistical package STATA version 82 to derive the standardised results
It was not possible to adjust the analyses for ethnic differences in social and economic factors and in diagnosis and severity of illness Such factors could affect the ethnic differences observed in the results
For descriptive variables such as religion and language we did not use standardisation
Confidence intervals as indicators of significant statistical differences
For all standardised results the national rates for England and Wales are taken as 100 and the usual 95 confidence intervals are given Rates of less than 100 or greater than 100 for specific ethnic groups show a lower or higher rate respectively than the national average after adjusting for age and gender Whether or not the difference is statistically significant from the national average depends on the confidence interval If the confidence interval overlaps 100 the difference from the national average is not statistically significant If both values are lower or higher than 100 it indicates that the difference compared with the national average is statistically significant at the 95 level
For example if a rate is 110 with the lower confidence interval being 105 and the upper confidence interval being 115 it indicates that the 10 excess over the national average of 100 is statistically significant But if a ratio is 110 with the lower confidence interval being 95 and the upper confidence interval being 125 it indicates that the 10 excess over the national average is not statistically significant We did not attempt to adjust the confidence intervals for multiple comparisons
Care Quality Commission Count me in census 2010 48
Appendix B Mental health tables
Table B1 Standardised admission ratios by ethnic group for England and Wales (excluding outpatients on a CTO) using 2007 ONS census population denominators (England and Wales = 100) All ages
Ethnic group
Men Women Persons Standardised
admission ratio
95 confidence
interval Observed numbers
Standardised admission
ratio
95 confidence
interval Observed numbers
Standardised admission
ratio
95 confidence
interval Observed numbers
White British 88 86 89 12435 94 93 96 10157 91 89 92 22592 White Irish 130 115 146 274 122 106 140 215 126 115 138 489 Other White 117 109 126 731 129 118 141 533 122 115 129 1264 White and Black Caribbean 557 493 627 276 274 223 333 101 436 393 483 377 White and Black African 312 247 388 80 259 186 351 41 292 242 349 121 White and Asian 140 110 174 79 124 90 166 44 134 111 159 123 Other Mixed 230 189 278 108 213 165 270 67 223 192 259 175 Indian 67 59 75 286 66 56 76 172 66 60 73 458 Pakistani 105 93 119 269 65 53 79 96 91 81 100 365 Bangladeshi 123 102 147 120 82 60 109 46 108 92 126 166 Other Asian 161 139 185 192 136 107 169 79 153 135 172 271 Black Caribbean 538 505 572 980 306 277 336 418 438 415 462 1398 Black African 246 226 267 550 219 194 247 277 236 221 253 827 Other Black 792 691 903 222 314 240 403 61 596 529 670 283 Chinese 27 20 38 39 43 30 59 35 33 26 41 74 Other 140 120 162 177 110 88 136 87 128 113 145 264 Total 100 16818 100 12429 100 29247
Care Quality Commission Count me in census 2010 49
Appendix B Mental health tables continued
Table B2 Standardised admission ratios by ethnic group for England and Wales (excluding outpatients on a CTO) using 2007 ONS census population denominators (England amp Wales = 100) Ages 65 and over
Ethnic group
Men Women Persons Standardised
admission ratio
95 confidence
interval Observed numbers
Standardised admission
ratio
95 confidence
interval Observed numbers
Standardised admission
ratio
95 confidence
interval Observed numbers
White British 95 92 99 3265 95 92 98 3887 95 93 97 7152 White Irish 142 116 172 106 102 82 125 92 120 104 138 198 Other White 207 174 244 141 213 183 248 171 210 188 235 312 White and Black Caribbean 406 210 710 12 333 152 632 9 371 230 568 21 White and Black African 231 28 836 2 198 24 714 2 213 58 546 4 White and Asian 28 1 156 1 110 30 281 4 69 23 162 5 Other Mixed 146 40 374 4 228 92 470 7 189 95 339 11 Indian 97 70 132 41 83 57 116 33 90 71 113 74 Pakistani 39 17 77 8 46 18 94 7 42 23 69 15 Bangladeshi 115 53 218 9 69 14 201 3 98 51 172 12 Other Asian 234 143 361 20 215 120 354 15 225 157 313 35 Black Caribbean 216 170 269 77 310 253 376 103 261 224 302 180 Black African 142 73 248 12 365 241 531 27 246 175 337 39 Other Black 164 34 479 3 366 134 796 6 259 119 493 9 Chinese 41 8 120 3 95 38 195 7 68 33 125 10 Other 253 126 453 11 390 238 602 20 327 222 464 31 Total 100 3715 100 4393 100 8108
Care Quality Commission Count me in census 2010 50
Appendix B Mental health tables continued
Table B3 Standardised ratios by ethnic group for patients referred by a GP (England and Wales = 100)
Ethnic group
Men Women Persons Standardised
referral ratio
95 confidence
interval Observed numbers
Standardised referral ratio
95 confidence
interval Observed numbers
Standardised referral ratio
95 confidence
interval Observed numbers
White British 110 103 117 904 107 101 114 1065 108 104 113 1969 White Irish 85 50 134 18 93 57 144 20 89 63 123 38 Other White 74 51 103 33 70 49 97 36 72 56 91 69 White and Black Caribbean 27 5 78 3 30 4 109 2 28 9 65 5 White and Black African 0 0 74 9 268 2 35 4 125 2 White and Asian 165 54 386 5 0 0 86 28 201 5 Other Mixed 48 6 172 2 68 14 198 3 58 19 136 5 Indian 69 34 123 11 79 39 141 11 73 46 111 22 Pakistani 88 42 162 10 59 16 151 4 77 42 130 14 Bangladeshi 81 22 207 4 61 7 221 2 73 27 159 6 Other Asian 80 32 166 7 108 43 223 7 92 50 155 14 Black Caribbean 35 20 56 17 37 20 62 14 36 24 51 31 Black African 57 29 100 12 66 35 113 13 61 40 91 25 Other Black 62 23 135 6 40 5 144 2 54 23 107 8 Chinese 56 1 314 1 139 38 356 4 108 35 251 5 Other 106 46 208 8 0 0 53 23 105 8 Total 100 1041 100 1185 100 2226
Care Quality Commission Count me in census 2010 51
Appendix B Mental health tables continued
Table B4 Standardised ratios by ethnic group for patients referred by a community mental health team (including crisis resolution home treatment) or community learning disability team (England and Wales = 100)
Ethnic group
Men Women Persons Standardised
referral ratio
95 confidence
interval Observed numbers
Standardised referral ratio
95 confidence
interval Observed numbers
Standardised referral ratio
95 confidence
interval Observed numbers
White British 107 104 111 3255 103 100 107 3386 105 103 108 6641 White Irish 90 69 116 61 89 68 114 61 90 74 107 122 Other White 59 48 71 105 79 67 94 141 69 61 78 246 White and Black Caribbean 106 83 135 68 75 49 111 25 96 77 117 93 White and Black African 43 19 84 8 66 30 124 9 52 31 84 17 White and Asian 95 56 150 18 84 43 147 12 90 61 129 30 Other Mixed 78 48 121 20 72 41 118 16 76 53 105 36 Indian 106 83 132 76 100 76 130 56 103 86 122 132 Pakistani 108 84 135 73 89 60 128 30 102 83 123 103 Bangladeshi 98 66 141 29 90 50 148 15 95 69 128 44 Other Asian 88 63 120 40 105 70 150 29 94 73 119 69 Black Caribbean 69 59 80 167 85 71 102 123 75 67 84 290 Black African 84 70 102 112 82 65 103 77 84 72 96 189 Other Black 52 36 74 31 64 36 106 15 56 41 74 46 Chinese 112 53 205 10 101 52 176 12 105 66 160 22 Other 86 60 120 35 106 71 151 30 94 73 120 65 Total 100 4108 100 4037 100 8145
Care Quality Commission Count me in census 2010 52
Appendix B Mental health tables continued
Table B5 Standardised ratios by ethnic group for patients referred by criminal justice routes (police prison probation courts court liaison and diversion) (England and Wales = 100)
Ethnic group
Men Women Persons Standardised
referral ratio
95 confidence
interval Observed numbers
Standardised referral ratio
95 confidence
interval Observed numbers
Standardised referral ratio
95 confidence
interval Observed numbers
White British 90 86 95 1495 95 86 104 421 91 87 95 1916 White Irish 133 94 183 38 59 19 138 5 116 84 157 43 Other White 112 93 134 119 103 68 150 27 111 93 130 146 White and Black Caribbean 117 89 151 58 145 69 266 10 120 94 153 68 White and Black African 190 127 273 29 141 38 361 4 183 126 256 33 White and Asian 75 39 131 12 160 52 373 5 89 52 143 17 Other Mixed 104 65 157 22 151 61 311 7 112 75 161 29 Indian 86 61 118 38 79 32 163 7 85 62 113 45 Pakistani 118 91 150 65 89 33 194 6 115 90 145 71 Bangladeshi 74 44 115 19 29 1 162 1 68 42 105 20 Other Asian 130 95 174 45 164 71 323 8 134 101 176 53 Black Caribbean 131 114 150 208 124 81 181 26 130 114 148 234 Black African 132 112 156 145 143 93 211 25 134 114 156 170 Other Black 141 109 180 65 236 113 435 10 149 117 187 75 Chinese 83 27 194 5 146 30 426 3 99 43 195 8 Other 129 93 175 41 113 37 264 5 127 93 170 46 Total 100 2404 100 570 100 2974
Care Quality Commission Count me in census 2010 53
Appendix B Mental health tables continued
Table B6 Standardised detention ratios by ethnic group all detentions on day of admission (excluding outpatients on a CTO) (England and Wales = 100)
Ethnic group
Men Women Persons Standardised
detention ratio
95 confidence
interval Observed numbers
Standardised detention
ratio
95 confidence
interval Observed numbers
Standardised detention
ratio
95 confidence
interval Observed numbers
White British 94 92 97 6449 94 91 97 3628 94 92 96 10077 White Irish 112 95 131 154 118 96 145 94 114 101 129 248 Other White 108 98 118 451 120 106 136 251 112 104 120 702 White and Black Caribbean 123 107 141 220 129 99 167 59 124 110 140 279 White and Black African 128 99 162 68 113 70 173 21 124 100 153 89 White and Asian 96 71 126 50 109 68 164 22 99 78 125 72 Other Mixed 115 92 143 82 139 100 188 42 122 102 146 124 Indian 97 83 113 164 110 86 137 77 101 88 114 241 Pakistani 109 94 126 194 102 74 136 44 108 94 122 238 Bangladeshi 86 67 109 69 91 55 142 19 87 70 107 88 Other Asian 109 92 130 133 120 86 163 40 112 96 130 173 Black Caribbean 129 121 139 774 143 125 162 238 132 124 141 1012 Black African 115 104 127 422 131 111 153 159 119 110 129 581 Other Black 117 100 136 170 148 105 202 39 122 106 140 209 Chinese 108 71 159 26 129 78 202 19 116 85 156 45 Other 111 92 132 126 116 83 157 41 112 96 130 167 Total 100 9552 100 4793 100 14345
Care Quality Commission Count me in census 2010 54
Appendix B Mental health tables continued
Table B7 Standardised detention ratios by ethnic group detention on day of admission ndash section 2 of the Mental Health Act (England and Wales = 100)
Ethnic group
Men Women Persons Standardised
detention ratio
95 confidence
interval Observed numbers
Standardised detention
ratio
95 confidence
interval Observed numbers
Standardised detention
ratio
95 confidence
interval Observed numbers
White British 97 91 102 1156 93 87 98 1133 95 91 99 2289 White Irish 78 47 120 20 116 79 166 30 97 72 128 50 Other White 100 78 126 70 134 108 166 88 116 99 136 158 White and Black Caribbean 55 30 93 14 60 24 124 7 57 35 87 21 White and Black African 91 37 188 7 150 60 308 7 113 62 190 14 White and Asian 80 29 174 6 119 44 258 6 96 49 167 12 Other Mixed 68 28 141 7 116 53 221 9 89 51 145 16 Indian 130 91 179 37 124 81 182 26 127 98 163 63 Pakistani 126 87 176 34 138 79 225 16 130 96 171 50 Bangladeshi 166 101 256 20 140 61 276 8 158 105 228 28 Other Asian 142 93 209 26 163 93 264 16 150 108 202 42 Black Caribbean 73 57 92 70 97 72 128 51 82 68 98 121 Black African 164 131 202 87 190 146 244 62 174 147 204 149 Other Black 114 75 166 27 140 72 245 12 121 86 165 39 Chinese 165 60 358 6 212 97 402 9 190 106 313 15 Other 218 153 302 36 179 108 280 19 203 153 264 55 Total 100 1623 100 1499 100 3122
Care Quality Commission Count me in census 2010 55
Appendix B Mental health tables continued
Table B8 Standardised detention ratios by ethnic group detention on day of admission ndash section 3 of the Mental Health Act (England and Wales = 100)
Ethnic group
Men Women Persons Standardised
detention ratio
95 confidence
interval Observed numbers
Standardised detention
ratio
95 confidence
interval Observed numbers
Standardised detention
ratio
95 confidence
interval Observed numbers
White British 99 95 103 2684 96 91 100 1852 98 95 101 4536 White Irish 116 89 149 60 135 101 177 52 124 102 149 112 Other White 112 96 129 186 110 92 132 121 111 99 124 307 White and Black Caribbean 114 91 143 79 130 90 183 33 119 98 143 112 White and Black African 97 60 148 21 107 54 192 11 100 69 141 32 White and Asian 84 50 133 18 97 48 173 11 89 59 127 29 Other Mixed 121 84 168 35 117 72 181 20 120 90 156 55 Indian 96 75 122 67 110 79 148 42 101 83 122 109 Pakistani 91 71 115 69 88 55 134 22 90 73 111 91 Bangladeshi 63 39 95 22 64 28 127 8 63 43 90 30 Other Asian 90 65 120 44 94 56 149 18 91 70 117 62 Black Caribbean 116 102 130 279 164 138 192 148 129 117 142 427 Black African 95 80 112 143 102 79 129 68 97 85 111 211 Other Black 75 55 99 49 99 58 159 17 80 62 102 66 Chinese 119 59 213 11 99 43 194 8 110 66 171 19 Other 85 60 116 38 84 48 136 16 84 63 110 54 Total 100 3805 100 2447 100 6252
Care Quality Commission Count me in census 2010 56
Appendix B Mental health tables continued
Table B9 Standardised detention ratios by ethnic group detention on day of admission ndash section 3741 of the Mental Health Act (England and Wales = 100)
Ethnic group
Men Women Persons Standardised
detention ratio
95 confidence
interval Observed numbers
Standardised detention
ratio
95 confidence
interval Observed numbers
Standardised detention
ratio
95 confidence
interval Observed numbers
White British 84 79 89 991 101 88 115 220 86 82 91 1211 White Irish 140 96 198 32 48 6 175 2 126 87 176 34 Other White 112 89 139 81 156 95 241 20 118 96 144 101 White and Black Caribbean 177 133 232 53 179 66 390 6 178 135 229 59 White and Black African 149 82 251 14 224 46 654 3 159 92 254 17 White and Asian 141 75 241 13 195 40 569 3 149 85 241 16 Other Mixed 144 85 227 18 264 97 575 6 162 104 242 24 Indian 86 56 126 26 44 5 160 2 80 53 116 28 Pakistani 122 87 166 40 0 0 111 79 152 40 Bangladeshi 66 32 122 10 0 0 60 29 110 10 Other Asian 99 61 151 21 0 0 89 55 136 21 Black Caribbean 200 174 229 210 78 34 153 8 189 165 216 218 Black African 127 101 157 82 84 34 172 7 122 98 150 89 Other Black 152 110 205 43 94 11 341 2 148 108 198 45 Chinese 100 27 255 4 0 0 80 22 204 4 Other 118 75 177 23 44 1 245 1 110 71 164 24 Total 100 1661 100 280 100 1941
Care Quality Commission Count me in census 2010 57
Appendix B Mental health tables continued
Table B10 Standardised detention ratios by ethnic group detention on day of admission ndash sections 47 48 4749 of the Mental Health Act (England and Wales = 100)
Ethnic group
Men Women Persons Standardised
detention ratio
95 confidence
interval Observed numbers
Standardised detention
ratio
95 confidence
interval Observed numbers
Standardised detention
ratio
95 confidence
interval Observed numbers
White British 97 90 106 583 104 81 131 73 98 91 106 656 White Irish 132 72 221 14 163 20 590 2 135 77 219 16 Other White 130 96 172 49 71 15 206 3 124 93 163 52 White and Black Caribbean 126 78 193 21 80 2 444 1 123 77 186 22 White and Black African 207 103 370 11 0 0 189 95 339 11 White and Asian 57 12 166 3 169 4 941 1 68 19 175 4 Other Mixed 112 48 221 8 233 28 843 2 125 60 230 10 Indian 57 26 108 9 0 252 0 52 24 99 9 Pakistani 92 54 147 17 0 314 0 86 50 138 17 Bangladeshi 46 12 117 4 167 4 930 1 53 17 125 5 Other Asian 101 52 177 12 0 0 95 49 166 12 Black Caribbean 126 98 159 70 125 34 319 4 126 99 158 74 Black African 74 48 107 27 104 21 303 3 76 51 108 30 Other Black 127 78 197 20 138 3 769 1 128 79 195 21 Chinese 0 0 0 0 0 0 Other 83 38 157 9 0 0 77 35 147 9 Total 100 857 100 91 100 948
Care Quality Commission Count me in census 2010 58
Appendix B Mental health tables continued
Table B11 Standardised ratios for all applications of the Mental Health Act (including outpatients on a CTO) by ethnic group on day of census (England and Wales = 100)
Ethnic group
Men Women Persons Standardised
ratio for all MHA
applications
95 confidence
interval Observed numbers
Standardised ratio for all MHA
applications
95 confidence
interval Observed numbers
Standardised ratio for all MHA
applications
95 confidence
interval Observed numbers
White British 97 94 99 7659 95 93 98 4335 96 94 98 11994 White Irish 99 83 116 147 104 84 128 95 101 89 114 242 Other White 87 79 95 427 97 85 110 249 90 84 97 676 White and Black Caribbean 117 103 133 245 130 103 163 76 120 107 134 321 White and Black African 120 95 150 79 93 58 141 22 113 92 137 101 White and Asian 101 78 128 65 119 81 169 31 106 86 129 96 Other Mixed 110 89 134 96 125 93 165 49 114 97 135 145 Indian 103 90 118 215 122 100 147 109 109 97 121 324 Pakistani 111 97 125 254 117 90 148 67 112 100 125 321 Bangladeshi 92 75 112 97 101 68 145 29 94 78 112 126 Other Asian 103 88 121 152 126 95 164 56 109 94 124 208 Black Caribbean 123 115 131 893 141 126 158 300 127 120 134 1193 Black African 112 103 122 511 121 104 140 188 114 106 123 699 Other Black 116 102 132 232 148 112 191 59 122 108 136 291 Chinese 97 64 140 27 101 61 157 19 98 72 131 46 Other 104 87 122 140 103 75 137 46 103 89 119 186 Total 100 11239 100 5730 100 16969
Care Quality Commission Count me in census 2010 59
Appendix B Mental health tables continued
Table B12 Standardised CTO ratios by ethnic group CTOs on day of census ndash section 17a of the Mental Health Act (England and Wales = 100)
Ethnic group
Men Women Persons
Standardised CTO ratio
95 confidence
interval Observed numbers
Standardised CTO ratio
95 confidence
interval Observed numbers
Standardised CTO ratio
95 confidence
interval Observed numbers
White British 94 89 99 1289 88 82 94 730 92 88 96 2019 White Irish 51 27 88 13 77 41 132 13 62 40 90 26 Other White 97 77 120 83 125 95 162 58 107 90 126 141 White and Black Caribbean 79 53 113 29 141 77 237 14 92 67 124 43 White and Black African 111 59 190 13 125 41 292 5 115 68 181 18 White and Asian 104 54 182 12 136 50 297 6 113 67 178 18 Other Mixed 102 59 166 16 136 62 257 9 112 73 166 25 Indian 134 99 177 48 152 98 226 24 139 109 175 72 Pakistani 145 110 187 59 174 101 279 17 151 119 189 76 Bangladeshi 142 93 206 27 205 99 378 10 155 109 213 37 Other Asian 107 71 155 28 182 99 305 14 124 89 168 42 Black Caribbean 121 103 142 152 171 132 218 65 133 116 152 217 Black African 116 94 142 94 139 98 192 37 122 102 145 131 Other Black 186 144 238 65 305 189 466 21 206 165 254 86 Chinese 83 23 213 4 152 49 354 5 111 51 211 9 Other 87 54 134 21 152 79 266 12 103 71 145 33 Total 100 1953 100 1040 100 2993
Care Quality Commission Count me in census 2010 60
Appendix C Learning disability tables
Table C1 Standardised admission ratios by ethnic group for England and Wales using 2007 ONS population denominators (England amp Wales = 100) All ages
Ethnic group
Men Women Persons Standardised
admission ratio
95 confidence
interval Observed numbers
Standardised admission
ratio
95 confidence
interval Observed numbers
Standardised admission
ratio
95 confidence
interval Observed numbers
White British 104 100 109 2163 108 101 115 941 105 102 109 3104 White Irish 108 72 156 28 151 89 238 18 121 89 162 46 Other White 81 65 101 85 49 30 75 21 72 59 87 106 White and Black Caribbean 280 186 405 28 246 118 453 10 270 191 371 38 White and Black African 102 33 239 5 165 34 482 3 119 51 235 8 White and Asian 66 26 135 7 154 56 335 6 89 47 152 13 Other Mixed 181 104 295 16 229 99 451 8 195 125 290 24 Indian 32 21 48 24 28 12 55 8 31 21 44 32 Pakistani 48 30 72 22 12 1 43 2 38 25 57 24 Bangladeshi 102 60 161 18 31 4 113 2 83 51 128 20 Other Asian 33 13 69 7 92 34 201 6 47 25 81 13 Black Caribbean 265 210 332 77 117 67 190 16 218 176 267 93 Black African 53 33 80 22 40 15 87 6 50 33 72 28 Other Black 228 118 399 12 134 28 392 3 200 112 330 15 Chinese 4 0 21 1 3 0 16 1 Other 26 9 56 6 11 0 59 1 21 9 44 7 Total 100 2521 100 1051 100 3572
Care Quality Commission Count me in census 2010 61
Appendix C Learning disability tables continued
Table C2 Standardised detention ratios by ethnic group all detentions on day of admission (England and Wales = 100)
Ethnic group
Persons Standardised
detention ratio
95 confidence
interval Observed numbers
White British 97 93 103 1431 White Irish 127 84 184 28 Other White 117 91 149 68 White and Black Caribbean 120 77 179 24 White and Black African 114 37 267 5 White and Asian 75 24 176 5 Other Mixed 94 49 165 12 Indian 119 72 186 19 Pakistani 110 61 181 15 Bangladeshi 144 84 231 17 Other Asian 59 16 150 4 Black Caribbean 119 90 155 57 Black African 138 85 210 21 Other Black 62 20 145 5 Chinese 0 0 Other 104 28 267 4 Total 100 1715
Care Quality Commission Count me in census 2010 62
copy Care Quality Commission and National Mental Health Development Unit 2011 Published April 2011
This publication may be reproduced in whole or in part in any format or medium for non-commercial purposes provided that it is reproduced accurately and not used in a derogatory manner or in a misleading context The source should be acknowledged by showing the publication title and copy Care Quality Commission and National Mental Health Development Unit 2011
How to contact us
Phone 03000 616161 Email enquiriescqcorguk Web wwwcqcorguk
Write to us at Care Quality Commission National Correspondence Citygate Gallowgate Newcastle upon Tyne NE1 4PA
Please contact us if you would like a summary of this publication in other formats or languages
Registered office Care Quality Commission Finsbury Tower 103ndash105 Bunhill Row London EC1Y 8TG
- Count me in 2010
- About the Care Quality Commission
- Contents
- Summary
- National organisations coordinating the census
- Introduction
- Data methods of analysis and interpretation
- Results mental health
- A comparison between the 2005 baseline and the 2010 census
- Results learning disabilities
- Data in the future Moving beyond a one-day census
- Conclusions
- References
- Appendix A Methods of analysis
- Appendix B Mental health tables
- Appendix C Learning disability tables
- How to contact us
-

Results mental health continued
Age and gender
Ethnic differences in the age profiles of patients largely reflect the age profiles of different minority ethnic populations The White British White Irish and Other White populations have an older age structure than other minority ethnic populations and therefore patients from the White groups are significantly older than patients from other ethnic groups (see Table 3)
Overall 58 of patients were men Men outnumbered women in all ethnic groups (see Table 3) The White British White Irish Other White and Chinese groups had smaller differences in the proportions of men and women compared with other ethnic groups
Table 3 Age and gender of patients
Ethnic group Age () Gender ()
Total (n) 0-17 18-24 25-49 50-64 65+ Men Women
White British 1 7 41 20 31 56 44 100 (24593)
White Irish 0 4 36 19 41 56 44 100 (514)
Other White 2 7 47 19 25 58 42 100 (1407) White and Black Caribbean 1 13 68 12 5 73 27 100 (418)
White and Black African 1 13 73 9 4 67 33 100 (139)
White and Asian 4 18 63 11 5 65 35 100 (141)
Other Mixed 2 13 69 11 6 62 38 100 (200)
Indian 1 4 58 21 15 63 37 100 (529)
Pakistani 2 10 73 12 4 74 26 100 (440)
Bangladeshi 2 15 69 8 6 72 28 100 (203)
Other Asian 2 12 61 13 13 70 30 100 (311)
Black Caribbean 1 6 61 20 13 70 30 100 (1608)
Black African 1 10 75 9 5 67 33 100 (957)
Other Black 1 6 78 11 3 78 22 100 (368)
Chinese 2 10 59 17 12 52 48 100 (83)
Other 2 12 57 18 11 67 33 100 (296)
1 7 46 19 27 58 42 100 Total (n=
471) (n=
2352) (n=
14998) (n=
6093) (n=
8885) (n=
19071) (n=
13684) (n=
32799)
Care Quality Commission Count me in census 2010 17
Results mental health continued
Language and religion
Similar to previous censuses 5 of patients reported that their first language was not English (see Table 4) The Chinese and Bangladeshi groups had the highest proportions of patients whose first language was not English (51 and 46 respectively) Among the Other White group 27 had a first language other than English Again similar to previous censuses about 2 of patients said they needed an interpreter and of these 24 were from the White British group
Table 4 Percentage of patients with a first language other than English
Ethnic group with first language other than English
White British 1
White Irish 3
Other White 27
White and Black Caribbean 2
White and Black African 10
White and Asian 6
Other Mixed 11
Indian 26
Pakistani 35
Bangladeshi 46
Other Asian 34
Black Caribbean 2
Black African 22
Other Black 13
Chinese 51
Other 41
Total 5
Care Quality Commission Count me in census 2010 18
Results mental health continued
Religion was not stated for 21 of patients and 15 of patients said they had no religion The proportions stating they did not have a religion were highest among the WhiteBlack Caribbean and WhiteAsian Mixed groups (23 and 21 respectively) and lowest among the South Asian groups (4) Table 5 shows the religion of patients
Table 5 Religion of patients by ethnic group
Ethnic group
Religion and faith groups ()
None Christian Buddhist Hindu Jewish Muslim Sikh Any other religion
Not stated
White British 16 58 1 0 1 0 0 3 21
White Irish 8 73 0 0 0 5 13
Other White 13 53 1 0 3 5 7 18 White and Black Caribbean 23 47 0 1 0 3 7 17
White and Black African 16 41 1 1 15 6 20
White and Asian 21 33 1 1 21 3 3 18
Other Mixed 15 41 3 3 16 8 17
Indian 5 10 0 29 15 28 2 11
Pakistani 4 3 0 1 1 80 1 2 10
Bangladeshi 4 1 1 1 76 1 5 11
Other Asian 6 14 5 12 39 5 3 16
Black Caribbean 12 59 1 0 0 2 8 17
Black African 10 45 0 0 22 0 3 19
Other Black 12 41 1 1 0 16 7 22
Chinese 18 30 16 1 4 31
Other 8 24 3 1 3 34 6 21
Total 15 54 1 1 1 4 1 4 21
Care Quality Commission Count me in census 2010 19
Results mental health continued
Sexual orientation
The results for sexual orientation were not valid for 1 of patients and for 20 the response was recorded as ldquonot knownrdquo Seventy-six per cent of patients said they were heterosexual 1 said gay lesbian 1 said bisexual and less than 1 said ldquootherrdquo The number of minority ethnic patients who were gaylesbian or bisexual was very low
The overall figure of 1 who said they were gay lesbian or bisexual is lower than some estimates of the proportions of gaylesbian or bisexual people in the general population (5 to 7)2021 However in the 200910 Integrated Household Survey of a representative sample of 238206 people in UK conducted by the Office for National Statistics 1 identified themselves as gay or lesbian 05 as bisexual 05 as ldquootherrdquo 3 responded as ldquodo not knowrdquo or refused to answer and 95 identified themselves as heterosexualstraight22
Disability
About 75 of patients said they did not have a disability and 25 said they had one or more disabilities Of these 7 were blind or visually impaired 1 were deaf or had a hearing impairment 1 had Autistic Spectrum Disorder 2 had a learning disability 4 had a mobility impairment and 2 used a wheelchair The remaining 8 had more than one disability The proportion of patients with a disability was highest among the White British White Irish and Other White groups (about 28) which could reflect the higher age profiles of these patients compared with other ethnic groups
Rates of admission (see section on interpreting the results on page 13)
The rates of admission derived using the 2007 ONS ethnic population estimates as denominators are given in Appendix B Tables B1 (all ages) and B2 (ages 65 and over) Outpatients on a CTO are excluded from these results
All ages Admission rates were lower than average for patients from the White British Indian and Chinese groups and were average for the Pakistani and Bangladeshi groups Rates were higher than average for other minority ethnic groups they were particularly high for the Black Caribbean Black African WhiteBlack Caribbean Mixed and WhiteBlack African Mixed groups who had rates two to four times higher than average and for the Other Black group with a rate six times higher
Ages 65 and over Age-standardised admission rates for minority ethnic groups at older ages show broadly similar patterns to those reported for all ages with rates two to three times higher than average among the Black and White Black Mixed groups Rates were high also in the White Irish Other White Other Asian and Other groups
Numbers of older Black and minority ethnic patients were too few in most ethnic groups to support analyses of subgroups within them for example those detained
Care Quality Commission Count me in census 2010 20
Results mental health continued
Source of referral
People can be referred to healthcare services in a number of ways Referrals for inpatient care often come from community mental health teams rather than the original source such as GPs and accident and emergency (AampE) departments Therefore referrals from these teams may include referrals from other sources Furthermore about a quarter of patients (26) were referred from tertiary care and information about their original referral source was not available We had no information about the source of referral for 13 of patients The results reflect the proportions of patients from each ethnic group that are referred from each source so a higher proportion of referrals from one source will inevitably mean that proportions from other referral sources are lower Outpatients on a CTO are excluded from these data
The referral patterns are broadly similar to those reported previously and the key results are presented below
GP referrals 7 of patients Rates were 8 higher than average among the White British group They were lower than average among the Other White Black Caribbean Black African and WhiteBlack Caribbean Mixed groups by 28 to 72 The rates of referral by GPs are given in Appendix B Table B3
Referrals from AampE departments 5 of patients The White British group had a 9 lower than average rate of such referrals The WhiteBlack African Mixed Indian Bangladeshi Black African and Other groups were more likely than average to be referred in this way
Referrals from community mental health teams 26 of patients For the White British group such referrals were 5 higher than the average rate They were lower than average among the Other White WhiteBlack African Mixed Black Caribbean Black African and
Other Black groups by 16 to 48 The rates of referral are given in Appendix B Table B4
Referrals from the criminal justice system 9 of patients This is defined as the police courts probation service prison and court liaison and diversion service
Patients from the White British group were less likely than average to be referred by the criminal justice agencies whereas the Black Caribbean Black African Other Black WhiteBlack African Mixed and Other Asian groups were 30 to 83 more likely than average to be referred in this way We observed no differences from the average rate for other ethnic groups Rates of referral by the criminal justice system are given in Appendix B Table B5
A significant proportion (26) of all referrals were from tertiary care
Tertiary care referrals from medium or high secure units 5 of patients The rate for such referrals (in NHS or independent sectors) was lower than average among the Other White and Indian groups It was higher than average among the Black Caribbean and WhiteBlack Caribbean Mixed groups by about 75
Tertiary care referrals from other inpatient services 21 of patients The rate for such referrals (NHS and independent) was higher than average among the White Irish and Other White groups by 29 and 59 respectively The rate was lower than average in the Indian and Other Black groups
Tertiary care referrals from other clinical specialties 9 of patients Rates of such referrals were higher than average among the White British and Indian groups and lower than average among the Other White WhiteBlack Caribbean Mixed Other Asian Black African Other Black and Chinese groups
Care Quality Commission Count me in census 2010 21
Results mental health continued
Detention under the Mental Health Act 1983 on day of admission
The Mental Health Act 2007 made a number of changes to the Mental Health Act 1983 These changes were reflected in the census of 2009 and 2010 which collected information on new provisions establishing supervised community treatment (section 17A) and excluded supervised discharge (section 25A) which was abolished
As in previous reports we present below the results for detention rates on the day of admission Outpatients on a CTO are excluded from these analyses After that we present rates for all patients subject to the Mental Health Act on census day (including outpatients on a CTO) followed by rates for patients on a CTO on census day
All detentions Forty-nine per cent (14637) of patients were detained under the Mental Health Act on admission to hospital This was a higher proportion than recorded in the previous censuses (40 in 2005 and 2006 43 in 2007 45 in 2008 and 47 in 2009)
Detention rates were 6 lower than average among White British patients and between 19 and 32 higher than average among the Black Caribbean Black African Other Black and WhiteBlack Caribbean Mixed groups Detention rates were also higher in the White Irish and Other White groups by about 13 and in the Other Mixed group by 22 No other ethnic differences were observed The results are given in Appendix B Table B6
These patterns are broadly similar to those reported in previous censuses
Detention under section 2 Section 2 of the Mental Health Act gives authority for a person to be detained in hospital for assessment for a period not exceeding 28 days It is mainly applied where the patient is unknown to the service or where there has been a significant interval between periods of inpatient treatment
Of all patients detained on admission 22 were detained under section 2 Rates of detention under this section were lower than average among the White British WhiteBlack Caribbean Mixed and Black Caribbean groups and higher than average among the Bangladeshi Other Asian Black African Chinese and Other groups by between 50 and 103 (see Appendix B Table B7)
Detention under section 3 Section 3 of the Act provides for the compulsory admission of a patient to hospital for lsquotreatmentrsquo and for his or her subsequent detention which can last for an initial period of up to six months and is renewable after this
Of all patients detained on admission 43 were detained under this section Rates were higher than average among the White Irish and Black Caribbean groups by 24 and 29 respectively and lower among than average among the Bangladeshi group No other ethnic differences were observed The rates of detention under section 3 are given in Appendix B Table B8
Detention under section 3741 Section 37 of the Mental Health Act allows a court to send a person to hospital for treatment when they might otherwise have been given a prison sentence and section 41 allows a court to place restrictions on a personrsquos discharge from hospital Admission to hospital rather than prison is generally regarded as a more positive outcome for the person concerned
Care Quality Commission Count me in census 2010 22
Results mental health continued
Of all patients detained on admission 14 were detained under section 37 with a section 41 restriction order applied The rates of detention are given in Appendix B Table B9 In all minority ethnic groups very few women were detained under section 3741 Among men the rate of detention for the White British group was 16 lower than average and it was higher than average in the WhiteBlack Caribbean Mixed group by 77 the Black Caribbean group by 100 the Black African group by 27 and the Other Black group by 52
A consistent pattern across all six annual censuses was the higher than average detention rate under section 3741 for the Black Caribbean and Other Black groups
Detention under sections 47 48 and 4749 These sections of the Mental Health Act allow the Ministry of Justice to issue a direction to transfer a person detained in prison to a hospital for treatment
Of all patients detained on admission 7 were detained under these sections The only ethnic differences observed were a 107 higher than average detention rate among men from the White Black African Mixed group and a lower than average rate for the Indian group We observed no other ethnic differences probably because the numbers of detentions under these sections were low in most minority ethnic groups These rates of detention are given in Appendix B Table B10
The previous four censuses also showed virtually no ethnic differences for rates of detention under sections 47 48 and 4749
Patients subject to the Mental Health Act 1983 on day of census
All patients subject to the Mental Health Act Of all the 32399 patients in the census a total of 53 (17299) were subject to the Mental Health Act on census day including 2959 outpatients and 75 inpatients on a CTO (either voluntarily or recalled) Ratios for the different ethnic groups for overall applications of the Mental Health Act including CTOs showed broadly similar patterns to detention rates on admission day from which patients on a CTO were excluded In both cases rates were higher than average among the Black Caribbean Black African Other Black and White Black Caribbean Mixed groups However the higher than average detention rates for the White Irish Other White and Other Mixed groups on admission day were not apparent on census day
The rates are given in Appendix B Table B11
Supervised community treatment under section 17A Community treatment orders (CTOs) were introduced in November 2008 as a result of the Mental Health Act 2007 They allow for supervised community treatment to be provided for up to six months with the possibility of an extension after this These orders are designed to help patients to maintain stable mental health outside hospital and to promote recovery by providing professionals with the power to set conditions on discharge from hospital and a power to recall patients if arrangements in the community are not working
Nine per cent of all patients in the census were on CTOs compared with 4 in 2009 Of all the 17299 patients subject to the Mental Health Act on census day almost 18 (3034) were on CTOs Of the patients on a CTO 2959 were outpatients and 75 were inpatients (50 voluntary and 25 recalled)
Care Quality Commission Count me in census 2010 23
Results mental health continued
The rate of supervised community treatment among all patients included in the census was lower than average in the White British and White Irish groups and higher than average in the South Asian (Indian Pakistani Bangladeshi) and Black (Black Caribbean Black African Other Black) groups by 22 to 106 The ratios are given in Appendix B Table B12
Consent
About 25 of informally admitted patients were deemed incapable of consenting to treatment The only ethnic difference observed was a higher than average rate for the Pakistani group but this was based on very few patients
About 18 of patients who were detained or on CTOs were deemed incapable of consenting to treatment These rates were lower than average by 7 in the White British group and were higher than average among the Other White WhiteBlack Caribbean Mixed and Black African groups by 21 35 and 36 respectively
In addition 13 of patients who were detained or on CTOs on census day were deemed capable of consenting to treatment but refused to do so The White British group had a rate of refusals that was 10 lower than average and rates were higher than average among the White Irish WhiteBlack Caribbean Mixed Other Mixed Black Caribbean and Black African groups by between 39 and 71
Care programme approach
The Care Programme Approach (CPA) is the process by which treatment care and support for people with serious mental health problems and accompanying health and social care needs are agreed coordinated and understood by all involved From October 2008 changes to the CPA in England
mean that it is no longer categorised into two parts (lsquostandardrsquo and lsquoenhancedrsquo) and just the one category of enhanced CPA applies This makes CPA policy in England different to that in Wales where the distinction still applies The CPA data presented here therefore includes all CPA patients in England and both lsquostandardrsquo and lsquoenhancedrsquo CPA patients in Wales
About 89 of all patients were on a CPA 3 were on a single assessment process (SAP) whereby assessments are made for adults with health and or social care needs and 8 were on neither CPA nor SAP As most patients were on a CPA no ethnic differences were observed
Recorded incidents
The 2010 census asked about the number of times that patients experienced seclusion hands-on restraint self-harm accident and physical assault in a current hospital spell or if the patientrsquos hospital spell was longer than three months the number that took place within the last three months Outpatients on a CTO are excluded from these data It should be noted that the rates of such events among minority ethnic groups can show yearly variation because of the low numbers of events in several groups
Seclusion Seclusion was defined as the supervised confinement of a patient in a room which may be locked to protect others from significant harm Four per cent of patients had experienced one or more episodes of seclusion The White British group had a seclusion rate that was 9 lower than average Rates were higher than average among the WhiteBlack Caribbean Mixed WhiteBlack African Mixed Black Caribbean and Black African groups by 80 90 36 and 56 respectively
Care Quality Commission Count me in census 2010 24
Results mental health continued
Although the number of incidents of seclusion was low in several minority ethnic groups some general patterns over the six censuses to date are
bull The proportion of all patients who had an episode of seclusion stayed fairly constant over the six censuses at about 4
bull Although there have been annual fluctuations the seclusion rate has been higher than average for the Black and WhiteBlack Mixed groups in three or four of the six censuses and in the Other White group in three censuses
Hands-on restraint This was defined as the physical restraint of a patient by one or more members of staff in response to aggressive behaviour or resistance to treatment About 12 of patients had experienced one or more episodes of hands-on restraint No ethnic differences were observed In fact very few ethnic differences have been observed in the previous censuses also and they have not shown a consistent pattern
Self-harm Eight per cent of patients had harmed themselves on one or more occasions Only the White British group had a rate that was higher than average (by 14) Rates were lower than average among several minority ethnic groups the three Black groups (Black Caribbean Black African and Other Black) by about 70 the three south Asian groups (Indian Pakistani Bangladeshi) by between 37 and 78 and the Other Mixed and Other Asian groups by about 60
In terms of comparison with previous years
bull The proportion of all patients who had harmed themselves stayed fairly constant at about 7ndash8
bull In all censuses the White British group had a higher than average rate of self-harm and the Black and South Asian groups had lower than average rates of self-harm
Accidents About 11 of patients had experienced one or more accidents Patients from the White British group experienced a rate of accidents that was 6 higher than average Rates were lower than average in the Black Caribbean Black African Other Black and Other Asian groups by about 50 to 70 No accidents were reported for the Chinese group
In terms of comparisons with previous years
bull The proportion of all patients who had had an accident stayed fairly constant
bull The rate of accidents in the different censuses was higher than average in the White British group and lower than average in the Black Caribbean group Few other ethnic differences were observed and they were not consistent
Physical assault on the patient The definition of assault includes incidents of physical assault on the patient irrespective of who committed the assault We do not have information on who committed the assault for example whether it was another patient or a member of staff Eleven per cent of patients were involved in one or more episodes of physical assault The only ethnic difference observed was a 19 lower than average rate among the Black Caribbean group
In terms of comparisons with previous years
bull The proportion of all patients who had experienced a physical assault stayed fairly constant
bull Very few ethnic differences in rates of assault were observed in the different censuses and they did not show a consistent pattern
Care Quality Commission Count me in census 2010 25
Results mental health continued
Duration of stay in hospital from admission to census day
We analysed the length of the period between each inpatientrsquos admission to hospital and the census day This period is of course shorter than a patientrsquos full length of stay in hospital which runs from admission to the date when they are discharged Outpatients on a CTO are excluded from the following analyses
bull 25 of inpatients had been in hospital for one month or less
bull 20 had been in hospital between one and three months
bull 13 had been in hospital between three and six months
bull 11 had been in hospital between six months and one year
bull 11 had been in hospital between one and two years
bull 12 had been in hospital between two and five years
bull 8 had been in hospital for more than five years
These results are similar to those of previous censuses About 31 of patients in the 2010 census had been in hospital for more than a year and had therefore also been included in the 2009 census About 20 of patients had been in hospital for more than two years and will have been included in both the 2008 and 2009 censuses
We calculated the median length of stay for different ethnic groups The median is the midpoint of the range of values so the median length of stay is the one at which half the patients had a length of stay less than the median and half had a stay longer than the median Overall and as in previous years the median amount of time that women had spent in hospital was about 25 months and the median for men was about 58 months (see Table 6) In most ethnic groups the median time spent in hospital was two to three times longer for men than for women in the Other Black group men had been in hospital four times longer than women
Median lengths of stay were longest for men from the Black Caribbean WhiteBlack Caribbean Mixed and Other Black groups and shortest for men from the Chinese Bangladeshi and Other groups Median lengths of stay were longest for women from the WhiteBlack Caribbean Mixed and Black Caribbean groups and shortest for women from the Chinese and Bangladeshi groups
A number of important factors influence a patientrsquos length of stay in hospital including age gender whether or not they are detained under the Mental Health Act (and the section under which they are detained and whether there is an additional restriction order) the type and severity of their illness the nature of their treatment and the availability of support in the community The data in the census does not allow for analysis of these factors
Table 6 Median number of days from the day of admission to the day of census
Ethnic group Men Women
White British 161 71
White Irish 218 114
Other White 238 113
White and Black Caribbean 275 191
White and Black African 182 92
White and Asian 226 78
Other Mixed 173 112
Indian 172 70
Pakistani 153 56
Bangladeshi 134 55
Other Asian 167 61
Black Caribbean 345 122
Black African 141 66
Other Black 248 58
Chinese 135 51
Other 131 76
Total 174 75
Care Quality Commission Count me in census 2010 26
Results mental health continued
Ward security
As in previous years about 11 of all patients were on a medium or high secure ward as opposed to a general (76) or low secure (13) ward
Patients from the White British Indian and Bangladeshi groups were less likely than average to be on a medium or high secure ward by 7 30 and 67 respectively Patients from the White Irish WhiteBlack Caribbean Mixed Black Caribbean and Other Black groups had a higher than average rate by between 43 and 55
Age range on wards
Among patients under 18 years of age 61 were being cared for on wards for working-age adults on census day and five patients were on a ward for older people Seven per cent of patients on wards for working-age adults were 65 or over and
8 of those on wards for older people were adults of working age There were very few lsquoout of agersquo placements among minority ethnic groups
Patients in wards designated as single sex or mixed
Providers were asked whether patients were on a ward designated as men or women only or mixed gender All the analyses of single sex accommodation and facilities exclude outpatients on a CTO Overall 61 of men and 77 of women were not in a ward designated for single sex use similar proportions as in previous years The proportion of patients not in a designated single sex ward was lower among almost all minority ethnic groups than among the White British group In all ethnic groups the proportion of men who were not in a designated single sex ward was lower than among women (see Table 7a)
Two further questions examined the single sex facilities that were available to patients
At the time of the 2010 census the following guidance from the Department of Health applied in England A ward can be described as single sex (ie the intended sex of the ward is either male or female and not mixed) when the accommodation complies with the following definition from the Department of Health of single sex accommodation ldquoSleeping areas must be segregated and members of one sex must not have to walk through an area occupied by the other sex to reach toilets or bathrooms Separate male and female only toilets and bathrooms must be provided There should be separate day rooms to which only women have accessrdquo However there is a discrepancy for providers because accommodation designated as a lsquowardrsquo for administrative purposes may incorporate single sex accommodation for both sexes that meets the guidelines ndash but in this case the ward would still be lsquomixedrsquo (based on guidance from Safety Privacy and Dignity Department of Health 2000)
As long as men and women are cared for in separate bays or rooms and have their own toilet facilities then it may well be appropriate for them to be on the same ward being cared for by the same team of doctors and nurses In practice good segregation can be achieved if men and women have separate sleeping areas (for example single sex bays) and have separate toilets and bathrooms that they can reach without having to pass through (or close to) areas for the opposite sex The layout of wards should minimise any risk of overlooking or overhearing by members of the opposite gender (from Privacy and Dignity ndash A report by the Chief Nursing Officer into mixed sex accommodation in hospitals Department of Health 2007)
The coalition governmentrsquos revised Operating Framework for 201011 requires NHS organisations to eliminate mixed-sex accommodation except under exceptional circumstances from 2011 The national guidance relating to mixed sex accommodation was issued in November 2010 and states that ldquoNo areas are exempt and every decision to mix must be justified by reference to the patientrsquos clinical needs not organisational convenience or custom and practicerdquo For mental health and learning disability trusts it states ldquoThere is no acceptable justification for admitting a mental health patient to mixed-sex accommodationrdquohellip It ldquomay be acceptable in a clinical emergency to admit a patient temporarily to a single ensuite room in the opposite-gender area of a ward In such cases a full risk-assessment must be carried out and complete safety privacy and dignity maintainedrdquo The guidance is available at wwwdhgovukenPublicationsandstatisticsLettersandcircularsProfessionallettersChiefnursingofficerlettersDH_121848
Care Quality Commission Count me in census 2010 27
Results mental health continued
Table 7a Percentage of patients not in a designated single sex ward by ethnic group
Ethnic group
Sex of patients and ward
Male Female
Male ward Female or mixed ward Female ward Male or mixed ward
White British 35 65 21 79
White Irish 41 59 28 72
Other White 44 56 28 72
White and Black Caribbean 56 44 31 69
White and Black African 48 52 41 59
White and Asian 43 57 34 66
Other Mixed 49 51 24 76
Indian 37 63 25 75
Pakistani 48 52 35 65
Bangladeshi 23 77 18 82
Other Asian 46 54 22 78
Black Caribbean 55 45 32 68
Black African 49 51 28 72
Other Black 49 51 30 70
Chinese 42 58 30 70
Other 43 57 20 80
Total 39 61 23 77
The vast majority of patients in this category were in mixed wards very few (under 05) male patients were on female-only wards or vice versa
Care Quality Commission Count me in census 2010 28
Results mental health continued
Patientsrsquo access to toilet and bathing facilities designated for single sex use
We asked providers if the patient had access to toilet and bathing facilities designated for single sex use Overall 13 of men and 16 of women
were reported as not having access to such facilities designated for single sex use This was an improvement over 2009 when these proportions were 19 and 24 respectively The proportion of patients not having access to toilet and bathing facilities designated for single sex use was lower among almost all minority ethnic groups than among the White British group (see Table 7b for details)
Table 7b Percentage of patients not having access to toilet and bathing facilities designated for single sex use by ethnic group
Ethnic group
Access to designated single sex bathing and toilet facilities
Male Female
Male facilities
Female or mixed facilities
Female facilities
Male or mixed facilities
White British 86 14 84 16
White Irish 87 13 87 13
Other White 89 11 86 14
White and Black Caribbean 93 7 93 7
White and Black African 90 10 93 7
White and Asian 90 10 84 16
Other Mixed 98 2 96 4
Indian 91 9 90 10
Pakistani 95 5 94 6
Bangladeshi 92 8 98 2
Other Asian 92 8 86 14
Black Caribbean 92 8 90 10
Black African 91 9 91 9
Other Black 92 8 89 11
Chinese 82 18 83 17
Other 87 13 90 10
Total 87 13 84 16
The vast majority of patients in this category had access to mixed facilities very few (1) of male patients had access to female-only facilities or vice versa
Care Quality Commission Count me in census 2010 29
Results mental health continued
Patientsrsquo access to a lounge area day space designated for single sex use
We also asked providers if patients had access to a lounge area or day space designated for single sex use Overall 37 of men and 39 of women were
reported as not having access to these facilities This was an improvement over 2009 when these proportions were 48 and 51 respectively The proportion of patients not having access to a lounge areaday space designated for single sex use was lower among most minority ethnic groups than among the White British group (see Table 7c for details)
Table 7c Percentage of patients not having access to a lounge areaday space designated for single sex use by ethnic group
Ethnic group
Access to a lounge areaday space designated for single sex use
Male Female
Male facilities
Female or mixed facilities
Female facilities
Male or mixed facilities
White British 59 41 60 40
White Irish 63 37 70 30
Other White 68 32 63 37
White and Black Caribbean 82 18 73 27
White and Black African 83 18 76 24
White and Asian 72 28 75 25
Other Mixed 79 21 67 33
Indian 59 41 66 34
Pakistani 80 20 72 28
Bangladeshi 53 47 52 48
Other Asian 70 30 61 39
Black Caribbean 78 22 70 30
Black African 73 27 70 30
Other Black 79 21 72 28
Chinese 59 41 60 40
Other 67 33 67 33
Total 63 37 61 39
The vast majority of patients in this category had access to mixed facilities very few (1) of male patients had access to female-only facilities or vice versa
Care Quality Commission Count me in census 2010 30
Results mental health continued
Patientsrsquo subject to deprivation of liberty safeguards
People who lack the mental capacity to consent to the care or treatment they need should be cared for in a way that is least restrictive of their rights or freedom of action In 2007 the Mental Capacity Act 2005 was amended to introduce Deprivation of Liberty Safeguards for people who lack capacity to decide about their care or treatment and who need to be deprived of their liberty to protect them from harm The Safeguards came into effect in April 2009 and strengthen the rights of hospital patients and those in care homes as well as ensuring compliance with the European Convention on Human Rights (ECHR)
The 2010 census introduced a new question ldquoIs the patient subject to deprivation of liberty authorisation on 31 March 2010rdquo Under 1 (269) patients were reported as being subject to a deprivation of liberty authorisation on census day No ethnic differences in the rates were observed which may be due to the low numbers of patients among minority ethnic groups (69)
Care Quality Commission Count me in census 2010 31
A comparison between the 2005 baseline and the 2010 census
The changes we have seen in the census results between 2005 and 2010 the timespan of the Delivering Race Equality (DRE) action plan are set out below This is not a review of the DRE programme The aim is to give an overview of how some variables in the census have changed during the course of DRE and the findings should be seen in the light of the caveats described on page 13
bull The number of inpatients went down from 33785 to 29840 ndash a fall of 12
bull The proportion of patients in independent hospitals rose from 10 to 16
bull The overall proportion of patients from minority ethnic groups increased from 20 to 23 However there have been demographic changes during this time ndash the population from Black and minority ethnic groups in England and Wales rising from 79 million in 2005 to 85 million in 2007 (the latest year for which these figures are available) an increase of 8 in two years
bull Admission rates showed similar patterns across all censuses ndash Lower than average rates among the White
British Indian and Chinese groups ndash About average rates among the Pakistani and
Bangladeshi groups ndash Higher than average rates among other
minority ethnic groups ndash particularly in the Black and WhiteBlack Mixed groups for whom rates were two or more times higher than average in 2010 The Other Black group continues to have exceptionally high rates of admission (even after the apparent reduction since 2005 see next point)
bull One of the 12 goals of DRE was a decline in admission rates among Black and minority ethnic groups Figure 1 provides a comparison between 2005 and 2010 Although admission rates for
many ethnic groups show relatively little change since 2005 the rate for the Other Black group is considerably lower in 2010 (six times higher than average) compared with 2005 (12 times higher than average) However rates for the other Black and WhiteBlack Mixed groups show small increases
bull In general rates of referral from GPs and community mental health teams were lower than average among some Black and WhiteBlack groups and referral from the criminal justice system was higher Patterns were less consistent for other minority ethnic groups
bull There was a steady increase in the overall proportion of patients subject to the Mental Health Act Compared with 40 in 2005 49 of all patients were subject to the Mental Health Act in 2010 (53 if outpatients on a CTO are excluded)
bull Another DRE goal was to reduce detention rates among Black and minority ethnic groups However detention rates have been higher than average among the Black Caribbean Black African and Other Black groups in all six censuses and almost consistently higher in the WhiteBlack Caribbean Mixed and Other White groups Rates have been average for other minority ethnic groups
bull A consistent pattern was the higher than average detention rate under section 3741 for the Black Caribbean and Other Black groups
bull Another DRE goal was to reduce seclusion among Black and minority ethnic groups Although there have been annual fluctuations in seclusion rates they have been higher than average for the Black and WhiteBlack Mixed groups and the Other White group in at least three of the six censuses Other minority ethnic groups did not show high rates
Care Quality Commission Count me in census 2010 32
A comparison between the 2005 baseline and the 2010 census continued
Figure 1 Admission ratios in the 2005 and 2010 Count me in censuses by ethnic group England and Wales
Other Black
Black Caribbean
White and Black Caribbean
White and Black African
Black African
Other Mixed
Other Asian
White and Asian
Other
White Irish
Other White
Bangladeshi
White British
Pakistani
Indian
Chinese
0 100 200 300 400 500 600 700 800 900 1000 1100 1200 1300
Ageshysex standardised admission ratios (EampW=100)
Census 2005 admission ratios using 2005 ONS populations
bull Minority ethnic groups do not compare unfavourably for other incidents Rates of self-harm have consistently been lower than average among the Black and South Asian groups Very few ethnic differences in hands-on restraint physical assault and accidents were observed across the different censuses and they did not show a consistent pattern
bull About 31 of patients in all censuses had been in hospital for one year or more and were therefore included in more than one census
Census 2010 admission ratios using ONS 2007 populations (excluding outpatients on a CTO)
(This is one reason why the census shows little change over the six years It should be noted again that because the census is a one-day count it over-represents long-stay admissions and under-represents short-stay admissions)
bull Mixed accommodation was reported for many patients across all censuses although patients from Black and minority ethnic groups were more likely to be in single sex accommodation than White British patients
The admission ratios for the 2005 census shown here are different from those published in the 2005 report This is because we updated the analysis of the 2005 admission ratios by using 2005 ONS census populations for ethnic groups as denominators These populations were not available at the time of the 2005 report which instead used the 2001 ONS population data
Care Quality Commission Count me in census 2010 33
Results learning disabilities
We obtained information about 3642 patients in 129 organisations providing services for people with learning disabilities in England and Wales Of these two were inpatients on CTOs The total number of inpatients has declined each year and by 21 from 4609 in 2006 to 3642 in 2010 The total number of providers did not change much from the baseline year of 2006 although the number of NHS providers has fallen steadily and the number of independent healthcare organisations has increased (see Table 8) The proportion of inpatients in independent
healthcare organisations increased from 20 in 2006 to 33 in 2010 This is likely to be a result of closing NHS campuses with people moving from hospital to community settings
The pattern of results for learning disability patients in 2010 is broadly similar to that reported in previous censuses This is not surprising since many of the patients had been in hospital for a considerable period of time and they therefore appear in successive censuses
Table 8 The number of providers of learning disability services and inpatients
NHS (England)
Independent (England)
NHS (Wales)
Independent (Wales) Total
2010 census Number of providers 55 61 4 9 129 Number of all patients (including patients 2304 1072 154 112 3642 on a CTO) of all patients 633 294 42 31 100
2009 census Number of providers 60 54 5 4 123 Number of all patients (including patients 2487 1014 139 55 3695 on a CTO) of all patients 673 274 38 15 100
2008 census Number of providers 62 57 5 5 129
Number of inpatients 2873 1050 143 41 4107
of inpatients 700 256 35 10 100 2007 census
Number of providers 64 47 5 4 120
Number of inpatients 3063 900 154 36 4153
of inpatients 738 217 37 09 100 2006 census
Number of providers 70 48 5 1 124
Number of inpatients 3505 930 164 10 4609
of inpatients 760 202 36 02 100
Care Quality Commission Count me in census 2010 34
Results learning disabilities continued
Ethnicity
Information about ethnicity was available for 98 of patients Of these 13 belonged to Black and minority ethnic groups defined as all groups that are not White British (see Table 9) This figure is somewhat higher than in previous years (11 in 2006) and is significantly lower than the 23 of mental health patients from minority ethnic groups as reported in the mental health section of this report
Although the patterns by ethnicity are broadly similar to previous years there was an increase between 2006 and 2010 in the proportion of patients from the Other White group and a fall in those from the White British group Some ethnic groups had very few patients
As in the previous censuses patients from Black and minority ethnic groups were concentrated in a relatively small number of organisations 70 were
Table 9 Learning disability patients by ethnic group
Ethnic group 2010 census 2009 census 2008 census 2007 census 2006 census
Number Number Number Number Number
White British 853 3106 867 3205 889 3616 883 3642 887 4037
White Irish 13 46 15 57 13 53 10 40 14 66
Other White 29 106 23 85 26 104 26 109 17 77
White and Black Caribbean 10 38 10 36 07 29 08 34 07 32
White and Black African 02 8 01 4 00 2 02 10 01 3
White and Asian 04 13 04 14 03 12 03 13 02 9
Other Mixed 07 24 05 19 03 14 04 16 03 14
Indian 09 32 09 35 07 28 08 32 11 49
Pakistani 07 24 09 33 07 30 08 32 07 34
Bangladeshi 05 20 06 21 03 11 03 11 02 9
Other Asian 04 13 03 10 03 12 02 8 03 12
Black Caribbean 26 93 22 81 23 94 26 108 28 129
Black African 08 28 09 35 07 29 08 33 07 33
Other Black 04 15 04 14 04 15 04 18 04 17
Chinese 00 1 01 2 01 5 02 8 02 7
Other 02 7 02 8 04 15 02 10 05 24
Not stated 19 68 10 36 09 38 07 29 12 57
Total 100 3642 100 3695 100 4069 100 4124 100 4552
Care Quality Commission Count me in census 2010 35
Results learning disabilities continued
patients in 25 of the 129 organisations that took part in the census Seventy-four organisations had fewer than 10 patients from Black and minority ethnic groups each and another 42 organisations had no inpatients at all from these groups
However it is important to note that the number of people with severe and profound learning disabilities in some areas is affected by past funding and placement practices especially the presence of old long stay hospitals and of people placed outside their original area of residence by funding authorities
Reporting of ethnicity
About half (56) of patients reported their own ethnic group Staff reported the ethnic group for 17 of patients and relatives for 21 This means that ethnicity could have been misreported for some patients We do not know how ethnicity was assessed for 6 of patients
Age and gender
Two per cent (59) of patients were under 18 years old The number of young inpatients from minority ethnic groups was low or zero in several ethnic minority groups
Overall 73 of patients were under 50 years old and 27 were aged 50 or over The proportion of patients under 50 was higher among patients from Black and minority ethnic groups (88) than among the White British group (71) This is not surprising given that minority ethnic populations are generally younger than the White population
Seventy per cent of patients in learning disability services were men whereas in mental health services 58 of patients were men
Language and religion
Eight per cent of patients reported that their first language was not English Non-verbal communication was the most often selected language after English accounting for 4 of patients Two per cent (84) of patients most of whom were from the White British group said they needed an interpreter
Religion was not stated for 22 of patients and 15 of patients said they had no religion South Asians (Indians Bangladeshis and Pakistanis) were mostly Muslim Hindu or Sikh and those from the White Black Caribbean and Black African groups were mostly Christian
Sexual orientation
Overall the result was not known for almost half (49) of patients 45 said they were heterosexual 2 said gaylesbian 3 said bisexual and 1 said ldquootherrdquo The numbers of patients from minority ethnic groups were too low for meaningful analysis
Disability
Of all inpatients in learning disability services
bull 4 were reported as having no disabilities
bull 44 had a learning disability only
bull 51 had multiple disabilities
The patterns among minority ethnic groups were similar in that most patients had either a learning disability or multiple disabilities
Care Quality Commission Count me in census 2010 36
Results learning disabilities continued
Rates of admission
The rates of admission based on ONS estimates of the general population in 2007 are given in Appendix C Table C1
Admission rates were lower than average among several minority ethnic groups Other White Indian Pakistani Other Asian Black African Chinese and Other Rates were two to three times higher than average among the WhiteBlack Caribbean Mixed Black Caribbean Other Black and Other Mixed groups The lower rates among the South Asian and Chinese groups and the higher rates among some Black groups are similar to patterns for inpatients in mental health establishments
These patterns of admission are similar to those we reported in previous census reports
Source of referral
As we reported in the section on mental health patients data about sources of referral must be interpreted with care as we do not always know the original referral source Furthermore in the case of inpatients with learning disabilities this information was invalid missing or unknown for 12 of patients
Because of the small numbers of patients in most minority ethnic groups we observed few ethnic differences in sources of referral
Detention under the Mental Health Act 1983 (on day of admission and on day of census)
The Mental Health Act 2007 made a number of changes to the Mental Health Act 1983 one of which was supervised community treatment (section 17A) These are reflected in the 2010 census
All detentions Of all the patients in learning disability services 48 were detained under the Mental Health Act on admission Rates of detention on the day of admission by ethnic group are in Appendix C Table C2 and no ethnic differences were observed As the number of detained patients from each minority ethnic group was low we did not undertake further analysis for individual sections of the Act
Rates of detention on census day also showed no ethnic differences with the exception of a lower than average rate for the Other White group
Consent
About 66 of informally admitted inpatients were deemed incapable of consenting to treatment which is a similar proportion to that reported previously
Among detained patients 38 were deemed incapable of consenting to treatment and 6 were deemed capable of consenting to treatment but refused
The numbers of patients from minority ethnic groups were too low for comment There were no or very few such patients among minority ethnic groups
Care Quality Commission Count me in census 2010 37
Results learning disabilities continued
Care programme approach
Details of the Care Programme Approach (CPA) are given on page 24
We found that 73 of all patients were on a CPA 2 on a single assessment process (SAP) and 25 on neither No ethnic differences were observed
Recorded incidents
The 2010 census asked about the number of times that patients experienced seclusion hands-on restraint self-harm accident and physical assault in a patientrsquos current hospital spell or if the patientrsquos hospital spell was longer than three months the number that took place within the last three months As in previous years we observed very few ethnic differences
Seclusion Five per cent of patients had experienced one or more episodes of seclusion The only ethnic differences observed were the higher than average rates among the White Irish and Other White groups but these were based on small numbers of patients
Physical assault on the patient The definition of assault includes incidents of physical assault on the patient irrespective of who committed the assault but we do not have information on who committed the assault About 28 of patients had been involved in one or more episodes of physical assault No ethnic differences were observed
Hands-on restraint self-harm accidents Thirty per cent of inpatients had experienced one or more episodes of hands-on restraint 22 had attempted to harm themselves and 24 had suffered an accident The numbers were very low in minority ethnic groups and we did not observe any ethnic differences except for a lower than average rate for self-harm among the Black Caribbean group but this was based on very few patients
Duration of stay in hospital
We analysed the length of the period between each patientrsquos admission to hospital and the census day This period is of course shorter than a patientrsquos full length of stay in hospital which runs from admission to the date when they are discharged
bull 10 of inpatients had been in hospital for one month or less
bull 6 had been in hospital between one and three months
bull 7 had been in hospital between three and six months
bull 10 had been in hospital between six months and one year
bull 14 had been in hospital between one and two years
bull 22 had been in hospital between two and five years
bull 31 had been in hospital for over five years
The patterns are very similar to those in previous censuses About 67 of patients in the 2010 census had been in hospital for more than a year and were therefore also included in the 2009 census In addition over half (53) of patients had been in hospital for more than two years and will have been included in both the 2008 and 2009 censuses A third of patients will have been included in each census since 2006
We also calculated the median length of stay (see page 26 for the definition of median) Overall the median amount of time that women had spent in hospital was about 31 months and the median for men was about 27 months This compares with a median for mental health patients of 25 months for women and 58 months for men It is not possible to reliably compare length of stay by ethnic group because of the small numbers of patients among several minority ethnic groups
Care Quality Commission Count me in census 2010 38
Results learning disabilities continued
Ward security
About 12 of all inpatients were on a medium or high secure ward as opposed to a general (54) or low secure (34) ward
As in the three previous years rates of patients on medium or high secure wards were about double the average among the White Irish and Other White groups Most other minority ethnic groups had very few patients on medium or high secure wards
Age range on wards
There were five patients under 18 years of age being cared for on wards for working-age adults and none were on wards for older people About 5 of patients on wards for working-age adults were aged 65 or over and there were very few patients (23) on wards for older people There were very few lsquoout of agersquo placements among minority ethnic groups
Patients in wards designated as single sex or mixed
We asked providers whether the patient was on a ward designated as men or women only or mixed gender Overall 47 of men and 69 of women were not in a ward designated for single sex use The numbers of such patients among minority ethnic groups were very low
Two further questions examined the single sex facilities that were available to patients Again due to the small numbers we do not present results by ethnicity for these questions
Patientsrsquo access to toilet and bathing facilities designated for single sex use
Overall 19 (497) of men and 27 (295) of women were reported as not having access to toilet and bathing facilities designated for single sex use
Patientsrsquo access to a lounge area day space designated for single sex use
Overall 32 (829) of men and 44 (470) of women were reported as not having access to a lounge area day space designated for single sex use
Patients subject to deprivation of liberty safeguards
For details of deprivation of liberty safeguards please see page 31
The 2010 census introduced a new question ldquoIs the patient subject to deprivation of liberty authorisation on 31 March 2010rdquo Two per cent (74) patients were reported as being subject to a deprivation of liberty order on census day but very few of these patients (15) were from minority ethnic groups
See footnote on single sex accommodation on page 27
Care Quality Commission Count me in census 2010 39
Data in the future Moving beyond a one-day census
For six years the Count me in census has provided a valuable one-day snapshot of inpatients in mental health and learning disability services And with the proportion of inpatients who are detained increasing steadily (from 25 in 200506 to 39 in 200910 ndash see Figure 2) ongoing ethnic monitoring of admissions and detentions becomes more vital than ever
However a one-day census only captures some events and the profile of patients can differ across a whole year For example there were
bull 29840 inpatients in the 2010 census compared with 107765 inpatients overall during 200910
bull 17299 patients in the 2010 census who were detained or on CTOs compared with 42479 new detentions and some 4100 new CTOs overall in England in 200910
bull 26 of patients in hospital for under one month and 31 for over one year per the census
whereas the MHMDS data consistently shows that for over 50 of records the average length of an inpatient stay was under one month and for 4 it was over one year
Looking ahead it is vital that robust data is available on all admitted patients and all those subject to the Mental Health Act not just those in hospital on one particular day Moreover patterns of use and outcomes of community care can have an impact on the need for admission to hospital and the risk of detention ndash therefore information about the care provided to patients before admission to hospital during their hospital stay and after they leave is also vital Furthermore under 84 of the 127 million people using specialist mental health services are admitted to hospital23 and so it is very important to examine the quality of community care for the 90 of patients who are not admitted to hospital
Figure 2 Number of people spending time in hospital 200506 to 200910
Num
ber
of p
atie
nts
90000
80000
70000
60000
50000
40000
30000
20000
10000
0 200506 200607 200708 200809 200910
Source NHS Information Centre Formally detained Not detained MHMDS Bulletin 2011
Care Quality Commission Count me in census 2010 40
Data in the future Moving beyond a one-day census continued
The Mental Health Minimum Data Set (MHMDS) is a rich source of data on people using specialist mental health services in England It covers both community and hospital services and includes a wide range of information about the demographic clinical and socioeconomic characteristics of individual patients and the services provided to those admitted to hospital and to the much larger number of those who donrsquot need a stay in hospital The data includes information about contact with services uses of the Mental Health Act and the Care Programme Approach for each individual patient All these details enable the use of services patterns of care and patient outcomes to be tracked including along pathways of care The MHMDS therefore provides a robust basis for ongoing monitoring of access to and outcomes of care for users of specialist ndash both community and hospital ndash mental health services
The MHMDS also enables an analysis of the numbers and rates of people from different ethnic groups using specialist mental health services overall (both inpatient and community) which provides an indication of the levels of mental illness and therefore the need for specialist care in different communities
At present the MHMDS does not cover high secure services and independent sector providers only started to provide data during 201011 However to support payment by results for mental health the scope of the data set will be extended to cover high secure services during 201112 (version 4 MHMDS) Further proposed changes to the dataset (version 41) will incorporate NHS-funded learning disability services and primary care mental health services A separate dataset for child and adolescent mental health services (CAMHS) has been developed and is awaiting formal approvals It is designed to include the same information about uses of the Mental Health Act as provided in the MHMDS
The latest MHMDS bulletin for 200910 provides a description of people using specialist mental health services in England including ethnic profiles of people using services hospital admissions detentions and the number of people on CPA24 It also provides information on differences by age and gender The bulletin illustrates some of the sorts of analyses that are possible using data from the MHMDS
The NHS Information Centre can provide guidance on these and other potential analyses based on MHMDS data
Care Quality Commission Count me in census 2010 41
Conclusions
While this report reviews changes in the census results since 2005 it is not a review or evaluation of the DRE programme overall Similarly the census cannot provide explanations for the patterns observed or examine whether mental health services are meeting the needs of individual ethnic minority groups As we have noted previously the results are subject to caveats in particular that the census provides a one-day snapshot that may not be representative of patients admitted to hospital throughout the year
Overview of findings
Overall the findings from the 2010 census show little change from those reported for previous annual censuses conducted since 2005 This is partly because many patients had been in hospital for a considerable period of time and had therefore been included in successive censuses The findings of this sixth and last census continue to show differences between Black and minority ethnic groups and White groups and also differences within these groups
In particular ethnic differences in rates of admission detention under the Mental Health Act and seclusion ndash three of DRErsquos 12 goals ndash have not altered materially since the inception of DRE in 2005
bull Admission rates remain higher than average among minority ethnic groups especially among Black and WhiteBlack Mixed groups for whom rates were two or more times higher than average in 2010 The Other Black group continues to have the highest admission rate ndash six times higher than average ndash although this is lower than in 2005 In contrast admission rates have consistently been lower than average among the Indian and Chinese groups and about average in the Pakistani and Bangladeshi groups
bull Detention rates remain higher than average among the Black and WhiteBlack Caribbean Mixed groups and among the Other White group A consistent pattern across all censuses was the higher than average detention rate
under section 3741 for the Black Caribbean and Other Black groups We also found that rates for being placed on a CTO were higher among the South Asian and Black groups
bull Although there have been annual fluctuations in seclusion rates they have been higher than average for the Black WhiteBlack Mixed and Other White groups in at least three of the six censuses
Overall the level of provision of single sex areas for patients continues to be unsatisfactory although there was no evidence that minority ethnic patients were disadvantaged in these respects Government policy for the NHS in England now requires that all providers of NHS-funded care including mental health trusts are expected to eliminate mixed-sex accommodation in accordance with the guidance set out in CNO201032526 From 2011 all providers of NHS-funded care must report breaches of sleeping accommodation which will attract sanctions
Implications for ways forward
The census findings do not in themselves show that mental health and learning disability services are failing to meet the needs of Black and minority ethnic service users
As noted in previous reports they need to be interpreted in the context of available evidence on ethnic differences in rates of mental illness pathways to care and factors such as socioeconomic disadvantages that all contribute to these differences Our previous reports have consistently highlighted the need for prevention early intervention and working collaboratively across sectors to reduce the risk of admission and detention where possible without compromising the care given to patients Mental health services have a key role to play but to achieve this all statutory agencies and organisations outside the healthcare sector Black and minority ethnic communities and people who use services themselves will need to work in partnership
Care Quality Commission Count me in census 2010 42
Conclusions continued
This message ndash about preventing mental ill-health by addressing the contributory factors and intervening early ndash is at the heart of No health without mental health the Department of Healthrsquos new strategy for the future of mental health care in England27
The strategy aims to tackle the economic social and environmental determinants and consequences of mental health problems and to improve outcomes and reduce inequalities
It specifies that by 2014 people in contact with the criminal justice system will have improved access to mental health services as set out in the Ministry of Justice Green Paper Breaking the Cycle Effective punishment rehabilitation and sentencing of offenders which confirms the approach outlined in Lord Bradleyrsquos report for early intervention and diversion from custody2829
Accompanying the new strategy is a supporting document that explains how its objectives will improve mental health outcomes the effective interventions and the underpinning evidence base30
The strategy is complemented by other government proposals for reforms in the NHS public health and adult social care as outlined in the NHS White Paper Equity and excellence liberating the NHS31 the public health strategy Healthy lives healthy people32 and the adult social care strategy A vision for adult social care capable communities and active citizens 33 Three outcomes frameworks have been developed alongside these strategies improving mental health outcomes and reducing inequalities is integral to them all
In this new healthcare landscape the proposed NHS Commissioning Board and GP consortia will have a statutory obligation to promote equality and reduce inequalities in healthcare (something also enshrined in the Equality Act 2010) As the lead commissioners of healthcare services it will be up to GP consortia to assess with local authorities the needs of their local populations and commission the right services that meet their requirements
And the strengthened public health role of local authorities offers significant potential for addressing the socioeconomic disadvantages faced by Black and minority ethnic communities which add to the burden of mental illness in these communities
Race Equality Action Plan A five-year review looked back at the work of the DRE action plan and describes some of the key challenges successes and learning34 Based on the experience and outcome of the DRE programme the report suggests ways forward for the next stage of mental health strategy development and implementation
Since April 2009 CQC has had a duty under the Mental Health Act 1983 to monitor how services exercise their powers in relation to patients who are detained in hospital or subject to CTOs or guardianship under the Act In its first annual report on the use of the Act CQC recommends a number of areas where improvements are needed for example over-occupancy on inpatient wards patient engagement use of control and restraint seclusion and capacity and consent35
In particular CQC highlighted a number of issues relating to the use of CTOs including concern about appropriate usage (30 of the patients in CQCrsquos sample did not have a reported history of non-compliance or disengagement with services after discharge) and over-representation of Black and minority ethnic groups CQC advised that research on the possible race equality impact of CTOs should be undertaken There were 6237 CTOs from their introduction in November 2008 to 31 March 2010 a much greater use of them than forecast for this period by the Department of Health before the power was introduced Just 31 of these orders had ended by end March 2010 suggesting that some people are being kept on supervised community treatment for long periods
Care Quality Commission Count me in census 2010 43
Conclusions continued
Data in the future Moving beyond a one-day census
Good information is the foundation of an effective healthcare system It is imperative for ensuring that services meet the needs of local populations and are equitable and that improvements are made where needed The availability of fit-for-purpose and comprehensive patient-level data sets with ethnicity and other key variables fully coded is therefore vitally important36 It enables the care provided to patients of all ethnic backgrounds to be monitored on an ongoing basis including for monitoring compliance with the Equality Act
Race Equality Action Plan A five-year review notes that better collection monitoring and use of ethnicity data to inform commissioning and provision in health and social care is required37 Key areas include good ethnic monitoring improving demographic information and ensuring good links between infomatics audit and equality and diversity leads within trusts in order to effectively use the information to inform service development monitoring and review at board management ward and community levels
The governmentrsquos proposed changes to the NHS will be supported by an information revolution aimed at improving and extending the information available to the NHS patients and the public on the quality and outcomes of NHS services including by equality dimensions38
Having information that is fit for purpose is vital for the effective regulation of mental health and learning disability services CQC uses routinely available data sets on an ongoing basis to assess the performance of health and social care organisations and their compliance with government policies and legislation We therefore expect those who commission and provide mental healthcare in the NHS and independent sector to have information systems that provide good quality data with fully
comprehensive recording and monitoring of ethnicity on an ongoing basis
Since 2005 the Count me in census has played a key role in providing information about the ethnicity and other characteristics of inpatients in mental health and learning disability services and on patients subject to the Mental Health Act It did this by providing a valuable one-day snapshot But ethnicity recording must be seen as an all-year round statutory requirement not a one-day annual event The number of inpatients throughout the year is much higher than the counts on one day and some patients will have more than one admission And there is a need to move on from counting patients to understanding more about care pathways for Black and minority ethnic patients and the factors leading to hospital admission and detention
We have consistently highlighted the need for commissioners and providers to make full use of the Mental Health Minimum Data Set (MHMDS) ndash the statutory data set submitted by providers of specialist mental health services in England It provides rich data on these issues and provides a robust information source for ongoing ethnic monitoring after this last census
Covering both community and hospital services ndash and now independent and third sector providers as well as NHS ndash it includes a wide range of information about individual patients the services provided to those admitted to hospital and to the much larger number who donrsquot need admission to hospital and the outcomes of care And because it includes year-round activity it is more representative of the overall picture of for example admission detention and readmission rates length of stay years in psychiatric care and contacts with services and professionals
We call on the Information Centre to routinely publish data on all admissions and uses of the Mental Health Act including CTOs in England (in both NHS and independent healthcare providers) by the ethnicity of
Care Quality Commission Count me in census 2010 44
Conclusions continued
patients making the MHMDS the definitive source of information about mental health and learning disability patients This data should be risk-adjusted for age gender and other variables as appropriate to enable reliable comparisons to be made across groups
It is important that all providers ndash NHS and independent ndash make strenuous efforts to improve the quality of the data they submit The Information Centre publishes reports on the quality of MHMDS data by provider (see wwwicnhsukservices mhmdsdq) and we urge providers to monitor this information and use it to improve their data quality
If GP consortia and local authorities are to be effective in their needs assessment and commissioning roles the Information Centre needs to make available and promote to them the data from the MHMDS and other sources And researchers and academics must make full use of the MHMDS to explore the factors that underlie the observed ethnic patterns
CQCrsquos role
In the meantime CQC will continue to focus strongly on the quality of care provided by mental health and learning disability services
People who find themselves admitted to mental health services or detained under the Mental Health Act and therefore counted by the Count me in census are among the most mentally unwell people in our society Our job is first and foremost to make sure that the care they receive meets the essential standards of quality and safety set out under the Health and Social Care Act 2008 and to work with providers to ensure this We act swiftly when we find services that do not Where we find systemic problems that organisations have not adequately addressed we may impose conditions on the providerrsquos registration to bring about the change needed to improve patientsrsquo experience of care
The essential standards of quality and safety include the requirement to provide single sex accommodation and we will continue to closely check that these standards are met by all mental health services
We intend to introduce a number of indicators derived from the rich information in the MHMDS into our quality and risk profiles for providers This will put greater emphasis on the experience of Black and minority ethnic patients in our regulatory activity
We will monitor the quality of MHMDS data submitted by providers (as reported by the NHS Information Centre) including independent service providers Those with poor data quality may be considered at higher risk in terms of their quality of care
In addition we will continue to monitor the progress of services in relation to the issues raised in the census and other reports including our report on the use of the Mental Health Act through our visits to services and meetings with patients by our Mental Health Act Commissioners and second opinion appointed doctors (SOADs) We will draw on patientsrsquo experiences to monitor the operation of the Mental Health Act
We will also assess the impact of advice and use of Local HealthWatch Local HealthWatch will be in a good position to make sure that providers and commissioners are held to account on matters of choice and access to services for people from Black and minority ethnic groups
Care Quality Commission Count me in census 2010 45
References
1 Department of Health Equity and excellence liberating the NHS 2010
2 Department of Health The NHS outcomes framework 201112 2010
3 Healthcare Commission Mental Health Act Commission National Institute for Mental Health in England Count me in results of a national census of inpatients in mental health hospitals and facilities in England and Wales 2005
4 Healthcare Commission Mental Health Act Commission National Institute for Mental Health in England Count me in results of the 2006 national census of inpatients in mental health and learning disability services in England and Wales 2006
5 Healthcare Commission Mental Health Act Commission National Institute for Mental Health in England Count me in results of the 2007 national census of inpatients in mental health and learning disability services in England and Wales 2007
6 Healthcare Commission Mental Health Act Commission National Institute for Mental Health in England Count me in results of the 2008 national census of inpatients in mental health and learning disability services in England and Wales 2008
7 Care Quality Commission National Mental Health Development Unit Results of the 2009 national census of inpatients and patients on supervised community treatment in mental health and learning disability services in England and Wales 2009
8 Department of Health Delivering race equality in mental health care an action plan for reform inside and outside services 2005
9 Welsh Assembly Government Adult Mental Health Services Raising the standard ndash Race Equality Action Plan for Adult Mental Health Services in Wales 2006
10Department of Health No health without mental health a cross-government mental health outcomes strategy for people of all ages 2011 wwwdhgovukprod_consum_dhgroups dh_digitalassetsdocumentsdigitalasset dh_124058pdf
11Department of Health New horizons towards a shared vision for mental health 2009 wwwdhgovukprod_consum_dhgroups dh_digitalassetsdhendocumentsdigital assetdh_109708pdf
12Department of Health Valuing people a new strategy for learning disability for the 21st century 2001
13Department of Health Valuing people now a new three year strategy for people with learning disabilities 2009
14Department of Health Healthcare for all report of the independent inquiry into access to healthcare for people with learning disabilities 2008
15Joint Committee on Human Rights A life like any other human rights of adults with learning disabilities (2008 HL Paper 401 HC 731) House of Lords House of Commons 2008
16Department of Health Valuing people now summary report March 2009 ndash September 2010 2010
17Disability Rights Commission Equal treatment investigation 2005
18Department of Health Mir G Nocon A Ahmad W Jones L Learning difficulties and ethnicity 2000
19ONS experimental population estimates by ethnic group 2007 wwwstatisticsgovukstatbase productaspvlnk=14238
Care Quality Commission Count me in census 2010 46
References continued
20Six percent of population are gay or lesbian according to Whitehall figures 2005 wwwtelegraphcouknewsmainjhtmlxml= news20051212ngay12xmlamps Sheet= news20051212ixhomehtml
21Department of Trade and Industry Amendment to Employment Equality (Sexual Orientation) Regulations 2003 2003
22Office for National Statistics Measuring sexual identity an evaluation report 2010
23 Information Centre Mental Health Bulletin Fourth report from Mental Health Minimum Dataset (MHMDS) annual returns 2010 2011 wwwicnhsukpubsmhbmhmds0910
24 Information Centre Mental Health Bulletin Fourth report from Mental Health Minimum Dataset (MHMDS) annual returns 2010 2011 wwwicnhsukpubsmhbmhmds0910
25The operating framework for the NHS in England 201112 Department of Health 2010 wwwdhgovukprod_consum_dhgroups dh_digitalassetsdhenpsdocuments digitalassetdh_122736pdf
26wwwdhgovukenPublicationsandstatistics LettersandcircularsProfessionalletters ChiefnursingofficerlettersDH_121848
27Department of Health No health without mental health a cross-government mental health outcomes strategy for people of all ages 2011 wwwdhgovukprod_consum_dhgroups dh_digitalassetsdocumentsdigitalasset dh_124058pdf
28Ministry of Justice Breaking the cycle effective punishment rehabilitation and sentencing of offenders 2010
29Department of Health The Bradley report Lord Bradleyrsquos review of people with mental health problems or learning disabilities in the criminal justice system 2009
30Department of Health No health without mental health delivering better mental health outcomes for people of all ages 2011
31Department of Health Equity and excellence liberating the NHS 2010 wwwdhgovukprod_ consum_dhgroupsdh_digitalassetsdhen psdocumentsdigitalassetdh_117794pdf
32Department of Health Healthy lives healthy people our strategy for public health in England 2010 wwwdhgovukprod_consum_dh groupsdh_digitalassetsdhenps documentsdigitalassetdh_122347pdf
33Department of Health A vision for adult social care capable communities and active citizens 2010 wwwdhgovukprod_consum_dh groupsdh_digitalassetsdhenps documentsdigitalassetdh_121971pdf
34Wilson M NMHDU Race equality action plan a five year review Delivering race equality in mental health care 2010 wwwnmhduorgukour-workmhep
35Care Quality Commission Monitoring the use of the Mental Health Act in 200910 2010
36Raleigh V S Collection of data on ethnic origin in England Editorial BMJ 20083376456
37Wilson M NMHDU Race equality action plan a five year review Delivering race equality in mental health care 2010 wwwnmhduorgukour-workmhep
38Department of Health Liberating the NHS an information revolution 2010
Care Quality Commission Count me in census 2010 47
Appendix A Methods of analysis
Standardisation by age and gender
Standardisation allows us to make comparisons between groups of the population by taking account of variations in age and gender Some differences in patterns of service use are related to the age or gender of the people using them so adjustments to the data have to be made to ensure that the interpretation of ethnic differences is reliable For example formal admissions are higher at a younger age so some Black and minority ethnic groups may have high formal admission rates simply because they have a high proportion of younger people Without adjustments for age and gender differences comparisons would be misleading
In this report most results are standardised for age and gender including those relating to admission detention source of referral care programme approach seclusion restraint accidents assault self-harm consent and presence on a secure ward The report uses the accepted statistical method of taking account of age and gender differences between groups when calculating these rates
We used the ONS estimates of total population by ethnic group for England and Wales in 2007 to standardise the rates of admission for different ethnic groups This takes account of the significant rises in the Black and ethnic minority population of England and Wales since the 2001 ONS census and hence gives more accurate and up to date estimates of admission ratios for different ethnic groups (although it does not take account of any further changes in the ethnic populations between 2007 and 2010 the date of this census) For comparison with the DRE baseline we also present admission rates from the 2005 census derived using the 2005 ONS estimates of populations by ethnic group These figures will not be the same as published in the 2005 census report which were based on the 2001 ONS census population estimates because updated estimates of populations by ethnic group were not available at that time
For other analyses we used the total number of inpatients and patients on CTOs in the census
as the basis for standardisation However CTO outpatients are excluded from selected analyses where appropriate namely the analysis of rates for admissions detentions on admission source of referral single sex accommodation and recorded incidents of seclusion restraint accidents assault and self-harm We used the statistical package STATA version 82 to derive the standardised results
It was not possible to adjust the analyses for ethnic differences in social and economic factors and in diagnosis and severity of illness Such factors could affect the ethnic differences observed in the results
For descriptive variables such as religion and language we did not use standardisation
Confidence intervals as indicators of significant statistical differences
For all standardised results the national rates for England and Wales are taken as 100 and the usual 95 confidence intervals are given Rates of less than 100 or greater than 100 for specific ethnic groups show a lower or higher rate respectively than the national average after adjusting for age and gender Whether or not the difference is statistically significant from the national average depends on the confidence interval If the confidence interval overlaps 100 the difference from the national average is not statistically significant If both values are lower or higher than 100 it indicates that the difference compared with the national average is statistically significant at the 95 level
For example if a rate is 110 with the lower confidence interval being 105 and the upper confidence interval being 115 it indicates that the 10 excess over the national average of 100 is statistically significant But if a ratio is 110 with the lower confidence interval being 95 and the upper confidence interval being 125 it indicates that the 10 excess over the national average is not statistically significant We did not attempt to adjust the confidence intervals for multiple comparisons
Care Quality Commission Count me in census 2010 48
Appendix B Mental health tables
Table B1 Standardised admission ratios by ethnic group for England and Wales (excluding outpatients on a CTO) using 2007 ONS census population denominators (England and Wales = 100) All ages
Ethnic group
Men Women Persons Standardised
admission ratio
95 confidence
interval Observed numbers
Standardised admission
ratio
95 confidence
interval Observed numbers
Standardised admission
ratio
95 confidence
interval Observed numbers
White British 88 86 89 12435 94 93 96 10157 91 89 92 22592 White Irish 130 115 146 274 122 106 140 215 126 115 138 489 Other White 117 109 126 731 129 118 141 533 122 115 129 1264 White and Black Caribbean 557 493 627 276 274 223 333 101 436 393 483 377 White and Black African 312 247 388 80 259 186 351 41 292 242 349 121 White and Asian 140 110 174 79 124 90 166 44 134 111 159 123 Other Mixed 230 189 278 108 213 165 270 67 223 192 259 175 Indian 67 59 75 286 66 56 76 172 66 60 73 458 Pakistani 105 93 119 269 65 53 79 96 91 81 100 365 Bangladeshi 123 102 147 120 82 60 109 46 108 92 126 166 Other Asian 161 139 185 192 136 107 169 79 153 135 172 271 Black Caribbean 538 505 572 980 306 277 336 418 438 415 462 1398 Black African 246 226 267 550 219 194 247 277 236 221 253 827 Other Black 792 691 903 222 314 240 403 61 596 529 670 283 Chinese 27 20 38 39 43 30 59 35 33 26 41 74 Other 140 120 162 177 110 88 136 87 128 113 145 264 Total 100 16818 100 12429 100 29247
Care Quality Commission Count me in census 2010 49
Appendix B Mental health tables continued
Table B2 Standardised admission ratios by ethnic group for England and Wales (excluding outpatients on a CTO) using 2007 ONS census population denominators (England amp Wales = 100) Ages 65 and over
Ethnic group
Men Women Persons Standardised
admission ratio
95 confidence
interval Observed numbers
Standardised admission
ratio
95 confidence
interval Observed numbers
Standardised admission
ratio
95 confidence
interval Observed numbers
White British 95 92 99 3265 95 92 98 3887 95 93 97 7152 White Irish 142 116 172 106 102 82 125 92 120 104 138 198 Other White 207 174 244 141 213 183 248 171 210 188 235 312 White and Black Caribbean 406 210 710 12 333 152 632 9 371 230 568 21 White and Black African 231 28 836 2 198 24 714 2 213 58 546 4 White and Asian 28 1 156 1 110 30 281 4 69 23 162 5 Other Mixed 146 40 374 4 228 92 470 7 189 95 339 11 Indian 97 70 132 41 83 57 116 33 90 71 113 74 Pakistani 39 17 77 8 46 18 94 7 42 23 69 15 Bangladeshi 115 53 218 9 69 14 201 3 98 51 172 12 Other Asian 234 143 361 20 215 120 354 15 225 157 313 35 Black Caribbean 216 170 269 77 310 253 376 103 261 224 302 180 Black African 142 73 248 12 365 241 531 27 246 175 337 39 Other Black 164 34 479 3 366 134 796 6 259 119 493 9 Chinese 41 8 120 3 95 38 195 7 68 33 125 10 Other 253 126 453 11 390 238 602 20 327 222 464 31 Total 100 3715 100 4393 100 8108
Care Quality Commission Count me in census 2010 50
Appendix B Mental health tables continued
Table B3 Standardised ratios by ethnic group for patients referred by a GP (England and Wales = 100)
Ethnic group
Men Women Persons Standardised
referral ratio
95 confidence
interval Observed numbers
Standardised referral ratio
95 confidence
interval Observed numbers
Standardised referral ratio
95 confidence
interval Observed numbers
White British 110 103 117 904 107 101 114 1065 108 104 113 1969 White Irish 85 50 134 18 93 57 144 20 89 63 123 38 Other White 74 51 103 33 70 49 97 36 72 56 91 69 White and Black Caribbean 27 5 78 3 30 4 109 2 28 9 65 5 White and Black African 0 0 74 9 268 2 35 4 125 2 White and Asian 165 54 386 5 0 0 86 28 201 5 Other Mixed 48 6 172 2 68 14 198 3 58 19 136 5 Indian 69 34 123 11 79 39 141 11 73 46 111 22 Pakistani 88 42 162 10 59 16 151 4 77 42 130 14 Bangladeshi 81 22 207 4 61 7 221 2 73 27 159 6 Other Asian 80 32 166 7 108 43 223 7 92 50 155 14 Black Caribbean 35 20 56 17 37 20 62 14 36 24 51 31 Black African 57 29 100 12 66 35 113 13 61 40 91 25 Other Black 62 23 135 6 40 5 144 2 54 23 107 8 Chinese 56 1 314 1 139 38 356 4 108 35 251 5 Other 106 46 208 8 0 0 53 23 105 8 Total 100 1041 100 1185 100 2226
Care Quality Commission Count me in census 2010 51
Appendix B Mental health tables continued
Table B4 Standardised ratios by ethnic group for patients referred by a community mental health team (including crisis resolution home treatment) or community learning disability team (England and Wales = 100)
Ethnic group
Men Women Persons Standardised
referral ratio
95 confidence
interval Observed numbers
Standardised referral ratio
95 confidence
interval Observed numbers
Standardised referral ratio
95 confidence
interval Observed numbers
White British 107 104 111 3255 103 100 107 3386 105 103 108 6641 White Irish 90 69 116 61 89 68 114 61 90 74 107 122 Other White 59 48 71 105 79 67 94 141 69 61 78 246 White and Black Caribbean 106 83 135 68 75 49 111 25 96 77 117 93 White and Black African 43 19 84 8 66 30 124 9 52 31 84 17 White and Asian 95 56 150 18 84 43 147 12 90 61 129 30 Other Mixed 78 48 121 20 72 41 118 16 76 53 105 36 Indian 106 83 132 76 100 76 130 56 103 86 122 132 Pakistani 108 84 135 73 89 60 128 30 102 83 123 103 Bangladeshi 98 66 141 29 90 50 148 15 95 69 128 44 Other Asian 88 63 120 40 105 70 150 29 94 73 119 69 Black Caribbean 69 59 80 167 85 71 102 123 75 67 84 290 Black African 84 70 102 112 82 65 103 77 84 72 96 189 Other Black 52 36 74 31 64 36 106 15 56 41 74 46 Chinese 112 53 205 10 101 52 176 12 105 66 160 22 Other 86 60 120 35 106 71 151 30 94 73 120 65 Total 100 4108 100 4037 100 8145
Care Quality Commission Count me in census 2010 52
Appendix B Mental health tables continued
Table B5 Standardised ratios by ethnic group for patients referred by criminal justice routes (police prison probation courts court liaison and diversion) (England and Wales = 100)
Ethnic group
Men Women Persons Standardised
referral ratio
95 confidence
interval Observed numbers
Standardised referral ratio
95 confidence
interval Observed numbers
Standardised referral ratio
95 confidence
interval Observed numbers
White British 90 86 95 1495 95 86 104 421 91 87 95 1916 White Irish 133 94 183 38 59 19 138 5 116 84 157 43 Other White 112 93 134 119 103 68 150 27 111 93 130 146 White and Black Caribbean 117 89 151 58 145 69 266 10 120 94 153 68 White and Black African 190 127 273 29 141 38 361 4 183 126 256 33 White and Asian 75 39 131 12 160 52 373 5 89 52 143 17 Other Mixed 104 65 157 22 151 61 311 7 112 75 161 29 Indian 86 61 118 38 79 32 163 7 85 62 113 45 Pakistani 118 91 150 65 89 33 194 6 115 90 145 71 Bangladeshi 74 44 115 19 29 1 162 1 68 42 105 20 Other Asian 130 95 174 45 164 71 323 8 134 101 176 53 Black Caribbean 131 114 150 208 124 81 181 26 130 114 148 234 Black African 132 112 156 145 143 93 211 25 134 114 156 170 Other Black 141 109 180 65 236 113 435 10 149 117 187 75 Chinese 83 27 194 5 146 30 426 3 99 43 195 8 Other 129 93 175 41 113 37 264 5 127 93 170 46 Total 100 2404 100 570 100 2974
Care Quality Commission Count me in census 2010 53
Appendix B Mental health tables continued
Table B6 Standardised detention ratios by ethnic group all detentions on day of admission (excluding outpatients on a CTO) (England and Wales = 100)
Ethnic group
Men Women Persons Standardised
detention ratio
95 confidence
interval Observed numbers
Standardised detention
ratio
95 confidence
interval Observed numbers
Standardised detention
ratio
95 confidence
interval Observed numbers
White British 94 92 97 6449 94 91 97 3628 94 92 96 10077 White Irish 112 95 131 154 118 96 145 94 114 101 129 248 Other White 108 98 118 451 120 106 136 251 112 104 120 702 White and Black Caribbean 123 107 141 220 129 99 167 59 124 110 140 279 White and Black African 128 99 162 68 113 70 173 21 124 100 153 89 White and Asian 96 71 126 50 109 68 164 22 99 78 125 72 Other Mixed 115 92 143 82 139 100 188 42 122 102 146 124 Indian 97 83 113 164 110 86 137 77 101 88 114 241 Pakistani 109 94 126 194 102 74 136 44 108 94 122 238 Bangladeshi 86 67 109 69 91 55 142 19 87 70 107 88 Other Asian 109 92 130 133 120 86 163 40 112 96 130 173 Black Caribbean 129 121 139 774 143 125 162 238 132 124 141 1012 Black African 115 104 127 422 131 111 153 159 119 110 129 581 Other Black 117 100 136 170 148 105 202 39 122 106 140 209 Chinese 108 71 159 26 129 78 202 19 116 85 156 45 Other 111 92 132 126 116 83 157 41 112 96 130 167 Total 100 9552 100 4793 100 14345
Care Quality Commission Count me in census 2010 54
Appendix B Mental health tables continued
Table B7 Standardised detention ratios by ethnic group detention on day of admission ndash section 2 of the Mental Health Act (England and Wales = 100)
Ethnic group
Men Women Persons Standardised
detention ratio
95 confidence
interval Observed numbers
Standardised detention
ratio
95 confidence
interval Observed numbers
Standardised detention
ratio
95 confidence
interval Observed numbers
White British 97 91 102 1156 93 87 98 1133 95 91 99 2289 White Irish 78 47 120 20 116 79 166 30 97 72 128 50 Other White 100 78 126 70 134 108 166 88 116 99 136 158 White and Black Caribbean 55 30 93 14 60 24 124 7 57 35 87 21 White and Black African 91 37 188 7 150 60 308 7 113 62 190 14 White and Asian 80 29 174 6 119 44 258 6 96 49 167 12 Other Mixed 68 28 141 7 116 53 221 9 89 51 145 16 Indian 130 91 179 37 124 81 182 26 127 98 163 63 Pakistani 126 87 176 34 138 79 225 16 130 96 171 50 Bangladeshi 166 101 256 20 140 61 276 8 158 105 228 28 Other Asian 142 93 209 26 163 93 264 16 150 108 202 42 Black Caribbean 73 57 92 70 97 72 128 51 82 68 98 121 Black African 164 131 202 87 190 146 244 62 174 147 204 149 Other Black 114 75 166 27 140 72 245 12 121 86 165 39 Chinese 165 60 358 6 212 97 402 9 190 106 313 15 Other 218 153 302 36 179 108 280 19 203 153 264 55 Total 100 1623 100 1499 100 3122
Care Quality Commission Count me in census 2010 55
Appendix B Mental health tables continued
Table B8 Standardised detention ratios by ethnic group detention on day of admission ndash section 3 of the Mental Health Act (England and Wales = 100)
Ethnic group
Men Women Persons Standardised
detention ratio
95 confidence
interval Observed numbers
Standardised detention
ratio
95 confidence
interval Observed numbers
Standardised detention
ratio
95 confidence
interval Observed numbers
White British 99 95 103 2684 96 91 100 1852 98 95 101 4536 White Irish 116 89 149 60 135 101 177 52 124 102 149 112 Other White 112 96 129 186 110 92 132 121 111 99 124 307 White and Black Caribbean 114 91 143 79 130 90 183 33 119 98 143 112 White and Black African 97 60 148 21 107 54 192 11 100 69 141 32 White and Asian 84 50 133 18 97 48 173 11 89 59 127 29 Other Mixed 121 84 168 35 117 72 181 20 120 90 156 55 Indian 96 75 122 67 110 79 148 42 101 83 122 109 Pakistani 91 71 115 69 88 55 134 22 90 73 111 91 Bangladeshi 63 39 95 22 64 28 127 8 63 43 90 30 Other Asian 90 65 120 44 94 56 149 18 91 70 117 62 Black Caribbean 116 102 130 279 164 138 192 148 129 117 142 427 Black African 95 80 112 143 102 79 129 68 97 85 111 211 Other Black 75 55 99 49 99 58 159 17 80 62 102 66 Chinese 119 59 213 11 99 43 194 8 110 66 171 19 Other 85 60 116 38 84 48 136 16 84 63 110 54 Total 100 3805 100 2447 100 6252
Care Quality Commission Count me in census 2010 56
Appendix B Mental health tables continued
Table B9 Standardised detention ratios by ethnic group detention on day of admission ndash section 3741 of the Mental Health Act (England and Wales = 100)
Ethnic group
Men Women Persons Standardised
detention ratio
95 confidence
interval Observed numbers
Standardised detention
ratio
95 confidence
interval Observed numbers
Standardised detention
ratio
95 confidence
interval Observed numbers
White British 84 79 89 991 101 88 115 220 86 82 91 1211 White Irish 140 96 198 32 48 6 175 2 126 87 176 34 Other White 112 89 139 81 156 95 241 20 118 96 144 101 White and Black Caribbean 177 133 232 53 179 66 390 6 178 135 229 59 White and Black African 149 82 251 14 224 46 654 3 159 92 254 17 White and Asian 141 75 241 13 195 40 569 3 149 85 241 16 Other Mixed 144 85 227 18 264 97 575 6 162 104 242 24 Indian 86 56 126 26 44 5 160 2 80 53 116 28 Pakistani 122 87 166 40 0 0 111 79 152 40 Bangladeshi 66 32 122 10 0 0 60 29 110 10 Other Asian 99 61 151 21 0 0 89 55 136 21 Black Caribbean 200 174 229 210 78 34 153 8 189 165 216 218 Black African 127 101 157 82 84 34 172 7 122 98 150 89 Other Black 152 110 205 43 94 11 341 2 148 108 198 45 Chinese 100 27 255 4 0 0 80 22 204 4 Other 118 75 177 23 44 1 245 1 110 71 164 24 Total 100 1661 100 280 100 1941
Care Quality Commission Count me in census 2010 57
Appendix B Mental health tables continued
Table B10 Standardised detention ratios by ethnic group detention on day of admission ndash sections 47 48 4749 of the Mental Health Act (England and Wales = 100)
Ethnic group
Men Women Persons Standardised
detention ratio
95 confidence
interval Observed numbers
Standardised detention
ratio
95 confidence
interval Observed numbers
Standardised detention
ratio
95 confidence
interval Observed numbers
White British 97 90 106 583 104 81 131 73 98 91 106 656 White Irish 132 72 221 14 163 20 590 2 135 77 219 16 Other White 130 96 172 49 71 15 206 3 124 93 163 52 White and Black Caribbean 126 78 193 21 80 2 444 1 123 77 186 22 White and Black African 207 103 370 11 0 0 189 95 339 11 White and Asian 57 12 166 3 169 4 941 1 68 19 175 4 Other Mixed 112 48 221 8 233 28 843 2 125 60 230 10 Indian 57 26 108 9 0 252 0 52 24 99 9 Pakistani 92 54 147 17 0 314 0 86 50 138 17 Bangladeshi 46 12 117 4 167 4 930 1 53 17 125 5 Other Asian 101 52 177 12 0 0 95 49 166 12 Black Caribbean 126 98 159 70 125 34 319 4 126 99 158 74 Black African 74 48 107 27 104 21 303 3 76 51 108 30 Other Black 127 78 197 20 138 3 769 1 128 79 195 21 Chinese 0 0 0 0 0 0 Other 83 38 157 9 0 0 77 35 147 9 Total 100 857 100 91 100 948
Care Quality Commission Count me in census 2010 58
Appendix B Mental health tables continued
Table B11 Standardised ratios for all applications of the Mental Health Act (including outpatients on a CTO) by ethnic group on day of census (England and Wales = 100)
Ethnic group
Men Women Persons Standardised
ratio for all MHA
applications
95 confidence
interval Observed numbers
Standardised ratio for all MHA
applications
95 confidence
interval Observed numbers
Standardised ratio for all MHA
applications
95 confidence
interval Observed numbers
White British 97 94 99 7659 95 93 98 4335 96 94 98 11994 White Irish 99 83 116 147 104 84 128 95 101 89 114 242 Other White 87 79 95 427 97 85 110 249 90 84 97 676 White and Black Caribbean 117 103 133 245 130 103 163 76 120 107 134 321 White and Black African 120 95 150 79 93 58 141 22 113 92 137 101 White and Asian 101 78 128 65 119 81 169 31 106 86 129 96 Other Mixed 110 89 134 96 125 93 165 49 114 97 135 145 Indian 103 90 118 215 122 100 147 109 109 97 121 324 Pakistani 111 97 125 254 117 90 148 67 112 100 125 321 Bangladeshi 92 75 112 97 101 68 145 29 94 78 112 126 Other Asian 103 88 121 152 126 95 164 56 109 94 124 208 Black Caribbean 123 115 131 893 141 126 158 300 127 120 134 1193 Black African 112 103 122 511 121 104 140 188 114 106 123 699 Other Black 116 102 132 232 148 112 191 59 122 108 136 291 Chinese 97 64 140 27 101 61 157 19 98 72 131 46 Other 104 87 122 140 103 75 137 46 103 89 119 186 Total 100 11239 100 5730 100 16969
Care Quality Commission Count me in census 2010 59
Appendix B Mental health tables continued
Table B12 Standardised CTO ratios by ethnic group CTOs on day of census ndash section 17a of the Mental Health Act (England and Wales = 100)
Ethnic group
Men Women Persons
Standardised CTO ratio
95 confidence
interval Observed numbers
Standardised CTO ratio
95 confidence
interval Observed numbers
Standardised CTO ratio
95 confidence
interval Observed numbers
White British 94 89 99 1289 88 82 94 730 92 88 96 2019 White Irish 51 27 88 13 77 41 132 13 62 40 90 26 Other White 97 77 120 83 125 95 162 58 107 90 126 141 White and Black Caribbean 79 53 113 29 141 77 237 14 92 67 124 43 White and Black African 111 59 190 13 125 41 292 5 115 68 181 18 White and Asian 104 54 182 12 136 50 297 6 113 67 178 18 Other Mixed 102 59 166 16 136 62 257 9 112 73 166 25 Indian 134 99 177 48 152 98 226 24 139 109 175 72 Pakistani 145 110 187 59 174 101 279 17 151 119 189 76 Bangladeshi 142 93 206 27 205 99 378 10 155 109 213 37 Other Asian 107 71 155 28 182 99 305 14 124 89 168 42 Black Caribbean 121 103 142 152 171 132 218 65 133 116 152 217 Black African 116 94 142 94 139 98 192 37 122 102 145 131 Other Black 186 144 238 65 305 189 466 21 206 165 254 86 Chinese 83 23 213 4 152 49 354 5 111 51 211 9 Other 87 54 134 21 152 79 266 12 103 71 145 33 Total 100 1953 100 1040 100 2993
Care Quality Commission Count me in census 2010 60
Appendix C Learning disability tables
Table C1 Standardised admission ratios by ethnic group for England and Wales using 2007 ONS population denominators (England amp Wales = 100) All ages
Ethnic group
Men Women Persons Standardised
admission ratio
95 confidence
interval Observed numbers
Standardised admission
ratio
95 confidence
interval Observed numbers
Standardised admission
ratio
95 confidence
interval Observed numbers
White British 104 100 109 2163 108 101 115 941 105 102 109 3104 White Irish 108 72 156 28 151 89 238 18 121 89 162 46 Other White 81 65 101 85 49 30 75 21 72 59 87 106 White and Black Caribbean 280 186 405 28 246 118 453 10 270 191 371 38 White and Black African 102 33 239 5 165 34 482 3 119 51 235 8 White and Asian 66 26 135 7 154 56 335 6 89 47 152 13 Other Mixed 181 104 295 16 229 99 451 8 195 125 290 24 Indian 32 21 48 24 28 12 55 8 31 21 44 32 Pakistani 48 30 72 22 12 1 43 2 38 25 57 24 Bangladeshi 102 60 161 18 31 4 113 2 83 51 128 20 Other Asian 33 13 69 7 92 34 201 6 47 25 81 13 Black Caribbean 265 210 332 77 117 67 190 16 218 176 267 93 Black African 53 33 80 22 40 15 87 6 50 33 72 28 Other Black 228 118 399 12 134 28 392 3 200 112 330 15 Chinese 4 0 21 1 3 0 16 1 Other 26 9 56 6 11 0 59 1 21 9 44 7 Total 100 2521 100 1051 100 3572
Care Quality Commission Count me in census 2010 61
Appendix C Learning disability tables continued
Table C2 Standardised detention ratios by ethnic group all detentions on day of admission (England and Wales = 100)
Ethnic group
Persons Standardised
detention ratio
95 confidence
interval Observed numbers
White British 97 93 103 1431 White Irish 127 84 184 28 Other White 117 91 149 68 White and Black Caribbean 120 77 179 24 White and Black African 114 37 267 5 White and Asian 75 24 176 5 Other Mixed 94 49 165 12 Indian 119 72 186 19 Pakistani 110 61 181 15 Bangladeshi 144 84 231 17 Other Asian 59 16 150 4 Black Caribbean 119 90 155 57 Black African 138 85 210 21 Other Black 62 20 145 5 Chinese 0 0 Other 104 28 267 4 Total 100 1715
Care Quality Commission Count me in census 2010 62
copy Care Quality Commission and National Mental Health Development Unit 2011 Published April 2011
This publication may be reproduced in whole or in part in any format or medium for non-commercial purposes provided that it is reproduced accurately and not used in a derogatory manner or in a misleading context The source should be acknowledged by showing the publication title and copy Care Quality Commission and National Mental Health Development Unit 2011
How to contact us
Phone 03000 616161 Email enquiriescqcorguk Web wwwcqcorguk
Write to us at Care Quality Commission National Correspondence Citygate Gallowgate Newcastle upon Tyne NE1 4PA
Please contact us if you would like a summary of this publication in other formats or languages
Registered office Care Quality Commission Finsbury Tower 103ndash105 Bunhill Row London EC1Y 8TG
- Count me in 2010
- About the Care Quality Commission
- Contents
- Summary
- National organisations coordinating the census
- Introduction
- Data methods of analysis and interpretation
- Results mental health
- A comparison between the 2005 baseline and the 2010 census
- Results learning disabilities
- Data in the future Moving beyond a one-day census
- Conclusions
- References
- Appendix A Methods of analysis
- Appendix B Mental health tables
- Appendix C Learning disability tables
- How to contact us
-

Results mental health continued
Language and religion
Similar to previous censuses 5 of patients reported that their first language was not English (see Table 4) The Chinese and Bangladeshi groups had the highest proportions of patients whose first language was not English (51 and 46 respectively) Among the Other White group 27 had a first language other than English Again similar to previous censuses about 2 of patients said they needed an interpreter and of these 24 were from the White British group
Table 4 Percentage of patients with a first language other than English
Ethnic group with first language other than English
White British 1
White Irish 3
Other White 27
White and Black Caribbean 2
White and Black African 10
White and Asian 6
Other Mixed 11
Indian 26
Pakistani 35
Bangladeshi 46
Other Asian 34
Black Caribbean 2
Black African 22
Other Black 13
Chinese 51
Other 41
Total 5
Care Quality Commission Count me in census 2010 18
Results mental health continued
Religion was not stated for 21 of patients and 15 of patients said they had no religion The proportions stating they did not have a religion were highest among the WhiteBlack Caribbean and WhiteAsian Mixed groups (23 and 21 respectively) and lowest among the South Asian groups (4) Table 5 shows the religion of patients
Table 5 Religion of patients by ethnic group
Ethnic group
Religion and faith groups ()
None Christian Buddhist Hindu Jewish Muslim Sikh Any other religion
Not stated
White British 16 58 1 0 1 0 0 3 21
White Irish 8 73 0 0 0 5 13
Other White 13 53 1 0 3 5 7 18 White and Black Caribbean 23 47 0 1 0 3 7 17
White and Black African 16 41 1 1 15 6 20
White and Asian 21 33 1 1 21 3 3 18
Other Mixed 15 41 3 3 16 8 17
Indian 5 10 0 29 15 28 2 11
Pakistani 4 3 0 1 1 80 1 2 10
Bangladeshi 4 1 1 1 76 1 5 11
Other Asian 6 14 5 12 39 5 3 16
Black Caribbean 12 59 1 0 0 2 8 17
Black African 10 45 0 0 22 0 3 19
Other Black 12 41 1 1 0 16 7 22
Chinese 18 30 16 1 4 31
Other 8 24 3 1 3 34 6 21
Total 15 54 1 1 1 4 1 4 21
Care Quality Commission Count me in census 2010 19
Results mental health continued
Sexual orientation
The results for sexual orientation were not valid for 1 of patients and for 20 the response was recorded as ldquonot knownrdquo Seventy-six per cent of patients said they were heterosexual 1 said gay lesbian 1 said bisexual and less than 1 said ldquootherrdquo The number of minority ethnic patients who were gaylesbian or bisexual was very low
The overall figure of 1 who said they were gay lesbian or bisexual is lower than some estimates of the proportions of gaylesbian or bisexual people in the general population (5 to 7)2021 However in the 200910 Integrated Household Survey of a representative sample of 238206 people in UK conducted by the Office for National Statistics 1 identified themselves as gay or lesbian 05 as bisexual 05 as ldquootherrdquo 3 responded as ldquodo not knowrdquo or refused to answer and 95 identified themselves as heterosexualstraight22
Disability
About 75 of patients said they did not have a disability and 25 said they had one or more disabilities Of these 7 were blind or visually impaired 1 were deaf or had a hearing impairment 1 had Autistic Spectrum Disorder 2 had a learning disability 4 had a mobility impairment and 2 used a wheelchair The remaining 8 had more than one disability The proportion of patients with a disability was highest among the White British White Irish and Other White groups (about 28) which could reflect the higher age profiles of these patients compared with other ethnic groups
Rates of admission (see section on interpreting the results on page 13)
The rates of admission derived using the 2007 ONS ethnic population estimates as denominators are given in Appendix B Tables B1 (all ages) and B2 (ages 65 and over) Outpatients on a CTO are excluded from these results
All ages Admission rates were lower than average for patients from the White British Indian and Chinese groups and were average for the Pakistani and Bangladeshi groups Rates were higher than average for other minority ethnic groups they were particularly high for the Black Caribbean Black African WhiteBlack Caribbean Mixed and WhiteBlack African Mixed groups who had rates two to four times higher than average and for the Other Black group with a rate six times higher
Ages 65 and over Age-standardised admission rates for minority ethnic groups at older ages show broadly similar patterns to those reported for all ages with rates two to three times higher than average among the Black and White Black Mixed groups Rates were high also in the White Irish Other White Other Asian and Other groups
Numbers of older Black and minority ethnic patients were too few in most ethnic groups to support analyses of subgroups within them for example those detained
Care Quality Commission Count me in census 2010 20
Results mental health continued
Source of referral
People can be referred to healthcare services in a number of ways Referrals for inpatient care often come from community mental health teams rather than the original source such as GPs and accident and emergency (AampE) departments Therefore referrals from these teams may include referrals from other sources Furthermore about a quarter of patients (26) were referred from tertiary care and information about their original referral source was not available We had no information about the source of referral for 13 of patients The results reflect the proportions of patients from each ethnic group that are referred from each source so a higher proportion of referrals from one source will inevitably mean that proportions from other referral sources are lower Outpatients on a CTO are excluded from these data
The referral patterns are broadly similar to those reported previously and the key results are presented below
GP referrals 7 of patients Rates were 8 higher than average among the White British group They were lower than average among the Other White Black Caribbean Black African and WhiteBlack Caribbean Mixed groups by 28 to 72 The rates of referral by GPs are given in Appendix B Table B3
Referrals from AampE departments 5 of patients The White British group had a 9 lower than average rate of such referrals The WhiteBlack African Mixed Indian Bangladeshi Black African and Other groups were more likely than average to be referred in this way
Referrals from community mental health teams 26 of patients For the White British group such referrals were 5 higher than the average rate They were lower than average among the Other White WhiteBlack African Mixed Black Caribbean Black African and
Other Black groups by 16 to 48 The rates of referral are given in Appendix B Table B4
Referrals from the criminal justice system 9 of patients This is defined as the police courts probation service prison and court liaison and diversion service
Patients from the White British group were less likely than average to be referred by the criminal justice agencies whereas the Black Caribbean Black African Other Black WhiteBlack African Mixed and Other Asian groups were 30 to 83 more likely than average to be referred in this way We observed no differences from the average rate for other ethnic groups Rates of referral by the criminal justice system are given in Appendix B Table B5
A significant proportion (26) of all referrals were from tertiary care
Tertiary care referrals from medium or high secure units 5 of patients The rate for such referrals (in NHS or independent sectors) was lower than average among the Other White and Indian groups It was higher than average among the Black Caribbean and WhiteBlack Caribbean Mixed groups by about 75
Tertiary care referrals from other inpatient services 21 of patients The rate for such referrals (NHS and independent) was higher than average among the White Irish and Other White groups by 29 and 59 respectively The rate was lower than average in the Indian and Other Black groups
Tertiary care referrals from other clinical specialties 9 of patients Rates of such referrals were higher than average among the White British and Indian groups and lower than average among the Other White WhiteBlack Caribbean Mixed Other Asian Black African Other Black and Chinese groups
Care Quality Commission Count me in census 2010 21
Results mental health continued
Detention under the Mental Health Act 1983 on day of admission
The Mental Health Act 2007 made a number of changes to the Mental Health Act 1983 These changes were reflected in the census of 2009 and 2010 which collected information on new provisions establishing supervised community treatment (section 17A) and excluded supervised discharge (section 25A) which was abolished
As in previous reports we present below the results for detention rates on the day of admission Outpatients on a CTO are excluded from these analyses After that we present rates for all patients subject to the Mental Health Act on census day (including outpatients on a CTO) followed by rates for patients on a CTO on census day
All detentions Forty-nine per cent (14637) of patients were detained under the Mental Health Act on admission to hospital This was a higher proportion than recorded in the previous censuses (40 in 2005 and 2006 43 in 2007 45 in 2008 and 47 in 2009)
Detention rates were 6 lower than average among White British patients and between 19 and 32 higher than average among the Black Caribbean Black African Other Black and WhiteBlack Caribbean Mixed groups Detention rates were also higher in the White Irish and Other White groups by about 13 and in the Other Mixed group by 22 No other ethnic differences were observed The results are given in Appendix B Table B6
These patterns are broadly similar to those reported in previous censuses
Detention under section 2 Section 2 of the Mental Health Act gives authority for a person to be detained in hospital for assessment for a period not exceeding 28 days It is mainly applied where the patient is unknown to the service or where there has been a significant interval between periods of inpatient treatment
Of all patients detained on admission 22 were detained under section 2 Rates of detention under this section were lower than average among the White British WhiteBlack Caribbean Mixed and Black Caribbean groups and higher than average among the Bangladeshi Other Asian Black African Chinese and Other groups by between 50 and 103 (see Appendix B Table B7)
Detention under section 3 Section 3 of the Act provides for the compulsory admission of a patient to hospital for lsquotreatmentrsquo and for his or her subsequent detention which can last for an initial period of up to six months and is renewable after this
Of all patients detained on admission 43 were detained under this section Rates were higher than average among the White Irish and Black Caribbean groups by 24 and 29 respectively and lower among than average among the Bangladeshi group No other ethnic differences were observed The rates of detention under section 3 are given in Appendix B Table B8
Detention under section 3741 Section 37 of the Mental Health Act allows a court to send a person to hospital for treatment when they might otherwise have been given a prison sentence and section 41 allows a court to place restrictions on a personrsquos discharge from hospital Admission to hospital rather than prison is generally regarded as a more positive outcome for the person concerned
Care Quality Commission Count me in census 2010 22
Results mental health continued
Of all patients detained on admission 14 were detained under section 37 with a section 41 restriction order applied The rates of detention are given in Appendix B Table B9 In all minority ethnic groups very few women were detained under section 3741 Among men the rate of detention for the White British group was 16 lower than average and it was higher than average in the WhiteBlack Caribbean Mixed group by 77 the Black Caribbean group by 100 the Black African group by 27 and the Other Black group by 52
A consistent pattern across all six annual censuses was the higher than average detention rate under section 3741 for the Black Caribbean and Other Black groups
Detention under sections 47 48 and 4749 These sections of the Mental Health Act allow the Ministry of Justice to issue a direction to transfer a person detained in prison to a hospital for treatment
Of all patients detained on admission 7 were detained under these sections The only ethnic differences observed were a 107 higher than average detention rate among men from the White Black African Mixed group and a lower than average rate for the Indian group We observed no other ethnic differences probably because the numbers of detentions under these sections were low in most minority ethnic groups These rates of detention are given in Appendix B Table B10
The previous four censuses also showed virtually no ethnic differences for rates of detention under sections 47 48 and 4749
Patients subject to the Mental Health Act 1983 on day of census
All patients subject to the Mental Health Act Of all the 32399 patients in the census a total of 53 (17299) were subject to the Mental Health Act on census day including 2959 outpatients and 75 inpatients on a CTO (either voluntarily or recalled) Ratios for the different ethnic groups for overall applications of the Mental Health Act including CTOs showed broadly similar patterns to detention rates on admission day from which patients on a CTO were excluded In both cases rates were higher than average among the Black Caribbean Black African Other Black and White Black Caribbean Mixed groups However the higher than average detention rates for the White Irish Other White and Other Mixed groups on admission day were not apparent on census day
The rates are given in Appendix B Table B11
Supervised community treatment under section 17A Community treatment orders (CTOs) were introduced in November 2008 as a result of the Mental Health Act 2007 They allow for supervised community treatment to be provided for up to six months with the possibility of an extension after this These orders are designed to help patients to maintain stable mental health outside hospital and to promote recovery by providing professionals with the power to set conditions on discharge from hospital and a power to recall patients if arrangements in the community are not working
Nine per cent of all patients in the census were on CTOs compared with 4 in 2009 Of all the 17299 patients subject to the Mental Health Act on census day almost 18 (3034) were on CTOs Of the patients on a CTO 2959 were outpatients and 75 were inpatients (50 voluntary and 25 recalled)
Care Quality Commission Count me in census 2010 23
Results mental health continued
The rate of supervised community treatment among all patients included in the census was lower than average in the White British and White Irish groups and higher than average in the South Asian (Indian Pakistani Bangladeshi) and Black (Black Caribbean Black African Other Black) groups by 22 to 106 The ratios are given in Appendix B Table B12
Consent
About 25 of informally admitted patients were deemed incapable of consenting to treatment The only ethnic difference observed was a higher than average rate for the Pakistani group but this was based on very few patients
About 18 of patients who were detained or on CTOs were deemed incapable of consenting to treatment These rates were lower than average by 7 in the White British group and were higher than average among the Other White WhiteBlack Caribbean Mixed and Black African groups by 21 35 and 36 respectively
In addition 13 of patients who were detained or on CTOs on census day were deemed capable of consenting to treatment but refused to do so The White British group had a rate of refusals that was 10 lower than average and rates were higher than average among the White Irish WhiteBlack Caribbean Mixed Other Mixed Black Caribbean and Black African groups by between 39 and 71
Care programme approach
The Care Programme Approach (CPA) is the process by which treatment care and support for people with serious mental health problems and accompanying health and social care needs are agreed coordinated and understood by all involved From October 2008 changes to the CPA in England
mean that it is no longer categorised into two parts (lsquostandardrsquo and lsquoenhancedrsquo) and just the one category of enhanced CPA applies This makes CPA policy in England different to that in Wales where the distinction still applies The CPA data presented here therefore includes all CPA patients in England and both lsquostandardrsquo and lsquoenhancedrsquo CPA patients in Wales
About 89 of all patients were on a CPA 3 were on a single assessment process (SAP) whereby assessments are made for adults with health and or social care needs and 8 were on neither CPA nor SAP As most patients were on a CPA no ethnic differences were observed
Recorded incidents
The 2010 census asked about the number of times that patients experienced seclusion hands-on restraint self-harm accident and physical assault in a current hospital spell or if the patientrsquos hospital spell was longer than three months the number that took place within the last three months Outpatients on a CTO are excluded from these data It should be noted that the rates of such events among minority ethnic groups can show yearly variation because of the low numbers of events in several groups
Seclusion Seclusion was defined as the supervised confinement of a patient in a room which may be locked to protect others from significant harm Four per cent of patients had experienced one or more episodes of seclusion The White British group had a seclusion rate that was 9 lower than average Rates were higher than average among the WhiteBlack Caribbean Mixed WhiteBlack African Mixed Black Caribbean and Black African groups by 80 90 36 and 56 respectively
Care Quality Commission Count me in census 2010 24
Results mental health continued
Although the number of incidents of seclusion was low in several minority ethnic groups some general patterns over the six censuses to date are
bull The proportion of all patients who had an episode of seclusion stayed fairly constant over the six censuses at about 4
bull Although there have been annual fluctuations the seclusion rate has been higher than average for the Black and WhiteBlack Mixed groups in three or four of the six censuses and in the Other White group in three censuses
Hands-on restraint This was defined as the physical restraint of a patient by one or more members of staff in response to aggressive behaviour or resistance to treatment About 12 of patients had experienced one or more episodes of hands-on restraint No ethnic differences were observed In fact very few ethnic differences have been observed in the previous censuses also and they have not shown a consistent pattern
Self-harm Eight per cent of patients had harmed themselves on one or more occasions Only the White British group had a rate that was higher than average (by 14) Rates were lower than average among several minority ethnic groups the three Black groups (Black Caribbean Black African and Other Black) by about 70 the three south Asian groups (Indian Pakistani Bangladeshi) by between 37 and 78 and the Other Mixed and Other Asian groups by about 60
In terms of comparison with previous years
bull The proportion of all patients who had harmed themselves stayed fairly constant at about 7ndash8
bull In all censuses the White British group had a higher than average rate of self-harm and the Black and South Asian groups had lower than average rates of self-harm
Accidents About 11 of patients had experienced one or more accidents Patients from the White British group experienced a rate of accidents that was 6 higher than average Rates were lower than average in the Black Caribbean Black African Other Black and Other Asian groups by about 50 to 70 No accidents were reported for the Chinese group
In terms of comparisons with previous years
bull The proportion of all patients who had had an accident stayed fairly constant
bull The rate of accidents in the different censuses was higher than average in the White British group and lower than average in the Black Caribbean group Few other ethnic differences were observed and they were not consistent
Physical assault on the patient The definition of assault includes incidents of physical assault on the patient irrespective of who committed the assault We do not have information on who committed the assault for example whether it was another patient or a member of staff Eleven per cent of patients were involved in one or more episodes of physical assault The only ethnic difference observed was a 19 lower than average rate among the Black Caribbean group
In terms of comparisons with previous years
bull The proportion of all patients who had experienced a physical assault stayed fairly constant
bull Very few ethnic differences in rates of assault were observed in the different censuses and they did not show a consistent pattern
Care Quality Commission Count me in census 2010 25
Results mental health continued
Duration of stay in hospital from admission to census day
We analysed the length of the period between each inpatientrsquos admission to hospital and the census day This period is of course shorter than a patientrsquos full length of stay in hospital which runs from admission to the date when they are discharged Outpatients on a CTO are excluded from the following analyses
bull 25 of inpatients had been in hospital for one month or less
bull 20 had been in hospital between one and three months
bull 13 had been in hospital between three and six months
bull 11 had been in hospital between six months and one year
bull 11 had been in hospital between one and two years
bull 12 had been in hospital between two and five years
bull 8 had been in hospital for more than five years
These results are similar to those of previous censuses About 31 of patients in the 2010 census had been in hospital for more than a year and had therefore also been included in the 2009 census About 20 of patients had been in hospital for more than two years and will have been included in both the 2008 and 2009 censuses
We calculated the median length of stay for different ethnic groups The median is the midpoint of the range of values so the median length of stay is the one at which half the patients had a length of stay less than the median and half had a stay longer than the median Overall and as in previous years the median amount of time that women had spent in hospital was about 25 months and the median for men was about 58 months (see Table 6) In most ethnic groups the median time spent in hospital was two to three times longer for men than for women in the Other Black group men had been in hospital four times longer than women
Median lengths of stay were longest for men from the Black Caribbean WhiteBlack Caribbean Mixed and Other Black groups and shortest for men from the Chinese Bangladeshi and Other groups Median lengths of stay were longest for women from the WhiteBlack Caribbean Mixed and Black Caribbean groups and shortest for women from the Chinese and Bangladeshi groups
A number of important factors influence a patientrsquos length of stay in hospital including age gender whether or not they are detained under the Mental Health Act (and the section under which they are detained and whether there is an additional restriction order) the type and severity of their illness the nature of their treatment and the availability of support in the community The data in the census does not allow for analysis of these factors
Table 6 Median number of days from the day of admission to the day of census
Ethnic group Men Women
White British 161 71
White Irish 218 114
Other White 238 113
White and Black Caribbean 275 191
White and Black African 182 92
White and Asian 226 78
Other Mixed 173 112
Indian 172 70
Pakistani 153 56
Bangladeshi 134 55
Other Asian 167 61
Black Caribbean 345 122
Black African 141 66
Other Black 248 58
Chinese 135 51
Other 131 76
Total 174 75
Care Quality Commission Count me in census 2010 26
Results mental health continued
Ward security
As in previous years about 11 of all patients were on a medium or high secure ward as opposed to a general (76) or low secure (13) ward
Patients from the White British Indian and Bangladeshi groups were less likely than average to be on a medium or high secure ward by 7 30 and 67 respectively Patients from the White Irish WhiteBlack Caribbean Mixed Black Caribbean and Other Black groups had a higher than average rate by between 43 and 55
Age range on wards
Among patients under 18 years of age 61 were being cared for on wards for working-age adults on census day and five patients were on a ward for older people Seven per cent of patients on wards for working-age adults were 65 or over and
8 of those on wards for older people were adults of working age There were very few lsquoout of agersquo placements among minority ethnic groups
Patients in wards designated as single sex or mixed
Providers were asked whether patients were on a ward designated as men or women only or mixed gender All the analyses of single sex accommodation and facilities exclude outpatients on a CTO Overall 61 of men and 77 of women were not in a ward designated for single sex use similar proportions as in previous years The proportion of patients not in a designated single sex ward was lower among almost all minority ethnic groups than among the White British group In all ethnic groups the proportion of men who were not in a designated single sex ward was lower than among women (see Table 7a)
Two further questions examined the single sex facilities that were available to patients
At the time of the 2010 census the following guidance from the Department of Health applied in England A ward can be described as single sex (ie the intended sex of the ward is either male or female and not mixed) when the accommodation complies with the following definition from the Department of Health of single sex accommodation ldquoSleeping areas must be segregated and members of one sex must not have to walk through an area occupied by the other sex to reach toilets or bathrooms Separate male and female only toilets and bathrooms must be provided There should be separate day rooms to which only women have accessrdquo However there is a discrepancy for providers because accommodation designated as a lsquowardrsquo for administrative purposes may incorporate single sex accommodation for both sexes that meets the guidelines ndash but in this case the ward would still be lsquomixedrsquo (based on guidance from Safety Privacy and Dignity Department of Health 2000)
As long as men and women are cared for in separate bays or rooms and have their own toilet facilities then it may well be appropriate for them to be on the same ward being cared for by the same team of doctors and nurses In practice good segregation can be achieved if men and women have separate sleeping areas (for example single sex bays) and have separate toilets and bathrooms that they can reach without having to pass through (or close to) areas for the opposite sex The layout of wards should minimise any risk of overlooking or overhearing by members of the opposite gender (from Privacy and Dignity ndash A report by the Chief Nursing Officer into mixed sex accommodation in hospitals Department of Health 2007)
The coalition governmentrsquos revised Operating Framework for 201011 requires NHS organisations to eliminate mixed-sex accommodation except under exceptional circumstances from 2011 The national guidance relating to mixed sex accommodation was issued in November 2010 and states that ldquoNo areas are exempt and every decision to mix must be justified by reference to the patientrsquos clinical needs not organisational convenience or custom and practicerdquo For mental health and learning disability trusts it states ldquoThere is no acceptable justification for admitting a mental health patient to mixed-sex accommodationrdquohellip It ldquomay be acceptable in a clinical emergency to admit a patient temporarily to a single ensuite room in the opposite-gender area of a ward In such cases a full risk-assessment must be carried out and complete safety privacy and dignity maintainedrdquo The guidance is available at wwwdhgovukenPublicationsandstatisticsLettersandcircularsProfessionallettersChiefnursingofficerlettersDH_121848
Care Quality Commission Count me in census 2010 27
Results mental health continued
Table 7a Percentage of patients not in a designated single sex ward by ethnic group
Ethnic group
Sex of patients and ward
Male Female
Male ward Female or mixed ward Female ward Male or mixed ward
White British 35 65 21 79
White Irish 41 59 28 72
Other White 44 56 28 72
White and Black Caribbean 56 44 31 69
White and Black African 48 52 41 59
White and Asian 43 57 34 66
Other Mixed 49 51 24 76
Indian 37 63 25 75
Pakistani 48 52 35 65
Bangladeshi 23 77 18 82
Other Asian 46 54 22 78
Black Caribbean 55 45 32 68
Black African 49 51 28 72
Other Black 49 51 30 70
Chinese 42 58 30 70
Other 43 57 20 80
Total 39 61 23 77
The vast majority of patients in this category were in mixed wards very few (under 05) male patients were on female-only wards or vice versa
Care Quality Commission Count me in census 2010 28
Results mental health continued
Patientsrsquo access to toilet and bathing facilities designated for single sex use
We asked providers if the patient had access to toilet and bathing facilities designated for single sex use Overall 13 of men and 16 of women
were reported as not having access to such facilities designated for single sex use This was an improvement over 2009 when these proportions were 19 and 24 respectively The proportion of patients not having access to toilet and bathing facilities designated for single sex use was lower among almost all minority ethnic groups than among the White British group (see Table 7b for details)
Table 7b Percentage of patients not having access to toilet and bathing facilities designated for single sex use by ethnic group
Ethnic group
Access to designated single sex bathing and toilet facilities
Male Female
Male facilities
Female or mixed facilities
Female facilities
Male or mixed facilities
White British 86 14 84 16
White Irish 87 13 87 13
Other White 89 11 86 14
White and Black Caribbean 93 7 93 7
White and Black African 90 10 93 7
White and Asian 90 10 84 16
Other Mixed 98 2 96 4
Indian 91 9 90 10
Pakistani 95 5 94 6
Bangladeshi 92 8 98 2
Other Asian 92 8 86 14
Black Caribbean 92 8 90 10
Black African 91 9 91 9
Other Black 92 8 89 11
Chinese 82 18 83 17
Other 87 13 90 10
Total 87 13 84 16
The vast majority of patients in this category had access to mixed facilities very few (1) of male patients had access to female-only facilities or vice versa
Care Quality Commission Count me in census 2010 29
Results mental health continued
Patientsrsquo access to a lounge area day space designated for single sex use
We also asked providers if patients had access to a lounge area or day space designated for single sex use Overall 37 of men and 39 of women were
reported as not having access to these facilities This was an improvement over 2009 when these proportions were 48 and 51 respectively The proportion of patients not having access to a lounge areaday space designated for single sex use was lower among most minority ethnic groups than among the White British group (see Table 7c for details)
Table 7c Percentage of patients not having access to a lounge areaday space designated for single sex use by ethnic group
Ethnic group
Access to a lounge areaday space designated for single sex use
Male Female
Male facilities
Female or mixed facilities
Female facilities
Male or mixed facilities
White British 59 41 60 40
White Irish 63 37 70 30
Other White 68 32 63 37
White and Black Caribbean 82 18 73 27
White and Black African 83 18 76 24
White and Asian 72 28 75 25
Other Mixed 79 21 67 33
Indian 59 41 66 34
Pakistani 80 20 72 28
Bangladeshi 53 47 52 48
Other Asian 70 30 61 39
Black Caribbean 78 22 70 30
Black African 73 27 70 30
Other Black 79 21 72 28
Chinese 59 41 60 40
Other 67 33 67 33
Total 63 37 61 39
The vast majority of patients in this category had access to mixed facilities very few (1) of male patients had access to female-only facilities or vice versa
Care Quality Commission Count me in census 2010 30
Results mental health continued
Patientsrsquo subject to deprivation of liberty safeguards
People who lack the mental capacity to consent to the care or treatment they need should be cared for in a way that is least restrictive of their rights or freedom of action In 2007 the Mental Capacity Act 2005 was amended to introduce Deprivation of Liberty Safeguards for people who lack capacity to decide about their care or treatment and who need to be deprived of their liberty to protect them from harm The Safeguards came into effect in April 2009 and strengthen the rights of hospital patients and those in care homes as well as ensuring compliance with the European Convention on Human Rights (ECHR)
The 2010 census introduced a new question ldquoIs the patient subject to deprivation of liberty authorisation on 31 March 2010rdquo Under 1 (269) patients were reported as being subject to a deprivation of liberty authorisation on census day No ethnic differences in the rates were observed which may be due to the low numbers of patients among minority ethnic groups (69)
Care Quality Commission Count me in census 2010 31
A comparison between the 2005 baseline and the 2010 census
The changes we have seen in the census results between 2005 and 2010 the timespan of the Delivering Race Equality (DRE) action plan are set out below This is not a review of the DRE programme The aim is to give an overview of how some variables in the census have changed during the course of DRE and the findings should be seen in the light of the caveats described on page 13
bull The number of inpatients went down from 33785 to 29840 ndash a fall of 12
bull The proportion of patients in independent hospitals rose from 10 to 16
bull The overall proportion of patients from minority ethnic groups increased from 20 to 23 However there have been demographic changes during this time ndash the population from Black and minority ethnic groups in England and Wales rising from 79 million in 2005 to 85 million in 2007 (the latest year for which these figures are available) an increase of 8 in two years
bull Admission rates showed similar patterns across all censuses ndash Lower than average rates among the White
British Indian and Chinese groups ndash About average rates among the Pakistani and
Bangladeshi groups ndash Higher than average rates among other
minority ethnic groups ndash particularly in the Black and WhiteBlack Mixed groups for whom rates were two or more times higher than average in 2010 The Other Black group continues to have exceptionally high rates of admission (even after the apparent reduction since 2005 see next point)
bull One of the 12 goals of DRE was a decline in admission rates among Black and minority ethnic groups Figure 1 provides a comparison between 2005 and 2010 Although admission rates for
many ethnic groups show relatively little change since 2005 the rate for the Other Black group is considerably lower in 2010 (six times higher than average) compared with 2005 (12 times higher than average) However rates for the other Black and WhiteBlack Mixed groups show small increases
bull In general rates of referral from GPs and community mental health teams were lower than average among some Black and WhiteBlack groups and referral from the criminal justice system was higher Patterns were less consistent for other minority ethnic groups
bull There was a steady increase in the overall proportion of patients subject to the Mental Health Act Compared with 40 in 2005 49 of all patients were subject to the Mental Health Act in 2010 (53 if outpatients on a CTO are excluded)
bull Another DRE goal was to reduce detention rates among Black and minority ethnic groups However detention rates have been higher than average among the Black Caribbean Black African and Other Black groups in all six censuses and almost consistently higher in the WhiteBlack Caribbean Mixed and Other White groups Rates have been average for other minority ethnic groups
bull A consistent pattern was the higher than average detention rate under section 3741 for the Black Caribbean and Other Black groups
bull Another DRE goal was to reduce seclusion among Black and minority ethnic groups Although there have been annual fluctuations in seclusion rates they have been higher than average for the Black and WhiteBlack Mixed groups and the Other White group in at least three of the six censuses Other minority ethnic groups did not show high rates
Care Quality Commission Count me in census 2010 32
A comparison between the 2005 baseline and the 2010 census continued
Figure 1 Admission ratios in the 2005 and 2010 Count me in censuses by ethnic group England and Wales
Other Black
Black Caribbean
White and Black Caribbean
White and Black African
Black African
Other Mixed
Other Asian
White and Asian
Other
White Irish
Other White
Bangladeshi
White British
Pakistani
Indian
Chinese
0 100 200 300 400 500 600 700 800 900 1000 1100 1200 1300
Ageshysex standardised admission ratios (EampW=100)
Census 2005 admission ratios using 2005 ONS populations
bull Minority ethnic groups do not compare unfavourably for other incidents Rates of self-harm have consistently been lower than average among the Black and South Asian groups Very few ethnic differences in hands-on restraint physical assault and accidents were observed across the different censuses and they did not show a consistent pattern
bull About 31 of patients in all censuses had been in hospital for one year or more and were therefore included in more than one census
Census 2010 admission ratios using ONS 2007 populations (excluding outpatients on a CTO)
(This is one reason why the census shows little change over the six years It should be noted again that because the census is a one-day count it over-represents long-stay admissions and under-represents short-stay admissions)
bull Mixed accommodation was reported for many patients across all censuses although patients from Black and minority ethnic groups were more likely to be in single sex accommodation than White British patients
The admission ratios for the 2005 census shown here are different from those published in the 2005 report This is because we updated the analysis of the 2005 admission ratios by using 2005 ONS census populations for ethnic groups as denominators These populations were not available at the time of the 2005 report which instead used the 2001 ONS population data
Care Quality Commission Count me in census 2010 33
Results learning disabilities
We obtained information about 3642 patients in 129 organisations providing services for people with learning disabilities in England and Wales Of these two were inpatients on CTOs The total number of inpatients has declined each year and by 21 from 4609 in 2006 to 3642 in 2010 The total number of providers did not change much from the baseline year of 2006 although the number of NHS providers has fallen steadily and the number of independent healthcare organisations has increased (see Table 8) The proportion of inpatients in independent
healthcare organisations increased from 20 in 2006 to 33 in 2010 This is likely to be a result of closing NHS campuses with people moving from hospital to community settings
The pattern of results for learning disability patients in 2010 is broadly similar to that reported in previous censuses This is not surprising since many of the patients had been in hospital for a considerable period of time and they therefore appear in successive censuses
Table 8 The number of providers of learning disability services and inpatients
NHS (England)
Independent (England)
NHS (Wales)
Independent (Wales) Total
2010 census Number of providers 55 61 4 9 129 Number of all patients (including patients 2304 1072 154 112 3642 on a CTO) of all patients 633 294 42 31 100
2009 census Number of providers 60 54 5 4 123 Number of all patients (including patients 2487 1014 139 55 3695 on a CTO) of all patients 673 274 38 15 100
2008 census Number of providers 62 57 5 5 129
Number of inpatients 2873 1050 143 41 4107
of inpatients 700 256 35 10 100 2007 census
Number of providers 64 47 5 4 120
Number of inpatients 3063 900 154 36 4153
of inpatients 738 217 37 09 100 2006 census
Number of providers 70 48 5 1 124
Number of inpatients 3505 930 164 10 4609
of inpatients 760 202 36 02 100
Care Quality Commission Count me in census 2010 34
Results learning disabilities continued
Ethnicity
Information about ethnicity was available for 98 of patients Of these 13 belonged to Black and minority ethnic groups defined as all groups that are not White British (see Table 9) This figure is somewhat higher than in previous years (11 in 2006) and is significantly lower than the 23 of mental health patients from minority ethnic groups as reported in the mental health section of this report
Although the patterns by ethnicity are broadly similar to previous years there was an increase between 2006 and 2010 in the proportion of patients from the Other White group and a fall in those from the White British group Some ethnic groups had very few patients
As in the previous censuses patients from Black and minority ethnic groups were concentrated in a relatively small number of organisations 70 were
Table 9 Learning disability patients by ethnic group
Ethnic group 2010 census 2009 census 2008 census 2007 census 2006 census
Number Number Number Number Number
White British 853 3106 867 3205 889 3616 883 3642 887 4037
White Irish 13 46 15 57 13 53 10 40 14 66
Other White 29 106 23 85 26 104 26 109 17 77
White and Black Caribbean 10 38 10 36 07 29 08 34 07 32
White and Black African 02 8 01 4 00 2 02 10 01 3
White and Asian 04 13 04 14 03 12 03 13 02 9
Other Mixed 07 24 05 19 03 14 04 16 03 14
Indian 09 32 09 35 07 28 08 32 11 49
Pakistani 07 24 09 33 07 30 08 32 07 34
Bangladeshi 05 20 06 21 03 11 03 11 02 9
Other Asian 04 13 03 10 03 12 02 8 03 12
Black Caribbean 26 93 22 81 23 94 26 108 28 129
Black African 08 28 09 35 07 29 08 33 07 33
Other Black 04 15 04 14 04 15 04 18 04 17
Chinese 00 1 01 2 01 5 02 8 02 7
Other 02 7 02 8 04 15 02 10 05 24
Not stated 19 68 10 36 09 38 07 29 12 57
Total 100 3642 100 3695 100 4069 100 4124 100 4552
Care Quality Commission Count me in census 2010 35
Results learning disabilities continued
patients in 25 of the 129 organisations that took part in the census Seventy-four organisations had fewer than 10 patients from Black and minority ethnic groups each and another 42 organisations had no inpatients at all from these groups
However it is important to note that the number of people with severe and profound learning disabilities in some areas is affected by past funding and placement practices especially the presence of old long stay hospitals and of people placed outside their original area of residence by funding authorities
Reporting of ethnicity
About half (56) of patients reported their own ethnic group Staff reported the ethnic group for 17 of patients and relatives for 21 This means that ethnicity could have been misreported for some patients We do not know how ethnicity was assessed for 6 of patients
Age and gender
Two per cent (59) of patients were under 18 years old The number of young inpatients from minority ethnic groups was low or zero in several ethnic minority groups
Overall 73 of patients were under 50 years old and 27 were aged 50 or over The proportion of patients under 50 was higher among patients from Black and minority ethnic groups (88) than among the White British group (71) This is not surprising given that minority ethnic populations are generally younger than the White population
Seventy per cent of patients in learning disability services were men whereas in mental health services 58 of patients were men
Language and religion
Eight per cent of patients reported that their first language was not English Non-verbal communication was the most often selected language after English accounting for 4 of patients Two per cent (84) of patients most of whom were from the White British group said they needed an interpreter
Religion was not stated for 22 of patients and 15 of patients said they had no religion South Asians (Indians Bangladeshis and Pakistanis) were mostly Muslim Hindu or Sikh and those from the White Black Caribbean and Black African groups were mostly Christian
Sexual orientation
Overall the result was not known for almost half (49) of patients 45 said they were heterosexual 2 said gaylesbian 3 said bisexual and 1 said ldquootherrdquo The numbers of patients from minority ethnic groups were too low for meaningful analysis
Disability
Of all inpatients in learning disability services
bull 4 were reported as having no disabilities
bull 44 had a learning disability only
bull 51 had multiple disabilities
The patterns among minority ethnic groups were similar in that most patients had either a learning disability or multiple disabilities
Care Quality Commission Count me in census 2010 36
Results learning disabilities continued
Rates of admission
The rates of admission based on ONS estimates of the general population in 2007 are given in Appendix C Table C1
Admission rates were lower than average among several minority ethnic groups Other White Indian Pakistani Other Asian Black African Chinese and Other Rates were two to three times higher than average among the WhiteBlack Caribbean Mixed Black Caribbean Other Black and Other Mixed groups The lower rates among the South Asian and Chinese groups and the higher rates among some Black groups are similar to patterns for inpatients in mental health establishments
These patterns of admission are similar to those we reported in previous census reports
Source of referral
As we reported in the section on mental health patients data about sources of referral must be interpreted with care as we do not always know the original referral source Furthermore in the case of inpatients with learning disabilities this information was invalid missing or unknown for 12 of patients
Because of the small numbers of patients in most minority ethnic groups we observed few ethnic differences in sources of referral
Detention under the Mental Health Act 1983 (on day of admission and on day of census)
The Mental Health Act 2007 made a number of changes to the Mental Health Act 1983 one of which was supervised community treatment (section 17A) These are reflected in the 2010 census
All detentions Of all the patients in learning disability services 48 were detained under the Mental Health Act on admission Rates of detention on the day of admission by ethnic group are in Appendix C Table C2 and no ethnic differences were observed As the number of detained patients from each minority ethnic group was low we did not undertake further analysis for individual sections of the Act
Rates of detention on census day also showed no ethnic differences with the exception of a lower than average rate for the Other White group
Consent
About 66 of informally admitted inpatients were deemed incapable of consenting to treatment which is a similar proportion to that reported previously
Among detained patients 38 were deemed incapable of consenting to treatment and 6 were deemed capable of consenting to treatment but refused
The numbers of patients from minority ethnic groups were too low for comment There were no or very few such patients among minority ethnic groups
Care Quality Commission Count me in census 2010 37
Results learning disabilities continued
Care programme approach
Details of the Care Programme Approach (CPA) are given on page 24
We found that 73 of all patients were on a CPA 2 on a single assessment process (SAP) and 25 on neither No ethnic differences were observed
Recorded incidents
The 2010 census asked about the number of times that patients experienced seclusion hands-on restraint self-harm accident and physical assault in a patientrsquos current hospital spell or if the patientrsquos hospital spell was longer than three months the number that took place within the last three months As in previous years we observed very few ethnic differences
Seclusion Five per cent of patients had experienced one or more episodes of seclusion The only ethnic differences observed were the higher than average rates among the White Irish and Other White groups but these were based on small numbers of patients
Physical assault on the patient The definition of assault includes incidents of physical assault on the patient irrespective of who committed the assault but we do not have information on who committed the assault About 28 of patients had been involved in one or more episodes of physical assault No ethnic differences were observed
Hands-on restraint self-harm accidents Thirty per cent of inpatients had experienced one or more episodes of hands-on restraint 22 had attempted to harm themselves and 24 had suffered an accident The numbers were very low in minority ethnic groups and we did not observe any ethnic differences except for a lower than average rate for self-harm among the Black Caribbean group but this was based on very few patients
Duration of stay in hospital
We analysed the length of the period between each patientrsquos admission to hospital and the census day This period is of course shorter than a patientrsquos full length of stay in hospital which runs from admission to the date when they are discharged
bull 10 of inpatients had been in hospital for one month or less
bull 6 had been in hospital between one and three months
bull 7 had been in hospital between three and six months
bull 10 had been in hospital between six months and one year
bull 14 had been in hospital between one and two years
bull 22 had been in hospital between two and five years
bull 31 had been in hospital for over five years
The patterns are very similar to those in previous censuses About 67 of patients in the 2010 census had been in hospital for more than a year and were therefore also included in the 2009 census In addition over half (53) of patients had been in hospital for more than two years and will have been included in both the 2008 and 2009 censuses A third of patients will have been included in each census since 2006
We also calculated the median length of stay (see page 26 for the definition of median) Overall the median amount of time that women had spent in hospital was about 31 months and the median for men was about 27 months This compares with a median for mental health patients of 25 months for women and 58 months for men It is not possible to reliably compare length of stay by ethnic group because of the small numbers of patients among several minority ethnic groups
Care Quality Commission Count me in census 2010 38
Results learning disabilities continued
Ward security
About 12 of all inpatients were on a medium or high secure ward as opposed to a general (54) or low secure (34) ward
As in the three previous years rates of patients on medium or high secure wards were about double the average among the White Irish and Other White groups Most other minority ethnic groups had very few patients on medium or high secure wards
Age range on wards
There were five patients under 18 years of age being cared for on wards for working-age adults and none were on wards for older people About 5 of patients on wards for working-age adults were aged 65 or over and there were very few patients (23) on wards for older people There were very few lsquoout of agersquo placements among minority ethnic groups
Patients in wards designated as single sex or mixed
We asked providers whether the patient was on a ward designated as men or women only or mixed gender Overall 47 of men and 69 of women were not in a ward designated for single sex use The numbers of such patients among minority ethnic groups were very low
Two further questions examined the single sex facilities that were available to patients Again due to the small numbers we do not present results by ethnicity for these questions
Patientsrsquo access to toilet and bathing facilities designated for single sex use
Overall 19 (497) of men and 27 (295) of women were reported as not having access to toilet and bathing facilities designated for single sex use
Patientsrsquo access to a lounge area day space designated for single sex use
Overall 32 (829) of men and 44 (470) of women were reported as not having access to a lounge area day space designated for single sex use
Patients subject to deprivation of liberty safeguards
For details of deprivation of liberty safeguards please see page 31
The 2010 census introduced a new question ldquoIs the patient subject to deprivation of liberty authorisation on 31 March 2010rdquo Two per cent (74) patients were reported as being subject to a deprivation of liberty order on census day but very few of these patients (15) were from minority ethnic groups
See footnote on single sex accommodation on page 27
Care Quality Commission Count me in census 2010 39
Data in the future Moving beyond a one-day census
For six years the Count me in census has provided a valuable one-day snapshot of inpatients in mental health and learning disability services And with the proportion of inpatients who are detained increasing steadily (from 25 in 200506 to 39 in 200910 ndash see Figure 2) ongoing ethnic monitoring of admissions and detentions becomes more vital than ever
However a one-day census only captures some events and the profile of patients can differ across a whole year For example there were
bull 29840 inpatients in the 2010 census compared with 107765 inpatients overall during 200910
bull 17299 patients in the 2010 census who were detained or on CTOs compared with 42479 new detentions and some 4100 new CTOs overall in England in 200910
bull 26 of patients in hospital for under one month and 31 for over one year per the census
whereas the MHMDS data consistently shows that for over 50 of records the average length of an inpatient stay was under one month and for 4 it was over one year
Looking ahead it is vital that robust data is available on all admitted patients and all those subject to the Mental Health Act not just those in hospital on one particular day Moreover patterns of use and outcomes of community care can have an impact on the need for admission to hospital and the risk of detention ndash therefore information about the care provided to patients before admission to hospital during their hospital stay and after they leave is also vital Furthermore under 84 of the 127 million people using specialist mental health services are admitted to hospital23 and so it is very important to examine the quality of community care for the 90 of patients who are not admitted to hospital
Figure 2 Number of people spending time in hospital 200506 to 200910
Num
ber
of p
atie
nts
90000
80000
70000
60000
50000
40000
30000
20000
10000
0 200506 200607 200708 200809 200910
Source NHS Information Centre Formally detained Not detained MHMDS Bulletin 2011
Care Quality Commission Count me in census 2010 40
Data in the future Moving beyond a one-day census continued
The Mental Health Minimum Data Set (MHMDS) is a rich source of data on people using specialist mental health services in England It covers both community and hospital services and includes a wide range of information about the demographic clinical and socioeconomic characteristics of individual patients and the services provided to those admitted to hospital and to the much larger number of those who donrsquot need a stay in hospital The data includes information about contact with services uses of the Mental Health Act and the Care Programme Approach for each individual patient All these details enable the use of services patterns of care and patient outcomes to be tracked including along pathways of care The MHMDS therefore provides a robust basis for ongoing monitoring of access to and outcomes of care for users of specialist ndash both community and hospital ndash mental health services
The MHMDS also enables an analysis of the numbers and rates of people from different ethnic groups using specialist mental health services overall (both inpatient and community) which provides an indication of the levels of mental illness and therefore the need for specialist care in different communities
At present the MHMDS does not cover high secure services and independent sector providers only started to provide data during 201011 However to support payment by results for mental health the scope of the data set will be extended to cover high secure services during 201112 (version 4 MHMDS) Further proposed changes to the dataset (version 41) will incorporate NHS-funded learning disability services and primary care mental health services A separate dataset for child and adolescent mental health services (CAMHS) has been developed and is awaiting formal approvals It is designed to include the same information about uses of the Mental Health Act as provided in the MHMDS
The latest MHMDS bulletin for 200910 provides a description of people using specialist mental health services in England including ethnic profiles of people using services hospital admissions detentions and the number of people on CPA24 It also provides information on differences by age and gender The bulletin illustrates some of the sorts of analyses that are possible using data from the MHMDS
The NHS Information Centre can provide guidance on these and other potential analyses based on MHMDS data
Care Quality Commission Count me in census 2010 41
Conclusions
While this report reviews changes in the census results since 2005 it is not a review or evaluation of the DRE programme overall Similarly the census cannot provide explanations for the patterns observed or examine whether mental health services are meeting the needs of individual ethnic minority groups As we have noted previously the results are subject to caveats in particular that the census provides a one-day snapshot that may not be representative of patients admitted to hospital throughout the year
Overview of findings
Overall the findings from the 2010 census show little change from those reported for previous annual censuses conducted since 2005 This is partly because many patients had been in hospital for a considerable period of time and had therefore been included in successive censuses The findings of this sixth and last census continue to show differences between Black and minority ethnic groups and White groups and also differences within these groups
In particular ethnic differences in rates of admission detention under the Mental Health Act and seclusion ndash three of DRErsquos 12 goals ndash have not altered materially since the inception of DRE in 2005
bull Admission rates remain higher than average among minority ethnic groups especially among Black and WhiteBlack Mixed groups for whom rates were two or more times higher than average in 2010 The Other Black group continues to have the highest admission rate ndash six times higher than average ndash although this is lower than in 2005 In contrast admission rates have consistently been lower than average among the Indian and Chinese groups and about average in the Pakistani and Bangladeshi groups
bull Detention rates remain higher than average among the Black and WhiteBlack Caribbean Mixed groups and among the Other White group A consistent pattern across all censuses was the higher than average detention rate
under section 3741 for the Black Caribbean and Other Black groups We also found that rates for being placed on a CTO were higher among the South Asian and Black groups
bull Although there have been annual fluctuations in seclusion rates they have been higher than average for the Black WhiteBlack Mixed and Other White groups in at least three of the six censuses
Overall the level of provision of single sex areas for patients continues to be unsatisfactory although there was no evidence that minority ethnic patients were disadvantaged in these respects Government policy for the NHS in England now requires that all providers of NHS-funded care including mental health trusts are expected to eliminate mixed-sex accommodation in accordance with the guidance set out in CNO201032526 From 2011 all providers of NHS-funded care must report breaches of sleeping accommodation which will attract sanctions
Implications for ways forward
The census findings do not in themselves show that mental health and learning disability services are failing to meet the needs of Black and minority ethnic service users
As noted in previous reports they need to be interpreted in the context of available evidence on ethnic differences in rates of mental illness pathways to care and factors such as socioeconomic disadvantages that all contribute to these differences Our previous reports have consistently highlighted the need for prevention early intervention and working collaboratively across sectors to reduce the risk of admission and detention where possible without compromising the care given to patients Mental health services have a key role to play but to achieve this all statutory agencies and organisations outside the healthcare sector Black and minority ethnic communities and people who use services themselves will need to work in partnership
Care Quality Commission Count me in census 2010 42
Conclusions continued
This message ndash about preventing mental ill-health by addressing the contributory factors and intervening early ndash is at the heart of No health without mental health the Department of Healthrsquos new strategy for the future of mental health care in England27
The strategy aims to tackle the economic social and environmental determinants and consequences of mental health problems and to improve outcomes and reduce inequalities
It specifies that by 2014 people in contact with the criminal justice system will have improved access to mental health services as set out in the Ministry of Justice Green Paper Breaking the Cycle Effective punishment rehabilitation and sentencing of offenders which confirms the approach outlined in Lord Bradleyrsquos report for early intervention and diversion from custody2829
Accompanying the new strategy is a supporting document that explains how its objectives will improve mental health outcomes the effective interventions and the underpinning evidence base30
The strategy is complemented by other government proposals for reforms in the NHS public health and adult social care as outlined in the NHS White Paper Equity and excellence liberating the NHS31 the public health strategy Healthy lives healthy people32 and the adult social care strategy A vision for adult social care capable communities and active citizens 33 Three outcomes frameworks have been developed alongside these strategies improving mental health outcomes and reducing inequalities is integral to them all
In this new healthcare landscape the proposed NHS Commissioning Board and GP consortia will have a statutory obligation to promote equality and reduce inequalities in healthcare (something also enshrined in the Equality Act 2010) As the lead commissioners of healthcare services it will be up to GP consortia to assess with local authorities the needs of their local populations and commission the right services that meet their requirements
And the strengthened public health role of local authorities offers significant potential for addressing the socioeconomic disadvantages faced by Black and minority ethnic communities which add to the burden of mental illness in these communities
Race Equality Action Plan A five-year review looked back at the work of the DRE action plan and describes some of the key challenges successes and learning34 Based on the experience and outcome of the DRE programme the report suggests ways forward for the next stage of mental health strategy development and implementation
Since April 2009 CQC has had a duty under the Mental Health Act 1983 to monitor how services exercise their powers in relation to patients who are detained in hospital or subject to CTOs or guardianship under the Act In its first annual report on the use of the Act CQC recommends a number of areas where improvements are needed for example over-occupancy on inpatient wards patient engagement use of control and restraint seclusion and capacity and consent35
In particular CQC highlighted a number of issues relating to the use of CTOs including concern about appropriate usage (30 of the patients in CQCrsquos sample did not have a reported history of non-compliance or disengagement with services after discharge) and over-representation of Black and minority ethnic groups CQC advised that research on the possible race equality impact of CTOs should be undertaken There were 6237 CTOs from their introduction in November 2008 to 31 March 2010 a much greater use of them than forecast for this period by the Department of Health before the power was introduced Just 31 of these orders had ended by end March 2010 suggesting that some people are being kept on supervised community treatment for long periods
Care Quality Commission Count me in census 2010 43
Conclusions continued
Data in the future Moving beyond a one-day census
Good information is the foundation of an effective healthcare system It is imperative for ensuring that services meet the needs of local populations and are equitable and that improvements are made where needed The availability of fit-for-purpose and comprehensive patient-level data sets with ethnicity and other key variables fully coded is therefore vitally important36 It enables the care provided to patients of all ethnic backgrounds to be monitored on an ongoing basis including for monitoring compliance with the Equality Act
Race Equality Action Plan A five-year review notes that better collection monitoring and use of ethnicity data to inform commissioning and provision in health and social care is required37 Key areas include good ethnic monitoring improving demographic information and ensuring good links between infomatics audit and equality and diversity leads within trusts in order to effectively use the information to inform service development monitoring and review at board management ward and community levels
The governmentrsquos proposed changes to the NHS will be supported by an information revolution aimed at improving and extending the information available to the NHS patients and the public on the quality and outcomes of NHS services including by equality dimensions38
Having information that is fit for purpose is vital for the effective regulation of mental health and learning disability services CQC uses routinely available data sets on an ongoing basis to assess the performance of health and social care organisations and their compliance with government policies and legislation We therefore expect those who commission and provide mental healthcare in the NHS and independent sector to have information systems that provide good quality data with fully
comprehensive recording and monitoring of ethnicity on an ongoing basis
Since 2005 the Count me in census has played a key role in providing information about the ethnicity and other characteristics of inpatients in mental health and learning disability services and on patients subject to the Mental Health Act It did this by providing a valuable one-day snapshot But ethnicity recording must be seen as an all-year round statutory requirement not a one-day annual event The number of inpatients throughout the year is much higher than the counts on one day and some patients will have more than one admission And there is a need to move on from counting patients to understanding more about care pathways for Black and minority ethnic patients and the factors leading to hospital admission and detention
We have consistently highlighted the need for commissioners and providers to make full use of the Mental Health Minimum Data Set (MHMDS) ndash the statutory data set submitted by providers of specialist mental health services in England It provides rich data on these issues and provides a robust information source for ongoing ethnic monitoring after this last census
Covering both community and hospital services ndash and now independent and third sector providers as well as NHS ndash it includes a wide range of information about individual patients the services provided to those admitted to hospital and to the much larger number who donrsquot need admission to hospital and the outcomes of care And because it includes year-round activity it is more representative of the overall picture of for example admission detention and readmission rates length of stay years in psychiatric care and contacts with services and professionals
We call on the Information Centre to routinely publish data on all admissions and uses of the Mental Health Act including CTOs in England (in both NHS and independent healthcare providers) by the ethnicity of
Care Quality Commission Count me in census 2010 44
Conclusions continued
patients making the MHMDS the definitive source of information about mental health and learning disability patients This data should be risk-adjusted for age gender and other variables as appropriate to enable reliable comparisons to be made across groups
It is important that all providers ndash NHS and independent ndash make strenuous efforts to improve the quality of the data they submit The Information Centre publishes reports on the quality of MHMDS data by provider (see wwwicnhsukservices mhmdsdq) and we urge providers to monitor this information and use it to improve their data quality
If GP consortia and local authorities are to be effective in their needs assessment and commissioning roles the Information Centre needs to make available and promote to them the data from the MHMDS and other sources And researchers and academics must make full use of the MHMDS to explore the factors that underlie the observed ethnic patterns
CQCrsquos role
In the meantime CQC will continue to focus strongly on the quality of care provided by mental health and learning disability services
People who find themselves admitted to mental health services or detained under the Mental Health Act and therefore counted by the Count me in census are among the most mentally unwell people in our society Our job is first and foremost to make sure that the care they receive meets the essential standards of quality and safety set out under the Health and Social Care Act 2008 and to work with providers to ensure this We act swiftly when we find services that do not Where we find systemic problems that organisations have not adequately addressed we may impose conditions on the providerrsquos registration to bring about the change needed to improve patientsrsquo experience of care
The essential standards of quality and safety include the requirement to provide single sex accommodation and we will continue to closely check that these standards are met by all mental health services
We intend to introduce a number of indicators derived from the rich information in the MHMDS into our quality and risk profiles for providers This will put greater emphasis on the experience of Black and minority ethnic patients in our regulatory activity
We will monitor the quality of MHMDS data submitted by providers (as reported by the NHS Information Centre) including independent service providers Those with poor data quality may be considered at higher risk in terms of their quality of care
In addition we will continue to monitor the progress of services in relation to the issues raised in the census and other reports including our report on the use of the Mental Health Act through our visits to services and meetings with patients by our Mental Health Act Commissioners and second opinion appointed doctors (SOADs) We will draw on patientsrsquo experiences to monitor the operation of the Mental Health Act
We will also assess the impact of advice and use of Local HealthWatch Local HealthWatch will be in a good position to make sure that providers and commissioners are held to account on matters of choice and access to services for people from Black and minority ethnic groups
Care Quality Commission Count me in census 2010 45
References
1 Department of Health Equity and excellence liberating the NHS 2010
2 Department of Health The NHS outcomes framework 201112 2010
3 Healthcare Commission Mental Health Act Commission National Institute for Mental Health in England Count me in results of a national census of inpatients in mental health hospitals and facilities in England and Wales 2005
4 Healthcare Commission Mental Health Act Commission National Institute for Mental Health in England Count me in results of the 2006 national census of inpatients in mental health and learning disability services in England and Wales 2006
5 Healthcare Commission Mental Health Act Commission National Institute for Mental Health in England Count me in results of the 2007 national census of inpatients in mental health and learning disability services in England and Wales 2007
6 Healthcare Commission Mental Health Act Commission National Institute for Mental Health in England Count me in results of the 2008 national census of inpatients in mental health and learning disability services in England and Wales 2008
7 Care Quality Commission National Mental Health Development Unit Results of the 2009 national census of inpatients and patients on supervised community treatment in mental health and learning disability services in England and Wales 2009
8 Department of Health Delivering race equality in mental health care an action plan for reform inside and outside services 2005
9 Welsh Assembly Government Adult Mental Health Services Raising the standard ndash Race Equality Action Plan for Adult Mental Health Services in Wales 2006
10Department of Health No health without mental health a cross-government mental health outcomes strategy for people of all ages 2011 wwwdhgovukprod_consum_dhgroups dh_digitalassetsdocumentsdigitalasset dh_124058pdf
11Department of Health New horizons towards a shared vision for mental health 2009 wwwdhgovukprod_consum_dhgroups dh_digitalassetsdhendocumentsdigital assetdh_109708pdf
12Department of Health Valuing people a new strategy for learning disability for the 21st century 2001
13Department of Health Valuing people now a new three year strategy for people with learning disabilities 2009
14Department of Health Healthcare for all report of the independent inquiry into access to healthcare for people with learning disabilities 2008
15Joint Committee on Human Rights A life like any other human rights of adults with learning disabilities (2008 HL Paper 401 HC 731) House of Lords House of Commons 2008
16Department of Health Valuing people now summary report March 2009 ndash September 2010 2010
17Disability Rights Commission Equal treatment investigation 2005
18Department of Health Mir G Nocon A Ahmad W Jones L Learning difficulties and ethnicity 2000
19ONS experimental population estimates by ethnic group 2007 wwwstatisticsgovukstatbase productaspvlnk=14238
Care Quality Commission Count me in census 2010 46
References continued
20Six percent of population are gay or lesbian according to Whitehall figures 2005 wwwtelegraphcouknewsmainjhtmlxml= news20051212ngay12xmlamps Sheet= news20051212ixhomehtml
21Department of Trade and Industry Amendment to Employment Equality (Sexual Orientation) Regulations 2003 2003
22Office for National Statistics Measuring sexual identity an evaluation report 2010
23 Information Centre Mental Health Bulletin Fourth report from Mental Health Minimum Dataset (MHMDS) annual returns 2010 2011 wwwicnhsukpubsmhbmhmds0910
24 Information Centre Mental Health Bulletin Fourth report from Mental Health Minimum Dataset (MHMDS) annual returns 2010 2011 wwwicnhsukpubsmhbmhmds0910
25The operating framework for the NHS in England 201112 Department of Health 2010 wwwdhgovukprod_consum_dhgroups dh_digitalassetsdhenpsdocuments digitalassetdh_122736pdf
26wwwdhgovukenPublicationsandstatistics LettersandcircularsProfessionalletters ChiefnursingofficerlettersDH_121848
27Department of Health No health without mental health a cross-government mental health outcomes strategy for people of all ages 2011 wwwdhgovukprod_consum_dhgroups dh_digitalassetsdocumentsdigitalasset dh_124058pdf
28Ministry of Justice Breaking the cycle effective punishment rehabilitation and sentencing of offenders 2010
29Department of Health The Bradley report Lord Bradleyrsquos review of people with mental health problems or learning disabilities in the criminal justice system 2009
30Department of Health No health without mental health delivering better mental health outcomes for people of all ages 2011
31Department of Health Equity and excellence liberating the NHS 2010 wwwdhgovukprod_ consum_dhgroupsdh_digitalassetsdhen psdocumentsdigitalassetdh_117794pdf
32Department of Health Healthy lives healthy people our strategy for public health in England 2010 wwwdhgovukprod_consum_dh groupsdh_digitalassetsdhenps documentsdigitalassetdh_122347pdf
33Department of Health A vision for adult social care capable communities and active citizens 2010 wwwdhgovukprod_consum_dh groupsdh_digitalassetsdhenps documentsdigitalassetdh_121971pdf
34Wilson M NMHDU Race equality action plan a five year review Delivering race equality in mental health care 2010 wwwnmhduorgukour-workmhep
35Care Quality Commission Monitoring the use of the Mental Health Act in 200910 2010
36Raleigh V S Collection of data on ethnic origin in England Editorial BMJ 20083376456
37Wilson M NMHDU Race equality action plan a five year review Delivering race equality in mental health care 2010 wwwnmhduorgukour-workmhep
38Department of Health Liberating the NHS an information revolution 2010
Care Quality Commission Count me in census 2010 47
Appendix A Methods of analysis
Standardisation by age and gender
Standardisation allows us to make comparisons between groups of the population by taking account of variations in age and gender Some differences in patterns of service use are related to the age or gender of the people using them so adjustments to the data have to be made to ensure that the interpretation of ethnic differences is reliable For example formal admissions are higher at a younger age so some Black and minority ethnic groups may have high formal admission rates simply because they have a high proportion of younger people Without adjustments for age and gender differences comparisons would be misleading
In this report most results are standardised for age and gender including those relating to admission detention source of referral care programme approach seclusion restraint accidents assault self-harm consent and presence on a secure ward The report uses the accepted statistical method of taking account of age and gender differences between groups when calculating these rates
We used the ONS estimates of total population by ethnic group for England and Wales in 2007 to standardise the rates of admission for different ethnic groups This takes account of the significant rises in the Black and ethnic minority population of England and Wales since the 2001 ONS census and hence gives more accurate and up to date estimates of admission ratios for different ethnic groups (although it does not take account of any further changes in the ethnic populations between 2007 and 2010 the date of this census) For comparison with the DRE baseline we also present admission rates from the 2005 census derived using the 2005 ONS estimates of populations by ethnic group These figures will not be the same as published in the 2005 census report which were based on the 2001 ONS census population estimates because updated estimates of populations by ethnic group were not available at that time
For other analyses we used the total number of inpatients and patients on CTOs in the census
as the basis for standardisation However CTO outpatients are excluded from selected analyses where appropriate namely the analysis of rates for admissions detentions on admission source of referral single sex accommodation and recorded incidents of seclusion restraint accidents assault and self-harm We used the statistical package STATA version 82 to derive the standardised results
It was not possible to adjust the analyses for ethnic differences in social and economic factors and in diagnosis and severity of illness Such factors could affect the ethnic differences observed in the results
For descriptive variables such as religion and language we did not use standardisation
Confidence intervals as indicators of significant statistical differences
For all standardised results the national rates for England and Wales are taken as 100 and the usual 95 confidence intervals are given Rates of less than 100 or greater than 100 for specific ethnic groups show a lower or higher rate respectively than the national average after adjusting for age and gender Whether or not the difference is statistically significant from the national average depends on the confidence interval If the confidence interval overlaps 100 the difference from the national average is not statistically significant If both values are lower or higher than 100 it indicates that the difference compared with the national average is statistically significant at the 95 level
For example if a rate is 110 with the lower confidence interval being 105 and the upper confidence interval being 115 it indicates that the 10 excess over the national average of 100 is statistically significant But if a ratio is 110 with the lower confidence interval being 95 and the upper confidence interval being 125 it indicates that the 10 excess over the national average is not statistically significant We did not attempt to adjust the confidence intervals for multiple comparisons
Care Quality Commission Count me in census 2010 48
Appendix B Mental health tables
Table B1 Standardised admission ratios by ethnic group for England and Wales (excluding outpatients on a CTO) using 2007 ONS census population denominators (England and Wales = 100) All ages
Ethnic group
Men Women Persons Standardised
admission ratio
95 confidence
interval Observed numbers
Standardised admission
ratio
95 confidence
interval Observed numbers
Standardised admission
ratio
95 confidence
interval Observed numbers
White British 88 86 89 12435 94 93 96 10157 91 89 92 22592 White Irish 130 115 146 274 122 106 140 215 126 115 138 489 Other White 117 109 126 731 129 118 141 533 122 115 129 1264 White and Black Caribbean 557 493 627 276 274 223 333 101 436 393 483 377 White and Black African 312 247 388 80 259 186 351 41 292 242 349 121 White and Asian 140 110 174 79 124 90 166 44 134 111 159 123 Other Mixed 230 189 278 108 213 165 270 67 223 192 259 175 Indian 67 59 75 286 66 56 76 172 66 60 73 458 Pakistani 105 93 119 269 65 53 79 96 91 81 100 365 Bangladeshi 123 102 147 120 82 60 109 46 108 92 126 166 Other Asian 161 139 185 192 136 107 169 79 153 135 172 271 Black Caribbean 538 505 572 980 306 277 336 418 438 415 462 1398 Black African 246 226 267 550 219 194 247 277 236 221 253 827 Other Black 792 691 903 222 314 240 403 61 596 529 670 283 Chinese 27 20 38 39 43 30 59 35 33 26 41 74 Other 140 120 162 177 110 88 136 87 128 113 145 264 Total 100 16818 100 12429 100 29247
Care Quality Commission Count me in census 2010 49
Appendix B Mental health tables continued
Table B2 Standardised admission ratios by ethnic group for England and Wales (excluding outpatients on a CTO) using 2007 ONS census population denominators (England amp Wales = 100) Ages 65 and over
Ethnic group
Men Women Persons Standardised
admission ratio
95 confidence
interval Observed numbers
Standardised admission
ratio
95 confidence
interval Observed numbers
Standardised admission
ratio
95 confidence
interval Observed numbers
White British 95 92 99 3265 95 92 98 3887 95 93 97 7152 White Irish 142 116 172 106 102 82 125 92 120 104 138 198 Other White 207 174 244 141 213 183 248 171 210 188 235 312 White and Black Caribbean 406 210 710 12 333 152 632 9 371 230 568 21 White and Black African 231 28 836 2 198 24 714 2 213 58 546 4 White and Asian 28 1 156 1 110 30 281 4 69 23 162 5 Other Mixed 146 40 374 4 228 92 470 7 189 95 339 11 Indian 97 70 132 41 83 57 116 33 90 71 113 74 Pakistani 39 17 77 8 46 18 94 7 42 23 69 15 Bangladeshi 115 53 218 9 69 14 201 3 98 51 172 12 Other Asian 234 143 361 20 215 120 354 15 225 157 313 35 Black Caribbean 216 170 269 77 310 253 376 103 261 224 302 180 Black African 142 73 248 12 365 241 531 27 246 175 337 39 Other Black 164 34 479 3 366 134 796 6 259 119 493 9 Chinese 41 8 120 3 95 38 195 7 68 33 125 10 Other 253 126 453 11 390 238 602 20 327 222 464 31 Total 100 3715 100 4393 100 8108
Care Quality Commission Count me in census 2010 50
Appendix B Mental health tables continued
Table B3 Standardised ratios by ethnic group for patients referred by a GP (England and Wales = 100)
Ethnic group
Men Women Persons Standardised
referral ratio
95 confidence
interval Observed numbers
Standardised referral ratio
95 confidence
interval Observed numbers
Standardised referral ratio
95 confidence
interval Observed numbers
White British 110 103 117 904 107 101 114 1065 108 104 113 1969 White Irish 85 50 134 18 93 57 144 20 89 63 123 38 Other White 74 51 103 33 70 49 97 36 72 56 91 69 White and Black Caribbean 27 5 78 3 30 4 109 2 28 9 65 5 White and Black African 0 0 74 9 268 2 35 4 125 2 White and Asian 165 54 386 5 0 0 86 28 201 5 Other Mixed 48 6 172 2 68 14 198 3 58 19 136 5 Indian 69 34 123 11 79 39 141 11 73 46 111 22 Pakistani 88 42 162 10 59 16 151 4 77 42 130 14 Bangladeshi 81 22 207 4 61 7 221 2 73 27 159 6 Other Asian 80 32 166 7 108 43 223 7 92 50 155 14 Black Caribbean 35 20 56 17 37 20 62 14 36 24 51 31 Black African 57 29 100 12 66 35 113 13 61 40 91 25 Other Black 62 23 135 6 40 5 144 2 54 23 107 8 Chinese 56 1 314 1 139 38 356 4 108 35 251 5 Other 106 46 208 8 0 0 53 23 105 8 Total 100 1041 100 1185 100 2226
Care Quality Commission Count me in census 2010 51
Appendix B Mental health tables continued
Table B4 Standardised ratios by ethnic group for patients referred by a community mental health team (including crisis resolution home treatment) or community learning disability team (England and Wales = 100)
Ethnic group
Men Women Persons Standardised
referral ratio
95 confidence
interval Observed numbers
Standardised referral ratio
95 confidence
interval Observed numbers
Standardised referral ratio
95 confidence
interval Observed numbers
White British 107 104 111 3255 103 100 107 3386 105 103 108 6641 White Irish 90 69 116 61 89 68 114 61 90 74 107 122 Other White 59 48 71 105 79 67 94 141 69 61 78 246 White and Black Caribbean 106 83 135 68 75 49 111 25 96 77 117 93 White and Black African 43 19 84 8 66 30 124 9 52 31 84 17 White and Asian 95 56 150 18 84 43 147 12 90 61 129 30 Other Mixed 78 48 121 20 72 41 118 16 76 53 105 36 Indian 106 83 132 76 100 76 130 56 103 86 122 132 Pakistani 108 84 135 73 89 60 128 30 102 83 123 103 Bangladeshi 98 66 141 29 90 50 148 15 95 69 128 44 Other Asian 88 63 120 40 105 70 150 29 94 73 119 69 Black Caribbean 69 59 80 167 85 71 102 123 75 67 84 290 Black African 84 70 102 112 82 65 103 77 84 72 96 189 Other Black 52 36 74 31 64 36 106 15 56 41 74 46 Chinese 112 53 205 10 101 52 176 12 105 66 160 22 Other 86 60 120 35 106 71 151 30 94 73 120 65 Total 100 4108 100 4037 100 8145
Care Quality Commission Count me in census 2010 52
Appendix B Mental health tables continued
Table B5 Standardised ratios by ethnic group for patients referred by criminal justice routes (police prison probation courts court liaison and diversion) (England and Wales = 100)
Ethnic group
Men Women Persons Standardised
referral ratio
95 confidence
interval Observed numbers
Standardised referral ratio
95 confidence
interval Observed numbers
Standardised referral ratio
95 confidence
interval Observed numbers
White British 90 86 95 1495 95 86 104 421 91 87 95 1916 White Irish 133 94 183 38 59 19 138 5 116 84 157 43 Other White 112 93 134 119 103 68 150 27 111 93 130 146 White and Black Caribbean 117 89 151 58 145 69 266 10 120 94 153 68 White and Black African 190 127 273 29 141 38 361 4 183 126 256 33 White and Asian 75 39 131 12 160 52 373 5 89 52 143 17 Other Mixed 104 65 157 22 151 61 311 7 112 75 161 29 Indian 86 61 118 38 79 32 163 7 85 62 113 45 Pakistani 118 91 150 65 89 33 194 6 115 90 145 71 Bangladeshi 74 44 115 19 29 1 162 1 68 42 105 20 Other Asian 130 95 174 45 164 71 323 8 134 101 176 53 Black Caribbean 131 114 150 208 124 81 181 26 130 114 148 234 Black African 132 112 156 145 143 93 211 25 134 114 156 170 Other Black 141 109 180 65 236 113 435 10 149 117 187 75 Chinese 83 27 194 5 146 30 426 3 99 43 195 8 Other 129 93 175 41 113 37 264 5 127 93 170 46 Total 100 2404 100 570 100 2974
Care Quality Commission Count me in census 2010 53
Appendix B Mental health tables continued
Table B6 Standardised detention ratios by ethnic group all detentions on day of admission (excluding outpatients on a CTO) (England and Wales = 100)
Ethnic group
Men Women Persons Standardised
detention ratio
95 confidence
interval Observed numbers
Standardised detention
ratio
95 confidence
interval Observed numbers
Standardised detention
ratio
95 confidence
interval Observed numbers
White British 94 92 97 6449 94 91 97 3628 94 92 96 10077 White Irish 112 95 131 154 118 96 145 94 114 101 129 248 Other White 108 98 118 451 120 106 136 251 112 104 120 702 White and Black Caribbean 123 107 141 220 129 99 167 59 124 110 140 279 White and Black African 128 99 162 68 113 70 173 21 124 100 153 89 White and Asian 96 71 126 50 109 68 164 22 99 78 125 72 Other Mixed 115 92 143 82 139 100 188 42 122 102 146 124 Indian 97 83 113 164 110 86 137 77 101 88 114 241 Pakistani 109 94 126 194 102 74 136 44 108 94 122 238 Bangladeshi 86 67 109 69 91 55 142 19 87 70 107 88 Other Asian 109 92 130 133 120 86 163 40 112 96 130 173 Black Caribbean 129 121 139 774 143 125 162 238 132 124 141 1012 Black African 115 104 127 422 131 111 153 159 119 110 129 581 Other Black 117 100 136 170 148 105 202 39 122 106 140 209 Chinese 108 71 159 26 129 78 202 19 116 85 156 45 Other 111 92 132 126 116 83 157 41 112 96 130 167 Total 100 9552 100 4793 100 14345
Care Quality Commission Count me in census 2010 54
Appendix B Mental health tables continued
Table B7 Standardised detention ratios by ethnic group detention on day of admission ndash section 2 of the Mental Health Act (England and Wales = 100)
Ethnic group
Men Women Persons Standardised
detention ratio
95 confidence
interval Observed numbers
Standardised detention
ratio
95 confidence
interval Observed numbers
Standardised detention
ratio
95 confidence
interval Observed numbers
White British 97 91 102 1156 93 87 98 1133 95 91 99 2289 White Irish 78 47 120 20 116 79 166 30 97 72 128 50 Other White 100 78 126 70 134 108 166 88 116 99 136 158 White and Black Caribbean 55 30 93 14 60 24 124 7 57 35 87 21 White and Black African 91 37 188 7 150 60 308 7 113 62 190 14 White and Asian 80 29 174 6 119 44 258 6 96 49 167 12 Other Mixed 68 28 141 7 116 53 221 9 89 51 145 16 Indian 130 91 179 37 124 81 182 26 127 98 163 63 Pakistani 126 87 176 34 138 79 225 16 130 96 171 50 Bangladeshi 166 101 256 20 140 61 276 8 158 105 228 28 Other Asian 142 93 209 26 163 93 264 16 150 108 202 42 Black Caribbean 73 57 92 70 97 72 128 51 82 68 98 121 Black African 164 131 202 87 190 146 244 62 174 147 204 149 Other Black 114 75 166 27 140 72 245 12 121 86 165 39 Chinese 165 60 358 6 212 97 402 9 190 106 313 15 Other 218 153 302 36 179 108 280 19 203 153 264 55 Total 100 1623 100 1499 100 3122
Care Quality Commission Count me in census 2010 55
Appendix B Mental health tables continued
Table B8 Standardised detention ratios by ethnic group detention on day of admission ndash section 3 of the Mental Health Act (England and Wales = 100)
Ethnic group
Men Women Persons Standardised
detention ratio
95 confidence
interval Observed numbers
Standardised detention
ratio
95 confidence
interval Observed numbers
Standardised detention
ratio
95 confidence
interval Observed numbers
White British 99 95 103 2684 96 91 100 1852 98 95 101 4536 White Irish 116 89 149 60 135 101 177 52 124 102 149 112 Other White 112 96 129 186 110 92 132 121 111 99 124 307 White and Black Caribbean 114 91 143 79 130 90 183 33 119 98 143 112 White and Black African 97 60 148 21 107 54 192 11 100 69 141 32 White and Asian 84 50 133 18 97 48 173 11 89 59 127 29 Other Mixed 121 84 168 35 117 72 181 20 120 90 156 55 Indian 96 75 122 67 110 79 148 42 101 83 122 109 Pakistani 91 71 115 69 88 55 134 22 90 73 111 91 Bangladeshi 63 39 95 22 64 28 127 8 63 43 90 30 Other Asian 90 65 120 44 94 56 149 18 91 70 117 62 Black Caribbean 116 102 130 279 164 138 192 148 129 117 142 427 Black African 95 80 112 143 102 79 129 68 97 85 111 211 Other Black 75 55 99 49 99 58 159 17 80 62 102 66 Chinese 119 59 213 11 99 43 194 8 110 66 171 19 Other 85 60 116 38 84 48 136 16 84 63 110 54 Total 100 3805 100 2447 100 6252
Care Quality Commission Count me in census 2010 56
Appendix B Mental health tables continued
Table B9 Standardised detention ratios by ethnic group detention on day of admission ndash section 3741 of the Mental Health Act (England and Wales = 100)
Ethnic group
Men Women Persons Standardised
detention ratio
95 confidence
interval Observed numbers
Standardised detention
ratio
95 confidence
interval Observed numbers
Standardised detention
ratio
95 confidence
interval Observed numbers
White British 84 79 89 991 101 88 115 220 86 82 91 1211 White Irish 140 96 198 32 48 6 175 2 126 87 176 34 Other White 112 89 139 81 156 95 241 20 118 96 144 101 White and Black Caribbean 177 133 232 53 179 66 390 6 178 135 229 59 White and Black African 149 82 251 14 224 46 654 3 159 92 254 17 White and Asian 141 75 241 13 195 40 569 3 149 85 241 16 Other Mixed 144 85 227 18 264 97 575 6 162 104 242 24 Indian 86 56 126 26 44 5 160 2 80 53 116 28 Pakistani 122 87 166 40 0 0 111 79 152 40 Bangladeshi 66 32 122 10 0 0 60 29 110 10 Other Asian 99 61 151 21 0 0 89 55 136 21 Black Caribbean 200 174 229 210 78 34 153 8 189 165 216 218 Black African 127 101 157 82 84 34 172 7 122 98 150 89 Other Black 152 110 205 43 94 11 341 2 148 108 198 45 Chinese 100 27 255 4 0 0 80 22 204 4 Other 118 75 177 23 44 1 245 1 110 71 164 24 Total 100 1661 100 280 100 1941
Care Quality Commission Count me in census 2010 57
Appendix B Mental health tables continued
Table B10 Standardised detention ratios by ethnic group detention on day of admission ndash sections 47 48 4749 of the Mental Health Act (England and Wales = 100)
Ethnic group
Men Women Persons Standardised
detention ratio
95 confidence
interval Observed numbers
Standardised detention
ratio
95 confidence
interval Observed numbers
Standardised detention
ratio
95 confidence
interval Observed numbers
White British 97 90 106 583 104 81 131 73 98 91 106 656 White Irish 132 72 221 14 163 20 590 2 135 77 219 16 Other White 130 96 172 49 71 15 206 3 124 93 163 52 White and Black Caribbean 126 78 193 21 80 2 444 1 123 77 186 22 White and Black African 207 103 370 11 0 0 189 95 339 11 White and Asian 57 12 166 3 169 4 941 1 68 19 175 4 Other Mixed 112 48 221 8 233 28 843 2 125 60 230 10 Indian 57 26 108 9 0 252 0 52 24 99 9 Pakistani 92 54 147 17 0 314 0 86 50 138 17 Bangladeshi 46 12 117 4 167 4 930 1 53 17 125 5 Other Asian 101 52 177 12 0 0 95 49 166 12 Black Caribbean 126 98 159 70 125 34 319 4 126 99 158 74 Black African 74 48 107 27 104 21 303 3 76 51 108 30 Other Black 127 78 197 20 138 3 769 1 128 79 195 21 Chinese 0 0 0 0 0 0 Other 83 38 157 9 0 0 77 35 147 9 Total 100 857 100 91 100 948
Care Quality Commission Count me in census 2010 58
Appendix B Mental health tables continued
Table B11 Standardised ratios for all applications of the Mental Health Act (including outpatients on a CTO) by ethnic group on day of census (England and Wales = 100)
Ethnic group
Men Women Persons Standardised
ratio for all MHA
applications
95 confidence
interval Observed numbers
Standardised ratio for all MHA
applications
95 confidence
interval Observed numbers
Standardised ratio for all MHA
applications
95 confidence
interval Observed numbers
White British 97 94 99 7659 95 93 98 4335 96 94 98 11994 White Irish 99 83 116 147 104 84 128 95 101 89 114 242 Other White 87 79 95 427 97 85 110 249 90 84 97 676 White and Black Caribbean 117 103 133 245 130 103 163 76 120 107 134 321 White and Black African 120 95 150 79 93 58 141 22 113 92 137 101 White and Asian 101 78 128 65 119 81 169 31 106 86 129 96 Other Mixed 110 89 134 96 125 93 165 49 114 97 135 145 Indian 103 90 118 215 122 100 147 109 109 97 121 324 Pakistani 111 97 125 254 117 90 148 67 112 100 125 321 Bangladeshi 92 75 112 97 101 68 145 29 94 78 112 126 Other Asian 103 88 121 152 126 95 164 56 109 94 124 208 Black Caribbean 123 115 131 893 141 126 158 300 127 120 134 1193 Black African 112 103 122 511 121 104 140 188 114 106 123 699 Other Black 116 102 132 232 148 112 191 59 122 108 136 291 Chinese 97 64 140 27 101 61 157 19 98 72 131 46 Other 104 87 122 140 103 75 137 46 103 89 119 186 Total 100 11239 100 5730 100 16969
Care Quality Commission Count me in census 2010 59
Appendix B Mental health tables continued
Table B12 Standardised CTO ratios by ethnic group CTOs on day of census ndash section 17a of the Mental Health Act (England and Wales = 100)
Ethnic group
Men Women Persons
Standardised CTO ratio
95 confidence
interval Observed numbers
Standardised CTO ratio
95 confidence
interval Observed numbers
Standardised CTO ratio
95 confidence
interval Observed numbers
White British 94 89 99 1289 88 82 94 730 92 88 96 2019 White Irish 51 27 88 13 77 41 132 13 62 40 90 26 Other White 97 77 120 83 125 95 162 58 107 90 126 141 White and Black Caribbean 79 53 113 29 141 77 237 14 92 67 124 43 White and Black African 111 59 190 13 125 41 292 5 115 68 181 18 White and Asian 104 54 182 12 136 50 297 6 113 67 178 18 Other Mixed 102 59 166 16 136 62 257 9 112 73 166 25 Indian 134 99 177 48 152 98 226 24 139 109 175 72 Pakistani 145 110 187 59 174 101 279 17 151 119 189 76 Bangladeshi 142 93 206 27 205 99 378 10 155 109 213 37 Other Asian 107 71 155 28 182 99 305 14 124 89 168 42 Black Caribbean 121 103 142 152 171 132 218 65 133 116 152 217 Black African 116 94 142 94 139 98 192 37 122 102 145 131 Other Black 186 144 238 65 305 189 466 21 206 165 254 86 Chinese 83 23 213 4 152 49 354 5 111 51 211 9 Other 87 54 134 21 152 79 266 12 103 71 145 33 Total 100 1953 100 1040 100 2993
Care Quality Commission Count me in census 2010 60
Appendix C Learning disability tables
Table C1 Standardised admission ratios by ethnic group for England and Wales using 2007 ONS population denominators (England amp Wales = 100) All ages
Ethnic group
Men Women Persons Standardised
admission ratio
95 confidence
interval Observed numbers
Standardised admission
ratio
95 confidence
interval Observed numbers
Standardised admission
ratio
95 confidence
interval Observed numbers
White British 104 100 109 2163 108 101 115 941 105 102 109 3104 White Irish 108 72 156 28 151 89 238 18 121 89 162 46 Other White 81 65 101 85 49 30 75 21 72 59 87 106 White and Black Caribbean 280 186 405 28 246 118 453 10 270 191 371 38 White and Black African 102 33 239 5 165 34 482 3 119 51 235 8 White and Asian 66 26 135 7 154 56 335 6 89 47 152 13 Other Mixed 181 104 295 16 229 99 451 8 195 125 290 24 Indian 32 21 48 24 28 12 55 8 31 21 44 32 Pakistani 48 30 72 22 12 1 43 2 38 25 57 24 Bangladeshi 102 60 161 18 31 4 113 2 83 51 128 20 Other Asian 33 13 69 7 92 34 201 6 47 25 81 13 Black Caribbean 265 210 332 77 117 67 190 16 218 176 267 93 Black African 53 33 80 22 40 15 87 6 50 33 72 28 Other Black 228 118 399 12 134 28 392 3 200 112 330 15 Chinese 4 0 21 1 3 0 16 1 Other 26 9 56 6 11 0 59 1 21 9 44 7 Total 100 2521 100 1051 100 3572
Care Quality Commission Count me in census 2010 61
Appendix C Learning disability tables continued
Table C2 Standardised detention ratios by ethnic group all detentions on day of admission (England and Wales = 100)
Ethnic group
Persons Standardised
detention ratio
95 confidence
interval Observed numbers
White British 97 93 103 1431 White Irish 127 84 184 28 Other White 117 91 149 68 White and Black Caribbean 120 77 179 24 White and Black African 114 37 267 5 White and Asian 75 24 176 5 Other Mixed 94 49 165 12 Indian 119 72 186 19 Pakistani 110 61 181 15 Bangladeshi 144 84 231 17 Other Asian 59 16 150 4 Black Caribbean 119 90 155 57 Black African 138 85 210 21 Other Black 62 20 145 5 Chinese 0 0 Other 104 28 267 4 Total 100 1715
Care Quality Commission Count me in census 2010 62
copy Care Quality Commission and National Mental Health Development Unit 2011 Published April 2011
This publication may be reproduced in whole or in part in any format or medium for non-commercial purposes provided that it is reproduced accurately and not used in a derogatory manner or in a misleading context The source should be acknowledged by showing the publication title and copy Care Quality Commission and National Mental Health Development Unit 2011
How to contact us
Phone 03000 616161 Email enquiriescqcorguk Web wwwcqcorguk
Write to us at Care Quality Commission National Correspondence Citygate Gallowgate Newcastle upon Tyne NE1 4PA
Please contact us if you would like a summary of this publication in other formats or languages
Registered office Care Quality Commission Finsbury Tower 103ndash105 Bunhill Row London EC1Y 8TG
- Count me in 2010
- About the Care Quality Commission
- Contents
- Summary
- National organisations coordinating the census
- Introduction
- Data methods of analysis and interpretation
- Results mental health
- A comparison between the 2005 baseline and the 2010 census
- Results learning disabilities
- Data in the future Moving beyond a one-day census
- Conclusions
- References
- Appendix A Methods of analysis
- Appendix B Mental health tables
- Appendix C Learning disability tables
- How to contact us
-
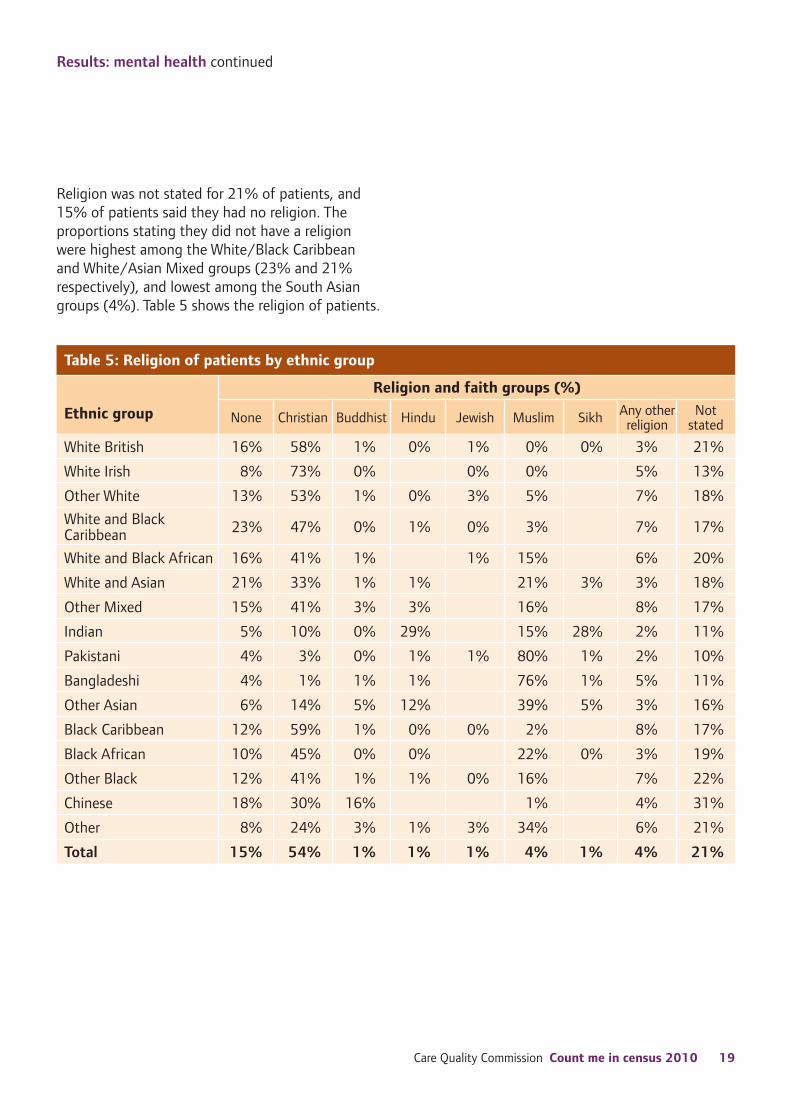
Results mental health continued
Sexual orientation
The results for sexual orientation were not valid for 1 of patients and for 20 the response was recorded as ldquonot knownrdquo Seventy-six per cent of patients said they were heterosexual 1 said gay lesbian 1 said bisexual and less than 1 said ldquootherrdquo The number of minority ethnic patients who were gaylesbian or bisexual was very low
The overall figure of 1 who said they were gay lesbian or bisexual is lower than some estimates of the proportions of gaylesbian or bisexual people in the general population (5 to 7)2021 However in the 200910 Integrated Household Survey of a representative sample of 238206 people in UK conducted by the Office for National Statistics 1 identified themselves as gay or lesbian 05 as bisexual 05 as ldquootherrdquo 3 responded as ldquodo not knowrdquo or refused to answer and 95 identified themselves as heterosexualstraight22
Disability
About 75 of patients said they did not have a disability and 25 said they had one or more disabilities Of these 7 were blind or visually impaired 1 were deaf or had a hearing impairment 1 had Autistic Spectrum Disorder 2 had a learning disability 4 had a mobility impairment and 2 used a wheelchair The remaining 8 had more than one disability The proportion of patients with a disability was highest among the White British White Irish and Other White groups (about 28) which could reflect the higher age profiles of these patients compared with other ethnic groups
Rates of admission (see section on interpreting the results on page 13)
The rates of admission derived using the 2007 ONS ethnic population estimates as denominators are given in Appendix B Tables B1 (all ages) and B2 (ages 65 and over) Outpatients on a CTO are excluded from these results
All ages Admission rates were lower than average for patients from the White British Indian and Chinese groups and were average for the Pakistani and Bangladeshi groups Rates were higher than average for other minority ethnic groups they were particularly high for the Black Caribbean Black African WhiteBlack Caribbean Mixed and WhiteBlack African Mixed groups who had rates two to four times higher than average and for the Other Black group with a rate six times higher
Ages 65 and over Age-standardised admission rates for minority ethnic groups at older ages show broadly similar patterns to those reported for all ages with rates two to three times higher than average among the Black and White Black Mixed groups Rates were high also in the White Irish Other White Other Asian and Other groups
Numbers of older Black and minority ethnic patients were too few in most ethnic groups to support analyses of subgroups within them for example those detained
Care Quality Commission Count me in census 2010 20
Results mental health continued
Source of referral
People can be referred to healthcare services in a number of ways Referrals for inpatient care often come from community mental health teams rather than the original source such as GPs and accident and emergency (AampE) departments Therefore referrals from these teams may include referrals from other sources Furthermore about a quarter of patients (26) were referred from tertiary care and information about their original referral source was not available We had no information about the source of referral for 13 of patients The results reflect the proportions of patients from each ethnic group that are referred from each source so a higher proportion of referrals from one source will inevitably mean that proportions from other referral sources are lower Outpatients on a CTO are excluded from these data
The referral patterns are broadly similar to those reported previously and the key results are presented below
GP referrals 7 of patients Rates were 8 higher than average among the White British group They were lower than average among the Other White Black Caribbean Black African and WhiteBlack Caribbean Mixed groups by 28 to 72 The rates of referral by GPs are given in Appendix B Table B3
Referrals from AampE departments 5 of patients The White British group had a 9 lower than average rate of such referrals The WhiteBlack African Mixed Indian Bangladeshi Black African and Other groups were more likely than average to be referred in this way
Referrals from community mental health teams 26 of patients For the White British group such referrals were 5 higher than the average rate They were lower than average among the Other White WhiteBlack African Mixed Black Caribbean Black African and
Other Black groups by 16 to 48 The rates of referral are given in Appendix B Table B4
Referrals from the criminal justice system 9 of patients This is defined as the police courts probation service prison and court liaison and diversion service
Patients from the White British group were less likely than average to be referred by the criminal justice agencies whereas the Black Caribbean Black African Other Black WhiteBlack African Mixed and Other Asian groups were 30 to 83 more likely than average to be referred in this way We observed no differences from the average rate for other ethnic groups Rates of referral by the criminal justice system are given in Appendix B Table B5
A significant proportion (26) of all referrals were from tertiary care
Tertiary care referrals from medium or high secure units 5 of patients The rate for such referrals (in NHS or independent sectors) was lower than average among the Other White and Indian groups It was higher than average among the Black Caribbean and WhiteBlack Caribbean Mixed groups by about 75
Tertiary care referrals from other inpatient services 21 of patients The rate for such referrals (NHS and independent) was higher than average among the White Irish and Other White groups by 29 and 59 respectively The rate was lower than average in the Indian and Other Black groups
Tertiary care referrals from other clinical specialties 9 of patients Rates of such referrals were higher than average among the White British and Indian groups and lower than average among the Other White WhiteBlack Caribbean Mixed Other Asian Black African Other Black and Chinese groups
Care Quality Commission Count me in census 2010 21
Results mental health continued
Detention under the Mental Health Act 1983 on day of admission
The Mental Health Act 2007 made a number of changes to the Mental Health Act 1983 These changes were reflected in the census of 2009 and 2010 which collected information on new provisions establishing supervised community treatment (section 17A) and excluded supervised discharge (section 25A) which was abolished
As in previous reports we present below the results for detention rates on the day of admission Outpatients on a CTO are excluded from these analyses After that we present rates for all patients subject to the Mental Health Act on census day (including outpatients on a CTO) followed by rates for patients on a CTO on census day
All detentions Forty-nine per cent (14637) of patients were detained under the Mental Health Act on admission to hospital This was a higher proportion than recorded in the previous censuses (40 in 2005 and 2006 43 in 2007 45 in 2008 and 47 in 2009)
Detention rates were 6 lower than average among White British patients and between 19 and 32 higher than average among the Black Caribbean Black African Other Black and WhiteBlack Caribbean Mixed groups Detention rates were also higher in the White Irish and Other White groups by about 13 and in the Other Mixed group by 22 No other ethnic differences were observed The results are given in Appendix B Table B6
These patterns are broadly similar to those reported in previous censuses
Detention under section 2 Section 2 of the Mental Health Act gives authority for a person to be detained in hospital for assessment for a period not exceeding 28 days It is mainly applied where the patient is unknown to the service or where there has been a significant interval between periods of inpatient treatment
Of all patients detained on admission 22 were detained under section 2 Rates of detention under this section were lower than average among the White British WhiteBlack Caribbean Mixed and Black Caribbean groups and higher than average among the Bangladeshi Other Asian Black African Chinese and Other groups by between 50 and 103 (see Appendix B Table B7)
Detention under section 3 Section 3 of the Act provides for the compulsory admission of a patient to hospital for lsquotreatmentrsquo and for his or her subsequent detention which can last for an initial period of up to six months and is renewable after this
Of all patients detained on admission 43 were detained under this section Rates were higher than average among the White Irish and Black Caribbean groups by 24 and 29 respectively and lower among than average among the Bangladeshi group No other ethnic differences were observed The rates of detention under section 3 are given in Appendix B Table B8
Detention under section 3741 Section 37 of the Mental Health Act allows a court to send a person to hospital for treatment when they might otherwise have been given a prison sentence and section 41 allows a court to place restrictions on a personrsquos discharge from hospital Admission to hospital rather than prison is generally regarded as a more positive outcome for the person concerned
Care Quality Commission Count me in census 2010 22
Results mental health continued
Of all patients detained on admission 14 were detained under section 37 with a section 41 restriction order applied The rates of detention are given in Appendix B Table B9 In all minority ethnic groups very few women were detained under section 3741 Among men the rate of detention for the White British group was 16 lower than average and it was higher than average in the WhiteBlack Caribbean Mixed group by 77 the Black Caribbean group by 100 the Black African group by 27 and the Other Black group by 52
A consistent pattern across all six annual censuses was the higher than average detention rate under section 3741 for the Black Caribbean and Other Black groups
Detention under sections 47 48 and 4749 These sections of the Mental Health Act allow the Ministry of Justice to issue a direction to transfer a person detained in prison to a hospital for treatment
Of all patients detained on admission 7 were detained under these sections The only ethnic differences observed were a 107 higher than average detention rate among men from the White Black African Mixed group and a lower than average rate for the Indian group We observed no other ethnic differences probably because the numbers of detentions under these sections were low in most minority ethnic groups These rates of detention are given in Appendix B Table B10
The previous four censuses also showed virtually no ethnic differences for rates of detention under sections 47 48 and 4749
Patients subject to the Mental Health Act 1983 on day of census
All patients subject to the Mental Health Act Of all the 32399 patients in the census a total of 53 (17299) were subject to the Mental Health Act on census day including 2959 outpatients and 75 inpatients on a CTO (either voluntarily or recalled) Ratios for the different ethnic groups for overall applications of the Mental Health Act including CTOs showed broadly similar patterns to detention rates on admission day from which patients on a CTO were excluded In both cases rates were higher than average among the Black Caribbean Black African Other Black and White Black Caribbean Mixed groups However the higher than average detention rates for the White Irish Other White and Other Mixed groups on admission day were not apparent on census day
The rates are given in Appendix B Table B11
Supervised community treatment under section 17A Community treatment orders (CTOs) were introduced in November 2008 as a result of the Mental Health Act 2007 They allow for supervised community treatment to be provided for up to six months with the possibility of an extension after this These orders are designed to help patients to maintain stable mental health outside hospital and to promote recovery by providing professionals with the power to set conditions on discharge from hospital and a power to recall patients if arrangements in the community are not working
Nine per cent of all patients in the census were on CTOs compared with 4 in 2009 Of all the 17299 patients subject to the Mental Health Act on census day almost 18 (3034) were on CTOs Of the patients on a CTO 2959 were outpatients and 75 were inpatients (50 voluntary and 25 recalled)
Care Quality Commission Count me in census 2010 23
Results mental health continued
The rate of supervised community treatment among all patients included in the census was lower than average in the White British and White Irish groups and higher than average in the South Asian (Indian Pakistani Bangladeshi) and Black (Black Caribbean Black African Other Black) groups by 22 to 106 The ratios are given in Appendix B Table B12
Consent
About 25 of informally admitted patients were deemed incapable of consenting to treatment The only ethnic difference observed was a higher than average rate for the Pakistani group but this was based on very few patients
About 18 of patients who were detained or on CTOs were deemed incapable of consenting to treatment These rates were lower than average by 7 in the White British group and were higher than average among the Other White WhiteBlack Caribbean Mixed and Black African groups by 21 35 and 36 respectively
In addition 13 of patients who were detained or on CTOs on census day were deemed capable of consenting to treatment but refused to do so The White British group had a rate of refusals that was 10 lower than average and rates were higher than average among the White Irish WhiteBlack Caribbean Mixed Other Mixed Black Caribbean and Black African groups by between 39 and 71
Care programme approach
The Care Programme Approach (CPA) is the process by which treatment care and support for people with serious mental health problems and accompanying health and social care needs are agreed coordinated and understood by all involved From October 2008 changes to the CPA in England
mean that it is no longer categorised into two parts (lsquostandardrsquo and lsquoenhancedrsquo) and just the one category of enhanced CPA applies This makes CPA policy in England different to that in Wales where the distinction still applies The CPA data presented here therefore includes all CPA patients in England and both lsquostandardrsquo and lsquoenhancedrsquo CPA patients in Wales
About 89 of all patients were on a CPA 3 were on a single assessment process (SAP) whereby assessments are made for adults with health and or social care needs and 8 were on neither CPA nor SAP As most patients were on a CPA no ethnic differences were observed
Recorded incidents
The 2010 census asked about the number of times that patients experienced seclusion hands-on restraint self-harm accident and physical assault in a current hospital spell or if the patientrsquos hospital spell was longer than three months the number that took place within the last three months Outpatients on a CTO are excluded from these data It should be noted that the rates of such events among minority ethnic groups can show yearly variation because of the low numbers of events in several groups
Seclusion Seclusion was defined as the supervised confinement of a patient in a room which may be locked to protect others from significant harm Four per cent of patients had experienced one or more episodes of seclusion The White British group had a seclusion rate that was 9 lower than average Rates were higher than average among the WhiteBlack Caribbean Mixed WhiteBlack African Mixed Black Caribbean and Black African groups by 80 90 36 and 56 respectively
Care Quality Commission Count me in census 2010 24
Results mental health continued
Although the number of incidents of seclusion was low in several minority ethnic groups some general patterns over the six censuses to date are
bull The proportion of all patients who had an episode of seclusion stayed fairly constant over the six censuses at about 4
bull Although there have been annual fluctuations the seclusion rate has been higher than average for the Black and WhiteBlack Mixed groups in three or four of the six censuses and in the Other White group in three censuses
Hands-on restraint This was defined as the physical restraint of a patient by one or more members of staff in response to aggressive behaviour or resistance to treatment About 12 of patients had experienced one or more episodes of hands-on restraint No ethnic differences were observed In fact very few ethnic differences have been observed in the previous censuses also and they have not shown a consistent pattern
Self-harm Eight per cent of patients had harmed themselves on one or more occasions Only the White British group had a rate that was higher than average (by 14) Rates were lower than average among several minority ethnic groups the three Black groups (Black Caribbean Black African and Other Black) by about 70 the three south Asian groups (Indian Pakistani Bangladeshi) by between 37 and 78 and the Other Mixed and Other Asian groups by about 60
In terms of comparison with previous years
bull The proportion of all patients who had harmed themselves stayed fairly constant at about 7ndash8
bull In all censuses the White British group had a higher than average rate of self-harm and the Black and South Asian groups had lower than average rates of self-harm
Accidents About 11 of patients had experienced one or more accidents Patients from the White British group experienced a rate of accidents that was 6 higher than average Rates were lower than average in the Black Caribbean Black African Other Black and Other Asian groups by about 50 to 70 No accidents were reported for the Chinese group
In terms of comparisons with previous years
bull The proportion of all patients who had had an accident stayed fairly constant
bull The rate of accidents in the different censuses was higher than average in the White British group and lower than average in the Black Caribbean group Few other ethnic differences were observed and they were not consistent
Physical assault on the patient The definition of assault includes incidents of physical assault on the patient irrespective of who committed the assault We do not have information on who committed the assault for example whether it was another patient or a member of staff Eleven per cent of patients were involved in one or more episodes of physical assault The only ethnic difference observed was a 19 lower than average rate among the Black Caribbean group
In terms of comparisons with previous years
bull The proportion of all patients who had experienced a physical assault stayed fairly constant
bull Very few ethnic differences in rates of assault were observed in the different censuses and they did not show a consistent pattern
Care Quality Commission Count me in census 2010 25
Results mental health continued
Duration of stay in hospital from admission to census day
We analysed the length of the period between each inpatientrsquos admission to hospital and the census day This period is of course shorter than a patientrsquos full length of stay in hospital which runs from admission to the date when they are discharged Outpatients on a CTO are excluded from the following analyses
bull 25 of inpatients had been in hospital for one month or less
bull 20 had been in hospital between one and three months
bull 13 had been in hospital between three and six months
bull 11 had been in hospital between six months and one year
bull 11 had been in hospital between one and two years
bull 12 had been in hospital between two and five years
bull 8 had been in hospital for more than five years
These results are similar to those of previous censuses About 31 of patients in the 2010 census had been in hospital for more than a year and had therefore also been included in the 2009 census About 20 of patients had been in hospital for more than two years and will have been included in both the 2008 and 2009 censuses
We calculated the median length of stay for different ethnic groups The median is the midpoint of the range of values so the median length of stay is the one at which half the patients had a length of stay less than the median and half had a stay longer than the median Overall and as in previous years the median amount of time that women had spent in hospital was about 25 months and the median for men was about 58 months (see Table 6) In most ethnic groups the median time spent in hospital was two to three times longer for men than for women in the Other Black group men had been in hospital four times longer than women
Median lengths of stay were longest for men from the Black Caribbean WhiteBlack Caribbean Mixed and Other Black groups and shortest for men from the Chinese Bangladeshi and Other groups Median lengths of stay were longest for women from the WhiteBlack Caribbean Mixed and Black Caribbean groups and shortest for women from the Chinese and Bangladeshi groups
A number of important factors influence a patientrsquos length of stay in hospital including age gender whether or not they are detained under the Mental Health Act (and the section under which they are detained and whether there is an additional restriction order) the type and severity of their illness the nature of their treatment and the availability of support in the community The data in the census does not allow for analysis of these factors
Table 6 Median number of days from the day of admission to the day of census
Ethnic group Men Women
White British 161 71
White Irish 218 114
Other White 238 113
White and Black Caribbean 275 191
White and Black African 182 92
White and Asian 226 78
Other Mixed 173 112
Indian 172 70
Pakistani 153 56
Bangladeshi 134 55
Other Asian 167 61
Black Caribbean 345 122
Black African 141 66
Other Black 248 58
Chinese 135 51
Other 131 76
Total 174 75
Care Quality Commission Count me in census 2010 26
Results mental health continued
Ward security
As in previous years about 11 of all patients were on a medium or high secure ward as opposed to a general (76) or low secure (13) ward
Patients from the White British Indian and Bangladeshi groups were less likely than average to be on a medium or high secure ward by 7 30 and 67 respectively Patients from the White Irish WhiteBlack Caribbean Mixed Black Caribbean and Other Black groups had a higher than average rate by between 43 and 55
Age range on wards
Among patients under 18 years of age 61 were being cared for on wards for working-age adults on census day and five patients were on a ward for older people Seven per cent of patients on wards for working-age adults were 65 or over and
8 of those on wards for older people were adults of working age There were very few lsquoout of agersquo placements among minority ethnic groups
Patients in wards designated as single sex or mixed
Providers were asked whether patients were on a ward designated as men or women only or mixed gender All the analyses of single sex accommodation and facilities exclude outpatients on a CTO Overall 61 of men and 77 of women were not in a ward designated for single sex use similar proportions as in previous years The proportion of patients not in a designated single sex ward was lower among almost all minority ethnic groups than among the White British group In all ethnic groups the proportion of men who were not in a designated single sex ward was lower than among women (see Table 7a)
Two further questions examined the single sex facilities that were available to patients
At the time of the 2010 census the following guidance from the Department of Health applied in England A ward can be described as single sex (ie the intended sex of the ward is either male or female and not mixed) when the accommodation complies with the following definition from the Department of Health of single sex accommodation ldquoSleeping areas must be segregated and members of one sex must not have to walk through an area occupied by the other sex to reach toilets or bathrooms Separate male and female only toilets and bathrooms must be provided There should be separate day rooms to which only women have accessrdquo However there is a discrepancy for providers because accommodation designated as a lsquowardrsquo for administrative purposes may incorporate single sex accommodation for both sexes that meets the guidelines ndash but in this case the ward would still be lsquomixedrsquo (based on guidance from Safety Privacy and Dignity Department of Health 2000)
As long as men and women are cared for in separate bays or rooms and have their own toilet facilities then it may well be appropriate for them to be on the same ward being cared for by the same team of doctors and nurses In practice good segregation can be achieved if men and women have separate sleeping areas (for example single sex bays) and have separate toilets and bathrooms that they can reach without having to pass through (or close to) areas for the opposite sex The layout of wards should minimise any risk of overlooking or overhearing by members of the opposite gender (from Privacy and Dignity ndash A report by the Chief Nursing Officer into mixed sex accommodation in hospitals Department of Health 2007)
The coalition governmentrsquos revised Operating Framework for 201011 requires NHS organisations to eliminate mixed-sex accommodation except under exceptional circumstances from 2011 The national guidance relating to mixed sex accommodation was issued in November 2010 and states that ldquoNo areas are exempt and every decision to mix must be justified by reference to the patientrsquos clinical needs not organisational convenience or custom and practicerdquo For mental health and learning disability trusts it states ldquoThere is no acceptable justification for admitting a mental health patient to mixed-sex accommodationrdquohellip It ldquomay be acceptable in a clinical emergency to admit a patient temporarily to a single ensuite room in the opposite-gender area of a ward In such cases a full risk-assessment must be carried out and complete safety privacy and dignity maintainedrdquo The guidance is available at wwwdhgovukenPublicationsandstatisticsLettersandcircularsProfessionallettersChiefnursingofficerlettersDH_121848
Care Quality Commission Count me in census 2010 27
Results mental health continued
Table 7a Percentage of patients not in a designated single sex ward by ethnic group
Ethnic group
Sex of patients and ward
Male Female
Male ward Female or mixed ward Female ward Male or mixed ward
White British 35 65 21 79
White Irish 41 59 28 72
Other White 44 56 28 72
White and Black Caribbean 56 44 31 69
White and Black African 48 52 41 59
White and Asian 43 57 34 66
Other Mixed 49 51 24 76
Indian 37 63 25 75
Pakistani 48 52 35 65
Bangladeshi 23 77 18 82
Other Asian 46 54 22 78
Black Caribbean 55 45 32 68
Black African 49 51 28 72
Other Black 49 51 30 70
Chinese 42 58 30 70
Other 43 57 20 80
Total 39 61 23 77
The vast majority of patients in this category were in mixed wards very few (under 05) male patients were on female-only wards or vice versa
Care Quality Commission Count me in census 2010 28
Results mental health continued
Patientsrsquo access to toilet and bathing facilities designated for single sex use
We asked providers if the patient had access to toilet and bathing facilities designated for single sex use Overall 13 of men and 16 of women
were reported as not having access to such facilities designated for single sex use This was an improvement over 2009 when these proportions were 19 and 24 respectively The proportion of patients not having access to toilet and bathing facilities designated for single sex use was lower among almost all minority ethnic groups than among the White British group (see Table 7b for details)
Table 7b Percentage of patients not having access to toilet and bathing facilities designated for single sex use by ethnic group
Ethnic group
Access to designated single sex bathing and toilet facilities
Male Female
Male facilities
Female or mixed facilities
Female facilities
Male or mixed facilities
White British 86 14 84 16
White Irish 87 13 87 13
Other White 89 11 86 14
White and Black Caribbean 93 7 93 7
White and Black African 90 10 93 7
White and Asian 90 10 84 16
Other Mixed 98 2 96 4
Indian 91 9 90 10
Pakistani 95 5 94 6
Bangladeshi 92 8 98 2
Other Asian 92 8 86 14
Black Caribbean 92 8 90 10
Black African 91 9 91 9
Other Black 92 8 89 11
Chinese 82 18 83 17
Other 87 13 90 10
Total 87 13 84 16
The vast majority of patients in this category had access to mixed facilities very few (1) of male patients had access to female-only facilities or vice versa
Care Quality Commission Count me in census 2010 29
Results mental health continued
Patientsrsquo access to a lounge area day space designated for single sex use
We also asked providers if patients had access to a lounge area or day space designated for single sex use Overall 37 of men and 39 of women were
reported as not having access to these facilities This was an improvement over 2009 when these proportions were 48 and 51 respectively The proportion of patients not having access to a lounge areaday space designated for single sex use was lower among most minority ethnic groups than among the White British group (see Table 7c for details)
Table 7c Percentage of patients not having access to a lounge areaday space designated for single sex use by ethnic group
Ethnic group
Access to a lounge areaday space designated for single sex use
Male Female
Male facilities
Female or mixed facilities
Female facilities
Male or mixed facilities
White British 59 41 60 40
White Irish 63 37 70 30
Other White 68 32 63 37
White and Black Caribbean 82 18 73 27
White and Black African 83 18 76 24
White and Asian 72 28 75 25
Other Mixed 79 21 67 33
Indian 59 41 66 34
Pakistani 80 20 72 28
Bangladeshi 53 47 52 48
Other Asian 70 30 61 39
Black Caribbean 78 22 70 30
Black African 73 27 70 30
Other Black 79 21 72 28
Chinese 59 41 60 40
Other 67 33 67 33
Total 63 37 61 39
The vast majority of patients in this category had access to mixed facilities very few (1) of male patients had access to female-only facilities or vice versa
Care Quality Commission Count me in census 2010 30
Results mental health continued
Patientsrsquo subject to deprivation of liberty safeguards
People who lack the mental capacity to consent to the care or treatment they need should be cared for in a way that is least restrictive of their rights or freedom of action In 2007 the Mental Capacity Act 2005 was amended to introduce Deprivation of Liberty Safeguards for people who lack capacity to decide about their care or treatment and who need to be deprived of their liberty to protect them from harm The Safeguards came into effect in April 2009 and strengthen the rights of hospital patients and those in care homes as well as ensuring compliance with the European Convention on Human Rights (ECHR)
The 2010 census introduced a new question ldquoIs the patient subject to deprivation of liberty authorisation on 31 March 2010rdquo Under 1 (269) patients were reported as being subject to a deprivation of liberty authorisation on census day No ethnic differences in the rates were observed which may be due to the low numbers of patients among minority ethnic groups (69)
Care Quality Commission Count me in census 2010 31
A comparison between the 2005 baseline and the 2010 census
The changes we have seen in the census results between 2005 and 2010 the timespan of the Delivering Race Equality (DRE) action plan are set out below This is not a review of the DRE programme The aim is to give an overview of how some variables in the census have changed during the course of DRE and the findings should be seen in the light of the caveats described on page 13
bull The number of inpatients went down from 33785 to 29840 ndash a fall of 12
bull The proportion of patients in independent hospitals rose from 10 to 16
bull The overall proportion of patients from minority ethnic groups increased from 20 to 23 However there have been demographic changes during this time ndash the population from Black and minority ethnic groups in England and Wales rising from 79 million in 2005 to 85 million in 2007 (the latest year for which these figures are available) an increase of 8 in two years
bull Admission rates showed similar patterns across all censuses ndash Lower than average rates among the White
British Indian and Chinese groups ndash About average rates among the Pakistani and
Bangladeshi groups ndash Higher than average rates among other
minority ethnic groups ndash particularly in the Black and WhiteBlack Mixed groups for whom rates were two or more times higher than average in 2010 The Other Black group continues to have exceptionally high rates of admission (even after the apparent reduction since 2005 see next point)
bull One of the 12 goals of DRE was a decline in admission rates among Black and minority ethnic groups Figure 1 provides a comparison between 2005 and 2010 Although admission rates for
many ethnic groups show relatively little change since 2005 the rate for the Other Black group is considerably lower in 2010 (six times higher than average) compared with 2005 (12 times higher than average) However rates for the other Black and WhiteBlack Mixed groups show small increases
bull In general rates of referral from GPs and community mental health teams were lower than average among some Black and WhiteBlack groups and referral from the criminal justice system was higher Patterns were less consistent for other minority ethnic groups
bull There was a steady increase in the overall proportion of patients subject to the Mental Health Act Compared with 40 in 2005 49 of all patients were subject to the Mental Health Act in 2010 (53 if outpatients on a CTO are excluded)
bull Another DRE goal was to reduce detention rates among Black and minority ethnic groups However detention rates have been higher than average among the Black Caribbean Black African and Other Black groups in all six censuses and almost consistently higher in the WhiteBlack Caribbean Mixed and Other White groups Rates have been average for other minority ethnic groups
bull A consistent pattern was the higher than average detention rate under section 3741 for the Black Caribbean and Other Black groups
bull Another DRE goal was to reduce seclusion among Black and minority ethnic groups Although there have been annual fluctuations in seclusion rates they have been higher than average for the Black and WhiteBlack Mixed groups and the Other White group in at least three of the six censuses Other minority ethnic groups did not show high rates
Care Quality Commission Count me in census 2010 32
A comparison between the 2005 baseline and the 2010 census continued
Figure 1 Admission ratios in the 2005 and 2010 Count me in censuses by ethnic group England and Wales
Other Black
Black Caribbean
White and Black Caribbean
White and Black African
Black African
Other Mixed
Other Asian
White and Asian
Other
White Irish
Other White
Bangladeshi
White British
Pakistani
Indian
Chinese
0 100 200 300 400 500 600 700 800 900 1000 1100 1200 1300
Ageshysex standardised admission ratios (EampW=100)
Census 2005 admission ratios using 2005 ONS populations
bull Minority ethnic groups do not compare unfavourably for other incidents Rates of self-harm have consistently been lower than average among the Black and South Asian groups Very few ethnic differences in hands-on restraint physical assault and accidents were observed across the different censuses and they did not show a consistent pattern
bull About 31 of patients in all censuses had been in hospital for one year or more and were therefore included in more than one census
Census 2010 admission ratios using ONS 2007 populations (excluding outpatients on a CTO)
(This is one reason why the census shows little change over the six years It should be noted again that because the census is a one-day count it over-represents long-stay admissions and under-represents short-stay admissions)
bull Mixed accommodation was reported for many patients across all censuses although patients from Black and minority ethnic groups were more likely to be in single sex accommodation than White British patients
The admission ratios for the 2005 census shown here are different from those published in the 2005 report This is because we updated the analysis of the 2005 admission ratios by using 2005 ONS census populations for ethnic groups as denominators These populations were not available at the time of the 2005 report which instead used the 2001 ONS population data
Care Quality Commission Count me in census 2010 33
Results learning disabilities
We obtained information about 3642 patients in 129 organisations providing services for people with learning disabilities in England and Wales Of these two were inpatients on CTOs The total number of inpatients has declined each year and by 21 from 4609 in 2006 to 3642 in 2010 The total number of providers did not change much from the baseline year of 2006 although the number of NHS providers has fallen steadily and the number of independent healthcare organisations has increased (see Table 8) The proportion of inpatients in independent
healthcare organisations increased from 20 in 2006 to 33 in 2010 This is likely to be a result of closing NHS campuses with people moving from hospital to community settings
The pattern of results for learning disability patients in 2010 is broadly similar to that reported in previous censuses This is not surprising since many of the patients had been in hospital for a considerable period of time and they therefore appear in successive censuses
Table 8 The number of providers of learning disability services and inpatients
NHS (England)
Independent (England)
NHS (Wales)
Independent (Wales) Total
2010 census Number of providers 55 61 4 9 129 Number of all patients (including patients 2304 1072 154 112 3642 on a CTO) of all patients 633 294 42 31 100
2009 census Number of providers 60 54 5 4 123 Number of all patients (including patients 2487 1014 139 55 3695 on a CTO) of all patients 673 274 38 15 100
2008 census Number of providers 62 57 5 5 129
Number of inpatients 2873 1050 143 41 4107
of inpatients 700 256 35 10 100 2007 census
Number of providers 64 47 5 4 120
Number of inpatients 3063 900 154 36 4153
of inpatients 738 217 37 09 100 2006 census
Number of providers 70 48 5 1 124
Number of inpatients 3505 930 164 10 4609
of inpatients 760 202 36 02 100
Care Quality Commission Count me in census 2010 34
Results learning disabilities continued
Ethnicity
Information about ethnicity was available for 98 of patients Of these 13 belonged to Black and minority ethnic groups defined as all groups that are not White British (see Table 9) This figure is somewhat higher than in previous years (11 in 2006) and is significantly lower than the 23 of mental health patients from minority ethnic groups as reported in the mental health section of this report
Although the patterns by ethnicity are broadly similar to previous years there was an increase between 2006 and 2010 in the proportion of patients from the Other White group and a fall in those from the White British group Some ethnic groups had very few patients
As in the previous censuses patients from Black and minority ethnic groups were concentrated in a relatively small number of organisations 70 were
Table 9 Learning disability patients by ethnic group
Ethnic group 2010 census 2009 census 2008 census 2007 census 2006 census
Number Number Number Number Number
White British 853 3106 867 3205 889 3616 883 3642 887 4037
White Irish 13 46 15 57 13 53 10 40 14 66
Other White 29 106 23 85 26 104 26 109 17 77
White and Black Caribbean 10 38 10 36 07 29 08 34 07 32
White and Black African 02 8 01 4 00 2 02 10 01 3
White and Asian 04 13 04 14 03 12 03 13 02 9
Other Mixed 07 24 05 19 03 14 04 16 03 14
Indian 09 32 09 35 07 28 08 32 11 49
Pakistani 07 24 09 33 07 30 08 32 07 34
Bangladeshi 05 20 06 21 03 11 03 11 02 9
Other Asian 04 13 03 10 03 12 02 8 03 12
Black Caribbean 26 93 22 81 23 94 26 108 28 129
Black African 08 28 09 35 07 29 08 33 07 33
Other Black 04 15 04 14 04 15 04 18 04 17
Chinese 00 1 01 2 01 5 02 8 02 7
Other 02 7 02 8 04 15 02 10 05 24
Not stated 19 68 10 36 09 38 07 29 12 57
Total 100 3642 100 3695 100 4069 100 4124 100 4552
Care Quality Commission Count me in census 2010 35
Results learning disabilities continued
patients in 25 of the 129 organisations that took part in the census Seventy-four organisations had fewer than 10 patients from Black and minority ethnic groups each and another 42 organisations had no inpatients at all from these groups
However it is important to note that the number of people with severe and profound learning disabilities in some areas is affected by past funding and placement practices especially the presence of old long stay hospitals and of people placed outside their original area of residence by funding authorities
Reporting of ethnicity
About half (56) of patients reported their own ethnic group Staff reported the ethnic group for 17 of patients and relatives for 21 This means that ethnicity could have been misreported for some patients We do not know how ethnicity was assessed for 6 of patients
Age and gender
Two per cent (59) of patients were under 18 years old The number of young inpatients from minority ethnic groups was low or zero in several ethnic minority groups
Overall 73 of patients were under 50 years old and 27 were aged 50 or over The proportion of patients under 50 was higher among patients from Black and minority ethnic groups (88) than among the White British group (71) This is not surprising given that minority ethnic populations are generally younger than the White population
Seventy per cent of patients in learning disability services were men whereas in mental health services 58 of patients were men
Language and religion
Eight per cent of patients reported that their first language was not English Non-verbal communication was the most often selected language after English accounting for 4 of patients Two per cent (84) of patients most of whom were from the White British group said they needed an interpreter
Religion was not stated for 22 of patients and 15 of patients said they had no religion South Asians (Indians Bangladeshis and Pakistanis) were mostly Muslim Hindu or Sikh and those from the White Black Caribbean and Black African groups were mostly Christian
Sexual orientation
Overall the result was not known for almost half (49) of patients 45 said they were heterosexual 2 said gaylesbian 3 said bisexual and 1 said ldquootherrdquo The numbers of patients from minority ethnic groups were too low for meaningful analysis
Disability
Of all inpatients in learning disability services
bull 4 were reported as having no disabilities
bull 44 had a learning disability only
bull 51 had multiple disabilities
The patterns among minority ethnic groups were similar in that most patients had either a learning disability or multiple disabilities
Care Quality Commission Count me in census 2010 36
Results learning disabilities continued
Rates of admission
The rates of admission based on ONS estimates of the general population in 2007 are given in Appendix C Table C1
Admission rates were lower than average among several minority ethnic groups Other White Indian Pakistani Other Asian Black African Chinese and Other Rates were two to three times higher than average among the WhiteBlack Caribbean Mixed Black Caribbean Other Black and Other Mixed groups The lower rates among the South Asian and Chinese groups and the higher rates among some Black groups are similar to patterns for inpatients in mental health establishments
These patterns of admission are similar to those we reported in previous census reports
Source of referral
As we reported in the section on mental health patients data about sources of referral must be interpreted with care as we do not always know the original referral source Furthermore in the case of inpatients with learning disabilities this information was invalid missing or unknown for 12 of patients
Because of the small numbers of patients in most minority ethnic groups we observed few ethnic differences in sources of referral
Detention under the Mental Health Act 1983 (on day of admission and on day of census)
The Mental Health Act 2007 made a number of changes to the Mental Health Act 1983 one of which was supervised community treatment (section 17A) These are reflected in the 2010 census
All detentions Of all the patients in learning disability services 48 were detained under the Mental Health Act on admission Rates of detention on the day of admission by ethnic group are in Appendix C Table C2 and no ethnic differences were observed As the number of detained patients from each minority ethnic group was low we did not undertake further analysis for individual sections of the Act
Rates of detention on census day also showed no ethnic differences with the exception of a lower than average rate for the Other White group
Consent
About 66 of informally admitted inpatients were deemed incapable of consenting to treatment which is a similar proportion to that reported previously
Among detained patients 38 were deemed incapable of consenting to treatment and 6 were deemed capable of consenting to treatment but refused
The numbers of patients from minority ethnic groups were too low for comment There were no or very few such patients among minority ethnic groups
Care Quality Commission Count me in census 2010 37
Results learning disabilities continued
Care programme approach
Details of the Care Programme Approach (CPA) are given on page 24
We found that 73 of all patients were on a CPA 2 on a single assessment process (SAP) and 25 on neither No ethnic differences were observed
Recorded incidents
The 2010 census asked about the number of times that patients experienced seclusion hands-on restraint self-harm accident and physical assault in a patientrsquos current hospital spell or if the patientrsquos hospital spell was longer than three months the number that took place within the last three months As in previous years we observed very few ethnic differences
Seclusion Five per cent of patients had experienced one or more episodes of seclusion The only ethnic differences observed were the higher than average rates among the White Irish and Other White groups but these were based on small numbers of patients
Physical assault on the patient The definition of assault includes incidents of physical assault on the patient irrespective of who committed the assault but we do not have information on who committed the assault About 28 of patients had been involved in one or more episodes of physical assault No ethnic differences were observed
Hands-on restraint self-harm accidents Thirty per cent of inpatients had experienced one or more episodes of hands-on restraint 22 had attempted to harm themselves and 24 had suffered an accident The numbers were very low in minority ethnic groups and we did not observe any ethnic differences except for a lower than average rate for self-harm among the Black Caribbean group but this was based on very few patients
Duration of stay in hospital
We analysed the length of the period between each patientrsquos admission to hospital and the census day This period is of course shorter than a patientrsquos full length of stay in hospital which runs from admission to the date when they are discharged
bull 10 of inpatients had been in hospital for one month or less
bull 6 had been in hospital between one and three months
bull 7 had been in hospital between three and six months
bull 10 had been in hospital between six months and one year
bull 14 had been in hospital between one and two years
bull 22 had been in hospital between two and five years
bull 31 had been in hospital for over five years
The patterns are very similar to those in previous censuses About 67 of patients in the 2010 census had been in hospital for more than a year and were therefore also included in the 2009 census In addition over half (53) of patients had been in hospital for more than two years and will have been included in both the 2008 and 2009 censuses A third of patients will have been included in each census since 2006
We also calculated the median length of stay (see page 26 for the definition of median) Overall the median amount of time that women had spent in hospital was about 31 months and the median for men was about 27 months This compares with a median for mental health patients of 25 months for women and 58 months for men It is not possible to reliably compare length of stay by ethnic group because of the small numbers of patients among several minority ethnic groups
Care Quality Commission Count me in census 2010 38
Results learning disabilities continued
Ward security
About 12 of all inpatients were on a medium or high secure ward as opposed to a general (54) or low secure (34) ward
As in the three previous years rates of patients on medium or high secure wards were about double the average among the White Irish and Other White groups Most other minority ethnic groups had very few patients on medium or high secure wards
Age range on wards
There were five patients under 18 years of age being cared for on wards for working-age adults and none were on wards for older people About 5 of patients on wards for working-age adults were aged 65 or over and there were very few patients (23) on wards for older people There were very few lsquoout of agersquo placements among minority ethnic groups
Patients in wards designated as single sex or mixed
We asked providers whether the patient was on a ward designated as men or women only or mixed gender Overall 47 of men and 69 of women were not in a ward designated for single sex use The numbers of such patients among minority ethnic groups were very low
Two further questions examined the single sex facilities that were available to patients Again due to the small numbers we do not present results by ethnicity for these questions
Patientsrsquo access to toilet and bathing facilities designated for single sex use
Overall 19 (497) of men and 27 (295) of women were reported as not having access to toilet and bathing facilities designated for single sex use
Patientsrsquo access to a lounge area day space designated for single sex use
Overall 32 (829) of men and 44 (470) of women were reported as not having access to a lounge area day space designated for single sex use
Patients subject to deprivation of liberty safeguards
For details of deprivation of liberty safeguards please see page 31
The 2010 census introduced a new question ldquoIs the patient subject to deprivation of liberty authorisation on 31 March 2010rdquo Two per cent (74) patients were reported as being subject to a deprivation of liberty order on census day but very few of these patients (15) were from minority ethnic groups
See footnote on single sex accommodation on page 27
Care Quality Commission Count me in census 2010 39
Data in the future Moving beyond a one-day census
For six years the Count me in census has provided a valuable one-day snapshot of inpatients in mental health and learning disability services And with the proportion of inpatients who are detained increasing steadily (from 25 in 200506 to 39 in 200910 ndash see Figure 2) ongoing ethnic monitoring of admissions and detentions becomes more vital than ever
However a one-day census only captures some events and the profile of patients can differ across a whole year For example there were
bull 29840 inpatients in the 2010 census compared with 107765 inpatients overall during 200910
bull 17299 patients in the 2010 census who were detained or on CTOs compared with 42479 new detentions and some 4100 new CTOs overall in England in 200910
bull 26 of patients in hospital for under one month and 31 for over one year per the census
whereas the MHMDS data consistently shows that for over 50 of records the average length of an inpatient stay was under one month and for 4 it was over one year
Looking ahead it is vital that robust data is available on all admitted patients and all those subject to the Mental Health Act not just those in hospital on one particular day Moreover patterns of use and outcomes of community care can have an impact on the need for admission to hospital and the risk of detention ndash therefore information about the care provided to patients before admission to hospital during their hospital stay and after they leave is also vital Furthermore under 84 of the 127 million people using specialist mental health services are admitted to hospital23 and so it is very important to examine the quality of community care for the 90 of patients who are not admitted to hospital
Figure 2 Number of people spending time in hospital 200506 to 200910
Num
ber
of p
atie
nts
90000
80000
70000
60000
50000
40000
30000
20000
10000
0 200506 200607 200708 200809 200910
Source NHS Information Centre Formally detained Not detained MHMDS Bulletin 2011
Care Quality Commission Count me in census 2010 40
Data in the future Moving beyond a one-day census continued
The Mental Health Minimum Data Set (MHMDS) is a rich source of data on people using specialist mental health services in England It covers both community and hospital services and includes a wide range of information about the demographic clinical and socioeconomic characteristics of individual patients and the services provided to those admitted to hospital and to the much larger number of those who donrsquot need a stay in hospital The data includes information about contact with services uses of the Mental Health Act and the Care Programme Approach for each individual patient All these details enable the use of services patterns of care and patient outcomes to be tracked including along pathways of care The MHMDS therefore provides a robust basis for ongoing monitoring of access to and outcomes of care for users of specialist ndash both community and hospital ndash mental health services
The MHMDS also enables an analysis of the numbers and rates of people from different ethnic groups using specialist mental health services overall (both inpatient and community) which provides an indication of the levels of mental illness and therefore the need for specialist care in different communities
At present the MHMDS does not cover high secure services and independent sector providers only started to provide data during 201011 However to support payment by results for mental health the scope of the data set will be extended to cover high secure services during 201112 (version 4 MHMDS) Further proposed changes to the dataset (version 41) will incorporate NHS-funded learning disability services and primary care mental health services A separate dataset for child and adolescent mental health services (CAMHS) has been developed and is awaiting formal approvals It is designed to include the same information about uses of the Mental Health Act as provided in the MHMDS
The latest MHMDS bulletin for 200910 provides a description of people using specialist mental health services in England including ethnic profiles of people using services hospital admissions detentions and the number of people on CPA24 It also provides information on differences by age and gender The bulletin illustrates some of the sorts of analyses that are possible using data from the MHMDS
The NHS Information Centre can provide guidance on these and other potential analyses based on MHMDS data
Care Quality Commission Count me in census 2010 41
Conclusions
While this report reviews changes in the census results since 2005 it is not a review or evaluation of the DRE programme overall Similarly the census cannot provide explanations for the patterns observed or examine whether mental health services are meeting the needs of individual ethnic minority groups As we have noted previously the results are subject to caveats in particular that the census provides a one-day snapshot that may not be representative of patients admitted to hospital throughout the year
Overview of findings
Overall the findings from the 2010 census show little change from those reported for previous annual censuses conducted since 2005 This is partly because many patients had been in hospital for a considerable period of time and had therefore been included in successive censuses The findings of this sixth and last census continue to show differences between Black and minority ethnic groups and White groups and also differences within these groups
In particular ethnic differences in rates of admission detention under the Mental Health Act and seclusion ndash three of DRErsquos 12 goals ndash have not altered materially since the inception of DRE in 2005
bull Admission rates remain higher than average among minority ethnic groups especially among Black and WhiteBlack Mixed groups for whom rates were two or more times higher than average in 2010 The Other Black group continues to have the highest admission rate ndash six times higher than average ndash although this is lower than in 2005 In contrast admission rates have consistently been lower than average among the Indian and Chinese groups and about average in the Pakistani and Bangladeshi groups
bull Detention rates remain higher than average among the Black and WhiteBlack Caribbean Mixed groups and among the Other White group A consistent pattern across all censuses was the higher than average detention rate
under section 3741 for the Black Caribbean and Other Black groups We also found that rates for being placed on a CTO were higher among the South Asian and Black groups
bull Although there have been annual fluctuations in seclusion rates they have been higher than average for the Black WhiteBlack Mixed and Other White groups in at least three of the six censuses
Overall the level of provision of single sex areas for patients continues to be unsatisfactory although there was no evidence that minority ethnic patients were disadvantaged in these respects Government policy for the NHS in England now requires that all providers of NHS-funded care including mental health trusts are expected to eliminate mixed-sex accommodation in accordance with the guidance set out in CNO201032526 From 2011 all providers of NHS-funded care must report breaches of sleeping accommodation which will attract sanctions
Implications for ways forward
The census findings do not in themselves show that mental health and learning disability services are failing to meet the needs of Black and minority ethnic service users
As noted in previous reports they need to be interpreted in the context of available evidence on ethnic differences in rates of mental illness pathways to care and factors such as socioeconomic disadvantages that all contribute to these differences Our previous reports have consistently highlighted the need for prevention early intervention and working collaboratively across sectors to reduce the risk of admission and detention where possible without compromising the care given to patients Mental health services have a key role to play but to achieve this all statutory agencies and organisations outside the healthcare sector Black and minority ethnic communities and people who use services themselves will need to work in partnership
Care Quality Commission Count me in census 2010 42
Conclusions continued
This message ndash about preventing mental ill-health by addressing the contributory factors and intervening early ndash is at the heart of No health without mental health the Department of Healthrsquos new strategy for the future of mental health care in England27
The strategy aims to tackle the economic social and environmental determinants and consequences of mental health problems and to improve outcomes and reduce inequalities
It specifies that by 2014 people in contact with the criminal justice system will have improved access to mental health services as set out in the Ministry of Justice Green Paper Breaking the Cycle Effective punishment rehabilitation and sentencing of offenders which confirms the approach outlined in Lord Bradleyrsquos report for early intervention and diversion from custody2829
Accompanying the new strategy is a supporting document that explains how its objectives will improve mental health outcomes the effective interventions and the underpinning evidence base30
The strategy is complemented by other government proposals for reforms in the NHS public health and adult social care as outlined in the NHS White Paper Equity and excellence liberating the NHS31 the public health strategy Healthy lives healthy people32 and the adult social care strategy A vision for adult social care capable communities and active citizens 33 Three outcomes frameworks have been developed alongside these strategies improving mental health outcomes and reducing inequalities is integral to them all
In this new healthcare landscape the proposed NHS Commissioning Board and GP consortia will have a statutory obligation to promote equality and reduce inequalities in healthcare (something also enshrined in the Equality Act 2010) As the lead commissioners of healthcare services it will be up to GP consortia to assess with local authorities the needs of their local populations and commission the right services that meet their requirements
And the strengthened public health role of local authorities offers significant potential for addressing the socioeconomic disadvantages faced by Black and minority ethnic communities which add to the burden of mental illness in these communities
Race Equality Action Plan A five-year review looked back at the work of the DRE action plan and describes some of the key challenges successes and learning34 Based on the experience and outcome of the DRE programme the report suggests ways forward for the next stage of mental health strategy development and implementation
Since April 2009 CQC has had a duty under the Mental Health Act 1983 to monitor how services exercise their powers in relation to patients who are detained in hospital or subject to CTOs or guardianship under the Act In its first annual report on the use of the Act CQC recommends a number of areas where improvements are needed for example over-occupancy on inpatient wards patient engagement use of control and restraint seclusion and capacity and consent35
In particular CQC highlighted a number of issues relating to the use of CTOs including concern about appropriate usage (30 of the patients in CQCrsquos sample did not have a reported history of non-compliance or disengagement with services after discharge) and over-representation of Black and minority ethnic groups CQC advised that research on the possible race equality impact of CTOs should be undertaken There were 6237 CTOs from their introduction in November 2008 to 31 March 2010 a much greater use of them than forecast for this period by the Department of Health before the power was introduced Just 31 of these orders had ended by end March 2010 suggesting that some people are being kept on supervised community treatment for long periods
Care Quality Commission Count me in census 2010 43
Conclusions continued
Data in the future Moving beyond a one-day census
Good information is the foundation of an effective healthcare system It is imperative for ensuring that services meet the needs of local populations and are equitable and that improvements are made where needed The availability of fit-for-purpose and comprehensive patient-level data sets with ethnicity and other key variables fully coded is therefore vitally important36 It enables the care provided to patients of all ethnic backgrounds to be monitored on an ongoing basis including for monitoring compliance with the Equality Act
Race Equality Action Plan A five-year review notes that better collection monitoring and use of ethnicity data to inform commissioning and provision in health and social care is required37 Key areas include good ethnic monitoring improving demographic information and ensuring good links between infomatics audit and equality and diversity leads within trusts in order to effectively use the information to inform service development monitoring and review at board management ward and community levels
The governmentrsquos proposed changes to the NHS will be supported by an information revolution aimed at improving and extending the information available to the NHS patients and the public on the quality and outcomes of NHS services including by equality dimensions38
Having information that is fit for purpose is vital for the effective regulation of mental health and learning disability services CQC uses routinely available data sets on an ongoing basis to assess the performance of health and social care organisations and their compliance with government policies and legislation We therefore expect those who commission and provide mental healthcare in the NHS and independent sector to have information systems that provide good quality data with fully
comprehensive recording and monitoring of ethnicity on an ongoing basis
Since 2005 the Count me in census has played a key role in providing information about the ethnicity and other characteristics of inpatients in mental health and learning disability services and on patients subject to the Mental Health Act It did this by providing a valuable one-day snapshot But ethnicity recording must be seen as an all-year round statutory requirement not a one-day annual event The number of inpatients throughout the year is much higher than the counts on one day and some patients will have more than one admission And there is a need to move on from counting patients to understanding more about care pathways for Black and minority ethnic patients and the factors leading to hospital admission and detention
We have consistently highlighted the need for commissioners and providers to make full use of the Mental Health Minimum Data Set (MHMDS) ndash the statutory data set submitted by providers of specialist mental health services in England It provides rich data on these issues and provides a robust information source for ongoing ethnic monitoring after this last census
Covering both community and hospital services ndash and now independent and third sector providers as well as NHS ndash it includes a wide range of information about individual patients the services provided to those admitted to hospital and to the much larger number who donrsquot need admission to hospital and the outcomes of care And because it includes year-round activity it is more representative of the overall picture of for example admission detention and readmission rates length of stay years in psychiatric care and contacts with services and professionals
We call on the Information Centre to routinely publish data on all admissions and uses of the Mental Health Act including CTOs in England (in both NHS and independent healthcare providers) by the ethnicity of
Care Quality Commission Count me in census 2010 44
Conclusions continued
patients making the MHMDS the definitive source of information about mental health and learning disability patients This data should be risk-adjusted for age gender and other variables as appropriate to enable reliable comparisons to be made across groups
It is important that all providers ndash NHS and independent ndash make strenuous efforts to improve the quality of the data they submit The Information Centre publishes reports on the quality of MHMDS data by provider (see wwwicnhsukservices mhmdsdq) and we urge providers to monitor this information and use it to improve their data quality
If GP consortia and local authorities are to be effective in their needs assessment and commissioning roles the Information Centre needs to make available and promote to them the data from the MHMDS and other sources And researchers and academics must make full use of the MHMDS to explore the factors that underlie the observed ethnic patterns
CQCrsquos role
In the meantime CQC will continue to focus strongly on the quality of care provided by mental health and learning disability services
People who find themselves admitted to mental health services or detained under the Mental Health Act and therefore counted by the Count me in census are among the most mentally unwell people in our society Our job is first and foremost to make sure that the care they receive meets the essential standards of quality and safety set out under the Health and Social Care Act 2008 and to work with providers to ensure this We act swiftly when we find services that do not Where we find systemic problems that organisations have not adequately addressed we may impose conditions on the providerrsquos registration to bring about the change needed to improve patientsrsquo experience of care
The essential standards of quality and safety include the requirement to provide single sex accommodation and we will continue to closely check that these standards are met by all mental health services
We intend to introduce a number of indicators derived from the rich information in the MHMDS into our quality and risk profiles for providers This will put greater emphasis on the experience of Black and minority ethnic patients in our regulatory activity
We will monitor the quality of MHMDS data submitted by providers (as reported by the NHS Information Centre) including independent service providers Those with poor data quality may be considered at higher risk in terms of their quality of care
In addition we will continue to monitor the progress of services in relation to the issues raised in the census and other reports including our report on the use of the Mental Health Act through our visits to services and meetings with patients by our Mental Health Act Commissioners and second opinion appointed doctors (SOADs) We will draw on patientsrsquo experiences to monitor the operation of the Mental Health Act
We will also assess the impact of advice and use of Local HealthWatch Local HealthWatch will be in a good position to make sure that providers and commissioners are held to account on matters of choice and access to services for people from Black and minority ethnic groups
Care Quality Commission Count me in census 2010 45
References
1 Department of Health Equity and excellence liberating the NHS 2010
2 Department of Health The NHS outcomes framework 201112 2010
3 Healthcare Commission Mental Health Act Commission National Institute for Mental Health in England Count me in results of a national census of inpatients in mental health hospitals and facilities in England and Wales 2005
4 Healthcare Commission Mental Health Act Commission National Institute for Mental Health in England Count me in results of the 2006 national census of inpatients in mental health and learning disability services in England and Wales 2006
5 Healthcare Commission Mental Health Act Commission National Institute for Mental Health in England Count me in results of the 2007 national census of inpatients in mental health and learning disability services in England and Wales 2007
6 Healthcare Commission Mental Health Act Commission National Institute for Mental Health in England Count me in results of the 2008 national census of inpatients in mental health and learning disability services in England and Wales 2008
7 Care Quality Commission National Mental Health Development Unit Results of the 2009 national census of inpatients and patients on supervised community treatment in mental health and learning disability services in England and Wales 2009
8 Department of Health Delivering race equality in mental health care an action plan for reform inside and outside services 2005
9 Welsh Assembly Government Adult Mental Health Services Raising the standard ndash Race Equality Action Plan for Adult Mental Health Services in Wales 2006
10Department of Health No health without mental health a cross-government mental health outcomes strategy for people of all ages 2011 wwwdhgovukprod_consum_dhgroups dh_digitalassetsdocumentsdigitalasset dh_124058pdf
11Department of Health New horizons towards a shared vision for mental health 2009 wwwdhgovukprod_consum_dhgroups dh_digitalassetsdhendocumentsdigital assetdh_109708pdf
12Department of Health Valuing people a new strategy for learning disability for the 21st century 2001
13Department of Health Valuing people now a new three year strategy for people with learning disabilities 2009
14Department of Health Healthcare for all report of the independent inquiry into access to healthcare for people with learning disabilities 2008
15Joint Committee on Human Rights A life like any other human rights of adults with learning disabilities (2008 HL Paper 401 HC 731) House of Lords House of Commons 2008
16Department of Health Valuing people now summary report March 2009 ndash September 2010 2010
17Disability Rights Commission Equal treatment investigation 2005
18Department of Health Mir G Nocon A Ahmad W Jones L Learning difficulties and ethnicity 2000
19ONS experimental population estimates by ethnic group 2007 wwwstatisticsgovukstatbase productaspvlnk=14238
Care Quality Commission Count me in census 2010 46
References continued
20Six percent of population are gay or lesbian according to Whitehall figures 2005 wwwtelegraphcouknewsmainjhtmlxml= news20051212ngay12xmlamps Sheet= news20051212ixhomehtml
21Department of Trade and Industry Amendment to Employment Equality (Sexual Orientation) Regulations 2003 2003
22Office for National Statistics Measuring sexual identity an evaluation report 2010
23 Information Centre Mental Health Bulletin Fourth report from Mental Health Minimum Dataset (MHMDS) annual returns 2010 2011 wwwicnhsukpubsmhbmhmds0910
24 Information Centre Mental Health Bulletin Fourth report from Mental Health Minimum Dataset (MHMDS) annual returns 2010 2011 wwwicnhsukpubsmhbmhmds0910
25The operating framework for the NHS in England 201112 Department of Health 2010 wwwdhgovukprod_consum_dhgroups dh_digitalassetsdhenpsdocuments digitalassetdh_122736pdf
26wwwdhgovukenPublicationsandstatistics LettersandcircularsProfessionalletters ChiefnursingofficerlettersDH_121848
27Department of Health No health without mental health a cross-government mental health outcomes strategy for people of all ages 2011 wwwdhgovukprod_consum_dhgroups dh_digitalassetsdocumentsdigitalasset dh_124058pdf
28Ministry of Justice Breaking the cycle effective punishment rehabilitation and sentencing of offenders 2010
29Department of Health The Bradley report Lord Bradleyrsquos review of people with mental health problems or learning disabilities in the criminal justice system 2009
30Department of Health No health without mental health delivering better mental health outcomes for people of all ages 2011
31Department of Health Equity and excellence liberating the NHS 2010 wwwdhgovukprod_ consum_dhgroupsdh_digitalassetsdhen psdocumentsdigitalassetdh_117794pdf
32Department of Health Healthy lives healthy people our strategy for public health in England 2010 wwwdhgovukprod_consum_dh groupsdh_digitalassetsdhenps documentsdigitalassetdh_122347pdf
33Department of Health A vision for adult social care capable communities and active citizens 2010 wwwdhgovukprod_consum_dh groupsdh_digitalassetsdhenps documentsdigitalassetdh_121971pdf
34Wilson M NMHDU Race equality action plan a five year review Delivering race equality in mental health care 2010 wwwnmhduorgukour-workmhep
35Care Quality Commission Monitoring the use of the Mental Health Act in 200910 2010
36Raleigh V S Collection of data on ethnic origin in England Editorial BMJ 20083376456
37Wilson M NMHDU Race equality action plan a five year review Delivering race equality in mental health care 2010 wwwnmhduorgukour-workmhep
38Department of Health Liberating the NHS an information revolution 2010
Care Quality Commission Count me in census 2010 47
Appendix A Methods of analysis
Standardisation by age and gender
Standardisation allows us to make comparisons between groups of the population by taking account of variations in age and gender Some differences in patterns of service use are related to the age or gender of the people using them so adjustments to the data have to be made to ensure that the interpretation of ethnic differences is reliable For example formal admissions are higher at a younger age so some Black and minority ethnic groups may have high formal admission rates simply because they have a high proportion of younger people Without adjustments for age and gender differences comparisons would be misleading
In this report most results are standardised for age and gender including those relating to admission detention source of referral care programme approach seclusion restraint accidents assault self-harm consent and presence on a secure ward The report uses the accepted statistical method of taking account of age and gender differences between groups when calculating these rates
We used the ONS estimates of total population by ethnic group for England and Wales in 2007 to standardise the rates of admission for different ethnic groups This takes account of the significant rises in the Black and ethnic minority population of England and Wales since the 2001 ONS census and hence gives more accurate and up to date estimates of admission ratios for different ethnic groups (although it does not take account of any further changes in the ethnic populations between 2007 and 2010 the date of this census) For comparison with the DRE baseline we also present admission rates from the 2005 census derived using the 2005 ONS estimates of populations by ethnic group These figures will not be the same as published in the 2005 census report which were based on the 2001 ONS census population estimates because updated estimates of populations by ethnic group were not available at that time
For other analyses we used the total number of inpatients and patients on CTOs in the census
as the basis for standardisation However CTO outpatients are excluded from selected analyses where appropriate namely the analysis of rates for admissions detentions on admission source of referral single sex accommodation and recorded incidents of seclusion restraint accidents assault and self-harm We used the statistical package STATA version 82 to derive the standardised results
It was not possible to adjust the analyses for ethnic differences in social and economic factors and in diagnosis and severity of illness Such factors could affect the ethnic differences observed in the results
For descriptive variables such as religion and language we did not use standardisation
Confidence intervals as indicators of significant statistical differences
For all standardised results the national rates for England and Wales are taken as 100 and the usual 95 confidence intervals are given Rates of less than 100 or greater than 100 for specific ethnic groups show a lower or higher rate respectively than the national average after adjusting for age and gender Whether or not the difference is statistically significant from the national average depends on the confidence interval If the confidence interval overlaps 100 the difference from the national average is not statistically significant If both values are lower or higher than 100 it indicates that the difference compared with the national average is statistically significant at the 95 level
For example if a rate is 110 with the lower confidence interval being 105 and the upper confidence interval being 115 it indicates that the 10 excess over the national average of 100 is statistically significant But if a ratio is 110 with the lower confidence interval being 95 and the upper confidence interval being 125 it indicates that the 10 excess over the national average is not statistically significant We did not attempt to adjust the confidence intervals for multiple comparisons
Care Quality Commission Count me in census 2010 48
Appendix B Mental health tables
Table B1 Standardised admission ratios by ethnic group for England and Wales (excluding outpatients on a CTO) using 2007 ONS census population denominators (England and Wales = 100) All ages
Ethnic group
Men Women Persons Standardised
admission ratio
95 confidence
interval Observed numbers
Standardised admission
ratio
95 confidence
interval Observed numbers
Standardised admission
ratio
95 confidence
interval Observed numbers
White British 88 86 89 12435 94 93 96 10157 91 89 92 22592 White Irish 130 115 146 274 122 106 140 215 126 115 138 489 Other White 117 109 126 731 129 118 141 533 122 115 129 1264 White and Black Caribbean 557 493 627 276 274 223 333 101 436 393 483 377 White and Black African 312 247 388 80 259 186 351 41 292 242 349 121 White and Asian 140 110 174 79 124 90 166 44 134 111 159 123 Other Mixed 230 189 278 108 213 165 270 67 223 192 259 175 Indian 67 59 75 286 66 56 76 172 66 60 73 458 Pakistani 105 93 119 269 65 53 79 96 91 81 100 365 Bangladeshi 123 102 147 120 82 60 109 46 108 92 126 166 Other Asian 161 139 185 192 136 107 169 79 153 135 172 271 Black Caribbean 538 505 572 980 306 277 336 418 438 415 462 1398 Black African 246 226 267 550 219 194 247 277 236 221 253 827 Other Black 792 691 903 222 314 240 403 61 596 529 670 283 Chinese 27 20 38 39 43 30 59 35 33 26 41 74 Other 140 120 162 177 110 88 136 87 128 113 145 264 Total 100 16818 100 12429 100 29247
Care Quality Commission Count me in census 2010 49
Appendix B Mental health tables continued
Table B2 Standardised admission ratios by ethnic group for England and Wales (excluding outpatients on a CTO) using 2007 ONS census population denominators (England amp Wales = 100) Ages 65 and over
Ethnic group
Men Women Persons Standardised
admission ratio
95 confidence
interval Observed numbers
Standardised admission
ratio
95 confidence
interval Observed numbers
Standardised admission
ratio
95 confidence
interval Observed numbers
White British 95 92 99 3265 95 92 98 3887 95 93 97 7152 White Irish 142 116 172 106 102 82 125 92 120 104 138 198 Other White 207 174 244 141 213 183 248 171 210 188 235 312 White and Black Caribbean 406 210 710 12 333 152 632 9 371 230 568 21 White and Black African 231 28 836 2 198 24 714 2 213 58 546 4 White and Asian 28 1 156 1 110 30 281 4 69 23 162 5 Other Mixed 146 40 374 4 228 92 470 7 189 95 339 11 Indian 97 70 132 41 83 57 116 33 90 71 113 74 Pakistani 39 17 77 8 46 18 94 7 42 23 69 15 Bangladeshi 115 53 218 9 69 14 201 3 98 51 172 12 Other Asian 234 143 361 20 215 120 354 15 225 157 313 35 Black Caribbean 216 170 269 77 310 253 376 103 261 224 302 180 Black African 142 73 248 12 365 241 531 27 246 175 337 39 Other Black 164 34 479 3 366 134 796 6 259 119 493 9 Chinese 41 8 120 3 95 38 195 7 68 33 125 10 Other 253 126 453 11 390 238 602 20 327 222 464 31 Total 100 3715 100 4393 100 8108
Care Quality Commission Count me in census 2010 50
Appendix B Mental health tables continued
Table B3 Standardised ratios by ethnic group for patients referred by a GP (England and Wales = 100)
Ethnic group
Men Women Persons Standardised
referral ratio
95 confidence
interval Observed numbers
Standardised referral ratio
95 confidence
interval Observed numbers
Standardised referral ratio
95 confidence
interval Observed numbers
White British 110 103 117 904 107 101 114 1065 108 104 113 1969 White Irish 85 50 134 18 93 57 144 20 89 63 123 38 Other White 74 51 103 33 70 49 97 36 72 56 91 69 White and Black Caribbean 27 5 78 3 30 4 109 2 28 9 65 5 White and Black African 0 0 74 9 268 2 35 4 125 2 White and Asian 165 54 386 5 0 0 86 28 201 5 Other Mixed 48 6 172 2 68 14 198 3 58 19 136 5 Indian 69 34 123 11 79 39 141 11 73 46 111 22 Pakistani 88 42 162 10 59 16 151 4 77 42 130 14 Bangladeshi 81 22 207 4 61 7 221 2 73 27 159 6 Other Asian 80 32 166 7 108 43 223 7 92 50 155 14 Black Caribbean 35 20 56 17 37 20 62 14 36 24 51 31 Black African 57 29 100 12 66 35 113 13 61 40 91 25 Other Black 62 23 135 6 40 5 144 2 54 23 107 8 Chinese 56 1 314 1 139 38 356 4 108 35 251 5 Other 106 46 208 8 0 0 53 23 105 8 Total 100 1041 100 1185 100 2226
Care Quality Commission Count me in census 2010 51
Appendix B Mental health tables continued
Table B4 Standardised ratios by ethnic group for patients referred by a community mental health team (including crisis resolution home treatment) or community learning disability team (England and Wales = 100)
Ethnic group
Men Women Persons Standardised
referral ratio
95 confidence
interval Observed numbers
Standardised referral ratio
95 confidence
interval Observed numbers
Standardised referral ratio
95 confidence
interval Observed numbers
White British 107 104 111 3255 103 100 107 3386 105 103 108 6641 White Irish 90 69 116 61 89 68 114 61 90 74 107 122 Other White 59 48 71 105 79 67 94 141 69 61 78 246 White and Black Caribbean 106 83 135 68 75 49 111 25 96 77 117 93 White and Black African 43 19 84 8 66 30 124 9 52 31 84 17 White and Asian 95 56 150 18 84 43 147 12 90 61 129 30 Other Mixed 78 48 121 20 72 41 118 16 76 53 105 36 Indian 106 83 132 76 100 76 130 56 103 86 122 132 Pakistani 108 84 135 73 89 60 128 30 102 83 123 103 Bangladeshi 98 66 141 29 90 50 148 15 95 69 128 44 Other Asian 88 63 120 40 105 70 150 29 94 73 119 69 Black Caribbean 69 59 80 167 85 71 102 123 75 67 84 290 Black African 84 70 102 112 82 65 103 77 84 72 96 189 Other Black 52 36 74 31 64 36 106 15 56 41 74 46 Chinese 112 53 205 10 101 52 176 12 105 66 160 22 Other 86 60 120 35 106 71 151 30 94 73 120 65 Total 100 4108 100 4037 100 8145
Care Quality Commission Count me in census 2010 52
Appendix B Mental health tables continued
Table B5 Standardised ratios by ethnic group for patients referred by criminal justice routes (police prison probation courts court liaison and diversion) (England and Wales = 100)
Ethnic group
Men Women Persons Standardised
referral ratio
95 confidence
interval Observed numbers
Standardised referral ratio
95 confidence
interval Observed numbers
Standardised referral ratio
95 confidence
interval Observed numbers
White British 90 86 95 1495 95 86 104 421 91 87 95 1916 White Irish 133 94 183 38 59 19 138 5 116 84 157 43 Other White 112 93 134 119 103 68 150 27 111 93 130 146 White and Black Caribbean 117 89 151 58 145 69 266 10 120 94 153 68 White and Black African 190 127 273 29 141 38 361 4 183 126 256 33 White and Asian 75 39 131 12 160 52 373 5 89 52 143 17 Other Mixed 104 65 157 22 151 61 311 7 112 75 161 29 Indian 86 61 118 38 79 32 163 7 85 62 113 45 Pakistani 118 91 150 65 89 33 194 6 115 90 145 71 Bangladeshi 74 44 115 19 29 1 162 1 68 42 105 20 Other Asian 130 95 174 45 164 71 323 8 134 101 176 53 Black Caribbean 131 114 150 208 124 81 181 26 130 114 148 234 Black African 132 112 156 145 143 93 211 25 134 114 156 170 Other Black 141 109 180 65 236 113 435 10 149 117 187 75 Chinese 83 27 194 5 146 30 426 3 99 43 195 8 Other 129 93 175 41 113 37 264 5 127 93 170 46 Total 100 2404 100 570 100 2974
Care Quality Commission Count me in census 2010 53
Appendix B Mental health tables continued
Table B6 Standardised detention ratios by ethnic group all detentions on day of admission (excluding outpatients on a CTO) (England and Wales = 100)
Ethnic group
Men Women Persons Standardised
detention ratio
95 confidence
interval Observed numbers
Standardised detention
ratio
95 confidence
interval Observed numbers
Standardised detention
ratio
95 confidence
interval Observed numbers
White British 94 92 97 6449 94 91 97 3628 94 92 96 10077 White Irish 112 95 131 154 118 96 145 94 114 101 129 248 Other White 108 98 118 451 120 106 136 251 112 104 120 702 White and Black Caribbean 123 107 141 220 129 99 167 59 124 110 140 279 White and Black African 128 99 162 68 113 70 173 21 124 100 153 89 White and Asian 96 71 126 50 109 68 164 22 99 78 125 72 Other Mixed 115 92 143 82 139 100 188 42 122 102 146 124 Indian 97 83 113 164 110 86 137 77 101 88 114 241 Pakistani 109 94 126 194 102 74 136 44 108 94 122 238 Bangladeshi 86 67 109 69 91 55 142 19 87 70 107 88 Other Asian 109 92 130 133 120 86 163 40 112 96 130 173 Black Caribbean 129 121 139 774 143 125 162 238 132 124 141 1012 Black African 115 104 127 422 131 111 153 159 119 110 129 581 Other Black 117 100 136 170 148 105 202 39 122 106 140 209 Chinese 108 71 159 26 129 78 202 19 116 85 156 45 Other 111 92 132 126 116 83 157 41 112 96 130 167 Total 100 9552 100 4793 100 14345
Care Quality Commission Count me in census 2010 54
Appendix B Mental health tables continued
Table B7 Standardised detention ratios by ethnic group detention on day of admission ndash section 2 of the Mental Health Act (England and Wales = 100)
Ethnic group
Men Women Persons Standardised
detention ratio
95 confidence
interval Observed numbers
Standardised detention
ratio
95 confidence
interval Observed numbers
Standardised detention
ratio
95 confidence
interval Observed numbers
White British 97 91 102 1156 93 87 98 1133 95 91 99 2289 White Irish 78 47 120 20 116 79 166 30 97 72 128 50 Other White 100 78 126 70 134 108 166 88 116 99 136 158 White and Black Caribbean 55 30 93 14 60 24 124 7 57 35 87 21 White and Black African 91 37 188 7 150 60 308 7 113 62 190 14 White and Asian 80 29 174 6 119 44 258 6 96 49 167 12 Other Mixed 68 28 141 7 116 53 221 9 89 51 145 16 Indian 130 91 179 37 124 81 182 26 127 98 163 63 Pakistani 126 87 176 34 138 79 225 16 130 96 171 50 Bangladeshi 166 101 256 20 140 61 276 8 158 105 228 28 Other Asian 142 93 209 26 163 93 264 16 150 108 202 42 Black Caribbean 73 57 92 70 97 72 128 51 82 68 98 121 Black African 164 131 202 87 190 146 244 62 174 147 204 149 Other Black 114 75 166 27 140 72 245 12 121 86 165 39 Chinese 165 60 358 6 212 97 402 9 190 106 313 15 Other 218 153 302 36 179 108 280 19 203 153 264 55 Total 100 1623 100 1499 100 3122
Care Quality Commission Count me in census 2010 55
Appendix B Mental health tables continued
Table B8 Standardised detention ratios by ethnic group detention on day of admission ndash section 3 of the Mental Health Act (England and Wales = 100)
Ethnic group
Men Women Persons Standardised
detention ratio
95 confidence
interval Observed numbers
Standardised detention
ratio
95 confidence
interval Observed numbers
Standardised detention
ratio
95 confidence
interval Observed numbers
White British 99 95 103 2684 96 91 100 1852 98 95 101 4536 White Irish 116 89 149 60 135 101 177 52 124 102 149 112 Other White 112 96 129 186 110 92 132 121 111 99 124 307 White and Black Caribbean 114 91 143 79 130 90 183 33 119 98 143 112 White and Black African 97 60 148 21 107 54 192 11 100 69 141 32 White and Asian 84 50 133 18 97 48 173 11 89 59 127 29 Other Mixed 121 84 168 35 117 72 181 20 120 90 156 55 Indian 96 75 122 67 110 79 148 42 101 83 122 109 Pakistani 91 71 115 69 88 55 134 22 90 73 111 91 Bangladeshi 63 39 95 22 64 28 127 8 63 43 90 30 Other Asian 90 65 120 44 94 56 149 18 91 70 117 62 Black Caribbean 116 102 130 279 164 138 192 148 129 117 142 427 Black African 95 80 112 143 102 79 129 68 97 85 111 211 Other Black 75 55 99 49 99 58 159 17 80 62 102 66 Chinese 119 59 213 11 99 43 194 8 110 66 171 19 Other 85 60 116 38 84 48 136 16 84 63 110 54 Total 100 3805 100 2447 100 6252
Care Quality Commission Count me in census 2010 56
Appendix B Mental health tables continued
Table B9 Standardised detention ratios by ethnic group detention on day of admission ndash section 3741 of the Mental Health Act (England and Wales = 100)
Ethnic group
Men Women Persons Standardised
detention ratio
95 confidence
interval Observed numbers
Standardised detention
ratio
95 confidence
interval Observed numbers
Standardised detention
ratio
95 confidence
interval Observed numbers
White British 84 79 89 991 101 88 115 220 86 82 91 1211 White Irish 140 96 198 32 48 6 175 2 126 87 176 34 Other White 112 89 139 81 156 95 241 20 118 96 144 101 White and Black Caribbean 177 133 232 53 179 66 390 6 178 135 229 59 White and Black African 149 82 251 14 224 46 654 3 159 92 254 17 White and Asian 141 75 241 13 195 40 569 3 149 85 241 16 Other Mixed 144 85 227 18 264 97 575 6 162 104 242 24 Indian 86 56 126 26 44 5 160 2 80 53 116 28 Pakistani 122 87 166 40 0 0 111 79 152 40 Bangladeshi 66 32 122 10 0 0 60 29 110 10 Other Asian 99 61 151 21 0 0 89 55 136 21 Black Caribbean 200 174 229 210 78 34 153 8 189 165 216 218 Black African 127 101 157 82 84 34 172 7 122 98 150 89 Other Black 152 110 205 43 94 11 341 2 148 108 198 45 Chinese 100 27 255 4 0 0 80 22 204 4 Other 118 75 177 23 44 1 245 1 110 71 164 24 Total 100 1661 100 280 100 1941
Care Quality Commission Count me in census 2010 57
Appendix B Mental health tables continued
Table B10 Standardised detention ratios by ethnic group detention on day of admission ndash sections 47 48 4749 of the Mental Health Act (England and Wales = 100)
Ethnic group
Men Women Persons Standardised
detention ratio
95 confidence
interval Observed numbers
Standardised detention
ratio
95 confidence
interval Observed numbers
Standardised detention
ratio
95 confidence
interval Observed numbers
White British 97 90 106 583 104 81 131 73 98 91 106 656 White Irish 132 72 221 14 163 20 590 2 135 77 219 16 Other White 130 96 172 49 71 15 206 3 124 93 163 52 White and Black Caribbean 126 78 193 21 80 2 444 1 123 77 186 22 White and Black African 207 103 370 11 0 0 189 95 339 11 White and Asian 57 12 166 3 169 4 941 1 68 19 175 4 Other Mixed 112 48 221 8 233 28 843 2 125 60 230 10 Indian 57 26 108 9 0 252 0 52 24 99 9 Pakistani 92 54 147 17 0 314 0 86 50 138 17 Bangladeshi 46 12 117 4 167 4 930 1 53 17 125 5 Other Asian 101 52 177 12 0 0 95 49 166 12 Black Caribbean 126 98 159 70 125 34 319 4 126 99 158 74 Black African 74 48 107 27 104 21 303 3 76 51 108 30 Other Black 127 78 197 20 138 3 769 1 128 79 195 21 Chinese 0 0 0 0 0 0 Other 83 38 157 9 0 0 77 35 147 9 Total 100 857 100 91 100 948
Care Quality Commission Count me in census 2010 58
Appendix B Mental health tables continued
Table B11 Standardised ratios for all applications of the Mental Health Act (including outpatients on a CTO) by ethnic group on day of census (England and Wales = 100)
Ethnic group
Men Women Persons Standardised
ratio for all MHA
applications
95 confidence
interval Observed numbers
Standardised ratio for all MHA
applications
95 confidence
interval Observed numbers
Standardised ratio for all MHA
applications
95 confidence
interval Observed numbers
White British 97 94 99 7659 95 93 98 4335 96 94 98 11994 White Irish 99 83 116 147 104 84 128 95 101 89 114 242 Other White 87 79 95 427 97 85 110 249 90 84 97 676 White and Black Caribbean 117 103 133 245 130 103 163 76 120 107 134 321 White and Black African 120 95 150 79 93 58 141 22 113 92 137 101 White and Asian 101 78 128 65 119 81 169 31 106 86 129 96 Other Mixed 110 89 134 96 125 93 165 49 114 97 135 145 Indian 103 90 118 215 122 100 147 109 109 97 121 324 Pakistani 111 97 125 254 117 90 148 67 112 100 125 321 Bangladeshi 92 75 112 97 101 68 145 29 94 78 112 126 Other Asian 103 88 121 152 126 95 164 56 109 94 124 208 Black Caribbean 123 115 131 893 141 126 158 300 127 120 134 1193 Black African 112 103 122 511 121 104 140 188 114 106 123 699 Other Black 116 102 132 232 148 112 191 59 122 108 136 291 Chinese 97 64 140 27 101 61 157 19 98 72 131 46 Other 104 87 122 140 103 75 137 46 103 89 119 186 Total 100 11239 100 5730 100 16969
Care Quality Commission Count me in census 2010 59
Appendix B Mental health tables continued
Table B12 Standardised CTO ratios by ethnic group CTOs on day of census ndash section 17a of the Mental Health Act (England and Wales = 100)
Ethnic group
Men Women Persons
Standardised CTO ratio
95 confidence
interval Observed numbers
Standardised CTO ratio
95 confidence
interval Observed numbers
Standardised CTO ratio
95 confidence
interval Observed numbers
White British 94 89 99 1289 88 82 94 730 92 88 96 2019 White Irish 51 27 88 13 77 41 132 13 62 40 90 26 Other White 97 77 120 83 125 95 162 58 107 90 126 141 White and Black Caribbean 79 53 113 29 141 77 237 14 92 67 124 43 White and Black African 111 59 190 13 125 41 292 5 115 68 181 18 White and Asian 104 54 182 12 136 50 297 6 113 67 178 18 Other Mixed 102 59 166 16 136 62 257 9 112 73 166 25 Indian 134 99 177 48 152 98 226 24 139 109 175 72 Pakistani 145 110 187 59 174 101 279 17 151 119 189 76 Bangladeshi 142 93 206 27 205 99 378 10 155 109 213 37 Other Asian 107 71 155 28 182 99 305 14 124 89 168 42 Black Caribbean 121 103 142 152 171 132 218 65 133 116 152 217 Black African 116 94 142 94 139 98 192 37 122 102 145 131 Other Black 186 144 238 65 305 189 466 21 206 165 254 86 Chinese 83 23 213 4 152 49 354 5 111 51 211 9 Other 87 54 134 21 152 79 266 12 103 71 145 33 Total 100 1953 100 1040 100 2993
Care Quality Commission Count me in census 2010 60
Appendix C Learning disability tables
Table C1 Standardised admission ratios by ethnic group for England and Wales using 2007 ONS population denominators (England amp Wales = 100) All ages
Ethnic group
Men Women Persons Standardised
admission ratio
95 confidence
interval Observed numbers
Standardised admission
ratio
95 confidence
interval Observed numbers
Standardised admission
ratio
95 confidence
interval Observed numbers
White British 104 100 109 2163 108 101 115 941 105 102 109 3104 White Irish 108 72 156 28 151 89 238 18 121 89 162 46 Other White 81 65 101 85 49 30 75 21 72 59 87 106 White and Black Caribbean 280 186 405 28 246 118 453 10 270 191 371 38 White and Black African 102 33 239 5 165 34 482 3 119 51 235 8 White and Asian 66 26 135 7 154 56 335 6 89 47 152 13 Other Mixed 181 104 295 16 229 99 451 8 195 125 290 24 Indian 32 21 48 24 28 12 55 8 31 21 44 32 Pakistani 48 30 72 22 12 1 43 2 38 25 57 24 Bangladeshi 102 60 161 18 31 4 113 2 83 51 128 20 Other Asian 33 13 69 7 92 34 201 6 47 25 81 13 Black Caribbean 265 210 332 77 117 67 190 16 218 176 267 93 Black African 53 33 80 22 40 15 87 6 50 33 72 28 Other Black 228 118 399 12 134 28 392 3 200 112 330 15 Chinese 4 0 21 1 3 0 16 1 Other 26 9 56 6 11 0 59 1 21 9 44 7 Total 100 2521 100 1051 100 3572
Care Quality Commission Count me in census 2010 61
Appendix C Learning disability tables continued
Table C2 Standardised detention ratios by ethnic group all detentions on day of admission (England and Wales = 100)
Ethnic group
Persons Standardised
detention ratio
95 confidence
interval Observed numbers
White British 97 93 103 1431 White Irish 127 84 184 28 Other White 117 91 149 68 White and Black Caribbean 120 77 179 24 White and Black African 114 37 267 5 White and Asian 75 24 176 5 Other Mixed 94 49 165 12 Indian 119 72 186 19 Pakistani 110 61 181 15 Bangladeshi 144 84 231 17 Other Asian 59 16 150 4 Black Caribbean 119 90 155 57 Black African 138 85 210 21 Other Black 62 20 145 5 Chinese 0 0 Other 104 28 267 4 Total 100 1715
Care Quality Commission Count me in census 2010 62
copy Care Quality Commission and National Mental Health Development Unit 2011 Published April 2011
This publication may be reproduced in whole or in part in any format or medium for non-commercial purposes provided that it is reproduced accurately and not used in a derogatory manner or in a misleading context The source should be acknowledged by showing the publication title and copy Care Quality Commission and National Mental Health Development Unit 2011
How to contact us
Phone 03000 616161 Email enquiriescqcorguk Web wwwcqcorguk
Write to us at Care Quality Commission National Correspondence Citygate Gallowgate Newcastle upon Tyne NE1 4PA
Please contact us if you would like a summary of this publication in other formats or languages
Registered office Care Quality Commission Finsbury Tower 103ndash105 Bunhill Row London EC1Y 8TG
- Count me in 2010
- About the Care Quality Commission
- Contents
- Summary
- National organisations coordinating the census
- Introduction
- Data methods of analysis and interpretation
- Results mental health
- A comparison between the 2005 baseline and the 2010 census
- Results learning disabilities
- Data in the future Moving beyond a one-day census
- Conclusions
- References
- Appendix A Methods of analysis
- Appendix B Mental health tables
- Appendix C Learning disability tables
- How to contact us
-

Results mental health continued
Source of referral
People can be referred to healthcare services in a number of ways Referrals for inpatient care often come from community mental health teams rather than the original source such as GPs and accident and emergency (AampE) departments Therefore referrals from these teams may include referrals from other sources Furthermore about a quarter of patients (26) were referred from tertiary care and information about their original referral source was not available We had no information about the source of referral for 13 of patients The results reflect the proportions of patients from each ethnic group that are referred from each source so a higher proportion of referrals from one source will inevitably mean that proportions from other referral sources are lower Outpatients on a CTO are excluded from these data
The referral patterns are broadly similar to those reported previously and the key results are presented below
GP referrals 7 of patients Rates were 8 higher than average among the White British group They were lower than average among the Other White Black Caribbean Black African and WhiteBlack Caribbean Mixed groups by 28 to 72 The rates of referral by GPs are given in Appendix B Table B3
Referrals from AampE departments 5 of patients The White British group had a 9 lower than average rate of such referrals The WhiteBlack African Mixed Indian Bangladeshi Black African and Other groups were more likely than average to be referred in this way
Referrals from community mental health teams 26 of patients For the White British group such referrals were 5 higher than the average rate They were lower than average among the Other White WhiteBlack African Mixed Black Caribbean Black African and
Other Black groups by 16 to 48 The rates of referral are given in Appendix B Table B4
Referrals from the criminal justice system 9 of patients This is defined as the police courts probation service prison and court liaison and diversion service
Patients from the White British group were less likely than average to be referred by the criminal justice agencies whereas the Black Caribbean Black African Other Black WhiteBlack African Mixed and Other Asian groups were 30 to 83 more likely than average to be referred in this way We observed no differences from the average rate for other ethnic groups Rates of referral by the criminal justice system are given in Appendix B Table B5
A significant proportion (26) of all referrals were from tertiary care
Tertiary care referrals from medium or high secure units 5 of patients The rate for such referrals (in NHS or independent sectors) was lower than average among the Other White and Indian groups It was higher than average among the Black Caribbean and WhiteBlack Caribbean Mixed groups by about 75
Tertiary care referrals from other inpatient services 21 of patients The rate for such referrals (NHS and independent) was higher than average among the White Irish and Other White groups by 29 and 59 respectively The rate was lower than average in the Indian and Other Black groups
Tertiary care referrals from other clinical specialties 9 of patients Rates of such referrals were higher than average among the White British and Indian groups and lower than average among the Other White WhiteBlack Caribbean Mixed Other Asian Black African Other Black and Chinese groups
Care Quality Commission Count me in census 2010 21
Results mental health continued
Detention under the Mental Health Act 1983 on day of admission
The Mental Health Act 2007 made a number of changes to the Mental Health Act 1983 These changes were reflected in the census of 2009 and 2010 which collected information on new provisions establishing supervised community treatment (section 17A) and excluded supervised discharge (section 25A) which was abolished
As in previous reports we present below the results for detention rates on the day of admission Outpatients on a CTO are excluded from these analyses After that we present rates for all patients subject to the Mental Health Act on census day (including outpatients on a CTO) followed by rates for patients on a CTO on census day
All detentions Forty-nine per cent (14637) of patients were detained under the Mental Health Act on admission to hospital This was a higher proportion than recorded in the previous censuses (40 in 2005 and 2006 43 in 2007 45 in 2008 and 47 in 2009)
Detention rates were 6 lower than average among White British patients and between 19 and 32 higher than average among the Black Caribbean Black African Other Black and WhiteBlack Caribbean Mixed groups Detention rates were also higher in the White Irish and Other White groups by about 13 and in the Other Mixed group by 22 No other ethnic differences were observed The results are given in Appendix B Table B6
These patterns are broadly similar to those reported in previous censuses
Detention under section 2 Section 2 of the Mental Health Act gives authority for a person to be detained in hospital for assessment for a period not exceeding 28 days It is mainly applied where the patient is unknown to the service or where there has been a significant interval between periods of inpatient treatment
Of all patients detained on admission 22 were detained under section 2 Rates of detention under this section were lower than average among the White British WhiteBlack Caribbean Mixed and Black Caribbean groups and higher than average among the Bangladeshi Other Asian Black African Chinese and Other groups by between 50 and 103 (see Appendix B Table B7)
Detention under section 3 Section 3 of the Act provides for the compulsory admission of a patient to hospital for lsquotreatmentrsquo and for his or her subsequent detention which can last for an initial period of up to six months and is renewable after this
Of all patients detained on admission 43 were detained under this section Rates were higher than average among the White Irish and Black Caribbean groups by 24 and 29 respectively and lower among than average among the Bangladeshi group No other ethnic differences were observed The rates of detention under section 3 are given in Appendix B Table B8
Detention under section 3741 Section 37 of the Mental Health Act allows a court to send a person to hospital for treatment when they might otherwise have been given a prison sentence and section 41 allows a court to place restrictions on a personrsquos discharge from hospital Admission to hospital rather than prison is generally regarded as a more positive outcome for the person concerned
Care Quality Commission Count me in census 2010 22
Results mental health continued
Of all patients detained on admission 14 were detained under section 37 with a section 41 restriction order applied The rates of detention are given in Appendix B Table B9 In all minority ethnic groups very few women were detained under section 3741 Among men the rate of detention for the White British group was 16 lower than average and it was higher than average in the WhiteBlack Caribbean Mixed group by 77 the Black Caribbean group by 100 the Black African group by 27 and the Other Black group by 52
A consistent pattern across all six annual censuses was the higher than average detention rate under section 3741 for the Black Caribbean and Other Black groups
Detention under sections 47 48 and 4749 These sections of the Mental Health Act allow the Ministry of Justice to issue a direction to transfer a person detained in prison to a hospital for treatment
Of all patients detained on admission 7 were detained under these sections The only ethnic differences observed were a 107 higher than average detention rate among men from the White Black African Mixed group and a lower than average rate for the Indian group We observed no other ethnic differences probably because the numbers of detentions under these sections were low in most minority ethnic groups These rates of detention are given in Appendix B Table B10
The previous four censuses also showed virtually no ethnic differences for rates of detention under sections 47 48 and 4749
Patients subject to the Mental Health Act 1983 on day of census
All patients subject to the Mental Health Act Of all the 32399 patients in the census a total of 53 (17299) were subject to the Mental Health Act on census day including 2959 outpatients and 75 inpatients on a CTO (either voluntarily or recalled) Ratios for the different ethnic groups for overall applications of the Mental Health Act including CTOs showed broadly similar patterns to detention rates on admission day from which patients on a CTO were excluded In both cases rates were higher than average among the Black Caribbean Black African Other Black and White Black Caribbean Mixed groups However the higher than average detention rates for the White Irish Other White and Other Mixed groups on admission day were not apparent on census day
The rates are given in Appendix B Table B11
Supervised community treatment under section 17A Community treatment orders (CTOs) were introduced in November 2008 as a result of the Mental Health Act 2007 They allow for supervised community treatment to be provided for up to six months with the possibility of an extension after this These orders are designed to help patients to maintain stable mental health outside hospital and to promote recovery by providing professionals with the power to set conditions on discharge from hospital and a power to recall patients if arrangements in the community are not working
Nine per cent of all patients in the census were on CTOs compared with 4 in 2009 Of all the 17299 patients subject to the Mental Health Act on census day almost 18 (3034) were on CTOs Of the patients on a CTO 2959 were outpatients and 75 were inpatients (50 voluntary and 25 recalled)
Care Quality Commission Count me in census 2010 23
Results mental health continued
The rate of supervised community treatment among all patients included in the census was lower than average in the White British and White Irish groups and higher than average in the South Asian (Indian Pakistani Bangladeshi) and Black (Black Caribbean Black African Other Black) groups by 22 to 106 The ratios are given in Appendix B Table B12
Consent
About 25 of informally admitted patients were deemed incapable of consenting to treatment The only ethnic difference observed was a higher than average rate for the Pakistani group but this was based on very few patients
About 18 of patients who were detained or on CTOs were deemed incapable of consenting to treatment These rates were lower than average by 7 in the White British group and were higher than average among the Other White WhiteBlack Caribbean Mixed and Black African groups by 21 35 and 36 respectively
In addition 13 of patients who were detained or on CTOs on census day were deemed capable of consenting to treatment but refused to do so The White British group had a rate of refusals that was 10 lower than average and rates were higher than average among the White Irish WhiteBlack Caribbean Mixed Other Mixed Black Caribbean and Black African groups by between 39 and 71
Care programme approach
The Care Programme Approach (CPA) is the process by which treatment care and support for people with serious mental health problems and accompanying health and social care needs are agreed coordinated and understood by all involved From October 2008 changes to the CPA in England
mean that it is no longer categorised into two parts (lsquostandardrsquo and lsquoenhancedrsquo) and just the one category of enhanced CPA applies This makes CPA policy in England different to that in Wales where the distinction still applies The CPA data presented here therefore includes all CPA patients in England and both lsquostandardrsquo and lsquoenhancedrsquo CPA patients in Wales
About 89 of all patients were on a CPA 3 were on a single assessment process (SAP) whereby assessments are made for adults with health and or social care needs and 8 were on neither CPA nor SAP As most patients were on a CPA no ethnic differences were observed
Recorded incidents
The 2010 census asked about the number of times that patients experienced seclusion hands-on restraint self-harm accident and physical assault in a current hospital spell or if the patientrsquos hospital spell was longer than three months the number that took place within the last three months Outpatients on a CTO are excluded from these data It should be noted that the rates of such events among minority ethnic groups can show yearly variation because of the low numbers of events in several groups
Seclusion Seclusion was defined as the supervised confinement of a patient in a room which may be locked to protect others from significant harm Four per cent of patients had experienced one or more episodes of seclusion The White British group had a seclusion rate that was 9 lower than average Rates were higher than average among the WhiteBlack Caribbean Mixed WhiteBlack African Mixed Black Caribbean and Black African groups by 80 90 36 and 56 respectively
Care Quality Commission Count me in census 2010 24
Results mental health continued
Although the number of incidents of seclusion was low in several minority ethnic groups some general patterns over the six censuses to date are
bull The proportion of all patients who had an episode of seclusion stayed fairly constant over the six censuses at about 4
bull Although there have been annual fluctuations the seclusion rate has been higher than average for the Black and WhiteBlack Mixed groups in three or four of the six censuses and in the Other White group in three censuses
Hands-on restraint This was defined as the physical restraint of a patient by one or more members of staff in response to aggressive behaviour or resistance to treatment About 12 of patients had experienced one or more episodes of hands-on restraint No ethnic differences were observed In fact very few ethnic differences have been observed in the previous censuses also and they have not shown a consistent pattern
Self-harm Eight per cent of patients had harmed themselves on one or more occasions Only the White British group had a rate that was higher than average (by 14) Rates were lower than average among several minority ethnic groups the three Black groups (Black Caribbean Black African and Other Black) by about 70 the three south Asian groups (Indian Pakistani Bangladeshi) by between 37 and 78 and the Other Mixed and Other Asian groups by about 60
In terms of comparison with previous years
bull The proportion of all patients who had harmed themselves stayed fairly constant at about 7ndash8
bull In all censuses the White British group had a higher than average rate of self-harm and the Black and South Asian groups had lower than average rates of self-harm
Accidents About 11 of patients had experienced one or more accidents Patients from the White British group experienced a rate of accidents that was 6 higher than average Rates were lower than average in the Black Caribbean Black African Other Black and Other Asian groups by about 50 to 70 No accidents were reported for the Chinese group
In terms of comparisons with previous years
bull The proportion of all patients who had had an accident stayed fairly constant
bull The rate of accidents in the different censuses was higher than average in the White British group and lower than average in the Black Caribbean group Few other ethnic differences were observed and they were not consistent
Physical assault on the patient The definition of assault includes incidents of physical assault on the patient irrespective of who committed the assault We do not have information on who committed the assault for example whether it was another patient or a member of staff Eleven per cent of patients were involved in one or more episodes of physical assault The only ethnic difference observed was a 19 lower than average rate among the Black Caribbean group
In terms of comparisons with previous years
bull The proportion of all patients who had experienced a physical assault stayed fairly constant
bull Very few ethnic differences in rates of assault were observed in the different censuses and they did not show a consistent pattern
Care Quality Commission Count me in census 2010 25
Results mental health continued
Duration of stay in hospital from admission to census day
We analysed the length of the period between each inpatientrsquos admission to hospital and the census day This period is of course shorter than a patientrsquos full length of stay in hospital which runs from admission to the date when they are discharged Outpatients on a CTO are excluded from the following analyses
bull 25 of inpatients had been in hospital for one month or less
bull 20 had been in hospital between one and three months
bull 13 had been in hospital between three and six months
bull 11 had been in hospital between six months and one year
bull 11 had been in hospital between one and two years
bull 12 had been in hospital between two and five years
bull 8 had been in hospital for more than five years
These results are similar to those of previous censuses About 31 of patients in the 2010 census had been in hospital for more than a year and had therefore also been included in the 2009 census About 20 of patients had been in hospital for more than two years and will have been included in both the 2008 and 2009 censuses
We calculated the median length of stay for different ethnic groups The median is the midpoint of the range of values so the median length of stay is the one at which half the patients had a length of stay less than the median and half had a stay longer than the median Overall and as in previous years the median amount of time that women had spent in hospital was about 25 months and the median for men was about 58 months (see Table 6) In most ethnic groups the median time spent in hospital was two to three times longer for men than for women in the Other Black group men had been in hospital four times longer than women
Median lengths of stay were longest for men from the Black Caribbean WhiteBlack Caribbean Mixed and Other Black groups and shortest for men from the Chinese Bangladeshi and Other groups Median lengths of stay were longest for women from the WhiteBlack Caribbean Mixed and Black Caribbean groups and shortest for women from the Chinese and Bangladeshi groups
A number of important factors influence a patientrsquos length of stay in hospital including age gender whether or not they are detained under the Mental Health Act (and the section under which they are detained and whether there is an additional restriction order) the type and severity of their illness the nature of their treatment and the availability of support in the community The data in the census does not allow for analysis of these factors
Table 6 Median number of days from the day of admission to the day of census
Ethnic group Men Women
White British 161 71
White Irish 218 114
Other White 238 113
White and Black Caribbean 275 191
White and Black African 182 92
White and Asian 226 78
Other Mixed 173 112
Indian 172 70
Pakistani 153 56
Bangladeshi 134 55
Other Asian 167 61
Black Caribbean 345 122
Black African 141 66
Other Black 248 58
Chinese 135 51
Other 131 76
Total 174 75
Care Quality Commission Count me in census 2010 26
Results mental health continued
Ward security
As in previous years about 11 of all patients were on a medium or high secure ward as opposed to a general (76) or low secure (13) ward
Patients from the White British Indian and Bangladeshi groups were less likely than average to be on a medium or high secure ward by 7 30 and 67 respectively Patients from the White Irish WhiteBlack Caribbean Mixed Black Caribbean and Other Black groups had a higher than average rate by between 43 and 55
Age range on wards
Among patients under 18 years of age 61 were being cared for on wards for working-age adults on census day and five patients were on a ward for older people Seven per cent of patients on wards for working-age adults were 65 or over and
8 of those on wards for older people were adults of working age There were very few lsquoout of agersquo placements among minority ethnic groups
Patients in wards designated as single sex or mixed
Providers were asked whether patients were on a ward designated as men or women only or mixed gender All the analyses of single sex accommodation and facilities exclude outpatients on a CTO Overall 61 of men and 77 of women were not in a ward designated for single sex use similar proportions as in previous years The proportion of patients not in a designated single sex ward was lower among almost all minority ethnic groups than among the White British group In all ethnic groups the proportion of men who were not in a designated single sex ward was lower than among women (see Table 7a)
Two further questions examined the single sex facilities that were available to patients
At the time of the 2010 census the following guidance from the Department of Health applied in England A ward can be described as single sex (ie the intended sex of the ward is either male or female and not mixed) when the accommodation complies with the following definition from the Department of Health of single sex accommodation ldquoSleeping areas must be segregated and members of one sex must not have to walk through an area occupied by the other sex to reach toilets or bathrooms Separate male and female only toilets and bathrooms must be provided There should be separate day rooms to which only women have accessrdquo However there is a discrepancy for providers because accommodation designated as a lsquowardrsquo for administrative purposes may incorporate single sex accommodation for both sexes that meets the guidelines ndash but in this case the ward would still be lsquomixedrsquo (based on guidance from Safety Privacy and Dignity Department of Health 2000)
As long as men and women are cared for in separate bays or rooms and have their own toilet facilities then it may well be appropriate for them to be on the same ward being cared for by the same team of doctors and nurses In practice good segregation can be achieved if men and women have separate sleeping areas (for example single sex bays) and have separate toilets and bathrooms that they can reach without having to pass through (or close to) areas for the opposite sex The layout of wards should minimise any risk of overlooking or overhearing by members of the opposite gender (from Privacy and Dignity ndash A report by the Chief Nursing Officer into mixed sex accommodation in hospitals Department of Health 2007)
The coalition governmentrsquos revised Operating Framework for 201011 requires NHS organisations to eliminate mixed-sex accommodation except under exceptional circumstances from 2011 The national guidance relating to mixed sex accommodation was issued in November 2010 and states that ldquoNo areas are exempt and every decision to mix must be justified by reference to the patientrsquos clinical needs not organisational convenience or custom and practicerdquo For mental health and learning disability trusts it states ldquoThere is no acceptable justification for admitting a mental health patient to mixed-sex accommodationrdquohellip It ldquomay be acceptable in a clinical emergency to admit a patient temporarily to a single ensuite room in the opposite-gender area of a ward In such cases a full risk-assessment must be carried out and complete safety privacy and dignity maintainedrdquo The guidance is available at wwwdhgovukenPublicationsandstatisticsLettersandcircularsProfessionallettersChiefnursingofficerlettersDH_121848
Care Quality Commission Count me in census 2010 27
Results mental health continued
Table 7a Percentage of patients not in a designated single sex ward by ethnic group
Ethnic group
Sex of patients and ward
Male Female
Male ward Female or mixed ward Female ward Male or mixed ward
White British 35 65 21 79
White Irish 41 59 28 72
Other White 44 56 28 72
White and Black Caribbean 56 44 31 69
White and Black African 48 52 41 59
White and Asian 43 57 34 66
Other Mixed 49 51 24 76
Indian 37 63 25 75
Pakistani 48 52 35 65
Bangladeshi 23 77 18 82
Other Asian 46 54 22 78
Black Caribbean 55 45 32 68
Black African 49 51 28 72
Other Black 49 51 30 70
Chinese 42 58 30 70
Other 43 57 20 80
Total 39 61 23 77
The vast majority of patients in this category were in mixed wards very few (under 05) male patients were on female-only wards or vice versa
Care Quality Commission Count me in census 2010 28
Results mental health continued
Patientsrsquo access to toilet and bathing facilities designated for single sex use
We asked providers if the patient had access to toilet and bathing facilities designated for single sex use Overall 13 of men and 16 of women
were reported as not having access to such facilities designated for single sex use This was an improvement over 2009 when these proportions were 19 and 24 respectively The proportion of patients not having access to toilet and bathing facilities designated for single sex use was lower among almost all minority ethnic groups than among the White British group (see Table 7b for details)
Table 7b Percentage of patients not having access to toilet and bathing facilities designated for single sex use by ethnic group
Ethnic group
Access to designated single sex bathing and toilet facilities
Male Female
Male facilities
Female or mixed facilities
Female facilities
Male or mixed facilities
White British 86 14 84 16
White Irish 87 13 87 13
Other White 89 11 86 14
White and Black Caribbean 93 7 93 7
White and Black African 90 10 93 7
White and Asian 90 10 84 16
Other Mixed 98 2 96 4
Indian 91 9 90 10
Pakistani 95 5 94 6
Bangladeshi 92 8 98 2
Other Asian 92 8 86 14
Black Caribbean 92 8 90 10
Black African 91 9 91 9
Other Black 92 8 89 11
Chinese 82 18 83 17
Other 87 13 90 10
Total 87 13 84 16
The vast majority of patients in this category had access to mixed facilities very few (1) of male patients had access to female-only facilities or vice versa
Care Quality Commission Count me in census 2010 29
Results mental health continued
Patientsrsquo access to a lounge area day space designated for single sex use
We also asked providers if patients had access to a lounge area or day space designated for single sex use Overall 37 of men and 39 of women were
reported as not having access to these facilities This was an improvement over 2009 when these proportions were 48 and 51 respectively The proportion of patients not having access to a lounge areaday space designated for single sex use was lower among most minority ethnic groups than among the White British group (see Table 7c for details)
Table 7c Percentage of patients not having access to a lounge areaday space designated for single sex use by ethnic group
Ethnic group
Access to a lounge areaday space designated for single sex use
Male Female
Male facilities
Female or mixed facilities
Female facilities
Male or mixed facilities
White British 59 41 60 40
White Irish 63 37 70 30
Other White 68 32 63 37
White and Black Caribbean 82 18 73 27
White and Black African 83 18 76 24
White and Asian 72 28 75 25
Other Mixed 79 21 67 33
Indian 59 41 66 34
Pakistani 80 20 72 28
Bangladeshi 53 47 52 48
Other Asian 70 30 61 39
Black Caribbean 78 22 70 30
Black African 73 27 70 30
Other Black 79 21 72 28
Chinese 59 41 60 40
Other 67 33 67 33
Total 63 37 61 39
The vast majority of patients in this category had access to mixed facilities very few (1) of male patients had access to female-only facilities or vice versa
Care Quality Commission Count me in census 2010 30
Results mental health continued
Patientsrsquo subject to deprivation of liberty safeguards
People who lack the mental capacity to consent to the care or treatment they need should be cared for in a way that is least restrictive of their rights or freedom of action In 2007 the Mental Capacity Act 2005 was amended to introduce Deprivation of Liberty Safeguards for people who lack capacity to decide about their care or treatment and who need to be deprived of their liberty to protect them from harm The Safeguards came into effect in April 2009 and strengthen the rights of hospital patients and those in care homes as well as ensuring compliance with the European Convention on Human Rights (ECHR)
The 2010 census introduced a new question ldquoIs the patient subject to deprivation of liberty authorisation on 31 March 2010rdquo Under 1 (269) patients were reported as being subject to a deprivation of liberty authorisation on census day No ethnic differences in the rates were observed which may be due to the low numbers of patients among minority ethnic groups (69)
Care Quality Commission Count me in census 2010 31
A comparison between the 2005 baseline and the 2010 census
The changes we have seen in the census results between 2005 and 2010 the timespan of the Delivering Race Equality (DRE) action plan are set out below This is not a review of the DRE programme The aim is to give an overview of how some variables in the census have changed during the course of DRE and the findings should be seen in the light of the caveats described on page 13
bull The number of inpatients went down from 33785 to 29840 ndash a fall of 12
bull The proportion of patients in independent hospitals rose from 10 to 16
bull The overall proportion of patients from minority ethnic groups increased from 20 to 23 However there have been demographic changes during this time ndash the population from Black and minority ethnic groups in England and Wales rising from 79 million in 2005 to 85 million in 2007 (the latest year for which these figures are available) an increase of 8 in two years
bull Admission rates showed similar patterns across all censuses ndash Lower than average rates among the White
British Indian and Chinese groups ndash About average rates among the Pakistani and
Bangladeshi groups ndash Higher than average rates among other
minority ethnic groups ndash particularly in the Black and WhiteBlack Mixed groups for whom rates were two or more times higher than average in 2010 The Other Black group continues to have exceptionally high rates of admission (even after the apparent reduction since 2005 see next point)
bull One of the 12 goals of DRE was a decline in admission rates among Black and minority ethnic groups Figure 1 provides a comparison between 2005 and 2010 Although admission rates for
many ethnic groups show relatively little change since 2005 the rate for the Other Black group is considerably lower in 2010 (six times higher than average) compared with 2005 (12 times higher than average) However rates for the other Black and WhiteBlack Mixed groups show small increases
bull In general rates of referral from GPs and community mental health teams were lower than average among some Black and WhiteBlack groups and referral from the criminal justice system was higher Patterns were less consistent for other minority ethnic groups
bull There was a steady increase in the overall proportion of patients subject to the Mental Health Act Compared with 40 in 2005 49 of all patients were subject to the Mental Health Act in 2010 (53 if outpatients on a CTO are excluded)
bull Another DRE goal was to reduce detention rates among Black and minority ethnic groups However detention rates have been higher than average among the Black Caribbean Black African and Other Black groups in all six censuses and almost consistently higher in the WhiteBlack Caribbean Mixed and Other White groups Rates have been average for other minority ethnic groups
bull A consistent pattern was the higher than average detention rate under section 3741 for the Black Caribbean and Other Black groups
bull Another DRE goal was to reduce seclusion among Black and minority ethnic groups Although there have been annual fluctuations in seclusion rates they have been higher than average for the Black and WhiteBlack Mixed groups and the Other White group in at least three of the six censuses Other minority ethnic groups did not show high rates
Care Quality Commission Count me in census 2010 32
A comparison between the 2005 baseline and the 2010 census continued
Figure 1 Admission ratios in the 2005 and 2010 Count me in censuses by ethnic group England and Wales
Other Black
Black Caribbean
White and Black Caribbean
White and Black African
Black African
Other Mixed
Other Asian
White and Asian
Other
White Irish
Other White
Bangladeshi
White British
Pakistani
Indian
Chinese
0 100 200 300 400 500 600 700 800 900 1000 1100 1200 1300
Ageshysex standardised admission ratios (EampW=100)
Census 2005 admission ratios using 2005 ONS populations
bull Minority ethnic groups do not compare unfavourably for other incidents Rates of self-harm have consistently been lower than average among the Black and South Asian groups Very few ethnic differences in hands-on restraint physical assault and accidents were observed across the different censuses and they did not show a consistent pattern
bull About 31 of patients in all censuses had been in hospital for one year or more and were therefore included in more than one census
Census 2010 admission ratios using ONS 2007 populations (excluding outpatients on a CTO)
(This is one reason why the census shows little change over the six years It should be noted again that because the census is a one-day count it over-represents long-stay admissions and under-represents short-stay admissions)
bull Mixed accommodation was reported for many patients across all censuses although patients from Black and minority ethnic groups were more likely to be in single sex accommodation than White British patients
The admission ratios for the 2005 census shown here are different from those published in the 2005 report This is because we updated the analysis of the 2005 admission ratios by using 2005 ONS census populations for ethnic groups as denominators These populations were not available at the time of the 2005 report which instead used the 2001 ONS population data
Care Quality Commission Count me in census 2010 33
Results learning disabilities
We obtained information about 3642 patients in 129 organisations providing services for people with learning disabilities in England and Wales Of these two were inpatients on CTOs The total number of inpatients has declined each year and by 21 from 4609 in 2006 to 3642 in 2010 The total number of providers did not change much from the baseline year of 2006 although the number of NHS providers has fallen steadily and the number of independent healthcare organisations has increased (see Table 8) The proportion of inpatients in independent
healthcare organisations increased from 20 in 2006 to 33 in 2010 This is likely to be a result of closing NHS campuses with people moving from hospital to community settings
The pattern of results for learning disability patients in 2010 is broadly similar to that reported in previous censuses This is not surprising since many of the patients had been in hospital for a considerable period of time and they therefore appear in successive censuses
Table 8 The number of providers of learning disability services and inpatients
NHS (England)
Independent (England)
NHS (Wales)
Independent (Wales) Total
2010 census Number of providers 55 61 4 9 129 Number of all patients (including patients 2304 1072 154 112 3642 on a CTO) of all patients 633 294 42 31 100
2009 census Number of providers 60 54 5 4 123 Number of all patients (including patients 2487 1014 139 55 3695 on a CTO) of all patients 673 274 38 15 100
2008 census Number of providers 62 57 5 5 129
Number of inpatients 2873 1050 143 41 4107
of inpatients 700 256 35 10 100 2007 census
Number of providers 64 47 5 4 120
Number of inpatients 3063 900 154 36 4153
of inpatients 738 217 37 09 100 2006 census
Number of providers 70 48 5 1 124
Number of inpatients 3505 930 164 10 4609
of inpatients 760 202 36 02 100
Care Quality Commission Count me in census 2010 34
Results learning disabilities continued
Ethnicity
Information about ethnicity was available for 98 of patients Of these 13 belonged to Black and minority ethnic groups defined as all groups that are not White British (see Table 9) This figure is somewhat higher than in previous years (11 in 2006) and is significantly lower than the 23 of mental health patients from minority ethnic groups as reported in the mental health section of this report
Although the patterns by ethnicity are broadly similar to previous years there was an increase between 2006 and 2010 in the proportion of patients from the Other White group and a fall in those from the White British group Some ethnic groups had very few patients
As in the previous censuses patients from Black and minority ethnic groups were concentrated in a relatively small number of organisations 70 were
Table 9 Learning disability patients by ethnic group
Ethnic group 2010 census 2009 census 2008 census 2007 census 2006 census
Number Number Number Number Number
White British 853 3106 867 3205 889 3616 883 3642 887 4037
White Irish 13 46 15 57 13 53 10 40 14 66
Other White 29 106 23 85 26 104 26 109 17 77
White and Black Caribbean 10 38 10 36 07 29 08 34 07 32
White and Black African 02 8 01 4 00 2 02 10 01 3
White and Asian 04 13 04 14 03 12 03 13 02 9
Other Mixed 07 24 05 19 03 14 04 16 03 14
Indian 09 32 09 35 07 28 08 32 11 49
Pakistani 07 24 09 33 07 30 08 32 07 34
Bangladeshi 05 20 06 21 03 11 03 11 02 9
Other Asian 04 13 03 10 03 12 02 8 03 12
Black Caribbean 26 93 22 81 23 94 26 108 28 129
Black African 08 28 09 35 07 29 08 33 07 33
Other Black 04 15 04 14 04 15 04 18 04 17
Chinese 00 1 01 2 01 5 02 8 02 7
Other 02 7 02 8 04 15 02 10 05 24
Not stated 19 68 10 36 09 38 07 29 12 57
Total 100 3642 100 3695 100 4069 100 4124 100 4552
Care Quality Commission Count me in census 2010 35
Results learning disabilities continued
patients in 25 of the 129 organisations that took part in the census Seventy-four organisations had fewer than 10 patients from Black and minority ethnic groups each and another 42 organisations had no inpatients at all from these groups
However it is important to note that the number of people with severe and profound learning disabilities in some areas is affected by past funding and placement practices especially the presence of old long stay hospitals and of people placed outside their original area of residence by funding authorities
Reporting of ethnicity
About half (56) of patients reported their own ethnic group Staff reported the ethnic group for 17 of patients and relatives for 21 This means that ethnicity could have been misreported for some patients We do not know how ethnicity was assessed for 6 of patients
Age and gender
Two per cent (59) of patients were under 18 years old The number of young inpatients from minority ethnic groups was low or zero in several ethnic minority groups
Overall 73 of patients were under 50 years old and 27 were aged 50 or over The proportion of patients under 50 was higher among patients from Black and minority ethnic groups (88) than among the White British group (71) This is not surprising given that minority ethnic populations are generally younger than the White population
Seventy per cent of patients in learning disability services were men whereas in mental health services 58 of patients were men
Language and religion
Eight per cent of patients reported that their first language was not English Non-verbal communication was the most often selected language after English accounting for 4 of patients Two per cent (84) of patients most of whom were from the White British group said they needed an interpreter
Religion was not stated for 22 of patients and 15 of patients said they had no religion South Asians (Indians Bangladeshis and Pakistanis) were mostly Muslim Hindu or Sikh and those from the White Black Caribbean and Black African groups were mostly Christian
Sexual orientation
Overall the result was not known for almost half (49) of patients 45 said they were heterosexual 2 said gaylesbian 3 said bisexual and 1 said ldquootherrdquo The numbers of patients from minority ethnic groups were too low for meaningful analysis
Disability
Of all inpatients in learning disability services
bull 4 were reported as having no disabilities
bull 44 had a learning disability only
bull 51 had multiple disabilities
The patterns among minority ethnic groups were similar in that most patients had either a learning disability or multiple disabilities
Care Quality Commission Count me in census 2010 36
Results learning disabilities continued
Rates of admission
The rates of admission based on ONS estimates of the general population in 2007 are given in Appendix C Table C1
Admission rates were lower than average among several minority ethnic groups Other White Indian Pakistani Other Asian Black African Chinese and Other Rates were two to three times higher than average among the WhiteBlack Caribbean Mixed Black Caribbean Other Black and Other Mixed groups The lower rates among the South Asian and Chinese groups and the higher rates among some Black groups are similar to patterns for inpatients in mental health establishments
These patterns of admission are similar to those we reported in previous census reports
Source of referral
As we reported in the section on mental health patients data about sources of referral must be interpreted with care as we do not always know the original referral source Furthermore in the case of inpatients with learning disabilities this information was invalid missing or unknown for 12 of patients
Because of the small numbers of patients in most minority ethnic groups we observed few ethnic differences in sources of referral
Detention under the Mental Health Act 1983 (on day of admission and on day of census)
The Mental Health Act 2007 made a number of changes to the Mental Health Act 1983 one of which was supervised community treatment (section 17A) These are reflected in the 2010 census
All detentions Of all the patients in learning disability services 48 were detained under the Mental Health Act on admission Rates of detention on the day of admission by ethnic group are in Appendix C Table C2 and no ethnic differences were observed As the number of detained patients from each minority ethnic group was low we did not undertake further analysis for individual sections of the Act
Rates of detention on census day also showed no ethnic differences with the exception of a lower than average rate for the Other White group
Consent
About 66 of informally admitted inpatients were deemed incapable of consenting to treatment which is a similar proportion to that reported previously
Among detained patients 38 were deemed incapable of consenting to treatment and 6 were deemed capable of consenting to treatment but refused
The numbers of patients from minority ethnic groups were too low for comment There were no or very few such patients among minority ethnic groups
Care Quality Commission Count me in census 2010 37
Results learning disabilities continued
Care programme approach
Details of the Care Programme Approach (CPA) are given on page 24
We found that 73 of all patients were on a CPA 2 on a single assessment process (SAP) and 25 on neither No ethnic differences were observed
Recorded incidents
The 2010 census asked about the number of times that patients experienced seclusion hands-on restraint self-harm accident and physical assault in a patientrsquos current hospital spell or if the patientrsquos hospital spell was longer than three months the number that took place within the last three months As in previous years we observed very few ethnic differences
Seclusion Five per cent of patients had experienced one or more episodes of seclusion The only ethnic differences observed were the higher than average rates among the White Irish and Other White groups but these were based on small numbers of patients
Physical assault on the patient The definition of assault includes incidents of physical assault on the patient irrespective of who committed the assault but we do not have information on who committed the assault About 28 of patients had been involved in one or more episodes of physical assault No ethnic differences were observed
Hands-on restraint self-harm accidents Thirty per cent of inpatients had experienced one or more episodes of hands-on restraint 22 had attempted to harm themselves and 24 had suffered an accident The numbers were very low in minority ethnic groups and we did not observe any ethnic differences except for a lower than average rate for self-harm among the Black Caribbean group but this was based on very few patients
Duration of stay in hospital
We analysed the length of the period between each patientrsquos admission to hospital and the census day This period is of course shorter than a patientrsquos full length of stay in hospital which runs from admission to the date when they are discharged
bull 10 of inpatients had been in hospital for one month or less
bull 6 had been in hospital between one and three months
bull 7 had been in hospital between three and six months
bull 10 had been in hospital between six months and one year
bull 14 had been in hospital between one and two years
bull 22 had been in hospital between two and five years
bull 31 had been in hospital for over five years
The patterns are very similar to those in previous censuses About 67 of patients in the 2010 census had been in hospital for more than a year and were therefore also included in the 2009 census In addition over half (53) of patients had been in hospital for more than two years and will have been included in both the 2008 and 2009 censuses A third of patients will have been included in each census since 2006
We also calculated the median length of stay (see page 26 for the definition of median) Overall the median amount of time that women had spent in hospital was about 31 months and the median for men was about 27 months This compares with a median for mental health patients of 25 months for women and 58 months for men It is not possible to reliably compare length of stay by ethnic group because of the small numbers of patients among several minority ethnic groups
Care Quality Commission Count me in census 2010 38
Results learning disabilities continued
Ward security
About 12 of all inpatients were on a medium or high secure ward as opposed to a general (54) or low secure (34) ward
As in the three previous years rates of patients on medium or high secure wards were about double the average among the White Irish and Other White groups Most other minority ethnic groups had very few patients on medium or high secure wards
Age range on wards
There were five patients under 18 years of age being cared for on wards for working-age adults and none were on wards for older people About 5 of patients on wards for working-age adults were aged 65 or over and there were very few patients (23) on wards for older people There were very few lsquoout of agersquo placements among minority ethnic groups
Patients in wards designated as single sex or mixed
We asked providers whether the patient was on a ward designated as men or women only or mixed gender Overall 47 of men and 69 of women were not in a ward designated for single sex use The numbers of such patients among minority ethnic groups were very low
Two further questions examined the single sex facilities that were available to patients Again due to the small numbers we do not present results by ethnicity for these questions
Patientsrsquo access to toilet and bathing facilities designated for single sex use
Overall 19 (497) of men and 27 (295) of women were reported as not having access to toilet and bathing facilities designated for single sex use
Patientsrsquo access to a lounge area day space designated for single sex use
Overall 32 (829) of men and 44 (470) of women were reported as not having access to a lounge area day space designated for single sex use
Patients subject to deprivation of liberty safeguards
For details of deprivation of liberty safeguards please see page 31
The 2010 census introduced a new question ldquoIs the patient subject to deprivation of liberty authorisation on 31 March 2010rdquo Two per cent (74) patients were reported as being subject to a deprivation of liberty order on census day but very few of these patients (15) were from minority ethnic groups
See footnote on single sex accommodation on page 27
Care Quality Commission Count me in census 2010 39
Data in the future Moving beyond a one-day census
For six years the Count me in census has provided a valuable one-day snapshot of inpatients in mental health and learning disability services And with the proportion of inpatients who are detained increasing steadily (from 25 in 200506 to 39 in 200910 ndash see Figure 2) ongoing ethnic monitoring of admissions and detentions becomes more vital than ever
However a one-day census only captures some events and the profile of patients can differ across a whole year For example there were
bull 29840 inpatients in the 2010 census compared with 107765 inpatients overall during 200910
bull 17299 patients in the 2010 census who were detained or on CTOs compared with 42479 new detentions and some 4100 new CTOs overall in England in 200910
bull 26 of patients in hospital for under one month and 31 for over one year per the census
whereas the MHMDS data consistently shows that for over 50 of records the average length of an inpatient stay was under one month and for 4 it was over one year
Looking ahead it is vital that robust data is available on all admitted patients and all those subject to the Mental Health Act not just those in hospital on one particular day Moreover patterns of use and outcomes of community care can have an impact on the need for admission to hospital and the risk of detention ndash therefore information about the care provided to patients before admission to hospital during their hospital stay and after they leave is also vital Furthermore under 84 of the 127 million people using specialist mental health services are admitted to hospital23 and so it is very important to examine the quality of community care for the 90 of patients who are not admitted to hospital
Figure 2 Number of people spending time in hospital 200506 to 200910
Num
ber
of p
atie
nts
90000
80000
70000
60000
50000
40000
30000
20000
10000
0 200506 200607 200708 200809 200910
Source NHS Information Centre Formally detained Not detained MHMDS Bulletin 2011
Care Quality Commission Count me in census 2010 40
Data in the future Moving beyond a one-day census continued
The Mental Health Minimum Data Set (MHMDS) is a rich source of data on people using specialist mental health services in England It covers both community and hospital services and includes a wide range of information about the demographic clinical and socioeconomic characteristics of individual patients and the services provided to those admitted to hospital and to the much larger number of those who donrsquot need a stay in hospital The data includes information about contact with services uses of the Mental Health Act and the Care Programme Approach for each individual patient All these details enable the use of services patterns of care and patient outcomes to be tracked including along pathways of care The MHMDS therefore provides a robust basis for ongoing monitoring of access to and outcomes of care for users of specialist ndash both community and hospital ndash mental health services
The MHMDS also enables an analysis of the numbers and rates of people from different ethnic groups using specialist mental health services overall (both inpatient and community) which provides an indication of the levels of mental illness and therefore the need for specialist care in different communities
At present the MHMDS does not cover high secure services and independent sector providers only started to provide data during 201011 However to support payment by results for mental health the scope of the data set will be extended to cover high secure services during 201112 (version 4 MHMDS) Further proposed changes to the dataset (version 41) will incorporate NHS-funded learning disability services and primary care mental health services A separate dataset for child and adolescent mental health services (CAMHS) has been developed and is awaiting formal approvals It is designed to include the same information about uses of the Mental Health Act as provided in the MHMDS
The latest MHMDS bulletin for 200910 provides a description of people using specialist mental health services in England including ethnic profiles of people using services hospital admissions detentions and the number of people on CPA24 It also provides information on differences by age and gender The bulletin illustrates some of the sorts of analyses that are possible using data from the MHMDS
The NHS Information Centre can provide guidance on these and other potential analyses based on MHMDS data
Care Quality Commission Count me in census 2010 41
Conclusions
While this report reviews changes in the census results since 2005 it is not a review or evaluation of the DRE programme overall Similarly the census cannot provide explanations for the patterns observed or examine whether mental health services are meeting the needs of individual ethnic minority groups As we have noted previously the results are subject to caveats in particular that the census provides a one-day snapshot that may not be representative of patients admitted to hospital throughout the year
Overview of findings
Overall the findings from the 2010 census show little change from those reported for previous annual censuses conducted since 2005 This is partly because many patients had been in hospital for a considerable period of time and had therefore been included in successive censuses The findings of this sixth and last census continue to show differences between Black and minority ethnic groups and White groups and also differences within these groups
In particular ethnic differences in rates of admission detention under the Mental Health Act and seclusion ndash three of DRErsquos 12 goals ndash have not altered materially since the inception of DRE in 2005
bull Admission rates remain higher than average among minority ethnic groups especially among Black and WhiteBlack Mixed groups for whom rates were two or more times higher than average in 2010 The Other Black group continues to have the highest admission rate ndash six times higher than average ndash although this is lower than in 2005 In contrast admission rates have consistently been lower than average among the Indian and Chinese groups and about average in the Pakistani and Bangladeshi groups
bull Detention rates remain higher than average among the Black and WhiteBlack Caribbean Mixed groups and among the Other White group A consistent pattern across all censuses was the higher than average detention rate
under section 3741 for the Black Caribbean and Other Black groups We also found that rates for being placed on a CTO were higher among the South Asian and Black groups
bull Although there have been annual fluctuations in seclusion rates they have been higher than average for the Black WhiteBlack Mixed and Other White groups in at least three of the six censuses
Overall the level of provision of single sex areas for patients continues to be unsatisfactory although there was no evidence that minority ethnic patients were disadvantaged in these respects Government policy for the NHS in England now requires that all providers of NHS-funded care including mental health trusts are expected to eliminate mixed-sex accommodation in accordance with the guidance set out in CNO201032526 From 2011 all providers of NHS-funded care must report breaches of sleeping accommodation which will attract sanctions
Implications for ways forward
The census findings do not in themselves show that mental health and learning disability services are failing to meet the needs of Black and minority ethnic service users
As noted in previous reports they need to be interpreted in the context of available evidence on ethnic differences in rates of mental illness pathways to care and factors such as socioeconomic disadvantages that all contribute to these differences Our previous reports have consistently highlighted the need for prevention early intervention and working collaboratively across sectors to reduce the risk of admission and detention where possible without compromising the care given to patients Mental health services have a key role to play but to achieve this all statutory agencies and organisations outside the healthcare sector Black and minority ethnic communities and people who use services themselves will need to work in partnership
Care Quality Commission Count me in census 2010 42
Conclusions continued
This message ndash about preventing mental ill-health by addressing the contributory factors and intervening early ndash is at the heart of No health without mental health the Department of Healthrsquos new strategy for the future of mental health care in England27
The strategy aims to tackle the economic social and environmental determinants and consequences of mental health problems and to improve outcomes and reduce inequalities
It specifies that by 2014 people in contact with the criminal justice system will have improved access to mental health services as set out in the Ministry of Justice Green Paper Breaking the Cycle Effective punishment rehabilitation and sentencing of offenders which confirms the approach outlined in Lord Bradleyrsquos report for early intervention and diversion from custody2829
Accompanying the new strategy is a supporting document that explains how its objectives will improve mental health outcomes the effective interventions and the underpinning evidence base30
The strategy is complemented by other government proposals for reforms in the NHS public health and adult social care as outlined in the NHS White Paper Equity and excellence liberating the NHS31 the public health strategy Healthy lives healthy people32 and the adult social care strategy A vision for adult social care capable communities and active citizens 33 Three outcomes frameworks have been developed alongside these strategies improving mental health outcomes and reducing inequalities is integral to them all
In this new healthcare landscape the proposed NHS Commissioning Board and GP consortia will have a statutory obligation to promote equality and reduce inequalities in healthcare (something also enshrined in the Equality Act 2010) As the lead commissioners of healthcare services it will be up to GP consortia to assess with local authorities the needs of their local populations and commission the right services that meet their requirements
And the strengthened public health role of local authorities offers significant potential for addressing the socioeconomic disadvantages faced by Black and minority ethnic communities which add to the burden of mental illness in these communities
Race Equality Action Plan A five-year review looked back at the work of the DRE action plan and describes some of the key challenges successes and learning34 Based on the experience and outcome of the DRE programme the report suggests ways forward for the next stage of mental health strategy development and implementation
Since April 2009 CQC has had a duty under the Mental Health Act 1983 to monitor how services exercise their powers in relation to patients who are detained in hospital or subject to CTOs or guardianship under the Act In its first annual report on the use of the Act CQC recommends a number of areas where improvements are needed for example over-occupancy on inpatient wards patient engagement use of control and restraint seclusion and capacity and consent35
In particular CQC highlighted a number of issues relating to the use of CTOs including concern about appropriate usage (30 of the patients in CQCrsquos sample did not have a reported history of non-compliance or disengagement with services after discharge) and over-representation of Black and minority ethnic groups CQC advised that research on the possible race equality impact of CTOs should be undertaken There were 6237 CTOs from their introduction in November 2008 to 31 March 2010 a much greater use of them than forecast for this period by the Department of Health before the power was introduced Just 31 of these orders had ended by end March 2010 suggesting that some people are being kept on supervised community treatment for long periods
Care Quality Commission Count me in census 2010 43
Conclusions continued
Data in the future Moving beyond a one-day census
Good information is the foundation of an effective healthcare system It is imperative for ensuring that services meet the needs of local populations and are equitable and that improvements are made where needed The availability of fit-for-purpose and comprehensive patient-level data sets with ethnicity and other key variables fully coded is therefore vitally important36 It enables the care provided to patients of all ethnic backgrounds to be monitored on an ongoing basis including for monitoring compliance with the Equality Act
Race Equality Action Plan A five-year review notes that better collection monitoring and use of ethnicity data to inform commissioning and provision in health and social care is required37 Key areas include good ethnic monitoring improving demographic information and ensuring good links between infomatics audit and equality and diversity leads within trusts in order to effectively use the information to inform service development monitoring and review at board management ward and community levels
The governmentrsquos proposed changes to the NHS will be supported by an information revolution aimed at improving and extending the information available to the NHS patients and the public on the quality and outcomes of NHS services including by equality dimensions38
Having information that is fit for purpose is vital for the effective regulation of mental health and learning disability services CQC uses routinely available data sets on an ongoing basis to assess the performance of health and social care organisations and their compliance with government policies and legislation We therefore expect those who commission and provide mental healthcare in the NHS and independent sector to have information systems that provide good quality data with fully
comprehensive recording and monitoring of ethnicity on an ongoing basis
Since 2005 the Count me in census has played a key role in providing information about the ethnicity and other characteristics of inpatients in mental health and learning disability services and on patients subject to the Mental Health Act It did this by providing a valuable one-day snapshot But ethnicity recording must be seen as an all-year round statutory requirement not a one-day annual event The number of inpatients throughout the year is much higher than the counts on one day and some patients will have more than one admission And there is a need to move on from counting patients to understanding more about care pathways for Black and minority ethnic patients and the factors leading to hospital admission and detention
We have consistently highlighted the need for commissioners and providers to make full use of the Mental Health Minimum Data Set (MHMDS) ndash the statutory data set submitted by providers of specialist mental health services in England It provides rich data on these issues and provides a robust information source for ongoing ethnic monitoring after this last census
Covering both community and hospital services ndash and now independent and third sector providers as well as NHS ndash it includes a wide range of information about individual patients the services provided to those admitted to hospital and to the much larger number who donrsquot need admission to hospital and the outcomes of care And because it includes year-round activity it is more representative of the overall picture of for example admission detention and readmission rates length of stay years in psychiatric care and contacts with services and professionals
We call on the Information Centre to routinely publish data on all admissions and uses of the Mental Health Act including CTOs in England (in both NHS and independent healthcare providers) by the ethnicity of
Care Quality Commission Count me in census 2010 44
Conclusions continued
patients making the MHMDS the definitive source of information about mental health and learning disability patients This data should be risk-adjusted for age gender and other variables as appropriate to enable reliable comparisons to be made across groups
It is important that all providers ndash NHS and independent ndash make strenuous efforts to improve the quality of the data they submit The Information Centre publishes reports on the quality of MHMDS data by provider (see wwwicnhsukservices mhmdsdq) and we urge providers to monitor this information and use it to improve their data quality
If GP consortia and local authorities are to be effective in their needs assessment and commissioning roles the Information Centre needs to make available and promote to them the data from the MHMDS and other sources And researchers and academics must make full use of the MHMDS to explore the factors that underlie the observed ethnic patterns
CQCrsquos role
In the meantime CQC will continue to focus strongly on the quality of care provided by mental health and learning disability services
People who find themselves admitted to mental health services or detained under the Mental Health Act and therefore counted by the Count me in census are among the most mentally unwell people in our society Our job is first and foremost to make sure that the care they receive meets the essential standards of quality and safety set out under the Health and Social Care Act 2008 and to work with providers to ensure this We act swiftly when we find services that do not Where we find systemic problems that organisations have not adequately addressed we may impose conditions on the providerrsquos registration to bring about the change needed to improve patientsrsquo experience of care
The essential standards of quality and safety include the requirement to provide single sex accommodation and we will continue to closely check that these standards are met by all mental health services
We intend to introduce a number of indicators derived from the rich information in the MHMDS into our quality and risk profiles for providers This will put greater emphasis on the experience of Black and minority ethnic patients in our regulatory activity
We will monitor the quality of MHMDS data submitted by providers (as reported by the NHS Information Centre) including independent service providers Those with poor data quality may be considered at higher risk in terms of their quality of care
In addition we will continue to monitor the progress of services in relation to the issues raised in the census and other reports including our report on the use of the Mental Health Act through our visits to services and meetings with patients by our Mental Health Act Commissioners and second opinion appointed doctors (SOADs) We will draw on patientsrsquo experiences to monitor the operation of the Mental Health Act
We will also assess the impact of advice and use of Local HealthWatch Local HealthWatch will be in a good position to make sure that providers and commissioners are held to account on matters of choice and access to services for people from Black and minority ethnic groups
Care Quality Commission Count me in census 2010 45
References
1 Department of Health Equity and excellence liberating the NHS 2010
2 Department of Health The NHS outcomes framework 201112 2010
3 Healthcare Commission Mental Health Act Commission National Institute for Mental Health in England Count me in results of a national census of inpatients in mental health hospitals and facilities in England and Wales 2005
4 Healthcare Commission Mental Health Act Commission National Institute for Mental Health in England Count me in results of the 2006 national census of inpatients in mental health and learning disability services in England and Wales 2006
5 Healthcare Commission Mental Health Act Commission National Institute for Mental Health in England Count me in results of the 2007 national census of inpatients in mental health and learning disability services in England and Wales 2007
6 Healthcare Commission Mental Health Act Commission National Institute for Mental Health in England Count me in results of the 2008 national census of inpatients in mental health and learning disability services in England and Wales 2008
7 Care Quality Commission National Mental Health Development Unit Results of the 2009 national census of inpatients and patients on supervised community treatment in mental health and learning disability services in England and Wales 2009
8 Department of Health Delivering race equality in mental health care an action plan for reform inside and outside services 2005
9 Welsh Assembly Government Adult Mental Health Services Raising the standard ndash Race Equality Action Plan for Adult Mental Health Services in Wales 2006
10Department of Health No health without mental health a cross-government mental health outcomes strategy for people of all ages 2011 wwwdhgovukprod_consum_dhgroups dh_digitalassetsdocumentsdigitalasset dh_124058pdf
11Department of Health New horizons towards a shared vision for mental health 2009 wwwdhgovukprod_consum_dhgroups dh_digitalassetsdhendocumentsdigital assetdh_109708pdf
12Department of Health Valuing people a new strategy for learning disability for the 21st century 2001
13Department of Health Valuing people now a new three year strategy for people with learning disabilities 2009
14Department of Health Healthcare for all report of the independent inquiry into access to healthcare for people with learning disabilities 2008
15Joint Committee on Human Rights A life like any other human rights of adults with learning disabilities (2008 HL Paper 401 HC 731) House of Lords House of Commons 2008
16Department of Health Valuing people now summary report March 2009 ndash September 2010 2010
17Disability Rights Commission Equal treatment investigation 2005
18Department of Health Mir G Nocon A Ahmad W Jones L Learning difficulties and ethnicity 2000
19ONS experimental population estimates by ethnic group 2007 wwwstatisticsgovukstatbase productaspvlnk=14238
Care Quality Commission Count me in census 2010 46
References continued
20Six percent of population are gay or lesbian according to Whitehall figures 2005 wwwtelegraphcouknewsmainjhtmlxml= news20051212ngay12xmlamps Sheet= news20051212ixhomehtml
21Department of Trade and Industry Amendment to Employment Equality (Sexual Orientation) Regulations 2003 2003
22Office for National Statistics Measuring sexual identity an evaluation report 2010
23 Information Centre Mental Health Bulletin Fourth report from Mental Health Minimum Dataset (MHMDS) annual returns 2010 2011 wwwicnhsukpubsmhbmhmds0910
24 Information Centre Mental Health Bulletin Fourth report from Mental Health Minimum Dataset (MHMDS) annual returns 2010 2011 wwwicnhsukpubsmhbmhmds0910
25The operating framework for the NHS in England 201112 Department of Health 2010 wwwdhgovukprod_consum_dhgroups dh_digitalassetsdhenpsdocuments digitalassetdh_122736pdf
26wwwdhgovukenPublicationsandstatistics LettersandcircularsProfessionalletters ChiefnursingofficerlettersDH_121848
27Department of Health No health without mental health a cross-government mental health outcomes strategy for people of all ages 2011 wwwdhgovukprod_consum_dhgroups dh_digitalassetsdocumentsdigitalasset dh_124058pdf
28Ministry of Justice Breaking the cycle effective punishment rehabilitation and sentencing of offenders 2010
29Department of Health The Bradley report Lord Bradleyrsquos review of people with mental health problems or learning disabilities in the criminal justice system 2009
30Department of Health No health without mental health delivering better mental health outcomes for people of all ages 2011
31Department of Health Equity and excellence liberating the NHS 2010 wwwdhgovukprod_ consum_dhgroupsdh_digitalassetsdhen psdocumentsdigitalassetdh_117794pdf
32Department of Health Healthy lives healthy people our strategy for public health in England 2010 wwwdhgovukprod_consum_dh groupsdh_digitalassetsdhenps documentsdigitalassetdh_122347pdf
33Department of Health A vision for adult social care capable communities and active citizens 2010 wwwdhgovukprod_consum_dh groupsdh_digitalassetsdhenps documentsdigitalassetdh_121971pdf
34Wilson M NMHDU Race equality action plan a five year review Delivering race equality in mental health care 2010 wwwnmhduorgukour-workmhep
35Care Quality Commission Monitoring the use of the Mental Health Act in 200910 2010
36Raleigh V S Collection of data on ethnic origin in England Editorial BMJ 20083376456
37Wilson M NMHDU Race equality action plan a five year review Delivering race equality in mental health care 2010 wwwnmhduorgukour-workmhep
38Department of Health Liberating the NHS an information revolution 2010
Care Quality Commission Count me in census 2010 47
Appendix A Methods of analysis
Standardisation by age and gender
Standardisation allows us to make comparisons between groups of the population by taking account of variations in age and gender Some differences in patterns of service use are related to the age or gender of the people using them so adjustments to the data have to be made to ensure that the interpretation of ethnic differences is reliable For example formal admissions are higher at a younger age so some Black and minority ethnic groups may have high formal admission rates simply because they have a high proportion of younger people Without adjustments for age and gender differences comparisons would be misleading
In this report most results are standardised for age and gender including those relating to admission detention source of referral care programme approach seclusion restraint accidents assault self-harm consent and presence on a secure ward The report uses the accepted statistical method of taking account of age and gender differences between groups when calculating these rates
We used the ONS estimates of total population by ethnic group for England and Wales in 2007 to standardise the rates of admission for different ethnic groups This takes account of the significant rises in the Black and ethnic minority population of England and Wales since the 2001 ONS census and hence gives more accurate and up to date estimates of admission ratios for different ethnic groups (although it does not take account of any further changes in the ethnic populations between 2007 and 2010 the date of this census) For comparison with the DRE baseline we also present admission rates from the 2005 census derived using the 2005 ONS estimates of populations by ethnic group These figures will not be the same as published in the 2005 census report which were based on the 2001 ONS census population estimates because updated estimates of populations by ethnic group were not available at that time
For other analyses we used the total number of inpatients and patients on CTOs in the census
as the basis for standardisation However CTO outpatients are excluded from selected analyses where appropriate namely the analysis of rates for admissions detentions on admission source of referral single sex accommodation and recorded incidents of seclusion restraint accidents assault and self-harm We used the statistical package STATA version 82 to derive the standardised results
It was not possible to adjust the analyses for ethnic differences in social and economic factors and in diagnosis and severity of illness Such factors could affect the ethnic differences observed in the results
For descriptive variables such as religion and language we did not use standardisation
Confidence intervals as indicators of significant statistical differences
For all standardised results the national rates for England and Wales are taken as 100 and the usual 95 confidence intervals are given Rates of less than 100 or greater than 100 for specific ethnic groups show a lower or higher rate respectively than the national average after adjusting for age and gender Whether or not the difference is statistically significant from the national average depends on the confidence interval If the confidence interval overlaps 100 the difference from the national average is not statistically significant If both values are lower or higher than 100 it indicates that the difference compared with the national average is statistically significant at the 95 level
For example if a rate is 110 with the lower confidence interval being 105 and the upper confidence interval being 115 it indicates that the 10 excess over the national average of 100 is statistically significant But if a ratio is 110 with the lower confidence interval being 95 and the upper confidence interval being 125 it indicates that the 10 excess over the national average is not statistically significant We did not attempt to adjust the confidence intervals for multiple comparisons
Care Quality Commission Count me in census 2010 48
Appendix B Mental health tables
Table B1 Standardised admission ratios by ethnic group for England and Wales (excluding outpatients on a CTO) using 2007 ONS census population denominators (England and Wales = 100) All ages
Ethnic group
Men Women Persons Standardised
admission ratio
95 confidence
interval Observed numbers
Standardised admission
ratio
95 confidence
interval Observed numbers
Standardised admission
ratio
95 confidence
interval Observed numbers
White British 88 86 89 12435 94 93 96 10157 91 89 92 22592 White Irish 130 115 146 274 122 106 140 215 126 115 138 489 Other White 117 109 126 731 129 118 141 533 122 115 129 1264 White and Black Caribbean 557 493 627 276 274 223 333 101 436 393 483 377 White and Black African 312 247 388 80 259 186 351 41 292 242 349 121 White and Asian 140 110 174 79 124 90 166 44 134 111 159 123 Other Mixed 230 189 278 108 213 165 270 67 223 192 259 175 Indian 67 59 75 286 66 56 76 172 66 60 73 458 Pakistani 105 93 119 269 65 53 79 96 91 81 100 365 Bangladeshi 123 102 147 120 82 60 109 46 108 92 126 166 Other Asian 161 139 185 192 136 107 169 79 153 135 172 271 Black Caribbean 538 505 572 980 306 277 336 418 438 415 462 1398 Black African 246 226 267 550 219 194 247 277 236 221 253 827 Other Black 792 691 903 222 314 240 403 61 596 529 670 283 Chinese 27 20 38 39 43 30 59 35 33 26 41 74 Other 140 120 162 177 110 88 136 87 128 113 145 264 Total 100 16818 100 12429 100 29247
Care Quality Commission Count me in census 2010 49
Appendix B Mental health tables continued
Table B2 Standardised admission ratios by ethnic group for England and Wales (excluding outpatients on a CTO) using 2007 ONS census population denominators (England amp Wales = 100) Ages 65 and over
Ethnic group
Men Women Persons Standardised
admission ratio
95 confidence
interval Observed numbers
Standardised admission
ratio
95 confidence
interval Observed numbers
Standardised admission
ratio
95 confidence
interval Observed numbers
White British 95 92 99 3265 95 92 98 3887 95 93 97 7152 White Irish 142 116 172 106 102 82 125 92 120 104 138 198 Other White 207 174 244 141 213 183 248 171 210 188 235 312 White and Black Caribbean 406 210 710 12 333 152 632 9 371 230 568 21 White and Black African 231 28 836 2 198 24 714 2 213 58 546 4 White and Asian 28 1 156 1 110 30 281 4 69 23 162 5 Other Mixed 146 40 374 4 228 92 470 7 189 95 339 11 Indian 97 70 132 41 83 57 116 33 90 71 113 74 Pakistani 39 17 77 8 46 18 94 7 42 23 69 15 Bangladeshi 115 53 218 9 69 14 201 3 98 51 172 12 Other Asian 234 143 361 20 215 120 354 15 225 157 313 35 Black Caribbean 216 170 269 77 310 253 376 103 261 224 302 180 Black African 142 73 248 12 365 241 531 27 246 175 337 39 Other Black 164 34 479 3 366 134 796 6 259 119 493 9 Chinese 41 8 120 3 95 38 195 7 68 33 125 10 Other 253 126 453 11 390 238 602 20 327 222 464 31 Total 100 3715 100 4393 100 8108
Care Quality Commission Count me in census 2010 50
Appendix B Mental health tables continued
Table B3 Standardised ratios by ethnic group for patients referred by a GP (England and Wales = 100)
Ethnic group
Men Women Persons Standardised
referral ratio
95 confidence
interval Observed numbers
Standardised referral ratio
95 confidence
interval Observed numbers
Standardised referral ratio
95 confidence
interval Observed numbers
White British 110 103 117 904 107 101 114 1065 108 104 113 1969 White Irish 85 50 134 18 93 57 144 20 89 63 123 38 Other White 74 51 103 33 70 49 97 36 72 56 91 69 White and Black Caribbean 27 5 78 3 30 4 109 2 28 9 65 5 White and Black African 0 0 74 9 268 2 35 4 125 2 White and Asian 165 54 386 5 0 0 86 28 201 5 Other Mixed 48 6 172 2 68 14 198 3 58 19 136 5 Indian 69 34 123 11 79 39 141 11 73 46 111 22 Pakistani 88 42 162 10 59 16 151 4 77 42 130 14 Bangladeshi 81 22 207 4 61 7 221 2 73 27 159 6 Other Asian 80 32 166 7 108 43 223 7 92 50 155 14 Black Caribbean 35 20 56 17 37 20 62 14 36 24 51 31 Black African 57 29 100 12 66 35 113 13 61 40 91 25 Other Black 62 23 135 6 40 5 144 2 54 23 107 8 Chinese 56 1 314 1 139 38 356 4 108 35 251 5 Other 106 46 208 8 0 0 53 23 105 8 Total 100 1041 100 1185 100 2226
Care Quality Commission Count me in census 2010 51
Appendix B Mental health tables continued
Table B4 Standardised ratios by ethnic group for patients referred by a community mental health team (including crisis resolution home treatment) or community learning disability team (England and Wales = 100)
Ethnic group
Men Women Persons Standardised
referral ratio
95 confidence
interval Observed numbers
Standardised referral ratio
95 confidence
interval Observed numbers
Standardised referral ratio
95 confidence
interval Observed numbers
White British 107 104 111 3255 103 100 107 3386 105 103 108 6641 White Irish 90 69 116 61 89 68 114 61 90 74 107 122 Other White 59 48 71 105 79 67 94 141 69 61 78 246 White and Black Caribbean 106 83 135 68 75 49 111 25 96 77 117 93 White and Black African 43 19 84 8 66 30 124 9 52 31 84 17 White and Asian 95 56 150 18 84 43 147 12 90 61 129 30 Other Mixed 78 48 121 20 72 41 118 16 76 53 105 36 Indian 106 83 132 76 100 76 130 56 103 86 122 132 Pakistani 108 84 135 73 89 60 128 30 102 83 123 103 Bangladeshi 98 66 141 29 90 50 148 15 95 69 128 44 Other Asian 88 63 120 40 105 70 150 29 94 73 119 69 Black Caribbean 69 59 80 167 85 71 102 123 75 67 84 290 Black African 84 70 102 112 82 65 103 77 84 72 96 189 Other Black 52 36 74 31 64 36 106 15 56 41 74 46 Chinese 112 53 205 10 101 52 176 12 105 66 160 22 Other 86 60 120 35 106 71 151 30 94 73 120 65 Total 100 4108 100 4037 100 8145
Care Quality Commission Count me in census 2010 52
Appendix B Mental health tables continued
Table B5 Standardised ratios by ethnic group for patients referred by criminal justice routes (police prison probation courts court liaison and diversion) (England and Wales = 100)
Ethnic group
Men Women Persons Standardised
referral ratio
95 confidence
interval Observed numbers
Standardised referral ratio
95 confidence
interval Observed numbers
Standardised referral ratio
95 confidence
interval Observed numbers
White British 90 86 95 1495 95 86 104 421 91 87 95 1916 White Irish 133 94 183 38 59 19 138 5 116 84 157 43 Other White 112 93 134 119 103 68 150 27 111 93 130 146 White and Black Caribbean 117 89 151 58 145 69 266 10 120 94 153 68 White and Black African 190 127 273 29 141 38 361 4 183 126 256 33 White and Asian 75 39 131 12 160 52 373 5 89 52 143 17 Other Mixed 104 65 157 22 151 61 311 7 112 75 161 29 Indian 86 61 118 38 79 32 163 7 85 62 113 45 Pakistani 118 91 150 65 89 33 194 6 115 90 145 71 Bangladeshi 74 44 115 19 29 1 162 1 68 42 105 20 Other Asian 130 95 174 45 164 71 323 8 134 101 176 53 Black Caribbean 131 114 150 208 124 81 181 26 130 114 148 234 Black African 132 112 156 145 143 93 211 25 134 114 156 170 Other Black 141 109 180 65 236 113 435 10 149 117 187 75 Chinese 83 27 194 5 146 30 426 3 99 43 195 8 Other 129 93 175 41 113 37 264 5 127 93 170 46 Total 100 2404 100 570 100 2974
Care Quality Commission Count me in census 2010 53
Appendix B Mental health tables continued
Table B6 Standardised detention ratios by ethnic group all detentions on day of admission (excluding outpatients on a CTO) (England and Wales = 100)
Ethnic group
Men Women Persons Standardised
detention ratio
95 confidence
interval Observed numbers
Standardised detention
ratio
95 confidence
interval Observed numbers
Standardised detention
ratio
95 confidence
interval Observed numbers
White British 94 92 97 6449 94 91 97 3628 94 92 96 10077 White Irish 112 95 131 154 118 96 145 94 114 101 129 248 Other White 108 98 118 451 120 106 136 251 112 104 120 702 White and Black Caribbean 123 107 141 220 129 99 167 59 124 110 140 279 White and Black African 128 99 162 68 113 70 173 21 124 100 153 89 White and Asian 96 71 126 50 109 68 164 22 99 78 125 72 Other Mixed 115 92 143 82 139 100 188 42 122 102 146 124 Indian 97 83 113 164 110 86 137 77 101 88 114 241 Pakistani 109 94 126 194 102 74 136 44 108 94 122 238 Bangladeshi 86 67 109 69 91 55 142 19 87 70 107 88 Other Asian 109 92 130 133 120 86 163 40 112 96 130 173 Black Caribbean 129 121 139 774 143 125 162 238 132 124 141 1012 Black African 115 104 127 422 131 111 153 159 119 110 129 581 Other Black 117 100 136 170 148 105 202 39 122 106 140 209 Chinese 108 71 159 26 129 78 202 19 116 85 156 45 Other 111 92 132 126 116 83 157 41 112 96 130 167 Total 100 9552 100 4793 100 14345
Care Quality Commission Count me in census 2010 54
Appendix B Mental health tables continued
Table B7 Standardised detention ratios by ethnic group detention on day of admission ndash section 2 of the Mental Health Act (England and Wales = 100)
Ethnic group
Men Women Persons Standardised
detention ratio
95 confidence
interval Observed numbers
Standardised detention
ratio
95 confidence
interval Observed numbers
Standardised detention
ratio
95 confidence
interval Observed numbers
White British 97 91 102 1156 93 87 98 1133 95 91 99 2289 White Irish 78 47 120 20 116 79 166 30 97 72 128 50 Other White 100 78 126 70 134 108 166 88 116 99 136 158 White and Black Caribbean 55 30 93 14 60 24 124 7 57 35 87 21 White and Black African 91 37 188 7 150 60 308 7 113 62 190 14 White and Asian 80 29 174 6 119 44 258 6 96 49 167 12 Other Mixed 68 28 141 7 116 53 221 9 89 51 145 16 Indian 130 91 179 37 124 81 182 26 127 98 163 63 Pakistani 126 87 176 34 138 79 225 16 130 96 171 50 Bangladeshi 166 101 256 20 140 61 276 8 158 105 228 28 Other Asian 142 93 209 26 163 93 264 16 150 108 202 42 Black Caribbean 73 57 92 70 97 72 128 51 82 68 98 121 Black African 164 131 202 87 190 146 244 62 174 147 204 149 Other Black 114 75 166 27 140 72 245 12 121 86 165 39 Chinese 165 60 358 6 212 97 402 9 190 106 313 15 Other 218 153 302 36 179 108 280 19 203 153 264 55 Total 100 1623 100 1499 100 3122
Care Quality Commission Count me in census 2010 55
Appendix B Mental health tables continued
Table B8 Standardised detention ratios by ethnic group detention on day of admission ndash section 3 of the Mental Health Act (England and Wales = 100)
Ethnic group
Men Women Persons Standardised
detention ratio
95 confidence
interval Observed numbers
Standardised detention
ratio
95 confidence
interval Observed numbers
Standardised detention
ratio
95 confidence
interval Observed numbers
White British 99 95 103 2684 96 91 100 1852 98 95 101 4536 White Irish 116 89 149 60 135 101 177 52 124 102 149 112 Other White 112 96 129 186 110 92 132 121 111 99 124 307 White and Black Caribbean 114 91 143 79 130 90 183 33 119 98 143 112 White and Black African 97 60 148 21 107 54 192 11 100 69 141 32 White and Asian 84 50 133 18 97 48 173 11 89 59 127 29 Other Mixed 121 84 168 35 117 72 181 20 120 90 156 55 Indian 96 75 122 67 110 79 148 42 101 83 122 109 Pakistani 91 71 115 69 88 55 134 22 90 73 111 91 Bangladeshi 63 39 95 22 64 28 127 8 63 43 90 30 Other Asian 90 65 120 44 94 56 149 18 91 70 117 62 Black Caribbean 116 102 130 279 164 138 192 148 129 117 142 427 Black African 95 80 112 143 102 79 129 68 97 85 111 211 Other Black 75 55 99 49 99 58 159 17 80 62 102 66 Chinese 119 59 213 11 99 43 194 8 110 66 171 19 Other 85 60 116 38 84 48 136 16 84 63 110 54 Total 100 3805 100 2447 100 6252
Care Quality Commission Count me in census 2010 56
Appendix B Mental health tables continued
Table B9 Standardised detention ratios by ethnic group detention on day of admission ndash section 3741 of the Mental Health Act (England and Wales = 100)
Ethnic group
Men Women Persons Standardised
detention ratio
95 confidence
interval Observed numbers
Standardised detention
ratio
95 confidence
interval Observed numbers
Standardised detention
ratio
95 confidence
interval Observed numbers
White British 84 79 89 991 101 88 115 220 86 82 91 1211 White Irish 140 96 198 32 48 6 175 2 126 87 176 34 Other White 112 89 139 81 156 95 241 20 118 96 144 101 White and Black Caribbean 177 133 232 53 179 66 390 6 178 135 229 59 White and Black African 149 82 251 14 224 46 654 3 159 92 254 17 White and Asian 141 75 241 13 195 40 569 3 149 85 241 16 Other Mixed 144 85 227 18 264 97 575 6 162 104 242 24 Indian 86 56 126 26 44 5 160 2 80 53 116 28 Pakistani 122 87 166 40 0 0 111 79 152 40 Bangladeshi 66 32 122 10 0 0 60 29 110 10 Other Asian 99 61 151 21 0 0 89 55 136 21 Black Caribbean 200 174 229 210 78 34 153 8 189 165 216 218 Black African 127 101 157 82 84 34 172 7 122 98 150 89 Other Black 152 110 205 43 94 11 341 2 148 108 198 45 Chinese 100 27 255 4 0 0 80 22 204 4 Other 118 75 177 23 44 1 245 1 110 71 164 24 Total 100 1661 100 280 100 1941
Care Quality Commission Count me in census 2010 57
Appendix B Mental health tables continued
Table B10 Standardised detention ratios by ethnic group detention on day of admission ndash sections 47 48 4749 of the Mental Health Act (England and Wales = 100)
Ethnic group
Men Women Persons Standardised
detention ratio
95 confidence
interval Observed numbers
Standardised detention
ratio
95 confidence
interval Observed numbers
Standardised detention
ratio
95 confidence
interval Observed numbers
White British 97 90 106 583 104 81 131 73 98 91 106 656 White Irish 132 72 221 14 163 20 590 2 135 77 219 16 Other White 130 96 172 49 71 15 206 3 124 93 163 52 White and Black Caribbean 126 78 193 21 80 2 444 1 123 77 186 22 White and Black African 207 103 370 11 0 0 189 95 339 11 White and Asian 57 12 166 3 169 4 941 1 68 19 175 4 Other Mixed 112 48 221 8 233 28 843 2 125 60 230 10 Indian 57 26 108 9 0 252 0 52 24 99 9 Pakistani 92 54 147 17 0 314 0 86 50 138 17 Bangladeshi 46 12 117 4 167 4 930 1 53 17 125 5 Other Asian 101 52 177 12 0 0 95 49 166 12 Black Caribbean 126 98 159 70 125 34 319 4 126 99 158 74 Black African 74 48 107 27 104 21 303 3 76 51 108 30 Other Black 127 78 197 20 138 3 769 1 128 79 195 21 Chinese 0 0 0 0 0 0 Other 83 38 157 9 0 0 77 35 147 9 Total 100 857 100 91 100 948
Care Quality Commission Count me in census 2010 58
Appendix B Mental health tables continued
Table B11 Standardised ratios for all applications of the Mental Health Act (including outpatients on a CTO) by ethnic group on day of census (England and Wales = 100)
Ethnic group
Men Women Persons Standardised
ratio for all MHA
applications
95 confidence
interval Observed numbers
Standardised ratio for all MHA
applications
95 confidence
interval Observed numbers
Standardised ratio for all MHA
applications
95 confidence
interval Observed numbers
White British 97 94 99 7659 95 93 98 4335 96 94 98 11994 White Irish 99 83 116 147 104 84 128 95 101 89 114 242 Other White 87 79 95 427 97 85 110 249 90 84 97 676 White and Black Caribbean 117 103 133 245 130 103 163 76 120 107 134 321 White and Black African 120 95 150 79 93 58 141 22 113 92 137 101 White and Asian 101 78 128 65 119 81 169 31 106 86 129 96 Other Mixed 110 89 134 96 125 93 165 49 114 97 135 145 Indian 103 90 118 215 122 100 147 109 109 97 121 324 Pakistani 111 97 125 254 117 90 148 67 112 100 125 321 Bangladeshi 92 75 112 97 101 68 145 29 94 78 112 126 Other Asian 103 88 121 152 126 95 164 56 109 94 124 208 Black Caribbean 123 115 131 893 141 126 158 300 127 120 134 1193 Black African 112 103 122 511 121 104 140 188 114 106 123 699 Other Black 116 102 132 232 148 112 191 59 122 108 136 291 Chinese 97 64 140 27 101 61 157 19 98 72 131 46 Other 104 87 122 140 103 75 137 46 103 89 119 186 Total 100 11239 100 5730 100 16969
Care Quality Commission Count me in census 2010 59
Appendix B Mental health tables continued
Table B12 Standardised CTO ratios by ethnic group CTOs on day of census ndash section 17a of the Mental Health Act (England and Wales = 100)
Ethnic group
Men Women Persons
Standardised CTO ratio
95 confidence
interval Observed numbers
Standardised CTO ratio
95 confidence
interval Observed numbers
Standardised CTO ratio
95 confidence
interval Observed numbers
White British 94 89 99 1289 88 82 94 730 92 88 96 2019 White Irish 51 27 88 13 77 41 132 13 62 40 90 26 Other White 97 77 120 83 125 95 162 58 107 90 126 141 White and Black Caribbean 79 53 113 29 141 77 237 14 92 67 124 43 White and Black African 111 59 190 13 125 41 292 5 115 68 181 18 White and Asian 104 54 182 12 136 50 297 6 113 67 178 18 Other Mixed 102 59 166 16 136 62 257 9 112 73 166 25 Indian 134 99 177 48 152 98 226 24 139 109 175 72 Pakistani 145 110 187 59 174 101 279 17 151 119 189 76 Bangladeshi 142 93 206 27 205 99 378 10 155 109 213 37 Other Asian 107 71 155 28 182 99 305 14 124 89 168 42 Black Caribbean 121 103 142 152 171 132 218 65 133 116 152 217 Black African 116 94 142 94 139 98 192 37 122 102 145 131 Other Black 186 144 238 65 305 189 466 21 206 165 254 86 Chinese 83 23 213 4 152 49 354 5 111 51 211 9 Other 87 54 134 21 152 79 266 12 103 71 145 33 Total 100 1953 100 1040 100 2993
Care Quality Commission Count me in census 2010 60
Appendix C Learning disability tables
Table C1 Standardised admission ratios by ethnic group for England and Wales using 2007 ONS population denominators (England amp Wales = 100) All ages
Ethnic group
Men Women Persons Standardised
admission ratio
95 confidence
interval Observed numbers
Standardised admission
ratio
95 confidence
interval Observed numbers
Standardised admission
ratio
95 confidence
interval Observed numbers
White British 104 100 109 2163 108 101 115 941 105 102 109 3104 White Irish 108 72 156 28 151 89 238 18 121 89 162 46 Other White 81 65 101 85 49 30 75 21 72 59 87 106 White and Black Caribbean 280 186 405 28 246 118 453 10 270 191 371 38 White and Black African 102 33 239 5 165 34 482 3 119 51 235 8 White and Asian 66 26 135 7 154 56 335 6 89 47 152 13 Other Mixed 181 104 295 16 229 99 451 8 195 125 290 24 Indian 32 21 48 24 28 12 55 8 31 21 44 32 Pakistani 48 30 72 22 12 1 43 2 38 25 57 24 Bangladeshi 102 60 161 18 31 4 113 2 83 51 128 20 Other Asian 33 13 69 7 92 34 201 6 47 25 81 13 Black Caribbean 265 210 332 77 117 67 190 16 218 176 267 93 Black African 53 33 80 22 40 15 87 6 50 33 72 28 Other Black 228 118 399 12 134 28 392 3 200 112 330 15 Chinese 4 0 21 1 3 0 16 1 Other 26 9 56 6 11 0 59 1 21 9 44 7 Total 100 2521 100 1051 100 3572
Care Quality Commission Count me in census 2010 61
Appendix C Learning disability tables continued
Table C2 Standardised detention ratios by ethnic group all detentions on day of admission (England and Wales = 100)
Ethnic group
Persons Standardised
detention ratio
95 confidence
interval Observed numbers
White British 97 93 103 1431 White Irish 127 84 184 28 Other White 117 91 149 68 White and Black Caribbean 120 77 179 24 White and Black African 114 37 267 5 White and Asian 75 24 176 5 Other Mixed 94 49 165 12 Indian 119 72 186 19 Pakistani 110 61 181 15 Bangladeshi 144 84 231 17 Other Asian 59 16 150 4 Black Caribbean 119 90 155 57 Black African 138 85 210 21 Other Black 62 20 145 5 Chinese 0 0 Other 104 28 267 4 Total 100 1715
Care Quality Commission Count me in census 2010 62
copy Care Quality Commission and National Mental Health Development Unit 2011 Published April 2011
This publication may be reproduced in whole or in part in any format or medium for non-commercial purposes provided that it is reproduced accurately and not used in a derogatory manner or in a misleading context The source should be acknowledged by showing the publication title and copy Care Quality Commission and National Mental Health Development Unit 2011
How to contact us
Phone 03000 616161 Email enquiriescqcorguk Web wwwcqcorguk
Write to us at Care Quality Commission National Correspondence Citygate Gallowgate Newcastle upon Tyne NE1 4PA
Please contact us if you would like a summary of this publication in other formats or languages
Registered office Care Quality Commission Finsbury Tower 103ndash105 Bunhill Row London EC1Y 8TG
- Count me in 2010
- About the Care Quality Commission
- Contents
- Summary
- National organisations coordinating the census
- Introduction
- Data methods of analysis and interpretation
- Results mental health
- A comparison between the 2005 baseline and the 2010 census
- Results learning disabilities
- Data in the future Moving beyond a one-day census
- Conclusions
- References
- Appendix A Methods of analysis
- Appendix B Mental health tables
- Appendix C Learning disability tables
- How to contact us
-

Results mental health continued
Ward security
As in previous years about 11 of all patients were on a medium or high secure ward as opposed to a general (76) or low secure (13) ward
Patients from the White British Indian and Bangladeshi groups were less likely than average to be on a medium or high secure ward by 7 30 and 67 respectively Patients from the White Irish WhiteBlack Caribbean Mixed Black Caribbean and Other Black groups had a higher than average rate by between 43 and 55
Age range on wards
Among patients under 18 years of age 61 were being cared for on wards for working-age adults on census day and five patients were on a ward for older people Seven per cent of patients on wards for working-age adults were 65 or over and
8 of those on wards for older people were adults of working age There were very few lsquoout of agersquo placements among minority ethnic groups
Patients in wards designated as single sex or mixed
Providers were asked whether patients were on a ward designated as men or women only or mixed gender All the analyses of single sex accommodation and facilities exclude outpatients on a CTO Overall 61 of men and 77 of women were not in a ward designated for single sex use similar proportions as in previous years The proportion of patients not in a designated single sex ward was lower among almost all minority ethnic groups than among the White British group In all ethnic groups the proportion of men who were not in a designated single sex ward was lower than among women (see Table 7a)
Two further questions examined the single sex facilities that were available to patients
At the time of the 2010 census the following guidance from the Department of Health applied in England A ward can be described as single sex (ie the intended sex of the ward is either male or female and not mixed) when the accommodation complies with the following definition from the Department of Health of single sex accommodation ldquoSleeping areas must be segregated and members of one sex must not have to walk through an area occupied by the other sex to reach toilets or bathrooms Separate male and female only toilets and bathrooms must be provided There should be separate day rooms to which only women have accessrdquo However there is a discrepancy for providers because accommodation designated as a lsquowardrsquo for administrative purposes may incorporate single sex accommodation for both sexes that meets the guidelines ndash but in this case the ward would still be lsquomixedrsquo (based on guidance from Safety Privacy and Dignity Department of Health 2000)
As long as men and women are cared for in separate bays or rooms and have their own toilet facilities then it may well be appropriate for them to be on the same ward being cared for by the same team of doctors and nurses In practice good segregation can be achieved if men and women have separate sleeping areas (for example single sex bays) and have separate toilets and bathrooms that they can reach without having to pass through (or close to) areas for the opposite sex The layout of wards should minimise any risk of overlooking or overhearing by members of the opposite gender (from Privacy and Dignity ndash A report by the Chief Nursing Officer into mixed sex accommodation in hospitals Department of Health 2007)
The coalition governmentrsquos revised Operating Framework for 201011 requires NHS organisations to eliminate mixed-sex accommodation except under exceptional circumstances from 2011 The national guidance relating to mixed sex accommodation was issued in November 2010 and states that ldquoNo areas are exempt and every decision to mix must be justified by reference to the patientrsquos clinical needs not organisational convenience or custom and practicerdquo For mental health and learning disability trusts it states ldquoThere is no acceptable justification for admitting a mental health patient to mixed-sex accommodationrdquohellip It ldquomay be acceptable in a clinical emergency to admit a patient temporarily to a single ensuite room in the opposite-gender area of a ward In such cases a full risk-assessment must be carried out and complete safety privacy and dignity maintainedrdquo The guidance is available at wwwdhgovukenPublicationsandstatisticsLettersandcircularsProfessionallettersChiefnursingofficerlettersDH_121848
Care Quality Commission Count me in census 2010 27
Results mental health continued
Table 7a Percentage of patients not in a designated single sex ward by ethnic group
Ethnic group
Sex of patients and ward
Male Female
Male ward Female or mixed ward Female ward Male or mixed ward
White British 35 65 21 79
White Irish 41 59 28 72
Other White 44 56 28 72
White and Black Caribbean 56 44 31 69
White and Black African 48 52 41 59
White and Asian 43 57 34 66
Other Mixed 49 51 24 76
Indian 37 63 25 75
Pakistani 48 52 35 65
Bangladeshi 23 77 18 82
Other Asian 46 54 22 78
Black Caribbean 55 45 32 68
Black African 49 51 28 72
Other Black 49 51 30 70
Chinese 42 58 30 70
Other 43 57 20 80
Total 39 61 23 77
The vast majority of patients in this category were in mixed wards very few (under 05) male patients were on female-only wards or vice versa
Care Quality Commission Count me in census 2010 28
Results mental health continued
Patientsrsquo access to toilet and bathing facilities designated for single sex use
We asked providers if the patient had access to toilet and bathing facilities designated for single sex use Overall 13 of men and 16 of women
were reported as not having access to such facilities designated for single sex use This was an improvement over 2009 when these proportions were 19 and 24 respectively The proportion of patients not having access to toilet and bathing facilities designated for single sex use was lower among almost all minority ethnic groups than among the White British group (see Table 7b for details)
Table 7b Percentage of patients not having access to toilet and bathing facilities designated for single sex use by ethnic group
Ethnic group
Access to designated single sex bathing and toilet facilities
Male Female
Male facilities
Female or mixed facilities
Female facilities
Male or mixed facilities
White British 86 14 84 16
White Irish 87 13 87 13
Other White 89 11 86 14
White and Black Caribbean 93 7 93 7
White and Black African 90 10 93 7
White and Asian 90 10 84 16
Other Mixed 98 2 96 4
Indian 91 9 90 10
Pakistani 95 5 94 6
Bangladeshi 92 8 98 2
Other Asian 92 8 86 14
Black Caribbean 92 8 90 10
Black African 91 9 91 9
Other Black 92 8 89 11
Chinese 82 18 83 17
Other 87 13 90 10
Total 87 13 84 16
The vast majority of patients in this category had access to mixed facilities very few (1) of male patients had access to female-only facilities or vice versa
Care Quality Commission Count me in census 2010 29
Results mental health continued
Patientsrsquo access to a lounge area day space designated for single sex use
We also asked providers if patients had access to a lounge area or day space designated for single sex use Overall 37 of men and 39 of women were
reported as not having access to these facilities This was an improvement over 2009 when these proportions were 48 and 51 respectively The proportion of patients not having access to a lounge areaday space designated for single sex use was lower among most minority ethnic groups than among the White British group (see Table 7c for details)
Table 7c Percentage of patients not having access to a lounge areaday space designated for single sex use by ethnic group
Ethnic group
Access to a lounge areaday space designated for single sex use
Male Female
Male facilities
Female or mixed facilities
Female facilities
Male or mixed facilities
White British 59 41 60 40
White Irish 63 37 70 30
Other White 68 32 63 37
White and Black Caribbean 82 18 73 27
White and Black African 83 18 76 24
White and Asian 72 28 75 25
Other Mixed 79 21 67 33
Indian 59 41 66 34
Pakistani 80 20 72 28
Bangladeshi 53 47 52 48
Other Asian 70 30 61 39
Black Caribbean 78 22 70 30
Black African 73 27 70 30
Other Black 79 21 72 28
Chinese 59 41 60 40
Other 67 33 67 33
Total 63 37 61 39
The vast majority of patients in this category had access to mixed facilities very few (1) of male patients had access to female-only facilities or vice versa
Care Quality Commission Count me in census 2010 30
Results mental health continued
Patientsrsquo subject to deprivation of liberty safeguards
People who lack the mental capacity to consent to the care or treatment they need should be cared for in a way that is least restrictive of their rights or freedom of action In 2007 the Mental Capacity Act 2005 was amended to introduce Deprivation of Liberty Safeguards for people who lack capacity to decide about their care or treatment and who need to be deprived of their liberty to protect them from harm The Safeguards came into effect in April 2009 and strengthen the rights of hospital patients and those in care homes as well as ensuring compliance with the European Convention on Human Rights (ECHR)
The 2010 census introduced a new question ldquoIs the patient subject to deprivation of liberty authorisation on 31 March 2010rdquo Under 1 (269) patients were reported as being subject to a deprivation of liberty authorisation on census day No ethnic differences in the rates were observed which may be due to the low numbers of patients among minority ethnic groups (69)
Care Quality Commission Count me in census 2010 31
A comparison between the 2005 baseline and the 2010 census
The changes we have seen in the census results between 2005 and 2010 the timespan of the Delivering Race Equality (DRE) action plan are set out below This is not a review of the DRE programme The aim is to give an overview of how some variables in the census have changed during the course of DRE and the findings should be seen in the light of the caveats described on page 13
bull The number of inpatients went down from 33785 to 29840 ndash a fall of 12
bull The proportion of patients in independent hospitals rose from 10 to 16
bull The overall proportion of patients from minority ethnic groups increased from 20 to 23 However there have been demographic changes during this time ndash the population from Black and minority ethnic groups in England and Wales rising from 79 million in 2005 to 85 million in 2007 (the latest year for which these figures are available) an increase of 8 in two years
bull Admission rates showed similar patterns across all censuses ndash Lower than average rates among the White
British Indian and Chinese groups ndash About average rates among the Pakistani and
Bangladeshi groups ndash Higher than average rates among other
minority ethnic groups ndash particularly in the Black and WhiteBlack Mixed groups for whom rates were two or more times higher than average in 2010 The Other Black group continues to have exceptionally high rates of admission (even after the apparent reduction since 2005 see next point)
bull One of the 12 goals of DRE was a decline in admission rates among Black and minority ethnic groups Figure 1 provides a comparison between 2005 and 2010 Although admission rates for
many ethnic groups show relatively little change since 2005 the rate for the Other Black group is considerably lower in 2010 (six times higher than average) compared with 2005 (12 times higher than average) However rates for the other Black and WhiteBlack Mixed groups show small increases
bull In general rates of referral from GPs and community mental health teams were lower than average among some Black and WhiteBlack groups and referral from the criminal justice system was higher Patterns were less consistent for other minority ethnic groups
bull There was a steady increase in the overall proportion of patients subject to the Mental Health Act Compared with 40 in 2005 49 of all patients were subject to the Mental Health Act in 2010 (53 if outpatients on a CTO are excluded)
bull Another DRE goal was to reduce detention rates among Black and minority ethnic groups However detention rates have been higher than average among the Black Caribbean Black African and Other Black groups in all six censuses and almost consistently higher in the WhiteBlack Caribbean Mixed and Other White groups Rates have been average for other minority ethnic groups
bull A consistent pattern was the higher than average detention rate under section 3741 for the Black Caribbean and Other Black groups
bull Another DRE goal was to reduce seclusion among Black and minority ethnic groups Although there have been annual fluctuations in seclusion rates they have been higher than average for the Black and WhiteBlack Mixed groups and the Other White group in at least three of the six censuses Other minority ethnic groups did not show high rates
Care Quality Commission Count me in census 2010 32
A comparison between the 2005 baseline and the 2010 census continued
Figure 1 Admission ratios in the 2005 and 2010 Count me in censuses by ethnic group England and Wales
Other Black
Black Caribbean
White and Black Caribbean
White and Black African
Black African
Other Mixed
Other Asian
White and Asian
Other
White Irish
Other White
Bangladeshi
White British
Pakistani
Indian
Chinese
0 100 200 300 400 500 600 700 800 900 1000 1100 1200 1300
Ageshysex standardised admission ratios (EampW=100)
Census 2005 admission ratios using 2005 ONS populations
bull Minority ethnic groups do not compare unfavourably for other incidents Rates of self-harm have consistently been lower than average among the Black and South Asian groups Very few ethnic differences in hands-on restraint physical assault and accidents were observed across the different censuses and they did not show a consistent pattern
bull About 31 of patients in all censuses had been in hospital for one year or more and were therefore included in more than one census
Census 2010 admission ratios using ONS 2007 populations (excluding outpatients on a CTO)
(This is one reason why the census shows little change over the six years It should be noted again that because the census is a one-day count it over-represents long-stay admissions and under-represents short-stay admissions)
bull Mixed accommodation was reported for many patients across all censuses although patients from Black and minority ethnic groups were more likely to be in single sex accommodation than White British patients
The admission ratios for the 2005 census shown here are different from those published in the 2005 report This is because we updated the analysis of the 2005 admission ratios by using 2005 ONS census populations for ethnic groups as denominators These populations were not available at the time of the 2005 report which instead used the 2001 ONS population data
Care Quality Commission Count me in census 2010 33
Results learning disabilities
We obtained information about 3642 patients in 129 organisations providing services for people with learning disabilities in England and Wales Of these two were inpatients on CTOs The total number of inpatients has declined each year and by 21 from 4609 in 2006 to 3642 in 2010 The total number of providers did not change much from the baseline year of 2006 although the number of NHS providers has fallen steadily and the number of independent healthcare organisations has increased (see Table 8) The proportion of inpatients in independent
healthcare organisations increased from 20 in 2006 to 33 in 2010 This is likely to be a result of closing NHS campuses with people moving from hospital to community settings
The pattern of results for learning disability patients in 2010 is broadly similar to that reported in previous censuses This is not surprising since many of the patients had been in hospital for a considerable period of time and they therefore appear in successive censuses
Table 8 The number of providers of learning disability services and inpatients
NHS (England)
Independent (England)
NHS (Wales)
Independent (Wales) Total
2010 census Number of providers 55 61 4 9 129 Number of all patients (including patients 2304 1072 154 112 3642 on a CTO) of all patients 633 294 42 31 100
2009 census Number of providers 60 54 5 4 123 Number of all patients (including patients 2487 1014 139 55 3695 on a CTO) of all patients 673 274 38 15 100
2008 census Number of providers 62 57 5 5 129
Number of inpatients 2873 1050 143 41 4107
of inpatients 700 256 35 10 100 2007 census
Number of providers 64 47 5 4 120
Number of inpatients 3063 900 154 36 4153
of inpatients 738 217 37 09 100 2006 census
Number of providers 70 48 5 1 124
Number of inpatients 3505 930 164 10 4609
of inpatients 760 202 36 02 100
Care Quality Commission Count me in census 2010 34
Results learning disabilities continued
Ethnicity
Information about ethnicity was available for 98 of patients Of these 13 belonged to Black and minority ethnic groups defined as all groups that are not White British (see Table 9) This figure is somewhat higher than in previous years (11 in 2006) and is significantly lower than the 23 of mental health patients from minority ethnic groups as reported in the mental health section of this report
Although the patterns by ethnicity are broadly similar to previous years there was an increase between 2006 and 2010 in the proportion of patients from the Other White group and a fall in those from the White British group Some ethnic groups had very few patients
As in the previous censuses patients from Black and minority ethnic groups were concentrated in a relatively small number of organisations 70 were
Table 9 Learning disability patients by ethnic group
Ethnic group 2010 census 2009 census 2008 census 2007 census 2006 census
Number Number Number Number Number
White British 853 3106 867 3205 889 3616 883 3642 887 4037
White Irish 13 46 15 57 13 53 10 40 14 66
Other White 29 106 23 85 26 104 26 109 17 77
White and Black Caribbean 10 38 10 36 07 29 08 34 07 32
White and Black African 02 8 01 4 00 2 02 10 01 3
White and Asian 04 13 04 14 03 12 03 13 02 9
Other Mixed 07 24 05 19 03 14 04 16 03 14
Indian 09 32 09 35 07 28 08 32 11 49
Pakistani 07 24 09 33 07 30 08 32 07 34
Bangladeshi 05 20 06 21 03 11 03 11 02 9
Other Asian 04 13 03 10 03 12 02 8 03 12
Black Caribbean 26 93 22 81 23 94 26 108 28 129
Black African 08 28 09 35 07 29 08 33 07 33
Other Black 04 15 04 14 04 15 04 18 04 17
Chinese 00 1 01 2 01 5 02 8 02 7
Other 02 7 02 8 04 15 02 10 05 24
Not stated 19 68 10 36 09 38 07 29 12 57
Total 100 3642 100 3695 100 4069 100 4124 100 4552
Care Quality Commission Count me in census 2010 35
Results learning disabilities continued
patients in 25 of the 129 organisations that took part in the census Seventy-four organisations had fewer than 10 patients from Black and minority ethnic groups each and another 42 organisations had no inpatients at all from these groups
However it is important to note that the number of people with severe and profound learning disabilities in some areas is affected by past funding and placement practices especially the presence of old long stay hospitals and of people placed outside their original area of residence by funding authorities
Reporting of ethnicity
About half (56) of patients reported their own ethnic group Staff reported the ethnic group for 17 of patients and relatives for 21 This means that ethnicity could have been misreported for some patients We do not know how ethnicity was assessed for 6 of patients
Age and gender
Two per cent (59) of patients were under 18 years old The number of young inpatients from minority ethnic groups was low or zero in several ethnic minority groups
Overall 73 of patients were under 50 years old and 27 were aged 50 or over The proportion of patients under 50 was higher among patients from Black and minority ethnic groups (88) than among the White British group (71) This is not surprising given that minority ethnic populations are generally younger than the White population
Seventy per cent of patients in learning disability services were men whereas in mental health services 58 of patients were men
Language and religion
Eight per cent of patients reported that their first language was not English Non-verbal communication was the most often selected language after English accounting for 4 of patients Two per cent (84) of patients most of whom were from the White British group said they needed an interpreter
Religion was not stated for 22 of patients and 15 of patients said they had no religion South Asians (Indians Bangladeshis and Pakistanis) were mostly Muslim Hindu or Sikh and those from the White Black Caribbean and Black African groups were mostly Christian
Sexual orientation
Overall the result was not known for almost half (49) of patients 45 said they were heterosexual 2 said gaylesbian 3 said bisexual and 1 said ldquootherrdquo The numbers of patients from minority ethnic groups were too low for meaningful analysis
Disability
Of all inpatients in learning disability services
bull 4 were reported as having no disabilities
bull 44 had a learning disability only
bull 51 had multiple disabilities
The patterns among minority ethnic groups were similar in that most patients had either a learning disability or multiple disabilities
Care Quality Commission Count me in census 2010 36
Results learning disabilities continued
Rates of admission
The rates of admission based on ONS estimates of the general population in 2007 are given in Appendix C Table C1
Admission rates were lower than average among several minority ethnic groups Other White Indian Pakistani Other Asian Black African Chinese and Other Rates were two to three times higher than average among the WhiteBlack Caribbean Mixed Black Caribbean Other Black and Other Mixed groups The lower rates among the South Asian and Chinese groups and the higher rates among some Black groups are similar to patterns for inpatients in mental health establishments
These patterns of admission are similar to those we reported in previous census reports
Source of referral
As we reported in the section on mental health patients data about sources of referral must be interpreted with care as we do not always know the original referral source Furthermore in the case of inpatients with learning disabilities this information was invalid missing or unknown for 12 of patients
Because of the small numbers of patients in most minority ethnic groups we observed few ethnic differences in sources of referral
Detention under the Mental Health Act 1983 (on day of admission and on day of census)
The Mental Health Act 2007 made a number of changes to the Mental Health Act 1983 one of which was supervised community treatment (section 17A) These are reflected in the 2010 census
All detentions Of all the patients in learning disability services 48 were detained under the Mental Health Act on admission Rates of detention on the day of admission by ethnic group are in Appendix C Table C2 and no ethnic differences were observed As the number of detained patients from each minority ethnic group was low we did not undertake further analysis for individual sections of the Act
Rates of detention on census day also showed no ethnic differences with the exception of a lower than average rate for the Other White group
Consent
About 66 of informally admitted inpatients were deemed incapable of consenting to treatment which is a similar proportion to that reported previously
Among detained patients 38 were deemed incapable of consenting to treatment and 6 were deemed capable of consenting to treatment but refused
The numbers of patients from minority ethnic groups were too low for comment There were no or very few such patients among minority ethnic groups
Care Quality Commission Count me in census 2010 37
Results learning disabilities continued
Care programme approach
Details of the Care Programme Approach (CPA) are given on page 24
We found that 73 of all patients were on a CPA 2 on a single assessment process (SAP) and 25 on neither No ethnic differences were observed
Recorded incidents
The 2010 census asked about the number of times that patients experienced seclusion hands-on restraint self-harm accident and physical assault in a patientrsquos current hospital spell or if the patientrsquos hospital spell was longer than three months the number that took place within the last three months As in previous years we observed very few ethnic differences
Seclusion Five per cent of patients had experienced one or more episodes of seclusion The only ethnic differences observed were the higher than average rates among the White Irish and Other White groups but these were based on small numbers of patients
Physical assault on the patient The definition of assault includes incidents of physical assault on the patient irrespective of who committed the assault but we do not have information on who committed the assault About 28 of patients had been involved in one or more episodes of physical assault No ethnic differences were observed
Hands-on restraint self-harm accidents Thirty per cent of inpatients had experienced one or more episodes of hands-on restraint 22 had attempted to harm themselves and 24 had suffered an accident The numbers were very low in minority ethnic groups and we did not observe any ethnic differences except for a lower than average rate for self-harm among the Black Caribbean group but this was based on very few patients
Duration of stay in hospital
We analysed the length of the period between each patientrsquos admission to hospital and the census day This period is of course shorter than a patientrsquos full length of stay in hospital which runs from admission to the date when they are discharged
bull 10 of inpatients had been in hospital for one month or less
bull 6 had been in hospital between one and three months
bull 7 had been in hospital between three and six months
bull 10 had been in hospital between six months and one year
bull 14 had been in hospital between one and two years
bull 22 had been in hospital between two and five years
bull 31 had been in hospital for over five years
The patterns are very similar to those in previous censuses About 67 of patients in the 2010 census had been in hospital for more than a year and were therefore also included in the 2009 census In addition over half (53) of patients had been in hospital for more than two years and will have been included in both the 2008 and 2009 censuses A third of patients will have been included in each census since 2006
We also calculated the median length of stay (see page 26 for the definition of median) Overall the median amount of time that women had spent in hospital was about 31 months and the median for men was about 27 months This compares with a median for mental health patients of 25 months for women and 58 months for men It is not possible to reliably compare length of stay by ethnic group because of the small numbers of patients among several minority ethnic groups
Care Quality Commission Count me in census 2010 38
Results learning disabilities continued
Ward security
About 12 of all inpatients were on a medium or high secure ward as opposed to a general (54) or low secure (34) ward
As in the three previous years rates of patients on medium or high secure wards were about double the average among the White Irish and Other White groups Most other minority ethnic groups had very few patients on medium or high secure wards
Age range on wards
There were five patients under 18 years of age being cared for on wards for working-age adults and none were on wards for older people About 5 of patients on wards for working-age adults were aged 65 or over and there were very few patients (23) on wards for older people There were very few lsquoout of agersquo placements among minority ethnic groups
Patients in wards designated as single sex or mixed
We asked providers whether the patient was on a ward designated as men or women only or mixed gender Overall 47 of men and 69 of women were not in a ward designated for single sex use The numbers of such patients among minority ethnic groups were very low
Two further questions examined the single sex facilities that were available to patients Again due to the small numbers we do not present results by ethnicity for these questions
Patientsrsquo access to toilet and bathing facilities designated for single sex use
Overall 19 (497) of men and 27 (295) of women were reported as not having access to toilet and bathing facilities designated for single sex use
Patientsrsquo access to a lounge area day space designated for single sex use
Overall 32 (829) of men and 44 (470) of women were reported as not having access to a lounge area day space designated for single sex use
Patients subject to deprivation of liberty safeguards
For details of deprivation of liberty safeguards please see page 31
The 2010 census introduced a new question ldquoIs the patient subject to deprivation of liberty authorisation on 31 March 2010rdquo Two per cent (74) patients were reported as being subject to a deprivation of liberty order on census day but very few of these patients (15) were from minority ethnic groups
See footnote on single sex accommodation on page 27
Care Quality Commission Count me in census 2010 39
Data in the future Moving beyond a one-day census
For six years the Count me in census has provided a valuable one-day snapshot of inpatients in mental health and learning disability services And with the proportion of inpatients who are detained increasing steadily (from 25 in 200506 to 39 in 200910 ndash see Figure 2) ongoing ethnic monitoring of admissions and detentions becomes more vital than ever
However a one-day census only captures some events and the profile of patients can differ across a whole year For example there were
bull 29840 inpatients in the 2010 census compared with 107765 inpatients overall during 200910
bull 17299 patients in the 2010 census who were detained or on CTOs compared with 42479 new detentions and some 4100 new CTOs overall in England in 200910
bull 26 of patients in hospital for under one month and 31 for over one year per the census
whereas the MHMDS data consistently shows that for over 50 of records the average length of an inpatient stay was under one month and for 4 it was over one year
Looking ahead it is vital that robust data is available on all admitted patients and all those subject to the Mental Health Act not just those in hospital on one particular day Moreover patterns of use and outcomes of community care can have an impact on the need for admission to hospital and the risk of detention ndash therefore information about the care provided to patients before admission to hospital during their hospital stay and after they leave is also vital Furthermore under 84 of the 127 million people using specialist mental health services are admitted to hospital23 and so it is very important to examine the quality of community care for the 90 of patients who are not admitted to hospital
Figure 2 Number of people spending time in hospital 200506 to 200910
Num
ber
of p
atie
nts
90000
80000
70000
60000
50000
40000
30000
20000
10000
0 200506 200607 200708 200809 200910
Source NHS Information Centre Formally detained Not detained MHMDS Bulletin 2011
Care Quality Commission Count me in census 2010 40
Data in the future Moving beyond a one-day census continued
The Mental Health Minimum Data Set (MHMDS) is a rich source of data on people using specialist mental health services in England It covers both community and hospital services and includes a wide range of information about the demographic clinical and socioeconomic characteristics of individual patients and the services provided to those admitted to hospital and to the much larger number of those who donrsquot need a stay in hospital The data includes information about contact with services uses of the Mental Health Act and the Care Programme Approach for each individual patient All these details enable the use of services patterns of care and patient outcomes to be tracked including along pathways of care The MHMDS therefore provides a robust basis for ongoing monitoring of access to and outcomes of care for users of specialist ndash both community and hospital ndash mental health services
The MHMDS also enables an analysis of the numbers and rates of people from different ethnic groups using specialist mental health services overall (both inpatient and community) which provides an indication of the levels of mental illness and therefore the need for specialist care in different communities
At present the MHMDS does not cover high secure services and independent sector providers only started to provide data during 201011 However to support payment by results for mental health the scope of the data set will be extended to cover high secure services during 201112 (version 4 MHMDS) Further proposed changes to the dataset (version 41) will incorporate NHS-funded learning disability services and primary care mental health services A separate dataset for child and adolescent mental health services (CAMHS) has been developed and is awaiting formal approvals It is designed to include the same information about uses of the Mental Health Act as provided in the MHMDS
The latest MHMDS bulletin for 200910 provides a description of people using specialist mental health services in England including ethnic profiles of people using services hospital admissions detentions and the number of people on CPA24 It also provides information on differences by age and gender The bulletin illustrates some of the sorts of analyses that are possible using data from the MHMDS
The NHS Information Centre can provide guidance on these and other potential analyses based on MHMDS data
Care Quality Commission Count me in census 2010 41
Conclusions
While this report reviews changes in the census results since 2005 it is not a review or evaluation of the DRE programme overall Similarly the census cannot provide explanations for the patterns observed or examine whether mental health services are meeting the needs of individual ethnic minority groups As we have noted previously the results are subject to caveats in particular that the census provides a one-day snapshot that may not be representative of patients admitted to hospital throughout the year
Overview of findings
Overall the findings from the 2010 census show little change from those reported for previous annual censuses conducted since 2005 This is partly because many patients had been in hospital for a considerable period of time and had therefore been included in successive censuses The findings of this sixth and last census continue to show differences between Black and minority ethnic groups and White groups and also differences within these groups
In particular ethnic differences in rates of admission detention under the Mental Health Act and seclusion ndash three of DRErsquos 12 goals ndash have not altered materially since the inception of DRE in 2005
bull Admission rates remain higher than average among minority ethnic groups especially among Black and WhiteBlack Mixed groups for whom rates were two or more times higher than average in 2010 The Other Black group continues to have the highest admission rate ndash six times higher than average ndash although this is lower than in 2005 In contrast admission rates have consistently been lower than average among the Indian and Chinese groups and about average in the Pakistani and Bangladeshi groups
bull Detention rates remain higher than average among the Black and WhiteBlack Caribbean Mixed groups and among the Other White group A consistent pattern across all censuses was the higher than average detention rate
under section 3741 for the Black Caribbean and Other Black groups We also found that rates for being placed on a CTO were higher among the South Asian and Black groups
bull Although there have been annual fluctuations in seclusion rates they have been higher than average for the Black WhiteBlack Mixed and Other White groups in at least three of the six censuses
Overall the level of provision of single sex areas for patients continues to be unsatisfactory although there was no evidence that minority ethnic patients were disadvantaged in these respects Government policy for the NHS in England now requires that all providers of NHS-funded care including mental health trusts are expected to eliminate mixed-sex accommodation in accordance with the guidance set out in CNO201032526 From 2011 all providers of NHS-funded care must report breaches of sleeping accommodation which will attract sanctions
Implications for ways forward
The census findings do not in themselves show that mental health and learning disability services are failing to meet the needs of Black and minority ethnic service users
As noted in previous reports they need to be interpreted in the context of available evidence on ethnic differences in rates of mental illness pathways to care and factors such as socioeconomic disadvantages that all contribute to these differences Our previous reports have consistently highlighted the need for prevention early intervention and working collaboratively across sectors to reduce the risk of admission and detention where possible without compromising the care given to patients Mental health services have a key role to play but to achieve this all statutory agencies and organisations outside the healthcare sector Black and minority ethnic communities and people who use services themselves will need to work in partnership
Care Quality Commission Count me in census 2010 42
Conclusions continued
This message ndash about preventing mental ill-health by addressing the contributory factors and intervening early ndash is at the heart of No health without mental health the Department of Healthrsquos new strategy for the future of mental health care in England27
The strategy aims to tackle the economic social and environmental determinants and consequences of mental health problems and to improve outcomes and reduce inequalities
It specifies that by 2014 people in contact with the criminal justice system will have improved access to mental health services as set out in the Ministry of Justice Green Paper Breaking the Cycle Effective punishment rehabilitation and sentencing of offenders which confirms the approach outlined in Lord Bradleyrsquos report for early intervention and diversion from custody2829
Accompanying the new strategy is a supporting document that explains how its objectives will improve mental health outcomes the effective interventions and the underpinning evidence base30
The strategy is complemented by other government proposals for reforms in the NHS public health and adult social care as outlined in the NHS White Paper Equity and excellence liberating the NHS31 the public health strategy Healthy lives healthy people32 and the adult social care strategy A vision for adult social care capable communities and active citizens 33 Three outcomes frameworks have been developed alongside these strategies improving mental health outcomes and reducing inequalities is integral to them all
In this new healthcare landscape the proposed NHS Commissioning Board and GP consortia will have a statutory obligation to promote equality and reduce inequalities in healthcare (something also enshrined in the Equality Act 2010) As the lead commissioners of healthcare services it will be up to GP consortia to assess with local authorities the needs of their local populations and commission the right services that meet their requirements
And the strengthened public health role of local authorities offers significant potential for addressing the socioeconomic disadvantages faced by Black and minority ethnic communities which add to the burden of mental illness in these communities
Race Equality Action Plan A five-year review looked back at the work of the DRE action plan and describes some of the key challenges successes and learning34 Based on the experience and outcome of the DRE programme the report suggests ways forward for the next stage of mental health strategy development and implementation
Since April 2009 CQC has had a duty under the Mental Health Act 1983 to monitor how services exercise their powers in relation to patients who are detained in hospital or subject to CTOs or guardianship under the Act In its first annual report on the use of the Act CQC recommends a number of areas where improvements are needed for example over-occupancy on inpatient wards patient engagement use of control and restraint seclusion and capacity and consent35
In particular CQC highlighted a number of issues relating to the use of CTOs including concern about appropriate usage (30 of the patients in CQCrsquos sample did not have a reported history of non-compliance or disengagement with services after discharge) and over-representation of Black and minority ethnic groups CQC advised that research on the possible race equality impact of CTOs should be undertaken There were 6237 CTOs from their introduction in November 2008 to 31 March 2010 a much greater use of them than forecast for this period by the Department of Health before the power was introduced Just 31 of these orders had ended by end March 2010 suggesting that some people are being kept on supervised community treatment for long periods
Care Quality Commission Count me in census 2010 43
Conclusions continued
Data in the future Moving beyond a one-day census
Good information is the foundation of an effective healthcare system It is imperative for ensuring that services meet the needs of local populations and are equitable and that improvements are made where needed The availability of fit-for-purpose and comprehensive patient-level data sets with ethnicity and other key variables fully coded is therefore vitally important36 It enables the care provided to patients of all ethnic backgrounds to be monitored on an ongoing basis including for monitoring compliance with the Equality Act
Race Equality Action Plan A five-year review notes that better collection monitoring and use of ethnicity data to inform commissioning and provision in health and social care is required37 Key areas include good ethnic monitoring improving demographic information and ensuring good links between infomatics audit and equality and diversity leads within trusts in order to effectively use the information to inform service development monitoring and review at board management ward and community levels
The governmentrsquos proposed changes to the NHS will be supported by an information revolution aimed at improving and extending the information available to the NHS patients and the public on the quality and outcomes of NHS services including by equality dimensions38
Having information that is fit for purpose is vital for the effective regulation of mental health and learning disability services CQC uses routinely available data sets on an ongoing basis to assess the performance of health and social care organisations and their compliance with government policies and legislation We therefore expect those who commission and provide mental healthcare in the NHS and independent sector to have information systems that provide good quality data with fully
comprehensive recording and monitoring of ethnicity on an ongoing basis
Since 2005 the Count me in census has played a key role in providing information about the ethnicity and other characteristics of inpatients in mental health and learning disability services and on patients subject to the Mental Health Act It did this by providing a valuable one-day snapshot But ethnicity recording must be seen as an all-year round statutory requirement not a one-day annual event The number of inpatients throughout the year is much higher than the counts on one day and some patients will have more than one admission And there is a need to move on from counting patients to understanding more about care pathways for Black and minority ethnic patients and the factors leading to hospital admission and detention
We have consistently highlighted the need for commissioners and providers to make full use of the Mental Health Minimum Data Set (MHMDS) ndash the statutory data set submitted by providers of specialist mental health services in England It provides rich data on these issues and provides a robust information source for ongoing ethnic monitoring after this last census
Covering both community and hospital services ndash and now independent and third sector providers as well as NHS ndash it includes a wide range of information about individual patients the services provided to those admitted to hospital and to the much larger number who donrsquot need admission to hospital and the outcomes of care And because it includes year-round activity it is more representative of the overall picture of for example admission detention and readmission rates length of stay years in psychiatric care and contacts with services and professionals
We call on the Information Centre to routinely publish data on all admissions and uses of the Mental Health Act including CTOs in England (in both NHS and independent healthcare providers) by the ethnicity of
Care Quality Commission Count me in census 2010 44
Conclusions continued
patients making the MHMDS the definitive source of information about mental health and learning disability patients This data should be risk-adjusted for age gender and other variables as appropriate to enable reliable comparisons to be made across groups
It is important that all providers ndash NHS and independent ndash make strenuous efforts to improve the quality of the data they submit The Information Centre publishes reports on the quality of MHMDS data by provider (see wwwicnhsukservices mhmdsdq) and we urge providers to monitor this information and use it to improve their data quality
If GP consortia and local authorities are to be effective in their needs assessment and commissioning roles the Information Centre needs to make available and promote to them the data from the MHMDS and other sources And researchers and academics must make full use of the MHMDS to explore the factors that underlie the observed ethnic patterns
CQCrsquos role
In the meantime CQC will continue to focus strongly on the quality of care provided by mental health and learning disability services
People who find themselves admitted to mental health services or detained under the Mental Health Act and therefore counted by the Count me in census are among the most mentally unwell people in our society Our job is first and foremost to make sure that the care they receive meets the essential standards of quality and safety set out under the Health and Social Care Act 2008 and to work with providers to ensure this We act swiftly when we find services that do not Where we find systemic problems that organisations have not adequately addressed we may impose conditions on the providerrsquos registration to bring about the change needed to improve patientsrsquo experience of care
The essential standards of quality and safety include the requirement to provide single sex accommodation and we will continue to closely check that these standards are met by all mental health services
We intend to introduce a number of indicators derived from the rich information in the MHMDS into our quality and risk profiles for providers This will put greater emphasis on the experience of Black and minority ethnic patients in our regulatory activity
We will monitor the quality of MHMDS data submitted by providers (as reported by the NHS Information Centre) including independent service providers Those with poor data quality may be considered at higher risk in terms of their quality of care
In addition we will continue to monitor the progress of services in relation to the issues raised in the census and other reports including our report on the use of the Mental Health Act through our visits to services and meetings with patients by our Mental Health Act Commissioners and second opinion appointed doctors (SOADs) We will draw on patientsrsquo experiences to monitor the operation of the Mental Health Act
We will also assess the impact of advice and use of Local HealthWatch Local HealthWatch will be in a good position to make sure that providers and commissioners are held to account on matters of choice and access to services for people from Black and minority ethnic groups
Care Quality Commission Count me in census 2010 45
References
1 Department of Health Equity and excellence liberating the NHS 2010
2 Department of Health The NHS outcomes framework 201112 2010
3 Healthcare Commission Mental Health Act Commission National Institute for Mental Health in England Count me in results of a national census of inpatients in mental health hospitals and facilities in England and Wales 2005
4 Healthcare Commission Mental Health Act Commission National Institute for Mental Health in England Count me in results of the 2006 national census of inpatients in mental health and learning disability services in England and Wales 2006
5 Healthcare Commission Mental Health Act Commission National Institute for Mental Health in England Count me in results of the 2007 national census of inpatients in mental health and learning disability services in England and Wales 2007
6 Healthcare Commission Mental Health Act Commission National Institute for Mental Health in England Count me in results of the 2008 national census of inpatients in mental health and learning disability services in England and Wales 2008
7 Care Quality Commission National Mental Health Development Unit Results of the 2009 national census of inpatients and patients on supervised community treatment in mental health and learning disability services in England and Wales 2009
8 Department of Health Delivering race equality in mental health care an action plan for reform inside and outside services 2005
9 Welsh Assembly Government Adult Mental Health Services Raising the standard ndash Race Equality Action Plan for Adult Mental Health Services in Wales 2006
10Department of Health No health without mental health a cross-government mental health outcomes strategy for people of all ages 2011 wwwdhgovukprod_consum_dhgroups dh_digitalassetsdocumentsdigitalasset dh_124058pdf
11Department of Health New horizons towards a shared vision for mental health 2009 wwwdhgovukprod_consum_dhgroups dh_digitalassetsdhendocumentsdigital assetdh_109708pdf
12Department of Health Valuing people a new strategy for learning disability for the 21st century 2001
13Department of Health Valuing people now a new three year strategy for people with learning disabilities 2009
14Department of Health Healthcare for all report of the independent inquiry into access to healthcare for people with learning disabilities 2008
15Joint Committee on Human Rights A life like any other human rights of adults with learning disabilities (2008 HL Paper 401 HC 731) House of Lords House of Commons 2008
16Department of Health Valuing people now summary report March 2009 ndash September 2010 2010
17Disability Rights Commission Equal treatment investigation 2005
18Department of Health Mir G Nocon A Ahmad W Jones L Learning difficulties and ethnicity 2000
19ONS experimental population estimates by ethnic group 2007 wwwstatisticsgovukstatbase productaspvlnk=14238
Care Quality Commission Count me in census 2010 46
References continued
20Six percent of population are gay or lesbian according to Whitehall figures 2005 wwwtelegraphcouknewsmainjhtmlxml= news20051212ngay12xmlamps Sheet= news20051212ixhomehtml
21Department of Trade and Industry Amendment to Employment Equality (Sexual Orientation) Regulations 2003 2003
22Office for National Statistics Measuring sexual identity an evaluation report 2010
23 Information Centre Mental Health Bulletin Fourth report from Mental Health Minimum Dataset (MHMDS) annual returns 2010 2011 wwwicnhsukpubsmhbmhmds0910
24 Information Centre Mental Health Bulletin Fourth report from Mental Health Minimum Dataset (MHMDS) annual returns 2010 2011 wwwicnhsukpubsmhbmhmds0910
25The operating framework for the NHS in England 201112 Department of Health 2010 wwwdhgovukprod_consum_dhgroups dh_digitalassetsdhenpsdocuments digitalassetdh_122736pdf
26wwwdhgovukenPublicationsandstatistics LettersandcircularsProfessionalletters ChiefnursingofficerlettersDH_121848
27Department of Health No health without mental health a cross-government mental health outcomes strategy for people of all ages 2011 wwwdhgovukprod_consum_dhgroups dh_digitalassetsdocumentsdigitalasset dh_124058pdf
28Ministry of Justice Breaking the cycle effective punishment rehabilitation and sentencing of offenders 2010
29Department of Health The Bradley report Lord Bradleyrsquos review of people with mental health problems or learning disabilities in the criminal justice system 2009
30Department of Health No health without mental health delivering better mental health outcomes for people of all ages 2011
31Department of Health Equity and excellence liberating the NHS 2010 wwwdhgovukprod_ consum_dhgroupsdh_digitalassetsdhen psdocumentsdigitalassetdh_117794pdf
32Department of Health Healthy lives healthy people our strategy for public health in England 2010 wwwdhgovukprod_consum_dh groupsdh_digitalassetsdhenps documentsdigitalassetdh_122347pdf
33Department of Health A vision for adult social care capable communities and active citizens 2010 wwwdhgovukprod_consum_dh groupsdh_digitalassetsdhenps documentsdigitalassetdh_121971pdf
34Wilson M NMHDU Race equality action plan a five year review Delivering race equality in mental health care 2010 wwwnmhduorgukour-workmhep
35Care Quality Commission Monitoring the use of the Mental Health Act in 200910 2010
36Raleigh V S Collection of data on ethnic origin in England Editorial BMJ 20083376456
37Wilson M NMHDU Race equality action plan a five year review Delivering race equality in mental health care 2010 wwwnmhduorgukour-workmhep
38Department of Health Liberating the NHS an information revolution 2010
Care Quality Commission Count me in census 2010 47
Appendix A Methods of analysis
Standardisation by age and gender
Standardisation allows us to make comparisons between groups of the population by taking account of variations in age and gender Some differences in patterns of service use are related to the age or gender of the people using them so adjustments to the data have to be made to ensure that the interpretation of ethnic differences is reliable For example formal admissions are higher at a younger age so some Black and minority ethnic groups may have high formal admission rates simply because they have a high proportion of younger people Without adjustments for age and gender differences comparisons would be misleading
In this report most results are standardised for age and gender including those relating to admission detention source of referral care programme approach seclusion restraint accidents assault self-harm consent and presence on a secure ward The report uses the accepted statistical method of taking account of age and gender differences between groups when calculating these rates
We used the ONS estimates of total population by ethnic group for England and Wales in 2007 to standardise the rates of admission for different ethnic groups This takes account of the significant rises in the Black and ethnic minority population of England and Wales since the 2001 ONS census and hence gives more accurate and up to date estimates of admission ratios for different ethnic groups (although it does not take account of any further changes in the ethnic populations between 2007 and 2010 the date of this census) For comparison with the DRE baseline we also present admission rates from the 2005 census derived using the 2005 ONS estimates of populations by ethnic group These figures will not be the same as published in the 2005 census report which were based on the 2001 ONS census population estimates because updated estimates of populations by ethnic group were not available at that time
For other analyses we used the total number of inpatients and patients on CTOs in the census
as the basis for standardisation However CTO outpatients are excluded from selected analyses where appropriate namely the analysis of rates for admissions detentions on admission source of referral single sex accommodation and recorded incidents of seclusion restraint accidents assault and self-harm We used the statistical package STATA version 82 to derive the standardised results
It was not possible to adjust the analyses for ethnic differences in social and economic factors and in diagnosis and severity of illness Such factors could affect the ethnic differences observed in the results
For descriptive variables such as religion and language we did not use standardisation
Confidence intervals as indicators of significant statistical differences
For all standardised results the national rates for England and Wales are taken as 100 and the usual 95 confidence intervals are given Rates of less than 100 or greater than 100 for specific ethnic groups show a lower or higher rate respectively than the national average after adjusting for age and gender Whether or not the difference is statistically significant from the national average depends on the confidence interval If the confidence interval overlaps 100 the difference from the national average is not statistically significant If both values are lower or higher than 100 it indicates that the difference compared with the national average is statistically significant at the 95 level
For example if a rate is 110 with the lower confidence interval being 105 and the upper confidence interval being 115 it indicates that the 10 excess over the national average of 100 is statistically significant But if a ratio is 110 with the lower confidence interval being 95 and the upper confidence interval being 125 it indicates that the 10 excess over the national average is not statistically significant We did not attempt to adjust the confidence intervals for multiple comparisons
Care Quality Commission Count me in census 2010 48
Appendix B Mental health tables
Table B1 Standardised admission ratios by ethnic group for England and Wales (excluding outpatients on a CTO) using 2007 ONS census population denominators (England and Wales = 100) All ages
Ethnic group
Men Women Persons Standardised
admission ratio
95 confidence
interval Observed numbers
Standardised admission
ratio
95 confidence
interval Observed numbers
Standardised admission
ratio
95 confidence
interval Observed numbers
White British 88 86 89 12435 94 93 96 10157 91 89 92 22592 White Irish 130 115 146 274 122 106 140 215 126 115 138 489 Other White 117 109 126 731 129 118 141 533 122 115 129 1264 White and Black Caribbean 557 493 627 276 274 223 333 101 436 393 483 377 White and Black African 312 247 388 80 259 186 351 41 292 242 349 121 White and Asian 140 110 174 79 124 90 166 44 134 111 159 123 Other Mixed 230 189 278 108 213 165 270 67 223 192 259 175 Indian 67 59 75 286 66 56 76 172 66 60 73 458 Pakistani 105 93 119 269 65 53 79 96 91 81 100 365 Bangladeshi 123 102 147 120 82 60 109 46 108 92 126 166 Other Asian 161 139 185 192 136 107 169 79 153 135 172 271 Black Caribbean 538 505 572 980 306 277 336 418 438 415 462 1398 Black African 246 226 267 550 219 194 247 277 236 221 253 827 Other Black 792 691 903 222 314 240 403 61 596 529 670 283 Chinese 27 20 38 39 43 30 59 35 33 26 41 74 Other 140 120 162 177 110 88 136 87 128 113 145 264 Total 100 16818 100 12429 100 29247
Care Quality Commission Count me in census 2010 49
Appendix B Mental health tables continued
Table B2 Standardised admission ratios by ethnic group for England and Wales (excluding outpatients on a CTO) using 2007 ONS census population denominators (England amp Wales = 100) Ages 65 and over
Ethnic group
Men Women Persons Standardised
admission ratio
95 confidence
interval Observed numbers
Standardised admission
ratio
95 confidence
interval Observed numbers
Standardised admission
ratio
95 confidence
interval Observed numbers
White British 95 92 99 3265 95 92 98 3887 95 93 97 7152 White Irish 142 116 172 106 102 82 125 92 120 104 138 198 Other White 207 174 244 141 213 183 248 171 210 188 235 312 White and Black Caribbean 406 210 710 12 333 152 632 9 371 230 568 21 White and Black African 231 28 836 2 198 24 714 2 213 58 546 4 White and Asian 28 1 156 1 110 30 281 4 69 23 162 5 Other Mixed 146 40 374 4 228 92 470 7 189 95 339 11 Indian 97 70 132 41 83 57 116 33 90 71 113 74 Pakistani 39 17 77 8 46 18 94 7 42 23 69 15 Bangladeshi 115 53 218 9 69 14 201 3 98 51 172 12 Other Asian 234 143 361 20 215 120 354 15 225 157 313 35 Black Caribbean 216 170 269 77 310 253 376 103 261 224 302 180 Black African 142 73 248 12 365 241 531 27 246 175 337 39 Other Black 164 34 479 3 366 134 796 6 259 119 493 9 Chinese 41 8 120 3 95 38 195 7 68 33 125 10 Other 253 126 453 11 390 238 602 20 327 222 464 31 Total 100 3715 100 4393 100 8108
Care Quality Commission Count me in census 2010 50
Appendix B Mental health tables continued
Table B3 Standardised ratios by ethnic group for patients referred by a GP (England and Wales = 100)
Ethnic group
Men Women Persons Standardised
referral ratio
95 confidence
interval Observed numbers
Standardised referral ratio
95 confidence
interval Observed numbers
Standardised referral ratio
95 confidence
interval Observed numbers
White British 110 103 117 904 107 101 114 1065 108 104 113 1969 White Irish 85 50 134 18 93 57 144 20 89 63 123 38 Other White 74 51 103 33 70 49 97 36 72 56 91 69 White and Black Caribbean 27 5 78 3 30 4 109 2 28 9 65 5 White and Black African 0 0 74 9 268 2 35 4 125 2 White and Asian 165 54 386 5 0 0 86 28 201 5 Other Mixed 48 6 172 2 68 14 198 3 58 19 136 5 Indian 69 34 123 11 79 39 141 11 73 46 111 22 Pakistani 88 42 162 10 59 16 151 4 77 42 130 14 Bangladeshi 81 22 207 4 61 7 221 2 73 27 159 6 Other Asian 80 32 166 7 108 43 223 7 92 50 155 14 Black Caribbean 35 20 56 17 37 20 62 14 36 24 51 31 Black African 57 29 100 12 66 35 113 13 61 40 91 25 Other Black 62 23 135 6 40 5 144 2 54 23 107 8 Chinese 56 1 314 1 139 38 356 4 108 35 251 5 Other 106 46 208 8 0 0 53 23 105 8 Total 100 1041 100 1185 100 2226
Care Quality Commission Count me in census 2010 51
Appendix B Mental health tables continued
Table B4 Standardised ratios by ethnic group for patients referred by a community mental health team (including crisis resolution home treatment) or community learning disability team (England and Wales = 100)
Ethnic group
Men Women Persons Standardised
referral ratio
95 confidence
interval Observed numbers
Standardised referral ratio
95 confidence
interval Observed numbers
Standardised referral ratio
95 confidence
interval Observed numbers
White British 107 104 111 3255 103 100 107 3386 105 103 108 6641 White Irish 90 69 116 61 89 68 114 61 90 74 107 122 Other White 59 48 71 105 79 67 94 141 69 61 78 246 White and Black Caribbean 106 83 135 68 75 49 111 25 96 77 117 93 White and Black African 43 19 84 8 66 30 124 9 52 31 84 17 White and Asian 95 56 150 18 84 43 147 12 90 61 129 30 Other Mixed 78 48 121 20 72 41 118 16 76 53 105 36 Indian 106 83 132 76 100 76 130 56 103 86 122 132 Pakistani 108 84 135 73 89 60 128 30 102 83 123 103 Bangladeshi 98 66 141 29 90 50 148 15 95 69 128 44 Other Asian 88 63 120 40 105 70 150 29 94 73 119 69 Black Caribbean 69 59 80 167 85 71 102 123 75 67 84 290 Black African 84 70 102 112 82 65 103 77 84 72 96 189 Other Black 52 36 74 31 64 36 106 15 56 41 74 46 Chinese 112 53 205 10 101 52 176 12 105 66 160 22 Other 86 60 120 35 106 71 151 30 94 73 120 65 Total 100 4108 100 4037 100 8145
Care Quality Commission Count me in census 2010 52
Appendix B Mental health tables continued
Table B5 Standardised ratios by ethnic group for patients referred by criminal justice routes (police prison probation courts court liaison and diversion) (England and Wales = 100)
Ethnic group
Men Women Persons Standardised
referral ratio
95 confidence
interval Observed numbers
Standardised referral ratio
95 confidence
interval Observed numbers
Standardised referral ratio
95 confidence
interval Observed numbers
White British 90 86 95 1495 95 86 104 421 91 87 95 1916 White Irish 133 94 183 38 59 19 138 5 116 84 157 43 Other White 112 93 134 119 103 68 150 27 111 93 130 146 White and Black Caribbean 117 89 151 58 145 69 266 10 120 94 153 68 White and Black African 190 127 273 29 141 38 361 4 183 126 256 33 White and Asian 75 39 131 12 160 52 373 5 89 52 143 17 Other Mixed 104 65 157 22 151 61 311 7 112 75 161 29 Indian 86 61 118 38 79 32 163 7 85 62 113 45 Pakistani 118 91 150 65 89 33 194 6 115 90 145 71 Bangladeshi 74 44 115 19 29 1 162 1 68 42 105 20 Other Asian 130 95 174 45 164 71 323 8 134 101 176 53 Black Caribbean 131 114 150 208 124 81 181 26 130 114 148 234 Black African 132 112 156 145 143 93 211 25 134 114 156 170 Other Black 141 109 180 65 236 113 435 10 149 117 187 75 Chinese 83 27 194 5 146 30 426 3 99 43 195 8 Other 129 93 175 41 113 37 264 5 127 93 170 46 Total 100 2404 100 570 100 2974
Care Quality Commission Count me in census 2010 53
Appendix B Mental health tables continued
Table B6 Standardised detention ratios by ethnic group all detentions on day of admission (excluding outpatients on a CTO) (England and Wales = 100)
Ethnic group
Men Women Persons Standardised
detention ratio
95 confidence
interval Observed numbers
Standardised detention
ratio
95 confidence
interval Observed numbers
Standardised detention
ratio
95 confidence
interval Observed numbers
White British 94 92 97 6449 94 91 97 3628 94 92 96 10077 White Irish 112 95 131 154 118 96 145 94 114 101 129 248 Other White 108 98 118 451 120 106 136 251 112 104 120 702 White and Black Caribbean 123 107 141 220 129 99 167 59 124 110 140 279 White and Black African 128 99 162 68 113 70 173 21 124 100 153 89 White and Asian 96 71 126 50 109 68 164 22 99 78 125 72 Other Mixed 115 92 143 82 139 100 188 42 122 102 146 124 Indian 97 83 113 164 110 86 137 77 101 88 114 241 Pakistani 109 94 126 194 102 74 136 44 108 94 122 238 Bangladeshi 86 67 109 69 91 55 142 19 87 70 107 88 Other Asian 109 92 130 133 120 86 163 40 112 96 130 173 Black Caribbean 129 121 139 774 143 125 162 238 132 124 141 1012 Black African 115 104 127 422 131 111 153 159 119 110 129 581 Other Black 117 100 136 170 148 105 202 39 122 106 140 209 Chinese 108 71 159 26 129 78 202 19 116 85 156 45 Other 111 92 132 126 116 83 157 41 112 96 130 167 Total 100 9552 100 4793 100 14345
Care Quality Commission Count me in census 2010 54
Appendix B Mental health tables continued
Table B7 Standardised detention ratios by ethnic group detention on day of admission ndash section 2 of the Mental Health Act (England and Wales = 100)
Ethnic group
Men Women Persons Standardised
detention ratio
95 confidence
interval Observed numbers
Standardised detention
ratio
95 confidence
interval Observed numbers
Standardised detention
ratio
95 confidence
interval Observed numbers
White British 97 91 102 1156 93 87 98 1133 95 91 99 2289 White Irish 78 47 120 20 116 79 166 30 97 72 128 50 Other White 100 78 126 70 134 108 166 88 116 99 136 158 White and Black Caribbean 55 30 93 14 60 24 124 7 57 35 87 21 White and Black African 91 37 188 7 150 60 308 7 113 62 190 14 White and Asian 80 29 174 6 119 44 258 6 96 49 167 12 Other Mixed 68 28 141 7 116 53 221 9 89 51 145 16 Indian 130 91 179 37 124 81 182 26 127 98 163 63 Pakistani 126 87 176 34 138 79 225 16 130 96 171 50 Bangladeshi 166 101 256 20 140 61 276 8 158 105 228 28 Other Asian 142 93 209 26 163 93 264 16 150 108 202 42 Black Caribbean 73 57 92 70 97 72 128 51 82 68 98 121 Black African 164 131 202 87 190 146 244 62 174 147 204 149 Other Black 114 75 166 27 140 72 245 12 121 86 165 39 Chinese 165 60 358 6 212 97 402 9 190 106 313 15 Other 218 153 302 36 179 108 280 19 203 153 264 55 Total 100 1623 100 1499 100 3122
Care Quality Commission Count me in census 2010 55
Appendix B Mental health tables continued
Table B8 Standardised detention ratios by ethnic group detention on day of admission ndash section 3 of the Mental Health Act (England and Wales = 100)
Ethnic group
Men Women Persons Standardised
detention ratio
95 confidence
interval Observed numbers
Standardised detention
ratio
95 confidence
interval Observed numbers
Standardised detention
ratio
95 confidence
interval Observed numbers
White British 99 95 103 2684 96 91 100 1852 98 95 101 4536 White Irish 116 89 149 60 135 101 177 52 124 102 149 112 Other White 112 96 129 186 110 92 132 121 111 99 124 307 White and Black Caribbean 114 91 143 79 130 90 183 33 119 98 143 112 White and Black African 97 60 148 21 107 54 192 11 100 69 141 32 White and Asian 84 50 133 18 97 48 173 11 89 59 127 29 Other Mixed 121 84 168 35 117 72 181 20 120 90 156 55 Indian 96 75 122 67 110 79 148 42 101 83 122 109 Pakistani 91 71 115 69 88 55 134 22 90 73 111 91 Bangladeshi 63 39 95 22 64 28 127 8 63 43 90 30 Other Asian 90 65 120 44 94 56 149 18 91 70 117 62 Black Caribbean 116 102 130 279 164 138 192 148 129 117 142 427 Black African 95 80 112 143 102 79 129 68 97 85 111 211 Other Black 75 55 99 49 99 58 159 17 80 62 102 66 Chinese 119 59 213 11 99 43 194 8 110 66 171 19 Other 85 60 116 38 84 48 136 16 84 63 110 54 Total 100 3805 100 2447 100 6252
Care Quality Commission Count me in census 2010 56
Appendix B Mental health tables continued
Table B9 Standardised detention ratios by ethnic group detention on day of admission ndash section 3741 of the Mental Health Act (England and Wales = 100)
Ethnic group
Men Women Persons Standardised
detention ratio
95 confidence
interval Observed numbers
Standardised detention
ratio
95 confidence
interval Observed numbers
Standardised detention
ratio
95 confidence
interval Observed numbers
White British 84 79 89 991 101 88 115 220 86 82 91 1211 White Irish 140 96 198 32 48 6 175 2 126 87 176 34 Other White 112 89 139 81 156 95 241 20 118 96 144 101 White and Black Caribbean 177 133 232 53 179 66 390 6 178 135 229 59 White and Black African 149 82 251 14 224 46 654 3 159 92 254 17 White and Asian 141 75 241 13 195 40 569 3 149 85 241 16 Other Mixed 144 85 227 18 264 97 575 6 162 104 242 24 Indian 86 56 126 26 44 5 160 2 80 53 116 28 Pakistani 122 87 166 40 0 0 111 79 152 40 Bangladeshi 66 32 122 10 0 0 60 29 110 10 Other Asian 99 61 151 21 0 0 89 55 136 21 Black Caribbean 200 174 229 210 78 34 153 8 189 165 216 218 Black African 127 101 157 82 84 34 172 7 122 98 150 89 Other Black 152 110 205 43 94 11 341 2 148 108 198 45 Chinese 100 27 255 4 0 0 80 22 204 4 Other 118 75 177 23 44 1 245 1 110 71 164 24 Total 100 1661 100 280 100 1941
Care Quality Commission Count me in census 2010 57
Appendix B Mental health tables continued
Table B10 Standardised detention ratios by ethnic group detention on day of admission ndash sections 47 48 4749 of the Mental Health Act (England and Wales = 100)
Ethnic group
Men Women Persons Standardised
detention ratio
95 confidence
interval Observed numbers
Standardised detention
ratio
95 confidence
interval Observed numbers
Standardised detention
ratio
95 confidence
interval Observed numbers
White British 97 90 106 583 104 81 131 73 98 91 106 656 White Irish 132 72 221 14 163 20 590 2 135 77 219 16 Other White 130 96 172 49 71 15 206 3 124 93 163 52 White and Black Caribbean 126 78 193 21 80 2 444 1 123 77 186 22 White and Black African 207 103 370 11 0 0 189 95 339 11 White and Asian 57 12 166 3 169 4 941 1 68 19 175 4 Other Mixed 112 48 221 8 233 28 843 2 125 60 230 10 Indian 57 26 108 9 0 252 0 52 24 99 9 Pakistani 92 54 147 17 0 314 0 86 50 138 17 Bangladeshi 46 12 117 4 167 4 930 1 53 17 125 5 Other Asian 101 52 177 12 0 0 95 49 166 12 Black Caribbean 126 98 159 70 125 34 319 4 126 99 158 74 Black African 74 48 107 27 104 21 303 3 76 51 108 30 Other Black 127 78 197 20 138 3 769 1 128 79 195 21 Chinese 0 0 0 0 0 0 Other 83 38 157 9 0 0 77 35 147 9 Total 100 857 100 91 100 948
Care Quality Commission Count me in census 2010 58
Appendix B Mental health tables continued
Table B11 Standardised ratios for all applications of the Mental Health Act (including outpatients on a CTO) by ethnic group on day of census (England and Wales = 100)
Ethnic group
Men Women Persons Standardised
ratio for all MHA
applications
95 confidence
interval Observed numbers
Standardised ratio for all MHA
applications
95 confidence
interval Observed numbers
Standardised ratio for all MHA
applications
95 confidence
interval Observed numbers
White British 97 94 99 7659 95 93 98 4335 96 94 98 11994 White Irish 99 83 116 147 104 84 128 95 101 89 114 242 Other White 87 79 95 427 97 85 110 249 90 84 97 676 White and Black Caribbean 117 103 133 245 130 103 163 76 120 107 134 321 White and Black African 120 95 150 79 93 58 141 22 113 92 137 101 White and Asian 101 78 128 65 119 81 169 31 106 86 129 96 Other Mixed 110 89 134 96 125 93 165 49 114 97 135 145 Indian 103 90 118 215 122 100 147 109 109 97 121 324 Pakistani 111 97 125 254 117 90 148 67 112 100 125 321 Bangladeshi 92 75 112 97 101 68 145 29 94 78 112 126 Other Asian 103 88 121 152 126 95 164 56 109 94 124 208 Black Caribbean 123 115 131 893 141 126 158 300 127 120 134 1193 Black African 112 103 122 511 121 104 140 188 114 106 123 699 Other Black 116 102 132 232 148 112 191 59 122 108 136 291 Chinese 97 64 140 27 101 61 157 19 98 72 131 46 Other 104 87 122 140 103 75 137 46 103 89 119 186 Total 100 11239 100 5730 100 16969
Care Quality Commission Count me in census 2010 59
Appendix B Mental health tables continued
Table B12 Standardised CTO ratios by ethnic group CTOs on day of census ndash section 17a of the Mental Health Act (England and Wales = 100)
Ethnic group
Men Women Persons
Standardised CTO ratio
95 confidence
interval Observed numbers
Standardised CTO ratio
95 confidence
interval Observed numbers
Standardised CTO ratio
95 confidence
interval Observed numbers
White British 94 89 99 1289 88 82 94 730 92 88 96 2019 White Irish 51 27 88 13 77 41 132 13 62 40 90 26 Other White 97 77 120 83 125 95 162 58 107 90 126 141 White and Black Caribbean 79 53 113 29 141 77 237 14 92 67 124 43 White and Black African 111 59 190 13 125 41 292 5 115 68 181 18 White and Asian 104 54 182 12 136 50 297 6 113 67 178 18 Other Mixed 102 59 166 16 136 62 257 9 112 73 166 25 Indian 134 99 177 48 152 98 226 24 139 109 175 72 Pakistani 145 110 187 59 174 101 279 17 151 119 189 76 Bangladeshi 142 93 206 27 205 99 378 10 155 109 213 37 Other Asian 107 71 155 28 182 99 305 14 124 89 168 42 Black Caribbean 121 103 142 152 171 132 218 65 133 116 152 217 Black African 116 94 142 94 139 98 192 37 122 102 145 131 Other Black 186 144 238 65 305 189 466 21 206 165 254 86 Chinese 83 23 213 4 152 49 354 5 111 51 211 9 Other 87 54 134 21 152 79 266 12 103 71 145 33 Total 100 1953 100 1040 100 2993
Care Quality Commission Count me in census 2010 60
Appendix C Learning disability tables
Table C1 Standardised admission ratios by ethnic group for England and Wales using 2007 ONS population denominators (England amp Wales = 100) All ages
Ethnic group
Men Women Persons Standardised
admission ratio
95 confidence
interval Observed numbers
Standardised admission
ratio
95 confidence
interval Observed numbers
Standardised admission
ratio
95 confidence
interval Observed numbers
White British 104 100 109 2163 108 101 115 941 105 102 109 3104 White Irish 108 72 156 28 151 89 238 18 121 89 162 46 Other White 81 65 101 85 49 30 75 21 72 59 87 106 White and Black Caribbean 280 186 405 28 246 118 453 10 270 191 371 38 White and Black African 102 33 239 5 165 34 482 3 119 51 235 8 White and Asian 66 26 135 7 154 56 335 6 89 47 152 13 Other Mixed 181 104 295 16 229 99 451 8 195 125 290 24 Indian 32 21 48 24 28 12 55 8 31 21 44 32 Pakistani 48 30 72 22 12 1 43 2 38 25 57 24 Bangladeshi 102 60 161 18 31 4 113 2 83 51 128 20 Other Asian 33 13 69 7 92 34 201 6 47 25 81 13 Black Caribbean 265 210 332 77 117 67 190 16 218 176 267 93 Black African 53 33 80 22 40 15 87 6 50 33 72 28 Other Black 228 118 399 12 134 28 392 3 200 112 330 15 Chinese 4 0 21 1 3 0 16 1 Other 26 9 56 6 11 0 59 1 21 9 44 7 Total 100 2521 100 1051 100 3572
Care Quality Commission Count me in census 2010 61
Appendix C Learning disability tables continued
Table C2 Standardised detention ratios by ethnic group all detentions on day of admission (England and Wales = 100)
Ethnic group
Persons Standardised
detention ratio
95 confidence
interval Observed numbers
White British 97 93 103 1431 White Irish 127 84 184 28 Other White 117 91 149 68 White and Black Caribbean 120 77 179 24 White and Black African 114 37 267 5 White and Asian 75 24 176 5 Other Mixed 94 49 165 12 Indian 119 72 186 19 Pakistani 110 61 181 15 Bangladeshi 144 84 231 17 Other Asian 59 16 150 4 Black Caribbean 119 90 155 57 Black African 138 85 210 21 Other Black 62 20 145 5 Chinese 0 0 Other 104 28 267 4 Total 100 1715
Care Quality Commission Count me in census 2010 62
copy Care Quality Commission and National Mental Health Development Unit 2011 Published April 2011
This publication may be reproduced in whole or in part in any format or medium for non-commercial purposes provided that it is reproduced accurately and not used in a derogatory manner or in a misleading context The source should be acknowledged by showing the publication title and copy Care Quality Commission and National Mental Health Development Unit 2011
How to contact us
Phone 03000 616161 Email enquiriescqcorguk Web wwwcqcorguk
Write to us at Care Quality Commission National Correspondence Citygate Gallowgate Newcastle upon Tyne NE1 4PA
Please contact us if you would like a summary of this publication in other formats or languages
Registered office Care Quality Commission Finsbury Tower 103ndash105 Bunhill Row London EC1Y 8TG
- Count me in 2010
- About the Care Quality Commission
- Contents
- Summary
- National organisations coordinating the census
- Introduction
- Data methods of analysis and interpretation
- Results mental health
- A comparison between the 2005 baseline and the 2010 census
- Results learning disabilities
- Data in the future Moving beyond a one-day census
- Conclusions
- References
- Appendix A Methods of analysis
- Appendix B Mental health tables
- Appendix C Learning disability tables
- How to contact us
-

Results mental health continued
Patientsrsquo access to toilet and bathing facilities designated for single sex use
We asked providers if the patient had access to toilet and bathing facilities designated for single sex use Overall 13 of men and 16 of women
were reported as not having access to such facilities designated for single sex use This was an improvement over 2009 when these proportions were 19 and 24 respectively The proportion of patients not having access to toilet and bathing facilities designated for single sex use was lower among almost all minority ethnic groups than among the White British group (see Table 7b for details)
Table 7b Percentage of patients not having access to toilet and bathing facilities designated for single sex use by ethnic group
Ethnic group
Access to designated single sex bathing and toilet facilities
Male Female
Male facilities
Female or mixed facilities
Female facilities
Male or mixed facilities
White British 86 14 84 16
White Irish 87 13 87 13
Other White 89 11 86 14
White and Black Caribbean 93 7 93 7
White and Black African 90 10 93 7
White and Asian 90 10 84 16
Other Mixed 98 2 96 4
Indian 91 9 90 10
Pakistani 95 5 94 6
Bangladeshi 92 8 98 2
Other Asian 92 8 86 14
Black Caribbean 92 8 90 10
Black African 91 9 91 9
Other Black 92 8 89 11
Chinese 82 18 83 17
Other 87 13 90 10
Total 87 13 84 16
The vast majority of patients in this category had access to mixed facilities very few (1) of male patients had access to female-only facilities or vice versa
Care Quality Commission Count me in census 2010 29
Results mental health continued
Patientsrsquo access to a lounge area day space designated for single sex use
We also asked providers if patients had access to a lounge area or day space designated for single sex use Overall 37 of men and 39 of women were
reported as not having access to these facilities This was an improvement over 2009 when these proportions were 48 and 51 respectively The proportion of patients not having access to a lounge areaday space designated for single sex use was lower among most minority ethnic groups than among the White British group (see Table 7c for details)
Table 7c Percentage of patients not having access to a lounge areaday space designated for single sex use by ethnic group
Ethnic group
Access to a lounge areaday space designated for single sex use
Male Female
Male facilities
Female or mixed facilities
Female facilities
Male or mixed facilities
White British 59 41 60 40
White Irish 63 37 70 30
Other White 68 32 63 37
White and Black Caribbean 82 18 73 27
White and Black African 83 18 76 24
White and Asian 72 28 75 25
Other Mixed 79 21 67 33
Indian 59 41 66 34
Pakistani 80 20 72 28
Bangladeshi 53 47 52 48
Other Asian 70 30 61 39
Black Caribbean 78 22 70 30
Black African 73 27 70 30
Other Black 79 21 72 28
Chinese 59 41 60 40
Other 67 33 67 33
Total 63 37 61 39
The vast majority of patients in this category had access to mixed facilities very few (1) of male patients had access to female-only facilities or vice versa
Care Quality Commission Count me in census 2010 30
Results mental health continued
Patientsrsquo subject to deprivation of liberty safeguards
People who lack the mental capacity to consent to the care or treatment they need should be cared for in a way that is least restrictive of their rights or freedom of action In 2007 the Mental Capacity Act 2005 was amended to introduce Deprivation of Liberty Safeguards for people who lack capacity to decide about their care or treatment and who need to be deprived of their liberty to protect them from harm The Safeguards came into effect in April 2009 and strengthen the rights of hospital patients and those in care homes as well as ensuring compliance with the European Convention on Human Rights (ECHR)
The 2010 census introduced a new question ldquoIs the patient subject to deprivation of liberty authorisation on 31 March 2010rdquo Under 1 (269) patients were reported as being subject to a deprivation of liberty authorisation on census day No ethnic differences in the rates were observed which may be due to the low numbers of patients among minority ethnic groups (69)
Care Quality Commission Count me in census 2010 31
A comparison between the 2005 baseline and the 2010 census
The changes we have seen in the census results between 2005 and 2010 the timespan of the Delivering Race Equality (DRE) action plan are set out below This is not a review of the DRE programme The aim is to give an overview of how some variables in the census have changed during the course of DRE and the findings should be seen in the light of the caveats described on page 13
bull The number of inpatients went down from 33785 to 29840 ndash a fall of 12
bull The proportion of patients in independent hospitals rose from 10 to 16
bull The overall proportion of patients from minority ethnic groups increased from 20 to 23 However there have been demographic changes during this time ndash the population from Black and minority ethnic groups in England and Wales rising from 79 million in 2005 to 85 million in 2007 (the latest year for which these figures are available) an increase of 8 in two years
bull Admission rates showed similar patterns across all censuses ndash Lower than average rates among the White
British Indian and Chinese groups ndash About average rates among the Pakistani and
Bangladeshi groups ndash Higher than average rates among other
minority ethnic groups ndash particularly in the Black and WhiteBlack Mixed groups for whom rates were two or more times higher than average in 2010 The Other Black group continues to have exceptionally high rates of admission (even after the apparent reduction since 2005 see next point)
bull One of the 12 goals of DRE was a decline in admission rates among Black and minority ethnic groups Figure 1 provides a comparison between 2005 and 2010 Although admission rates for
many ethnic groups show relatively little change since 2005 the rate for the Other Black group is considerably lower in 2010 (six times higher than average) compared with 2005 (12 times higher than average) However rates for the other Black and WhiteBlack Mixed groups show small increases
bull In general rates of referral from GPs and community mental health teams were lower than average among some Black and WhiteBlack groups and referral from the criminal justice system was higher Patterns were less consistent for other minority ethnic groups
bull There was a steady increase in the overall proportion of patients subject to the Mental Health Act Compared with 40 in 2005 49 of all patients were subject to the Mental Health Act in 2010 (53 if outpatients on a CTO are excluded)
bull Another DRE goal was to reduce detention rates among Black and minority ethnic groups However detention rates have been higher than average among the Black Caribbean Black African and Other Black groups in all six censuses and almost consistently higher in the WhiteBlack Caribbean Mixed and Other White groups Rates have been average for other minority ethnic groups
bull A consistent pattern was the higher than average detention rate under section 3741 for the Black Caribbean and Other Black groups
bull Another DRE goal was to reduce seclusion among Black and minority ethnic groups Although there have been annual fluctuations in seclusion rates they have been higher than average for the Black and WhiteBlack Mixed groups and the Other White group in at least three of the six censuses Other minority ethnic groups did not show high rates
Care Quality Commission Count me in census 2010 32
A comparison between the 2005 baseline and the 2010 census continued
Figure 1 Admission ratios in the 2005 and 2010 Count me in censuses by ethnic group England and Wales
Other Black
Black Caribbean
White and Black Caribbean
White and Black African
Black African
Other Mixed
Other Asian
White and Asian
Other
White Irish
Other White
Bangladeshi
White British
Pakistani
Indian
Chinese
0 100 200 300 400 500 600 700 800 900 1000 1100 1200 1300
Ageshysex standardised admission ratios (EampW=100)
Census 2005 admission ratios using 2005 ONS populations
bull Minority ethnic groups do not compare unfavourably for other incidents Rates of self-harm have consistently been lower than average among the Black and South Asian groups Very few ethnic differences in hands-on restraint physical assault and accidents were observed across the different censuses and they did not show a consistent pattern
bull About 31 of patients in all censuses had been in hospital for one year or more and were therefore included in more than one census
Census 2010 admission ratios using ONS 2007 populations (excluding outpatients on a CTO)
(This is one reason why the census shows little change over the six years It should be noted again that because the census is a one-day count it over-represents long-stay admissions and under-represents short-stay admissions)
bull Mixed accommodation was reported for many patients across all censuses although patients from Black and minority ethnic groups were more likely to be in single sex accommodation than White British patients
The admission ratios for the 2005 census shown here are different from those published in the 2005 report This is because we updated the analysis of the 2005 admission ratios by using 2005 ONS census populations for ethnic groups as denominators These populations were not available at the time of the 2005 report which instead used the 2001 ONS population data
Care Quality Commission Count me in census 2010 33
Results learning disabilities
We obtained information about 3642 patients in 129 organisations providing services for people with learning disabilities in England and Wales Of these two were inpatients on CTOs The total number of inpatients has declined each year and by 21 from 4609 in 2006 to 3642 in 2010 The total number of providers did not change much from the baseline year of 2006 although the number of NHS providers has fallen steadily and the number of independent healthcare organisations has increased (see Table 8) The proportion of inpatients in independent
healthcare organisations increased from 20 in 2006 to 33 in 2010 This is likely to be a result of closing NHS campuses with people moving from hospital to community settings
The pattern of results for learning disability patients in 2010 is broadly similar to that reported in previous censuses This is not surprising since many of the patients had been in hospital for a considerable period of time and they therefore appear in successive censuses
Table 8 The number of providers of learning disability services and inpatients
NHS (England)
Independent (England)
NHS (Wales)
Independent (Wales) Total
2010 census Number of providers 55 61 4 9 129 Number of all patients (including patients 2304 1072 154 112 3642 on a CTO) of all patients 633 294 42 31 100
2009 census Number of providers 60 54 5 4 123 Number of all patients (including patients 2487 1014 139 55 3695 on a CTO) of all patients 673 274 38 15 100
2008 census Number of providers 62 57 5 5 129
Number of inpatients 2873 1050 143 41 4107
of inpatients 700 256 35 10 100 2007 census
Number of providers 64 47 5 4 120
Number of inpatients 3063 900 154 36 4153
of inpatients 738 217 37 09 100 2006 census
Number of providers 70 48 5 1 124
Number of inpatients 3505 930 164 10 4609
of inpatients 760 202 36 02 100
Care Quality Commission Count me in census 2010 34
Results learning disabilities continued
Ethnicity
Information about ethnicity was available for 98 of patients Of these 13 belonged to Black and minority ethnic groups defined as all groups that are not White British (see Table 9) This figure is somewhat higher than in previous years (11 in 2006) and is significantly lower than the 23 of mental health patients from minority ethnic groups as reported in the mental health section of this report
Although the patterns by ethnicity are broadly similar to previous years there was an increase between 2006 and 2010 in the proportion of patients from the Other White group and a fall in those from the White British group Some ethnic groups had very few patients
As in the previous censuses patients from Black and minority ethnic groups were concentrated in a relatively small number of organisations 70 were
Table 9 Learning disability patients by ethnic group
Ethnic group 2010 census 2009 census 2008 census 2007 census 2006 census
Number Number Number Number Number
White British 853 3106 867 3205 889 3616 883 3642 887 4037
White Irish 13 46 15 57 13 53 10 40 14 66
Other White 29 106 23 85 26 104 26 109 17 77
White and Black Caribbean 10 38 10 36 07 29 08 34 07 32
White and Black African 02 8 01 4 00 2 02 10 01 3
White and Asian 04 13 04 14 03 12 03 13 02 9
Other Mixed 07 24 05 19 03 14 04 16 03 14
Indian 09 32 09 35 07 28 08 32 11 49
Pakistani 07 24 09 33 07 30 08 32 07 34
Bangladeshi 05 20 06 21 03 11 03 11 02 9
Other Asian 04 13 03 10 03 12 02 8 03 12
Black Caribbean 26 93 22 81 23 94 26 108 28 129
Black African 08 28 09 35 07 29 08 33 07 33
Other Black 04 15 04 14 04 15 04 18 04 17
Chinese 00 1 01 2 01 5 02 8 02 7
Other 02 7 02 8 04 15 02 10 05 24
Not stated 19 68 10 36 09 38 07 29 12 57
Total 100 3642 100 3695 100 4069 100 4124 100 4552
Care Quality Commission Count me in census 2010 35
Results learning disabilities continued
patients in 25 of the 129 organisations that took part in the census Seventy-four organisations had fewer than 10 patients from Black and minority ethnic groups each and another 42 organisations had no inpatients at all from these groups
However it is important to note that the number of people with severe and profound learning disabilities in some areas is affected by past funding and placement practices especially the presence of old long stay hospitals and of people placed outside their original area of residence by funding authorities
Reporting of ethnicity
About half (56) of patients reported their own ethnic group Staff reported the ethnic group for 17 of patients and relatives for 21 This means that ethnicity could have been misreported for some patients We do not know how ethnicity was assessed for 6 of patients
Age and gender
Two per cent (59) of patients were under 18 years old The number of young inpatients from minority ethnic groups was low or zero in several ethnic minority groups
Overall 73 of patients were under 50 years old and 27 were aged 50 or over The proportion of patients under 50 was higher among patients from Black and minority ethnic groups (88) than among the White British group (71) This is not surprising given that minority ethnic populations are generally younger than the White population
Seventy per cent of patients in learning disability services were men whereas in mental health services 58 of patients were men
Language and religion
Eight per cent of patients reported that their first language was not English Non-verbal communication was the most often selected language after English accounting for 4 of patients Two per cent (84) of patients most of whom were from the White British group said they needed an interpreter
Religion was not stated for 22 of patients and 15 of patients said they had no religion South Asians (Indians Bangladeshis and Pakistanis) were mostly Muslim Hindu or Sikh and those from the White Black Caribbean and Black African groups were mostly Christian
Sexual orientation
Overall the result was not known for almost half (49) of patients 45 said they were heterosexual 2 said gaylesbian 3 said bisexual and 1 said ldquootherrdquo The numbers of patients from minority ethnic groups were too low for meaningful analysis
Disability
Of all inpatients in learning disability services
bull 4 were reported as having no disabilities
bull 44 had a learning disability only
bull 51 had multiple disabilities
The patterns among minority ethnic groups were similar in that most patients had either a learning disability or multiple disabilities
Care Quality Commission Count me in census 2010 36
Results learning disabilities continued
Rates of admission
The rates of admission based on ONS estimates of the general population in 2007 are given in Appendix C Table C1
Admission rates were lower than average among several minority ethnic groups Other White Indian Pakistani Other Asian Black African Chinese and Other Rates were two to three times higher than average among the WhiteBlack Caribbean Mixed Black Caribbean Other Black and Other Mixed groups The lower rates among the South Asian and Chinese groups and the higher rates among some Black groups are similar to patterns for inpatients in mental health establishments
These patterns of admission are similar to those we reported in previous census reports
Source of referral
As we reported in the section on mental health patients data about sources of referral must be interpreted with care as we do not always know the original referral source Furthermore in the case of inpatients with learning disabilities this information was invalid missing or unknown for 12 of patients
Because of the small numbers of patients in most minority ethnic groups we observed few ethnic differences in sources of referral
Detention under the Mental Health Act 1983 (on day of admission and on day of census)
The Mental Health Act 2007 made a number of changes to the Mental Health Act 1983 one of which was supervised community treatment (section 17A) These are reflected in the 2010 census
All detentions Of all the patients in learning disability services 48 were detained under the Mental Health Act on admission Rates of detention on the day of admission by ethnic group are in Appendix C Table C2 and no ethnic differences were observed As the number of detained patients from each minority ethnic group was low we did not undertake further analysis for individual sections of the Act
Rates of detention on census day also showed no ethnic differences with the exception of a lower than average rate for the Other White group
Consent
About 66 of informally admitted inpatients were deemed incapable of consenting to treatment which is a similar proportion to that reported previously
Among detained patients 38 were deemed incapable of consenting to treatment and 6 were deemed capable of consenting to treatment but refused
The numbers of patients from minority ethnic groups were too low for comment There were no or very few such patients among minority ethnic groups
Care Quality Commission Count me in census 2010 37
Results learning disabilities continued
Care programme approach
Details of the Care Programme Approach (CPA) are given on page 24
We found that 73 of all patients were on a CPA 2 on a single assessment process (SAP) and 25 on neither No ethnic differences were observed
Recorded incidents
The 2010 census asked about the number of times that patients experienced seclusion hands-on restraint self-harm accident and physical assault in a patientrsquos current hospital spell or if the patientrsquos hospital spell was longer than three months the number that took place within the last three months As in previous years we observed very few ethnic differences
Seclusion Five per cent of patients had experienced one or more episodes of seclusion The only ethnic differences observed were the higher than average rates among the White Irish and Other White groups but these were based on small numbers of patients
Physical assault on the patient The definition of assault includes incidents of physical assault on the patient irrespective of who committed the assault but we do not have information on who committed the assault About 28 of patients had been involved in one or more episodes of physical assault No ethnic differences were observed
Hands-on restraint self-harm accidents Thirty per cent of inpatients had experienced one or more episodes of hands-on restraint 22 had attempted to harm themselves and 24 had suffered an accident The numbers were very low in minority ethnic groups and we did not observe any ethnic differences except for a lower than average rate for self-harm among the Black Caribbean group but this was based on very few patients
Duration of stay in hospital
We analysed the length of the period between each patientrsquos admission to hospital and the census day This period is of course shorter than a patientrsquos full length of stay in hospital which runs from admission to the date when they are discharged
bull 10 of inpatients had been in hospital for one month or less
bull 6 had been in hospital between one and three months
bull 7 had been in hospital between three and six months
bull 10 had been in hospital between six months and one year
bull 14 had been in hospital between one and two years
bull 22 had been in hospital between two and five years
bull 31 had been in hospital for over five years
The patterns are very similar to those in previous censuses About 67 of patients in the 2010 census had been in hospital for more than a year and were therefore also included in the 2009 census In addition over half (53) of patients had been in hospital for more than two years and will have been included in both the 2008 and 2009 censuses A third of patients will have been included in each census since 2006
We also calculated the median length of stay (see page 26 for the definition of median) Overall the median amount of time that women had spent in hospital was about 31 months and the median for men was about 27 months This compares with a median for mental health patients of 25 months for women and 58 months for men It is not possible to reliably compare length of stay by ethnic group because of the small numbers of patients among several minority ethnic groups
Care Quality Commission Count me in census 2010 38
Results learning disabilities continued
Ward security
About 12 of all inpatients were on a medium or high secure ward as opposed to a general (54) or low secure (34) ward
As in the three previous years rates of patients on medium or high secure wards were about double the average among the White Irish and Other White groups Most other minority ethnic groups had very few patients on medium or high secure wards
Age range on wards
There were five patients under 18 years of age being cared for on wards for working-age adults and none were on wards for older people About 5 of patients on wards for working-age adults were aged 65 or over and there were very few patients (23) on wards for older people There were very few lsquoout of agersquo placements among minority ethnic groups
Patients in wards designated as single sex or mixed
We asked providers whether the patient was on a ward designated as men or women only or mixed gender Overall 47 of men and 69 of women were not in a ward designated for single sex use The numbers of such patients among minority ethnic groups were very low
Two further questions examined the single sex facilities that were available to patients Again due to the small numbers we do not present results by ethnicity for these questions
Patientsrsquo access to toilet and bathing facilities designated for single sex use
Overall 19 (497) of men and 27 (295) of women were reported as not having access to toilet and bathing facilities designated for single sex use
Patientsrsquo access to a lounge area day space designated for single sex use
Overall 32 (829) of men and 44 (470) of women were reported as not having access to a lounge area day space designated for single sex use
Patients subject to deprivation of liberty safeguards
For details of deprivation of liberty safeguards please see page 31
The 2010 census introduced a new question ldquoIs the patient subject to deprivation of liberty authorisation on 31 March 2010rdquo Two per cent (74) patients were reported as being subject to a deprivation of liberty order on census day but very few of these patients (15) were from minority ethnic groups
See footnote on single sex accommodation on page 27
Care Quality Commission Count me in census 2010 39
Data in the future Moving beyond a one-day census
For six years the Count me in census has provided a valuable one-day snapshot of inpatients in mental health and learning disability services And with the proportion of inpatients who are detained increasing steadily (from 25 in 200506 to 39 in 200910 ndash see Figure 2) ongoing ethnic monitoring of admissions and detentions becomes more vital than ever
However a one-day census only captures some events and the profile of patients can differ across a whole year For example there were
bull 29840 inpatients in the 2010 census compared with 107765 inpatients overall during 200910
bull 17299 patients in the 2010 census who were detained or on CTOs compared with 42479 new detentions and some 4100 new CTOs overall in England in 200910
bull 26 of patients in hospital for under one month and 31 for over one year per the census
whereas the MHMDS data consistently shows that for over 50 of records the average length of an inpatient stay was under one month and for 4 it was over one year
Looking ahead it is vital that robust data is available on all admitted patients and all those subject to the Mental Health Act not just those in hospital on one particular day Moreover patterns of use and outcomes of community care can have an impact on the need for admission to hospital and the risk of detention ndash therefore information about the care provided to patients before admission to hospital during their hospital stay and after they leave is also vital Furthermore under 84 of the 127 million people using specialist mental health services are admitted to hospital23 and so it is very important to examine the quality of community care for the 90 of patients who are not admitted to hospital
Figure 2 Number of people spending time in hospital 200506 to 200910
Num
ber
of p
atie
nts
90000
80000
70000
60000
50000
40000
30000
20000
10000
0 200506 200607 200708 200809 200910
Source NHS Information Centre Formally detained Not detained MHMDS Bulletin 2011
Care Quality Commission Count me in census 2010 40
Data in the future Moving beyond a one-day census continued
The Mental Health Minimum Data Set (MHMDS) is a rich source of data on people using specialist mental health services in England It covers both community and hospital services and includes a wide range of information about the demographic clinical and socioeconomic characteristics of individual patients and the services provided to those admitted to hospital and to the much larger number of those who donrsquot need a stay in hospital The data includes information about contact with services uses of the Mental Health Act and the Care Programme Approach for each individual patient All these details enable the use of services patterns of care and patient outcomes to be tracked including along pathways of care The MHMDS therefore provides a robust basis for ongoing monitoring of access to and outcomes of care for users of specialist ndash both community and hospital ndash mental health services
The MHMDS also enables an analysis of the numbers and rates of people from different ethnic groups using specialist mental health services overall (both inpatient and community) which provides an indication of the levels of mental illness and therefore the need for specialist care in different communities
At present the MHMDS does not cover high secure services and independent sector providers only started to provide data during 201011 However to support payment by results for mental health the scope of the data set will be extended to cover high secure services during 201112 (version 4 MHMDS) Further proposed changes to the dataset (version 41) will incorporate NHS-funded learning disability services and primary care mental health services A separate dataset for child and adolescent mental health services (CAMHS) has been developed and is awaiting formal approvals It is designed to include the same information about uses of the Mental Health Act as provided in the MHMDS
The latest MHMDS bulletin for 200910 provides a description of people using specialist mental health services in England including ethnic profiles of people using services hospital admissions detentions and the number of people on CPA24 It also provides information on differences by age and gender The bulletin illustrates some of the sorts of analyses that are possible using data from the MHMDS
The NHS Information Centre can provide guidance on these and other potential analyses based on MHMDS data
Care Quality Commission Count me in census 2010 41
Conclusions
While this report reviews changes in the census results since 2005 it is not a review or evaluation of the DRE programme overall Similarly the census cannot provide explanations for the patterns observed or examine whether mental health services are meeting the needs of individual ethnic minority groups As we have noted previously the results are subject to caveats in particular that the census provides a one-day snapshot that may not be representative of patients admitted to hospital throughout the year
Overview of findings
Overall the findings from the 2010 census show little change from those reported for previous annual censuses conducted since 2005 This is partly because many patients had been in hospital for a considerable period of time and had therefore been included in successive censuses The findings of this sixth and last census continue to show differences between Black and minority ethnic groups and White groups and also differences within these groups
In particular ethnic differences in rates of admission detention under the Mental Health Act and seclusion ndash three of DRErsquos 12 goals ndash have not altered materially since the inception of DRE in 2005
bull Admission rates remain higher than average among minority ethnic groups especially among Black and WhiteBlack Mixed groups for whom rates were two or more times higher than average in 2010 The Other Black group continues to have the highest admission rate ndash six times higher than average ndash although this is lower than in 2005 In contrast admission rates have consistently been lower than average among the Indian and Chinese groups and about average in the Pakistani and Bangladeshi groups
bull Detention rates remain higher than average among the Black and WhiteBlack Caribbean Mixed groups and among the Other White group A consistent pattern across all censuses was the higher than average detention rate
under section 3741 for the Black Caribbean and Other Black groups We also found that rates for being placed on a CTO were higher among the South Asian and Black groups
bull Although there have been annual fluctuations in seclusion rates they have been higher than average for the Black WhiteBlack Mixed and Other White groups in at least three of the six censuses
Overall the level of provision of single sex areas for patients continues to be unsatisfactory although there was no evidence that minority ethnic patients were disadvantaged in these respects Government policy for the NHS in England now requires that all providers of NHS-funded care including mental health trusts are expected to eliminate mixed-sex accommodation in accordance with the guidance set out in CNO201032526 From 2011 all providers of NHS-funded care must report breaches of sleeping accommodation which will attract sanctions
Implications for ways forward
The census findings do not in themselves show that mental health and learning disability services are failing to meet the needs of Black and minority ethnic service users
As noted in previous reports they need to be interpreted in the context of available evidence on ethnic differences in rates of mental illness pathways to care and factors such as socioeconomic disadvantages that all contribute to these differences Our previous reports have consistently highlighted the need for prevention early intervention and working collaboratively across sectors to reduce the risk of admission and detention where possible without compromising the care given to patients Mental health services have a key role to play but to achieve this all statutory agencies and organisations outside the healthcare sector Black and minority ethnic communities and people who use services themselves will need to work in partnership
Care Quality Commission Count me in census 2010 42
Conclusions continued
This message ndash about preventing mental ill-health by addressing the contributory factors and intervening early ndash is at the heart of No health without mental health the Department of Healthrsquos new strategy for the future of mental health care in England27
The strategy aims to tackle the economic social and environmental determinants and consequences of mental health problems and to improve outcomes and reduce inequalities
It specifies that by 2014 people in contact with the criminal justice system will have improved access to mental health services as set out in the Ministry of Justice Green Paper Breaking the Cycle Effective punishment rehabilitation and sentencing of offenders which confirms the approach outlined in Lord Bradleyrsquos report for early intervention and diversion from custody2829
Accompanying the new strategy is a supporting document that explains how its objectives will improve mental health outcomes the effective interventions and the underpinning evidence base30
The strategy is complemented by other government proposals for reforms in the NHS public health and adult social care as outlined in the NHS White Paper Equity and excellence liberating the NHS31 the public health strategy Healthy lives healthy people32 and the adult social care strategy A vision for adult social care capable communities and active citizens 33 Three outcomes frameworks have been developed alongside these strategies improving mental health outcomes and reducing inequalities is integral to them all
In this new healthcare landscape the proposed NHS Commissioning Board and GP consortia will have a statutory obligation to promote equality and reduce inequalities in healthcare (something also enshrined in the Equality Act 2010) As the lead commissioners of healthcare services it will be up to GP consortia to assess with local authorities the needs of their local populations and commission the right services that meet their requirements
And the strengthened public health role of local authorities offers significant potential for addressing the socioeconomic disadvantages faced by Black and minority ethnic communities which add to the burden of mental illness in these communities
Race Equality Action Plan A five-year review looked back at the work of the DRE action plan and describes some of the key challenges successes and learning34 Based on the experience and outcome of the DRE programme the report suggests ways forward for the next stage of mental health strategy development and implementation
Since April 2009 CQC has had a duty under the Mental Health Act 1983 to monitor how services exercise their powers in relation to patients who are detained in hospital or subject to CTOs or guardianship under the Act In its first annual report on the use of the Act CQC recommends a number of areas where improvements are needed for example over-occupancy on inpatient wards patient engagement use of control and restraint seclusion and capacity and consent35
In particular CQC highlighted a number of issues relating to the use of CTOs including concern about appropriate usage (30 of the patients in CQCrsquos sample did not have a reported history of non-compliance or disengagement with services after discharge) and over-representation of Black and minority ethnic groups CQC advised that research on the possible race equality impact of CTOs should be undertaken There were 6237 CTOs from their introduction in November 2008 to 31 March 2010 a much greater use of them than forecast for this period by the Department of Health before the power was introduced Just 31 of these orders had ended by end March 2010 suggesting that some people are being kept on supervised community treatment for long periods
Care Quality Commission Count me in census 2010 43
Conclusions continued
Data in the future Moving beyond a one-day census
Good information is the foundation of an effective healthcare system It is imperative for ensuring that services meet the needs of local populations and are equitable and that improvements are made where needed The availability of fit-for-purpose and comprehensive patient-level data sets with ethnicity and other key variables fully coded is therefore vitally important36 It enables the care provided to patients of all ethnic backgrounds to be monitored on an ongoing basis including for monitoring compliance with the Equality Act
Race Equality Action Plan A five-year review notes that better collection monitoring and use of ethnicity data to inform commissioning and provision in health and social care is required37 Key areas include good ethnic monitoring improving demographic information and ensuring good links between infomatics audit and equality and diversity leads within trusts in order to effectively use the information to inform service development monitoring and review at board management ward and community levels
The governmentrsquos proposed changes to the NHS will be supported by an information revolution aimed at improving and extending the information available to the NHS patients and the public on the quality and outcomes of NHS services including by equality dimensions38
Having information that is fit for purpose is vital for the effective regulation of mental health and learning disability services CQC uses routinely available data sets on an ongoing basis to assess the performance of health and social care organisations and their compliance with government policies and legislation We therefore expect those who commission and provide mental healthcare in the NHS and independent sector to have information systems that provide good quality data with fully
comprehensive recording and monitoring of ethnicity on an ongoing basis
Since 2005 the Count me in census has played a key role in providing information about the ethnicity and other characteristics of inpatients in mental health and learning disability services and on patients subject to the Mental Health Act It did this by providing a valuable one-day snapshot But ethnicity recording must be seen as an all-year round statutory requirement not a one-day annual event The number of inpatients throughout the year is much higher than the counts on one day and some patients will have more than one admission And there is a need to move on from counting patients to understanding more about care pathways for Black and minority ethnic patients and the factors leading to hospital admission and detention
We have consistently highlighted the need for commissioners and providers to make full use of the Mental Health Minimum Data Set (MHMDS) ndash the statutory data set submitted by providers of specialist mental health services in England It provides rich data on these issues and provides a robust information source for ongoing ethnic monitoring after this last census
Covering both community and hospital services ndash and now independent and third sector providers as well as NHS ndash it includes a wide range of information about individual patients the services provided to those admitted to hospital and to the much larger number who donrsquot need admission to hospital and the outcomes of care And because it includes year-round activity it is more representative of the overall picture of for example admission detention and readmission rates length of stay years in psychiatric care and contacts with services and professionals
We call on the Information Centre to routinely publish data on all admissions and uses of the Mental Health Act including CTOs in England (in both NHS and independent healthcare providers) by the ethnicity of
Care Quality Commission Count me in census 2010 44
Conclusions continued
patients making the MHMDS the definitive source of information about mental health and learning disability patients This data should be risk-adjusted for age gender and other variables as appropriate to enable reliable comparisons to be made across groups
It is important that all providers ndash NHS and independent ndash make strenuous efforts to improve the quality of the data they submit The Information Centre publishes reports on the quality of MHMDS data by provider (see wwwicnhsukservices mhmdsdq) and we urge providers to monitor this information and use it to improve their data quality
If GP consortia and local authorities are to be effective in their needs assessment and commissioning roles the Information Centre needs to make available and promote to them the data from the MHMDS and other sources And researchers and academics must make full use of the MHMDS to explore the factors that underlie the observed ethnic patterns
CQCrsquos role
In the meantime CQC will continue to focus strongly on the quality of care provided by mental health and learning disability services
People who find themselves admitted to mental health services or detained under the Mental Health Act and therefore counted by the Count me in census are among the most mentally unwell people in our society Our job is first and foremost to make sure that the care they receive meets the essential standards of quality and safety set out under the Health and Social Care Act 2008 and to work with providers to ensure this We act swiftly when we find services that do not Where we find systemic problems that organisations have not adequately addressed we may impose conditions on the providerrsquos registration to bring about the change needed to improve patientsrsquo experience of care
The essential standards of quality and safety include the requirement to provide single sex accommodation and we will continue to closely check that these standards are met by all mental health services
We intend to introduce a number of indicators derived from the rich information in the MHMDS into our quality and risk profiles for providers This will put greater emphasis on the experience of Black and minority ethnic patients in our regulatory activity
We will monitor the quality of MHMDS data submitted by providers (as reported by the NHS Information Centre) including independent service providers Those with poor data quality may be considered at higher risk in terms of their quality of care
In addition we will continue to monitor the progress of services in relation to the issues raised in the census and other reports including our report on the use of the Mental Health Act through our visits to services and meetings with patients by our Mental Health Act Commissioners and second opinion appointed doctors (SOADs) We will draw on patientsrsquo experiences to monitor the operation of the Mental Health Act
We will also assess the impact of advice and use of Local HealthWatch Local HealthWatch will be in a good position to make sure that providers and commissioners are held to account on matters of choice and access to services for people from Black and minority ethnic groups
Care Quality Commission Count me in census 2010 45
References
1 Department of Health Equity and excellence liberating the NHS 2010
2 Department of Health The NHS outcomes framework 201112 2010
3 Healthcare Commission Mental Health Act Commission National Institute for Mental Health in England Count me in results of a national census of inpatients in mental health hospitals and facilities in England and Wales 2005
4 Healthcare Commission Mental Health Act Commission National Institute for Mental Health in England Count me in results of the 2006 national census of inpatients in mental health and learning disability services in England and Wales 2006
5 Healthcare Commission Mental Health Act Commission National Institute for Mental Health in England Count me in results of the 2007 national census of inpatients in mental health and learning disability services in England and Wales 2007
6 Healthcare Commission Mental Health Act Commission National Institute for Mental Health in England Count me in results of the 2008 national census of inpatients in mental health and learning disability services in England and Wales 2008
7 Care Quality Commission National Mental Health Development Unit Results of the 2009 national census of inpatients and patients on supervised community treatment in mental health and learning disability services in England and Wales 2009
8 Department of Health Delivering race equality in mental health care an action plan for reform inside and outside services 2005
9 Welsh Assembly Government Adult Mental Health Services Raising the standard ndash Race Equality Action Plan for Adult Mental Health Services in Wales 2006
10Department of Health No health without mental health a cross-government mental health outcomes strategy for people of all ages 2011 wwwdhgovukprod_consum_dhgroups dh_digitalassetsdocumentsdigitalasset dh_124058pdf
11Department of Health New horizons towards a shared vision for mental health 2009 wwwdhgovukprod_consum_dhgroups dh_digitalassetsdhendocumentsdigital assetdh_109708pdf
12Department of Health Valuing people a new strategy for learning disability for the 21st century 2001
13Department of Health Valuing people now a new three year strategy for people with learning disabilities 2009
14Department of Health Healthcare for all report of the independent inquiry into access to healthcare for people with learning disabilities 2008
15Joint Committee on Human Rights A life like any other human rights of adults with learning disabilities (2008 HL Paper 401 HC 731) House of Lords House of Commons 2008
16Department of Health Valuing people now summary report March 2009 ndash September 2010 2010
17Disability Rights Commission Equal treatment investigation 2005
18Department of Health Mir G Nocon A Ahmad W Jones L Learning difficulties and ethnicity 2000
19ONS experimental population estimates by ethnic group 2007 wwwstatisticsgovukstatbase productaspvlnk=14238
Care Quality Commission Count me in census 2010 46
References continued
20Six percent of population are gay or lesbian according to Whitehall figures 2005 wwwtelegraphcouknewsmainjhtmlxml= news20051212ngay12xmlamps Sheet= news20051212ixhomehtml
21Department of Trade and Industry Amendment to Employment Equality (Sexual Orientation) Regulations 2003 2003
22Office for National Statistics Measuring sexual identity an evaluation report 2010
23 Information Centre Mental Health Bulletin Fourth report from Mental Health Minimum Dataset (MHMDS) annual returns 2010 2011 wwwicnhsukpubsmhbmhmds0910
24 Information Centre Mental Health Bulletin Fourth report from Mental Health Minimum Dataset (MHMDS) annual returns 2010 2011 wwwicnhsukpubsmhbmhmds0910
25The operating framework for the NHS in England 201112 Department of Health 2010 wwwdhgovukprod_consum_dhgroups dh_digitalassetsdhenpsdocuments digitalassetdh_122736pdf
26wwwdhgovukenPublicationsandstatistics LettersandcircularsProfessionalletters ChiefnursingofficerlettersDH_121848
27Department of Health No health without mental health a cross-government mental health outcomes strategy for people of all ages 2011 wwwdhgovukprod_consum_dhgroups dh_digitalassetsdocumentsdigitalasset dh_124058pdf
28Ministry of Justice Breaking the cycle effective punishment rehabilitation and sentencing of offenders 2010
29Department of Health The Bradley report Lord Bradleyrsquos review of people with mental health problems or learning disabilities in the criminal justice system 2009
30Department of Health No health without mental health delivering better mental health outcomes for people of all ages 2011
31Department of Health Equity and excellence liberating the NHS 2010 wwwdhgovukprod_ consum_dhgroupsdh_digitalassetsdhen psdocumentsdigitalassetdh_117794pdf
32Department of Health Healthy lives healthy people our strategy for public health in England 2010 wwwdhgovukprod_consum_dh groupsdh_digitalassetsdhenps documentsdigitalassetdh_122347pdf
33Department of Health A vision for adult social care capable communities and active citizens 2010 wwwdhgovukprod_consum_dh groupsdh_digitalassetsdhenps documentsdigitalassetdh_121971pdf
34Wilson M NMHDU Race equality action plan a five year review Delivering race equality in mental health care 2010 wwwnmhduorgukour-workmhep
35Care Quality Commission Monitoring the use of the Mental Health Act in 200910 2010
36Raleigh V S Collection of data on ethnic origin in England Editorial BMJ 20083376456
37Wilson M NMHDU Race equality action plan a five year review Delivering race equality in mental health care 2010 wwwnmhduorgukour-workmhep
38Department of Health Liberating the NHS an information revolution 2010
Care Quality Commission Count me in census 2010 47
Appendix A Methods of analysis
Standardisation by age and gender
Standardisation allows us to make comparisons between groups of the population by taking account of variations in age and gender Some differences in patterns of service use are related to the age or gender of the people using them so adjustments to the data have to be made to ensure that the interpretation of ethnic differences is reliable For example formal admissions are higher at a younger age so some Black and minority ethnic groups may have high formal admission rates simply because they have a high proportion of younger people Without adjustments for age and gender differences comparisons would be misleading
In this report most results are standardised for age and gender including those relating to admission detention source of referral care programme approach seclusion restraint accidents assault self-harm consent and presence on a secure ward The report uses the accepted statistical method of taking account of age and gender differences between groups when calculating these rates
We used the ONS estimates of total population by ethnic group for England and Wales in 2007 to standardise the rates of admission for different ethnic groups This takes account of the significant rises in the Black and ethnic minority population of England and Wales since the 2001 ONS census and hence gives more accurate and up to date estimates of admission ratios for different ethnic groups (although it does not take account of any further changes in the ethnic populations between 2007 and 2010 the date of this census) For comparison with the DRE baseline we also present admission rates from the 2005 census derived using the 2005 ONS estimates of populations by ethnic group These figures will not be the same as published in the 2005 census report which were based on the 2001 ONS census population estimates because updated estimates of populations by ethnic group were not available at that time
For other analyses we used the total number of inpatients and patients on CTOs in the census
as the basis for standardisation However CTO outpatients are excluded from selected analyses where appropriate namely the analysis of rates for admissions detentions on admission source of referral single sex accommodation and recorded incidents of seclusion restraint accidents assault and self-harm We used the statistical package STATA version 82 to derive the standardised results
It was not possible to adjust the analyses for ethnic differences in social and economic factors and in diagnosis and severity of illness Such factors could affect the ethnic differences observed in the results
For descriptive variables such as religion and language we did not use standardisation
Confidence intervals as indicators of significant statistical differences
For all standardised results the national rates for England and Wales are taken as 100 and the usual 95 confidence intervals are given Rates of less than 100 or greater than 100 for specific ethnic groups show a lower or higher rate respectively than the national average after adjusting for age and gender Whether or not the difference is statistically significant from the national average depends on the confidence interval If the confidence interval overlaps 100 the difference from the national average is not statistically significant If both values are lower or higher than 100 it indicates that the difference compared with the national average is statistically significant at the 95 level
For example if a rate is 110 with the lower confidence interval being 105 and the upper confidence interval being 115 it indicates that the 10 excess over the national average of 100 is statistically significant But if a ratio is 110 with the lower confidence interval being 95 and the upper confidence interval being 125 it indicates that the 10 excess over the national average is not statistically significant We did not attempt to adjust the confidence intervals for multiple comparisons
Care Quality Commission Count me in census 2010 48
Appendix B Mental health tables
Table B1 Standardised admission ratios by ethnic group for England and Wales (excluding outpatients on a CTO) using 2007 ONS census population denominators (England and Wales = 100) All ages
Ethnic group
Men Women Persons Standardised
admission ratio
95 confidence
interval Observed numbers
Standardised admission
ratio
95 confidence
interval Observed numbers
Standardised admission
ratio
95 confidence
interval Observed numbers
White British 88 86 89 12435 94 93 96 10157 91 89 92 22592 White Irish 130 115 146 274 122 106 140 215 126 115 138 489 Other White 117 109 126 731 129 118 141 533 122 115 129 1264 White and Black Caribbean 557 493 627 276 274 223 333 101 436 393 483 377 White and Black African 312 247 388 80 259 186 351 41 292 242 349 121 White and Asian 140 110 174 79 124 90 166 44 134 111 159 123 Other Mixed 230 189 278 108 213 165 270 67 223 192 259 175 Indian 67 59 75 286 66 56 76 172 66 60 73 458 Pakistani 105 93 119 269 65 53 79 96 91 81 100 365 Bangladeshi 123 102 147 120 82 60 109 46 108 92 126 166 Other Asian 161 139 185 192 136 107 169 79 153 135 172 271 Black Caribbean 538 505 572 980 306 277 336 418 438 415 462 1398 Black African 246 226 267 550 219 194 247 277 236 221 253 827 Other Black 792 691 903 222 314 240 403 61 596 529 670 283 Chinese 27 20 38 39 43 30 59 35 33 26 41 74 Other 140 120 162 177 110 88 136 87 128 113 145 264 Total 100 16818 100 12429 100 29247
Care Quality Commission Count me in census 2010 49
Appendix B Mental health tables continued
Table B2 Standardised admission ratios by ethnic group for England and Wales (excluding outpatients on a CTO) using 2007 ONS census population denominators (England amp Wales = 100) Ages 65 and over
Ethnic group
Men Women Persons Standardised
admission ratio
95 confidence
interval Observed numbers
Standardised admission
ratio
95 confidence
interval Observed numbers
Standardised admission
ratio
95 confidence
interval Observed numbers
White British 95 92 99 3265 95 92 98 3887 95 93 97 7152 White Irish 142 116 172 106 102 82 125 92 120 104 138 198 Other White 207 174 244 141 213 183 248 171 210 188 235 312 White and Black Caribbean 406 210 710 12 333 152 632 9 371 230 568 21 White and Black African 231 28 836 2 198 24 714 2 213 58 546 4 White and Asian 28 1 156 1 110 30 281 4 69 23 162 5 Other Mixed 146 40 374 4 228 92 470 7 189 95 339 11 Indian 97 70 132 41 83 57 116 33 90 71 113 74 Pakistani 39 17 77 8 46 18 94 7 42 23 69 15 Bangladeshi 115 53 218 9 69 14 201 3 98 51 172 12 Other Asian 234 143 361 20 215 120 354 15 225 157 313 35 Black Caribbean 216 170 269 77 310 253 376 103 261 224 302 180 Black African 142 73 248 12 365 241 531 27 246 175 337 39 Other Black 164 34 479 3 366 134 796 6 259 119 493 9 Chinese 41 8 120 3 95 38 195 7 68 33 125 10 Other 253 126 453 11 390 238 602 20 327 222 464 31 Total 100 3715 100 4393 100 8108
Care Quality Commission Count me in census 2010 50
Appendix B Mental health tables continued
Table B3 Standardised ratios by ethnic group for patients referred by a GP (England and Wales = 100)
Ethnic group
Men Women Persons Standardised
referral ratio
95 confidence
interval Observed numbers
Standardised referral ratio
95 confidence
interval Observed numbers
Standardised referral ratio
95 confidence
interval Observed numbers
White British 110 103 117 904 107 101 114 1065 108 104 113 1969 White Irish 85 50 134 18 93 57 144 20 89 63 123 38 Other White 74 51 103 33 70 49 97 36 72 56 91 69 White and Black Caribbean 27 5 78 3 30 4 109 2 28 9 65 5 White and Black African 0 0 74 9 268 2 35 4 125 2 White and Asian 165 54 386 5 0 0 86 28 201 5 Other Mixed 48 6 172 2 68 14 198 3 58 19 136 5 Indian 69 34 123 11 79 39 141 11 73 46 111 22 Pakistani 88 42 162 10 59 16 151 4 77 42 130 14 Bangladeshi 81 22 207 4 61 7 221 2 73 27 159 6 Other Asian 80 32 166 7 108 43 223 7 92 50 155 14 Black Caribbean 35 20 56 17 37 20 62 14 36 24 51 31 Black African 57 29 100 12 66 35 113 13 61 40 91 25 Other Black 62 23 135 6 40 5 144 2 54 23 107 8 Chinese 56 1 314 1 139 38 356 4 108 35 251 5 Other 106 46 208 8 0 0 53 23 105 8 Total 100 1041 100 1185 100 2226
Care Quality Commission Count me in census 2010 51
Appendix B Mental health tables continued
Table B4 Standardised ratios by ethnic group for patients referred by a community mental health team (including crisis resolution home treatment) or community learning disability team (England and Wales = 100)
Ethnic group
Men Women Persons Standardised
referral ratio
95 confidence
interval Observed numbers
Standardised referral ratio
95 confidence
interval Observed numbers
Standardised referral ratio
95 confidence
interval Observed numbers
White British 107 104 111 3255 103 100 107 3386 105 103 108 6641 White Irish 90 69 116 61 89 68 114 61 90 74 107 122 Other White 59 48 71 105 79 67 94 141 69 61 78 246 White and Black Caribbean 106 83 135 68 75 49 111 25 96 77 117 93 White and Black African 43 19 84 8 66 30 124 9 52 31 84 17 White and Asian 95 56 150 18 84 43 147 12 90 61 129 30 Other Mixed 78 48 121 20 72 41 118 16 76 53 105 36 Indian 106 83 132 76 100 76 130 56 103 86 122 132 Pakistani 108 84 135 73 89 60 128 30 102 83 123 103 Bangladeshi 98 66 141 29 90 50 148 15 95 69 128 44 Other Asian 88 63 120 40 105 70 150 29 94 73 119 69 Black Caribbean 69 59 80 167 85 71 102 123 75 67 84 290 Black African 84 70 102 112 82 65 103 77 84 72 96 189 Other Black 52 36 74 31 64 36 106 15 56 41 74 46 Chinese 112 53 205 10 101 52 176 12 105 66 160 22 Other 86 60 120 35 106 71 151 30 94 73 120 65 Total 100 4108 100 4037 100 8145
Care Quality Commission Count me in census 2010 52
Appendix B Mental health tables continued
Table B5 Standardised ratios by ethnic group for patients referred by criminal justice routes (police prison probation courts court liaison and diversion) (England and Wales = 100)
Ethnic group
Men Women Persons Standardised
referral ratio
95 confidence
interval Observed numbers
Standardised referral ratio
95 confidence
interval Observed numbers
Standardised referral ratio
95 confidence
interval Observed numbers
White British 90 86 95 1495 95 86 104 421 91 87 95 1916 White Irish 133 94 183 38 59 19 138 5 116 84 157 43 Other White 112 93 134 119 103 68 150 27 111 93 130 146 White and Black Caribbean 117 89 151 58 145 69 266 10 120 94 153 68 White and Black African 190 127 273 29 141 38 361 4 183 126 256 33 White and Asian 75 39 131 12 160 52 373 5 89 52 143 17 Other Mixed 104 65 157 22 151 61 311 7 112 75 161 29 Indian 86 61 118 38 79 32 163 7 85 62 113 45 Pakistani 118 91 150 65 89 33 194 6 115 90 145 71 Bangladeshi 74 44 115 19 29 1 162 1 68 42 105 20 Other Asian 130 95 174 45 164 71 323 8 134 101 176 53 Black Caribbean 131 114 150 208 124 81 181 26 130 114 148 234 Black African 132 112 156 145 143 93 211 25 134 114 156 170 Other Black 141 109 180 65 236 113 435 10 149 117 187 75 Chinese 83 27 194 5 146 30 426 3 99 43 195 8 Other 129 93 175 41 113 37 264 5 127 93 170 46 Total 100 2404 100 570 100 2974
Care Quality Commission Count me in census 2010 53
Appendix B Mental health tables continued
Table B6 Standardised detention ratios by ethnic group all detentions on day of admission (excluding outpatients on a CTO) (England and Wales = 100)
Ethnic group
Men Women Persons Standardised
detention ratio
95 confidence
interval Observed numbers
Standardised detention
ratio
95 confidence
interval Observed numbers
Standardised detention
ratio
95 confidence
interval Observed numbers
White British 94 92 97 6449 94 91 97 3628 94 92 96 10077 White Irish 112 95 131 154 118 96 145 94 114 101 129 248 Other White 108 98 118 451 120 106 136 251 112 104 120 702 White and Black Caribbean 123 107 141 220 129 99 167 59 124 110 140 279 White and Black African 128 99 162 68 113 70 173 21 124 100 153 89 White and Asian 96 71 126 50 109 68 164 22 99 78 125 72 Other Mixed 115 92 143 82 139 100 188 42 122 102 146 124 Indian 97 83 113 164 110 86 137 77 101 88 114 241 Pakistani 109 94 126 194 102 74 136 44 108 94 122 238 Bangladeshi 86 67 109 69 91 55 142 19 87 70 107 88 Other Asian 109 92 130 133 120 86 163 40 112 96 130 173 Black Caribbean 129 121 139 774 143 125 162 238 132 124 141 1012 Black African 115 104 127 422 131 111 153 159 119 110 129 581 Other Black 117 100 136 170 148 105 202 39 122 106 140 209 Chinese 108 71 159 26 129 78 202 19 116 85 156 45 Other 111 92 132 126 116 83 157 41 112 96 130 167 Total 100 9552 100 4793 100 14345
Care Quality Commission Count me in census 2010 54
Appendix B Mental health tables continued
Table B7 Standardised detention ratios by ethnic group detention on day of admission ndash section 2 of the Mental Health Act (England and Wales = 100)
Ethnic group
Men Women Persons Standardised
detention ratio
95 confidence
interval Observed numbers
Standardised detention
ratio
95 confidence
interval Observed numbers
Standardised detention
ratio
95 confidence
interval Observed numbers
White British 97 91 102 1156 93 87 98 1133 95 91 99 2289 White Irish 78 47 120 20 116 79 166 30 97 72 128 50 Other White 100 78 126 70 134 108 166 88 116 99 136 158 White and Black Caribbean 55 30 93 14 60 24 124 7 57 35 87 21 White and Black African 91 37 188 7 150 60 308 7 113 62 190 14 White and Asian 80 29 174 6 119 44 258 6 96 49 167 12 Other Mixed 68 28 141 7 116 53 221 9 89 51 145 16 Indian 130 91 179 37 124 81 182 26 127 98 163 63 Pakistani 126 87 176 34 138 79 225 16 130 96 171 50 Bangladeshi 166 101 256 20 140 61 276 8 158 105 228 28 Other Asian 142 93 209 26 163 93 264 16 150 108 202 42 Black Caribbean 73 57 92 70 97 72 128 51 82 68 98 121 Black African 164 131 202 87 190 146 244 62 174 147 204 149 Other Black 114 75 166 27 140 72 245 12 121 86 165 39 Chinese 165 60 358 6 212 97 402 9 190 106 313 15 Other 218 153 302 36 179 108 280 19 203 153 264 55 Total 100 1623 100 1499 100 3122
Care Quality Commission Count me in census 2010 55
Appendix B Mental health tables continued
Table B8 Standardised detention ratios by ethnic group detention on day of admission ndash section 3 of the Mental Health Act (England and Wales = 100)
Ethnic group
Men Women Persons Standardised
detention ratio
95 confidence
interval Observed numbers
Standardised detention
ratio
95 confidence
interval Observed numbers
Standardised detention
ratio
95 confidence
interval Observed numbers
White British 99 95 103 2684 96 91 100 1852 98 95 101 4536 White Irish 116 89 149 60 135 101 177 52 124 102 149 112 Other White 112 96 129 186 110 92 132 121 111 99 124 307 White and Black Caribbean 114 91 143 79 130 90 183 33 119 98 143 112 White and Black African 97 60 148 21 107 54 192 11 100 69 141 32 White and Asian 84 50 133 18 97 48 173 11 89 59 127 29 Other Mixed 121 84 168 35 117 72 181 20 120 90 156 55 Indian 96 75 122 67 110 79 148 42 101 83 122 109 Pakistani 91 71 115 69 88 55 134 22 90 73 111 91 Bangladeshi 63 39 95 22 64 28 127 8 63 43 90 30 Other Asian 90 65 120 44 94 56 149 18 91 70 117 62 Black Caribbean 116 102 130 279 164 138 192 148 129 117 142 427 Black African 95 80 112 143 102 79 129 68 97 85 111 211 Other Black 75 55 99 49 99 58 159 17 80 62 102 66 Chinese 119 59 213 11 99 43 194 8 110 66 171 19 Other 85 60 116 38 84 48 136 16 84 63 110 54 Total 100 3805 100 2447 100 6252
Care Quality Commission Count me in census 2010 56
Appendix B Mental health tables continued
Table B9 Standardised detention ratios by ethnic group detention on day of admission ndash section 3741 of the Mental Health Act (England and Wales = 100)
Ethnic group
Men Women Persons Standardised
detention ratio
95 confidence
interval Observed numbers
Standardised detention
ratio
95 confidence
interval Observed numbers
Standardised detention
ratio
95 confidence
interval Observed numbers
White British 84 79 89 991 101 88 115 220 86 82 91 1211 White Irish 140 96 198 32 48 6 175 2 126 87 176 34 Other White 112 89 139 81 156 95 241 20 118 96 144 101 White and Black Caribbean 177 133 232 53 179 66 390 6 178 135 229 59 White and Black African 149 82 251 14 224 46 654 3 159 92 254 17 White and Asian 141 75 241 13 195 40 569 3 149 85 241 16 Other Mixed 144 85 227 18 264 97 575 6 162 104 242 24 Indian 86 56 126 26 44 5 160 2 80 53 116 28 Pakistani 122 87 166 40 0 0 111 79 152 40 Bangladeshi 66 32 122 10 0 0 60 29 110 10 Other Asian 99 61 151 21 0 0 89 55 136 21 Black Caribbean 200 174 229 210 78 34 153 8 189 165 216 218 Black African 127 101 157 82 84 34 172 7 122 98 150 89 Other Black 152 110 205 43 94 11 341 2 148 108 198 45 Chinese 100 27 255 4 0 0 80 22 204 4 Other 118 75 177 23 44 1 245 1 110 71 164 24 Total 100 1661 100 280 100 1941
Care Quality Commission Count me in census 2010 57
Appendix B Mental health tables continued
Table B10 Standardised detention ratios by ethnic group detention on day of admission ndash sections 47 48 4749 of the Mental Health Act (England and Wales = 100)
Ethnic group
Men Women Persons Standardised
detention ratio
95 confidence
interval Observed numbers
Standardised detention
ratio
95 confidence
interval Observed numbers
Standardised detention
ratio
95 confidence
interval Observed numbers
White British 97 90 106 583 104 81 131 73 98 91 106 656 White Irish 132 72 221 14 163 20 590 2 135 77 219 16 Other White 130 96 172 49 71 15 206 3 124 93 163 52 White and Black Caribbean 126 78 193 21 80 2 444 1 123 77 186 22 White and Black African 207 103 370 11 0 0 189 95 339 11 White and Asian 57 12 166 3 169 4 941 1 68 19 175 4 Other Mixed 112 48 221 8 233 28 843 2 125 60 230 10 Indian 57 26 108 9 0 252 0 52 24 99 9 Pakistani 92 54 147 17 0 314 0 86 50 138 17 Bangladeshi 46 12 117 4 167 4 930 1 53 17 125 5 Other Asian 101 52 177 12 0 0 95 49 166 12 Black Caribbean 126 98 159 70 125 34 319 4 126 99 158 74 Black African 74 48 107 27 104 21 303 3 76 51 108 30 Other Black 127 78 197 20 138 3 769 1 128 79 195 21 Chinese 0 0 0 0 0 0 Other 83 38 157 9 0 0 77 35 147 9 Total 100 857 100 91 100 948
Care Quality Commission Count me in census 2010 58
Appendix B Mental health tables continued
Table B11 Standardised ratios for all applications of the Mental Health Act (including outpatients on a CTO) by ethnic group on day of census (England and Wales = 100)
Ethnic group
Men Women Persons Standardised
ratio for all MHA
applications
95 confidence
interval Observed numbers
Standardised ratio for all MHA
applications
95 confidence
interval Observed numbers
Standardised ratio for all MHA
applications
95 confidence
interval Observed numbers
White British 97 94 99 7659 95 93 98 4335 96 94 98 11994 White Irish 99 83 116 147 104 84 128 95 101 89 114 242 Other White 87 79 95 427 97 85 110 249 90 84 97 676 White and Black Caribbean 117 103 133 245 130 103 163 76 120 107 134 321 White and Black African 120 95 150 79 93 58 141 22 113 92 137 101 White and Asian 101 78 128 65 119 81 169 31 106 86 129 96 Other Mixed 110 89 134 96 125 93 165 49 114 97 135 145 Indian 103 90 118 215 122 100 147 109 109 97 121 324 Pakistani 111 97 125 254 117 90 148 67 112 100 125 321 Bangladeshi 92 75 112 97 101 68 145 29 94 78 112 126 Other Asian 103 88 121 152 126 95 164 56 109 94 124 208 Black Caribbean 123 115 131 893 141 126 158 300 127 120 134 1193 Black African 112 103 122 511 121 104 140 188 114 106 123 699 Other Black 116 102 132 232 148 112 191 59 122 108 136 291 Chinese 97 64 140 27 101 61 157 19 98 72 131 46 Other 104 87 122 140 103 75 137 46 103 89 119 186 Total 100 11239 100 5730 100 16969
Care Quality Commission Count me in census 2010 59
Appendix B Mental health tables continued
Table B12 Standardised CTO ratios by ethnic group CTOs on day of census ndash section 17a of the Mental Health Act (England and Wales = 100)
Ethnic group
Men Women Persons
Standardised CTO ratio
95 confidence
interval Observed numbers
Standardised CTO ratio
95 confidence
interval Observed numbers
Standardised CTO ratio
95 confidence
interval Observed numbers
White British 94 89 99 1289 88 82 94 730 92 88 96 2019 White Irish 51 27 88 13 77 41 132 13 62 40 90 26 Other White 97 77 120 83 125 95 162 58 107 90 126 141 White and Black Caribbean 79 53 113 29 141 77 237 14 92 67 124 43 White and Black African 111 59 190 13 125 41 292 5 115 68 181 18 White and Asian 104 54 182 12 136 50 297 6 113 67 178 18 Other Mixed 102 59 166 16 136 62 257 9 112 73 166 25 Indian 134 99 177 48 152 98 226 24 139 109 175 72 Pakistani 145 110 187 59 174 101 279 17 151 119 189 76 Bangladeshi 142 93 206 27 205 99 378 10 155 109 213 37 Other Asian 107 71 155 28 182 99 305 14 124 89 168 42 Black Caribbean 121 103 142 152 171 132 218 65 133 116 152 217 Black African 116 94 142 94 139 98 192 37 122 102 145 131 Other Black 186 144 238 65 305 189 466 21 206 165 254 86 Chinese 83 23 213 4 152 49 354 5 111 51 211 9 Other 87 54 134 21 152 79 266 12 103 71 145 33 Total 100 1953 100 1040 100 2993
Care Quality Commission Count me in census 2010 60
Appendix C Learning disability tables
Table C1 Standardised admission ratios by ethnic group for England and Wales using 2007 ONS population denominators (England amp Wales = 100) All ages
Ethnic group
Men Women Persons Standardised
admission ratio
95 confidence
interval Observed numbers
Standardised admission
ratio
95 confidence
interval Observed numbers
Standardised admission
ratio
95 confidence
interval Observed numbers
White British 104 100 109 2163 108 101 115 941 105 102 109 3104 White Irish 108 72 156 28 151 89 238 18 121 89 162 46 Other White 81 65 101 85 49 30 75 21 72 59 87 106 White and Black Caribbean 280 186 405 28 246 118 453 10 270 191 371 38 White and Black African 102 33 239 5 165 34 482 3 119 51 235 8 White and Asian 66 26 135 7 154 56 335 6 89 47 152 13 Other Mixed 181 104 295 16 229 99 451 8 195 125 290 24 Indian 32 21 48 24 28 12 55 8 31 21 44 32 Pakistani 48 30 72 22 12 1 43 2 38 25 57 24 Bangladeshi 102 60 161 18 31 4 113 2 83 51 128 20 Other Asian 33 13 69 7 92 34 201 6 47 25 81 13 Black Caribbean 265 210 332 77 117 67 190 16 218 176 267 93 Black African 53 33 80 22 40 15 87 6 50 33 72 28 Other Black 228 118 399 12 134 28 392 3 200 112 330 15 Chinese 4 0 21 1 3 0 16 1 Other 26 9 56 6 11 0 59 1 21 9 44 7 Total 100 2521 100 1051 100 3572
Care Quality Commission Count me in census 2010 61
Appendix C Learning disability tables continued
Table C2 Standardised detention ratios by ethnic group all detentions on day of admission (England and Wales = 100)
Ethnic group
Persons Standardised
detention ratio
95 confidence
interval Observed numbers
White British 97 93 103 1431 White Irish 127 84 184 28 Other White 117 91 149 68 White and Black Caribbean 120 77 179 24 White and Black African 114 37 267 5 White and Asian 75 24 176 5 Other Mixed 94 49 165 12 Indian 119 72 186 19 Pakistani 110 61 181 15 Bangladeshi 144 84 231 17 Other Asian 59 16 150 4 Black Caribbean 119 90 155 57 Black African 138 85 210 21 Other Black 62 20 145 5 Chinese 0 0 Other 104 28 267 4 Total 100 1715
Care Quality Commission Count me in census 2010 62
copy Care Quality Commission and National Mental Health Development Unit 2011 Published April 2011
This publication may be reproduced in whole or in part in any format or medium for non-commercial purposes provided that it is reproduced accurately and not used in a derogatory manner or in a misleading context The source should be acknowledged by showing the publication title and copy Care Quality Commission and National Mental Health Development Unit 2011
How to contact us
Phone 03000 616161 Email enquiriescqcorguk Web wwwcqcorguk
Write to us at Care Quality Commission National Correspondence Citygate Gallowgate Newcastle upon Tyne NE1 4PA
Please contact us if you would like a summary of this publication in other formats or languages
Registered office Care Quality Commission Finsbury Tower 103ndash105 Bunhill Row London EC1Y 8TG
- Count me in 2010
- About the Care Quality Commission
- Contents
- Summary
- National organisations coordinating the census
- Introduction
- Data methods of analysis and interpretation
- Results mental health
- A comparison between the 2005 baseline and the 2010 census
- Results learning disabilities
- Data in the future Moving beyond a one-day census
- Conclusions
- References
- Appendix A Methods of analysis
- Appendix B Mental health tables
- Appendix C Learning disability tables
- How to contact us
-

Results mental health continued
Patientsrsquo access to a lounge area day space designated for single sex use
We also asked providers if patients had access to a lounge area or day space designated for single sex use Overall 37 of men and 39 of women were
reported as not having access to these facilities This was an improvement over 2009 when these proportions were 48 and 51 respectively The proportion of patients not having access to a lounge areaday space designated for single sex use was lower among most minority ethnic groups than among the White British group (see Table 7c for details)
Table 7c Percentage of patients not having access to a lounge areaday space designated for single sex use by ethnic group
Ethnic group
Access to a lounge areaday space designated for single sex use
Male Female
Male facilities
Female or mixed facilities
Female facilities
Male or mixed facilities
White British 59 41 60 40
White Irish 63 37 70 30
Other White 68 32 63 37
White and Black Caribbean 82 18 73 27
White and Black African 83 18 76 24
White and Asian 72 28 75 25
Other Mixed 79 21 67 33
Indian 59 41 66 34
Pakistani 80 20 72 28
Bangladeshi 53 47 52 48
Other Asian 70 30 61 39
Black Caribbean 78 22 70 30
Black African 73 27 70 30
Other Black 79 21 72 28
Chinese 59 41 60 40
Other 67 33 67 33
Total 63 37 61 39
The vast majority of patients in this category had access to mixed facilities very few (1) of male patients had access to female-only facilities or vice versa
Care Quality Commission Count me in census 2010 30
Results mental health continued
Patientsrsquo subject to deprivation of liberty safeguards
People who lack the mental capacity to consent to the care or treatment they need should be cared for in a way that is least restrictive of their rights or freedom of action In 2007 the Mental Capacity Act 2005 was amended to introduce Deprivation of Liberty Safeguards for people who lack capacity to decide about their care or treatment and who need to be deprived of their liberty to protect them from harm The Safeguards came into effect in April 2009 and strengthen the rights of hospital patients and those in care homes as well as ensuring compliance with the European Convention on Human Rights (ECHR)
The 2010 census introduced a new question ldquoIs the patient subject to deprivation of liberty authorisation on 31 March 2010rdquo Under 1 (269) patients were reported as being subject to a deprivation of liberty authorisation on census day No ethnic differences in the rates were observed which may be due to the low numbers of patients among minority ethnic groups (69)
Care Quality Commission Count me in census 2010 31
A comparison between the 2005 baseline and the 2010 census
The changes we have seen in the census results between 2005 and 2010 the timespan of the Delivering Race Equality (DRE) action plan are set out below This is not a review of the DRE programme The aim is to give an overview of how some variables in the census have changed during the course of DRE and the findings should be seen in the light of the caveats described on page 13
bull The number of inpatients went down from 33785 to 29840 ndash a fall of 12
bull The proportion of patients in independent hospitals rose from 10 to 16
bull The overall proportion of patients from minority ethnic groups increased from 20 to 23 However there have been demographic changes during this time ndash the population from Black and minority ethnic groups in England and Wales rising from 79 million in 2005 to 85 million in 2007 (the latest year for which these figures are available) an increase of 8 in two years
bull Admission rates showed similar patterns across all censuses ndash Lower than average rates among the White
British Indian and Chinese groups ndash About average rates among the Pakistani and
Bangladeshi groups ndash Higher than average rates among other
minority ethnic groups ndash particularly in the Black and WhiteBlack Mixed groups for whom rates were two or more times higher than average in 2010 The Other Black group continues to have exceptionally high rates of admission (even after the apparent reduction since 2005 see next point)
bull One of the 12 goals of DRE was a decline in admission rates among Black and minority ethnic groups Figure 1 provides a comparison between 2005 and 2010 Although admission rates for
many ethnic groups show relatively little change since 2005 the rate for the Other Black group is considerably lower in 2010 (six times higher than average) compared with 2005 (12 times higher than average) However rates for the other Black and WhiteBlack Mixed groups show small increases
bull In general rates of referral from GPs and community mental health teams were lower than average among some Black and WhiteBlack groups and referral from the criminal justice system was higher Patterns were less consistent for other minority ethnic groups
bull There was a steady increase in the overall proportion of patients subject to the Mental Health Act Compared with 40 in 2005 49 of all patients were subject to the Mental Health Act in 2010 (53 if outpatients on a CTO are excluded)
bull Another DRE goal was to reduce detention rates among Black and minority ethnic groups However detention rates have been higher than average among the Black Caribbean Black African and Other Black groups in all six censuses and almost consistently higher in the WhiteBlack Caribbean Mixed and Other White groups Rates have been average for other minority ethnic groups
bull A consistent pattern was the higher than average detention rate under section 3741 for the Black Caribbean and Other Black groups
bull Another DRE goal was to reduce seclusion among Black and minority ethnic groups Although there have been annual fluctuations in seclusion rates they have been higher than average for the Black and WhiteBlack Mixed groups and the Other White group in at least three of the six censuses Other minority ethnic groups did not show high rates
Care Quality Commission Count me in census 2010 32
A comparison between the 2005 baseline and the 2010 census continued
Figure 1 Admission ratios in the 2005 and 2010 Count me in censuses by ethnic group England and Wales
Other Black
Black Caribbean
White and Black Caribbean
White and Black African
Black African
Other Mixed
Other Asian
White and Asian
Other
White Irish
Other White
Bangladeshi
White British
Pakistani
Indian
Chinese
0 100 200 300 400 500 600 700 800 900 1000 1100 1200 1300
Ageshysex standardised admission ratios (EampW=100)
Census 2005 admission ratios using 2005 ONS populations
bull Minority ethnic groups do not compare unfavourably for other incidents Rates of self-harm have consistently been lower than average among the Black and South Asian groups Very few ethnic differences in hands-on restraint physical assault and accidents were observed across the different censuses and they did not show a consistent pattern
bull About 31 of patients in all censuses had been in hospital for one year or more and were therefore included in more than one census
Census 2010 admission ratios using ONS 2007 populations (excluding outpatients on a CTO)
(This is one reason why the census shows little change over the six years It should be noted again that because the census is a one-day count it over-represents long-stay admissions and under-represents short-stay admissions)
bull Mixed accommodation was reported for many patients across all censuses although patients from Black and minority ethnic groups were more likely to be in single sex accommodation than White British patients
The admission ratios for the 2005 census shown here are different from those published in the 2005 report This is because we updated the analysis of the 2005 admission ratios by using 2005 ONS census populations for ethnic groups as denominators These populations were not available at the time of the 2005 report which instead used the 2001 ONS population data
Care Quality Commission Count me in census 2010 33
Results learning disabilities
We obtained information about 3642 patients in 129 organisations providing services for people with learning disabilities in England and Wales Of these two were inpatients on CTOs The total number of inpatients has declined each year and by 21 from 4609 in 2006 to 3642 in 2010 The total number of providers did not change much from the baseline year of 2006 although the number of NHS providers has fallen steadily and the number of independent healthcare organisations has increased (see Table 8) The proportion of inpatients in independent
healthcare organisations increased from 20 in 2006 to 33 in 2010 This is likely to be a result of closing NHS campuses with people moving from hospital to community settings
The pattern of results for learning disability patients in 2010 is broadly similar to that reported in previous censuses This is not surprising since many of the patients had been in hospital for a considerable period of time and they therefore appear in successive censuses
Table 8 The number of providers of learning disability services and inpatients
NHS (England)
Independent (England)
NHS (Wales)
Independent (Wales) Total
2010 census Number of providers 55 61 4 9 129 Number of all patients (including patients 2304 1072 154 112 3642 on a CTO) of all patients 633 294 42 31 100
2009 census Number of providers 60 54 5 4 123 Number of all patients (including patients 2487 1014 139 55 3695 on a CTO) of all patients 673 274 38 15 100
2008 census Number of providers 62 57 5 5 129
Number of inpatients 2873 1050 143 41 4107
of inpatients 700 256 35 10 100 2007 census
Number of providers 64 47 5 4 120
Number of inpatients 3063 900 154 36 4153
of inpatients 738 217 37 09 100 2006 census
Number of providers 70 48 5 1 124
Number of inpatients 3505 930 164 10 4609
of inpatients 760 202 36 02 100
Care Quality Commission Count me in census 2010 34
Results learning disabilities continued
Ethnicity
Information about ethnicity was available for 98 of patients Of these 13 belonged to Black and minority ethnic groups defined as all groups that are not White British (see Table 9) This figure is somewhat higher than in previous years (11 in 2006) and is significantly lower than the 23 of mental health patients from minority ethnic groups as reported in the mental health section of this report
Although the patterns by ethnicity are broadly similar to previous years there was an increase between 2006 and 2010 in the proportion of patients from the Other White group and a fall in those from the White British group Some ethnic groups had very few patients
As in the previous censuses patients from Black and minority ethnic groups were concentrated in a relatively small number of organisations 70 were
Table 9 Learning disability patients by ethnic group
Ethnic group 2010 census 2009 census 2008 census 2007 census 2006 census
Number Number Number Number Number
White British 853 3106 867 3205 889 3616 883 3642 887 4037
White Irish 13 46 15 57 13 53 10 40 14 66
Other White 29 106 23 85 26 104 26 109 17 77
White and Black Caribbean 10 38 10 36 07 29 08 34 07 32
White and Black African 02 8 01 4 00 2 02 10 01 3
White and Asian 04 13 04 14 03 12 03 13 02 9
Other Mixed 07 24 05 19 03 14 04 16 03 14
Indian 09 32 09 35 07 28 08 32 11 49
Pakistani 07 24 09 33 07 30 08 32 07 34
Bangladeshi 05 20 06 21 03 11 03 11 02 9
Other Asian 04 13 03 10 03 12 02 8 03 12
Black Caribbean 26 93 22 81 23 94 26 108 28 129
Black African 08 28 09 35 07 29 08 33 07 33
Other Black 04 15 04 14 04 15 04 18 04 17
Chinese 00 1 01 2 01 5 02 8 02 7
Other 02 7 02 8 04 15 02 10 05 24
Not stated 19 68 10 36 09 38 07 29 12 57
Total 100 3642 100 3695 100 4069 100 4124 100 4552
Care Quality Commission Count me in census 2010 35
Results learning disabilities continued
patients in 25 of the 129 organisations that took part in the census Seventy-four organisations had fewer than 10 patients from Black and minority ethnic groups each and another 42 organisations had no inpatients at all from these groups
However it is important to note that the number of people with severe and profound learning disabilities in some areas is affected by past funding and placement practices especially the presence of old long stay hospitals and of people placed outside their original area of residence by funding authorities
Reporting of ethnicity
About half (56) of patients reported their own ethnic group Staff reported the ethnic group for 17 of patients and relatives for 21 This means that ethnicity could have been misreported for some patients We do not know how ethnicity was assessed for 6 of patients
Age and gender
Two per cent (59) of patients were under 18 years old The number of young inpatients from minority ethnic groups was low or zero in several ethnic minority groups
Overall 73 of patients were under 50 years old and 27 were aged 50 or over The proportion of patients under 50 was higher among patients from Black and minority ethnic groups (88) than among the White British group (71) This is not surprising given that minority ethnic populations are generally younger than the White population
Seventy per cent of patients in learning disability services were men whereas in mental health services 58 of patients were men
Language and religion
Eight per cent of patients reported that their first language was not English Non-verbal communication was the most often selected language after English accounting for 4 of patients Two per cent (84) of patients most of whom were from the White British group said they needed an interpreter
Religion was not stated for 22 of patients and 15 of patients said they had no religion South Asians (Indians Bangladeshis and Pakistanis) were mostly Muslim Hindu or Sikh and those from the White Black Caribbean and Black African groups were mostly Christian
Sexual orientation
Overall the result was not known for almost half (49) of patients 45 said they were heterosexual 2 said gaylesbian 3 said bisexual and 1 said ldquootherrdquo The numbers of patients from minority ethnic groups were too low for meaningful analysis
Disability
Of all inpatients in learning disability services
bull 4 were reported as having no disabilities
bull 44 had a learning disability only
bull 51 had multiple disabilities
The patterns among minority ethnic groups were similar in that most patients had either a learning disability or multiple disabilities
Care Quality Commission Count me in census 2010 36
Results learning disabilities continued
Rates of admission
The rates of admission based on ONS estimates of the general population in 2007 are given in Appendix C Table C1
Admission rates were lower than average among several minority ethnic groups Other White Indian Pakistani Other Asian Black African Chinese and Other Rates were two to three times higher than average among the WhiteBlack Caribbean Mixed Black Caribbean Other Black and Other Mixed groups The lower rates among the South Asian and Chinese groups and the higher rates among some Black groups are similar to patterns for inpatients in mental health establishments
These patterns of admission are similar to those we reported in previous census reports
Source of referral
As we reported in the section on mental health patients data about sources of referral must be interpreted with care as we do not always know the original referral source Furthermore in the case of inpatients with learning disabilities this information was invalid missing or unknown for 12 of patients
Because of the small numbers of patients in most minority ethnic groups we observed few ethnic differences in sources of referral
Detention under the Mental Health Act 1983 (on day of admission and on day of census)
The Mental Health Act 2007 made a number of changes to the Mental Health Act 1983 one of which was supervised community treatment (section 17A) These are reflected in the 2010 census
All detentions Of all the patients in learning disability services 48 were detained under the Mental Health Act on admission Rates of detention on the day of admission by ethnic group are in Appendix C Table C2 and no ethnic differences were observed As the number of detained patients from each minority ethnic group was low we did not undertake further analysis for individual sections of the Act
Rates of detention on census day also showed no ethnic differences with the exception of a lower than average rate for the Other White group
Consent
About 66 of informally admitted inpatients were deemed incapable of consenting to treatment which is a similar proportion to that reported previously
Among detained patients 38 were deemed incapable of consenting to treatment and 6 were deemed capable of consenting to treatment but refused
The numbers of patients from minority ethnic groups were too low for comment There were no or very few such patients among minority ethnic groups
Care Quality Commission Count me in census 2010 37
Results learning disabilities continued
Care programme approach
Details of the Care Programme Approach (CPA) are given on page 24
We found that 73 of all patients were on a CPA 2 on a single assessment process (SAP) and 25 on neither No ethnic differences were observed
Recorded incidents
The 2010 census asked about the number of times that patients experienced seclusion hands-on restraint self-harm accident and physical assault in a patientrsquos current hospital spell or if the patientrsquos hospital spell was longer than three months the number that took place within the last three months As in previous years we observed very few ethnic differences
Seclusion Five per cent of patients had experienced one or more episodes of seclusion The only ethnic differences observed were the higher than average rates among the White Irish and Other White groups but these were based on small numbers of patients
Physical assault on the patient The definition of assault includes incidents of physical assault on the patient irrespective of who committed the assault but we do not have information on who committed the assault About 28 of patients had been involved in one or more episodes of physical assault No ethnic differences were observed
Hands-on restraint self-harm accidents Thirty per cent of inpatients had experienced one or more episodes of hands-on restraint 22 had attempted to harm themselves and 24 had suffered an accident The numbers were very low in minority ethnic groups and we did not observe any ethnic differences except for a lower than average rate for self-harm among the Black Caribbean group but this was based on very few patients
Duration of stay in hospital
We analysed the length of the period between each patientrsquos admission to hospital and the census day This period is of course shorter than a patientrsquos full length of stay in hospital which runs from admission to the date when they are discharged
bull 10 of inpatients had been in hospital for one month or less
bull 6 had been in hospital between one and three months
bull 7 had been in hospital between three and six months
bull 10 had been in hospital between six months and one year
bull 14 had been in hospital between one and two years
bull 22 had been in hospital between two and five years
bull 31 had been in hospital for over five years
The patterns are very similar to those in previous censuses About 67 of patients in the 2010 census had been in hospital for more than a year and were therefore also included in the 2009 census In addition over half (53) of patients had been in hospital for more than two years and will have been included in both the 2008 and 2009 censuses A third of patients will have been included in each census since 2006
We also calculated the median length of stay (see page 26 for the definition of median) Overall the median amount of time that women had spent in hospital was about 31 months and the median for men was about 27 months This compares with a median for mental health patients of 25 months for women and 58 months for men It is not possible to reliably compare length of stay by ethnic group because of the small numbers of patients among several minority ethnic groups
Care Quality Commission Count me in census 2010 38
Results learning disabilities continued
Ward security
About 12 of all inpatients were on a medium or high secure ward as opposed to a general (54) or low secure (34) ward
As in the three previous years rates of patients on medium or high secure wards were about double the average among the White Irish and Other White groups Most other minority ethnic groups had very few patients on medium or high secure wards
Age range on wards
There were five patients under 18 years of age being cared for on wards for working-age adults and none were on wards for older people About 5 of patients on wards for working-age adults were aged 65 or over and there were very few patients (23) on wards for older people There were very few lsquoout of agersquo placements among minority ethnic groups
Patients in wards designated as single sex or mixed
We asked providers whether the patient was on a ward designated as men or women only or mixed gender Overall 47 of men and 69 of women were not in a ward designated for single sex use The numbers of such patients among minority ethnic groups were very low
Two further questions examined the single sex facilities that were available to patients Again due to the small numbers we do not present results by ethnicity for these questions
Patientsrsquo access to toilet and bathing facilities designated for single sex use
Overall 19 (497) of men and 27 (295) of women were reported as not having access to toilet and bathing facilities designated for single sex use
Patientsrsquo access to a lounge area day space designated for single sex use
Overall 32 (829) of men and 44 (470) of women were reported as not having access to a lounge area day space designated for single sex use
Patients subject to deprivation of liberty safeguards
For details of deprivation of liberty safeguards please see page 31
The 2010 census introduced a new question ldquoIs the patient subject to deprivation of liberty authorisation on 31 March 2010rdquo Two per cent (74) patients were reported as being subject to a deprivation of liberty order on census day but very few of these patients (15) were from minority ethnic groups
See footnote on single sex accommodation on page 27
Care Quality Commission Count me in census 2010 39
Data in the future Moving beyond a one-day census
For six years the Count me in census has provided a valuable one-day snapshot of inpatients in mental health and learning disability services And with the proportion of inpatients who are detained increasing steadily (from 25 in 200506 to 39 in 200910 ndash see Figure 2) ongoing ethnic monitoring of admissions and detentions becomes more vital than ever
However a one-day census only captures some events and the profile of patients can differ across a whole year For example there were
bull 29840 inpatients in the 2010 census compared with 107765 inpatients overall during 200910
bull 17299 patients in the 2010 census who were detained or on CTOs compared with 42479 new detentions and some 4100 new CTOs overall in England in 200910
bull 26 of patients in hospital for under one month and 31 for over one year per the census
whereas the MHMDS data consistently shows that for over 50 of records the average length of an inpatient stay was under one month and for 4 it was over one year
Looking ahead it is vital that robust data is available on all admitted patients and all those subject to the Mental Health Act not just those in hospital on one particular day Moreover patterns of use and outcomes of community care can have an impact on the need for admission to hospital and the risk of detention ndash therefore information about the care provided to patients before admission to hospital during their hospital stay and after they leave is also vital Furthermore under 84 of the 127 million people using specialist mental health services are admitted to hospital23 and so it is very important to examine the quality of community care for the 90 of patients who are not admitted to hospital
Figure 2 Number of people spending time in hospital 200506 to 200910
Num
ber
of p
atie
nts
90000
80000
70000
60000
50000
40000
30000
20000
10000
0 200506 200607 200708 200809 200910
Source NHS Information Centre Formally detained Not detained MHMDS Bulletin 2011
Care Quality Commission Count me in census 2010 40
Data in the future Moving beyond a one-day census continued
The Mental Health Minimum Data Set (MHMDS) is a rich source of data on people using specialist mental health services in England It covers both community and hospital services and includes a wide range of information about the demographic clinical and socioeconomic characteristics of individual patients and the services provided to those admitted to hospital and to the much larger number of those who donrsquot need a stay in hospital The data includes information about contact with services uses of the Mental Health Act and the Care Programme Approach for each individual patient All these details enable the use of services patterns of care and patient outcomes to be tracked including along pathways of care The MHMDS therefore provides a robust basis for ongoing monitoring of access to and outcomes of care for users of specialist ndash both community and hospital ndash mental health services
The MHMDS also enables an analysis of the numbers and rates of people from different ethnic groups using specialist mental health services overall (both inpatient and community) which provides an indication of the levels of mental illness and therefore the need for specialist care in different communities
At present the MHMDS does not cover high secure services and independent sector providers only started to provide data during 201011 However to support payment by results for mental health the scope of the data set will be extended to cover high secure services during 201112 (version 4 MHMDS) Further proposed changes to the dataset (version 41) will incorporate NHS-funded learning disability services and primary care mental health services A separate dataset for child and adolescent mental health services (CAMHS) has been developed and is awaiting formal approvals It is designed to include the same information about uses of the Mental Health Act as provided in the MHMDS
The latest MHMDS bulletin for 200910 provides a description of people using specialist mental health services in England including ethnic profiles of people using services hospital admissions detentions and the number of people on CPA24 It also provides information on differences by age and gender The bulletin illustrates some of the sorts of analyses that are possible using data from the MHMDS
The NHS Information Centre can provide guidance on these and other potential analyses based on MHMDS data
Care Quality Commission Count me in census 2010 41
Conclusions
While this report reviews changes in the census results since 2005 it is not a review or evaluation of the DRE programme overall Similarly the census cannot provide explanations for the patterns observed or examine whether mental health services are meeting the needs of individual ethnic minority groups As we have noted previously the results are subject to caveats in particular that the census provides a one-day snapshot that may not be representative of patients admitted to hospital throughout the year
Overview of findings
Overall the findings from the 2010 census show little change from those reported for previous annual censuses conducted since 2005 This is partly because many patients had been in hospital for a considerable period of time and had therefore been included in successive censuses The findings of this sixth and last census continue to show differences between Black and minority ethnic groups and White groups and also differences within these groups
In particular ethnic differences in rates of admission detention under the Mental Health Act and seclusion ndash three of DRErsquos 12 goals ndash have not altered materially since the inception of DRE in 2005
bull Admission rates remain higher than average among minority ethnic groups especially among Black and WhiteBlack Mixed groups for whom rates were two or more times higher than average in 2010 The Other Black group continues to have the highest admission rate ndash six times higher than average ndash although this is lower than in 2005 In contrast admission rates have consistently been lower than average among the Indian and Chinese groups and about average in the Pakistani and Bangladeshi groups
bull Detention rates remain higher than average among the Black and WhiteBlack Caribbean Mixed groups and among the Other White group A consistent pattern across all censuses was the higher than average detention rate
under section 3741 for the Black Caribbean and Other Black groups We also found that rates for being placed on a CTO were higher among the South Asian and Black groups
bull Although there have been annual fluctuations in seclusion rates they have been higher than average for the Black WhiteBlack Mixed and Other White groups in at least three of the six censuses
Overall the level of provision of single sex areas for patients continues to be unsatisfactory although there was no evidence that minority ethnic patients were disadvantaged in these respects Government policy for the NHS in England now requires that all providers of NHS-funded care including mental health trusts are expected to eliminate mixed-sex accommodation in accordance with the guidance set out in CNO201032526 From 2011 all providers of NHS-funded care must report breaches of sleeping accommodation which will attract sanctions
Implications for ways forward
The census findings do not in themselves show that mental health and learning disability services are failing to meet the needs of Black and minority ethnic service users
As noted in previous reports they need to be interpreted in the context of available evidence on ethnic differences in rates of mental illness pathways to care and factors such as socioeconomic disadvantages that all contribute to these differences Our previous reports have consistently highlighted the need for prevention early intervention and working collaboratively across sectors to reduce the risk of admission and detention where possible without compromising the care given to patients Mental health services have a key role to play but to achieve this all statutory agencies and organisations outside the healthcare sector Black and minority ethnic communities and people who use services themselves will need to work in partnership
Care Quality Commission Count me in census 2010 42
Conclusions continued
This message ndash about preventing mental ill-health by addressing the contributory factors and intervening early ndash is at the heart of No health without mental health the Department of Healthrsquos new strategy for the future of mental health care in England27
The strategy aims to tackle the economic social and environmental determinants and consequences of mental health problems and to improve outcomes and reduce inequalities
It specifies that by 2014 people in contact with the criminal justice system will have improved access to mental health services as set out in the Ministry of Justice Green Paper Breaking the Cycle Effective punishment rehabilitation and sentencing of offenders which confirms the approach outlined in Lord Bradleyrsquos report for early intervention and diversion from custody2829
Accompanying the new strategy is a supporting document that explains how its objectives will improve mental health outcomes the effective interventions and the underpinning evidence base30
The strategy is complemented by other government proposals for reforms in the NHS public health and adult social care as outlined in the NHS White Paper Equity and excellence liberating the NHS31 the public health strategy Healthy lives healthy people32 and the adult social care strategy A vision for adult social care capable communities and active citizens 33 Three outcomes frameworks have been developed alongside these strategies improving mental health outcomes and reducing inequalities is integral to them all
In this new healthcare landscape the proposed NHS Commissioning Board and GP consortia will have a statutory obligation to promote equality and reduce inequalities in healthcare (something also enshrined in the Equality Act 2010) As the lead commissioners of healthcare services it will be up to GP consortia to assess with local authorities the needs of their local populations and commission the right services that meet their requirements
And the strengthened public health role of local authorities offers significant potential for addressing the socioeconomic disadvantages faced by Black and minority ethnic communities which add to the burden of mental illness in these communities
Race Equality Action Plan A five-year review looked back at the work of the DRE action plan and describes some of the key challenges successes and learning34 Based on the experience and outcome of the DRE programme the report suggests ways forward for the next stage of mental health strategy development and implementation
Since April 2009 CQC has had a duty under the Mental Health Act 1983 to monitor how services exercise their powers in relation to patients who are detained in hospital or subject to CTOs or guardianship under the Act In its first annual report on the use of the Act CQC recommends a number of areas where improvements are needed for example over-occupancy on inpatient wards patient engagement use of control and restraint seclusion and capacity and consent35
In particular CQC highlighted a number of issues relating to the use of CTOs including concern about appropriate usage (30 of the patients in CQCrsquos sample did not have a reported history of non-compliance or disengagement with services after discharge) and over-representation of Black and minority ethnic groups CQC advised that research on the possible race equality impact of CTOs should be undertaken There were 6237 CTOs from their introduction in November 2008 to 31 March 2010 a much greater use of them than forecast for this period by the Department of Health before the power was introduced Just 31 of these orders had ended by end March 2010 suggesting that some people are being kept on supervised community treatment for long periods
Care Quality Commission Count me in census 2010 43
Conclusions continued
Data in the future Moving beyond a one-day census
Good information is the foundation of an effective healthcare system It is imperative for ensuring that services meet the needs of local populations and are equitable and that improvements are made where needed The availability of fit-for-purpose and comprehensive patient-level data sets with ethnicity and other key variables fully coded is therefore vitally important36 It enables the care provided to patients of all ethnic backgrounds to be monitored on an ongoing basis including for monitoring compliance with the Equality Act
Race Equality Action Plan A five-year review notes that better collection monitoring and use of ethnicity data to inform commissioning and provision in health and social care is required37 Key areas include good ethnic monitoring improving demographic information and ensuring good links between infomatics audit and equality and diversity leads within trusts in order to effectively use the information to inform service development monitoring and review at board management ward and community levels
The governmentrsquos proposed changes to the NHS will be supported by an information revolution aimed at improving and extending the information available to the NHS patients and the public on the quality and outcomes of NHS services including by equality dimensions38
Having information that is fit for purpose is vital for the effective regulation of mental health and learning disability services CQC uses routinely available data sets on an ongoing basis to assess the performance of health and social care organisations and their compliance with government policies and legislation We therefore expect those who commission and provide mental healthcare in the NHS and independent sector to have information systems that provide good quality data with fully
comprehensive recording and monitoring of ethnicity on an ongoing basis
Since 2005 the Count me in census has played a key role in providing information about the ethnicity and other characteristics of inpatients in mental health and learning disability services and on patients subject to the Mental Health Act It did this by providing a valuable one-day snapshot But ethnicity recording must be seen as an all-year round statutory requirement not a one-day annual event The number of inpatients throughout the year is much higher than the counts on one day and some patients will have more than one admission And there is a need to move on from counting patients to understanding more about care pathways for Black and minority ethnic patients and the factors leading to hospital admission and detention
We have consistently highlighted the need for commissioners and providers to make full use of the Mental Health Minimum Data Set (MHMDS) ndash the statutory data set submitted by providers of specialist mental health services in England It provides rich data on these issues and provides a robust information source for ongoing ethnic monitoring after this last census
Covering both community and hospital services ndash and now independent and third sector providers as well as NHS ndash it includes a wide range of information about individual patients the services provided to those admitted to hospital and to the much larger number who donrsquot need admission to hospital and the outcomes of care And because it includes year-round activity it is more representative of the overall picture of for example admission detention and readmission rates length of stay years in psychiatric care and contacts with services and professionals
We call on the Information Centre to routinely publish data on all admissions and uses of the Mental Health Act including CTOs in England (in both NHS and independent healthcare providers) by the ethnicity of
Care Quality Commission Count me in census 2010 44
Conclusions continued
patients making the MHMDS the definitive source of information about mental health and learning disability patients This data should be risk-adjusted for age gender and other variables as appropriate to enable reliable comparisons to be made across groups
It is important that all providers ndash NHS and independent ndash make strenuous efforts to improve the quality of the data they submit The Information Centre publishes reports on the quality of MHMDS data by provider (see wwwicnhsukservices mhmdsdq) and we urge providers to monitor this information and use it to improve their data quality
If GP consortia and local authorities are to be effective in their needs assessment and commissioning roles the Information Centre needs to make available and promote to them the data from the MHMDS and other sources And researchers and academics must make full use of the MHMDS to explore the factors that underlie the observed ethnic patterns
CQCrsquos role
In the meantime CQC will continue to focus strongly on the quality of care provided by mental health and learning disability services
People who find themselves admitted to mental health services or detained under the Mental Health Act and therefore counted by the Count me in census are among the most mentally unwell people in our society Our job is first and foremost to make sure that the care they receive meets the essential standards of quality and safety set out under the Health and Social Care Act 2008 and to work with providers to ensure this We act swiftly when we find services that do not Where we find systemic problems that organisations have not adequately addressed we may impose conditions on the providerrsquos registration to bring about the change needed to improve patientsrsquo experience of care
The essential standards of quality and safety include the requirement to provide single sex accommodation and we will continue to closely check that these standards are met by all mental health services
We intend to introduce a number of indicators derived from the rich information in the MHMDS into our quality and risk profiles for providers This will put greater emphasis on the experience of Black and minority ethnic patients in our regulatory activity
We will monitor the quality of MHMDS data submitted by providers (as reported by the NHS Information Centre) including independent service providers Those with poor data quality may be considered at higher risk in terms of their quality of care
In addition we will continue to monitor the progress of services in relation to the issues raised in the census and other reports including our report on the use of the Mental Health Act through our visits to services and meetings with patients by our Mental Health Act Commissioners and second opinion appointed doctors (SOADs) We will draw on patientsrsquo experiences to monitor the operation of the Mental Health Act
We will also assess the impact of advice and use of Local HealthWatch Local HealthWatch will be in a good position to make sure that providers and commissioners are held to account on matters of choice and access to services for people from Black and minority ethnic groups
Care Quality Commission Count me in census 2010 45
References
1 Department of Health Equity and excellence liberating the NHS 2010
2 Department of Health The NHS outcomes framework 201112 2010
3 Healthcare Commission Mental Health Act Commission National Institute for Mental Health in England Count me in results of a national census of inpatients in mental health hospitals and facilities in England and Wales 2005
4 Healthcare Commission Mental Health Act Commission National Institute for Mental Health in England Count me in results of the 2006 national census of inpatients in mental health and learning disability services in England and Wales 2006
5 Healthcare Commission Mental Health Act Commission National Institute for Mental Health in England Count me in results of the 2007 national census of inpatients in mental health and learning disability services in England and Wales 2007
6 Healthcare Commission Mental Health Act Commission National Institute for Mental Health in England Count me in results of the 2008 national census of inpatients in mental health and learning disability services in England and Wales 2008
7 Care Quality Commission National Mental Health Development Unit Results of the 2009 national census of inpatients and patients on supervised community treatment in mental health and learning disability services in England and Wales 2009
8 Department of Health Delivering race equality in mental health care an action plan for reform inside and outside services 2005
9 Welsh Assembly Government Adult Mental Health Services Raising the standard ndash Race Equality Action Plan for Adult Mental Health Services in Wales 2006
10Department of Health No health without mental health a cross-government mental health outcomes strategy for people of all ages 2011 wwwdhgovukprod_consum_dhgroups dh_digitalassetsdocumentsdigitalasset dh_124058pdf
11Department of Health New horizons towards a shared vision for mental health 2009 wwwdhgovukprod_consum_dhgroups dh_digitalassetsdhendocumentsdigital assetdh_109708pdf
12Department of Health Valuing people a new strategy for learning disability for the 21st century 2001
13Department of Health Valuing people now a new three year strategy for people with learning disabilities 2009
14Department of Health Healthcare for all report of the independent inquiry into access to healthcare for people with learning disabilities 2008
15Joint Committee on Human Rights A life like any other human rights of adults with learning disabilities (2008 HL Paper 401 HC 731) House of Lords House of Commons 2008
16Department of Health Valuing people now summary report March 2009 ndash September 2010 2010
17Disability Rights Commission Equal treatment investigation 2005
18Department of Health Mir G Nocon A Ahmad W Jones L Learning difficulties and ethnicity 2000
19ONS experimental population estimates by ethnic group 2007 wwwstatisticsgovukstatbase productaspvlnk=14238
Care Quality Commission Count me in census 2010 46
References continued
20Six percent of population are gay or lesbian according to Whitehall figures 2005 wwwtelegraphcouknewsmainjhtmlxml= news20051212ngay12xmlamps Sheet= news20051212ixhomehtml
21Department of Trade and Industry Amendment to Employment Equality (Sexual Orientation) Regulations 2003 2003
22Office for National Statistics Measuring sexual identity an evaluation report 2010
23 Information Centre Mental Health Bulletin Fourth report from Mental Health Minimum Dataset (MHMDS) annual returns 2010 2011 wwwicnhsukpubsmhbmhmds0910
24 Information Centre Mental Health Bulletin Fourth report from Mental Health Minimum Dataset (MHMDS) annual returns 2010 2011 wwwicnhsukpubsmhbmhmds0910
25The operating framework for the NHS in England 201112 Department of Health 2010 wwwdhgovukprod_consum_dhgroups dh_digitalassetsdhenpsdocuments digitalassetdh_122736pdf
26wwwdhgovukenPublicationsandstatistics LettersandcircularsProfessionalletters ChiefnursingofficerlettersDH_121848
27Department of Health No health without mental health a cross-government mental health outcomes strategy for people of all ages 2011 wwwdhgovukprod_consum_dhgroups dh_digitalassetsdocumentsdigitalasset dh_124058pdf
28Ministry of Justice Breaking the cycle effective punishment rehabilitation and sentencing of offenders 2010
29Department of Health The Bradley report Lord Bradleyrsquos review of people with mental health problems or learning disabilities in the criminal justice system 2009
30Department of Health No health without mental health delivering better mental health outcomes for people of all ages 2011
31Department of Health Equity and excellence liberating the NHS 2010 wwwdhgovukprod_ consum_dhgroupsdh_digitalassetsdhen psdocumentsdigitalassetdh_117794pdf
32Department of Health Healthy lives healthy people our strategy for public health in England 2010 wwwdhgovukprod_consum_dh groupsdh_digitalassetsdhenps documentsdigitalassetdh_122347pdf
33Department of Health A vision for adult social care capable communities and active citizens 2010 wwwdhgovukprod_consum_dh groupsdh_digitalassetsdhenps documentsdigitalassetdh_121971pdf
34Wilson M NMHDU Race equality action plan a five year review Delivering race equality in mental health care 2010 wwwnmhduorgukour-workmhep
35Care Quality Commission Monitoring the use of the Mental Health Act in 200910 2010
36Raleigh V S Collection of data on ethnic origin in England Editorial BMJ 20083376456
37Wilson M NMHDU Race equality action plan a five year review Delivering race equality in mental health care 2010 wwwnmhduorgukour-workmhep
38Department of Health Liberating the NHS an information revolution 2010
Care Quality Commission Count me in census 2010 47
Appendix A Methods of analysis
Standardisation by age and gender
Standardisation allows us to make comparisons between groups of the population by taking account of variations in age and gender Some differences in patterns of service use are related to the age or gender of the people using them so adjustments to the data have to be made to ensure that the interpretation of ethnic differences is reliable For example formal admissions are higher at a younger age so some Black and minority ethnic groups may have high formal admission rates simply because they have a high proportion of younger people Without adjustments for age and gender differences comparisons would be misleading
In this report most results are standardised for age and gender including those relating to admission detention source of referral care programme approach seclusion restraint accidents assault self-harm consent and presence on a secure ward The report uses the accepted statistical method of taking account of age and gender differences between groups when calculating these rates
We used the ONS estimates of total population by ethnic group for England and Wales in 2007 to standardise the rates of admission for different ethnic groups This takes account of the significant rises in the Black and ethnic minority population of England and Wales since the 2001 ONS census and hence gives more accurate and up to date estimates of admission ratios for different ethnic groups (although it does not take account of any further changes in the ethnic populations between 2007 and 2010 the date of this census) For comparison with the DRE baseline we also present admission rates from the 2005 census derived using the 2005 ONS estimates of populations by ethnic group These figures will not be the same as published in the 2005 census report which were based on the 2001 ONS census population estimates because updated estimates of populations by ethnic group were not available at that time
For other analyses we used the total number of inpatients and patients on CTOs in the census
as the basis for standardisation However CTO outpatients are excluded from selected analyses where appropriate namely the analysis of rates for admissions detentions on admission source of referral single sex accommodation and recorded incidents of seclusion restraint accidents assault and self-harm We used the statistical package STATA version 82 to derive the standardised results
It was not possible to adjust the analyses for ethnic differences in social and economic factors and in diagnosis and severity of illness Such factors could affect the ethnic differences observed in the results
For descriptive variables such as religion and language we did not use standardisation
Confidence intervals as indicators of significant statistical differences
For all standardised results the national rates for England and Wales are taken as 100 and the usual 95 confidence intervals are given Rates of less than 100 or greater than 100 for specific ethnic groups show a lower or higher rate respectively than the national average after adjusting for age and gender Whether or not the difference is statistically significant from the national average depends on the confidence interval If the confidence interval overlaps 100 the difference from the national average is not statistically significant If both values are lower or higher than 100 it indicates that the difference compared with the national average is statistically significant at the 95 level
For example if a rate is 110 with the lower confidence interval being 105 and the upper confidence interval being 115 it indicates that the 10 excess over the national average of 100 is statistically significant But if a ratio is 110 with the lower confidence interval being 95 and the upper confidence interval being 125 it indicates that the 10 excess over the national average is not statistically significant We did not attempt to adjust the confidence intervals for multiple comparisons
Care Quality Commission Count me in census 2010 48
Appendix B Mental health tables
Table B1 Standardised admission ratios by ethnic group for England and Wales (excluding outpatients on a CTO) using 2007 ONS census population denominators (England and Wales = 100) All ages
Ethnic group
Men Women Persons Standardised
admission ratio
95 confidence
interval Observed numbers
Standardised admission
ratio
95 confidence
interval Observed numbers
Standardised admission
ratio
95 confidence
interval Observed numbers
White British 88 86 89 12435 94 93 96 10157 91 89 92 22592 White Irish 130 115 146 274 122 106 140 215 126 115 138 489 Other White 117 109 126 731 129 118 141 533 122 115 129 1264 White and Black Caribbean 557 493 627 276 274 223 333 101 436 393 483 377 White and Black African 312 247 388 80 259 186 351 41 292 242 349 121 White and Asian 140 110 174 79 124 90 166 44 134 111 159 123 Other Mixed 230 189 278 108 213 165 270 67 223 192 259 175 Indian 67 59 75 286 66 56 76 172 66 60 73 458 Pakistani 105 93 119 269 65 53 79 96 91 81 100 365 Bangladeshi 123 102 147 120 82 60 109 46 108 92 126 166 Other Asian 161 139 185 192 136 107 169 79 153 135 172 271 Black Caribbean 538 505 572 980 306 277 336 418 438 415 462 1398 Black African 246 226 267 550 219 194 247 277 236 221 253 827 Other Black 792 691 903 222 314 240 403 61 596 529 670 283 Chinese 27 20 38 39 43 30 59 35 33 26 41 74 Other 140 120 162 177 110 88 136 87 128 113 145 264 Total 100 16818 100 12429 100 29247
Care Quality Commission Count me in census 2010 49
Appendix B Mental health tables continued
Table B2 Standardised admission ratios by ethnic group for England and Wales (excluding outpatients on a CTO) using 2007 ONS census population denominators (England amp Wales = 100) Ages 65 and over
Ethnic group
Men Women Persons Standardised
admission ratio
95 confidence
interval Observed numbers
Standardised admission
ratio
95 confidence
interval Observed numbers
Standardised admission
ratio
95 confidence
interval Observed numbers
White British 95 92 99 3265 95 92 98 3887 95 93 97 7152 White Irish 142 116 172 106 102 82 125 92 120 104 138 198 Other White 207 174 244 141 213 183 248 171 210 188 235 312 White and Black Caribbean 406 210 710 12 333 152 632 9 371 230 568 21 White and Black African 231 28 836 2 198 24 714 2 213 58 546 4 White and Asian 28 1 156 1 110 30 281 4 69 23 162 5 Other Mixed 146 40 374 4 228 92 470 7 189 95 339 11 Indian 97 70 132 41 83 57 116 33 90 71 113 74 Pakistani 39 17 77 8 46 18 94 7 42 23 69 15 Bangladeshi 115 53 218 9 69 14 201 3 98 51 172 12 Other Asian 234 143 361 20 215 120 354 15 225 157 313 35 Black Caribbean 216 170 269 77 310 253 376 103 261 224 302 180 Black African 142 73 248 12 365 241 531 27 246 175 337 39 Other Black 164 34 479 3 366 134 796 6 259 119 493 9 Chinese 41 8 120 3 95 38 195 7 68 33 125 10 Other 253 126 453 11 390 238 602 20 327 222 464 31 Total 100 3715 100 4393 100 8108
Care Quality Commission Count me in census 2010 50
Appendix B Mental health tables continued
Table B3 Standardised ratios by ethnic group for patients referred by a GP (England and Wales = 100)
Ethnic group
Men Women Persons Standardised
referral ratio
95 confidence
interval Observed numbers
Standardised referral ratio
95 confidence
interval Observed numbers
Standardised referral ratio
95 confidence
interval Observed numbers
White British 110 103 117 904 107 101 114 1065 108 104 113 1969 White Irish 85 50 134 18 93 57 144 20 89 63 123 38 Other White 74 51 103 33 70 49 97 36 72 56 91 69 White and Black Caribbean 27 5 78 3 30 4 109 2 28 9 65 5 White and Black African 0 0 74 9 268 2 35 4 125 2 White and Asian 165 54 386 5 0 0 86 28 201 5 Other Mixed 48 6 172 2 68 14 198 3 58 19 136 5 Indian 69 34 123 11 79 39 141 11 73 46 111 22 Pakistani 88 42 162 10 59 16 151 4 77 42 130 14 Bangladeshi 81 22 207 4 61 7 221 2 73 27 159 6 Other Asian 80 32 166 7 108 43 223 7 92 50 155 14 Black Caribbean 35 20 56 17 37 20 62 14 36 24 51 31 Black African 57 29 100 12 66 35 113 13 61 40 91 25 Other Black 62 23 135 6 40 5 144 2 54 23 107 8 Chinese 56 1 314 1 139 38 356 4 108 35 251 5 Other 106 46 208 8 0 0 53 23 105 8 Total 100 1041 100 1185 100 2226
Care Quality Commission Count me in census 2010 51
Appendix B Mental health tables continued
Table B4 Standardised ratios by ethnic group for patients referred by a community mental health team (including crisis resolution home treatment) or community learning disability team (England and Wales = 100)
Ethnic group
Men Women Persons Standardised
referral ratio
95 confidence
interval Observed numbers
Standardised referral ratio
95 confidence
interval Observed numbers
Standardised referral ratio
95 confidence
interval Observed numbers
White British 107 104 111 3255 103 100 107 3386 105 103 108 6641 White Irish 90 69 116 61 89 68 114 61 90 74 107 122 Other White 59 48 71 105 79 67 94 141 69 61 78 246 White and Black Caribbean 106 83 135 68 75 49 111 25 96 77 117 93 White and Black African 43 19 84 8 66 30 124 9 52 31 84 17 White and Asian 95 56 150 18 84 43 147 12 90 61 129 30 Other Mixed 78 48 121 20 72 41 118 16 76 53 105 36 Indian 106 83 132 76 100 76 130 56 103 86 122 132 Pakistani 108 84 135 73 89 60 128 30 102 83 123 103 Bangladeshi 98 66 141 29 90 50 148 15 95 69 128 44 Other Asian 88 63 120 40 105 70 150 29 94 73 119 69 Black Caribbean 69 59 80 167 85 71 102 123 75 67 84 290 Black African 84 70 102 112 82 65 103 77 84 72 96 189 Other Black 52 36 74 31 64 36 106 15 56 41 74 46 Chinese 112 53 205 10 101 52 176 12 105 66 160 22 Other 86 60 120 35 106 71 151 30 94 73 120 65 Total 100 4108 100 4037 100 8145
Care Quality Commission Count me in census 2010 52
Appendix B Mental health tables continued
Table B5 Standardised ratios by ethnic group for patients referred by criminal justice routes (police prison probation courts court liaison and diversion) (England and Wales = 100)
Ethnic group
Men Women Persons Standardised
referral ratio
95 confidence
interval Observed numbers
Standardised referral ratio
95 confidence
interval Observed numbers
Standardised referral ratio
95 confidence
interval Observed numbers
White British 90 86 95 1495 95 86 104 421 91 87 95 1916 White Irish 133 94 183 38 59 19 138 5 116 84 157 43 Other White 112 93 134 119 103 68 150 27 111 93 130 146 White and Black Caribbean 117 89 151 58 145 69 266 10 120 94 153 68 White and Black African 190 127 273 29 141 38 361 4 183 126 256 33 White and Asian 75 39 131 12 160 52 373 5 89 52 143 17 Other Mixed 104 65 157 22 151 61 311 7 112 75 161 29 Indian 86 61 118 38 79 32 163 7 85 62 113 45 Pakistani 118 91 150 65 89 33 194 6 115 90 145 71 Bangladeshi 74 44 115 19 29 1 162 1 68 42 105 20 Other Asian 130 95 174 45 164 71 323 8 134 101 176 53 Black Caribbean 131 114 150 208 124 81 181 26 130 114 148 234 Black African 132 112 156 145 143 93 211 25 134 114 156 170 Other Black 141 109 180 65 236 113 435 10 149 117 187 75 Chinese 83 27 194 5 146 30 426 3 99 43 195 8 Other 129 93 175 41 113 37 264 5 127 93 170 46 Total 100 2404 100 570 100 2974
Care Quality Commission Count me in census 2010 53
Appendix B Mental health tables continued
Table B6 Standardised detention ratios by ethnic group all detentions on day of admission (excluding outpatients on a CTO) (England and Wales = 100)
Ethnic group
Men Women Persons Standardised
detention ratio
95 confidence
interval Observed numbers
Standardised detention
ratio
95 confidence
interval Observed numbers
Standardised detention
ratio
95 confidence
interval Observed numbers
White British 94 92 97 6449 94 91 97 3628 94 92 96 10077 White Irish 112 95 131 154 118 96 145 94 114 101 129 248 Other White 108 98 118 451 120 106 136 251 112 104 120 702 White and Black Caribbean 123 107 141 220 129 99 167 59 124 110 140 279 White and Black African 128 99 162 68 113 70 173 21 124 100 153 89 White and Asian 96 71 126 50 109 68 164 22 99 78 125 72 Other Mixed 115 92 143 82 139 100 188 42 122 102 146 124 Indian 97 83 113 164 110 86 137 77 101 88 114 241 Pakistani 109 94 126 194 102 74 136 44 108 94 122 238 Bangladeshi 86 67 109 69 91 55 142 19 87 70 107 88 Other Asian 109 92 130 133 120 86 163 40 112 96 130 173 Black Caribbean 129 121 139 774 143 125 162 238 132 124 141 1012 Black African 115 104 127 422 131 111 153 159 119 110 129 581 Other Black 117 100 136 170 148 105 202 39 122 106 140 209 Chinese 108 71 159 26 129 78 202 19 116 85 156 45 Other 111 92 132 126 116 83 157 41 112 96 130 167 Total 100 9552 100 4793 100 14345
Care Quality Commission Count me in census 2010 54
Appendix B Mental health tables continued
Table B7 Standardised detention ratios by ethnic group detention on day of admission ndash section 2 of the Mental Health Act (England and Wales = 100)
Ethnic group
Men Women Persons Standardised
detention ratio
95 confidence
interval Observed numbers
Standardised detention
ratio
95 confidence
interval Observed numbers
Standardised detention
ratio
95 confidence
interval Observed numbers
White British 97 91 102 1156 93 87 98 1133 95 91 99 2289 White Irish 78 47 120 20 116 79 166 30 97 72 128 50 Other White 100 78 126 70 134 108 166 88 116 99 136 158 White and Black Caribbean 55 30 93 14 60 24 124 7 57 35 87 21 White and Black African 91 37 188 7 150 60 308 7 113 62 190 14 White and Asian 80 29 174 6 119 44 258 6 96 49 167 12 Other Mixed 68 28 141 7 116 53 221 9 89 51 145 16 Indian 130 91 179 37 124 81 182 26 127 98 163 63 Pakistani 126 87 176 34 138 79 225 16 130 96 171 50 Bangladeshi 166 101 256 20 140 61 276 8 158 105 228 28 Other Asian 142 93 209 26 163 93 264 16 150 108 202 42 Black Caribbean 73 57 92 70 97 72 128 51 82 68 98 121 Black African 164 131 202 87 190 146 244 62 174 147 204 149 Other Black 114 75 166 27 140 72 245 12 121 86 165 39 Chinese 165 60 358 6 212 97 402 9 190 106 313 15 Other 218 153 302 36 179 108 280 19 203 153 264 55 Total 100 1623 100 1499 100 3122
Care Quality Commission Count me in census 2010 55
Appendix B Mental health tables continued
Table B8 Standardised detention ratios by ethnic group detention on day of admission ndash section 3 of the Mental Health Act (England and Wales = 100)
Ethnic group
Men Women Persons Standardised
detention ratio
95 confidence
interval Observed numbers
Standardised detention
ratio
95 confidence
interval Observed numbers
Standardised detention
ratio
95 confidence
interval Observed numbers
White British 99 95 103 2684 96 91 100 1852 98 95 101 4536 White Irish 116 89 149 60 135 101 177 52 124 102 149 112 Other White 112 96 129 186 110 92 132 121 111 99 124 307 White and Black Caribbean 114 91 143 79 130 90 183 33 119 98 143 112 White and Black African 97 60 148 21 107 54 192 11 100 69 141 32 White and Asian 84 50 133 18 97 48 173 11 89 59 127 29 Other Mixed 121 84 168 35 117 72 181 20 120 90 156 55 Indian 96 75 122 67 110 79 148 42 101 83 122 109 Pakistani 91 71 115 69 88 55 134 22 90 73 111 91 Bangladeshi 63 39 95 22 64 28 127 8 63 43 90 30 Other Asian 90 65 120 44 94 56 149 18 91 70 117 62 Black Caribbean 116 102 130 279 164 138 192 148 129 117 142 427 Black African 95 80 112 143 102 79 129 68 97 85 111 211 Other Black 75 55 99 49 99 58 159 17 80 62 102 66 Chinese 119 59 213 11 99 43 194 8 110 66 171 19 Other 85 60 116 38 84 48 136 16 84 63 110 54 Total 100 3805 100 2447 100 6252
Care Quality Commission Count me in census 2010 56
Appendix B Mental health tables continued
Table B9 Standardised detention ratios by ethnic group detention on day of admission ndash section 3741 of the Mental Health Act (England and Wales = 100)
Ethnic group
Men Women Persons Standardised
detention ratio
95 confidence
interval Observed numbers
Standardised detention
ratio
95 confidence
interval Observed numbers
Standardised detention
ratio
95 confidence
interval Observed numbers
White British 84 79 89 991 101 88 115 220 86 82 91 1211 White Irish 140 96 198 32 48 6 175 2 126 87 176 34 Other White 112 89 139 81 156 95 241 20 118 96 144 101 White and Black Caribbean 177 133 232 53 179 66 390 6 178 135 229 59 White and Black African 149 82 251 14 224 46 654 3 159 92 254 17 White and Asian 141 75 241 13 195 40 569 3 149 85 241 16 Other Mixed 144 85 227 18 264 97 575 6 162 104 242 24 Indian 86 56 126 26 44 5 160 2 80 53 116 28 Pakistani 122 87 166 40 0 0 111 79 152 40 Bangladeshi 66 32 122 10 0 0 60 29 110 10 Other Asian 99 61 151 21 0 0 89 55 136 21 Black Caribbean 200 174 229 210 78 34 153 8 189 165 216 218 Black African 127 101 157 82 84 34 172 7 122 98 150 89 Other Black 152 110 205 43 94 11 341 2 148 108 198 45 Chinese 100 27 255 4 0 0 80 22 204 4 Other 118 75 177 23 44 1 245 1 110 71 164 24 Total 100 1661 100 280 100 1941
Care Quality Commission Count me in census 2010 57
Appendix B Mental health tables continued
Table B10 Standardised detention ratios by ethnic group detention on day of admission ndash sections 47 48 4749 of the Mental Health Act (England and Wales = 100)
Ethnic group
Men Women Persons Standardised
detention ratio
95 confidence
interval Observed numbers
Standardised detention
ratio
95 confidence
interval Observed numbers
Standardised detention
ratio
95 confidence
interval Observed numbers
White British 97 90 106 583 104 81 131 73 98 91 106 656 White Irish 132 72 221 14 163 20 590 2 135 77 219 16 Other White 130 96 172 49 71 15 206 3 124 93 163 52 White and Black Caribbean 126 78 193 21 80 2 444 1 123 77 186 22 White and Black African 207 103 370 11 0 0 189 95 339 11 White and Asian 57 12 166 3 169 4 941 1 68 19 175 4 Other Mixed 112 48 221 8 233 28 843 2 125 60 230 10 Indian 57 26 108 9 0 252 0 52 24 99 9 Pakistani 92 54 147 17 0 314 0 86 50 138 17 Bangladeshi 46 12 117 4 167 4 930 1 53 17 125 5 Other Asian 101 52 177 12 0 0 95 49 166 12 Black Caribbean 126 98 159 70 125 34 319 4 126 99 158 74 Black African 74 48 107 27 104 21 303 3 76 51 108 30 Other Black 127 78 197 20 138 3 769 1 128 79 195 21 Chinese 0 0 0 0 0 0 Other 83 38 157 9 0 0 77 35 147 9 Total 100 857 100 91 100 948
Care Quality Commission Count me in census 2010 58
Appendix B Mental health tables continued
Table B11 Standardised ratios for all applications of the Mental Health Act (including outpatients on a CTO) by ethnic group on day of census (England and Wales = 100)
Ethnic group
Men Women Persons Standardised
ratio for all MHA
applications
95 confidence
interval Observed numbers
Standardised ratio for all MHA
applications
95 confidence
interval Observed numbers
Standardised ratio for all MHA
applications
95 confidence
interval Observed numbers
White British 97 94 99 7659 95 93 98 4335 96 94 98 11994 White Irish 99 83 116 147 104 84 128 95 101 89 114 242 Other White 87 79 95 427 97 85 110 249 90 84 97 676 White and Black Caribbean 117 103 133 245 130 103 163 76 120 107 134 321 White and Black African 120 95 150 79 93 58 141 22 113 92 137 101 White and Asian 101 78 128 65 119 81 169 31 106 86 129 96 Other Mixed 110 89 134 96 125 93 165 49 114 97 135 145 Indian 103 90 118 215 122 100 147 109 109 97 121 324 Pakistani 111 97 125 254 117 90 148 67 112 100 125 321 Bangladeshi 92 75 112 97 101 68 145 29 94 78 112 126 Other Asian 103 88 121 152 126 95 164 56 109 94 124 208 Black Caribbean 123 115 131 893 141 126 158 300 127 120 134 1193 Black African 112 103 122 511 121 104 140 188 114 106 123 699 Other Black 116 102 132 232 148 112 191 59 122 108 136 291 Chinese 97 64 140 27 101 61 157 19 98 72 131 46 Other 104 87 122 140 103 75 137 46 103 89 119 186 Total 100 11239 100 5730 100 16969
Care Quality Commission Count me in census 2010 59
Appendix B Mental health tables continued
Table B12 Standardised CTO ratios by ethnic group CTOs on day of census ndash section 17a of the Mental Health Act (England and Wales = 100)
Ethnic group
Men Women Persons
Standardised CTO ratio
95 confidence
interval Observed numbers
Standardised CTO ratio
95 confidence
interval Observed numbers
Standardised CTO ratio
95 confidence
interval Observed numbers
White British 94 89 99 1289 88 82 94 730 92 88 96 2019 White Irish 51 27 88 13 77 41 132 13 62 40 90 26 Other White 97 77 120 83 125 95 162 58 107 90 126 141 White and Black Caribbean 79 53 113 29 141 77 237 14 92 67 124 43 White and Black African 111 59 190 13 125 41 292 5 115 68 181 18 White and Asian 104 54 182 12 136 50 297 6 113 67 178 18 Other Mixed 102 59 166 16 136 62 257 9 112 73 166 25 Indian 134 99 177 48 152 98 226 24 139 109 175 72 Pakistani 145 110 187 59 174 101 279 17 151 119 189 76 Bangladeshi 142 93 206 27 205 99 378 10 155 109 213 37 Other Asian 107 71 155 28 182 99 305 14 124 89 168 42 Black Caribbean 121 103 142 152 171 132 218 65 133 116 152 217 Black African 116 94 142 94 139 98 192 37 122 102 145 131 Other Black 186 144 238 65 305 189 466 21 206 165 254 86 Chinese 83 23 213 4 152 49 354 5 111 51 211 9 Other 87 54 134 21 152 79 266 12 103 71 145 33 Total 100 1953 100 1040 100 2993
Care Quality Commission Count me in census 2010 60
Appendix C Learning disability tables
Table C1 Standardised admission ratios by ethnic group for England and Wales using 2007 ONS population denominators (England amp Wales = 100) All ages
Ethnic group
Men Women Persons Standardised
admission ratio
95 confidence
interval Observed numbers
Standardised admission
ratio
95 confidence
interval Observed numbers
Standardised admission
ratio
95 confidence
interval Observed numbers
White British 104 100 109 2163 108 101 115 941 105 102 109 3104 White Irish 108 72 156 28 151 89 238 18 121 89 162 46 Other White 81 65 101 85 49 30 75 21 72 59 87 106 White and Black Caribbean 280 186 405 28 246 118 453 10 270 191 371 38 White and Black African 102 33 239 5 165 34 482 3 119 51 235 8 White and Asian 66 26 135 7 154 56 335 6 89 47 152 13 Other Mixed 181 104 295 16 229 99 451 8 195 125 290 24 Indian 32 21 48 24 28 12 55 8 31 21 44 32 Pakistani 48 30 72 22 12 1 43 2 38 25 57 24 Bangladeshi 102 60 161 18 31 4 113 2 83 51 128 20 Other Asian 33 13 69 7 92 34 201 6 47 25 81 13 Black Caribbean 265 210 332 77 117 67 190 16 218 176 267 93 Black African 53 33 80 22 40 15 87 6 50 33 72 28 Other Black 228 118 399 12 134 28 392 3 200 112 330 15 Chinese 4 0 21 1 3 0 16 1 Other 26 9 56 6 11 0 59 1 21 9 44 7 Total 100 2521 100 1051 100 3572
Care Quality Commission Count me in census 2010 61
Appendix C Learning disability tables continued
Table C2 Standardised detention ratios by ethnic group all detentions on day of admission (England and Wales = 100)
Ethnic group
Persons Standardised
detention ratio
95 confidence
interval Observed numbers
White British 97 93 103 1431 White Irish 127 84 184 28 Other White 117 91 149 68 White and Black Caribbean 120 77 179 24 White and Black African 114 37 267 5 White and Asian 75 24 176 5 Other Mixed 94 49 165 12 Indian 119 72 186 19 Pakistani 110 61 181 15 Bangladeshi 144 84 231 17 Other Asian 59 16 150 4 Black Caribbean 119 90 155 57 Black African 138 85 210 21 Other Black 62 20 145 5 Chinese 0 0 Other 104 28 267 4 Total 100 1715
Care Quality Commission Count me in census 2010 62
copy Care Quality Commission and National Mental Health Development Unit 2011 Published April 2011
This publication may be reproduced in whole or in part in any format or medium for non-commercial purposes provided that it is reproduced accurately and not used in a derogatory manner or in a misleading context The source should be acknowledged by showing the publication title and copy Care Quality Commission and National Mental Health Development Unit 2011
How to contact us
Phone 03000 616161 Email enquiriescqcorguk Web wwwcqcorguk
Write to us at Care Quality Commission National Correspondence Citygate Gallowgate Newcastle upon Tyne NE1 4PA
Please contact us if you would like a summary of this publication in other formats or languages
Registered office Care Quality Commission Finsbury Tower 103ndash105 Bunhill Row London EC1Y 8TG
- Count me in 2010
- About the Care Quality Commission
- Contents
- Summary
- National organisations coordinating the census
- Introduction
- Data methods of analysis and interpretation
- Results mental health
- A comparison between the 2005 baseline and the 2010 census
- Results learning disabilities
- Data in the future Moving beyond a one-day census
- Conclusions
- References
- Appendix A Methods of analysis
- Appendix B Mental health tables
- Appendix C Learning disability tables
- How to contact us
-

Results learning disabilities continued
Ethnicity
Information about ethnicity was available for 98 of patients Of these 13 belonged to Black and minority ethnic groups defined as all groups that are not White British (see Table 9) This figure is somewhat higher than in previous years (11 in 2006) and is significantly lower than the 23 of mental health patients from minority ethnic groups as reported in the mental health section of this report
Although the patterns by ethnicity are broadly similar to previous years there was an increase between 2006 and 2010 in the proportion of patients from the Other White group and a fall in those from the White British group Some ethnic groups had very few patients
As in the previous censuses patients from Black and minority ethnic groups were concentrated in a relatively small number of organisations 70 were
Table 9 Learning disability patients by ethnic group
Ethnic group 2010 census 2009 census 2008 census 2007 census 2006 census
Number Number Number Number Number
White British 853 3106 867 3205 889 3616 883 3642 887 4037
White Irish 13 46 15 57 13 53 10 40 14 66
Other White 29 106 23 85 26 104 26 109 17 77
White and Black Caribbean 10 38 10 36 07 29 08 34 07 32
White and Black African 02 8 01 4 00 2 02 10 01 3
White and Asian 04 13 04 14 03 12 03 13 02 9
Other Mixed 07 24 05 19 03 14 04 16 03 14
Indian 09 32 09 35 07 28 08 32 11 49
Pakistani 07 24 09 33 07 30 08 32 07 34
Bangladeshi 05 20 06 21 03 11 03 11 02 9
Other Asian 04 13 03 10 03 12 02 8 03 12
Black Caribbean 26 93 22 81 23 94 26 108 28 129
Black African 08 28 09 35 07 29 08 33 07 33
Other Black 04 15 04 14 04 15 04 18 04 17
Chinese 00 1 01 2 01 5 02 8 02 7
Other 02 7 02 8 04 15 02 10 05 24
Not stated 19 68 10 36 09 38 07 29 12 57
Total 100 3642 100 3695 100 4069 100 4124 100 4552
Care Quality Commission Count me in census 2010 35
Results learning disabilities continued
patients in 25 of the 129 organisations that took part in the census Seventy-four organisations had fewer than 10 patients from Black and minority ethnic groups each and another 42 organisations had no inpatients at all from these groups
However it is important to note that the number of people with severe and profound learning disabilities in some areas is affected by past funding and placement practices especially the presence of old long stay hospitals and of people placed outside their original area of residence by funding authorities
Reporting of ethnicity
About half (56) of patients reported their own ethnic group Staff reported the ethnic group for 17 of patients and relatives for 21 This means that ethnicity could have been misreported for some patients We do not know how ethnicity was assessed for 6 of patients
Age and gender
Two per cent (59) of patients were under 18 years old The number of young inpatients from minority ethnic groups was low or zero in several ethnic minority groups
Overall 73 of patients were under 50 years old and 27 were aged 50 or over The proportion of patients under 50 was higher among patients from Black and minority ethnic groups (88) than among the White British group (71) This is not surprising given that minority ethnic populations are generally younger than the White population
Seventy per cent of patients in learning disability services were men whereas in mental health services 58 of patients were men
Language and religion
Eight per cent of patients reported that their first language was not English Non-verbal communication was the most often selected language after English accounting for 4 of patients Two per cent (84) of patients most of whom were from the White British group said they needed an interpreter
Religion was not stated for 22 of patients and 15 of patients said they had no religion South Asians (Indians Bangladeshis and Pakistanis) were mostly Muslim Hindu or Sikh and those from the White Black Caribbean and Black African groups were mostly Christian
Sexual orientation
Overall the result was not known for almost half (49) of patients 45 said they were heterosexual 2 said gaylesbian 3 said bisexual and 1 said ldquootherrdquo The numbers of patients from minority ethnic groups were too low for meaningful analysis
Disability
Of all inpatients in learning disability services
bull 4 were reported as having no disabilities
bull 44 had a learning disability only
bull 51 had multiple disabilities
The patterns among minority ethnic groups were similar in that most patients had either a learning disability or multiple disabilities
Care Quality Commission Count me in census 2010 36
Results learning disabilities continued
Rates of admission
The rates of admission based on ONS estimates of the general population in 2007 are given in Appendix C Table C1
Admission rates were lower than average among several minority ethnic groups Other White Indian Pakistani Other Asian Black African Chinese and Other Rates were two to three times higher than average among the WhiteBlack Caribbean Mixed Black Caribbean Other Black and Other Mixed groups The lower rates among the South Asian and Chinese groups and the higher rates among some Black groups are similar to patterns for inpatients in mental health establishments
These patterns of admission are similar to those we reported in previous census reports
Source of referral
As we reported in the section on mental health patients data about sources of referral must be interpreted with care as we do not always know the original referral source Furthermore in the case of inpatients with learning disabilities this information was invalid missing or unknown for 12 of patients
Because of the small numbers of patients in most minority ethnic groups we observed few ethnic differences in sources of referral
Detention under the Mental Health Act 1983 (on day of admission and on day of census)
The Mental Health Act 2007 made a number of changes to the Mental Health Act 1983 one of which was supervised community treatment (section 17A) These are reflected in the 2010 census
All detentions Of all the patients in learning disability services 48 were detained under the Mental Health Act on admission Rates of detention on the day of admission by ethnic group are in Appendix C Table C2 and no ethnic differences were observed As the number of detained patients from each minority ethnic group was low we did not undertake further analysis for individual sections of the Act
Rates of detention on census day also showed no ethnic differences with the exception of a lower than average rate for the Other White group
Consent
About 66 of informally admitted inpatients were deemed incapable of consenting to treatment which is a similar proportion to that reported previously
Among detained patients 38 were deemed incapable of consenting to treatment and 6 were deemed capable of consenting to treatment but refused
The numbers of patients from minority ethnic groups were too low for comment There were no or very few such patients among minority ethnic groups
Care Quality Commission Count me in census 2010 37
Results learning disabilities continued
Care programme approach
Details of the Care Programme Approach (CPA) are given on page 24
We found that 73 of all patients were on a CPA 2 on a single assessment process (SAP) and 25 on neither No ethnic differences were observed
Recorded incidents
The 2010 census asked about the number of times that patients experienced seclusion hands-on restraint self-harm accident and physical assault in a patientrsquos current hospital spell or if the patientrsquos hospital spell was longer than three months the number that took place within the last three months As in previous years we observed very few ethnic differences
Seclusion Five per cent of patients had experienced one or more episodes of seclusion The only ethnic differences observed were the higher than average rates among the White Irish and Other White groups but these were based on small numbers of patients
Physical assault on the patient The definition of assault includes incidents of physical assault on the patient irrespective of who committed the assault but we do not have information on who committed the assault About 28 of patients had been involved in one or more episodes of physical assault No ethnic differences were observed
Hands-on restraint self-harm accidents Thirty per cent of inpatients had experienced one or more episodes of hands-on restraint 22 had attempted to harm themselves and 24 had suffered an accident The numbers were very low in minority ethnic groups and we did not observe any ethnic differences except for a lower than average rate for self-harm among the Black Caribbean group but this was based on very few patients
Duration of stay in hospital
We analysed the length of the period between each patientrsquos admission to hospital and the census day This period is of course shorter than a patientrsquos full length of stay in hospital which runs from admission to the date when they are discharged
bull 10 of inpatients had been in hospital for one month or less
bull 6 had been in hospital between one and three months
bull 7 had been in hospital between three and six months
bull 10 had been in hospital between six months and one year
bull 14 had been in hospital between one and two years
bull 22 had been in hospital between two and five years
bull 31 had been in hospital for over five years
The patterns are very similar to those in previous censuses About 67 of patients in the 2010 census had been in hospital for more than a year and were therefore also included in the 2009 census In addition over half (53) of patients had been in hospital for more than two years and will have been included in both the 2008 and 2009 censuses A third of patients will have been included in each census since 2006
We also calculated the median length of stay (see page 26 for the definition of median) Overall the median amount of time that women had spent in hospital was about 31 months and the median for men was about 27 months This compares with a median for mental health patients of 25 months for women and 58 months for men It is not possible to reliably compare length of stay by ethnic group because of the small numbers of patients among several minority ethnic groups
Care Quality Commission Count me in census 2010 38
Results learning disabilities continued
Ward security
About 12 of all inpatients were on a medium or high secure ward as opposed to a general (54) or low secure (34) ward
As in the three previous years rates of patients on medium or high secure wards were about double the average among the White Irish and Other White groups Most other minority ethnic groups had very few patients on medium or high secure wards
Age range on wards
There were five patients under 18 years of age being cared for on wards for working-age adults and none were on wards for older people About 5 of patients on wards for working-age adults were aged 65 or over and there were very few patients (23) on wards for older people There were very few lsquoout of agersquo placements among minority ethnic groups
Patients in wards designated as single sex or mixed
We asked providers whether the patient was on a ward designated as men or women only or mixed gender Overall 47 of men and 69 of women were not in a ward designated for single sex use The numbers of such patients among minority ethnic groups were very low
Two further questions examined the single sex facilities that were available to patients Again due to the small numbers we do not present results by ethnicity for these questions
Patientsrsquo access to toilet and bathing facilities designated for single sex use
Overall 19 (497) of men and 27 (295) of women were reported as not having access to toilet and bathing facilities designated for single sex use
Patientsrsquo access to a lounge area day space designated for single sex use
Overall 32 (829) of men and 44 (470) of women were reported as not having access to a lounge area day space designated for single sex use
Patients subject to deprivation of liberty safeguards
For details of deprivation of liberty safeguards please see page 31
The 2010 census introduced a new question ldquoIs the patient subject to deprivation of liberty authorisation on 31 March 2010rdquo Two per cent (74) patients were reported as being subject to a deprivation of liberty order on census day but very few of these patients (15) were from minority ethnic groups
See footnote on single sex accommodation on page 27
Care Quality Commission Count me in census 2010 39
Data in the future Moving beyond a one-day census
For six years the Count me in census has provided a valuable one-day snapshot of inpatients in mental health and learning disability services And with the proportion of inpatients who are detained increasing steadily (from 25 in 200506 to 39 in 200910 ndash see Figure 2) ongoing ethnic monitoring of admissions and detentions becomes more vital than ever
However a one-day census only captures some events and the profile of patients can differ across a whole year For example there were
bull 29840 inpatients in the 2010 census compared with 107765 inpatients overall during 200910
bull 17299 patients in the 2010 census who were detained or on CTOs compared with 42479 new detentions and some 4100 new CTOs overall in England in 200910
bull 26 of patients in hospital for under one month and 31 for over one year per the census
whereas the MHMDS data consistently shows that for over 50 of records the average length of an inpatient stay was under one month and for 4 it was over one year
Looking ahead it is vital that robust data is available on all admitted patients and all those subject to the Mental Health Act not just those in hospital on one particular day Moreover patterns of use and outcomes of community care can have an impact on the need for admission to hospital and the risk of detention ndash therefore information about the care provided to patients before admission to hospital during their hospital stay and after they leave is also vital Furthermore under 84 of the 127 million people using specialist mental health services are admitted to hospital23 and so it is very important to examine the quality of community care for the 90 of patients who are not admitted to hospital
Figure 2 Number of people spending time in hospital 200506 to 200910
Num
ber
of p
atie
nts
90000
80000
70000
60000
50000
40000
30000
20000
10000
0 200506 200607 200708 200809 200910
Source NHS Information Centre Formally detained Not detained MHMDS Bulletin 2011
Care Quality Commission Count me in census 2010 40
Data in the future Moving beyond a one-day census continued
The Mental Health Minimum Data Set (MHMDS) is a rich source of data on people using specialist mental health services in England It covers both community and hospital services and includes a wide range of information about the demographic clinical and socioeconomic characteristics of individual patients and the services provided to those admitted to hospital and to the much larger number of those who donrsquot need a stay in hospital The data includes information about contact with services uses of the Mental Health Act and the Care Programme Approach for each individual patient All these details enable the use of services patterns of care and patient outcomes to be tracked including along pathways of care The MHMDS therefore provides a robust basis for ongoing monitoring of access to and outcomes of care for users of specialist ndash both community and hospital ndash mental health services
The MHMDS also enables an analysis of the numbers and rates of people from different ethnic groups using specialist mental health services overall (both inpatient and community) which provides an indication of the levels of mental illness and therefore the need for specialist care in different communities
At present the MHMDS does not cover high secure services and independent sector providers only started to provide data during 201011 However to support payment by results for mental health the scope of the data set will be extended to cover high secure services during 201112 (version 4 MHMDS) Further proposed changes to the dataset (version 41) will incorporate NHS-funded learning disability services and primary care mental health services A separate dataset for child and adolescent mental health services (CAMHS) has been developed and is awaiting formal approvals It is designed to include the same information about uses of the Mental Health Act as provided in the MHMDS
The latest MHMDS bulletin for 200910 provides a description of people using specialist mental health services in England including ethnic profiles of people using services hospital admissions detentions and the number of people on CPA24 It also provides information on differences by age and gender The bulletin illustrates some of the sorts of analyses that are possible using data from the MHMDS
The NHS Information Centre can provide guidance on these and other potential analyses based on MHMDS data
Care Quality Commission Count me in census 2010 41
Conclusions
While this report reviews changes in the census results since 2005 it is not a review or evaluation of the DRE programme overall Similarly the census cannot provide explanations for the patterns observed or examine whether mental health services are meeting the needs of individual ethnic minority groups As we have noted previously the results are subject to caveats in particular that the census provides a one-day snapshot that may not be representative of patients admitted to hospital throughout the year
Overview of findings
Overall the findings from the 2010 census show little change from those reported for previous annual censuses conducted since 2005 This is partly because many patients had been in hospital for a considerable period of time and had therefore been included in successive censuses The findings of this sixth and last census continue to show differences between Black and minority ethnic groups and White groups and also differences within these groups
In particular ethnic differences in rates of admission detention under the Mental Health Act and seclusion ndash three of DRErsquos 12 goals ndash have not altered materially since the inception of DRE in 2005
bull Admission rates remain higher than average among minority ethnic groups especially among Black and WhiteBlack Mixed groups for whom rates were two or more times higher than average in 2010 The Other Black group continues to have the highest admission rate ndash six times higher than average ndash although this is lower than in 2005 In contrast admission rates have consistently been lower than average among the Indian and Chinese groups and about average in the Pakistani and Bangladeshi groups
bull Detention rates remain higher than average among the Black and WhiteBlack Caribbean Mixed groups and among the Other White group A consistent pattern across all censuses was the higher than average detention rate
under section 3741 for the Black Caribbean and Other Black groups We also found that rates for being placed on a CTO were higher among the South Asian and Black groups
bull Although there have been annual fluctuations in seclusion rates they have been higher than average for the Black WhiteBlack Mixed and Other White groups in at least three of the six censuses
Overall the level of provision of single sex areas for patients continues to be unsatisfactory although there was no evidence that minority ethnic patients were disadvantaged in these respects Government policy for the NHS in England now requires that all providers of NHS-funded care including mental health trusts are expected to eliminate mixed-sex accommodation in accordance with the guidance set out in CNO201032526 From 2011 all providers of NHS-funded care must report breaches of sleeping accommodation which will attract sanctions
Implications for ways forward
The census findings do not in themselves show that mental health and learning disability services are failing to meet the needs of Black and minority ethnic service users
As noted in previous reports they need to be interpreted in the context of available evidence on ethnic differences in rates of mental illness pathways to care and factors such as socioeconomic disadvantages that all contribute to these differences Our previous reports have consistently highlighted the need for prevention early intervention and working collaboratively across sectors to reduce the risk of admission and detention where possible without compromising the care given to patients Mental health services have a key role to play but to achieve this all statutory agencies and organisations outside the healthcare sector Black and minority ethnic communities and people who use services themselves will need to work in partnership
Care Quality Commission Count me in census 2010 42
Conclusions continued
This message ndash about preventing mental ill-health by addressing the contributory factors and intervening early ndash is at the heart of No health without mental health the Department of Healthrsquos new strategy for the future of mental health care in England27
The strategy aims to tackle the economic social and environmental determinants and consequences of mental health problems and to improve outcomes and reduce inequalities
It specifies that by 2014 people in contact with the criminal justice system will have improved access to mental health services as set out in the Ministry of Justice Green Paper Breaking the Cycle Effective punishment rehabilitation and sentencing of offenders which confirms the approach outlined in Lord Bradleyrsquos report for early intervention and diversion from custody2829
Accompanying the new strategy is a supporting document that explains how its objectives will improve mental health outcomes the effective interventions and the underpinning evidence base30
The strategy is complemented by other government proposals for reforms in the NHS public health and adult social care as outlined in the NHS White Paper Equity and excellence liberating the NHS31 the public health strategy Healthy lives healthy people32 and the adult social care strategy A vision for adult social care capable communities and active citizens 33 Three outcomes frameworks have been developed alongside these strategies improving mental health outcomes and reducing inequalities is integral to them all
In this new healthcare landscape the proposed NHS Commissioning Board and GP consortia will have a statutory obligation to promote equality and reduce inequalities in healthcare (something also enshrined in the Equality Act 2010) As the lead commissioners of healthcare services it will be up to GP consortia to assess with local authorities the needs of their local populations and commission the right services that meet their requirements
And the strengthened public health role of local authorities offers significant potential for addressing the socioeconomic disadvantages faced by Black and minority ethnic communities which add to the burden of mental illness in these communities
Race Equality Action Plan A five-year review looked back at the work of the DRE action plan and describes some of the key challenges successes and learning34 Based on the experience and outcome of the DRE programme the report suggests ways forward for the next stage of mental health strategy development and implementation
Since April 2009 CQC has had a duty under the Mental Health Act 1983 to monitor how services exercise their powers in relation to patients who are detained in hospital or subject to CTOs or guardianship under the Act In its first annual report on the use of the Act CQC recommends a number of areas where improvements are needed for example over-occupancy on inpatient wards patient engagement use of control and restraint seclusion and capacity and consent35
In particular CQC highlighted a number of issues relating to the use of CTOs including concern about appropriate usage (30 of the patients in CQCrsquos sample did not have a reported history of non-compliance or disengagement with services after discharge) and over-representation of Black and minority ethnic groups CQC advised that research on the possible race equality impact of CTOs should be undertaken There were 6237 CTOs from their introduction in November 2008 to 31 March 2010 a much greater use of them than forecast for this period by the Department of Health before the power was introduced Just 31 of these orders had ended by end March 2010 suggesting that some people are being kept on supervised community treatment for long periods
Care Quality Commission Count me in census 2010 43
Conclusions continued
Data in the future Moving beyond a one-day census
Good information is the foundation of an effective healthcare system It is imperative for ensuring that services meet the needs of local populations and are equitable and that improvements are made where needed The availability of fit-for-purpose and comprehensive patient-level data sets with ethnicity and other key variables fully coded is therefore vitally important36 It enables the care provided to patients of all ethnic backgrounds to be monitored on an ongoing basis including for monitoring compliance with the Equality Act
Race Equality Action Plan A five-year review notes that better collection monitoring and use of ethnicity data to inform commissioning and provision in health and social care is required37 Key areas include good ethnic monitoring improving demographic information and ensuring good links between infomatics audit and equality and diversity leads within trusts in order to effectively use the information to inform service development monitoring and review at board management ward and community levels
The governmentrsquos proposed changes to the NHS will be supported by an information revolution aimed at improving and extending the information available to the NHS patients and the public on the quality and outcomes of NHS services including by equality dimensions38
Having information that is fit for purpose is vital for the effective regulation of mental health and learning disability services CQC uses routinely available data sets on an ongoing basis to assess the performance of health and social care organisations and their compliance with government policies and legislation We therefore expect those who commission and provide mental healthcare in the NHS and independent sector to have information systems that provide good quality data with fully
comprehensive recording and monitoring of ethnicity on an ongoing basis
Since 2005 the Count me in census has played a key role in providing information about the ethnicity and other characteristics of inpatients in mental health and learning disability services and on patients subject to the Mental Health Act It did this by providing a valuable one-day snapshot But ethnicity recording must be seen as an all-year round statutory requirement not a one-day annual event The number of inpatients throughout the year is much higher than the counts on one day and some patients will have more than one admission And there is a need to move on from counting patients to understanding more about care pathways for Black and minority ethnic patients and the factors leading to hospital admission and detention
We have consistently highlighted the need for commissioners and providers to make full use of the Mental Health Minimum Data Set (MHMDS) ndash the statutory data set submitted by providers of specialist mental health services in England It provides rich data on these issues and provides a robust information source for ongoing ethnic monitoring after this last census
Covering both community and hospital services ndash and now independent and third sector providers as well as NHS ndash it includes a wide range of information about individual patients the services provided to those admitted to hospital and to the much larger number who donrsquot need admission to hospital and the outcomes of care And because it includes year-round activity it is more representative of the overall picture of for example admission detention and readmission rates length of stay years in psychiatric care and contacts with services and professionals
We call on the Information Centre to routinely publish data on all admissions and uses of the Mental Health Act including CTOs in England (in both NHS and independent healthcare providers) by the ethnicity of
Care Quality Commission Count me in census 2010 44
Conclusions continued
patients making the MHMDS the definitive source of information about mental health and learning disability patients This data should be risk-adjusted for age gender and other variables as appropriate to enable reliable comparisons to be made across groups
It is important that all providers ndash NHS and independent ndash make strenuous efforts to improve the quality of the data they submit The Information Centre publishes reports on the quality of MHMDS data by provider (see wwwicnhsukservices mhmdsdq) and we urge providers to monitor this information and use it to improve their data quality
If GP consortia and local authorities are to be effective in their needs assessment and commissioning roles the Information Centre needs to make available and promote to them the data from the MHMDS and other sources And researchers and academics must make full use of the MHMDS to explore the factors that underlie the observed ethnic patterns
CQCrsquos role
In the meantime CQC will continue to focus strongly on the quality of care provided by mental health and learning disability services
People who find themselves admitted to mental health services or detained under the Mental Health Act and therefore counted by the Count me in census are among the most mentally unwell people in our society Our job is first and foremost to make sure that the care they receive meets the essential standards of quality and safety set out under the Health and Social Care Act 2008 and to work with providers to ensure this We act swiftly when we find services that do not Where we find systemic problems that organisations have not adequately addressed we may impose conditions on the providerrsquos registration to bring about the change needed to improve patientsrsquo experience of care
The essential standards of quality and safety include the requirement to provide single sex accommodation and we will continue to closely check that these standards are met by all mental health services
We intend to introduce a number of indicators derived from the rich information in the MHMDS into our quality and risk profiles for providers This will put greater emphasis on the experience of Black and minority ethnic patients in our regulatory activity
We will monitor the quality of MHMDS data submitted by providers (as reported by the NHS Information Centre) including independent service providers Those with poor data quality may be considered at higher risk in terms of their quality of care
In addition we will continue to monitor the progress of services in relation to the issues raised in the census and other reports including our report on the use of the Mental Health Act through our visits to services and meetings with patients by our Mental Health Act Commissioners and second opinion appointed doctors (SOADs) We will draw on patientsrsquo experiences to monitor the operation of the Mental Health Act
We will also assess the impact of advice and use of Local HealthWatch Local HealthWatch will be in a good position to make sure that providers and commissioners are held to account on matters of choice and access to services for people from Black and minority ethnic groups
Care Quality Commission Count me in census 2010 45
References
1 Department of Health Equity and excellence liberating the NHS 2010
2 Department of Health The NHS outcomes framework 201112 2010
3 Healthcare Commission Mental Health Act Commission National Institute for Mental Health in England Count me in results of a national census of inpatients in mental health hospitals and facilities in England and Wales 2005
4 Healthcare Commission Mental Health Act Commission National Institute for Mental Health in England Count me in results of the 2006 national census of inpatients in mental health and learning disability services in England and Wales 2006
5 Healthcare Commission Mental Health Act Commission National Institute for Mental Health in England Count me in results of the 2007 national census of inpatients in mental health and learning disability services in England and Wales 2007
6 Healthcare Commission Mental Health Act Commission National Institute for Mental Health in England Count me in results of the 2008 national census of inpatients in mental health and learning disability services in England and Wales 2008
7 Care Quality Commission National Mental Health Development Unit Results of the 2009 national census of inpatients and patients on supervised community treatment in mental health and learning disability services in England and Wales 2009
8 Department of Health Delivering race equality in mental health care an action plan for reform inside and outside services 2005
9 Welsh Assembly Government Adult Mental Health Services Raising the standard ndash Race Equality Action Plan for Adult Mental Health Services in Wales 2006
10Department of Health No health without mental health a cross-government mental health outcomes strategy for people of all ages 2011 wwwdhgovukprod_consum_dhgroups dh_digitalassetsdocumentsdigitalasset dh_124058pdf
11Department of Health New horizons towards a shared vision for mental health 2009 wwwdhgovukprod_consum_dhgroups dh_digitalassetsdhendocumentsdigital assetdh_109708pdf
12Department of Health Valuing people a new strategy for learning disability for the 21st century 2001
13Department of Health Valuing people now a new three year strategy for people with learning disabilities 2009
14Department of Health Healthcare for all report of the independent inquiry into access to healthcare for people with learning disabilities 2008
15Joint Committee on Human Rights A life like any other human rights of adults with learning disabilities (2008 HL Paper 401 HC 731) House of Lords House of Commons 2008
16Department of Health Valuing people now summary report March 2009 ndash September 2010 2010
17Disability Rights Commission Equal treatment investigation 2005
18Department of Health Mir G Nocon A Ahmad W Jones L Learning difficulties and ethnicity 2000
19ONS experimental population estimates by ethnic group 2007 wwwstatisticsgovukstatbase productaspvlnk=14238
Care Quality Commission Count me in census 2010 46
References continued
20Six percent of population are gay or lesbian according to Whitehall figures 2005 wwwtelegraphcouknewsmainjhtmlxml= news20051212ngay12xmlamps Sheet= news20051212ixhomehtml
21Department of Trade and Industry Amendment to Employment Equality (Sexual Orientation) Regulations 2003 2003
22Office for National Statistics Measuring sexual identity an evaluation report 2010
23 Information Centre Mental Health Bulletin Fourth report from Mental Health Minimum Dataset (MHMDS) annual returns 2010 2011 wwwicnhsukpubsmhbmhmds0910
24 Information Centre Mental Health Bulletin Fourth report from Mental Health Minimum Dataset (MHMDS) annual returns 2010 2011 wwwicnhsukpubsmhbmhmds0910
25The operating framework for the NHS in England 201112 Department of Health 2010 wwwdhgovukprod_consum_dhgroups dh_digitalassetsdhenpsdocuments digitalassetdh_122736pdf
26wwwdhgovukenPublicationsandstatistics LettersandcircularsProfessionalletters ChiefnursingofficerlettersDH_121848
27Department of Health No health without mental health a cross-government mental health outcomes strategy for people of all ages 2011 wwwdhgovukprod_consum_dhgroups dh_digitalassetsdocumentsdigitalasset dh_124058pdf
28Ministry of Justice Breaking the cycle effective punishment rehabilitation and sentencing of offenders 2010
29Department of Health The Bradley report Lord Bradleyrsquos review of people with mental health problems or learning disabilities in the criminal justice system 2009
30Department of Health No health without mental health delivering better mental health outcomes for people of all ages 2011
31Department of Health Equity and excellence liberating the NHS 2010 wwwdhgovukprod_ consum_dhgroupsdh_digitalassetsdhen psdocumentsdigitalassetdh_117794pdf
32Department of Health Healthy lives healthy people our strategy for public health in England 2010 wwwdhgovukprod_consum_dh groupsdh_digitalassetsdhenps documentsdigitalassetdh_122347pdf
33Department of Health A vision for adult social care capable communities and active citizens 2010 wwwdhgovukprod_consum_dh groupsdh_digitalassetsdhenps documentsdigitalassetdh_121971pdf
34Wilson M NMHDU Race equality action plan a five year review Delivering race equality in mental health care 2010 wwwnmhduorgukour-workmhep
35Care Quality Commission Monitoring the use of the Mental Health Act in 200910 2010
36Raleigh V S Collection of data on ethnic origin in England Editorial BMJ 20083376456
37Wilson M NMHDU Race equality action plan a five year review Delivering race equality in mental health care 2010 wwwnmhduorgukour-workmhep
38Department of Health Liberating the NHS an information revolution 2010
Care Quality Commission Count me in census 2010 47
Appendix A Methods of analysis
Standardisation by age and gender
Standardisation allows us to make comparisons between groups of the population by taking account of variations in age and gender Some differences in patterns of service use are related to the age or gender of the people using them so adjustments to the data have to be made to ensure that the interpretation of ethnic differences is reliable For example formal admissions are higher at a younger age so some Black and minority ethnic groups may have high formal admission rates simply because they have a high proportion of younger people Without adjustments for age and gender differences comparisons would be misleading
In this report most results are standardised for age and gender including those relating to admission detention source of referral care programme approach seclusion restraint accidents assault self-harm consent and presence on a secure ward The report uses the accepted statistical method of taking account of age and gender differences between groups when calculating these rates
We used the ONS estimates of total population by ethnic group for England and Wales in 2007 to standardise the rates of admission for different ethnic groups This takes account of the significant rises in the Black and ethnic minority population of England and Wales since the 2001 ONS census and hence gives more accurate and up to date estimates of admission ratios for different ethnic groups (although it does not take account of any further changes in the ethnic populations between 2007 and 2010 the date of this census) For comparison with the DRE baseline we also present admission rates from the 2005 census derived using the 2005 ONS estimates of populations by ethnic group These figures will not be the same as published in the 2005 census report which were based on the 2001 ONS census population estimates because updated estimates of populations by ethnic group were not available at that time
For other analyses we used the total number of inpatients and patients on CTOs in the census
as the basis for standardisation However CTO outpatients are excluded from selected analyses where appropriate namely the analysis of rates for admissions detentions on admission source of referral single sex accommodation and recorded incidents of seclusion restraint accidents assault and self-harm We used the statistical package STATA version 82 to derive the standardised results
It was not possible to adjust the analyses for ethnic differences in social and economic factors and in diagnosis and severity of illness Such factors could affect the ethnic differences observed in the results
For descriptive variables such as religion and language we did not use standardisation
Confidence intervals as indicators of significant statistical differences
For all standardised results the national rates for England and Wales are taken as 100 and the usual 95 confidence intervals are given Rates of less than 100 or greater than 100 for specific ethnic groups show a lower or higher rate respectively than the national average after adjusting for age and gender Whether or not the difference is statistically significant from the national average depends on the confidence interval If the confidence interval overlaps 100 the difference from the national average is not statistically significant If both values are lower or higher than 100 it indicates that the difference compared with the national average is statistically significant at the 95 level
For example if a rate is 110 with the lower confidence interval being 105 and the upper confidence interval being 115 it indicates that the 10 excess over the national average of 100 is statistically significant But if a ratio is 110 with the lower confidence interval being 95 and the upper confidence interval being 125 it indicates that the 10 excess over the national average is not statistically significant We did not attempt to adjust the confidence intervals for multiple comparisons
Care Quality Commission Count me in census 2010 48
Appendix B Mental health tables
Table B1 Standardised admission ratios by ethnic group for England and Wales (excluding outpatients on a CTO) using 2007 ONS census population denominators (England and Wales = 100) All ages
Ethnic group
Men Women Persons Standardised
admission ratio
95 confidence
interval Observed numbers
Standardised admission
ratio
95 confidence
interval Observed numbers
Standardised admission
ratio
95 confidence
interval Observed numbers
White British 88 86 89 12435 94 93 96 10157 91 89 92 22592 White Irish 130 115 146 274 122 106 140 215 126 115 138 489 Other White 117 109 126 731 129 118 141 533 122 115 129 1264 White and Black Caribbean 557 493 627 276 274 223 333 101 436 393 483 377 White and Black African 312 247 388 80 259 186 351 41 292 242 349 121 White and Asian 140 110 174 79 124 90 166 44 134 111 159 123 Other Mixed 230 189 278 108 213 165 270 67 223 192 259 175 Indian 67 59 75 286 66 56 76 172 66 60 73 458 Pakistani 105 93 119 269 65 53 79 96 91 81 100 365 Bangladeshi 123 102 147 120 82 60 109 46 108 92 126 166 Other Asian 161 139 185 192 136 107 169 79 153 135 172 271 Black Caribbean 538 505 572 980 306 277 336 418 438 415 462 1398 Black African 246 226 267 550 219 194 247 277 236 221 253 827 Other Black 792 691 903 222 314 240 403 61 596 529 670 283 Chinese 27 20 38 39 43 30 59 35 33 26 41 74 Other 140 120 162 177 110 88 136 87 128 113 145 264 Total 100 16818 100 12429 100 29247
Care Quality Commission Count me in census 2010 49
Appendix B Mental health tables continued
Table B2 Standardised admission ratios by ethnic group for England and Wales (excluding outpatients on a CTO) using 2007 ONS census population denominators (England amp Wales = 100) Ages 65 and over
Ethnic group
Men Women Persons Standardised
admission ratio
95 confidence
interval Observed numbers
Standardised admission
ratio
95 confidence
interval Observed numbers
Standardised admission
ratio
95 confidence
interval Observed numbers
White British 95 92 99 3265 95 92 98 3887 95 93 97 7152 White Irish 142 116 172 106 102 82 125 92 120 104 138 198 Other White 207 174 244 141 213 183 248 171 210 188 235 312 White and Black Caribbean 406 210 710 12 333 152 632 9 371 230 568 21 White and Black African 231 28 836 2 198 24 714 2 213 58 546 4 White and Asian 28 1 156 1 110 30 281 4 69 23 162 5 Other Mixed 146 40 374 4 228 92 470 7 189 95 339 11 Indian 97 70 132 41 83 57 116 33 90 71 113 74 Pakistani 39 17 77 8 46 18 94 7 42 23 69 15 Bangladeshi 115 53 218 9 69 14 201 3 98 51 172 12 Other Asian 234 143 361 20 215 120 354 15 225 157 313 35 Black Caribbean 216 170 269 77 310 253 376 103 261 224 302 180 Black African 142 73 248 12 365 241 531 27 246 175 337 39 Other Black 164 34 479 3 366 134 796 6 259 119 493 9 Chinese 41 8 120 3 95 38 195 7 68 33 125 10 Other 253 126 453 11 390 238 602 20 327 222 464 31 Total 100 3715 100 4393 100 8108
Care Quality Commission Count me in census 2010 50
Appendix B Mental health tables continued
Table B3 Standardised ratios by ethnic group for patients referred by a GP (England and Wales = 100)
Ethnic group
Men Women Persons Standardised
referral ratio
95 confidence
interval Observed numbers
Standardised referral ratio
95 confidence
interval Observed numbers
Standardised referral ratio
95 confidence
interval Observed numbers
White British 110 103 117 904 107 101 114 1065 108 104 113 1969 White Irish 85 50 134 18 93 57 144 20 89 63 123 38 Other White 74 51 103 33 70 49 97 36 72 56 91 69 White and Black Caribbean 27 5 78 3 30 4 109 2 28 9 65 5 White and Black African 0 0 74 9 268 2 35 4 125 2 White and Asian 165 54 386 5 0 0 86 28 201 5 Other Mixed 48 6 172 2 68 14 198 3 58 19 136 5 Indian 69 34 123 11 79 39 141 11 73 46 111 22 Pakistani 88 42 162 10 59 16 151 4 77 42 130 14 Bangladeshi 81 22 207 4 61 7 221 2 73 27 159 6 Other Asian 80 32 166 7 108 43 223 7 92 50 155 14 Black Caribbean 35 20 56 17 37 20 62 14 36 24 51 31 Black African 57 29 100 12 66 35 113 13 61 40 91 25 Other Black 62 23 135 6 40 5 144 2 54 23 107 8 Chinese 56 1 314 1 139 38 356 4 108 35 251 5 Other 106 46 208 8 0 0 53 23 105 8 Total 100 1041 100 1185 100 2226
Care Quality Commission Count me in census 2010 51
Appendix B Mental health tables continued
Table B4 Standardised ratios by ethnic group for patients referred by a community mental health team (including crisis resolution home treatment) or community learning disability team (England and Wales = 100)
Ethnic group
Men Women Persons Standardised
referral ratio
95 confidence
interval Observed numbers
Standardised referral ratio
95 confidence
interval Observed numbers
Standardised referral ratio
95 confidence
interval Observed numbers
White British 107 104 111 3255 103 100 107 3386 105 103 108 6641 White Irish 90 69 116 61 89 68 114 61 90 74 107 122 Other White 59 48 71 105 79 67 94 141 69 61 78 246 White and Black Caribbean 106 83 135 68 75 49 111 25 96 77 117 93 White and Black African 43 19 84 8 66 30 124 9 52 31 84 17 White and Asian 95 56 150 18 84 43 147 12 90 61 129 30 Other Mixed 78 48 121 20 72 41 118 16 76 53 105 36 Indian 106 83 132 76 100 76 130 56 103 86 122 132 Pakistani 108 84 135 73 89 60 128 30 102 83 123 103 Bangladeshi 98 66 141 29 90 50 148 15 95 69 128 44 Other Asian 88 63 120 40 105 70 150 29 94 73 119 69 Black Caribbean 69 59 80 167 85 71 102 123 75 67 84 290 Black African 84 70 102 112 82 65 103 77 84 72 96 189 Other Black 52 36 74 31 64 36 106 15 56 41 74 46 Chinese 112 53 205 10 101 52 176 12 105 66 160 22 Other 86 60 120 35 106 71 151 30 94 73 120 65 Total 100 4108 100 4037 100 8145
Care Quality Commission Count me in census 2010 52
Appendix B Mental health tables continued
Table B5 Standardised ratios by ethnic group for patients referred by criminal justice routes (police prison probation courts court liaison and diversion) (England and Wales = 100)
Ethnic group
Men Women Persons Standardised
referral ratio
95 confidence
interval Observed numbers
Standardised referral ratio
95 confidence
interval Observed numbers
Standardised referral ratio
95 confidence
interval Observed numbers
White British 90 86 95 1495 95 86 104 421 91 87 95 1916 White Irish 133 94 183 38 59 19 138 5 116 84 157 43 Other White 112 93 134 119 103 68 150 27 111 93 130 146 White and Black Caribbean 117 89 151 58 145 69 266 10 120 94 153 68 White and Black African 190 127 273 29 141 38 361 4 183 126 256 33 White and Asian 75 39 131 12 160 52 373 5 89 52 143 17 Other Mixed 104 65 157 22 151 61 311 7 112 75 161 29 Indian 86 61 118 38 79 32 163 7 85 62 113 45 Pakistani 118 91 150 65 89 33 194 6 115 90 145 71 Bangladeshi 74 44 115 19 29 1 162 1 68 42 105 20 Other Asian 130 95 174 45 164 71 323 8 134 101 176 53 Black Caribbean 131 114 150 208 124 81 181 26 130 114 148 234 Black African 132 112 156 145 143 93 211 25 134 114 156 170 Other Black 141 109 180 65 236 113 435 10 149 117 187 75 Chinese 83 27 194 5 146 30 426 3 99 43 195 8 Other 129 93 175 41 113 37 264 5 127 93 170 46 Total 100 2404 100 570 100 2974
Care Quality Commission Count me in census 2010 53
Appendix B Mental health tables continued
Table B6 Standardised detention ratios by ethnic group all detentions on day of admission (excluding outpatients on a CTO) (England and Wales = 100)
Ethnic group
Men Women Persons Standardised
detention ratio
95 confidence
interval Observed numbers
Standardised detention
ratio
95 confidence
interval Observed numbers
Standardised detention
ratio
95 confidence
interval Observed numbers
White British 94 92 97 6449 94 91 97 3628 94 92 96 10077 White Irish 112 95 131 154 118 96 145 94 114 101 129 248 Other White 108 98 118 451 120 106 136 251 112 104 120 702 White and Black Caribbean 123 107 141 220 129 99 167 59 124 110 140 279 White and Black African 128 99 162 68 113 70 173 21 124 100 153 89 White and Asian 96 71 126 50 109 68 164 22 99 78 125 72 Other Mixed 115 92 143 82 139 100 188 42 122 102 146 124 Indian 97 83 113 164 110 86 137 77 101 88 114 241 Pakistani 109 94 126 194 102 74 136 44 108 94 122 238 Bangladeshi 86 67 109 69 91 55 142 19 87 70 107 88 Other Asian 109 92 130 133 120 86 163 40 112 96 130 173 Black Caribbean 129 121 139 774 143 125 162 238 132 124 141 1012 Black African 115 104 127 422 131 111 153 159 119 110 129 581 Other Black 117 100 136 170 148 105 202 39 122 106 140 209 Chinese 108 71 159 26 129 78 202 19 116 85 156 45 Other 111 92 132 126 116 83 157 41 112 96 130 167 Total 100 9552 100 4793 100 14345
Care Quality Commission Count me in census 2010 54
Appendix B Mental health tables continued
Table B7 Standardised detention ratios by ethnic group detention on day of admission ndash section 2 of the Mental Health Act (England and Wales = 100)
Ethnic group
Men Women Persons Standardised
detention ratio
95 confidence
interval Observed numbers
Standardised detention
ratio
95 confidence
interval Observed numbers
Standardised detention
ratio
95 confidence
interval Observed numbers
White British 97 91 102 1156 93 87 98 1133 95 91 99 2289 White Irish 78 47 120 20 116 79 166 30 97 72 128 50 Other White 100 78 126 70 134 108 166 88 116 99 136 158 White and Black Caribbean 55 30 93 14 60 24 124 7 57 35 87 21 White and Black African 91 37 188 7 150 60 308 7 113 62 190 14 White and Asian 80 29 174 6 119 44 258 6 96 49 167 12 Other Mixed 68 28 141 7 116 53 221 9 89 51 145 16 Indian 130 91 179 37 124 81 182 26 127 98 163 63 Pakistani 126 87 176 34 138 79 225 16 130 96 171 50 Bangladeshi 166 101 256 20 140 61 276 8 158 105 228 28 Other Asian 142 93 209 26 163 93 264 16 150 108 202 42 Black Caribbean 73 57 92 70 97 72 128 51 82 68 98 121 Black African 164 131 202 87 190 146 244 62 174 147 204 149 Other Black 114 75 166 27 140 72 245 12 121 86 165 39 Chinese 165 60 358 6 212 97 402 9 190 106 313 15 Other 218 153 302 36 179 108 280 19 203 153 264 55 Total 100 1623 100 1499 100 3122
Care Quality Commission Count me in census 2010 55
Appendix B Mental health tables continued
Table B8 Standardised detention ratios by ethnic group detention on day of admission ndash section 3 of the Mental Health Act (England and Wales = 100)
Ethnic group
Men Women Persons Standardised
detention ratio
95 confidence
interval Observed numbers
Standardised detention
ratio
95 confidence
interval Observed numbers
Standardised detention
ratio
95 confidence
interval Observed numbers
White British 99 95 103 2684 96 91 100 1852 98 95 101 4536 White Irish 116 89 149 60 135 101 177 52 124 102 149 112 Other White 112 96 129 186 110 92 132 121 111 99 124 307 White and Black Caribbean 114 91 143 79 130 90 183 33 119 98 143 112 White and Black African 97 60 148 21 107 54 192 11 100 69 141 32 White and Asian 84 50 133 18 97 48 173 11 89 59 127 29 Other Mixed 121 84 168 35 117 72 181 20 120 90 156 55 Indian 96 75 122 67 110 79 148 42 101 83 122 109 Pakistani 91 71 115 69 88 55 134 22 90 73 111 91 Bangladeshi 63 39 95 22 64 28 127 8 63 43 90 30 Other Asian 90 65 120 44 94 56 149 18 91 70 117 62 Black Caribbean 116 102 130 279 164 138 192 148 129 117 142 427 Black African 95 80 112 143 102 79 129 68 97 85 111 211 Other Black 75 55 99 49 99 58 159 17 80 62 102 66 Chinese 119 59 213 11 99 43 194 8 110 66 171 19 Other 85 60 116 38 84 48 136 16 84 63 110 54 Total 100 3805 100 2447 100 6252
Care Quality Commission Count me in census 2010 56
Appendix B Mental health tables continued
Table B9 Standardised detention ratios by ethnic group detention on day of admission ndash section 3741 of the Mental Health Act (England and Wales = 100)
Ethnic group
Men Women Persons Standardised
detention ratio
95 confidence
interval Observed numbers
Standardised detention
ratio
95 confidence
interval Observed numbers
Standardised detention
ratio
95 confidence
interval Observed numbers
White British 84 79 89 991 101 88 115 220 86 82 91 1211 White Irish 140 96 198 32 48 6 175 2 126 87 176 34 Other White 112 89 139 81 156 95 241 20 118 96 144 101 White and Black Caribbean 177 133 232 53 179 66 390 6 178 135 229 59 White and Black African 149 82 251 14 224 46 654 3 159 92 254 17 White and Asian 141 75 241 13 195 40 569 3 149 85 241 16 Other Mixed 144 85 227 18 264 97 575 6 162 104 242 24 Indian 86 56 126 26 44 5 160 2 80 53 116 28 Pakistani 122 87 166 40 0 0 111 79 152 40 Bangladeshi 66 32 122 10 0 0 60 29 110 10 Other Asian 99 61 151 21 0 0 89 55 136 21 Black Caribbean 200 174 229 210 78 34 153 8 189 165 216 218 Black African 127 101 157 82 84 34 172 7 122 98 150 89 Other Black 152 110 205 43 94 11 341 2 148 108 198 45 Chinese 100 27 255 4 0 0 80 22 204 4 Other 118 75 177 23 44 1 245 1 110 71 164 24 Total 100 1661 100 280 100 1941
Care Quality Commission Count me in census 2010 57
Appendix B Mental health tables continued
Table B10 Standardised detention ratios by ethnic group detention on day of admission ndash sections 47 48 4749 of the Mental Health Act (England and Wales = 100)
Ethnic group
Men Women Persons Standardised
detention ratio
95 confidence
interval Observed numbers
Standardised detention
ratio
95 confidence
interval Observed numbers
Standardised detention
ratio
95 confidence
interval Observed numbers
White British 97 90 106 583 104 81 131 73 98 91 106 656 White Irish 132 72 221 14 163 20 590 2 135 77 219 16 Other White 130 96 172 49 71 15 206 3 124 93 163 52 White and Black Caribbean 126 78 193 21 80 2 444 1 123 77 186 22 White and Black African 207 103 370 11 0 0 189 95 339 11 White and Asian 57 12 166 3 169 4 941 1 68 19 175 4 Other Mixed 112 48 221 8 233 28 843 2 125 60 230 10 Indian 57 26 108 9 0 252 0 52 24 99 9 Pakistani 92 54 147 17 0 314 0 86 50 138 17 Bangladeshi 46 12 117 4 167 4 930 1 53 17 125 5 Other Asian 101 52 177 12 0 0 95 49 166 12 Black Caribbean 126 98 159 70 125 34 319 4 126 99 158 74 Black African 74 48 107 27 104 21 303 3 76 51 108 30 Other Black 127 78 197 20 138 3 769 1 128 79 195 21 Chinese 0 0 0 0 0 0 Other 83 38 157 9 0 0 77 35 147 9 Total 100 857 100 91 100 948
Care Quality Commission Count me in census 2010 58
Appendix B Mental health tables continued
Table B11 Standardised ratios for all applications of the Mental Health Act (including outpatients on a CTO) by ethnic group on day of census (England and Wales = 100)
Ethnic group
Men Women Persons Standardised
ratio for all MHA
applications
95 confidence
interval Observed numbers
Standardised ratio for all MHA
applications
95 confidence
interval Observed numbers
Standardised ratio for all MHA
applications
95 confidence
interval Observed numbers
White British 97 94 99 7659 95 93 98 4335 96 94 98 11994 White Irish 99 83 116 147 104 84 128 95 101 89 114 242 Other White 87 79 95 427 97 85 110 249 90 84 97 676 White and Black Caribbean 117 103 133 245 130 103 163 76 120 107 134 321 White and Black African 120 95 150 79 93 58 141 22 113 92 137 101 White and Asian 101 78 128 65 119 81 169 31 106 86 129 96 Other Mixed 110 89 134 96 125 93 165 49 114 97 135 145 Indian 103 90 118 215 122 100 147 109 109 97 121 324 Pakistani 111 97 125 254 117 90 148 67 112 100 125 321 Bangladeshi 92 75 112 97 101 68 145 29 94 78 112 126 Other Asian 103 88 121 152 126 95 164 56 109 94 124 208 Black Caribbean 123 115 131 893 141 126 158 300 127 120 134 1193 Black African 112 103 122 511 121 104 140 188 114 106 123 699 Other Black 116 102 132 232 148 112 191 59 122 108 136 291 Chinese 97 64 140 27 101 61 157 19 98 72 131 46 Other 104 87 122 140 103 75 137 46 103 89 119 186 Total 100 11239 100 5730 100 16969
Care Quality Commission Count me in census 2010 59
Appendix B Mental health tables continued
Table B12 Standardised CTO ratios by ethnic group CTOs on day of census ndash section 17a of the Mental Health Act (England and Wales = 100)
Ethnic group
Men Women Persons
Standardised CTO ratio
95 confidence
interval Observed numbers
Standardised CTO ratio
95 confidence
interval Observed numbers
Standardised CTO ratio
95 confidence
interval Observed numbers
White British 94 89 99 1289 88 82 94 730 92 88 96 2019 White Irish 51 27 88 13 77 41 132 13 62 40 90 26 Other White 97 77 120 83 125 95 162 58 107 90 126 141 White and Black Caribbean 79 53 113 29 141 77 237 14 92 67 124 43 White and Black African 111 59 190 13 125 41 292 5 115 68 181 18 White and Asian 104 54 182 12 136 50 297 6 113 67 178 18 Other Mixed 102 59 166 16 136 62 257 9 112 73 166 25 Indian 134 99 177 48 152 98 226 24 139 109 175 72 Pakistani 145 110 187 59 174 101 279 17 151 119 189 76 Bangladeshi 142 93 206 27 205 99 378 10 155 109 213 37 Other Asian 107 71 155 28 182 99 305 14 124 89 168 42 Black Caribbean 121 103 142 152 171 132 218 65 133 116 152 217 Black African 116 94 142 94 139 98 192 37 122 102 145 131 Other Black 186 144 238 65 305 189 466 21 206 165 254 86 Chinese 83 23 213 4 152 49 354 5 111 51 211 9 Other 87 54 134 21 152 79 266 12 103 71 145 33 Total 100 1953 100 1040 100 2993
Care Quality Commission Count me in census 2010 60
Appendix C Learning disability tables
Table C1 Standardised admission ratios by ethnic group for England and Wales using 2007 ONS population denominators (England amp Wales = 100) All ages
Ethnic group
Men Women Persons Standardised
admission ratio
95 confidence
interval Observed numbers
Standardised admission
ratio
95 confidence
interval Observed numbers
Standardised admission
ratio
95 confidence
interval Observed numbers
White British 104 100 109 2163 108 101 115 941 105 102 109 3104 White Irish 108 72 156 28 151 89 238 18 121 89 162 46 Other White 81 65 101 85 49 30 75 21 72 59 87 106 White and Black Caribbean 280 186 405 28 246 118 453 10 270 191 371 38 White and Black African 102 33 239 5 165 34 482 3 119 51 235 8 White and Asian 66 26 135 7 154 56 335 6 89 47 152 13 Other Mixed 181 104 295 16 229 99 451 8 195 125 290 24 Indian 32 21 48 24 28 12 55 8 31 21 44 32 Pakistani 48 30 72 22 12 1 43 2 38 25 57 24 Bangladeshi 102 60 161 18 31 4 113 2 83 51 128 20 Other Asian 33 13 69 7 92 34 201 6 47 25 81 13 Black Caribbean 265 210 332 77 117 67 190 16 218 176 267 93 Black African 53 33 80 22 40 15 87 6 50 33 72 28 Other Black 228 118 399 12 134 28 392 3 200 112 330 15 Chinese 4 0 21 1 3 0 16 1 Other 26 9 56 6 11 0 59 1 21 9 44 7 Total 100 2521 100 1051 100 3572
Care Quality Commission Count me in census 2010 61
Appendix C Learning disability tables continued
Table C2 Standardised detention ratios by ethnic group all detentions on day of admission (England and Wales = 100)
Ethnic group
Persons Standardised
detention ratio
95 confidence
interval Observed numbers
White British 97 93 103 1431 White Irish 127 84 184 28 Other White 117 91 149 68 White and Black Caribbean 120 77 179 24 White and Black African 114 37 267 5 White and Asian 75 24 176 5 Other Mixed 94 49 165 12 Indian 119 72 186 19 Pakistani 110 61 181 15 Bangladeshi 144 84 231 17 Other Asian 59 16 150 4 Black Caribbean 119 90 155 57 Black African 138 85 210 21 Other Black 62 20 145 5 Chinese 0 0 Other 104 28 267 4 Total 100 1715
Care Quality Commission Count me in census 2010 62
copy Care Quality Commission and National Mental Health Development Unit 2011 Published April 2011
This publication may be reproduced in whole or in part in any format or medium for non-commercial purposes provided that it is reproduced accurately and not used in a derogatory manner or in a misleading context The source should be acknowledged by showing the publication title and copy Care Quality Commission and National Mental Health Development Unit 2011
How to contact us
Phone 03000 616161 Email enquiriescqcorguk Web wwwcqcorguk
Write to us at Care Quality Commission National Correspondence Citygate Gallowgate Newcastle upon Tyne NE1 4PA
Please contact us if you would like a summary of this publication in other formats or languages
Registered office Care Quality Commission Finsbury Tower 103ndash105 Bunhill Row London EC1Y 8TG
- Count me in 2010
- About the Care Quality Commission
- Contents
- Summary
- National organisations coordinating the census
- Introduction
- Data methods of analysis and interpretation
- Results mental health
- A comparison between the 2005 baseline and the 2010 census
- Results learning disabilities
- Data in the future Moving beyond a one-day census
- Conclusions
- References
- Appendix A Methods of analysis
- Appendix B Mental health tables
- Appendix C Learning disability tables
- How to contact us
-
Results learning disabilities continued
patients in 25 of the 129 organisations that took part in the census Seventy-four organisations had fewer than 10 patients from Black and minority ethnic groups each and another 42 organisations had no inpatients at all from these groups
However it is important to note that the number of people with severe and profound learning disabilities in some areas is affected by past funding and placement practices especially the presence of old long stay hospitals and of people placed outside their original area of residence by funding authorities
Reporting of ethnicity
About half (56) of patients reported their own ethnic group Staff reported the ethnic group for 17 of patients and relatives for 21 This means that ethnicity could have been misreported for some patients We do not know how ethnicity was assessed for 6 of patients
Age and gender
Two per cent (59) of patients were under 18 years old The number of young inpatients from minority ethnic groups was low or zero in several ethnic minority groups
Overall 73 of patients were under 50 years old and 27 were aged 50 or over The proportion of patients under 50 was higher among patients from Black and minority ethnic groups (88) than among the White British group (71) This is not surprising given that minority ethnic populations are generally younger than the White population
Seventy per cent of patients in learning disability services were men whereas in mental health services 58 of patients were men
Language and religion
Eight per cent of patients reported that their first language was not English Non-verbal communication was the most often selected language after English accounting for 4 of patients Two per cent (84) of patients most of whom were from the White British group said they needed an interpreter
Religion was not stated for 22 of patients and 15 of patients said they had no religion South Asians (Indians Bangladeshis and Pakistanis) were mostly Muslim Hindu or Sikh and those from the White Black Caribbean and Black African groups were mostly Christian
Sexual orientation
Overall the result was not known for almost half (49) of patients 45 said they were heterosexual 2 said gaylesbian 3 said bisexual and 1 said ldquootherrdquo The numbers of patients from minority ethnic groups were too low for meaningful analysis
Disability
Of all inpatients in learning disability services
bull 4 were reported as having no disabilities
bull 44 had a learning disability only
bull 51 had multiple disabilities
The patterns among minority ethnic groups were similar in that most patients had either a learning disability or multiple disabilities
Care Quality Commission Count me in census 2010 36
Results learning disabilities continued
Rates of admission
The rates of admission based on ONS estimates of the general population in 2007 are given in Appendix C Table C1
Admission rates were lower than average among several minority ethnic groups Other White Indian Pakistani Other Asian Black African Chinese and Other Rates were two to three times higher than average among the WhiteBlack Caribbean Mixed Black Caribbean Other Black and Other Mixed groups The lower rates among the South Asian and Chinese groups and the higher rates among some Black groups are similar to patterns for inpatients in mental health establishments
These patterns of admission are similar to those we reported in previous census reports
Source of referral
As we reported in the section on mental health patients data about sources of referral must be interpreted with care as we do not always know the original referral source Furthermore in the case of inpatients with learning disabilities this information was invalid missing or unknown for 12 of patients
Because of the small numbers of patients in most minority ethnic groups we observed few ethnic differences in sources of referral
Detention under the Mental Health Act 1983 (on day of admission and on day of census)
The Mental Health Act 2007 made a number of changes to the Mental Health Act 1983 one of which was supervised community treatment (section 17A) These are reflected in the 2010 census
All detentions Of all the patients in learning disability services 48 were detained under the Mental Health Act on admission Rates of detention on the day of admission by ethnic group are in Appendix C Table C2 and no ethnic differences were observed As the number of detained patients from each minority ethnic group was low we did not undertake further analysis for individual sections of the Act
Rates of detention on census day also showed no ethnic differences with the exception of a lower than average rate for the Other White group
Consent
About 66 of informally admitted inpatients were deemed incapable of consenting to treatment which is a similar proportion to that reported previously
Among detained patients 38 were deemed incapable of consenting to treatment and 6 were deemed capable of consenting to treatment but refused
The numbers of patients from minority ethnic groups were too low for comment There were no or very few such patients among minority ethnic groups
Care Quality Commission Count me in census 2010 37
Results learning disabilities continued
Care programme approach
Details of the Care Programme Approach (CPA) are given on page 24
We found that 73 of all patients were on a CPA 2 on a single assessment process (SAP) and 25 on neither No ethnic differences were observed
Recorded incidents
The 2010 census asked about the number of times that patients experienced seclusion hands-on restraint self-harm accident and physical assault in a patientrsquos current hospital spell or if the patientrsquos hospital spell was longer than three months the number that took place within the last three months As in previous years we observed very few ethnic differences
Seclusion Five per cent of patients had experienced one or more episodes of seclusion The only ethnic differences observed were the higher than average rates among the White Irish and Other White groups but these were based on small numbers of patients
Physical assault on the patient The definition of assault includes incidents of physical assault on the patient irrespective of who committed the assault but we do not have information on who committed the assault About 28 of patients had been involved in one or more episodes of physical assault No ethnic differences were observed
Hands-on restraint self-harm accidents Thirty per cent of inpatients had experienced one or more episodes of hands-on restraint 22 had attempted to harm themselves and 24 had suffered an accident The numbers were very low in minority ethnic groups and we did not observe any ethnic differences except for a lower than average rate for self-harm among the Black Caribbean group but this was based on very few patients
Duration of stay in hospital
We analysed the length of the period between each patientrsquos admission to hospital and the census day This period is of course shorter than a patientrsquos full length of stay in hospital which runs from admission to the date when they are discharged
bull 10 of inpatients had been in hospital for one month or less
bull 6 had been in hospital between one and three months
bull 7 had been in hospital between three and six months
bull 10 had been in hospital between six months and one year
bull 14 had been in hospital between one and two years
bull 22 had been in hospital between two and five years
bull 31 had been in hospital for over five years
The patterns are very similar to those in previous censuses About 67 of patients in the 2010 census had been in hospital for more than a year and were therefore also included in the 2009 census In addition over half (53) of patients had been in hospital for more than two years and will have been included in both the 2008 and 2009 censuses A third of patients will have been included in each census since 2006
We also calculated the median length of stay (see page 26 for the definition of median) Overall the median amount of time that women had spent in hospital was about 31 months and the median for men was about 27 months This compares with a median for mental health patients of 25 months for women and 58 months for men It is not possible to reliably compare length of stay by ethnic group because of the small numbers of patients among several minority ethnic groups
Care Quality Commission Count me in census 2010 38
Results learning disabilities continued
Ward security
About 12 of all inpatients were on a medium or high secure ward as opposed to a general (54) or low secure (34) ward
As in the three previous years rates of patients on medium or high secure wards were about double the average among the White Irish and Other White groups Most other minority ethnic groups had very few patients on medium or high secure wards
Age range on wards
There were five patients under 18 years of age being cared for on wards for working-age adults and none were on wards for older people About 5 of patients on wards for working-age adults were aged 65 or over and there were very few patients (23) on wards for older people There were very few lsquoout of agersquo placements among minority ethnic groups
Patients in wards designated as single sex or mixed
We asked providers whether the patient was on a ward designated as men or women only or mixed gender Overall 47 of men and 69 of women were not in a ward designated for single sex use The numbers of such patients among minority ethnic groups were very low
Two further questions examined the single sex facilities that were available to patients Again due to the small numbers we do not present results by ethnicity for these questions
Patientsrsquo access to toilet and bathing facilities designated for single sex use
Overall 19 (497) of men and 27 (295) of women were reported as not having access to toilet and bathing facilities designated for single sex use
Patientsrsquo access to a lounge area day space designated for single sex use
Overall 32 (829) of men and 44 (470) of women were reported as not having access to a lounge area day space designated for single sex use
Patients subject to deprivation of liberty safeguards
For details of deprivation of liberty safeguards please see page 31
The 2010 census introduced a new question ldquoIs the patient subject to deprivation of liberty authorisation on 31 March 2010rdquo Two per cent (74) patients were reported as being subject to a deprivation of liberty order on census day but very few of these patients (15) were from minority ethnic groups
See footnote on single sex accommodation on page 27
Care Quality Commission Count me in census 2010 39
Data in the future Moving beyond a one-day census
For six years the Count me in census has provided a valuable one-day snapshot of inpatients in mental health and learning disability services And with the proportion of inpatients who are detained increasing steadily (from 25 in 200506 to 39 in 200910 ndash see Figure 2) ongoing ethnic monitoring of admissions and detentions becomes more vital than ever
However a one-day census only captures some events and the profile of patients can differ across a whole year For example there were
bull 29840 inpatients in the 2010 census compared with 107765 inpatients overall during 200910
bull 17299 patients in the 2010 census who were detained or on CTOs compared with 42479 new detentions and some 4100 new CTOs overall in England in 200910
bull 26 of patients in hospital for under one month and 31 for over one year per the census
whereas the MHMDS data consistently shows that for over 50 of records the average length of an inpatient stay was under one month and for 4 it was over one year
Looking ahead it is vital that robust data is available on all admitted patients and all those subject to the Mental Health Act not just those in hospital on one particular day Moreover patterns of use and outcomes of community care can have an impact on the need for admission to hospital and the risk of detention ndash therefore information about the care provided to patients before admission to hospital during their hospital stay and after they leave is also vital Furthermore under 84 of the 127 million people using specialist mental health services are admitted to hospital23 and so it is very important to examine the quality of community care for the 90 of patients who are not admitted to hospital
Figure 2 Number of people spending time in hospital 200506 to 200910
Num
ber
of p
atie
nts
90000
80000
70000
60000
50000
40000
30000
20000
10000
0 200506 200607 200708 200809 200910
Source NHS Information Centre Formally detained Not detained MHMDS Bulletin 2011
Care Quality Commission Count me in census 2010 40
Data in the future Moving beyond a one-day census continued
The Mental Health Minimum Data Set (MHMDS) is a rich source of data on people using specialist mental health services in England It covers both community and hospital services and includes a wide range of information about the demographic clinical and socioeconomic characteristics of individual patients and the services provided to those admitted to hospital and to the much larger number of those who donrsquot need a stay in hospital The data includes information about contact with services uses of the Mental Health Act and the Care Programme Approach for each individual patient All these details enable the use of services patterns of care and patient outcomes to be tracked including along pathways of care The MHMDS therefore provides a robust basis for ongoing monitoring of access to and outcomes of care for users of specialist ndash both community and hospital ndash mental health services
The MHMDS also enables an analysis of the numbers and rates of people from different ethnic groups using specialist mental health services overall (both inpatient and community) which provides an indication of the levels of mental illness and therefore the need for specialist care in different communities
At present the MHMDS does not cover high secure services and independent sector providers only started to provide data during 201011 However to support payment by results for mental health the scope of the data set will be extended to cover high secure services during 201112 (version 4 MHMDS) Further proposed changes to the dataset (version 41) will incorporate NHS-funded learning disability services and primary care mental health services A separate dataset for child and adolescent mental health services (CAMHS) has been developed and is awaiting formal approvals It is designed to include the same information about uses of the Mental Health Act as provided in the MHMDS
The latest MHMDS bulletin for 200910 provides a description of people using specialist mental health services in England including ethnic profiles of people using services hospital admissions detentions and the number of people on CPA24 It also provides information on differences by age and gender The bulletin illustrates some of the sorts of analyses that are possible using data from the MHMDS
The NHS Information Centre can provide guidance on these and other potential analyses based on MHMDS data
Care Quality Commission Count me in census 2010 41
Conclusions
While this report reviews changes in the census results since 2005 it is not a review or evaluation of the DRE programme overall Similarly the census cannot provide explanations for the patterns observed or examine whether mental health services are meeting the needs of individual ethnic minority groups As we have noted previously the results are subject to caveats in particular that the census provides a one-day snapshot that may not be representative of patients admitted to hospital throughout the year
Overview of findings
Overall the findings from the 2010 census show little change from those reported for previous annual censuses conducted since 2005 This is partly because many patients had been in hospital for a considerable period of time and had therefore been included in successive censuses The findings of this sixth and last census continue to show differences between Black and minority ethnic groups and White groups and also differences within these groups
In particular ethnic differences in rates of admission detention under the Mental Health Act and seclusion ndash three of DRErsquos 12 goals ndash have not altered materially since the inception of DRE in 2005
bull Admission rates remain higher than average among minority ethnic groups especially among Black and WhiteBlack Mixed groups for whom rates were two or more times higher than average in 2010 The Other Black group continues to have the highest admission rate ndash six times higher than average ndash although this is lower than in 2005 In contrast admission rates have consistently been lower than average among the Indian and Chinese groups and about average in the Pakistani and Bangladeshi groups
bull Detention rates remain higher than average among the Black and WhiteBlack Caribbean Mixed groups and among the Other White group A consistent pattern across all censuses was the higher than average detention rate
under section 3741 for the Black Caribbean and Other Black groups We also found that rates for being placed on a CTO were higher among the South Asian and Black groups
bull Although there have been annual fluctuations in seclusion rates they have been higher than average for the Black WhiteBlack Mixed and Other White groups in at least three of the six censuses
Overall the level of provision of single sex areas for patients continues to be unsatisfactory although there was no evidence that minority ethnic patients were disadvantaged in these respects Government policy for the NHS in England now requires that all providers of NHS-funded care including mental health trusts are expected to eliminate mixed-sex accommodation in accordance with the guidance set out in CNO201032526 From 2011 all providers of NHS-funded care must report breaches of sleeping accommodation which will attract sanctions
Implications for ways forward
The census findings do not in themselves show that mental health and learning disability services are failing to meet the needs of Black and minority ethnic service users
As noted in previous reports they need to be interpreted in the context of available evidence on ethnic differences in rates of mental illness pathways to care and factors such as socioeconomic disadvantages that all contribute to these differences Our previous reports have consistently highlighted the need for prevention early intervention and working collaboratively across sectors to reduce the risk of admission and detention where possible without compromising the care given to patients Mental health services have a key role to play but to achieve this all statutory agencies and organisations outside the healthcare sector Black and minority ethnic communities and people who use services themselves will need to work in partnership
Care Quality Commission Count me in census 2010 42
Conclusions continued
This message ndash about preventing mental ill-health by addressing the contributory factors and intervening early ndash is at the heart of No health without mental health the Department of Healthrsquos new strategy for the future of mental health care in England27
The strategy aims to tackle the economic social and environmental determinants and consequences of mental health problems and to improve outcomes and reduce inequalities
It specifies that by 2014 people in contact with the criminal justice system will have improved access to mental health services as set out in the Ministry of Justice Green Paper Breaking the Cycle Effective punishment rehabilitation and sentencing of offenders which confirms the approach outlined in Lord Bradleyrsquos report for early intervention and diversion from custody2829
Accompanying the new strategy is a supporting document that explains how its objectives will improve mental health outcomes the effective interventions and the underpinning evidence base30
The strategy is complemented by other government proposals for reforms in the NHS public health and adult social care as outlined in the NHS White Paper Equity and excellence liberating the NHS31 the public health strategy Healthy lives healthy people32 and the adult social care strategy A vision for adult social care capable communities and active citizens 33 Three outcomes frameworks have been developed alongside these strategies improving mental health outcomes and reducing inequalities is integral to them all
In this new healthcare landscape the proposed NHS Commissioning Board and GP consortia will have a statutory obligation to promote equality and reduce inequalities in healthcare (something also enshrined in the Equality Act 2010) As the lead commissioners of healthcare services it will be up to GP consortia to assess with local authorities the needs of their local populations and commission the right services that meet their requirements
And the strengthened public health role of local authorities offers significant potential for addressing the socioeconomic disadvantages faced by Black and minority ethnic communities which add to the burden of mental illness in these communities
Race Equality Action Plan A five-year review looked back at the work of the DRE action plan and describes some of the key challenges successes and learning34 Based on the experience and outcome of the DRE programme the report suggests ways forward for the next stage of mental health strategy development and implementation
Since April 2009 CQC has had a duty under the Mental Health Act 1983 to monitor how services exercise their powers in relation to patients who are detained in hospital or subject to CTOs or guardianship under the Act In its first annual report on the use of the Act CQC recommends a number of areas where improvements are needed for example over-occupancy on inpatient wards patient engagement use of control and restraint seclusion and capacity and consent35
In particular CQC highlighted a number of issues relating to the use of CTOs including concern about appropriate usage (30 of the patients in CQCrsquos sample did not have a reported history of non-compliance or disengagement with services after discharge) and over-representation of Black and minority ethnic groups CQC advised that research on the possible race equality impact of CTOs should be undertaken There were 6237 CTOs from their introduction in November 2008 to 31 March 2010 a much greater use of them than forecast for this period by the Department of Health before the power was introduced Just 31 of these orders had ended by end March 2010 suggesting that some people are being kept on supervised community treatment for long periods
Care Quality Commission Count me in census 2010 43
Conclusions continued
Data in the future Moving beyond a one-day census
Good information is the foundation of an effective healthcare system It is imperative for ensuring that services meet the needs of local populations and are equitable and that improvements are made where needed The availability of fit-for-purpose and comprehensive patient-level data sets with ethnicity and other key variables fully coded is therefore vitally important36 It enables the care provided to patients of all ethnic backgrounds to be monitored on an ongoing basis including for monitoring compliance with the Equality Act
Race Equality Action Plan A five-year review notes that better collection monitoring and use of ethnicity data to inform commissioning and provision in health and social care is required37 Key areas include good ethnic monitoring improving demographic information and ensuring good links between infomatics audit and equality and diversity leads within trusts in order to effectively use the information to inform service development monitoring and review at board management ward and community levels
The governmentrsquos proposed changes to the NHS will be supported by an information revolution aimed at improving and extending the information available to the NHS patients and the public on the quality and outcomes of NHS services including by equality dimensions38
Having information that is fit for purpose is vital for the effective regulation of mental health and learning disability services CQC uses routinely available data sets on an ongoing basis to assess the performance of health and social care organisations and their compliance with government policies and legislation We therefore expect those who commission and provide mental healthcare in the NHS and independent sector to have information systems that provide good quality data with fully
comprehensive recording and monitoring of ethnicity on an ongoing basis
Since 2005 the Count me in census has played a key role in providing information about the ethnicity and other characteristics of inpatients in mental health and learning disability services and on patients subject to the Mental Health Act It did this by providing a valuable one-day snapshot But ethnicity recording must be seen as an all-year round statutory requirement not a one-day annual event The number of inpatients throughout the year is much higher than the counts on one day and some patients will have more than one admission And there is a need to move on from counting patients to understanding more about care pathways for Black and minority ethnic patients and the factors leading to hospital admission and detention
We have consistently highlighted the need for commissioners and providers to make full use of the Mental Health Minimum Data Set (MHMDS) ndash the statutory data set submitted by providers of specialist mental health services in England It provides rich data on these issues and provides a robust information source for ongoing ethnic monitoring after this last census
Covering both community and hospital services ndash and now independent and third sector providers as well as NHS ndash it includes a wide range of information about individual patients the services provided to those admitted to hospital and to the much larger number who donrsquot need admission to hospital and the outcomes of care And because it includes year-round activity it is more representative of the overall picture of for example admission detention and readmission rates length of stay years in psychiatric care and contacts with services and professionals
We call on the Information Centre to routinely publish data on all admissions and uses of the Mental Health Act including CTOs in England (in both NHS and independent healthcare providers) by the ethnicity of
Care Quality Commission Count me in census 2010 44
Conclusions continued
patients making the MHMDS the definitive source of information about mental health and learning disability patients This data should be risk-adjusted for age gender and other variables as appropriate to enable reliable comparisons to be made across groups
It is important that all providers ndash NHS and independent ndash make strenuous efforts to improve the quality of the data they submit The Information Centre publishes reports on the quality of MHMDS data by provider (see wwwicnhsukservices mhmdsdq) and we urge providers to monitor this information and use it to improve their data quality
If GP consortia and local authorities are to be effective in their needs assessment and commissioning roles the Information Centre needs to make available and promote to them the data from the MHMDS and other sources And researchers and academics must make full use of the MHMDS to explore the factors that underlie the observed ethnic patterns
CQCrsquos role
In the meantime CQC will continue to focus strongly on the quality of care provided by mental health and learning disability services
People who find themselves admitted to mental health services or detained under the Mental Health Act and therefore counted by the Count me in census are among the most mentally unwell people in our society Our job is first and foremost to make sure that the care they receive meets the essential standards of quality and safety set out under the Health and Social Care Act 2008 and to work with providers to ensure this We act swiftly when we find services that do not Where we find systemic problems that organisations have not adequately addressed we may impose conditions on the providerrsquos registration to bring about the change needed to improve patientsrsquo experience of care
The essential standards of quality and safety include the requirement to provide single sex accommodation and we will continue to closely check that these standards are met by all mental health services
We intend to introduce a number of indicators derived from the rich information in the MHMDS into our quality and risk profiles for providers This will put greater emphasis on the experience of Black and minority ethnic patients in our regulatory activity
We will monitor the quality of MHMDS data submitted by providers (as reported by the NHS Information Centre) including independent service providers Those with poor data quality may be considered at higher risk in terms of their quality of care
In addition we will continue to monitor the progress of services in relation to the issues raised in the census and other reports including our report on the use of the Mental Health Act through our visits to services and meetings with patients by our Mental Health Act Commissioners and second opinion appointed doctors (SOADs) We will draw on patientsrsquo experiences to monitor the operation of the Mental Health Act
We will also assess the impact of advice and use of Local HealthWatch Local HealthWatch will be in a good position to make sure that providers and commissioners are held to account on matters of choice and access to services for people from Black and minority ethnic groups
Care Quality Commission Count me in census 2010 45
References
1 Department of Health Equity and excellence liberating the NHS 2010
2 Department of Health The NHS outcomes framework 201112 2010
3 Healthcare Commission Mental Health Act Commission National Institute for Mental Health in England Count me in results of a national census of inpatients in mental health hospitals and facilities in England and Wales 2005
4 Healthcare Commission Mental Health Act Commission National Institute for Mental Health in England Count me in results of the 2006 national census of inpatients in mental health and learning disability services in England and Wales 2006
5 Healthcare Commission Mental Health Act Commission National Institute for Mental Health in England Count me in results of the 2007 national census of inpatients in mental health and learning disability services in England and Wales 2007
6 Healthcare Commission Mental Health Act Commission National Institute for Mental Health in England Count me in results of the 2008 national census of inpatients in mental health and learning disability services in England and Wales 2008
7 Care Quality Commission National Mental Health Development Unit Results of the 2009 national census of inpatients and patients on supervised community treatment in mental health and learning disability services in England and Wales 2009
8 Department of Health Delivering race equality in mental health care an action plan for reform inside and outside services 2005
9 Welsh Assembly Government Adult Mental Health Services Raising the standard ndash Race Equality Action Plan for Adult Mental Health Services in Wales 2006
10Department of Health No health without mental health a cross-government mental health outcomes strategy for people of all ages 2011 wwwdhgovukprod_consum_dhgroups dh_digitalassetsdocumentsdigitalasset dh_124058pdf
11Department of Health New horizons towards a shared vision for mental health 2009 wwwdhgovukprod_consum_dhgroups dh_digitalassetsdhendocumentsdigital assetdh_109708pdf
12Department of Health Valuing people a new strategy for learning disability for the 21st century 2001
13Department of Health Valuing people now a new three year strategy for people with learning disabilities 2009
14Department of Health Healthcare for all report of the independent inquiry into access to healthcare for people with learning disabilities 2008
15Joint Committee on Human Rights A life like any other human rights of adults with learning disabilities (2008 HL Paper 401 HC 731) House of Lords House of Commons 2008
16Department of Health Valuing people now summary report March 2009 ndash September 2010 2010
17Disability Rights Commission Equal treatment investigation 2005
18Department of Health Mir G Nocon A Ahmad W Jones L Learning difficulties and ethnicity 2000
19ONS experimental population estimates by ethnic group 2007 wwwstatisticsgovukstatbase productaspvlnk=14238
Care Quality Commission Count me in census 2010 46
References continued
20Six percent of population are gay or lesbian according to Whitehall figures 2005 wwwtelegraphcouknewsmainjhtmlxml= news20051212ngay12xmlamps Sheet= news20051212ixhomehtml
21Department of Trade and Industry Amendment to Employment Equality (Sexual Orientation) Regulations 2003 2003
22Office for National Statistics Measuring sexual identity an evaluation report 2010
23 Information Centre Mental Health Bulletin Fourth report from Mental Health Minimum Dataset (MHMDS) annual returns 2010 2011 wwwicnhsukpubsmhbmhmds0910
24 Information Centre Mental Health Bulletin Fourth report from Mental Health Minimum Dataset (MHMDS) annual returns 2010 2011 wwwicnhsukpubsmhbmhmds0910
25The operating framework for the NHS in England 201112 Department of Health 2010 wwwdhgovukprod_consum_dhgroups dh_digitalassetsdhenpsdocuments digitalassetdh_122736pdf
26wwwdhgovukenPublicationsandstatistics LettersandcircularsProfessionalletters ChiefnursingofficerlettersDH_121848
27Department of Health No health without mental health a cross-government mental health outcomes strategy for people of all ages 2011 wwwdhgovukprod_consum_dhgroups dh_digitalassetsdocumentsdigitalasset dh_124058pdf
28Ministry of Justice Breaking the cycle effective punishment rehabilitation and sentencing of offenders 2010
29Department of Health The Bradley report Lord Bradleyrsquos review of people with mental health problems or learning disabilities in the criminal justice system 2009
30Department of Health No health without mental health delivering better mental health outcomes for people of all ages 2011
31Department of Health Equity and excellence liberating the NHS 2010 wwwdhgovukprod_ consum_dhgroupsdh_digitalassetsdhen psdocumentsdigitalassetdh_117794pdf
32Department of Health Healthy lives healthy people our strategy for public health in England 2010 wwwdhgovukprod_consum_dh groupsdh_digitalassetsdhenps documentsdigitalassetdh_122347pdf
33Department of Health A vision for adult social care capable communities and active citizens 2010 wwwdhgovukprod_consum_dh groupsdh_digitalassetsdhenps documentsdigitalassetdh_121971pdf
34Wilson M NMHDU Race equality action plan a five year review Delivering race equality in mental health care 2010 wwwnmhduorgukour-workmhep
35Care Quality Commission Monitoring the use of the Mental Health Act in 200910 2010
36Raleigh V S Collection of data on ethnic origin in England Editorial BMJ 20083376456
37Wilson M NMHDU Race equality action plan a five year review Delivering race equality in mental health care 2010 wwwnmhduorgukour-workmhep
38Department of Health Liberating the NHS an information revolution 2010
Care Quality Commission Count me in census 2010 47
Appendix A Methods of analysis
Standardisation by age and gender
Standardisation allows us to make comparisons between groups of the population by taking account of variations in age and gender Some differences in patterns of service use are related to the age or gender of the people using them so adjustments to the data have to be made to ensure that the interpretation of ethnic differences is reliable For example formal admissions are higher at a younger age so some Black and minority ethnic groups may have high formal admission rates simply because they have a high proportion of younger people Without adjustments for age and gender differences comparisons would be misleading
In this report most results are standardised for age and gender including those relating to admission detention source of referral care programme approach seclusion restraint accidents assault self-harm consent and presence on a secure ward The report uses the accepted statistical method of taking account of age and gender differences between groups when calculating these rates
We used the ONS estimates of total population by ethnic group for England and Wales in 2007 to standardise the rates of admission for different ethnic groups This takes account of the significant rises in the Black and ethnic minority population of England and Wales since the 2001 ONS census and hence gives more accurate and up to date estimates of admission ratios for different ethnic groups (although it does not take account of any further changes in the ethnic populations between 2007 and 2010 the date of this census) For comparison with the DRE baseline we also present admission rates from the 2005 census derived using the 2005 ONS estimates of populations by ethnic group These figures will not be the same as published in the 2005 census report which were based on the 2001 ONS census population estimates because updated estimates of populations by ethnic group were not available at that time
For other analyses we used the total number of inpatients and patients on CTOs in the census
as the basis for standardisation However CTO outpatients are excluded from selected analyses where appropriate namely the analysis of rates for admissions detentions on admission source of referral single sex accommodation and recorded incidents of seclusion restraint accidents assault and self-harm We used the statistical package STATA version 82 to derive the standardised results
It was not possible to adjust the analyses for ethnic differences in social and economic factors and in diagnosis and severity of illness Such factors could affect the ethnic differences observed in the results
For descriptive variables such as religion and language we did not use standardisation
Confidence intervals as indicators of significant statistical differences
For all standardised results the national rates for England and Wales are taken as 100 and the usual 95 confidence intervals are given Rates of less than 100 or greater than 100 for specific ethnic groups show a lower or higher rate respectively than the national average after adjusting for age and gender Whether or not the difference is statistically significant from the national average depends on the confidence interval If the confidence interval overlaps 100 the difference from the national average is not statistically significant If both values are lower or higher than 100 it indicates that the difference compared with the national average is statistically significant at the 95 level
For example if a rate is 110 with the lower confidence interval being 105 and the upper confidence interval being 115 it indicates that the 10 excess over the national average of 100 is statistically significant But if a ratio is 110 with the lower confidence interval being 95 and the upper confidence interval being 125 it indicates that the 10 excess over the national average is not statistically significant We did not attempt to adjust the confidence intervals for multiple comparisons
Care Quality Commission Count me in census 2010 48
Appendix B Mental health tables
Table B1 Standardised admission ratios by ethnic group for England and Wales (excluding outpatients on a CTO) using 2007 ONS census population denominators (England and Wales = 100) All ages
Ethnic group
Men Women Persons Standardised
admission ratio
95 confidence
interval Observed numbers
Standardised admission
ratio
95 confidence
interval Observed numbers
Standardised admission
ratio
95 confidence
interval Observed numbers
White British 88 86 89 12435 94 93 96 10157 91 89 92 22592 White Irish 130 115 146 274 122 106 140 215 126 115 138 489 Other White 117 109 126 731 129 118 141 533 122 115 129 1264 White and Black Caribbean 557 493 627 276 274 223 333 101 436 393 483 377 White and Black African 312 247 388 80 259 186 351 41 292 242 349 121 White and Asian 140 110 174 79 124 90 166 44 134 111 159 123 Other Mixed 230 189 278 108 213 165 270 67 223 192 259 175 Indian 67 59 75 286 66 56 76 172 66 60 73 458 Pakistani 105 93 119 269 65 53 79 96 91 81 100 365 Bangladeshi 123 102 147 120 82 60 109 46 108 92 126 166 Other Asian 161 139 185 192 136 107 169 79 153 135 172 271 Black Caribbean 538 505 572 980 306 277 336 418 438 415 462 1398 Black African 246 226 267 550 219 194 247 277 236 221 253 827 Other Black 792 691 903 222 314 240 403 61 596 529 670 283 Chinese 27 20 38 39 43 30 59 35 33 26 41 74 Other 140 120 162 177 110 88 136 87 128 113 145 264 Total 100 16818 100 12429 100 29247
Care Quality Commission Count me in census 2010 49
Appendix B Mental health tables continued
Table B2 Standardised admission ratios by ethnic group for England and Wales (excluding outpatients on a CTO) using 2007 ONS census population denominators (England amp Wales = 100) Ages 65 and over
Ethnic group
Men Women Persons Standardised
admission ratio
95 confidence
interval Observed numbers
Standardised admission
ratio
95 confidence
interval Observed numbers
Standardised admission
ratio
95 confidence
interval Observed numbers
White British 95 92 99 3265 95 92 98 3887 95 93 97 7152 White Irish 142 116 172 106 102 82 125 92 120 104 138 198 Other White 207 174 244 141 213 183 248 171 210 188 235 312 White and Black Caribbean 406 210 710 12 333 152 632 9 371 230 568 21 White and Black African 231 28 836 2 198 24 714 2 213 58 546 4 White and Asian 28 1 156 1 110 30 281 4 69 23 162 5 Other Mixed 146 40 374 4 228 92 470 7 189 95 339 11 Indian 97 70 132 41 83 57 116 33 90 71 113 74 Pakistani 39 17 77 8 46 18 94 7 42 23 69 15 Bangladeshi 115 53 218 9 69 14 201 3 98 51 172 12 Other Asian 234 143 361 20 215 120 354 15 225 157 313 35 Black Caribbean 216 170 269 77 310 253 376 103 261 224 302 180 Black African 142 73 248 12 365 241 531 27 246 175 337 39 Other Black 164 34 479 3 366 134 796 6 259 119 493 9 Chinese 41 8 120 3 95 38 195 7 68 33 125 10 Other 253 126 453 11 390 238 602 20 327 222 464 31 Total 100 3715 100 4393 100 8108
Care Quality Commission Count me in census 2010 50
Appendix B Mental health tables continued
Table B3 Standardised ratios by ethnic group for patients referred by a GP (England and Wales = 100)
Ethnic group
Men Women Persons Standardised
referral ratio
95 confidence
interval Observed numbers
Standardised referral ratio
95 confidence
interval Observed numbers
Standardised referral ratio
95 confidence
interval Observed numbers
White British 110 103 117 904 107 101 114 1065 108 104 113 1969 White Irish 85 50 134 18 93 57 144 20 89 63 123 38 Other White 74 51 103 33 70 49 97 36 72 56 91 69 White and Black Caribbean 27 5 78 3 30 4 109 2 28 9 65 5 White and Black African 0 0 74 9 268 2 35 4 125 2 White and Asian 165 54 386 5 0 0 86 28 201 5 Other Mixed 48 6 172 2 68 14 198 3 58 19 136 5 Indian 69 34 123 11 79 39 141 11 73 46 111 22 Pakistani 88 42 162 10 59 16 151 4 77 42 130 14 Bangladeshi 81 22 207 4 61 7 221 2 73 27 159 6 Other Asian 80 32 166 7 108 43 223 7 92 50 155 14 Black Caribbean 35 20 56 17 37 20 62 14 36 24 51 31 Black African 57 29 100 12 66 35 113 13 61 40 91 25 Other Black 62 23 135 6 40 5 144 2 54 23 107 8 Chinese 56 1 314 1 139 38 356 4 108 35 251 5 Other 106 46 208 8 0 0 53 23 105 8 Total 100 1041 100 1185 100 2226
Care Quality Commission Count me in census 2010 51
Appendix B Mental health tables continued
Table B4 Standardised ratios by ethnic group for patients referred by a community mental health team (including crisis resolution home treatment) or community learning disability team (England and Wales = 100)
Ethnic group
Men Women Persons Standardised
referral ratio
95 confidence
interval Observed numbers
Standardised referral ratio
95 confidence
interval Observed numbers
Standardised referral ratio
95 confidence
interval Observed numbers
White British 107 104 111 3255 103 100 107 3386 105 103 108 6641 White Irish 90 69 116 61 89 68 114 61 90 74 107 122 Other White 59 48 71 105 79 67 94 141 69 61 78 246 White and Black Caribbean 106 83 135 68 75 49 111 25 96 77 117 93 White and Black African 43 19 84 8 66 30 124 9 52 31 84 17 White and Asian 95 56 150 18 84 43 147 12 90 61 129 30 Other Mixed 78 48 121 20 72 41 118 16 76 53 105 36 Indian 106 83 132 76 100 76 130 56 103 86 122 132 Pakistani 108 84 135 73 89 60 128 30 102 83 123 103 Bangladeshi 98 66 141 29 90 50 148 15 95 69 128 44 Other Asian 88 63 120 40 105 70 150 29 94 73 119 69 Black Caribbean 69 59 80 167 85 71 102 123 75 67 84 290 Black African 84 70 102 112 82 65 103 77 84 72 96 189 Other Black 52 36 74 31 64 36 106 15 56 41 74 46 Chinese 112 53 205 10 101 52 176 12 105 66 160 22 Other 86 60 120 35 106 71 151 30 94 73 120 65 Total 100 4108 100 4037 100 8145
Care Quality Commission Count me in census 2010 52
Appendix B Mental health tables continued
Table B5 Standardised ratios by ethnic group for patients referred by criminal justice routes (police prison probation courts court liaison and diversion) (England and Wales = 100)
Ethnic group
Men Women Persons Standardised
referral ratio
95 confidence
interval Observed numbers
Standardised referral ratio
95 confidence
interval Observed numbers
Standardised referral ratio
95 confidence
interval Observed numbers
White British 90 86 95 1495 95 86 104 421 91 87 95 1916 White Irish 133 94 183 38 59 19 138 5 116 84 157 43 Other White 112 93 134 119 103 68 150 27 111 93 130 146 White and Black Caribbean 117 89 151 58 145 69 266 10 120 94 153 68 White and Black African 190 127 273 29 141 38 361 4 183 126 256 33 White and Asian 75 39 131 12 160 52 373 5 89 52 143 17 Other Mixed 104 65 157 22 151 61 311 7 112 75 161 29 Indian 86 61 118 38 79 32 163 7 85 62 113 45 Pakistani 118 91 150 65 89 33 194 6 115 90 145 71 Bangladeshi 74 44 115 19 29 1 162 1 68 42 105 20 Other Asian 130 95 174 45 164 71 323 8 134 101 176 53 Black Caribbean 131 114 150 208 124 81 181 26 130 114 148 234 Black African 132 112 156 145 143 93 211 25 134 114 156 170 Other Black 141 109 180 65 236 113 435 10 149 117 187 75 Chinese 83 27 194 5 146 30 426 3 99 43 195 8 Other 129 93 175 41 113 37 264 5 127 93 170 46 Total 100 2404 100 570 100 2974
Care Quality Commission Count me in census 2010 53
Appendix B Mental health tables continued
Table B6 Standardised detention ratios by ethnic group all detentions on day of admission (excluding outpatients on a CTO) (England and Wales = 100)
Ethnic group
Men Women Persons Standardised
detention ratio
95 confidence
interval Observed numbers
Standardised detention
ratio
95 confidence
interval Observed numbers
Standardised detention
ratio
95 confidence
interval Observed numbers
White British 94 92 97 6449 94 91 97 3628 94 92 96 10077 White Irish 112 95 131 154 118 96 145 94 114 101 129 248 Other White 108 98 118 451 120 106 136 251 112 104 120 702 White and Black Caribbean 123 107 141 220 129 99 167 59 124 110 140 279 White and Black African 128 99 162 68 113 70 173 21 124 100 153 89 White and Asian 96 71 126 50 109 68 164 22 99 78 125 72 Other Mixed 115 92 143 82 139 100 188 42 122 102 146 124 Indian 97 83 113 164 110 86 137 77 101 88 114 241 Pakistani 109 94 126 194 102 74 136 44 108 94 122 238 Bangladeshi 86 67 109 69 91 55 142 19 87 70 107 88 Other Asian 109 92 130 133 120 86 163 40 112 96 130 173 Black Caribbean 129 121 139 774 143 125 162 238 132 124 141 1012 Black African 115 104 127 422 131 111 153 159 119 110 129 581 Other Black 117 100 136 170 148 105 202 39 122 106 140 209 Chinese 108 71 159 26 129 78 202 19 116 85 156 45 Other 111 92 132 126 116 83 157 41 112 96 130 167 Total 100 9552 100 4793 100 14345
Care Quality Commission Count me in census 2010 54
Appendix B Mental health tables continued
Table B7 Standardised detention ratios by ethnic group detention on day of admission ndash section 2 of the Mental Health Act (England and Wales = 100)
Ethnic group
Men Women Persons Standardised
detention ratio
95 confidence
interval Observed numbers
Standardised detention
ratio
95 confidence
interval Observed numbers
Standardised detention
ratio
95 confidence
interval Observed numbers
White British 97 91 102 1156 93 87 98 1133 95 91 99 2289 White Irish 78 47 120 20 116 79 166 30 97 72 128 50 Other White 100 78 126 70 134 108 166 88 116 99 136 158 White and Black Caribbean 55 30 93 14 60 24 124 7 57 35 87 21 White and Black African 91 37 188 7 150 60 308 7 113 62 190 14 White and Asian 80 29 174 6 119 44 258 6 96 49 167 12 Other Mixed 68 28 141 7 116 53 221 9 89 51 145 16 Indian 130 91 179 37 124 81 182 26 127 98 163 63 Pakistani 126 87 176 34 138 79 225 16 130 96 171 50 Bangladeshi 166 101 256 20 140 61 276 8 158 105 228 28 Other Asian 142 93 209 26 163 93 264 16 150 108 202 42 Black Caribbean 73 57 92 70 97 72 128 51 82 68 98 121 Black African 164 131 202 87 190 146 244 62 174 147 204 149 Other Black 114 75 166 27 140 72 245 12 121 86 165 39 Chinese 165 60 358 6 212 97 402 9 190 106 313 15 Other 218 153 302 36 179 108 280 19 203 153 264 55 Total 100 1623 100 1499 100 3122
Care Quality Commission Count me in census 2010 55
Appendix B Mental health tables continued
Table B8 Standardised detention ratios by ethnic group detention on day of admission ndash section 3 of the Mental Health Act (England and Wales = 100)
Ethnic group
Men Women Persons Standardised
detention ratio
95 confidence
interval Observed numbers
Standardised detention
ratio
95 confidence
interval Observed numbers
Standardised detention
ratio
95 confidence
interval Observed numbers
White British 99 95 103 2684 96 91 100 1852 98 95 101 4536 White Irish 116 89 149 60 135 101 177 52 124 102 149 112 Other White 112 96 129 186 110 92 132 121 111 99 124 307 White and Black Caribbean 114 91 143 79 130 90 183 33 119 98 143 112 White and Black African 97 60 148 21 107 54 192 11 100 69 141 32 White and Asian 84 50 133 18 97 48 173 11 89 59 127 29 Other Mixed 121 84 168 35 117 72 181 20 120 90 156 55 Indian 96 75 122 67 110 79 148 42 101 83 122 109 Pakistani 91 71 115 69 88 55 134 22 90 73 111 91 Bangladeshi 63 39 95 22 64 28 127 8 63 43 90 30 Other Asian 90 65 120 44 94 56 149 18 91 70 117 62 Black Caribbean 116 102 130 279 164 138 192 148 129 117 142 427 Black African 95 80 112 143 102 79 129 68 97 85 111 211 Other Black 75 55 99 49 99 58 159 17 80 62 102 66 Chinese 119 59 213 11 99 43 194 8 110 66 171 19 Other 85 60 116 38 84 48 136 16 84 63 110 54 Total 100 3805 100 2447 100 6252
Care Quality Commission Count me in census 2010 56
Appendix B Mental health tables continued
Table B9 Standardised detention ratios by ethnic group detention on day of admission ndash section 3741 of the Mental Health Act (England and Wales = 100)
Ethnic group
Men Women Persons Standardised
detention ratio
95 confidence
interval Observed numbers
Standardised detention
ratio
95 confidence
interval Observed numbers
Standardised detention
ratio
95 confidence
interval Observed numbers
White British 84 79 89 991 101 88 115 220 86 82 91 1211 White Irish 140 96 198 32 48 6 175 2 126 87 176 34 Other White 112 89 139 81 156 95 241 20 118 96 144 101 White and Black Caribbean 177 133 232 53 179 66 390 6 178 135 229 59 White and Black African 149 82 251 14 224 46 654 3 159 92 254 17 White and Asian 141 75 241 13 195 40 569 3 149 85 241 16 Other Mixed 144 85 227 18 264 97 575 6 162 104 242 24 Indian 86 56 126 26 44 5 160 2 80 53 116 28 Pakistani 122 87 166 40 0 0 111 79 152 40 Bangladeshi 66 32 122 10 0 0 60 29 110 10 Other Asian 99 61 151 21 0 0 89 55 136 21 Black Caribbean 200 174 229 210 78 34 153 8 189 165 216 218 Black African 127 101 157 82 84 34 172 7 122 98 150 89 Other Black 152 110 205 43 94 11 341 2 148 108 198 45 Chinese 100 27 255 4 0 0 80 22 204 4 Other 118 75 177 23 44 1 245 1 110 71 164 24 Total 100 1661 100 280 100 1941
Care Quality Commission Count me in census 2010 57
Appendix B Mental health tables continued
Table B10 Standardised detention ratios by ethnic group detention on day of admission ndash sections 47 48 4749 of the Mental Health Act (England and Wales = 100)
Ethnic group
Men Women Persons Standardised
detention ratio
95 confidence
interval Observed numbers
Standardised detention
ratio
95 confidence
interval Observed numbers
Standardised detention
ratio
95 confidence
interval Observed numbers
White British 97 90 106 583 104 81 131 73 98 91 106 656 White Irish 132 72 221 14 163 20 590 2 135 77 219 16 Other White 130 96 172 49 71 15 206 3 124 93 163 52 White and Black Caribbean 126 78 193 21 80 2 444 1 123 77 186 22 White and Black African 207 103 370 11 0 0 189 95 339 11 White and Asian 57 12 166 3 169 4 941 1 68 19 175 4 Other Mixed 112 48 221 8 233 28 843 2 125 60 230 10 Indian 57 26 108 9 0 252 0 52 24 99 9 Pakistani 92 54 147 17 0 314 0 86 50 138 17 Bangladeshi 46 12 117 4 167 4 930 1 53 17 125 5 Other Asian 101 52 177 12 0 0 95 49 166 12 Black Caribbean 126 98 159 70 125 34 319 4 126 99 158 74 Black African 74 48 107 27 104 21 303 3 76 51 108 30 Other Black 127 78 197 20 138 3 769 1 128 79 195 21 Chinese 0 0 0 0 0 0 Other 83 38 157 9 0 0 77 35 147 9 Total 100 857 100 91 100 948
Care Quality Commission Count me in census 2010 58
Appendix B Mental health tables continued
Table B11 Standardised ratios for all applications of the Mental Health Act (including outpatients on a CTO) by ethnic group on day of census (England and Wales = 100)
Ethnic group
Men Women Persons Standardised
ratio for all MHA
applications
95 confidence
interval Observed numbers
Standardised ratio for all MHA
applications
95 confidence
interval Observed numbers
Standardised ratio for all MHA
applications
95 confidence
interval Observed numbers
White British 97 94 99 7659 95 93 98 4335 96 94 98 11994 White Irish 99 83 116 147 104 84 128 95 101 89 114 242 Other White 87 79 95 427 97 85 110 249 90 84 97 676 White and Black Caribbean 117 103 133 245 130 103 163 76 120 107 134 321 White and Black African 120 95 150 79 93 58 141 22 113 92 137 101 White and Asian 101 78 128 65 119 81 169 31 106 86 129 96 Other Mixed 110 89 134 96 125 93 165 49 114 97 135 145 Indian 103 90 118 215 122 100 147 109 109 97 121 324 Pakistani 111 97 125 254 117 90 148 67 112 100 125 321 Bangladeshi 92 75 112 97 101 68 145 29 94 78 112 126 Other Asian 103 88 121 152 126 95 164 56 109 94 124 208 Black Caribbean 123 115 131 893 141 126 158 300 127 120 134 1193 Black African 112 103 122 511 121 104 140 188 114 106 123 699 Other Black 116 102 132 232 148 112 191 59 122 108 136 291 Chinese 97 64 140 27 101 61 157 19 98 72 131 46 Other 104 87 122 140 103 75 137 46 103 89 119 186 Total 100 11239 100 5730 100 16969
Care Quality Commission Count me in census 2010 59
Appendix B Mental health tables continued
Table B12 Standardised CTO ratios by ethnic group CTOs on day of census ndash section 17a of the Mental Health Act (England and Wales = 100)
Ethnic group
Men Women Persons
Standardised CTO ratio
95 confidence
interval Observed numbers
Standardised CTO ratio
95 confidence
interval Observed numbers
Standardised CTO ratio
95 confidence
interval Observed numbers
White British 94 89 99 1289 88 82 94 730 92 88 96 2019 White Irish 51 27 88 13 77 41 132 13 62 40 90 26 Other White 97 77 120 83 125 95 162 58 107 90 126 141 White and Black Caribbean 79 53 113 29 141 77 237 14 92 67 124 43 White and Black African 111 59 190 13 125 41 292 5 115 68 181 18 White and Asian 104 54 182 12 136 50 297 6 113 67 178 18 Other Mixed 102 59 166 16 136 62 257 9 112 73 166 25 Indian 134 99 177 48 152 98 226 24 139 109 175 72 Pakistani 145 110 187 59 174 101 279 17 151 119 189 76 Bangladeshi 142 93 206 27 205 99 378 10 155 109 213 37 Other Asian 107 71 155 28 182 99 305 14 124 89 168 42 Black Caribbean 121 103 142 152 171 132 218 65 133 116 152 217 Black African 116 94 142 94 139 98 192 37 122 102 145 131 Other Black 186 144 238 65 305 189 466 21 206 165 254 86 Chinese 83 23 213 4 152 49 354 5 111 51 211 9 Other 87 54 134 21 152 79 266 12 103 71 145 33 Total 100 1953 100 1040 100 2993
Care Quality Commission Count me in census 2010 60
Appendix C Learning disability tables
Table C1 Standardised admission ratios by ethnic group for England and Wales using 2007 ONS population denominators (England amp Wales = 100) All ages
Ethnic group
Men Women Persons Standardised
admission ratio
95 confidence
interval Observed numbers
Standardised admission
ratio
95 confidence
interval Observed numbers
Standardised admission
ratio
95 confidence
interval Observed numbers
White British 104 100 109 2163 108 101 115 941 105 102 109 3104 White Irish 108 72 156 28 151 89 238 18 121 89 162 46 Other White 81 65 101 85 49 30 75 21 72 59 87 106 White and Black Caribbean 280 186 405 28 246 118 453 10 270 191 371 38 White and Black African 102 33 239 5 165 34 482 3 119 51 235 8 White and Asian 66 26 135 7 154 56 335 6 89 47 152 13 Other Mixed 181 104 295 16 229 99 451 8 195 125 290 24 Indian 32 21 48 24 28 12 55 8 31 21 44 32 Pakistani 48 30 72 22 12 1 43 2 38 25 57 24 Bangladeshi 102 60 161 18 31 4 113 2 83 51 128 20 Other Asian 33 13 69 7 92 34 201 6 47 25 81 13 Black Caribbean 265 210 332 77 117 67 190 16 218 176 267 93 Black African 53 33 80 22 40 15 87 6 50 33 72 28 Other Black 228 118 399 12 134 28 392 3 200 112 330 15 Chinese 4 0 21 1 3 0 16 1 Other 26 9 56 6 11 0 59 1 21 9 44 7 Total 100 2521 100 1051 100 3572
Care Quality Commission Count me in census 2010 61
Appendix C Learning disability tables continued
Table C2 Standardised detention ratios by ethnic group all detentions on day of admission (England and Wales = 100)
Ethnic group
Persons Standardised
detention ratio
95 confidence
interval Observed numbers
White British 97 93 103 1431 White Irish 127 84 184 28 Other White 117 91 149 68 White and Black Caribbean 120 77 179 24 White and Black African 114 37 267 5 White and Asian 75 24 176 5 Other Mixed 94 49 165 12 Indian 119 72 186 19 Pakistani 110 61 181 15 Bangladeshi 144 84 231 17 Other Asian 59 16 150 4 Black Caribbean 119 90 155 57 Black African 138 85 210 21 Other Black 62 20 145 5 Chinese 0 0 Other 104 28 267 4 Total 100 1715
Care Quality Commission Count me in census 2010 62
copy Care Quality Commission and National Mental Health Development Unit 2011 Published April 2011
This publication may be reproduced in whole or in part in any format or medium for non-commercial purposes provided that it is reproduced accurately and not used in a derogatory manner or in a misleading context The source should be acknowledged by showing the publication title and copy Care Quality Commission and National Mental Health Development Unit 2011
How to contact us
Phone 03000 616161 Email enquiriescqcorguk Web wwwcqcorguk
Write to us at Care Quality Commission National Correspondence Citygate Gallowgate Newcastle upon Tyne NE1 4PA
Please contact us if you would like a summary of this publication in other formats or languages
Registered office Care Quality Commission Finsbury Tower 103ndash105 Bunhill Row London EC1Y 8TG
- Count me in 2010
- About the Care Quality Commission
- Contents
- Summary
- National organisations coordinating the census
- Introduction
- Data methods of analysis and interpretation
- Results mental health
- A comparison between the 2005 baseline and the 2010 census
- Results learning disabilities
- Data in the future Moving beyond a one-day census
- Conclusions
- References
- Appendix A Methods of analysis
- Appendix B Mental health tables
- Appendix C Learning disability tables
- How to contact us
-

Results learning disabilities continued
Ward security
About 12 of all inpatients were on a medium or high secure ward as opposed to a general (54) or low secure (34) ward
As in the three previous years rates of patients on medium or high secure wards were about double the average among the White Irish and Other White groups Most other minority ethnic groups had very few patients on medium or high secure wards
Age range on wards
There were five patients under 18 years of age being cared for on wards for working-age adults and none were on wards for older people About 5 of patients on wards for working-age adults were aged 65 or over and there were very few patients (23) on wards for older people There were very few lsquoout of agersquo placements among minority ethnic groups
Patients in wards designated as single sex or mixed
We asked providers whether the patient was on a ward designated as men or women only or mixed gender Overall 47 of men and 69 of women were not in a ward designated for single sex use The numbers of such patients among minority ethnic groups were very low
Two further questions examined the single sex facilities that were available to patients Again due to the small numbers we do not present results by ethnicity for these questions
Patientsrsquo access to toilet and bathing facilities designated for single sex use
Overall 19 (497) of men and 27 (295) of women were reported as not having access to toilet and bathing facilities designated for single sex use
Patientsrsquo access to a lounge area day space designated for single sex use
Overall 32 (829) of men and 44 (470) of women were reported as not having access to a lounge area day space designated for single sex use
Patients subject to deprivation of liberty safeguards
For details of deprivation of liberty safeguards please see page 31
The 2010 census introduced a new question ldquoIs the patient subject to deprivation of liberty authorisation on 31 March 2010rdquo Two per cent (74) patients were reported as being subject to a deprivation of liberty order on census day but very few of these patients (15) were from minority ethnic groups
See footnote on single sex accommodation on page 27
Care Quality Commission Count me in census 2010 39
Data in the future Moving beyond a one-day census
For six years the Count me in census has provided a valuable one-day snapshot of inpatients in mental health and learning disability services And with the proportion of inpatients who are detained increasing steadily (from 25 in 200506 to 39 in 200910 ndash see Figure 2) ongoing ethnic monitoring of admissions and detentions becomes more vital than ever
However a one-day census only captures some events and the profile of patients can differ across a whole year For example there were
bull 29840 inpatients in the 2010 census compared with 107765 inpatients overall during 200910
bull 17299 patients in the 2010 census who were detained or on CTOs compared with 42479 new detentions and some 4100 new CTOs overall in England in 200910
bull 26 of patients in hospital for under one month and 31 for over one year per the census
whereas the MHMDS data consistently shows that for over 50 of records the average length of an inpatient stay was under one month and for 4 it was over one year
Looking ahead it is vital that robust data is available on all admitted patients and all those subject to the Mental Health Act not just those in hospital on one particular day Moreover patterns of use and outcomes of community care can have an impact on the need for admission to hospital and the risk of detention ndash therefore information about the care provided to patients before admission to hospital during their hospital stay and after they leave is also vital Furthermore under 84 of the 127 million people using specialist mental health services are admitted to hospital23 and so it is very important to examine the quality of community care for the 90 of patients who are not admitted to hospital
Figure 2 Number of people spending time in hospital 200506 to 200910
Num
ber
of p
atie
nts
90000
80000
70000
60000
50000
40000
30000
20000
10000
0 200506 200607 200708 200809 200910
Source NHS Information Centre Formally detained Not detained MHMDS Bulletin 2011
Care Quality Commission Count me in census 2010 40
Data in the future Moving beyond a one-day census continued
The Mental Health Minimum Data Set (MHMDS) is a rich source of data on people using specialist mental health services in England It covers both community and hospital services and includes a wide range of information about the demographic clinical and socioeconomic characteristics of individual patients and the services provided to those admitted to hospital and to the much larger number of those who donrsquot need a stay in hospital The data includes information about contact with services uses of the Mental Health Act and the Care Programme Approach for each individual patient All these details enable the use of services patterns of care and patient outcomes to be tracked including along pathways of care The MHMDS therefore provides a robust basis for ongoing monitoring of access to and outcomes of care for users of specialist ndash both community and hospital ndash mental health services
The MHMDS also enables an analysis of the numbers and rates of people from different ethnic groups using specialist mental health services overall (both inpatient and community) which provides an indication of the levels of mental illness and therefore the need for specialist care in different communities
At present the MHMDS does not cover high secure services and independent sector providers only started to provide data during 201011 However to support payment by results for mental health the scope of the data set will be extended to cover high secure services during 201112 (version 4 MHMDS) Further proposed changes to the dataset (version 41) will incorporate NHS-funded learning disability services and primary care mental health services A separate dataset for child and adolescent mental health services (CAMHS) has been developed and is awaiting formal approvals It is designed to include the same information about uses of the Mental Health Act as provided in the MHMDS
The latest MHMDS bulletin for 200910 provides a description of people using specialist mental health services in England including ethnic profiles of people using services hospital admissions detentions and the number of people on CPA24 It also provides information on differences by age and gender The bulletin illustrates some of the sorts of analyses that are possible using data from the MHMDS
The NHS Information Centre can provide guidance on these and other potential analyses based on MHMDS data
Care Quality Commission Count me in census 2010 41
Conclusions
While this report reviews changes in the census results since 2005 it is not a review or evaluation of the DRE programme overall Similarly the census cannot provide explanations for the patterns observed or examine whether mental health services are meeting the needs of individual ethnic minority groups As we have noted previously the results are subject to caveats in particular that the census provides a one-day snapshot that may not be representative of patients admitted to hospital throughout the year
Overview of findings
Overall the findings from the 2010 census show little change from those reported for previous annual censuses conducted since 2005 This is partly because many patients had been in hospital for a considerable period of time and had therefore been included in successive censuses The findings of this sixth and last census continue to show differences between Black and minority ethnic groups and White groups and also differences within these groups
In particular ethnic differences in rates of admission detention under the Mental Health Act and seclusion ndash three of DRErsquos 12 goals ndash have not altered materially since the inception of DRE in 2005
bull Admission rates remain higher than average among minority ethnic groups especially among Black and WhiteBlack Mixed groups for whom rates were two or more times higher than average in 2010 The Other Black group continues to have the highest admission rate ndash six times higher than average ndash although this is lower than in 2005 In contrast admission rates have consistently been lower than average among the Indian and Chinese groups and about average in the Pakistani and Bangladeshi groups
bull Detention rates remain higher than average among the Black and WhiteBlack Caribbean Mixed groups and among the Other White group A consistent pattern across all censuses was the higher than average detention rate
under section 3741 for the Black Caribbean and Other Black groups We also found that rates for being placed on a CTO were higher among the South Asian and Black groups
bull Although there have been annual fluctuations in seclusion rates they have been higher than average for the Black WhiteBlack Mixed and Other White groups in at least three of the six censuses
Overall the level of provision of single sex areas for patients continues to be unsatisfactory although there was no evidence that minority ethnic patients were disadvantaged in these respects Government policy for the NHS in England now requires that all providers of NHS-funded care including mental health trusts are expected to eliminate mixed-sex accommodation in accordance with the guidance set out in CNO201032526 From 2011 all providers of NHS-funded care must report breaches of sleeping accommodation which will attract sanctions
Implications for ways forward
The census findings do not in themselves show that mental health and learning disability services are failing to meet the needs of Black and minority ethnic service users
As noted in previous reports they need to be interpreted in the context of available evidence on ethnic differences in rates of mental illness pathways to care and factors such as socioeconomic disadvantages that all contribute to these differences Our previous reports have consistently highlighted the need for prevention early intervention and working collaboratively across sectors to reduce the risk of admission and detention where possible without compromising the care given to patients Mental health services have a key role to play but to achieve this all statutory agencies and organisations outside the healthcare sector Black and minority ethnic communities and people who use services themselves will need to work in partnership
Care Quality Commission Count me in census 2010 42
Conclusions continued
This message ndash about preventing mental ill-health by addressing the contributory factors and intervening early ndash is at the heart of No health without mental health the Department of Healthrsquos new strategy for the future of mental health care in England27
The strategy aims to tackle the economic social and environmental determinants and consequences of mental health problems and to improve outcomes and reduce inequalities
It specifies that by 2014 people in contact with the criminal justice system will have improved access to mental health services as set out in the Ministry of Justice Green Paper Breaking the Cycle Effective punishment rehabilitation and sentencing of offenders which confirms the approach outlined in Lord Bradleyrsquos report for early intervention and diversion from custody2829
Accompanying the new strategy is a supporting document that explains how its objectives will improve mental health outcomes the effective interventions and the underpinning evidence base30
The strategy is complemented by other government proposals for reforms in the NHS public health and adult social care as outlined in the NHS White Paper Equity and excellence liberating the NHS31 the public health strategy Healthy lives healthy people32 and the adult social care strategy A vision for adult social care capable communities and active citizens 33 Three outcomes frameworks have been developed alongside these strategies improving mental health outcomes and reducing inequalities is integral to them all
In this new healthcare landscape the proposed NHS Commissioning Board and GP consortia will have a statutory obligation to promote equality and reduce inequalities in healthcare (something also enshrined in the Equality Act 2010) As the lead commissioners of healthcare services it will be up to GP consortia to assess with local authorities the needs of their local populations and commission the right services that meet their requirements
And the strengthened public health role of local authorities offers significant potential for addressing the socioeconomic disadvantages faced by Black and minority ethnic communities which add to the burden of mental illness in these communities
Race Equality Action Plan A five-year review looked back at the work of the DRE action plan and describes some of the key challenges successes and learning34 Based on the experience and outcome of the DRE programme the report suggests ways forward for the next stage of mental health strategy development and implementation
Since April 2009 CQC has had a duty under the Mental Health Act 1983 to monitor how services exercise their powers in relation to patients who are detained in hospital or subject to CTOs or guardianship under the Act In its first annual report on the use of the Act CQC recommends a number of areas where improvements are needed for example over-occupancy on inpatient wards patient engagement use of control and restraint seclusion and capacity and consent35
In particular CQC highlighted a number of issues relating to the use of CTOs including concern about appropriate usage (30 of the patients in CQCrsquos sample did not have a reported history of non-compliance or disengagement with services after discharge) and over-representation of Black and minority ethnic groups CQC advised that research on the possible race equality impact of CTOs should be undertaken There were 6237 CTOs from their introduction in November 2008 to 31 March 2010 a much greater use of them than forecast for this period by the Department of Health before the power was introduced Just 31 of these orders had ended by end March 2010 suggesting that some people are being kept on supervised community treatment for long periods
Care Quality Commission Count me in census 2010 43
Conclusions continued
Data in the future Moving beyond a one-day census
Good information is the foundation of an effective healthcare system It is imperative for ensuring that services meet the needs of local populations and are equitable and that improvements are made where needed The availability of fit-for-purpose and comprehensive patient-level data sets with ethnicity and other key variables fully coded is therefore vitally important36 It enables the care provided to patients of all ethnic backgrounds to be monitored on an ongoing basis including for monitoring compliance with the Equality Act
Race Equality Action Plan A five-year review notes that better collection monitoring and use of ethnicity data to inform commissioning and provision in health and social care is required37 Key areas include good ethnic monitoring improving demographic information and ensuring good links between infomatics audit and equality and diversity leads within trusts in order to effectively use the information to inform service development monitoring and review at board management ward and community levels
The governmentrsquos proposed changes to the NHS will be supported by an information revolution aimed at improving and extending the information available to the NHS patients and the public on the quality and outcomes of NHS services including by equality dimensions38
Having information that is fit for purpose is vital for the effective regulation of mental health and learning disability services CQC uses routinely available data sets on an ongoing basis to assess the performance of health and social care organisations and their compliance with government policies and legislation We therefore expect those who commission and provide mental healthcare in the NHS and independent sector to have information systems that provide good quality data with fully
comprehensive recording and monitoring of ethnicity on an ongoing basis
Since 2005 the Count me in census has played a key role in providing information about the ethnicity and other characteristics of inpatients in mental health and learning disability services and on patients subject to the Mental Health Act It did this by providing a valuable one-day snapshot But ethnicity recording must be seen as an all-year round statutory requirement not a one-day annual event The number of inpatients throughout the year is much higher than the counts on one day and some patients will have more than one admission And there is a need to move on from counting patients to understanding more about care pathways for Black and minority ethnic patients and the factors leading to hospital admission and detention
We have consistently highlighted the need for commissioners and providers to make full use of the Mental Health Minimum Data Set (MHMDS) ndash the statutory data set submitted by providers of specialist mental health services in England It provides rich data on these issues and provides a robust information source for ongoing ethnic monitoring after this last census
Covering both community and hospital services ndash and now independent and third sector providers as well as NHS ndash it includes a wide range of information about individual patients the services provided to those admitted to hospital and to the much larger number who donrsquot need admission to hospital and the outcomes of care And because it includes year-round activity it is more representative of the overall picture of for example admission detention and readmission rates length of stay years in psychiatric care and contacts with services and professionals
We call on the Information Centre to routinely publish data on all admissions and uses of the Mental Health Act including CTOs in England (in both NHS and independent healthcare providers) by the ethnicity of
Care Quality Commission Count me in census 2010 44
Conclusions continued
patients making the MHMDS the definitive source of information about mental health and learning disability patients This data should be risk-adjusted for age gender and other variables as appropriate to enable reliable comparisons to be made across groups
It is important that all providers ndash NHS and independent ndash make strenuous efforts to improve the quality of the data they submit The Information Centre publishes reports on the quality of MHMDS data by provider (see wwwicnhsukservices mhmdsdq) and we urge providers to monitor this information and use it to improve their data quality
If GP consortia and local authorities are to be effective in their needs assessment and commissioning roles the Information Centre needs to make available and promote to them the data from the MHMDS and other sources And researchers and academics must make full use of the MHMDS to explore the factors that underlie the observed ethnic patterns
CQCrsquos role
In the meantime CQC will continue to focus strongly on the quality of care provided by mental health and learning disability services
People who find themselves admitted to mental health services or detained under the Mental Health Act and therefore counted by the Count me in census are among the most mentally unwell people in our society Our job is first and foremost to make sure that the care they receive meets the essential standards of quality and safety set out under the Health and Social Care Act 2008 and to work with providers to ensure this We act swiftly when we find services that do not Where we find systemic problems that organisations have not adequately addressed we may impose conditions on the providerrsquos registration to bring about the change needed to improve patientsrsquo experience of care
The essential standards of quality and safety include the requirement to provide single sex accommodation and we will continue to closely check that these standards are met by all mental health services
We intend to introduce a number of indicators derived from the rich information in the MHMDS into our quality and risk profiles for providers This will put greater emphasis on the experience of Black and minority ethnic patients in our regulatory activity
We will monitor the quality of MHMDS data submitted by providers (as reported by the NHS Information Centre) including independent service providers Those with poor data quality may be considered at higher risk in terms of their quality of care
In addition we will continue to monitor the progress of services in relation to the issues raised in the census and other reports including our report on the use of the Mental Health Act through our visits to services and meetings with patients by our Mental Health Act Commissioners and second opinion appointed doctors (SOADs) We will draw on patientsrsquo experiences to monitor the operation of the Mental Health Act
We will also assess the impact of advice and use of Local HealthWatch Local HealthWatch will be in a good position to make sure that providers and commissioners are held to account on matters of choice and access to services for people from Black and minority ethnic groups
Care Quality Commission Count me in census 2010 45
References
1 Department of Health Equity and excellence liberating the NHS 2010
2 Department of Health The NHS outcomes framework 201112 2010
3 Healthcare Commission Mental Health Act Commission National Institute for Mental Health in England Count me in results of a national census of inpatients in mental health hospitals and facilities in England and Wales 2005
4 Healthcare Commission Mental Health Act Commission National Institute for Mental Health in England Count me in results of the 2006 national census of inpatients in mental health and learning disability services in England and Wales 2006
5 Healthcare Commission Mental Health Act Commission National Institute for Mental Health in England Count me in results of the 2007 national census of inpatients in mental health and learning disability services in England and Wales 2007
6 Healthcare Commission Mental Health Act Commission National Institute for Mental Health in England Count me in results of the 2008 national census of inpatients in mental health and learning disability services in England and Wales 2008
7 Care Quality Commission National Mental Health Development Unit Results of the 2009 national census of inpatients and patients on supervised community treatment in mental health and learning disability services in England and Wales 2009
8 Department of Health Delivering race equality in mental health care an action plan for reform inside and outside services 2005
9 Welsh Assembly Government Adult Mental Health Services Raising the standard ndash Race Equality Action Plan for Adult Mental Health Services in Wales 2006
10Department of Health No health without mental health a cross-government mental health outcomes strategy for people of all ages 2011 wwwdhgovukprod_consum_dhgroups dh_digitalassetsdocumentsdigitalasset dh_124058pdf
11Department of Health New horizons towards a shared vision for mental health 2009 wwwdhgovukprod_consum_dhgroups dh_digitalassetsdhendocumentsdigital assetdh_109708pdf
12Department of Health Valuing people a new strategy for learning disability for the 21st century 2001
13Department of Health Valuing people now a new three year strategy for people with learning disabilities 2009
14Department of Health Healthcare for all report of the independent inquiry into access to healthcare for people with learning disabilities 2008
15Joint Committee on Human Rights A life like any other human rights of adults with learning disabilities (2008 HL Paper 401 HC 731) House of Lords House of Commons 2008
16Department of Health Valuing people now summary report March 2009 ndash September 2010 2010
17Disability Rights Commission Equal treatment investigation 2005
18Department of Health Mir G Nocon A Ahmad W Jones L Learning difficulties and ethnicity 2000
19ONS experimental population estimates by ethnic group 2007 wwwstatisticsgovukstatbase productaspvlnk=14238
Care Quality Commission Count me in census 2010 46
References continued
20Six percent of population are gay or lesbian according to Whitehall figures 2005 wwwtelegraphcouknewsmainjhtmlxml= news20051212ngay12xmlamps Sheet= news20051212ixhomehtml
21Department of Trade and Industry Amendment to Employment Equality (Sexual Orientation) Regulations 2003 2003
22Office for National Statistics Measuring sexual identity an evaluation report 2010
23 Information Centre Mental Health Bulletin Fourth report from Mental Health Minimum Dataset (MHMDS) annual returns 2010 2011 wwwicnhsukpubsmhbmhmds0910
24 Information Centre Mental Health Bulletin Fourth report from Mental Health Minimum Dataset (MHMDS) annual returns 2010 2011 wwwicnhsukpubsmhbmhmds0910
25The operating framework for the NHS in England 201112 Department of Health 2010 wwwdhgovukprod_consum_dhgroups dh_digitalassetsdhenpsdocuments digitalassetdh_122736pdf
26wwwdhgovukenPublicationsandstatistics LettersandcircularsProfessionalletters ChiefnursingofficerlettersDH_121848
27Department of Health No health without mental health a cross-government mental health outcomes strategy for people of all ages 2011 wwwdhgovukprod_consum_dhgroups dh_digitalassetsdocumentsdigitalasset dh_124058pdf
28Ministry of Justice Breaking the cycle effective punishment rehabilitation and sentencing of offenders 2010
29Department of Health The Bradley report Lord Bradleyrsquos review of people with mental health problems or learning disabilities in the criminal justice system 2009
30Department of Health No health without mental health delivering better mental health outcomes for people of all ages 2011
31Department of Health Equity and excellence liberating the NHS 2010 wwwdhgovukprod_ consum_dhgroupsdh_digitalassetsdhen psdocumentsdigitalassetdh_117794pdf
32Department of Health Healthy lives healthy people our strategy for public health in England 2010 wwwdhgovukprod_consum_dh groupsdh_digitalassetsdhenps documentsdigitalassetdh_122347pdf
33Department of Health A vision for adult social care capable communities and active citizens 2010 wwwdhgovukprod_consum_dh groupsdh_digitalassetsdhenps documentsdigitalassetdh_121971pdf
34Wilson M NMHDU Race equality action plan a five year review Delivering race equality in mental health care 2010 wwwnmhduorgukour-workmhep
35Care Quality Commission Monitoring the use of the Mental Health Act in 200910 2010
36Raleigh V S Collection of data on ethnic origin in England Editorial BMJ 20083376456
37Wilson M NMHDU Race equality action plan a five year review Delivering race equality in mental health care 2010 wwwnmhduorgukour-workmhep
38Department of Health Liberating the NHS an information revolution 2010
Care Quality Commission Count me in census 2010 47
Appendix A Methods of analysis
Standardisation by age and gender
Standardisation allows us to make comparisons between groups of the population by taking account of variations in age and gender Some differences in patterns of service use are related to the age or gender of the people using them so adjustments to the data have to be made to ensure that the interpretation of ethnic differences is reliable For example formal admissions are higher at a younger age so some Black and minority ethnic groups may have high formal admission rates simply because they have a high proportion of younger people Without adjustments for age and gender differences comparisons would be misleading
In this report most results are standardised for age and gender including those relating to admission detention source of referral care programme approach seclusion restraint accidents assault self-harm consent and presence on a secure ward The report uses the accepted statistical method of taking account of age and gender differences between groups when calculating these rates
We used the ONS estimates of total population by ethnic group for England and Wales in 2007 to standardise the rates of admission for different ethnic groups This takes account of the significant rises in the Black and ethnic minority population of England and Wales since the 2001 ONS census and hence gives more accurate and up to date estimates of admission ratios for different ethnic groups (although it does not take account of any further changes in the ethnic populations between 2007 and 2010 the date of this census) For comparison with the DRE baseline we also present admission rates from the 2005 census derived using the 2005 ONS estimates of populations by ethnic group These figures will not be the same as published in the 2005 census report which were based on the 2001 ONS census population estimates because updated estimates of populations by ethnic group were not available at that time
For other analyses we used the total number of inpatients and patients on CTOs in the census
as the basis for standardisation However CTO outpatients are excluded from selected analyses where appropriate namely the analysis of rates for admissions detentions on admission source of referral single sex accommodation and recorded incidents of seclusion restraint accidents assault and self-harm We used the statistical package STATA version 82 to derive the standardised results
It was not possible to adjust the analyses for ethnic differences in social and economic factors and in diagnosis and severity of illness Such factors could affect the ethnic differences observed in the results
For descriptive variables such as religion and language we did not use standardisation
Confidence intervals as indicators of significant statistical differences
For all standardised results the national rates for England and Wales are taken as 100 and the usual 95 confidence intervals are given Rates of less than 100 or greater than 100 for specific ethnic groups show a lower or higher rate respectively than the national average after adjusting for age and gender Whether or not the difference is statistically significant from the national average depends on the confidence interval If the confidence interval overlaps 100 the difference from the national average is not statistically significant If both values are lower or higher than 100 it indicates that the difference compared with the national average is statistically significant at the 95 level
For example if a rate is 110 with the lower confidence interval being 105 and the upper confidence interval being 115 it indicates that the 10 excess over the national average of 100 is statistically significant But if a ratio is 110 with the lower confidence interval being 95 and the upper confidence interval being 125 it indicates that the 10 excess over the national average is not statistically significant We did not attempt to adjust the confidence intervals for multiple comparisons
Care Quality Commission Count me in census 2010 48
Appendix B Mental health tables
Table B1 Standardised admission ratios by ethnic group for England and Wales (excluding outpatients on a CTO) using 2007 ONS census population denominators (England and Wales = 100) All ages
Ethnic group
Men Women Persons Standardised
admission ratio
95 confidence
interval Observed numbers
Standardised admission
ratio
95 confidence
interval Observed numbers
Standardised admission
ratio
95 confidence
interval Observed numbers
White British 88 86 89 12435 94 93 96 10157 91 89 92 22592 White Irish 130 115 146 274 122 106 140 215 126 115 138 489 Other White 117 109 126 731 129 118 141 533 122 115 129 1264 White and Black Caribbean 557 493 627 276 274 223 333 101 436 393 483 377 White and Black African 312 247 388 80 259 186 351 41 292 242 349 121 White and Asian 140 110 174 79 124 90 166 44 134 111 159 123 Other Mixed 230 189 278 108 213 165 270 67 223 192 259 175 Indian 67 59 75 286 66 56 76 172 66 60 73 458 Pakistani 105 93 119 269 65 53 79 96 91 81 100 365 Bangladeshi 123 102 147 120 82 60 109 46 108 92 126 166 Other Asian 161 139 185 192 136 107 169 79 153 135 172 271 Black Caribbean 538 505 572 980 306 277 336 418 438 415 462 1398 Black African 246 226 267 550 219 194 247 277 236 221 253 827 Other Black 792 691 903 222 314 240 403 61 596 529 670 283 Chinese 27 20 38 39 43 30 59 35 33 26 41 74 Other 140 120 162 177 110 88 136 87 128 113 145 264 Total 100 16818 100 12429 100 29247
Care Quality Commission Count me in census 2010 49
Appendix B Mental health tables continued
Table B2 Standardised admission ratios by ethnic group for England and Wales (excluding outpatients on a CTO) using 2007 ONS census population denominators (England amp Wales = 100) Ages 65 and over
Ethnic group
Men Women Persons Standardised
admission ratio
95 confidence
interval Observed numbers
Standardised admission
ratio
95 confidence
interval Observed numbers
Standardised admission
ratio
95 confidence
interval Observed numbers
White British 95 92 99 3265 95 92 98 3887 95 93 97 7152 White Irish 142 116 172 106 102 82 125 92 120 104 138 198 Other White 207 174 244 141 213 183 248 171 210 188 235 312 White and Black Caribbean 406 210 710 12 333 152 632 9 371 230 568 21 White and Black African 231 28 836 2 198 24 714 2 213 58 546 4 White and Asian 28 1 156 1 110 30 281 4 69 23 162 5 Other Mixed 146 40 374 4 228 92 470 7 189 95 339 11 Indian 97 70 132 41 83 57 116 33 90 71 113 74 Pakistani 39 17 77 8 46 18 94 7 42 23 69 15 Bangladeshi 115 53 218 9 69 14 201 3 98 51 172 12 Other Asian 234 143 361 20 215 120 354 15 225 157 313 35 Black Caribbean 216 170 269 77 310 253 376 103 261 224 302 180 Black African 142 73 248 12 365 241 531 27 246 175 337 39 Other Black 164 34 479 3 366 134 796 6 259 119 493 9 Chinese 41 8 120 3 95 38 195 7 68 33 125 10 Other 253 126 453 11 390 238 602 20 327 222 464 31 Total 100 3715 100 4393 100 8108
Care Quality Commission Count me in census 2010 50
Appendix B Mental health tables continued
Table B3 Standardised ratios by ethnic group for patients referred by a GP (England and Wales = 100)
Ethnic group
Men Women Persons Standardised
referral ratio
95 confidence
interval Observed numbers
Standardised referral ratio
95 confidence
interval Observed numbers
Standardised referral ratio
95 confidence
interval Observed numbers
White British 110 103 117 904 107 101 114 1065 108 104 113 1969 White Irish 85 50 134 18 93 57 144 20 89 63 123 38 Other White 74 51 103 33 70 49 97 36 72 56 91 69 White and Black Caribbean 27 5 78 3 30 4 109 2 28 9 65 5 White and Black African 0 0 74 9 268 2 35 4 125 2 White and Asian 165 54 386 5 0 0 86 28 201 5 Other Mixed 48 6 172 2 68 14 198 3 58 19 136 5 Indian 69 34 123 11 79 39 141 11 73 46 111 22 Pakistani 88 42 162 10 59 16 151 4 77 42 130 14 Bangladeshi 81 22 207 4 61 7 221 2 73 27 159 6 Other Asian 80 32 166 7 108 43 223 7 92 50 155 14 Black Caribbean 35 20 56 17 37 20 62 14 36 24 51 31 Black African 57 29 100 12 66 35 113 13 61 40 91 25 Other Black 62 23 135 6 40 5 144 2 54 23 107 8 Chinese 56 1 314 1 139 38 356 4 108 35 251 5 Other 106 46 208 8 0 0 53 23 105 8 Total 100 1041 100 1185 100 2226
Care Quality Commission Count me in census 2010 51
Appendix B Mental health tables continued
Table B4 Standardised ratios by ethnic group for patients referred by a community mental health team (including crisis resolution home treatment) or community learning disability team (England and Wales = 100)
Ethnic group
Men Women Persons Standardised
referral ratio
95 confidence
interval Observed numbers
Standardised referral ratio
95 confidence
interval Observed numbers
Standardised referral ratio
95 confidence
interval Observed numbers
White British 107 104 111 3255 103 100 107 3386 105 103 108 6641 White Irish 90 69 116 61 89 68 114 61 90 74 107 122 Other White 59 48 71 105 79 67 94 141 69 61 78 246 White and Black Caribbean 106 83 135 68 75 49 111 25 96 77 117 93 White and Black African 43 19 84 8 66 30 124 9 52 31 84 17 White and Asian 95 56 150 18 84 43 147 12 90 61 129 30 Other Mixed 78 48 121 20 72 41 118 16 76 53 105 36 Indian 106 83 132 76 100 76 130 56 103 86 122 132 Pakistani 108 84 135 73 89 60 128 30 102 83 123 103 Bangladeshi 98 66 141 29 90 50 148 15 95 69 128 44 Other Asian 88 63 120 40 105 70 150 29 94 73 119 69 Black Caribbean 69 59 80 167 85 71 102 123 75 67 84 290 Black African 84 70 102 112 82 65 103 77 84 72 96 189 Other Black 52 36 74 31 64 36 106 15 56 41 74 46 Chinese 112 53 205 10 101 52 176 12 105 66 160 22 Other 86 60 120 35 106 71 151 30 94 73 120 65 Total 100 4108 100 4037 100 8145
Care Quality Commission Count me in census 2010 52
Appendix B Mental health tables continued
Table B5 Standardised ratios by ethnic group for patients referred by criminal justice routes (police prison probation courts court liaison and diversion) (England and Wales = 100)
Ethnic group
Men Women Persons Standardised
referral ratio
95 confidence
interval Observed numbers
Standardised referral ratio
95 confidence
interval Observed numbers
Standardised referral ratio
95 confidence
interval Observed numbers
White British 90 86 95 1495 95 86 104 421 91 87 95 1916 White Irish 133 94 183 38 59 19 138 5 116 84 157 43 Other White 112 93 134 119 103 68 150 27 111 93 130 146 White and Black Caribbean 117 89 151 58 145 69 266 10 120 94 153 68 White and Black African 190 127 273 29 141 38 361 4 183 126 256 33 White and Asian 75 39 131 12 160 52 373 5 89 52 143 17 Other Mixed 104 65 157 22 151 61 311 7 112 75 161 29 Indian 86 61 118 38 79 32 163 7 85 62 113 45 Pakistani 118 91 150 65 89 33 194 6 115 90 145 71 Bangladeshi 74 44 115 19 29 1 162 1 68 42 105 20 Other Asian 130 95 174 45 164 71 323 8 134 101 176 53 Black Caribbean 131 114 150 208 124 81 181 26 130 114 148 234 Black African 132 112 156 145 143 93 211 25 134 114 156 170 Other Black 141 109 180 65 236 113 435 10 149 117 187 75 Chinese 83 27 194 5 146 30 426 3 99 43 195 8 Other 129 93 175 41 113 37 264 5 127 93 170 46 Total 100 2404 100 570 100 2974
Care Quality Commission Count me in census 2010 53
Appendix B Mental health tables continued
Table B6 Standardised detention ratios by ethnic group all detentions on day of admission (excluding outpatients on a CTO) (England and Wales = 100)
Ethnic group
Men Women Persons Standardised
detention ratio
95 confidence
interval Observed numbers
Standardised detention
ratio
95 confidence
interval Observed numbers
Standardised detention
ratio
95 confidence
interval Observed numbers
White British 94 92 97 6449 94 91 97 3628 94 92 96 10077 White Irish 112 95 131 154 118 96 145 94 114 101 129 248 Other White 108 98 118 451 120 106 136 251 112 104 120 702 White and Black Caribbean 123 107 141 220 129 99 167 59 124 110 140 279 White and Black African 128 99 162 68 113 70 173 21 124 100 153 89 White and Asian 96 71 126 50 109 68 164 22 99 78 125 72 Other Mixed 115 92 143 82 139 100 188 42 122 102 146 124 Indian 97 83 113 164 110 86 137 77 101 88 114 241 Pakistani 109 94 126 194 102 74 136 44 108 94 122 238 Bangladeshi 86 67 109 69 91 55 142 19 87 70 107 88 Other Asian 109 92 130 133 120 86 163 40 112 96 130 173 Black Caribbean 129 121 139 774 143 125 162 238 132 124 141 1012 Black African 115 104 127 422 131 111 153 159 119 110 129 581 Other Black 117 100 136 170 148 105 202 39 122 106 140 209 Chinese 108 71 159 26 129 78 202 19 116 85 156 45 Other 111 92 132 126 116 83 157 41 112 96 130 167 Total 100 9552 100 4793 100 14345
Care Quality Commission Count me in census 2010 54
Appendix B Mental health tables continued
Table B7 Standardised detention ratios by ethnic group detention on day of admission ndash section 2 of the Mental Health Act (England and Wales = 100)
Ethnic group
Men Women Persons Standardised
detention ratio
95 confidence
interval Observed numbers
Standardised detention
ratio
95 confidence
interval Observed numbers
Standardised detention
ratio
95 confidence
interval Observed numbers
White British 97 91 102 1156 93 87 98 1133 95 91 99 2289 White Irish 78 47 120 20 116 79 166 30 97 72 128 50 Other White 100 78 126 70 134 108 166 88 116 99 136 158 White and Black Caribbean 55 30 93 14 60 24 124 7 57 35 87 21 White and Black African 91 37 188 7 150 60 308 7 113 62 190 14 White and Asian 80 29 174 6 119 44 258 6 96 49 167 12 Other Mixed 68 28 141 7 116 53 221 9 89 51 145 16 Indian 130 91 179 37 124 81 182 26 127 98 163 63 Pakistani 126 87 176 34 138 79 225 16 130 96 171 50 Bangladeshi 166 101 256 20 140 61 276 8 158 105 228 28 Other Asian 142 93 209 26 163 93 264 16 150 108 202 42 Black Caribbean 73 57 92 70 97 72 128 51 82 68 98 121 Black African 164 131 202 87 190 146 244 62 174 147 204 149 Other Black 114 75 166 27 140 72 245 12 121 86 165 39 Chinese 165 60 358 6 212 97 402 9 190 106 313 15 Other 218 153 302 36 179 108 280 19 203 153 264 55 Total 100 1623 100 1499 100 3122
Care Quality Commission Count me in census 2010 55
Appendix B Mental health tables continued
Table B8 Standardised detention ratios by ethnic group detention on day of admission ndash section 3 of the Mental Health Act (England and Wales = 100)
Ethnic group
Men Women Persons Standardised
detention ratio
95 confidence
interval Observed numbers
Standardised detention
ratio
95 confidence
interval Observed numbers
Standardised detention
ratio
95 confidence
interval Observed numbers
White British 99 95 103 2684 96 91 100 1852 98 95 101 4536 White Irish 116 89 149 60 135 101 177 52 124 102 149 112 Other White 112 96 129 186 110 92 132 121 111 99 124 307 White and Black Caribbean 114 91 143 79 130 90 183 33 119 98 143 112 White and Black African 97 60 148 21 107 54 192 11 100 69 141 32 White and Asian 84 50 133 18 97 48 173 11 89 59 127 29 Other Mixed 121 84 168 35 117 72 181 20 120 90 156 55 Indian 96 75 122 67 110 79 148 42 101 83 122 109 Pakistani 91 71 115 69 88 55 134 22 90 73 111 91 Bangladeshi 63 39 95 22 64 28 127 8 63 43 90 30 Other Asian 90 65 120 44 94 56 149 18 91 70 117 62 Black Caribbean 116 102 130 279 164 138 192 148 129 117 142 427 Black African 95 80 112 143 102 79 129 68 97 85 111 211 Other Black 75 55 99 49 99 58 159 17 80 62 102 66 Chinese 119 59 213 11 99 43 194 8 110 66 171 19 Other 85 60 116 38 84 48 136 16 84 63 110 54 Total 100 3805 100 2447 100 6252
Care Quality Commission Count me in census 2010 56
Appendix B Mental health tables continued
Table B9 Standardised detention ratios by ethnic group detention on day of admission ndash section 3741 of the Mental Health Act (England and Wales = 100)
Ethnic group
Men Women Persons Standardised
detention ratio
95 confidence
interval Observed numbers
Standardised detention
ratio
95 confidence
interval Observed numbers
Standardised detention
ratio
95 confidence
interval Observed numbers
White British 84 79 89 991 101 88 115 220 86 82 91 1211 White Irish 140 96 198 32 48 6 175 2 126 87 176 34 Other White 112 89 139 81 156 95 241 20 118 96 144 101 White and Black Caribbean 177 133 232 53 179 66 390 6 178 135 229 59 White and Black African 149 82 251 14 224 46 654 3 159 92 254 17 White and Asian 141 75 241 13 195 40 569 3 149 85 241 16 Other Mixed 144 85 227 18 264 97 575 6 162 104 242 24 Indian 86 56 126 26 44 5 160 2 80 53 116 28 Pakistani 122 87 166 40 0 0 111 79 152 40 Bangladeshi 66 32 122 10 0 0 60 29 110 10 Other Asian 99 61 151 21 0 0 89 55 136 21 Black Caribbean 200 174 229 210 78 34 153 8 189 165 216 218 Black African 127 101 157 82 84 34 172 7 122 98 150 89 Other Black 152 110 205 43 94 11 341 2 148 108 198 45 Chinese 100 27 255 4 0 0 80 22 204 4 Other 118 75 177 23 44 1 245 1 110 71 164 24 Total 100 1661 100 280 100 1941
Care Quality Commission Count me in census 2010 57
Appendix B Mental health tables continued
Table B10 Standardised detention ratios by ethnic group detention on day of admission ndash sections 47 48 4749 of the Mental Health Act (England and Wales = 100)
Ethnic group
Men Women Persons Standardised
detention ratio
95 confidence
interval Observed numbers
Standardised detention
ratio
95 confidence
interval Observed numbers
Standardised detention
ratio
95 confidence
interval Observed numbers
White British 97 90 106 583 104 81 131 73 98 91 106 656 White Irish 132 72 221 14 163 20 590 2 135 77 219 16 Other White 130 96 172 49 71 15 206 3 124 93 163 52 White and Black Caribbean 126 78 193 21 80 2 444 1 123 77 186 22 White and Black African 207 103 370 11 0 0 189 95 339 11 White and Asian 57 12 166 3 169 4 941 1 68 19 175 4 Other Mixed 112 48 221 8 233 28 843 2 125 60 230 10 Indian 57 26 108 9 0 252 0 52 24 99 9 Pakistani 92 54 147 17 0 314 0 86 50 138 17 Bangladeshi 46 12 117 4 167 4 930 1 53 17 125 5 Other Asian 101 52 177 12 0 0 95 49 166 12 Black Caribbean 126 98 159 70 125 34 319 4 126 99 158 74 Black African 74 48 107 27 104 21 303 3 76 51 108 30 Other Black 127 78 197 20 138 3 769 1 128 79 195 21 Chinese 0 0 0 0 0 0 Other 83 38 157 9 0 0 77 35 147 9 Total 100 857 100 91 100 948
Care Quality Commission Count me in census 2010 58
Appendix B Mental health tables continued
Table B11 Standardised ratios for all applications of the Mental Health Act (including outpatients on a CTO) by ethnic group on day of census (England and Wales = 100)
Ethnic group
Men Women Persons Standardised
ratio for all MHA
applications
95 confidence
interval Observed numbers
Standardised ratio for all MHA
applications
95 confidence
interval Observed numbers
Standardised ratio for all MHA
applications
95 confidence
interval Observed numbers
White British 97 94 99 7659 95 93 98 4335 96 94 98 11994 White Irish 99 83 116 147 104 84 128 95 101 89 114 242 Other White 87 79 95 427 97 85 110 249 90 84 97 676 White and Black Caribbean 117 103 133 245 130 103 163 76 120 107 134 321 White and Black African 120 95 150 79 93 58 141 22 113 92 137 101 White and Asian 101 78 128 65 119 81 169 31 106 86 129 96 Other Mixed 110 89 134 96 125 93 165 49 114 97 135 145 Indian 103 90 118 215 122 100 147 109 109 97 121 324 Pakistani 111 97 125 254 117 90 148 67 112 100 125 321 Bangladeshi 92 75 112 97 101 68 145 29 94 78 112 126 Other Asian 103 88 121 152 126 95 164 56 109 94 124 208 Black Caribbean 123 115 131 893 141 126 158 300 127 120 134 1193 Black African 112 103 122 511 121 104 140 188 114 106 123 699 Other Black 116 102 132 232 148 112 191 59 122 108 136 291 Chinese 97 64 140 27 101 61 157 19 98 72 131 46 Other 104 87 122 140 103 75 137 46 103 89 119 186 Total 100 11239 100 5730 100 16969
Care Quality Commission Count me in census 2010 59
Appendix B Mental health tables continued
Table B12 Standardised CTO ratios by ethnic group CTOs on day of census ndash section 17a of the Mental Health Act (England and Wales = 100)
Ethnic group
Men Women Persons
Standardised CTO ratio
95 confidence
interval Observed numbers
Standardised CTO ratio
95 confidence
interval Observed numbers
Standardised CTO ratio
95 confidence
interval Observed numbers
White British 94 89 99 1289 88 82 94 730 92 88 96 2019 White Irish 51 27 88 13 77 41 132 13 62 40 90 26 Other White 97 77 120 83 125 95 162 58 107 90 126 141 White and Black Caribbean 79 53 113 29 141 77 237 14 92 67 124 43 White and Black African 111 59 190 13 125 41 292 5 115 68 181 18 White and Asian 104 54 182 12 136 50 297 6 113 67 178 18 Other Mixed 102 59 166 16 136 62 257 9 112 73 166 25 Indian 134 99 177 48 152 98 226 24 139 109 175 72 Pakistani 145 110 187 59 174 101 279 17 151 119 189 76 Bangladeshi 142 93 206 27 205 99 378 10 155 109 213 37 Other Asian 107 71 155 28 182 99 305 14 124 89 168 42 Black Caribbean 121 103 142 152 171 132 218 65 133 116 152 217 Black African 116 94 142 94 139 98 192 37 122 102 145 131 Other Black 186 144 238 65 305 189 466 21 206 165 254 86 Chinese 83 23 213 4 152 49 354 5 111 51 211 9 Other 87 54 134 21 152 79 266 12 103 71 145 33 Total 100 1953 100 1040 100 2993
Care Quality Commission Count me in census 2010 60
Appendix C Learning disability tables
Table C1 Standardised admission ratios by ethnic group for England and Wales using 2007 ONS population denominators (England amp Wales = 100) All ages
Ethnic group
Men Women Persons Standardised
admission ratio
95 confidence
interval Observed numbers
Standardised admission
ratio
95 confidence
interval Observed numbers
Standardised admission
ratio
95 confidence
interval Observed numbers
White British 104 100 109 2163 108 101 115 941 105 102 109 3104 White Irish 108 72 156 28 151 89 238 18 121 89 162 46 Other White 81 65 101 85 49 30 75 21 72 59 87 106 White and Black Caribbean 280 186 405 28 246 118 453 10 270 191 371 38 White and Black African 102 33 239 5 165 34 482 3 119 51 235 8 White and Asian 66 26 135 7 154 56 335 6 89 47 152 13 Other Mixed 181 104 295 16 229 99 451 8 195 125 290 24 Indian 32 21 48 24 28 12 55 8 31 21 44 32 Pakistani 48 30 72 22 12 1 43 2 38 25 57 24 Bangladeshi 102 60 161 18 31 4 113 2 83 51 128 20 Other Asian 33 13 69 7 92 34 201 6 47 25 81 13 Black Caribbean 265 210 332 77 117 67 190 16 218 176 267 93 Black African 53 33 80 22 40 15 87 6 50 33 72 28 Other Black 228 118 399 12 134 28 392 3 200 112 330 15 Chinese 4 0 21 1 3 0 16 1 Other 26 9 56 6 11 0 59 1 21 9 44 7 Total 100 2521 100 1051 100 3572
Care Quality Commission Count me in census 2010 61
Appendix C Learning disability tables continued
Table C2 Standardised detention ratios by ethnic group all detentions on day of admission (England and Wales = 100)
Ethnic group
Persons Standardised
detention ratio
95 confidence
interval Observed numbers
White British 97 93 103 1431 White Irish 127 84 184 28 Other White 117 91 149 68 White and Black Caribbean 120 77 179 24 White and Black African 114 37 267 5 White and Asian 75 24 176 5 Other Mixed 94 49 165 12 Indian 119 72 186 19 Pakistani 110 61 181 15 Bangladeshi 144 84 231 17 Other Asian 59 16 150 4 Black Caribbean 119 90 155 57 Black African 138 85 210 21 Other Black 62 20 145 5 Chinese 0 0 Other 104 28 267 4 Total 100 1715
Care Quality Commission Count me in census 2010 62
copy Care Quality Commission and National Mental Health Development Unit 2011 Published April 2011
This publication may be reproduced in whole or in part in any format or medium for non-commercial purposes provided that it is reproduced accurately and not used in a derogatory manner or in a misleading context The source should be acknowledged by showing the publication title and copy Care Quality Commission and National Mental Health Development Unit 2011
How to contact us
Phone 03000 616161 Email enquiriescqcorguk Web wwwcqcorguk
Write to us at Care Quality Commission National Correspondence Citygate Gallowgate Newcastle upon Tyne NE1 4PA
Please contact us if you would like a summary of this publication in other formats or languages
Registered office Care Quality Commission Finsbury Tower 103ndash105 Bunhill Row London EC1Y 8TG
- Count me in 2010
- About the Care Quality Commission
- Contents
- Summary
- National organisations coordinating the census
- Introduction
- Data methods of analysis and interpretation
- Results mental health
- A comparison between the 2005 baseline and the 2010 census
- Results learning disabilities
- Data in the future Moving beyond a one-day census
- Conclusions
- References
- Appendix A Methods of analysis
- Appendix B Mental health tables
- Appendix C Learning disability tables
- How to contact us
-

Data in the future Moving beyond a one-day census
For six years the Count me in census has provided a valuable one-day snapshot of inpatients in mental health and learning disability services And with the proportion of inpatients who are detained increasing steadily (from 25 in 200506 to 39 in 200910 ndash see Figure 2) ongoing ethnic monitoring of admissions and detentions becomes more vital than ever
However a one-day census only captures some events and the profile of patients can differ across a whole year For example there were
bull 29840 inpatients in the 2010 census compared with 107765 inpatients overall during 200910
bull 17299 patients in the 2010 census who were detained or on CTOs compared with 42479 new detentions and some 4100 new CTOs overall in England in 200910
bull 26 of patients in hospital for under one month and 31 for over one year per the census
whereas the MHMDS data consistently shows that for over 50 of records the average length of an inpatient stay was under one month and for 4 it was over one year
Looking ahead it is vital that robust data is available on all admitted patients and all those subject to the Mental Health Act not just those in hospital on one particular day Moreover patterns of use and outcomes of community care can have an impact on the need for admission to hospital and the risk of detention ndash therefore information about the care provided to patients before admission to hospital during their hospital stay and after they leave is also vital Furthermore under 84 of the 127 million people using specialist mental health services are admitted to hospital23 and so it is very important to examine the quality of community care for the 90 of patients who are not admitted to hospital
Figure 2 Number of people spending time in hospital 200506 to 200910
Num
ber
of p
atie
nts
90000
80000
70000
60000
50000
40000
30000
20000
10000
0 200506 200607 200708 200809 200910
Source NHS Information Centre Formally detained Not detained MHMDS Bulletin 2011
Care Quality Commission Count me in census 2010 40
Data in the future Moving beyond a one-day census continued
The Mental Health Minimum Data Set (MHMDS) is a rich source of data on people using specialist mental health services in England It covers both community and hospital services and includes a wide range of information about the demographic clinical and socioeconomic characteristics of individual patients and the services provided to those admitted to hospital and to the much larger number of those who donrsquot need a stay in hospital The data includes information about contact with services uses of the Mental Health Act and the Care Programme Approach for each individual patient All these details enable the use of services patterns of care and patient outcomes to be tracked including along pathways of care The MHMDS therefore provides a robust basis for ongoing monitoring of access to and outcomes of care for users of specialist ndash both community and hospital ndash mental health services
The MHMDS also enables an analysis of the numbers and rates of people from different ethnic groups using specialist mental health services overall (both inpatient and community) which provides an indication of the levels of mental illness and therefore the need for specialist care in different communities
At present the MHMDS does not cover high secure services and independent sector providers only started to provide data during 201011 However to support payment by results for mental health the scope of the data set will be extended to cover high secure services during 201112 (version 4 MHMDS) Further proposed changes to the dataset (version 41) will incorporate NHS-funded learning disability services and primary care mental health services A separate dataset for child and adolescent mental health services (CAMHS) has been developed and is awaiting formal approvals It is designed to include the same information about uses of the Mental Health Act as provided in the MHMDS
The latest MHMDS bulletin for 200910 provides a description of people using specialist mental health services in England including ethnic profiles of people using services hospital admissions detentions and the number of people on CPA24 It also provides information on differences by age and gender The bulletin illustrates some of the sorts of analyses that are possible using data from the MHMDS
The NHS Information Centre can provide guidance on these and other potential analyses based on MHMDS data
Care Quality Commission Count me in census 2010 41
Conclusions
While this report reviews changes in the census results since 2005 it is not a review or evaluation of the DRE programme overall Similarly the census cannot provide explanations for the patterns observed or examine whether mental health services are meeting the needs of individual ethnic minority groups As we have noted previously the results are subject to caveats in particular that the census provides a one-day snapshot that may not be representative of patients admitted to hospital throughout the year
Overview of findings
Overall the findings from the 2010 census show little change from those reported for previous annual censuses conducted since 2005 This is partly because many patients had been in hospital for a considerable period of time and had therefore been included in successive censuses The findings of this sixth and last census continue to show differences between Black and minority ethnic groups and White groups and also differences within these groups
In particular ethnic differences in rates of admission detention under the Mental Health Act and seclusion ndash three of DRErsquos 12 goals ndash have not altered materially since the inception of DRE in 2005
bull Admission rates remain higher than average among minority ethnic groups especially among Black and WhiteBlack Mixed groups for whom rates were two or more times higher than average in 2010 The Other Black group continues to have the highest admission rate ndash six times higher than average ndash although this is lower than in 2005 In contrast admission rates have consistently been lower than average among the Indian and Chinese groups and about average in the Pakistani and Bangladeshi groups
bull Detention rates remain higher than average among the Black and WhiteBlack Caribbean Mixed groups and among the Other White group A consistent pattern across all censuses was the higher than average detention rate
under section 3741 for the Black Caribbean and Other Black groups We also found that rates for being placed on a CTO were higher among the South Asian and Black groups
bull Although there have been annual fluctuations in seclusion rates they have been higher than average for the Black WhiteBlack Mixed and Other White groups in at least three of the six censuses
Overall the level of provision of single sex areas for patients continues to be unsatisfactory although there was no evidence that minority ethnic patients were disadvantaged in these respects Government policy for the NHS in England now requires that all providers of NHS-funded care including mental health trusts are expected to eliminate mixed-sex accommodation in accordance with the guidance set out in CNO201032526 From 2011 all providers of NHS-funded care must report breaches of sleeping accommodation which will attract sanctions
Implications for ways forward
The census findings do not in themselves show that mental health and learning disability services are failing to meet the needs of Black and minority ethnic service users
As noted in previous reports they need to be interpreted in the context of available evidence on ethnic differences in rates of mental illness pathways to care and factors such as socioeconomic disadvantages that all contribute to these differences Our previous reports have consistently highlighted the need for prevention early intervention and working collaboratively across sectors to reduce the risk of admission and detention where possible without compromising the care given to patients Mental health services have a key role to play but to achieve this all statutory agencies and organisations outside the healthcare sector Black and minority ethnic communities and people who use services themselves will need to work in partnership
Care Quality Commission Count me in census 2010 42
Conclusions continued
This message ndash about preventing mental ill-health by addressing the contributory factors and intervening early ndash is at the heart of No health without mental health the Department of Healthrsquos new strategy for the future of mental health care in England27
The strategy aims to tackle the economic social and environmental determinants and consequences of mental health problems and to improve outcomes and reduce inequalities
It specifies that by 2014 people in contact with the criminal justice system will have improved access to mental health services as set out in the Ministry of Justice Green Paper Breaking the Cycle Effective punishment rehabilitation and sentencing of offenders which confirms the approach outlined in Lord Bradleyrsquos report for early intervention and diversion from custody2829
Accompanying the new strategy is a supporting document that explains how its objectives will improve mental health outcomes the effective interventions and the underpinning evidence base30
The strategy is complemented by other government proposals for reforms in the NHS public health and adult social care as outlined in the NHS White Paper Equity and excellence liberating the NHS31 the public health strategy Healthy lives healthy people32 and the adult social care strategy A vision for adult social care capable communities and active citizens 33 Three outcomes frameworks have been developed alongside these strategies improving mental health outcomes and reducing inequalities is integral to them all
In this new healthcare landscape the proposed NHS Commissioning Board and GP consortia will have a statutory obligation to promote equality and reduce inequalities in healthcare (something also enshrined in the Equality Act 2010) As the lead commissioners of healthcare services it will be up to GP consortia to assess with local authorities the needs of their local populations and commission the right services that meet their requirements
And the strengthened public health role of local authorities offers significant potential for addressing the socioeconomic disadvantages faced by Black and minority ethnic communities which add to the burden of mental illness in these communities
Race Equality Action Plan A five-year review looked back at the work of the DRE action plan and describes some of the key challenges successes and learning34 Based on the experience and outcome of the DRE programme the report suggests ways forward for the next stage of mental health strategy development and implementation
Since April 2009 CQC has had a duty under the Mental Health Act 1983 to monitor how services exercise their powers in relation to patients who are detained in hospital or subject to CTOs or guardianship under the Act In its first annual report on the use of the Act CQC recommends a number of areas where improvements are needed for example over-occupancy on inpatient wards patient engagement use of control and restraint seclusion and capacity and consent35
In particular CQC highlighted a number of issues relating to the use of CTOs including concern about appropriate usage (30 of the patients in CQCrsquos sample did not have a reported history of non-compliance or disengagement with services after discharge) and over-representation of Black and minority ethnic groups CQC advised that research on the possible race equality impact of CTOs should be undertaken There were 6237 CTOs from their introduction in November 2008 to 31 March 2010 a much greater use of them than forecast for this period by the Department of Health before the power was introduced Just 31 of these orders had ended by end March 2010 suggesting that some people are being kept on supervised community treatment for long periods
Care Quality Commission Count me in census 2010 43
Conclusions continued
Data in the future Moving beyond a one-day census
Good information is the foundation of an effective healthcare system It is imperative for ensuring that services meet the needs of local populations and are equitable and that improvements are made where needed The availability of fit-for-purpose and comprehensive patient-level data sets with ethnicity and other key variables fully coded is therefore vitally important36 It enables the care provided to patients of all ethnic backgrounds to be monitored on an ongoing basis including for monitoring compliance with the Equality Act
Race Equality Action Plan A five-year review notes that better collection monitoring and use of ethnicity data to inform commissioning and provision in health and social care is required37 Key areas include good ethnic monitoring improving demographic information and ensuring good links between infomatics audit and equality and diversity leads within trusts in order to effectively use the information to inform service development monitoring and review at board management ward and community levels
The governmentrsquos proposed changes to the NHS will be supported by an information revolution aimed at improving and extending the information available to the NHS patients and the public on the quality and outcomes of NHS services including by equality dimensions38
Having information that is fit for purpose is vital for the effective regulation of mental health and learning disability services CQC uses routinely available data sets on an ongoing basis to assess the performance of health and social care organisations and their compliance with government policies and legislation We therefore expect those who commission and provide mental healthcare in the NHS and independent sector to have information systems that provide good quality data with fully
comprehensive recording and monitoring of ethnicity on an ongoing basis
Since 2005 the Count me in census has played a key role in providing information about the ethnicity and other characteristics of inpatients in mental health and learning disability services and on patients subject to the Mental Health Act It did this by providing a valuable one-day snapshot But ethnicity recording must be seen as an all-year round statutory requirement not a one-day annual event The number of inpatients throughout the year is much higher than the counts on one day and some patients will have more than one admission And there is a need to move on from counting patients to understanding more about care pathways for Black and minority ethnic patients and the factors leading to hospital admission and detention
We have consistently highlighted the need for commissioners and providers to make full use of the Mental Health Minimum Data Set (MHMDS) ndash the statutory data set submitted by providers of specialist mental health services in England It provides rich data on these issues and provides a robust information source for ongoing ethnic monitoring after this last census
Covering both community and hospital services ndash and now independent and third sector providers as well as NHS ndash it includes a wide range of information about individual patients the services provided to those admitted to hospital and to the much larger number who donrsquot need admission to hospital and the outcomes of care And because it includes year-round activity it is more representative of the overall picture of for example admission detention and readmission rates length of stay years in psychiatric care and contacts with services and professionals
We call on the Information Centre to routinely publish data on all admissions and uses of the Mental Health Act including CTOs in England (in both NHS and independent healthcare providers) by the ethnicity of
Care Quality Commission Count me in census 2010 44
Conclusions continued
patients making the MHMDS the definitive source of information about mental health and learning disability patients This data should be risk-adjusted for age gender and other variables as appropriate to enable reliable comparisons to be made across groups
It is important that all providers ndash NHS and independent ndash make strenuous efforts to improve the quality of the data they submit The Information Centre publishes reports on the quality of MHMDS data by provider (see wwwicnhsukservices mhmdsdq) and we urge providers to monitor this information and use it to improve their data quality
If GP consortia and local authorities are to be effective in their needs assessment and commissioning roles the Information Centre needs to make available and promote to them the data from the MHMDS and other sources And researchers and academics must make full use of the MHMDS to explore the factors that underlie the observed ethnic patterns
CQCrsquos role
In the meantime CQC will continue to focus strongly on the quality of care provided by mental health and learning disability services
People who find themselves admitted to mental health services or detained under the Mental Health Act and therefore counted by the Count me in census are among the most mentally unwell people in our society Our job is first and foremost to make sure that the care they receive meets the essential standards of quality and safety set out under the Health and Social Care Act 2008 and to work with providers to ensure this We act swiftly when we find services that do not Where we find systemic problems that organisations have not adequately addressed we may impose conditions on the providerrsquos registration to bring about the change needed to improve patientsrsquo experience of care
The essential standards of quality and safety include the requirement to provide single sex accommodation and we will continue to closely check that these standards are met by all mental health services
We intend to introduce a number of indicators derived from the rich information in the MHMDS into our quality and risk profiles for providers This will put greater emphasis on the experience of Black and minority ethnic patients in our regulatory activity
We will monitor the quality of MHMDS data submitted by providers (as reported by the NHS Information Centre) including independent service providers Those with poor data quality may be considered at higher risk in terms of their quality of care
In addition we will continue to monitor the progress of services in relation to the issues raised in the census and other reports including our report on the use of the Mental Health Act through our visits to services and meetings with patients by our Mental Health Act Commissioners and second opinion appointed doctors (SOADs) We will draw on patientsrsquo experiences to monitor the operation of the Mental Health Act
We will also assess the impact of advice and use of Local HealthWatch Local HealthWatch will be in a good position to make sure that providers and commissioners are held to account on matters of choice and access to services for people from Black and minority ethnic groups
Care Quality Commission Count me in census 2010 45
References
1 Department of Health Equity and excellence liberating the NHS 2010
2 Department of Health The NHS outcomes framework 201112 2010
3 Healthcare Commission Mental Health Act Commission National Institute for Mental Health in England Count me in results of a national census of inpatients in mental health hospitals and facilities in England and Wales 2005
4 Healthcare Commission Mental Health Act Commission National Institute for Mental Health in England Count me in results of the 2006 national census of inpatients in mental health and learning disability services in England and Wales 2006
5 Healthcare Commission Mental Health Act Commission National Institute for Mental Health in England Count me in results of the 2007 national census of inpatients in mental health and learning disability services in England and Wales 2007
6 Healthcare Commission Mental Health Act Commission National Institute for Mental Health in England Count me in results of the 2008 national census of inpatients in mental health and learning disability services in England and Wales 2008
7 Care Quality Commission National Mental Health Development Unit Results of the 2009 national census of inpatients and patients on supervised community treatment in mental health and learning disability services in England and Wales 2009
8 Department of Health Delivering race equality in mental health care an action plan for reform inside and outside services 2005
9 Welsh Assembly Government Adult Mental Health Services Raising the standard ndash Race Equality Action Plan for Adult Mental Health Services in Wales 2006
10Department of Health No health without mental health a cross-government mental health outcomes strategy for people of all ages 2011 wwwdhgovukprod_consum_dhgroups dh_digitalassetsdocumentsdigitalasset dh_124058pdf
11Department of Health New horizons towards a shared vision for mental health 2009 wwwdhgovukprod_consum_dhgroups dh_digitalassetsdhendocumentsdigital assetdh_109708pdf
12Department of Health Valuing people a new strategy for learning disability for the 21st century 2001
13Department of Health Valuing people now a new three year strategy for people with learning disabilities 2009
14Department of Health Healthcare for all report of the independent inquiry into access to healthcare for people with learning disabilities 2008
15Joint Committee on Human Rights A life like any other human rights of adults with learning disabilities (2008 HL Paper 401 HC 731) House of Lords House of Commons 2008
16Department of Health Valuing people now summary report March 2009 ndash September 2010 2010
17Disability Rights Commission Equal treatment investigation 2005
18Department of Health Mir G Nocon A Ahmad W Jones L Learning difficulties and ethnicity 2000
19ONS experimental population estimates by ethnic group 2007 wwwstatisticsgovukstatbase productaspvlnk=14238
Care Quality Commission Count me in census 2010 46
References continued
20Six percent of population are gay or lesbian according to Whitehall figures 2005 wwwtelegraphcouknewsmainjhtmlxml= news20051212ngay12xmlamps Sheet= news20051212ixhomehtml
21Department of Trade and Industry Amendment to Employment Equality (Sexual Orientation) Regulations 2003 2003
22Office for National Statistics Measuring sexual identity an evaluation report 2010
23 Information Centre Mental Health Bulletin Fourth report from Mental Health Minimum Dataset (MHMDS) annual returns 2010 2011 wwwicnhsukpubsmhbmhmds0910
24 Information Centre Mental Health Bulletin Fourth report from Mental Health Minimum Dataset (MHMDS) annual returns 2010 2011 wwwicnhsukpubsmhbmhmds0910
25The operating framework for the NHS in England 201112 Department of Health 2010 wwwdhgovukprod_consum_dhgroups dh_digitalassetsdhenpsdocuments digitalassetdh_122736pdf
26wwwdhgovukenPublicationsandstatistics LettersandcircularsProfessionalletters ChiefnursingofficerlettersDH_121848
27Department of Health No health without mental health a cross-government mental health outcomes strategy for people of all ages 2011 wwwdhgovukprod_consum_dhgroups dh_digitalassetsdocumentsdigitalasset dh_124058pdf
28Ministry of Justice Breaking the cycle effective punishment rehabilitation and sentencing of offenders 2010
29Department of Health The Bradley report Lord Bradleyrsquos review of people with mental health problems or learning disabilities in the criminal justice system 2009
30Department of Health No health without mental health delivering better mental health outcomes for people of all ages 2011
31Department of Health Equity and excellence liberating the NHS 2010 wwwdhgovukprod_ consum_dhgroupsdh_digitalassetsdhen psdocumentsdigitalassetdh_117794pdf
32Department of Health Healthy lives healthy people our strategy for public health in England 2010 wwwdhgovukprod_consum_dh groupsdh_digitalassetsdhenps documentsdigitalassetdh_122347pdf
33Department of Health A vision for adult social care capable communities and active citizens 2010 wwwdhgovukprod_consum_dh groupsdh_digitalassetsdhenps documentsdigitalassetdh_121971pdf
34Wilson M NMHDU Race equality action plan a five year review Delivering race equality in mental health care 2010 wwwnmhduorgukour-workmhep
35Care Quality Commission Monitoring the use of the Mental Health Act in 200910 2010
36Raleigh V S Collection of data on ethnic origin in England Editorial BMJ 20083376456
37Wilson M NMHDU Race equality action plan a five year review Delivering race equality in mental health care 2010 wwwnmhduorgukour-workmhep
38Department of Health Liberating the NHS an information revolution 2010
Care Quality Commission Count me in census 2010 47
Appendix A Methods of analysis
Standardisation by age and gender
Standardisation allows us to make comparisons between groups of the population by taking account of variations in age and gender Some differences in patterns of service use are related to the age or gender of the people using them so adjustments to the data have to be made to ensure that the interpretation of ethnic differences is reliable For example formal admissions are higher at a younger age so some Black and minority ethnic groups may have high formal admission rates simply because they have a high proportion of younger people Without adjustments for age and gender differences comparisons would be misleading
In this report most results are standardised for age and gender including those relating to admission detention source of referral care programme approach seclusion restraint accidents assault self-harm consent and presence on a secure ward The report uses the accepted statistical method of taking account of age and gender differences between groups when calculating these rates
We used the ONS estimates of total population by ethnic group for England and Wales in 2007 to standardise the rates of admission for different ethnic groups This takes account of the significant rises in the Black and ethnic minority population of England and Wales since the 2001 ONS census and hence gives more accurate and up to date estimates of admission ratios for different ethnic groups (although it does not take account of any further changes in the ethnic populations between 2007 and 2010 the date of this census) For comparison with the DRE baseline we also present admission rates from the 2005 census derived using the 2005 ONS estimates of populations by ethnic group These figures will not be the same as published in the 2005 census report which were based on the 2001 ONS census population estimates because updated estimates of populations by ethnic group were not available at that time
For other analyses we used the total number of inpatients and patients on CTOs in the census
as the basis for standardisation However CTO outpatients are excluded from selected analyses where appropriate namely the analysis of rates for admissions detentions on admission source of referral single sex accommodation and recorded incidents of seclusion restraint accidents assault and self-harm We used the statistical package STATA version 82 to derive the standardised results
It was not possible to adjust the analyses for ethnic differences in social and economic factors and in diagnosis and severity of illness Such factors could affect the ethnic differences observed in the results
For descriptive variables such as religion and language we did not use standardisation
Confidence intervals as indicators of significant statistical differences
For all standardised results the national rates for England and Wales are taken as 100 and the usual 95 confidence intervals are given Rates of less than 100 or greater than 100 for specific ethnic groups show a lower or higher rate respectively than the national average after adjusting for age and gender Whether or not the difference is statistically significant from the national average depends on the confidence interval If the confidence interval overlaps 100 the difference from the national average is not statistically significant If both values are lower or higher than 100 it indicates that the difference compared with the national average is statistically significant at the 95 level
For example if a rate is 110 with the lower confidence interval being 105 and the upper confidence interval being 115 it indicates that the 10 excess over the national average of 100 is statistically significant But if a ratio is 110 with the lower confidence interval being 95 and the upper confidence interval being 125 it indicates that the 10 excess over the national average is not statistically significant We did not attempt to adjust the confidence intervals for multiple comparisons
Care Quality Commission Count me in census 2010 48
Appendix B Mental health tables
Table B1 Standardised admission ratios by ethnic group for England and Wales (excluding outpatients on a CTO) using 2007 ONS census population denominators (England and Wales = 100) All ages
Ethnic group
Men Women Persons Standardised
admission ratio
95 confidence
interval Observed numbers
Standardised admission
ratio
95 confidence
interval Observed numbers
Standardised admission
ratio
95 confidence
interval Observed numbers
White British 88 86 89 12435 94 93 96 10157 91 89 92 22592 White Irish 130 115 146 274 122 106 140 215 126 115 138 489 Other White 117 109 126 731 129 118 141 533 122 115 129 1264 White and Black Caribbean 557 493 627 276 274 223 333 101 436 393 483 377 White and Black African 312 247 388 80 259 186 351 41 292 242 349 121 White and Asian 140 110 174 79 124 90 166 44 134 111 159 123 Other Mixed 230 189 278 108 213 165 270 67 223 192 259 175 Indian 67 59 75 286 66 56 76 172 66 60 73 458 Pakistani 105 93 119 269 65 53 79 96 91 81 100 365 Bangladeshi 123 102 147 120 82 60 109 46 108 92 126 166 Other Asian 161 139 185 192 136 107 169 79 153 135 172 271 Black Caribbean 538 505 572 980 306 277 336 418 438 415 462 1398 Black African 246 226 267 550 219 194 247 277 236 221 253 827 Other Black 792 691 903 222 314 240 403 61 596 529 670 283 Chinese 27 20 38 39 43 30 59 35 33 26 41 74 Other 140 120 162 177 110 88 136 87 128 113 145 264 Total 100 16818 100 12429 100 29247
Care Quality Commission Count me in census 2010 49
Appendix B Mental health tables continued
Table B2 Standardised admission ratios by ethnic group for England and Wales (excluding outpatients on a CTO) using 2007 ONS census population denominators (England amp Wales = 100) Ages 65 and over
Ethnic group
Men Women Persons Standardised
admission ratio
95 confidence
interval Observed numbers
Standardised admission
ratio
95 confidence
interval Observed numbers
Standardised admission
ratio
95 confidence
interval Observed numbers
White British 95 92 99 3265 95 92 98 3887 95 93 97 7152 White Irish 142 116 172 106 102 82 125 92 120 104 138 198 Other White 207 174 244 141 213 183 248 171 210 188 235 312 White and Black Caribbean 406 210 710 12 333 152 632 9 371 230 568 21 White and Black African 231 28 836 2 198 24 714 2 213 58 546 4 White and Asian 28 1 156 1 110 30 281 4 69 23 162 5 Other Mixed 146 40 374 4 228 92 470 7 189 95 339 11 Indian 97 70 132 41 83 57 116 33 90 71 113 74 Pakistani 39 17 77 8 46 18 94 7 42 23 69 15 Bangladeshi 115 53 218 9 69 14 201 3 98 51 172 12 Other Asian 234 143 361 20 215 120 354 15 225 157 313 35 Black Caribbean 216 170 269 77 310 253 376 103 261 224 302 180 Black African 142 73 248 12 365 241 531 27 246 175 337 39 Other Black 164 34 479 3 366 134 796 6 259 119 493 9 Chinese 41 8 120 3 95 38 195 7 68 33 125 10 Other 253 126 453 11 390 238 602 20 327 222 464 31 Total 100 3715 100 4393 100 8108
Care Quality Commission Count me in census 2010 50
Appendix B Mental health tables continued
Table B3 Standardised ratios by ethnic group for patients referred by a GP (England and Wales = 100)
Ethnic group
Men Women Persons Standardised
referral ratio
95 confidence
interval Observed numbers
Standardised referral ratio
95 confidence
interval Observed numbers
Standardised referral ratio
95 confidence
interval Observed numbers
White British 110 103 117 904 107 101 114 1065 108 104 113 1969 White Irish 85 50 134 18 93 57 144 20 89 63 123 38 Other White 74 51 103 33 70 49 97 36 72 56 91 69 White and Black Caribbean 27 5 78 3 30 4 109 2 28 9 65 5 White and Black African 0 0 74 9 268 2 35 4 125 2 White and Asian 165 54 386 5 0 0 86 28 201 5 Other Mixed 48 6 172 2 68 14 198 3 58 19 136 5 Indian 69 34 123 11 79 39 141 11 73 46 111 22 Pakistani 88 42 162 10 59 16 151 4 77 42 130 14 Bangladeshi 81 22 207 4 61 7 221 2 73 27 159 6 Other Asian 80 32 166 7 108 43 223 7 92 50 155 14 Black Caribbean 35 20 56 17 37 20 62 14 36 24 51 31 Black African 57 29 100 12 66 35 113 13 61 40 91 25 Other Black 62 23 135 6 40 5 144 2 54 23 107 8 Chinese 56 1 314 1 139 38 356 4 108 35 251 5 Other 106 46 208 8 0 0 53 23 105 8 Total 100 1041 100 1185 100 2226
Care Quality Commission Count me in census 2010 51
Appendix B Mental health tables continued
Table B4 Standardised ratios by ethnic group for patients referred by a community mental health team (including crisis resolution home treatment) or community learning disability team (England and Wales = 100)
Ethnic group
Men Women Persons Standardised
referral ratio
95 confidence
interval Observed numbers
Standardised referral ratio
95 confidence
interval Observed numbers
Standardised referral ratio
95 confidence
interval Observed numbers
White British 107 104 111 3255 103 100 107 3386 105 103 108 6641 White Irish 90 69 116 61 89 68 114 61 90 74 107 122 Other White 59 48 71 105 79 67 94 141 69 61 78 246 White and Black Caribbean 106 83 135 68 75 49 111 25 96 77 117 93 White and Black African 43 19 84 8 66 30 124 9 52 31 84 17 White and Asian 95 56 150 18 84 43 147 12 90 61 129 30 Other Mixed 78 48 121 20 72 41 118 16 76 53 105 36 Indian 106 83 132 76 100 76 130 56 103 86 122 132 Pakistani 108 84 135 73 89 60 128 30 102 83 123 103 Bangladeshi 98 66 141 29 90 50 148 15 95 69 128 44 Other Asian 88 63 120 40 105 70 150 29 94 73 119 69 Black Caribbean 69 59 80 167 85 71 102 123 75 67 84 290 Black African 84 70 102 112 82 65 103 77 84 72 96 189 Other Black 52 36 74 31 64 36 106 15 56 41 74 46 Chinese 112 53 205 10 101 52 176 12 105 66 160 22 Other 86 60 120 35 106 71 151 30 94 73 120 65 Total 100 4108 100 4037 100 8145
Care Quality Commission Count me in census 2010 52
Appendix B Mental health tables continued
Table B5 Standardised ratios by ethnic group for patients referred by criminal justice routes (police prison probation courts court liaison and diversion) (England and Wales = 100)
Ethnic group
Men Women Persons Standardised
referral ratio
95 confidence
interval Observed numbers
Standardised referral ratio
95 confidence
interval Observed numbers
Standardised referral ratio
95 confidence
interval Observed numbers
White British 90 86 95 1495 95 86 104 421 91 87 95 1916 White Irish 133 94 183 38 59 19 138 5 116 84 157 43 Other White 112 93 134 119 103 68 150 27 111 93 130 146 White and Black Caribbean 117 89 151 58 145 69 266 10 120 94 153 68 White and Black African 190 127 273 29 141 38 361 4 183 126 256 33 White and Asian 75 39 131 12 160 52 373 5 89 52 143 17 Other Mixed 104 65 157 22 151 61 311 7 112 75 161 29 Indian 86 61 118 38 79 32 163 7 85 62 113 45 Pakistani 118 91 150 65 89 33 194 6 115 90 145 71 Bangladeshi 74 44 115 19 29 1 162 1 68 42 105 20 Other Asian 130 95 174 45 164 71 323 8 134 101 176 53 Black Caribbean 131 114 150 208 124 81 181 26 130 114 148 234 Black African 132 112 156 145 143 93 211 25 134 114 156 170 Other Black 141 109 180 65 236 113 435 10 149 117 187 75 Chinese 83 27 194 5 146 30 426 3 99 43 195 8 Other 129 93 175 41 113 37 264 5 127 93 170 46 Total 100 2404 100 570 100 2974
Care Quality Commission Count me in census 2010 53
Appendix B Mental health tables continued
Table B6 Standardised detention ratios by ethnic group all detentions on day of admission (excluding outpatients on a CTO) (England and Wales = 100)
Ethnic group
Men Women Persons Standardised
detention ratio
95 confidence
interval Observed numbers
Standardised detention
ratio
95 confidence
interval Observed numbers
Standardised detention
ratio
95 confidence
interval Observed numbers
White British 94 92 97 6449 94 91 97 3628 94 92 96 10077 White Irish 112 95 131 154 118 96 145 94 114 101 129 248 Other White 108 98 118 451 120 106 136 251 112 104 120 702 White and Black Caribbean 123 107 141 220 129 99 167 59 124 110 140 279 White and Black African 128 99 162 68 113 70 173 21 124 100 153 89 White and Asian 96 71 126 50 109 68 164 22 99 78 125 72 Other Mixed 115 92 143 82 139 100 188 42 122 102 146 124 Indian 97 83 113 164 110 86 137 77 101 88 114 241 Pakistani 109 94 126 194 102 74 136 44 108 94 122 238 Bangladeshi 86 67 109 69 91 55 142 19 87 70 107 88 Other Asian 109 92 130 133 120 86 163 40 112 96 130 173 Black Caribbean 129 121 139 774 143 125 162 238 132 124 141 1012 Black African 115 104 127 422 131 111 153 159 119 110 129 581 Other Black 117 100 136 170 148 105 202 39 122 106 140 209 Chinese 108 71 159 26 129 78 202 19 116 85 156 45 Other 111 92 132 126 116 83 157 41 112 96 130 167 Total 100 9552 100 4793 100 14345
Care Quality Commission Count me in census 2010 54
Appendix B Mental health tables continued
Table B7 Standardised detention ratios by ethnic group detention on day of admission ndash section 2 of the Mental Health Act (England and Wales = 100)
Ethnic group
Men Women Persons Standardised
detention ratio
95 confidence
interval Observed numbers
Standardised detention
ratio
95 confidence
interval Observed numbers
Standardised detention
ratio
95 confidence
interval Observed numbers
White British 97 91 102 1156 93 87 98 1133 95 91 99 2289 White Irish 78 47 120 20 116 79 166 30 97 72 128 50 Other White 100 78 126 70 134 108 166 88 116 99 136 158 White and Black Caribbean 55 30 93 14 60 24 124 7 57 35 87 21 White and Black African 91 37 188 7 150 60 308 7 113 62 190 14 White and Asian 80 29 174 6 119 44 258 6 96 49 167 12 Other Mixed 68 28 141 7 116 53 221 9 89 51 145 16 Indian 130 91 179 37 124 81 182 26 127 98 163 63 Pakistani 126 87 176 34 138 79 225 16 130 96 171 50 Bangladeshi 166 101 256 20 140 61 276 8 158 105 228 28 Other Asian 142 93 209 26 163 93 264 16 150 108 202 42 Black Caribbean 73 57 92 70 97 72 128 51 82 68 98 121 Black African 164 131 202 87 190 146 244 62 174 147 204 149 Other Black 114 75 166 27 140 72 245 12 121 86 165 39 Chinese 165 60 358 6 212 97 402 9 190 106 313 15 Other 218 153 302 36 179 108 280 19 203 153 264 55 Total 100 1623 100 1499 100 3122
Care Quality Commission Count me in census 2010 55
Appendix B Mental health tables continued
Table B8 Standardised detention ratios by ethnic group detention on day of admission ndash section 3 of the Mental Health Act (England and Wales = 100)
Ethnic group
Men Women Persons Standardised
detention ratio
95 confidence
interval Observed numbers
Standardised detention
ratio
95 confidence
interval Observed numbers
Standardised detention
ratio
95 confidence
interval Observed numbers
White British 99 95 103 2684 96 91 100 1852 98 95 101 4536 White Irish 116 89 149 60 135 101 177 52 124 102 149 112 Other White 112 96 129 186 110 92 132 121 111 99 124 307 White and Black Caribbean 114 91 143 79 130 90 183 33 119 98 143 112 White and Black African 97 60 148 21 107 54 192 11 100 69 141 32 White and Asian 84 50 133 18 97 48 173 11 89 59 127 29 Other Mixed 121 84 168 35 117 72 181 20 120 90 156 55 Indian 96 75 122 67 110 79 148 42 101 83 122 109 Pakistani 91 71 115 69 88 55 134 22 90 73 111 91 Bangladeshi 63 39 95 22 64 28 127 8 63 43 90 30 Other Asian 90 65 120 44 94 56 149 18 91 70 117 62 Black Caribbean 116 102 130 279 164 138 192 148 129 117 142 427 Black African 95 80 112 143 102 79 129 68 97 85 111 211 Other Black 75 55 99 49 99 58 159 17 80 62 102 66 Chinese 119 59 213 11 99 43 194 8 110 66 171 19 Other 85 60 116 38 84 48 136 16 84 63 110 54 Total 100 3805 100 2447 100 6252
Care Quality Commission Count me in census 2010 56
Appendix B Mental health tables continued
Table B9 Standardised detention ratios by ethnic group detention on day of admission ndash section 3741 of the Mental Health Act (England and Wales = 100)
Ethnic group
Men Women Persons Standardised
detention ratio
95 confidence
interval Observed numbers
Standardised detention
ratio
95 confidence
interval Observed numbers
Standardised detention
ratio
95 confidence
interval Observed numbers
White British 84 79 89 991 101 88 115 220 86 82 91 1211 White Irish 140 96 198 32 48 6 175 2 126 87 176 34 Other White 112 89 139 81 156 95 241 20 118 96 144 101 White and Black Caribbean 177 133 232 53 179 66 390 6 178 135 229 59 White and Black African 149 82 251 14 224 46 654 3 159 92 254 17 White and Asian 141 75 241 13 195 40 569 3 149 85 241 16 Other Mixed 144 85 227 18 264 97 575 6 162 104 242 24 Indian 86 56 126 26 44 5 160 2 80 53 116 28 Pakistani 122 87 166 40 0 0 111 79 152 40 Bangladeshi 66 32 122 10 0 0 60 29 110 10 Other Asian 99 61 151 21 0 0 89 55 136 21 Black Caribbean 200 174 229 210 78 34 153 8 189 165 216 218 Black African 127 101 157 82 84 34 172 7 122 98 150 89 Other Black 152 110 205 43 94 11 341 2 148 108 198 45 Chinese 100 27 255 4 0 0 80 22 204 4 Other 118 75 177 23 44 1 245 1 110 71 164 24 Total 100 1661 100 280 100 1941
Care Quality Commission Count me in census 2010 57
Appendix B Mental health tables continued
Table B10 Standardised detention ratios by ethnic group detention on day of admission ndash sections 47 48 4749 of the Mental Health Act (England and Wales = 100)
Ethnic group
Men Women Persons Standardised
detention ratio
95 confidence
interval Observed numbers
Standardised detention
ratio
95 confidence
interval Observed numbers
Standardised detention
ratio
95 confidence
interval Observed numbers
White British 97 90 106 583 104 81 131 73 98 91 106 656 White Irish 132 72 221 14 163 20 590 2 135 77 219 16 Other White 130 96 172 49 71 15 206 3 124 93 163 52 White and Black Caribbean 126 78 193 21 80 2 444 1 123 77 186 22 White and Black African 207 103 370 11 0 0 189 95 339 11 White and Asian 57 12 166 3 169 4 941 1 68 19 175 4 Other Mixed 112 48 221 8 233 28 843 2 125 60 230 10 Indian 57 26 108 9 0 252 0 52 24 99 9 Pakistani 92 54 147 17 0 314 0 86 50 138 17 Bangladeshi 46 12 117 4 167 4 930 1 53 17 125 5 Other Asian 101 52 177 12 0 0 95 49 166 12 Black Caribbean 126 98 159 70 125 34 319 4 126 99 158 74 Black African 74 48 107 27 104 21 303 3 76 51 108 30 Other Black 127 78 197 20 138 3 769 1 128 79 195 21 Chinese 0 0 0 0 0 0 Other 83 38 157 9 0 0 77 35 147 9 Total 100 857 100 91 100 948
Care Quality Commission Count me in census 2010 58
Appendix B Mental health tables continued
Table B11 Standardised ratios for all applications of the Mental Health Act (including outpatients on a CTO) by ethnic group on day of census (England and Wales = 100)
Ethnic group
Men Women Persons Standardised
ratio for all MHA
applications
95 confidence
interval Observed numbers
Standardised ratio for all MHA
applications
95 confidence
interval Observed numbers
Standardised ratio for all MHA
applications
95 confidence
interval Observed numbers
White British 97 94 99 7659 95 93 98 4335 96 94 98 11994 White Irish 99 83 116 147 104 84 128 95 101 89 114 242 Other White 87 79 95 427 97 85 110 249 90 84 97 676 White and Black Caribbean 117 103 133 245 130 103 163 76 120 107 134 321 White and Black African 120 95 150 79 93 58 141 22 113 92 137 101 White and Asian 101 78 128 65 119 81 169 31 106 86 129 96 Other Mixed 110 89 134 96 125 93 165 49 114 97 135 145 Indian 103 90 118 215 122 100 147 109 109 97 121 324 Pakistani 111 97 125 254 117 90 148 67 112 100 125 321 Bangladeshi 92 75 112 97 101 68 145 29 94 78 112 126 Other Asian 103 88 121 152 126 95 164 56 109 94 124 208 Black Caribbean 123 115 131 893 141 126 158 300 127 120 134 1193 Black African 112 103 122 511 121 104 140 188 114 106 123 699 Other Black 116 102 132 232 148 112 191 59 122 108 136 291 Chinese 97 64 140 27 101 61 157 19 98 72 131 46 Other 104 87 122 140 103 75 137 46 103 89 119 186 Total 100 11239 100 5730 100 16969
Care Quality Commission Count me in census 2010 59
Appendix B Mental health tables continued
Table B12 Standardised CTO ratios by ethnic group CTOs on day of census ndash section 17a of the Mental Health Act (England and Wales = 100)
Ethnic group
Men Women Persons
Standardised CTO ratio
95 confidence
interval Observed numbers
Standardised CTO ratio
95 confidence
interval Observed numbers
Standardised CTO ratio
95 confidence
interval Observed numbers
White British 94 89 99 1289 88 82 94 730 92 88 96 2019 White Irish 51 27 88 13 77 41 132 13 62 40 90 26 Other White 97 77 120 83 125 95 162 58 107 90 126 141 White and Black Caribbean 79 53 113 29 141 77 237 14 92 67 124 43 White and Black African 111 59 190 13 125 41 292 5 115 68 181 18 White and Asian 104 54 182 12 136 50 297 6 113 67 178 18 Other Mixed 102 59 166 16 136 62 257 9 112 73 166 25 Indian 134 99 177 48 152 98 226 24 139 109 175 72 Pakistani 145 110 187 59 174 101 279 17 151 119 189 76 Bangladeshi 142 93 206 27 205 99 378 10 155 109 213 37 Other Asian 107 71 155 28 182 99 305 14 124 89 168 42 Black Caribbean 121 103 142 152 171 132 218 65 133 116 152 217 Black African 116 94 142 94 139 98 192 37 122 102 145 131 Other Black 186 144 238 65 305 189 466 21 206 165 254 86 Chinese 83 23 213 4 152 49 354 5 111 51 211 9 Other 87 54 134 21 152 79 266 12 103 71 145 33 Total 100 1953 100 1040 100 2993
Care Quality Commission Count me in census 2010 60
Appendix C Learning disability tables
Table C1 Standardised admission ratios by ethnic group for England and Wales using 2007 ONS population denominators (England amp Wales = 100) All ages
Ethnic group
Men Women Persons Standardised
admission ratio
95 confidence
interval Observed numbers
Standardised admission
ratio
95 confidence
interval Observed numbers
Standardised admission
ratio
95 confidence
interval Observed numbers
White British 104 100 109 2163 108 101 115 941 105 102 109 3104 White Irish 108 72 156 28 151 89 238 18 121 89 162 46 Other White 81 65 101 85 49 30 75 21 72 59 87 106 White and Black Caribbean 280 186 405 28 246 118 453 10 270 191 371 38 White and Black African 102 33 239 5 165 34 482 3 119 51 235 8 White and Asian 66 26 135 7 154 56 335 6 89 47 152 13 Other Mixed 181 104 295 16 229 99 451 8 195 125 290 24 Indian 32 21 48 24 28 12 55 8 31 21 44 32 Pakistani 48 30 72 22 12 1 43 2 38 25 57 24 Bangladeshi 102 60 161 18 31 4 113 2 83 51 128 20 Other Asian 33 13 69 7 92 34 201 6 47 25 81 13 Black Caribbean 265 210 332 77 117 67 190 16 218 176 267 93 Black African 53 33 80 22 40 15 87 6 50 33 72 28 Other Black 228 118 399 12 134 28 392 3 200 112 330 15 Chinese 4 0 21 1 3 0 16 1 Other 26 9 56 6 11 0 59 1 21 9 44 7 Total 100 2521 100 1051 100 3572
Care Quality Commission Count me in census 2010 61
Appendix C Learning disability tables continued
Table C2 Standardised detention ratios by ethnic group all detentions on day of admission (England and Wales = 100)
Ethnic group
Persons Standardised
detention ratio
95 confidence
interval Observed numbers
White British 97 93 103 1431 White Irish 127 84 184 28 Other White 117 91 149 68 White and Black Caribbean 120 77 179 24 White and Black African 114 37 267 5 White and Asian 75 24 176 5 Other Mixed 94 49 165 12 Indian 119 72 186 19 Pakistani 110 61 181 15 Bangladeshi 144 84 231 17 Other Asian 59 16 150 4 Black Caribbean 119 90 155 57 Black African 138 85 210 21 Other Black 62 20 145 5 Chinese 0 0 Other 104 28 267 4 Total 100 1715
Care Quality Commission Count me in census 2010 62
copy Care Quality Commission and National Mental Health Development Unit 2011 Published April 2011
This publication may be reproduced in whole or in part in any format or medium for non-commercial purposes provided that it is reproduced accurately and not used in a derogatory manner or in a misleading context The source should be acknowledged by showing the publication title and copy Care Quality Commission and National Mental Health Development Unit 2011
How to contact us
Phone 03000 616161 Email enquiriescqcorguk Web wwwcqcorguk
Write to us at Care Quality Commission National Correspondence Citygate Gallowgate Newcastle upon Tyne NE1 4PA
Please contact us if you would like a summary of this publication in other formats or languages
Registered office Care Quality Commission Finsbury Tower 103ndash105 Bunhill Row London EC1Y 8TG
- Count me in 2010
- About the Care Quality Commission
- Contents
- Summary
- National organisations coordinating the census
- Introduction
- Data methods of analysis and interpretation
- Results mental health
- A comparison between the 2005 baseline and the 2010 census
- Results learning disabilities
- Data in the future Moving beyond a one-day census
- Conclusions
- References
- Appendix A Methods of analysis
- Appendix B Mental health tables
- Appendix C Learning disability tables
- How to contact us
-

Conclusions continued
patients making the MHMDS the definitive source of information about mental health and learning disability patients This data should be risk-adjusted for age gender and other variables as appropriate to enable reliable comparisons to be made across groups
It is important that all providers ndash NHS and independent ndash make strenuous efforts to improve the quality of the data they submit The Information Centre publishes reports on the quality of MHMDS data by provider (see wwwicnhsukservices mhmdsdq) and we urge providers to monitor this information and use it to improve their data quality
If GP consortia and local authorities are to be effective in their needs assessment and commissioning roles the Information Centre needs to make available and promote to them the data from the MHMDS and other sources And researchers and academics must make full use of the MHMDS to explore the factors that underlie the observed ethnic patterns
CQCrsquos role
In the meantime CQC will continue to focus strongly on the quality of care provided by mental health and learning disability services
People who find themselves admitted to mental health services or detained under the Mental Health Act and therefore counted by the Count me in census are among the most mentally unwell people in our society Our job is first and foremost to make sure that the care they receive meets the essential standards of quality and safety set out under the Health and Social Care Act 2008 and to work with providers to ensure this We act swiftly when we find services that do not Where we find systemic problems that organisations have not adequately addressed we may impose conditions on the providerrsquos registration to bring about the change needed to improve patientsrsquo experience of care
The essential standards of quality and safety include the requirement to provide single sex accommodation and we will continue to closely check that these standards are met by all mental health services
We intend to introduce a number of indicators derived from the rich information in the MHMDS into our quality and risk profiles for providers This will put greater emphasis on the experience of Black and minority ethnic patients in our regulatory activity
We will monitor the quality of MHMDS data submitted by providers (as reported by the NHS Information Centre) including independent service providers Those with poor data quality may be considered at higher risk in terms of their quality of care
In addition we will continue to monitor the progress of services in relation to the issues raised in the census and other reports including our report on the use of the Mental Health Act through our visits to services and meetings with patients by our Mental Health Act Commissioners and second opinion appointed doctors (SOADs) We will draw on patientsrsquo experiences to monitor the operation of the Mental Health Act
We will also assess the impact of advice and use of Local HealthWatch Local HealthWatch will be in a good position to make sure that providers and commissioners are held to account on matters of choice and access to services for people from Black and minority ethnic groups
Care Quality Commission Count me in census 2010 45
References
1 Department of Health Equity and excellence liberating the NHS 2010
2 Department of Health The NHS outcomes framework 201112 2010
3 Healthcare Commission Mental Health Act Commission National Institute for Mental Health in England Count me in results of a national census of inpatients in mental health hospitals and facilities in England and Wales 2005
4 Healthcare Commission Mental Health Act Commission National Institute for Mental Health in England Count me in results of the 2006 national census of inpatients in mental health and learning disability services in England and Wales 2006
5 Healthcare Commission Mental Health Act Commission National Institute for Mental Health in England Count me in results of the 2007 national census of inpatients in mental health and learning disability services in England and Wales 2007
6 Healthcare Commission Mental Health Act Commission National Institute for Mental Health in England Count me in results of the 2008 national census of inpatients in mental health and learning disability services in England and Wales 2008
7 Care Quality Commission National Mental Health Development Unit Results of the 2009 national census of inpatients and patients on supervised community treatment in mental health and learning disability services in England and Wales 2009
8 Department of Health Delivering race equality in mental health care an action plan for reform inside and outside services 2005
9 Welsh Assembly Government Adult Mental Health Services Raising the standard ndash Race Equality Action Plan for Adult Mental Health Services in Wales 2006
10Department of Health No health without mental health a cross-government mental health outcomes strategy for people of all ages 2011 wwwdhgovukprod_consum_dhgroups dh_digitalassetsdocumentsdigitalasset dh_124058pdf
11Department of Health New horizons towards a shared vision for mental health 2009 wwwdhgovukprod_consum_dhgroups dh_digitalassetsdhendocumentsdigital assetdh_109708pdf
12Department of Health Valuing people a new strategy for learning disability for the 21st century 2001
13Department of Health Valuing people now a new three year strategy for people with learning disabilities 2009
14Department of Health Healthcare for all report of the independent inquiry into access to healthcare for people with learning disabilities 2008
15Joint Committee on Human Rights A life like any other human rights of adults with learning disabilities (2008 HL Paper 401 HC 731) House of Lords House of Commons 2008
16Department of Health Valuing people now summary report March 2009 ndash September 2010 2010
17Disability Rights Commission Equal treatment investigation 2005
18Department of Health Mir G Nocon A Ahmad W Jones L Learning difficulties and ethnicity 2000
19ONS experimental population estimates by ethnic group 2007 wwwstatisticsgovukstatbase productaspvlnk=14238
Care Quality Commission Count me in census 2010 46
References continued
20Six percent of population are gay or lesbian according to Whitehall figures 2005 wwwtelegraphcouknewsmainjhtmlxml= news20051212ngay12xmlamps Sheet= news20051212ixhomehtml
21Department of Trade and Industry Amendment to Employment Equality (Sexual Orientation) Regulations 2003 2003
22Office for National Statistics Measuring sexual identity an evaluation report 2010
23 Information Centre Mental Health Bulletin Fourth report from Mental Health Minimum Dataset (MHMDS) annual returns 2010 2011 wwwicnhsukpubsmhbmhmds0910
24 Information Centre Mental Health Bulletin Fourth report from Mental Health Minimum Dataset (MHMDS) annual returns 2010 2011 wwwicnhsukpubsmhbmhmds0910
25The operating framework for the NHS in England 201112 Department of Health 2010 wwwdhgovukprod_consum_dhgroups dh_digitalassetsdhenpsdocuments digitalassetdh_122736pdf
26wwwdhgovukenPublicationsandstatistics LettersandcircularsProfessionalletters ChiefnursingofficerlettersDH_121848
27Department of Health No health without mental health a cross-government mental health outcomes strategy for people of all ages 2011 wwwdhgovukprod_consum_dhgroups dh_digitalassetsdocumentsdigitalasset dh_124058pdf
28Ministry of Justice Breaking the cycle effective punishment rehabilitation and sentencing of offenders 2010
29Department of Health The Bradley report Lord Bradleyrsquos review of people with mental health problems or learning disabilities in the criminal justice system 2009
30Department of Health No health without mental health delivering better mental health outcomes for people of all ages 2011
31Department of Health Equity and excellence liberating the NHS 2010 wwwdhgovukprod_ consum_dhgroupsdh_digitalassetsdhen psdocumentsdigitalassetdh_117794pdf
32Department of Health Healthy lives healthy people our strategy for public health in England 2010 wwwdhgovukprod_consum_dh groupsdh_digitalassetsdhenps documentsdigitalassetdh_122347pdf
33Department of Health A vision for adult social care capable communities and active citizens 2010 wwwdhgovukprod_consum_dh groupsdh_digitalassetsdhenps documentsdigitalassetdh_121971pdf
34Wilson M NMHDU Race equality action plan a five year review Delivering race equality in mental health care 2010 wwwnmhduorgukour-workmhep
35Care Quality Commission Monitoring the use of the Mental Health Act in 200910 2010
36Raleigh V S Collection of data on ethnic origin in England Editorial BMJ 20083376456
37Wilson M NMHDU Race equality action plan a five year review Delivering race equality in mental health care 2010 wwwnmhduorgukour-workmhep
38Department of Health Liberating the NHS an information revolution 2010
Care Quality Commission Count me in census 2010 47
Appendix A Methods of analysis
Standardisation by age and gender
Standardisation allows us to make comparisons between groups of the population by taking account of variations in age and gender Some differences in patterns of service use are related to the age or gender of the people using them so adjustments to the data have to be made to ensure that the interpretation of ethnic differences is reliable For example formal admissions are higher at a younger age so some Black and minority ethnic groups may have high formal admission rates simply because they have a high proportion of younger people Without adjustments for age and gender differences comparisons would be misleading
In this report most results are standardised for age and gender including those relating to admission detention source of referral care programme approach seclusion restraint accidents assault self-harm consent and presence on a secure ward The report uses the accepted statistical method of taking account of age and gender differences between groups when calculating these rates
We used the ONS estimates of total population by ethnic group for England and Wales in 2007 to standardise the rates of admission for different ethnic groups This takes account of the significant rises in the Black and ethnic minority population of England and Wales since the 2001 ONS census and hence gives more accurate and up to date estimates of admission ratios for different ethnic groups (although it does not take account of any further changes in the ethnic populations between 2007 and 2010 the date of this census) For comparison with the DRE baseline we also present admission rates from the 2005 census derived using the 2005 ONS estimates of populations by ethnic group These figures will not be the same as published in the 2005 census report which were based on the 2001 ONS census population estimates because updated estimates of populations by ethnic group were not available at that time
For other analyses we used the total number of inpatients and patients on CTOs in the census
as the basis for standardisation However CTO outpatients are excluded from selected analyses where appropriate namely the analysis of rates for admissions detentions on admission source of referral single sex accommodation and recorded incidents of seclusion restraint accidents assault and self-harm We used the statistical package STATA version 82 to derive the standardised results
It was not possible to adjust the analyses for ethnic differences in social and economic factors and in diagnosis and severity of illness Such factors could affect the ethnic differences observed in the results
For descriptive variables such as religion and language we did not use standardisation
Confidence intervals as indicators of significant statistical differences
For all standardised results the national rates for England and Wales are taken as 100 and the usual 95 confidence intervals are given Rates of less than 100 or greater than 100 for specific ethnic groups show a lower or higher rate respectively than the national average after adjusting for age and gender Whether or not the difference is statistically significant from the national average depends on the confidence interval If the confidence interval overlaps 100 the difference from the national average is not statistically significant If both values are lower or higher than 100 it indicates that the difference compared with the national average is statistically significant at the 95 level
For example if a rate is 110 with the lower confidence interval being 105 and the upper confidence interval being 115 it indicates that the 10 excess over the national average of 100 is statistically significant But if a ratio is 110 with the lower confidence interval being 95 and the upper confidence interval being 125 it indicates that the 10 excess over the national average is not statistically significant We did not attempt to adjust the confidence intervals for multiple comparisons
Care Quality Commission Count me in census 2010 48
Appendix B Mental health tables
Table B1 Standardised admission ratios by ethnic group for England and Wales (excluding outpatients on a CTO) using 2007 ONS census population denominators (England and Wales = 100) All ages
Ethnic group
Men Women Persons Standardised
admission ratio
95 confidence
interval Observed numbers
Standardised admission
ratio
95 confidence
interval Observed numbers
Standardised admission
ratio
95 confidence
interval Observed numbers
White British 88 86 89 12435 94 93 96 10157 91 89 92 22592 White Irish 130 115 146 274 122 106 140 215 126 115 138 489 Other White 117 109 126 731 129 118 141 533 122 115 129 1264 White and Black Caribbean 557 493 627 276 274 223 333 101 436 393 483 377 White and Black African 312 247 388 80 259 186 351 41 292 242 349 121 White and Asian 140 110 174 79 124 90 166 44 134 111 159 123 Other Mixed 230 189 278 108 213 165 270 67 223 192 259 175 Indian 67 59 75 286 66 56 76 172 66 60 73 458 Pakistani 105 93 119 269 65 53 79 96 91 81 100 365 Bangladeshi 123 102 147 120 82 60 109 46 108 92 126 166 Other Asian 161 139 185 192 136 107 169 79 153 135 172 271 Black Caribbean 538 505 572 980 306 277 336 418 438 415 462 1398 Black African 246 226 267 550 219 194 247 277 236 221 253 827 Other Black 792 691 903 222 314 240 403 61 596 529 670 283 Chinese 27 20 38 39 43 30 59 35 33 26 41 74 Other 140 120 162 177 110 88 136 87 128 113 145 264 Total 100 16818 100 12429 100 29247
Care Quality Commission Count me in census 2010 49
Appendix B Mental health tables continued
Table B2 Standardised admission ratios by ethnic group for England and Wales (excluding outpatients on a CTO) using 2007 ONS census population denominators (England amp Wales = 100) Ages 65 and over
Ethnic group
Men Women Persons Standardised
admission ratio
95 confidence
interval Observed numbers
Standardised admission
ratio
95 confidence
interval Observed numbers
Standardised admission
ratio
95 confidence
interval Observed numbers
White British 95 92 99 3265 95 92 98 3887 95 93 97 7152 White Irish 142 116 172 106 102 82 125 92 120 104 138 198 Other White 207 174 244 141 213 183 248 171 210 188 235 312 White and Black Caribbean 406 210 710 12 333 152 632 9 371 230 568 21 White and Black African 231 28 836 2 198 24 714 2 213 58 546 4 White and Asian 28 1 156 1 110 30 281 4 69 23 162 5 Other Mixed 146 40 374 4 228 92 470 7 189 95 339 11 Indian 97 70 132 41 83 57 116 33 90 71 113 74 Pakistani 39 17 77 8 46 18 94 7 42 23 69 15 Bangladeshi 115 53 218 9 69 14 201 3 98 51 172 12 Other Asian 234 143 361 20 215 120 354 15 225 157 313 35 Black Caribbean 216 170 269 77 310 253 376 103 261 224 302 180 Black African 142 73 248 12 365 241 531 27 246 175 337 39 Other Black 164 34 479 3 366 134 796 6 259 119 493 9 Chinese 41 8 120 3 95 38 195 7 68 33 125 10 Other 253 126 453 11 390 238 602 20 327 222 464 31 Total 100 3715 100 4393 100 8108
Care Quality Commission Count me in census 2010 50
Appendix B Mental health tables continued
Table B3 Standardised ratios by ethnic group for patients referred by a GP (England and Wales = 100)
Ethnic group
Men Women Persons Standardised
referral ratio
95 confidence
interval Observed numbers
Standardised referral ratio
95 confidence
interval Observed numbers
Standardised referral ratio
95 confidence
interval Observed numbers
White British 110 103 117 904 107 101 114 1065 108 104 113 1969 White Irish 85 50 134 18 93 57 144 20 89 63 123 38 Other White 74 51 103 33 70 49 97 36 72 56 91 69 White and Black Caribbean 27 5 78 3 30 4 109 2 28 9 65 5 White and Black African 0 0 74 9 268 2 35 4 125 2 White and Asian 165 54 386 5 0 0 86 28 201 5 Other Mixed 48 6 172 2 68 14 198 3 58 19 136 5 Indian 69 34 123 11 79 39 141 11 73 46 111 22 Pakistani 88 42 162 10 59 16 151 4 77 42 130 14 Bangladeshi 81 22 207 4 61 7 221 2 73 27 159 6 Other Asian 80 32 166 7 108 43 223 7 92 50 155 14 Black Caribbean 35 20 56 17 37 20 62 14 36 24 51 31 Black African 57 29 100 12 66 35 113 13 61 40 91 25 Other Black 62 23 135 6 40 5 144 2 54 23 107 8 Chinese 56 1 314 1 139 38 356 4 108 35 251 5 Other 106 46 208 8 0 0 53 23 105 8 Total 100 1041 100 1185 100 2226
Care Quality Commission Count me in census 2010 51
Appendix B Mental health tables continued
Table B4 Standardised ratios by ethnic group for patients referred by a community mental health team (including crisis resolution home treatment) or community learning disability team (England and Wales = 100)
Ethnic group
Men Women Persons Standardised
referral ratio
95 confidence
interval Observed numbers
Standardised referral ratio
95 confidence
interval Observed numbers
Standardised referral ratio
95 confidence
interval Observed numbers
White British 107 104 111 3255 103 100 107 3386 105 103 108 6641 White Irish 90 69 116 61 89 68 114 61 90 74 107 122 Other White 59 48 71 105 79 67 94 141 69 61 78 246 White and Black Caribbean 106 83 135 68 75 49 111 25 96 77 117 93 White and Black African 43 19 84 8 66 30 124 9 52 31 84 17 White and Asian 95 56 150 18 84 43 147 12 90 61 129 30 Other Mixed 78 48 121 20 72 41 118 16 76 53 105 36 Indian 106 83 132 76 100 76 130 56 103 86 122 132 Pakistani 108 84 135 73 89 60 128 30 102 83 123 103 Bangladeshi 98 66 141 29 90 50 148 15 95 69 128 44 Other Asian 88 63 120 40 105 70 150 29 94 73 119 69 Black Caribbean 69 59 80 167 85 71 102 123 75 67 84 290 Black African 84 70 102 112 82 65 103 77 84 72 96 189 Other Black 52 36 74 31 64 36 106 15 56 41 74 46 Chinese 112 53 205 10 101 52 176 12 105 66 160 22 Other 86 60 120 35 106 71 151 30 94 73 120 65 Total 100 4108 100 4037 100 8145
Care Quality Commission Count me in census 2010 52
Appendix B Mental health tables continued
Table B5 Standardised ratios by ethnic group for patients referred by criminal justice routes (police prison probation courts court liaison and diversion) (England and Wales = 100)
Ethnic group
Men Women Persons Standardised
referral ratio
95 confidence
interval Observed numbers
Standardised referral ratio
95 confidence
interval Observed numbers
Standardised referral ratio
95 confidence
interval Observed numbers
White British 90 86 95 1495 95 86 104 421 91 87 95 1916 White Irish 133 94 183 38 59 19 138 5 116 84 157 43 Other White 112 93 134 119 103 68 150 27 111 93 130 146 White and Black Caribbean 117 89 151 58 145 69 266 10 120 94 153 68 White and Black African 190 127 273 29 141 38 361 4 183 126 256 33 White and Asian 75 39 131 12 160 52 373 5 89 52 143 17 Other Mixed 104 65 157 22 151 61 311 7 112 75 161 29 Indian 86 61 118 38 79 32 163 7 85 62 113 45 Pakistani 118 91 150 65 89 33 194 6 115 90 145 71 Bangladeshi 74 44 115 19 29 1 162 1 68 42 105 20 Other Asian 130 95 174 45 164 71 323 8 134 101 176 53 Black Caribbean 131 114 150 208 124 81 181 26 130 114 148 234 Black African 132 112 156 145 143 93 211 25 134 114 156 170 Other Black 141 109 180 65 236 113 435 10 149 117 187 75 Chinese 83 27 194 5 146 30 426 3 99 43 195 8 Other 129 93 175 41 113 37 264 5 127 93 170 46 Total 100 2404 100 570 100 2974
Care Quality Commission Count me in census 2010 53
Appendix B Mental health tables continued
Table B6 Standardised detention ratios by ethnic group all detentions on day of admission (excluding outpatients on a CTO) (England and Wales = 100)
Ethnic group
Men Women Persons Standardised
detention ratio
95 confidence
interval Observed numbers
Standardised detention
ratio
95 confidence
interval Observed numbers
Standardised detention
ratio
95 confidence
interval Observed numbers
White British 94 92 97 6449 94 91 97 3628 94 92 96 10077 White Irish 112 95 131 154 118 96 145 94 114 101 129 248 Other White 108 98 118 451 120 106 136 251 112 104 120 702 White and Black Caribbean 123 107 141 220 129 99 167 59 124 110 140 279 White and Black African 128 99 162 68 113 70 173 21 124 100 153 89 White and Asian 96 71 126 50 109 68 164 22 99 78 125 72 Other Mixed 115 92 143 82 139 100 188 42 122 102 146 124 Indian 97 83 113 164 110 86 137 77 101 88 114 241 Pakistani 109 94 126 194 102 74 136 44 108 94 122 238 Bangladeshi 86 67 109 69 91 55 142 19 87 70 107 88 Other Asian 109 92 130 133 120 86 163 40 112 96 130 173 Black Caribbean 129 121 139 774 143 125 162 238 132 124 141 1012 Black African 115 104 127 422 131 111 153 159 119 110 129 581 Other Black 117 100 136 170 148 105 202 39 122 106 140 209 Chinese 108 71 159 26 129 78 202 19 116 85 156 45 Other 111 92 132 126 116 83 157 41 112 96 130 167 Total 100 9552 100 4793 100 14345
Care Quality Commission Count me in census 2010 54
Appendix B Mental health tables continued
Table B7 Standardised detention ratios by ethnic group detention on day of admission ndash section 2 of the Mental Health Act (England and Wales = 100)
Ethnic group
Men Women Persons Standardised
detention ratio
95 confidence
interval Observed numbers
Standardised detention
ratio
95 confidence
interval Observed numbers
Standardised detention
ratio
95 confidence
interval Observed numbers
White British 97 91 102 1156 93 87 98 1133 95 91 99 2289 White Irish 78 47 120 20 116 79 166 30 97 72 128 50 Other White 100 78 126 70 134 108 166 88 116 99 136 158 White and Black Caribbean 55 30 93 14 60 24 124 7 57 35 87 21 White and Black African 91 37 188 7 150 60 308 7 113 62 190 14 White and Asian 80 29 174 6 119 44 258 6 96 49 167 12 Other Mixed 68 28 141 7 116 53 221 9 89 51 145 16 Indian 130 91 179 37 124 81 182 26 127 98 163 63 Pakistani 126 87 176 34 138 79 225 16 130 96 171 50 Bangladeshi 166 101 256 20 140 61 276 8 158 105 228 28 Other Asian 142 93 209 26 163 93 264 16 150 108 202 42 Black Caribbean 73 57 92 70 97 72 128 51 82 68 98 121 Black African 164 131 202 87 190 146 244 62 174 147 204 149 Other Black 114 75 166 27 140 72 245 12 121 86 165 39 Chinese 165 60 358 6 212 97 402 9 190 106 313 15 Other 218 153 302 36 179 108 280 19 203 153 264 55 Total 100 1623 100 1499 100 3122
Care Quality Commission Count me in census 2010 55
Appendix B Mental health tables continued
Table B8 Standardised detention ratios by ethnic group detention on day of admission ndash section 3 of the Mental Health Act (England and Wales = 100)
Ethnic group
Men Women Persons Standardised
detention ratio
95 confidence
interval Observed numbers
Standardised detention
ratio
95 confidence
interval Observed numbers
Standardised detention
ratio
95 confidence
interval Observed numbers
White British 99 95 103 2684 96 91 100 1852 98 95 101 4536 White Irish 116 89 149 60 135 101 177 52 124 102 149 112 Other White 112 96 129 186 110 92 132 121 111 99 124 307 White and Black Caribbean 114 91 143 79 130 90 183 33 119 98 143 112 White and Black African 97 60 148 21 107 54 192 11 100 69 141 32 White and Asian 84 50 133 18 97 48 173 11 89 59 127 29 Other Mixed 121 84 168 35 117 72 181 20 120 90 156 55 Indian 96 75 122 67 110 79 148 42 101 83 122 109 Pakistani 91 71 115 69 88 55 134 22 90 73 111 91 Bangladeshi 63 39 95 22 64 28 127 8 63 43 90 30 Other Asian 90 65 120 44 94 56 149 18 91 70 117 62 Black Caribbean 116 102 130 279 164 138 192 148 129 117 142 427 Black African 95 80 112 143 102 79 129 68 97 85 111 211 Other Black 75 55 99 49 99 58 159 17 80 62 102 66 Chinese 119 59 213 11 99 43 194 8 110 66 171 19 Other 85 60 116 38 84 48 136 16 84 63 110 54 Total 100 3805 100 2447 100 6252
Care Quality Commission Count me in census 2010 56
Appendix B Mental health tables continued
Table B9 Standardised detention ratios by ethnic group detention on day of admission ndash section 3741 of the Mental Health Act (England and Wales = 100)
Ethnic group
Men Women Persons Standardised
detention ratio
95 confidence
interval Observed numbers
Standardised detention
ratio
95 confidence
interval Observed numbers
Standardised detention
ratio
95 confidence
interval Observed numbers
White British 84 79 89 991 101 88 115 220 86 82 91 1211 White Irish 140 96 198 32 48 6 175 2 126 87 176 34 Other White 112 89 139 81 156 95 241 20 118 96 144 101 White and Black Caribbean 177 133 232 53 179 66 390 6 178 135 229 59 White and Black African 149 82 251 14 224 46 654 3 159 92 254 17 White and Asian 141 75 241 13 195 40 569 3 149 85 241 16 Other Mixed 144 85 227 18 264 97 575 6 162 104 242 24 Indian 86 56 126 26 44 5 160 2 80 53 116 28 Pakistani 122 87 166 40 0 0 111 79 152 40 Bangladeshi 66 32 122 10 0 0 60 29 110 10 Other Asian 99 61 151 21 0 0 89 55 136 21 Black Caribbean 200 174 229 210 78 34 153 8 189 165 216 218 Black African 127 101 157 82 84 34 172 7 122 98 150 89 Other Black 152 110 205 43 94 11 341 2 148 108 198 45 Chinese 100 27 255 4 0 0 80 22 204 4 Other 118 75 177 23 44 1 245 1 110 71 164 24 Total 100 1661 100 280 100 1941
Care Quality Commission Count me in census 2010 57
Appendix B Mental health tables continued
Table B10 Standardised detention ratios by ethnic group detention on day of admission ndash sections 47 48 4749 of the Mental Health Act (England and Wales = 100)
Ethnic group
Men Women Persons Standardised
detention ratio
95 confidence
interval Observed numbers
Standardised detention
ratio
95 confidence
interval Observed numbers
Standardised detention
ratio
95 confidence
interval Observed numbers
White British 97 90 106 583 104 81 131 73 98 91 106 656 White Irish 132 72 221 14 163 20 590 2 135 77 219 16 Other White 130 96 172 49 71 15 206 3 124 93 163 52 White and Black Caribbean 126 78 193 21 80 2 444 1 123 77 186 22 White and Black African 207 103 370 11 0 0 189 95 339 11 White and Asian 57 12 166 3 169 4 941 1 68 19 175 4 Other Mixed 112 48 221 8 233 28 843 2 125 60 230 10 Indian 57 26 108 9 0 252 0 52 24 99 9 Pakistani 92 54 147 17 0 314 0 86 50 138 17 Bangladeshi 46 12 117 4 167 4 930 1 53 17 125 5 Other Asian 101 52 177 12 0 0 95 49 166 12 Black Caribbean 126 98 159 70 125 34 319 4 126 99 158 74 Black African 74 48 107 27 104 21 303 3 76 51 108 30 Other Black 127 78 197 20 138 3 769 1 128 79 195 21 Chinese 0 0 0 0 0 0 Other 83 38 157 9 0 0 77 35 147 9 Total 100 857 100 91 100 948
Care Quality Commission Count me in census 2010 58
Appendix B Mental health tables continued
Table B11 Standardised ratios for all applications of the Mental Health Act (including outpatients on a CTO) by ethnic group on day of census (England and Wales = 100)
Ethnic group
Men Women Persons Standardised
ratio for all MHA
applications
95 confidence
interval Observed numbers
Standardised ratio for all MHA
applications
95 confidence
interval Observed numbers
Standardised ratio for all MHA
applications
95 confidence
interval Observed numbers
White British 97 94 99 7659 95 93 98 4335 96 94 98 11994 White Irish 99 83 116 147 104 84 128 95 101 89 114 242 Other White 87 79 95 427 97 85 110 249 90 84 97 676 White and Black Caribbean 117 103 133 245 130 103 163 76 120 107 134 321 White and Black African 120 95 150 79 93 58 141 22 113 92 137 101 White and Asian 101 78 128 65 119 81 169 31 106 86 129 96 Other Mixed 110 89 134 96 125 93 165 49 114 97 135 145 Indian 103 90 118 215 122 100 147 109 109 97 121 324 Pakistani 111 97 125 254 117 90 148 67 112 100 125 321 Bangladeshi 92 75 112 97 101 68 145 29 94 78 112 126 Other Asian 103 88 121 152 126 95 164 56 109 94 124 208 Black Caribbean 123 115 131 893 141 126 158 300 127 120 134 1193 Black African 112 103 122 511 121 104 140 188 114 106 123 699 Other Black 116 102 132 232 148 112 191 59 122 108 136 291 Chinese 97 64 140 27 101 61 157 19 98 72 131 46 Other 104 87 122 140 103 75 137 46 103 89 119 186 Total 100 11239 100 5730 100 16969
Care Quality Commission Count me in census 2010 59
Appendix B Mental health tables continued
Table B12 Standardised CTO ratios by ethnic group CTOs on day of census ndash section 17a of the Mental Health Act (England and Wales = 100)
Ethnic group
Men Women Persons
Standardised CTO ratio
95 confidence
interval Observed numbers
Standardised CTO ratio
95 confidence
interval Observed numbers
Standardised CTO ratio
95 confidence
interval Observed numbers
White British 94 89 99 1289 88 82 94 730 92 88 96 2019 White Irish 51 27 88 13 77 41 132 13 62 40 90 26 Other White 97 77 120 83 125 95 162 58 107 90 126 141 White and Black Caribbean 79 53 113 29 141 77 237 14 92 67 124 43 White and Black African 111 59 190 13 125 41 292 5 115 68 181 18 White and Asian 104 54 182 12 136 50 297 6 113 67 178 18 Other Mixed 102 59 166 16 136 62 257 9 112 73 166 25 Indian 134 99 177 48 152 98 226 24 139 109 175 72 Pakistani 145 110 187 59 174 101 279 17 151 119 189 76 Bangladeshi 142 93 206 27 205 99 378 10 155 109 213 37 Other Asian 107 71 155 28 182 99 305 14 124 89 168 42 Black Caribbean 121 103 142 152 171 132 218 65 133 116 152 217 Black African 116 94 142 94 139 98 192 37 122 102 145 131 Other Black 186 144 238 65 305 189 466 21 206 165 254 86 Chinese 83 23 213 4 152 49 354 5 111 51 211 9 Other 87 54 134 21 152 79 266 12 103 71 145 33 Total 100 1953 100 1040 100 2993
Care Quality Commission Count me in census 2010 60
Appendix C Learning disability tables
Table C1 Standardised admission ratios by ethnic group for England and Wales using 2007 ONS population denominators (England amp Wales = 100) All ages
Ethnic group
Men Women Persons Standardised
admission ratio
95 confidence
interval Observed numbers
Standardised admission
ratio
95 confidence
interval Observed numbers
Standardised admission
ratio
95 confidence
interval Observed numbers
White British 104 100 109 2163 108 101 115 941 105 102 109 3104 White Irish 108 72 156 28 151 89 238 18 121 89 162 46 Other White 81 65 101 85 49 30 75 21 72 59 87 106 White and Black Caribbean 280 186 405 28 246 118 453 10 270 191 371 38 White and Black African 102 33 239 5 165 34 482 3 119 51 235 8 White and Asian 66 26 135 7 154 56 335 6 89 47 152 13 Other Mixed 181 104 295 16 229 99 451 8 195 125 290 24 Indian 32 21 48 24 28 12 55 8 31 21 44 32 Pakistani 48 30 72 22 12 1 43 2 38 25 57 24 Bangladeshi 102 60 161 18 31 4 113 2 83 51 128 20 Other Asian 33 13 69 7 92 34 201 6 47 25 81 13 Black Caribbean 265 210 332 77 117 67 190 16 218 176 267 93 Black African 53 33 80 22 40 15 87 6 50 33 72 28 Other Black 228 118 399 12 134 28 392 3 200 112 330 15 Chinese 4 0 21 1 3 0 16 1 Other 26 9 56 6 11 0 59 1 21 9 44 7 Total 100 2521 100 1051 100 3572
Care Quality Commission Count me in census 2010 61
Appendix C Learning disability tables continued
Table C2 Standardised detention ratios by ethnic group all detentions on day of admission (England and Wales = 100)
Ethnic group
Persons Standardised
detention ratio
95 confidence
interval Observed numbers
White British 97 93 103 1431 White Irish 127 84 184 28 Other White 117 91 149 68 White and Black Caribbean 120 77 179 24 White and Black African 114 37 267 5 White and Asian 75 24 176 5 Other Mixed 94 49 165 12 Indian 119 72 186 19 Pakistani 110 61 181 15 Bangladeshi 144 84 231 17 Other Asian 59 16 150 4 Black Caribbean 119 90 155 57 Black African 138 85 210 21 Other Black 62 20 145 5 Chinese 0 0 Other 104 28 267 4 Total 100 1715
Care Quality Commission Count me in census 2010 62
copy Care Quality Commission and National Mental Health Development Unit 2011 Published April 2011
This publication may be reproduced in whole or in part in any format or medium for non-commercial purposes provided that it is reproduced accurately and not used in a derogatory manner or in a misleading context The source should be acknowledged by showing the publication title and copy Care Quality Commission and National Mental Health Development Unit 2011
How to contact us
Phone 03000 616161 Email enquiriescqcorguk Web wwwcqcorguk
Write to us at Care Quality Commission National Correspondence Citygate Gallowgate Newcastle upon Tyne NE1 4PA
Please contact us if you would like a summary of this publication in other formats or languages
Registered office Care Quality Commission Finsbury Tower 103ndash105 Bunhill Row London EC1Y 8TG
- Count me in 2010
- About the Care Quality Commission
- Contents
- Summary
- National organisations coordinating the census
- Introduction
- Data methods of analysis and interpretation
- Results mental health
- A comparison between the 2005 baseline and the 2010 census
- Results learning disabilities
- Data in the future Moving beyond a one-day census
- Conclusions
- References
- Appendix A Methods of analysis
- Appendix B Mental health tables
- Appendix C Learning disability tables
- How to contact us
-

Appendix B Mental health tables continued
Table B7 Standardised detention ratios by ethnic group detention on day of admission ndash section 2 of the Mental Health Act (England and Wales = 100)
Ethnic group
Men Women Persons Standardised
detention ratio
95 confidence
interval Observed numbers
Standardised detention
ratio
95 confidence
interval Observed numbers
Standardised detention
ratio
95 confidence
interval Observed numbers
White British 97 91 102 1156 93 87 98 1133 95 91 99 2289 White Irish 78 47 120 20 116 79 166 30 97 72 128 50 Other White 100 78 126 70 134 108 166 88 116 99 136 158 White and Black Caribbean 55 30 93 14 60 24 124 7 57 35 87 21 White and Black African 91 37 188 7 150 60 308 7 113 62 190 14 White and Asian 80 29 174 6 119 44 258 6 96 49 167 12 Other Mixed 68 28 141 7 116 53 221 9 89 51 145 16 Indian 130 91 179 37 124 81 182 26 127 98 163 63 Pakistani 126 87 176 34 138 79 225 16 130 96 171 50 Bangladeshi 166 101 256 20 140 61 276 8 158 105 228 28 Other Asian 142 93 209 26 163 93 264 16 150 108 202 42 Black Caribbean 73 57 92 70 97 72 128 51 82 68 98 121 Black African 164 131 202 87 190 146 244 62 174 147 204 149 Other Black 114 75 166 27 140 72 245 12 121 86 165 39 Chinese 165 60 358 6 212 97 402 9 190 106 313 15 Other 218 153 302 36 179 108 280 19 203 153 264 55 Total 100 1623 100 1499 100 3122
Care Quality Commission Count me in census 2010 55
Appendix B Mental health tables continued
Table B8 Standardised detention ratios by ethnic group detention on day of admission ndash section 3 of the Mental Health Act (England and Wales = 100)
Ethnic group
Men Women Persons Standardised
detention ratio
95 confidence
interval Observed numbers
Standardised detention
ratio
95 confidence
interval Observed numbers
Standardised detention
ratio
95 confidence
interval Observed numbers
White British 99 95 103 2684 96 91 100 1852 98 95 101 4536 White Irish 116 89 149 60 135 101 177 52 124 102 149 112 Other White 112 96 129 186 110 92 132 121 111 99 124 307 White and Black Caribbean 114 91 143 79 130 90 183 33 119 98 143 112 White and Black African 97 60 148 21 107 54 192 11 100 69 141 32 White and Asian 84 50 133 18 97 48 173 11 89 59 127 29 Other Mixed 121 84 168 35 117 72 181 20 120 90 156 55 Indian 96 75 122 67 110 79 148 42 101 83 122 109 Pakistani 91 71 115 69 88 55 134 22 90 73 111 91 Bangladeshi 63 39 95 22 64 28 127 8 63 43 90 30 Other Asian 90 65 120 44 94 56 149 18 91 70 117 62 Black Caribbean 116 102 130 279 164 138 192 148 129 117 142 427 Black African 95 80 112 143 102 79 129 68 97 85 111 211 Other Black 75 55 99 49 99 58 159 17 80 62 102 66 Chinese 119 59 213 11 99 43 194 8 110 66 171 19 Other 85 60 116 38 84 48 136 16 84 63 110 54 Total 100 3805 100 2447 100 6252
Care Quality Commission Count me in census 2010 56
Appendix B Mental health tables continued
Table B9 Standardised detention ratios by ethnic group detention on day of admission ndash section 3741 of the Mental Health Act (England and Wales = 100)
Ethnic group
Men Women Persons Standardised
detention ratio
95 confidence
interval Observed numbers
Standardised detention
ratio
95 confidence
interval Observed numbers
Standardised detention
ratio
95 confidence
interval Observed numbers
White British 84 79 89 991 101 88 115 220 86 82 91 1211 White Irish 140 96 198 32 48 6 175 2 126 87 176 34 Other White 112 89 139 81 156 95 241 20 118 96 144 101 White and Black Caribbean 177 133 232 53 179 66 390 6 178 135 229 59 White and Black African 149 82 251 14 224 46 654 3 159 92 254 17 White and Asian 141 75 241 13 195 40 569 3 149 85 241 16 Other Mixed 144 85 227 18 264 97 575 6 162 104 242 24 Indian 86 56 126 26 44 5 160 2 80 53 116 28 Pakistani 122 87 166 40 0 0 111 79 152 40 Bangladeshi 66 32 122 10 0 0 60 29 110 10 Other Asian 99 61 151 21 0 0 89 55 136 21 Black Caribbean 200 174 229 210 78 34 153 8 189 165 216 218 Black African 127 101 157 82 84 34 172 7 122 98 150 89 Other Black 152 110 205 43 94 11 341 2 148 108 198 45 Chinese 100 27 255 4 0 0 80 22 204 4 Other 118 75 177 23 44 1 245 1 110 71 164 24 Total 100 1661 100 280 100 1941
Care Quality Commission Count me in census 2010 57
Appendix B Mental health tables continued
Table B10 Standardised detention ratios by ethnic group detention on day of admission ndash sections 47 48 4749 of the Mental Health Act (England and Wales = 100)
Ethnic group
Men Women Persons Standardised
detention ratio
95 confidence
interval Observed numbers
Standardised detention
ratio
95 confidence
interval Observed numbers
Standardised detention
ratio
95 confidence
interval Observed numbers
White British 97 90 106 583 104 81 131 73 98 91 106 656 White Irish 132 72 221 14 163 20 590 2 135 77 219 16 Other White 130 96 172 49 71 15 206 3 124 93 163 52 White and Black Caribbean 126 78 193 21 80 2 444 1 123 77 186 22 White and Black African 207 103 370 11 0 0 189 95 339 11 White and Asian 57 12 166 3 169 4 941 1 68 19 175 4 Other Mixed 112 48 221 8 233 28 843 2 125 60 230 10 Indian 57 26 108 9 0 252 0 52 24 99 9 Pakistani 92 54 147 17 0 314 0 86 50 138 17 Bangladeshi 46 12 117 4 167 4 930 1 53 17 125 5 Other Asian 101 52 177 12 0 0 95 49 166 12 Black Caribbean 126 98 159 70 125 34 319 4 126 99 158 74 Black African 74 48 107 27 104 21 303 3 76 51 108 30 Other Black 127 78 197 20 138 3 769 1 128 79 195 21 Chinese 0 0 0 0 0 0 Other 83 38 157 9 0 0 77 35 147 9 Total 100 857 100 91 100 948
Care Quality Commission Count me in census 2010 58
Appendix B Mental health tables continued
Table B11 Standardised ratios for all applications of the Mental Health Act (including outpatients on a CTO) by ethnic group on day of census (England and Wales = 100)
Ethnic group
Men Women Persons Standardised
ratio for all MHA
applications
95 confidence
interval Observed numbers
Standardised ratio for all MHA
applications
95 confidence
interval Observed numbers
Standardised ratio for all MHA
applications
95 confidence
interval Observed numbers
White British 97 94 99 7659 95 93 98 4335 96 94 98 11994 White Irish 99 83 116 147 104 84 128 95 101 89 114 242 Other White 87 79 95 427 97 85 110 249 90 84 97 676 White and Black Caribbean 117 103 133 245 130 103 163 76 120 107 134 321 White and Black African 120 95 150 79 93 58 141 22 113 92 137 101 White and Asian 101 78 128 65 119 81 169 31 106 86 129 96 Other Mixed 110 89 134 96 125 93 165 49 114 97 135 145 Indian 103 90 118 215 122 100 147 109 109 97 121 324 Pakistani 111 97 125 254 117 90 148 67 112 100 125 321 Bangladeshi 92 75 112 97 101 68 145 29 94 78 112 126 Other Asian 103 88 121 152 126 95 164 56 109 94 124 208 Black Caribbean 123 115 131 893 141 126 158 300 127 120 134 1193 Black African 112 103 122 511 121 104 140 188 114 106 123 699 Other Black 116 102 132 232 148 112 191 59 122 108 136 291 Chinese 97 64 140 27 101 61 157 19 98 72 131 46 Other 104 87 122 140 103 75 137 46 103 89 119 186 Total 100 11239 100 5730 100 16969
Care Quality Commission Count me in census 2010 59
Appendix B Mental health tables continued
Table B12 Standardised CTO ratios by ethnic group CTOs on day of census ndash section 17a of the Mental Health Act (England and Wales = 100)
Ethnic group
Men Women Persons
Standardised CTO ratio
95 confidence
interval Observed numbers
Standardised CTO ratio
95 confidence
interval Observed numbers
Standardised CTO ratio
95 confidence
interval Observed numbers
White British 94 89 99 1289 88 82 94 730 92 88 96 2019 White Irish 51 27 88 13 77 41 132 13 62 40 90 26 Other White 97 77 120 83 125 95 162 58 107 90 126 141 White and Black Caribbean 79 53 113 29 141 77 237 14 92 67 124 43 White and Black African 111 59 190 13 125 41 292 5 115 68 181 18 White and Asian 104 54 182 12 136 50 297 6 113 67 178 18 Other Mixed 102 59 166 16 136 62 257 9 112 73 166 25 Indian 134 99 177 48 152 98 226 24 139 109 175 72 Pakistani 145 110 187 59 174 101 279 17 151 119 189 76 Bangladeshi 142 93 206 27 205 99 378 10 155 109 213 37 Other Asian 107 71 155 28 182 99 305 14 124 89 168 42 Black Caribbean 121 103 142 152 171 132 218 65 133 116 152 217 Black African 116 94 142 94 139 98 192 37 122 102 145 131 Other Black 186 144 238 65 305 189 466 21 206 165 254 86 Chinese 83 23 213 4 152 49 354 5 111 51 211 9 Other 87 54 134 21 152 79 266 12 103 71 145 33 Total 100 1953 100 1040 100 2993
Care Quality Commission Count me in census 2010 60
Appendix C Learning disability tables
Table C1 Standardised admission ratios by ethnic group for England and Wales using 2007 ONS population denominators (England amp Wales = 100) All ages
Ethnic group
Men Women Persons Standardised
admission ratio
95 confidence
interval Observed numbers
Standardised admission
ratio
95 confidence
interval Observed numbers
Standardised admission
ratio
95 confidence
interval Observed numbers
White British 104 100 109 2163 108 101 115 941 105 102 109 3104 White Irish 108 72 156 28 151 89 238 18 121 89 162 46 Other White 81 65 101 85 49 30 75 21 72 59 87 106 White and Black Caribbean 280 186 405 28 246 118 453 10 270 191 371 38 White and Black African 102 33 239 5 165 34 482 3 119 51 235 8 White and Asian 66 26 135 7 154 56 335 6 89 47 152 13 Other Mixed 181 104 295 16 229 99 451 8 195 125 290 24 Indian 32 21 48 24 28 12 55 8 31 21 44 32 Pakistani 48 30 72 22 12 1 43 2 38 25 57 24 Bangladeshi 102 60 161 18 31 4 113 2 83 51 128 20 Other Asian 33 13 69 7 92 34 201 6 47 25 81 13 Black Caribbean 265 210 332 77 117 67 190 16 218 176 267 93 Black African 53 33 80 22 40 15 87 6 50 33 72 28 Other Black 228 118 399 12 134 28 392 3 200 112 330 15 Chinese 4 0 21 1 3 0 16 1 Other 26 9 56 6 11 0 59 1 21 9 44 7 Total 100 2521 100 1051 100 3572
Care Quality Commission Count me in census 2010 61
Appendix C Learning disability tables continued
Table C2 Standardised detention ratios by ethnic group all detentions on day of admission (England and Wales = 100)
Ethnic group
Persons Standardised
detention ratio
95 confidence
interval Observed numbers
White British 97 93 103 1431 White Irish 127 84 184 28 Other White 117 91 149 68 White and Black Caribbean 120 77 179 24 White and Black African 114 37 267 5 White and Asian 75 24 176 5 Other Mixed 94 49 165 12 Indian 119 72 186 19 Pakistani 110 61 181 15 Bangladeshi 144 84 231 17 Other Asian 59 16 150 4 Black Caribbean 119 90 155 57 Black African 138 85 210 21 Other Black 62 20 145 5 Chinese 0 0 Other 104 28 267 4 Total 100 1715
Care Quality Commission Count me in census 2010 62
copy Care Quality Commission and National Mental Health Development Unit 2011 Published April 2011
This publication may be reproduced in whole or in part in any format or medium for non-commercial purposes provided that it is reproduced accurately and not used in a derogatory manner or in a misleading context The source should be acknowledged by showing the publication title and copy Care Quality Commission and National Mental Health Development Unit 2011
How to contact us
Phone 03000 616161 Email enquiriescqcorguk Web wwwcqcorguk
Write to us at Care Quality Commission National Correspondence Citygate Gallowgate Newcastle upon Tyne NE1 4PA
Please contact us if you would like a summary of this publication in other formats or languages
Registered office Care Quality Commission Finsbury Tower 103ndash105 Bunhill Row London EC1Y 8TG
- Count me in 2010
- About the Care Quality Commission
- Contents
- Summary
- National organisations coordinating the census
- Introduction
- Data methods of analysis and interpretation
- Results mental health
- A comparison between the 2005 baseline and the 2010 census
- Results learning disabilities
- Data in the future Moving beyond a one-day census
- Conclusions
- References
- Appendix A Methods of analysis
- Appendix B Mental health tables
- Appendix C Learning disability tables
- How to contact us
-
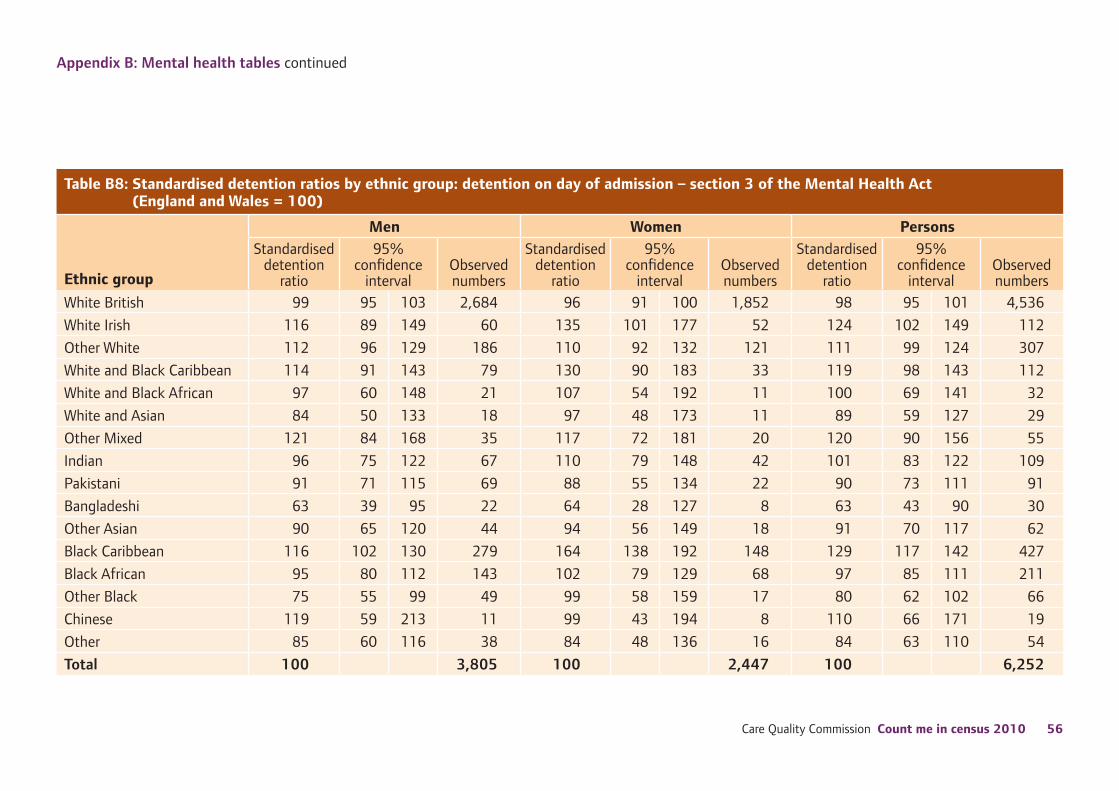
Appendix B Mental health tables continued
Table B12 Standardised CTO ratios by ethnic group CTOs on day of census ndash section 17a of the Mental Health Act (England and Wales = 100)
Ethnic group
Men Women Persons
Standardised CTO ratio
95 confidence
interval Observed numbers
Standardised CTO ratio
95 confidence
interval Observed numbers
Standardised CTO ratio
95 confidence
interval Observed numbers
White British 94 89 99 1289 88 82 94 730 92 88 96 2019 White Irish 51 27 88 13 77 41 132 13 62 40 90 26 Other White 97 77 120 83 125 95 162 58 107 90 126 141 White and Black Caribbean 79 53 113 29 141 77 237 14 92 67 124 43 White and Black African 111 59 190 13 125 41 292 5 115 68 181 18 White and Asian 104 54 182 12 136 50 297 6 113 67 178 18 Other Mixed 102 59 166 16 136 62 257 9 112 73 166 25 Indian 134 99 177 48 152 98 226 24 139 109 175 72 Pakistani 145 110 187 59 174 101 279 17 151 119 189 76 Bangladeshi 142 93 206 27 205 99 378 10 155 109 213 37 Other Asian 107 71 155 28 182 99 305 14 124 89 168 42 Black Caribbean 121 103 142 152 171 132 218 65 133 116 152 217 Black African 116 94 142 94 139 98 192 37 122 102 145 131 Other Black 186 144 238 65 305 189 466 21 206 165 254 86 Chinese 83 23 213 4 152 49 354 5 111 51 211 9 Other 87 54 134 21 152 79 266 12 103 71 145 33 Total 100 1953 100 1040 100 2993
Care Quality Commission Count me in census 2010 60
Appendix C Learning disability tables
Table C1 Standardised admission ratios by ethnic group for England and Wales using 2007 ONS population denominators (England amp Wales = 100) All ages
Ethnic group
Men Women Persons Standardised
admission ratio
95 confidence
interval Observed numbers
Standardised admission
ratio
95 confidence
interval Observed numbers
Standardised admission
ratio
95 confidence
interval Observed numbers
White British 104 100 109 2163 108 101 115 941 105 102 109 3104 White Irish 108 72 156 28 151 89 238 18 121 89 162 46 Other White 81 65 101 85 49 30 75 21 72 59 87 106 White and Black Caribbean 280 186 405 28 246 118 453 10 270 191 371 38 White and Black African 102 33 239 5 165 34 482 3 119 51 235 8 White and Asian 66 26 135 7 154 56 335 6 89 47 152 13 Other Mixed 181 104 295 16 229 99 451 8 195 125 290 24 Indian 32 21 48 24 28 12 55 8 31 21 44 32 Pakistani 48 30 72 22 12 1 43 2 38 25 57 24 Bangladeshi 102 60 161 18 31 4 113 2 83 51 128 20 Other Asian 33 13 69 7 92 34 201 6 47 25 81 13 Black Caribbean 265 210 332 77 117 67 190 16 218 176 267 93 Black African 53 33 80 22 40 15 87 6 50 33 72 28 Other Black 228 118 399 12 134 28 392 3 200 112 330 15 Chinese 4 0 21 1 3 0 16 1 Other 26 9 56 6 11 0 59 1 21 9 44 7 Total 100 2521 100 1051 100 3572
Care Quality Commission Count me in census 2010 61
Appendix C Learning disability tables continued
Table C2 Standardised detention ratios by ethnic group all detentions on day of admission (England and Wales = 100)
Ethnic group
Persons Standardised
detention ratio
95 confidence
interval Observed numbers
White British 97 93 103 1431 White Irish 127 84 184 28 Other White 117 91 149 68 White and Black Caribbean 120 77 179 24 White and Black African 114 37 267 5 White and Asian 75 24 176 5 Other Mixed 94 49 165 12 Indian 119 72 186 19 Pakistani 110 61 181 15 Bangladeshi 144 84 231 17 Other Asian 59 16 150 4 Black Caribbean 119 90 155 57 Black African 138 85 210 21 Other Black 62 20 145 5 Chinese 0 0 Other 104 28 267 4 Total 100 1715
Care Quality Commission Count me in census 2010 62
copy Care Quality Commission and National Mental Health Development Unit 2011 Published April 2011
This publication may be reproduced in whole or in part in any format or medium for non-commercial purposes provided that it is reproduced accurately and not used in a derogatory manner or in a misleading context The source should be acknowledged by showing the publication title and copy Care Quality Commission and National Mental Health Development Unit 2011
How to contact us
Phone 03000 616161 Email enquiriescqcorguk Web wwwcqcorguk
Write to us at Care Quality Commission National Correspondence Citygate Gallowgate Newcastle upon Tyne NE1 4PA
Please contact us if you would like a summary of this publication in other formats or languages
Registered office Care Quality Commission Finsbury Tower 103ndash105 Bunhill Row London EC1Y 8TG
- Count me in 2010
- About the Care Quality Commission
- Contents
- Summary
- National organisations coordinating the census
- Introduction
- Data methods of analysis and interpretation
- Results mental health
- A comparison between the 2005 baseline and the 2010 census
- Results learning disabilities
- Data in the future Moving beyond a one-day census
- Conclusions
- References
- Appendix A Methods of analysis
- Appendix B Mental health tables
- Appendix C Learning disability tables
- How to contact us
-